OMB APPROVAL
OMB Number: 3235-0570
Expires: September 30, 2007
Estimated average burden hours per response: 19.3
UNITED STATES
SECURITIES AND EXCHANGE COMMISSION
Washington, D.C. 20549
FORM N-CSR
CERTIFIED SHAREHOLDER REPORT OF
REGISTERED MANAGEMENT INVESTMENT COMPANIES
Investment Company Act file number: 811-8319
ING Partners, Inc.
(Exact name of registrant as specified in charter)
7337 E. Doubletree Ranch Rd., Scottsdale, AZ | | 85258 |
(Address of principal executive offices) | | (Zip code) |
The Corporation Trust Company, 1209 Orange Street, Wilmington, DE 19801
(Name and address of agent for service)
Registrant’s telephone number, including area code: 1-800-992-0180
Date of fiscal year end: | December 31 |
| |
Date of reporting period: | January 1, 2006 to December 31, 2006 |
Item 1. Reports to Stockholders.
The following is a copy of the report transmitted to stockholders pursuant to Rule 30e-1 under the Act (17 CFR 270.30e-1):

Funds
Annual Report
December 31, 2006
Classes I, S and ADV
ING Partners, Inc.
n ING American Century Large Company Value Portfolio
n ING American Century Select Portfolio
n ING American Century Small-Mid Cap Value Portfolio (formerly, ING American Century Small Cap Value Portfolio)
n ING Baron Asset Portfolio
n ING Baron Small Cap Growth Portfolio
n ING Columbia Small Cap Value II Portfolio
n ING Davis Venture Value Portfolio
n ING Fundamental Research Portfolio
n ING Goldman Sachs® Capital Growth Portfolio
n ING Goldman Sachs® Structured Equity Portfolio (formerly, ING Goldman Sachs® Core Equity Portfolio)
n ING JPMorgan International Portfolio
n ING JPMorgan Mid Cap Value Portfolio
n ING Legg Mason Partners Aggressive Growth Portfolio (formerly, ING Salomon Brothers Aggressive Growth Portfolio)
n ING Legg Mason Partners Large Cap Growth Portfolio (formerly, ING Salomon Brothers Large Cap Growth Portfolio)
n ING Lord Abbett U.S. Government Securities Portfolio
n ING Neuberger Berman Partners Portfolio
n ING Neuberger Berman Regency Portfolio
n ING OpCap Balanced Value Portfolio
n ING Oppenheimer Global Portfolio
n ING Oppenheimer Strategic Income Portfolio
n ING PIMCO Total Return Portfolio
n ING Pioneer High Yield Portfolio
n ING T. Rowe Price Diversified Mid Cap Growth Portfolio
n ING T. Rowe Price Growth Equity Portfolio
n ING Templeton Foreign Equity Portfolio
n ING Thornburg Value Portfolio
(formerly, ING MFS Capital Opportunities Portfolio)
n ING UBS U.S. Large Cap Equity Portfolio
n ING UBS U.S. Small Cap Growth Portfolio
n ING Van Kampen Comstock Portfolio
n ING Van Kampen Equity and Income Portfolio
This report is submitted for general information to shareholders of the ING Funds. It is not authorized for distribution to prospective shareholders unless accompanied or preceded by a prospectus which includes details regarding the funds' investment objectives, risks, charges, expenses and other information. This information should be read carefully.

TABLE OF CONTENTS
| President's Letter | | | 1 | | |
|
| Market Perspective | | | 2 | | |
|
| Portfolio Managers' Reports | | | 4 | | |
|
| Shareholder Expense Examples | | | 64 | | |
|
| Report of Independent Registered Public Accounting Firm | | | 73 | | |
|
| Statements of Assets and Liabilities | | | 74 | | |
|
| Statements of Operations | | | 84 | | |
|
| Statements of Changes in Net Assets | | | 92 | | |
|
| Financial Highlights | | | 107 | | |
|
| Notes to Financial Statements | | | 158 | | |
|
| Portfolios of Investments | | | 186 | | |
|
| Tax Information | | | 297 | | |
|
| Director and Officer Information | | | 300 | | |
|
| Shareholder Meeting Information | | | 304 | | |
|
| Advisory Contract Approval Discussion | | | 305 | | |
|
PROXY VOTING INFORMATION
A description of the policies and procedures that the Portfolios use to determine how to vote proxies related to portfolio securities is available (1) without charge, upon request, by calling Shareholder Services toll-free at 1-800-992-0180; (2) on the ING Funds' website at www.ingfunds.com; and (3) on the SEC's website at www.sec.gov. Information regarding how the Portfolios voted proxies related to portfolio securities during the most recent 12-month period ended June 30 is available without charge on the ING Funds' website at www.ingfunds.com and on the SEC's website at www.sec.gov.
QUARTERLY PORTFOLIO HOLDINGS
The Portfolios file their complete schedule of portfolio holdings with the SEC for the first and third quarters of each fiscal year on Form N-Q. The Portfolios' Forms N-Q are available on the SEC's website at www.sec.gov. The Portfolios' Forms N-Q may be reviewed and copied at the SEC's Public Reference Room in Washington, DC, and information on the operation of the Public Reference Room may be obtained by calling 1-800-SEC-0330; and is available upon request from the Portfolios by calling Shareholder Services toll-free at 1-800-992-0180.
(THIS PAGE INTENTIONALLY LEFT BLANK)
PRESIDENT'S LETTER

Dear Shareholder,
In its recent meetings, the U.S. Federal Reserve Board (the "Fed") ceased what was a two-year trend. That trend — a string of 17 consecutive interest rate hikes that ended last fall — was seen by many analysts as a sign that the Fed was concerned about containing inflation.
Now, the Fed is neither raising nor lowering interest rates, which puts us in the midst of what economists refer to as a "plateau." Historically, there have been six similar plateaus since 1982 and during four of those periods the Standard & Poor's 500® Composite Stock Price Index(1) ("S&P 500® Index") rose significantly.
Of course, the Fed's actions impact economies and market performance around the world. For instance, the current interest rate climate has been cited as one reason for a decline in the value of the dollar. Last year, that drop in the dollar meant that international stocks — which are often determined in foreign currencies — generally experienced strong performance as foreign currencies climbed and world stock markets continued to produce strong results.
Meanwhile, here at home, 2006 was an interesting year for equity investors. In May of 2006, the S&P 500® Index hit a five-year high followed by a market correction and several months of non-directional returns. A strong rally occurred in the second half of the year driven in part by the aforementioned dollar decline and the interest rate plateau. The good news is many economists believe that these conditions may continue in the months to come.
At ING Funds, we are committed to providing you, the investor, with an array of investment choices that enables you to build a diversified portfolio across a variety of asset classes. We do so, with a view that the globalization of markets is an initial consideration in the products we offer.
We take the confidence you place in us with your investments very seriously — everyone in our firm is committed to renewing this trust each and every day.

Shaun Mathews
President
ING Funds
January 31, 2007
The views expressed in the President's Letter reflect those of the President as of the date of the letter. Any such views are subject to change at any time based upon market or other conditions and ING Funds disclaims any responsibility to update such views. These views may not be relied on as investment advice and because investment decisions for an ING Fund are based on numerous factors, may not be relied on as an indication of investment intent on behalf of any ING Fund. Reference to specific company securities should not be construed as recommendations or investment advice.
(1) The S&P 500® Index is an unmanaged index that measures the performance of the securities of approximately 500 of the largest companies in the U.S.
1
MARKET PERSPECTIVE: YEAR ENDED DECEMBER 31, 2006
In our semi-annual report, we described how the feast of the first quarter had turned to famine in the second quarter for global equity markets on concerns that rising interest rates would freeze out global growth. Indeed as late as June 27, 2006, the year-to-date return on the Morgan Stanley Capital International ("MSCI") World IndexSM(1) measured in local currencies, including net reinvested dividends had been precisely 0%. However, the second half of the year ended December 31, 2006, was much healthier and the same index powered ahead 12.3% and for the year ended December 31, 2006, returned 20.07%. The return to dollar based in vestors was a little better at 13.2%, as late in the year a slowing economy and hints that central banks would be diversifying out of dollars weighed on that currency. For the six months ended December 31, 2006, the dollar fell 3.1% against the euro and 5.6% against the pound, but gained 4.1% on the yen due to stumbling growth and miniscule interest rates in Japan. For the year ended December 31, 2006, the dollar fell 10.6% against the euro and 12.4% against the pound, but gained 1.3% against the yen.
As the first half of 2006 ended, the Federal Open Market Committee ("FOMC") had just raised the federal funds rate for the seventeenth time since June 2004, to 5.25%. The relatively mild accompanying language led many in the fixed income market to hope that the tightening cycle was now over. Not everyone believed it, especially when new Middle East conflict pushed the price of oil to another record on July 14, 2006. But data, especially on housing, had mostly pointed to cooling demand and a tame employment report on August 4, 2006 probably decided the matter. Four days later the FOMC met and left rates unchanged. The booming housing market had been a powerful driver of growth in recent years through new construction and demand created by mortgage loan refinancing. This boom was deteriorating a ppreciably with housing prices and the key new building permits measure falling sharply. Only in the last few days of 2006 did the slump show some signs of bottoming out with unexpectedly good new and existing home sales figures reported, along with rebounding consumer confidence. For the six months ended December 31, 2006, the Lehman Brothers® Aggregate Bond ("LBAB") Index(2) of investment grade bonds gained 5.09% and for the year ended December 31, 2006 it gained 4.33%. The most important dynamic was the broad yield curve inversion, suggestive of an expected fall in interest rates and a further economic slow down. The ten-year Treasury yield fell 43 basis points (0.43%) to 4.71%, while the yield on the three-month Bill rose by 3 basis points (0.03%) to 4.89%. Since mid-August, with the exception of two days, bond investors had been prepare d to lend money to the government for ten years at a lower interest rate than for three months.
Faced with fading business activity, as the key housing engine seized up, and a yield curve inverted to the point of recession according to some commentators, investors in U.S. equities must have been in the mood to sell. Not so fast. Those investors saw things differently and indeed the apparent "disagreement" between the bond market and global stock markets was a well discussed feature of the second half of the year. For one thing, the oil price, having hit its record, fell back, as surly calm returned to the Middle East, as the summer driving and hurricane seasons came and went and as winter got off to a mild start in the key North East region. The price of oil averaged 22% less in the fourth quarter than at its peak, boosting consumers' spending power and confidence. And if longer-term int erest rates were falling then stocks looked more attractive as bonds provided less competition and the present value of future corporate profits rose. Speaking of which, Standard & Poor's 500® Composite Stock Price ("S&P 500®") Index(3) companies duly reported their 13th straight double-digit quarterly percentage earnings gain. Gross domestic product ("GDP") growth may have slowed, but the share of corporate profits, reported at 12.4%, was the highest since the 1950's. The next merger or acquisition to get investors in the mood never seemed far away. Five of them were even announced in one day on November 6, 2006, sending markets up about 1%. For the six months ended December 31, 2006, the S&P 500® Index, including dividends, rose 12.7% and for the year ended December 31, 2006, the S&P 500&r eg; Index, including dividends, rose 15.8%. All but 30 basis points (0.30%) of the gain came after August 8, 2006, making six-year highs as the year ended.
International markets, based on MSCI local currency indices, as in the U.S., finished near their best levels for the year. In Japan the market advanced 8.7%, in 2006, after a late surge. The long awaited increase in interest rates from 0.0% to 0.25% took place in July just as the economic recovery was losing impetus. Third quarter growth was estimated at only 0.8% and generated by exports and capital spending alone. Consumer spending was lagging despite low
2
MARKET PERSPECTIVE: YEAR ENDED DECEMBER 31, 2006
unemployment and almost flat prices, yet business confidence remained high and profit growth healthy. Elsewhere, Asian markets ex Japan rose 28.2% in 2006, but with wide disparities, ranging from –2.0% in Thailand to 83.4% in China. In Thailand the uncertainty caused by a military coup was compounded when the junta imposed exchange controls to hold back the strong baht, only to rescind them the next day. China's market soared in surely speculative excess, and in the absence of attractive alternatives, as investors sought a piece of the world's fourth largest economy. By the end of 2006 the Chinese market had become the third biggest emerging market after South Korea and Taiwan. European ex UK markets surged 16.1%, in 2006. The Eurozone's GDP growth had recorded its best first half of a year since 2000, 1.7%, and the lowest unemployment rate, 7.8%, since the start of the Eurozone itself. But as the second half of 2006, wore on there were signs that the best news was behind it and the third quarter's annualized growth fell to 2.0%. Business confidence, however, stayed buoyant and cheered by extensive merger and acquisition activity despite headwinds in the form of a strengthening euro, a hawkish European Central Bank that raised rates three times and the looming rise in German sales tax. UK equities added 8.6% in the six months ended December 31, 2006. The Bank of England raised rates twice as GDP growth accelerated to 2.9% year over year, inflation climbed above target and house prices, an import ant demand generator, continued their recovery with average prices up more than 10% in 2006. Again, however, it was widespread, large scale mergers and acquisitions energizing the market.
(1) The MSCI World IndexSM is an unmanaged index that measures the performance of over 1,400 securities listed on exchanges in the U.S., Europe, Canada, Australia, New Zealand and the Far East.
(2) The LBAB Index is a widely recognized, unmanaged index of publicly issued investment grade U.S. Government, mortgage-backed, asset-backed and corporate debt securities.
(3) The S&P 500® Index is an unmanaged index that measures the performance of the securities of approximately 500 of the largest companies in the U.S.
All indices are unmanaged and investors cannot invest directly in an index.
Past performance does not guarantee future results. The performance quoted represents past performance. Investment return and principal value of an investment will fluctuate, and shares, when redeemed, may be worth more or less than their original cost. The Portfolios' performance is subject to change since the period's end and may be lower or higher than the performance data shown. Please call (800) 992-0180 or log on to www.ingfunds.com to obtain performance data current to the most recent month end.
Market Perspective reflects the views of the Chief Investment Risk Officer only through the end of the period, and is subject to change based on market and other conditions.
3
ING AMERICAN CENTURY LARGE COMPANY VALUE PORTFOLIO
PORTFOLIO MANAGERS' REPORT
The ING American Century Large Company Value Portfolio (the "Portfolio") seeks long-term capital growth. Income is a secondary objective. The Portfolio is managed by a team of portfolio managers comprised of Charles A. Ritter, Vice President and Senior Portfolio Manager and Brendan Healy, Vice President and Portfolio Manager*, American Century Investment Management, Inc. — the Sub-Adviser.
Performance: For the year ended December 31, 2006, the Portfolio's Class S shares provided a total return of 19.30% compared to the Russell 1000® Value Index(1) and the Standard & Poor's 500 Composite Stock Price® Index(2) ("S&P 500 Index"), which returned 22.25% and 15.79%, respectively, for the same period.
Portfolio Specifics: Economic growth surged early in the 12-month period ended December 31, 2006. This in turn drove commodity prices, short-term interest rates, and inflation higher. But growth and inflation moderated in the period's second half, during which the U.S Federal Reserve Board ("Fed") halted its two-year string of interest rate hikes. The Fed's pause and expectations for lower interest rates and mild inflation going forward helped produce double-digit stock index returns for the 12-month fiscal period ended December 31.
In that environment, we received positive absolute contributions from each of the ten sectors in which we were invested, and all of our sector positions delivered double-digit returns. Nevertheless, for the fiscal year, security selection modestly slowed relative performance, causing the Portfolio to trail its benchmark by a slight margin.
Our investments in the financials sector, on average our largest single position, contributed the most to absolute performance during 2006. In a period marked by strong market performance, companies involved with the capital markets fared well overall. That was especially true for mega-cap commercial banks and for companies involved in investment banking such as Merrill Lynch & Co., Inc. and Morgan Stanley. However our zero weighting in Real Estate held back relative returns against the financials sector of the benchmark.
The energy sector also made a significant contribution to total return. We maintained a focus on international integrated oil and gas companies, which sport better valuations and are considered more defensive than their higher-beta, more aggressive cousins in the exploration and production industry. Earlier in the year, the latter group excelled, but in the second half, our patience was rewarded when oil and gas companies like the ones we own came to the market forefront. Major, integrated oil and gas companies, including ExxonMobil Corp. and Chevron Corp., were top performers.
The telecom sector was the market's best-performing area. After years of underperformance, stabilizing fundamentals among companies in the sector drove a strong reversal that made the group a rich source of absolute contribution. AT&T, Inc. and BellSouth Corp. were both top stocks. The acquisition of BellSouth Corp. by AT&T, Inc., a deal valued at $85 billion that will create the largest phone company in the United States, kept both stocks aloft.
While no sector detracted from absolute performance, we still encountered some individual challenges along the way. Chipmaker Intel Corp., saw its shares fall sharply early in the year after announcing robust earnings and revenue growth that nevertheless fell short of heightened expectations.
Elsewhere in the information technology sector, our stake in the computers & peripherals industry was rewarding. We held only one stock, and it was a top contributor. Hewlett Packard Co. is a good example of our price-sensitive discipline. It has long been a top performer, and as it has appreciated, we've gradually reduced our position.
From a relative perspective, stock selection in the consumer discretionary sector turned out to be a liability, and that group slowed performance against the benchmark the most. That was particularly true in the media industry, where a number of names performed well but did not meet our valuation criteria. Consequently, the Portfolio missed some of that performance. Unfavorable selection among multi-line retail firms also generated drag.
The top-detracting stock for the year on a relative basis was mortgage lender Freddie Mac. For much of the period, the stock struggled as delays in implementing new accounting systems raised regulatory scrutiny. The managers continue to have confidence in this firm's long-term prospects and have maintained the position.
Current Strategy & Outlook: The Portfolio is designed for investors seeking long-term capital growth who can tolerate relatively moderate share price fluctuation compared with volatility from more aggressive, growth-oriented investments. The Portfolio can serve as a solid core holding in a diversified portfolio, with the capability to outperform growth-oriented investments when the value discipline is more in favor, as it was for much of the reporting period.
As fundamental, bottom-up managers, we evaluate each company individually on its own merits, and build the Portfolio from the ground up, one stock at a time. In our search for companies that are undervalued, we will structure exposure to stocks and market segments as warranted based on the strength of individual companies.
Top Ten Holdings*
as of December 31, 2006
(as a percent of net assets)
| Citigroup, Inc. | | | 4.8 | % | |
| ExxonMobil Corp. | | | 4.7 | % | |
| Bank of America Corp. | | | 3.8 | % | |
| Chevron Corp. | | | 3.0 | % | |
| Freddie Mac | | | 2.8 | % | |
| Wells Fargo & Co. | | | 2.7 | % | |
| Royal Dutch Shell PLC ADR | | | 2.7 | % | |
| ConocoPhillips | | | 2.1 | % | |
| Pfizer, Inc. | | | 1.9 | % | |
| Morgan Stanley | | | 1.9 | % | |
* Excludes short-term investments related to securities lending collateral and U.S. government agency obligation.
Portfolio holdings are subject to change daily.
* Effective December 31, 2006, Mark Mallon retired as the portfolio manager to the Portfolio.
Portfolio holdings and characteristics are subject to change and may not be representative of current holdings and characteristics. The outlook for this Portfolio may differ from that presented for other ING Funds. Performance for the different classes of shares will vary based on differences in fees associated with each class.
4
PORTFOLIO MANAGERS' REPORT
ING AMERICAN CENTURY LARGE COMPANY VALUE PORTFOLIO
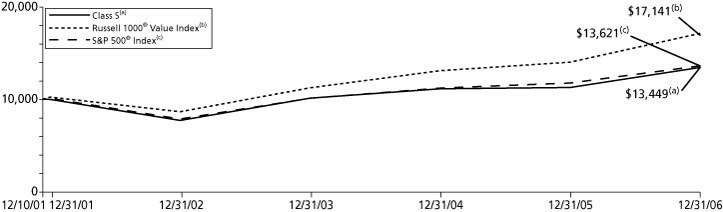
| Average Annual Total Returns for the Periods Ended December 31, 2006 | |
| | | 1 Year | | 5 Year | | Since Inception
of Classes I, S and ADV
December 10, 2001 | |
| Class I | | | 19.58 | % | | | 6.41 | % | | | 6.30 | % | |
| Class S | | | 19.30 | % | | | 6.14 | % | | | 6.03 | % | |
| Class ADV | | | 18.89 | % | | | 5.87 | % | | | 5.75 | % | |
| Russell 1000® Value Index(1) | | | 22.25 | % | | | 10.86 | % | | | 11.18 | %(3) | |
| S&P 500® Index(2) | | | 15.79 | % | | | 6.19 | % | | | 6.27 | %(3) | |
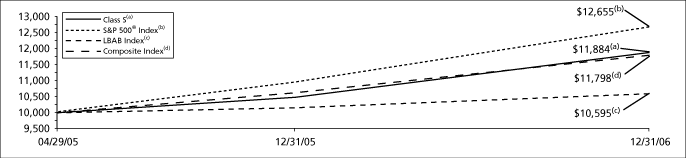
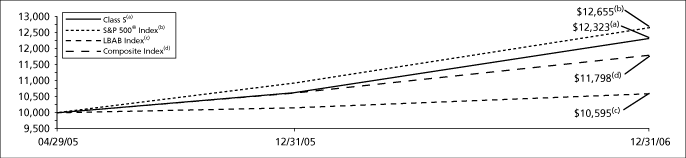
Based on a $10,000 initial investment, the graph and table above illustrate the total return of ING American Century Large Company Value Portfolio against the indices indicated. An index is unmanaged and has no cash in its portfolio, imposes no sales charges and incurs no operating expenses. An investor cannot invest directly in an index. The Portfolio's performance is shown without the imposition of any expenses or charges which are, or may be, imposed under your annuity contract. Total returns would have been lower if such expenses or charges were included.
The performance graph and table do not reflect the deduction of taxes that a shareholder will pay on portfolio distributions or the redemption of portfolio shares.
The performance shown may include the effect of fee waivers and/or expense reimbursements by the Investment Adviser and/or other service providers, which have the effect of increasing total return. Had all fees and expenses been considered, the total returns would have been lower.
The performance update illustrates performance for a variable investment option available through a variable annuity contract. The performance shown indicates past performance and is not a projection or prediction of future results. Actual investment returns and principal value will fluctuate so that shares and/or units, at redemption, may be worth more or less than their original cost. Please call (800) 262-3862 to get performance through the most recent month end.
This report contains statements that may be "forward-looking" statements. Actual results may differ materially from those projected in the "forward-looking" statements.
The views expressed in this report reflect those of the portfolio manager only through the end of the period as stated on the cover. The portfolio manager's views are subject to change at any time based on marked and other conditions.
Portfolio holdings are subject to change daily.
(1) The Russell 1000® Value Index is an unmanaged index that measures the performance of those Russell 1000® companies with lower price-to-book ratios and lower than forecasted growth values.
(2) The S&P 500® Index is an unmanaged index that measures the performance of the securities of approximately 500 of the largest companies in the U.S.
(3) Since inception performance of the index is shown as of December 1, 2001.
5
ING AMERICAN CENTURY SELECT PORTFOLIO
PORTFOLIO MANAGERS' REPORT
The ING American Century Select Portfolio (the "Portfolio") seeks long-term growth of capital. The Portfolio is managed by Keith Lee and Michael Li, Portfolio Managers of American Century Investment Management, Inc. — the Sub-Adviser.
Performance: For the year ended Dec. 31, 2006, the Portfolio's Class S shares provided a total return of (1.75)%, compared with the Russell 1000® Growth Index(1), which returned 9.07% for the same period.
Portfolio Specifics: U.S. stock markets surged in 2006 as the U.S. Federal Reserve Board halted its two-year string of interest rate hikes. Rising stock prices early in the year gave way to a mid-year slump amid fears that rising inflation would accompany a recession. Inflation moderated late in the year and the economy remained relatively strong. As a result, markets began rebounding in July and rallied through the end of the year.
In April 2006, Harold Bradley took over as lead portfolio manager of the Portfolio and enhanced the Portfolio's investment process to focus more heavily on stocks exhibiting classic growth and price momentum features. The timing of the process change proved poor.
Prior to the change, the market favored sectors — energy, industrials and materials — that the Portfolio generally avoided because those sectors, particularly energy, have a spotty record in producing returns on capital. While a focus on return on capital remains important in the Portfolio's process, Mr. Bradley steered the portfolio toward more growth and momentum-oriented stocks, enabling the Portfolio to better take advantage of hot areas of the market.
However, investors tended to avoid stocks with growth and momentum features after the mid-year market selloff, which sent the S&P 500 down 5.68% between the end of April and July 15. Even as the market rebounded in the third quarter of 2006, adverse conditions for growth and momentum investment factors persisted. With the new process, the portfolio likely will perform best when the market rewards growth and momentum factors. But it typically will not generate excess returns during market cycles when both factors rotate out of favor.
The Portfolio recovered in the fourth quarter of 2006, as its 6.90% return outpaced its benchmark by 20 basis points. But for the year as a whole, overweight stakes and poor security selection in both health care and energy accounted for the bulk of the Portfolio's significant relative underperformance, and nine of the Portfolio's 10 leading individual detractors came from those two sectors. Poor security selection in financials and consumer-oriented stocks further reduced relative returns.
Current Strategy and Outlook: The Portfolio's investment team will continue seeking companies with attractive valuations and risk/reward characteristics that also appear capable of sustaining long-term growth in earnings and revenue. Growth and momentum factors returned to favor somewhat in the fourth quarter of 2006, and the Portfolio's performance improved as a result. If that environment remains in place in early 2007, we believe the Portfolio should stand to benefit, particularly if the market rally intact at the end of 2006 also continues.
Effective January 5, 2007, Mr. Bradley was removed as portfolio manager as he has left American Century after 19 years with the firm to take over as chief investment officer of the Kansas City, Mo.-based Kauffman Foundation. Co-portfolio managers Keith Lee and Michael Li will remain in their current roles.
Portfolio holdings and characteristics are subject to change and may not be representative of current holdings and characteristics. The outlook for this Portfolio may differ from that presented for other ING Funds. Performance for the different classes of shares will vary based on differences in fees associated with each class.
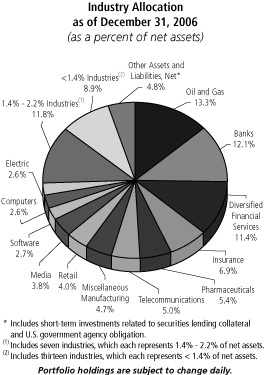
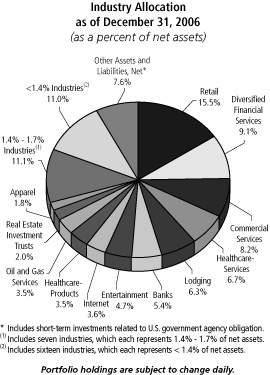
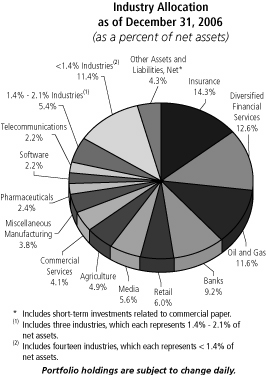
Industry Allocation
as of December 31, 2006
(as a percent of net assets) | |
| Software | | | 7.7 | % | |
| Healthcare-Products | | | 7.2 | % | |
| Insurance | | | 7.0 | % | |
| Diversified Financial Services | | | 5.5 | % | |
| Aerospace/Defense | | | 5.3 | % | |
| Semiconductors | | | 4.9 | % | |
| Lodging | | | 4.4 | % | |
| Oil & Gas | | | 4.4 | % | |
| Telecommunications | | | 4.1 | % | |
| Engineering & Construction | | | 4.0 | % | |
| Retail | | | 4.0 | % | |
| Media | | | 3.8 | % | |
| Industries between 2.6%-3.3%(1) | | | 17.5 | % | |
| Industries between 1.1%-2.4%(2) | | | 16.6 | % | |
| Industries less than 1.0%(3) | | | 3.6 | % | |
| Other Assets and Liabilities, Net* | | | 0.0 | % | |
| Net Assets | | | 100.0 | % | |
* Includes short-term investments related to securities lending collateral and U.S. government agency obligation.
(1) Includes six industries, which each represents 2.6% - 3.3% of net assets.
(2) Includes nine industries, which each represents 1.1% - 2.4% of net assets.
(3) Includes five industries, which each represents less than 1.0% of net assets.
Portfolio holdings are subject to change daily.
Top Ten Holdings*
as of December 31, 2006
(as a percent of net assets)
| MEMC Electronic Materials, Inc. | | | 3.1 | % | |
| ABB Ltd. ADR | | | 2.9 | % | |
| Loews Corp. | | | 2.8 | % | |
| Las Vegas Sands Corp. | | | 2.8 | % | |
| Baxter International, Inc. | | | 2.8 | % | |
| Diageo PLC | | | 2.6 | % | |
| Omnicom Group | | | 2.6 | % | |
| Cisco Systems, Inc. | | | 2.5 | % | |
| Infosys Technologies Ltd. ADR | | | 2.5 | % | |
| Microsoft Corp. | | | 2.4 | % | |
* Excludes short-term investments related to securities lending collateral.
Portfolio holdings are subject to change daily.
6
PORTFOLIO MANAGERS' REPORT
ING AMERICAN CENTURY SELECT PORTFOLIO
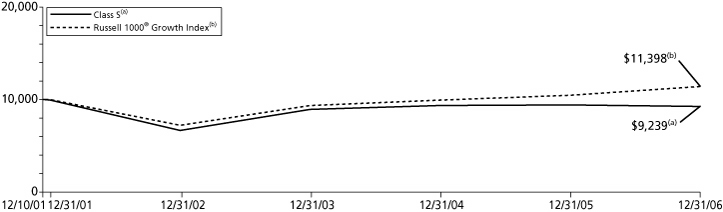
| Average Annual Total Returns for the Periods Ended December 31, 2006 | |
| | | 1 Year | | 5 Year | | Since Inception
of Classes I, S and ADV
December 10, 2001 | |
| Class I | | | (1.61 | )% | | | (1.17 | )% | | | (1.29 | )% | |
| Class S | | | (1.75 | )% | | | (1.43 | )% | | | (1.55 | )% | |
| Class ADV | | | (2.01 | )% | | | (1.67 | )% | | | (1.79 | )% | |
| Russell 1000® Growth Index(1) | | | 9.07 | % | | | 2.69 | % | | | 2.61 | %(2) | |
Based on a $10,000 initial investment, the graph and table above illustrate the total return of ING American Century Select Portfolio against the index indicated. An index is unmanaged and has no cash in its portfolio, imposes no sales charges and incurs no operating expenses. An investor cannot invest directly in an index. The Portfolio's performance is shown without the imposition of any expenses or charges which are, or may be, imposed under your annuity contract. Total returns would have been lower if such expenses or charges were included.
The performance graph and table do not reflect the deduction of taxes that a shareholder will pay on portfolio distributions or the redemption of portfolio shares.
The performance shown may include the effect of fee waivers and/or expense reimbursements by the Investment Adviser and/or other service providers, which have the effect of increasing total return. Had all fees and expenses been considered, the total returns would have been lower.
The performance update illustrates performance for a variable investment option available through a variable annuity contract. The performance shown indicates past performance and is not a projection or prediction of future results. Actual investment returns and principal value will fluctuate so that shares and/or units, at redemption, may be worth more or less than their original cost. Please call (800) 262-3862 to get performance through the most recent month end.
This report contains statements that may be "forward-looking" statements. Actual results may differ materially from those projected in the "forward-looking" statements.
The views expressed in this report reflect those of the portfolio manager only through the end of the period as stated on the cover. The portfolio manager's views are subject to change at any time based on marked and other conditions.
Portfolio holdings are subject to change daily.
(1) The Russell 1000® Growth Index is an index of common stocks designed to track performance of large capitalization companies with greater than average growth orientation.
(2) Since inception performance of the index is shown from December 1, 2001.
7
ING AMERICAN CENTURY SMALL-MID CAP VALUE PORTFOLIO
PORTFOLIO MANAGERS' REPORT
The ING American Century Small-Mid Cap Value Portfolio (the "Portfolio") seeks long-term capital growth, income is a secondary objective. The Portfolio is managed by a team of portfolio managers comprised of Benjamin Z. Giele, Steve Roth, Phillip N. Davidson, Scott A. Moore, and Michael Liss, Portfolio Managers* of American Century Investment Management, Inc. — the Sub-Adviser.
Performance: For the year ended December 31, 2006, the Portfolio's Class S shares provided a total return of 15.43% compared to the Russell 2500TM Value Index(1), Standard & Poor's ("S&P") SmallCap 600/CitigroupValue Index(2) and S&P Small Cap 600 Index(3) ("S&P 600 Index"), which returned 20.18%, 19.57% and 15.12%, respectively, for the same period.
Portfolio Specifics: Small-Cap Value- The Portfolio's small-cap value investment sleeve received positive absolute contributions from all ten of the sectors in which it was invested but fell short of the S&P SmallCap 600/Citigroup Value Index, results attributable primarily to unfavorable security selection in the consumer discretionary and the materials sectors.
Investments in the financials sector, on average our largest sector weighting, contributed the most to total return during the period. Real estate investment trusts ("REITs"), were the strongest performers, followed by capital markets firms. In the latter group, we held several names that advanced and were not represented in the benchmark, including Lazard Ltd., a top-contributing stock. However, a significant underweight overall in REITs proved costly to performance against the benchmark.
Finally, effective security selection made the information technology sector another rich source of contribution and yielded the top-contributing stock. During the year, long-time holding Sybase, an infrastructure and mobile applications software company, raised its profit outlook for 2007 and announced plans to buy Mobile 365, which will make Sybase the leader in mobile messaging and content delivery.
Despite these successes, we encountered some difficulties along the way. Stock selection proved unfavorable in the consumer discretionary sector, which weighed the most on relative performance. One holding from that group that fell short was specialty retailer Pier 1 Imports. Despite aggressive pricing and advertising campaigns, the company reported disappointing sales, recording losses amid tepid consumer response to new merchandising initiatives.
In addition, we also maintained an underweight position in the metals & mining industry, a momentum-driven area where a number of companies did not meet our valuation criteria and therefore did not merit inclusion in the Portfolio. Our relatively smaller exposure slowed performance relative to the benchmark in this area.
Mid-Cap Value — The Portfolio's mid-cap value investment sleeve received positive contributions from all ten sectors in which it was invested. A strategic weighting and stock selection among companies involved in consumer staples (particularly providers of food products), plus an effective mix of information technology businesses, contributed the most to the Portfolio's relative performance.
In consumer staples, the investment team was rewarded for its decision to own Diamond Foods Inc., a holding not found in the benchmark. Diamond is a specialty food company that focuses on culinary and snack nuts, such as walnuts, pine nuts, and peanuts. The leader in its category with a nearly 40% market share, Diamond is expanding its product line, with an emphasis on higher-margin products.
While the information technology sector was up as a whole for the period, communications equipment companies were down for the period. The investment team avoided that part of the sector entirely, which weighed on the benchmark's return. Similarly, an effective mix of semiconductor companies added to the Portfolio's progress; the industry turned in negative results for the Russell Midcap® Value Index.
On the down side, investments in the consumer discretionary sector represented the largest drag on performance against the Russell Midcap® Value Index. A case in point was the Portfolio's larger position in Dollar General Corp. Over much of the period, the discount retailer found its profits squeezed by markdowns, higher shrink (loss from theft) and gasoline prices that both raised transportation costs and slowed spending by consumers.
Elsewhere, in financials, an underweight position in REITs, which were up strongly during the period, restrained the Portfolio. Shares of REITs have surged during the past few years, and continued their march in 2006. As a result of their sustained upswing, few REITs fell within the Portfolio's valuation criteria.
Current Strategy & Outlook: As fundamental, bottom-up managers, we evaluate each company individually on its own merits, and build the Portfolio from the ground up, one stock at a time. In our search for companies that are undervalued, we will structure exposure to stocks and market segments as warranted based on the strength of individual companies.

Top Ten Holdings*
as of December 31, 2006
(as a percent of net assets) | |
| iShares Russell 2000 Value Index Fund | | | 2.5 | % | |
| iShares Russell 2000 Index Fund | | | 2.1 | % | |
| Sybase, Inc. | | | 1.6 | % | |
| Puget Energy, Inc. | | | 1.2 | % | |
| Minerals Technologies, Inc. | | | 1.2 | % | |
| WGL Holdings, Inc. | | | 1.1 | % | |
| Washington Federal, Inc. | | | 1.1 | % | |
| Platinum Underwriters Holdings Ltd. | | | 1.0 | % | |
| South Financial Group, Inc. | | | 1.0 | % | |
| Parametric Technology Corp. | | | 1.0 | % | |
* Excludes short-term investments related to securities lending collateral.
Portfolio holdings are subject to change daily.
* Effective November 1, 2006, Steve Roth replaced Kevin Laub as portfolio manager to the Portfolio.
Portfolio holdings and characteristics are subject to change and may not be representative of current holdings and characteristics. The outlook for this Portfolio may differ from that presented for other ING Funds. Performance for the different classes of shares will vary based on differences in fees associated with each class.
8
PORTFOLIO MANAGERS' REPORT
ING AMERICAN CENTURY SMALL-MID CAP VALUE PORTFOLIO

| Average Annual Total Returns for the Periods Ended December 31, 2006 | |
| | | 1 Year | | Since Inception
of Classes I, S and ADV
May 1, 2002 | |
| Class I | | | 15.75 | % | | | 11.87 | % | |
| Class S | | | 15.43 | % | | | 11.58 | % | |
| Class ADV | | | 15.14 | % | | | 11.30 | % | |
| Russell 2500TM Value Index(1) | | | 20.18 | % | | | 14.26 | % | |
| S&P SmallCap 600/Citigroup Value Index(2) | | | 19.57 | % | | | 11.83 | % | |
| S&P SmallCap 600 Index(3) | | | 15.12 | % | | | 11.15 | % | |
Based on a $10,000 initial investment, the graph and table above illustrate the total return of ING American Century Small-Mid Cap Value Portfolio against the indices indicated. An index is unmanaged and has no cash in its portfolio, imposes no sales charges and incurs no operating expenses. An investor cannot invest directly in an index. The Portfolio's performance is shown without the imposition of any expenses or charges which are, or may be, imposed under your annuity contract. Total returns would have been lower if such expenses or charges were included.
The performance graph and table do not reflect the deduction of taxes that a shareholder will pay on portfolio distributions or the redemption of portfolio shares.
The performance shown may include the effect of fee waivers and/or expense reimbursements by the Investment Adviser and/or other service providers, which have the effect of increasing total return. Had all fees and expenses been considered, the total returns would have been lower.
The performance update illustrates performance for a variable investment option available through a variable annuity contract. The performance shown indicates past performance and is not a projection or prediction of future results. Actual investment returns and principal value will fluctuate so that shares and/or units, at redemption, may be worth more or less than their original cost. Please call (800) 262-3862 to get performance through the most recent month end.
This report contains statements that may be "forward-looking" statements. Actual results may differ materially from those projected in the "forward-looking" statements.
The views expressed in this report reflect those of the portfolio manager only through the end of the period as stated on the cover. The portfolio manager's views are subject to change at any time based on marked and other conditions.
Portfolio holdings are subject to change daily.
(1) The Russell 2500TM Value Index measures the performance of those Russell 2500 companies with lower price-to-book ratios and lower forecasted growth values.
(2) The S&P SmallCap 600/Citigroup Value Index measures the performance of those S&P 600 Index companies with lower price-to-book ratios.
(3) The S&P SmallCap 600 Index is a market-weighted index of 600 small-sized domestic stocks.
9
ING BARON ASSET PORTFOLIO
PORTFOLIO MANAGERS' REPORT
The ING Baron Asset Portfolio (the "Portfolio") seeks capital appreciation. The Portfolio is managed by Ronald Baron, Founder, Chief Executive Officer, Chief Investment Officer, Chairman and Andrew Peck, Vice President, Portfolio Managers of BAMCO, Inc. ("BAMCO") — the Sub-Adviser.
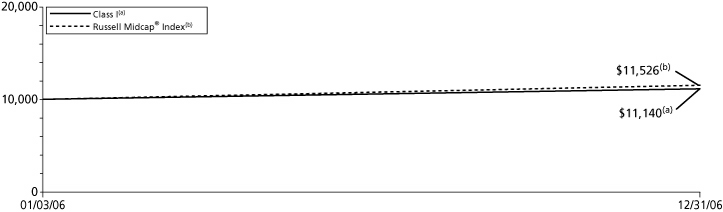
Performance: Since Portfolio's inception on January 3, 2006 through December 31, 2006, the Portfolio's Class I shares provided a total return of 11.40% compared to the Russell Midcap® Index(1), which returned 15.26% for the year ended December 31, 2006.
Portfolio Specifics: The recreation and resorts industry had the most positive impact on the Portfolio's performance during 2006, led by Las Vegas Sands Corp. ("LVS"). The company's stock increased 130% last year as investors started to see value in its Macau China development plans for Henquin Island, an island about a five minute drive from the Cotai Strip that is expected to contain all non-gaming amenities to complement the gaming area of the Strip. The company plans to sell up to $20,000 condos, develop three golf courses as well as a marina and have other entertainment options for the Island including tennis and water sports activities. Strong results from Wynn Resorts Ltd. also helped LVS as it appeared Wynn Resorts Ltd. was growing the market and was not taking share away from LVS's Sands Macau property. In addition, investors became excited as the company's chief operating officer announced that it should be able to sell its Macau mall space for total proceeds between $6 billion and $12 billion, which could completely finance its Cotai Strip land developments. Finally, the company won a license to open a $3.6-billion casino in Singapore on the Marina Bay Waterfront that is expected to open in 2009. We believe this is a strong positive for the company as it will now be able to cross market the Chinese high rollers between both its Macau and Singapore properties. We think this cross marketing should be an even greater benefit for LVS as it will be able to take advantage of the gaming tax disparity, as the gaming tax in Macau is 39% while it is just 15% in Singapore. We believe the company's future projects on the Cotai Strip, as well as the opening of its Palazzo casino on the Las Vegas Strip in June 2007, should continue to drive the stock and the company's growth over the next few years.
The financial services-brokerages & exchanges industry also had a positive impact on performance for 2006 as all four of the Portfolio's holdings in this industry were up during the year. International Security Exchange had the most positive impact as the stock price increased in response to its impressive 50% earnings per share growth during the first three quarters. This earnings growth was driven by an increase in the exchange's average daily trading volume of approximately 40% during this period. Given the company's largely fixed cost structure, earnings generally grow at a faster rate than revenues. Options trading volume was helped by the growing institutional adoption of equity and index options as an attractive security class to both hedge risk and to make leveraged bets on the movement of underlying stock prices.
Advertising services and distribution industries had the most negative impact on performance during 2006. Stock photo provider Getty Images, Inc. was the Portfolio's poorest performer during the period. Getty Images, Inc. lowered guidance several times this year, as its creative images growth rates have slowed due to customers beginning to purchase images at lower effective prices from micro-payment sites and under subscription plans, as well as due to increased competition from traditional players. We have reduced our Getty position during the past several months, and now have a smaller investment in Getty Images, Inc. Shares of air conditioning equipment and parts distributor Watsco, Inc. were down in 2006 as investors digested the company's earnings which came in mostly in-line with expectations and were highlighted by double digit organic revenue and earnings growth. However, we think investors have sold the stock for two reasons: 1) con cerns that the company can not maintain its reported record revenue growth from price inflation and 2) the industry's transition to higher priced, more energy efficient air conditioning units known as SEER 13, where significant inventory dollars have been committed. Despite what we think is a highly predictable replacement business, Wall Street has been unkind to building materials distributors of late, choosing to value them as cyclical stocks tied to new construction housing. In reality, only 25% of Watsco Inc.'s business is connected to residential new construction. The fundamentals of its primary repair and maintenance business remain healthy in our estimation. In the beginning of the winter, the majority of the U.S. experienced unusually warm temperatures making its higher efficiency, higher quality air-conditioning units as relevant as ever.
Current Strategy and Outlook: BAMCO invests for the long-term in what we believe to be forward-looking, well-managed, fast-growing businesses. We believe the companies we own will continue to grow at healthy and sustainable rates.
Portfolio holdings and characteristics are subject to change and may not be representative of current holdings and characteristics. The outlook for this Portfolio may differ from that presented for other ING Funds. Performance for the different classes of shares will vary based on differences in fees associated with each class.
Top Ten Holdings
as of December 31, 2006
(as a percent of net assets) | |
| Las Vegas Sands Corp. | | | 3.9 | % | |
| CB Richard Ellis Group, Inc. | | | 3.6 | % | |
| Wynn Resorts Ltd. | | | 3.6 | % | |
| Boyd Gaming Corp. | | | 2.7 | % | |
| Polo Ralph Lauren Corp. | | | 2.6 | % | |
| Iron Mountain, Inc. | | | 2.6 | % | |
| AllianceBernstein Holding LP | | | 2.4 | % | |
| Lamar Advertising Co. | | | 2.4 | % | |
| Charles Schwab Corp. | | | 2.3 | % | |
| International Securities Exchange, Inc. | | | 2.3 | % | |
Portfolio holdings are subject to change daily.
10
PORTFOLIO MANAGERS' REPORT
ING BARON ASSET PORTFOLIO
| Cumulative Total Returns for the Periods Ended December 31, 2006 | |
| | | Since Inception
of Class I
January 3, 2006 | | Since Inception
of Class S
May 3, 2006 | | Since Inception
of Class ADV
January 18, 2006 | |
| Class I | | | 11.40 | % | | | — | | | | — | | |
| Class S | | | — | | | | 3.45 | % | | | — | | |
| Class ADV | | | — | | | | — | | | | 10.46 | % | |
| Russell Midcap® Index(1) | | | 15.26 | %(2) | | | 6.36 | %(3) | | | 9.63 | %(4) | |
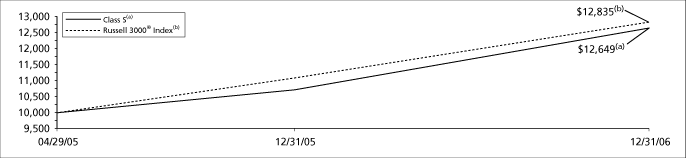
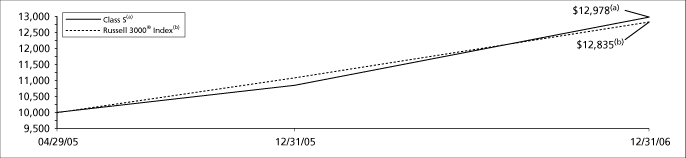
Based on a $10,000 initial investment, the graph and table above illustrate the total return of ING Baron Asset Portfolio against the index indicated. An index is unmanaged and has no cash in its portfolio, imposes no sales charges and incurs no operating expenses. An investor cannot invest directly in an index. The Portfolio's performance is shown without the imposition of any expenses or charges which are, or may be, imposed under your annuity contract. Total returns would have been lower if such expenses or charges were included.
The performance graph and table do not reflect the deduction of taxes that a shareholder will pay on portfolio distributions or the redemption of portfolio shares.
The performance shown may include the effect of fee waivers and/or expense reimbursements by the Investment Adviser and/or other service providers, which have the effect of increasing total return. Had all fees and expenses been considered, the total returns would have been lower.
The performance update illustrates performance for a variable investment option available through a variable annuity contract. The performance shown indicates past performance and is not a projection or prediction of future results. Actual investment returns and principal value will fluctuate so that shares and/or units, at redemption, may be worth more or less than their original cost. Please call (800) 262-3862 to get performance through the most recent month end.
This report contains statements that may be "forward-looking" statements. Actual results may differ materially from those projected in the "forward-looking" statements.
The views expressed in this report reflect those of the portfolio manager only through the end of the period as stated on the cover. The portfolio manager's views are subject to change at any time based on marked and other conditions.
Portfolio holdings are subject to change daily.
(1) The Russell Midcap® Index is an unmanaged index that measures the performance of the 800 smallest companies in the Russell 1000® Index, which represents approximately 26% of the total market capitalization of the Russell 1000® Index.
(2) Since inception performance of the index is shown from January 1, 2006.
(3) Since inception performance of the index is shown from May 1, 2006.
(4) Since inception performance of the index is shown from February 1, 2006.
11
ING BARON SMALL CAP GROWTH PORTFOLIO
PORTFOLIO MANAGERS' REPORT
The ING Baron Small Cap Growth Portfolio (the "Portfolio") seeks capital appreciation. The Portfolio is managed by Ronald Baron, Founder, Chief Executive Officer, Chief Investment Officer, Chairman, and Portfolio Manager of BAMCO, Inc. ("BAMCO") — the Sub-Adviser.
Performance: For the year ended December 31, 2006, the Portfolio's Class S shares provided a total return of 15.24% compared to the Russell 2000® Index(1), which returned 18.37% for the same period.
Portfolio Specifics: Industries that had the most positive contribution over the one-year period included retail-specialty stores, recreation & resorts and health services-insurance.
The retail-specialty stores industry made the largest contribution to the Portfolio's gain, with Dick's Sporting Goods, Inc. leading the way. The retail industry has attracted a lot of attention from private equity firms due to the stable cash flows, high free cash generation and real estate assets. Dick's Sporting Goods share price performed very well in 2006 posting a gain of 41%. In mid November, the company reported very strong third quarter sales and net income which the company attributed to cold weather. Increasing same store sales, strong performance from new stores, and improvements in private labels has allowed for gross margins to increase and for selling, general and administrative costs to be lowered. We believe new store returns should increase as Dick's Sporting Goods, Inc. has opened stores in, we think, the best trade locations and as competition among sporting goods retailers has dissipated following Dick's Sporting Goods acquisition of Galyan's and The Sports Authority privatization.
The recreation & resorts industry also made a significant contribution, led by Wynn Resorts Ltd. Wynn Resorts Ltd. was up 72% last year mainly due to investor excitement over the company's sale of its Macau subconcession for $900 million and the opening of the first phase of its $1.2 billion Macau casino in September. The proceeds from the sale of the subconcession helped Wynn Resorts Ltd. almost completely finance its Macau casino and significantly improved the company's leverage. Wynn Resorts Ltd. was also up on the announcement that it is paying out a special $6 per share dividend or $660 million to shareholders as a result of selling its Macau subconcession, a sign the company is confident about its prospects in Macau and feels well financed for its future developments in Macau on the Cotai Strip. Further helping the stock was Wynn Resorts Ltd.'s ability to increase its Macau market share from 9% in October to 16% in November. In addition, the stock continued to trade up as Las Vegas Sands Corp. continued to report strong Macau earnings and continued to maintain its 20% Macau market share even in the face of new capacity coming online.
Restaurants and distribution were the worst performing industries for the Portfolio in 2006. The decline in the restaurant industry was led by Red Robin Gourmet Burgers, Inc. which lowered guidance in November causing the shares to plummet. The company's new stores are more heavily weighted to new markets (60% of new stores are in new markets vs. 40% in 2005). These new stores in new markets did not regain a large portion of their honeymoon period sales and therefore had much lower sales than new stores in existing markets. At this time the percent of new stores in new markets cannot be scaled back to the prior 40% level because strong existing markets are either nearing capacity or have been sold to franchisees. The company now plans to scale back total growth and will attempt to grow new markets' average unit volume to a respectable level through experimenting with outdoor marketing, increased radio and potentially TV ads. We question how long it will take the company to succeed. The Portfolio no longer has a position in Red Robin Gourmet Burgers, Inc.
Current Strategy and Outlook: BAMCO invests for the long-term in what we believe to be forward-looking, well-managed, fast-growing businesses. We believe the companies we own will continue to grow at healthy and sustainable rates.
Portfolio holdings and characteristics are subject to change and may not be representative of current holdings and characteristics. The outlook for this Portfolio may differ from that presented for other ING Funds. Performance for the different classes of shares will vary based on differences in fees associated with each class.
Top Ten Holdings*
as of December 31, 2006
(as a percent of net assets) | |
| Cohen & Steers, Inc. | | | 2.4 | % | |
| WellCare Health Plans, Inc. | | | 2.2 | % | |
| Dick's Sporting Goods, Inc. | | | 2.1 | % | |
| International Securities Exchange, Inc. | | | 2.0 | % | |
| DeVry, Inc. | | | 1.9 | % | |
| Equinix, Inc. | | | 1.9 | % | |
| CB Richard Ellis Group, Inc. | | | 1.7 | % | |
| Carter's, Inc. | | | 1.6 | % | |
| Amerigroup Corp. | | | 1.5 | % | |
| Eagle Materials, Inc. | | | 1.5 | % | |
* Excludes short-term investments related to U.S. government agency obligation.
Portfolio holdings are subject to change daily.
12
PORTFOLIO MANAGERS' REPORT
ING BARON SMALL CAP GROWTH PORTFOLIO
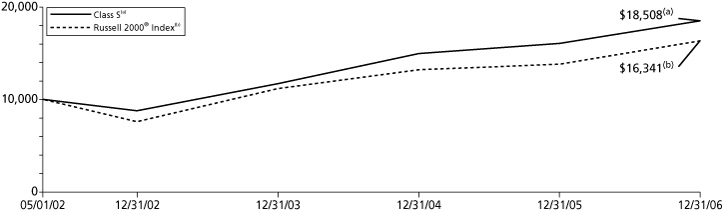
| Average Annual Total Returns for the Periods Ended December 31, 2006 | |
| | | 1 Year | | Since Inception
of Classes I, S and ADV
May 1, 2002 | |
| Class I | | | 15.54 | % | | | 14.38 | % | |
| Class S | | | 15.24 | % | | | 14.09 | % | |
| Class ADV | | | 15.02 | % | | | 13.80 | % | |
| Russell 2000® Index(1) | | | 18.37 | % | | | 11.10 | % | |
Based on a $10,000 initial investment, the graph and table above illustrate the total return of ING Baron Small Cap Growth Portfolio against the index indicated. An index is unmanaged and has no cash in its portfolio, imposes no sales charges and incurs no operating expenses. An investor cannot invest directly in an index. The Portfolio's performance is shown without the imposition of any expenses or charges which are, or may be, imposed under your annuity contract. Total returns would have been lower if such expenses or charges were included.
The performance graph and table do not reflect the deduction of taxes that a shareholder will pay on portfolio distributions or the redemption of portfolio shares.
The performance shown may include the effect of fee waivers and/or expense reimbursements by the Investment Adviser and/or other service providers, which have the effect of increasing total return. Had all fees and expenses been considered, the total returns would have been lower.
The performance update illustrates performance for a variable investment option available through a variable annuity contract. The performance shown indicates past performance and is not a projection or prediction of future results. Actual investment returns and principal value will fluctuate so that shares and/or units, at redemption, may be worth more or less than their original cost. Please call (800) 262-3862 to get performance through the most recent month end.
This report contains statements that may be "forward-looking" statements. Actual results may differ materially from those projected in the "forward-looking" statements.
The views expressed in this report reflect those of the portfolio manager only through the end of the period as stated on the cover. The portfolio manager's views are subject to change at any time based on marked and other conditions.
Portfolio holdings are subject to change daily.
(1) The Russell 2000® Index is a broad-based unmanaged capitalization weighted index of small capitalization companies.
13
ING COLUMBIA SMALL CAP VALUE II PORTFOLIO
PORTFOLIO MANAGERS' REPORT
The ING Columbia Small Cap Value II Portfolio (the "Portfolio") seeks long-term growth of capital. The Portfolio is managed by Christian Stadlinger and Jarl Ginsberg, Portfolio Managers, Columbia Management Advisors, LLC — the Sub-Adviser.
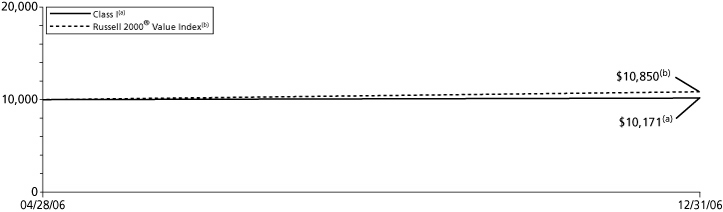
Performance: Since the Portfolio inception on April 28, 2006 through December 31, 2006, the Portfolio's Class I shares provided a total return of 1.70% compared to the Russell 2000® Value Index(1), which returned 8.50% for the period beginning May 1, 2006 through December 1, 2006.
Portfolio Specifics: Detracting from the relative performance were areas of the Portfolio that experienced weak stock performance versus the corresponding Russell 2000® Value Index sectors. For example, the Portfolio's industrial holdings (down 3.3%) underperformed those in the Russell 2000® Value Index (up 5.6%). The Portfolio's consumer discretionary and information technology investments were down 3.0% and 8% respectively, which lagged the benchmark's 9.2% consumer discretionary sector return and 0.6% loss in the information technology sector..
On the plus side, the Portfolio's investments in the consumer staples sector gained 28.9%, compared to 17.4% for the Russell 2000® Value Index, while the Portfolio's financial investments (up 12.4%) outperformed those in the Russell 2000® Value Index (up 11.3%) due to strong stock picking in the capital markets and insurance industries.
The third and fourth quarters were studies in contrasts as fears of a weakening economy hurt many cyclicals and helped more defensive sectors during the third quarter, despite company-specific fundamentals that signaled continued expansion and revenue growth. However, in the fourth quarter, investors realized that fears of a dramatic slowdown were unwarranted which spurred a rebound in many cyclical sectors. As a result, the Portfolio's industrial holdings declined 9.3% during the third quarter yet, rebounded by 13.7% in the fourth quarter.
Not convinced that fears of a wholesale economic slowdown were warranted, we continued to focus on strong company fundamentals rather than the prospects for a given sector. At the same time, we increased exposure to areas where improvement occurred, such as the textile and clothing goods companies within the consumer discretionary sector. Many of these companies may benefit from declining fuel costs, stabilizing in interest rates and resurgent consumer spending.
Current Strategy and Outlook: We employ a disciplined, bottom-up approach that incorporates quantitative screens, fundamental analysis and sophisticated risk management techniques. The investment process is designed to separate value opportunities — companies with solid top-line growth prospects and good cash flow fundamentals — from "value traps," those at a competitive disadvantage due to poor management, a weak product line or a hostile business environment.
We believe that the key to converting opportunity into performance is to purchase stocks that are at an "inflection point," i.e., companies likely to achieve improved earnings because of a change in business strategy, the introduction of new product or a change in the business environment, to list a few possible performance catalysts.
The Portfolio is positioned to avoid rate-sensitive financial companies, which may have difficulty expanding their margins due to pressure from an inverted yield curve, tight credit spreads, potentially deteriorating credit quality and slowing economic growth. We see opportunities within the capital markets area, where companies are more engaged in fee-based activities and where continued industry consolidation and heightened merger and acquisition activity bodes well for performance next year.
Additionally, we see opportunity in the industrials area, specifically those companies serving the aerospace and defense market. Within that group, some of the more promising prospects, which are likely to benefit from strong military spending trends, are in the original equipment and aftermarket space.
Portfolio holdings and characteristics are subject to change and may not be representative of current holdings and characteristics. The outlook for this Portfolio may differ from that presented for other ING Funds. Performance for the different classes of shares will vary based on differences in fees associated with each class.
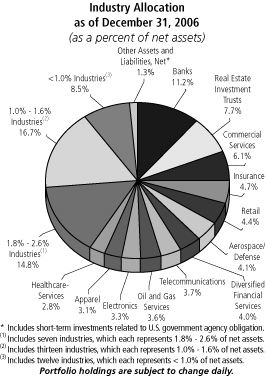
Top Ten Holdings
as of December 31, 2006
(as a percent of net assets) | |
| Barnes Group, Inc. | | | 1.1 | % | |
| Warnaco Group, Inc. | | | 1.1 | % | |
| LaSalle Hotel Properties | | | 1.1 | % | |
| Brown Shoe Co., Inc. | | | 1.1 | % | |
| Lazard Ltd. | | | 1.1 | % | |
| Atmos Energy Corp. | | | 1.1 | % | |
| Genesco, Inc. | | | 1.1 | % | |
| Magellan Health Services, Inc. | | | 1.1 | % | |
| AAR Corp. | | | 1.1 | % | |
| DRS Technologies, Inc. | | | 1.1 | % | |
Portfolio holdings are subject to change daily.
14
PORTFOLIO MANAGERS' REPORT
ING COLUMBIA SMALL CAP VALUE II PORTFOLIO
| Cumulative Total Returns for the Periods Ended December 31, 2006* | |
| | | Since Inception
of Class I
April 28, 2006 | | Since Inception
of Class S
May 1, 2006 | |
| Class I | | | 1.70 | % | | | — | | |
| Class S | | | — | | | | 2.01 | % | |
| Russell 2000® Value Index(1) | | | 8.50 | %(2) | | | 8.50 | % | |
Based on a $10,000 initial investment, the graph and table above illustrate the total return of ING Columbia Small Cap Value II Portfolio against the index indicated. An index is unmanaged and has no cash in its portfolio, imposes no sales charges and incurs no operating expenses. An investor cannot invest directly in an index. The Portfolio's performance is shown without the imposition of any expenses or charges which are, or may be, imposed under your annuity contract. Total returns would have been lower if such expenses or charges were included.
The performance graph and table do not reflect the deduction of taxes that a shareholder will pay on portfolio distributions or the redemption of portfolio shares.
The performance shown may include the effect of fee waivers and/or expense reimbursements by the Investment Adviser and/or other service providers, which have the effect of increasing total return. Had all fees and expenses been considered, the total returns would have been lower.
The performance update illustrates performance for a variable investment option available through a variable annuity contract. The performance shown indicates past performance and is not a projection or prediction of future results. Actual investment returns and principal value will fluctuate so that shares and/or units, at redemption, may be worth more or less than their original cost. Please call (800) 262-3862 to get performance through the most recent month end.
This report contains statements that may be "forward-looking" statements. Actual results may differ materially from those projected in the "forward-looking" statements.
The views expressed in this report reflect those of the portfolio manager only through the end of the period as stated on the cover. The portfolio manager's views are subject to change at any time based on marked and other conditions.
Portfolio holdings are subject to change daily.
* Class ADV commenced operations on December 29, 2006, therefore, there is no performance information for the period ended December 31, 2006.
(1) The Russell 2000® Value Index is an unmanaged index measures the performance of those Russell 2000 securities with lower price-to-book ratios and lower forecasted growth values.
(2) Since inception performance of the index is shown from May 1, 2006.
15
ING DAVIS VENTURE VALUE PORTFOLIO
PORTFOLIO MANAGERS' REPORT
The ING Davis Venture Value Portfolio (the "Portfolio") seeks long-term growth of capital. The Portfolio is managed by Christopher C. Davis and Kenneth C. Feinberg, Portfolio Managers, with Davis Selected Advisers, L.P. — the Sub-Adviser.
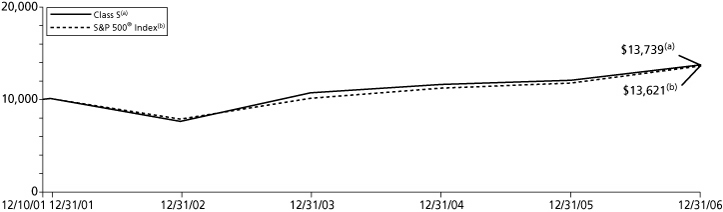
Performance: For the year ended December 31, 2006, the Portfolio's Class S shares provided a total return of 13.85% compared to the Standard & Poor's 500® Composite Stock Price Index(1) ("S&P 500® Index"), which returned 15.79% for the same period.
Portfolio Specifics: Diversified financial companies were the most important contributors to the Portfolio's performance over the twelve-month period. The Portfolio benefited from its substantial investment in this sector, which out-performed the S&P 500® Index. Three diversified financial companies, JPMorgan Chase, Citigroup, and American Express, were among the top contributors to performance.
Consumer discretionary and consumer staple companies also made important contributions to performance. One consumer discretionary company, Comcast Corp., and two consumer staple companies, Altria Group, Inc. and Diageo PLC ADR, were among the top contributors to performance. Two consumer discretionary companies, Apollo Group (purchased in March 2006) and H&R Block, and one consumer staples company, Hershey Foods, were among the top detractors from performance.
The Portfolio's largest investment was in insurance companies. While insurance companies made a positive contribution to performance, they under performed the S&P 500® Index. Berkshire Hathaway, Inc and Loews Corp. were among the top contributors to performance. Progressive Corp., Transatlantic Holdings, Inc. and Marsh & McLennan were among the top detractors from performance.
Our stock selections in the industry groups within the energy sector under-performed the corresponding stocks in the S&P 500® Index and this is the main reason why the Portfolio underperformed over all.
The Portfolio's investments in telecommunication service and energy companies also contributed to the Portfolio under-performing the S&P 500® Index over the twelve-month period. Telecommunication service companies were the strongest performing sector of the S&P 500® Index, but the telecommunication service companies owned by the Portfolio did not perform as well. While energy companies made positive contributions to performance, they also under performed the S&P 500® Index. One energy company, ConocoPhillips, was among the top contributors to performance. One telecommunication services company, Sprint Nextel (purchased in March 2006), and one energy company, EOG Resources, were among the top detractors from performance.
The Portfolio had approximately 10% of its assets invested in foreign companies at December 31, 2006. As a group, the foreign companies owned by the Portfolio out-performed the S&P 500® Index over the twelve-month period.
Current Strategy and Outlook: We believe that a twelve-month period is too short to provide meaningful insight into a Portfolio's future long-term performance. We are building a portfolio which is quite different in composition from the S&P 500® Index. The Portfolio's investment strategy is to perform extensive research to buy durable companies at a discount to their intrinsic values and hold them for the long term.
Consistent with our low-turnover strategy, only two companies dropped out of the Portfolio's top 10 holdings, Progressive Corp. and Golden West Financial. Progressive remains among the Portfolio's top 20 holdings at year-end and Golden West Financial was acquired by Wachovia. Two new additions to the Portfolio's top 10 holdings at year-end were ConocoPhillips and Comcast, both of which had already been top 20 holdings at the beginning of the year.
Top Ten Holdings*
as of December 31, 2006
(as a percent of net assets) | |
| Altria Group, Inc. | | | 4.9 | % | |
| American Express Co. | | | 4.9 | % | |
| ConocoPhillips | | | 4.3 | % | |
| American International Group, Inc. | | | 4.3 | % | |
| Tyco International Ltd. | | | 3.8 | % | |
| JPMorgan Chase & Co. | | | 3.5 | % | |
| Costco Wholesale Corp. | | | 3.0 | % | |
| Berkshire Hathaway, Inc.-Class A | | | 2.7 | % | |
| Wells Fargo & Co. | | | 2.7 | % | |
| Comcast Corp. | | | 2.6 | % | |
* Excludes short-term investments related to commercial paper.
Portfolio holdings are subject to change daily.
Portfolio holdings and characteristics are subject to change and may not be representative of current holdings and characteristics. The outlook for this Portfolio may differ from that presented for other ING Funds. Performance for the different classes of shares will vary based on differences in fees associated with each class.
16
PORTFOLIO MANAGERS' REPORT
ING DAVIS VENTURE VALUE PORTFOLIO
| Average Annual Total Returns for the Periods Ended December 31, 2006 | |
| | | 1 Year | | 5 Year | | Since Inception
of Classes I, S and ADV
December 10, 2001 | |
| Class I | | | 14.19 | % | | | 6.62 | % | | | 6.74 | % | |
| Class S | | | 13.85 | % | | | 6.34 | % | | | 6.47 | % | |
| Class ADV | | | 13.58 | % | | | 6.09 | % | | | 6.21 | % | |
| S&P 500® Index(1) | | | 15.79 | % | | | 6.19 | % | | | 6.27 | %(2) | |
Based on a $10,000 initial investment, the graph and table above illustrate the total return of ING Davis Venture Value Portfolio against the index indicated. An index is unmanaged and has no cash in its portfolio, imposes no sales charges and incurs no operating expenses. An investor cannot invest directly in an index. The Portfolio's performance is shown without the imposition of any expenses or charges which are, or may be, imposed under your annuity contract. Total returns would have been lower if such expenses or charges were included.
The performance graph and table do not reflect the deduction of taxes that a shareholder will pay on portfolio distributions or the redemption of portfolio shares.
The performance shown may include the effect of fee waivers and/or expense reimbursements by the Investment Adviser and/or other service providers, which have the effect of increasing total return. Had all fees and expenses been considered, the total returns would have been lower.
The performance update illustrates performance for a variable investment option available through a variable annuity contract. The performance shown indicates past performance and is not a projection or prediction of future results. Actual investment returns and principal value will fluctuate so that shares and/or units, at redemption, may be worth more or less than their original cost. Please call (800) 262-3862 to get performance through the most recent month end.
This report contains statements that may be "forward-looking" statements. Actual results may differ materially from those projected in the "forward-looking" statements.
The views expressed in this report reflect those of the portfolio manager only through the end of the period as stated on the cover. The portfolio manager's views are subject to change at any time based on marked and other conditions.
Portfolio holdings are subject to change daily.
(1) The S&P 500® Index is an unmanaged index that measures the performance of the securities of approximately 500 of the largest companies in the U.S.
(2) Since inception performance of the index is shown as of December 1, 2001.
17
ING FUNDAMENTAL RESEARCH PORTFOLIO
PORTFOLIO MANAGERS' REPORT
The ING Fundamental Research Portfolio (the "Portfolio") seeks to maximize total return through investments in a diversified portfolio of common stocks and securities convertible into common stock. The Portfolio is managed by Christopher F. Corapi, Portfolio Manager and Director of Fundamental Equity Research of ING Investment Management Co. — the Sub-Adviser.
Performance: For the year ended December 31, 2006, the Portfolio's Class S shares provided a total return of 12.14% compared to the Standard & Poor's 500® Composite Stock Index(1) ("S&P 500® Index"), which returned 15.79% for the same period.
Portfolio Specifics: The Portfolio benefited from favorable stock selection within industrials and, to a lesser extent, telecommunications. Underperformance can partially be attributed to weak stock selection in energy and health care. Our decision to underweight integrated oils and gas companies in favor of exploration and production companies also detracted from performance. This sector experienced a flight to quality in the second half of this year, caused partly by a sharp and unanticipated decline in natural gas prices as cooler weather allowed inventories to build. Within technology, the Portfolio was hurt by weak stock selection in the hardware and equipment industry group as well as our decision to overweight the sector.
WESCO International, Inc. and ABB Ltd. were the greatest contributors to relative performance. Strength in WESCO International, Inc.'s commercial construction end markets, as well as utility company spending on the upgrading of electricity transmission and distribution (i.e., the power grid) helped fuel strong organic growth and margin performance. Like WESCO International, Inc., ABB Ltd. delivered excellent margin improvement and robust sales growth from utility spending on energy infrastructure. We believe ABB Ltd. still has significant upside potential going forward given strong demand and pricing in transmission and distribution and continued capital spending in the global energy markets. The Portfolio also benefited from investments in Verizon Communications, Inc. and AT&T, Inc. AT&T, Inc. benefited this year from improved wireline performance and margin recovery at Cingular Wireless. Verizon Communications, Inc. saw strong perf ormance in the second half of this year due to solid organic growth.
By comparison, our investment in Evergreen Energy, Inc., a company with a potentially revolutionary coal cleaning process, was a significant detractor to performance as management failed to reach its performance milestones during the period. This investment is in the process of being eliminated. Our investment in Teva Pharmaceutical Industries Ltd. declined due partially to Wal-Mart Stores, Inc.'s announcement in October that they would sell generic prescription drugs for $4. Teva Pharmaceutical Industries Ltd. was also hurt by increased competition and pricing pressures as well as the expiration of their exclusivity contract with Zocor. We saw significant headwinds for this company in 2007 and decided to eliminate our position. Within technology, our position in Yahoo!, Inc. was hurt by weakness in search and brand advertising as well as concerns over the delayed launch of its new search system. Due to a lack of positive catalysts for the s tock, we decided to replace it with Google, Inc. which we believe is better long-term investment in the on-line advertising space.
Current Strategy and Outlook: Currently, the Portfolio is positioned in companies which we believe have strong or improving competitive positions, robust end markets and/or superior capital allocation opportunities. Furthermore, we believe each stock possesses an attractive valuation and a clear catalyst to improve it. Top holdings include News Corp., General Cable Corp., Staples, Inc., Medco Health Solutions, Inc., and St. Jude Medical, Inc.
We believe that 2007 estimates for consumer discretionary imply an overly optimistic view of consumer spending which face significant headwinds such as the risk of a prolonged downturn in housing, a resurgence in the price of oil, or a longer-than-expected pause by the Federal Reserve Board. As a result, we remain selective in the sector favoring stocks with specific catalysts and less exposure to the consumer such as Staples, Inc. This company stands to benefit from several potential catalysts, including a turnaround in European operations and a strong and growing delivery business. Within media, we find News Corp. attractive based on our view that advertising spending growth will remain robust and that Internet advertising will continue to grow more rapidly than the industry as a whole. We believe News Corp is well positioned due to a number of key strategic acquisitions, such as MySpace and Scout. Additionally, New Corp should benefit fro m the renegotiation of its affiliate rates which are currently much lower than its competitors. We believe General Cable Corp. will best expectations given the robust end markets in transmission and distribution infrastructure, power and communications. We also expect that lower copper prices will drive margin expansion going forward. Finally, we believe that a recovery in the implantable cardioverter defibrillator ("ICD") market will be a significant growth driver for St. Jude Medical, Inc. as their sales growth is highly levered to this segment. We believe St. Jude Medical, Inc. should also benefit from a robust product line that continues to take market share in the ICD market.
Portfolio holdings and characteristics are subject to change and may not be representative of current holdings and characteristics. The outlook for this Portfolio may differ from that presented for other ING Funds. Performance for the different classes of shares will vary based on differences in fees associated with each class.
Top Ten Holdings
as of December 31, 2006
(as a percent of net assets) | |
| ExxonMobil Corp. | | | 3.3 | % | |
| Microsoft Corp. | | | 3.1 | % | |
| Altria Group, Inc. | | | 3.0 | % | |
| AT&T, Inc. | | | 2.7 | % | |
| American International Group, Inc. | | | 2.6 | % | |
| General Electric Co. | | | 2.6 | % | |
| Citigroup, Inc. | | | 2.5 | % | |
| Bank of America Corp. | | | 2.5 | % | |
| Isilon Systems, Inc. | | | 2.3 | % | |
| Procter & Gamble Co. | | | 2.3 | % | |
Portfolio holdings are subject to change daily.
18
PORTFOLIO MANAGERS' REPORT
ING FUNDAMENTAL RESEARCH PORTFOLIO

| Average Annual Total Returns for the Periods Ended December 31, 2006 | |
| | | 1 Year | | 5 Year | | Since Inception
of Classes I, S and ADV
December 10, 2001 | |
| Class I | | | 12.49 | % | | | 5.31 | % | | | 5.07 | % | |
| Class S | | | 12.14 | % | | | 5.06 | % | | | 4.82 | % | |
| Class ADV | | | 11.91 | % | | | 4.80 | % | | | 4.57 | % | |
| S&P 500® Index(1) | | | 15.79 | % | | | 6.19 | % | | | 6.27 | %(2) | |
Based on a $10,000 initial investment, the graph and table above illustrate the total return of ING Fundamental Research Portfolio against the index indicated. An index is unmanaged and has no cash in its portfolio, imposes no sales charges and incurs no operating expenses. An investor cannot invest directly in an index. The Portfolio's performance is shown without the imposition of any expenses or charges which are, or may be, imposed under your annuity contract. Total returns would have been lower if such expenses or charges were included.
The performance graph and table do not reflect the deduction of taxes that a shareholder will pay on portfolio distributions or the redemption of portfolio shares.
The performance shown may include the effect of fee waivers and/or expense reimbursements by the Investment Adviser and/or other service providers, which have the effect of increasing total return. Had all fees and expenses been considered, the total returns would have been lower.
The performance update illustrates performance for a variable investment option available through a variable annuity contract. The performance shown indicates past performance and is not a projection or prediction of future results. Actual investment returns and principal value will fluctuate so that shares and/or units, at redemption, may be worth more or less than their original cost. Please call (800) 262-3862 to get performance through the most recent month end.
This report contains statements that may be "forward-looking" statements. Actual results may differ materially from those projected in the "forward-looking" statements.
The views expressed in this report reflect those of the portfolio manager only through the end of the period as stated on the cover. The portfolio manager's views are subject to change at any time based on marked and other conditions.
Portfolio holdings are subject to change daily.
(1) The S&P 500® Index is an unmanaged index that measures the performance of the securities of approximately 500 of the largest companies in the U.S.
(2) Since inception performance for the index is shown as of December 1, 2001.
19
ING GOLDMAN SACHS® CAPITAL GROWTH PORTFOLIO
PORTFOLIO MANAGERS' REPORT
The ING Goldman Sachs® Capital Growth Portfolio (the "Portfolio") seeks long-term growth of capital. The Portfolio is managed by a team of investment professionals led by David G. Shell, CFA, Managing Director, Chief Investment Officer and Senior Portfolio Manager, Steven M. Barry, Managing Director, Chief Investment Officer and Senior Portfolio Manager, and Gregory H. Ekizian, CFA, Managing Director, Chief Investment Officer and Senior Portfolio Manager, of Goldman Sachs Asset Management, L.P. — the Sub-Adviser.
Performance: For the year ended December 31, 2006, the Portfolio's Class S shares provided a total return of 8.57% to the Russell 1000® Growth Index(1) and the Standard & Poor's 500® Composite Stock Price Index(2) ("S&P 500® Index"), which returned 9.07% and 15.79%, respectively, for the same period.
Portfolio Specifics: We continue to base investment decisions on the identification of high-quality business franchises, rather than top-down macroeconomic views, sector rotation, momentum trends or next quarter's earnings.
During the period, energy was the top contributing sector due to strong stock selection. Although the energy sector overall pulled back in the second half of 2006 and ended the year as the worst performing sector in the index, the strong stock selection more than offset the broader sector's underperformance. Performance was mainly driven by oil well service companies such as Schlumberger Ltd, Suncor, Inc., and Baker Hughes, Inc. which tend to be less sensitive to the price swings in oil and in our belief exhibit long-term sustainable growth characteristics that are consistent with our investment philosophy.
McGraw-Hill Companies, Inc., a media company, aided returns as it reported higher fiscal third quarter earnings and boosted its 2006 revenue outlook during the year. While the education market continued to show weakness, management attributed the company's strength to improved cost management and performance within its financial services segment: Standard & Poor's. McGraw-Hill Companies, Inc. also announced that it expects to post double-digit earnings growth in 2007.
In the technology sector, shares of Research In Motion were up 58%, driven by rallies in September and November that resulted from continued indications of consumer interest for the BlackBerry Pearl product. In addition, more carriers, including major operators in Europe such as Vodafone as well as Cingular in the U.S., have launched the Pearl. We believe the multimedia device should be largely incremental to the company's growth, as it expands its addressable market from the corporate into the higher end consumer market.
Shares of Yahoo!, Inc. sold off after the company reported second quarter earnings and warned of weakness in third quarter sales due to slower-than-expected growth in auto and financial advertising spending. Slightly lower-than-expected second quarter revenue was attributed to the company's lower revenue share in the search category of advertising. However, we observe that Yahoo!, Inc. is holding its share in total number of searches from a volume perspective. We believe that Project Panama, Yahoo!, Inc.'s new search platform, should help close the monetization gap with Google, Inc.
Stock selection in the consumer discretionary sector lagged the most for the period including our holding in Carnival Cruise Lines. Carnival Corp. detracted from performance during the period and, in the second quarter of 2006, we sold out of the position. While the company met our investment criteria for its brand name, dominant market share, and strong free cash flow, the company has been beset by economic factors that have put pressure on profit margins. With the prolonged increase in oil prices, Carnival Corp.'s energy costs had grown over 50% in the past year. Carnival Corp. had been able to manage this cost through its pricing power, passing these prices on to the consumer. However, we became concerned that with the bifurcation of the consumer due to high gas prices, Carnival Corp. could not exhibit the pricing power it once had.
Current Strategy and Outlook: We believe that we are very well positioned for positive excess returns when many of the macro trends that proved to be headwinds over the past few years start to change and create an investment environment that bodes well for our strategy of investing in high-quality growth companies. Those multiyear trends include value outperforming growth, low quality outperforming high quality, and cyclical growth companies outperforming sustainable growth companies. Driven by a strong global economy, stocks of cyclical and commodity-based businesses that are dependent on a robust economy for growth have outperformed. The Portfolio is comprised of high-quality businesses that generate free cash flow and have long-term double-digit earnings-per-share growth rates. After 17 interest rate increases, consensus views predict that the economy wi ll moderate and aggregate profit growth will slow. In that environment, we believe our higher-quality investments in those businesses that are less dependent on a strong economy for growth will outperform. We saw this trend start to take hold in the second half of 2006, as many cyclical and commodity businesses started to lose the momentum they gained during the economic recovery. After four years of low-quality stocks outperforming, we believe we have observed a turn in the market as high-quality stocks led the market in the second half of this past year. In this environment, the quality growth bias in our Portfolio has begun to change from a performance headwind to a tailwind. In addition, as an out-of-favor asset class, we believe high-quality growth stocks are trading at attractive valuations. Stock buybacks, spin-offs, acquisitions and consensus-beating earnings all contribute to closing this valuation gap. As Warren Buffet said, "If a business does well, the stock eventually follows."
The Portfolio invests in large-capitalization U.S. equity investments and is subject to market risk so that the value of the securities in which it invests may go up or down in response to the prospects of individual companies, particular industry sectors and/or general economic conditions.
Portfolio holdings and characteristics are subject to change and may not be representative of current holdings and characteristics. The outlook for this Portfolio may differ from that presented for other ING Funds. Performance for the different classes of shares will vary based on differences in fees associated with each class.

Top Ten Holdings*
as of December 31, 2006
(as a percent of net assets) | |
| Freddie Mac | | | 4.8 | % | |
| Microsoft Corp. | | | 4.5 | % | |
| Google, Inc. | | | 3.4 | % | |
| Cisco Systems, Inc. | | | 3.2 | % | |
| Suncor Energy, Inc. | | | 2.9 | % | |
| Yahoo!, Inc. | | | 2.7 | % | |
| Baker Hughes, Inc. | | | 2.7 | % | |
| American Tower Corp. | | | 2.6 | % | |
| McGraw-Hill Cos., Inc. | | | 2.6 | % | |
| Schlumberger Ltd. | | | 2.4 | % | |
* Excludes short-term investments related to securities lending collateral.
Portfolio holdings are subject to change daily.
20
PORTFOLIO MANAGERS' REPORT
ING GOLDMAN SACHS® CAPITAL GROWTH PORTFOLIO
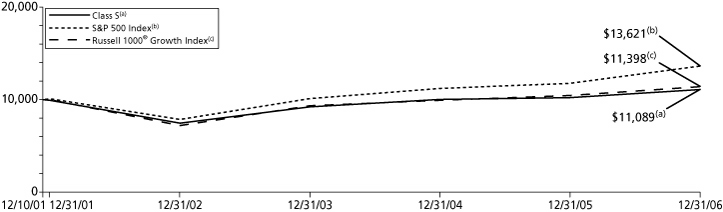
| Average Annual Total Returns for the Periods Ended December 31, 2006 | |
| | | 1 Year | | 5 Year | | Since Inception
of Classes I, S and ADV
December 10, 2001 | |
| Class I | | | 8.79 | % | | | 2.49 | % | | | 2.30 | % | |
| Class S | | | 8.57 | % | | | 2.25 | % | | | 2.06 | % | |
| Class ADV | | | 8.22 | % | | | 2.10 | % | | | 1.92 | % | |
| S&P 500® Index(1) | | | 15.79 | % | | | 6.19 | % | | | 6.27 | %(3) | |
| Russell 1000® Growth Index(2) | | | 9.07 | % | | | 2.69 | % | | | 2.61 | %(3) | |
Based on a $10,000 initial investment, the graph and table above illustrate the total return of ING Goldman Sachs® Capital Growth Portfolio against the indices indicated. An index is unmanaged and has no cash in its portfolio, imposes no sales charges and incurs no operating expenses. An investor cannot invest directly in an index. The Portfolio's performance is shown without the imposition of any expenses or charges which are, or may be, imposed under your annuity contract. Total returns would have been lower if such expenses or charges were included.
The performance graph and table do not reflect the deduction of taxes that a shareholder will pay on portfolio distributions or the redemption of portfolio shares.
The performance shown may include the effect of fee waivers and/or expense reimbursements by the Investment Adviser and/or other service providers, which have the effect of increasing total return. Had all fees and expenses been considered, the total returns would have been lower.
The performance update illustrates performance for a variable investment option available through a variable annuity contract. The performance shown indicates past performance and is not a projection or prediction of future results. Actual investment returns and principal value will fluctuate so that shares and/or units, at redemption, may be worth more or less than their original cost. Please call (800) 262-3862 to get performance through the most recent month end.
This report contains statements that may be "forward-looking" statements. Actual results may differ materially from those projected in the "forward-looking" statements.
The views expressed in this report reflect those of the portfolio manager only through the end of the period as stated on the cover. The portfolio manager's views are subject to change at any time based on marked and other conditions.
Portfolio holdings are subject to change daily.
(1) The S&P 500® Index is an unmanaged index that measures the performance of the securities of approximately 500 of the largest companies in the U.S.
(2) The Russell 1000® Growth Index is an index of common stocks designed to track performance of large capitalization companies with greater than average growth orientation.
(3) Since inception performance for the indices is shown as of December 1, 2001.
21
ING GOLDMAN SACHS® STRUCTURED EQUITY PORTFOLIO
PORTFOLIO MANAGERS' REPORT
The ING Goldman Sachs® Structured Equity Portfolio (the "Portfolio") seeks long-term growth of capital and dividend income. The Portfolio is managed by a team of investment professionals led by Melissa R. Brown, CFA, Managing Director and Senior Portfolio Manager, and Robert Jones, CFA, Managing Director and Chair of the Quantitative Equity Investment Policy Committee of Goldman Sachs Asset Management, L.P. — the Sub-Adviser.
Performance: For the year ended December 31, 2006, the Portfolio's Class S shares provided a total return of 11.41% compared to the Standard & Poor's 500® Composite Stock Price Index(1) ("S&P 500® Index"), which returned 15.79% for the same period.
Portfolio Specifics: In managing the Portfolio, we do not take size or sector bets. We hope to add value versus the index by individual stock selection. Our quantitative process seeks stocks with good momentum that also appear to be good values. We prefer stocks about which fundamental research analysts are becoming more positive, and companies with strong profit margins, sustainable earnings, and that use their capital to enhance shareholder value. Over the long term, these factors have led to excess returns, and they are not highly correlated, which diversifies the Portfolios' sources of returns.
The Portfolio underperformed the S&P 500® Index for the year ended December 31, 2006. Returns to the investment themes were mixed for the period. Valuation and management impact contributed the most positively to relative returns. Momentum and profitability also added value, albeit less significantly. On the downside, analyst sentiment and earnings quality detracted from excess returns for the year. However, most of the shortfall for the quarter was the result of stock specific/residual factors. Over longer periods, we expect to see very little return coming from these factors, although over a shorter time frame they may contribute more significantly to performance.
In sectors, stock selection was negative in seven of the ten sectors for the year. The Portfolio's holdings in the energy and financials sectors lagged their peers in the benchmark the most. In contrast, holdings in the consumer staples and materials sector contributed most positively to relative performance.
In individual stocks, overweight positions in Jabil Circuit, Inc., Texas Instruments, Inc., and Amgen, Inc. were among the largest detractors from the Portfolio's relative performance. Conversely, overweights in Hewlett-Packard Co., Corning, and Synopsys, Inc. contributed most positively to relative returns for the year-end reporting period.
Current Strategy and Outlook: Looking ahead, we continue to believe that cheaper stocks should outpace more expensive ones and good momentum stocks should do better than poor momentum stocks. We also prefer names about which fundamental research analysts are becoming more positive and companies that are profitable, have sustainable earnings and use their capital to enhance shareholder value. As such, we anticipate remaining fully invested and we believe that the value we add over time will be due to stock selection, as opposed to sector or size allocations.
Portfolio holdings and characteristics are subject to change and may not be representative of current holdings and characteristics. The outlook for this Portfolio may differ from that presented for other ING Funds. Performance for the different classes of shares will vary based on differences in fees associated with each class.
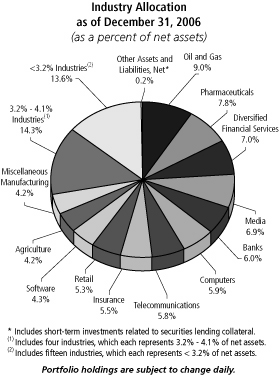
Top Ten Holdings*
as of December 31, 2006
(as a percent of net assets) | |
| ExxonMobil Corp. | | | 5.2 | % | |
| Bank of America Corp. | | | 3.4 | % | |
| Pfizer, Inc. | | | 3.1 | % | |
| Cisco Systems, Inc. | | | 2.9 | % | |
| JPMorgan Chase & Co. | | | 2.9 | % | |
| General Electric Co. | | | 2.9 | % | |
| Hewlett-Packard Co. | | | 2.5 | % | |
| Wells Fargo & Co. | | | 2.4 | % | |
| Time Warner, Inc. | | | 2.3 | % | |
| Merck & Co., Inc. | | | 2.3 | % | |
* Excludes short-term investments related to securities lending collateral.
Portfolio holdings are subject to change daily.
22
PORTFOLIO MANAGERS' REPORT
ING GOLDMAN SACHS® STRUCTURED EQUITY PORTFOLIO

| Average Annual Total Returns for the Periods Ended December 31, 2006 | |
| | | 1 Year | | Since Inception
of Classes I, S and ADV
May 1, 2003* | |
| Class I | | | 11.66 | % | | | 14.76 | % | |
| Class S | | | 11.41 | % | | | 14.64 | % | |
| Class ADV | | | 11.11 | % | | | 14.17 | % | |
| S&P 500® Index(1) | | | 15.79 | % | | | 14.70 | % | |
Based on a $10,000 initial investment, the graph and table above illustrate the total return of ING Goldman Sachs® Structured Equity Portfolio against the index indicated. An index is unmanaged and has no cash in its portfolio, imposes no sales charges and incurs no operating expenses. An investor cannot invest directly in an index. The Portfolio's performance is shown without the imposition of any expenses or charges which are, or may be, imposed under your annuity contract. Total returns would have been lower if such expenses or charges were included.
The performance graph and table do not reflect the deduction of taxes that a shareholder will pay on portfolio distributions or the redemption of portfolio shares.
The performance shown may include the effect of fee waivers and/or expense reimbursements by the Investment Adviser and/or other service providers, which have the effect of increasing total return. Had all fees and expenses been considered, the total returns would have been lower.
The performance update illustrates performance for a variable investment option available through a variable annuity contract. The performance shown indicates past performance and is not a projection or prediction of future results. Actual investment returns and principal value will fluctuate so that shares and/or units, at redemption, may be worth more or less than their original cost. Please call (800) 262-3862 to get performance through the most recent month end.
This report contains statements that may be "forward-looking" statements. Actual results may differ materially from those projected in the "forward-looking" statements.
The views expressed in this report reflect those of the portfolio manager only through the end of the period as stated on the cover. The portfolio manager's views are subject to change at any time based on marked and other conditions.
Portfolio holdings are subject to change daily.
* Class I commenced operations on May 1, 2003. On May 5, 2006, all outstanding shares of Class I were fully redeemed. On December 29, 2006, Class I re-commenced operations. The returns for Class I include the performance of Class S, adjusted to reflect the lower expenses of Class I, for the period of May 6, 2006 to December 28, 2006.
(1) The S&P 500® Index is an unmanaged index that measures the performance of the securities of approximately 500 of the largest companies in the U.S.
23
ING JPMORGAN INTERNATIONAL PORTFOLIO
PORTFOLIO MANAGERS' REPORT
The ING JPMorgan International Portfolio (the "Portfolio") seeks long-term growth of capital. The Portfolio is managed by Howard Williams, Managing Director and James Fisher, Portfolio Managers of J.P. Morgan Asset Management (U.K.) Limited — the Sub-Adviser.
Performance: For the year ended December 31, 2006, the Portfolio's Class I shares provided a total return of 22.20% compared to the Morgan Stanley Capital International Europe, Australasia and Far East® Index(1) ("MSCI EAFE® Index"), which returned 26.34% for the same period.
Portfolio Specifics: The Portfolio seeks to be diversified by both region and sector, with stock selection as the primary source of performance. From a regional perspective, our exposure to emerging markets and the U.K. aided returns, while Continental Europe and Japan detracted. Sector-wise, consumer discretionary and energy holdings proved beneficial to performance, while financials and utilities held back returns.
Japanese financials continue to lag, owing to uncertainties about the resilience of the Japanese recovery. In addition, some Japanese financials were held back by news of the government considering capping loan rates such as Credit Saison, which detracted from returns for the year.
GlaxoSmithKline PLC, the global pharmaceutical company, also detracted from performance over the period following news of potential new product delays and concerns over a slowdown in its asthma treatment sales. We continue to find shares attractively valued at current levels and believe the strength of the new product pipeline is underestimated.
On a positive note, CVRD, the Brazilian iron ore company, had a strong showing. There are market concerns about the supply/demand outlook for iron ore ahead of next year's price negotiations, but the companies we have spoken with have given early indications of another robust round of negotiations that should be supportive of prices. Nearing the end of 2006, CVRD completed its acquisition of Inco, the Canadian nickel producer, which should help transform the company into one of the leading nickel players in the market.
Our overweight position in Esprit, the Hong Kong-based global clothing retailer, also contributed positively to returns as shares rose after full-year profits increased to record highs. Esprit has an aggressive strategy to increase its market share in Europe, comprising about 85% of its global sales. We remain confident that the company is well-positioned to benefit from a new management team focused on expanding its brands and geographic reach.
Current Strategy and Outlook: Despite a backdrop of rising U.S. interest rates and a slowing U.S. economy, global equity markets performed well in 2006. There is, however, much to be vigilant about, such as the threat of even higher interest rates globally. Although the raising of rates in Japan would be a positive sign — that the domestic economy is at last finding some traction — further rate hikes elsewhere would be a cause for concern. Slower economic expansion, especially in the U.S., where the focus is on the housing market slump and its potential effects, could prompt cuts in interest rates. While frequently taken as initially positive by investors, this could portend more troubled times ahead.
In the meantime, markets still remain underpinned by valuation. While earnings growth expectations for this year are lower than last year, markets are still attractively valued. However, companies that disappoint with earnings expectations will likely be punished severely by the markets going forward. In an environment of anticipated scarcer growth, we expect our Portfolio of higher-growth, more cheaply valued companies to outperform the broader market.
In terms of asset allocation, we continue to prefer European, Asian and Japanese markets over that of the U.S. We have continued to favor increasing exposure to recovery in the domestic Japanese economy. While this proved disappointing in 2006, we continue to believe that all the conditions for a domestic recovery are in place and will be rewarded in the coming year.
Portfolio holdings and characteristics are subject to change and may not be representative of current holdings and characteristics. The outlook for this Portfolio may differ from that presented for other ING Funds. Performance for the different classes of shares will vary based on differences in fees associated with each class.

Top Ten Holdings*
as of December 31, 2006
(as a percent of net assets) | |
| Total SA | | | 3.8 | % | |
| ENI S.p.A. | | | 3.1 | % | |
| HSBC Holdings PLC | | | 3.0 | % | |
| UBS AG | | | 2.3 | % | |
| Tesco PLC | | | 2.3 | % | |
| Vodafone Group PLC | | | 2.1 | % | |
| AXA SA | | | 2.0 | % | |
| GlaxoSmithKline PLC | | | 2.0 | % | |
| Barclays PLC | | | 1.9 | % | |
| Roche Holding AG | | | 1.9 | % | |
* Excludes short-term investments related to securities lending collateral and U.S. government agency obligation.
Portfolio holdings are subject to change daily.
24
PORTFOLIO MANAGERS' REPORT
ING JPMORGAN INTERNATIONAL PORTFOLIO

| Average Annual Total Returns for the Periods Ended December 31, 2006 | |
| | | 1 Year | | 5 Year | | Since Inception
of Class I
November 28, 1997 | | Since Inception of
Classes S and ADV
December 10, 2001 | |
| Class I | | | 22.20 | % | | | 11.13 | % | | | 7.37 | % | | | — | | |
| Class S | | | 21.92 | % | | | 10.92 | % | | | — | | | | 10.46 | % | |
| Class ADV | | | 21.65 | % | | | 10.63 | % | | | — | | | | 10.18 | % | |
| MSCI EAFE® Index(1) | | | 26.34 | % | | | 14.98 | % | | | 8.41 | %(2) | | | 14.85 | %(3) | |
Based on a $10,000 initial investment, the graph and table above illustrate the total return of ING JPMorgan International Portfolio against the index indicated. An index is unmanaged and has no cash in its portfolio, imposes no sales charges and incurs no operating expenses. An investor cannot invest directly in an index. The Portfolio's performance is shown without the imposition of any expenses or charges which are, or may be, imposed under your annuity contract. Total returns would have been lower if such expenses or charges were included.
The performance graph and table do not reflect the deduction of taxes that a shareholder will pay on portfolio distributions or the redemption of portfolio shares.
The performance shown may include the effect of fee waivers and/or expense reimbursements by the Investment Adviser and/or other service providers, which have the effect of increasing total return. Had all fees and expenses been considered, the total returns would have been lower.
The performance update illustrates performance for a variable investment option available through a variable annuity contract. The performance shown indicates past performance and is not a projection or prediction of future results. Actual investment returns and principal value will fluctuate so that shares and/or units, at redemption, may be worth more or less than their original cost. Please call (800) 262-3862 to get performance through the most recent month end.
This report contains statements that may be "forward-looking" statements. Actual results may differ materially from those projected in the "forward-looking" statements.
The views expressed in this report reflect those of the portfolio manager only through the end of the period as stated on the cover. The portfolio manager's views are subject to change at any time based on marked and other conditions.
Portfolio holdings are subject to change daily.
(1) The MSCI EAFE® Index is an unmanaged index that measures the performance of securities listed on exchanges in markets in Europe, Australia, and the Far East.
(2) Since inception performance for the index is shown as of December 1, 1997.
(3) Since inception performance for the index is shown as of December 1, 2001.
25
ING JPMORGAN MID CAP VALUE PORTFOLIO
PORTFOLIO MANAGERS' REPORT
The ING JPMorgan Mid Cap Value Portfolio (the "Portfolio") seeks growth from capital appreciation. The Portfolio is managed by Jonathan K.L. Simon and Lawrence Playford, Portfolio Managers of J.P. Morgan Investment Management Inc. — the Sub-Adviser.
Performance: For the year ended December 31, 2006, the Portfolio's Class S shares provided a total return of 16.52% compared to the Russell Midcap® Value Index(1), which returned 20.22% for the same period.
Portfolio Specifics: The Portfolio underperformed the Russell Midcap® Value Index mostly due to stock selection in the consumer staples and healthcare sectors. Positively affecting performance was stock selection in the consumer discretionary and materials sectors.
At the stock level, Omnicare, Inc., a pharmaceutical services company, was a detractor to performance as its shares were pressured by several events, including legal disputes with regulators and the company's ongoing lawsuit against UnitedHealthcare Group, Inc. Despite these negative developments, Omnicare, Inc. is the largest institutional pharmacy provider with a significant low-cost advantage relative to its competitors.
Another detractor from performance for the period was CA, Inc., a corporate software firm. CA, Inc., missed its annual report filing deadline, and said it will likely need to restate previously reported results related to stock-option grants dating back to fiscal 1997. In addition, the company announced it may have also understated some of its subscription revenue prior to fiscal 2006. Given the company's uncertain outlook, we eliminated our position in CA, Inc.
Several holdings made positive contributions to performance, including VF Corporation, a leading apparel manufacturer. The company saw strong momentum in its outdoor apparel business and improvement in denim. VF Corporation also announced that it is in negotiations to acquire Eagle Creek, Inc., a supplier of adventure travel gear, which would bolster its fast-growing outdoor business. Acquisitions have allowed VF Corporation to transition its mature, lower-growth denim business into a diversified portfolio of higher-margin lifestyle brands.
Albemarle Corp., a specialty chemical company, was another top contributor to results. Shares of the company were strong throughout the year as relief from higher raw material costs and price increases resulted in higher margins and profitability. The outlook for Albemarle Corp. remains positive as demand for refining catalysts is expected to increase and declining raw material costs could lead to higher margins.
Sector allocations are a byproduct of our bottom-up stock selection process. The two-largest portfolio overweights are in the consumer discretionary and telecommunications services sector. The overweight in consumer discretionary results from the fact that many names in the sector have the sustainable free cash flow we look for in our investments. Our overweight in telecommunications services is based on our outlook for the underlying fundamentals of the stocks that we hold. We prefer to own rural telecommunications providers due to their defensive competitive profile.
The two-largest portfolio underweights at year end were in the information technology and utilities sectors. We underweighted utilities as we find it difficult to find attractive valuations in this sector. We also believe that many technology firms lack the stable business models we seek in our investments and, therefore, typically underweight this sector.
Current Strategy and Outlook: We employ a bottom-up approach to stock selection, constructing portfolios based on company fundamentals, quantitative screening and proprietary fundamental analysis. Our aim is to identify undervalued companies that have the potential to increase their intrinsic values per share and to purchase these companies at a discount.
Portfolio holdings and characteristics are subject to change and may not be representative of current holdings and characteristics. The outlook for this Portfolio may differ from that presented for other ING Funds. Performance for the different classes of shares will vary based on differences in fees associated with each class.
Top Ten Holdings*
as of December 31, 2006
(as a percent of net assets) | |
| Assurant, Inc. | | | 2.4 | % | |
| VF Corp. | | | 2.3 | % | |
| Coventry Health Care, Inc. | | | 2.2 | % | |
| Fortune Brands, Inc. | | | 1.7 | % | |
| Autozone, Inc. | | | 1.7 | % | |
| Genuine Parts Co. | | | 1.7 | % | |
| Old Republic International Corp. | | | 1.6 | % | |
| Vulcan Materials Co. | | | 1.6 | % | |
| M&T Bank Corp. | | | 1.6 | % | |
| Kinder Morgan, Inc. | | | 1.6 | % | |
* Excludes short-term investments related to securities lending collateral and U.S. government agency obligation.
Portfolio holdings are subject to change daily.
26
PORTFOLIO MANAGERS' REPORT
ING JPMORGAN MID CAP VALUE PORTFOLIO
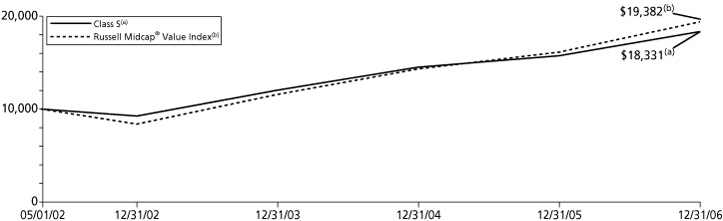
| Average Annual Total Returns for the Periods Ended December 31, 2006 | |
| | | 1 Year | | Since Inception
of Classes I, S and ADV
May 1, 2002 | |
| Class I | | | 16.84 | % | | | 14.14 | % | |
| Class S | | | 16.52 | % | | | 13.85 | % | |
| Class ADV | | | 16.26 | % | | | 13.56 | % | |
| Russell Midcap® Value Index(1) | | | 20.22 | % | | | 15.23 | % | |
Based on a $10,000 initial investment, the graph and table above illustrate the total return of ING JPMorgan Mid Cap Value Portfolio against the index indicated. An index is unmanaged and has no cash in its portfolio, imposes no sales charges and incurs no operating expenses. An investor cannot invest directly in an index. The Portfolio's performance is shown without the imposition of any expenses or charges which are, or may be, imposed under your annuity contract. Total returns would have been lower if such expenses or charges were included.
The performance graph and table do not reflect the deduction of taxes that a shareholder will pay on portfolio distributions or the redemption of portfolio shares.
The performance shown may include the effect of fee waivers and/or expense reimbursements by the Investment Adviser and/or other service providers, which have the effect of increasing total return. Had all fees and expenses been considered, the total returns would have been lower.
The performance update illustrates performance for a variable investment option available through a variable annuity contract. The performance shown indicates past performance and is not a projection or prediction of future results. Actual investment returns and principal value will fluctuate so that shares and/or units, at redemption, may be worth more or less than their original cost. Please call (800) 262-3862 to get performance through the most recent month end.
This report contains statements that may be "forward-looking" statements. Actual results may differ materially from those projected in the "forward-looking" statements.
The views expressed in this report reflect those of the portfolio manager only through the end of the period as stated on the cover. The portfolio manager's views are subject to change at any time based on marked and other conditions.
Portfolio holdings are subject to change daily.
(1) The Russell Midcap® Value Index measures the performance of those Russell Midcap companies with lower price-to-book ratios and lower forecasted growth values.
27
ING LEGG MASON PARTNERS AGGRESSIVE GROWTH PORTFOLIO
PORTFOLIO MANAGERS' REPORT
The ING Legg Mason Partners Aggressive Growth Portfolio (the "Portfolio") seeks long-term growth of capital. The Portfolio is managed by Richie Freeman Managing Director and Portfolio Manager, of ClearBridge Advisors, LLC* — the Sub-Adviser.
Performance: For the year ended December 31, 2006, the Portfolio's Class I shares provided a total return of 10.29% compared to the Russell 3000® Growth Index(1) and the Standard & Poor's 500® Composite Stock Price Index(2) ("S&P 500® Index"), which returned 9.46% and 15.79%, respectively, for the same period.
Portfolio Specifics: The stock market ended the fourth quarter and the past year on an upbeat note, with a broad market rally that began in mid-July and continued through the end of the year. In mid-December, the Dow Jones Industrial Average† recorded a new all-time high and several other major market averages made substantial advances, leaving them at or near multi-year highs. Last year marked the fourth year in a row of gains for equities following the difficult bear market from 2000 to 2002.
For 2006, the effect of the Portfolio's stock selection overall contributed positively to performance relative to its benchmark of the Russell 3000® Growth Index, while the effect of sector allocation overall was negative. Stock selection in consumer discretionary had a very strong positive impact on relative performance, while stock selection in financials also had a meaningful positive impact. Portfolio overweights to consumer discretionary and financials, as well as an underweight to information technology also contributed positively to relative performance. Significant detractors from relative performance for the year included stock selection in information technology, health care and energy sectors, as well as an overweight to health care and underweights to consumer staples, industrials and materials.
In terms of individual stocks, leading contributors to relative performance included several media and cable television stocks that were among the Portfolio's leading detractors last year, including Comcast Corp., Cablevision Systems Corp., Time Warner Inc., and Walt Disney Co., all in the consumer discretionary sector. Other significant contributors to performance for the year included Merrill Lynch & Co. Inc. and Lehman Brothers Holdings Inc. in financials, Forest Laboratories Inc. and Biogen Idec Inc., both in health care, as well as Weatherford International Ltd. in energy and Tyco International Ltd. in industrials.
Leading detractors from performance included holdings in UnitedHealth Group Inc., Amgen Inc., Genzyme Corp. and ImClone Systems Inc., all in health care, SanDisk Corp., Intel Corp. and Motorola Inc. in information technology, Anadarko Petroleum Corp. and Grant Prideco Inc. in energy, and Sirius Satellite Radio Inc. in consumer discretionary.
Current Strategy and Outlook: At the close of the year, the Portfolio remained overweight in the health care, energy, financials and consumer discretionary sectors, with underweights in industrials and information technology, and no significant holdings in consumer staples, materials, telecommunications services or utilities. As always, the Portfolio's sector allocation is determined by the manager's disciplined, bottom-up stock selection process. The Portfolio's top 10 holdings as of December 31, 2006 were Comcast Corp. in consumer discretionary, Forest Laboratories Inc. in health care, Lehman Brothers Holdings Inc. and Merrill Lynch & Co. Inc. in financials, UnitedHealth Group Inc. in health care, Time Warner Inc. in consumer discretionary, Tyco International Ltd. in industrials, Amgen Inc. and Genzyme Corp. in health care, and Anadarko Petroleum Corp . in energy.
In our experience, significant market advances have typically occurred during periods of extreme pessimism rather that during periods of euphoria. It is our contention that in order to create a more sustainable advance, it would be healthy for the market to undergo a correction, or at least a period of marking-time, in order to digest the gains of the second half of 2006. We believe the sooner such a correction is able to get underway the more durable the bull-market will be expected to be.
* On November 9, 2006 the Board of Directors of ING Partners, Inc. approved the transfer of sub-advisory responsibilities, effective December 1, 2006, from Salomon Brothers Asset Management Inc, a wholly-owned subsidiary of Legg Mason, Inc., to ClearBridge Advisors, LLC, also a wholly-owned subsidiary of Legg Mason, Inc.
† The Dow Jones Industrial Average is a widely followed measurement of the stock market. The average is comprised of 30 stocks that represent leading companies in major industries. These stocks, widely held by both individual and institutional investors, are considered to be all blue-chip companies
Portfolio holdings and characteristics are subject to change and may not be representative of current holdings and characteristics. The outlook for this Portfolio may differ from that presented for other ING Funds. Performance for the different classes of shares will vary based on differences in fees associated with each class.
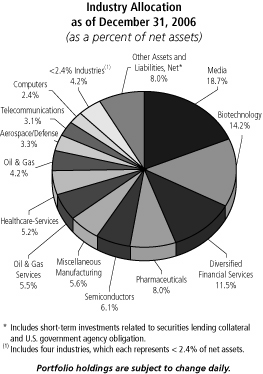
Top Ten Holdings*
as of December 31, 2006
(as a percent of net assets)
| Comcast Corp. | | | 5.5 | % | |
| Forest Laboratories, Inc. | | | 5.5 | % | |
| Lehman Brothers Holdings, Inc. | | | 5.4 | % | |
| Merrill Lynch & Co., Inc. | | | 5.4 | % | |
| UnitedHealth Group, Inc. | | | 5.2 | % | |
| Time Warner, Inc. | | | 4.7 | % | |
| Tyco International Ltd. | | | 4.5 | % | |
| Amgen, Inc. | | | 4.3 | % | |
| Genzyme Corp. | | | 4.3 | % | |
| Anadarko Petroleum Corp. | | | 4.2 | % | |
* Excludes short-term investments related to securities lending collateral and U.S. government agency obligation.
Portfolio holdings are subject to change daily.
28
PORTFOLIO MANAGERS' REPORT
ING LEGG MASON PARTNERS AGGRESSIVE GROWTH PORTFOLIO
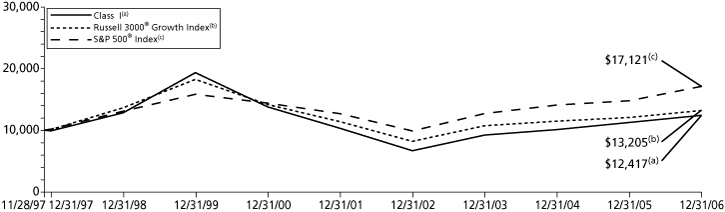
| Average Annual Total Returns for the Periods Ended December 31, 2006 | |
| | | 1 Year | | 5 Year | | Since Inception
of Class I
November 28, 1997 | | Since Inception
of Classes S and ADV
December 10, 2001 | |
| Class I | | | 10.29 | % | | | 3.81 | % | | | 2.41 | % | | | — | | |
| Class S | | | 10.00 | % | | | 3.55 | % | | | — | | | | 3.33 | % | |
| Class ADV | | | 9.74 | % | | | 3.30 | % | | | — | | | | 3.07 | % | |
| Russell 3000® Growth Index(1) | | | 9.46 | % | | | 3.02 | % | | | 3.11 | %(3) | | | 3.01 | %(4) | |
| S&P 500® Index(2) | | | 15.79 | % | | | 6.19 | % | | | 6.10 | %(3) | | | 6.27 | %(4) | |
Based on a $10,000 initial investment, the graph and table above illustrate the total return of ING Legg Mason Partners Aggressive Growth Portfolio against the indices indicated. An index is unmanaged and has no cash in its portfolio, imposes no sales charges and incurs no operating expenses. An investor cannot invest directly in an index. The Portfolio's performance is shown without the imposition of any expenses or charges which are, or may be, imposed under your annuity contract. Total returns would have been lower if such expenses or charges were included.
The performance graph and table do not reflect the deduction of taxes that a shareholder will pay on portfolio distributions or the redemption of portfolio shares.
The performance shown may include the effect of fee waivers and/or expense reimbursements by the Investment Adviser and/or other service providers, which have the effect of increasing total return. Had all fees and expenses been considered, the total returns would have been lower.
The performance update illustrates performance for a variable investment option available through a variable annuity contract. The performance shown indicates past performance and is not a projection or prediction of future results. Actual investment returns and principal value will fluctuate so that shares and/or units, at redemption, may be worth more or less than their original cost. Please call (800) 262-3862 to get performance through the most recent month end.
This report contains statements that may be "forward-looking" statements. Actual results may differ materially from those projected in the "forward-looking" statements.
The views expressed in this report reflect those of the portfolio manager only through the end of the period as stated on the cover. The portfolio manager's views are subject to change at any time based on marked and other conditions.
Portfolio holdings are subject to change daily.
(1) The Russell 3000® Growth Index measures the performance of the 3000 largest U.S. companies based on total market capitalization, which represent approximately 98% of the U.S. equity market.
(2) The S&P 500® Index is an unmanaged index that measures the performance of the securities of approximately 500 of the largest companies in the U.S.
(3) Since inception performance for the indices is shown from December 1, 1997.
(4) Since inception performance for the indices is shown from December 1, 2001.
29
ING LEGG MASON PARTNERS LARGE CAP GROWTH PORTFOLIO
PORTFOLIO MANAGERS' REPORT
The ING Legg Mason Partners Large Cap Growth Portfolio (the "Portfolio") seeks long-term capital appreciation. The Portfolio is managed by Alan Blake Managing Director and Portfolio Manager, of ClearBridge Advisors, LLC(1) — the Sub-Adviser.
Performance: For the year ended December 31, 2006, the Portfolio's Class S provided a total return of 3.88% compared to the Russell 1000® Growth Index(1) and the Standard & Poor's 500® Composite Stock Price Index(2) ("S&P 500® Index"), which returned 9.07% and 15.79%, respectively, for the same period.
Portfolio Specifics: After early weakness in the first and second quarters, large cap stocks had a very good third quarter and an even better fourth quarter, with the Dow Jones Industrial Average(2) setting all time highs in the final week of the year. The appreciation in the second half of the year was largely fueled by a more dovish Federal Reserve ("Fed") beginning in June, declining commodity prices (oil, industrial metals), record share buybacks, strong merger and acquisition activity and most importantly, record corporate profits. In our opinion, corporate earnings remain strong, valuations are reasonable, and we note that the case for multiple expansion is not without precedent during a mid-cycle s lowdown, which would be welcome relief after five years of multiple contraction.
For 2006, relative to the benchmark Russell 1000 Growth Index, both overall stock selection and overall sector allocation negatively impacted portfolio performance, with stock selection accounting for the majority of the difference between the portfolio's return and the benchmark return for the same period.
Leading contributors to relative performance included stock selection in the financials and consumer staples sectors, as well as an overweight to financials and an underweight to energy. In terms of individual stocks, significant contributors to relative performance for the period include positions in Akamai Technologies, Inc. and Cisco Systems, Inc. in information technology (IT), Merrill Lynch & Co., Inc. and Morgan Stanley in financials, and Walt Disney Co. in consumer discretionary.
Significant detractors from relative performance for the period included stock selection in the IT sector, and to a lesser degree, stock selection in the health care, industrials and consumer discretionary sectors. The portfolio's overweight to IT and its underweights to the industrials, materials, and utilities sectors also negatively impacted relative performance. For the period, leading stock detractors from relative portfolio performance included positions in Yahoo!, Inc. and eBay, Inc. in IT, Amazon.com, Inc. in consumer discretionary, as well as Genentech, Inc. and Amgen, Inc., both in health care.
During the period, the Portfolio closed its positions in EMC Corp. in IT, Bed Bath & Beyond, Inc. in consumer discretionary, Eli Lilly & Co. in health care, Expedia, Inc. in consumer discretionary and Xilinx, Inc. and Dell, Inc. in IT, and established new positions in Electronic Arts, Inc. in IT, NASDAQ Stock Market, Inc. in financials, and Medtronic, Inc. in health care. The portfolio also added to several existing positions during the year.
Current Strategy and Outlook: Earlier this year, we argued that the market corrections of the summer were a harbinger of a much larger and longer change in market leadership, one that would recognize balance sheet strength and the consistency and quality of top-tier large cap growth stocks. Far from over, we believe we are in the early stages of this change in market leadership and that, despite strong price appreciation in the large cap growth space during the second half of 2006, valuations remain favorable. We believe 2007 will continue this trend as investors rebalance their portfolios as they reassess risk.
Though we maintain a positive outlook going into 2007, there remain significant issues that weigh on the global landscape at large that we continue to watch carefully. Weakness in the U.S. housing market (with its potential impact on the broader economy via consumer spending), a weakening dollar, an inverted yield curve, lack of measured progress in Iraq and a Fed balancing act, leads us to be believe that the coming year will be very much like the one we have just witnessed. We anticipate a high degree of volatility and additional emphasis on the importance of stock selection in investor portfolios.
(1) On November 9, 2006 the Board of Directors of ING Partners, Inc. approved the transfer of sub-advisory responsibilities, effective December 1, 2006, from Salomon Brothers Asset Management, Inc., a wholly-owned subsidiary of Legg Mason, Inc., to ClearBridge Advisors, LLC, also a wholly-owned subsidiary of Legg Mason, Inc.
(2) The Dow Jones Industrial Average is a widely followed measurement of the stock market. The average is comprised of 30 stocks that represent leading companies in major industries. These stocks, widely held by both individual and institutional investors, are considered to be all blue-chip companies
Portfolio holdings and characteristics are subject to change and may not be representative of current holdings and characteristics. The outlook for this Portfolio may differ from that presented for other ING Funds. Performance for the different classes of shares will vary based on differences in fees associated with each class.
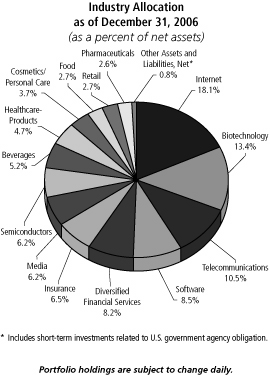
Top Ten Holdings
as of December 31, 2006
(as a percent of net assets)
| Amazon.com, Inc. | | | 5.7 | % | |
| Genentech, Inc. | | | 5.5 | % | |
| Amgen, Inc. | | | 5.1 | % | |
| Merrill Lynch & Co., Inc. | | | 4.7 | % | |
| Akamai Technologies, Inc. | | | 3.9 | % | |
| Berkshire Hathaway, Inc. | | | 3.7 | % | |
| Procter & Gamble Co. | | | 3.7 | % | |
| Texas Instruments, Inc. | | | 3.4 | % | |
| Time Warner, Inc. | | | 3.3 | % | |
| Motorola, Inc. | | | 3.3 | % | |
Portfolio holdings are subject to change daily.
30
PORTFOLIO MANAGERS' REPORT
ING LEGG MASON PARTNERS LARGE CAP GROWTH PORTFOLIO
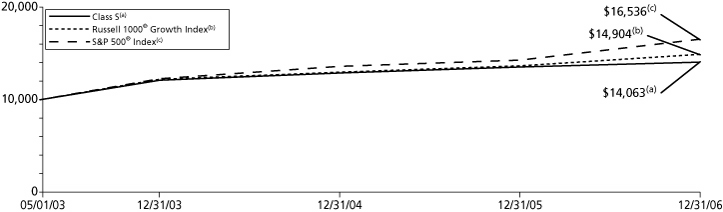
| Average Annual Total Returns for the Periods Ended December 31, 2006 | |
| | | 1 Year | | Since Inception
of Classes I, S and ADV
May 1, 2003 | |
| Class I | | | 4.19 | % | | | 10.03 | % | |
| Class S | | | 3.88 | % | | | 9.74 | % | |
| Class ADV | | | 3.64 | % | | | 9.48 | % | |
| Russell 1000® Growth Index(1) | | | 9.07 | % | | | 11.50 | % | |
| S&P 500® Index(2) | | | 15.79 | % | | | 14.70 | % | |
Based on a $10,000 initial investment, the graph and table above illustrate the total return of ING Legg Mason Partners Large Cap Growth Portfolio against the indices indicated. An index is unmanaged and has no cash in its portfolio, imposes no sales charges and incurs no operating expenses. An investor cannot invest directly in an index. The Portfolio's performance is shown without the imposition of any expenses or charges which are, or may be, imposed under your annuity contract. Total returns would have been lower if such expenses or charges were included.
The performance graph and table do not reflect the deduction of taxes that a shareholder will pay on portfolio distributions or the redemption of portfolio shares.
The performance shown may include the effect of fee waivers and/or expense reimbursements by the Investment Adviser and/or other service providers, which have the effect of increasing total return. Had all fees and expenses been considered, the total returns would have been lower.
The performance update illustrates performance for a variable investment option available through a variable annuity contract. The performance shown indicates past performance and is not a projection or prediction of future results. Actual investment returns and principal value will fluctuate so that shares and/or units, at redemption, may be worth more or less than their original cost. Please call (800) 262-3862 to get performance through the most recent month end.
This report contains statements that may be "forward-looking" statements. Actual results may differ materially from those projected in the "forward-looking" statements.
The views expressed in this report reflect those of the portfolio manager only through the end of the period as stated on the cover. The portfolio manager's views are subject to change at any time based on marked and other conditions.
Portfolio holdings are subject to change daily.
(1) The Russell 1000® Growth Index is an index of common stocks designed to track performance of large capitalization companies with greater than average growth orientation.
(2) The S&P 500® Index is an unmanaged index that measures the performance of the securities of approximately 500 of the largest companies in the U.S.
31
ING LORD ABBETT U.S. GOVERNMENT PORTFOLIO
PORTFOLIO MANAGERS' REPORT
The ING Lord Abbett U.S. Government Securities Portfolio (the "Portfolio") seeks high current income consistent with reasonable risk. The Portfolio is managed by Robert I. Gerber, Partner, Director of Taxable Fixed Income Management and Portfolio Manager of Lord, Abbett & Co. LLC — the Sub-Adviser.
Performance: Since the Portfolio's inception on January 3, 2006 through December 31, 2006, the Portfolio's Class I shares provided a total return of 3.81% compared to the Lehman Brothers® Government Bond Index(1), which returned 3.48% for the year ended December 31, 2006. Duration relative to the index did not directly or inadvertently affect performance.
Portfolio Specifics: Bond markets faced headwinds in the first half of 2006 as tighter U.S. and international monetary policy and better-than-expected economic data pushed bond yields higher (and prices lower). The benchmark 10-year Treasury began the year yielding 4.39% and by June 30 had risen to 5.15%. As a result, most sectors of the bond market produced negative returns during the first six months of the year. However, the world changed for bond investors in the second half of 2006. The bond market rallied over 5% in price terms as the 10-year Treasury yield ended the year at 4.71%. The reversal could be attributed to a number of factors leading market participants to believe that the U.S. Federal Reserve Board's, ("Fed") interest rate tightening cycle was over and would be followed by a set of eases. In August, the Fed decided to hold the fed funds ra te (the rate at which banks lend to one another) steady at 5.25% after increasing it 17 straight times since June 2004. The Fed subsequently held rates steady at its meetings in September, October and December.
The primary contributing factor to the bond market rally was the evident slowing of the economy. Second quarter gross domestic product ("GDP") came in at 2.6%, sharply lower than first quarter GDP of 5.6% while final results for third quarter GDP were 2.0%. The downshift in economic activity is supportive of bond prices as investors expect the Fed to be compelled to hold rates steady, or lower them, in order to avert a recession. Additionally, benign inflation reports suggest that rate increases to date have, in the context of a slowing economy, been sufficient to temper incipient inflationary pressure.
With the exception of the May-June retrenchment in investor appetite for risk, portfolio securities with excess yield over Treasuries outperformed comparable maturity Treasury securities during the year. Therefore, our decision to overweight non-Treasury securities was rewarded.
The primary contributor to relative performance for the year was our large overweight in agency mortgage-backed pass-through securities ("MBS"). Based on attractive valuations, however, we significantly reduced our overweight position in MBS during the third and fourth quarters and added to our position in agencies. We have thus moved out of an appreciated sector and into one that, in our view, offers greater potential for return.
The maturity structure of the Portfolio marginally contributed to relative performance during the year. As the yield curve steepened in the second quarter, our underweight in long maturity debt and overweight in intermediate maturity debt improved relative returns. While we maintain our view that diminished global liquidity and the specter of inflation will cause the yield curve to steepen, we continue to opportunistically reduce the maturity structure position, diminishing exposure to the intermediate part of the curve and adding longer maturity debt.
Current Strategy and Outlook: Weakness in housing and manufacturing has resulted in a slowdown in the economy from its rapid pace earlier this year. Many market participants believe that the next move by the Fed may be to lower interest rates, coming as early as the first half of 2007. We believe, however, this may be premature. Change in the Fed's stance on monetary policy will be dictated by forthcoming readings on inflation and growth of the economy. Should inflation rates remain above the Fed's stated comfort range of 1-2% annually, the Fed will likely delay the beginning of any interest rate ease. However, if the slowdown in housing and auto manufacturing extends into other segments of the economy, and the slowdown in the broader economy is (as the Fed expects) sufficient to rein in inflation, then the policy outlook could become more volatile.
Portfolio holdings and characteristics are subject to change and may not be representative of current holdings and characteristics. The outlook for this Portfolio may differ from that presented for other ING Funds. Performance for the different classes of shares will vary based on differences in fees associated with each class.
Agency Allocation
as of December 31, 2006
(as a percent of net assets)
| Federal National Mortgage Association | | | 49.6 | % | |
| Federal Home Loan Mortgage Corporation | | | 20.6 | % | |
| Government National Mortgage Association | | | 10.8 | % | |
| U.S. Treasury Bonds | | | 10.5 | % | |
| Federal Home Loan Bank | | | 9.7 | % | |
| U.S. Treasury Notes | | | 3.2 | % | |
| Other Assets and Liabilities, Net | | | (4.4 | )% | |
| Net Assets | | | 100.0 | % | |
Portfolio holdings are subject to change daily.
Top Ten Holdings
as of December 31, 2006
(as a percent of net assets)
Federal National Mortgage Association,
5.500%, due 02/01/36 | | | 22.5% | | |
| Federal Home Loan Bank, 5.125%, due 08/14/13 | | | 9.7 | % | |
Government National Mortgage Association,
5.500%, due 02/15/36 | | | 8.6% | | |
Federal Home Loan Mortgage Corporation,
5.500%, due 01/15/19 | | | 7.0% | | |
Federal National Mortgage Association,
5.500%, due 01/01/37 | | | 5.0% | | |
Federal National Mortgage Association,
6.000%, due 05/15/11 | | | 4.3% | | |
Federal National Mortgage Association,
5.500%, due 03/01/36 | | | 4.2% | | |
| U.S. Treasury Bond, 4.500%, due 02/15/36 | | | 4.2 | % | |
| U.S. Treasury Bond, 6.125%, due 08/15/29 | | | 4.1 | % | |
Federal Home Loan Mortgage Corporation,
5.000%, due 04/01/20 | | | 3.4% | | |
Portfolio holdings are subject to change daily.
32
PORTFOLIO MANAGERS' REPORT
ING LORD ABBETT U.S. GOVERNMENT SECURITIES PORTFOLIO

| Cumulative Total Returns for the Periods Ended December 31, 2006 | |
| | | Since Inception
of Class I
January 3, 2006 | | Since Inception
of Class S
January 18, 2006 | | Since Inception
of Class ADV
December 20, 2006 | |
| Class I | | | 3.81 | % | | | — | | | | — | | |
| Class S | | | — | | | | 3.01 | % | | | — | | |
| Class ADV | | | — | | | | — | | | | (0.28 | )% | |
| Lehman Brothers® Government Bond Index(1) | | | 3.48 | %(2) | | | 3.65 | %(3) | | | N/A(4) | | |
Based on a $10,000 initial investment, the graph and table above illustrate the total return of ING Lord Abbett U.S. Government Securities Portfolio against the index indicated. An index is unmanaged and has no cash in its portfolio, imposes no sales charges and incurs no operating expenses. An investor cannot invest directly in an index. The Portfolio's performance is shown without the imposition of any expenses or charges which are, or may be, imposed under your annuity contract. Total returns would have been lower if such expenses or charges were included.
The performance graph and table do not reflect the deduction of taxes that a shareholder will pay on portfolio distributions or the redemption of portfolio shares.
The performance shown may include the effect of fee waivers and/or expense reimbursements by the Investment Adviser and/or other service providers, which have the effect of increasing total return. Had all fees and expenses been considered, the total returns would have been lower.
The performance update illustrates performance for a variable investment option available through a variable annuity contract. The performance shown indicates past performance and is not a projection or prediction of future results. Actual investment returns and principal value will fluctuate so that shares and/or units, at redemption, may be worth more or less than their original cost. Please call (800) 262-3862 to get performance through the most recent month end.
This report contains statements that may be "forward-looking" statements. Actual results may differ materially from those projected in the "forward-looking" statements.
The views expressed in this report reflect those of the portfolio manager only through the end of the period as stated on the cover. The portfolio manager's views are subject to change at any time based on marked and other conditions.
Portfolio holdings are subject to change daily.
(1) The Lehman Brothers® Government Bond Index is an index of U.S. Treasury bonds and notes, and government-agency bonds (excluding mortgage-backed securities).
(2) Since inception performance of the index is shown from January 1, 2006.
(3) Since inception performance of the index is shown from February 1, 2006.
(4) Since inception performance for the index is not shown.
33
ING NEUBERGER BERMAN PARTNERS PORTFOLIO
PORTFOLIO MANAGERS' REPORT
The ING Neuberger Berman Partners Portfolio (the "Portfolio") seeks capital growth. The Portfolio is managed by S. Basu Mullick, Vice President and Portfolio Manager of Neuberger Berman Management Inc. — the Sub-Adviser.
Performance: Since the Portfolio's inception on January 3, 2006 through December 31, 2006, the Portfolio's Class S shares provided a total return of 9.00% compared to the Standard & Poor's 500® Composite Stock Price Index(1) ("S&P 500® Index"), which returned 15.79% for the year ended December 31, 2006.
Portfolio Specifics: We have placed considerable emphasis on energy and the consumer durables sub-sectors of the consumer discretionary sector, believing both in the secular supply/demand trends favoring oil, gas and coal companies and in the underlying demographics and macroeconomic variables supporting the long-term prospects of home construction firms and the overall strength of the consumer. For much of the year, these areas were a substantial drag on performance. For the first group, unusually mild winter - and then summer - weather lifted natural gas and coal inventories to high levels, putting pressure on commodity prices and, by extension, the share prices of our stocks in those areas. Meanwhile, homebuilding stocks were hit by the U.S. Federal Reserve Board's ("Fed") interest rate campaign and the rapid slowdown of the housing market. D.R. Horton, Inc. and KB Home were two homebuilders we owned which were particularly hard hit.
However, in the wake of the Fed's pause and renewed optimism for stable, albeit slower, economic growth, these areas recovered late in the year. In energy, the fall season brought with it a reduction in natural gas inventories and recovery in natural gas prices, as well as the stabilization of oil prices, which had declined from earlier peaks. In consumer discretionary, homebuilding stocks enjoyed strong fourth quarter returns, as did our retailers. However, this was not enough to make up for our earlier shortfalls.
Overall, financial stocks provided the largest contribution to Portfolio total return, in spite of our underweighting based on concerns about interest rate trends, as we outperformed benchmark constituents mainly because of brokerage shares.
Among our individual holdings, Phelps Dodge Corp. provided the largest contribution to total return, as the copper mining company agreed to be acquired by Freeport-McMoRan Copper & Gold, Inc. Within the industrials sector, mining equipment manufacturer Terex Corp. posted a substantial gain, as fundamentals reflected the continued U.S. economic expansion, particularly in the construction and mining sectors, despite weakness in residential construction. Meanwhile, energy companies Arch Coal, Inc. and Foundation Coal Holdings, Inc. suffered pressure on the downside, due to weak prices related to the mild weather noted above.
Current Strategy and Outlook: The energy sector remains our largest overweight versus the index. We believe the long-term fundamentals for energy stocks are strong, and that our companies involved in oil sands, Barnett shale and other non-conventional sources of oil and gas are likely to perform well over the long term. We remain committed to our consumer discretionary holdings, believing the housing sector will stabilize in the months ahead and that the consumer will show resilience. Meanwhile, it seems likely we will add to our health care overweighting, as we are finding a number of attractive opportunities.
We are reasonably optimistic about the overall operating environment for our Portfolio holdings. In our opinion, although the U.S. economy has clearly slowed, low unemployment, still manageable interest rates and a still resilient consumer should maintain the expansion. We believe our energy, consumer discretionary, industrials and materials stocks are likely to benefit in this environment. We remain confident regarding the outlook for our selection of high-quality companies within these sectors and others, in part based on their attractive attributes including low debt, high margins, strong earnings growth potential and low valuations.
Portfolio holdings and characteristics are subject to change and may not be representative of current holdings and characteristics. The outlook for this Portfolio may differ from that presented for other ING Funds. Performance for the different classes of shares will vary based on differences in fees associated with each class.
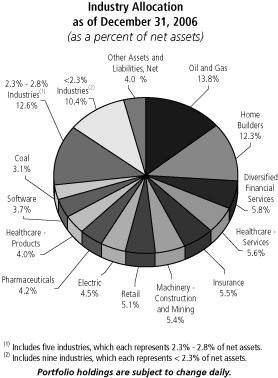
Top Ten Holdings
as of December 31, 2006
(as a percent of net assets)
| Berkshire Hathaway, Inc. | | | 2.3 | % | |
| NVR, Inc. | | | 2.2 | % | |
| KB Home | | | 2.2 | % | |
| D.R. Horton, Inc. | | | 2.2 | % | |
| American International Group, Inc. | | | 2.2 | % | |
| Goldman Sachs Group, Inc. | | | 2.2 | % | |
| Centex Corp. | | | 2.0 | % | |
| UnitedHealth Group, Inc. | | | 2.0 | % | |
| Lennar Corp. | | | 2.0 | % | |
| TXU Corp. | | | 2.0 | % | |
Portfolio holdings are subject to change daily.
34
PORTFOLIO MANAGERS' REPORT
ING NEUBERGER BERMAN PARTNERS PORTFOLIO
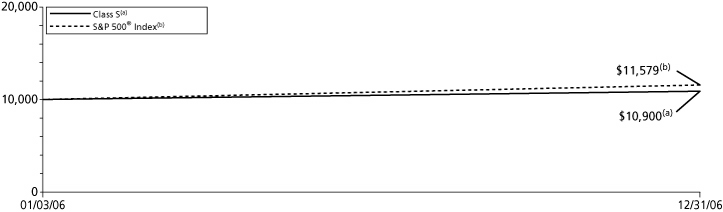
| Cumulative Total Returns for the Periods Ended December 31, 2006* | |
| | | Since Inception
of Class I
January 19, 2006 | | Since Inception
of Class S
January 3, 2006 | |
| Class I | | | 7.16 | % | | | — | | |
| Class S | | | — | | | | 9.00 | % | |
| S&P 500® Index(1) | | | 12.81 | %(2) | | | 15.79 | %(3) | |
Based on a $10,000 initial investment, the graph and table above illustrate the total return of ING Neuberger Berman Partners Portfolio against the index indicated. An index is unmanaged and has no cash in its portfolio, imposes no sales charges and incurs no operating expenses. An investor cannot invest directly in an index. The Portfolio's performance is shown without the imposition of any expenses or charges which are, or may be, imposed under your annuity contract. Total returns would have been lower if such expenses or charges were included.
The performance graph and table do not reflect the deduction of taxes that a shareholder will pay on portfolio distributions or the redemption of portfolio shares.
The performance shown may include the effect of fee waivers and/or expense reimbursements by the Investment Advisor and/or other service providers, which have the effect of increasing total return. Had all fees and expenses been considered, the total returns would have been lower.
The performance update illustrates performance for a variable investment option available through a variable annuity contract. The performance shown indicates past performance and is not a projection or prediction of future results. Actual investment returns and principal value will fluctuate so that shares and/or units, at redemption, may be worth more or less than their original cost. Please call (800) 262-3862 to get performance through the most recent month end.
This report contains statements that may be "forward-looking" statements. Actual results may differ materially from those projected in the "forward-looking" statements.
The views expressed in this report reflect those of the portfolio manager only through the end of the period as stated on the cover. The portfolio manager's views are subject to change at any time based on marked and other conditions.
Portfolio holdings are subject to change daily.
* Class ADV commenced operations on December 29, 2006, therefore, there is no performance information for the period ended December 31, 2006.
(1) The S&P 500® Index is an unmanaged index that measures the performance of the securities of approximately 500 of the largest companies in the U.S.
(2) Since inception performance of the index is shown from February 1, 2006.
(3) Since inception performance of the index is shown from January 1, 2006.
35
ING NEUBERGER BERMAN REGENCY PORTFOLIO
PORTFOLIO MANAGERS' REPORT
The ING Neuberger Berman Regency Portfolio (the "Portfolio") seeks capital growth. The Portfolio is managed by S. Basu Mullick, Vice President and Portfolio Manager of Neuberger Berman Management Inc. — the Sub-Adviser.
Performance: Since the Portfolio's inception on January 3, 2006 through December 31, 2006, the Portfolio's Class I shares provided a total return of 7.35% compared to the Russell Midcap® Value Index(1), which returned 20.22% for the year ended December 31, 2006.
Portfolio Specifics: We have placed considerable emphasis on the energy and consumer discretionary sectors, believing both in the secular supply/demand trends favoring oil, gas and coal companies and in the underlying demographics and macroeconomic variables supporting the long-term prospects of home construction firms and the overall strength of the consumer. For much of the year, these areas were a substantial drag on performance. For the first group, unusually mild winter - and then summer - weather lifted natural gas and coal inventories to high levels, putting pressure on commodity prices and, by extension, the share prices of our stocks in those areas. Meanwhile, homebuilding stocks were hit by the U.S. Federal Reserve Board's ("Fed") interest rate campaign and the rapid slowdown of the housing market.
However, in the wake of the Fed's pause and renewed optimism for stable, albeit slower, economic growth, these areas recovered late in the year. In energy, the fall season brought with it a reduction in natural gas inventories and recovery in natural gas prices, as well as the stabilization of oil prices, which had declined from earlier peaks. In consumer discretionary, homebuilding stocks enjoyed strong fourth quarter returns, as did our retailers. However, this was not enough to make up for our earlier shortfalls.
Overall, industrial and financial holdings provided the largest contribution to Portfolio total return, benefiting from the Fed's rate pause and overall expectations for a soft landing. In contrast, stock selection within the energy and consumer discretionary sectors accounted for much of our performance shortfall. In energy, the Portfolio was negatively affected by holdings in natural gas and coal, as prices for those commodities were disproportionately weaker for much of the year. Quicksilver Resources Inc. and Foundation Coal Holdings, Inc. are two stocks that were particularly sensitive to those short-term commodity price moves. Although we eliminated Foundation Coal Holdings, Inc. from the Portfolio, we maintained our overall energy weighting, favoring areas outside of natural gas and coal. In consumer discretionary, our homebuilders, including Hovnanian Enterprises, Inc. and Centex Corp., were affected by a speculator-driven increase i n inventories. We sold Pulte Homes Inc., but in most cases added to our holdings in these stocks, as we believe homebuilding stocks are significantly oversold at a time when fundamentals likely are approaching a bottom.
Among other individual holdings, mining equipment manufacturer Terex Corp. provided the largest contribution to total return, with its fundamentals reflecting continued U.S. economic expansion, particularly in the construction and mining sectors, despite weakness in residential construction. Phelps Dodge Corp. also posted a sizable gain, as the copper mining company agreed to be acquired by Freeport-McMoRan Copper & Gold, Inc. Meanwhile, Omnicare, Inc., the pharmaceutical care company, came under pressure due to difficulties in absorbing a 2005 acquisition. However, we remain committed to the stock, which has substantial earnings power and a modest valuation.
Current Strategy and Outlook: The energy sector remains our largest overweight versus the index. We believe the long-term fundamentals for energy stocks are strong, and that our companies involved in oil sands, Barnett shale and other non-conventional sources of energy are likely to perform well over the long term. We remain committed to our consumer discretionary holdings, believing that the housing sector will stabilize in the months ahead and that the consumer will show resilience. The Portfolio remains underweighted in financials, in part due to our difficulty finding value among real estate investment trusts. We are also underweight consumer staples, and we have no exposure to telecommunication services.
We are reasonably optimistic about the overall operating environment for our portfolio holdings. In our opinion, although the U.S. economy has clearly slowed, low unemployment, still manageable interest rates and a still resilient consumer should maintain the expansion. We believe our energy, consumer discretionary, industrials and materials stocks are likely to benefit in this environment. We remain confident regarding the outlook for our selection of high-quality companies within these sectors and others, in part based on their attractive attributes including low debt, high margins, strong earnings growth potential and low valuations.
Portfolio holdings and characteristics are subject to change and may not be representative of current holdings and characteristics. The outlook for this Portfolio may differ from that presented for other ING Funds. Performance for the different classes of shares will vary based on differences in fees associated with each class.

Top Ten Holdings
as of December 31, 2006
(as a percent of net assets)
| Phelps Dodge Corp. | | | 2.1 | % | |
| Bear Stearns Cos., Inc. | | | 2.0 | % | |
| Joy Global, Inc. | | | 2.0 | % | |
| Shire PLC | | | 1.9 | % | |
| Terex Corp. | | | 1.9 | % | |
| TXU Corp. | | | 1.8 | % | |
| NVR, Inc. | | | 1.7 | % | |
| KB Home | | | 1.7 | % | |
| Lennar Corp. | | | 1.7 | % | |
| NBTY, Inc. | | | 1.7 | % | |
Portfolio holdings are subject to change daily.
36
PORTFOLIO MANAGERS' REPORT
ING NEUBERGER BERMAN REGENCY PORTFOLIO

| Cumulative Total Returns for the Periods Ended December 31, 2006 | |
| | | Since Inception
of Class I
January 3, 2006 | | Since Inception
of Class S
January 12, 2006 | | Since Inception
of Class ADV
December 20, 2006 | |
| Class I | | | 7.35 | % | | | — | | | | — | | |
| Class S | | | — | | | | 5.62 | % | | | — | | |
| Class ADV | | | — | | | | — | | | | (0.61 | )% | |
| Russell Midcap® Value Index(1) | | | 20.22 | %(2) | | | 20.22 | %(2) | | | N/A(3) | | |
Based on a $10,000 initial investment, the graph and table above illustrate the total return of ING Neuberger Berman Regency Portfolio against the index indicated. An index is unmanaged and has no cash in its portfolio, imposes no sales charges and incurs no operating expenses. An investor cannot invest directly in an index. The Portfolio's performance is shown without the imposition of any expenses or charges which are, or may be, imposed under your annuity contract. Total returns would have been lower if such expenses or charges were included.
The performance graph and table do not reflect the deduction of taxes that a shareholder will pay on portfolio distributions or the redemption of portfolio shares.
The performance shown may include the effect of fee waivers and/or expense reimbursements by the Investment Adviser and/or other service providers, which have the effect of increasing total return. Had all fees and expenses been considered, the total returns would have been lower.
The performance update illustrates performance for a variable investment option available through a variable annuity contract. The performance shown indicates past performance and is not a projection or prediction of future results. Actual investment returns and principal value will fluctuate so that shares and/or units, at redemption, may be worth more or less than their original cost. Please call (800) 262-3862 to get performance through the most recent month end.
This report contains statements that may be "forward-looking" statements. Actual results may differ materially from those projected in the "forward-looking" statements.
The views expressed in this report reflect those of the portfolio manager only through the end of the period as stated on the cover. The portfolio manager's views are subject to change at any time based on marked and other conditions.
Portfolio holdings are subject to change daily.
(1) The Russell Midcap® Value Index measures the performance of those Russell Midcap companies with lower price-to-book ratios and lower forecasted growth values.
(2) Since inception performance of the index is shown from January 1, 2006.
(3) Since inception performance for the index is not shown.
37
ING OPCAP BALANCED VALUE PORTFOLIO
PORTFOLIO MANAGERS' REPORT
The ING OpCap Balanced Value Portfolio (the "Portfolio") seeks capital growth, and secondarily, investment income. The Portfolio is managed by Colin Glinsman, Managing Director and Chief Investment Officer of Oppenheimer Capital LLC — the Sub-Adviser.
Performance: For the year ended December 31, 2006, the Portfolio's Class S shares provided a total return of 10.36% compared to the Standard & Poor's 500® Composite Stock Price Index ("S&P 500® Index")(1), the Lehman Brothers® Intermediate Government/ Credit Bond Index(2) and the Composite Index (60% S&P 500® Index/40% Lehman Brothers Intermediate Government/Credit Bond Index)(3), which returned 15.79%, 4.08% and 13.20%, respectively, for the same period.
Portfolio Specifics: For the year ending December 31, 2006, the Portfolio delivered strong returns, finishing the period behind with its custom benchmark, a blend of the S&P 500® Index and the Lehman Brothers Intermediate Government/Credit Bond Index. Stock selection in the healthcare, materials and energy sectors had a positive effect on performance relative to the benchmark. Stock selection in consumer discretionary and financials sectors detracted from relative results.
Returns for the Portfolio were boosted by the selection of stocks in the healthcare industry. Aetna, Inc. shares rose through the period on strong projections. The country's No. 3 health insurer in plan membership rolls announced a 28% increase in third-quarter earnings and raised profit forecast for next year. Our position in UnitedHealth Group, Inc. also contributed positively as the company and its stock began to recover from a series of incidents and actions that led to the ouster of its chairman and prompted sweeping new corporate governance measures. The company is one of the largest managed care providers in the world and has amassed a record of solid revenue and earnings growth.
In materials, where stock selection was also strong, shares of INCO, the No. 2 nickel miner, boosted returns, attributable to news on mergers and acquisitions in the industry.
Stock selection was weakest in the consumer discretionary sector and was the main source of the underperformance for the year. Non-profit education provider Apollo Group, Inc. faced a U.S. Securities and Exchange Commission investigation of its stock-option grants as well as reporting disappointing earnings due to increased expenses and weak revenue growth as a result of declining student drop-outs. Royal Caribbean Cruises Ltd. suffered from high fuel costs and weaker demand for Caribbean cruises due to the volatile 2005 hurricane season.
The short duration bond portfolio, consisting of 100% short and intermediate corporate bonds' benefited the fixed income portion of the Portfolio during the year.
Market Environment — US stocks rallied in 2006 marking a fourth year of advances for equities and extending the third longest bull market since 1900. Value-oriented stocks generally outperformed growth stocks and small-cap stocks generally outperformed large. Among U.S. large caps, the telecom sector posted the largest advance, buoyed by heavy mergers and acquisitions activity. Energy stocks also did well, benefiting from higher oil prices, and utilities were strong. The health care sector had the weakest return for the year.
Bond yields rose for the first half of the year as the U.S. Federal Reserve Board ("Fed") continued to raise rates. Yields declined the second half of the year as the Fed refrained from further rate increases with the perception that the economy was slowing due to a weakening housing market and high oil prices. Still, the net effect for the year was an increase in yields and lower bond prices. The yield curve was inverted for most of the year as longer term bonds outperformed due to investors perception that the economy was slowing and the Fed would be forced to lower short-term rates in the near future. Continued purchases of bonds by foreign central banks were also instrumental in inverting the yield curve. Excess global liquidity dampened volatility during the year allowing corporate bonds and mortgage backed securities to outperform Treasuries.
Current Strategy and Outlook: We continue to believe that the U.S. economy remains fundamentally strong, despite the recent deceleration, and inflation, it can be kept in check under these conditions. With moderating inflation and stabilizing oil prices, the economy may be in the middle of a decade-long expansion. We believe there is, however, some risk of a recession in 2007 or 2008, especially if inflation were to increase and the Fed were to raise interest rates to bring it under control.
We believe the stock market could move higher in 2007 if corporate earnings grow and investors become convinced that a recession is unlikely. Generally speaking, we believe valuations appear reasonable on profitability levels that can still rise.
Portfolio holdings and characteristics are subject to change and may not be representative of current holdings and characteristics. The outlook for this Portfolio may differ from that presented for other ING Funds. Performance for the different classes of shares will vary based on differences in fees associated with each class.
Investment Type Allocation
as of December 31, 2006
(as a percent of net assets)
| Common Stock | | | 72.8 | % | |
| Corporate Bonds/Notes | | | 25.6 | % | |
| U.S. Government Agency Obligations | | | 2.1 | % | |
| Other Assets and Liabilities, Net* | | | (0.5 | )% | |
| Net Assets | | | 100.0 | % | |
*Includes securities lending collateral.
Portfolio holdings are subject to change daily.
Top Ten Holdings*
as of December 31, 2006
(as a percent of net assets)
| ConocoPhillips | | | 6.1 | % | |
| Countrywide Financial Corp. | | | 4.5 | % | |
| Roche Holding AG ADR | | | 4.5 | % | |
| Royal Caribbean Cruises Ltd. | | | 4.0 | % | |
| Bank of New York Co., Inc. | | | 3.6 | % | |
| UnitedHealth Group, Inc. | | | 3.3 | % | |
| Merrill Lynch & Co., Inc. | | | 3.2 | % | |
| Centex Corp. | | | 3.0 | % | |
| Motorola, Inc. | | | 2.8 | % | |
| AMBAC Financial Group, Inc. | | | 2.8 | % | |
* Excludes short-term investments related to securities lending collateral.
Portfolio holdings are subject to change daily.
38
PORTFOLIO MANAGERS' REPORT
ING OPCAP BALANCED VALUE PORTFOLIO
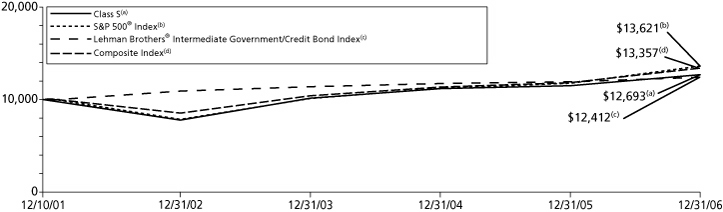
| Average Annual Total Returns for the Periods Ended December 31, 2006 | |
| | | 1 Year | | 5 Year | | Since Inception
of Classes I, S and ADV
December 10, 2001 | |
| Class I | | | 10.75 | % | | | 5.41 | % | | | 5.09 | % | |
| Class S | | | 10.36 | % | | | 5.13 | % | | | 4.82 | % | |
| Class ADV | | | 10.19 | % | | | 4.88 | % | | | 4.57 | % | |
| S&P 500® Index(1) | | | 15.79 | % | | | 6.19 | % | | | 6.27 | %(4) | |
| Lehman Brothers® Intermediate Government/Credit Bond Index(2) | | | 4.08 | % | | | 4.53 | % | | | 4.34 | %(4) | |
| Composite Index(3) | | | 13.20 | % | | | 5.84 | % | | | 5.86 | %(4) | |
Based on a $10,000 initial investment, the graph and table above illustrate the total return of ING OpCap Balanced Value Portfolio against the indices indicated. An index is unmanaged and has no cash in its portfolio, imposes no sales charges and incurs no operating expenses. An investor cannot invest directly in an index. The Portfolio's performance is shown without the imposition of any expenses or charges which are, or may be, imposed under your annuity contract. Total returns would have been lower if such expenses or charges were included.
The performance graph and table do not reflect the deduction of taxes that a shareholder will pay on portfolio distributions or the redemption of portfolio shares.
The performance shown may include the effect of fee waivers and/or expense reimbursements by the Investment Adviser and/or other service providers, which have the effect of increasing total return. Had all fees and expenses been considered, the total returns would have been lower.
The performance update illustrates performance for a variable investment option available through a variable annuity contract. The performance shown indicates past performance and is not a projection or prediction of future results. Actual investment returns and principal value will fluctuate so that shares and/or units, at redemption, may be worth more or less than their original cost. Please call (800) 262-3862 to get performance through the most recent month end.
This report contains statements that may be "forward-looking" statements. Actual results may differ materially from those projected in the "forward-looking" statements.
The views expressed in this report reflect those of the portfolio manager only through the end of the period as stated on the cover. The portfolio manager's views are subject to change at any time based on marked and other conditions.
Portfolio holdings are subject to change daily.
(1) The S&P 500® Index is an unmanaged index that measures the performance of the securities of approximately 500 of the largest companies in the U.S.
(2) The Lehman Brothers® Intermediate Government/Credit Bond Index is an unmanaged index composed of securities including U.S. Government Treasury and agency securities.
(3) The Composite Index consists of 60% of the return of (securities included in) S&P 500® Index and 40% of the return of (securities included in) Lehman Brothers Intermediate Government/Credit Bond Index.
(4) Since inception performance for the indices is shown from December 1, 2001.
39
ING OPPENHEIMER GLOBAL PORTFOLIO
PORTFOLIO MANAGERS' REPORT
The ING Oppenheimer Global Portfolio (the "Portfolio") seeks capital appreciation. The Portfolio is managed by Rajeev Bhaman, Vice President of OppenheimerFunds, Inc. — the Sub-Adviser.
Performance: For the year ended December 31, 2006, the Portfolio's Class S shares provided a total return of 17.60% compared to the Morgan Stanley Capital International ("MSCI") World IndexSM(1) and the MSCI All Country World IndexSM(2), which returned 20.07% and 20.95%, respectively, for the same period.
Portfolio Specifics: The Portfolio underperformed its benchmarks, the MSCI World IndexSM and the MSCI All Country World IndexSM, over the 12 months ended December 31, 2006. Our investment philosophy is based on the idea that earnings growth drives stock prices and that we are most likely to identify long-term earnings growth opportunities by examining trends that provide tailwinds for growth in the coming decade. We are very interested in attributes of industries and companies within those industries that are likely to be beneficiaries of these long-term trends. Ideally, we like to buy these businesses at a bargain price, that is, a price where we have the opportunity to double our investment in three to five years. This rarely happens except when there is a perception that something has gone wrong with a wonderful business. If we can identify that what has gone wrong is merely temporary, rather than permanent, we have the makings of a good investment.
From a market perspective, the weakest performing country relative to the MSCI World IndexSM was the United States, driven by poor stock selection. However, underperformance in the United States was partially mitigated by sector bets made in several emerging markets, including Mexico and India. The strongest relative performing sectors were consumer staples and energy, with healthcare and information technology the most significant underperformers.
We had some notable successes with some of our larger holdings such as Infosys Technologies Ltd., Reckitt Benckiser plc and H&M Hennes & Mauritz AB, but also some significant underperformances from eBay, Inc., Advanced Micro Devices, Inc. and Boston Scientific Corp.
There were a few other disappointments, including a significant market slowdown in the demand for implantable cardiac defibrillators and a slowdown in the growth rate of knee and hip replacements which hurt a couple of our holdings. We remain confident that the long-term opportunity set for all of the segments that faced setbacks in the past year remains excellent and that our original theses will come to pass.
Our investments in software companies, Intuit, Inc. and Adobe Systems, Inc., continue to pay off, as the companies continue to innovate with new products that delight not only their existing customer bases but achieve even broader appeal. Our investments in Inditex S.A., the owner of Zara stores and Tesco plc, the UK's leading grocery chain, have been worthwhile as they continue to grow rapidly worldwide, leveraging their scale and supply chain to achieve high economic returns. Our investments in television companies, Zee Telefilms Ltd. in India, and Grupo Televisa SA in Mexico, contributed positively to the Portfolio's performance as they continue to retain high market shares in their respective markets and as the appeal of their programming grows worldwide.
Current Strategy and Outlook: We are finding terrific opportunities across a variety of areas particularly in technology. It should be noted that our investment decision making process considers the next three to five years as the operative period rather than the next quarter or two. We continue to favor a number of our existing holdings such as L.M. Ericsson and Juniper Networks, Inc., with additional investments, as the opportunity for communication network build-outs remains robust. Additionally, we are finding good opportunities to invest in the areas of analog and mixed signal semiconductors.
As global growth continues to chug along nicely and interest rates remain relatively low, we remain optimistic about markets generally. As such, we expect to continue to see good opportunities for investment. We remain focused on our long-term investment philosophy and our mantra of looking for "good companies in good businesses at good prices."
Portfolio holdings and characteristics are subject to change and may not be representative of current holdings and characteristics. The outlook for this Portfolio may differ from that presented for other ING Funds. Performance for the different classes of shares will vary based on differences in fees associated with each class.
Country Allocation
as of December 31, 2006
(as a percent of net assets)
| United States | | | 36.2 | % | |
| United Kingdom | | | 12.6 | % | |
| Japan | | | 10.7 | % | |
| Sweden | | | 6.5 | % | |
| Germany | | | 5.7 | % | |
| France | | | 5.6 | % | |
| Switzerland | | | 3.4 | % | |
| India | | | 2.5 | % | |
| Mexico | | | 2.5 | % | |
| Netherlands | | | 2.3 | % | |
| South Korea | | | 2.0 | % | |
| Canada | | | 1.6 | % | |
| Countries between 1.2% - 1.5%(1) | | | 4.2 | % | |
| Countries less than 1.2%(2) | | | 4.4 | % | |
| Other Assets and Liabilities, Net* | | | (0.2 | )% | |
| Net Assets | | | 100.0 | % | |
* Includes short-term investments related to securities lending collateral.
(1) Includes three countries, which each represents 1.2% - 1.5% of net assets.
(2) Includes ten countries, which each represents less than 1.2% of net assets.
Portfolio holdings are subject to change daily.
Top Ten Holdings*
as of December 31, 2006
(as a percent of net assets)
| Telefonaktiebolaget LM Ericsson | | | 3.9 | % | |
| Hennes & Mauritz AB | | | 2.0 | % | |
| Vodafone Group PLC | | | 1.9 | % | |
| Microsoft Corp. | | | 1.8 | % | |
| Royal Bank of Scotland Group PLC | | | 1.6 | % | |
| Siemens AG | | | 1.6 | % | |
| Sanofi-Aventis | | | 1.5 | % | |
| Reckitt Benckiser PLC | | | 1.5 | % | |
| eBay, Inc. | | | 1.5 | % | |
| Credit Suisse Group | | | 1.4 | % | |
* Excludes short-term investments related to securities lending collateral.
Portfolio holdings are subject to change daily.
40
PORTFOLIO MANAGERS' REPORT
ING OPPENHEIMER GLOBAL PORTFOLIO
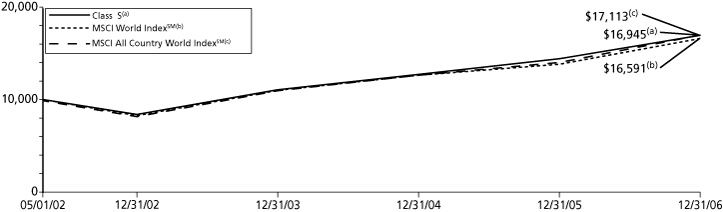
| Average Annual Total Returns for the Periods Ended December 31, 2006 | |
| | | 1 Year | | Since Inception
of Classes I, S and ADV
May 1, 2002 | |
| Class I | | | 17.98 | % | | | 12.52 | % | |
| Class S | | | 17.60 | % | | | 11.95 | % | |
| Class ADV | | | 17.36 | % | | | 11.71 | % | |
| MSCI World IndexSM(1) | | | 20.07 | % | | | 11.46 | % | |
| MSCI All Country World IndexSM(2) | | | 20.95 | % | | | 12.20 | % | |
Based on a $10,000 initial investment, the graph and table above illustrate the total return of ING Oppenheimer Global Portfolio against the indices indicated. An index is unmanaged and has no cash in its portfolio, imposes no sales charges and incurs no operating expenses. An investor cannot invest directly in an index. The Portfolio's performance is shown without the imposition of any expenses or charges which are, or may be, imposed under your annuity contract. Total returns would have been lower if such expenses or charges were included.
The performance graph and table do not reflect the deduction of taxes that a shareholder will pay on portfolio distributions or the redemption of portfolio shares.
The performance shown may include the effect of fee waivers and/or expense reimbursements by the Investment Adviser and/or other service providers, which have the effect of increasing total return. Had all fees and expenses been considered, the total returns would have been lower.
The performance update illustrates performance for a variable investment option available through a variable annuity contract. The performance shown indicates past performance and is not a projection or prediction of future results. Actual investment returns and principal value will fluctuate so that shares and/or units, at redemption, may be worth more or less than their original cost. Please call (800) 262-3862 to get performance through the most recent month end.
This report contains statements that may be "forward-looking" statements. Actual results may differ materially from those projected in the "forward-looking" statements.
The views expressed in this report reflect those of the portfolio manager only through the end of the period as stated on the cover. The portfolio manager's views are subject to change at any time based on marked and other conditions.
Portfolio holdings are subject to change daily.
(1) The MSCI World IndexSM is an unmanaged index that measures the performance of over 1,400 securities listed on exchanges in the U.S., Europe, Canada, Australia, New Zealand and the Far East.
(2) The MSCI All Country World IndexSM is a broad-based unmanaged index comprised of equity securities in countries around the world, including the United States, other developed countries and emerging markets.
41
ING OPPENHEIMER STRATEGIC INCOME PORTFOLIO
PORTFOLIO MANAGERS' REPORT
The ING Oppenheimer Strategic Income Portfolio (the "Portfolio") seeks a high level of current income principally derived from interest on debt securities. The Portfolio is managed by Arthur P. Steinmetz, Vice President and Senior Portfolio Manager of OppenheimerFunds, Inc. — the Sub-Adviser.
Performance: For the year ended December 31, 2006, the Portfolio's Class S shares provided a total return of 8.33% compared to the Lehman Brothers® Aggregate Bond ("LBAB") Index(1), which returned 4.33% for the same period.
Portfolio Specifics: The Portfolio benefited from its emphasis on bonds and currencies from the emerging markets in 2006. Investments in Brazil, Mexico and Russia produced particularly attractive returns as these nations made progress toward reforming their financial systems and taming inflation. When concerns arose in the spring that a U.S. economic slowdown might precede a downturn in international economic conditions, the Portfolio's overweighted position in emerging market bonds hurt its relative performance. However, most of the Portfolio's emerging markets positions bounced back when U.S. economic growth moderated and U.S. interest rates stabilized. Bonds from Turkey proved to be an exception, as the country encountered regional political difficulties over the second half of the year.
The Portfolio's returns also were bolstered by its relatively heavy exposure to the euro, which gained value relative to the U.S. dollar. In fact, due to low interest rates, a soaring current account deficit and other factors, most major currencies advanced against the U.S. dollar during 2006, making investments denominated in foreign currencies more valuable for U.S. residents.
In addition, the Portfolio received generally positive contributions from high-yield corporate bonds. However, bonds in the lower rating categories tended to fare better than those with higher credit ratings. Because we had reduced the Portfolio's exposure to high-yield bonds generally and lower-rated securities in particular in anticipation of slower U.S. economic growth, the Portfolio did not participate fully in the high-yield sector's strength during the second half of the year.
Finally, our security selection and duration management strategies helped support returns from U.S. government securities. We captured higher yields than those provided by U.S. Treasuries by focusing on mortgage- and asset-backed securities from U.S. government agencies. In the spring we began to increase the Portfolio's average duration toward a range that was closer to industry averages. This change helped the Portfolio participate more fully in rallies as the market rebounded during the summer and fall.
Current Strategy and Outlook: As of the end of 2006, we remain guardedly optimistic regarding the prospects for currencies and bonds in the emerging and developed markets. We believe that the emerging markets remain fundamentally sound despite signs of slower growth in the United States, and bond prices may rise further as the global economic expansion continues. While strong corporate profits may continue to support high yield bond prices, we have remain concerned about rich valuations and the possibility that recent trends in corporate financing may cause default rates to rise. Finally, we expect U.S. interest rates to remain relatively stable, which may help keep prices and yields of U.S. Treasury securities near current levels.
Portfolio holdings and characteristics are subject to change and may not be representative of current holdings and characteristics. The outlook for this Portfolio may differ from that presented for other ING Funds. Performance for the different classes of shares will vary based on differences in fees associated with each class.
Investment Type Allocation
as of December 31, 2006
(as a percent of net assets)
| Corporate Bonds/Notes | | | 29.2 | % | |
| Other Bonds | | | 22.0 | % | |
| U.S. Government Agency Obligations | | | 20.2 | % | |
| Other Structured Product | | | 16.1 | % | |
| U.S. Government Agency Obligations | | | 7.5 | % | |
| U.S. Treasury Obligations | | | 4.2 | % | |
| Asset-Backed Securities | | | 1.7 | % | |
| Collateralized Mortgage Obligations | | | 1.4 | % | |
| Preferred Stock | | | 0.2 | % | |
| Common Stock | | | 0.1 | % | |
| Positions In Purchased Options | | | 0.0 | % | |
| Other Assets and Liabilities, Net* | | | (2.6 | )% | |
| Net Assets | | | 100.0 | % | |
* Includes securities lending collateral.
Portfolio holdings are subject to change daily.
Top Ten Holdings*
as of December 31, 2006
(as a percent of net assets)
| Federal Home Loan Bank, 4.600%, due 01/02/07 | | | 7.5 | % | |
Barclays Bank - RUR Currency Linked Note,
due 08/18/08 | | | 1.6% | | |
| Republic Of Argentina, 7.000%, due 03/28/11 | | | 1.3 | % | |
Federal National Mortgage Association,
6.000%, due 01/15/19 | | | 1.1% | | |
| German Treasury Bill, 3.500%, due 03/14/07 | | | 1.0 | % | |
Federal Home Loan Mortgage Corporation,
5.250%, due 07/18/11 | | | 1.0% | | |
Brazil Government International Bond,
8.000%, due 01/15/18 | | | 1.0% | | |
| Morgan Stanley - Philippines | |
Floating Rate Credit Linked Notes,
(3-month USD-LIBOR +4.85%), due 09/20/15 | | | 1.0% | | |
Federal National Mortgage Association,
6.500%, due 01/15/35 | | | 0.9% | | |
Deutsche Bank - Turkey Treasury Bill, 16.110%,
due 01/24/07 | | | 0.8% | | |
* Excludes short-term investments related to securities lending collateral.
Portfolio holdings are subject to change daily.
42
PORTFOLIO MANAGERS' REPORT
ING OPPENHEIMER STRATEGIC INCOME PORTFOLIO
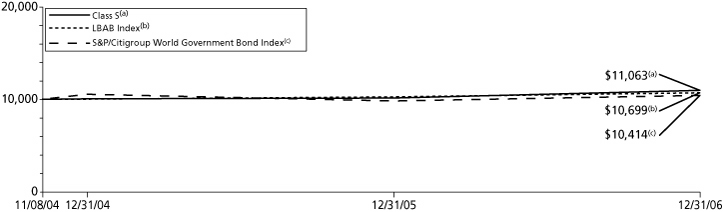
| Average Annual Total Returns for the Periods Ended December 31, 2006 | |
| | | 1 Year | | Since Inception
of Classes I, S and ADV
November 8, 2004 | |
| Class I | | | 8.42 | % | | | 5.04 | % | |
| Class S | | | 8.33 | % | | | 4.82 | % | |
| Class ADV | | | 7.99 | % | | | 4.55 | % | |
| LBAB Index(1) | | | 4.33 | % | | | 3.17 | %(3) | |
| S&P/Citigroup World Government Bond Index(2) | | | 6.12 | % | | | 1.89 | %(3) | |
Based on a $10,000 initial investment, the graph and table above illustrate the total return of ING Oppenheimer Strategic Income Portfolio against the indices indicated. An index is unmanaged and has no cash in its portfolio, imposes no sales charges and incurs no operating expenses. An investor cannot invest directly in an index. The Portfolio's performance is shown without the imposition of any expenses or charges which are, or may be, imposed under your annuity contract. Total returns would have been lower if such expenses or charges were included.
The performance graph and table do not reflect the deduction of taxes that a shareholder will pay on portfolio distributions or the redemption of portfolio shares.
The performance shown may include the effect of fee waivers and/or expense reimbursements by the Investment Adviser and/or other service providers, which have the effect of increasing total return. Had all fees and expenses been considered, the total returns would have been lower.
The performance update illustrates performance for a variable investment option available through a variable annuity contract. The performance shown indicates past performance and is not a projection or prediction of future results. Actual investment returns and principal value will fluctuate so that shares and/or units, at redemption, may be worth more or less than their original cost. Please call (800) 262-3862 to get performance through the most recent month end.
This report contains statements that may be "forward-looking" statements. Actual results may differ materially from those projected in the "forward-looking" statements.
The views expressed in this report reflect those of the portfolio manager only through the end of the period as stated on the cover. The portfolio manager's views are subject to change at any time based on marked and other conditions.
Portfolio holdings are subject to change daily.
(1) The LBAB Index in an unmanaged index composed of securities from the Lehman Brothers Intermediate Government/Corporate Bond Index, Mortgage-Backed Securities Index, and the Asset Backed Securities Index including securities that are investment-grade quality or better and have at least one year to maturity.
(2) The S&P/Citigroup World Government Bond Index is an unmanaged index of bonds from 14 world government bond markets with maturities of at least one year.
(3) Since inception performance for the indices is shown from November 1, 2004.
43
ING PIMCO TOTAL RETURN PORTFOLIO
PORTFOLIO MANAGERS' REPORT
The ING PIMCO Total Return Portfolio (the "Portfolio") seeks maximum total return, consistent with preservation of capital and prudent investment management. The Portfolio is managed by Pasi Hamalainen, Managing Director and Portfolio Manager, of Pacific Investment Management Company LLC — the Sub-Adviser.
Performance: For year ended December 31, 2006, the Portfolio's Class S shares provided a total return of 4.00% compared to the Lehman Brothers® Aggregate Bond ("LBAB") Index(1), which returned 4.33% for the same period.
Portfolio Specifics: Fixed income assets gained during 2006 as a whole despite a difficult environment in the first half of the year. The LBAB Index, a widely used index of high-grade bonds, returned 4.33% for the full year. At the close of 2006 the benchmark ten-year Treasury yielded 4.71 percent, 31 basis points higher than at the start of the year. The 2-10 year portion of the U.S. Treasury yield curve was inverted by 11 basis points at year-end.
In the first half of the year, bond markets struggled, as the U.S. Federal Reserve Board ("Fed") raised rates a total of four times and inflation pressures mounted, led by higher oil prices. The economic backdrop, in the final two quarters, was generally more benign. Interest rates moved lower for most of this period as the Fed held rates steady four times in a row and oil prices reversed course, helping ease headline inflation pressure. Markets interpreted the Fed pause as the end of a protracted tightening cycle in which the central bank boosted the federal funds rate 17 straight times between June 2004 and June 2006.
Interest rate strategies were mixed for performance during the year. An above benchmark duration through most of the year was positive for performance as interest rates stabilized and fell in the second half of the year. However, an emphasis on short maturities was negative as the yield curve flattened and inverted. An overweight to mortgage-backed bonds and security selection added to returns, as this sector outpaced Treasuries. An underweight to corporates was negative for returns, as demand remained robust in this sector despite historically thin credit premiums. A tactical allocation to high yield corporate bonds added value, as these securities significantly outperformed their high-grade counterparts. A modest exposure to municipal bonds also added value, as their lower volatility helped performance versus taxable bonds. Non-U.S. positions were mixed; Eurozone exposure designed to benefit when interest rates rise, was positive for perfo rmance, while exposure to the front of the United Kingdom curve detracted value, as their central bank raised rates. Exposure to emerging market bonds was positive, with capital continuing to flow into this sector. Currency exposure to the yen detracted from performance, as theYen depreciated versus the U.S. dollar. By contrast, exposure to the Euro was positive, as the Euro appreciated versus the U.S. dollar.
Current Strategy and Outlook: In our opinion, the most likely outcome for the global economy in 2007 is slower growth with modest disinflation. We believe growth in Europe and Asia will be less reliant on U.S. demand than in the recent past. Each of these major economic regions is likely to grow, in our opinion, at an annual rate of about 2%. We believe, the slowdown in the U.S. will be triggered by weakness in the property market that will spill over into consumption. In our opinion, the decline in the U.S. housing and auto sectors should generate weakness on a broader level in 2007, causing the Fed to begin easing over the course of the year. The predominant risk to the forecast is that the downturn in the U.S. economy will be worse than we anticipate because of a more severe contraction in housing. In an environment where risk is masked by low volatility and risk premiums are near historical lows, we plan to focus on select strategies that we believe can offer the highest potential reward relative to the potential risks incurred. These strategies include targeting duration above index and emphasizing short maturity positions based on a belief that global yield curves will steepen.
Portfolio holdings and characteristics are subject to change and may not be representative of current holdings and characteristics. The outlook for this Portfolio may differ from that presented for other ING Funds. Performance for the different classes of shares will vary based on differences in fees associated with each class.
Investment Type Allocation
as of December 31, 2006
(as a percent of net assets)
| U.S. Government Agency Obligations | | | 89.3 | % | |
| Corporate Bonds/Notes | | | 8.8 | % | |
| Other Bonds | | | 8.8 | % | |
| Collateralized Mortgage Obligations | | | 8.7 | % | |
| U.S. Treasury Obligations | | | 6.7 | % | |
| Commercial Paper | | | 5.7 | % | |
| Asset-Backed Securities | | | 1.8 | % | |
| Municipal Bonds | | | 1.2 | % | |
| Options | | | 0.3 | % | |
| Other Assets and Liabilities, Net* | | | (31.3 | )% | |
| Net Assets | | | 100.0 | % | |
* Includes short-term investments related to securities lending collateral.
Portfolio holdings are subject to change daily.
Top Ten Holdings*
as of December 31, 2006
(as a percent of net assets)
Federal National Mortgage Association,
6.000%, due 01/15/34 | | | 31.2 | % | |
| Bundesobligation, 4.000%, due 02/16/07 | | | 7.7 | % | |
Federal National Mortgage Association,
5.500%, due 02/01/35 | | | 6.0 | % | |
Federal National Mortgage Association,
5.000%, due 03/01/36 | | | 5.0 | % | |
Federal National Mortgage Association,
5.000%, due 08/01/20 | | | 3.5 | % | |
Federal National Mortgage Association,
5.000%, due 02/01/36 | | | 3.1 | % | |
Federal National Mortgage Association,
5.500%, due 09/01/35 | | | 2.1 | % | |
Federal National Mortgage Association,
6.500%, due 01/15/35 | | | 2.1 | % | |
Treasury Inflation Protected Security,
0.875%, due 04/15/10 | | | 2.0 | % | |
Treasury Inflation Protected Security,
3.625%, due 01/15/08 | | | 1.9 | % | |
* Excludes short-term investments related to commercial paper and U.S. government agency obligation.
Portfolio holdings are subject to change daily.
44
PORTFOLIO MANAGERS' REPORT
ING PIMCO TOTAL RETURN PORTFOLIO
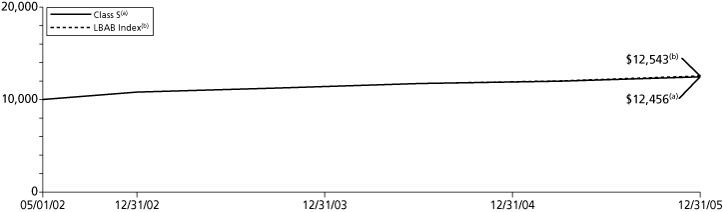
| Average Annual Total Returns for the Periods Ended December 31, 2006 | |
| | | 1 Year | | Since Inception
of Classes I, S and ADV
May 1, 2002 | |
| Class I | | | 4.21 | % | | | 5.08 | % | |
| Class S | | | 4.00 | % | | | 4.81 | % | |
| Class ADV | | | 3.71 | % | | | 4.55 | % | |
| LBAB Index(1) | | | 4.33 | % | | | 4.98 | % | |
Based on a $10,000 initial investment, the graph and table above illustrate the total return of ING PIMCO Total Return Portfolio against the index indicated. An index is unmanaged and has no cash in its portfolio, imposes no sales charges and incurs no operating expenses. An investor cannot invest directly in an index. The Portfolio's performance is shown without the imposition of any expenses or charges which are, or may be, imposed under your annuity contract. Total returns would have been lower if such expenses or charges were included.
The performance graph and table do not reflect the deduction of taxes that a shareholder will pay on portfolio distributions or the redemption of portfolio shares.
The performance shown may include the effect of fee waivers and/or expense reimbursements by the Investment Adviser and/or other service providers, which have the effect of increasing total return. Had all fees and expenses been considered, the total returns would have been lower.
The performance update illustrates performance for a variable investment option available through a variable annuity contract. The performance shown indicates past performance and is not a projection or prediction of future results. Actual investment returns and principal value will fluctuate so that shares and/or units, at redemption, may be worth more or less than their original cost. Please call (800) 262-3862 to get performance through the most recent month end.
This report contains statements that may be "forward-looking" statements. Actual results may differ materially from those projected in the "forward-looking" statements.
The views expressed in this report reflect those of the portfolio manager only through the end of the period as stated on the cover. The portfolio manager's views are subject to change at any time based on marked and other conditions.
Portfolio holdings are subject to change daily.
(1) The LBAB Index is an unmanaged index composed of securities from the Lehman Brothers Intermediate Government/Corporate Bond Index, Mortgage-Backed Securities Index, and the Asset Backed Securities Index including securities that are investment-grade quality or better and have at least one year to maturity.
45
ING PIONEER HIGH YIELD PORTFOLIO
PORTFOLIO MANAGERS' REPORT
The ING Pioneer High Yield Bond Portfolio (the "Portfolio") seeks to maximize total return through a combination of income and capital appreciation. The Portfolio is managed by Margaret Patel, Portfolio Manager, and Pioneer Investments, the Sub-Adviser.
Performance: Since the Portfolio's inception on January 3, 2006 through December 31, 2006, the Portfolio's Class I shares provided a total return of 8.24% compared to the Merrill Lynch High Yield Master II Index(1) and the Merrill Lynch Convertible Bonds (Speculative Quality) Index(2), which returned 11.77% and 17.15%, respectively, for the year ended December 31, 2006.
Portfolio Specifics: In 2006, high yield bonds generally performed well in absolute terms and relative to investment grade bonds, with performance boosted by very low default rates and generally narrowing credit spreads. Although spreads widened in a mid-year sell-off, the option-adjusted spread of the Merrill Lynch High Yield Master II Index over Treasury bonds narrowed from roughly 370 basis points at the beginning of the year to roughly 290 basis points at the end of the year. Lower quality issues generally outperformed higher-quality issues in a year marked by declining risk aversion, with the bonds of telecom, auto, and airline companies leading, posting returns over 20%.
Consistent with what would be expected in an environment where lower quality generally outperformed, our higher quality bias as well as our avoidance of CCC-rated issues and lack of exposure to the telecom, auto, and airline industries produced returns that were lower than the Merrill Lynch High Yield Master II Index. Yield spreads offered little incremental compensation for incremental credit risk. We also avoided new-issue C-rated issues believing that the fundamental riskiness of the issuing companies was problematic and that there were companies with better fundamentals and attractive risk return tradeoffs. Returns were boosted by our success in selecting the bonds of companies whose profitability, free cash flow, and creditworthiness benefited from the strong economy (in sectors such as manufacturing, chemicals, and real estate, in particular), by the success of our value-oriented approach in buying the bonds of companies which were acq uired (and the bonds called or pre-paid), and by the superior returns earned by our common stock and convertible bonds and convertible preferred stocks, whose performance is linked to the underlying equities. . As always, specific issuer/security selection decisions can be important drivers of returns in the short run, but our diversification disciplines ensured that no individual name had an outsized performance impact over the full year.
Current Strategy and Outlook: We continue to believe that the U.S. economy, while slowing moderately, has the potential to surprise on the upside next year. We are not expecting the Federal Reserve Board ("Fed") to lower rates in the first half of 2007. The economy is strong and inflation remains in the upper end of the Fed's tolerance zone.
Employing our industry-centered approach, we continue to favor economically sensitive sectors such as basic materials and industrials which should continue to post improving financial results, benefiting from strong economic growth worldwide. Materials had strong earnings growth in 2006, but with continued demand, fears about excess capacity and price weaknesses are unlikely to be realized.
While an economic slowdown does not appear imminent, we continue to focus on high yield bonds with above-average quality ratings, with minimal exposure to the lowest-rated issues. We do not think incremental yields for moving to lower quality issues adequately compensate investors for incremental credit risk. Our strategy may lead to modest underperformance in the short run — as long as markets reward risk-taking — but we believe our strategy should protect investors' capital if and when conditions weaken and investors engage in a flight to safety.
Portfolio holdings and characteristics are subject to change and may not be representative of current holdings and characteristics. The outlook for this Portfolio may differ from that presented for other ING Funds. Performance for the different classes of shares will vary based on differences in fees associated with each class.
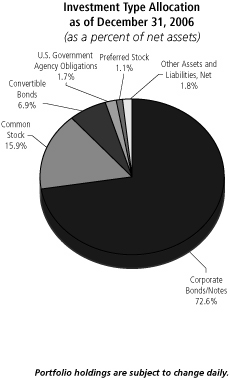
Top Ten Holdings
as of December 31, 2006
(as a percent of net assets)
| Manitowoc Co., 7.125%, due 11/01/13 | | | 3.7 | % | |
| Wesco Distribution, Inc., 7.500%, due 10/15/17 | | | 3.5 | % | |
| General Cable Corp., 9.500%, due 11/15/10 | | | 3.3 | % | |
| DRS Technologies, Inc., 6.875%, due 11/01/13 | | | 3.1 | % | |
| Itron, Inc., 7.750%, due 05/15/12 | | | 3.0 | % | |
| Esterline Technologies Corp., 7.750%, due 06/15/13 | | | 3.0 | % | |
| Allegheny Energy, Inc., 8.250%, due 04/15/12 | | | 2.6 | % | |
| Frontier Oil Corp., 6.625%, due 10/01/11 | | | 2.5 | % | |
| Texas Industries, Inc., 7.250%, due 07/15/13 | | | 2.4 | % | |
| NRG Energy, Inc., 7.250%, due 02/01/14 | | | 2.4 | % | |
Portfolio holdings are subject to change daily.
46
PORTFOLIO MANAGERS' REPORT
ING PIONEER HIGH YIELD PORTFOLIO
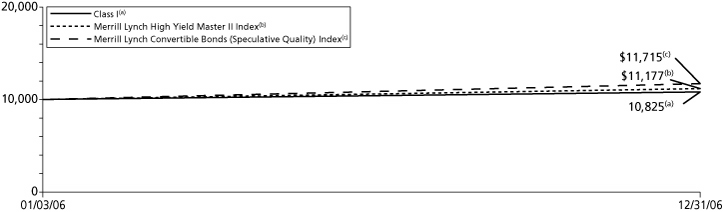
| Cumulative Total Returns for the Periods Ended December 31, 2006 | |
| | | Since Inception
of Class I
January 3, 2006 | | Since Inception
of Classes S and ADV
January 20, 2006 | |
| Class I | | | 8.24 | % | | | — | | |
| Class S | | | — | | | | 8.01 | % | |
| Class ADV | | | — | | | | 7.98 | % | |
| Merrill Lynch High Yield Master II Index(1) | | | 11.77 | %(3) | | | 10.02 | %(4) | |
| Merrill Lynch Convertible Bonds (Speculative Quality) Index(2) | | | 17.15 | %(3) | | | 11.56 | %(4) | |
Based on a $10,000 initial investment, the graph and table above illustrate the total return of ING Pioneer High Yield Portfolio against the indices indicated. An index is unmanaged and has no cash in its portfolio, imposes no sales charges and incurs no operating expenses. An investor cannot invest directly in an index. The Portfolio's performance is shown without the imposition of any expenses or charges which are, or may be, imposed under your annuity contract. Total returns would have been lower if such expenses or charges were included.
The performance graph and table do not reflect the deduction of taxes that a shareholder will pay on portfolio distributions or the redemption of portfolio shares.
The performance shown may include the effect of fee waivers and/or expense reimbursements by the Investment Adviser and/or other service providers, which have the effect of increasing total return. Had all fees and expenses been considered, the total returns would have been lower.
The performance update illustrates performance for a variable investment option available through a variable annuity contract. The performance shown indicates past performance and is not a projection or prediction of future results. Actual investment returns and principal value will fluctuate so that shares and/or units, at redemption, may be worth more or less than their original cost. Please call (800) 262-3862 to get performance through the most recent month end.
This report contains statements that may be "forward-looking" statements. Actual results may differ materially from those projected in the "forward-looking" statements.
The views expressed in this report reflect those of the portfolio manager only through the end of the period as stated on the cover. The portfolio manager's views are subject to change at any time based on marked and other conditions.
Portfolio holdings are subject to change daily.
(1) The Merrill Lynch High Yield Master II Index is a broad-based index consisting of all U.S. dollar-denominated high-yield bonds with a minimum outstanding amount of $100 million and with a maturity of greater than one year period. The quality rating is less than BBB by Standard & Poor's.
(2) The Merrill Lynch Convertible Bonds (Speculative Quality) Index is a market-capitalization weighted index including mandatory and non-mandatory domestic corporate convertible securities. Securities in this index are convertible to U.S. dollar-denominated common stocks, ADRs, or cash equivalent and have an average rating of Ba1/BB+ or lower from Moody's and Standard & Poor's, respectively.
(3) Since inception performance of the indices is shown from January 1, 2006.
(4) Since inception performance of the indices is shown from February 1, 2006.
47
ING T. ROWE PRICE DIVERSIFIED MID CAP GROWTH PORTFOLIO
PORTFOLIO MANAGERS' REPORT
ING T. Rowe Price Diversified Mid Cap Growth Portfolio (the "Portfolio") seeks long term capital appreciation. The Portfolio is managed by Donald J. Peters, Portfolio Manager of T. Rowe Price Associates, Inc. — the Sub-Adviser.
Performance: For the year ended December 31, 2006, the Portfolio's Class S shares provided a total return of 8.97% compared to the Standard & Poor's ("S&P") 400 Index(1) and the Russell Midcap® Growth Index(2), which returned 10.32% and 10.66%, respectively, for the same period.
Portfolio Specifics: Gains for the Portfolio were broadly based; with only the energy sector serving up negative returns. On a relative basis, the Portfolio trailed its Russell Midcap® Growth Index for the year, largely as a result of stock selection decisions. Active sector weighting decisions were largely offsetting.
Holdings in the information technology sector contributed most significantly to underperformance for the year; stock selection decisions in the materials sector and among industrials and business service companies also detracted. Portfolio holdings in the consumer discretionary sector and among consumer staples and utilities companies benefited relative results. The underweighting of the materials sector and the overweighting of healthcare hampered relative performance but were largely offset by the benefits of overweights in telecommunication services, driven by our exposure to wireless telecommunication services and financials.
Stock selection in the semiconductors and semiconductor services industry was most problematic for the Portfolio. Not holding shares of the graphics chipmaker Nvidia Corp. hurt relative returns, while our position in Marvell Technology Group Ltd., the leading developer of chips for electronic switches and gateways, was weak for several reasons — investor concerns over acquisition of Intel Corp's handset chip business, weak end markets, and stock options back-dating fears. Stock picks in Internet software and services also lagged the benchmark. Stock selection among software companies was a bright spot. Holding the design software company Autodesk, Inc. benefited relative results as share prices rose on strong sales and profitability. Technology spending currently stands at nearly a 10-year low level, which we believe is unsustainable for businesses. With technology valuations modest and profitability strong, we remain constructive.
Within the consumer discretionary sector, stock selection in media and specialty retail aided relative performance. In media, the Portfolio benefited from not owning Sirius Satellite Radio, Inc. or XM Satellite Radio Holdings, Inc. The two companies, fierce competitors, have struggled to add new users and retain existing listeners. They continue to undercut each other in a price war. Our position in media company Lamar Advertising Co. contributed positively.
Current Strategy and Outlook: Overall, we remain optimistic about the Portfolio's prospects, even as we are somewhat guarded about the economic environment. We will continue to utilize the same techniques for finding reasonably priced growth stocks that have served us well in the past. We believe investor concerns toward inflation, the pace of economic growth, and geopolitical instability may lead from a risk-seeking posture to one that is more balanced. Already some of the more speculative market activity appears to have dissipated and investors' raised awareness of risks could well create a more favorable environment for our investment style. In our opinion, long-term investors may value the types of high-quality growth stocks we favor — companies with solid fundamentals, well considered business models and competent managements with long-term orient ation. These types of businesses have the ability to sustain and grow earnings even in tough economic conditions and we remain optimistic about their future prospects.
Portfolio holdings and characteristics are subject to change and may not be representative of current holdings and characteristics. The outlook for this Portfolio may differ from that presented for other ING Funds. Performance for the different classes of shares will vary based on differences in fees associated with each class.
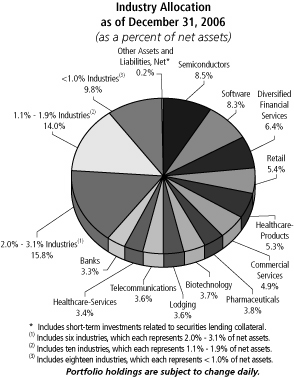
Top Ten Holdings*
as of December 31, 2006
(as a percent of net assets)
| Cbot Holdings, Inc. | | | 1.0 | % | |
| Celgene Corp. | | | 1.0 | % | |
| Rockwell Collins, Inc. | | | 1.0 | % | |
| American Tower Corp. | | | 0.9 | % | |
| Northern Trust Corp. | | | 0.9 | % | |
| Harley-Davidson, Inc. | | | 0.9 | % | |
| Crown Castle International Corp. | | | 0.9 | % | |
| Chicago Mercantile Exchange Holdings, Inc. | | | 0.9 | % | |
| Precision Castparts Corp. | | | 0.8 | % | |
| Linear Technology Corp. | | | 0.8 | % | |
* Excludes short-term investments related to securities lending collateral.
Portfolio holdings are subject to change daily
48
PORTFOLIO MANAGERS' REPORT
ING T. ROWE DIVERSIFIED MID CAP GROWTH PORTFOLIO
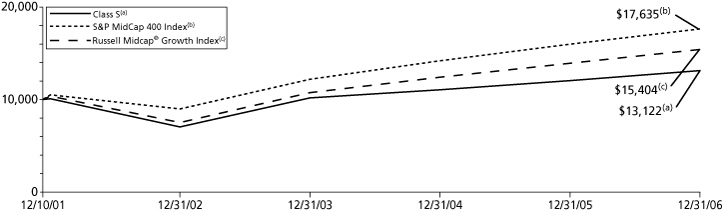
| Average Annual Total Returns for the Periods Ended December 31, 2006 | |
| | | 1 Year | | 5 Year | | Since Inception
of Classes I, S and ADV
December 10, 2001 | |
| Class I | | | 9.10 | % | | | 5.67 | % | | | 5.78 | % | |
| Class S | | | 8.97 | % | | | 5.41 | % | | | 5.52 | % | |
| Class ADV | | | 8.70 | % | | | 5.16 | % | | | 5.27 | % | |
| S&P MidCap 400 Index(1) | | | 10.32 | % | | | 10.89 | % | | | 11.81 | %(3) | |
| Russell Midcap® Growth Index(2) | | | 10.66 | % | | | 8.22 | % | | | 8.87 | %(3) | |
Based on a $10,000 initial investment, the graph and table above illustrate the total return of ING T. Rowe Diversified Mid cap Growth Portfolio against the indices indicated. An index is unmanaged and has no cash in its portfolio, imposes no sales charges and incurs no operating expenses. An investor cannot invest directly in an index. The Portfolio's performance is shown without the imposition of any expenses or charges which are, or may be, imposed under your annuity contract. Total returns would have been lower if such expenses or charges were included.
The performance graph and table do not reflect the deduction of taxes that a shareholder will pay on portfolio distributions or the redemption of portfolio shares.
The performance shown may include the effect of fee waivers and/or expense reimbursements by the Investment Adviser and/or other service providers, which have the effect of increasing total return. Had all fees and expenses been considered, the total returns would have been lower.
The performance update illustrates performance for a variable investment option available through a variable annuity contract. The performance shown indicates past performance and is not a projection or prediction of future results. Actual investment returns and principal value will fluctuate so that shares and/or units, at redemption, may be worth more or less than their original cost. Please call (800) 262-3862 to get performance through the most recent month end.
This report contains statements that may be "forward-looking" statements. Actual results may differ materially from those projected in the "forward-looking" statements.
The views expressed in this report reflect those of the portfolio manager only through the end of the period as stated on the cover. The portfolio manager's views are subject to change at any time based on marked and other conditions.
Portfolio holdings are subject to change daily.
(1) The S&P MidCap 400 Index is a market capitalization-weighted index of 400 medium-capitalization stocks chosed for market size, liquidity, and industry group representation.
(2) The Russell Midcap® Growth Index measures the performance of the 800 smallest companies the Russell 1000® Index with higher price-to-book ratios and higher forecasted growth values.
(3) Since inception performance for the indices is shown from December 1, 2001.
49
ING T. ROWE PRICE GROWTH EQUITY PORTFOLIO
PORTFOLIO MANAGERS' REPORT
The ING T. Rowe Price Growth Equity Portfolio (the "Portfolio") seeks long-term capital growth, and secondarily, increasing dividend income. The Portfolio is managed by Robert W. Smith, Portfolio Manager of T. Rowe Price Associates, Inc. — the Sub-Adviser.
Performance: For the year ended December 31, 2006, the Portfolio's Class I shares, provided a total return of 13.30% compared to the Standard & Poor's 500® Composite Stock Price Index(1) ("S&P 500® Index"), which returned 15.79% for the same period.
Portfolio Specifics: The Portfolio's return in 2006 reflected the double-digit gain in the U.S. stock market — its fourth consecutive year of positive performance. Despite evidence of slowing economic growth, stocks rallied thanks to robust corporate earnings growth, declining energy prices, and significant merger and acquisition activity, particularly a marked increase in buyouts by private equity firms. One reason the Portfolio lagged the S&P 500® Index was the general underperformance of large-cap growth stocks, which generally trailed large-cap value issues by a wide margin in 2006.
Sector weightings also contributed to the Portfolio's underperformance of the index in 2006. In particular, overweights in the information technology and healthcare sectors — which were the weakest-performing segments of the index — and an underweight in the energy sector detracted from relative performance. On the positive side, an overweight in consumer discretionary stocks and an underweight in the industrial and business services sector provided a lift to relative results.
Stock selection was mixed but detracted overall from performance compared with the index. Within the Portfolio's holdings, seven of the ten biggest detractors from relative results came from the information technology and health care sectors. Internet company Yahoo!, Inc. was the Portfolio's bottom relative contributor, declining amid concerns about a new software product, while computer maker Dell, Inc. struggled with increased price competition and poor execution of its business model. In the health care sector, an emphasis on health services providers hindered relative results; UnitedHealth Group, Inc. which fell after an investigation uncovered backdating of stock options at the company, was the Portfolio's biggest relative detractor in this area. Health care equipment companies such as Medtronic, Inc. and St. Jude Medical, Inc. were hurt by slowing sales, product recalls, and Medicare reimbursement difficulties.
On the positive side, stock selection was most successful in the consumer discretionary sector, where choices among gaming companies and retailers added value. Casino operators Wynn Resorts Ltd. and MGM Mirage posted strong returns amid high expectations for growth in Macau, a major Asian gaming destination. Department store chain Kohl's Corp. and online retailer Amazon.com, Inc. also delivered healthy gains for the year. Another favorable area for stock selection was the industrial and business services sector, where an overweight position in machinery stocks — including instrumentation manufacturer Danaher Corp., mining equipment maker Joy Global, Inc. and agricultural machinery company Deere & Co. — helped the most as sales remained robust despite the economic slowdown.
Current Strategy and Outlook: We believe the market is underestimating the strength of the global economy and the resilience of corporate earnings and cash-flow growth. Nonetheless, U.S. economic growth is likely to moderate in the coming year, and as a result, earnings delivery will be the key driver of relative performance. We believe that investors will be attracted to — and bestow higher prices on — companies producing stable earnings growth. Toward that end, we are focusing on companies with diversified revenue streams and significant business outside of the U.S. We believe that our Portfolio of high-quality growth stocks is well positioned as we move into 2007.
Portfolio holdings and characteristics are subject to change and may not be representative of current holdings and characteristics. The outlook for this Portfolio may differ from that presented for other ING Funds. Performance for the different classes of shares will vary based on differences in fees associated with each class.

Top Ten Holdings*
as of December 31, 2006
(as a percent of net assets)
| General Electric Co. | | | 4.2 | % | |
| UnitedHealth Group, Inc. | | | 2.4 | % | |
| UBS AG | | | 2.0 | % | |
| Schlumberger Ltd. | | | 1.9 | % | |
| Microsoft Corp. | | | 1.8 | % | |
| Google, Inc. | | | 1.8 | % | |
| Accenture Ltd. | | | 1.8 | % | |
| Caremark Rx, Inc. | | | 1.7 | % | |
| Amgen, Inc. | | | 1.6 | % | |
| WellPoint, Inc. | | | 1.6 | % | |
* Excludes short-term investments related to securities lending collateral.
Portfolio holdings are subject to change daily.
50
PORTFOLIO MANAGERS' REPORT
ING T. ROWE PRICE GROWTH EQUITY PORTFOLIO
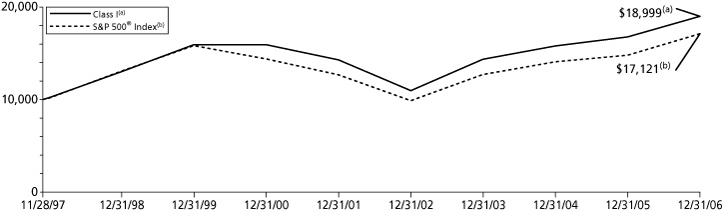
| Average Annual Total Returns for the Periods Ended December 31, 2006 | |
| | | 1 Year | | 5 Year | | Since Inception
of Class I
November 28, 1997 | | Since Inception
of Classes S and ADV
December 10, 2001 | |
| Class I | | | 13.30 | % | | | 5.85 | % | | | 7.31 | % | | | — | | |
| Class S | | | 13.03 | % | | | 5.59 | % | | | — | | | | 5.46 | % | |
| Class ADV | | | 12.73 | % | | | 5.32 | % | | | — | | | | 5.20 | % | |
| S&P 500® Index(1) | | | 15.79 | % | | | 6.19 | % | | | 6.10 | %(2) | | | 6.27 | %(3) | |
Based on a $10,000 initial investment, the graph and table above illustrate the total return of ING T. Rowe Price Growth Equity Portfolio against the index indicated. An index is unmanaged and has no cash in its portfolio, imposes no sales charges and incurs no operating expenses. An investor cannot invest directly in an index. The Portfolio's performance is shown without the imposition of any expenses or charges which are, or may be, imposed under your annuity contract. Total returns would have been lower if such expenses or charges were included.
The performance graph and table do not reflect the deduction of taxes that a shareholder will pay on portfolio distributions or the redemption of portfolio shares.
The performance shown may include the effect of fee waivers and/or expense reimbursements by the Investment Adviser and/or other service providers, which have the effect of increasing total return. Had all fees and expenses been considered, the total returns would have been lower.
The performance update illustrates performance for a variable investment option available through a variable annuity contract. The performance shown indicates past performance and is not a projection or prediction of future results. Actual investment returns and principal value will fluctuate so that shares and/or units, at redemption, may be worth more or less than their original cost. Please call (800) 262-3862 to get performance through the most recent month end.
This report contains statements that may be "forward-looking" statements. Actual results may differ materially from those projected in the "forward-looking" statements.
The views expressed in this report reflect those of the portfolio manager only through the end of the period as stated on the cover. The portfolio manager's views are subject to change at any time based on marked and other conditions.
Portfolio holdings are subject to change daily.
(1) The S&P 500® Index is an unmanaged index that measures the performance of the securities of approximately 500 of the largest companies in the U.S.
(2) Since inception performance for the index is shown from December 1, 1997.
(3) Since inception performance for the index is shown from December 1, 2001.
51
ING TEMPLETON FOREIGN EQUITY PORTFOLIO
PORTFOLIO MANAGERS' REPORT
The ING Templeton Foreign Equity Portfolio (the "Portfolio") seeks long-term capital growth. The Portfolio is managed by Mr. Gary Motyl, Cindy Sweeting, Antonio Docal, Peter Nori, and Matthew Nagle of Templeton Investment Counsel, LLC, the Sub-Adviser.
Performance: Since the Portfolio's inception on January 3, 2006 through December 31, 2006, the Portfolio's Class I shares provided a total return of 21.70% compared to Morgan Stanley Capital International ("MSCI") All Country World ex U.S. IndexSM(1), which returned 26.65% for the year ended December 31, 2006.
Portfolio Specifics: Global equity markets performed well in 2006, driven by strong corporate profit growth, resilient consumer spending and a relatively moderate interest rate environment. Broad merger and acquisition activity, most notably involving private equity, was a driver of market appreciation in Europe and the U.S. In the year's second half, oil prices declined from elevated levels and provided additional momentum to stock prices. Aside from crude oil prices, which ended the year relatively flat, many commodities' prices rose sharply in 2006, buoyed by strong demand growth from emerging markets and investors.
Although U.S. equity markets staged a strong recovery in the year's fourth quarter, many overseas stock markets outperformed their U.S. counterparts, in part due to the U.S. dollar's weakness against the euro and other currencies. Asian markets performed well, with the notable exception of Japan, which appreciated modestly after climbing significantly in 2005.
During the period under review, the Portfolio experienced double-digit total returns in eight of ten major sectors, with the industrials, consumer discretionary and telecommunication services sectors performing well. Holdings that delivered strong returns from these sectors included France's Michelin (tire manufacturer), Sweden's Atlas Copco AB (compressors and construction and mining equipment), the U.K.'s Compass Group PLC (food services), and Norway's Telenor ASA, Spain's Telefonica SA and China Telecom (telecommunication services). The Portfolio's underweighted positions in the financials, materials and consumer staples sectors hindered results relative to the MSCI All Country World ex U.S. IndexSM. Each of these sectors performed well during the period. In an environment of protracted global economic growth, demand for industrial commodities and related equities was heightened. Certain technology stocks also hindered relative results, including South Korea's Samsung Electronics Co., Ltd. GDR (semiconductors and semiconductor equipment) and Taiwan's Compal Electronics, Inc. GDR (computers and peripherals). These stocks, which are not index components, lost value during the period. Cash was also a drag on relative performance during the period.
The U.S. dollar depreciated versus most foreign currencies for the year, which also contributed to the Portfolio's performance because investments in securities with non-U.S. currency exposure gained value as the dollar weakened.
Current Strategy and Outlook: Our value-oriented, bottom-up process drives our stock selection and, therefore, the Portfolio's returns. Over the past several quarters, we deemed valuations in certain of our materials-related holdings exceeded what we could justify based on underlying company and industry fundamentals. Consequently, we reduced or liquidated several positions, especially given investment alternatives that our analyses indicated had greater potential to unlock shareholder value over the long term. We used part of the proceeds to purchase shares of telecommunication services companies. At period-end, the portfolio's largest relative overweighted position was in the telecommunication services sector.
Portfolio holdings and characteristics are subject to change and may not be representative of current holdings and characteristics. The outlook for this Portfolio may differ from that presented for other ING Funds. Performance for the different classes of shares will vary based on differences in fees associated with each class.

Top Ten Holdings*
as of December 31, 2006
(as a percent of net assets)
| Samsung Electronics Co., Ltd. GDR | | | 2.2 | % | |
| Royal Bank of Scotland Group PLC | | | 1.8 | % | |
| Compass Group PLC | | | 1.8 | % | |
| Sanofi-Aventis | | | 1.7 | % | |
| GlaxoSmithKline PLC | | | 1.6 | % | |
| HSBC Holdings PLC | | | 1.6 | % | |
| Deutsche Post AG | | | 1.6 | % | |
| Vodafone Group PLC | | | 1.5 | % | |
| Telefonica SA | | | 1.5 | % | |
| France Telecom SA | | | 1.5 | % | |
* Excludes short-term investments related to U.S. government agency obligation.
Portfolio holdings are subject to change daily.
52
PORTFOLIO MANAGERS' REPORT
ING TEMPLETON FOREIGN EQUITY PORTFOLIO
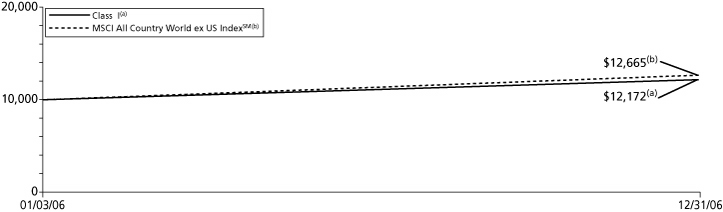
| Cumulative Total Returns for the Periods Ended December 31, 2006 | |
| | | Since Inception
of Class I
January 3, 2006 | | Since Inception
of Class S
January 12, 2006 | | Since Inception
of Class ADV
December 20, 2006 | |
| Class I | | | 21.70 | % | | | — | | | | — | | |
| Class S | | | — | | | | 21.14 | % | | | — | | |
| Class ADV | | | — | | | | — | | | | 0.66 | % | |
| MSCI ACWI ex US IndexSM(1) | | | 26.65 | %(2) | | | 26.65 | %(2) | | | N/A(3) | | |
Based on a $10,000 initial investment, the graph and table above illustrate the total return of ING Templeton Foreign Equity Portfolio against the index indicated. An index is unmanaged and has no cash in its portfolio, imposes no sales charges and incurs no operating expenses. An investor cannot invest directly in an index. The Portfolio's performance is shown without the imposition of any expenses or charges which are, or may be, imposed under your annuity contract. Total returns would have been lower if such expenses or charges were included.
The performance graph and table do not reflect the deduction of taxes that a shareholder will pay on portfolio distributions or the redemption of portfolio shares.
The performance shown may include the effect of fee waivers and/or expense reimbursements by the Investment Adviser and/or other service providers, which have the effect of increasing total return. Had all fees and expenses been considered, the total returns would have been lower.
The performance update illustrates performance for a variable investment option available through a variable annuity contract. The performance shown indicates past performance and is not a projection or prediction of future results. Actual investment returns and principal value will fluctuate so that shares and/or units, at redemption, may be worth more or less than their original cost. Please call (800) 262-3862 to get performance through the most recent month end.
This report contains statements that may be "forward-looking" statements. Actual results may differ materially from those projected in the "forward-looking" statements.
The views expressed in this report reflect those of the portfolio manager only through the end of the period as stated on the cover. The portfolio manager's views are subject to change at any time based on marked and other conditions.
Portfolio holdings are subject to change daily.
(1) The MSCI ACWI ex US IndexSM measures the returns of equities of companies which are domiciled outside the U.S. It includes the reinvestment of dividends and distributions net of withholding taxes, but does not reflect fees, brokerage commissions or other expenses of investing.
(2) Since inception performance of the index is shown from January 1, 2006.
(3) Since inception performance for the index is not shown.
53
ING THORNBURG VALUE PORTFOLIO
PORTFOLIO MANAGERS' REPORT
The ING Thornburg Value Portfolio (the "Portfolio") seeks capital appreciation. The Portfolio is managed by of Thornburg Investment Management ("Thornburg") — the Sub-Adviser*.
Performance: For the year ended December 31, 2006, the Portfolio's Class I shares provided a total return of 16.84% compared to the Standard & Poor's 500® Composite Stock Price Index(1) ("S&P 500® Index"), which returned 15.79% for the same period.
Portfolio Specifics: The Portfolio was sub-advised by Massachusetts Financial Services Company for the period from January 1, 2006 through August 7, 2006. During this time period technology, consumer discretionary, utilities and communications were the Portfolio's top detracting sectors relative to the benchmark. Within the technology sector, a combination of stock selection and an over-weighted position hurt relative performance. In this sector, network equipment manufacturer Juniper Networks, direct-sale computer vendor Dell, telecommunications equipment company Nortel Networks, and semiconductor company Intel were among the Portfolio's top detractors. Stock selection and, to a lesser extent, our over-weighted position in the retailing sector held back relative performance. Apparel retailer Urban Outfitters and auto parts company Advance Auto Parts dampen ed relative results. In the utilities and communications sector, a combination of stock selection and an underweighted position detracted from relative returns. Stock selection in other sectors also had a negative impact on relative performance and included package manufacturer Owens Illinois, multimedia image provider Getty Images, manufacturing conglomerate Tyco International, and cardiovascular medical devices maker St. Jude Medical.
Consumer staples and financial services were the top contributing sectors relative to the Portfolio's benchmark. In both sectors, stock selection was the key factor. In the consumer staples sector, global food company Nestle S.A was beneficial to relative results. Stock selection in other sectors had a positive impact on relative returns also included mining giant BHP Billiton, discount department store Kohl's, integrated oil and gas company Hess, and specialty used-car dealer CarMax. Elsewhere, billing software company Amdocs, media conglomerate Walt Disney, and software giants Oracle and Microsoft aided relative results. Not holding weak-performing benchmark constituent General Electric also helped.
For the period from August 8, 2006 through December 31, 2006, the Portfolio's stock selection was particularly strong in the Consumer Discretionary sector with positive contributions from a diverse array of holdings including Las Vegas Sands and DIRECTV Group. Las Vegas Sands, the largest single contributor to the Portfolio, was recognized for the potential value of its gaming property developments in Macau and Singapore. DIRECTV Group rebounded from a modest valuation for its attractive annuity-like subscription revenue stream.
Financials and Telecommunications also offered positive contributors such as NYSE Group and NII Holdings. NYSE Group has successfully transitioned the business model away from a not-for-profit entity run for its exchange members to a for-profit enterprise that will speed execution, enhance trading volumes, and lift pricing power. NII Holdings continues to add mobile subscribers profitably and expand penetration rates in Latin America.
A few of our investments did not perform as expected. One example included Sirius Satellite Radio, where the company was unable to sustain subscriber growth at levels we had anticipated. As the investment thesis was not developing as anticipated, this stock was sold for risk control purposes.
Other stocks that detracted from performance that were ultimately sold from the Portfolio included Caremark and Pfizer. Caremark's outlook became clouded following the announced transaction with CVS at no premium. We exited the stock based on concerns regarding the strategic positioning of the PBM business. The halt of Pfizer's Torcetrapib trial removes the company's most exciting pipeline candidate as well as weakens its defensive strategy with regard to its largest drug, Lipitor. The position was sold based on poor visibility into post-Lipitor earnings and a high likelihood of a too expensive acquisition to fill the gap.
Current Strategy and Outlook: The most recent rise in non-farm payrolls (167,000) reinforcing the view that the U.S. economy remains healthy. While we would relish having the dual benefits of both earnings and lower interest rates supporting stock prices, we may have to wait awhile for the later to become a factor. Much of the worry about disappointing retail sales during the holiday season was misplaced. Headlines focused on sales gains being less than last year, but last year was a great year; plus over 8%. This year was up over 6%. Seems like normal business. In any case, we would expect leading companies with well established business models to likely report earnings progress in the year ahead. This would represent a good outcome for investors in the Portfolio.
* Prior to August 7, 2006 the Portfolio was sub-advised by Massachusetts Financial Services Company and was known as MFS Capital Opportunities Portfolio. Effective August 7, 2006 Thornburg became the sub–adviser and the Portfolio's principal investment strategies changed.
Portfolio holdings and characteristics are subject to change and may not be representative of current holdings and characteristics. The outlook for this Portfolio may differ from that presented for other ING Funds. Performance for the different classes of shares will vary based on differences in fees associated with each class.

Top Ten Holdings*
as of December 31, 2006
(as a percent of net assets)
| ExxonMobil Corp. | | | 3.9 | % | |
| Hertz Global Holdings, Inc. | | | 3.1 | % | |
| American International Group, Inc. | | | 3.1 | % | |
| WellPoint, Inc. | | | 3.1 | % | |
| Citigroup, Inc. | | | 3.1 | % | |
| Microsoft Corp. | | | 3.0 | % | |
| General Electric Co. | | | 2.9 | % | |
| Alcoa, Inc. | | | 2.9 | % | |
| Dell, Inc. | | | 2.9 | % | |
| Target Corp. | | | 2.7 | % | |
* Excludes short-term investments related to securities lending collateral and U.S. government agency obligation.
Portfolio holdings are subject to change daily.
54
PORTFOLIO MANAGERS' REPORT
ING THORNBURG VALUE PORTFOLIO
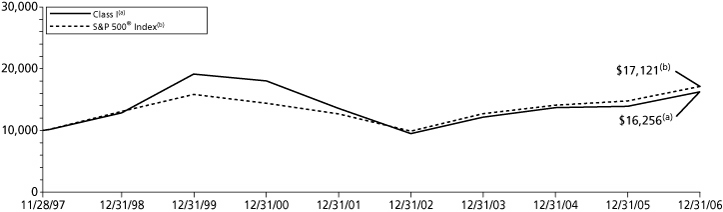
| Average Annual Total Returns for the Periods Ended December 31, 2006 | |
| | | 1 Year | | 5 Year | | Since Inception
of Class I
November 28, 1997 | | Since Inception of
Classes S and ADV
December 10, 2001 | |
| Class I | | | 16.84 | % | | | 3.68 | % | | | 5.49 | % | | | — | | |
| Class S | | | 16.57 | % | | | 3.41 | % | | | — | | | | 3.30 | % | |
| Class ADV | | | 16.26 | % | | | 3.16 | % | | | — | | | | 3.05 | % | |
| S&P 500® Index(1) | | | 15.79 | % | | | 6.19 | % | | | 6.10 | %(2) | | | 6.27 | %(3) | |
Based on a $10,000 initial investment, the graph and table above illustrate the total return of ING Thornburg Value Portfolio against the index indicated. An index is unmanaged and has no cash in its portfolio, imposes no sales charges and incurs no operating expenses. An investor cannot invest directly in an index. The Portfolio's performance is shown without the imposition of any expenses or charges which are, or may be, imposed under your annuity contract. Total returns would have been lower if such expenses or charges were included.
The performance graph and table do not reflect the deduction of taxes that a shareholder will pay on portfolio distributions or the redemption of portfolio shares.
The performance shown may include the effect of fee waivers and/or expense reimbursements by the Investment Adviser and/or other service providers, which have the effect of increasing total return. Had all fees and expenses been considered, the total returns would have been lower.
The performance update illustrates performance for a variable investment option available through a variable annuity contract. The performance shown indicates past performance and is not a projection or prediction of future results. Actual investment returns and principal value will fluctuate so that shares and/or units, at redemption, may be worth more or less than their original cost. Please call (800) 262-3862 to get performance through the most recent month end.
This report contains statements that may be "forward-looking" statements. Actual results may differ materially from those projected in the "forward-looking" statements.
The views expressed in this report reflect those of the portfolio manager only through the end of the period as stated on the cover. The portfolio manager's views are subject to change at any time based on marked and other conditions.
Portfolio holdings are subject to change daily.
(1) The S&P 500® Index is an unmanaged index that measures the performance of the securities of approximately 500 of the largest companies in the U.S.
(2) Since inception performance for the index is shown from December 1, 1997.
(3) Since inception performance for the index is shown from December 1, 2001.
55
ING UBS U.S. LARGE CAP EQUITY PORTFOLIO
PORTFOLIO MANAGERS' REPORT
The ING UBS U.S. Large Cap Equity Portfolio (the "Portfolio") seeks long-term growth of capital and future income. The Portfolio is managed by the North American Equities Investment Management Team ("N.A. Equities Team") led by John Leonard, Portfolio Manager, Head of N.A. Equities Team, and Deputy Global Head of Equities and Managing Director of UBS Global Asset Management (Americas) Inc. — the Sub-Adviser.
Performance: For the year ended December 31, 2006, the Portfolio's Class I shares provided a total return of 14.51% compared to the compared to the Standard & Poor's 500® Composite Stock Price Index(1) ("S&P 500® Index") and the Russell 1000® Index(2), which returned 15.79% and 15.46%, respectively, for the same period.
Portfolio Specifics: The overall US equity market generated strong returns in 2006. After treading water during the first half of the year, stock prices rallied sharply on the back of strong corporate earnings, a pause in U.S. Federal Reserve Board interest rate hikes, moderating oil prices, and a robust merger and acquisition environment. During the one-year period ended December 31, 2006, large cap stocks, as represented by the Russell 1000® Index, returned 15.46%. In contrast, small cap stocks, as represented by the Russell 2000® Index, gained 18.37% over the same period. This marked the sixth time in the last seven years that small caps outperformed their large cap counterparts. However, excluding the month of January 2006, large caps outperformed during the year. During the last 11 months of the year large-caps returned 12 .31% versus 8.63% for small-caps. This could be a signal that a long anticipated shift in market leadership to large caps may be beginning.
As always, during the year we relied on our bottom-up research process to guide sector allocation and stock selection for the Portfolio. During the fiscal year, overweights in the securities and asset management industry, as well as the electric utilities were beneficial to performance. In terms of individual stocks, financial companies Morgan Stanley and Citigroup, Inc. were the largest contributors to performance during the 12-month period. Oil refining company Marathon Oil Corp. boosted returns given high oil prices during much of the year. Computer software giants Oracle Corp. and Microsoft Corp. were also major contributors to performance. Good stock selection in the software and services industry group and being underweight in the technology sector were also beneficial to performance.
In contrast, from an industry perspective, overweights in medical services and banks detracted from results. Elsewhere, underweights in energy were a drag on performance. Online travel company Expedia was the largest detractor from performance on an individual stock basis. Stocks from a variety of industries also hurt returns, including medical services company UnitedHealth Group, global communications firm Sprint Nextel Corp., computer hardware company Dell, Inc. and biotech firm Genzyme Corp.
Current Strategy and Outlook: The utilities sector has outperformed the S&P 500® Index for three consecutive years, an unprecedented run. This occurred during a time of overall market strength, in a sector that is normally considered defensive. We continue to find utilities attractive. We believe the financial sector also provides us with interesting opportunities and we continue to be overweighted to companies with exposure to the capital markets. While the investment banking cycle in the US is entering the mature phase, this area is attractive, in our opinion, with the most appeal coming from firms with a global reach. We also feel that rail companies continue to provide us with an attractive opportunity, as pricing power is still strong. We believe this is sustainable because the excess capacity that has been in rail industry for decad es is gone. Therefore, in our view, pricing power should remain strong with, even minimal volume growth.
Portfolio holdings and characteristics are subject to change and may not be representative of current holdings and characteristics. The outlook for this Portfolio may differ from that presented for other ING Funds. Performance for the different classes of shares will vary based on differences in fees associated with each class.
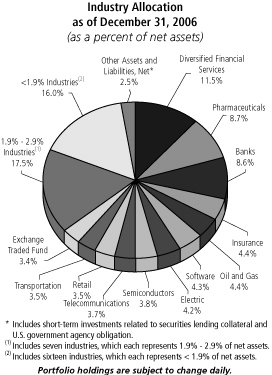
Top Ten Holdings*
as of December 31, 2006
(as a percent of net assets)
| Citigroup, Inc. | | | 4.5 | % | |
| Morgan Stanley | | | 3.9 | % | |
| Microsoft Corp. | | | 3.6 | % | |
| SPDR Trust Series 1 | | | 3.4 | % | |
| Wells Fargo & Co. | | | 3.0 | % | |
| Exelon Corp. | | | 2.6 | % | |
| American International Group, Inc. | | | 2.3 | % | |
| Allergan, Inc. | | | 2.3 | % | |
| Wyeth | | | 2.3 | % | |
| Johnson Controls, Inc. | | | 2.0 | % | |
* Excludes short-term investments related to securities lending collateral and U.S. government agency obligation.
Portfolio holdings are subject to change daily.
56
PORTFOLIO MANAGERS' REPORT
ING UBS U.S. LARGE CAP EQUITY PORTFOLIO
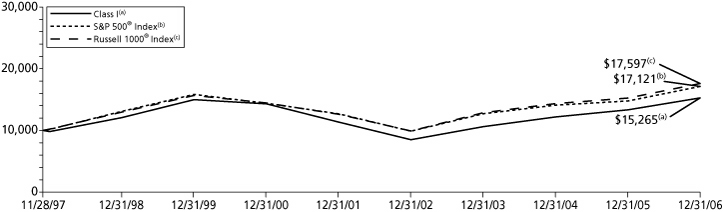
| Average Annual Total Returns for the Periods Ended December 31, 2006 | |
| | | 1 Year | | 5 Year | | Since Inception
of Class I
November 28, 1997 | | Since Inception of
Classes S and ADV
December 10, 2001 | |
| Class I | | | 14.51 | % | | | 6.14 | % | | | 4.76 | % | | | — | | |
| Class S | | | 14.32 | % | | | 5.88 | % | | | — | | | | 5.76 | % | |
| Class ADV | | | 14.05 | % | | | 5.64 | % | | | — | | | | 5.52 | % | |
| S&P 500® Index(1) | | | 15.79 | % | | | 6.19 | % | | | 6.10 | %(3) | | | 6.27 | %(4) | |
| Russell 1000® Index(2) | | | 15.46 | % | | | 6.82 | % | | | 6.42 | %(3) | | | 6.93 | %(4) | |
Based on a $10,000 initial investment, the graph and table above illustrate the total return of ING UBS U.S. Large Cap Equity Portfolio against the indices indicated. An index is unmanaged and has no cash in its portfolio, imposes no sales charges and incurs no operating expenses. An investor cannot invest directly in an index. The Portfolio's performance is shown without the imposition of any expenses or charges which are, or may be, imposed under your annuity contract. Total returns would have been lower if such expenses or charges were included.
The performance graph and table do not reflect the deduction of taxes that a shareholder will pay on portfolio distributions or the redemption of portfolio shares.
The performance shown may include the effect of fee waivers and/or expense reimbursements by the Investment Adviser and/or other service providers, which have the effect of increasing total return. Had all fees and expenses been considered, the total returns would have been lower.
The performance update illustrates performance for a variable investment option available through a variable annuity contract. The performance shown indicates past performance and is not a projection or prediction of future results. Actual investment returns and principal value will fluctuate so that shares and/or units, at redemption, may be worth more or less than their original cost. Please call (800) 262-3862 to get performance through the most recent month end.
This report contains statements that may be "forward-looking" statements. Actual results may differ materially from those projected in the "forward-looking" statements.
The views expressed in this report reflect those of the portfolio manager only through the end of the period as stated on the cover. The portfolio manager's views are subject to change at any time based on marked and other conditions.
Portfolio holdings are subject to change daily.
(1) The S&P 500® Index is an unmanaged index that measures the performance of the securities of approximately 500 of the largest companies in the U.S.
(2) The Russell 1000® Index is a comprehensive large-cap index measuring the performance of the largest 1,000 U.S. incorporated companies.
(3) Since inception performance for the indices is shown from December 1, 1997.
(4) Since inception performance for the indices is shown from December 1, 2001.
57
ING UBS U.S. SMALL CAP GROWTH PORTFOLIO
PORTFOLIO MANAGERS' REPORT
The ING UBS U.S. Small Cap Growth Portfolio (the "Portfolio") seeks long-term capital appreciation. The Portfolio is managed by an investment management team co-led by Paul Graham and David Wabnik, Portfolio Managers of UBS Global Asset Management (Americas) Inc. — the Sub-Adviser.
Performance: Since the Portfolio inception on April 28, 2006 through December 31, 2006, the Portfolio's Class S shares, provided a total return of (2.17)% compared to the Russell 2000® Growth Index, which returned (0.60)% for the period beginning May 1, 2006 through December 31, 2006.
Portfolio Specifics: During the period, the primary reason for the Portfolio's underperformance was due to stock selection in the healthcare sector. Specifically, for the period, the names that we held in the biotechnology, healthcare equipment and pharmaceuticals industries substantially underperformed their peers. Our strongest returns during the period resulted from our stock selection in materials and industrials.
With respect to individual security selection, two of the Portfolio's top performing stocks included Ventas, Inc., one of the nation's leading healthcare real estate investment trusts, and RSA Security, Inc., The security division of EMC Corp., which is an expert in information-centric security, offering industry-leading solutions in identity assurance & access control, encryption & key management, compliance and security information management and fraud protection. RSA was formed in September 2006 following EMC Corporation's acquisitions of RSA Security, Inc. and Network Intelligence Corp.
Conversely, two of the Portfolio's worst performing stocks were Technical Olympic USA, Inc., a leading homebuilder and financial services company operating throughout Florida, the mid-atlantic, Texas and the west, and Christopher & Banks Corp., a Minneapolis, Minnesota based specialty retailer of women's apparel.
Within the small cap growth market, top performing industries were metals & mining, real estate management & development, and several consumer staples sub-sectors. The Russell 2000® Growth Index lagged the broader small cap universe, declining 0.60%, while the Russell 2000® Value Index returned 8.50%.
The large differential in performance between growth and value was driven by the strong performance of financial and energy stocks which dominate the Russell 2000® Value Index, and the weak performance of the information technology and healthcare sectors which are more important contributors to the Russel 2000® Growth Index.
These performance differentials, in our opinion, reflected investor preference for companies with above-average dividend yields and cash flows as well as modest earnings risk and low multiples. Additionally, better than expected reported earnings of cyclical growth companies diminished the relative appeal of growth companies.
After last year's brief interlude, we think investors are beginning to refocus on companies with stronger growth fundamentals. This change became evident when the U.S. Federal Reserve Board shifted to a "pause" in its policy of increasing the level of the federal funds rate at mid-year. Since this announcement, growth stocks have modestly outperformed the broader markets.
Current Strategy and Outlook: We believe the recent favorable performance of growth stocks will continue in 2007. We think that the economy is experiencing a mid-cycle slowdown and the profit cycle has likely peaked. Companies with sustainable earnings growth prospects going forward should, in our opinion, outperform those sectors of the economy that are more cyclical in nature. We believe prospects for stronger relative earnings growth in the information technology and healthcare sectors are likely to bolster performance of the growth indices. In our view, diminishing inflation expectations, combined with a slowing economy, also should widen the price/earnings multiples for the best positioned growth companies.
We enter 2007 with our sector weightings relatively close to the Russell 2000® Growth Index benchmark. We are modestly overweight the energy and industrial sectors and slightly underweight the information technology and financials sectors. Industries where we have an above-average exposure include energy equipment and services, and air freight and logistics, while we are significantly underweight commercial banks and internet software and services.
Although investment performance was subpar during the reporting period, we remain confident in our investment disciplines going forward. Our team remains committed to identifying companies that we believe will generate capital appreciation over the next few years.
Portfolio holdings and characteristics are subject to change and may not be representative of current holdings and characteristics. The outlook for this Portfolio may differ from that presented for other ING Funds. Performance for the different classes of shares will vary based on differences in fees associated with each class.
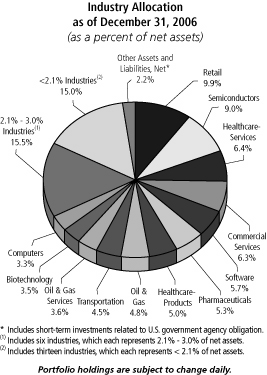
Top Ten Holdings
as of December 31, 2006
(as a percent of net assets)
| Pediatrix Medical Group, Inc. | | | 2.9 | % | |
| Tetra Technologies, Inc. | | | 2.6 | % | |
| VCA Antech, Inc. | | | 2.6 | % | |
| Phillips-Van Heusen | | | 2.3 | % | |
| Psychiatric Solutions, Inc. | | | 2.3 | % | |
| Orient-Express Hotels Ltd. | | | 2.1 | % | |
| Ventas, Inc. | | | 2.0 | % | |
| Childrens Place Retail Stores, Inc. | | | 2.0 | % | |
| Nice Systems Ltd. ADR | | | 2.0 | % | |
| EXCO Resources, Inc. | | | 1.7 | % | |
Portfolio holdings are subject to change daily.
58
PORTFOLIO MANAGERS' REPORT
ING UBS U.S. SMALL CAP GROWTH PORTFOLIO

| Cumulative Total Returns for the Periods Ended December 31, 2006 | |
| | | Since Inception
of Classes I, S and ADV
April 28, 2006 | |
| Class I | | | (1.97 | )% | |
| Class S | | | (2.17 | )% | |
| Class ADV | | | (2.47 | )% | |
| Russell 2000® Growth Index(1) | | | (0.60 | )%(2) | |
Based on a $10,000 initial investment, the graph and table above illustrate the total return of ING UBS U.S. Small Cap Growth Portfolio against the index indicated. An index is unmanaged and has no cash in its portfolio, imposes no sales charges and incurs no operating expenses. An investor cannot invest directly in an index. The Portfolio's performance is shown without the imposition of any expenses or charges which are, or may be, imposed under your annuity contract. Total returns would have been lower if such expenses or charges were included.
The performance graph and table do not reflect the deduction of taxes that a shareholder will pay on portfolio distributions or the redemption of portfolio shares.
The performance shown may include the effect of fee waivers and/or expense reimbursements by the Investment Adviser and/or other service providers, which have the effect of increasing total return. Had all fees and expenses been considered, the total returns would have been lower.
The performance update illustrates performance for a variable investment option available through a variable annuity contract. The performance shown indicates past performance and is not a projection or prediction of future results. Actual investment returns and principal value will fluctuate so that shares and/or units, at redemption, may be worth more or less than their original cost. Please call (800) 262-3862 to get performance through the most recent month end.
This report contains statements that may be "forward-looking" statements. Actual results may differ materially from those projected in the "forward-looking" statements.
The views expressed in this report reflect those of the portfolio manager only through the end of the period as stated on the cover. The portfolio manager's views are subject to change at any time based on marked and other conditions.
Portfolio holdings are subject to change daily.
(1) The Russell 2000® Growth Index is an unmanaged index that measures the performance of securities of smaller U.S. companies with greater than average growth orientation.
(2) Since inception performance for the index is shown from May 1, 2006.
59
ING VAN KAMPEN COMSTOCK PORTFOLIO
PORTFOLIO MANAGERS' REPORT
The ING Van Kampen Comstock Portfolio (the "Portfolio") seeks capital growth and income. The Portfolio is managed by B. Robert Baker, Jason Leder and Kevin Holt, each a Managing Director of Morgan Stanley Investment Management, Inc., d/b/a "Van Kampen" — the Sub-Adviser.
Performance: For the year ended December 31, 2006, the Portfolio's Class S shares, provided a total return of 15.86% compared to the Russell 1000® Value Index(1) and the Standard & Poor's 500® Composite Stock Price Index(2) ("S&P 500 ® Index"), which returned 22.25% and 15.79%, respectively, for the same period.
Portfolio Specifics: Generally speaking, large cap value stocks outperformed the broad market. However, leadership within the Russell 1000® Value Index was very narrow during the period, with gains being driven largely by a few large-cap energy stocks and strength in the cyclical, commodity-driven sectors.
The health care, materials and energy sectors were the largest detractors from performance relative to the Russell 1000® Value Index. Within the health care sector, the Portfolio's long-standing emphasis on large cap pharmaceutical stocks was a drag on performance, as investors began to anticipate the Democrats taking control of both the House and Senate in the mid-term elections. The main concern for drug companies is that potential Medicare reform would allow the government to be involved in the negotiation of drug pricing; however, given the president's veto power, actual legislation likely remains in the distant future. Within the materials sector, the Portfolio lacked exposure to those basic materials stocks with a high degree of exposure to the rising demand from China and other developing economies. In the energy sector, compelling valuations remained sparse in our view, and as a result the Portfolio maintained a significant underweight in the sector.
While the Portfolio had few positive contributors at the sector level relative to the Russell 1000® Value Index, on an absolute basis, the Portfolio captured gains across several areas. The Portfolio's exposure to media stocks added to results, as select holdings benefited from positive company-specific factors. In the telecommunication services sector, the Portfolio's holdings were boosted by the sector's ongoing merger and acquisition activity and the greater efficiencies of the resulting integrated companies. The Portfolio's financials holdings were also notable positive contributors to total return during the period.
Relative to the S&P 500® Index, the chief contributors to performance were the consumer discretionary, information technology and telecommunication services sectors, while the materials and energy sectors diminished relative results.
Current Strategy and Outlook: We maintain our focus on bottom-up selection of stocks with reasonable valuations relative to our assessment of fair value. The Portfolio's positioning — with its significant underweight in energy and large overweight in large-cap pharmaceuticals — remained largely unchanged throughout the period and portfolio turnover was low. Our long-term perspective affords us the patience to buy and hold some of the Portfolio's more contrarian positions.
Portfolio holdings and characteristics are subject to change and may not be representative of current holdings and characteristics. The outlook for this Portfolio may differ from that presented for other ING Funds. Performance for the different classes of shares will vary based on differences in fees associated with each class.

Top Ten Holdings*
as of December 31, 2006
(as a percent of net assets)
| Citigroup, Inc. | | | 4.0 | % | |
| International Paper Co. | | | 3.2 | % | |
| Verizon Communications, Inc. | | | 3.2 | % | |
| Bank of America Corp. | | | 3.1 | % | |
| AT&T, Inc. | | | 2.9 | % | |
| EI DuPont de Nemours & Co. | | | 2.7 | % | |
| Bristol-Myers Squibb Co. | | | 2.6 | % | |
| Freddie Mac | | | 2.5 | % | |
| Wachovia Corp. | | | 2.2 | % | |
| Alcoa, Inc. | | | 2.2 | % | |
* Excludes short-term investments related to securities lending collateral and U.S. government agency obligation.
Portfolio holdings are subject to change daily.
60
PORTFOLIO MANAGERS' REPORT
ING VAN KAMPEN COMSTOCK PORTFOLIO

| Average Annual Total Returns for the Periods Ended December 31, 2006 | |
| | | 1 Year | | Since Inception
of Classes I, S and ADV
May 1, 2002 | |
| Class I | | | 16.19 | % | | | 9.65 | % | |
| Class S | | | 15.86 | % | | | 9.38 | % | |
| Class ADV | | | 15.57 | % | | | 9.10 | % | |
| Russell 1000® Value Index(1) | | | 22.25 | % | | | 11.56 | % | |
| S&P 500® Index(2) | | | 15.79 | % | | | 8.02 | % | |
Based on a $10,000 initial investment, the graph and table above illustrate the total return of ING Van Kampen Comstock Portfolio against the indices indicated. An index is unmanaged and has no cash in its portfolio, imposes no sales charges and incurs no operating expenses. An investor cannot invest directly in an index. The Portfolio's performance is shown without the imposition of any expenses or charges which are, or may be, imposed under your annuity contract. Total returns would have been lower if such expenses or charges were included.
The performance graph and table do not reflect the deduction of taxes that a shareholder will pay on portfolio distributions or the redemption of portfolio shares.
The performance shown may include the effect of fee waivers and/or expense reimbursements by the Investment Adviser and/or other service providers, which have the effect of increasing total return. Had all fees and expenses been considered, the total returns would have been lower.
The performance update illustrates performance for a variable investment option available through a variable annuity contract. The performance shown indicates past performance and is not a projection or prediction of future results. Actual investment returns and principal value will fluctuate so that shares and/or units, at redemption, may be worth more or less than their original cost. Please call (800) 262-3862 to get performance through the most recent month end.
This report contains statements that may be "forward-looking" statements. Actual results may differ materially from those projected in the "forward-looking" statements.
The views expressed in this report reflect those of the portfolio manager only through the end of the period as stated on the cover. The portfolio manager's views are subject to change at any time based on marked and other conditions.
Portfolio holdings are subject to change daily.
(1) The Russell 1000® Value Index is an unmanaged index that measures the performance of those Russell 1000 securities with lower price-to-book ratios and lower forecasted growth values.
(2) The S&P 500® Index is an unmanaged index that measures the performance of the securities of approximately 500 of the largest companies in the U.S.
61
ING VAN KAMPEN EQUITY AND INCOME PORTFOLIO
PORTFOLIO MANAGERS' REPORT
The ING Van Kampen Equity and Income Portfolio (the "Portfolio") seeks total return, consisting of long-term capital appreciation and current income. The Portfolio is managed by James A. Gilligan, Managing Director; James O. Roeder and Thomas B. Bastian, Executive Directors; Sergio Marcheli and Vincent E. Vizachero, Vice Presidents, of Morgan Stanley Investment Management, Inc., d/b/a "Van Kampen" — the Sub-Adviser.
Performance: For the year ended December 31, 2006, the Portfolio's Class S shares provided a total return of 12.40% compared to the Standard & Poor's 500® Composite Stock Price Index(1) ("S&P 500® Index") and the Russell 1000® Value Index, which returned 15.79% and 22.25%, respectively, for the same period.
Portfolio Specifics: Relative to the S&P 500® Index, the equity portion of the Portfolio was hampered by under performance in the telecommunication services, energy and financials sectors. However, the Portfolio out performed in the materials, consumer discretionary and healthcare sectors, which boosted results relative to the S&P 500® Index. Relative to the Russell 1000® Value Ind ex, the telecommunications sector was the largest drag on performance, primarily due to security selection. The healthcare sector was an area of weakness, primarily due to a surprise negative announcement by a health care equipment and services company early in the year. In addition, the Portfolio's health care sector overweight is largely composed of pharmaceutical stocks, which proved to be a negative influence. An underweight in the energy sector also hurt results. We had been reducing exposure to the sector all year, as the lofty valuations of many energy stocks appear to exceed what we would consider an appropriate balance of risk and return. However, in the consumer discretionary sector, our security selection among retailers and autos served the Portfolio well. The financial services sector also contributed positively to performance relative to the Russell 1000® Value Index, particularly in diversified financial companies that had strong exposure to the capital markets. In the utilities sector, the Portfolio owned some of the sector's best performing stocks, which offset the negative impact of an underweight in the sector.
The bond portfolio slightly underperformed the Lehman Brothers U.S. Government/Credit Index for the year. We kept the Portfolio's overall duration (a measure of interest rate sensitivity) well below that of the Lehman Brothers U.S. Government/Credit Index during the period. This posture was beneficial as interest rates rose across the market, but detracted from relative performance during periods of sharp yield increases. An underweight to the agency sector detracted slightly from relative performance as this sector posted solid returns. Given aggressive bond valuations at the start of the year and concerns regarding increasing leverage trends, we chose to maintain a defensive posture in credit over the course of 2006. This positioning had a small negative effect on the performance of the Portfolio relative to the Lehman Brothers U.S. Government/Credit Index over the period, as spreads (or the extra return required by investors for assuming credit risk) generally narrowed. However, good security selection helped offset a portion of this weakness.
The Portfolio's convertible securities, in aggregate, were neither a significant contributor nor detractor from performance during the period. However, we did increase the Portfolio's exposure to convertible securities over the course of the fiscal year, as attractive new issuance provided some opportunities that fit our investment parameters.
Current Strategy and Outlook: We continue to seek value stocks, high-quality bonds, and convertible securities, using our bottom-up security selection process. We look for undervalued companies that offer a potential catalyst for change. Such catalysts could be new company management, growth or consolidation within an industry or sector, or new products.
Portfolio holdings and characteristics are subject to change and may not be representative of current holdings and characteristics. The outlook for this Portfolio may differ from that presented for other ING Funds. Performance for the different classes of shares will vary based on differences in fees associated with each class.
Investment Type Allocation
as of December 31, 2006
(as a percent of net assets)
| Common Stock | | | 61.5 | % | |
| Convertible Bonds | | | 12.1 | % | |
| U.S. Treasury Obligations | | | 11.4 | % | |
| U.S. Government Agency Obligations | | | 8.7 | % | |
| Corporate Bonds/Notes | | | 4.7 | % | |
| Preferred Stock | | | 3.8 | % | |
| Asset-Backed Securities | | | 2.6 | % | |
| Other Assets and Liabilities, Net | | | (4.8 | )% | |
| Net Assets | | | 100.0 | % | |
Portfolio holdings are subject to change daily.
Top Ten Holdings*
as of December 31, 2006
(as a percent of net assets)
| U.S. Treasury Bond, 4.250%, due 08/15/13 | | | 2.6 | % | |
| JPMorgan Chase & Co. | | | 2.3 | % | |
| Citigroup, Inc. | | | 2.2 | % | |
| U.S. Treasury Note, 4.500%, due 02/28/11 | | | 1.9 | % | |
| Bayer AG ADR | | | 1.8 | % | |
| General Electric Co. | | | 1.6 | % | |
| Time Warner, Inc. | | | 1.6 | % | |
| Schering-Plough Corp. | | | 1.5 | % | |
| Verizon Communications, Inc. | | | 1.5 | % | |
| Freddie Mac | | | 1.5 | % | |
* Excludes short-term investments related to U.S. government agency obligation.
Portfolio holdings are subject to change daily.
62
PORTFOLIO MANAGERS' REPORT
ING VAN KAMPEN EQUITY AND INCOME PORTFOLIO
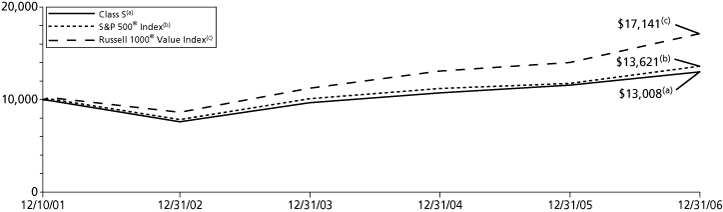
| Average Annual Total Returns for the Periods Ended December 31, 2006 | |
| | | 1 Year | | 5 Year | | Since Inception
of Classes I, S and ADV
December 10, 2001 | |
| Class I | | | 12.67 | % | | | 5.79 | % | | | 5.53 | % | |
| Class S | | | 12.40 | % | | | 5.53 | % | | | 5.27 | % | |
| Class ADV | | | 12.12 | % | | | 5.26 | % | | | 5.00 | % | |
| S&P 500® Index(1) | | | 15.79 | % | | | 6.19 | % | | | 6.27 | %(2) | |
| Russell 1000® Value Index(3) | | | 22.25 | % | | | 10.86 | % | | | 11.18 | %(2) | |
Based on a $10,000 initial investment, the graph and table above illustrate the total return of ING Van Kampen Equity and Income Portfolio against the indices indicated. An index is unmanaged and has no cash in its portfolio, imposes no sales charges and incurs no operating expenses. An investor cannot invest directly in an index. The Portfolio's performance is shown without the imposition of any expenses or charges which are, or may be, imposed under your annuity contract. Total returns would have been lower if such expenses or charges were included.
The performance graph and table do not reflect the deduction of taxes that a shareholder will pay on portfolio distributions or the redemption of portfolio shares.
The performance shown may include the effect of fee waivers and/or expense reimbursements by the Investment Adviser and/or other service providers, which have the effect of increasing total return. Had all fees and expenses been considered, the total returns would have been lower.
The performance update illustrates performance for a variable investment option available through a variable annuity contract. The performance shown indicates past performance and is not a projection or prediction of future results. Actual investment returns and principal value will fluctuate so that shares and/or units, at redemption, may be worth more or less than their original cost. Please call (800) 262-3862 to get performance through the most recent month end.
This report contains statements that may be "forward-looking" statements. Actual results may differ materially from those projected in the "forward-looking" statements.
The views expressed in this report reflect those of the portfolio manager only through the end of the period as stated on the cover. The portfolio manager's views are subject to change at any time based on marked and other conditions.
Portfolio holdings are subject to change daily.
(1) The S&P 500® Index is an unmanaged index that measures the performances of the securities of approximately 500 of the largest companies in the U.S
(2) Since inception performance for the indices is shown from December 1, 2001.
(3) The Russell 1000® Value Index is an unmanaged index that measures the performance of those Rusell 1000® companies with lower price-to-book ratios and lower than forecasted growth values.
63
SHAREHOLDER EXPENSE EXAMPLES (UNAUDITED)
As a shareholder of a Portfolio, you incur two types of costs: (1) transaction costs, redemption fees; and exchange fees; and (2) ongoing costs, including management fees; distribution and/or service (12b-1) fees; and other Portfolio expenses. These Examples are intended to help you understand your ongoing costs (in dollars) of investing in a Fund and to compare these costs with the ongoing costs of investing in other mutual funds.
The Examples are based on an investment of $1,000 invested at the beginning of the period and held for the entire period from July 1, 2006 to December 31, 2006. The Portfolios' expenses are shown without the imposition of any charges which are, or may be, imposed under your annuity contract. Expenses would have been higher if such charges were included.
Actual Expenses
The first section of the table shown, "Actual Portfolio Return," provides information about actual account values and actual expenses. You may use the information in this section, together with the amount you invested, to estimate the expenses that you paid over the period. Simply divide your account value by $1,000 (for example, an $8,600 account value divided by $1,000 = 8.6), then multiply the result by the number in the first section under the heading entitled "Expenses Paid During Period'' to estimate the expenses you paid on your account during this period.
Hypothetical Example for Comparison Purposes
The second section of the table shown, "Hypothetical 5% Return," provides information about hypothetical account values and hypothetical expenses based on the Portfolio's actual expense ratio and an assumed rate of return of 5% per year before expenses, which is not the Portfolio's actual return. The hypothetical account values and expenses may not be used to estimate the actual ending account balance or expenses you paid for the period. You may use this information to compare the ongoing costs of investing in the Portfolio and other mutual funds. To do so, compare this 5% hypothetical example with the 5% hypothetical examples that appear in the shareholder reports of the other mutual funds.
Please note that the expenses shown in the table are meant to highlight your ongoing costs only and do not reflect any transactional costs, redemption fees, or exchange fees. Therefore, the hypothetical lines of the table are useful in comparing ongoing costs only, and will not help you determine the relative total costs of owning different funds. In addition, if these transactional costs were included, your costs would have been higher.
ING American Century
Large Company Value Portfolio | | Beginning
Account
Value
July 1, 2006 | | Ending
Account
Value
December 31, 2006 | | Annualized
Expense
Ratio | | Expenses Paid
During the Six
Months Ended
December 31, 2006* | |
| Actual Portfolio Return | |
| Class I | | $ | 1,000.00 | | | $ | 1,147.40 | | | | 1.00 | % | | $ | 5.41 | | |
| Class S | | | 1,000.00 | | | | 1,146.20 | | | | 1.25 | | | | 6.76 | | |
| Class ADV | | | 1,000.00 | | | | 1,144.30 | | | | 1.50 | | | | 8.11 | | |
| Hypothetical (5% return before expenses) | |
| Class I | | $ | 1,000.00 | | | $ | 1,020.16 | | | | 1.00 | % | | $ | 5.09 | | |
| Class S | | | 1,000.00 | | | | 1,018.90 | | | | 1.25 | | | | 6.36 | | |
| Class ADV | | | 1,000.00 | | | | 1,017.64 | | | | 1.50 | | | | 7.63 | | |
* Expenses are equal to each Fund's respective annualized expense ratios multiplied by the average account value over the period, multiplied by 184/365 to reflect the most recent fiscal half-year.
64
SHAREHOLDER EXPENSE EXAMPLES (UNAUDITED) (CONTINUED)
| ING American Century Select Portfolio | | Beginning
Account
Value
July 1, 2006 | | Ending
Account
Value
December 31, 2006 | | Annualized
Expense
Ratio | | Expenses Paid
During the Six
Months Ended
December 31, 2006* | |
| Actual Portfolio Return | |
| Class I | | $ | 1,000.00 | | | $ | 1,059.00 | | | | 0.66 | % | | $ | 3.43 | | |
| Class S | | | 1,000.00 | | | | 1,058.50 | | | | 0.91 | | | | 4.72 | | |
| Class ADV | | | 1,000.00 | | | | 1,057.70 | | | | 1.16 | | | | 6.02 | | |
| Hypothetical (5% return before expenses) | |
| Class I | | $ | 1,000.00 | | | $ | 1,021.88 | | | | 0.66 | % | | $ | 3.36 | | |
| Class S | | | 1,000.00 | | | | 1,020.62 | | | | 0.91 | | | | 4.63 | | |
| Class ADV | | | 1,000.00 | | | | 1,019.36 | | | | 1.16 | | | | 5.90 | | |
ING American Century Small-
Mid Cap Value Portfolio | |
| Actual Portfolio Return | |
| Class I | | $ | 1,000.00 | | | $ | 1,117.60 | | | | 1.22 | % | | $ | 6.51 | | |
| Class S | | | 1,000.00 | | | | 1,116.30 | | | | 1.47 | | | | 7.84 | | |
| Class ADV | | | 1,000.00 | | | | 1,115.00 | | | | 1.72 | | | | 9.17 | | |
| Hypothetical (5% return before expenses) | |
| Class I | | $ | 1,000.00 | | | $ | 1,019.06 | | | | 1.22 | % | | $ | 6.21 | | |
| Class S | | | 1,000.00 | | | | 1,017.80 | | | | 1.47 | | | | 7.48 | | |
| Class ADV | | | 1,000.00 | | | | 1,016.53 | | | | 1.72 | | | | 8.74 | | |
| ING Baron Asset Portfolio | |
| Actual Portfolio Return | |
| Class I | | $ | 1,000.00 | | | $ | 1,073.20 | | | | 1.05 | % | | $ | 5.49 | | |
| Class S | | | 1,000.00 | | | | 1,072.50 | | | | 1.30 | | | | 6.79 | | |
| Class ADV | | | 1,000.00 | | | | 1,071.50 | | | | 1.55 | | | | 8.09 | | |
| Hypothetical (5% return before expenses) | |
| Class I | | $ | 1,000.00 | | | $ | 1,019.91 | | | | 1.05 | % | | $ | 5.35 | | |
| Class S | | | 1,000.00 | | | | 1,018.65 | | | | 1.30 | | | | 6.61 | | |
| Class ADV | | | 1,000.00 | | | | 1,017.39 | | | | 1.55 | | | | 7.88 | | |
| ING Baron Small Cap Growth Portfolio | |
| Actual Portfolio Return | |
| Class I | | $ | 1,000.00 | | | $ | 1,072.60 | | | | 1.08 | % | | $ | 5.64 | | |
| Class S | | | 1,000.00 | | | | 1,071.10 | | | | 1.33 | | | | 6.94 | | |
| Class ADV | | | 1,000.00 | | | | 1,069.50 | | | | 1.58 | | | | 8.24 | | |
| Hypothetical (5% return before expenses) | |
| Class I | | $ | 1,000.00 | | | $ | 1,019.76 | | | | 1.08 | % | | $ | 5.50 | | |
| Class S | | | 1,000.00 | | | | 1,018.50 | | | | 1.33 | | | | 6.77 | | |
| Class ADV | | | 1,000.00 | | | | 1,017.24 | | | | 1.58 | | | | 8.03 | | |
* Expenses are equal to each Fund's respective annualized expense ratios multiplied by the average account value over the period, multiplied by 184/365 to reflect the most recent fiscal half-year.
65
SHAREHOLDER EXPENSE EXAMPLES (UNAUDITED) (CONTINUED)
ING Columbia Small
Cap Value II Portfolio | | Beginning
Account
Value
July 1, 2006 | | Ending
Account
Value
December 31, 2006 | | Annualized
Expense
Ratio | | Expenses Paid
During the Six
Months Ended
December 31, 2006* | |
| Actual Portfolio Return | |
| Class I | | $ | 1,000.00 | | | $ | 1,070.50 | | | | 0.96 | % | | $ | 5.01 | | |
| Class S | | | 1,000.00 | | | | 1,069.50 | | | | 1.21 | | | | 6.31 | | |
| Class ADV(a) | | | 1,000.00 | | | | 1,000.00 | | | | 1.46 | | | | 0.12 | | |
| Hypothetical (5% return before expenses) | |
| Class I | | $ | 1,000.00 | | | $ | 1,020.37 | | | | 0.96 | % | | $ | 4.89 | | |
| Class S | | | 1,000.00 | | | | 1,019.11 | | | | 1.21 | | | | 6.16 | | |
| Class ADV | | | 1,000.00 | | | | 1,017.85 | | | | 1.46 | | | | 7.43 | | |
| ING Davis Venture Value Portfolio | |
| Actual Portfolio Return | |
| Class I | | $ | 1,000.00 | | | $ | 1,111.10 | | | | 0.90 | % | | $ | 4.79 | | |
| Class S | | | 1,000.00 | | | | 1,109.50 | | | | 1.15 | | | | 6.11 | | |
| Class ADV | | | 1,000.00 | | | | 1,108.20 | | | | 1.40 | | | | 7.44 | | |
| Hypothetical (5% return before expenses) | |
| Class I | | $ | 1,000.00 | | | $ | 1,020.67 | | | | 0.90 | % | | $ | 4.58 | | |
| Class S | | | 1,000.00 | | | | 1,019.41 | | | | 1.15 | | | | 5.85 | | |
| Class ADV | | | 1,000.00 | | | | 1,018.15 | | | | 1.40 | | | | 7.12 | | |
| ING Fundamental Research Portfolio | |
| Actual Portfolio Return | |
| Class I | | $ | 1,000.00 | | | $ | 1,112.70 | | | | 0.76 | % | | $ | 4.05 | | |
| Class S | | | 1,000.00 | | | | 1,111.60 | | | | 1.01 | | | | 5.38 | | |
| Class ADV | | | 1,000.00 | | | | 1,110.50 | | | | 1.26 | | | | 6.70 | | |
| Hypothetical (5% return before expenses) | |
| Class I | | $ | 1,000.00 | | | $ | 1,021.37 | | | | 0.76 | % | | $ | 3.87 | | |
| Class S | | | 1,000.00 | | | | 1,020.11 | | | | 1.01 | | | | 5.14 | | |
| Class ADV | | | 1,000.00 | | | | 1,018.85 | | | | 1.26 | | | | 6.41 | | |
ING Goldman Sachs®
Capital Growth Portfolio | |
| Actual Portfolio Return | |
| Class I | | $ | 1,000.00 | | | $ | 1,092.70 | | | | 0.89 | % | | $ | 4.69 | | |
| Class S | | | 1,000.00 | | | | 1,091.40 | | | | 1.14 | | | | 6.01 | | |
| Class ADV | | | 1,000.00 | | | | 1,089.90 | | | | 1.39 | | | | 7.32 | | |
| Hypothetical (5% return before expenses) | |
| Class I | | $ | 1,000.00 | | | $ | 1,020.72 | | | | 0.89 | % | | $ | 4.53 | | |
| Class S | | | 1,000.00 | | | | 1,019.46 | | | | 1.14 | | | | 5.80 | | |
| Class ADV | | | 1,000.00 | | | | 1,018.20 | | | | 1.39 | | | | 7.07 | | |
* Expenses are equal to each Portfolio's respective annualized expense ratios multiplied by the average account value over the period, multiplied by 184/365 to reflect the most recent fiscal half-year (except "Actual Portfolio Return" information for all share classes footnoted above).
(a) Commencement of operations was December 29, 2006. Expenses paid reflect the three-day period ended December 31, 2006 with 0.00% return.
66
SHAREHOLDER EXPENSE EXAMPLES (UNAUDITED) (CONTINUED)
ING Goldman Sachs®
Structured Equity Portfolio | | Beginning
Account
Value
July 1, 2006 | | Ending
Account
Value
December 31, 2006 | | Annualized
Expense
Ratio | | Expenses Paid
During the Six
Months Ended
December 31, 2006* | |
| Actual Portfolio Return | |
| Class I(a) | | $ | 1,000.00 | | | $ | 1,000.00 | | | | 0.90 | % | | $ | 0.07 | | |
| Class S | | | 1,000.00 | | | | 1,092.20 | | | | 1.15 | | | | 6.06 | | |
| Class ADV | | | 1,000.00 | | | | 1,090.80 | | | | 1.40 | | | | 7.38 | | |
| Hypothetical (5% return before expenses) | |
| Class I | | $ | 1,000.00 | | | $ | 1,020.67 | | | | 0.90 | % | | $ | 4.58 | | |
| Class S | | | 1,000.00 | | | | 1,019.41 | | | | 1.15 | | | | 5.85 | | |
| Class ADV | | | 1,000.00 | | | | 1,018.15 | | | | 1.40 | | | | 7.12 | | |
| ING JPMorgan International Portfolio | |
| Actual Portfolio Return | |
| Class I | | $ | 1,000.00 | | | $ | 1,114.90 | | | | 1.00 | % | | $ | 5.33 | | |
| Class S | | | 1,000.00 | | | | 1,113.20 | | | | 1.25 | | | | 6.66 | | |
| Class ADV | | | 1,000.00 | | | | 1,112.50 | | | | 1.50 | | | | 7.99 | | |
| Hypothetical (5% return before expenses) | |
| Class I | | $ | 1,000.00 | | | $ | 1,020.16 | | | | 1.00 | % | | $ | 5.09 | | |
| Class S | | | 1,000.00 | | | | 1,018.95 | | | | 1.25 | | | | 6.36 | | |
| Class ADV | | | 1,000.00 | | | | 1,017.64 | | | | 1.50 | | | | 7.63 | | |
| ING JPMorgan MidCap Value Portfolio | |
| Actual Portfolio Return | |
| Class I | | $ | 1,000.00 | | | $ | 1,099.40 | | | | 1.00 | % | | $ | 5.29 | | |
| Class S | | | 1,000.00 | | | | 1,097.70 | | | | 1.25 | | | | 6.61 | | |
| Class ADV | | | 1,000.00 | | | | 1,096.30 | | | | 1.50 | | | | 7.93 | | |
| Hypothetical (5% return before expenses) | |
| Class I | | $ | 1,000.00 | | | $ | 1,020.16 | | | | 1.00 | % | | $ | 5.09 | | |
| Class S | | | 1,000.00 | | | | 1,018.90 | | | | 1.25 | | | | 6.36 | | |
| Class ADV | | | 1,000.00 | | | | 1,017.64 | | | | 1.50 | | | | 7.63 | | |
ING Legg Mason Partners
Aggressive Growth Portfolio | |
| Actual Portfolio Return | |
| Class I | | $ | 1,000.00 | | | $ | 1,093.10 | | | | 0.80 | % | | $ | 4.22 | | |
| Class S | | | 1,000.00 | | | | 1,091.90 | | | | 1.05 | | | | 5.54 | | |
| Class ADV | | | 1,000.00 | | | | 1,090.40 | | | | 1.30 | | | | 6.85 | | |
| Hypothetical (5% return before expenses) | |
| Class I | | $ | 1,000.00 | | | $ | 1,021.17 | | | | 0.80 | % | | $ | 4.08 | | |
| Class S | | | 1,000.00 | | | | 1,019.91 | | | | 1.05 | | | | 5.35 | | |
| Class ADV | | | 1,000.00 | | | | 1,018.65 | | | | 1.30 | | | | 6.61 | | |
* Expenses are equal to each Portfolio's respective annualized expense ratios multiplied by the average account value over the period, multiplied by 184/365 to reflect the most recent fiscal half-year (except "Actual Portfolio Return" information for all share classes footnoted above).
(a) Commencement of operations was December 29, 2006. Expenses paid reflect the three-day period ended December 31, 2006 with 0.00% return.
67
SHAREHOLDER EXPENSE EXAMPLES (UNAUDITED) (CONTINUED)
ING Legg Mason Partners
Large Cap Growth Portfolio | | Beginning
Account
Value
July 1, 2006 | | Ending
Account
Value
December 31, 2006 | | Annualized
Expense
Ratio | | Expenses Paid
During the Six
Months Ended
December 31, 2006* | |
| Actual Portfolio Return | |
| Class I | | $ | 1,000.00 | | | $ | 1,114.60 | | | | 0.84 | % | | $ | 4.48 | | |
| Class S | | | 1,000.00 | | | | 1,113.90 | | | | 1.09 | | | | 5.81 | | |
| Class ADV | | | 1,000.00 | | | | 1,111.90 | | | | 1.34 | | | | 7.13 | | |
| Hypothetical (5% return before expenses) | |
| Class I | | $ | 1,000.00 | | | $ | 1,020.97 | | | | 0.84 | % | | $ | 4.28 | | |
| Class S | | | 1,000.00 | | | | 1,019.71 | | | | 1.09 | | | | 5.55 | | |
| Class ADV | | | 1,000.00 | | | | 1,018.45 | | | | 1.34 | | | | 6.82 | | |
ING Lord Abbett U.S.
Government Securities Portfolio | |
| Actual Portfolio Return | |
| Class I | | $ | 1,000.00 | | | $ | 1,048.60 | | | | 0.73 | % | | $ | 3.77 | | |
| Class S | | | 1,000.00 | | | | 1,047.80 | | | | 0.98 | | | | 5.06 | | |
| Class ADV(b) | | | 1,000.00 | | | | 997.20 | | | | 1.23 | | | | 0.40 | | |
| Hypothetical (5% return before expenses) | |
| Class I | | $ | 1,000.00 | | | $ | 1,021.58 | | | | 0.73 | % | | $ | 3.72 | | |
| Class S | | | 1,000.00 | | | | 1,020.32 | | | | 0.98 | | | | 4.99 | | |
| Class ADV | | | 1,000.00 | | | | 1,019.06 | | | | 1.23 | | | | 6.26 | | |
| ING Neuberger Berman Partners Portfolio | |
| Actual Portfolio Return | |
| Class I | | $ | 1,000.00 | | | $ | 1,119.90 | | | | 0.67 | % | | $ | 3.58 | | |
| Class S | | | 1,000.00 | | | | 1,117.90 | | | | 0.92 | | | | 4.91 | | |
| Class ADV(a) | | | 1,000.00 | | | | 1,000.00 | | | | 1.17 | | | | 0.10 | | |
| Hypothetical (5% return before expenses) | |
| Class I | | $ | 1,000.00 | | | $ | 1,021.83 | | | | 0.67 | % | | $ | 3.41 | | |
| Class S | | | 1,000.00 | | | | 1,020.57 | | | | 0.92 | | | | 4.69 | | |
| Class ADV | | | 1,000.00 | | | | 1,019.31 | | | | 1.17 | | | | 5.96 | | |
| ING Neuberger Berman Regency Portfolio | |
| Actual Portfolio Return | |
| Class I | | $ | 1,000.00 | | | $ | 1,085.40 | | | | 0.88 | % | | $ | 4.63 | | |
| Class S | | | 1,000.00 | | | | 1,084.00 | | | | 1.13 | | | | 5.94 | | |
| Class ADV(b) | | | 1,000.00 | | | | 993.90 | | | | 1.38 | | | | 0.45 | | |
| Hypothetical (5% return before expenses) | |
| Class I | | $ | 1,000.00 | | | $ | 1,020.82 | | | | 0.88 | % | | $ | 4.48 | | |
| Class S | | | 1,000.00 | | | | 1,019.56 | | | | 1.13 | | | | 5.75 | | |
| Class ADV | | | 1,000.00 | | | | 1,018.30 | | | | 1.38 | | | | 7.02 | | |
* Expenses are equal to each Portfolio's respective annualized expense ratios multiplied by the average account value over the period, multiplied by 184/365 to reflect the most recent fiscal half-year (except "Actual Portfolio Return" information for all share classes footnoted above).
(a) Commencement of operations was December 29, 2006. Expenses paid reflect the three-day period ended December 31, 2006 with 0.00% return.
(b) Commencement of operations was December 20, 2006. Expenses paid reflect the 12 day period ended December 31, 2006.
68
SHAREHOLDER EXPENSE EXAMPLES (UNAUDITED) (CONTINUED)
| ING OpCap Balanced Value Portfolio | | Beginning
Account
Value
July 1, 2006 | | Ending
Account
Value
December 31, 2006 | | Annualized
Expense
Ratio | | Expenses Paid
During the Six
Months Ended
December 31, 2006* | |
| Actual Portfolio Return | |
| Class I | | $ | 1,000.00 | | | $ | 1,105.10 | | | | 0.97 | % | | $ | 5.15 | | |
| Class S | | | 1,000.00 | | | | 1,102.80 | | | | 1.22 | | | | 6.47 | | |
| Class ADV | | | 1,000.00 | | | | 1,101.90 | | | | 1.47 | | | | 7.79 | | |
| Hypothetical (5% return before expenses) | |
| Class I | | $ | 1,000.00 | | | $ | 1,020.32 | | | | 0.97 | % | | $ | 4.94 | | |
| Class S | | | 1,000.00 | | | | 1,019.06 | | | | 1.22 | | | | 6.21 | | |
| Class ADV | | | 1,000.00 | | | | 1,017.80 | | | | 1.47 | | | | 7.48 | | |
| ING Oppenheimer Global Portfolio | |
| Actual Portfolio Return | |
| Class I | | $ | 1,000.00 | | | $ | 1,134.10 | | | | 0.66 | % | | $ | 3.55 | | |
| Class S | | | 1,000.00 | | | | 1,132.00 | | | | 0.91 | | | | 4.89 | | |
| Class ADV | | | 1,000.00 | | | | 1,131.10 | | | | 1.15 | | | | 6.18 | | |
| Hypothetical (5% return before expenses) | |
| Class I | | $ | 1,000.00 | | | $ | 1,021.88 | | | | 0.66 | % | | $ | 3.36 | | |
| Class S | | | 1,000.00 | | | | 1,020.62 | | | | 0.91 | | | | 4.63 | | |
| Class ADV | | | 1,000.00 | | | | 1,019.41 | | | | 1.15 | | | | 5.85 | | |
ING Oppenheimer
Strategic Income Portfolio | |
| Actual Portfolio Return | |
| Class I | | $ | 1,000.00 | | | $ | 1,084.20 | | | | 0.54 | % | | $ | 2.84 | | |
| Class S | | | 1,000.00 | | | | 1,083.30 | | | | 0.75 | | | | 3.94 | | |
| Class ADV | | | 1,000.00 | | | | 1,082.10 | | | | 1.00 | | | | 5.25 | | |
| Hypothetical (5% return before expenses) | |
| Class I | | $ | 1,000.00 | | | $ | 1,022.48 | | | | 0.54 | % | | $ | 2.75 | | |
| Class S | | | 1,000.00 | | | | 1,021.42 | | | | 0.75 | | | | 3.82 | | |
| Class ADV | | | 1,000.00 | | | | 1,020.16 | | | | 1.00 | | | | 5.09 | | |
| ING PIMCO Total Return Portfolio | |
| Actual Portfolio Return | |
| Class I | | $ | 1,000.00 | | | $ | 1,049.80 | | | | 0.77 | % | | $ | 3.98 | | |
| Class S | | | 1,000.00 | | | | 1,048.60 | | | | 1.02 | | | | 5.27 | | |
| Class ADV | | | 1,000.00 | | | | 1,046.70 | | | | 1.27 | | | | 6.55 | | |
| Hypothetical (5% return before expenses) | |
| Class I | | $ | 1,000.00 | | | $ | 1,021.32 | | | | 0.77 | % | | $ | 3.92 | | |
| Class S | | | 1,000.00 | | | | 1,020.06 | | | | 1.02 | | | | 5.19 | | |
| Class ADV | | | 1,000.00 | | | | 1,018.80 | | | | 1.27 | | | | 6.46 | | |
* Expenses are equal to each Portfolio's respective annualized expense ratios multiplied by the average account value over the period, multiplied by 184/365 to reflect the most recent fiscal half-year.
69
SHAREHOLDER EXPENSE EXAMPLES (UNAUDITED) (CONTINUED)
| ING Pioneer High Yield Portfolio | | Beginning
Account
Value
July 1, 2006 | | Ending
Account
Value
December 31, 2006 | | Annualized
Expense
Ratio | | Expenses Paid
During the Six
Months Ended
December 31, 2006* | |
| Actual Portfolio Return | |
| Class I | | $ | 1,000.00 | | | $ | 1,067.80 | | | | 0.73 | % | | $ | 3.80 | | |
| Class S | | | 1,000.00 | | | | 1,066.70 | | | | 0.98 | | | | 5.11 | | |
| Class ADV | | | 1,000.00 | | | | 1,067.50 | | | | 1.23 | | | | 6.41 | | |
| Hypothetical (5% return before expenses) | |
| Class I | | $ | 1,000.00 | | | $ | 1,021.53 | | | | 0.73 | % | | $ | 3.72 | | |
| Class S | | | 1,000.00 | | | | 1,020.27 | | | | 0.98 | | | | 4.99 | | |
| Class ADV | | | 1,000.00 | | | | 1,019.00 | | | | 1.23 | | | | 6.26 | | |
ING T. Rowe Price
Diversified Mid Cap Growth Portfolio | |
| Actual Portfolio Return | |
| Class I | | $ | 1,000.00 | | | $ | 1,073.60 | | | | 0.66 | % | | $ | 3.45 | | |
| Class S | | | 1,000.00 | | | | 1,073.40 | | | | 0.91 | | | | 4.76 | | |
| Class ADV | | | 1,000.00 | | | | 1,071.80 | | | | 1.15 | | | | 6.01 | | |
| Hypothetical (5% return before expenses) | |
| Class I | | $ | 1,000.00 | | | $ | 1,021.88 | | | | 0.66 | % | | $ | 3.36 | | |
| Class S | | | 1,000.00 | | | | 1,020.62 | | | | 0.91 | | | | 4.63 | | |
| Class ADV | | | 1,000.00 | | | | 1,019.41 | | | | 1.15 | | | | 5.85 | | |
ING T. Rowe Price
Growth Equity Portfolio | |
| Actual Portfolio Return | |
| Class I | | $ | 1,000.00 | | | $ | 1,124.40 | | | | 0.75 | % | | $ | 4.02 | | |
| Class S | | | 1,000.00 | | | | 1,123.20 | | | | 1.00 | | | | 5.35 | | |
| Class ADV | | | 1,000.00 | | | | 1,121.70 | | | | 1.25 | | | | 6.68 | | |
| Hypothetical (5% return before expenses) | |
| Class I | | $ | 1,000.00 | | | $ | 1,021.42 | | | | 0.75 | % | | $ | 3.82 | | |
| Class S | | | 1,000.00 | | | | 1,020.21 | | | | 1.00 | | | | 5.09 | | |
| Class ADV | | | 1,000.00 | | | | 1,018.90 | | | | 1.25 | | | | 6.36 | | |
| ING Templeton Foreign Equity Portfolio | |
| Actual Portfolio Return | |
| Class I | | $ | 1,000.00 | | | $ | 1,167.90 | | | | 0.98 | % | | $ | 5.36 | | |
| Class S | | | 1,000.00 | | | | 1,167.10 | | | | 1.23 | | | | 6.72 | | |
| Class ADV(a) | | | 1,000.00 | | | | 1,006.60 | | | | 1.48 | | | | 0.49 | | |
| Hypothetical (5% return before expenses) | |
| Class I | | $ | 1,000.00 | | | $ | 1,020.27 | | | | 0.98 | % | | $ | 4.99 | | |
| Class S | | | 1,000.00 | | | | 1,019.00 | | | | 1.23 | | | | 6.26 | | |
| Class ADV | | | 1,000.00 | | | | 1,017.74 | | | | 1.48 | | | | 7.53 | | |
* Expenses are equal to each Portfolio's respective annualized expense ratios multiplied by the average account value over the period, multiplied by 184/365 to reflect the most recent fiscal half-year (except "Actual Portfolio Return" information for all share classes footnoted above).
(a) Commencement of operations was December 20, 2006. Expenses paid reflect the 12 day period ended December 31, 2006.
70
SHAREHOLDER EXPENSE EXAMPLES (UNAUDITED) (CONTINUED)
| ING Thornburg Value Portfolio | | Beginning
Account
Value
July 1, 2006 | | Ending
Account
Value
December 31, 2006 | | Annualized
Expense
Ratio | | Expenses Paid
During the Six
Months Ended
December 31, 2006* | |
| Actual Portfolio Return | |
| Class I | | $ | 1,000.00 | | | $ | 1,147.90 | | | | 0.90 | % | | $ | 4.87 | | |
| Class S | | | 1,000.00 | | | | 1,146.30 | | | | 1.15 | | | | 6.22 | | |
| Class ADV | | | 1,000.00 | | | | 1,144.80 | | | | 1.40 | | | | 7.57 | | |
| Hypothetical (5% return before expenses) | |
| Class I | | $ | 1,000.00 | | | $ | 1,020.67 | | | | 0.90 | % | | $ | 4.58 | | |
| Class S | | | 1,000.00 | | | | 1,019.36 | | | | 1.15 | | | | 5.85 | | |
| Class ADV | | | 1,000.00 | | | | 1,018.15 | | | | 1.40 | | | | 7.12 | | |
| ING UBS U.S. LargeCap Equity Portfolio | |
| Actual Portfolio Return | |
| Class I | | $ | 1,000.00 | | | $ | 1,129.30 | | | | 0.84 | % | | $ | 4.51 | | |
| Class S | | | 1,000.00 | | | | 1,128.50 | | | | 1.09 | | | | 5.85 | | |
| Class ADV | | | 1,000.00 | | | | 1,125.80 | | | | 1.34 | | | | 7.18 | | |
| Hypothetical (5% return before expenses) | |
| Class I | | $ | 1,000.00 | | | $ | 1,020.97 | | | | 0.84 | % | | $ | 4.28 | | |
| Class S | | | 1,000.00 | | | | 1,019.71 | | | | 1.09 | | | | 5.55 | | |
| Class ADV | | | 1,000.00 | | | | 1,018.45 | | | | 1.34 | | | | 6.82 | | |
| ING UBS U.S. Small Cap Growth Portfolio | |
| Actual Portfolio Return | |
| Class I | | $ | 1,000.00 | | | $ | 1,045.10 | | | | 0.95 | % | | $ | 4.90 | | |
| Class S | | | 1,000.00 | | | | 1,042.90 | | | | 1.20 | | | | 6.18 | | |
| Class ADV | | | 1,000.00 | | | | 1,040.90 | | | | 1.45 | | | | 7.46 | | |
| Hypothetical (5% return before expenses) | |
| Class I | | $ | 1,000.00 | | | $ | 1,020.42 | | | | 0.95 | % | | $ | 4.84 | | |
| Class S | | | 1,000.00 | | | | 1,019.11 | | | | 1.20 | | | | 6.11 | | |
| Class ADV | | | 1,000.00 | | | | 1,017.64 | | | | 1.45 | | | | 7.37 | | |
| ING Van Kampen Comstock Portfolio | |
| Actual Portfolio Return | |
| Class I | | $ | 1,000.00 | | | $ | 1,119.80 | | | | 0.84 | % | | $ | 4.49 | | |
| Class S | | | 1,000.00 | | | | 1,118.10 | | | | 1.09 | | | | 5.82 | | |
| Class ADV | | | 1,000.00 | | | | 1,116.90 | | | | 1.34 | | | | 7.15 | | |
| Hypothetical (5% return before expenses) | |
| Class I | | $ | 1,000.00 | | | $ | 1,021.02 | | | | 0.84 | % | | $ | 4.28 | | |
| Class S | | | 1,000.00 | | | | 1,019.71 | | | | 1.09 | | | | 5.55 | | |
| Class ADV | | | 1,000.00 | | | | 1,018.45 | | | | 1.34 | | | | 6.82 | | |
* Expenses are equal to each Portfolio's respective annualized expense ratios multiplied by the average account value over the period, multiplied by 184/365 to reflect the most recent fiscal half-year.
71
SHAREHOLDER EXPENSE EXAMPLES (UNAUDITED) (CONTINUED)
ING Van Kampen
Equity and Income Portfolio | | Beginning
Account
Value
July 1, 2006 | | Ending
Account
Value
December 31, 2006 | | Annualized
Expense
Ratio | | Expenses Paid
During the Six
Months Ended
December 31, 2006* | |
| Actual Portfolio Return | |
| Class I | | $ | 1,000.00 | | | $ | 1,102.00 | | | | 0.57 | % | | $ | 3.02 | | |
| Class S | | | 1,000.00 | | | | 1,100.80 | | | | 0.82 | | | | 4.34 | | |
| Class ADV | | | 1,000.00 | | | | 1,099.30 | | | | 1.07 | | | | 5.66 | | |
| Hypothetical (5% return before expenses) | |
| Class I | | $ | 1,000.00 | | | $ | 1,022.33 | | | | 0.57 | % | | $ | 2.91 | | |
| Class S | | | 1,000.00 | | | | 1,021.07 | | | | 0.82 | | | | 4.18 | | |
| Class ADV | | | 1,000.00 | | | | 1,019.81 | | | | 1.07 | | | | 5.45 | | |
* Expenses are equal to each Portfolio's respective annualized expense ratios multiplied by the average account value over the period, multiplied by 184/365 to reflect the most recent fiscal half-year.
72
REPORT OF INDEPENDENT REGISTERED PUBLIC ACCOUNTING FIRM
The Shareholders and Board of Directors
ING Partners Inc.
We have audited the accompanying statements of assets and liabilities, including the portfolios of investments, of ING American Century Large Company Value Portfolio, ING American Century Select Portfolio, ING American Century Small-Mid Cap Value Portfolio (formerly, ING American Century Small Cap Value Portfolio), ING Baron Asset Portfolio, ING Baron Small Cap Growth Portfolio, ING Columbia Small Cap Value II Portfolio, ING Davis Venture Value Portfolio, ING Fundamental Research Portfolio, ING Goldman Sachs® Capital Growth Portfolio, ING Goldman Sachs® Structured Equity Portfolio (formerly, ING Goldman Sachs Core Equity Portfolio), ING JPMorgan International Portfolio (formerly, ING JPMorgan Fleming International), ING JPMorgan Mid Cap Value Portfolio, ING Legg Mason Partners Aggressive Growth Portfolio (formerly, ING Salomon Brothers Aggressive Growth Portfolio), ING Legg Mason Partners Large Cap Growth Portfo lio (formerly, ING Salomon Brothers Large Cap Growth Portfolio), ING Lord Abbett U.S. Government Securities, ING Neuberger Berman Partners Portfolio, ING Neuberger Berman Regency Portfolio, ING OpCap Balanced Value Portfolio, ING Oppenheimer Global Portfolio, ING Oppenheimer Strategic Income Portfolio, ING PIMCO Total Return Portfolio, ING Pioneer High Yield Portfolio, ING T. Rowe Price Diversified Mid Cap Growth Portfolio, ING T. Rowe Price Growth Equity Portfolio, ING Templeton Foreign Equity Portfolio, ING Thornburg Value Portfolio (formerly, ING MFS Capital Opportunities Portfolio), ING UBS U.S. Large Cap Equity Portfolio, ING UBS U.S. Small Cap Growth Portfolio, ING Van Kampen Comstock Portfolio, and ING Van Kampen Equity and Income Portfolio, each a series of ING Partners Inc. as of December 31, 2006, and the related statements of operations, the statements of changes in net assets, and the financial highlights for the periods presented. These financial statements and financial highlights are the respo nsibility of management. Our responsibility is to express an opinion on these financial statements and financial highlights based on our audits.
We conducted our audits in accordance with the standards of the Public Company Accounting Oversight Board (United States). Those standards require that we plan and perform the audit to obtain reasonable assurance about whether the financial statements and financial highlights are free of material misstatement. An audit includes examining, on a test basis, evidence supporting the amounts and disclosures in the financial statements. Our procedures included confirmation of securities owned as of December 31, 2006 by correspondence with the custodian and brokers, or by other appropriate auditing procedures when replies were not received. An audit also includes assessing the accounting principles used and significant estimates made by management, as well as evaluating the overall financial statement presentation. We believe that our audits provide a reasonable basis for our opinion.
In our opinion, the financial statements and financial highlights referred to above, present fairly, in all material respects, the financial position of the aforementioned portfolios of ING Partners Inc. as of December 31, 2006, the results of their operations, the changes in their net assets, and the financial highlights for the periods indicated in the first paragraph above, in conformity with U.S. generally accepted accounting principles.

Boston, Massachusetts
February 28, 2007
73
STATEMENTS OF ASSETS AND LIABILITIES AS OF DECEMBER 31, 2006
| | | ING American
Century Large
Company
Value Portfolio | | ING American
Century Select
Portfolio | | ING American
Century
Small-Mid Cap
Value Portfolio | | ING Baron
Asset
Portfolio | |
| ASSETS: | |
| Investments in securities at value+* | | $ | 110,284,055 | | | $ | 323,993,419 | | | $ | 105,325,700 | | | $ | 8,665,823 | | |
| Short-term investments at amortized cost | | | 31,270,407 | | | | 67,779,951 | | | | 21,258,300 | | | | — | | |
| Cash | | | 865,659 | | | | 633,047 | | | | 4,291,234 | | | | 447,579 | | |
| Foreign currencies at value** | | | — | | | | 1,489 | | | | 104 | | | | — | | |
| Receivables: | |
| Investment securities sold | | | 34,789 | | | | 3,054,442 | | | | 1,985,564 | | | | — | | |
| Fund shares sold | | | 227,067 | | | | 4,324 | | | | 52,490 | | | | 1,305 | | |
| Dividends and interest | | | 123,405 | | | | 347,527 | | | | 163,773 | | | | 6,666 | | |
Unrealized appreciation on forward foreign
currency contracts | | | — | | | | 11,412 | | | | 374 | | | | — | | |
| Prepaid expenses | | | — | | | | — | | | | — | | | | 282 | | |
| Reimbursement due from manager | | | — | | | | — | | | | — | | | | 2,479 | | |
| Total assets | | | 142,805,382 | | | | 395,825,611 | | | | 133,077,539 | | | | 9,124,134 | | |
| LIABILITIES: | |
| Payable for investment securities purchased | | | 732,707 | | | | 3,212,100 | | | | 2,616,229 | | | | — | | |
| Payable for fund shares redeemed | | | 475,189 | | | | 2,776,614 | | | | 541,308 | | | | — | | |
| Payable upon receipt of securities loaned | | | 25,694,832 | | | | 65,554,520 | | | | 21,258,300 | | | | — | | |
Unrealized depreciation on forward
currency contracts | | | — | | | | 36,922 | | | | 1,866 | | | | — | | |
| Payable to affiliates | | | 105,102 | | | | 191,405 | | | | 130,441 | | | | 9,570 | | |
| Payable for directors fees | | | — | | | | — | | | | — | | | | 698 | | |
| Other accrued expenses and liabilities | | | — | | | | — | | | | — | | | | 6,402 | | |
| Total liabilities | | | 27,007,830 | | | | 71,771,561 | | | | 24,548,144 | | | | 16,670 | | |
| NET ASSETS | | $ | 115,797,552 | | | $ | 324,054,050 | | | $ | 108,529,395 | | | $ | 9,107,464 | | |
| NET ASSETS WERE COMPRISED OF: | |
| Paid-in capital | | $ | 92,868,437 | | | $ | 314,227,975 | | | $ | 90,579,274 | | | $ | 8,196,417 | | |
| Undistributed net investment income | | | 1,681,936 | | | | 1,916,891 | | | | 519,895 | | | | — | | |
Accumulated net realized gain (loss) on
investments, foreign currency related
transactions, and futures | | | 7,250,890 | | | | (19,793,442 | ) | | | 10,980,299 | | | | (222,106 | ) | |
Net unrealized appreciation on investments,
foreign currency related transactions,
and futures | | | 13,996,289 | | | | 27,702,626 | | | | 6,449,927 | | | | 1,133,153 | | |
| NET ASSETS | | $ | 115,797,552 | | | $ | 324,054,050 | | | $ | 108,529,395 | | | $ | 9,107,464 | | |
| + Including securities loaned at value | | $ | 24,777,215 | | | $ | 63,353,437 | | | $ | 20,486,880 | | | $ | — | | |
| * Cost of investments in securities | | $ | 96,282,350 | | | $ | 296,267,224 | | | $ | 98,874,271 | | | $ | 7,532,670 | | |
| ** Cost of foreign currencies | | $ | — | | | $ | 10 | | | $ | 105 | | | $ | — | | |
| Class I: | |
| Net Assets | | $ | 82,254,423 | | | $ | 308,345,852 | | | $ | 48,088,053 | | | $ | 5,583,256 | | |
| Shares authorized | | | 100,000,000 | | | | 100,000,000 | | | | 100,000,000 | | | | 100,000,000 | | |
| Par value | | $ | 0.001 | | | $ | 0.001 | | | $ | 0.001 | | | $ | 0.001 | | |
| Shares outstanding | | | 5,132,751 | | | | 33,647,497 | | | | 3,541,397 | | | | 501,045 | | |
| Net asset value and redemption price per share | | $ | 16.03 | | | $ | 9.16 | | | $ | 13.58 | | | $ | 11.14 | | |
| Class S: | |
| Net Assets | | $ | 23,019,436 | | | $ | 4,602,401 | | | $ | 47,839,240 | | | $ | 312,796 | | |
| Shares authorized | | | 100,000,000 | | | | 100,000,000 | | | | 100,000,000 | | | | 100,000,000 | | |
| Par value | | $ | 0.001 | | | $ | 0.001 | | | $ | 0.001 | | | $ | 0.001 | | |
| Shares outstanding | | | 1,434,622 | | | | 506,427 | | | | 3,540,348 | | | | 28,171 | | |
| Net asset value and redemption price per share | | $ | 16.05 | | | $ | 9.09 | | | $ | 13.51 | | | $ | 11.10 | | |
| Class ADV: | |
| Net Assets | | $ | 10,523,693 | | | $ | 11,105,797 | | | $ | 12,602,102 | | | $ | 3,211,412 | | |
| Shares authorized | | | 100,000,000 | | | | 100,000,000 | | | | 100,000,000 | | | | 100,000,000 | | |
| Par value | | $ | 0.001 | | | $ | 0.001 | | | $ | 0.001 | | | $ | 0.001 | | |
| Shares outstanding | | | 665,960 | | | | 1,232,402 | | | | 943,946 | | | | 289,580 | | |
| Net asset value and redemption price per share | | $ | 15.80 | | | $ | 9.01 | | | $ | 13.35 | | | $ | 11.09 | | |
See Accompanying Notes to Financial Statements
74
STATEMENTS OF ASSETS AND LIABILITIES AS OF DECEMBER 31, 2006
| | | ING
Baron Small
Cap Growth
Portfolio | | ING
Columbia Small
Cap Value II
Portfolio | | ING
Davis Venture
Value
Portfolio | | ING
Fundamental
Research
Portfolio | |
| ASSETS: | |
| Investments in securities at value* | | $ | 439,632,888 | | | $ | 86,523,052 | | | $ | 198,750,976 | | | $ | 98,424,192 | | |
| Short-term investments at amortized cost | | | 33,527,430 | | | | 475,878 | | | | 10,881,830 | | | | — | | |
| Cash | | | 3,790,222 | | | | 476,623 | | | | — | | | | — | | |
| Receivables: | |
| Investment securities sold | | | 322,608 | | | | 103,232 | | | | — | | | | 2,644,332 | | |
| Fund shares sold | | | 376,312 | | | | 255,419 | | | | 364,951 | | | | 13,502 | | |
| Dividends and interest | | | 205,777 | | | | 94,087 | | | | 235,345 | | | | 118,930 | | |
| Prepaid expenses | | | — | | | | 5,451 | | | | — | | | | — | | |
| Reimbursement due from manager | | | — | | | | — | | | | — | | | | 2,340 | | |
| Total assets | | | 477,855,237 | | | | 87,933,742 | | | | 210,233,102 | | | | 101,203,296 | | |
| LIABILITIES: | |
| Payable for investment securities purchased | | | — | | | | 119,310 | | | | 2,198,580 | | | | 775,583 | | |
| Payable for fund shares redeemed | | | 1,678,758 | | | | 69 | | | | 40,446 | | | | 371,925 | | |
| Payable to affiliates | | | 518,649 | | | | 76,455 | | | | 187,007 | | | | 76,787 | | |
| Payable to custodian due to bank overdraft | | | — | | | | — | | | | 33,727 | | | | 851,253 | | |
Payable to custodian due to foreign
currency overdraft** | | | — | | | | — | | | | 285 | | | | — | | |
| Payable for directors fees | | | — | | | | 2,847 | | | | — | | | | 5,216 | | |
| Other accrued expenses and liabilities | | | — | | | | 26,367 | | | | — | | | | 40,913 | | |
| Total liabilities | | | 2,197,407 | | | | 225,048 | | | | 2,460,045 | | | | 2,121,677 | | |
| NET ASSETS | | $ | 475,657,830 | | | $ | 87,708,694 | | | $ | 207,773,057 | | | $ | 99,081,619 | | |
| NET ASSETS WERE COMPRISED OF: | |
| Paid-in capital | | $ | 366,119,248 | | | $ | 83,166,840 | | | $ | 186,296,020 | | | $ | 93,233,722 | | |
| Undistributed net investment income | | | 38,018 | | | | 197,055 | | | | 777,814 | | | | 766,438 | | |
Accumulated net realized gain (loss) on
investments, foreign currency related
transactions, and futures | | | (1,776,657 | ) | | | (826,526 | ) | | | 1,050,624 | | | | (1,963,689 | ) | |
Net unrealized appreciation on
investments and foreign currency
related transactions | | | 111,277,221 | | | | 5,171,325 | | | | 19,648,599 | | | | 7,045,148 | | |
| NET ASSETS | | $ | 475,657,830 | | | $ | 87,708,694 | | | $ | 207,773,057 | | | $ | 99,081,619 | | |
| * Cost of investments in securities | | $ | 328,355,667 | | | $ | 81,351,727 | | | $ | 179,103,378 | | | $ | 91,379,044 | | |
| ** Cost of foreign currency overdraft | | $ | — | | | $ | — | | | $ | 285 | | | $ | — | | |
| Class I: | |
| Net Assets | | $ | 130,779,764 | | | $ | 11,697,574 | | | $ | 59,748,763 | | | $ | 59,969,453 | | |
| Shares authorized | | | 100,000,000 | | | | 100,000,000 | | | | 100,000,000 | | | | 100,000,000 | | |
| Par value | | $ | 0.001 | | | $ | 0.001 | | | $ | 0.001 | | | $ | 0.001 | | |
| Shares outstanding | | | 7,050,697 | | | | 1,149,872 | | | | 3,006,450 | | | | 5,972,011 | | |
| Net asset value and redemption price per share | | $ | 18.55 | | | $ | 10.17 | | | $ | 19.87 | | | $ | 10.04 | | |
| Class S: | |
| Net Assets | | $ | 299,287,404 | | | $ | 76,010,120 | | | $ | 134,821,337 | | | $ | 35,244,894 | | |
| Shares authorized | | | 100,000,000 | | | | 100,000,000 | | | | 100,000,000 | | | | 100,000,000 | | |
| Par value | | $ | 0.001 | | | $ | 0.001 | | | $ | 0.001 | | | $ | 0.001 | | |
| Shares outstanding | | | 16,328,053 | | | | 7,486,659 | | | | 6,842,415 | | | | 3,513,870 | | |
| Net asset value and redemption price per share | | $ | 18.33 | | | $ | 10.15 | | | $ | 19.70 | | | $ | 10.03 | | |
| Class ADV: | |
| Net Assets | | $ | 45,590,662 | | | $ | 1,000 | | | $ | 13,202,957 | | | $ | 3,867,272 | | |
| Shares authorized | | | 100,000,000 | | | | 100,000,000 | | | | 100,000,000 | | | | 100,000,000 | | |
| Par value | | $ | 0.001 | | | $ | 0.001 | | | $ | 0.001 | | | $ | 0.001 | | |
| Shares outstanding | | | 2,517,585 | | | | 99 | | | | 680,823 | | | | 389,365 | | |
| Net asset value and redemption price per share | | $ | 18.11 | | | $ | 10.15 | | | $ | 19.39 | | | $ | 9.93 | | |
See Accompanying Notes to Financial Statements
75
STATEMENTS OF ASSETS AND LIABILITIES AS OF DECEMBER 31, 2006
| | | ING Goldman
Sachs Capital
Growth Portfolio | | ING Goldman
Sachs Structured
Equity Portfolio | | ING JPMorgan
International
Portfolio | | ING JPMorgan
MidCap Value
Portfolio | |
| ASSETS: | |
| Investments in securities at value+* | | $ | 37,022,897 | | | $ | 54,916,732 | | | $ | 1,072,489,167 | | | $ | 228,393,862 | | |
| Short-term investments at amortized cost | | | 10,329,478 | | | | 9,556,070 | | | | 82,646,502 | | | | 59,912,886 | | |
| Cash | | | 423,959 | | | | 251,249 | | | | 4,859,497 | | | | 1,184,571 | | |
| Cash collateral for futures | | | — | | | | 9,513 | | | | — | | | | — | | |
| Foreign currencies at value** | | | — | | | | — | | | | 875,965 | | | | — | | |
| Receivables: | |
| Investment securities sold | | | — | | | | — | | | | — | | | | 69,539 | | |
| Fund shares sold | | | 14,668 | | | | 1,000 | | | | 634,012 | | | | 125,786 | | |
| Dividends and interest | | | 17,260 | | | | 85,391 | | | | 2,160,957 | | | | 308,123 | | |
| Total assets | | | 47,808,262 | | | | 64,819,955 | | | | 1,163,666,100 | | | | 289,994,767 | | |
| LIABILITIES: | |
| Payable for investment securities purchased | | | — | | | | — | | | | — | | | | 364,549 | | |
| Payable for fund shares redeemed | | | 781,302 | | | | 203,367 | | | | 2,656,082 | | | | 1,030,699 | | |
| Payable for futures variation margin | | | — | | | | 810 | | | | — | | | | — | | |
| Payable upon receipt of securities loaned | | | 9,906,586 | | | | 9,556,070 | | | | 53,604,926 | | | | 49,306,597 | | |
| Payable to affiliates | | | 37,231 | | | | 54,514 | | | | 965,127 | | | | 230,346 | | |
| Total liabilities | | | 10,725,119 | | | | 9,814,761 | | | | 57,226,135 | | | | 50,932,191 | | |
| NET ASSETS | | $ | 37,083,143 | | | $ | 55,005,194 | | | $ | 1,106,439,965 | | | $ | 239,062,576 | | |
| NET ASSETS WERE COMPRISED OF: | |
| Paid-in capital | | $ | 42,809,993 | | | $ | 41,171,252 | | | $ | 856,817,797 | | | $ | 195,443,666 | | |
| Undistributed net investment income | | | 57,790 | | | | 359,046 | | | | 14,128,261 | | | | 1,776,925 | | |
Accumulated net realized gain (loss) on
investments, foreign currency related
transactions, and futures | | | (10,446,448 | ) | | | 7,008,828 | | | | (84,258,134 | ) | | | 12,646,203 | | |
Net unrealized appreciation on
investments, foreign currency related
transactions, and futures | | | 4,661,808 | | | | 6,466,068 | | | | 319,752,041 | | | | 29,195,782 | | |
| NET ASSETS | | $ | 37,083,143 | | | $ | 55,005,194 | | | $ | 1,106,439,965 | | | $ | 239,062,576 | | |
| + Including securities loaned at value | | $ | 9,612,582 | | | $ | 9,198,815 | | | $ | 51,236,416 | | | $ | 47,768,546 | | |
| * Cost of investments in securities | | $ | 32,361,089 | | | $ | 48,449,961 | | | $ | 752,770,073 | | | $ | 199,198,080 | | |
| ** Cost of foreign currencies | | $ | — | | | $ | — | | | $ | 876,642 | | | $ | — | | |
| Class I: | |
| Net Assets | | $ | 3,190,603 | | | $ | 1,000 | | | $ | 941,150,044 | | | $ | 125,601,793 | | |
| Shares authorized | | | 100,000,000 | | | | 100,000,000 | | | | 100,000,000 | | | | 100,000,000 | | |
| Par value | | $ | 0.001 | | | $ | 0.001 | | | $ | 0.001 | | | $ | 0.001 | | |
| Shares outstanding | | | 255,241 | | | | 85 | | | | 57,865,102 | | | | 7,723,191 | | |
| Net asset value and redemption price per share | | $ | 12.50 | | | $ | 11.74 | | | $ | 16.26 | | | $ | 16.26 | | |
| Class S: | |
| Net Assets | | $ | 31,117,461 | | | $ | 52,034,734 | | | $ | 155,075,042 | | | $ | 91,338,000 | | |
| Shares authorized | | | 100,000,000 | | | | 100,000,000 | | | | 100,000,000 | | | | 100,000,000 | | |
| Par value | | $ | 0.001 | | | $ | 0.001 | | | $ | 0.001 | | | $ | 0.001 | | |
| Shares outstanding | | | 2,505,395 | | | | 4,432,572 | | | | 9,548,247 | | | | 5,647,805 | | |
| Net asset value and redemption price per share | | $ | 12.42 | | | $ | 11.74 | | | $ | 16.24 | | | $ | 16.17 | | |
| Class ADV: | |
| Net Assets | | $ | 2,775,079 | | | $ | 2,969,460 | | | $ | 10,214,879 | | | $ | 22,122,783 | | |
| Shares authorized | | | 100,000,000 | | | | 100,000,000 | | | | 100,000,000 | | | | 100,000,000 | | |
| Par value | | $ | 0.001 | | | $ | 0.001 | | | $ | 0.001 | | | $ | 0.001 | | |
| Shares outstanding | | | 224,356 | | | | 257,981 | | | | 637,546 | | | | 1,379,656 | | |
| Net asset value and redemption price per share | | $ | 12.37 | | | $ | 11.51 | | | $ | 16.02 | | | $ | 16.03 | | |
See Accompanying Notes to Financial Statements
76
STATEMENTS OF ASSETS AND LIABILITIES AS OF DECEMBER 31, 2006
| | | ING
Legg Mason
Partners Aggressive
Growth Portfolio | | ING
Legg Mason
Partners Large Cap
Growth Portfolio | | ING
Lord Abbett
U.S. Government
Securities Portfolio | | ING
Neuberger
Berman Partners
Portfolio | |
| ASSETS: | |
| Investments in securities at value+* | | $ | 1,241,925,052 | | | $ | 43,700,749 | | | $ | 51,468,105 | | | $ | 397,161,986 | | |
| Short-term investments at amortized cost | | | 349,317,676 | | | | 107,973 | | | | — | | | | — | | |
| Cash | | | 11,991,962 | | | | 250,896 | | | | 2,609,454 | | | | 13,129,480 | | |
| Foreign currencies at value** | | | — | | | | — | | | | — | | | | 97,746 | | |
| Receivables: | |
| Investment securities sold | | | — | | | | — | | | | 2,371,274 | | | | 42,139,865 | | |
| Fund shares sold | | | 865,268 | | | | 31,541 | | | | 232,997 | | | | 172,433 | | |
| Dividends and interest | | | 619,648 | | | | 24,207 | | | | 374,206 | | | | 387,435 | | |
| Prepaid expenses | | | — | | | | — | | | | 692 | | | | 2,967 | | |
| Reimbursement due from manager | | | — | | | | — | | | | — | | | | 7,980 | | |
| Total assets | | | 1,604,719,606 | | | | 44,115,366 | | | | 57,056,728 | | | | 453,099,892 | | |
| LIABILITIES: | |
| Payable for investment securities purchased | | | — | | | | — | | | | 3,828,434 | | | | 39,142,312 | | |
| Payable for fund shares redeemed | | | 4,862,736 | | | | 27,445 | | | | 36,160 | | | | 125,521 | | |
| Payable for reverse repurchase agreements# | | | — | | | | — | | | | 1,825,369 | | | | — | | |
| Payable upon receipt of securities loaned | | | 248,826,363 | | | | — | | | | — | | | | — | | |
| Sale commitments, at value (Note 3)^ | | | — | | | | — | | | | 2,006,529 | | | | — | | |
| Payable to affiliates | | | 964,725 | | | | 42,116 | | | | 34,605 | | | | 278,026 | | |
| Payable for directors fees | | | — | | | | — | | | | 2,572 | | | | 1,373 | | |
| Other accrued expenses and liabilities | | | — | | | | — | | | | 16,735 | | | | 23,128 | | |
| Total liabilities | | | 254,653,824 | | | | 69,561 | | | | 7,750,404 | | | | 39,570,360 | | |
| NET ASSETS | | $ | 1,350,065,782 | | | $ | 44,045,805 | | | $ | 49,306,324 | | | $ | 413,529,532 | | |
| NET ASSETS WERE COMPRISED OF: | |
| Paid-in capital | | $ | 1,228,146,399 | | | $ | 37,959,829 | | | $ | 49,196,035 | | | $ | 373,566,505 | | |
| Undistributed net investment income | | | — | | | | — | | | | — | | | | 1,130,355 | | |
Accumulated net realized gain (loss) on
investments and foreign currency
related transactions | | | (239,203,154 | ) | | | (28,216 | ) | | | (263,112 | ) | | | 19,825,838 | | |
Net unrealized appreciation
on investments and foreign currency
related transactions | | | 361,122,537 | | | | 6,114,192 | | | | 373,401 | | | | 19,006,834 | | |
| NET ASSETS | | $ | 1,350,065,782 | | | $ | 44,045,805 | | | $ | 49,306,324 | | | $ | 413,529,532 | | |
| + Including securities loaned at value | | $ | 239,393,951 | | | $ | — | | | $ | — | | | $ | — | | |
| * Cost of investments in securities | | $ | 880,802,515 | | | $ | 37,586,557 | | | $ | 51,106,618 | | | $ | 378,153,882 | | |
| ** Cost of foreign currencies | | $ | — | | | $ | — | | | $ | — | | | $ | 97,759 | | |
| ^ Proceeds receivable from sale commitments | | $ | — | | | $ | — | | | $ | 2,018,443 | | | $ | — | | |
| # Proceeds from reverse repurchase agreement | | $ | — | | | $ | — | | | $ | 1,825,369 | | | $ | — | | |
| Class I: | |
| Net Assets | | $ | 1,155,243,541 | | | $ | 14,282,793 | | | $ | 35,252,613 | | | $ | 232,029,731 | | |
| Shares authorized | | | 100,000,000 | | | | 100,000,000 | | | | 100,000,000 | | | | 100,000,000 | | |
| Par value | | $ | 0.001 | | | $ | 0.001 | | | $ | 0.001 | | | $ | 0.001 | | |
| Shares outstanding | | | 23,526,210 | | | | 1,196,098 | | | | 3,550,876 | | | | 21,237,344 | | |
| Net asset value and redemption price per share | | $ | 49.10 | | | $ | 11.94 | | | $ | 9.93 | | | $ | 10.93 | | |
| Class S: | |
| Net Assets | | $ | 186,363,011 | | | $ | 11,402,416 | | | $ | 14,052,751 | | | $ | 181,498,801 | | |
| Shares authorized | | | 100,000,000 | | | | 100,000,000 | | | | 100,000,000 | | | | 100,000,000 | | |
| Par value | | $ | 0.001 | | | $ | 0.001 | | | $ | 0.001 | | | $ | 0.001 | | |
| Shares outstanding | | | 3,843,325 | | | | 965,438 | | | | 1,415,442 | | | | 16,658,439 | | |
| Net asset value and redemption price per share | | $ | 48.49 | | | $ | 11.81 | | | $ | 9.93 | | | $ | 10.90 | | |
| Class ADV: | |
| Net Assets | | $ | 8,459,230 | | | $ | 18,360,596 | | | $ | 960 | | | $ | 1,000 | | |
| Shares authorized | | | 100,000,000 | | | | 100,000,000 | | | | 100,000,000 | | | | 100,000,000 | | |
| Par value | | $ | 0.001 | | | $ | 0.001 | | | $ | 0.001 | | | $ | 0.001 | | |
| Shares outstanding | | | 176,623 | | | | 1,568,618 | | | | 97 | | | | 92 | | |
| Net asset value and redemption price per share | | $ | 47.89 | | | $ | 11.70 | | | $ | 9.90 | | | $ | 10.90 | | |
See Accompanying Notes to Financial Statements
77
STATEMENTS OF ASSETS AND LIABILITIES AS OF DECEMBER 31, 2006
| | | ING
Neuberger
Berman Regency
Portfolio | | ING
OpCap Balanced
Value
Portfolio | | ING
Oppenheimer
Global
Portfolio | | ING
Oppenheimer
Strategic Income
Portfolio | |
| ASSETS: | |
| Investments in securities at value+* | | $ | 11,600,345 | | | $ | 86,207,294 | | | $ | 2,763,236,141 | | | $ | 390,968,141 | | |
| Short-term investments** | | | — | | | | — | | | | — | | | | 13,174,702 | | |
| Short-term investments at amortized cost | | | — | | | | 23,411,246 | | | | 249,224,950 | | | | 103,092,755 | | |
| Cash | | | 926,380 | | | | 471,445 | | | | — | | | | 3,420,737 | | |
| Foreign currencies at value*** | | | — | | | | — | | | | 11,017,080 | | | | — | | |
| Receivables: | |
| Investment securities sold | | | 13 | | | | — | | | | 2,052,942 | | | | 2,070,388 | | |
| Fund shares sold | | | 15,484 | | | | 422 | | | | 236,524 | | | | 124,073 | | |
| Dividends and interest | | | 11,185 | | | | 283,202 | | | | 2,731,745 | | | | 5,034,178 | | |
| Variation margin receivable | | | — | | | | — | | | | — | | | | 103,145 | | |
Unrealized appreciation on forward foreign
currency contracts | | | — | | | | — | | | | — | | | | 3,570,291 | | |
| Unrealized appreciation on swap agreements | | | — | | | | — | | | | — | | | | 2,253,757 | | |
| Prepaid expenses | | | 233 | | | | — | | | | — | | | | — | | |
| Reimbursement due from manager | | | 2,477 | | | | — | | | | — | | | | — | | |
| Total assets | | | 12,556,117 | | | | 110,373,609 | | | | 3,028,499,382 | | | | 523,812,167 | | |
| LIABILITIES: | |
| Payable for investment securities purchased | | | 3,505 | | | | 328,372 | | | | — | | | | 19,782,710 | | |
| Payable for fund shares redeemed | | | 64 | | | | 806,864 | | | | 11,901,499 | | | | 2,559,267 | | |
| Payable for futures variation margin | | | — | | | | — | | | | — | | | | 38,359 | | |
| Payable upon receipt of securities loaned | | | — | | | | 21,545,723 | | | | 249,224,950 | | | | 71,242,896 | | |
Unrealized depreciation on forward
currency contracts | | | — | | | | — | | | | — | | | | 3,236,340 | | |
| Unrealized depreciation on swap agreements | | | — | | | | — | | | | — | | | | 492,251 | | |
| Payable to affiliates | | | 10,072 | | | | 93,261 | | | | 1,623,875 | | | | 208,995 | | |
| Payable to custodian due to bank overdraft | | | — | | | | — | | | | 6,741,431 | | | | — | | |
Payable to custodian due to foreign
currency overdraft**** | | | — | | | | — | | | | — | | | | 1,010,919 | | |
| Payable for directors fees | | | 1,179 | | | | — | | | | — | | | | — | | |
| Other accrued expenses and liabilities | | | 7,923 | | | | — | | | | 161 | | | | — | | |
| Options written (premiums received $61,150) | | | — | | | | — | | | | — | | | | 32,722 | | |
| Total liabilities | | | 22,743 | | | | 22,774,220 | | | | 269,491,916 | | | | 98,604,459 | | |
| NET ASSETS | | $ | 12,533,374 | | | $ | 87,599,389 | | | $ | 2,759,007,466 | | | $ | 425,207,708 | | |
| NET ASSETS WERE COMPRISED OF: | |
| Paid-in capital | | $ | 11,762,415 | | | $ | 71,957,893 | | | $ | 2,017,857,528 | | | $ | 396,956,331 | | |
| Undistributed net investment income | | | 3,991 | | | | 1,006,530 | | | | 28,989,763 | | | | 19,686,469 | | |
Accumulated net realized gain (loss) on
investments, foreign currency related
transactions, futures, swaps, and written options | | | 33,026 | | | | 8,137,856 | | | | 94,218,321 | | | | (523,267 | ) | |
Net unrealized appreciation on investments,
foreign currency related transactions, futures,
swaps, and written options | | | 733,942 | | | | 6,497,110 | | | | 617,941,854 | | | | 9,088,175 | | |
| NET ASSETS | | $ | 12,533,374 | | | $ | 87,599,389 | | | $ | 2,759,007,466 | | | $ | 425,207,708 | | |
| + Including securities loaned at value | | $ | — | | | $ | 20,946,203 | | | $ | 237,900,334 | | | $ | 69,149,628 | | |
| * Cost of investments in securities | | $ | 10,866,403 | | | $ | 79,710,184 | | | $ | 2,145,349,179 | | | $ | 383,290,318 | | |
| ** Cost of short-term investments | | $ | — | | | $ | — | | | $ | — | | | $ | 13,167,377 | | |
| *** Cost of foreign currencies | | $ | — | | | $ | — | | | $ | 10,981,453 | | | $ | — | | |
| **** Cost of foreign currency overdraft | | $ | — | | | $ | — | | | $ | — | | | $ | 999,939 | | |
See Accompanying Notes to Financial Statements
78
STATEMENTS OF ASSETS AND LIABILITIES AS OF DECEMBER 31, 2006 (CONTINUED)
| | | ING
Neuberger
Berman Regency
Portfolio | | ING
OpCap Balanced
Value
Portfolio | | ING
Oppenheimer
Global
Portfolio | | ING
Oppenheimer
Strategic Income
Portfolio | |
| Class I: | |
| Net Assets | | $ | 6,086,796 | | | $ | 4,459,453 | | | $ | 2,518,661,638 | | | $ | 359,888,236 | | |
| Shares authorized | | | 100,000,000 | | | | 250,000,000 | | | | 100,000,000 | | | | 100,000,000 | | |
| Par value | | $ | 0.001 | | | $ | 0.001 | | | $ | 0.001 | | | $ | 0.001 | | |
| Shares outstanding | | | 570,862 | | | | 296,372 | | | | 151,041,895 | | | | 33,317,855 | | |
| Net asset value and redemption price per share | | $ | 10.66 | | | $ | 15.05 | | | $ | 16.68 | | | $ | 10.80 | | |
| Class S: | |
| Net Assets | | $ | 6,445,578 | | | $ | 79,370,904 | | | $ | 145,060,148 | | | $ | 56,053,658 | | |
| Shares authorized | | | 100,000,000 | | | | 100,000,000 | | | | 100,000,000 | | | | 100,000,000 | | |
| Par value | | $ | 0.001 | | | $ | 0.001 | | | $ | 0.001 | | | $ | 0.001 | | |
| Shares outstanding | | | 605,014 | | | | 5,279,571 | | | | 8,891,301 | | | | 5,187,711 | | |
| Net asset value and redemption price per share | | $ | 10.65 | | | $ | 15.03 | | | $ | 16.31 | | | $ | 10.81 | | |
| Class ADV: | |
| Net Assets | | $ | 1,000 | | | $ | 3,769,032 | | | $ | 95,285,680 | | | $ | 9,265,814 | | |
| Shares authorized | | | 100,000,000 | | | | 100,000,000 | | | | 100,000,000 | | | | 100,000,000 | | |
| Par value | | $ | 0.001 | | | $ | 0.001 | | | $ | 0.001 | | | $ | 0.001 | | |
| Shares outstanding | | | 94 | | | | 253,304 | | | | 5,876,327 | | | | 861,313 | | |
| Net asset value and redemption price per share | | $ | 10.64 | | | $ | 14.88 | | | $ | 16.22 | | | $ | 10.76 | | |
See Accompanying Notes to Financial Statements
79
STATEMENTS OF ASSETS AND LIABILITIES AS OF DECEMBER 31, 2006
| | | ING
PIMCO Total
Return
Portfolio | | ING
Pioneer High
Yield
Portfolio | | ING
T. Rowe Price
Diversified Mid Cap
Growth
Portfolio | | ING
T. Rowe Price
Growth Equity
Portfolio | |
| ASSETS: | |
| Investments in securities at value+* | | $ | 396,598,975 | | | $ | 124,271,378 | | | $ | 1,124,098,541 | | | $ | 1,376,336,022 | | |
| Short-term investments at amortized cost | | | 44,476,905 | | | | 2,238,428 | | | | 309,512,716 | | | | 250,015,114 | | |
| Cash | | | 14,258,427 | | | | 741,308 | | | | — | | | | 30,808,527 | | |
| Foreign currencies at value** | | | 3,245,820 | | | | — | | | | — | | | | — | | |
| Receivables: | |
| Investment securities sold | | | 272,770,590 | | | | — | | | | 11,615,474 | | | | 13,428,668 | | |
| Fund shares sold | | | 206,367 | | | | 150,710 | | | | 3,045 | | | | 530,955 | | |
| Dividends and interest | | | 2,411,758 | | | | 1,484,139 | | | | 493,910 | | | | 1,524,341 | | |
| Variation margin receivable | | | 47,896 | | | | — | | | | — | | | | — | | |
Unrealized appreciation on forward foreign
currency contracts | | | 254,921 | | | | — | | | | — | | | | — | | |
| Upfront payments made on swap agreements | | | 1,249,084 | | | | — | | | | — | | | | — | | |
| Unrealized appreciation on swap agreements | | | 1,210,428 | | | | — | | | | — | | | | — | | |
| Prepaid expenses | | | — | | | | 1,446 | | | | — | | | | — | | |
| Reimbursement due from manager | | | — | | | | 26,301 | | | | — | | | | — | | |
| Total assets | | | 736,731,171 | | | | 128,913,710 | | | | 1,445,723,686 | | | | 1,672,643,627 | | |
| LIABILITIES: | |
| Payable for investment securities purchased | | | 339,477,173 | | | | — | | | | 641,474 | | | | 2,101,368 | | |
| Payable for fund shares redeemed | | | 1,118,558 | | | | 60,465 | | | | 8,484,281 | | | | 4,968,097 | | |
| Payable for futures variation margin | | | 89,212 | | | | — | | | | — | | | | — | | |
| Payable upon receipt of securities loaned | | | 3,842,658 | | | | — | | | | 309,512,716 | | | | 250,015,114 | | |
| Sales commitments, at value (Note 2)^ | | | 54,211,953 | | | | — | | | | — | | | | — | | |
Unrealized depreciation on forward
currency contracts | | | 527,781 | | | | — | | | | — | | | | — | | |
| Upfront payments received on swap agreements | | | 1,351,849 | | | | — | | | | — | | | | — | | |
| Unrealized depreciation on swap agreements | | | 957,350 | | | | — | | | | — | | | | — | | |
| Income distribution payable | | | — | | | | 174 | | | | — | | | | — | | |
| Payable to affiliates | | | 242,732 | | | | 76,739 | | | | 671,668 | | | | 949,795 | | |
| Payable to custodian due to bank overdraft | | | — | | | | — | | | | 632,267 | | | | — | | |
Payable to custodian due to foreign
currency overdraft*** | | | — | | | | — | | | | — | | | | 1,004 | | |
| Payable for directors fees | | | — | | | | 1,720 | | | | — | | | | — | | |
| Payable for floating rate note issued | | | 749,031 | | | | — | | | | — | | | | — | | |
| Other accrued expenses and liabilities | | | — | | | | 26,660 | | | | — | | | | — | | |
| Options written (premium received $1,707,323) | | | 1,323,489 | | | | — | | | | — | | | | — | | |
| Accrued income on short positions | | | 15,207 | | | | — | | | | — | | | | — | | |
| Total liabilities | | | 403,906,993 | | | | 165,758 | | | | 319,942,406 | | | | 258,035,378 | | |
| NET ASSETS | | $ | 332,824,178 | | | $ | 128,747,952 | | | $ | 1,125,781,280 | | | $ | 1,414,608,249 | | |
| NET ASSETS WERE COMPRISED OF: | |
| Paid-in capital | | $ | 322,006,488 | | | $ | 126,179,632 | | | $ | 886,686,469 | | | $ | 1,108,574,319 | | |
| Undistributed net investment income | | | 14,285,429 | | | | 2,120 | | | | 1,957,378 | | | | 6,772,277 | | |
Accumulated net realized gain (loss) on
investments, foreign currency related
transactions, futures, swaps, and
written options | | | (3,065,721 | ) | | | (23,094 | ) | | | 92,138,585 | | | | 65,771,187 | | |
Net unrealized appreciation or depreciation
on investments, foreign currency related
transactions, futures, swaps, and
written options | | | (402,018 | ) | | | 2,589,294 | | | | 144,998,848 | | | | 233,490,466 | | |
| NET ASSETS | | $ | 332,824,178 | | | $ | 128,747,952 | | | $ | 1,125,781,280 | | | $ | 1,414,608,249 | | |
| + Including securities loaned at value | | $ | 3,763,173 | | | $ | — | | | $ | 300,472,103 | | | $ | 242,907,836 | | |
| * Cost of investments in securities | | $ | 396,538,927 | | | $ | 121,682,084 | | | $ | 979,099,693 | | | $ | 1,142,839,366 | | |
| ** Cost of foreign currencies | | $ | 3,252,765 | | | $ | — | | | $ | — | | | $ | — | | |
| *** Cost of foreign currency overdraft | | $ | — | | | $ | — | | | $ | — | | | $ | 533 | | |
| ^ Proceeds from sales commitments | | $ | 54,491,719 | | | $ | — | | | $ | — | | | $ | — | | |
See Accompanying Notes to Financial Statements
80
STATEMENTS OF ASSETS AND LIABILITIES AS OF DECEMBER 31, 2006 (CONTINUED)
| | | ING
PIMCO Total
Return
Portfolio | | ING
Pioneer High
Yield
Portfolio | | ING
T. Rowe Price
Diversified Mid Cap
Growth
Portfolio | | ING
T. Rowe Price
Growth Equity
Portfolio | |
| Class I: | |
| Net Assets | | $ | 213,733,503 | | | $ | 119,958,535 | | | $ | 1,067,515,459 | | | $ | 1,271,481,042 | | |
| Shares authorized | | | 100,000,000 | | | | 100,000,000 | | | | 250,000,000 | | | | 100,000,000 | | |
| Par value | | $ | 0.001 | | | $ | 0.001 | | | $ | 0.001 | | | $ | 0.001 | | |
| Shares outstanding | | | 19,158,426 | | | | 11,740,247 | | | | 115,719,833 | | | | 21,420,078 | | |
| Net asset value and redemption price per share | | $ | 11.16 | | | $ | 10.22 | | | $ | 9.22 | | | $ | 59.36 | | |
| Class S: | |
| Net Assets | | $ | 93,487,342 | | | $ | 8,279,684 | | | $ | 10,100,450 | | | $ | 37,306,298 | | |
| Shares authorized | | | 100,000,000 | | | | 100,000,000 | | | | 100,000,000 | | | | 100,000,000 | | |
| Par value | | $ | 0.001 | | | $ | 0.001 | | | $ | 0.001 | | | $ | 0.001 | | |
| Shares outstanding | | | 8,417,133 | | | | 810,403 | | | | 1,110,073 | | | | 633,952 | | |
| Net asset value and redemption price per share | | $ | 11.11 | | | $ | 10.22 | | | $ | 9.10 | | | $ | 58.85 | | |
| Class ADV: | |
| Net Assets | | $ | 25,603,333 | | | $ | 509,733 | | | $ | 48,165,371 | | | $ | 105,820,909 | | |
| Shares authorized | | | 100,000,000 | | | | 100,000,000 | | | | 100,000,000 | | | | 100,000,000 | | |
| Par value | | $ | 0.001 | | | $ | 0.001 | | | $ | 0.001 | | | $ | 0.001 | | |
| Shares outstanding | | | 2,321,911 | | | | 49,895 | | | | 5,359,759 | | | | 1,812,958 | | |
| Net asset value and redemption price per share | | $ | 11.03 | | | $ | 10.22 | | | $ | 8.99 | | | $ | 58.37 | | |
See Accompanying Notes to Financial Statements
81
STATEMENTS OF ASSETS AND LIABILITIES AS OF DECEMBER 31, 2006
| | | ING
Templeton
Foreign Equity
Portfolio | | ING
Thornburg
Value
Portfolio | | ING
UBS U.S. Large
Cap Equity
Portfolio | | ING
UBS U.S. Small
Cap Growth
Portfolio | |
| ASSETS: | |
| Investments in securities at value+* | | $ | 45,192,391 | | | $ | 185,913,346 | | | $ | 377,593,433 | | | $ | 26,887,252 | | |
| Short-term investments at amortized cost | | | 6,336,310 | | | | 46,431,775 | | | | 78,254,293 | | | | 409,895 | | |
| Cash | | | 1,337 | | | | 619,914 | | | | 1,247,229 | | | | 260,339 | | |
| Foreign currencies at value** | | | 7,514 | | | | 310 | | | | — | | | | — | | |
| Receivables: | |
| Investment securities sold | | | — | | | | 2,279,326 | | | | 804,644 | | | | 1,203,094 | | |
| Fund shares sold | | | 327,115 | | | | 18,606 | | | | 248,693 | | | | 60,092 | | |
| Dividends and interest | | | 40,541 | | | | 132,748 | | | | 525,424 | | | | 11,227 | | |
| Prepaid expenses | | | 420 | | | | — | | | | — | | | | 4,931 | | |
| Reimbursement due from manager | | | 3,243 | | | | — | | | | — | | | | 6,764 | | |
| Total assets | | | 51,908,871 | | | | 235,396,025 | | | | 458,673,716 | | | | 28,843,594 | | |
| LIABILITIES: | |
| Payable for investment securities purchased | | | 4,525,794 | | | | 334,898 | | | | 724,562 | | | | 1,315,031 | | |
| Payable for fund shares redeemed | | | 108,742 | | | | 445,648 | | | | 1,181,229 | | | | — | | |
| Payable upon receipt of securities loaned | | | — | | | | 40,882,194 | | | | 69,037,649 | | | | — | | |
| Payable to affiliates | | | 43,934 | | | | 150,827 | | | | 286,450 | | | | 24,328 | | |
| Payable for directors fees | | | 2,101 | | | | — | | | | — | | | | 860 | | |
| Other accrued expenses and liabilities | | | 35,543 | | | | — | | | | — | | | | 19,567 | | |
| Total liabilities | | | 4,716,114 | | | | 41,813,567 | | | | 71,229,890 | | | | 1,359,786 | | |
| NET ASSETS | | $ | 47,192,757 | | | $ | 193,582,458 | | | $ | 387,443,826 | | | $ | 27,483,808 | | |
| NET ASSETS WERE COMPRISED OF: | |
| Paid-in capital | | $ | 41,498,592 | | | $ | 340,288,740 | | | $ | 400,889,458 | | | $ | 26,883,652 | | |
| Undistributed net investment income | | | 1,653 | | | | 926,863 | | | | 3,083,237 | | | | 43 | | |
Accumulated net realized gain (loss) on
investments and foreign currency related
transactions | | | 21,945 | | | | (170,380,343 | ) | | | (71,392,175 | ) | | | (305,266 | ) | |
Net unrealized appreciation on
investments and foreign currency related
transactions | | | 5,670,567 | | | | 22,747,198 | | | | 54,863,306 | | | | 905,379 | | |
| NET ASSETS | | $ | 47,192,757 | | | $ | 193,582,458 | | | $ | 387,443,826 | | | $ | 27,483,808 | | |
| + Including securities loaned at value | | $ | — | | | $ | 39,336,030 | | | $ | 66,757,959 | | | $ | — | | |
| * Cost of investments in securities | | $ | 39,508,086 | | | $ | 163,167,640 | | | $ | 322,730,127 | | | $ | 25,981,873 | | |
| ** Cost of foreign currencies | | $ | 7,522 | | | $ | 300 | | | $ | — | | | $ | — | | |
| Class I: | |
| Net Assets | | $ | 10,991,298 | | | $ | 186,114,676 | | | $ | 355,204,148 | | | $ | 22,417,457 | | |
| Shares authorized | | | 100,000,000 | | | | 100,000,000 | | | | 100,000,000 | | | | 100,000,000 | | |
| Par value | | $ | 0.001 | | | $ | 0.001 | | | $ | 0.001 | | | $ | 0.001 | | |
| Shares outstanding | | | 913,629 | | | | 5,844,383 | | | | 33,627,207 | | | | 2,307,021 | | |
| Net asset value and redemption price per share | | $ | 12.03 | | | $ | 31.85 | | | $ | 10.56 | | | $ | 9.72 | | |
| Class S: | |
| Net Assets | | $ | 36,200,424 | | | $ | 6,794,665 | | | $ | 28,207,154 | | | $ | 5,065,374 | | |
| Shares authorized | | | 100,000,000 | | | | 100,000,000 | | | | 100,000,000 | | | | 100,000,000 | | |
| Par value | | $ | 0.001 | | | $ | 0.001 | | | $ | 0.001 | | | $ | 0.001 | | |
| Shares outstanding | | | 3,014,397 | | | | 214,495 | | | | 2,700,307 | | | | 522,279 | | |
| Net asset value and redemption price per share | | $ | 12.01 | | | $ | 31.68 | �� | | $ | 10.45 | | | $ | 9.70 | | |
| Class ADV: | |
| Net Assets | | $ | 1,035 | | | $ | 673,117 | | | $ | 4,032,524 | | | $ | 977 | | |
| Shares authorized | | | 100,000,000 | | | | 100,000,000 | | | | 100,000,000 | | | | 100,000,000 | | |
| Par value | | $ | 0.001 | | | $ | 0.001 | | | $ | 0.001 | | | $ | 0.001 | | |
| Shares outstanding | | | 86 | | | | 21,449 | | | | 387,717 | | | | 101 | | |
| Net asset value and redemption price per share | | $ | 12.03 | | | $ | 31.38 | | | $ | 10.40 | | | $ | 9.67 | | |
See Accompanying Notes to Financial Statements
82
STATEMENTS OF ASSETS AND LIABILITIES AS OF DECEMBER 31, 2006
| | | | | ING
Van Kampen
Comstock
Portfolio | | ING
Van Kampen
Equity and Income
Portfolio | |
| ASSETS: | |
| Investments in securities at value+* | | | | $ | 945,487,427 | | | $ | 992,101,233 | | |
| Short-term investments at amortized cost | | | | | 181,029,869 | | | | 89,620,652 | | |
| Cash | | | | | 576,767 | | | | 39,265 | | |
| Foreign currencies at value** | | | | | — | | | | 3,425 | | |
| Receivables: | |
| Investment securities sold | | | | | 317,134 | | | | 429,896 | | |
| Fund shares sold | | | | | 660,523 | | | | 56,553 | | |
| Dividends and interest | | | | | 1,114,797 | | | | 3,543,252 | | |
| Total assets | | | | | 1,129,186,517 | | | | 1,085,794,276 | | |
| LIABILITIES: | |
| Payable for investment securities purchased | | | | | — | | | | 46,489,177 | | |
| Payable for fund shares redeemed | | | | | 90,570 | | | | 6,675,260 | | |
| Payable upon receipt of securities loaned | | | | | 97,842,059 | | | | — | | |
| Payable to affiliates | | | | | 921,974 | | | | 530,392 | | |
| Total liabilities | | | | | 98,854,603 | | | | 53,694,829 | | |
| NET ASSETS | | | | $ | 1,030,331,914 | | | $ | 1,032,099,447 | | |
| NET ASSETS WERE COMPRISED OF: | |
| Paid-in capital | | | | $ | 874,964,151 | | | $ | 868,114,084 | | |
| Undistributed net investment income | | | | | 15,068,013 | | | | 24,096,125 | | |
Accumulated net realized gain on investments
and foreign currency related transactions | | | | | 27,147,007 | | | | 22,419,495 | | |
Net unrealized appreciation on investments
and foreign currency related transactions | | | | | 113,152,743 | | | | 117,469,743 | | |
| NET ASSETS | | | | $ | 1,030,331,914 | | | $ | 1,032,099,447 | | |
| + Including securities loaned at value | | | | $ | 94,590,206 | | | $ | — | | |
| * Cost of investments in securities | | | | $ | 832,334,684 | | | $ | 874,631,744 | | |
| ** Cost of foreign currencies | | | | $ | — | | | $ | 3,171 | | |
| Class I: | |
| Net Assets | | | | $ | 634,469,855 | | | $ | 925,304,837 | | |
| Shares authorized | | | | | 100,000,000 | | | | 100,000,000 | | |
| Par value | | | | $ | 0.001 | | | $ | 0.001 | | |
| Shares outstanding | | | | | 47,456,805 | | | | 24,051,817 | | |
| Net asset value and redemption price per share | | | | $ | 13.37 | | | $ | 38.47 | | |
| Class S: | |
| Net Assets | | | | $ | 358,430,841 | | | $ | 88,409,425 | | |
| Shares authorized | | | | | 100,000,000 | | | | 100,000,000 | | |
| Par value | | | | $ | 0.001 | | | $ | 0.001 | | |
| Shares outstanding | | | | | 26,942,570 | | | | 2,312,232 | | |
| Net asset value and redemption price per share | | | | $ | 13.30 | | | $ | 38.24 | | |
| Class ADV: | |
| Net Assets | | | | $ | 37,431,218 | | | $ | 18,385,185 | | |
| Shares authorized | | | | | 100,000,000 | | | | 100,000,000 | | |
| Par value | | | | $ | 0.001 | | | $ | 0.001 | | |
| Shares outstanding | | | | | 2,841,759 | | | | 486,160 | | |
| Net asset value and redemption price per share | | | | $ | 13.17 | | | $ | 37.82 | | |
See Accompanying Notes to Financial Statements
83
STATEMENTS OF OPERATIONS
| | | ING
American Century
Large Company
Value
Portfolio | | ING
American Century
Select
Portfolio | | ING
American Century
Small-Mid Cap
Value
Portfolio | | ING
Baron Asset
Portfolio | |
| | | Year Ended
December 31,
2006 | | Year Ended
December 31,
2006 | | Year Ended
December 31,
2006 | | January 3,
2006(1)
to
December 31,
2006 | |
| INVESTMENT INCOME: | |
| Dividends, net of foreign taxes withheld* | | $ | 2,598,824 | | | $ | 5,363,728 | | | $ | 1,945,211 | | | $ | 73,149 | | |
| Interest | | | 268,487 | | | | 193,666 | | | | 151,272 | | | | 9,060 | | |
| Securities lending income | | | 6,938 | | | | 59,801 | | | | 51,115 | | | | — | | |
| Total investment income | | | 2,874,249 | | | | 5,617,195 | | | | 2,147,598 | | | | 82,209 | | |
| EXPENSES: | |
| Investment management fees | | | 845,943 | | | | 2,346,688 | | | | 1,130,403 | | | | 77,154 | | |
| Distribution and service fees: | |
| Class S | | | 71,017 | | | | 13,161 | | | | 113,304 | | | | 170 | | |
| Class ADV | | | 61,610 | | | | 74,082 | | | | 62,716 | | | | 14,260 | | |
| Transfer agent fees | | | — | | | | — | | | | — | | | | 466 | | |
| Administrative service fees | | | 211,488 | | | | 73,328 | | | | 282,600 | | | | 8,121 | | |
| Shareholder reporting expense | | | — | | | | — | | | | — | | | | 2,534 | | |
| Professional fees | | | — | | | | — | | | | — | | | | 6,009 | | |
| Custody and accounting expense | | | — | | | | — | | | | — | | | | 2,646 | | |
| Directors fees | | | — | | | | — | | | | — | | | | 2,923 | | |
| Offering expense | | | — | | | | — | | | | — | | | | 24,797 | | |
| Miscellaneous expense | | | — | | | | — | | | | — | | | | 3,331 | | |
| Total expenses | | | 1,190,058 | | | | 2,507,259 | | | | 1,589,023 | | | | 142,411 | | |
| Net waived and reimbursed fees | | | — | | | | — | | | | (31,957 | ) | | | (42,786 | ) | |
| Net expenses | | | 1,190,058 | | | | 2,507,259 | | | | 1,557,066 | | | | 99,625 | | |
| Net investment income (loss) | | | 1,684,191 | | | | 3,109,936 | | | | 590,532 | | | | (17,416 | ) | |
REALIZED AND UNREALIZED GAIN (LOSS) ON
INVESTMENTS, FOREIGN CURRENCY RELATED
TRANSACTIONS, AND FUTURES: | |
| Net realized gain (loss) on: | |
| Investments | | | 7,847,335 | | | | (15,919,447 | ) | | | 12,632,743 | | | | (223,504 | ) | |
| Foreign currency related transactions | | | — | | | | (1,117,258 | ) | | | (7,255 | ) | | | — | | |
| Futures | | | (423,905 | ) | | | 87,052 | | | | (846,858 | ) | | | — | | |
Net realized gain (loss) on investments, foreign
currency related transactions, and futures | | | 7,423,430 | | | | (16,949,653 | ) | | | 11,778,630 | | | | (223,504 | ) | |
Net change in unrealized appreciation
or depreciation on: | |
| Investments | | | 8,782,335 | | | | 4,358,712 | | | | 2,322,604 | | | | 1,133,153 | | |
| Foreign currency related transactions | | | — | | | | (93,674 | ) | | | (1,502 | ) | | | — | | |
| Futures | | | (5,416 | ) | | | — | | | | — | | | | — | | |
Net change in unrealized appreciation or depreciation
on investments, foreign currency related
transactions, and futures | | | 8,776,919 | | | | 4,265,038 | | | | 2,321,102 | | | | 1,133,153 | | |
Net realized and unrealized gain (loss) on investments,
foreign currency related transactions, and futures | | | 16,200,349 | | | | (12,684,615 | ) | | | 14,099,732 | | | | 909,649 | | |
Increase (decrease) in net assets resulting from
operations | | $ | 17,884,540 | | | $ | (9,574,679 | ) | | $ | 14,690,264 | | | $ | 892,233 | | |
| * Foreign taxes withheld | | $ | 20,119 | | | $ | 111,749 | | | $ | 1,063 | | | $ | — | | |
(1) Commencement of operations
See Accompanying Notes to Financial Statements
84
STATEMENTS OF OPERATIONS
| | | ING
Baron Small
Cap Growth
Portfolio | | ING
Columbia Small
Cap Value II
Portfolio | | ING
Davis Venture
Value
Portfolio | | ING
Fundamental
Research
Portfolio | |
| | | Year Ended
December 31,
2006 | | April 28,
2006(1)
to December 31,
2006 | | Year Ended
December 31,
2006 | | Year Ended
December 31,
2006 | |
| INVESTMENT INCOME: | |
| Dividends, net of foreign taxes withheld* | | $ | 2,218,508 | | | $ | 499,982 | | | $ | 1,744,867 | | | $ | 1,354,797 | | |
| Interest | | | 1,736,622 | | | | 80,771 | | | | 357,308 | | | | 180,340 | | |
| Total investment income | | | 3,955,130 | | | | 580,753 | | | | 2,102,175 | | | | 1,535,137 | | |
| EXPENSES: | |
| Investment management fees | | | 3,535,070 | | | | 248,542 | | | | 914,647 | | | | 516,334 | | |
| Distribution and service fees: | |
| Class S | | | 648,328 | | | | 63,727 | | | | 203,269 | | | | 96,708 | | |
| Class ADV | | | 194,772 | | | | — | | | | 57,592 | | | | 18,294 | | |
| Transfer agent fees | | | — | | | | 515 | | | | — | | | | — | | |
| Administrative service fees | | | 956,552 | | | | 33,139 | | | | 114,330 | | | | 172,425 | | |
| Shareholder reporting expense | | | — | | | | 11,270 | | | | — | | | | — | | |
| Professional fees | | | — | | | | 8,416 | | | | — | | | | — | | |
| Custody and accounting expense | | | — | | | | 10,720 | | | | — | | | | — | | |
| Directors fees | | | — | | | | 3,042 | | | | — | | | | — | | |
| Offering expense | | | — | | | | 10,069 | | | | — | | | | — | | |
| Miscellaneous expense | | | — | | | | 1,633 | | | | — | | | | — | | |
| Total expenses | | | 5,334,722 | | | | 391,073 | | | | 1,289,838 | | | | 803,761 | | |
| Net waived and reimbursed fees | | | — | | | | — | | | | — | | | | (35,157 | ) | |
| Brokerage commission recapture | | | (940 | ) | | | (7,916 | ) | | | — | | | | — | | |
| Net expenses | | | 5,333,782 | | | | 383,157 | | | | 1,289,838 | | | | 768,604 | | |
| Net investment income (loss) | | | (1,378,652 | ) | | | 197,596 | | | | 812,337 | | | | 766,533 | | |
REALIZED AND UNREALIZED GAIN (LOSS) ON INVESTMENTS,
FOREIGN CURRENCY RELATED TRANSACTIONS,
AND FUTURES: | |
| Net realized gain (loss) on: | |
| Investments | | | (1,279,457 | ) | | | (846,617 | ) | | | 1,048,495 | | | | 2,368,274 | | |
| Foreign currency related transactions | | | — | | | | — | | | | (28,052 | ) | | | — | | |
| Futures | | | — | | | | — | | | | — | | | | 541,509 | | |
Net realized gain (loss) on investments, foreign
currency related transactions, and futures | | | (1,279,457 | ) | | | (846,617 | ) | | | 1,020,443 | | | | 2,909,783 | | |
Net change in unrealized appreciation
or depreciation on: | |
| Investments | | | 58,074,197 | | | | 5,171,325 | | | | 17,058,744 | | | | 4,175,600 | | |
| Foreign currency related transactions | | | — | | | | — | | | | 531 | | | | — | | |
| | | | — | | | | — | | | | — | | | | 10,960 | | |
Net change in unrealized appreciation or
depreciation on investments and foreign currency
related transactions | | | 58,074,197 | | | | 5,171,325 | | | | 17,059,275 | | | | 4,186,560 | | |
Net realized and unrealized gain on
investments, foreign currency related transactions,
and futures | | | 56,794,740 | | | | 4,324,708 | | | | 18,079,718 | | | | 7,096,343 | | |
| Increase in net assets resulting from operations | | $ | 55,416,088 | | | $ | 4,522,304 | | | $ | 18,892,055 | | | $ | 7,862,876 | | |
| * Foreign taxes withheld | | $ | 1,176 | | | $ | — | | | $ | 10,572 | | | $ | 14,417 | | |
(1) Commencement of operations
See Accompanying Notes to Financial Statements
85
STATEMENTS OF OPERATIONS FOR THE YEAR ENDED DECEMBER 31, 2006
| | | ING
Goldman Sachs
Capital Growth
Portfolio | | ING
Goldman Sachs
Structured Equity
Portfolio | | ING
JPMorgan
International
Portfolio | | ING
JPMorgan
MidCap Value
Portfolio | |
| INVESTMENT INCOME: | |
| Dividends, net of foreign taxes withheld* | | $ | 423,679 | | | $ | 1,142,021 | | | $ | 21,579,464 | | | $ | 3,843,748 | | |
| Interest | | | 13,188 | | | | 7,937 | | | | 928,991 | | | | 369,797 | | |
| Securities lending income | | | 2,670 | | | | 4,498 | | | | 151,153 | | | | 25,064 | | |
| Total investment income | | | 439,537 | | | | 1,154,456 | | | | 22,659,608 | | | | 4,238,609 | | |
| EXPENSES: | |
| Investment management fees | | | 368,752 | | | | 476,316 | | | | 7,847,777 | | | | 1,510,458 | | |
| Distribution and service fees: | |
| Class S | | | 99,666 | | | | 165,967 | | | | 688,373 | | | | 207,084 | | |
| Class ADV | | | 16,366 | | | | 8,298 | | | | 28,194 | | | | 84,456 | | |
| Administrative service fees | | | 46,094 | | | | 136,095 | | | | 1,961,962 | | | | 564,278 | | |
| Total expenses | | | 530,878 | | | | 786,676 | | | | 10,526,306 | | | | 2,366,276 | | |
| Net waived and reimbursed fees | | | — | | | | — | | | | (27,158 | ) | | | — | | |
| Brokerage commission recapture | | | (4,453 | ) | | | — | | | | — | | | | — | | |
| Net expenses | | | 526,425 | | | | 786,676 | | | | 10,499,148 | | | | 2,366,276 | | |
| Net investment income (loss) | | | (86,888 | ) | | | 367,780 | | | | 12,160,460 | | | | 1,872,333 | | |
REALIZED AND UNREALIZED GAIN (LOSS) ON
INVESTMENTS, FOREIGN CURRENCY RELATED
TRANSACTIONS, AND FUTURES: | |
| Net realized gain (loss) on: | |
| Investments | | | 7,133,358 | | | | 9,631,699 | | | | 73,739,057 | | | | 12,710,480 | | |
| Foreign currency related transactions | | | — | | | | — | | | | (306,465 | ) | | | — | | |
| Futures | | | — | | | | 49,657 | | | | — | | | | — | | |
Net realized gain on investments, foreign currency
related transactions, and futures | | | 7,133,358 | | | | 9,681,356 | | | | 73,432,592 | | | | 12,710,480 | | |
| Net change in unrealized appreciation or depreciation on: | |
| Investments | | | (3,223,059 | ) | | | (2,072,156 | ) | | | 114,694,903 | | | | 16,832,277 | | |
| Foreign currency related transactions | | | — | | | | — | | | | 131,972 | | | | — | | |
| Futures | | | — | | | | (703 | ) | | | — | | | | — | | |
Net change in unrealized appreciation or depreciation on
investments, foreign currency related transactions,
and futures | | | (3,223,059 | ) | | | (2,072,859 | ) | | | 114,826,875 | | | | 16,832,277 | | |
Net realized and unrealized gain on investments,
foreign currency related transactions, and futures | | | 3,910,299 | | | | 7,608,497 | | | | 188,259,467 | | | | 29,542,757 | | |
| Increase in net assets resulting from operations | | $ | 3,823,411 | | | $ | 7,976,277 | | | $ | 200,419,927 | | | $ | 31,415,090 | | |
| * Foreign taxes withheld | | $ | 1,343 | | | $ | — | | | $ | 1,833,891 | | | $ | 9,519 | | |
See Accompanying Notes to Financial Statements
86
STATEMENTS OF OPERATIONS
| | | ING
Legg Mason
Partners
Aggressive
Growth
Portfolio | | ING
Legg Mason
Partners
Large Cap
Growth
Portfolio | | ING
Lord Abbett U.S.
Government
Securities
Portfolio | | ING
Neuberger
Berman
Partners
Portfolio | |
| | | Year Ended
December 31,
2006 | | Year Ended
December 31,
2006 | | January 3,
2006(1)
to December 31,
2006 | | January 3,
2006(1)
to December 31,
2006 | |
| INVESTMENT INCOME: | |
| Dividends, net of foreign taxes withheld* | | $ | 5,349,920 | | | $ | 452,849 | | | $ | — | | | $ | 2,192,023 | | |
| Interest | | | 3,080,039 | | | | 5,936 | | | | 2,449,759 | | | | 230,960 | | |
| Securities lending income | | | 172,686 | | | | — | | | | — | | | | — | | |
| Total investment income | | | 8,602,645 | | | | 458,785 | | | | 2,449,759 | | | | 2,422,983 | | |
| EXPENSES: | |
| Investment management fees | | | 7,952,491 | | | | 315,117 | | | | 218,352 | | | | 1,105,529 | | |
| Distribution and service fees: | | | | | | | | | | | | | | | | | |
| Class S | | | 734,908 | | | | 30,447 | | | | 39,526 | | | | 91,343 | | |
| Class ADV | | | 55,612 | | | | 98,352 | | | | — | | | | — | | |
| Transfer agent fees | | | — | | | | — | | | | 514 | | | | 520 | | |
| Administrative service fees | | | 1,540,479 | | | | 98,475 | | | | 46,457 | | | | 184,253 | | |
| Shareholder reporting expense | | | — | | | | — | | | | 16,960 | | | | 21,106 | | |
| Professional fees | | | — | | | | — | | | | 7,543 | | | | 11,585 | | |
| Custody and accounting expense | | | — | | | | — | | | | 10,307 | | | | 20,122 | | |
| Directors fees | | | — | | | | — | | | | 3,327 | | | | 3,998 | | |
| Offering expense | | | — | | | | — | | | | 24,862 | | | | 24,862 | | |
| Miscellaneous expense | | | — | | | | — | | | | 7,142 | | | | 6,852 | | |
| Income on reverse repurchase agreements | | | — | | | | — | | | | 5,925 | | | | — | | |
| Total expenses | | | 10,283,490 | | | | 542,391 | | | | 380,915 | | | | 1,470,170 | | |
| Net waived and reimbursed fees | | | — | | | | — | | | | (1,228 | ) | | | (146,974 | ) | |
| Net expenses | | | 10,283,490 | | | | 542,391 | | | | 379,687 | | | | 1,323,196 | | |
| Net investment income (loss) | | | (1,680,845 | ) | | | (83,606 | ) | | | 2,070,072 | | | | 1,099,787 | | |
REALIZED AND UNREALIZED GAIN (LOSS) ON
INVESTMENTS AND FOREIGN CURRENCY RELATED
TRANSACTIONS: | |
| Net realized gain (loss) on: | |
| Investments | | | 16,245,044 | | | | 454,385 | | | | (258,122 | ) | | | 20,129,404 | | |
| Foreign currency related transactions | | | — | | | | — | | | | — | | | | (28,826 | ) | |
Net realized gain (loss) on investments and
foreign currency related transactions | | | 16,245,044 | | | | 454,385 | | | | (258,122 | ) | | | 20,100,578 | | |
| Net change in unrealized appreciation or depreciation on: | |
| Investments | | | 100,027,669 | | | | 1,200,255 | | | | 373,401 | | | | (5,613,903 | ) | |
| Foreign currency related transactions | | | — | | | | — | | | | — | | | | (1,270 | ) | |
Net change in unrealized appreciation or depreciation
on investments | | | 100,027,669 | | | | 1,200,255 | | | | 373,401 | | | | (5,615,173 | ) | |
Net realized and unrealized gain on investments
and foreign currency related transactions | | | 116,272,713 | | | | 1,654,640 | | | | 115,279 | | | | 14,485,405 | | |
| Increase in net assets resulting from operations | | $ | 114,591,868 | | | $ | 1,571,034 | | | $ | 2,185,351 | | | $ | 15,585,192 | | |
| * Foreign taxes withheld | | $ | 23,648 | | | $ | — | | | $ | — | | | $ | 10,118 | | |
(1) Commencement of operations
See Accompanying Notes to Financial Statements
87
STATEMENTS OF OPERATIONS
| | | ING
Neuberger
Berman
Regency
Portfolio | | ING
OpCap
Balanced
Value
Portfolio | | ING
Oppenheimer
Global
Portfolio | | ING
Oppenheimer
Strategic
Income
Portfolio | |
| | | January 3,
2006(1)
to December 31,
2006 | | Year Ended
December 31,
2006 | | Year Ended
December 31,
2006 | | Year Ended
December 31,
2006 | |
| INVESTMENT INCOME: | |
| Dividends, net of foreign taxes withheld* | | $ | 123,269 | | | $ | 1,050,878 | | | $ | 39,327,161 | | | $ | 175,369 | | |
| Interest | | | 14,047 | | | | 1,149,949 | | | | 1,136,066 | | | | 25,985,894 | | |
| Securities lending income | | | — | | | | 9,083 | | | | 1,462,572 | | | | 190,216 | | |
| Total investment income | | | 137,316 | | | | 2,209,910 | | | | 41,925,799 | | | | 26,351,479 | | |
| EXPENSES: | |
| Investment management fees | | | 67,472 | | | | 787,775 | | | | 15,492,068 | | | | 1,900,002 | | |
| Distribution and service fees: | | | | | | | | | | | | | | | | | |
| Class S | | | 9,456 | | | | 226,424 | | | | 227,509 | | | | 142,429 | | |
| Class ADV | | | — | | | | 17,356 | | | | 557,998 | | | | 34,454 | | |
| Transfer agent fees | | | 460 | | | | — | | | | — | | | | — | | |
| Administrative service fees | | | 8,996 | | | | 196,945 | | | | 1,549,169 | | | | 152,002 | | |
| Shareholder reporting expense | | | 6,476 | | | | — | | | | — | | | | — | | |
| Professional fees | | | 6,471 | | | | — | | | | — | | | | — | | |
| Custody and accounting expense | | | 3,362 | | | | — | | | | — | | | | — | | |
| Directors fees | | | 1,302 | | | | — | | | | — | | | | — | | |
| Offering expense | | | 24,862 | | | | — | | | | — | | | | — | | |
| Miscellaneous expense | | | 4,006 | | | | — | | | | — | | | | — | | |
| Total expenses | | | 132,863 | | | | 1,228,500 | | | | 17,826,744 | | | | 2,228,887 | | |
| Net waived and reimbursed fees | | | (44,767 | ) | | | — | | | | (11,161 | ) | | | (25,545 | ) | |
| Brokerage commission recapture | | | — | | | | (27,575 | ) | | | — | | | | — | | |
| Net expenses | | | 88,096 | | | | 1,200,925 | | | | 17,815,583 | | | | 2,203,342 | | |
| Net investment income | | | 49,220 | | | | 1,008,985 | | | | 24,110,216 | | | | 24,148,137 | | |
REALIZED AND UNREALIZED GAIN (LOSS) ON
INVESTMENTS, FOREIGN CURRENCY RELATED
TRANSACTIONS, FUTURES, AND SWAPS: | |
| Net realized gain (loss) on: | |
Investments (net of foreign tax on sale of
Indian investments)** | | | 64,825 | | | | 9,325,152 | | | | 107,548,633 | | | | 733,150 | | |
| Foreign currency related transactions | | | — | | | | — | | | | (439,409 | ) | | | (3,736,022 | ) | |
| Futures, swaps, and written options | | | — | | | | — | | | | — | | | | 613,012 | | |
Net realized gain (loss) on investments, foreign
currency related transactions, futures, swaps,
and written options | | | 64,825 | | | | 9,325,152 | | | | 107,109,224 | | | | (2,389,860 | ) | |
| Net change in unrealized appreciation or depreciation on: | |
| Investments | | | 733,942 | | | | (1,112,478 | ) | | | 295,385,178 | | | | 9,662,659 | | |
| Foreign currency related transactions | | | — | | | | — | | | | 191,233 | | | | (332,423 | ) | |
| Futures, swaps, and written options | | | — | | | | — | | | | — | | | | 704,651 | | |
Net change in unrealized appreciation or depreciation
on investments, foreign currency related transactions,
futures, swaps, and written options | | | 733,942 | | | | (1,112,478 | ) | | | 295,576,411 | | | | 10,034,887 | | |
Net realized and unrealized gain on investments,
foreign currency related transactions,
futures, and swaps | | | 798,767 | | | | 8,212,674 | | | | 402,685,635 | | | | 7,645,027 | | |
| Increase in net assets resulting from operations | | $ | 847,987 | | | $ | 9,221,659 | | | $ | 426,795,851 | | | $ | 31,793,164 | | |
| * Foreign taxes withheld | | $ | 545 | | | $ | 21,964 | | | $ | 2,702,430 | | | $ | 40,277 | | |
| ** Foreign tax on sale of Indian investments | | $ | — | | | $ | — | | | $ | 303,333 | | | $ | — | | |
(1) Commencement of operations
See Accompanying Notes to Financial Statements
88
STATEMENTS OF OPERATIONS
| | | ING
PIMCO Total
Return
Portfolio | | ING
Pioneer High
Yield
Portfolio | | ING
T. Rowe Price
Diversified
Mid Cap Growth
Portfolio | | ING
T. Rowe Price
Growth Equity
Portfolio | |
| | | Year Ended
December 31,
2006 | | January 3, 2006(1)
to December 31,
2006 | | Year Ended
December 31,
2006 | | Year Ended
December 31,
2006 | |
| INVESTMENT INCOME: | |
| Dividends, net of foreign taxes withheld* | | $ | — | | | $ | 212,004 | | | $ | 9,512,287 | | | $ | 15,182,184 | | |
| Interest | | | 14,951,869 | ** | | | 5,000,191 | | | | 35,033 | | | | 1,526,895 | | |
| Securities lending income | | | 13,106 | | | | — | | | | 670,135 | | | | 433,105 | | |
| Total investment income | | | 14,964,975 | | | | 5,212,195 | | | | 10,217,455 | | | | 17,142,184 | | |
| EXPENSES: | |
| Investment management fees | | | 1,617,192 | | | | 486,094 | | | | 7,650,353 | | | | 7,558,643 | | |
| Distribution and service fees: | |
| Class S | | | 218,494 | | | | 21,211 | | | | 50,417 | | | | 229,405 | | |
| Class ADV | | | 126,428 | | | | 17,596 | | | | 331,834 | | | | 476,898 | | |
| Transfer agent fees | | | — | | | | 1,514 | | | | — | | | | — | | |
| Administrative service fees | | | 808,596 | | | | 81,015 | | | | 239,055 | | | | 1,889,661 | | |
| Shareholder reporting expense | | | — | | | | 18,150 | | | | — | | | | — | | |
| Professional fees | | | — | | | | 12,632 | | | | — | | | | — | | |
| Custody and accounting expense | | | — | | | | 12,217 | | | | — | | | | — | | |
| Directors fees | | | — | | | | 2,860 | | | | — | | | | — | | |
| Offering expense | | | — | | | | 26,612 | | | | — | | | | — | | |
| Miscellaneous expense | | | — | | | | 5,881 | | | | — | | | | — | | |
| Interest expense | | | 51,506 | | | | — | | | | — | | | | — | | |
| Total expenses | | | 2,822,216 | | | | 685,782 | | | | 8,271,659 | | | | 10,154,607 | | |
| Net waived and reimbursed fees | | | — | | | | (55,492 | ) | | | (6,637 | ) | | | — | | |
| Brokerage commission recapture | | | — | | | | — | | | | (4,945 | ) | | | (40,953 | ) | |
| Net expenses | | | 2,822,216 | | | | 630,290 | | | | 8,260,077 | | | | 10,113,654 | | |
| Net investment income | | | 12,142,759 | | | | 4,581,905 | | | | 1,957,378 | | | | 7,028,530 | | |
REALIZED AND UNREALIZED GAIN (LOSS) ON
INVESTMENTS, FOREIGN CURRENCY RELATED
TRANSACTIONS, FUTURES, AND SWAPS: | |
| Net realized gain (loss) on: | |
| Investments | | | (772,169 | ) | | | 318,237 | | | | 98,051,061 | | | | 71,759,679 | | |
| Foreign currency related transactions | | | (274,585 | ) | | | — | | | | — | | | | (254,425 | ) | |
| Futures, swaps, and written options | | | 2,261,529 | | | | — | | | | — | | | | — | | |
Net realized gain on investments, foreign
currency related transactions, futures, swaps,
and written options | | | 1,214,775 | | | | 318,237 | | | | 98,051,061 | | | | 71,505,254 | | |
| Net change in unrealized appreciation or depreciation on: | |
| Investments | | | 896,520 | | | | 2,589,294 | | | | 2,141,700 | | | | 83,050,452 | | |
| Foreign currency related transactions | | | (158,164 | ) | | | — | | | | 35 | | | | (152 | ) | |
| Futures, swaps, and written options | | | (403,662 | ) | | | — | | | | — | | | | — | | |
Net change in unrealized appreciation or depreciation
on investments, foreign currency related transactions,
futures, swaps, and written options | | | 334,694 | | | | 2,589,294 | | | | 2,141,735 | | | | 83,050,300 | | |
Net realized and unrealized gain on investments,
foreign currency related transactions,
futures, and swaps | | | 1,549,469 | | | | 2,907,531 | | | | 100,192,796 | | | | 154,555,554 | | |
| Increase in net assets resulting from operations | | $ | 13,692,228 | | | $ | 7,489,436 | | | $ | 102,150,174 | | | $ | 161,584,084 | | |
| * Foreign taxes withheld | | $ | — | | | $ | 340 | | | $ | 24,527 | | | $ | 373,839 | | |
| ** Net of foreign taxes withheld | | $ | 4,662 | | | $ | — | | | $ | — | | | $ | — | | |
(1) Commencement of operations
See Accompanying Notes to Financial Statements
89
STATEMENTS OF OPERATIONS
| | | ING
Templeton
Foreign
Equity
Portfolio | | ING
Thornburg
Value
Portfolio | | ING
UBS
U.S. Large
Cap Equity
Portfolio | | ING
UBS
U.S. Small
Cap Growth
Portfolio | |
| | | January 3,
2006(1)
to
December 31,
2006 | | Year
Ended
December 31,
2006 | | Year
Ended
December 31,
2006 | | April 28,
2006(1)
to
December 31,
2006 | |
| INVESTMENT INCOME: | |
| Dividends, net of foreign taxes withheld* | | $ | 602,039 | | | $ | 2,312,741 | | | $ | 5,465,523 | | | $ | 33,256 | | |
| Interest | | | 162,682 | | | | 159,022 | | | | 312,120 | | | | 19,131 | | |
| Securities lending income | | | — | | | | 142,746 | | | | 16,991 | | | | — | | |
| Total investment income | | | 764,721 | | | | 2,614,509 | | | | 5,794,634 | | | | 52,387 | | |
| EXPENSES: | |
| Investment management fees | | | 196,250 | | | | 1,197,000 | | | | 2,202,378 | | | | 89,506 | | |
| Distribution and service fees: | | | | | | | | | | | | | | | | | |
| Class S | | | 36,106 | | | | 3,766 | | | | 42,623 | | | | 2,126 | | |
| Class ADV | | | — | | | | 1,532 | | | | 7,222 | | | | 4 | | |
| Transfer agent fees | | | 1,583 | | | | — | | | | — | | | | 467 | | |
| Administrative service fees | | | 24,531 | | | | 460,431 | | | | 471,939 | | | | 9,945 | | |
| Shareholder reporting expense | | | 17,561 | | | | — | | | | — | | | | 3,347 | | |
| Professional fees | | | 10,619 | | | | — | | | | — | | | | 1,793 | | |
| Custody and accounting expense | | | 21,389 | | | | — | | | | — | | | | 9,363 | | |
| Directors fees | | | 2,384 | | | | — | | | | — | | | | 923 | | |
| Offering expense | | | 24,862 | | | | — | | | | — | | | | 10,069 | | |
| Miscellaneous expense | | | 5,076 | | | | — | | | | — | | | | 964 | | |
| Total expenses | | | 340,361 | | | | 1,662,729 | | | | 2,724,162 | | | | 128,507 | | |
| Net waived and reimbursed fees | | | (64,212 | ) | | | — | | | | — | | | | (26,700 | ) | |
| Brokerage commission recapture | | | (231 | ) | | | (4,944 | ) | | | (16,002 | ) | | | (4,917 | ) | |
| Net expenses | | | 275,918 | | | | 1,657,785 | | | | 2,708,160 | | | | 96,890 | | |
| Net investment income (loss) | | | 488,803 | | | | 956,724 | | | | 3,086,474 | | | | (44,503 | ) | |
REALIZED AND UNREALIZED GAIN (LOSS) ON
INVESTMENTS AND FOREIGN CURRENCY
RELATED TRANSACTIONS: | |
| Net realized gain (loss) on: | |
| Investments | | | 51,627 | | | | 15,730,334 | | | | 21,199,886 | | | | (27,700 | ) | |
| Foreign currency related transactions | | | (16,813 | ) | | | (27,357 | ) | | | — | | | | — | | |
Net realized gain (loss) on investments and foreign
currency related transactions | | | 34,814 | | | | 15,702,977 | | | | 21,199,886 | | | | (27,700 | ) | |
| Net change in unrealized appreciation or depreciation on: | |
| Investments | | | 5,684,305 | | | | 12,079,200 | | | | 22,179,628 | | | | 905,379 | | |
| Foreign currency related transactions | | | (13,738 | ) | | | 1,492 | | | | — | | | | — | | |
Net change in unrealized appreciation or depreciation
on investments | | | 5,670,567 | | | | 12,080,692 | | | | 22,179,628 | | | | 905,379 | | |
Net realized and unrealized gain on investments and
foreign currency related transactions | | | 5,705,381 | | | | 27,783,669 | | | | 43,379,514 | | | | 877,679 | | |
| Increase in net assets resulting from operations | | $ | 6,194,184 | | | $ | 28,740,393 | | | $ | 46,465,988 | | | $ | 833,176 | | |
| * Foreign taxes withheld | | $ | 47,036 | | | $ | 64,117 | | | $ | — | | | $ | — | | |
(1) Commencement of operations
See Accompanying Notes to Financial Statements
90
STATEMENTS OF OPERATIONS FOR THE YEAR ENDED DECEMBER 31, 2006
| | | ING
Van Kampen
Comstock
Portfolio | | ING
Van Kampen
Equity and Income
Portfolio | |
| INVESTMENT INCOME: | |
| Dividends, net of foreign taxes withheld* | | $ | 19,960,746 | | | $ | 15,665,070 | | |
| Interest | | | 3,456,103 | | | | 14,320,868 | | |
| Securities lending income | | | 59,672 | | | | — | | |
| Total investment income | | | 23,476,521 | | | | 29,985,938 | | |
| EXPENSES: | |
| Investment management fees | | | 5,122,624 | | | | 5,394,743 | | |
| Distribution and service fees: | |
| Class S | | | 1,112,027 | | | | 205,044 | | |
| Class ADV | | | 159,294 | | | | 80,002 | | |
| Administrative service fees | | | 2,377,398 | | | | 196,156 | | |
| Total expenses | | | 8,771,343 | | | | 5,875,945 | | |
| Net waived and reimbursed fees | | | (364,899 | ) | | | — | | |
| Net expenses | | | 8,406,444 | | | | 5,875,945 | | |
| Net investment income | | | 15,070,077 | | | | 24,109,993 | | |
REALIZED AND UNREALIZED GAIN (LOSS) ON
INVESTMENTS AND FOREIGN CURRENCY
RELATED TRANSACTIONS: | |
| Net realized gain (loss) on: | |
| Investments | | | 27,683,718 | | | | 28,000,139 | | |
| Foreign currency related transactions | | | — | | | | (11,623 | ) | |
Net realized gain on investments and foreign currency
related transactions | | | 27,683,718 | | | | 27,988,516 | | |
| Net change in unrealized appreciation or depreciation on: | |
| Investments | | | 89,764,920 | | | | 65,730,007 | | |
| Foreign currency related transactions | | | — | | | | 147 | | |
Net change in unrealized appreciation or
depreciation on investments | | | 89,764,920 | | | | 65,730,154 | | |
Net realized and unrealized gain on investments and
foreign currency related transactions | | | 117,448,638 | | | | 93,718,670 | | |
| Increase in net assets resulting from operations | | $ | 132,518,715 | | | $ | 117,828,663 | | |
| * Foreign taxes withheld | | $ | 179,514 | | | $ | 359,529 | | |
See Accompanying Notes to Financial Statements
91
STATEMENTS OF CHANGES IN NET ASSETS
| | | ING American Century
Large Company Value Portfolio | | ING American Century
Select Portfolio | |
| | | Year
Ended
December 31,
2006 | | Year
Ended
December 31,
2005 | | Year
Ended
December 31,
2006 | | Year
Ended
December 31,
2005 | |
| FROM OPERATIONS: | |
| Net investment income | | $ | 1,684,191 | | | $ | 847,280 | | | $ | 3,109,936 | | | $ | 1,431,421 | | |
Net realized gain (loss) on investments, foreign
currency related transactions, and futures | | | 7,423,430 | | | | 6,661,783 | | | | (16,949,653 | ) | | | 3,784,351 | | |
Net change in unrealized appreciation or depreciation
on investments, foreign currency related transactions,
and futures | | | 8,776,919 | | | | (6,488,782 | ) | | | 4,265,038 | | | | 16,637,682 | | |
Net increase (decrease) in net assets resulting from
operations | | | 17,884,540 | | | | 1,020,281 | | | | (9,574,679 | ) | | | 21,853,454 | | |
| FROM DISTRIBUTIONS TO SHAREHOLDERS: | |
| Net investment income: | | | | | | | | | | | | | | | | | |
| Class I | | | (698,723 | ) | | | (179,496 | ) | | | (4,330,077 | ) | | | — | | |
| Class S | | | (55,160 | ) | | | (521,380 | ) | | | (36,331 | ) | | | — | | |
| Class ADV | | | (81,896 | ) | | | (68,599 | ) | | | (65,623 | ) | | | — | | |
| Net realized gains: | | | | | | | | | | | | | | | | | |
| Class I | | | (3,884,031 | ) | | | — | | | | — | | | | — | | |
| Class S | | | (1,011,852 | ) | | | — | | | | — | | | | — | | |
| Class ADV | | | (712,066 | ) | | | — | | | | — | | | | — | | |
| Total distributions | | | (6,443,728 | ) | | | (769,475 | ) | | | (4,432,031 | ) | | | — | | |
| FROM CAPITAL SHARE TRANSACTIONS: | |
| Net proceeds from sale of shares | | | 113,580,487 | | | | 48,249,646 | | | | 23,334,474 | | | | 284,479,850 | | |
| Dividends reinvested | | | 6,443,728 | | | | 769,474 | | | | 4,432,031 | | | | — | | |
| | | | 120,024,215 | | | | 49,019,120 | | | | 27,766,505 | | | | 284,479,850 | | |
| Cost of shares redeemed | | | (110,225,198 | ) | | | (32,619,007 | ) | | | (124,085,262 | ) | | | (118,024,396 | ) | |
Net increase (decrease) in net assets resulting from
capital share transactions | | | 9,799,017 | | | | 16,400,113 | | | | (96,318,757 | ) | | | 166,455,454 | | |
| Net increase (decrease) in net assets | | | 21,239,829 | | | | 16,650,919 | | | | (110,325,467 | ) | | | 188,308,908 | | |
| NET ASSETS: | |
| Beginning of year | | | 94,557,723 | | | | 77,906,804 | | | | 434,379,517 | | | | 246,070,609 | | |
| End of year | | $ | 115,797,552 | | | $ | 94,557,723 | | | $ | 324,054,050 | | | $ | 434,379,517 | | |
| Undistributed net investment income at end of year | | $ | 1,681,936 | | | $ | 833,524 | | | $ | 1,916,891 | | | $ | 4,356,244 | | |
See Accompanying Notes to Financial Statements
92
STATEMENTS OF CHANGES IN NET ASSETS
| | | ING American Century
Small-Mid Cap Value Portfolio | | ING Baron Asset Portfolio | |
| | | Year
Ended
December 31,
2006 | | Year
Ended
December 31,
2005 | | January 3,
2006(1) to
December 31,
2006 | |
| FROM OPERATIONS: | |
| Net investment income (loss) | | $ | 590,532 | | | $ | 365,190 | | | $ | (17,416 | ) | |
Net realized gain (loss) on investments, foreign currency
related transactions, and futures | | | 11,778,630 | | | | 9,320,042 | | | | (223,504 | ) | |
Net change in unrealized appreciation or depreciation on
investments and foreign currency related transactions | | | 2,321,102 | | | | (2,786,831 | ) | | | 1,133,153 | | |
| Net increase in net assets resulting from operations | | | 14,690,264 | | | | 6,898,401 | | | | 892,233 | | |
| FROM DISTRIBUTIONS TO SHAREHOLDERS: | |
| Net investment income: | |
| Class I | | | (17,356 | ) | | | (193,431 | ) | | | — | | |
| Class S | | | (7,533 | ) | | | (74,329 | ) | | | — | | |
| Class ADV | | | (1,313 | ) | | | (9,562 | ) | | | — | | |
| Net realized gains: | |
| Class I | | | (181,971 | ) | | | (5,000,736 | ) | | | — | | |
| Class S | | | (124,123 | ) | | | (4,715,809 | ) | | | — | | |
| Class ADV | | | (37,866 | ) | | | (1,143,069 | ) | | | — | | |
| Total distributions | | | (370,162 | ) | | | (11,136,936 | ) | | | — | | |
| FROM CAPITAL SHARE TRANSACTIONS: | |
| Net proceeds from sale of shares | | | 41,001,670 | | | | 41,255,914 | | | | 8,628,315 | | |
| Dividends reinvested | | | 370,162 | | | | 11,136,936 | | | | — | | |
| | | | 41,371,832 | | | | 52,392,850 | | | | 8,628,315 | | |
| Cost of shares redeemed | | | (47,475,484 | ) | | | (19,356,113 | ) | | | (413,084 | ) | |
Net increase (decrease) in net assets resulting from
capital share transactions | | | (6,103,652 | ) | | | 33,036,737 | | | | 8,215,231 | | |
| Net increase in net assets | | | 8,216,450 | | | | 28,798,202 | | | | 9,107,464 | | |
| NET ASSETS: | |
| Beginning of year | | | 100,312,945 | | | | 71,514,743 | | | | — | | |
| End of year | | $ | 108,529,395 | | | $ | 100,312,945 | | | $ | 9,107,464 | | |
| Undistributed net investment income at end of year | | $ | 519,895 | | | $ | 55,273 | | | $ | — | | |
(1) Commencement of operations
See Accompanying Notes to Financial Statements
93
STATEMENTS OF CHANGES IN NET ASSETS
| | | ING Baron Small Cap
Growth Portfolio | | ING Columbia Small Cap
Value II Portfolio | |
| | | Year
Ended
December 31,
2006 | | Year
Ended
December 31,
2005 | | April 28,
2006(1) to
December 31,
2006 | |
| FROM OPERATIONS: | |
| Net investment income (loss) | | $ | (1,378,652 | ) | | $ | (2,197,546 | ) | | $ | 197,596 | | |
| Net realized gain (loss) on investments | | | (1,279,457 | ) | | | 7,571,949 | | | | (846,617 | ) | |
Net change in unrealized appreciation or depreciation
on investments | | | 58,074,197 | | | | 11,255,372 | | | | 5,171,325 | | |
| Net increase in net assets resulting from operations | | | 55,416,088 | | | | 16,629,775 | | | | 4,522,304 | | |
| FROM DISTRIBUTIONS TO SHAREHOLDERS: | |
| Net realized gains: | |
| Class I | | | (1,151,733 | ) | | | — | | | | — | | |
| Class S | | | (2,389,008 | ) | | | — | | | | — | | |
| Class ADV | | | (368,625 | ) | | | — | | | | — | | |
| Total distributions | | | (3,909,366 | ) | | | — | | | | — | | |
| FROM CAPITAL SHARE TRANSACTIONS: | |
| Net proceeds from sale of shares | | | 231,956,068 | | | | 184,661,901 | | | | 90,490,052 | | |
| Dividends reinvested | | | 3,906,693 | | | | — | | | | — | | |
| | | | 235,862,761 | | | | 184,661,901 | | | | 90,490,052 | | |
| Cost of shares redeemed | | | (132,467,474 | ) | | | (41,707,603 | ) | | | (7,303,662 | ) | |
Net increase in net assets resulting from
capital share transactions | | | 103,395,287 | | | | 142,954,298 | | | | 83,186,390 | | |
| Net increase in net assets | | | 154,902,009 | | | | 159,584,073 | | | | 87,708,694 | | |
| NET ASSETS: | |
| Beginning of year | | | 320,755,821 | | | | 161,171,748 | | | | — | | |
| End of year | | $ | 475,657,830 | | | $ | 320,755,821 | | | $ | 87,708,694 | | |
| Undistributed net investment income at end of year | | $ | 38,018 | | | $ | 38,018 | | | $ | 197,055 | | |
(1) Commencement of operations
See Accompanying Notes to Financial Statements
94
STATEMENTS OF CHANGES IN NET ASSETS
| | | ING Davis Venture
Value Portfolio | | ING Fundamental
Research Portfolio | |
| | | Year
Ended
December 31,
2006 | | Year
Ended
December 31,
2005 | | Year
Ended
December 31,
2006 | | Year
Ended
December 31,
2005 | |
| FROM OPERATIONS: | |
| Net investment income | | $ | 812,337 | | | $ | 14,983 | | | $ | 766,533 | | | $ | 223,332 | | |
Net realized gain on investments, foreign
currency related transactions, and futures | | | 1,020,443 | | | | 12,956,720 | | | | 2,909,783 | | | | 4,898,578 | | |
Net change in unrealized appreciation or depreciation
on investments and foreign currency related transactions | | | 17,059,275 | | | | (11,075,272 | ) | | | 4,186,560 | | | | (2,672,283 | ) | |
| Net increase in net assets resulting from operations | | | 18,892,055 | | | | 1,896,431 | | | | 7,862,876 | | | | 2,449,627 | | |
| FROM DISTRIBUTIONS TO SHAREHOLDERS: | |
| Net investment income: | |
| Class I | | | (3,834 | ) | | | (7,346 | ) | | | (184,566 | ) | | | (49,929 | ) | |
| Class S | | | (4,777 | ) | | | — | | | | (35,617 | ) | | | (339,663 | ) | |
| Class ADV | | | — | | | | (5,573 | ) | | | — | | | | (27,298 | ) | |
| Net realized gains: | |
| Class I | | | (1,096,008 | ) | | | — | | | | (941,287 | ) | | | — | | |
| Class S | | | (6,206,778 | ) | | | — | | | | (585,312 | ) | | | — | | |
| Class ADV | | | (842,626 | ) | | | — | | | | (57,802 | ) | | | — | | |
| Total distributions | | | (8,154,023 | ) | | | (12,919 | ) | | | (1,804,584 | ) | | | (416,890 | ) | |
| FROM CAPITAL SHARE TRANSACTIONS: | |
| Net proceeds from sale of shares | | | 150,618,280 | | | | 19,075,747 | | | | 62,944,969 | | | | 6,671,750 | | |
| Proceeds issued in merger | | | — | | | | — | | | | 17,722,782 | | | | 6,558,722 | | |
| Dividends reinvested | | | 8,154,023 | | | | 12,919 | | | | 1,804,584 | | | | 416,890 | | |
| | | | 158,772,303 | | | | 19,088,666 | | | | 82,472,335 | | | | 13,647,362 | | |
| Cost of shares redeemed | | | (17,972,189 | ) | | | (34,385,548 | ) | | | (30,610,639 | ) | | | (21,847,250 | ) | |
Net increase (decrease) in net assets resulting from
capital share transactions | | | 140,800,114 | | | | (15,296,882 | ) | | | 51,861,696 | | | | (8,199,888 | ) | |
| Net increase (decrease) in net assets | | | 151,538,146 | | | | (13,413,370 | ) | | | 57,919,988 | | | | (6,167,151 | ) | |
| NET ASSETS: | |
| Beginning of year | | | 56,234,911 | | | | 69,648,281 | | | | 41,161,631 | | | | 47,328,782 | | |
| End of year | | $ | 207,773,057 | | | $ | 56,234,911 | | | $ | 99,081,619 | | | $ | 41,161,631 | | |
| Undistributed net investment income at end of year | | $ | 777,814 | | | $ | 8,141 | | | $ | 766,438 | | | $ | 220,088 | | |
See Accompanying Notes to Financial Statements
95
STATEMENTS OF CHANGES IN NET ASSETS
| | | ING Goldman Sachs
Capital Growth Portfolio | | ING Goldman Sachs
Structured Equity Portfolio | |
| | | Year
Ended
December 31,
2006 | | Year
Ended
December 31,
2005 | | Year
Ended
December 31,
2006 | | Year
Ended
December 31,
2005 | |
| FROM OPERATIONS: | |
| Net investment income (loss) | | $ | (86,888 | ) | | $ | (209,053 | ) | | $ | 367,780 | | | $ | 569,254 | | |
| Net realized gain on investments and futures | | | 7,133,358 | | | | 917,207 | | | | 9,681,356 | | | | 7,743,960 | | |
Net change in unrealized appreciation or depreciation
on investments and futures | | | (3,223,059 | ) | | | (164,568 | ) | | | (2,072,859 | ) | | | (3,001,885 | ) | |
| Net increase in net assets resulting from operations | | | 3,823,411 | | | | 543,586 | | | | 7,976,277 | | | | 5,311,329 | | |
| FROM DISTRIBUTIONS TO SHAREHOLDERS: | |
| Net investment income: | |
| Class I | | | — | | | | (9,755 | ) | | | — | | | | (15 | ) | |
| Class S | | | — | | | | (226,138 | ) | | | (539,654 | ) | | | (891,307 | ) | |
| Class ADV | | | — | | | | — | | | | (19,682 | ) | | | (7,453 | ) | |
| Net realized gains: | | | | | | | | | | | | | | | | | |
| Class I | | | — | | | | — | | | | — | | | | (150 | ) | |
| Class S | | | — | | | | — | | | | (7,622,920 | ) | | | (11,280,104 | ) | |
| Class ADV | | | — | | | | — | | | | (215,959 | ) | | | (75,142 | ) | |
| Total distributions | | | — | | | | (235,893 | ) | | | (8,398,215 | ) | | | (12,254,171 | ) | |
| FROM CAPITAL SHARE TRANSACTIONS: | |
| Net proceeds from sale of shares | | | 7,571,270 | | | | 8,276,562 | | | | 7,785,360 | | | | 9,121,069 | | |
| Dividends reinvested | | | — | | | | 235,892 | | | | 8,398,215 | | | | 12,254,177 | | |
| | | | 7,571,270 | | | | 8,512,454 | | | | 16,183,575 | | | | 21,375,246 | | |
| Cost of shares redeemed | | | (36,747,372 | ) | | | (41,616,066 | ) | | | (61,430,490 | ) | | | (26,870,423 | ) | |
Net decrease in net assets resulting from
capital share transactions | | | (29,176,102 | ) | | | (33,103,612 | ) | | | (45,246,915 | ) | | | (5,495,177 | ) | |
| Net decrease in net assets | | | (25,352,691 | ) | | | (32,795,919 | ) | | | (45,668,853 | ) | | | (12,438,019 | ) | |
| NET ASSETS: | |
| Beginning of year | | | 62,435,834 | | | | 95,231,753 | | | | 100,674,047 | | | | 113,112,066 | | |
| End of year | | $ | 37,083,143 | | | $ | 62,435,834 | | | $ | 55,005,194 | | | $ | 100,674,047 | | |
| Undistributed net investment income at end of year | | $ | 57,790 | | | $ | 3,322 | | | $ | 359,046 | | | $ | 558,080 | | |
See Accompanying Notes to Financial Statements
96
STATEMENTS OF CHANGES IN NET ASSETS
| | | ING JPMorgan
International Portfolio | | ING JPMorgan MidCap
Value Portfolio | |
| | | Year
Ended
December 31,
2006 | | Year
Ended
December 31,
2005 | | Year
Ended
December 31,
2006 | | Year
Ended
December 31,
2005 | |
| FROM OPERATIONS: | |
| Net investment income | | $ | 12,160,460 | | | $ | 8,873,247 | | | $ | 1,872,333 | | | $ | 732,876 | | |
Net realized gain on investments and foreign
currency related transactions | | | 73,432,592 | | | | 14,924,250 | | | | 12,710,480 | | | | 12,106,839 | | |
Net change in unrealized appreciation or depreciation
on investments and foreign currency related transactions | | | 114,826,875 | | | | 59,824,235 | | | | 16,832,277 | | | | (739,943 | ) | |
| Net increase in net assets resulting from operations | | | 200,419,927 | | | | 83,621,732 | | | | 31,415,090 | | | | 12,099,772 | | |
| FROM DISTRIBUTIONS TO SHAREHOLDERS: | |
| Net investment income: | |
| Class I | | | (8,050,923 | ) | | | (2,668,525 | ) | | | (15,763 | ) | | | (401,198 | ) | |
| Class S | | | (180,927 | ) | | | (2,914,895 | ) | | | (4,366 | ) | | | (214,725 | ) | |
| Class ADV | | | (36,480 | ) | | | (13,389 | ) | | | (112 | ) | | | (20,785 | ) | |
| Net realized gains: | |
| Class I | | | — | | | | — | | | | (730,561 | ) | | | (5,487,183 | ) | |
| Class S | | | — | | | | — | | | | (581,795 | ) | | | (5,587,089 | ) | |
| Class ADV | | | — | | | | — | | | | (119,694 | ) | | | (837,030 | ) | |
| Total distributions | | | (8,268,330 | ) | | | (5,596,809 | ) | | | (1,452,291 | ) | | | (12,548,010 | ) | |
| FROM CAPITAL SHARE TRANSACTIONS: | |
| Net proceeds from sale of shares | | | 834,826,124 | | | | 460,466,142 | | | | 68,003,190 | | | | 76,471,872 | | |
| Dividends reinvested | | | 8,268,330 | | | | 5,596,809 | | | | 1,452,291 | | | | 12,548,010 | | |
| | | | 843,094,454 | | | | 466,062,951 | | | | 69,455,481 | | | | 89,019,882 | | |
| Cost of shares redeemed | | | (847,832,867 | ) | | | (203,247,154 | ) | | | (31,649,117 | ) | | | (41,841,366 | ) | |
Net increase (decrease) in net assets resulting from
capital share transactions | | | (4,738,413 | ) | | | 262,815,797 | | | | 37,806,364 | | | | 47,178,516 | | |
| Net increase in net assets | | | 187,413,184 | | | | 340,840,720 | | | | 67,769,163 | | | | 46,730,278 | | |
| NET ASSETS: | |
| Beginning of year | | | 919,026,781 | | | | 578,186,061 | | | | 171,293,413 | | | | 124,563,135 | | |
| End of year | | $ | 1,106,439,965 | | | $ | 919,026,781 | | | $ | 239,062,576 | | | $ | 171,293,413 | | |
| Undistributed net investment income at end of year | | $ | 14,128,261 | | | $ | 8,267,001 | | | $ | 1,776,925 | | | $ | 37,022 | | |
See Accompanying Notes to Financial Statements
97
STATEMENTS OF CHANGES IN NET ASSETS
| | | ING Legg Mason Partners Aggressive
Growth Portfolio | | ING Legg Mason Partners Large Cap
Growth Portfolio | |
| | | Year
Ended
December 31,
2006 | | Year
Ended
December 31,
2005 | | Year
Ended
December 31,
2006 | | Year
Ended
December 31,
2005 | |
| FROM OPERATIONS: | |
| Net investment loss | | $ | (1,680,845 | ) | | $ | (4,071,807 | ) | | $ | (83,606 | ) | | $ | (174,227 | ) | |
| Net realized gain on investments | | | 16,245,044 | | | | 40,718,226 | | | | 454,385 | | | | 740,873 | | |
Net change in unrealized appreciation or depreciation
on investments | | | 100,027,669 | | | | 52,471,455 | | | | 1,200,255 | | | | 2,548,360 | | |
| Net increase in net assets resulting from operations | | | 114,591,868 | | | | 89,117,874 | | | | 1,571,034 | | | | 3,115,006 | | |
| FROM DISTRIBUTIONS TO SHAREHOLDERS: | |
| Net realized gains: | |
| Class I | | | — | | | | — | | | | (290,112 | ) | | | (2,054,680 | ) | |
| Class S | | | — | | | | — | | | | (196,333 | ) | | | (1,369,162 | ) | |
| Class ADV | | | — | | | | — | | | | (311,057 | ) | | | (2,850,971 | ) | |
| Total distributions | | | — | | | | — | | | | (797,502 | ) | | | (6,274,813 | ) | |
| FROM CAPITAL SHARE TRANSACTIONS: | |
| Net proceeds from sale of shares | | | 839,171,554 | | | | 321,714,457 | | | | 7,259,163 | | | | 11,904,700 | | |
| Dividends reinvested | | | — | | | | — | | | | 797,502 | | | | 6,274,813 | | |
| | | | 839,171,554 | | | | 321,714,457 | | | | 8,056,665 | | | | 18,179,513 | | |
| Cost of shares redeemed | | | (580,359,060 | ) | | | (369,126,556 | ) | | | (22,910,555 | ) | | | (25,006,303 | ) | |
Net increase (decrease) in net assets resulting from
capital share transactions | | | 258,812,494 | | | | (47,412,099 | ) | | | (14,853,890 | ) | | | (6,826,790 | ) | |
| Net increase (decrease) in net assets | | | 373,404,362 | | | | 41,705,775 | | | | (14,080,358 | ) | | | (9,986,597 | ) | |
| NET ASSETS: | |
| Beginning of year | | | 976,661,420 | | | | 934,955,645 | | | | 58,126,163 | | | | 68,112,760 | | |
| End of year | | $ | 1,350,065,782 | | | $ | 976,661,420 | | | $ | 44,045,805 | | | $ | 58,126,163 | | |
| Undistributed net investment income at end of year | | $ | — | | | $ | — | | | $ | — | | | $ | — | | |
See Accompanying Notes to Financial Statements
98
STATEMENTS OF CHANGES IN NET ASSETS
| | | ING Lord Abbett
U.S. Government
Securities Portfolio | | ING Neuberger
Berman Partners
Portfolio | |
| | | January 3,
2006(1) to
December 31,
2006 | | January 3,
2006(1) to
December 31,
2006 | |
| FROM OPERATIONS: | |
| Net investment income | | $ | 2,070,072 | | | $ | 1,099,787 | | |
Net realized gain (loss) on investments and foreign
currency related transactions | | | (258,122 | ) | | | 20,100,578 | | |
Net change in unrealized appreciation or depreciation on
investments and foreign currency related transactions | | | 373,401 | | | | (5,615,173 | ) | |
| Net increase in net assets resulting from operations | | | 2,185,351 | | | | 15,585,192 | | |
| FROM DISTRIBUTIONS TO SHAREHOLDERS: | |
| Net investment income: | |
| Class I | | | (1,544,159 | ) | | | — | | |
| Class S | | | (574,796 | ) | | | — | | |
| Class ADV | | | (44 | ) | | | — | | |
| Total distributions | | | (2,118,999 | ) | | | — | | |
| FROM CAPITAL SHARE TRANSACTIONS: | |
| Net proceeds from sale of shares | | | 75,533,877 | | | | 357,380,071 | | |
| Proceeds issued in merger | | | — | | | | 178,456,953 | | |
| Dividends reinvested | | | 2,003,224 | | | | — | | |
| | | | 77,537,101 | | | | 535,837,024 | | |
| Cost of shares redeemed | | | (28,297,129 | ) | | | (137,892,684 | ) | |
| Net increase in net assets resulting from capital share transactions | | | 49,239,972 | | | | 397,944,340 | | |
| Net increase in net assets | | | 49,306,324 | | | | 413,529,532 | | |
| NET ASSETS: | |
| End of year | | $ | 49,306,324 | | | $ | 413,529,532 | | |
| Undistributed net investment income at end of year | | $ | — | | | $ | 1,130,355 | | |
(1) Commencement of operations
See Accompanying Notes to Financial Statements
99
STATEMENTS OF CHANGES IN NET ASSETS
| | | ING Neuberger Berman
Regency Portfolio | | ING OpCap Balanced
Value Portfolio | |
| | | January 3,
2006(1) to
December 31,
2006 | | Year
Ended
December 31,
2006 | | Year
Ended
December 31,
2005 | |
| FROM OPERATIONS: | |
| Net investment income | | $ | 49,220 | | | $ | 1,008,985 | | | $ | 846,520 | | |
| Net realized gain on investments | | | 64,825 | | | | 9,325,152 | | | | 7,799,945 | | |
Net change in unrealized appreciation or depreciation
on investments | | | 733,942 | | | | (1,112,478 | ) | | | (5,196,957 | ) | |
| Net increase in net assets resulting from operations | | | 847,987 | | | | 9,221,659 | | | | 3,449,508 | | |
| FROM DISTRIBUTIONS TO SHAREHOLDERS: | |
| Net investment income: | |
| Class I | | | (26,062 | ) | | | (63,166 | ) | | | (28,329 | ) | |
| Class S | | | (18,035 | ) | | | (755,243 | ) | | | (520,776 | ) | |
| Class ADV | | | (4 | ) | | | (28,385 | ) | | | (7,580 | ) | |
| Net realized gains: | |
| Class I | | | (17,052 | ) | | | — | | | | — | | |
| Class S | | | (17,975 | ) | | | — | | | | — | | |
| Class ADV | | | (3 | ) | | | — | | | | — | | |
| Total distributions | | | (79,131 | ) | | | (846,794 | ) | | | (556,685 | ) | |
| FROM CAPITAL SHARE TRANSACTIONS: | |
| Net proceeds from sale of shares | | | 13,473,019 | | | | 7,538,615 | | | | 13,204,322 | | |
| Dividends reinvested | | | 41,323 | | | | 846,794 | | | | 556,685 | | |
| | | | 13,514,342 | | | | 8,385,409 | | | | 13,761,007 | | |
| Cost of shares redeemed | | | (1,749,824 | ) | | | (57,097,899 | ) | | | (56,688,446 | ) | |
Net increase (decrease) in net assets resulting from capital
share transactions | | | 11,764,518 | | | | (48,712,490 | ) | | | (42,927,439 | ) | |
| Net increase (decrease) in net assets | | | 12,533,374 | | | | (40,337,625 | ) | | | (40,034,616 | ) | |
| NET ASSETS: | |
| Beginning of period | | | — | | | | 127,937,014 | | | | 167,971,630 | | |
| End of period | | $ | 12,533,374 | | | $ | 87,599,389 | | | $ | 127,937,014 | | |
| Undistributed net investment income at end of period | | $ | 3,991 | | | $ | 1,006,530 | | | $ | 844,339 | | |
(1) Commencement of operations
See Accompanying Notes to Financial Statements
100
STATEMENTS OF CHANGES IN NET ASSETS
| | | ING Oppenheimer
Global Portfolio | | ING Oppenheimer Strategic
Income Portfolio | |
| | | Year
Ended
December 31,
2006 | | Year
Ended
December 31,
2005 | | Year
Ended
December 31,
2006 | | Year
Ended
December 31,
2005 | |
| FROM OPERATIONS: | |
| Net investment income | | $ | 24,110,216 | | | $ | 18,731,629 | | | $ | 24,148,137 | | | $ | 10,527,028 | | |
Net realized gain (loss) on investments, foreign
currency related transactions, futures, swaps,
and written options | | | 107,109,224 | | | | 38,078,729 | | | | (2,389,860 | ) | | | (4,426,128 | ) | |
Net change in unrealized appreciation or depreciation
on investments, foreign currency related transactions,
futures, swaps, and written options | | | 295,576,411 | | | | 301,396,130 | | | | 10,034,887 | | | | (432,116 | ) | |
| Net increase in net assets resulting from operations | | | 426,795,851 | | | | 358,206,488 | | | | 31,793,164 | | | | 5,668,784 | | |
| FROM DISTRIBUTIONS TO SHAREHOLDERS: | |
| Net investment income: | |
| Class I | | | (1,633,130 | ) | | | (18,570,448 | ) | | | (1,398,755 | ) | | | (6,830,671 | ) | |
| Class S | | | (64,010 | ) | | | (262,232 | ) | | | (62,039 | ) | | | (1,224,476 | ) | |
| Class ADV | | | (65,785 | ) | | | (274,831 | ) | | | (14,604 | ) | | | (97,781 | ) | |
| Net realized gains: | |
| Class I | | | (3,444,323 | ) | | | (38,556,836 | ) | | | — | | | | — | | |
| Class S | | | (150,378 | ) | | | (623,934 | ) | | | — | | | | — | | |
| Class ADV | | | (177,950 | ) | | | (1,887,663 | ) | | | — | | | | — | | |
| Total distributions | | | (5,535,576 | ) | | | (60,175,944 | ) | | | (1,475,398 | ) | | | (8,152,928 | ) | |
| FROM CAPITAL SHARE TRANSACTIONS: | |
| Net proceeds from sale of shares | | | 219,061,778 | | | | 1,313,067,141 | | | | 90,602,877 | | | | 257,525,626 | | |
| Dividends reinvested | | | 5,535,576 | | | | 60,175,944 | | | | 1,475,398 | | | | 8,152,928 | | |
| | | | 224,597,354 | | | | 1,373,243,085 | | | | 92,078,275 | | | | 265,678,554 | | |
| Cost of shares redeemed | | | (296,392,861 | ) | | | (251,779,828 | ) | | | (65,688,710 | ) | | | (62,468,193 | ) | |
Net increase (decrease) in net assets resulting from
capital share transactions | | | (71,795,507 | ) | | | 1,121,463,257 | | | | 26,389,565 | | | | 203,210,361 | | |
| Net increase in net assets | | | 349,464,768 | | | | 1,419,493,801 | | | | 56,707,331 | | | | 200,726,217 | | |
| NET ASSETS: | |
| Beginning of year | | | 2,409,542,698 | | | | 990,048,897 | | | | 368,500,377 | | | | 167,774,160 | | |
| End of year | | $ | 2,759,007,466 | | | $ | 2,409,542,698 | | | $ | 425,207,708 | | | $ | 368,500,377 | | |
Undistributed net investment income
(accumulated net investment loss) at end of year | | $ | 28,989,763 | | | $ | 1,566,525 | | | $ | 19,686,469 | | | $ | (301,523 | ) | |
See Accompanying Notes to Financial Statements
101
STATEMENTS OF CHANGES IN NET ASSETS
| | | ING PIMCO Total
Return Portfolio | | ING Pioneer
High Yield Portfolio | |
| | | Year
Ended
December 31,
2006 | | Year
Ended
December 31,
2005 | | January 3,
2006(1) to
December 31,
2006 | |
| FROM OPERATIONS: | |
| Net investment income | | $ | 12,142,759 | | | $ | 6,658,839 | | | $ | 4,581,905 | | |
Net realized gain (loss) on investments, foreign currency
related transactions, futures, swaps, and written options | | | 1,214,775 | | | | (1,344,837 | ) | | | 318,237 | | |
Net change in unrealized appreciation or depreciation on
investments, foreign currency related transactions,
futures, swaps, and written options | | | 334,694 | | | | (594,196 | ) | | | 2,589,294 | | |
| Net increase in net assets resulting from operations | | | 13,692,228 | | | | 4,719,806 | | | | 7,489,436 | | |
| FROM DISTRIBUTIONS TO SHAREHOLDERS: | |
| Net investment income: | | | | | | | | | | | | | |
| Class I | | | (4,464,221 | ) | | | (2,420,204 | ) | | | (3,999,136 | ) | |
| Class S | | | (1,499,405 | ) | | | (1,260,749 | ) | | | (466,680 | ) | |
| Class ADV | | | (429,622 | ) | | | (278,056 | ) | | | (175,101 | ) | |
| Net realized gains: | | | | | | | | | | | | | |
| Class I | | | — | | | | (1,621,001 | ) | | | (331,780 | ) | |
| Class S | | | — | | | | (946,778 | ) | | | (23,180 | ) | |
| Class ADV | | | — | | | | (236,721 | ) | | | (1,397 | ) | |
| Total distributions | | | (6,393,248 | ) | | | (6,763,509 | ) | | | (4,997,274 | ) | |
| FROM CAPITAL SHARE TRANSACTIONS: | |
| Net proceeds from sale of shares | | | 131,923,895 | | | | 156,194,807 | | | | 147,746,231 | | |
| Dividends reinvested | | | 6,393,248 | | | | 6,763,509 | | | | 4,830,169 | | |
| | | | 138,317,143 | | | | 162,958,316 | | | | 152,576,400 | | |
| Cost of shares redeemed | | | (96,199,045 | ) | | | (59,280,406 | ) | | | (26,320,610 | ) | |
| Net increase in net assets resulting from capital share transactions | | | 42,118,098 | | | | 103,677,910 | | | | 126,255,790 | | |
| Net increase in net assets | | | 49,417,078 | | | | 101,634,207 | | | | 128,747,952 | | |
| NET ASSETS: | |
| Beginning of year | | | 283,407,100 | | | | 181,772,893 | | | | — | | |
| End of year | | $ | 332,824,178 | | | $ | 283,407,100 | | | $ | 128,747,952 | | |
| Undistributed net investment income at end of year | | $ | 14,285,429 | | | $ | 6,533,108 | | | $ | 2,120 | | |
(1) Commencement of operations
See Accompanying Notes to Financial Statements
102
STATEMENTS OF CHANGES IN NET ASSETS
| | | ING T. Rowe Price Diversified
Mid Cap Growth Portfolio | | ING T. Rowe Price
Growth Equity Portfolio | |
| | | Year
Ended
December 31,
2006 | | Year
Ended
December 31,
2005 | | Year
Ended
December 31,
2006 | | Year
Ended
December 31,
2005 | |
| FROM OPERATIONS: | |
| Net investment income (loss) | | $ | 1,957,378 | | | $ | (747,595 | ) | | $ | 7,028,530 | | | $ | 3,158,210 | | |
Net realized gain on investments and foreign
currency related transactions | | | 98,051,061 | | | | 21,391,388 | | | | 71,505,254 | | | | 54,315,097 | | |
Net change in unrealized appreciation
or depreciation on investments and
foreign currency related transactions | | | 2,141,735 | | | | 124,275,272 | | | | 83,050,300 | | | | 8,240,956 | | |
| Net increase in net assets resulting from operations | | | 102,150,174 | | | | 144,919,065 | | | | 161,584,084 | | | | 65,714,263 | | |
| FROM DISTRIBUTIONS TO SHAREHOLDERS: | |
| Net investment income: | |
| Class I | | | — | | | | — | | | | (2,793,872 | ) | | | (4,157,878 | ) | |
| Class S | | | — | | | | — | | | | — | | | | (459,082 | ) | |
| Class ADV | | | — | | | | — | | | | — | | | | (86,062 | ) | |
| Net realized gains: | | | | | | | | | | | | | | | | | |
| Class I | | | (23,791,368 | ) | | | (18,009,139 | ) | | | (1,879,138 | ) | | | — | | |
| Class S | | | (530,826 | ) | | | (369,650 | ) | | | (77,274 | ) | | | — | | |
| Class ADV | | | (1,209,471 | ) | | | (1,195,725 | ) | | | (164,722 | ) | | | — | | |
| Total distributions | | | (25,531,665 | ) | | | (19,574,514 | ) | | | (4,915,006 | ) | | | (4,703,022 | ) | |
| FROM CAPITAL SHARE TRANSACTIONS: | |
| Net proceeds from sale of shares | | | 98,056,004 | | | | 705,259,094 | | | | 463,870,698 | | | | 261,255,686 | | |
| Dividends reinvested | | | 25,531,665 | | | | 19,574,514 | | | | 4,915,006 | | | | 4,703,022 | | |
| | | | 123,587,669 | | | | 724,833,608 | | | | 468,785,704 | | | | 265,958,708 | | |
| Cost of shares redeemed | | | (297,212,857 | ) | | | (211,755,331 | ) | | | (358,916,531 | ) | | | (106,445,922 | ) | |
Net increase (decrease) in net assets resulting from
capital share transactions | | | (173,625,188 | ) | | | 513,078,277 | | | | 109,869,173 | | | | 159,512,786 | | |
| Net increase (decrease) in net assets | | | (97,006,679 | ) | | | 638,422,828 | | | | 266,538,251 | | | | 220,524,027 | | |
| NET ASSETS: | |
| Beginning of year | | | 1,222,787,959 | | | | 584,365,131 | | | | 1,148,069,998 | | | | 927,545,971 | | |
| End of year | | $ | 1,125,781,280 | | | $ | 1,222,787,959 | | | $ | 1,414,608,249 | | | $ | 1,148,069,998 | | |
| Undistributed net investment income at end of year | | $ | 1,957,378 | | | $ | — | | | $ | 6,772,277 | | | $ | 2,799,826 | | |
See Accompanying Notes to Financial Statements
103
STATEMENTS OF CHANGES IN NET ASSETS
| | | ING Templeton Foreign
Equity Portfolio | | ING Thornburg
Value Portfolio | |
| | | January 3,
2006(1) to
December 31,
2006 | | Year
Ended
December 31,
2006 | | Year
Ended
December 31,
2005 | |
| FROM OPERATIONS: | |
| Net investment income | | $ | 488,803 | | | $ | 956,724 | | | $ | 892,887 | | |
Net realized gain on investments and foreign currency
related transactions | | | 34,814 | | | | 15,702,977 | | | | 21,394,227 | | |
Net change in unrealized appreciation or depreciation
on investments and foreign currency related transactions | | | 5,670,567 | | | | 12,080,692 | | | | (20,168,080 | ) | |
| Net increase in net assets resulting from operations | | | 6,194,184 | | | | 28,740,393 | | | | 2,119,034 | | |
| FROM DISTRIBUTIONS TO SHAREHOLDERS: | |
| Net investment income: | |
| Class I | | | (120,416 | ) | | | (882,011 | ) | | | (1,677,923 | ) | |
| Class S | | | (353,221 | ) | | | (742 | ) | | | (1,735 | ) | |
| Class ADV | | | (11 | ) | | | (421 | ) | | | (946 | ) | |
| Net realized gains: | |
| Class I | | | (7,035 | ) | | | — | | | | — | | |
| Class S | | | (22,646 | ) | | | — | | | | — | | |
| Class ADV | | | (1 | ) | | | — | | | | — | | |
| Total distributions | | | (503,330 | ) | | | (883,174 | ) | | | (1,680,604 | ) | |
| FROM CAPITAL SHARE TRANSACTIONS: | |
| Net proceeds from sale of shares | | | 46,702,244 | | | | 13,297,964 | | | | 5,877,626 | | |
| Dividends reinvested | | | 375,868 | | | | 883,174 | | | | 1,680,604 | | |
| | | | 47,078,112 | | | | 14,181,138 | | | | 7,558,230 | | |
| Cost of shares redeemed | | | (5,576,209 | ) | | | (40,932,472 | ) | | | (50,839,039 | ) | |
Net increase (decrease) in net assets resulting from capital
share transactions | | | 41,501,903 | | | | (26,751,334 | ) | | | (43,280,809 | ) | |
| Net increase (decrease) in net assets | | | 47,192,757 | | | | 1,105,885 | | | | (42,842,379 | ) | |
| NET ASSETS: | |
| Beginning of period | | | — | | | | 192,476,573 | | | | 235,318,952 | | |
| End of period | | $ | 47,192,757 | | | $ | 193,582,458 | | | $ | 192,476,573 | | |
| Undistributed net investment income at end of period | | $ | 1,653 | | | $ | 926,863 | | | $ | 880,670 | | |
(1) Commencement of operations
See Accompanying Notes to Financial Statements
104
STATEMENTS OF CHANGES IN NET ASSETS
| | | ING UBS U.S. LargeCap
Equity Portfolio | | ING UBS U.S. Small
Cap Growth Portfolio | |
| | | Year
Ended
December 31,
2006 | | Year
Ended
December 31,
2005 | | April 28,
2006(1) to
December 31,
2006 | |
| FROM OPERATIONS: | |
| Net investment income (loss) | | $ | 3,086,474 | | | $ | 2,427,937 | | | $ | (44,503 | ) | |
| Net realized gain (loss) on investments | | | 21,199,886 | | | | 16,383,118 | | | | (27,700 | ) | |
Net change in unrealized appreciation or
depreciation on investments | | | 22,179,628 | | | | 5,356,121 | | | | 905,379 | | |
| Net increase in net assets resulting from operations | | | 46,465,988 | | | | 24,167,176 | | | | 833,176 | | |
| FROM DISTRIBUTIONS TO SHAREHOLDERS: | |
| Net investment income: | | | | | | | | | | | | | |
| Class I | | | (2,308,904 | ) | | | (2,317,124 | ) | | | — | | |
| Class S | | | (110,985 | ) | | | (36,503 | ) | | | — | | |
| Class ADV | | | (9,291 | ) | | | (913 | ) | | | — | | |
| Net realized gains: | | | | | | | | | | | | | |
| Class I | | | — | | | | — | | | | (190,476 | ) | |
| Class S | | | — | | | | — | | | | (43,189 | ) | |
| Class ADV | | | — | | | | — | | | | (8 | ) | |
| Total distributions | | | (2,429,180 | ) | | | (2,354,540 | ) | | | (233,673 | ) | |
| FROM CAPITAL SHARE TRANSACTIONS: | |
| Net proceeds from sale of shares | | | 123,409,952 | | | | 36,702,100 | | | | 34,639,445 | | |
| Dividends reinvested | | | 2,429,180 | | | | 2,354,540 | | | | 191,856 | | |
| | | | 125,839,132 | | | | 39,056,640 | | | | 34,831,301 | | |
| Cost of shares redeemed | | | (63,216,458 | ) | | | (49,737,719 | ) | | | (7,946,996 | ) | |
Net increase (decrease) in net assets resulting from
capital share transactions | | | 62,622,674 | | | | (10,681,079 | ) | | | 26,884,305 | | |
| Net increase in net assets | | | 106,659,482 | | | | 11,131,557 | | | | 27,483,808 | | |
| NET ASSETS: | |
| Beginning of year | | | 280,784,344 | | | | 269,652,787 | | | | — | | |
| End of year | | $ | 387,443,826 | | | $ | 280,784,344 | | | $ | 27,483,808 | | |
| Undistributed net investment income at end of year | | $ | 3,083,237 | | | $ | 2,425,943 | | | $ | 43 | | |
(1) Commencement of operations
See Accompanying Notes to Financial Statements
105
STATEMENTS OF CHANGES IN NET ASSETS
| | | ING Van Kampen
Comstock Portfolio | | ING Van Kampen
Equity and Income Portfolio | |
| | | Year
Ended
December 31,
2006 | | Year
Ended
December 31,
2005 | | Year
Ended
December 31,
2006 | | Year
Ended
December 31,
2005 | |
| FROM OPERATIONS: | |
| Net investment income | | $ | 15,070,077 | | | $ | 7,267,851 | | | $ | 24,109,993 | | | $ | 18,761,491 | | |
Net realized gain on investments and foreign
currency related transactions | | | 27,683,718 | | | | 41,320,450 | | | | 27,988,516 | | | | 28,387,584 | | |
Net change in unrealized appreciation or
depreciation on investments and foreign
currency related transactions | | | 89,764,920 | | | | (22,798,099 | ) | | | 65,730,154 | | | | 39,278,253 | | |
| Net increase in net assets resulting from operations | | | 132,518,715 | | | | 25,790,202 | | | | 117,828,663 | | | | 86,427,328 | | |
| FROM DISTRIBUTIONS TO SHAREHOLDERS: | |
| Net investment income: | |
| Class I | | | (4,223,582 | ) | | | (597,068 | ) | | | (16,983,138 | ) | | | (934,945 | ) | |
| Class S | | | (2,802,840 | ) | | | (2,370,408 | ) | | | (1,563,228 | ) | | | — | | |
| Class ADV | | | (241,587 | ) | | | (58,758 | ) | | | (264,974 | ) | | | (2,613 | ) | |
| Net realized gains: | |
| Class I | | | (20,901,834 | ) | | | (3,495,178 | ) | | | (30,185,503 | ) | | | (937,820 | ) | |
| Class S | | | (19,152,742 | ) | | | (16,744,159 | ) | | | (2,949,494 | ) | | | (29,541 | ) | |
| Class ADV | | | (1,609,973 | ) | | | (638,099 | ) | | | (581,467 | ) | | | (11,548 | ) | |
| Total distributions | | | (48,932,558 | ) | | | (23,903,670 | ) | | | (52,527,804 | ) | | | (1,916,467 | ) | |
| FROM CAPITAL SHARE TRANSACTIONS: | |
| Net proceeds from sale of shares | | | 634,525,643 | | | | 315,024,796 | | | | 90,334,622 | | | | 572,188,500 | | |
| Dividends reinvested | | | 48,932,558 | | | | 23,903,670 | | | | 52,527,804 | | | | 1,916,468 | | |
| | | | 683,458,201 | | | | 338,928,466 | | | | 142,862,426 | | | | 574,104,968 | | |
| Cost of shares redeemed | | | (433,245,639 | ) | | | (44,956,448 | ) | | | (98,160,881 | ) | | | (331,095,654 | ) | |
Net increase in net assets resulting from
capital share transactions | | | 250,212,562 | | | | 293,972,018 | | | | 44,701,545 | | | | 243,009,314 | | |
| Net increase in net assets | | | 333,798,719 | | | | 295,858,550 | | | | 110,002,404 | | | | 327,520,175 | | |
| NET ASSETS: | |
| Beginning of year | | | 696,533,195 | | | | 400,674,645 | | | | 922,097,043 | | | | 594,576,868 | | |
| End of year | | $ | 1,030,331,914 | | | $ | 696,533,195 | | | $ | 1,032,099,447 | | | $ | 922,097,043 | | |
| Undistributed net investment income at end of year | | $ | 15,068,013 | | | $ | 7,265,945 | | | $ | 24,096,125 | | | $ | 18,809,095 | | |
See Accompanying Notes to Financial Statements
106
ING AMERICAN CENTURY LARGE COMPANY VALUE PORTFOLIO
FINANCIAL
HIGHLIGHTS
Selected data for a share outstanding for each year.
| | | | | Class I | |
| | | | | Year Ended December 31, | |
| | | | | 2006 | | 2005 | | 2004 | | 2003 | | 2002 | |
| Per Share Operating Performance: | |
| Net asset value, beginning of year | | $ | | | 14.24 | | | | 14.22 | | | | 13.03 | | | | 9.97 | | | | 12.90 | | |
| Income (loss) from investment operations: | |
| Net investment income | | $ | | | 0.26 | * | | | 0.21 | | | | 0.17 | | | | 0.06 | | | | 0.03 | | |
Net realized and unrealized gain (loss)
on investments | | $ | | | 2.42 | | | | 0.00 | ** | | | 1.15 | | | | 3.09 | | | | (2.94 | ) | |
| Total from investment operations | | $ | | | 2.68 | | | | 0.21 | | | | 1.32 | | | | 3.15 | | | | (2.91 | ) | |
| Less distributions: | |
| Net investment income | | $ | | | 0.14 | | | | 0.19 | | | | 0.13 | | | | 0.09 | | | | 0.01 | | |
| Net realized gain on investments | | $ | | | 0.75 | | | | — | | | | — | | | | — | | | | 0.01 | | |
| Total distributions | | $ | | | 0.89 | | | | 0.19 | | | | 0.13 | | | | 0.09 | | | | 0.02 | | |
| Net asset value, end of year | | $ | | | 16.03 | | | | 14.24 | | | | 14.22 | | | | 13.03 | | | | 9.97 | | |
| Total Return(1) | | % | | | 19.58 | | | | 1.51 | | | | 10.24 | | | | 31.74 | | | | (22.59 | ) | |
| Ratios and Supplemental Data: | |
| Net assets, end of year (000's) | | $ | | | 82,254 | | | | 39,624 | | | | 2,956 | | | | 1,077 | | | | 35 | | |
| Ratios to average net assets: | |
| Expenses | | % | | | 1.00 | | | | 1.00 | | | | 1.00 | | | | 1.00 | | | | 1.00 | | |
| Net investment income | | % | | | 1.73 | | | | 1.50 | | | | 1.39 | | | | 1.20 | | | | 0.98 | | |
| Portfolio turnover rate | | % | | | 56 | | | | 105 | | | | 38 | | | | 38 | | | | 47 | | |
| | | | | Class S | |
| | | | | Year Ended December 31, | |
| | | | | 2006 | | 2005 | | 2004 | | 2003 | | 2002 | |
| Per Share Operating Performance: | |
| Net asset value, beginning of year | | $ | | | 14.20 | | | | 14.17 | | | | 12.98 | | | | 9.94 | | | | 12.89 | | |
| Income (loss) from investment operations: | |
| Net investment income | | $ | | | 0.21 | * | | | 0.15 | | | | 0.15 | | | | 0.11 | | | | 0.07 | | |
Net realized and change in unrealized
gain (loss) on investments | | $ | | | 2.43 | | | | 0.02 | | | | 1.14 | | | | 3.00 | | | | (3.01 | ) | |
| Total from investment operations | | $ | | | 2.64 | | | | 0.17 | | | | 1.29 | | | | 3.11 | | | | (2.94 | ) | |
| Less distributions: | |
| Net investment income | | $ | | | 0.04 | | | | 0.14 | | | | 0.10 | | | | 0.07 | | | | 0.00 | ** | |
| Net realized gain on investments | | $ | | | 0.75 | | | | — | | | | — | | | | — | | | | 0.01 | | |
| Total distributions | | $ | | | 0.79 | | | | 0.14 | | | | 0.10 | | | | 0.07 | | | | 0.01 | | |
| Net asset value, end of year | | $ | | | 16.05 | | | | 14.20 | | | | 14.17 | | | | 12.98 | | | | 9.94 | | |
| Total Return(1) | | % | | | 19.30 | | | | 1.26 | | | | 10.05 | | | | 31.34 | | | | (22.84 | ) | |
| Ratios and Supplemental Data: | |
| Net assets, end of year (000's) | | $ | | | 23,019 | | | | 43,127 | | | | 66,267 | | | | 63,547 | | | | 46,345 | | |
| Ratios to average net assets: | |
| Expenses | | % | | | 1.25 | | | | 1.25 | | | | 1.25 | | | | 1.25 | | | | 1.25 | | |
| Net investment income | | % | | | 1.43 | | | | 1.06 | | | | 1.05 | | | | 1.00 | | | | 0.70 | | |
| Portfolio turnover rate | | % | | | 56 | | | | 105 | | | | 38 | | | | 38 | | | | 47 | | |
(1) Total return is calculated assuming reinvestment of all dividends and capital gain distributions at net asset value and does not reflect the effect of insurance contract changes.
* Per share numbers have been calculated using average number of shares outstanding throughout the period.
** Amount is less than $0.005.
See Accompanying Notes to Financial Statements
107
ING AMERICAN CENTURY LARGE COMPANY VALUE PORTFOLIO (CONTINUED)
FINANCIAL
HIGHLIGHTS
Selected data for a share outstanding for each year.
| | | | | Class ADV | |
| | | | | Year Ended December 31, | |
| | | | | 2006 | | 2005 | | 2004 | | 2003 | | 2002 | |
| Per Share Operating Performance: | |
| Net asset value, beginning of year | | $ | | | 14.08 | | | | 14.05 | | | | 12.89 | | | | 9.90 | | | | 12.89 | | |
| Income (loss) from investment operations: | |
| Net investment income | | $ | | | 0.18 | * | | | 0.12 | * | | | 0.10 | | | | 0.08 | | | | 0.03 | | |
Net realized and unrealized gain (loss)
on investments | | $ | | | 2.38 | | | | 0.03 | | | | 1.14 | | | | 2.99 | | | | (3.00 | ) | |
| Total from investment operations | | $ | | | 2.56 | | | | 0.15 | | | | 1.24 | | | | 3.07 | | | | (2.97 | ) | |
| Less distributions: | |
| Net investment income | | $ | | | 0.09 | | | | 0.12 | | | | 0.08 | | | | 0.08 | | | | 0.01 | | |
| Net realized gain on investments | | $ | | | 0.75 | | | | — | | | | — | | | | — | | | | 0.01 | | |
| Total distributions | | $ | | | 0.84 | | | | 0.12 | | | | 0.08 | | | | 0.08 | | | | 0.02 | | |
| Net asset value, end of year | | $ | | | 15.80 | | | | 14.08 | | | | 14.05 | | | | 12.89 | | | | 9.90 | | |
| Total Return(1) | | % | | | 18.89 | | | | 1.09 | | | | 9.70 | | | | 31.13 | | | | (23.08 | ) | |
| Ratios and Supplemental Data: | |
| Net assets, end of year (000's) | | $ | | | 10,524 | | | | 11,806 | | | | 8,684 | | | | 7,313 | | | | 5,197 | | |
| Ratios to average net assets: | |
| Expenses | | % | | | 1.50 | | | | 1.50 | | | | 1.50 | | | | 1.50 | | | | 1.50 | | |
| Net investment income | | % | | | 1.21 | | | | 0.87 | | | | 0.81 | | | | 0.75 | | | | 0.99 | | |
| Portfolio turnover rate | | % | | | 56 | | | | 105 | | | | 38 | | | | 38 | | | | 47 | | |
(1) Total return is calculated assuming reinvestment of all dividends and capital gain distributions at net asset value and does not reflect the effect of insurance contract changes.
* Per share numbers have been calculated using average number of shares outstanding throughout the period.
See Accompanying Notes to Financial Statements
108
ING AMERICAN CENTURY SELECT PORTFOLIO
FINANCIAL HIGHLIGHTS
Selected data for a share outstanding for each year.
| | | | | Class I | |
| | | | | Year Ended December 31,, | |
| | | | | 2006 | | 2005 | | 2004 | | 2003 | | 2002 | |
| Per Share Operating Performance: | |
| Net asset value, beginning of year | | $ | | | 9.44 | | | | 9.35 | | | | 8.90 | | | | 6.62 | | | | 9.85 | | |
| Income (loss) from investment operations: | |
| Net investment income (loss) | | $ | | | 0.08 | ** | | | 0.03 | | | | 0.00 | * | | | (0.01 | ) | | | (0.00 | )* | |
Net realized and unrealized gain (loss)
on investments | | $ | | | (0.24 | ) | | | 0.06 | | | | 0.45 | | | | 2.29 | | | | (3.23 | ) | |
| Total from investment operations | | $ | | | (0.16 | ) | | | 0.09 | | | | 0.45 | | | | 2.28 | | | | (3.23 | ) | |
| Less distributions: | |
| Net investment income | | $ | | | 0.12 | | | | — | | | | — | | | | — | | | | — | | |
| Total distributions | | $ | | | 0.12 | | | | — | | | | — | | | | — | | | | — | | |
| Net asset value, end of year | | $ | | | 9.16 | | | | 9.44 | | | | 9.35 | | | | 8.90 | | | | 6.62 | | |
| Total Return(1) | | % | | | (1.61 | ) | | | 0.96 | † | | | 5.06 | | | | 34.44 | | | | (32.79 | ) | |
| Ratios and Supplemental Data: | |
| Net assets, end of year (000's) | | $ | | | 308,346 | | | | 404,822 | | | | 202,265 | | | | 721 | | | | 82 | | |
| Ratios to average net assets: | |
| Expenses | | % | | | 0.66 | | | | 0.66 | | | | 0.90 | | | | 1.00 | | | | 1.00 | | |
| Net investment income (loss) | | % | | | 0.87 | | | | 0.41 | | | | 0.38 | | | | (0.21 | ) | | | (0.09 | ) | |
| Portfolio turnover rate | | % | | | 220 | | | | 133 | | | | 506 | | | | 169 | | | | 245 | | |
| | | | | Class S | |
| | | | | Year Ended December 31, | |
| | | | | 2006 | | 2005 | | 2004 | | 2003 | | 2002 | |
| Per Share Operating Performance: | |
| Net asset value, beginning of year | | $ | | | 9.33 | | | | 9.27 | | | | 8.85 | | | | 6.60 | | | | 9.85 | | |
| Income (loss) from investment operations: | |
| Net investment income (loss) | | $ | | | 0.06 | ** | | | 0.02 | | | | (0.00 | )* | | | (0.02 | ) | | | (0.01 | ) | |
Net realized and unrealized gain (loss)
on investments | | $ | | | (0.23 | ) | | | 0.04 | | | | 0.42 | | | | 2.27 | | | | (3.24 | ) | |
| Total from investment operations | | $ | | | (0.17 | ) | | | 0.06 | | | | 0.42 | | | | 2.25 | | | | (3.25 | ) | |
| Less distributions: | |
| Net investment income | | $ | | | 0.07 | | | | — | | | | — | | | | — | | | | — | | |
| Total distributions | | $ | | | 0.07 | | | | — | | | | — | | | | — | | | | — | | |
| Net asset value, end of year | | $ | | | 9.09 | | | | 9.33 | | | | 9.27 | | | | 8.85 | | | | 6.60 | | |
| Total Return(1) | | % | | | (1.75 | ) | | | 0.65 | † | | | 4.75 | | | | 34.29 | | | | (33.10 | ) | |
| Ratios and Supplemental Data: | |
| Net assets, end of year (000's) | | $ | | | 4,602 | | | | 8,168 | | | | 13,482 | | | | 2,874 | | | | 321 | | |
| Ratios to average net assets: | |
| Expenses | | % | | | 0.91 | | | | 0.91 | | | | 1.15 | | | | 1.25 | | | | 1.25 | | |
| Net investment income (loss) | | % | | | 0.62 | | | | 0.11 | | | | (0.10 | ) | | | (0.45 | ) | | | (0.31 | ) | |
| Portfolio turnover rate | | % | | | 220 | | | | 133 | | | | 506 | | | | 169 | | | | 245 | | |
(1) Total return is calculated assuming reinvestment of all dividends and capital gain distributions at net asset value and does not reflect the effect of insurance contract changes.
* Amount is less than $0.005 or more than $(0.005).
** Per share numbers have been calculated using average number of shares outstanding throughout the period.
† In 2005, the Sub-Adviser fully reimbursed the Portfolio for a loss on a transaction not meeting the Portfolio's investment guidelines, which does not impact total return.
See Accompanying Notes to Financial Statements
109
ING AMERICAN CENTURY SELECT PORTFOLIO (CONTINUED)
FINANCIAL HIGHLIGHTS
Selected data for a share outstanding for each year.
| | | | | Class ADV | |
| | | | | Year Ended December 31, | |
| | | | | 2006 | | 2005 | | 2004 | | 2003 | | 2002 | |
| Per Share Operating Performance: | |
| Net asset value, beginning of year | | $ | | | 9.24 | | | | 9.20 | | | | 8.81 | | | | 6.58 | | | | 9.85 | | |
| Income (loss) from investment operations: | |
| Net investment income (loss) | | $ | | | 0.03 | * | | | (0.01 | ) | | | (0.08 | ) | | | (0.05 | ) | | | (0.05 | ) | |
Net realized and unrealized gain (loss)
on investments | | $ | | | (0.22 | ) | | | 0.05 | | | | 0.47 | | | | 2.28 | | | | (3.22 | ) | |
| Total from investment operations | | $ | | | (0.19 | ) | | | 0.04 | | | | 0.39 | | | | 2.23 | | | | (3.27 | ) | |
| Less distributions: | |
| Net investment income | | $ | | | 0.04 | | | | — | | | | — | | | | — | | | | — | | |
| Total distributions | | $ | | | 0.04 | | | | — | | | | — | | | | — | | | | — | | |
| Net asset value, end of year | | $ | | | 9.01 | | | | 9.24 | | | | 9.20 | | | | 8.81 | | | | 6.58 | | |
| Total Return(1) | | % | | | (2.01 | ) | | | 0.43 | † | | | 4.43 | | | | 33.89 | | | | (33.20 | ) | |
| Ratios and Supplemental Data: | |
| Net assets, end of year (000's) | | $ | | | 11,106 | | | | 21,390 | | | | 30,324 | | | | 53,998 | | | | 45,533 | | |
| Ratios to average net assets: | |
| Expenses | | % | | | 1.16 | | | | 1.16 | | | | 1.40 | | | | 1.50 | | | | 1.50 | | |
| Net investment income (loss) | | % | | | 0.36 | | | | (0.13 | ) | | | (0.60 | ) | | | (0.70 | ) | | | (0.65 | ) | |
| Portfolio turnover rate | | % | | | 220 | | | | 133 | | | | 506 | | | | 169 | | | | 245 | | |
(1) Total return is calculated assuming reinvestment of all dividends and capital gain distributions at net asset value and does not reflect the effect of insurance contract changes.
* Per share numbers have been calculated using average number of shares outstanding throughout the period.
† In 2005, the Sub-Adviser fully reimbursed the Portfolio for a loss on a transaction not meeting the Portfolio's investment guidelines, which did not impact total return.
See Accompanying Notes to Financial Statements
110
ING AMERICAN CENTURY SMALL-MID CAP VALUE PORTFOLIO
FINANCIAL
HIGHLIGHTS
Selected data for a share outstanding for each period.
| | | | | Class I | |
| | | | | Year Ended December 31, | | May 1,
2002(1) to
December 31, | |
| | | | | 2006 | | 2005 | | 2004 | | 2003 | | 2002 | |
| Per Share Operating Performance: | |
| Net asset value, beginning of period | | $ | | | 11.77 | | | | 12.24 | | | | 10.77 | | | | 8.16 | | | | 10.00 | | |
| Income (loss) from investment operations: | |
| Net investment income | | $ | | | 0.09 | * | | | 0.06 | | | | 0.03 | | | | 0.02 | | | | 0.01 | | |
Net realized and unrealized gain (loss)
on investments | | $ | | | 1.75 | | | | 0.94 | | | | 2.28 | | | | 2.89 | | | | (1.84 | ) | |
| Total from investment operations | | $ | | | 1.84 | | | | 1.00 | | | | 2.31 | | | | 2.91 | | | | (1.83 | ) | |
| Less distributions: | |
| Net investment income | | $ | | | 0.00 | ** | | | 0.05 | | | | 0.02 | | | | 0.03 | | | | 0.01 | | |
| Net realized gain on investments | | $ | | | 0.03 | | | | 1.42 | | | | 0.82 | | | | 0.27 | | | | — | | |
| Total distributions | | $ | | | 0.03 | | | | 1.47 | | | | 0.84 | | | | 0.30 | | | | 0.01 | | |
| Net asset value, end of period | | $ | | | 13.58 | | | | 11.77 | | | | 12.24 | | | | 10.77 | | | | 8.16 | | |
| Total Return(2) | | % | | | 15.75 | | | | 8.17 | | | | 21.61 | | | | 35.84 | | | | (18.36 | ) | |
| Ratios and Supplemental Data: | |
| Net assets, end of period (000's) | | $ | | | 48,088 | | | | 46,237 | | | | 28,433 | | | | 8,007 | | | | 669 | | |
| Ratios to average net assets: | |
| Net expenses after expense reimbursement(3) | | % | | | 1.22 | | | | 1.30 | | | | 1.30 | | | | 1.32 | | | | 1.40 | | |
| Gross expenses prior to expense reimbursement(3) | | % | | | 1.25 | | | | 1.30 | | | | 1.30 | | | | 1.40 | | | | 1.40 | | |
Net investment income after expense
reimbursement(3) | | % | | | 0.71 | | | | 0.61 | | | | 0.35 | | | | 0.53 | | | | 0.48 | | |
| Portfolio turnover rate | | % | | | 156 | | | | 101 | | | | 107 | | | | 137 | | | | 70 | | |
| | | | | Class S | |
| | | | | Year Ended December 31, | | May 1,
2002(1) to
December 31, | |
| | | | | 2006 | | 2005 | | 2004 | | 2003 | | 2002 | |
| Per Share Operating Performance: | |
| Net asset value, beginning of period | | $ | | | 11.74 | | | | 12.22 | | | | 10.76 | | | | 8.15 | | | | 10.00 | | |
| Income (loss) from investment operations: | |
| Net investment income | | $ | | | 0.05 | | | | 0.04 | | | | 0.00 | ** | | | 0.02 | | | | 0.00 | ** | |
Net realized and unrealized gain (loss)
on investments | | $ | | | 1.75 | | | | 0.92 | | | | 2.28 | | | | 2.87 | | | | (1.85 | ) | |
| Total from investment operations | | $ | | | 1.80 | | | | 0.96 | | | | 2.28 | | | | 2.89 | | | | (1.85 | ) | |
| Less distributions: | |
| Net investment income | | $ | | | 0.00 | ** | | | 0.02 | | | | 0.00 | ** | | | 0.01 | | | | 0.00 | ** | |
| Net realized gain on investments | | $ | | | 0.03 | | | | 1.42 | | | | 0.82 | | | | 0.27 | | | | — | | |
| Total distributions | | $ | | | 0.03 | | | | 1.44 | | | | 0.82 | | | | 0.28 | | | | 0.00 | | |
| Net asset value, end of period | | $ | | | 13.51 | | | | 11.74 | | | | 12.22 | | | | 10.76 | | | | 8.15 | | |
| Total Return(2) | | % | | | 15.43 | | | | 7.85 | | | | 21.34 | | | | 35.49 | | | | (18.48 | ) | |
| Ratios and Supplemental Data: | |
| Net assets, end of period (000's) | | $ | | | 47,839 | | | | 43,053 | | | | 37,816 | | | | 12,363 | | | | 6,324 | | |
| Ratios to average net assets: | |
| Net expenses after expense reimbursement(3) | | % | | | 1.47 | | | | 1.55 | | | | 1.55 | | | | 1.57 | | | | 1.65 | | |
| Gross expenses prior to expense reimbursement(3) | | % | | | 1.50 | | | | 1.55 | | | | 1.55 | | | | 1.65 | | | | 1.65 | | |
Net investment income after expense
reimbursement(3) | | % | | | 0.39 | | | | 0.35 | | | | 0.09 | | | | 0.23 | | | | 0.09 | | |
| Portfolio turnover rate | | % | | | 156 | | | | 101 | | | | 107 | | | | 137 | | | | 70 | | |
(1) Commencement of operations.
(2) Total return is calculated assuming reinvestment of all dividends and capital gain distributions at net asset value and does not reflect the effect of insurance contract changes. Total return for periods less than one year is not annualized.
(3) Annualized for periods less than one year.
* Per share data calculated using average shares outstanding throughout the period.
** Amount is less than $ 0.005.
See Accompanying Notes to Financial Statements
111
ING AMERICAN CENTURY SMALL-MID CAP VALUE PORTFOLIO (CONTINUED)
FINANCIAL
HIGHLIGHTS
Selected data for a share outstanding for each period.
| | | | | Class ADV | |
| | | | | Year Ended December 31, | | May 1,
2002(1) to
December 31, | |
| | | | | 2006 | | 2005 | | 2004 | | 2003 | | 2002 | |
| Per Share Operating Performance: | |
| Net asset value, beginning of period | | $ | | | 11.63 | | | | 12.13 | | | | 10.71 | | | | 8.13 | | | | 10.00 | | |
| Income (loss) from investment operations: | |
| Net investment income (loss) | | $ | | | 0.02 | | | | 0.01 | | | | (0.02 | ) | | | 0.01 | | | | 0.00 | * | |
Net realized and unrealized gain (loss)
on investments | | $ | | | 1.73 | | | | 0.92 | | | | 2.26 | | | | 2.84 | | | | (1.86 | ) | |
| Total from investment operations | | $ | | | 1.75 | | | | 0.93 | | | | 2.24 | | | | 2.85 | | | | (1.86 | ) | |
| Less distributions: | |
| Net investment income | | $ | | | 0.00 | * | | | 0.01 | | | | — | | | | 0.00 | * | | | 0.01 | | |
| Net realized gain on investments | | $ | | | 0.03 | | | | 1.42 | | | | 0.82 | | | | 0.27 | | | | — | | |
| Total distributions | | $ | | | 0.03 | | | | 1.43 | | | | 0.82 | | | | 0.27 | | | | 0.01 | | |
| Net asset value, end of period | | $ | | | 13.35 | | | | 11.63 | | | | 12.13 | | | | 10.71 | | | | 8.13 | | |
| Total Return(2) | | % | | | 15.14 | | | | 7.65 | | | | 21.03 | | | | 35.08 | | | | (18.62 | ) | |
| Ratios and Supplemental Data: | |
| Net assets, end of period (000's) | | $ | | | 12,602 | | | | 11,023 | | | | 5,266 | | | | 2,843 | | | | 815 | | |
| Ratios to average net assets: | |
| Net expenses after expense reimbursement(3) | | % | | | 1.72 | | | | 1.80 | | | | 1.80 | | | | 1.82 | | | | 1.90 | | |
| Gross expenses prior to expense reimbursement(3) | | % | | | 1.75 | | | | 1.80 | | | | 1.80 | | | | 1.90 | | | | 1.90 | | |
Net investment income (loss) after expense
reimbursement(3) | | % | | | 0.18 | | | | 0.10 | | | | (0.14) | | | | 0.00* | | | | 0.06 | | |
| Portfolio turnover rate | | % | | | 156 | | | | 101 | | | | 107 | | | | 137 | | | | 70 | | |
(1) Commencement of operations.
(2) Total return is calculated assuming reinvestment of all dividends and capital gain distributions at net asset value and does not reflect the effect of insurance contract changes. Total return for periods less than one year is not annualized.
(3) Annualized for periods less than one year.
* Amount is less than $0.005 or 0.005%.
See Accompanying Notes to Financial Statements
112
ING BARON ASSET PORTFOLIO
FINANCIAL HIGHLIGHTS
Selected data for a share outstanding for each period.
| | | | | Class I | | Class S | |
| | | | | January 3,
2006(1) to
December 31,
2006 | | May 3
2006(1) to
December 31,
2006 | |
| Per Share Operating Performance: | |
| Net asset value, beginning of period | | $ | | | 10.00 | | | | 10.73 | | |
| Income (loss) from investment operations: | |
| Net investment income (loss) | | $ | | | (0.00 | )** | | | 0.03 | * | |
| Net realized and unrealized gain on investments | | $ | | | 1.14 | | | | 0.34 | | |
| Total from investment operations | | $ | | | 1.14 | | | | 0.37 | | |
| Net asset value, end of period | | $ | | | 11.14 | | | | 11.10 | | |
| Total Return(2) | | % | | | 11.40 | | | | 3.45 | | |
| Ratios and Supplemental Data: | |
| Net assets, end of period (000's) | | $ | | | 5,583 | | | | 313 | | |
| Ratios to average net assets: | |
| Net expenses after expense reimbursement(3)(4) | | % | | | 1.05 | | | | 1.30 | | |
| Gross expenses prior to expense reimbursement(3) | | % | | | 1.58 | | | | 1.83 | | |
| Net investment loss after expense reimbursement(3)(4) | | % | | | (0.05 | ) | | | 0.31 | | |
| Portfolio turnover rate | | % | | | 23 | | | | 23 | | |
| | | | | Class ADV | |
| | | | | January 18,
2006(1) to
December 31,
2006 | |
| Per Share Operating Performance: | |
| Net asset value, beginning of period | | $ | | | 10.04 | | |
| Income (loss) from investment operations: | |
| Net investment loss | | $ | | | (0.06 | ) | |
| Net realized and unrealized income on investments | | $ | | | 1.11 | | |
| Total from investment operations | | $ | | | 1.05 | | |
| Net asset value, end of period | | $ | | | 11.09 | | |
| Total Return(2) | | % | | | 10.46 | | |
| Ratios and Supplemental Data: | |
| Net assets, end of period (000's) | | $ | | | 3,211 | | |
| Ratios to average net assets: | |
| Net expenses after expense reimbursement(3)(4) | | % | | | 1.55 | | |
| Gross expenses prior to expense reimbursement(3) | | % | | | 2.08 | | |
| Net investment loss after expense reimbursement(3)(4) | | % | | | (0.57 | ) | |
| Portfolio turnover rate | | % | | | 23 | | |
(1) Commencement of operations.
(2) Total return is calculated assuming reinvestment of all dividends and capital gain distributions at net asset value and does not reflect the effect of insurance contract changes. Total return for periods less than one year is not annualized.
(3) Annualized for periods less than one year.
(4) The Investment Adviser has agreed to limit expenses, (excluding interest, taxes, brokerage and extraordinary expenses) subject to possible recoupment by the Investment Adviser within three years of being incurred.
* Per share numbers have been calculated using the average number of shares outstanding throughout the period.
** Amount is more than $(0.005).
See Accompanying Notes to Financial Statements
113
ING BARON SMALL CAP GROWTH PORTFOLIO
FINANCIAL HIGHLIGHTS
Selected data for a share outstanding for each period.
| | | | | Class I | |
| | | | | Year Ended December 31, | | May 1,
2002(1) to
December 31, | |
| | | | | 2006 | | 2005 | | 2004 | | 2003 | | 2002 | |
| Per Share Operating Performance: | |
| Net asset value, beginning of period | | $ | | | 16.21 | | | | 15.06 | | | | 11.74 | | | | 8.77 | | | | 10.00 | | |
| Income (loss) from investment operations: | |
| Net investment loss | | $ | | | (0.02 | ) | | | (0.14 | )* | | | (0.07 | ) | | | (0.05 | ) | | | (0.03 | ) | |
Net realized and unrealized gain (loss)
on investments | | $ | | | 2.51 | | | | 1.29 | | | | 3.39 | | | | 3.02 | | | | (1.20 | ) | |
| Total from investment operations | | $ | | | 2.49 | | | | 1.15 | | | | 3.32 | | | | 2.97 | | | | (1.23 | ) | |
| Less distributions: | |
| Net realized gain on investments | | $ | | | 0.15 | | | | — | | | | — | | | | — | | | | — | | |
| Total distributions | | $ | | | 0.15 | | | | — | | | | — | | | | — | | | | — | | |
| Net asset value, end of period | | $ | | | 18.55 | | | | 16.21 | | | | 15.06 | | | | 11.74 | | | | 8.77 | | |
| Total Return(2) | | % | | | 15.54 | | | | 7.64 | | | | 28.28 | | | | 33.87 | | | | (12.30 | ) | |
| Ratios and Supplemental Data: | |
| Net assets, end of period (000's) | | $ | | | 130,780 | | | | 81,664 | | | | 29,954 | | | | 10,522 | | | | 706 | | |
| Ratios to average net assets: | |
Net expenses after expense reimbursement and
brokerage commission recapture(3) | | % | | | 1.08 | | | | 1.20 | | | | 1.20 | | | | 1.21 | | | | 1.25 | | |
Net expenses after expense reimbursement and
prior to brokerage commission recapture(3) | | % | | | 1.08 | | | | 1.20 | | | | 1.20 | | | | 1.21 | | | | 1.25 | | |
Gross expenses prior to expense reimbursement
and brokerage commission recapture(3) | | % | | | 1.08 | | | | 1.25 | | | | 1.20 | | | | 1.25 | | | | 1.25 | | |
Net investment loss after expense reimbursement
and brokerage commission recapture(3) | | % | | | (0.13 | ) | | | (0.87 | ) | | | (0.71 | ) | | | (0.90 | ) | | | (1.01 | ) | |
| Portfolio turnover rate | | % | | | 15 | | | | 11 | | | | 19 | | | | 19 | | | | 12 | | |
| | | | | Class S | |
| | | | | Year Ended December 31, | | May 1,
2002(1) to
December 31, | |
| | | | | 2006 | | 2005 | | 2004 | | 2003 | | 2002 | |
| Per Share Operating Performance: | |
| Net asset value, beginning of period | | $ | | | 16.06 | | | | 14.96 | | | | 11.69 | | | | 8.76 | | | | 10.00 | | |
| Income (loss) from investment operations: | |
| Net investment loss | | $ | | | (0.06 | ) | | | (0.14 | )* | | | (0.09 | ) | | | (0.07 | ) | | | (0.06 | ) | |
Net realized and unrealized gain (loss)
on investments | | $ | | | 2.48 | | | | 1.24 | | | | 3.36 | | | | 3.00 | | | | (1.18 | ) | |
| Total from investment operations | | $ | | | 2.42 | | | | 1.10 | | | | 3.27 | | | | 2.93 | | | | (1.24 | ) | |
| Less distributions: | |
| Net realized gain on investments | | $ | | | 0.15 | | | | — | | | | — | | | | — | | | | — | | |
| Total distributions | | $ | | | 0.15 | | | | — | | | | — | | | | — | | | | — | | |
| Net asset value, end of period | | $ | | | 18.33 | | | | 16.06 | | | | 14.96 | | | | 11.69 | | | | 8.76 | | |
| Total Return(2) | | % | | | 15.24 | | | | 7.35 | | | | 27.97 | | | | 33.45 | | | | (12.40 | ) | |
| Ratios and Supplemental Data: | |
| Net assets, end of period (000's) | | $ | | | 299,287 | | | | 207,527 | | | | 114,112 | | | | 44,200 | | | | 7,793 | | |
| Ratios to average net assets: | |
Net expenses after expense reimbursement and
brokerage commission recapture(3) | | % | | | 1.33 | | | | 1.45 | | | | 1.45 | | | | 1.46 | | | | 1.50 | | |
Net expenses after expense reimbursement and
prior to brokerage commission recapture(3) | | % | | | 1.33 | | | | 1.45 | | | | 1.45 | | | | 1.46 | | | | 1.50 | | |
Gross expenses prior to expense reimbursement
and brokerage commission recapture(3) | | % | | | 1.33 | | | | 1.50 | | | | 1.45 | | | | 1.50 | | | | 1.50 | | |
Net investment loss after expense reimbursement
and brokerage commission recapture(3) | | % | | | (0.38 | ) | | | (0.92 | ) | | | (0.96 | ) | | | (1.15 | ) | | | (1.23 | ) | |
| Portfolio turnover rate | | % | | | 15 | | | | 11 | | | | 19 | | | | 19 | | | | 12 | | |
(1) Commencement of operations.
(2) Total return is calculated assuming reinvestment of all dividends and capital gain distributions at net asset value and does not reflect the effect of insurance contract changes. Total return for periods less than one year is not annualized.
(3) Annualized for periods less than one year.
* Per share numbers have been calculated using average number of shares outstanding throughout the period.
See Accompanying Notes to Financial Statements
114
ING BARON SMALL CAP GROWTH PORTFOLIO (CONTINUED)
FINANCIAL HIGHLIGHTS
Selected data for a share outstanding for each period.
| | | | | Class ADV | |
| | | | | Year Ended December 31, | | May 1,
2002(1) to
December 31, | |
| | | | | 2006 | | 2005 | | 2004 | | 2003 | | 2002 | |
| Per Share Operating Performance: | |
| Net asset value, beginning of period | | $ | | | 15.90 | | | | 14.85 | | | | 11.64 | | | | 8.74 | | | | 10.00 | | |
| Income (loss) from investment operations: | |
| Net investment loss | | $ | | | (0.10 | ) | | | (0.19 | )* | | | (0.09 | ) | | | (0.12 | ) | | | (0.02 | ) | |
Net realized and unrealized gain (loss)
on investments | | $ | | | 2.46 | | | | 1.24 | | | | 3.30 | | | | 3.02 | | | | (1.24 | ) | |
| Total from investment operations | | $ | | | 2.36 | | | | 1.05 | | | | 3.21 | | | | 2.90 | | | | (1.26 | ) | |
| Less distributions: | |
| Net realized gain on investments | | $ | | | 0.15 | | | | — | | | | — | | | | — | | | | — | | |
| Total distributions | | $ | | | 0.15 | | | | — | | | | — | | | | — | | | | — | | |
| Net asset value, end of period | | $ | | | 18.11 | | | | 15.90 | | | | 14.85 | | | | 11.64 | | | | 8.74 | | |
| Total Return(2) | | % | | | 15.02 | | | | 7.07 | | | | 27.58 | | | | 33.18 | | | | (12.60 | ) | |
| Ratios and Supplemental Data: | |
| Net assets, end of period (000's) | | $ | | | 45,591 | | | | 31,565 | | | | 17,106 | | | | 3,950 | | | | 2,131 | | |
| Ratios to average net assets: | |
Net expenses after expense reimbursement and
brokerage commission recapture(3) | | % | | | 1.58 | | | | 1.70 | | | | 1.70 | | | | 1.71 | | | | 1.75 | | |
Net expenses after expense reimbursement and
prior to brokerage commission recapture(3) | | % | | | 1.58 | | | | 1.70 | | | | 1.70 | | | | 1.71 | | | | 1.75 | | |
Gross expenses prior to expense reimbursements
and brokerage commission recapture(3) | | % | | | 1.58 | | | | 1.75 | | | | 1.70 | | | | 1.75 | | | | 1.75 | | |
Net investment loss after expense reimbursement
and brokerage commission recapture(3) | | % | | | (0.63 | ) | | | (1.23 | ) | | | (1.22 | ) | | | (1.42 | ) | | | (1.56 | ) | |
| Portfolio turnover rate | | % | | | 15 | | | | 11 | | | | 19 | | | | 19 | | | | 12 | | |
(1) Commencement of operations.
(2) Total return is calculated assuming reinvestment of all dividends and capital gain distributions at net asset value and does not reflect the effect of insurance contract changes. Total return for periods less than one year is not annualized.
(3) Annualized for periods less than one year.
* Per share numbers have been calculated using average number of shares outstanding throughout the period.
See Accompanying Notes to Financial Statements
115
ING COLUMBIA SMALL CAP VALUE II PORTFOLIO
FINANCIAL
HIGHLIGHTS
Selected data for a share outstanding for each period.
| | | | | Class I | |
| | | | | April 28,
2006(1) to
December 31,
2006 | |
| Per Share Operating Performance: | |
| Net asset value, beginning of period | | $ | | | 10.00 | | |
| Income from investment operations: | |
| Net investment income | | $ | | | 0.05 | | |
| Net realized and unrealized income on investments | | $ | | | 0.12 | | |
| Total from investment operations | | $ | | | 0.17 | | |
| Net asset value, end of period | | $ | | | 10.17 | | |
| Total Return(2) | | % | | | 1.70 | | |
| Ratios and Supplemental Data: | |
| Net assets, end of period (000's) | | $ | | | 11,698 | | |
| Ratios to average net assets: | |
| Net expenses after brokerage commission recapture(3) | | % | | | 0.96 | | |
| Net expenses prior to brokerage commission recapture(3) | | % | | | 0.99 | | |
| Gross expenses prior to brokerage commission recapture(3) | | % | | | 0.99 | | |
| Net investment income after brokerage commission recapture(3) | | % | | | 0.78 | | |
| Portfolio turnover rate | | % | | | 48 | | |
| | | | | Class S | | Class ADV | |
| | | | | May 1,
2006(1) to
December 31,
2006 | | December 29,
2006(1) to
December 31,
2006 | |
| Per Share Operating Performance: | |
| Net asset value, beginning of period | | $ | | | 9.95 | | | | 10.15 | | |
| Income from investment operations: | |
| Net investment income (loss) | | $ | | | 0.04 | * | | | (0.00 | )** | |
| Net realized and unrealized income on investments | | $ | | | 0.16 | | | | — | | |
| Total from investment operations | | $ | | | 0.20 | | | | (0.00 | )** | |
| Net asset value, end of period | | $ | | | 10.15 | | | | 10.15 | | |
| Total Return(2) | | % | | | 2.01 | | | | — | | |
| Ratios and Supplemental Data: | |
| Net assets, end of period (000's) | | $ | | | 76,010 | | | | 1 | | |
| Ratios to average net assets: | |
| Net expenses after brokerage commission recapture(3) | | % | | | 1.21 | | | | 1.46 | | |
| Net expenses prior to brokerage commission recapture(3) | | % | | | 1.24 | | | | 1.49 | | |
| Gross expenses prior to brokerage commission recapture(3) | | % | | | 1.24 | | | | 1.49 | | |
| Net investment income (loss) after brokerage commission recapture(3) | | % | | | 0.53 | | | | (1.46 | ) | |
| Portfolio turnover rate | | % | | | 48 | | | | 48 | | |
(1) Commencement of operations.
(2) Total return is calculated assuming reinvestment of all dividends and capital gain distributions at net asset value and does not reflect the effect of insurance contract changes. Total return for periods less than one year is not annualized.
(3) Annualized for periods less than one year.
* Per share numbers have been calculated using average number of shares outstanding throughout the period.
** Amount is more than $(0.005).
See Accompanying Notes to Financial Statements
116
ING DAVIS VENTURE VALUE PORTFOLIO
FINANCIAL HIGHLIGHTS
Selected data for a share outstanding for each year.
| | | | | Class I | |
| | | | | Year Ended December 31, | |
| | | | | 2006 | | 2005 | | 2004 | | 2003 | | 2002 | |
| Per Share Operating Performance: | |
| Net asset value, beginning of year | | $ | | | 18.79 | | | | 18.09 | | | | 16.64 | | | | 12.00 | | | | 16.01 | | |
| Income (loss) from investment operations: | |
| Net investment income (loss) | | $ | | | 0.18 | * | | | 0.06 | * | | | 0.05 | | | | (0.03 | )* | | | 0.10 | | |
Net realized and unrealized gain (loss)
on investments | | $ | | | 2.34 | | | | 0.66 | | | | 1.40 | | | | 4.92 | | | | (4.01 | ) | |
| Total from investment operations | | $ | | | 2.52 | | | | 0.72 | | | | 1.45 | | | | 4.89 | | | | (3.91 | ) | |
| Less distributions: | |
| Net investment income | | $ | | | 0.01 | | | | 0.02 | | | | — | | | | 0.25 | | | | 0.01 | | |
| Net realized gain on investments | | $ | | | 1.43 | | | | — | | | | — | | | | — | | | | 0.09 | | |
| Total distributions | | $ | | | 1.44 | | | | 0.02 | | | | — | | | | 0.25 | | | | 0.10 | | |
| Net asset value, end of year | | $ | | | 19.87 | | | | 18.79 | | | | 18.09 | | | | 16.64 | | | | 12.00 | | |
| Total Return(1) | | % | | | 14.19 | | | | 4.10 | | | | 8.71 | | | | 41.06 | | | | (24.42 | ) | |
| Ratios and Supplemental Data: | |
| Net assets, end of year (000's) | | $ | | | 59,749 | | | | 3,108 | | | | 3,295 | | | | 2,102 | | | | 62 | | |
| Ratios to average net assets: | |
| Expenses | | % | | | 0.90 | | | | 1.07 | | | | 1.10 | | | | 1.10 | | | | 1.10 | | |
| Net investment income (loss) | | % | | | 0.94 | | | | 0.33 | | | | 0.31 | | | | (0.21 | ) | | | 2.13 | | |
| Portfolio turnover rate | | % | | | 6 | | | | 110 | | | | 33 | | | | 105 | | | | 114 | | |
| | | | | Class S | |
| | | | | Year Ended December 31, | |
| | | | | 2006 | | 2005 | | 2004 | | 2003 | | 2002 | |
| Per Share Operating Performance: | |
| Net asset value, beginning of year | | $ | | | 18.69 | | | | 17.99 | | | | 16.59 | | | | 11.97 | | | | 16.01 | | |
| Income (loss) from investment operations: | |
| Net investment income (loss) | | $ | | | 0.13 | * | | | 0.01 | * | | | 0.00 | ** | | | (0.02 | )* | | | 0.21 | | |
Net realized and unrealized gain (loss)
on investments | | $ | | | 2.31 | | | | 0.69 | | | | 1.40 | | | | 4.86 | | | | (4.15 | ) | |
| Total from investment operations | | $ | | | 2.44 | | | | 0.70 | | | | 1.40 | | | | 4.84 | | | | (3.94 | ) | |
| Less distributions: | |
| Net investment income | | $ | | | — | | | | — | | | | — | | | | 0.22 | | | | 0.01 | | |
| Net realized gain on investments | | $ | | | 1.43 | | | | — | | | | — | | | | — | | | | 0.09 | | |
| Total distributions | | $ | | | 1.43 | | | | — | | | | — | | | | 0.22 | | | | 0.10 | | |
| Net asset value, end of year | | $ | | | 19.70 | | | | 18.69 | | | | 17.99 | | | | 16.59 | | | | 11.97 | | |
| Total Return(1) | | % | | | 13.85 | | | | 3.89 | | | | 8.44 | | | | 40.68 | | | | (24.62 | ) | |
| Ratios and Supplemental Data: | |
| Net assets, end of year (000's) | | $ | | | 134,821 | | | | 41,822 | | | | 56,159 | | | | 56,159 | | | | 34,833 | | |
| Ratios to average net assets: | |
| Expenses | | % | | | 1.15 | | | | 1.32 | | | | 1.35 | | | | 1.35 | | | | 1.35 | | |
| Net investment income (loss) | | % | | | 0.69 | | | | 0.06 | | | | 0.02 | | | | (0.17 | ) | | | 1.48 | | |
| Portfolio turnover rate | | % | | | 6 | | | | 110 | | | | 33 | | | | 105 | | | | 114 | | |
(1) Total return is calculated assuming reinvestment of all dividends and capital gain distributions at net asset value and does not reflect the effect of insurance contract changes.
* Per share numbers have been calculated using average number of shares outstanding throughout the period.
** Amount is less than $0.005.
See Accompanying Notes to Financial Statements
117
ING DAVIS VENTURE VALUE PORTFOLIO (CONTINUED)
FINANCIAL HIGHLIGHTS
Selected data for a share outstanding for each year.
| | | | | Class ADV | |
| | | | | Year Ended December 31, | |
| | | | | 2006 | | 2005 | | 2004 | | 2003 | | 2002 | |
| Per Share Operating Performance: | |
| Net asset value, beginning of year | | $ | | | 18.46 | | | | 17.82 | | | | 16.47 | | | | 11.94 | | | | 16.01 | | |
| Income (loss) from investment operations: | |
| Net investment income (loss) | | $ | | | 0.07 | | | | (0.03 | )* | | | (0.02 | ) | | | (0.07 | )* | | | 0.06 | | |
Net realized and unrealized gain (loss)
on investments | | $ | | | 2.29 | | | | 0.67 | | | | 1.37 | | | | 4.85 | | | | (4.03 | ) | |
| Total from investment operations | | $ | | | 2.36 | | | | 0.64 | | | | 1.35 | | | | 4.78 | | | | (3.97 | ) | |
| Less distributions: | |
| Net investment income | | $ | | | — | | | | 0.00 | ** | | | — | | | | 0.25 | | | | 0.01 | | |
| Net realized gain on investments | | $ | | | 1.43 | | | | — | | | | — | | | | — | | | | 0.09 | | |
| Total distributions | | $ | | | 1.43 | | | | 0.00 | ** | | | — | | | | 0.25 | | | | 0.10 | | |
| Net asset value, end of year | | $ | | | 19.39 | | | | 18.46 | | | | 17.82 | | | | 16.47 | | | | 11.94 | | |
| Total Return(1) | | % | | | 13.58 | | | | 3.62 | | | | 8.20 | | | | 40.31 | | | | (24.79 | ) | |
| Ratios and Supplemental Data: | |
| Net assets, end of year (000's) | | $ | | | 13,203 | | | | 11,305 | | | | 10,195 | | | | 3,299 | | | | 535 | | |
| Ratios to average net assets: | |
| Expenses | | % | | | 1.40 | | | | 1.57 | | | | 1.60 | | | | 1.60 | | | | 1.60 | | |
| Net investment income (loss) | | % | | | 0.44 | | | | (0.18 | ) | | | (0.18 | ) | | | (0.51 | ) | | | 1.79 | | |
| Portfolio turnover rate | | % | | | 6 | | | | 110 | | | | 33 | | | | 105 | | | | 114 | | |
(1) Total return is calculated assuming reinvestment of all dividends and capital gain distributions at net asset value and does not reflect the effect of insurance contract changes.
* Per share numbers have been calculated using average number of shares outstanding throughout the period.
** Amount is less than $0.005.
See Accompanying Notes to Financial Statements
118
ING FUNDAMENTAL RESEARCH PORTFOLIO
FINANCIAL HIGHLIGHTS
Selected data for a share outstanding for each year.
| | | | | Class I | |
| | | | | Year Ended December 31, | |
| | | | | 2006 | | 2005 | | 2004 | | 2003 | | 2002 | |
| Per Share Operating Performance: | |
| Net asset value, beginning of year | | $ | | | 9.10 | | | | 8.71 | | | | 7.97 | | | | 6.30 | | | | 8.16 | | |
| Income (loss) from investment operations: | |
| Net investment income | | $ | | | 0.10 | ** | | | 0.07 | ** | | | 0.07 | | | | 0.04 | | | | 0.03 | | |
| Net realized and unrealized gain (loss) on investments | | $ | | | 1.02 | | | | 0.44 | | | | 0.73 | | | | 1.70 | | | | (1.89 | ) | |
| Total from investment operations | | $ | | | 1.12 | | | | 0.51 | | | | 0.80 | | | | 1.74 | | | | (1.86 | ) | |
| Less distributions: | |
| Net investment income | | $ | | | 0.03 | | | | 0.12 | | | | 0.06 | | | | 0.07 | | | | 0.00 | * | |
| Net realized gain on investments | | $ | | | 0.15 | | | | — | | | | — | | | | — | | | | 0.00 | * | |
| Total distributions | | $ | | | 0.18 | | | | 0.12 | | | | 0.06 | | | | 0.07 | | | | 0.00 | | |
| Net asset value, end of year | | $ | | | 10.04 | | | | 9.10 | | | | 8.71 | | | | 7.97 | | | | 6.30 | | |
| Total Return(1) | | % | | | 12.49 | | | | 5.90 | | | | 10.19 | | | | 27.74 | | | | (22.76 | ) | |
| Ratios and Supplemental Data: | |
| Net assets, end of year (000's) | | $ | | | 59,969 | | | | 10,591 | | | | 4,047 | | | | 650 | | | | 199 | | |
| Ratios to average net assets: | |
| Net expenses after expense reimbursement(2) | | % | | | 0.76 | | | | 0.80 | | | | 0.80 | | | | 0.80 | | | | 0.80 | | |
| Gross expenses prior to expense reimbursement | | % | | | 0.80 | | | | 0.80 | | | | 0.80 | | | | 0.80 | | | | 0.80 | | |
| Net investment income after expense reimbursement(2) | | % | | | 1.10 | | | | 0.78 | | | | 1.33 | | | | 1.03 | | | | 1.08 | | |
| Portfolio turnover rate | | % | | | 194 | | | | 220 | | | | 91 | | | | 35 | | | | 60 | | |
| | | | | Class S | |
| | | | | Year Ended December 31, | |
| | | | | 2006 | | 2005 | | 2004 | | 2003 | | 2002 | |
| Per Share Operating Performance: | |
| Net asset value, beginning of year | | $ | | | 9.10 | | | | 8.70 | | | | 7.96 | | | | 6.29 | | | | 8.16 | | |
| Income (loss) from investment operations: | |
| Net investment income | | $ | | | 0.07 | | | | 0.05 | ** | | | 0.08 | | | | 0.06 | | | | 0.05 | | |
| Net realized and unrealized gain (loss) on investments | | $ | | | 1.02 | | | | 0.44 | | | | 0.71 | | | | 1.66 | | | | (1.92 | ) | |
| Total from investment operations | | $ | | | 1.09 | | | | 0.49 | | | | 0.79 | | | | 1.72 | | | | (1.87 | ) | |
| Less distributions: | |
| Net investment income | | $ | | | 0.01 | | | | 0.09 | | | | 0.05 | | | | 0.05 | | | | 0.00 | * | |
| Net realized gain on investments | | $ | | | 0.15 | | | | — | | | | — | | | | — | | | | 0.00 | * | |
| Total distributions | | $ | | | 0.16 | | | | 0.09 | | | | 0.05 | | | | 0.05 | | | | 0.00 | | |
| Net asset value, end of year | | $ | | | 10.03 | | | | 9.10 | | | | 8.70 | | | | 7.96 | | | | 6.29 | | |
| Total Return(1) | | % | | | 12.14 | | | | 5.71 | | | | 9.95 | | | | 27.38 | | | | (22.89 | ) | |
| Ratios and Supplemental Data: | |
| Net assets, end of year (000's) | | $ | | | 35,245 | | | | 26,757 | | | | 39,657 | | | | 37,612 | | | | 32,443 | | |
| Ratios to average net assets: | |
| Net expenses after expense reimbursement(2) | | % | | | 1.01 | | | | 1.05 | | | | 1.05 | | | | 1.05 | | | | 1.05 | | |
| Gross expenses prior to expense reimbursement | | % | | | 1.05 | | | | 1.05 | | | | 1.05 | | | | 1.05 | | | | 1.05 | | |
| Net investment income after expense reimbursement(2) | | % | | | 0.70 | | | | 0.55 | | | | 0.93 | | | | 0.74 | | | | 0.57 | | |
| Portfolio turnover rate | | % | | | 194 | | | | 220 | | | | 91 | | | | 35 | | | | 60 | | |
(1) Total return is calculated assuming reinvestment of all dividends and capital gain distributions at net asset value and does not reflect the effect of insurance contract changes.
(2) The Investment Adviser has agreed to limit expenses, (excluding interest, taxes, brokerage and extraordinary expenses) subject to possible recoupment by the Investment Adviser within three years of being incurred.
* Amount is less than $0.005.
** Per share numbers have been calculated using the average number of shares outstanding throughout the period.
See Accompanying Notes to Financial Statements
119
ING FUNDAMENTAL RESEARCH PORTFOLIO (CONTINUED)
FINANCIAL
HIGHLIGHTS
Selected data for a share outstanding for each year.
| | | | | Class ADV | |
| | | | | Year Ended December 31, | |
| | | | | 2006 | | 2005 | | 2004 | | 2003 | | 2002 | |
| Per Share Operating Performance: | |
| Net asset value, beginning of year | | $ | | | 9.02 | | | | 8.63 | | | | 7.90 | | | | 6.28 | | | | 8.16 | | |
| Income (loss) from investment operations: | |
| Net investment income | | $ | | | 0.04 | | | | 0.03 | ** | | | 0.05 | | | | 0.05 | | | | 0.00 | * | |
| Net realized and unrealized gain (loss) on investments | | $ | | | 1.02 | | | | 0.43 | | | | 0.71 | | | | 1.64 | | | | (1.88 | ) | |
| Total from investment operations | | $ | | | 1.06 | | | | 0.46 | | | | 0.76 | | | | 1.69 | | | | (1.88 | ) | |
| Less distributions: | |
| Net investment income | | $ | | | — | | | | 0.07 | | | | 0.03 | | | | 0.07 | | | | 0.00 | * | |
| Net realized gain on investments | | $ | | | 0.15 | | | | — | | | | — | | | | — | | | | 0.00 | * | |
| Total distributions | | $ | | | 0.15 | | | | 0.07 | | | | 0.03 | | | | 0.07 | | | | 0.00 | | |
| Net asset value, end of year | | $ | | | 9.93 | | | | 9.02 | | | | 8.63 | | | | 7.90 | | | | 6.28 | | |
| Total Return(1) | | % | | | 11.91 | | | | 5.33 | | | | 9.73 | | | | 26.99 | | | | (23.03 | ) | |
| Ratios and Supplemental Data: | |
| Net assets, end of year (000's) | | $ | | | 3,867 | | | | 3,813 | | | | 3,625 | | | | 4,669 | | | | 1,036 | | |
| Ratios to average net assets: | |
| Net expenses after expense reimbursement(2) | | % | | | 1.26 | | | | 1.30 | | | | 1.30 | | | | 1.30 | | | | 1.30 | | |
| Gross expenses prior to expense reimbursement | | % | | | 1.30 | | | | 1.30 | | | | 1.30 | | | | 1.30 | | | | 1.30 | | |
| Net investment income after expense reimbursement(2) | | % | | | 0.43 | | | | 0.30 | | | | 0.61 | | | | 0.50 | | | | 0.53 | | |
| Portfolio turnover rate | | % | | | 194 | | | | 220 | | | | 91 | | | | 35 | | | | 60 | | |
(1) Total return is calculated assuming reinvestment of all dividends and capital gain distributions at net asset value and does not reflect the effect of insurance contract changes.
(2) The Investment Adviser has agreed to limit expenses, (excluding interest, taxes, brokerage and extraordinary expenses) subject to possible recoupment by the Investment Adviser within three years of being incurred.
* Amount is less than $0.005.
** Per share numbers have been calculated using the average number of shares outstanding throughout the period.
See Accompanying Notes to Financial Statements
120
ING GOLDMAN SACHS® CAPITAL GROWTH PORTFOLIO
FINANCIAL HIGHLIGHTS
Selected data for a share outstanding for each year.
| | | | | Class I | |
| | | | | Year Ended December 31, | |
| | | | | 2006 | | 2005 | | 2004 | | 2003 | | 2002 | |
| Per Share Operating Performance: | |
| Net asset value, beginning of year | | $ | | | 11.49 | | | | 11.31 | | | | 10.40 | | | | 8.40 | | | | 11.15 | | |
| Income (loss) from investment operations: | |
| Net investment income (loss) | | $ | | | 0.01 | | | | (0.00 | )** | | | 0.05 | | | | 0.02 | | | | 0.01 | | |
Net realized and unrealized gain (loss)
on investments | | $ | | | 1.00 | | | | 0.24 | | | | 0.89 | | | | 1.98 | | | | (2.76 | ) | |
| Total from investment operations | | $ | | | 1.01 | | | | 0.24 | | | | 0.94 | | | | 2.00 | | | | (2.75 | ) | |
| Less distributions: | |
| Net investment income | | $ | | | — | | | | 0.06 | | | | 0.03 | | | | — | | | | 0.00 | * | |
| Total distributions | | $ | | | — | | | | 0.06 | | | | 0.03 | | | | — | | | | 0.00 | | |
| Net asset value, end of year | | $ | | | 12.50 | | | | 11.49 | | | | 11.31 | | | | 10.40 | | | | 8.40 | | |
| Total Return(1) | | % | | | 8.79 | | | | 2.17 | | | | 9.08 | | | | 23.81 | | | | (24.65 | ) | |
| Ratios and Supplemental Data: | |
| Net assets, end of year (000's) | | $ | | | 3,191 | | | | 2,806 | | | | 1,761 | | | | 1,210 | | | | 173 | | |
| Ratios to net assets: | |
Net expenses after brokerage
commission recapture | | % | | | 0.89 | | | | 1.05 | | | | 1.05 | | | | 1.05 | | | | 1.05 | | |
Gross expenses prior to brokerage
commission recapture | | % | | | 0.90 | | | | 1.05 | | | | 1.05 | | | | 1.05 | | | | 1.05 | | |
Net investment income (loss) after brokerage
commission recapture | | $ | | | 0.08 | | | | (0.01 | ) | | | 0.54 | | | | 0.30 | | | | 0.45 | | |
| Portfolio turnover rate | | $ | | | 56 | | | | 34 | | | | 46 | | | | 23 | | | | 32 | | |
| | | | | Class S | |
| | | | | Year Ended December 31, | |
| | | | | 2006 | | 2005 | | 2004 | | 2003 | | 2002 | |
| Per Share Operating Performance: | |
| Net asset value, beginning of year | | $ | | | 11.44 | | | | 11.26 | | | | 10.36 | | | | 8.38 | | | | 11.15 | | |
| Income (loss) from investment operations: | |
| Net investment income (loss) | | $ | | | (0.03 | ) | | | (0.03 | )** | | | 0.02 | | | | 0.01 | | | | (0.01 | ) | |
Net realized and unrealized gain (loss)
on investments | | $ | | | 1.01 | | | | 0.24 | | | | 0.88 | | | | 1.97 | | | | (2.76 | ) | |
| Total from investment operations | | $ | | | 0.98 | | | | 0.21 | | | | 0.90 | | | | 1.98 | | | | (2.77 | ) | |
| Less distributions: | |
| Net investment income | | $ | | | — | | | | 0.03 | | | | 0.00 | * | | | — | | | | 0.00 | * | |
| Total distributions | | $ | | | — | | | | 0.03 | | | | 0.00 | | | | — | | | | 0.00 | | |
| Net asset value, end of year | | $ | | | 12.42 | | | | 11.44 | | | | 11.26 | | | | 10.36 | | | | 8.38 | | |
| Total Return(1) | | % | | | 8.57 | | | | 1.90 | | | | 8.74 | | | | 23.63 | | | | (24.84 | ) | |
| Ratios and Supplemental Data: | |
| Net assets, end of year (000's) | | $ | | | 31,117 | | | | 55,785 | | | | 87,353 | | | | 90,005 | | | | 78,023 | | |
| Ratios to net assets: | |
Net expenses after brokerage
commission recapture | | % | | | 1.14 | | | | 1.30 | | | | 1.30 | | | | 1.30 | | | | 1.30 | | |
Gross expenses prior to brokerage
commission recapture | | % | | | 1.15 | | | | 1.30 | | | | 1.30 | | | | 1.30 | | | | 1.30 | | |
Net investment income (loss) after brokerage
commission recapture | | % | | | (0.19 | ) | | | (0.26 | ) | | | 0.28 | | | | 0.06 | | | | (0.08 | ) | |
| Portfolio turnover rate | | % | | | 56 | | | | 34 | | | | 46 | | | | 23 | | | | 32 | | |
(1) Total return is calculated assuming reinvestment of all dividends and capital gain distributions at net asset value and does not reflect the effect of insurance contract changes.
* Amount is less than $0.005 or more than $(0.005).
** Per share numbers have been calculated using average number of shares outstanding throughout the period.
See Accompanying Notes to Financial Statements
121
ING GOLDMAN SACHS® CAPITAL GROWTH PORTFOLIO (CONTINUED)
FINANCIAL HIGHLIGHTS
Selected data for a share outstanding for each year.
| | | | | Class ADV | |
| | | | | Year Ended December 31, | |
| | | | | 2006 | | 2005 | | 2004 | | 2003 | | 2002 | |
| Per Share Operating Performance: | |
| Net asset value, beginning of year | | $ | | | 11.43 | | | | 11.24 | | | | 10.36 | | | | 8.41 | | | | 11.15 | | |
| Income (loss) from investment operations: | |
| Net investment income (loss) | | $ | | | (0.06 | ) | | | (0.06 | )* | | | 0.01 | | | | (0.02 | ) | | | (0.00 | )** | |
Net realized and unrealized gain (loss)
on investments | | $ | | | 1.00 | | | | 0.25 | | | | 0.87 | | | | 1.97 | | | | (2.74 | ) | |
| Total from investment operations | | $ | | | 0.94 | | | | 0.19 | | | | 0.88 | | | | 1.95 | | | | (2.74 | ) | |
| Less distributions: | |
| Net investment income | | $ | | | — | | | | — | | | | — | | | | — | | | | 0.00 | ** | |
| Total distributions | | $ | | | — | | | | — | | | | — | | | | — | | | | 0.00 | ** | |
| Net asset value, end of year | | $ | | | 12.37 | | | | 11.43 | | | | 11.24 | | | | 10.36 | | | | 8.41 | | |
| Total Return(1) | | % | | | 8.22 | | | | 1.69 | | | | 8.49 | | | | 23.19 | | | | (24.56 | ) | |
| Ratios and Supplemental Data: | |
| Net assets, end of year (000's) | | $ | | | 2,775 | | | | 3,845 | | | | 6,117 | | | | 5,299 | | | | 4,124 | | |
| Ratios to average net assets: | |
Net expenses after brokerage
commission recapture | | % | | | 1.39 | | | | 1.55 | | | | 1.55 | | | | 1.55 | | | | 1.55 | | |
Gross expenses prior to brokerage
commission recapture | | % | | | 1.40 | | | | 1.55 | | | | 1.55 | | | | 1.55 | | | | 1.55 | | |
Net investment income (loss) after brokerage
commission recapture | | % | | | (0.44 | ) | | | (0.51 | ) | | | 0.06 | | | | (0.19 | ) | | | (0.09 | ) | |
| Portfolio turnover rate | | % | | | 56 | | | | 34 | | | | 46 | | | | 23 | | | | 32 | | |
(1) Total return is calculated assuming reinvestment of all dividends and capital gain distributions at net asset value and does not reflect the effect of insurance contract changes.
* Per share numbers have been calculated using average number of shares outstanding throughout the period.
** Amount is less than $0.005 or more than $(0.005).
See Accompanying Notes to Financial Statements
122
ING GOLDMAN SACHS® STRUCTURED EQUITY PORTFOLIO
FINANCIAL HIGHLIGHTS
Selected data for a share outstanding for each period.
| | | | | Class I | | Class S | |
| | | | | December 29,
2006(4) to
December 31, | | January 1,
2006 to
May 4, | | Year Ended
December 31 | | May 1,
2003(1) to
December 31, | | Year Ended
December 31, | | May 1,
2003(1) to
December 31, | |
| | | | | 2006 | | 2006(4) | | 2005 | | 2004 | | 2003 | | 2006 | | 2005 | | 2004 | | 2003 | |
| Per Share Operating Performance: | |
| Net asset value, beginning of period | | $ | | | 11.74 | | | | 12.50 | | | | 13.42 | | | | 12.46 | | | | 10.00 | | | | 12.45 | | | | 13.38 | | | | 12.44 | | | | 10.00 | | |
Income (loss) from investment
operations: | |
| Net investment income (loss) | | $ | | | (0.00 | )** | | | 0.03 | * | | | 0.11 | | | | 0.14 | | | | 0.60 | | | | 0.07 | * | | | 0.07 | | | | 0.11 | | | | 0.04 | | |
Net realized and unrealized gain
on investments | | $ | | | — | | | | 0.77 | | | | 0.53 | | | | 1.44 | | | | 2.40 | | | | 1.18 | | | | 0.53 | | | | 1.43 | | | | 2.40 | | |
| Total from investment operations | | $ | | | (0.00 | )** | | | 0.80 | | | | 0.64 | | | | 1.58 | | | | 2.46 | | | | 1.25 | | | | 0.60 | | | | 1.54 | | | | 2.44 | | |
| Less distributions: | |
| Net investment income | | $ | | | — | | | | — | | | | 0.14 | | | | 0.06 | | | | — | | | | 0.13 | | | | 0.11 | | | | 0.04 | | | | — | | |
| Net realized gain on investments | | $ | | | — | | | | — | | | | 1.42 | | | | 0.56 | | | | — | | | | 1.83 | | | | 1.42 | | | | 0.56 | | | | — | | |
| Total distributions | | $ | | | — | | | | — | | | | 1.56 | | | | 0.62 | | | | — | | | | 1.96 | | | | 1.53 | | | | 0.60 | | | | — | | |
| Net asset value, end of period | | $ | | | 11.74 | | | | 13.30 | | | | 12.50 | | | | 13.42 | | | | 12.46 | | | | 11.74 | | | | 12.45 | | | | 13.38 | | | | 12.44 | | |
| Total Return(2) | | % | | | — | | | | 6.40 | | | | 5.88 | | | | 13.32 | | | | 24.60 | | | | 11.41 | | | | 5.54 | | | | 13.00 | | | | 24.40 | | |
| Ratios and Supplemental Data: | |
| Net assets, end of period (000's) | | $ | | | 1 | | | | 2 | | | | 1 | | | | 1 | | | | 1 | | | | 52,035 | | | | 99,719 | | | | 113,003 | | | | 96,497 | | |
| Ratios to average net assets: | |
| Expenses(3) | | % | | | 0.90 | | | | 0.90 | | | | 0.90 | | | | 0.90 | | | | 0.90 | | | | 1.15 | | | | 1.15 | | | | 1.15 | | | | 1.15 | | |
| Net investment income (loss)(3) | | % | | | (0.90 | ) | | | 0.62 | | | | 0.86 | | | | 1.16 | | | | 0.80 | | | | 0.55 | | | | 0.54 | | | | 0.91 | | | | 0.53 | | |
| Portfolio turnover rate | | % | | | 83 | | | | 83 | | | | 108 | | | | 120 | | | | 66 | | | | 83 | | | | 108 | | | | 120 | | | | 66 | | |
| | | | | Class ADV | |
| | | | | Year Ended December 31, | | May 1,
2003(1) to
December 31, | |
| | | | | 2006 | | 2005 | | 2004 | | 2003 | |
| Per Share Operating Performance: | |
| Net asset value, beginning of period | | $ | | | 12.31 | | | | 13.31 | | | | 12.42 | | | | 10.00 | | |
| Income from investment operations: | |
| Net investment income | | $ | | | 0.04 | * | | | 0.04 | * | | | 0.08 | | | | 0.02 | | |
| Net realized and unrealized gain on investments | | $ | | | 1.16 | | | | 0.52 | | | | 1.43 | | | | 2.40 | | |
| Total from investment operations | | $ | | | 1.20 | | | | 0.56 | | | | 1.51 | | | | 2.42 | | |
| Less distributions: | |
| Net investment income | | $ | | | 0.17 | | | | 0.14 | | | | 0.06 | | | | — | | |
| Net realized gain on investments | | $ | | | 1.83 | | | | 1.42 | | | | 0.56 | | | | — | | |
| Total distributions | | $ | | | 2.00 | | | | 1.56 | | | | 0.62 | | | | — | | |
| Net asset value, end of period | | $ | | | 11.51 | | | | 12.31 | | | | 13.31 | | | | 12.42 | | |
| Total Return(2) | | % | | | 11.11 | | | | 5.26 | | | | 12.76 | | | | 24.20 | | |
| Ratios and Supplemental Data: | |
| Net assets, end of period (000's) | | $ | | | 2,969 | | | | 953 | | | | 108 | | | | 1 | | |
| Ratios to average net assets: | |
| Expenses(3) | | % | | | 1.40 | | | | 1.40 | | | | 1.40 | | | | 1.40 | | |
| Net investment income(3) | | % | | | 0.35 | | | | 0.34 | | | | 1.14 | | | | 0.27 | | |
| Portfolio turnover rate | | % | | | 83 | | | | 108 | | | | 120 | | | | 66 | | |
(1) Commencement of operations.
(2) Total return is calculated assuming reinvestment of all dividends and capital gain distributions at net asset value and does not reflect the effect of insurance contract changes. Total return for periods less than one year is not annualized.
(3) Annualized for periods less than one year.
(4) Class I was fully redeemed on May 5, 2006 and recommenced operations on December 29, 2006.
* Per share numbers have been calculated using average number of shares outstanding throughout the period.
** Amount is more than $(0.005).
See Accompanying Notes to Financial Statements
123
ING JPMORGAN INTERNATIONAL PORTFOLIO
FINANCIAL HIGHLIGHTS
Selected data for a share outstanding for each year.
| | | | | Class I | |
| | | | | Year Ended December 31, | |
| | | | | 2006 | | 2005 | | 2004 | | 2003 | | 2002 | |
| Per Share Operating Performance: | |
| Net asset value, beginning of year | | $ | | | 13.43 | | | | 12.31 | | | | 10.47 | | | | 8.16 | | | | 10.03 | | |
| Income (loss) from investment operations: | |
| Net investment income | | $ | | | 0.20 | * | | | 0.17 | * | | | 0.18 | | | | 0.14 | | | | 0.06 | * | |
Net realized and unrealized gain (loss)
on investments | | $ | | | 2.77 | | | | 1.04 | | | | 1.79 | | | | 2.26 | | | | (1.88 | ) | |
| Total from investment operations | | $ | | | 2.97 | | | | 1.21 | | | | 1.97 | | | | 2.40 | | | | (1.82 | ) | |
| Less distributions: | |
| Net investment income | | $ | | | 0.14 | | | | 0.09 | | | | 0.13 | | | | 0.09 | | | | 0.05 | | |
| Net realized gain on investments | | $ | | | — | | | | — | | | | — | | | | — | | | | — | | |
| Total distributions | | $ | | | 0.14 | | | | 0.09 | | | | 0.13 | | | | 0.09 | | | | 0.05 | | |
| Net asset value, end of year | | $ | | | 16.26 | | | | 13.43 | | | | 12.31 | | | | 10.47 | | | | 8.16 | | |
| Total Return(1) | | % | | | 22.20 | | | | 9.95 | | | | 18.99 | | | | 29.45 | | | | (18.08 | ) | |
| Ratios and Supplemental Data: | |
| Net assets, end of year (000's) | | $ | | | 941,150 | | | | 352,116 | | | | 374,309 | | | | 338,566 | | | | 282,054 | | |
| Ratios to average net assets: | |
| Net expenses after expense reimbursement | | % | | | 1.00 | | | | 1.00 | | | | 1.00 | | | | 1.00 | | | | 1.00 | | |
| Gross expenses prior to expense reimbursement | | % | | | 1.00 | | | | 1.00 | | | | 1.00 | | | | 1.00 | | | | 1.00 | | |
Net investment income after expense
reimbursement | | % | | | 1.32 | | | | 1.38 | | | | 1.46 | | | | 1.56 | | | | 0.65 | | |
| Portfolio turnover rate | | % | | | 22 | | | | 8 | | | | 12 | | | | 23 | | | | 174 | | |
| | | | | Class S | |
| | | | | Year Ended December 31, | |
| | | | | 2006 | | 2005 | | 2004 | | 2003 | | 2002 | |
| Per Share Operating Performance: | |
| Net asset value, beginning of year | | $ | | | 13.34 | | | | 12.24 | | | | 10.44 | | | | 8.15 | | | | 10.04 | | |
| Income (loss) from investment operations: | |
| Net investment income (loss) | | $ | | | 0.15 | * | | | 0.13 | * | | | 0.11 | | | | (0.05 | ) | | | 0.02 | * | |
Net realized and unrealized gain (loss)
on investments | | $ | | | 2.77 | | | | 1.06 | | | | 1.81 | | | | 2.43 | | | | (1.86 | ) | |
| Total from investment operations | | $ | | | 2.92 | | | | 1.19 | | | | 1.92 | | | | 2.38 | | | | (1.84 | ) | |
| Less distributions: | |
| Net investment income | | $ | | | 0.02 | | | | 0.09 | | | | 0.12 | | | | 0.09 | | | | 0.05 | | |
| Total distributions | | $ | | | 0.02 | | | | 0.09 | | | | 0.12 | | | | 0.09 | | | | 0.05 | | |
| Net asset value, end of year | | $ | | | 16.24 | | | | 13.34 | | | | 12.24 | | | | 10.44 | | | | 8.15 | | |
| Total Return(1) | | % | | | 21.92 | | | | 9.79 | | | | 18.65 | | | | 29.38 | | | | (18.29 | ) | |
| Ratios and Supplemental Data: | |
| Net assets, end of year (000's) | | $ | | | 155,075 | | | | 563,406 | | | | 201,653 | | | | 8,034 | | | | 1 | | |
| Ratios to average net assets: | |
| Net expenses after expense reimbursement | | % | | | 1.25 | | | | 1.25 | | | | 1.25 | | | | 1.25 | | | | 1.25 | | |
| Gross expenses prior to expense reimbursement | | % | | | 1.25 | | | | 1.25 | | | | 1.25 | | | | 1.25 | | | | 1.25 | | |
Net investment income (loss) after expense
reimbursement | | % | | | 1.05 | | | | 1.03 | | | | 0.85 | | | | (0.21) | | | | 0.24 | | |
| Portfolio turnover rate | | % | | | 22 | | | | 8 | | | | 12 | | | | 23 | | | | 174 | | |
(1) Total return is calculated assuming reinvestment of all dividends and capital gain distributions at net asset value and does not reflect the effect of insurance contract changes.
* Per share numbers have been calculated using average number of shares outstanding throughout the period.
See Accompanying Notes to Financial Statements
124
ING JPMORGAN INTERNATIONAL PORTFOLIO (CONTINUED)
FINANCIAL HIGHLIGHTS
Selected data for a share outstanding for each year.
| | | | | Class ADV | |
| | | | | Year Ended December 31, | |
| | | | | 2006 | | 2005 | | 2004 | | 2003 | | 2002 | |
| Per Share Operating Performance: | |
| Net asset value, beginning of year | | $ | | | 13.26 | | | | 12.18 | | | | 10.40 | | | | 8.13 | | | | 10.03 | | |
| Income (loss) from investment operations: | |
| Net investment income (loss) | | $ | | | 0.10 | * | | | 0.10 | * | | | 0.08 | | | | 0.05 | | | | (0.04 | )* | |
Net realized and unrealized gain (loss)
on investments | | $ | | | 2.76 | | | | 1.04 | | | | 1.81 | | | | 2.30 | | | | (1.81 | ) | |
| Total from investment operations | | $ | | | 2.86 | | | | 1.14 | | | | 1.89 | | | | 2.35 | | | | (1.85 | ) | |
| Less distributions: | |
| Net investment income | | $ | | | 0.10 | | | | 0.06 | | | | 0.11 | | | | 0.08 | | | | 0.05 | | |
| Total distributions | | $ | | | 0.10 | | | | 0.06 | | | | 0.11 | | | | 0.08 | | | | 0.05 | | |
| Net asset value, end of year | | $ | | | 16.02 | | | | 13.26 | | | | 12.18 | | | | 10.40 | | | | 8.13 | | |
| Total Return(1) | | % | | | 21.65 | | | | 9.42 | | | | 18.34 | | | | 28.98 | | | | (18.48 | ) | |
| Ratios and Supplemental Data: | |
| Net assets, end of year (000's) | | $ | | | 10,215 | | | | 3,505 | | | | 2,224 | | | | 1,184 | | | | 485 | | |
| Ratios to average net assets: | |
| Net expenses after expense reimbursement | | % | | | 1.50 | | | | 1.50 | | | | 1.50 | | | | 1.50 | | | | 1.50 | | |
| Gross expenses prior to expense reimbursement | | % | | | 1.50 | | | | 1.50 | | | | 1.50 | | | | 1.50 | | | | 1.50 | | |
Net investment income (loss) after expense
reimbursement | | % | | | 0.68 | | | | 0.84 | | | | 0.85 | | | | 0.86 | | | | (0.45) | | |
| Portfolio turnover rate | | % | | | 22 | | | | 8 | | | | 12 | | | | 23 | | | | 174 | | |
(1) Total return is calculated assuming reinvestment of all dividends and capital gain distributions at net asset value and does not reflect the effect of insurance contract changes.
* Per share numbers have been calculated using average number of shares outstanding throughout the period.
See Accompanying Notes to Financial Statements
125
ING JPMORGAN MID CAP VALUE PORTFOLIO
FINANCIAL HIGHLIGHTS
Selected data for a share outstanding for each period.
| | | | | Class I | |
| | | | | Year Ended December 31, | | May 1,
2002(1) to
December 31, | |
| | | | | 2006 | | 2005 | | 2004 | | 2003 | | 2002 | |
| Per Share Operating Performance: | |
| Net asset value, beginning of period | | $ | | | 14.02 | | | | 13.93 | | | | 11.91 | | | | 9.24 | | | | 10.00 | | |
| Income (loss) from investment operations: | |
| Net investment income | | $ | | | 0.14 | | | | 0.08 | | | | 0.04 | | | | 0.05 | | | | 0.02 | | |
Net realized and unrealized gain (loss)
on investments | | $ | | | 2.21 | | | | 1.14 | | | | 2.44 | | | | 2.75 | | | | (0.75 | ) | |
| Total from investment operations | | $ | | | 2.35 | | | | 1.22 | | | | 2.48 | | | | 2.80 | | | | (0.73 | ) | |
| Less distributions: | |
| Net investment income | | $ | | | 0.00 | * | | | 0.08 | | | | 0.04 | | | | 0.05 | | | | 0.03 | | |
| Net realized gain on investments | | $ | | | 0.11 | | | | 1.05 | | | | 0.42 | | | | 0.08 | | | | — | | |
| Total distributions | | $ | | | 0.11 | | | | 1.13 | | | | 0.46 | | | | 0.13 | | | | 0.03 | | |
| Net asset value, end of period | | $ | | | 16.26 | | | | 14.02 | | | | 13.93 | | | | 11.91 | | | | 9.24 | | |
| Total Return(2) | | % | | | 16.84 | | | | 8.71 | | | | 20.88 | | | | 30.31 | | | | (7.30 | ) | |
| Ratios and Supplemental Data: | |
| Net assets, end of period (000's) | | $ | | | 125,602 | | | | 80,426 | | | | 55,163 | | | | 16,662 | | | | 957 | | |
| Ratios to average net assets: | |
| Expenses(3) | | % | | | 1.03 | | | | 1.10 | | | | 1.10 | | | | 1.10 | | | | 1.10 | | |
| Net investment income(3) | | % | | | 1.08 | | | | 0.67 | | | | 0.49 | | | | 1.04 | | | | 0.85 | | |
| Portfolio turnover rate | | % | | | 44 | | | | 52 | | | | 45 | | | | 44 | | | | 31 | | |
| | | | | Class S | |
| | | | | Year Ended December 31, | | May 1,
2002(1) to
December 31, | |
| | | | | 2006 | | 2005 | | 2004 | | 2003 | | 2002 | |
| Per Share Operating Performance: | |
| Net asset value, beginning of period | | $ | | | 13.98 | | | | 13.89 | | | | 11.89 | | | | 9.23 | | | | 10.00 | | |
| Income (loss) from investment operations: | |
| Net investment income | | $ | | | 0.12 | | | | 0.05 | | | | 0.02 | | | | 0.04 | | | | 0.02 | | |
Net realized and unrealized gain (loss)
on investments | | $ | | | 2.18 | | | | 1.13 | | | | 2.42 | | | | 2.73 | | | | (0.77 | ) | |
| Total from investment operations | | $ | | | 2.30 | | | | 1.18 | | | | 2.44 | | | | 2.77 | | | | (0.75 | ) | |
| Less distributions: | |
| Net investment income | | $ | | | 0.00 | * | | | 0.04 | | | | 0.02 | | | | 0.03 | | | | 0.02 | | |
| Net realized gain on investments | | $ | | | 0.11 | | | | 1.05 | | | | 0.42 | | | | 0.08 | | | | — | | |
| Total distributions | | $ | | | 0.11 | | | | 1.09 | | | | 0.44 | | | | 0.11 | | | | 0.02 | | |
| Net asset value, end of period | | $ | | | 16.17 | | | | 13.98 | | | | 13.89 | | | | 11.89 | | | | 9.23 | | |
| Total Return(2) | | % | | | 16.52 | | | | 8.49 | | | | 20.59 | | | | 30.05 | | | | (7.53 | ) | |
| Ratios and Supplemental Data: | |
| Net assets, end of period (000's) | | $ | | | 91,338 | | | | 78,459 | | | | 64,420 | | | | 16,372 | | | | 6,027 | | |
| Ratios to average net assets: | |
| Expenses(3) | | % | | | 1.28 | | | | 1.35 | | | | 1.35 | | | | 1.35 | | | | 1.35 | | |
| Net investment income(3) | | % | | | 0.81 | | | | 0.39 | | | | 0.26 | | | | 0.61 | | | | 0.35 | | |
| Portfolio turnover rate | | % | | | 44 | | | | 52 | | | | 45 | | | | 44 | | | | 31 | | |
(1) Commencement of operations.
(2) Total return is calculated assuming reinvestment of all dividends and capital gain distributions at net asset value and does not reflect the effect of insurance contract changes. Total return for periods less than one year is not annualized.
(3) Annualized for periods less than one year.
* Amount is less than $0.005.
See Accompanying Notes to Financial Statements
126
ING JPMORGAN MID CAP VALUE PORTFOLIO (CONTINUED)
FINANCIAL HIGHLIGHTS
Selected data for a share outstanding for each period.
| | | | | Class ADV | |
| | | | | Year Ended December 31, | | May 1,
2002(1) to
December 31, | |
| | | | | 2006 | | 2005 | | 2004 | | 2003 | | 2002 | |
| Per Share Operating Performance: | |
| Net asset value, beginning of period | | $ | | | 13.89 | | | | 13.84 | | | | 11.86 | | | | 9.22 | | | | 10.00 | | |
| Income (loss) from investment operations: | |
| Net investment income (loss) | | $ | | | 0.07 | | | | 0.02 | | | | (0.00 | )* | | | 0.03 | | | | 0.01 | | |
Net realized and unrealized gain (loss)
on investments | | $ | | | 2.18 | | | | 1.11 | | | | 2.40 | | | | 2.70 | | | | (0.77 | ) | |
| Total from investment operations | | $ | | | 2.25 | | | | 1.13 | | | | 2.40 | | | | 2.73 | | | | (0.76 | ) | |
| Less distributions: | |
| Net investment income | | $ | | | 0.00 | * | | | 0.03 | | | | — | | | | 0.01 | | | | 0.02 | | |
| Net realized gain on investments | | $ | | | 0.11 | | | | 1.05 | | | | 0.42 | | | | 0.08 | | | | — | | |
| Total distributions | | $ | | | 0.11 | | | | 1.08 | | | | 0.42 | | | | 0.09 | | | | 0.02 | | |
| Net asset value, end of period | | $ | | | 16.03 | | | | 13.89 | | | | 13.84 | | | | 11.86 | | | | 9.22 | | |
| Total Return(2) | | % | | | 16.26 | | | | 8.11 | | | | 20.31 | | | | 29.68 | | | | (7.64 | ) | |
| Ratios and Supplemental Data: | |
| Net assets, end of period (000's) | | $ | | | 22,123 | | | | 12,408 | | | | 4,980 | | | | 1,354 | | | | 331 | | |
| Ratios to average net assets: | |
| Expenses(3) | | % | | | 1.53 | | | | 1.60 | | | | 1.60 | | | | 1.60 | | | | 1.60 | | |
| Net investment income (loss)(3) | | % | | | 0.61 | | | | 0.20 | | | | (0.02 | ) | | | 0.36 | | | | 0.26 | | |
| Portfolio turnover rate | | % | | | 44 | | | | 52 | | | | 45 | | | | 44 | | | | 31 | | |
(1) Commencement of operations.
(2) Total return is calculated assuming reinvestment of all dividends and capital gain distributions at net asset value and does not reflect the effect of insurance contract changes. Total return for periods less than one year is not annualized.
(3) Annualized for periods less than one year.
* Amount is less than $0.005 or more than $(0.005).
See Accompanying Notes to Financial Statements
127
ING LEGG MASON PARTNERS AGGRESSIVE GROWTH PORTFOLIO
FINANCIAL HIGHLIGHTS
Selected data for a share outstanding for each year.
| | | | | Class I | |
| | | | | Year Ended December 31, | |
| | | | | 2006 | | 2005 | | 2004 | | 2003 | | 2002 | |
| Per Share Operating Performance: | |
| Net asset value, beginning of year | | $ | | | 44.52 | | | | 39.95 | | | | 36.41 | | | | 26.35 | | | | 40.73 | | |
| Income (loss) from investment operations: | |
| Net investment income (loss) | | $ | | | (0.02 | )* | | | (0.15 | ) | | | 0.03 | | | | (0.14 | )* | | | (0.11 | ) | |
Net realized and unrealized gain (loss)
on investments | | $ | | | 4.60 | | | | 4.72 | | | | 3.51 | | | | 10.20 | | | | (14.27 | ) | |
| Total from investment operations | | $ | | | 4.58 | | | | 4.57 | | | | 3.54 | | | | 10.06 | | | | (14.38 | ) | |
| Net asset value, end of year | | $ | | | 49.10 | | | | 44.52 | | | | 39.95 | | | | 36.41 | | | | 26.35 | | |
| Total Return(1) | | % | | | 10.29 | | | | 11.44 | † | | | 9.72 | | | | 38.18 | | | | (35.31 | ) | |
| Ratios and Supplemental Data: | |
| Net assets, end of year (000's) | | $ | | | 1,155,244 | | | | 531,343 | | | | 575,903 | | | | 610,593 | | | | 452,465 | | |
| Ratios to average net assets: | |
| Expenses | | % | | | 0.80 | | | | 0.81 | | | | 0.82 | | | | 0.83 | | | | 0.82 | | |
| Net investment income (loss) | | % | | | (0.05 | ) | | | (0.33 | ) | | | 0.06 | | | | (0.46 | ) | | | (0.31 | ) | |
| Portfolio turnover rate | | % | | | 6 | | | | 10 | | | | 3 | | | | 0 | | | | 174 | | |
| | | | | Class S | |
| | | | | Year Ended December 31, | |
| | | | | 2006 | | 2005 | | 2004 | | 2003 | | 2002 | |
| Per Share Operating Performance: | |
| Net asset value, beginning of year | | $ | | | 44.08 | | | | 39.65 | | | | 36.23 | | | | 26.28 | | | | 40.72 | | |
| Income (loss) from investment operations: | |
| Net investment loss | | $ | | | (0.18 | )* | | | (0.23 | ) | | | (0.01 | ) | | | (0.28 | )* | | | (0.18 | ) | |
Net realized and unrealized gain (loss)
on investments | | $ | | | 4.59 | | | | 4.66 | | | | 3.43 | | | | 10.23 | | | | (14.26 | ) | |
| Total from investment operations | | $ | | | 4.41 | | | | 4.43 | | | | 3.42 | | | | 9.95 | | | | (14.44 | ) | |
| Net asset value, end of year | | $ | | | 48.49 | | | | 44.08 | | | | 39.65 | | | | 36.23 | | | | 26.28 | | |
| Total Return(1) | | % | | | 10.00 | | | | 11.17 | † | | | 9.44 | | | | 37.86 | | | | (35.46 | ) | |
| Ratios and Supplemental Data: | |
| Net assets, end of year (000's) | | $ | | | 186,363 | | | | 437,476 | | | | 355,857 | | | | 13,970 | | | | 7 | | |
| Ratios to average net assets: | |
| Expenses | | % | | | 1.05 | | | | 1.06 | | | | 1.07 | | | | 1.12 | | | | 1.07 | | |
| Net investment income (loss) | | % | | | (0.40 | ) | | | (0.58 | ) | | | (0.04 | ) | | | (0.82 | ) | | | (0.57 | ) | |
| Portfolio turnover rate | | % | | | 6 | | | | 10 | | | | 3 | | | | 0 | | | | 174 | | |
(1) Total return is calculated assuming reinvestment of all dividends and capital gain distributions at net asset value and does not reflect the effect of insurance contract changes.
* Per share numbers have been calculated using average number of shares outstanding throughout the period.
† In 2005, there was no impact on total return from the gain realized on the disposal of investments made in violation of the Portfolio's investment restrictions.
See Accompanying Notes to Financial Statements
128
ING LEGG MASON PARTNERS AGGRESSIVE GROWTH PORTFOLIO (CONTINUED)
FINANCIAL HIGHLIGHTS
Selected data for a share outstanding for each year.
| | | | | Class ADV | |
| | | | | Year Ended December 31, | |
| | | | | 2006 | | 2005 | | 2004 | | 2003 | | 2002 | |
| Per Share Operating Performance: | |
| Net asset value, beginning of year | | $ | | | 43.64 | | | | 39.35 | | | | 36.04 | | | | 26.22 | | | | 40.71 | | |
| Income (loss) from investment operations: | |
| Net investment loss | | $ | | | (0.27 | )* | | | (0.33 | )* | | | (0.12 | ) | | | (0.28 | )* | | | (0.25 | ) | |
Net realized and unrealized gain (loss)
on investments | | $ | | | 4.52 | | | | 4.62 | | | | 3.43 | | | | 10.10 | | | | (14.24 | ) | |
| Total from investment operations | | $ | | | 4.25 | | | | 4.29 | | | | 3.31 | | | | 9.82 | | | | (14.49 | ) | |
| Net asset value, end of year | | $ | | | 47.89 | | | | 43.64 | | | | 39.35 | | | | 36.04 | | | | 26.22 | | |
| Total Return(1) | | % | | | 9.74 | | | | 10.90 | † | | | 9.18 | | | | 37.45 | | | | (35.59 | ) | |
| Ratios and Supplemental Data: | |
| Net assets, end of year (000's) | | $ | | | 8,459 | | | | 7,843 | | | | 3,196 | | | | 1,014 | | | | 489 | | |
| Ratios to average net assets: | |
| Expenses | | % | | | 1.30 | | | | 1.31 | | | | 1.32 | | | | 1.33 | | | | 1.32 | | |
| Net investment loss | | % | | | (0.59 | ) | | | (0.82 | ) | | | (0.45 | ) | | | (0.88 | ) | | | (0.76 | ) | |
| Portfolio turnover rate | | % | | | 6 | | | | 10 | | | | 3 | | | | 0 | | | | 174 | | |
(1) Total return is calculated assuming reinvestment of all dividends and capital gain distributions at net asset value and does not reflect the effect of insurance contract changes.
* Per share numbers have been calculated using average number of shares outstanding throughout the period.
† In 2005, there was no impact on total return from the gain realized on the disposal of investments made in violation of the Portfolio's investment restrictions.
See Accompanying Notes to Financial Statements
129
ING LEGG MASON PARTNERS LARGE CAP GROWTH PORTFOLIO
FINANCIAL HIGHLIGHTS
Selected data for a share outstanding for each period.
| | | | | Class I | |
| | | | | Year Ended December 31, | | May 1,
2003(1) to
December 31, | |
| | | | | 2006 | | 2005 | | 2004 | | 2003 | |
| Per Share Operating Performance: | |
| Net asset value, beginning of period | | $ | | | 11.66 | | | | 12.28 | | | | 12.13 | | | | 10.00 | | |
| Income (loss) from investment operations: | |
| Net investment income (loss) | | $ | | | 0.01 | | | | 0.00 | * | | | 0.00 | * | | | (0.02 | ) | |
| Net realized and unrealized gain (loss) on investments | | $ | | | 0.45 | | | | 0.53 | | | | 0.71 | | | | 2.15 | | |
| Total from investment operations | | $ | | | 0.46 | | | | 0.53 | | | | 0.71 | | | | 2.13 | | |
| Less distributions: | |
| Net realized gain on investments | | $ | | | 0.18 | | | | 1.15 | | | | 0.56 | | | | — | | |
| Total distributions | | $ | | | 0.18 | | | | 1.15 | | | | 0.56 | | | | — | | |
| Net asset value, end of period | | $ | | | 11.94 | | | | 11.66 | | | | 12.28 | | | | 12.13 | | |
| Total Return(2) | | % | | | 4.19 | | | | 5.24 | | | | 6.69 | | | | 21.30 | | |
| Ratios and Supplemental Data: | |
| Net assets, end of period (000's) | | $ | | | 14,283 | | | | 18,673 | | | | 18,587 | | | | 1 | | |
| Ratios to average net assets: | |
| Expenses(3) | | % | | | 0.84 | | | | 0.84 | | | | 0.89 | | | | 0.90 | | |
| Net investment income (loss)(3) | | % | | | 0.10 | | | | 0.01 | | | | 0.04 | | | | (0.26 | ) | |
| Portfolio turnover rate | | % | | | 14 | | | | 27 | | | | 291 | | | | 116 | | |
| | | | | Class S | |
| | | | | Year Ended December 31, | | May 1,
2003(1) to
December 31, | |
| | | | | 2006 | | 2005 | | 2004 | | 2003 | |
| Per Share Operating Performance: | |
| Net asset value, beginning of period | | $ | | | 11.57 | | | | 12.22 | | | | 12.11 | | | | 10.00 | | |
| Income (loss) from investment operations: | |
| Net investment loss | | $ | | | (0.02 | ) | | | (0.03 | ) | | | (0.00 | )* | | | (0.04 | ) | |
| Net realized and unrealized gain (loss) on investments | | $ | | | 0.44 | | | | 0.53 | | | | 0.67 | | | | 2.15 | | |
| Total from investment operations | | $ | | | 0.42 | | | | 0.50 | | | | 0.67 | | | | 2.11 | | |
| Less distributions: | |
| Net realized gain on investments | | $ | | | 0.18 | | | | 1.15 | | | | 0.56 | | | | — | | |
| Total distributions | | $ | | | 0.18 | | | | 1.15 | | | | 0.56 | | | | — | | |
| Net asset value, end of period | | $ | | | 11.81 | | | | 11.57 | | | | 12.22 | | | | 12.11 | | |
| Total Return(2) | | % | | | 3.88 | | | | 5.02 | | | | 6.45 | | | | 21.00 | | |
| Ratios and Supplemental Data: | |
| Net assets, end of period (000's) | | $ | | | 11,402 | | | | 14,287 | | | | 16,118 | | | | 1 | | |
| Ratios to average net assets: | |
| Expenses(3) | | % | | | 1.09 | | | | 1.09 | | | | 1.14 | | | | 1.15 | | |
| Net investment loss(3) | | % | | | (0.16 | ) | | | (0.23 | ) | | | (0.21 | ) | | | (0.53 | ) | |
| Portfolio turnover rate | | % | | | 14 | | | | 27 | | | | 291 | | | | 116 | | |
(1) Commencement of operations.
(2) Total return is calculated assuming reinvestment of all dividends and capital gain distributions at net asset value and does not reflect the effect of insurance contract changes. Total return for periods less than one year is not annualized.
(3) Annualized for periods less than one year.
* Amount is less than $0.005 or more than $(0.005).
See Accompanying Notes to Financial Statements
130
ING LEGG MASON PARTNERS LARGE CAP GROWTH PORTFOLIO (CONTINUED)
FINANCIAL HIGHLIGHTS
Selected data for a share outstanding for each period.
| | | | | Class ADV | |
| | | | | Year Ended December 31, | | May 1,
2003(1) to
December 31, | |
| | | | | 2006 | | 2005 | | 2004 | | 2003 | |
| Per Share Operating Performance: | |
| Net asset value, beginning of period | | $ | | | 11.49 | | | | 12.18 | | | | 12.09 | | | | 10.00 | | |
| Income (loss) from investment operations: | |
| Net investment loss | | $ | | | (0.05 | ) | | | (0.06 | ) | | | (0.08 | ) | | | (0.06 | ) | |
| Net realized and unrealized gain on investments | | $ | | | 0.44 | | | | 0.52 | | | | 0.73 | | | | 2.15 | | |
| Total from investment operations | | $ | | | 0.39 | | | | 0.46 | | | | 0.65 | | | | 2.09 | | |
| Less distributions: | |
| Net realized gain on investments | | $ | | | 0.18 | | | | 1.15 | | | | 0.56 | | | | — | | |
| Total distributions | | $ | | | 0.18 | | | | 1.15 | | | | 0.56 | | | | — | | |
| Net asset value, end of period | | $ | | | 11.70 | | | | 11.49 | | | | 12.18 | | | | 12.09 | | |
| Total Return(2) | | % | | | 3.64 | | | | 4.69 | | | | 6.21 | | | | 20.90 | | |
| Ratios and Supplemental Data: | |
| Net assets, end of period (000's) | | $ | | | 18,361 | | | | 25,166 | | | | 33,408 | | | | 42,935 | | |
| Ratios to average net assets: | |
| Expenses(3) | | % | | | 1.34 | | | | 1.34 | | | | 1.39 | | | | 1.40 | | |
| Net investment loss(3) | | % | | | (0.41 | ) | | | (0.49 | ) | | | (0.57 | ) | | | (0.78 | ) | |
| Portfolio turnover rate | | % | | | 14 | | | | 27 | | | | 291 | | | | 116 | | |
(1) Commencement of operations.
(2) Total return is calculated assuming reinvestment of all dividends and capital gain distributions at net asset value and does not reflect the effect of insurance contract changes. Total return for periods less than one year is not annualized.
(3) Annualized for periods less than one year.
See Accompanying Notes to Financial Statements
131
ING LORD ABBETT U.S. GOVERNMENT SECURITIES PORTFOLIO
FINANCIAL HIGHLIGHTS
Selected data for a share outstanding for each period.
| | | | | Class I | |
| | | | | January 3,
2006(1) to
December 31,
2006 | |
| Per Share Operating Performance: | |
| Net asset value, beginning of period | | $ | | | 10.00 | | |
| Income (loss) from investment operations: | |
| Net investment income | | $ | | | 0.45 | * | |
| Net realized and unrealized loss on investments | | $ | | | (0.07 | ) | |
| Total from investment operations | | $ | | | 0.38 | | |
| Less distributions: | |
| Net investment income | | $ | | | 0.45 | | |
| Total distributions | | $ | | | 0.45 | | |
| Net asset value, end of period | | $ | | | 9.93 | | |
| Total Return(2) | | % | | | 3.81 | | |
| Ratios and Supplemental Data: | |
| Net assets, end of period (000's) | | $ | | | 35,253 | | |
| Ratios to average net assets: | |
| Net expenses after expense reimbursement(3)(4) | | % | | | 0.73 | | |
Net expense before interest expense on reverse repurchase
agreements and after expense reimbursements(3)(4) | | % | | | 0.72 | | |
| Gross expenses prior to expense reimbursement(3) | | % | | | 0.73 | | |
| Net investment income after expense reimbursement(3)(4) | | % | | | 4.55 | | |
| Portfolio turnover rate | | % | | | 699 | | |
| | | | | Class S | | Class ADV | |
| | | | | January 18,
2006(1) to
December 31,
2006 | | December 20,
2006(1) to
December 31,
2006 | |
| Per Share Operating Performance: | |
| Net asset value, beginning of period | | $ | | | 10.05 | | | | 10.38 | | |
| Income (loss) from investment operations: | |
| Net investment income | | $ | | | 0.42 | * | | | 0.40 | * | |
| Net realized and unrealized loss on investments | | $ | | | (0.12 | ) | | | (0.43 | ) | |
| Total from investment operations | | $ | | | 0.30 | | | | (0.03 | ) | |
| Less distributions: | |
| Net investment income | | $ | | | 0.42 | | | | 0.45 | | |
| Total distributions | | $ | | | 0.42 | | | | 0.45 | | |
| Net asset value, end of period | | $ | | | 9.93 | | | | 9.90 | | |
| Total Return(2) | | % | | | 3.01 | | | | (0.28 | ) | |
| Ratios and Supplemental Data: | |
| Net assets, end of period (000's) | | $ | | | 14,053 | | | | 1 | | |
| Ratios to average net assets: | |
| Net expenses after expense reimbursement(3)(4) | | % | | | 0.98 | | | | 1.23 | | |
Net expense before interest expense on reverse repurchase
agreements and after expense reimbursements(3)(4) | | % | | | 0.97 | | | | 1.22 | | |
| Gross expenses prior to expense reimbursement(3) | | % | | | 0.98 | | | | 1.23 | | |
| Net investment income after expense reimbursement(3)(4) | | % | | | 4.26 | | | | 3.94 | | |
| Portfolio turnover rate | | % | | | 699 | | | | 699 | | |
(1) Commencement of operations.
(2) Total return is calculated assuming reinvestment of all dividends and capital gain distributions at net asset value and does not reflect the effect of insurance contract changes. Total return for periods less than one year is not annualized.
(3) Annualized for periods less than one year.
(4) The Investment Adviser has agreed to limit expenses, (excluding interest, taxes, brokerage and extraordinary expenses) subject to possible recoupment by the Investment Adviser within three years of being incurred.
* Per share numbers calculated using average shares outstanding throughout the period.
See Accompanying Notes to Financial Statements
132
ING NEUBERGER BERMAN PARTNERS PORTFOLIO
FINANCIAL HIGHLIGHTS
Selected data for a share outstanding for each period.
| | | | | Class I | |
| | | | | January 19,
2006(1) to
December 31,
2006 | |
| Per Share Operating Performance: | |
| Net asset value, beginning of period | | $ | | | 10.20 | | |
| Income (loss) from investment operations: | |
| Net investment income | | $ | | | 0.06 | * | |
| Net realized and unrealized loss on investments | | $ | | | 0.67 | | |
| Total from investment operations | | $ | | | 0.73 | | |
| Net asset value, end of period | | $ | | | 10.93 | | |
| Total Return(2) | | % | | | 7.16 | | |
| Ratios and Supplemental Data: | |
| Net assets, end of period (000's) | | $ | | | 232,030 | | |
| Ratios to average net assets: | |
| Net expenses after expense reimbursement(3)(4) | | % | | | 0.67 | | |
| Gross expenses prior to expense reimbursement(3) | | % | | | 0.75 | | |
| Net investment income after expense reimbursement(3)(4) | | % | | | 0.65 | | |
| Portfolio turnover rate | | % | | | 111 | | |
| | | | | Class S | | Class ADV | |
| | | | | January 3,
2006(1) to
December 31,
2006 | | December 29,
2006(1) to
December 31,
2006 | |
| Per Share Operating Performance: | |
| Net asset value, beginning of period | | $ | | | 10.00 | | | | 10.90 | | |
| Income (loss) from investment operations: | |
| Net investment income (loss) | | $ | | | 0.04 | * | | | (0.00 | )** | |
| Net realized and unrealized loss on investments | | $ | | | 0.86 | | | | — | | |
| Total from investment operations | | $ | | | 0.90 | | | | (0.00 | )** | |
| Net asset value, end of period | | $ | | | 10.90 | | | | 10.90 | | |
| Total Return(2) | | % | | | 9.00 | | | | — | | |
| Ratios and Supplemental Data: | |
| Net assets, end of period (000's) | | $ | | | 181,499 | | | | 1 | | |
| Ratios to average net assets: | |
| Net expenses after expense reimbursement(3)(4) | | % | | | 0.92 | | | | 1.17 | | |
| Gross expenses prior to expense reimbursement(3) | | % | | | 1.00 | | | | 1.25 | | |
| Net investment income (loss) after expense reimbursement(3)(4) | | % | | | 0.37 | | | | (1.17 | ) | |
| Portfolio turnover rate | | % | | | 111 | | | | 111 | | |
(1) Commencement of operations.
(2) Total return is calculated assuming reinvestment of all dividends and capital gain distributions at net asset value and does not reflect the effect of insurance contract changes. Total return for periods less than one year is not annualized.
(3) Annualized for periods less than one year.
(4) The Investment Adviser has agreed to limit expenses, (excluding interest, taxes, brokerage and extraordinary expenses) subject to possible recoupment by the Investment Adviser within three years of being incurred.
* Per share numbers calculated using average number of shares outstanding throughout the period.
** Amount is more than $(0.005).
See Accompanying Notes to Financial Statements
133
ING NEUBERGER BERMAN REGENCY PORTFOLIO
FINANCIAL HIGHLIGHTS
Selected data for a share outstanding for each period.
| | | | | Class I | |
| | | | | January 3,
2006(1) to
December 31,
2006 | |
| Per Share Operating Performance: | |
| Net asset value, beginning of period | | $ | | | 10.00 | | |
| Income from investment operations: | |
| Net investment income | | $ | | | 0.06 | * | |
| Net realized and unrealized gain on investments | | $ | | | 0.68 | | |
| Total from investment operations | | $ | | | 0.74 | | |
| Less distributions from: | |
| Net investment income | | $ | | | 0.05 | | |
| Net realized gain on investments | | $ | | | 0.03 | | |
| Total distributions | | $ | | | 0.08 | | |
| Net asset value, end of period | | $ | | | 10.66 | | |
| Total Return(2) | | % | | | 7.35 | | |
| Ratios and Supplemental Data: | |
| Net assets, end of period (000's) | | $ | | | 6,087 | | |
| Ratios to average net assets: | |
| Net expenses after expense reimbursement(3)(4) | | % | | | 0.88 | | |
| Gross expenses prior to expense reimbursement(3) | | % | | | 1.38 | | |
| Net investment income after expense reimbursement(3)(4) | | % | | | 0.62 | | |
| Portfolio turnover rate | | % | | | 36 | | |
| | | | | Class S | | Class ADV | |
| | | | | January 12,
2006(1) to
December 31,
2006 | | December 20,
2006(1) to
December 31,
2006 | |
| Per Share Operating Performance: | |
| Net asset value, beginning of period | | $ | | | 10.14 | | | | 10.78 | | |
| Income (loss) from investment operations: | |
| Net investment income (loss) | | $ | | | 0.04 | * | | | (0.00 | )** | |
| Net realized and unrealized gain (loss) on investments | | $ | | | 0.53 | | | | (0.07 | ) | |
| Total from investment operations | | $ | | | 0.57 | | | | (0.07 | ) | |
| Less distributions from: | |
| Net investment income | | $ | | | 0.03 | | | | 0.04 | | |
| Net realized gain on investments | | $ | | | 0.03 | | | | 0.03 | | |
| Total distributions | | $ | | | 0.06 | | | | 0.07 | | |
| Net asset value, end of period | | $ | | | 10.65 | | | | 10.64 | | |
| Total Return(2) | | % | | | 5.62 | | | | (0.61 | ) | |
| Ratios and Supplemental Data: | |
| Net assets, end of period (000's) | | $ | | | 6,446 | | | | 1 | | |
| Ratios to average net assets: | |
| Net expenses after expense reimbursement(3)(4) | | % | | | 1.13 | | | | 1.38 | | |
| Gross expenses prior to expense reimbursement(3) | | % | | | 1.63 | | | | 1.88 | | |
| Net investment income (loss) after expense reimbursement(3)(4) | | % | | | 0.45 | | | | (0.06 | ) | |
| Portfolio turnover rate | | | % | | | | 36 | | | | 36 | | |
(1) Commencement of operations.
(2) Total return is calculated assuming reinvestment of all dividends and capital gain distributions at net asset value and does not reflect the effect of insurance contract changes. Total return for periods less than one year is not annualized.
(3) Annualized for periods less than one year.
(4) The Investment Adviser has agreed to limit expenses, (excluding interest, taxes, brokerage and extraordinary expenses) subject to possible recoupment by the Investment Adviser within three years of being incurred.
* Per share numbers calculated using average number of shares outstanding throughout the period.
** Amount is more than $(0.005).
See Accompanying Notes to Financial Statements
134
ING OPCAP BALANCED VALUE PORTFOLIO
FINANCIAL HIGHLIGHTS
Selected data for a share outstanding for each year.
| | | | | Class I | |
| | | | | Year Ended December 31, | |
| | | | | 2006 | | 2005 | | 2004 | | 2003 | | 2002 | |
| Per Share Operating Performance: | |
| Net asset value, beginning of year | | $ | | | 13.78 | | | | 13.47 | | | | 12.32 | | | | 9.66 | | | | 12.40 | | |
| Income (loss) from investment operations: | |
| Net investment income | | $ | | | 0.17 | | | | 0.11 | | | | 0.14 | | | | 0.10 | | | | 0.07 | | |
Net realized and unrealized gain (loss)
on investments | | $ | | | 1.29 | | | | 0.29 | | | | 1.15 | | | | 2.84 | | | | (2.68 | ) | |
| Total from investment operations | | $ | | | 1.46 | | | | 0.40 | | | | 1.29 | | | | 2.94 | | | | (2.61 | ) | |
| Less distributions: | |
| Net investment income | | $ | | | 0.19 | | | | 0.09 | | | | 0.14 | | | | 0.28 | | | | 0.01 | | |
| Net realized gain on investments | | $ | | | — | | �� | | — | | | | — | | | | — | | | | 0.12 | | |
| Total distributions | | $ | | | 0.19 | | | | 0.09 | | | | 0.14 | | | | 0.28 | | | | 0.13 | | |
| Net asset value, end of year | | $ | | | 15.05 | | | | 13.78 | | | | 13.47 | | | | 12.32 | | | | 9.66 | | |
| Total Return(1) | | % | | | 10.75 | | | | 2.98 | | | | 10.58 | | | | 30.72 | | | | (21.06 | ) | |
| Ratios and Supplemental Data: | |
| Net assets, end of year (000's) | | $ | | | 4,459 | | | | 4,204 | | | | 4,046 | | | | 1,064 | | | | 196 | | |
| Ratios to average net assets: | |
Net expenses after brokerage commission
recapture | | % | | | 0.97 | | | | 1.00 | | | | 1.00 | | | | 1.00 | | | | 1.00 | | |
Gross expenses prior to brokerage commission
recapture | | % | | | 1.00 | | | | 1.00 | | | | 1.00 | | | | 1.00 | | | | 1.00 | | |
Net investment income after brokerage
commission recapture | | % | | | 1.30 | | | | 0.82 | | | | 0.59 | | | | 1.12 | | | | 2.11 | | |
| Portfolio turnover rate | | % | | | 79 | | | | 80 | | | | 110 | | | | 125 | | | | 133 | | |
| | | | | Class S | |
| | | | | Year Ended December 31, | |
| | | | | 2006 | | 2005 | | 2004 | | 2003 | | 2002 | |
| Per Share Operating Performance: | |
| Net asset value, beginning of year | | $ | | | 13.75 | | | | 13.43 | | | | 12.29 | | | | 9.64 | | | | 12.40 | | |
| Income (loss) from investment operations: | |
| Net investment income | | $ | | | 0.14 | * | | | 0.08 | | | | 0.04 | | | | 0.11 | | | | 0.23 | | |
Net realized and unrealized gain (loss)
on investments | | $ | | | 1.27 | | | | 0.29 | | | | 1.22 | | | | 2.79 | | | | (2.86 | ) | |
| Total from investment operations | | $ | | | 1.41 | | | | 0.37 | | | | 1.26 | | | | 2.90 | | | | (2.63 | ) | |
| Less distributions: | |
| Net investment income | | $ | | | 0.13 | | | | 0.05 | | | | 0.12 | | | | 0.25 | | | | 0.01 | | |
| Net realized gain on investments | | $ | | | — | | | | — | | | | — | | | | — | | | | 0.12 | | |
| Total distributions | | $ | | | 0.13 | | | | 0.05 | | | | 0.12 | | | | 0.25 | | | | 0.13 | | |
| Net asset value, end of year | | $ | | | 15.03 | | | | 13.75 | | | | 13.43 | | | | 12.29 | | | | 9.64 | | |
| Total Return(1) | | % | | | 10.36 | | | | 2.70 | | | | 10.32 | | | | 30.32 | | | | (21.23 | ) | |
| Ratios and Supplemental Data: | |
| Net assets, end of year (000's) | | $ | | | 79,371 | | | | 120,274 | | | | 160,159 | | | | 140,554 | | | | 102,619 | | |
| Ratios to average net assets: | |
Net expenses after brokerage commission
recapture | | % | | | 1.22 | | | | 1.25 | | | | 1.25 | | | | 1.25 | | | | 1.25 | | |
Gross expenses prior to brokerage commission
recapture | | % | | | 1.25 | | | | 1.25 | | | | 1.25 | | | | 1.25 | | | | 1.25 | | |
Net investment income after brokerage
commission recapture | | % | | | 1.02 | | | | 0.58 | | | | 0.35 | | | | 1.00 | | | | 1.85 | | |
| Portfolio turnover rate | | % | | | 79 | | | | 80 | | | | 110 | | | | 125 | | | | 133 | | |
(1) Total return is calculated assuming reinvestment of all dividends and capital gain distributions at net asset value and does not reflect the effect of insurance contract changes.
* Per share numbers calculated using average number of shares outstanding throughout the period.
See Accompanying Notes to Financial Statements
135
ING OPCAP BALANCED VALUE PORTFOLIO (CONTINUED)
FINANCIAL
HIGHLIGHTS
Selected data for a share outstanding for each year.
| | | | | Class ADV | |
| | | | | Year Ended December 31, | |
| | | | | 2006 | | 2005 | | 2004 | | 2003 | | 2002 | |
| Per Share Operating Performance: | |
| Net asset value, beginning of year | | $ | | | 13.62 | | | | 13.32 | | | | 12.21 | | | | 9.61 | | | | 12.40 | | |
| Income (loss) from investment operations: | |
| Net investment income | | $ | | | 0.11 | | | | 0.04 | | | | 0.04 | | | | 0.09 | | | | 0.05 | | |
Net realized and unrealized gain (loss)
on investments | | $ | | | 1.26 | | | | 0.29 | | | | 1.17 | | | | 2.77 | | | | (2.71 | ) | |
| Total from investment operations | | $ | | | 1.37 | | | | 0.33 | | | | 1.21 | | | | 2.86 | | | | (2.66 | ) | |
| Less distributions: | |
| Net investment income | | $ | | | 0.11 | | | | 0.03 | | | | 0.10 | | | | 0.26 | | | | 0.01 | | |
| Net realized gain on investments | | $ | | | — | | | | — | | | | — | | | | — | | | | 0.12 | | |
| Total distributions | | $ | | | 0.11 | | | | 0.03 | | | | 0.10 | | | | 0.26 | | | | 0.13 | | |
| Net asset value, end of year | | $ | | | 14.88 | | | | 13.62 | | | | 13.32 | | | | 12.21 | | | | 9.61 | | |
| Total Return(1) | | % | | | 10.19 | | | | 2.46 | | | | 10.00 | | | | 30.08 | | | | (21.46 | ) | |
| Ratios and Supplemental Data: | |
| Net assets, end of year (000's) | | $ | | | 3,769 | | | | 3,458 | | | | 3,767 | | | | 2,665 | | | | 1,756 | | |
| Ratios to average net assets: | |
Net expenses after brokerage commission
recapture | | % | | | 1.47 | | | | 1.50 | | | | 1.50 | | | | 1.50 | | | | 1.50 | | |
Gross expenses prior to brokerage commission
recapture | | % | | | 1.50 | | | | 1.50 | | | | 1.50 | | | | 1.50 | | | | 1.50 | | |
Net investment income after brokerage
commission recapture | | % | | | 0.78 | | | | 0.32 | | | | 0.10 | | | | 0.74 | | | | 1.40 | | |
| Portfolio turnover rate | | % | | | 79 | | | | 80 | | | | 110 | | | | 125 | | | | 133 | | |
(1) Total return is calculated assuming reinvestment of all dividends and capital gain distributions at net asset value and does not reflect the effect of insurance contract changes.
See Accompanying Notes to Financial Statements
136
ING OPPENHEIMER GLOBAL PORTFOLIO
FINANCIAL HIGHLIGHTS
Selected data for a share outstanding for each period.
| | | | | Class I | |
| | | | | Year Ended December 31, | | May 1,
2002(1) to
December 31, | |
| | | | | 2006 | | 2005 | | 2004 | | 2003 | | 2002 | |
| Per Share Operating Performance: | |
| Net asset value, beginning of period | | $ | | | 14.17 | | | | 12.80 | | | | 11.23 | | | | 8.40 | | | | 10.00 | | |
| Income (loss) from investment operations: | |
| Net investment income | | $ | | | 0.15 | * | | | 0.14 | * | | | 0.01 | | | | 0.00 | ** | | | 0.02 | | |
Net realized and unrealized gain (loss)
on investments | | $ | | | 2.39 | | | | 1.60 | | | | 1.69 | | | | 2.83 | | | | (1.62 | ) | |
| Total from investment operations | | $ | | | 2.54 | | | | 1.74 | | | | 1.70 | | | | 2.83 | | | | (1.60 | ) | |
| Less distributions: | |
| Net investment income | | $ | | | 0.01 | | | | 0.12 | | | | 0.01 | | | | 0.00 | ** | | | — | | |
| Net realized gain on investments | | $ | | | 0.02 | | | | 0.25 | | | | 0.12 | | | | — | | | | — | | |
| Total distributions | | $ | | | 0.03 | | | | 0.37 | | | | 0.13 | | | | 0.00 | | | | — | | |
| Net asset value, end of period | | $ | | | 16.68 | | | | 14.17 | | | | 12.80 | | | | 11.23 | | | | 8.40 | | |
| Total Return(2) | | % | | | 17.98 | | | | 13.57 | | | | 15.28 | | | | 33.73 | | | | (16.00 | ) | |
| Ratios and Supplemental Data: | |
| Net assets, end of period (000's) | | $ | | | 2,518,662 | | | | 2,262,201 | | | | 843,253 | | | | 426 | | | | 89 | | |
| Ratios to average net assets: | |
| Expenses(3) | | % | | | 0.66 | | | | 0.66 | | | | 0.77 | | | | 1.20 | | | | 1.20 | | |
| Net investment income(3) | | % | | | 0.96 | | | | 1.05 | | | | 1.11 | | | | 0.22 | | | | 0.33 | | |
| Portfolio turnover rate | | % | | | 23 | | | | 53 | | | | 390 | | | | 157 | | | | 87 | | |
| | | | | Class S | |
| | | | | Year Ended December 31, | | May 1,
2002(1) to
December 31, | |
| | | | | 2006 | | 2005 | | 2004 | | 2003 | | 2002 | |
| Per Share Operating Performance: | |
| Net asset value, beginning of period | | $ | | | 13.90 | | | | 12.58 | | | | 11.06 | | | | 8.39 | | | | 10.00 | | |
| Income (loss) from investment operations: | |
| Net investment income | | $ | | | 0.10 | * | | | 0.09 | * | | | 0.02 | | | | 0.02 | | | | 0.00 | ** | |
Net realized and unrealized gain (loss)
on investments | | $ | | | 2.34 | | | | 1.58 | | | | 1.62 | | | | 2.65 | | | | (1.61 | ) | |
| Total from investment operations | | $ | | | 2.44 | | | | 1.67 | | | | 1.64 | | | | 2.67 | | | | (1.61 | ) | |
| Less distributions: | |
| Net investment income | | $ | | | 0.01 | | | | 0.10 | | | | 0.00 | ** | | | — | | | | — | | |
| Net realized gain on investments | | $ | | | 0.02 | | | | 0.25 | | | | 0.12 | | | | — | | | | — | | |
| Total distributions | | $ | | | 0.03 | | | | 0.35 | | | | 0.12 | | | | — | | | | — | | |
| Net asset value, end of period | | $ | | | 16.31 | | | | 13.90 | | | | 12.58 | | | | 11.06 | | | | 8.39 | | |
| Total Return(2) | | % | | | 17.60 | | | | 13.27 | | | | 15.01 | | | | 31.82 | | | | (16.10 | ) | |
| Ratios and Supplemental Data: | |
| Net assets, end of period (000's) | | $ | | | 145,060 | | | | 40,831 | | | | 19,143 | | | | 14,291 | | | | 8,516 | | |
| Ratios to average net assets: | |
| Expenses(3) | | % | | | 0.91 | | | | 0.91 | | | | 1.02 | | | | 1.45 | | | | 1.45 | | |
| Net investment income(3) | | % | | | 0.66 | | | | 0.71 | | | | 0.19 | | | | 0.19 | | | | 0.07 | | |
| Portfolio turnover rate | | % | | | 23 | | | | 53 | | | | 390 | | | | 157 | | | | 87 | | |
(1) Commencement of operations.
(2) Total return is calculated assuming reinvestment of all dividends and capital gain distributions at net asset value and does not reflect the effect of insurance contract changes. Total return for periods less than one year is not annualized.
(3) Annualized for periods less than one year.
* Per share numbers have been calculated using average number of shares outstanding throughout the period.
** Amount is less than $0.005.
See Accompanying Notes to Financial Statements
137
ING OPPENHEIMER GLOBAL PORTFOLIO (CONTINUED)
FINANCIAL HIGHLIGHTS
Selected data for a share outstanding for each period.
| | | | | Class ADV | |
| | | | | Year Ended December 31, | | May 1,
2002(1) to
December 31, | |
| | | | | 2006 | | 2005 | | 2004 | | 2003 | | 2002 | |
| Per Share Operating Performance: | |
| Net asset value, beginning of period | | $ | | | 13.85 | | | | 12.50 | | | | 11.02 | | | | 8.38 | | | | 10.00 | | |
| Income (loss) from investment operations: | |
| Net investment income (loss) | | $ | | | 0.07 | * | | | 0.07 | * | | | 0.03 | | | | 0.00 | ** | | | (0.01 | ) | |
Net realized and unrealized gain (loss)
on investments | | $ | | | 2.33 | | | | 1.56 | | | | 1.57 | | | | 2.64 | | | | (1.61 | ) | |
| Total from investment operations | | $ | | | 2.40 | | | | 1.63 | | | | 1.60 | | | | 2.64 | | | | (1.62 | ) | |
| Less distributions: | |
| Net investment income | | $ | | | 0.01 | | | | 0.04 | | | | 0.00 | ** | | | — | | | | — | | |
| Net realized gain on investments | | $ | | | 0.02 | | | | 0.24 | | | | 0.12 | | | | — | | | | — | | |
| Total distributions | | $ | | | 0.03 | | | | 0.28 | | | | 0.12 | | | | — | | | | — | | |
| Net asset value, end of period | | $ | | | 16.22 | | | | 13.85 | | | | 12.50 | | | | 11.02 | | | | 8.38 | | |
| Total Return(2) | | % | | | 17.36 | | | | 13.07 | | | | 14.71 | | | | 31.50 | | | | (16.20 | ) | |
| Ratios and Supplemental Data: | |
| Net assets, end of period (000's) | | $ | | | 95,286 | | | | 106,510 | | | | 127,653 | | | | 856 | | | | 665 | | |
| Ratios to net assets: | |
| Net expenses after expense reimbursement(3) | | % | | | 1.15 | | | | 1.15 | | | | 1.27 | | | | 1.70 | | | | 1.70 | | |
| Gross expenses prior to expense reimbursement(3) | | % | | | 1.16 | | | | 1.16 | | | | 1.28 | | | | 1.70 | | | | 1.70 | | |
Net investment income (loss) after expense
reimbursement(3) | | % | | | 0.51 | | | | 0.60 | | | | 0.55 | | | | 0.01 | | | | (0.43) | | |
| Portfolio turnover rate | | % | | | 23 | | | | 53 | | | | 390 | | | | 157 | | | | 87 | | |
(1) Commencement of operations.
(2) Total return is calculated assuming reinvestment of all dividends and capital gain distributions at net asset value and does not reflect the effect of insurance contract changes. Total return for periods less than one year is not annualized.
(3) Annualized for periods less than one year.
* Per share numbers have been calculated using average number of shares outstanding throughout the period.
** Amount is less than $0.005.
See Accompanying Notes to Financial Statements
138
ING OPPENHEIMER STRATEGIC INCOME PORTFOLIO
FINANCIAL HIGHLIGHTS
Selected data for a share outstanding for each period.
| | | | | Class I | |
| | | | | Year Ended December 31, | | November 8,
2004(1) to
December 31, | |
| | | | | 2006 | | 2005 | | 2004 | |
| Per Share Operating Performance: | |
| Net asset value, beginning of period | | $ | | | 10.00 | | | | 10.12 | | | | 10.00 | | |
| Income (loss) from investment operations: | |
| Net investment income | | $ | | | 0.66 | * | | | 0.35 | * | | | 0.02 | | |
| Net realized and unrealized gain (loss) on investments | | $ | | | 0.18 | | | | (0.24 | ) | | | 0.12 | | |
| Total from investment operations | | $ | | | 0.84 | | | | 0.11 | | | | 0.14 | | |
| Less distributions: | |
| Net investment income | | $ | | | 0.04 | | | | 0.23 | | | | 0.02 | | |
| Total distributions | | $ | | | 0.04 | | | | 0.23 | | | | 0.02 | | |
| Net asset value, end of period | | $ | | | 10.80 | | | | 10.00 | | | | 10.12 | | |
| Total Return(2) | | % | | | 8.42 | | | | 1.09 | | | | 1.39 | | |
| Ratios and Supplemental Data: | |
| Net assets, end of period (000's) | | $ | | | 359,888 | | | | 302,941 | | | | 103,283 | | |
| Ratios to average net assets: | |
| Expenses(3) | | % | | | 0.54 | | | | 0.54 | | | | 0.52 | | |
| Net investment income(3) | | % | | | 6.39 | | | | 3.50 | | | | 2.56 | | |
| Portfolio turnover rate | | % | | | 140 | | | | 216 | | | | 145 | | |
| | | | | Class S | |
| | | | | Year Ended December 31, | | November 8,
2004(1) to
December 31, | |
| | | | | 2006 | | 2005 | | 2004 | |
| Per Share Operating Performance: | |
| Net asset value, beginning of period | | $ | | | 9.99 | | | | 10.11 | | | | 10.00 | | |
| Income (loss) from investment operations: | |
| Net investment income | | $ | | | 0.64 | * | | | 0.32 | * | | | 0.02 | | |
| Net realized and unrealized gain (loss) on investments | | $ | | | 0.19 | | | | (0.24 | ) | | | 0.11 | | |
| Total from investment operations | | $ | | | 0.83 | | | | 0.08 | | | | 0.13 | | |
| Less distributions: | |
| Net investment income | | $ | | | 0.01 | | | | 0.20 | | | | 0.02 | | |
| Total distributions | | $ | | | 0.01 | | | | 0.20 | | | | 0.02 | | |
| Net asset value, end of period | | $ | | | 10.81 | | | | 9.99 | | | | 10.11 | | |
| Total Return(2) | | % | | | 8.33 | | | | 0.84 | | | | 1.27 | | |
| Ratios and Supplemental Data: | |
| Net assets, end of period (000's) | | $ | | | 56,054 | | | | 60,478 | | | | 60,836 | | |
| Ratios to average net assets: | |
| Net expenses after expense reimbursement(3) | | % | | | 0.75 | | | | 0.75 | | | | 0.77 | | |
| Gross expenses prior to expense reimbursement(3) | | % | | | 0.79 | | | | 0.79 | | | | 0.81 | | |
| Net investment income after expense reimbursement(3) | | % | | | 6.20 | | | | 3.14 | | | | 2.40 | | |
| Portfolio turnover rate | | % | | | 140 | | | | 216 | | | | 145 | | |
(1) Commencement of operations.
(2) Total return is calculated assuming reinvestment of all dividends and capital gain distributions at net asset value and does not reflect the effect of insurance contract changes. Total return for periods less than one year is not annualized.
(3) Annualized for periods less than one year.
* Per share numbers have been calculated using average number of shares outstanding throughout the period.
See Accompanying Notes to Financial Statements
139
ING OPPENHEIMER STRATEGIC INCOME PORTFOLIO (CONTINUED)
FINANCIAL HIGHLIGHTS
Selected data for a share outstanding for each period.
| | | | | Class ADV | |
| | | | | Year Ended December 31, | | November 8,
2004(1) to
December 31, | |
| | | | | 2006 | | 2005 | | 2004 | |
| Per Share Operating Performance: | |
| Net asset value, beginning of period | | $ | | | 9.98 | | | | 10.11 | | | | 10.00 | | |
| Income (loss) from investment operations: | |
| Net investment income | | $ | | | 0.62 | * | | | 0.30 | * | | | 0.02 | | |
| Net realized and unrealized gain (loss) on investments | | $ | | | 0.18 | | | | (0.24 | ) | | | 0.11 | | |
| Total from investment operations | | $ | | | 0.80 | | | | 0.06 | | | | 0.13 | | |
| Less distributions: | |
| Net investment income | | $ | | | 0.02 | | | | 0.19 | | | | 0.02 | | |
| Total distributions | | $ | | | 0.02 | | | | 0.19 | | | | 0.02 | | |
| Net asset value, end of period | | $ | | | 10.76 | | | | 9.98 | | | | 10.11 | | |
| Total Return(2) | | % | | | 7.99 | | | | 0.61 | | | | 1.26 | | |
| Ratios and Supplemental Data: | |
| Net assets, end of period (000's) | | $ | | | 9,266 | | | | 5,082 | | | | 3,655 | | |
| Ratios to net assets: | |
| Net expenses after expense reimbursement(3) | | % | | | 1.00 | | | | 1.00 | | | | 1.02 | | |
| Gross expenses prior to expense reimbursement(3) | | % | | | 1.04 | | | | 1.04 | | | | 1.06 | | |
| Net investment income after expense reimbursement(3) | | % | | | 6.09 | | | | 2.94 | | | | 2.15 | | |
| Portfolio turnover rate | | % | | | 140 | | | | 216 | | | | 145 | | |
(1) Commencement of operations.
(2) Total return is calculated assuming reinvestment of all dividends and capital gain distributions at net asset value and does not reflect the effect of insurance contract changes. Total return for periods less than one year is not annualized.
(3) Annualized for periods less than one year.
* Per share numbers have been calculated using average number of shares outstanding throughout the period.
See Accompanying Notes to Financial Statements
140
ING PIMCO TOTAL RETURN PORTFOLIO
FINANCIAL HIGHLIGHTS
Selected data for a share outstanding for each period.
| | | | | Class I | |
| | | | | Year Ended December 31, | | May 1,
2002(1) to
December 31, | |
| | | | | 2006 | | 2005 | | 2004 | | 2003 | | 2002 | |
| Per Share Operating Performance: | |
| Net asset value, beginning of period | | $ | | | 10.92 | | | | 11.00 | | | | 10.62 | | | | 10.55 | | | | 10.00 | | |
| Income (loss) from investment operations: | |
| Net investment income | | $ | | | 0.42 | * | | | 0.34 | * | | | 0.16 | * | | | 0.29 | * | | | 0.09 | | |
Net realized and unrealized gain (loss) on
investments | | $ | | | 0.03 | | | | (0.08 | ) | | | 0.33 | | | | 0.17 | | | | 0.73 | | |
| Total from investment operations | | $ | | | 0.45 | | | | 0.26 | | | | 0.49 | | | | 0.46 | | | | 0.82 | | |
| Less distributions: | |
| Net investment income | | $ | | | 0.21 | | | | 0.20 | | | | — | | | | 0.32 | | | | 0.16 | | |
| Net realized gain on investments | | $ | | | — | | | | 0.14 | | | | 0.11 | | | | 0.07 | | | | 0.11 | | |
| Total distributions | | $ | | | 0.21 | | | | 0.34 | | | | 0.11 | | | | 0.39 | | | | 0.27 | | |
| Net asset value, end of period | | $ | | | 11.16 | | | | 10.92 | | | | 11.00 | | | | 10.62 | | | | 10.55 | | |
| Total Return(2) | | % | | | 4.21 | | | | 2.36 | | | | 4.61 | | | | 4.36 | | | | 8.21 | | |
| Ratios and Supplemental Data: | |
| Net assets, end of period (000's) | | $ | | | 213,734 | | | | 176,607 | | | | 78,521 | | | | 43,987 | | | | 8,026 | | |
| Ratios to average net assets: | |
| Expenses(3)(4) | | % | | | 0.77 | | | | 0.85 | | | | 0.85 | | | | 0.85 | | | | 0.85 | | |
| Net investment income(3) | | % | | | 3.86 | | | | 3.07 | | | | 1.51 | | | | 2.67 | | | | 2.99 | | |
| Portfolio turnover rate | | % | | | 826 | | | | 926 | | | | 377 | | | | 471 | | | | 419 | | |
| | | | | Class S | |
| | | | | Year Ended December 31, | | May 1,
2002(1) to
December 31, | |
| | | | | 2006 | | 2005 | | 2004 | | 2003 | | 2002 | |
| Per Share Operating Performance: | |
| Net asset value, beginning of period | | $ | | | 10.87 | | | | 10.96 | | | | 10.61 | | | | 10.55 | | | | 10.00 | | |
| Income (loss) from investment operations: | |
| Net investment income | | $ | | | 0.39 | * | | | 0.30 | * | | | 0.14 | * | | | 0.22 | * | | | 0.14 | | |
Net realized and unrealized gain (loss) on
investments | | $ | | | 0.04 | | | | (0.07 | ) | | | 0.32 | | | | 0.21 | | | | 0.67 | | |
| Total from investment operations | | $ | | | 0.43 | | | | 0.23 | | | | 0.46 | | | | 0.43 | | | | 0.81 | | |
| Less distributions: | |
| Net investment income | | $ | | | 0.19 | | | | 0.18 | | | | — | | | | 0.30 | | | | 0.15 | | |
| Net realized gain on investments | | $ | | | — | | | | 0.14 | | | | 0.11 | | | | 0.07 | | | | 0.11 | | |
| Total distributions | | $ | | | 0.19 | | | | 0.32 | | | | 0.11 | | | | 0.37 | | | | 0.26 | | |
| Net asset value, end of period | | $ | | | 11.11 | | | | 10.87 | | | | 10.96 | | | | 10.61 | | | | 10.55 | | |
| Total Return(2) | | % | | | 4.00 | | | | 2.08 | | | | 4.33 | | | | 4.06 | | | | 8.07 | | |
| Ratios and Supplemental Data: | |
| Net assets, end of period (000's) | | $ | | | 93,487 | | | | 83,782 | | | | 88,424 | | | | 50,174 | | | | 25,186 | | |
| Ratios to average net assets: | |
| Expenses(3)(4) | | % | | | 1.02 | | | | 1.10 | | | | 1.10 | | | | 1.10 | | | | 1.10 | | |
| Net investment income(3) | | % | | | 3.61 | | | | 2.73 | | | | 1.32 | | | | 2.07 | | | | 2.60 | | |
| Portfolio turnover rate | | % | | | 826 | | | | 926 | | | | 377 | | | | 471 | | | | 419 | | |
(1) Commencement of operations.
(2) Total return is calculated assuming reinvestment of all dividends and capital gain distributions at net asset value and does not reflect the effect of insurance contract changes. Total return for periods less than one year is not annualized.
(3) Annualized for periods less than one year.
(4) Includes the impact of interest expense on inverse floaters.
* Per share numbers have been calculated using average number of shares outstanding throughout the period.
See Accompanying Notes to Financial Statements
141
ING PIMCO TOTAL RETURN PORTFOLIO (CONTINUED)
FINANCIAL HIGHLIGHTS
Selected data for a share outstanding for each period.
| | | | | Class ADV | |
| | | | | Year Ended December 31, | | May 1,
2002(1) to
December 31, | |
| | | | | 2006 | | 2005 | | 2004 | | 2003 | | 2002 | |
| Per Share Operating Performance: | |
| Net asset value, beginning of period | | $ | | | 10.81 | | | | 10.91 | | | | 10.59 | | | | 10.53 | | | | 10.00 | | |
| Income (loss) from investment operations: | |
| Net investment income | | $ | | | 0.36 | * | | | 0.28 | * | | | 0.09 | * | | | 0.20 | * | | | 0.07 | | |
Net realized and unrealized gain (loss) on
investments | | $ | | | 0.03 | | | | (0.08 | ) | | | 0.34 | | | | 0.20 | | | | 0.72 | | |
| Total from investment operations | | $ | | | 0.39 | | | | 0.20 | | | | 0.43 | | | | 0.40 | | | | 0.79 | | |
| Less distributions: | |
| Net investment income | | $ | | | 0.17 | | | | 0.16 | | | | — | | | | 0.27 | | | | 0.15 | | |
| Net realized gain on investments | | $ | | | — | | | | 0.14 | | | | 0.11 | | | | 0.07 | | | | 0.11 | | |
| Total distributions | | $ | | | 0.17 | | | | 0.30 | | | | 0.11 | | | | 0.34 | | | | 0.26 | | |
| Net asset value, end of period | | $ | | | 11.03 | | | | 10.81 | | | | 10.91 | | | | 10.59 | | | | 10.53 | | |
| Total Return(2) | | % | | | 3.71 | | | | 1.80 | | | | 4.06 | | | | 3.86 | | | | 7.88 | | |
| Ratios and Supplemental Data: | |
| Net assets, end of period (000's) | | $ | | | 25,603 | | | | 23,018 | | | | 14,827 | | | | 10,388 | | | | 4,880 | | |
| Ratios to average net assets: | |
| Expenses(3)(4) | | % | | | 1.27 | | | | 1.35 | | | | 1.35 | | | | 1.35 | | | | 1.35 | | |
| Net investment income(3) | | % | | | 3.36 | | | | 2.54 | | | | 0.81 | | | | 1.84 | | | | 2.40 | | |
| Portfolio turnover rate | | % | | | 826 | | | | 926 | | | | 377 | | | | 471 | | | | 419 | | |
(1) Commencement of operations.
(2) Total return is calculated assuming reinvestment of all dividends and capital gain distributions at net asset value and does not reflect the effect of insurance contract changes. Total return for periods less than one year is not annualized.
(3) Annualized for periods less than one year.
(4) Includes impact of interest expense on inverse floaters.
* Per share numbers have been calculated using average number of shares outstanding throughout the period.
See Accompanying Notes to Financial Statements
142
ING PIONEER HIGH YIELD PORTFOLIO
FINANCIAL HIGHLIGHTS
Selected data for a share outstanding for each period.
| | | | | Class I | | Class S | |
| | | | | January 3,
2006(1) to
December 31,
2006 | | January 20,
2006(1) to
December 31,
2006 | |
| Per Share Operating Performance: | |
| Net asset value, beginning of period | | $ | | | 10.00 | | | | 9.99 | | |
| Income from investment operations: | |
| Net investment income | | $ | | | 0.57 | * | | | 0.54 | * | |
| Net realized and unrealized income on investments | | $ | | | 0.23 | | | | 0.24 | | |
| Total from investment operations | | $ | | | 0.80 | | | | 0.78 | | |
| Less distributions: | |
| Net investment income | | $ | | | 0.55 | | | | 0.52 | | |
| Net realized gains on investments | | $ | | | 0.03 | | | | 0.03 | | |
| Total distributions | | $ | | | 0.58 | | | | 0.55 | | |
| Net asset value, end of period | | $ | | | 10.22 | | | | 10.22 | | |
| Total Return(2) | | % | | | 8.24 | | | | 8.01 | | |
| Ratios and Supplemental Data: | |
| Net assets, end of period (000's) | | $ | | | 119,959 | | | | 8,280 | | |
| Ratios to average net assets: | |
| Net expenses after expense reimbursement(3)(4) | | % | | | 0.73 | | | | 0.98 | | |
| Gross expenses prior to expense reimbursement(3) | | % | | | 0.80 | | | | 1.05 | | |
| Net investment income after expense reimbursement(3)(4) | | % | | | 5.70 | | | | 5.43 | | |
| Portfolio turnover rate | | % | | | 20 | | | | 20 | | |
| | | | | Class ADV | |
| | | | | January 20,
2006(1) to
December 31,
2006 | |
| Per Share Operating Performance: | |
| Net asset value, beginning of period | | $ | | | 9.99 | | |
| Income from investment operations: | |
| Net investment income | | $ | | | 0.47 | * | |
| Net realized and unrealized income on investments | | $ | | | 0.30 | | |
| Total from investment operations | | $ | | | 0.77 | | |
| Less distributions: | |
| Net investment income | | $ | | | 0.51 | | |
| Net realized gains on investments | | $ | | | 0.03 | | |
| Total distributions | | $ | | | 0.54 | | |
| Net asset value, end of period | | $ | | | 10.22 | | |
| Total Return(2) | | % | | | 7.98 | | |
| Ratios and Supplemental Data: | |
| Net assets, end of period (000's) | | $ | | | 510 | | |
| Ratios to average net assets: | |
| Net expenses after expense reimbursement(3)(4) | | % | | | 1.23 | | |
| Gross expenses prior to expense reimbursement(3) | | % | | | 1.30 | | |
| Net investment income after expense reimbursement(3)(4) | | % | | | 4.97 | | |
| Portfolio turnover rate | | % | | | 20 | | |
(1) Commencement of operations.
(2) Total return is calculated assuming reinvestment of all dividends and capital gain distributions at net asset value and does not reflect the effect of insurance contract changes. Total return for periods less than one year is not annualized.
(3) Annualized for periods less than one year.
(4) The Investment Adviser has agreed to limit expenses, (excluding interest, taxes, brokerage and extraordinary expenses) subject to possible recoupment by the Investment Adviser within three years of being incurred.
* Per share numbers have been calculated using the average number of shares outstanding throughout the period.
See Accompanying Notes to Financial Statements
143
ING T. ROWE PRICE DIVERSIFIED MID CAP GROWTH PORTFOLIO
FINANCIAL HIGHLIGHTS
Selected data for a share outstanding for each year.
| | | | | Class I | |
| | | | | Year Ended December 31, | |
| | | | | 2006 | | 2005 | | 2004 | | 2003 | | 2002 | |
| Per Share Operating Performance: | |
| Net asset value, beginning of year | | $ | | | 8.65 | | | | 8.06 | | | | 7.40 | | | | 5.11 | | | | 7.29 | | |
| Income (loss) from investment operations: | |
| Net investment income (loss) | | $ | | | 0.02 | | | | (0.00 | )* | | | (0.00 | )* | | | (0.02 | ) | | | (0.01 | ) | |
Net realized and unrealized gain (loss)
on investments | | $ | | | 0.74 | | | | 0.73 | | | | 0.66 | | | | 2.31 | | | | (2.17 | ) | |
| Total from investment operations | | $ | | | 0.76 | | | | 0.73 | | | | 0.66 | | | | 2.29 | | | | (2.18 | ) | |
| Less distributions: | |
| Net realized gain on investments | | $ | | | 0.19 | | | | 0.14 | | | | — | | | | — | | | | — | | |
| Total distributions | | $ | | | 0.19 | | | | 0.14 | | | | — | | | | — | | | | — | | |
| Net asset value, end of year | | $ | | | 9.22 | | | | 8.65 | | | | 8.06 | | | | 7.40 | | | | 5.11 | | |
| Total Return(1) | | % | | | 9.10 | | | | 9.26 | | | | 8.92 | | | | 44.81 | | | | (29.90 | ) | |
| Ratios and Supplemental Data: | |
| Net assets, end of year (000's) | | $ | | | 1,067,515 | | | | 1,131,231 | | | | 474,397 | | | | 35,010 | | | | 2,644 | | |
| Ratios to average net assets: | |
| Expenses | | % | | | 0.66 | | | | 0.66 | | | | 0.96 | | | | 1.05 | | | | 1.05 | | |
| Net investment income (loss) | | % | | | 0.19 | | | | (0.04 | ) | | | (0.06 | ) | | | (0.76 | ) | | | (0.68 | ) | |
| Portfolio turnover rate | | % | | | 37 | | | | 94 | | | | 441 | | | | 187 | | | | 328 | | |
| | | | | Class S | |
| | | | | Year Ended December 31, | |
| | | | | 2006 | | 2005 | | 2004 | | 2003 | | 2002 | |
| Per Share Operating Performance: | |
| Net asset value, beginning of year | | $ | | | 8.55 | | | | 7.99 | | | | 7.36 | | | | 5.09 | | | | 7.29 | | |
| Income (loss) from investment operations: | |
| Net investment loss | | $ | | | (0.01 | ) | | | (0.03 | ) | | | (0.07 | ) | | | (0.04 | ) | | | (0.02 | ) | |
Net realized and unrealized gain (loss) on
investments | | $ | | | 0.75 | | | | 0.73 | | | | 0.70 | | | | 2.31 | | | | (2.18 | ) | |
| Total from investment operations | | $ | | | 0.74 | | | | 0.70 | | | | 0.63 | | | | 2.27 | | | | (2.20 | ) | |
| Less distributions: | |
| Net realized gain on investments | | $ | | | 0.19 | | | | 0.14 | | | | — | | | | — | | | | — | | |
| Total distributions | | $ | | | 0.19 | | | | 0.14 | | | | — | | | | — | | | | — | | |
| Net asset value, end of year | | $ | | | 9.10 | | | | 8.55 | | | | 7.99 | | | | 7.36 | | | | 5.09 | | |
| Total Return(1) | | % | | | 8.97 | | | | 8.96 | | | | 8.56 | | | | 44.60 | | | | (30.18 | ) | |
| Ratios and Supplemental Data: | |
| Net assets, end of year (000's) | | $ | | | 10,100 | | | | 21,871 | | | | 29,155 | | | | 30,354 | | | | 1,110 | | |
| Ratios to average net assets: | |
| Expenses | | % | | | 0.91 | | | | 0.91 | | | | 1.21 | | | | 1.30 | | | | 1.30 | | |
| Net investment loss | | % | | | (0.07 | ) | | | (0.30 | ) | | | (0.88 | ) | | | (1.00 | ) | | | (0.90 | ) | |
| Portfolio turnover rate | | % | | | 37 | | | | 94 | | | | 441 | | | | 187 | | | | 328 | | |
(1) Total return is calculated assuming reinvestment of all dividends and capital gain distributions at net asset value and does not reflect the effect of insurance contract changes.
* Amount is more than $(0.005).
See Accompanying Notes to Financial Statements
144
ING T. ROWE PRICE DIVERSIFIED MID CAP GROWTH PORTFOLIO (CONTINUED)
FINANCIAL HIGHLIGHTS
Selected data for a share outstanding for each year.
| | | | | Class ADV | |
| | | | | Year Ended December 31, | |
| | | | | 2006 | | 2005 | | 2004 | | 2003 | | 2002 | |
| Per Share Operating Performance: | |
| Net asset value, beginning of year | | $ | | | 8.47 | | | | 7.94 | | | | 7.33 | | | | 5.08 | | | | 7.29 | | |
| Income (loss) from investment operations: | |
| Net investment loss | | $ | | | (0.03 | ) | | | (0.05 | ) | | | (0.10 | ) | | | (0.07 | ) | | | (0.07 | ) | |
Net realized and unrealized gain (loss)
on investments | | $ | | | 0.74 | | | | 0.72 | | | | 0.71 | | | | 2.32 | | | | (2.14 | ) | |
| Total from investment operations | | $ | | | 0.71 | | | | 0.67 | | | | 0.61 | | | | 2.25 | | | | (2.21 | ) | |
| Less distributions: | |
| Net realized gain on investments | | $ | | | 0.19 | | | | 0.14 | | | | — | | | | — | | | | — | | |
| Total distributions | | $ | | | 0.19 | | | | 0.14 | | | | — | | | | — | | | | — | | |
| Net asset value, end of year | | $ | | | 8.99 | | | | 8.47 | | | | 7.94 | | | | 7.33 | | | | 5.08 | | |
| Total Return(1) | | % | | | 8.70 | | | | 8.64 | | | | 8.32 | | | | 44.29 | | | | (30.32 | ) | |
| Ratios and Supplemental Data: | |
| Net assets, end of year (000's) | | $ | | | 48,165 | | | | 69,686 | | | | 80,813 | | | | 107,353 | | | | 71,775 | | |
| Ratios to net assets: | |
| Net expenses after expense reimbursement | | % | | | 1.15 | | | | 1.15 | | | | 1.46 | | | | 1.55 | | | | 1.55 | | |
Gross expenses prior to expense
reimbursement | | % | | | 1.16 | | | | 1.16 | | | | 1.47 | | | | 1.55 | | | | 1.55 | | |
Net investment loss after expense
reimbursement | | % | | | (0.23 | ) | | | (0.54 | ) | | | (1.13 | ) | | | (1.24 | ) | | | (1.19 | ) | |
| Portfolio turnover rate | | % | | | 37 | | | | 94 | | | | 441 | | | | 187 | | | | 328 | | |
(1) Total return is calculated assuming reinvestment of all dividends and capital gain distributions at net asset value and does not reflect the effect of insurance contract changes.
See Accompanying Notes to Financial Statements
145
ING T. ROWE PRICE GROWTH EQUITY PORTFOLIO
FINANCIAL HIGHLIGHTS
Selected data for a share outstanding for each year.
| | | | | Class I | |
| | | | | Year Ended December 31, | |
| | | | | 2006 | | 2005 | | 2004 | | 2003 | | 2002 | |
| Per Share Operating Performance: | |
| Net asset value, beginning of year | | $ | | | 52.62 | | | | 49.81 | | | | 45.35 | | | | 34.69 | | | | 45.32 | | |
| Income (loss) from investment operations: | |
| Net investment income | | $ | | | 0.33 | * | | | 0.19 | * | | | 0.29 | | | | 0.09 | | | | 0.08 | * | |
Net realized and unrealized gain (loss)
on investments | | $ | | | 6.64 | | | | 2.87 | | | | 4.24 | | | | 10.63 | | | | (10.63 | ) | |
| Total from investment operations | | $ | | | 6.97 | | | | 3.06 | | | | 4.53 | | | | 10.72 | | | | (10.55 | ) | |
| Less distributions: | |
| Net investment income | | $ | | | 0.14 | | | | 0.25 | | | | 0.07 | | | | 0.06 | | | | 0.08 | | |
| Net realized gain on investments | | $ | | | 0.09 | | | | — | | | | — | | | | — | | | | — | | |
| Total distributions | | $ | | | 0.23 | | | | 0.25 | | | | 0.07 | | | | 0.06 | | | | 0.08 | | |
| Net asset value, end of year | | $ | | | 59.36 | | | | 52.62 | | | | 49.81 | | | | 45.35 | | | | 34.69 | | |
| Total Return(1) | | % | | | 13.30 | | | | 6.17 | | | | 10.02 | | | | 30.93 | | | | (23.29 | ) | |
| Ratios and Supplemental Data: | |
| Net assets, end of year (000's) | | $ | | | 1,271,481 | | | | 898,102 | | | | 830,034 | | | | 669,956 | | | | 429,634 | | |
| Ratios to average net assets: | |
Net expenses after brokerage
commission recapture | | % | | | 0.75 | | | | 0.75 | | | | 0.75 | | | | 0.75 | | | | 0.75 | | |
Gross expenses prior to brokerage
commission recapture | | % | | | 0.75 | | | | 0.75 | | | | 0.75 | | | | 0.75 | | | | 0.75 | | |
Net investment income after brokerage
commission recapture | | % | | | 0.60 | | | | 0.38 | | | | 0.66 | | | | 0.30 | | | | 0.21 | | |
| Portfolio turnover rate | | % | | | 43 | | | | 41 | | | | 39 | | | | 34 | | | | 49 | | |
| | | | | Class S | |
| | | | | Year Ended December 31, | |
| | | | | 2006 | | 2005 | | 2004 | | 2003 | | 2002 | |
| Per Share Operating Performance: | |
| Net asset value, beginning of year | | $ | | | 52.16 | | | | 49.48 | | | | 45.12 | | | | 34.59 | | | | 45.31 | | |
| Income (loss) from investment operations: | |
| Net investment income | | $ | | | 0.28 | * | | | 0.06 | * | | | 0.22 | | | | 0.06 | | | | 0.03 | * | |
Net realized and unrealized gain (loss) on
investments | | $ | | | 6.50 | | | | 2.85 | | | | 4.16 | | | | 10.52 | | | | (10.67 | ) | |
| Total from investment operations | | $ | | | 6.78 | | | | 2.91 | | | | 4.38 | | | | 10.58 | | | | (10.64 | ) | |
| Less distributions: | |
| Net realized gain on investments | | $ | | | 0.09 | | | | 0.23 | | | | 0.02 | | | | 0.05 | | | | 0.08 | | |
| Total distributions | | $ | | | 0.09 | | | | 0.23 | | | | 0.02 | | | | 0.05 | | | | 0.08 | | |
| Net asset value, end of year | | $ | | | 58.85 | | | | 52.16 | | | | 49.48 | | | | 45.12 | | | | 34.59 | | |
| Total Return(1) | | % | | | 13.03 | | | | 5.92 | | | | 9.74 | | | | 30.58 | | | | (23.50 | ) | |
| Ratios and Supplemental Data: | |
| Net assets, end of year (000's) | | $ | | | 37,306 | | | | 163,188 | | | | 18,642 | | | | 8,251 | | | | 1,530 | | |
| Ratios to average net assets: | |
Net expenses after brokerage commission
recapture | | % | | | 1.00 | | | | 1.00 | | | | 1.00 | | | | 1.00 | | | | 1.00 | | |
Gross expenses prior to brokerage commission
recapture | | % | | | 1.00 | | | | 1.00 | | | | 1.00 | | | | 1.00 | | | | 1.00 | | |
Net investment income after brokerage
commission recapture | | % | | | 0.51 | | | | 0.12 | | | | 0.62 | | | | 0.04 | | | | 0.09 | | |
| Portfolio turnover rate | | % | | | 43 | | | | 41 | | | | 39 | | | | 34 | | | | 49 | | |
(1) Total return is calculated assuming reinvestment of all dividends and capital gain distributions at net asset value and does not reflect the effect of insurance contract changes.
* Per share numbers have been calculated using average number of shares outstanding throughout the period.
See Accompanying Notes to Financial Statements
146
ING T. ROWE PRICE GROWTH EQUITY PORTFOLIO (CONTINUED)
FINANCIAL
HIGHLIGHTS
Selected data for a share outstanding for each year.
| | | | | Class ADV | |
| | | | | Year Ended December 31, | |
| | | | | 2006 | | 2005 | | 2004 | | 2003 | | 2002 | |
| Per Share Operating Performance: | |
| Net asset value, beginning of year | | $ | | | 51.87 | | | | 49.14 | | | | 44.89 | | | | 34.50 | | | | 45.30 | | |
| Income (loss) from investment operations: | |
| Net investment income (loss) | | $ | | | 0.05 | | | | (0.06 | )* | | | 0.11 | | | | (0.01 | ) | | | (0.06 | )* | |
Net realized and unrealized gain (loss) on
investments | | $ | | | 6.54 | | | | 2.84 | | | | 4.14 | | | | 10.44 | | | | (10.66 | ) | |
| Total from investment operations | | $ | | | 6.59 | | | | 2.78 | | | | 4.25 | | | | 10.43 | | | | (10.72 | ) | |
| Less distributions: | |
| Net realized gain on investments | | $ | | | 0.09 | | | | 0.05 | | | | — | | | | 0.04 | | | | 0.08 | | |
| Total distributions | | $ | | | 0.09 | | | | 0.05 | | | | — | | | | 0.04 | | | | 0.08 | | |
| Net asset value, end of year | | $ | | | 58.37 | | | | 51.87 | | | | 49.14 | | | | 44.89 | | | | 34.50 | | |
| Total Return(1) | | % | | | 12.73 | | | | 5.66 | | | | 9.47 | | | | 30.27 | | | | (23.70 | ) | |
| Ratios and Supplemental Data: | |
| Net assets, end of year (000's) | | $ | | | 105,821 | | | | 86,781 | | | | 78,870 | | | | 60,182 | | | | 13,601 | | |
| Ratios to average net assets: | |
Net expenses after brokerage
commission recapture | | % | | | 1.25 | | | | 1.25 | | | | 1.25 | | | | 1.25 | | | | 1.25 | | |
Gross expenses prior to brokerage
commission recapture | | % | | | 1.25 | | | | 1.25 | | | | 1.25 | | | | 1.25 | | | | 1.25 | | |
Net investment income (loss) after brokerage
commission recapture | | % | | | 0.11 | | | | (0.12 | ) | | | 0.19 | | | | (0.24 | ) | | | (0.18 | ) | |
| Portfolio turnover rate | | % | | | 43 | | | | 41 | | | | 39 | | | | 34 | | | | 49 | | |
(1) Total return is calculated assuming reinvestment of all dividends and capital gain distributions at net asset value and does not reflect the effect of insurance contract changes.
* Per share numbers have been calculated using average number of shares outstanding throughout the period.
See Accompanying Notes to Financial Statements
147
ING TEMPLETON FOREIGN EQUITY PORTFOLIO
FINANCIAL HIGHLIGHTS
Selected data for a share outstanding for each period.
| | | | | Class I | |
| | | | | January 3,
2006(1) to
December 31,
2006 | |
| Per Share Operating Performance: | |
| Net asset value, beginning of period | | $ | | | 10.00 | | |
| Income from investment operations: | |
| Net investment income | | $ | | | 0.27 | | |
| Net realized and unrealized gain on investments | | $ | | | 1.90 | | |
| Total from investment operations | | $ | | | 2.17 | | |
| Less distributions: | |
| Net investment income | | $ | | | 0.13 | | |
| Net realized gain on investments | | $ | | | 0.01 | | |
| Total distributions | | $ | | | 0.14 | | |
| Net asset value, end of period | | $ | | | 12.03 | | |
| Total Return(2) | | % | | | 21.70 | | |
| Ratios and Supplemental Data: | |
| Net assets, end of period (000's) | | $ | | | 10,991 | | |
| Ratios to average net assets: | |
| Net expenses after expense reimbursement(3)(4) | | % | | | 0.98 | | |
| Gross expenses prior to expense reimbursement(3) | | % | | | 1.24 | | |
| Net investment income after expense reimbursement(3)(4) | | % | | | 2.53 | | |
| Portfolio turnover rate | | % | | | 5 | | |
| | | | | Class S | | Class ADV | |
| | | | | January 12,
2006(1) to
December 31,
2006 | | December 20,
2006(1) to
December 31,
2006 | |
| Per Share Operating Performance: | |
| Net asset value, beginning of period | | $ | | | 10.02 | | | | 12.09 | | |
| Income from investment operations: | |
| Net investment income (loss) | | $ | | | 0.17 | * | | | 0.00 | ** | |
| Net realized and unrealized gain on investments | | $ | | | 1.95 | | | | 0.08 | | |
| Total from investment operations | | $ | | | 2.12 | | | | 0.08 | | |
| Less distributions: | |
| Net investment income | | $ | | | 0.12 | | | | 0.13 | | |
| Net realized gain on investments | | $ | | | 0.01 | | | | 0.01 | | |
| Total distributions | | $ | | | 0.13 | | | | 0.14 | | |
| Net asset value, end of period | | $ | | | 12.01 | | | | 12.03 | | |
| Total Return(2) | | % | | | 21.14 | | | | 0.66 | | |
| Ratios and Supplemental Data: | |
| Net assets, end of period (000's) | | $ | | | 36,200 | | | | 1 | | |
| Ratios to average net assets: | |
| Net expenses after expense reimbursement(3)(4) | | % | | | 1.23 | | | | 1.48 | | |
| Gross expenses prior to expense reimbursement(3) | | % | | | 1.49 | | | | 1.74 | | |
| Net investment income (loss) after expense reimbursement(3)(4) | | % | | | 1.57 | | | | 0.00 | ** | |
| Portfolio turnover rate | | % | | | 5 | | | | 5 | | |
(1) Commencement of operations.
(2) Total return is calculated assuming reinvestment of all dividends and capital gain distributions at net asset value and does not reflect the effect of insurance contract changes. Total return for periods less than one year is not annualized.
(3) Annualized for periods less than one year.
(4) The Investment Adviser has agreed to limit expenses, (excluding interest, taxes, brokerage and extraordinary expenses) subject to possible recoupment by the Investment Adviser within three years of being incurred.
* Per share numbers have been calculated using average number of shares outstanding throughout the period.
** Amount is less than $0.005 or 0.005%.
See Accompanying Notes to Financial Statements
148
ING THORNBURG VALUE PORTFOLIO
FINANCIAL HIGHLIGHTS
Selected data for a share outstanding for each year.
| | | | | Class I | |
| | | | | Year Ended December 31, | |
| | | | | 2006 | | 2005 | | 2004 | | 2003 | | 2002 | |
| Per Share Operating Performance: | |
| Net asset value, beginning of year | | $ | | | 27.40 | | | | 27.20 | | | | 24.21 | | | | 18.94 | | | | 27.12 | | |
| Income (loss) from investment operations: | |
| Net investment income | | $ | | | 0.15 | * | | | 0.11 | * | | | 0.24 | * | | | 0.10 | * | | | 0.04 | * | |
Net realized and unrealized gain (loss)
on investments | | $ | | | 4.44 | | | | 0.31 | | | | 2.86 | | | | 5.21 | | | | (8.22 | ) | |
| Total from investment operations | | $ | | | 4.59 | | | | 0.42 | | | | 3.10 | | | | 5.31 | | | | (8.18 | ) | |
| Less distributions: | |
| Net investment income | | $ | | | 0.14 | | | | 0.22 | | | | 0.11 | | | | 0.04 | | | | — | | |
| Total distributions | | $ | | | 0.14 | | | | 0.22 | | | | 0.11 | | | | 0.04 | | | | — | | |
| Net asset value, end of year | | $ | | | 31.85 | | | | 27.40 | | | | 27.20 | | | | 24.21 | | | | 18.94 | | |
| Total Return(1) | | % | | | 16.84 | | | | 1.56 | | | | 12.88 | | | | 28.07 | | | | (30.16 | ) | |
| Ratios and Supplemental Data: | |
| Net assets, end of year (000's) | | $ | | | 186,115 | | | | 191,985 | | | | 234,606 | | | | 247,542 | | | | 212,841 | | |
| Ratios to average net assets: | |
| Net expenses after brokerage commission recapture | | % | | | 0.90 | | | | 0.90 | | | | 0.90 | | | | 0.90 | | | | 0.90 | | |
Gross expenses prior to brokerage
commission recapture | | % | | | 0.90 | | | | 0.90 | | | | 0.90 | | | | 0.90 | | | | 0.90 | | |
Net investment income after brokerage
commission recapture | | % | | | 0.51 | | | | 0.43 | | | | 0.85 | | | | 0.47 | | | | 0.19 | | |
| Portfolio turnover rate | | % | | | 171 | | | | 95 | | | | 74 | | | | 65 | | | | 151 | | |
| | | | | Class S | |
| | | | | Year Ended December 31, | |
| | | | | 2006 | | 2005 | | 2004 | | 2003 | | 2002 | |
| Per Share Operating Performance: | |
| Net asset value, beginning of year | | $ | | | 27.24 | | | | 27.04 | | | | 24.09 | | | | 18.89 | | | | 27.11 | | |
| Income (loss) from investment operations: | |
| Net investment income | | $ | | | 0.36 | * | | | 0.05 | * | | | 0.16 | * | | | 0.05 | * | | | 0.02 | * | |
Net realized and unrealized gain (loss)
on investments | | $ | | | 4.14 | | | | 0.28 | | | | 2.87 | | | | 5.19 | | | | (8.24 | ) | |
| Total from investment operations | | $ | | | 4.50 | | | | 0.33 | | | | 3.03 | | | | 5.24 | | | | (8.22 | ) | |
| Less distributions: | |
| Net investment income | | $ | | | 0.06 | | | | 0.13 | | | | 0.08 | | | | 0.04 | | | | — | | |
| Total distributions | | $ | | | 0.06 | | | | 0.13 | | | | 0.08 | | | | 0.04 | | | | — | | |
| Net asset value, end of year | | $ | | | 31.68 | | | | 27.24 | | | | 27.04 | | | | 24.09 | | | | 18.89 | | |
| Total Return(1) | | % | | | 16.57 | | | | 1.25 | | | | 12.63 | | | | 27.74 | | | | (30.35 | ) | |
| Ratios and Supplemental Data: | |
| Net assets, end of year (000's) | | $ | | | 6,795 | | | | 277 | | | | 445 | | | | 391 | | | | 80 | | |
| Ratios to average net assets: | |
| Net expenses after brokerage commission recapture | | % | | | 1.15 | | | | 1.15 | | | | 1.15 | | | | 1.15 | | | | 1.15 | | |
Gross expenses prior prior to brokerage
commission recapture | | % | | | 1.15 | | | | 1.15 | | | | 1.15 | | | | 1.15 | | | | 1.15 | | |
Net investment income after brokerage
commission recapture | | % | | | 1.19 | | | | 0.18 | | | | 0.62 | | | | 0.21 | | | | 0.08 | | |
| Portfolio turnover rate | | % | | | 171 | | | | 95 | | | | 74 | | | | 65 | | | | 151 | | |
(1) Total return is calculated assuming reinvestment of all dividends and capital gain distributions at net asset value and does not reflect the effect of insurance contract changes.
* Per share numbers have been calculated using average number of shares outstanding throughout the period.
See Accompanying Notes to Financial Statements
149
ING THORNBURG VALUE PORTFOLIO (CONTINUED)
FINANCIAL HIGHLIGHTS
Selected data for a share outstanding for each year.
| | | | | Class ADV | |
| | | | | Year Ended December 31, | |
| | | | | 2006 | | 2005 | | 2004 | | 2003 | | 2002 | |
| Per Share Operating Performance: | |
| Net asset value, beginning of year | | $ | | | 27.03 | | | | 26.86 | | | | 23.98 | | | | 18.84 | | | | 27.11 | | |
| Income (loss) from investment operations: | |
| Net investment income (loss) | | $ | | | 0.05 | * | | | (0.02 | )* | | | 0.03 | * | | | (0.01 | )* | | | (0.01 | )* | |
Net realized and unrealized gain (loss)
on investments | | $ | | | 4.34 | | | | 0.29 | | | | 2.92 | | | | 5.17 | | | | (8.26 | ) | |
| Total from investment operations | | $ | | | 4.39 | | | | 0.27 | | | | 2.95 | | | | 5.16 | | | | (8.27 | ) | |
| Less distributions: | |
| Net investment income | | $ | | | 0.04 | | | | 0.10 | | | | 0.07 | | | | 0.02 | | | | — | | |
| Total distributions | | $ | | | 0.04 | | | | 0.10 | | | | 0.07 | | | | 0.02 | | | | — | | |
| Net asset value, end of year | | $ | | | 31.38 | | | | 27.03 | | | | 26.86 | | | | 23.98 | | | | 18.84 | | |
| Total Return(1) | | % | | | 16.26 | | | | 1.03 | | | | 12.36 | | | | 27.39 | | | | (30.51 | ) | |
| Ratios and Supplemental Data: | |
| Net assets, end of year (000's) | | $ | | | 673 | | | | 214 | | | | 267 | | | | 159 | | | | 54 | | |
| Ratios to average net assets: | |
| Net expenses after brokerage commission recapture | | % | | | 1.40 | | | | 1.40 | | | | 1.40 | | | | 1.40 | | | | 1.40 | | |
Gross expenses prior to brokerage
commission recapture | | % | | | 1.40 | | | | 1.40 | | | | 1.40 | | | | 1.40 | | | | 1.40 | | |
Net investment income (loss) after brokerage
commission recapture | | % | | | 0.18 | | | | (0.08 | ) | | | 0.27 | | | | (0.04 | ) | | | (0.06 | ) | |
| Portfolio turnover rate | | % | | | 171 | | | | 95 | | | | 74 | | | | 65 | | | | 151 | | |
(1) Total return is calculated assuming reinvestment of all dividends and capital gain distributions at net asset value and does not reflect the effect of insurance contract changes.
* Per share numbers have been calculated using average number of shares outstanding throughout the period.
See Accompanying Notes to Financial Statements
150
ING UBS U.S. LARGE CAP EQUITY PORTFOLIO
FINANCIAL HIGHLIGHTS
Selected data for a share outstanding for each year.
| | | | | Class I | |
| | | | | Year Ended December 31, | |
| | | | | 2006 | | 2005 | | 2004 | | 2003 | | 2002 | |
| Per Share Operating Performance: | |
| Net asset value, beginning of year | | $ | | | 9.30 | | | | 8.58 | | | | 7.54 | | | | 6.07 | | | | 8.11 | | |
| Income (loss) from investment operations: | |
| Net investment income | | $ | | | 0.09 | | | | 0.08 | * | | | 0.10 | | | | 0.06 | | | | 0.03 | | |
Net realized and unrealized gain (loss) on
investments | | $ | | | 1.25 | | | | 0.72 | | | | 1.00 | | | | 1.45 | | | | (2.06 | ) | |
| Total from investment operations | | $ | | | 1.34 | | | | 0.80 | | | | 1.10 | | | | 1.51 | | | | (2.03 | ) | |
| Less distributions: | |
| Net investment income | | $ | | | 0.08 | | | | 0.08 | | | | 0.06 | | | | 0.04 | | | | 0.01 | | |
| Total distributions | | $ | | | 0.08 | | | | 0.08 | | | | 0.06 | | | | 0.04 | | | | 0.01 | | |
| Net asset value, end of year | | $ | | | 10.56 | | | | 9.30 | | | | 8.58 | | | | 7.54 | | | | 6.07 | | |
| Total Return(1) | | % | | | 14.51 | | | | 9.38 | | | | 14.76 | | | | 24.95 | | | | (24.98 | ) | |
| Ratios and Supplemental Data: | |
| Net assets, end of year (000's) | | $ | | | 355,204 | | | | 270,692 | | | | 267,249 | | | | 264,755 | | | | 245,281 | | |
| Ratios to average net assets: | |
Net expenses after brokerage
commission recapture | | $ | | | 0.84 | | | | 0.85 | | | | 0.85 | | | | 0.85 | | | | 0.85 | | |
Gross expenses prior to brokerage
commission recapture | | % | | | 0.85 | | | | 0.85 | | | | 0.85 | | | | 0.85 | | | | 0.85 | | |
Net investment income after brokerage
commission recapture | | % | | | 0.99 | | | | 0.92 | | | | 1.22 | | | | 0.83 | | | | 0.50 | | |
| Portfolio turnover rate | | % | | | 39 | | | | 51 | | | | 140 | | | | 126 | | | | 106 | | |
| | | | | Class S | |
| | | | | Year Ended December 31, | |
| | | | | 2006 | | 2005 | | 2004 | | 2003 | | 2002 | |
| Per Share Operating Performance: | |
| Net asset value, beginning of year | | $ | | | 9.21 | | | | 8.52 | | | | 7.49 | | | | 6.05 | | | | 8.10 | | |
| Income from investment operations: | |
| Net investment income (loss) | | $ | | | 0.08 | * | | | 0.06 | * | | | 0.09 | | | | 0.01 | | | | 0.01 | | |
Net realized and unrealized gain (loss) on
investments | | $ | | | 1.23 | | | | 0.70 | | | | 1.00 | | | | 1.47 | | | | (2.05 | ) | |
| Total from investment operations | | $ | | | 1.31 | | | | 0.76 | | | | 1.09 | | | | 1.48 | | | | (2.04 | ) | |
| Less distributions: | |
| Net investment income | | $ | | | 0.07 | | | | 0.07 | | | | 0.06 | | | | 0.04 | | | | 0.01 | | |
| Total distributions | | $ | | | 0.07 | | | | 0.07 | | | | 0.06 | | | | 0.04 | | | | 0.01 | | |
| Net asset value, end of year | | $ | | | 10.45 | | | | 9.21 | | | | 8.52 | | | | 7.49 | | | | 6.05 | | |
| Total Return(1) | | % | | | 14.32 | | | | 8.99 | | | | 14.59 | | | | 24.54 | | | | (25.15 | ) | |
| Ratios and Supplemental Data: | |
| Net assets, end of year (000's) | | $ | | | 28,207 | | | | 9,667 | | | | 2,356 | | | | 1,352 | | | | 8 | | |
| Ratios to average net assets: | |
Net expenses after brokerage
commission recapture | | $ | | | 1.09 | | | | 1.10 | | | | 1.10 | | | | 1.10 | | | | 1.09 | | |
Gross expenses prior to brokerage
commission recapture | | % | | | 1.10 | | | | 1.10 | | | | 1.10 | | | | 1.10 | | | | 1.09 | | |
Net investment income after brokerage
commission recapture | | % | | | 0.79 | | | | 0.64 | | | | 1.06 | | | | 0.37 | | | | 0.26 | | |
| Portfolio turnover rate | | % | | | 39 | | | | 51 | | | | 140 | | | | 126 | | | | 106 | | |
(1) Total return is calculated assuming reinvestment of all dividends and capital gain distributions at net asset value and does not reflect the effect of insurance contract changes.
* Per share numbers have been calculated using average number of shares outstanding throughout the period.
See Accompanying Notes to Financial Statements
151
ING UBS U.S. LARGE CAP EQUITY PORTFOLIO (CONTINUED)
FINANCIAL HIGHLIGHTS
Selected data for a share outstanding for each year.
| | | | | Class ADV | |
| | | | | Year Ended December 31, | |
| | | | | 2006 | | 2005 | | 2004 | | 2003 | | 2002 | |
| Per Share Operating Performance: | |
| Net asset value, beginning of year | | $ | | | 9.19 | | | | 8.52 | | | | 7.49 | | | | 6.04 | | | | 8.10 | | |
| Income (loss) from investment operations: | |
| Net investment income | | $ | | | 0.06 | * | | | 0.03 | * | | | 0.05 | | | | 0.02 | | | | 0.02 | | |
Net realized and unrealized gain (loss) on
investments | | $ | | | 1.22 | | | | 0.70 | | | | 1.01 | | | | 1.45 | | | | (2.07 | ) | |
| Total from investment operations | | $ | | | 1.28 | | | | 0.73 | | | | 1.06 | | | | 1.47 | | | | (2.05 | ) | |
| Less distributions: | |
| Net investment income | | $ | | | 0.07 | | | | 0.06 | | | | 0.03 | | | | 0.02 | | | | 0.01 | | |
| Total distributions | | $ | | | 0.07 | | | | 0.06 | | | | 0.03 | | | | 0.02 | | | | 0.01 | | |
| Net asset value, end of year | | $ | | | 10.40 | | | | 9.19 | | | | 8.52 | | | | 7.49 | | | | 6.04 | | |
| Total Return(1) | | % | | | 14.05 | | | | 8.67 | | | | 14.21 | | | | 24.42 | | | | (25.29 | ) | |
| Ratios and Supplemental Data: | |
| Net assets, end of year (000's) | | $ | | | 4,033 | | | | 426 | | | | 48 | | | | 39 | | | | 39 | | |
| Ratios to average net assets: | |
Net expenses after brokerage
commission recapture | | $ | | | 1.34 | | | | 1.35 | | | | 1.35 | | | | 1.35 | | | | 1.34 | | |
Gross expenses prior to brokerage
commission recapture | | % | | | 1.35 | | | | 1.35 | | | | 1.35 | | | | 1.35 | | | | 1.34 | | |
Net investment income after brokerage
commission recapture | | % | | | 0.58 | | | | 0.37 | | | | 0.73 | | | | 0.33 | | | | 0.29 | | |
| Portfolio turnover rate | | % | | | 39 | | | | 51 | | | | 140 | | | | 126 | | | | 106 | | |
(1) Total return is calculated assuming reinvestment of all dividends and capital gain distributions at net asset value and does not reflect the effect of insurance contract changes.
* Per share numbers have been calculated using average number of shares outstanding throughout the period.
See Accompanying Notes to Financial Statements
152
ING UBS U.S. SMALL CAP GROWTH PORTFOLIO
FINANCIAL HIGHLIGHTS
Selected data for a share outstanding for each period.
| | | | | Class I | | Class S | |
| | | | | April 28,
2006(1) to
December 31,
2006 | | April 28,
2006(1) to
December 31,
2006 | |
| Per Share Operating Performance: | |
| Net asset value, beginning of period | | $ | | | 10.00 | | | | 10.00 | | |
| Income (loss) from investment operations: | |
| Net investment (loss) | | $ | | | (0.02 | ) | | | (0.04 | )* | |
| Net realized and unrealized loss on investments | | $ | | | (0.18 | ) | | | (0.18 | ) | |
| Total from investment operations | | $ | | | (0.20 | ) | | | (0.22 | ) | |
| Less distributions: | |
| Net realized gain on investments | | $ | | | 0.08 | | | | 0.08 | | |
| Total distributions | | $ | | | 0.08 | | | | 0.08 | | |
| Net asset value, end of period | | $ | | | 9.72 | | | | 9.70 | | |
| Total Return(2) | | % | | | (1.97 | ) | | | (2.17 | ) | |
| Ratios and Supplemental Data: | |
| Net assets, end of period (000's) | | $ | | | 22,417 | | | | 5,065 | | |
| Ratios to average net assets: | |
| Net expenses after expense reimbursement and brokerage commission recapture | | % | | | 0.95 | | | | 1.20 | | |
| Net expenses after expense reimbursement and prior to brokerage commission recapture(3)(4) | | % | | | 1.00 | | | | 1.25 | | |
| Gross expenses prior to expense reimbursement and brokerage commission recapture(3) | | % | | | 1.27 | | | | 1.52 | | |
| Net investment loss after expense reimbursement and brokerage commission recapture(3)(4) | | % | | | (0.43 | ) | | | (0.64 | ) | |
| Portfolio turnover rate | | % | | | 104 | | | | 104 | | |
| | | | | Class ADV | |
| | | | | April 28,
2006(1) to
December 31,
2006 | |
| Per Share Operating Performance: | |
| Net asset value, beginning of period | | $ | | | 10.00 | | |
| Income (loss) from investment operations: | |
| Net investment loss | | $ | | | (0.08 | ) | |
| Net realized and unrealized loss on investments | | $ | | | (0.17 | ) | |
| Total from investment operations | | $ | | | (0.25 | ) | |
| Less distributions: | |
| Net realized gain on investments | | $ | | | 0.08 | | |
| Total distributions | | $ | | | 0.08 | | |
| Net asset value, end of period | | $ | | | 9.67 | | |
| Total Return(2) | | % | | | (2.47 | ) | |
| Ratios and Supplemental Data: | |
| Net assets, end of period (000's) | | $ | | | 1 | | |
| Ratios to average net assets: | |
| Net expenses after expense reimbursement and brokerage commission recapture | | % | | | 1.45 | | |
| Net expenses after expense reimbursement and prior to brokerage commission recapture(3)(4) | | % | | | 1.50 | | |
| Gross expenses prior to expense reimbursement and brokerage commission recapture(3) | | % | | | 1.77 | | |
| Net investment loss after expense reimbursement and brokerage commission recapture(3)(4) | | % | | | (1.19 | ) | |
| Portfolio turnover rate | | % | | | 104 | | |
(1) Commencement of operations.
(2) Total return is calculated assuming reinvestment of all dividends and capital gain distributions at net asset value and does not reflect the effect of insurance contract changes. Total return for periods less than one year is not annualized.
(3) Annualized for periods less than one year.
(4) The Investment Adviser has agreed to limit expenses, (excluding interest, taxes, brokerage and extraordinary expenses) subject to possible recoupment by the Investment Adviser within three years of being incurred.
* Per share numbers have been calculated using average number of shares outstanding throughout the period.
See Accompanying Notes to Financial Statements
153
ING VAN KAMPEN COMSTOCK PORTFOLIO
FINANCIAL HIGHLIGHTS
Selected data for a share outstanding for each period.
| | | | | Class I | |
| | | | | Year Ended December 31, | | May 1,
2002(1) to
December 31, | |
| | | | | 2006 | | 2005 | | 2004 | | 2003 | | 2002 | |
| Per Share Operating Performance: | |
| Net asset value, beginning of period | | $ | | | 12.22 | | | | 12.33 | | | | 10.60 | | | | 8.35 | | | | 10.00 | | |
| Income (loss) from investment operations: | |
| Net investment income | | $ | | | 0.24 | * | | | 0.19 | * | | | 0.12 | | | | 0.09 | | | | 0.04 | | |
Net realized and unrealized gain (loss) on
investments | | $ | | | 1.66 | | | | 0.24 | | | | 1.66 | | | | 2.41 | | | | (1.64 | ) | |
| Total from investment operations | | $ | | | 1.90 | | | | 0.43 | | | | 1.78 | | | | 2.50 | | | | (1.60 | ) | |
| Less distributions: | |
| Net investment income | | $ | | | 0.13 | | | | 0.08 | | | | — | | | | 0.08 | | | | 0.05 | | |
| Net realized gain on investments | | $ | | | 0.62 | | | | 0.46 | | | | 0.05 | | | | 0.17 | | | | — | | |
| Total distributions | | $ | | | 0.75 | | | | 0.54 | | | | 0.05 | | | | 0.25 | | | | 0.05 | | |
| Net asset value, end of period | | $ | | | 13.37 | | | | 12.22 | | | | 12.33 | | | | 10.60 | | | | 8.35 | | |
| Total Return(2) | | % | | | 16.19 | | | | 3.74 | | | | 16.90 | | | | 29.92 | | | | (16.01 | ) | |
| Ratios and Supplemental Data: | |
| Net assets, end of period (000's) | | $ | | | 634,470 | | | | 133,987 | | | | 70,308 | | | | 33,398 | | | | 3,874 | | |
| Ratios to average net assets: | |
| Net expenses after expense reimbursement(3) | | % | | | 0.84 | | | | 0.87 | | | | 0.90 | | | | 0.95 | | | | 0.95 | | |
Gross expenses prior to expense
reimbursement(3) | | % | | | 0.88 | | | | 0.95 | | | | 0.90 | | | | 0.95 | | | | 0.95 | | |
Net investment income after expense
reimbursement(3) | | % | | | 1.91 | | | | 1.57 | | | | 1.40 | | | | 1.28 | | | | 1.70 | | |
| Portfolio turnover rate | | % | | | 27 | | | | 27 | | | | 30 | | | | 32 | | | | 47 | | |
| | | | | Class S | |
| | | | | Year Ended December 31, | | May 1,
2002(1) to
December 31, | |
| | | | | 2006 | | 2005 | | 2004 | | 2003 | | 2002 | |
| Per Share Operating Performance: | |
| Net asset value, beginning of period | | $ | | | 12.16 | | | | 12.29 | | | | 10.58 | | | | 8.34 | | | | 10.00 | | |
| Income (loss) from investment operations: | |
| Net investment income | | $ | | | 0.21 | * | | | 0.16 | * | | | 0.09 | | | | 0.05 | | | | 0.05 | | |
Net realized and unrealized gain (loss) on
investments | | $ | | | 1.64 | | | | 0.24 | | | | 1.67 | | | | 2.42 | | | | (1.67 | ) | |
| Total from investment operations | | $ | | | 1.85 | | | | 0.40 | | | | 1.76 | | | | 2.47 | | | | (1.62 | ) | |
| Less distributions: | |
| Net investment income | | $ | | | 0.09 | | | | 0.07 | | | | — | | | | 0.06 | | | | 0.04 | | |
| Net realized gain on investments | | $ | | | 0.62 | | | | 0.46 | | | | 0.05 | | | | 0.17 | | | | — | | |
| Total distributions | | $ | | | 0.71 | | | | 0.53 | | | | 0.05 | | | | 0.23 | | | | 0.04 | | |
| Net asset value, end of period | | $ | | | 13.30 | | | | 12.16 | | | | 12.29 | | | | 10.58 | | | | 8.34 | | |
| Total Return(2) | | % | | | 15.86 | | | | 3.47 | | | | 16.74 | | | | 29.67 | | | | (16.22 | ) | |
| Ratios and Supplemental Data: | |
| Net assets, end of period (000's) | | $ | | | 358,431 | | | | 537,092 | | | | 317,797 | | | | 139,236 | | | | 12,723 | | |
| Ratios to average net assets: | |
| Net expenses after expense reimbursement(3) | | % | | | 1.09 | | | | 1.12 | | | | 1.15 | | | | 1.20 | | | | 1.20 | | |
Gross expenses prior to expense
reimbursement(3) | | % | | | 1.13 | | | | 1.20 | | | | 1.15 | | | | 1.20 | | | | 1.20 | | |
Net investment income after expense
reimbursement(3) | | % | | | 1.67 | | | | 1.31 | | | | 1.15 | | | | 1.06 | | | | 1.23 | | |
| Portfolio turnover rate | | % | | | 27 | | | | 27 | | | | 30 | | | | 32 | | | | 47 | | |
(1) Commencement of operations.
(2) Total return is calculated assuming reinvestment of all dividends and capital gain distributions at net asset value and does not reflect the effect of insurance contract changes. Total return for periods less than one year is not annualized.
(3) Annualized for periods less than one year.
* Per share numbers have been calculated using average number of shares outstanding throughout the period.
See Accompanying Notes to Financial Statements
154
ING VAN KAMPEN COMSTOCK PORTFOLIO (CONTINUED)
FINANCIAL HIGHLIGHTS
Selected data for a share outstanding for each period.
| | | | | Class ADV | |
| | | | | Year Ended December 31, | | May 1,
2002(1) to
December 31, | |
| | | | | 2006 | | 2005 | | 2004 | | 2003 | | 2002 | |
| Per Share Operating Performance: | |
| Net asset value, beginning of period | | $ | | | 12.08 | | | | 12.22 | | | | 10.55 | | | | 8.32 | | | | 10.00 | | |
| Income (loss) from investment operations: | |
| Net investment income | | $ | | | 0.18 | * | | | 0.13 | * | | | 0.08 | | | | 0.07 | | | | 0.01 | | |
Net realized and unrealized gain (loss) on
investments | | $ | | | 1.62 | | | | 0.24 | | | | 1.64 | | | | 2.37 | | | | (1.65 | ) | |
| Total from investment operations | | $ | | | 1.80 | | | | 0.37 | | | | 1.72 | | | | 2.44 | | | | (1.64 | ) | |
| Less distributions: | |
| Net investment income | | $ | | | 0.09 | | | | 0.04 | | | | — | | | | 0.04 | | | | 0.04 | | |
| Net realized gain on investments | | $ | | | 0.62 | | | | 0.47 | | | | 0.05 | | | | 0.17 | | | | — | | |
| Total distributions | | $ | | | 0.71 | | | | 0.51 | | | | 0.05 | | | | 0.21 | | | | 0.04 | | |
| Net asset value, end of period | | $ | | | 13.17 | | | | 12.08 | | | | 12.22 | | | | 10.55 | | | | 8.32 | | |
| Total Return(2) | | % | | | 15.57 | | | | 3.20 | | | | 16.41 | | | | 29.34 | | | | (16.36 | ) | |
| Ratios and Supplemental Data: | |
| Net assets, end of period (000's) | | $ | | | 37,431 | | | | 25,455 | | | | 12,569 | | | | 8,556 | | | | 3,699 | | |
| Ratios to average net assets: | |
| Net expenses after expense reimbursement(3) | | % | | | 1.34 | | | | 1.37 | | | | 1.40 | | | | 1.45 | | | | 1.45 | | |
Gross expenses prior to expense
reimbursement(3) | | % | | | 1.38 | | | | 1.45 | | | | 1.40 | | | | 1.45 | | | | 1.45 | | |
Net investment income after expense
reimbursement(3) | | % | | | 1.42 | | | | 1.06 | | | | 0.86 | | | | 0.77 | | | | 1.75 | | |
| Portfolio turnover rate | | % | | | 27 | | | | 27 | | | | 30 | | | | 32 | | | | 47 | | |
(1) Commencement of operations.
(2) Total return is calculated assuming reinvestment of all dividends and capital gain distributions at net asset value and does not reflect the effect of insurance contract changes. Total return for periods less than one year is not annualized.
(3) Annualized for periods less than one year.
* Per share numbers have been calculated using average number of shares outstanding throughout the period.
See Accompanying Notes to Financial Statements
155
ING VAN KAMPEN EQUITY AND INCOME PORTFOLIO
FINANCIAL HIGHLIGHTS
Selected data for a share outstanding for each year.
| | | | | Class I | |
| | | | | Year Ended December 31, | |
| | | | | 2006 | | 2005 | | 2004 | | 2003 | | 2002 | |
| Per Share Operating Performance: | |
| Net asset value, beginning of year | | $ | | | 36.09 | | | | 33.47 | | | | 30.35 | | | | 23.94 | | | | 31.14 | | |
| Income (loss) from investment operations: | |
| Net investment income | | $ | | | 0.92 | * | | | 0.73 | * | | | 0.14 | | | | 0.14 | | | | 0.07 | | |
Net realized and unrealized gain (loss) on
investments | | $ | | | 3.48 | | | | 1.95 | | | | 3.15 | | | | 6.40 | | | | (7.22 | ) | |
| Total from investment operations | | $ | | | 4.40 | | | | 2.68 | | | | 3.29 | | | | 6.54 | | | | (7.15 | ) | |
| Less distributions: | |
| Net investment income | | $ | | | 0.73 | | | | 0.03 | | | | 0.17 | | | | 0.13 | | | | 0.00 | ** | |
| Net realized gain on investments | | $ | | | 1.29 | | | | 0.03 | | | | — | | | | — | | | | 0.05 | | |
| Total distributions | | $ | | | 2.02 | | | | 0.06 | | | | 0.17 | | | | 0.13 | | | | 0.05 | | |
| Net asset value, end of year | | $ | | | 38.47 | | | | 36.09 | | | | 33.47 | | | | 30.35 | | | | 23.94 | | |
| Total Return(1) | | % | | | 12.67 | | | | 8.02 | | | | 10.86 | | | | 27.37 | | | | (22.92 | ) | |
| Ratios and Supplemental Data: | |
| Net assets, end of year (000's) | | $ | | | 925,305 | | | | 847,997 | | | | 551,489 | | | | 2,883 | | | | 1,378 | | |
| Ratios to average net assets: | |
| Expenses | | % | | | 0.57 | | | | 0.57 | | | | 0.74 | | | | 1.10 | | | | 1.10 | | |
| Net investment income | | % | | | 2.49 | | | | 2.10 | | | | 1.88 | | | | 0.72 | | | | 0.73 | | |
| Portfolio turnover rate | | % | | | 57 | | | | 125 | | | | 797 | | | | 17 | | | | 15 | | |
| | | | | Class S | |
| | | | | Year Ended December 31, | |
| | | | | 2006 | | 2005 | | 2004 | | 2003 | | 2002 | |
| Per Share Operating Performance: | |
| Net asset value, beginning of year | | $ | | | 35.93 | | | | 33.37 | | | | 30.27 | | | | 23.88 | | | | 31.14 | | |
| Income (loss) from investment operations: | |
| Net investment income | | $ | | | 0.82 | * | | | 0.63 | * | | | 0.17 | | | | 0.12 | | | | 0.07 | | |
Net realized and unrealized gain (loss) on
investments | | $ | | | 3.47 | | | | 1.96 | | | | 3.03 | | | | 6.33 | | | | (7.28 | ) | |
| Total from investment operations | | $ | | | 4.29 | | | | 2.59 | | | | 3.20 | | | | 6.45 | | | | (7.21 | ) | |
| Less distributions: | |
| Net investment income | | $ | | | 0.69 | | | | — | | | | 0.10 | | | | 0.06 | | | | 0.00 | ** | |
| Net realized gain on investments | | $ | | | 1.29 | | | | 0.03 | | | | — | | | | — | | | | 0.05 | | |
| Total distributions | | $ | | | 1.98 | | | | 0.03 | | | | 0.10 | | | | 0.06 | | | | 0.05 | | |
| Net asset value, end of year | | $ | | | 38.24 | | | | 35.93 | | | | 33.37 | | | | 30.27 | | | | 23.88 | | |
| Total Return(1) | | % | | | 12.40 | | | | 7.77 | | | | 10.62 | | | | 27.04 | | | | (23.13 | ) | |
| Ratios and Supplemental Data: | |
| Net assets, end of year (000's) | | $ | | | 88,409 | | | | 59,793 | | | | 34,477 | | | | 17,744 | | | | 13,685 | | |
| Ratios to average net assets: | |
| Expenses | | % | | | 0.82 | | | | 0.82 | | | | 0.99 | | | | 1.35 | | | | 1.35 | | |
| Net investment income | | % | | | 2.25 | | | | 1.84 | | | | 0.99 | | | | 0.46 | | | | 0.27 | | |
| Portfolio turnover rate | | % | | | 57 | | | | 125 | | | | 797 | | | | 17 | | | | 15 | | |
(1) Total return is calculated assuming reinvestment of all dividends and capital gain distributions at net asset value and does not reflect the effect of insurance contract changes.
* Per share numbers have been calculated using average number of shares outstanding throughout the period.
** Amount is less than $0.005.
See Accompanying Notes to Financial Statements
156
ING VAN KAMPEN EQUITY AND INCOME PORTFOLIO (CONTINUED)
FINANCIAL HIGHLIGHTS
Selected data for a share outstanding for each year.
| | | | | Class ADV | |
| | | | | Year Ended December 31, | |
| | | | | 2006 | | 2005 | | 2004 | | 2003 | | 2002 | |
| Per Share Operating Performance: | |
| Net asset value, beginning of year | | $ | | | 35.55 | | | | 33.11 | | | | 30.07 | | | | 23.81 | | | | 31.13 | | |
| Income (loss) from investment operations: | |
| Net investment income | | $ | | | 0.72 | * | | | 0.53 | * | | | 0.15 | | | | 0.06 | | | | 0.02 | | |
Net realized and unrealized gain (loss) on
investments | | $ | | | 3.43 | | | | 1.95 | | | | 2.96 | | | | 6.30 | | | | (7.29 | ) | |
| Total income (loss) from investment operations | | $ | | | 4.15 | | | | 2.48 | | | | 3.11 | | | | 6.36 | | | | (7.27 | ) | |
| Less distributions: | |
| Net investment income | | $ | | | 0.59 | | | | 0.01 | | | | 0.07 | | | | 0.10 | | | | — | | |
| Net realized gain on investments | | $ | | | 1.29 | | | | 0.03 | | | | — | | | | — | | | | 0.05 | | |
| Total distributions | | $ | | | 1.88 | | | | 0.04 | | | | 0.07 | | | | 0.10 | | | | 0.05 | | |
| Net asset value, end of year | | $ | | | 37.82 | | | | 35.55 | | | | 33.11 | | | | 30.07 | | | | 23.81 | | |
| Total Return(1) | | % | | | 12.12 | | | | 7.49 | | | | 10.32 | | | | 26.76 | | | | (23.35 | ) | |
| Ratios and Supplemental Data: | |
| Net assets, end of year (000's) | | $ | | | 18,385 | | | | 14,307 | | | | 8,611 | | | | 123 | | | | 22 | | |
| Ratios to average net assets: | |
| Expenses | | % | | | 1.07 | | | | 1.07 | | | | 1.24 | | | | 1.60 | | | | 1.60 | | |
| Net investment income | | % | | | 1.98 | | | | 1.56 | | | | 1.29 | | | | 0.22 | | | | 0.09 | | |
| Portfolio turnover rate | | % | | | 57 | | | | 125 | | | | 797 | | | | 17 | | | | 15 | | |
(1) Total return is calculated assuming reinvestment of all dividends and capital gain distributions at net asset value and does not reflect the effect of insurance contract changes.
* Per share numbers have been calculated using average number of shares outstanding throughout the period.
See Accompanying Notes to Financial Statements
157
NOTES TO FINANCIAL STATEMENTS AS OF DECEMBER 31, 2006
NOTE 1 — ORGANIZATION
ING Partners, Inc. (the "Fund") is an open-end management investment company registered under the Investment Company Act of 1940, as amended (the "1940 Act"). It was incorporated under the laws of Maryland on May 7, 1997. The Articles of Incorporation permit the Fund to offer separate series (each a "Portfolio" and collectively, the "Portfolios"), each of which has its own investment objective, policies and restrictions. The Fund serves as an investment option in underlying variable insurance products offered by Directed Services, LLC(1) ("DSL" or the "Investment Adviser").
The Fund currently consists of twenty-eight diversified Portfolios and two non-diversified Portfolios. The thirty included in this report are: ING American Century Large Company Value Portfolio ("American Century Large Company Value"); ING American Century Select Portfolio ("American Century Select"); ING American Century Small-Mid Cap Value Portfolio ("American Century Small-Mid Cap"); ING Baron Asset Portfolio ("Baron Asset"); ING Baron Small Cap Growth Portfolio ("Baron Small Cap Growth"); ING Columbia Small Cap Value II Portfolio ("Columbia Small Cap Value II"); ING Davis Venture Value Portfolio ("Davis Venture Value"); ING Fundamental Research Portfolio ("Fundamental Research"); ING Goldman Sachs® Capital Growth Portfolio ("Goldman Sachs® Capital Growth"); ING Goldman Sachs® Structured Equity Portfolio ("Goldman Sachs® Structured Equity"); ING JPMorgan International Portfolio ("JPMorgan International"); ING JPMorgan Mid Cap Value Portfolio ("JPMorgan Mid Cap Value"); ING Legg Mason Partners Aggressive Growth Portfolio ("Legg Mason Partners Aggressive Growth"); ING Legg Mason Partners Large Cap Growth Portfolio ("Legg Mason Partners Large Cap Growth"); ING Lord Abbett U.S. Government Securities Portfolio ("Lord Abbett U.S. Government Securities"); ING Neuberger Berman Partners Portfolio ("Neuberger Berman Partners"); ING Neuberger Berman Regency Portfolio ("Neuberger Berman Regency"); ING OpCap Balanced Value Portfolio ("OpCap Balanced Value"); ING Oppenheimer Global Portfolio ("Oppenheimer Global"); ING Oppenheimer Strategic Income Portfolio ("Oppenheimer Strategic Income"); ING PIMCO Total Return Portfolio ("PIMCO Total Return"); ING Pioneer High Yield Portfolio ("Pioneer High Yield"); ING T. Rowe Price Diversified Mid Cap Growth Portfolio ("T. Rowe Price Diversified Mid Cap Growth"); ING T. Rowe Price Growth Equity Portfolio ("T. Rowe Price Growth Equity"); ING Templeton Foreign Equity Portfolio ("Templeton Foreign Equity"); ING Thornburg Value Portfolio (formerly, ING MFS Capital Opportunities Portfolio, "Thornburg Value"); ING UBS U.S. Large Cap Equity Portfolio ("UBS U.S. Large Cap Equity"); ING UBS U.S. Small Cap Growth Portfolio ("UBS U.S. Small Cap Growth"); ING Van Kampen Comstock Portfolio ("Van Kampen Comstock"); and ING Van Kampen Equit y and Income Portfolio ("Van Kampen Equity and Income").
Davis Venture Value and JPMorgan Mid Cap Value are classified as "non-diversified" portfolios under the 1940 Act.
The following is a brief description of each Portfolio's investment objective:
• American Century Large Company Value seeks long-term capital growth, income is a second objective;
• American Century Select seeks long-term capital growth;
• American Century Small-Mid Cap Value seeks long-term growth of capital, income is a secondary objective;
• Baron Asset seeks capital appreciation;
• Baron Small Cap Growth seeks capital appreciation;
• Columbia Small Cap Value II seeks long-term growth of capital;
• Davis Venture Value seeks long-term growth of capital;
• Fundamental Research seeks to maximize total return through investments in a diversified portfolio of common stocks and securities convertible into common stocks;
• Goldman Sachs® Capital Growth seeks long-term growth of capital;
• Goldman Sachs® Structured Equity seeks long-term growth of capital and dividend income;
• JPMorgan International seeks long-term growth of capital;
• JPMorgan Mid Cap Value seeks growth from capital appreciation;
• Legg Mason Partners Aggressive Growth seeks long-term growth of capital;
• Legg Mason Partners Large Cap Growth seeks long-term capital appreciation;
• Lord Abbett U.S. Government Securities seeks high current income consistent with reasonable risk;
• Neuberger Berman Partners seeks capital growth;
158
NOTES TO FINANCIAL STATEMENTS AS OF DECEMBER 31, 2006 (CONTINUED)
NOTE 1 — ORGANIZATION (continued)
• Neuberger Berman Regency seeks capital growth;
• OpCap Balanced Value seeks capital growth, and secondarily, investment income;
• Oppenheimer Global seeks capital appreciation;
• Oppenheimer Strategic Income seeks a high level of current income principally derived from interest on debt securities;
• PIMCO Total Return seeks maximum total return, consistent with capital preservation and prudent investment management;
• Pioneer High Yield seeks to maximize total return through income and capital appreciation;
• T. Rowe Price Diversified Mid Cap Growth seeks long-term capital appreciation;
• T. Rowe Price Growth Equity seeks long-term capital growth, and secondarily, increasing dividend income;
• Templeton Foreign Equity seeks long-term capital growth;
• Thornburg Value seeks capital appreciation;
• UBS U.S. Large Cap Equity seeks long-term growth of capital and future income;
• UBS U.S. Small Cap Growth seeks long-term capital appreciation;
• Van Kampen Comstock seeks capital growth and income; and
• Van Kampen Equity and Income seeks total return, consisting of long-term capital appreciation and current income.
The Fund offers three classes of shares, referred to as Initial Class (Class "I"), Service Class (Class "S") and Adviser Class (Class "ADV"). The classes differ principally in applicable distribution and shareholder service fees. Shareholders of each class also bear certain expenses that pertain to that particular class. All shareholders bear the common expenses of the Portfolios and earn income and realized gains/losses from the Portfolio pro rata based on the average daily net assets of each class, without discrimination between share classes. Differences in per share dividend rates generally result from differences in separate class expenses, including distribution and shareholder servicing fees. Class I shares are intended for distribution networks including non-qualified annuity and life insurance contracts and qualified retirement plans offered through an annuity contract, as well as qualified retirement plans offered through a custodi al account where the sale is made on a direct basis without the involvement of a financial intermediary or where the qualified retirement plan has assets of $50 million or more. Class S and Class ADV shares of a Portfolio are intended for distribution networks including qualified retirement plans offered through an annuity contract or custodial account. Shareholders of the Class I shares of each Portfolio will generally be entitled to exchange those shares at net asset value ("NAV") for Class I shares of other Portfolios that offer Class I shares. Shareholders of the Class ADV shares of each Portfolio will generally be entitled to exchange those shares at NAV for Class ADV shares of other Portfolios that offer Class ADV shares. Shareholders of the Class ADV shares continue to be subject to the Rule 12b-1 Plan fee applicable to Class ADV shares after the exchange. Shareholders of Class S shares of each Portfolio will generally be entitled to exchange those shares at net asset value for Class S shares of other Portfolios that offer Class S shares. Each Portfolio's shares may be offered to variable annuity and variable life insurance separate accounts, qualified pension and retirement plans outside the separate account context, and to certain investment advisers and their affiliates.
Directed Services, LLC(1) ("DSL" or "Investment Adviser"), a Delaware limited liability company, serves as the investment adviser to the Portfolios. DSL has engaged ING Investment Management Co. ("ING IM''), a Connecticut corporation, to serve as the sub-adviser to Fundamental Research. ING Funds Distributor, LLC (2) ("IFD" or the "Distributor") serves as the principal underwriter to the Portfolios. DSL, ING IM and IFD are indirect, wholly-owned subsidiaries of ING Groep N.V. ("ING Groep"). ING Groep is one of the largest financial services organizations in the world, and offers an array of banking, insurance and asset mana gement services to both individuals and institutional investors.
(1) Prior to December 31, 2006, ING Life Insurance and Annuity Company ("ILIAC") served as the investment adviser to the Portfolios. On November 9, 2006, the Board approved the consolidation of investment advisory functions of ILIAC into DSL resulting in the assumption by DSL of the advisory agreement between the Company and ILIAC.
(2) Prior to December 31, 2006, ING Financial Advisers, LLC ("IFA") served as distributor to the Portfolios. On November 9, 2006, the Board approved the consolidation of distributor functions of IFA into IFD resulting in the assumption by IFD of the distribution agreement between the Company and IFA.
159
NOTES TO FINANCIAL STATEMENTS AS OF DECEMBER 31, 2006 (CONTINUED)
NOTE 2 — SIGNIFICANT ACCOUNTING POLICIES
The following significant accounting policies are consistently followed by the Portfolios in the preparation of their financial statements. Such policies are in conformity with U.S. generally accepted accounting principles for investment companies.
A. Security Valuation. Investments in equity securities traded on a national securities exchange are valued at the last reported sale price. Securities reported by NASDAQ are valued at the NASDAQ official closing prices. Securities traded on an exchange or NASDAQ for which there has been no sale and securities traded in the over-the-counter-market are valued at the mean between the last reported bid and ask prices. All investments quoted in foreign currencies will be valued daily in U.S. dollars on the basis of the foreign currency exchange rates prevailing at that time. Debt securities are valued at prices obtained from independent services or from one or more dealers making markets in the securities and may be adjusted based on the Portfolios' valuation procedures. U.S. government obligations are valued by using market quotations or independent pricing services that use prices provided by market-makers or estimates of market values obtained from yield data relating to instruments or securities with similar characteristics.
Securities and assets for which market quotations are not readily available (which may include certain restricted securities, which are subject to limitations as to their sale) are valued at their fair values as determined in good faith by or under the supervision of the Portfolios' Board of Directors ("Board"), in accordance with methods that are specifically authorized by the Board. Securities traded on exchanges, including foreign exchanges, which close earlier than the time that a Portfolio calculates its NAV may also be valued at their fair values as determined in good faith by or under the supervision of a Portfolio's Board, in accordance with methods that are specifically authorized by the Board. If an event occurs after the time at which the market for foreign securities held by a Portfolio closes but before the time that the Portfolio's NAV is calculated, such event may cause the closing price on the foreign exchange to not represen t a readily available reliable market value quotation for such securities at the time the Portfolio determines its NAV. In such a case, a Portfolio will use the fair value of such securities as determined under a Portfolio's valuation procedures. Events after the close of trading on a foreign market that could require a Portfolio to fair value some or all of its foreign securities include, among others, securities trading in the U.S. and other markets, corporate announcements, natural and other disasters, and political and other events. Among other elements of analysis in the determination of a security's fair value, the Board has authorized the use of one or more independent research services to assist with such determinations. An independent research service may use statistical analyses and quantitative models to help determine fair value as of the time a Portfolio calculates its NAV. There can be no assurance that such models accurate ly reflect the behavior of the applicable markets or the effect of the behavior of such markets on the fair value of securities, or that such markets will continue to behave in a fashion that is consistent with such models. Unlike the closing price of a security on an exchange, fair value determinations employ elements of judgment. Consequently, the fair value assigned to a security may not represent the actual value that a Portfolio could obtain if it were to sell the security at the time of the close of the NYSE. Pursuant to procedures adopted by the Board, a Portfolio is not obligated to use the fair valuations suggested by any research service, and valuation recommendations provided by such research services may be overridden if other events have occurred or if other fair valuations are determined in good faith to be more accurate. Unless an event is such that it causes a Portfolio to determine that the closing prices for one or more securities do not represent readily available reliable market value quo tations at the time a Portfolio determines its NAV, events that occur between the time of the close of the foreign market on which they are traded and the close of regular trading on the NYSE will not be reflected in the Portfolio's NAV. Investments in securities maturing in 60 days or less at the date of valuation are valued at amortized cost, which, when combined with accrued interest, approximates market value.
B. Security Transactions and Revenue Recognition. Securities transactions are accounted for on the trade date. Realized gains and losses are reported on the basis of identified cost of securities sold. Interest income is recorded on an accrual basis. Dividend income is recorded on the ex-dividend date, or for certain foreign securities, when the information becomes available to the Portfolios. Premium amortization and discount accretion are determined by the effective yield method.
C. Foreign Currency Translation. The books and records of the Portfolios are maintained in U.S. dollars. Any foreign currency amounts are translated into U.S. dollars on the following basis:
(1) Market value of investment securities, other assets and liabilities — at the exchange rates prevailing at the end of the day.
(2) Purchases and sales of investment securities, income and expenses — at the rates of exchange prevailing on the respective dates of such transactions.
160
NOTES TO FINANCIAL STATEMENTS AS OF DECEMBER 31, 2006 (CONTINUED)
NOTE 2 — SIGNIFICANT ACCOUNTING POLICIES (continued)
Although the net assets and the market values are presented at the foreign exchange rates at the end of the day, the Portfolios do not isolate the portion of the results of operations resulting from changes in foreign exchange rates on investments from the fluctuations arising from changes in market prices of securities held. Such fluctuations are included with the net realized and unrealized gains or losses from investments. For securities, which are subject to foreign withholding tax upon disposition, liabilities are recorded on the Statements of Assets and Liabilities for the estimated tax withholding based on the securities' current market value. Upon disposition, realized gains or losses on such securities are recorded net of foreign withholding tax. Reported net realized foreign exchange gains or losses arise from sales of foreign currencies, currency gains or losses realized between the trade and settlement dates on securities transac tions, the difference between the amounts of dividends, interest, and foreign withholding taxes recorded on the Portfolios' books, and the U.S. dollar equivalent of the amounts actually received or paid. Net unrealized foreign exchange gains and losses arise from changes in the value of assets and liabilities other than investments in securities at fiscal year end, resulting from changes in the exchange rate. Foreign security and currency transactions may involve certain considerations and risks not typically associated with investing in U.S. companies and U.S. government securities. These risks include, but are not limited to, revaluation of currencies and future adverse political and economic developments, which could cause securities and their markets to be less liquid and prices more volatile than those of comparable U.S. companies and U.S. government securities.
D. Foreign Currency Transactions and Futures Contracts. Certain Portfolios may enter into foreign currency exchange transactions to convert to and from different foreign currencies and to and from the U.S. dollar in connection with the planned purchases or sales of securities. When entering into a currency forward contract, a Portfolio agrees to receive or deliver a fixed quantity of foreign currency for an agreed-upon price on an agreed future date. The Portfolios either enter into these transactions on a spot basis at the spot rate prevailing in the foreign currency exchange market or use forward foreign currency contracts to purchase or sell foreign currencies. When the contract is fulfilled or closed, gains or losses are realized. Until then, the gain or loss is included in unrealized appreciation or depreciation. Risks may arise upon entering into forward contracts from the potential inability of counterparties to meet the terms of their forward contracts and from unanticipated movements in the value of foreign currencies relative to the U.S. dollar. Certain Portfolios may enter into futures contracts involving foreign currency, interest rates, securities and securities indices. A futures contract obligates the seller of the contract to deliver and the purchaser of the contract to take delivery of the type of foreign currency, financial instrument or security called for in the contract at a specified future time for a specified price. Upon entering into such a contract, a Portfolio is required to deposit and maintain as collateral such initial margin as required by the exchange on which the contract is traded. Pursuant to the contract, a Portfolio agrees to receive from or pay to the broker an amount equal to the daily fluctuations in the value of the contract. Such receipts or payments are known as variation margins and are recorded as unrealized gains or losses by the Portfolio. When the contract is closed, the Portfolio records a realized gain or loss equal to the difference between the value of the contract at the time it was opened and the value at the time it was closed.
E. Distributions to Shareholders. The Portfolios record distributions to their shareholders on the ex-dividend date. Dividends from net investment income and capital gains, if any, are declared and paid annually. The Portfolios may make distributions on a more frequent basis to comply with the distribution requirements of subchapter M of the Internal Revenue Code. The characteristics of income and gains to be distributed are determined in accordance with income tax regulations, which may differ from U.S. generally accepted accounting principles for investment companies.
F. Federal Income Taxes. It is the policy of the Portfolios to comply with subchapter M of the Internal Revenue Code and related excise tax provisions applicable to regulated investment companies and to distribute substantially all of their net investment income and any net realized capital gains to their shareholders. Therefore, no federal income tax provision is required. No capital gain distributions shall be made until any capital loss carryforwards have been fully utilized or expired.
161
NOTES TO FINANCIAL STATEMENTS AS OF DECEMBER 31, 2006 (CONTINUED)
NOTE 2 — SIGNIFICANT ACCOUNTING POLICIES (continued)
G. Use of Estimates. Management of the Portfolios has made certain estimates and assumptions relating to the reporting of assets, liabilities, income, and expenses to prepare these financial statements in conformity with U.S. generally accepted accounting principles for investment companies. Actual results could differ from these estimates.
H. Repurchase Agreements. Each Portfolio may invest in repurchase agreements only with government securities dealers recognized by the Board of Governors of the Federal Reserve System. Under such agreements, the seller of the security agrees to repurchase it at a mutually agreed upon time and price. The resale price is in excess of the purchase price and reflects an agreed upon interest rate for the period of time the agreement is outstanding. The period of the repurchase agreements is usually short, from overnight to one week, while the underlying securities generally have longer maturities. Each Portfolio will receive as collateral securities acceptable to it whose market value is equal to at least 100% of the carrying amount of the repurchase agreements, plus accrued interest, be ing invested by the Portfolio. The underlying collateral is valued daily on a mark-to-market basis to assure that the value, including accrued interest is at least equal to the repurchase price. There would be a potential loss to the Portfolio in the event the Portfolio is delayed or prevented from exercising its right to dispose of the collateral, and it might incur disposition costs in liquidating the collateral.
I. Securities Lending. Each Portfolio has the option to temporarily loan up to 30% of its total assets to brokers, dealers or other financial institutions in exchange for a negotiated lender's fee. The borrower is required to fully collateralize the loans with cash or U.S. Government securities. Generally, in the event of counterparty default, the Portfolio has the right to use collateral to offset losses incurred. There would be potential loss to the Portfolio in the event the Portfolio is delayed or prevented from exercising its right to dispose of the collateral. The Portfolio bears the risk of loss with respect to the investment of collateral. Engaging in securities lending could have a leveraging effect, which may intensify the credit, market and other risks associated with inv esting in a Portfolio.
J. Illiquid and Restricted Securities. The Portfolios may not invest more than 15% of their net assets in illiquid securities. Illiquid securities are not readily marketable. Disposing of illiquid investments may involve time consuming negotiation and legal expenses, and it may be difficult or impossible for the Portfolios to sell them promptly at an acceptable price. The Portfolios may also invest in restricted securities, which include those sold under Rule 144A of the Securities Act of 1933 ("1933 Act") or securities offered pursuant to Section 4(2) of the 1933 Act, and/or are subject to legal or contractual restrictions on resale and may not be publicly sold without registration under the 1933 Act. Certain r estricted securities may be considered liquid pursuant to guidelines approved by the Board or may be deemed to be illiquid because they may not be readily marketable. Illiquid and restricted securities are valued using market quotations when readily available. In the absence of market quotations, the securities are valued based upon their fair value determined under procedures approved by the Board.
K. Delayed Delivery Transactions. Certain Portfolios may purchase or sell securities on a when-issued or forward commitment basis. The price of the underlying securities and date when the securities will be delivered and paid for are fixed at the time the transaction is negotiated. The market value of such is identified in the Portfolios' Portfolio of Investments. Losses may arise due to changes in the market value of the securities or from the inability of counterparties to meet the terms of the contract. In connection with such purchases, the Portfolios are required to hold liquid assets as collateral with the Portfolios' custodian sufficient to cover the purchase price.
L. Mortgage Dollar Roll Transactions. Columbia Small Cap Value II, Fundamental Research, Goldman Sachs® Structured Equity, Legg Mason Partners Aggressive Growth, Lord Abbett U.S. Government Securities, Oppenheimer Global, Oppenheimer Strategic Income, PIMCO Total Return, Pioneer High Yield, Templeton Foreign Equity, Thornburg Value, UBS U.S. Small Cap Growth and Van Kampen Equity and Income may engage in dollar roll transactions with respect to mortgage-backed securities issued by Government National Mortgage Association, Federal National Mortgage Association and Federal Home Loan Mortgage Corp. In a dollar roll transaction, a Portfolio sells a mortgage-backed security to a financial institution, such as a bank or broker/dealer, and simultaneously agrees to repurchas e a substantially similar (i.e., same type, coupon, and maturity) security from the institution on a delayed delivery basis at an agreed upon price. The mortgage-backed
162
NOTES TO FINANCIAL STATEMENTS AS OF DECEMBER 31, 2006 (CONTINUED)
NOTE 2 — SIGNIFICANT ACCOUNTING POLICIES (continued)
securities that are repurchased will bear the same interest rate as those sold, but generally will be collateralized by different pools of mortgages with different prepayment histories. The Portfolios account for dollar roll transactions as purchases and sales. For fee based dollar roll transactions, the fee is recorded as income.
M. Options Contracts. Each Portfolio, with the exception of Baron Small Cap Growth, may purchase put and call options and may write (sell) put options and covered call options. Thornburg Value may only write or sell calls on securities if the calls are covered. The Portfolios may engage in option transactions as a hedge against adverse movements in the value of portfolio holdings or to increase market exposure. Option contracts are valued daily and unrealized gains or losses are recorded based upon the last sales price on the principal exchange on which the options are traded. The Portfolios will realize a gain or loss upon the expiration or closing of the option contract. When an option is exercised, the proceeds on sales of the underlying security for a written call option, the pu rchase cost of the security for a written put option, or the cost of the security for a purchased put or call option is adjusted by the amount of premium received or paid. Realized and unrealized gains or losses on option contracts are reflected in the accompanying financial statements. The risk in writing a call option is that the Portfolios give up the opportunity for profit if the market price of the security increases and the option is exercised. The risk in writing a put option is that the Portfolios may incur a loss if the market price of the security decreases and the option is exercised. The risk in buying an option is that the Portfolios pay a premium whether or not the option is exercised. Risks may also arise from an illiquid secondary market or from the inability of counterparties to meet the terms of the contract.
N. Futures Contracts. Each Portfolio, with the exception of Baron Asset and Baron Small Cap Growth, may enter into futures contracts involving foreign currency, interest rates, securities and securities indices. Goldman Sachs® Structured Equity may enter into futures transactions only with respect to the S&P 500® Index. A futures contract obligates the seller of the contract to deliver and the purchaser of the contract to take delivery of the type of foreign currency, financial instrument or security called for in the contract at a specified future time for a specified price. Upon entering into such a contract, a Portfolio is required to deposit and maintain as collateral such i nitial margin as required by the exchange on which the contract is traded. Pursuant to the contract, a Portfolio agrees to receive from or pay to the broker an amount equal to the daily fluctuations in the value of the contract. Such receipts or payments are known as variation margins and are recorded as unrealized gains or losses by the Portfolio. When the contract is closed, a Portfolio records a realized gain or loss equal to the difference between the value of the contract at the time it was opened and the value at the time it was closed.
O. Swap Contracts. Certain Portfolios may enter into interest rate swaps, currency swaps and other types of swap agreements, including swaps on securities and indices. A swap is an agreement between two parties pursuant to which each party agrees to make one or more payments to the other on regularly scheduled dates over a stated term, based on different interest rates, currency exchange rates, security prices, the prices or rates of other types of financial instruments or assets or the levels of specified indices. During the term of the swap, changes in the value of the swap are recognized as unrealized appreciation or depreciation.
P. Reverse Repurchase Agreements. A reverse repurchase agreement involves the sale of a security, with an agreement to repurchase the same or substantially similar securities at an agreed upon price and date. Whether such a transaction produces a gain for a Portfolio depends upon the costs of the agreements and the income and gains of the securities purchased with the proceeds received from the sale of the security. If the income and gains on the securities purchased fail to exceed the costs, NAV will decline faster than otherwise would be the case. Reverse repurchase agreements, as a leveraging technique, may increase a Portfolio's yield; however, such transactions also increase a Portfolio's risk to capital and may result in a shareholder's loss of principal.
Q. Floating Rate Notes Issued in Conjunction with Securities Held — PIMCO Total Return invested in "inverse floaters" which are fixed income instruments with interest rates that vary with short term interest rate indices in such a way that the yield is inversely related to the market rate of interest. Statement of Financial Accounting Standards No. 140 ("FAS 140"), with respect to certain types of inverse floaters which entail a transaction in which the Portfolio sells a municipal
163
NOTES TO FINANCIAL STATEMENTS AS OF DECEMBER 31, 2006 (CONTINUED)
NOTE 2 — SIGNIFICANT ACCOUNTING POLICIES (continued)
bond to a trust to create the inverse floater, requires that the transaction be characterized as financing instead of a sale for financial statement presentations purposes. At December 31, 2006, PIMCO Total Return investments of these types of inverse floaters were as follows:
| Trust | | Value of
Underlying
Municipal Bond | | Floating
Rate Notes
Outstanding | | Current
Rate | |
New York City Municipal
Water Finance
Authority, 5.000%,
due 06/15/38 | | $ | 632,952 | | | $ | 299,562 | | | | 3.84 | % | |
Orange County
Sanitation District,
5.000%, due 02/01/33 | | | 943,596 | | | | 449,469 | | | | 4.13 | % | |
R. Sale Commitments: Sale commitments involve commitments where the unit price and the estimated principal amount are established upon entering into the contract, with the actual principal amount being within a specified range of the estimate. A Portfolio will enter into sale commitments to hedge its portfolio positions or to sell mortgage-backed securities it owns under delayed delivery arrangements. Proceeds of sale commitments are not received until the contractual settlement date. During the time a sale commitment is outstanding, the Portfolio will maintain, in a segregated account, cash or marketable securities in an amount sufficient to meet the purchase price. Unsettled sale commitments are valued at current market value of the underlying securities. If the sale commitment is closed through the acquisition of an offsetting purchase commitment, the Portfolio realizes a gain or loss on the commitment without regard to any unrealized gain or loss on the underlying security. If the Portfolio delivers securities under the commitment, the Portfolio realizes a gain or loss from the sale of the securities, based upon the unit price established at the date the commitment was entered into.
S. Indemnifications. In the normal course of business, the Fund may enter into contracts that provide certain indemnifications. The Fund's maximum exposure under these arrangements is dependent on future claims that may be made against the Portfolios and, therefore, cannot be estimated; however, based on experience, the risk of loss from such claims is considered remote.
NOTE 3 — INVESTMENT TRANSACTIONS
For the year ended December 31, 2006, the cost of purchases and the proceeds from the sales of securities, excluding U.S. government and short-term securities, were as follows:
| | | Purchases | | Sales | |
American Century Large
Company Value | | $ | 58,501,250 | | | $ | 55,987,473 | | |
| American Century Select | | | 799,641,057 | | | | 891,898,021 | | |
American Century Small-Mid
Cap Value | | | 168,439,726 | | | | 176,172,801 | | |
| Baron Asset | | | 9,498,216 | | | | 1,742,042 | | |
| Baron Small Cap Growth | | | 147,212,823 | | | | 59,667,080 | | |
| Columbia Small Cap Value II | | | 107,785,464 | | | | 25,579,742 | | |
| Davis Venture Value | | | 130,553,246 | | | | 6,660,621 | | |
| Fundamental Research | | | 208,526,153 | | | | 158,327,873 | | |
| Goldman Sachs® Capital Growth | | | 25,650,026 | | | | 58,663,979 | | |
| Goldman Sachs® Structured Equity | | | 58,367,081 | | | | 115,703,181 | | |
| JPMorgan International | | | 213,956,307 | | | | 212,269,845 | | |
| JPMorgan Mid Cap Value | | | 115,872,198 | | | | 85,811,043 | | |
Legg Mason Partners Aggressive
Growth | | | 273,016,157 | | | | 71,775,814 | | |
Legg Mason Partners Large
Cap Growth | | | 6,842,095 | | | | 23,237,956 | | |
Lord Abbett U.S. Government
Securities | | | 7,598,126 | | | | 2,792,589 | | |
| Neuberger Berman Partners | | | 567,088,378 | | | | 209,055,912 | | |
| Neuberger Berman Regency | | | 14,058,896 | | | | 3,257,317 | | |
| OpCap Balanced Value | | | 76,854,505 | | | | 130,194,974 | | |
| Oppenheimer Global | | | 594,576,519 | | | | 633,394,940 | | |
| Oppenheimer Strategic Income | | | 310,417,454 | | | | 302,147,021 | | |
| PIMCO Total Return | | | 44,411,840 | | | | 35,925,109 | | |
| Pioneer High Yield | | | 136,352,828 | | | | 15,202,603 | | |
| T.Rowe Price Diversified Mid Cap | | | 439,704,399 | | | | 637,890,355 | | |
| T.Rowe Price Growth Equity | | | 642,043,148 | | | | 532,202,918 | | |
| Templeton Foreign Equity | | | 40,678,232 | | | | 1,222,524 | | |
| Thornburg Value | | | 307,733,350 | | | | 333,149,797 | | |
| UBS U.S. Large Cap Equity | | | 184,912,498 | | | | 128,205,900 | | |
| UBS U.S. Small Cap Growth | | | 42,123,106 | | | | 16,104,168 | | |
| Van Kampen Comstock | | | 394,275,692 | | | | 213,047,145 | | |
| Van Kampen Equity and Income | | | 244,576,969 | | | | 243,402,176 | | |
U.S. government securities not included above were as follows:
| | | Purchases | | Sales | |
Lord Abbett U.S. Government
Securities | | $ | 382,446,971 | | | $ | 337,936,291 | | |
| Oppenheimer Strategic Income | | | 215,361,278 | | | | 190,024,243 | | |
| PIMCO Total Return | | | 2,764,737,430 | | | | 2,734,033,897 | | |
| Van Kampen Equity and Income | | | 350,149,095 | | | | 292,425,912 | | |
NOTE 4 — INVESTMENT ADVISORY AND ADMINISTRATIVE FEES
For its services, each Portfolio pays the Investment Adviser a monthly fee in arrears equal to the following as a percentage of each Portfolio's average daily net assets during the month:
| Portfolio | | Fee | |
| American Century Large Company Value | | | 0.80 | % | |
| American Century Select | | | 0.64 | % | |
| American Century Small-Mid Cap Value | | | 1.00 | % | |
| Baron Asset | | | 0.95 | % | |
| Baron Small Cap Growth | | | 0.85 | % | |
| Columbia Small Cap Value II | | | 0.75 | % | |
| Davis Venture Value | | | 0.80 | % | |
| Fundamental Research(1) | | | 0.60% on the first $2 billion | | |
| | | | 0.55% on the next $1 billion | | |
| | | | 0.50% on assets over $3 billion | | |
164
NOTES TO FINANCIAL STATEMENTS AS OF DECEMBER 31, 2006 (CONTINUED)
NOTE 4 — INVESTMENT ADVISORY AND ADMINISTRATIVE FEES (continued)
| Portfolio | | Fee | |
| Goldman Sachs® Capital Growth(2) | | | 0.80 | % | |
| Goldman Sachs® Structured Equity | | | 0.70 | % | |
| JPMorgan International | | | 0.80 | % | |
| JPMorgan Mid Cap Value | | | 0.75 | % | |
| Legg Mason Partners Aggressive Growth | | | 0.70% on the first $500 million | | |
| | | | 0.65% on assets over $500 million | | |
| Legg Mason Partners Large Cap Growth | | | 0.64 | % | |
| Lord Abbett U.S. Government Securities | | | 0.47% on the first $250 million | | |
| | | | 0.45% on assets over $250 million | | |
| Neuberger Berman Partners | | | 0.60 | % | |
| Neuberger Berman Regency | | | 0.75 | % | |
| OpCap Balanced Value | | | 0.80 | % | |
| Oppenheimer Global | | | 0.60 | % | |
| Oppenheimer Strategic Income(3) | | | 0.50% on the first $6.5 billion | | |
| | | | 0.475% on the next $5 billion | | |
| | | | 0.45% on the next $5 billion | | |
| | | | 0.43% on assets over $16.5 billion | | |
| PIMCO Total Return | | | 0.50 | % | |
| Pioneer High Yield | | | 0.60% on the first $5 billion | | |
| | | | 0.50% on the next $2 billion | | |
| | | | 0.40% on the next $2 billion | | |
| | | | 0.30% on assets over $9 billion | | |
| T. Rowe Price Diversified Mid Cap Growth | | | 0.64 | % | |
| T. Rowe Price Growth Equity | | | 0.60 | % | |
| Templeton Foreign Equity | | | 0.80% on the first $500 million | | |
| | | | 0.75% on assets over $500 million | | |
| Thornburg Value | | | 0.65 | % | |
| UBS U.S. Large Cap Equity | | | 0.70% on the first $500 million | | |
| | | | 0.65% on assets over $500 million | | |
| UBS U.S. Small Cap Growth | | | 0.90 | % | |
| Van Kampen Comstock | | | 0.60 | % | |
| Van Kampen Equity and Income | | | 0.55 | % | |
(1) Prior to April 28, 2006, the rate was 0.60% for all assets
(2) Prior to January 1, 2006, the rate was 0.85%
(3) Prior to April 28, 2006, the rate was 0.50% for all assets
DSL has contractually agreed to waive a portion of the advisory fee for American Century Small-Mid Cap Value, JPMorgan International and Van Kampen Comstock.
For the year ended December 31, 2006, DSL waived $31,957, $27,158 and $194,811 for American Century Small-Mid Cap Value, JPMorgan International and Van Kampen Comstock, respectively.
The waiver represents 50% of negotiated fee reductions in sub-advisory fees being charged to the investment adviser. The waiver only renews at the election of DSL.
American Century Investment Management, Inc. serves as Sub-Adviser to American Century Large Company Value, American Century Select, and American Century Small-Mid Cap Value. BAMCO, Inc. serves as Sub-Adviser to Baron Asset and Baron Small Cap Growth. Columbia Management Advisors, LLC serves as Sub-Adviser to Columbia Small Cap Value II. Davis Selected Advisers, L.P. serves as Sub-Adviser to Davis Venture Value. Goldman Sachs Asset Management, L.P. serves as Sub-Adviser to Goldman Sachs® Capital Growth and Goldman Sachs® Structured Equity. JPMorgan Asset Management (U.K.) Limited serves as Sub-Adviser to JPMorgan International. J .P. Morgan Investment Management Inc. serves as Sub-Adviser to JPMorgan Mid Cap Value. ClearBridge Advisors, LLC serves as Sub-Adviser to Legg Mason Partners Aggressive Growth and Legg Mason Partners Large Cap Growth. Lord, Abbett & Co., LLC serves as Sub-Adviser to Lord Abbett U.S. Government Securities. Neuberger Berman Management, Inc. serves as Sub-Adviser to Neuberger Berman Partners and Neuberger Berman Regency. Oppenheimer Capital LLC serves as Sub-Adviser to OpCap Balanced Value. OppenheimerFunds, Inc. serves as Sub-Adviser to Oppenheimer Global and Oppenheimer Strategic Income. Pacific Investment Management Company LLC serves as Sub-Adviser to PIMCO Total Return. Pioneer Investment Management, Inc. serves as Sub-Adviser to Pioneer High Yield. T. Rowe Price Associates, Inc. serves as Sub-Adviser to T. Rowe Price Diversified Mid Cap Growth and T. Rowe Price Growth Equity. Templeton Investment Counsel, LLC serves as Sub-Adviser to Templeton Foreign Equity. Thornburg Investment Management, Inc. serv es as Sub-Adviser to Thornburg Value. UBS Global Asset Management (Americas) Inc. serves as Sub-Adviser to UBS U.S. Large Cap Equity and UBS U.S. Small Cap Growth. Morgan Stanley Investment Management Inc., d/b/a Van Kampen, serves as Sub-Adviser to Van Kampen Comstock and Van Kampen Equity and Income.
Under an Administrative Services Agreement, ING Funds Services, LLC (the "Administrator"), an indirect, wholly-owned subsidiary of ING Groep, acts as administrator and provides certain administrative and shareholder services necessary for the following Portfolio's operations and is responsible for the supervision of other service providers. For its services, the Administrator is entitled to receive from each of the following Portfolios a fee at an annual rate of 0.10% of the Portfolios' average daily net assets:
| Portfolio | | Fee | |
| Baron Asset | | | 0.10 | % | |
| Columbia Small Cap Value II | | | 0.10 | % | |
| Lord Abbett U.S. Government Securities | | | 0.10 | % | |
| Neuberger Berman Partners | | | 0.10 | % | |
| Neuberger Berman Regency | | | 0.10 | % | |
| Pioneer High Yield | | | 0.10 | % | |
| Templeton Foreign Equity | | | 0.10 | % | |
| UBS U.S. Small Cap Growth | | | 0.10 | % | |
165
NOTES TO FINANCIAL STATEMENTS AS OF DECEMBER 31, 2006 (CONTINUED)
NOTE 4 — INVESTMENT ADVISORY AND ADMINISTRATIVE FEES (continued)
In addition to providing all administrative services necessary for the Portfolios' operations, the administrator also assumes all ordinary recurring direct costs of the Portfolios below, such as custodian fees, director's fees, transfer agency fees and accounting fees. As compensation for these services, the Administrator receives a monthly fee from each Portfolio below at an annual rate based on the average daily net assets of each Portfolio as follows:
| Portfolio | | Fee | |
| American Century Large Company Value | | | 0.20 | % | |
| American Century Select | | | 0.02 | % | |
| American Century Small-Mid Cap Value(1) | | | 0.25 | % | |
| Baron Small Cap Growth(1) | | | 0.23 | % | |
| Davis Venture Value | | | 0.10 | % | |
| Fundamental Research | | | 0.20 | % | |
| Goldman Sachs® Capital Growth(2) | | | 0.10 | % | |
| Goldman Sachs® Structured Equity | | | 0.20 | % | |
| JPMorgan International | | | 0.20 | % | |
| JPMorgan Mid Cap Value(3) | | | 0.25 | % | |
| Legg Mason Partners Aggressive Growth | | | 0.13 | % | |
| Legg Mason Partners Large Cap Growth | | | 0.20 | % | |
| OpCap Balanced Value | | | 0.20 | % | |
| Oppenheimer Global | | | 0.06 | % | |
| Oppenheimer Strategic Income | | | 0.04 | % | |
| PIMCO Total Return(4) | | | 0.25 | % | |
| T. Rowe Price Diversified Mid Cap Growth | | | 0.02 | % | |
| T. Rowe Price Growth Equity | | | 0.15 | % | |
| Thornburg Value | | | 0.25 | % | |
| UBS U.S. Large Cap Equity | | | 0.15 | % | |
| Van Kampen Comstock(3) | | | 0.25 | % | |
| Van Kampen Equity and Income | | | 0.02 | % | |
(1) Prior to January 1, 2006, the rate was 0.40%
(2) Prior to January 1, 2006, the rate was 0.20%
(3) Prior to April 28, 2006, the rate was 0.35%. The Administrator had also contractually agreed through May 1, 2006 to waive all or a portion of the administrative services fees and/or reimburse the administrative expenses for the Van Kampen Comstock I Class so that the total net operating expense did not exceed 0.88%. For the year ended December 31, 2006, the Administrator waived $170,088 of the Portfolio's I Class administrative fees.
(4) Prior to January 1, 2006, the rate was 0.35%
NOTE 5 — DISTRIBUTION AND SERVICE FEES
The Fund has adopted a Plan of Distribution pursuant to Rule 12b-1 ("the Plan") for the ADV Class shares of each Portfolio. The Plan provides for a distribution fee, payable to the Distributor. The Distributor may pay, on behalf of each Portfolio, out of its distribution fee, compensation to certain financial institutions for providing distribution assistance. Under the Plan, a Portfolio makes payments at an annual rate of 0.25% of the Portfolio's average daily net assets attributable to its ADV Class shares. Effective April 28, 2006, the Distributor has voluntarily agreed to waive all or a portion of the distribution fees for Oppenheimer Global and T. Rowe Price Diversified Mid Cap Growth so that total net operating expenses do not exceed 1.15% for each Portfolio's respective ADV Class shares through May 1, 2007.
S Class and ADV Class of shares are further subject to a shareholder servicing fee payable to Shareholder Organizations pursuant to the Shareholder Servicing Plan adopted for S Class and ADV Class which shall not exceed an annual rate of 0.25% of the average daily net assets of each of the S Class and ADV Class. Effective May 1, 2006, the Distributor has voluntarily agreed to waive all or a portion of the services fees for Oppenheimer Strategic Income, so that total net operating expenses for ADV Class shares do not exceed 1.00% and for S Class shares do not exceed 0.75%, through May 1, 2008. Effective December 16, 2006, the Distributor has voluntarily agreed to waive all or a portion of service fee for the Neuberger Berman Partners so that total net operation expenses do not exceed 0.89% for the Portfolio's respective S Class shares through April 30, 2009.
Fees paid to the Distributor and Shareholder Organizations by class during the year ended December 31, 2006 are shown in the accompanying Statements of Operations.
NOTE 6 — OTHER TRANSACTIONS WITH AFFILIATES AND RELATED PARTIES
At December 31, 2006, the Portfolios had the following amounts recorded in payable to affiliates on the accompanying Statements of Assets and Liabilities (See Note 4):
| Portfolio | | Accrued
Investment
Management
Fees | | Accrued
Administrative
Fees | | Accrued
Shareholder
Service and
Distribution
Fees | | Accrued
Recoupment | | Total | |
American Century
Large Company
Value | | $ | 76,608 | | | $ | 19,152 | | | $ | 9,342 | | | $ | — | | | $ | 105,102 | | |
American Century
Select | | | 179,582 | | | | 5,824 | | | | 5,999 | | | | — | | | | 191,405 | | |
American Century
Small-Mid
Cap Value | | | 91,969 | | | | 22,992 | | | | 15,480 | | | | — | | | | 130,441 | | |
| Baron Asset | | | 7,366 | | | | 775 | | | | 1,429 | | | | — | | | | 9,570 | | |
Baron Small Cap
Growth | | | 343,149 | | | | 92,852 | | | | 82,648 | | | | — | | | | 518,649 | | |
Columbia Small
Cap Value II | | | 53,846 | | | | 7,179 | | | | 15,430 | | | | — | | | | 76,455 | | |
Davis Venture
Value | | | 136,713 | | | | 17,089 | | | | 33,205 | | | | — | | | | 187,007 | | |
Fundamental
Research | | | 50,701 | | | | 16,900 | | | | 9,186 | | | | — | | | | 76,787 | | |
Goldman Sachs®
Capital Growth | | | 25,915 | | | | 3,239 | | | | 8,077 | | | | — | | | | 37,231 | | |
Goldman Sachs®
Structured
Equity | | | 32,808 | | | | 9,374 | | | | 12,332 | | | | — | | | | 54,514 | | |
JPMorgan
International | | | 742,874 | | | | 185,720 | | | | 36,533 | | | | — | | | | 965,127 | | |
JPMorgan
MidCap Value | | | 151,270 | | | | 50,423 | | | | 28,653 | | | | — | | | | 230,346 | | |
Legg Mason
Partners
Aggressive
Growth | | | 770,516 | | | | 149,855 | | | | 44,354 | | | | — | | | | 964,725 | | |
Legg Mason
Partners Large
Cap Growth | | | 24,316 | | | | 7,599 | | | | 10,201 | | | | — | | | | 42,116 | | |
Lord Abbett U.S.
Government
Securities | | | 20,500 | | | | 4,362 | | | | 2,987 | | | | 6,756 | | | | 34,605 | | |
Neuberger Berman
Partners | | | 214,332 | | | | 26,985 | | | | 36,709 | | | | — | | | | 278,026 | | |
Neuberger Berman
Regency | | | 7,761 | | | | 1,035 | | | | 1,276 | | | | — | | | | 10,072 | | |
166
NOTES TO FINANCIAL STATEMENTS AS OF DECEMBER 31, 2006 (CONTINUED)
NOTE 6 — OTHER TRANSACTIONS WITH AFFILIATES AND RELATED PARTIES (continued)
| Portfolio | | Accrued
Investment
Management
Fees | | Accrued
Administrative
Fees | | Accrued
Shareholder
Service and
Distribution
Fees | | Accrued
Recoupment | | Total | |
OpCap Balanced
Value | | $ | 59,776 | | | $ | 14,944 | | | $ | 18,541 | | | $ | — | | | $ | 93,261 | | |
Oppenheimer
Global | | | 1,413,003 | | | | 141,297 | | | | 69,575 | | | | — | | | | 1,623,875 | | |
Oppenheimer
Strategic
Income | | | 181,004 | | | | 14,480 | | | | 13,511 | | | | — | | | | 208,995 | | |
PIMCO Total
Return | | | 141,312 | | | | 70,656 | | | | 30,764 | | | | — | | | | 242,732 | | |
| Pioneer High Yield | | | 64,089 | | | | 10,681 | | | | 1,969 | | | | — | | | | 76,739 | | |
T. Rowe Price
Diversified Mid
Cap Growth | | | 628,629 | | | | 19,643 | | | | 23,396 | | | | — | | | | 671,668 | | |
T. Rowe Price
Growth Equity | | | 717,793 | | | | 179,448 | | | | 52,554 | | | | — | | | | 949,795 | | |
Templeton Foreign
Equity | | | 29,501 | | | | 3,688 | | | | 6,894 | | | | 3,851 | | | | 43,934 | | |
| Thornburg Value | | | 107,719 | | | | 41,430 | | | | 1,678 | | | | — | | | | 150,827 | | |
UBS U.S. LargeCap
Equity | | | 229,663 | | | | 49,214 | | | | 7,573 | | | | — | | | | 286,450 | | |
UBS U.S. Small
Cap Growth | | | 20,890 | | | | 2,321 | | | | 1,117 | | | | — | | | | 24,328 | | |
Van Kampen
Comstock | | | 614,301 | | | | 215,789 | | | | 91,884 | | | | — | | | | 921,974 | | |
Van Kampen
Equity and
Income | | | 486,185 | | | | 17,678 | | | | 26,529 | | | | — | | | | 530,392 | | |
At December 31, 2006, all shares of the Portfolios were owned by 1) separate accounts of DSL and its insurance company affiliates for the benefit of variable contract policyholders 2) ING National Trust, an indirect, wholly-owned subsidiary of ING Groep, as trustee or custodian of qualified pension and retirement plans that invest in the Portfolios directly and 3) DSL in connection with seed capital contributions made to the Portfolios.
The following portfolios placed a portion of its portfolio transactions with brokerage firms that are affiliates of the Investment Adviser. The commissions paid to these affiliated firms were:
| Portfolio | | Affiliated
Brokers | | Commissions
Paid | |
| JPMorgan International | | ING Baring LLC | | $ | 7,821 | | |
| OpCap Balanced Value | | ING Baring LLC | | | 84 | | |
NOTE 7 — OTHER ACCRUED EXPENSES AND LIABILITIES
At December 31, 2006, Baron Asset and Neuberger Berman Regency had the following expenses included in Other Accrued Expenses and Liabilities on the Statement of Assets and Liabilities that exceded 5% of total liabilities.
| Portfolio | | Expense | | Amount | |
| Baron Asset | | Offering
Custody
Postage
Printing | | | $1,869
1,154
868
1,168 | | |
| Neuberger Berman Regency | | Miscellaneous
Postage | | | 1,335
2,840 | | |
NOTE 8 — EXPENSE LIMITATIONS
The Investment Adviser has entered into a written expense limitation agreement ("expense limitation agreement") with certain of the Portfolios, whereby the Investment Adviser has agreed to limit expenses, excluding interest, taxes, brokerage and extraordinary expenses to the following annual expenses to average daily net assets:
| | | Class ADV | | Class I | | Class S | |
| Baron Asset | | | 1.55 | % | | | 1.05 | % | | | 1.30 | % | |
Columbia Small Cap
Value II | | | 1.65 | % | | | 1.15 | % | | | 1.40 | % | |
| Fundamental Research(1) | | | 1.25 | % | | | 0.75 | % | | | 1.00 | % | |
Lord Abbett U.S.
Government Securities | | | 1.22 | % | | | 0.72 | % | | | 0.97 | % | |
| Neuberger Berman Partners | | | 1.17 | % | | | 0.67 | % | | | 0.92 | % | |
| Neuberger Berman Regency | | | 1.38 | % | | | 0.88 | % | | | 1.13 | % | |
| Pioneer High Yield | | | 1.25 | % | | | 0.75 | % | | | 1.00 | % | |
| Templeton Foreign Equity | | | 1.48 | % | | | 0.98 | % | | | 1.23 | % | |
| UBS U.S. Small Cap Growth | | | 1.50 | % | | | 1.00 | % | | | 1.25 | % | |
(1) Effective April 28, 2006, Fundamental Research Portfolio implemented an expense limitation.
The Investment Adviser may, at a later date, recoup from a Portfolio for management fees waived and other expenses assumed by the Investment Adviser during the previous 36 months, but only if, after such recoupment, the Portfolio's expense ratio does not exceed the percentage described above. Waived and reimbursed fees by, and any recoupment to the Investment Adviser of such waived and reimbursed fees are reflected on the accompanying Statements of Operations for each Portfolio. Amounts payable by the Investment Adviser are reflected on the accompanying Statements of Assets and Liabilities for each Portfolio.
For the year ended December 31, 2006, the amounts of waived and reimbursed fees that are subject to possible recoupment by the Investment Manager, and the related expiration dates are as follows:
| | | December 31 | |
| | | 2007 | | 2008 | | 2009 | | Total | |
| Baron Asset | | $ | — | | | $ | — | | | $ | 42,786 | | | $ | 42,786 | | |
Fundamental
Research | | | — | | | | — | | | | 35,157 | | | | 35,157 | | |
Lord Abbett U.S.
Government
Securities | | | — | | | | — | | | | 1,228 | | | | 1,228 | | |
Neuberger Berman
Partners | | | — | | | | — | | | | 144,882 | | | | 144,882 | | |
Neuberger Berman
Regency | | | — | | | | — | | | | 44,767 | | | | 44,767 | | |
| Pioneer High Yield | | | — | | | | — | | | | 55,492 | | | | 55,492 | | |
Templeton Foreign
Equity | | | — | | | | — | | | | 64,212 | | | | 64,212 | | |
UBS U.S. Small Cap
Growth | | | — | | | | — | | | | 26,700 | | | | 26,700 | | |
The Expense Limitation Agreement is contractual and shall renew automatically unless DSL provides written notice of the termination of the Expense Limitation Agreement within 90 days of the end of the then current term.
167
NOTES TO FINANCIAL STATEMENTS AS OF DECEMBER 31, 2006 (CONTINUED)
NOTE 9 — OPTIONS WRITTEN
Transactions in options written for Oppenheimer Strategic Income for the year ended December 31, 2006 were as follows:
Oppenheimer Strategic Income:
| | | USD
Notional | | EUR
Notional | | GBP
Notional | | JPY
Notional | | MXN
Notional | | TRY
Notional | |
Premium | |
| Balance at 12/31/05 | | | 3,890,000 | | | | | | | | — | | | | — | | | | — | | | | — | | | $ | 15,949 | | |
| Options Written | | | — | | | | 5,460,000 | | | | 520,000 | | | | 1,842,000,000 | | | | 4,300,000 | | | | 1,780,000 | | | | 117,636 | | |
Options Terminated in Closing
Purchase Transactions | | | | | | | (640,000 | ) | | | (260,000 | ) | | | — | | | | (4,300,000 | ) | | | — | | | | (11,322 | ) | |
| Options Expirations | | | (3,890,000 | ) | | | (640,000 | ) | | | (260,000 | ) | | | (1,842,000,000 | ) | | | — | | | | — | | | | (61,112 | ) | |
| Options Exercised | | | — | | | | — | | | | — | | | | — | | | | — | | | | — | | | | — | | |
| Balance at 12/31/06 | | | — | | | | 4,180,000 | | | | — | | | | — | | | | — | | | | 1,780,000 | | | $ | 61,150 | | |
Transactions in options written for PIMCO Total Return for the year ended December 31, 2006 were as follows:
PIMCO Total Return:
| | | USD
Notional | | EUR
Notional | | GBP
Notional | |
Premium | |
| Balance at 12/31/05 | | | 24,400,000 | | | | — | | | | — | | | $ | 229,024 | | |
| Options Written | | | 203,600,000 | | | | 15,500,000 | | | | 9,700,000 | | | | 2,114,630 | | |
| Options Terminated in Closing Purchase Transactions | | | (72,400,000 | ) | | | | | | | | | | | (683,476 | ) | |
| Options Expirations | | | (7,300,000 | ) | | | | | | | | | | | (58,598 | ) | |
| Options Exercised | | | (15,000,000 | ) | | | | | | | | | | | (43,652 | ) | |
| Balance at 12/31/06 | | | 133,300,000 | | | | 15,500,000 | | | | 9,700,000 | | | $ | 1,557,928 | | |
| | | Number of
Contracts | | Premium | |
| Balance at 12/31/05 | | | 128 | | | $ | 29,914 | | |
| Options Written | | | 839 | | | | 306,147 | | |
| Options Terminated in Closing Purchase Transactions | | | (259 | ) | | | (69,999 | ) | |
| Options Expirations | | | (256 | ) | | | (89,504 | ) | |
| Options Exercised | | | (46 | ) | | | (27,163 | ) | |
| Balance at 12/31/06 | | | 406 | | | $ | 149,395 | | |
12/31/06 BALANCE OF PREMIUMS RECEIVED FOR OPTIONS
WRITTEN: | | | | | | $ | 1,707,323 | | |
NOTE 10 — CAPITAL SHARES
Transactions in capital shares and dollars were as follows:
| | | Class I | | Class S | | Class ADV | |
| | | Year
Ended
December 31,
2006 | | Year
Ended
December 31,
2005 | | Year
Ended
December 31,
2006 | | Year
Ended
December 31,
2005 | | Year
Ended
December 31,
2006 | | Year
Ended
December 31,
2005 | |
American Century Large Company Value
(Number of Shares) | |
| Shares sold | | | 6,955,603 | | | | 2,661,918 | | | | 411,958 | | | | 306,759 | | | | 303,456 | | | | 478,928 | | |
| Dividends reinvested | | | 321,371 | | | | 13,064 | | | | 74,668 | | | | 38,001 | | | | 56,349 | | | | 5,040 | | |
| Shares redeemed | | | (4,925,884 | ) | | | (101,274 | ) | | | (2,088,243 | ) | | | (1,986,733 | ) | | | (532,587 | ) | | | (263,373 | ) | |
| Net increase (decrease) in shares outstanding | | | 2,351,090 | | | | 2,573,708 | | | | (1,601,617 | ) | | | (1,641,973 | ) | | | (172,782 | ) | | | 220,595 | | |
| American Century Large Company Value ($) | |
| Shares sold | | $ | 103,021,839 | | | $ | 37,349,021 | | | $ | 6,122,417 | | | $ | 4,287,796 | | | $ | 4,436,231 | | | $ | 6,612,829 | | |
| Dividends reinvested | | | 4,582,754 | | | | 179,496 | | | | 1,067,012 | | | | 521,379 | | | | 793,962 | | | | 68,599 | | |
| Shares redeemed | | | (71,687,988 | ) | | | (1,407,870 | ) | | | (30,870,813 | ) | | | (27,663,175 | ) | | | (7,666,397 | ) | | | (3,547,962 | ) | |
| Net increase (decrease) | | $ | 35,916,605 | | | $ | 36,120,647 | | | $ | (23,681,384 | ) | | $ | (22,854,000 | ) | | $ | (2,436,204 | ) | | $ | 3,133,466 | | |
168
NOTES TO FINANCIAL STATEMENTS AS OF DECEMBER 31, 2006 (CONTINUED)
NOTE 10 — CAPITAL SHARES (continued)
| | | Class I | | Class S | | Class ADV | |
| | | Year
Ended
December 31,
2006 | | Year
Ended
December 31,
2005 | | Year
Ended
December 31,
2006 | | Year
Ended
December 31,
2005 | | Year
Ended
December 31,
2006 | | Year
Ended
December 31,
2005 | |
| American Century Select (Number of Shares) | |
| Shares sold | | | 1,827,218 | | | | 31,914,281 | | | | 118,906 | | | | 436,803 | | | | 571,291 | | | | 246,400 | | |
| Dividends reinvested | | | 519,194 | | | | — | | | | 4,388 | | | | — | | | | 7,983 | | | | — | | |
| Shares redeemed | | | (11,580,555 | ) | | | (10,661,975 | ) | | | (492,043 | ) | | | (1,016,486 | ) | | | (1,660,756 | ) | | | (1,227,514 | ) | |
| Net increase (decrease) in shares outstanding | | | (9,234,143 | ) | | | 21,252,306 | | | | (368,749 | ) | | | (579,683 | ) | | | (1,081,482 | ) | | | (981,114 | ) | |
| American Century Select ($) | |
| Shares sold | | $ | 17,106,401 | | | $ | 278,369,130 | | | $ | 1,075,520 | | | $ | 3,904,181 | | | $ | 5,152,553 | | | $ | 2,206,539 | | |
| Dividends reinvested | | | 4,330,077 | | | | — | | | | 36,331 | | | | — | | | | 65,623 | | | | — | | |
| Shares redeemed | | | (104,612,463 | ) | | | (97,997,787 | ) | | | (4,470,898 | ) | | | (9,000,068 | ) | | | (15,001,901 | ) | | | (11,026,541 | ) | |
| Net increase (decrease) | | $ | (83,175,985 | ) | | $ | 180,371,343 | | | $ | (3,359,047 | ) | | $ | (5,095,887 | ) | | $ | (9,783,725 | ) | | $ | (8,820,002 | ) | |
| | | Class I | | Class S | | Class ADV | |
| | | Year
Ended
December 31,
2006 | | Year
Ended
December 31,
2005 | | Year
Ended
December 31,
2006 | | Year
Ended
December 31,
2005 | | Year
Ended
December 31,
2006 | | Year
Ended
December 31,
2005 | |
American Century Small-Mid Cap Value
(Number of Shares) | |
| Shares sold | | | 2,277,704 | | | | 1,827,763 | | | | 619,621 | | | | 912,770 | | | | 388,600 | | | | 587,711 | | |
| Dividends reinvested | | | 16,708 | | | | 436,034 | | | | 11,082 | | | | 402,482 | | | | 3,334 | | | | 97,983 | | |
| Shares redeemed | | | (2,681,397 | ) | | | (657,550 | ) | | | (758,282 | ) | | | (742,863 | ) | | | (396,055 | ) | | | (171,647 | ) | |
| Net increase (decrease) in shares outstanding | | | (386,985 | ) | | | 1,606,247 | | | | (127,579 | ) | | | 572,389 | | | | (4,121 | ) | | | 514,047 | | |
| American Century Small-Mid Cap Value ($) | |
| Shares sold | | $ | 28,364,750 | | | $ | 22,769,281 | | | $ | 7,844,421 | | | $ | 11,224,653 | | | $ | 4,792,499 | | | $ | 7,261,980 | | |
| Dividends reinvested | | | 199,327 | | | | 5,194,173 | | | | 131,656 | | | | 4,790,132 | | | | 39,179 | | | | 1,152,631 | | |
| Shares redeemed | | | (33,077,908 | ) | | | (7,948,088 | ) | | | (9,535,053 | ) | | | (9,329,831 | ) | | | (4,862,523 | ) | | | (2,078,194 | ) | |
| Net increase (decrease) | | $ | (4,513,831 | ) | | $ | 20,015,366 | | | $ | (1,558,976 | ) | | $ | 6,684,954 | | | $ | (30,845 | ) | | $ | 6,336,417 | | |
| | | Class I | | Class S | | Class ADV | |
| | | January 3,
2006(1) to
December 31,
2006 | | May 3,
2006(1) to
December 31,
2006 | | January 18,
2006(1) to
December 31,
2006 | |
| Baron Asset (Number of Shares) | |
| Shares sold | | | 509,448 | | | | 28,654 | | | | 320,896 | | |
| Shares redeemed | | | (8,403 | ) | | | (483 | ) | | | (31,316 | ) | |
| Net increase in shares outstanding | | | 501,045 | | | | 28,171 | | | | 289,580 | | |
| Baron Asset ($) | |
| Shares sold | | $ | 5,094,491 | | | $ | 303,753 | | | $ | 3,230,071 | | |
| Shares redeemed | | | (87,166 | ) | | | (5,436 | ) | | | (320,482 | ) | |
| Net increase | | $ | 5,007,325 | | | $ | 298,317 | | | $ | 2,909,589 | | |
| | | Class I | | Class S | | Class ADV | |
| | | Year
Ended
December 31,
2006 | | Year
Ended
December 31,
2005 | | Year
Ended
December 31,
2006 | | Year
Ended
December 31,
2005 | | Year
Ended
December 31,
2006 | | Year
Ended
December 31,
2005 | |
| Baron Small Cap Growth (Number of Shares) | |
| Shares sold | | | 5,011,290 | | | | 3,405,463 | | | | 7,459,932 | | | | 7,294,601 | | | | 988,254 | | | | 1,175,024 | | |
| Dividends reinvested | | | 71,771 | | | | — | | | | 150,917 | | | | — | | | | 23,539 | | | | — | | |
| Shares redeemed | | | (3,071,531 | ) | | | (355,053 | ) | | | (4,208,141 | ) | | | (1,997,997 | ) | | | (478,967 | ) | | | (341,891 | ) | |
| Net increase in shares outstanding | | | 2,011,530 | | | | 3,050,410 | | | | 3,402,708 | | | | 5,296,604 | | | | 532,826 | | | | 833,133 | | |
| Baron Small Cap Growth ($) | |
| Shares sold | | $ | 86,211,661 | | | $ | 53,251,215 | | | $ | 128,766,418 | | | $ | 113,602,924 | | | $ | 16,977,989 | | | $ | 17,807,762 | | |
| Dividends reinvested | | | 1,149,060 | | | | — | | | | 2,389,008 | | | | — | | | | 368,625 | | | | — | | |
| Shares redeemed | | | (52,227,320 | ) | | | (5,541,929 | ) | | | (72,246,291 | ) | | | (30,969,966 | ) | | | (7,993,863 | ) | | | (5,195,708 | ) | |
| Net increase | | $ | 35,133,401 | | | $ | 47,709,286 | | | $ | 58,909,135 | | | $ | 82,632,958 | | | $ | 9,352,751 | | | $ | 12,612,054 | | |
(1) Commencement of operations.
169
NOTES TO FINANCIAL STATEMENTS AS OF DECEMBER 31, 2006 (CONTINUED)
NOTE 10 — CAPITAL SHARES (continued)
| | | Class I | | Class S | | Class ADV | |
| | | April 28,
2006(1) to
December 31,
2006 | | May 1,
2006(1) to
December 31,
2006 | | December 29,
2006(1) to
December 31,
2006 | |
Columbia Small Cap Value II
(Number of Shares) | |
| Shares sold | | | 1,366,939 | | | | 8,022,908 | | | | 99 | | |
| Shares redeemed | | | (217,067 | ) | | | (536,249 | ) | | | — | | |
| Net increase in shares outstanding | | | 1,149,872 | | | | 7,486,659 | | | | 99 | | |
| Columbia Small Cap Value II ($) | |
| Shares sold | | $ | 13,596,217 | * | | $ | 76,892,835 | | | $ | 1,000 | | |
| Shares redeemed | | | (2,084,285 | ) | | | (5,219,377 | ) | | | — | | |
| Net increase | | $ | 11,511,932 | | | $ | 71,673,458 | | | $ | 1,000 | | |
| | | Class I | | Class S | | Class ADV | |
| | | Year
Ended
December 31,
2006 | | Year
Ended
December 31,
2005 | | Year
Ended
December 31,
2006 | | Year
Ended
December 31,
2005 | | Year
Ended
December 31,
2006 | | Year
Ended
December 31,
2005 | |
| Davis Venture Value (Number of Shares) | |
| Shares sold | | | 2,891,880 | | | | 45,465 | | | | 4,999,094 | | | | 486,605 | | | | 116,404 | | | | 539,144 | | |
| Dividends reinvested | | | 61,204 | | | | 408 | | | | 348,181 | | | | — | | | | 47,958 | | | | 315 | | |
| Shares redeemed | | | (112,032 | ) | | | (62,574 | ) | | | (743,043 | ) | | | (1,369,582 | ) | | | (96,026 | ) | | | (499,011 | ) | |
| Net increase (decrease) in shares outstanding | | | 2,841,052 | | | | (16,701 | ) | | | 4,604,232 | | | | (882,977 | ) | | | 68,336 | | | | 40,448 | | |
| Davis Venture Value ($) | |
| Shares sold | | $ | 54,082,000 | | | $ | 817,668 | | | $ | 94,372,300 | | | $ | 8,749,608 | | | $ | 2,163,980 | | | $ | 9,508,471 | | |
| Dividends reinvested | | | 1,099,844 | | | | 7,346 | | | | 6,211,554 | | | | — | | | | 842,625 | | | | 5,573 | | |
| Shares redeemed | | | (2,104,773 | ) | | | (1,130,716 | ) | | | (14,069,002 | ) | | | (24,365,401 | ) | | | (1,798,414 | ) | | | (8,889,431 | ) | |
| Net increase (decrease) | | $ | 53,077,071 | | | $ | (305,702 | ) | | $ | 86,514,852 | | | $ | (15,615,793 | ) | | $ | 1,208,191 | | | $ | 624,613 | | |
| | | Class I | | Class S | | Class ADV | |
| | | Year
Ended
December 31,
2006 | | Year
Ended
December 31,
2005 | | Year
Ended
December 31,
2006 | | Year
Ended
December 31,
2005 | | Year
Ended
December 31,
2006 | | Year
Ended
December 31,
2005 | |
| Fundamental Research (Number of Shares) | |
| Shares sold | | | 4,109,012 | | | | 62,654 | | | | 2,444,767 | | | | 652,623 | | | | 45,519 | | | | 53,097 | | |
| Shares issued from merger | | | 1,827,316 | | | | 795,084 | | | | — | | | | — | | | | — | | | | — | | |
| Dividends reinvested | | | 124,817 | | | | 5,902 | | | | 68,839 | | | | 40,102 | | | | 6,466 | | | | 3,246 | | |
| Shares redeemed | | | (1,253,395 | ) | | | (163,939 | ) | | | (1,941,787 | ) | | | (2,307,923 | ) | | | (85,403 | ) | | | (53,779 | ) | |
| Net increase (decrease) in shares outstanding | | | 4,807,750 | | | | 699,701 | | | | 571,819 | | | | (1,615,198 | ) | | | (33,418 | ) | | | 2,564 | | |
| Fundamental Research ($) | |
| Shares sold | | $ | 39,827,015 | | | $ | 545,101 | | | $ | 22,691,949 | | | $ | 5,666,170 | | | $ | 426,005 | | | $ | 460,479 | | |
| Shares issued from merger | | | 17,722,782 | | | | 7,324,877 | | | | — | | | | — | | | | — | | | | — | | |
| Dividends reinvested | | | 1,125,853 | | | | 49,929 | | | | 620,929 | | | | 339,663 | | | | 57,802 | | | | 27,298 | | |
| Shares redeemed | | | (11,719,719 | ) | | | (1,422,007 | ) | | | (18,092,450 | ) | | | (19,964,556 | ) | | | (798,470 | ) | | | (460,687 | ) | |
| Net increase (decrease) | | $ | 46,955,931 | | | $ | 6,497,900 | | | $ | 5,220,428 | | | $ | (13,958,723 | ) | | $ | (314,663 | ) | | $ | 27,090 | | |
(1) Commencement of operations.
* Includes in-kind subscription from a substitution.
170
NOTES TO FINANCIAL STATEMENTS AS OF DECEMBER 31, 2006 (CONTINUED)
NOTE 10 — CAPITAL SHARES (continued)
| | | Class I | | Class S | | Class ADV | |
| | | Year
Ended
December 31,
2006 | | Year
Ended
December 31,
2005 | | Year
Ended
December 31,
2006 | | Year
Ended
December 31,
2005 | | Year
Ended
December 31,
2006 | | Year
Ended
December 31,
2005 | |
Goldman Sachs® Capital Growth
(Number of Shares) | |
| Shares sold | | | 100,663 | | | | 118,944 | | | | 436,496 | | | | 565,786 | | | | 100,392 | | | | 69,593 | | |
| Dividends reinvested | | | — | | | | 895 | | | | — | | | | 20,823 | | | | — | | | | — | | |
| Shares redeemed | | | (89,608 | ) | | | (31,348 | ) | | | (2,805,630 | ) | | | (3,466,737 | ) | | | (212,536 | ) | | | (277,094 | ) | |
| Net increase (decrease) in shares outstanding | | | 11,055 | | | | 88,491 | | | | (2,369,134 | ) | | | (2,880,128 | ) | | | (112,144 | ) | | | (207,501 | ) | |
| Goldman Sachs® Capital Growth ($) | |
| Shares sold | | $ | 1,221,502 | | | $ | 1,337,332 | | | $ | 5,173,569 | | | $ | 6,177,415 | | | $ | 1,176,199 | | | $ | 761,815 | | |
| Dividends reinvested | | | — | | | | 9,754 | | | | — | | | | 226,138 | | | | — | | | | — | | |
| Shares redeemed | | | (1,069,040 | ) | | | (345,991 | ) | | | (33,124,040 | ) | | | (38,259,051 | ) | | | (2,554,292 | ) | | | (3,011,024 | ) | |
| Net increase (decrease) | | $ | 152,462 | | | $ | 1,001,095 | | | $ | (27,950,471 | ) | | $ | (31,855,498 | ) | | $ | (1,378,093 | ) | | $ | (2,249,209 | ) | |
| | | Class I(1) | | Class S | | Class ADV | |
| | | Year
Ended
December 31,
2006 | | Year
Ended
December 31,
2005 | | Year
Ended
December 31,
2006 | | Year
Ended
December 31,
2005 | | Year
Ended
December 31,
2006 | | Year
Ended
December 31,
2005 | |
Goldman Sachs® Structured Equity
(Number of Shares) | |
| Shares sold | | | 85 | | | | — | | | | 429,259 | | | | 634,380 | | | | 210,575 | | | | 92,324 | | |
| Dividends reinvested | | | — | | | | 15 | | | | 754,397 | | | | 1,064,865 | | | | 22,188 | | | | 7,296 | | |
| Shares redeemed | | | (120 | ) | | | — | | | | (4,758,471 | ) | | | (2,136,095 | ) | | | (52,204 | ) | | | (30,304 | ) | |
| Net increase (decrease) in shares outstanding | | | (35 | ) | | | 15 | | | | (3,574,815 | ) | | | (436,850 | ) | | | 180,559 | | | | 69,316 | | |
| Goldman Sachs® Structured Equity ($) | |
| Shares sold | | $ | 1,000 | | | $ | — | | | $ | 5,325,000 | | | $ | 7,962,329 | | | $ | 2,459,360 | | | $ | 1,158,740 | | |
| Dividends reinvested | | | — | | | | 170 | | | | 8,162,576 | | | | 12,171,411 | | | | 235,639 | | | | 82,596 | | |
| Shares redeemed | | | (1,575 | ) | | | — | | | | (60,796,191 | ) | | | (26,495,371 | ) | | | (632,724 | ) | | | (375,052 | ) | |
| Net increase (decrease) | | $ | (575 | ) | | $ | 170 | | | $ | (47,308,615 | ) | | $ | (6,361,631 | ) | | $ | 2,062,275 | | | $ | 866,284 | | |
| | | Class I | | Class S | | Class ADV | |
| | | Year
Ended
December 31,
2006 | | Year
Ended
December 31,
2005 | | Year
Ended
December 31,
2006 | | Year
Ended
December 31,
2005 | | Year
Ended
December 31,
2006 | | Year
Ended
December 31,
2005 | |
| JPMorgan International (Number of Shares) | |
| Shares sold | | | 45,558,811 | | | | 2,992,581 | | | | 9,306,142 | | | | 34,481,815 | | | | 417,670 | | | | 164,851 | | |
| Dividends reinvested | | | 549,926 | | | | 224,057 | | | | 12,367 | | | | 246,190 | | | | 2,525 | | | | 1,136 | | |
| Shares redeemed | | | (14,457,382 | ) | | | (7,421,491 | ) | | | (42,019,041 | ) | | | (8,952,601 | ) | | | (46,939 | ) | | | (84,381 | ) | |
| Net increase (decrease) in shares outstanding | | | 31,651,355 | | | | (4,204,853 | ) | | | (32,700,532 | ) | | | 25,775,404 | | | | 373,256 | | | | 81,606 | | |
| JPMorgan International ($) | |
| Shares sold | | $ | 693,275,127 | | | $ | 37,093,357 | | | $ | 135,310,861 | | | $ | 421,334,049 | | | $ | 6,240,136 | | | $ | 2,038,736 | | |
| Dividends reinvested | | | 8,050,923 | | | | 2,668,525 | | | | 180,927 | | | | 2,914,895 | | | | 36,480 | | | | 13,389 | | |
| Shares redeemed | | | (217,426,374 | ) | | | (91,750,930 | ) | | | (629,724,417 | ) | | | (110,440,369 | ) | | | (682,076 | ) | | | (1,055,855 | ) | |
| Net increase (decrease) | | $ | 483,899,676 | | | $ | (51,989,048 | ) | | $ | (494,232,629 | ) | | $ | 313,808,575 | | | $ | 5,594,540 | | | $ | 996,270 | | |
| | | Class I | | Class S | | Class ADV | |
| | | Year
Ended
December 31,
2006 | | Year
Ended
December 31,
2005 | | Year
Ended
December 31,
2006 | | Year
Ended
December 31,
2005 | | Year
Ended
December 31,
2006 | | Year
Ended
December 31,
2005 | |
| JPMorgan MidCap Value (Number of Shares) | |
| Shares sold | | | 2,819,227 | | | | 2,647,024 | | | | 1,058,452 | | | | 2,011,533 | | | | 626,803 | | | | 666,879 | | |
| Dividends reinvested | | | 50,978 | | | | 414,890 | | | | 40,231 | | | | 410,041 | | | | 8,285 | | | | 61,014 | | |
| Shares redeemed | | | (882,739 | ) | | | (1,286,352 | ) | | | (1,063,949 | ) | | | (1,445,928 | ) | | | (148,523 | ) | | | (194,750 | ) | |
| Net increase in shares outstanding | | | 1,987,466 | | | | 1,775,562 | | | | 34,734 | | | | 975,646 | | | | 486,565 | | | | 533,143 | | |
| JPMorgan MidCap Value ($) | |
| Shares sold | | $ | 42,547,053 | | | $ | 38,175,596 | | | $ | 16,122,783 | | | $ | 28,693,277 | | | $ | 9,333,354 | | | $ | 9,602,999 | | |
| Dividends reinvested | | | 746,324 | | | | 5,888,381 | | | | 586,161 | | | | 5,801,817 | | | | 119,806 | | | | 857,812 | | |
| Shares redeemed | | | (13,435,093 | ) | | | (18,071,001 | ) | | | (16,014,541 | ) | | | (20,973,214 | ) | | | (2,199,483 | ) | | | (2,797,151 | ) | |
| Net increase | | $ | 29,858,284 | | | $ | 25,992,976 | | | $ | 694,403 | | | $ | 13,521,880 | | | $ | 7,253,677 | | | $ | 7,663,660 | | |
(1) Class I fully redeemed on May 5, 2006 and recommenced operations on December 29, 2006.
171
NOTES TO FINANCIAL STATEMENTS AS OF DECEMBER 31, 2006 (CONTINUED)
NOTE 10 — CAPITAL SHARES (continued)
| | | Class I | | Class S | | Class ADV | |
| | | Year
Ended
December 31,
2006 | | Year
Ended
December 31,
2005 | | Year
Ended
December 31,
2006 | | Year
Ended
December 31,
2005 | | Year
Ended
December 31,
2006 | | Year
Ended
December 31,
2005 | |
Legg Mason Partners Aggressive Growth
(Number of Shares) | |
| Shares sold | | | 14,639,264 | | | | 501,090 | | | | 3,132,784 | | | | 7,470,449 | | | | 175,580 | | | | 117,048 | | |
| Shares redeemed | | | (3,047,781 | ) | | | (2,982,665 | ) | | | (9,213,654 | ) | | | (6,520,178 | ) | | | (178,669 | ) | | | (18,541 | ) | |
| Net increase (decrease) in shares outstanding | | | 11,591,483 | | | | (2,481,575 | ) | | | (6,080,870 | ) | | | 950,271 | | | | (3,089 | ) | | | 98,507 | | |
| Legg Mason Partners Aggressive Growth ($) | |
| Shares sold | | $ | 687,226,545 | | | $ | 21,086,158 | | | $ | 144,043,823 | | | $ | 295,891,931 | | | $ | 7,901,186 | | | $ | 4,736,368 | | |
| Shares redeemed | | | (142,216,819 | ) | | | (119,361,484 | ) | | | (429,980,390 | ) | | | (249,022,493 | ) | | | (8,161,851 | ) | | | (742,579 | ) | |
| Net increase (decrease) | | $ | 545,009,726 | | | $ | (98,275,326 | ) | | $ | (285,936,567 | ) | | $ | 46,869,438 | | | $ | (260,665 | ) | | $ | 3,993,789 | | |
| | | Class I | | Class S | | Class ADV | |
| | | Year
Ended
December 31,
2006 | | Year
Ended
December 31,
2005 | | Year
Ended
December 31,
2006 | | Year
Ended
December 31,
2005 | | Year
Ended
December 31,
2006 | | Year
Ended
December 31,
2005 | |
Legg Mason Partners Large Cap Growth
(Number of Shares) | |
| Shares sold | | | 272,902 | | | | 562,690 | | | | 101,246 | | | | 156,502 | | | | 270,377 | | | | 324,990 | | |
| Dividends reinvested | | | 27,949 | | | | 193,291 | | | | 19,117 | | | | 129,778 | | | | 30,526 | | | | 271,521 | | |
| Shares redeemed | | | (705,884 | ) | | | (668,226 | ) | | | (390,256 | ) | | | (370,087 | ) | | | (922,106 | ) | | | (1,150,132 | ) | |
| Net increase (decrease) in shares outstanding | | | (405,033 | ) | | | 87,755 | | | | (269,893 | ) | | | (83,807 | ) | | | (621,203 | ) | | | (553,621 | ) | |
| Legg Mason Partners Large Cap Growth ($) | |
| Shares sold | | $ | 3,110,302 | | | $ | 6,393,969 | | | $ | 1,129,218 | | | $ | 1,799,706 | | | $ | 3,019,643 | | | $ | 3,711,025 | | |
| Dividends reinvested | | | 290,112 | | | | 2,054,680 | | | | 196,333 | | | | 1,369,162 | | | | 311,057 | | | | 2,850,971 | | |
| Shares redeemed | | | (8,171,323 | ) | | | (7,577,392 | ) | | | (4,462,310 | ) | | | (4,297,264 | ) | | | (10,276,922 | ) | | | (13,131,647 | ) | |
| Net increase (decrease) | | $ | (4,770,909 | ) | | $ | 871,257 | | | $ | (3,136,759 | ) | | $ | (1,128,396 | ) | | $ | (6,946,222 | ) | | $ | (6,569,651 | ) | |
| | | Class I | | Class S | | Class ADV | |
| | | January 3,
2006(1) to
December 31,
2006 | | January 18,
2006(1) to
December 31,
2006 | | December 20,
2006(1) to
December 31,
2006 | |
Lord Abbett U.S. Government Securities
(Number of Shares) | |
| Shares sold | | | 5,117,101 | | | | 2,458,020 | | | | 97 | | |
| Dividends reinvested | | | 143,705 | | | | 57,827 | | | | — | | |
| Shares redeemed | | | (1,709,930 | ) | | | (1,100,405 | ) | | | — | | |
| Net increase in shares outstanding | | | 3,550,876 | | | | 1,415,442 | | | | 97 | | |
| Lord Abbett U.S. Government Securities ($) | |
| Shares sold | | $ | 50,827,619 | | | $ | 24,705,248 | | | $ | 1,010 | | |
| Dividends reinvested | | | 1,428,428 | | | | 574,796 | | | | — | | |
| Shares redeemed | | | (17,296,230 | ) | | | (11,000,899 | ) | | | — | | |
| Net increase | | $ | 34,959,817 | | | $ | 14,279,145 | | | $ | 1,010 | | |
| | | Class I | | Class S | | Class ADV | |
| | | January 19,
2006(1) to
December 31,
2006 | | January 3,
2006(1) to
December 31,
2006 | | December 29,
2006(1) to
December 31,
2006 | |
Neuberger Berman Partners
(Number of Shares) | |
| Shares sold | | | 25,101,066 | | | | 9,880,195 | | | | 92 | | |
| Shares issued from merger | | | 1 | | | | 16,275,105 | | | | — | | |
| Shares redeemed | | | (3,863,723 | ) | | | (9,496,861 | ) | | | — | | |
| Net increase in shares outstanding | | | 21,237,344 | | | | 16,658,439 | | | | 92 | | |
| Neuberger Berman Partners ($) | |
| Shares sold | | $ | 258,138,091 | | | $ | 99,240,980 | | | $ | 1,000 | | |
| Shares issued from merger | | | 18 | | | | 178,456,935 | | | | — | | |
| Shares redeemed | | | (39,243,444 | ) | | | (98,649,240 | ) | | | — | | |
| Net increase | | $ | 218,894,665 | | | $ | 179,048,675 | | | $ | 1,000 | | |
(1) Commencement of operations.
172
NOTES TO FINANCIAL STATEMENTS AS OF DECEMBER 31, 2006 (CONTINUED)
NOTE 10 — CAPITAL SHARES (continued)
| | | Class I | | Class S | | Class ADV | |
| | | January 3,
2006(1) to
December 31,
2006 | | January 12,
2006(1) to
December 31,
2006 | | December 20,
2006(1) to
December 31,
2006 | |
Neuberger Berman Regency
(Number of Shares) | |
| Shares sold | | | 573,279 | | | | 771,224 | | | | 94 | | |
| Dividends reinvested | | | 495 | | | | 3,356 | | | | — | | |
| Shares redeemed | | | (2,912 | ) | | | (169,566 | ) | | | — | | |
| Net increase in shares outstanding | | | 570,862 | | | | 605,014 | | | | 94 | | |
| Neuberger Berman Regency ($) | |
| Shares sold | | $ | 5,718,914 | | | $ | 7,753,095 | | | $ | 1,010 | | |
| Dividends reinvested | | | 5,314 | | | | 36,009 | | | | — | | |
| Shares redeemed | | | (28,762 | ) | | | (1,721,062 | ) | | | — | | |
| Net increase | | $ | 5,695,466 | | | $ | 6,068,042 | | | $ | 1,010 | | |
| | | Class I | | Class S | | Class ADV | |
| | | Year
Ended
December 31,
2006 | | Year
Ended
December 31,
2005 | | Year
Ended
December 31,
2006 | | Year
Ended
December 31,
2005 | | Year
Ended
December 31,
2006 | | Year
Ended
December 31,
2005 | |
| OpCap Balanced Value (Number of Shares) | |
| Shares sold | | | 80,660 | | | | 80,997 | | | | 396,940 | | | | 862,329 | | | | 58,246 | | | | 44,169 | | |
| Dividends reinvested | | | 4,696 | | | | 2,106 | | | | 56,152 | | | | 38,777 | | | | 2,131 | | | | 569 | | |
| Shares redeemed | | | (94,031 | ) | | | (78,341 | ) | | | (3,923,866 | ) | | | (4,073,657 | ) | | | (60,924 | ) | | | (73,629 | ) | |
| Net increase (decrease) in shares outstanding | | | (8,675 | ) | | | 4,762 | | | | (3,470,774 | ) | | | (3,172,551 | ) | | | (547 | ) | | | (28,891 | ) | |
| OpCap Balanced Value ($) | |
| Shares sold | | $ | 1,134,525 | | | $ | 1,080,048 | | | $ | 5,587,245 | | | $ | 11,538,629 | | | $ | 816,845 | | | $ | 585,645 | | |
| Dividends reinvested | | | 63,166 | | | | 28,329 | | | | 755,243 | | | | 520,776 | | | | 28,385 | | | | 7,580 | | |
| Shares redeemed | | | (1,332,794 | ) | | | (1,056,901 | ) | | | (54,913,812 | ) | | | (54,650,002 | ) | | | (851,293 | ) | | | (981,543 | ) | |
| Net increase (decrease) | | $ | (135,103 | ) | | $ | 51,476 | | | $ | (48,571,324 | ) | | $ | (42,590,597 | ) | | $ | (6,063 | ) | | $ | (388,318 | ) | |
| | | Class I | | Class S | | Class ADV | |
| | | Year
Ended
December 31,
2006 | | Year
Ended
December 31,
2005 | | Year
Ended
December 31,
2006 | | Year
Ended
December 31,
2005 | | Year
Ended
December 31,
2006 | | Year
Ended
December 31,
2005 | |
| Oppenheimer Global (Number of Shares) | |
| Shares sold | | | 6,424,797 | | | | 103,016,953 | | | | 6,382,382 | | | | 3,428,892 | | | | 1,696,793 | | | | 1,210,802 | | |
| Dividends reinvested | | | 347,770 | | | | 4,041,348 | | | | 14,921 | | | | 63,798 | | | | 17,165 | | | | 156,780 | | |
| Shares redeemed | | | (15,372,206 | ) | | | (13,320,574 | ) | | | (443,727 | ) | | | (2,076,401 | ) | | | (3,529,353 | ) | | | (3,887,592 | ) | |
| Net increase (decrease) in shares outstanding | | | (8,599,639 | ) | | | 93,737,727 | | | | 5,953,576 | | | | 1,416,289 | | | | (1,815,395 | ) | | | (2,520,010 | ) | |
| Oppenheimer Global ($) | |
| Shares sold | | $ | 99,387,512 | | | $ | 1,252,579,506 | | | $ | 94,829,014 | | | $ | 45,138,934 | | | $ | 24,845,252 | | | $ | 15,348,701 | | |
| Dividends reinvested | | | 5,077,453 | | | | 57,127,283 | | | | 214,388 | | | | 886,167 | | | | 243,735 | | | | 2,162,494 | | |
| Shares redeemed | | | (237,338,053 | ) | | | (174,735,557 | ) | | | (6,691,967 | ) | | | (25,073,244 | ) | | | (52,362,841 | ) | | | (51,971,027 | ) | |
| Net increase (decrease) | | $ | (132,873,088 | ) | | $ | 1,134,971,232 | | | $ | 88,351,435 | | | $ | 20,951,857 | | | $ | (27,273,854 | ) | | $ | (34,459,832 | ) | |
| | | Class I | | Class S | | Class ADV | |
| | | Year
Ended
December 31,
2006 | | Year
Ended
December 31,
2005 | | Year
Ended
December 31,
2006 | | Year
Ended
December 31,
2005 | | Year
Ended
December 31,
2006 | | Year
Ended
December 31,
2005 | |
Oppenheimer Strategic Income
(Number of Shares) | |
| Shares sold | | | 7,029,713 | | | | 23,300,205 | | | | 1,212,240 | | | | 2,073,206 | | | | 526,361 | | | | 277,984 | | |
| Dividends reinvested | | | 130,181 | | | | 685,117 | | | | 5,803 | | | | 122,816 | | | | 1,365 | | | | 9,827 | | |
| Shares redeemed | | | (4,141,588 | ) | | | (3,891,420 | ) | | | (2,082,268 | ) | | | (2,161,397 | ) | | | (175,540 | ) | | | (140,231 | ) | |
| Net increase (decrease) in shares outstanding | | | 3,018,306 | | | | 20,093,902 | | | | (864,225 | ) | | | 34,625 | | | | 352,186 | | | | 147,580 | | |
| Oppenheimer Strategic Income ($) | |
| Shares sold | | $ | 72,764,925 | | | $ | 233,758,163 | | | $ | 12,449,477 | | | $ | 20,965,239 | | | $ | 5,388,475 | | | $ | 2,802,224 | | |
| Dividends reinvested | | | 1,398,755 | | | | 6,830,671 | | | | 62,039 | | | | 1,224,476 | | | | 14,604 | | | | 97,781 | | |
| Shares redeemed | | | (42,555,223 | ) | | | (39,258,179 | ) | | | (21,328,206 | ) | | | (21,799,624 | ) | | | (1,805,281 | ) | | | (1,410,390 | ) | |
| Net increase (decrease) | | $ | 31,608,457 | | | $ | 201,330,655 | | | $ | (8,816,690 | ) | | $ | 390,091 | | | $ | 3,597,798 | | | $ | 1,489,615 | | |
(1) Commencement of operations.
173
NOTES TO FINANCIAL STATEMENTS AS OF DECEMBER 31, 2006 (CONTINUED)
NOTE 10 — CAPITAL SHARES (continued)
| | | Class I | | Class S | | Class ADV | |
| | | Year
Ended
December 31,
2006 | | Year
Ended
December 31,
2005 | | Year
Ended
December 31,
2006 | | Year
Ended
December 31,
2005 | | Year
Ended
December 31,
2006 | | Year
Ended
December 31,
2005 | |
| PIMCO Total Return (Number of Shares) | |
| Shares sold | | | 9,297,232 | | | | 9,717,091 | | | | 1,694,599 | | | | 3,353,861 | | | | 1,090,059 | | | | 1,177,965 | | |
| Dividends reinvested | | | 413,354 | | | | 370,074 | | | | 139,350 | | | | 202,898 | | | | 40,189 | | | | 47,533 | | |
| Shares redeemed | | | (6,727,849 | ) | | | (1,047,575 | ) | | | (1,122,866 | ) | | | (3,915,857 | ) | | | (937,716 | ) | | | (455,201 | ) | |
| Net increase (decrease) in shares outstanding | | | 2,982,737 | | | | 9,039,590 | | | | 711,083 | | | | (359,098 | ) | | | 192,532 | | | | 770,297 | | |
| PIMCO Total Return ($) | |
| Shares sold | | $ | 101,621,577 | | | $ | 106,751,522 | | | $ | 18,505,896 | | | $ | 36,646,753 | | | $ | 11,796,422 | | | $ | 12,796,531 | | |
| Dividends reinvested | | | 4,464,221 | | | | 4,041,205 | | | | 1,499,405 | | | | 2,207,527 | | | | 429,622 | | | | 514,778 | | |
| Shares redeemed | | | (73,757,665 | ) | | | (11,475,514 | ) | | | (12,285,990 | ) | | | (42,874,969 | ) | | | (10,155,390 | ) | | | (4,929,923 | ) | |
| Net increase (decrease) | | $ | 32,328,133 | | | $ | 99,317,213 | | | $ | 7,719,311 | | | $ | (4,020,689 | ) | | $ | 2,070,654 | | | $ | 8,381,386 | | |
| | | Class I | | Class S | | Class ADV | |
| | | January 3,
2006(1) to
December 31,
2006 | | January 20,
2006(1) to
December 31,
2006 | | January 20,
2006(1) to
December 31,
2006 | |
| Pioneer High Yield (Number of Shares) | |
| Shares sold | | | 12,879,573 | | | | 1,074,712 | | | | 804,412 | | |
| Dividends reinvested | | | 412,987 | | | | 48,798 | | | | 17,775 | | |
| Shares redeemed | | | (1,552,313 | ) | | | (313,107 | ) | | | (772,292 | ) | |
| Net increase in shares outstanding | | | 11,740,247 | | | | 810,403 | | | | 49,895 | | |
| Pioneer High Yield ($) | |
| Shares sold | | $ | 128,967,126 | | | $ | 10,739,273 | | | $ | 8,039,832 | | |
| Dividends reinvested | | | 4,162,628 | | | | 490,098 | | | | 177,443 | | |
| Shares redeemed | | | (15,539,024 | ) | | | (3,134,130 | ) | | | (7,647,456 | ) | |
| Net increase | | $ | 117,590,730 | | | $ | 8,095,241 | | | $ | 569,819 | | |
| | | Class I | | Class S | | Class ADV | |
| | | Year
Ended
December 31,
2006 | | Year
Ended
December 31,
2005 | | Year
Ended
December 31,
2006 | | Year
Ended
December 31,
2005 | | Year
Ended
December 31,
2006 | | Year
Ended
December 31,
2005 | |
T. Rowe Price Diversified Mid Cap Growth
(Number of Shares) | |
| Shares sold | | | 6,108,855 | | | | 90,855,628 | | | | 562,060 | | | | 830,513 | | | | 4,340,652 | | | | 1,278,984 | | |
| Dividends reinvested | | | 2,901,386 | | | | 2,294,158 | | | | 65,615 | | | | 47,513 | | | | 151,184 | | | | 155,088 | | |
| Shares redeemed | | | (24,129,518 | ) | | | (21,132,843 | ) | | | (2,075,230 | ) | | | (1,967,457 | ) | | | (7,359,250 | ) | | | (3,384,627 | ) | |
| Net increase (decrease) in shares outstanding | | | (15,119,277 | ) | | | 72,016,943 | | | | (1,447,555 | ) | | | (1,089,431 | ) | | | (2,867,414 | ) | | | (1,950,555 | ) | |
| T. Rowe Price Diversified Mid Cap Growth ($) | |
| Shares sold | | $ | 55,394,856 | | | $ | 688,591,097 | | | $ | 4,998,673 | | | $ | 6,593,530 | | | $ | 37,662,475 | | | $ | 10,074,467 | | |
| Dividends reinvested | | | 23,791,368 | | | | 18,009,139 | | | | 530,826 | | | | 369,650 | | | | 1,209,471 | | | | 1,195,725 | | |
| Shares redeemed | | | (214,858,831 | ) | | | (170,184,281 | ) | | | (17,594,314 | ) | | | (14,967,425 | ) | | | (64,759,712 | ) | | | (26,603,625 | ) | |
| Net increase (decrease) | | $ | (135,672,607 | ) | | $ | 536,415,955 | | | $ | (12,064,815 | ) | | $ | (8,004,245 | ) | | $ | (25,887,766 | ) | | $ | (15,333,433 | ) | |
(1) Commencement of operations.
174
NOTES TO FINANCIAL STATEMENTS AS OF DECEMBER 31, 2006 (CONTINUED)
NOTE 10 — CAPITAL SHARES (continued)
| | | Class I | | Class S | | Class ADV | |
| | | Year
Ended
December 31,
2006 | | Year
Ended
December 31,
2005 | | Year
Ended
December 31,
2006 | | Year
Ended
December 31,
2005 | | Year
Ended
December 31,
2006 | | Year
Ended
December 31,
2005 | |
T. Rowe Price Growth Equity
(Number of Shares) | |
| Shares sold | | | 7,098,028 | | | | 1,609,059 | | | | 825,959 | | | | 3,099,968 | | | | 552,839 | | | | 570,153 | | |
| Dividends reinvested | | | 89,917 | | | | 84,803 | | | | 1,498 | | | | 9,434 | | | | 3,217 | | | | 1,776 | | |
| Shares redeemed | | | (2,834,054 | ) | | | (1,291,892 | ) | | | (3,321,964 | ) | | | (357,686 | ) | | | (416,092 | ) | | | (503,779 | ) | |
| Net increase (decrease) in shares outstanding | | | 4,353,891 | | | | 401,970 | | | | (2,494,507 | ) | | | 2,751,716 | | | | 139,964 | | | | 68,150 | | |
| T. Rowe Price Growth Equity ($) | |
| Shares sold | | $ | 389,488,623 | | | $ | 79,961,165 | | | $ | 44,679,348 | | | $ | 153,365,981 | | | $ | 29,702,727 | | | $ | 27,928,540 | | |
| Dividends reinvested | | | 4,673,010 | | | | 4,157,878 | | | | 77,274 | | | | 459,082 | | | | 164,722 | | | | 86,062 | | |
| Shares redeemed | | | (154,954,764 | ) | | | (63,812,431 | ) | | | (181,745,667 | ) | | | (18,001,009 | ) | | | (22,216,100 | ) | | | (24,632,482 | ) | |
| Net increase (decrease) | | $ | 239,206,869 | | | $ | 20,306,612 | | | $ | (136,989,045 | ) | | $ | 135,824,054 | | | $ | 7,651,349 | | | $ | 3,382,120 | | |
| | | Class I | | Class S | | Class ADV | |
| | | January 3,
2006(1) to
December 31,
2006 | | January 12,
2006(1) to
December 31,
2006 | | December 20,
2006(1) to
December 31,
2006 | |
Templeton Foreign Equity
(Number of Shares) | |
| Shares sold | | | 1,000,001 | | | | 3,418,607 | | | | 86 | | |
| Dividends reinvested | | | — | | | | 31,296 | | | | — | | |
| Shares redeemed | | | (86,372 | ) | | | (435,506 | ) | | | — | | |
| Net increase in shares outstanding | | | 913,629 | | | | 3,014,397 | | | | 86 | | |
| Templeton Foreign Equity ($) | |
| Shares sold | | $ | 10,000,010 | | | $ | 36,701,224 | | | $ | 1,010 | | |
| Dividends reinvested | | | — | | | | 375,868 | | | | — | | |
| Shares redeemed | | | (900,000 | ) | | | (4,676,209 | ) | | | — | | |
| Net increase | | $ | 9,100,010 | | | $ | 32,400,883 | | | $ | 1,010 | | |
| | | Class I | | Class S | | Class ADV | |
| | | Year
Ended
December 31,
2006 | | Year
Ended
December 31,
2005 | | Year
Ended
December 31,
2006 | | Year
Ended
December 31,
2005 | | Year
Ended
December 31,
2006 | | Year
Ended
December 31,
2005 | |
| Thornburg Value (Number of Shares) | |
| Shares sold | | | 122,100 | | | | 218,098 | | | | 307,683 | | | | 766 | | | | 16,010 | | | | 1,354 | | |
| Dividends reinvested | | | 32,202 | | | | 63,630 | | | | 27 | | | | 66 | | | | 16 | | | | 36 | | |
| Shares redeemed | | | (1,317,692 | ) | | | (1,898,027 | ) | | | (103,396 | ) | | | (7,115 | ) | | | (2,510 | ) | | | (3,414 | ) | |
| Net increase (decrease) in shares outstanding | | | (1,163,390 | ) | | | (1,616,299 | ) | | | 204,314 | | | | (6,283 | ) | | | 13,516 | | | | (2,024 | ) | |
| Thornburg Value ($) | |
| Shares sold | | $ | 3,560,314 | | | $ | 5,821,235 | | | $ | 9,260,104 | | | $ | 20,613 | | | $ | 477,546 | | | $ | 35,779 | | |
| Dividends reinvested | | | 882,011 | | | | 1,677,923 | | | | 742 | | | | 1,734 | | | | 421 | | | | 946 | | |
| Shares redeemed | | | (37,725,387 | ) | | | (50,560,022 | ) | | | (3,138,049 | ) | | | (188,367 | ) | | | (69,036 | ) | | | (90,650 | ) | |
| Net increase (decrease) | | $ | (33,283,062 | ) | | $ | (43,060,864 | ) | | $ | 6,122,797 | | | $ | (166,020 | ) | | $ | 408,931 | | | $ | (53,925 | ) | |
(1) Commencement of operations.
175
NOTES TO FINANCIAL STATEMENTS AS OF DECEMBER 31, 2006 (CONTINUED)
NOTE 10 — CAPITAL SHARES (continued)
| | | Class I | | Class S | | Class ADV | |
| | | Year
Ended
December 31,
2006 | | Year
Ended
December 31,
2005 | | Year
Ended
December 31,
2006 | | Year
Ended
December 31,
2005 | | Year
Ended
December 31,
2006 | | Year
Ended
December 31,
2005 | |
UBS U.S. Large Cap Equity
(Number of Shares) | |
| Shares sold | | | 9,595,093 | | | | 2,809,555 | | | | 2,772,902 | | | | 1,353,016 | | | | 366,913 | | | | 47,362 | | |
| Dividends reinvested | | | 244,847 | | | | 267,258 | | | | 11,883 | | | | 4,244 | | | | 998 | | | | 106 | | |
| Shares redeemed | | | (5,332,212 | ) | | | (5,088,577 | ) | | | (1,134,560 | ) | | | (583,822 | ) | | | (26,504 | ) | | | (6,802 | ) | |
| Net increase (decrease) in shares outstanding | | | 4,507,728 | | | | (2,011,764 | ) | | | 1,650,225 | | | | 773,438 | | | | 341,407 | | | | 40,666 | | |
| UBS U.S. Large Cap Equity ($) | |
| Shares sold | | $ | 93,073,309 | | | $ | 24,386,763 | | | $ | 26,738,676 | | | $ | 11,895,077 | | | $ | 3,597,967 | | | $ | 420,260 | | |
| Dividends reinvested | | | 2,308,904 | | | | 2,317,124 | | | | 110,985 | | | | 36,503 | | | | 9,291 | | | | 913 | | |
| Shares redeemed | | | (51,922,487 | ) | | | (44,378,759 | ) | | | (11,044,116 | ) | | | (5,299,117 | ) | | | (249,855 | ) | | | (59,843 | ) | |
| Net increase (decrease) | | $ | 43,459,726 | | | $ | (17,674,872 | ) | | $ | 15,805,545 | | | $ | 6,632,463 | | | $ | 3,357,403 | | | $ | 361,330 | | |
| | | Class I | | Class S | | Class ADV | |
| | | April 28,
2006(1) to
December 31,
2006 | | April 28,
2006(1) to
December 31,
2006 | | April 28,
2006(1) to
December 31,
2006 | |
UBS U.S. Small Cap Growth
(Number of Shares) | |
| Shares sold | | | 2,686,575 | | | | 952,635 | | | | 101 | | |
| Dividends reinvested | | | 15,156 | | | | 4,411 | | | | — | | |
| Shares redeemed | | | (394,710 | ) | | | (434,767 | ) | | | — | | |
| Net increase in shares outstanding | | | 2,307,021 | | | | 522,279 | | | | 101 | | |
| UBS U.S. Small Cap Growth ($) | |
| Shares sold | | $ | 25,476,263 | | | $ | 9,162,176 | | | $ | 1,006 | | |
| Dividends reinvested | | | 148,676 | | | | 43,180 | | | | — | | |
| Shares redeemed | | | (3,820,768 | ) | | | (4,126,228 | ) | | | — | | |
| Net increase | | $ | 21,804,171 | | | $ | 5,079,128 | | | $ | 1,006 | | |
| | | Class I | | Class S | | Class ADV | |
| | | Year
Ended
December 31,
2006 | | Year
Ended
December 31,
2005 | | Year
Ended
December 31,
2006 | | Year
Ended
December 31,
2005 | | Year
Ended
December 31,
2006 | | Year
Ended
December 31,
2005 | |
| Van Kampen Comstock (Number of Shares) | |
| Shares sold | | | 40,993,359 | | | | 5,486,121 | | | | 7,978,292 | | | | 19,691,222 | | | | 1,124,623 | | | | 1,196,208 | | |
| Dividends reinvested | | | 2,092,041 | | | | 351,568 | | | | 1,834,218 | | | | 1,647,807 | | | | 156,118 | | | | 60,386 | | |
| Shares redeemed | | | (6,592,555 | ) | | | (574,665 | ) | | | (27,051,120 | ) | | | (3,022,164 | ) | | | (546,815 | ) | | | (177,672 | ) | |
| Net increase (decrease) in shares outstanding | | | 36,492,845 | | | | 5,263,024 | | | | (17,238,610 | ) | | | 18,316,865 | | | | 733,926 | | | | 1,078,922 | | |
| Van Kampen Comstock ($) | |
| Shares sold | | $ | 520,979,421 | | | $ | 65,570,222 | | | $ | 99,575,160 | | | $ | 235,202,173 | | | $ | 13,971,062 | | | $ | 14,252,401 | | |
| Dividends reinvested | | | 25,125,416 | | | | 4,092,246 | | | | 21,955,582 | | | | 19,114,567 | | | | 1,851,560 | | | | 696,857 | | |
| Shares redeemed | | | (82,439,322 | ) | | | (6,932,026 | ) | | | (344,077,235 | ) | | | (35,920,390 | ) | | | (6,729,082 | ) | | | (2,104,032 | ) | |
| Net increase (decrease) | | $ | 463,665,515 | | | $ | 62,730,442 | | | $ | (222,546,493 | ) | | $ | 218,396,350 | | | $ | 9,093,540 | | | $ | 12,845,226 | | |
(1) Commencement of operations.
176
NOTES TO FINANCIAL STATEMENTS AS OF DECEMBER 31, 2006 (CONTINUED)
NOTE 10 — CAPITAL SHARES (continued)
| | | Class I | | Class S | | Class ADV | |
| | | Year
Ended
December 31,
2006 | | Year
Ended
December 31,
2005 | | Year
Ended
December 31,
2006 | | Year
Ended
December 31,
2005 | | Year
Ended
December 31,
2006 | | Year
Ended
December 31,
2005 | |
Van Kampen Equity and Income
(Number of Shares) | |
| Shares sold | | | 1,375,407 | | | | 15,795,367 | | | | 952,673 | | | | 1,212,672 | | | | 127,128 | | | | 216,494 | | |
| Dividends reinvested | | | 1,330,944 | | | | 54,984 | | | | 127,984 | | | | 870 | | | | 24,246 | | | | 421 | | |
| Shares redeemed | | | (2,148,019 | ) | | | (8,835,762 | ) | | | (432,456 | ) | | | (582,681 | ) | | | (67,625 | ) | | | (74,607 | ) | |
| Net increase in shares outstanding | | | 558,332 | | | | 7,014,589 | | | | 648,201 | | | | 630,861 | | | | 83,749 | | | | 142,308 | | |
| Van Kampen Equity and Income ($) | |
| Shares sold | | $ | 50,898,732 | | | $ | 522,792,481 | | | $ | 34,829,393 | | | $ | 42,084,427 | | | $ | 4,606,497 | | | $ | 7,311,592 | | |
| Dividends reinvested | | | 47,168,642 | | | | 1,872,766 | | | | 4,512,722 | | | | 29,541 | | | | 846,440 | | | | 14,161 | | |
| Shares redeemed | | | (79,896,329 | ) | | | (309,018,920 | ) | | | (15,811,167 | ) | | | (19,559,547 | ) | | | (2,453,385 | ) | | | (2,517,187 | ) | |
| Net increase | | $ | 18,171,045 | | | $ | 215,646,327 | | | $ | 23,530,948 | | | $ | 22,554,421 | | | $ | 2,999,552 | | | $ | 4,808,566 | | |
NOTE 11 — ILLIQUID SECURITIES
Pursuant to guidelines adopted by the Portfolios' board, the following securities have been deemed to be illiquid. The Portfolios may invest up to 15% of net assets, in illiquid securities. ING value for certain of securities was determined by ING Funds Valuation Committee appointed by the Portfolios' Board.
| Portfolio | | Security | | Notional
Principal/Par
Value | | Initial
Acquision
Date | | Cost/
(Upfront
Payments) | | Value | | Percent
of Net
Assets | |
Oppenheimer
| |
Strategic
| |
| Income | | Argentina Bonos, 0.000%, due 09/30/14 | | | 7,983,000 | | | 07/08/05 | | $ | 2,700,397 | | | $ | 2,874,094 | | | | 0.7 | % | |
| | | Argentina Government International Bond, 2.000%,
due 02/04/18 | | | 1,003,200 | | | 05/15/05 | | | 433,963 | | | | 529,018 | | | | 0.1 | % | |
| | | CITI EGYTB CLN, 8.775%, due 02/22/07 | | | 1,670,000 | | | 08/15/06 | | | 287,290 | | | | 288,394 | | | | 0.1 | % | |
| | | CITI EGYTB CLN, 9.079%, due 03/22/07 | | | 6,000,000 | | | 09/19/06 | | | 1,025,082 | | | | 1,028,045 | | | | 0.2 | % | |
| | | CITI EGYTB CLN, 8.700%, due 07/12/07 | | | 1,750,000 | | | 08/01/06 | | | 291,329 | | | | 291,169 | | | | 0.1 | % | |
| | | DEU EGYCD TRS, 10.029%, due 09/12/07 | | | 2,560,000 | | | 12/12/06 | | | 418,486 | | | | 417,130 | | | | 0.1 | % | |
| | | New Turkish Lira (TRY) Put/Japanese Yen (JPY) Call,
Exercise Price 65.00, expires 01/30/07 | | | (1,780,000 | ) | | 07/28/06 | | | (30,218 | ) | | | — | | | | 0.0 | % | |
| | | | | | | | | | | | | | | $ | 5,427,850 | | | | 1.3 | % | |
PIMCO Total
Return | | Credit Default Swaps | | | | | | | | | | | | | | | | | | | |
| | | American International Group 5.6%
due 10/18/2016, receive 0.55% | | | 1,600,000 | | | 12/20/06 | | | — | | | | 671 | | | | 0.0 | % | |
| | | American International Group Convertible,
zero coupon, due 11/9/2031, receive 0.050% | | | 1,600,000 | | | 09/26/06 | | | — | | | | 489 | | | | 0.0 | % | |
| | | Citifinancial, 6.625%, due 6/1/2015, pay 0.145% | | | 400,000 | | | 10/19/06 | | | — | | | | 12 | | | | 0.0 | % | |
| | | CVS Corporation, 5.75%, 8/15/2011, pay 0.235% | | | 2,800,000 | | | 10/19/06 | | | — | | | | 182 | | | | 0.0 | % | |
| | | Dow Jones CDX.NA.IG.5 Index 10-Year
(10-15% Tranche), receive 0.460% | | | 3,300,000 | | | 11/30/06 | | | — | | | | 678 | | | | 0.0 | % | |
| | | Dow Jones CDX.EM.3 Index, receive 2.100% | | | 900,000 | | | 04/15/05 | | | (23,400 | ) | | | 51,067 | | | | 0.0 | % | |
| | | Ford Motor Credit Company 7% due 10/01/2013,
receive 2.680% | | | 500,000 | | | 04/08/05 | | | — | | | | 5,380 | | | | 0.0 | % | |
| | | General Motors Acceptance Corporation 6.875%
due 8/28/2012, receive 3.550% | | | 500,000 | | | 04/07/05 | | | — | | | | 7,602 | | | | 0.0 | % | |
| | | Russian Federation 5% Step due 3/31/2030,
receive 0.610% | | | 400,000 | | | 03/14/05 | | | — | | | | 415 | | | | 0.0 | % | |
| | | Russian Federation 5% Step due 3/31/2030,
receive 0.700% | | | 500,000 | | | 03/15/05 | | | — | | | | 620 | | | | 0.0 | % | |
| | | Russian Federation 2.25% Step due 3/31/2030,
receive 0.770% | | | 200,000 | | | 05/19/05 | | | — | | | | 443 | | | | 0.0 | % | |
| | | Russian Federation 5% Step due 3/31/2030,
receive 0.260% | | | 300,000 | | | 12/14/06 | | | — | | | | 1 | | | | 0.0 | % | |
| | | Russian Federation 5% Step due 3/31/2030,
receive 0.260% | | | 300,000 | | | 12/14/06 | | | — | | | | 1 | | | | 0.0 | % | |
| | | Interest Rate Swaps | |
| | | Receive a fixed rate equal to 14.36% and pay
a floating rate based on the Brazil Cetip Interbank
Deposit Rate Annualized
Counterparty: Merrill Lynch Capital Services, Inc. | | | 2,200,000 | | | 09/22/06 | | | — | | | | 39,294 | | | | 0.0 | % | |
| | | Receive a floating rate based on 6-month
EUR-Euribor and pay a fixed rate equal to 4%
Counterparty: HSBC Bank USA, N.A. | | | 9,200,000 | | | 07/19/06 | | | 206,983 | | | | 114,326 | | | | 0.1 | % | |
| | | Receive a floating rate based on 6-month
EUR-Euribor and pay a fixed rate equal to 4%
Counterparty: Barclays Bank PLC, London | | | 3,400,000 | | | 06/21/06 | | | 62,734 | | | | 42,251 | | | | 0.0 | % | |
| | | Receive a floating rate based on 6-month
EUR-Euribor and pay a fixed rate equal to 4%
Counterparty: Deutsche Bank AG | | | 1,100,000 | | | 07/19/06 | | | 24,748 | | | | 13,669 | | | | 0.0 | % | |
177
NOTES TO FINANCIAL STATEMENTS AS OF DECEMBER 31, 2006 (CONTINUED)
NOTE 11 — ILLIQUID SECURITIES (continued)
| Portfolio | | Security | | Notional
Principal/Par
Value | | Initial
Acquision
Date | | Cost/
(Upfront
Payments) | | Value | | Percent
of Net
Assets | |
Pimco Total
Return
(continued) | | Receive a fixed rate equal to 6% and pay a
floating rate based on 6-month EUR-Euribor
Counterparty: Morgan Stanley Capital Services, Inc. | | | 4,300,000 | | | 07/31/06 | | $ | 644,303 | | | $ | 892,332 | | | | 0.3 | % | |
| | | Receive a floating rate based on 6-month
GBP-LIBOR and pay a fixed rate equal to 4.25%
Counterparty: Goldman Sachs Capital Markets, L.P. | | | 600,000 | | | 06/27/06 | | | 64,307 | | | | 50,003 | | | | 0.0 | % | |
| | | Receive a floating rate based on 6-month
GBP-LIBOR and pay a fixed rate equal to 4%
Counterparty: Goldman Sachs Capital Markets, L.P. | | | 3,000,000 | | | 11/30/06 | | | (53,545 | ) | | | 4,512 | | | | 0.0 | % | |
| | | Receive a floating rate based on 6-month
GBP-LIBOR and pay a fixed rate equal to 4%
Counterparty: Deutsche Bank AG | | | 2,900,000 | | | 03/08/06 | | | 56,150 | | | | 3,402 | | | | 0.0 | % | |
| | | Receive a floating rate based on 6-month
GBP-LIBOR and pay a fixed rate equal to 4%
Counterparty: Barclays Bank PLC, London | | | 1,100,000 | | | 01/11/06 | | | (17,862 | ) | | | 1,291 | | | | 0.0 | % | |
| | | Receive a fixed rate equal to 8.86% and pay a
floating rate based on 28-day MXN-TIIE-BANXICO
Counterparty: Citibank N.A., New York | | | 13,000,000 | | | 09/22/06 | | | — | | | | 83,139 | | | | 0.0 | % | |
| | | Receive a fixed rate equal to 8.17% and pay a
floating rate based on 28-day MXN-TIIE-BANXICO
Counterparty: Citibank N.A., New York | | | 21,600,000 | | | 11/16/06 | | | (2,056 | ) | | | 42,516 | | | | 0.0 | % | |
| | | Receive a fixed rate equal to 8.17% and pay a
floating rate based on 28-day MXN-TIIE-BANXICO
Counterparty: Merrill Lynch Capital Services, Inc. | | | 10,300,000 | | | 11/17/06 | | | (6,235 | ) | | | 20,274 | | | | 0.0 | % | |
| | | Receive a fixed rate equal to 8.72% and pay a
floating rate based on 28-day MXN-TIIE-BANXICO
Counterparty: Merrill Lynch Capital Services, Inc. | | | 9,400,000 | | | 11/15/06 | | | 29,141 | | | | 51,701 | | | | 0.0 | % | |
| | | Receive a fixed rate equal to 8.72% and pay a
floating rate based on 28-day MXN-TIIE-BANXICO
Counterparty: Citibank N.A., New York | | | 22,900,000 | | | 11/09/06 | | | 58,651 | | | | 125,953 | | | | 0.1 | % | |
| | | Receive a floating rate based on 3-month
USD-LIBOR and pay a fixed rate equal to 5%
Counterparty: The Royal Bank of Scotland PLC | | | 18,100,000 | | | 12/05/06 | | | (8,666 | ) | | | 244,125 | | | | 0.1 | % | |
| | | Receive a fixed rate equal to 5% and pay a
floating rate based on 3-month USD-LIBOR
Counterparty: UBS AG, London | | | 49,900,000 | | | 08/02/06 | | | (126,664 | ) | | | 26,257 | | | | 0.0 | % | |
| | | Receive a fixed rate equal to 12.948% and pay a
floating rate based on the Brazil Cetip Interbank
Deposit Rate Annualized
Counterparty: Merrill Lynch Capital Services, Inc. | | | 17,300,000 | | | 12/06/06 | | | 2,286 | | | | 90,283 | | | | 0.0 | % | |
| | | Call Options | |
| | | Call Swaption OTC — Wachovia Bank, N.A.
3 Month USD-LIBOR — Fund Pays Floating
Strike @ 4.73% Exp 2/1/2007 | | | 10,700,000 | | | 02/15/06 | | | 36,648 | | | | 353 | | | | 0.0 | % | |
| | | Call Swaption OTC — The Royal Bank of Scotland PLC
3 Month USD-LIBOR — Fund Pays Floating
Strike @ 5.08% Exp 4/19/2007 | | | 12,000,000 | | | 05/02/06 | | | 40,350 | | | | 35,928 | | | | 0.0 | % | |
| | | Call Swaption OTC — The Royal Bank of Scotland PLC
3 Month USD-LIBOR — Fund Pays Floating
Strike @ 5.25% Exp 6/7/2007 | | | 19,000,000 | | | 06/07/06 | | | 83,600 | | | | 111,473 | | | | 0.0 | % | |
| | | Call Swaption OTC — The Royal Bank of Scotland PLC
3 Month USD-LIBOR — Fund Pays Floating
Strike @ 5.5% Exp 6/29/2007 | | | 26,200,000 | | | 07/05/06 | | | 112,267 | | | | 252,647 | | | | 0.1 | % | |
| | | Call Swaption OTC — The Royal Bank of Scotland PLC
3 Month USD-LIBOR — Fund Pays Floating
Strike @ 4.75% Exp 7/2/2007 | | | 380,200,000 | | | 12/12/06 | | | 650,522 | | | | 281,766 | | | | 0.1 | % | |
| | | Call Swaption OTC — Lehman Brothers
Special Financing Inc. 3 Month
USD-LIBOR — Fund Pays Floating
Strike @ 5.00% Exp 12/20/2007 | | | 16,700,000 | | | 09/20/06 | | | 108,216 | | | | 101,879 | | | | 0.1 | % | |
| | | Call Swaption OTC — Citibank N.A., London
6 Month EUR-EURIBOR — Fund Pays Floating
Strike @ 3.96% Exp 7/2/2007 | | | 36,400,000 | | | 08/03/06 | | | 198,716 | | | | 59,005 | | | | 0.0 | % | |
| | | European Style Call Swaption OTC — The Royal Bank
of Scotland PLC
3 Month USD-LIBOR — Fund Pays Floating
Strike @ 4.85% Exp 3/26/2007 | | | 35,100,000 | | | 10/04/06 | | | 48,965 | | | | 6,461 | | | | 0.0 | % | |
| | | Call Swaption OTC — The Royal Bank of Scotland PLC
3 Month USD-LIBOR — Fund Pays Floating
Strike @ 4.9% Exp 10/25/2007 | | | 11,700,000 | | | 10/25/06 | | | 47,093 | | | | 53,608 | | | | 0.0 | % | |
| | | Call Swaption OTC — Citibank N.A., London
6 Month GBP-LIBOR — Fund Pays Floating
Strike @ 5.00% Exp 6/15/2007 | | | 6,300,000 | | | 09/15/06 | | | 26,301 | | | | 2,775 | | | | 0.0 | % | |
| | | Call Swaption OTC — The Royal Bank of Scotland PLC
6 Month GBP-LIBOR — Fund Pays Floating
Strike @ 5.1835% Exp 9/14/2007 | | | 24,000,000 | | | 11/07/06 | | | 137,206 | | | | 65,596 | | | | 0.0 | % | |
| | | Call Swaption OTC — JPMorgan Chase Bank, N.A.
6 Month GBP-LIBOR — Fund Pays Floating
Strike @ 5.0625% Exp 6/15/2007 | | | 3,500,000 | | | 09/18/06 | | | 15,134 | | | | 2,652 | | | | 0.0 | % | |
| | | Put Option OTC | |
| | | FNMA 6% 30-Year March TBA
Strike @ $91.875 Exp 3/6/2007 | | | 22,000,000 | | | 12/06/06 | | $ | 2,578 | | | $ | 5,456 | | | | 0.0 | % | |
| | | | | | | | | | | | | | | $ | 2,892,488 | | | | 0.9 | % | |
178
NOTES TO FINANCIAL STATEMENTS AS OF DECEMBER 31, 2006 (CONTINUED)
| Portfolio | | Security | | Notional
Principal/Par
Value | | Initial
Acquision
Date | | Cost | | Value | | Percent
of Net
Assets | |
UBS U.S. Small
| |
Cap Growth
| |
| Portfolio | | PetroHawk Energy Corp. | | | 31,915 | | | 05/12/06 | | $ | 366,901 | | | $ | 367,023 | | | | 1.3 | % | |
| | | | | | | | | | | $ | 367,023 | | | | 1.3 | % | |
NOTE 12 — REORGANIZATIONS
On December 16, 2006, Neuberger Berman Partners, as listed below ("Acquiring Portfolio"), acquired the assets and certain liabilities of ING Eagle Asset Capital Appreciation Portfolio, also listed below ("Acquired Portfolio"), in a tax-free reorganization in exchange for shares of the Acquiring Portfolio, pursuant to a plan or reorganization approved by the Acquired Portfolio's shareholders. The number and value of shares issued by the Acquiring Portfolio are presented in Note 10 — Capital Share Transactions. Net assets and unrealized appreciation as of the reorganization date were as follows:
Acquiring
Portfolio | | Acquired
Portfolio | | Total Net Assets of
Acquired Portfolio (000's) | | Total Net Assets of
Acquiring Portfolio (000's) | | Acquired Portfolio
Unrealized
Appreciation (000's) | | Conversion
Ratio | |
| Neuberger | | ING Eagle Asset | | | | | | | |
| |
| Berman | | Capital Appreciation | | | | | | | |
| |
| | | Portfolio | | $ | 178,457 | | | $ | 237,795 | | | $ | 24,622 | | | | 1.60 | | |
The net assets of Neuberger Berman Partners after the acquisition were $416,252,210.
On April 29, 2006, Fundamental Research, as listed below ("Acquiring Portfolio"), acquired the assets and certain liabilities of USLICO Series Fund — The Stock Portfolio, also listed below ("Acquired Portfolio"), in a tax-free reorganization in exchange for shares of the Acquiring Portfolio, pursuant to a plan or reorganization approved by the Acquired Portfolio's shareholders. The number and value of shares issued by the Acquiring Portfolio are presented in Note 10 — Capital Share Transactions. Net assets and unrealized appreciation as of the reorganization date were as follows:
Acquiring
Portfolio | | Acquired
Portfolio | | Total Net Assets of
Acquired Portfolio (000's) | | Total Net Assets of
Acquiring Portfolio (000's) | | Acquired Portfolio
Unrealized
Appreciation (000's) | | Conversion
Ratio | |
| Fundamental | | USLICO Series | | | | | | | |
| |
| Research | | Fund — The Stock | | | | | | | |
| |
| | Portfolio | | $ | 17,723 | | | $ | 59,979 | | | $ | 1,478 | | | | 0.85 | | |
The net assets of Fundamental Research after the acquisition were $77,702,010.
On December 3, 2005, Fundamental Research as listed below ("Acquiring Portfolio"), acquired the assets and certain liabilities of ING VP Disciplined Large Cap Portfolio, also listed below ("Acquired Portfolio"), in a tax-free reorganization in exchange for shares of the Acquiring Portfolio, pursuant to a plan or reorganization approved by the Acquired Portfolio's shareholders. The number and value of shares issued by the Acquiring Portfolio are presented in Note 10 — Capital Share Transactions. Net assets and unrealized appreciation as of the reorganization dates were as follows:
Acquiring
Portfolio
Portfolio | |
Acquired
Portfolio | |
Total Net Assets of
Acquired Portfolio (000's) | |
Total Net Assets of
Acquiring Portfolio (000's) | | Acquired Portfolio
Unrealized
Appreciation (000) | |
Conversion
Ratio | |
| Fundamental | | ING VP Disciplined | | | | | | | | | | | | | | |
| | |
| Research | | LargeCap Portfolio | | $ | 7,325 | | | $ | 34,839 | | | $ | 766 | | | | 0.46 | | |
The Net assets of Fundamental Research after the acquisition were $42,163,829.
NOTE 13 — CONCENTRATION OF RISKS
Non-Diversified (JPMorgan Mid Cap Value and Davis Venture Value). There is additional risk associated with being non-diversified, since the Portfolios are not limited in the proportion of their assets in a single issuer. The investment of a large percentage of a Portfolio's assets in the securities of a small number of issuers may cause that Portfolio's share price to fluctuate more than that of a diversified portfolio.
NOTE 14 — SECURITIES LENDING
Under an agreement with The Bank of New York ("BNY"), the Portfolios can lend their securities to approved brokers, dealers and other financial institutions. Loans are collateralized by cash and U.S. Government securities. The collateral must be in an amount equal to at least 105% of the market value of non-U.S. securities loaned and 102% of the market value of U.S. securities loaned. The cash collateral received is invested in approved investments as defined in the Securities Lending Agreement with BNY (the "Agreement"). The securities purchased with
179
NOTES TO FINANCIAL STATEMENTS AS OF DECEMBER 31, 2006 (CONTINUED)
NOTE 14 — SECURITIES LENDING (continued)
cash collateral received are reflected in the Portfolio of Investments. Generally, in the event of counterparty default, the Portfolios have the right to use the collateral to offset losses incurred. The Agreement contains certain guarantees by BNY in the event of counterparty default and/or a borrower's failure to return a loaned security, however there would be a potential loss to the Portfolios in the event the Portfolios are delayed or prevented from exercising their right to dispose of the collateral. The Portfolios bear the risk of loss with respect to the investment of collateral. Engaging in securities lending could have a leveraging effect, which may intensify the credit, market and other risks associated with investing in a Portfolio. At December 31, 2006, the following Portfolios had securities on loan with the following market values:
| Portfolio | | Value of
Securities
Loaned | | Value of
Collateral | |
American Century Large
Company Value | | $ | 24,777,215 | | | $ | 25,694,832 | | |
| American Century Select | | | 63,353,437 | | | | 65,554,520 | | |
| American Century Small-Mid Cap Value | | | 20,486,880 | | | | 21,258,300 | | |
| Goldman Sachs® Capital Growth | | | 9,612,582 | | | | 9,906,586 | | |
| Goldman Sachs® Structured Equity | | | 9,198,815 | | | | 9,556,070 | | |
| JPMorgan International | | | 51,236,416 | | | | 53,604,926 | | |
| JPMorgan Mid Cap Value | | | 47,768,546 | | | | 49,306,597 | | |
Legg Mason Partners Aggressive
Growth | | | 239,393,951 | | | | 248,826,363 | | |
| OpCap Balanced Value | | | 20,946,203 | | | | 21,545,723 | | |
| Oppenheimer Global | | | 237,900,334 | | | | 249,224,950 | | |
| Oppenheimer Strategic Income | | | 69,149,628 | | | | 71,242,896 | | |
| PIMCO Total Return | | | 3,763,173 | | | | 3,842,658 | | |
T. Rowe Price Diversified
Mid Cap Growth | | | 300,472,103 | | | | 309,512,716 | | |
| T. Rowe Price Growth Equity | | | 242,907,836 | | | | 250,015,114 | | |
| Thornburg Value | | | 39,336,030 | | | | 40,882,194 | | |
| UBS U.S. Large Cap Equity | | | 66,757,959 | | | | 69,037,649 | | |
| Van Kampen Comstock | | | 94,590,206 | | | | 97,842,059 | | |
NOTE 15 — REVERSE REPURCHASE AGREEMENT
During the year ended December 31, 2006, Lord Abbett U.S. Government Securities entered into reverse repurchase agreements that had an average daily balance outstanding of $1,740,112 with an average interest rate of 4.903% and paid interest of $5,925. At December 31, 2006, At December 31, 2006, the reverse repurchase outstanding for the Portfolio was as follows:
Repurchase
Amount | | Counterparty | | Interest
Rate | | Maturity
Date | |
| $ | 1,825,369 | | | Morgan Stanley | | | 4.70 | % | | | 1/31/2007 | | |
NOTE 16 — FEDERAL INCOME TAXES AND OTHER TAX MATTERS
The amount of distributions from net investment income and net realized capital gains are determined in accordance with federal income tax regulations, which may differ from U.S. generally accepted accounting principles for investment companies. These book/tax differences may be either temporary or permanent. Permanent differences are reclassified within the capital accounts based on their federal tax-basis treatment; temporary differences are not reclassified. Key differences include the treatment of short-term capital gains, foreign currency transactions, and wash sale deferrals. Distributions in excess of net investment income and/or net realized capital gains for tax purposes are reported as distributions of paid-in capital.
The following permanent tax differences have been reclassified as of December 31, 2006:
| | | Paid-in
Capital | | Undistributed
Net
Investment
Income | | Accumulated
Net Realized
Gains/
(Losses) | |
| American Century Select | | $ | — | | | $ | (1,117,258 | ) | | $ | 1,117,258 | | |
American Century
Small-Mid Cap | | | — | | | | (99,708 | ) | | | 99,708 | | |
| Baron Asset | | | (18,814 | ) | | | 17,416 | | | | 1,398 | | |
| Baron Small Cap Growth | | | (1,380,265 | ) | | | 1,378,652 | | | | 1,613 | | |
Columbia Small Cap
Value II | | | (19,550 | ) | | | (541 | ) | | | 20,091 | | |
| Davis Venture Value | | | — | | | | (34,053 | ) | | | 34,053 | | |
| Fundamental Research | | | (9,681,656 | ) | | | — | | | | 9,681,656 | | |
Goldman Sachs® Capital
Growth | | | — | | | | 141,356 | | | | (141,356 | ) | |
Goldman Sachs®
Structured Equity | | | 2,183,695 | | | | (7,478 | ) | | | (2,176,217 | ) | |
| JPMorgan International | | | — | | | | 1,969,130 | | | | (1,969,130 | ) | |
| JPMorgan MidCap Value | | | — | | | | (112,189 | ) | | | 112,189 | | |
Legg Mason Partners
Aggressive Growth | | | (1,680,845 | ) | | | 1,680,845 | | | | — | | |
Legg Mason Partners
Large Cap Growth | | | (83,606 | ) | | | 83,606 | | | | — | | |
Lord Abbett U.S.
Government Securities | | | (43,937 | ) | | | 48,927 | | | | (4,990 | ) | |
| Neuberger Berman Partners | | | 244,172 | | | | 30,568 | | | | (274,740 | ) | |
| Neuberger Berman Regency | | | (2,103 | ) | | | (1,128 | ) | | | 3,231 | | |
| Oppenheimer Global | | | — | | | | 5,075,947 | | | | (5,075,947 | ) | |
Oppenheimer Strategic
Income | | | — | | | | (3,857,781 | ) | | | 3,857,781 | | |
| PIMCO Total Return | | | — | | | | 2,002,810 | | | | (2,002,810 | ) | |
| Pioneer High Yield | | | (76,158 | ) | | | 61,132 | | | | 15,026 | | |
T. Rowe Price Growth
Equity | | | — | | | | (262,207 | ) | | | 262,207 | | |
| Templeton Foreign Equity | | | (3,311 | ) | | | (13,502 | ) | | | 16,813 | | |
| Thornburg Value | | | — | | | | (27,357 | ) | | | 27,357 | | |
| UBS U.S. Small Cap Growth | | | (653 | ) | | | 44,546 | | | | (43,893 | ) | |
Van Kampen Equity and
Income | | | — | | | | (11,623 | ) | | | 11,623 | | |
180
NOTES TO FINANCIAL STATEMENTS AS OF DECEMBER 31, 2006 (CONTINUED)
NOTE 16 — FEDERAL INCOME TAXES AND OTHER TAX MATTERS (continued)
Dividends paid by the Portfolios from net investment income and distributions of net realized short-term capital gains are, for federal income tax purposes, taxable as ordinary income to shareholders.
The tax composition of dividends and distributions to shareholders was as follows:
| | | Year Ended
December 31, 2006 | | Year Ended
December 31, 2005 | |
| | | Ordinary
Income | | Long-Term
Capital Gains | | Ordinary
Income | | Long-Term
Capital Gains | |
| American Century Large Company Value | | $ | 1,442,728 | | | $ | 5,001,000 | | | $ | 769,475 | | | $ | — | | |
| American Century Select | | | 4,432,031 | | | | — | | | | — | | | | — | | |
| American Century Small-Mid Cap | | | 240,929 | | | | 129,233 | | | | 8,405,035 | | | | 2,731,901 | | |
| Baron Small Cap Growth | | | — | | | | 3,909,366 | | | | — | | | | — | | |
| Davis Venture Value | | | 8,611 | | | | 8,145,412 | | | | 12,919 | | | | — | | |
| Fundamental Research | | | 970,069 | | | | 834,515 | | | | 416,890 | | | | — | | |
| Goldman Sachs® Capital Growth | | | — | | | | — | | | | 235,893 | | | | — | | |
| Goldman Sachs® Structured Equity | | | 2,649,561 | | | | 5,748,654 | | | | 4,563,634 | | | | 7,690,537 | | |
| JPMorgan International | | | 8,268,330 | | | | — | | | | 5,596,809 | | | | — | | |
| JPMorgan MidCap Value | | | 32,332 | | | | 1,419,959 | | | | 5,769,366 | | | | 6,778,644 | | |
| Legg Mason Partners Large Cap Growth | | | 751,416 | | | | 46,086 | | | | 3,143,124 | | | | 3,131,689 | | |
| Lord Abbett U.S. Government Securities | | | 2,118,999 | | | | — | | | | — | | | | — | | |
| Neuberger Berman Regency | | | 74,796 | | | | 4,335 | | | | — | | | | — | | |
| OpCap Balanced Value | | | 846,794 | | | | — | | | | 556,685 | | | | — | | |
| Oppenheimer Global | | | 1,762,925 | | | | 3,772,651 | | | | 56,677,221 | | | | 3,498,723 | | |
| Oppenheimer Strategic Income | | | 1,475,398 | | | | — | | | | 8,152,928 | | | | — | | |
| PIMCO Total Return | | | 6,393,248 | | | | — | | | | 5,368,461 | | | | 1,395,048 | | |
| Pioneer High Yield | | | 4,983,683 | | | | 13,591 | | | | — | | | | — | | |
| T. Rowe Price Diversified Mid Cap Growth | | | 23,217,817 | | | | 2,313,848 | | | | 11,971,399 | | | | 7,603,115 | | |
| T. Rowe Price Growth Equity | | | 2,793,872 | | | | 2,121,134 | | | | 4,703,022 | | | | — | | |
| Templeton Foreign Equity | | | 503,330 | | | | — | | | | — | | | | — | | |
| Thornburg Value | | | 883,174 | | | | — | | | | 1,680,604 | | | | — | | |
| UBS U.S. Large Cap Equity | | | 2,429,180 | | | | — | | | | 2,354,540 | | | | — | | |
| UBS U.S. Small Cap Growth | | | 233,673 | | | | — | | | | — | | | | — | | |
| Van Kampen Comstock | | | 19,664,407 | | | | 29,268,151 | | | | 8,250,085 | | | | 15,653,585 | | |
| Van Kampen Equity and Income | | | 52,527,804 | | | | — | | | | 1,595,480 | | | | 320,987 | | |
The tax-basis components of distributable earnings and the expiration dates of the capital loss carryforwards which may be used to offset future realized capital gains for federal income tax purposes as of December 31, 2006 were:
| | | Undistributed
Ordinary
Income | | Undistributed
Long Term
Capital Gains | | Unrealized
Appreciation/
(Depreciation) | | Post-October
Capital
Losses
Deferred | | Post-October
Currency
Losses
Deferred | | Capital
Loss
Carryforwards | | Expiration
Dates | |
American Century Large
Company Value | | $ | 2,654,374 | | | $ | 6,876,874 | | | $ | 13,397,867 | | | $ | — | | | $ | — | | | $ | — | | | | — | | |
| American Century Select | | | 1,901,425 | | | | — | | | | 26,431,046 | | | | — | | | | — | | | | (1,748,688 | ) | | | 2010 | | |
| | | | | | | | | | | | | | | | | | | | | | | | (16,757,708 | ) | | | 2014 | | |
| | | | | | | | | | | | | | | | | | | | | | | $ | (18,506,396 | ) | | | | | |
| American Century Small-Mid Cap | | | 9,399,267 | | | | 4,373,141 | | | | 4,185,621 | | | | — | | | | (7,908 | ) | | | — | | | | — | | |
| Baron Asset | | | — | | | | — | | | | 1,129,384 | | | | (183 | ) | | | — | | | | (218,154 | ) | | | 2014 | | |
| Baron Small Cap Growth | | | — | | | | — | | | | 111,036,219 | | | | — | | | | — | | | | (1,497,637 | ) | | | 2014 | | |
| Columbia Small Cap Value II | | | 168,887 | | | | — | | | | 5,118,636 | | | | — | | | | — | | | | (745,669 | ) | | | 2014 | | |
| Davis Venture Value | | | 1,726,719 | | | | 89,859 | | | | 19,660,459 | | | | — | | | | — | | | | — | | | | — | | |
| Fundamental Research | | | 2,063,759 | | | | 1,100,251 | | | | 6,209,412 | | | | — | | | | — | | | | (2,140,134 | ) | | | 2008 | | |
| | | | | | | | | | | | | | | | | | | | | | | | (1,063,078 | ) | | | 2009 | | |
| | | | | | | | | | | | | | | | | | | | | | | | (322,313 | ) | | | 2010 | | |
| | | | | | | | | | | | | | | | | | | | | | | $ | (3,525,525 | ) | | | | | |
| Goldman Sachs® Capital Growth | | | 57,790 | | | | — | | | | 3,894,446 | | | | — | | | | — | | | | (3,419,687 | ) | | | 2010 | | |
| | | | | | | | | | | | | | | | | | | | | | | | (4,114,134 | ) | | | 2011 | | |
| | | | | | | | | | | | | | | | | | | | | | | | (2,145,265 | ) | | | 2012 | | |
| | | | | | | | | | | | | | | | | | | | | | | $ | (9,679,086 | ) | | | | | |
| Goldman Sachs® Structured Equity | | | 2,690,847 | | | | 5,122,964 | | | | 6,020,131 | | | | — | | | | — | | | | — | | | | — | | |
| JPMorgan International | | | 14,128,261 | | | | — | | | | 315,011,571 | | | | — | | | | — | | | | (8,746,321 | ) | | | 2009 | | |
| | | | | | | | | | | | | | | | | | | | | | | | (70,771,343 | ) | | | 2010 | | |
| | | | | | | | | | | | | | | | | | | | | | | $ | (79,517,664 | ) | | | | | |
181
NOTES TO FINANCIAL STATEMENTS AS OF DECEMBER 31, 2006 (CONTINUED)
NOTE 16 — FEDERAL INCOME TAXES AND OTHER TAX MATTERS (continued)
| | | Undistributed
Ordinary
Income | | Undistributed
Long Term
Capital Gains | | Unrealized
Appreciation/
(Depreciation) | | Post-October
Capital
Losses
Deferred | | Post-October
Currency
Losses
Deferred | | Capital
Loss
Carryforwards | | Expiration
Dates | |
| JPMorgan MidCap Value | | $ | 4,091,938 | | | $ | 10,561,808 | | | $ | 28,965,164 | | | $ | — | | | $ | — | | | $ | — | | | | — | | |
Legg Mason Partners
Aggressive Growth | | | — | | | | — | | | | 359,778,822 | | | | — | | | | — | | | | (237,859,439 | ) | | | 2010 | | |
Legg Mason Partners
Large Cap Growth | | | — | | | | 515,637 | | | | 5,570,339 | | | | — | | | | — | | | | — | | | | — | | |
Lord Abbett U.S.
Government Securities | | | — | | | | — | | | | 373,401 | | | | — | | | | — | | | | (263,112 | ) | | | 2014 | | |
| Neuberger Berman Partners | | | 3,735,119 | | | | 17,333,506 | | | | 18,896,917 | | | | — | | | | (2,515 | ) | | | — | | | | — | | |
| Neuberger Berman Regency | | | 32,091 | | | | 1,085 | | | | 737,783 | | | | — | | | | — | | | | — | | | | — | | |
| OpCap Balanced Value | | | 2,111,568 | | | | 7,271,057 | | | | 6,258,871 | | | | — | | | | — | | | | — | | | | — | | |
| Oppenheimer Global | | | 53,582,617 | | | | 86,867,057 | | | | 600,700,264 | | | | — | | | | — | | | | — | | | | — | | |
| Oppenheimer Strategic Income | | | 20,460,903 | | | | — | | | | 8,501,644 | | | | — | | | | — | | | | (711,170 | ) | | | 2013 | | |
| PIMCO Total Return | | | 14,035,171 | | | | — | | | | 324,567 | | | | — | | | | — | | | | (1,828,225 | ) | | | 2013 | | |
| | | | | | | | | | | | | | | | | | | | | | | | (1,713,823 | ) | | | 2014 | | |
| | | | | | | | | | | | | | | | | | | | | | | $ | (3,542,048 | ) | | | — | | |
| Pioneer High Yield | | | — | | | | — | | | | 2,568,320 | | | | — | | | | — | | | | — | | | | — | | |
T. Rowe Price Diversified
Mid Cap Growth | | | 19,199,095 | | | | 78,160,440 | | | | 141,735,276 | | | | — | | | | — | | | | — | | | | — | | |
| T. Rowe Price Growth Equity | | | 18,401,380 | | | | 59,098,234 | | | | 228,534,316 | | | | — | | | | — | | | | — | | | | — | | |
| Templeton Foreign Equity | | | 23,598 | | | | — | | | | 5,670,567 | | | | — | | | | — | | | | — | | | | — | | |
| Thornburg Value | | | 926,863 | | | | — | | | | 22,115,513 | | | | — | | | | — | | | | (56,380,893 | ) | | | 2009 | | |
| | | | | | | | | | | | | | | | | | | | | | | | (113,367,765 | ) | | | 2010 | | |
| | | | | | | | | | | | | | | | | | | | | | | $ | (169,748,658 | ) | | | | | |
| UBS U.S. Large Cap Equity | | | 3,083,237 | | | | — | | | | 54,326,627 | | | | — | | | | — | | | | (70,855,496 | ) | | | 2010 | | |
| UBS U.S. Small Cap Growth | | | 244,197 | | | | — | | | | 355,959 | | | | — | | | | — | | | | — | | | | — | | |
| Van Kampen Comstock | | | 17,869,003 | | | | 26,161,222 | | | | 111,337,538 | | | | — | | | | — | | | | — | | | | — | | |
| Van Kampen Equity and Income | | | 32,038,608 | | | | 19,564,855 | | | | 112,381,900 | | | | — | | | | — | | | | — | | | | — | | |
Under U.S. federal income tax law, as specified in the Internal Revenue Code (the "Code") and U.S. Treasury regulations, the Portfolios must meet various technical requirements relating to fund administration, portfolio investments, and "eligible investors" in the Portfolios. Complying with these requirements is a condition for beneficial tax treatment of certain insurance products that offer the Portfolios as investment options. The failure of the Portfolios to meet any of these complex requirements could result in an excise tax, administrative penalties imposed by the Internal Revenue Service, potential liability to insurers whose products include the Portfolios as investment options, and unanticipated costs associated with remedying a failure. We are aware that an affiliate of the Portfolios' investment adviser may have failed to limit the availability of American Century Large Company Value, American Century Small-Mid Cap Value, Baron Sm all Cap Growth, Davis Venture Value, JPMorgan MidCap Value, Legg Mason Partners Aggressive Growth, Oppenheimer Strategic Income, PIMCO Total Return, T. Rowe Price Growth Equity, UBS U.S. Large Cap Equity, UBS U.S. Small Cap Growth and Van Kampen Comstock for investment to "eligible investors" under the Code. The legal and tax consequences, if any, of this are currently under active review, but we do not believe that it is probable that any liability has been incurred by the Portfolios. Although it is not probable that any liability has been incurred, ING has agreed to indemnify any affected Portfolio from and against economic consequences of any such failure incurred either (i) directly or (ii) by virtue of any indemnification by the Portfolios resulting from such failure.
NOTE 17 — SUBSEQUENT EVENTS
On January 11, 2007, the Board approved a proposal to reorganize American Century Select into ING BlackRock Large Cap Growth Portfolio. If shareholder approval is obtained, it is expected that the reorganization will take place on or about April 28, 2007.
Subsequent to December 31, 2006, the following Portfolios declared the following dividends and distributions:
| Type | | Per Share
Amount | | Payable Date | | Record Date | |
| Pioneer High Yield | |
| Class ADV NII | | $ | 0.0460 | | | February 1, 2007 | | Daily | |
| Class I NII | | $ | 0.0504 | | | February 1, 2007 | | Daily | |
| Class S NII | | $ | 0.0482 | | | February 1, 2007 | | Daily | |
| Goldman Sachs Capital Growth | |
| Class ADV NII | | $ | 0.1184 | | | January 12, 2007 | | January 9, 2007 | |
| Class I NII | | $ | 0.1907 | | | January 12, 2007 | | January 9, 2007 | |
| Class S NII | | $ | 0.1499 | | | January 12, 2007 | | January 9, 2007 | |
| Goldman Sachs Structured Equity | |
| Class ADV NII | | $ | 0.1525 | | | January 12, 2007 | | January 9, 2007 | |
| Class I NII | | $ | 0.2098 | | | January 12, 2007 | | January 9, 2007 | |
| Class S NII | | $ | 0.0741 | | | January 12, 2007 | | January 9, 2007 | |
| All Classes STCG | | $ | 0.5676 | | | January 12, 2007 | | January 9, 2007 | |
| All Classes LTCG | | $ | 1.5888 | | | January 12, 2007 | | January 9, 2007 | |
NII - Net investment income
STCG - Short-term capital gain
LTCG - Long-term capital gain
182
NOTES TO FINANCIAL STATEMENTS AS OF DECEMBER 31, 2006 (CONTINUED)
NOTE 18 — OTHER ACCOUNTING PRONOUNCEMENTS
In June 2006, the Financial Accounting Standards Board ("FASB") issued FASB Interpretation No. 48 ("FIN 48"), "Accounting for Uncertainty in Income Taxes." This standard defines the threshold for recognizing the benefits of tax-return positions in the financial statements as "more-likely-than-not" to be sustained upon challenge by the taxing authority and requires measurement of a tax position meeting the more-likely-than-not criterion, based on the largest benefit that is more than 50 percent likely to be realized. FIN 48 is effective for fiscal years beginning after December 15, 2006, with early application permitted if no interim financial statements have been issued. However, acknowledging the unique issues that FIN 48 presents for investment companies that calculate NAVs, the Securities and Exchange Commission (the "SEC") has indicated that they would not object if a fund implements FIN 48 in its NAV calculation as late as its last NAV calculation in the first required financial statement reporting period for its fiscal year beginning after December 15, 2006. For calendar-year open-end funds, this would be no later than their June 29, 2007 NAV and the effects of FIN 48 would be reflected in the funds' semi-annual financial statements contained in their Form N-CSR filing. At adoption, companies must adjust their financial statements to reflect only those tax positions that are more likely-than-not to be sustained as of the adoption date. Management is currently analyzing the tax positions of the Portfolios. To date, this analysis reflects an uncertain tax position in American Century Large Company Value, American Century Small-Mid Cap Value, Baron Small Cap Growth, Davis Venture Value, JPMorgan MidCap Value, Legg Mason Partners Aggressive Growth, Oppenheimer Strategic Income, PIMCO Total Return, T. Rowe Price Growth Equity, UBS U.S. Large Cap Equity, UBS U.S. Small Cap Growth and Van Kampen Comstock that has the potential to result in a lia bility upon adoption of FIN 48. Management of the Portfolios is presently determining whether the tax benefits recorded by these Portfolios are more likely-than-not to be sustained if challenged by taxing authorities. To the extent that, in Management's judgment, the more likely-than-not threshold cannot be achieved, ING has agreed to indemnify the Portfolios and will bear any taxes and other costs related to this position that may occur. As a result, in Management's opinion, the adoption of FIN 48 is not expected to have a material impact on the financial statements of the Portfolios.
On September 15, 2006, the FASB issued Statement of Financial Accounting Standards No. 157 ("SFAS No. 157"), "Fair Value Measurements". The new accounting statement defines fair value, establishes a framework for measuring fair value in generally accepted accounting principles ("GAAP"), and expands disclosures about fair value measurements. SFAS No. 157 defines fair value as the price that would be received to sell an asset or paid to transfer a liability in an orderly transaction between market participants at the measurement date (an exit price). SFAS No. 157 also stipulates that, as a market-based measurement, fair value measurement should be determined based on the assumptions that market participants would use in pricing the asset or liability, and establishes a fair value hierarchy that distinguishes between (a) market participant assumptions developed based on market data obtained from sources independent of the reporting entity (observable inputs) and (b) the reporting entity's own assumptions about market participant assumptions developed based on the best information available in the circumstances (unobservable inputs). SFAS No. 157 is effective for financial statements issued for fiscal years beginning after November 15, 2007. As of December 31, 2006, management of the Portfolios is currently assessing the impact, if any, that will result from adopting SFAS No. 157.
NOTE 19 — INFORMATION REGARDING TRADING OF ING'S U.S. MUTUAL FUNDS
In 2004, DSL (formerly known as, ILIAC) reported to the Boards of Directors/Trustees (the "Boards") of the ING Funds that, like many U.S. financial services companies, DSL and certain of its U.S. affiliates have received informal and formal requests for information since September 2003 from various governmental and self-regulatory agencies in connection with investigations related to mutual funds and variable insurance products. DSL has advised the Boards that it and its affiliates have cooperated fully with each request.
In addition to responding to regulatory and governmental requests, DSL reported that management of U.S. affiliates of ING Groep, including DSL (collectively, "ING"), on their own initiative, have conducted, through independent special counsel and a national accounting firm, an extensive internal review of trading in ING insurance, retirement, and mutual fund products. The goal of this review was to identify any instances of inappropriate trading in those products by third parties or by ING investment professionals and other ING personnel. ING's internal review related to mutual fund trading is now substantially completed. ING has reported that, of the millions of customer relationships that ING maintains, the internal review identified several isolated
183
NOTES TO FINANCIAL STATEMENTS AS OF DECEMBER 31, 2006 (CONTINUED)
NOTE 19 — INFORMATION REGARDING TRADING OF ING'S U.S. MUTUAL FUNDS (continued)
arrangements allowing third parties to engage in frequent trading of mutual funds within ING's variable insurance and mutual fund products, and identified other circumstances where frequent trading occurred, despite measures taken by ING intended to combat market timing. ING further reported that each of these arrangements has been terminated and fully disclosed to regulators. The results of the internal review were also reported to the independent members of the Board.
DSL has advised the Boards that most of the identified arrangements were initiated prior to ING's acquisition of the businesses in question in the U.S. DSL further reported that the companies in question did not receive special benefits in return for any of these arrangements, which have all been terminated.
Based on the internal review, DSL has advised the Boards that the identified arrangements do not represent a systemic problem in any of the companies that were involved.
In September 2005, ING Funds Distributor, LLC ("IFD"), the distributor of certain ING Funds, settled an administrative proceeding with the NASD regarding three arrangements, dating from 1995, 1996 and 1998, under which the administrator to the then-Pilgrim Funds, which subsequently became part of the ING Funds, entered into formal and informal arrangements that permitted frequent trading. Under the terms of the Letter of Acceptance, Waiver and Consent ("AWC") with the NASD, under which IFD neither admitted nor denied the allegations or findings, IFD consented to the following sanctions: (i) a censure; (ii) a fine of $1.5 million; (iii) restitution of approximately $1.44 million to certain ING Funds for losses attributable to excessive trading described in the AWC; and (iv) agreement to make certification to NASD regarding the review and establishment of certain procedures.
In addition to the arrangements discussed above, in 2004, DSL reported to the Boards that, at that time, these instances include the following, in addition to the arrangements subject to the AWC discussed above:
• Aeltus Investment Management, Inc. (a predecessor entity to ING Investment Management Co.) identified two investment professionals who engaged in extensive frequent trading in certain ING Funds. One was subsequently terminated for cause and incurred substantial financial penalties in connection with this conduct and the second has been disciplined.
• ReliaStar Life Insurance Company ("ReliaStar") entered into agreements seven years ago permitting the owner of policies issued by the insurer to engage in frequent trading and to submit orders until 4pm Central Time. In 2001 ReliaStar also entered into a selling agreement with a broker-dealer that engaged in frequent trading. Employees of ING affiliates were terminated and/or disciplined in connection with these matters.
• In 1998, Golden American Life Insurance Company entered into arrangements permitting a broker-dealer to frequently trade up to certain specific limits in a fund available in an ING variable annuity product. No employee responsible for this arrangement remains at the company.
For additional information regarding these matters and the AWC, you may consult the Form 8-K and Form 8-K/A for each of four life insurance companies, ING USA Annuity and Life Insurance Company, ING Life Insurance and Annuity Company, ING Insurance Company of America, and ReliaStar Life Insurance Company of New York, each filed with the SEC on October 29, 2004 and September 8, 2004. These Forms 8-K and Forms 8-K/A can be accessed through the SEC's Web site at http://www.sec.gov. Despite the extensive internal review conducted through independent special counsel and a national accounting firm, there can be no assurance that the instances of inappropriate trading reported to the Boards are the only instances of such trading respecting the ING Funds.
DSL reported to the Boards that ING is committed to conducting its business with the highest standards of ethical conduct with zero tolerance for noncompliance. Accordingly, DSL advised the Boards that ING management was disappointed that its voluntary internal review identified these situations. Viewed in the context of the breadth and magnitude of its U.S. business as a whole, ING management does not believe that ING's acquired companies had systemic ethical or compliance issues in these areas. Nonetheless, DSL reported that given ING's refusal to tolerate any lapses, it has taken the steps noted below, and will continue to seek opportunities to further strengthen the internal controls of its affiliates.
• ING has agreed with the ING Funds to indemnify and hold harmless the ING Funds from all damages resulting from wrongful conduct by ING or its employees or from ING's internal investigation, any investigations conducted by any governmental or self-regulatory agencies, litigation or other formal proceedings, including any proceedings by the Securities and Exchange
184
NOTES TO FINANCIAL STATEMENTS AS OF DECEMBER 31, 2006 (CONTINUED)
NOTE 19 — INFORMATION REGARDING TRADING OF ING'S U.S. MUTUAL FUNDS (continued)
Commission. DSL reported to the Boards that ING management believes that the total amount of any indemnification obligations will not be material to ING or its U.S. business.
• ING updated its Code of Conduct for employees reinforcing its employees' obligation to conduct personal trading activity consistent with the law, disclosed limits, and other requirements.
• The ING Funds, upon a recommendation from ING, updated their respective Codes of Ethics applicable to investment professionals with ING entities and certain other fund personnel, requiring such personnel to pre-clear any purchases or sales of ING Funds that are not systematic in nature (i.e., dividend reinvestment), and imposing minimum holding periods for shares of ING Funds.
• ING instituted excessive trading policies for all customers in its variable insurance and retirement products and for shareholders of the ING Funds sold to the public through financial intermediaries. ING does not make exceptions to these policies.
• ING reorganized and expanded its U.S. Compliance Department, and created an Enterprise Compliance team to enhance controls and consistency in regulatory compliance.
Other Regulatory Matters
The New York Attorney General (the "NYAG") and other federal and state regulators are also conducting broad inquiries and investigations involving the insurance industry. These initiatives currently focus on, among other things, compensation and other sales incentives; potential conflicts of interest; potential anti-competitive activity; reinsurance; marketing practices (including suitability); specific product types (including group annuities and indexed annuities); fund selection for investment products and brokerage sales; and disclosure. It is likely that the scope of these industry investigations will further broaden before they conclude. ING has received formal and informal requests in connection with such investigations, and is cooperating fully with each request. In connection with one such investigation, affiliates of ING Investments were named in a petition for relief and cease and desist order filed by the New Hampshire Bureau of Securities Regulation (the "NH Bureau") concerning their administration of the New Hampshire state employees deferred compensation plan.
On October 10, 2006, an affiliate of DSL entered into an assurance of discontinuance with the NYAG (the "NYAG Agreement") regarding the endorsement of its products by the New York State United Teachers Union Member Benefits Trust ("NYSUT") and the sale of their products to NYSUT members. Under the terms of the NYAG Agreement, the affiliate of ING Investments, without admitting or denying the NYAG's findings, will distribute $30 million to NYSUT members, and/or former NYSUT members, who participated in the NYSUT-endorsed products at any point between January 1, 2001 and June 30, 2006. The affiliate also agreed with the NYAG's office to develop a one-page disclosure that will further improve transparency and disclosure regarding retirement product fees (the "One-Page Disclosure"). Pursuant to the terms of the NYAG Agreement, the affiliate has agreed for a five year period to provide its retirement product customers with the One-Page Disclosure .
In addition, on the same date, these affiliates of DSL entered into a consent agreement with the NH Bureau (the "NH Agreement") to resolve this petition for relief and cease and desist order. Under the terms of the NH Agreement, these affiliates of ING Investments, without admitting or denying the NH Bureau's claims, have agreed to pay $3 million to resolve the matter, and for a five year period to provide their retirement product customers with the One-Page Disclosure described above.
Other federal and state regulators could initiate similar actions in this or other areas of ING's businesses.
These regulatory initiatives may result in new legislation and regulation that could significantly affect the financial services industry, including businesses in which ING is engaged.
In light of these and other developments, ING continuously reviews whether modifications to its business practices are appropriate.
At this time, in light of the current regulatory factors, ING U.S. is actively engaged in reviewing whether any modifications in our practices are appropriate for the future.
There can be no assurance that these matters, or the adverse publicity associated with them, will not result in increased fund redemptions, reduced sale of fund shares, or other adverse consequences to ING Funds.
185
ING AMERICAN CENTURY PORTFOLIO OF INVESTMENTS
LARGE COMPANY VALUE PORTFOLIO AS OF DECEMBER 31, 2006
| Shares | | | | | | Value | |
| COMMON STOCK: 95.2% | | | |
| | | | | Aerospace/Defense: 0.8% | |
| | 14,200 | | | | | Northrop Grumman Corp. | | $ | 961,340 | | |
| | | | 961,340 | | |
| | | | | Agriculture: 1.4% | |
| | 19,100 | | | | | Altria Group, Inc. | | | 1,639,162 | | |
| | | | 1,639,162 | | |
| | | | | Apparel: 1.4% | |
| | 18,400 | | | L | | Liz Claiborne, Inc. | | | 799,664 | | |
| | 9,500 | | | L | | VF Corp. | | | 779,760 | | |
| | | | 1,579,424 | | |
| | | | | Banks: 12.1% | |
| | 83,500 | | | | | Bank of America Corp. | | | 4,458,065 | | |
| | 29,000 | | | | | Bank of New York Co., Inc. | | | 1,141,730 | | |
| | 20,000 | | | L | | National City Corp. | | | 731,200 | | |
| | 10,600 | | | | | PNC Financial Services Group, Inc. | | | 784,824 | | |
| | 47,600 | | | | | US Bancorp. | | | 1,722,644 | | |
| | 36,300 | | | L | | Wachovia Corp. | | | 2,067,285 | | |
| | 88,800 | | | | | Wells Fargo & Co. | | | 3,157,728 | | |
| | | | 14,063,476 | | |
| | | | | Beverages: 1.9% | |
| | 27,200 | | | | | Coca-Cola Co. | | | 1,312,400 | | |
| | 28,100 | | | L | | Pepsi Bottling Group, Inc. | | | 868,571 | | |
| | | | 2,180,971 | | |
| | | | | Chemicals: 2.0% | |
| | 22,100 | | | L | | EI DuPont de Nemours & Co. | | | 1,076,491 | | |
| | 18,800 | | | L | | PPG Industries, Inc. | | | 1,207,148 | | |
| | | | 2,283,639 | | |
| | | | | Commercial Services: 1.2% | |
| | 26,300 | | | L | | H&R Block, Inc. | | | 605,952 | | |
| | 21,000 | | | | | RR Donnelley & Sons Co. | | | 746,340 | | |
| | | | 1,352,292 | | |
| | | | | Computers: 2.6% | |
| | 39,600 | | | | | Hewlett-Packard Co. | | | 1,631,124 | | |
| | 14,900 | | | | | International Business
Machines Corp. | | | 1,447,535 | | |
| | | | 3,078,659 | | |
| | | | | Diversified Financial Services: 11.4% | |
| | 100,000 | | | | | Citigroup, Inc. | | | 5,570,000 | | |
| | 46,900 | | | | | Freddie Mac | | | 3,184,510 | | |
| | 23,600 | | | | | Merrill Lynch & Co., Inc. | | | 2,197,160 | | |
| | 27,100 | | | | | Morgan Stanley | | | 2,206,753 | | |
| | | | 13,158,423 | | |
| | | | | Electric: 2.6% | |
| | 27,000 | | | | | Exelon Corp. | | | 1,671,030 | | |
| | 38,300 | | | L | | PPL Corp. | | | 1,372,672 | | |
| | | | 3,043,702 | | |
| | | | | Environmental Control: 0.5% | |
| | 16,500 | | | | | Waste Management, Inc. | | | 606,705 | | |
| | | | 606,705 | | |
| | | | | Exchange Traded Fund: 1.2% | |
| | 9,500 | | | L | | SPDR Trust Series 1 | | | 1,346,055 | | |
| | | | 1,346,055 | | |
| Shares | | | | | | Value | |
| | | | | Food: 2.2% | |
| $ | 52,400 | | | L | | Kroger Co. | | $ | 1,208,868 | | |
| | 47,400 | | | @@ | | Unilever NV ADR | | | 1,291,650 | | |
| | | | 2,500,518 | | |
| | | | | Forest Products & Paper: 1.2% | |
| | 20,200 | | | L | | Weyerhaeuser Co. | | | 1,427,130 | | |
| | | | 1,427,130 | | |
| | | | | Gas: 0.6% | |
| | 28,500 | | | L | | NiSource, Inc. | | | 686,850 | | |
| | | | 686,850 | | |
| | | | | Healthcare-Products: 1.4% | |
| | 24,400 | | | | | Johnson & Johnson | | | 1,610,888 | | |
| | | | 1,610,888 | | |
| | | | | Healthcare-Services: 0.3% | |
| | 6,200 | | | | | Quest Diagnostics | | | 328,600 | | |
| | | | 328,600 | | |
| | | | | Housewares: 0.6% | |
| | 24,300 | | | L | | Newell Rubbermaid, Inc. | | | 703,485 | | |
| | | | 703,485 | | |
| | | | | Insurance: 6.9% | |
| | 23,600 | | | | | Allstate Corp. | | | 1,536,596 | | |
| | 29,100 | | | | | American International
Group, Inc. | | | 2,085,306 | | |
| | 14,500 | | | | | Hartford Financial Services
Group, Inc. | | | 1,352,995 | | |
| | 23,300 | | | | | Loews Corp. | | | 966,251 | | |
| | 22,000 | | | | | Marsh & McLennan Cos., Inc. | | | 674,520 | | |
| | 10,300 | | | L | | MGIC Investment Corp. | | | 644,162 | | |
| | 11,300 | | | | | Torchmark Corp. | | | 720,488 | | |
| | | | 7,980,318 | | |
| | | | | Iron/Steel: 0.4% | |
| | 8,400 | | | | | Nucor Corp. | | | 459,144 | | |
| | | | 459,144 | | |
| | | | | Machinery-Diversified: 0.7% | |
| | 8,800 | | | | | Deere & Co. | | | 836,616 | | |
| | | | 836,616 | | |
| | | | | Media: 3.8% | |
| | 22,000 | | | L | | Gannett Co., Inc. | | | 1,330,120 | | |
| | 97,500 | | | L | | Time Warner, Inc. | | | 2,123,550 | | |
| | 22,400 | | | @,L | | Viacom, Inc. | | | 919,072 | | |
| | | | 4,372,742 | | |
| | | | | Miscellaneous Manufacturing: 4.7% | |
| | 16,200 | | | L | | Dover Corp. | | | 794,124 | | |
| | 44,000 | | | | | General Electric Co. | | | 1,637,240 | | |
| | 24,100 | | | @@,L | | Ingersoll-Rand Co. | | | 943,033 | | |
| | 9,000 | | | | | Parker Hannifin Corp. | | | 691,920 | | |
| | 44,500 | | | @@ | | Tyco International Ltd. | | | 1,352,800 | | |
| | | | 5,419,117 | | |
| | | | | Office/Business Equipment: 0.6% | |
| | 43,000 | | | @ | | Xerox Corp. | | | 728,850 | | |
| | | | 728,850 | | |
See Accompanying Notes to Financial Statements
186
ING AMERICAN CENTURY PORTFOLIO OF INVESTMENTS
LARGE COMPANY VALUE PORTFOLIO AS OF DECEMBER 31, 2006 (CONTINUED)
| Shares | | | | | | Value | |
| | | | | Oil & Gas: 13.3% | |
| | 9,300 | | | L | | Anadarko Petroleum Corp. | | $ | 404,736 | | |
| | 47,200 | | | L | | Chevron Corp. | | | 3,470,616 | | |
| | 33,500 | | | | | ConocoPhillips | | | 2,410,325 | | |
| | 7,700 | | | L | | Devon Energy Corp. | | | 516,516 | | |
| | 71,500 | | | L | | ExxonMobil Corp. | | | 5,479,045 | | |
| | 44,600 | | | @@ | | Royal Dutch Shell PLC ADR | | | 3,157,234 | | |
| | | | 15,438,472 | | |
| | | | | Oil & Gas Services: 0.1% | |
| | 2,300 | | | @,L | | National Oilwell Varco, Inc. | | | 140,714 | | |
| | | | 140,714 | | |
| | | | | Pharmaceuticals: 5.4% | |
| | 33,800 | | | | | Abbott Laboratories | | | 1,646,398 | | |
| | 18,000 | | | | | Merck & Co., Inc. | | | 784,800 | | |
| | 85,600 | | | | | Pfizer, Inc. | | | 2,217,040 | | |
| | 31,300 | | | L | | Wyeth | | | 1,593,796 | | |
| | | | 6,242,034 | | |
| | | | | Retail: 4.0% | |
| | 53,900 | | | | | Dollar General Corp. | | | 865,634 | | |
| | 34,100 | | | | | Gap, Inc. | | | 664,950 | | |
| | 23,000 | | | L | | Home Depot, Inc. | | | 923,680 | | |
| | 26,100 | | | L | | McDonald's Corp. | | | 1,157,013 | | |
| | 22,700 | | | | | Wal-Mart Stores, Inc. | | | 1,048,286 | | |
| | | | 4,659,563 | | |
| | | | | Savings & Loans: 1.5% | |
| | 37,900 | | | L | | Washington Mutual, Inc. | | | 1,724,071 | | |
| | | | 1,724,071 | | |
| | | | | Semiconductors: 0.7% | |
| | 6,200 | | | L | | Applied Materials, Inc. | | | 114,390 | | |
| | 32,100 | | | | | Intel Corp. | | | 650,025 | | |
| | | | 764,415 | | |
| | | | | Software: 2.7% | |
| | 11,800 | | | @,L | | Fiserv, Inc. | | | 618,556 | | |
| | 62,500 | | | | | Microsoft Corp. | | | 1,866,250 | | |
| | 38,100 | | | @,L | | Oracle Corp. | | | 653,034 | | |
| | | | 3,137,840 | | |
| | | | | Telecommunications: 5.0% | |
| | 61,200 | | | | | AT&T, Inc. | | | 2,187,900 | | |
| | 24,300 | | | | | BellSouth Corp. | | | 1,144,773 | | |
| | 52,300 | | | | | Sprint Nextel Corp. | | | 987,947 | | |
| | 40,500 | | | | | Verizon Communications, Inc. | | | 1,508,220 | | |
| | | | 5,828,840 | | |
Total Common Stock
(Cost $96,282,350) | | | 110,284,055 | | |
Principal
Amount | | | | Value | |
| SHORT-TERM INVESTMENTS: 27.0% | |
| | | U.S. Government Agency
Obligations: 4.8% | |
| $ | 5,577,000 | | | Federal Home Loan Bank,
4.600%, due 01/02/07 | | | 5,575,575 | | |
Total U.S. Government
Agency Obligations
(Cost $5,575,575) | | | 5,575,575 | | |
Principal
Amount | | | | Value | |
| | | Securities Lending Collateralcc: 22.2% | |
| | 25,694,832 | | | The Bank of New York Institutional
Cash Reserves Fund | | $ | 25,694,832 | | |
Total Securities Lending Collateral
(Cost $25,694,832) | | | 25,694,832 | | |
Total Short-Term Investments
(Cost $31,270,407) | | | 31,270,407 | | |
Total Investments in
Securities (Cost
$127,552,757)* | | | 122.2 | % | | $ | 141,554,462 | | |
Other Assets and
Liabilities - Net | | | (22.2 | ) | | | (25,756,910 | ) | |
| Net Assets | | | 100.0 | % | | $ | 115,797,552 | | |
@ Non-income producing security
@@ Foreign Issuer
ADR American Depositary Receipt
cc Securities purchased with cash collateral for securities loaned.
L Loaned security, a portion or all of the security is on loan at December 31, 2006.
* Cost for federal income tax purposes is $128,156,595.
Net unrealized appreciation consists of:
| Gross Unrealized Appreciation | | $ | 13,547,727 | | |
| Gross Unrealized Depreciation | | | (149,860 | ) | |
| Net Unrealized Appreciation | | $ | 13,397,867 | | |
Information concerning open futures contracts at December 31, 2006 is shown below:
| Long Contracts | | No. of
Contracts | | Notional
Market Value | | Expiration
Date | | Unrealized
Gain (Loss) | |
| S&P 500 E-Mini | | | 12 | | | $ | 857,040 | | | | 03/16/2007 | | | $ | (5,416 | ) | |
| | | | | | | $ | 857,040 | | | | | | | $ | (5,416 | ) | |
See Accompanying Notes to Financial Statements
187
ING AMERICAN CENTURY PORTFOLIO OF INVESTMENTS
SELECT PORTFOLIO AS OF DECEMBER 31, 2006
| Shares | | | | | | Value | |
| COMMON STOCK: 100.0% | | | |
| | | | | Advertising: 2.6% | |
| | 79,310 | | | L | | Omnicom Group | | $ | 8,291,067 | | |
| | | | 8,291,067 | | |
| | | | | Aerospace/Defense: 5.3% | |
| | 80,890 | | | | | Boeing Co. | | | 7,186,268 | | |
| | 82,260 | | | | | General Dynamics Corp. | | | 6,116,031 | | |
| | 61,600 | | | | | Rockwell Collins, Inc. | | | 3,898,664 | | |
| | | | 17,200,963 | | |
| | | | | Banks: 2.1% | |
| | 83,370 | | | | | Bank of New York Co., Inc. | | | 3,282,277 | | |
| | 48,580 | | | L | | PNC Financial Services
Group, Inc. | | | 3,596,863 | | |
| | | | 6,879,140 | | |
| | | | | Beverages: 2.6% | |
| | 423,331 | | | @@ | | Diageo PLC | | | 8,317,465 | | |
| | | | 8,317,465 | | |
| | | | | Commercial Services: 0.7% | |
| | 2,572,500 | | | @@ | | Hopewell Highway
Infrastructure Ltd. | | | 2,204,732 | | |
| | | | 2,204,732 | | |
| | | | | Computers: 1.8% | |
| | 447,730 | | | @,L | | EMC Corp. | | | 5,910,036 | | |
| | | | 5,910,036 | | |
| | | | | Cosmetics/Personal Care: 2.1% | |
| | 103,980 | | | | | Colgate-Palmolive Co. | | | 6,783,655 | | |
| | | | 6,783,655 | | |
| | | | | Diversified Financial Services: 5.5% | |
| | 30,550 | | | | | Goldman Sachs Group, Inc. | | | 6,090,143 | | |
| | 229,811 | | | L | | Janus Capital Group, Inc. | | | 4,961,619 | | |
| | 83,780 | | | | | Morgan Stanley | | | 6,822,205 | | |
| | | | 17,873,967 | | |
| | | | | Electric: 0.8% | |
| | 120,380 | | | @ | | AES Corp. | | | 2,653,175 | | |
| | | | 2,653,175 | | |
| | | | | | | Electrical Components &
Equipment: 2.0% | | | | | |
| | 67,709 | | | | | Molex, Inc. | | | 2,141,636 | | |
| | 104,410 | | | @,@@ | | Vestas Wind Systems A/S | | | 4,394,058 | | |
| | | | 6,535,694 | | |
| | | | | Electronics: 0.8% | |
| | 43,486 | | | | | Amphenol Corp. | | | 2,699,611 | | |
| | | | 2,699,611 | | |
| | | | | Energy-Alternate Sources: 0.8% | |
| | 56,450 | | | @,@@ | | Q-Cells AG | | | 2,525,864 | | |
| | | | 2,525,864 | | |
| | | | | Engineering & Construction: 4.0% | |
| | 525,970 | | | @@,S | | ABB Ltd. ADR | | | 9,456,940 | | |
| | 121,850 | | | @@ | | Chicago Bridge & Iron Co. NV | | | 3,331,379 | | |
| | | | 12,788,319 | | |
| Shares | | | | | | Value | |
| | | | | Food: 1.3% | |
| | 117,560 | | | | | Sysco Corp. | | $ | 4,321,506 | | |
| | | | 4,321,506 | | |
| | | | | Healthcare-Products: 7.2% | |
| | 194,520 | | | S | | Baxter International, Inc. | | | 9,023,783 | | |
| | 112,110 | | | S | | Johnson & Johnson | | | 7,401,502 | | |
| | 126,790 | | | | | Medtronic, Inc. | | | 6,784,533 | | |
| | | | 23,209,818 | | |
| | | | | Healthcare-Services: 2.7% | |
| | 66,479 | | | @,L | | Laboratory Corp. of
America Holdings | | | 4,884,212 | | |
| | 84,090 | | | L | | Manor Care, Inc. | | | 3,945,503 | | |
| | | | 8,829,715 | | |
| | | | | Holding Companies-Diversified: 0.5% | |
| | 354,231 | | | @@ | | China Merchants Holdings
International Co., Ltd. | | | 1,449,048 | | |
| | | | 1,449,048 | | |
| | | | | Insurance: 7.0% | |
| | 91,680 | | | | | American International
Group, Inc. | | | 6,569,789 | | |
| | 220,550 | | | S | | Loews Corp. | | | 9,146,209 | | |
| | 130,130 | | | | | St. Paul Travelers Cos., Inc. | | | 6,986,680 | | |
| | | | 22,702,678 | | |
| | | | | Internet: 3.3% | |
| | 169,940 | | | @,L | | eBay, Inc. | | | 5,110,096 | | |
| | 12,390 | | | @ | | Google, Inc. | | | 5,705,347 | | |
| | | | 10,815,443 | | |
| | | | | Iron/Steel: 3.2% | |
| | 79,001 | | | | | Allegheny Technologies, Inc. | | | 7,163,811 | | |
| | 78,610 | | | @@,L | | Mittal Steel Co. NV | | | 3,315,770 | | |
| | | | 10,479,581 | | |
| | | | | Leisure Time: 3.1% | |
| | 140,020 | | | L | | Carnival Corp. | | | 6,867,981 | | |
| | 46,310 | | | | | Harley-Davidson, Inc. | | | 3,263,466 | | |
| | | | 10,131,447 | | |
| | | | | Lodging: 4.4% | |
| | 102,010 | | | @,L | | Las Vegas Sands Corp. | | | 9,127,855 | | |
| | 81,540 | | | | | Starwood Hotels & Resorts
Worldwide, Inc. | | | 5,096,250 | | |
| | | | 14,224,105 | | |
| | | | | | | Machinery-Construction &
Mining: 1.1% | | | | | |
| | 56,480 | | | @ | | Terex Corp. | | | 3,647,478 | | |
| | | | 3,647,478 | | |
| | | | | Media: 3.8% | |
| | 174,970 | | | @,L | | Comcast Corp. | | | 7,406,480 | | |
| | 164,600 | | | @@ | | Rogers Communications,
Inc.-Class B | | | 4,897,843 | | |
| | | | 12,304,323 | | |
| | | | | Mining: 1.6% | |
| | 41,860 | | | L | | Phelps Dodge Corp. | | | 5,011,479 | | |
| | | | 5,011,479 | | |
See Accompanying Notes to Financial Statements
188
ING AMERICAN CENTURY PORTFOLIO OF INVESTMENTS
SELECT PORTFOLIO AS OF DECEMBER 31, 2006 (CONTINUED)
| Shares | | | | | | Value | |
| | | | | Miscellaneous Manufacturing: 2.2% | |
| | 230,970 | | | @@,L | | Tyco International Ltd. | | $ | 7,021,488 | | |
| | | | 7,021,488 | | |
| | | | | Oil & Gas: 4.4% | |
| | 178,740 | | | S | | Frontier Oil Corp. | | | 5,136,988 | | |
| | 112,140 | | | | | Occidental Petroleum Corp. | | | 5,475,796 | | |
| | 138,940 | | | @@,L | | Statoil ASA ADR | | | 3,656,901 | | |
| | | | 14,269,685 | | |
| | | | | Pharmaceuticals: 2.4% | |
| | 28,910 | | | @@ | | Roche Holding AG | | | 5,172,391 | | |
| | 111,960 | | | | | Schering-Plough Corp. | | | 2,646,734 | | |
| | | | 7,819,125 | | |
| | | | | Retail: 4.0% | |
| | 197,150 | | | L | | Limited Brands, Inc. | | | 5,705,521 | | |
| | 117,950 | | | @@ | | Next PLC | | | 4,145,610 | | |
| | 55,270 | | | | | Yum! Brands, Inc. | | | 3,249,876 | | |
| | | | 13,101,007 | | |
| | | | | Semiconductors: 4.9% | |
| | 223,730 | | | @,@@ | | ASML Holding NV | | | 5,521,301 | | |
| | 260,380 | | | @,L | | MEMC Electronic Materials, Inc. | | | 10,191,273 | | |
| | | | 15,712,574 | | |
| | | | | Software: 7.7% | |
| | 134,370 | | | @,L | | Adobe Systems, Inc. | | | 5,525,294 | | |
| | 102,950 | | | @,L | | Hyperion Solutions Corp. | | | 3,700,023 | | |
| | 146,650 | | | @@ | | Infosys Technologies Ltd. ADR | | | 8,001,224 | | |
| | 256,690 | | | | | Microsoft Corp. | | | 7,664,763 | | |
| | | | 24,891,304 | | |
| | | | | Telecommunications: 4.1% | |
| | 297,830 | | | @,S | | Cisco Systems, Inc. | | | 8,139,694 | | |
| | 140,930 | | | | | Verizon Communications, Inc. | | | 5,248,233 | | |
| | | | 13,387,927 | | |
Total Common Stock
(Cost $296,267,224) | | | 323,993,419 | | |
Principal
Amount | | | | Value | |
| SHORT-TERM INVESTMENTS: 20.9% | |
| | | U.S. Government Agency
Obligations: 0.7% | |
| $ | 2,226,000 | | | Federal Home Loan Bank,
4.600%, due 01/02/07 | | | 2,225,431 | | |
Total U.S. Government
Agency Obligations
(Cost $2,225,431) | | | 2,225,431 | | |
| | | Securities Lending Collateralcc: 20.2% | |
| | 65,554,520 | | | The Bank of New York Institutional
Cash Reserves Fund | | | 65,554,520 | | |
Total Securities Lending Collateral
(Cost $65,554,520) | | | 65,554,520 | | |
Total Short-Term Investments
(Cost $67,779,951) | | | 67,779,951 | | |
Total Investments in
Securities (Cost
$364,047,175)* | | | 120.9 | % | | $ | 391,773,370 | | |
Other Assets and
Liabilities - Net | | | (20.9 | ) | | | (67,719,320 | ) | |
| Net Assets | | | 100.0 | % | | $ | 324,054,050 | | |
@ Non-income producing security
@@ Foreign Issuer
ADR American Depositary Receipt
cc Securities purchased with cash collateral for securities loaned.
S Segregated securities for certain derivatives, when-issued or delayed delivery securities And forward currency exchange contracts.
L Loaned security, a portion or all of the security is on loan at December 31, 2006.
* Cost for federal income tax purposes is $365,334,221.
Net unrealized appreciation consists of:
| Gross Unrealized Appreciation | | $ | 29,937,441 | | |
| Gross Unrealized Depreciation | | | (3,498,292 | ) | |
| Net Unrealized Appreciation | | $ | 26,439,149 | | |
At December 31, 2006 the following forward currency contracts were outstanding for the ING American Century Select Portfolio:
| Currency | | Buy/Sell | | Settlement
Date | | In
Exchange
For | | Value | | Unrealized
Appreciation
(Depreciation) | |
| Canada Dollars | | | | | | USD | | | | |
| | |
| CAD 2,757,873 | | Sell | | 1/31/07 | | 2,376,350 | | | 2,364,938 | | | $ | 11,412 | | |
Switzerland Francs
CHF 3,158,417 | | Sell | | 1/31/07 | | USD
2,585,751 | | |
2,592,054 | | | | (6,303 | ) | |
Denmark Kroner
DKK 11,954,945 | | Sell | | 1/31/07 | | USD
2,107,229 | | |
2,116,368 | | | | (9,139 | ) | |
EURO
EUR 2,982,358 | | Sell | | 1/31/07 | | USD
3,920,339 | | |
3,936,846 | | | | (16,507 | ) | |
British Pound Sterling
GBP 3,144,338 | | Sell | | 1/31/07 | | USD
6,151,583 | | |
6,156,556 | | | | (4,973 | ) | |
| | | $ | (25,510 | ) | |
See Accompanying Notes to Financial Statements
189
ING AMERICAN CENTURY PORTFOLIO OF INVESTMENTS
SMALL-MID CAP VALUE PORTFOLIO AS OF DECEMBER 31, 2006
| Shares | | | | | | Value | |
| COMMON STOCK: 96.3% | | | |
| | | | | Aerospace/Defense: 2.2% | |
| | 9,900 | | | @,L | | Alliant Techsystems, Inc. | | $ | 774,081 | | |
| | 8,021 | | | | | Curtiss-Wright Corp. | | | 297,419 | | |
| | 8,700 | | | | | DRS Technologies, Inc. | | | 458,316 | | |
| | 16,003 | | | L | | EDO Corp. | | | 379,911 | | |
| | 7,100 | | | @,L | | Moog, Inc. | | | 271,149 | | |
| | 2,409 | | | | | Northrop Grumman Corp. | | | 163,089 | | |
| | | | 2,343,965 | | |
| | | | | Agriculture: 0.2% | |
| | 6,400 | | | | | Delta & Pine Land Co. | | | 258,880 | | |
| | | | 258,880 | | |
| | | | | Airlines: 0.7% | |
| | 6,500 | | | @ | | Alaska Air Group, Inc. | | | 256,750 | | |
| | 13,600 | | | | | Skywest, Inc. | | | 346,936 | | |
| | 11,098 | | | | | Southwest Airlines Co. | | | 170,021 | | |
| | | | 773,707 | | |
| | | | | Apparel: 0.6% | |
| | 4,600 | | | L | | Columbia Sportswear Co. | | | 256,220 | | |
| | 15,200 | | | | | Wolverine World Wide, Inc. | | | 433,504 | | |
| | | | 689,724 | | |
| | | | | Auto Manufacturers: 0.4% | |
| | 25,976 | | | | | Wabash National Corp. | | | 392,238 | | |
| | | | 392,238 | | |
| | | | | Auto Parts & Equipment: 1.0% | |
| | 26,200 | | | L | | ArvinMeritor, Inc. | | | 477,626 | | |
| | 1,349 | | | | | BorgWarner, Inc. | | | 79,618 | | |
| | 4,200 | | | L | | Lear Corp. | | | 124,026 | | |
| | 18,293 | | | L | | Superior Industries International | | | 352,506 | | |
| | | | 1,033,776 | | |
| | | | | Banks: 7.5% | |
| | 3,938 | | | | | BB&T Corp. | | | 172,996 | | |
| | 10,100 | | | L | | Central Pacific Financial Corp. | | | 391,476 | | |
| | 10,700 | | | | | Chemical Financial Corp. | | | 356,310 | | |
| | 6,100 | | | | | City National Corp. | | | 434,320 | | |
| | 1,431 | | | | | Commerce Bancshares, Inc. | | | 69,275 | | |
| | 4,700 | | | | | Cullen/Frost Bankers, Inc. | | | 262,354 | | |
| | 11,057 | | | | | Fifth Third Bancorp. | | | 452,563 | | |
| | 20,200 | | | | | First Midwest Bancorp., Inc. | | | 781,336 | | |
| | 52,300 | | | | | Fulton Financial Corp. | | | 873,410 | | |
| | 16,600 | | | | | Greater Bay Bancorp. | | | 437,078 | | |
| | 19,300 | | | | | Hanmi Financial Corp. | | | 434,829 | | |
| | 3,019 | | | | | Marshall & Ilsley Corp. | | | 145,244 | | |
| | 13,100 | | | L | | Pacific Capital Bancorp. | | | 439,898 | | |
| | 4,900 | | | | | Provident Bankshares Corp. | | | 174,440 | | |
| | 39,490 | | | | | South Financial Group, Inc. | | | 1,050,039 | | |
| | 17,400 | | | L | | Sterling Bancshares, Inc. | | | 226,548 | | |
| | 4,421 | | | | | SunTrust Banks, Inc. | | | 373,353 | | |
| | 5,170 | | | L | | Susquehanna Bancshares, Inc. | | | 138,970 | | |
| | 15,700 | | | L | | TCF Financial Corp. | | | 430,494 | | |
| | 3,800 | | | | | Webster Financial Corp. | | | 185,136 | | |
| | 4,800 | | | | | Wilmington Trust Corp. | | | 202,416 | | |
| | 1,886 | | | | | Zions Bancorp. | | | 155,482 | | |
| | | | 8,187,967 | | |
| Shares | | | | | | Value | |
| | | | | Beverages: 0.9% | |
| | 6,773 | | | | | Anheuser-Busch Cos., Inc. | | $ | 333,232 | | |
| | 22,983 | | | | | Coca-Cola Enterprises, Inc. | | | 469,313 | | |
| | 5,641 | | | | | Pepsi Bottling Group, Inc. | | | 174,363 | | |
| | | | 976,908 | | |
| | | | | Biotechnology: 0.1% | |
| | 2,239 | | | @ | | Invitrogen Corp. | | | 126,705 | | |
| | | | 126,705 | | |
| | | | | Building Materials: 0.3% | |
| | 7,900 | | | | | LSI Industries, Inc. | | | 156,815 | | |
| | 4,593 | | | | | Masco Corp. | | | 137,193 | | |
| | | | 294,008 | | |
| | | | | Chemicals: 3.0% | |
| | 5,500 | | | | | CF Industries Holdings, Inc. | | | 141,020 | | |
| | 553 | | | | | EI DuPont de Nemours & Co. | | | 26,937 | | |
| | 17,100 | | | | | Ferro Corp. | | | 353,799 | | |
| | 1,900 | | | | | FMC Corp. | | | 145,445 | | |
| | 17,083 | | | @ | | Innophos, Inc. | | | 250,778 | | |
| | 321 | | | | | International Flavors &
Fragrances, Inc. | | | 15,780 | | |
| | 21,614 | | | | | Minerals Technologies, Inc. | | | 1,270,687 | | |
| | 39,962 | | | L | | Olin Corp. | | | 660,172 | | |
| | 1,461 | | | | | Rohm & Haas Co. | | | 74,686 | | |
| | 7,300 | | | | | Sensient Technologies Corp. | | | 179,580 | | |
| | 5,200 | | | L | | UAP Holding Corp. | | | 130,936 | | |
| | | | 3,249,820 | | |
| | | | | Coal: 0.3% | |
| | 24,200 | | | @,L | | Alpha Natural Resources, Inc. | | | 344,366 | | |
| | | | 344,366 | | |
| | | | | Commercial Services: 1.9% | |
| | 426 | | | | | ABM Industries, Inc. | | | 9,674 | | |
| | 35,600 | | | L | | Advance America Cash
Advance Centers, Inc. | | | 521,540 | | |
| | 4,547 | | | @,@@ | | Aegean Marine Petroleum
Network, Inc. | | | 74,571 | | |
| | 10,947 | | | | | Aramark Corp. | | | 366,177 | | |
| | 22,300 | | | @,L | | Corinthian Colleges, Inc. | | | 303,949 | | |
| | 6,400 | | | @ | | Healthspring, Inc. | | | 130,240 | | |
| | 4,500 | | | | | Kelly Services, Inc. | | | 130,230 | | |
| | 11,700 | | | L | | MAXIMUS, Inc. | | | 360,126 | | |
| | 8,000 | | | @ | | Valassis Communications, Inc. | | | 116,000 | | |
| | | | 2,012,507 | | |
| | | | | Computers: 1.8% | |
| | 1,354 | | | | | Diebold, Inc. | | | 63,096 | | |
| | 2,034 | | | @ | | DST Systems, Inc. | | | 127,389 | | |
| | 10,400 | | | @ | | Electronics for Imaging | | | 276,432 | | |
| | 4,672 | | | | | Imation Corp. | | | 216,921 | | |
| | 11,800 | | | | | Jack Henry & Associates, Inc. | | | 252,520 | | |
| | 6,383 | | | @ | | NCI, Inc. | | | 97,596 | | |
| | 53,000 | | | @ | | Perot Systems Corp. | | | 868,670 | | |
| | 1,513 | | | @ | | Synopsys, Inc. | | | 40,442 | | |
| | | | 1,943,066 | | |
See Accompanying Notes to Financial Statements
190
ING AMERICAN CENTURY PORTFOLIO OF INVESTMENTS
SMALL-MID CAP VALUE PORTFOLIO AS OF DECEMBER 31, 2006 (CONTINUED)
| Shares | | | | | | Value | |
| | | | | Distribution/Wholesale: 0.8% | |
| | 4,569 | | | | | Genuine Parts Co. | | $ | 216,708 | | |
| | 2,132 | | | | | Owens & Minor, Inc. | | | 66,668 | | |
| | 9,500 | | | @ | | United Stationers, Inc. | | | 443,555 | | |
| | 2,412 | | | | | WW Grainger, Inc. | | | 168,695 | | |
| | | | 895,626 | | |
| | | | | Diversified Financial Services: 2.4% | |
| | 18,900 | | | @ | | Asset Acceptance Capital Corp. | | | 317,898 | | |
| | 23,600 | | | @,L | | Cowen Group, Inc. | | | 499,140 | | |
| | 5,865 | | | | | Freddie Mac | | | 398,234 | | |
| | 9,200 | | | @ | | Knight Capital Group, Inc. | | | 176,364 | | |
| | 3,600 | | | @@,L | | Lazard Ltd. | | | 170,424 | | |
| | 9,200 | | | L | | National Financial Partners Corp. | | | 404,524 | | |
| | 1,986 | | | | | Nuveen Investments, Inc. | | | 103,034 | | |
| | 20,700 | | | | | Waddell & Reed Financial, Inc. | | | 566,352 | | |
| | | | 2,635,970 | | |
| | | | | Electric: 3.2% | |
| | 6,756 | | | | | Ameren Corp. | | | 363,000 | | |
| | 1,778 | | | | | Consolidated Edison, Inc. | | | 85,468 | | |
| | 9,000 | | | L | | Empire District Electric Co. | | | 222,210 | | |
| | 12,000 | | | | | Great Plains Energy, Inc. | | | 381,600 | | |
| | 3,300 | | | | | Idacorp, Inc. | | | 127,545 | | |
| | 14,485 | | | | | Portland General Electric Co. | | | 394,716 | | |
| | 50,781 | | | | | Puget Energy, Inc. | | | 1,287,806 | | |
| | 12,900 | | | | | Westar Energy, Inc. | | | 334,884 | | |
| | 3,128 | | | | | Wisconsin Energy Corp. | | | 148,455 | | |
| | 7,564 | | | | | Xcel Energy, Inc. | | | 174,426 | | |
| | | | 3,520,110 | | |
| | | | | | | Electrical Components &
Equipment: 0.8% | | | | | |
| | 4,110 | | | | | Hubbell, Inc. — Class A | | | 185,813 | | |
| | 8,103 | | | | | Hubbell, Inc. — Class B | | | 360,584 | | |
| | 11,223 | | | @ | | Littelfuse, Inc. | | | 357,789 | | |
| | | | 904,186 | | |
| | | | | Electronics: 1.8% | |
| | 8,200 | | | @ | | Avnet, Inc. | | | 209,346 | | |
| | 10,900 | | | @ | | Benchmark Electronics, Inc. | | | 265,524 | | |
| | 8,300 | | | @,L | | Coherent, Inc. | | | 262,031 | | |
| | 3,802 | | | | | Methode Electronics, Inc. | | | 41,176 | | |
| | 23,500 | | | @ | | Paxar Corp. | | | 541,910 | | |
| | 48,923 | | | @ | | Vishay Intertechnology, Inc. | | | 662,417 | | |
| | | | 1,982,404 | | |
| | | | | Engineering & Construction: 1.1% | |
| | 8,000 | | | @,L | | Insituform Technologies, Inc. | | | 206,880 | | |
| | 7,800 | | | @,L | | Shaw Group, Inc. | | | 261,300 | | |
| | 9,200 | | | @ | | URS Corp. | | | 394,220 | | |
| | 6,100 | | | | | Washington Group
International, Inc. | | | 364,719 | | |
| | | | 1,227,119 | | |
| | | | | Entertainment: 1.4% | |
| | 13,942 | | | | | International Speedway Corp. | | | 711,600 | | |
| | 19,543 | | | L | | Speedway Motorsports, Inc. | | | 750,451 | | |
| | | | 1,462,051 | | |
| | | | | Environmental Control: 0.7% | |
| | 19,100 | | | | | American Ecology Corp. | | | 353,541 | | |
| | 2,977 | | | @ | | Nalco Holding Co. | | | 60,909 | | |
| | 8,760 | | | | | Republic Services, Inc. | | | 356,269 | | |
| | | | 770,719 | | |
| Shares | | | | | | Value | |
| | | | | Exchange Traded Fund: 5.3% | |
| | 29,800 | | | @@,L | | iShares Russell 2000 Index Fund | | $ | 2,327,082 | | |
| | 33,400 | | | @@,L | | iShares Russell 2000 Value
Index Fund | | | 2,672,668 | | |
| | 5,481 | | | @@ | | iShares S&P MidCap 400
Index Fund | | | 439,576 | | |
| | 4,800 | | | @@,L | | iShares S&P SmallCap
600/BARRA Value Index Fund | | | 361,632 | | |
| | | | 5,800,958 | | |
| | | | | Food: 1.8% | |
| | 1,503 | | | | | ConAgra Foods, Inc. | | | 40,581 | | |
| | 7,500 | | | | | Corn Products International, Inc. | | | 259,050 | | |
| | 14,102 | | | | | Diamond Foods, Inc. | | | 268,079 | | |
| | 2,946 | | | | | General Mills, Inc. | | | 169,690 | | |
| | 10,342 | | | | | HJ Heinz Co. | | | 465,493 | | |
| | 5,300 | | | | | JM Smucker Co. | | | 256,891 | | |
| | 11,791 | | | @@ | | Maple Leaf Foods, Inc. | | | 124,770 | | |
| | 480 | | | @,L | | Performance Food Group Co. | | | 13,267 | | |
| | 7,700 | | | | | Pilgrim's Pride Corp. | | | 226,611 | | |
| | 5,513 | | | @@ | | Unilever NV ADR | | | 150,229 | | |
| | | | 1,974,661 | | |
| | | | | Forest Products & Paper: 0.6% | |
| | 8,700 | | | | | Glatfelter | | | 134,850 | | |
| | 5,043 | | | | | MeadWestvaco Corp. | | | 151,593 | | |
| | 6,000 | | | | | Neenah Paper, Inc. | | | 211,920 | | |
| | 2,417 | | | | | Weyerhaeuser Co. | | | 170,761 | | |
| | | | 669,124 | | |
| | | | | Gas: 1.5% | |
| | 13,300 | | | | | Atmos Energy Corp. | | | 424,403 | | |
| | 37,332 | | | | | WGL Holdings, Inc. | | | 1,216,277 | | |
| | | | 1,640,680 | | |
| | | | | Hand/Machine Tools: 0.8% | |
| | 8,900 | | | | | Kennametal, Inc. | | | 523,765 | | |
| | 6,300 | | | | | Regal-Beloit Corp. | | | 330,813 | | |
| | | | 854,578 | | |
| | | | | Healthcare-Products: 3.6% | |
| | 4,100 | | | | | Arrow International, Inc. | | | 145,058 | | |
| | 16,530 | | | | | Beckman Coulter, Inc. | | | 988,494 | | |
| | 7,000 | | | @,L | | Biosite, Inc. | | | 341,950 | | |
| | 15,424 | | | | | Dade Behring Holdings, Inc. | | | 614,029 | | |
| | 14,200 | | | @,@@,L | | Orthofix International NV | | | 710,000 | | |
| | 12,327 | | | L | | Steris Corp. | | | 310,271 | | |
| | 34,276 | | | @ | | Symmetry Medical, Inc. | | | 474,037 | | |
| | 7,000 | | | | | Vital Signs, Inc. | | | 349,440 | | |
| | | | 3,933,279 | | |
| | | | | Healthcare-Services: 3.4% | |
| | 26,000 | | | @ | | Alliance Imaging, Inc. | | | 172,900 | | |
| | 24,600 | | | @ | | Amsurg Corp. | | | 565,800 | | |
| | 25,702 | | | @,L | | Assisted Living Concepts | | | 254,193 | | |
| | 14,300 | | | @ | | Community Health Systems, Inc. | | | 522,236 | | |
| | 10,815 | | | | | Health Management
Associates, Inc. | | | 228,305 | | |
| | 10,100 | | | @ | | LifePoint Hospitals, Inc. | | | 340,370 | | |
| | 7,594 | | | @ | | National Dentex Corp. | | | 132,895 | | |
| | 3,500 | | | @ | | Pediatrix Medical Group, Inc. | | | 171,150 | | |
| | 12,300 | | | @ | | RehabCare Group, Inc. | | | 182,655 | | |
| | 23,000 | | | @,L | | Triad Hospitals, Inc. | | | 962,090 | | |
| | 3,284 | | | | | Universal Health Services, Inc. | | | 182,032 | | |
| | | | 3,714,626 | | |
See Accompanying Notes to Financial Statements
191
ING AMERICAN CENTURY PORTFOLIO OF INVESTMENTS
SMALL-MID CAP VALUE PORTFOLIO AS OF DECEMBER 31, 2006 (CONTINUED)
| Shares | | | | | | Value | |
| | | | | Home Builders: 0.2% | |
| | 6,500 | | | @,L | | WCI Communities, Inc. | | $ | 124,670 | | |
| | 1,051 | | | | | Winnebago Industries | | | 34,588 | | |
| | | | 159,258 | | |
| | | | | Home Furnishings: 0.6% | |
| | 11,100 | | | | | Ethan Allen Interiors, Inc. | | | 400,821 | | |
| | 11,300 | | | L | | La-Z-Boy, Inc. | | | 134,131 | | |
| | 1,975 | | | | | Whirlpool Corp. | | | 163,965 | | |
| | | | 698,917 | | |
| | | | | Household Products/Wares: 0.5% | |
| | 1,075 | | | | | Clorox Co. | | | 68,961 | | |
| | 7,533 | | | | | Kimberly-Clark Corp. | | | 511,867 | | |
| | | | 580,828 | | |
| | | | | Housewares: 0.1% | |
| | 1,757 | | | @@ | | Hunter Douglas NV | | | 141,247 | | |
| | | | 141,247 | | |
| | | | | Insurance: 6.2% | |
| | 2,254 | | | | | AMBAC Financial Group, Inc. | | | 200,764 | | |
| | 16,400 | | | L | | American Equity Investment
Life Holding Co. | | | 213,692 | | |
| | 675 | | | | | Arthur J Gallagher & Co. | | | 19,946 | | |
| | 34,484 | | | @@ | | Aspen Insurance Holdings Ltd. | | | 908,998 | | |
| | 3,279 | | | | | Chubb Corp. | | | 173,492 | | |
| | 3,210 | | | | | Delphi Financial Group | | | 129,877 | | |
| | 11,900 | | | @@ | | Endurance Specialty
Holdings Ltd. | | | 435,302 | | |
| | 6,701 | | | | | Genworth Financial, Inc. | | | 229,241 | | |
| | 1,393 | | | | | Hartford Financial Services
Group, Inc. | | | 129,981 | | |
| | 8,800 | | | | | HCC Insurance Holdings, Inc. | | | 282,392 | | |
| | 6,300 | | | | | Hilb Rogal & Hobbs Co. | | | 265,356 | | |
| | 2,562 | | | | | Horace Mann Educators Corp. | | | 51,752 | | |
| | 5,500 | | | @@ | | IPC Holdings Ltd. | | | 172,975 | | |
| | 7,051 | | | | | Marsh & McLennan Cos., Inc. | | | 216,184 | | |
| | 7,254 | | | | | MGIC Investment Corp. | | | 453,665 | | |
| | 18,300 | | | @ | | National Atlantic Holdings Corp. | | | 213,378 | | |
| | 4,900 | | | @,L | | Onebeacon Insurance
Group, Ltd. | | | 137,200 | | |
| | 6,000 | | | @@,L | | PartnerRe Ltd. | | | 426,180 | | |
| | 11,100 | | | | | Phoenix Cos., Inc. | | | 176,379 | | |
| | 34,100 | | | @@ | | Platinum Underwriters
Holdings Ltd. | | | 1,055,054 | | |
| | 1,449 | | | @,L | | ProAssurance Corp. | | | 72,334 | | �� |
| | 6,400 | | | | | Protective Life Corp. | | | 304,000 | | |
| | 11,806 | | | @,@@ | | RAM Holdings Ltd. | | | 168,708 | | |
| | 9,700 | | | | | United Fire & Casualty Co. | | | 341,925 | | |
| | | | 6,778,775 | | |
| | | | | Internet: 0.5% | |
| | 19,600 | | | @,L | | Digitas, Inc. | | | 262,836 | | |
| | 30,200 | | | @,L | | WebMethods, Inc. | | | 222,272 | | |
| | | | 485,108 | | |
| | | | | Investment Companies: 1.4% | |
| | 11,500 | | | L | | Apollo Investment Corp. | | | 257,600 | | |
| | 14,037 | | | @,L | | Kohlberg Capital Corp. | | | 242,840 | | |
| | 17,300 | | | L | | MCG Capital Corp. | | | 351,536 | | |
| | 42,900 | | | L | | Patriot Capital Funding, Inc. | | | 621,621 | | |
| | | | 1,473,597 | | |
| Shares | | | | | | Value | |
| | | | | Iron/Steel: 1.3% | |
| | 7,700 | | | @,L | | Claymont Steel Holdings, Inc. | | $ | 141,603 | | |
| | 3,000 | | | | | Cleveland-Cliffs, Inc. | | | 145,320 | | |
| | 6,000 | | | | | Gibraltar Industries, Inc. | | | 141,060 | | |
| | 2,700 | | | @ | | Oregon Steel Mills, Inc. | | | 168,507 | | |
| | 3,400 | | | L | | Reliance Steel & Aluminum Co. | | | 133,892 | | |
| | 5,600 | | | | | Ryerson, Inc. | | | 140,504 | | |
| | 10,100 | | | | | Schnitzer Steel Industries, Inc. | | | 400,970 | | |
| | 7,500 | | | | | Steel Technologies, Inc. | | | 131,625 | | |
| | | | 1,403,481 | | |
| | | | | Leisure Time: 0.8% | |
| | 6,200 | | | | | Arctic Cat, Inc. | | | 109,058 | | |
| | 29,800 | | | @,L | | K2, Inc. | | | 393,062 | | |
| | 4,000 | | | L | | Polaris Industries, Inc. | | | 187,320 | | |
| | 11,100 | | | @,L | | Town Sports International
Holdings, Inc. | | | 182,928 | | |
| | | | 872,368 | | |
| | | | | Machinery-Diversified: 0.7% | |
| | 8,000 | | | | | Albany International Corp. | | | 263,280 | | |
| | 24,669 | | | @,L | | Altra Holdings, Inc. | | | 346,600 | | |
| | 6,400 | | | | | Briggs & Stratton Corp. | | | 172,480 | | |
| | | | 782,360 | | |
| | | | | Media: 1.0% | |
| | 17,000 | | | | | Hearst-Argyle Television, Inc. | | | 433,500 | | |
| | 47,100 | | | | | Journal Communications, Inc. | | | 593,931 | | |
| | | | 1,027,431 | | |
| | | | | Metal Fabricate/Hardware: 1.5% | |
| | 17,900 | | | L | | Kaydon Corp. | | | 711,346 | | |
| | 12,700 | | | | | Mueller Industries, Inc. | | | 402,590 | | |
| | 18,000 | | | | | Timken Co. | | | 525,240 | | |
| | | | 1,639,176 | | |
| | | | | Mining: 0.2% | |
| | 976 | | | | | Compass Minerals
International, Inc. | | | 30,803 | | |
| | 3,765 | | | | | Newmont Mining Corp. | | | 169,990 | | |
| | | | 200,793 | | |
| | | | | Miscellaneous Manufacturing: 2.3% | |
| | 5,000 | | | | | AO Smith Corp. | | | 187,800 | | |
| | 7,127 | | | L | | Aptargroup, Inc. | | | 420,778 | | |
| | 7,600 | | | | | Crane Co. | | | 278,464 | | |
| | 20,000 | | | @,L | | Griffon Corp. | | | 510,000 | | |
| | 2,789 | | | | | Honeywell International, Inc. | | | 126,174 | | |
| | 6,498 | | | | | Lancaster Colony Corp. | | | 287,926 | | |
| | 15,300 | | | | | Pentair, Inc. | | | 480,420 | | |
| | 6,700 | | | | | Reddy Ice Holdings, Inc. | | | 172,994 | | |
| | | | 2,464,556 | | |
| | | | | Office Furnishings: 0.3% | |
| | 10,000 | | | | | Herman Miller, Inc. | | | 363,600 | | |
| | | | 363,600 | | |
| | | | | Office/Business Equipment: 0.1% | |
| | 2,327 | | | | | Pitney Bowes, Inc. | | | 107,484 | | |
| | | | 107,484 | | |
| | | | | Oil & Gas: 2.3% | |
| | 1,903 | | | | | Apache Corp. | | | 126,569 | | |
| | 7,100 | | | | | Cimarex Energy Co. | | | 259,150 | | |
| | 10,500 | | | @,L | | Encore Acquisition Co. | | | 257,565 | | |
See Accompanying Notes to Financial Statements
192
ING AMERICAN CENTURY PORTFOLIO OF INVESTMENTS
SMALL-MID CAP VALUE PORTFOLIO AS OF DECEMBER 31, 2006 (CONTINUED)
| Shares | | | | | | Value | |
| | | | | Oil & Gas (continued) | |
| | 6,500 | | | @ | | Forest Oil Corp. | | $ | 212,420 | | |
| | 15,300 | | | | | Helmerich & Payne, Inc. | | | 374,391 | | |
| | 4,272 | | | | | Murphy Oil Corp. | | | 217,231 | | |
| | 15,679 | | | L | | St. Mary Land & Exploration Co. | | | 577,614 | | |
| | 6,200 | | | @ | | Stone Energy Corp. | | | 219,170 | | |
| | 5,400 | | | @ | | Unit Corp. | | | 261,630 | | |
| | | | 2,505,740 | | |
| | | | | Oil & Gas Services: 2.4% | |
| | 43,600 | | | @ | | Global Industries Ltd. | | | 568,544 | | |
| | 11,700 | | | @ | | Helix Energy Solutions
Group, Inc. | | | 367,029 | | |
| | 3,500 | | | @,L | | Hornbeck Offshore Services, Inc. | | | 124,950 | | |
| | 30,900 | | | @ | | Key Energy Services, Inc. | | | 483,585 | | |
| | 10,800 | | | @ | | Lone Star Technologies | | | 522,828 | | |
| | 6,100 | | | | | Lufkin Industries, Inc. | | | 354,288 | | |
| | 13,900 | | | @,@@ | | North American Energy Partners | | | 226,292 | | |
| | | | 2,647,516 | | |
| | | | | Packaging & Containers: 0.9% | |
| | 19,020 | | | | | Bemis Co. | | | 646,300 | | |
| | 7,800 | | | | | Sonoco Products Co. | | | 296,868 | | |
| | | | 943,168 | | |
| | | | | Pharmaceuticals: 1.3% | |
| | 29,000 | | | | | Alpharma, Inc. | | | 698,900 | | |
| | 11,700 | | | @,L | | Par Pharmaceutical Cos., Inc. | | | 261,729 | | |
| | 10,100 | | | | | Perrigo Co. | | | 174,730 | | |
| | 8,509 | | | @ | | Watson Pharmaceuticals, Inc. | | | 221,489 | | |
| | | | 1,356,848 | | |
| | | | | Pipelines: 0.6% | |
| | 14,237 | | | | | Equitable Resources, Inc. | | | 594,395 | | |
| | | | 594,395 | | |
| | | | | Real Estate: 0.1% | |
| | 3,239 | | | @@ | | British Land Co. PLC | | | 108,361 | | |
| | | | 108,361 | | |
| | | | | Real Estate Investment Trusts: 4.1% | |
| | 30,400 | | | L | | Alesco Financial, Inc. | | | 325,280 | | |
| | 41,531 | | | | | Annaly Capital
Management, Inc. | | | 577,696 | | |
| | 6,186 | | | | | DCT Industrial Trust, Inc. | | | 72,995 | | |
| | 33,757 | | | L | | Education Realty Trust, Inc. | | | 498,591 | | |
| | 28,157 | | | | | Getty Realty Corp. | | | 870,051 | | |
| | 11,300 | | | | | Healthcare Realty Trust, Inc. | | | 446,802 | | |
| | 12,400 | | | | | Highland Hospitality Corp. | | | 176,700 | | |
| | 19,900 | | | L | | Lexington Corporate
Properties Trust | | | 446,158 | | |
| | 3,400 | | | | | Mack-Cali Realty Corp. | | | 173,400 | | |
| | 22,200 | | | | | MFA Mortgage Investments, Inc. | | | 170,718 | | |
| | 13,400 | | | | | National Retail Properties, Inc. | | | 307,530 | | |
| | 1,353 | | | | | Rayonier, Inc. | | | 55,541 | | |
| | 10,900 | | | | | Realty Income Corp. | | | 301,930 | | |
| | | | 4,423,392 | | |
| | | | | Retail: 5.6% | |
| | 6,700 | | | | | Barnes & Noble, Inc. | | | 266,057 | | |
| | 4,100 | | | @ | | BJ's Wholesale Club, Inc. | | | 127,551 | | |
| | 11,500 | | | | | Borders Group, Inc. | | | 257,025 | | |
| | 6,900 | | | | | Casey's General Stores, Inc. | | | 162,495 | | |
| | 7,600 | | | | | Cato Corp. | | | 174,116 | | |
| | 12,900 | | | @,L | | CEC Entertainment, Inc. | | | 519,225 | | |
| Shares | | | | | | Value | |
| | 19,444 | | | | | Dollar General Corp. | | $ | 312,271 | | |
| | 29,300 | | | L | | Fred's, Inc. | | | 352,772 | | |
| | 26,800 | | | @,L | | HOT Topic, Inc. | | | 357,512 | | |
| | 22,319 | | | L | | Kenneth Cole Productions, Inc. | | | 535,433 | | |
| | 4,041 | | | | | Lowe's Cos., Inc. | | | 125,877 | | |
| | 8,376 | | | | | OSI Restaurant Partners, Inc. | | | 328,339 | | |
| | 42,500 | | | @,L | | Pier 1 Imports, Inc. | | | 252,875 | | |
| | 10,900 | | | @,L | | Rare Hospitality
International, Inc. | | | 358,937 | | |
| | 18,500 | | | @,L | | Red Robin Gourmet
Burgers, Inc. | | | 663,225 | | |
| | 6,200 | | | | | Ruby Tuesday, Inc. | | | 170,128 | | |
| | 4,100 | | | | | Stage Stores, Inc. | | | 124,599 | | |
| | 14,700 | | | L | | Talbots, Inc. | | | 354,270 | | |
| | 19,600 | | | L | | Tuesday Morning Corp. | | | 304,780 | | |
| | 7,500 | | | L | | United Auto Group, Inc. | | | 176,775 | | |
| | 6,100 | | | @ | | Zale Corp. | | | 172,081 | | |
| | | | 6,096,343 | | |
| | | | | Savings & Loans: 1.3% | |
| | 11,500 | | | | | Flagstar Bancorp., Inc. | | | 170,660 | | |
| | 1,139 | | | | | MAF Bancorp., Inc. | | | 50,902 | | |
| | 50,510 | | | | | Washington Federal, Inc. | | | 1,188,500 | | |
| | | | 1,410,062 | | |
| | | | | Semiconductors: 1.8% | |
| | 6,475 | | | | | Applied Materials, Inc. | | | 119,464 | | |
| | 5,300 | | | @,L | | Cabot Microelectronics Corp. | | | 179,882 | | |
| | 26,800 | | | @,L | | Emulex Corp. | | | 522,868 | | |
| | 10,906 | | | @ | | Exar Corp. | | | 141,778 | | |
| | 20,017 | | | @ | | Mattson Technology, Inc. | | | 186,558 | | |
| | 8,500 | | | @,L | | Rudolph Technologies, Inc. | | | 135,320 | | |
| | 8,416 | | | @ | | Teradyne, Inc. | | | 125,903 | | |
| | 3,000 | | | @ | | Varian Semiconductor
Equipment Associates, Inc. | | | 136,560 | | |
| | 18,700 | | | @,L | | Veeco Instruments, Inc. | | | 350,251 | | |
| | | | 1,898,584 | | |
| | | | | Software: 4.1% | |
| | 19,700 | | | @,L | | Aspen Technology, Inc. | | | 217,094 | | |
| | 9,400 | | | @ | | Efunds Corp. | | | 258,500 | | |
| | 12,400 | | | | | Inter-Tel, Inc. | | | 274,784 | | |
| | 24,100 | | | @,L | | Lawson Software, Inc. | | | 178,099 | | |
| | 25,162 | | | @,L | | Neoware, Inc. | | | 332,390 | | |
| | 58,000 | | | @,L | | Parametric Technology Corp. | | | 1,045,161 | | |
| | 71,100 | | | @,L | | Sybase, Inc. | | | 1,756,170 | | |
| | 42,113 | | | @,L | | Ulticom, Inc. | | | 403,864 | | |
| | | | 4,466,062 | | |
| | | | | Telecommunications: 1.6% | |
| | 14,000 | | | @,L | | Aeroflex, Inc. | | | 164,080 | | |
| | 11,906 | | | | | Commonwealth Telephone
Enterprises, Inc. | | | 498,385 | | |
| | 4,100 | | | @,L | | CommScope, Inc. | | | 124,968 | | |
| | 6,023 | | | @ | | CPI International, Inc. | | | 90,345 | | |
| | 46,800 | | | @,L | | EFJ, Inc. | | | 315,432 | | |
| | 19,373 | | | | | Iowa Telecommunications
Services, Inc. | | | 381,842 | | |
| | 8,200 | | | L | | Plantronics, Inc. | | | 173,840 | | |
| | | | 1,748,892 | | |
| | | | | Textiles: 0.4% | |
| | 11,103 | | | | | G&K Services, Inc. | | | 431,796 | | |
| | | | 431,796 | | |
See Accompanying Notes to Financial Statements
193
ING AMERICAN CENTURY PORTFOLIO OF INVESTMENTS
SMALL-MID CAP VALUE PORTFOLIO AS OF DECEMBER 31, 2006 (CONTINUED)
| Shares | | | | | | Value | |
| | | | | Toys/Games/Hobbies: 0.1% | |
| | 4,364 | | | | | Hasbro, Inc. | | $ | 118,919 | | |
| | | | 118,919 | | |
| | | | | Transportation: 1.7% | |
| | 3,800 | | | L | | Alexander & Baldwin, Inc. | | | 168,492 | | |
| | 2,669 | | | L | | Arkansas Best Corp. | | | 96,084 | | |
| | 9,500 | | | @@ | | Arlington Tankers Ltd. | | | 222,015 | | |
| | 21,800 | | | @@,L | | Double Hull Tankers, Inc. | | | 352,942 | | |
| | 19,855 | | | | | Heartland Express, Inc. | | | 298,222 | | |
| | 39,500 | | | | | Werner Enterprises, Inc. | | | 690,460 | | |
| | | | 1,828,215 | | |
| | | | | Trucking & Leasing: 0.2% | |
| | 4,200 | | | | | Aircastle Ltd. | | | 123,900 | | |
| | 2,512 | | | @@ | | Genesis Lease, Ltd. ADR | | | 59,032 | | |
| | | | 182,932 | | |
Total Common Stock
(Cost $98,152,253) | | | 104,553,932 | | |
| PREFERRED STOCK: 0.7% | | | |
| | | | | Insurance: 0.6% | |
| | 11,900 | | | @@ | | Aspen Insurance Holdings Ltd. | | | 647,063 | | |
| | | | 647,063 | | |
| | | | | Real Estate Investment Trusts: 0.1% | |
| | 4,900 | | | P | | Natl Retail Properties | | | 124,705 | | |
| | | | 124,705 | | |
Total Preferred Stock
(Cost $722,018) | | | 771,768 | | |
Total Long-Term Investments
(Cost $98,874,271) | | | 105,325,700 | | |
Principal
Amount | | | | Value | |
| SHORT-TERM INVESTMENTS: 19.6% | |
| | | Securities Lending Collateralcc: 19.6% | |
| $ | 21,258,300 | | | The Bank of New York Institutional
Cash Reserves Fund | | | 21,258,300 | | |
Total Short-Term Investments
(Cost $21,258,300) | | | 21,258,300 | | |
Total Investments in
Securities (Cost
$120,132,571)* | | | 116.6 | % | | $ | 126,584,000 | | |
Other Assets and
Liabilities - Net | | | (16.6 | ) | | | (18,054,605 | ) | |
| Net Assets | | | 100.0 | % | | $ | 108,529,395 | | |
@ Non-income producing security
@@ Foreign Issuer
ADR American Depositary Receipt
P Preferred Stock may be called prior to convertible date.
cc Securities purchased with cash collateral for securities loaned.
L Loaned security, a portion or all of the security is on loan at December 31, 2006.
* Cost for federal income tax purposes is $122,398,371.
Net unrealized appreciation consists of:
| Gross Unrealized Appreciation | | $ | 5,381,535 | | |
| Gross Unrealized Depreciation | | | (1,195,906 | ) | |
| Net Unrealized Appreciation | | $ | 4,185,629 | | |
At December 31, 2006 the following forward currency contracts were outstanding for the ING American Century Small-Mid Cap Value Portfolio:
| Currency | | Buy/Sell | | Settlement
Date | | In
Exchange
For | | Value | | Unrealized
Appreciation
(Depreciation) | |
| Canada Dollars | | | | | | USD | | | | | | |
| | |
| CAD 112,988 | | Sell | | 1/31/07 | | 97,357 | | | 96,983 | | | $ | 374 | | |
EURO
EUR 232,566 | | Sell | | 1/31/07 | | USD
305,710 | | | 307,485 | | | | (1,775 | ) | |
British Pound Sterling
GBP 45,380 | | Sell | | 1/31/07 | | USD
88,781 | | | 88,872 | | | | (91 | ) | |
| | | $ | (1,492 | ) | |
See Accompanying Notes to Financial Statements
194
PORTFOLIO OF INVESTMENTS
ING BARON ASSET PORTFOLIO AS OF DECEMBER 31, 2006
| Shares | | | | | | Value | |
| COMMON STOCK: 95.2% | | | |
| | | | | Advertising: 2.6% | |
| | 600 | | | @ | | Getty Images, Inc. | | $ | 25,692 | | |
| | 3,300 | | | @ | | Lamar Advertising Co. | | | 215,787 | | |
| | | | 241,479 | | |
| | | | | Aerospace/Defense: 1.0% | |
| | 2,200 | | | @@ | | Empresa Brasileira de
Aeronautica SA | | | 91,102 | | |
| | | | 91,102 | | |
| | | | | Apparel: 2.6% | |
| | 3,100 | | | | | Polo Ralph Lauren Corp. | | | 240,746 | | |
| | | | 240,746 | | |
| | | | | Banks: 2.4% | |
| | 2,100 | | | | | Cathay General Bancorp. | | | 72,471 | | |
| | 2,000 | | | | | City National Corp. | | | 142,400 | | |
| | | | 214,871 | | |
| | | | | Commercial Services: 4.4% | |
| | 1,000 | | | | | Corporate Executive Board Co. | | | 87,700 | | |
| | 5,700 | | | @ | | Iron Mountain, Inc. | | | 235,638 | | |
| | 4,500 | | | @ | | SAIC, Inc. | | | 80,055 | | |
| | | | 403,393 | | |
| | | | | Distribution/Wholesale: 2.4% | |
| | 3,300 | | | | | Fastenal Co. | | | 118,404 | | |
| | 2,500 | | | | | Pool Corp. | | | 97,925 | | |
| | | | 216,329 | | |
| | | | | Diversified Financial Services: 16.5% | |
| | 2,700 | | | | | AllianceBernstein Holding LP | | | 217,080 | | |
| | 10,700 | | | | | Charles Schwab Corp. | | | 206,938 | | |
| | 400 | | | | | Chicago Mercantile Exchange
Holdings, Inc. | | | 203,900 | | |
| | 5,500 | | | | | Eaton Vance Corp. | | | 181,555 | | |
| | 900 | | | | | First Marblehead Corp. | | | 49,185 | | |
| | 4,400 | | | | | International Securities Exchange, Inc. | | | 205,876 | | |
| | 7,600 | | | | | Jefferies Group, Inc. | | | 203,832 | | |
| | 3,000 | | | | | Nuveen Investments, Inc. | | | 155,640 | | |
| | 400 | | | | | Student Loan Corp. | | | 82,920 | | |
| | | | 1,506,926 | | |
| | | | | Entertainment: 1.5% | |
| | 4,500 | | | @ | | Scientific Games Corp. | | | 136,035 | | |
| | | | 136,035 | | |
| | | | | Environmental Control: 1.9% | |
| | 2,300 | | | @ | | Stericycle, Inc. | | | 173,650 | | |
| | | | 173,650 | | |
| | | | | Food: 1.4% | |
| | 2,700 | | | | | Whole Foods Market, Inc. | | | 126,711 | | |
| | | | 126,711 | | |
| | | | | Gas: 2.0% | |
| | 6,500 | | | | | Southern Union Co. | | | 181,675 | | |
| | | | 181,675 | | |
| | | | | Healthcare-Products: 4.9% | |
| | 3,600 | | | | | Dentsply International, Inc. | | | 107,460 | | |
| | 2,300 | | | @ | | Edwards Lifesciences Corp. | | | 108,192 | | |
| | 2,600 | | | @ | | Henry Schein, Inc. | | | 127,348 | | |
| | 1,300 | | | @ | | Idexx Laboratories, Inc. | | | 103,090 | | |
| | | | 446,090 | | |
| Shares | | | | | | Value | |
| | | | | Healthcare-Services: 7.1% | |
| | 2,200 | | | | | Brookdale Senior Living, Inc. | | $ | 105,600 | | |
| | 3,400 | | | @ | | Community Health Systems, Inc. | | | 124,168 | | |
| | 1,900 | | | @ | | Covance, Inc. | | | 111,929 | | |
| | 1,800 | | | @ | | Laboratory Corp. of America Holdings | | | 132,246 | | |
| | 3,700 | | | | | Manor Care, Inc. | | | 173,604 | | |
| | | | 647,547 | | |
| | | | | Home Builders: 1.8% | |
| | 5,000 | | | @ | | Toll Brothers, Inc. | | | 161,150 | | |
| | | | 161,150 | | |
| | | | | Insurance: 5.6% | |
| | 2,300 | | | @,@@ | | Arch Capital Group Ltd. | | | 155,503 | | |
| | 2,500 | | | | | Assurant, Inc. | | | 138,125 | | |
| | 5,000 | | | | | Brown & Brown, Inc. | | | 141,050 | | |
| | 2,500 | | | | | HCC Insurance Holdings, Inc. | | | 80,225 | | |
| | | | 514,903 | | |
| | | | | Lodging: 10.3% | |
| | 5,500 | | | | | Boyd Gaming Corp. | | | 249,205 | | |
| | 4,000 | | | @ | | Las Vegas Sands Corp. | | | 357,920 | | |
| | 3,500 | | | @ | | Wynn Resorts Ltd. | | | 328,475 | | |
| | | | 935,600 | | |
| | | | | Oil & Gas: 3.5% | |
| | 3,200 | | | | | Helmerich & Payne, Inc. | | | 78,304 | | |
| | 3,500 | | | | | Range Resources Corp. | | | 96,110 | | |
| | 3,000 | | | | | XTO Energy, Inc. | | | 141,150 | | |
| | | | 315,564 | | |
| | | | | Oil & Gas Services: 1.2% | |
| | 1,100 | | | @ | | SEACOR Holdings, Inc. | | | 109,054 | | |
| | | | 109,054 | | |
| | | | | Pharmaceuticals: 1.1% | |
| | 3,200 | | | @ | | VCA Antech, Inc. | | | 103,008 | | |
| | | | 103,008 | | |
| | | | | Real Estate: 5.7% | |
| | 10,000 | | | @ | | CB Richard Ellis Group, Inc. | | | 332,000 | | |
| | 1,800 | | | | | Forest City Enterprises, Inc. | | | 105,120 | | |
| | 1,500 | | | | | St. Joe Co. | | | 80,355 | | |
| | | | 517,475 | | |
| | | | | Real Estate Investment Trusts: 3.5% | |
| | 500 | | | | | AvalonBay Communities, Inc. | | | 65,025 | | |
| | 2,400 | | | @ | | Douglas Emmett, Inc. | | | 63,816 | | |
| | 1,400 | | | | | SL Green Realty Corp. | | | 185,892 | | |
| | | | 314,733 | | |
| | | | | Retail: 6.2% | |
| | 2,200 | | | @ | | Carmax, Inc. | | | 117,986 | | |
| | 3,800 | | | @ | | Cheesecake Factory | | | 93,480 | | |
| | 3,500 | | | @ | | Copart, Inc. | | | 105,000 | | |
| | 2,500 | | | @ | | O'Reilly Automotive, Inc. | | | 80,150 | | |
| | 4,200 | | | | | Tiffany & Co. | | | 164,808 | | |
| | | | 561,424 | | |
| | | | | Software: 1.5% | |
| | 2,300 | | | | | SEI Investments Co. | | | 136,988 | | |
| | | | 136,988 | | |
See Accompanying Notes to Financial Statements
195
PORTFOLIO OF INVESTMENTS
ING BARON ASSET PORTFOLIO AS OF DECEMBER 31, 2006 (CONTINUED)
| Shares | | | | | | Value | |
| | | | | Transportation: 4.1% | |
| | 3,000 | | | @ | | CH Robinson Worldwide, Inc. | | $ | 122,670 | | |
| | 2,400 | | | | | Expeditors International
Washington, Inc. | | | 97,200 | | |
| | 5,000 | | | @@ | | UTI Worldwide, Inc. | | | 149,500 | | |
| | | | 369,370 | | |
Total Investments in
Securities (Cost
$7,532,670)* | | | 95.2 | % | | $ | 8,665,823 | | |
Other Assets and
Liabilities - Net | | | 4.8 | | | | 441,641 | | |
| Net Assets | | | 100.0 | % | | $ | 9,107,464 | | |
@ Non-income producing security
@@ Foreign Issuer
* Cost for federal income tax purposes is $7,536,439.
Net unrealized appreciation consists of:
| Gross Unrealized Appreciation | | $ | 1,395,642 | | |
| Gross Unrealized Depreciation | | | (266,258 | ) | |
| Net Unrealized Appreciation | | $ | 1,129,384 | | |
See Accompanying Notes to Financial Statements
196
ING BARON SMALL CAP PORTFOLIO OF INVESTMENTS
GROWTH PORTFOLIO AS OF DECEMBER 31, 2006
| Shares | | | | | | Value | |
| COMMON STOCK: 91.6% | | | |
| | | | | Advertising: 0.2% | |
| | 5,000 | | | @ | | Getty Images, Inc. | | $ | 214,100 | | |
| | 10,000 | | | @ | | R.H. Donnelley Corp. | | | 627,300 | | |
| | | | 841,400 | | |
| | | | | Airlines: 0.4% | |
| | 145,000 | | | @ | | JetBlue Airways Corp. | | | 2,059,000 | | |
| | | | 2,059,000 | | |
| | | | | Apparel: 1.8% | |
| | 300,000 | | | @ | | Carter's, Inc. | | | 7,650,000 | | |
| | 10,000 | | | | | Polo Ralph Lauren Corp. | | | 776,600 | | |
| | | | 8,426,600 | | |
| | | | | Auto Parts & Equipment: 0.4% | |
| | 451,500 | | | @ | | Delphi Corp. | | | 1,724,730 | | |
| | | | 1,724,730 | | |
| | | | | Banks: 5.4% | |
| | 80,000 | | | | | Cathay General Bancorp. | | | 2,760,800 | | |
| | 190,000 | | | | | Center Financial Corp. | | | 4,554,300 | | |
| | 120,000 | | | | | Central Pacific Financial Corp. | | | 4,651,200 | | |
| | 160,000 | | | | | First Republic Bank | | | 6,252,800 | | |
| | 200,000 | | | | | UCBH Holdings, Inc. | | | 3,512,000 | | |
| | 110,000 | | | @ | | Western Alliance Bancorp. | | | 3,824,700 | | |
| | | | 25,555,800 | | |
| | | | | Beverages: 0.7% | |
| | 125,000 | | | @ | | Peet's Coffee & Tea, Inc. | | | 3,280,000 | | |
| | | | 3,280,000 | | |
| | | | | Biotechnology: 0.3% | |
| | 32,000 | | | @ | | Charles River Laboratories
International, Inc. | | | 1,384,000 | | |
| | | | 1,384,000 | | |
| | | | | Building Materials: 1.5% | |
| | 160,000 | | | | | Eagle Materials, Inc. | | | 6,916,800 | | |
| | | | 6,916,800 | | |
| | | | | Chemicals: 1.1% | |
| | 250,000 | | | @ | | Symyx Technologies | | | 5,397,500 | | |
| | | | 5,397,500 | | |
| | | | | Commercial Services: 8.2% | |
| | 125,000 | | | | | Chemed Corp. | | | 4,622,500 | | |
| | 47,100 | | | @ | | ChoicePoint, Inc. | | | 1,854,798 | | |
| | 120,000 | | | @ | | CoStar Group, Inc. | | | 6,427,200 | | |
| | 325,000 | | | | | DeVry, Inc. | | | 9,100,000 | | |
| | 130,000 | | | | | Macquarie Infrastructure
Co. Trust | | | 4,612,400 | | |
| | 100,000 | | | @ | | Morningstar, Inc. | | | 4,505,000 | | |
| | 160,000 | | | @ | | PRA International | | | 4,043,200 | | |
| | 100,000 | | | @ | | Senomyx, Inc. | | | 1,299,000 | | |
| | 25,000 | | | | | Strayer Education, Inc. | | | 2,651,250 | | |
| | | | 39,115,348 | | |
| | | | | Distribution/Wholesale: 1.7% | |
| | 135,000 | | | @ | | Beacon Roofing Supply, Inc. | | | 2,540,700 | | |
| | 80,000 | | | | | Pool Corp. | | | 3,133,600 | | |
| | 50,000 | | | | | Watsco, Inc. | | | 2,358,000 | | |
| | | | 8,032,300 | | |
| Shares | | | | | | Value | |
| | | | | Diversified Financial Services: 9.1% | |
| | 280,000 | | | | | Cohen & Steers, Inc. | | $ | 11,247,600 | | |
| | 41,000 | | | @ | | Evercore Partners, Inc. | | | 1,510,850 | | |
| | 97,500 | | | | | First Marblehead Corp. | | | 5,328,375 | | |
| | 16,000 | | | | | GAMCO Investors, Inc. | | | 615,360 | | |
| | 200,000 | | | | | International Securities
Exchange, Inc. | | | 9,358,000 | | |
| | 250,000 | | | | | Jefferies Group, Inc. | | | 6,705,000 | | |
| | 145,000 | | | | | National Financial Partners Corp. | | | 6,375,650 | | |
| | 100,000 | | | @ | | Thomas Weisel Partners
Group, Inc. | | | 2,110,000 | | |
| | | | 43,250,835 | | |
| | | | | Electric: 1.4% | |
| | 160,000 | | | | | ITC Holdings Corp. | | | 6,384,000 | | |
| | | | 6,384,000 | | |
| | | | | Energy-Alternate Sources: 1.1% | |
| | 142,308 | | | @ | | Sunpower Corp. | | | 5,289,588 | | |
| | | | 5,289,588 | | |
| | | | | Entertainment: 4.7% | |
| | 75,000 | | | @ | | Great Wolf Resorts, Inc. | | | 1,047,000 | | |
| | 200,000 | | | @ | | Isle of Capri Casinos, Inc. | | | 5,316,000 | | |
| | 50,000 | | | @ | | Penn National Gaming, Inc. | | | 2,081,000 | | |
| | 100,000 | | | @ | | Pinnacle Entertainment, Inc. | | | 3,314,000 | | |
| | 150,000 | | | @ | | Scientific Games Corp. | | | 4,534,500 | | |
| | 150,000 | | | @ | | Shuffle Master, Inc. | | | 3,930,000 | | |
| | 45,000 | | | @ | | Vail Resorts, Inc. | | | 2,016,900 | | |
| | | | 22,239,400 | | |
| | | | | Food: 1.3% | |
| | 125,000 | | | @ | | Ralcorp Holdings, Inc. | | | 6,361,250 | | |
| | | | 6,361,250 | | |
| | | | | Gas: 0.5% | |
| | 88,198 | | | | | Southern Union Co. | | | 2,465,134 | | |
| | | | 2,465,134 | | |
| | | | | Healthcare-Products: 3.5% | |
| | 100,000 | | | @ | | Edwards Lifesciences Corp. | | | 4,704,000 | | |
| | 75,000 | | | @ | | Gen-Probe, Inc. | | | 3,927,750 | | |
| | 35,000 | | | @ | | Intuitive Surgical, Inc. | | | 3,356,500 | | |
| | 70,000 | | | @ | | Kensey Nash Corp. | | | 2,226,000 | | |
| | 115,000 | | | @ | | PSS World Medical, Inc. | | | 2,245,950 | | |
| | | | 16,460,200 | | |
| | | | | Healthcare-Services: 6.7% | |
| | 200,000 | | | @ | | Amerigroup Corp. | | | 7,178,000 | | |
| | 175,000 | | | @ | | Centene Corp. | | | 4,299,750 | | |
| | 80,000 | | | @ | | Community Health Systems, Inc. | | | 2,921,600 | | |
| | 35,000 | | | | | Manor Care, Inc. | | | 1,642,200 | | |
| | 122,000 | | | @ | | Nighthawk Radiology
Holdings, Inc. | | | 3,111,000 | | |
| | 90,000 | | | @ | | Odyssey HealthCare, Inc. | | | 1,193,400 | | |
| | 45,000 | | | @ | | United Surgical Partners
International, Inc. | | | 1,275,750 | | |
| | 150,000 | | | @ | | WellCare Health Plans, Inc. | | | 10,335,000 | | |
| | | | 31,956,700 | | |
| | | | | Home Builders: 1.6% | |
| | 100,000 | | | | | Brookfield Homes Corp. | | | 3,755,000 | | |
| | 40,000 | | | @ | | Hovnanian Enterprises, Inc. | | | 1,356,000 | | |
| | 40,000 | | | @ | | Meritage Homes Corp. | | | 1,908,800 | | |
| | 25,000 | | | | | Standard-Pacific Corp. | | | 669,750 | | |
| | | | 7,689,550 | | |
See Accompanying Notes to Financial Statements
197
ING BARON SMALL CAP PORTFOLIO OF INVESTMENTS
GROWTH PORTFOLIO AS OF DECEMBER 31, 2006 (CONTINUED)
| Shares | | | | | | Value | |
| | | | | Household Products/Wares: 1.1% | |
| | 125,000 | | | | | Church & Dwight Co., Inc. | | $ | 5,331,250 | | |
| | | | 5,331,250 | | |
| | | | | Insurance: 1.0% | |
| | 65,000 | | | @,@@ | | Arch Capital Group Ltd. | | | 4,394,650 | | |
| | 10,000 | | | | | Brown & Brown, Inc. | | | 282,100 | | |
| | | | 4,676,750 | | |
| | | | | Internet: 3.6% | |
| | 80,000 | | | @ | | Blue Nile, Inc. | | | 2,951,200 | | |
| | 50,000 | | | @ | | Checkfree Corp. | | | 2,008,000 | | |
| | 120,000 | | | @ | | Equinix, Inc. | | | 9,074,400 | | |
| | 125,000 | | | @ | | NetFlix, Inc. | | | 3,232,500 | | |
| | | | 17,266,100 | | |
| | | | | Leisure Time: 0.8% | |
| | 80,000 | | | @ | | Life Time Fitness, Inc. | | | 3,880,800 | | |
| | | | 3,880,800 | | |
| | | | | Lodging: 5.5% | |
| | 200,000 | | | | | Ameristar Casinos, Inc. | | | 6,148,000 | | |
| | 70,000 | | | | | Choice Hotels International, Inc. | | | 2,947,000 | | |
| | 80,000 | | | @@ | | Four Seasons Hotels, Inc. | | | 6,559,200 | | |
| | 40,000 | | | @ | | Gaylord Entertainment Co. | | | 2,037,200 | | |
| | 45,000 | | | | | Station Casinos, Inc. | | | 3,675,150 | | |
| | 50,000 | | | @ | | Wynn Resorts Ltd. | | | 4,692,500 | | |
| | | | 26,059,050 | | |
| | | | | Media: 1.1% | |
| | 75,000 | | | @,@@ | | Central European Media
Enterprises Ltd. | | | 5,250,000 | | |
| | | | 5,250,000 | | |
| | | | | Miscellaneous Manufacturing: 0.3% | |
| | 35,000 | | | | | American Railcar Industries, Inc. | | | 1,191,400 | | |
| | | | 1,191,400 | | |
| | | | | Oil & Gas: 1.7% | |
| | 160,000 | | | @ | | Encore Acquisition Co. | | | 3,924,800 | | |
| | 60,000 | | | @ | | EXCO Resources, Inc. | | | 1,014,600 | | |
| | 45,000 | | | | | Range Resources Corp. | | | 1,235,700 | | |
| | 45,000 | | | @ | | Whiting Petroleum Corp. | | | 2,097,000 | | |
| | | | 8,272,100 | | |
| | | | | Oil & Gas Services: 3.5% | |
| | 80,000 | | | @,@@ | | Core Laboratories NV | | | 6,480,000 | | |
| | 160,000 | | | @ | | Dresser-Rand Group, Inc. | | | 3,915,200 | | |
| | 80,000 | | | @ | | FMC Technologies, Inc. | | | 4,930,400 | | |
| | 15,000 | | | @ | | SEACOR Holdings, Inc. | | | 1,487,100 | | |
| | | | 16,812,700 | | |
| | | | | Pharmaceuticals: 0.2% | |
| | 250,000 | | | @ | | Depomed, Inc. | | | 862,500 | | |
| | | | 862,500 | | |
| | | | | Real Estate: 1.7% | |
| | 240,000 | | | @ | | CB Richard Ellis Group, Inc. | | | 7,968,000 | | |
| | | | 7,968,000 | | |
| | | | | Real Estate Investment Trusts: 2.0% | |
| | 10,500 | | | @ | | Alexander's, Inc. | | | 4,406,325 | | |
| | 201,800 | | | | | CBRE Realty Finance, Inc. | | | 3,170,278 | | |
| | 160,000 | | | | | Spirit Finance Corp. | | | 1,995,200 | | |
| | | | 9,571,803 | | |
| Shares | | | | | | Value | |
| | | | | Retail: 15.5% | |
| | | | 85,000 | | | @ | | Cabela's, Inc. | | $ | 2,051,050 | | |
| | | | 180,000 | | | @ | | California Pizza Kitchen, Inc. | | | 5,995,800 | | |
| | | | 100,000 | | | @ | | Carmax, Inc. | | | 5,363,000 | | |
| | | | 180,000 | | | @ | | Cheesecake Factory | | | 4,428,000 | | |
| | | | 200,000 | | | @ | | Copart, Inc. | | | 6,000,000 | | |
| | | | 200,000 | | | @ | | Dick's Sporting Goods, Inc. | | | 9,798,000 | | |
| | | | 100,000 | | | @ | | DSW, Inc. | | | 3,857,000 | | |
| | | | 80,000 | | | @ | | Guitar Center, Inc. | | | 3,636,800 | | |
| | | | 120,000 | | | @ | | J Crew Group, Inc. | | | 4,626,000 | | |
| | | | 60,000 | | | @ | | Panera Bread Co. | | | 3,354,600 | | |
| | | | 75,000 | | | @ | | PF Chang's China Bistro, Inc. | | | 2,878,500 | | |
| | | | 300,000 | | | @ | | Select Comfort Corp. | | | 5,217,000 | | |
| | | | 100,000 | | | @ | | Texas Roadhouse, Inc. | | | 1,326,000 | | |
| | | | 70,000 | | | @ | | Tractor Supply Co. | | | 3,129,700 | | |
| | | | 125,000 | | | @ | | Under Armour, Inc. | | | 6,306,250 | | |
| | | | 250,000 | | | | | United Auto Group, Inc. | | | 5,892,500 | | |
| | | | 73,860,200 | | |
| | | | | Telecommunications: 0.5% | |
| | | | 90,000 | | | @ | | SBA Communications Corp. | | | 2,475,000 | | |
| | | | 2,475,000 | | |
| | | | | Transportation: 1.5% | |
| | | | 30,000 | | | | | Florida East Coast Industries | | | 1,788,000 | | |
| | | | 120,000 | | | @ | | Genesee & Wyoming, Inc. | | | 3,148,800 | | |
| | | | 60,000 | | | | | Landstar System, Inc. | | | 2,290,800 | | |
| | | | 7,227,600 | | |
Total Common Stock
(Cost $327,373,793) | | | 435,535,388 | | |
Principal
Amount | | | | | | Value | |
| CONVERTIBLE BONDS: 0.8% | |
| | | | | Lodging: 0.8% | |
| $ | 1,000,000 | | | | #,C | | | Wynn Resorts Ltd.,
6.000%, due 07/15/15 | | | | | 4,097,500 | | |
Total Convertible Bonds
(Cost $981,874) | | | 4,097,500 | | |
Total Long-Term Investments
(Cost $328,355,667) | | | 439,632,888 | | |
| SHORT-TERM INVESTMENTS: 7.1% | |
| | | U.S. Government
Agency Obligations: 7.1% | |
| | 33,536,000 | | | Federal Home Loan Bank,
4.600%, due 01/02/07 | | | 33,527,430 | | |
Total Short-Term Investments
(Cost $33,527,430) | | | 33,527,430 | | |
Total Investments in
Securities (Cost
$361,883,097)* | | | 99.5 | % | | $ | 473,160,318 | | |
Other Assets and
Liabilities - Net | | | 0.5 | | | | 2,497,512 | | |
| Net Assets | | | 100.0 | % | | $ | 475,657,830 | | |
@ Non-income producing security
@@ Foreign Issuer
# Securities with purchases pursuant to Rule 144A, under the Securities Act of 1933 and may Not be resold subject to that rule except to qualified institutional buyers. These securities
See Accompanying Notes to Financial Statements
198
ING BARON SMALL CAP PORTFOLIO OF INVESTMENTS
GROWTH PORTFOLIO AS OF DECEMBER 31, 2006 (CONTINUED)
Have been determined to be liquid under the guidelines established by the Funds' Board of Directors/Trustees.
C Bond may be called prior to maturity date.
* Cost for federal income tax purposes is $362,124,099.
Net unrealized appreciation consists of:
| Gross Unrealized Appreciation | | $ | 120,911,683 | | |
| Gross Unrealized Depreciation | | | (9,875,464 | ) | |
| Net Unrealized Appreciation | | $ | 111,036,219 | | |
See Accompanying Notes to Financial Statements
199
ING COLUMBIA PORTFOLIO OF INVESTMENTS
SMALL CAP VALUE II PORTFOLIO AS OF DECEMBER 31, 2006
| Shares | | | | | | Value | |
| COMMON STOCK: 98.7% | | | |
| | | | | Aerospace/Defense: 4.1% | |
| | 32,500 | | | @ | | AAR Corp. | | $ | 948,675 | | |
| | 34,000 | | | @ | | BE Aerospace, Inc. | | | 873,120 | | |
| | 18,000 | | | | | DRS Technologies, Inc. | | | 948,240 | | |
| | 20,000 | | | @ | | Esterline Technologies Corp. | | | 804,600 | | |
| | | | 3,574,635 | | |
| | | | | Agriculture: 1.1% | |
| | 19,000 | | | | | Universal Corp. | | | 931,190 | | |
| | | | 931,190 | | |
| | | | | Airlines: 1.6% | |
| | 59,500 | | | @ | | Airtran Holdings, Inc. | | | 698,530 | | |
| | 18,000 | | | @ | | Alaska Air Group, Inc. | | | 711,000 | | |
| | | | 1,409,530 | | |
| | | | | Apparel: 3.1% | |
| | 16,000 | | | | | Phillips-Van Heusen | | | 802,720 | | |
| | 59,000 | | | @ | | Quiksilver, Inc. | | | 929,250 | | |
| | 39,000 | | | @ | | Warnaco Group, Inc. | | | 989,820 | | |
| | | | 2,721,790 | | |
| | | | | Auto Parts & Equipment: 1.2% | |
| | 28,000 | | | @ | | Tenneco, Inc. | | | 692,160 | | |
| | 40,600 | | | @ | | Visteon Corp. | | | 344,288 | | |
| | | | 1,036,448 | | |
| | | | | Banks: 11.2% | |
| | 34,000 | | | | | Americanwest Bancorp. | | | 823,480 | | |
| | 28,000 | | | | | Bancorpsouth, Inc. | | | 750,960 | | |
| | 24,500 | | | | | Colonial BancGroup, Inc. | | | 630,630 | | |
| | 30,000 | | | | | Community Bank System, Inc. | | | 690,000 | | |
| | 18,000 | | | | | First Midwest Bancorp., Inc. | | | 696,240 | | |
| | 9,000 | | | | | First Republic Bank | | | 351,720 | | |
| | 24,500 | | | | | First State Bancorp. | | | 606,375 | | |
| | 23,000 | | | | | Independent Bank Corp. | | | 828,690 | | |
| | 27,000 | | | | | Pacific Capital Bancorp. | | | 906,660 | | |
| | 28,000 | | | | | Placer Sierra Bancshares | | | 665,560 | | |
| | 24,000 | | | | | Prosperity Bancshares, Inc. | | | 828,240 | | |
| | 14,800 | | | | | Seacoast Banking Corp. of Florida | | | 367,040 | | |
| | 17,500 | | | @ | | SVB Financial Group | | | 815,850 | | |
| | 30,000 | | | | | Umpqua Holdings Corp. | | | 882,900 | | |
| | | | 9,844,345 | | |
| | | | | Beverages: 0.5% | |
| | 29,100 | | | @,@@ | | Cott Corp. | | | 416,421 | | |
| | | | 416,421 | | |
| | | | | Building Materials: 1.9% | |
| | 67,000 | | | | | Comfort Systems USA, Inc. | | | 846,880 | | |
| | 41,000 | | | | | LSI Industries, Inc. | | | 813,850 | | |
| | | | 1,660,730 | | |
| | | | | Commercial Services: 6.1% | |
| | 40,000 | | | | | ABM Industries, Inc. | | | 908,400 | | |
| | 23,000 | | | @ | | AMN Healthcare Services, Inc. | | | 633,420 | | |
| | 14,100 | | | @ | | Consolidated Graphics, Inc. | | | 832,887 | | |
| | 29,000 | | | @ | | FTI Consulting, Inc. | | | 808,810 | | |
| | 13,300 | | | @ | | H&E Equipment Services, Inc. | | | 329,441 | | |
| | 44,000 | | | @ | | MPS Group, Inc. | | | 623,920 | | |
| | 76,000 | | | | | Stewart Enterprises, Inc. | | | 475,000 | | |
| | 16,000 | | | | | Watson Wyatt Worldwide, Inc. | | | 722,400 | | |
| | | | 5,334,278 | | |
| Shares | | | | | | Value | |
| | | | | Computers: 2.2% | |
| | 65,900 | | | @ | | Brocade Communications
Systems, Inc. | | $ | 541,039 | | |
| | 33,500 | | | @ | | Electronics for Imaging | | | 890,430 | | |
| | 30,000 | | | @ | | SYKES Enterprises, Inc. | | | 529,200 | | |
| | | | 1,960,669 | | |
| | | | | Cosmetics/Personal Care: 1.3% | |
| | 13,000 | | | @ | | Chattem, Inc. | | | 651,040 | | |
| | 24,500 | | | | | Inter Parfums, Inc. | | | 470,155 | | |
| | | | 1,121,195 | | |
| | | | | Diversified Financial Services: 4.0% | |
| | 9,000 | | | @ | | Affiliated Managers Group, Inc. | | | 946,170 | | |
| | 32,000 | | | @ | | Cowen Group, Inc. | | | 676,800 | | |
| | 20,500 | | | @@ | | Lazard Ltd. | | | 970,470 | | |
| | 20,500 | | | | | National Financial Partners Corp. | | | 901,385 | | |
| | | | 3,494,825 | | |
| | | | | Electric: 2.6% | |
| | 16,600 | | | | | ITC Holdings Corp. | | | 662,340 | | |
| | 27,000 | | | | | PNM Resources, Inc. | | | 839,700 | | |
| | 15,000 | | | | | WPS Resources Corp. | | | 810,450 | | |
| | | | 2,312,490 | | |
| | | | | Electronics: 3.3% | |
| | 23,500 | | | @ | | Benchmark Electronics, Inc. | | | 572,460 | | |
| | 14,700 | | | @ | | Electro Scientific Industries, Inc. | | | 296,058 | | |
| | 22,000 | | | | | Park Electrochemical Corp. | | | 564,300 | | |
| | 26,600 | | | @ | | Plexus Corp. | | | 635,208 | | |
| | 11,300 | | | @ | | Rofin-Sinar Technologies, Inc. | | | 683,198 | | |
| | 9,653 | | | | | X-Rite, Inc. | | | 118,732 | | |
| | | | 2,869,956 | | |
| | | | | Engineering & Construction: 0.9% | |
| | 14,000 | | | | | Washington Group
International, Inc. | | | 837,060 | | |
| | | | 837,060 | | |
| | | | | Entertainment: 1.0% | |
| | 21,700 | | | @ | | Bally Technologies, Inc. | | | 405,356 | | |
| | 25,000 | | | | | Carmike Cinemas, Inc. | | | 509,750 | | |
| | | | 915,106 | | |
| | | | | Exchange Traded Fund: 0.5% | |
| | 5,800 | | | @@ | | iShares Nasdaq Biotech Index | | | 451,008 | | |
| | | | 451,008 | | |
| | | | | Food: 1.0% | |
| | 28,000 | | | | | Sanderson Farms, Inc. | | | 848,120 | | |
| | | | 848,120 | | |
| | | | | Forest Products & Paper: 0.6% | |
| | 34,000 | | | | | Glatfelter | | | 527,000 | | |
| | | | 527,000 | | |
| | | | | Gas: 2.0% | |
| | 30,000 | | | | | Atmos Energy Corp. | | | 957,300 | | |
| | 17,000 | | | | | New Jersey Resources Corp. | | | 825,860 | | |
| | | | 1,783,160 | | |
| | | | | Healthcare-Products: 1.5% | |
| | 14,000 | | | | | Datascope Corp. | | | 510,160 | | |
| | 25,000 | | | @ | | Medical Action Industries, Inc. | | | 806,000 | | |
| | | | 1,316,160 | | |
See Accompanying Notes to Financial Statements
200
ING COLUMBIA PORTFOLIO OF INVESTMENTS
SMALL CAP VALUE II PORTFOLIO AS OF DECEMBER 31, 2006 (CONTINUED)
| Shares | | | | | | Value | |
| | | | | Healthcare-Services: 2.8% | |
| | 27,200 | | | @ | | LifePoint Hospitals, Inc. | | $ | 916,640 | | |
| | 22,000 | | | @ | | Magellan Health Services, Inc. | | | 950,840 | | |
| | 34,000 | | | @ | | Res-Care, Inc. | | | 617,100 | | |
| | | | 2,484,580 | | |
| | | | | Home Builders: 0.8% | |
| | 21,500 | | | @ | | Hovnanian Enterprises, Inc. | | | 728,850 | | |
| | | | 728,850 | | |
| | | | | Household Products/Wares: 1.4% | |
| | 9,000 | | | @ | | Central Garden & Pet Co. | | | 435,780 | | |
| | 33,000 | | | @,@@ | | Helen of Troy Ltd. | | | 800,580 | | |
| | | | 1,236,360 | | |
| | | | | Insurance: 4.7% | |
| | 26,000 | | | @ | | Argonaut Group, Inc. | | | 906,360 | | |
| | 21,000 | | | | | Delphi Financial Group | | | 849,660 | | |
| | 16,000 | | | | | NYMAGIC, Inc. | | | 585,600 | | |
| | 27,500 | | | @@ | | Platinum Underwriters
Holdings Ltd. | | | 850,850 | | |
| | 20,000 | | | | | Zenith National Insurance Corp. | | | 938,200 | | |
| | | | 4,130,670 | | |
| | | | | Internet: 1.5% | |
| | 40,000 | | | @ | | i2 Technologies, Inc. | | | 912,800 | | |
| | 51,500 | | | @ | | WebMethods, Inc. | | | 379,040 | | |
| | | | 1,291,840 | | |
| | | | | Investment Companies: 1.4% | |
| | 6,900 | | | | | American Capital Strategies Ltd. | | | 319,194 | | |
| | 39,459 | | | | | Apollo Investment Corp. | | | 883,882 | | |
| | | | 1,203,076 | | |
| | | | | Iron/Steel: 1.8% | |
| | 7,400 | | | | | Carpenter Technology Corp. | | | 758,648 | | |
| | 26,000 | | | | | Steel Dynamics, Inc. | | | 843,700 | | |
| | | | 1,602,348 | | |
| | | | | Machinery-Diversified: 2.3% | |
| | 20,500 | | | @ | | AGCO Corp. | | | 634,270 | | |
| | 21,500 | | | @ | | Gardner Denver, Inc. | | | 802,165 | | |
| | 44,000 | | | @ | | Gerber Scientific, Inc. | | | 552,640 | | |
| | | | 1,989,075 | | |
| | | | | Media: 0.8% | |
| | 43,000 | | | | | World Wrestling
Entertainment, Inc. | | | 700,900 | | |
| | | | 700,900 | | |
| | | | | Mining: 0.7% | |
| | 22,000 | | | | | Amcol International Corp. | | | 610,280 | | |
| | | | 610,280 | | |
| | | | | Miscellaneous Manufacturing: 2.0% | |
| | 46,000 | | | | | Barnes Group, Inc. | | | 1,000,500 | | |
| | 19,500 | | | | | Crane Co. | | | 714,480 | | |
| | | | 1,714,980 | | |
| | | | | Oil & Gas: 0.8% | |
| | 30,000 | | | @ | | Encore Acquisition Co. | | | 735,900 | | |
| | | | 735,900 | | |
| Shares | | | | | | Value | |
| | | | | Oil & Gas Services: 3.6% | |
| | 19,900 | | | @ | | Dawson Geophysical Co. | | $ | 724,957 | | |
| | 35,000 | | | @ | | Dresser-Rand Group, Inc. | | | 856,450 | | |
| | 25,500 | | | @ | | Oil States International, Inc. | | | 821,865 | | |
| | 12,000 | | | @ | | Universal Compression
Holdings, Inc. | | | 745,320 | | |
| | | | 3,148,592 | | |
| | | | | Packaging & Containers: 1.1% | |
| | 45,000 | | | @ | | Crown Holdings, Inc. | | | 941,400 | | |
| | | | 941,400 | | |
| | | | | Real Estate Investment Trusts: 7.7% | |
| | 9,000 | | | | | Alexandria Real Estate Equities, Inc. | | | 903,600 | | |
| | 44,000 | | | | | Equity Inns, Inc. | | | 702,240 | | |
| | 21,500 | | | | | LaSalle Hotel Properties | | | 985,775 | | |
| | 32,000 | | | | | LTC Properties, Inc. | | | 873,920 | | |
| | 14,000 | | | | | Mid-America Apartment
Communities, Inc. | | | 801,360 | | |
| | 50,000 | | | | | Omega Healthcare Investors, Inc. | | | 886,000 | | |
| | 23,000 | | | | | Tanger Factory Outlet Centers | | | 898,840 | | |
| | 33,500 | | | | | U-Store-It Trust | | | 688,425 | | |
| | | | 6,740,160 | | |
| | | | | Retail: 4.4% | |
| | 24,000 | | | @ | | AC Moore Arts & Crafts, Inc. | | | 520,080 | | |
| | 20,500 | | | | | Brown Shoe Co., Inc. | | | 978,670 | | |
| | 25,500 | | | @ | | Genesco, Inc. | | | 951,150 | | |
| | 35,000 | | | @ | | O'Charleys, Inc. | | | 744,800 | | |
| | 23,000 | | | | | Ruby Tuesday, Inc. | | | 631,120 | | |
| | | | 3,825,820 | | |
| | | | | Savings & Loans: 0.8% | |
| | 45,000 | | | | | First Niagara Financial Group, Inc. | | | 668,700 | | |
| | | | 668,700 | | |
| | | | | Semiconductors: 1.0% | |
| | 20,500 | | | @ | | Cypress Semiconductor Corp. | | | 345,835 | | |
| | 60,000 | | | @ | | Kulicke & Soffa Industries, Inc. | | | 504,000 | | |
| | | | 849,835 | | |
| | | | | Software: 0.5% | |
| | 65,000 | | | @ | | Lawson Software, Inc. | | | 480,350 | | |
| | | | 480,350 | | |
| | | | | Telecommunications: 3.7% | |
| | 141,000 | | | @ | | 3Com Corp. | | | 579,510 | | |
| | 68,000 | | | @ | | Aeroflex, Inc. | | | 796,960 | | |
| | 160,000 | | | @ | | Cincinnati Bell, Inc. | | | 731,200 | | |
| | 24,000 | | | @ | | CommScope, Inc. | | | 731,520 | | |
| | 57,000 | | | @ | | RF Micro Devices, Inc. | | | 387,030 | | |
| | | | 3,226,220 | | |
| | | | | Textiles: 0.7% | |
| | 17,000 | | | | | Unifirst Corp. | | | 652,970 | | |
| | | | 652,970 | | |
| | | | | Transportation: 1.6% | |
| | 31,500 | | | @@ | | Arlington Tankers Ltd. | | | 736,155 | | |
| | 31,000 | | | | | OMI Corp. | | | 656,270 | | |
| | | | 1,392,425 | | |
See Accompanying Notes to Financial Statements
201
ING COLUMBIA PORTFOLIO OF INVESTMENTS
SMALL CAP VALUE II PORTFOLIO AS OF DECEMBER 31, 2006 (CONTINUED)
| Shares | | | | | | Value | |
| | | | | Trucking & Leasing: 0.9% | |
| | 18,500 | | | | | GATX Corp. | | $ | 801,605 | | |
| | | | 801,605 | | |
Total Common Stock
(Cost $81,351,727) | | | 86,523,052 | | |
Principal
Amount | | | | Value | |
| SHORT-TERM INVESTMENTS: 0.5% | |
| | | U.S. Government Agency Obligations: 0.5% | |
| $ | 476,000 | | | Federal Home Loan Bank,
4.600%, due 01/02/07 | | | 475,878 | | |
Total Short-Term Investments
(Cost $475,878) | | | 475,878 | | |
Total Investments in
Securities (Cost
$81,827,605)* | | | 99.2 | % | | $ | 86,998,930 | | |
Other Assets and
Liabilities - Net | | | 0.8 | | | | 709,764 | | |
| Net Assets | | | 100.0 | % | | $ | 87,708,694 | | |
@ Non-income producing security
@@ Foreign Issuer
* Cost for federal income tax purposes is $81,880,294.
Net unrealized appreciation consists of:
| Gross Unrealized Appreciation | | $ | 6,229,013 | | |
| Gross Unrealized Depreciation | | | (1,110,377 | ) | |
| Net Unrealized Appreciation | | $ | 5,118,636 | | |
See Accompanying Notes to Financial Statements
202
PORTFOLIO OF INVESTMENTS
ING DAVIS VENTURE VALUE PORTFOLIO AS OF DECEMBER 31, 2006
| Shares | | | | | | Value | |
| COMMON STOCK: 95.7% | | | |
| | | | | Advertising: 0.3% | |
| | 8,500 | | | @@ | | WPP Group PLC | | $ | 575,790 | | |
| | | | 575,790 | | |
| | | | | Agriculture: 4.9% | |
| | 119,300 | | | | | Altria Group, Inc. | | | 10,238,326 | | |
| | | | 10,238,326 | | |
| | | | | Banks: 9.2% | |
| | 32,800 | | | | | Commerce Bancorp., Inc. | | | 1,156,856 | | |
| | 288,818 | | | @@ | | HSBC Holdings PLC | | | 5,256,442 | | |
| | 41,400 | | | | | Mellon Financial Corp. | | | 1,745,246 | | |
| | 9,400 | | | | | State Street Corp. | | | 633,936 | | |
| | 83,890 | | | | | Wachovia Corp. | | | 4,777,536 | | |
| | 154,900 | | | | | Wells Fargo & Co. | | | 5,508,244 | | |
| | | | 19,078,260 | | |
| | | | | Beverages: 2.1% | |
| | 36,400 | | | @@ | | Diageo PLC ADR | | | 2,886,884 | | |
| | 37,800 | | | @@ | | Heineken Holding NV | | | 1,535,455 | | |
| | | | 4,422,339 | | |
| | | | | Building Materials: 1.0% | |
| | 19,100 | | | | | Martin Marietta Materials, Inc. | | | 1,984,681 | | |
| | | | 1,984,681 | | |
| | | | | Coal: 0.2% | |
| | 705,500 | | | @,@@ | | China Coal Energy Co. | | | 458,040 | | |
| | | | 458,040 | | |
| | | | | Commercial Services: 4.1% | |
| | 12,900 | | | @ | | Apollo Group, Inc. | | | 502,713 | | |
| | 227,010 | | | @@ | | COSCO Pacific Ltd. | | | 531,066 | | |
| | 85,700 | | | | | H&R Block, Inc. | | | 1,974,528 | | |
| | 59,600 | | | @ | | Iron Mountain, Inc. | | | 2,463,864 | | |
| | 43,100 | | | | | Moody's Corp. | | | 2,976,486 | | |
| | | | 8,448,657 | | |
| | | | | Computers: 1.2% | |
| | 48,700 | | | @ | | Dell, Inc. | | | 1,221,883 | | |
| | 31,300 | | | | | Hewlett-Packard Co. | | | 1,289,247 | | |
| | | | 2,511,130 | | |
| | | | | Cosmetics/Personal Care: 1.4% | |
| | 25,800 | | | | | Avon Products, Inc. | | | 852,432 | | |
| | 33,000 | | | | | Procter & Gamble Co. | | | 2,120,910 | | |
| | | | 2,973,342 | | |
| | | | | Diversified Financial Services: 12.6% | |
| | 167,800 | | | | | American Express Co. | | | 10,180,426 | | |
| | 40,830 | | | | | Ameriprise Financial, Inc. | | | 2,225,235 | | |
| | 92,200 | | | | | Citigroup, Inc. | | | 5,135,540 | | |
| | 150,200 | | | | | JPMorgan Chase & Co. | | | 7,254,660 | | |
| | 18,000 | | | | | Morgan Stanley | | | 1,465,740 | | |
| | | | 26,261,601 | | |
| | | | | Food: 0.6% | |
| | 25,500 | | | | | Hershey Co. | | | 1,269,900 | | |
| | | | 1,269,900 | | |
| | | | | Food Service: 0.0% | |
| | 5,486 | | | @,X | | FHC Delaware, Inc. | | | 38,073 | | |
| | | | 38,073 | | |
| Shares | | | | | | Value | |
| | | | | Healthcare-Services: 1.3% | |
| | 49,300 | | | | | UnitedHealth Group, Inc. | | $ | 2,648,889 | | |
| | | | 2,648,889 | | |
| | | | | Holding Companies-Diversified: 0.6% | |
| | 321,020 | | | @@ | | China Merchants Holdings
International Co., Ltd. | | | 1,313,192 | | |
| | | | 1,313,192 | | |
| | | | | Housewares: 0.2% | |
| | 5,600 | | | @@ | | Hunter Douglas NV | | | 450,188 | | |
| | | | 450,188 | | |
| | | | | Insurance: 14.3% | |
| | 1,400 | | | | | AMBAC Financial Group, Inc. | | | 124,745 | | |
| | 125,300 | | | | | American International
Group, Inc. | | | 8,978,998 | | |
| | 41,600 | | | | | AON Corp. | | | 1,470,144 | | |
| | 51 | | | @ | | Berkshire Hathaway, Inc.-Class A | | | 5,609,490 | | |
| | 60 | | | @ | | Berkshire Hathaway, Inc.-Class B | | | 219,960 | | |
| | 15,330 | | | | | Chubb Corp. | | | 811,110 | | |
| | 2,900 | | | @@ | | Everest Re Group Ltd. | | | 284,519 | | |
| | 108,600 | | | | | Loews Corp. | | | 4,503,642 | | |
| | 390 | | | @ | | Markel Corp. | | | 187,239 | | |
| | 12,400 | | | | | Principal Financial Group | | | 727,880 | | |
| | 191,300 | | | | | Progressive Corp. | | | 4,633,286 | | |
| | 6,700 | | | @@ | | Sun Life Financial, Inc. | | | 283,745 | | |
| | 29,200 | | | | | Transatlantic Holdings, Inc. | | | 1,813,320 | | |
| | | | 29,648,078 | | |
| | | | | Internet: 1.3% | |
| | 33,600 | | | @ | | Amazon.com, Inc. | | | 1,325,856 | | |
| | 11,400 | | | @ | | Expedia, Inc. | | | 239,172 | | |
| | 11,200 | | | @ | | InterActiveCorp | | | 416,192 | | |
| | 28,600 | | | @ | | Liberty Media Holding
Corp.-Interactive | | | 616,902 | | |
| | | | 2,598,122 | | |
| | | | | Leisure Time: 1.3% | |
| | 39,300 | | | | | Harley-Davidson, Inc. | | | 2,769,471 | | |
| | | | 2,769,471 | | |
| | | | | Media: 5.6% | |
| | 131,000 | | | @ | | Comcast Corp. | | | 5,486,280 | | |
| | 7,700 | | | | | Gannett Co., Inc. | | | 465,542 | | |
| | 22,500 | | | @@ | | Lagardere SCA | | | 1,806,964 | | |
| | 5,840 | | | @ | | Liberty Media Holding Corp. | | | 572,203 | | |
| | 157,700 | | | | | News Corp., Inc. | | | 3,387,396 | | |
| | | | 11,718,385 | | |
| | | | | Mining: 1.3% | |
| | 22,100 | | | @@ | | BHP Billiton PLC | | | 404,716 | | |
| | 8,000 | | | @@ | | Rio Tinto PLC | | | 423,969 | | |
| | 20,600 | | | | | Vulcan Materials Co. | | | 1,851,322 | | |
| | | | 2,680,007 | | |
| | | | | Miscellaneous Manufacturing: 3.8% | |
| | 256,500 | | | @@ | | Tyco International Ltd. | | | 7,797,600 | | |
| | | | 7,797,600 | | |
| | | | | Oil & Gas: 11.6% | |
| | 38,600 | | | @@ | | Canadian Natural Resources Ltd. | | | 2,054,582 | | |
| | 125,400 | | | | | ConocoPhillips | | | 9,022,530 | | |
| | 69,900 | | | | | Devon Energy Corp. | | | 4,688,892 | | |
| | 55,800 | | | | | EOG Resources, Inc. | | | 3,484,710 | | |
See Accompanying Notes to Financial Statements
203
PORTFOLIO OF INVESTMENTS
ING DAVIS VENTURE VALUE PORTFOLIO AS OF DECEMBER 31, 2006 (CONTINUED)
| Shares | | | | | | Value | |
| | | | | Oil & Gas (continued) | |
| | 65,550 | | | | | Occidental Petroleum Corp. | | $ | 3,200,807 | | |
| | 20,800 | | | @ | | Transocean, Inc. | | | 1,682,512 | | |
| | | | 24,134,033 | | |
| | | | | Packaging & Containers: 1.9% | |
| | 60,400 | | | | | Sealed Air Corp. | | | 3,921,168 | | |
| | | | 3,921,168 | | |
| | | | | Pharmaceuticals: 2.4% | |
| | 23,800 | | | | | Cardinal Health, Inc. | | | 1,533,434 | | |
| | 43,300 | | | | | Caremark Rx, Inc. | | | 2,472,863 | | |
| | 14,400 | | | @ | | Express Scripts, Inc. | | | 1,031,040 | | |
| | | | 5,037,337 | | |
| | | | | Real Estate Investment Trusts: 1.3% | |
| | 51,000 | | | | | General Growth Properties, Inc. | | | 2,663,730 | | |
| | | | 2,663,730 | | |
| | | | | Retail: 6.0% | |
| | 32,700 | | | @ | | Bed Bath & Beyond, Inc. | | | 1,245,870 | | |
| | 10,400 | | | @ | | Carmax, Inc. | | | 557,752 | | |
| | 117,600 | | | | | Costco Wholesale Corp. | | | 6,217,512 | | |
| | 30,800 | | | | | Lowe's Cos., Inc. | | | 959,420 | | |
| | 2,900 | | | @ | | Sears Holding Corp. | | | 486,997 | | |
| | 63,700 | | | | | Wal-Mart Stores, Inc. | | | 2,941,666 | | |
| | | | 12,409,217 | | |
| | | | | Software: 2.2% | |
| | 152,100 | | | | | Microsoft Corp. | | | 4,541,706 | | |
| | | | 4,541,706 | | |
| | | | | Telecommunications: 2.2% | |
| | 23,000 | | | @@ | | Nokia OYJ ADR | | | 467,360 | | |
| | 36,756 | | | | | NTL, Inc. | | | 927,721 | | |
| | 39,400 | | | @@ | | SK Telecom Co., Ltd. ADR | | | 1,043,312 | | |
| | 111,000 | | | | | Sprint Nextel Corp. | | | 2,096,790 | | |
| | | | 4,535,183 | | |
| | | | | Transportation: 0.8% | |
| | 8,800 | | | @@ | | Kuehne & Nagel International AG | | | 639,294 | | |
| | 13,140 | | | | | United Parcel Service, Inc. | | | 985,237 | | |
| | | | 1,624,531 | | |
Total Common Stock
(Cost $179,103,378) | | | 198,750,976 | | |
Principal
Amount | | | | Value | |
| SHORT-TERM INVESTMENTS: 5.2% | |
| | | Commercial Paper: 5.2% | |
| $ | 8,987,000 | | | Rabobank, 5.220%, due 01/02/07 | | | 8,984,394 | | |
| | 1,898,000 | | | Three Pillars, 5.350%, due 01/02/07 | | | 1,897,436 | | |
Total Short-Term Investments
(Cost $10,881,830) | | | 10,881,830 | | |
Total Investments in
Securities (Cost
$189,985,208)* | | | 100.9 | % | | $ | 209,632,806 | | |
Other Assets and
Liabilities - Net | | | (0.9 | ) | | | (1,859,749 | ) | |
| Net Assets | | | 100.0 | % | | $ | 207,773,057 | | |
@ Non-income producing security
@@ Foreign Issuer
ADR American Depositary Receipt
X Fair value determined by ING Funds Valuation Committee appointed by the Funds' Board Of Directors/Trustees.
* Cost for federal income tax purposes is $189,973,348.
Net unrealized appreciation consists of:
| Gross Unrealized Appreciation | | $ | 20,994,577 | | |
| Gross Unrealized Depreciation | | | (1,335,119 | ) | |
| Net Unrealized Appreciation | | $ | 19,659,458 | | |
See Accompanying Notes to Financial Statements
204
PORTFOLIO OF INVESTMENTS
ING FUNDAMENTAL RESEARCH PORTFOLIO AS OF DECEMBER 31, 2006
| Shares | | | | | | Value | |
| COMMON STOCK: 99.3% | | | |
| | | | | Advertising: 0.0% | |
| | 19 | | | @ | | Interpublic Group of Cos., Inc. | | $ | 233 | | |
| | | | 233 | | |
| | | | | Agriculture: 3.0% | |
| | 34,838 | | | | | Altria Group, Inc. | | | 2,989,797 | | |
| | | | 2,989,797 | | |
| | | | | Banks: 7.0% | |
| | 45,735 | | | | | Bank of America Corp. | | | 2,441,792 | | |
| | 29,400 | | | | | Bank of New York Co., Inc. | | | 1,157,478 | | |
| | 17,479 | | | | | Capital One Financial Corp. | | | 1,342,737 | | |
| | 40,600 | | | | | US Bancorp. | | | 1,469,314 | | |
| | 14,082 | | | | | Wells Fargo & Co. | | | 500,756 | | |
| | | | 6,912,077 | | |
| | | | | Beverages: 1.3% | |
| | 19,800 | | | | | PepsiCo, Inc. | | | 1,238,490 | | |
| | | | 1,238,490 | | |
| | | | | Biotechnology: 0.7% | |
| | 10,900 | | | @ | | Genzyme Corp. | | | 671,222 | | |
| | | | 671,222 | | |
| | | | | Chemicals: 1.0% | |
| | 14,400 | | | | | Air Products & Chemicals, Inc. | | | 1,012,032 | | |
| | | | 1,012,032 | | |
| | | | | Computers: 6.9% | |
| | 17,500 | | | @ | | CACI International, Inc. | | | 988,750 | | |
| | 37,300 | | | | | Hewlett-Packard Co. | | | 1,536,387 | | |
| | 10,700 | | | | | International Business
Machines Corp. | | | 1,039,505 | | |
| | 83,300 | | | @ | | Isilon Systems, Inc. | | | 2,299,078 | | |
| | 37,700 | | | @@ | | Seagate Technology, Inc. | | | 999,050 | | |
| | 2,600 | | | @,X | | Seagate Technology, Inc.-Escrow | | | — | | |
| | | | 6,862,770 | | |
| | | | | Cosmetics/Personal Care: 2.3% | |
| | 35,696 | | | | | Procter & Gamble Co. | | | 2,294,182 | | |
| | | | 2,294,182 | | |
| | | | | Diversified Financial Services: 7.3% | |
| | 44,276 | | | | | Citigroup, Inc. | | | 2,466,173 | | |
| | 23,670 | | | | | Countrywide Financial Corp. | | | 1,004,792 | | |
| | 29,490 | | | @ | | E*Trade Financial Corp. | | | 661,166 | | |
| | 20,500 | | | | | JPMorgan Chase & Co. | | | 990,150 | | |
| | 17,365 | | | | | Merrill Lynch & Co., Inc. | | | 1,616,682 | | |
| | 29,500 | | | @ | | TD Ameritrade Holding Corp. | | | 477,310 | | |
| | | | 7,216,273 | | |
| | | | | Electric: 1.1% | |
| | 369 | | | @ | | Dynegy, Inc. | | | 2,672 | | |
| | 33,000 | | | @ | | Mirant Corp. | | | 1,041,810 | | |
| | | | 1,044,482 | | |
| | | | | Electrical Components & Equipment: 2.1% | |
| | 17,300 | | | | | Emerson Electric Co. | | | 762,757 | | |
| | 30,800 | | | @ | | General Cable Corp. | | | 1,346,268 | | |
| | | | 2,109,025 | | |
| Shares | | | | | | Value | |
| | | | | Electronics: 1.2% | |
| | 63,800 | | | @,@@ | | Flextronics International Ltd. | | $ | 732,424 | | |
| | 10,400 | | | @ | | Thomas & Betts Corp. | | | 491,712 | | |
| | | | 1,224,136 | | |
| | | | | Energy-Alternate Sources: 0.8% | |
| | 27,500 | | | @ | | First Solar, Inc. | | | 819,500 | | |
| | | | 819,500 | | |
| | | | | Engineering & Construction: 0.9% | |
| | 50,200 | | | @@ | | ABB Ltd. ADR | | | 902,596 | | |
| | | | 902,596 | | |
| | | | | Entertainment: 0.8% | |
| | 16,600 | | | | | International Game Technology | | | 766,920 | | |
| | | | 766,920 | | |
| | | | | Healthcare-Products: 3.1% | |
| | 25,810 | | | | | Johnson & Johnson | | | 1,703,976 | | |
| | 38,400 | | | @ | | St. Jude Medical, Inc. | | | 1,403,904 | | |
| | | | 3,107,880 | | |
| | | | | Healthcare-Services: 1.3% | |
| | 30,200 | | | | | Aetna, Inc. | | | 1,304,036 | | |
| | | | 1,304,036 | | |
| | | | | Household Products/Wares: 1.0% | |
| | 15,200 | | | | | Clorox Co. | | | 975,080 | | |
| | | | 975,080 | | |
| | | | | Insurance: 6.9% | |
| | 36,400 | | | | | American International Group, Inc. | | | 2,608,424 | | |
| | 28,000 | | | | | AON Corp. | | | 989,520 | | |
| | 19,600 | | | | | Metlife, Inc. | | | 1,156,596 | | |
| | 25,500 | | | | | St. Paul Travelers Cos., Inc. | | | 1,369,095 | | |
| | 16,400 | | | | | Stancorp Financial Group, Inc. | | | 738,820 | | |
| | | | 6,862,455 | | |
| | | | | Internet: 1.6% | |
| | 3,500 | | | @ | | Google, Inc. | | | 1,611,680 | | |
| | | | 1,611,680 | | |
| | | | | Investment Companies: 3.1% | |
| | 91,762 | | | @,@@ | | KKR Private Equity Investors LP | | | 2,096,762 | | |
| | 27,155 | | | | | Utilities Select Sector SPDR | | | 997,132 | | |
| | | | 3,093,894 | | |
| | | | | Iron/Steel: 1.3% | |
| | 14,000 | | | | | Allegheny Technologies, Inc. | | | 1,269,520 | | |
| | | | 1,269,520 | | |
| | | | | Media: 2.6% | |
| | 67,500 | | | | | News Corp., Inc. | | | 1,449,900 | | |
| | 33,100 | | | | | Walt Disney Co. | | | 1,134,337 | | |
| | | | 2,584,237 | | |
| | | | | Metal Fabricate/Hardware: 1.1% | |
| | 14,300 | | | | | Precision Castparts Corp. | | | 1,119,404 | | |
| | | | 1,119,404 | | |
| | | | | Mining: 1.5% | |
| | 13,000 | | | | | Freeport-McMoRan
Copper & Gold, Inc. | | | 724,490 | | |
| | 3,300 | | | @@ | | Rio Tinto PLC ADR | | | 701,217 | | |
| | | | 1,425,707 | | |
See Accompanying Notes to Financial Statements
205
PORTFOLIO OF INVESTMENTS
ING FUNDAMENTAL RESEARCH PORTFOLIO AS OF DECEMBER 31, 2006 (CONTINUED)
| Shares | | | | | | Value | |
| | | | | Miscellaneous Manufacturing: 5.1% | |
| | 15,950 | | | | | Cooper Industries Ltd. | | $ | 1,442,359 | | |
| | 68,505 | | | | | General Electric Co. | | | 2,549,071 | | |
| | 20,346 | | | | | Roper Industries, Inc. | | | 1,022,183 | | |
| | | | 5,013,613 | | |
| | | | | Oil & Gas: 4.5% | |
| | 43,115 | | | | | ExxonMobil Corp. | | | 3,303,902 | | |
| | 13,220 | | | @ | | Newfield Exploration Co. | | | 607,459 | | |
| | 16,600 | | | @ | | Southwestern Energy Co. | | | 581,830 | | |
| | | | 4,493,191 | | |
| | | | | Oil & Gas Services: 1.7% | |
| | 15,002 | | | | | Schlumberger Ltd. | | | 947,526 | | |
| | 18,200 | | | @ | | Weatherford International Ltd. | | | 760,578 | | |
| | | | 1,708,104 | | |
| | | | | Pharmaceuticals: 7.2% | |
| | 31,200 | | | | | Abbott Laboratories | | | 1,519,752 | | |
| | 29,800 | | | | | Caremark Rx, Inc. | | | 1,701,878 | | |
| | 24,331 | | | @ | | Medco Health Solutions, Inc. | | | 1,300,249 | | |
| | 61,258 | | | | | Pfizer, Inc. | | | 1,586,582 | | |
| | 19,200 | | | | | Wyeth | | | 977,664 | | |
| | | | 7,086,125 | | |
| | | | | Retail: 4.8% | |
| | 18,500 | | | | | Best Buy Co., Inc. | | | 910,015 | | |
| | 41,600 | | | | | CVS Corp. | | | 1,285,856 | | |
| | 12,500 | | | | | Home Depot, Inc. | | | 502,000 | | |
| | 47,600 | | | | | Staples, Inc. | | | 1,270,920 | | |
| | 15,800 | | | | | Wal-Mart Stores, Inc. | | | 729,644 | | |
| | | | 4,698,435 | | |
| | | | | Semiconductors: 3.1% | |
| | 102,300 | | | | | Intel Corp. | | | 2,071,575 | | |
| | 91,252 | | | @@ | | Taiwan Semiconductor
Manufacturing Co., Ltd. ADR | | | 997,384 | | |
| | | | 3,068,959 | | |
| | | | | Software: 5.0% | |
| | 41,900 | | | @ | | Activision, Inc. | | | 722,356 | | |
| | 22,600 | | | @@ | | Infosys Technologies Ltd. ADR | | | 1,233,056 | | |
| | 101,679 | | | | | Microsoft Corp. | | | 3,036,135 | | |
| | | | 4,991,547 | | |
| | | | | Telecommunications: 8.0% | |
| | 74,700 | | | | | AT&T, Inc. | | | 2,670,525 | | |
| | 84,800 | | | | | Motorola, Inc. | | | 1,743,488 | | |
| | 37,900 | | | | | Qualcomm, Inc. | | | 1,432,241 | | |
| | 56,400 | | | | | Verizon Communications, Inc. | | | 2,100,336 | | |
| | | | 7,946,590 | | |
Total Investments in
Securities (Cost
$91,379,044)* | | | 99.3 | % | | $ | 98,424,192 | | |
Other Assets and
Liabilities - Net | | | 0.7 | | | | 657,427 | | |
| Net Assets | | | 100.0 | % | | $ | 99,081,619 | | |
@ Non-income producing security
@@ Foreign Issuer
ADR American Depositary Receipt
X Fair value determined by ING Funds Valuation Committee appointed by the Funds' Board Of Directors/Trustees.
* Cost for federal income tax purposes is $92,214,780.
Net unrealized appreciation consists of:
| Gross Unrealized Appreciation | | $ | 7,088,612 | | |
| Gross Unrealized Depreciation | | | (879,200 | ) | |
| Net Unrealized Appreciation | | $ | 6,209,412 | | |
See Accompanying Notes to Financial Statements
206
ING GOLDMAN SACHS® PORTFOLIO OF INVESTMENTS
CAPITAL GROWTH PORTFOLIO AS OF DECEMBER 31, 2006
| Shares | | | | | | Value | |
| COMMON STOCK: 99.8% | | | |
| | | | | Advertising: 1.3% | |
| | 7,270 | | | @,L | | Lamar Advertising Co. | | $ | 475,385 | | |
| | | | 475,385 | | |
| | | | | Aerospace/Defense: 1.6% | |
| | 9,280 | | | | | United Technologies Corp. | | | 580,186 | | |
| | | | 580,186 | | |
| | | | | Banks: 1.0% | |
| | 4,530 | | | L | | SunTrust Banks, Inc. | | | 382,559 | | |
| | | | 382,559 | | |
| | | | | Beverages: 2.4% | |
| | 14,220 | | | | | PepsiCo, Inc. | | | 889,461 | | |
| | | | 889,461 | | |
| | | | | Biotechnology: 9.6% | |
| | 12,930 | | | @ | | Amgen, Inc. | | | 883,248 | | |
| | 15,180 | | | @,L | | Celgene Corp. | | | 873,305 | | |
| | 4,550 | | | @,L | | Charles River Laboratories
International, Inc. | | | 196,788 | | |
| | 9,320 | | | @,L | | Genentech, Inc. | | | 756,132 | | |
| | 25,870 | | | @,L | | Medimmune, Inc. | | | 837,412 | | |
| | | | 3,546,885 | | |
| | | | | Commercial Services: 2.8% | |
| | 7,440 | | | | | Moody's Corp. | | | 513,806 | | |
| | 23,180 | | | | | Western Union Co. | | | 519,696 | | |
| | | | 1,033,502 | | |
| | | | | Computers: 3.0% | |
| | 3,730 | | | @ | | Cognizant Technology
Solutions Corp. | | | 287,807 | | |
| | 33,390 | | | @,L | | EMC Corp. | | | 440,748 | | |
| | 3,120 | | | @,@@,L | | Research In Motion Ltd. | | | 398,674 | | |
| | | | 1,127,229 | | |
| | | | | Distribution/Wholesale: 0.7% | |
| | 3,950 | | | | | WW Grainger, Inc. | | | 276,263 | | |
| | | | 276,263 | | |
| | | | | Diversified Financial Services: 12.6% | |
| | 10,060 | | | | | American Express Co. | | | 610,340 | | |
| | 29,010 | | | | | Charles Schwab Corp. | | | 561,053 | | |
| | 740 | | | | | Chicago Mercantile Exchange
Holdings, Inc. | | | 377,215 | | |
| | 7,050 | | | | | Fannie Mae | | | 418,700 | | |
| | 26,440 | | | | | Freddie Mac | | | 1,795,276 | | |
| | 3,570 | | | L | | Legg Mason, Inc. | | | 339,329 | | |
| | 3,160 | | | | | Merrill Lynch & Co., Inc. | | | 294,196 | | |
| | 3,540 | | | | | Morgan Stanley | | | 288,262 | | |
| | | | 4,684,371 | | |
| | | | | Electronics: 0.7% | |
| | 5,580 | | | @ | | Thermo Electron Corp. | | | 252,718 | | |
| | | | 252,718 | | |
| | | | | Healthcare-Products: 5.1% | |
| | 13,630 | | | | | Medtronic, Inc. | | | 729,341 | | |
| | 9,820 | | | @ | | St. Jude Medical, Inc. | | | 359,019 | | |
| | 7,140 | | | | | Stryker Corp. | | | 393,485 | | |
| | 5,470 | | | @,L | | Zimmer Holdings, Inc. | | | 428,739 | | |
| | | | 1,910,584 | | |
| Shares | | | | | | Value | |
| | | | | Home Furnishings: 1.2% | |
| | 4,290 | | | | | Harman International
Industries, Inc. | | $ | 428,614 | | |
| | | | 428,614 | | |
| | | | | Household Products/Wares: 2.0% | |
| | 8,830 | | | L | | Fortune Brands, Inc. | | | 753,994 | | |
| | | | 753,994 | | |
| | | | | Housewares: 0.8% | |
| | 9,920 | | | | | Newell Rubbermaid, Inc. | | | 287,184 | | |
| | | | 287,184 | | |
| | | | | Internet: 6.6% | |
| | 4,320 | | | @,L | | Checkfree Corp. | | | 173,491 | | |
| | 2,770 | | | @ | | Google, Inc. | | | 1,275,530 | | |
| | 39,540 | | | @,L | | Yahoo!, Inc. | | | 1,009,849 | | |
| | | | 2,458,870 | | |
| | | | | Lodging: 0.8% | |
| | 3,520 | | | | | Harrah's Entertainment, Inc. | | | 291,174 | | |
| | | | 291,174 | | |
| | | | | Machinery - Diversified: 1.4% | |
| | 8,670 | | | | | Rockwell Automation, Inc. | | | 529,564 | | |
| | | | 529,564 | | |
| | | | | Media: 3.5% | |
| | 13,910 | | | | | McGraw-Hill Cos., Inc. | | | 946,158 | | |
| | 8,791 | | | @ | | Viacom, Inc. | | | 360,695 | | |
| | | | 1,306,853 | | |
| | | | | Oil & Gas: 7.4% | |
| | 14,510 | | | @@ | | Canadian Natural Resources Ltd. | | | 772,367 | | |
| | 22,410 | | | | | Chesapeake Energy Corp. | | | 651,011 | | |
| | 6,310 | | | @,L | | Quicksilver Resources, Inc. | | | 230,883 | | |
| | 13,660 | | | @@,L | | Suncor Energy, Inc. | | | 1,077,911 | | |
| | | | 2,732,172 | | |
| | | | | Oil & Gas Services: 6.5% | |
| | 13,210 | | | | | Baker Hughes, Inc. | | | 986,259 | | |
| | 4,530 | | | @ | | Grant Prideco, Inc. | | | 180,158 | | |
| | 14,340 | | | L | | Schlumberger Ltd. | | | 905,714 | | |
| | 8,230 | | | @ | | Weatherford International Ltd. | | | 343,932 | | |
| | | | 2,416,063 | | |
| | | | | Pharmaceuticals: 0.9% | |
| | 6,340 | | | | | Wyeth | | | 322,833 | | |
| | | | 322,833 | | |
| | | | | Retail: 7.4% | |
| | 7,050 | | | @,L | | Chico's FAS, Inc. | | | 145,865 | | |
| | 24,480 | | | | | Lowe's Cos., Inc. | | | 762,552 | | |
| | 14,760 | | | | | Target Corp. | | | 842,058 | | |
| | 17,680 | | | | | Wal-Mart Stores, Inc. | | | 816,462 | | |
| | 5,470 | | | L | | Williams-Sonoma, Inc. | | | 171,977 | | |
| | | | 2,738,914 | | |
| | | | | Semiconductors: 2.5% | |
| | 11,080 | | | | | Intel Corp. | | | 224,370 | | |
| | 23,210 | | | L | | Linear Technology Corp. | | | 703,727 | | |
| | | | 928,097 | | |
See Accompanying Notes to Financial Statements
207
ING GOLDMAN SACHS® PORTFOLIO OF INVESTMENTS
CAPITAL GROWTH PORTFOLIO AS OF DECEMBER 31, 2006 (CONTINUED)
| Shares | | | | | | Value | |
| | | | | Software: 7.9% | |
| | 13,330 | | | @,L | | Electronic Arts, Inc. | | $ | 671,299 | | |
| | 23,070 | | | | | First Data Corp. | | | 588,746 | | |
| | 56,130 | | | | | Microsoft Corp. | | | 1,676,042 | | |
| | | | 2,936,087 | | |
| | | | | Telecommunications: 10.1% | |
| | 25,850 | | | @,L | | American Tower Corp. | | | 963,688 | | |
| | 43,240 | | | @ | | Cisco Systems, Inc. | | | 1,181,749 | | |
| | 7,000 | | | @,L | | Crown Castle International Corp. | | | 226,100 | | |
| | 7,180 | | | @,L | | NeuStar, Inc. | | | 232,919 | | |
| | 20,140 | | | | | Qualcomm, Inc. | | | 761,091 | | |
| | 19,470 | | | | | Sprint Nextel Corp. | | | 367,788 | | |
| | | | 3,733,335 | | |
Total Common Stock
(Cost $32,361,089) | | | 37,022,897 | | |
Principal
Amount | | | | Value | |
| SHORT-TERM INVESTMENTS: 27.9% | |
| | | U.S. Government Agency Obligations: 1.2% | |
| $ | 423,000 | | | Federal Home Loan Bank,
4.600%, due 01/02/07 | | | 422,892 | | |
Total U.S. Government
Agency Obligations
(Cost $422,892) | | | 422,892 | | |
| | | Securities Lending Collateralcc: 26.7% | |
| | 9,906,586 | | | The Bank of New York Institutional
Cash Reserves Fund | | | 9,906,586 | | |
Total Securities Lending Collateral
(Cost $9,906,586) | | | 9,906,586 | | |
Total Short-Term Investments
(Cost $10,329,478) | | | 10,329,478 | | |
Total Investments in
Securities (Cost
$42,690,567)* | | | 127.7 | % | | $ | 47,352,375 | | |
Other Assets and
Liabilities - Net | | | (27.7 | ) | | | (10,269,232 | ) | |
| Net Assets | | | 100.0 | % | | $ | 37,083,143 | | |
@ Non-income producing security
@@ Foreign Issuer
cc Securities purchased with cash collateral for securities loaned.
L Loaned security, a portion or all of the security is on loan at December 31, 2006.
* Cost for federal income tax purposes is $43,457,929.
Net unrealized appreciation consists of:
| Gross Unrealized Appreciation | | $ | 4,634,107 | | |
| Gross Unrealized Depreciation | | | (739,661 | ) | |
| Net Unrealized Appreciation | | $ | 3,894,446 | | |
See Accompanying Notes to Financial Statements
208
ING GOLDMAN SACHS® PORTFOLIO OF INVESTMENTS
STRUCTURED EQUITY PORTFOLIO AS OF DECEMBER 31, 2006
| Shares | | | | | | Value | |
| COMMON STOCK: 99.8% | | | |
| | | | | Aerospace/Defense: 4.1% | |
| | 1,902 | | | | | Boeing Co. | | $ | 168,974 | | |
| | 7,200 | | | | | Lockheed Martin Corp. | | | 662,904 | | |
| | 13,800 | | | | | Northrop Grumman Corp. | | | 934,260 | | |
| | 8,800 | | | | | Raytheon Co. | | | 464,640 | | |
| | | | 2,230,778 | | |
| | | | | Agriculture: 4.2% | |
| | 6,500 | | | | | Altria Group, Inc. | | | 557,830 | | |
| | 17,699 | | | | | Archer-Daniels-Midland Co. | | | 565,660 | | |
| | 4,836 | | | L | | Reynolds American, Inc. | | | 316,613 | | |
| | 14,687 | | | L | | UST, Inc. | | | 854,783 | | |
| | | | 2,294,886 | | |
| | | | | Banks: 6.0% | |
| | 34,700 | | | S | | Bank of America Corp. | | | 1,852,633 | | |
| | 3,100 | | | | | Regions Financial Corp. | | | 115,940 | | |
| | 37,600 | | | | | Wells Fargo & Co. | | | 1,337,056 | | |
| | | | 3,305,629 | | |
| | | | | Biotechnology: 3.0% | |
| | 16,600 | | | @ | | Amgen, Inc. | | | 1,133,946 | | |
| | 8,700 | | | @,L | | Celgene Corp. | | | 500,511 | | |
| | | | 1,634,457 | | |
| | | | | Chemicals: 0.9% | |
| | 9,900 | | | | | Monsanto Co. | | | 520,047 | | |
| | | | 520,047 | | |
| | | | | Commercial Services: 1.7% | |
| | 11,100 | | | @@ | | Accenture Ltd. | | | 409,923 | | |
| | 3,000 | | | L | | Manpower, Inc. | | | 224,790 | | |
| | 4,000 | | | | | Moody's Corp. | | | 276,240 | | |
| | | | 910,953 | | |
| | | | | Computers: 5.9% | |
| | 16,800 | | | @ | | Computer Sciences Corp. | | | 896,616 | | |
| | 33,300 | | | | | Hewlett-Packard Co. | | | 1,371,627 | | |
| | 1,300 | | | @,L | | Lexmark International, Inc. | | | 95,160 | | |
| | 2,200 | | | @, X | | Seagate Technology, Inc.-Escrow | | | — | | |
| | 32,692 | | | @ | | Synopsys, Inc. | | | 873,857 | | |
| | | | 3,237,260 | | |
| | | | | Cosmetics/Personal Care: 0.8% | |
| | 6,600 | | | | | Colgate-Palmolive Co. | | | 430,584 | | |
| | | | 430,584 | | |
| | | | | Diversified Financial Services: 7.0% | |
| | 1,500 | | | | | American Express Co. | | | 91,005 | | |
| | 12,400 | | | @,L | | AmeriCredit Corp. | | | 312,108 | | |
| | 500 | | | | | Blackrock, Inc. | | | 75,950 | | |
| | 4,566 | | | | | Citigroup, Inc. | | | 254,326 | | |
| | 2,600 | | | L | | Countrywide Financial Corp. | | | 110,370 | | |
| | 33,100 | | | S | | JPMorgan Chase & Co. | | | 1,598,730 | | |
| | 13,600 | | | | | Merrill Lynch & Co., Inc. | | | 1,266,160 | | |
| | 2,100 | | | | | Morgan Stanley | | | 171,003 | | |
| | | | 3,879,652 | | |
| | | | | Electric: 3.2% | |
| | 19,051 | | | | | PG&E Corp. | | | 901,684 | | |
| | 15,513 | | | | | TXU Corp. | | | 840,960 | | |
| | | | 1,742,644 | | |
| Shares | | | | | | Value | |
| | | | | Electronics: 0.1% | |
| | 1,228 | | | @ | | Waters Corp. | | $ | 60,135 | | |
| | | | 60,135 | | |
| | | | | Food: 2.4% | |
| | 20,924 | | | L | | Kraft Foods, Inc. | | | 746,987 | | |
| | 17,000 | | | | | Safeway, Inc. | | | 587,520 | | |
| | | | 1,334,507 | | |
| | | | | Healthcare-Products: 1.3% | |
| | 7,714 | | | | | Johnson & Johnson | | | 509,278 | | |
| | 4,000 | | | | | Medtronic, Inc. | | | 214,040 | | |
| | | | 723,318 | | |
| | | | | Healthcare-Services: 0.7% | |
| | 6,727 | | | @ | | Humana, Inc. | | | 372,070 | | |
| | | | 372,070 | | |
| | | | | Insurance: 5.5% | |
| | 25,709 | | | | | Genworth Financial, Inc. | | | 879,505 | | |
| | 23,100 | | | | | Loews Corp. | | | 957,957 | | |
| | 12,799 | | | | | MBIA, Inc. | | | 935,095 | | |
| | 1,100 | | | | | Radian Group, Inc. | | | 59,301 | | |
| | 6,275 | | | | | WR Berkley Corp. | | | 216,550 | | |
| | | | 3,048,408 | | |
| | | | | Internet: 0.2% | |
| | 10,200 | | | @,L | | Emdeon Corp. | | | 126,378 | | |
| | | | 126,378 | | |
| | | | | Iron/Steel: 0.2% | |
| | 1,900 | | | | | Nucor Corp. | | | 103,854 | | |
| | | | 103,854 | | |
| | | | | Lodging: 0.2% | |
| | 2,700 | | | | | Marriott International, Inc. | | | 128,844 | | |
| | | | 128,844 | | |
| | | | | Media: 6.9% | |
| | 31,305 | | | L | | CBS Corp.-Class B | | | 976,090 | | |
| | 10,800 | | | @,L | | Comcast Corp. | | | 457,164 | | |
| | 5,461 | | | @,L | | DIRECTV Group, Inc. | | | 136,197 | | |
| | 900 | | | | | McGraw-Hill Cos., Inc. | | | 61,218 | | |
| | 58,650 | | | L | | Time Warner, Inc. | | | 1,277,398 | | |
| | 26,351 | | | | | Walt Disney Co. | | | 903,049 | | |
| | | | 3,811,116 | | |
| | | | | Mining: 0.7% | |
| | 1,200 | | | | | Newmont Mining Corp. | | | 54,180 | | |
| | 800 | | | | | Phelps Dodge Corp. | | | 95,776 | | |
| | 4,100 | | | L | | Southern Copper Corp. | | | 220,949 | | |
| | | | 370,905 | | |
| | | | | Miscellaneous Manufacturing: 4.2% | |
| | 42,756 | | | | | General Electric Co. | | | 1,590,951 | | |
| | 7,800 | | | | | SPX Corp. | | | 477,048 | | |
| | 8,500 | | | @@,L | | Tyco International Ltd. | | | 258,400 | | |
| | | | 2,326,399 | | |
| | | | | Oil & Gas: 9.0% | |
| | 14,200 | | | | | Devon Energy Corp. | | | 952,536 | | |
| | 36,972 | | | | | ExxonMobil Corp. | | | 2,833,164 | | |
| | 2,900 | | | L | | Holly Corp. | | | 149,060 | | |
| | 9,000 | | | | | Marathon Oil Corp. | | | 832,500 | | |
See Accompanying Notes to Financial Statements
209
ING GOLDMAN SACHS® PORTFOLIO OF INVESTMENTS
STRUCTURED EQUITY PORTFOLIO AS OF DECEMBER 31, 2006 (CONTINUED)
| Shares | | | | | | Value | |
| | | | | Oil & Gas (continued) | |
| | 3,700 | | | | | Valero Energy Corp. | | $ | 189,292 | | |
| | | | 4,956,552 | | |
| | | | | Oil & Gas Services: 0.2% | |
| | 2,100 | | | L | | Schlumberger Ltd. | | | 132,636 | | |
| | | | 132,636 | | |
| | | | | Pharmaceuticals: 7.8% | |
| | 19,458 | | | | | AmerisourceBergen Corp. | | | 874,832 | | |
| | 3,500 | | | @ | | Forest Laboratories, Inc. | | | 177,100 | | |
| | 29,117 | | | | | Merck & Co., Inc. | | | 1,269,501 | | |
| | 65,995 | | | | | Pfizer, Inc. | | | 1,709,271 | | |
| | 4,700 | | | | | Wyeth | | | 239,324 | | |
| | | | 4,270,028 | | |
| | | | | Real Estate Investment Trusts: 1.1% | |
| | 7,500 | | | | | Equity Office Properties Trust | | | 361,275 | | |
| | 3,148 | | | | | Kimco Realty Corp. | | | 141,503 | | |
| | 800 | | | | | Public Storage, Inc. | | | 78,000 | | |
| | | | 580,778 | | |
| | | | | Retail: 5.3% | |
| | 35,800 | | | @,L | | Autonation, Inc. | | | 763,256 | | |
| | 31,437 | | | | | Circuit City Stores, Inc. | | | 596,674 | | |
| | 7,200 | | | | | Dillard's, Inc. | | | 251,784 | | |
| | 5,000 | | | @ | | Kohl's Corp. | | | 342,150 | | |
| | 7,723 | | | @,L | | Office Depot, Inc. | | | 294,787 | | |
| | 4,900 | | | @,L | | Starbucks Corp. | | | 173,558 | | |
| | 10,600 | | | L | | Wal-Mart Stores, Inc. | | | 489,508 | | |
| | | | 2,911,717 | | |
| | | | | Savings & Loans: 0.1% | |
| | 4,824 | | | L | | Hudson City Bancorp., Inc. | | | 66,957 | | |
| | | | 66,957 | | |
| | | | | Semiconductors: 3.4% | |
| | 58,000 | | | @,L | | Micron Technology, Inc. | | | 809,680 | | |
| | 36,058 | | | | | Texas Instruments, Inc. | | | 1,038,470 | | |
| | | | 1,848,150 | | |
| | | | | Software: 4.3% | |
| | 5,583 | | | | | First Data Corp. | | | 142,478 | | |
| | 38,300 | | | | | Microsoft Corp. | | | 1,143,638 | | |
| | 41,200 | | | @ | | Oracle Corp. | | | 706,168 | | |
| | 6,600 | | | | | SEI Investments Co. | | | 393,096 | | |
| | | | 2,385,380 | | |
| | | | | Telecommunications: 5.8% | |
| | 7,900 | | | | | BellSouth Corp. | | | 372,169 | | |
| | 16,500 | | | | | CenturyTel, Inc. | | | 720,390 | | |
| | 58,500 | | | @ | | Cisco Systems, Inc. | | | 1,598,805 | | |
| | 13,100 | | | L | | Sprint Nextel Corp. | | | 247,459 | | |
| | 2,100 | | | | | Telephone & Data Systems,
Inc. - Special Shares | | | 104,160 | | |
| | 3,197 | | | | | Telephone & Data Systems, Inc. | | | 173,693 | | |
| | | | 3,216,676 | | |
| | | | | Transportation: 3.6% | |
| | 25,100 | | | | | CSX Corp. | | | 864,193 | | |
| | 14,100 | | | | | Norfolk Southern Corp. | | | 709,089 | | |
| | 5,800 | | | L | | Overseas Shipholding Group | | | 326,540 | | |
| | 600 | | | | | Union Pacific Corp. | | | 55,212 | | |
| | | | 1,955,034 | | |
Total Common Stock
(Cost $48,449,961) | | | 54,916,732 | | |
Principal
Amount | | | | Value | |
| SHORT-TERM INVESTMENTS: 17.4% | |
| | | Securities Lending Collateralcc: 17.4% | |
| $ | 9,556,070 | | | The Bank of New York Institutional
Cash Reserves Fund | | $ | 9,556,070 | | |
Total Short-Term Investments
(Cost $9,556,070) | | | 9,556,070 | | |
Total Investments in
Securities (Cost
$58,006,031)* | | | 117.2 | % | | $ | 64,472,802 | | |
Other Assets and
Liabilities - Net | | | (17.2 | ) | | | (9,467,608 | ) | |
| Net Assets | | | 100.0 | % | | $ | 55,005,194 | | |
@ Non-income producing security
@@ Foreign Issuer
cc Securities purchased with cash collateral for securities loaned.
S Segregated securities for certain derivatives, when-issued or delayed delivery securities and forward currency exchange contracts.
L Loaned security, a portion or all of the security is on loan at December 31, 2006.
X Fair value determined by ING Funds Valuation Committee appointed by the Funds' Board of Directors/Trustees.
* Cost for federal income tax purposes is $58,452,671.
Net unrealized appreciation consists of:
| Gross Unrealized Appreciation | | $ | 6,871,320 | | |
| Gross Unrealized Depreciation | | | (851,189 | ) | |
| Net Unrealized Appreciation | | $ | 6,020,131 | | |
Information concerning open futures contracts at December 31, 2006 is shown below:
| Long Contracts | | No. of
Contracts | | Notional
Market Value | | Expiration
Date | | Unrealized
Gain (Loss) | |
| S&P 500 E-Mini | | | 3 | | | $ | 214,260 | | | | 03/16/2007 | | | $ | (703 | ) | |
| | | | | | | $ | 214,260 | | | | | | | $ | (703 | ) | |
See Accompanying Notes to Financial Statements
210
ING JPMORGAN PORTFOLIO OF INVESTMENTS
INTERNATIONAL PORTFOLIO AS OF DECEMBER 31, 2006
| Shares | | | | | | Value | |
| COMMON STOCK: 96.9% | | | |
| | | | | Australia: 1.4% | |
| | 622,689 | | | | | BHP Billiton Ltd. | | $ | 12,384,727 | | |
| | 192,900 | | | | | Zinifex Ltd. | | | 2,843,197 | | |
| | | | 15,227,924 | | |
| | | | | Belgium: 1.7% | |
| | 334,800 | | | | | Dexia | | | 9,149,160 | | |
| | 221,015 | | | | | Fortis | | | 9,405,795 | | |
| | | | 18,554,955 | | |
| | | | | Brazil: 2.1% | |
| | 428,782 | | | L | | Cia Vale do Rio Doce | | | 12,751,977 | | |
| | 101,686 | | | | | Petroleo Brasileiro SA | | | 10,472,641 | | |
| | | | 23,224,618 | | |
| | | | | Finland: 1.3% | |
| | 723,612 | | | | | Nokia OYJ | | | 14,694,403 | | |
| | | | 14,694,403 | | |
| | | | | France: 13.7% | |
| | 126,600 | | | L | | Accor SA | | | 9,789,428 | | |
| | 547,328 | | | | | AXA SA | | | 22,063,545 | | |
| | 172,906 | | | | | BNP Paribas | | | 18,810,143 | | |
| | 199,399 | | | | | Cie de Saint-Gobain | | | 16,707,919 | | |
| | 93,548 | | | | | Imerys SA | | | 8,312,748 | | |
| | 116,953 | | | L | | Lafarge SA | | | 17,384,498 | | |
| | 172,500 | | | | | Sanofi-Aventis | | | 15,904,616 | | |
| | 586,996 | | | | | Total SA | | | 42,238,708 | | |
| | | | 151,211,605 | | |
| | | | | Germany: 4.4% | |
| | 78,706 | | | | | BASF AG | | | 7,675,571 | | |
| | 132,270 | | | | | Bayerische Motoren
Werke AG | | | 7,597,108 | | |
| | 379,790 | | | | | Deutsche Post AG | | | 11,462,764 | | |
| | 3,887 | | | | | Linde AG | | | 401,844 | | |
| | 164,616 | | | | | SAP AG | | | 8,747,329 | | |
| | 136,393 | | | | | Siemens AG | | | 13,467,557 | | |
| | | | 49,352,173 | | |
| | | | | Hong Kong: 1.3% | |
| | 1,252,500 | | | | | Esprit Holdings Ltd. | | | 13,950,926 | | |
| | | | 13,950,926 | | |
| | | | | Ireland: 0.9% | |
| | 414,391 | | | | | Bank of Ireland | | | 9,541,590 | | |
| | | | 9,541,590 | | |
| | | | | Italy: 6.0% | |
| | 1,324,000 | | | | | Banca Intesa S.p.A. | | | 10,196,600 | | |
| | 1,021,961 | | | | | ENI S.p.A. | | | 34,373,798 | | |
| | 629,256 | | | | | Mediaset S.p.A. | | | 7,452,105 | | |
| | 1,695,400 | | | | | UniCredito Italiano S.p.A. | | | 14,820,717 | | |
| | | | 66,843,220 | | |
| | | | | Japan: 21.0% | |
| | 257,200 | | | | | Astellas Pharma, Inc. | | | 11,658,886 | | |
| | 1,066,000 | | | | | Bank of Yokohama Ltd. | | | 8,325,461 | | |
| | 243,000 | | | | | Canon, Inc. | | | 13,680,938 | | |
| | 177,400 | | | | | Credit Saison Co., Ltd. | | | 6,093,889 | | |
| | 232,800 | | | | | Daikin Industries Ltd. | | | 8,084,948 | | |
| | 46,200 | | | @ | | Hirose Electric Co., Ltd. | | | 5,239,170 | | |
| | 437,800 | | | @,L | | Honda Motor Co., Ltd. | | | 17,279,606 | | |
| | 327,800 | | | @ | | Hoya Corp. | | | 12,776,611 | | |
| | 500,900 | | | | | Mitsubishi Corp. | | | 9,411,289 | | |
| Shares | | | | | | Value | |
| | 1,654 | | | | | Mitsubishi UFJ Financial
Group, Inc. | | $ | 20,519,190 | | |
| | 486,000 | | | | | Mitsui Fudosan Co., Ltd. | | | 11,841,005 | | |
| | 1,726 | | | | | Mizuho Financial Group, Inc. | | | 12,311,501 | | |
| | 110,700 | | | | | Nidec Corp. | | | 8,567,566 | | |
| | 535,500 | | | L | | Nikko Cordial Corp. | | | 6,141,157 | | |
| | 168,400 | | | | | Nitto Denko Corp. | | | 8,412,260 | | |
| | 305,200 | | | | | Nomura Holdings, Inc. | | | 5,757,523 | | |
| | 297,200 | | | | | Seven & I Holdings Co., Ltd. | | | 9,241,437 | | |
| | 148,400 | | | | | Shin-Etsu Chemical Co., Ltd. | | | 9,905,899 | | |
| | 63,100 | | | | | SMC Corp. | | | 8,930,182 | | |
| | 222,600 | | | | | Sony Corp. | | | 9,532,898 | | |
| | 944,000 | | | | | Sumitomo Corp. | | | 14,131,428 | | |
| | 1,444 | | | | | Sumitomo Mitsui
Financial Group, Inc. | | | 14,784,437 | | |
| | | | 232,627,281 | | |
| | | | | Mexico: 0.6% | |
| | 55,400 | | | | | Fomento Economico
Mexicano SA de CV ADR | | | 6,413,104 | | |
| | | | 6,413,104 | | |
| | | | | Netherlands: 2.9% | |
| | 257,395 | | | | | Koninklijke Philips
Electronics NV | | | 9,678,853 | | |
| | 636,965 | | | | | Reed Elsevier NV | | | 10,845,485 | | |
| | 400,469 | | | | | Wolters Kluwer NV | | | 11,488,583 | | |
| | | | 32,012,921 | | |
| | | | | South Korea: 0.7% | |
| | 23,163 | | | #,L | | Samsung Electronics Co.,
Ltd. GDR | | | 7,633,828 | | |
| | | | 7,633,828 | | |
| | | | | Spain: 1.4% | |
| | 657,700 | | | L | | Banco Bilbao Vizcaya
Argentaria SA | | | 15,801,581 | | |
| | | | 15,801,581 | | |
| | | | | Sweden: 1.7% | |
| | 4,587,700 | | | | | Telefonaktiebolaget
LM Ericsson | | | 18,447,884 | | |
| | | | 18,447,884 | | |
| | | | | Switzerland: 11.5% | |
| | 144,129 | | | | | Adecco SA | | | 9,823,324 | | |
| | 145,699 | | | | | Holcim Ltd. | | | 13,324,570 | | |
| | 53,879 | | | | | Nestle SA | | | 19,111,267 | | |
| | 343,096 | | | | | Novartis AG | | | 19,709,580 | | |
| | 115,710 | | | | | Roche Holding AG | | | 20,702,090 | | |
| | 424,222 | | | | | UBS AG | | | 25,672,945 | | |
| | 71,271 | | | | | Zurich Financial Services AG | | | 19,121,084 | | |
| | | | 127,464,860 | | |
| | | | | United Kingdom: 24.3% | |
| | 1,453,444 | | | | | Barclays PLC | | | 20,752,239 | | |
| | 912,479 | | | | | BG Group PLC | | | 12,407,756 | | |
| | 227,500 | | | | | BHP Billiton PLC | | | 4,166,197 | | |
| | 461,171 | | | | | British Land Co. PLC | | | 15,428,474 | | |
| | 187,287 | | | | | Burberry Group PLC | | | 2,359,027 | | |
| | 1,464,092 | | | | | Centrica PLC | | | 10,131,598 | | |
| | 826,487 | | | | | GlaxoSmithKline PLC | | | 21,753,805 | | |
| | 1,810,800 | | | | | HSBC Holdings PLC | | | 33,141,621 | | |
| | 1,970,485 | | | | | Kingfisher PLC | | | 9,187,669 | | |
| | 449,677 | | | | | Royal Bank of Scotland
Group PLC | | | 17,500,613 | | |
See Accompanying Notes to Financial Statements
211
ING JPMORGAN PORTFOLIO OF INVESTMENTS
INTERNATIONAL PORTFOLIO AS OF DECEMBER 31, 2006 (CONTINUED)
| Shares | | | | | | Value | |
| | | | | United Kingdom (continued) | |
| | 282,130 | | | | | Schroders PLC | | $ | 5,760,265 | | |
| | 1,007,892 | | | | | Smith & Nephew PLC | | | 10,513,760 | | |
| | 479,200 | | | | | Standard Chartered PLC | | | 13,959,721 | | |
| | 3,175,260 | | | | | Tesco PLC | | | 25,092,226 | | |
| | 8,495,380 | | | | | Vodafone Group PLC | | | 23,461,423 | | |
| | 2,679,670 | | | | | WM Morrison
Supermarkets PLC | | | 13,337,131 | | |
| | 731,527 | | | | | Wolseley PLC | | | 17,642,415 | | |
| | 955,177 | | | | | WPP Group PLC | | | 12,890,354 | | |
| | | | 269,486,294 | | |
Total Common Stock
(Cost $752,770,073) | | | 1,072,489,167 | | |
Principal
Amount | | | | Value | |
| SHORT-TERM INVESTMENTS: 7.5% | |
| | | U.S. Government Agency Obligations: 2.6% | |
| $ | 29,049,000 | | | Federal Home Loan Bank,
4.600%, due 01/02/07 | | | 29,041,576 | | |
Total U.S. Government
Agency Obligations
(Cost $29,041,576) | | | 29,041,576 | | |
| | | Securities Lending Collateralcc: 4.9% | |
| | 53,604,926 | | | The Bank of New York Institutional
Cash Reserves Fund | | | 53,604,926 | | |
Total Securities Lending Collateral
(Cost $53,604,926) | | | 53,604,926 | | |
Total Short-Term Investments
(Cost $82,646,502) | | | 82,646,502 | | |
Total Investments in
Securities (Cost
$835,416,575)* | | | 104.4 | % | | $ | 1,155,135,669 | | |
Other Assets and
Liabilities - Net | | | (4.4 | ) | | | (48,695,704 | ) | |
| Net Assets | | | 100.0 | % | | $ | 1,106,439,965 | | |
Certain foreign securities may have been fair valued in accordance with procedures approved by the Board of Directors/Trustees (note 2A).
@ Non-income producing security
ADR American Depositary Receipt
GDR Global Depositary Receipt
# Securities with purchases pursuant to Rule 144A, under the Securities Act of 1933 and may Not be resold subject to that rule except to qualified institutional buyers. These securities have been determined to be liquid under the guidelines established by the Funds' Board of Directors/Trustees.
cc Securities purchased with cash collateral for securities loaned.
L Loaned security, a portion or all of the security is on loan at December 31, 2006.
* Cost for federal income tax purposes is $840,157,045.
Net unrealized appreciation consists of:
| Gross Unrealized Appreciation | | $ | 322,984,686 | | |
| Gross Unrealized Depreciation | | | (8,006,062 | ) | |
| Net Unrealized Appreciation | | $ | 314,978,624 | | |
| Industry | | Percentage of
Net Assets | |
| Advertising | | | 1.2 | % | |
| Apparel | | | 0.2 | | |
| Auto Manufacturers | | | 2.2 | | |
| Banks | | | 20.7 | | |
| Beverages | | | 0.6 | | |
| Building Materials | | | 5.8 | | |
| Chemicals | | | 2.3 | | |
| Commercial Services | | | 0.9 | | |
| Distribution/Wholesale | | | 5.0 | | |
| Diversified Financial Services | | | 4.5 | | |
| Electronics | | | 2.5 | | |
| Engineering & Construction | | | 0.0 | | |
| Food | | | 5.2 | | |
| Gas | | | 0.9 | | |
| Hand/Machine Tools | | | 1.6 | | |
| Healthcare - Products | | | 0.9 | | |
| Home Furnishings | | | 0.9 | | |
| Insurance | | | 3.7 | | |
| Lodging | | | 0.9 | | |
| Media | | | 2.7 | | |
| Mining | | | 2.9 | | |
| Miscellaneous Manufacturing | | | 1.2 | | |
| Office/Business Equipment | | | 1.2 | | |
| Oil & Gas | | | 9.0 | | |
| Pharmaceuticals | | | 8.1 | | |
| Real Estate | | | 2.5 | | |
| Retail | | | 1.7 | | |
| Semiconductors | | | 0.7 | | |
| Software | | | 0.8 | | |
| Telecommunications | | | 5.1 | | |
| Transportation | | | 1.0 | | |
| Short-Term Investments | | | 7.5 | | |
| Other Assets and Liabilities-Net | | | (4.4 | ) | |
| Net Assets | | | 100.0 | % | |
See Accompanying Notes to Financial Statements
212
ING JPMORGAN PORTFOLIO OF INVESTMENTS
MID CAP VALUE PORTFOLIO AS OF DECEMBER 31, 2006
| Shares | | | | | | Value | |
| COMMON STOCK: 95.5% | | | |
| | | | | Advertising: 0.5% | |
| | 44,500 | | | @,L | | Clear Channel Outdoor
Holdings, Inc. | | $ | 1,241,995 | | |
| | | | 1,241,995 | | |
| | | | | Apparel: 3.2% | |
| | 36,800 | | | L | | Columbia Sportswear Co. | | | 2,049,760 | | |
| | 68,400 | | | | | VF Corp. | | | 5,614,272 | | |
| | | | 7,664,032 | | |
| | | | | Banks: 8.1% | |
| | 41,700 | | | | | Cullen/Frost Bankers, Inc. | | | 2,327,694 | | |
| | 31,600 | | | L | | M&T Bank Corp. | | | 3,860,256 | | |
| | 34,300 | | | | | Northern Trust Corp. | | | 2,081,667 | | |
| | 108,200 | | | | | Synovus Financial Corp. | | | 3,335,806 | | |
| | 63,000 | | | L | | TCF Financial Corp. | | | 1,727,460 | | |
| | 25,900 | | | | | Webster Financial Corp. | | | 1,261,848 | | |
| | 52,400 | | | | | Wilmington Trust Corp. | | | 2,209,708 | | |
| | 30,600 | | | | | Zions Bancorp. | | | 2,522,664 | | |
| | | | 19,327,103 | | |
| | | | | Beverages: 2.2% | |
| | 34,800 | | | | | Brown-Forman Corp. | | | 2,305,152 | | |
| | 106,000 | | | @,L | | Constellation Brands, Inc. | | | 3,076,120 | | |
| | | | 5,381,272 | | |
| | | | | Building Materials: 0.9% | |
| | 47,000 | | | | | American Standard Cos., Inc. | | | 2,154,950 | | |
| | | | 2,154,950 | | |
| | | | | Chemicals: 3.4% | |
| | 39,854 | | | | | Albemarle Corp. | | | 2,861,517 | | |
| | 39,200 | | | | | PPG Industries, Inc. | | | 2,517,032 | | |
| | 36,700 | | | L | | Sigma-Aldrich Corp. | | | 2,852,324 | | |
| | | | 8,230,873 | | |
| | | | | Commercial Services: 0.4% | |
| | 41,600 | | | @ | | Interactive Data Corp. | | | 1,000,064 | | |
| | | | 1,000,064 | | |
| | | | | Computers: 1.6% | |
| | 29,700 | | | @,L | | Affiliated Computer
Services, Inc. | | | 1,450,548 | | |
| | 58,100 | | | @ | | NCR Corp. | | | 2,484,356 | | |
| | | | 3,934,904 | | |
| | | | | | | Cosmetics/
Personal Care: 0.6% | | | | | |
| | 36,700 | | | L | | Estee Lauder Cos., Inc. | | | 1,498,094 | | |
| | | | 1,498,094 | | |
| | | | | Distribution/Wholesale: 1.7% | |
| | 83,900 | | | | | Genuine Parts Co. | | | 3,979,377 | | |
| | | | 3,979,377 | | |
| | | | | | | Diversified Financial
Services: 1.2% | | | | | |
| | 77,700 | | | @,L | | E*Trade Financial Corp. | | | 1,742,034 | | |
| | 27,300 | | | | | T. Rowe Price Group, Inc. | | | 1,194,921 | | |
| | | | 2,936,955 | | |
| Shares | | | | | | Value | |
| | | | | Electric: 6.2% | |
| | 67,400 | | | L | | American Electric
Power Co., Inc. | | $ | 2,869,892 | | |
| | 65,800 | | | | | Energy East Corp. | | | 1,631,840 | | |
| | 31,800 | | | | | FirstEnergy Corp. | | | 1,917,540 | | |
| | 45,400 | | | | | PG&E Corp. | | | 2,148,782 | | |
| | 53,800 | | | | | PPL Corp. | | | 1,928,192 | | |
| | 53,100 | | | W | | SCANA Corp. | | | 2,156,922 | | |
| | 82,300 | | | L | | Westar Energy, Inc. | | | 2,136,508 | | |
| | | | 14,789,676 | | |
| | | | | | | Electrical Components &
Equipment: 1.0% | | | | | |
| | 76,400 | | | | | Ametek, Inc. | | | 2,432,576 | | |
| | | | 2,432,576 | | |
| | | | | Electronics: 2.4% | |
| | 29,200 | | | | | Amphenol Corp. | | | 1,812,736 | | |
| | 65,600 | | | @ | | Arrow Electronics, Inc. | | | 2,069,680 | | |
| | 75,300 | | | | | Jabil Circuit, Inc. | | | 1,848,615 | | |
| | | | 5,731,031 | | |
| | | | | Environmental Control: 0.9% | |
| | 50,900 | | | | | Republic Services, Inc. | | | 2,070,103 | | |
| | | | 2,070,103 | | |
| | | | | Food: 2.7% | |
| | 54,350 | | | @ | | Dean Foods Co. | | | 2,297,918 | | |
| | 143,100 | | | | | Del Monte Foods Co. | | | 1,578,393 | | |
| | 73,000 | | | L | | Supervalu, Inc. | | | 2,609,750 | | |
| | | | 6,486,061 | | |
| | | | | Forest Products & Paper: 0.3% | |
| | 18,900 | | | L | | Plum Creek Timber Co., Inc. | | | 753,165 | | |
| | | | 753,165 | | |
| | | | | Gas: 1.9% | |
| | 55,900 | | | | | Energen Corp. | | | 2,623,946 | | |
| | 66,300 | | | | | UGI Corp. | | | 1,808,664 | | |
| | | | 4,432,610 | | |
| | | | | Healthcare-Products: 0.3% | |
| | 14,878 | | | @ | | Henry Schein, Inc. | | | 728,724 | | |
| | | | 728,724 | | |
| | | | | Healthcare-Services: 3.9% | |
| | 67,600 | | | @,L | | Community Health
Systems, Inc. | | | 2,468,752 | | |
| | 103,200 | | | @ | | Coventry Health Care, Inc. | | | 5,165,160 | | |
| | 34,100 | | | | | Quest Diagnostics | | | 1,807,300 | | |
| | | | 9,441,212 | | |
| | | | | | | Holding Companies-
Diversified: 0.6% | | | | | |
| | 57,800 | | | L | | Walter Industries, Inc. | | | 1,563,490 | | |
| | | | 1,563,490 | | |
| | | | | | | Household Products/
Wares: 3.5% | | | | | |
| | 46,300 | | | | | Clorox Co. | | | 2,970,145 | | |
| | 47,900 | | | | | Fortune Brands, Inc. | | | 4,090,181 | | |
| | 34,600 | | | @ | | Jarden Corp. | | | 1,203,734 | | |
| | | | 8,264,060 | | |
See Accompanying Notes to Financial Statements
213
ING JPMORGAN PORTFOLIO OF INVESTMENTS
MID CAP VALUE PORTFOLIO AS OF DECEMBER 31, 2006 (CONTINUED)
| Shares | | | | | | Value | |
| | | | | Insurance: 9.7% | |
| | 103,800 | | | L | | Assurant, Inc. | | $ | 5,734,950 | | |
| | 60,961 | | | | | Cincinnati Financial Corp. | | | 2,762,143 | | |
| | 18,700 | | | @@ | | Everest Re Group Ltd. | | | 1,834,657 | | |
| | 32,500 | | | @@,L | | IPC Holdings Ltd. | | | 1,022,125 | | |
| | 27,200 | | | L | | MGIC Investment Corp. | | | 1,701,088 | | |
| | 167,550 | | | | | Old Republic
International Corp. | | | 3,900,564 | | |
| | 30,300 | | | @,L | | Onebeacon Insurance
Group, Ltd. | | | 848,400 | | |
| | 38,400 | | | | | Principal Financial Group | | | 2,254,080 | | |
| | 18,500 | | | | | Safeco Corp. | | | 1,157,175 | | |
| | 58,700 | | | | | WR Berkley Corp. | | | 2,025,737 | | |
| | | | 23,240,919 | | |
| | | | | Lodging: 1.2% | |
| | 82,200 | | | L | | Hilton Hotels Corp. | | | 2,868,780 | | |
| | | | 2,868,780 | | |
| | | | | Media: 3.8% | |
| | 70,400 | | | @,L | | Cablevision Systems Corp. | | | 2,004,992 | | |
| | 79,000 | | | | | Clear Channel
Communications, Inc. | | | 2,807,660 | | |
| | 45,200 | | | L | | McClatchy Co. | | | 1,957,160 | | |
| | 3,180 | | | L | | Washington Post | | | 2,371,008 | | |
| | | | 9,140,820 | | |
| | | | | Metal Fabricate/
Hardware: 0.5% | |
| | 76,811 | | | @ | | Mueller Water Products,
Inc.-Class B | | | 1,144,484 | | |
| | | | 1,144,484 | | |
| | | | | Mining: 1.6% | |
| | 43,200 | | | L | | Vulcan Materials Co. | | | 3,882,384 | | |
| | | | 3,882,384 | | |
| | | | | Miscellaneous
Manufacturing: 3.4% | |
| | 31,700 | | | | | Carlisle Cos., Inc. | | | 2,488,450 | | |
| | 53,300 | | | L | | Crane Co. | | | 1,952,912 | | |
| | 53,800 | | | | | Dover Corp. | | | 2,637,276 | | |
| | 14,700 | | | | | Harsco Corp. | | | 1,118,670 | | |
| | | | 8,197,308 | | |
| | | | | Oil & Gas: 1.4% | |
| | 48,400 | | | | | Devon Energy Corp. | | | 3,246,672 | | |
| | | | 3,246,672 | | |
| | | | | Oil & Gas Services: 0.7% | |
| | 51,800 | | | @,L | | Helix Energy Solutions
Group, Inc. | | | 1,624,966 | | |
| | | | 1,624,966 | | |
| | | | | Packaging & Containers: 1.4% | |
| | 74,600 | | | L | | Ball Corp. | | | 3,252,560 | | |
| | | | 3,252,560 | | |
| | | | | Pharmaceuticals: 1.4% | |
| | 47,800 | | | L | | Omnicare, Inc. | | | 1,846,514 | | |
| | 108,500 | | | @,@@,L | | Warner Chilcott Ltd. | | | 1,499,470 | | |
| | | | 3,345,984 | | |
| | | | | Pipelines: 4.0% | |
| | 36,100 | | | | | Kinder Morgan, Inc. | | | 3,817,575 | | |
| | 34,700 | | | | | Questar Corp. | | | 2,881,835 | | |
| | 106,500 | | | | | Williams Cos., Inc. | | | 2,781,780 | | |
| | | | 9,481,190 | | |
| Shares | | | | | | Value | |
| | | | | Real Estate: 2.3% | |
| | 81,800 | | | L | | Brookfield Properties Co. | | $ | 3,217,194 | | |
| | 38,500 | | | | | Forest City Enterprises, Inc. | | | 2,248,400 | | |
| | | | 5,465,594 | | |
| | | | | Real Estate Investment
Trusts: 3.4% | |
| | 65,200 | | | L | | iStar Financial, Inc. | | | 3,117,864 | | |
| | 55,106 | | | | | Rayonier, Inc. | | | 2,262,101 | | |
| | 22,600 | | | L | | Vornado Realty Trust | | | 2,745,900 | | |
| | | | 8,125,865 | | |
| | | | | Retail: 8.3% | |
| | 105,300 | | | | | Applebees International, Inc. | | | 2,597,751 | | |
| | 110,423 | | | @,L | | Autonation, Inc. | | | 2,354,218 | | |
| | 35,100 | | | @ | | Autozone, Inc. | | | 4,056,156 | | |
| | 19,652 | | | | | Federated Department
Stores, Inc. | | | 749,331 | | |
| | 84,600 | | | | | Limited Brands, Inc. | | | 2,448,324 | | |
| | 48,000 | | | | | OSI Restaurant Partners, Inc. | | | 1,881,600 | | |
| | 81,000 | | | | | Tiffany & Co. | | | 3,178,440 | | |
| | 86,500 | | | | | TJX Cos., Inc. | | | 2,466,980 | | |
| | | | 19,732,800 | | |
| | | | | Telecommunications: 3.9% | |
| | 83,000 | | | L | | CenturyTel, Inc. | | | 3,623,780 | | |
| | 50,400 | | | | | Telephone & Data Systems, Inc. | | | 2,499,840 | | |
| | 222,521 | | | | | Windstream Corp. | | | 3,164,249 | | |
| | | | 9,287,869 | | |
| | | | | Transportation: 1.0% | |
| | 46,000 | | | | | Norfolk Southern Corp. | | $ | 2,313,340 | | |
| | | | 2,313,340 | | |
Total Common Stock
(Cost $199,198,080) | | | 228,393,862 | | |
Principal
Amount | | | | Value | |
| SHORT-TERM INVESTMENTS: 25.1% | |
| | | U.S. Government Agency
Obligations: 4.5% | | | |
| $ | 10,609,000 | | | Federal Home Loan Bank,
4.600%, due 01/02/07 | | | 10,606,289 | | |
Total U.S. Government Agency
Obligations (Cost $10,606,289) | | | 10,606,289 | | |
| | | Securities Lending Collateralcc: 20.6% | |
| | 49,306,597 | | | The Bank of New York Institutional
Cash Reserves Fund | | | 49,306,597 | | |
Total Securities Lending Collateral
(Cost $49,306,597) | | | 49,306,597 | | |
Total Short-Term Investments
(Cost $59,912,886) | | | 59,912,886 | | |
Total Investments in
Securities (Cost
$259,110,966)* | | | 120.6 | % | | $ | 288,306,748 | | |
Other Assets and
Liabilities - Net | | | (20.6 | ) | | | (49,244,172 | ) | |
| Net Assets | | | 100.0 | % | | $ | 239,062,576 | | |
@ Non-income producing security
@@ Foreign Issuer
cc Securities purchased with cash collateral for securities loaned.
W When-issued or delayed delivery security
See Accompanying Notes to Financial Statements
214
ING JPMORGAN PORTFOLIO OF INVESTMENTS
MID CAP VALUE PORTFOLIO AS OF DECEMBER 31, 2006 (CONTINUED)
L Loaned security, a portion or all of the security is on loan at December 31, 2006.
* Cost for federal income tax purposes is $259,341,584.
Net unrealized appreciation consists of:
| Gross Unrealized Appreciation | | $ | 30,750,499 | | |
| Gross Unrealized Depreciation | | | (1,785,335 | ) | |
| Net Unrealized Appreciation | | $ | 28,965,164 | | |
See Accompanying Notes to Financial Statements
215
ING LEGG MASON PARTNERS AGGRESSIVE PORTFOLIO OF INVESTMENTS
GROWTH PORTFOLIO AS OF DECEMBER 31, 2006
| Shares | | | | | | Value | |
| COMMON STOCK: 92.0% | | | |
| | | | | Aerospace/Defense: 3.3% | |
| | 550,500 | | | | | L-3 Communications
Holdings, Inc. | | $ | 45,019,890 | | |
| | | | 45,019,890 | | |
| | | | | Biotechnology: 14.2% | |
| | 859,190 | | | @,L | | Amgen, Inc. | | | 58,691,269 | | |
| | 1,129,200 | | | @,L | | Biogen Idec, Inc. | | | 55,545,348 | | |
| | 98,300 | | | @,L | | BioMimetic
Therapeutics, Inc. | | | 1,296,577 | | |
| | 31,700 | | | @,L | | Genentech, Inc. | | | 2,571,821 | | |
| | 936,070 | | | @,L | | Genzyme Corp. | | | 57,643,191 | | |
| | 34,300 | | | @,L | | Micromet, Inc. | | | 102,900 | | |
| | 713,700 | | | @,L | | Millennium
Pharmaceuticals, Inc. | | | 7,779,330 | | |
| | 198,300 | | | @,L | | Vertex Pharmaceuticals, Inc. | | | 7,420,386 | | |
| | | | 191,050,822 | | |
| | | | | Computers: 2.4% | |
| | 31,500 | | | @,L | | LaserCard Corp. | | | 337,365 | | |
| | 534,600 | | | @ | | Quantum Corp. | | | 1,240,272 | | |
| | 505,800 | | | @,L | | Sandisk Corp. | | | 21,764,574 | | |
| | 330,766 | | | @@,L | | Seagate Technology, Inc. | | | 8,765,299 | | |
| | 83,100 | | | @,X | | Seagate Technology,
Inc.-Escrow | | | 1 | | |
| | | | 32,107,511 | | |
| | | | | | | Diversified Financial
Services: 11.5% | | | | | |
| | 76,800 | | | | | CIT Group, Inc. | | | 4,283,136 | | |
| | 125,200 | | | | | Cohen & Steers, Inc. | | | 5,029,284 | | |
| | 2,696 | | | | | Goldman Sachs Group, Inc. | | | 537,448 | | |
| | 933,208 | | | | | Lehman Brothers
Holdings, Inc. | | | 72,902,209 | | |
| | 782,160 | | | | | Merrill Lynch & Co., Inc. | | | 72,819,096 | | |
| | | | 155,571,173 | | |
| | | | | Healthcare-Products: 1.4% | |
| | 79,800 | | | @,L | | Biosite, Inc. | | | 3,898,230 | | |
| | 20,900 | | | @,L | | BioVeris Corp. | | | 286,748 | | |
| | 230,100 | | | | | Johnson & Johnson | | | 15,191,202 | | |
| | | | 19,376,180 | | |
| | | | | Healthcare-Services: 5.2% | |
| | 1,314,500 | | | | | UnitedHealth Group, Inc. | | | 70,628,085 | | |
| | | | 70,628,085 | | |
| | | | | Internet: 1.2% | |
| | 769,275 | | | @ | | Liberty Media Holding
Corp.-Interactive | | | 16,593,262 | | |
| | | | 16,593,262 | | |
| | | | | Media: 18.7% | |
| | 1,205,700 | | | @,L | | Cablevision Systems Corp. | | | 34,338,336 | | |
| | 181,805 | | | L | | CBS Corp.-Class B | | | 5,668,680 | | |
| | 112,300 | | | @,L | | Comcast Corp.-Class A | | | 4,753,659 | | |
| | 1,768,190 | | | @,L | | Comcast Corp.-Special Class A | | | 74,051,797 | | |
| | 193,210 | | | @,L | | Discovery Holding Co. | | | 3,108,749 | | |
| | 62,213 | | | @,L | | Liberty Global, Inc.-Series C | | | 1,741,964 | | |
| | 61,346 | | | @ | | Liberty Global, Inc.-A | | | 1,788,236 | | |
| | 158,855 | | | @ | | Liberty Media
Holding Corp. | | | 15,564,613 | | |
| | 2,534,720 | | | @,L | | Sirius Satellite Radio, Inc. | | | 8,972,909 | | |
| Shares | | | | | | Value | |
| | 2,892,530 | | | L | | Time Warner, Inc. | | $ | 62,999,302 | | |
| | 181,805 | | | @,L | | Viacom, Inc. | | | 7,459,459 | | |
| | 884,500 | | | | | Walt Disney Co. | | | 30,311,815 | | |
| | 93,300 | | | L | | World Wrestling
Entertainment, Inc. | | | 1,520,790 | | |
| | | | 252,280,309 | | |
| | | | | | | Miscellaneous
Manufacturing: 5.6% | | | | | |
| | 408,300 | | | | | Pall Corp. | | | 14,106,765 | | |
| | 2,016,395 | | | @@,L | | Tyco International Ltd. | | | 61,298,408 | | |
| | | | 75,405,173 | | |
| | | | | Oil & Gas: 4.2% | |
| | 1,299,000 | | | L | | Anadarko Petroleum Corp. | | | 56,532,480 | | |
| | 5,645 | | | @,L | | Bill Barrett Corp. | | | 153,600 | | |
| | | | 56,686,080 | | |
| | | | | Oil & Gas Services: 5.5% | |
| | 540,700 | | | @ | | Grant Prideco, Inc. | | | 21,503,639 | | |
| | 1,277,800 | | | @,L | | Weatherford
International Ltd. | | | 53,399,262 | | |
| | | | 74,902,901 | | |
| | | | | Pharmaceuticals: 8.0% | |
| | 136,500 | | | @,L | | Alkermes, Inc. | | | 1,825,005 | | |
| | 1,457,044 | | | @,L | | Forest Laboratories, Inc. | | | 73,726,426 | | |
| | 550,000 | | | @,L | | ImClone Systems, Inc. | | | 14,718,000 | | |
| | 94,400 | | | @,L | | Isis Pharmaceuticals, Inc. | | | 1,049,728 | | |
| | 326,700 | | | @,L | | King Pharmaceuticals, Inc. | | | 5,201,064 | | |
| | 74,600 | | | @ | | Nabi Biopharmaceuticals | | | 505,788 | | |
| | 80,050 | | | | | Pfizer, Inc. | | | 2,073,295 | | |
| | 67,832 | | | @@ | | Teva Pharmaceutical
Industries Ltd. ADR | | | 2,108,219 | | |
| | 371,600 | | | L | | Valeant Pharmaceuticals
International | | | 6,406,384 | | |
| | 27,445 | | | @ | | ViaCell, Inc. | | | 129,540 | | |
| | | | 107,743,449 | | |
| | | | | Retail: 0.2% | |
| | 193,300 | | | @,L | | Charming Shoppes, Inc. | | | 2,615,349 | | |
| | 13,000 | | | @,L | | J Crew Group, Inc. | | | 501,150 | | |
| | | | 3,116,499 | | |
| | | | | Semiconductors: 6.1% | |
| | 616,800 | | | @,L | | Broadcom Corp. | | | 19,928,808 | | |
| | 90,400 | | | @,L | | Cabot
Microelectronics Corp. | | | 3,068,176 | | |
| | 328,000 | | | @ | | Cirrus Logic, Inc. | | | 2,256,640 | | |
| | 117,000 | | | @,L | | Cree, Inc. | | | 2,026,440 | | |
| | 86,600 | | | @ | | DSP Group, Inc. | | | 1,879,220 | | |
| | 683,100 | | | | | Intel Corp. | | | 13,832,775 | | |
| | 5,800 | | | @,L | | IPG Photonics Corp. | | | 139,200 | | |
| | 2,454,000 | | | @,L | | Micron Technology, Inc. | | | 34,257,840 | | |
| | 296,100 | | | @,L | | Teradyne, Inc. | | | 4,429,656 | | |
| | | | 81,818,755 | | |
| | | | | Software: 1.4% | |
| | 97,800 | | | @ | | Advent Software, Inc. | | | 3,451,362 | | |
| | 239,400 | | | @ | | Autodesk, Inc. | | | 9,686,124 | | |
| | 176,900 | | | | | Microsoft Corp. | | | 5,282,234 | | |
| | | | 18,419,720 | | |
See Accompanying Notes to Financial Statements
216
ING LEGG MASON PARTNERS AGGRESSIVE PORTFOLIO OF INVESTMENTS
GROWTH PORTFOLIO AS OF DECEMBER 31, 2006 (CONTINUED)
| Shares | | | | | | Value | |
| | | | | Telecommunications: 3.1% | |
| | 254,100 | | | @,L | | C-COR, Inc. | | $ | 2,830,674 | | |
| | 1,410,200 | | | | | Motorola, Inc. | | | 28,993,712 | | |
| | 302,900 | | | @@ | | Nokia OYJ ADR | | | 6,154,928 | | |
| | 475,100 | | | @,L | | RF Micro Devices, Inc. | | | 3,225,929 | | |
| | | | 41,205,243 | | |
Total Common Stock
(Cost $880,802,515) | | | 1,241,925,052 | | |
Principal
Amount | | | | Value | |
| SHORT-TERM INVESTMENTS: 25.9% | |
U.S. Government Agency
Obligations: 7.5% | | | | | |
| $ | 100,517,000 | | | Federal Home Loan Bank,
4.600%, due 01/02/07 | | | 100,491,313 | | |
Total U.S. Government Agency
Obligations (Cost $100,491,313) | | | 100,491,313 | | |
| | | Securities Lending Collateralcc: 18.4% | |
| | 248,826,363 | | | The Bank of New York Institutional
Cash Reserves Fund | | | 248,826,363 | | |
Total Securities Lending Collateral
(Cost $248,826,363) | | | 248,826,363 | | |
Total Short-Term Investments
(Cost $349,317,676) | | | 349,317,676 | | |
Total Investments in
Securities (Cost
$1,230,120,191)* | | | 117.9 | % | | $ | 1,591,242,728 | | |
Other Assets and
Liabilities - Net | | | (17.9 | ) | | | (241,176,946 | ) | |
| Net Assets | | | 100.0 | % | | $ | 1,350,065,782 | | |
@ Non-income producing security
@@ Foreign Issuer
ADR American Depositary Receipt
cc Securities purchased with cash collateral for securities loaned.
L Loaned security, a portion or all of the security is on loan at December 31, 2006.
X Fair value determined by ING Funds Valuation Committee appointed by the Funds' Board of Directors/Trustees.
* Cost for federal income tax purposes is $1,231,463,906.
Net unrealized appreciation consists of:
| Gross Unrealized Appreciation | | $ | 370,246,928 | | |
| Gross Unrealized Depreciation | | | (10,468,106 | ) | |
| Net Unrealized Appreciation | | $ | 359,778,822 | | |
See Accompanying Notes to Financial Statements
217
ING LEGG MASON PARTNERS LARGE CAP PORTFOLIO OF INVESTMENTS
GROWTH PORTFOLIO AS OF DECEMBER 31, 2006
| Shares | | | | | | Value | |
| COMMON STOCK: 99.2% | | | |
| | | | | Beverages: 5.2% | |
| | 24,600 | | | | | Coca-Cola Co. | | $ | 1,186,950 | | |
| | 17,400 | | | | | PepsiCo, Inc. | | | 1,088,370 | | |
| | | | 2,275,320 | | |
| | | | | Biotechnology: 13.4% | |
| | 32,800 | | | @ | | Amgen, Inc. | | | 2,240,568 | | |
| | 25,400 | | | @ | | Biogen Idec, Inc. | | | 1,249,426 | | |
| | 29,800 | | | @ | | Genentech, Inc. | | | 2,417,674 | | |
| | | | 5,907,668 | | |
| | | | | Cosmetics/Personal Care: 3.7% | |
| | 25,303 | | | | | Procter & Gamble Co. | | | 1,626,224 | | |
| | | | 1,626,224 | | |
| | | | | | | Diversified Financial
Services: 8.2% | | | | | |
| | 22,400 | | | | | Merrill Lynch & Co., Inc. | | | 2,085,440 | | |
| | 15,500 | | | | | Morgan Stanley | | | 1,262,165 | | |
| | 7,700 | | | @ | | Nasdaq Stock Market, Inc. | | | 237,083 | | |
| | | | 3,584,688 | | |
| | | | | Food: 2.7% | |
| | 23,275 | | | | | WM Wrigley Jr. Co. | | | 1,203,783 | | |
| | | | 1,203,783 | | |
| | | | | Healthcare-Products: 4.7% | |
| | 16,500 | | | | | Johnson & Johnson | | | 1,089,330 | | |
| | 18,600 | | | | | Medtronic, Inc. | | | 995,286 | | |
| | | | 2,084,616 | | |
| | | | | Insurance: 6.5% | |
| | 17,100 | | | | | American International
Group, Inc. | | | 1,225,386 | | |
| | 15 | | | @ | | Berkshire Hathaway, Inc. | | | 1,649,850 | | |
| | | | 2,875,236 | | |
| | | | | Internet: 18.1% | |
| | 32,000 | | | @ | | Akamai Technologies, Inc. | | | 1,699,840 | | |
| | 63,300 | | | @ | | Amazon.com, Inc. | | | 2,497,818 | | |
| | 41,800 | | | @ | | eBay, Inc. | | | 1,256,926 | | |
| | 37,100 | | | @ | | InterActiveCorp | | | 1,378,636 | | |
| | 44,700 | | | @ | | Yahoo!, Inc. | | | 1,141,638 | | |
| | | | 7,974,858 | | |
| | | | | Media: 6.2% | |
| | 67,026 | | | | | Time Warner, Inc. | | | 1,459,826 | | |
| | 37,300 | | | | | Walt Disney Co. | | | 1,278,271 | | |
| | | | 2,738,097 | | |
| | | | | Pharmaceuticals: 2.6% | |
| | 44,618 | | | | | Pfizer, Inc. | | | 1,155,606 | | |
| | | | 1,155,606 | | |
| | | | | Retail: 2.7% | |
| | 30,000 | | | | | Home Depot, Inc. | | | 1,204,800 | | |
| | | | 1,204,800 | | |
| | | | | Semiconductors: 6.2% | |
| | 59,500 | | | | | Intel Corp. | | | 1,204,875 | | |
| | 52,100 | | | | | Texas Instruments, Inc. | | | 1,500,480 | | |
| | | | 2,705,355 | | |
| | | | | Software: 8.5% | |
| | 26,100 | | | @ | | Electronic Arts, Inc. | | | 1,314,396 | | |
| | 42,400 | | | | | Microsoft Corp. | | | 1,266,064 | | |
| | 49,900 | | | @ | | Red Hat, Inc. | | | 1,147,700 | | |
| | | | 3,728,160 | | |
| Shares | | | | | | Value | |
| | | | | Telecommunications: 10.5% | |
| | 50,400 | | | @ | | Cisco Systems, Inc. | | $ | 1,377,432 | | |
| | 40,900 | | | @ | | Juniper Networks, Inc. | | | 774,646 | | |
| | 70,100 | | | | | Motorola, Inc. | | | 1,441,256 | | |
| | 27,600 | | | | | Qualcomm, Inc. | | | 1,043,004 | | |
| | | | 4,636,338 | | |
Total Common Stock
(Cost $37,586,557) | | | 43,700,749 | | |
Principal
Amount | | | | Value | |
| SHORT-TERM INVESTMENTS: 0.3% | |
| | | U.S. Government Agency Obligations: 0.3% | |
| $ | 108,000 | | | Federal Home Loan Bank, 4.600%,
due 01/02/07 | | | 107,973 | | |
Total Short-Term Investments
(Cost $107,973) | | | 107,973 | | |
Total Investments in
Securities (Cost
$37,694,530)* | | | 99.5 | % | | $ | 43,808,722 | | |
Other Assets and
Liabilities - Net | | | 0.5 | | | | 237,083 | | |
| Net Assets | | | 100.0 | % | | $ | 44,045,805 | | |
@ Non-income producing security
* Cost for federal income tax purposes is $38,238,383.
Net unrealized appreciation consists of:
| Gross Unrealized Appreciation | | $ | 6,818,083 | | |
| Gross Unrealized Depreciation | | | (1,247,744 | ) | |
| Net Unrealized Appreciation | | $ | 5,570,339 | | |
See Accompanying Notes to Financial Statements
218
ING LORD ABBETT PORTFOLIO OF INVESTMENTS
U.S. GOVERNMENT SECURITIES AS OF DECEMBER 31, 2006
Principal
Amount | | | | | | Value | |
| U.S. GOVERNMENT AGENCY OBLIGATIONS: 90.7% | | | |
| | | | | Federal Home Loan Bank: 9.7% | |
| $ | 4,740,000 | | | | | 5.125%, due 08/14/13 | | $ | 4,785,765 | | |
| | | | 4,785,765 | | |
| | | | | | | Federal Home Loan Mortgage
Corporation: 20.6% | | | | | |
| | 347,886 | | | | | 4.197%, due 01/01/34 | | | 342,020 | | |
| | 304,143 | | | | | 4.683%, due 03/01/35 | | | 300,717 | | |
| | 1,701,306 | | | S | | 5.000%, due 04/01/20 | | | 1,672,099 | | |
| | 1,294,022 | | | | | 5.000%, due 10/01/20 | | | 1,271,806 | | |
| | 555,563 | | | | | 5.000%, due 12/01/20 | | | 546,025 | | |
| | 1,059,561 | | | | | 5.000%, due 04/01/21 | | | 1,041,195 | | |
| | 268,318 | | | | | 5.000%, due 08/01/21 | | | 263,667 | | |
| | 3,470,000 | | | W | | 5.500%, due 01/15/19 | | | 3,467,831 | | |
| | 135,804 | | | | | 5.500%, due 01/01/21 | | | 135,736 | | |
| | 835,933 | | | | | 5.500%, due 03/01/21 | | | 835,549 | | |
| | 57,081 | | | C | | 6.500%, due 06/15/08 | | | 56,966 | | |
| | 225,161 | | | | | 7.000%, due 04/01/32 | | | 231,545 | | |
| | | | 10,165,156 | | |
| | | | | | | Federal National Mortgage
Association: 49.6% | | | | | |
| | 224,334 | | | | | 3.499%, due 08/01/33 | | | 221,309 | | |
| | 900,000 | | | | | 4.625%, due 10/15/13 | | | 882,996 | | |
| | 250,820 | | | | | 5.000%, due 01/01/19 | | | 247,053 | | |
| | 155,191 | | | | | 5.000%, due 05/01/20 | | | 152,527 | | |
| | 116,069 | | | | | 5.000%, due 12/01/20 | | | 114,076 | | |
| | 405,848 | | | | | 5.020%, due 04/01/35 | | | 406,704 | | |
| | 659,154 | | | | | 5.263%, due 10/01/35 | | | 674,930 | | |
| | 456,756 | | | | | 5.394%, due 04/01/36 | | | 468,160 | | |
| | 687,993 | | | | | 5.417%, due 09/01/36 | | | 688,045 | | |
| | 1,501,088 | | | | | 5.500%, due 02/01/35 | | | 1,485,464 | | |
| | 11,223,168 | | | | | 5.500%, due 02/01/36 | | | 11,094,569 | | |
| | 2,086,537 | | | | | 5.500%, due 03/01/36 | | | 2,062,629 | | |
| | 579,134 | | | | | 5.500%, due 04/01/36 | | | 583,071 | | |
| | 2,510,000 | | | W | | 5.500%, due 01/01/37 | | | 2,481,240 | | |
| | 410,607 | | | | | 5.517%, due 04/01/36 | | | 414,113 | | |
| | 365,271 | | | | | 5.775%, due 10/01/36 | | | 367,502 | | |
| | 2,031,000 | | | S | | 6.000%, due 05/15/11 | | | 2,116,769 | | |
| | | | 24,461,157 | | |
| | | | | | | Government National
Mortgage Association: 10.8% | | | | | |
| | 4,274,218 | | | | | 5.500%, due 02/15/36 | | | 4,255,008 | | |
| | 1,037,020 | | | | | 5.500%, due 04/15/36 | | | 1,032,359 | | |
| | | | 5,287,367 | | |
Total U.S. Government Agency
Obligations (Cost $44,280,732) | | | 44,699,445 | | |
| U.S. TREASURY OBLIGATIONS: 13.7% | | | |
| | | | | U.S. Treasury Bonds: 10.5% | |
| | 1,133,000 | | | | | 4.250%, due 11/15/13 | | | 1,103,437 | | |
| | 2,160,000 | | | S | | 4.500%, due 02/15/36 | | | 2,054,702 | | |
| | 1,718,000 | | | S | | 6.125%, due 08/15/29 | | | 2,008,450 | | |
| | | | 5,166,589 | | |
Principal
Amount | | | | | | Value | |
| | | | | U.S. Treasury Notes: 3.2% | |
| $ | 1,575,000 | | | S | | 5.125%, due 06/30/11 | | $ | 1,602,071 | | |
| | | | 1,602,071 | | |
Total U.S. Treasury Obligations
(Cost $6,825,886) | | | 6,768,660 | | |
Total Investments in
Securities (Cost
$51,106,618)* | | | 104.4 | % | | $ | 51,468,105 | | |
Other Assets and
Liabilities - Net | | | (4.4 | ) | | | (2,161,781 | ) | |
| Net Assets | | | 100.0 | % | | $ | 49,306,324 | | |
C Bond may be called prior to maturity date.
W When-issued or delayed delivery security
S Segregated securities for certain derivatives, when-issued or delayed delivery securities, forward currency exchange contracts and reserve repurchase agreements.
* Cost for federal income tax purposes is the same as for financial statement purposes.
Net unrealized appreciation consists of:
| Gross Unrealized Appreciation | | $ | 491,649 | | |
| Gross Unrealized Depreciation | | | (130,162 | ) | |
| Net Unrealized Appreciation | | $ | 361,487 | | |
The following sale commitments were held by the ING Lord Abbett U.S. Government Securities Portfolio at December 31, 2006:
Principal
Amount | | | | Market
Descriptions | | Value | |
| $ | (2,030,000 | ) | | W | | Federal National Mortgage
Association, 5.500%,
due 01/12/36 | | $ | (2,006,529 | ) | |
Total Sale Commitments
(Proceeds $2,018,443) | | $ | (2,006,529 | ) | |
See Accompanying Notes to Financial Statements
219
ING NEUBERGER PORTFOLIO OF INVESTMENTS
BERMAN PARTNERS PORTFOLIO AS OF DECEMBER 31, 2006
| Shares | | | | | | Value | |
| COMMON STOCK: 96.0% | | | |
| | | | | Aerospace/Defense: 1.3% | |
| | 68,200 | | | | | L-3 Communications
Holdings, Inc. | | $ | 5,577,396 | | |
| | | | 5,577,396 | | |
| | | | | Building Materials: 2.5% | |
| | 208,172 | | | @,@@ | | Cemex SA de CV ADR | | | 7,052,867 | | |
| | 108,000 | | | @ | | Owens Corning, Inc. | | | 3,229,200 | | |
| | | | 10,282,067 | | |
| | | | | Coal: 3.1% | |
| | 218,900 | | | | | Arch Coal, Inc. | | | 6,573,567 | | |
| | 150,500 | | | | | Peabody Energy Corp. | | | 6,081,705 | | |
| | | | 12,655,272 | | |
| | | | | Computers: 1.2% | |
| | 67,400 | | | @ | | Lexmark International, Inc. | | | 4,933,680 | | |
| | | | 4,933,680 | | |
| | | | | | | Diversified Financial
Services: 5.8% | | | | | |
| | 193,700 | | | | | Countrywide Financial Corp. | | | 8,222,565 | | |
| | 44,950 | | | | | Goldman Sachs Group, Inc. | | | 8,960,783 | | |
| | 75,100 | | | | | Merrill Lynch & Co., Inc. | | | 6,991,810 | | |
| | | | 24,175,158 | | |
| | | | | Electric: 4.5% | |
| | 129,800 | | | @ | | Mirant Corp. | | | 4,097,786 | | |
| | 109,000 | | | @ | | NRG Energy, Inc. | | | 6,105,090 | | |
| | 152,000 | | | | | TXU Corp. | | | 8,239,920 | | |
| | | | 18,442,796 | | |
| | | | | | | Engineering &
Construction: 1.6% | | | | | |
| | 237,100 | | | @@ | | Chicago Bridge & Iron Co. NV | | | 6,482,314 | | |
| | | | 6,482,314 | | |
| | | | | Healthcare-Products: 4.0% | |
| | 255,100 | | | @ | | Boston Scientific Corp. | | | 4,382,618 | | |
| | 114,600 | | | | | Medtronic, Inc. | | | 6,132,246 | | |
| | 79,140 | | | @ | | Zimmer Holdings, Inc. | | | 6,202,993 | | |
| | | | 16,717,857 | | |
| | | | | Healthcare-Services: 5.6% | |
| | 187,600 | | | | | Aetna, Inc. | | | 8,100,568 | | |
| | 154,600 | | | | | UnitedHealth Group, Inc. | | | 8,306,658 | | |
| | 83,600 | | | @ | | WellPoint, Inc. | | | 6,578,484 | | |
| | | | 22,985,710 | | |
| | | | | Home Builders: 12.3% | |
| | 149,700 | | | | | Centex Corp. | | | 8,423,619 | | |
| | 345,100 | | | | | D.R. Horton, Inc. | | | 9,141,700 | | |
| | 200,700 | | | @ | | Hovnanian Enterprises, Inc. | | | 6,803,730 | | |
| | 179,400 | | | | | KB Home | | | 9,199,632 | | |
| | 157,800 | | | | | Lennar Corp. | | | 8,278,188 | | |
| | 14,300 | | | @ | | NVR, Inc. | | | 9,223,500 | | |
| | | | 51,070,369 | | |
| | | | | Home Furnishings: 0.3% | |
| | 17,400 | | | | | Whirlpool Corp. | | | 1,444,548 | | |
| | | | 1,444,548 | | |
| Shares | | | | | | Value | |
| | | | | Insurance: 5.5% | |
| | 126,820 | | | | | American International
Group, Inc. | | $ | 9,087,921 | | |
| | 2,600 | | | @ | | Berkshire Hathaway, Inc. | | | 9,531,600 | | |
| | 42,200 | | | | | Hartford Financial Services
Group, Inc. | | | 3,937,682 | | |
| | | | 22,557,203 | | |
| | | | | Internet: 2.8% | |
| | 224,800 | | | @,@@ | | Check Point Software
Technologies | | | 4,927,616 | | |
| | 322,500 | | | @ | | Symantec Corp. | | | 6,724,125 | | |
| | | | 11,651,741 | | |
| | | | | Iron/Steel: 1.3% | |
| | 74,700 | | | | | United States Steel Corp. | | | 5,463,558 | | |
| | | | 5,463,558 | | |
| | | | | Leisure Time: 1.5% | |
| | 87,700 | | | | | Harley-Davidson, Inc. | | | 6,180,219 | | |
| | | | 6,180,219 | | |
| | | | | | | Machinery-Construction &
Mining: 5.4% | | | | | |
| | 110,900 | | | | | Caterpillar, Inc. | | | 6,801,497 | | |
| | 169,900 | | | | | Joy Global, Inc. | | | 8,212,966 | | |
| | 111,100 | | | @ | | Terex Corp. | | | 7,174,838 | | |
| | | | 22,189,301 | | |
| | | | | Mining: 2.4% | |
| | 37,500 | | | | | Phelps Dodge Corp. | | | 4,489,500 | | |
| | 107,500 | | | @@ | | Xstrata PLC | | | 5,349,152 | | |
| | | | 9,838,652 | | |
| | | | | | | Miscellaneous
Manufacturing: 1.5% | | | | | |
| | 171,200 | | | | | General Electric Co. | | | 6,370,352 | | |
| | | | 6,370,352 | | |
| | | | | Oil & Gas: 13.8% | |
| | 97,200 | | | | | Anadarko Petroleum Corp. | | | 4,230,144 | | |
| | 142,400 | | | @@ | | Canadian Natural
Resources Ltd. | | | 7,579,952 | | |
| | 79,100 | | | @ | | Denbury Resources, Inc. | | | 2,198,189 | | |
| | 57,900 | | | | | EOG Resources, Inc. | | | 3,615,855 | | |
| | 64,500 | | | | | ExxonMobil Corp. | | | 4,942,635 | | |
| | 76,100 | | | | | Noble Corp. | | | 5,795,015 | | |
| | 54,300 | | | @@ | | Petroleo Brasileiro SA | | | 5,592,357 | | |
| | 123,700 | | | @ | | Quicksilver Resources, Inc. | | | 4,526,183 | | |
| | 135,400 | | | @ | | Southwestern Energy Co. | | | 4,745,770 | | |
| | 247,980 | | | @@ | | Talisman Energy, Inc. | | | 4,213,180 | | |
| | 103,600 | | | | | Valero Energy Corp. | | | 5,300,176 | | |
| | 87,800 | | | | | XTO Energy, Inc. | | | 4,130,990 | | |
| | | | 56,870,446 | | |
| | | | | Oil & Gas Services: 2.6% | |
| | 175,800 | | | | | Halliburton Co. | | | 5,458,590 | | |
| | 86,200 | | | @ | | National Oilwell Varco, Inc. | | | 5,273,716 | | |
| | | | 10,732,306 | | |
| | | | | Pharmaceuticals: 4.2% | |
| | 127,800 | | | | | Caremark Rx, Inc. | | | 7,298,658 | | |
| | 67,900 | | | @ | | NBTY, Inc. | | | 2,822,603 | | |
| | 116,400 | | | @@ | | Shire PLC | | | 7,188,864 | | |
| | | | 17,310,125 | | |
See Accompanying Notes to Financial Statements
220
ING NEUBERGER PORTFOLIO OF INVESTMENTS
BERMAN PARTNERS PORTFOLIO AS OF DECEMBER 31, 2006 (CONTINUED)
| Shares | | | | | | Value | |
| | | | | Retail: 5.1% | |
| | 104,300 | | | | | Best Buy Co., Inc. | | $ | 5,130,517 | | |
| | 140,200 | | | | | Federated Department
Stores, Inc. | | | 5,345,826 | | |
| | 85,000 | | | | | JC Penney Co., Inc. | | | 6,575,600 | | |
| | 144,700 | | | | | TJX Cos., Inc. | | | 4,126,844 | | |
| | | | 21,178,787 | | |
| | | | | Savings & Loans: 0.8% | |
| | 237,600 | | | | | Hudson City Bancorp., Inc. | | | 3,297,888 | | |
| | | | 3,297,888 | | |
| | | | | Semiconductors: 2.3% | |
| | 200,300 | | | @ | | Advanced Micro Devices, Inc. | | | 4,076,105 | | |
| | 151,500 | | | @,@@ | | ASML Holding NV | | | 3,731,445 | | |
| | 59,100 | | | | | Texas Instruments, Inc. | | | 1,702,080 | | |
| | | | 9,509,630 | | |
| | | | | Software: 3.7% | |
| | 277,100 | | | @ | | Activision, Inc. | | | 4,777,204 | | |
| | 177,280 | | | | | Microsoft Corp. | | | 5,293,581 | | |
| | 314,610 | | | @ | | Oracle Corp. | | | 5,392,415 | | |
| | | | 15,463,200 | | |
| | | | | Transportation: 0.9% | |
| | 39,600 | | | @@ | | Frontline Ltd. | | | 1,274,018 | | |
| | 105,530 | | | @@ | | Ship Finance International Ltd. | | | 2,507,393 | | |
| | | | 3,781,411 | | |
Total Investments in
Securities (Cost
$378,153,882)* | | | 96.0 | % | | $ | 397,161,986 | | |
Other Assets and
Liabilities - Net | | | 4.0 | | | | 16,367,546 | | |
| Net Assets | | | 100.0 | % | | $ | 413,529,532 | | |
@ Non-income producing security
@@ Foreign Issuer
ADR American Depositary Receipt
* Cost for federal income tax purposes is $378,263,799.
Net unrealized appreciation consists of:
| Gross Unrealized Appreciation | | $ | 28,330,134 | | |
| Gross Unrealized Depreciation | | | (9,431,947 | ) | |
| Net Unrealized Appreciation | | $ | 18,898,187 | | |
See Accompanying Notes to Financial Statements
221
ING NEUBERGER PORTFOLIO OF INVESTMENTS
BERMAN REGENCY PORTFOLIO AS OF DECEMBER 31, 2006
| Shares | | | | | | Value | |
| COMMON STOCK: 92.6% | | | |
| | | | | Aerospace/Defense: 2.4% | |
| | 3,700 | | | @@ | | Empresa Brasileira de
Aeronautica SA | | $ | 153,217 | | |
| | 1,800 | | | | | L-3 Communications
Holdings, Inc. | | | 147,204 | | |
| | | | 300,421 | | |
| | | | | Auto Parts & Equipment: 0.3% | |
| | 400 | | | | | Johnson Controls, Inc. | | | 34,368 | | |
| | | | 34,368 | | |
| | | | | Beverages: 1.2% | |
| | 5,400 | | | @ | | Constellation Brands, Inc. | | | 156,708 | | |
| | | | 156,708 | | |
| | | | | Coal: 2.1% | |
| | 4,900 | | | | | Arch Coal, Inc. | | | 147,147 | | |
| | 2,900 | | | | | Peabody Energy Corp. | | | 117,189 | | |
| | | | 264,336 | | |
| | | | | Commercial Services: 1.3% | |
| | 6,200 | | | @ | | United Rentals, Inc. | | | 157,666 | | |
| | | | 157,666 | | |
| | | | | Computers: 2.2% | |
| | 1,800 | | | @ | | Affiliated Computer
Services, Inc. | | | 87,912 | | |
| | 2,525 | | | @ | | Lexmark International, Inc. | | | 184,830 | | |
| | | | 272,742 | | |
| | | | | | | Diversified Financial
Services: 3.4% | | | | | |
| | 1,550 | | | | | Bear Stearns Cos., Inc. | | | 252,309 | | |
| | 3,800 | | | | | IndyMac Bancorp., Inc. | | | 171,608 | | |
| | | | 423,917 | | |
| | | | | Electric: 6.2% | |
| | 4,000 | | | | | DPL, Inc. | | | 111,120 | | |
| | 2,400 | | | | | Edison International | | | 109,152 | | |
| | 4,600 | | | @ | | Mirant Corp. | | | 145,222 | | |
| | 3,300 | | | @ | | NRG Energy, Inc. | | | 184,833 | | |
| | 4,200 | | | | | TXU Corp. | | | 227,682 | | |
| | | | 778,009 | | |
| | | | | Electronics: 0.9% | |
| | 4,200 | | | @ | | Avnet, Inc. | | | 107,226 | | |
| | | | 107,226 | | |
| | | | | | | Engineering &
Construction: 1.5% | | | | | |
| | 6,700 | | | @@ | | Chicago Bridge & Iron Co. NV | | | 183,178 | | |
| | | | 183,178 | | |
| | | | | Food: 1.2% | |
| | 8,900 | | | | | Tyson Foods, Inc. | | | 146,405 | | |
| | | | 146,405 | | |
| | | | | Healthcare-Products: 0.7% | |
| | 2,100 | | | | | Cooper Cos., Inc. | | | 93,450 | | |
| | | | 93,450 | | |
| Shares | | | | | | Value | |
| | | | | Healthcare-Services: 3.8% | |
| | 4,500 | | | | | Aetna, Inc. | | $ | 194,310 | | |
| | 3,300 | | | @ | | Coventry Health Care, Inc. | | | 165,165 | | |
| | 3,400 | | | @ | | LifePoint Hospitals, Inc. | | | 114,580 | | |
| | | | 474,055 | | |
| | | | | | | Holding Companies-
Diversified: 0.7% | | | | | |
| | 3,300 | | | | | Walter Industries, Inc. | | | 89,265 | | |
| | | | 89,265 | | |
| | | | | Home Builders: 10.4% | |
| | 3,600 | | | | | Centex Corp. | | | 202,572 | | |
| | 5,900 | | | @ | | Hovnanian Enterprises, Inc. | | | 200,010 | | |
| | 4,100 | | | | | KB Home | | | 210,248 | | |
| | 4,000 | | | | | Lennar Corp. | | | 209,840 | | |
| | 3,900 | | | @ | | Meritage Homes Corp. | | | 186,108 | | |
| | 340 | | | @ | | NVR, Inc. | | | 219,300 | | |
| | 1,300 | | | | | Ryland Group, Inc. | | | 71,006 | | |
| | | | 1,299,084 | | |
| | | | | Home Furnishings: 1.2% | |
| | 1,850 | | | | | Whirlpool Corp. | | | 153,587 | | |
| | | | 153,587 | | |
| | | | | Insurance: 3.5% | |
| | 1,500 | | | | | Cigna Corp. | | | 197,355 | | |
| | 4,400 | | | @@ | | Endurance Specialty
Holdings Ltd. | | | 160,952 | | |
| | 1,600 | | | | | PMI Group, Inc. | | | 75,472 | | |
| | | | 433,779 | | |
| | | | | Internet: 1.4% | |
| | 5,400 | | | @,@@ | | Check Point Software
Technologies | | | 118,368 | | |
| | 2,200 | | | @ | | McAfee, Inc. | | | 62,436 | | |
| | | | 180,804 | | |
| | | | | Iron/Steel: 2.5% | |
| | 3,900 | | | | | Cleveland-Cliffs, Inc. | | | 188,916 | | |
| | 1,700 | | | | | United States Steel Corp. | | | 124,338 | | |
| | | | 313,254 | | |
| | | | | Leisure Time: 1.1% | |
| | 2,000 | | | | | Harley-Davidson, Inc. | | | 140,940 | | |
| | | | 140,940 | | |
| | | | | | | Machinery-Construction &
Mining: 3.9% | | | | | |
| | 5,150 | | | | | Joy Global, Inc. | | | 248,951 | | |
| | 3,700 | | | @ | | Terex Corp. | | | 238,946 | | |
| | | | 487,897 | | |
| | | | | Metal Fabricate/Hardware: 1.2% | |
| | 243 | | | @ | | Mueller Water Products,
Inc.-Class B | | | 3,621 | | |
| | 5,100 | | | | | Timken Co. | | | 148,818 | | |
| | | | 152,439 | | |
| | | | | Mining: 2.0% | |
| | 2,150 | | | | | Phelps Dodge Corp. | | | 257,398 | | |
| | | | 257,398 | | |
See Accompanying Notes to Financial Statements
222
ING NEUBERGER PORTFOLIO OF INVESTMENTS
BERMAN REGENCY PORTFOLIO AS OF DECEMBER 31, 2006 (CONTINUED)
| Shares | | | | | | Value | |
| | | | | | | Miscellaneous
Manufacturing: 1.4% | | | | | |
| | 1,300 | | | | | Eaton Corp. | | $ | 97,682 | | |
| | 2,100 | | | @@ | | Ingersoll-Rand Co. | | | 82,173 | | |
| | | | 179,855 | | |
| | | | | Oil & Gas: 8.8% | |
| | 3,400 | | | @@ | | Canadian Natural Resources Ltd. | | | 180,982 | | |
| | 5,000 | | | @ | | Denbury Resources, Inc. | | | 138,950 | | |
| | 2,300 | | | | | Noble Corp. | | | 175,145 | | |
| | 3,400 | | | @ | | Quicksilver Resources, Inc. | | | 124,406 | | |
| | 3,900 | | | @ | | Southwestern Energy Co. | | | 136,695 | | |
| | 1,500 | | | | | Sunoco, Inc. | | | 93,540 | | |
| | 6,555 | | | @@ | | Talisman Energy, Inc. | | | 111,369 | | |
| | 3,000 | | | | | XTO Energy, Inc. | | | 141,150 | | |
| | | | 1,102,237 | | |
| | | | | Oil & Gas Services: 1.8% | |
| | 2,900 | | | @ | | Oceaneering International, Inc. | | | 115,130 | | |
| | 3,600 | | | @ | | Oil States International, Inc. | | | 116,028 | | |
| | | | 231,158 | | |
| | | | | Pharmaceuticals: 5.7% | |
| | 4,300 | | | @ | | Endo Pharmaceuticals
Holdings, Inc. | | | 118,594 | | |
| | 5,000 | | | @ | | NBTY, Inc. | | | 207,850 | | |
| | 3,900 | | | | | Omnicare, Inc. | | | 150,657 | | |
| | 3,900 | | | @@ | | Shire PLC | | | 240,864 | | |
| | | | 717,965 | | |
| | | | | Pipelines: 2.0% | |
| | 2,800 | | | | | National Fuel Gas Co. | | | 107,912 | | |
| | 5,400 | | | | | Williams Cos., Inc. | | | 141,048 | | |
| | | | 248,960 | | |
| | | | | | | Real Estate Investment
Trusts: 5.5% | | | | | |
| | 5,500 | | | | | Annaly Capital
Management, Inc. | | | 76,505 | | |
| | 2,400 | | | | | Colonial Properties Trust | | | 112,512 | | |
| | 1,600 | | | | | Developers Diversified
Realty Corp. | | | 100,720 | | |
| | 2,500 | | | | | First Industrial Realty Trust, Inc. | | | 117,225 | | |
| | 4,200 | | | | | iStar Financial, Inc. | | | 200,844 | | |
| | 1,800 | | | | | Ventas, Inc. | | | 76,176 | | |
| | | | 683,982 | | |
| | | | | Retail: 5.8% | |
| | 4,200 | | | | | Advance Auto Parts, Inc. | | | 149,352 | | |
| | 4,600 | | | @ | | Aeropostale, Inc. | | | 142,002 | | |
| | 7,000 | | | | | Circuit City Stores, Inc. | | | 132,860 | | |
| | 6,500 | | | @ | | HOT Topic, Inc. | | | 86,710 | | |
| | 3,200 | | | | | Ross Stores, Inc. | | | 93,760 | | |
| | 4,300 | | | | | TJX Cos., Inc. | | | 122,636 | | |
| | | | 727,320 | | |
| | | | | Savings & Loans: 1.2% | |
| | 10,800 | | | | | Hudson City Bancorp., Inc. | | | 149,904 | | |
| | | | 149,904 | | |
| | | | | Semiconductors: 0.8% | |
| | 2,500 | | | @ | | International Rectifier Corp. | | | 96,325 | | |
| | | | 96,325 | | |
| Shares | | | | | | Value | |
| | | | | Software: 2.2% | |
| | 7,300 | | | @ | | Activision, Inc. | | $ | 125,852 | | |
| | 8,700 | | | @ | | Take-Two Interactive
Software, Inc. | | | 154,512 | | |
| | | | 280,364 | | |
| | | | | Telecommunications: 1.2% | |
| | 11,700 | | | @ | | Arris Group, Inc. | | | 146,367 | | |
| | | | 146,367 | | |
| | | | | Transportation: 1.1% | |
| | 2,000 | | | @@ | | Frontline Ltd. | | | 63,700 | | |
| | 3,000 | | | @@ | | Ship Finance International Ltd. | | | 71,280 | | |
| | | | 134,980 | | |
Total Investments in
Securities (Cost
$10,866,403)* | | | 92.6 | % | | $ | 11,600,345 | | |
Other Assets and
Liabilities - Net | | | 7.4 | | | | 933,029 | | |
| Net Assets | | | 100.0 | % | | $ | 12,533,374 | | |
@ Non-income producing security
@@ Foreign Issuer
* Cost for federal income tax purposes is $10,862,562.
Net unrealized appreciation consists of:
| Gross Unrealized Appreciation | | $ | 1,224,596 | | |
| Gross Unrealized Depreciation | | | (486,813 | ) | |
| Net Unrealized Appreciation | | $ | 737,783 | | |
See Accompanying Notes to Financial Statements
223
PORTFOLIO OF INVESTMENTS
ING OPCAP BALANCED VALUE PORTFOLIO AS OF DECEMBER 31, 2006
| Shares | | | | | | Value | |
| COMMON STOCK: 72.8% | | | |
| | | | | Aerospace/Defense: 2.2% | |
| | 21,800 | | | | | Boeing Co. | | $ | 1,936,712 | | |
| | | | 1,936,712 | | |
| | | | | Banks: 3.6% | |
| | 80,000 | | | | | Bank of New York Co., Inc. | | | 3,149,600 | | |
| | | | 3,149,600 | | |
| | | | | Beverages: 1.5% | |
| | 27,000 | | | | | Coca-Cola Co. | | | 1,302,750 | | |
| | | | 1,302,750 | | |
| | | | | Commercial Services: 1.5% | |
| | 32,350 | | | @ | | ChoicePoint, Inc. | | | 1,273,943 | | |
| | | | 1,273,943 | | |
| | | | | Computers: 4.9% | |
| | 20,300 | | | @ | | Apple Computer, Inc. | | | 1,722,252 | | |
| | 33,300 | | | @ | | Dell, Inc. | | | 835,497 | | |
| | 134,000 | | | @ | | EMC Corp. | | | 1,768,800 | | |
| | | | 4,326,549 | | |
| | | | | | | Cosmetics/Personal
Care: 1.5% | | | | | |
| | 20,000 | | | | | Colgate-Palmolive Co. | | | 1,304,800 | | |
| | | | 1,304,800 | | |
| | | | | | | Diversified Financial
Services: 7.7% | | | | | |
| | 93,200 | | | L | | Countrywide Financial Corp. | | | 3,956,340 | | |
| | 29,800 | | | | | Merrill Lynch & Co., Inc. | | | 2,774,380 | | |
| | | | 6,730,720 | | |
| | | | | Electric: 1.3% | |
| | 13,400 | | | L | | Dominion Resources, Inc. | | | 1,123,456 | | |
| | | | 1,123,456 | | |
| | | | | Healthcare-Services: 5.1% | |
| | 37,600 | | | | | Aetna, Inc. | | | 1,623,568 | | |
| | 53,400 | | | L | | UnitedHealth Group, Inc. | | | 2,869,182 | | |
| | | | 4,492,750 | | |
| | | | | Home Builders: 3.0% | |
| | 46,000 | | | L | | Centex Corp. | | | 2,588,420 | | |
| | | | 2,588,420 | | |
| | | | | Insurance: 4.8% | |
| | 27,200 | | | | | AMBAC Financial Group, Inc. | | | 2,422,704 | | |
| | 305,000 | | | | | Conseco Escrow | | | - | | |
| | 7,000 | | | @@ | | Everest Re Group Ltd. | | | 686,770 | | |
| | 12,012 | | | | | Hartford Financial Services
Group, Inc. | | | 1,120,840 | | |
| | | | 4,230,314 | | |
| | | | | Leisure Time: 5.2% | |
| | 20,400 | | | L | | Carnival Corp. | | | 1,000,620 | | |
| | 85,400 | | | L | | Royal Caribbean Cruises Ltd. | | | 3,533,852 | | |
| | | | 4,534,472 | | |
| | | | | | | Miscellaneous
Manufacturing: 2.3% | | | | | |
| | 26,800 | | | | | Eaton Corp. | | | 2,013,752 | | |
| | | | 2,013,752 | | |
| Shares | | | | | | Value | |
| | | | | Oil & Gas: 8.9% | |
| | 17,600 | | | | | Chevron Corp. | | $ | 1,294,128 | | |
| | 74,500 | | | | | ConocoPhillips | | | 5,360,275 | | |
| | 20,000 | | | L | | GlobalSantaFe Corp. | | | 1,175,600 | | |
| | | | 7,830,003 | | |
| | | | | Pharmaceuticals: 6.9% | |
| | 44,300 | | | | | Abbott Laboratories | | | 2,157,853 | | |
| | 43,700 | | | @@ | | Roche Holding AG ADR | | | 3,911,054 | | |
| | | | 6,068,907 | | |
| | | | | Retail: 3.2% | |
| | 19,000 | | | | | Walgreen Co. | | | 871,910 | | |
| | 32,250 | | | | | Yum! Brands, Inc. | | | 1,896,300 | | |
| | | | 2,768,210 | | |
| | | | | Semiconductors: 0.8% | |
| | 66,003 | | | @@ | | Taiwan Semiconductor
Manufacturing Co., Ltd. ADR | | | 721,413 | | |
| | | | 721,413 | | |
| | | | | Software: 0.9% | |
| | 27,000 | | | | | Microsoft Corp. | | | 806,220 | | |
| | | | 806,220 | | |
| | | | | Telecommunications: 7.5% | |
| | 53,700 | | | | | AT&T, Inc. | | | 1,919,775 | | |
| | 121,000 | | | | | Motorola, Inc. | | | 2,487,759 | | |
| | 33,500 | | | @,L | | NII Holdings, Inc. | | | 2,158,740 | | |
| | | | 6,566,274 | | |
Total Commo+n Stock
(Cost $57,163,493) | | | 63,769,265 | | |
Principal
Amount | | | | | | Value | |
| CORPORATE BONDS/NOTES: 25.6% | | | |
| | | | | Aerospace/Defense: 1.2% | |
| $ | 450,000 | | | C | | General Dynamics Corp.,
4.500%, due 08/15/10 | | | 440,806 | | |
| | 585,000 | | | C | | Raytheon Co., 6.750%,
due 08/15/07 | | | 589,396 | | |
| | | | 1,030,202 | | |
| | | | | Auto Manufacturers: 0.5% | |
| | 400,000 | | | | | DaimlerChrysler Holding Corp.,
4.750%, due 01/15/08 | | | 396,451 | | |
| | | | 396,451 | | |
| | | | | Banks: 2.5% | |
| | 720,000 | | | | | Bank of America Corp.,
4.375%, due 12/01/10 | | | 700,434 | | |
| | 610,000 | | | | | Keycorp, 2.750%,
due 02/27/07 | | | 607,265 | | |
| | 220,000 | | | L | | US Bancorp., 4.500%,
due 07/29/10 | | | 215,158 | | |
| | 200,000 | | | L | | US Bancorp., 5.300%,
due 04/28/09 | | | 200,599 | | |
| | 460,000 | | | L | | Wachovia Corp., 4.375%,
due 06/01/10 | | | 448,809 | | |
| | | | 2,172,265 | | |
See Accompanying Notes to Financial Statements
224
PORTFOLIO OF INVESTMENTS
ING OPCAP BALANCED VALUE PORTFOLIO AS OF DECEMBER 31, 2006 (CONTINUED)
Principal
Amount | | | | | | Value | |
| | | | | Chemicals: 0.7% | |
| $ | 635,000 | | | C,L | | EI Du Pont de Nemours & Co.,
4.125%, due 04/30/10 | | $ | 616,605 | | |
| | | | 616,605 | | |
| | | | | Cosmetics/Personal Care: 0.6% | |
| | 555,000 | | | C,L | | Procter & Gamble Co., 3.500%,
due 12/15/08 | | | 537,933 | | |
| | | | 537,933 | | |
| | | | | Diversified Financial
Services: 9.4% | |
| | 260,000 | | | | | American Express Credit Corp.,
3.000%, due 05/16/08 | | | 252,430 | | |
| | 405,000 | | | L | | American Express Credit Corp.,
5.000%, due 12/02/10 | | | 402,653 | | |
| | 520,000 | | | C | | Ameriprise Financial, Inc.,
5.350%, due 11/15/10 | | | 521,609 | | |
| | 470,000 | | | | | Bear Stearns Cos., Inc., 7.800%,
due 08/15/07 | | | 477,049 | | |
| | 575,000 | | | C,L | | Boeing Capital Corp., 6.500%,
due 02/15/12 | | | 606,927 | | |
| | 325,000 | | | | | CIT Group, Inc., 4.750%,
due 12/15/10 | | | 318,564 | | |
| | 200,000 | | | | | CIT Group, Inc., 7.750%,
due 04/02/12 | | | 220,741 | | |
| | 305,000 | | | | | Citigroup, Inc., 5.000%,
due 03/06/07 | | | 304,799 | | |
| | 300,000 | | | L | | Citigroup, Inc., 6.000%,
due 02/21/12 | | | 309,663 | | |
| | 610,000 | | | C,L | | Credit Suisse First Boston
USA, Inc., 5.750%,
due 04/15/07 | | | 610,509 | | |
| | 350,000 | | | | | General Electric Capital Corp.,
4.875%, due 10/21/10 | | | 346,614 | | |
| | 200,000 | | | | | General Electric Capital Corp.,
6.000%, due 06/15/12 | | | 207,274 | | |
| | 600,000 | | | L | | Goldman Sachs Group, Inc.,
5.700%, due 09/01/12 | | | 611,795 | | |
| | 200,000 | | | | | HSBC Finance Corp., 7.000%,
due 05/15/12 | | | 215,879 | | |
| | 610,000 | | | L | | International Lease Finance
Corp., 5.625%, due 06/01/07 | | | 610,468 | | |
| | 520,000 | | | | | John Deere Capital Corp.,
3.875%, due 03/07/07 | | | 518,591 | | |
| | 605,000 | | | | | JPMorgan Chase & Co., 5.250%,
due 05/30/07 | | | 604,829 | | |
| | 640,000 | | | | | Merrill Lynch & Co., Inc.,
3.700%, due 04/21/08 | | | 626,401 | | |
| | 500,000 | | | | | SLM Corp., 4.500%,
due 07/26/10 | | | 487,075 | | |
| | | | 8,253,870 | | |
| | | | | Environmental Control: 0.2% | |
| | 125,000 | | | C | | Waste Management, Inc.,
6.500%, due 11/15/08 | | | 127,405 | | |
| | | | 127,405 | | |
| | | | | Food: 1.8% | |
| | 530,000 | | | C | | General Mills, Inc.,
6.000%, due 02/15/12 | | | 543,476 | | |
| | 545,000 | | | C | | Kellogg Co., 2.875%,
due 06/01/08 | | | 526,211 | | |
| | 520,000 | | | C | | Safeway, Inc., 4.800%,
due 07/16/07 | | | 518,051 | | |
| | | | 1,587,738 | | |
Principal
Amount | | | | | | Value | |
| | | | | Insurance: 0.6% | |
| $ | 540,000 | | | C | | Berkshire Hathaway Finance
Corp., 3.375%, due 10/15/08 | | $ | 523,575 | | |
| | 2,350,000 | | | ^ | | Conseco Finance Trust I | | | — | | |
| | 2,345,000 | | | ^ | | Conseco Finance Trust II | | | — | | |
| | | | 523,575 | | |
| | | | | Media: 1.5% | |
| | 125,000 | | | | | News America Holdings,
9.250%, due 02/01/13 | | | 146,846 | | |
| | 280,000 | | | | | Time Warner Entertainment
Co. LP, 7.250%, due 09/01/08 | | | 287,986 | | |
| | 360,000 | | | | | Viacom, Inc., 5.625%,
due 05/01/07 | | | 360,215 | | |
| | 545,000 | | | C,L | | Walt Disney Co., 5.700%,
due 07/15/11 | | | 555,094 | | |
| | | | 1,350,141 | | |
| | | | | Mining: 0.7% | |
| | 630,000 | | | C | | Alcoa, Inc., 4.250%,
due 08/15/07 | | | 624,290 | | |
| | | | 624,290 | | |
| | | | | Oil & Gas: 1.8% | |
| | 620,000 | | | @@,C,L | | ChevronTexaco Capital Co.,
3.500%, due 09/17/07 | | | 612,830 | | |
| | 595,000 | | | C | | Marathon Oil Corp., 5.375%,
due 06/01/07 | | | 594,842 | | |
| | 405,000 | | | C | | Valero Energy Corp., 6.125%,
due 04/15/07 | | | 405,537 | | |
| | | | 1,613,209 | | |
| | | | | Pipelines: 0.5% | |
| | 415,000 | | | C | | Duke Capital, LLC, 7.500%,
due 10/01/09 | | | 436,922 | | |
| | | | 436,922 | | |
| | | | | Retail: 0.6% | |
| | 530,000 | | | C | | CVS Corp., 3.875%, due 11/01/07 | | | 523,344 | | |
| | | | 523,344 | | |
| | | | | Savings & Loans: 0.5% | |
| | 425,000 | | | | | World Savings Bank FSB,
4.125%, due 03/10/08 | | | 417,690 | | |
| | | | 417,690 | | |
| | | | | Telecommunications: 1.8% | |
| | 385,000 | | | C | | AT&T Wireless Services, Inc.,
7.500%, due 05/01/07 | | | 387,362 | | |
| | 630,000 | | | | | Motorola, Inc., 4.608%,
due 11/16/07 | | | 625,914 | | |
| | 350,000 | | | C | | Verizon Global Funding Corp.,
7.250%, due 12/01/10 | | | 373,401 | | |
| | 200,000 | | | C | | Verizon Global Funding Corp.,
7.375%, due 09/01/12 | | | 218,919 | | |
| | | | 1,605,596 | | |
| | | | | Transportation: 0.7% | |
| | 625,000 | | | | | FedEx Corp., 2.650%,
due 04/01/07 | | | 620,793 | | |
| | | | 620,793 | | |
Total Corporate Bonds/Notes
(Cost $22,546,691) | | | 22,438,029 | | |
Total Long-Term Investments
(Cost $79,710,184) | | | 86,207,294 | | |
See Accompanying Notes to Financial Statements
225
PORTFOLIO OF INVESTMENTS
ING OPCAP BALANCED VALUE PORTFOLIO AS OF DECEMBER 31, 2006 (CONTINUED)
Principal
Amount | | | | Value | |
| SHORT-TERM INVESTMENTS: 26.7% | |
| | | U.S. Government Agency Obligations: 2.1% | |
| $ | 1,866,000 | | | Federal Home Loan Bank, 4.600%,
due 01/02/07 | | $ | 1,865,523 | | |
Total U.S. Government Agency
Obligations (Cost $1,865,523) | | | 1,865,523 | | |
| | | Securities Lending Collateralcc: 24.6% | |
| | 21,545,723 | | | The Bank of New York Institutional
Cash Reserves Fund | | | 21,545,723 | | |
Total Securities Lending Collateral
(Cost $21,545,723) | | | 21,545,723 | | |
Total Short-Term Investments
(Cost $23,411,246) | | | 23,411,246 | | |
Total Investments in
Securities (Cost
$103,121,430)* | | | 125.1 | % | | $ | 109,618,540 | | |
Other Assets and
Liabilities - Net | | | (25.1 | ) | | | (22,019,151 | ) | |
| Net Assets | | | 100.0 | % | | $ | 87,599,389 | | |
@ Non-income producing security
@@ Foreign Issuer
ADR American Depositary Receipt
C Bond may be called prior to maturity date.
cc Securities purchased with cash collateral for securities loaned.
L Loaned security, a portion or all of the security is on loan at December 31, 2006.
^ Defaulted security
* Cost for federal income tax purposes is $103,359,669.
Net unrealized appreciation consists of:
| Gross Unrealized Appreciation | | $ | 6,801,335 | | |
| Gross Unrealized Depreciation | | | (542,464 | ) | |
| Net Unrealized Appreciation | | $ | 6,258,871 | | |
See Accompanying Notes to Financial Statements
226
ING OPPENHEIMER PORTFOLIO OF INVESTMENTS
GLOBAL PORTFOLIO AS OF DECEMBER 31, 2006
| Shares | | | | | | Value | |
| COMMON STOCK: 99.0% | | | |
| | | | | Barbados: 0.3% | |
| | 80,400 | | | | | Everest Re Group Ltd. | | $ | 7,888,044 | | |
| | | | 7,888,044 | | |
| | | | | Bermuda: 1.2% | |
| | 294,100 | | | | | ACE Ltd. | | | 17,813,637 | | |
| | 195,100 | | | L | | XL Capital Ltd. | | | 14,051,102 | | |
| | | | 31,864,739 | | |
| | | | | Brazil: 1.5% | |
| | 356,400 | | | L | | Cia de Bebidas das
Americas ADR | | | 17,392,320 | | |
| | 604,300 | | | L | | Empresa Brasileira de
Aeronautica SA | | | 25,024,063 | | |
| | | | 42,416,383 | | |
| | | | | Canada: 1.6% | |
| | 457,700 | | | L | | Husky Energy, Inc. | | | 30,629,771 | | |
| | 425,000 | | | L | | Manulife Financial Corp. | | | 14,340,994 | | |
| | | | 44,970,765 | | |
| | | | | Denmark: 0.3% | |
| | 105,800 | | | | | Novo-Nordisk A/S | | | 8,809,760 | | |
| | | | 8,809,760 | | |
| | | | | Finland: 0.7% | |
| | 608,900 | | | | | Fortum OYJ | | | 17,292,997 | | |
| | 35,975 | | | | | Neste Oil OYJ | | | 1,090,147 | | |
| | | | 18,383,144 | | |
| | | | | France: 5.6% | |
| | 98,622 | | | @ | | Arkema | | | 5,049,693 | | |
| | 334,478 | | | L | | LVMH Moet Hennessy Louis
Vuitton SA | | | 35,185,421 | | |
| | 123,910 | | | @,L | | NicOx SA | | | 3,709,765 | | |
| | 463,489 | | | | | Sanofi-Aventis | | | 42,733,998 | | |
| | 147,105 | | | | | Societe Generale | | | 24,885,766 | | |
| | 439,004 | | | L | | Technip SA | | | 30,112,267 | | |
| | 168,654 | | | | | Total SA | | | 12,135,904 | | |
| | | | 153,812,814 | | |
| | | | | Germany: 5.0% | |
| | 171,879 | | | | | Allianz AG | | | 34,969,420 | | |
| | 460,901 | | | | | Bayerische Motoren
Werke AG | | | 26,472,477 | | |
| | 576,776 | | | | | SAP AG | | | 30,648,598 | | |
| | 453,424 | | | | | Siemens AG | | | 44,771,460 | | |
| | | | 136,861,955 | | |
| | | | | Hong Kong: 0.4% | |
| | 1,042,000 | | | @ | | Hutchison Whampoa Ltd. | | | 10,563,953 | | |
| | | | 10,563,953 | | |
| | | | | India: 2.5% | |
| | 175,400 | | | L | | ICICI Bank Ltd. ADR | | | 7,321,196 | | |
| | 714,227 | | | | | Infosys Technologies Ltd. | | | 36,094,170 | | |
| | 3,095,676 | | | | | ZEE Telefilms Ltd. | | | 25,653,344 | | |
| | | | 69,068,710 | | |
| | | | | Ireland: 0.2% | |
| | 491,255 | | | | | Experian Group Ltd. | | | 5,752,650 | | |
| | | | 5,752,650 | | |
| Shares | | | | | | Value | |
| | | | | Italy: 0.5% | |
| | 977,400 | | | L | | Bulgari S.p.A. | | $ | 13,834,214 | | |
| | | | 13,834,214 | | |
| | | | | Japan: 10.7% | |
| | 201,300 | | | | | Canon, Inc. | | | 11,333,221 | | |
| | 483,800 | | | L | | Chugai Pharmaceutical
Co., Ltd. | | | 9,960,354 | | |
| | 510,600 | | | | | Credit Saison Co., Ltd. | | | 17,539,682 | | |
| | 79,500 | | | | | Fanuc Ltd. | | | 7,802,270 | | |
| | 461,000 | | | @ | | Hoya Corp. | | | 17,968,328 | | |
| | 3,967 | | | | | KDDI Corp. | | | 26,930,461 | | |
| | 61,430 | | | | | Keyence Corp. | | | 15,163,324 | | |
| | 151,200 | | | | | Kyocera Corp. | | | 14,293,338 | | |
| | 377,300 | | | | | Murata Manufacturing
Co., Ltd. | | | 25,458,444 | | |
| | 105,000 | | | L | | Nidec Corp. | | | 8,126,418 | | |
| | 62,800 | | | | | Nintendo Co., Ltd. | | | 16,258,207 | | |
| | 3,865 | | | L | | Resona Holdings, Inc. | | | 10,543,606 | | |
| | 220,500 | | | | | Secom Co., Ltd. | | | 11,416,273 | | |
| | 166,800 | | | | | Sega Sammy Holdings, Inc. | | | 4,483,877 | | |
| | 220,871 | | | | | Seven & I Holdings Co., Ltd. | | | 6,867,986 | | |
| | 727,000 | | | | | Shionogi & Co., Ltd. | | | 14,277,674 | | |
| | 751,400 | | | | | Sony Corp. | | | 32,178,883 | | |
| | 408,800 | | | L | | Square Enix Co., Ltd. | | | 10,737,848 | | |
| | 566 | | | | | Sumitomo Mitsui Financial
Group, Inc. | | | 5,795,008 | | |
| | 422,100 | | | | | Toyota Motor Corp. | | | 28,249,887 | | |
| | | | 295,385,089 | | |
| | | | | Mexico: 2.5% | |
| | 1,809,800 | | | | | Fomento Economico
Mexicano SA de CV ADR | | | 20,999,577 | | |
| | 2,518,200 | | | | | Grupo Modelo SA | | | 13,939,495 | | |
| | 1,222,100 | | | | | Grupo Televisa SA | | | 33,008,921 | | |
| | | | 67,947,993 | | |
| | | | | Netherlands: 2.3% | |
| | 904,393 | | | L | | European Aeronautic
Defence and Space Co. NV | | | 31,031,211 | | |
| | 864,877 | | | | | Koninklijke Philips
Electronics NV | | | 32,522,067 | | |
| | | | 63,553,278 | | |
| | | | | Norway: 0.4% | |
| | 810,700 | | | L | | Tandberg ASA | | | 12,162,393 | | |
| | | | 12,162,393 | | |
| | | | | Singapore: 0.2% | |
| | 2,288,800 | | | | | Singapore Press
Holdings Ltd. | | | 6,370,513 | | |
| | | | 6,370,513 | | |
| | | | | South Korea: 2.0% | |
| | 67,663 | | | | | Hyudai Heavy Industries | | | 9,133,189 | | |
| | 28,299 | | | | | Samsung Electronics Co., Ltd. | | | 18,564,388 | | |
| | 991,800 | | | L | | SK Telecom Co., Ltd. ADR | | | 26,262,864 | | |
| | | | 53,960,441 | | |
| | | | | Spain: 0.9% | |
| | 486,800 | | | L | | Inditex SA | | | 26,186,421 | | |
| | | | 26,186,421 | | |
See Accompanying Notes to Financial Statements
227
ING OPPENHEIMER PORTFOLIO OF INVESTMENTS
GLOBAL PORTFOLIO AS OF DECEMBER 31, 2006 (CONTINUED)
| Shares | | | | | | Value | |
| | | | | Sweden: 6.5% | |
| | 1,078,600 | | | | | Hennes & Mauritz AB | | $ | 54,399,369 | | |
| | 701,904 | | | | | Investor AB | | | 17,147,843 | | |
| | 26,666,700 | | | | | Telefonaktiebolaget LM
Ericsson | | | 107,231,113 | | |
| | | | 178,778,325 | | |
| | | | | Switzerland: 3.4% | |
| | 544,342 | | | | | Credit Suisse Group | | | 37,950,414 | | |
| | 255,261 | | | | | Novartis AG | | | 14,663,788 | | |
| | 195,605 | | | | | Roche Holding AG | | | 34,996,390 | | |
| | 35,490 | | | | | Syngenta AG | | | 6,592,637 | | |
| | | | 94,203,229 | | |
| | | | | Taiwan: 1.5% | |
| | 8,747,000 | | | @ | | Benq Corp. | | | 4,675,760 | | |
| | 2,015,700 | | | | | MediaTek, Inc. | | | 20,758,329 | | |
| | 8,420,766 | | | | | Taiwan Semiconductor
Manufacturing Co., Ltd. | | | 17,289,364 | | |
| | | | 42,723,453 | | |
| | | | | United Kingdom: 12.6% | |
| | 362,746 | | | | | 3i Group PLC | | | 7,152,046 | | |
| | 321,300 | | | | | BP PLC ADR | | | 21,559,230 | | |
| | 978,938 | | | | | Burberry Group PLC | | | 12,330,492 | | |
| | 2,735,650 | | | | | Cadbury Schweppes PLC | | | 29,218,293 | | |
| | 805,141 | | | | | Diageo PLC | | | 15,819,139 | | |
| | 437,094 | | | | | Home Retail Group | | | 3,508,870 | | |
| | 1,504,521 | | | L | | HSBC Holdings PLC | | | 27,536,042 | | |
| | 796,173 | | | | | Pearson PLC | | | 11,999,744 | | |
| | 1,908,816 | | | | | Prudential PLC | | | 26,078,602 | | |
| | 890,496 | | | | | Reckitt Benckiser PLC | | | 40,621,848 | | |
| | 1,168,877 | | | | | Royal Bank of Scotland
Group PLC | | | 45,490,572 | | |
| | 1,415,754 | | | | | Smith & Nephew PLC | | | 14,768,346 | | |
| | 2,877,901 | | | | | Tesco PLC | | | 22,742,371 | | |
| | 19,446,596 | | | | | Vodafone Group PLC | | | 53,705,053 | | |
| | 1,021,218 | | | | | WPP Group PLC | | | 13,781,594 | | |
| | | | 346,312,242 | | |
| | | | | United States: 36.2% | |
| | 338,600 | | | | | 3M Co. | | | 26,387,098 | | |
| | 862,000 | | | @,L | | Adobe Systems, Inc. | | | 35,445,440 | | |
| | 1,505,600 | | | @ | | Advanced Micro
Devices, Inc. | | | 30,638,960 | | |
| | 245,200 | | | @,L | | Affymetrix, Inc. | | | 5,654,312 | | |
| | 880,000 | | | @ | | Altera Corp. | | | 17,318,400 | | |
| | 189,700 | | | @ | | Amgen, Inc. | | | 12,958,407 | | |
| | 569,000 | | | @,L | | Atherogenics, Inc. | | | 5,638,790 | | |
| | 654,500 | | | | | Automatic Data
Processing, Inc. | | | 32,234,125 | | |
| | 100,340 | | | L | | Avis Budget Group, Inc. | | | 2,176,375 | | |
| | 379,800 | | | | | Avon Products, Inc. | | | 12,548,592 | | |
| | 4,600 | | | @,L | | Berkshire Hathaway, Inc. | | | 16,863,600 | | |
| | 420,900 | | | | | Biomet, Inc. | | | 17,370,543 | | |
| | 210,400 | | | | | Boeing Co. | | | 18,691,936 | | |
| | 1,083,954 | | | @ | | Boston Scientific Corp. | | | 18,622,330 | | |
| | 724,300 | | | L | | Carnival Corp. | | | 35,526,915 | | |
| | 262,100 | | | | | Chevron Corp. | | | 19,272,213 | | |
| | 467,400 | | | @ | | Cisco Systems, Inc. | | | 12,774,042 | | |
| | 373,400 | | | @ | | Coach, Inc. | | | 16,041,264 | | |
| | 257,300 | | | | | Colgate-Palmolive Co. | | | 16,786,252 | | |
| | 1,279,000 | | | @ | | Corning, Inc. | | | 23,930,090 | | |
| | 435,200 | | | @,L | | Cree, Inc. | | | 7,537,664 | | |
| Shares | | | | | | Value | |
| | 1,340,900 | | | @ | | eBay, Inc. | | $ | 40,320,863 | | |
| | 629,800 | | | | | Emerson Electric Co. | | | 27,767,882 | | |
| | 137,300 | | | @ | | Express Scripts, Inc. | | | 9,830,680 | | |
| | 141,200 | | | @ | | Genentech, Inc. | | | 11,455,556 | | |
| | 173,800 | | | @ | | Getty Images, Inc. | | | 7,442,116 | | |
| | 321,600 | | | @ | | Gilead Sciences, Inc. | | | 20,881,488 | | |
| | 411,700 | | | L | | GlobalSantaFe Corp. | | | 24,199,726 | | |
| | 386,900 | | | | | International Game
Technology | | | 17,874,780 | | |
| | 267,300 | | | @,L | | International Rectifier Corp. | | | 10,299,069 | | |
| | 705,400 | | | @,L | | Intuit, Inc. | | | 21,521,754 | | |
| | 106,600 | | | | | Johnson & Johnson | | | 7,037,732 | | |
| | 286,400 | | | | | JPMorgan Chase & Co. | | | 13,833,120 | | |
| | 1,342,000 | | | @,L | | Juniper Networks, Inc. | | | 25,417,480 | | |
| | 270,000 | | | L | | Linear Technology Corp. | | | 8,186,400 | | |
| | 169,800 | | | | | Lockheed Martin Corp. | | | 15,633,486 | | |
| | 617,300 | | | | | Maxim Integrated Products | | | 18,901,726 | | |
| | 407,100 | | | L | | McDonald's Corp. | | | 18,046,743 | | |
| | 194,300 | | | | | Medtronic, Inc. | | | 10,396,993 | | |
| | 1,682,900 | | | | | Microsoft Corp. | | | 50,251,394 | | |
| | 373,500 | | | | | Morgan Stanley | | | 30,414,105 | | |
| | 170,700 | | | @,L | | Nektar Therapeutics | | | 2,596,347 | | |
| | 438,500 | | | | | Northern Trust Corp. | | | 26,612,565 | | |
| | 189,200 | | | | | Northrop Grumman Corp. | | | 12,808,840 | | |
| | 146,200 | | | @,L | | Nuvelo, Inc. | | | 584,800 | | |
| | 36,560 | | | | | Qualcomm, Inc. | | | 1,381,602 | | |
| | 216,900 | | | | | Quest Diagnostics | | | 11,495,700 | | |
| | 312,400 | | | | | Raytheon Co. | | | 16,494,720 | | |
| | 267,150 | | | @ | | Realogy Corp. | | | 8,099,988 | | |
| | 130,400 | | | @,L | | Regeneron
Pharmaceuticals, Inc. | | | 2,617,128 | | |
| | 5,269,139 | | | @,L | | Sirius Satellite Radio, Inc. | | | 18,652,752 | | |
| | 205,800 | | | @,L | | Theravance, Inc. | | | 6,357,162 | | |
| | 567,700 | | | L | | Tiffany & Co. | | | 22,276,548 | | |
| | 382,300 | | | @,L | | Transocean, Inc. | | | 30,924,247 | | |
| | 545,700 | | | | | Wal-Mart Stores, Inc. | | | 25,200,426 | | |
| | 563,100 | | | | | Walt Disney Co. | | | 19,297,437 | | |
| | 588,000 | | | | | Xilinx, Inc. | | | 14,000,280 | | |
| | 188,800 | | | @,L | | Yahoo!, Inc. | | | 4,821,952 | | |
| | | | 998,352,935 | | |
Total Common Stock
(Cost $2,124,636,747) | | | 2,730,163,443 | | |
| EQUITY-LINKED SECURITIES: 0.5% | | | |
| | | India: 0.5% | |
| | 2,980,184 | | | Hindustan Lever Ltd. | | | 14,573,500 | | |
Total Equity-Linked Securities
(Cost $11,109,863) | | | 14,573,500 | | |
| PREFERRED STOCK: 0.7% | |
| | | Germany: 0.7% | |
| | 14,538 | | | Porsche AG | | | 18,499,198 | | |
Total Preferred Stock
(Cost $9,602,569) | | | 18,499,198 | | |
Total Long-Term Investments
(Cost $2,145,349,179) | | | 2,763,236,141 | | |
See Accompanying Notes to Financial Statements
228
ING OPPENHEIMER PORTFOLIO OF INVESTMENTS
GLOBAL PORTFOLIO AS OF DECEMBER 31, 2006 (CONTINUED)
Principal
Amount | | | | Value | |
| SHORT-TERM INVESTMENTS: 9.0% | |
| | | Securities Lending Collateralcc: 9.0% | |
| $ | 249,224,950 | | | The Bank of New York Institutional
Cash Reserves Fund | | $ | 249,224,950 | | |
Total Short-Term Investments
(Cost $249,224,950) | | | 249,224,950 | | |
Total Investments in
Securities (Cost
$2,394,574,129)* | | | 109.2 | % | | $ | 3,012,461,091 | | |
Other Assets and
Liabilities - Net | | | (9.2 | ) | | | (253,453,625 | ) | |
| Net Assets | | | 100.0 | % | | $ | 2,759,007,466 | | |
Certain foreign securities may have been fair valued in accordance with procedures approved by the Board of Directors/Trustees (note 2A).
@ Non-income producing security
ADR American Depositary Receipt
cc Securities purchased with cash collateral for securities loaned.
L Loaned security, a portion or all of the security is on loan at December 31, 2006.
* Cost for federal income tax purposes is $2,411,815,570.
Net unrealized appreciation consists of:
| Gross Unrealized Appreciation | | $ | 639,174,677 | | |
| Gross Unrealized Depreciation | | | (38,529,156 | ) | |
| Net Unrealized Appreciation | | $ | 600,645,521 | | |
| Industry | | Percent of
Net Assets | |
| Advertising | | | 0.8 | % | |
| Aerospace/Defense | | | 4.3 | | |
| Apparel | | | 1.0 | | |
| Auto Manufacturers | | | 2.7 | | |
| Banks | | | 5.4 | | |
| Beverages | | | 2.5 | | |
| Biotechnology | | | 1.4 | | |
| Chemicals | | | 0.4 | | |
| Commercial Services | | | 0.7 | | |
| Computers | | | 0.2 | | |
| Cosmetics/Personal Care | | | 1.1 | | |
| Diversified Financial Services | | | 3.6 | | |
| Electric | | | 0.6 | | |
| Electrical Components & Equipment | | | 1.0 | | |
| Electronics | | | 4.1 | | |
| Entertainment | | | 0.6 | | |
| Food | | | 1.9 | | |
| Hand/Machine Tools | | | 0.3 | | |
| Healthcare-Products | | | 2.5 | | |
| Healthcare-Services | | | 0.4 | | |
| Holding Companies-Diversified | | | 1.6 | | |
| Home Furnishings | | | 1.2 | | |
| Household Products/Wares | | | 2.0 | | |
| Industrial | | | 0.3 | | |
| Insurance | | | 4.8 | | |
| Internet | | | 1.6 | | |
| Investment Companies | | | 0.6 | | |
| Leisure Time | | | 1.4 | | |
| Media | | | 4.2 | | |
| Miscellaneous Manufacturing | | | 2.6 | | |
| Office/Business Equipment | | | 0.4 | | |
| Oil & Gas | | | 5.1 | | |
| Oil & Gas Services | | | 1.1 | | |
| Pharmaceuticals | | | 6.1 | | |
| Real Estate | | | 0.3 | | |
| Retail | | | 6.2 | | |
| Semiconductors | | | 5.9 | | |
| Software | | | 7.9 | | |
| Telecommunications | | | 10.5 | | |
| Toys/Games/Hobbies | | | 0.6 | | |
| Venture Capital | | | 0.3 | | |
| Short-Term Investments | | | 9.0 | | |
| Other Assets and Liabilities-Net | | | (9.2 | ) | |
| Net Assets | | | 100.0 | % | |
See Accompanying Notes to Financial Statements
229
ING OPPENHEIMER PORTFOLIO OF INVESTMENTS
STRATEGIC INCOME PORTFOLIO AS OF DECEMBER 31, 2006
| Shares | | | | | | Value | |
| COMMON STOCK: 0.1% | |
| | | | | | | Diversified Financial
Services: 0.0% | |
| | | | 425 | | | | | Goldman Sachs Group,
Inc. | | $ | 84,724 | | |
| | | | 84,724 | | |
| | | | | | | Pipelines: 0.1% | |
| | | | 7,900 | | | L | | El Paso Corp. | | | 120,712 | | |
| | | | 120,712 | | |
Total Common Stock
(Cost $187,532) | | | 205,436 | | |
| PREFERRED STOCK: 0.2% | |
| | | | | | | Diversified Financial
Services: 0.1% | |
| | | | 5,400 | | | P | | Chevy Chase Preferred
Capital Corp. | | | 284,040 | | |
| | | | 284,040 | | |
| | | | | | | Media: 0.0% | |
| | | | 17 | | | P | | ION Media Networks, Inc. | | | 126,650 | | |
| | | | 126,650 | | |
| | | | | | | Savings & Loans: 0.1% | |
| | | | 18,450 | | | P | | Chevy Chase Bank FSB | | | 483,575 | | |
| | | | 483,575 | | |
Total Preferred Stock
(Cost $968,802) | | | 894,265 | | |
Principal
Amount | | | | | | Value | |
| CORPORATE BONDS/NOTES: 29.2% | |
| | | | | | | Advertising: 0.6% | |
| $ | 278,000 | | | | C | | | Lamar Media Corp.,
6.625%, due 08/15/15 | | | | | 276,958 | | |
| | | | 975,000 | | | C | | R.H. Donnelley Corp.,
6.875%, due 01/15/13 | | | 939,657 | | |
| | | | 925,000 | | | C | | R.H. Donnelley Corp.,
8.875%, due 01/15/16 | | | 975,875 | | |
| | | | 300,000 | | | C,L | | RH Donnelley Corp.,
6.875%, due 01/15/13 | | | 289,125 | | |
| | | | 2,481,615 | | |
| | | | | | | Aerospace/Defense: 0.4% | |
| | | | 275,000 | | | C,S | | Alliant Techsystems, Inc.,
6.750%, due 04/01/16 | | | 275,688 | | |
| | | | 340,000 | | | C,L | | DRS Technologies, Inc.,
6.625%, due 02/01/16 | | | 344,250 | | |
| | | | 60,000 | | | C | | DRS Technologies, Inc.,
7.625%, due 02/01/18 | | | 62,100 | | |
| | | | 50,000 | | | C,S,L | | L-3 Communications Corp.,
5.875%, due 01/15/15 | | | 48,500 | | |
| | | | 100,000 | | | C | | L-3 Communications Corp.,
6.125%, due 01/15/14 | | | 98,250 | | |
| | | | 525,000 | | | C | | L-3 Communications Corp.,
6.375%, due 10/15/15 | | | 522,375 | | |
| | | | 300,000 | | | C,L | | L-3 Communications Corp.,
7.625%, due 06/15/12 | | | 312,000 | | |
| | | | 1,663,163 | | |
Principal
Amount | | | | | | Value | |
| | | | | | | | | | Agriculture: 0.2% | | |
| $ | 200,000 | | | C,L | | Hines Nurseries, Inc.,
10.250%, due 10/01/11 | | $ | 175,000 | | |
| | 300,000 | | | @@,#,C | | MHP SA, 10.250%,
due 11/30/11 | | | 308,250 | | |
| | 435,000 | | | C | | Reynolds American, Inc.,
7.250%, due 06/01/13 | | | 454,356 | | |
| | | | 937,606 | | |
| | | | | | | | | | Apparel: 0.1% | | |
| | 352,000 | | | C,L | | Levi Strauss & Co., 9.750%,
due 01/15/15 | | | 381,040 | | |
| | 225,000 | | | C,L | | Quiksilver, Inc., 6.875%,
due 04/15/15 | | | 222,188 | | |
| | | | 603,228 | | |
| | | | | | | | | | Auto Manufacturers: 0.0% | | |
| | 100,000 | | | L | | Ford Motor Co., 7.450%,
due 07/16/31 | | | 79,000 | | |
| | | | 79,000 | | |
| | | | | | | | | | Auto Parts &
Equipment: 0.4% | | |
| | 500,000 | | | C | | Goodyear Tire & Rubber Co.,
7.857%, due 08/15/11 | | | 505,000 | | |
| | 270,000 | | | C,L | | Goodyear Tire & Rubber Co.,
9.000%, due 07/01/15 | | | 284,175 | | |
| | 350,000 | | | C,L | | Tenneco, Inc., 8.625%,
due 11/15/14 | | | 358,750 | | |
| | 50,000 | | | C,L | | Visteon Corp., 7.000%,
due 03/10/14 | | | 44,000 | | |
| | 500,000 | | | C,L | | Visteon Corp., 8.250%,
due 08/01/10 | | | 490,000 | | |
| | | | 1,681,925 | | |
| | | | | | | | | | Banks: 2.4% | | |
| | 930,000 | | | @@,# | | Banco BMG SA, 9.150%,
due 01/15/16 | | | 944,880 | | |
| | 305,000 | | | @@,#,C | | Banco Credito Del Peru,
6.950%, due 11/07/21 | | | 305,000 | | |
| | 395,000 | | | @@,# | | Banco Hipotecario SA,
9.750%, due 04/27/16 | | | 421,169 | | |
| EUR | 460,000 | | | @@ | | Depfa Bank PLC, 3.500%,
due 03/16/11 | | | 593,473 | | |
| EUR | 1,320,000 | | | @@ | | HBOS Treasury Services PLC,
4.375%, due 07/13/16 | | | 1,763,006 | | |
| EUR | 1,230,000 | | | @@ | | HBOS Treasury Services PLC,
4.500%, due 07/13/21 | | | 1,652,681 | | |
| $ | 290,000 | | | @@ | | HSBC Bank PLC, 20.160%,
due 07/08/09 | | | 191,400 | | |
| | 920,000 | | | @@ | | HSBC Bank PLC, 21.070%,
due 01/12/10 | | | 515,200 | | |
| | 290,000 | | | @@ | | HSBC Bank PLC, 26.460%,
due 03/09/09 | | | 182,700 | | |
| | 375,000 | | | @@,#,S | | HSBK Europe BV, 7.750%,
due 05/13/13 | | | 397,500 | | |
| | 730,000 | | | @@,# | | Kuznetski Capital for Bank
of Moscow, 7.375%,
due 11/26/10 | | | 747,838 | | |
| | 760,000 | | | @@,# | | RSHB Capital SA for OJSC
Russian Agricultural Bank,
7.175%, due 05/16/13 | | | 802,750 | | |
See Accompanying Notes to Financial Statements
230
ING OPPENHEIMER PORTFOLIO OF INVESTMENTS
STRATEGIC INCOME PORTFOLIO AS OF DECEMBER 31, 2006 (CONTINUED)
Principal
Amount | | | | | | Value | |
| | | | | | | Banks (continued) | | | | | |
| $ | 830,000 | | | @@,C | | UBS Luxembourg SA for
Sberbank, 6.230%,
due 02/11/15 | | $ | 844,484 | | |
| | 1,020,000 | | | @@,#,L | | VTB Capital SA, 6.250%,
due 06/30/35 | | | 1,042,950 | | |
| | | | 10,405,031 | | |
| | | | | | | Beverages: 0.1% | | | | | |
| | 290,000 | | | C,L | | Constellation Brands, Inc.,
7.250%, due 09/01/16 | | | 299,425 | | |
| | | | 299,425 | | |
| | | | | | | Building Materials: 0.2% | | | | | |
| | 200,000 | | | C,S,L | | Goodman Global Holding
Co., Inc., 7.875%,
due 12/15/12 | | | 197,500 | | |
| | 85,000 | | | C | | Interline Brands, Inc.,
8.125%, due 06/15/14 | | | 87,763 | | |
| | 350,000 | | | C | | Nortek, Inc. - Old, 8.500%,
due 09/01/14 | | | 344,750 | | |
| | 335,000 | | | C,L | | NTK Holdings, Inc., 4.940%,
due 03/01/14 | | | 236,175 | | |
| | | | 866,188 | | |
| | | | | | | Chemicals: 0.4% | | | | | |
| | 50,000 | | | C | | Equistar Chemicals LP,
8.750%, due 02/15/09 | | | 52,625 | | |
| | 285,000 | | | #,C,L | | Georgia Gulf Corp.,
10.750%, due 10/15/16 | | | 275,025 | | |
| | 470,000 | | | #,C,L | | Huntsman International, LLC,
7.375%, due 01/01/15 | | | 468,825 | | |
| | 55,000 | | | #,C,L | | Huntsman International, LLC,
7.875%, due 11/15/14 | | | 55,688 | | |
| | 300,000 | | | @@,#,C,L | | Ineos Group Holdings PLC,
8.500%, due 02/15/16 | | | 288,000 | | |
| | 50,000 | | | C | | Innophos, Inc., 8.875%,
due 08/15/14 | | | 51,000 | | |
| | 265,000 | | | C | | Lyondell Chemical Co.,
8.000%, due 09/15/14 | | | 276,263 | | |
| | 145,000 | | | C,L | | Lyondell Chemical Co.,
8.250%, due 09/15/16 | | | 152,975 | | |
| | 75,000 | | | C | | Lyondell Chemical Co.,
10.500%, due 06/01/13 | | | 82,875 | | |
| | 70,000 | | | #,C | | Mosaic Co., 7.375%,
due 12/01/14 | | | 72,188 | | |
| | 70,000 | | | #,C,L | | Mosaic Co., 7.625%,
due 12/01/16 | | | 72,888 | | |
| | 57,000 | | | C | | Tronox Worldwide, LLC,
9.500%, due 12/01/12 | | | 60,278 | | |
| | | | 1,908,630 | | |
| | | | | | | Coal: 0.3% | | | | | |
| | 400,000 | | | C,S | | Arch Western Finance, LLC,
6.750%, due 07/01/13 | | | 399,000 | | |
| | 400,000 | | | C,L | | Foundation PA Coal Co.,
7.250%, due 08/01/14 | | | 409,000 | | |
| | 90,000 | | | C,L | | Massey Energy Co.,
6.875%, due 12/15/13 | | | 85,050 | | |
| | 400,000 | | | C | | Peabody Energy Corp.,
6.875%, due 03/15/13 | | | 412,000 | | |
| | | | 1,305,050 | | |
Principal
Amount | | | | | | Value | |
| | | | | | | Commercial Services: 0.7% | | | | | |
| $ | 35,000 | | | #,C | | ACE Cash Express, Inc.,
10.250%, due 10/01/14 | | $ | 35,613 | | |
| | 90,000 | | | #,C,L | | Ashtead Capital, Inc.,
9.000%, due 08/15/16 | | | 96,750 | | |
| | 85,000 | | | #,C | | Avis Budget Car Rental, LLC,
7.750%, due 05/15/16 | | | 82,238 | | |
| | 35,000 | | | #,C,L | | Avis Budget Car Rental, LLC,
7.874%, due 05/15/14 | | | 33,950 | | |
| | 250,000 | | | C,L | | Cenveo Corp., 7.875%,
due 12/01/13 | | | 241,250 | | |
| | 85,000 | | | C,S | | Corrections Corp. of
America, 6.250%,
due 03/15/13 | | | 84,681 | | |
| | 100,000 | | | C | | DynCorp International,
9.500%, due 02/15/13 | | | 106,500 | | |
| | 275,000 | | | #,C,L | | Education Management
Corp., 10.250%,
due 06/01/16 | | | 292,188 | | |
| | 125,000 | | | #,C | | FTI Consulting, Inc.,
7.750%, due 10/01/16 | | | 130,313 | | |
| | 100,000 | | | C | | H&E Equipment Services,
Inc., 8.375%,
due 07/15/16 | | | 105,250 | | |
| | 220,000 | | | #,C | | Hertz Corp., 8.875%,
due 01/01/14 | | | 231,550 | | |
| | 140,000 | | | #,C,L | | Hertz Corp., 10.500%,
due 01/01/16 | | | 154,700 | | |
| | 75,000 | | | C | | Ipayment, Inc., 9.750%,
due 05/15/14 | | | 77,438 | | |
| | 200,000 | | | C,L | | Iron Mountain, Inc., 7.750%,
due 01/15/15 | | | 205,000 | | |
| | 85,000 | | | @@,#,C | | Quebecor World Capital
Corp., 8.750%,
due 03/15/16 | | | 81,813 | | |
| | 100,000 | | | C | | Rent-A-Center, Inc., 7.500%,
due 05/01/10 | | | 100,750 | | |
| | 900,000 | | | C,L | | United Rentals North
America,
Inc., 7.000%, due 02/15/14 | | | 887,625 | | |
| | | | 2,947,609 | | |
| | | | | | | Computers: 0.2% | | | | | |
| | 175,000 | | | @@,C,L | | Seagate Technology HDD
Holdings, 6.375%,
due 10/01/11 | | | 175,875 | | |
| | 55,000 | | | @@,C,L | | Seagate Technology HDD
Holdings, 6.800%,
due 10/01/16 | | | 55,550 | | |
| | 205,000 | | | C,L | | Sungard Data Systems, Inc.,
9.125%, due 08/15/13 | | | 216,275 | | |
| | 555,000 | | | C,L | | SunGard Data Systems,
Inc.,
10.250%, due 08/15/15 | | | 595,238 | | |
| | | | 1,042,938 | | |
| | | | | | | Cosmetics/Personal
Care: 0.1% | | | | | |
| | 275,000 | | | C,L | | Elizabeth Arden, Inc.,
7.750%, due 01/15/14 | | | 278,438 | | |
| | | | 278,438 | | |
See Accompanying Notes to Financial Statements
231
ING OPPENHEIMER PORTFOLIO OF INVESTMENTS
STRATEGIC INCOME PORTFOLIO AS OF DECEMBER 31, 2006 (CONTINUED)
Principal
Amount | | | | | | Value | |
| | | | | | | Distribution/
Wholesale: 0.0% | | | | | |
| $ | 185,000 | | | C | | SGS International, Inc.,
12.000%, due 12/15/13 | | $ | 193,325 | | |
| | | | 193,325 | | |
| | | | | | | Diversified Financial
Services: 3.4% | | | | | |
| | 200,000 | | | C | | Alamosa Delaware, Inc.,
8.500%, due 01/31/12 | | | 212,025 | | |
| | 844,793 | | | @@,# | | Autopistas Del Nordeste,
9.390%, due 04/15/24 | | | 874,361 | | |
| | 700,000 | | | C,S,L | | BCP Crystal US Holdings
Corp.,
9.625%, due 06/15/14 | | | 777,000 | | |
| | 1,200,000 | | | @@,#,C | | C10 Capital, Ltd., 6.722%,
due 01/00/00 | | | 1,206,559 | | |
| | 270,000 | | | #,C,L | | CCM Merger, Inc., 8.000%,
due 08/01/13 | | | 265,275 | | |
| | 400,000 | | | @@,C | | Cloverie PLC, 9.615%,
due 12/20/10 | | | 404,400 | | |
| | 60,000 | | | C | | Crystal US Holdings 3, LLC,
1.880%, due 10/01/14 | | | 51,900 | | |
| RUB | 21,800,000 | | | @@ | | Dali Capital, PLC, 7.250%,
due 11/25/09 | | | 831,407 | | |
| RUB | 10,600,000 | | | @@ | | Dali Capital, PLC, 8.000%,
due 09/30/09 | | | 405,269 | | |
| $ | 254,000 | | | C | | E*Trade Financial Corp.,
7.375%, due 09/15/13 | | | 265,430 | | |
| | 150,000 | | | C | | E*Trade Financial Corp.,
8.000%, due 06/15/11 | | | 157,500 | | |
| | 980,000 | | | | | Ford Motor Credit Co.,
7.375%, due 10/28/09 | | | 982,703 | | |
| | 1,380,000 | | | S | | General Motors
Acceptance Corp.,
6.875%, due 09/15/11 | | | 1,416,872 | | |
| | 570,000 | | | S | | General Motors
Acceptance Corp.,
8.000%, due 11/01/31 | | | 656,299 | | |
| | 565,000 | | | #,C | | Idearc, Inc., 8.000%,
due 11/15/16 | | | 576,300 | | |
| | 1,234,517 | | | @@,#,L | | IIRSA Norte Finance Ltd.,
8.750%, due 05/30/24 | | | 1,453,643 | | |
| | 465,000 | | | @@,#,L | | Majapahit Holding BV,
7.250%, due 10/17/11 | | | 478,950 | | |
| | 430,000 | | | @@,# | | Majapahit Holding BV,
7.750%, due 10/17/16 | | | 457,413 | | |
| | 50,000 | | | | | Milacron Escrow Corp.,
11.500%, due 05/15/11 | | | 47,750 | | |
| | 455,000 | | | @@,#,C | | National Gas Co. of Trinidad
and Tobago Ltd., 6.050%,
due 01/15/36 | | | 446,035 | | |
| | 500,000 | | | @@,#,C | | Osiris Capital PLC, 10.360%,
due 01/15/10 | | | 502,800 | | |
| | 400,000 | | | #,C | | Rainbow National Services,
LLC, 8.750%, due 09/01/12 | | | 422,500 | | |
| RUB | 4,000,000 | | | @@,X | | Reachcom Public Ltd. for
Renaissance Capital,
10.500%, due 07/27/07 | | | 153,235 | | |
| $ | 300,000 | | | @@,#,C | | Salisbury International
Investments Ltd., 9.524%,
due 07/22/11 | | | 300,000 | | |
| | 55,000 | | | #,C | | Sally Holdings, LLC,
9.250%, due 11/15/14 | | | 56,306 | | |
Principal
Amount | | | | | | Value | |
| $ | 55,000 | | | #,C,L | | Sally Holdings, LLC,
10.500%, due 11/15/16 | | $ | 56,375 | | |
| | 785,000 | | | | | Tiers Trust, 0.960%,
due 06/15/97 | | | 329,740 | | |
| | 190,000 | | | C | | Universal City
Development Partners,
11.750%, due 04/01/10 | | | 204,488 | | |
| | 700,000 | | | C | | Vanguard Health Holding
Co. I, LLC, 2.930%,
due 10/01/15 | | | 542,500 | | |
| | | | 14,535,035 | | |
| | | | | | | Electric: 2.0% | | | | | |
| | 75,000 | | | C,S | | AES Corp., 7.750%,
due 03/01/14 | | | 79,500 | | |
| | 600,000 | | | #,C,S | | AES Corp., 8.750%,
due 05/15/13 | | | 645,750 | | |
| | 395,000 | | | @@,#,C | | Aes Dominicana Energia
Finance SA, 11.000%,
due 12/13/15 | | | 416,725 | | |
| | 240,000 | | | @@,#,C | | AES Panama SA, 6.350%,
due 12/21/16 | | | 236,724 | | |
| | 200,000 | | | C,L | | CMS Energy Corp., 7.500%,
due 01/15/09 | | | 207,250 | | |
| | 85,000 | | | C,L | | Edison Mission Energy,
7.500%, due 06/15/13 | | | 89,250 | | |
| | 120,000 | | | C,L | | Edison Mission Energy,
7.750%, due 06/15/16 | | | 127,800 | | |
| BRL | 475,000 | | | @@,# | | Eletropaulo Metropolitana
de Sao Paulo SA,
19.125%, due 06/28/10 | | | 252,340 | | |
| $ | 740,000 | | | C | | Midwest Generation, LLC,
8.750%, due 05/01/34 | | | 806,600 | | |
| | 1,000,000 | | | C | | Mirant Americas
Generation, LLC,
8.300%, due 05/01/11 | | | 1,030,000 | | |
| | 200,000 | | | C | | Mirant Americas
Generation, LLC,
9.125%, due 05/01/31 | | | 213,000 | | |
| | 161,818 | | | C | | Mirant Mid Atlantic, LLC,
8.625%, due 06/30/12 | | | 171,224 | | |
| PHP | 23,800,000 | | | @@ | | National Power Corp.,
5.875%, due 12/19/16 | | | 485,219 | | |
| $ | 302,000 | | | @@,# | | National Power Corp.,
6.875%, due 11/02/16 | | | 307,504 | | |
| | 660,000 | | | @@ | | National Power Corp.,
9.625%, due 05/15/28 | | | 802,813 | | |
| | 925,000 | | | C | | NRG Energy, Inc., 7.375%,
due 02/01/16 | | | 931,938 | | |
| | 450,000 | | | C | | NRG Energy, Inc., 7.375%,
due 01/15/17 | | | 452,250 | | |
| | 100,000 | | | C,L | | Reliant Resources, Inc.,
9.250%, due 07/15/10 | | | 105,500 | | |
| | 360,000 | | | C | | Reliant Resources, Inc.,
9.500%, due 07/15/13 | | | 387,900 | | |
| | 607,000 | | | C | | Sierra Pacific Resources,
6.750%, due 08/15/17 | | | 598,387 | | |
| | | | 8,347,674 | | |
| | | | | | | Electronics: 0.3% | | | | | |
| | 479,000 | | | @@,C,L | | Flextronics International Ltd.,
6.250%, due 11/15/14 | | | 464,630 | | |
| | 90,000 | | | @@,#,C | | NXP BV, 7.875%,
due 10/15/14 | | | 93,488 | | |
See Accompanying Notes to Financial Statements
232
ING OPPENHEIMER PORTFOLIO OF INVESTMENTS
STRATEGIC INCOME PORTFOLIO AS OF DECEMBER 31, 2006 (CONTINUED)
Principal
Amount | | | | | | Value | |
| | | | | | | Electronics (continued) | | | | | |
| $ | 45,000 | | | C,L | | Sanmina-SCI Corp.,
6.750%, due 03/01/13 | | $ | 41,625 | | |
| | 215,000 | | | C,L | | Sanmina-SCI Corp.,
8.125%, due 03/01/16 | | | 209,088 | | |
| | 120,000 | | | @@,C,L | | Solectron Global Finance Ltd.,
8.000%, due 03/15/16 | | | 122,100 | | |
| | 200,000 | | | C | | Stoneridge, Inc., 11.500%,
due 05/01/12 | | | 207,000 | | |
| | | | 1,137,931 | | |
| | | | | | | Entertainment: 1.5% | | | | | |
| | 100,000 | | | C,S | | AMC Entertainment, Inc.,
9.500%, due 02/01/11 | | | 100,875 | | |
| | 390,000 | | | C,L | | AMC Entertainment, Inc.,
9.875%, due 02/01/12 | | | 411,450 | | |
| | 400,000 | | | C | | American Casino &
Entertainment Properties,
LLC, 7.850%,
due 02/01/12 | | | 410,500 | | |
| | 800,000 | | | C,S | | Cinemark USA, Inc.,
9.000%, due 02/01/13 | | | 852,000 | | |
| | 200,000 | | | C,S | | Cinemark, Inc., 2.040%,
due 03/15/14 | | | 172,750 | | |
| | 380,000 | | | #,C | | Greektown Holdings, LLC,
10.750%, due 12/01/13 | | | 399,000 | | |
| | 500,000 | | | C,L | | Isle of Capri Casinos, Inc.,
7.000%, due 03/01/14 | | | 500,000 | | |
| | 300,000 | | | C,L | | Marquee Holdings, Inc.,
2.240%, due 08/15/14 | | | 253,125 | | |
| | 40,000 | | | C | | Mohegan Tribal Gaming
Authority, 6.125%,
due 02/15/13 | | | 39,900 | | |
| | 360,000 | | | C,L | | Mohegan Tribal Gaming
Authority, 6.875%,
due 02/15/15 | | | 362,700 | | |
| | 200,000 | | | C | | Mohegan Tribal Gaming
Authority, 7.125%,
due 08/15/14 | | | 203,750 | | |
| | 200,000 | | | C | | Mohegan Tribal Gaming
Authority, 8.000%,
due 04/01/12 | | | 209,250 | | |
| | 40,000 | | | C | | Penn National Gaming, Inc.,
6.750%, due 03/01/15 | | | 39,400 | | |
| | 150,000 | | | C | | Penn National Gaming, Inc.,
6.875%, due 12/01/11 | | | 151,875 | | |
| | 600,000 | | | C | | Pinnacle Entertainment, Inc.,
8.250%, due 03/15/12 | | | 609,000 | | |
| | 120,000 | | | #,C | | Pokagon Gaming Authority,
10.375%, due 06/15/14 | | | 132,000 | | |
| | 60,000 | | | C,L | | Six Flags Theme Parks, Inc.,
8.875%, due 02/01/10 | | | 58,350 | | |
| | 50,000 | | | C | | Six Flags Theme Parks, Inc.,
9.625%, due 06/01/14 | | | 46,625 | | |
| | 150,000 | | | C,L | | Six Flags Theme Parks, Inc.,
9.750%, due 04/15/13 | | | 141,563 | | |
| | 250,000 | | | #,C | | Steinway Musical
Instruments,
7.000%, due 03/01/14 | | | 245,625 | | |
| | 350,000 | | | C | | Vail Resorts, Inc., 6.750%,
due 02/15/14 | | | 351,750 | | |
| | 800,000 | | | C | | WMG Holdings Corp.,
2.750%, due 12/15/14 | | | 644,000 | | |
| | | | 6,335,488 | | |
Principal
Amount | | | | | | Value | |
| | | | | | | Environmental
Control: 0.2% | | | | | |
| $ | 150,000 | | | C,L | | Allied Waste North
America, Inc.,
7.250%, due 03/15/15 | | $ | 150,938 | | |
| | 500,000 | | | C,L | | Allied Waste North
America, Inc.,
7.375%, due 04/15/14 | | | 500,000 | | |
| | | | 650,938 | | |
| | | | | | | Food: 0.5% | | | | | |
| | 272,000 | | | C | | Albertson's, Inc., 8.000%,
due 05/01/31 | | | 277,266 | | |
| | 35,000 | | | C | | Del Monte Corp., 6.750%,
due 02/15/15 | | | 34,825 | | |
| | 160,000 | | | C,S | | Del Monte Corp., 8.625%,
due 12/15/12 | | | 169,600 | | |
| | 819,000 | | | C | | Delhaize America, Inc.,
9.000%, due 04/15/31 | | | 976,498 | | |
| | 100,000 | | | C | | Dole Food Co., Inc.,
7.250%, due 06/15/10 | | | 95,750 | | |
| | 200,000 | | | | | Smithfield Foods, Inc.,
7.000%, due 08/01/11 | | | 203,000 | | |
| | 180,000 | | | C | | Supervalu, Inc., 7.500%,
due 11/15/14 | | | 188,586 | | |
| | | | 1,945,525 | | |
| | | | | | | Forest Products &
Paper: 0.3% | | | | | |
| | 300,000 | | | @@,C,L | | Abitibi-Consolidated Co.
of Canada, 8.375%,
due 04/01/15 | | | 261,000 | | |
| | 100,000 | | | @@,C,L | | Abitibi-Consolidated Co.
of Canada, 8.550%,
due 08/01/10 | | | 95,500 | | |
| | 100,000 | | | @@,C | | Abitibi-Consolidated, Inc.,
8.850%, due 08/01/30 | | | 82,500 | | |
| | 105,000 | | | C,L | | Boise Cascade, LLC,
7.125%, due 10/15/14 | | | 102,113 | | |
| | 100,000 | | | @@,C | | Catalyst Paper Corp.,
7.375%, due 03/01/14 | | | 95,250 | | |
| | 200,000 | | | @@,C | | Catalyst Paper Corp.,
8.625%, due 06/15/11 | | | 203,500 | | |
| | 100,000 | | | @@,C | | Domtar, Inc., 7.125%,
due 08/15/15 | | | 98,500 | | |
| | 45,000 | | | C | | Mercer International, Inc.,
9.250%, due 02/15/13 | | | 44,213 | | |
| | 105,000 | | | #,C | | Verso Paper Holdings, LLC,
9.121%, due 08/01/14 | | | 107,100 | | |
| | 105,000 | | | #,C | | Verso Paper Holdings, LLC,
11.375%, due 08/01/16 | | | 110,775 | | |
| | | | 1,200,451 | | |
| | | | | | | Healthcare-Products: 0.1% | | | | | |
| | 105,000 | | | | | Fresenius Medical Care
Capital Trust, 7.875%,
due 06/15/11 | | | 110,513 | | |
| | 200,000 | | | C | | Inverness Medical
Innovations, Inc.,
8.750%, due 02/15/12 | | | 209,000 | | |
| | | | 319,513 | | |
See Accompanying Notes to Financial Statements
233
ING OPPENHEIMER PORTFOLIO OF INVESTMENTS
STRATEGIC INCOME PORTFOLIO AS OF DECEMBER 31, 2006 (CONTINUED)
Principal
Amount | | | | | | Value | |
| | | | | | | Healthcare-Services: 0.8% | | | | | |
| $ | 85,000 | | | C | | DaVita, Inc., 6.625%,
due 03/15/13 | | $ | 85,638 | | |
| | 570,000 | | | C,L | | DaVita, Inc., 7.250%,
due 03/15/15 | | | 584,250 | | |
| | 100,000 | | | C | | Genesis HealthCare Corp.,
8.000%, due 10/15/13 | | | 104,750 | | |
| | 20,000 | | | C | | HCA, Inc., 6.250%,
due 02/15/13 | | | 17,750 | | |
| | 81,000 | | | C,L | | HCA, Inc., 6.300%,
due 10/01/12 | | | 74,318 | | |
| | 229,000 | | | C,L | | HCA, Inc., 6.375%,
due 01/15/15 | | | 194,650 | | |
| | 400,000 | | | C,S | | HCA, Inc., 8.750%,
due 09/01/10 | | | 418,000 | | |
| | 70,000 | | | #,C | | HCA, Inc., 9.125%,
due 11/15/14 | | | 74,988 | | |
| | 70,000 | | | #,C | | HCA, Inc., 9.250%,
due 11/15/16 | | | 75,163 | | |
| | 180,000 | | | #,C | | HCA, Inc., 9.625%,
due 11/15/16 | | | 193,950 | | |
| | 195,000 | | | #,C,S | | Healthsouth Corp.,
10.750%, due 06/15/16 | | | 210,844 | | |
| | 90,000 | | | C | | Psychiatric Solutions, Inc.,
7.750%, due 07/15/15 | | | 90,225 | | |
| | 485,000 | | | C | | Select Medical Corp.,
7.625%, due 02/01/15 | | | 404,975 | | |
| | 150,000 | | | C | | Tenet Healthcare Corp.,
6.375%, due 12/01/11 | | | 138,000 | | |
| | 20,000 | | | C | | Tenet Healthcare Corp.,
7.375%, due 02/01/13 | | | 18,475 | | |
| | 518,000 | | | C,L | | Tenet Healthcare Corp.,
9.875%, due 07/01/14 | | | 529,655 | | |
| | 135,000 | | | C,L | | Triad Hospitals, Inc.,
7.000%, due 11/15/13 | | | 136,519 | | |
| | 55,000 | | | C | | US Oncology, Inc., 9.000%,
due 08/15/12 | | | 58,300 | | |
| | | | 3,410,450 | | |
| | | | | | | Holding Companies-
Diversified: 0.2% | | | | | |
| | 360,000 | | | @@,#,C,L | | Basell AF SCA, 8.375%,
due 08/15/15 | | | 371,700 | | |
| | 65,000 | | | @@,C,L | | JSG Funding PLC, 7.750%,
due 04/01/15 | | | 62,725 | | |
| | 400,000 | | | @@,C | | Stena AB, 7.500%,
due 11/01/13 | | | 397,000 | | |
| | | | 831,425 | | |
| | | | | | | Home Builders: 0.2% | | | | | |
| | 300,000 | | | C,L | | Beazer Homes USA, Inc.,
8.375%, due 04/15/12 | | | 309,750 | | |
| | 50,000 | | | C,L | | K Hovnanian Enterprises,
Inc., 7.750%,
due 05/15/13 | | | 50,125 | | |
| | 50,000 | | | C,L | | Standard-Pacific Corp.,
7.750%, due 03/15/13 | | | 49,875 | | |
| | 200,000 | | | C,L | | WCI Communities, Inc.,
9.125%, due 05/01/12 | | | 191,500 | | |
| | 200,000 | | | C | | William Lyon Homes, Inc.,
10.750%, due 04/01/13 | | | 191,500 | | |
| | | | 792,750 | | |
Principal
Amount | | | | | | Value | |
| | | | | | | Home Furnishings: 0.0% | | | | | |
| $ | 68,000 | | | C,L | | Sealy Mattress Co., 8.250%,
due 06/15/14 | | $ | 71,400 | | |
| | | | 71,400 | | |
| | | | | | | Household Products/
Wares: 0.2% | | | | | |
| | 50,000 | | | C,L | | Church & Dwight Co., Inc.,
6.000%, due 12/15/12 | | | 49,125 | | |
| | 460,000 | | | C,L | | Playtex Products, Inc.,
9.375%, due 06/01/11 | | | 481,850 | | |
| | 250,000 | | | C,L | | Spectrum Brands, Inc.,
7.375%, due 02/01/15 | | | 217,500 | | |
| | | | 748,475 | | |
| | | | | | | Iron/Steel: 0.1% | | | | | |
| | 200,000 | | | C,S | | AK Steel Corp., 7.750%,
due 06/15/12 | | | 202,500 | | |
| | 110,000 | | | C | | Gibraltar Industries, Inc.,
8.000%, due 12/01/15 | | | 109,038 | | |
| | 85,000 | | | C | | Rathgibson, Inc., 11.250%,
due 02/15/14 | | | 90,525 | | |
| | | | 402,063 | | |
| | | | | | | Leisure Time: 0.2% | | | | | |
| | 240,000 | | | C | | Leslie's Poolmart, 7.750%,
due 02/01/13 | | | 240,000 | | |
| | 100,000 | | | @@,C | | NCL Corp., 10.625%,
due 07/15/14 | | | 100,500 | | |
| | 300,000 | | | #,C,L | | TDS Investor Corp.,
11.875%, due 09/01/16 | | | 309,000 | | |
| | | | 649,500 | | |
| | | | | | | Lodging: 1.0% | | | | | |
| | 400,000 | | | C,S | | Boyd Gaming Corp.,
8.750%, due 04/15/12 | | | 420,000 | | |
| | 400,000 | | | C | | Caesars Entertainment, Inc.,
7.875%, due 03/15/10 | | | 419,000 | | |
| | 375,000 | | | #,C,S | | French Lick Resorts &
Casino, LLC, 10.750%,
due 04/15/14 | | | 352,500 | | |
| | 300,000 | | | C | | Gaylord Entertainment Co.,
8.000%, due 11/15/13 | | | 312,750 | | |
| | 300,000 | | | C,L | | MGM Mirage, 6.625%,
due 07/15/15 | | | 287,250 | | |
| | 170,000 | | | C,L | | MGM Mirage, 6.750%,
due 04/01/13 | | | 167,025 | | |
| | 600,000 | | | C,L | | MGM Mirage, 8.375%,
due 02/01/11 | | | 625,500 | | |
| �� | 372,000 | | | C | | Station Casinos, Inc.,
6.500%, due 02/01/14 | | | 332,475 | | |
| | 90,000 | | | C | | Station Casinos, Inc.,
6.875%, due 03/01/16 | | | 81,225 | | |
| | 500,000 | | | C,L | | Trump Entertainment
Resorts, Inc., 8.500%,
due 06/01/15 | | | 500,000 | | |
| | 726,000 | | | C,L | | Wynn Las Vegas, LLC,
6.625%, due 12/01/14 | | | 725,093 | | |
| | | | 4,222,818 | | |
| | | | | | | Machinery-Diversified: 0.1% | | | | | |
| | 140,000 | | | C | | Case New Holland, Inc.,
7.125%, due 03/01/14 | | | 142,800 | | |
See Accompanying Notes to Financial Statements
234
ING OPPENHEIMER PORTFOLIO OF INVESTMENTS
STRATEGIC INCOME PORTFOLIO AS OF DECEMBER 31, 2006 (CONTINUED)
Principal
Amount | | | | | | Value | |
| | | | | | | Machinery-Diversified
(continued) | | | | | |
| $ | 100,000 | | | C | | Case New Holland, Inc.,
9.250%, due 08/01/11 | | $ | 106,375 | | |
| | 200,000 | | | #,C | | Douglas Dynamics, LLC,
7.750%, due 01/15/12 | | | 189,000 | | |
| | | | 438,175 | | |
| | | | | | | Media: 2.4% | | | | | |
| | 200,000 | | | S | | Adelphia Communications
Corp., 1.040%,
due 06/15/11 | | | 191,000 | | |
| | 400,000 | | | C,S | | Allbritton Communications
Co., 7.750%, due 12/15/12 | | | 406,000 | | |
| | 300,000 | | | C,S,L | | American Media
Operations, Inc.,
10.250%, due 05/01/09 | | | 291,375 | | |
| | 130,000 | | | #,C,S | | Block Communications, Inc.,
8.250%, due 12/15/15 | | | 130,325 | | |
| | 400,000 | | | C | | CCH II, LLC, 10.250%,
due 09/15/10 | | | 419,500 | | |
| | 100,000 | | | C | | Charter Communications
Holdings II, LLC,
10.250%, due 09/15/10 | | | 105,125 | | |
| | 547,000 | | | #,C | | Charter Communications
Operating, LLC, 8.375%,
due 04/30/14 | | | 573,666 | | |
| | 94,000 | | | S | | CSC Holdings, Inc., 7.625%,
due 04/01/11 | | | 96,233 | | |
| | 300,000 | | | S | | CSC Holdings, Inc., 7.625%,
due 07/15/18 | | | 293,625 | | |
| | 220,000 | | | C,S | | Dex Media East, LLC,
12.125%, due 11/15/12 | | | 242,825 | | |
| | 225,000 | | | C,S | | Dex Media West, LLC,
9.875%, due 08/15/13 | | | 246,375 | | |
| | 1,080,000 | | | C,S | | Dex Media, Inc., 8.000%,
due 11/15/13 | | | 1,117,800 | | |
| | 50,000 | | | C | | DirecTV Holdings, LLC,
6.375%, due 06/15/15 | | | 48,188 | | |
| | 300,000 | | | C | | DirecTV Holdings, LLC,
8.375%, due 03/15/13 | | | 313,500 | | |
| | 398,000 | | | C | | Echostar DBS Corp.,
6.625%, due 10/01/14 | | | 389,045 | | |
| | 125,000 | | | C | | Echostar DBS Corp.,
7.000%, due 10/01/13 | | | 125,469 | | |
| | 300,000 | | | C | | Echostar DBS Corp.,
7.125%, due 02/01/16 | | | 301,500 | | |
| | 407,000 | | | C,L | | Granite Broadcasting Corp.,
9.750%, due 12/01/10 | | | 397,843 | | |
| | 240,000 | | | #,C | | ION Media Networks, Inc.,
11.624%, due 01/15/13 | | | 244,200 | | |
| | 55,000 | | | C,L | | LIN Television Corp.,
6.500%, due 05/15/13 | | | 52,663 | | |
| | 395,000 | | | C,L | | Mediacom Broadband, LLC,
8.500%, due 10/15/15 | | | 401,913 | | |
| | 300,000 | | | C,L | | Mediacom, LLC, 9.500%,
due 01/15/13 | | | 310,500 | | |
| | 850,000 | | | C | | Medianews Group, Inc.,
6.875%, due 10/01/13 | | | 773,500 | | |
| | 340,000 | | | #,C,L | | Nielsen Finance, LLC,
3.850%, due 08/01/16 | | | 235,875 | | |
| | 590,000 | | | #,C | | Nielsen Finance, LLC,
10.000%,due 08/01/14 | | | 642,363 | | |
Principal
Amount | | | | | | Value | |
| $ | 400,000 | | | C,L | | Primedia, Inc., 8.875%,
due 05/15/11 | | $ | 410,000 | | |
| | 775,000 | | | C,S | | Sinclair Broadcast Group,
Inc., 8.000%, due 03/15/12 | | | 804,063 | | |
| | 70,000 | | | C,L | | Sirius Satellite Radio, Inc.,
9.625%, due 08/01/13 | | | 69,213 | | |
| | 300,000 | | | C | | Vertis, Inc., 9.750%,
due 04/01/09 | | | 310,500 | | |
| | 100,000 | | | C,L | | Vertis, Inc., 10.875%,
due 06/15/09 | | | 101,000 | | |
| | 340,000 | | | C,L | | Xm Satellite Radio, Inc.,
9.750%, due 05/01/14 | | | 341,700 | | |
| | | | 10,386,884 | | |
| | | | | | | Metal Fabricate/
Hardware: 0.1% | | | | | |
| | 350,000 | | | C | | Trimas Corp., 9.875%,
due 06/15/12 | | | 340,375 | | |
| | 181,000 | | | #,C | | Wolverine Tube, Inc.,
7.375%, due 08/01/08 | | | 143,895 | | |
| | | | 484,270 | | |
| | | | | | | Mining: 0.8% | | | | | |
| | 2,505,000 | | | @@ | | ALROSA Finance SA,
8.875%, due 11/17/14 | | | 2,907,120 | | |
| | 330,000 | | | @@,#,C,L | | Novelis, Inc., 8.250%,
due 02/15/15 | | | 320,925 | | |
| | | | 3,228,045 | | |
| | | | | | | Miscellaneous
Manufacturing: 0.2% | | | | | |
| | 90,000 | | | @@,#,C,L | | Bombardier, Inc., 8.000%,
due 11/15/14 | | | 92,700 | | |
| | 252,000 | | | #,C,S | | Covalence Specialty
Materials Corp., 10.250%,
due 03/01/16 | | | 231,840 | | |
| | 200,000 | | | C,S | | Jacuzzi Brands, Inc.,
9.625%, due 07/01/10 | | | 213,500 | | |
| | 105,000 | | | #,C | | Nutro Products, Inc.,
10.750%, due 04/15/14 | | | 115,238 | | |
| | 75,000 | | | #,C,L | | RBS Global, Inc. and
Rexnord Corp., 9.500%,
due 08/01/14 | | | 78,375 | | |
| | 115,000 | | | #,C | | RBS Global, Inc. and
Rexnord Corp., 11.750%,
due 08/01/16 | | | 120,750 | | |
| | | | 852,403 | | |
| | | | | | | Oil & Gas: 1.8% | | | | | |
| | 50,000 | | | C | | Berry Petroleum Co.,
8.250%, due 11/01/16 | | | 50,313 | | |
| | 850,000 | | | C,S | | Chesapeake Energy Corp.,
6.875%, due 01/15/16 | | | 861,688 | | |
| | 35,000 | | | C | | Clayton Williams Energy,
Inc., 7.750%,
due 08/01/13 | | | 32,463 | | |
| | 365,000 | | | @@,C,S | | Compton Petroleum
Finance Corp., 7.625%,
due 12/01/13 | | | 354,050 | | |
| | 681,000 | | | C, S | | El Paso Production Holding
Co., 7.750%,
due 06/01/13 | | | 715,901 | | |
| | 120,000 | | | C | | Forest Oil Corp., 8.000%,
due 12/15/11 | | | 125,400 | | |
See Accompanying Notes to Financial Statements
235
ING OPPENHEIMER PORTFOLIO OF INVESTMENTS
STRATEGIC INCOME PORTFOLIO AS OF DECEMBER 31, 2006 (CONTINUED)
Principal
Amount | | | | | | Value | |
| | | | | | | Oil & Gas (continued) | | | | | |
| $ | 200,000 | | | C | | Frontier Oil Corp., 6.625%,
due 10/01/11 | | $ | 200,500 | | |
| | 325,000 | | | @@,# | | Gaz Capital SA, 8.625%,
due 04/28/34 | | | 418,438 | | |
| | 600,000 | | | C | | Newfield Exploration Co.,
6.625%, due 09/01/14 | | | 603,000 | | |
| | 85,000 | | | C | | Pogo Producing Co.,
7.875%, due 05/01/13 | | | 85,850 | | |
| | 65,000 | | | C | | Premcor Refining Group,
Inc., 9.500%,
due 02/01/13 | | | 70,223 | | |
| | 270,000 | | | C | | Quicksilver Resources, Inc.,
7.125%, due 04/01/16 | | | 265,275 | | |
| | 140,000 | | | C,L | | Range Resources Corp.,
6.375%, due 03/15/15 | | | 137,200 | | |
| | 350,000 | | | C | | Range Resources Corp.,
7.500%, due 05/15/16 | | | 360,500 | | |
| | 325,000 | | | # | | Sabine Pass LP, 7.250%,
due 11/30/13 | | | 323,781 | | |
| | 545,000 | | | # | | Sabine Pass LP, 7.500%,
due 11/30/16 | | | 544,319 | | |
| | 650,000 | | | C,S | | Stone Energy Corp.,
6.750%, due 12/15/14 | | | 624,000 | | |
| | 572,000 | | | @@,# | | Tengizchevroil Finance Co.
SARL, 6.124%,
due 11/15/14 | | | 573,430 | | |
| | 140,000 | | | C | | Tesoro Corp., 6.250%,
due 11/01/12 | | | 140,000 | | |
| | 340,000 | | | C | | Tesoro Corp., 6.625%,
due 11/01/15 | | | 339,150 | | |
| | 700,000 | | | C | | Whiting Petroleum Corp.,
7.250%, due 05/01/12 | | | 705,250 | | |
| | | | 7,530,731 | | |
| | | | | | | Oil & Gas Services: 0.1% | | | | | |
| | 85,000 | | | C | | Basic Energy Services, Inc.,
7.125%, due 04/15/16 | | | 84,150 | | |
| | 200,000 | | | C,S | | Hanover Compressor Co.,
8.625%, due 12/15/10 | | | 210,000 | | |
| | | | 294,150 | | |
| | | | | | | Packaging &
Containers: 0.9% | | | | | |
| | 275,000 | | | C | | Ball Corp., 6.625%,
due 03/15/18 | | | 274,313 | | |
| | 145,000 | | | #,C | | Berry Plastics Holding Corp.,
8.875%, due 09/15/14 | | | 147,900 | | |
| | 145,000 | | | #,C,L | | Berry Plastics Holding Corp.,
9.235%, due 09/15/14 | | | 147,538 | | |
| | 250,000 | | | C,L | | Crown Americas, LLC and
Crown Americas Capital
Corp., 7.750%,
due 11/15/15 | | | 260,625 | | |
| | 500,000 | | | C,L | | Graham Packaging Co., Inc.,
9.875%, due 10/15/14 | | | 507,500 | | |
| | 500,000 | | | C,L | | Graphic Packaging
International Corp.,
8.500%, due 08/15/11 | | | 520,000 | | |
| | 100,000 | | | C,L | | Graphic Packaging
International Corp.,
9.500%, due 08/15/13 | | | 106,000 | | |
| | 124,000 | | | C,L | | Jefferson Smurfit Corp. US,
8.250%, due 10/01/12 | | | 121,520 | | |
Principal
Amount | | | | | | Value | |
| $ | 155,000 | | | C | | Owens Brockway Glass
Container, Inc., 7.750%,
due 05/15/11 | | $ | 160,038 | | |
| | 200,000 | | | C | | Owens Brockway Glass
Container, Inc., 8.250%,
due 05/15/13 | | | 207,750 | | |
| | 72,000 | | | C | | Owens Brockway Glass
Container, Inc., 8.750%,
due 11/15/12 | | | 76,680 | | |
| | 418,000 | | | C | | Owens Brockway Glass
Container, Inc., 8.875%,
due 02/15/09 | | | 429,495 | | |
| | 375,000 | | | C,L | | Solo Cup Co., 8.500%,
due 02/15/14 | | | 326,250 | | |
| | 630,000 | | | C | | Stone Container Corp.,
8.375%, due 07/01/12 | | | 620,550 | | |
| | 55,000 | | | #,C,L | | Tekni-Plex, Inc., 10.875%,
due 08/15/12 | | | 62,150 | | |
| | | | 3,968,309 | | |
| | | | | | | Pharmaceuticals: 0.1% | | | | | |
| | 85,000 | | | @@,#,C,L | | Angiotech Pharmaceuticals,
Inc., 7.750%,
due 04/01/14 | | | 74,375 | | |
| | 75,000 | | | C | | Omnicare, Inc., 6.750%,
due 12/15/13 | | | 74,438 | | |
| | 90,000 | | | C,L | | Omnicare, Inc., 6.875%,
due 12/15/15 | | | 89,325 | | |
| | | | 238,138 | | |
| | | | | | | Pipelines: 0.8% | | | | | |
| | 90,000 | | | C | | Atlas Pipeline Partners LP,
8.125%, due 12/15/15 | | | 92,925 | | |
| | 50,000 | | | C | | Copano Energy, LLC,
8.125%, due 03/01/16 | | | 52,000 | | |
| | 200,000 | | | C | | Dynegy Holdings, Inc.,
6.875%, due 04/01/11 | | | 201,000 | | |
| | 270,000 | | | L | | Dynegy Holdings, Inc.,
8.375%, due 05/01/16 | | | 284,850 | | |
| | 37,000 | | | C | | Dynegy Holdings, Inc.,
8.750%, due 02/15/12 | | | 39,405 | | |
| | 610,000 | | | L | | El Paso Corp., 7.625%,
due 09/01/08 | | | 631,350 | | |
| | 335,000 | | | C,L | | El Paso Corp., 7.875%,
due 06/15/12 | | | 360,963 | | |
| | 140 | | | #,C | | Kern River Funding Corp.,
4.893%, due 04/30/18 | | | 136 | | |
| | 35,000 | | | C | | Pacific Energy Partners LP,
6.250%, due 09/15/15 | | | 34,274 | | |
| | 185,000 | | | #,C | | Targa Resources, Inc.,
8.500%, due 11/01/13 | | | 187,313 | | |
| | 583,000 | | | | | Tennessee Gas Pipeline Co.,
7.500%, due 04/01/17 | | | 639,048 | | |
| | 120,000 | | | C | | Transcontinental Gas Pipe
Line Corp., 6.400%,
due 04/15/16 | | | 121,800 | | |
| | 400,000 | | | C | | Williams Cos., Inc., 7.125%,
due 09/01/11 | | | 418,000 | | |
| | 72,000 | | | C | | Williams Cos., Inc., 7.625%,
due 07/15/19 | | | 77,400 | | |
| | 331,000 | | | C,L | | Williams Cos., Inc., 8.750%,
due 03/15/32 | | | 375,685 | | |
| | | | 3,516,149 | | |
See Accompanying Notes to Financial Statements
236
ING OPPENHEIMER PORTFOLIO OF INVESTMENTS
STRATEGIC INCOME PORTFOLIO AS OF DECEMBER 31, 2006 (CONTINUED)
Principal
Amount | | | | | | Value | |
| | | | | | | Real Estate Investment
Trusts: 0.2% | | | | | |
| $ | 300,000 | | | | | Felcor Lodging LP, 8.500%,
due 06/01/11 | | $ | 321,000 | | |
| | 50,000 | | | #,C | | Host Hotels & Resorts LP,
6.875%, due 11/01/14 | | | 50,875 | | |
| | 200,000 | | | C,S | | Host Marriott LP, 6.375%,
due 03/15/15 | | | 198,250 | | |
| | 200,000 | | | C | | Host Marriott LP, 6.750%,
due 06/01/16 | | | 201,250 | | |
| | 105,000 | | | C | | Ventas Realty LP, 6.750%,
due 04/01/17 | | | 108,938 | | |
| | | | 880,313 | | |
| | | | | | | Retail: 0.7% | | | | | |
| | 430,000 | | | C,L | | Bon-Ton Stores, Inc.,
10.250%, due 03/15/14 | | | 441,825 | | |
| | 70,000 | | | #,C | | Buffets, Inc., 12.500%,
due 11/01/14 | | | 70,875 | | |
| | 200,000 | | | C | | Dominos, Inc., 8.250%,
due 07/01/11 | | | 208,250 | | |
| | 155,000 | | | C,L | | Inergy LP, 8.250%,
due 03/01/16 | | | 163,525 | | |
| | 600,000 | | | @@,C,L | | Jean Coutu Group, Inc.,
8.500%, due 08/01/14 | | | 606,750 | | |
| | 340,000 | | | C,L | | Linens 'n Things, Inc.,
10.999%, due 01/15/14 | | | 331,500 | | |
| | 355,000 | | | C,L | | Neiman-Marcus Group, Inc.,
9.000%, due 10/15/15 | | | 389,169 | | |
| | 180,000 | | | C,L | | Neiman-Marcus Group, Inc.,
10.375%, due 10/15/15 | | | 201,150 | | |
| | 300,000 | | | C,L | | Rite Aid Corp., 8.125%,
due 05/01/10 | | | 307,875 | | |
| | 200,000 | | | C | | Rite Aid Corp., 9.500%,
due 02/15/11 | | | 210,250 | | |
| | | | 2,931,169 | | |
| | | | | | | Semiconductors: 0.5% | | | | | |
| | 436,000 | | | C | | Advanced Micro Devices,
Inc., 7.750%,
due 11/01/12 | | | 453,440 | | |
| | 500,000 | | | C,S | | Amkor Technology, Inc.,
7.750%, due 05/15/13 | | | 461,875 | | |
| | 90,000 | | | #,C | | Conexant Systems, Inc.,
9.126%, due 11/15/10 | | | 91,800 | | |
| | 270,000 | | | #,C | | Freescale Semiconductor,
8.875%, due 12/15/14 | | | 270,338 | | |
| | 450,000 | | | #,C | | Freescale Semiconductor,
9.125%, due 12/15/14 | | | 449,438 | | |
| | 360,000 | | | #,C,L | | Freescale Semiconductor,
10.125%, due 12/15/16 | | | 362,250 | | |
| | | | 2,089,141 | | |
| | | | | | | Sovereign: 0.3% | | | | | |
| | 710,000 | | | @@,C | | Credit Suisse First Boston
International for CJSC
The EXIM of Ukraine,
8.400%, due 02/09/16 | | | 727,750 | | |
| | 530,000 | | | @@ | | Philippine Government
International Bond,
9.500%, due 02/02/30 | | | 707,550 | | |
| | | | 1,435,300 | | |
Principal
Amount | | | | | | Value | |
| | | | | | | Storage/Warehousing: 0.0% | | | | | |
| $ | 25,000 | | | #,C | | Mobile Services Group, Inc.,
9.750%, due 08/01/14 | | $ | 26,250 | | |
| | | | 26,250 | | |
| | | | | | | Telecommunications: 3.0% | | | | | |
| | 250,000 | | | C | | American Cellular Corp.,
10.000%, due 08/01/11 | | | 265,625 | | |
| | 1,000,000 | | | C,S | | American Tower Corp.,
7.125%, due 10/15/12 | | | 1,032,500 | | |
| | 536,000 | | | C,S | | Centennial Cellular
Operating Co., 10.125%,
due 06/15/13 | | | 580,220 | | |
| | 800,000 | | | C | | Citizens Communications
Co., 6.250%,
due 01/15/13 | | | 789,000 | | |
| | 175,000 | | | #,C,L | | Cricket Communications,
Inc., 9.375%,
due 11/01/14 | | | 185,500 | | |
| | 50,000 | | | C,L | | Dobson Cellular Systems,
8.375%, due 11/01/11 | | | 52,938 | | |
| | 300,000 | | | C,L | | Dobson Communications
Corp., 8.875%,
due 10/01/13 | | | 307,125 | | |
| | 55,000 | | | C | | Dobson Communications
Corp., 9.624%,
due 10/15/12 | | | 56,375 | | |
| | 45,000 | | | @@,#,C | | Intelsat Bermuda Ltd.,
11.250%, due 06/15/16 | | | 49,613 | | |
| | 100,000 | | | @@,C | | Intelsat Subsidiary Holding
Co., Ltd., 8.250%,
due 01/15/13 | | | 102,000 | | |
| | 255,000 | | | @@,C,L | | Intelsat Subsidiary Holding
Co., Ltd., 8.625%,
due 01/15/15 | | | 266,475 | | |
| | 315,000 | | | #,C | | Level 3 Financing, Inc.,
9.250%, due 11/01/14 | | | 322,875 | | |
| | 840,000 | | | S | | Lucent Technologies, Inc.,
6.450%, due 03/15/29 | | | 779,100 | | |
| | 285,000 | | | C | | Nextel Communications,
Inc., 6.875%,
due 10/31/13 | | | 288,236 | | |
| | 932,000 | | | C | | Nextel Communications,
Inc., 7.375%,
due 08/01/15 | | | 956,615 | | |
| | 50,000 | | | C | | Nextel Partners, Inc.,
8.125%, due 07/01/11 | | | 52,313 | | |
| | 85,000 | | | @@,#,C,L | | Nordic Telephone Co.
Holdings ApS, 8.875%,
due 05/01/16 | | | 91,375 | | |
| | 88,000 | | | @@,# | | Nortel Networks Ltd.,
9.624%, due 07/15/11 | | | 93,170 | | |
| | 80,000 | | | @@,C | | NTL Cable PLC, 9.125%,
due 08/15/16 | | | 84,900 | | |
| | 800,000 | | | C | | PanAmSat Corp., 9.000%,
due 08/15/14 | | | 849,000 | | |
| | 180,000 | | | #,C | | PanAmSat Corp., 9.000%,
due 06/15/16 | | | 191,475 | | |
| | 200,000 | | | C,L | | Qwest Capital Funding, Inc.,
7.250%, due 02/15/11 | | | 205,250 | | |
| | 300,000 | | | C,L | | Qwest Capital Funding, Inc.,
7.900%, due 08/15/10 | | | 313,875 | | |
| | 175,000 | | | C,L | | Qwest Corp., 7.500%,
due 10/01/14 | | | 186,375 | | |
See Accompanying Notes to Financial Statements
237
ING OPPENHEIMER PORTFOLIO OF INVESTMENTS
STRATEGIC INCOME PORTFOLIO AS OF DECEMBER 31, 2006 (CONTINUED)
Principal
Amount | | | | | | Value | |
| | | | | | | Telecommunications
(Continued) | | | | | |
| $ | 850,000 | | | C | | Qwest Corp., 8.875%,
due 03/15/12 | | $ | 950,938 | | |
| | 568,000 | | | @@,C | | Rogers Wireless, Inc.,
7.500%, due 03/15/15 | | | 619,120 | | |
| | 500,000 | | | C,L | | Rural Cellular Corp.,
9.750%, due 01/15/10 | | | 516,250 | | |
| | 400,000 | | | C | | Rural Cellular Corp.,
9.875%, due 02/01/10 | | | 427,500 | | |
| PEN | 1,194,600 | | | @@,# | | Telefonica del Peru SAA,
8.000%, due 04/11/16 | | | 412,035 | | |
| $ | 480,000 | | | C,L | | Time Warner Telecom
Holdings, Inc., 9.250%,
due 02/15/14 | | | 515,400 | | |
| | 40,000 | | | C,L | | Valor Telecommunications
Enterprises, LLC/Finance
Corp., 7.750%,
due 02/15/15 | | | 43,250 | | |
| | 310,000 | | | #,C | | West Corp., 9.500%,
due 10/15/14 | | | 311,550 | | |
| | 135,000 | | | #,C | | West Corp., 11.000%,
due 10/15/16 | | | 137,025 | | |
| | 130,000 | | | #,C,L | | Windstream Corp., 8.125%,
due 08/01/13 | | | 141,375 | | |
| | 530,000 | | | #,C | | Windstream Corp., 8.625%,
due 08/01/16 | | | 583,000 | | |
| | | | 12,759,373 | | |
| | | | | | | Textiles: 0.1% | | | | | |
| | 200,000 | | | C,L | | Collins & Aikman Floor
Cover, 9.750%,
due 02/15/10 | | | 205,500 | | |
| | 353,000 | | | #,C | | Invista, 9.250%,
due 05/01/12 | | | 380,358 | | |
| | | | 585,858 | | |
| | | | | | | Transportation: 0.0% | | | | | |
| | 100,000 | | | C | | PHI, INC., 7.125%,
due 04/15/13 | | | 97,250 | | |
| | | | 97,250 | | |
| | | | | | | Trucking & Leasing: 0.0% | | | | | |
| | 170,000 | | | C | | Greenbrier Cos., Inc.,
8.375%, due 05/15/15 | | | 173,825 | | |
| | | | 173,825 | | |
Total Corporate Bonds/Notes
(Cost $122,923,036) | | | 124,210,340 | | |
| U.S. GOVERNMENT AGENCY OBLIGATIONS: 20.2% | | | |
| | | | | | | Federal Home Loan
Mortgage
Corporation: 5.1% | | | | | |
| | 680,167 | | | C,S,^ | | 0.800%, due 07/15/25 | | | 23,935 | | |
| | 975,882 | | | C,^ | | 0.800%, due 07/15/35 | | | 27,059 | | |
| | 873,866 | | | C,S,^ | | 2.300%, due 03/15/29 | | | 58,033 | | |
| | 936,077 | | | C,S,^ | | 2.350%, due 03/15/29 | | | 64,577 | | |
| | 1,141,457 | | | C | | 3.300%, due 11/15/26 | | | 1,104,780 | | |
| | 263,872 | | | C | | 3.500%, due 09/15/25 | | | 257,289 | | |
| | 1,184,243 | | | C,^ | | 3.600%, due 08/15/29 | | | 117,189 | | |
| | 500,000 | | | S | | 3.625%, due 02/15/07 | | | 499,146 | | |
| | 565,000 | | | S | | 4.125%, due 07/12/10 | | | 551,041 | | |
| | 542,379 | | | S | | 4.500%, due 02/01/18 | | | 524,527 | | |
| | 995,448 | | | | | 4.500%, due 05/01/19 | | | 960,773 | | |
Principal
Amount | | | | | | Value | |
| $ | 240,785 | | | S | | 4.500%, due 02/01/20 | | $ | 232,173 | | |
| | 480,000 | | | W | | 5.000%, due 01/15/35 | | | 463,200 | | |
| | 145,000 | | | L | | 5.000%, due 09/16/08 | | | 144,921 | | |
| | 54,044 | | | | | 5.000%, due 01/01/20 | | | 53,117 | | |
| | 379,655 | | | | | 5.000%, due 02/01/20 | | | 373,137 | | |
| | 401,885 | | | C | | 5.000%, due 04/15/24 | | | 400,128 | | |
| | 678,766 | | | | | 5.000%, due 08/01/33 | | | 656,299 | | |
| | 927,000 | | | C | | 5.000%, due 02/15/35 | | | 867,375 | | |
| | 214,196 | | | C | | 5.133%, due 08/15/35 | | | 215,343 | | |
| | 4,350,000 | | | L | | 5.250%, due 07/18/11 | | | 4,406,472 | | |
| | 290,392 | | | S | | 5.500%, due 01/01/18 | | | 290,977 | | |
| | 24,174 | | | C,S | | 5.500%, due 03/15/22 | | | 24,148 | | |
| | 482,511 | | | S | | 5.500%, due 12/01/32 | | | 478,171 | | |
| | 511,982 | | | S | | 5.500%, due 12/01/34 | | | 507,021 | | |
| | 115,345 | | | C | | 5.730%, due 05/15/36 | | | 115,831 | | |
| | 358,224 | | | C | | 5.800%, due 02/15/29 | | | 362,161 | | |
| | 561,915 | | | C | | 5.850%, due 01/15/33 | | | 570,137 | | |
| | 690,397 | | | S | | 6.000%, due 04/01/17 | | | 700,458 | | |
| | 1,072,159 | | | S | | 6.000%, due 09/01/24 | | | 1,085,629 | | |
| | 460,000 | | | C | | 6.000%, due 05/15/31 | | | 463,092 | | |
| | 290,602 | | | S | | 6.000%, due 02/01/34 | | | 293,058 | | |
| | 357,726 | | | C | | 6.330%, due 02/15/32 | | | 366,479 | | |
| | 140,837 | | | C | | 6.350%, due 02/15/32 | | | 144,133 | | |
| | 261,073 | | | C | | 6.350%, due 03/15/32 | | | 267,968 | | |
| | 79,235 | | | S | | 6.500%, due 04/01/18 | | | 81,140 | | |
| | 488,807 | | | | | 6.500%, due 04/01/21 | | | 500,656 | | |
| | 144,633 | | | | | 6.500%, due 02/01/22 | | | 148,240 | | |
| | 146,446 | | | | | 6.500%, due 09/01/22 | | | 150,098 | | |
| | 251,663 | | | C | | 6.500%, due 04/15/28 | | | 257,256 | | |
| | 101,717 | | | C,S | | 6.500%, due 06/15/31 | | | 103,982 | | |
| | 334,679 | | | C | | 6.500%, due 06/15/32 | | | 348,713 | | |
| | 42,743 | | | S | | 6.500%, due 08/01/32 | | | 43,759 | | |
| | 144,231 | | | S | | 6.500%, due 07/01/34 | | | 147,091 | | |
| | 500,000 | | | S | | 6.625%, due 09/15/09 | | | 521,071 | | |
| | 455,501 | | | C | | 6.750%, due 02/15/24 | | | 471,118 | | |
| | 611,875 | | | C | | 7.000%, due 09/15/26 | | | 637,737 | | |
| | 103,255 | | | C,S,^ | | 7.000%, due 03/15/28 | | | 18,839 | | |
| | 609,525 | | | C,S,^ | | 7.000%, due 04/15/28 | | | 111,558 | | |
| | 526,653 | | | C | | 7.500%, due 09/15/22 | | | 547,279 | | |
| | | | 21,758,314 | | |
| | | | | | | Federal National Mortgage
Association: 14.2% | | | | | |
| | 87,341 | | | | | Principal only STRIP,
due 09/01/33 | | | 63,829 | | |
| | 3,306,507 | | | ^ | | 0.700%, due 10/25/35 | | | 107,767 | | |
| | 926,530 | | | ^ | | 1.120%, due 08/25/36 | | | 42,331 | | |
| | 515,378 | | | S,^ | | 1.350%, due 05/25/35 | | | 25,224 | | |
| | 895,074 | | | ^ | | 1.350%, due 10/25/35 | | | 48,997 | | |
| | 176,399 | | | S,^ | | 1.400%, due 05/25/35 | | | 7,756 | | |
| | 431,286 | | | S,^ | | 1.430%, due 08/25/25 | | | 25,090 | | |
| | 1,750,428 | | | ^ | | 1.850%, due 05/25/36 | | | 152,758 | | |
| | 1,397,507 | | | S,^ | | 2.400%, due 07/25/31 | | | 118,824 | | |
| | 726,968 | | | ^ | | 2.400%, due 02/25/32 | | | 61,668 | | |
| | 296,326 | | | ^ | | 2.600%, due 07/25/32 | | | 25,491 | | |
| | 542,398 | | | S,^ | | 2.750%, due 12/25/33 | | | 67,061 | | |
| | 173,089 | | | S,^ | | 2.900%, due 02/25/33 | | | 18,178 | | |
| | 425,397 | | | | | 3.000%, due 04/25/13 | | | 416,570 | | |
| | 232,306 | | | | | 3.000%, due 06/25/22 | | | 228,341 | | |
| | 150,140 | | | C | | 3.500%, due 10/15/22 | | | 147,328 | | |
| | 145,000 | | | S | | 4.000%, due 02/28/07 | | | 144,745 | | |
| | 160,980 | | | C | | 4.000%, due 05/15/24 | | | 158,652 | | |
| | 321,019 | | | | | 4.000%, due 03/25/25 | | | 315,333 | | |
| | 1,594,616 | | | | | 4.500%, due 09/01/18 | | | 1,542,571 | | |
See Accompanying Notes to Financial Statements
238
ING OPPENHEIMER PORTFOLIO OF INVESTMENTS
STRATEGIC INCOME PORTFOLIO AS OF DECEMBER 31, 2006 (CONTINUED)
Principal
Amount | | | | | | Value | |
| | | | | | | Federal National Mortgage
Association (continued) | | | | | |
| $ | 113,373 | | | S | | 4.500%, due 03/01/19 | | $ | 109,673 | | |
| | 389,823 | | | S | | 4.500%, due 02/01/20 | | | 376,637 | | |
| | 628,094 | | | | | 4.500%, due 07/25/24 | | | 621,379 | | |
| | 400,000 | | | S | | 4.500%, due 08/25/25 | | | 369,312 | | |
| | 865,863 | | | | | 4.583%, due 06/25/36 | | | 839,223 | | |
| | 2,050,000 | | | L | | 4.625%, due 01/15/08 | | | 2,038,377 | | |
| | 1,005,000 | | | | | 4.750%, due 12/15/10 | | | 999,466 | | |
| | 193,554 | | | | | 4.950%, due 03/25/36 | | | 192,231 | | |
| | 2,110,000 | | | W | | 5.000%, due 01/12/36 | | | 2,037,469 | | |
| | 1,600,000 | | | L | | 5.000%, due 10/15/11 | | | 1,605,234 | | |
| | 471,368 | | | | | 5.000%, due 12/01/17 | | | 465,006 | | |
| | 274,271 | | | | | 5.000%, due 02/01/18 | | | 270,321 | | |
| | 1,064,139 | | | | | 5.000%, due 03/01/18 | | | 1,048,813 | | |
| | 903,762 | | | | | 5.000%, due 04/01/18 | | | 890,745 | | |
| | 270,732 | | | | | 5.000%, due 06/01/18 | | | 266,832 | | |
| | 294,911 | | | | | 5.000%, due 07/01/18 | | | 290,931 | | |
| | 393,780 | | | S | | 5.000%, due 11/01/18 | | | 388,108 | | |
| | 626,859 | | | S | | 5.000%, due 08/01/19 | | | 617,128 | | |
| | 1,281,000 | | | W | | 5.000%, due 01/15/20 | | | 1,259,383 | | |
| | 204,244 | | | | | 5.000%, due 12/01/32 | | | 197,703 | | |
| | 907,603 | | | | | 5.000%, due 06/01/33 | | | 878,235 | | |
| | 270,666 | | | | | 5.000%, due 07/01/33 | | | 261,908 | | |
| | 500,231 | | | | | 5.000%, due 08/01/33 | | | 484,044 | | |
| | 87,341 | | | ^ | | 5.000%, due 09/01/33 | | | 21,064 | | |
| | 2,078,505 | | | | | 5.000%, due 11/01/33 | | | 2,011,248 | | |
| | 230,131 | | | S | | 5.000%, due 04/01/34 | | | 222,684 | | |
| | 518,000 | | | S | | 5.060%, due 01/31/07 | | | 515,834 | | |
| | 1,325,000 | | | W | | 5.500%, due 01/12/36 | | | 1,309,680 | | |
| | 391,663 | | | S | | 5.500%, due 09/01/19 | | | 392,067 | | |
| | 143,000 | | | W | | 5.500%, due 01/15/20 | | | 143,000 | | |
| | 698,000 | | | S | | 5.500%, due 03/25/23 | | | 681,992 | | |
| | 992,000 | | | S | | 5.500%, due 04/25/23 | | | 970,508 | | |
| | 464,781 | | | S | | 5.500%, due 09/01/24 | | | 462,451 | | |
| | 160,000 | | | | | 5.500%, due 11/25/25 | | | 154,144 | | |
| | 500,000 | | | | | 5.500%, due 12/25/26 | | | 501,258 | | |
| | 645,791 | | | | | 5.500%, due 08/25/27 | | | 646,674 | | |
| | 673,944 | | | S | | 5.500%, due 02/01/33 | | | 667,423 | | |
| | 198,696 | | | S | | 5.500%, due 03/01/33 | | | 196,733 | | |
| | 1,807,247 | | | ^ | | 5.500%, due 06/25/33 | | | 370,096 | | |
| | 1,861,210 | | | S | | 5.500%, due 07/01/33 | | | 1,842,819 | | |
| | 274,854 | | | S | | 5.500%, due 11/01/33 | | | 272,138 | | |
| | 159,060 | | | S | | 5.500%, due 12/01/33 | | | 157,488 | | |
| | 917,780 | | | ^ | | 5.500%, due 12/01/33 | | | 212,065 | | |
| | 326,984 | | | S | | 5.500%, due 02/01/34 | | | 323,581 | | |
| | 56,323 | | | | | 5.750%, due 11/25/33 | | | 56,683 | | |
| | 1,683,915 | | | | | 5.850%, due 12/25/31 | | | 1,704,064 | | |
| | 1,678,000 | | | S | | 6.000%, due 05/15/11 | | | 1,748,862 | | |
| | 263,282 | | | | | 6.000%, due 03/25/17 | | | 266,864 | | |
| | 4,553,000 | | | W | | 6.000%, due 01/15/19 | | | 4,617,024 | | |
| | 610,000 | | | | | 6.000%, due 04/25/23 | | | 615,369 | | |
| | 803,962 | | | | | 6.000%, due 07/01/24 | | | 813,545 | | |
| | 113,359 | | | | | 6.000%, due 09/01/24 | | | 114,711 | | |
| | 500,346 | | | | | 6.000%, due 12/01/28 | | | 506,203 | | |
| | 961,162 | | | | | 6.000%, due 11/01/29 | | | 973,379 | | |
| | 310,236 | | | | | 6.000%, due 01/25/32 | | | 313,944 | | |
| | 1,068,293 | | | S | | 6.000%, due 09/01/32 | | | 1,078,375 | | |
| | 229,670 | | | S | | 6.000%, due 11/01/32 | | | 231,992 | | |
| | 508,089 | | | ^ | | 6.000%, due 02/01/33 | | | 106,763 | | |
| | 824,950 | | | | | 6.000%, due 04/01/33 | | | 832,163 | | |
| | 1,459,109 | | | ^ | | 6.000%, due 10/01/33 | | | 331,558 | | |
| | 197,332 | | | ^ | | 6.000%, due 12/01/33 | | | 44,749 | | |
| | 911,986 | | | ^ | | 6.000%, due 08/01/35 | | | 192,698 | | |
| | 346,404 | | | ^ | | 6.000%, due 09/01/35 | | | 73,831 | | |
| | 280,000 | | | | | 6.350%, due 12/25/31 | | | 286,041 | | |
Principal
Amount | | | | | | Value | |
| $ | 144,471 | | | C | | 6.350%, due 02/15/32 | | $ | 148,439 | | |
| | 200,032 | | | | | 6.350%, due 04/25/32 | | | 205,627 | | |
| | 837,078 | | | | | 6.350%, due 09/25/32 | | | 856,617 | | |
| | 418,550 | | | | | 6.350%, due 12/25/32 | | | 431,231 | | |
| | 3,963,000 | | | W | | 6.500%, due 01/15/35 | | | 4,038,543 | | |
| | 614,097 | | | | | 6.500%, due 06/01/17 | | | 629,290 | | |
| | 401,835 | | | | | 6.500%, due 10/25/28 | | | 413,166 | | |
| | 318,174 | | | | | 6.500%, due 11/01/28 | | | 326,679 | | |
| | 162,578 | | | S | | 6.500%, due 12/01/28 | | | 166,924 | | |
| | 152,879 | | | | | 6.500%, due 04/25/29 | | | 157,287 | | |
| | 877,773 | | | | | 6.500%, due 12/01/29 | | | 901,493 | | |
| | 474,681 | | | | | 6.500%, due 09/25/30 | | | 487,822 | | |
| | 274,161 | | | | | 6.500%, due 04/01/31 | | | 281,489 | | |
| | 273,928 | | | S | | 6.500%, due 10/25/31 | | | 279,954 | | |
| | 134,162 | | | | | 6.500%, due 01/25/32 | | | 138,013 | | |
| | 319,159 | | | | | 6.500%, due 04/25/32 | | | 326,591 | | |
| | 43,889 | | | S | | 7.000%, due 09/01/14 | | | 45,175 | | |
| | 149,629 | | | S | | 7.000%, due 11/01/17 | | | 154,037 | | |
| | 243,482 | | | S,^ | | 7.000%, due 02/01/28 | | | 54,491 | | |
| | 330,185 | | | ^ | | 7.000%, due 03/25/33 | | | 73,855 | | |
| | 379,617 | | | | | 7.000%, due 04/01/33 | | | 392,183 | | |
| | 266,860 | | | ^ | | 7.000%, due 04/25/33 | | | 59,024 | | |
| | 747,817 | | | | | 7.000%, due 04/01/34 | | | 772,220 | | |
| | 1,140,000 | | | | | 7.250%, due 01/15/10 | | | 1,213,666 | | |
| | 332,264 | | | ^ | | 7.500%, due 01/01/24 | | | 78,349 | | |
| | 180,805 | | | | | 7.500%, due 09/01/32 | | | 188,757 | | |
| | 440,122 | | | | | 7.500%, due 01/01/33 | | | 459,603 | | |
| | | | 60,490,962 | | |
| | | | | | | Government National
Mortgage
Association: 0.6% | | | | | |
| | 525,638 | | | | | 5.000%, due 04/15/34 | | | 511,716 | | |
| | 368,957 | | | | | 5.500%, due 04/15/33 | | | 367,725 | | |
| | 80,834 | | | | | 5.500%, due 07/15/33 | | | 80,564 | | |
| | 168,492 | | | | | 5.500%, due 04/15/34 | | | 167,840 | | |
| | 411,354 | | | | | 6.000%, due 10/20/34 | | | 416,436 | | |
| | 573,869 | | | C | | 6.500%, due 12/16/31 | | | 592,499 | | |
| | 153,790 | | | | | 6.500%, due 02/20/35 | | | 157,266 | | |
| | 296,054 | | | C | | 8.000%, due 01/16/30 | | | 311,881 | | |
| | | | 2,605,927 | | |
| | | | | | | Other U.S. Government
Agencies: 0.3% | | | | | |
| | 2,233,000 | | | S,Æ | | Resolution Funding
Corp. Discount STRIP
7.190%, due 01/15/21 | | | 1,102,894 | | |
| | | | 1,102,894 | | |
Total U.S. Government
Agency Obligations
(Cost $86,418,355) | | | 85,958,097 | | |
| U.S. TREASURY OBLIGATIONS: 1.1% | | | |
| | | | | | | U.S. Treasury Bonds: 0.3% | | | | | |
| | 55,000 | | | L | | 4.500%, due 02/15/36 | | | 52,319 | | |
| | 310,000 | | | L | | 5.375%, due 02/15/31 | | | 332,160 | | |
| | 730,000 | | | L | | 6.250%, due 05/15/30 | | | 869,841 | | |
| | | | 1,254,320 | | |
| | | | | | | Treasury Inflation Protected
Securities: 0.5% | | | | | |
| | 2,235,000 | | | L | | 2.500%, due 07/15/16 | | | 2,250,947 | | |
| | | | 2,250,947 | | |
See Accompanying Notes to Financial Statements
239
ING OPPENHEIMER PORTFOLIO OF INVESTMENTS
STRATEGIC INCOME PORTFOLIO AS OF DECEMBER 31, 2006 (CONTINUED)
Principal
Amount | | | | | | Value | |
| | | | | | | | | U.S. Treasury Notes: 0.3% | | | | | |
| $ | 1,000,000 | | | | L | | | 4.250%, due 11/30/07 | | $ | 993,438 | | |
| | | | 993,438 | | |
Total U.S. Treasury
Obligations
(Cost $4,555,217) | | | 4,498,705 | | |
| ASSET-BACKED SECURITIES: 1.7% | | | | | |
| | | | | | | | | Automobile Asset-Backed
Securities: 0.3% | | | | | |
| | 40,000 | | | | #,C | | | AESOP Funding II, LLC,
5.410%, due 04/20/09 | | | 40,040 | | |
| | 240,000 | | | | C | | | BMW Vehicle Owner Trust,
5.300%, due 05/26/09 | | | 239,887 | | |
| | 410,000 | | | | C | | | Daimler Chrysler Auto
Trust, 5.250%,
due 05/08/09 | | | 409,616 | | |
| | 48,937 | | | | C | | | Ford Credit Auto Owner
Trust, 3.480%,
due 11/15/08 | | | 48,662 | | |
| | 58,647 | | | | C | | | Ford Credit Auto Owner
Trust, 4.240%,
due 03/15/08 | | | 58,628 | | |
| | 115,487 | | | | C | | | GS Auto Loan Trust,
4.320%, due 05/15/08 | | | 115,470 | | |
| | 112,324 | | | | C | | | Nissan Auto Receivables
Owner Trust, 4.140%,
due 01/15/08 | | | 112,271 | | |
| | 150,000 | | | | @@,#,C | | | Taganka Car Loan
Finance PLC, 8.650%,
due 11/14/13 | | | 150,000 | | |
| | | | 1,174,574 | | |
| | | | | | | | | Home Equity Asset-Backed
Securities: 0.5% | | | | | |
| | 140,000 | | | | +, | C,S | | ACE Securities Corp.,
5.530%, (step rate
5.680%), due 11/25/35 | | | 140,137 | | |
| | 480,000 | | | | +, | C,L | | Argent Securities, Inc.,
5.830%, (step rate
6.280%), due 05/25/34 | | | 481,713 | | |
| | 245,410 | | | | +, | C,S | | Centex Home Equity,
4.140%, (step rate
4.640%), due 03/25/28 | | | 243,830 | | |
| | 63,792 | | | | +, | C | | Centex Home Equity,
5.040%, (step rate
5.540%), due 10/25/35 | | | 63,573 | | |
| | 250,000 | | | | C | | | Centex Home Equity,
5.450%, due 06/25/36 | | | 250,193 | | |
| | 90,000 | | | | C | | | HFC Home Equity Loan
Asset-Backed Certificates,
5.460%, due 03/20/36 | | | 90,000 | | |
| | 130,212 | | | | C | | | HFC Home Equity Loan
Asset-Backed Certificates,
5.610%, due 01/20/35 | | | 130,423 | | |
| | 310,000 | | | | C | | | MASTR Asset-Backed
Securities Trust, 5.420%,
due 08/25/36 | | | 309,903 | | |
| | 330,000 | | | | C | | | Option One Mortgage
Loan Trust, 5.450%,
due 07/25/36 | | | 330,000 | | |
| | 240,000 | | | | C | | | Residential Asset Securities
Corp., 5.420%,
due 09/25/36 | | | 239,963 | | |
| | | | 2,279,735 | | |
Principal
Amount | | | | | | Value | |
| | | | | | | Other Asset-Backed
Securities: 0.9% | | | | | |
| $ | 155,974 | | | C,S | | Ameriquest Mortgage
Securities, Inc., 5.410%,
due 04/25/36 | | $ | 156,086 | | |
| | 130,000 | | | C | | Ameriquest Mortgage
Securities, Inc., 5.420%,
due 10/25/36 | | | 129,959 | | |
| | 200,000 | | | C | | Argent Securities, Inc.,
5.450%, due 06/25/36 | | | 200,153 | | |
| | 136,073 | | | C | | Chase Funding Mortgage
Loan Asset-Backed
Certificates, 5.630%,
due 02/25/33 | | | 136,279 | | |
| | 140,000 | | | C | | Citigroup Mortgage Loan
Trust, Inc., 5.450%,
due 10/25/36 | | | 140,089 | | |
| | 60,000 | | | C,S | | Countrywide Asset-Backed
Certificates, 5.363%,
due 05/25/36 | | | 59,785 | | |
| | 100,000 | | | C | | Countrywide Asset-Backed
Certificates, 5.382%,
due 05/25/36 | | | 99,669 | | |
| | 230,000 | | | | | Countrywide Asset-Backed
Certificates, 5.470%,
due 01/00/00 | | | 230,000 | | |
| | 114,372 | | | C | | Countrywide Asset-Backed
Certificates, 5.510%,
due 02/25/36 | | | 114,460 | | |
| | 108,874 | | | C | | Countrywide Asset-Backed
Certificates, 5.550%,
due 05/25/36 | | | 108,997 | | |
| | 101,075 | | | C | | First Franklin Mortgage
Loan Asset-Backed
Certificates, 5.400%,
due 04/25/36 | | | 101,145 | | |
| | 190,000 | | | C | | First Franklin Mortgage
Loan Asset-Backed
Certificates, 5.410%,
due 07/25/36 | | | 190,121 | | |
| | 100,000 | | | C | | First Franklin Mortgage
Loan Asset-Backed
Certificates, 5.430%,
due 06/25/36 | | | 100,000 | | |
| | 410,000 | | | C,S | | First Franklin Mortgage
Loan Asset-Backed
Certificates, 5.560%,
(step rate 5.680%),
due 11/25/35 | | | 410,406 | | |
| | 153,367 | | | | +, | C | | Lehman XS Trust, 5.180%,
due 08/25/35 | | | 153,032 | | |
| | 83,590 | | | C | | Merrill Lynch Mortgage
Investors, Inc., 5.530%,
due 04/25/36 | | | 83,652 | | |
| | 120,000 | | | C | | Morgan Stanley Capital I,
5.610%, due 07/25/35 | | | 120,231 | | |
| | 9,300 | | | C | | Popular Mortgage Pass-
Through Trust, 3.914%,
due 05/25/35 | | | 9,268 | | |
| | 40,000 | | | C | | Popular Mortgage Pass-
Through Trust, 4.415%,
due 04/25/35 | | | 39,623 | | |
| | 100,000 | | | C | | Popular Mortgage Pass-
Through Trust, 5.680%,
due 01/25/36 | | | 99,729 | | |
See Accompanying Notes to Financial Statements
240
ING OPPENHEIMER PORTFOLIO OF INVESTMENTS
STRATEGIC INCOME PORTFOLIO AS OF DECEMBER 31, 2006 (CONTINUED)
Principal
Amount | | | | | | Value | |
| | | | | | | | | Other Asset-Backed
Securities (continued) | | | | | |
| $ | 137,163 | | | | C | | | Residential Asset Mortgage
Products, Inc., 4.450%,
due 07/25/28 | | $ | 136,207 | | |
| | 102,446 | | | | C | | | Residential Asset Mortgage
Products, Inc., 5.430%,
due 07/25/36 | | | 102,519 | | |
| | 210,000 | | | | @@,# | | | STRT 2006-3A F, 5.353%,
due 06/07/11 | | | 210,000 | | |
| | 98,816 | | | | C | | | Structured Asset Investment
Loan Trust, 5.410%,
due 04/25/36 | | | 98,884 | | |
| | 7,734 | | | | +, | C | | Structured Asset Securities
Corp., 4.510%,
(step rate 5.010%),
due 08/25/33 | | | 7,686 | | |
| | 142,945 | | | | +, | C | | Structured Asset Securities
Corp., 5.180%,
(step rate 5.680%),
due 03/25/35 | | | 142,597 | | |
| | 190,000 | | | | C | | | Wells Fargo Home Equity
Trust, 5.590%,
due 07/25/36 | | | 190,121 | | |
| | | | 3,570,698 | | |
Total Asset-Backed
Securities
(Cost $7,028,282) | | | 7,025,007 | | |
| COLLATERALIZED MORTGAGE OBLIGATIONS: 1.4% | | | | | |
| | 290,000 | | | | C | | | Banc of America
Commercial Mortgage,
Inc., 4.501%,
due 07/10/43 | | | 283,427 | | |
| | 400,000 | | | | C | | | Banc of America
Commercial Mortgage,
Inc., 5.317%,
due 09/10/47 | | | 401,304 | | |
| | 17,421 | | | | C | | | Banc of America Mortgage
Securities, 4.975%,
due 06/25/35 | | | 17,392 | | |
| | 163,468 | | | | C | | | Chaseflex Trust, 5.607%,
due 09/25/36 | | | 163,639 | | |
| | 70,000 | | | | +, | C | | Citigroup Mortgage Loan
Trust, Inc., 5.536%,
(step rate 6.036%),
due 03/25/36 | | | 69,789 | | |
| | 416,514 | | | | C | | | Countrywide Alternative
Loan Trust, 6.500%,
due 08/25/32 | | | 421,069 | | |
| | 328,108 | | | | C | | | Deutsche Alternative-A
Securities, Inc. Alternate
Loan Trust, 5.961%,
due 06/25/36 | | | 327,510 | | |
| | 398,639 | | | | C | | | Deutsche Alternative-A
Securities, Inc. Alternate
Loan Trust, 6.005%,
due 10/25/36 | | | 398,640 | | |
| | 95,097 | | | | C | | | Deutsche Alternative-A
Securities, Inc. Alternate
Loan Trust, 6.360%,
due 07/25/36 | | | 95,123 | | |
| | 170,000 | | | | C | | | GE Capital Commercial
Mortgage Corp., 4.853%,
due 07/10/45 | | | 168,099 | | |
Principal
Amount | | | | | | Value | |
| $ | 233,000 | | | C | | GMAC Commercial
Mortgage Securities,
Inc., 7.090%,
due 05/15/30 | | $ | 244,603 | | |
| | 80,000 | | | C | | Greenwich Capital
Commercial Funding
Corp., 4.305%,
due 08/10/42 | | | 77,931 | | |
| | 408,000 | | | C | | Greenwich Capital
Commercial Funding
Corp., 5.117%,
due 04/10/37 | | | 406,804 | | |
| | 390,000 | | | C | | GS Mortgage Securities
Corp. II, 5.479%,
due 11/10/39 | | | 393,720 | | |
| | 70,000 | | | C | | JP Morgan Chase
Commercial Mortgage
Securities Corp., 4.575%,
due 07/15/42 | | | 68,581 | | |
| | 240,000 | | | C | | JP Morgan Chase
Commercial Mortgage
Securities Corp., 4.790%,
due 10/15/42 | | | 236,509 | | |
| | 200,000 | | | C | | LB-UBS Commercial
Mortgage Trust, 4.885%,
due 09/15/30 | | | 198,197 | | |
| | 118,121 | | | | +, | C | | MASTR Alternative Loans
Trust, 4.700%,
(step rate 5.200%),
due 08/25/34 | | | 117,185 | | |
| | 43,957 | | | C | | MASTR Alternative Loans
Trust, 6.000%,
due 07/25/34 | | | 43,764 | | |
| | 137,706 | | | C | | Residential Accredit Loans,
Inc., 5.750%,
due 01/25/33 | | | 137,099 | | |
| | 385,085 | | | C | | Residential Accredit Loans,
Inc., 6.000%,
due 05/25/36 | | | 384,394 | | |
| | 460,882 | | | C | | Residential Accredit Loans,
Inc., 6.000%,
due 09/25/36 | | | 459,306 | | |
| | 404,960 | | | C | | Residential Asset
Securitization Trust,
6.000%, due 09/25/36 | | | 403,902 | | |
| | 150,000 | | | C | | Wachovia Bank
Commercial Mortgage
Trust, 4.782%,
due 03/15/42 | | | 148,038 | | |
| | 296,000 | | | | | Wachovia Bank
Commercial Mortgage
Trust, 5.275%,
due 11/15/48 | | | 296,099 | | |
| | 70,834 | | | C | | Washington Mutual
Alternative Mortgage
Pass-Through Certificates,
4.673%, due 05/25/35 | | | 70,687 | | |
| | 117,847 | | | C | | Washington Mutual, Inc.,
5.600%, due 07/25/45 | | | 118,153 | | |
| | | | 6,150,964 | | |
Total Collateralized
Mortgage Obligations
(Cost $6,183,586) | | | 6,150,964 | | |
See Accompanying Notes to Financial Statements
241
ING OPPENHEIMER PORTFOLIO OF INVESTMENTS
STRATEGIC INCOME PORTFOLIO AS OF DECEMBER 31, 2006 (CONTINUED)
Principal
Amount | | | | | | Value | |
| OTHER BONDS: 22.0% | | | |
| | | | | | | Foreign Government
Bonds: 21.1% | | | | | |
| ARS | 7,983,000 | | | @@,I | | Argentina Bonos, 0.000%,
due 09/30/14 | | $ | 2,874,094 | | |
| ARS | 1,003,200 | | | @@,I | | Argentina Government
International Bond,
2.000%, due 02/04/18 | | | 529,018 | | |
| $ | 1,281,000 | | | @@,X | | Argentina Government
International Bond,
5.590%, due 08/03/12 | | | 1,209,056 | | |
| EUR | 515,000 | | | @@ | | Belgium Government
International Bond,
5.000%, due 03/28/35 | | | 775,871 | | |
| | 565,000 | | | @@ | | Brazil Government
International Bond,
10.500%, due 07/14/14 | | | 716,138 | | |
| $ | 3,815,000 | | | @@,X | | Brazil Government
International Bond,
8.000%, due 01/15/18 | | | 4,243,043 | | |
| | 2,235,000 | | | @@ | | Brazil Government
International Bond,
8.875%, due 10/14/19 | | | 2,732,288 | | |
| EUR | 2,005,000 | | | @@ | | Bundesrepublik
Deutschland, 4.000%,
due 01/04/37 | | | 2,611,087 | | |
| CAD | 3,450,000 | | | @@,L | | Canadian Government
International Bond,
4.000%, due 09/01/10 | | | 2,960,169 | | |
| $ | 80,000 | | | @@ | | Colombia Government
International Bond,
10.750%, due 01/15/13 | | | 99,400 | | |
| COP | 435,000,000 | | | @@ | | Colombia Government
International Bond,
11.750%, due 03/01/10 | | | 209,785 | | |
| $ | 303,000 | | | @@ | | Costa Rica Government
International Bond,
9.995%, due 08/01/20 | | | 398,445 | | |
| DKK | 1,200,000 | | | @@ | | Denmark Government
International Bond,
4.000%, due 08/15/08 | | | 212,561 | | |
| DKK | 1,135,000 | | | @@ | | Denmark Government
International Bond,
4.000%, due 11/15/10 | | | 201,370 | | |
| DKK | 835,000 | | | @@ | | Denmark Government
International Bond,
4.000%, due 11/15/15 | | | 148,745 | | |
| DKK | 305,000 | | | @@ | | Denmark Government
International Bond,
7.000%, due 11/10/24 | | | 74,006 | | |
| $ | 362,290 | | | @@,# | | Dominican Republic
International Bond,
9.500%, due 09/27/11 | | | 391,092 | | |
| | 440,000 | | | @@,# | | El Salvador Government
International Bond,
7.650%, due 06/15/35 | | | 500,500 | | |
| | 1,195,000 | | | @@ | | Federal Republic Of Brazil,
8.750%, due 02/04/25 | | | 1,477,618 | | |
| EUR | 2,025,000 | | | @@ | | France Government
International Bond OAT,
3.250%, due 04/25/16 | | | 2,521,789 | | |
| EUR | 1,410,000 | | | @@ | | France Government
International Bond OAT,
4.000%, due 04/25/55 | | | 1,836,955 | | |
Principal
Amount | | | | | | Value | |
| EUR | 1,130,000 | | | @@ | | French Discount T-Bill,
3.690%, due 05/10/07 | | $ | 1,472,513 | | |
| EUR | 3,400,000 | | | @@ | | German Treasury Bill,
3.500%, due 03/14/07 | | | 4,456,870 | | |
| EUR | 1,185,000 | | | @@ | | Hellenic Republic
Government
International Bond,
4.600%, due 05/20/13 | | | 1,606,976 | | |
| $ | 930,000 | | | @@,# | | Indonesia Government
International Bond,
6.750%, due 03/10/14 | | | 975,338 | | |
| | 50,000 | | | @@,# | | Indonesia Government
International Bond,
7.250%, due 04/20/15 | | | 54,125 | | |
| | 480,000 | | | @@,#,L | | Indonesia Government
International Bond,
8.500%, due 10/12/35 | | | 596,400 | | |
| ILS | 7,770,000 | | | @@,X | | Israel Government
International Bond,
7.500%, due 03/31/14 | | | 2,154,862 | | |
| EUR | 1,960,000 | | | @@ | | Italy Certificati di Credito
del Tesoro, 4.000%,
due 07/01/09 | | | 2,600,483 | | |
| JPY | 129,000,000 | | | @@ | | Japan Government
Ten Year Bond, 1.500%,
due 03/20/15 | | | 1,078,187 | | |
| JPY | 278,834,000 | | | @@ | | Japanese Government CPI
Linked Bond, 0.800%,
due 03/10/16 | | | 2,270,363 | | |
| MYR | 2,280,000 | | | @@ | | Malaysian Government,
4.720%, due 09/30/15 | | | 692,569 | | |
| MXN | 8,010,000 | | | @@ | | Mexico Government
International Bond,
10.000%, due 11/20/36 | | | 963,157 | | |
| $ | 320,000 | | | @@,L | | Mexico Government
International Bond,
7.500%, due 01/14/12 | | | 351,520 | | |
| NGN | 50,900,000 | | | @@ | | Nigeria Treasury Bond,
11.990%, due 12/22/13 | | | 396,965 | | |
| NGN | 17,400,000 | | | @@ | | Nigeria Treasury Bond,
12.740%, due 10/27/13 | | | 141,537 | | |
| NGN | 31,000,000 | | | @@ | | Nigeria Treasury Bond,
12.990%, due 09/29/11 | | | 255,269 | | |
| $ | 1,340,000 | | | @@ | | Oriental Republic of
Uruguay, 7.625%,
due 03/21/36 | | | 1,480,700 | | |
| | 1,914,000 | | | @@ | | Panama Government
International Bond,
7.250%, due 03/15/15 | | | 2,081,475 | | |
| | 450,000 | | | @@ | | Panama Government
International Bond,
9.375%, due 04/01/29 | | | 603,000 | | |
| PEN | 2,310,000 | | | @@ | | Peru Bono Soberano,
8.600%, due 08/12/17 | | | 861,157 | | |
| PEN | 270,000 | | | @@ | | Peru Government
International Bond,
12.250%, due 08/10/11 | | | 106,077 | | |
| $ | 196,840 | | | @@,C | | Peru Government
International Bond,
5.000%, due 03/07/17 | | | 196,348 | | |
| PEN | 5,800,000 | | | @@ | | Peru Government
International Bond,
7.840%, due 08/12/20 | | | 2,086,141 | | |
See Accompanying Notes to Financial Statements
242
ING OPPENHEIMER PORTFOLIO OF INVESTMENTS
STRATEGIC INCOME PORTFOLIO AS OF DECEMBER 31, 2006 (CONTINUED)
Principal
Amount | | | | | | Value | |
| | | | | | | Foreign Government
Bonds (continued) | | | | | |
| PEN | 575,000 | | | @@ | | Peru Government
International Bond,
8.200%, due 08/12/26 | | $ | 214,190 | | |
| $ | 423,000 | | | @@,L | | Peru Government
International Bond,
9.875%, due 02/06/15 | | | 536,364 | | |
| PEN | 3,335,000 | | | @@ | | Peru Government
International Bond,
9.910%, due 05/05/15 | | | 1,309,994 | | |
| $ | 1,225,000 | | | @@ | | Philippine Government
International Bond,
7.750%, due 01/14/31 | | | 1,396,500 | | |
| | 745,000 | | | @@,L | | Philippine Government
International Bond,
9.000%, due 02/15/13 | | | 864,200 | | |
| PLN | 2,050,000 | | | @@ | | Poland Government
International Bond,
4.070%, due 08/12/07 | | | 689,049 | | |
| PLN | 2,130,000 | | | @@ | | Poland Government
International Bond,
4.250%, due 05/24/11 | | | 713,344 | | |
| PLN | 2,650,000 | | | @@ | | Poland Government
International Bond,
5.000%, due 10/24/13 | | | 907,786 | | |
| PLN | 635,000 | | | @@ | | Poland Government
International Bond,
5.750%, due 09/23/22 | | | 228,929 | | |
| | 5,273,000 | | | @@ | | Republic Of Argentina,
7.000%, due 03/28/11 | | | 5,325,730 | | |
| | 265,000 | | | @@,X | | Republic Of Argentina,
7.000%, due 09/12/13 | | | 260,813 | | |
| | 1,030,000 | | | @@ | | Republic Of Brazil, 6.000%,
due 01/17/17 | | | 1,017,125 | | |
| COP | 4,836,000,000 | | | @@ | | Republic Of Colombia,
12.000%, due 10/22/15 | | | 2,561,341 | | |
| $ | 1,280,000 | | | @@,L | | Republic of Colombia,
7.375%, due 09/18/37 | | | 1,377,280 | | |
| | 1,795,000 | | | @@,S,L | | Republic of Colombia,
8.125%, due 05/21/24 | | | 2,082,200 | | |
| | 1,920,000 | | | @@ | | Republic of Turkey, 7.000%,
due 09/26/16 | | | 1,957,114 | | |
| UYU | 11,880,000 | | | @@ | | Republica Orient Uruguay,
5.000%, due 09/14/18 | | | 536,459 | | |
| $ | 220,000 | | | @@ | | Russian Ministry of Finance,
3.000%, due 05/14/11 | | | 199,030 | | |
| EUR | 785,000 | | | @@ | | Spain Government
International Bond,
3.800%, due 01/31/17 | | | 1,019,075 | | |
| EUR | 1,565,000 | | | @@ | | Spain Letras Del Tesoro,
3.820%, due 10/19/07 | | | 2,004,886 | | |
| EUR | 1,395,000 | | | @@ | | TREASURY CERTIFICATES,
3.640%, due 05/10/07 | | | 1,818,184 | | |
| | 160,000 | | | @@ | | Turkey Government
International Bond,
11.000%, due 01/14/13 | | | 196,800 | | |
| $ | 240,000 | | | @@ | | Turkey Government
International Bond,
7.250%, due 03/15/15 | | | 249,300 | | |
| | 740,000 | | | @@ | | Turkey Government
International Bond,
9.500%, due 01/15/14 | | | 865,800 | | |
Principal
Amount | | | | | | Value | |
| $ | 378,000 | | | @@,L | | Ukraine Government
International Bond,
7.650%, due 06/11/13 | | $ | 407,824 | | |
| GBP | 740,000 | | | @@ | | United Kingdom Gilt,
4.000%, due 03/07/09 | | | 1,414,695 | | |
| GBP | 725,000 | | | @@ | | United Kingdom Gilt,
5.000%, due 03/07/08 | | | 1,416,764 | | |
| GBP | 940,000 | | | @@ | | United Kingdom Gilt,
6.000%, due 12/07/28 | | | 2,249,726 | | |
| $ | 1,335,000 | | | @@ | | Uruguay Government
International Bond,
8.000%, due 11/18/22 | | | 1,521,900 | | |
| | | | 89,547,464 | | |
| | | | | | | Regional (state/
province): 0.9% | | | | | |
| MYR | 1,920,000 | | | @@ | | Johor Corp., 1.000%,
due 07/31/12 | | | 564,818 | | |
| AUD | 3,930,000 | | | @@ | | New South Wales Treasury
Corp., 8.000%,
due 03/01/08 | | | 3,156,843 | | |
| $ | 375,000 | | | @@,# | | Provincia DEL Neuquen
Titulo Provincial, 8.656%,
due 10/18/14 | | | 389,063 | | |
| | | | 4,110,724 | | |
Total Other Bonds
(Cost $89,144,562) | | | 93,658,188 | | |
| OTHER STRUCTURED PRODUCTS 16.1% | | | |
| EUR | 250,000 | | | # | | Aiolos Ltd. Floating Rate
Catastrophe Linked Nts
(3-month EUR-EURIBOR
+4.75%), 04/08/09 | | | 326,810 | | |
| $ | 400,000 | | | | | Atlantic & Western Re Ltd.
Series B Floating Rate
Catastrophe Linked Nts.
(3-month USD-LIBOR
+10%), 11/15/10 | | | 389,896 | | |
| RUB | 200,000,000 | | | | | Barclays Bank PLC - RUB
Currency Linked Nts.,
5.16%*, 08/18/08 | | | 6,960,552 | | |
| $ | 250,000 | | | # | | Calabash Re Ltd. Class A-1
Floating Rate Catastrophe
Linked Nts., (3-month
USD-LIBOR), 06/01/09 | | | 253,400 | | |
| | 250,000 | | | # | | Cascadia Ltd.Floating Rate
Catastrophe Linked Nts
(3-month USD-LIBOR
+3.125%), 06/13/08 | | | 246,713 | | |
| | 250,000 | | | # | | Cat-Mex Ltd. Class A
Floating Rate Catastrophe
Linked Nts (3-month
USD-LIBOR +2.35%),
5/19/09 | | | 250,348 | | |
| | 300,000 | | | | | Champlain Ltd. Class A
Floating Rate Catastrophe
Linked Nts. (3-month
US-LIBOR +12.75%),
01/07/09 | | | 300,615 | | |
| ARS | 170,000 | | | | | Citigroup Funding Inc. -
Argentina Unsecured
Inflation Indexed Currency
and Credit Linked Nts.,
Ref Amt x 1.477 Ref Fact
x Change in CER Inflation
Index x 4%, 05/22/08 | | | 152,520 | | |
See Accompanying Notes to Financial Statements
243
ING OPPENHEIMER PORTFOLIO OF INVESTMENTS
STRATEGIC INCOME PORTFOLIO AS OF DECEMBER 31, 2006 (CONTINUED)
Principal
Amount | | | | | | Value | |
| COP | 410,000,000 | | | | | Citigroup Funding Inc. -
Colombia (TES)
Unsecured Credit Linked
Nts., 11%, 07/27/20 | | $ | 218,509 | | |
| DOP | 14,100,000 | | | | | Citigroup Funding Inc. -
Dominican Republic Local
Market Unsecured Credit
Linked Nts. (linked to
Dominican Treasury Bills),
11.648%z, 09/24/07 | | | 387,609 | | |
| DOP | 8,200,000 | | | | | Citigroup Funding Inc. -
Dominican Republic Local
Market Unsecured Credit
Linked Nts.(linked to
Dominican Treasury Bills),
14.608%z, 05/14/07 | | | 235,846 | | |
| DOP | 10,940,000 | | | | | Citigroup Funding Inc. -
Dominican Republic Local
Market Unsecured Credit
Linked Nts.(linked to
Dominican Treasury Bills),
15.638%z, 04/30/07 | | | 315,935 | | |
| DOP | 23,990,000 | | | | | Citigroup Funding Inc. -
Dominican Republic Local
Market Unsecured Credit
Linked Nts.(linked to
Dominican Treasury Bills),
15.736%z, 04/30/07 | | | 692,805 | | |
| DOP | 3,500,000 | | | | | Citigroup Funding Inc. -
Dominican Republic
Local Market Unsecured
Credit Linked Nts.,
10.105%z, 07/02/07 | | | 99,360 | | |
| DOP | 7,200,000 | | | | | Citigroup Funding Inc. -
Dominican Republic Local
Market Unsecured Credit
Linked Nts.,
16.15%z, 03/12/07 | | | 210,914 | | |
| DOP | 8,200,000 | | | | | Citigroup Funding Inc. -
Dominican Republic Local
Market Unsecured Credit
Linked Nts.,
16.953%, 03/12/07 | | | 254,066 | | |
| DOP | 5,800,000 | | | | | Citigroup Funding Inc. -
Dominican Republic Local
Market Unsecured Credit
Linked Nts., 22%, 10/03/11 | | | 200,762 | | |
| EGP | 1,300,000 | | | | | Citigroup Funding Inc. -
Egypt Currency Indexed
Unsecured Credit Linked
Nts (linked to Egyptian
Treasury Bills),
9.0625%, 02/16/08 | | | 227,359 | | |
| EGP | 1,750,000 | | | I | | Citigroup Funding Inc. -
Egypt Unsecured Credit
Linked Nts (linked to
Egyptian Treasury
Bills), 8.7%z, 07/12/07 | | | 291,169 | | |
| EGP | 6,000,000 | | | I | | Citigroup Funding Inc. -
Egypt Unsecured Credit
Linked Nts (linked to
Egyptian Treasury
Bills), 9.079%z, 03/22/07 | | | 1,028,045 | | |
Principal
Amount | | | | | | Value | |
| EGP | 1,670,000 | | | I | | Citigroup Funding Inc. -
Egypt Unsecured Credit
Linked Nts. (linked to
Egyptian Treasury Bills),
8.775%z, 02/22/07 | | $ | 288,394 | | |
| NGN | 48,780,000 | | | | | Citigroup Funding Inc. -
Nigeria Unsecured Credit
Linked Nts (linked to
Nigerian Treasury Bonds),
12.474%z, 07/22/07 | | | 357,556 | | |
| NGN | 96,000,000 | | | | | Citigroup Funding Inc. -
Nigeria Unsecured Credit
Linked Nts (linked to
Nigerian Treasury Bonds),
14.5%, 03/01/11 | | | 804,574 | | |
| NGN | 69,000,000 | | | | | Citigroup Funding Inc. -
Nigeria Unsecured Credit
Linked Nts. (linked to
Nigerian Treasury Bonds),
14.5%, 04/04/11 | | | 579,054 | | |
| RUB | 11,000,000 | | | | | Citigroup Funding Inc. -
Russia Local Market
Unsecured Credit Linked Nts.,
7.48%, 12/04/08 | | | 420,965 | | |
| ZMK | 900,000,000 | | | | | Citigroup Funding Inc. -
Zambia Currency Indexed
Unsecured Credit Linked
Nts (linked to Zambian
Treasury Bills),
10.684%z, 02/21/07 | | | 200,669 | | |
| ZMK | 370,000,000 | | | | | Citigroup Funding Inc. -
Zambia Currency Indexed
Unsecured Credit Linked
Nts (linked to Zambian
Treasury Bills),
10.745%z, 02/21/07 | | | 82,497 | | |
| DOP | 2,616,000 | | | | | Citigroup Funding Inc.-
Dominican Republic Local
Market Unsecured Credit
Linked Nts.,
15.603%z, 04/23/07 | | | 76,483 | | |
| UAH | 300,000 | | | | | Citigroup Funding Inc.-
Ukraine Currency Indexed
Unsecured Credit Linked
Nts., 11.94%, 01/02/10 | | | 63,809 | | |
| TRY | 1,470,000 | | | | | Credit Suisse First Boston,
Nassau - Turkey Series
EMG 056 Credit Linked
Nts. (linked to Turkish
Treasury Bills),
20.853%z, 07/16/08 | | | 770,061 | | |
| TRY | 430,000 | | | | | Credit Suisse First Boston,
Nassau - Turkey Series
EMG 059 Credit Linked Nts.
(linked to Turkish Treasury
Bills), 21.41%z, 07/16/08 | | | 225,256 | | |
| UAH | 4,600,000 | | | | | Credit Suisse First Boston,
Nassau - Ukraine
Government Bonds Credit
Linked Nts., Series EMG 27,
11.94%, 12/30/09 | | | 1,014,094 | | |
See Accompanying Notes to Financial Statements
244
ING OPPENHEIMER PORTFOLIO OF INVESTMENTS
STRATEGIC INCOME PORTFOLIO AS OF DECEMBER 31, 2006 (CONTINUED)
Principal
Amount | | | | | | Value | |
| UAH | 400,000 | | | | | Credit Suisse First Boston,
Nassau - Ukraine Series
EMG 13 Credit Linked
Nts., 11.94%, 12/30/09 | | $ | 88,182 | | |
| UAH | 1,440,000 | | | | | Credit Suisse First Boston,
Nassau - Ukraine Series
NPC 12 Credit Linked
Nts., 11.94%, 12/30/09 | | | 317,456 | | |
| IDR | 3,700,000,000 | | | | | Credit Suisse International -
Indonesia Total Return
Linked Nts.,
12%, 09/16/11 | | | 449,636 | | |
| RUB | 10,610,000 | | | | | Credit Suisse International -
Russian Railways Total
Return Linked Bonds,
6.67%, 01/22/09 | | | 403,434 | | |
| $ | 85,000 | | | | | Deutsche Bank AG- Peru
Floating Rate Credit
Linked Nts. (6-month
USD-LIBOR +1.28%),
02/20/11 | | | 88,753 | | |
| ARS | 1,090,000 | | | | | Deutsche Bank AG, London -
Argentina Total Return
Credit Linked Nts., 4%,
12/21/11 | | | 931,852 | | |
| MXN | 3,899,168 | | | | | Deutsche Bank AG, London - Arrendadora Capita
Corporation SA de CV and
The Capita Corporation
de Mexico, SA de CV
Credit Linked Nts.,
9.09%, 01/05/11 | | | 361,385 | | |
| MXN | 2,547,341 | | | | | Deutsche Bank AG, London - Arrendadora Capita
Corporation SA de CV
and The Capita
Corporation de Mexico,
SA de CV Credit Linked
Nts., 9.52%, 01/05/11 | | | 236,684 | | |
| MXN | 2,540,430 | | | | | Deutsche Bank AG, London - Arrendadora Capita
Corporation SA de CV
and The Capita
Corporation de Mexico,
SA de CV Credit Linked
Nts., 9.65%, 01/05/11 | | | 236,335 | | |
| BRL | 595,000 | | | | | Deutsche Bank AG, London -
Brazil IPCA Total Return
Linked Nts., 6%, 08/18/10 | | | 423,045 | | |
| COP | 457,000,000 | | | | | Deutsche Bank AG, London -
Colombia Total Return
Linked Nts.,
13.5%, 09/16/14 | | | 253,540 | | |
| EGP | 2,560,000 | | | I | | Deutsche Bank AG, London -
Egypt Total Return
Linked Nts., 10.029%z,
09/12/07 | | | 417,130 | | |
| RUB | 10,900,000 | | | | | Deutsche Bank AG, London - Federalnaya Setevaya
Kompaniya Edinoy Energe
Total Return Linked Nts.,
7.1%, 12/16/08 | | | 415,807 | | |
Principal
Amount | | | | | | Value | |
| $ | 549,961 | | | | | Deutsche Bank AG, London -
Grupo TMM SA, Multiple
Reference Entities,
Credit Linked Nts.,
6%, 09/07/12 | | $ | 554,122 | | |
| KZT | 74,290,000 | | | | | Deutsche Bank AG,
London - JSC Halyk Bank
of Kazakhstan Total
Return Linked Nts.,
7.25%, 03/24/09 | | | 612,424 | | |
| RUB | 490,000 | | | | | Deutsche Bank AG, London -
Moscow Region Total
Return Linked Nts.,
9%, 04/21/11 | | | 20,349 | | |
| NGN | 19,500,000 | | | | | Deutsche Bank AG,
London - Nigeria Total
Return Credit Linked Nts.,
12.5%, 02/27/09 | | | 162,116 | | |
| NGN | 26,000,000 | | | | | Deutsche Bank AG, London -
Nigeria Total Return
Credit Linked Nts.,
15%, 01/30/09 | | | 229,196 | | |
| EUR | 1,750,000 | | | | | Deutsche Bank AG, London -
Piazza Vittoria Finance
Floating Rate Total
Return Linked Nts.
(3-month EUR -
EURIBOR +.7%) 07/30/10 | | | 2,317,702 | | |
| RUB | 12,430,000 | | | | | Deutsche Bank AG, London - Rosselkhozbank Total
Return Linked Notes,
6.926%z, 02/22/08 | | | 436,201 | | |
| RUB | 16,580,000 | | | | | Deutsche Bank AG, London -
Sberbank Total Return
Linked Nts., 6.588%z,
02/27/08 | | | 582,241 | | |
| RUB | 12,430,000 | | | | | Deutsche Bank AG, London -
Sberbank Total Return
Linked Nts., 6.593%z,
02/20/08 | | | 437,052 | | |
| TRY | 4,800,000 | | | | | Deutsche Bank AG, London -
Turkey Total Return
Linked Nts., 15.672%z,
01/26/07 | | | 3,355,005 | | |
| UAH | 900,000 | | | | | Deutsche Bank AG, London -
Ukraine Credit Linked
Total Return Linked Nts.,
5.592%, 05/18/07 | | | 180,009 | | |
| UAH | 900,000 | | | | | Deutsche Bank AG,
London - Ukraine Credit
Linked Total Return
Linked Nts.,
5.592%, 05/18/07 | | | 180,009 | | |
| $ | 420,000 | | | | | Deutsche Bank AG, London - Ukrtelecom Floating Rate
Credit Linked Total
Return Nts (6-month
USD-LIBOR +3.4%),
08/25/10 | | | 437,396 | | |
| | 420,000 | | | | | Deutsche Bank AG, London - Ukrtelecom Floating Rate
Credit Linked Total
Return Nts (6-month
USD-LIBOR +3.5%),
02/25/11 | | | 437,048 | | |
See Accompanying Notes to Financial Statements
245
ING OPPENHEIMER PORTFOLIO OF INVESTMENTS
STRATEGIC INCOME PORTFOLIO AS OF DECEMBER 31, 2006 (CONTINUED)
Principal
Amount | | | | | | Value | |
| $ | 420,000 | | | | | Deutsche Bank AG, London - Ukrtelecom Floating
Rate Credit Linked Total
Return Nts (6-month
USD-LIBOR +3.6%),
08/25/11 | | $ | 436,972 | | |
| | 420,000 | | | | | Deutsche Bank AG, London - Ukrtelecom Floating
Rate Credit Linked Total
Return Nts (6-month
USD-LIBOR
+3.68%), 02/27/12 | | | 436,435 | | |
| | 420,000 | | | | | Deutsche Bank AG, London - Ukrtelecom Floating Rate
Credit Linked Total Return
Nts (6-month USD-LIBOR
+3.75%), 08/28/12 | | | 435,305 | | |
| MXN | 853,053 | | | | | Deutsche Bank AG, London -
United Mexican States
Total Return Linked Nts.,
6.1%, 09/27/35 | | | 310,954 | | |
| EUR | 2,100,000 | | | | | Deutsche Bank AG,
London Piazza Vittoria
Finance Floating Rate
Total Return Linked Nts
(3-month EUR-EURIBOR
+.7%), 07/30/10 | | | 2,749,363 | | |
| $ | 157,867 | | | | | Deutsche Bank AG,
Singapore - Indonesia
Credit Linked Nts.,
14.25%, 06/22/13 | | | 189,677 | | |
| | 1,189,440 | | | # | | Dow Jones CDX Index
High Yield Series 4-T1,
8.25%, 06/29/10 | | | 1,237,018 | | |
| | 2,055,000 | | | # | | Dow Jones CDX Index High
Yield Series 7-T1, 8.375%,
12/29/11 | | | 2,111,513 | | |
| RUB | 7,890,000 | | | | | Dresdner Bank AG,
London - Lukoil Credit
Linked Nts.,
7.04%, 12/12/11 | | | 300,114 | | |
| $ | 505,000 | | | | | Emblem Finance Co.
Limited - Swaziland
Floating Rate Credit
Linked Nts (3-month
USD-LIBOR +4%), 06/20/10 | | | 501,314 | | |
| | 310,000 | | | # | | Eurus Ltd. Floating Rate
Catastrophe Linked Nts.
(3-month USD LIBOR
+6.25%), 04/08/09 | | | 310,682 | | |
| | 360,000 | | | # | | Fhu-Jin Ltd. Class B
Floating Rate
Catastrophe Linked Nts.
(3-month USD-LIBOR
+3.9%), 08/10/11 | | | 363,186 | | |
| | 250,000 | | | # | | Foundation Re II Ltd.
Series 2006-I, Class G
Floating Rate Catastrophe
Linked Nts (3-month
USD-LIBOR +9.8%),
01/08/09 | | | 249,388 | | |
| | 250,000 | | | # | | Foundation Re Ltd.
Class A Floating Rate
Catastrophe Linked Nts.,
(3-month USD-LIBOR
+4.10%), 11/24/08 | | | 235,795 | | |
Principal
Amount | | | | | | Value | |
| RUB | 19,300,000 | | | | | Goldman Sachs Capital
Markets LP - OJSC Russian Agricultural Bank,
8%, 05/13/09 | | $ | 743,751 | | |
| RUB | 10,900,000 | | | | | Goldman Sachs Capital
Markets, LP - OJSC
Russian Agricultural Bank
Credit Linked Nts.,
7.25%, 12/23/09 | | | 414,047 | | |
| BRL | 679,800 | | | | | J.P. Morgan (Jersey)
Limited - Brazil Credit
Linked Nts., 12.08%*,
01/02/15 | | | 123,929 | | |
| BRL | 2,430,000 | | | | | J.P. Morgan (Jersey)
Limited - Brazil Credit
Linked Nts.,
12.683%*, 06/01/13 | | | 529,868 | | |
| BRL | 1,480,000 | | | | | J.P. Morgan (Jersey)
Limited - Brazil Credit
Linked Nts.,
13.553%*, 01/02/15 | | | 269,808 | | |
| BRL | 15,272,000 | | | | | JPMorgan Chase Bank, N.A,
London. - Brazil
Unsecured Credit
Linked Nts., 12.184%*,
01/02/15 | | | 2,784,129 | | |
| COP | 6,500,000,000 | | | | | JPMorgan Chase Bank,
N.A. - COP and Colombia
Credit Linked Nts.,
10.19%*, 01/05/16 | | | 1,178,624 | | |
| COP | 2,663,000,000 | | | # | | JPMorgan Chase Bank,
N.A. - COP and Colombia
Credit Linked Nts.,
10.218%*, 10/31/16 | | | 422,321 | | |
| COP | 2,674,000,000 | | | # | | JPMorgan Chase Bank,
N.A. - COP and Colombia
Credit Linked Nts.,
10.218%*, 10/31/16 | | | 424,065 | | |
| ARS | 1,565,000 | | | | | JPMorgan Chase Bank,
N.A. - Inflation Linked
ARS and Brazil Credit
Linked Nts.,
2.731%*, 11/30/12 | | | 424,813 | | |
| PEN | 1,360,000 | | | | | JPMorgan Chase Bank,
N.A. - PEN and Peru
Credit Linked Nts.,
8.115%*, 09/02/15 | | | 233,689 | | |
| BRL | 1,665,000 | | | # | | JPMorgan Chase Bank,
N.A., London - Brazil
NTN-B Credit Linked
Nts., 6%, 05/16/45 | | | 1,057,674 | | |
| COP | 4,650,000,000 | | | | | JPMorgan Chase Bank,
N.A., London -
Colombian Peso and
Colombia Credit Linked
Nts., 11.198%*, 08/03/20 | | | 577,115 | | |
| $ | 500,000 | | | # | | Lakeside RE Ltd., Floating
Rate Catastrophe
Linked Nts., (3-month
USD-LIBOR +6.5%,
12/31/09 | | | 501,425 | | |
| COP | 392,000,000 | | | | | LatAm Walker Cayman
Trust Series 2006-102 -
COP and Colombia Credit
Linked Nts., 10.00%,
11/17/16 | | | 175,117 | | |
See Accompanying Notes to Financial Statements
246
ING OPPENHEIMER PORTFOLIO OF INVESTMENTS
STRATEGIC INCOME PORTFOLIO AS OF DECEMBER 31, 2006 (CONTINUED)
Principal
Amount | | | | | | Value | |
| RON | 98,000 | | | | | Lehman Brothers Special
Financing - Romania
Total Return Linked Nts.
(Linked to Romanian
Treasury Bills),
7.75%, 04/21/08 | | $ | 38,147 | | |
| RON | 470,000 | | | | | Lehman Brothers Special
Financing - Romania
Total Return Linked Nts.
(Linked to Romanian
Treasury Bills),
6.75%, 03/11/08 | | | 181,011 | | |
| RON | 41,000 | | | | | Lehman Brothers Special
Financing - Romania
Total Return Linked Nts.
(Linked to Romanian
Treasury Bills),
7.25%, 04/19/10 | | | 15,728 | | |
| RON | 68,000 | | | | | Lehman Brothers Special
Financing - Romania
Total Return Linked Nts.
(Linked to Romanian
Treasury Bills),
7.5%, 03/06/07 | | | 26,498 | | |
| RON | 69,000 | | | | | Lehman Brothers Special
Financing - Romania
Total Return Linked Nts.
(Linked to Romanian
Treasury Bills),
7.75%, 04/21/08 | | | 26,859 | | |
| RUB | 10,000,000 | | | | | Merrill Lynch International -
Ensorte Enterprises
Limited, 10.5%, 5/12/08 | | | 379,860 | | |
| BRL | 2,049,837 | | | | | Morgan Stanley - Brazil
Sr. Credit Linked Nts.,
14.4%, 08/04/16 | | | 1,144,129 | | |
| $ | 3,460,000 | | | # | | Morgan Stanley -
Philippines Floating Rate
Credit Linked Nts.
(3-month USD-LIBOR
+4.85%), 09/20/15 | | | 4,094,391 | | |
| | 290,000 | | | # | | Morgan Stanley -
Philippines Senior
Floating Rate Credit
Linked Nts (3-month
USD-LIBOR +4.15%),
09/20/15 | | | 329,020 | | |
| | 900,000 | | | | | Morgan Stanley - United
Mexican States Floating
Rate Credit Linked Nts.,
(6-month USD LIBOR
+1.13%), 11/20/15 | | | 913,320 | | |
| | 685,000 | | | | | Morgan Stanley -
Venezuela Floating Rate
Credit Linked Nts
(6-month USD-LIBOR
+2.2%), 05/20/10 | | | 704,660 | | |
| | 125,000 | | | | | Morgan Stanley -
Venezuela Floating Rate
Credit Linked Nts
(6-month USD-LIBOR
+3.48%), 11/20/15 | | | 136,113 | | |
| | 550,000 | | | | | Morgan Stanley -
Venezuela Floating Rate
Credit Linked Nts
(6-month USD-LIBOR
+4%), 05/20/10 | | | 600,105 | | |
Principal
Amount | | | | | | Value | |
| KZT | 110,000,000 | | | | | Morgan Stanley Capital
Services Inc. - Bank
Center Total Return
Credit Linked Nts.,
7.52%, 06/06/08 | | $ | 875,944 | | |
| RUB | 8,020,976 | | | | | Morgan Stanley Capital
Services Inc. - Red Arrow International Leasing PLC
Total Return Linked Nts.,
11%, 07/06/12 | | | 312,549 | | |
| RUB | 9,712,054 | | | | | Morgan Stanley Capital
Services Inc. - Red Arrow International Leasing PLC
Total Return Linked Nts.,
8.375%, 07/06/12 | | | 381,465 | | |
| $ | 780,000 | | | | | Morgan Stanley Capital
Services Inc. - WTI
Trading Limited Total
Return Linked Nts.,
0%, 02/06/09 | | | 780,000 | | |
| | 1,040,000 | | | | | Morgan Stanley Capital
Services Inc. - WTI
Trading Limited Total
Return Linked Nts.,
0%, 02/06/09 | | | 1,040,000 | | |
| | 300,000 | | | | | Residential Reinsurance Ltd.
Series B Floating Rate
Catastrophe Linked Nts
(3-month USD-LIBOR
+8.45%), 06/06/08 | | | 277,590 | | |
| | 280,000 | | | # | | Successor Euro Wind Ltd.
Series A-I Floating Rate
Catastrophe Linked Nts.
(3-month USD-LIBOR
+5.25%), 06/06/08 | | | 276,682 | | |
| | 250,000 | | | # | | Successor II Ltd. Series A-I
Floating Rate Catastrophe
Linked Nts (3-month
USD-LIBOR +17.50%),
06/06/08 | | | 253,288 | | |
| | 630,000 | | | # | | Successor Japan Quake
Series A-I Floating Rate
Catastrophe Linked Nts.
(3-month USD-LIBOR
+4.25%), 06/06/08 | | | 634,001 | | |
| | 1,920,000 | | | # | | Trains HY-1-2006, 7.548%,
05/01/16 | | | 1,962,582 | | |
| GHC | 2,630,550,000 | | | | | UBS AG, Jersey - Ghana
Credit Linked Nts.,
14.47%, 12/28/11 | | | 290,317 | | |
| $ | 360,000 | | | # | | VASCO Re 2006 Ltd.
Floating Rate
Catastrophe Linked Nts.
(3-month USD-LIBOR
+8.5%), 06/05/09 | | | 365,796 | | |
| | | Total Other Structured
Products
(Cost $65,751,247) | | | 68,258,900 | | |
See Accompanying Notes to Financial Statements
247
ING OPPENHEIMER PORTFOLIO OF INVESTMENTS
STRATEGIC INCOME PORTFOLIO AS OF DECEMBER 31, 2006 (CONTINUED)
| Notional Amount | | | | | | Value | |
| Positions in Purchased Options: 0.0% | | | |
| EUR | 2,410,000 | | | | | European Style Currency
Option OTC
Euro (EUR) Call/USD Put
Strike @1.343 - Exp 1/4/07 | | $ | 324 | | |
| EUR | 4,180,000 | | | | | European Style Currency
Option OTC Euro (EUR)
Call/USD Put Strike
@ 1.3335 - Exp 3/5/07 | | | 43,413 | | |
| TRY | 1,780,000 | | | | | American Style Currency
Option OTC New Turkish
Lira (TRY) Call/Japanese
Yen (JPY) Put Strike
@ 77 - Exp 01/30/2007 | | | 64,502 | | |
| | | Total Purchased Options
(Cost $129,699) | | | 108,239 | | |
| | | Total Long-Term
Investments
(Cost $383,290,318) | | | 390,968,141 | | |
Principal
Amount | | | | | | Value | |
| SHORT-TERM INVESTMENTS: 27.3% | | | |
| | | | | | | U.S. Government
Agency
Obligations: 7.5% | | | | | |
| $ | 31,858,000 | | | | | Federal Home Loan Bank,
4.600%, due 01/02/07 | | $ | 31,849,859 | | |
| | | Total U.S. Government
Agency Obligations
(Cost $31,849,859) | | | 31,849,859 | | |
| | | | | | | U.S. Treasury Bills: 3.1% | | | | | |
| | 13,405,000 | | | L | | 4.840%, due 05/10/07 | | | 13,174,702 | | |
| | | Total U.S. Treasury Bills
(Cost $13,167,377) | | | 13,174,702 | | |
| | | | | | | Securities Lending
Collateralcc: 16.7% | | | | | |
| | 71,242,896 | | | | | The Bank of New York
Institutional Cash
Reserves Fund | | | 71,242,896 | | |
| | | Total Securities Lending
Collateral
(Cost $71,242,896) | | | 71,242,896 | | |
| | | Total Short-Term
Investments
(Cost $116,260,132) | | | 116,267,457 | | |
| | | Total Investments in
Securities
(Cost
$499,550,450)* | | | 119.3 | % | | $ | 507,235,598 | | |
| | | | | Other Assets and
Liabilities - Net | | | (19.3 | ) | | | (82,027,890 | ) | |
| | | Net Assets | | | 100.0 | % | | $ | 425,207,708 | | |
@@ Foreign Issuer
ADR American Depositary Receipt
STRIP Seperate Trading of Registered Interest and Principal of Securities
MASTR Mortgage Asset Securitization Transaction, Inc.
+ Step-up basis bonds. Interest rates shown reflect current and future coupon rates.
# Securities with purchases pursuant to Rule 144A, under the Securities Act of 1933 and may not be resold subject to that rule except to qualified institutional buyers. These securities have been determined to be liquid under the guidelines established by the Funds' Board of Directors/Trustees.
C Bond may be called prior to maturity date.
P Preferred Stock may be called prior to convertible date.
cc Securities purchased with cash collateral for securities loaned.
W When-issued or delayed delivery security
S Segregated securities for certain derivatives, when-issued or delayed delivery securities and forward currency exchange contracts.
I Illiquid Security
L Loaned security, a portion or all of the security is on loan at December 31, 2006.
X Fair value determined by ING Funds Valuation Committee appointed by the Funds' Board of Directors/Trustees.
^ Interest Only (IO) STRIP
Æ Principal Only (PO) STRIP
Z Indicates Zero Coupon Bond; coupon shown reflects effective yield on the date of purchase
ARS Argentine Peso
AUD Australian Dollar
BRL Brazilian Real
CAD Canadian Dollar
COP Colombian Peso
DKK Danish Krone
DOP Dominican Peso
EGP Egyptian Pound
EUR EU Euro
GBP British Pound
GHC Ghana Cedi
IDR Indonesian Rupiah
ILS Israeli New Shekel
JPY Japanese Yen
KZT Kazakhstan Tenge
MXN Mexican Peso
MYR Malaysian Ringgit
NGN Nigerian Naira
PEN Peruvian Nuevo Sol
PHP Philippine Peso
PLN Polish Zloty
RON Romanian New Leu
RUB Russian Ruble
TRY Turkish Lira
UAH Ukranian Hryvnia
UYU Uruguayan Peso Uruguayo
ZMK Zambian Kwacha
* Cost for federal income tax purposes is $499,689,343.
| Net unrealized appreciation consists of: | |
| Gross Unrealized Appreciation | | $ | 10,964,038 | | |
| Gross Unrealized Depreciation | | | (3,417,783 | ) | |
| Net Unrealized Appreciation | | $ | 7,546,255 | | |
See Accompanying Notes to Financial Statements
248
ING OPPENHEIMER PORTFOLIO OF INVESTMENTS
STRATEGIC INCOME PORTFOLIO AS OF DECEMBER 31, 2006 (CONTINUED)
Written Options Outstanding on December 31, 2006:
| Description | | Counterparty | | Exercise
Price | | Expiration
Date | | Notional
Amount | | Premium
Received | | Value | |
Currency Option OTC
New Turkish Lira (TRY) Put/
Japanese Yen (JPY) Call I | | JPMorgan Chase | | | 65 | | | 01/30/07 | | TRY | 1,780,000.00 | | | $ | 30,218 | | | $ | — | | |
Currency Option OTC
Euro (EUR) Put/USD Call | | Lehman Brothers | | | 1.3055 | | | 03/05/07 | | EUR | 4,180,000.00 | | | | 30,932 | | | | (32,722 | ) | |
| | | | | $ | 61,150 | | | $ | (32,722 | ) | |
Information concerning open futures contracts at December 31, 2006 is shown below:
| Long Contracts | | No. of
Contracts | | Notional
Market
Value ($) | | Expiration
Date | | Unrealized
Gain (Loss) | |
Amsterdam
Exchanges
Index | | | 3 | | | | 393,360 | | | 01/19/2007 | | $ | 10,259 | | |
Canada
10-Year Bond | | | 10 | | | | 976,032 | | | 03/21/2007 | | | (9,500 | ) | |
| DAX Index | | | 3 | | | | 658,620 | | | 03/16/2007 | | | 11,554 | | |
Euro-Bund
10-Year Note | | | 23 | | | | 3,522,791 | | | 03/08/2007 | | | (85,501 | ) | |
Euro-Schatz
2-Year Note | | | 104 | | | | 14,204,158 | | | 03/08/2007 | | | (81,959 | ) | |
Japan
10-Year Bond | | | 6 | | | | 6,758,540 | | | 03/09/2007 | | | (34,849 | ) | |
Long Gilt
10-Year Note | | | 16 | | | | 3,387,465 | | | 03/28/2007 | | | (39,761 | ) | |
| OMXS30 | | | 57 | | | | 960,415 | | | 01/26/2007 | | | 6,004 | | |
| S&P/MIB Index | | | 2 | | | | 551,185 | | | 03/16/2007 | | | 6,886 | | |
U.S. Treasury
Long Bond | | | 263 | | | | 29,308,063 | | | 03/21/2007 | | | (621,730 | ) | |
| | | | | | | | 60,720,627 | | | | | $ | (838,597 | ) | |
| Short Contracts | |
Australia
10-Year Bond | | | 6 | | | | (478,038 | ) | | 03/15/2007 | | $ | 8,768 | | |
| CAC40 10 Index | | | 10 | | | | (732,229 | ) | | 01/19/2007 | | | (13,818 | ) | |
Euro-Bobl
5-Year Note | | | 5 | | | | (718,236 | ) | | 03/08/2007 | | | 5,299 | | |
| FTSE 100 Index | | | 13 | | | | (1,582,206 | ) | | 03/16/2007 | | | (6,925 | ) | |
| FTSE/JSE Top 40 | | | 15 | | | | (491,135 | ) | | 03/15/2007 | | | (15,024 | ) | |
Japan
10-Year Mini | | | 33 | | | | (3,713,869 | ) | | 03/08/2007 | | | 23,603 | | |
NASDAQ 100
E-Mini | | | 40 | | | | — | | | 03/16/2007 | | | — | | |
| NIKKEI 225 Index | | | 19 | | | | (2,757,279 | ) | | 03/08/2007 | | | (158,788 | ) | |
| S&P 500 E-Mini | | | 114 | | | | (8,141,880 | ) | | 03/16/2007 | | | (9,308 | ) | |
U.S. Treasury
10-Year Note | | | 122 | | | | (13,111,188 | ) | | 03/21/2007 | | | 42,675 | | |
U.S. Treasury
2-Year Note | | | 51 | | | | (10,405,594 | ) | | 03/30/2007 | | | 24,881 | | |
U.S. Treasury
5-Year Note | | | 241 | | | | (25,320,063 | ) | | 03/30/2007 | | | 203,542 | | |
| | | | | | | | (67,451,716 | ) | | | | $ | 104,905 | | |
At December 31, 2006 the following forward currency contracts were outstanding for the ING Oppenheimer Strategic Income Portfolio:
| Currency | | Buy/Sell | | Settlement
Date | | In
Exchange
For | | Value | | Unrealized
Appreciation
(Depreciation) | |
Argentina Pesos
ARS 5,010,000 | |
Buy | |
01/19/07 | | | USD
1,634,584 | | | | 1,637,897 | | | $ | 3,313 | | |
Australia Dollars
AUD 665,000 | | Buy | | 01/10/07 | | | 499,980 | | | | 524,768 | | | | 24,788 | | |
Australia Dollars
AUD 710,000 | | Buy | | 01/10/07 | | | 536,639 | | | | 560,278 | | | | 23,639 | | |
Australia Dollars
AUD 2,450,000 | | Buy | | 03/05/07 | | | 1,863,299 | | | | 1,930,527 | | | | 67,228 | | |
Australia Dollars
AUD 134,000 | | Buy | | 01/16/07 | | | 105,190 | | | | 105,725 | | | | 535 | | |
Brazil Real
BRL 10,925,000 | | Buy | | 02/21/07 | | | 4,721,262 | | | | 5,070,794 | | | | 349,532 | | |
Brazil Real
BRL 1,370,000 | | Buy | | 02/21/07 | | | 587,731 | | | | 635,880 | | | | 48,149 | | |
Brazil Real
BRL 5,610,000 | | Buy | | 08/02/07 | | | 2,372,093 | | | | 2,549,421 | | | | 177,328 | | |
Brazil Real
BRL 6,170,000 | | Buy | | 08/02/07 | | | 2,608,328 | | | | 2,803,908 | | | | 195,580 | | |
Brazil Real
BRL 2,290,000 | | Buy | | 09/05/07 | | | 982,411 | | | | 1,040,673 | | | | 58,262 | | |
Brazil Real
BRL 5,310,000 | | Buy | | 09/05/07 | | | 2,277,621 | | | | 2,413,088 | | | | 135,467 | | |
Brazil Real
BRL 5,830,000 | | Buy | | 10/02/07 | | | 2,524,903 | | | | 2,649,398 | | | | 124,495 | | |
Brazil Real
BRL 3,615,000 | | Buy | | 11/05/07 | | | 1,582,750 | | | | 1,642,809 | | | | 60,059 | | |
Brazil Real
BRL 3,600,000 | | Buy | | 01/03/07 | | | 1,636,289 | | | | 1,684,019 | | | | 47,730 | | |
Brazil Real
BRL 3,600,000 | | Buy | | 02/02/07 | | | 1,656,010 | | | | 1,674,615 | | | | 18,605 | | |
Canada Dollars
CAD 410,000 | | Buy | | 01/10/07 | | | 364,250 | | | | 351,691 | | | | (12,559 | ) | |
Canada Dollars
CAD 465,000 | | Buy | | 01/16/07 | | | 402,946 | | | | 398,941 | | | | (4,005 | ) | |
Switzerland Francs
CHF 2,310,000 | | Buy | | 03/05/07 | | | 1,907,136 | | | | 1,906,695 | | | | (441 | ) | |
Switzerland Francs
CHF 310,000 | | Buy | | 03/06/07 | | | 256,580 | | | | 255,899 | | | | (681 | ) | |
Switzerland Francs
CHF 3,775,000 | | Buy | | 01/10/07 | | | 3,063,079 | | | | 3,101,046 | | | | 37,967 | | |
Switzerland Francs
CHF 1,510,000 | | Buy | | 01/10/07 | | | 1,217,742 | | | | 1,240,419 | | | | 22,677 | | |
Switzerland Francs
CHF 315,000 | | Buy | | 01/10/07 | | | 254,124 | | | | 258,762 | | | | 4,638 | | |
Switzerland Francs
CHF 690,000 | | Buy | | 01/10/07 | | | 546,439 | | | | 566,813 | | | | 20,374 | | |
See Accompanying Notes to Financial Statements
249
ING OPPENHEIMER PORTFOLIO OF INVESTMENTS
STRATEGIC INCOME PORTFOLIO AS OF DECEMBER 31, 2006 (CONTINUED)
| Currency | | Buy/Sell | | Settlement
Date | | In
Exchange
For | | Value | | Unrealized
Appreciation
(Depreciation) | |
Switzerland Francs
CHF 1,450,000 | | Buy | | 01/10/07 | | | 1,173,899 | | | | 1,191,130 | | | $ | 17,231 | | |
Switzerland Francs
CHF 860,000 | | Buy | | 01/10/07 | | | 716,983 | | | | 706,463 | | | | (10,520 | ) | |
Switzerland Francs
CHF 129,000 | | Buy | | 01/16/07 | | | 107,769 | | | | 106,030 | | | | (1,739 | ) | |
Chile Pesos
CLP 454,000,000 | | Buy | | 02/20/07 | | | 861,186 | | | | 852,832 | | | | (8,354 | ) | |
Chile Pesos
CLP 364,000,000 | | Buy | | 03/28/07 | | | 689,159 | | | | 683,645 | | | | (5,514 | ) | |
Dominican Republic Pesos
DOP 3,338,801 | | Buy | | 01/10/07 | | | 100,114 | | | | 99,815 | | | | (299 | ) | |
EURO
EUR 290,000 | | Buy | | 01/31/07 | | | 374,970 | | | | 383,421 | | | | 8,451 | | |
EURO
EUR 1,460,000 | | Buy | | 03/5/07 | | | 1,888,364 | | | | 1,932,985 | | | | 44,621 | | |
EURO
EUR 1,170,000 | | Buy | | 03/6/07 | | | 1,515,595 | | | | 1,549,099 | | | | 33,504 | | |
EURO
EUR 210,000 | | Buy | | 01/31/07 | | | 269,157 | | | | 277,650 | | | | 8,493 | | |
EURO
EUR 165,000 | | Buy | | 01/31/07 | | | 210,243 | | | | 218,154 | | | | 7,911 | | |
EURO
EUR 1,455,000 | | Buy | | 01/10/07 | | | 1,856,042 | | | | 1,921,656 | | | | 65,614 | | |
EURO
EUR 1,615,000 | | Buy | | 01/10/07 | | | 2,080,621 | | | | 2,132,972 | | | | 52,351 | | |
EURO
EUR 560,000 | | Buy | | 01/10/07 | | | 715,394 | | | | 739,606 | | | | 24,212 | | |
EURO
EUR 595,000 | | Buy | | 01/10/07 | | | 758,536 | | | | 785,832 | | | | 27,296 | | |
EURO
EUR 445,000 | | Buy | | 01/10/07 | | | 560,286 | | | | 587,723 | | | | 27,437 | | |
EURO
EUR 990,000 | | Buy | | 01/10/07 | | | 1,268,190 | | | | 1,307,518 | | | | 39,328 | | |
EURO
EUR 720,000 | | Buy | | 01/10/07 | | | 949,291 | | | | 950,922 | | | | 1,631 | | |
EURO
EUR 2,090,000 | | Buy | | 03/6/07 | | | 2,795,605 | | | | 2,767,192 | | | | (28,413 | ) | |
EURO
EUR 1,945,000 | | Buy | | 01/16/07 | | | 2,581,112 | | | | 2,569,605 | | | | (11,507 | ) | |
EURO
EUR 1,050,000 | | Buy | | 01/10/07 | | | 1,376,125 | | | | 1,386,762 | | | | 10,637 | | |
British Pound Sterling
GBP 1,215,000 | | Buy | | 01/10/07 | | | 2,306,702 | | | | 2,379,119 | | | | 72,417 | | |
British Pound Sterling
GBP 315,000 | | Buy | | 01/10/07 | | | 590,707 | | | | 616,809 | | | | 26,102 | | |
British Pound Sterling
GBP 35,000 | | Buy | | 01/10/07 | | | 65,047 | | | | 68,534 | | | | 3,487 | | |
British Pound Sterling
GBP 570,000 | | Buy | | 01/10/07 | | | 1,076,793 | | | | 1,116,130 | | | | 39,337 | | |
British Pound Sterling
GBP 300,000 | | Buy | | 01/10/07 | | | 581,223 | | | | 587,437 | | | | 6,214 | | |
British Pound Sterling
GBP 215,000 | | Buy | | 01/16/07 | | | 423,081 | | | | 421,014 | | | | (2,067 | ) | |
Hungary Forint
HUF 338,000,000 | | Buy | | 01/04/07 | | | 1,734,045 | | | | 1,774,205 | | | | 40,160 | | |
Japanese Yen
JPY 274,000,000 | | Buy | | 01/10/07 | | | 2,386,760 | | | | 2,305,631 | | | | (81,129 | ) | |
| Currency | | Buy/Sell | | Settlement
Date | | In
Exchange
For | | Value | | Unrealized
Appreciation
(Depreciation) | |
Japanese Yen
JPY 72,000,000 | | Buy | | 01/10/07 | | | 619,323 | | | | 605,859 | | | $ | (13,464 | ) | |
Japanese Yen
JPY 146,000,000 | | Buy | | 01/10/07 | | | 1,255,849 | | | | 1,228,548 | | | | (27,301 | ) | |
Japanese Yen
JPY 1,069,000,000 | | Buy | | 01/10/07 | | | 9,203,537 | | | | 8,995,328 | | | | (208,209 | ) | |
Japanese Yen
JPY 343,000,000 | | Buy | | 01/10/07 | | | 2,946,735 | | | | 2,886,246 | | | | (60,489 | ) | |
Japanese Yen
JPY 404,000,000 | | Buy | | 01/10/07 | | | 3,470,254 | | | | 3,399,544 | | | | (70,710 | ) | |
Japanese Yen
JPY 204,000,000 | | Buy | | 01/10/07 | | | 1,729,400 | | | | 1,716,602 | | | | (12,798 | ) | |
Japanese Yen
JPY 220,000,000 | | Buy | | 03/05/07 | | | 1,889,314 | | | | 1,864,194 | | | | (25,120 | ) | |
Japanese Yen
JPY 306,000,000 | | Buy | | 02/28/07 | | | 2,662,583 | | | | 2,591,214 | | | | (71,369 | ) | |
Japanese Yen
JPY 153,000,000 | | Buy | | 02/28/07 | | | 1,331,210 | | | | 1,295,607 | | | | (35,603 | ) | |
Japanese Yen
JPY 73,000,000 | | Buy | | 01/16/07 | | | 627,148 | | | | 614,787 | | | | (12,361 | ) | |
Japanese Yen
JPY 245,000,000 | | Buy | | 01/10/07 | | | 2,075,990 | | | | 2,061,605 | | | | (14,385 | ) | |
Japanese Yen
JPY 247,000,000 | | Buy | | 01/10/07 | | | 2,092,157 | | | | 2,078,435 | | | | (13,722 | ) | |
Korea (South) Won
KRW 922,000,000 | | Buy | | 01/12/07 | | | 976,126 | | | | 991,654 | | | | 15,528 | | |
Korea (South) Won
KRW 1,000,000,000 | | Buy | | 02/02/07 | | | 1,060,951 | | | | 1,076,027 | | | | 15,076 | | |
Mexico Pesos
MXN 9,900,000 | | Buy | | 02/22/07 | | | 901,721 | | | | 914,345 | | | | 12,624 | | |
Mexico Pesos
MXN 11,710,000 | | Buy | | 02/23/07 | | | 1,059,269 | | | | 1,081,469 | | | | 22,202 | | |
Mexico Pesos
MXN 14,910,000 | | Buy | | 02/26/07 | | | 1,352,185 | | | | 1,376,836 | | | | 24,651 | | |
Mexico Pesos
MXN 14,920,000 | | Buy | | 02/27/07 | | | 1,346,449 | | | | 1,377,703 | | | | 31,254 | | |
Malaysia Ringgits
MYR 1,520,000 | | Buy | | 02/16/07 | | | 420,296 | | | | 431,832 | | | | 11,536 | | |
Malaysia Ringgits
MYR 1,530,000 | | Buy | | 02/21/07 | | | 422,769 | | | | 434,767 | | | | 11,998 | | |
Norway Krone
NOK 5,855,000 | | Buy | | 01/10/07 | | | 906,347 | | | | 939,482 | | | | 33,135 | | |
Norway Krone
NOK 635,000 | | Buy | | 01/10/07 | | | 94,880 | | | | 101,891 | | | | 7,011 | | |
Norway Krone
NOK 7,070,000 | | Buy | | 01/10/07 | | | 1,151,261 | | | | 1,134,438 | | | | (16,823 | ) | |
New Zealand Dollars
NZD 2,850,000 | | Buy | | 03/05/07 | | | 1,851,346 | | | | 2,000,037 | | | | 148,691 | | |
New Zealand Dollars
NZD 1,060,000 | | Buy | | 03/05/07 | | | 681,485 | | | | 743,874 | | | | 62,389 | | |
New Zealand Dollars
NZD 360,000 | | Buy | | 03/05/07 | | | 234,493 | | | | 252,636 | | | | 18,143 | | |
Russia Rubles
RUR 9,835,000 | | Buy | | 03/06/07 | | | 375,812 | | | | 373,683 | | | | (2,129 | ) | |
Russia Rubles
RUR 8,190,000 | | Buy | | 03/07/07 | | | 313,193 | | | | 311,183 | | | | (2,010 | ) | |
Russia Rubles
RUR 18,090,000 | | Buy | | 03/07/07 | | | 689,143 | | | | 687,339 | | | | (1,804 | ) | |
See Accompanying Notes to Financial Statements
250
ING OPPENHEIMER PORTFOLIO OF INVESTMENTS
STRATEGIC INCOME PORTFOLIO AS OF DECEMBER 31, 2006 (CONTINUED)
| Currency | | Buy/Sell | | Settlement
Date | | In
Exchange
For | | Value | | Unrealized
Appreciation
(Depreciation) | |
Sweden Kronor
SEK 1,890,000 | | Buy | | 01/10/07 | | | 260,262 | | | | 276,264 | | | $ | 16,002 | | |
Sweden Kronor
SEK 13,570,000 | | Buy | | 03/05/07 | | | 1,927,557 | | | | 1,990,037 | | | | 62,480 | | |
Thailand Baht
THB 46,000,000 | | Buy | | 01/17/07 | | | 1,225,360 | | | | 1,290,414 | | | | 65,054 | | |
Turkey New Lira
TRY 3,785,000 | | Buy | | 01/24/08 | | | 2,533,467 | | | | 2,503,075 | | | | (30,392 | ) | |
Turkey New Lira
TRY 2,855,000 | | Buy | | 02/1/08 | | | 1,515,232 | | | | 1,888,053 | | | | 372,821 | | |
Turkey New Lira
TRY 65,000 | | Buy | | 02/1/08 | | | 32,067 | | | | 42,985 | | | | 10,918 | | |
Turkey New Lira
TRY 2,300,000 | | Buy | | 01/22/07 | | | 1,590,595 | | | | 1,610,809 | | | | 20,214 | | |
South Africa Rand
ZAR 11,700,000 | | Buy | | 01/08/07 | | | 1,626,355 | | | | 1,666,675 | | | | 40,320 | | |
| | | $ | 2,192,930 | | |
Australia Dollars
AUD 2,450,000 | | Sell | | 03/05/07 | | | 1,860,530 | | | | 1,930,526 | | | | (69,996 | ) | |
Australia Dollars
AUD 3,345,000 | | Sell | | 01/10/07 | | | 2,521,528 | | | | 2,639,623 | | | | (118,095 | ) | |
Australia Dollars
AUD 740,000 | | Sell | | 01/10/07 | | | 554,593 | | | | 583,952 | | | | (29,359 | ) | |
Brazil Real
BRL 7,865,000 | | Sell | | 02/21/07 | | | 3,445,783 | | | | 3,650,507 | | | | (204,724 | ) | |
Brazil Real
BRL 3,600,000 | | Sell | | 01/03/07 | | | 1,666,667 | | | | 1,684,019 | | | | (17,352 | ) | |
Canada Dollars
CAD 3,220,000 | | Sell | | 01/10/07 | | | 2,889,940 | | | | 2,762,060 | | | | 127,880 | | |
Canada Dollars
CAD 370,000 | | Sell | | 01/10/07 | | | 326,624 | | | | 317,379 | | | | 9,245 | | |
Switzerland Francs
CHF 2,305,000 | | Sell | | 01/10/07 | | | 1,861,979 | | | | 1,893,486 | | | | (31,507 | ) | |
Switzerland Francs
CHF 225,000 | | Sell | | 01/10/07 | | | 182,562 | | | | 184,831 | | | | (2,269 | ) | |
Switzerland Francs
CHF 1,285,000 | | Sell | | 01/10/07 | | | 1,016,341 | | | | 1,055,588 | | | | (39,247 | ) | |
Switzerland Francs
CHF 2,475,000 | | Sell | | 01/10/07 | | | 1,959,062 | | | | 2,033,137 | | | | (74,075 | ) | |
Switzerland Francs
CHF 470,000 | | Sell | | 01/10/07 | | | 371,512 | | | | 386,090 | | | | (14,578 | ) | |
Switzerland Francs
CHF 70,000 | | Sell | | 01/10/07 | | | 55,888 | | | | 57,503 | | | | (1,615 | ) | |
Switzerland Francs
CHF 780,000 | | Sell | | 02/15/07 | | | 632,409 | | | | 642,840 | | | | (10,431 | ) | |
Switzerland Francs
CHF 310,000 | | Sell | | 03/06/07 | | | 251,777 | | | | 255,899 | | | | (4,122 | ) | |
Switzerland Francs
CHF 2,310,000 | | Sell | | 03/05/07 | | | 1,877,591 | | | | 1,906,695 | | | | (29,104 | ) | |
Switzerland Francs
CHF 255,000 | | Sell | | 12/19/07 | | | 214,918 | | | | 212,543 | | | | 2,375 | | |
Switzerland Francs
CHF 550,000 | | Sell | | 12/19/07 | | | 462,340 | | | | 458,425 | | | | 3,915 | | |
Switzerland Francs
CHF 490,000 | | Sell | | 12/21/07 | | | 414,797 | | | | 408,415 | | | | 6,382 | | |
Switzerland Francs
CHF 2,010,000 | | Sell | | 01/22/07 | | | 1,656,898 | | | | 1,653,053 | | | | 3,845 | | |
| Currency | | Buy/Sell | | Settlement
Date | | In
Exchange
For | | Value | | Unrealized
Appreciation
(Depreciation) | |
China Yuan Renminbi
CNY 12,700,000 | | Sell | | 01/22/07 | | | 1,631,447 | | | | 1,632,840 | | | $ | (1,393 | ) | |
Czech Republic Koruny
CZK 4,400,000 | | Sell | | 12/19/07 | | | 212,941 | | | | 214,240 | | | | (1,299 | ) | |
Czech Republic Koruny
CZK 9,670,000 | | Sell | | 12/19/07 | | | 466,159 | | | | 470,842 | | | | (4,683 | ) | |
Czech Republic Koruny
CZK 8,500,000 | | Sell | | 12/21/07 | | | 414,295 | | | | 413,874 | | | | 421 | | |
Czech Republic Koruny
CZK 36,000,000 | | Sell | | 01/22/07 | | | 1,736,614 | | | | 1,732,266 | | | | 4,348 | | |
EURO
EUR 665,000 | | Sell | | 01/31/07 | | | 849,804 | | | | 879,225 | | | | (29,421 | ) | |
EURO
EUR 1,100,000 | | Sell | | 02/7/07 | | | 1,421,365 | | | | 1,454,783 | | | | (33,418 | ) | |
EURO
EUR 160,000 | | Sell | | 02/7/07 | | | 204,768 | | | | 211,605 | | | | (6,837 | ) | |
EURO
EUR 655,000 | | Sell | | 01/10/07 | | | 836,094 | | | | 865,075 | | | | (28,981 | ) | |
EURO
EUR 1,435,000 | | Sell | | 01/10/07 | | | 1,832,495 | | | | 1,895,241 | | | | (62,746 | ) | |
EURO
EUR 10,000 | | Sell | | 02/07/07 | | | 12,759 | | | | 13,225 | | | | (466 | ) | |
EURO
EUR 1,840,000 | | Sell | | 01/10/07 | | | 2,311,298 | | | | 2,430,135 | | | | (118,837 | ) | |
EURO
EUR 740,000 | | Sell | | 01/10/07 | | | 928,774 | | | | 977,337 | | | | (48,563 | ) | |
EURO
EUR 70,000 | | Sell | | 01/10/07 | | | 88,015 | | | | 92,451 | | | | (4,436 | ) | |
EURO
EUR 20,000 | | Sell | | 02/07/07 | | | 25,508 | | | | 26,450 | | | | (942 | ) | |
EURO
EUR 490,000 | | Sell | | 02/15/07 | | | 630,263 | | | | 648,258 | | | | (17,995 | ) | |
EURO
EUR 1,170,000 | | Sell | | 03/06/07 | | | 1,506,129 | | | | 1,549,098 | | | | (42,969 | ) | |
EURO
EUR 1,460,000 | | Sell | | 03/05/07 | | | 1,879,341 | | | | 1,932,985 | | | | (53,644 | ) | |
EURO
EUR 250,000 | | Sell | | 05/21/07 | | | 322,125 | | | | 331,971 | | | | (9,846 | ) | |
EURO
EUR 1,520,000 | | Sell | | 01/10/07 | | | 2,018,013 | | | | 2,007,503 | | | | 10,510 | | |
EURO
EUR 415,000 | | Sell | | 01/10/07 | | | 548,962 | | | | 548,101 | | | | 861 | | |
EURO
EUR 4,230,000 | | Sell | | 03/06/07 | | | 5,586,011 | | | | 5,600,585 | | | | (14,574 | ) | |
British Pound Sterling
GBP 580,000 | | Sell | | 02/07/07 | | | 1,096,925 | | | | 1,135,898 | | | | (38,973 | ) | |
British Pound Sterling
GBP 1,200,000 | | Sell | | 01/10/07 | | | 2,254,500 | | | | 2,349,747 | | | | (95,247 | ) | |
British Pound Sterling
GBP 60,000 | | Sell | | 02/07/07 | | | 112,951 | | | | 117,507 | | | | (4,556 | ) | |
British Pound Sterling
GBP 35,000 | | Sell | | 01/10/07 | | | 65,973 | | | | 68,535 | | | | (2,562 | ) | |
British Pound Sterling
GBP 10,000 | | Sell | | 02/07/07 | | | 18,999 | | | | 19,584 | | | | (585 | ) | |
British Pound Sterling
GBP 210,000 | | Sell | | 03/27/07 | | | 411,944 | | | | 411,304 | | | | 640 | | |
Hong Kong Dollars
HKD 3,220,000 | | Sell | | 12/19/07 | | | 419,074 | | | | 416,860 | | | | 2,214 | | |
See Accompanying Notes to Financial Statements
251
ING OPPENHEIMER PORTFOLIO OF INVESTMENTS
STRATEGIC INCOME PORTFOLIO AS OF DECEMBER 31, 2006 (CONTINUED)
| Currency | | Buy/Sell | | Settlement
Date | | In
Exchange
For | | Value | | Unrealized
Appreciation
(Depreciation) | |
Hong Kong Dollars
HKD 7,160,000 | | Sell | | 12/19/07 | | | 931,930 | | | | 926,933 | | | $ | 4,997 | | |
Hong Kong Dollars
HKD 6,370,000 | | Sell | | 12/21/07 | | | 828,648 | | | | 824,660 | | | | 3,988 | | |
Japanese Yen
JPY 130,000,000 | | Sell | | 02/07/07 | | | 1,156,995 | | | | 1,098,028 | | | | 58,967 | | |
Japanese Yen
JPY 220,000,000 | | Sell | | 03/05/07 | | | 1,923,371 | | | | 1,864,194 | | | | 59,177 | | |
Japanese Yen
JPY 80,000,000 | | Sell | | 01/10/07 | | | 689,049 | | | | 673,177 | | | | 15,872 | | |
Japanese Yen
JPY 53,000,000 | | Sell | | 01/10/07 | | | 455,440 | | | | 445,980 | | | | 9,460 | | |
Japanese Yen
JPY 13,000,000 | | Sell | | 02/07/07 | | | 111,936 | | | | 109,803 | | | | 2,133 | | |
Japanese Yen
JPY 171,000,000 | | Sell | | 01/10/07 | | | 1,467,068 | | | | 1,438,916 | | | | 28,152 | | |
Japanese Yen
JPY 249,000,000 | | Sell | | 01/10/07 | | | 2,125,752 | | | | 2,095,263 | | | | 30,489 | | |
Japanese Yen
JPY 2,000,000 | | Sell | | 02/07/07 | | | 17,152 | | | | 16,893 | | | | 259 | | |
Japanese Yen
JPY 223,700,000 | | Sell | | 02/15/07 | | | 1,916,725 | | | | 1,891,298 | | | | 25,427 | | |
Japanese Yen
JPY 220,000,000 | | Sell | | 01/10/07 | | | 1,893,183 | | | | 1,851,237 | | | | 41,946 | | |
Japanese Yen
JPY 225,000,000 | | Sell | | 02/28/07 | | | 1,958,225 | | | | 1,905,305 | | | | 52,920 | | |
Japanese Yen
JPY 170,000,000 | | Sell | | 02/28/07 | | | 1,456,001 | | | | 1,439,563 | | | | 16,438 | | |
Japanese Yen
JPY 306,000,000 | | Sell | | 02/28/07 | | | 2,621,389 | | | | 2,591,214 | | | | 30,175 | | |
Japanese Yen
JPY 162,000,000 | | Sell | | 01/10/07 | | | 1,380,039 | | | | 1,363,184 | | | | 16,855 | | |
| Currency | | Buy/Sell | | Settlement
Date | | In
Exchange
For | | Value | | Unrealized
Appreciation
(Depreciation) | |
Japanese Yen
JPY 189,000,000 | | Sell | | 01/22/07 | | | 1,603,053 | | | | 1,593,035 | | | $ | 10,018 | | |
Norway Krone
NOK 750,000 | | Sell | | 01/10/07 | | | 112,891 | | | | 120,344 | | | | (7,453 | ) | |
New Zealand Dollars
NZD 510,000 | | Sell | | 03/05/07 | | | 337,569 | | | | 357,901 | | | | (20,332 | ) | |
New Zealand Dollars
NZD 2,700,000 | | Sell | | 03/05/07 | | | 1,774,251 | | | | 1,894,771 | | | | (120,520 | ) | |
New Zealand Dollars
NZD 1,060,000 | | Sell | | 03/05/07 | | | 695,752 | | | | 743,873 | | | | (48,121 | ) | |
Sweden Kronor
SEK 13,570,000 | | Sell | | 03/05/07 | | | 1,894,296 | | | | 1,990,037 | | | | (95,741 | ) | |
Sweden Kronor
SEK 1,340,000 | | Sell | | 01/10/07 | | | 186,770 | | | | 195,870 | | | | (9,100 | ) | |
Sweden Kronor
SEK 1,320,000 | | Sell | | 01/10/07 | | | 179,998 | | | | 192,947 | | | | (12,949 | ) | |
Sweden Kronor
SEK 8,280,000 | | Sell | | 01/10/07 | | | 1,214,236 | | | | 1,210,303 | | | | 3,933 | | |
Turkey New Lira
TRY 610,000 | | Sell | | 02/01/08 | | | 338,701 | | | | 403,402 | | | | (64,701 | ) | |
Turkey New Lira
TRY 610,000 | | Sell | | 01/24/08 | | | 339,285 | | | | 403,402 | | | | (64,117 | ) | |
Turkey New Lira
TRY 320,000 | | Sell | | 01/24/08 | | | 170,213 | | | | 211,621 | | | | (41,408 | ) | |
Turkey New Lira
TRY 175,000 | | Sell | | 02/01/08 | | | 93,001 | | | | 115,730 | | | | (22,729 | ) | |
Turkey New Lira
TRY 2,855,000 | | Sell | | 01/24/08 | | | 1,518,617 | | | | 1,888,053 | | | | (369,436 | ) | |
Turkey New Lira
TRY 2,135,000 | | Sell | | 02/01/08 | | | 1,107,537 | | | | 1,411,906 | | | | (304,369 | ) | |
Taiwan New Dollars
TWD 55,000,000 | | Sell | | 01/04/07 | | | 1,696,327 | | | | 1,688,725 | | | | 7,602 | | |
| | | $ | (1,858,979 | ) | |
ING Oppenheimer Strategic Income Portfolio Credit Default Swap Agreements Outstanding on December 31, 2006:
| Counterparty | | Reference
Entity/Obligation | | Buy/Sell
Protection | | (Pay)/Receive
Fixed Rate | | Termination
Date | | Notional
Amount | | Unrealized
Appreciation/
(Depreciation) | |
Morgan Stanley Finansbank, A.S./USD 6.25%
Capital Services Inc. Eurobonds due 3/24/2011 and
6.50 | | USD% Eurobonds
due 3/24/2013(1) | | Sell | | | 1.30 | % | | 03/24/13 | | USD | 1,290,000 | | | $ | (8,488 | ) | |
| Deutsche Bank AG | | Ford Motor Company
7.45% due 7/16/2031 | | Buy | | | (3.30 | )% | | 12/20/08 | | USD | 555,000 | | | | (10,309 | ) | |
| Deutsche Bank AG | | Ford Motor Company
7.45% due 7/16/2031 | | Buy | | | (3.65 | )% | | 12/20/08 | | USD | 365,000 | | | | (9,526 | ) | |
| Deutsche Bank AG | | Ford Motor Company
7.45% due 7/16/2031 | | Buy | | | (3.05 | )% | | 12/20/08 | | USD | 445,000 | | | | (5,942 | ) | |
| Deutsche Bank AG | | Ford Motor Company
7.45% due 7/16/2031 | | Sell | | | 6.00 | % | | 12/20/16 | | USD | 455,000 | | | | 8,444 | | |
| Deutsche Bank AG | | Ford Motor Company
7.45% due 7/16/2031 | | Sell | | | 5.85 | % | | 12/20/16 | | USD | 695,000 | | | | 6,388 | | |
| Deutsche Bank AG | | Ford Motor Company
7.45% due 7/16/2031 | | Sell | | | 5.80 | % | | 12/20/16 | | USD | 555,000 | | | | 3,170 | | |
JPMorgan Chase Bank, Ford Motor Company
N.A., NY | | 7.45% due 7/16/2031 | | Buy | | | (3.60 | )% | | 12/20/08 | | USD | 365,000 | | | | (7,895 | ) | |
JPMorgan Chase Bank, Ford Motor Company
N.A., NY | | 7.45% due 7/16/2031 | | Sell | | | 6.00 | % | | 12/20/16 | | USD | 455,000 | | | | 7,589 | | |
Morgan Stanley Capital Ford Motor Company
Services Inc. | | 7.45% due 7/16/2031 | | Buy | | | (3.70 | )% | | 12/20/08 | | USD | 365,000 | | | | (9,801 | ) | |
Morgan Stanley Capital Ford Motor Company
Services Inc. | | 7.45% due 7/16/2031 | | Sell | | | 6.15 | % | | 12/20/16 | | USD | 455,000 | | | | 5,943 | | |
See Accompanying Notes to Financial Statements
252
ING OPPENHEIMER PORTFOLIO OF INVESTMENTS
STRATEGIC INCOME PORTFOLIO AS OF DECEMBER 31, 2006 (CONTINUED)
| Counterparty | | Reference
Entity/Obligation | | Buy/Sell
Protection | | (Pay)/Receive
Fixed Rate | | Termination
Date | | Notional
Amount | | Unrealized
Appreciation/
(Depreciation) | |
| Deutsche Bank AG | | General Motors
7.125% due 7/15/2013 | | Buy | | | (2.55 | )% | | 12/20/08 | | USD | 365,000 | | | $ | (5,810 | ) | |
| Deutsche Bank AG | | General Motors
7.125% due 7/15/2013 | | Buy | | | (2.03 | )% | | 12/20/08 | | USD | 445,000 | | | | (2,247 | ) | |
| Deutsche Bank AG | | General Motors
7.125% due 7/15/2013 | | Sell | | | 4.75 | % | | 12/20/16 | | USD | 365,000 | | | | 5,339 | | |
| Deutsche Bank AG | | General Motors
7.125% due 7/15/2013 | | Sell | | | 4.68 | % | | 12/20/16 | | USD | 445,000 | | | | 3,983 | | |
Goldman Sachs Capital General Motors
Markets L.P. | | 7.125% due 7/15/2013 | | Buy | | | (2.70 | )% | | 12/20/08 | | USD | 365,000 | | | | (6,858 | ) | |
Goldman Sachs Capital General Motors
Markets L.P. | | 7.125% due 7/15/2013 | | Sell | | | 4.95 | % | | 12/20/16 | | USD | 365,000 | | | | 8,890 | | |
JPMorgan Chase Bank, General Motors
N.A., NY | | 7.125% due 7/15/2013 | | Buy | | | (2.35 | )% | | 12/20/08 | | USD | 555,000 | | | | (3,923 | ) | |
JPMorgan Chase Bank, General Motors
N.A., NY | | 7.125% due 7/15/2013 | | Sell | | | 4.75 | % | | 12/20/16 | | USD | 555,000 | | | | 4,335 | | |
Morgan Stanley Capital General Motors
Services Inc. | | 7.125% due 7/15/2013 | | Buy | | | (2.70 | )% | | 12/20/08 | | USD | 365,000 | | | | (6,443 | ) | |
Morgan Stanley Capital General Motors
Services Inc. | | 7.125% due 7/15/2013 | | Sell | | | 4.90 | % | | 12/20/16 | | USD | 365,000 | | | | 10,430 | | |
Morgan Stanley Capital Republic of Colombia
Services Inc. | | 10.375% due 1/28/2033 | | Buy | | | (3.70 | )% | | 08/20/15 | | USD | 360,000 | | | | (52,440 | ) | |
| Citibank, N.A., New York | | Republic of Hungary
4.5% due 1/29/2014 | | Buy | | | (0.40 | )% | | 12/20/15 | | USD | 745,000 | | | | (2,347 | ) | |
Morgan Stanley Capital Republic of Indonesia
Services Inc. | | 6.75% due 3/10/2014 | | Buy | | | (1.68 | )% | | 03/20/11 | | USD | 300,000 | | | | (8,712 | ) | |
Morgan Stanley Capital Republic of Indonesia
Services Inc. | | 6.75% due 3/10/2014 | | Sell | | | 1.67 | % | | 06/20/11 | | USD | 300,000 | | | | 8,240 | | |
| UBS AG | | Republic of Indonesia
6.75% due 3/10/2014 | | Sell | | | 2.30 | % | | 09/20/11 | | USD | 275,000 | | | | 14,279 | | |
| Deutsche Bank AG | | Republic of Peru
8.75% due 11/21/2033 | | Buy | | | (1.71 | )% | | 12/20/16 | | USD | 420,000 | | | | (8,919 | ) | |
| Deutsche Bank AG, London | | Republic of the Philippines
10.625% 3/16/2025 | | Buy | | | (3.69 | )% | | 09/20/15 | | USD | 1,500,000 | | | | (182,984 | ) | |
Morgan Stanley Capital Republic of Turkey
Services Inc. | | 11.875% due 1/15/2030 | | Sell | | | 2.75 | % | | 11/20/16 | | USD | 255,000 | | | | 6,751 | | |
Morgan Stanley Capital Republic of Venezuela
Services Inc. | | 9.25% due 9/15/2027 | | Buy | | | (2.20 | )% | | 05/20/10 | | USD | 685,000 | | | | (31,028 | ) | |
Morgan Stanley Capital Republic of Venezuela
Services Inc. | | 9.25% due 9/15/2027 | | Buy | | | (3.48 | )% | | 11/20/15 | | USD | 125,000 | | | | (13,201 | ) | |
| Citibank, N.A., New York | | Ukraine Government
7.65% due 6/11/2013 | | Buy | | | (1.08 | )% | | 11/20/09 | | USD | 560,000 | | | | (2,335 | ) | |
JPMorgan Chase Bank, Ukraine Government
N.A., London | | 7.65% due 6/11/2013 | | Sell | | | 1.92 | % | | 08/20/11 | | USD | 75,000 | | | | 1,918 | | |
| | | $ | (283,509 | ) | |
(1) Issued by Istanbul Bond Company to provide funds to finance loans to Finansbank, A.S.
For the purposes of this transaction each such loan shall be an underlying loan.
See Accompanying Notes to Financial Statements
253
ING OPPENHEIMER PORTFOLIO OF INVESTMENTS
STRATEGIC INCOME PORTFOLIO AS OF DECEMBER 31, 2006 (CONTINUED)
ING Oppenheimer Strategic Income Portfolio Interest Rate Swap Agreements Outstanding on December 31, 2006:
| | | Termination
Date | | Notional
Principal
Amount | | Unrealized
Appreciation/
(Depreciation) | |
Receive a fixed rate equal to
| |
17.18% and pay a floating
| |
rate based on the Brazil
| |
Cetip Interbank Deposit
| |
| Rate Annualized | | 01/02/08 | | BRL | 2,773,913 | | | $ | 21,985 | | |
Counterparty: J. Aron &
| |
| Company | | | | | | | | | |
Receive a floating rate based
on 3-month ZAR-JIBAR-SAFEX
and pay a fixed rate equal
to 8.29%
Counterparty: JPMorgan
Chase Bank, N.A. | | 06/21/08 | | ZAR | 9,120,000 | | | | 13,729 | | |
Receive a fixed rate equal to
14.89% and pay a floating
rate based on the Brazil
Cetip Interbank Deposit
Rate Annualized
Counterparty: J. Aron &
Company | | 01/04/10 | | BRL | 8,390,000 | | | | 305,222 | | |
Receive a fixed rate equal to
12.67% and pay a floating
rate based on the Brazil
Cetip Interbank Deposit
Rate Annualized
Counterparty: J. Aron &
Company | | 01/04/10 | | BRL | 1,910,000 | | | | 5,187 | | |
Receive a fixed rate equal to
12.71% and pay a floating
rate based on the Brazil
Cetip Interbank Deposit
Rate Annualized
Counterparty: J. Aron &
Company | | 01/04/10 | | BRL | 1,910,000 | | | | 5,880 | | |
Receive a fixed rate equal to
12.61% and pay a floating
rate based on the Brazil
Cetip Interbank Deposit
Rate Annualized
Counterparty: J. Aron &
Company | | 01/04/10 | | BRL | 5,720,000 | | | | 12,523 | | |
Receive a fixed rate equal to
5.52% and pay a floating
rate based on 6-month
PLZ-WIBOR
Counterparty: Citibank N.A.,
London | | 03/24/10 | | PLN | 20,000 | | | | 336 | | |
Receive a fixed rate equal to
5.55% and pay a floating
rate based on 6-month
PLZ-WIBOR
Counterparty: Citibank N.A.,
London | | 03/25/10 | | PLN | 32,000 | | | | 545 | | |
Receive a fixed rate equal to
4.48% and pay a floating
rate based on 6-month
PLZ-WIBOR
Counterparty: Credit Suisse
First Boston International | | 07/01/10 | | PLN | 265,000 | | | | (1,248 | ) | |
| | | Termination
Date | | Notional
Principal
Amount | | Unrealized
Appreciation/
(Depreciation) | |
Receive a fixed rate equal to
| |
4.53% and pay a floating
| |
rate based on 6-month
| |
| PLZ-WIBOR | | 07/04/10 | | PLN | 1,950,000 | | | $ | (8,114 | ) | |
Counterparty: Lehman
| |
Brothers International
| |
| (Europe) | | | | | | | | | |
Receive a floating rate based
on 3-month TWD-TELERATE
and pay a fixed rate equal
to 2.32%
Counterparty: Citibank N.A.,
New York | | 06/27/11 | | TWD | 16,900,000 | | | | (7,022 | ) | |
Receive a floating rate based
on overnight
INR-MIBOR-OIS-COMPOUND
and pay a fixed rate equal
to 7.175%
Counterparty: Deutsche
Bank AG | | 06/27/11 | | INR | 16,900,000 | | | | 4,436 | | |
Receive a floating rate based
on 6-month HUF-BUBOR
and pay a fixed rate equal
to 8.44%
Counterparty: Deutsche
Bank AG | | 07/03/11 | | HUF | 82,000,000 | | | | (103 | ) | |
Receive a fixed rate equal to
12.38% and pay a floating
rate based on the Brazil
Cetip Interbank Deposit
Rate Annualized
Counterparty: JPMorgan
Chase Bank, N.A. | | 01/02/12 | | BRL | 4,200,000 | | | | 1,335 | | |
Receive a fixed rate equal to
13.91% and pay a floating
rate based on the Brazil
Cetip Interbank Deposit
Rate Annualized
Counterparty: JPMorgan
Chase Bank, N.A. | | 01/02/12 | | BRL | 2,070,000 | | | | 37,012 | | |
Receive a fixed rate equal to
14.05% and pay a floating
rate based on the Brazil
Cetip Interbank Deposit
Rate Annualized
Counterparty: J. Aron &
Company | | 01/02/12 | | BRL | 1,040,000 | | | | 20,476 | | |
Receive a fixed rate equal to
12.39% and pay a floating
rate based on the Brazil
Cetip Interbank Deposit
Rate Annualized
Counterparty: J. Aron &
Company | | 01/02/12 | | BRL | 4,200,000 | | | | 2,328 | | |
Receive a fixed rate equal to
14% and pay a floating rate
based on the Brazil Cetip
Interbank Deposit Rate
Annualized
Counterparty: Banco
Santander Central Hispano,
S.A. | | 01/03/12 | | BRL | 1,040,000 | | | | 19,326 | | |
See Accompanying Notes to Financial Statements
254
ING OPPENHEIMER PORTFOLIO OF INVESTMENTS
STRATEGIC INCOME PORTFOLIO AS OF DECEMBER 31, 2006 (CONTINUED)
| | | Termination
Date | | Notional
Principal
Amount | | Unrealized
Appreciation/
(Depreciation) | |
Receive a fixed rate equal to
| |
12.92% and pay a floating
| |
rate based on the Brazil
| |
Cetip Interbank Deposit
| |
| Rate Annualized | | 01/02/14 | | BRL | 1,920,000 | | | $ | 14,408 | | |
Counterparty: J. Aron &
| |
| Company | | | | | | | | | |
Receive a fixed rate equal to
12.84% and pay a floating
rate based on the Brazil
Cetip Interbank Deposit
Rate Annualized
Counterparty: J. Aron &
Company | | 01/02/14 | | BRL | 580,000 | | | | 3,750 | | |
Receive a fixed rate equal to
12.87% and pay a floating
rate based on the Brazil
Cetip Interbank Deposit
Rate Annualized
Counterparty: J. Aron &
Company | | 01/02/14 | | BRL | 960,000 | | | | 6,584 | | |
Receive a fixed rate equal to
12.73% and pay a floating
rate based on the Brazil
Cetip Interbank Deposit
Rate Annualized
Counterparty: J. Aron &
Company | | 01/02/14 | | BRL | 1,240,000 | | | | 6,240 | | |
Receive a fixed rate equal to
10.85% and pay a floating
rate based on 28-day
MXN-TIIE-BANXICO
Counterparty: J. Aron &
Company | | 03/05/15 | | MXN | 800,000 | | | | 14,237 | | |
Receive a fixed rate equal to
10.7% and pay a floating
rate based on 28-day
MXN-TIIE-BANXICO
Counterparty: J. Aron &
Company | | 05/08/15 | | MXN | 4,060,000 | | | | 69,298 | | |
Receive a fixed rate of 5.46%
(notional value
UDI 2,252,229.80) Pay a
floating rate based on
6-month USD-LIBOR
(notional value
USD 730,000.00) Upon
termination of the contract,
receive UDI 2,252,229.80
and pay USD 730,000.00
Counterparty: Deutsche
Bank AG London | | 05/13/15 | | | SEE DESCRIPTION | | | | 150,694 | | |
Receive a fixed rate equal to
10.43% and pay a floating
rate based on 28-day
MXN-TIIE-BANXICO
Counterparty: J. Aron &
Company | | 05/29/15 | | MXN | 3,400,000 | | | | 53,084 | | |
Receive a fixed rate equal to
10.30% and pay a floating
rate based on 28-day
MXN-TIIE-BANXICO
Counterparty: J. Aron &
Company | | 06/01/15 | | MXN | 3,400,000 | | | | 50,413 | | |
| | | Termination
Date | | Notional
Principal
Amount | | Unrealized
Appreciation/
(Depreciation) | |
Receive a fixed rate equal to
| |
10.29% and pay a floating
| |
rate based on 28-day
| |
| MXN-TIIE-BANXICO | | 06/04/15 | | MXN | 2,340,000 | | | $ | 34,542 | | |
Counterparty: J. Aron &
| |
| Company | | | | | | | | | |
Receive a fixed rate equal to
5.25% (notional value UDI
1,184,117.66 converted to
MXN) Pay a floating rate
based on 6-month
USD-LIBOR (notional value
$390,000.00) Upon
termination of the contract,
receive UDI 1,184,117.66
(converted into MXN) and
pay USD 390,000.00
Counterparty: Deutsche
Bank AG London | | 06/23/15 | | | SEE DESCRIPTION | | | | 67,277 | | |
Receive a fixed rate equal to
10% and pay a floating rate
based on 28-day
MXN-TIIE-BANXICO
Counterparty: J. Aron &
Company | | 06/24/15 | | MXN | 1,920,000 | | | | 25,270 | | |
Receive a fixed rate equal to
9.99% and pay a floating
rate based on 28-day
MXN-TIIE-BANXICO
Counterparty: Lehman
Brothers Special Financing
Inc. | | 07/09/15 | | MXN | 3,790,000 | | | | 48,875 | | |
Receive a fixed rate equal to
10% and pay a floating rate
base on 28-day
MXN-TIIE-BANXICO
Counterparty: Credit Suisse
First Boston International | | 07/09/15 | | MXN | 3,830,000 | | | | 50,112 | | |
Receive a fixed rate equal to
9.76% and pay a floating
rate based on 28-day
MXN-TIIE-BANXICO
Counterparty: JPMorgan
Chase Bank, N.A. | | 08/17/15 | | MXN | 3,700,000 | | | | 42,769 | | |
Receive a fixed rate equal to
8.70% and pay a floating
rate based on 28-day
MXN-TIIE-BANXICO
Counterparty: J. Aron &
Company | | 02/05/16 | | MXN | 13,500,000 | | | | 75,285 | | |
Receive a fixed rate equal to
5.57% and pay a floating
rate based on 3-month
USD-LIBOR
Counterparty: JPMorgan
Chase Bank, N.A. | | 05/26/16 | | USD | 12,000,000 | | | | 369,429 | | |
Receive a fixed rate equal to
9.41% and pay a floating
rate based on 28-day
MXN-TIIE-BANXICO
Counterparty: J. Aron &
Company | | 08/31/20 | | MXN | 2,240,000 | | | | 26,196 | | |
See Accompanying Notes to Financial Statements
255
ING OPPENHEIMER PORTFOLIO OF INVESTMENTS
STRATEGIC INCOME PORTFOLIO AS OF DECEMBER 31, 2006 (CONTINUED)
| | | Termination
Date | | Notional
Principal
Amount | | Unrealized
Appreciation/
(Depreciation) | |
Receive a fixed rate equal to
| |
9.51% and pay a floating
| |
rate based on 28-day
| |
| MXN-TIIE-BANXICO | | 08/26/25 | | MXN | 6,700,000 | | | $ | 91,003 | | |
Counterparty: J. Aron &
| |
| Company | | | | | | | | | |
Receive a fixed rate equal to
9.5% and pay a floating rate
based on 28-day
MXN-TIIE-BANXICO
Counterparty: J. Aron &
Company | | 08/28/25 | | MXN | 4,450,000 | | | | 60,020 | | |
Receive a fixed rate equal to
9.29% and pay a floating
rate based on 28-day
MXN-TIIE-BANXICO
Counterparty: J. Aron &
Company | | 07/17/26 | | MXN | 3,700,000 | | | | 42,717 | | |
Receive a fixed rate equal to
9.27% and pay a floating
rate based on 28-day
MXN-TIIE-BANXICO
Counterparty: Barclays Bank
PLC | | 07/17/26 | | MXN | 4,600,000 | | | | 46,123 | | |
Receive a fixed rate equal to
9.15% and pay a floating
rate based on 28-day
MXN-TIIE-BANXICO
Counterparty: J. Aron &
Company | | 08/27/26 | | MXN | 5,270,000 | | | | 54,229 | | |
Receive a fixed rate equal to
9.33% and pay a floating
rate based on 28-day
MXN-TIIE-BANXICO
Counterparty: J. Aron &
Company | | 09/16/26 | | MXN | 2,200,000 | | | | 26,232 | | |
| | | | | $ | 1,862,620 | | |
ING Oppenheimer Strategic Income Portfolio Total Return Swap Agreements Outstanding on December 31, 2006:
| | | Termination
Date | | Notional
Principal
Amount | | Unrealized
Appreciation/
(Depreciation) | |
Receive absolute value of
| |
price depreciation on the
| |
INDF/NSE Nifty Index Futures
| |
(January 07) Pay price
| |
appreciation on the
| |
INDF/NSE Nifty Index Futures
| |
| (January 07) | | 02/01/07 | | INR | 19,445,050 | | | $ | (8,923 | ) | |
Counterparty: Goldman
| |
| Sachs International | | | | | | | |
Receive price appreciation on
the Bovespa Index Futures
Exchange-Traded Contract
(February 07) Pay price
absolute value of price
depreciation on the Bovespa
Index Futures Exchange-
Traded Contract (February 07)
Counterparty: Goldman
Sachs International | | 02/15/07 | | BRL | 973,048 | | | | 9,410 | | |
| | | Termination
Date | | Notional
Principal
Amount | | Unrealized
Appreciation/
(Depreciation) | |
Receive absolute value of
| |
price depreciation on the
| |
Swiss Market Index Futures
| |
(March 07) Pay price
| |
appreciation on the Swiss
| |
Market Index Futures
| |
| (March 07) | | 03/21/07 | | CHF | 519,260 | | | $ | (6,261 | ) | |
Counterparty: Goldman
| |
| Sachs International | | | | | | | | | |
Receive total return of custom
basket, if positive Pay
one-month EUR-LIBOR plus
spread and, if negative, the
absolute value of the total
return of custom basket
Counterparty: Morgan
Stanley & Co. International | | 10/09/07 | | EUR | 1,265,721 | | | | 121,972 | | |
Receive total return of custom
basket, if positive. Pay
one-month GBP-LIBOR plus
spread and, if negative, the
absolute value of the total
return of custom basket
Counterparty: Morgan
Stanley & Co. International | | 10/09/07 | | GBP | 650,469 | | | | 81,784 | | |
Receive total return on the
MSCI Daily TR Net Belgium
USD Market Index Pay
one-month USD-LIBOR and,
if negative, the absolute
value of the total return on
the MSCI Daily TR Net
Belgium USD Market Index
Counterparty: Goldman
Sachs International | | 10/09/07 | | USD | 418,455 | | | | 19,252 | | |
Receive total return of custom
basket, if positive Pay
one-month USD-LIBOR minus
5 basis pts. and, if negative,
the absolute value of the
total return of custom
basket
Counterparty: Goldman
Sachs International | | 12/10/07 | | USD | 1,067,699 | | | | (6,112 | ) | |
Receive total return of custom
basket, if positive Pay
one-month USD-LIBOR plus
30 basis pts. and, if negative,
the absolute value of the
total return of custom basket
Counterparty: Goldman
Sachs International | | 12/10/07 | | USD | 4,186,678 | | | | (75,260 | ) | |
Receive price appreciation on
the Korea Stock Price 200
Index Futures (March 07)
Pay absolute value of price
depreciation on the Korean
Stock Price 200 Index Futures
(March 07)
Counterparty: Morgan
Stanley & Co. International | | 12/15/09 | | KRW | 357,678,800 | | | | 17,120 | | |
See Accompanying Notes to Financial Statements
256
ING OPPENHEIMER PORTFOLIO OF INVESTMENTS
STRATEGIC INCOME PORTFOLIO AS OF DECEMBER 31, 2006 (CONTINUED)
| | | Termination
Date | | Notional
Principal
Amount | | Unrealized
Appreciation/
(Depreciation) | |
Receive total return of custom
| |
basket, if positive Pay
| |
one-month JPY-LIBOR plus
| |
40 basis pts. and, if negative,
| |
the absolute value of the
| |
total return of custom
| |
| basket | | 12/20/07 | | JPY | 147,217,800 | | | $ | 29,413 | | |
Counterparty: Morgan
| |
| Stanley & Co. International | | | | | | | |
| | | | | $ | 182,395 | | |
See Accompanying Notes to Financial Statements
257
PORTFOLIO OF INVESTMENTS
ING PIMCO TOTAL RETURN PORTFOLIO AS OF DECEMBER 31, 2006
Principal
Amount | | | | | | Value | |
| CORPORATE BONDS/NOTES: 8.8% | | | |
| | | | | | | Agriculture: 0.1% | | | | | |
| $ | 300,000 | | | C | | Reynolds American, Inc.,
7.625%, due 06/01/16 | | $ | 319,360 | | |
| | | | 319,360 | | |
| | | | | | | Auto Manufacturers: 0.2% | | | | | |
| | 500,000 | | | | | DaimlerChrysler Holding
Corp., 5.600%,
due 03/07/07 | | | 500,105 | | |
| | | | 500,105 | | |
| | | | | | | Banks: 3.5% | | | | | |
| | 1,400,000 | | | | | Countrywide Bank,
5.350%, due 04/25/07 | | | 1,399,912 | | |
| DKK | 6,100,000 | | | @@ | | Nykredit, 4.833%,
due 10/01/38 | | | 1,058,490 | | |
| DKK | 11,700,000 | | | @@ | | Realkredit Danmark,
4.510%, due 10/01/38 | | | 2,026,785 | | |
| $ | 1,500,000 | | | @@,# | | Santander US Debt SA
Unipersonal, 5.428%,
due 02/06/09 | | | 1,502,414 | | |
| | 3,300,000 | | | | | UBS Financial, Inc.,
5.250%, due 06/12/07 | | | 3,223,374 | | |
| | 1,600,000 | | | @@,# | | Unicredit Luxembourg
Finance SA, 5.426%,
due 10/24/08 | | | 1,600,781 | | |
| | 800,000 | | | @@,# | | VTB Capital
(VNESHTORGBK),
5.970%, due 08/01/08 | | | 801,400 | | |
| | | | 11,613,156 | | |
| | | | | | | Diversified Financial
Services: 1.2% | | | | | |
| | 150,000 | | | | | CIT Group, Inc., 7.750%,
due 04/02/12 | | | 165,555 | | |
| | 400,000 | | | | | CitiFinancial, 6.625%,
due 06/01/15 | | | 430,410 | | |
| | 100,000 | | | S | | Citigroup, Inc., 5.625%,
due 08/27/12 | | | 101,569 | | |
| | 1,100,000 | | | | | Ford Motor Credit Co.,
7.000%, due 10/01/13 | | | 1,051,859 | | |
| | 400,000 | | | | | Ford Motor Credit Co.,
7.250%, due 10/25/11 | | | 392,099 | | |
| | 1,600,000 | | | | | HSBC Finance Corp.,
5.420%, due 10/21/09 | | | 1,601,446 | | |
| | 100,000 | | | C | | Morgan Stanley, 5.300%,
due 03/01/13 | | | 99,830 | | |
| | | | 3,842,768 | | |
| | | | | | | Electric: 0.3% | | | | | |
| | 300,000 | | | C,S | | Columbus Southern Power
Co., 6.600%,
due 03/01/33 | | | 319,860 | | |
| | 100,000 | | | C | | Entergy Gulf States, Inc.,
3.600%, due 06/01/08 | | | 97,392 | | |
| | 700,000 | | | C | | NRG Energy, Inc., 7.375%,
due 02/01/16 | | | 705,250 | | |
| | | | 1,122,502 | | |
| | | | | | | Healthcare-Products: 0.3% | | | | | |
| | 1,000,000 | | | X | | Fresenius Medical Care
Capital Trust II, 7.875%,
due 02/01/08 | | | 1,020,000 | | |
| | | | 1,020,000 | | |
Principal
Amount | | | | | | Value | |
| | | | | | | Media: 0.4% | | | | | |
| $ | 1,400,000 | | | | | Viacom, Inc., 5.590%,
due 05/29/07 | | $ | 1,400,000 | | |
| | | | 1,400,000 | | |
| | | | | | | Mining: 0.1% | | | | | |
| | 200,000 | | | @@,C | | Vale Overseas, Ltd.,
6.250%, due 01/23/17 | | | 201,909 | | |
| | | | 201,909 | | |
| | | | | | | Office/Business
Equipment: 0.2% | | | | | |
| | 700,000 | | | C | | Xerox Corp., 9.750%,
due 01/15/09 | | | 759,500 | | |
| | | | 759,500 | | |
| | | | | | | Oil & Gas: 0.1% | | | | | |
| | 100,000 | | | | | Pemex Project Funding
Master Trust, 7.375%,
due 12/15/14 | | | 110,350 | | |
| | 200,000 | | | | | Pemex Project Funding
Master Trust, 8.625%,
due 02/01/22 | | | 247,700 | | |
| | 100,000 | | | L | | Pemex Project Funding
Master Trust, 9.250%,
due 03/30/18 | | | 126,350 | | |
| | | | 484,400 | | |
| | | | | | | Pipelines: 0.2% | | | | | |
| | 200,000 | | | C,L | | El Paso Corp., 7.750%,
due 01/15/32 | | | 220,000 | | |
| | 300,000 | | | # | | Williams Cos., Inc., 6.375%,
due 10/01/10 | | | 303,375 | | |
| | | | 523,375 | | |
| | | | | | | Regional (state/
province): 0.2% | | | | | |
| CAD | 900,000 | | | @@ | | Quebec Province, 5.000%,
due 12/01/38 | | | 810,745 | | |
| | | | 810,745 | | |
| | | | | | | Retail: 0.8% | | | | | |
| $ | 2,700,000 | | | C | | CVS Corp., 5.750%,
due 08/15/11 | | | 2,735,213 | | |
| | | | 2,735,213 | | |
| | | | | | | Telecommunications: 1.2% | | | | | |
| | 24,000 | | | C,L | | AT&T Corp., 7.300%,
due 11/15/11 | | | 26,011 | | |
| | 400,000 | | | C,S | | AT&T, Inc., 4.125%,
due 09/15/09 | | | 388,746 | | |
| | 3,500,000 | | | C,L | | BellSouth Corp., 5.200%,
due 09/15/14 | | | 3,421,047 | | |
| | 30,000 | | | C,S | | New Cingular Wireless
Services, Inc., 7.875%,
due 03/01/11 | | | 32,752 | | |
| | 200,000 | | | C | | Qwest Corp., 8.875%,
due 03/15/12 | | | 223,750 | | |
| | | | 4,092,306 | | |
Total Corporate Bonds/
Notes
(Cost $29,230,480) | | | 29,425,339 | | |
See Accompanying Notes to Financial Statements
258
PORTFOLIO OF INVESTMENTS
ING PIMCO TOTAL RETURN PORTFOLIO AS OF DECEMBER 31, 2006 (CONTINUED)
Principal
Amount | | | | | | Value | |
| U.S. GOVERNMENT AGENCY OBLIGATIONS: 83.2% | | | |
| | | | | | | Federal Home Loan
Mortgage
Corporation: 9.8% | | | | | |
| | 1,900,000 | | | C | | 3.000%, due 05/15/22 | | $ | 1,850,532 | | |
| | 1,405,058 | | | C,S | | 3.500%, due 05/15/22 | | | 1,385,823 | | |
| | 2,200,000 | | | C,S | | 3.500%, due 11/15/22 | | | 2,151,618 | | |
| | 36,771 | | | C | | 3.500%, due 07/15/32 | | | 35,076 | | |
| | 3,155,030 | | | C | | 4.000%, due 06/15/22 | | | 3,115,563 | | |
| | 2,800,000 | | | C | | 4.500%, due 11/15/13 | | | 2,773,890 | | |
| | 85,858 | | | C | | 5.000%, due 09/15/16 | | | 85,434 | | |
| | 5,070,841 | | | C | | 5.000%, due 12/15/23 | | | 5,048,203 | | |
| | 3,336,607 | | | C | | 5.000%, due 01/15/24 | | | 3,323,384 | | |
| | 2,480,914 | | | C,S | | 5.000%, due 07/15/24 | | | 2,470,134 | | |
| | 480,530 | | | | | 5.000%, due 08/01/35 | | | 463,966 | | |
| | 933,318 | | | | | 5.000%, due 09/01/35 | | | 901,146 | | |
| | 1,811,073 | | | | | 5.339%, due 09/01/35 | | | 1,814,435 | | |
| | 24,139 | | | | | 5.500%, due 08/01/07 | | | 24,139 | | |
| | 203,103 | | | | | 5.500%, due 03/01/23 | | | 202,313 | | |
| | 439,518 | | | | | 5.500%, due 05/01/23 | | | 437,808 | | |
| | 18,344 | | | | | 5.500%, due 08/15/30 | | | 18,287 | | |
| | 2,815,244 | | | | | 5.500%, due 05/01/35 | | | 2,785,595 | | |
| | 1,000,000 | | | W | | 5.500%, due 01/00/00 | | | 989,062 | | |
| | 401,572 | | | C,S | | 5.670%, due 01/25/45 | | | 403,353 | | |
| | 72,436 | | | | | 5.739%, due 04/01/32 | | | 74,437 | | |
| | 11,067 | | | C | | 5.750%, due 05/15/29 | | | 11,078 | | |
| | 697,636 | | | C | | 5.958%, due 10/25/44 | | | 701,576 | | |
| | 9,038 | | | | | 6.000%, due 10/01/17 | | | 9,169 | | |
| | 43,097 | | | | | 6.000%, due 02/01/22 | | | 43,708 | | |
| | 901,553 | | | S | | 6.000%, due 03/01/23 | | | 913,724 | | |
| | 683,889 | | | C | | 6.875%, due 03/25/24 | | | 705,284 | | |
| | | | 32,738,737 | | |
| | | | | | | Federal National
Mortgage
Association: 73.4% | | | | | |
| | 4,978,986 | | | | | 3.851%, due 10/01/33 | | | 4,924,100 | | |
| | 2,686,567 | | | | | 4.190%, due 11/01/34 | | | 2,660,896 | | |
| | 1,780,345 | | | | | 4.383%, due 02/01/35 | | | 1,771,033 | | |
| | 1,366,741 | | | | | 4.737%, due 09/01/35 | | | 1,385,479 | | |
| | 967,204 | | | | | 4.991%, due 09/01/34 | | | 954,364 | | |
| | 123,549 | | | | | 5.000%, due 05/01/18 | | | 121,769 | | |
| | 873,115 | | | | | 5.000%, due 11/01/18 | | | 860,540 | | |
| | 447,382 | | | | | 5.000%, due 02/01/19 | | | 440,436 | | |
| | 83,531 | | | | | 5.000%, due 08/01/19 | | | 82,234 | | |
| | 422,786 | | | | | 5.000%, due 10/01/19 | | | 416,223 | | |
| | 500,000 | | | W | | 5.000%, due 01/15/20 | | | 491,563 | | |
| | 314,336 | | | | | 5.000%, due 06/01/20 | | | 309,123 | | |
| | 310,801 | | | | | 5.000%, due 07/01/20 | | | 305,647 | | |
| | 12,002,818 | | | | | 5.000%, due 08/01/20 | | | 11,803,760 | | |
| | 3,651,601 | | | | | 5.000%, due 09/01/20 | | | 3,591,041 | | |
| | 3,680,007 | | | | | 5.000%, due 01/01/21 | | | 3,618,977 | | |
| | 2,167,188 | | | | | 5.000%, due 05/01/21 | | | 2,130,978 | | |
| | 296,269 | | | | | 5.000%, due 06/01/21 | | | 291,319 | | |
| | 5,326,068 | | | | | 5.000%, due 07/01/21 | | | 5,237,078 | | |
| | 265,950 | | | | | 5.000%, due 09/01/21 | | | 261,507 | | |
| | 4,535,870 | | | | | 5.000%, due 06/25/27 | | | 4,509,598 | | |
| | 679,591 | | | | | 5.000%, due 08/01/35 | | | 656,522 | | |
| | 10,659,825 | | | | | 5.000%, due 02/01/36 | | | 10,297,972 | | |
| | 17,120,098 | | | | | 5.000%, due 03/01/36 | | | 16,538,942 | | |
| | 238,005 | | | | | 5.470%, due 03/25/34 | | | 238,327 | | |
| | 122,179 | | | | | 5.500%, due 03/01/16 | | | 122,699 | | |
| | 258,965 | | | | | 5.500%, due 06/01/23 | | | 257,805 | | |
Principal
Amount | | | | | | Value | |
| $ | 688,224 | | | | | 5.500%, due 02/01/24 | | $ | 685,143 | | |
| | 91,894 | | | | | 5.500%, due 05/01/33 | | | 90,986 | | |
| | 37,720 | | | | | 5.500%, due 07/01/33 | | | 37,348 | | |
| | 1,010,535 | | | | | 5.500%, due 11/01/33 | | | 1,000,550 | | |
| | 193,060 | | | | | 5.500%, due 12/01/33 | | | 191,153 | | |
| | 441,734 | | | | | 5.500%, due 04/01/34 | | | 437,369 | | |
| | 84,370 | | | | | 5.500%, due 10/01/34 | | | 83,492 | | |
| | 742,313 | | | S | | 5.500%, due 11/01/34 | | | 734,587 | | |
| | 1,060,510 | | | | | 5.500%, due 12/01/34 | | | 1,049,472 | | |
| | 1,227,334 | | | | | 5.500%, due 01/01/35 | | | 1,214,559 | | |
| | 20,137,959 | | | S | | 5.500%, due 02/01/35 | | | 19,928,358 | | |
| | 162,067 | | | | | 5.500%, due 04/01/35 | | | 160,266 | | |
| | 3,344,097 | | | | | 5.500%, due 05/01/35 | | | 3,306,947 | | |
| | 1,497,913 | | | | | 5.500%, due 06/01/35 | | | 1,481,272 | | |
| | 1,219,921 | | | | | 5.500%, due 07/01/35 | | | 1,206,369 | | |
| | 5,422,808 | | | | | 5.500%, due 08/01/35 | | | 5,362,567 | | |
| | 7,218,074 | | | | | 5.500%, due 09/01/35 | | | 7,137,888 | | |
| | 191,976 | | | | | 5.500%, due 10/01/35 | | | 189,844 | | |
| | 864,551 | | | | | 5.500%, due 12/01/35 | | | 854,946 | | |
| | 195,012 | | | | | 5.500%, due 03/01/36 | | | 192,778 | | |
| | 95,935 | | | | | 5.500%, due 04/01/36 | | | 94,836 | | |
| | 972,143 | | | | | 5.500%, due 05/01/36 | | | 961,344 | | |
| | 863,795 | | | | | 5.500%, due 07/01/36 | | | 853,898 | | |
| | 229,057 | | | | | 5.649%, due 04/01/32 | | | 229,519 | | |
| | 829,051 | | | | | 5.958%, due 10/01/44 | | | 836,185 | | |
| | 103,000,000 | | | | | 6.000%, due 01/15/34 | | | 103,708,125 | | |
| | 39,251 | | | | | 6.000%, due 04/01/17 | | | 39,840 | | |
| | 377,283 | | | | | 6.000%, due 06/01/17 | | | 382,945 | | |
| | 64,090 | | | | | 6.000%, due 01/01/18 | | | 65,052 | | |
| | 38,667 | | | | | 6.000%, due 12/01/18 | | | 39,280 | | |
| | 468,938 | | | | | 6.000%, due 04/01/22 | | | 475,294 | | |
| | 1,032,683 | | | S | | 6.000%, due 06/01/22 | | | 1,046,682 | | |
| | 195,961 | | | | | 6.000%, due 01/01/23 | | | 198,617 | | |
| | 155,147 | | | | | 6.339%, due 12/01/36 | | | 156,741 | | |
| | 7,000,000 | | | W | | 6.500%, due 01/15/35 | | | 7,133,434 | | |
| | 147,583 | | | | | 6.500%, due 03/01/17 | | | 151,198 | | |
| | 39,590 | | | | | 6.500%, due 07/01/29 | | | 40,619 | | |
| | 1,500,000 | | | | | 6.500%, due 06/17/38 | | | 1,552,745 | | |
| | 25,106 | | | | | 6.745%, due 02/01/20 | | | 25,859 | | |
| | 1,821,115 | | | | | 6.791%, due 02/01/33 | | | 1,831,818 | | |
| | 192,554 | | | | | 6.875%, due 04/25/24 | | | 197,233 | | |
| | 23,125 | | | | | 7.099%, due 09/01/31 | | | 23,395 | | |
| | 4,343,554 | | | | | 7.500%, due 08/25/35 | | | 4,462,283 | | |
| | | | 244,132,768 | | |
| | | | | | | Government National
Mortgage
Association: 0.0% | | | | | |
| | 50,264 | | | C | | 5.750%, due 03/16/32 | | | 50,615 | | |
| | | | 50,615 | | |
Total U.S. Government
Agency Obligations
(Cost $277,660,751) | | | 276,922,120 | | |
| U.S. TREASURY OBLIGATIONS: 6.3% | | | |
| | | | | | | Treasury Inflation
Protected Securities: 6.3% | | | | | |
| | 6,500,000 | | | | | 0.875%, due 04/15/10 | | | 6,566,378 | | |
| | 1,700,000 | | | | | 2.000%, due 07/15/14 | | | 1,767,023 | | |
| | 1,700,000 | | | L | | 2.500%, due 07/15/16 | | | 1,712,130 | | |
| | 3,400,000 | | | | | 3.375%, due 01/15/07 | | | 4,323,582 | | |
| | 5,100,000 | | | | | 3.625%, due 01/15/08 | | | 6,440,390 | | |
Total U.S. Treasury
Obligations
(Cost $20,990,137) | | | 20,809,503 | | |
See Accompanying Notes to Financial Statements
259
PORTFOLIO OF INVESTMENTS
ING PIMCO TOTAL RETURN PORTFOLIO AS OF DECEMBER 31, 2006 (CONTINUED)
Principal
Amount | | | | | | Value | |
| ASSET-BACKED SECURITIES: 1.8% | | | |
| | | | | | | Credit Card Asset-Backed
Securities: 0.6% | | | | | |
| | 1,900,000 | | | C | | Citibank Credit Card
Issuance Trust, 5.435%,
due 03/20/09 | | $ | 1,901,573 | | |
| | | | 1,901,573 | | |
| | | | | | | Home Equity Asset-Backed
Securities: 0.2% | | | | | |
| | 360,096 | | | C,L | | ACE Securities Corp.,
5.460%, due 10/25/35 | | | 360,375 | | |
| | 154,235 | | | C | | Argent Securities, Inc.,
5.450%, due 11/25/35 | | | 154,347 | | |
| | 26,211 | | | +,C | | New Century Home Equity
Loan Trust, 5.460%,
due 09/25/35 | | | 26,225 | | |
| | | | 540,947 | | |
| | | | | | | Other Asset-Backed
Securities: 1.0% | | | | | |
| | 1,356,150 | | | C | | Countrywide Asset-Backed
Certificates, 5.380%,
due 01/25/46 | | | 1,357,084 | | |
| | 1,401,636 | | | C | | Lehman XS Trust, 5.430%,
due 07/25/46 | | | 1,401,636 | | |
| | 594,645 | | | C | | Long Beach Mortgage
Loan Trust, 5.630%,
due 10/25/34 | | | 595,301 | | |
| | 59,275 | | | #,C,S | | Quest Trust, 5.910%,
due 06/25/34 | | | 59,490 | | |
| | | | 3,413,511 | | |
Total Asset-Backed
Securities
(Cost $5,853,720) | | | 5,856,031 | | |
| COLLATERALIZED MORTGAGE OBLIGATIONS: 8.7% | | | |
| | 653,047 | | | C | | Adjustable Rate Mortgage
Trust, 4.594%,
due 05/25/35 | | | 642,045 | | |
| | 877,524 | | | C | | American Home Mortgage
Investment Trust,
4.390%, due 02/25/45 | | | 863,296 | | |
| | 1,032,576 | | | C | | Banc of America Funding
Corp., 4.114%,
due 05/25/35 | | | 1,009,179 | | |
| | 830,241 | | | C | | Banc of America
Mortgage Securities,
3.994%, due 07/25/33 | | | 799,318 | | |
| | 440,674 | | | C,L | | Banc of America
Mortgage Securities,
5.000%, due 05/25/34 | | | 433,823 | | |
| | 261,632 | | | C,S | | Banc of America
Mortgage Securities,
5.800%, due 01/25/34 | | | 262,961 | | |
| | 986,583 | | | C | | Bear Stearns Adjustable
Rate Mortgage Trust,
4.750%, due 10/25/35 | | | 976,008 | | |
| | 612,933 | | | C,S | | Bear Stearns Alternative-A
Trust, 5.390%,
due 05/25/35 | | | 614,103 | | |
| | 1,052,664 | | | C | | Bear Stearns Alternative-A
Trust, 5.840%,
due 11/25/36 | | | 1,056,507 | | |
Principal
Amount | | | | | | Value | |
| $ | 1,003,140 | | | C | | Citigroup Mortgage
Loan Trust, Inc., 4.681%,
due 08/25/35 | | $ | 987,404 | | |
| | 1,174,060 | | | C,S,L | | Countrywide Alternative
Loan Trust, 5.560%,
due 11/20/35 | | | 1,175,503 | | |
| | 5,190 | | | C,S | | Countrywide Home Loan
Mortgage Pass-Through
Trust, 5.630%,
due 08/25/34 | | | 5,194 | | |
| | 429,957 | | | C,S | | Countrywide Home Loan
Mortgage Pass-Through
Trust, 5.670%,
due 03/25/35 | | | 431,838 | | |
| | 1,596,328 | | | #,C,S | | Countrywide Home Loan
Mortgage Pass-Through
Trust, 5.690%,
due 06/25/35 | | | 1,594,302 | | |
| | 484,865 | | | C | | Downey Savings & Loan
Association Mortgage
Loan Trust, 6.953%,
due 07/19/44 | | | 493,700 | | |
| | 55,332 | | | | | Fannie Mae, 3.500%,
due 04/25/17 | | | 55,125 | | |
| | 3,660,677 | | | C | | FHLMC Structured Pass-
Through Securities,
6.158%, due 07/25/44 | | | 3,680,387 | | |
| | 417,836 | | | C | | GMAC Mortgage Corp.
Loan Trust, 5.500%,
due 09/25/34 | | | 414,956 | | |
| | 316,020 | | | C | | GSR Mortgage Loan Trust,
3.393%, due 06/25/34 | | | 315,250 | | |
| | 1,074,794 | | | C | | GSR Mortgage Loan Trust,
4.540%, due 09/25/35 | | | 1,056,435 | | |
| | 9,615 | | | C | | GSR Mortgage Loan Trust,
6.000%, due 03/25/32 | | | 9,485 | | |
| | 501,895 | | | C | | Harborview Mortgage
Loan Trust, 5.570%,
due 05/19/35 | | | 503,334 | | |
| | 1,131,930 | | | C,S | | RAAC Series, 5.000%,
due 09/25/34 | | | 1,123,125 | | |
| | 208,964 | | | C,S | | Residential Accredit Loans,
Inc., 5.750%,
due 03/25/33 | | | 209,763 | | |
| | 248,262 | | | C | | Residential Asset
Securitization Trust,
5.750%, due 05/25/33 | | | 249,557 | | |
| | 49,289 | | | C,S | | Residential Funding
Mortgage Security I,
6.500%, due 03/25/32 | | | 49,599 | | |
| | 479,546 | | | C,S | | Sequoia Mortgage Trust,
5.700%, due 07/20/33 | | | 481,248 | | |
| | 1,708,761 | | | C | | Thornburg Mortgage
Securities Trust,
5.440%, due 08/25/36 | | | 1,707,146 | | |
| | 78,541 | | | C,S | | Washington Mutual, Inc.,
5.596%, due 02/27/34 | | | 78,759 | | |
| | 689,782 | | | +,C,S | | Washington Mutual, Inc.,
5.620%, due 12/25/27 | | | 690,089 | | |
| | 398,109 | | | C,S | | Washington Mutual, Inc.,
5.660%, due 01/25/45 | | | 399,071 | | |
| | 1,613,764 | | | C | | Washington Mutual, Inc.,
5.777%, due 07/25/46 | | | 1,622,113 | | |
See Accompanying Notes to Financial Statements
260
PORTFOLIO OF INVESTMENTS
ING PIMCO TOTAL RETURN PORTFOLIO AS OF DECEMBER 31, 2006 (CONTINUED)
Principal
Amount | | | | | | Value | |
| COLLATERALIZED MORTGAGE OBLIGATIONS (continued) | | | |
| $ | 1,652,919 | | | C | | Washington Mutual, Inc.,
5.777%, due 08/25/46 | | $ | 1,661,610 | | |
| | 81,718 | | | C | | Washington Mutual, Inc.,
6.227%, due 08/25/42 | | | 81,874 | | |
| | 1,652,257 | | | C,S | | Wells Fargo Mortgage-
Backed Securities Trust,
3.989%, due 12/25/34 | | | 1,619,399 | | |
| | 913,038 | | | C,S | | Wells Fargo Mortgage-
Backed Securities Trust,
4.362%, due 05/25/35 | | | 896,513 | | |
| | 825,000 | | | C | | Wells Fargo Mortgage-
Backed Securities Trust,
5.537%, due 08/25/36 | | | 823,106 | | |
Total Collateralized
Mortgage Obligations
(Cost $29,124,415) | | | 29,073,125 | | |
| MUNICIPAL BONDS: 1.2% | | | |
| | | | | | | California: 0.4% | | | | | |
| | 100,000 | | | C | | Golden State Tobacco
Securitization Corp.,
6.250%, due 06/01/33 | | | 111,885 | | |
| | 300,000 | | | C | | Golden State Tobacco
Securitization Corp.,
6.750%, due 06/01/39 | | | 344,028 | | |
| | 900,000 | | | C | | (1)Orange County Sanitation
District, 5.000%,
due 02/01/33 | | | 943,596 | | |
| | | | 1,399,509 | | |
| | | | | | | Louisiana: 0.0% | | | | | |
| | 100,000 | | | C,S | | Tobacco Settlement
Financing Corp., 5.875%,
due 05/15/39 | | | 107,148 | | |
| | | | 107,148 | | |
| | | | | | | New York: 0.2% | | | | | |
| | 600,000 | | | C | | (2)New York City Municipal
Water Finance Authority,
5.000%, due 06/15/38 | | | 632,952 | | |
| | | | 632,952 | | |
| | | | | | | Ohio: 0.0% | | | | | |
| | 100,000 | | | C | | Kettering, 5.000%,
due 12/01/30 | | | 107,651 | | |
| | | | 107,651 | | |
| | | | | | | Rhode Island: 0.1% | | | | | |
| | 200,000 | | | C,S | | Tobacco Settlement
Financing Corp., 6.250%,
due 06/01/42 | | | 213,954 | | |
| | | | 213,954 | | |
| | | | | | | Texas: 0.2% | | | | | |
| | 600,000 | | | C | | State of Texas, 4.750%,
due 04/01/35 | | | 615,204 | | |
| | | | 615,204 | | |
| | | | | | | Wisconsin: 0.3% | | | | | |
| | 185,000 | | | C | | Badger TOB Asset
Securitization Corp.,
6.125%, due 06/01/27 | | | 199,730 | | |
Principal
Amount | | | | | | Value | |
| $ | 800,000 | | | C,S | | Badger TOB Asset
Securitization Corp.,
6.375%, due 06/01/32 | | $ | 872,432 | | |
| | | | 1,072,162 | | |
Total Municipal Bonds
(Cost $3,839,025) | | | 4,148,580 | | |
| OTHER BONDS: 8.8% | | | |
| | | | | | | Foreign Government
Bonds: 8.8% | | | | | |
| EUR | 19,330,000 | | | @@ | | Bundesobligation, 4.000%,
due 02/16/07 | | | 25,526,652 | | |
| EUR | 1,100,000 | | | @@ | | Bundesrepublik
Deutschland, 4.250%,
due 01/04/14 | | | 1,477,870 | | |
| EUR | 600,000 | | | @@ | | Bundesrepublik
Deutschland, 4.250%,
due 07/04/14 | | | 806,935 | | |
| $ | 600,000 | | | @@,# | | Export-Import Bank of
China, 4.875%,
due 07/21/15 | | | 580,323 | | |
| | 400,000 | | | @@,# | | Hong Kong Government
International Bond,
5.125%, due 08/01/14 | | | 400,406 | | |
| | 32,000 | | | @@,L | | Panama Government
International Bond,
6.700%, due 01/26/36 | | | 33,440 | | |
| | 250,000 | | | @@ | | Panama Government
International Bond,
8.875%, due 09/30/27 | | | 318,750 | | |
| | 84,000 | | | @@ | | Panama Government
International Bond,
9.625%, due 02/08/11 | | | 96,180 | | |
| | 75,000 | | | @@ | | South Africa Government
International Bond,
9.125%, due 05/19/09 | | | 81,188 | | |
| | 39,211 | | | @@ | | Ukraine Government
International Bond,
11.000%, due 03/15/07 | | | 39,691 | | |
Total Other Bonds
(Cost $28,214,208) | | | 29,361,435 | | |
Number of Contracts/
Notional Amount | | Value | |
| OPTIONS: 0.3% | |
| Positions in Purchased Fixed Income Options | |
| | 236 | | | | | Call Option CME 90-Day
Eurodollar Future 6/07
Strike @ $95.25 -
Exp 6/18/2007 | | $ | 17,700 | | |
| | 575 | | | | | Put Option CME 90-Day
Eurodollar Future 6/07
Strike @ $91.25 -
Exp 6/18/2007 | | | — | | |
| | 438 | | | | | Put Option CME 90-Day
Eurodollar Future 9/07
Strike @ $91.25 -
Exp 9/17/2007 | | | — | | |
| | 433 | | | | | Put Option CME 90-Day
Eurodollar Future 9/07
Strike @ $91.50 -
Exp 9/17/2007 | | | — | | |
See Accompanying Notes to Financial Statements
261
PORTFOLIO OF INVESTMENTS
ING PIMCO TOTAL RETURN PORTFOLIO AS OF DECEMBER 31, 2006 (CONTINUED)
Number of Contracts/
Notional Amount | | | | | | Value | |
| OPTIONS (continued) | | | |
| | 158 | | | | | Put Option CME 90-Day
Eurodollar Future 12/07
Strike @ $91.25 -
Exp 12/17/2007 | | $ | — | | |
| | 100 | | | | | Put Option CME 90-Day
Eurodollar Future 12/07
Strike @ $92.25 -
Exp 12/17/2007 | | | 50 | | |
| | 72 | | | | | Put Option CME 90-Day
Eurodollar Future 3/08
Strike @ $91.50 -
Exp 3/17/2008 | | | 36 | | |
| | 133 | | | | | Put Option CME 90-Day
Eurodollar Future 3/08
Strike @ $91.75 -
Exp 3/17/2008 | | | 100 | | |
| | 192 | | | | | Put Option LIFFE 90-Day
Sterling Future 12/07
Strike @ GBP 93.25 -
Exp 12/19/2007 | | | 5,357 | | |
| USD | 22,000,000 | | | | | Put Option OTC -
Merrill Lynch
FNMA 6%
30-Year March TBA
Strike @ $91.875 -
Exp 3/6/2007 | | | 5,456 | | |
| Positions in Purchased Interest Rate Swap Options | | | |
| USD | 10,700,000 | | | I | | Call Swaption OTC -
Wachovia Bank, N.A.
3 Month USD-LIBOR -
Fund Pays Floating
Strike @ 4.73% -
Exp 2/1/2007 | | | 353 | | |
| USD | 35,100,000 | | | I | | Call Swaption OTC - The
Royal Bank of Scotland PLC
3 Month USD-LIBOR -
Fund Pays Floating
Strike @ 4.85% -
Exp 3/26/2007 | | | 6,461 | | |
| USD | 12,000,000 | | | I | | Call Swaption OTC - The
Royal Bank of Scotland PLC
3 Month USD-LIBOR -
Fund Pays Floating
Strike @ 5.08% -
Exp 4/19/2007 | | | 35,928 | | |
| USD | 19,000,000 | | | I | | Call Swaption OTC - The
Royal Bank of Scotland PLC
3 Month USD-LIBOR -
Fund Pays Floating
Strike @ 5.25% -
Exp 6/7/2007 | | | 111,473 | | |
| USD | 26,200,000 | | | I | | Call Swaption OTC - The
Royal Bank of Scotland PLC
3 Month USD-LIBOR -
Fund Pays Floating
Strike @ 5.5% -
Exp 6/29/2007 | | | 252,647 | | |
| USD | 380,200,000 | | | I | | Call Swaption OTC - The
Royal Bank of Scotland PLC
3 Month USD-LIBOR -
Fund Pays Floating
Strike @ 4.75% -
Exp 7/2/2007 | | | 281,766 | | |
Number of Contracts/
Notional Amount | | | | | | Value | |
| USD | 11,700,000 | | | I | | Call Swaption OTC - The
Royal Bank of Scotland PLC
3 Month USD-LIBOR -
Fund Pays Floating
Strike @ 4.9% -
Exp 10/25/2007 | | $ | 53,608 | | |
| USD | 16,700,000 | | | I | | Call Swaption OTC - Lehman
Brothers Special Financing Inc.
3 Month USD-LIBOR -
Fund Pays Floating
Strike @ 5.00% -
Exp 12/20/2007 | | | 101,879 | | |
| EUR | 36,400,000 | | | I | | Call Swaption OTC - Citibank
N.A., London 6 Month
EUR-EURIBOR - Fund
Pays Floating
Strike @ 3.96% -
Exp 7/2/2007 | | | 59,005 | | |
| GBP | 6,300,000 | | | I | | Call Swaption OTC -
Citibank N.A., London
6 Month GBP-LIBOR -
Fund Pays Floating
Strike @ 5.00% -
Exp 6/15/2007 | | | 2,775 | | |
| GBP | 3,500,000 | | | I | | Call Swaption OTC -
JPMorgan Chase Bank, N.A.
6 Month GBP-LIBOR -
Fund Pays Floating
Strike @ 5.0625% -
Exp 6/15/2007 | | | 2,652 | | |
| GBP | 24,000,000 | | | I | | Call Swaption OTC - The
Royal Bank of Scotland PLC
6 Month GBP-LIBOR -
Fund Pays Floating
Strike @ 5.1835% -
Exp 9/14/2007 | | | 65,596 | | |
Total Options Purchased
(Cost $1,626,191) | | | 1,002,842 | | |
Total Long-Term
Investments
(Cost $396,538,927) | | | 396,598,975 | | |
Principal
Amount | | | | Value | |
| SHORT-TERM INVESTMENTS: 13.4% | | | |
| | | Commercial Paper: 5.7% | |
| $ | 15,700,000 | | | Bank of America, 5.170%,
due 03/15/07 | | $ | 15,534,836 | | |
| | 3,500,000 | | | Freddie Mac Discount
Note, 5.200%,
due 01/23/07 | | | 3,488,406 | | |
Total Commercial Paper
(Cost $19,023,242) | | | 19,023,242 | | |
| | | U.S. Government Agency
Obligations: 6.1% | |
| | 20,200,000 | | | Federal Home Loan Bank,
4.800%, due 01/02/07 | | | 20,194,613 | | |
Total U.S. Government
Agency Obligations
(Cost $20,194,613) | | | 20,194,613 | | |
See Accompanying Notes to Financial Statements
262
PORTFOLIO OF INVESTMENTS
ING PIMCO TOTAL RETURN PORTFOLIO AS OF DECEMBER 31, 2006 (CONTINUED)
Principal
Amount | | | | Value | |
| | | U.S. Treasury Bills 0.4% | |
| $ | 1,430,000 | | | 4.670%, due 01/02/07 | | $ | 1,416,392 | | |
Total U.S. Treasury Bills
(Cost $1,416,392) | | | 1,416,392 | | |
| | | Securities Lending
Collateralcc: 1.2% | |
| | 3,842,658 | | | The Bank of New York
Institutional Cash
Reserves Fund | | | 3,842,658 | | |
Total Securities Lending
Collateral
(Cost $3,842,658) | | | 3,842,658 | | |
Total Short-Term
Investments
(Cost $44,476,905) | | | 44,476,905 | | |
Total Investments in
Securities
(Cost $441,015,832)* | | | 132.5 | % | | $ | 441,075,880 | | |
Other Assets and
Liabilities - Net | | | (32.5 | ) | | | (108,251,702 | ) | |
| Net Assets | | | 100.0 | % | | $ | 332,824,178 | | |
@@ Foreign Issuer
+ Step-up basis bonds. Interest rates shown reflect current and future coupon rates.
# Securities with purchases pursuant to Rule 144A, under the Securities Act of 1933 and may not be resold subject to that rule except to qualified institutional buyers. These securities have been determined to be liquid under the guidelines established by the Funds' Board of Directors/Trustees.
C Bond may be called prior to maturity date.
cc Securities purchased with cash collateral for securities loaned.
W When-issued or delayed delivery security
S Segregated securities for certain derivatives, when-issued or delayed delivery securities and forward currency exchange contracts.
I Illiquid Security
L Loaned security, a portion or all of the security is on loan at December 31, 2006.
X Fair value determined by ING Funds Valuation Committee appointed by the Funds' Board of Directors/Trustees.
(1) Security represents the underlying municipal obligation of an inverse floating rate obligation, Orange County Sanitation District, 5.870%, due 02/01/33.
(2) Security represents the underlying municipal obligation of an inverse floating rate obligation, New York City Municipal Water Finance Authority, 6.163%, due 06/15/38.
CAD Canadian Dollar
DKK Danish Krone
EUR EU Euro
* Cost for federal income tax purposes is $441,329,101.
Net unrealized depreciation consists of:
| Gross Unrealized Appreciation | | $ | 2,278,342 | | |
| Gross Unrealized Depreciation | | | (2,531,563 | ) | |
| Net Unrealized Depreciation | | $ | (253,221 | ) | |
Written Options Outstanding on December 31, 2006
Options on Exchange Traded Future Contracts
| Description/Name of Issuer | | Exercise
Price | | Expiration
Date | | # of
Contracts | | Premium
Received | | Value | |
| Call Option CME 90-Day Eurodollar Future 6/08 | | USD | 95.75 | | | 6/15/07 | | | 236 | | | $ | 105,433 | | | $ | (6,726 | ) | |
| Call Option Eurex Euro-Bund 10-Year Note Future 3/07 | | EUR | 120.5 | | | 2/21/07 | | | 85 | | | | 18,852 | | | | (1,122 | ) | |
| Put Option Eurex Euro-Bund 10-Year Note Future 3/07 | | EUR | 116.5 | | | 2/21/07 | | | 85 | | | | 25,110 | | | | (107,716 | ) | |
| | | | | | | $ | 149,395 | | | $ | (115,564 | ) | |
| Interest Rate Swaptions | |
| Description | | Counterparty | | Floating Rate
Index | | Pay/Receive
Floating | | Exercise
Rate | | Expiration
Date | | Notional
Amount | | Premium
Received | | Value | |
Call - OTC Interest
Rate Swap | | Lehman Brothers
Special
Financing Inc. | | 3-month USD-LIBOR | | Receive | | | 5.15 | % | | 12/20/07 | | USD | 7,300,000 | | | $ | 105,467 | | | $ | (110,934 | ) | |
Call - OTC Interest
Rate Swap | | The Royal Bank
of Scotland PLC | | 3-month USD-LIBOR | | Receive | | | 4.85 | % | | 03/26/07 | | USD | 8,400,000 | | | | 55,650 | | | | (21,783 | ) | |
Call - OTC Interest
Rate Swap | | The Royal Bank
of Scotland PLC | | 3-month USD-LIBOR | | Receive | | | 5.22 | % | | 04/19/07 | | USD | 5,200,000 | | | | 41,086 | | | | (56,202 | ) | |
Call - OTC Interest
Rate Swap | | The Royal Bank
of Scotland PLC | | 3-month USD-LIBOR | | Receive | | | 5.34 | % | | 06/07/07 | | USD | 8,000,000 | | | | 81,360 | | | | (127,840 | ) | |
Call - OTC Interest
Rate Swap | | The Royal Bank
of Scotland PLC | | 3-month USD-LIBOR | | Receive | | | 5.60 | % | | 06/29/07 | | USD | 11,400,000 | | | | 114,741 | | | | (288,386 | ) | |
Call - OTC Interest
Rate Swap | | The Royal Bank
of Scotland PLC | | 3-month USD-LIBOR | | Receive | | | 4.75 | % | | 07/02/07 | | USD | 83,300,000 | | | | 692,591 | | | | (347,829 | ) | |
Call - OTC Interest
Rate Swap | | The Royal Bank
of Scotland PLC | | 3-month USD-LIBOR | | Receive | | | 5.01 | % | | 10/25/07 | | USD | 5,100,000 | | | | 46,951 | | | | (56,796 | ) | |
Call - OTC Interest
Rate Swap | | Wachovia Bank,
N.A. | | 3-month USD-LIBOR | | Receive | | | 4.78 | % | | 02/01/07 | | USD | 4,600,000 | | | | 37,720 | | | | (1,201 | ) | |
Call - OTC Interest
Rate Swap | | Citibank N.A.,
London | | 6-month EUR-EURIBOR | | Receive | | | 4.10 | % | | 07/02/07 | | EUR | 15,500,000 | | | | 195,993 | | | | (120,227 | ) | |
Call - OTC Interest
Rate Swap | | Citibank N.A.,
London | | 6-month GBP-LIBOR | | Receive | | | 4.85 | % | | 06/15/07 | | GBP | 1,800,000 | | | | 33,172 | | | | (8,667 | ) | |
Call - OTC Interest
Rate Swap | | JPMorgan Chase
Bank N.A. | | 6-month GBP-LIBOR | | Receive | | | 4.85 | % | | 06/15/07 | | GBP | 1,000,000 | | | | 15,134 | | | | (4,815 | ) | |
Call - OTC Interest
Rate Swap | | The Royal Bank
of Scotland PLC | | 6-month GBP-LIBOR | | Receive | | | 4.85 | % | | 09/14/07 | | GBP | 6,900,000 | | | | 138,063 | | | | (63,245 | ) | |
| | | | | | | | | | | | | | | | | | | $ | 1,557,928 | | | $ | (1,207,925 | ) | |
See Accompanying Notes to Financial Statements
263
PORTFOLIO OF INVESTMENTS
ING PIMCO TOTAL RETURN PORTFOLIO AS OF DECEMBER 31, 2006 (CONTINUED)
Information concerning open futures contracts at December 31, 2006 is shown below:
| Long Contracts | | No. of
Contracts | | Notional
Market
Value ($) | | Expiration
Date | | Unrealized
Gain (Loss) | |
3-Month Euro
Euribor | | | 50 | | | | 15,824,863 | | | 09/17/2007 | | $ | (43,394 | ) | |
| 90-Day Eurodollar | | | 179 | | | | 42,369,300 | | | 03/19/2007 | | | (21,254 | ) | |
| 90-Day Eurodollar | | | 392 | | | | 93,207,800 | | | 03/17/2008 | | | (143,710 | ) | |
| 90-Day Eurodollar | | | 289 | | | | 68,471,325 | | | 06/18/2007 | | | (19,438 | ) | |
| 90-Day Eurodollar | | | 193 | | | | 45,796,488 | | | 09/17/2007 | | | (151,529 | ) | |
| 90-Day Eurodollar | | | 442 | | | | 105,030,250 | | | 12/17/2007 | | | (134,174 | ) | |
| 90-Day Sterling | | | 384 | | | | 88,832,847 | | | 12/19/2007 | | | (270,152 | ) | |
Euro-Bobl
5-Year Note | | | 6 | | | | 861,884 | | | 03/08/2007 | | | (11,309 | ) | |
Euro-Bund
10-Year Note | | | 32 | | | | 4,901,274 | | | 03/08/2007 | | | (115,939 | ) | |
U.S. Treasury
10-Year Note | | | 189 | | | | 20,311,594 | | | 03/21/2007 | | | (224,461 | ) | |
| | | | | | | | 485,607,624 | | | | | $ | (1,135,360 | ) | |
The following sale commitments were held by the ING PIMCO Total Return Portfolio at December 31, 2006:
Principal
Amount | | | | Descriptions | | Market Value | |
| $ | (12,000,000 | ) | | W | | Federal National Mortgage
Association, 5.000%,
due 01/12/36 | | $ | (11,587,500 | ) | |
| | (12,000,000 | ) | | W | | Federal National Mortgage
Association, 5.000%,
due 02/13/36 | | | (11,587,500 | ) | |
| | (31,400,000 | ) | | W | | Federal National Mortgage
Association, 5.500%,
due 01/12/36 | | | (31,036,953 | ) | |
Total Sale Commitments
(Proceeds $54,491,719) | | $ | (54,211,953 | ) | |
At December 31, 2006 the following forward currency contracts were outstanding for the ING Pimco Total Return Portfolio:
| Currency | | Buy/Sell | | Settlement
Date | | In
Exchange
For | | Value | | Unrealized
Appreciation
(Depreciation) | |
| | | | | | | | | | | | | USD | | | | | | | |
Australia Dollars
AUD 142,000 | | Buy | | 01/11/07 | | | 110,377 | | | | 112,053 | | | $ | 1,676 | | |
Australia Dollars
AUD 153,000 | | Buy | | 02/01/07 | | | 119,784 | | | | 120,661 | | | | 877 | | |
Brazil Real
BRL 402,024 | | Buy | | 06/04/07 | | | 179,836 | | | | 183,481 | | | | 3,645 | | |
Brazil Real
BRL 402,393 | | Buy | | 06/04/07 | | | 179,840 | | | | 183,649 | | | | 3,809 | | |
Brazil Real
BRL 399,394 | | Buy | | 06/04/07 | | | 178,620 | | | | 182,281 | | | | 3,661 | | |
Brazil Real
BRL 399,804 | | Buy | | 06/04/07 | | | 178,763 | | | | 182,468 | | | | 3,705 | | |
Brazil Real
BRL 420,676 | | Buy | | 05/03/07 | | | 188,011 | | | | 193,044 | | | | 5,033 | | |
Brazil Real
BRL 422,396 | | Buy | | 01/03/07 | | | 194,000 | | | | 197,590 | | | | 3,590 | | |
Brazil Real
BRL 846,464 | | Buy | | 01/03/07 | | | 389,000 | | | | 395,962 | | | | 6,962 | | |
| Currency | | Buy/Sell | | Settlement
Date | | In
Exchange
For | | Value | | Unrealized
Appreciation
(Depreciation) | |
| | | | | | | | | | | | | USD | | | | | | | |
Brazil Real
BRL 1,296,900 | | Buy | | 01/03/07 | | | 600,000 | | | | 606,668 | | | $ | 6,668 | | |
Brazil Real
BRL 831,498 | | Buy | | 06/04/07 | | | 375,563 | | | | 379,490 | | | | 3,927 | | |
Brazil Real
BRL 902,765 | | Buy | | 06/04/07 | | | 407,569 | | | | 412,016 | | | | 4,447 | | |
Brazil Real
BRL 831,498 | | Buy | | 06/04/07 | | | 375,309 | | | | 379,490 | | | | 4,181 | | |
Chile Pesos
CLP 13,795,665 | | Buy | | 05/08/07 | | | 26,220 | | | | 25,905 | | | | (315) | | |
Chile Pesos
CLP 13,411,027 | | Buy | | 05/08/07 | | | 25,466 | | | | 25,182 | | | | (284) | | |
Chile Pesos
CLP 13,793,308 | | Buy | | 05/08/07 | | | 26,221 | | | | 25,900 | | | | (320) | | |
Chile Pesos
CLP 4,500,000 | | Buy | | 06/19/07 | | | 8,534 | | | | 8,448 | | | | (86) | | |
China Yuan Renminbi
CNY 3,155,658 | | Buy | | 05/09/07 | | | 411,000 | | | | 411,946 | | | | 946 | | |
China Yuan Renminbi
CNY 10,020,573 | | Buy | | 05/09/07 | | | 1,305,000 | | | | 1,308,107 | | | | 3,107 | | |
China Yuan Renminbi
CNY 10,372,978 | | Buy | | 05/09/07 | | | 1,351,000 | | | | 1,354,111 | | | | 3,111 | | |
China Yuan Renminbi
CNY 6,892,000 | | Buy | | 05/09/07 | | | 896,929 | | | | 899,696 | | | | 2,767 | | |
China Yuan Renminbi
CNY 4,132,000 | | Buy | | 05/09/07 | | | 538,126 | | | | 539,400 | | | | 1,274 | | |
China Yuan Renminbi
CNY 1,750,000 | | Buy | | 05/09/07 | | | 228,132 | | | | 228,449 | | | | 317 | | |
China Yuan Renminbi
CNY 2,229,000 | | Buy | | 05/09/07 | | | 290,348 | | | | 290,978 | | | | 630 | | |
China Yuan Renminbi
CNY 4,581,100 | | Buy | | 11/21/07 | | | 610,000 | | | | 602,618 | | | | (7,382) | | |
China Yuan Renminbi
CNY 4,580,490 | | Buy | | 11/21/07 | | | 610,000 | | | | 602,537 | | | | (7,463) | | |
China Yuan Renminbi
CNY 7,753,185 | | Buy | | 11/26/07 | | | 1,035,000 | | | | 1,019,888 | | | | (15,112) | | |
China Yuan Renminbi
CNY 7,753,185 | | Buy | | 11/26/07 | | | 1,035,000 | | | | 1,019,888 | | | | (15,112) | | |
EURO
EUR 6,800,000 | | Buy | | 01/23/07 | | | 8,986,302 | | | | 8,986,950 | | | | 648 | | |
EURO
EUR 8,240,000 | | Buy | | 01/23/07 | | | 10,825,522 | | | | 10,890,069 | | | | 64,547 | | |
India Rupees
INR 2,323,000 | | Buy | | 03/20/07 | | | 50,065 | | | | 51,971 | | | | 1,906 | | |
Japanese Yen
JPY 99,666,000 | | Buy | | 01/25/07 | | | 845,800 | | | | 840,410 | | | | (5,390) | | |
Japanese Yen
JPY 741,049,000 | | Buy | | 02/15/07 | | | 6,349,599 | | | | 6,265,286 | | | | (84,313) | | |
Korea (South) Won
KRW 28,157,000 | | Buy | | 02/26/07 | | | 29,410 | | | | 30,312 | | | | 902 | | |
Korea (South) Won
KRW 35,629,000 | | Buy | | 03/21/07 | | | 37,410 | | | | 38,376 | | | | 966 | | |
Korea (South) Won
KRW 140,700,000 | | Buy | | 03/26/07 | | | 151,862 | | | | 151,566 | | | | (296) | | |
Mexico Pesos
MXN 189,675 | | Buy | | 01/16/07 | | | 17,102 | | | | 17,545 | | | | 443 | | |
Mexico Pesos
MXN 148,325 | | Buy | | 01/16/07 | | | 13,371 | | | | 13,720 | | | | 349 | | |
See Accompanying Notes to Financial Statements
264
PORTFOLIO OF INVESTMENTS
ING PIMCO TOTAL RETURN PORTFOLIO AS OF DECEMBER 31, 2006 (CONTINUED)
| Currency | | Buy/Sell | | Settlement
Date | | In
Exchange
For | | Value | | Unrealized
Appreciation
(Depreciation) | |
| | | | | | | | | | | | | USD | | | | | | | |
Mexico Pesos
MXN 360,000 | | Buy | | 04/18/07 | | | 32,367 | | | | 33,160 | | | $ | 793 | | |
Mexico Pesos
MXN 360,000 | | Buy | | 04/18/07 | | | 32,358 | | | | 33,160 | | | | 802 | | |
Mexico Pesos
MXN 5,447,832 | | Buy | | 01/16/07 | | | 494,000 | | | | 503,933 | | | | 9,933 | | |
Mexico Pesos
MXN 3,465,473 | | Buy | | 01/16/07 | | | 315,000 | | | | 320,562 | | | | 5,562 | | |
Mexico Pesos
MXN 2,591,280 | | Buy | | 01/16/07 | | | 236,000 | | | | 239,698 | | | | 3,698 | | |
Russia Rubles
RUR 422,602 | | Buy | | 03/15/07 | | | 15,899 | | | | 16,058 | | | | 159 | | |
Russia Rubles
RUR 247,699 | | Buy | | 03/15/07 | | | 9,312 | | | | 9,412 | | | | 100 | | |
Russia Rubles
RUR 247,699 | | Buy | | 03/15/07 | | | 9,320 | | | | 9,412 | | | | 92 | | |
Russia Rubles
RUR 1,019,877 | | Buy | | 01/17/07 | | | 38,241 | | | | 38,734 | | | | 493 | | |
Russia Rubles
RUR 1,019,877 | | Buy | | 01/17/07 | | | 38,284 | | | | 38,734 | | | | 450 | | |
Russia Rubles
RUR 239,123 | | Buy | | 09/19/07 | | | 9,135 | | | | 9,098 | | | | (37) | | |
Russia Rubles
RUR 239,123 | | Buy | | 09/19/07 | | | 9,143 | | | | 9,099 | | | | (44) | | |
Singapore Dollars
SGD 52,000 | | Buy | | 03/21/07 | | | 33,104 | | | | 34,042 | | | | 938 | | |
Singapore Dollars
SGD 151,000 | | Buy | | 01/29/07 | | | 97,331 | | | | 98,600 | | | | 1,269 | | |
Taiwan New Dollars
TWD 804,000 | | Buy | | 02/26/07 | | | 25,101 | | | | 24,809 | | | | (292) | | |
Taiwan New Dollars
TWD 1,002,000 | | Buy | | 02/26/07 | | | 30,793 | | | | 30,920 | | | | 127 | | |
| | | $ | 22,064 | | |
| Currency | | Buy/Sell | | Settlement
Date | | In
Exchange
For | | Value | | Unrealized
Appreciation
(Depreciation) | |
| | | | | | | | | | | | | USD | | | | | | | |
Brazil Real
BRL 831,498 | | Sell | | 01/3/07 | | | 385,488 | | | | 388,961 | | | $ | (3,473 | ) | |
Brazil Real
BRL 831,498 | | Sell | | 01/3/07 | | | 385,309 | | | | 388,960 | | | | (3,651 | ) | |
Brazil Real
BRL 902,765 | | Sell | | 01/3/07 | | | 418,237 | | | | 422,298 | | | | (4,061) | | |
Canada Dollars
CAD 1,287,731 | | Sell | | 01/11/07 | | | 1,126,000 | | | | 1,104,627 | | | | 21,373 | | |
Canada Dollars
CAD 1,287,497 | | Sell | | 01/11/07 | | | 1,126,000 | | | | 1,104,426 | | | | 21,574 | | |
Canada Dollars
CAD 947,000 | | Sell | | 01/11/07 | | | 820,773 | | | | 812,345 | | | | 8,428 | | |
Denmark Kroner
DKK 7,289,000 | | Sell | | 03/06/07 | | | 1,282,575 | | | | 1,293,957 | | | | (11,382) | | |
Denmark Kroner
DKK 10,440,000 | | Sell | | 03/06/07 | | | 1,849,949 | | | | 1,853,329 | | | | (3,380) | | |
EURO
EUR 36,777,000 | | Sell | | 01/23/07 | | | 48,253,300 | | | | 48,604,864 | | | | (351,564) | | |
EURO
EUR 13,000 | | Sell | | 01/23/07 | | | 17,180 | | | | 17,181 | | | | (1) | | |
British Pound Sterling
GBP 1,513,000 | | Sell | | 01/11/07 | | | 2,948,837 | | | | 2,962,660 | | | | (13,823) | | |
Japanese Yen
JPY 187,363,200 | | Sell | | 01/25/07 | | | 1,600,000 | | | | 1,579,897 | | | | 20,103 | | |
Japanese Yen
JPY 140,500,590 | | Sell | | 01/25/07 | | | 1,205,000 | | | | 1,184,739 | | | | 20,261 | | |
Japanese Yen
JPY 62,684,000 | | Sell | | 01/25/07 | | | 533,240 | | | | 528,568 | | | | 4,672 | | |
| | | $ | (294,924 | ) | |
ING PIMCO Total Return Portfolio Credit Default Swap Agreements Outstanding on December 31, 2006:
| Counterparty | | Reference
Entity/Obligation | | Buy/Sell
Protection | | (Pay)/Receive
Fixed Rate | | Termination
Date | | Notional
Amount | | Unrealized
Appreciation/
(Depreciation) | |
Goldman Sachs
International | | ABX.HE.A.06-1 Index | | | | Buy | | | (0.54 | )% | | 07/25/45 | | USD | 1,000,000 | | | $ | (2,429 | ) | |
Lehman Brothers
Special Financing Inc. | | American International Group
5.6% due 10/18/2016 | | I | | Sell | | | 0.055 | % | | 03/20/08 | | USD | 1,600,000 | | | | 671 | | |
JPMorgan Chase
Bank, N.A. | | American International Group
Convertible Zero Coupon
due 11/9/2031 | | I | | Sell | | | 0.05 | % | | 12/20/07 | | USD | 1,600,000 | | | | 489 | | |
Lehman Brothers
Special Financing Inc. | | Bellsouth Corporation 5.2%
due 9/15/2014 | | | | Buy | | | (0.325 | )% | | 09/20/14 | | USD | 3,500,000 | | | | (3,042 | ) | |
| Barclays Bank PLC | | Citifinancial 6.625% due 6/1/2015 | | I | | Buy | | | (0.145 | )% | | 06/20/15 | | USD | 400,000 | | | | 12 | | |
Morgan Stanley
Capital Services Inc. | | CVS Corporation 5.75% 8/15/2011 | | I | | Buy | | | (0.235 | )% | | 09/20/11 | | USD | 2,800,000 | | | | 182 | | |
Morgan Stanley Capital
Services Inc. | | Dow Jones CDX.EM.3 Index | | I | | Sell | | | 2.10 | % | | 06/20/10 | | USD | 900,000 | | | | 74,468 | | |
Morgan Stanley Capital
Services Inc. | | Dow Jones CDX.NA.IG.5 Index
10-Year (10-15% Tranche) | | I | | Sell | | | 0.46 | % | | 12/20/15 | | USD | 3,300,000 | | | | 678 | | |
Morgan Stanley
Capital Services Inc. | | Dow Jones CDX.NA.IG.5 Index
7-Year (10-15% Tranche) | | | | Buy | | | (0.14 | )% | | 12/20/12 | | USD | 4,600,000 | | | | (482 | ) | |
| Deutsche Bank AG | | Dow Jones CDX.NA.IG.7 Index | | | | Buy | | | (0.40 | )% | | 12/20/11 | | USD | 7,100,000 | | | | (1,210 | ) | |
See Accompanying Notes to Financial Statements
265
PORTFOLIO OF INVESTMENTS
ING PIMCO TOTAL RETURN PORTFOLIO AS OF DECEMBER 31, 2006 (CONTINUED)
| Counterparty | | Reference
Entity/Obligation | | | | Buy/Sell
Protection | | (Pay)/Receive
Fixed Rate | | Termination
Date | | Notional
Amount | | Unrealized
Appreciation/
(Depreciation) | |
Morgan Stanley
Capital Services Inc. | | Dow Jones CDX.NA.IG.7 Index | | | | Buy | | | (0.65 | )% | | 12/20/16 | | USD | 5,800,000 | | | $ | 12,572 | | |
| HSBC Bank USA, N.A. | | Ford Motor Credit Company 7%
due 10/01/2013 | | I | | Sell | | | 2.68 | % | | 06/20/07 | | USD | 500,000 | | | | 5,380 | | |
Lehman Brothers
Special Financing Inc. | | General Motors Acceptance
Corporation 6.875%
due 8/28/2012 | | I | | Sell | | | 3.55 | % | | 06/20/07 | | USD | 500,000 | | | | 7,602 | | |
| BNP Paribas | | iTraxx Europe HiVol
Series 6 Version 1 Index | | | | Buy | | | (0.85 | )% | | 12/20/16 | | EUR | 3,000,000 | | | | 3,563 | | |
| Deutsche Bank AG | | iTraxx Europe HiVol
Series 6 Version 1 Index | | | | Buy | | | (0.85 | )% | | 12/20/16 | | EUR | 2,700,000 | | | | 1,011 | | |
JPMorgan Chase
Bank, N.A. | | Ivy Lane CDO Ltd. Series 2006-1A
Floating Rate due 2/5/2046 | | | | Buy | | | (1.60 | )% | | 02/05/46 | | USD | 3,100,000 | | | | — | | |
The Royal Bank of
Scotland PLC | | Republic of Indonesia 6.75%
due 3/10/2014 | | | | Sell | | | 0.40 | % | | 12/20/08 | | USD | 200,000 | | | | (26 | ) | |
Lehman Brothers Special
Financing Inc. | | Republic of Turkey 11.875%
due 1/15/2030 | | | | Buy | | | (2.11 | )% | | 10/20/10 | | USD | 100,000 | | | | (3,045 | ) | |
Morgan Stanley Capital
Services Inc. | | Republic of Turkey 11.875%
due 1/15/2030 | | | | Buy | | | (2.20 | )% | | 10/20/10 | | USD | 100,000 | | | | (3,350 | ) | |
JPMorgan Chase
Bank, N.A. | | Russian Federation 2.25% Step
due 3/31/2030 | | I | | Sell | | | 0.77 | % | | 05/20/07 | | USD | 200,000 | | | | 443 | | |
| Deutsche Bank AG | | Russian Federation 5% Step
due 3/31/2030 | | I | | Sell | | | 0.26 | % | | 12/20/07 | | USD | 300,000 | | | | 1 | | |
Goldman Sachs
International | | Russian Federation 5% Step
due 3/31/2030 | | I | | Sell | | | 0.70 | % | | 03/20/07 | | USD | 500,000 | | | | 620 | | |
| Merrill Lynch International | | Russian Federation 5% Step
due 3/31/2030 | | I | | Sell | | | 0.61 | % | | 03/20/07 | | USD | 400,000 | | | | 415 | | |
Morgan Stanley Capital
Services Inc. | | Russian Federation 5% Step
due 3/31/2030 | | I | | Sell | | | 0.26 | % | | 12/20/07 | | USD | 300,000 | | | | 1 | | |
| Barclays Bank PLC | | Ukraine Government 7.65%
due 6/11/2013 | | | | Sell | | | 0.71 | % | | 12/20/08 | | USD | 100,000 | | | | (134 | ) | |
| Deutsche Bank AG | | Ukraine Government 7.65%
due 6/11/2013 | | | | Sell | | | 0.72 | % | | 12/20/08 | | USD | 100,000 | | | | (116 | ) | |
| | | $ | 94,274 | | |
See Accompanying Notes to Financial Statements
266
PORTFOLIO OF INVESTMENTS
ING PIMCO TOTAL RETURN PORTFOLIO AS OF DECEMBER 31, 2006 (CONTINUED)
ING PIMCO Total Return Portfolio Interest Rate Swap Agreements Outstanding on December 31, 2006:
| | | | | Termination
Date | | Notional
Principal
Amount | | Unrealized
Appreciation/
(Depreciation) | |
Receive a fixed rate equal to
| |
7.25% and pay a floating
| |
rate based on 3-month
| |
| NZD-BBR-FRA | | | | 6/15/09 | | NZD | 34,600,000 | | | $ | (63,964 | ) | |
Counterparty:
| |
| Citibank N.A., London | | | | | | | | | | | |
Receive a fixed rate equal to
5% and pay a floating rate
based on 3-month
USD-LIBOR
Counterparty:
UBS AG, London | | I | | 6/18/09 | | USD | 49,900,000 | | | | 152,921 | | |
Receive a fixed rate equal to
6% and pay a floating rate
based on 6-month
AUD-BBR-BBSW
Counterparty: JPMorgan
Chase Bank, N.A. | | | | 6/20/09 | | AUD | 16,900,000 | | | | (28,953 | ) | |
Receive a fixed rate equal to
6% and pay a floating rate
based on 6-month
AUD-BBR-BBSW
Counterparty: Deutsche
Bank AG | | | | 6/20/09 | | AUD | 32,700,000 | | | | (146,057 | ) | |
Receive a fixed rate equal to
14.36% and pay a floating
rate based on the Brazil
Cetip Interbank Deposit
Rate Annualized
Counterparty: Merrill Lynch
Capital Services, Inc. | | I | | 1/4/10 | | BRL | 2,200,000 | | | | 39,294 | | |
Receive a fixed rate equal to
12.86% and pay a floating
rate based on the Brazil
Cetip Interbank Deposit
Rate Annualized
Counterparty: Goldman
Sachs Capital Markets, L.P. | | | | 1/4/10 | | BRL | 25,500,000 | | | | (40,341 | ) | |
Receive a fixed rate equal to
12.948% and pay a floating
rate based on the Brazil
Cetip Interbank Deposit
Rate Annualized
Counterparty: Merrill Lynch
Capital Services, Inc. | | I | | 1/4/10 | | BRL | 17,300,000 | | | | 87,997 | | |
Receive a floating rate
based on 6-month
JPY-LIBOR and pay a fixed
rate equal to 2%
Counterparty: Morgan
Stanley Capital Services Inc. | | | | 12/20/13 | | JPY | 1,000,000 | | | | (5 | ) | |
Receive a floating rate
based on 6-month
EUR-Euribor and pay a
fixed rate equal to 4%
Counterparty: Barclays
Bank PLC, London | | I | | 12/15/14 | | EUR | 3,400,000 | | | | (20,483 | ) | |
Receive a floating rate
based on 6-month
EUR-Euribor and pay a
fixed rate equal to 4%
Counterparty: HSBC
Bank USA, N.A. | | I | | 12/15/14 | | EUR | 9,200,000 | | | | (92,657 | ) | |
| | | | | Termination
Date | | Notional
Principal
Amount | | Unrealized
Appreciation/
(Depreciation) | |
Receive a floating rate
| |
based on 6-month
| |
EUR-Euribor and pay a
| |
| fixed rate equal to 4% | | I | | 12/15/14 | | EUR | 1,100,000 | | | $ | (11,079 | ) | |
Counterparty: Deutsche
| |
| Bank AG | | | | | | | | | | | |
Receive a fixed rate equal
to 5% and pay a floating
rate based on 6-month
GBP-LIBOR
Counterparty: Goldman
Sachs Capital Markets, L.P. | | | | 9/15/15 | | GBP | 900,000 | | | | (21,360 | ) | |
Receive a fixed rate equal
to 5% and pay a floating
rate based on 6-month
GBP-LIBOR
Counterparty: Deutsche
Bank AG | | | | 9/15/15 | | GBP | 900,000 | | | | (22,727 | ) | |
Receive a fixed rate equal to
8.72% and pay a floating
rate based on 28-day
MXN-TIIE-BANXICO
Counterparty: Merrill
Lynch Capital Services, Inc. | | I | | 9/5/16 | | MXN | 9,400,000 | | | | 22,560 | | |
Receive a fixed rate equal to
8.72% and pay a floating
rate based on 28-day
MXN-TIIE-BANXICO
Counterparty: Citibank N.A.,
New York | | I | | 9/5/16 | | MXN | 22,900,000 | | | | 67,302 | | |
Receive a fixed rate equal to
8.86% and pay a floating
rate based on 28-day
MXN-TIIE-BANXICO
Counterparty: Citibank N.A.,
New York | | I | | 9/12/16 | | MXN | 13,000,000 | | | | 83,139 | | |
Receive a fixed rate equal to
8.17% and pay a floating
rate based on 28-day
MXN-TIIE-BANXICO
Counterparty: Citibank N.A.,
New York | | I | | 11/4/16 | | MXN | 21,600,000 | | | | 44,572 | | |
Receive a fixed rate equal to
8.17% and pay a floating
rate based on 28-day
MXN-TIIE-BANXICO
Counterparty: Merrill Lynch
Capital Services, Inc. | | I | | 11/4/16 | | MXN | 10,300,000 | | | | 26,508 | | |
Receive a floating rate
based on 3-month
USD-LIBOR and pay a
fixed rate equal to 5%
Counterparty: The Royal
Bank of Scotland PLC | | I | | 6/20/17 | | USD | 18,100,000 | | | | 252,790 | | |
Receive a fixed rate equal to
4.5% and pay a floating
rate based on 3-month
CAD-BA-CDOR
Counterparty: Royal Bank
of Canada | | | | 6/15/27 | | CAD | 700,000 | | | | (10,453 | ) | |
See Accompanying Notes to Financial Statements
267
PORTFOLIO OF INVESTMENTS
ING PIMCO TOTAL RETURN PORTFOLIO AS OF DECEMBER 31, 2006 (CONTINUED)
| | | | | Termination
Date | | Notional
Principal
Amount | | Unrealized
Appreciation/
(Depreciation) | |
Receive a fixed rate equal to
| |
6% and pay a floating rate
| |
based on 6-month
| |
| EUR-Euribor | | I | | 6/18/34 | | EUR | 4,300,000 | | | $ | 248,029 | | |
Counterparty: Morgan
| |
| Stanley Capital Services, Inc. | | | | | | | | | | | |
Receive a floating rate based
on 6-month GBP-LIBOR and
pay a fixed rate equal to 4%
Counterparty: Goldman
Sachs Capital Markets, L.P. | | I | | 12/15/35 | | GBP | 3,000,000 | | | | 58,056 | | |
Receive a fixed rate equal to
5% and pay a floating rate
based on 3-month
USD-LIBOR
Counterparty: Deutsche
Bank AG | | | | 12/15/35 | | USD | 7,700,000 | | | | (103,426 | ) | |
Receive a floating rate based
on 6-month GBP-LIBOR and
pay a fixed rate equal to 4%
Counterparty: Barclays
Bank PLC, London | | I | | 12/15/35 | | GBP | 1,100,000 | | | | 19,152 | | |
Receive a floating rate
based on 6-month
GBP-LIBOR and pay a fixed
rate equal to 4%
Counterparty: Deutsche
Bank AG | | I | | 12/15/35 | | GBP | 2,900,000 | | | | (23,428 | ) | |
Receive a floating rate
based on 6-month
GBP-LIBOR and pay a fixed
rate equal to 4.25%
Counterparty: Goldman
Sachs Capital Markets, L.P. | | I | | 6/12/36 | | GBP | 600,000 | | | | (14,303 | ) | |
Receive a fixed rate equal to
5% and pay a floating rate
based on 3-month
USD-LIBOR
Counterparty: Citibank N.A.,
New York | | | | 6/20/37 | | USD | 1,100,000 | | | | (27,194 | ) | |
Receive a fixed rate equal to
5% and pay a floating rate
based on 3-month
USD-LIBOR
Counterparty: Deutsche
Bank AG | | | | 6/20/37 | | USD | 5,800,000 | | | | (143,388 | ) | |
Receive a fixed rate equal to
5% and pay a floating rate
based on 3-month
USD-LIBOR
Counterparty: The Royal
Bank of Scotland PLC | | | | 6/20/37 | | USD | 10,700,000 | | | | (151,626 | ) | |
Receive a fixed rate equal to
5% and pay a floating rate
based on 3-month
USD-LIBOR
Counterparty: Morgan
Stanley Capital Services, Inc. | | | | 6/20/37 | | USD | 1,000,000 | | | | (22,072 | ) | |
| | | | | | | $ | 158,804 | | |
See Accompanying Notes to Financial Statements
268
PORTFOLIO OF INVESTMENTS
ING PIONEER HIGH YIELD PORTFOLIO AS OF DECEMBER 31, 2006
| Shares | | | | | | Value | |
| COMMON STOCK: 15.9% | | | |
| | | | | Building Materials: 0.4% | |
| | 8,700 | | | | | Texas Industries, Inc. | | $ | 558,801 | | |
| | | | 558,801 | | |
| | | | | Chemicals: 1.0% | |
| | 7,100 | | | | | Air Products & Chemicals, Inc. | | | 498,988 | | |
| | 7,900 | | | | | Dow Chemical Co. | | | 315,526 | | |
| | 24,900 | | | | | RPM International, Inc. | | | 520,161 | | |
| | | | 1,334,675 | | |
| | | | | Commercial Services: 0.3% | |
| | 12,525 | | | | | Pharmaceutical Product
Development, Inc. | | | 403,556 | | |
| | | | 403,556 | | |
| | | | | Diversified Financial Services: 0.2% | |
| | 5,600 | | | @@ | | Lazard., Ltd. | | | 265,104 | | |
| | | | 265,104 | | |
| | | | | Electric: 2.2% | |
| | 28,900 | | | @ | | NRG Energy, Inc. | | | 1,618,689 | | |
| | 18,800 | | | | | Public Service Enterprise
Group, Inc. | | | 1,247,944 | | |
| | | | 2,866,633 | | |
| | | | | | | Electrical Components &
Equipment: 0.5% | | | | | |
| | 14,000 | | | @ | | General Cable Corp. | | | 611,940 | | |
| | | | 611,940 | | |
| | | | | Electronics: 1.2% | |
| | 8,800 | | | | | Amphenol Corp. | | | 546,304 | | |
| | 1,300 | | | | | Applera Corp.-Applied
Biosystems Group | | | 47,697 | | |
| | 11,800 | | | @ | | FEI Co. | | | 311,166 | | |
| | 13,800 | | | @ | | Thermo Electron Corp. | | | 625,002 | | |
| | | | 1,530,169 | | |
| | | | | Engineering & Construction: 0.6% | |
| | 27,600 | | | @ | | KBR, Inc. | | | 722,016 | | |
| | | | 722,016 | | |
| | | | | Gas: 1.1% | |
| | 42,600 | | | | | Southern Union Co. | | | 1,190,670 | | |
| | 4,500 | | | | | WGL Holdings, Inc. | | | 146,610 | | |
| | | | 1,337,280 | | |
| | | | | Healthcare-Products: 0.8% | |
| | 6,750 | | | | | Beckman Coulter, Inc. | | | 403,650 | | |
| | 15,100 | | | @ | | Inverness Medical
Innovations, Inc. | | | 584,370 | | |
| | | | 988,020 | | |
| | | | | Mining: 1.2% | |
| | 10,300 | | | @@ | | Barrick Gold Corp. | | | 316,210 | | |
| | 21,900 | | | | | Freeport-McMoRan Copper &
Gold, Inc. | | | 1,220,487 | | |
| | | | 1,536,697 | | |
| | | | | Miscellaneous Manufacturing: 1.0% | |
| | 11,000 | | | | | Cooper Industries Ltd. | | | 994,730 | | |
| | 5,700 | | | | | ITT Corp. | | | 323,874 | | |
| | | | 1,318,604 | | |
| Shares | | | | | | Value | |
| | | | | Oil & Gas: 0.4% | |
| | 6,960 | | | | | Pogo Producing Co. | | $ | 337,142 | | |
| | 3,400 | | | | | Tesoro Petroleum Corp. | | | 223,618 | | |
| | | | 560,760 | | |
| | | | | Pharmaceuticals: 0.2% | |
| | 9,700 | | | | | Bristol-Myers Squibb Co. | | | 255,304 | | |
| | | | 255,304 | | |
| | | | | Pipelines: 1.3% | |
| | 10,000 | | | | | Kinder Morgan, Inc. | | | 1,057,500 | | |
| | 7,000 | | | | | Questar Corp. | | | 581,350 | | |
| | | | 1,638,850 | | |
| | | | | Real Estate: 0.5% | |
| | 11,200 | | | | | Forest City Enterprises, Inc. | | | 654,080 | | |
| | | | 654,080 | | |
| | | | | Real Estate Investment Trusts: 3.0% | |
| | 6,100 | | | | | Equity Office Properties Trust | | | 293,837 | | |
| | 27,700 | | | | | General Growth Properties, Inc. | | | 1,446,771 | | |
| | 7,200 | | | | | Host Hotels & Resorts, Inc. | | | 176,760 | | |
| | 11,200 | | | | | Liberty Property Trust | | | 550,368 | | |
| | 3,100 | | | | | Macerich Co. | | | 268,367 | | |
| | 12,500 | | | | | Mack-Cali Realty Corp. | | | 637,500 | | |
| | 3,000 | | | | | Saul Centers, Inc. | | | 165,570 | | |
| | 8,200 | | | | | Washington Real Estate
Investment Trust | | | 328,000 | | |
| | | | 3,867,173 | | |
Total Common Stock
(Cost $19,086,003) | | | 20,449,662 | | |
| PREFERRED STOCK: 1.1% | | | |
| | | | | Mining: 0.7% | |
| | 675 | | | | | Freeport-McMoRan Copper &
Gold, Inc. | | | 881,972 | | |
| | | | 881,972 | | |
| | | | | Savings & Loans: 0.4% | |
| | 10,000 | | | | | Sovereign Capital Trust | | | 497,500 | | |
| | | | 497,500 | | |
Total Preferred Stock
(Cost $1,278,756) | | | 1,379,472 | | |
Principal
Amount | | | | | | Value | |
| CONVERTIBLE BONDS: 6.9% | | | |
| | | | | Advertising: 2.3% | |
| $ | 2,400,000 | | | #,C | | Interpublic Group of Cos, Inc.,
4.250%, due 03/15/23 | | | 2,946,000 | | |
| | | | 2,946,000 | | |
| | | | | Aerospace/Defense: 1.9% | |
| | 2,500,000 | | | C | | EDO Corp., 4.000%,
due 11/15/25 | | | 2,418,750 | | |
| | | | 2,418,750 | | |
| | | | | Healthcare-Products: 0.3% | |
| | 500,000 | | | #,C | | EPIX Pharmaceuticals, Inc.,
3.000%, due 06/15/24 | | | 401,250 | | |
| | | | 401,250 | | |
See Accompanying Notes to Financial Statements
269
PORTFOLIO OF INVESTMENTS
ING PIONEER HIGH YIELD PORTFOLIO AS OF DECEMBER 31, 2006 (CONTINUED)
Principal
Amount | | | | | | Value | |
| | | | | Miscellaneous Manufacturing: 0.8% | |
| $ | 1,500,000 | | | C | | Roper Industries, Inc.,
1.481%, due 01/15/34 | | $ | 982,500 | | |
| | | | 982,500 | | |
| | | | | Pharmaceuticals: 0.9% | |
| | 1,170,000 | | | | | Mannkind Corp., 3.750%,
due 12/15/13 | | | 1,231,425 | | |
| | | | 1,231,425 | | |
| | | | | Semiconductors: 0.7% | |
| | 1,000,000 | | | C | | Veeco Instruments, Inc.,
4.125%, due 12/21/08 | | | 975,000 | | |
| | | | 975,000 | | |
Total Convertible Bonds
(Cost $8,569,970) | | | 8,954,925 | | |
| CORPORATE BONDS/NOTES: 72.6% | | | |
| | | | | Advertising: 0.3% | |
| | 350,000 | | | C | | Interpublic Group of Cos, Inc.,
7.250%, due 08/15/11 | | | 355,250 | | |
| | | | 355,250 | | |
| | | | | Aerospace/Defense: 6.0% | |
| | 3,900,000 | | | C | | DRS Technologies, Inc.,
6.875%, due 11/01/13 | | | 3,948,750 | | |
| | 3,750,000 | | | C | | Esterline Technologies Corp.,
7.750%, due 06/15/13 | | | 3,843,750 | | |
| | | | 7,792,500 | | |
| | | | | Biotechnology: 3.0% | |
| | 2,850,000 | | | C | | Bio-Rad Laboratories, Inc.,
6.125%, due 12/15/14 | | | 2,771,625 | | |
| | 1,000,000 | | | C | | Bio-Rad Laboratories, Inc.,
7.500%, due 08/15/13 | | | 1,035,000 | | |
| | | | 3,806,625 | | |
| | | | | Building Materials: 2.4% | |
| | 3,000,000 | | | C | | Texas Industries, Inc., 7.250%,
due 07/15/13 | | | 3,060,000 | | |
| | | | 3,060,000 | | |
| | | | | Chemicals: 5.6% | |
| | 3,000,000 | | | #,C | | Georgia Gulf Corp., 9.500%,
due 10/15/14 | | | 2,940,000 | | |
| | 550,000 | | | | | Millennium America, Inc.,
7.625%, due 11/15/26 | | | 504,625 | | |
| | 1,500,000 | | | @@,C | | Nova Chemicals Corp.,
6.500%, due 01/15/12 | | | 1,428,750 | | |
| | 1,175,000 | | | @@,C | | Nova Chemicals Corp.,
7.400%, due 04/01/09 | | | 1,195,563 | | |
| | 1,200,000 | | | @@,C | | Nova Chemicals, Ltd.,
7.875%, due 09/15/25 | | | 1,098,000 | | |
| | | | 7,166,938 | | |
| | | | | Coal: 0.5% | |
| | 750,000 | | | C | | Massey Energy Co., 6.875%,
due 12/15/13 | | | 708,750 | | |
| | | | 708,750 | | |
Principal
Amount | | | | | | Value | |
| | | | | Distribution/Wholesale: 3.5% | |
| $ | 4,405,000 | | | C | | Wesco Distribution, Inc.,
7.500%, due 10/15/17 | | $ | 4,449,050 | | |
| | | | 4,449,050 | | |
| | | | | Electric: 8.0% | |
| | 3,020,000 | | | #,C | | Allegheny Energy, Inc.,
8.250%, due 04/15/12 | | | 3,329,550 | | |
| | 2,000,000 | | | C | | CMS Energy Corp., 6.875%,
due 12/15/15 | | | 2,075,000 | | |
| | 750,000 | | | C | | CMS Energy Corp., 7.750%,
due 08/01/10 | | | 795,000 | | |
| | 3,000,000 | | | C | | NRG Energy, Inc., 7.250%,
due 02/01/14 | | | 3,030,000 | | |
| | 1,033,000 | | | C | | NRG Energy, Inc., 7.375%,
due 01/15/17 | | | 1,038,165 | | |
| | | | 10,267,715 | | |
| | | | | | | Electrical Components &
Equipment: 3.3% | | | | | |
| | 4,000,000 | | | C | | General Cable Corp., 9.500%,
due 11/15/10 | | | 4,260,000 | | |
| | | | 4,260,000 | | |
| | | | | Electronics: 3.0% | |
| | 3,750,000 | | | C | | Itron, Inc., 7.750%,
due 05/15/12 | | | 3,853,125 | | |
| | | | 3,853,125 | | |
| | | | | Forest Products & Paper: 2.7% | |
| | 1,000,000 | | | @@,C | | Bowater Canada Finance,
7.950%, due 11/15/11 | | | 985,000 | | |
| | 2,750,000 | | | C | | Bowater, Inc., 6.500%,
due 06/15/13 | | | 2,523,125 | | |
| | | | 3,508,125 | | |
| | | | | Healthcare-Products: 0.6% | |
| | 700,000 | | | C | | Inverness Medical Innovations,
Inc., 8.750%, due 02/15/12 | | | 731,500 | | |
| | | | 731,500 | | |
| | | | | Household Products/Wares: 2.0% | |
| | 2,450,000 | | | C | | Scotts Miracle-Gro Co.,
6.625%, due 11/15/13 | | | 2,578,625 | | |
| | | | 2,578,625 | | |
| | | | | Machinery-Diversified: 5.7% | |
| | 2,500,000 | | | C | | Gardner Denver, Inc., 8.000%,
due 05/01/13 | | | 2,612,500 | | |
| | 4,650,000 | | | C | | Manitowoc Co., 7.125%,
due 11/01/13 | | | 4,719,750 | | |
| | | | 7,332,250 | | |
| | | | | Metal Fabricate/Hardware: 1.8% | |
| | 2,500,000 | | | C | | Mueller Industries, Inc.,
6.000%, due 11/01/14 | | | 2,340,625 | | |
| | | | 2,340,625 | | |
| | | | | Mining: 1.1% | |
| | 1,500,000 | | | @@,#,C | | Novelis, Inc., 8.250%,
due 02/15/15 | | | 1,458,750 | | |
| | | | 1,458,750 | | |
See Accompanying Notes to Financial Statements
270
PORTFOLIO OF INVESTMENTS
ING PIONEER HIGH YIELD PORTFOLIO AS OF DECEMBER 31, 2006 (CONTINUED)
Principal
Amount | | | | | | Value | |
| | | | | Oil & Gas: 5.0% | |
| $ | 3,175,000 | | | C | | Frontier Oil Corp., 6.625%,
due 10/01/11 | | $ | 3,182,936 | | |
| | 250,000 | | | C | | Pogo Producing Co., 6.625%,
due 03/15/15 | | | 239,375 | | |
| | 515,000 | | | C | | Tesoro Corp., 6.250%,
due 11/01/12 | | | 515,000 | | |
| | 2,470,000 | | | C | | Tesoro Corp., 6.625%,
due 11/01/15 | | | 2,463,825 | | |
| | | | 6,401,136 | | |
| | | | | Pharmaceuticals: 0.3% | |
| | 425,000 | | | C | | Valeant Pharmaceuticals
International, 7.000%,
due 12/15/11 | | | 410,125 | | |
| | | | 410,125 | | |
| | | | | Pipelines: 1.9% | |
| | 2,500,000 | | | C | | Holly Energy Partners LP,
6.250%, due 03/01/15 | | | 2,387,500 | | |
| | | | 2,387,500 | | |
| | | | | Real Estate: 4.1% | |
| | 2,700,000 | | | C | | Forest City Enterprises, Inc.,
6.500%, due 02/01/17 | | | 2,659,500 | | |
| | 2,615,000 | | | C | | Forest City Enterprises, Inc.,
7.625%, due 06/01/15 | | | 2,680,375 | | |
| | | | 5,339,875 | | |
| | | | | Real Estate Investment Trusts: 5.5% | |
| | 1,550,000 | | | C | | BF Saul Reit, 7.500%,
due 03/01/14 | | | 1,582,938 | | |
| | 2,500,000 | | | C | | Host Marriott LP, 6.750%,
due 06/01/16 | | | 2,515,625 | | |
| | 3,000,000 | | | #,C | | Rouse Co. LP, 6.750%,
due 05/01/13 | | | 3,027,756 | | |
| | | | 7,126,319 | | |
| | | | | Retail: 1.2% | |
| | 1,000,000 | | | C | | Brown Shoe Co., Inc., 8.750%,
due 05/01/12 | | | 1,060,000 | | |
| | 500,000 | | | C | | Sonic Automotive, Inc.,
8.625%, due 08/15/13 | | | 517,500 | | |
| | | | 1,577,500 | | |
| | | | | Telecommunications: 3.1% | |
| | 3,000,000 | | | C | | Anixter International, Inc.,
5.950%, due 03/01/15 | | | 2,790,000 | | |
| | 1,000,000 | | | | | Corning, Inc., 8.875%,
due 08/15/21 | | | 1,228,786 | | |
| | | | 4,018,786 | | |
| | | | | Trucking & Leasing: 2.0% | |
| | 2,500,000 | | | C | | Greenbrier Cos., Inc., 8.375%,
due 05/15/15 | | | 2,556,250 | | |
| | | | 2,556,250 | | |
Total Corporate Bonds/Notes
(Cost $92,747,355) | | | 93,487,319 | | |
Total Long-Term Investments
(Cost $121,682,084) | | | 124,271,378 | | |
Principal
Amount | | | | Value | |
| SHORT-TERM INVESTMENTS: 1.8% | |
| | | U.S. Government Agency Obligations: 1.8% | |
| $ | 2,239,000 | | | Federal Home Loan Bank, 4.600%,
due 01/02/07 | | $ | 2,238,428 | | |
Total Short-Term Investments
(Cost $2,238,428) | | | | | 2,238,428 | | |
Total Investments in
Securities (Cost
$123,920,512)* | | | 98.3 | % | | $ | 126,509,806 | | |
Other Assets and
Liabilities-Net | | | 1.7 | | | | 2,238,146 | | |
| Net Assets | | | 100.0 | % | | $ | 128,747,952 | | |
@ Non-income producing security
@@ Foreign Issuer
# Securities with purchases pursuant to Rule 144A, under the Securities Act of 1933 and may not be resold subject to that rule except to qualified institutional buyers. These securities have been determined to be liquid under the guidelines established by the Funds' Board of Directors/Trustees.
C Bond may be called prior to maturity date.
* Cost for federal income tax purposes is $123,941,486.
Net unrealized appreciation consists of:
| Gross Unrealized Appreciation | | $ | 3,142,495 | | |
| Gross Unrealized Depreciation | | | (574,175 | ) | |
| Net Unrealized Appreciation | | $ | 2,568,320 | | |
See Accompanying Notes to Financial Statements
271
ING T. ROWE PRICE PORTFOLIO OF INVESTMENTS
DIVERSIFIED MID CAP PORTFOLIO AS OF DECEMBER 31, 2006
| Shares | | | | | | Value | |
| COMMON STOCK: 99.8% | | | |
| | | | | Advertising: 3.0% | |
| | 248,200 | | | @,L | | Clear Channel Outdoor
Holdings, Inc. | | $ | 6,927,262 | | |
| | 49,400 | | | @,L | | Getty Images, Inc. | | | 2,115,308 | | |
| | 86,400 | | | | | Harte-Hanks, Inc. | | | 2,394,144 | | |
| | 125,500 | | | @,L | | Lamar Advertising Co. | | | 8,206,445 | | |
| | 74,500 | | | | | Omnicom Group | | | 7,788,230 | | |
| | 96,300 | | | @@,L | | WPP Group PLC | | | 6,523,362 | | |
| | | | 33,954,751 | | |
| | | | | Aerospace/Defense: 1.3% | |
| | 99,000 | | | @@,L | | Empresa Brasileira de
Aeronautica SA | | | 4,099,590 | | |
| | 170,000 | | | | | Rockwell Collins, Inc. | | | 10,759,300 | | |
| | | | 14,858,890 | | |
| | | | | Airlines: 1.1% | |
| | 248,900 | | | | | Skywest, Inc. | | | 6,349,439 | | |
| | 421,400 | | | | | Southwest Airlines Co. | | | 6,455,848 | | |
| | | | 12,805,287 | | |
| | | | | Apparel: 0.8% | |
| | 207,900 | | | @ | | Coach, Inc. | | | 8,931,384 | | |
| | | | 8,931,384 | | |
| | | | | Banks: 3.3% | |
| | 31,800 | | | | | City National Corp. | | | 2,264,160 | | |
| | 60,500 | | | | | East-West Bancorp., Inc. | | | 2,142,910 | | |
| | 53,100 | | | | | First Horizon National Corp. | | | 2,218,518 | | |
| | 151,600 | | | L | | Investors Financial
Services Corp. | | | 6,468,772 | | |
| | 171,600 | | | | | Northern Trust Corp. | | | 10,414,404 | | |
| | 89,600 | | | | | State Street Corp. | | | 6,042,624 | | |
| | 52,400 | | | @,L | | SVB Financial Group | | | 2,442,888 | | |
| | 104,300 | | | | | Synovus Financial Corp. | | | 3,215,569 | | |
| | 104,400 | | | | | UCBH Holdings, Inc. | | | 1,833,264 | | |
| | | | 37,043,109 | | |
| | | | | Biotechnology: 3.7% | |
| | 191,600 | | | @,L | | Celgene Corp. | | | 11,022,748 | | |
| | 56,500 | | | @,L | | Charles River Laboratories
International, Inc. | | | 2,443,625 | | |
| | 301,300 | | | @,@@,L | | deCODE genetics, Inc. | | | 1,364,889 | | |
| | 40,300 | | | @ | | Genzyme Corp. | | | 2,481,674 | | |
| | 55,600 | | | @,L | | Integra LifeSciences
Holdings Corp. | | | 2,368,004 | | |
| | 37,800 | | | @,L | | Invitrogen Corp. | | | 2,139,102 | | |
| | 55,100 | | | @,L | | Martek Biosciences Corp. | | | 1,286,034 | | |
| | 81,200 | | | @,L | | Medimmune, Inc. | | | 2,628,444 | | |
| | 216,400 | | | @,L | | Millennium
Pharmaceuticals, Inc. | | | 2,358,760 | | |
| | 31,200 | | | @,L | | Millipore Corp. | | | 2,077,920 | | |
| | 119,500 | | | @,L | | Nektar Therapeutics | | | 1,817,595 | | |
| | 86,400 | | | @,L | | PDL BioPharma, Inc. | | | 1,740,096 | | |
| | 254,100 | | | @,@@,L | | Qiagen NV | | | 3,844,533 | | |
| | 99,000 | | | @,L | | Vertex Pharmaceuticals, Inc. | | | 3,704,580 | | |
| | | | 41,278,004 | | |
| | | | | Chemicals: 1.1% | |
| | 125,000 | | | | | Ecolab, Inc. | | | 5,650,000 | | |
| | 27,200 | | | | | Sigma-Aldrich Corp. | | | 2,113,984 | | |
| | 84,600 | | | @,L | | Symyx Technologies | | | 1,826,514 | | |
| | 107,100 | | | | | Valspar Corp. | | | 2,960,244 | | |
| | | | 12,550,742 | | |
| Shares | | | | | | Value | |
| | | | | Coal: 0.4% | |
| | 61,400 | | | | | Consol Energy, Inc. | | $ | 1,972,782 | | |
| | 91,000 | | | | | Foundation Coal
Holdings, Inc. | | | 2,890,160 | | |
| | | | 4,862,942 | | |
| | | | | Commercial Services: 4.9% | |
| | 36,300 | | | @,L | | Apollo Group, Inc. | | | 1,414,611 | | |
| | 63,700 | | | @ | | ChoicePoint, Inc. | | | 2,508,506 | | |
| | 72,000 | | | | | Corporate Executive
Board Co. | | | 6,314,400 | | |
| | 74,500 | | | | | DeVry, Inc. | | | 2,086,000 | | |
| | 76,600 | | | L | | Equifax, Inc. | | | 3,109,960 | | |
| | 89,700 | | | L | | H&R Block, Inc. | | | 2,066,688 | | |
| | 135,200 | | | @,L | | Iron Mountain, Inc. | | | 5,589,168 | | |
| | 45,700 | | | @ | | ITT Educational Services, Inc. | | | 3,033,109 | | |
| | 115,000 | | | @ | | LECG Corp. | | | 2,125,200 | | |
| | 39,300 | | | | | Manpower, Inc. | | | 2,944,749 | | |
| | 141,200 | | | @ | | Monster Worldwide, Inc. | | | 6,585,568 | | |
| | 74,900 | | | | | Moody's Corp. | | | 5,172,594 | | |
| | 78,900 | | | @@,L | | Ritchie Bros Auctioneers, Inc. | | | 4,224,306 | | |
| | 152,800 | | | | | Robert Half
International, Inc. | | | 5,671,936 | | |
| | 86,900 | | | @,L | | Universal Technical
Institute, Inc. | | | 1,930,049 | | |
| | | | 54,776,844 | | |
| | | | | Computers: 1.7% | |
| | 129,700 | | | @,L | | Cadence Design Systems, Inc. | | | 2,322,927 | | |
| | 95,000 | | | @ | | Cognizant Technology
Solutions Corp. | | | 7,330,200 | | |
| | 33,200 | | | @,L | | DST Systems, Inc. | | | 2,079,316 | | |
| | 58,000 | | | | | Factset Research Systems, Inc. | | | 3,275,840 | | |
| | 98,100 | | | | | Jack Henry & Associates, Inc. | | | 2,099,340 | | |
| | 88,800 | | | @ | | Synopsys, Inc. | | | 2,373,624 | | |
| | | | 19,481,247 | | |
| | | | | Cosmetics/Personal Care: 0.6% | |
| | 210,100 | | | | | Avon Products, Inc. | | | 6,941,704 | | |
| | | | 6,941,704 | | |
| | | | | Distribution/Wholesale: 0.9% | |
| | 38,000 | | | L | | CDW Corp. | | | 2,672,160 | | |
| | 72,000 | | | L | | Fastenal Co. | | | 2,583,360 | | |
| | 75,000 | | | L | | WW Grainger, Inc. | | | 5,245,500 | | |
| | | | 10,501,020 | | |
| | | | | Diversified Financial Services: 6.4% | |
| | 20,300 | | | @,L | | Affiliated Managers
Group, Inc. | | | 2,134,139 | | |
| | 35,100 | | | | | Blackrock, Inc. | | | 5,331,690 | | |
| | 74,000 | | | @ | | Cbot Holdings, Inc. | | | 11,208,780 | | |
| | 107,500 | | | | | Charles Schwab Corp. | | | 2,079,050 | | |
| | 19,000 | | | | | Chicago Mercantile Exchange
Holdings, Inc. | | | 9,685,250 | | |
| | 220,000 | | | @ | | E*Trade Financial Corp. | | | 4,932,400 | | |
| | 135,500 | | | L | | Eaton Vance Corp. | | | 4,472,855 | | |
| | 66,000 | | | | | Federated Investors, Inc. | | | 2,229,480 | | |
| | 85,200 | | | @,L | | IntercontinentalExchange, Inc. | | | 9,193,080 | | |
| | 47,300 | | | L | | International Securities
Exchange, Inc. | | | 2,213,167 | | |
| | 100,100 | | | L | | Janus Capital Group, Inc. | | | 2,161,159 | | |
| | 80,600 | | | @@,L | | Lazard Ltd. | | | 3,815,604 | | |
| | 26,000 | | | L | | Legg Mason, Inc. | | | 2,471,300 | | |
| | 88,000 | | | | | Nuveen Investments, Inc. | | | 4,565,440 | | |
| | 17,800 | | | @,L | | Nymex Holdings, Inc. | | | 2,207,378 | | |
See Accompanying Notes to Financial Statements
272
ING T. ROWE PRICE PORTFOLIO OF INVESTMENTS
DIVERSIFIED MID CAP PORTFOLIO AS OF DECEMBER 31, 2006 (CONTINUED)
| Shares | | | | | | Value | |
| | | | | Diversified Financial
Services (continued) | |
| | 70,000 | | | | | OptionsXpress Holdings, Inc. | | $ | 1,588,300 | | |
| | 129,400 | | | @,L | | TD Ameritrade Holding Corp. | | | 2,093,692 | | |
| | | | 72,382,764 | | |
| | | | | Electric: 0.8% | |
| | 395,000 | | | @ | | AES Corp. | | | 8,705,800 | | |
| | 2,201 | | | @ | | Dynegy, Inc. | | | 15,935 | | |
| | | | 8,721,735 | | |
| | | | | Electrical Components &
Equipment: 0.4% | |
| | 148,050 | | | L | | Ametek, Inc. | | | 4,713,912 | | |
| | | | 4,713,912 | | |
| | | | | Electronics: 2.5% | |
| | 176,500 | | | @,L | | Cogent, Inc. | | | 1,943,265 | | |
| | 44,700 | | | @,L | | Cymer, Inc. | | | 1,964,565 | | |
| | 73,700 | | | @ | | Dolby Laboratories, Inc. | | | 2,286,174 | | |
| | 64,500 | | | @,L | | Flir Systems, Inc. | | | 2,053,035 | | |
| | 27,200 | | | @@,L | | Garmin Ltd. | | | 1,513,952 | | |
| | 138,000 | | | | | Gentex Corp. | | | 2,147,280 | | |
| | 93,000 | | | @ | | II-VI, Inc. | | | 2,598,420 | | |
| | 182,400 | | | | | Jabil Circuit, Inc. | | | 4,477,920 | | |
| | 86,300 | | | | | National Instruments Corp. | | | 2,350,812 | | |
| | 50,000 | | | @ | | Thermo Electron Corp. | | | 2,264,500 | | |
| | 89,000 | | | @ | | Waters Corp. | | | 4,358,330 | | |
| | | | 27,958,253 | | |
| | | | | Engineering & Construction: 0.8% | |
| | 75,600 | | | | | Fluor Corp. | | | 6,172,740 | | |
| | 49,100 | | | @ | | Foster Wheeler, Ltd. | | | 2,707,374 | | |
| | | | 8,880,114 | | |
| | | | | Entertainment: 1.4% | |
| | 68,200 | | | @,L | | DreamWorks Animation
SKG, Inc. | | | 2,011,218 | | |
| | 203,000 | | | L | | International Game
Technology | | | 9,378,600 | | |
| | 144,750 | | | @,L | | Shuffle Master, Inc. | | | 3,792,450 | | |
| | | | 15,182,268 | | |
| | | | | Environmental Control: 0.4% | |
| | 53,200 | | | @,L | | Stericycle, Inc. | | | 4,016,600 | | |
| | | | 4,016,600 | | |
| | | | | Food: 1.2% | |
| | 109,000 | | | L | | Hershey Co. | | | 5,428,200 | | |
| | 53,400 | | | | | McCormick & Co., Inc. | | | 2,059,104 | | |
| | 125,750 | | | | | WM Wrigley Jr. Co. | | | 6,503,790 | | |
| | | | 13,991,094 | | |
| | | | | Healthcare - Products: 5.3% | |
| | 121,800 | | | @,L | | American Medical Systems
Holdings, Inc. | | | 2,255,736 | | |
| | 48,400 | | | @,L | | Arthrocare Corp. | | | 1,932,128 | | |
| | 29,000 | | | | | Becton Dickinson & Co. | | | 2,034,350 | | |
| | 51,900 | | | | | CR Bard, Inc. | | | 4,306,143 | | |
| | 52,600 | | | | | Dade Behring Holdings, Inc. | | | 2,094,006 | | |
| | 68,100 | | | | | Dentsply International, Inc. | | | 2,032,785 | | |
| | 38,200 | | | @ | | Edwards Lifesciences Corp. | | | 1,796,928 | | |
| | 40,100 | | | @ | | Gen-Probe, Inc. | | | 2,100,037 | | |
| | 76,400 | | | @ | | Henry Schein, Inc. | | | 3,742,072 | | |
| | 43,000 | | | @,L | | Hologic, Inc. | | | 2,033,040 | | |
| Shares | | | | | | Value | |
| | 62,300 | | | @,L | | Kyphon, Inc. | | $ | 2,516,920 | | |
| | 53,900 | | | @,L | | Patterson Cos., Inc. | | | 1,913,989 | | |
| | 86,800 | | | @,L | | Resmed, Inc. | | | 4,272,296 | | |
| | 81,900 | | | @ | | Respironics, Inc. | | | 3,091,725 | | |
| | 207,000 | | | @ | | St. Jude Medical, Inc. | | | 7,567,920 | | |
| | 87,000 | | | @ | | Techne Corp. | | | 4,824,150 | | |
| | 93,900 | | | @ | | Varian Medical Systems, Inc. | | | 4,466,823 | | |
| | 40,200 | | | @ | | Ventana Medical Systems | | | 1,729,806 | | |
| | 56,000 | | | @,L | | Zimmer Holdings, Inc. | | | 4,389,280 | | |
| | | | 59,100,134 | | |
| | | | | Healthcare - Services: 3.4% | |
| | 104,450 | | | @ | | Coventry Health Care, Inc. | | | 5,227,723 | | |
| | 63,000 | | | @ | | DaVita, Inc. | | | 3,583,440 | | |
| | 94,600 | | | L | | Health Management
Associates, Inc. | | | 1,997,006 | | |
| | 72,000 | | | @ | | Health Net, Inc. | | | 3,503,520 | | |
| | 67,400 | | | @,L | | Healthways, Inc. | | | 3,215,654 | | |
| | 78,700 | | | @ | | Humana, Inc. | | | 4,352,897 | | |
| | 44,900 | | | @,L | | Laboratory Corp. of
America Holdings | | | 3,298,803 | | |
| | 52,200 | | | @ | | LifePoint Hospitals, Inc. | | | 1,759,140 | | |
| | 94,700 | | | @ | | Lincare Holdings, Inc. | | | 3,772,848 | | |
| | 95,100 | | | L | | Manor Care, Inc. | | | 4,462,092 | | |
| | 66,000 | | | | | Quest Diagnostics | | | 3,498,000 | | |
| | | | 38,671,123 | | |
| | | | | Home Builders: 1.6% | |
| | 45,900 | | | L | | Centex Corp. | | | 2,582,793 | | |
| | 41,000 | | | L | | KB Home | | | 2,102,480 | | |
| | 59,000 | | | L | | Lennar Corp. | | | 3,095,140 | | |
| | 37,000 | | | @,L | | Meritage Homes Corp. | | | 1,765,640 | | |
| | 68,200 | | | | | Pulte Homes, Inc. | | | 2,258,784 | | |
| | 47,400 | | | L | | Thor Industries, Inc. | | | 2,085,126 | | |
| | 54,600 | | | @,L | | Toll Brothers, Inc. | | | 1,759,758 | | |
| | 65,600 | | | L | | Winnebago Industries | | | 2,158,896 | | |
| | | | 17,808,617 | | |
| | | | | Home Furnishings: 0.2% | |
| | 22,000 | | | L | | Harman International
Industries, Inc. | | | 2,198,020 | | |
| | | | 2,198,020 | | |
| | | | | Household Products/Wares: 0.4% | |
| | 30,800 | | | | | Avery Dennison Corp. | | | 2,092,244 | | |
| | 31,500 | | | | | Clorox Co. | | | 2,020,725 | | |
| | | | 4,112,969 | | |
| | | | | Insurance: 2.6% | |
| | 24,900 | | | | | AMBAC Financial Group, Inc. | | | 2,217,843 | | |
| | 47,400 | | | @,@@ | | Arch Capital Group Ltd. | | | 3,204,714 | | |
| | 75,700 | | | @@ | | Axis Capital Holdings Ltd. | | | 2,526,109 | | |
| | 88,400 | | | L | | Brown & Brown, Inc. | | | 2,493,764 | | |
| | 32,300 | | | | | Cigna Corp. | | | 4,249,711 | | |
| | 6,800 | | | @ | | Markel Corp. | | | 3,264,680 | | |
| | 74,700 | | | L | | Marsh & McLennan Cos., Inc. | | | 2,290,302 | | |
| | 29,000 | | | L | | MBIA, Inc. | | | 2,118,740 | | |
| | 91,200 | | | @ | | Onebeacon Insurance
Group, Ltd. | | | 2,553,600 | | |
| | 40,500 | | | @@ | | RenaissanceRe Holdings Ltd. | | | 2,430,000 | | |
| | 55,700 | | | @@ | | Willis Group Holdings Ltd. | | | 2,211,847 | | |
| | | | 29,561,310 | | |
See Accompanying Notes to Financial Statements
273
ING T. ROWE PRICE PORTFOLIO OF INVESTMENTS
DIVERSIFIED MID CAP PORTFOLIO AS OF DECEMBER 31, 2006 (CONTINUED)
| Shares | | | | | | Value | |
| | | | | Internet: 2.6% | |
| | 78,100 | | | @,L | | Amazon.com, Inc. | | $ | 3,081,826 | | |
| | 36,200 | | | @,@@,L | | Baidu.com ADR | | | 4,080,464 | | |
| | 101,400 | | | @,@@,L | | Check Point Software
Technologies | | | 2,222,688 | | |
| | 85,500 | | | @,L | | Checkfree Corp. | | | 3,433,680 | | |
| | 55,600 | | | @,L | | Digital River, Inc. | | | 3,101,924 | | |
| | 31,900 | | | @ | | F5 Networks, Inc. | | | 2,367,299 | | |
| | 115,000 | | | @ | | McAfee, Inc. | | | 3,263,700 | | |
| | 78,800 | | | @,@@,L | | Sina Corp. | | | 2,261,560 | | |
| | 142,100 | | | @,L | | VeriSign, Inc. | | | 3,417,505 | | |
| | 89,600 | | | @ | | Websense, Inc. | | | 2,045,568 | | |
| | | | 29,276,214 | | |
| | | | | Leisure Time: 1.5% | |
| | 49,900 | | | | | Brunswick Corp. | | | 1,591,810 | | |
| | 145,700 | | | | | Harley-Davidson, Inc. | | | 10,267,479 | | |
| | 60,500 | | | L | | Royal Caribbean Cruises Ltd. | | | 2,503,490 | | |
| | 72,900 | | | @,L | | WMS Industries, Inc. | | | 2,541,294 | | |
| | | | 16,904,073 | | |
| | | | | Lodging: 3.6% | |
| | 46,000 | | | L | | Boyd Gaming Corp. | | | 2,084,260 | | |
| | 110,000 | | | | | Choice Hotels
International, Inc. | | | 4,631,000 | | |
| | 261,200 | | | L | | Hilton Hotels Corp. | | | 9,115,880 | | |
| | 187,800 | | | | | Marriott International, Inc. | | | 8,961,816 | | |
| | 24,000 | | | @@,L | | Melco Pbl Entertainment ADR | | | 510,240 | | |
| | 102,000 | | | | | Starwood Hotels & Resorts
Worldwide, Inc. | | | 6,375,000 | | |
| | 31,000 | | | L | | Station Casinos, Inc. | | | 2,531,770 | | |
| | 70,000 | | | @,L | | Wynn Resorts Ltd. | | | 6,569,500 | | |
| | | | 40,779,466 | | |
| | | | | Machinery-Construction &
Mining: 0.4% | |
| | 82,500 | | | | | Joy Global, Inc. | | | 3,988,050 | | |
| | | | 3,988,050 | | |
| | | | | Machinery-Diversified: 0.8% | |
| | 125,700 | | | | | Graco, Inc. | | | 4,980,234 | | |
| | 37,400 | | | | | IDEX Corp. | | | 1,773,134 | | |
| | 62,000 | | | @,L | | Zebra Technologies Corp. | | | 2,156,980 | | |
| | | | 8,910,348 | | |
| | | | | Media: 1.2% | |
| | 155,300 | | | | | Citadel Broadcasting Corp. | | | 1,546,788 | | |
| | 46,800 | | | | | EW Scripps Co. | | | 2,337,192 | | |
| | 35,000 | | | | | McGraw-Hill Cos., Inc. | | | 2,380,700 | | |
| | 39,400 | | | L | | Meredith Corp. | | | 2,220,190 | | |
| | 59,000 | | | @@ | | Rogers Communications, Inc. | | | 3,516,400 | | |
| | 170,500 | | | @ | | Salem Communications Corp. | | | 2,037,475 | | |
| | | | 14,038,745 | | |
| | | | | Metal Fabricate/Hardware: 0.8% | |
| | 121,400 | | | | | Precision Castparts Corp. | | | 9,503,192 | | |
| | | | 9,503,192 | | |
| | | | | Miscellaneous Manufacturing: 0.7% | |
| | 44,100 | | | | | ITT Corp. | | | 2,505,762 | | |
| | 62,800 | | | | | Pall Corp. | | | 2,169,740 | | |
| | 66,500 | | | | | Roper Industries, Inc. | | | 3,340,960 | | |
| | | | 8,016,462 | | |
| Shares | | | | | | Value | |
| | | | | Office Furnishings: 0.2% | |
| | 48,400 | | | | | HNI, Corp. | | $ | 2,149,444 | | |
| | | | 2,149,444 | | |
| | | | | Oil & Gas: 1.9% | |
| | 75,600 | | | @,L | | Bill Barrett Corp. | | | 2,057,076 | | |
| | 200,400 | | | @,@@,L | | Compton Petroleum Corp. | | | 1,827,648 | | |
| | 30,000 | | | L | | Diamond Offshore Drilling | | | 2,398,200 | | |
| | 124,000 | | | @,L | | Mariner Energy, Inc. | | | 2,430,400 | | |
| | 93,000 | | | | | Murphy Oil Corp. | | | 4,729,050 | | |
| | 90,000 | | | @,@@,L | | Nabors Industries Ltd. | | | 2,680,200 | | |
| | 42,000 | | | @,L | | Ultra Petroleum Corp. | | | 2,005,500 | | |
| | 74,200 | | | | | XTO Energy, Inc. | | | 3,491,110 | | |
| | | | 21,619,184 | | |
| | | | | Oil & Gas Services: 3.1% | |
| | 69,900 | | | | | BJ Services Co. | | | 2,049,468 | | |
| | 170,600 | | | @ | | Cameron International Corp. | | | 9,050,330 | | |
| | 36,900 | | | @,@@,L | | Core Laboratories NV | | | 2,988,900 | | |
| | 189,300 | | | @ | | Grant Prideco, Inc. | | | 7,528,461 | | |
| | 201,100 | | | | | Smith International, Inc. | | | 8,259,177 | | |
| | 24,900 | | | @ | | Tetra Technologies, Inc. | | | 636,942 | | |
| | 113,400 | | | @ | | Weatherford
International Ltd. | | | 4,738,986 | | |
| | | | 35,252,264 | | |
| | | | | Packaging & Containers: 0.2% | |
| | 32,100 | | | | | Sealed Air Corp. | | | 2,083,932 | | |
| | | | 2,083,932 | | |
| | | | | Pharmaceuticals: 3.8% | |
| | 94,300 | | | @,L | | Alkermes, Inc. | | | 1,260,791 | | |
| | 73,232 | | | L | | Allergan, Inc. | | | 8,768,800 | | |
| | 53,800 | | | @,L | | Amylin Pharmaceuticals, Inc. | | | 1,940,566 | | |
| | 141,300 | | | @,L | | Atherogenics, Inc. | | | 1,400,283 | | |
| | 53,900 | | | @,L | | Cephalon, Inc. | | | 3,795,099 | | |
| | 92,800 | | | @ | | Express Scripts, Inc. | | | 6,644,480 | | |
| | 145,400 | | | @ | | Medco Health Solutions, Inc. | | | 7,770,176 | | |
| | 102,500 | | | @,L | | Neurocrine Biosciences, Inc. | | | 1,068,050 | | |
| | 38,700 | | | L | | Omnicare, Inc. | | | 1,494,981 | | |
| | 61,300 | | | @,L | | OSI Pharmaceuticals, Inc. | | | 2,144,274 | | |
| | 67,300 | | | @,L | | Sepracor, Inc. | | | 4,144,334 | | |
| | 90,300 | | | @ | | Theravance, Inc. | | | 2,789,367 | | |
| | | | 43,221,201 | | |
| | | | | Pipelines: 0.6% | |
| | 236,000 | | | L | | Williams Cos., Inc. | | | 6,164,320 | | |
| | | | 6,164,320 | | |
| | | | | Retail: 5.4% | |
| | 43,000 | | | L | | Advance Auto Parts, Inc. | | | 1,529,080 | | |
| | 187,000 | | | @ | | Bed Bath & Beyond, Inc. | | | 7,124,700 | | |
| | 71,900 | | | @,L | | Cheesecake Factory | | | 1,768,740 | | |
| | 60,000 | | | @,L | | Dick's Sporting Goods, Inc. | | | 2,939,400 | | |
| | 135,500 | | | | | Dollar General Corp. | | | 2,176,130 | | |
| | 119,400 | | | | | Family Dollar Stores, Inc. | | | 3,502,002 | | |
| | 138,000 | | | L | | Fred's, Inc. | | | 1,661,520 | | |
| | 56,200 | | | L | | Men's Wearhouse, Inc. | | | 2,150,212 | | |
| | 97,600 | | | @,L | | O'Reilly Automotive, Inc. | | | 3,129,056 | | |
| | 39,400 | | | @,L | | Panera Bread Co. | | | 2,202,854 | | |
| | 109,000 | | | | | Petsmart, Inc. | | | 3,145,740 | | |
| | 90,000 | | | L | | Ross Stores, Inc. | | | 2,637,000 | | |
| | 137,955 | | | | | Staples, Inc. | | | 3,683,399 | | |
| | 158,000 | | | L | | Tiffany & Co. | | | 6,199,920 | | |
| | 75,550 | | | @@ | | Tim Hortons, Inc. | | | 2,187,928 | | |
See Accompanying Notes to Financial Statements
274
ING T. ROWE PRICE PORTFOLIO OF INVESTMENTS
DIVERSIFIED MID CAP PORTFOLIO AS OF DECEMBER 31, 2006 (CONTINUED)
| Shares | | | | | | Value | |
| | | | | Retail (continued) | |
| | 258,000 | | | | | TJX Cos., Inc. | | $ | 7,358,160 | | |
| | 50,600 | | | @,L | | Tractor Supply Co. | | | 2,262,326 | | |
| | 100,000 | | | @,L | | Urban Outfitters, Inc. | | | 2,303,000 | | |
| | 103,000 | | | L | | Williams-Sonoma, Inc. | | | 3,238,320 | | |
| | | | 61,199,487 | | |
| | | | | Semiconductors: 8.5% | |
| | 447,500 | | | @ | | Altera Corp. | | | 8,806,800 | | |
| | 207,000 | | | | | Analog Devices, Inc. | | | 6,804,090 | | |
| | 156,850 | | | @,L | | Broadcom Corp. | | | 5,067,824 | | |
| | 121,400 | | | @,L | | Fairchild Semiconductor
International, Inc. | | | 2,040,734 | | |
| | 201,500 | | | @ | | Integrated Device
Technology, Inc. | | | 3,119,220 | | |
| | 99,800 | | | L | | Intersil Corp. | | | 2,387,216 | | |
| | 41,800 | | | L | | KLA-Tencor Corp. | | | 2,079,550 | | |
| | 52,200 | | | @,L | | Lam Research Corp. | | | 2,642,364 | | |
| | 310,300 | | | L | | Linear Technology Corp. | | | 9,408,295 | | |
| | 294,800 | | | @,@@,L | | Marvell Technology
Group Ltd. | | | 5,657,212 | | |
| | 266,000 | | | | | Maxim Integrated Products | | | 8,144,920 | | |
| | 109,000 | | | @ | | MEMC Electronic
Materials, Inc. | | | 4,266,260 | | |
| | 279,000 | | | | | Microchip Technology, Inc. | | | 9,123,300 | | |
| | 283,000 | | | L | | National Semiconductor
Corp. | | | 6,424,100 | | |
| | 112,000 | | | @ | | QLogic Corp. | | | 2,455,040 | | |
| | 111,400 | | | @ | | Semtech Corp. | | | 1,455,998 | | |
| | 129,000 | | | @,L | | Silicon Laboratories, Inc. | | | 4,469,850 | | |
| | 162,000 | | | @,L | | Teradyne, Inc. | | | 2,423,520 | | |
| | 370,000 | | | L | | Xilinx, Inc. | | | 8,809,700 | | |
| | | | 95,585,993 | | |
| | | | | Software: 8.3% | |
| | 199,180 | | | @,L | | Activision, Inc. | | | 3,433,863 | | |
| | 82,700 | | | @ | | Adobe Systems, Inc. | | | 3,400,624 | | |
| | 93,100 | | | @ | | American Reprographics Co. | | | 3,101,161 | | |
| | 231,800 | | | @ | | Autodesk, Inc. | | | 9,378,628 | | |
| | 50,100 | | | @,L | | Avid Technology, Inc. | | | 1,866,726 | | |
| | 92,100 | | | @ | | Citrix Systems, Inc. | | | 2,491,305 | | |
| | 57,000 | | | @,@@ | | Cognos, Inc. | | | 2,420,220 | | |
| | 37,500 | | | @ | | Dun & Bradstreet Corp. | | | 3,104,625 | | |
| | 148,900 | | | @,L | | Electronic Arts, Inc. | | | 7,498,604 | | |
| | 52,500 | | | L | | Fair Isaac Corp. | | | 2,134,125 | | |
| | 51,800 | | | | | Fidelity National Information
Services, Inc. | | | 2,076,662 | | |
| | 46,800 | | | @ | | Fiserv, Inc. | | | 2,453,256 | | |
| | 61,700 | | | | | Global Payments, Inc. | | | 2,856,710 | | |
| | 55,350 | | | @ | | Hyperion Solutions Corp. | | | 1,989,279 | | |
| | 195,300 | | | @,L | | Intuit, Inc. | | | 5,958,603 | | |
| | 198,000 | | | | | MoneyGram
International, Inc. | | | 6,209,280 | | |
| | 186,600 | | | @,L | | Navteq Corp. | | | 6,525,402 | | |
| | 223,900 | | | | | Paychex, Inc. | | | 8,853,006 | | |
| | 229,700 | | | @,L | | Red Hat, Inc. | | | 5,283,100 | | |
| | 84,000 | | | @,L | | Salesforce.com, Inc. | | | 3,061,800 | | |
| | 160,000 | | | @@,L | | Satyam Computer Services
Ltd. ADR | | | 3,841,600 | | |
| | 34,700 | | | | | SEI Investments Co. | | | 2,066,732 | | |
| | 98,400 | | | @,L | | THQ, Inc. | | | 3,199,968 | | |
| | | | 93,205,279 | | |
| Shares | | | | | | Value | |
| | | | | Telecommunications: 3.6% | |
| | 282,700 | | | @,L | | American Tower Corp. | | $ | 10,539,056 | | |
| | 302,300 | | | @,L | | Crown Castle International
Corp. | | | 9,764,290 | | |
| | 122,000 | | | @,L | | Juniper Networks, Inc. | | | 2,310,680 | | |
| | 64,100 | | | @,L | | NeuStar, Inc. | | | 2,079,404 | | |
| | 85,000 | | | @,L | | NII Holdings, Inc. | | | 5,477,400 | | |
| | 313,150 | | | @,L | | SBA Communications Corp. | | | 8,611,625 | | |
| | 78,600 | | | @,L | | Time Warner Telecom, Inc. | | | 1,566,498 | | |
| | | | 40,348,953 | | |
| | | | | Textiles: 0.4% | |
| | 98,600 | | | | | Cintas Corp. | | | 3,915,406 | | |
| | | | 3,915,406 | | |
| | | | | Transportation: 2.0% | |
| | 109,700 | | | | | CH Robinson Worldwide, Inc. | | | 4,485,633 | | |
| | 141,000 | | | L | | Expeditors International
Washington, Inc. | | | 5,710,500 | | |
| | 128,100 | | | | | Landstar System, Inc. | | | 4,890,858 | | |
| | 253,000 | | | @@ | | UTI Worldwide, Inc. | | | 7,564,700 | | |
| | | | 22,651,691 | | |
Total Common Stock
(Cost $979,099,693) | | | 1,124,098,541 | | |
Principal
Amount | | | | Value | |
| SHORT-TERM INVESTMENTS: 27.5% | |
| | | Securities Lending Collateralcc: 27.5% | |
| $ | 309,512,716 | | | The Bank of New York Institutional
Cash Reserves Fund | | $ | 309,512,716 | | |
Total Short-Term Investments
(Cost $309,512,716) | | | 309,512,716 | | |
Total Investments in
Securities (Cost
$1,288,612,409)* | | | 127.3 | % | | $ | 1,433,611,257 | | |
Other Assets and
Liabilities-Net | | | (27.3 | ) | | | (307,829,977 | ) | |
| Net Assets | | | 100.0 | % | | $ | 1,125,781,280 | | |
@ Non-income producing security
@@ Foreign Issuer
ADR American Depositary Receipt
cc Securities purchased with cash collateral for securities loaned.
L Loaned security, a portion or all of the security is on loan at December 31, 2006.
* Cost for federal income tax purposes is $1,291,875,981.
Net unrealized appreciation consists of:
| Gross Unrealized Appreciation | | $ | 185,727,357 | | |
| Gross Unrealized Depreciation | | | (43,992,081 | ) | |
| Net Unrealized Appreciation | | $ | 141,735,276 | | |
See Accompanying Notes to Financial Statements
275
ING T. ROWE PRICE PORTFOLIO OF INVESTMENTS
GROWTH EQUITY PORTFOLIO AS OF DECEMBER 31, 2006
| Shares | | | | | | Value | |
| COMMON STOCK: 97.3% | | | |
| | | | | Aerospace/Defense: 0.5% | |
| | 90,300 | | | | | General Dynamics Corp. | | $ | 6,713,805 | | |
| | | | 6,713,805 | | |
| | | | | Airlines: 1.0% | |
| | 886,600 | | | | | Southwest Airlines Co. | | | 13,582,712 | | |
| | | | 13,582,712 | | |
| | | | | Apparel: 0.5% | |
| | 69,500 | | | L | | Nike, Inc. | | | 6,882,585 | | |
| | | | 6,882,585 | | |
| | | | | Banks: 4.4% | |
| | 590,283 | | | @@ | | Anglo Irish Bank Corp. PLC | | | 12,222,888 | | |
| | 172,000 | | | @@ | | Erste Bank der
Oesterreichischen
Sparkassen AG | | | 13,169,543 | | |
| | 166,000 | | | | | Northern Trust Corp. | | | 10,074,540 | | |
| | 269,500 | | | | | State Street Corp. | | | 18,175,080 | | |
| | 1,058,400 | | | @@ | | UniCredito Italiano S.p.A. | | | 9,252,239 | | |
| | | | 62,894,290 | | |
| | | | | Beverages: 1.3% | |
| | 93,800 | | | @@ | | InBev NV | | | 6,171,883 | | |
| | 184,700 | | | | | PepsiCo, Inc. | | | 11,552,985 | | |
| | | | 17,724,868 | | |
| | | | | Biotechnology: 2.9% | |
| | 337,400 | | | @ | | Amgen, Inc. | | | 23,047,794 | | |
| | 143,100 | | | @,L | | Celgene Corp. | | | 8,232,543 | | |
| | 120,700 | | | @,L | | Genentech, Inc. | | | 9,792,391 | | |
| | | | 41,072,728 | | |
| | | | | Chemicals: 0.6% | |
| | 160,400 | | | | | Monsanto Co. | | | 8,425,812 | | |
| | | | 8,425,812 | | |
| | | | | Commercial Services: 1.8% | |
| | 682,700 | | | @@ | | Accenture Ltd. | | | 25,212,111 | | |
| | | | 25,212,111 | | |
| | | | | Computers: 1.5% | |
| | 28,300 | | | @ | | Affiliated Computer
Services, Inc. | | | 1,382,172 | | |
| | 96,600 | | | @ | | Apple Computer, Inc. | | | 8,195,544 | | |
| | 178,200 | | | @ | | Dell, Inc. | | | 4,471,038 | | |
| | 582,000 | | | @,L | | EMC Corp. | | | 7,682,400 | | |
| | | | 21,731,154 | | |
| | | | | Cosmetics/Personal Care: 1.0% | |
| | 223,880 | | | | | Procter & Gamble Co. | | | 14,388,768 | | |
| | | | 14,388,768 | | |
| | | | | Distribution/Wholesale: 0.3% | |
| | 112,400 | | | L | | Fastenal Co. | | | 4,032,912 | | |
| | | | 4,032,912 | | |
| | | | | Diversified Financial Services: 12.3% | |
| | 359,600 | | | | | American Express Co. | | | 21,816,932 | | |
| | 619,000 | | | | | Charles Schwab Corp. | | | 11,971,460 | | |
| | 4,000 | | | | | Chicago Mercantile
Exchange Holdings, Inc. | | | 2,039,000 | | |
| | 402,910 | | | | | Citigroup, Inc. | | | 22,442,087 | | |
| | 264,700 | | | L | | Countrywide Financial Corp. | | | 11,236,515 | | |
| Shares | | | | | | Value | |
| | 24,900 | | | @@ | | Deutsche Boerse AG | | $ | 4,585,840 | | |
| | 584,300 | | | @ | | E*Trade Financial Corp. | | | 13,100,006 | | |
| | 119,000 | | | | | Franklin Resources, Inc. | | | 13,110,230 | | |
| | 47,900 | | | | | Goldman Sachs Group, Inc. | | | 9,548,865 | | |
| | 107,300 | | | L | | Legg Mason, Inc. | | | 10,198,865 | | |
| | 157,400 | | | | | Morgan Stanley | | | 12,817,082 | | |
| | 273,800 | | | | | SLM Corp. | | | 13,353,226 | | |
| | 462,000 | | | @@ | | UBS AG | | | 27,959,184 | | |
| | | | 174,179,292 | | |
| | | | | Entertainment: 0.6% | |
| | 198,600 | | | | | International Game
Technology | | | 9,175,320 | | |
| | | | 9,175,320 | | |
| | | | | Food: 0.7% | |
| | 147,900 | | | | | Sysco Corp. | | | 5,436,804 | | |
| | 97,200 | | | | | Whole Foods Market, Inc. | | | 4,561,596 | | |
| | | | 9,998,400 | | |
| | | | | Healthcare-Products: 2.6% | |
| | 320,300 | | | | | Medtronic, Inc. | | | 17,139,253 | | |
| | 125,100 | | | @ | | St. Jude Medical, Inc. | | | 4,573,656 | | |
| | 160,600 | | | | | Stryker Corp. | | | 8,850,666 | | |
| | 76,900 | | | @,L | | Zimmer Holdings, Inc. | | | 6,027,422 | | |
| | | | 36,590,997 | | |
| | | | | Healthcare-Services: 4.9% | |
| | 203,000 | | | L | | Aetna, Inc. | | | 8,765,540 | | |
| | 89,600 | | | @ | | Humana, Inc. | | | 4,955,776 | | |
| | 626,300 | | | L | | UnitedHealth Group, Inc. | | | 33,651,099 | | |
| | 285,400 | | | @ | | WellPoint, Inc. | | | 22,458,126 | | |
| | | | 69,830,541 | | |
| | | | | Home Builders: 0.6% | |
| | 169,700 | | | L | | Lennar Corp. | | | 8,902,462 | | |
| | | | 8,902,462 | | |
| | | | | Home Furnishings: 1.0% | |
| | 137,000 | | | L | | Harman International
Industries, Inc. | | | 13,687,670 | | |
| | | | 13,687,670 | | |
| | | | | Household Products/Wares: 0.4% | |
| | 127,470 | | | @@ | | Reckitt Benckiser PLC | | | 5,814,812 | | |
| | | | 5,814,812 | | |
| | | | | Insurance: 3.0% | |
| | 311,800 | | | | | American International
Group, Inc. | | | 22,343,588 | | |
| | 54,600 | | | | | Hartford Financial Services
Group, Inc. | | | 5,094,726 | | |
| | 173,500 | | | L | | Prudential Financial, Inc. | | | 14,896,710 | | |
| | | | 42,335,024 | | |
| | | | | Internet: 4.2% | |
| | 331,100 | | | @,L | | Amazon.com, Inc. | | | 13,065,206 | | |
| | 195,700 | | | @ | | eBay, Inc. | | | 5,884,699 | | |
| | 54,900 | | | @ | | Google, Inc. | | | 25,280,352 | | |
| | 332,141 | | | @ | | Liberty Media Holding
Corp.-Interactive | | | 7,164,281 | | |
| | 328,100 | | | @,L | | Yahoo!, Inc. | | | 8,379,674 | | |
| | | | 59,774,212 | | |
See Accompanying Notes to Financial Statements
276
ING T. ROWE PRICE PORTFOLIO OF INVESTMENTS
GROWTH EQUITY PORTFOLIO AS OF DECEMBER 31, 2006 (CONTINUED)
| Shares | | | | | | Value | |
| | | | | Leisure Time: 0.4% | |
| | 114,000 | | | L | | Carnival Corp. | | $ | 5,591,700 | | |
| | | | 5,591,700 | | |
| | | | | Lodging: 1.7% | |
| | 115,000 | | | | | Marriott International, Inc. | | | 5,487,800 | | |
| | 153,500 | | | @,L | | MGM Mirage | | | 8,803,225 | | |
| | 107,000 | | | @,L | | Wynn Resorts Ltd. | | | 10,041,950 | | |
| | | | 24,332,975 | | |
| | | | | Machinery-Construction &
Mining: 0.5% | |
| | 136,000 | | | | | Joy Global, Inc. | | | 6,574,240 | | |
| | | | 6,574,240 | | |
| | | | | Machinery-Diversified: 0.3% | |
| | 50,400 | | | | | Deere & Co. | | | 4,791,528 | | |
| | | | 4,791,528 | | |
| | | | | Media: 3.9% | |
| | 116,600 | | | @,L | | EchoStar Communications
Corp. | | | 4,434,298 | | |
| | 351,500 | | | @@,L | | Grupo Televisa SA | | | 9,494,015 | | |
| | 120,488 | | | @ | | Liberty Media Holding Corp. | | | 11,805,414 | | |
| | 294,700 | | | @@ | | Rogers Communications, Inc. | | | 17,564,120 | | |
| | 293,500 | | | @ | | Viacom, Inc. | | | 12,042,305 | | |
| | | | 55,340,152 | | |
| | | | | Mining: 0.8% | |
| | 538,400 | | | @@ | | BHP Billiton Ltd. | | | 10,708,294 | | |
| | | | 10,708,294 | | |
| | | | | Miscellaneous Manufacturing: 6.5% | |
| | 281,800 | | | | | Danaher Corp. | | | 20,413,592 | | |
| | 1,597,700 | | | | | General Electric Co. | | | 59,450,417 | | |
| | 400,500 | | | @@ | | Tyco International Ltd. | | | 12,175,200 | | |
| | | | 92,039,209 | | |
| | | | | Oil & Gas: 3.2% | |
| | 127,800 | | | | | EOG Resources, Inc. | | | 7,981,110 | | |
| | 189,538 | | | | | ExxonMobil Corp. | | | 14,524,297 | | |
| | 121,300 | | | L | | Murphy Oil Corp. | | | 6,168,105 | | |
| | 225,800 | | | @@ | | Total SA | | | 16,247,982 | | |
| | | | 44,921,494 | | |
| | | | | Oil & Gas Services: 3.0% | |
| | 210,100 | | | L | | Baker Hughes, Inc. | | | 15,686,066 | | |
| | 419,200 | | | L | | Schlumberger Ltd. | | | 26,476,672 | | |
| | | | 42,162,738 | | |
| | | | | Pharmaceuticals: 7.2% | |
| | 417,300 | | | | | Caremark Rx, Inc. | | | 23,832,003 | | |
| | 116,800 | | | | | Eli Lilly & Co. | | | 6,085,280 | | |
| | 179,000 | | | @ | | Gilead Sciences, Inc. | | | 11,622,470 | | |
| | 201,900 | | | @ | | Medco Health Solutions, Inc. | | | 10,789,536 | | |
| | 319,337 | | | @@ | | Novartis AG | | | 18,344,714 | | |
| | 81,100 | | | @@ | | Roche Holding AG | | | 14,509,891 | | |
| | 118,200 | | | @,L | | Sepracor, Inc. | | | 7,278,756 | | |
| | 176,000 | | | | | Wyeth | | | 8,961,920 | | |
| | | | 101,424,570 | | |
| | | | | Retail: 6.4% | |
| | 68,975 | | | | | Best Buy Co., Inc. | | | 3,392,880 | | |
| | 265,200 | | | L | | CVS Corp. | | | 8,197,332 | | |
| Shares | | | | | | Value | |
| | 147,300 | | | L | | Home Depot, Inc. | | $ | 5,915,568 | | |
| | 284,300 | | | @ | | Kohl's Corp. | | | 19,454,649 | | |
| | 323,400 | | | | | Petsmart, Inc. | | | 9,333,324 | | |
| | 321,400 | | | | | Target Corp. | | | 18,335,870 | | |
| | 161,700 | | | | | Walgreen Co. | | | 7,420,413 | | |
| | 100,600 | | | @@,L | | Wal-Mart de Mexico
SA de CV | | | 4,416,330 | | |
| | 305,500 | | | L | | Wal-Mart Stores, Inc. | | | 14,107,990 | | |
| | | | 90,574,356 | | |
| | | | | Semiconductors: 5.1% | |
| | 318,000 | | | | | Analog Devices, Inc. | | | 10,452,660 | | |
| | 450,100 | | | L | | Applied Materials, Inc. | | | 8,304,345 | | |
| | 121,200 | | | @,@@ | | ASML Holding NV | | | 2,985,156 | | |
| | 216,600 | | | | | Intel Corp. | | | 4,386,150 | | |
| | 837,200 | | | @,@@,L | | Marvell Technology
Group Ltd. | | | 16,065,868 | | |
| | 407,000 | | | | | Maxim Integrated Products | | | 12,462,340 | | |
| | 5,794 | | | @@ | | Samsung Electronics Co., Ltd. | | | 3,800,914 | | |
| | 114,600 | | | | | Texas Instruments, Inc. | | | 3,300,480 | | |
| | 429,400 | | | L | | Xilinx, Inc. | | | 10,224,014 | | |
| | | | 71,981,927 | | |
| | | | | Software: 5.0% | |
| | 202,200 | | | @ | | Adobe Systems, Inc. | | | 8,314,464 | | |
| | 248,900 | | | @ | | Autodesk, Inc. | | | 10,070,494 | | |
| | 339,000 | | | | | Automatic Data
Processing, Inc. | | | 16,695,750 | | |
| | 167,600 | | | @,L | | Intuit, Inc. | | | 5,113,476 | | |
| | 856,525 | | | | | Microsoft Corp. | | | 25,575,837 | | |
| | 297,000 | | | @ | | Oracle Corp. | | | 5,090,580 | | |
| | | | 70,860,601 | | |
| | | | | Telecommunications: 6.7% | |
| | 350,000 | | | @,@@ | | Amdocs Ltd. | | | 13,562,500 | | |
| | 345,600 | | | @@ | | America Movil SA de CV | | | 15,628,032 | | |
| | 622,900 | | | @ | | Cisco Systems, Inc. | | | 17,023,857 | | |
| | 264,800 | | | @,L | | Corning, Inc. | | | 4,954,408 | | |
| | 465,700 | | | @,L | | Crown Castle International
Corp. | | | 15,042,110 | | |
| | 505,100 | | | @,L | | Juniper Networks, Inc. | | | 9,566,594 | | |
| | 111,800 | | | | | Qualcomm, Inc. | | | 4,224,922 | | |
| | 2,686,000 | | | @@ | | Telefonaktiebolaget LM
Ericsson | | | 10,800,840 | | |
| | 95,000 | | | @@ | | TELUS Corp. | | | 4,243,650 | | |
| | | | 95,046,913 | | |
| | | | | Transportation: 0.5% | |
| | 173,700 | | | | | Expeditors International
Washington, Inc. | | | 7,034,850 | | |
| | | | 7,034,850 | | |
Total Common Stock
(Cost $1,142,839,366) | | | 1,376,336,022 | | |
See Accompanying Notes to Financial Statements
277
ING T. ROWE PRICE PORTFOLIO OF INVESTMENTS
GROWTH EQUITY PORTFOLIO AS OF DECEMBER 31, 2006 (CONTINUED)
Principal
Amount | | | | Value | |
| SHORT-TERM INVESTMENTS: 17.7% | |
| | | Securities Lending Collateralcc: 17.7% | |
| $ | 250,015,114 | | | The Bank of New York Institutional
Cash Reserves Fund | | | 250,015,114 | | |
Total Short-Term Investments
(Cost $250,015,114) | | | 250,015,114 | | |
Total Investments in
Securities (Cost
$1,392,854,480)* | | | 115.0 | % | | $ | 1,626,351,136 | | |
Other Assets and
Liabilities-Net | | | (15.0 | ) | | | (211,742,887 | ) | |
| Net Assets | | | 100.0 | % | | $ | 1,414,608,249 | | |
@ Non-income producing security
@@ Foreign Issuer
cc Securities purchased with cash collateral for securities loaned.
L Loaned security, a portion or all of the security is on loan at December 31, 2006.
* Cost for federal income tax purposes is $1,397,820,014.
Net unrealized appreciation consists of:
| Gross Unrealized Appreciation | | $ | 245,953,444 | | |
| Gross Unrealized Depreciation | | | (17,422,322 | ) | |
| Net Unrealized Appreciation | | $ | 228,531,122 | | |
See Accompanying Notes to Financial Statements
278
ING TEMPLETON FOREIGN PORTFOLIO OF INVESTMENTS
EQUITY PORTFOLIO AS OF DECEMBER 31, 2006
| Shares | | | | | | Value | |
| COMMON STOCK: 95.8% | | | |
| | | | | Australia: 2.0% | |
| | 14,411 | | | | | Alumina Ltd. | | $ | 71,944 | | |
| | 13,204 | | | | | National Australia Bank Ltd. | | | 420,372 | | |
| | 113,847 | | | | | Qantas Airways Ltd. | | | 469,251 | | |
| | | | 961,567 | | |
| | | | | Belgium: 0.6% | |
| | 10,230 | | | | | AGFA-Gevaert NV | | | 260,725 | | |
| | | | 260,725 | | |
| | | | | Bermuda: 1.5% | |
| | 7,220 | | | | | ACE Ltd. | | | 437,315 | | |
| | 3,720 | | | | | XL Capital Ltd. | | | 267,914 | | |
| | | | 705,229 | | |
| | | | | Brazil: 1.4% | |
| | 10,560 | | | | | Empresa Brasileira de
Aeronautica SA | | | 437,290 | | |
| | 15,490 | | | | | Tele Norte Leste Participacoes
SA ADR | | | 231,111 | | |
| | | | 668,401 | | |
| | | | | Canada: 1.6% | |
| | 2,200 | | | | | Alcan, Inc. | | | 107,118 | | |
| | 12,626 | | | | | BCE, Inc. | | | 339,970 | | |
| | 36,800 | | | @ | | Domtar, Inc. | | | 310,835 | | |
| | | | 757,923 | | |
| | | | | China: 4.2% | |
| | 127,500 | | | @ | | Byd Co., Ltd. | | | 486,544 | | |
| | 256,500 | | | | | China Shenhua Energy Co., Ltd. | | | 616,637 | | |
| | 1,180,000 | | | | | China Telecom Corp., Ltd. | | | 644,285 | | |
| | 580,000 | | | | | Shanghai Electric Group Co., Ltd. | | | 242,827 | | |
| | | | 1,990,293 | | |
| | | | | Denmark: 0.8% | |
| | 8,960 | | | @ | | Vestas Wind Systems A/S | | | 377,078 | | |
| | | | 377,078 | | |
| | | | | Finland: 2.3% | |
| | 7,650 | | | | | Stora Enso OYJ | | | 120,339 | | |
| | 16,990 | | | | | Stora Enso OYJ (Euro
Denominated Security) | | | 267,891 | | |
| | 28,100 | | | | | UPM-Kymmene OYJ | | | 707,961 | | |
| | | | 1,096,191 | | |
| | | | | France: 9.6% | |
| | 2,940 | | | | | Accor SA | | | 227,337 | | |
| | 11,181 | | | | | AXA SA | | | 450,722 | | |
| | 5,130 | | | | | Compagnie Generale des
Etablissements Michelin | | | 490,032 | | |
| | 6,620 | | | | | Electricite de France | | | 481,361 | | |
| | 26,050 | | | | | France Telecom SA | | | 718,723 | | |
| | 8,600 | | | | | Sanofi-Aventis | | | 792,926 | | |
| | 8,360 | | | | | Suez SA | | | 432,074 | | |
| | 29,280 | | | | | Thomson | | | 571,900 | | |
| | 5,230 | | | | | Total SA | | | 376,337 | | |
| | | | 4,541,412 | | |
| | | | | Germany: 9.7% | |
| | 1,170 | | | | | BASF AG | | | 114,101 | | |
| | 10,450 | | | | | Bayerische Motoren Werke AG | | | 600,210 | | |
| | 13,470 | | | | | Celesio AG | | | 714,454 | | |
| | 24,380 | | | | | Deutsche Post AG | | | 735,833 | | |
| | 4,720 | | | | | EON AG | | | 640,261 | | |
| | 39,890 | | | @ | | Infineon Technologies AG | | | 558,693 | | |
| Shares | | | | | | Value | |
| | 1,780 | | | | | Muenchener
Rueckversicherungs AG | | $ | 306,697 | | |
| | 6,410 | | | | | Siemens AG | | | 632,929 | | |
| | 2,690 | | | | | Siemens AG ADR | | | 265,100 | | |
| | | | 4,568,278 | | |
| | | | | Hong Kong: 2.1% | |
| | 36,200 | | | | | Cheung Kong Holdings Ltd. ADR | | | 445,676 | | |
| | 42,000 | | | @ | | Hutchison Whampoa Ltd. | | | 425,802 | | |
| | 11,500 | | | | | Swire Pacific Ltd. | | | 123,313 | | |
| | | | 994,791 | | |
| | | | | Israel: 0.3% | |
| | 5,990 | | | @ | | Check Point Software Technologies | | | 131,301 | | |
| | | | 131,301 | | |
| | | | | Italy: 2.7% | |
| | 7,335 | | | | | ENI S.p.A. | | | 246,714 | | |
| | 32,952 | | | | | Mediaset S.p.A. | | | 390,241 | | |
| | 71,357 | | | | | UniCredito Italiano S.p.A. | | | 623,783 | | |
| | | | 1,260,738 | | |
| | | | | Japan: 4.5% | |
| | 12,400 | | | | | Fuji Photo Film Co., Ltd. | | | 510,733 | | |
| | 14,000 | | | @ | | Hitachi Ltd. | | | 87,205 | | |
| | 12,500 | | | | | Konica Minolta Holdings, Inc. | | | 176,409 | | |
| | 18 | | | | | Mitsubishi UFJ Financial
Group, Inc. | | | 223,304 | | |
| | 900 | | | | | Nintendo Co., Ltd. | | | 233,000 | | |
| | 6,000 | | | | | Olympus Corp. | | | 188,307 | | |
| | 13,700 | | | | | Sony Corp. | | | 586,706 | | |
| | 2,000 | | | | | Takeda Pharmaceutical Co., Ltd. | | | 137,072 | | |
| | | | 2,142,736 | | |
| | | | | Mexico: 1.1% | |
| | 18,880 | | | | | Telefonos de Mexico SA de CV | | | 533,549 | | |
| | | | 533,549 | | |
| | | | | Netherlands: 5.1% | |
| | 11,110 | | | | | Koninklijke Philips Electronics NV | | | 417,771 | | |
| | 31,370 | | | | | Reed Elsevier NV | | | 534,131 | | |
| | 8,980 | | | | | Royal Dutch Shell PLC ADR | | | 638,927 | | |
| | 7,860 | | | | | SBM Offshore NV | | | 269,722 | | |
| | 10,910 | | | | | Unilever NV | | | 297,510 | | |
| | 11,530 | | | | | Vedior NV | | | 238,360 | | |
| | | | 2,396,421 | | |
| | | | | Norway: 2.1% | |
| | 23,140 | | | | | Norske Skogindustrier ASA | | | 397,040 | | |
| | 30,760 | | | | | Telenor ASA | | | 576,399 | | |
| | | | 973,439 | | |
| | | | | Portugal: 0.8% | |
| | 27,570 | | | | | Portugal Telecom SGPS SA | | | 357,499 | | |
| | | | 357,499 | | |
| | | | | Singapore: 1.5% | |
| | 35,000 | | | | | DBS Group Holdings Ltd. | | | 513,834 | | |
| | 96,000 | | | | | Singapore Telecommunications Ltd. | | | 204,733 | | |
| | | | 718,567 | | |
| | | | | South Africa: 0.6% | |
| | 18,360 | | | | | Sappi Ltd. ADR | | | 307,897 | | |
| | | | 307,897 | | |
See Accompanying Notes to Financial Statements
279
ING TEMPLETON FOREIGN PORTFOLIO OF INVESTMENTS
EQUITY PORTFOLIO AS OF DECEMBER 31, 2006 (CONTINUED)
| Shares | | | | | | Value | |
| | | | | South Korea: 5.7% | |
| | 7,240 | | | | | Kookmin Bank ADR | | $ | 583,834 | | |
| | 18,390 | | | | | Korea Electric Power Corp. ADR | | | 417,637 | | |
| | 4,210 | | | | | Posco ADR | | | 348,041 | | |
| | 3,200 | | | # | | Samsung Electronics Co., Ltd. GDR | | | 1,054,624 | | |
| | 10,610 | | | | | SK Telecom Co., Ltd. ADR | | | 280,953 | | |
| | | | 2,685,089 | | |
| | | | | Spain: 4.8% | |
| | 26,600 | | | | | Banco Santander Central
Hispano SA | | | 495,321 | | |
| | 8,507 | | | | | Iberdrola SA | | | 370,857 | | |
| | 19,706 | | | | | Repsol YPF SA | | | 678,972 | | |
| | 34,090 | | | | | Telefonica SA | | | 723,755 | | |
| | | | 2,268,905 | | |
| | | | | Sweden: 2.8% | |
| | 7,550 | | | | | Atlas Copco AB | | | 252,797 | | |
| | 2,220 | | | | | Autoliv, Inc. | | | 133,866 | | |
| | 3,660 | | | | | ForeningsSparbanken AB | | | 132,610 | | |
| | 29,390 | | | | | Nordea Bank AB | | | 453,276 | | |
| | 14,950 | | | | | Securitas AB | | | 230,852 | | |
| | 12,940 | | | @ | | Securitas Direct AB | | | 41,017 | | |
| | 14,950 | | | @ | | Securitas Systems AB | | | 60,491 | | |
| | | | 1,304,909 | | |
| | | | | Switzerland: 3.9% | |
| | 2,170 | | | | | Adecco SA | | | 147,900 | | |
| | 1,650 | | | | | Lonza Group AG | | | 142,221 | | |
| | 1,640 | | | | | Nestle SA | | | 581,720 | | |
| | 7,791 | | | | | Swiss Reinsurance | | | 660,294 | | |
| | 5,150 | | | | | UBS AG | | | 311,666 | | |
| | | | 1,843,801 | | |
| | | | | Taiwan: 1.4% | |
| | 5,727 | | | | | Chunghwa Telecom Co., Ltd. ADR | | | 112,994 | | |
| | 74,417 | | | # | | Compal Electronics, Inc. GDR | | | 331,719 | | |
| | 15,063 | | | | | Lite-On Technology Corp. GDR | | | 203,629 | | |
| | | | 648,342 | | |
| | | | | United Kingdom: 22.7% | |
| | 18,360 | | | | | Aviva PLC | | | 294,536 | | |
| | 67,240 | | | | | BAE Systems PLC | | | 559,005 | | |
| | 20,515 | | | | | Boots Group PLC | | | 335,810 | | |
| | 37,030 | | | | | BP PLC | | | 412,925 | | |
| | 46,740 | | | | | British Sky Broadcasting PLC | | | 477,851 | | |
| | 37,050 | | | | | Burberry Group PLC | | | 466,674 | | |
| | 64,210 | | | | | Cadbury Schweppes PLC | | | 685,799 | | |
| | 150,750 | | | | | Compass Group PLC | | | 854,026 | | |
| | 87,310 | | | | | GKN PLC | | | 473,903 | | |
| | 29,480 | | | | | GlaxoSmithKline PLC | | | 775,937 | | |
| | 106,410 | | | | | Group 4 Securicor PLC | | | 391,696 | | |
| | 41,200 | | | | | HSBC Holdings PLC | | | 754,051 | | |
| | 72,560 | | | | | Kingfisher PLC | | | 338,321 | | |
| | 12,020 | | | | | Lloyds TSB Group PLC | | | 135,123 | | |
| | 17,000 | | | | | National Grid PLC | | | 246,047 | | |
| | 162,450 | | | | | Old Mutual PLC | | | 552,888 | | |
| | 14,080 | | | | | Pearson PLC | | | 212,211 | | |
| | 22,280 | | | | | Rolls-Royce Group PLC-Class B | | | 194,701 | | |
| | 707,943 | | | @ | | Rolls-Royce Group PLC | | | 1,386 | | |
| | 22,100 | | | | | Royal Bank of Scotland Group PLC | | | 860,092 | | |
| | 13,310 | | | | | Smiths Group PLC | | | 257,930 | | |
| | 14,090 | | | | | Standard Chartered PLC | | | 410,460 | | |
| | 264,276 | | | | | Vodafone Group PLC | | | 729,839 | | |
| Shares | | | | | | Value | |
| | 30,530 | | | | | WM Morrison Supermarkets PLC | | $ | 151,953 | | |
| | 11,150 | | | | | Yell Group PLC | | | 124,146 | | |
| | | | 10,697,310 | | |
| | | Total Common Stock
(Cost $39,508,086) | | | 45,192,391 | | |
Principal
Amount | | | | Value | |
| SHORT-TERM INVESTMENTS: 13.4% | |
| | | U.S. Government Agency Obligations: 13.4% | |
| $ | 6,338,000 | | | Federal Home Loan Bank,
4.800%, due 01/02/07 | | | 6,336,310 | | |
Total Short-Term Investments
(Cost $6,336,310) | | | 6,336,310 | | |
Total Investments in
Securities (Cost
$45,844,396)* | | | 109.2 | % | | $ | 51,528,701 | | |
Other Assets and
Liabilities-Net | | | (9.2 | ) | | | (4,335,944 | ) | |
| Net Assets | | | 100.0 | % | | $ | 47,192,757 | | |
Certain foreign securities may have been fair valued in accordance with procedures approved by the Board of Directors/Trustees (note 2A).
@ Non-income producing security
ADR American Depositary Receipt
GDR Global Depositary Receipt
# Securities with purchases pursuant to Rule 144A, under the Securities Act of 1933 and may not be resold subject to that rule except to qualified institutional buyers. These securities have been determined to be liquid under the guidelines established by the Funds' Board of Directors/Trustees.
* Cost for federal income tax purposes is the same as for financial statement purposes.
Net unrealized appreciation consists of:
| Gross Unrealized Appreciation | | $ | 5,754,521 | | |
| Gross Unrealized Depreciation | | | (70,216 | ) | |
| Net Unrealized Appreciation | | $ | 5,684,305 | | |
See Accompanying Notes to Financial Statements
280
ING TEMPLETON FOREIGN PORTFOLIO OF INVESTMENTS
EQUITY PORTFOLIO AS OF DECEMBER 31, 2006 (CONTINUED)
| Industry | | Percentage of
Net Assets | |
| Aerospace/Defense | | | 2.5 | % | |
| Airlines | | | 1.0 | | |
| Apparel | | | 1.0 | | |
| Auto Manufacturers | | | 1.3 | | |
| Auto Parts & Equipment | | | 2.3 | | |
| Banks | | | 11.9 | | |
| Chemicals | | | 0.5 | | |
| Coal | | | 1.3 | | |
| Commercial Services | | | 2.3 | | |
| Computers | | | 1.1 | | |
| Diversified Financial Services | | | 0.7 | | |
| Electric | | | 5.5 | | |
| Electrical Components & Equipment | | | 2.0 | | |
| Electronics | | | 0.9 | | |
| Food | | | 3.6 | | |
| Food Service | | | 1.8 | | |
| Forest Products & Paper | | | 4.5 | | |
| Holding Companies - Diversified | | | 1.2 | | |
| Home Furnishings | | | 2.5 | | |
| Insurance | | | 6.3 | | |
| Internet | | | 0.3 | | |
| Iron/Steel | | | 0.7 | | |
| Lodging | | | 0.5 | | |
| Machinery - Construction & Mining | | | 0.5 | | |
| Machinery - Diversified | | | 0.5 | | |
| Media | | | 3.7 | | |
| Mining | | | 0.4 | | |
| Miscellaneous Manufacturing | | | 4.9 | | |
| Oil & Gas | | | 5.0 | | |
| Oil & Gas Services | | | 0.6 | | |
| Pharmaceuticals | | | 5.1 | | |
| Real Estate | | | 0.9 | | |
| Retail | | | 1.4 | | |
| Semiconductors | | | 3.4 | | |
| Telecommunications | | | 11.6 | | |
| Toys/Games/Hobbies | | | 0.5 | | |
| Transportation | | | 1.6 | | |
| Short-Term Investments | | | 13.4 | | |
| Other Assets and Liabilities - Net | | | (9.2 | ) | |
| Net Assets | | | 100.0 | % | |
See Accompanying Notes to Financial Statements
281
PORTFOLIO OF INVESTMENTS
ING THORNBURG VALUE PORTFOLIO AS OF DECEMBER 31, 2006
| Shares | | | | | | Value | |
| COMMON STOCK: 96.0% | | | |
| | | | | Airlines: 2.6% | |
| | 361,800 | | | @,L | | JetBlue Airways Corp. | | $ | 5,137,560 | | |
| | | | 5,137,560 | | |
| | | | | Auto Manufacturers: 2.2% | |
| | 64,623 | | | @@ | | Peugeot SA | | | 4,278,673 | | |
| | | | 4,278,673 | | |
| | | | | Banks: 1.7% | |
| | 184,100 | | | @@ | | HSBC Holdings PLC | | | 3,369,435 | | |
| | | | 3,369,435 | | |
| | | | | Chemicals: 2.3% | |
| | 64,800 | | | | | Air Products & Chemicals, Inc. | | | 4,554,144 | | |
| | | | 4,554,144 | | |
| | | | | Commercial Services: 5.1% | |
| | 477,776 | | | @,L | | BearingPoint, Inc. | | | 3,760,097 | | |
| | 350,150 | | | @,L | | Hertz Global Holdings, Inc. | | | 6,089,109 | | |
| | | | 9,849,206 | | |
| | | | | Computers: 2.9% | |
| | 220,500 | | | @ | | Dell, Inc. | | | 5,532,345 | | |
| | 64,800 | | | @,X | | Seagate Technology, Inc.-Escrow | | | 1 | | |
| | | | 5,532,346 | | |
| | | | | Diversified Financial Services: 9.0% | |
| | 154,200 | | | L | | Charles Schwab Corp. | | | 2,982,228 | | |
| | 106,100 | | | | | Citigroup, Inc. | | | 5,909,770 | | |
| | 67,500 | | | | | Freddie Mac | | | 4,583,250 | | |
| | 40,400 | | | @,L | | NYSE Group, Inc. | | | 3,926,880 | | |
| | | | 17,402,128 | | |
| | | | | Electric: 2.1% | |
| | 18,100 | | | @ | | Dynegy, Inc. | | | 131,044 | | |
| | 43,500 | | | | | Entergy Corp. | | | 4,015,920 | | |
| | | | 4,146,964 | | |
| | | | | Electronics: 2.4% | |
| | 100,800 | | | @ | | Thermo Electron Corp. | | | 4,565,232 | | |
| | | | 4,565,232 | | |
| | | | | Healthcare - Products: 2.4% | |
| | 70,548 | | | @,L | | Cytyc Corp. | | | 1,996,508 | | |
| | 41,200 | | | | | Johnson & Johnson | | | 2,720,024 | | |
| | | | 4,716,532 | | |
| | | | | Healthcare - Services: 3.1% | |
| | 76,500 | | | @ | | WellPoint, Inc. | | | 6,019,785 | | |
| | | | 6,019,785 | | |
| | | | | Insurance: 3.1% | |
| | 84,600 | | | | | American International
Group, Inc. | | | 6,062,436 | | |
| | | | 6,062,436 | | |
| | | | | Internet: 1.6% | |
| | 6,885 | | | @ | | Google, Inc. | | | 3,170,405 | | |
| | | | 3,170,405 | | |
| | | | | Lodging: 2.4% | |
| | 51,100 | | | @,L | | Las Vegas Sands Corp. | | | 4,572,428 | | |
| | | | 4,572,428 | | |
| Shares | | | | | | Value | |
| | | | | Media: 3.8% | |
| | 98,800 | | | @ | | Comcast Corp. | | $ | 4,137,744 | | |
| | 126,400 | | | @,L | | DIRECTV Group, Inc. | | | 3,152,416 | | |
| | | | 7,290,160 | | |
| | | | | Mining: 5.4% | |
| | 187,700 | | | | | Alcoa, Inc. | | | 5,632,877 | | |
| | 90,100 | | | L | | Southern Copper Corp. | | | 4,855,489 | | |
| | | | 10,488,366 | | |
| | | | | Miscellaneous Manufacturing: 2.9% | |
| | 151,500 | | | | | General Electric Co. | | | 5,637,315 | | |
| | | | 5,637,315 | | |
| | | | | Oil & Gas: 11.4% | |
| | 72,000 | | | L | | Apache Corp. | | | 4,788,720 | | |
| | 65,975 | | | | | Chevron Corp. | | | 4,851,142 | | |
| | 68,200 | | | | | ConocoPhillips | | | 4,906,990 | | |
| | 97,800 | | | | | ExxonMobil Corp. | | | 7,494,414 | | |
| | | | 22,041,266 | | |
| | | | | Pharmaceuticals: 2.0% | |
| | 124,100 | | | @@ | | Teva Pharmaceutical
Industries Ltd. ADR | | | 3,857,028 | | |
| | | | 3,857,028 | | |
| | | | | Retail: 6.8% | |
| | 51,700 | | | | | Abercrombie & Fitch Co. | | | 3,599,871 | | |
| | 787,400 | | | @,L | | Rite Aid Corp. | | | 4,283,456 | | |
| | 92,200 | | | | | Target Corp. | | | 5,260,010 | | |
| | | | 13,143,337 | | |
| | | | | Semiconductors: 1.9% | |
| | 91,830 | | | @ | | MEMC Electronic Materials, Inc. | | | 3,594,226 | | |
| | | | 3,594,226 | | |
| | | | | Software: 7.0% | |
| | 168,779 | | | @ | | Eclipsys Corp. | | | 3,470,096 | | |
| | 195,600 | | | | | Microsoft Corp. | | | 5,840,616 | | |
| | 243,600 | | | @ | | Oracle Corp. | | | 4,175,304 | | |
| | | | 13,486,016 | | |
| | | | | Telecommunications: 11.9% | |
| | 107,500 | | | @,L | | American Tower Corp. | | | 4,007,600 | | |
| | 431,300 | | | @@ | | China Mobile Ltd. | | | 3,717,784 | | |
| | 203,560 | | | @@ | | Chunghwa Telecom Co., Ltd.
ADR | | | 4,016,239 | | |
| | 766,700 | | | @,L | | Level 3 Communications Inc. | | | 4,293,520 | | |
| | 151,200 | | | L | | Motorola, Inc. | | | 3,108,672 | | |
| | 59,816 | | | @,L | | NII Holdings, Inc. | | | 3,854,543 | | |
| | | | 22,998,358 | | |
Total Common Stock
(Cost $163,167,640) | | | 185,913,346 | | |
Principal
Amount | | | | Value | |
| SHORT-TERM INVESTMENTS: 24.0% | |
| | | U.S. Government Agency Obligations: 2.9% | |
| $ | 5,551,000 | | | Federal Home Loan Bank, 4.600%,
due 01/02/07 | | | 5,549,581 | | |
Total U.S. Government Agency
Obligations
(Cost $5,549,581) | | | 5,549,581 | | |
See Accompanying Notes to Financial Statements
282
PORTFOLIO OF INVESTMENTS
ING THORNBURG VALUE PORTFOLIO AS OF DECEMBER 31, 2006 (CONTINUED)
Principal
Amount | | | | Value | |
| | | Securities Lending Collateralcc: 21.1% | |
| $ | 40,882,194 | | | The Bank of New York Institutional
Cash Reserves Fund | | $ | 40,882,194 | | |
Total Securities Lending Collateral
(Cost $40,882,194) | | | 40,882,194 | | |
Total Short-Term Investments
(Cost $46,431,775) | | | 46,431,775 | | |
Total Investments in
Securities (Cost
$209,599,415)* | | | 120.0 | % | | $ | 232,345,121 | | |
Other Assets and
Liabilities-Net | | | (20.0 | ) | | | (38,762,663 | ) | |
| Net Assets | | | 100.0 | % | | $ | 193,582,458 | | |
@ Non-income producing security
@@ Foreign Issuer
ADR American Depositary Receipt
cc Securities purchased with cash collateral for securities loaned.
L Loaned security, a portion or all of the security is on loan at December 31, 2006.
X Fair value determined by ING Funds Valuation Committee appointed by the Funds' Board of Directors/Trustees.
* Cost for federal income tax purposes is $210,231,100.
Net unrealized appreciation consists of:
| Gross Unrealized Appreciation | | $ | 23,575,933 | | |
| Gross Unrealized Depreciation | | | (1,461,912 | ) | |
| Net Unrealized Appreciation | | $ | 22,114,021 | | |
See Accompanying Notes to Financial Statements
283
ING UBS PORTFOLIO OF INVESTMENTS
U.S. LARGE CAP EQUITY PORTFOLIO AS OF DECEMBER 31, 2006
| Shares | | | | | | Value | |
| COMMON STOCK: 97.5% | | | |
| | | | | Advertising: 2.6% | |
| | 65,800 | | | L | | Omnicom Group | | $ | 6,878,732 | | |
| | 52,086 | | | @,L | | R.H. Donnelley Corp. | | | 3,267,355 | | |
| | | | 10,146,087 | | |
| | | | | Aerospace/Defense: 0.8% | |
| | 46,200 | | | | | Northrop Grumman Corp. | | | 3,127,740 | | |
| | | | 3,127,740 | | |
| | | | | Apparel: 0.5% | |
| | 48,200 | | | @ | | Coach, Inc. | | | 2,070,672 | | |
| | | | 2,070,672 | | |
| | | | | Auto Manufacturers: 1.1% | |
| | 63,500 | | | L | | Paccar, Inc. | | | 4,121,150 | | |
| | | | 4,121,150 | | |
| | | | | Auto Parts & Equipment: 2.9% | |
| | 59,300 | | | L | | BorgWarner, Inc. | | | 3,499,886 | | |
| | 90,100 | | | L | | Johnson Controls, Inc. | | | 7,741,392 | | |
| | | | 11,241,278 | | |
| | | | | Banks: 8.6% | |
| | 25,100 | | | | | City National Corp. | | | 1,787,120 | | |
| | 172,700 | | | | | Fifth Third Bancorp. | | | 7,068,611 | | |
| | 169,500 | | | L | | Mellon Financial Corp. | | | 7,144,425 | | |
| | 77,100 | | | | | PNC Financial Services
Group, Inc. | | | 5,708,484 | | |
| | 322,900 | | | | | Wells Fargo & Co. | | | 11,482,324 | | |
| | | | 33,190,964 | | |
| | | | | Beverages: 1.4% | |
| | 55,600 | | | L | | Anheuser-Busch Cos., Inc. | | | 2,735,520 | | |
| | 97,700 | | | @,L | | Constellation Brands, Inc. | | | 2,835,254 | | |
| | | | 5,570,774 | | |
| | | | | Biotechnology: 1.7% | |
| | 83,900 | | | @ | | Genzyme Corp. | | | 5,166,562 | | |
| | 136,100 | | | @,L | | Millennium Pharmaceuticals, Inc. | | | 1,483,490 | | |
| | | | 6,650,052 | | |
| | | | | Building Materials: 2.0% | |
| | 256,700 | | | | | Masco Corp. | | | 7,667,629 | | |
| | | | 7,667,629 | | |
| | | | | Commercial Services: 1.3% | |
| | 90,600 | | | @@ | | Accenture Ltd. | | | 3,345,858 | | |
| | 75,200 | | | L | | H&R Block, Inc. | | | 1,732,608 | | |
| | | | 5,078,466 | | |
| | | | | Computers: 0.7% | |
| | 109,900 | | | @ | | Dell, Inc. | | | 2,757,391 | | |
| | 69,400 | | | @,X | | Seagate Technology, Inc.-Escrow | | | 1 | | |
| | | | 2,757,392 | | |
| | | | | Diversified Financial Services: 11.5% | |
| | 311,900 | | | | | Citigroup, Inc. | | | 17,372,830 | | |
| | 69,500 | | | | | Freddie Mac | | | 4,719,050 | | |
| | 151,700 | | | | | JPMorgan Chase & Co. | | | 7,327,110 | | |
| | 187,300 | | | | | Morgan Stanley | | | 15,251,839 | | |
| | | | 44,670,829 | | |
| Shares | | | | | | Value | |
| | | | | Electric: 4.2% | |
| | 79,200 | | | | | American Electric Power Co., Inc. | | $ | 3,372,336 | | |
| | 3,910 | | | @ | | Dynegy, Inc. | | | 28,308 | | |
| | 160,800 | | | | | Exelon Corp. | | | 9,951,912 | | |
| | 41,100 | | | L | | Northeast Utilities | | | 1,157,376 | | |
| | 61,900 | | | | | Pepco Holdings, Inc. | | | 1,610,019 | | |
| | | | 16,119,951 | | |
| | | | | Electronics: 0.7% | |
| | 58,800 | | | @ | | Waters Corp. | | | 2,879,436 | | |
| | | | 2,879,436 | | |
| | | | | Exchange Traded Fund: 3.4% | |
| | 92,100 | | | L | | SPDR Trust Series 1 | | | 13,049,649 | | |
| | | | 13,049,649 | | |
| | | | | Food: 1.5% | |
| | 153,100 | | | | | Sysco Corp. | | | 5,627,956 | | |
| | | | 5,627,956 | | |
| | | | | Gas: 1.7% | |
| | 94,500 | | | L | | NiSource, Inc. | | | 2,277,450 | | |
| | 75,200 | | | | | Sempra Energy | | | 4,214,208 | | |
| | | | 6,491,658 | | |
| | | | | Healthcare-Products: 2.8% | |
| | 101,100 | | | | | Johnson & Johnson | | | 6,674,622 | | |
| | 80,200 | | | | | Medtronic, Inc. | | | 4,291,502 | | |
| | | | 10,966,124 | | |
| | | | | Healthcare-Services: 1.9% | |
| | 140,300 | | | | | UnitedHealth Group, Inc. | | | 7,538,319 | | |
| | | | 7,538,319 | | |
| | | | | Household Products/Wares: 0.4% | |
| | 17,600 | | | | | Fortune Brands, Inc. | | | 1,502,864 | | |
| | | | 1,502,864 | | |
| | | | | Insurance: 4.4% | |
| | 62,100 | | | | | Allstate Corp. | | | 4,043,331 | | |
| | 125,400 | | | | | American International
Group, Inc. | | | 8,986,164 | | |
| | 42,800 | | | | | Hartford Financial Services
Group, Inc. | | | 3,993,668 | | |
| | | | 17,023,163 | | |
| | | | | Internet: 2.9% | |
| | 58,500 | | | @,L | | Amazon.com, Inc. | | | 2,308,410 | | |
| | 61,400 | | | @,L | | McAfee, Inc. | | | 1,742,532 | | |
| | 223,904 | | | @,L | | Symantec Corp. | | | 4,668,398 | | |
| | 97,800 | | | @,L | | Yahoo!, Inc. | | | 2,497,812 | | |
| | | | 11,217,152 | | |
| | | | | Leisure Time: 2.4% | |
| | 129,600 | | | L | | Carnival Corp. | | | 6,356,880 | | |
| | 44,100 | | | | | Harley-Davidson, Inc. | | | 3,107,727 | | |
| | | | 9,464,607 | | |
| | | | | Lodging: 0.2% | |
| | 27,840 | | | @,L | | Wyndham Worldwide Corp. | | | 891,437 | | |
| | | | 891,437 | | |
See Accompanying Notes to Financial Statements
284
ING UBS PORTFOLIO OF INVESTMENTS
U.S. LARGE CAP EQUITY PORTFOLIO AS OF DECEMBER 31, 2006 (CONTINUED)
| Shares | | | | | | Value | |
| | | | | Media: 1.0% | |
| | 136,700 | | | | | News Corp., Inc. | | $ | 2,936,316 | | |
| | 20,200 | | | @,L | | Univision Communications, Inc. | | | 715,484 | | |
| | 8,100 | | | @ | | Viacom, Inc. | | | 332,343 | | |
| | | | 3,984,143 | | |
| | | | | Miscellaneous Manufacturing: 1.8% | |
| | 148,500 | | | | | Illinois Tool Works, Inc. | | | 6,859,215 | | |
| | | | 6,859,215 | | |
| | | | | Oil & Gas: 4.4% | |
| | 33,400 | | | | | Chevron Corp. | | | 2,455,902 | | |
| | 70,100 | | | | | ENSCO International, Inc. | | | 3,509,206 | | |
| | 47,700 | | | | | EOG Resources, Inc. | | | 2,978,865 | | |
| | 52,200 | | | | | ExxonMobil Corp. | | | 4,000,086 | | |
| | 68,300 | | | L | | GlobalSantaFe Corp. | | | 4,014,674 | | |
| | | | 16,958,733 | | |
| | | | | Oil & Gas Services: 0.9% | |
| | 109,700 | | | | | Halliburton Co. | | | 3,406,185 | | |
| | | | 3,406,185 | | |
| | | | | Pharmaceuticals: 8.7% | |
| | 74,100 | | | L | | Allergan, Inc. | | | 8,872,734 | | |
| | 176,900 | | | | | Bristol-Myers Squibb Co. | | | 4,656,008 | | |
| | 27,400 | | | @,L | | Cephalon, Inc. | | | 1,929,234 | | |
| | 76,400 | | | @ | | Medco Health Solutions, Inc. | | | 4,082,816 | | |
| | 121,300 | | | | | Merck & Co., Inc. | | | 5,288,680 | | |
| | 171,500 | | | | | Wyeth | | | 8,732,780 | | |
| | | | 33,562,252 | | |
| | | | | Real Estate: 0.3% | |
| | 36,700 | | | @ | | Realogy Corp. | | | 1,112,744 | | |
| | | | 1,112,744 | | |
| | | | | Retail: 3.5% | |
| | 103,600 | | | @,L | | Chico's FAS, Inc. | | | 2,143,484 | | |
| | 98,300 | | | L | | Costco Wholesale Corp. | | | 5,197,121 | | |
| | 150,700 | | | L | | Home Depot, Inc. | | | 6,052,112 | | |
| | | | 13,392,717 | | |
| | | | | Semiconductors: 3.8% | |
| | 139,500 | | | L | | Analog Devices, Inc. | | | 4,585,365 | | |
| | 325,200 | | | | | Intel Corp. | | | 6,585,300 | | |
| | 154,000 | | | L | | Xilinx, Inc. | | | 3,666,740 | | |
| | | | 14,837,405 | | |
| | | | | Software: 4.3% | |
| | 471,200 | | | | | Microsoft Corp. | | | 14,070,033 | | |
| | 112,500 | | | @,L | | Red Hat, Inc. | | | 2,587,500 | | |
| | | | 16,657,533 | | |
| | | | | Telecommunications: 3.7% | |
| | 157,700 | | | | | AT&T, Inc. | | | 5,637,775 | | |
| | 20,349 | | | | | Embarq Corp. | | | 1,069,543 | | |
| | 406,889 | | | | | Sprint Nextel Corp. | | | 7,686,133 | | |
| | | | 14,393,451 | | |
| | | | | Transportation: 3.5% | |
| | 93,200 | | | | | Burlington Northern
Santa Fe Corp. | | | 6,879,092 | | |
| | 59,700 | | | | | FedEx Corp. | | | 6,484,614 | | |
| | | | 13,363,706 | | |
Total Common Stock
(Cost $322,730,127) | | | 377,593,433 | | |
Principal
Amount | | | | Value | |
| SHORT-TERM INVESTMENTS: 20.2% | |
| | | U.S. Government Agency Obligations: 2.4% | |
| $ | 9,219,000 | | | Federal Home Loan Bank, 4.600%,
due 01/02/07 | | | | $ | 9,216,644 | | |
Total U.S. Government
Agency Obligations
(Cost $9,216,644) | | | 9,216,644 | | |
| | | Securities Lending Collateralcc: 17.8% | |
| | | | 69,037,649 | | | The Bank of New York Institutional
Cash Reserves Fund | | | 69,037,649 | | |
Total Securities Lending Collateral
(Cost $69,037,649) | | | 69,037,649 | | |
Total Short-Term Investments
(Cost $78,254,293) | | | 78,254,293 | | |
Total Investments in
Securities (Cost
$400,984,420)* | | | 117.7 | % | | $ | 455,847,726 | | |
Other Assets and
Liabilities-Net | | | (17.7 | ) | | | (68,403,900 | ) | |
| Net Assets | | | 100.0 | % | | $ | 387,443,826 | | |
@ Non-income producing security
@@ Foreign Issuer
cc Securities purchased with cash collateral for securities loaned.
L Loaned security, a portion or all of the security is on loan at December 31, 2006.
X Fair value determined by ING Funds Valuation Committee appointed by the Funds' Board of Directors/Trustees.
* Cost for federal income tax purposes is $401,521,099.
Net unrealized appreciation consists of:
| Gross Unrealized Appreciation | | $ | 57,015,786 | | |
| Gross Unrealized Depreciation | | | (2,689,159 | ) | |
| Net Unrealized Appreciation | | $ | 54,326,627 | | |
See Accompanying Notes to Financial Statements
285
ING UBS PORTFOLIO OF INVESTMENTS
U.S. SMALL CAP GROWTH PORTFOLIO AS OF DECEMBER 31, 2006
| Shares | | | | | | Value | |
| COMMON STOCK: 97.8% | | | |
| | | | | Aerospace/Defense: 2.0% | |
| | 14,000 | | | @ | | AAR Corp. | | $ | 408,660 | | |
| | 2,600 | | | | | DRS Technologies, Inc. | | | 136,968 | | |
| | | | 545,628 | | |
| | | | | Airlines: 0.1% | |
| | 1,300 | | | @ | | Allegiant Travel Co. | | | 36,478 | | |
| | | | 36,478 | | |
| | | | | Apparel: 2.4% | |
| | 700 | | | @ | | Heelys, Inc. | | | 22,477 | | |
| | 12,600 | | | | | Phillips-Van Heusen | | | 632,142 | | |
| | | | 654,619 | | |
| | | | | Banks: 3.0% | |
| | 10,700 | | | | | Investors Financial Services Corp. | | | 456,569 | | |
| | 21,500 | | | | | UCBH Holdings, Inc. | | | 377,540 | | |
| | | | 834,109 | | |
| | | | | Biotechnology: 3.5% | |
| | 3,700 | | | @ | | Alexion Pharmaceuticals, Inc. | | | 149,443 | | |
| | 800 | | | @ | | Charles River Laboratories
International, Inc. | | | 34,600 | | |
| | 14,100 | | | @ | | Exelixis, Inc. | | | 126,900 | | |
| | 10,500 | | | @ | | Keryx Biopharmaceuticals, Inc. | | | 139,650 | | |
| | 7,400 | | | @ | | Lifecell Corp. | | | 178,636 | | |
| | 5,300 | | | @ | | Myriad Genetics, Inc. | | | 165,890 | | |
| | 8,500 | | | @ | | Regeneron Pharmaceuticals, Inc. | | | 170,595 | | |
| | | | 965,714 | | |
| | | | | Building Materials: 1.5% | |
| | 5,300 | | | @ | | Genlyte Group, Inc. | | | 413,983 | | |
| | | | 413,983 | | |
| | | | | Commercial Services: 6.3% | |
| | 7,200 | | | @ | | CRA International, Inc. | | | 377,280 | | |
| | 4,700 | | | @ | | Korn/Ferry International | | | 107,912 | | |
| | 18,300 | | | @ | | Labor Ready, Inc. | | | 335,439 | | |
| | 9,500 | | | @ | | Peoplesupport, Inc. | | | 199,975 | | |
| | 19,000 | | | @ | | TeleTech Holdings, Inc. | | | 453,720 | | |
| | 8,000 | | | @,@@ | | WNS Holdings Ltd. ADR | | | 248,800 | | |
| | | | 1,723,126 | | |
| | | | | Computers: 3.3% | |
| | 6,900 | | | @ | | CACI International, Inc. | | | 389,850 | | |
| | 6,100 | | | | | Factset Research Systems, Inc. | | | 344,528 | | |
| | 900 | | | @ | | Isilon Systems, Inc. | | | 24,840 | | |
| | 9,600 | | | @ | | Radisys Corp. | | | 160,032 | | |
| | | | 919,250 | | |
| | | | | Distribution/Wholesale: 1.5% | |
| | 6,750 | | | @ | | Beacon Roofing Supply, Inc. | | | 127,035 | | |
| | 12,400 | | | @ | | LKQ Corp. | | | 285,076 | | |
| | | | 412,111 | | |
| | | | | | | Electrical Components &
Equipment: 0.5% | | | | | |
| | 3,800 | | | @ | | Energy Conversion Devices, Inc. | | | 129,124 | | |
| | | | 129,124 | | |
| | | | | Electronics: 1.4% | |
| | 15,700 | | | @ | | Benchmark Electronics, Inc. | | | 382,452 | | |
| | | | 382,452 | | |
| Shares | | | | | | Value | |
| | | | | Energy - Alternate Sources: 0.6% | |
| | 5,200 | | | @ | | First Solar, Inc. | | $ | 154,960 | | |
| | | | 154,960 | | |
| | | | | Engineering & Construction: 1.4% | |
| | 6,900 | | | @ | | EMCOR Group, Inc. | | | 392,265 | | |
| | | | 392,265 | | |
| | | | | Healthcare - Products: 5.0% | |
| | 9,500 | | | @ | | Arthrocare Corp. | | | 379,240 | | |
| | 7,300 | | | @ | | Aspect Medical Systems, Inc. | | | 137,313 | | |
| | 10,700 | | | @ | | DexCom, Inc. | | | 105,502 | | |
| | 10,400 | | | @ | | Hansen Medical, Inc. | | | 120,016 | | |
| | 4,400 | | | @ | | Resmed, Inc. | | | 216,568 | | |
| | 15,100 | | | @ | | Viasys Healthcare, Inc. | | | 420,082 | | |
| | | | 1,378,721 | | |
| | | | | Healthcare-Services: 6.4% | |
| | 16,500 | | | @ | | Pediatrix Medical Group, Inc. | | | 806,850 | | |
| | 16,800 | | | @ | | Psychiatric Solutions, Inc. | | | 630,336 | | |
| | 11,100 | | | @ | | United Surgical Partners
International, Inc. | | | 314,685 | | |
| | | | 1,751,871 | | |
| | | | | Household Products/Wares: 1.4% | |
| | 8,200 | | | @ | | Central Garden & Pet Co. | | | 397,044 | | |
| | | | 397,044 | | |
| | | | | Internet: 1.2% | |
| | 14,100 | | | @ | | Perficient, Inc. | | | 231,381 | | |
| | 16,700 | | | @ | | Secure Computing Corp. | | | 109,552 | | |
| | | | 340,933 | | |
| | | | | Iron/Steel: 1.6% | |
| | 13,400 | | | | | Steel Dynamics, Inc. | | | 434,830 | | |
| | | | 434,830 | | |
| | | | | Leisure Time: 0.3% | |
| | 5,800 | | | | | Nautilus, Inc. | | | 81,200 | | |
| | | | 81,200 | | |
| | | | | Lodging: 2.1% | |
| | 12,000 | | | @@ | | Orient-Express Hotels Ltd. | | | 567,840 | | |
| | | | 567,840 | | |
| | | | | Machinery-Diversified: 2.4% | |
| | 12,800 | | | | | Cognex Corp. | | | 304,896 | | |
| | 3,400 | | | @ | | Middleby Corp. | | | 355,878 | | |
| | | | 660,774 | | |
| | | | | Miscellaneous Manufacturing: 1.5% | |
| | 9,000 | | | @ | | ESCO Technologies, Inc. | | | 408,960 | | |
| | | | 408,960 | | |
| | | | | Oil & Gas: 4.8% | |
| | 28,000 | | | @ | | EXCO Resources, Inc. | | | 473,479 | | |
| | 11,500 | | | | | Patterson-UTI Energy, Inc. | | | 267,145 | | |
| | 31,915 | | | @, I | | PetroHawk Energy Corp. | | | 367,023 | | |
| | 5,500 | | | @ | | Quicksilver Resources, Inc. | | | 201,245 | | |
| | | | 1,308,892 | | |
| | | | | Oil & Gas Services: 3.6% | |
| | 3,200 | | | @,@@ | | Core Laboratories NV | | | 259,200 | | |
| | 28,000 | | | @ | | Tetra Technologies, Inc. | | | 716,240 | | |
| | | | 975,440 | | |
See Accompanying Notes to Financial Statements
286
ING UBS PORTFOLIO OF INVESTMENTS
U.S. SMALL CAP GROWTH PORTFOLIO AS OF DECEMBER 31, 2006 (CONTINUED)
| Shares | | | | | | Value | |
| | | | | Pharmaceuticals: 5.3% | |
| | 9,500 | | | @ | | BioMarin Pharmaceuticals, Inc. | | $ | 155,705 | | |
| | 5,900 | | | @ | | Cubist Pharmaceuticals, Inc. | | | 106,849 | | |
| | 11,300 | | | @ | | Emergent Biosolutions, Inc. | | | 126,108 | | |
| | 13,400 | | | @ | | Isis Pharmaceuticals, Inc. | | | 149,008 | | |
| | 8,800 | | | @ | | Nuvelo, Inc. | | | 35,200 | | |
| | 9,800 | | | @ | | Penwest Pharmaceuticals Co. | | | 162,876 | | |
| | 9,900 | | | @ | | Renovis, Inc. | | | 31,284 | | |
| | 21,800 | | | @ | | VCA Antech, Inc. | | | 701,742 | | |
| | | | 1,468,772 | | |
| | | | | Real Estate Investment Trusts: 2.8% | |
| | 7,100 | | | | | BioMed Realty Trust, Inc. | | | 203,060 | | |
| | 13,100 | | | | | Ventas, Inc. | | | 554,392 | | |
| | | | 757,452 | | |
| | | | | Retail: 9.9% | |
| | 3,300 | | | @ | | Buffalo Wild Wings, Inc. | | | 175,560 | | |
| | 12,400 | | | @ | | California Pizza Kitchen, Inc. | | | 413,044 | | |
| | 8,500 | | | @ | | Childrens Place Retail Stores, Inc. | | | 539,920 | | |
| | 19,100 | | | | | Christopher & Banks Corp. | | | 356,406 | | |
| | 25,700 | | | | | CKE Restaurants, Inc. | | | 472,880 | | |
| | 3,600 | | | @ | | DSW, Inc. | | | 138,852 | | |
| | 5,700 | | | @ | | Guitar Center, Inc. | | | 259,122 | | |
| | 9,200 | | | @ | | Tween Brands, Inc. | | | 367,356 | | |
| | | | 2,723,140 | | |
| | | | | Semiconductors: 9.0% | |
| | 8,700 | | | @ | | Diodes, Inc. | | | 308,676 | | |
| | 11,200 | | | @ | | Exar Corp. | | | 145,600 | | |
| | 7,000 | | | @ | | Hittite Microwave Corp. | | | 226,240 | | |
| | 21,300 | | | @ | | Microsemi Corp. | | | 418,545 | | |
| | 11,100 | | | @ | | Photronics, Inc. | | | 181,374 | | |
| | 8,800 | | | @ | | Power Integrations, Inc. | | | 206,360 | | |
| | 16,000 | | | @ | | Rudolph Technologies, Inc. | | | 254,720 | | |
| | 23,700 | | | @ | | Silicon Image, Inc. | | | 301,464 | | |
| | 6,800 | | | @ | | Standard Microsystems Corp. | | | 190,264 | | |
| | 28,500 | | | @ | | Syntax-Brillian Corp. | | | 244,815 | | |
| | | | 2,478,058 | | |
| | | | | Software: 5.7% | |
| | 2,100 | | | @ | | DivX, Inc. | | | 48,447 | | |
| | 700 | | | | | Fair Isaac Corp. | | | 28,455 | | |
| | 11,200 | | | @ | | Neoware, Inc. | | | 147,952 | | |
| | 33,700 | | | @ | | Nuance Communications, Inc. | | | 386,202 | | |
| | 10,171 | | | @ | | Phase Forward, Inc. | | | 152,362 | | |
| | 11,100 | | | @ | | Progress Software Corp. | | | 310,023 | | |
| | 5,900 | | | @ | | THQ, Inc. | | | 191,868 | | |
| | 8,628 | | | @ | | Verint Systems, Inc. | | | 295,768 | | |
| | | | 1,561,077 | | |
| | | | | Telecommunications: 2.8% | |
| | 6,000 | | | @ | | NeuStar, Inc. | | | 194,640 | | |
| | 17,500 | | | @,@@ | | Nice Systems Ltd. ADR | | | 538,650 | | |
| | 1,800 | | | @ | | Optium Corp. | | | 44,892 | | |
| | | | 778,182 | | |
| | | | | Transportation: 4.5% | |
| | 16,300 | | | @ | | HUB Group, Inc. | | | 449,065 | | |
| | 11,900 | | | | | Landstar System, Inc. | | | 454,342 | | |
| | 11,600 | | | @@ | | UTI Worldwide, Inc. | | | 346,840 | | |
| | | | 1,250,247 | | |
Total Common Stock
(Cost $25,981,873) | | | 26,887,252 | | |
Principal
Amount | | | | Value | |
| SHORT-TERM INVESTMENTS: 1.5% | |
| | | U.S. Government Agency Obligations: 1.5% | |
| $ | 410,000 | | | Federal Home Loan Bank, 4.600%,
due 01/02/07 | | $ | 409,895 | | |
Total Short-Term Investments
(Cost $409,895) | | | 409,895 | | |
Total Investments in
Securities (Cost
$26,391,768)* | | | 99.3 | % | | $ | 27,297,147 | | |
Other Assets and
Liabilities-Net | | | 0.7 | | | | 186,661 | | |
| Net Assets | | | 100.0 | % | | $ | 27,483,808 | | |
@ Non-income producing security
@@ Foreign Issuer
ADR American Depositary Receipt
I Illiquid security
* Cost for federal income tax purposes is $26,941,188.
Net unrealized appreciation consists of:
| Gross Unrealized Appreciation | | $ | 1,320,041 | | |
| Gross Unrealized Depreciation | | | (964,082 | ) | |
| Net Unrealized Appreciation | | $ | 355,959 | | |
See Accompanying Notes to Financial Statements
287
PORTFOLIO OF INVESTMENTS
ING VAN KAMPEN COMSTOCK PORTFOLIO AS OF DECEMBER 31, 2006
| Shares | | | | | | Value | |
| COMMON STOCK: 91.7% | | | |
| | | | | Agriculture: 1.6% | |
| | 191,300 | | | | | Altria Group, Inc. | | $ | 16,417,366 | | |
| | | | 16,417,366 | | |
| | | | | Airlines: 0.0% | |
| | 19,400 | | | | | Southwest Airlines Co. | | | 297,208 | | |
| | | | 297,208 | | |
| | | | | Banks: 10.0% | |
| | 606,700 | | | | | Bank of America Corp. | | | 32,391,713 | | |
| | 338,500 | | | | | Bank of New York Co., Inc. | | | 13,326,745 | | |
| | 37,500 | | | @@,L | | Barclays PLC ADR | | | 2,180,250 | | |
| | 113,600 | | | | | PNC Financial Services
Group, Inc. | | | 8,410,944 | | |
| | 36,820 | | | L | | SunTrust Banks, Inc. | | | 3,109,449 | | |
| | 132,500 | | | | | US Bancorp. | | | 4,795,175 | | |
| | 404,700 | | | L | | Wachovia Corp. | | | 23,047,665 | | |
| | 432,500 | | | | | Wells Fargo & Co. | | | 15,379,700 | | |
| | | | 102,641,641 | | |
| | | | | Beverages: 2.6% | |
| | 133,400 | | | | | Anheuser-Busch Cos., Inc. | | | 6,563,280 | | |
| | 428,300 | | | | | Coca-Cola Co. | | | 20,665,475 | | |
| | | | 27,228,755 | | |
| | | | | Chemicals: 3.4% | |
| | 564,800 | | | L | | EI DuPont de Nemours & Co. | | | 27,511,408 | | |
| | 147,100 | | | L | | Rohm & Haas Co. | | | 7,519,752 | | |
| | | | 35,031,160 | | |
| | | | | Commercial Services: 0.3% | |
| | 162,700 | | | | | Western Union Co. | | | 3,647,734 | | |
| | | | 3,647,734 | | |
| | | | | Computers: 2.7% | |
| | 47,412 | | | @,L | | Affiliated Computer
Services, Inc. | | | 2,315,602 | | |
| | 514,700 | | | @ | | Dell, Inc. | | | 12,913,823 | | |
| | 105,200 | | | | | Hewlett-Packard Co. | | | 4,333,188 | | |
| | 85,500 | | | | | International Business
Machines Corp. | | | 8,306,325 | | |
| | | | 27,868,938 | | |
| | | | | Diversified Financial Services: 9.6% | |
| | 746,500 | | | | | Citigroup, Inc. | | | 41,580,050 | | |
| | 83,500 | | | | | Fannie Mae | | | 4,959,065 | | |
| | 385,700 | | | | | Freddie Mac | | | 26,189,030 | | |
| | 263,700 | | | | | JPMorgan Chase & Co. | | | 12,736,710 | | |
| | 141,900 | | | | | Merrill Lynch & Co., Inc. | | | 13,210,890 | | |
| | | | 98,675,745 | | |
| | | | | Electric: 0.7% | |
| | 162,150 | | | | | American Electric Power
Co., Inc. | | | 6,904,347 | | |
| | | | 6,904,347 | | |
| | | | | Electronics: 0.1% | |
| | 63,080 | | | @,@@,L | | Flextronics International Ltd. | | | 724,158 | | |
| | 33,950 | | | @,L | | Kemet Corp. | | | 247,835 | | |
| | | | 971,993 | | |
| Shares | | | | | | Value | |
| | | | | Food: 4.4% | |
| | 288,600 | | | @@ | | Cadbury Schweppes PLC ADR | | $ | 12,389,598 | | |
| | 386,300 | | | L | | Kraft Foods, Inc. | | | 13,790,910 | | |
| | 703,300 | | | @@ | | Unilever NV ADR | | | 19,164,925 | | |
| | | | 45,345,433 | | |
| | | | | Forest Products & Paper: 3.2% | |
| | 960,077 | | | L | | International Paper Co. | | | 32,738,626 | | |
| | | | 32,738,626 | | |
| | | | | Healthcare - Products: 0.7% | |
| | 449,200 | | | @ | | Boston Scientific Corp. | | | 7,717,256 | | |
| | | | 7,717,256 | | |
| | | | | Household Products/Wares: 2.0% | |
| | 304,900 | | | | | Kimberly-Clark Corp. | | | 20,717,955 | | |
| | | | 20,717,955 | | |
| | | | | Insurance: 6.2% | |
| | 115,600 | | | L | | Aflac, Inc. | | | 5,317,600 | | |
| | 149,500 | | | | | American International
Group, Inc. | | | 10,713,170 | | |
| | 1,520 | | | @,L | | Berkshire Hathaway, Inc. | | | 5,572,320 | | |
| | 254,860 | | | L | | Chubb Corp. | | | 13,484,643 | | |
| | 92,100 | | | | | Genworth Financial, Inc. | | | 3,150,741 | | |
| | 40,200 | | | | | Hartford Financial Services
Group, Inc. | | | 3,751,062 | | |
| | 120,200 | | | L | | Metlife, Inc. | | | 7,093,002 | | |
| | 185,505 | | | | | St. Paul Travelers Cos., Inc. | | | 9,959,763 | | |
| | 71,370 | | | | | Torchmark Corp. | | | 4,550,551 | | |
| | | | 63,592,852 | | |
| | | | | Internet: 1.4% | |
| | 436,175 | | | @ | | Liberty Media Holding Corp.-
Interactive | | | 9,408,295 | | |
| | 162,600 | | | @ | | McAfee, Inc. | | | 4,614,588 | | |
| | | | 14,022,883 | | |
| | | | | Machinery-Diversified: 0.0% | |
| | 21,970 | | | L | | Cognex Corp. | | | 523,325 | | |
| | | | 523,325 | | |
| | | | | Media: 9.3% | |
| | 230,899 | | | | | Clear Channel
Communications, Inc. | | | 8,206,150 | | |
| | 438,700 | | | @,L | | Comcast Corp. | | | 18,570,171 | | |
| | 75,600 | | | L | | Gannett Co., Inc. | | | 4,570,776 | | |
| | 89,135 | | | @ | | Liberty Media Holding Corp. | | | 8,733,447 | | |
| | 410,500 | | | | | News Corp., Inc. | | | 9,137,730 | | |
| | 1,021,000 | | | L | | Time Warner, Inc. | | | 22,237,380 | | |
| | 461,250 | | | @ | | Viacom, Inc. | | | 18,925,088 | | |
| | 163,640 | | | | | Walt Disney Co. | | | 5,607,943 | | |
| | | | 95,988,685 | | |
| | | | | Mining: 2.2% | |
| | 764,500 | | | L | | Alcoa, Inc. | | | 22,942,645 | | |
| | | | 22,942,645 | | |
| | | | | Miscellaneous Manufacturing: 0.6% | |
| | 167,400 | | | | | General Electric Co. | | | 6,228,954 | | |
| | | | 6,228,954 | | |
See Accompanying Notes to Financial Statements
288
PORTFOLIO OF INVESTMENTS
ING VAN KAMPEN COMSTOCK PORTFOLIO AS OF DECEMBER 31, 2006 (CONTINUED)
| Shares | | | | | | Value | |
| | | | | Oil & Gas: 0.5% | |
| | 70,600 | | | @@ | | Total SA ADR | | $ | 5,077,552 | | |
| | | | 5,077,552 | | |
| | | | | Pharmaceuticals: 16.7% | |
| | 262,500 | | | | | Abbott Laboratories | | | 12,786,375 | | |
| | 1,021,400 | | | | | Bristol-Myers Squibb Co. | | | 26,883,248 | | |
| | 136,500 | | | | | Cardinal Health, Inc. | | | 8,794,695 | | |
| | 323,500 | | | | | Eli Lilly & Co. | | | 16,854,350 | | |
| | 406,200 | | | @@,L | | GlaxoSmithKline PLC ADR | | | 21,431,112 | | |
| | 675,100 | | | | | Pfizer, Inc. | | | 17,485,090 | | |
| | 188,700 | | | @@ | | Roche Holding AG ADR | | | 16,888,235 | | |
| | 197,300 | | | @@ | | Sanofi-Aventis ADR | | | 9,109,341 | | |
| | 911,500 | | | | | Schering-Plough Corp. | | | 21,547,860 | | |
| | 391,000 | | | | | Wyeth | | | 19,909,720 | | |
| | | | 171,690,026 | | |
| | | | | Retail: 3.5% | |
| | 349,200 | | | L | | CVS Corp. | | | 10,793,772 | | |
| | 120,900 | | | | | Lowe's Cos., Inc. | | | 3,766,035 | | |
| | 464,300 | | | | | Wal-Mart Stores, Inc. | | | 21,441,374 | | |
| | | | 36,001,181 | | |
| | | | | Semiconductors: 1.8% | |
| | 448,980 | | | | | Intel Corp. | | | 9,091,845 | | |
| | 108,700 | | | L | | KLA-Tencor Corp. | | | 5,407,825 | | |
| | 134,800 | | | L | | Texas Instruments, Inc. | | | 3,882,240 | | |
| | | | 18,381,910 | | |
| | | | | Software: 0.9% | |
| | 162,600 | | | | | First Data Corp. | | | 4,149,552 | | |
| | 187,600 | | | | | Microsoft Corp. | | | 5,601,736 | | |
| | | | 9,751,288 | | |
| | | | | Telecommunications: 7.3% | |
| | 829,000 | | | | | AT&T, Inc. | | | 29,636,750 | | |
| | 192,200 | | | @ | | Cisco Systems, Inc. | | | 5,252,826 | | |
| | 19,755 | | | | | Embarq Corp. | | | 1,038,323 | | |
| | 38,430 | | | @@ | | Nokia OYJ ADR | | | 780,898 | | |
| | 265,700 | | | L | | Sprint Nextel Corp. | | | 5,019,073 | | |
| | 18,377 | | | @@ | | Telefonaktiebolaget LM
Ericsson ADR | | | 739,307 | | |
| | 875,800 | | | | | Verizon Communications, Inc. | | | 32,614,792 | | |
| | | | 75,081,969 | | |
Total Common Stock
(Cost $832,334,684) | | | 945,487,427 | | |
Principal
Amount | | | | Value | |
| SHORT-TERM INVESTMENTS: 17.6% | |
| | | U.S. Government Agency Obligations: 8.1% | |
| $ | 83,210,000 | | | Fannie Mae, 4.800%, due 01/02/07 | | | 83,187,810 | | |
Total U.S. Government
Agency Obligations
(Cost $83,187,810) | | | 83,187,810 | | |
Principal
Amount | | | | Value | |
| | | Securities Lending Collateralcc: 9.5% | |
| $ | 97,842,059 | | | The Bank of New York Institutional
Cash Reserves Fund | | $ | 97,842,059 | | |
Total Securities Lending Collateral
(Cost $97,842,059) | | | 97,842,059 | | |
Total Short-Term Investments
(Cost $181,029,869) | | | 181,029,869 | | |
Total Investments in
Securities (Cost
$1,013,364,553)* | | | 109.3 | % | | $ | 1,126,517,296 | | |
Other Assets and
Liabilities-Net | | | (9.3 | ) | | | (96,185,382 | ) | |
| Net Assets | | | 100.0 | % | | $ | 1,030,331,914 | | |
@ Non-income producing security
@@ Foreign Issuer
ADR American Depositary Receipt
cc Securities purchased with cash collateral for securities loaned.
L Loaned security, a portion or all of the security is on loan at December 31, 2006.
* Cost for federal income tax purposes is $1,015,179,758.
Net unrealized appreciation consists of:
| Gross Unrealized Appreciation | | $ | 118,903,932 | | |
| Gross Unrealized Depreciation | | | (7,566,394 | ) | |
| Net Unrealized Appreciation | | $ | 111,337,538 | | |
See Accompanying Notes to Financial Statements
289
ING VAN KAMPEN PORTFOLIO OF INVESTMENTS
EQUITY & INCOME PORTFOLIO AS OF DECEMBER 31, 2006
| Shares | | | | | | Value | |
| COMMON STOCK: 61.5% | | | |
| | | | | Aerospace/Defense: 1.3% | |
| | 83,480 | | | | | Northrop Grumman Corp. | | $ | 5,651,596 | | |
| | 146,280 | | | | | Raytheon Co. | | | 7,723,584 | | |
| | | | 13,375,180 | | |
| | | | | Agriculture: 1.0% | |
| | 123,180 | | | | | Altria Group, Inc. | | | 10,571,308 | | |
| | | | 10,571,308 | | |
| | | | | Auto Manufacturers: 0.6% | |
| | 156,950 | | | @@ | | Honda Motor Co., Ltd. ADR | | | 6,205,803 | | |
| | | | 6,205,803 | | |
| | | | | Banks: 2.7% | |
| | 166,056 | | | | | Bank of America Corp. | | | 8,865,730 | | |
| | 150,300 | | | | | Fifth Third Bancorp. | | | 6,151,779 | | |
| | 95,440 | | | | | PNC Financial Services
Group, Inc. | | | 7,066,378 | | |
| | 84,350 | | | | | State Street Corp. | | | 5,688,564 | | |
| | | | 27,772,451 | | |
| | | | | Beverages: 1.3% | |
| | 211,360 | | | | | Coca-Cola Co. | | | 10,198,120 | | |
| | 44,000 | | | @@ | | Diageo PLC ADR | | | 3,489,640 | | |
| | | | 13,687,760 | | |
| | | | | Chemicals: 2.6% | |
| | 356,080 | | | @@ | | Bayer AG ADR | | | 19,000,429 | | |
| | 172,000 | | | | | EI DuPont de Nemours & Co. | | | 8,378,120 | | |
| | | | 27,378,549 | | |
| | | | | Commercial Services: 0.1% | |
| | 28,900 | | | | | H&R Block, Inc. | | | 665,856 | | |
| | 4,159 | | | | | McKesson Corp. | | | 210,861 | | |
| | | | 876,717 | | |
| | | | | Computers: 0.2% | |
| | 59,916 | | | | | Hewlett-Packard Co. | | | 2,467,940 | | |
| | | | 2,467,940 | | |
| | | | | Cosmetics/Personal Care: 0.4% | |
| | 62,110 | | | | | Procter & Gamble Co. | | | 3,991,810 | | |
| | | | 3,991,810 | | |
| | | | | Diversified Financial Services: 8.5% | |
| | 548,300 | | | | | Charles Schwab Corp. | | | 10,604,122 | | |
| | 399,880 | | | | | Citigroup, Inc. | | | 22,273,316 | | |
| | 227,170 | | | | | Freddie Mac | | | 15,424,843 | | |
| | 7,340 | | | | | Goldman Sachs Group, Inc. | | | 1,463,229 | | |
| | 481,552 | | | | | JPMorgan Chase & Co. | | | 23,258,962 | | |
| | 154,550 | | | | | Merrill Lynch & Co., Inc. | | | 14,388,605 | | |
| | | | 87,413,077 | | |
| | | | | Electric: 2.6% | |
| | 158,870 | | | | | American Electric Power
Co., Inc. | | | 6,764,685 | | |
| | 11,000 | | | C | | CenterPoint Energy
Resources Corp. | | | 428,417 | | |
| | 74 | | | @ | | Dynegy, Inc. | | | 536 | | |
| | 123,565 | | | | | Entergy Corp. | | | 11,407,521 | | |
| | 129,920 | | | | | FirstEnergy Corp. | | | 7,834,176 | | |
| | | | 26,435,335 | | |
| Shares | | | | | | Value | |
| | | | | Electronics: 0.4% | |
| | 112,230 | | | | | Applera Corp.-Applied
Biosystems Group | | $ | 4,117,719 | | |
| | | | 4,117,719 | | |
| | | | | Food: 2.3% | |
| | 180,300 | | | @@ | | Cadbury Schweppes PLC ADR | | | 7,740,279 | | |
| | 113,200 | | | | | ConAgra Foods, Inc. | | | 3,056,400 | | |
| | 46,600 | | | | | Safeway, Inc. | | | 1,610,496 | | |
| | 56,750 | | | | | Supervalu, Inc. | | | 2,028,813 | | |
| | 352,700 | | | @@ | | Unilever NV ADR | | | 9,611,075 | | |
| | | | 24,047,063 | | |
| | | | | Healthcare-Products: 1.1% | |
| | 158,674 | | | | | Baxter International, Inc. | | | 7,360,887 | | |
| | 244,100 | | | @ | | Boston Scientific Corp. | | | 4,193,638 | | |
| | | | 11,554,525 | | |
| | | | | Household Products/Wares: 0.3% | |
| | 38,850 | | | | | Kimberly-Clark Corp. | | | 2,639,858 | | |
| | | | 2,639,858 | | |
| | | | | Insurance: 5.6% | |
| | 153,360 | | | @@ | | Aegon NV ADR | | | 2,906,172 | | |
| | 191,594 | | | | | Chubb Corp. | | | 10,137,239 | | |
| | 41,150 | | | | | Cigna Corp. | | | 5,414,106 | | |
| | 69,180 | | | | | Hartford Financial Services
Group, Inc. | | | 6,455,186 | | |
| | 490,000 | | | | | Marsh & McLennan Cos., Inc. | | | 15,023,400 | | |
| | 238,461 | | | | | St. Paul Travelers Cos., Inc. | | | 12,802,971 | | |
| | 73,400 | | | @@ | | XL Capital Ltd. | | | 5,286,268 | | |
| | | | 58,025,342 | | |
| | | | | Internet: 2.3% | |
| | 103,200 | | | @ | | Amazon.com, Inc. | | | 4,072,272 | | |
| | 699,133 | | | @ | | Symantec Corp. | | | 14,576,923 | | |
| | 192,700 | | | @ | | Yahoo!, Inc. | | | 4,921,558 | | |
| | | | 23,570,753 | | |
| | | | | Media: 3.7% | |
| | 135,749 | | | | | Clear Channel
Communications, Inc. | | | 4,824,519 | | |
| | 109,800 | | | @ | | Comcast Corp. | | | 4,647,834 | | |
| | 773,480 | | | | | Time Warner, Inc. | | | 16,846,378 | | |
| | 283,625 | | | @ | | Viacom, Inc. | | | 11,637,134 | | |
| | | | 37,955,865 | | |
| | | | | Mining: 0.7% | |
| | 156,050 | | | | | Newmont Mining Corp. | | | 7,045,658 | | |
| | | | 7,045,658 | | |
| | | | | Miscellaneous Manufacturing: 2.8% | |
| | 456,140 | | | | | General Electric Co. | | | 16,972,969 | | |
| | 41,530 | | | @@ | | Ingersoll-Rand Co. | | | 1,625,069 | | |
| | 109,330 | | | @@ | | Siemens AG ADR | | | 10,774,472 | | |
| | | | 29,372,510 | | |
| | | | | Oil & Gas: 2.9% | |
| | 9,820 | | | @@ | | BP PLC ADR | | | 658,922 | | |
| | 155,280 | | | | | ConocoPhillips | | | 11,172,396 | | |
| | 90,610 | | | | | ExxonMobil Corp. | | | 6,943,444 | | |
| | 161,230 | | | @@ | | Royal Dutch Shell PLC ADR | | | 11,413,472 | | |
| | | | 30,188,234 | | |
See Accompanying Notes to Financial Statements
290
ING VAN KAMPEN PORTFOLIO OF INVESTMENTS
EQUITY & INCOME PORTFOLIO AS OF DECEMBER 31, 2006 (CONTINUED)
| Shares | | | | | | Value | |
| | | | | Oil & Gas Services: 0.7% | |
| | 117,670 | | | | | Schlumberger Ltd. | | $ | 7,432,037 | | |
| | | | 7,432,037 | | |
| | | | | Pharmaceuticals: 9.5% | |
| | 289,900 | | | | | Abbott Laboratories | | | 14,121,029 | | |
| | 452,490 | | | | | Bristol-Myers Squibb Co. | | | 11,909,537 | | |
| | 288,810 | | | | | Eli Lilly & Co. | | | 15,047,001 | | |
| | 86,050 | | | @@ | | GlaxoSmithKline PLC ADR | | | 4,539,998 | | |
| | 339,500 | | | | | Pfizer, Inc. | | | 8,793,050 | | |
| | 146,460 | | | @@ | | Roche Holding AG ADR | | | 13,107,848 | | |
| | 99,660 | | | @@ | | Sanofi-Aventis ADR | | | 4,601,302 | | |
| | 670,210 | | | | | Schering-Plough Corp. | | | 15,843,764 | | |
| | 191,760 | | | | | Wyeth | | | 9,764,419 | | |
| | | | 97,727,948 | | |
| | | | | Pipelines: 0.6% | |
| | 218,700 | | | | | Williams Cos., Inc. | | | 5,712,444 | | |
| | | | 5,712,444 | | |
| | | | | Retail: 2.0% | |
| | 46,160 | | | @ | | Kohl's Corp. | | | 3,158,729 | | |
| | 85,060 | | | | | McDonald's Corp. | | | 3,770,710 | | |
| | 78,400 | | | @ | | Office Depot, Inc. | | | 2,992,528 | | |
| | 234,510 | | | | | Wal-Mart Stores, Inc. | | | 10,829,672 | | |
| | | | 20,751,639 | | |
| | | | | Semiconductors: 1.4% | |
| | 465,027 | | | | | Intel Corp. | | | 9,416,797 | | |
| | 336,538 | | | @ | | Micron Technology, Inc. | | | 4,698,070 | | |
| | | | 14,114,867 | | |
| | | | | Telecommunications: 3.9% | |
| | 66,826 | | | | | Embarq Corp. | | | 3,512,375 | | |
| | 198,600 | | | @@ | | France Telecom SA ADR | | | 5,501,220 | | |
| | 154,660 | | | | | Motorola, Inc. | | | 3,179,810 | | |
| | 646,157 | | | | | Sprint Nextel Corp. | | | 12,205,906 | | |
| | 414,956 | | | | | Verizon Communications, Inc. | | | 15,452,961 | | |
| | | | 39,852,272 | | |
Total Common Stock
(Cost $521,528,778) | | | 634,284,664 | | |
| PREFERRED STOCK: 3.8% | | | |
| | | | | Advertising: 0.1% | |
| | 900 | | | #,P | | Interpublic Group of Cos., Inc. | | | 995,625 | | |
| | | | 995,625 | | |
| | | | | Commercial Services: 0.1% | |
| | 25,281 | | | P | | United Rentals Trust I | | | 1,238,769 | | |
| | | | 1,238,769 | | |
| | | | | Diversified Financial Services: 0.1% | |
| | 24,600 | | | @@ | | Lazard Ltd. | | | 1,020,654 | | |
| | | | 1,020,654 | | |
| | | | | Healthcare-Services: 0.2% | |
| | 1,600 | | | # | | Healthsouth Corp. | | | 1,598,400 | | |
| | | | 1,598,400 | | |
| | | | | Housewares: 0.3% | |
| | 73,100 | | | P | | Newell Financial Trust I | | | 3,499,663 | | |
| | | | 3,499,663 | | |
| Shares | | | | | | Value | |
| | | | | Insurance: 0.5% | |
| | | | 56,850 | | | | | Conseco, Inc. | | $ | 1,417,839 | | |
| | | | 83,650 | | | P | | Travelers Property Casualty
Corp. | | | 2,186,611 | | |
| | | | 53,600 | | | @@ | | XL Capital Ltd. | | | 1,420,400 | | |
| | | | 5,024,850 | | |
| | | | | Media: 0.2% | |
| | | | 27,920 | | | P | | Tribune Co. | | | 1,916,708 | | |
| | | | 1,916,708 | | |
| | | | | Pharmaceuticals: 0.5% | |
| | | | 89,650 | | | | | Schering-Plough Corp. | | | 5,100,189 | | |
| | | | 5,100,189 | | |
| | | | | Pipelines: 0.6% | |
| | | | 1,900 | | | | | El Paso Corp. | | | 2,522,250 | | |
| | | | 105,000 | | | P | | El Paso Energy Capital
Trust I | | | 4,074,000 | | |
| | | | 6,596,250 | | |
| | | | | Savings & Loans: 0.1% | |
| | | | 13,600 | | | | | Sovereign Capital Trust | | | 676,600 | | |
| | | | 676,600 | | |
| | | | | Sovereign: 0.5% | |
| | | | 50 | | | P | | Fannie Mae | | | 5,000,732 | | |
| | | | 5,000,732 | | |
| | | | | Telecommunications: 0.6% | |
| | | | 6,000 | | | P | | Lucent Technologies
Capital Trust I | | | 6,199,500 | | |
| | | | 6,199,500 | | |
Total Preferred Stock
(Cost $36,583,933) | | | 38,867,940 | | |
Principal
Amount | | | | | | Value | |
| CONVERTIBLE BONDS: 12.1% | |
| | | | | Aerospace/Defense: 0.4% | |
| $ | 4,225,000 | | | | C | | | L-3 Communications Corp.,
3.000%, due 08/01/35 | | | | | 4,457,375 | | |
| | | | 4,457,375 | | |
| | | | | Airlines: 0.1% | |
| | | | 956,000 | | | C | | Continental Airlines, Inc.,
4.500%, due 02/01/07 | | | 990,479 | | |
| | | | 990,479 | | |
| | | | | Auto Manufacturers: 0.3% | |
| | | | 2,598,000 | | | C | | Ford Motor Co., 4.250%,
due 12/15/36 | | | 2,789,603 | | |
| | | | 2,789,603 | | |
| | | | | Biotechnology: 0.8% | |
| | | | 4,200,000 | | | # | | Amgen, Inc., 0.375%,
due 02/01/13 | | | 4,147,500 | | |
| | | | 1,598,000 | | | # | | Charles River Laboratories
International, Inc., 2.250%,
due 06/15/13 | | | 1,735,828 | | |
| | | | 2,300,000 | | | C | | Invitrogen Corp., 1.500%,
due 02/15/24 | | | 1,975,125 | | |
| | | | 7,858,453 | | |
See Accompanying Notes to Financial Statements
291
ING VAN KAMPEN PORTFOLIO OF INVESTMENTS
EQUITY & INCOME PORTFOLIO AS OF DECEMBER 31, 2006 (CONTINUED)
Principal
Amount | | | | | | Value | |
| | | | | Computers: 0.7% | |
| $ | 3,150,000 | | | C | | Electronic Data Systems Corp.,
3.875%, due 07/15/23 | | $ | 3,358,688 | | |
| | 3,959,000 | | | # | | EMC Corp., 1.750%,
due 12/01/11 | | | 4,122,309 | | |
| | | | 7,480,997 | | |
| | | | | Diversified Financial Services: 1.7% | |
| | 5,800,000 | | | C | | Goldman Sachs Group, Inc.,
2.000%, due 02/02/12 | | | 5,868,730 | | |
| | 3,970,000 | | | #,C | | Goldman Sachs Group, Inc.,
2.000%, due 06/29/13 | | | 3,996,520 | | |
| | 7,800,000 | | | | | Lehman Brothers Holdings,
Inc., 1.500%, due 03/23/12 | | | 8,047,260 | | |
| | | | 17,912,510 | | |
| | | | | Environmental Control: 0.1% | |
| | 1,161,000 | | | C | | Allied Waste North America,
Inc., 4.250%, due 04/15/34 | | | 1,114,560 | | |
| | | | 1,114,560 | | |
| | | | | Food: 1.0% | |
| | 10,800,000 | | | C | | General Mills, Inc., 1.870%,
due 10/28/22 | | | 8,059,500 | | |
| | 7,100,000 | | | C | | Supervalu, Inc., 4.240%,
due 11/02/31 | | | 2,529,375 | | |
| | | | 10,588,875 | | |
| | | | | Healthcare-Products: 0.9% | |
| | 1,300,000 | | | C | | Advanced Medical Optics, Inc.,
2.500%, due 07/15/24 | | | 1,264,250 | | |
| | 3,104,000 | | | #,C | | Beckman Coulter, Inc.,
2.500%, due 12/15/36 | | | 3,148,636 | | |
| | 1,263,000 | | | C | | Edwards Lifesciences Corp.,
3.875%, due 05/15/33 | | | 1,294,575 | | |
| | 3,960,000 | | | C | | Medtronic, Inc., 1.250%,
due 09/15/21 | | | 3,984,750 | | |
| | | | 9,692,211 | | |
| | | | | Healthcare-Services: 0.6% | |
| | 2,600,000 | | | C | | Health Management
Associates, Inc., 4.375%,
due 08/01/23 | | | 2,655,250 | | |
| | 3,138,000 | | | C | | Manor Care, Inc., 2.125%,
due 08/01/35 | | | 3,561,630 | | |
| | | | 6,216,880 | | |
| | | | | Insurance: 0.2% | |
| | 2,035,000 | | | C | | Conseco, Inc., 3.500%,
due 09/30/35 | | | 2,019,738 | | |
| | | | 2,019,738 | | |
| | | | | Internet: 0.9% | |
| | 5,740,000 | | | C | | Amazon.com, Inc., 4.750%,
due 02/01/09 | | | 5,661,075 | | |
| | 2,647,000 | | | # | | Symantec Corp., 0.750%,
due 06/15/11 | | | 3,202,870 | | |
| | 278,000 | | | # | | Symantec Corp., 1.000%,
due 06/15/13 | | | 339,508 | | |
| | | | 9,203,453 | | |
| | | | | Media: 0.4% | |
| | 2,428,000 | | | C | | EchoStar Communications
Corp., 5.750%, due 05/15/08 | | | 2,485,665 | | |
Principal
Amount | | | | | | Value | |
| $ | 1,615,000 | | | C | | Sinclair Broadcast Group, Inc.,
6.000%, due 09/15/12 | | $ | 1,485,800 | | |
| | | | 3,971,465 | | |
| | | | | Miscellaneous Manufacturing: 0.6% | |
| | 3,750,000 | | | C | | 3M Co., 2.400%,
due 11/21/32 | | | 3,440,625 | | |
| | 2,700,000 | | | C | | Eastman Kodak Co.,
3.375%, due 10/15/33 | | | 2,865,375 | | |
| | | | 6,306,000 | | |
| | | | | Packaging & Containers: 0.3% | |
| | 2,900,000 | | | #,C | | Sealed Air Corp., 3.000%,
due 06/30/33 | | | 3,023,250 | | |
| | | | 3,023,250 | | |
| | | | | Pharmaceuticals: 1.0% | |
| | 3,200,000 | | | C | | ImClone Systems, Inc.,
1.375%, due 05/15/24 | | | 2,908,000 | | |
| | 4,005,000 | | | @@,C | | Teva Pharmaceutical
Finance Co. BV, 1.750%,
due 02/01/26 | | | 3,709,631 | | |
| | 3,512,000 | | | C | | Watson Pharmaceuticals, Inc.,
1.750%, due 03/15/23 | | | 3,257,380 | | |
| | | | 9,875,011 | | |
| | | | | Retail: 0.1% | |
| | 1,050,000 | | | C | | Best Buy Co., Inc., 2.250%,
due 01/15/22 | | | 1,172,063 | | |
| | | | 1,172,063 | | |
| | | | | Semiconductors: 0.2% | |
| | 2,750,000 | | | | | Intel Corp., 2.950%,
due 12/15/35 | | | 2,502,500 | | |
| | | | 2,502,500 | | |
| | | | | Telecommunications: 1.8% | |
| | 2,000,000 | | | #,C | | JDS Uniphase Corp., 1.000%,
due 05/15/26 | | | 1,742,500 | | |
| | 2,600,000 | | | C | | JDS Uniphase Corp., 2.430%,
due 11/15/10 | | | 2,369,250 | | |
| | 2,100,000 | | | | | Juniper Networks, Inc.,
0.000%, due 06/15/08 | | | 2,281,125 | | |
| | 2,200,000 | | | | | Level 3 Communications, Inc.,
2.875%, due 07/15/10 | | | 2,318,250 | | |
| | 800,000 | | | C | | Level 3 Communications, Inc.,
3.500%, due 06/15/12 | | | 998,000 | | |
| | 1,300,000 | | | | | Level 3 Communications, Inc.,
6.000%, due 03/15/10 | | | 1,205,750 | | |
| | 5,006,000 | | | @@,C | | Nortel Networks Corp.,
4.250%, due 09/01/08 | | | 4,868,335 | | |
| | 1,412,000 | | | C | | Qwest Communications
International, Inc., 3.500%,
due 11/15/25 | | | 2,215,075 | | |
| | | | 17,998,285 | | |
Total Convertible Bonds
(Cost $121,665,576) | | | 125,173,708 | | |
| CORPORATE BONDS/NOTES: 4.7% | | | |
| | | | | Aerospace/Defense: 0.0% | |
| | 255,000 | | | C | | Raytheon Co., 6.150%,
due 11/01/08 | | | 258,374 | | |
| | | | 258,374 | | |
See Accompanying Notes to Financial Statements
292
ING VAN KAMPEN PORTFOLIO OF INVESTMENTS
EQUITY & INCOME PORTFOLIO AS OF DECEMBER 31, 2006 (CONTINUED)
Principal
Amount | | | | | | Value | |
| | | | | Airlines: 0.0% | |
| $ | 453,040 | | | | | America West Airlines, Inc.,
7.100%, due 04/02/21 | | $ | 479,373 | | |
| | | | 479,373 | | |
| | | | | Auto Manufacturers: 0.0% | |
| | 325,000 | | | | | DaimlerChrysler Holding Corp.,
7.750%, due 01/18/11 | | | 348,181 | | |
| | | | 348,181 | | |
| | | | | Banks: 0.6% | |
| | 425,000 | | | | | Bank of New York, 3.800%,
due 02/01/08 | | | 418,228 | | |
| | 75,000 | | | | | Bank of New York, 5.200%,
due 07/01/07 | | | 74,997 | | |
| | 175,000 | | | | | Bank One Corp., 6.000%,
due 02/17/09 | | | 177,273 | | |
| | 750,000 | | | | | Marshall & Ilsley Bank,
3.800%, due 02/08/08 | | | 738,313 | | |
| | 270,000 | | | | | Popular North America, Inc.,
5.650%, due 04/15/09 | | | 270,779 | | |
| | 125,000 | | | | | Sovereign Bank, 4.000%,
due 02/01/08 | | | 123,228 | | |
| | 905,000 | | | @@,# | | Unicredit Luxembourg
Finance SA, 5.426%,
due 10/24/08 | | | 905,442 | | |
| | 745,000 | | | C | | USB Capital IX, 6.189%,
due 03/29/49 | | | 761,568 | | |
| | 2,225,000 | | | C | | Wachovia Capital Trust III,
5.800%, due 12/31/49 | | | 2,245,434 | | |
| | | | 5,715,262 | | |
| | | | | Beverages: 0.1% | |
| | 485,000 | | | @@,# | | FBG Finance Ltd., 5.125%,
due 06/15/15 | | | 459,246 | | |
| | 445,000 | | | #,C | | Miller Brewing Co., 4.250%,
due 08/15/08 | | | 437,291 | | |
| | | | 896,537 | | |
| | | | | Computers: 0.0% | |
| | 430,000 | | | C | | Hewlett-Packard Co., 5.496%,
due 05/22/09 | | | 430,967 | | |
| | | | 430,967 | | |
| | | | | Diversified Financial Services: 1.4% | |
| | 1,100,000 | | | # | | AIG SunAmerica Global
Financing VI, 6.300%,
due 05/10/11 | | | 1,145,810 | | |
| | 705,000 | | | | | American General Finance
Corp., 4.625%, due 05/15/09 | | | 694,252 | | |
| | 50,000 | | | | | American General Finance
Corp., 4.625%, due 09/01/10 | | | 48,835 | | |
| | 200,000 | | | C | | AXA Financial, Inc., 6.500%,
due 04/01/08 | | | 202,466 | | |
| | 690,000 | | | | | Caterpillar Financial Services
Corp., 3.625%, due 11/15/07 | | | 680,076 | | |
| | 100,000 | | | | | CIT Group, Inc., 3.650%,
due 11/23/07 | | | 98,596 | | |
| | 305,000 | | | | | CIT Group, Inc., 4.750%,
due 08/15/08 | | | 302,526 | | |
| | 100,000 | | | | | CIT Group, Inc., 7.375%,
due 04/02/07 | | | 100,482 | | |
| | 645,000 | | | | | Countrywide Home Loans,
Inc., 3.250%, due 05/21/08 | | | 627,251 | | |
Principal
Amount | | | | | | Value | |
| $ | 600,000 | | | # | | Farmers Exchange Capital,
7.050%, due 07/15/28 | | $ | 627,881 | | |
| | 250,000 | | | | | General Electric Capital Corp.,
4.250%, due 12/01/10 | | | 242,100 | | |
| | 3,500,000 | | | | | Goldman Sachs Group, Inc.,
0.250%, due 08/30/08 | | | 3,558,765 | | |
| | 125,000 | | | | | Household Finance Corp.,
4.125%, due 12/15/08 | | | 122,574 | | |
| | 160,000 | | | | | HSBC Finance Corp., 4.125%,
due 11/16/09 | | | 155,658 | | |
| | 75,000 | | | | | HSBC Finance Corp., 6.375%,
due 10/15/11 | | | 78,507 | | |
| | 150,000 | | | | | HSBC Finance Corp., 6.400%,
due 06/17/08 | | | 152,351 | | |
| | 775,000 | | | | | HSBC Finance Corp., 6.750%,
due 05/15/11 | | | 820,988 | | |
| | 50,000 | | | | | HSBC Finance Corp., 8.000%,
due 07/15/10 | | | 54,357 | | |
| | 75,000 | | | # | | John Hancock Global
Funding II, 7.900%,
due 07/02/10 | | | 81,139 | | |
| | 425,000 | | | | | JPMorgan Chase & Co.,
6.750%, due 02/01/11 | | | 447,204 | | |
| | 400,000 | | | @@,#,C | | Mantis Reef Ltd., 4.692%,
due 11/14/08 | | | 395,038 | | |
| | 510,000 | | | | | MBNA Corp., 5.798%,
due 05/05/08 | | | 513,325 | | |
| | 630,000 | | | @@,# | | Nationwide Building Society,
4.250%, due 02/01/10 | | | 610,782 | | |
| | 910,000 | | | C | | Residential Capital Corp.,
6.375%, due 06/30/10 | | | 921,303 | | |
| | 475,000 | | | | | SLM Corp., 4.000%,
due 01/15/10 | | | 458,479 | | |
| | 215,000 | | | | | Textron Financial Corp.,
4.125%, due 03/03/08 | | | 212,041 | | |
| | 480,000 | | | | | Textron Financial Corp.,
5.125%, due 02/03/11 | | | 476,882 | | |
| | 355,000 | | | @@,#,C | | Two-Rock Pass-Through Trust,
6.316%, due 02/11/50 | | | 349,753 | | |
| | 690,000 | | | # | | Xlliac Global Funding,
4.800%, due 08/10/10 | | | 676,782 | | |
| | | | 14,856,203 | | |
| | | | | Electric: 0.6% | |
| | 435,000 | | | | | Ameren Corp., 4.263%,
due 05/15/07 | | | 432,775 | | |
| | 500,000 | | | C | | Arizona Public Service Co.,
5.800%, due 06/30/14 | | | 499,605 | | |
| | 485,000 | | | C | | Carolina Power & Light Co.,
5.125%, due 09/15/13 | | | 477,470 | | |
| | 385,000 | | | | | CC Funding Trust I, 6.900%,
due 02/16/07 | | | 385,555 | | |
| | 110,000 | | | C | | Consumers Energy Co.,
4.000%, due 05/15/10 | | | 105,224 | | |
| | 175,000 | | | C | | Consumers Energy Co.,
4.800%, due 02/17/09 | | | 172,793 | | |
| | 190,000 | | | C | | Detroit Edison Co., 6.125%,
due 10/01/10 | | | 194,402 | | |
| | 370,000 | | | C | | Duquesne Light Co.,
5.700%, due 05/15/14 | | | 371,669 | | |
| | 245,000 | | | C | | Entergy Gulf States, Inc.,
3.600%, due 06/01/08 | | | 238,610 | | |
| | 170,000 | | | C | | Entergy Gulf States, Inc.,
5.769%, due 12/01/09 | | | 169,768 | | |
See Accompanying Notes to Financial Statements
293
ING VAN KAMPEN PORTFOLIO OF INVESTMENTS
EQUITY & INCOME PORTFOLIO AS OF DECEMBER 31, 2006 (CONTINUED)
Principal
Amount | | | | | | Value | |
| | | | | Electric (continued) | |
| $ | 235,000 | | | C | | Nisource Finance Corp.,
5.940%, due 11/23/09 | | $ | 235,256 | | |
| | 430,000 | | | C | | Ohio Power Co., 6.000%,
due 06/01/16 | | | 442,322 | | |
| | 518,000 | | | | | Pacific Gas & Electric Co.,
9.500%, due 06/30/10 | | | 1,767,028 | | |
| | 300,000 | | | C | | Wisconsin Electric Power,
3.500%, due 12/01/07 | | | 295,149 | | |
| | | | 5,787,626 | | |
| | | | | | | Electrical Components &
Equipment: 0.1% | | | | | |
| | 365,000 | | | C | | Cooper Industries, Inc.,
5.250%, due 11/15/12 | | | 361,760 | | |
| | 280,000 | | | @@,# | | LG Electronics, Inc., 5.000%,
due 06/17/10 | | | 274,667 | | |
| | | | 636,427 | | |
| | | | | Environmental Control: 0.0% | |
| | 150,000 | | | C | | Waste Management, Inc.,
7.375%, due 08/01/10 | | | 159,681 | | |
| | | | 159,681 | | |
| | | | | Food: 0.1% | |
| | 205,000 | | | C | | ConAgra Foods, Inc., 7.000%,
due 10/01/28 | | | 222,733 | | |
| | 190,000 | | | C | | ConAgra Foods, Inc., 8.250%,
due 09/15/30 | | | 234,033 | | |
| | 430,000 | | | C | | Fred Meyer, Inc., 7.450%,
due 03/01/08 | | | 439,430 | | |
| | 290,000 | | | C | | Sara Lee Corp., 6.125%,
due 11/01/32 | | | 263,204 | | |
| | | | 1,159,400 | | |
| | | | | Gas: 0.0% | |
| | 300,000 | | | | | Sempra Energy, 4.621%,
due 05/17/07 | | | 298,883 | | |
| | | | 298,883 | | |
| | | | | Healthcare - Services: 0.1% | |
| | 430,000 | | | | | WellPoint, Inc., 3.750%,
due 12/14/07 | | | 423,309 | | |
| | 95,000 | | | C | | WellPoint, Inc., 4.250%,
due 12/15/09 | | | 92,407 | | |
| | | | 515,716 | | |
| | | | | Insurance: 0.2% | |
| | 225,000 | | | # | | Farmers Insurance Exchange,
8.625%, due 05/01/24 | | | 270,531 | | |
| | 250,000 | | | | | Nationwide Financial Services,
6.250%, due 11/15/11 | | | 258,678 | | |
| | 205,000 | | | C | | Platinum Underwriters
Finance, Inc., 7.500%,
due 06/01/17 | | | 216,580 | | |
| | 370,000 | | | @@ | | Platinum Underwriters
Holdings Ltd., 6.371%,
due 11/16/07 | | | 367,777 | | |
| | 490,000 | | | | | St. Paul Travelers Cos., Inc.,
5.010%, due 08/16/07 | | | 488,198 | | |
| | | | 1,601,764 | | |
Principal
Amount | | | | | | Value | |
| | | | | Lodging: 0.0% | |
| $ | 340,000 | | | #,C | | Hyatt Equities, LLC, 6.875%,
due 06/15/07 | | $ | 341,450 | | |
| | | | 341,450 | | |
| | | | | Media: 0.2% | |
| | 755,000 | | | C | | Comcast Cable
Communications Holdings,
Inc., 6.750%, due 01/30/11 | | | 791,782 | | |
| | 220,000 | | | | | News America, Inc., 7.280%,
due 06/30/28 | | | 237,427 | | |
| | 835,000 | | | | | Time Warner, Inc., 5.606%,
due 11/13/09 | | | 836,202 | | |
| | 440,000 | | | C | | Viacom, Inc., 6.875%,
due 04/30/36 | | | 436,377 | | |
| | | | 2,301,788 | | |
| | | | | Pharmaceuticals: 0.4% | |
| | 3,890,000 | | | C | | Omnicare, Inc., 3.250%,
due 12/15/35 | | | 3,394,025 | | |
| | 207,000 | | | C | | Valeant Pharmaceuticals
International, 4.000%,
due 11/15/13 | | | 198,203 | | |
| | | | 3,592,228 | | |
| | | | | Pipelines: 0.1% | |
| | 175,000 | | | C | | Consolidated Natural Gas Co.,
6.250%, due 11/01/11 | | | 180,933 | | |
| | 140,000 | | | C | | Panhandle Eastern Pipe Line,
2.750%, due 03/15/07 | | | 139,180 | | |
| | 435,000 | | | #,C | | Plains All American Pipeline LP,
6.700%, due 05/15/36 | | | 448,909 | | |
| | 215,000 | | | C | | Texas Eastern Transmission LP,
7.000%, due 07/15/32 | | | 242,142 | | |
| | | | 1,011,164 | | |
| | | | | Real Estate: 0.1% | |
| | 575,000 | | | @@ | | Brookfield Asset
Management, Inc.,
7.125%, due 06/15/12 | | | 613,335 | | |
| | 671,365 | | | # | | World Financial Properties,
6.910%, due 09/01/13 | | | 702,818 | | |
| | | | 1,316,153 | | |
| | | | | Retail: 0.2% | |
| | 130,000 | | | C | | CVS Corp., 5.750%,
due 08/15/11 | | | 131,695 | | |
| | 755,000 | | | #,C | | CVS Corp., 6.036%,
due 12/10/28 | | | 754,158 | | |
| | 10,000 | | | C | | Federated Department Stores,
6.900%, due 04/01/29 | | | 10,153 | | |
| | 220,000 | | | C | | Home Depot, Inc., 5.490%,
due 12/16/09 | | | 220,163 | | |
| | 425,000 | | | C | | May Department Stores Co.,
6.700%, due 07/15/34 | | | 420,510 | | |
| | 230,000 | | | C | | Yum! Brands, Inc., 8.875%,
due 04/15/11 | | | 258,239 | | |
| | | | 1,794,918 | | |
| | | | | Savings & Loans: 0.1% | |
| | 225,000 | | | | | Washington Mutual Bank,
5.500%, due 01/15/13 | | | 224,357 | | |
See Accompanying Notes to Financial Statements
294
ING VAN KAMPEN PORTFOLIO OF INVESTMENTS
EQUITY & INCOME PORTFOLIO AS OF DECEMBER 31, 2006 (CONTINUED)
Principal
Amount | | | | | | Value | |
| | | | | Savings & Loans (continued) | |
| $ | 300,000 | | | #,C | | Washington Mutual
Preferred Funding II,
6.665%, due 12/29/49 | | $ | 301,349 | | |
| | 430,000 | | | | | Washington Mutual, Inc.,
8.250%, due 04/01/10 | | | 463,498 | | |
| | | | 989,204 | | |
| | | | | Telecommunications: 0.3% | |
| | 480,000 | | | @@,C | | France Telecom SA, 8.500%,
due 03/01/31 | | | 631,979 | | |
| | 270,000 | | | C | | SBC Communications, Inc.,
6.150%, due 09/15/34 | | | 266,435 | | |
| | 185,000 | | | C | | Sprint Capital Corp., 8.750%,
due 03/15/32 | | | 223,298 | | |
| | 630,000 | | | @@,C | | Telecom Italia Capital SA,
4.000%, due 01/15/10 | | | 602,003 | | |
| | 490,000 | | | @@,C | | Telefonica Europe BV,
8.250%, due 09/15/30 | | | 585,455 | | |
| | 410,000 | | | @@ | | Vodafone Group PLC,
5.454%, due 12/28/07 | | | 410,315 | | |
| | | | 2,719,485 | | |
| | | | | Textiles: 0.0% | |
| | 227,000 | | | C | | Mohawk Industries, Inc.,
7.200%, due 04/15/12 | | | 236,036 | | |
| | | | 236,036 | | |
| | | | | Transportation: 0.1% | |
| | 470,000 | | | | | Burlington Northern
Santa Fe Corp., 6.125%,
due 03/15/09 | | | 477,664 | | |
| | 250,000 | | | | | FedEx Corp., 2.650%,
due 04/01/07 | | | 248,317 | | |
| | 140,000 | | | | | Norfolk Southern Corp.,
7.350%, due 05/15/07 | | | 140,983 | | |
| | 585,000 | | | | | Union Pacific Corp., 6.625%,
due 02/01/08 | | | 591,945 | | |
| | | | 1,458,909 | | |
Total Corporate Bonds/Notes
(Cost $49,333,187) | | | 48,905,729 | | |
| U.S. TREASURY OBLIGATIONS: 11.4% | | | |
| | | | | U.S. Treasury Bonds: 6.5% | |
| | 3,250,000 | | | | | 4.000%, due 02/15/14 | | | 3,112,005 | | |
| | 27,140,000 | | | | | 4.250%, due 08/15/13 | | | 26,467,878 | | |
| | 4,500,000 | | | | | 4.250%, due 11/15/13 | | | 4,382,582 | | |
| | 5,000,000 | | | | | 4.750%, due 11/15/08 | | | 4,995,120 | | |
| | 475,000 | | | | | 5.500%, due 08/15/28 | | | 513,297 | | |
| | 535,000 | | | | | 6.125%, due 08/15/29 | | | 625,449 | | |
| | 1,325,000 | | | | | 6.250%, due 05/15/30 | | | 1,578,821 | | |
| | 1,410,000 | | | | | 6.375%, due 08/15/27 | | | 1,678,231 | | |
| | 4,425,000 | | | | | 7.625%, due 02/15/25 | | | 5,857,943 | | |
| | 2,060,000 | | | | | 8.125%, due 08/15/19 | | | 2,692,002 | | |
| | 7,050,000 | | | | | 8.125%, due 08/15/21 | | | 9,411,200 | | |
| | 1,925,000 | | | | | 8.750%, due 08/15/20 | | | 2,661,915 | | |
| | 2,200,000 | | | | | 9.000%, due 11/15/18 | | | 3,025,860 | | |
| | | | 67,002,303 | | |
| | | | | U.S. Treasury Notes: 4.8% | |
| | 5,000,000 | | | | | 3.250%, due 01/15/09 | | | 4,853,130 | | |
| | 525,000 | | | | | 4.250%, due 11/15/14 | | | 509,455 | | |
| | 9,875,000 | | | | | 4.375%, due 01/31/08 | | | 9,812,896 | | |
Principal
Amount | | | | | | Value | |
| $ | 19,725,000 | | | | | 4.500%, due 02/28/11 | | $ | 19,585,544 | | |
| | 5,000,000 | | | | | 4.625%, due 02/29/08 | | | 4,980,470 | | |
| | 4,875,000 | | | | | 4.625%, due 03/31/08 | | | 4,855,768 | | |
| | 5,000,000 | | | | | 6.000%, due 08/15/09 | | | 5,152,540 | | |
| | | | 49,749,803 | | |
| | | | | U.S. Treasury STRIP: 0.1% | |
| | 3,100,000 | | | ^ | | 7.880%, due 05/15/25 | | | 1,255,671 | | |
| | | | 1,255,671 | | |
Total U.S. Treasury Obligations
(Cost $118,532,009) | | | 118,007,777 | | |
| ASSET-BACKED SECURITIES: 2.6% | | | |
| | | | | | | Automobile Asset-Backed
Securities: 1.8% | | | | | |
| | 1,175,000 | | | C | | Capital Auto Receivables
Asset Trust, 4.050%,
due 07/15/09 | | | 1,167,527 | | |
| | 1,350,000 | | | C | | Capital Auto Receivables
Asset Trust, 4.980%,
due 05/15/11 | | | 1,345,360 | | |
| | 400,000 | | | C | | Capital Auto Receivables
Asset Trust, 5.030%,
due 10/15/09 | | | 398,974 | | |
| | 1,550,000 | | | #,C | | Capital Auto Receivables
Asset Trust, 5.310%,
due 10/20/09 | | | 1,551,938 | | |
| | 700,000 | | | C | | Capital One Auto Finance
Trust, 5.070%, due 07/15/11 | | | 697,703 | | |
| | 760,597 | | | C | | Daimler Chrysler Auto Trust,
4.040%, due 09/08/09 | | | 755,718 | | |
| | 296,724 | | | C | | Ford Credit Auto Owner
Trust, 4.170%, due 01/15/09 | | | 295,303 | | |
| | 650,000 | | | C | | Ford Credit Auto Owner
Trust, 5.050%, due 03/15/10 | | | 648,628 | | |
| | 1,225,000 | | | C | | Ford Credit Auto Owner
Trust, 5.260%, due 10/15/10 | | | 1,226,608 | | |
| | 1,175,000 | | | C | | Harley-Davidson Motorcycle
Trust, 3.760%, due 12/17/12 | | | 1,156,983 | | |
| | 825,000 | | | C | | Harley-Davidson Motorcycle
Trust, 4.070%, due 02/15/12 | | | 811,102 | | |
| | 1,000,000 | | | C | | Harley-Davidson Motorcycle
Trust, 4.410%, due 06/15/12 | | | 989,890 | | |
| | 600,000 | | | #,C | | Hertz Vehicle Financing, LLC,
4.930%, due 02/25/10 | | | 596,849 | | |
| | 257,852 | | | C | | Honda Auto Receivables
Owner Trust, 3.930%,
due 01/15/09 | | | 256,282 | | |
| | 800,000 | | | C | | Honda Auto Receivables
Owner Trust, 4.850%,
due 10/19/09 | | | 797,294 | | |
| | 1,275,000 | | | C | | Merrill Auto Trust
Securitization, 4.100%,
due 08/25/09 | | | 1,265,930 | | |
| | 1,142,325 | | | C | | Nissan Auto Receivables
Owner Trust, 3.990%,
due 07/15/09 | | | 1,133,644 | | |
| | 208,820 | | | C | | USAA Auto Owner Trust,
3.160%, due 02/17/09 | | | 207,477 | | |
| | 680,000 | | | C | | USAA Auto Owner Trust,
3.580%, due 02/15/11 | | | 671,669 | | |
| | 680,511 | | | C | | USAA Auto Owner Trust,
3.900%, due 07/15/09 | | | 675,801 | | |
See Accompanying Notes to Financial Statements
295
ING VAN KAMPEN PORTFOLIO OF INVESTMENTS
EQUITY & INCOME PORTFOLIO AS OF DECEMBER 31, 2006 (CONTINUED)
Principal
Amount | | | | | | Value | |
| | | | | | | Automobile Asset-Backed
Securities (continued) | | | | | |
| $ | 262,859 | | | C | | Volkswagen Auto Lease Trust,
3.820%, due 05/20/08 | | $ | 261,716 | | |
| | 580,495 | | | C | | Wachovia Auto Owner Trust,
4.060%, due 09/21/09 | | | 576,262 | | |
| | 825,000 | | | C | | Wachovia Auto Owner Trust,
4.790%, due 04/20/10 | | | 821,642 | | |
| | 124,466 | | | C | | World Omni Auto Receivables
Trust, 3.290%, due 11/12/08 | | | 124,046 | | |
| | | | 18,434,346 | | |
| | | | | | | Credit Card Asset-Backed
Securities: 0.1% | | | | | |
| | 1,200,000 | | | C | | MBNA Credit Card Master
Note Trust, 2.700%,
due 09/15/09 | | | 1,192,110 | | |
| | | | 1,192,110 | | |
| | | | | Other Asset-Backed Securities: 0.7% | |
| | 694,447 | | | C | | Caterpillar Financial Asset
Trust, 3.900%, due 02/25/09 | | | 690,011 | | |
| | 1,125,000 | | | C | | Caterpillar Financial Asset
Trust, 5.570%, due 05/25/10 | | | 1,127,285 | | |
| | 153,518 | | | C | | CIT Equipment Collateral,
3.500%, due 09/20/08 | | | 151,909 | | |
| | 750,000 | | | C | | CITEC, Inc., 5.070%,
due 02/20/10 | | | 746,133 | | |
| | 375,310 | | | C | | CNH Equipment Trust,
4.020%, due 04/15/09 | | | 373,051 | | |
| | 1,525,000 | | | C | | CNH Equipment Trust,
4.270%, due 01/15/10 | | | 1,509,398 | | |
| | 600,000 | | | C | | CNH Equipment Trust,
5.200%, due 06/15/10 | | | 598,031 | | |
| | 1,050,000 | | | #,C | | GE Equipment Small Ticket,
LLC, 4.380%, due 07/22/09 | | | 1,042,723 | | |
| | 1,000,000 | | | #,C | | GE Equipment Small Ticket,
LLC, 4.880%, due 10/22/09 | | | 996,418 | | |
| | | | 7,234,959 | | |
Total Asset-Backed Securities
(Cost $26,988,261) | | | 26,861,415 | | |
Total Long-Term Investments
(Cost $874,631,744) | | | 992,101,233 | | |
| SHORT-TERM INVESTMENTS: 8.7% | | | |
| | | U.S. Government Agency Obligations: 8.7% | |
| | 8,600,000 | | | Fannie Mae, 4.720%, due 02/28/07 | | | 8,533,947 | | |
| | 69,660,000 | | | Fannie Mae, 4.800%, due 01/02/07 | | | 69,641,424 | | |
| | 2,100,000 | | | Fannie Mae, 5.080%, due 02/27/07 | | | 2,082,944 | | |
| | 9,439,000 | | | US DOMESTIC, 5.080%, due 02/27/07 | | | 9,362,337 | | |
Total Short-Term Investments
(Cost $89,620,652) | | | 89,620,652 | | |
Total Investments in
Securities (Cost
$964,252,396)* | | | 104.8 | % | | $ | 1,081,721,885 | | |
Other Assets and
Liabilities-Net | | | (4.8 | ) | | | (49,622,438 | ) | |
| Net Assets | | | 100.0 | % | | $ | 1,032,099,447 | | |
@ Non-income producing security
@@ Foreign Issuer
ADR American Depositary Receipt
STRIP Separate Trading of Registered Interest and Principal of Securities
# Securities with purchases pursuant to Rule 144A, under the Securities Act of 1933 and may not be resold subject to that rule except to qualified institutional buyers. These securities have been determined to be liquid under the guidelines established by the Funds' Board of Directors/Trustees.
C Bond may be called prior to maturity date.
P Preferred Stock may be called prior to convertible date.
^ Interest Only (IO) security
* Cost for federal income tax purposes is $969,340,239.
Net unrealized appreciation consists of:
| Gross Unrealized Appreciation | | $ | 118,884,248 | | |
| Gross Unrealized Depreciation | | | (6,502,602 | ) | |
| Net Unrealized Appreciation | | $ | 112,381,646 | | |
See Accompanying Notes to Financial Statements
296
TAX INFORMATION (UNAUDITED)
Dividends paid during the year ended December 31, 2006 were as follows:
| Fund Name | | Type | | Per Share Amount | |
ING American Century Large
Company Value Portfolio | |
| Class ADV | | NII | | $ | 0.0865 | | |
| Class I | | NII | | $ | 0.1353 | | |
| Class S | | NII | | $ | 0.0410 | | |
| All Classes | | STCG | | $ | 0.0814 | | |
| All Classes | | LTCG | | $ | 0.6707 | | |
ING American Century Select
Portfolio | |
| Class ADV | | NII | | $ | 0.0403 | | |
| Class I | | NII | | $ | 0.1163 | | |
| Class S | | NII | | $ | 0.0701 | | |
ING American Century Small-Mid Cap
Value Portfolio | |
| Class ADV | | NII | | $ | 0.0012 | | |
| Class I | | NII | | $ | 0.0033 | | |
| Class S | | NII | | $ | 0.0021 | | |
| All Classes | | STCG | | $ | 0.0216 | | |
| All Classes | | LTCG | | $ | 0.0130 | | |
ING Baron Small Cap
Growth Portfolio | |
| All Classes | | LTCG | | $ | 0.1539 | | |
| ING Davis Venture Value Portfolio | |
| Class ADV | | NII | | $ | — | | |
| Class I | | NII | | $ | 0.0050 | | |
| Class S | | NII | | $ | 0.0011 | | |
| All Classes | | LTCG | | $ | 1.4292 | | |
| ING Fundamental Research Portfolio | |
| Class ADV | | NII | | $ | — | | |
| Class I | | NII | | $ | 0.0290 | | |
| Class S | | NII | | $ | 0.0090 | | |
| All Classes | | STCG | | $ | 0.0700 | | |
| All Classes | | LTCG | | $ | 0.0779 | | |
ING Goldman Sachs Structured
Equity Portfolio | |
| Class ADV | | NII | | $ | 0.1671 | | |
| Class S | | NII | | $ | 0.1298 | | |
| All Classes(1) | | STCG | | $ | 0.4889 | | |
| All Classes(1) | | LTCG | | $ | 1.3446 | | |
ING JPMorgan International
Portfolio | |
| Class ADV | | NII | | $ | 0.0999 | | |
| Class I | | NII | | $ | 0.1367 | | |
| Class S | | NII | | $ | 0.0217 | | |
ING JPMorgan Mid Cap Value
Portfolio | |
| Class ADV | | NII | | $ | 0.0001 | | |
| Class I | | NII | | $ | 0.0023 | | |
| Class S | | NII | | $ | 0.0008 | | |
| All Classes | | STCG | | $ | 0.0009 | | |
| All Classes | | LTCG | | $ | 0.1057 | | |
ING Legg Mason Partners
Large Cap Growth Portfolio | |
| All Classes | | STCG | | $ | 0.1711 | | |
| All Classes | | LTCG | | $ | 0.0106 | | |
ING Lord Abbett U.S. Government
Securities Portfolio | |
| Class ADV | | NII | | $ | 0.4510 | | |
| Class I | | NII | | $ | 0.4518 | | |
| Class S | | NII | | $ | 0.4228 | | |
ING Neuberger Berman
Regency Portfolio | |
| Class ADV | | NII | | $ | 0.0447 | | |
| Class I | | NII | | $ | 0.0457 | | |
| Class S | | NII | | $ | 0.0300 | | |
| All Classes | | STCG | | $ | 0.0262 | | |
| All Classes | | LTCG | | $ | 0.0037 | | |
| Fund Name | | Type | | Per Share Amount | |
| ING OpCap Balanced Value Portfolio | |
| Class ADV | | NII | | $ | 0.1147 | | |
| Class I | | NII | | $ | 0.1888 | | |
| Class S | | NII | | $ | 0.1293 | | |
| ING Oppenheimer Global Portfolio | |
| Class ADV | | NII | | $ | 0.0079 | | |
| Class I | | NII | | $ | 0.0105 | | |
| Class S | | NII | | $ | 0.0099 | | |
| All Classes | | LTCG | | $ | 0.0222 | | |
ING Oppenheimer Strategic
Income Portfolio | |
| Class ADV | | NII | | $ | 0.0174 | | |
| Class I | | NII | | $ | 0.0421 | | |
| Class S | | NII | | $ | 0.0118 | | |
| ING PIMCO Total Return Portfolio | |
| Class ADV | | NII | | $ | 0.1749 | | |
| Class I | | NII | | $ | 0.2131 | | |
| Class S | | NII | | $ | 0.1883 | | |
| ING Pioneer High Yield Portfolio | |
| Class ADV | | NII | | $ | 0.5122 | | |
| Class I | | NII | | $ | 0.5499 | | |
| Class S | | NII | | $ | 0.5156 | | |
| All Classes | | STCG | | $ | 0.0275 | | |
| All Classes | | LTCG | | $ | 0.0011 | | |
ING T. Rowe Price Diversified
Mid Cap Growth Portfolio | |
| All Classes | | STCG | | $ | 0.1756 | | |
| All Classes | | LTCG | | $ | 0.0175 | | |
ING T. Rowe Price Growth
Equity Portfolio | |
| Class ADV | | NII | | $ | — | | |
| Class I | | NII | | $ | 0.1350 | | |
| Class S | | NII | | $ | — | | |
| All Classes | | LTCG | | $ | 0.0908 | | |
ING Templeton Foreign
Equity Portfolio | |
| Class ADV | | NII | | $ | 0.1319 | | |
| Class I | | NII | | $ | 0.1318 | | |
| Class S | | NII | | $ | 0.1201 | | |
| All Classes | | STCG | | $ | 0.0077 | | |
ING Thornburg Value Portfolio
Portfolio | |
| Class ADV | | NII | | $ | 0.0381 | | |
| Class I | | NII | | $ | 0.1418 | | |
| Class S | | NII | | $ | 0.0633 | | |
ING UBS U.S. Large Cap
Equity Portfolio | |
| Class ADV | | NII | | $ | 0.0730 | | |
| Class I | | NII | | $ | 0.0797 | | |
| Class S | | NII | | $ | 0.0709 | | |
ING UBS U.S. Small Cap
Growth Portfolio | |
| All Classes | | STCG | | $ | 0.0836 | | |
| ING Van Kampen Comstock Portfolio | |
| Class ADV | | NII | | $ | 0.0929 | | |
| Class I | | NII | | $ | 0.1251 | | |
| Class S | | NII | | $ | 0.0906 | | |
| All Classes | | STCG | | $ | 0.1842 | | |
| All Classes | | LTCG | | $ | 0.4349 | | |
ING Van Kampen Equity and
Income Portfolio | |
| Class ADV | | NII | | $ | 0.5894 | | |
| Class I | | NII | | $ | 0.7277 | | |
| Class S | | NII | | $ | 0.6855 | | |
| All Classes | | STCG | | $ | 1.2934 | | |
NII — Net investment income
STCG — Short-term capital gain
LTCG — Long-term capital gain
(1) Except Class I which commenced operations after the distribution occurred.
297
TAX INFORMATION (UNAUDITED) (CONTINUED)
Of the ordinary distributions made during the year ended December 31, 2006, the following percentages qualify for the dividends received deduction (DRD) available to corporate shareholders:
| ING American Century Large Company Value Portfolio | | | 99.98 | % | |
| ING American Century Select Portfolio | | | 72.92 | % | |
| ING American Century Small-Mid Cap Value Portfolio | | | 15.98 | % | |
| ING Davis Venture Value Portfolio | | | 98.72 | % | |
| ING Fundamental Research Portfolio | | | 58.66 | % | |
| ING Goldman Sachs® Structured Equity Portfolio | | | 64.43 | % | |
| ING JPMorgan Mid Cap Value Portfolio | | | 44.91 | % | |
| ING Legg Mason Partners Large Cap Growth Portfolio | | | 71.33 | % | |
| ING Neuberger Berman Regency Portfolio | | | 62.33 | % | |
| ING OpCap Balanced Value Portfolio | | | 99.82 | % | |
| ING Oppenheimer Global Portfolio | | | 13.36 | % | |
| ING Oppenheimer Strategic Income Portfolio | | | 1.19 | % | |
| ING Pioneer High Yield Portfolio | | | 2.09 | % | |
| ING T. Rowe Price Diversified Mid Cap Growth Portfolio | | | 23.13 | % | |
| ING T. Rowe Price Growth Equity Portfolio | | | 99.98 | % | |
| ING Templeton Foreign Equity Portfolio | | | 1.31 | % | |
| ING Thornburg Value Portfolio Portfolio | | | 100.00 | % | |
| ING UBS U.S. Large Cap Equity Portfolio | | | 100.00 | % | |
| ING UBS U.S. Small Cap Growth Portfolio | | | 3.24 | % | |
| ING Van Kampen Comstock Portfolio | | | 54.44 | % | |
| ING Van Kampen Equity and Income Portfolio | | | 21.48 | % | |
| Pursuant to Section 853 of the Internal Revenue Code, the Portfolios designate the following amounts as foreign taxes paid for the year December 31, 2006: | |
| | | Foreign Taxes
Paid | | Per Share
Amount | |
| ING JPMorgan International Portfolio | | $ | 1,833,564 | | | $ | 0.0269 | | |
| ING Oppenheimer Global Portfolio | | $ | 2,523,898 | | | $ | 0.0152 | | |
| ING Templeton Foreign Equity Portfolio | | $ | 44,859 | | | $ | 0.0115 | | |
| Listed below are the gross income earned and foreign taxes paid by country for each Portfolio shown above. Foreign taxes paid for purposes of Section 853 may be less than actual foreign taxes paid for financial statement purposes. | |
ING JPMorgan International Portfolio
| Country | | Gross Income
Earned | | Foreign
Tax Withheld | |
| Australia | | $ | 412,580 | | | $ | — | | |
| Belgium | | | 632,409 | | | | 97,932 | | |
| Bermuda | | | 372,148 | | | | — | | |
| Brazil | | | 385,286 | | | | — | | |
| Finland | | | 301,613 | | | | 45,242 | | |
| France | | | 3,513,393 | | | | 459,011 | | |
| Germany | | | 1,055,003 | | | | 118,471 | | |
| Ireland | | | 303,573 | | | | (875 | ) | |
| Italy | | | 2,324,486 | | | | 348,673 | | |
| Japan | | | 2,419,477 | | | | 169,363 | | |
| Korea | | | 70,961 | | | | 11,709 | | |
| Mexico | | | 43,441 | | | | — | | |
| Netherlands | | | 1,225,804 | | | | 146,015 | | |
| South Korea | | | (12,830 | ) | | | (2,117 | ) | |
| Spain | | | 753,676 | | | | 113,048 | | |
| Sweden | | | 187,217 | | | | 28,083 | | |
| Switzerland | | | 1,993,397 | | | | 299,009 | | |
| United Kingdom | | | 7,397,188 | | | | — | | |
| Subtotal | | | 23,378,822 | | | | 1,833,564 | | |
| United States | | | 185,685 | | | | — | | |
| Total | | $ | 23,564,508 | | | $ | 1,833,564 | | |
298
TAX INFORMATION (UNAUDITED) (CONTINUED)
ING Oppenheimer Global Portfolio
| Country | | Gross Income
Earned | | Foreign
Tax Withheld | |
| Australia | | $ | 420,996 | | | $ | — | | |
| Bermuda | | | 48,456 | | | | — | | |
| Brazil | | | 890,146 | | | | — | | |
| Canada | | | 892,987 | | | | 133,948 | | |
| Cayman Islands | | | 663,986 | | | | — | | |
| Denmark | | | 104,422 | | | | 15,663 | | |
| Finland | | | 837,418 | | | | 125,613 | | |
| France | | | 3,753,755 | | | | 556,243 | | |
| Germany | | | 1,613,521 | | | | 241,476 | | |
| Hong Kong | | | 386,162 | | | | — | | |
| India | | | 991,616 | | | | — | | |
| Italy | | | 238,478 | | | | 35,772 | | |
| Japan | | | 2,952,651 | | | | 206,539 | | |
| Mexico | | | 615,635 | | | | — | | |
| Netherlands | | | 1,028,817 | | | | 154,323 | | |
| Norway | | | 90,272 | | | | 13,513 | | |
| Panama | | | 619,133 | | | | — | | |
| Portugal | | | 31,278 | | | | 3,072 | | |
| Singapore | | | 422,561 | | | | — | | |
| South Korea | | | 502,700 | | | | 84,106 | | |
| Spain | | | 419,741 | | | | 62,958 | | |
| Sweden | | | 2,791,935 | | | | 418,790 | | |
| Switzerland | | | 1,513,984 | | | | 227,097 | | |
| Taiwan | | | 1,419,319 | | | | 244,785 | | |
| United Kingdom | | | 10,600,759 | | | | — | | |
| Subtotal | | | 33,850,728 | | | | 2,523,898 | | |
| United States | | | 10,109,063 | | | | — | | |
| Total | | $ | 43,959,792 | | | $ | 2,523,898 | | |
ING Templeton Foreign Equity Portfolio
| Country | | Gross Income
Earned | | Foreign
Tax Withheld | |
| Australia | | $ | 26,635 | | | $ | — | | |
| Belgium | | | 2,613 | | | | 392 | | |
| Brazil | | | 4,039 | | | | — | | |
| Canada | | | 30,896 | | | | 1,712 | | |
| Cayman Islands | | | 4,251 | | | | — | | |
| Finland | | | 24,408 | | | | 3,661 | | |
| France | | | 57,555 | | | | 8,930 | | |
| Germany | | | 40,889 | | | | 6,133 | | |
| Hong Kong | | | 15,713 | | | | — | | |
| Italy | | | 15,858 | | | | 2,379 | | |
| Japan | | | 13,625 | | | | 954 | | |
| Korea | | | 254 | | | | 42 | | |
| Mexico | | | 8,031 | | | | — | | |
| Netherlands | | | 19,877 | | | | 2,981 | | |
| Norway | | | 10,929 | | | | 1,639 | | |
| Portugal | | | 12,731 | | | | 1,910 | | |
| Singapore | | | 8,779 | | | | — | | |
| South Korea | | | 2,360 | | | | 389 | | |
| Spain | | | 31,658 | | | | 4,573 | | |
| Sweden | | | 12,857 | | | | 1,929 | | |
| Switzerland | | | 17,704 | | | | 2,656 | | |
| Taiwan | | | 22,894 | | | | 4,579 | | |
| United Kingdom | | | 269,939 | | | | — | | |
| Subtotal | | | 654,495 | | | | 44,859 | | |
| United States | | | 7,505 | | | | — | | |
| Total | | $ | 662,000 | | | $ | 44,859 | | |
Foreign taxes paid or withheld should be included in taxable income with an offsetting deduction from gross income or as a credit for taxes paid to foreign governments. Shareholders are strongly advised to consult their own tax advisors regarding the appropriate treatment of foreign taxes paid.
Above figures may differ from those cited elsewhere in this report due to differences in the calculation of income and gains under U.S. generally accepted accounting principles (book) purposes and Internal Revenue Service (tax) purposes.
Shareholders are strongly advised to consult their own tax advisers with respect to the tax consequences of their investments in the Portfolios. In January, shareholders, excluding corporate shareholders, receive an IRS 1099-DIV regarding the federal tax status of the dividends and distributions they received in the calendar year.
299
DIRECTOR AND OFFICER INFORMATION (UNAUDITED)
The business and affairs of the Fund are managed under the direction of the Fund's Board. A Director who is not an interested person of the Fund, as defined in the 1940 Act, is an independent director ("Independent Director"). The Directors and Officers of the Fund are listed below. The Statement of Additional Information includes additional information about directors of the Fund and is available, without charge, upon request at 1-800-992-0180.
Name, Address
and Age | | Position(s)
Held with
Fund | | Term of
Office and
Length of
Time
Served(1) | | Principal
Occupation(s)
During the
Past Five Years | | Number of
Portfolios in
Fund Complex
Overseen
by Director | | Other
Directorships
Held by
Director | |
| Independent Trustees: | |
|
John V. Boyer(3)
7337 E. Doubletree Ranch Rd.
Scottsdale, Arizona 85258
Age: 53 | | Director | | November 1997 - Present | | President and Chief Executive Officer, Franklin and Eleanor Roosevelt Institute (March 2006 - Present). Formerly, Executive Director, The Mark Twain House & Museum(2) (September 1989 - November 2005). | | | 180 | | | None | |
|
Patricia W. Chadwick(3)
7337 E. Doubletree Ranch Rd.
Scottsdale, Arizona 85258
Age: 58 | | Director | | January 2006 - Present | | Consultant and President of self-owned company, Ravengate Partners LLC (January 2000 - Present). | | | 180 | | | None | |
|
J. Michael Earley(4)
7337 E. Doubletree Ranch Rd.
Scottsdale, Arizona 85258
Age: 61 | | Director | | January 2005 - Present | | President and Chief Executive Officer, Bankers Trust Company, N.A. (June 1992 - Present). | | | 180 | | | None | |
|
R. Barbara Gitenstein(3)
7337 E. Doubletree Ranch Rd.
Scottsdale, Arizona 85258
Age: 58 | | Director | | January 2005 - Present | | President, College of New Jersey (January 1999 - Present). | | | 180 | | | None | |
|
Patrick W. Kenny(4)
7337 E. Doubletree Ranch Rd.
Scottsdale, Arizona 85258
Age: 63 | | Director | | March 2002 - Present | | President and Chief Executive Officer, International Insurance Society (June 2001 - Present). | | | 180 | | | Assured Guaranty Ltd. (November 2003 - Present). | |
|
Jock Patton(3)
7337 E. Doubletree Ranch Rd. Scottsdale, Arizona 85258
Age: 61 | | Chairman and Director | | January 2005 - Present | | Private Investor (June 1997 - Present). Formerly, Director and Chief Executive Officer, Rainbow Multimedia Group, Inc. (January 1999 - December 2001). | | | 180 | | | JDA Software Group, Inc. (January 1999 - Present); and Swift Transportation Co. (March 2004 - Present). | |
|
Sheryl K. Pressler(4)
7337 E. Doubletree Ranch Rd.
Scottsdale, Arizona 85258
Age: 56 | | Director | | January 2006 - Present | | Consultant (May 2001 - Present). Formerly, Chief Executive Officer, Lend Lease Real Estate Investments, Inc. (March 2000 - April 2001). | | | 180 | | | Stillwater Mining Company (May 2002 - Present); California HealthCare Foundation (June 1999 - Present); and Romanian- American Enterprise Fund (February 2004 - Present). | |
|
300
DIRECTOR AND OFFICER INFORMATION (UNAUDITED) (CONTINUED)
Name, Address
and Age | | Position(s)
Held with
Fund | | Term of
Office and
Length of
Time
Served(1) | | Principal
Occupation(s)
During the
Past Five Years | | Number of
Portfolios in
Fund Complex
Overseen
by Director | | Other
Directorships
Held by
Director | |
David W.C. Putnam(4)
7337 E. Doubletree Ranch Rd. Scottsdale, Arizona 85258
Age: 67 | | Director | | January 2005 - Present | | President and Director, F.L. Putnam Securities Company, Inc. (June 1978 - Present). | | | 180 | | | Principled Equity Market Trust (December 1996 - Present); and Asian American Bank and Trust Company (June 1993 - Present). | |
|
Roger B. Vincent(4)
7337 E. Doubletree Ranch Rd. Scottsdale, Arizona 85258
Age: 61 | | Director | | January 2005 - Present | | President, Springwell Corporation (March 1989 - Present). | | | 180 | | | AmeriGas Propane, Inc. (January 1998 - Present); and UGI Corporation (February 2006 - Present). | |
|
| Director who is an "Interested Person": | |
|
John G. Turner(5)
7337 E. Doubletree Ranch Rd. Scottsdale, Arizona 85258
Age: 67 | | Director | | January 2005 - Present | | Retired. Formerly, Vice Chairman of ING Americas (September 2000 - January 2002); Director of ReliaStar Life Insurance Company of New York (April 1975 - December 2001); and Chairman and Trustee of the Northstar affiliated investment companies (May 1993 - December 2001). | | | 180 | | | Hormel Foods Corporation (March 2000 - Present); ShopKo Stores, Inc. (August 1999 - Present); and Conseco, Inc. (September 2003 - Present). | |
|
(1) Directors serve until their successors are duly elected and qualified, subject to the Board's retirement policy.
(2) Shaun Mathews, President, ING USFS Mutual Funds and Investment Products, has held a seat on the board of directors of The Mark Twain House & Museum since September 19, 2002. ING Groep makes non-material, charitable contributions to The Mark Twain House & Museum.
(3) Valuation, Proxy and Brokerage Committee member.
(4) Audit Committee member.
(5) Mr. Turner is an "interested person," as defined under the 1940 Act, because of his affiliation with ING Groep, the parent corporation of the Investment Adviser, ING Investments, LLC and the Distributor, ING Funds Distributor, LLC.
301
DIRECTOR AND OFFICER INFORMATION (UNAUDITED) (CONTINUED)
Name, Address
and Age | | Position(s)
Held with the Fund | | Term of Office and
Length of Time Served(1) | | Principal Occupation(s) during the
Past Five Years | |
Shaun P. Mathews
7337 East Doubletree Ranch Rd.
Scottsdale, Arizona 85258
Age: 51 | | President and Chief Executive Officer | | November 2006 - Present | | President and Chief Executive Officer, ING Investments, LLC and ING Funds Services, LLC (November 2006 - Present); and Head of ING USFS Mutual Funds and Investment Products (October 2004 - Present). Formerly, CMO, ING USFS (April 2002 - October 2004); and Head of Rollover/Payout (October 2001 - December 2003). | |
|
Michael J. Roland
7337 E. Doubletree Ranch Rd. Scottsdale, Arizona 85258
Age: 48 | | Executive Vice President | | January 2005 - Present | | Executive Vice President, ING Investments, LLC (December 2001 - Present). Formerly, Chief Compliance Officer, ING Investments, LLC and Directed Services, LLC (October 2004 - December 2005); Chief Financial Officer and Treasurer, ING Investments, LLC (December 2001 - March 2005); and Senior Vice President, ING Investments, LLC (June 1998 - December 2001). | |
|
Stanley D. Vyner
7337 E. Doubletree Ranch Rd. Scottsdale, Arizona 85258
Age: 56 | | Executive Vice President | | January 2005 - Present | | Executive Vice President, ING Investments, LLC (July 2000 - Present), and Chief Investment Risk Officer, ING Investments, LLC (January 2003 - Present). Formerly, Chief Investment Officer of the International Portfolios, ING Investments, LLC (August 2000 - January 2003). | |
|
Joseph M. O'Donnell
7337 E. Doubletree Ranch Rd.
Scottsdale, Arizona 85258
Age: 52 | | Chief Compliance Officer
Executive Vice President | | January 2005 - Present
March 2006 - Present | | Chief Compliance Officer of the ING Funds (November 2004 - Present); ING Investments, LLC and Directed Services, LLC (March 2006 - Present); and Executive Vice President of the ING Funds (March 2006 - Present). Formerly, Vice President, Chief Legal Counsel, Chief Compliance Officer and Secretary of Atlas Securities, Inc., Atlas Advisers, Inc. and Atlas Funds (October 2001 - October 2004); and Chief Operating Officer and General Counsel of Matthews International Capital Management LLC and Vice President and Secretary of Matthews International Funds (August 1999 - May 2001). | |
|
Robert S. Naka
7337 E. Doubletree Ranch Rd. Scottsdale, Arizona 85258
Age: 43 | | Executive Vice President and Chief Operating Officer
Assistant Secretary | | March 2006 - Present
January 2005 - Present | | Executive Vice President and Chief Operating Officer, ING Funds Services, LLC and ING Investments, LLC (March 2006 - Present); and Assistant Secretary, ING Funds Services, LLC (October 2001 - Present). Formerly, Senior Vice President, ING Investments, LLC (August 1999 - March 2006). | |
|
Todd Modic
7337 E. Doubletree Ranch Rd. Scottsdale, Arizona 85258
Age: 39 | | Senior Vice President, Chief/Principal Financial Officer and Assistant Secretary | | March 2005 - Present | | Senior Vice President, ING Funds Services, LLC (April 2005 - Present). Formerly, Vice President, ING Funds Services, LLC (September 2002 - March 2005); and Director of Financial Reporting, ING Investments, LLC (March 2001 - September 2002). | |
|
Kimberly A. Anderson
7337 E. Doubletree Ranch Rd. Scottsdale, Arizona 85258
Age: 42 | | Senior Vice President | | January 2005 - Present | | Senior Vice President, ING Investments, LLC (October 2003 - Present). Formerly, Vice President and Assistant Secretary, ING Investments, LLC (January 2001 - October 2003). | |
|
Ernest J. C'DeBaca
7337 E. Doubletree Ranch Rd. Scottsdale, Arizona 85258
Age: 37 | | Senior Vice President | | May 2006 - Present | | Senior Vice President, ING Funds Services, LLC (April 2006 - Present). Formerly, Counsel, ING Americas, U.S. Legal Services (January 2004 - March 2006); and Attorney-Adviser, U.S. Securities and Exchange Commission (May 2001 - December 2003). | |
|
302
DIRECTOR AND OFFICER INFORMATION (UNAUDITED) (CONTINUED)
Name, Address
and Age | | Position(s)
Held with the Fund | | Term of Office and
Length of Time Served(1) | | Principal Occupation(s) during the
Past Five Years | |
Robert Terris
7337 E. Doubletree Ranch Rd. Scottsdale, Arizona 85258
Age: 36 | | Senior Vice President | | May 2006 - Present | | Senior Vice President of Operations, ING Funds Services, LLC (May 2006 - Present). Formerly, Vice President of Administration, ING Funds Services, LLC (September 2001 - May 2006). | |
|
Robyn L. Ichilov
7337 E. Doubletree Ranch Rd. Scottsdale, Arizona 85258
Age: 39 | | Vice President and Treasurer | | January 2005 - Present | | Vice President and Treasurer, ING Funds Services, LLC (October 2001 - Present) and ING Investments, LLC (August 1997 - Present). | |
|
Lauren D. Bensinger
7337 E. Doubletree Ranch Rd. Scottsdale, Arizona 85258
Age: 52 | | Vice President | | January 2005 - Present | | Vice President and Chief Compliance Officer, ING Funds Distributor, LLC (July 1995 - Present); and Vice President (February 1996 - Present); and Director of Compliance, ING Investments, LLC (October 2004 - Present). Formerly, Chief Compliance Officer, ING Investments, LLC (October 2001 - October 2004). | |
|
Maria M. Anderson
7337 E. Doubletree Ranch Rd. Scottsdale, Arizona 85258
Age: 48 | | Vice President | | January 2005 - Present | | Vice President, ING Funds Services, LLC (September 2004 - Present). Formerly, Assistant Vice President, ING Funds Services, LLC (October 2001 - September 2004); and Manager Fund Accounting and Fund Compliance, ING Investments, LLC (September 1999 - October 2001). | |
|
Denise Lewis
7337 E. Doubletree Ranch Rd. Scottsdale, Arizona 85258
Age: 43 | | Vice President | | January 2007 - Present | | Vice President, ING Funds Services, LLC (December 2006 - Present). Formerly, Senior Vice President, UMB Investment Services Group, LLC (November 2003 - December 2006); and Vice President, Wells Fargo Funds Management, LLC (December 2000 - August 2003). | |
|
Kimberly K. Palmer
7337 E. Doubletree Rand Rd.
Scottsdale, Arizona 85258
Age: 49 | | Vice President | | March 2006 - Present | | Vice President, ING Funds Services, LLC (March 2006 - Present). Formerly, Assistant Vice President, ING Funds Services, LLC (August 2004 - March 2006); Manager, Registration Statements, ING Funds Services, LLC (May 2003 - August 2004); Associate Partner, AMVESCAP PLC (October 2000 - May 2003); and Director of Federal Filings and Blue Sky Filings, INVESCO Funds Group, Inc. (March 1994 - May 2003). | |
|
Laurie M. Tillinghast
151 Farmington Ave.
Hartford, Connecticut 06156
Age: 54 | | Vice President | | May 2003 - Present | | Senior Vice President, ING Investments, LLC (March 2006 - Present) and Vice President, ING Life Insurance and Annuity Company, (December 2000 - Present); Formerly, Vice President, Aetna Retirement Services, Fund Strategy and Management, (December 1995 - December 2000); and, Director and President, ING Partners, Inc. (November 1997 - May 2003) | |
|
Susan P. Kinens
7337 E. Doubletree Ranch Rd. Scottsdale, Arizona 85258
Age: 30 | | Assistant Vice President | | January 2005 - Present | | Assistant Vice President, ING Funds Services, LLC (December 2002 - Present); and has held various other positions with ING Funds Services, LLC for more than the last five years. | |
|
Huey P. Falgout, Jr.
7337 E. Doubletree Ranch Rd.
Scottsdale, Arizona 85258
Age: 43 | | Secretary | | August 2003 - Present | | Chief Counsel, ING Americas, U.S. Legal Services (September 2003 - Present). Formerly, Counsel, ING Americas, U.S. Legal Services (November 2002 - September 2003); and Associate General Counsel of AIG American General (January 1999 - November 2002). | |
|
Theresa K. Kelety
7337 E. Doubletree Ranch Rd.
Scottsdale, Arizona 85258
Age: 43 | | Assistant Secretary | | August 2003 - Present | | Counsel, ING Americas, U.S. Legal Services (April 2003 - Present). Formerly, Senior Associate with Shearman & Sterling (February 2000 - April 2003). | |
|
(1) The officers hold office until the next annual meeting of the Directors and until their successors have been elected and qualified.
303
SHAREHOLDER MEETING INFORMATION (UNAUDITED)
A special meeting of shareholders of the ING Partners Inc. was held April 4, 2006, at the offices of ING Funds, 7337 East Doubletree Ranch Road, Scottsdale, AZ 85258.
A brief description of each matter voted upon as well as the results are outlined below:
Matter:
To approve a change in the Portfolio's fundamental investment restriction governing portfolio diversification.
Result:
| | | Proposal | | Shares voted for | | Shares voted
against or
withheld | | Shares
abstained | | Broker
non-vote | | Total shares
voted | |
ING Legg Mason Partners
Aggressive Growth Portfolio | | | 1 | | | | 15,104,193 | | | | 1,137,846 | | | | 945,692 | | | | — | | | | 17,187,731 | | |
* Proposal 1 passed at this meeting.
304
ADVISORY CONTRACT APPROVAL DISCUSSION (UNAUDITED)
Board Consideration and Re-Approval of Investment Advisory and Sub-Advisory Contracts
Section 15(c) of the 1940 Act provides that, after an initial period, the Portfolios' existing investment advisory and sub-advisory contracts remain in effect only if the Board of Directors (the "Board") of ING Partners, Inc. ("IPI"), including a majority of the Directors who have no direct or indirect interest in the advisory and sub-advisory contracts, and who are not "interested persons" of the Portfolios, as such term is defined under the 1940 Act (the "Independent Directors"), annually review and renew them. In this regard, at a meeting held on November 9, 2006 the Board, including a majority of the Independent Directors, considered whether to renew the investment advisory contracts (the "Advisory Contracts") between Directed Services, LLC (formerly, ING Life Insurance and Annuity Company) (the "Adviser") and the Portfolios and the sub-advisory contracts ("Sub-Advisory Contracts") with the sub-adviser to each Portfolio (the "Sub-Adviser s").
The Independent Directors also held separate meetings on October 12, 2006 and November 7, 2006 to consider renewals of the Advisory Contracts and Sub-Advisory Contracts. Thus, references herein to factors considered and determinations made by the Independent Directors include, as applicable, factors considered and determinations made on those earlier dates.
At the November 9, 2006 meeting, the Board voted to renew the Advisory and Sub-Advisory Contracts for the Portfolios. In reaching these decisions, the Board took into account information furnished throughout the year at regular Board meetings, as well as information prepared specifically in connection with the annual review process. The Board's determination took into account a number of factors that its members believed, in light of the legal advice furnished to them by Kirkpatrick & Lockhart Preston Gates Ellis LLP ("K&L Gates"), their independent legal counsel, and their own business judgment, to be relevant. Further, while the Advisory Contracts and Sub-Advisory Contracts for all the Portfolios were considered at the same Board meeting, the Directors considered each Portfolio's advisory and sub-advisory relationships separately.
Provided below is an overview of the Board's contract approval process in general, as well as a discussion of certain of the specific factors the Board considered at the November 9, 2006 meeting. While the Board gave its attention to the information furnished, at its request, that was most relevant to its consideration, discussed below are a number of the primary factors relevant to the Board's consideration as to whether to renew the Advisory and Sub-Advisory Contracts for the one-year period ending November 30, 2007. Each Director may have accorded different weight to the various factors in reaching his or her conclusions with respect to the Portfolios' advisory and sub-advisory arrangements.
Overview of the Contract Renewal and Approval Process
In 2003, the Independent Directors determined to undertake steps to further enhance the process under which the Board determines whether to renew existing advisory and sub-advisory arrangements for the funds in the ING Funds complex, including IPI's existing Advisory and Sub-Advisory Contracts, and to approve new advisory and sub-advisory arrangements. Among these measures, the Board: retained the services of an independent consultant with experience in the mutual fund industry to assist the Independent Directors in working with the personnel employed by the Adviser or its affiliates who administer the Portfolios ("Management") to identify the types of information presented to the Board to inform its deliberations with respect to advisory and sub-advisory relationships; established the format in which the information requested by the Board is provided to the Board; and determined the process for reviewing such information in connection with the Advisory and Sub-Advisory Contract renewal process. The end result was the implementation of the current process relied upon by the Board to review and analyze information in connection with the annual renewal of the Portfolios' Advisory and Sub-Advisory Contracts, as well as its review and approval of new advisory relationships.
Since the foregoing approval and renewal process was implemented, the Board regularly has reviewed and refined the process. In addition, the Board established a Contracts Committee and two Investment Review Committees. The type and format of the information provided to the Board or its counsel to inform its approval and annual review and renewal process has been codified in the Portfolios' "15(c) Methodology Guide" (the "Methodology Guide"). The Methodology Guide was developed under the direction of the Independent Directors, and sets out a written blueprint under which the Independent Directors request certain information necessary to facilitate a thorough and informed review in connection with the annual Advisory and Sub-Advisory Contract renewal process. Management provides Portfolio-specific information to the Independent Directors based on the Methodology
305
ADVISORY CONTRACT APPROVAL DISCUSSION (UNAUDITED) (CONTINUED)
Guide through "Fund Analysis and Comparison Tables" or "FACT" sheets prior to the Independent Directors' review of Advisory and Sub-Advisory Contracts. In 2005, the Independent Directors retained an independent firm to verify and test the accuracy of certain of this information for a representative sample of funds in the ING Funds complex. The Independent Directors have determined to conduct such testing periodically.
As part of a regular on-going process, the Board's Contracts Committee recommends or considers recommendations from Management for refinements and other changes to the Methodology Guide and other aspects of the review process, and the Board's Investment Review Committees review benchmarks used to assess the performance of each Portfolio. The Investment Review Committees also meet regularly with the Adviser and periodically with the Portfolios' Sub-Advisers. The Investment Review Committees may apply a heightened level of scrutiny in cases where performance has lagged a Portfolio's relevant benchmark and/or peer group of investment companies.
The Board employed its process for reviewing contracts when considering the renewals of the Advisory and Sub-Advisory Contracts that would be effective through November 30, 2007. A number of the Board's primary considerations and conclusions resulting from this process are discussed below.
Nature, Extent and Quality of Service
In determining whether to approve the Advisory Contracts and Sub-Advisory Contracts for the Portfolios for the year ending November 30, 2007, the Independent Directors received and evaluated such information as they deemed necessary regarding the nature, extent and quality of services provided to the Portfolios by the Adviser and Sub-Advisers. This included information regarding the Adviser and Sub-Advisers to the Portfolios provided throughout the year at regular Board meetings, as well as information furnished for the November 9, 2006 Board meeting, which was held specifically to consider contracts renewals for the period ending November 30, 2007. In addition, the Board's Independent Directors also held meetings on October 12 and November 7, prior to the November 9, 2006 meeting of the full Board, to consider the annual renewal of the Advisory and Sub-Advisory Contracts.
The materials requested by and provided to the Board and/or to K&L Gates prior to the November 2006 Board meeting included the following items: (1) FACT sheets for each Portfolio that provided information about the performance and expenses of the Portfolio and other similarly managed funds in a selected peer group ("Selected Peer Group"), as well as information about the Portfolio's investment portfolio, objectives and strategies; (2) the Methodology Guide, which describes how the FACT sheets were prepared, including the manner in which benchmarks and Selected Peer Groups were selected and how profitability was determined; (3) responses from the Advisers and Sub-Advisers to a detailed series of questions posed by K&L Gates; (4) copies of each form of Advisory Contract and Sub-Advisory Contract; (5) copies of the Forms ADV for the Adviser and each Sub-Adviser to the Portfolios; (6) financial statements for the Adviser and each Sub-Adv iser; (7) drafts of narrative summaries addressing key factors the Board customarily considers in evaluating the renewals of Advisory Contracts and Sub-Advisory Contracts, including a written analysis for each Portfolio of how performance and fees compare to its Selected Peer Group and/or designated benchmarks; and (8) other information relevant to the Board's evaluations.
For each Portfolio, Class I shares were used for purposes of certain comparisons to the funds in its Selected Peer Group. Class I shares were selected, as general matter, so that the Portfolio class with the longest performance history was compared to the analogous class of shares for each fund in the Selected Peer Group. The mutual funds chosen for inclusion in a Portfolio's Selected Peer Group were selected based upon criteria designed to mirror the Portfolio class being compared to the Selected Peer Group.
In arriving at its conclusions with respect to the Advisory Contracts, the Board was mindful of the "manager-of-managers" platform of the ING Funds. The Board also considered the techniques that the Adviser developed, at the Board's direction, to screen and perform due diligence on Sub-Advisers that are recommended to the Board to manage the Portfolios' portfolios. The Board noted the resources that the Adviser has committed to the Board and its Investment Review Committees to assist the Board and members of the Committees with their assessment of the investment performance of the Portfolios on an ongoing basis throughout the year. This includes the appointment of a Chief Investment Risk Officer and his staff, who report directly to the Board and who have developed attribution analyses and other metrics used by the Investment Review Committees to analyze the key factors underlying investment performance for the Portfolios.
306
ADVISORY CONTRACT APPROVAL DISCUSSION (UNAUDITED) (CONTINUED)
The Board also noted the techniques used by the Adviser to monitor the performance of the Sub-Advisers and took note of the pro-active approach that the Adviser, working in cooperation with the Board's Investment Review Committees, has taken to advocate or recommend, when it believed appropriate, changes intended to assist in improving the performance of the Portfolios. These changes have historically included modifications in personnel responsible for managing a Portfolio and/or changing the Sub-Adviser to a Portfolio.
In considering the Portfolios' Advisory Contracts, the Board also considered the extent of benefits provided to the Portfolios' shareholders, beyond advisory services, from being part of the ING family of Funds. This includes, in most cases, the right to exchange or transfer investments, without a sales charge, between the same class of shares of such Portfolios or among Portfolios available on a product platform, and the wide variety in the types of Portfolios available for exchange or transfer.
The Board also took into account the Adviser's extensive efforts in recent years to reduce the expenses of the ING Funds through re-negotiated arrangements with the ING Funds' service providers. In addition, the Board considered the extensive efforts of the Adviser and expense it incurred in recent years to help make the ING Funds complex more efficient by reducing the number of funds through combinations of similar funds.
Further, the Board received periodic reports showing that the investment policies and restrictions for each Portfolio were consistently complied with and other periodic reports covering matters such as compliance by Adviser and Sub-Adviser personnel with codes of ethics. The Board considered reports from the Portfolios' Chief Compliance Officer ("CCO") evaluating the regulatory compliance systems of the Adviser and each Sub-Adviser and procedures reasonably designed by them to assure compliance with the federal securities laws, including those related to late trading and market timing, best execution, fair value pricing, proxy voting procedures, and trade allocation, among others. The Board considered the implementation by the Adviser and certain Sub-Advisers of enhanced compliance policies and procedures in response to SEC rule changes and other regulatory initiatives. The Board also took into account the CCO's annual and periodic reports w ith respect to service provider compliance and his recommendations regarding service providers' compliance programs. In this regard, the Board also considered the policies and procedures developed by the CCO in consultation with the Board's Compliance Committee that guide the CCO's compliance oversight function.
The Board reviewed the level of staffing, quality and experience of each Portfolio's portfolio management team. The Board took into account the respective resources and reputations of the Adviser and the Sub-Advisers, and evaluated the ability of the Adviser and the Sub-Advisers to attract and retain qualified investment advisory personnel. The Board also considered the adequacy of the resources committed to the Portfolios (and other relevant funds in the ING Funds complex) by the Adviser and the Sub-Advisers, and whether those resources are commensurate with the needs of the Portfolios and are appropriate to attempt to sustain expected levels of performance, compliance, and other needs.
Based on their deliberations and the materials presented to them, the Board concluded that the advisory and related services provided by the Adviser and Sub-Advisers are appropriate in light of the Portfolios' operations, the competitive landscape of the investment company business, and investor needs, and that the nature and quality of the overall services provided by the Adviser and Sub-Advisers were appropriate.
Portfolio Performance
In assessing advisory and sub-advisory relationships, the Board placed emphasis on the investment performance of each Portfolio, taking into account the importance of such performance to Portfolio shareholders. While the Board considered the performance reports and discussions with portfolio managers at Board and Committee meetings during the year, particular attention in assessing performance was given to the Fund FACT sheets furnished in advance of the November meeting of the Independent Directors. The FACT sheet prepared for each Portfolio included its investment performance compared to the Morningstar category median, Lipper category median, Selected Peer Group and Portfolio's primary benchmark. The Board's findings specific to each Portfolio's performance are discussed under "Portfolio-by-Portfolio Analysis," below.
Economies of Scale
In considering the reasonableness of advisory fees, the Board also considered whether economies of scale will be realized by the Adviser as a Portfolio grows larger and the extent to which this is reflected in the level of
307
ADVISORY CONTRACT APPROVAL DISCUSSION (UNAUDITED) (CONTINUED)
management fee rates charged. In this regard, the Board noted any breakpoints in advisory fee schedules that resulted in a lower advisory fee because a Portfolio achieved sufficient asset levels to receive a breakpoint discount. In the case of sub-advisory fees, the Board considered that breakpoints would inure to the benefit of the Adviser, except to the extent that these savings are passed through in the form of breakpoints on advisory fees that resulted in savings to the Portfolios. For a Portfolio that did not have breakpoint discounts on advisory fees, but did benefit from waivers to or reimbursements of advisory or other fees, the Board also considered the extent to which economies of scale could effectively be realized through such waivers, reimbursements, or expense reductions.
In evaluating economies of scale, the Independent Directors considered a management report presented to them and also considered an evaluation and analysis presented to them on November 8, 2006 by an independent consultant regarding fee breakpoint arrangements.
Information about Services to Other Clients
The Board requested, and if received considered, information about the nature of services and fee rates offered by the Adviser and the Sub-Advisers to other clients, including other registered investment companies and institutional accounts. When rates offered to other clients differed materially from those charged to the Portfolios, the Board considered the underlying rationale provided by the Adviser and/or Sub-Advisers for these differences. For the unaffiliated Sub-Advisers, the Board did not view this information as imperative to its deliberations because of the arms-length nature of the negotiations between the Adviser and unaffiliated Sub-Advisers with respect to sub-advisory fees. The Board also noted that the fee rates charged to the Portfolios and similar institutional clients may differ materially due to the different services and additional regulatory overlay associated with registered investment companies, such as the Portfolios .
Fee Rates and Profitability
The Board reviewed and considered each contractual investment advisory fee rate, combined with the administrative fee rate, payable by each Portfolio to the Adviser. The Board also considered the contractual sub-advisory fee rates payable by the Adviser to each Sub-Adviser for sub-advisory services. In addition, the Board reviewed and took into account existing and proposed fee waivers and expense limitations applicable to the fees payable by the Portfolios.
The Board considered the fee structures of the Portfolios as they relate to the services provided under the Contracts, and the potential fall-out benefits to the Adviser and Sub-Advisers, and their respective affiliates, from their association with the Portfolios. For each Portfolio, the Board determined that the fees payable to the Adviser and Sub-Advisers are reasonable for the services that each performs, which were considered in light of the nature and quality of the services that each has performed and is expected to perform through the year ending November 30, 2007.
For each Portfolio, the Board considered information on revenues, costs and profits realized by the Adviser, which was prepared by Management in accordance with the allocation methodology (including assumptions) specified in the Methodology Guide. In analyzing the profitability of the Adviser in connection with its services to a Portfolio, the Board took into account the sub-advisory fee rate payable by the Adviser to the Sub-Adviser to that Portfolio. The Board also considered information that it requested and was provided by Management with respect to the profitability of service providers affiliated with the Adviser, as well as information provided by certain Sub-Advisers with respect to their profitability. In the case of non-affiliated Sub-Advisers, the Board gave less weight to profitability considerations, or did not view this data as imperative to its deliberations, given the arms-length nature of the relationship between the Adviser and these Sub-Advisers with respect to the negotiation of sub-advisory fees.
The Board determined that it had requested and received sufficient information to gain a reasonable understanding regarding the Adviser's and affiliated Sub-Advisers' profitability. The Board also recognized that profitability analysis is not an exact science and there is no uniform methodology for determining profitability for this purpose. In this context, the Board realized that Management's calculations regarding its costs incurred in establishing the infrastructure necessary for the Portfolios' operations may not be fully reflected in the expenses allocated to each Portfolio in determining profitability, and that the information presented may not portray all
308
ADVISORY CONTRACT APPROVAL DISCUSSION (UNAUDITED) (CONTINUED)
of the costs borne by Management nor capture Management's entrepreneurial risk associated with offering and managing a mutual fund complex in today's regulatory environment.
In their review of advisory fee rates, the Independent Directors have, from time to time, requested the Adviser, and the Adviser has agreed, to implement remedial actions for certain Portfolios. These remedial actions have included, among others: reductions in expense caps or management fee rates; reductions in 12b-1 fees payable by a Portfolio; the merger of certain Portfolios with and into comparable Portfolios; changes to the Sub-Adviser or portfolio manager managing a Portfolio; and enhancements to the resources available to a Sub-Adviser when managing a Portfolio. The Independent Directors have requested these adjustments primarily on the basis of: (a) a Portfolio's performance, as compared to its Selected Peer Group; (b) the performance of a Portfolio, as compared to its benchmarks; or (c) a Portfolio's expenses in relation to its Selected Peer Group.
Based on the information on revenues, costs, and profitability considered by the Board, after considering the factors described in this section, as well as any remedial actions requested by the Independent Directors and agreed to by the Adviser, the Board concluded that the profits, if any, realized by the Adviser and Sub-Advisers were not excessive. In making its determinations, the Board considered that the Adviser had incentives to negotiate the most favorable fees from unaffiliated Sub-Advisers, and it based its conclusions on the reasonableness of the sub-advisory fees of the Sub-Advisers primarily on the factors described for each Portfolio below and, in the case of non-affiliated Sub-Advisers, in reliance on the arms-length nature of the negotiations between the Adviser and Sub-Advisers with respect to sub-advisory fees.
Portfolio-by-Portfolio Analysis
The following paragraphs outline certain of the specific factors that the Board considered, and the conclusions reached, at its November 2006 meeting in relation to renewing each Portfolio's current Advisory Contract and its Sub-Advisory Contract for the year ending November 30, 2007. These specific factors are in addition to those considerations discussed above. In each case, the Portfolio's performance was compared to its Morningstar category median and its primary benchmark, a broad-based securities market index that appears in the Portfolio's prospectus. Each Portfolio's management fee and expense ratio were compared to the fees and expense ratios of the funds in its Selected Peer Group.
ING American Century Large Company Value Portfolio
In considering whether to approve the renewal of the Advisory and Sub-Advisory Contracts for ING American Century Large Company Value Portfolio, the Board considered that, based on performance data for the periods ended June 30, 2006: (1) the Portfolio underperformed its Morningstar category median and its primary benchmark for all periods presented, except it outperformed its Morningstar category median for the most recent calendar quarter; and (2) the Portfolio is in the second quintile of its Morningstar category for the most recent calendar quarter, in the third quintile of its Morningstar category for the year-to-date period, in the fourth quintile of its Morningstar category for the one-year period, and in the fifth (lowest) quintile of its Morningstar category for the three-year period
In analyzing this performance data, the Board took into account: (1) the Sub-Adviser assumed management of the Portfolio in April 2005; (2) Management's view that the investment process of the Sub-Adviser will result in reasonable longer-term performance; and (3) Management's representation that it will continue to monitor, and the Board or its Investment Review Committee will periodically review, the Portfolio's performance.
In considering the fees payable under the Advisory and Sub-Advisory Contracts for ING American Century Large Company Value Portfolio, the Board took into account the factors described above and also considered: (1) the fairness of the compensation under an Advisory Contract with level fees that does not include breakpoints; (2) the pricing structure (including the expense ratio to be borne by shareholders) of the Portfolio, as compared to its Selected Peer Group, including that: (a) the management fee for the Portfolio is above the median and the average management fees of the funds in its Selected Peer Group; and (b) the expense ratio for the Portfolio is above the median and the average expense ratios of the funds in its Selected Peer Group.
After its deliberation, the Board reached the following conclusions: (1) the Portfolio's management fee rate is reasonable in the context of all factors considered by the Board; (2) the Portfolio's expense ratio is reasonable in
309
ADVISORY CONTRACT APPROVAL DISCUSSION (UNAUDITED) (CONTINUED)
the context of all factors considered by the Board; (3) it is reasonable to permit the Sub-Adviser to continue to manage the Portfolio to meet Management's expectation of more favorable longer-term performance; and (4) the sub-advisory fee rate payable by the Adviser to the Sub-Adviser is reasonable in the context of all factors considered by the Board. Based on these conclusions and other factors, the Board voted to renew the Advisory and Sub-Advisory Contracts for the Portfolio for the year ending November 30, 2007. During this renewal process, different Board members may have given different weight to different individual factors and related conclusions.
ING American Century Select Portfolio
In considering whether to approve the renewal of the Advisory and Sub-Advisory Contracts for ING American Century Select Portfolio, the Board considered that, based on performance data for the periods ended June 30, 2006: (1) the Portfolio underperformed its Morningstar category median and its primary benchmark for all periods presented; and (2) the Portfolio is ranked in the fifth (lowest) quintile of its Morningstar category for all periods presented.
In analyzing this performance data, the Board also took into account: (1) Management's analysis regarding the Sub-Adviser's rationale for underperformance, including the negative effect of sector allocation on the Portfolio's performance; (2) in April 2006, the portfolio management team was restructured; and (3) Management's representation that it would continue to monitor, and the Board or its Investment Review Committee would periodically review, the Portfolio's investment performance.
In considering the fees payable under the Advisory and Sub-Advisory Contracts for ING American Century Select Portfolio, the Board took into account the factors described above and also considered: (1) the fairness of the compensation under an Advisory Contract with level fees that does not include breakpoints; (2) the pricing structure (including the expense ratio to be borne by shareholders) of the Portfolio, as compared to its Selected Peer Group, including that: (a) the management fee for the Portfolio is below the median and the average management fees of the funds in its Selected Peer Group; and (b) the expense ratio for the Portfolio is below the median and the average expense ratios of the funds in its Selected Peer Group.
After its deliberation, the Board reached the following conclusions: (1) the Portfolio's management fee rate is reasonable in the context of all factors considered by the Board; (2) the Portfolio's expense ratio is reasonable in the context of all factors considered by the Board; (3) taking into account the change in portfolio managers in April 2006, as well as Management's representations that it will continue to monitor, and the Board or its Investment Review Committee will periodically review, the Portfolio's performance, and it is reasonable to permit the Sub-Adviser to continue to manage the Portfolio to appropriately assess the longer-term performance of the new portfolio management team; and (4) the sub-advisory fee rate payable by the Adviser to the Sub-Adviser is reasonable in the context of all factors considered by the Board. Based on these conclusions and other factors, the Board voted to renew the Advisory and Sub-Advisory Contr acts for the Portfolio for the year ending November 30, 2007. During this renewal process, different Board members may have given different weight to different individual factors and related conclusions.
ING American Century Small-Mid Cap Value Portfolio
In considering whether to approve the renewal of the Advisory and Sub-Advisory Contracts for ING American Small-Mid Cap Value Portfolio (formerly, ING American Century Small Cap Value Portfolio), the Board considered that, based on performance data for the periods ended June 30, 2006: (1) the Portfolio underperformed its Morningstar category median and its primary and secondary benchmarks for all periods presented; and (2) the Portfolio is ranked in the fourth quintile of its Morningstar category for the one- and three-year periods, and in the fifth (lowest) quintile of its Morningstar category for the most recent calendar quarter and year-to-date periods.
In analyzing this performance data, the Board took into account: (1) in April 2006, a new portfolio management team assumed responsibility for managing a portion of the Portfolio's assets; (2) in conjunction with the addition of the new portfolio management team, the Portfolio's strategy was changed to a small-/mid-capitalization style; and (3) Management will continue to monitor, and the Board or its Investment Review Committee will periodically review, the Portfolio's performance.
310
ADVISORY CONTRACT APPROVAL DISCUSSION (UNAUDITED) (CONTINUED)
In considering the fees payable under the Advisory and Sub-Advisory Contracts for ING American Century Small-Mid Cap Value Portfolio, the Board took into account the factors described above and also considered: (1) the fairness of the compensation under an Advisory Contract with level fees that does not include breakpoints; and (2) the pricing structure (including the expense ratio to be borne by shareholders) of the Portfolio, as compared to its Selected Peer Group, including that: (a) the management fee for the Portfolio is above the median and the average management fees of the funds in its Selected Peer Group; and (b) the expense ratio for the Portfolio is above the median and the average expense ratios of the funds in its Selected Peer Group.
In analyzing this fee data, the Board took into account: (1) in January 2006, at the direction of the Board following the 2005 contract renewal process, Management reduced the Portfolio's administration fee; and (2) in April 2006, Management put into place a fee waiver arrangement under which the Adviser waives its management fee in amounts equal to 50% of the savings from a reduction in sub-advisory fees that took effect in April 2006.
After its deliberation, the Board reached the following conclusions: (1) the Portfolio's management fee rate is reasonable in the context of all factors considered by the Board; (2) the Portfolio's expense ratio is reasonable in the context of all factors considered by the Board; (3) in April 2006, a new mid-cap portfolio management team assumed management of a portion of the Portfolio's assets and its strategies were modified in conjunction with the transition to the new team, and it is reasonable to permit the Sub-Adviser to continue to manage the Portfolio to appropriately assess performance; and (4) the sub-advisory fee rate payable by the Adviser to the Sub-Adviser is reasonable in the context of all factors considered by the Board. Based on these conclusions and other factors, the Board voted to renew the Advisory and Sub-Advisory Contracts for the Portfolio for the year ending November 30, 2007. During this renewal process, different Board members may have given different weight to different individual factors and related conclusions.
ING Baron Asset Portfolio
In considering whether to approve the renewal of the Advisory and Sub-Advisory Contracts for ING Baron Asset Portfolio, the Board considered that, based on performance data for the periods ended June 30, 2006: (1) the Portfolio outperformed its Morningstar category median for the most recent calendar quarter; and (2) the Portfolio underperformed its primary benchmark for the most recent calendar quarter. In considering this performance data, the Board took into account that the Portfolio launched in January 2006, and therefore had a limited operating history for purposes of analyzing Portfolio performance. The Board noted further that Morningstar category rankings were not yet available for the Portfolio.
In considering the fees payable under the Advisory and Sub-Advisory Contracts for ING Baron Asset Portfolio, the Board took into account the factors described above and also considered: (1) the fairness of the compensation under an Advisory Contract with level fees that does not include breakpoints; and (2) the pricing structure (including the expense ratio to be borne by shareholders) of the Portfolio, as compared to its Selected Peer Group, including that: (a) the management fee (inclusive of an advisory fee and a 0.10% administration fee) for the Portfolio is above the median and the average management fees of the funds in its Selected Peer Group; and (b) the expense ratio for the Portfolio is above the median and average expense ratios of the funds in its Selected Peer Group.
After its deliberation, the Board reached the following conclusions: (1) the Portfolio's management fee rate is reasonable in the context of all factors considered by the Board; (2) the Portfolio's expense ratio is reasonable in the context of all factors considered by the Board; (3) the sub-advisory fee rate payable by the Adviser to the Sub-Adviser is reasonable in the context of all factors considered by the Board; and (4) the Portfolio was launched in January 2006, and it is reasonable to permit the Portfolio to establish a longer operating history for purposes of evaluating performance. Based on these conclusions and other factors, the Board voted to renew the Advisory and Sub-Advisory Contracts for the Portfolio for the year ending November 30, 2007. During this renewal process, different Board members may have given different weight to different individual factors and related conclusions.
ING Baron Small Cap Growth Portfolio
In considering whether to approve the renewal of the Advisory and Sub-Advisory Contracts for ING Baron Small Cap Growth Portfolio, the Board considered that, based on performance data for the periods ended June 30, 2006: (1) the Portfolio outperformed its Morningstar category median for all periods presented, but underperformed
311
ADVISORY CONTRACT APPROVAL DISCUSSION (UNAUDITED) (CONTINUED)
for the one-year period; (2) the Portfolio outperformed its primary benchmark for the most recent calendar quarter and three-year periods, but underperformed for the year-to-date and one-year periods; and (3) the Portfolio is ranked in the first (highest) quintile of its Morningstar category for the most recent calendar quarter and three-year periods, the second quintile of its Morningstar category for the year-to-date period and the third quintile of its Morningstar category for the one-year period.
In analyzing this performance data, the Board also took into account Management's analysis regarding the Sub-Adviser's rationale for underperformance during certain periods, including its analysis regarding the negative effect of stock selection on the Portfolio's performance during certain periods.
In considering the fees payable under the Advisory and Sub-Advisory Contracts for ING Baron Small Cap Growth Portfolio, the Board took into account the factors described above and also considered: (1) the fairness of the compensation under an Advisory Contract with level fees that do not include breakpoints; and (2) the pricing structure (including the expense ratio to be borne by shareholders) of ING Baron Small Cap Growth Portfolio, as compared to its Selected Peer Group, including that: (a) the management fee for the Portfolio is below the median and above the average management fees of the funds in its Selected Peer Group; and (b) the expense ratio for the Portfolio is above the median and the average expense ratios of the funds in its Selected Peer Group. In analyzing this fee data, the Board took into account that in January 2006, at the direction of the Board following the 2005 contract renewal process, Management reduced the Portfoli o's administration fee rate.
After its deliberation, the Board reached the following conclusions: (1) the Portfolio's management fee rate is reasonable in the context of all factors considered by the Board; (2) the Portfolio's expense ratio is reasonable in the context of all factors considered by the Board; (3) the Portfolio's performance is reasonable in the context of all factors considered by the Board; and (4) the sub-advisory fee rate payable by the Adviser to the Sub-Adviser is reasonable in the context of all factors considered by the Board. Based on these conclusions and other factors, the Board voted to renew the Advisory and Sub-Advisory Contracts for the Portfolio for the year ending November 30, 2007. During this renewal process, different Board members may have given different weight to different individual factors and related conclusions.
ING Davis Venture Value Portfolio
In considering whether to approve the renewal of the Advisory and Sub-Advisory Contracts for ING Davis Venture Value Portfolio, the Board considered that, based on performance data for the periods ended June 30, 2006: (1) the Portfolio outperformed its Morningstar category median for all periods presented; (2) the Portfolio outperformed its primary benchmark for all periods presented; (3) the Portfolio is ranked in the first (highest) quintile of its Morningstar category for most recent calendar quarter, the second quintile of its Morningstar category for the year-to-date and three-year periods, and the third quintile of its Morningstar category or the one-year period.
In considering the fees payable under the Advisory and Sub-Advisory Contracts for ING Davis Venture Value Portfolio, the Board took into account the factors described above and also considered: (1) the fairness of the compensation under an Advisory Contract with level fees that does not include breakpoints; and (2) the pricing structure (including the expense ratio to be borne by shareholders) of the Portfolio, as compared to its Selected Peer Group, including that: (a) the management fee for the Portfolio is above the median and the average management fees of the funds in its Selected Peer Group; and (b) the expense ratio for the Portfolio is above the median and the average expense ratios of the funds in its Selected Peer Group.
After its deliberation, the Board reached the following conclusions: (1) the Portfolio's management fee rate is reasonable in the context of all factors considered by the Board; (2) the Portfolio's expense ratio of the Adviser is reasonable in the context of all factors considered by the Board; (3) the Portfolio's performance is reasonable in the context of all factors considered by the Board; and (4) the sub-advisory fee rate payable by the Adviser to the Sub-Adviser is reasonable in the context of all factors considered by the Board. Based on these conclusions and other factors, the Board voted to renew the Advisory Contract for the Portfolio for the year ending November 30, 2007. During this renewal process, different Board members may have given different weight to different individual factors and related conclusions.
312
ADVISORY CONTRACT APPROVAL DISCUSSION (UNAUDITED) (CONTINUED)
ING Fundamental Research Portfolio
In considering whether to approve the renewal of the Advisory and Sub-Advisory Contracts for ING Fundamental Research Portfolio, the Board considered that, based on performance data for the periods ended June 30, 2006: (1) the Portfolio underperformed its Morningstar category median and its primary benchmark for the most recent calendar quarter, year-to-date and three-year periods, but outperformed for the one-year period; and (2) the Portfolio is ranked in the third quintile of its Morningstar category for the one-year period, in the fourth quintile of its Morningstar category for the year-to-date and three-year periods and in the fifth (lowest) quintile of its Morningstar category for the most recent calendar quarter.
In analyzing this performance data, the Board also took into account: (1) Management's representations that in order to address the Board's concerns about the Portfolio's performance, in April 2005 there was a change in portfolio managers; and (2) Management's analysis regarding the Sub-Adviser's rationale for underperformance in certain periods, including its analysis regarding the negative effect of stock selection on the Portfolio's more recent performance.
In considering the fees payable under the Advisory and Sub-Advisory Contracts for ING Fundamental Research Portfolio, the Board took into account the factors described above and also considered: (1) the fairness of the compensation under an Advisory Contract with a breakpoint fee schedule where the asset level necessary to achieve a breakpoint discount had not been reached by the Portfolio; (2) the pricing structure (including the expense ratio to be borne by shareholders) of the Portfolio, as compared to its Selected Peer Group, including that: (a) the management fee for the Portfolio is below the median and the average management fees of the funds in its Selected Peer Group; and (b) the expense ratio for the Portfolio is below the median and the average expense ratios of the funds in its Selected Peer Group.
After its deliberation, the Board reached the following conclusions: (1) the Portfolio's management fee rate is reasonable in the context of all factors considered by the Board; (2) the Portfolio's expense ratio is reasonable in the context of all factors considered by the Board; (3) there was a change in portfolio managers in April 2005, and it is reasonable to permit the Sub-Adviser to continue to manage the Portfolio to appropriately assess the longer-term performance of the new portfolio management team; and (4) the sub-advisory fee rate payable by the Adviser to the Sub-Adviser is reasonable in the context of all factors considered by the Board. Based on these conclusions and other factors, the Board voted to renew the Advisory and Sub-Advisory Contracts for the Portfolio for the year ending November 30, 2007. During this renewal process, different Board members may have given different weight to different individual factors and related conclusions.
ING Goldman Sachs® Capital Growth Portfolio
In considering whether to approve the renewal of the Advisory and Sub-Advisory Contracts for ING Goldman Sachs® Capital Growth Portfolio, the Board considered that, based on performance data for the periods ended June 30, 2006: (1) the Portfolio underperformed its Morningstar category median for all periods presented, except it outperformed for the year-to-date period; (2) the Portfolio underperformed its primary benchmark for all periods presented; and (3) the Portfolio is ranked in the second quintile of its Morningstar category for the year-to-date period, in the third quintile of its Morningstar category for the most recent calendar quarter, and in the fourth quintile of its Morningstar category for the one- and three-year periods.
In analyzing this performance data, the Board took into account that it had approved, at the Board's May 2006 meeting, the merger of the Portfolio with and into ING VP Growth Portfolio, another fund in the ING Funds complex overseen by another Board of Directors, and that this merger would be completed during the first quarter of 2007 if approved by the Portfolio's shareholders and by the Board of Directors that administers ING VP Growth Portfolio.
In considering the fees payable under the Advisory and Sub-Advisory Contracts for ING Goldman Sachs® Capital Growth Portfolio, the Board took into account the factors described above and also considered: (1) the fairness of the compensation under an Advisory Contract with level fees that does not include breakpoints; and (2) the pricing structure (including the expense ratio to be borne by shareholders) of ING Goldman Sachs® Capital Growth Portfolio, as compared to its Selected Peer Group, including that: (a) the management fee for the Portfolio is
313
ADVISORY CONTRACT APPROVAL DISCUSSION (UNAUDITED) (CONTINUED)
above the median and the average management fees of the funds in its Selected Peer Group; and (b) the expense ratio for the Portfolio is above the median and the average expense ratios of the funds in its Selected Peer Group.
After its deliberation, the Board reached the following conclusions: (1) the Portfolio's management fee rate is reasonable in the context of all factors considered by the Board; (2) the Portfolio's expense ratio is reasonable in the context of all factors considered by the Board; (3) the Portfolio's performance is reasonable in the context of all factors considered by the Board; and (4) the sub-advisory fee rate payable by the Adviser to the Sub-Adviser is reasonable in the context of all factors considered by the Board. Based on these conclusions and other factors, the Board voted to renew the Advisory and Sub-Advisory Contracts for the Portfolio for the year ending November 30, 2007. During this renewal process, different Board members may have given different weight to different individual factors and related conclusions.
ING Goldman Sachs® Structured Equity Portfolio
In considering whether to approve the renewal of the Advisory and Sub-Advisory Contracts for ING Goldman Sachs® Structured Equity Portfolio, the Board considered that, based on performance data for the periods ended June 30, 2006: (1) the Portfolio underperformed its Morningstar category median for the most recent calendar quarter and year-to-date periods, but outperformed for the one- and three-year periods; (2) the Portfolio underperformed its primary benchmark for the most recent calendar quarter and year-to-date periods, but outperformed its primary benchmark for the one- and three-year periods; and (3) the Portfolio is ranked in the second quintile of its Morningstar category for the one- and three-year periods, the fourth quintile of its Morningstar category for the year-to-date period and the fifth (lowest) quintile of its Morningstar category for the most recent calendar quarter.
In analyzing this performance data, the Board also took into account that it had approved, at its May 25, 2006 meeting, the merger of the Portfolio with and into ING UBS U.S. Large Cap Equity Portfolio and that this merger is expected to occur in the first quarter of 2007 if approved by the Portfolio's shareholders.
In considering the fees payable under the Advisory and Sub-Advisory Contracts for ING Goldman Sachs® Structured Equity Portfolio, the Board took into account the factors described above and also considered: (1) the economies of scale benefits to the Portfolio and its shareholders from breakpoint discounts applicable to the Portfolio's advisory fee, which result in lower fees at higher asset levels; (2) the pricing structure (including the expense ratio to be borne by shareholders) of the Portfolio, as compared to its Selected Peer Group, including that: (a) the management fee for the Portfolio is above the median and the average management fees of the funds in its Selected Peer Group; and (b) the expense ratio for the Portfolio is above the median and the average expense ratios of the funds in its Selected Peer Group.
After its deliberation, the Board reached the following conclusions: (1) the Portfolio's management fee rate is reasonable in the context of all factors considered by the Board; (2) the Portfolio's expense ratio is reasonable in the context of all factors considered by the Board; (3) the sub-advisory fee rate payable by the Adviser to the Sub-Adviser is reasonable in the context of all factors considered by the Board; and (4) the Portfolio's performance is reasonable in the context of all factors considered by the Board. Based on these conclusions and other factors, the Board voted to renew the Advisory and Sub-Advisory Contracts for the Portfolio for the year ending November 30, 2007. During this renewal process, different Board members may have given different weight to different individual factors and related conclusions.
ING JPMorgan International Portfolio
In considering whether to approve the renewal of the Advisory and Sub-Advisory Contracts for ING JPMorgan International Portfolio, the Board considered that, based on performance data for the periods ended June 30, 2006: (1) the Portfolio outperformed its Morningstar category median for the most recent calendar quarter and year-to-date periods, but underperformed for the one-, three- and five-year periods; (2) the Portfolio underperformed its primary benchmark for all periods presented; and (3) the Portfolio is ranked in the second quintile of its Morningstar category for the most recent calendar quarter and year-to-date periods, in the fourth quintile of its Morningstar category for the three-year period, and in the fifth (lowest) quintile of its Morningstar category for the one- and five-year periods.
314
ADVISORY CONTRACT APPROVAL DISCUSSION (UNAUDITED) (CONTINUED)
In analyzing this performance data, the Board took into account: (1) Management's analysis regarding the Sub-Adviser's rationale for underperformance during certain periods; and (2) Management would continue to monitor, and the Board or its Investment Review Committee would periodically review, the Portfolio's investment performance.
In considering the fees payable under the Advisory and Sub-Advisory Contracts for ING JPMorgan International Portfolio, the Board took into account the factors described above and also considered: (1) the fairness of the compensation under an Advisory Contract with level fees that does not include breakpoints; (2) the pricing structure (including the expense ratio to be borne by shareholders) of the Portfolio, as compared to its Selected Peer Group, including that: (a) the management fee for the Portfolio is below the median and the average management fees of the funds in its Selected Peer Group; and (b) the expense ratio for the Portfolio is below the median and the average expense ratios of the funds in its Selected Peer Group.
After its deliberation, the Board reached the following conclusions: (1) the Portfolio's management fee rate is reasonable in the context of all factors considered by the Board; (2) the Portfolio's expense ratio is reasonable in the context of all factors considered by the Board; (3) taking into account Management's representations that it will continue to monitor, and the Board or its Investment Review Committee will periodically review, the Portfolio's performance, such performance is reasonable in the context of all factors considered by the Board; and (4) the sub-advisory fee rate payable by the Adviser to the Sub-Adviser is reasonable in the context of all factors considered by the Board. Based on these conclusions and other factors, the Board voted to renew the Advisory and Sub-Advisory Contracts for the Portfolio for the year ending November 30, 2007. During this renewal process, different Board members may have given different weight to different individual factors and related conclusions.
ING JPMorgan Mid Cap Value Portfolio
In considering whether to approve the renewal of the Advisory and Sub-Advisory Contracts for ING JPMorgan Mid Cap Value Portfolio, the Board considered that, based on performance data for the periods ended June 30, 2006: (1) the Portfolio outperformed its Morningstar category median for the most recent calendar quarter and year-to-date periods, but underperformed for the one- and three-year periods; (2) the Portfolio underperformed its primary benchmark for all periods presented, except that it outperformed for the most recent calendar quarter; and (3) the Portfolio is ranked in the first (highest) quintile of its Morningstar category for the most recent calendar quarter and year-to-date periods, in the third quintile of its Morningstar category for the three-year period, and in the fourth quintile of its Morningstar category or the one-year period.
In analyzing this performance data, the Board took into account Management's analysis of the Sub-Adviser's underperformance during certain periods, including its representations regarding the negative effect of stock selection and sector allocation on the Portfolio's performance.
In considering the fees payable under the Advisory and Sub-Advisory Contracts for ING JPMorgan Mid Cap Value Portfolio, the Board took into account the factors described above and also considered: (1) the fairness of the compensation under an Advisory Contract with level fees that does not include breakpoints; (2) the pricing structure (including the expense ratio to be borne by shareholders) of ING JPMorgan Mid Cap Value Portfolio, as compared to its Selected Peer Group, including that: (a) the management fee for the Portfolio is equal to the median and above the average management fees of the funds in its Selected Peer Group; and (b) the expense ratio for the Portfolio is above the median and the average expense ratios of the funds in its Selected Peer Group. In analyzing this fee data, the Board took into account that, effective April 28, 2006, Management lowered the Portfolio's administration fee rate, effectively reducing the Portfolio' s expense ratio.
After its deliberation, the Board reached the following conclusions: (1) the Portfolio's management fee rate is reasonable in the context of all factors considered by the Board; (2) the Portfolio's expense ratio is reasonable in the context of all factors considered by the Board; (3) the Portfolio's performance is reasonable in the context of all factors considered by the Board; and (4) the sub-advisory fee rate payable by the Adviser to the Sub-Adviser is reasonable in the context of all factors considered by the Board. Based on these conclusions and other factors, the Board voted to renew the Advisory and Sub-Advisory Contracts for the Portfolio for the year ending November 30, 2007. During this renewal process, different Board members may have given different weight to different individual factors and related conclusions.
315
ADVISORY CONTRACT APPROVAL DISCUSSION (UNAUDITED) (CONTINUED)
ING Legg Mason Partners Aggressive Growth Portfolio (formerly, ING Salomon Brothers Aggressive Growth Portfolio)
In considering whether to approve the renewal of the Advisory and Sub-Advisory Contracts for ING Legg Mason Partners Aggressive Growth Portfolio, the Board considered that, based on performance data for the periods ended June 30, 2006: (1) the Portfolio outperformed its Morningstar category median and primary benchmark for the most recent calendar quarter, year-to-date, one- and three-year periods, but underperformed for the five-year period; and (2) the Portfolio is ranked in the first (highest) quintile of its Morningstar category for the one- and three-year periods, in the second quintile of its Morningstar category for the most recent calendar quarter and year-to-date periods, and in the third quintile of its Morningstar category for the five-year period.
In considering the fees payable under the Advisory and Sub-Advisory Contracts for ING Legg Mason Partners Aggressive Growth Portfolio, the Board took into account the factors described above and also considered: (1) the economies of scale benefits to the Portfolio and its shareholders from breakpoint discounts applicable to the Portfolio's advisory fee, which result in lower fees at higher asset levels; (2) the pricing structure (including the expense ratio to be borne by shareholders) of ING Legg Mason Partners Aggressive Growth Portfolio, as compared to its Selected Peer Group, including that: (a) the management fee for the Portfolio is below the median and the average management fees of the funds in its Selected Peer Group; and (b) the expense ratio for the Portfolio is above the median and the average expense ratios of the funds in its Selected Peer Group.
After its deliberation, the Board reached the following conclusions: (1) the Portfolio's management fee rate is reasonable in the context of all factors considered by the Board; (2) the Portfolio's expense ratio is reasonable in the context of all factors considered by the Board; (3) the sub-advisory fee rate payable by the Adviser to the Sub-Adviser is reasonable in the context of all factors considered by the Board; and (4) the Portfolio's performance is reasonable in the context of all factors considered by the Board. Based on these conclusions and other factors, the Board voted to renew the Advisory and Sub-Advisory Contracts for the Portfolio for the year ending November 30, 2007. During this renewal process, different Board members may have given different weight to different individual factors and related conclusions.
ING Legg Mason Partners Large Cap Growth Portfolio (formerly, ING Salomon Brothers Large Cap Growth Portfolio)
In considering whether to approve the renewal of the Advisory and Sub-Advisory Contracts for ING Legg Mason Partners Large Cap Growth Portfolio, the Board considered that, based on performance data for the periods ended June 30, 2006: (1) the Portfolio underperformed its Morningstar category median and its primary benchmark for all periods presented; and (2) the Portfolio is ranked in the fourth quintile of its Morningstar category for the most recent calendar quarter and in the fifth (lowest) quintile of its Morningstar category for the year-to-date, one- and three-year periods.
In analyzing this performance data, the Board took into account: (1) Management's analysis regarding the Sub-Adviser's rationale for underperformance, including its representations that underperformance in more recent periods could be attributed to the negative effect of underweighting certain industry sectors; (2) Management's view that the Sub-Adviser's investment process will yield reasonable longer-term performance; and (3) Management's representations regarding steps being undertaken to address the Board's concerns regarding the Portfolio's performance.
In considering the fees payable under the Advisory and Sub-Advisory Contracts for ING Legg Mason Partners Large Cap Growth Portfolio, the Board took into account the factors described above and also considered: (1) the fairness of the compensation under an Advisory Contract with level fees that does not include breakpoints; (2) the pricing structure (including the expense ratio to be borne by shareholders) of the Portfolio, as compared to its Selected Peer Group, including that: (a) the management fee for the Portfolio is below the median and the average management fees of the funds in its Selected Peer Group; and (b) the expense ratio for the Portfolio is below the median and the average expense ratios of the funds in its Selected Peer Group.
After its deliberation, the Board reached the following conclusions: (1) the Portfolio's management fee rate is reasonable in the context of all factors considered by the Board; (2) the Portfolio's expense ratio is reasonable in the context of all factors considered by the Board; (3) the Portfolio's performance is reasonable in the context of
316
ADVISORY CONTRACT APPROVAL DISCUSSION (UNAUDITED) (CONTINUED)
all factors considered by the Board, including Management's representations regarding the steps being undertaken, at the Board's direction, to address performance; and (4) the sub-advisory fee rate payable by the Adviser to the Sub-Adviser is reasonable in the context of all factors considered by the Board. Based on these conclusions and other factors, the Board voted to renew the Advisory and Sub-Advisory Contracts for the Portfolio for the year ending November 30, 2007. During this renewal process, different Board members may have given different weight to different individual factors and related conclusions.
ING OpCap Balanced Value Portfolio
In considering whether to approve the renewal of the Advisory and Sub-Advisory Contracts for ING OpCap Balanced Value Portfolio, the Board considered that, based on performance data for the periods ended June 30, 2006: (1) the Portfolio underperformed its Morningstar category median and it primary benchmark for the most recent calendar quarter, year-to-date and one-year periods, but outperformed for the three-year period; and (2) the Portfolio is ranked in the second quintile of its Morningstar category for the three-year period, in the fourth quintile of its Morningstar category for the most recent calendar quarter, and in the fifth (lowest) quintile of its Morningstar category for the year-to-date and one-year periods.
In analyzing this performance data, the Board took into account: (1) Management's analysis regarding the Sub-Adviser's rationale for underperformance in certain periods, including its analysis of the negative effect of sector weightings on the Portfolio's more recent performance; and (2) Management's representations regarding steps being undertaken to address the Board's concerns regarding the Portfolio's performance.
In considering the fees payable under the Advisory and Sub-Advisory Contracts for ING OpCap Balanced Value Portfolio, the Board took into account the factors described above and also considered: (1) the fairness of the compensation under an Advisory Contract with level fees that does not include breakpoints; (2) the pricing structure (including the expense ratio to be borne by shareholders) of ING OpCap Balanced Value Portfolio, as compared to its Selected Peer Group, including that: (a) the management fee for the Portfolio is above the median and the average management fees of the funds in its Selected Peer Group; and (b) the expense ratio for the Portfolio is above the median and the average expense ratios of the funds in its Selected Peer Group.
After its deliberation, the Board reached the following conclusions: (1) the Portfolio's management fee rate is reasonable in the context of all factors considered by the Board; (2) the Portfolio's expense ratio is reasonable in the context of all factors considered by the Board; (3) the Portfolio's performance is reasonable in the context of all factors considered by the Board, including Management's representations regarding the steps being undertaken, at the Board's direction, to address performance; and (4) the sub-advisory fee rate payable by the Adviser to the Sub-Adviser is reasonable in the context of all factors considered by the Board. Based on these conclusions and other factors, the Board voted to renew the Advisory and Sub-Advisory Contracts for the Portfolio for the year ending November 30, 2007. During this renewal process, different Board members may have given different weight to different individual factors and related conc lusions.
ING Oppenheimer Global Portfolio
In considering whether to approve the renewal of the Advisory and Sub-Advisory Contracts for ING Oppenheimer Global Portfolio, the Board considered that, based on performance data for the periods ended June 30, 2006: (1) the Portfolio underperformed its Morningstar category median for the most recent calendar quarter and year-to-date periods, but outperformed for the one- and three-year periods; (2) the Portfolio underperformed its primary benchmark for the most recent calendar quarter and year-to-date periods, but outperformed for the one-year period and matched its benchmark's performance for the three-year period; and (3) the Portfolio ranked in the second quintile of its Morningstar category for the one- and three-year periods and in the fourth quintile of its Morningstar category for the most recent calendar quarter and year-to-date periods.
In considering the fees payable under the Advisory and Sub-Advisory Contracts for ING Oppenheimer Global Portfolio, the Board took into account the factors described above and also considered: (1) the fairness of the compensation under an Advisory Contract with level fees that does not include breakpoints; (2) the pricing structure (including the expense ratio to be borne by shareholders) of the Portfolio, as compared to its Selected Peer Group, including that: (a) the management fee for the Portfolio is below the median and the average
317
ADVISORY CONTRACT APPROVAL DISCUSSION (UNAUDITED) (CONTINUED)
management fees of the funds in its Selected Peer Group; and (b) the expense ratio for the Portfolio is below the median and the average expense ratios of the funds in its Selected Peer Group.
After its deliberation, the Board reached the following conclusions: (1) the Portfolio's management fee rate is reasonable in the context of all factors considered by the Board; (2) the Portfolio's expense ratio is reasonable in the context of all factors considered by the Board; (3) the Portfolio's performance is reasonable in the context of all factors considered by the Board; and (4) the sub-advisory fee rate payable by the Adviser to the Sub-Adviser is reasonable in the context of all factors considered by the Board. Based on these conclusions and other factors, the Board voted to renew the Advisory and Sub-Advisory Contracts for the Portfolio for the year ending November 30, 2007. During this renewal process, different Board members may have given different weight to different individual factors and related conclusions.
ING Oppenheimer Strategic Income Portfolio
In considering whether to approve the renewal of the Advisory and Sub-Advisory Contracts for ING Oppenheimer Strategic Income Portfolio, the Board considered that, based on performance data for the periods ended June 30, 2006: (1) the Portfolio underperformed its Morningstar category median for all periods presented; (2) the Portfolio underperformed its primary benchmark for the most recent calendar quarter, but outperformed the primary benchmark for the year-to-date and one-year periods; and (3) the Portfolio ranked in the fourth quintile of its Morningstar category for the year-to-date and one-year periods, and in the fifth (lowest) quintile of its Morningstar category for the most recent calendar quarter.
In analyzing this performance data, the Board took into account: (1) Management's analysis regarding the Sub-Adviser's rationale for underperformance, including its discussion of the negative effect of stock selection and sector allocation on the Portfolio's performance; (2) Management's view that the Portfolio launched in November 2004, and it is reasonable to permit the Sub-Adviser to continue to manage the Portfolio to assess Portfolio performance; and (3) Management's expectation that the Sub-Adviser will deliver reasonable longer-term performance in the future.
In considering the fees payable under the Advisory and Sub-Advisory Contracts for ING Oppenheimer Strategic Income Portfolio, the Board took into account the factors described above and also considered: (1) the fairness of the compensation under an Advisory Contract with level fees that does not include breakpoints; and (2) the pricing structure (including the expense ratio to be borne by shareholders) of the Portfolio, as compared to its Selected Peer Group, including that: (a) the management fee for the Portfolio is below the median and the average management fees of the funds in its Selected Peer Group; and (b) the expense ratio for the Portfolio is below the median and average expense ratios of the funds in its Selected Peer Group.
After its deliberation, the Board reached the following conclusions: (1) the Portfolio's management fee rate is reasonable in the context of all factors considered by the Board; (2) the Portfolio's expense ratio is reasonable in the context of all factors considered by the Board; (3) the sub-advisory fee rate payable by the Adviser to the Sub-Adviser is reasonable in the context of all factors considered by the Board; and (4) the Portfolio was launched in November 2004, and it is reasonable to permit the Portfolio to establish a longer operating history for purposes of evaluating whether the Portfolio meets the Adviser's expectation of more favorable longer-term performance. Based on these conclusions and other factors, the Board voted to renew the Advisory and Sub-Advisory Contracts for the Portfolio for the year ending November 30, 2007. During this renewal process, different Board members may have given different weight to different indiv idual factors and related conclusions.
ING PIMCO Total Return Portfolio
In considering whether to approve the renewal of the Advisory and Sub-Advisory Contracts for ING PIMCO Total Return Portfolio, the Board considered that, based on performance data for the periods ended June 30, 2006: (1) the Portfolio outperformed its Morningstar category median for all periods presented, except it underperformed for the one-year period; (2) the Portfolio underperformed its benchmark for all periods presented, except it outperformed for the three-year period; and (3) the Portfolio is ranked in the second quintile of its Morningstar category for the most recent calendar quarter and in the third quintile of its Morningstar category for the year-to-date, one- and three-year periods.
318
ADVISORY CONTRACT APPROVAL DISCUSSION (UNAUDITED) (CONTINUED)
In considering the fees payable under the Advisory and Sub-Advisory Contracts for ING PIMCO Total Return Portfolio, the Board took into account the factors described above and also considered: (1) the fairness of the compensation under an Advisory Contract with level fees that does not include breakpoints; and (2) the pricing structure (including the expense ratio to be borne by shareholders) of ING PIMCO Total Return Portfolio, as compared to its Selected Peer Group, including that: (a) the management fee for the Portfolio is below the median and the average management fees of the funds in its Selected Peer Group; and (b) the expense ratio for the Portfolio is above the median and average expense ratios of the funds in its Selected Peer Group.
In analyzing this fee information, the Board noted that in January 2006, at the direction of the Board following the 2005 contract renewal process, Management reduced the Portfolio's administration fee.
After its deliberation, the Board reached the following conclusions: (1) the Portfolio's management fee rate is reasonable in the context of all factors considered by the Board; (2) the Portfolio's expense ratio is reasonable in the context of all factors considered by the Board; (3) the Portfolio's performance is reasonable in the context of all factors considered by the Board; and (4) the sub-advisory fee rate payable by the Adviser to the Sub-Adviser is reasonable in the context of all factors considered by the Board. Based on these conclusions and other factors, the Board voted to renew the Advisory and Sub-Advisory Contracts for the Portfolio for the year ending November 30, 2007. During this renewal process, different Board members may have given different weight to different individual factors and related conclusions.
ING T. Rowe Price Diversified Mid Cap Growth Portfolio
In considering whether to approve the renewal of the Advisory and Sub-Advisory Contracts for ING T. Rowe Price Diversified Mid Cap Growth Portfolio, the Board considered that, based on performance data for the periods ended June 30, 2006: (1) the Portfolio outperformed its Morningstar category median for the most recent calendar quarter, but underperformed for the year-to-date, one-, and three-year periods; (2) the Portfolio underperformed its primary benchmark for all periods presented; and (3) the Portfolio is ranked in the second quintile of its Morningstar category for the most recent calendar quarter, and in the fourth quintile for the year-to-date, one- and three-year periods.
In analyzing this performance data, the Board took into account that, in November 2004, T. Rowe Price Associates, Inc. was appointed as the new Sub-Adviser to the Portfolio. The Board also noted that the Portfolio's investment strategy was modified in conjunction with this change in Sub-Adviser.
In considering the fees payable under the Advisory and Sub-Advisory Contracts for ING T. Rowe Price Diversified Mid Cap Growth Portfolio, the Board took into account the factors described above and also considered: (1) the fairness of the compensation under an Advisory Contract with level fees that do not include breakpoints; (2) the pricing structure (including the expense ratio to be borne by shareholders) of the Portfolio, as compared to its Selected Peer Group, including that: (a) the management fee for the Portfolio is below the median and the average management fees of the funds in its Selected Peer Group; and (b) the expense ratio for the Portfolio is below the median and the average expense ratios of the funds in its Selected Peer Group.
After its deliberation, the Board reached the following conclusions: (1) the Portfolio's management fee rate is reasonable in the context of all factors considered by the Board; (2) the Portfolio's expense ratio is reasonable in the context of all factors considered by the Board; (3) the Portfolio's Sub-Adviser and strategy were changed in November 2004, and it is reasonable to permit the Sub-Adviser to continue to manage the Portfolio to assess whether longer-term performance improves as a result of the changes that have been implemented; and (4) the sub-advisory fee rate payable by the Adviser to the Sub-Adviser is reasonable in the context of all factors considered by the Board. Based on these conclusions and other factors, the Board voted to renew the Advisory and Sub-Advisory Contracts for the Portfolio for the year ending November 30, 2007. During this renewal process, different Board members may have given different weight to differen t individual factors and related conclusions.
ING T. Rowe Price Growth Equity Portfolio
In considering whether to approve the renewal of the Advisory and Sub-Advisory Contracts for ING T. Rowe Price Growth Equity Portfolio, the Board considered that, based on performance data for the periods ended June 30, 2006: (1) the Portfolio outperformed its Morningstar category median for all periods presented; (2) the Portfolio
319
ADVISORY CONTRACT APPROVAL DISCUSSION (UNAUDITED) (CONTINUED)
underperformed its primary benchmark for all periods presented, except that it outperformed for the five-year period. The Portfolio is ranked in the first (highest) quintile of its Morningstar category for the most recent calendar quarter and five-year periods and in the second quintile of its Morningstar category for the year-to-date, one- and three-year periods.
In considering the fees payable under the Advisory and Sub-Advisory Contracts for ING T. Rowe Price Growth Equity Portfolio, the Board took into account the factors described above and also considered: (1) the fairness of the compensation under an Advisory Contract with level fees that do not include breakpoints; (2) the pricing structure (including the expense ratio to be borne by shareholders) of the Portfolio, as compared to its Selected Peer Group, including that: (a) the management fee for the Portfolio is below the median and the average management fees of the funds in its Selected Peer Group; and (b) the expense ratio for the Portfolio is below the median and above the average expense ratios of the funds in its Selected Peer Group.
After its deliberation, the Board reached the following conclusions: (1) the Portfolio's management fee rate is reasonable in the context of all factors considered by the Board; (2) the Portfolio's expense ratio is reasonable in the context of all factors considered by the Board; (3) the Portfolio's performance is reasonable in the context of all factors considered by the Board; and (4) the sub-advisory fee rate payable by the Adviser to the Sub-Adviser is reasonable in the context of all factors considered by the Board. Based on these conclusions and other factors, the Board voted to renew the Advisory and Sub-Advisory Contracts for the Portfolio for the year ending November 30, 2007. During this renewal process, different Board members may have given different weight to different individual factors and related conclusions.
ING Thornburg Value Portfolio (formerly, ING MFS Capital Opportunities Portfolio)
In considering whether to approve the renewal of the Advisory and Sub-Advisory Contracts for ING Thornburg Value Portfolio (formerly, ING MFS Capital Opportunities Portfolio), the Board considered that, based on performance data for the periods ended June 30, 2006: (1) the Portfolio underperformed its Morningstar category median and its primary benchmark for all periods presented, except it equaled the performance of its Morningstar category median for the most recent calendar quarter; and (2) the Portfolio is ranked in the third quintile for the most recent calendar quarter, in the fourth quintile for the year-to-date period, and in the fifth (lowest) quintile for the one-, three- and five-year periods.
In analyzing this performance data, the Board took into account that, to address the Board's concerns regarding the Portfolio's performance, in August 2006 Thornburg Investment Management assumed responsibility for the management of the Portfolio.
In considering the fees payable under the Advisory and Sub-Advisory Contracts for ING Thornburg Value Portfolio, the Board took into account the factors described above and also considered: (1) the fairness of the compensation under an Advisory Contract with level fees that does not include breakpoints; and (2) the pricing structure (including the expense ratio to be borne by shareholders) of ING Thornburg Value Portfolio, as compared to its Selected Peer Group, including that: (a) the management fee for the Portfolio is below the median and the average management fees of the funds in its Selected Peer Group; and (b) the expense ratio for the Portfolio is above the median and the average expense ratios of the funds in its Selected Peer Group.
After its deliberation, the Board reached the following conclusions: (1) the Portfolio's management fee rate is reasonable in the context of all factors considered by the Board; (2) the Portfolio's expense ratio is reasonable in the context of all factors considered by the Board; (3) in August 2006 there was a change in Sub-Advisers to the Portfolio, and it is reasonable to permit the new Sub-Adviser to continue to manage the Portfolio to assess performance; and (4) the sub-advisory fee rate payable by the Adviser to the Sub-Adviser is reasonable in the context of all factors considered by the Board. Based on these conclusions and other factors, the Board voted to renew the Advisory and Sub-Advisory Contracts for the Portfolio for the year ending November 30, 2007. During this renewal process, different Board members may have given different weight to different individual factors and related conclusions.
320
ADVISORY CONTRACT APPROVAL DISCUSSION (UNAUDITED) (CONTINUED)
ING UBS U.S. Large Cap Equity Portfolio
In considering whether to approve the renewal of the Advisory and Sub-Advisory Contracts for ING UBS U.S. Large Cap Equity Portfolio, the Board considered that, based on performance data for the periods ended June 30, 2006: (1) the Portfolio outperformed its Morningstar category median and its primary benchmark for the one- and three-year periods, but underperformed its Morningstar category median and its primary benchmark for the most recent calendar quarter, year-to-date and five-year periods; and (2) the Portfolio is ranked in the second quintile of its Morningstar category for the three-year period, in the third quintile of its Morningstar category for the most recent calendar quarter and one-year periods, and in the fourth quintile of its Morningstar category for the year-to-date and five-year periods.
In analyzing this performance data, the Board took into account that in May 2004 UBS Global Asset Management Inc. assumed responsibility for the Portfolio, and its performance has improved since this change was implemented. The Board also took into account Management's analysis regarding the Sub-Advisor's rationale for underperformance in certain periods, including its analysis of the negative effect of stock selection.
In considering the fees payable under the Advisory and Sub-Advisory Contracts for ING UBS U.S. Large Cap Equity Portfolio, the Board took into account the factors described above and also considered: (1) the fairness of the compensation under an Advisory Contract with a breakpoint fee schedule where the asset level necessary to achieve a breakpoint discount had not been reached by the Portfolio; (2) the pricing structure (including the expense ratio to be borne by shareholders) of ING UBS U.S. Large Cap Equity Portfolio, as compared to its Selected Peer Group, including that: (a) the management fee for the Portfolio is above the median and the average management fees of the funds in its Selected Peer Group; and (b) the expense ratio for the Portfolio is above the median and the average expense ratios of the funds in its Selected Peer Group.
After its deliberation, the Board reached the following conclusions: (1) the Portfolio's management fee rate is reasonable in the context of all factors considered by the Board; (2) the Portfolio's expense ratio is reasonable in the context of all factors considered by the Board; (3) there was a change in Sub-Adviser in May 2004, and since that change was implemented the Portfolio's performance has been reasonable; and (4) the sub-advisory fee rate payable by the Adviser to the Sub-Adviser is reasonable in the context of all factors considered by the Board. Based on these conclusions and other factors, the Board voted to renew the Advisory and Sub-Advisory Contracts for the Portfolio for the year ending November 30, 2007. During this renewal process, different Board members may have given different weight to different individual factors and related conclusions.
ING UBS U.S. Small Cap Growth
In considering whether to approve the renewal of the Advisory and Sub-Advisory Contracts for ING UBS U.S. Small Cap Growth Portfolio, the Board considered that the Portfolio was launched on April 28, 2006 and has less than one calendar quarter of operating history. Therefore, the Board concluded that it is reasonable to permit the Portfolio to establish a longer operating history for purposes of evaluating performance
In considering the fees payable under the Advisory and Sub-Advisory Contracts for ING UBS U.S. Small Cap Growth Portfolio, the Board took into account the factors described above and also considered: (1) the fairness of the compensation under an Advisory Contract with level fees that does not include breakpoints; and (2) the pricing structure (including the expense ratio to be borne by shareholders) of the Portfolio, as compared to its Selected Peer Group, including that: (a) the management fee for the Portfolio is above the median and the average management fees of the funds in its Selected Peer Group; and (b) the expense ratio for the Portfolio is above the median and the average expense ratios of the funds in its Selected Peer Group.
In analyzing this fee data, the Board took into account that the Adviser is waiving a portion of its management fee, in effect reducing the Portfolio's expense ratio.
After its deliberation, the Board reached the following conclusions: (1) the Portfolio's management fee rate is reasonable in the context of all factors considered by the Board; (2) the Portfolio's expense ratio is reasonable in the context of all factors considered by the Board; (3) the sub-advisory fee rate payable by the Adviser to the Sub-Adviser is reasonable in the context of all factors considered by the Board; and (4) the Portfolio was launched in April 2006, and it is reasonable to permit the Portfolio to establish a longer operating history for purposes of
321
ADVISORY CONTRACT APPROVAL DISCUSSION (UNAUDITED) (CONTINUED)
evaluating performance. Based on these conclusions and other factors, the Board voted to renew the Advisory and Sub-Advisory Contracts for the Portfolio for the year ending November 30, 2007. During this renewal process, different Board members may have given different weight to different individual factors and related conclusions.
ING Van Kampen Comstock Portfolio
In considering whether to approve the renewal of the Advisory and Sub-Advisory Contracts for ING Van Kampen Comstock Portfolio, the Board considered that, based on performance data for the periods ended June 30, 2006: (1) the Portfolio underperformed its Morningstar category median for the year-to-date and one-year periods, but outperformed for the most recent calendar quarter and three-year periods; (2) the Portfolio outperformed its primary benchmark for all periods presented; and (3) the Portfolio is ranked in first (highest) quintile of its Morningstar category for the most recent calendar quarter, in the third quintile of its Morningstar category for the three-year period, and in the fourth quintile of its Morningstar category for the year-to-date and one-year periods.
In analyzing this performance data, the Board took into account Management's analysis regarding the Sub-Adviser's rationale for underperformance in certain periods, including its analysis of the negative effect of sector weightings on the Portfolio's performance during certain periods.
In considering the fees payable under the Advisory and Sub-Advisory Contracts for ING Van Kampen Comstock Portfolio, the Board took into account the factors described above and also considered: (1) the fairness of the compensation under an Advisory Contract with level fees that does not include breakpoints; (2) the pricing structure (including the expense ratio to be borne by shareholders) of ING Van Kampen Comstock Portfolio, as compared to its Selected Peer Group, including that: (a) the management fee for the Portfolio is below the median and the average management fees of the funds in its Selected Peer Group; and (b) the expense ratio for the Portfolio is above the median and the average expense ratios of the funds in its Selected Peer Group. In analyzing this fee data, the Board took into account that, in April 2006, the Portfolio's expense ratio was reduced.
After its deliberation, the Board reached the following conclusions: (1) the Portfolio's management fee rate is reasonable in the context of all factors considered by the Board; (2) the Portfolio's expense ratio is reasonable in the context of all factors considered by the Board; (3) the Portfolio's performance is reasonable in the context of all factors considered by the Board; and (4) the sub-advisory fee rate payable by the Adviser to the Sub-Adviser is reasonable in the context of all factors considered by the Board. Based on these conclusions and other factors, the Board voted to renew the Advisory and Sub-Advisory Contracts for the Portfolio for the year ending November 30, 2007. During this renewal process, different Board members may have given different weight to different individual factors and related conclusions.
ING Van Kampen Equity & Income Portfolio
In considering whether to approve the renewal of the Advisory and Sub-Advisory Contracts for ING Van Kampen Equity and Income Portfolio, the Board considered that, based on performance data for the periods ended June 30, 2006: (1) the Portfolio outperformed its Morningstar category median for all periods presented; (2) the Portfolio underperformed its primary benchmark for all periods presented; and (3) the Portfolio is ranked in the first (highest) quintile of its Morningstar category for the most recent calendar quarter and three-year period and in the second quintile of its Morningstar category for the year-to-date and one-year periods.
In considering the fees payable under the Advisory and Sub-Advisory Contracts for ING Van Kampen Equity and Income Portfolio, the Board took into account the factors described above and also considered: (1) the fairness of the compensation under an Advisory Contract with level fees that do not include breakpoints; (2) the pricing structure (including the expense ratio to be borne by shareholders) of the Portfolio, as compared to its Selected Peer Group, including that: (a) the management fee for the Portfolio is below the median and the average management fees of the funds in its Selected Peer Group, and (b) the expense ratio for the Portfolio is below the median and the average expense ratios of the funds in its Selected Peer Group.
After its deliberation, the Board reached the following conclusions: (1) the Portfolio's management fee rate is reasonable in the context of all factors considered by the Board; (2) the Portfolio's expense ratio is reasonable in the context of all factors considered by the Board; (3) the Portfolio's performance is reasonable in the context of all factors considered by the Board; and (4) the sub-advisory fee rate payable by the Adviser to the Sub-Adviser is
322
ADVISORY CONTRACT APPROVAL DISCUSSION (UNAUDITED) (CONTINUED)
reasonable in the context of all factors considered by the Board. Based on these conclusions and other factors, the Board voted to renew the Advisory and Sub-Advisory Contracts for the Portfolio for the year ending November 30, 2007. During this renewal process, different Board members may have given different weight to different individual factors and related conclusions.
ING Columbia Small Cap Value II Portfolio
Approval of New Advisory and Sub-Advisory Arrangements
Section 15 of the Investment Company Act of 1940 mandates that, when a Portfolio enters into new advisory or sub-advisory arrangement the Board, including a majority of the Non-Interested Directors, must approve those new arrangements. Therefore, in order for a new series of IPI to be launched, the Board must approve an Advisory Contract and, if applicable, Sub-Advisory Contract for that series prior to the commencement of its operations. At a meeting held on January 19, 2006, the Board considered the approval of a new Advisory Contract and Sub-Advisory contract with Columbia Management Advisors, LLC ("Columbia") for ING Columbia Small Cap Value II Portfolio ("Columbia Small Cap Value"), a recently-launched series of IPI.
The materials provided to the Board and/or its legal counsel in support of the proposed advisory and sub-advisory arrangements included the following: (1) a memorandum presenting Management's rationale for requesting the launch of Columbia Small Cap Value that discusses, among other things, the performance of Columbia in managing a fund similar to the Portfolio, with such performance being compared against the Portfolio's Morningstar Category average and proposed primary benchmark; (2) information regarding the Portfolio's proposed investment objective and strategies and anticipated portfolio characteristics; (3) FACT sheets for the Portfolio that compare the performance of a similarly-managed fund managed by Columbia against that of the Portfolio's Selected Peer Group and its Morningstar category median; (4) responses from the Adviser and Columbia to questions posed by K&L Gates, independent legal counsel, on behalf of the Non-Intereste d Directors; (5) supporting documentation, including copies of the forms of Advisory and Sub-Advisory Contracts for Columbia Small Cap Value; and (6) other information relevant to the Board's evaluation. In addition, the Board considered the information provided periodically throughout the year in presentations to the Board by the Adviser in the context of the Adviser's oversight of other sub-advisers managing Funds in the ING Funds complex.
The Board considered that Columbia Small Cap Value would be subject to the standard policies and procedures of IPI previously approved by the Board for other Series of IPI and approved in accordance with Rule 38a-1 under the 1940 Act. The Board also noted that, in managing Columbia Small Cap Value, the Adviser would be subject to procedures adopted pursuant to Rule 206(4)-7 under the Investment Advisers Act of 1940 that had been previously approved by the Board in connection with other Funds. In the case of Columbia, the Board considered, among other things, a preliminary report from the CCO.
The Board's consideration of whether to approve the Advisory Contract with the Adviser on behalf of Columbia Small Cap Value took into account several factors including, but not limited to, the following: (1) the nature and quality of the services to be provided by the Adviser to Columbia Small Cap Value under the proposed Advisory Contract; (2) the Adviser's experience as a manager-of-managers overseeing sub-advisers to other Funds within the ING Funds complex; (3) the Adviser's strength and reputation within the industry; (4) the fairness of the compensation under the proposed Advisory Contract in light of the services to be provided to Columbia Small Cap Value and taking into account the sub-advisory fees payable by the Adviser to Columbia; (5) the economies of scale benefits to the Fund and its shareholders from breakpoint discounts applicable to the Fund's advisory fee, which result in lower fees at higher asset levels, taking into acco unt that it would take time to reach these discounts after the Portfolio is launched; (6) the pricing structure (including the estimated expense ratio to be borne by shareholders) of Columbia Small Cap Value, as compared to other similarly-managed funds in its Selected Peer Group, including Management's analysis that: (a) the proposed management fee (inclusive of a 0.10% administration fee) is above the median and average management fees of the funds in Columbia Small Cap Value's Selected Peer Group; and (b) the estimated expense ratio for Columbia Small Cap Value is above the median and average expense ratios of the funds in Columbia Small Cap Value's Selected Peer Group; (7) the projected profitability of the Adviser when sub-advisory fees payable by the Adviser to Columbia are taken into account; (8) the personnel, operations, financial condition, and investment management capabilities, methodologies and resources of the Adviser, including its management team's expertise in the management of
323
ADVISORY CONTRACT APPROVAL DISCUSSION (UNAUDITED) (CONTINUED)
other Funds; (9) the Adviser's compliance capabilities, as demonstrated by, among other things, its policies and procedures designed to prevent violations of the Federal securities laws, which had previously been approved by the Board in connection with their oversight of other Funds in the ING Funds complex; (10) the information that had been provided by the Adviser at regular Board meetings, with respect to its capabilities as a manager-of-managers; and (11) "fall-out benefits" to the Adviser and its affiliates that were anticipated to arise from the Adviser's management of Columbia Small Cap Value. In analyzing the pricing structure of Columbia Small Cap Value, the Board took into account Management's representations that the level of the Portfolio's management fee and expense ratio reflects that availability of small capitalization capacity in the current market is increasingly scarce, leading to higher sub-advisory fees for small capita lization investment mandates.
In reviewing the proposed Sub-Advisory Contract with Columbia, the Board considered a number of factors, including, but not limited to, the following: (1) the Adviser's view of Columbia's capabilities in managing in the strategy to be employed by Columbia Small Cap Value; (2) Columbia's strength and reputation in the industry; (3) the nature and quality of the services to be provided by Columbia under the proposed Sub-Advisory Contract; (4) the performance of Columbia's proprietary fund managed in the same style in which the Portfolio would be managed, compared to the Portfolio's Morningstar Category average, Morningstar Category median, its proposed primary benchmark and the performance of the funds in Columbia Small Cap Value's Selected Peer Group; (5) the personnel, operations, financial condition, and investment management capabilities, methodologies and resources of Columbia and its fit among the stable of managers in the ING Funds line - -up; (6) the fairness of the compensation under the proposed Sub-Advisory Contract in light of the services to be provided by and the projected profitability of Columbia as Columbia Small Cap Value's sub-adviser and taking into account the ability of Columbia to deliver small-capitalization investment management expertise in a market where access to small-capacity advisory services is increasingly scarce; (7) the costs for the services to be provided by Columbia; (8) Columbia's operations and compliance program, including its policies and procedures intended to assure compliance with the Federal securities laws, which were under review and evaluation by ING IPI's Chief Compliance Officer; (9) Columbia's financial condition; (10) the appropriateness of the selection of Columbia in light of Columbia Small Cap Value's investment objective and prospective investor base; and (11) Columbia's Code of Ethics, which has previously been approved for other ING Funds, presented and approved at the January 2006 meeting, and related procedures for complying with that Code.
After its deliberation, the Board reached the following conclusions: (1) Columbia Small Cap Value's proposed management fee rate is reasonable in the context of all factors considered by the Board; (2) Columbia Small Cap Value's expense ratio is reasonable in the context of all factors considered by the Board; (3) the sub-advisory fee rate payable by the Adviser to Columbia is reasonable in the context of all factors considered by the Board; (4) the Adviser maintains an appropriate compliance program, with this conclusion based upon the Board's previous and ongoing review of the compliance program; and (5) Columbia maintains an appropriate compliance program, with this conclusion based upon, among other things, a representation from IPI's Chief Compliance Officer that, based upon his analysis to date, Columbia's compliance policies and procedures are reasonably designed to assure compliance with the Federal securities laws, and his represent ation that if any compliance issues were identified, he would inform the Board. Based on these conclusions and other factors, the Board voted to approve the Advisory and Sub-Advisory Contracts for Columbia Small Cap Value. During its deliberations, different Board members may have given different weight to different individual factors and related conclusions.
324
(THIS PAGE INTENTIONALLY LEFT BLANK)
(THIS PAGE INTENTIONALLY LEFT BLANK)
Investment Adviser
Directed Services, LLC
1475 Dunwoody Drive
West Chester, Pennsylvania 19380
Administrator
ING Funds Services, LLC
7337 East Doubletree Ranch Road
Scottsdale, Arizona 85258
Distributor
ING Funds Distributor, LLC
7337 East Doubletree Ranch Road
Scottsdale, Arizona 85258
Transfer Agent
DST Systems, Inc.
P.O. Box 419368
Kansas City, Missouri 64141
Independent Registered Public
Accounting Firm
KPMG LLP
99 High Street
Boston, Massachusetts 02110
Custodian
The Bank of New York
One Wall Street
New York, New York 10286
Legal Counsel
Dechert LLP
1775 I Street, N.W.
Washington, D.C. 20006
Before investing, carefully consider the investment objectives, risks, charges and expenses of the variable universal life insurance policy or variable annuity contract and the underlying variable investment options. This and other information is contained in the prospectus for the variable universal life policy or variable annuity contract and the underlying variable investment options. Obtain these prospectuses from your agent/registered representative and read them carefully before investing.

VPAR-UIPI
(1206-022807)
| |
| | Annual Report |
| |
| | December 31, 2006 |
| |
| | Adviser Class (“ADV”), Initial Class (“I”), Service Class (“S”)
and Class T |
| |
| | ING Partners, Inc. |
| |
| | • ING Solution Income Portfolio |
| | • ING Solution 2015 Portfolio |
| | • ING Solution 2025 Portfolio |
| | • ING Solution 2035 Portfolio |
| | • ING Solution 2045 Portfolio |
| | |
| | This report is submitted for general information to shareholders of the ING Funds. It is not authorized for distribution to prospective shareholders unless accompanied or preceded by a prospectus which includes details regarding the funds’ investment objectives, risks, charges, expenses and other information. This information should be read carefully. | |
TABLE OF CONTENTS
| | | |
|
|
|
|
| | 1 |
|
|
|
|
| | 2 |
|
|
|
|
| | 4 |
|
|
|
|
| | 10 |
|
|
|
|
| | 13 |
|
|
|
|
| | 14 |
|
|
|
|
| | 16 |
|
|
|
|
| | 17 |
|
|
|
|
| | 20 |
|
|
|
|
| | 25 |
|
|
|
|
| | 35 |
|
|
|
|
| | 36 |
|
|
|
|
| | 41 |
|
|
|
|
| | 42 |
|
|
|
|
| | 47 |
PROXY VOTING INFORMATION
A description of the policies and procedures that the Portfolios use to determine how to vote proxies related to portfolio securities is available (1) without charge, upon request, by calling Shareholder Services toll-free at 1-800-992-0180; (2) on the ING Funds’ website at www.ingfunds.com; and (3) on the SEC’s website at www.sec.gov. Information regarding how the Portfolios voted proxies related to portfolio securities during the most recent 12-month period ended June 30 is available without charge on the ING Funds’ website at www.ingfunds.com and on the SEC’s website at www.sec.gov.
QUARTERLY PORTFOLIO HOLDINGS
The Portfolios file their complete schedule of portfolio holdings with the SEC for the first and third quarters of each fiscal year on Form N-Q. The Portfolios’ Forms N-Q are available on the SEC’s website at www.sec.gov. The Portfolio’s Forms N-Q may be reviewed and copied at the SEC’s Public Reference Room in Washington, DC, and information on the operation of the Public Reference Room may be obtained by calling 1-800-SEC-0330; and is available upon request from the Portfolio by calling Shareholder Services toll-free at 1-800-992-0180.
(THIS PAGE INTENTIONALLY LEFT BLANK)
PRESIDENT’S LETTER

Dear Shareholder,
In its recent meetings, the U.S. Federal Reserve Board (the “Fed”) ceased what was a two-year trend. That trend — a string of 17 consecutive interest rate hikes that ended last fall — was seen by many analysts as a sign that the Fed was concerned about containing inflation.
Now, the Fed is neither raising nor lowering interest rates, which puts us in the midst of what economists refer to as a “plateau.” Historically, there have been six similar plateaus since 1982 and during four of those periods the Standard & Poor’s 500® Composite Stock Price Index(1) (“S&P 500® Index”) rose significantly.
Of course, the Fed’s actions impact economies and market performance around the world. For instance, the current interest rate climate has been cited as one reason for a decline in the value of the dollar. Last year, that drop in the dollar meant that international stocks — which are often determined in foreign currencies — generally experienced strong performance as foreign currencies climbed and world stock markets continued to produce strong results.
Meanwhile, here at home, 2006 was an interesting year for equity investors. In May of 2006, the S&P 500® Index hit a five-year high followed by a market correction and several months of non-directional returns. A strong rally occurred in the second half of the year driven in part by the aforementioned dollar decline and the interest rate plateau. The good news is many economists believe that these conditions may continue in the months to come.
At ING Funds, we are committed to providing you, the investor, with an array of investment choices that enables you to build a diversified portfolio across a variety of asset classes. We do so, with a view that the globalization of markets is an initial consideration in the products we offer.
We take the confidence you place in us with your investments very seriously — everyone in our firm is committed to renewing this trust each and every day.

Shaun Mathews
President
ING Funds
January 31, 2007
The views expressed in the President’s Letter reflect those of the President as of the date of the letter. Any such views are subject to change at any time based upon market or other conditions and ING Funds disclaims any responsibility to update such views. These views may not be relied on as investment advice and because investment decisions for an ING Fund are based on numerous factors, may not be relied on as an indication of investment intent on behalf of any ING Fund. Reference to specific company securities should not be construed as recommendations or investment advice.
(1) The S&P 500® Index is an unmanaged index that measures the performance of the securities of approximately 500 of the largest companies in the U.S.
1
MARKET PERSPECTIVE: YEAR ENDED DECEMBER 31, 2006
In our semi-annual report, we described how the feast of the first quarter had turned to famine in the second quarter for global equity markets on concerns that rising interest rates would freeze out global growth. Indeed as late as June 27, 2006, the year-to-date return on the Morgan Stanley Capital International (“MSCI”) World IndexSM(1) measured in local currencies, including net reinvested dividends had been precisely 0%. However, the second half of the year ended December 31, 2006, was much healthier and the same index powered ahead 12.3% and for the year ended December 31, 2006, returned 20.07%. The return to dollar based investors was a little better at 13.2%, as late in the year a slowing economy and hints that central banks would be diversifying out of dollars weighed on that currency. For the six months ended December 31, 2006, the dollar fell 3.1% against the euro and 5.6% against the pound, but gained 4.1% on the yen due to stumbling growth and miniscule interest rates in Japan. For the year ended December 31, 2006, the dollar fell 10.6% against the euro and 12.4% against the pound, but gained 1.3% against the yen.
As the first half of 2006 ended, the Federal Open Market Committee (“FOMC”) had just raised the federal funds rate for the seventeenth time since June 2004, to 5.25%. The relatively mild accompanying language led many in the fixed income market to hope that the tightening cycle was now over. Not everyone believed it, especially when new Middle East conflict pushed the price of oil to another record on July 14, 2006. But data, especially on housing, had mostly pointed to cooling demand and a tame employment report on August 4, 2006 probably decided the matter. Four days later the FOMC met and left rates unchanged. The booming housing market had been a powerful driver of growth in recent years through new construction and demand created by mortgage loan refinancing. This boom was deteriorating appreciably with housing prices and the key new building permits measure falling sharply. Only in the last few days of 2006 did the slump show some signs of bottoming out with unexpectedly good new and existing home sales figures reported, along with rebounding consumer confidence. For the six months ended December 31, 2006, the Lehman Brothers® Aggregate Bond (“LBAB”) Index(2) of investment grade bonds gained 5.09% and for the year ended December 31, 2006 it gained 4.33%. The most important dynamic was the broad yield curve inversion, suggestive of an expected fall in interest rates and a further economic slow down. The ten-year Treasury yield fell 43 basis points (0.43%) to 4.71%, while the yield on the three-month Bill rose by 3 basis points (0.03%) to 4.89%. Since mid-August, with the exception of two days, bond investors had been prepared to lend money to the government for ten years at a lower interest rate than for three months.
Faced with fading business activity, as the key housing engine seized up, and a yield curve inverted to the point of recession according to some commentators, investors in U.S. equities must have been in the mood to sell. Not so fast. Those investors saw things differently and indeed the apparent “disagreement” between the bond market and global stock markets was a well discussed feature of the second half of the year. For one thing, the oil price, having hit its record, fell back, as surly calm returned to the Middle East, as the summer driving and hurricane seasons came and went and as winter got off to a mild start in the key North East region. The price of oil averaged 22% less in the fourth quarter than at its peak, boosting consumers’ spending power and confidence. And if longer-term interest rates were falling then stocks looked more attractive as bonds provided less competition and the present value of future corporate profits rose. Speaking of which, Standard & Poor’s 500® Composite Stock Price (“S&P 500®”) Index(3) companies duly reported their 13th straight double-digit quarterly percentage earnings gain. Gross domestic product (“GDP”) growth may have slowed, but the share of corporate profits, reported at 12.4%, was the highest since the 1950’s. The next merger or acquisition to get investors in the mood never seemed far away. Five of them were even announced in one day on November 6, 2006, sending markets up about 1%. For the six months ended December 31, 2006, the S&P 500® Index, including dividends, rose 12.7% and for the year ended December 31, 2006, the S&P 500® Index, including dividends, rose 15.8%. All but 30 basis points (0.30%) of the gain came after August 8, 2006, making six-year highs as the year ended.
International markets, based on MSCI local currency indices, as in the U.S., finished near their best levels for the year. In Japan the market advanced 8.7%, in 2006, after a late surge. The long awaited increase in interest rates from 0.0% to 0.25% took place in July just as the economic recovery was losing impetus. Third quarter growth was estimated at only 0.8% and generated by exports and capital spending alone. Consumer spending was lagging despite low
2
MARKET PERSPECTIVE: YEAR ENDED DECEMBER 31, 2006
unemployment and almost flat prices, yet business confidence remained high and profit growth healthy. Elsewhere, Asian markets ex Japan rose 28.2% in 2006, but with wide disparities, ranging from -2.0% in Thailand to 83.4% in China. In Thailand the uncertainty caused by a military coup was compounded when the junta imposed exchange controls to hold back the strong baht, only to rescind them the next day. China’s market soared in surely speculative excess, and in the absence of attractive alternatives, as investors sought a piece of the world’s fourth largest economy. By the end of 2006 the Chinese market had become the third biggest emerging market after South Korea and Taiwan. European ex UK markets surged 16.1%, in 2006. The Eurozone’s GDP growth had recorded its best first half of a year since 2000, 1.7%, and the lowest unemployment rate, 7.8%, since the start of the Eurozone itself. But as the second half of 2006, wore on there were signs that the best news was behind it and the third quarter’s annualized growth fell to 2.0%. Business confidence, however, stayed buoyant and cheered by extensive merger and acquisition activity despite headwinds in the form of a strengthening euro, a hawkish European Central Bank that raised rates three times and the looming rise in German sales tax. UK equities added 8.6% in the six months ended December 31, 2006. The Bank of England raised rates twice as GDP growth accelerated to 2.9% year over year, inflation climbed above target and house prices, an important demand generator, continued their recovery with average prices up more than 10% in 2006. Again, however, it was widespread, large scale mergers and acquisitions energizing the market.
(1) The MSCI World IndexSM is an unmanaged index that measures the performance of over 1,400 securities listed on exchanges in the U.S., Europe, Canada, Australia, New Zealand and the Far East.
(2) The LBAB Index is a widely recognized, unmanaged index of publicly issued investment grade U.S. Government, mortgage-backed, asset-backed and corporate debt securities.
(3) The S&P 500® Index is an unmanaged index that measures the performance of the securities of approximately 500 of the largest companies in the U.S.
All indices are unmanaged and investors cannot invest directly in an index.
Past performance does not guarantee future results. The performance quoted represents past performance. Investment return and principal value of an investment will fluctuate, and shares, when redeemed, may be worth more or less than their original cost. The Portfolios’ performance is subject to change since the period’s end and may be lower or higher than the performance data shown. Please call (800) 262-3862 or log on to www.ingfunds.com to obtain performance data current to the most recent month end.
Market Perspective reflects the views of the Chief Investment Risk Officer only through the end of the period, and is subject to change based on market and other conditions.
3
ING SOLUTION PORTFOLIOS
PORTFOLIO MANAGERS’ REPORT
The ING Solution Portfolios (the “Portfolios” or “Solution Portfolios”) each seek to achieve their investment objective by investing in other ING Funds (“Underlying Funds”) and uses asset allocation strategies to determine how much to invest in the Underlying Funds.
Portfolio Specifics: Directed Services, LLC(1) (“DSL” or “Investment Adviser”) is the investment adviser of each Portfolio. The Adviser is an indirect, wholly-owned subsidiary of ING Groep, N.V. (“ING Groep”), a global financial institution active in the fields of insurance, banking and asset management.
ING Investment Management Co. (“Consultant”) is a consultant to the Investment Adviser. Both the Investment Adviser and the Consultant are indirect, wholly-owned subsidiaries of ING Groep. The Adviser and the Consultant, working together, have designed Target Date asset allocation funds, called Solution Portfolios that will be constructed and managed in accordance with the following processes:
The Investment Adviser uses an asset allocation process to determine each Portfolio’s investment mix. This asset allocation process can be found in the Prospectus.
The following tables illustrate the Target Sub-Asset Mix allocation as of December 31, 2006:
| |
| (1) | Prior to December 31, 2006, ING Life Insurance and Annuity Company (“ILIAC”) served as the investment adviser to the Portfolios. On November 9, 2006, the Board approved the consolidation of investment advisory functions of ILIAC into DSL resulting in the assumption by DSL of the advisory agreement between ING Partners, Inc. and ILIAC. |
Asset Allocation
as of December 31, 2006
(as a percent of net assets)
| | | | | | | | | | | | | | | | | | | | | | |
| | ING Solution | | ING Solution | | ING Solution | | ING Solution | | ING Solution |
| | Income | | 2015 | | 2025 | | 2035 | | 2045 |
| Target Sub-Asset Mix(1) | | Portfolio | | Portfolio | | Portfolio | | Portfolio | | Portfolio |
| |
| |
| |
| |
| |
|
| | U.S. Large Cap Blend | | | 17% | | | | 15% | | | | 10% | | | | 10% | | | | 10% | |
| | U.S. Large Cap Growth | | | 0% | | | | 12% | | | | 19% | | | | 24% | | | | 27% | |
| | U.S. Large Cap Value | | | 0% | | | | 5% | | | | 12% | | | | 16% | | | | 18% | |
| | U.S. Mid Cap | | | 0% | | | | 0% | | | | 3% | | | | 4% | | | | 5% | |
| | U.S. Small Cap | | | 0% | | | | 0% | | | | 6% | | | | 8% | | | | 10% | |
| | Non-U.S./International | | | 3% | | | | 8% | | | | 10% | | | | 13% | | | | 15% | |
| | Real Estate | | | 0% | | | | 5% | | | | 5% | | | | 5% | | | | 5% | |
| | Intermediate-Term Bond | | | 45% | | | | 30% | | | | 20% | | | | 20% | | | | 10% | |
| | High Yield Bond | | | 10% | | | | 10% | | | | 5% | | | | 0% | | | | 0% | |
| | Short-Term Bond | | | 25% | | | | 15% | | | | 10% | | | | 0% | | | | 0% | |
| | | |
| | | |
| | | |
| | | |
| | | |
| |
| | | | 100% | | | | 100% | | | | 100% | | | | 100% | | | | 100% | |
| Portfolio holdings are subject to change daily. |
| |
| (1) | Although the Solution Portfolios expect to be fully invested at all times, they may maintain liquidity reserves to meet redemption requests. |
4
ING SOLUTION INCOME PORTFOLIO
PORTFOLIO MANAGERS’ REPORT
| | | | | | | | | | | | | |
|
| Average Annual Total Returns for the Periods Ended December 31, 2006 |
|
| | |
| | Since Inception | | Since Inception |
| | of Classes ADV, I and S | | of Class T |
| | 1 Year | | April 29, 2005 | | August 31, 2005 |
| |
| |
| |
|
| Class ADV | | | 7.21 | % | | | 6.35 | % | | | — | |
| Class I | | | 7.66 | % | | | 6.92 | % | | | — | |
| Class S | | | 7.37 | % | | | 6.62 | % | | | — | |
| Class T | | | 6.93 | % | | | — | | | | 5.61 | % |
LBAB Index(1) | | | 4.33 | % | | | 3.53 | %(2) | | | 2.89 | %(3) |
Based on a $10,000 initial investment, the graph and table above illustrate the total return of ING Solution Income Portfolio against the index indicated. An index is unmanaged and has no cash in its portfolio, imposes no sales charges and incurs no operating expenses. An investor cannot invest directly in an index.
The performance graph and table do not reflect the deduction of taxes that a shareholder will pay on Portfolio distributions or the redemption of Portfolio shares.
The performance shown may include the effect of fee waivers and/or expense reimbursements by the Investment Adviser and/or other service providers, which have the effect of increasing total return. Had all fees and expenses been considered, the total returns would have been lower.
Performance data represents past performance and is no assurance of future results. Investment return and principal value of an investment in the Portfolio will fluctuate. Shares, when sold, may be worth more or less than their original cost. The Portfolio’s current performance may be lower or higher than the performance data shown. Please log on to www.ingfunds.com or call (800) 262-3862 to get performance through the most recent month end.
This report contains statements that may be “forward-looking” statements. Actual results may differ materially from those projected in the “forward-looking” statements.
The views expressed in this report reflect those of the Investment Adviser, only through the end of the period as stated on the cover. The Investment Adviser’s views are subject to change at any time based on market and other conditions.
Portfolio holdings are subject to change daily.
(1)The LBAB Index is an unmanaged index of publicly issued investment grade U.S. government, mortgage-backed, asset-backed and corporate debt securities.
(2)Since inception performance for the index is shown as of May 1, 2005.
(3)Since inception performance for the index is shown as of September 1, 2005.
5
ING SOLUTION 2015 PORTFOLIO
PORTFOLIO MANAGERS’ REPORT
| | | | | | | | | | | | | |
|
| Average Annual Total Returns for the Periods Ended December 31, 2006 |
|
| | |
| | Since Inception | | Since Inception |
| | of Classes ADV, I and S | | of Class T |
| | 1 Year | | April 29, 2005 | | August 31, 2005 |
| |
| |
| |
|
| Class ADV | | | 10.54 | % | | | 10.53 | % | | | — | |
| Class I | | | 10.96 | % | | | 11.15 | % | | | — | |
| Class S | | | 10.78 | % | | | 10.86 | % | | | — | |
| Class T | | | 10.26 | % | | | — | | | | 9.20 | % |
S&P 500® Index(1) | | | 15.79 | % | | | 15.17 | %(2) | | | 14.06 | %(3) |
LBAB Index(4) | | | 4.33 | % | | | 3.53 | %(2) | | | 2.89 | %(3) |
Composite Index(5) | | | 11.12 | % | | | 10.43 | %(2) | | | 9.50 | %(5) |
Based on a $10,000 initial investment, the graph and table above illustrate the total return of ING Solution 2015 Portfolio against the indices indicated. An index is unmanaged and has no cash in its portfolio, imposes no sales charges and incurs no operating expenses. An investor cannot invest directly in an index.
The performance graph and table do not reflect the deduction of taxes that a shareholder will pay on Portfolio distributions or the redemption of Portfolio shares.
The performance shown may include the effect of fee waivers and/or expense reimbursements by the Investment Adviser and/or other service providers, which have the effect of increasing total return. Had all fees and expenses been considered, the total returns would have been lower.
Performance data represents past performance and is no assurance of future results. Investment return and principal value of an investment in the Portfolio will fluctuate. Shares, when sold, may be worth more or less than their original cost. The Portfolio’s current performance may be lower or higher than the performance data shown. Please log on to www.ingfunds.com or call (800) 262-3862 to get performance through the most recent month end.
This report contains statements that may be “forward-looking” statements. Actual results may differ materially from those projected in the “forward-looking” statements.
The views expressed in this report reflect those of the Investment Adviser, only through the end of the period as stated on the cover. The Investment Adviser’s views are subject to change at any time based on market and other conditions.
Portfolio holdings are subject to change daily.
(1)The S&P 500® Index is a value-weighted, unmanaged index of 500 of the largest companies in the U.S.
(2)Since inception performance for the indices is shown from May 1, 2005.
(3)Since inception performance for the indices is shown from September 1, 2005.
(4)The LBAB Index is an unmanaged index of publicly issued investment grade U.S. government, mortgage-backed, asset-backed and corporate debt securities.
(5)The Composite Index consists of 60% of return of (securities included in) the S&P 500® Index and 40% of the return of (securities included in) the LBAB Index.
6
ING SOLUTION 2025 PORTFOLIO
PORTFOLIO MANAGERS’ REPORT
| | | | | | | | | | | | | |
|
| Average Annual Total Returns for the Periods Ended December 31, 2006 |
|
| | | | |
| | Since Inception | | Since Inception |
| | of Classes ADV, I and S | | of Class T |
| | 1 Year | | April 29, 2005 | | August 31, 2005 |
| |
| |
| |
|
| Class ADV | | | 12.37 | % | | | 12.97 | % | | | — | |
| Class I | | | 12.94 | % | | | 13.69 | % | | | — | |
| Class S | | | 12.59 | % | | | 13.29 | % | | | — | |
| Class T | | | 12.09 | % | | | — | | | | 11.14 | % |
S&P 500® Index(1) | | | 15.79 | % | | | 15.17 | %(2) | | | 14.06 | %(3) |
LBAB Index(4) | | | 4.33 | % | | | 3.53 | %(2) | | | 2.89 | %(3) |
Composite Index(5) | | | 11.12 | % | | | 10.43 | %(2) | | | 9.50 | %(3) |
Based on a $10,000 initial investment, the graph and table above illustrate the total return of ING Solution 2025 Portfolio against the indices indicated. An index is unmanaged and has no cash in its portfolio, imposes no sales charges and incurs no operating expenses. An investor cannot invest directly in an index.
The performance graph and table do not reflect the deduction of taxes that a shareholder will pay on Portfolio distributions or the redemption of Portfolio shares.
The performance shown may include the effect of fee waivers and/or expense reimbursements by the Investment Adviser and/or other service providers, which have the effect of increasing total return. Had all fees and expenses been considered, the total returns would have been lower.
Performance data represents past performance and is no assurance of future results. Investment return and principal value of an investment in the Portfolio will fluctuate. Shares, when sold, may be worth more or less than their original cost. The Portfolio’s current performance may be lower or higher than the performance data shown. Please log on to www.ingfunds.com or call (800) 262-3862 to get performance through the most recent month end.
This report contains statements that may be “forward-looking” statements. Actual results may differ materially from those projected in the “forward-looking” statements.
The views expressed in this report reflect those of the Investment Adviser, only through the end of the period as stated on the cover. The Investment Adviser’s views are subject to change at any time based on market and other conditions.
Portfolio holdings are subject to change daily.
(1)The S&P 500® Index is an unmanaged index that measures the performance of the securities of approximately 500 of the largest companies in the U.S.
(2)Since inception performance for the indices is shown from May 1, 2005.
(3)Since inception performance for the indices is shown from September 1, 2005.
(4)The LBAB Index is an unmanaged index of publicly issued investment grade U.S. government, mortgage-backed, asset-backed and corporate debt securities.
(5)The Composite Index consists of 60% return of (securities included in) the S&P 500® Index and 40% of the return of (securities included in) the LBAB Index.
7
ING SOLUTION 2035 PORTFOLIO
PORTFOLIO MANAGERS’ REPORT
| | | | | | | | | | | | | |
|
| Average Annual Total Returns for the Periods Ended December 31, 2006 |
|
| | Since Inception | | Since Inception |
| | of Classes ADV, I, and S | | of Class T |
| | 1 Year | | April 29, 2005 | | August 31, 2005 |
| |
| |
| |
|
| Class ADV | | | 13.91 | % | | | 14.75 | % | | | — | |
| Class I | | | 14.29 | % | | | 15.35 | % | | | — | |
| Class S | | | 14.13 | % | | | 15.07 | % | | | — | |
| Class T | | | 13.56 | % | | | — | | | | 12.75 | % |
Russell 3000® Index(1) | | | 15.72 | % | | | 16.16 | %(2) | | | 14.01 | %(3) |
Based on a $10,000 initial investment, the graph and table above illustrate the total return of ING Solution 2035 Portfolio against the Index indicated. An Index is unmanaged and has no cash in its portfolio, imposes no sales charges and incurs no operating expenses. An investor cannot invest directly in an index.
The performance graph and table do not reflect the deduction of taxes that a shareholder will pay on Portfolio distributions or the redemption of Portfolio shares.
The performance shown may include the effect of fee waivers and/or expense reimbursements by the Investment Adviser and/or other service providers, which have the effect of increasing total return. Had all fees and expenses been considered, the total returns would have been lower.
Performance data represents past performance and is no assurance of future results. Investment return and principal value of an investment in the Portfolio will fluctuate. Shares, when sold, may be worth more or less than their original cost. The Portfolio’s current performance may be lower or higher than the performance data shown. Please log on to www.ingfunds.com or call (800) 262-3862 to get performance through the most recent month end.
This report contains statements that may be “forward-looking” statements. Actual results may differ materially from those projected in the “forward-looking” statements.
The views expressed in this report reflect those of the Investment Adviser, only through the end of the period as stated on the cover. The Investment Adviser’s views are subject to change at any time based on market and other conditions.
Portfolio holdings are subject to change daily.
(1)The Russell 3000® Index measures the performance of the 3000 largest U.S. companies based on total market capitalization, which represent approximately 98% of the U.S. equity market.
(2)Since inception performance for the index is shown from May 1, 2005.
(3)Since inception performance for the index is shown from September 1, 2005.
8
ING SOLUTION 2045 PORTFOLIO
PORTFOLIO MANAGERS’ REPORT
| | | | | | | | | | | | | |
|
| Average Annual Total Returns for the Periods Ended December 31, 2006 |
|
| | Since Inception | | Since Inception |
| | of Classes ADV, I, and S | | of Class T |
| | 1 Year | | April 29, 2005 | | August 31, 2005 |
| |
| |
| |
|
| Class ADV | | | 14.82 | % | | | 16.59 | % | | | — | |
| Class I | | | 15.38 | % | | | 17.23 | % | | | — | |
| Class S | | | 15.06 | % | | | 16.85 | % | | | — | |
| Class T | | | 14.57 | % | | | — | | | | 13.99 | % |
Russell 3000® Index(1) | | | 15.72 | % | | | 16.16 | %(2) | | | 14.01 | %(3) |
Based on a $10,000 initial investment, the graph and table above illustrate the total return of ING Solution 2045 Portfolio against the Russell 3000® Index. The Index is unmanaged and has no cash in its portfolio, imposes no sales charges and incurs no operating expenses. An investor cannot invest directly in an index.
The performance graph and table do not reflect the deduction of taxes that a shareholder will pay on Portfolio distributions or the redemption of Portfolio shares.
The performance shown may include the effect of fee waivers and/or expense reimbursements by the Investment Adviser and/or other service providers, which have the effect of increasing total return. Had all fees and expenses been considered, the total returns would have been lower.
Performance data represents past performance and is no assurance of future results. Investment return and principal value of an investment in the Portfolio will fluctuate. Shares, when sold, may be worth more or less than their original cost. The Portfolio’s current performance may be lower or higher than the performance data shown. Please log on to www.ingfunds.com or call (800) 262-3862 to get performance through the most recent month end.
This report contains statements that may be “forward-looking” statements. Actual results may differ materially from those projected in the “forward-looking” statements.
The views expressed in this report reflect those of the Investment Adviser, only through the end of the period as stated on the cover. The Investment Adviser’s views are subject to change at any time based on market and other conditions.
Portfolio holdings are subject to change daily.
(1)The Russell 3000® Index measures the performance of the 3000 largest U.S. companies based on total market capitalization, which represent approximately 98% of the U.S. equity market.
(2)Since inception performance for the index is shown from May 1, 2005.
(3)Since inception performance for the index is shown from September 1, 2005.
9
SHAREHOLDER EXPENSE EXAMPLES (UNAUDITED)
As a shareholder of a Portfolio, you incur two types of costs: (1) transaction costs, including exchange fees; and (2) ongoing costs including management fees, distribution and/or service (12b-1) fees, and other Portfolio expenses. These Examples are intended to help you understand your ongoing costs (in dollars) of investing in a Portfolio and to compare these costs with the ongoing costs of investing in other mutual funds.
The Examples are based on an investment of $1,000 invested at the beginning of the period (except as noted) and held for the entire period from July 1, 2006, to December 31, 2006. The Portfolios’ expenses are shown without the imposition of any charges which are, or may be, imposed under your annuity contract. Expenses would have been higher if such charges were included.
Actual Expenses
The first section of the table shown, “Actual Portfolio Return,” provides information about actual account values and actual expenses. You may use the information in this section, together with the amount you invested, to estimate the expenses that you paid over the period. Simply divide your account value by $1,000 (for example, an $8,600 account value divided by $1,000 = 8.6), then multiply the result by the number in the first section under the heading entitled “Expenses Paid During Period” to estimate the expenses you paid on your account during this period.
Hypothetical Example for Comparison Purposes
The second section of the table shown, “Hypothetical 5% Return,” provides information about hypothetical account values and hypothetical expenses based on the Portfolio’s actual expense ratio and an assumed rate of return of 5% per year before expenses, which is not the Portfolio’s actual return. The hypothetical account values and expenses may not be used to estimate the actual ending account balance or expenses you paid for the period. You may use this information to compare the ongoing costs of investing in the Fund and other mutual funds. To do so, compare this 5% hypothetical example with the 5% hypothetical examples that appear in the shareholder reports of the other mutual funds.
Please note that the expenses shown in the table are meant to highlight your ongoing costs only and do not reflect any transactional costs, such as redemption fees or exchange fees. Therefore, the hypothetical lines of the table are useful in comparing ongoing costs only, and will not help you determine the relative total costs of owning different mutual funds. In addition, if these transactional costs were included, your costs would have been higher.
| | | | | | | | | | | | | | | | | |
| | Beginning | | Ending | | | | Expenses Paid |
| | Account | | Account | | Annualized | | During the Six |
| | Value | | Value | | Expense | | Months Ended |
| ING Solution Income Portfolio | | July 1, 2006 | | December 31, 2006 | | Ratio* | | December 31, 2006** |
| |
| |
| |
| |
|
| Actual Portfolio Return | | | | | | | | | | | | | | | | |
| Class ADV | | $ | 1,000.00 | | | $ | 1,066.90 | | | | 0.62 | % | | $ | 3.23 | |
| Class I | | | 1,000.00 | | | | 1,068.40 | | | | 0.12 | | | | 0.63 | |
| Class S | | | 1,000.00 | | | | 1,066.50 | | | | 0.37 | | | | 1.93 | |
| Class T | | | 1,000.00 | | | | 1,064.10 | | | | 0.82 | | | | 4.27 | |
| Hypothetical (5% return before expenses) | | | | | | | | | | | | | | | | |
| Class ADV | | $ | 1,000.00 | | | $ | 1,022.08 | | | | 0.62 | % | | $ | 3.16 | |
| Class I | | | 1,000.00 | | | | 1,024.60 | | | | 0.12 | | | | 0.61 | |
| Class S | | | 1,000.00 | | | | 1,023.34 | | | | 0.37 | | | | 1.89 | |
| Class T | | | 1,000.00 | | | | 1,021.07 | | | | 0.82 | | | | 4.18 | |
|
| |
| * | Expense ratios do not include expenses of the underlying funds. |
| |
| ** | Expenses are equal to each Portfolio’s respective annualized expense ratios multiplied by the average account value over the period, multiplied by 184/365 to reflect the most recent fiscal half-year. |
10
SHAREHOLDER EXPENSE EXAMPLES (UNAUDITED) (CONTINUED)
| | | | | | | | | | | | | | | | | | |
| | Beginning | | Ending | | | | Expenses Paid |
| | Account | | Account | | Annualized | | During the Six |
| | Value | | Value | | Expense | | Months Ended |
| ING Solution 2015 Portfolio | | July 1, 2006 | | December 31, 2006 | | Ratio* | | December 31, 2006** |
| |
| |
| |
| |
|
| | Actual Portfolio Return | | | | | | | | | | | | | | | | |
| | Class ADV | | $ | 1,000.00 | | | $ | 1,087.20 | | | | 0.62 | % | | $ | 3.26 | |
| | Class I | | | 1,000.00 | | | | 1,089.40 | | | | 0.12 | | | | 0.63 | |
| | Class S | | | 1,000.00 | | | | 1,088.60 | | | | 0.37 | | | | 1.95 | |
| | Class T | | | 1,000.00 | | | | 1,085.40 | | | | 0.82 | | | | 4.31 | |
| | Hypothetical (5% return before expenses) | | | | | | | | | | | | | | | | |
| | Class ADV | | $ | 1,000.00 | | | $ | 1,022.08 | | | | 0.62 | % | | $ | 3.16 | |
| | Class I | | | 1,000.00 | | | | 1,024.60 | | | | 0.12 | | | | 0.61 | |
| | Class S | | | 1,000.00 | | | | 1,023.34 | | | | 0.37 | | | | 1.89 | |
| | Class T | | | 1,000.00 | | | | 1,021.07 | | | | 0.82 | | | | 4.18 | |
| |
|
|
|
|
ING Solution 2025 Portfolio | | | | | | | | | | | | | | | | |
| | Actual Portfolio Return | | | | | | | | | | | | | | | | |
| | Class ADV | | $ | 1,000.00 | | | $ | 1,094.70 | | | | 0.62 | % | | $ | 3.27 | |
| | Class I | | | 1,000.00 | | | | 1,097.60 | | | | 0.12 | | | | 0.63 | |
| | Class S | | | 1,000.00 | | | | 1,096.00 | | | | 0.37 | | | | 1.95 | |
| | Class T | | | 1,000.00 | | | | 1,094.00 | | | | 0.82 | | | | 4.33 | |
| | Hypothetical (5% return before expenses) | | | | | | | | | | | | | | | | |
| | Class ADV | | $ | 1,000.00 | | | $ | 1,022.08 | | | | 0.62 | % | | $ | 3.16 | |
| | Class I | | | 1,000.00 | | | | 1,024.60 | | | | 0.12 | | | | 0.61 | |
| | Class S | | | 1,000.00 | | | | 1,023.34 | | | | 0.37 | | | | 1.89 | |
| | Class T | | | 1,000.00 | | | | 1,021.07 | | | | 0.82 | | | | 4.18 | |
| |
|
|
|
|
ING Solution 2035 Portfolio | | | | | | | | | | | | | | | | |
| | Actual Portfolio Return | | | | | | | | | | | | | | | | |
| | Class ADV | | $ | 1,000.00 | | | $ | 1,105.30 | | | | 0.62 | % | | $ | 3.29 | |
| | Class I | | | 1,000.00 | | | | 1,107.20 | | | | 0.12 | | | | 0.64 | |
| | Class S | | | 1,000.00 | | | | 1,106.60 | | | | 0.37 | | | | 1.96 | |
| | Class T | | | 1,000.00 | | | | 1,102.90 | | | | 0.82 | | | | 4.35 | |
| | Hypothetical (5% return before expenses) | | | | | | | | | | | | | | | | |
| | Class ADV | | $ | 1,000.00 | | | $ | 1,022.08 | | | | 0.62 | % | | $ | 3.16 | |
| | Class I | | | 1,000.00 | | | | 1,024.60 | | | | 0.12 | | | | 0.61 | |
| | Class S | | | 1,000.00 | | | | 1,023.34 | | | | 0.37 | | | | 1.89 | |
| | Class T | | | 1,000.00 | | | | 1,021.07 | | | | 0.82 | | | | 4.18 | |
|
| |
| * | Expense ratios do not include expenses of the underlying funds. |
| |
| ** | Expenses are equal to each Portfolio’s respective annualized expense ratios multiplied by the average account value over the period, multiplied by 184/365 to reflect the most recent fiscal half-year. |
11
SHAREHOLDER EXPENSE EXAMPLES (UNAUDITED) (CONTINUED)
| | | | | | | | | | | | | | | | | |
| | Beginning | | Ending | | | | Expenses Paid |
| | Account | | Account | | Annualized | | During the Six |
| | Value | | Value | | Expense | | Months Ended |
| ING Solution 2045 Portfolio | | July 1, 2006 | | December 31, 2006 | | Ratio* | | December 31, 2006** |
| |
| |
| |
| |
|
| Actual Portfolio Return | | | | | | | | | | | | | | | | |
| Class ADV | | $ | 1,000.00 | | | $ | 1,109.10 | | | | 0.62 | % | | $ | 3.30 | |
| Class I | | | 1,000.00 | | | | 1,112.80 | | | | 0.12 | | | | 0.64 | |
| Class S | | | 1,000.00 | | | | 1,110.50 | | | | 0.37 | | | | 1.97 | |
| Class T | | | 1,000.00 | | | | 1,107.60 | | | | 0.82 | | | | 4.36 | |
| Hypothetical (5% return before expenses) | | | | | | | | | | | | | | | | |
| Class ADV | | $ | 1,000.00 | | | $ | 1,022.08 | | | | 0.62 | % | | $ | 3.16 | |
| Class I | | | 1,000.00 | | | | 1,024.60 | | | | 0.12 | | | | 0.61 | |
| Class S | | | 1,000.00 | | | | 1,023.34 | | | | 0.37 | | | | 1.89 | |
| Class T | | | 1,000.00 | | | | 1,021.07 | | | | 0.82 | | | | 4.18 | |
|
| |
| * | Expense ratios do not include expenses of the underlying funds. |
| |
| ** | Expenses are equal to each Portfolio’s respective annualized expense ratios multiplied by the average account value over the period, multiplied by 184/365 to reflect the most recent fiscal half-year. |
12
REPORT OF INDEPENDENT REGISTERED PUBLIC ACCOUNTING FIRM
The Shareholders and Board of Directors
ING Partners, Inc.
We have audited the accompanying statements of assets and liabilities, including the portfolios of investments, of ING Solution Income Portfolio, ING Solution 2015 Portfolio, ING Solution 2025 Portfolio, ING Solution 2035 Portfolio, and ING Solution 2045 Portfolio, each a series of ING Partners, Inc., as of December 31, 2006, and the related statements of operations, the statements of changes in net assets for each of the years or periods in the two-year period then ended, and the financial highlights for the year ended December 31, 2006, and for the period from April 29, 2005 (commencement of operations) to December 31, 2005. These financial statements and financial highlights are the responsibility of management. Our responsibility is to express an opinion on these financial statements and financial highlights based on our audits.
We conducted our audits in accordance with the standards of the Public Company Accounting Oversight Board (United States). Those standards require that we plan and perform the audits to obtain reasonable assurance about whether the financial statements and financial highlights are free of material misstatement. An audit includes examining, on a test basis, evidence supporting the amounts and disclosures in the financial statements. Our procedures included confirmation of securities owned as of December 31, 2006, by correspondence with the transfer agent of the underlying funds. An audit also includes assessing the accounting principles used and significant estimates made by management, as well as evaluating the overall financial statement presentation. We believe that our audits provide a reasonable basis for our opinion.
In our opinion, the financial statements and financial highlights referred to above present fairly, in all material respects, the financial position of the aforementioned portfolios as of December 31, 2006, the results of their operations, the changes in their net assets, and the financial highlights for the periods specified in the first paragraph above, in conformity with U.S. generally accepted accounting principles.

Boston, Massachusetts
February 28, 2007
| |
| * | Expense ratios do not include expenses of the underlying funds. |
| |
| ** | Expenses are equal to each Portfolio’s respective annualized expense ratios multiplied by the average account value over the period, multiplied by 184/365 to reflect the most recent fiscal half-year. |
13
STATEMENTS OF ASSETS AND LIABILITIES AS OF DECEMBER 31, 2006
| | | | | | | | | | | | | | | |
| | ING | | ING | | ING |
| | Solution | | Solution | | Solution |
| | Income | | 2015 | | 2025 |
| | Portfolio | | Portfolio | | Portfolio |
| |
| |
| |
|
ASSETS: | | | | | | | | | | | | |
| Investments in affiliated underlying funds at value* | | $ | 80,438,552 | | | $ | 282,168,749 | | | $ | 409,438,816 | |
|
|
|
|
| Receivables: | | | | | | | | | | | | |
| | Investment securities sold | | | 94,742 | | | | 168,256 | | | | — | |
| | Fund shares sold | | | 289,505 | | | | 678,011 | | | | 1,597,874 | |
| | Dividends from affiliated underlying funds | | | 13 | | | | 40 | | | | — | |
| | | |
| | | |
| | | |
| |
| | | Total assets | | | 80,822,812 | | | | 283,015,056 | | | | 411,036,690 | |
| | | |
| | | |
| | | |
| |
|
|
|
|
LIABILITIES: | | | | | | | | | | | | |
| Payable for investments purchased in affiliated underlying funds | | | — | | | | — | | | | 598,428 | |
| Payable for fund shares redeemed | | | 384,247 | | | | 846,268 | | | | 999,446 | |
| Payable to affiliates | | | 29,443 | | | | 101,133 | | | | 145,703 | |
| | | |
| | | |
| | | |
| |
| | | Total liabilities | | | 413,690 | | | | 947,401 | | | | 1,743,577 | |
| | | |
| | | |
| | | |
| |
NET ASSETS | | $ | 80,409,122 | | | $ | 282,067,655 | | | $ | 409,293,113 | |
| | | |
| | | |
| | | |
| |
|
|
|
|
NET ASSETS WERE COMPRISED OF: | | | | | | | | | | | | |
| Paid-in capital | | $ | 77,389,103 | | | $ | 266,350,004 | | | $ | 381,503,154 | |
| Undistributed net investment income | | | 887,929 | | | | 2,458,163 | | | | 2,742,172 | |
| Accumulated net realized gain on investments | | | 77,081 | | | | 665,905 | | | | 1,966,060 | |
| Net unrealized appreciation on investments | | | 2,055,009 | | | | 12,593,583 | | | | 23,081,727 | |
| | | |
| | | |
| | | |
| |
NET ASSETS | | $ | 80,409,122 | | | $ | 282,067,655 | | | $ | 409,293,113 | |
| | | |
| | | |
| | | |
| |
| | | | | | | | | | | | |
| * Cost of investments in affiliated underlying funds | | $ | 78,383,543 | | | $ | 269,575,166 | | | $ | 386,357,089 | |
|
|
|
|
Class ADV: | | | | | | | | | | | | |
| Net assets | | $ | 20,477,419 | | | $ | 71,922,753 | | | $ | 100,094,891 | |
| Shares authorized | | | 100,000,000 | | | | 100,000,000 | | | | 100,000,000 | |
| Par value | | $ | 0.001 | | | $ | 0.001 | | | $ | 0.001 | |
| Shares outstanding | | | 1,848,898 | | | | 6,076,831 | | | | 8,154,317 | |
| Net asset value and redemption price per share | | $ | 11.08 | | | $ | 11.84 | | | $ | 12.28 | |
|
|
|
|
Class I: | | | | | | | | | | | | |
| Net assets | | $ | 3,052,633 | | | $ | 14,383,772 | | | $ | 17,540,120 | |
| Shares authorized | | | 100,000,000 | | | | 100,000,000 | | | | 100,000,000 | |
| Par value | | $ | 0.001 | | | $ | 0.001 | | | $ | 0.001 | |
| Shares outstanding | | | 272,944 | | | | 1,203,786 | | | | 1,413,813 | |
| Net asset value and redemption price per share | | $ | 11.18 | | | $ | 11.95 | | | $ | 12.41 | |
|
|
|
|
Class S: | | | | | | | | | | | | |
| Net assets | | $ | 54,634,049 | | | $ | 191,100,240 | | | $ | 282,069,801 | |
| Shares authorized | | | 100,000,000 | | | | 100,000,000 | | | | 100,000,000 | |
| Par value | | $ | 0.001 | | | $ | 0.001 | | | $ | 0.001 | |
| Shares outstanding | | | 4,906,970 | | | | 16,063,415 | | | | 22,855,350 | |
| Net asset value and redemption price per share | | $ | 11.13 | | | $ | 11.90 | | | $ | 12.34 | |
|
|
|
|
Class T: | | | | | | | | | | | | |
| Net assets | | $ | 2,245,021 | | | $ | 4,660,890 | | | $ | 9,588,301 | |
| Shares authorized | | | 100,000,000 | | | | 100,000,000 | | | | 100,000,000 | |
| Par value | | $ | 0.001 | | | $ | 0.001 | | | $ | 0.001 | |
| Shares outstanding | | | 203,572 | | | | 394,772 | | | | 782,736 | |
| Net asset value and redemption price per share | | $ | 11.03 | | | $ | 11.81 | | | $ | 12.25 | |
See Accompanying Notes to Financial Statements
14
STATEMENTS OF ASSETS AND LIABILITIES AS OF DECEMBER 31, 2006 (CONTINUED)
| | | | | | | | | | |
| | ING | | ING |
| | Solution | | Solution |
| | 2035 | | 2045 |
| | Portfolio | | Portfolio |
| |
| |
|
ASSETS: | | | | | | | | |
| Investments in affiliated underlying funds at value* | | $ | 321,469,535 | | | $ | 165,136,200 | |
| Receivable for fund shares sold | | | 1,087,154 | | | | 1,150,876 | |
| | | |
| | | |
| |
| | Total assets | | | 322,556,689 | | | | 166,287,076 | |
| | | |
| | | |
| |
|
|
|
|
LIABILITIES: | | | | | | | | |
| Payable for investments in affiliated underlying funds purchased | | | 688,642 | | | | 1,049,006 | |
| Payable for fund shares redeemed | | | 398,512 | | | | 101,870 | |
| Payable to affiliates | | | 113,526 | | | | 56,514 | |
| | | |
| | | |
| |
| | Total liabilities | | | 1,200,680 | | | | 1,207,390 | |
| | | |
| | | |
| |
NET ASSETS | | $ | 321,356,009 | | | $ | 165,079,686 | |
| | | |
| | | |
| |
|
|
|
|
NET ASSETS WERE COMPRISED OF: | | | | | | | | |
| Paid-in capital | | $ | 297,316,620 | | | $ | 152,444,968 | |
| Undistributed net investment income | | | 2,298,752 | | | | 690,414 | |
| Accumulated net realized gain on investments | | | 1,377,199 | | | | 647,092 | |
| Net unrealized appreciation on investments | | | 20,363,438 | | | | 11,297,212 | |
| | | |
| | | |
| |
NET ASSETS | | $ | 321,356,009 | | | $ | 165,079,686 | |
| | | |
| | | |
| |
| | | | | | | | |
| * Cost of investments in affiliated underlying funds | | $ | 301,106,097 | | | $ | 153,838,988 | |
|
|
|
|
Class ADV: | | | | | | | | |
| Net assets | | $ | 73,682,583 | | | $ | 36,740,651 | |
| Shares authorized | | | 100,000,000 | | | | 100,000,000 | |
| Par value | | $ | 0.001 | | | $ | 0.001 | |
| Shares outstanding | | | 5,826,757 | | | | 2,823,410 | |
| Net asset value and redemption price per share | | $ | 12.65 | | | $ | 13.01 | |
|
|
|
|
Class I: | | | | | | | | |
| Net assets | | $ | 16,646,956 | | | $ | 10,442,397 | |
| Shares authorized | | | 100,000,000 | | | | 100,000,000 | |
| Par value | | $ | 0.001 | | | $ | 0.001 | |
| Shares outstanding | | | 1,304,130 | | | | 795,475 | |
| Net asset value and redemption price per share | | $ | 12.76 | | | $ | 13.13 | |
|
|
|
|
Class S: | | | | | | | | |
| Net assets | | $ | 222,501,667 | | | $ | 114,649,588 | |
| Shares authorized | | | 100,000,000 | | | | 100,000,000 | |
| Par value | | $ | 0.001 | | | $ | 0.001 | |
| Shares outstanding | | | 17,506,403 | | | | 8,776,188 | |
| Net asset value and redemption price per share | | $ | 12.71 | | | $ | 13.06 | |
|
|
|
|
Class T: | | | | | | | | |
| Net assets | | $ | 8,524,803 | | | $ | 3,247,050 | |
| Shares authorized | | | 100,000,000 | | | | 100,000,000 | |
| Par value | | $ | 0.001 | | | $ | 0.001 | |
| Shares outstanding | | | 676,469 | | | | 250,317 | |
| Net asset value and redemption price per share | | $ | 12.60 | | | $ | 12.97 | |
See Accompanying Notes to Financial Statements
15
STATEMENTS OF OPERATIONS FOR THE YEAR ENDED DECEMBER 31, 2006
| | | | | | | | | | | | | | | | | | | | | | |
| | ING | | ING | | ING | | ING | | ING |
| | Solution | | Solution | | Solution | | Solution | | Solution |
| | Income | | 2015 | | 2025 | | 2035 | | 2045 |
| | Portfolio | | Portfolio | | Portfolio | | Portfolio | | Portfolio |
| |
| |
| |
| |
| |
|
INVESTMENT INCOME: | | | | | | | | | | | | | | | | | | | | |
| Dividends from affiliated underlying funds | | $ | 917,820 | | | $ | 2,600,456 | | | $ | 2,748,267 | | | $ | 2,215,697 | | | $ | 629,323 | |
| | | |
| | | |
| | | |
| | | |
| | | |
| |
| | Total investment income | | | 917,820 | | | | 2,600,456 | | | | 2,748,267 | | | | 2,215,697 | | | | 629,323 | |
| | | |
| | | |
| | | |
| | | |
| | | |
| |
|
|
|
|
EXPENSES: | | | | | | | | | | | | | | | | | | | | |
| Investment management fees | | | 24,303 | | | | 88,377 | | | | 135,643 | | | | 98,470 | | | | 48,778 | |
|
|
|
|
| Distribution and service fees: | | | | | | | | | | | | | | | | | | | | |
| | Class ADV | | | 18,980 | | | | 77,665 | | | | 108,408 | | | | 78,534 | | | | 38,095 | |
| | Class S | | | 41,401 | | | | 148,807 | | | | 240,130 | | | | 169,137 | | | | 83,060 | |
| | Class T | | | 23,053 | | | | 63,743 | | | | 88,502 | | | | 67,671 | | | | 26,203 | |
| Administrative service fees | | | 4,860 | | | | 17,674 | | | | 27,127 | | | | 19,692 | | | | 9,755 | |
| | | |
| | | |
| | | |
| | | |
| | | |
| |
| | Total expenses | | | 112,597 | | | | 396,266 | | | | 599,810 | | | | 433,504 | | | | 205,891 | |
| | Net waived and reimbursed fees | | | (1,537 | ) | | | (4,250 | ) | | | (5,900 | ) | | | (4,512 | ) | | | (1,747 | ) |
| | | |
| | | |
| | | |
| | | |
| | | |
| |
| | Net expenses | | | 111,060 | | | | 392,016 | | | | 593,910 | | | | 428,992 | | | | 204,144 | |
| | | |
| | | |
| | | |
| | | |
| | | |
| |
| Net investment income | | | 806,760 | | | | 2,208,440 | | | | 2,154,357 | | | | 1,786,705 | | | | 425,179 | |
| | | |
| | | |
| | | |
| | | |
| | | |
| |
|
|
|
|
REALIZED AND UNREALIZED GAIN (LOSS) ON AFFILIATED UNDERLYING FUNDS: | | | | | | | | | | | | | | | | | | | | |
| Distributions of realized gains from affiliated underlying funds | | | 115,329 | | | | 469,473 | | | | 1,174,366 | | | | 963,476 | | | | 492,103 | |
| Net realized gain on affiliated underlying funds | | | 45,996 | | | | 455,726 | | | | 1,399,930 | | | | 930,109 | | | | 424,501 | |
| Net change in unrealized appreciation or depreciation on affiliated underlying funds | | | 2,057,529 | | | | 12,537,767 | | | | 22,592,857 | | | | 20,212,377 | | | | 11,285,992 | |
| | | |
| | | |
| | | |
| | | |
| | | |
| |
| Net realized and unrealized gain on affiliated underlying funds | | | 2,218,854 | | | | 13,462,966 | | | | 25,167,153 | | | | 22,105,962 | | | | 12,202,596 | |
| | | |
| | | |
| | | |
| | | |
| | | |
| |
Increase in net assets resulting from operations | | $ | 3,025,614 | | | $ | 15,671,406 | | | $ | 27,321,510 | | | $ | 23,892,667 | | | $ | 12,627,775 | |
| | | |
| | | |
| | | |
| | | |
| | | |
| |
See Accompanying Notes to Financial Statements
16
STATEMENTS OF CHANGES IN NET ASSETS
| | | | | | | | | | | | | | | | | | |
| | | | |
| | ING Solution Income Portfolio | | ING Solution 2015 Portfolio |
| |
| |
|
| | Year Ended | | April 29, 2005(1) | | Year Ended | | April 29, 2005(1) |
| | December 31, | | to December 31, | | December 31, | | to December 31, |
| | 2006 | | 2005 | | 2006 | | 2005 |
| |
| |
| |
| |
|
FROM OPERATIONS: | | | | | | | | | | | | | | | | |
| Net investment income from affiliated underlying funds | | $ | 806,760 | | | $ | 12,658 | | | $ | 2,208,440 | | | $ | 56,612 | |
| Net realized gain on affiliated underlying funds | | | 161,325 | | | | 1,405 | | | | 925,199 | | | | 22,736 | |
| Net change in unrealized appreciation or depreciation on affiliated underlying funds | | | 2,057,529 | | | | (2,520 | ) | | | 12,537,767 | | | | 55,816 | |
| | | |
| | | |
| | | |
| | | |
| |
| Net increase in net assets resulting from operations | | | 3,025,614 | | | | 11,543 | | | | 15,671,406 | | | | 135,164 | |
| | | |
| | | |
| | | |
| | | |
| |
|
|
|
|
FROM DISTRIBUTIONS TO SHAREHOLDERS: | | | | | | | | | | | | | | | | |
|
|
|
|
| Net investment income: | | | | | | | | | | | | | | | | |
| | Class ADV | | | (4,748 | ) | | | — | | | | (16,429 | ) | | | — | |
| | Class I | | | (713 | ) | | | — | | | | (6,011 | ) | | | — | |
| | Class S | | | (5,235 | ) | | | — | | | | (26,675 | ) | | | — | |
| | Class T | | | (3,528 | ) | | | — | | | | (9,123 | ) | | | — | |
|
|
|
|
| Net realized gains: | | | | | | | | | | | | | | | | |
| | Class ADV | | | (968 | ) | | | — | | | | (8,506 | ) | | | — | |
| | Class I | | | (142 | ) | | | — | | | | (2,991 | ) | | | — | |
| | Class S | | | (1,137 | ) | | | — | | | | (14,550 | ) | | | — | |
| | Class T | | | (729 | ) | | | — | | | | (4,772 | ) | | | — | |
| | | |
| | | |
| | | |
| | | |
| |
| Total distributions | | | (17,200 | ) | | | — | | | | (89,057 | ) | | | — | |
| | | |
| | | |
| | | |
| | | |
| |
|
|
|
|
FROM CAPITAL SHARE TRANSACTIONS: | | | | | | | | | | | | | | | | |
| Net proceeds from sale of shares | | | 88,382,379 | | | | 818,111 | | | | 289,918,561 | | | | 6,044,016 | |
| Dividends reinvested | | | 17,200 | | | | — | | | | 89,057 | | | | — | |
| | | |
| | | |
| | | |
| | | |
| |
| | | | 88,399,579 | | | | 818,111 | | | | 290,007,618 | | | | 6,044,016 | |
| Cost of shares redeemed | | | (11,798,218 | ) | | | (30,307 | ) | | | (29,363,311 | ) | | | (338,181 | ) |
| | | |
| | | |
| | | |
| | | |
| |
| Net increase in net assets resulting from capital share transactions | | | 76,601,361 | | | | 787,804 | | | | 260,644,307 | | | | 5,705,835 | |
| | | |
| | | |
| | | |
| | | |
| |
| Net increase in net assets | | | 79,609,775 | | | | 799,347 | | | | 276,226,656 | | | | 5,840,999 | |
| | | |
| | | |
| | | |
| | | |
| |
NET ASSETS: | | | | | | | | | | | | | | | | |
| Beginning of period | | | 799,347 | | | | — | | | | 5,840,999 | | | | — | |
| | | |
| | | |
| | | |
| | | |
| |
| End of period | | $ | 80,409,122 | | | $ | 799,347 | | | $ | 282,067,655 | | | $ | 5,840,999 | |
| | | |
| | | |
| | | |
| | | |
| |
| Undistributed net investment income at end of period | | $ | 887,929 | | | $ | 12,720 | | | $ | 2,458,163 | | | $ | 56,750 | |
| | | |
| | | |
| | | |
| | | |
| |
| |
| (1) | Commencement of operations. |
See Accompanying Notes to Financial Statements
17
STATEMENTS OF CHANGES IN NET ASSETS
| | | | | | | | | | | | | | | | | | |
| | | | |
| | ING Solution 2025 Portfolio | | ING Solution 2035 Portfolio |
| |
| |
|
| | Year Ended | | April 29, 2005(1) | | Year Ended | | April 29, 2005(1) |
| | December 31, | | to December 31, | | December 31, | | to December 31, |
| | 2006 | | 2005 | | 2006 | | 2005 |
| |
| |
| |
| |
|
FROM OPERATIONS: | | | | | | | | | | | | | | | | |
| Net investment income from affiliated underlying funds | | $ | 2,154,357 | | | $ | 126,412 | | | $ | 1,786,705 | | | $ | 39,870 | |
| Net realized gain on affiliated underlying funds | | | 2,574,296 | | | | 69,314 | | | | 1,893,585 | | | | 32,991 | |
| Net change in unrealized appreciation or depreciation on affiliated underlying funds | | | 22,592,857 | | | | 488,870 | | | | 20,212,377 | | | | 151,061 | |
| | | |
| | | |
| | | |
| | | |
| |
| Net increase in net assets resulting from operations | | | 27,321,510 | | | | 684,596 | | | | 23,892,667 | | | | 223,922 | |
| | | |
| | | |
| | | |
| | | |
| |
|
|
|
|
FROM DISTRIBUTIONS TO SHAREHOLDERS: | | | | | | | | | | | | | | | | |
|
|
|
|
| Net investment income: | | | | | | | | | | | | | | | | |
| | Class ADV | | | (30,595 | ) | | | — | | | | (12,127 | ) | | | — | |
| | Class I | | | (7,286 | ) | | | — | | | | (5,261 | ) | | | — | |
| | Class S | | | (72,887 | ) | | | — | | | | (16,903 | ) | | | — | |
| | Class T | | | (17,250 | ) | | | — | | | | (7,106 | ) | | | — | |
|
|
|
|
| Net realized gains: | | | | | | | | | | | | | | | | |
| | Class ADV | | | (20,156 | ) | | | — | | | | (10,106 | ) | | | — | |
| | Class I | | | (4,654 | ) | | | — | | | | (4,231 | ) | | | — | |
| | Class S | | | (51,886 | ) | | | — | | | | (15,551 | ) | | | — | |
| | Class T | | | (11,500 | ) | | | — | | | | (5,921 | ) | | | — | |
| | | |
| | | |
| | | |
| | | |
| |
| Total distributions | | | (216,214 | ) | | | — | | | | (77,206 | ) | | | — | |
| | | |
| | | |
| | | |
| | | |
| |
|
|
|
|
FROM CAPITAL SHARE TRANSACTIONS: | | | | | | | | | | | | | | | | |
| Net proceeds from sale of shares | | | 393,904,233 | | | | 17,145,903 | | | | 315,209,674 | | | | 5,591,300 | |
| Dividends reinvested | | | 216,214 | | | | — | | | | 77,206 | | | | — | |
| | | |
| | | |
| | | |
| | | |
| |
| | | | 394,120,447 | | | | 17,145,903 | | | | 315,286,880 | | | | 5,591,300 | |
| Cost of shares redeemed | | | (29,385,613 | ) | | | (377,516 | ) | | | (23,423,811 | ) | | | (137,743 | ) |
| | | |
| | | |
| | | |
| | | |
| |
| Net increase in net assets resulting from capital share transactions | | | 364,734,834 | | | | 16,768,387 | | | | 291,863,069 | | | | 5,453,557 | |
| | | |
| | | |
| | | |
| | | |
| |
| Net increase in net assets | | | 391,840,130 | | | | 17,452,983 | | | | 315,678,530 | | | | 5,677,479 | |
| | | |
| | | |
| | | |
| | | |
| |
|
|
|
|
NET ASSETS: | | | | | | | | | | | | | | | | |
| Beginning of period | | | 17,452,983 | | | | — | | | | 5,677,479 | | | | — | |
| | | |
| | | |
| | | |
| | | |
| |
| End of period | | $ | 409,293,113 | | | $ | 17,452,983 | | | $ | 321,356,009 | | | $ | 5,677,479 | |
| | | |
| | | |
| | | |
| | | |
| |
| Undistributed net investment income at end of period | | $ | 2,742,172 | | | $ | 126,479 | | | $ | 2,298,752 | | | $ | 39,876 | |
| | | |
| | | |
| | | |
| | | |
| |
| |
| (1) | Commencement of operations. |
See Accompanying Notes to Financial Statements
18
STATEMENTS OF CHANGES IN NET ASSETS
| | | | | | | | | | |
| | |
| | ING Solution 2045 Portfolio |
| |
|
| | Year Ended | | April 29, 2005(1) |
| | December 31, | | to December 31, |
| | 2006 | | 2005 |
| |
| |
|
FROM OPERATIONS: | | | | | | | | |
| Net investment income from affiliated underlying funds | | $ | 425,179 | | | $ | 4,899 | |
| Net realized gain on affiliated underlying funds | | | 916,604 | | | | 20,187 | |
| Net change in unrealized appreciation or depreciation on affiliated underlying funds | | | 11,285,992 | | | | 11,220 | |
| | | |
| | | |
| |
| Net increase in net assets resulting from operations | | | 12,627,775 | | | | 36,306 | |
| | | |
| | | |
| |
|
|
|
|
FROM DISTRIBUTIONS TO SHAREHOLDERS: | | | | | | | | |
|
|
|
|
| Net investment income: | | | | | | | | |
| | Class ADV | | | (1,819 | ) | | | — | |
| | Class I | | | (1,552 | ) | | | — | |
| | Class S | | | (2,219 | ) | | | — | |
| | Class T | | | (796 | ) | | | — | |
|
|
|
|
| Net realized gains: | | | | | | | | |
| | Class ADV | | | (6,640 | ) | | | — | |
| | Class I | | | (4,873 | ) | | | — | |
| | Class S | | | (8,711 | ) | | | — | |
| | Class T | | | (2,779 | ) | | | — | |
| | | |
| | | |
| |
| Total distributions | | | (29,389 | ) | | | — | |
| | | |
| | | |
| |
|
|
|
|
FROM CAPITAL SHARE TRANSACTIONS: | | | | | | | | |
| Net proceeds from sale of shares | | | 166,572,144 | | | | 1,647,245 | |
| Dividends reinvested | | | 29,389 | | | | — | |
| | | |
| | | |
| |
| | | | 166,601,533 | | | | 1,647,245 | |
| Cost of shares redeemed | | | (15,422,677 | ) | | | (381,107 | ) |
| | | |
| | | |
| |
| Net increase in net assets resulting from capital share transactions | | | 151,178,856 | | | | 1,266,138 | |
| | | |
| | | |
| |
| Net increase in net assets | | | 163,777,242 | | | | 1,302,444 | |
| | | |
| | | |
| |
|
|
|
|
NET ASSETS: | | | | | | | | |
| Beginning of period | | | 1,302,444 | | | | — | |
| | | |
| | | |
| |
| End of period | | $ | 165,079,686 | | | $ | 1,302,444 | |
| | | |
| | | |
| |
| Undistributed net investment income at end of period | | $ | 690,414 | | | $ | 4,925 | |
| | | |
| | | |
| |
| |
| (1) | Commencement of operations. |
See Accompanying Notes to Financial Statements
19
ING SOLUTION INCOME PORTFOLIO
FINANCIAL HIGHLIGHTS
Selected data for a share of beneficial interest outstanding throughout each period.
| | | | | | | | | | | | | | | | | | | |
| | | | | | |
| | | | Class ADV | | Class I |
| | | |
| |
|
| | | | Year | | April 29, | | Year | | April 29, |
| | | | Ended | | 2005(1) to | | Ended | | 2005(1) to |
| | | | December 31, | | December 31, | | December 31, | | December 31, |
| | | | 2006 | | 2005 | | 2006 | | 2005 |
|
Per Share Operating Performance: | | | | | | | | | | | | | | | | | | |
| Net asset value, beginning of period | | $ | | | 10.36 | | | | 10.02 | | | | 10.41 | | | | 10.02 | |
|
|
|
|
| Income (loss) from investment operations: | | | | | | | | | | | | | | | | | | |
| Net investment income | | $ | | | 0.57 | * | | | 0.54 | * | | | 0.42 | * | | | 0.29 | |
| Net realized and unrealized gain (loss) on investments | | $ | | | 0.17 | | | | (0.20 | ) | | | 0.37 | | | | 0.10 | |
| Total from investment operations | | $ | | | 0.74 | | | | 0.34 | | | | 0.79 | | | | 0.39 | |
|
|
|
|
| Less distributions from: | | | | | | | | | | | | | | | | | | |
| Net investment income | | $ | | | 0.02 | | | | — | | | | 0.02 | | | | — | |
| Net realized gains on investments | | $ | | | 0.00 | ** | | | — | | | | 0.00 | ** | | | — | |
| Total distributions | | $ | | | 0.02 | | | | — | | | | 0.02 | | | | — | |
| Net asset value, end of period | | $ | | | 11.08 | | | | 10.36 | | | | 11.18 | | | | 10.41 | |
|
|
|
|
| Total Return(2) | | % | | | 7.21 | | | | 3.39 | | | | 7.66 | | | | 3.89 | |
| |
|
|
|
|
Ratios and Supplemental Data: | | | | | | | | | | | | | | | | | | |
| Net assets, end of period (000’s) | | $ | | | 20,477 | | | | 188 | | | | 3,053 | | | | 1 | |
|
|
|
|
| Ratios to average net assets: | | | | | | | | | | | | | | | | | | |
| Net expenses after expense waiver (3)(4) | | % | | | 0.62 | | | | 0.62 | | | | 0.12 | | | | 0.12 | |
| Gross expenses prior to expense waiver (3)(4) | | % | | | 0.62 | | | | 0.62 | | | | 0.12 | | | | 0.12 | |
| Net investment income(3) | | % | | | 5.29 | | | | 7.93 | | | | 3.89 | | | | 4.27 | |
| Portfolio turnover rate | | % | | | 32 | | | | 21 | | | | 32 | | | | 21 | |
|
| | | | | | | | | | | | | | | | | | | |
| | | | | | |
| | | | Class S | | Class T |
| | | |
| |
|
| | | | Year | | April 29, | | Year | | August 31, |
| | | | Ended | | 2005(1) to | | Ended | | 2005(1) to |
| | | | December 31, | | December 31, | | December 31, | | December 31, |
| | | | 2006 | | 2005 | | 2006 | | 2005 |
|
Per Share Operating Performance: | | | | | | | | | | | | | | | | | | |
| Net asset value, beginning of period | | $ | | | 10.39 | | | | 10.02 | | | | 10.34 | | | | 10.28 | |
|
|
|
|
| Income (loss) from investment operations: | | | | | | | | | | | | | | | | | | |
| Net investment income | | $ | | | 0.36 | * | | | 0.36 | * | | | 0.10 | * | | | 0.12 | |
| Net realized and unrealized gain (loss) on investments | | $ | | | 0.40 | | | | 0.01 | | | | 0.61 | | | | (0.06 | ) |
| Total from investment operations | | $ | | | 0.76 | | | | 0.37 | | | | 0.71 | | | | 0.06 | |
|
|
|
|
| Less distributions from: | | | | | | | | | | | | | | | | | | |
| Net investment income | | $ | | | 0.02 | | | | — | | | | 0.02 | | | | — | |
| Net realized gains on investments | | $ | | | 0.00 | ** | | | — | | | | 0.00 | ** | | | — | |
| Total distributions | | $ | | | 0.02 | | | | — | | | | 0.02 | | | | — | |
| Net asset value, end of period | | $ | | | 11.13 | | | | 10.39 | | | | 11.03 | | | | 10.34 | |
|
|
|
|
| Total Return(2) | | % | | | 7.37 | | | | 3.69 | | | | 6.93 | | | | 0.58 | |
| |
|
|
|
|
Ratios and Supplemental Data: | | | | | | | | | | | | | | | | | | |
| Net assets, end of period (000’s) | | $ | | | 54,634 | | | | 507 | | | | 2,245 | | | | 103 | |
|
|
|
|
| Ratios to average net assets: | | | | | | | | | | | | | | | | | | |
| Net expenses after expense waiver (3)(4) | | % | | | 0.37 | | | | 0.37 | | | | 0.82 | | | | 0.82 | |
| Gross expenses prior to expense waiver (3)(4) | | % | | | 0.37 | | | | 0.37 | | | | 0.87 | | | | 0.87 | |
| Net investment income(3) | | % | | | 3.28 | | | | 5.22 | | | | 0.94 | | | | 6.36 | |
| Portfolio turnover rate | | % | | | 32 | | | | 21 | | | | 32 | | | | 21 | |
|
(1) Commencement of operations.
(2) Total return is calculated assuming reinvestment of all dividends and capital gain distributions at net asset value and does not reflect the effect of insurance contract charges. Total returns for periods less than one year is not annualized.
(3) Annualized for periods less than one year.
(4) Expense ratios do not include expenses of Underlying Funds and do not include fees and expenses charged under the variable annuity contract or variable life insurance policy.
* Per share numbers have been calculated using average number of shares outstanding throughout the period.
** Amount represents less than $0.005 per share.
20
ING SOLUTION 2015 PORTFOLIO
FINANCIAL HIGHLIGHTS
Selected data for a share of beneficial interest outstanding throughout each period.
| | | | | | | | | | | | | | | | | | | |
| | | | | | |
| | | | Class ADV | | Class I |
| | | |
| |
|
| | | | Year | | April 29, | | Year | | April 29, |
| | | | Ended | | 2005(1) to | | Ended | | 2005(1) to |
| | | | December 31, | | December 31, | | December 31, | | December 31, |
| | | | 2006 | | 2005 | | 2006 | | 2005 |
|
Per Share Operating Performance: | | | | | | | | | | | | | | | | | | |
| Net asset value, beginning of period | | $ | | | 10.74 | | | | 10.04 | | | | 10.80 | | | | 10.04 | |
|
|
|
|
| Income from investment operations: | | | | | | | | | | | | | | | | | | |
| Net investment income | | $ | | | 0.40 | * | | | 0.44 | * | | | 0.33 | * | | | 0.11 | |
| Net realized and unrealized gain on investments | | $ | | | 0.73 | | | | 0.26 | | | | 0.85 | | | | 0.65 | |
| Total from investment operations | | $ | | | 1.13 | | | | 0.70 | | | | 1.18 | | | | 0.76 | |
| |
|
|
|
|
| Less distributions from: | | | | | | | | | | | | | | | | | | |
| Net investment income | | $ | | | 0.02 | | | | — | | | | 0.02 | | | | — | |
| Net realized gains on investments | | $ | | | 0.01 | | | | — | | | | 0.01 | | | | — | |
| Total distributions | | $ | | | 0.03 | | | | — | | | | 0.03 | | | | — | |
| Net asset value, end of period | | $ | | | 11.84 | | | | 10.74 | | | | 11.95 | | | | 10.80 | |
|
|
|
|
| Total Return(2) | | % | | | 10.54 | | | | 6.97 | | | | 10.96 | | | | 7.57 | |
| |
|
|
|
|
Ratios and Supplemental Data: | | | | | | | | | | | | | | | | | | |
| Net assets, end of period (000’s) | | $ | | | 71,923 | | | | 1,032 | | | | 14,384 | | | | 1 | |
|
|
|
|
| Ratios to average net assets: | | | | | | | | | | | | | | | | | | |
| Net expenses after expense waiver (3)(4) | | % | | | 0.62 | | | | 0.62 | | | | 0.12 | | | | 0.12 | |
| Gross expenses prior to expense waiver (3)(4) | | % | | | 0.62 | | | | 0.62 | | | | 0.12 | | | | 0.12 | |
| Net investment income(3) | | % | | | 3.49 | | | | 6.29 | | | | 2.85 | | | | 1.51 | |
| Portfolio turnover rate | | % | | | 14 | | | | 49 | | | | 14 | | | | 49 | |
|
| | | | | | | | | | | | | | | | | | | |
| | | | | | |
| | | | Class S | | Class T |
| | | |
| |
|
| | | | Year | | April 29, | | Year | | August 31, |
| | | | Ended | | 2005(1) to | | Ended | | 2005(1) to |
| | | | December 31, | | December 31, | | December 31, | | December 31, |
| | | | 2006 | | 2005 | | 2006 | | 2005 |
|
Per Share Operating Performance: | | | | | | | | | | | | | | | | | | |
| Net asset value, beginning of period | | $ | | | 10.77 | | | | 10.04 | | | | 10.74 | | | | 10.53 | |
|
|
|
|
| Income from investment operations: | | | | | | | | | | | | | | | | | | |
| Net investment income | | $ | | | 0.29 | * | | | 0.27 | * | | | 0.04 | * | | | 0.13 | |
| Net realized and unrealized gain on investments | | $ | | | 0.87 | | | | 0.46 | | | | 1.06 | | | | 0.08 | |
| Total from investment operations | | $ | | | 1.16 | | | | 0.73 | | | | 1.10 | | | | 0.21 | |
| |
|
|
|
|
| Less distributions from: | | | | | | | | | | | | | | | | | | |
| Net investment income | | $ | | | 0.02 | | | | — | | | | 0.02 | | | | — | |
| Net realized gains on investments | | $ | | | 0.01 | | | | — | | | | 0.01 | | | | — | |
| Total distributions | | $ | | | 0.03 | | | | — | | | | 0.03 | | | | — | |
| Net asset value, end of period | | $ | | | 11.90 | | | | 10.77 | | | | 11.81 | | | | 10.74 | |
|
|
|
|
| Total Return(2) | | % | | | 10.78 | | | | 7.27 | | | | 10.26 | | | | 1.99 | |
| |
|
|
|
|
Ratios and Supplemental Data: | | | | | | | | | | | | | | | | | | |
| Net assets, end of period (000’s) | | $ | | | 191,100 | | | | 4,114 | | | | 4,661 | | | | 694 | |
|
|
|
|
| Ratios to average net assets: | | | | | | | | | | | | | | | | | | |
| Net expenses after expense waiver (3)(4) | | % | | | 0.37 | | | | 0.37 | | | | 0.82 | | | | 0.82 | |
| Gross expenses prior to expense waiver (3)(4) | | % | | | 0.37 | | | | 0.37 | | | | 0.87 | | | | 0.87 | |
| Net investment income(3) | | % | | | 2.52 | | | | 3.82 | | | | 0.38 | | | | 11.28 | |
| Portfolio turnover rate | | % | | | 14 | | | | 49 | | | | 14 | | | | 49 | |
|
(1) Commencement of operations.
(2) Total return is calculated assuming reinvestment of all dividends and capital gain distributions at net asset value and does not reflect the effect of insurance contract charges. Total returns for periods less than one year are not annualized.
(3) Annualized for periods less than one year.
(4) Expense ratios do not include expenses of Underlying Funds and do not include fees and expenses charged under the variable annuity contract or variable life insurance policy.
* Per share numbers have been calculated using average number of shares outstanding throughout the period.
See Accompanying Notes to Financial Statements
21
ING SOLUTION 2025 PORTFOLIO
FINANCIAL HIGHLIGHTS
Selected data for a share of beneficial interest outstanding throughout each period.
| | | | | | | | | | | | | | | | | | | |
| | | | | | |
| | | | Class ADV | | Class I |
| | | |
| |
|
| | | | Year | | April 29, | | Year | | April 29, |
| | | | Ended | | 2005(1) to | | Ended | | 2005(1) to |
| | | | December 31, | | December 31, | | December 31, | | December 31, |
| | | | 2006 | | 2005 | | 2006 | | 2005 |
|
Per Share Operating Performance: | | | | | | | | | | | | | | | | | | |
| Net asset value, beginning of period | | $ | | | 10.97 | | | | 10.05 | | | | 11.03 | | | | 10.05 | |
|
|
|
|
| Income from investment operations: | | | | | | | | | | | | | | | | | | |
| Net investment income | | $ | | | 0.27 | * | | | 0.24 | * | | | 0.22 | * | | | 0.05 | † |
| Net realized and unrealized gain on investments | | $ | | | 1.09 | | | | 0.68 | | | | 1.21 | | | | 0.93 | |
| Total from investment operations | | $ | | | 1.35 | | | | 0.92 | | | | 1.43 | | | | 0.98 | |
|
|
|
|
| Less distributions from: | | | | | | | | | | | | | | | | | | |
| Net investment income | | $ | | | 0.03 | | | | — | | | | 0.03 | | | | — | |
| Net realized gains on investments | | $ | | | 0.02 | | | | — | | | | 0.02 | | | | — | |
| Total distributions | | $ | | | 0.05 | | | | — | | | | 0.05 | | | | — | |
| Net asset value, end of period | | $ | | | 12.28 | | | | 10.97 | | | | 12.41 | | | | 11.03 | |
|
|
|
|
| Total Return(2) | | % | | | 12.37 | | | | 9.15 | | | | 12.94 | | | | 9.75 | |
|
|
|
|
Ratios and Supplemental Data: | | | | | | | | | | | | | | | | | | |
| Net assets, end of period (000’s) | | $ | | | 100,091 | | | | 944 | | | | 17,540 | | | | 36 | |
|
|
|
|
| Ratios to average net assets: | | | | | | | | | | | | | | | | | | |
| Net expenses after expense waiver (3)(4) | | % | | | 0.62 | | | | 0.62 | | | | 0.12 | | | | 0.12 | |
| Gross expenses prior to expense waiver (3)(4) | | % | | | 0.62 | | | | 0.62 | | | | 0.12 | | | | 0.12 | |
| Net investment income(3) | | % | | | 2.29 | | | | 3.37 | | | | 1.87 | | | | 0.79 | |
| Portfolio turnover rate | | % | | | 23 | | | | 47 | | | | 23 | | | | 47 | |
|
| | | | | | | | | | | | | | | | | | | |
| | | | | | |
| | | | Class S | | Class T |
| | | |
| |
|
| | | | Year | | April 29, | | Year | | August 31, |
| | | | Ended | | 2005(1) to | | Ended | | 2005(1) to |
| | | | December 31, | | December 31, | | December 31, | | December 31, |
| | | | 2006 | | 2005 | | 2006 | | 2005 |
|
Per Share Operating Performance: | | | | | | | | | | | | | | | | | | |
| Net asset value, beginning of period | | $ | | | 11.00 | | | | 10.05 | | | | 10.97 | | | | 10.68 | |
|
|
|
|
| Income from investment operations: | | | | | | | | | | | | | | | | | | |
| Net investment income | | $ | | | 0.19 | * | | | 0.24 | * | | | 0.02 | * | | | 0.08 | |
| Net realized and unrealized gain on investments | | $ | | | 1.19 | | | | 0.71 | | | | 1.31 | | | | 0.21 | |
| Total from investment operations | | $ | | | 1.38 | | | | 0.95 | | | | 1.33 | | | | 0.29 | |
|
|
|
|
| Less distributions from: | | | | | | | | | | | | | | | | | | |
| Net investment income | | $ | | | 0.02 | | | | — | | | | 0.03 | | | | — | |
| Net realized gains on investments | | $ | | | 0.02 | | | | — | | | | 0.02 | | | | — | |
| Total distributions | | $ | | | 0.04 | | | | — | | | | 0.05 | | | | — | |
| Net asset value, end of period | | $ | | | 12.34 | | | | 11.00 | | | | 12.25 | | | | 10.97 | |
|
|
|
|
| Total Return(2) | | % | | | 12.59 | | | | 9.45 | | | | 12.09 | | | | 2.72 | |
|
|
|
|
Ratios and Supplemental Data: | | | | | | | | | | | | | | | | | | |
| Net assets, end of period (000’s) | | $ | | | 282,074 | | | | 15,503 | | | | 9,588 | | | | 971 | |
|
|
|
|
| Ratios to average net assets: | | | | | | | | | | | | | | | | | | |
| Net expenses after expense waiver (3)(4) | | % | | | 0.37 | | | | 0.37 | | | | 0.82 | | | | 0.82 | |
| Gross expenses prior to expense waiver (3)(4) | | % | | | 0.37 | | | | 0.37 | | | | 0.87 | | | | 0.87 | |
| Net investment income(3) | | % | | | 1.58 | | | | 3.38 | | | | 0.19 | | | | 6.79 | |
| Portfolio turnover rate | | % | | | 23 | | | | 47 | | | | 23 | | | | 47 | |
|
(1) Commencement of operations.
(2) Total return is calculated assuming reinvestment of all dividends and capital gain distributions at net asset value and does not reflect the effect of insurance contract charges. Total returns for periods less than one year are not annualized.
(3) Annualized for periods less than one year.
(4) Expense ratios do not include expenses of Underlying Funds and do not include fees and expenses charged under the variable annuity contract or variable life insurance policy.
* Per share numbers have been calculated using average number of shares outstanding throughout the period.
See Accompanying Notes to Financial Statements
22
ING SOLUTION 2035 PORTFOLIO
FINANCIAL HIGHLIGHTS
Selected data for a share of beneficial interest outstanding throughout each period.
| | | | | | | | | | | | | | | | | | | |
| | | | | | |
| | | | Class ADV | | Class I |
| | | |
| |
|
| | | | Year | | April 29, | | Year | | April 29, |
| | | | Ended | | 2005(1) to | | Ended | | 2005(1) to |
| | | | December 31, | | December 31, | | December 31, | | December 31, |
| | | | 2006 | | 2005 | | 2006 | | 2005 |
|
Per Share Operating Performance: | | | | | | | | | | | | | | | | | | |
| Net asset value, beginning of period | | $ | | | 11.13 | | | | 10.07 | | | | 11.19 | | | | 10.07 | |
|
|
|
|
| Income from investment operations: | | | | | | | | | | | | | | | | | | |
| Net investment income | | $ | | | 0.31 | * | | | 0.34 | * | | | 0.22 | * | | | 0.98 | * |
| Net realized and unrealized gain on investments | | $ | | | 1.23 | | | | 0.72 | | | | 1.37 | | | | 0.14 | |
| Total from investment operations | | $ | | | 1.54 | | | | 1.06 | | | | 1.59 | | | | 1.12 | |
|
|
|
|
| Less distributions from: | | | | | | | | | | | | | | | | | | |
| Net investment income | | $ | | | 0.01 | | | | — | | | | 0.01 | | | | — | |
| Net realized gain on investments | | $ | | | 0.01 | | | | — | | | | 0.01 | | | | — | |
| Total distributions | | $ | | | 0.02 | | | | — | | | | 0.02 | | | | — | |
| Net asset value, end of period | | $ | | | 12.65 | | | | 11.13 | | | | 12.76 | | | | 11.19 | |
|
|
|
|
| Total Return(2) | | % | | | 13.91 | | | | 10.53 | | | | 14.29 | | | | 11.12 | |
| |
| |
|
|
|
|
Ratios and Supplemental Data: | | | | | | | | | | | | | | | | | | |
| Net assets, end of period (000’s) | | $ | | | 73,683 | | | | 542 | | | | 16,647 | | | | 20 | |
|
|
|
|
| Ratios to average net assets: | | | | | | | | | | | | | | | | | | |
| Net expenses after expense waiver (3)(4) | | % | | | 0.62 | | | | 0.62 | | | | 0.12 | | | | 0.12 | |
| Gross expenses prior to expense waiver (3)(4) | | % | | | 0.62 | | | | 0.62 | | | | 0.12 | | | | 0.12 | |
| Net investment income(3) | | % | | | 2.60 | | | | 4.59 | | | | 1.84 | | | | 13.21 | |
| Portfolio turnover rate | | % | | | 15 | | | | 33 | | | | 15 | | | | 33 | |
|
| | | | | | | | | | | | | | | | | | | |
| | | | | | |
| | | | Class S | | Class T |
| | | |
| |
|
| | | | Year | | April 29, | | Year | | August 31, |
| | | | Ended | | 2005(1) to | | Ended | | 2005(1) to |
| | | | December 31, | | December 31, | | December 31, | | December 31, |
| | | | 2006 | | 2005 | | 2006 | | 2005 |
|
Per Share Operating Performance: | | | | | | | | | | | | | | | | | | |
| Net asset value, beginning of period | | $ | | | 11.16 | | | | 10.07 | | | | 11.12 | | | | 10.76 | |
|
|
|
|
| Income from investment operations: | | | | | | | | | | | | | | | | | | |
| Net investment income | | $ | | | 0.22 | * | | | 0.23 | * | | | 0.02 | * | | | 0.12 | |
| Net realized and unrealized gain on investments | | $ | | | 1.35 | | | | 0.86 | | | | 1.48 | | | | 0.24 | |
| Total from investment operations | | $ | | | 1.57 | | | | 1.09 | | | | 1.50 | | | | 0.36 | |
|
|
|
|
| Less distributions from: | | | | | | | | | | | | | | | | | | |
| Net investment income | | $ | | | 0.01 | | | | — | | | | 0.01 | | | | — | |
| Net realized gain on investments | | $ | | | 0.01 | | | | — | | | | 0.01 | | | | — | |
| Total distributions | | $ | | | 0.02 | | | | — | | | | 0.02 | | | | — | |
| Net asset value, end of period | | $ | | | 12.71 | | | | 11.16 | | | | 12.60 | | | | 11.12 | |
|
|
|
|
| Total Return(2) | | % | | | 14.13 | | | | 10.82 | | | | 13.56 | | | | 3.35 | |
| |
|
|
|
|
Ratios and Supplemental Data: | | | | | | | | | | | | | | | | | | |
| Net assets, end of period (000’s) | | $ | | | 222,502 | | | | 4,656 | | | | 8,525 | | | | 460 | |
|
|
|
|
| Ratios to average net assets: | | | | | | | | | | | | | | | | | | |
| Net expenses after expense waiver(3)(4) | | % | | | 0.37 | | | | 0.37 | | | | 0.82 | | | | 0.82 | |
| Gross expenses prior to expense waiver(3)(4) | | % | | | 0.37 | | | | 0.37 | | | | 0.87 | | | | 0.87 | |
| Net investment income(3) | | % | | | 1.85 | | | | 3.16 | | | | 0.18 | | | | 15.26 | |
| Portfolio turnover rate | | % | | | 15 | | | | 33 | | | | 15 | | | | 33 | |
|
(1) Commencement of operations.
(2) Total return is calculated assuming reinvestment of all dividends and capital gain distributions at net asset value and does not reflect the effect of insurance contract charges. Total returns for periods less than one year are not annualized.
(3) Annualized for periods less than one year.
(4) Expense ratios do not include expenses of Underlying Funds and do not include fees and expenses charged under the variable annuity contract or variable life insurance policy.
* Per share numbers have been calculated using average number of shares outstanding throughout the period.
See Accompanying Notes to Financial Statements
23
ING SOLUTION 2045 PORTFOLIO
FINANCIAL HIGHLIGHTS
Selected data for a share of beneficial interest outstanding throughout each period.
| | | | | | | | | | | | | | | | | | | |
| | | | | | |
| | | | Class ADV | | Class I |
| | | |
| |
|
| | | | Year | | April 29, | | Year | | April 29, |
| | | | Ended | | 2005(1) to | | Ended | | 2005(1) to |
| | | | December 31, | | December 31, | | December 31, | | December 31, |
| | | | 2006 | | 2005 | | 2006 | | 2005 |
|
Per Share Operating Performance: | | | | | | | | | | | | | | | | | | |
| Net asset value, beginning of period | | $ | | | 11.35 | | | | 10.08 | | | | 11.40 | | | | 10.08 | |
|
|
|
|
| Income from investment operations: | | | | | | | | | | | | | | | | | | |
| Net investment income | | $ | | | 0.15 | † | | | 0.19 | † | | | 0.12 | † | | | 0.08 | † |
| Net realized and unrealized gain on investments | | $ | | | 1.53 | | | | 1.08 | | | | 1.64 | | | | 1.24 | |
| Total from investment operations | | $ | | | 1.68 | | | | 1.27 | | | | 1.76 | | | | 1.32 | |
|
|
|
|
| Less distributions from: | | | | | | | | | | | | | | | | | | |
| Net investment income | | $ | | | 0.00 | * | | | — | | | | 0.01 | | | | — | |
| Net realized gains on investments | | $ | | | 0.02 | | | | — | | | | 0.02 | | | | — | |
| Total distributions | | $ | | | 0.02 | | | | — | | | | 0.03 | | | | — | |
| Net asset value, end of period | | $ | | | 13.01 | | | | 11.35 | | | | 13.13 | | | | 11.40 | |
|
|
|
|
| Total Return(2) | | % | | | 14.82 | | | | 12.60 | | | | 15.38 | | | | 13.10 | |
| |
|
|
|
|
Ratios and Supplemental Data: | | | | | | | | | | | | | | | | | | |
| Net assets, end of period (000’s) | | $ | | | 36,741 | | | | 334 | | | | 10,442 | | | | 2 | |
|
|
|
|
| Ratios to average net assets: | | | | | | | | | | | | | | | | | | |
| Net expenses after expense waiver(3)(4) | | % | | | 0.62 | | | | 0.62 | | | | 0.12 | | | | 0.12 | |
| Gross expenses prior to expense waiver(3)(4) | | % | | | 0.62 | | | | 0.62 | | | | 0.12 | | | | 0.12 | |
| Net investment income(3) | | % | | | 1.22 | | | | 2.54 | | | | 0.98 | | | | 1.12 | |
| Portfolio turnover rate | | % | | | 20 | | | | 106 | | | | 20 | | | | 106 | |
|
| | | | | | | | | | | | | | | | | | | |
| | | | | | |
| | | | Class S | | Class T |
| | | |
| |
|
| | | | Year | | April 29, | | Year | | August 31, |
| | | | Ended | | 2005(1) to | | Ended | | 2005(1) to |
| | | | December 31, | | December 31, | | December 31, | | December 31, |
| | | | 2006 | | 2005 | | 2006 | | 2005 |
|
Per Share Operating Performance: | | | | | | | | | | | | | | | | | | |
| Net asset value, beginning of period | | $ | | | 11.37 | | | | 10.08 | | | | 11.34 | | | | 10.91 | |
|
|
|
|
| Income from investment operations: | | | | | | | | | | | | | | | | | | |
| Net investment income (loss) | | $ | | | 0.11 | † | | | 0.08 | † | | | (0.04 | )† | | | 0.33 | † |
| Net realized and unrealized gain on investments | | $ | | | 1.60 | | | | 1.21 | | | | 1.69 | | | | 0.10 | |
| Total from investment operations | | $ | | | 1.71 | | | | 1.29 | | | | 1.65 | | | | 0.43 | |
|
|
|
|
| Less distributions from: | | | | | | | | | | | | | | | | | | |
| Net investment income | | $ | | | 0.00 | * | | | — | | | | 0.00 | * | | | — | |
| Net realized gains on investments | | $ | | | 0.02 | | | | — | | | | 0.02 | | | | — | |
| Total distributions | | $ | | | 0.02 | | | | — | | | | 0.02 | | | | — | |
| Net asset value, end of period | | $ | | | 13.06 | | | | 11.37 | | | | 12.97 | | | | 11.34 | |
|
|
|
|
| Total Return(2) | | % | | | 15.06 | | | | 12.80 | | | | 14.57 | | | | 3.94 | |
| |
|
|
|
|
Ratios and Supplemental Data: | | | | | | | | | | | | | | | | | | |
| Net assets, end of period (000’s) | | $ | | | 114,650 | | | | 783 | | | | 3,247 | | | | 183 | |
|
|
|
|
| Ratios to average net assets: | | | | | | | | | | | | | | | | | | |
| Net expenses after expense waiver(3)(4) | | % | | | 0.37 | | | | 0.37 | | | | 0.82 | | | | 0.82 | |
| Gross expenses prior to expense waiver(3)(4) | | % | | | 0.37 | | | | 0.37 | | | | 0.87 | | | | 0.87 | |
| Net investment income (loss)(3) | | % | | | 0.90 | | | | 1.11 | | | | (0.29 | ) | | | 9.02 | |
| Portfolio turnover rate | | % | | | 20 | | | | 106 | | | | 20 | | | | 106 | |
|
(1) Commencement of operations.
(2) Total return is calculated assuming reinvestment of all dividends and capital gain distributions at net asset value and does not reflect the effect of insurance contract charges. Total returns for periods less than one year are not annualized.
(3) Annualized for periods less than one year.
(4) Expense ratios do not include expenses of Underlying Funds and do not include fees and expenses charged under the variable annuity contract or variable life insurance policy.
† Per share numbers have been calculated using average number of shares outstanding throughout the period.
* Amount is less than $0.005.
24
NOTES TO FINANCIAL STATEMENTS AS OF DECEMBER 31, 2006
NOTE 1 — ORGANIZATION
Organization. A predecessor of Directed Services, LLC(1) (“DSL” or the “Investment Adviser”) ING Life Insurance and Annuity Company (“ILIAC”) created ING Partners, Inc. (the “Fund”) to serve as an investment option underlying variable insurance products offered by the Investment Adviser and its insurance company affiliates. The Fund is an open-end management investment company registered under the Investment Company Act of 1940, as amended (the “1940 Act”). It was incorporated under the laws of Maryland on May 7, 1997. The Articles of Incorporation permit the Fund to offer separate series, each of which has its own investment objective, policies and restrictions. The Fund currently consists of thirty-nine Portfolios. The five Portfolios included in this report are: ING Solution Income Portfolio (“Solution Income”), ING Solution 2015 Portfolio (“Solution 2015”), ING Solution 2025 Portfolio (“Solution 2025”), ING Solution 2035 Portfolio (“Solution 2035”) and ING Solution 2045 Portfolio (“Solution 2045”) (each a “Portfolio” and collectively, the “Portfolios”). The investment objectives of the Portfolios are as follows: Solution Income — a combination of total return and stability of principal consistent with an asset allocation targeted to retirement; and Solution 2015, 2025, 2035 and 2045 Portfolios — until the day prior to the Target Dates, the Portfolios will seek to provide total return consistent with an asset allocation targeted at retirement in approximately 2015, 2025, 2035 and 2045, respectively. On the Target Date, the investment objective will be to seek to provide a combination of total return and stability of principal consistent with an asset allocation targeted to retirement. When Solution 2015, 2025, 2035 and 2045 Portfolios reach their respective Target Date, they may be combined with the Income Portfolio, without a vote of shareholders, if approved by the Board of Directors.
Shares of the Fund are currently being offered only to participating insurance companies for allocation to certain of their separate accounts established for the purpose of funding variable annuity contracts and variable life insurance policies issued by the participating insurance companies.
The Portfolios offer the following four classes: Adviser Class (“Class ADV”), Initial Class (“Class I”), Service Class (“Class S”) and Class T. The classes differ principally in applicable distribution and shareholder service fees. Shareholders of each class also bear certain expenses that pertain to that particular class. All shareholders bear the common expenses of the Portfolios and earn income and realized gains/losses from the Portfolio pro rata based on the average daily net assets of each class, without discrimination between share classes. Differences in per share dividend rates generally result from differences in separate class expenses, including distribution and shareholder servicing fees.
Each Portfolio seeks to achieve its investment objective by investing in other ING Funds (“Underlying Funds”) and uses asset allocation strategies to determine how much to invest in the Underlying Funds.
| |
| (1) | Prior to December 31, 2006, ING Life Insurance and Annuity Company (“ILIAC”) served as the investment adviser to the Portfolios. On November 9, 2006, the Board approved the consolidation of investment advisory functions of ILIAC into DSL resulting in the assumption by DSL of the advisory agreement between the Fund and ILIAC. |
NOTE 2 — SIGNIFICANT ACCOUNTING POLICIES
The following significant accounting policies are consistently followed by the Portfolios in the preparation of their financial statements. Such policies are in conformity with U.S. generally accepted accounting principles for investment companies.
| |
| A. | Security Valuation. The valuation of each Portfolio’s investments in its underlying funds is based on the net asset values of the underlying funds each business day. |
| |
| B. | Security Transactions and Revenue Recognition. Securities transactions are accounted for on the trade date. Realized gains and losses are reported on the basis of identified cost of securities sold. Interest income is recorded on an accrual basis. Dividend income is recorded on the ex-dividend date. |
| |
| C. | Distributions to Shareholders. The Portfolios record distributions to their shareholders on the ex-dividend date. Each Portfolio distributes dividends and capital gains, if any, annually. The Portfolios may make distributions on a more frequent basis to comply with the distribution requirements of the Internal Revenue Code. The characteristics of income and gains to be distributed are determined in accordance with income tax regulations, which may differ from U.S. generally accepted accounting principles for investment companies. |
25
NOTES TO FINANCIAL STATEMENTS AS OF DECEMBER 31, 2006 (CONTINUED)
NOTE 2 — SIGNIFICANT ACCOUNTING POLICIES (continued)
| |
| D. | Federal Income Taxes. It is the policy of the Portfolios to comply with subchapter M of the Internal Revenue Code and related excise tax provisions applicable to regulated investment companies and to distribute substantially all of their net investment income and any net realized capital gains to their shareholders. Therefore, no federal income tax provision is required. |
| |
| | The Board of Directors intends to offset any net capital gains with any available capital loss carryforward until each carryforward has been fully utilized or expires. In addition, no capital gain distribution shall be made until the capital loss carryforward has been fully utilized or expires. |
| |
| E. | Use of Estimates. The preparation of financial statements in conformity with U.S. generally accepted accounting principles requires management to make estimates and assumptions that affect the reported amounts of assets and liabilities and disclosure of contingent assets and liabilities at the date of the financial statements and the reported amounts of increases and decreases in net assets from operations during the reporting period. Actual results could differ from those estimates. |
| |
| F. | Repurchase Agreements. Certain of the Underlying Funds may invest in repurchase agreements only with government securities dealers recognized by the Board of Governors of the Federal Reserve System. Under such agreements, the seller of the security agrees to repurchase it at a mutually agreed upon time and price. The resale price is in excess of the purchase price and reflects an agreed upon interest rate for the period of time the agreement is outstanding. The period of the repurchase agreements is usually short, from overnight to one week, while the underlying securities generally have longer maturities. An Underlying Fund will receive as collateral securities acceptable to it whose market value is equal to at least 100% of the carrying amount of the repurchase agreements, plus accrued interest, being invested by the Portfolio. The underlying collateral is valued daily on a mark to market basis to assure that the value, including accrued interest is at least equal to the repurchase price. There would be potential loss to the Underlying Fund in the event the Underlying Fund is delayed or prevented from exercising its right to dispose of the collateral, and it might incur disposition costs in liquidating the collateral. |
| |
| G. | Indemnifications. In the normal course of business, the Fund may enter into contracts that provide certain indemnifications. The Fund’s maximum exposure under these arrangements is dependent on future claims that may be made against the Portfolios and, therefore, cannot be estimated; however, based on experience, the risk of loss from such claims is considered remote. |
NOTE 3 — INVESTMENT ADVISER AND ADMINISTRATIVE SERVICE FEES
The Portfolios entered into an investment management agreement with the Investment Adviser. For its services, each Portfolio pays the Investment Adviser a monthly fee in arrears equal to 0.10% of each Portfolio’s average daily net assets during the month.
ING Investment Management Co. (the “Consultant”) is a consultant to the Investment Adviser. DSL pays the Consultant a consulting fee of 0.03% of the first $500 million, 0.025% of the next $500 million, 0.02% of the next $1 billion and 0.01% of amounts over $2 billion based on each Portfolio’s average daily net assets. Both the Investment Adviser and the Consultant are indirect, wholly-owned subsidiaries of ING Groep. ING Groep is one of the largest financial services organizations in the world, and offers an array of banking, insurance and asset management services to both individuals and institutional investors. The Consultant will provide tactical allocation recommendations to the Investment Adviser. The Investment Adviser has set up an Investment Committee made up of a team of professionals to consider, review and implement the recommendations of the Consultant, and will retain discretion over implementation of the Consultant’s recommendations. The Consultant will provide ongoing recommendations to the Investment Committee of the Investment Adviser quarterly or as warranted by market conditions.
Under an Administrative Services Agreement between ING Fund Services, LLC (“IFS”), an indirect, wholly-owned subsidiary of ING Groep, IFS provides all administrative services necessary for the Portfolios’ operations and is responsible for the supervision of the Portfolios’ other service providers. IFS also
26
NOTES TO FINANCIAL STATEMENTS AS OF DECEMBER 31, 2006 (CONTINUED)
NOTE 3 — INVESTMENT ADVISER AND ADMINISTRATIVE SERVICE FEES (continued)
assumes all ordinary recurring direct costs of the Portfolios, such as custodian fees, director fees, transfer agency fees and accounting fees. As compensation for these services, IFS receives a monthly fee from each portfolio at an annual rate of 0.02% based on the average daily net assets of each Portfolio.
NOTE 4 — INVESTMENTS IN AFFILIATED UNDERLYING FUNDS
For the year ended December 31, 2006, the cost of purchases and the proceeds from sales of the Underlying Funds were as follows:
| | | | | | | | | |
| | Purchases | | Sales |
| |
| |
|
| Solution Income | | $ | 85,443,610 | | | $ | 7,919,613 | |
| Solution 2015 | | | 275,938,401 | | | | 12,644,452 | |
| Solution 2025 | | | 399,953,198 | | | | 31,965,913 | |
| Solution 2035 | | | 309,704,425 | | | | 15,056,754 | |
| Solution 2045 | | | 162,392,403 | | | | 10,269,646 | |
NOTE 5 — DISTRIBUTION AND SERVICE FEES
Class ADV and Class T of the Portfolios have adopted a Plan of Distribution pursuant to Rule 12b-1 under the 1940 Act (the “12b-1 Plans”), whereby ING Funds Distributor, LLC(1) (the “Distributor” or “IFD”), an indirect, wholly-owned subsidiary of ING Groep, is reimbursed or compensated by the Portfolios for expenses incurred in the distribution of each Portfolio’s shares (“Distribution Fees”). The Distributor may pay, on behalf of each Portfolio, out of its distribution fee, compensation to certain financial institutions for providing distribution assistance pursuant to a Distribution Services Agreement. Under the Rule 12b-1 Plan, each Portfolio makes payments to IFD at an annual rate of 0.25% and 0.50% of the Portfolio’s average daily net assets attributable to its Class ADV and Class T shares, respectively. The Distributor has contractually agreed to waive 0.05% for Class T shares so that the actual fee paid is an annual rate of 0.45%. The expense waiver will continue through at least May 1, 2008.
The Fund has also adopted a Shareholder Servicing Plan (“Service Plan”) for the Classes ADV, S and T shares of each Portfolio. The Service Plan allows the Fund’s distributor to enter into shareholder servicing agreements with insurance companies, broker dealers or other financial intermediaries that provide administrative services related to Classes ADV, S and T shares and their shareholders including Variable Contract owners or Qualified Plan participants with interests in the Portfolios. Under the Service Plan, each Portfolio makes payments to IFD at an annual rate of 0.25% of each Portfolio’s average daily net assets attributable to its Classes ADV, S and T shares.
| |
| (1) | Prior to December 31, 2006, ING Financial Advisers, LLC (“IFA”) served as distributor to the Portfolios. On November 9, 2006, the Board approved the consolidation of distributor functions of IFA into IFD resulting in the assumption by IFD of the distribution agreement between the Company and IFA. |
NOTE 6 — OTHER TRANSACTIONS WITH AFFILIATES AND RELATED PARTIES
Each Portfolio has adopted a Retirement Policy (“Policy”) covering all Independent Directors of the Portfolio who will have served as an Independent Directors for at least five years at the time of retirement. Benefits under this Policy are based on an annual rate as defined in the Policy.
At December 31, 2006, the following indirect, wholly-owned subsidiaries of ING Groep owned more than 5% of the following Series:
ING Life Insurance and Annuity Company — Solution Income (90.41%); Solution 2015 (88.50%); Solution 2025 (89.85%); Solution 2035 (90.38%); Solution 2045 (90.82%).
ING National Trust — Solution Income (5.99%); Solution 2015 (7.30%); Solution 2025 (6.07%); Solution 2035 (5.62%); Solution 2045 (6.55%).
NOTE 7 — OTHER ACCRUED EXPENSES
At December 31, 2006, the Portfolios had the following amounts recorded in payable to affiliates on the accompanying Statements of Assets and Liabilities (see Notes 5 and 6):
| | | | | | | | | | | | | | | | | |
| | Accrued | | | | Accrued | | |
| | Investment | | Accrued | | Shareholder | | |
| | Management | | Administrative | | Services | | |
| | Fees | | Fees | | Fees | | Total |
| |
| |
| |
| |
|
| Solution Income | | $ | 6,606 | | | $ | 1,321 | | | $ | 21,516 | | | $ | 29,443 | |
| Solution 2015 | | | 23,189 | | | | 4,638 | | | | 73,306 | | | | 101,133 | |
| Solution 2025 | | | 33,528 | | | | 6,705 | | | | 105,470 | | | | 145,703 | |
| Solution 2035 | | | 26,341 | | | | 5,268 | | | | 81,917 | | | | 113,526 | |
| Solution 2045 | | | 13,397 | | | | 2,679 | | | | 40,438 | | | | 56,514 | |
NOTE 8 — EXPENSE LIMITATIONS
For the following Portfolios, the Investment Adviser has agreed to limit expenses, excluding interest, taxes, brokerage and extraordinary expenses to the levels listed below:
| | | | | | | | | | | | | | | | | |
| Portfolio(1) | | Class ADV | | Class I | | Class S | | Class T |
| |
| |
| |
| |
|
| Solution Income | | | 0.62 | % | | | 0.12 | % | | | 0.37 | % | | | 0.82 | % |
| Solution 2015 | | | 0.62 | % | | | 0.12 | % | | | 0.37 | % | | | 0.82 | % |
| Solution 2025 | | | 0.62 | % | | | 0.12 | % | | | 0.37 | % | | | 0.82 | % |
| Solution 2035 | | | 0.62 | % | | | 0.12 | % | | | 0.37 | % | | | 0.82 | % |
| Solution 2045 | | | 0.62 | % | | | 0.12 | % | | | 0.37 | % | | | 0.82 | % |
| |
| (1) | The operating expense limits apply only at the Portfolio level and do not limit the fees payable by the underlying investment companies in which the Portfolios invest. |
27
NOTES TO FINANCIAL STATEMENTS AS OF DECEMBER 31, 2006 (CONTINUED)
NOTE 8 — EXPENSE LIMITATIONS (continued)
The Investment Adviser may at a later date recoup from a Portfolio for management fees waived and other expenses assumed by the Investment Adviser during the previous 36 months, but only if, after such reimbursement, the Portfolio’s expense ratio does not exceed the percentage described above. Waived and reimbursed fees and any recoupment by the Investment Adviser of such waived and reimbursed fees are reflected on the accompanying Statements of Operations for each Portfolio.
As of December 31, 2006 the Portfolios did not have any waiver or reimbursed fees subject to recoupment.
Outstanding reimbursement balances due to the Portfolios, if any, under their respective expense limitation agreements are reflected in Reimbursement Due from Manager on the accompanying Statements of Assets and Liabilities.
The expense limitation agreement is contractual and shall renew automatically for one-year terms unless the Investment Adviser provides written notice of the termination of the expense limitation agreement within 90 days of the end of the then current term.
NOTE 9 — CAPITAL SHARES
Transactions in capital shares and dollars were as follows:
| | | | | | | | | | | | | | | | | | | | | | | | | |
| | | | | | |
| | Class ADV | | Class I | | Class S |
| |
| |
| |
|
| | Year | | April 29, | | Year | | April 29, | | Year | | April 29, |
| | Ended | | 2005(1) to | | Ended | | 2005(1) to | | Ended | | 2005(1) to |
| | December 31, | | December 31, | | December 31, | | December 31, | | December 31, | | December 31, |
| | 2006 | | 2005 | | 2006 | | 2005 | | 2006 | | 2005 |
| |
| |
| |
| |
| |
| |
|
Solution Income (Number of Shares) | | | | | | | | | | | | | | | | | | | | | | | | |
| Shares sold | | | 1,907,885 | | | | 18,429 | | | | 556,689 | | | | 101 | | | | 5,027,469 | | | | 50,923 | |
| Dividends reinvested | | | 545 | | | | — | | | | 81 | | | | — | | | | 606 | | | | — | |
| Shares redeemed | | | (77,675 | ) | | | (286 | ) | | | (283,927 | ) | | | — | | | | (169,911 | ) | | | (2,117 | ) |
| | | |
| | | |
| | | |
| | | |
| | | |
| | | |
| |
| Net increase in shares outstanding | | | 1,830,755 | | | | 18,143 | | | | 272,843 | | | | 101 | | | | 4,858,164 | | | | 48,806 | |
| | | |
| | | |
| | | |
| | | |
| | | |
| | | |
| |
|
|
|
|
| Solution Income ($) |
| Shares sold | | $ | 20,740,763 | | | $ | 188,909 | | | $ | 5,946,250 | | | $ | 1,015 | | | $ | 53,762,702 | | | $ | 520,544 | |
| Dividends reinvested | | | 5,716 | | | | — | | | | 855 | | | | — | | | | 6,372 | | | | — | |
| Shares redeemed | | | (856,402 | ) | | | (2,956 | ) | | | (2,997,928 | ) | | | — | | | | (1,813,910 | ) | | | (21,887 | ) |
| | | |
| | | |
| | | |
| | | |
| | | |
| | | |
| |
| Net increase | | $ | 19,890,077 | | | $ | 185,953 | | | $ | 2,949,177 | | | $ | 1,015 | | | $ | 51,955,164 | | | $ | 498,657 | |
| | | |
| | | |
| | | |
| | | |
| | | |
| | | |
| |
| | | | | | | | | |
| | |
| | Class T |
| |
|
| | Year | | August 31, |
| | Ended | | 2005(1) to |
| | December 31, | | December 31, |
| | 2006 | | 2005 |
| |
| |
|
|
|
|
|
Solution Income (Number of Shares) | | | | | | | | |
| Shares sold | | | 749,746 | | | | 10,522 | |
| Dividends reinvested | | | 407 | | | | — | |
| Shares redeemed | | | (556,567 | ) | | | (536 | ) |
| | | |
| | | |
| |
| Net increase in shares outstanding | | | 193,586 | | | | 9,986 | |
| | | |
| | | |
| |
|
|
|
|
| Solution Income ($) |
| Shares sold | | $ | 7,932,664 | | | $ | 107,643 | |
| Dividends reinvested | | | 4,257 | | | | — | |
| Shares redeemed | | | (6,129,978 | ) | | | (5,464 | ) |
| | | |
| | | |
| |
| Net increase | | $ | 1,806,943 | | | $ | 102,179 | |
| | | |
| | | |
| |
| |
| (1) | Commencement of operations. |
28
NOTES TO FINANCIAL STATEMENTS AS OF DECEMBER 31, 2006 (CONTINUED)
NOTE 9 — CAPITAL SHARES (continued)
| | | | | | | | | | | | | | | | | | | | | | | | | |
| | | | | | |
| | Class ADV | | Class I | | Class S |
| |
| |
| |
|
| | Year | | April 29, | | Year | | April 29, | | Year | | April 29, |
| | Ended | | 2005(1) to | | Ended | | 2005(1) to | | Ended | | 2005(1) to |
| | December 31, | | December 31, | | December 31, | | December 31, | | December 31, | | December 31, |
| | 2006 | | 2005 | | 2006 | | 2005 | | 2006 | | 2005 |
| |
| |
| |
| |
| |
| |
|
Solution 2015 (Number of Shares) | | | | | | | | | | | | | | | | | | | | | | | | |
| Shares sold | | | 6,105,141 | | | | 105,917 | | | | 1,541,635 | | | | 101 | | | | 16,004,205 | | | | 403,952 | |
| Dividends reinvested | | | 2,279 | | | | — | | | | 816 | | | | — | | | | 3,751 | | | | — | |
| Shares redeemed | | | (126,726 | ) | | | (9,780 | ) | | | (338,766 | ) | | | — | | | | (326,494 | ) | | | (21,999 | ) |
| | | |
| | | |
| | | |
| | | |
| | | |
| | | |
| |
| Net increase in shares outstanding | | | 5,980,694 | | | | 96,137 | | | | 1,203,685 | | | | 101 | | | | 15,681,462 | | | | 381,953 | |
| | | |
| | | |
| | | |
| | | |
| | | |
| | | |
| |
|
|
|
|
| Solution 2015 ($) |
| Shares sold | | $ | 69,935,176 | | | $ | 1,121,677 | | | $ | 17,405,454 | | | $ | 1,010 | | | $ | 179,620,021 | | | $ | 4,231,966 | |
| Dividends reinvested | | | 24,935 | | | | — | | | | 9,002 | | | | — | | | | 41,225 | | | | — | |
| Shares redeemed | | | (1,480,275 | ) | | | (101,097 | ) | | | (3,787,325 | ) | | | — | | | | (3,706,649 | ) | | | (232,751 | ) |
| | | |
| | | |
| | | |
| | | |
| | | |
| | | |
| |
| Net increase | | $ | 68,479,836 | | | $ | 1,020,580 | | | $ | 13,627,131 | | | $ | 1,010 | | | $ | 175,954,597 | | | $ | 3,999,215 | |
| | | |
| | | |
| | | |
| | | |
| | | |
| | | |
| |
| | | | | | | | | |
| | |
| | Class T |
| |
|
| | Year | | August 31, |
| | Ended | | 2005(1) to |
| | December 31, | | December 31, |
| | 2006 | | 2005 |
| |
| |
|
|
|
|
|
Solution 2015 (Number of Shares) | | | | | | | | |
| Shares sold | | | 2,061,655 | | | | 64,995 | |
| Dividends reinvested | | | 1,271 | | | | — | |
| Shares redeemed | | | (1,732,735 | ) | | | (414 | ) |
| | | |
| | | |
| |
| Net increase in shares outstanding | | | 330,191 | | | | 64,581 | |
| | | |
| | | |
| |
|
|
|
|
| Solution 2015 ($) |
| Shares sold | | $ | 22,957,910 | | | $ | 689,363 | |
| Dividends reinvested | | | 13,895 | | | | — | |
| Shares redeemed | | | (20,389,062 | ) | | | (4,333 | ) |
| | | |
| | | |
| |
| Net increase | | $ | 2,582,743 | | | $ | 685,030 | |
| | | |
| | | |
| |
| | | | | | | | | | | | | | | | | | | | | | | | | |
| | | | | | |
| | Class ADV | | Class I | | Class S |
| |
| |
| |
|
| | Year | | April 29, | | Year | | April 29, | | Year | | April 29, |
| | Ended | | 2005(1) to | | Ended | | 2005(1) to | | Ended | | 2005(1) to |
| | December 31, | | December 31, | | December 31, | | December 31, | | December 31, | | December 31, |
| | 2006 | | 2005 | | 2006 | | 2005 | | 2006 | | 2005 |
| |
| |
| |
| |
| |
| |
|
Solution 2025 (Number of Shares) | | | | | | | | | | | | | | | | | | | | | | | | |
| Shares sold | | | 8,235,636 | | | | 88,717 | | | | 1,754,814 | | | | 3,263 | | | | 21,609,670 | | | | 1,440,645 | |
| Dividends reinvested | | | 4,539 | | | | — | | | | 1,059 | | | | — | | | | 11,111 | | | | — | |
| Shares redeemed | | | (171,857 | ) | | | (2,718 | ) | | | (345,323 | ) | | | — | | | | (174,510 | ) | | | (31,566 | ) |
| | | |
| | | |
| | | |
| | | |
| | | |
| | | |
| |
| Net increase in shares outstanding | | | 8,068,318 | | | | 85,999 | | | | 1,410,550 | | | | 3,263 | | | | 21,446,271 | | | | 1,409,079 | |
| | | |
| | | |
| | | |
| | | |
| | | |
| | | |
| |
|
|
|
|
| Solution 2025 ($) |
| Shares sold | | $ | 97,202,839 | | | $ | 946,537 | | | $ | 20,311,966 | | | $ | 36,015 | | | $ | 248,578,051 | | | $ | 15,196,157 | |
| Dividends reinvested | | | 50,751 | | | | — | | | | 11,941 | | | | — | | | | 124,773 | | | | — | |
| Shares redeemed | | | (2,061,444 | ) | | | (28,625 | ) | | | (4,009,731 | ) | | | — | | | | (2,033,538 | ) | | | (341,002 | ) |
| | | |
| | | |
| | | |
| | | |
| | | |
| | | |
| |
| Net increase | | $ | 95,192,146 | | | $ | 917,912 | | | $ | 16,314,176 | | | $ | 36,015 | | | $ | 246,669,286 | | | $ | 14,855,155 | |
| | | |
| | | |
| | | |
| | | |
| | | |
| | | |
| |
| | | | | | | | | |
| | |
| | Class T |
| |
|
| | Year | | August 31, |
| | Ended | | 2005(1) to |
| | December 31, | | December 31, |
| | 2006 | | 2005 |
| |
| |
|
|
|
|
|
Solution 2025 (Number of Shares) | | | | | | | | |
| Shares sold | | | 2,444,861 | | | | 89,258 | |
| Dividends reinvested | | | 2,576 | | | | — | |
| Shares redeemed | | | (1,753,211 | ) | | | (748 | ) |
| | | |
| | | |
| |
| Net increase in shares outstanding | | | 694,226 | | | | 88,510 | |
| | | |
| | | |
| |
|
|
|
|
| Solution 2025 ($) |
| Shares sold | | $ | 27,811,377 | | | $ | 967,194 | |
| Dividends reinvested | | | 28,749 | | | | — | |
| Shares redeemed | | | (21,280,900 | ) | | | (7,889 | ) |
| | | |
| | | |
| |
| Net increase | | $ | 6,559,226 | | | $ | 959,305 | |
| | | |
| | | |
| |
| |
| (1) | Commencement of operations. |
29
NOTES TO FINANCIAL STATEMENTS AS OF DECEMBER 31, 2006 (CONTINUED)
NOTE 9 — CAPITAL SHARES (continued)
| | | | | | | | | | | | | | | | | | | | | | | | | |
| | | | | | |
| | Class ADV | | Class I | | Class S |
| |
| |
| |
|
| | Year | | April 29, | | Year | | April 29, | | Year | | April 29, |
| | Ended | | 2005(1) to | | Ended | | 2005(1) to | | Ended | | 2005(1) to |
| | December 31, | | December 31, | | December 31, | | December 31, | | December 31, | | December 31, |
| | 2006 | | 2005 | | 2006 | | 2005 | | 2006 | | 2005 |
| |
| |
| |
| |
| |
| |
|
Solution 2035 (Number of Shares) | | | | | | | | | | | | | | | | | | | | | | | | |
| Shares sold | | | 5,836,546 | | | | 48,885 | | | | 1,598,144 | | | | 4,862 | | | | 17,302,033 | | | | 426,175 | |
| Dividends reinvested | | | 1,954 | | | | — | | | | 828 | | | | — | | | | 2,842 | | | | — | |
| Shares redeemed | | | (60,452 | ) | | | (176 | ) | | | (296,587 | ) | | | (3,117 | ) | | | (215,632 | ) | | | (9,015 | ) |
| | | |
| | | |
| | | |
| | | |
| | | |
| | | |
| |
| Net increase in shares outstanding | | | 5,778,048 | | | | 48,709 | | | | 1,302,385 | | | | 1,745 | | | | 17,089,243 | | | | 417,160 | |
| | | |
| | | |
| | | |
| | | |
| | | |
| | | |
| |
|
|
|
|
| Solution 2035 ($) |
| Shares sold | | $ | 70,492,067 | | | $ | 532,594 | | | $ | 18,948,312 | | | $ | 54,325 | | | $ | 202,986,613 | | | $ | 4,542,888 | |
| Dividends reinvested | | | 22,234 | | | | — | | | | 9,491 | | | | — | | | | 32,454 | | | | — | |
| Shares redeemed | | | (756,495 | ) | | | (1,945 | ) | | | (3,509,479 | ) | | | (35,000 | ) | | | (2,529,800 | ) | | | (98,830 | ) |
| | | |
| | | |
| | | |
| | | |
| | | |
| | | |
| |
| Net increase | | $ | 69,757,806 | | | $ | 530,649 | | | $ | 15,448,324 | | | $ | 19,325 | | | $ | 200,489,267 | | | $ | 4,444,058 | |
| | | |
| | | |
| | | |
| | | |
| | | |
| | | |
| |
| | | | | | | | | |
| | |
| | Class T |
| |
|
| | Year | | August 31, |
| | Ended | | 2005(1) to |
| | December 31, | | December 31, |
| | 2006 | | 2005 |
| |
| |
|
|
|
|
|
Solution 2035 (Number of Shares) | | | | | | | | |
| Shares sold | | | 1,964,584 | | | | 41,567 | |
| Dividends reinvested | | | 1,148 | | | | — | |
| Shares redeemed | | | (1,330,655 | ) | | | (175 | ) |
| | | |
| | | |
| |
| Net increase in shares outstanding | | | 635,077 | | | | 41,392 | |
| | | |
| | | |
| |
|
|
|
|
| Solution 2035 ($) |
| Shares sold | | $ | 22,782,682 | | | $ | 461,493 | |
| Dividends reinvested | | | 13,027 | | | | — | |
| Shares redeemed | | | (16,628,037 | ) | | | (1,968 | ) |
| | | |
| | | |
| |
| Net increase | | $ | 6,167,672 | | | $ | 459,525 | |
| | | |
| | | |
| |
| | | | | | | | | | | | | | | | | | | | | | | | | |
| | | | | | |
| | Class ADV | | Class I | | Class S |
| |
| |
| |
|
| | Year | | April 29, | | Year | | April 29, | | Year | | April 29, |
| | Ended | | 2005(1) to | | Ended | | 2005(1) to | | Ended | | 2005(1) to |
| | December 31, | | December 31, | | December 31, | | December 31, | | December 31, | | December 31, |
| | 2006 | | 2005 | | 2006 | | 2005 | | 2006 | | 2005 |
| |
| |
| |
| |
| |
| |
|
Solution 2045 (Number of Shares) | | | | | | | | | | | | | | | | | | | | | | | | |
| Shares sold | | | 2,819,182 | | | | 29,467 | | | | 1,075,065 | | | | 146 | | | | 8,983,495 | | | | 101,444 | |
| Dividends reinvested | | | 727 | | | | — | | | | 549 | | | | — | | | | 937 | | | | — | |
| Shares redeemed | | | (25,954 | ) | | | (12 | ) | | | (280,285 | ) | | | — | | | | (277,134 | ) | | | (32,554 | ) |
| | | |
| | | |
| | | |
| | | |
| | | |
| | | |
| |
| Net increase in shares outstanding | | | 2,793,955 | | | | 29,455 | | | | 795,329 | | | | 146 | | | | 8,707,298 | | | | 68,890 | |
| | | |
| | | |
| | | |
| | | |
| | | |
| | | |
| |
|
|
|
|
| Solution 2045 ($) |
| Shares sold | | $ | 35,057,716 | | | $ | 330,615 | | | $ | 12,980,615 | | | $ | 1,529 | | | $ | 108,029,718 | | | $ | 1,117,355 | |
| Dividends reinvested | | | 8,459 | | | | — | | | | 6,425 | | | | — | | | | 10,930 | | | | — | |
| Shares redeemed | | | (320,552 | ) | | | (126 | ) | | | (3,369,963 | ) | | | — | | | | (3,449,562 | ) | | | (365,948 | ) |
| | | |
| | | |
| | | |
| | | |
| | | |
| | | |
| |
| Net increase | | $ | 34,745,623 | | | $ | 330,489 | | | $ | 9,617,077 | | | $ | 1,529 | | | $ | 104,591,086 | | | $ | 751,407 | |
| | | |
| | | |
| | | |
| | | |
| | | |
| | | |
| |
| | | | | | | | | |
| | |
| | Class T |
| |
|
| | Year | | August 31, |
| | Ended | | 2005(1) to |
| | December 31, | | December 31, |
| | 2006 | | 2005 |
| |
| |
|
|
|
|
|
Solution 2045 (Number of Shares) | | | | | | | | |
| Shares sold | | | 878,375 | | | | 17,484 | |
| Dividends reinvested | | | 308 | | | | — | |
| Shares redeemed | | | (644,531 | ) | | | (1,319 | ) |
| | | |
| | | |
| |
| Net increase in shares outstanding | | | 234,152 | | | | 16,165 | |
| | | |
| | | |
| |
|
|
|
|
| Solution 2045 ($) |
| Shares sold | | $ | 10,504,095 | | | $ | 197,744 | |
| Dividends reinvested | | | 3,575 | | | | — | |
| Shares redeemed | | | (8,282,600 | ) | | | (15,031 | ) |
| | | |
| | | |
| |
| Net increase | | $ | 2,225,070 | | | $ | 182,713 | |
| | | |
| | | |
| |
| |
| (1) | Commencement of operations. |
30
NOTES TO FINANCIAL STATEMENTS AS OF DECEMBER 31, 2006 (CONTINUED)
NOTE 10 — FEDERAL INCOME TAXES AND OTHER TAX MATTERS
The amount of distributions from net investment income and net realized capital gains are determined in accordance with federal income tax regulations, which may differ from U.S. generally accepted accounting principles for investment companies. These book/ tax differences may be either temporary or permanent. Permanent differences are reclassified within the capital accounts based on their federal tax-basis treatment; temporary differences are not reclassified. Key differences include the treatment of short-term capital gains, foreign currency transactions, and wash sale deferrals. Distributions in excess of net investment income and/or net realized capital gains for tax purposes are reported as distributions of paid-in capital.
The following permanent tax differences have been reclassified as of December 31, 2006:
| | | | | | | | | |
| | Undistributed | | |
| | Net Investment | | Accumulated |
| | Income On | | Net Realized |
| | Investments | | Gains/(Losses) |
| |
| |
|
| Solution Income | | $ | 82,673 | | | $ | (82,673 | ) |
| Solution 2015 | | | 251,211 | | | | (251,211 | ) |
| Solution 2025 | | | 589,354 | | | | (589,354 | ) |
| Solution 2035 | | | 513,568 | | | | (513,568 | ) |
| Solution 2045 | | | 266,696 | | | | (266,696 | ) |
Dividends paid by the Portfolios from net investment income and distributions of net realized short-term capital gains are, for federal income tax purposes, taxable as ordinary income to shareholders.
The Portfolios paid no dividends or distributions during the year ended December 31, 2005. The tax composition of dividends and distributions to shareholders during the year ended December 31, 2006 was as follows:
| | | | | | | | | |
| | Ordinary | | Long-Term |
| | Income | | Capital Gains |
| |
| |
|
| Solution Income | | $ | 16,646 | | | $ | 554 | |
| Solution 2015 | | | 82,410 | | | | 6,647 | |
| Solution 2025 | | | 192,065 | | | | 24,149 | |
| Solution 2035 | | | 67,553 | | | | 9,653 | |
| Solution 2045 | | | 26,605 | | | | 2,784 | |
The tax-basis components of distributable earnings and the expiration dates of the capital loss carryforwards which may be used to offset future realized capital gains for federal income tax purposes as of December 31, 2006 were:
| | | | | | | | | | | | | | | | | |
| | Undistributed | | Undistributed | | Unrealized | | Capital |
| | Ordinary | | Long Term | | Appreciation/ | | Loss |
| | Income | | Capital Gains | | Depreciation | | Carryforwards |
| |
| |
| |
| |
|
| Solution Income | | $ | 973,607 | | | $ | 33,781 | | | $ | 2,012,631 | | | $ | — | |
| Solution 2015 | | | 2,956,667 | | | | 223,292 | | | | 12,537,692 | | | | — | |
| Solution 2025 | | | 4,104,570 | | | | 769,847 | | | | 22,915,542 | | | | — | |
| Solution 2035 | | | 3,307,724 | | | | 458,783 | | | | 20,272,882 | | | | — | |
| Solution 2045 | | | 1,165,001 | | | | 224,921 | | | | 11,244,796 | | | | — | |
Under U.S. federal income tax law, as specified in the Internal Revenue Code (the “Code”) and U.S. Treasury regulations, the Portfolios must meet various technical requirements relating to fund administration, portfolio investments, and “eligible investors” in the Portfolios. Complying with these requirements is a condition for beneficial tax treatment of certain insurance products that offer the Portfolios as investment options. The failure of the Portfolios to meet any of these complex requirements could result in an excise tax, administrative penalties imposed by the Internal Revenue Service, potential liability to insurers whose products include the Portfolios as investment options, and unanticipated costs associated with remedying a failure. We are aware that an affiliate of the Portfolios’ investment adviser may have failed to limit the availability of Solution 2025 and Solution 2035 for investment to “eligible investors” under the Code. The legal and tax consequences, if any, of this are currently under active review, but we do not believe that it is probable that any liability has been incurred by the Portfolios. Although it is not probable that any liability has been incurred, ING has agreed to indemnify any affected Portfolio from and against economic consequences of any such failure incurred either (i) directly or (ii) by virtue of any indemnification by the Portfolios resulting from such failure.
NOTE 11 — OTHER ACCOUNTING PRONOUNCEMENTS
In June 2006, the Financial Accounting Standards Board (“FASB”) issued FASB Interpretation No. 48 (“FIN 48”), “Accounting for Uncertainty in Income Taxes.” This standard defines the threshold for recognizing the benefits of tax-return positions in the financial statements as “more-likely-than-not” to be sustained upon challenge by the taxing authority and requires measurement of a tax position meeting the more-likely-than-not criterion, based on the largest benefit that is more than 50 percent likely to be realized. FIN 48 is effective for fiscal years beginning
31
NOTES TO FINANCIAL STATEMENTS AS OF DECEMBER 31, 2006 (CONTINUED)
NOTE 11 — OTHER ACCOUNTING PRONOUNCEMENTS (continued)
after December 15, 2006, with early application permitted if no interim financial statements have been issued. However, acknowledging the unique issues that FIN 48 presents for investment companies that calculate NAVs, the Securities and Exchange Commission (the “SEC”) has indicated that they would not object if a fund implements FIN 48 in its NAV calculation as late as its last NAV calculation in the first required financial statement reporting period for its fiscal year beginning after December 15, 2006. For calendar-year open-end funds, this would be no later than their June 29, 2007 NAV and the effects of FIN 48 would be reflected in the funds’ semi-annual financial statements contained in their Form N-CSR filing. At adoption, companies must adjust their financial statements to reflect only those tax positions that are more likely-than-not to be sustained as of the adoption date. Management is currently analyzing the tax positions of the Portfolios. To date, this analysis reflects an uncertain tax position in Solution 2025 and Solution 2035 that has the potential to result in a liability upon adoption of FIN 48. Management of the Portfolios is presently determining whether the tax benefits recorded by these Portfolios are more likely-than-not to be sustained if challenged by taxing authorities. To the extent that, in Management’s judgment, the more likely-than-not threshold cannot be achieved, ING has agreed to indemnify the Portfolios and will bear any taxes and other costs related to this position that may occur. As a result, in Management’s opinion, the adoption of FIN 48 is not expected to have a material impact on the financial statements of the Portfolios.
On September 15, 2006, the FASB issued Statement of Financial Accounting Standards No. 157 (“SFAS No. 157”), “Fair Value Measurements.” The new accounting statement defines fair value, establishes a framework for measuring fair value in generally accepted accounting principles (“GAAP”), and expands disclosures about fair value measurements. SFAS No. 157 defines fair value as the price that would be received to sell an asset or paid to transfer a liability in an orderly transaction between market participants at the measurement date (an exit price). SFAS No. 157 also stipulates that, as a market-based measurement, fair value measurement should be determined based on the assumptions that market participants would use in pricing the asset or liability, and establishes a fair value hierarchy that distinguishes between (a) market participant assumptions developed based on market data obtained from sources independent of the reporting entity (observable inputs) and (b) the reporting entity’s own assumptions about market participant assumptions developed based on the best information available in the circumstances (unobservable inputs). SFAS No. 157 is effective for financial statements issued for fiscal years beginning after November 15, 2007. As of December 31, 2006, management of the Portfolios is currently assessing the impact, if any, that will result from adopting SFAS No. 157.
NOTE 12 — INFORMATION REGARDING TRADING OF ING’S U.S. MUTUAL FUNDS
In 2004, DSL (formerly, known as ILIAC) reported to the Boards of Directors/ Trustees (the “Boards”) of the ING Funds that, like many U.S. financial services companies, ING Investments and certain of its U.S. affiliates have received informal and formal requests for information since September 2003 from various governmental and self-regulatory agencies in connection with investigations related to mutual funds and variable insurance products. DSL has advised the Boards that it and its affiliates have cooperated fully with each request.
In addition to responding to regulatory and governmental requests, DSL reported that management of U.S. affiliates of ING Groep, including DSL (collectively, “ING”), on their own initiative, have conducted, through independent special counsel and a national accounting firm, an extensive internal review of trading in ING insurance, retirement, and mutual fund products. The goal of this review was to identify any instances of inappropriate trading in those products by third parties or by DSL professionals and other ING personnel. ING’s internal review related to mutual fund trading is now substantially completed. ING has reported that, of the millions of customer relationships that ING maintains, the internal review identified several isolated arrangements allowing third parties to engage in frequent trading of mutual funds within ING’s variable insurance and mutual fund products, and identified other circumstances where frequent trading occurred, despite measures taken by ING intended to combat market timing. ING further reported that each of these arrangements has been terminated and fully disclosed to regulators. The results of the internal review were also reported to the independent members of the Boards.
32
NOTES TO FINANCIAL STATEMENTS AS OF DECEMBER 31, 2006 (CONTINUED)
NOTE 12 — INFORMATION REGARDING TRADING OF ING’S U.S. MUTUAL FUNDS (continued)
DSL has advised the Boards that most of the identified arrangements were initiated prior to ING’s acquisition of the businesses in question in the U.S. DSL further reported that the companies in question did not receive special benefits in return for any of these arrangements, which have all been terminated.
Based on the internal review, DSL has advised the Boards that the identified arrangements do not represent a systemic problem in any of the companies that were involved.
In September 2005, ING Funds Distributor, LLC (“IFD”), the distributor of certain ING Funds, settled an administrative proceeding with the National Association of Securities Dealers (“NASD”) regarding three arrangements, dating from 1995, 1996 and 1998, under which the administrator to the then-Pilgrim Funds, which subsequently became part of the ING Funds, entered into formal and informal arrangements that permitted frequent trading. Under the terms of the Letter of Acceptance, Waiver and Consent (“AWC”) with the NASD, under which IFD neither admitted nor denied the allegations or findings, IFD consented to the following sanctions: (i) a censure; (ii) a fine of $1.5 million; (iii) restitution of approximately $1.44 million to certain ING Funds for losses attributable to excessive trading described in the AWC; and (iv) agreement to make certification to NASD regarding the review and establishment of certain procedures.
In addition to the arrangements discussed above, in 2004 DSL reported to the Boards that, at that time, these instances include the following, in addition to the arrangements subject to the AWC discussed above:
| |
| • | Aeltus Investment Management, Inc. (a predecessor entity to ING Investment Management Co.) identified two investment professionals who engaged in extensive frequent trading in certain ING Funds. One was subsequently terminated for cause and incurred substantial financial penalties in connection with this conduct and the second has been disciplined. |
| |
| • | ReliaStar Life Insurance Company (“ReliaStar”) entered into agreements seven years ago permitting the owner of policies issued by the insurer to engage in frequent trading and to submit orders until 4pm Central Time. In 2001 ReliaStar also entered into a selling agreement with a broker-dealer that engaged in frequent trading. Employees of ING affiliates were terminated and/or disciplined in connection with these matters. |
| |
| • | In 1998, Golden American Life Insurance Company entered into arrangements permitting a broker-dealer to frequently trade up to certain specific limits in a fund available in an ING variable annuity product. No employee responsible for this arrangement remains at the company. |
For additional information regarding these matters, you may consult the Form 8-K and Form 8-K/A for each of four life insurance companies, ING USA Annuity and Life Insurance Company, ING Life Insurance and Annuity Company, ING Insurance Company of America, and ReliaStar Life Insurance Company of New York, each filed with the SEC on October 29, 2004 and September 8, 2004. These Forms 8-K and Forms 8-K/A can be accessed through the SEC’s Web site at http://www.sec.gov. Despite the extensive internal review conducted through independent special counsel and a national accounting firm, there can be no assurance that the instances of inappropriate trading reported to the Boards are the only instances of such trading respecting the ING Funds.
DSL reported to the Boards that ING is committed to conducting its business with the highest standards of ethical conduct with zero tolerance for noncompliance. Accordingly, ING Investments advised the Boards that ING management was disappointed that its voluntary internal review identified these situations. Viewed in the context of the breadth and magnitude of its U.S. business as a whole, ING management does not believe that ING’s acquired companies had systemic ethical or compliance issues in these areas. Nonetheless, DSL reported that given ING’s refusal to tolerate any lapses, it has taken the steps noted below, and will continue to seek opportunities to further strengthen the internal controls of its affiliates.
| |
| • | ING has agreed with the ING Funds to indemnify and hold harmless the ING Funds from all damages resulting from wrongful conduct by ING or its employees or from ING’s internal investigation, any investigations conducted by any governmental or self-regulatory agencies, litigation or other formal proceedings, including any proceedings by the SEC. ING Investments reported to the Board that ING management believes that the total amount of any indemnification obligations will not be material to ING or its U.S. business. |
33
NOTES TO FINANCIAL STATEMENTS AS OF DECEMBER 31, 2006 (CONTINUED)
NOTE 12 — INFORMATION REGARDING TRADING OF ING’S U.S. MUTUAL FUNDS (continued)
| |
| • | ING updated its Code of Conduct for employees reinforcing its employees’ obligation to conduct personal trading activity consistent with the law, disclosed limits, and other requirements. |
| |
| • | The ING Funds, upon a recommendation from ING, updated their respective Codes of Ethics applicable to investment professionals with ING entities and certain other fund personnel, requiring such personnel to pre-clear any purchases or sales of ING Funds that are not systematic in nature (i.e., dividend reinvestment), and imposing minimum holding periods for shares of ING Funds. |
| |
| • | ING instituted excessive trading policies for all customers in its variable insurance and retirement products and for shareholders of the ING Funds sold to the public through financial intermediaries. ING does not make exceptions to these policies. |
| |
| • | ING reorganized and expanded its U.S. Compliance Department, and created an Enterprise Compliance team to enhance controls and consistency in regulatory compliance. |
Other Regulatory Matters
The New York Attorney General (the ���NYAG”) and other federal and state regulators are also conducting broad inquiries and investigations involving the insurance industry. These initiatives currently focus on, among other things, compensation and other sales incentives; potential conflicts of interest; potential anti-competitive activity; reinsurance; marketing practices (including suitability); specific product types (including group annuities and indexed annuities); fund selection for investment products and brokerage sales; and disclosure. It is likely that the scope of these industry investigations will further broaden before they conclude. ING has received formal and informal requests in connection with such investigations, and is cooperating fully with each request. In connection with one such investigation, affiliates of DSL were named in a petition for relief and cease and desist order filed by the New Hampshire Bureau of Securities Regulation (the “NH Bureau”) concerning their administration of the New Hampshire state employees deferred compensation plan.
On October 10, 2006, an affiliate of DSL entered into an assurance of discontinuance with the NYAG (the “NYAG Agreement”) regarding the endorsement of its products by the New York State United Teachers Union Member Benefits Trust (“NYSUT”) and the sale of their products to NYSUT members. Under the terms of the NYAG Agreement, the affiliate of DSL, without admitting or denying the NYAG’s findings, will distribute $30 million to NYSUT members, and/or former NYSUT members, who participated in the NYSUT-endorsed products at any point between January 1, 2001 and June 30, 2006. The affiliate also agreed with the NYAG’s office to develop a one-page disclosure that will further improve transparency and disclosure regarding retirement product fees (the “One-Page Disclosure”). Pursuant to the terms of the NYAG Agreement, the affiliate has agreed for a five year period to provide its retirement product customers with the One-Page Disclosure.
In addition, on the same date, these affiliates of DSL entered into a consent agreement with the NH Bureau (the “NH Agreement”) to resolve this petition for relief and cease and desist order. Under the terms of the NH Agreement, these affiliates of ING Investments, without admitting or denying the NH Bureau’s claims, have agreed to pay $3 million to resolve the matter, and for a five year period to provide their retirement product customers with the One-Page Disclosure described above. Other federal and state regulators could initiate similar actions in this or other areas of ING’s businesses.
In light of these and other developments, ING continuously reviews whether modifications to its business practices are appropriate.
At this time, in light of the current regulatory factors, ING U.S. is actively engaged in reviewing whether any modifications in our practices are appropriate for the future.
There can be no assurance that these matters, or the adverse publicity associated with them, will not result in increased fund redemptions, reduced sale of fund shares, or other adverse consequences to ING Funds.
34
PORTFOLIO ASSET ALLOCATION
AS OF DECEMBER 31, 2006
ING SOLUTION PORTFOLIOS
The following table illustrates the asset allocation of the Underlying Portfolios as of December 31, 2006 (as a percent of net assets).
| | | | | | | | | | | | | | | | | | | | | |
| | Solution | | Solution | | Solution | | Solution | | Solution |
| Underlying Affiliated Portfolios | | Income | | 2015 | | 2025 | | 2035 | | 2045 |
|
|
| ING American Century Large Company Value Portfolio, Class I | | | 2.0 | % | | | 2.0 | % | | | 6.1 | % | | | 8.0 | % | | | 9.0 | % |
| ING Baron Small Cap Growth Portfolio, Class I | | | — | | | | — | | | | 2.0 | % | | | 2.0 | % | | | 2.0 | % |
| ING Davis Venture Value Portfolio, Class I | | | 3.1 | % | | | 3.1 | % | | | 4.0 | % | | | 4.0 | % | | | 3.0 | % |
| ING Julius Baer Foreign Portfolio, Class I | | | — | | | | 4.2 | % | | | 5.3 | % | | | 6.2 | % | | | 7.2 | % |
| ING Legg Mason Partners Aggressive Growth Portfolio, Class I | | | — | | | | 3.0 | % | | | 4.9 | % | | | 5.9 | % | | | 6.8 | % |
| ING Legg Mason Value Portfolio, Class I | | | 3.1 | % | | | 3.0 | % | | | 4.0 | % | | | 4.0 | % | | | 3.0 | % |
| ING Limited Bond Portfolio, Class I | | | 21.7 | % | | | 16.7 | % | | | 12.7 | % | | | — | | | | — | |
| ING Marsico Growth Portfolio, Class I | | | — | | | | 3.0 | % | | | 5.0 | % | | | 6.0 | % | | | 7.0 | % |
| ING Marsico International Opportunities Portfolio, Class I | | | — | | | | 3.2 | % | | | 3.1 | % | | | 4.2 | % | | | 5.2 | % |
| ING Oppenheimer Strategic Income Portfolio, Class I | | | 10.1 | % | | | 10.0 | % | | | 5.0 | % | | | — | | | | — | |
| ING PIMCO High Yield Bond Portfolio, Class I | | | 3.0 | % | | | 3.0 | % | | | — | | | | — | | | | — | |
| ING PIMCO Total Return Portfolio, Class I | | | 12.8 | % | | | 2.9 | % | | | — | | | | — | | | | — | |
| ING T. Rowe Price Growth Equity Portfolio, Class I | | | 2.0 | % | | | 6.1 | % | | | 9.0 | % | | | 12.0 | % | | | 13.0 | % |
| ING UBS U.S. Large Cap Equity Portfolio, Class I | | | 7.1 | % | | | 7.0 | % | | | 5.0 | % | | | 5.0 | % | | | 5.0 | % |
| ING UBS U.S. Small Cap Growth Portfolio, Class I | | | — | | | | — | | | | 2.0 | % | | | 2.0 | % | | | 1.9 | % |
| ING Van Kampen Comstock Portfolio, Class I | | | — | | | | 2.0 | % | | | 6.0 | % | | | 8.0 | % | | | 9.0 | % |
| ING VP Index Plus International Equity Portfolio, Class I | | | 6.2 | % | | | 4.1 | % | | | 5.2 | % | | | 6.1 | % | | | 6.1 | % |
| ING VP Index Plus LargeCap Portfolio, Class I | | | 7.1 | % | | | 8.0 | % | | | 5.0 | % | | | 5.0 | % | | | 5.0 | % |
| ING VP Index Plus MidCap Portfolio, Class I | | | — | | | | — | | | | 2.0 | % | | | 3.0 | % | | | 4.0 | % |
| ING VP Index Plus SmallCap Portfolio, Class I | | | — | | | | — | | | | — | | | | 2.0 | % | | | 4.0 | % |
| ING VP Intermediate Bond Portfolio, Class I | | | 21.8 | % | | | 16.7 | % | | | 11.7 | % | | | 14.6 | % | | | 6.8 | % |
| ING VP Real Estate Portfolio, Class I | | | — | | | | 2.0 | % | | | 2.0 | % | | | 2.0 | % | | | 2.0 | % |
Other Assets and Liabilities, Net(1) | | | (0.0 | )% | | | (0.0 | )% | | | (0.0 | )% | | | (0.0 | )% | | | (0.0 | )% |
|
| | | | 100.0 | % | | | 100.0 | % | | | 100.0 | % | | | 100.0 | % | | | 100.0 | % |
|
| |
| (1) | Amounts are greater than (0.005)%. |
Portfolio holdings are subject to change daily.
35
PORTFOLIO OF INVESTMENTS
ING SOLUTION INCOME PORTFOLIO
AS OF DECEMBER 31, 2006
| | | | | | | | | | | |
| Shares | | | | | | Value |
|
|
|
|
|
|
| AFFILIATED INVESTMENT COMPANIES: 100.0% |
| | 102,399 | | | | | ING American Century Large Company Value Portfolio, Class I | | $ | 1,641,455 | |
| | 123,992 | | | | | ING Davis Venture Value Portfolio, Class I | | | 2,463,722 | |
| | 217,741 | | | | | ING Legg Mason Value Portfolio, Class I | | | 2,462,653 | |
| | 1,632,113 | | | | | ING Limited Bond Portfolio, Class I | | | 17,463,610 | |
| | 749,573 | | | | | ING Oppenheimer Strategic Income Portfolio, Class I | | | 8,095,386 | |
| | 237,474 | | | | | ING PIMCO High Yield Bond Portfolio, Class I | | | 2,448,362 | |
| | 926,178 | | | | | ING PIMCO Total Return Portfolio, Class I | | | 10,336,148 | |
| | 27,514 | | | | | ING T. Rowe Price Growth Equity Portfolio, Class I | | | 1,633,242 | |
| | 539,106 | | | | | ING UBS U.S. Large Cap Equity Portfolio, Class I | | | 5,692,962 | |
| | 381,863 | | | | | ING VP Index Plus International Equity Portfolio, Class I | | | 5,006,225 | |
| | 325,937 | | | | | ING VP Index Plus LargeCap Portfolio, Class I | | | 5,697,372 | |
| | 1,350,109 | | | | | ING VP Intermediate Bond Portfolio, Class I | | | 17,497,415 | |
| | | | | | | | | | | | | |
| | | | | Total Investments in Securities
(Cost $78,383,543)* | | | 100.0 | % | | $ | 80,438,552 | |
| | | | | Other Assets and
Liabilities-Net | | | (0.0 | ) | | | (29,430 | ) |
| | | | | | | |
| | | |
| |
| | | | | Net Assets | | | 100.0 | % | | $ | 80,409,122 | |
| | | | | | | |
| | | |
| |
| | | |
| * | | Cost for federal income tax purposes is $78,425,921. |
| | | | | |
|
|
|
|
| Net unrealized appreciation consists of: | | | | |
| Gross Unrealized Appreciation | | $ | 2,401,679 | |
| Gross Unrealized Depreciation | | | (389,048 | ) |
| | | |
| |
| Net Unrealized Appreciation | | $ | 2,012,631 | |
| | | |
| |
See Accompanying Notes to Financial Statements
36
PORTFOLIO OF INVESTMENTS
ING SOLUTION 2015 PORTFOLIO
AS OF DECEMBER 31, 2006
| | | | | | | | | | | |
| Shares | | | | | | Value |
|
|
|
|
|
|
| AFFILIATED INVESTMENT COMPANIES: 100.0% |
| | 356,384 | | | | | ING American Century Large Company Value Portfolio, Class I | | $ | 5,712,829 | |
| | 432,017 | | | | | ING Davis Venture Value Portfolio, Class I | | | 8,584,179 | |
| | 694,325 | | | | | ING Julius Baer Foreign Portfolio, Class I | | | 11,761,865 | |
| | 170,212 | | | | | ING Legg Mason Partners Aggressive Growth Portfolio, Class I | | | 8,357,394 | |
| | 758,681 | | | | | ING Legg Mason Value Portfolio, Class I | | | 8,580,686 | |
| | 4,390,187 | | | | | ING Limited Bond Portfolio, Class I | | | 46,975,003 | |
| | 511,302 | | | | | ING Marsico Growth Portfolio, Class I | | | 8,554,080 | |
| | 580,378 | | | | | ING Marsico International Opportunities Portfolio, Class I | | | 8,891,392 | |
| | 2,611,096 | | | | | ING Oppenheimer Strategic Income Portfolio, Class I | | | 28,199,836 | |
| | 828,875 | | | | | ING PIMCO High Yield Bond Portfolio, Class I | | | 8,545,699 | |
| | 744,439 | | | | | ING PIMCO Total Return Portfolio, Class I | | | 8,307,939 | |
| | 287,879 | | | | | ING T. Rowe Price Growth Equity Portfolio, Class I | | | 17,088,526 | |
| | 1,878,157 | | | | | ING UBS U.S. Large Cap Equity Portfolio, Class I | | | 19,833,338 | |
| | 423,954 | | | | | ING Van Kampen Comstock Portfolio, Class I | | | 5,668,264 | |
| | 886,740 | | | | | ING VP Index Plus International Equity Portfolio, Class I | | | 11,625,157 | |
| | 1,297,695 | | | | | ING VP Index Plus LargeCap Portfolio, Class I | | | 22,683,716 | |
| | 3,633,794 | | | | | ING VP Intermediate Bond Portfolio, Class I | | | 47,093,972 | |
| | 290,768 | | | | | ING VP Real Estate Portfolio, Class I | | | 5,704,874 | |
| | | | | | | | | | | | | |
| | | | | Total Investments in Securities
(Cost $269,575,166)* | | | 100.0 | % | | $ | 282,168,749 | |
| | | | | Other Assets and
Liabilities-Net | | | (0.0 | ) | | | (101,094 | ) |
| | | | | | | |
| | | |
| |
| | | | | Net Assets | | | 100.0 | % | | $ | 282,067,655 | |
| | | | | | | |
| | | |
| |
| | | |
| * | | Cost for federal income tax purposes is $269,631,057. |
| | | | | |
|
|
|
|
| Net unrealized appreciation consists of: | | | | |
| Gross Unrealized Appreciation | | $ | 13,539,900 | |
| Gross Unrealized Depreciation | | | (1,002,208 | ) |
| | | |
| |
| Net Unrealized Appreciation | | $ | 12,537,692 | |
| | | |
| |
See Accompanying Notes to Financial Statements
37
PORTFOLIO OF INVESTMENTS
ING SOLUTION 2025 PORTFOLIO
AS OF DECEMBER 31, 2006
| | | | | | | | | | | |
| Shares | | | | | | Value |
|
|
|
|
|
|
| AFFILIATED INVESTMENT COMPANIES: 100.0% |
| | 1,547,602 | | | | | ING American Century Large Company Value Portfolio, Class I | | $ | 24,808,054 | |
| | 443,471 | | | | | ING Baron Small Cap Growth Portfolio, Class I | | | 8,226,389 | |
| | 832,340 | | | | | ING Davis Venture Value Portfolio, Class I | | | 16,538,587 | |
| | 1,266,341 | | | | | ING Julius Baer Foreign Portfolio, Class I | | | 21,451,815 | |
| | 409,157 | | | | | ING Legg Mason Partners Aggressive Growth Portfolio, Class I | | | 20,089,628 | |
| | 1,461,735 | | | | | ING Legg Mason Value Portfolio, Class I | | | 16,532,221 | |
| | 4,854,035 | | | | | ING Limited Bond Portfolio, Class I | | | 51,938,169 | |
| | 1,232,132 | | | | | ING Marsico Growth Portfolio, Class I | | | 20,613,566 | |
| | 840,632 | | | | | ING Marsico International Opportunities Portfolio, Class I | | | 12,878,481 | |
| | 1,886,669 | | | | | ING Oppenheimer Strategic Income Portfolio, Class I | | | 20,376,027 | |
| | 623,789 | | | | | ING T. Rowe Price Growth Equity Portfolio, Class I | | | 37,028,110 | |
| | 1,936,928 | | | | | ING UBS U.S. Large Cap Equity Portfolio, Class I | | | 20,453,954 | |
| | 826,667 | | | | | ING UBS U.S. Small Cap Growth Portfolio, Class I | | | 8,035,204 | |
| | 1,840,448 | | | | | ING Van Kampen Comstock Portfolio, Class I | | | 24,606,795 | |
| | 1,604,998 | | | | | ING VP Index Plus International Equity Portfolio, Class I | | | 21,041,521 | |
| | 1,172,041 | | | | | ING VP Index Plus LargeCap Portfolio, Class I | | | 20,487,276 | |
| | 427,866 | | | | | ING VP Index Plus MidCap Portfolio, Class I | | | 8,082,382 | |
| | 3,707,023 | | | | | ING VP Intermediate Bond Portfolio, Class I | | | 48,043,021 | |
| | 418,329 | | | | | ING VP Real Estate Portfolio, Class I | | | 8,207,616 | |
| | | | | | | | | | | | | |
| | | | | Total Investments in Securities
(Cost $386,357,089)* | | | 100.0 | % | | $ | 409,438,816 | |
| | | | | Other Assets and
Liabilities-Net | | | (0.0 | ) | | | (145,703 | ) |
| | | | | | | |
| | | |
| |
| | | | | Net Assets | | | 100.0 | % | | $ | 409,293,113 | |
| | | | | | | |
| | | |
| |
| | | |
| * | | Cost for federal income tax purposes is $386,523,274. |
| | | | | |
|
|
|
|
| Net unrealized appreciation consists of: | | | | |
| Gross Unrealized Appreciation | | $ | 23,920,105 | |
| Gross Unrealized Depreciation | | | (1,004,563 | ) |
| | | |
| |
| Net Unrealized Appreciation | | $ | 22,915,542 | |
| | | |
| |
See Accompanying Notes to Financial Statements
38
PORTFOLIO OF INVESTMENTS
ING SOLUTION 2035 PORTFOLIO
AS OF DECEMBER 31, 2006
| | | | | | | | | | | |
| Shares | | | | | | Value |
|
|
|
|
|
|
| AFFILIATED INVESTMENT COMPANIES: 100.0% |
| | 1,611,939 | | | | | ING American Century Large Company Value Portfolio, Class I | | $ | 25,839,389 | |
| | 348,217 | | | | | ING Baron Small Cap Growth Portfolio, Class I | | | 6,459,426 | |
| | 651,065 | | | | | ING Davis Venture Value Portfolio, Class I | | | 12,936,671 | |
| | 1,177,913 | | | | | ING Julius Baer Foreign Portfolio, Class I | | | 19,953,841 | |
| | 384,956 | | | | | ING Legg Mason Partners Aggressive Growth Portfolio, Class I | | | 18,901,349 | |
| | 1,143,413 | | | | | ING Legg Mason Value Portfolio, Class I | | | 12,932,004 | |
| | 1,156,625 | | | | | ING Marsico Growth Portfolio, Class I | | | 19,350,331 | |
| | 874,995 | | | | | ING Marsico International Opportunities Portfolio, Class I | | | 13,404,925 | |
| | 651,109 | | | | | ING T. Rowe Price Growth Equity Portfolio, Class I | | | 38,649,811 | |
| | 1,516,983 | | | | | ING UBS U.S. Large Cap Equity Portfolio, Class I | | | 16,019,342 | |
| | 648,202 | | | | | ING UBS U.S. Small Cap Growth Portfolio, Class I | | | 6,300,522 | |
| | 1,917,564 | | | | | ING Van Kampen Comstock Portfolio, Class I | | | 25,637,837 | |
| | 1,504,070 | | | | | ING VP Index Plus International Equity Portfolio, Class I | | | 19,718,352 | |
| | 917,166 | | | | | ING VP Index Plus LargeCap Portfolio, Class I | | | 16,032,067 | |
| | 504,151 | | | | | ING VP Index Plus MidCap Portfolio, Class I | | | 9,523,412 | |
| | 353,923 | | | | | ING VP Index Plus SmallCap Portfolio, Class I | | | 6,367,068 | |
| | 3,625,507 | | | | | ING VP Intermediate Bond Portfolio, Class I | | | 46,986,575 | |
| | 329,083 | | | | | ING VP Real Estate Portfolio, Class I | | | 6,456,613 | |
| | | | | | | | | | | | | |
| | | | | Total Investments in Securities
(Cost $301,106,097)* | | | 100.0 | % | | $ | 321,469,535 | |
| | | | | Other Assets and
Liabilities-Net | | | (0.0 | ) | | | (113,526 | ) |
| | | | | | | |
| | | |
| |
| | | | | Net Assets | | | 100.0 | % | | $ | 321,356,009 | |
| | | | | | | |
| | | |
| |
| | | |
| * | | Cost for federal income tax purposes is $301,196,653. |
| | | | | |
|
|
|
|
| Net unrealized appreciation consists of: | | | | |
| Gross Unrealized Appreciation | | $ | 21,283,118 | |
| Gross Unrealized Depreciation | | | (1,010,236 | ) |
| | | |
| |
| Net Unrealized Appreciation | | $ | 20,272,882 | |
| | | |
| |
See Accompanying Notes to Financial Statements
39
PORTFOLIO OF INVESTMENTS
ING SOLUTION 2045 PORTFOLIO
AS OF DECEMBER 31, 2006
| | | | | | | | | | | |
| Shares | | | | | | Value |
|
|
|
|
|
|
| AFFILIATED INVESTMENT COMPANIES: 100.0% |
| | 926,710 | | | | | ING American Century Large Company Value Portfolio, Class I | | $ | 14,855,164 | |
| | 180,830 | | | | | ING Baron Small Cap Growth Portfolio, Class I | | | 3,354,398 | |
| | 247,937 | | | | | ING Davis Venture Value Portfolio, Class I | | | 4,926,516 | |
| | 704,280 | | | | | ING Julius Baer Foreign Portfolio, Class I | | | 11,930,511 | |
| | 230,267 | | | | | ING Legg Mason Partners Aggressive Growth Portfolio, Class I | | | 11,306,133 | |
| | 435,351 | | | | | ING Legg Mason Value Portfolio, Class I | | | 4,923,820 | |
| | 691,581 | | | | | ING Marsico Growth Portfolio, Class I | | | 11,570,150 | |
| | 560,400 | | | | | ING Marsico International Opportunities Portfolio, Class I | | | 8,585,330 | |
| | 361,494 | | | | | ING T. Rowe Price Growth Equity Portfolio, Class I | | | 21,458,276 | |
| | 777,600 | | | | | ING UBS U.S. Large Cap Equity Portfolio, Class I | | | 8,211,454 | |
| | 332,151 | | | | | ING UBS U.S. Small Cap Growth Portfolio, Class I | | | 3,228,510 | |
| | 1,106,106 | | | | | ING Van Kampen Comstock Portfolio, Class I | | | 14,788,638 | |
| | 771,040 | | | | | ING VP Index Plus International Equity Portfolio, Class I | | | 10,108,332 | |
| | 470,156 | | | | | ING VP Index Plus LargeCap Portfolio, Class I | | | 8,218,321 | |
| | 346,777 | | | | | ING VP Index Plus MidCap Portfolio, Class I | | | 6,550,615 | |
| | 364,757 | | | | | ING VP Index Plus SmallCap Portfolio, Class I | | | 6,561,977 | |
| | 867,857 | | | | | ING VP Intermediate Bond Portfolio, Class I | | | 11,247,425 | |
| | 168,738 | | | | | ING VP Real Estate Portfolio, Class I | | | 3,310,630 | |
| | | | | | | | | | | | | |
| | | | | Total Investments in Securities
(Cost $153,838,988)* | | | 100.0 | % | | $ | 165,136,200 | |
| | | | | Other Assets and
Liabilities-Net | | | (0.0 | ) | | | (56,514 | ) |
| | | | | | | |
| | | |
| |
| | | | | Net Assets | | | 100.0 | % | | $ | 165,079,686 | |
| | | | | | | |
| | | |
| |
| | | |
| * | | Cost for federal income tax purposes is $153,891,404. |
| | | | | |
|
|
|
|
| Net unrealized appreciation consists of: | | | | |
| Gross Unrealized Appreciation | | $ | 11,492,473 | |
| Gross Unrealized Depreciation | | | (247,677 | ) |
| | | |
| |
| Net Unrealized Appreciation | | $ | 11,244,796 | |
| | | |
| |
See Accompanying Notes to Financial Statements
40
TAX INFORMATION (UNAUDITED)
Dividends paid during the year ended December 31, 2006 were as follows:
| | | | | | | | | | |
| Portfolio Name | | Type | | Per Share Amount |
| |
| |
|
| ING Solution Income Portfolio | | | | | | | | |
| | Class ADV | | | NII | | | $ | 0.0211 | |
| | Class I | | | NII | | | $ | 0.0216 | |
| | Class S | | | NII | | | $ | 0.0198 | |
| | Class T | | | NII | | | $ | 0.0208 | |
| | All Classes | | | STCG | | | $ | 0.0035 | |
| | All Classes | | | LTCG | | | $ | 0.0008 | |
| ING Solution 2015 Portfolio | | | | | | | | |
| | Class ADV | | | NII | | | $ | 0.0197 | |
| | Class I | | | NII | | | $ | 0.0205 | |
| | Class S | | | NII | | | $ | 0.0187 | |
| | Class T | | | NII | | | $ | 0.0195 | |
| | All Classes | | | STCG | | | $ | 0.0080 | |
| | All Classes | | | LTCG | | | $ | 0.0022 | |
| ING Solution 2025 Portfolio | | | | | | | | |
| | Class ADV | | | NII | | | $ | 0.0255 | |
| | Class I | | | NII | | | $ | 0.0263 | |
| | Class S | | | NII | | | $ | 0.0236 | |
| | Class T | | | NII | | | $ | 0.0252 | |
| | All Classes | | | STCG | | | $ | 0.0122 | |
| | All Classes | | | LTCG | | | $ | 0.0046 | |
| ING Solution 2035 Portfolio | | | | | | | | |
| | Class ADV | | | NII | | | $ | 0.0138 | |
| | Class I | | | NII | | | $ | 0.0143 | |
| | Class S | | | NII | | | $ | 0.0125 | |
| | Class T | | | NII | | | $ | 0.0138 | |
| | All Classes | | | STCG | | | $ | 0.0084 | |
| | All Classes | | | LTCG | | | $ | 0.0031 | |
| ING Solution 2045 Portfolio | | | | | | | | |
| | Class ADV | | | NII | | | $ | 0.0043 | |
| | Class I | | | NII | | | $ | 0.0050 | |
| | Class S | | | NII | | | $ | 0.0040 | |
| | Class T | | | NII | | | $ | 0.0045 | |
| | All Classes | | | STCG | | | $ | 0.0138 | |
| | All Classes | | | LTCG | | | $ | 0.0019 | |
NII — Net investment income
STCG — Short-term capital gain
LTCG — Long-term capital gain
Of the ordinary distributions made during the year ended December 31, 2006, the following percentages qualify for the dividends received deduction (DRD) available to corporate shareholders:
| | | |
| ING Solution Income Portfolio | | 3.01% |
| ING Solution 2015 Portfolio | | 1.69% |
| ING Solution 2025 Portfolio | | 0.67% |
| ING Solution 2035 Portfolio | | 0.45% |
| ING Solution 2045 Portfolio | | 1.56% |
Above figures may differ from those cited elsewhere in this report due to differences in the calculation of income and gains under U.S. generally accepted accounting principles (book) purposes and Internal Revenue Service (tax) purposes.
Shareholders are strongly advised to consult their own tax advisers with respect to the tax consequences of their investments in the Portfolios. In January, shareholders, excluding corporate shareholders, receive an IRS 1099-DIV regarding the federal tax status of the dividends and distributions they received in the calendar year.
41
DIRECTOR AND OFFICER INFORMATION (UNAUDITED)
The business and affairs of the Fund are managed under the direction of the Fund’s Board. A Director who is not an interested person of the Fund, as defined in the 1940 Act, is an independent director (“Independent Director”). The Directors and Officers of the Fund are listed below. The Statement of Additional Information includes additional information about directors of the Fund and is available, without charge, upon request at 1-800-992-0180.
| | | | | | | | | | | |
| | | | | | | | Number of | | |
| | | | | | | | Portfolios | | |
| | | | | | Principal | | in Fund | | |
| | Position(s) | | Term of Office | | Occupation(s) | | Complex | | |
| | held with | | and Length of | | during the Past Five | | Overseen | | Other Directorships |
| Name, Address and Age | | Fund | | Time Served(1) | | Years | | by Director | | held by Director |
| |
| |
| |
| |
| |
|
|
|
|
|
Independent Trustees: | | | | | | | | | | |
| |
John V. Boyer(2)
7337 E. Doubletree Ranch Rd.
Scottsdale, Arizona 85258
Age: 53 | | Director | | November 1997 — Present | | President and Chief Executive Officer, Franklin and Eleanor Roosevelt Institute (March 2006 — Present). Formerly, Executive Director, The Mark Twain House & Museum(2) (September 1989 — November 2005). | | 180 | | None |
| |
Patricia W. Chadwick(3)
7337 E. Doubletree Ranch Rd.
Scottsdale, Arizona 85258
Age: 58 | | Director | | January 2006 — Present | | Consultant and President of self- owned company, Ravengate Partners LLC (January 2000 — Present). | | 180 | | None |
| |
J. Michael Earley(4)
7337 E. Doubletree Ranch Rd.
Scottsdale, Arizona 85258
Age: 61 | | Director | | January 2005 — Present | | President and Chief Executive Officer, Bankers Trust Company, N.A. (June 1992 — Present). | | 180 | | None |
| |
R. Barbara Gitenstein(3)
7337 E. Doubletree Ranch Rd.
Scottsdale, Arizona 85258
Age: 58 | | Director | | January 2005 — Present | | President, College of New Jersey (January 1999 — Present). | | 180 | | None |
| |
Patrick W. Kenny(4)
7337 E. Doubletree Ranch Rd.
Scottsdale, Arizona 85258
Age: 63 | | Director | | March 2002 — Present | | President and Chief Executive Officer, International Insurance Society (June 2001 — Present). | | 180 | | Assured Guaranty Ltd. (November 2003 — Present). |
| |
Jock Patton(3)
7337 E. Doubletree Ranch Rd.
Scottsdale, Arizona 85258
Age: 61 | | Chairman and Director | | January 2005 — Present | | Private Investor (June 1997 — Present). Formerly Director and Chief Executive Officer, Rainbow Multimedia Group, Inc. (January 1999 — December 2001). | | 180 | | JDA Software Group, Inc. (January 1999 — Present); and Swift Transportation Co. (March 2004 — Present). |
| |
Sheryl K. Pressler(4)
7337 E. Doubletree Ranch Rd.
Scottsdale, Arizona 85258
Age: 56 | | Director | | January 2006 — Present | | Consultant (May 2001 — Present). Formerly, Chief Executive Officer, Lend Lease Real Estate Investments, Inc. (March 2000 — April 2001). | | 180 | | Stillwater Mining Company (May 2002 — Present); California Healthcare Foundation (June 1999 — Present); and Romanian-American Enterprise Fund (February 2004 — Present). |
| |
David W.C. Putnam(4)
7337 E. Doubletree Ranch Rd.
Scottsdale, Arizona 85258
Age: 67 | | Director | | January 2005 — Present | | President and Director, F.L. Putnam Securities Company, Inc. (June 1978 — Present). | | 180 | | Principled Equity Market Trust (December 1996 — Present); and Asian American Bank and Trust Company (June 1993 — Present). |
| |
Roger B. Vincent(4)
7337 E. Doubletree Ranch Rd.
Scottsdale, Arizona 85258
Age: 61 | | Director | | January 2005 — Present | | President, Springwell Corporation (March 1989 — Present). | | 180 | | AmeriGas Propane, Inc. (January 1998 — Present); and UGI Corporation (February 2006 — Present). |
42
DIRECTOR AND OFFICER INFORMATION (UNAUDITED) (CONTINUED)
| | | | | | | | | | | |
| | | | | | | | Number of | | |
| | | | | | | | Portfolios | | |
| | | | | | Principal | | in Fund | | |
| | Position(s) | | Term of Office | | Occupation(s) | | Complex | | |
| | held with | | and Length of | | during the Past Five | | Overseen | | Other Directorships |
| Name, Address and Age | | Fund | | Time Served(1) | | Years | | by Director | | held by Director |
| |
| |
| |
| |
| |
|
|
|
|
|
| Director who is an “Interested Person”: | | | | | | | | |
| |
John G. Turner(5)
7337 E. Doubletree Ranch Rd.
Scottsdale, Arizona 85258
Age: 67 | | Director | | January 2005 — Present | | Retired. Formerly, Vice Chairman of ING Americas (September 2000 — January 2002); Director of ReliaStar Life Insurance Company of New York (April 1975 — December 2001); and Chairman and Trustee of the Northstar affiliated investment companies (May 1993 — December 2001). | | 180 | | Hormel Foods Corporation (March 2000 — Present); ShopKo Stores, Inc. (August 1999 — Present); and Conseco, Inc. (September 2003 — Present). |
| |
| (1) | Directors serve until their successors are duly elected and qualified, subject to the Board’s retirement policy. |
| |
| (2) | Shaun Mathews, President, ING USFS Mutual Funds and Investment Products, has held a seat on the board of directors of The Mark Twain House & Museum since September 19, 2002. ING Groep makes non-material, charitable contributions to The Mark Twain House & Museum. |
| |
| (3) | Valuation, Proxy and Brokerage Committee member. |
| |
| (4) | Audit Committee member. |
| |
| (5) | Mr. Turner is an “interested person,” as defined under the 1940 Act, because of his affiliation with ING Groep, the parent corporation of the Investment Adviser, ING Investments, LLC and the Distributor, ING Funds Distributor, LLC. |
43
DIRECTOR AND OFFICER INFORMATION (UNAUDITED) (CONTINUED)
| | | | | | | |
| | | | Term of Office | | |
| | Position(s) Held | | and Length of | | Principal Occupation(s) |
| Name, Address and Age | | with the Fund | | Time Served(1) | | during the Past Five Years |
| |
| |
| |
|
|
|
|
|
Officers: | | | | | | |
| |
Shaun P. Mathews
7337 E. Doubletree Ranch Rd.
Scottsdale, Arizona 85258
Age: 51 | | President and Chief Executive Officer | | November 2006 — Present | | President and Chief Executive Officer, ING Investments, LLC and ING Funds Services, LLC (November 2006 — Present); and Head of ING USFS Mutual Funds and Investment Products (October 2004 — Present). Formerly, CMO, ING USFS (April 2002 — October 2004); and Head of Rollover/ Payout (October 2001 — December 2003). |
| |
Michael J. Roland
7337 E. Doubletree Ranch Rd.
Scottsdale, Arizona 85258
Age: 48 | | Executive Vice President | | January 2005 — Present | | Executive Vice President, ING Investments, LLC (December 2001 — Present). Formerly, Chief Compliance Officer, ING Investments, LLC and Directed Services, LLC (October 2004 — December 2005); Chief Financial Officer and Treasurer, ING Investments, LLC (December 2001 — March 2005); and Senior Vice President, ING Investments, LLC (June 1998 — December 2001). |
| |
Stanley D. Vyner
7337 E. Doubletree Ranch Rd.
Scottsdale, Arizona 85258
Age: 56 | | Executive Vice President | | January 2005 — Present | | Executive Vice President, ING Investments, LLC (July 2000 — Present); and Chief Investment Risk Officer, ING Investments, LLC (January 2003 — Present). Formerly, Chief Investment Officer of the International Portfolios, ING Investments, LLC (August 2000 — January 2003). |
| |
Joseph M. O’Donnell
7337 E. Doubletree Ranch Rd.
Scottsdale, Arizona 85258
Age: 52 | | Chief Compliance Officer
Executive Vice President | | January 2005 — Present
March 2006 — Present | | Chief Compliance Officer of the ING Funds (November 2004 — Present); ING Investments, LLC and Directed Services, LLC (March 2006 — Present); and Executive Vice President of the ING Funds (March 2006 — Present). Formerly, Vice President, Chief Legal Counsel, Chief Compliance Officer and Secretary of Atlas Securities, Inc., Atlas Advisers, Inc. and Atlas Funds (October 2001 — October 2004); and Chief Operating Officer and General Counsel of Matthews International Capital Management LLC and Vice President and Secretary of Matthews International Funds (August 1999 — May 2001). |
| |
Robert S. Naka
7337 E. Doubletree Ranch Rd.
Scottsdale, Arizona 85258
Age: 43 | | Executive Vice President and Chief Operating Officer
Assistant Secretary | | March 2006 — Present
January 2005 — Present | | Executive Vice President and Chief Operating Officer, ING Funds Services, LLC and ING Investments, LLC (March 2006 — Present); and Assistant Secretary, ING Funds Services, LLC (October 2001 — Present). Formerly, Senior Vice President, ING Investments, LLC (August 1999 — March 2006). |
| |
Todd Modic
7337 E. Doubletree Ranch Rd.
Scottsdale, Arizona 85258
Age: 39 | | Senior Vice President, Chief/Principal Financial Officer and Assistant Secretary | | March 2005 — Present | | Senior Vice President, ING Funds Services, LLC (April 2005 — Present). Formerly, Vice President, ING Funds Services, LLC (September 2002 — March 2005); and Director of Financial Reporting, ING Investments, LLC (March 2001 — September 2002). |
44
DIRECTOR AND OFFICER INFORMATION (UNAUDITED) (CONTINUED)
| | | | | | | |
| | | | Term of Office | | |
| | Position(s) Held | | and Length of | | Principal Occupation(s) |
| Name, Address and Age | | with the Fund | | Time Served(1) | | during the Past Five Years |
| |
| |
| |
|
Kimberly A. Anderson
7337 E. Doubletree Ranch Rd.
Scottsdale, Arizona 85258
Age: 42 | | Senior Vice President | | January 2005 — Present | | Senior Vice President, ING Investments, LLC (October 2003 — Present). Formerly, Vice President and Assistant Secretary, ING Investments, LLC (January 2001 — October 2003). |
| |
Ernest J. C’DeBaca
7337 E. Doubletree Ranch Rd.
Scottsdale, Arizona 85258
Age: 37 | | Senior Vice President | | May 2006 — Present | | Senior Vice President, ING Funds Services, LLC (April 2006 — Present). Formerly, Counsel, ING Americas, U.S. Legal Services (January 2004 — March 2006); and Attorney-Adviser, U.S. Securities and Exchange Commission (May 2001 — December 2003). |
| |
Robert Terris
7337 E. Doubletree Ranch Rd.
Scottsdale, Arizona 85258
Age: 36 | | Senior Vice President | | May 2006 — Present | | Senior Vice President of Operations, ING Funds Services, LLC (May 2006 — Present). Formerly, Vice President of Administration, ING Funds Services, LLC (September 2001 — May 2006). |
| |
Robyn L. Ichilov
7337 E. Doubletree Ranch Rd.
Scottsdale, AZ 85258
Age: 39 | | Vice President and Treasurer | | January 2005 — Present | | Vice President and Treasurer, ING Funds Services, LLC (October 2001 — Present) and ING Investments, LLC (August 1997 — Present). |
| |
Lauren D. Bensinger
7337 E. Doubletree Ranch Rd.
Scottsdale, Arizona 85258
Age: 52 | | Vice President | | January 2005 — Present | | Vice President and Chief Compliance Officer, ING Funds Distributor, LLC (July 1995 — Present); and Vice President (February 1996 — Present); and Director of Compliance, ING Investments, LLC (October 2004 — Present). Formerly, Chief Compliance Officer, ING Investments, LLC (October 2001 — October 2004). |
| |
Maria M. Anderson
7337 E. Doubletree Ranch Rd.
Scottsdale, Arizona 85258
Age: 48 | | Vice President | | January 2005 — Present | | Vice President, ING Funds Services, LLC (September 2004 — Present). Formerly, Assistant Vice President, ING Funds Services, LLC (October 2001 — September 2004); and Manager Fund Accounting and Fund Compliance, ING Investments, LLC (September 1999 — October 2001). |
| |
Denise Lewis
7337 E. Doubletree Ranch Rd.
Scottsdale, Arizona 85258
Age: 43 | | Vice President | | January 2007 — Present | | Vice President, ING Funds Services, LLC (December 2006 — Present). Formerly, Senior Vice President, UMB Investment Services Group, LLC (November 2003 — December 2006); and Vice President, Wells Fargo Funds Management, LLC (December 2000 — August 2003). |
| |
Kimberly K. Palmer
7337 E. Doubletree Ranch Rd.
Scottsdale, Arizona 85258
Age: 49 | | Vice President | | March 2006 — Present | | Vice President, ING Funds Services, LLC (March 2006 — Present). Formerly, Assistant Vice President, ING Funds Services, LLC (August 2004 — March 2006); Manager, Registration Statements, ING Funds Services, LLC (May 2003 — August 2004); Associate Partner, AMVESCAP PLC (October 2000 — May 2003); and Director of Federal Filings and Blue Sky Filings, INVESCO Funds Group, Inc. (March 1994 — May 2003). |
45
DIRECTOR AND OFFICER INFORMATION (UNAUDITED) (CONTINUED)
| | | | | | | |
| | | | Term of Office | | |
| | Position(s) Held | | and Length of | | Principal Occupation(s) |
| Name, Address and Age | | with the Fund | | Time Served(1) | | during the Past Five Years |
| |
| |
| |
|
Laurie M. Tillinghast
151 Farmington Avenue
Hartford, Connecticut 06156
Age: 54 | | Vice President | | May 2003 — Present | | Senior Vice President, ING Investments, LLC (March 2006 — Present) and Vice President, ING Life Insurance and Annuity Company, (December 2000 — Present). Formerly, Vice President, Aetna Retirement Services, Fund Strategy and Management, (December 1995 — December 2000); and, Director and President, ING Partners, Inc. (November 1997 — May 2003) |
| |
Susan P. Kinens
7337 E. Doubletree Ranch Rd.
Scottsdale, Arizona 85258
Age: 30 | | Assistant Vice President | | January 2005 — Present | | Assistant Vice President, ING Funds Services, LLC (December 2002 — Present); and has held various other positions with ING Funds Services, LLC for more than the last five years. |
| |
Huey P. Falgout, Jr.
7337 E. Doubletree Ranch Rd.
Scottsdale, Arizona 85258
Age: 43 | | Secretary | | August 2003 — Present | | Chief Counsel, ING Americas, U.S. Legal Services (September 2003 — Present). Formerly, Counsel, ING Americas, U.S. Legal Services (November 2002 — September 2003); and Associate General Counsel of AIG American General (January 1999 — November 2002). |
| |
Theresa K. Kelety
7337 E. Doubletree Ranch Rd.
Scottsdale, Arizona 85258
Age: 43 | | Assistant Secretary | | August 2003 — Present | | Counsel, ING Americas, U.S. Legal Services (April 2003 — Present). Formerly, Senior Associate with Shearman & Sterling (February 2000 — April 2003). |
| |
| (1) | The officers hold office until the next annual meeting of the Directors and until their successors have been elected and qualified. |
46
ADVISORY CONTRACT APPROVAL DISCUSSION (UNAUDITED)
Board Consideration and Re-Approval of Investment Advisory and Sub-Advisory Contracts
Section 15(c) of the 1940 Act provides that, after an initial period, the Investment Advisory Agreement (the “Advisory Contract”) between Directed Services, LLC (formerly, ING Life Insurance and Annuity Company) (the “Adviser”) and IPI, on behalf of the Portfolios, remains in effect only if the Board of Directors (the “Board”) of ING Partners, Inc. (“IPI”), including a majority of the Directors who have no direct or indirect interest in the Advisory Contract, and who are not “interested persons” of IPI, as such term is defined under the 1940 Act (the “Independent Directors”), annually review and renew the Contract. In this regard, at a meeting held on November 9, 2006 the Board, including a majority of the Independent Directors, considered whether to renew the Advisory Contract.
The Independent Directors also held separate meetings on October 12, 2006 and November 7, 2006 to consider renewals of the Advisory Contract. Thus, references herein to factors considered and determinations made by the Independent Directors include, as applicable, factors considered and determinations made on those earlier dates.
At the November 9, 2006 meeting, the Board voted to renew the Advisory Contract for the Portfolios. In reaching this decision, the Board took into account information furnished throughout the year at regular Board meetings, as well as information prepared specifically in connection with the annual review process. The Board’s determination took into account a number of factors that its members believed, in light of the legal advice furnished to them by Kirkpatrick & Lockhart Preston Gates Ellis LLP (“K&L Gates”), their independent legal counsel, and their own business judgment, to be relevant.
Provided below is an overview of the Board’s contract approval process in general, as well as a discussion of certain of the specific factors the Board considered at the November 9, 2006 meeting. While the Board gave its attention to the information furnished, at its request, that was most relevant to its consideration, discussed below are a number of the primary factors relevant to the Board’s consideration as to whether to renew the Advisory Contract for the one-year period ending November 30, 2007. Each Director may have accorded different weight to the various factors in reaching his or her conclusions with respect to the Portfolios’ advisory arrangements.
Overview of the Contract Renewal and Approval Process
In 2003, the Independent Directors determined to undertake steps to further enhance the process under which the Board determines whether to renew existing advisory arrangements for the funds in the ING Funds complex, including the Portfolios’ existing Advisory Contract, and to approve new advisory arrangements. Among these measures, the Board: retained the services of an independent consultant with experience in the mutual fund industry to assist the Independent Directors in working with the personnel employed by the Adviser or its affiliates who administer the Portfolios (“Management”) to identify the types of information presented to the Board to inform its deliberations with respect to advisory relationships; established the format in which the information requested by the Board is provided to the Board; and determined the process for reviewing such information in connection with the Advisory Contract renewal process. The end result was the implementation of the current process relied upon by the Board to review and analyze information in connection with the annual renewal of the Portfolios’ Advisory Contract, as well as its review and approval of new advisory relationships.
Since the foregoing approval and renewal process was implemented, the Board regularly has reviewed and refined the process. In addition, the Board established a Contracts Committee and two Investment Review Committees, including the Domestic Equity Funds Investment Review Committee (the “I/B/F IRC”). The type and format of the information provided to the Board or its counsel to inform its approval and annual review and renewal process has been codified in the Portfolios’ “15(c) Methodology Guide” (the “Methodology Guide”). The Methodology Guide was developed under the direction of the Independent Directors, and sets out a written blueprint under which the Independent Directors request certain information necessary to facilitate a thorough and informed review in connection with the annual Advisory Contract renewal process. Management provides Portfolio-specific information to the Independent Directors based on the Methodology Guide through “Fund Analysis and Comparison Tables” or “FACT” sheets prior to the Independent Directors’ review of advisory agreement. In 2005, the Independent Directors retained an independent firm to verify and test the accuracy of certain of this information for a representative sample of funds in
47
ADVISORY CONTRACT APPROVAL DISCUSSION (UNAUDITED) (CONTINUED)
the ING Funds complex. The Independent Directors have determined to conduct such testing periodically.
As part of a regular on-going process, the Board’s Contracts Committee recommends or considers recommendations from Management for refinements and other changes to the Methodology Guide and other aspects of the review process, and the I/B/F IRC reviews benchmarks used to assess the performance of each Portfolio. The I/B/F IRC also meets regularly with the Adviser.
The Board employed its process for reviewing contracts when considering the renewals of the Advisory Contract that would be effective through November 30, 2007. A number of the Board’s primary considerations and conclusions resulting from this process are discussed below.
Nature, Extent and Quality of Service
In determining whether to approve the Advisory Contract for the year ending November 30, 2007, the Independent Directors received and evaluated such information as they deemed necessary regarding the nature, extent and quality of services provided to the Portfolios by the Adviser. This included information regarding the Adviser provided throughout the year at regular Board meetings, as well as information furnished for the November 9, 2006 Board meeting, which was held specifically to consider contracts renewals for the period ending November 30, 2007. In addition, the Board’s Independent Directors also held meetings on October 12 and November 7, prior to the November 9, 2006 meeting of the full Board, to consider the annual renewal of the Advisory Contract.
The materials requested by and provided to the Board and/or to K&L Gates prior to the November 2006 Board meeting included the following items: (1) FACT sheets for each Portfolio that provided information about the performance and expenses of the Portfolio and other similarly managed funds in a selected peer group (“Selected Peer Group”), as well as information about the Portfolio’s investment portfolio, objectives and strategies; (2) the Methodology Guide, which describes how the FACT sheets were prepared, including the manner in which benchmarks and Selected Peer Groups were selected and how profitability was determined; (3) responses from the Adviser to a detailed series of questions posed by K&L Gates; (4) copies of the form of Advisory Contract; (5) copies of the Form ADV for the Adviser; (6) financial statements for the Adviser; (7) drafts of narrative summaries addressing key factors the Board customarily considers in evaluating the renewals of the Advisory Contract, including a written analysis for each Portfolio of how performance and fees compare to its Selected Peer Group and/or designated benchmarks; and (8) other information relevant to the Board’s evaluations.
Each Portfolio’s Class I shares were used for purposes of certain comparisons to the funds in its Selected Peer Group. Class I shares were selected, as general matter, so that the Portfolio’s class with the longest performance history (at the Fund-of-Funds or underlying Funds level, as relevant) was compared to the analogous class of shares for each fund in the Selected Peer Group. The mutual funds chosen for inclusion in a Portfolio’s Selected Peer Group were selected based upon criteria designed to mirror the class being compared to the Selected Peer Group.
In arriving at its conclusions with respect to the Advisory Contract, the Board was mindful of the “manager-of-managers” platform of the ING Funds. The Board noted the resources that the Adviser has committed to the Board and its Investment Review Committees, including the I/B/F IRC, to assist the Board and members of the Committees with their assessment of the investment performance of the funds in the ING Funds Complex, including the Portfolios, on an ongoing basis throughout the year. This includes the appointment of a Chief Investment Risk Officer and his staff, who report directly to the Board and who have developed attribution analyses and other metrics used by the I/B/F IRC to analyze the key factors underlying investment performance for the funds in the ING Funds Complex, including the Portfolios.
In considering the Portfolios’ Advisory Contract, the Board also considered the extent of benefits provided to the Portfolios’ shareholders, beyond advisory services, from being part of the ING family of Funds. This includes, in most cases, the right to exchange or transfer investments, without a sales charge, between the same class of shares of the Portfolios and other ING Funds or among the Portfolios and other ING Funds available on a product platform, and the wide variety in the types of ING Funds available for exchange or transfer.
The Board also took into account the Adviser’s extensive efforts in recent years to reduce the expenses of the ING Funds, including the Portfolios,
48
ADVISORY CONTRACT APPROVAL DISCUSSION (UNAUDITED) (CONTINUED)
through re-negotiated arrangements with the ING Funds’ service providers.
Further, the Board received periodic reports showing that the investment policies and restrictions for each Portfolio were consistently complied with and other periodic reports covering matters such as compliance by Adviser personnel with the code of ethics. The Board considered reports from IPI’s Chief Compliance Officer (“CCO”) evaluating the regulatory compliance systems of the Adviser and procedures reasonably designed by the Adviser to assure compliance with the federal securities laws, including those related to late trading and market timing, best execution, fair value pricing, proxy voting procedures, and trade allocation, among others. The Board considered the implementation by the Adviser of enhanced compliance policies and procedures in response to SEC rule changes and other regulatory initiatives. The Board also took into account the CCO’s annual and periodic reports with respect to service provider compliance and his recommendations regarding service providers’ compliance programs. In this regard, the Board also considered the policies and procedures developed by the CCO in consultation with the Board’s Compliance Committee that guide the CCO’s compliance oversight function.
The Board reviewed the level of staffing, quality and experience of each Portfolio’s portfolio management team. The Board took into account the resources and reputation of the Adviser, and evaluated the ability of the Adviser to attract and retain qualified investment advisory personnel, including the members of the Adviser’s Investment Review Committee. The Board also considered the adequacy of the resources committed to the Portfolios (and other relevant funds in the ING Funds complex) by the Adviser, and whether those resources are commensurate with the needs of the Portfolios and are appropriate to attempt to sustain expected levels of performance, compliance, and other needs.
Based on their deliberations and the materials presented to them, the Board concluded that the advisory and related services provided by the Adviser are appropriate in light of the Portfolios’ operations, the competitive landscape of the investment company business, and investor needs, and that the nature and quality of the overall services provided by the Adviser were appropriate.
Principal Protection Funds
In assessing advisory relationships, the Board placed emphasis on the investment performance of each Portfolio, taking into account the importance of such performance to Portfolio shareholders. While the Board considered the performance reports and discussions with portfolio managers at Board and Committee meetings during the year, particular attention in assessing performance was given to the Fund FACT sheets furnished in advance of the November meeting of the Independent Directors. The FACT sheet prepared for each Portfolio included its investment performance compared to the Morningstar category median, Lipper category median, Selected Peer Group and Portfolio’s primary benchmark. The Board’s findings specific to each Portfolio’s performance are discussed under “Portfolio-by-Portfolio Analysis,” below.
Economies of Scale
In considering the reasonableness of advisory fees, the Board also considered whether economies of scale will be realized by the Adviser as a Portfolio grows larger and the extent to which this is reflected in the level of management fee rates charged. In this regard, the Board noted any breakpoints in advisory fee schedules at the underlying Fund level that would indirectly benefit Portfolio shareholders because they result in lower advisory fees when the underlying Fund achieves sufficient asset levels to receive a breakpoint discount. The Board also noted that, for underlying Funds that did not have breakpoint discounts on advisory fees, certain Funds may benefit from waivers to or reimbursements of advisory or other fees, and the extent to which economies of scale could effectively be realized through such waivers, reimbursements, or expense reductions.
In evaluating economies of scale, the Independent Directors considered a management report presented to them and also considered an evaluation and analysis presented to them on November 8, 2006 by an independent consultant regarding fee breakpoint arrangements for the underlying Funds.
Information about Services to Other Clients
The Board requested, and if received considered, information about the nature of services and fee rates offered by the Adviser to other clients, including other registered investment companies and institutional accounts.
49
ADVISORY CONTRACT APPROVAL DISCUSSION (UNAUDITED) (CONTINUED)
Fee Rates and Profitability
The Board reviewed and considered each contractual investment advisory fee rate payable by each Portfolio to the Adviser. The Board considered the fee structures of the Portfolios as they relate to the services provided under the Contracts, and the potential fall-out benefits to the Adviser, and its affiliates, from their association with the Portfolios. For each Portfolio, the Board determined that the fee payable to the Adviser is reasonable for the services that it performs, which were considered in light of the nature and quality of the services that it has performed and is expected to perform through the year ending November 30, 2007.
For each Portfolio, the Board considered information on revenues, costs and profits realized by the Adviser, which was prepared by Management in accordance with the allocation methodology (including assumptions) specified in the Methodology Guide. The Board also considered information that it requested and was provided by Management with respect to the profitability of service providers affiliated with the Adviser.
The Board determined that it had requested and received sufficient information to gain a reasonable understanding regarding the Adviser’s profitability. The Board also recognized that profitability analysis is not an exact science and there is no uniform methodology for determining profitability for this purpose. In this context, the Board realized that Management’s calculations regarding its costs incurred in establishing the infrastructure necessary for the Portfolios’ operations may not be fully reflected in the expenses allocated to each Portfolio in determining profitability, and that the information presented may not portray all of the costs borne by Management nor capture Management’s entrepreneurial risk associated with offering and managing a mutual fund complex in today’s regulatory environment.
Based on the information on revenues, costs, and profitability considered by the Board, after considering the factors described in this section, the Board concluded that the profits, if any, realized by the Adviser were not excessive.
Portfolio-by-Portfolio Analysis
The following paragraphs outline certain of the specific factors that the Board considered, and the conclusions reached, at its November 2006 meeting in relation to renewing the Portfolios’ Advisory Contract for the year ending November 30, 2007. These specific factors are in addition to those considerations discussed above. In each case, the Portfolio’s performance was compared to its Morningstar category median and its primary benchmark, a broad-based securities market index, and its style-specific benchmark, each of which appears in the Portfolio’s prospectus. Each Portfolio’s management fee and expense ratio were compared to the fees and expense ratios of the funds in its Selected Peer Group.
ING Solution Income Portfolio
In considering whether to approve the renewal of the Advisory Contract for ING Solution Income Portfolio, the Board considered that, based on performance data for the periods ended June 30, 2006: (1) the Portfolio underperformed both its variable and retail Morningstar category medians for the year-to-date and one-year periods, but outperformed for the most recent calendar quarter; (2) the Portfolio outperformed its primary benchmark for the year-to-date and one-year periods, but underperformed for the most recent calendar quarter; (3) the Portfolio is ranked in the second quintile for the most recent calendar quarter and in the fifth (lowest) quintile for the year-to-date and one-year periods when compared to its variable Morningstar category median; and (4) the Portfolio is ranked in the second quintile for the most recent calendar quarter and in the fourth quintile for the year-to-date and one-year periods when compared to its retail Morningstar category median.
In considering this performance data, the Board took into account that the Portfolio launched in April 2005, and therefore has a limited operating history for purposes of analyzing Portfolio performance.
In considering the fees payable under the Advisory Contract for ING Solution Income Portfolio, the Board took into account the factors described above and also considered: (1) the fairness of the compensation under an Advisory Contract with level fees that does not include breakpoints; and (2) the pricing structure (including the expense ratio to be borne by shareholders) of the Portfolio, as compared to its Selected Peer Group, including that: (a) the management fee (inclusive of the advisory fee and a 0.02% administration fee) for the Portfolio is below the median and the average management fees of the
50
ADVISORY CONTRACT APPROVAL DISCUSSION (UNAUDITED) (CONTINUED)
funds in its Selected Peer Group; and (b) the expense ratio for the Portfolio is below the median and average expense ratios of the funds in its Selected Peer Group. In analyzing this fee data, the Board took into account that the Portfolio indirectly bears the fees payable by the underlying Funds in which the Portfolio invests.
After its deliberation, the Board reached the following conclusions: (1) the Portfolio’s management fee rate is reasonable in the context of all factors considered by the Board; (2) the Portfolio’s expense ratio is reasonable in the context of all factors considered by the Board; and (3) the Portfolio launched in April 2005, and it is reasonable to permit the Portfolio to establish a longer operating history for the purpose of evaluating performance. Based on these conclusions and other factors, the Board voted to renew the Advisory Contract for the Portfolio for the year ending November 30, 2007. During this renewal process, different Board members may have given different weight to different individual factors and related conclusions.
ING Solution 2015 Portfolio
In considering whether to approve the renewal of the Advisory Contract for ING Solution 2015 Portfolio, the Board considered that, based on performance data for the periods ended June 30, 2006: (1) the Portfolio underperformed both its variable and retail Morningstar category medians and its primary benchmark for all periods presented, except it outperformed all three performance measures for the most recent calendar quarter; (2) the Portfolio is ranked in the second quintile for the most recent calendar quarter and in the fifth (lowest) quintile for the year-to-date and one-year periods when compared to its variable Morningstar category; and (4) the Portfolio is ranked in the first (highest) quintile for the most recent calendar quarter and in the fourth quintile for the year-to-date and one-year periods when compared to its retail Morningstar category.
In considering this performance data, the Board took into account that the Portfolio launched in April 2005, and therefore has a limited operating history for purposes of analyzing Portfolio performance.
In considering the fees payable under the Advisory Contract for ING Solution 2015 Portfolio, the Board took into account the factors described above and also considered: (1) the fairness of the compensation under an Advisory Contract with level fees that does not include breakpoints; and (2) the pricing structure (including the expense ratio to be borne by shareholders) of the Portfolio, as compared to its Selected Peer Group, including that: (a) the management fee (inclusive of the advisory fee and a 0.02% administration fee) for the Portfolio is below the median and the average management fees of the funds in its Selected Peer Group; and (b) the expense ratio for the Portfolio is below the median and average expense ratios of the funds in its Selected Peer Group. In analyzing this fee data, the Board took into account that the Portfolio indirectly bears the fees payable by the underlying Funds in which the Portfolio invests.
After its deliberation, the Board reached the following conclusions: (1) the Portfolio’s management fee rate is reasonable in the context of all factors considered by the Board; (2) the Portfolio’s expense ratio is reasonable in the context of all factors considered by the Board; and (3) the Portfolio launched in April 2005, and it is reasonable to permit the Portfolio to establish a longer operating history for the purpose of evaluating performance. Based on these conclusions and other factors, the Board voted to renew the Advisory Contract for the Portfolio for the year ending November 30, 2007. During this renewal process, different Board members may have given different weight to different individual factors and related conclusions.
ING Solution 2025 Portfolio
In considering whether to approve the renewal of the Advisory Contract for ING Solution 2025 Portfolio, the Board considered that, based on performance data for the periods ended June 30, 2006: (1) the Portfolio outperformed its variable Morningstar category median for the year-to-date period, but underperformed for the most recent calendar quarter and one-year periods; (2) the Portfolio outperformed its retail Morningstar category median for all periods presented; (3) the Portfolio outperformed its primary benchmark for all periods presented; (4) the Portfolio is ranked in the second quintile for the year-to-date period and in the fourth quintile for the most recent calendar quarter and one-year periods when compared to its variable Morningstar category median; and (5) the Portfolio is ranked in the second quintile for all periods presented when compared to its retail Morningstar category median.
51
ADVISORY CONTRACT APPROVAL DISCUSSION (UNAUDITED) (CONTINUED)
In considering this performance data, the Board took into account that the Portfolio launched in April 2005, and therefore has a limited operating history for purposes of analyzing Portfolio performance.
In considering the fees payable under the Advisory Contract for ING Solution 2025 Portfolio, the Board took into account the factors described above and also considered: (1) the fairness of the compensation under an Advisory Contract with level fees that does not include breakpoints; and (2) the pricing structure (including the expense ratio to be borne by shareholders) of the Portfolio, as compared to its Selected Peer Group, including that: (a) the management fee (inclusive of the advisory fee and a 0.02% administration fee) for the Portfolio is below the median and the average management fees of the funds in its Selected Peer Group; and (b) the expense ratio for the Portfolio is below the median and average expense ratios of the funds in its Selected Peer Group. In analyzing this fee data, the Board took into account that the Portfolio indirectly bears the fees payable by the underlying Funds in which the Portfolio invests. After its deliberation, the Board reached the following conclusions: (1) the Portfolio’s management fee rate is reasonable in the context of all factors considered by the Board; (2) the Portfolio’s expense ratio is reasonable in the context of all factors considered by the Board; and (3) the Portfolio launched in April 2005, and it is reasonable to permit the Portfolio to establish a longer operating history for the purpose of evaluating performance. Based on these conclusions and other factors, the Board voted to renew the Advisory Contract for the Portfolio for the year ending November 30, 2007. During this renewal process, different Board members may have given different weight to different individual factors and related conclusions.
ING Solution 2035 Portfolio
In considering whether to approve the renewal of the Advisory Contract for ING Solution 2035 Portfolio, the Board considered that, based on performance data for the periods ended June 30, 2006: (1) the Portfolio underperformed its variable Morningstar category median for the most recent calendar quarter and one-year periods, but outperformed for the year-to-date period; (2) the Portfolio underperformed its retail Morningstar category median for the year-to-date and one-year periods, but outperformed it for the most recent calendar quarter; (3) the Portfolio outperformed its primary benchmark for the most recent calendar quarter and one-year periods, but underperformed for the year-to-date period; (4) the Portfolio is ranked in the third quintile for the year-to-date period and in the fourth quintile for the most recent calendar quarter and one-year periods when compared to its variable Morningstar category median; and (5) the Portfolio is ranked in the second quintile for the most recent calendar quarter, in the third quintile for the year-to-date, and in the fourth quintile for the one-year period when compared to the retail Morningstar category median.
In considering this performance data, the Board took into account that the Portfolio launched in April 2005, and therefore has a limited operating history for purposes of analyzing Portfolio performance.
In considering the fees payable under the Advisory Contract for ING Solution 2035 Portfolio, the Board took into account the factors described above and also considered: (1) the fairness of the compensation under an Advisory Contract with level fees that does not include breakpoints; and (2) the pricing structure (including the expense ratio to be borne by shareholders) of the Portfolio, as compared to its Selected Peer Group, including that: (a) the management fee (inclusive of the advisory fee and a 0.02% administration fee) for the Portfolio is below the median and the average management fees of the funds in its Selected Peer Group; and (b) the expense ratio for the Portfolio is below the median and average expense ratios of the funds in its Selected Peer Group. In analyzing this fee data, the Board took into account that the Portfolio indirectly bears the fees payable by the underlying Funds in which the Portfolio invests.
After its deliberation, the Board reached the following conclusions: (1) the Portfolio’s management fee rate is reasonable in the context of all factors considered by the Board; (2) the Portfolio’s expense ratio is reasonable in the context of all factors considered by the Board; and (3) the Portfolio launched in April 2005, and it is reasonable to permit the Portfolio to establish a longer operating history for the purpose of evaluating performance. Based on these conclusions and other factors, the Board voted to renew the Advisory Contract for the Portfolio for the year ending November 30, 2007. During this renewal process, different Board members may have given different weight to different individual factors and related conclusions.
52
ADVISORY CONTRACT APPROVAL DISCUSSION (UNAUDITED) (CONTINUED)
ING Solution 2045 Portfolio
In considering whether to approve the renewal of the Advisory Contract for ING Solution 2045 Portfolio, the Board considered that, based on performance data for the periods ended June 30, 2006: (1) the Portfolio outperformed its variable Morningstar category median and its primary benchmark for the year-to-date and one-year periods, but underperformed both for the most recent calendar quarter; (2) the Portfolio underperformed its retail Morningstar category medial for all periods presented; (3) the Portfolio is ranked in the first (highest)quintile for the year-to-date period, in the third quintile for the one-year period, and in the fourth quintile for the most recent calendar quarter when compared to its variable Morningstar category median; and (4) the Portfolio is ranked in the second quintile for the year-to-date and one-year periods and in the third quintile for the most recent calendar quarter when compared to the retail Morningstar category median.
In considering this performance data, the Board took into account that the Portfolio launched in April 2005, and therefore has a limited operating history for purposes of analyzing Portfolio performance.
In considering the fees payable under the Advisory Contract for ING Solution 2045 Portfolio, the Board took into account the factors described above and also considered: (1) the fairness of the compensation under an Advisory Contract with level fees that does not include breakpoints; and (2) the pricing structure (including the expense ratio to be borne by shareholders) of the Portfolio, as compared to its Selected Peer Group, including that: (a) the management fee (inclusive of the advisory fee and a 0.02% administration fee) for the Portfolio is below the median and the average management fees of the funds in its Selected Peer Group; and (b) the expense ratio for the Portfolio is below the median and average expense ratios of the funds in its Selected Peer Group. In analyzing this fee data, the Board took into account that the Portfolio indirectly bears the fees payable by the underlying Funds in which the Portfolio invests.
After its deliberation, the Board reached the following conclusions: (1) the Portfolio’s management fee rate is reasonable in the context of all factors considered by the Board; (2) the Portfolio’s expense ratio is reasonable in the context of all factors considered by the Board; and (3) the Portfolio launched in April 2005, and it is reasonable to permit the Portfolio to establish a longer operating history for the purpose of evaluating performance. Based on these conclusions and other factors, the Board voted to renew the Advisory Contract for the Portfolio for the year ending November 30, 2007. During this renewal process, different Board members may have given different weight to different individual factors and related conclusions.
53
Investment Adviser
Directed Services, LLC
1475 Dunwoody Drive
West Chester, Pennsylvania 19380
Administrator
ING Funds Services, LLC
7337 East Doubletree Ranch Road
Scottsdale, Arizona 85258
Distributor
ING Funds Distributor, LLC
7337 East Doubletree Ranch Road
Scottsdale, Arizona 85258
Transfer Agent
DST Systems, Inc.
P.O. Box 419368
Kansas City, Missouri 64141
Custodian
The Bank of New York
One Wall Street
New York, New York 10286
Legal Counsel
Dechert LLP
1775 I Street, N.W.
Washington, D.C. 20006
Independent Registered Public Accounting Firm
KPMG LLP
99 High Street
Boston, Massachusetts 02110
Before investing, carefully consider the investment objectives, risks, charges and expenses of the variable universal life insurance policy or variable annuity contract and the underlying variable investment options. This and other information is contained in the prospectus for the variable universal life policy or variable annuity contract and the underlying variable investment options. Obtain these prospectuses from your agent/registered representative and read them carefully before investing.
| |
 | VPAR-USOL (1206-022807) |
| |
| | Annual Report |
| |
| | December 31, 2006 |
| |
| | Service Class (“Class S”) and
Adviser Class (“Class ADV”) |
| |
| | ING Partners, Inc. |
| |
| | • ING Fidelity® VIP Contrafund® Portfolio* |
| | • ING Fidelity® VIP Equity-Income Portfolio* |
| | • ING Fidelity® VIP Growth Portfolio* |
| | • ING Fidelity® VIP Mid Cap Portfolio* |
| | |
| | This report is submitted for general information to shareholders of the ING Funds. It is not authorized for distribution to prospective shareholders unless accompanied or preceded by a prospectus which includes details regarding the funds’ investment objectives, risks, charges, expenses and other information. This information should be read carefully. | |
* Fidelity and Contrafund are registered trademarks of FMR Corp.
TABLE OF CONTENTS
| | | |
|
|
|
|
| | 1 |
|
|
|
|
| | 2 |
|
|
|
|
| | 4 |
|
|
|
|
| | 8 |
|
|
|
|
| | 10 |
|
|
|
|
| | 11 |
|
|
|
|
| | 12 |
|
|
|
|
| | 13 |
|
|
|
|
| | 15 |
|
|
|
|
| | 20 |
|
|
|
|
| | 28 |
|
|
|
|
| | 32 |
|
|
|
|
| | 33 |
|
|
|
|
| | 38 |
PROXY VOTING INFORMATION
A description of the policies and procedures that the Portfolios use to determine how to vote proxies related to portfolio securities is available (1) without charge, upon request, by calling Shareholder Services toll-free at 1-800-992-0180; (2) on the ING Funds’ website at www.ingfunds.com and (3) on the SEC website at www.sec.gov. Information regarding how the Portfolios voted proxies related to portfolio securities during the most recent 12-month period ended June 30 is available without charge on the ING Funds’ website at www.ingfunds.com and on the SEC’s website at www.sec.gov.
QUARTERLY PORTFOLIO HOLDINGS
The Portfolio files their complete schedule of portfolio holdings with the SEC for the first and third quarters of each fiscal year on Form N-Q. The Portfolio’s Forms N-Q are available on the SEC’s website at www.sec.gov. The Portfolio’s Forms N-Q may be reviewed and copied at the SEC’s Public Reference Room in Washington, DC, and information on the operation of the Public Reference Room may be obtained by calling 1-800-SEC-0330; and is available upon request from the Portfolio by calling Shareholder Services toll-free at 1-800-992-0180.
(THIS PAGE INTENTIONALLY LEFT BLANK)
PRESIDENT’S LETTER

Dear Shareholder,
In its recent meetings, the U.S. Federal Reserve Board (the “Fed”) ceased what was a two-year trend. That trend — a string of 17 consecutive interest rate hikes that ended last fall — was seen by many analysts as a sign that the Fed was concerned about containing inflation.
Now, the Fed is neither raising nor lowering interest rates, which puts us in the midst of what economists refer to as a “plateau.” Historically, there have been six similar plateaus since 1982 and during four of those periods the Standard & Poor’s 500® Composite Stock Price Index(1) (“S&P 500® Index”) rose significantly.
Of course, the Fed’s actions impact economies and market performance around the world. For instance, the current interest rate climate has been cited as one reason for a decline in the value of the dollar. Last year, that drop in the dollar meant that international stocks — which are often determined in foreign currencies — generally experienced strong performance as foreign currencies climbed and world stock markets continued to produce strong results.
Meanwhile, here at home, 2006 was an interesting year for equity investors. In May of 2006, the S&P 500® Index hit a five-year high followed by a market correction and several months of non-directional returns. A strong rally occurred in the second half of the year driven in part by the aforementioned dollar decline and the interest rate plateau. The good news is many economists believe that these conditions may continue in the months to come.
At ING Funds, we are committed to providing you, the investor, with an array of investment choices that enables you to build a diversified portfolio across a variety of asset classes. We do so, with a view that the globalization of markets is an initial consideration in the products we offer.
We take the confidence you place in us with your investments very seriously — everyone in our firm is committed to renewing this trust each and every day.

Shaun Mathews
President
ING Funds
January 31, 2007
The views expressed in the President’s Letter reflect those of the President as of the date of the letter. Any such views are subject to change at any time based upon market or other conditions and ING Funds disclaims any responsibility to update such views. These views may not be relied on as investment advice and because investment decisions for an ING Fund are based on numerous factors, may not be relied on as an indication of investment intent on behalf of any ING Fund. Reference to specific company securities should not be construed as recommendations or investment advice.
(1) The S&P 500® Index is an unmanaged index that measures the performance of the securities of approximately 500 of the largest companies in the U.S.
1
MARKET PERSPECTIVE: YEAR ENDED DECEMBER 31, 2006
In our semi-annual report, we described how the feast of the first quarter had turned to famine in the second quarter for global equity markets on concerns that rising interest rates would freeze out global growth. Indeed as late as June 27, 2006, the year-to-date return on the Morgan Stanley Capital International (“MSCI”) World IndexSM(1) measured in local currencies, including net reinvested dividends had been precisely 0%. However, the second half of the year ended December 31, 2006, was much healthier and the same index powered ahead 12.3% and for the year ended December 31, 2006, returned 20.07%. The return to dollar based investors was a little better at 13.2%, as late in the year a slowing economy and hints that central banks would be diversifying out of dollars weighed on that currency. For the six months ended December 31, 2006, the dollar fell 3.1% against the euro and 5.6% against the pound, but gained 4.1% on the yen due to stumbling growth and miniscule interest rates in Japan. For the year ended December 31, 2006, the dollar fell 10.6% against the euro and 12.4% against the pound, but gained 1.3% against the yen.
As the first half of 2006 ended, the Federal Open Market Committee (“FOMC”) had just raised the federal funds rate for the seventeenth time since June 2004, to 5.25%. The relatively mild accompanying language led many in the fixed income market to hope that the tightening cycle was now over. Not everyone believed it, especially when new Middle East conflict pushed the price of oil to another record on July 14, 2006. But data, especially on housing, had mostly pointed to cooling demand and a tame employment report on August 4, 2006 probably decided the matter. Four days later the FOMC met and left rates unchanged. The booming housing market had been a powerful driver of growth in recent years through new construction and demand created by mortgage loan refinancing. This boom was deteriorating appreciably with housing prices and the key new building permits measure falling sharply. Only in the last few days of 2006 did the slump show some signs of bottoming out with unexpectedly good new and existing home sales figures reported, along with rebounding consumer confidence. For the six months ended December 31, 2006, the Lehman Brothers® Aggregate Bond (“LBAB”) Index(2) of investment grade bonds gained 5.09% and for the year ended December 31, 2006 it gained 4.33%. The most important dynamic was the broad yield curve inversion, suggestive of an expected fall in interest rates and a further economic slow down. The ten-year Treasury yield fell 43 basis points (0.43%) to 4.71%, while the yield on the three-month Bill rose by 3 basis points (0.03%) to 4.89%. Since mid-August, with the exception of two days, bond investors had been prepared to lend money to the government for ten years at a lower interest rate than for three months.
Faced with fading business activity, as the key housing engine seized up, and a yield curve inverted to the point of recession according to some commentators, investors in U.S. equities must have been in the mood to sell. Not so fast. Those investors saw things differently and indeed the apparent “disagreement” between the bond market and global stock markets was a well discussed feature of the second half of the year. For one thing, the oil price, having hit its record, fell back, as surly calm returned to the Middle East, as the summer driving and hurricane seasons came and went and as winter got off to a mild start in the key North East region. The price of oil averaged 22% less in the fourth quarter than at its peak, boosting consumers’ spending power and confidence. And if longer-term interest rates were falling then stocks looked more attractive as bonds provided less competition and the present value of future corporate profits rose. Speaking of which, Standard & Poor’s 500® Composite Stock Price (“S&P 500®”) Index(3) companies duly reported their 13th straight double-digit quarterly percentage earnings gain. Gross domestic product (“GDP”) growth may have slowed, but the share of corporate profits, reported at 12.4%, was the highest since the 1950’s. The next merger or acquisition to get investors in the mood never seemed far away. Five of them were even announced in one day on November 6, 2006, sending markets up about 1%. For the six months ended December 31, 2006, the S&P 500® Index, including dividends, rose 12.7% and for the year ended December 31, 2006, the S&P 500® Index, including dividends, rose 15.8%. All but 30 basis points (0.30%) of the gain came after August 8, 2006, making six-year highs as the year ended.
International markets, based on MSCI local currency indices, as in the U.S., finished near their best levels for the year. In Japan the market advanced 8.7%, in 2006, after a late surge. The long awaited increase in interest rates from 0.0% to 0.25% took place in July just as the economic recovery was losing impetus. Third quarter growth was estimated at only 0.8% and generated by exports and capital spending alone. Consumer spending was lagging despite low
2
MARKET PERSPECTIVE: YEAR ENDED DECEMBER 31, 2006
unemployment and almost flat prices, yet business confidence remained high and profit growth healthy. Elsewhere, Asian markets ex Japan rose 28.2% in 2006, but with wide disparities, ranging from -2.0% in Thailand to 83.4% in China. In Thailand the uncertainty caused by a military coup was compounded when the junta imposed exchange controls to hold back the strong baht, only to rescind them the next day. China’s market soared in surely speculative excess, and in the absence of attractive alternatives, as investors sought a piece of the world’s fourth largest economy. By the end of 2006 the Chinese market had become the third biggest emerging market after South Korea and Taiwan. European ex UK markets surged 16.1%, in 2006. The Eurozone’s GDP growth had recorded its best first half of a year since 2000, 1.7%, and the lowest unemployment rate, 7.8%, since the start of the Eurozone itself. But as the second half of 2006, wore on there were signs that the best news was behind it and the third quarter’s annualized growth fell to 2.0%. Business confidence, however, stayed buoyant and cheered by extensive merger and acquisition activity despite headwinds in the form of a strengthening euro, a hawkish European Central Bank that raised rates three times and the looming rise in German sales tax. UK equities added 8.6% in the six months ended December 31, 2006. The Bank of England raised rates twice as GDP growth accelerated to 2.9% year over year, inflation climbed above target and house prices, an important demand generator, continued their recovery with average prices up more than 10% in 2006. Again, however, it was widespread, large scale mergers and acquisitions energizing the market.
(1) The MSCI World IndexSM is an unmanaged index that measures the performance of over 1,400 securities listed on exchanges in the U.S., Europe, Canada, Australia, New Zealand and the Far East.
(2) The LBAB Index is a widely recognized, unmanaged index of publicly issued investment grade U.S. Government, mortgage-backed, asset-backed and corporate debt securities.
(3) The S&P 500® Index is an unmanaged index that measures the performance of the securities of approximately 500 of the largest companies in the U.S.
All indices are unmanaged and investors cannot invest directly in an index.
Past performance does not guarantee future results. The performance quoted represents past performance. Investment return and principal value of an investment will fluctuate, and shares, when redeemed, may be worth more or less than their original cost. The Portfolios’ performance is subject to change since the period’s end and may be lower or higher than the performance data shown. Please call (800) 262-3862 or log on to www.ingfunds.com to obtain performance data current to the most recent month end.
Market Perspective reflects the views of the Chief Investment Risk Officer only through the end of the period, and is subject to change based on market and other conditions.
3
ING FIDELITY® VIP CONTRAFUND® PORTFOLIO
PORTFOLIO MANAGERS’ REPORT
The ING Fidelity® VIP Contrafund® Portfolio (the “Portfolio”) seeks long-term capital appreciation by investing all of its assets in the Service Class 2 shares of the VIP Contrafund® Portfolio, a series of Fidelity Variable Insurance Products Fund II, a registered open-end investment company. Please refer to Management’s Discussion of Fund Performance on page 4 of the included Fidelity® Variable Insurance Products: Contrafund® Portfolio Annual Report.
For the year ended December 31, 2006, the Portfolio’s Class S and Class ADV shares returned 11.16% and 10.78%, respectively, compared to the S&P 500® Index(1), which returned 15.79%.
| | | | | | | | | |
|
| Average Annual Total Returns for the Periods Ended December 31, 2006 |
|
| | Since Inception |
| | 1 Year | | November 15, 2004 |
| |
| |
|
| Class S | | | 11.16 | % | | | 14.65 | % |
| Class ADV | | | 10.78 | % | | | 14.28 | % |
S&P 500® Index(1) | | | 15.79 | % | | | 13.15 | %(2) |
Based on a $10,000 initial investment, the graph and table above illustrate the total return of ING Fidelity® VIP Contrafund® Portfolio against the index indicated. An index is unmanaged, has no cash in its portfolio, imposes no sales charges and incurs no operating expenses. An investor cannot invest directly in the index. The Portfolio’s performance is shown without the imposition of any expenses or charges which are, or may be, imposed under your annuity contract. Total returns would have been lower if such expenses or charges were included.
The performance graph and table do not reflect the deduction of taxes that a shareholder will pay on Portfolio distributions or the redemption of Portfolio Shares.
The performance shown may include the effect of fee waivers and/or expense reimbursements by the Investment Adviser and/or other service providers, which have the effect of increasing total return. Had all fees and expenses been considered, the total returns would have been lower.
The performance update illustrates performance for a variable investment option available through a variable annuity contract. The performance shown indicates past performance and is not a projection or prediction of future results. Actual investment returns and principal value will fluctuate so that shares and/or units, at redemption, may be worth more or less than their original cost. Please call (800) 992-0180 to get performance through the most recent month end.
(1)The S&P 500® Index is an unmanaged index that measures the performance of the securities of approximately 500 of the largest companies in the U.S.
(2)Since inception performance of the index is shown from November 1, 2004.
This report contains statements that may be “forward-looking” statements. Actual results may differ materially from those projected in the “forward-looking” statements.
The views expressed in this report reflect those of the portfolio managers, only through the end of the period as stated on the cover. The portfolio managers’ views are subject to change at any time based on market and other conditions.
4
ING FIDELITY® VIP EQUITY-INCOME PORTFOLIO
PORTFOLIO MANAGERS’ REPORT
The ING Fidelity® VIP Equity-Income Portfolio (the “Portfolio”) seeks reasonable income by investing all of its assets in the Service Class 2 shares of the VIP Equity-Income Portfolio, a series of Fidelity Variable Insurance Products Fund, a registered open-end investment company. Please refer to Management’s Discussion of Fund Performance on page 4 of the included Fidelity® Variable Insurance Products: Equity-Income Portfolio Annual Report.
For the year ended December 31, 2006, the Portfolio’s Class S and Class ADV shares returned 19.61% and 19.14%, respectively, compared to the Russell 3000® Value Index(1), which returned 22.34%.
| | | | | | | | | |
|
| Average Annual Total Returns for the Periods Ended December 31, 2006 |
|
| | Since Inception |
| | 1 Year | | November 15, 2004 |
| |
| |
|
| Class S | | | 19.61 | % | | | 12.95 | % |
| Class ADV | | | 19.14 | % | | | 12.49 | % |
Russell 3000® Value Index(1) | | | 22.34 | % | | | 17.66 | %(2) |
Based on a $10,000 initial investment, the graph and table above illustrate the total return of ING Fidelity® VIP Equity-Income Portfolio against the index indicated. An index is unmanaged, has no cash in its portfolio, imposes no sales charges and incurs no operating expenses. An investor cannot invest directly in the index. The Portfolio’s performance is shown without the imposition of any expenses or charges which are, or may be, imposed under your annuity contract. Total returns would have been lower if such expenses or charges were included.
The performance graph and table do not reflect the deduction of taxes that a shareholder will pay on Portfolio distributions or the redemption of Portfolio Shares.
The performance shown may include the effect of fee waivers and/or expense reimbursements by the Investment Adviser and/or other service providers, which have the effect of increasing total return. Had all fees and expenses been considered, the total returns would have been lower.
The performance update illustrates performance for a variable investment option available through a variable annuity contract. The performance shown indicates past performance and is not a projection or prediction of future results. Actual investment returns and principal value will fluctuate so that shares and/or units, at redemption, may be worth more or less than their original cost. Please call (800) 992-0181 to get performance through the most recent month end.
(1)The Russell 3000® Value Index measures the performance of those Russell 3000 securities with lower price-to-book ratios and lower forecasted growth values.
(2)Since inception performance of the index is shown from November 1, 2004.
This report contains statements that may be “forward-looking” statements. Actual results may differ materially from those projected in the “forward-looking” statements.
The views expressed in this report reflect those of the portfolio managers, only through the end of the period as stated on the cover. The portfolio managers’ views are subject to change at any time based on market and other conditions.
5
ING FIDELITY® VIP GROWTH PORTFOLIO
PORTFOLIO MANAGERS’ REPORT
The ING Fidelity® VIP Growth Portfolio (the “Portfolio”) seeks capital appreciation by investing all of its assets in the Service Class 2 shares of the VIP Growth Portfolio, a series of Fidelity Variable Insurance Products Fund, a registered open-end investment company. Please refer to Management’s Discussion of Fund Performance on page 4 of the included Fidelity® Variable Insurance Products: Growth Portfolio Annual Report.
For the year ended December 31, 2006, the Portfolio’s Class S and Class ADV shares returned 6.19% and 6.69%, respectively, compared to the Russell 3000® Growth Index(1), which returned 9.46%.
| | | | | | | | | |
|
| Average Annual Total Returns for the Periods Ended December 31, 2006 |
|
| | Since Inception |
| | 1 Year | | November 15, 2004 |
| |
| |
|
| Class S | | | 6.19 | % | | | 6.33 | % |
| Class ADV | | | 5.89 | % † | | | 5.87 | %† |
Russell 3000® Growth Index(1) | | | 9.46 | % | | | 10.52 | %(2) |
Based on a $10,000 initial investment, the graph and table above illustrate the total return of ING Fidelity® VIP Growth Portfolio against the index indicated. An index is unmanaged, has no cash in its portfolio, imposes no sales charges and incurs no operating expenses. An investor cannot invest directly in the index. The Portfolio’s performance is shown without the imposition of any expenses or charges which are, or may be, imposed under your annuity contract. Total returns would have been lower if such expenses or charges were included.
The performance graph and table do not reflect the deduction of taxes that a shareholder will pay on Portfolio distributions or the redemption of Portfolio Shares.
The performance shown may include the effect of fee waivers and/or expense reimbursements by the Investment Adviser and/or other service providers, which have the effect of increasing total return. Had all fees and expenses been considered, the total returns would have been lower.
The performance update illustrates performance for a variable investment option available through a variable annuity contract. The performance shown indicates past performance and is not a projection or prediction of future results. Actual investment returns and principal value will fluctuate so that shares and/or units, at redemption, may be worth more or less than their original cost. Please call (800) 992-0181 to get performance through the most recent month end.
† On May 5, 2006, all outstanding shares of Class ADV were fully redeemed. On October 30, 2006, Class ADV re-commenced operations. The returns for Class ADV include the performance of Class S, adjusted to reflect the higher expenses of Class ADV, for the period between May 6, 2006 to October 29, 2006.
(1)The Russell 3000® Growth Index is an index that measures the performance of those Russell 3000® Index companies with higher price-to-book ratios and higher forecasted growth values.
(2)Since inception performance of the index is shown from November 1, 2004.
This report contains statements that may be “forward-looking” statements. Actual results may differ materially from those projected in the “forward-looking” statements.
The views expressed in this report reflect those of the portfolio managers, only through the end of the period as stated on the cover. The portfolio managers’ views are subject to change at any time based on market and other conditions.
6
ING FIDELITY® VIP MID CAP PORTFOLIO
PORTFOLIO MANAGERS’ REPORT
The ING Fidelity® VIP Mid Cap Portfolio (the “Portfolio”) seeks long-term growth of capital by investing all of its assets in the Service Class 2 shares of the VIP Mid Cap Portfolio, a series of Fidelity Variable Insurance Products III, a registered open-end investment company. Please refer to Management’s Discussion of Fund Performance on page 4 of the included Fidelity® Variable Insurance Products: Mid Cap Portfolio Annual Report.
For the year ended December 31, 2006, the Portfolio’s Class S and Class ADV shares returned 12.15% and 11.77%, respectively, compared to the S&P MidCap 400® Index(1), which returned 10.32%.

| | | | | | | | | |
|
| Average Annual Total Returns for the Periods Ended December 31, 2006 |
|
| | Since Inception |
| | 1 Year | | November 15, 2004 |
| |
| |
|
| Class S | | | 12.15 | % | | | 16.87 | % |
| Class ADV | | | 11.77 | % | | | 16.55 | % |
S&P MidCap 400® Index(1) | | | 10.32 | % | | | 15.67 | %(2) |
Based on a $10,000 initial investment, the graph and table above illustrate the total return of ING Fidelity® VIP Mid Cap Portfolio against the index indicated. An index is unmanaged, has no cash in its portfolio, imposes no sales charges and incurs no operating expenses. An investor cannot invest directly in the index. The Portfolio’s performance is shown without the imposition of any expenses or charges which are, or may be, imposed under your annuity contract. Total returns would have been lower if such expenses or charges were included.
The performance graph and table do not reflect the deduction of taxes that a shareholder will pay on Portfolio distributions or the redemption of Portfolio Shares.
The performance shown may include the effect of fee waivers and/or expense reimbursements by the Investment Adviser and/or other service providers, which have the effect of increasing total return. Had all fees and expenses been considered, the total returns would have been lower.
The performance update illustrates performance for a variable investment option available through a variable annuity contract. The performance shown indicates past performance and is not a projection or prediction of future results. Actual investment returns and principal value will fluctuate so that shares and/or units, at redemption, may be worth more or less than their original cost. Please call (800) 992-0181 to get performance through the most recent month end.
(1)The S&P MidCap 400® Index is an unmanaged index that measures the performance of the mid-size company segment of the U.S. market.
(2)Since inception performance of the index is shown from November 1, 2004.
This report contains statements that may be “forward-looking” statements. Actual results may differ materially from those projected in the “forward-looking” statements.
The views expressed in this report reflect those of the portfolio managers, only through the end of the period as stated on the cover. The portfolio managers’ views are subject to change at any time based on market and other conditions.
7
SHAREHOLDER EXPENSE EXAMPLES (UNAUDITED)
As a shareholder of a Portfolio, you incur two types of costs: (1) transaction costs, including redemption fees and exchange fees; and (2) ongoing costs, including management fees; distribution and/or service (12b-1) fees; and other Portfolio expenses. These Examples are intended to help you understand your ongoing costs (in dollars) of investing in a Portfolio and to compare these costs with the ongoing costs of investing in other mutual funds.
The Examples are based on an investment of $1,000 invested at the beginning of the period and held for the entire period from July 1, 2006 to December 31, 2006, unless otherwise indicated. The Portfolios’ expenses are shown without the imposition of any charges which are, or may be, imposed under your annuity contract. Expenses would have been higher if such charges were included.
Actual Expenses
The first section of the table shown, “Actual Portfolio Return,” provides information about actual account values and actual expenses. You may use the information in this section, together with the amount you invested, to estimate the expenses that you paid over the period. Simply divide your account value by $1,000 (for example, an $8,600 account value divided by $1,000 = 8.6), then multiply the result by the number in the first section under the heading entitled “Expenses Paid During Period” to estimate the expenses you paid on your account during this period.
Hypothetical Example for Comparison Purposes
The second section of the table shown, “Hypothetical 5% Return,” provides information about hypothetical account values and hypothetical expenses based on the Portfolio’s actual expense ratio and an assumed rate of return of 5% per year before expenses, which is not the Portfolio’s actual return. The hypothetical account values and expenses may not be used to estimate the actual ending account balance or expenses you paid for the period. You may use this information to compare the ongoing costs of investing in the Portfolio and other mutual funds. To do so, compare this 5% hypothetical example with the 5% hypothetical examples that appear in the shareholder reports of the other mutual funds.
Please note that the expenses shown in the table are meant to highlight your ongoing costs only and do not reflect any transactional costs, such as redemption fees or exchange fees. Therefore, the hypothetical lines of the table are useful in comparing ongoing costs only, and will not help you determine the relative total costs of owning different funds. In addition, if these transactional costs were included, your costs would have been higher.
| | | | | | | | | | | | | | | | | |
| | Beginning | | Ending | | | | Expenses Paid |
| | Account | | Account | | Annualized | | During the |
| | Value | | Value | | Expense | | Six Months Ended |
| ING Fidelity® VIP Contrafund® | | July 1, 2006 | | December 31, 2006 | | Ratio | | December 31, 2006* |
| |
| |
| |
| |
|
Actual Portfolio Return | | | | | | | | | | | | | | | | |
| Class S | | $ | 1,000.00 | | | $ | 1,071.50 | | | | 1.20 | % | | $ | 6.27 | |
| Class ADV | | | 1,000.00 | | | | 1,069.40 | | | | 1.45 | | | | 7.56 | |
| Hypothetical (5% return before expenses) | | | | | | | | | | | | | | | | |
| Class S | | $ | 1,000.00 | | | $ | 1,019.16 | | | | 1.20 | % | | $ | 6.11 | |
| Class ADV | | | 1,000.00 | | | | 1,017.90 | | | | 1.45 | | | | 7.37 | |
|
| |
| * | Expenses are equal to each Portfolio’s respective annualized expense ratios, including the expenses of the underlying Portfolio multiplied by the average account value over the period, multiplied by 184/365 to reflect the most recent fiscal one-half year. |
8
SHAREHOLDER EXPENSE EXAMPLES (UNAUDITED) (CONTINUED)
________________________________________________________________________________
| | | | | | | | | | | | | | | | | |
| | Beginning | | Ending | | | | Expenses Paid |
| | Account | | Account | | Annualized | | During the |
| | Value | | Value | | Expense | | Six Months Ended |
| ING Fidelity® VIP Equity-Income Portfolio | | July 1, 2006 | | December 31, 2006 | | Ratio | | December 31, 2006* |
| |
| |
| |
| |
|
Actual Portfolio Return | | | | | | | | | | | | | | | | |
| Class S | | $ | 1,000.00 | | | $ | 1,140.30 | | | | 1.12 | % | | $ | 6.04 | |
| Class ADV | | | 1,000.00 | | | | 1,139.60 | | | | 1.37 | | | | 7.39 | |
| Hypothetical (5% return before expenses) | | | | | | | | | | | | | | | | |
| Class S | | $ | 1,000.00 | | | $ | 1,019.56 | | | | 1.12 | % | | $ | 5.70 | |
| Class ADV | | | 1,000.00 | | | | 1,018.30 | | | | 1.37 | | | | 6.97 | |
|
| | | | | | | | | | | | | | | | | |
| | Beginning | | Ending | | | | Expenses Paid |
| | Account | | Account | | Annualized | | During the |
| | Value | | Value | | Expense | | Six Months Ended |
| ING Fidelity® VIP Growth Portfolio | | July 1, 2006 | | December 31, 2006 | | Ratio | | December 31, 2006* |
| |
| |
| |
| |
|
Actual Portfolio Return | | | | | | | | | | | | | | | | |
| Class S | | $ | 1,000.00 | | | $ | 1,064.90 | | | | 1.24 | % | | $ | 6.45 | |
| Class ADV | | | 1,000.00 | | | | 1,064.90 | | | | 1.49 | | | | 7.75 | |
| Hypothetical (5% return before expenses) | | | | | | | | | | | | | | | | |
| Class S | | $ | 1,000.00 | | | $ | 1,018.95 | | | | 1.24 | % | | $ | 6.31 | |
| Class ADV | | | 1,000.00 | | | | 1,017.69 | | | | 1.49 | | | | 7.58 | |
|
| | | | | | | | | | | | | | | | | |
| | Beginning | | Ending | | | | Expenses Paid |
| | Account | | Account | | Annualized | | During the |
| | Value | | Value | | Expense | | Six Months Ended |
| ING Fidelity® VIP Mid Cap Portfolio | | July 1, 2006 | | December 31, 2006 | | Ratio | | December 31, 2006* |
| |
| |
| |
| |
|
Actual Portfolio Return | | | | | | | | | | | | | | | | |
| Class S | | $ | 1,000.00 | | | $ | 1,052.80 | | | | 1.21 | % | | $ | 6.26 | |
| Class ADV | | | 1,000.00 | | | | 1,051.50 | | | | 1.46 | | | | 7.55 | |
| Hypothetical (5% return before expenses) | | | | | | | | | | | | | | | | |
| Class S | | $ | 1,000.00 | | | $ | 1,019.00 | | | | 1.21 | % | | $ | 6.16 | |
| Class ADV | | | 1,000.00 | | | | 1,017.74 | | | | 1.46 | | | | 7.43 | |
|
| |
| * | Expenses are equal to each Portfolio’s respective annualized expense ratios, including the expenses of the underlying Portfolio multiplied by the average account value over the period, multiplied by 184/365 to reflect the most recent fiscal one-half year. |
9
REPORT OF INDEPENDENT REGISTERED PUBLIC ACCOUNTING FIRM
The Shareholders and Board of Directors
ING Partners, Inc.
We have audited the accompanying statements of assets and liabilities, including the portfolios of investments, of ING Fidelity VIP Contrafund Portfolio, ING Fidelity VIP Equity Income Portfolio, ING Fidelity VIP Growth Portfolio, and ING Fidelity VIP Mid Cap Portfolio, each a series of ING Partners, Inc., as of December 31, 2006, and the related statements of operations for the year then ended, the statements of changes in net assets for each of the years in the two-year period then ended, and the financial highlights for each of the years or periods in the two-year period then ended and the period from November 15, 2004 (commencement of operations) to December 31, 2004. These financial statements and financial highlights are the responsibility of management. Our responsibility is to express an opinion on these financial statements and financial highlights based on our audits.
We conducted our audits in accordance with the standards of the Public Company Accounting Oversight Board (United States). Those standards require that we plan and perform the audits to obtain reasonable assurance about whether the financial statements and financial highlights are free of material misstatement. An audit includes examining, on a test basis, evidence supporting the amounts and disclosures in the financial statements. Our procedures included confirmation of securities owned as of December 31, 2006, by correspondence with the transfer agent of the underlying funds. An audit also includes assessing the accounting principles used and significant estimates made by management, as well as evaluating the overall financial statement presentation. We believe that our audits provide a reasonable basis for our opinion.
In our opinion, the financial statements and financial highlights referred to above present fairly, in all material respects, the financial position of the aforementioned portfolios as of December 31, 2006, and the results of their operations, the changes in their net assets, and the financial highlights for the periods specified in the first paragraph above, in conformity with U.S. generally accepted accounting principles.

Boston, Massachusetts
February 26, 2007
10
STATEMENTS OF ASSETS AND LIABILITIES AS OF DECEMBER 31, 2006
| | | | | | | | | | | | | | | | | | | |
| | ING | | ING | | ING | | ING |
| | Fidelity® VIP | | Fidelity® VIP | | Fidelity® VIP | | Fidelity® VIP |
| | Contrafund® | | Equity-Income | | Growth | | Mid Cap |
| | Portfolio | | Portfolio | | Portfolio | | Portfolio |
| |
| |
| |
| |
|
ASSETS: | | | | | | | | | | | | | | | | |
Investments in affiliated underlying fund(1) at value* | | $ | 224,300,527 | | | $ | 34,047,331 | | | $ | 17,458,736 | | | $ | 40,762,935 | |
| Cash | | | 267 | | | | 702 | | | | 1 | | | | 33 | |
|
|
|
|
| Receivables: | | | | | | | | | | | | | | | | |
| | Investment securities sold | | | — | | | | — | | | | 4,888 | | | | — | |
| | Fund shares sold | | | 269,313 | | | | 41,684 | | | | — | | | | 70,124 | |
| | | |
| | | |
| | | |
| | | |
| |
| | | Total assets | | | 224,570,107 | | | | 34,089,717 | | | | 17,463,625 | | | | 40,833,092 | |
| | | |
| | | |
| | | |
| | | |
| |
| |
|
|
|
|
| LIABILITIES: |
| Payable for investment securities purchased | | | 269,313 | | | | 41,684 | | | | — | | | | 70,124 | |
| Payable for fund shares redeemed | | | — | | | | — | | | | 4,888 | | | | — | |
| Payable to affiliates | | | 57,168 | | | | 8,506 | | | | 4,518 | | | | 10,622 | |
| | | |
| | | |
| | | |
| | | |
| |
| | | Total liabilities | | | 326,481 | | | | 50,190 | | | | 9,406 | | | | 80,746 | |
| | | |
| | | |
| | | |
| | | |
| |
NET ASSETS | | $ | 224,243,626 | | | $ | 34,039,527 | | | $ | 17,454,219 | | | $ | 40,752,346 | |
| | | |
| | | |
| | | |
| | | |
| |
| |
|
|
|
|
NET ASSETS WERE COMPRISED OF: | | | | | | | | | | | | | | | | |
| Paid-in capital | | $ | 204,161,610 | | | $ | 29,376,432 | | | $ | 16,153,954 | | | $ | 38,270,968 | |
| Undistributed net investment income | | | 1,259,972 | | | | 848,423 | | | | — | | | | 40,472 | |
| Accumulated net realized gain on investments | | | 17,575,963 | | | | 2,837,492 | | | | 456,899 | | | | 1,092,952 | |
| Net unrealized appreciation on investments | | | 1,246,081 | | | | 977,180 | | | | 843,366 | | | | 1,347,954 | |
| | | |
| | | |
| | | |
| | | |
| |
NET ASSETS | | $ | 224,243,626 | | | $ | 34,039,527 | | | $ | 17,454,219 | | | $ | 40,752,346 | |
| | |
| | | |
| | | |
| | | |
| |
| * Cost of investments in affiliated underlying fund | | $ | 223,054,446 | | | $ | 33,070,151 | | | $ | 16,615,370 | | | $ | 39,414,981 | |
|
|
|
|
Class S: | | | | | | | | | | | | | | | | |
| Net assets | | $ | 217,926,837 | | | $ | 33,037,783 | | | $ | 17,433,664 | | | $ | 38,562,147 | |
| Shares authorized | | | 100,000,000 | | | | 100,000,000 | | | | 100,000,000 | | | | 100,000,000 | |
| Par value | | $ | 0.001 | | | $ | 0.001 | | | $ | 0.001 | | | $ | 0.001 | |
| Shares outstanding | | | 16,304,161 | | | | 2,553,967 | | | | 1,531,418 | | | | 2,770,903 | |
| Net asset value and redemption price per share | | $ | 13.37 | | | $ | 12.94 | | | $ | 11.38 | | | $ | 13.92 | |
|
|
|
|
Class ADV: | | | | | | | | | | | | | | | | |
| Net assets | | $ | 6,316,789 | | | $ | 1,001,744 | | | $ | 20,555 | | | $ | 2,190,199 | |
| Shares authorized | | | 100,000,000 | | | | 100,000,000 | | | | 100,000,000 | | | | 100,000,000 | |
| Par value | | $ | 0.001 | | | $ | 0.001 | | | $ | 0.001 | | | $ | 0.001 | |
| Shares outstanding | | | 475,557 | | | | 78,102 | | | | 1,807 | | | | 158,300 | |
| Net asset value and redemption price per share | | $ | 13.28 | | | $ | 12.83 | | | $ | 11.38 | | | $ | 13.84 | |
| |
| (1) | The affiliated underlying funds for the ING Fidelity® VIP Contrafund®, ING Fidelity® VIP Equity-Income, ING Fidelity® VIP Growth and ING Fidelity® VIP MidCap Portfolios are the Fidelity® VIP Contrafund®, Fidelity® VIP Equity-Income, Fidelity® VIP Growth and Fidelity® VIP Mid Cap Portfolios, respectively. These financial statements should be read in conjunction with the affiliated underlying Fidelity funds’ financial statements. |
See Accompanying Notes to Financial Statements
11
STATEMENTS OF OPERATIONS FOR THE YEAR ENDED DECEMBER 31, 2006
| | | | | | | | | | | | | | | | | | |
| | ING | | ING | | ING | | ING |
| | Fidelity® VIP | | Fidelity® VIP | | Fidelity® VIP | | Fidelity® VIP |
| | Contrafund® | | Equity-Income | | Growth | | Mid Cap |
| | Portfolio | | Portfolio | | Portfolio | | Portfolio |
| |
| |
| |
| |
|
INVESTMENT INCOME: | | | | | | | | | | | | | | | | |
Dividends from affiliated underlying fund(1) | | $ | 1,636,121 | | | $ | 661,091 | | | $ | 18,472 | | | $ | 15,706 | |
| Interest | | | 252 | | | | — | | | | — | | | | 28 | |
| | | |
| | | |
| | | |
| | | |
| |
| | Total investment income | | | 1,636,373 | | | | 661,091 | | | | 18,472 | | | | 15,734 | |
| | | |
| | | |
| | | |
| | | |
| |
|
|
|
|
EXPENSES: | | | | | | | | | | | | | | | | |
|
|
|
|
| Distribution and service fees: | | | | | | | | | | | | | | | | |
| | Class S | | | 346,486 | | | | 51,987 | | | | 37,948 | | | | 50,749 | |
| | Class ADV | | | 23,736 | | | | 3,244 | | | | 21 | | | | 8,767 | |
| Administrative service fees | | | 71,673 | | | | 10,722 | | | | 7,592 | | | | 11,027 | |
| | | |
| | | |
| | | |
| | | |
| |
| | Total expenses | | | 441,895 | | | | 65,953 | | | | 45,561 | | | | 70,543 | |
| | | |
| | | |
| | | |
| | | |
| |
| Net investment income (loss) | | | 1,194,478 | | | | 595,138 | | | | (27,089 | ) | | | (54,809 | ) |
| | | |
| | | |
| | | |
| | | |
| |
|
|
|
|
REALIZED AND UNREALIZED GAIN (LOSS) ON AFFILIATED UNDERLYING FUNDS: | | | | | | | | | | | | | | | | |
| Distributions of realized gains from affiliated underlying funds | | | 16,637,987 | | | | 2,923,421 | | | | — | | | | 1,048,087 | |
| Net realized gain on affiliated underlying funds | | | 1,004,150 | | | | 167,964 | | | | 487,638 | | | | 141,371 | |
| | | |
| | | |
| | | |
| | | |
| |
| Net realized gain on affiliated investments | | | 17,642,137 | | | | 3,091,385 | | | | 487,638 | | | | 1,189,458 | |
| | | |
| | | |
| | | |
| | | |
| |
| Net change in unrealized appreciation or depreciation on affiliated underlying funds | | | (2,829,162 | ) | | | 553,400 | | | | 418,050 | | | | 935,565 | |
| | | |
| | | |
| | | |
| | | |
| |
| Net realized and unrealized gain on affiliated underlying funds and net realized gain distributions from underlying fund | | | 14,812,975 | | | | 3,644,785 | | | | 905,688 | | | | 2,125,023 | |
| | | |
| | | |
| | | |
| | | |
| |
Increase in net assets resulting from operations | | $ | 16,007,453 | | | $ | 4,239,923 | | | $ | 878,599 | | | $ | 2,070,214 | |
| | | |
| | | |
| | | |
| | | |
| |
| |
| (1) | The affiliated underlying funds for the ING Fidelity® VIP Contrafund®, ING Fidelity® VIP Equity-Income, ING Fidelity® VIP Growth and ING Fidelity® VIP MidCap Portfolios are the Fidelity® VIP Contrafund®, Fidelity® VIP Equity-Income, Fidelity® VIP Growth and Fidelity® VIP Mid Cap Portfolios, respectively. These financial statements should be read in conjunction with the affiliated underlying Fidelity funds’ financial statements. |
See Accompanying Notes to Financial Statements
12
STATEMENTS OF CHANGES IN NET ASSETS
| | | | | | | | | | | | | | | | | | |
| | | | |
| | ING Fidelity® VIP | | ING Fidelity® VIP |
| | Contrafund® Portfolio | | Equity-Income Portfolio |
| |
| |
|
| | Year Ended | | Year Ended | | Year Ended | | Year Ended |
| | December 31, | | December 31, | | December 31, | | December 31, |
| | 2006 | | 2005 | | 2006 | | 2005 |
| |
| |
| |
| |
|
FROM OPERATIONS: | | | | | | | | | | | | | | | | |
| Net investment income (loss) | | $ | 1,194,478 | | | $ | (62,744 | ) | | $ | 595,138 | | | $ | (11,464 | ) |
| Net realized gain on affiliated underlying funds | | | 17,642,137 | | | | 85,247 | | | | 3,091,385 | | | | 35,914 | |
| Net change in unrealized appreciation or depreciation on affiliated underlying funds | | | (2,829,162 | ) | | | 4,075,175 | | | | 553,400 | | | | 423,723 | |
| | | |
| | | |
| | | |
| | | |
| |
| Net increase in net assets resulting from operations | | | 16,007,453 | | | | 4,097,678 | | | | 4,239,923 | | | | 448,173 | |
| | | |
| | | |
| | | |
| | | |
| |
|
|
|
|
FROM DISTRIBUTIONS TO SHAREHOLDERS: | | | | | | | | | | | | | | | | |
|
|
|
|
| Net realized gains: | | | | | | | | | | | | | | | | |
| | Class S | | | (22,772 | ) | | | — | | | | (24,482 | ) | | | — | |
| | Class ADV | | | (698 | ) | | | — | | | | (577 | ) | | | — | |
| | | |
| | | |
| | | |
| | | |
| |
| Total distributions | | | (23,470 | ) | | | — | | | | (25,059 | ) | | | — | |
| | | |
| | | |
| | | |
| | | |
| |
|
|
|
|
FROM CAPITAL SHARE TRANSACTIONS: | | | | | | | | | | | | | | | | |
| Net proceeds from sale of shares | | | 152,796,791 | | | | 58,299,540 | | | | 21,831,009 | | | | 10,730,499 | |
| Dividends reinvested | | | 23,470 | | | | — | | | | 25,059 | | | | — | |
| | | |
| | | |
| | | |
| | | |
| |
| | | | 152,820,261 | | | | 58,299,540 | | | | 21,856,068 | | | | 10,730,499 | |
| Cost of shares redeemed | | | (5,906,700 | ) | | | (1,085,336 | ) | | | (2,368,517 | ) | | | (843,615 | ) |
| | | |
| | | |
| | | |
| | | |
| |
| Net increase in net assets resulting from capital share transactions | | | 146,913,561 | | | | 57,214,204 | | | | 19,487,551 | | | | 9,886,884 | |
| | | |
| | | |
| | | |
| | | |
| |
| Net increase in net assets | | | 162,897,544 | | | | 61,311,882 | | | | 23,702,415 | | | | 10,335,057 | |
| | | |
| | | |
| | | |
| | | |
| |
|
|
|
|
NET ASSETS: | | | | | | | | | | | | | | | | |
| Beginning of year | | | 61,346,082 | | | | 34,200 | | | | 10,337,112 | | | | 2,055 | |
| | | |
| | | |
| | | |
| | | |
| |
| End of year | | $ | 224,243,626 | | | $ | 61,346,082 | | | $ | 34,039,527 | | | $ | 10,337,112 | |
| | | |
| | | |
| | | |
| | | |
| |
| Undistributed net investment income at end of year | | $ | 1,259,972 | | | $ | — | | | $ | 848,423 | | | $ | — | |
| | | |
| | | |
| | | |
| | | |
| |
See Accompanying Notes to Financial Statements
13
STATEMENTS OF CHANGES IN NET ASSETS
| | | | | | | | | | | | | | | | | | |
| | | | |
| | ING Fidelity® VIP | | ING Fidelity® VIP |
| | Growth Portfolio | | Mid Cap Portfolio |
| |
| |
|
| | Year Ended | | Year Ended | | Year Ended | | Year Ended |
| | December 31, | | December 31, | | December 31, | | December 31, |
| | 2006 | | 2005 | | 2006 | | 2005 |
| |
| |
| |
| |
|
FROM OPERATIONS: | | | | | | | | | | | | | | | | |
| Net investment loss | | $ | (27,089 | ) | | $ | (10,178 | ) | | $ | (54,809 | ) | | $ | (6,819 | ) |
| Net realized gain on affiliated underlying funds | | | 487,638 | | | | 26,800 | | | | 1,189,458 | | | | 20,819 | |
| Net change in unrealized appreciation or depreciation on affiliated underlying funds | | | 418,050 | | | | 425,274 | | | | 935,565 | | | | 412,270 | |
| | | |
| | | |
| | | |
| | | |
| |
| Net increase in net assets resulting from operations | | | 878,599 | | | | 441,896 | | | | 2,070,214 | | | | 426,270 | |
| | | |
| | | |
| | | |
| | | |
| |
|
|
|
|
FROM DISTRIBUTIONS TO SHAREHOLDERS: | | | | | | | | | | | | | | | | |
|
|
|
|
| Net realized gains: | | | | | | | | | | | | | | | | |
| | Class S | | | (20,310 | ) | | | — | | | | (14,205 | ) | | | — | |
| | Class ADV | | | — | | | | — | | | | (1,042 | ) | | | — | |
| | | |
| | | |
| | | |
| | | |
| |
| Total distributions | | | (20,310 | ) | | | — | | | | (15,247 | ) | | | — | |
| | | |
| | | |
| | | |
| | | |
| |
|
|
|
|
FROM CAPITAL SHARE TRANSACTIONS: | | | | | | | | | | | | | | | | |
| Net proceeds from sale of shares | | | 12,365,025 | | | | 11,332,632 | | | | 34,788,020 | | | | 5,390,919 | |
| Dividends reinvested | | | 20,310 | | | | — | | | | 15,247 | | | | — | |
| | | |
| | | |
| | | |
| | | |
| |
| | | | 12,385,335 | | | | 11,332,632 | | | | 34,803,267 | | | | 5,390,919 | |
| Cost of shares redeemed | | | (6,469,105 | ) | | | (1,096,869 | ) | | | (1,671,925 | ) | | | (269,445 | ) |
| | | |
| | | |
| | | |
| | | |
| |
| Net increase in net assets resulting from capital share transactions | | | 5,916,230 | | | | 10,235,763 | | | | 33,131,342 | | | | 5,121,474 | |
| | | |
| | | |
| | | |
| | | |
| |
| Net increase in net assets | | | 6,774,519 | | | | 10,677,659 | | | | 35,186,309 | | | | 5,547,744 | |
| | | |
| | | |
| | | |
| | | |
| |
|
|
|
|
NET ASSETS: | | | | | | | | | | | | | | | | |
| Beginning of year | | | 10,679,700 | | | | 2,041 | | | | 5,566,037 | | | | 18,293 | |
| | | |
| | | |
| | | |
| | | |
| |
| End of year | | $ | 17,454,219 | | | $ | 10,679,700 | | | $ | 40,752,346 | | | $ | 5,566,037 | |
| | | |
| | | |
| | | |
| | | |
| |
| Undistributed net investment income at end of year | | $ | — | | | $ | — | | | $ | 40,472 | | | $ | — | |
| | | |
| | | |
| | | |
| | | |
| |
See Accompanying Notes to Financial Statements
14
ING FIDELITY® VIP CONTRAFUND PORTFOLIO
FINANCIAL HIGHLIGHTS
Selected data for a share of beneficial interest outstanding throughout each period.
| | | | | | | | | | | | | | | | | | | | | | | | | | | |
| | | | | | |
| | | | Class S | | Class ADV |
| | | |
| |
|
| | | | | | November 15, | | | | November 15, |
| | | | Year Ended | | Year Ended | | 2004(1) to | | Year Ended | | Year Ended | | 2004(1) to |
| | | | December 31, | | December 31, | | December 31, | | December 31, | | December 31, | | December 31, |
| | | | 2006 | | 2005 | | 2004 | | 2006 | | 2005 | | 2004 |
|
Per Share Operating Performance: | | | | | | | | | | | | | | | | | | | | | | | | | | |
| Net asset value, beginning of period | | $ | | | 12.03 | | | | 10.34 | | | | 10.00 | | | | 11.99 | | | | 10.34 | | | | 10.00 | |
|
|
|
|
| Income (loss) from investment operations: | | | | | | | | | | | | | | | | | | | | | | | | | | |
| Net investment income (loss) | | $ | | | 0.11 | ** | | | (0.01 | ) | | | 0.00 | * | | | 0.07 | ** | | | (0.03 | ) | | | (0.01 | ) |
| Net realized and unrealized gain on investments | | $ | | | 1.23 | | | | 1.70 | | | | 0.34 | | | | 1.22 | | | | 1.68 | | | | 0.35 | |
| Total from investment operations | | $ | | | 1.34 | | | | 1.69 | | | | 0.34 | | | | 1.29 | | | | 1.65 | | | | 0.34 | |
|
|
|
|
| Less distributions from: | | | | | | | | | | | | | | | | | | | | | | | | | | |
| Net realized gains on investments | | $ | | | 0.00 | * | | | — | | | | — | | | | 0.00 | * | | | — | | | | — | |
| Total distributions | | $ | | | 0.00 | * | | | — | | | | — | | | | 0.00 | * | | | — | | | | — | |
| Net asset value, end of period | | $ | | | 13.37 | | | | 12.03 | | | | 10.34 | | | | 13.28 | | | | 11.99 | | | | 10.34 | |
|
|
|
|
| Total Return(2) | | % | | | 11.16 | | | | 16.34 | | | | 3.40 | | | | 10.78 | | | | 15.96 | | | | 3.40 | |
| |
|
|
|
|
Ratios and Supplemental Data: | | | | | | | | | | | | | | | | | | | | | | | | | | |
| Net assets, end of period (000’s) | | $ | | | 217,927 | | | | 57,988 | | | | 33 | | | | 6,317 | | | | 3,358 | | | | 1 | |
|
|
|
|
| Ratios to average net assets: | | | | | | | | | | | | | | | | | | | | | | | | | | |
| Expenses excluding expenses of the master fund | | % | | | 0.30 | | | | 0.30 | | | | 0.30 | | | | 0.55 | | | | 0.55 | | | | 0.55 | |
| Net investment income (loss) excluding expenses of the master fund | | % | | | 0.84 | | | | (0.29 | ) | | | (0.30 | ) | | | 0.53 | | | | (0.50 | ) | | | (0.55 | ) |
| Portfolio turnover rate(3) | | % | | | 16 | | | | 5 | | | | 0 | | | | 16 | | | | 5 | | | | 0 | |
|
(1) Commencement of operations.
(2) Total return is calculated assuming reinvestment of all dividends and capital gain distributions at net asset value and excluding the deduction of sales charges. Total returns for periods less than one year are not annualized. The Portfolio’s performance is shown without the imposition of any expenses or charges which are, or may be, imposed under your annuity contract. Total returns would have been lower if such expenses or charges were included.
(3) Portfolio turnover rate is calculated based on the Portfolio’s purchases or sales of the master fund.
* Amount is less than $0.005 per share.
** Per share data calculated using average shares outstanding throughout the period.
| | | | | | | | | | | | | | | | | | | | | | | | | | | |
| | | | | | |
| | | | Class S | | Class ADV |
| | | |
| |
|
| | | | | | November 15, | | | | November 15, |
| | | | Year Ended | | Year Ended | | 2004(1) to | | Year Ended | | Year Ended | | 2004(1) to |
| | | | December 31, | | December 31, | | December 31, | | December 31, | | December 31, | | December 31, |
| | | | 2006 | | 2005 | | 2004 | | 2006 | | 2005 | | 2004 |
|
| Expenses including expenses net of all reductions of the master fund | | % | | | 1.20 | | | | 1.19 | | | | 1.21 | † | | | 1.45 | | | | 1.44 | | | | 1.46 | † |
| Expenses including expenses net of voluntary waivers, if any, of the master fund | | % | | | 1.21 | | | | 1.21 | | | | 1.23 | † | | | 1.46 | | | | 1.46 | | | | 1.48 | † |
| Expenses including gross expenses of the master fund | | % | | | 1.21 | | | | 1.21 | | | | 1.23 | † | | | 1.46 | | | | 1.46 | | | | 1.48 | † |
| Portfolio turnover rate of master fund | | % | | | 75 | | | | 60 | | | | 64 | † | | | 75 | | | | 60 | | | | 64 | † |
|
† Expenses of the master fund included in the ratio, as well as the portfolio turnover rate, are for the year ended December 31, 2004.
See Accompanying Notes to Financial Statements
15
ING FIDELITY® VIP EQUITY-INCOME PORTFOLIO
FINANCIAL HIGHLIGHTS
| | | | | �� | | | | | | | | | | | | | | | | | | | | | | |
| | | | | | |
| | | | Class S | | Class ADV |
| | | |
| |
|
| | | | | | November 15, | | | | November 15, |
| | | | Year Ended | | Year Ended | | 2004(1) to | | Year Ended | | Year Ended | | 2004(1) to |
| | | | December 31, | | December 31, | | December 31, | | December 31, | | December 31, | | December 31, |
| | | | 2006 | | 2005 | | 2004 | | 2006 | | 2005 | | 2004 |
|
Per Share Operating Performance: | | | | | | | | | | | | | | | | | | | | | | | | | | |
| Net asset value, beginning of period | | $ | | | 10.83 | | | | 10.28 | | | | 10.00 | | | | 10.78 | | | | 10.27 | | | | 10.00 | |
|
|
|
|
| Income (loss) from investment operations: | | | | | | | | | | | | | | | | | | | | | | | | | | |
| Net investment income (loss) | | $ | | | 0.33 | ** | | | (0.01 | ) | | | 0.00 | * | | | 0.33 | ** | | | (0.03 | ) | | | (0.01 | ) |
| Net realized and unrealized gain on investments | | $ | | | 1.79 | | | | 0.56 | | | | 0.28 | | | | 1.73 | | | | 0.54 | | | | 0.28 | |
| Total from investment operations | | $ | | | 2.12 | | | | 0.55 | | | | 0.28 | | | | 2.06 | | | | 0.51 | | | | 0.27 | |
|
|
|
|
| Less distributions from: | | | | | | | | | | | | | | | | | | | | | | | | | | |
| Net realized gains on investments | | $ | | | 0.01 | | | | — | | | | — | | | | 0.01 | | | | — | | | | — | |
| Total distributions | | $ | | | 0.01 | | | | — | | | | — | | | | 0.01 | | | | — | | | | — | |
| Net asset value, end of period | | $ | | | 12.94 | | | | 10.83 | | | | 10.28 | | | | 12.83 | | | | 10.78 | | | | 10.27 | |
|
|
|
|
| Total Return(2) | | % | | | 19.61 | | | | 5.35 | | | | 2.80 | | | | 19.14 | | | | 4.97 | | | | 2.70 | |
| |
|
|
|
|
Ratios and Supplemental Data: | | | | | | | | | | | | | | | | | | | | | | | | | | |
| Net assets, end of period (000’s) | | $ | | | 33,038 | | | | 10,259 | | | | 1 | | | | 1,002 | | | | 78 | | | | 1 | |
|
|
|
|
| Ratios to average net assets: | | | | | | | | | | | | | | | | | | | | | | | | | | |
| Expenses excluding expenses of the master fund | | % | | | 0.30 | | | | 0.30 | | | | 0.30 | | | | 0.55 | | | | 0.55 | | | | 0.55 | |
| Net investment income (loss) excluding expenses of the master fund | | % | | | 2.77 | | | | (0.30 | ) | | | (0.30 | ) | | | 2.80 | | | | (0.44 | ) | | | (0.55 | ) |
| Portfolio turnover rate(3) | | % | | | 25 | | | | 22 | | | | 0 | | | | 25 | | | | 22 | | | | 0 | |
|
(1) Commencement of operations.
(2) Total return is calculated assuming reinvestment of all dividends and capital gain distributions at net asset value and excluding the deduction of sales charges. Total returns for periods less than one year are not annualized. The Portfolio’s performance is shown without the imposition of any expenses or charges which are, or may be, imposed under your annuity contract. Total returns would have been lower if such expenses or charges were included.
(3) Portfolio turnover rate is calculated based on the Portfolio’s purchases or sales of the master fund.
* Amount is less than $0.005 per share.
** Per share data calculated using average number of shares outstanding throughout the period.
| | | | | | | | | | | | | | | | | | | | | | | | | | | |
| | | | | | |
| | | | Class S | | Class ADV |
| | | |
| |
|
| | | | | | November 15, | | | | November 15, |
| | | | Year Ended | | Year Ended | | 2004(1) to | | Year Ended | | Year Ended | | 2004(1) to |
| | | | December 31, | | December 31, | | December 31, | | December 31, | | December 31, | | December 31, |
| | | | 2006 | | 2005 | | 2004 | | 2006 | | 2005 | | 2004 |
|
| Expenses including expenses net of all reductions of the master fund | | % | | | 1.12 | | | | 1.10 | | | | 1.12 | † | | | 1.37 | | | | 1.35 | | | | 1.37 | † |
| Expenses including expenses net of voluntary waivers, if any, of the master fund | | % | | | 1.12 | | | | 1.11 | | | | 1.13 | † | | | 1.37 | | | | 1.36 | | | | 1.38 | † |
| Expenses including gross expenses of the master fund | | % | | | 1.12 | | | | 1.11 | | | | 1.13 | † | | | 1.37 | | | | 1.36 | | | | 1.38 | † |
| Portfolio turnover rate of master fund | | % | | | 22 | | | | 19 | | | | 22 | † | | | 22 | | | | 19 | | | | 22 | † |
|
† Expenses of the master fund included in the ratio, as well as the portfolio turnover rate, are for the year ended December 31, 2004.
See Accompanying Notes to Financial Statements
16
ING FIDELITY® VIP GROWTH PORTFOLIO
FINANCIAL HIGHLIGHTS
| | | | | | | | | | | | | | | | | | | | | | | | | | | | | | | |
| | | | | | |
| | | | Class S | | Class ADV |
| | | |
| |
|
| | | | | | November 15, | | October 30, | | January 1, | | | | November 15, |
| | | | Year Ended | | Year Ended | | 2004(1) to | | 2006(4)to | | 2006 to | | Year Ended | | 2004(1) to |
| | | | December 31, | | December 31, | | December 31, | | December 31, | | May 4, | | December 31, | | December 31, |
| | | | 2006 | | 2005 | | 2004 | | 2006 | | 2006(4) | | 2005 | | 2004 |
|
Per Share Operating Performance: | | | | | | | | | | | | | | | | | | | | | | | | | | | | | | |
| Net asset value, beginning of period | | $ | | | 10.73 | | | | 10.21 | | | | 10.00 | | | | 11.34 | | | | 10.68 | | | | 10.20 | | | | 10.00 | |
|
|
|
|
| Income (loss) from investment operations: | | | | | | | | | | | | | | | | | | | | | | | | | | | | | | |
| Net investment loss | | $ | | | (0.02 | ) | | | (0.01 | ) | | | (0.00 | )* | | | (0.01 | ) | | | (0.01 | ) | | | (0.05 | ) | | | (0.01 | ) |
| Net realized and unrealized gain (loss) on investments | | $ | | | 0.68 | | | | 0.53 | | | | 0.21 | | | | 0.05 | | | | 0.53 | | | | 0.53 | | | | 0.21 | |
| Total from investment operations | | $ | | | 0.66 | | | | 0.52 | | | | 0.21 | | | | 0.04 | | | | 0.52 | | | | 0.48 | | | | 0.20 | |
|
|
|
|
| Less distributions from: | | | | | | | | | | | | | | | | | | | | | | | | | | | | | | |
| Net realized gains on investments | | $ | | | 0.01 | | | | — | | | | — | | | | — | | | | — | | | | — | | | | — | |
| Total distributions | | $ | | | 0.01 | | | | — | | | | — | | | | — | | | | — | | | | — | | | | — | |
| Net asset value, end of period | | $ | | | 11.38 | | | | 10.73 | | | | 10.21 | | | | 11.38 | | | | 11.20 | | | | 10.68 | | | | 10.20 | |
|
|
|
|
| Total Return (2) | | % | | | 6.19 | | | | 5.09 | | | | 2.10 | | | | 0.35 | | | | 4.87 | | | | 4.71 | | | | 2.00 | |
| |
|
|
|
|
Ratios and Supplemental Data: | | | | | | | | | | | | | | | | | | | | | | | | | | | | | | |
| Net assets, end of period (000’s) | | $ | | | 17,434 | | | | 10,679 | | | | 1 | | | | 21 | | | | 1 | | | | 1 | | | | 1 | |
|
|
|
|
| Ratios to average net assets: | | | | | | | | | | | | | | | | | | | | | | | | | | | | | | |
| Expenses excluding expenses of the master fund | | % | | | 0.30 | | | | 0.30 | | | | 0.30 | | | | 0.55 | | | | 0.55 | | | | 0.55 | | | | 0.55 | |
| Net investment loss excluding expenses of the master fund | | % | | | (0.18 | ) | | | (0.28 | ) | | | (0.30 | ) | | | (0.55 | ) | | | (0.20 | ) | | | (0.25 | ) | | | (0.55 | ) |
| Portfolio turnover rate(3) | | % | | | 43 | | | | 29 | | | | 0 | | | | 43 | | | | 43 | | | | 29 | | | | 0 | |
|
(1) Commencement of operations.
(2) Total return is calculated assuming reinvestment of all dividends and capital gain distributions at net asset value and excluding the deduction of sales charges. Total returns for periods less than one year are not annualized. The Portfolio’s performance is shown without the imposition of any expenses or charges which are, or may be, imposed under your annuity contract. Total returns would have been lower if such expenses or charges were included.
(3) Portfolio turnover rate is calculated based on the Portfolio’s purchases and sales of the master fund.
(4) Class ADV was fully redeemed on May 5, 2006 and recommenced operations on October 30, 2006.
* Amount is more than $(0.005) per share.
** Per share data calculated using average shares outstanding throughout the period.
See Accompanying Notes to Financial Statements
17
ING FIDELITY® VIP GROWTH PORTFOLIO (CONTINUED)
FINANCIAL HIGHLIGHTS
| | | | | | | | | | | | | | | | | | | | | | | | | | | | | | | |
| | | | | | |
| | | | Class S | | Class ADV |
| | | |
| |
|
| | | | | | November 15, | | October 30, | | January 1, | | | | November 15, |
| | | | Year Ended | | Year Ended | | 2004(1) to | | 2006(4) to | | 2006 to | | Year Ended | | 2004(1) to |
| | | | December 31, | | December 31, | | December 31, | | December 31, | | May 4, | | December 31, | | December 31, |
| | | | 2006 | | 2005 | | 2004 | | 2006 | | 2006(4) | | 2005 | | 2004 |
|
| Expenses including expenses net of all reductions of the master fund | | % | | | 1.22 | | | | 1.18 | | | | 1.20 | † | | | 1.47 | | | | 1.47 | | | | 1.43 | | | | 1.45 | † |
| Expenses including expenses net of voluntary waivers, if any, of the master fund | | % | | | 1.24 | | | | 1.22 | | | | 1.23 | † | | | 1.49 | | | | 1.49 | | | | 1.47 | | | | 1.48 | † |
| Expenses including gross expenses of the master fund | | % | | | 1.24 | | | | 1.22 | | | | 1.23 | † | | | 1.49 | | | | 1.49 | | | | 1.47 | | | | 1.48 | † |
| Portfolio turnover rate of master fund | | % | | | 114 | | | | 79 | | | | 72 | † | | | 114 | | | | 114 | | | | 79 | | | | 72 | † |
|
† Expenses of the master fund included in the ratio, as well as the portfolio turnover rate, are for the year ended December 31, 2004.
See Accompanying Notes to Financial Statements
18
ING FIDELITY® VIP MID CAP PORTFOLIO
FINANCIAL HIGHLIGHTS
| | | | | | | | | | | | | | | | | | | | | | | | | | | |
| | | | | | |
| | | | Class S | | Class ADV |
| | | |
| |
|
| | | | | | November 15, | | | | November 15, |
| | | | Year Ended | | Year Ended | | 2004(1) to | | Year Ended | | Year Ended | | 2004(1) to |
| | | | December 31, | | December 31, | | December 31, | | December 31, | | December 31, | | December 31, |
| | | | 2006 | | 2005 | | 2004 | | 2006 | | 2005 | | 2004 |
|
Per Share Operating Performance: | | | | | | | | | | | | | | | | | | | | | | | | | | |
| Net asset value, beginning of period | | $ | | | 12.42 | | | | 10.56 | | | | 10.00 | | | | 12.39 | | | | 10.55 | | | | 10.00 | |
|
|
|
|
| Income (loss) from investment operations: | | | | | | | | | | | | | | | | | | | | | | | | | | |
| Net investment loss | | $ | | | (0.03 | )** | | | (0.01 | ) | | | (0.00 | )* | | | (0.05 | )** | | | (0.02 | ) | | | (0.00 | )* |
| Net realized and unrealized gain on investments | | $ | | | 1.54 | | | | 1.87 | | | | 0.56 | | | | 1.51 | | | | 1.86 | | | | 0.55 | |
| Total from investment operations | | $ | | | 1.51 | | | | 1.86 | | | | 0.56 | | | | 1.46 | | | | 1.84 | | | | 0.55 | |
|
|
|
|
| Less Distributions from: | | | | | | | | | | | | | | | | | | | | | | | | | | |
| Net realized gains on investments | | $ | | | 0.01 | | | | — | | | | — | | | | 0.01 | | | | — | | | | — | |
| Total Distributions | | $ | | | 0.01 | | | | — | | | | — | | | | 0.01 | | | | — | | | | — | |
| Net asset value, end of period | | $ | | | 13.92 | | | | 12.42 | | | | 10.56 | | | | 13.84 | | | | 12.39 | | | | 10.55 | |
|
|
|
|
| Total Return(2) | | % | | | 12.15 | | | | 17.61 | | | | 5.60 | | | | 11.77 | | | | 17.44 | | | | 5.50 | |
| |
|
|
|
|
Ratios and Supplemental Data: | | | | | | | | | | | | | | | | | | | | | | | | | | |
| Net assets, end of period (000’s) | | $ | | | 38,562 | | | | 4,065 | | | | 17 | | | | 2,190 | | | | 1,501 | | | | 1 | |
|
|
|
|
| Ratios to average net assets: | | | | | | | | | | | | | | | | | | | | | | | | | | |
| Expenses excluding expenses of the master fund | | % | | | 0.30 | | | | 0.30 | | | | 0.30 | | | | 0.55 | | | | 0.55 | | | | 0.55 | |
| Net investment loss excluding expenses of the master fund | | % | | | (0.24 | ) | | | (0.32 | ) | | | (0.30 | ) | | | (0.40 | ) | | | (0.48 | ) | | | (0.55 | ) |
| Portfolio turnover rate(3) | | % | | | 12 | | | | 14 | | | | 0 | | | | 12 | | | | 14 | | | | 0 | |
|
(1) Commencement of operations.
(2) Total return is calculated assuming reinvestment of all dividends and capital gain distributions at net asset value and excluding the deduction of sales charges. Total returns for periods less than one year are not annualized. The Portfolio’s performance is shown without the imposition of any expenses or charges which are, or may be, imposed under your annuity contract. Total returns would have been lower if such expenses or charges were included.
(3) Portfolio turnover rate is calculated based on the Portfolio’s purchases and sales of the master fund.
* Amount is more than $(0.005) per share.
** Per share data calculated using average shares outstanding throughout the period.
| | | | | | | | | | | | | | | | | | | | | | | | | | | |
| | | | | | |
| | | | Class S | | Class ADV |
| | | |
| |
|
| | | | | | November 15, | | | | November 15, |
| | | | Year Ended | | Year Ended | | 2004(1) to | | Year Ended | | Year Ended | | 2004(1) to |
| | | | December 31, | | December 31, | | December 31, | | December 31, | | December 31, | | December 31, |
| | | | 2006 | | 2005 | | 2004 | | 2006 | | 2005 | | 2004 |
|
| Expenses including expenses net of all reductions of the master fund | | % | | | 1.21 | | | | 1.19 | | | | 1.23 | † | | | 1.46 | | | | 1.44 | | | | 1.48 | † |
| Expenses including expenses net of voluntary waivers, if any, of the master fund | | % | | | 1.23 | | | | 1.24 | | | | 1.26 | † | | | 1.48 | | | | 1.49 | | | | 1.51 | † |
| Expenses including gross expenses of the master fund | | % | | | 1.23 | | | | 1.24 | | | | 1.26 | † | | | 1.48 | | | | 1.49 | | | | 1.51 | † |
| Portfolio turnover rate of master fund | | % | | | 149 | | | | 107 | | | | 55 | † | | | 149 | | | | 107 | | | | 55 | † |
|
† Expenses of the master fund included in the ratio, as well as the portfolio turnover rate, are for the year ended December 31, 2004.
See Accompanying Notes to Financial Statements
19
NOTES TO FINANCIAL STATEMENTS AS OF DECEMBER 31, 2006
NOTE 1 — ORGANIZATION
The ING Partners, Inc. (the “Fund”) is an open-end management investment company registered under the Investment Company Act of 1940, as amended (the “1940 Act”). It was incorporated under the laws of Maryland on May 7, 1997. The Articles of Incorporation permit the Fund to offer separate series (“Portfolios”), each of which has its own investment objective, policies and restrictions. The Portfolios serve as investment options underlying variable insurance products offered by ING Directed Services, LLC(1) (“DSL” or the “Investment Adviser”) and its insurance company affiliates. At December 31, 2006 there were thirty-nine separate investment series which comprise the Fund. The four Portfolios included in this report are: ING Fidelity® VIP Contrafund® Portfolio* (“Contrafund”); ING Fidelity® VIP Equity-Income Portfolio (“Equity-Income”), ING Fidelity® VIP Growth Portfolio (“Growth”) and ING Fidelity® VIP Mid Cap Portfolio (“Mid Cap”) (each a “Portfolio” and collectively, the “Portfolios”).
Contrafund seeks long-term capital appreciation by investing all of its assets in the Service Class 2 Shares of the VIP Contrafund Portfolio, a series of Fidelity Variable Insurance Products Fund II, a registered open-end investment company.
Equity-Income seeks reasonable income and considers the potential for capital appreciation by investing all of its assets in the Service Class 2 Shares of the VIP Equity-Income Portfolio, a series of Fidelity Variable Insurance Products Fund, a registered open-end investment company.
Growth seeks capital appreciation by investing all of its assets in the Service Class 2 Shares of the VIP Growth Portfolio, a series of Fidelity Variable Insurance Products Fund, a registered open-end investment company.
Mid Cap seeks long-term growth of capital by investing all of its assets in the Service Class 2 Shares of the VIP Mid Cap Portfolio, a series of Fidelity Variable Insurance Products III, a registered open-end investment company.
Each Portfolio in this report operates as a “feeder fund” which means the only investment security is a separate mutual fund, the master funds: VIP Contrafund® Portfolio, VIP Equity-Income Portfolio, VIP Growth Portfolio and VIP Mid Cap Portfolio (each a “Master Fund” and collectively, the “Master Funds”). VIP Contrafund Portfolio is a series of Fidelity Variable Insurance Products Fund II; VIP Equity-Income Portfolio and VIP Growth Portfolio are series of Fidelity Variable Insurance Products Fund; and VIP Mid Cap Growth Portfolio is a series of Fidelity Variable Insurance Products Fund III. Each Portfolio has the same investment objective and limitations as the Master Fund in which it invests. Typically, the Portfolios do not buy investment securities directly. The Master Funds, on the other hand, invest directly in portfolio securities. At December 31, 2006, Contrafund, Equity-Income, Growth and Mid Cap Portfolios each held 1.1% or less of their respective Master Fund.
The Portfolios offer two classes of shares, referred to as Service Class (Class “S”) and Adviser Class (Class “ADV”). Each share class represents interests in the same portfolio of investments of the particular Portfolio, and shall be identical in all respects, except for the impact of expenses, voting, exchange privileges, and any different shareholder services relating to a class of shares. Shareholders of the Adviser Class of each Portfolio will generally be entitled to exchange those shares at net asset value for Adviser Class shares of other Portfolios that offer Adviser Class shares. Shareholders of the Adviser Class shares continue to be subject to the Rule 12b-1 Plan fee applicable to Adviser Class shares after an exchange. Shareholders of Service Class shares of each Portfolio will generally be entitled to exchange those shares at net asset value for Service Class shares of other Portfolios that offer Service Class shares. Shares of the Portfolios may be offered to segregated asset accounts (“Separate Accounts”) of insurance companies as investment options in connection with variable annuity contracts and variable life insurance policies (“Variable Contracts”) and to certain of the Portfolios’ investment advisers and their affiliates. In the future, shares may also be offered to qualified pension and retirement plans (“Qualified Plans”) outside the Separate Account context. Shares of the
| |
| (1) | Prior to December 31, 2006, ING Life Insurance and Annuity Company (“ILIAC”) served as the investment adviser to the Portfolios. On November 9, 2006, the Board approved the consolidation of investment advisory functions of ILIAC into DSL resulting in the assumption by DSL of the advisory agreement between the Fund and ILIAC. |
* Fidelity and Contrafund are registered trademarks of FMR Corp.
20
NOTES TO FINANCIAL STATEMENTS AS OF DECEMBER 31, 2006 (CONTINUED)
NOTE 1 — ORGANIZATION (continued)
Portfolios are not currently offered directly to Qualified Plans or custodial accounts.
Each Portfolio is distributed by ING Funds Distributor, LLC(1) (“IFD” or the “Distributor”). DSL serves as the investment adviser to each Portfolio. IFD and DSL are both indirect, wholly-owned subsidiaries of ING Groep N.V. (“ING Groep”). ING Groep is one of the largest financial services institutions in the world, and offers an array of banking, insurance and asset management services to both individuals and institutional investors.
NOTE 2 — SIGNIFICANT ACCOUNTING POLICIES
The following significant accounting policies are consistently followed by the Portfolios in the preparation of their financial statements. Such policies are in conformity with U.S. generally accepted accounting principles for investment companies.
| |
| A. | Security Valuation. The valuation of each Portfolio’s investment in its corresponding Master Fund is based on the net asset value of that Master Fund each business day. Valuation of the investments by the Master Funds is discussed in the Master Funds’ notes to their financial statements, which accompany this report. |
| |
| |
| B. | Security Transactions and Revenue Recognition. Securities transactions are accounted for on the trade date. Realized gains and losses are reported on the basis of identified cost of securities sold. Interest income is recorded on an accrual basis. Dividend income is recorded on the ex-dividend date. |
| |
| |
| C. | Distributions to Shareholders. The Portfolios record distributions to their shareholders on the ex-dividend date. Each Portfolio distributes dividends and capital gains, if any, annually. The Portfolios may make distributions on a more frequent basis to comply with the distribution requirements of the Internal Revenue Code. The characteristics of income and gains to be distributed are determined in accordance with income tax regulations, which may differ from U.S. generally accepted accounting principles for investment companies. |
| |
| |
| D. | Federal Income Taxes. It is the policy of the Portfolios to comply with subchapter M of the Internal Revenue Code and related excise tax provisions applicable to regulated investment companies and to distribute substantially all of their net investment income and any net realized capital gains to their shareholders. Therefore, no federal income tax provision is required. The Board of Directors (“Board”) intends to offset any net capital gains with any available capital loss carryforward until each carryforward has been fully utilized or expires. In addition, no capital gain distribution shall be made until the capital loss carryforward has been fully utilized or expires. |
| |
| |
| E. | Use of Estimates. The preparation of financial statements in conformity with U.S. generally accepted accounting principles requires management to make estimates and assumptions that affect the reported amounts of assets and liabilities and disclosure of contingent assets and liabilities at the date of the financial statements and the reported amounts of increases and decreases in net assets from operations during the reporting period. Actual results could differ from those estimates. |
| |
| |
| F. | Repurchase Agreements. Each Portfolio may invest in repurchase agreements only with government securities dealers recognized by the Board of Governors of the Federal Reserve System. Under such agreements, the seller of the security agrees to repurchase it at a mutually agreed upon time and price. The resale price is in excess of the purchase price and reflects an agreed upon interest rate for the period of time the agreement is outstanding. The period of the repurchase agreements is usually short, from overnight to one week, while the underlying securities generally have longer maturities. Each Portfolio will always receive as collateral securities acceptable to it whose market value is equal at least 100% of the carrying amount of the repurchase agreements, plus accrued interest, being invested by the Portfolio. The underlying collateral is valued daily on a mark-to-market basis to assure that the value, including accrued interest is at least equal to the |
| |
| (1) | Prior to December 31, 2006, ING Financial Advisers, LLC (“IFA”) served as distributor to the Portfolios. On November 9, 2006, the Board approved the consolidation of distributor functions of IFA into IFD resulting in the assumption by IFD of the distribution agreement between the Fund and IFA. |
21
NOTES TO FINANCIAL STATEMENTS AS OF DECEMBER 31, 2006 (CONTINUED)
NOTE 2 — SIGNIFICANT ACCOUNTING POLICIES (continued)
repurchase price. There would be potential loss to the Portfolio in the event the Portfolio is delayed or prevented from exercising its right to dispose of the collateral, and it might incur disposition costs in liquidating the collateral.
| |
| G. | Indemnifications. In the normal course of business, the Fund may enter into contracts that provide certain indemnifications. The Fund’s maximum exposure under these arrangements is dependent on future claims that may be made against the Portfolios and, therefore, cannot be estimated; however, based on experience, the risk of loss from such claims is considered remote. |
NOTE 3 — INVESTMENT MANAGEMENT AND ADMINISTRATIVE FEES
Fidelity Management & Research Company (“FMR”) serves as manager to each Master Fund. FMR has day-to-day responsibility for choosing investments for each Master Fund. As shareholders of the Master Funds, the Portfolios indirectly pay a portion of the master-level management fee.
Each Master Fund, VIP Contrafund® Portfolio, VIP Equity-Income Portfolio, VIP Growth Portfolio, and VIP Mid Cap Portfolio, pays FMR a management fee for advisory services at annual rates of 0.57%, 0.47%, 0.57%, and 0.57%, of each respective Master Fund’s current average daily net assets. Pursuant to its Investment Management Agreement with the Fund, DSL may charge an annual advisory fee to a respective Portfolio at annual rates equal to 0.58%, 0.48%, 0.58% and 0.58% of average daily net assets if the respective Portfolio does not invest substantially all of its assets in another investment company. If a Portfolio invests substantially all of its assets in another investment company, DSL does not charge an advisory fee. Each Portfolio anticipates investing substantially all of its assets in another investment company.
If a Portfolio invests substantially all of its assets in another investment company, ING Funds Services, LLC will charge an administration fee of 0.05% of average daily net assets for that Portfolio. Pursuant to its administration agreement with the Portfolios, ING Funds Services, LLC may receive an annual administration fee equal to 0.15%, 0.15%, 0.15% and 0.17% of average daily net assets for Contrafund, Equity-Income, Growth and Mid Cap, respectively, if the respective Portfolio does not invest substantially all of its assets in another investment company.
NOTE 4 — INVESTMENT IN UNDERLYING PORTFOLIOS
For the year ended December 31, 2006, the cost of purchases and proceeds from sales of the Master Funds were as follows:
| | | | | | | | | |
| Portfolio | | Purchases | | Sales |
| |
| |
|
| Contrafund | | $ | 170,428,311 | | | $ | 22,301,055 | |
| Equity Income | | | 25,370,530 | | | | 5,306,650 | |
| Growth | | | 12,331,270 | | | | 6,460,344 | |
| Mid Cap | | | 35,718,165 | | | | 2,647,826 | |
NOTE 5 — DISTRIBUTION AND SERVICE FEES
Each Portfolio has adopted a Shareholder Servicing Plan (“Service Plan”) for the Class S and Class ADV shares of each Portfolio. Under the Service Plan, a Portfolio makes payments at an annual rate of 0.25% of the Portfolio’s average daily net assets attributable to its Class S and Class ADV shares.
Each Portfolio has adopted a Plan of Distribution pursuant to Rule 12b-1 under the 1940 Act (“Distribution Plan“) for the Class ADV shares of each Portfolio. The Distribution Plan provides for a distribution fee, payable to IFD as the Fund’s Distributor at an annual rate of 0.25% of the Portfolio’s average daily net assets attributable to Class ADV shares.
Fidelity Distributors Corporation (“FDC”) distributes Service Class 2 shares of each Master Fund. Service Class 2 of each Master Fund currently pays FDC a 12b-1 (service) fee at an annual rate of 0.25% of its average net assets throughout the month. Shareholders of Class S and Class ADV of each Portfolio pay only their proportionate share of the Master Fund 12b-1 plan expenses.
NOTE 6 — OTHER TRANSACTIONS WITH AFFILIATES AND RELATED PARTIES
At December 31, 2006, the Portfolios had the following amounts recorded as payable to affiliates on the accompanying Statements of Assets and Liabilities:
| | | | | | | | | | | | | |
| | Accrued | | Accrued | | |
| | Administrative | | Distribution | | |
| | Service Fee | | Fee | | Total |
| |
| |
| |
|
| Contrafund | | $ | 9,307 | | | $ | 47,861 | | | $ | 57,168 | |
| Equity-Income | | | 1,383 | | | | 7,123 | | | | 8,506 | |
| Growth | | | 753 | | | | 3,765 | | | | 4,518 | |
| Mid Cap | | | 1,692 | | | | 8,930 | | | | 10,622 | |
22
NOTES TO FINANCIAL STATEMENTS AS OF DECEMBER 31, 2006 (CONTINUED)
NOTE 6 — OTHER TRANSACTIONS WITH AFFILIATES AND RELATED PARTIES (continued)
At December 31, 2006, the following indirect, wholly-owned subsidiaries of ING Groep owned more than 5% of the following Portfolios:
ING Life Insurance and Annuity Company — Contrafund (99.72%); Equity-Income (99.73%); Growth (99.98%); Mid Cap (99.52%).
Each Portfolio has adopted a Retirement Policy (“Policy”) covering all independent directors of the Portfolio who will have served as an independent director for at least five years at the time of retirement. Benefits under this Policy are based on an annual rate as defined in the Policy.
Investors in the Portfolios should recognize that an investment in the Portfolios bears not only a proportionate share of the expenses of the Portfolios (including operating costs and management fees, if any), but also indirectly similar expenses of the underlying mutual funds in which each Portfolio invests. Investors also bear their proportionate share of any sales charges incurred by the Portfolios related to the purchase of shares of the mutual fund investments.
NOTE 7 — CAPITAL SHARES
Transactions in capital shares and dollars were as follows:
| | | | | | | | | | | | | | | | | |
| | | | |
| | Class S | | Class ADV |
| |
| |
|
| | Year Ended | | Year Ended | | Year Ended | | Year Ended |
| | December 31, | | December 31, | | December 31, | | December 31, |
| | 2006 | | 2005 | | 2006 | | 2005 |
| |
| |
| |
| |
|
Contrafund (Number of Shares) | | | | | | | | | | | | | | | | |
| Shares sold | | | 11,899,717 | | | | 4,898,470 | | | | 239,767 | | | | 297,528 | |
| Dividends reinvested | | | 1,862 | | | | — | | | | 57 | | | | — | |
| Shares redeemed | | | (416,699 | ) | | | (82,397 | ) | | | (44,327 | ) | | | (17,568 | ) |
| | | |
| | | |
| | | |
| | | |
| |
| Net increase in shares outstanding | | | 11,484,880 | | | | 4,816,073 | | | | 195,497 | | | | 279,960 | |
| | | |
| | | |
| | | |
| | | |
| |
Contrafund ($) | | | | | | | | | | | | | | | | |
| Shares sold | | $ | 149,782,783 | | | $ | 55,076,541 | | | $ | 3,014,008 | | | $ | 3,222,999 | |
| Dividends reinvested | | | 22,772 | | | | — | | | | 698 | | | | — | |
| Shares redeemed | | | (5,352,587 | ) | | | (892,763 | ) | | | (554,113 | ) | | | (192,573 | ) |
| | | |
| | | |
| | | |
| | | |
| |
| Net increase | | $ | 144,452,968 | | | $ | 54,183,778 | | | $ | 2,460,593 | | | $ | 3,030,426 | |
| | | |
| | | |
| | | |
| | | |
| |
| | | | | | | | | | | | | | | | | |
| | | | |
| | Class S | | Class ADV |
| |
| |
|
| | Year Ended | | Year Ended | | Year Ended | | Year Ended |
| | December 31, | | December 31, | | December 31, | | December 31, |
| | 2006 | | 2005 | | 2006 | | 2005 |
| |
| |
| |
| |
|
Equity-Income (Number of Shares) | | | | | | | | | | | | | | | | |
| Shares sold | | | 1,802,997 | | | | 1,026,875 | | | | 77,569 | | | | 8,314 | |
| Dividends reinvested | | | 2,138 | | | | — | | | | 51 | | | | — | |
| Shares redeemed | | | (198,437 | ) | | | (79,706 | ) | | | (6,778 | ) | | | (1,154 | ) |
| | | |
| | | |
| | | |
| | | |
| |
| Net increase in shares outstanding | | | 1,606,698 | | | | 947,169 | | | | 70,842 | | | | 7,160 | |
| | | |
| | | |
| | | |
| | | |
| |
Equity-Income ($) | | | | | | | | | | | | | | | | |
| Shares sold | | $ | 20,947,596 | | | $ | 10,646,329 | | | $ | 883,413 | | | $ | 84,170 | |
| Dividends reinvested | | | 24,482 | | | | — | | | | 577 | | | | — | |
| Shares redeemed | | | (2,290,414 | ) | | | (831,747 | ) | | | (78,103 | ) | | | (11,868 | ) |
| | | |
| | | |
| | | |
| | | |
| |
| Net increase | | $ | 18,681,664 | | | $ | 9,814,582 | | | $ | 805,887 | | | $ | 72,302 | |
| | | |
| | | |
| | | |
| | | |
| |
23
NOTES TO FINANCIAL STATEMENTS AS OF DECEMBER 31, 2006 (CONTINUED)
NOTE 7 — CAPITAL SHARES (continued)
| | | | | | | | | | | | | | | | | |
| | | | |
| | Class S | | Class ADV |
| |
| |
|
| | Year Ended | | Year Ended | | Year Ended | | Year Ended |
| | December 31, | | December 31, | | December 31, | | December 31, |
| | 2006 | | 2005 | | 2006(1) | | 2005 |
| |
| |
| |
| |
|
Growth (Number of Shares) | | | | | | | | | | | | | | | | |
| Shares sold | | | 1,124,091 | | | | 1,102,036 | | | | 2,495 | | | | (6,232 | ) |
| Dividends reinvested | | | 1,960 | | | | — | | | | — | | | | — | |
| Shares redeemed | | | (590,138 | ) | | | (106,631 | ) | | | (788 | ) | | | 121,051 | |
| | | |
| | | |
| | | |
| | | |
| |
| Net increase in shares outstanding | | | 535,913 | | | | 995,405 | | | | 1,707 | | | | 114,819 | |
| | | |
| | | |
| | | |
| | | |
| |
Growth ($) | | | | | | | | | | | | | | | | |
| Shares sold | | $ | 12,336,946 | | | $ | 11,332,632 | | | $ | 28,079 | | | $ | (70,437 | ) |
| Dividends reinvested | | | 20,310 | | | | — | | | | — | | | | — | |
| Shares redeemed | | | (6,460,226 | ) | | | (1,096,869 | ) | | | (8,879 | ) | | | 1,407,067 | |
| | | |
| | | |
| | | |
| | | |
| |
| Net increase | | $ | 5,897,030 | | | $ | 10,235,763 | | | $ | 19,200 | | | $ | 1,336,630 | |
| | | |
| | | |
| | | |
| | | |
| |
(1) Class ADV was fully redeemed on May 5, 2006 and recommenced operations on October 30, 2006.
| | | | | | | | | | | | | | | | | |
| | | | |
| | Class S | | Class ADV |
| |
| |
|
| | Year Ended | | Year Ended | | Year Ended | | Year Ended |
| | December 31, | | December 31, | | December 31, | | December 31, |
| | 2006 | | 2005 | | 2006 | | 2005 |
| |
| |
| |
| |
|
Mid Cap (Number of Shares) | | | | | | | | | | | | | | | | |
| Shares sold | | | 2,544,937 | | | | 342,770 | | | | 61,632 | | | | 127,283 | |
| Dividends reinvested | | | 1,092 | | | | — | | | | 80 | | | | — | |
| Shares redeemed | | | (102,288 | ) | | | (17,241 | ) | | | (24,563 | ) | | | (6,232 | ) |
| | | |
| | | |
| | | |
| | | |
| |
| Net increase in shares outstanding | | | 2,443,741 | | | | 325,529 | | | | 37,149 | | | | 121,051 | |
| | | |
| | | |
| | | |
| | | |
| |
Mid Cap ($) | | | | | | | | | | | | | | | | |
| Shares sold | | $ | 33,967,125 | | | $ | 3,913,415 | | | $ | 820,895 | | | $ | 1,477,504 | |
| Dividends reinvested | | | 14,205 | | | | — | | | | 1,042 | | | | — | |
| Shares redeemed | | | (1,351,628 | ) | | | (199,008 | ) | | | (320,297 | ) | | | (70,437 | ) |
| | | |
| | | |
| | | |
| | | |
| |
| Net increase | | $ | 32,629,702 | | | $ | 3,714,407 | | | $ | 501,640 | | | $ | 1,407,067 | |
| | | |
| | | |
| | | |
| | | |
| |
NOTE 8 — FEDERAL INCOME TAXES
The amount of distributions from net investment income and net realized capital gains are determined in accordance with federal income tax regulations, which may differ from U.S. generally accepted accounting principles for investment companies. These book/tax differences may be either temporary or permanent. Permanent differences are reclassified within the capital accounts based on their federal tax-basis treatment; temporary differences are not reclassified. Key differences include the treatment of short-term capital gains, foreign currency transactions, and wash sale deferrals. Distributions in excess of net investment income and/or net realized capital gains for tax purposes are reported as distributions of paid-in capital.
The following permanent tax differences have been reclassified as of December 31, 2006:
| | | | | | | | | |
| | | | Accumulated |
| | Undistributed | | Net Realized |
| | Net Investment Income | | Gains/(Losses) |
| |
| |
|
| Contrafund | | $ | 65,494 | | | $ | (65,494 | ) |
| Equity-Income | | | 253,285 | | | | (253,285 | ) |
| Growth | | | 27,089 | | | | (27,089 | ) |
| Mid Cap | | | 95,281 | | | | (95,281 | ) |
Dividends paid by the Portfolios from net investment income and distributions of net realized short-term capital gains are, for federal income tax purposes, taxable as ordinary income to shareholders.
The Portfolios paid no dividends or distributions during the year ended December 31, 2005. The tax composition of dividends and distributions to shareholders during the year ended December 31, 2006 was as follows:
| | | | | | | | | |
| | Ordinary | | Long-Term |
| | Income | | Capital Gains |
| |
| |
|
| Contrafund | | $ | 23,470 | | | $ | — | |
| Equity-Income | | | 25,059 | | | | — | |
| Growth | | | 20,310 | | | | — | |
| Mid Cap | | | 13,176 | | | | 2,071 | |
The tax-basis components of distributable earnings and the expiration dates of the capital loss carryforwards which may be used to offset future
24
NOTES TO FINANCIAL STATEMENTS AS OF DECEMBER 31, 2006 (CONTINUED)
NOTE 8 — FEDERAL INCOME TAXES (continued)
realized capital gains for federal income tax purposes as of December 31, 2006 were:
| | | | | | | | | | | | | | | | | |
| | Undistributed | | Undistributed | | Unrealized | | |
| | Ordinary | | Long Term | | Appreciation/ | | Capital Loss |
| | Income | | Capital Gains | | Depreciation | | Carryforwards |
| |
| |
| |
| |
|
| Contrafund | | $ | 1,445,296 | | | $ | 17,390,640 | | | $ | 1,246,081 | | | $ | — | |
| Equity-Income | | | 949,335 | | | | 2,736,584 | | | | 977,177 | | �� | | — | |
| Growth | | | 259,733 | | | | 199,436 | | | | 841,097 | | | | — | |
| Mid Cap | | | 79,447 | | | | 1,053,978 | | | | 1,347,954 | | | | — | |
NOTE 9 — OTHER ACCOUNTING PRONOUNCEMENTS
In June 2006, the Financial Accounting Standards Board (“FASB”) issued FASB Interpretation No. 48 (“FIN 48”), “Accounting for Uncertainty in Income Taxes.” This standard defines the threshold for recognizing the benefits of tax-return positions in the financial statements as “more-likely-than-not” to be sustained upon challenge by the taxing authority and requires measurement of a tax position meeting the more-likely-than-not criterion, based on the largest benefit that is more than 50 percent likely to be realized. FIN 48 is effective for fiscal years beginning after December 15, 2006, with early application permitted if no interim financial statements have been issued. However, acknowledging the unique issues that FIN 48 presents for investment companies that calculate NAVs, the Securities and Exchange Commission (the “SEC”) has indicated that they would not object if a fund implements FIN 48 in its NAV calculation as late as its last NAV calculation in the first required financial statement reporting period for its fiscal year beginning after December 15, 2006. For calendar-year open-end funds, this would be no later than their June 29, 2007 NAV and the effects of FIN 48 would be reflected in the funds’ semi-annual financial statements contained in their Form N-CSR filing. At adoption, companies must adjust their financial statements to reflect only those tax positions that are more likely-than-not to be sustained as of the adoption date. Management of the Portfolios has assessed the impact of adopting FIN 48 and currently does not believe that there will be a material impact to the Portfolios.
On September 15, 2006, the FASB issued Statement of Financial Accounting Standards No. 157 (“SFAS No. 157”), “Fair Value Measurements.” The new accounting statement defines fair value, establishes a framework for measuring fair value in generally accepted accounting principles (“GAAP”), and expands disclosures about fair value measurements. SFAS No. 157 defines fair value as the price that would be received to sell an asset or paid to transfer a liability in an orderly transaction between market participants at the measurement date (an exit price). SFAS No. 157 also stipulates that, as a market-based measurement, fair value measurement should be determined based on the assumptions that market participants would use in pricing the asset or liability, and establishes a fair value hierarchy that distinguishes between (a) market participant assumptions developed based on market data obtained from sources independent of the reporting entity (observable inputs) and (b) the reporting entity’s own assumptions about market participant assumptions developed based on the best information available in the circumstances (unobservable inputs). SFAS No. 157 is effective for financial statements issued for fiscal years beginning after November 15, 2007. As of December 31, 2006, management of the Portfolios is currently assessing the impact, if any, that will result from adopting SFAS No. 157.
NOTE 10 — INFORMATION REGARDING TRADING OF ING’S U.S. MUTUAL FUNDS
In 2004, DSL (formerly, known as ILIAC) reported to the Boards of Directors/ Trustees (the “Boards”) of the ING Funds that, like many U.S. financial services companies, ING Investments and certain of its U.S. affiliates have received informal and formal requests for information since September 2003 from various governmental and self-regulatory agencies in connection with investigations related to mutual funds and variable insurance products. DSL has advised the Boards that it and its affiliates have cooperated fully with each request.
In addition to responding to regulatory and governmental requests, DSL reported that management of U.S. affiliates of ING Groep, including DSL (collectively, “ING”), on their own initiative, have conducted, through independent special counsel and a national accounting firm, an extensive internal review of trading in ING insurance, retirement, and mutual fund products. The goal of this review was to identify any instances of inappropriate trading in those products by third parties or by ING investment professionals and other ING personnel. ING’s internal review related to mutual fund trading is now substantially completed. ING has reported that, of the millions of customer relationships that ING maintains, the internal review identified several isolated arrangements allowing third parties to engage in frequent trading of mutual funds within ING’s variable insurance and mutual fund products, and identified other circumstances where frequent
25
NOTES TO FINANCIAL STATEMENTS AS OF DECEMBER 31, 2006 (CONTINUED)
NOTE 10 — INFORMATION REGARDING TRADING OF ING’S U.S. MUTUAL FUNDS (continued)
trading occurred, despite measures taken by ING intended to combat market timing. ING further reported that each of these arrangements has been terminated and fully disclosed to regulators. The results of the internal review were also reported to the independent members of the Boards.
DSL has advised the Boards that most of the identified arrangements were initiated prior to ING’s acquisition of the businesses in question in the U.S. DSL further reported that the companies in question did not receive special benefits in return for any of these arrangements, which have all been terminated.
Based on the internal review, DSL has advised the Boards that the identified arrangements do not represent a systemic problem in any of the companies that were involved.
In September 2005, ING Funds Distributor, LLC (“IFD”), the distributor of certain ING Funds, settled an administrative proceeding with the National Association of Securities Dealers (“NASD”) regarding three arrangements, dating from 1995, 1996 and 1998, under which the administrator to the then-Pilgrim Funds, which subsequently became part of the ING Funds, entered into formal and informal arrangements that permitted frequent trading. Under the terms of the Letter of Acceptance, Waiver and Consent (“AWC”) with the NASD, under which IFD neither admitted nor denied the allegations or findings, IFD consented to the following sanctions: (i) a censure; (ii) a fine of $1.5 million; (iii) restitution of approximately $1.44 million to certain ING Funds for losses attributable to excessive trading described in the AWC; and (iv) agreement to make certification to NASD regarding the review and establishment of certain procedures.
In addition to the arrangements discussed above, in 2004 DSL reported to the Boards that, at that time, these instances include the following, in addition to the arrangements subject to the AWC discussed above:
| |
| • | Aeltus Investment Management, Inc. (a predecessor entity to ING Investment Management Co.) identified two investment professionals who engaged in extensive frequent trading in certain ING Funds. One was subsequently terminated for cause and incurred substantial financial penalties in connection with this conduct and the second has been disciplined. |
| |
| • | ReliaStar Life Insurance Company (“ReliaStar”) entered into agreements seven years ago permitting the owner of policies issued by the insurer to engage in frequent trading and to submit orders until 4pm Central Time. In 2001 ReliaStar also entered into a selling agreement with a broker-dealer that engaged in frequent trading. Employees of ING affiliates were terminated and/or disciplined in connection with these matters. |
| |
| • | In 1998, Golden American Life Insurance Company entered into arrangements permitting a broker-dealer to frequently trade up to certain specific limits in a fund available in an ING variable annuity product. No employee responsible for this arrangement remains at the company. |
For additional information regarding these matters, you may consult the Form 8-K and Form 8-K/A for each of four life insurance companies, ING USA Annuity and Life Insurance Company, ING Life Insurance and Annuity Company, ING Insurance Company of America, and ReliaStar Life Insurance Company of New York, each filed with the SEC on October 29, 2004 and September 8, 2004. These Forms 8-K and Forms 8-K/A can be accessed through the SEC’s Web site at http://www.sec.gov. Despite the extensive internal review conducted through independent special counsel and a national accounting firm, there can be no assurance that the instances of inappropriate trading reported to the Boards are the only instances of such trading respecting the ING Funds.
DSL reported to the Boards that ING is committed to conducting its business with the highest standards of ethical conduct with zero tolerance for noncompliance. Accordingly, DSL advised the Board that ING management was disappointed that its voluntary internal review identified these situations. Viewed in the context of the breadth and magnitude of its U.S. business as a whole, ING management does not believe that ING’s acquired companies had systemic ethical or compliance issues in these areas. Nonetheless, DSL reported that given ING’s refusal to tolerate any lapses, it has taken the steps noted below, and will continue to seek opportunities to further strengthen the internal controls of its affiliates.
| |
| • | ING has agreed with the ING Funds to indemnify and hold harmless the ING Funds from all damages |
26
NOTES TO FINANCIAL STATEMENTS AS OF DECEMBER 31, 2006 (CONTINUED)
NOTE 10 — INFORMATION REGARDING TRADING OF ING’S U.S. MUTUAL FUNDS (continued)
| |
| resulting from wrongful conduct by ING or its employees or from ING’s internal investigation, any investigations conducted by any governmental or self-regulatory agencies, litigation or other formal proceedings, including any proceedings by the SEC. DSL reported to the Boards that ING management believes that the total amount of any indemnification obligations will not be material to ING or its U.S. business. |
| |
| • | ING updated its Code of Conduct for employees reinforcing its employees’ obligation to conduct personal trading activity consistent with the law, disclosed limits, and other requirements. |
| |
| • | The ING Funds, upon a recommendation from ING, updated their respective Codes of Ethics applicable to investment professionals with ING entities and certain other fund personnel, requiring such personnel to pre-clear any purchases or sales of ING Funds that are not systematic in nature (i.e., dividend reinvestment), and imposing minimum holding periods for shares of ING Funds. |
| |
| • | ING instituted excessive trading policies for all customers in its variable insurance and retirement products and for shareholders of the ING Funds sold to the public through financial intermediaries. ING does not make exceptions to these policies. |
| |
| • | ING reorganized and expanded its U.S. Compliance Department, and created an Enterprise Compliance team to enhance controls and consistency in regulatory compliance. |
Other Regulatory Matters
The New York Attorney General (the “NYAG”) and other federal and state regulators are also conducting broad inquiries and investigations involving the insurance industry. These initiatives currently focus on, among other things, compensation and other sales incentives; potential conflicts of interest; potential anti-competitive activity; reinsurance; marketing practices (including suitability); specific product types (including group annuities and indexed annuities); fund selection for investment products and brokerage sales; and disclosure. It is likely that the scope of these industry investigations will further broaden before they conclude. ING has received formal and informal requests in connection with such investigations, and is cooperating fully with each request. In connection with one such investigation, affiliates of DSL were named in a petition for relief and cease and desist order filed by the New Hampshire Bureau of Securities Regulation (the “NH Bureau”) concerning their administration of the New Hampshire state employees deferred compensation plan.
On October 10, 2006, an affiliate of DSL entered into an assurance of discontinuance with the NYAG (the “NYAG Agreement”) regarding the endorsement of its products by the New York State United Teachers Union Member Benefits Trust (“NYSUT”) and the sale of their products to NYSUT members. Under the terms of the NYAG Agreement, the affiliate of DSL, without admitting or denying the NYAG’s findings, will distribute $30 million to NYSUT members, and/or former NYSUT members, who participated in the NYSUT-endorsed products at any point between January 1, 2001 and June 30, 2006. The affiliate also agreed with the NYAG’s office to develop a one-page disclosure that will further improve transparency and disclosure regarding retirement product fees (the “One-Page Disclosure”). Pursuant to the terms of the NYAG Agreement, the affiliate has agreed for a five year period to provide its retirement product customers with the One-Page Disclosure.
In addition, on the same date, these affiliates of DSL entered into a consent agreement with the NH Bureau (the “NH Agreement”) to resolve this petition for relief and cease and desist order. Under the terms of the NH Agreement, these affiliates of ING Investments, without admitting or denying the NH Bureau’s claims, have agreed to pay $3 million to resolve the matter, and for a five year period to provide their retirement product customers with the One-Page Disclosure described above. Other federal and state regulators could initiate similar actions in this or other areas of ING’s businesses.
In light of these and other developments, ING continuously reviews whether modifications to its business practices are appropriate.
At this time, in light of the current regulatory factors, ING U.S. is actively engaged in reviewing whether any modifications in our practices are appropriate for the future.
There can be no assurance that these matters, or the adverse publicity associated with them, will not result in increased fund redemptions, reduced sale of fund shares, or other adverse consequences to ING Funds.
27
PORTFOLIO OF INVESTMENTS
ING FIDELITY® VIP CONTRAFUND® PORTFOLIO
AS OF DECEMBER 31, 2006
| | | | | | | | | | | |
| | | | | | |
| Shares | | | | | | Value |
|
|
|
|
|
|
| AFFILIATED INVESTMENT COMPANIES: 100.0% |
| | 7,209,917 | | | Fidelity® VIP Contrafund® Portfolio — Service Class 2 shares | | $ | 224,300,527 | |
| | | | | | | | | | | | | |
| | | | | Total Investments in Securities
(Cost $223,054,446)* | | | 100.0 | % | | $ | 224,300,527 | |
| | | | | Other Assets and Liabilities - Net | | | (0.0 | ) | | | (56,901 | ) |
| | | | | | | |
| | | |
| |
| | | | | Net Assets | | | 100.0 | % | | $ | 224,243,626 | |
| | | | | | | |
| | | |
| |
| | | |
| * | | Cost for federal income tax purposes is the same as for financial statement purposes.
Net unrealized appreciation consists of: |
| | | | | |
| Gross Unrealized Appreciation | | $ | 1,246,081 | |
| Gross Unrealized Depreciation | | | — | |
| | | |
| |
| Net Unrealized Appreciation | | $ | 1,246,081 | |
| | | |
| |
See Accompanying Notes to Financial Statements
28
PORTFOLIO OF INVESTMENTS
ING FIDELITY® VIP EQUITY-INCOME PORTFOLIO
AS OF DECEMBER 31, 2006
| | | | | | | | | | | |
| | | | | | |
| Shares | | | | | | Value |
|
|
|
|
|
|
| AFFILIATED INVESTMENT COMPANIES: 100.0% |
| | 1,316,093 | | | Fidelity® VIP Equity-Income Portfolio — Service Class 2 shares | | $ | 34,047,331 | |
| | | | | | | | | | | | | |
| | | | | Total Investments in Securities
(Cost $33,070,151)* | | | 100.0 | % | | $ | 34,047,331 | |
| | | | | Other Assets and Liabilities - Net | | | (0.0 | ) | | | (7,804 | ) |
| | | | | | | |
| | | |
| |
| | | | | Net Assets | | | 100.0 | % | | $ | 34,039,527 | |
| | | | | | | |
| | | |
| |
| | | |
| * | | Cost for federal income tax purposes is $33,070,154.
Net unrealized appreciation consists of: |
| | | | | |
| Gross Unrealized Appreciation | | $ | 977,177 | |
| Gross Unrealized Depreciation | | | — | |
| | | |
| |
| Net Unrealized Appreciation | | $ | 977,177 | |
| | | |
| |
See Accompanying Notes to Financial Statements
29
PORTFOLIO OF INVESTMENTS
ING FIDELITY® VIP GROWTH PORTFOLIO
AS OF DECEMBER 31, 2006
| | | | | | | | | | | |
| | | | | | |
| Shares | | | | | | Value |
|
|
|
|
|
|
| AFFILIATED INVESTMENT COMPANIES: 100.0% |
| | 492,906 | | | Fidelity® VIP Growth Portfolio — Service Class 2 shares | | $ | 17,458,736 | |
| | | | | | | | | | | | | |
| | | | | Total Investments in Securities
(Cost $16,615,370)* | | | 100.0 | % | | $ | 17,458,736 | |
| | | | | Other Assets and Liabilities - Net | | | (0.0 | ) | | | (4,517 | ) |
| | | | | | | |
| | | |
| |
| | | | | Net Assets | | | 100.0 | % | | $ | 17,454,219 | |
| | | | | | | |
| | | |
| |
| | | |
| * | | Cost for federal income tax purposes is $16,617,639.
Net unrealized appreciation consists of: |
| | | | | |
| Gross Unrealized Appreciation | | $ | 841,097 | |
| Gross Unrealized Depreciation | | | — | |
| | | |
| |
| Net Unrealized Appreciation | | $ | 841,097 | |
| | | |
| |
See Accompanying Notes to Financial Statements
30
PORTFOLIO OF INVESTMENTS
ING FIDELITY® VIP MID CAP PORTFOLIO
AS OF DECEMBER 31, 2006
| | | | | | | | | | | |
| | | | | | |
| Shares | | | | | | Value |
|
|
|
|
|
|
| AFFILIATED INVESTMENT COMPANIES: 100.0% |
| | 1,190,159 | | | Fidelity® VIP Mid Cap Portfolio — Service Class 2 shares | | $ | 40,762,935 | |
| | | | | | | | | | | | | |
| | | | | Total Investments in Securities
(Cost $39,414,981)* | | | 100.0 | % | | $ | 40,762,935 | |
| | | | | Other Assets and Liabilities - Net | | | (0.0 | ) | | | (10,589 | ) |
| | | | | | | |
| | | |
| |
| | | | | Net Assets | | | 100.0 | % | | $ | 40,752,346 | |
| | | | | | | |
| | | |
| |
| | | |
| * | | Cost for federal income tax purposes is the same as for financial statement purposes.
Net unrealized appreciation consists of: |
| | | | | |
| Gross Unrealized Appreciation | | $ | 1,347,954 | |
| Gross Unrealized Depreciation | | | — | |
| | | |
| |
| Net Unrealized Appreciation | | $ | 1,347,954 | |
| | | |
| |
See Accompanying Notes to Financial Statements
31
TAX INFORMATION (UNAUDITED)
Dividends paid during the year ended December 31, 2006 were as follows:
| | | | | | | | | | |
| Fund Name | | Type | | Per Share Amount |
| |
| |
|
ING Fidelity® VIP Contrafund® Portfolio | | | | | | | | |
| | All Classes | | | STCG | | | $ | 0.0019 | |
ING Fidelity® VIP Equity-Income Portfolio | | | | | | | | |
| | All Classes | | | STCG | | | $ | 0.0122 | |
ING Fidelity® VIP Growth Portfolio | | | | | | | | |
| | All Classes | | | STCG | | | $ | 0.0129 | |
ING Fidelity® VIP Mid Cap Portfolio | | | | | | | | |
| | All Classes | | | STCG | | | $ | 0.0070 | |
| | All Classes | | | LTCG | | | $ | 0.0011 | |
STCG — Short-term capital gain
LTCG — Long-term capital gain
Of the ordinary distributions made during the year ended December 31, 2006, the following percentages qualify for the dividends received deduction (DRD) available to corporate shareholders:
| | | |
ING Fidelity® VIP Contrafund® Portfolio | | 11.86% |
ING Fidelity® VIP Equity-Income Portfolio | | 2.26% |
ING Fidelity® VIP Growth Portfolio | | 2.51% |
ING Fidelity® VIP Mid Cap Portfolio | | 0.07% |
Above figures may differ from those cited elsewhere in this report due to differences in the calculation of income and gains under U.S. generally accepted accounting principles (book) purposes and Internal Revenue Service (tax) purposes.
Shareholders are strongly advised to consult their own tax advisers with respect to the tax consequences of their investments in the Portfolios. In January, shareholders, excluding corporate shareholders, receive an IRS 1099-DIV regarding the federal tax status of the dividends and distributions they received in the calendar year.
32
DIRECTOR AND OFFICER INFORMATION (UNAUDITED)
The business and affairs of the Fund are managed under the direction of the Fund’s Board. A Director who is not an interested person of the Fund, as defined in the 1940 Act, is an independent director (“Independent Director”). The Directors and Officers of the Fund are listed below. The Statement of Additional Information includes additional information about directors of the Fund and is available, without charge, upon request at 1-800-992-0180.
| | | | | | | |
| | | | | | Principal |
| | Position(s) | | Term of Office | | Occupation(s) |
| | held with | | and Length of | | during the Past Five |
| Name, Address and Age | | Fund | | Time Served(1) | | Years |
| |
| |
| |
|
|
|
|
|
Independent Trustees: | | | | | | |
| |
John V. Boyer(2)
7337 E. Doubletree Ranch Rd.
Scottsdale, Arizona 85258
Age: 53 | | Director | | November 1997 — Present | | President and Chief Executive Officer, Franklin and Eleanor Roosevelt Institute (March 2006 — Present). Formerly, Executive Director, The Mark Twain House & Museum(2) (September 1989 — November 2005). |
| |
Patricia W. Chadwick(3)
7337 E. Doubletree Ranch Rd.
Scottsdale, Arizona 85258
Age: 58 | | Director | | January 2006 — Present | | Consultant and President of self- owned company, Ravengate Partners LLC (January 2000 — Present). |
| |
J. Michael Earley(4)
7337 E. Doubletree Ranch Rd.
Scottsdale, Arizona 85258
Age: 61 | | Director | | January 2005 — Present | | President and Chief Executive Officer, Bankers Trust Company, N.A. (June 1992 — Present). |
| |
R. Barbara Gitenstein(3)
7337 E. Doubletree Ranch Rd.
Scottsdale, Arizona 85258
Age: 58 | | Director | | January 2005 — Present | | President, College of New Jersey (January 1999 — Present). |
| |
Patrick W. Kenny(4)
7337 E. Doubletree Ranch Rd.
Scottsdale, Arizona 85258
Age: 63 | | Director | | March 2002 — Present | | President and Chief Executive Officer, International Insurance Society (June 2001 — Present). |
| |
Jock Patton(3)
7337 E. Doubletree Ranch Rd.
Scottsdale, Arizona 85258
Age: 61 | | Chairman and Director | | January 2005 — Present | | Private Investor (June 1997 — Present). Formerly Director and Chief Executive Officer, Rainbow Multimedia Group, Inc. (January 1999 — December 2001). |
| |
Sheryl K. Pressler(4)
7337 E. Doubletree Ranch Rd.
Scottsdale, Arizona 85258
Age: 56 | | Director | | January 2006 — Present | | Consultant (May 2001 — Present), Formerly, Chief Executive Officer, Lend Lease Real Estate Investments, Inc. (March 2000 — April 2001). |
| |
David W.C. Putnam(4)
7337 E. Doubletree Ranch Rd.
Scottsdale, Arizona 85258
Age: 67 | | Director | | January 2005 — Present | | President and Director, F.L. Putnam Securities Company, Inc. (June 1978 — Present). |
| |
Roger B. Vincent(4)
7337 E. Doubletree Ranch Rd.
Scottsdale, Arizona 85258
Age: 61 | | Director | | January 2005 — Present | | President, Springwell Corporation (March 1989 — Present). |
[Additional columns below]
[Continued from above table, first column(s) repeated]
| | | | | |
| | Number of | | |
| | Portfolios | | |
| | in Fund | | |
| | Complex | | |
| | Overseen | | Other Directorships |
| Name, Address and Age | | by Director | | held by Director |
| |
| |
|
|
|
|
|
Independent Trustees: | | | | |
John V. Boyer(2)
7337 E. Doubletree Ranch Rd.
Scottsdale, Arizona 85258
Age: 53 | | 180 | | None |
Patricia W. Chadwick(3)
7337 E. Doubletree Ranch Rd.
Scottsdale, Arizona 85258
Age: 58 | | 180 | | None |
J. Michael Earley(4)
7337 E. Doubletree Ranch Rd.
Scottsdale, Arizona 85258
Age: 61 | | 180 | | None |
R. Barbara Gitenstein(3)
7337 E. Doubletree Ranch Rd.
Scottsdale, Arizona 85258
Age: 58 | | 180 | | None |
Patrick W. Kenny(4)
7337 E. Doubletree Ranch Rd.
Scottsdale, Arizona 85258
Age: 63 | | 180 | | Assured Guaranty Ltd. (November 2003 — Present). |
Jock Patton(3)
7337 E. Doubletree Ranch Rd.
Scottsdale, Arizona 85258
Age: 61 | | 180 | | JDA Software Group, Inc. (January 1999 — Present); and Swift Transportation Co. (March 2004 — Present). |
Sheryl K. Pressler(4)
7337 E. Doubletree Ranch Rd.
Scottsdale, Arizona 85258
Age: 56 | | 180 | | Stillwater Mining Company (May 2002 — Present); California Healthcare Foundation (June 1999 — Present); and Romanian-American Enterprise Fund (February 2004 — Present). |
David W.C. Putnam(4)
7337 E. Doubletree Ranch Rd.
Scottsdale, Arizona 85258
Age: 67 | | 180 | | Principled Equity Market Trust (November 1996 — Present); and Asian American Bank and Trust Company (June 1992 — Present). |
Roger B. Vincent(4)
7337 E. Doubletree Ranch Rd.
Scottsdale, Arizona 85258
Age: 61 | | 180 | | AmeriGas Propane, Inc. (January 1998 — Present); and UGI Corporation (February 2006 — Present). |
33
DIRECTOR AND OFFICER INFORMATION (UNAUDITED) (CONTINUED)
| | | | | | | |
| | | | | | Principal |
| | Position(s) | | Term of Office | | Occupation(s) |
| | held with | | and Length of | | during the Past Five |
| Name, Address and Age | | Fund | | Time Served(1) | | Years |
| |
| |
| |
|
|
|
|
|
Director who is an “Interested Person”: | | | | | | |
| |
John G. Turner(5)
7337 E. Doubletree Ranch Rd.
Scottsdale, Arizona 85258
Age: 67 | | Director | | January 2005 — Present | | Retired. Formerly, Vice Chairman of ING Americas (September 2000 — January 2002); Director of ReliaStar Life Insurance Company of New York (April 1975 — December 2001); and Chairman and Trustee of the Northstar affiliated investment companies (May 1993 — December 2001). |
[Additional columns below]
[Continued from above table, first column(s) repeated]
| | | | | |
| | Number of | | |
| | Portfolios | | |
| | in Fund | | |
| | Complex | | |
| | Overseen | | Other Directorships |
| Name, Address and Age | | by Director | | held by Director |
| |
| |
|
|
|
|
|
Director who is an “Interested Person”: | | | | |
John G. Turner(5)
7337 E. Doubletree Ranch Rd.
Scottsdale, Arizona 85258
Age: 67 | | 180 | | Hormel Foods Corporation (March 2000 — Present); ShopKo Stores, Inc. (August 1999 — Present); and Conseco, Inc. (September 2003 — Present). |
| |
| (1) | Directors serve until their successors are duly elected and qualified, subject to the Board’s retirement policy. |
| |
| (2) | Shaun Mathews, President, ING USFS Mutual Funds and Investment Products, has held a seat on the board of directors of The Mark Twain House & Museum since September 19, 2002. ING Groep makes non-material, charitable contributions to The Mark Twain House & Museum. |
| |
| (3) | Valuation, Proxy and Brokerage Committee member. |
| |
| (4) | Audit Committee member. |
| |
| (5) | Mr. Turner is an “interested person,” as defined under the 1940 Act, because of his affiliation with ING Groep, the parent corporation of the Investment Adviser, ING Investments, LLC and the Distributor, ING Funds Distributor, LLC. |
34
DIRECTOR AND OFFICER INFORMATION (UNAUDITED) (CONTINUED)
| | | | | | | |
| | | | Term of Office | | |
| | Position(s) Held | | and Length of | | Principal Occupation(s) |
| Name, Address and Age | | with the Fund | | Time Served(1) | | during the Past Five Years |
| |
| |
| |
|
|
|
|
|
Officers: | | | | | | |
| |
Shaun P. Mathews
7337 E. Doubletree Ranch Rd.
Scottsdale, Arizona 85258
Age: 51 | | President and Chief Executive Officer | | November 2006 — Present | | President and Chief Executive Officer, ING Investments, LLC and ING Funds Services, LLC (November 2006 — Present); and Head of ING USFS Mutual Funds and Investment Products (October 2004 — Present). Formerly, CMO, ING USFS (April 2002 — October 2004); and Head of Rollover/ Payout (October 2001 — December 2003). |
| |
Michael J. Roland
7337 E. Doubletree Ranch Rd.
Scottsdale, AZ 85258
Age: 48 | | Executive Vice President | | January 2005 — Present | | Executive Vice President, ING Investments, LLC (December 2001 — Present). Formerly, Chief Compliance Officer, ING Investments, LLC and Directed Services, LLC (October 2004 — December 2005); Chief Financial Officer and Treasurer, ING Investments, LLC (December 2001 — January 2005); and Senior Vice President, ING Investments, LLC (June 1998 — December 2001). |
| |
Stanley D. Vyner
7337 E. Doubletree Ranch Rd.
Scottsdale, AZ 85258
Age: 56 | | Executive Vice President | | January 2005 — Present | | Executive Vice President, ING Investments, LLC (July 2000 — Present); and Chief Investment Risk Officer, ING Investments, LLC (January 2003 — Present). Formerly, Chief Investment Officer of the International Portfolios, ING Investments, LLC (August 2000 — January 2003). |
| |
Joseph M. O’Donnell
7337 E. Doubletree Ranch Rd.
Scottsdale, AZ 85258
Age: 52 | | Chief Compliance Officer
Executive Vice President | | January 2005 — Present
March 2006 — Present | | Chief Compliance Officer of the ING Funds (November 2004 — Present); ING Investments, LLC and Directed Services, LLC (March 2006 — Present); and Executive Vice President of the ING Funds (March 2006 — Present). Formerly, Vice President, Chief Legal Counsel, Chief Compliance Officer and Secretary of Atlas Securities, Inc., Atlas Advisers, Inc. and Atlas Funds (October 2001 — October 2004); and Chief Operating Officer and General Counsel of Matthews International Capital Management LLC and Vice President and Secretary of Matthews International Funds (August 1999 — May 2001). |
| |
Robert S. Naka
7337 E. Doubletree Ranch Rd.
Scottsdale, AZ 85258
Age: 43 | | Executive Vice President and Chief Operating Officer
Assistant Secretary | | March 2006 — Present
January 2005 — Present | | Executive Vice President and Chief Operating Officer, ING Funds Services, LLC and ING Investments, LLC (March 2006 — Present); and Assistant Secretary, ING Funds Services, LLC (October 2001 — Present). Formerly, Senior Vice President, ING Investments, LLC (August 1999 — March 2006). |
| |
Todd Modic
7337 E. Doubletree Ranch Rd.
Scottsdale, Arizona 85258
Age: 39 | | Senior Vice President, Chief, Principal Financial Officer and Assistant Secretary | | March 2005 — Present | | Senior Vice President, ING Funds Services, LLC (April 2005 — Present). Formerly, Vice President, ING Funds Services, LLC (September 2002 — March 2005); and Director of Financial Reporting, ING Investments, LLC (March 2001 — September 2002). |
35
DIRECTOR AND OFFICER INFORMATION (UNAUDITED) (CONTINUED)
| | | | | | | |
| | | | Term of Office | | |
| | Position(s) Held | | and Length of | | Principal Occupation(s) |
| Name, Address and Age | | with the Fund | | Time Served(1) | | during the Past Five Years |
| |
| |
| |
|
Kimberly A. Anderson
7337 E. Doubletree Ranch Rd.
Scottsdale, AZ 85258
Age: 42 | | Senior Vice President | | January 2005 — Present | | Senior Vice President and Assistant Secretary, ING Investments, LLC (October 2003 — Present). Formerly, Vice President and Assistant Secretary, ING Investments, LLC (January 2001 — October 2003). |
| |
Ernest J. C’DeBaca
7337 E. Doubletree Ranch Rd.
Scottsdale, Arizona 85258
Age: 37 | | Senior Vice President | | May 2006 — Present | | Senior Vice President, ING Funds Services, LLC (April 2006 — Present). Formerly, Counsel, ING Americas, U.S. Legal Services (January 2004 — March 2006); and Attorney-Adviser, U.S. Securities and Exchange Commission (May 2001 — December 2003). |
| |
Robert Terris
7337 E. Doubletree Ranch Rd.
Scottsdale, Arizona 85258
Age: 36 | | Senior Vice President | | May 2006 — Present | | Senior Vice President of Operations, ING Funds Services, LLC (May 2006 — Present). Formerly, Vice President of Administration, ING Funds Services, LLC (September 2001 — May 2006). |
| |
Robyn L. Ichilov
7337 E. Doubletree Ranch Rd.
Scottsdale, AZ 85258
Age: 39 | | Vice President and
Treasurer | | January 2005 — Present | | Vice President and Treasurer, ING Funds Services, LLC (October 2001 — Present) and ING Investments, LLC (August 1997 — Present). |
| |
Lauren D. Bensinger
7337 E. Doubletree Ranch Rd.
Scottsdale, Arizona 85258
Age: 52 | | Vice President | | January 2005 — Present | | Vice President and Chief Compliance Officer, ING Funds Distributor, LLC (July 1995 — Present); and Vice President (February 1996 — Present); and Director of Compliance, ING Investments, LLC (October 2004 — Present). Formerly, Chief Compliance Officer, ING Investments, LLC (October 2001 — October 2004). |
| |
Maria M. Anderson
7337 E. Doubletree Ranch Rd.
Scottsdale, AZ 85258
Age: 48 | | Vice President | | January 2005 — Present | | Vice President, ING Funds Services, LLC (September 2004 — Present). Formerly, Assistant Vice President, ING Funds Services, LLC (October 2001 — September 2004); and Manager Fund Accounting and Fund Compliance, ING Investments, LLC (September 1999 — October 2001). |
| |
Denise Lewis
7337 E. Doubletree Ranch Rd.
Scottsdale, Arizona 85258
Age: 43 | | Vice President | | January 2007 — Present | | Vice President, ING Funds Services, LLC (December 2006 — Present). Formerly, Senior Vice President, UMB Investment Services Group, LLC (November 2003 — December 2006); and Vice President, Wells Fargo Funds Management, LLC (December 2000 — August 2003). |
| |
Laurie M. Tillinghast
151 Farmington Avenue
Hartford, Connecticut 06156
Age: 54 | | Vice President | | May 2003 — Present | | Senior Vice President, ING Investments, LLC (March 2006 — Present) and Vice President, ING Life Insurance and Annuity Company, (December 2000 — Present). Formerly, Vice President, Aetna Retirement Services, Fund Strategy and Management, (December 1995 — December 2000); and Director and President, ING Partners, Inc. (November 1997 — May 2003). |
36
DIRECTOR AND OFFICER INFORMATION (UNAUDITED) (CONTINUED)
| | | | | | | |
| | | | Term of Office | | |
| | Position(s) Held | | and Length of | | Principal Occupation(s) |
| Name, Address and Age | | with the Fund | | Time Served(1) | | during the Past Five Years |
| |
| |
| |
|
Kimberly K. Palmer
7337 E. Doubletree Ranch Rd.
Scottsdale, AZ 85258
Age: 48 | | Vice President | | March 2006 — Present | | Vice President, ING Funds Services, LLC (March 2006 — Present). Formerly, Assistant Vice President, ING Funds Services, LLC (August 2004 — March 2006); Manager, Registration Statements, ING Funds Services, LLC (May 2003 — August 2004); Associate Partner, AMVESCAP PLC (October 2000 — May 2003); and Director of Federal Filings and Blue Sky Filings, INVESCO Funds Group, Inc. (March 1994 — May 2003). |
| |
Susan P. Kinens
7337 E. Doubletree Ranch Rd.
Scottsdale, AZ 85258
Age: 30 | | Assistant Vice President | | January 2005 — Present | | Assistant Vice President, ING Funds Services, LLC (December 2002 — Present); and has held various other positions with ING Funds Services, LLC for more than the last five years. |
| |
Huey P. Falgout, Jr.
7337 E. Doubletree Ranch Rd.
Scottsdale, AZ 85258
Age: 43 | | Secretary | | August 2003 — Present | | Chief Counsel, ING Americas, U.S. Legal Services (September 2003 — Present). Formerly, Counsel, ING Americas, U.S. Legal Services (November 2002 — September 2003); and Associate General Counsel of AIG American General (January 1999 — November 2002). |
| |
Theresa K. Kelety
7337 E. Doubletree Ranch Rd.
Scottsdale, AZ 85258
Age: 43 | | Assistant Secretary | | August 2003 — Present | | Counsel, ING Americas, U.S. Legal Services (April 2003 — Present). Formerly, Senior Associate with Shearman & Sterling (February 2000 — April 2003). |
| |
| (1) | The officers hold office until the next annual meeting of the Directors and until their successors have been elected and qualified. |
37
ADVISORY CONTRACT APPROVAL DISCUSSION (UNAUDITED)
Board Consideration and Re-Approval of Investment Advisory Contract
Section 15(c) of the Investment Company Act of 1940 (the “1940 Act”) provides that, after an initial period, the Portfolios’ existing advisory agreement (the “Advisory Contract”) between the Portfolios and Directed Services, LLC (formerly, ING Life Insurance and Annuity Company) (the “Adviser”) and the Portfolios remains in effect only if the Board of Directors (the “Board”) of ING Partners, Inc. (“IPI”), including a majority of the Directors who have no direct or indirect interest in the Advisory Contract, and who are not “interested persons” of the Portfolios, as such term is defined under the 1940 Act (the “Independent Directors”), annually review and renew the Contract. In this regard, at a meeting held on November 9, 2006 the Board, including a majority of the Independent Directors, considered whether to renew the Advisory Contract.
The Independent Directors also held separate meetings on October 12, 2006 and November 7, 2006 to consider renewal of the Advisory Contract. Thus, references herein to factors considered and determinations made by the Independent Directors include, as applicable, factors considered and determinations made on those earlier dates.
At the November 9, 2006 meeting, the Board voted to renew the Advisory Contract for the Portfolios. In reaching this decision, the Board took into account information furnished throughout the year at regular Board meetings, as well as information prepared specifically in connection with the annual review process. The Board’s determination took into account a number of factors that its members believed, in light of the legal advice furnished to them by Kirkpatrick & Lockhart Preston Gates Ellis LLP (“K&L Gates”), their independent legal counsel, and their own business judgment, to be relevant.
Provided below is an overview of the Board’s contract approval process in general, as well as a discussion of certain of the specific factors the Board considered at the November 9, 2006 meeting. While the Board gave its attention to the information furnished, at its request, that was most relevant to its consideration, discussed below are a number of the primary factors relevant to the Board’s consideration as to whether to renew the Advisory Contract for the one-year period ending November 30, 2007. Each Director may have accorded different weight to the various factors in reaching his or her conclusions with respect to the Portfolios’ advisory arrangements.
Overview of the Contract Renewal and Approval Process
In 2003, the Independent Directors determined to undertake steps to further enhance the process under which the Board determines whether to renew existing advisory arrangements for the funds in the ING Funds complex, including IPI’s existing Advisory Contract, and to approve new advisory arrangements. Among these measures, the Board: retained the services of an independent consultant with experience in the mutual fund industry to assist the Independent Directors in working with the personnel employed by the Adviser or its affiliates who administer the Portfolios (“Management”) to identify the types of information presented to the Board to inform its deliberations with respect to advisory relationships; established the format in which the information requested by the Board is provided to the Board; and determined the process for reviewing such information in connection with the Advisory Contract renewal process. The end result was the implementation of the current process relied upon by the Board to review and analyze information in connection with the annual renewal of the Portfolios’ Advisory Contract, as well as its review and approval of new advisory relationships.
Since the foregoing approval and renewal process was implemented, the Board regularly has reviewed and refined the process. In addition, the Board established a Contracts Committee and two Investment Review Committees. The type and format of the information provided to the Board or its counsel to inform its approval and annual review and renewal process has been codified in the Portfolios’ “15(c) Methodology Guide” (the “Methodology Guide”). The Methodology Guide was developed under the direction of the Independent Directors, and sets out a written blueprint under which the Independent Directors request certain information necessary to facilitate a thorough and informed review in connection with the annual Advisory Contract renewal process. Management provides Portfolio-specific information to the Independent Directors based on the Methodology Guide through “Fund Analysis and Comparison Tables” or “FACT” sheets prior to the Independent Directors’ review of Advisory and Contracts. In 2005, the Independent Directors retained an independent firm to verify and
38
ADVISORY CONTRACT APPROVAL DISCUSSION (UNAUDITED) (CONTINUED)
test the accuracy of certain of this information for a representative sample of funds in the ING Funds complex. The Independent Directors have determined to conduct such testing periodically.
As part of a regular on-going process, the Board’s Contracts Committee recommends or considers recommendations from Management for refinements and other changes to the Methodology Guide and other aspects of the review process, and the Board’s Investment Review Committees review benchmarks used to assess the performance of each Portfolio. The Investment Review Committees also meet regularly with the Adviser. The Investment Review Committees may apply a heightened level of scrutiny in cases where performance has lagged a Portfolio’s relevant benchmark and/or peer group of investment companies.
The Board employed its process for reviewing contracts when considering the renewal of the Advisory Contract that would be effective through November 30, 2007. A number of the Board’s primary considerations and conclusions resulting from this process are discussed below.
Nature, Extent and Quality of Service
In determining whether to approve the Advisory Contract for the Portfolios for the year ending November 30, 2007, the Independent Directors received and evaluated such information as they deemed necessary regarding the nature, extent and quality of services provided to the Portfolios by the Adviser. This included information regarding the Adviser to the Portfolios provided throughout the year at regular Board meetings, as well as information furnished for the November 9, 2006 Board meeting, which was held specifically to consider contracts renewal for the period ending November 30, 2007. In addition, the Board’s Independent Directors also held meetings on October 12 and November 7, prior to the November 9, 2006 meeting of the full Board, to consider the annual renewal of the Advisory Contract.
The materials requested by and provided to the Board and/or to K&L Gates prior to the November 2006 Board meeting included the following items: (1) FACT sheets for each Portfolio that provided information about the performance and expenses of the Portfolio and other similarly managed funds in a selected peer group (“Selected Peer Group”), as well as information about the Portfolio’s investment portfolio, objectives and strategies; (2) the Methodology Guide, which describes how the FACT sheets were prepared, including the manner in which benchmarks and Selected Peer Groups were selected and how profitability was determined; (3) responses from the Adviser to a detailed series of questions posed by K&L Gates; (4) a copy of the form of Advisory Contract; (5) a copy of the Adviser’s Form ADV; (6) financial statements for the Adviser; (7) drafts of narrative summaries addressing key factors the Board customarily considers in evaluating the renewal of the Advisory Contract, including a written analysis for each Portfolio of how performance and fees compare to its Selected Peer Group and/or designated benchmarks; and (8) other information relevant to the Board’s evaluations.
Each Portfolio currently has only one class of shares, which was compared to the analogous class of shares for each fund in the Selected Peer Group. It should be noted that, as a technical matter, the performance of a Portfolio reflects that of the Master Fund in which it invests. Mutual funds chosen for inclusion in a Portfolio’s Selected Peer Group were selected based upon criteria designed to mirror the Portfolio’s class being compared to the funds in the Selected Peer Group.
In arriving at its conclusions with respect to the Advisory Contract, the Board noted the resources that the Adviser has committed to the Board and its Investment Review Committees to assist the Board and members of the Committees with their assessment of the investment performance of the Portfolios on an ongoing basis throughout the year. This includes the appointment of a Chief Investment Risk Officer and his staff, who report directly to the Board and who have developed attribution analyses and other metrics used by the Investment Review Committees to analyze the key factors underlying investment performance for the Portfolios.
In considering the Portfolios’ Advisory Contract, the Board considered the extent of benefits provided to the Portfolios’ shareholders, beyond advisory services, from being part of the ING family of Funds. This includes, in most cases, the right to exchange or transfer investments, without a sales charge, between shares of the Portfolios or among Funds available on a product platform, and the wide variety in the types of Funds available for exchange or transfer.
The Board also took into account the Adviser’s extensive efforts in recent years to reduce the administrative expenses of the ING Funds, including
39
ADVISORY CONTRACT APPROVAL DISCUSSION (UNAUDITED) (CONTINUED)
the Portfolios, through re-negotiated arrangements with the ING Funds’ service providers.
Further, the Board received periodic reports showing that the investment policies and restrictions for each Portfolio were consistently complied with and other periodic reports covering matters such as compliance by the Adviser’s personnel with the code of ethics. The Board considered reports from the Portfolios’ Chief Compliance Officer (“CCO”) evaluating the regulatory compliance systems of the Adviser and procedures reasonably designed by the Adviser to assure compliance with the federal securities laws, including those related to late trading and market timing, best execution, fair value pricing, proxy voting procedures, and trade allocation, among others. The Board considered the implementation by the Adviser of enhanced compliance policies and procedures in response to SEC rule changes and other regulatory initiatives. The Board also took into account the CCO’s annual and periodic reports with respect to service provider compliance and his recommendations regarding service providers’ compliance programs. In this regard, the Board also considered the policies and procedures developed by the CCO in consultation with the Board’s Compliance Committee that guide the CCO’s compliance oversight function.
The Board considered the adequacy of the resources committed to the Portfolios (and other relevant funds in the ING Funds complex) by the Adviser, and whether those resources are commensurate with the needs of the Portfolios and are appropriate to attempt to sustain expected levels of performance, compliance, and other needs.
Based on their deliberations and the materials presented to them, the Board concluded that the advisory and related services provided by the Adviser are appropriate in light of the Portfolios’ operations, the competitive landscape of the investment company business, and investor needs, and that the nature and quality of the overall services provided by the Adviser were appropriate.
Portfolio Performance
In assessing advisory relationships, the Board placed emphasis on the investment performance of each Portfolio, taking into account the importance of such performance to Portfolio shareholders. The Board noted that the performance of each Portfolio reflects the performance of the underlying Master Fund in which it invests.
While the Board considered the performance reports and discussions with portfolio managers at Board and Committee meetings during the year, particular attention in assessing performance was given to the Fund FACT sheets furnished in advance of the November meeting of the Independent Directors. The FACT sheet prepared for each Portfolio included its investment performance compared to the Morningstar category median, Lipper category median, Selected Peer Group and the Portfolio’s primary benchmark. The Board’s findings specific to each Portfolio’s performance are discussed under “Portfolio-by-Portfolio Analysis,” below.
Economies of Scale
In considering the reasonableness of advisory fees, the Board also considered whether economies of scale will be realized by the Adviser as a Portfolio grows larger and the extent to which this is reflected in the level of management fee rates charged. In this regard, the Board noted that each Portfolio invests all of its assets in a corresponding “Master Fund” managed by Fidelity Management & Research Company (“FMR”), and that FMR applies a “group rate” discount based upon the assets under FMR’s management, lowering the management fees payable by the Master Funds at higher asset levels. The Board considered that these reductions would indirectly benefit the Portfolios. The Board also noted that any waivers to or reimbursements of advisory or other fees payable by the Master Funds would have an indirect benefit to the Portfolios.
Information about Services to Other Clients
The Board requested, and if received considered, information about the nature of services and fee rates offered by the Adviser to other clients, including other registered investment companies. The Board also noted that the fee rates charged to the Portfolios and similar institutional clients may differ materially due to the different services and additional regulatory overlay associated with registered investment companies, such as the Portfolios.
Fee Rates and Profitability
The Board reviewed and considered each contractual investment advisory fee rate, combined with the administrative fee rate, payable by each Portfolio to the Adviser. In analyzing this information, the Board took into account that no advisory fees are charged
40
ADVISORY CONTRACT APPROVAL DISCUSSION (UNAUDITED) (CONTINUED)
when the Portfolio is fully invested in the corresponding Master Fund, and that advisory fees are charged by the Master Funds are indirectly borne by Portfolio shareholders. The Board considered the fee structures of the Portfolios as they relate to the services provided under the Advisory Contract, and the potential fall-out benefits to the Adviser, and its affiliates, from its association with the Portfolios. For each Portfolio, the Board determined that the fees payable to the Adviser are reasonable for the services that it performs, which were considered in light of the nature and quality of the services that it has performed and is expected to perform through the year ending November 30, 2007.
For each Portfolio, the Board considered information on revenues, costs and profits realized by the Adviser, which was prepared by Management in accordance with the allocation methodology (including assumptions) specified in the Methodology Guide. The Board also considered information that it requested and was provided by Management with respect to the profitability of service providers affiliated with the Adviser.
The Board determined that it had requested and received sufficient information to gain a reasonable understanding regarding the Adviser’s profitability. The Board also recognized that profitability analysis is not an exact science and there is no uniform methodology for determining profitability for this purpose. In this context, the Board realized that Management’s calculations regarding its costs incurred in establishing the infrastructure necessary for the Portfolios’ operations may not be fully reflected in the expenses allocated to each Portfolio in determining profitability, and that the information presented may not portray all of the costs borne by Management nor capture Management’s entrepreneurial risk associated with offering and managing a mutual fund complex in today’s regulatory environment.
Based on the information on revenues, costs, and profitability considered by the Board, after considering the factors described in this section, the Board concluded that the profits, if any, realized by the Adviser were not excessive.
Portfolio-by-Portfolio Analysis
The following paragraphs outline certain of the specific factors that the Board considered, and the conclusions reached, at its November 2006 meeting in relation to renewing each Portfolio’s current Advisory Contract for the year ending November 30, 2007. These specific factors are in addition to those considerations discussed above. In each case, the Portfolio’s performance was compared to its Morningstar category median and its primary benchmark, a broad-based securities market index that appears in the Portfolio’s prospectus. Each Portfolio’s management fee and expense ratio were compared to the fees and expense ratios of the funds in its Selected Peer Group.
ING Fidelity® VIP Contrafund® Portfolio
In considering whether to approve the renewal of the Advisory Contract for ING Fidelity® VIP Contrafund® Portfolio, the Board considered that, based on performance data for the periods ended June 30, 2006: (1) the Portfolio outperformed its Morningstar category median and its primary benchmark for all periods presented; (2) the Portfolio ranked in the first (highest) quintile of its Morningstar category for all periods presented.
In considering the fees payable under the Advisory Contract for ING Fidelity® VIP Contrafund Portfolio®, the Board took into account the factors described above and also considered: (1) the fairness of the compensation under an Advisory Contract (a) under which no advisory fees are charged when the Portfolio is fully invested in Fidelity’s VIP Contrafund Portfolio (the “Contrafund Master Fund”), and (b) advisory fees are charged by the Contrafund Master Fund and indirectly borne by Portfolio shareholders; and (2) the pricing structure (including the expense ratio to be borne by shareholders) of ING Fidelity® VIP Contrafund® Portfolio, as compared to its Selected Peer Group, including Management’s analysis that (a) the management fee for the Portfolio (consisting of a 0.05% administration fee) is below the median and the average management fees of the funds in its Selected Peer Group, and (b) the expense ratio for the Portfolio is equal to the median and above the average expense ratios of the funds in its Selected Peer Group.
After its deliberation, the Board reached the following conclusions: (1) the Portfolio’s management fee rate is reasonable in the context of all factors considered by the Board; (2) the Portfolio’s expense ratio is reasonable in the context of all factors considered by the Board; and (3) the Portfolio’s performance is reasonable in the context of all factors
41
ADVISORY CONTRACT APPROVAL DISCUSSION (UNAUDITED) (CONTINUED)
considered by the Board. Based on these conclusions and other factors, the Board voted to renew the Advisory Contract for the Portfolio for the year ending November 30, 2007. During this renewal process, different Board members may have given different weight to different individual factors and related conclusions.
ING Fidelity® VIP Equity-Income Portfolio
In considering whether to approve the renewal of the Advisory Contract for ING Fidelity® VIP Equity-Income Portfolio, the Board considered that, based on performance data for the periods ended June 30, 2006: (1) the Portfolio outperformed its Morningstar category median, but underperformed its primary benchmark for all periods presented; and (2) the Portfolio is ranked in the second quintile of its Morningstar category for the one-year period and in the third quintile for the year-to-date and most recent calendar quarter periods.
In considering the fees payable under the Advisory Contract for ING Fidelity® VIP Equity-Income Portfolio, the Board took into account the factors described above and also considered: (1) the fairness of the compensation under an Advisory Contract (a) under which no advisory fees are charged when the Portfolio is fully invested in Fidelity’s VIP Equity-Income Portfolio (the “Equity-Income Master Fund”), and (b) advisory fees are charged by the Equity-Income Master Fund and indirectly borne by Portfolio shareholders; and (2) the pricing structure (including the expense ratio to be borne by shareholders) of ING Fidelity® VIP Equity-Income Portfolio, as compared to its Selected Peer Group, including Management’s analysis that (a) the management fee for the Portfolio (consisting of a 0.05% administration fee) is below the median and the average management fees of the funds in its Selected Peer Group, and (b) the expense ratio for the Portfolio is equal to the median and above the average expense ratios of the funds in its Selected Peer Group.
After its deliberation, the Board reached the following conclusions: (1) the Portfolio’s management fee rate is reasonable in the context of all factors considered by the Board; (2) the Portfolio’s expense ratio is reasonable in the context of all factors considered by the Board; and (3) the Portfolio’s performance is reasonable in the context of all factors considered by the Board. Based on these conclusions and other factors, the Board voted to renew the Advisory Contract for the Portfolio for the year ending November 30, 2007. During this renewal process, different Board members may have given different weight to different individual factors and related conclusions.
ING Fidelity® VIP Growth Portfolio
In considering whether to approve the renewal of the Advisory Contract for ING Fidelity® VIP Growth Portfolio, the Board considered that, based on performance data for the periods ended June 30, 2006: (1) the Portfolio outperformed its Morningstar category median and its primary benchmark for all periods presented; and (2) the Portfolio is ranked in the second quintile of its Morningstar category for the year-to-date period and in the third quintile for the most recent calendar quarter and one-year periods.
In considering the fees payable under the Advisory Contract for ING Fidelity® VIP Growth Portfolio, the Board took into account the factors described above and also considered: (1) the fairness of the compensation under an Advisory Contract (a) under which no advisory fees are charged when the Portfolio is fully invested in Fidelity’s VIP Growth Portfolio (the “Growth Master Fund”), and (b) advisory fees are charged by the Growth Master Fund and indirectly borne by Portfolio shareholders; and (2) the pricing structure (including the expense ratio to be borne by shareholders) of ING Fidelity® VIP Growth Portfolio, as compared to its Selected Peer Group, including Management’s analysis that (a) the management fee for the Portfolio (consisting of a 0.05% administration fee) is below the median and the average management fees of the funds in its Selected Peer Group, and (b) the expense ratio for the Portfolio is equal to the median and above the average expense ratios of the funds in its Selected Peer Group.
After its deliberation, the Board reached the following conclusions: (1) the Portfolio’s management fee rate is reasonable in the context of all factors considered by the Board; (2) the Portfolio’s expense ratio is reasonable in the context of all factors considered by the Board; and (3) the Portfolio’s performance is reasonable in the context of all factors considered by the Board. Based on these conclusions and other factors, the Board voted to renew the Advisory Contract for the Portfolio for the year ending November 30, 2007. During this renewal
42
ADVISORY CONTRACT APPROVAL DISCUSSION (UNAUDITED) (CONTINUED)
process, different Board members may have given different weight to different individual factors and related conclusions.
ING Fidelity® VIP Mid Cap Portfolio
In considering whether to approve the renewal of the Advisory Contract for ING Fidelity® VIP Mid Cap Portfolio, the Board considered that, based on performance data for the periods ended June 30, 2006: (1) the Portfolio outperformed its Morningstar category median and its primary benchmark for all periods presented; and (2) the Portfolio is ranked in the first (highest) quintile of its Morningstar category for the year-to-date and one-year periods and in the third quintile for the most recent calendar quarter.
In considering the fees payable under the Advisory Contract for ING Fidelity® VIP Mid Cap Portfolio, the Board took into account the factors described above and also considered: (1) the fairness of the compensation under an Advisory Contract (a) under which no advisory fees are charged when the Portfolio is fully invested in Fidelity’s VIP Mid Cap Portfolio (the “Mid Cap Master Fund”), and (b) advisory fees are charged by the Mid Cap Master Fund and indirectly borne by Portfolio shareholders; and (2) the pricing structure (including the expense ratio to be borne by shareholders) of ING Fidelity® VIP Mid Cap Portfolio, as compared to its Selected Peer Group, including Management’s analysis that (a) the management fee for the Portfolio (consisting of a 0.05% administration fee) is below the median and the average management fees of the funds in its Selected Peer Group, and (b) the expense ratio for the Portfolio is equal to the median and above the average expense ratios of the funds in its Selected Peer Group.
After its deliberation, the Board reached the following conclusions: (1) the Portfolio’s management fee rate is reasonable in the context of all factors considered by the Board; (2) the Portfolio’s expense ratio is reasonable in the context of all factors considered by the Board; and (3) the Portfolio’s performance is reasonable in the context of all factors considered by the Board. Based on these conclusions and other factors, the Board voted to renew the Advisory Contract for the Portfolio for the year ending November 30, 2007. During this renewal process, different Board members may have given different weight to different individual factors and related conclusions.
43
Investment Adviser
ING Directed Services, LLC
1475 Dunwoody Drive
West Chester, Pennsylvania 19380
Distributor
ING Funds Distributor, LLC
7337 East Doubletree Ranch Road
Scottsdale, Arizona 85258
Custodian
The Bank of New York
One Wall Street
New York, New York 10286
Independent Registered Public Accounting Firm
KPMG LLP
99 High Street
Boston, Massachusetts 02110
Legal Counsel
Dechert LLP
1775 I Street, N.W.
Washington, D.C. 20006
Before investing, carefully consider the investment objectives, risks, charges and expenses of the variable annuity contract and the underlying variable investment options. This and other information is contained in the prospectus for the variable annuity contract and the underlying variable investment options. Obtain these prospectuses from your agent/registered representative and read them carefully before investing.
| |
 | VPAR-UFID (1206-022607) |
Item 2. Code of Ethics.
As of the end of the period covered by this report, Registrant had adopted a code of ethics, as defined in Item 2 of Form N-CSR, that applies to the Registrant’s principal executive officer and principal financial officer. There were no amendments to the Code during the period covered by the report. The Registrant did not grant any waivers, including implicit waivers, from any provisions of the Code during the period covered by this report. The code of ethics is filed herewith pursuant to Item 10(a)(1), Exhibit 99.CODE ETH.
Item 3. Audit Committee Financial Expert.
The Board of Trustees has determined that Patrick W. Kenny is an audit committee financial expert, as defined in Item 3 of Form N-CSR. Mr. Kenny is “independent” for purposes of Item 3 of Form N-CSR.
Item 4. Principal Accountant Fees and Services.
(a) Audit Fees: The aggregate fees billed for each of the last two fiscal years for professional services rendered by KPMG LLP (“KPMG”), the principal accountant for the audit of the registrant’s annual financial statements, for services that are normally provided by the accountant in connection with statutory and regulatory filings or engagements for those fiscal years were $638,250 for year ended December 31, 2006 and $445,750 for year ended December 31, 2005.
(b) Audit-Related Fees: The aggregate fees billed in each of the last two fiscal years for assurance and related services by KPMG that are reasonably related to the performance of the audit of the registrant’s financial statements and are not reported under paragraph (a) of this Item were $77,025 for year ended December 31, 2006 and $0 for year ended December 31, 2005.
None
(c) Tax Fees: The aggregate fees billed in each of the last two fiscal years for professional services rendered by KPMG for tax compliance, tax advice, and tax planning were $184,760 in the year ended December 31, 2006 and $24,250 in the year ended December 31, 2005. Such services included review of excise distribution calculations (if applicable), preparation of the Funds’ federal, state and excise tax returns, tax services related to mergers and routine consulting.
(d) All Other Fees: The aggregate fees billed in each of the last two fiscal years for products and services provided by KPMG, other than the services reported in paragraphs (a) through (c) of this Item.
None
(e) (1) Audit Committee Pre-Approval Policies and Procedures
2
FORM OF
AUDIT AND NON-AUDIT SERVICES
PRE-APPROVAL POLICY
I. Statement of Principles
Under the Sarbanes-Oxley Act of 2002 (the “Act”), the Audit Committee of the Board of Directors or Trustees (the “Committee”) of the ING Funds (each a “Fund,” collectively, the “Funds”) set out on Exhibit A to this Audit and Non-Audit Services Pre-Approval Policy (“Policy”) is responsible for the oversight of the work of the Funds’ independent auditors. As part of its responsibilities, the Committee must pre-approve the audit and non-audit services performed by the auditors in order to assure that the provision of these services does not impair the auditors’ independence from the Funds. The Committee has adopted, and the Board has ratified, this Policy, which sets out the procedures and conditions under which the services of the independent auditors may be pre-approved.
Under Securities and Exchange Commission (“SEC”) rules promulgated in accordance with the Act, the Funds may establish two different approaches to pre-approving audit and non-audit services. The Committee may approve services without consideration of specific case-by-case services (“general pre-approval”) or it may pre-approve specific services (“specific pre-approval”). The Committee believes that the combination of these approaches contemplated in this Policy results in an effective and efficient method for pre-approving audit and non-audit services to be performed by the Funds’ independent auditors. Under this Policy, services that are not of a type that may receive general pre-approval require specific pre-approval by the Committee. Any proposed services that exceed pre-approved cost levels or budgeted amounts will also require the Committee’s specific pre-approval.
For both types of approval, the Committee considers whether the subject services are consistent with the SEC’s rules on auditor independence and that such services are compatible with maintaining the auditors independence. The Committee also considers whether a particular audit firm is in the best position to provide effective and efficient services to the Funds. Reasons that the auditors are in the best position include the auditors’ familiarity with the Funds’ business, personnel, culture, accounting systems, risk profile, and other factors, and whether the services will enhance the Funds’ ability to manage and control risk or improve audit quality. Such factors will be considered as a whole, with no one factor being determinative.
The appendices attached to this Policy describe the audit, audit-related, tax-related, and other services that have the Committee’s general pre-approval. For any service that has been approved through general pre-approval, the general pre-approval will remain in place for a period 12 months from the date of pre-approval, unless the Committee determines that a different period is appropriate. The Committee will annually review and pre-approve the services that may be provided by the independent auditors without specific pre-approval. The Committee will revise the list of services subject to general pre-approval as appropriate. This Policy does not serve as a delegation to Fund management of the Committee’s duty to pre-approve services performed by the Funds’ independent auditors.
3
II. Audit Services
The annual audit services engagement terms and fees are subject to the Committee’s specific pre-approval. Audit services are those services that are normally provided by auditors in connection with statutory and regulatory filings or engagements or those that generally only independent auditors can reasonably provide. They include the Funds’ annual financial statement audit and procedures that the independent auditors must perform in order to form an opinion on the Funds’ financial statements (e.g., information systems and procedural reviews and testing). The Committee will monitor the audit services engagement and approve any changes in terms, conditions or fees deemed by the Committee to be necessary or appropriate.
The Committee may grant general pre-approval to other audit services, such as statutory audits and services associated with SEC registration statements, periodic reports and other documents filed with the SEC or issued in connection with securities offerings.
The Committee has pre-approved the audit services listed on Appendix A. The Committee must specifically approve all audit services not listed on Appendix A.
III. Audit-related Services
Audit-related services are assurance and related services that are reasonably related to the performance of the audit or the review of the Funds’ financial statements or are traditionally performed by the independent auditors. The Committee believes that the provision of audit-related services will not impair the independent auditors’ independence, and therefore may grant pre-approval to audit-related services. Audit-related services include accounting consultations related to accounting, financial reporting or disclosure matters not classified as “audit services;” assistance with understanding and implementing new accounting and financial reporting guidance from rulemaking authorities; agreed-upon or expanded audit procedures relating to accounting and/or billing records required to respond to or comply with financial, accounting or regulatory reporting matters; and assistance with internal control reporting requirements under Form N-SAR or Form N-CSR.
The Committee has pre-approved the audit-related services listed on Appendix B. The Committee must specifically approve all audit-related services not listed on Appendix B.
IV. Tax Services
The Committee believes the independent auditors can provide tax services to the Funds, including tax compliance, tax planning, and tax advice, without compromising the auditors’ independence. Therefore, the Committee may grant general pre-approval with respect to tax services historically provided by the Funds’ independent auditors that do not, in the Committee’s view, impair auditor independence and that are consistent with the SEC’s rules on auditor independence.
The Committee will not grant pre-approval if the independent auditors initially recommends a transaction the sole business purpose of which is tax avoidance and the tax treatment of which may not be supported in the Internal Revenue Code and related regulations. The Committee may consult
4
outside counsel to determine that tax planning and reporting positions are consistent with this Policy.
The Committee has pre-approved the tax-related services listed on Appendix C. The Committee must specifically approve all tax-related services not listed on Appendix C.
V. Other Services
The Committee believes it may grant approval of non-audit services that are permissible services for independent auditors to a Fund. The Committee has determined to grant general pre-approval to other services that it believes are routine and recurring, do not impair auditor independence, and are consistent with SEC rules on auditor independence.
The Committee has pre-approved the non-audit services listed on Appendix D. The Committee must specifically approve all non-audit services not listed on Appendix D.
A list of the SEC’s prohibited non-audit services is attached to this Policy as Appendix E. The SEC’s rules and relevant guidance should be consulted to determine the precise definitions of these impermissible services and the applicability of exceptions to certain of the SEC’s prohibitions.
VI. Pre-approval of Fee levels and Budgeted Amounts
The Committee will annually establish pre-approval fee levels or budgeted amounts for audit, audit-related, tax and non-audit services to be provided to the Funds by the independent auditors. Any proposed services exceeding these levels or amounts require the Committee’s specific pre-approval. The Committee considers fees for audit and non-audit services when deciding whether to pre-approve services. The Committee may determine, for a pre-approval period of 12 months, the appropriate ratio between the total amount of fees for the Fund’s audit, audit-related, and tax services (including fees for services provided to Fund affiliates that are subject to pre-approval), and the total amount of fees for certain permissible non-audit services for the Fund classified as other services (including any such services provided to Fund affiliates that are subject to pre-approval).
VII. Procedures
Requests or applications for services to be provided by the independent auditors will be submitted to management. If management determines that the services do not fall within those services generally pre-approved by the Committee and set out in the appendices to these procedures, management will submit the services to the Committee or its delagee. Any such submission will include a detailed description of the services to be rendered. Notwithstanding this paragraph, the Committee will, on a quarterly basis, receive from the independent auditors a list of services provided for the previous calendar quarter on a cumulative basis by the auditors during the Pre-Approval Period.
5
VIII. Delegation
The Committee may delegate pre-approval authority to one or more of the Committee’s members. Any member or members to whom such pre-approval authority is delegated must report any pre-approval decisions, including any pre-approved services, to the Committee at its next scheduled meeting. The Committee will identify any member to whom pre-approval authority is delegated in writing. The member will retain such authority for a period of 12 months from the date of pre-approval unless the Committee determines that a different period is appropriate. The period of delegated authority may be terminated by the Committee or at the option of the member.
IX. Additional Requirements
The Committee will take any measures the Committee deems necessary or appropriate to oversee the work of the independent auditors and to assure the auditors’ independence from the Funds. This may include reviewing a formal written statement from the independent auditors delineating all relationships between the auditors and the Funds, consistent with Independence Standards Board No. 1, and discussing with the auditors their methods and procedures for ensuring independence.
Amended: November 9, 2005
6
Appendix A
Pre-Approved Audit Services for the Pre-Approval Period January 1, 2006 through December 31, 2006
Service
| | The Fund(s) | | Fee Range |
| | | | |
Statutory audits or financial audits (including tax services associated with audit services) | | ý | | As presented to Audit Committee(1) |
| | | | |
Services associated with SEC registration statements, periodic reports and other documents filed with the SEC or other documents issued in connection with securities offerings (e.g., consents), and assistance in responding to SEC comment letters. | | ý | | Not to exceed $9,300 per filing |
| | | | |
Consultations by Fund management with respect to accounting or disclosure treatment of transactions or events and/or the actual or potential effect of final or proposed rules, standards or interpretations by the SEC, Financial Accounting Standards Board, or other regulatory or standard setting bodies. | | ý | | Not to exceed $8,000 during the Pre-Approval Period |
| | | | |
Seed capital audit and related review and issuance of consent on the N-2 registration statement | | ý | | Not to exceed $12,000 per audit |
(1) For new Funds launched during the Pre-Approval Period, the fee ranges pre-approved will be the same as those for existing Funds, pro-rated in accordance with inception dates as provided in the auditors’ Proposal or any Engagement Letter covering the period at issue. Fees in the Engagement Letter will be controlling.
7
Appendix B
Pre-Approved Audit-Related Services for the Pre-Approval Period January 1, 2006 through December 31, 2006
Service
| | The Fund(s) | | Fund Affiliates | | Fee Range |
| | | | | | |
Services related to Fund mergers (Excludes tax services - See Appendix C for tax services associated with Fund mergers) | | ý | | ý | | Not to exceed $10,000 per merger |
| | | | | | |
Consultations by Fund management with respect to accounting or disclosure treatment of transactions or events and/or the actual or potential effect of final or proposed rules, standards or interpretations by the SEC, Financial Accounting Standards Board, or other regulatory or standard setting bodies. [Note: Under SEC rules some consultations may be “audit” services and others may be “audit-related” services.] | | ý | | | | Not to exceed $5,000 per occurrence during the Pre-Approval Period |
| | | | | | |
Review of the Funds’ semi-annual financial statements | | ý | | | | Not to exceed $2,100 per set of financial statements per fund |
| | | | | | |
Reports to regulatory or government agencies related to the annual engagement | | ý | | | | Up to $5,000 per occurrence during the Pre-Approval Period |
| | | | | | |
Regulatory compliance assistance | | ý | | ý | | Not to exceed $5,000 per quarter |
| | | | | | |
Training courses | | ý | | ý | | Not to exceed $2,000 per course |
| | | | | | |
For Prime Rate Trust, agreed upon procedures for quarterly reports to rating agencies | | ý | | | | Not to exceed $9,000 per quarter |
| | | | | | |
For Prime Rate Trust and Senior Income Fund, agreed upon procedures for the Revolving Credit and Security Agreement with Citigroup | | ý | | | | Not to exceed $20,000 per fund per year |
8
Appendix C
Pre-Approved Tax Services for the Pre-Approval Period January 1, 2006 through December 31, 2006
Service
| | The Fund(s) | | Fund
Affiliates | | Fee Range |
| | | | | | |
Preparation of federal and state income tax returns and federal excise tax returns for the Funds including assistance and review with excise tax distributions | | ý | | | | As presented to Audit Committee(2) |
| | | | | | |
Review of IRC Sections 851(b) and
817(h) diversification testing on a real-time basis | | ý | | | | As presented to Audit Committee(2) |
| | | | | | |
Assistance and advice regarding year-end reporting for 1099’s | | ý | | | | As presented to Audit Committee(2) |
| | | | | | |
Tax assistance and advice regarding statutory, regulatory or administrative developments | | ý | | ý | | Not to exceed $5,000 for the Funds or for the Funds’ investment adviser during the Pre-Approval Period |
(2) For new Funds launched during the Pre-Approval Period, the fee ranges pre-approved will be the same as those for existing Funds, pro-rated in accordance with inception dates as provided in the auditors’ Proposal or any Engagement Letter covering the period at issue. Fees in the Engagement Letter will be controlling.
9
Appendix C
Pre-Approved Tax Services for the Pre-Approval Period January 1, 2006 through December 31, 2006 (continued)
Service
| | The Fund(s) | | Fund
Affiliates | | Fee Range |
| | | | | | |
Tax training courses | | ý | | ý | | Not to exceed $2,000 per course during the Pre-Approval Period |
| | | | | | |
Tax services associated with Fund mergers | | ý | | ý | | Not to exceed $4,000 per fund per merger during the Pre-Approval Period |
| | | | | | |
Loan Staff Services | | ý | | | | Not to exceed $15,000 during the Pre-Approval Period |
| | | | | | |
Other tax-related assistance and consultation, including, without limitation, assistance in evaluating derivative financial instruments and international tax issues, qualification and distribution issues, and similar routine tax consultations. | | ý | | | | Not to exceed $120,000 during the Pre-Approval Period |
10
Appendix D
Pre-Approved Other Services for the Pre-Approval Period January 1, 2006 through December 31, 2006
Service
| | The Fund(s) | | Fund Affiliates | | Fee Range |
| | | | | | |
Agreed-upon procedures for Class B share 12b-1 programs | | | | ý | | Not to exceed $50,000 during the Pre-Approval Period |
| | | | | | |
Security counts performed pursuant to Rule 17f-2 of the 1940 Act (i.e., counts for Funds holding securities with affiliated sub-custodians) | | ý | | | | Not to exceed $5,000 per Fund during the Pre-Approval Period |
| | | | | | |
Agreed upon procedures for 15 (c) FACT Books | | ý | | | | Not to exceed $35,000 during the Pre-Approval Period |
11
Appendix E
Prohibited Non-Audit Services
Dated: January 1, 2006
• Bookkeeping or other services related to the accounting records or financial statements of the Funds
• Financial information systems design and implementation
• Appraisal or valuation services, fairness opinions, or contribution-in-kind reports
• Actuarial services
• Internal audit outsourcing services
• Management functions
• Human resources
• Broker-dealer, investment adviser, or investment banking services
• Legal services
• Expert services unrelated to the audit
• Any other service that the Public Company Accounting Oversight Board determines, by regulation, is impermissible
12
EXHIBIT A
ING EQUITY TRUST
ING FUNDS TRUST
ING INVESTMENT FUNDS, INC.
ING INVESTORS TRUST
ING MAYFLOWER TRUST
ING MUTUAL FUNDS
ING PRIME RATE TRUST
ING SENIOR INCOME FUND
ING VARIABLE INSURANCE TRUST
ING VARIABLE PRODUCTS TRUST
ING VP NATURAL RESOURCES TRUST
ING CORPORATE LEADERS TRUST FUND
ING PARTNERS, INC.
ING GLOBAL EQUITY DIVIDEND AND PREMIUM OPPORTUNITY FUND
ING GLOBAL ADVANTAGE AND PREMIUM OPPORTUNITY FUND
ING RISK MANAGED NATURAL RESOURCES FUND
13
(e) (2) Percentage of services referred to in 4(b) — (4)(d) that were approved by the audit committee
100% of the services were approved by the audit committee.
(f) Percentage of hours expended attributable to work performed by other than full time employees of KPMG if greater than 50%.
Not applicable.
(g) Non-Audit Fees: The non-audit fees billed by the registrant’s accountant for services rendered to the registrant, and rendered to the registrant’s investment adviser, and any entity controlling, controlled by, or under common control with the adviser that provides ongoing services to the registrant for each of the last two fiscal years of the registrant were $986,810 for year ended December 31, 2006 and $300,889 for year ended December 31, 2005.
(h) Principal Accountants Independence: The Registrant’s Audit committee has considered whether the provision of non-audit services that were rendered to the registrant’s investment adviser and any entity controlling, controlled by, or under common control with the investment adviser that provides ongoing services to the registrant that were not pre-approved pursuant to Rule 2-01(c)(7)(ii) of Regulation S-X is compatible with maintaining KPMG’s independence.
14
Item 5. Audit Committee of Listed Registrants.
Not applicable.
Item 6. Schedule of Investments
Schedule is included as part of the report to shareholders filed under Item 1 of this Form.
Item 7. Disclosure of Proxy Voting Policies and Procedures for Closed-End Management Investment Companies.
Not applicable.
Item 8. Portfolio Managers of Closed-End Management Investment Companies.
Not applicable.
Item 9. Purchases of Equity Securities by Closed-End Management Investment Company and Affiliated Purchasers
Not applicable.
Item 10. Submission of Matters to a Vote of Security Holders.
The Board has a Nominating Committee for the purpose of considering and presenting to the Board candidates it proposes for nomination to fill Independent Trustee vacancies on the Board. The Committee currently consists of all Independent Trustees of the Board (6 individuals). The Nominating Committee operates pursuant to a Charter approved by the Board. The primary purpose of the Nominating Committee is to consider and present to the Board the candidates it proposes for nomination to fill vacancies on the Board. In evaluating candidates, the Nominating Committee may consider a variety of factors, but it has not at this time set any specific minimum qualifications that must be met. Specific qualifications of candidates for Board membership will be based on the needs of the Board at the time of nomination.
The Nominating Committee is willing to consider nominations received from shareholders and shall assess shareholder nominees in the same manner as it reviews its own nominees. A shareholder nominee for director should be submitted in writing to the Fund’s Secretary. Any such shareholder nomination should include at a minimum the following information as to each individual proposed for nomination as trustee: such individual’s written consent to be named in the proxy statement as a nominee (if nominated) and to serve as a trustee (if elected), and all information relating to such individual that is required to be disclosed in the solicitation of proxies for election of trustees, or is otherwise required, in each case under applicable federal securities laws, rules and regulations.
The Secretary shall submit all nominations received in a timely manner to the Nominating Committee. To be timely, any such submission must be delivered to the Fund’s Secretary not earlier than the 90th day prior to such meeting and not later than the close of business on the later of the 60th day prior to such meeting or the 10th day following the day on which public announcement of the date of the meeting is first made, by either disclosure in a press release or in a document publicly filed by the Fund with the Securities and Exchange Commission.
Item 11. Controls and Procedures.
(a) Based on our evaluation conducted within 90 days of the filing date, hereof, the design and operation of the registrant’s disclosure controls and procedures are effective to ensure that material information relating to the registrant is made known to the certifying officers by others within the appropriate entities, particularly during the period in which Forms N-CSR are being prepared, and the registrant’s disclosure controls and procedures allow timely preparation and review of the information for the registrant’s Form N-CSR and the officer certifications of such Form N-CSR.
(b) There were no significant changes in the registrant’s internal controls that occurred during the second fiscal quarter of the period covered by this report that has materially affected, or is reasonably likely to materially affect, the registrant’s internal control over financial reporting.
Item 12. Exhibits.
(a)(1) Code of Ethics pursuant to Item 2 of Form N-CSR is filed and attached hereto as
EX-99.CODE ETH.
(a)(2) A separate certification for each principal executive officer and principal financial officer of the registrant as required by Rule 30a-2 under the Act (17 CFR 270.30a-2) is attached hereto as EX-99.CERT.
(b) The officer certifications required by Section 906 of the Sarbanes-Oxley Act of 2002 are attached hereto as EX-99.906CERT.
(3) Not applicable.
15
SIGNATURES
Pursuant to the requirements of the Securities Exchange Act of 1934 and the Investment Company Act of 1940, the registrant has duly caused this report to be signed on its behalf by the undersigned, thereunto duly authorized.
(Registrant): ING Partners, Inc.
By | /s/ Shaun P. Mathews |
| Shaun P. Mathews |
| President and Chief Executive Officer |
Date: March 8, 2007
Pursuant to the requirements of the Securities Exchange Act of 1934 and the Investment Company Act of 1940, this report has been signed below by the following persons on behalf of the registrant and in the capacities and on the dates indicated.
By | /s/ Shaun P. Mathews |
| Shaun P. Mathews |
| President and Chief Executive Officer |
Date: March 8, 2007
By | /s/ Todd Modic |
| Todd Modic |
| Senior Vice President and Chief Financial Officer |
Date: March 8, 2007
16