OMB APPROVAL
OMB Number: 3235-0570
Expires: August 31, 2011
Estimated average burden hours per response: 18.9
UNITED STATES
SECURITIES AND EXCHANGE COMMISSION
Washington, D.C. 20549
FORM N-CSR
CERTIFIED SHAREHOLDER REPORT OF
REGISTERED MANAGEMENT INVESTMENT COMPANIES
Investment Company Act file number: 811-8319
ING Partners, Inc.
(Exact name of registrant as specified in charter)
7337 E. Doubletree Ranch Rd., Scottsdale, AZ | | 85258 |
(Address of principal executive offices) | | (Zip code) |
The Corporation Trust Company, 1209 Orange Street, Wilmington, DE 19801
(Name and address of agent for service)
Registrant’s telephone number, including area code: 1-800-992-0180
Date of fiscal year end: | December 31 |
| |
Date of reporting period: | January 1, 2010 to December 31, 2010 |
ITEM 1. REPORTS TO STOCKHOLDERS.
The following is a copy of the report transmitted to stockholders pursuant to Rule 30e-1 under the Act (17 CFR 270.30e-1):

Annual Report
December 31, 2010
Classes ADV, I, S and S2
ING Partners, Inc.
n ING American Century Small-Mid Cap Value Portfolio
n ING Baron Small Cap Growth Portfolio
n ING Columbia Small Cap Value Portfolio
n ING Davis New York Venture Portfolio
n ING JPMorgan Mid Cap Value Portfolio
n ING Legg Mason ClearBridge Aggressive Growth Portfolio
n ING Oppenheimer Global Portfolio
n ING Oppenheimer Global Strategic Income Portfolio
n ING PIMCO Total Return Portfolio
n ING Pioneer High Yield Portfolio
n ING T. Rowe Price Diversified Mid Cap Growth Portfolio
n ING T. Rowe Price Growth Equity Portfolio
n ING Templeton Foreign Equity Portfolio
n ING Thornburg Value Portfolio
n ING UBS U.S. Large Cap Equity Portfolio
n ING Van Kampen Comstock Portfolio
n ING Van Kampen Equity and Income Portfolio
This report is submitted for general information to shareholders of the ING Funds. It is not authorized for distribution to prospective shareholders unless accompanied or preceded by a prospectus which includes details regarding the funds' investment objectives, risks, charges, expenses and other information. This information should be read carefully.
MUTUAL FUNDS

TABLE OF CONTENTS
| President's Letter | | | 1 | | |
|
| Market Perspective | | | 3 | | |
|
| Portfolio Managers' Report | | | 6 | | |
|
| Shareholder Expense Examples | | | 40 | | |
|
| Report of Independent Registered Public Accounting Firm | | | 44 | | |
|
| Statements of Assets and Liabilities | | | 45 | | |
|
| Statements of Operations | | | 55 | | |
|
| Statements of Changes in Net Assets | | | 60 | | |
|
| Financial Highlights | | | 69 | | |
|
| Notes to Financial Statements | | | 76 | | |
|
| Summary Portfolios of Investments | | | 102 | | |
|
| Tax Information | | | 208 | | |
|
| Director and Officer Information | | | 210 | | |
|
| Advisory Contract Approval Discussion | | | 214 | | |
|
PROXY VOTING INFORMATION
A description of the policies and procedures that the Portfolios use to determine how to vote proxies related to portfolio securities is available: (1) without charge, upon request, by calling Shareholder Services toll-free at (800) 992-0180; (2) on the ING Funds' website at www.ingfunds.com; and (3) on the U.S. Securities and Exchange Commission's ("SEC") website at www.sec.gov. Information regarding how the Portfolios voted proxies related to portfolio securities during the most recent 12-month period ended June 30 is available without charge on the ING Funds' website at www.ingfunds.com and on the SEC's website at www.sec.gov.
QUARTERLY PORTFOLIO HOLDINGS
The Portfolios file their complete schedule of portfolio holdings with the SEC for the first and third quarters of each fiscal year on Form N-Q. This report contains a summary portfolio of investments for the Portfolios. The Portfolios' Forms N-Q are available on the SEC's website at www.sec.gov. The Portfolios' Forms N-Q may be reviewed and copied at the SEC's Public Reference Room in Washington, DC, and information on the operation of the Public Reference Room may be obtained by calling (800) SEC-0330. The Portfolios' Forms N-Q, as well as a complete portfolio of investments, are available without charge upon request from the Portfolios by calling Shareholder Services toll-free at (800) 992-0180.
PRESIDENT'S LETTER

Big Picture vs. Details
Dear Shareholder,
On January 25, 2011, President Obama delivered his second State of the Union address. He called on Americans to put aside partisan differences and harness the nation's creativity to adapt and thrive in a rapidly changing global economy. The president's challenge is timely: the United States is approaching a nexus of intermediate- and long-term concerns, and the choices we make over the next two years could determine the nation's competitiveness in the global economy for decades to come.
There are reasons to be optimistic — the International Monetary Fund ("IMF") predicts the U.S. economy will grow about 3% in 2011. China and India are expected to grow at about 9% and even the euro zone appears to be recovering from crisis; this growth, however, is being accompanied by mounting inflation pressures in certain regions, suggesting that many economies are expanding at unsustainable rates.
As I write this, the World Economic Forum is getting underway in Davos, Switzerland, and there are numerous concerns to deal with. Chief among them are the still-present risk of sovereign debt defaults in the euro zone; high unemployment and banking problems in the advanced economies; and inflationary pressures in emerging markets, especially with regard to food, fuel and commodities.
As we've noted before, uncertainty is a defining characteristic of our age and, in our opinion, is likely to remain so beyond this year. How should you respond within your investment portfolio? Remember that the most important consideration is your long-term goals, not the outlook for 2011. With investment hazards and opportunities everywhere, we believe it makes sense to cast as broad a net as possible around the globe. In our opinion, you want your portfolio to be well diversified so that it is not harmed too much by the trouble spots, and has some exposure to positive trends.
As always, we believe the best approach is a well-diversified portfolio and a well-defined investment plan. As we've noted many times before, it's important to discuss any proposed changes thoroughly with your advisor before taking any action. Thank you for your continued confidence in ING Funds. We look forward to serving your investment needs in the future.
Sincerely,

Shaun Mathews
President and Chief Executive Officer
ING Funds
January 26, 2011
The views expressed in the President's Letter reflect those of the President as of the date of the letter. Any such views are subject to change at any time based upon market or other conditions and ING Funds disclaim any responsibility to update such views. These views may not be relied on as investment advice and because investment decisions for an ING Fund are based on numerous factors, may not be relied on as an indication of investment intent on behalf of any ING Fund. Reference to specific company securities should not be construed as recommendations or investment advice. Consider the fund's investment objectives, risks, and charges and expenses carefully before investing. The prospectus contains this information and other information about the fund.
International investing poses special risks including currency fluctuation, economic and political risks not found in investments that are solely domestic.
1
(THIS PAGE INTENTIONALLY LEFT BLANK)
MARKET PERSPECTIVE: YEAR ENDED DECEMBER 31, 2010
In our semi-annual report we described how, after a 13-month advance through mid-April, a confluence of local and world issues sent global equities, in the form of the MSCI World IndexSM measured in local currencies, including net reinvested dividends ("MSCI" for regions discussed below), reeling to a loss for the first half of the fiscal year. In the second half of the year, the MSCI World IndexSM bounced back and for 2010 returned 10.01%. (The MSCI World IndexSM returned 11.76% for the one year ended December 31, 2010, measured in U.S. dollars.) By year end, investor sentiment had turned distinctly positive, despite the grave concerns that remained.
It was a bumpy ride. Markets from stocks to bonds to currencies were continually buffeted by news and events relating to three main themes: the stuttering U.S. economic recovery, the sovereign debt crisis in the Eurozone and growth dynamics in China.
In the U.S., quarterly gross domestic product ("GDP") growth decelerated from 2.7% (annualized) in the first quarter of 2010 to 1.7% in the second, before recovering to 2.6% in the third. But attention was focused more on employment and housing. The 18-month recession which ended in June of 2009 had cost some 8.7 million jobs. But since then, the unemployment rate had been stuck between 9.4% and 10.1%, barely dented by private sector new jobs averaging 107,000 per month as 2010 ended.
The other weakening link was housing. Sales of new and existing homes collapsed after the expiry in April of a program of tax credits for home buyers and languished thereafter. House prices (based on the S&P/Case-Shiller 20-City Composite Home Price Index), having shown annual increases from February, resumed a downward trend in October with the index still 30% below the peak recorded in April 2006.
To be sure, there were some grounds for optimism as 2010 drew to a close. Consumer spending had risen for five straight months. Investment in equipment and software was growing at double-digit annual percentage rates. On December 30, new unemployment claims were reported below 400,000 for the first time since July 2008. The Federal Reserve in November announced a second round of quantitative easing and would buy $600 billion in Treasury notes and bonds. The mixed mid-term election results forced a "compromise" stimulus package worth an estimated $858 billion for 2011. In combination, these two measures increased the attractiveness of riskier asset classes like equities at the expense of high grade bonds, which sold off.
In the Eurozone, after default was narrowly averted on Greece's maturing bonds, the creation in May of a European Financial Stabilization "mechanism", funded with up to €750 billion seemed to calm nerves for a while. But in October, attention turned to Ireland, where the Irish government had injected huge sums into local banks, rendering its own fiscal position untenable. The November 29, 2010 European Union/International Monetary Fund bail-out worth €67.5 billion left markets unimpressed. Suddenly it was May again with downgrades, soaring yields on peripheral Eurozone bonds, fears of contagion, falling stock markets and doubts about the viability of the euro itself. The European Central Bank aggressively bought sovereign bonds and the mood settled. But with Spain's banks needing to refinance €85 billion of debt in 2011, the issue remains unresolved.
Investors watched nervously as China, the source of much of the world's growth, wrestled with inflation, which reached 5.1% in November, and a housing bubble. The authorities tightened mortgage requirements, raised banks' reserve ratio requirements six times in 2010 and interest rates twice in the last quarter. More interest rate increases seem inevitable.
In U.S. fixed income markets, the Barclays Capital U.S. Aggregate Bond Index of investment grade bonds returned 6.54% in 2010. A slight balance towards risk aversion in the first half gave way to improved risk appetite in the second. For the whole year, the Barclays Capital U.S. Treasury index returned 5.87%, underperforming the Barclays Capital Corporate Investment Grade Bond Index with a return of 9.00%, but both fell well short of the Barclays Capital High Yield Bond — 2% Issuer Constrained Composite Index which gained 14.94% for the one year period.
U.S. equities, represented by the S&P 500® Index including dividends, rose 15.06% in 2010, including its best September, a return of 8.92%, since 1939 and best December, a return of 6.68%, since 1991. Prices were supported by strong earnings reports, with operating earnings per share for S&P 500® companies recording four straight quarters of annual growth. Equities also benefited from improved risk appetite through the quantitative easing initiative and stimulus package referred to above.
In currencies, the worst of the gloom about the Eurozone in early June was replaced by renewed pessimism about the dollar in a stalling economy, before markets were seized by another bout of Eurozone angst. For the year, the dollar gained 8.15% against the euro and 2.95% against the pound, but lost 11.59% to the yen, which was sold in the market by the Bank of Japan after breaching 15-year high levels.
In international markets, the MSCI Japan® Index returned just 0.57% for the year after a strong last quarter, as quarterly GDP growth bounced back to 1.1% and the yen retreated from multi-year peaks. The tone of the market was generally poor with household spending fragile and consumer prices down for 21 months. The MSCI Europe ex UK® Index returned 4.84%, with Germany up 15.97% and Portugal, Italy, Ireland, Greece and Spain all falling. This broadly reflected the two-tier economy that has developed, with economic statistics favoring more soundly based countries at the expense of the peripherals. The MSCI UK® Index advanced 12.18%, despite the prospect of severe public spending cuts intended to eliminate an 11% budget deficit. Supporting sentiment was resilient, if perhaps temporary, quarterly GDP growth averaging 0.9% in the second half of the year.
Parentheses denote a negative number.
Past performance does not guarantee future results. The performance quoted represents past performance. Investment return and principal value of an investment will fluctuate, and shares, when redeemed, may be worth more or less than their original cost. The Portfolios' performance is subject to change since the period's end and may be lower or higher than the performance data shown. Please call (800) 262-3862 or log on to www.ingfunds.com to obtain performance data current to the most recent month end.
Market Perspective reflects the views of ING's Chief Investment Risk Officer only through the end of the period, and is subject to change based on market and other conditions.
3
BENCHMARK DESCRIPTIONS
| Index | | Description | |
| MSCI World IndexSM | | An unmanaged index that measures the performance of over 1,400 securities listed on exchanges in the U.S., Europe, Canada, Australia, New Zealand and the Far East. | |
|
| S&P/Case-Shiller 20-City Composite Home Price Index | | A composite index of the home price index for the top 20 Metropolitan Statistical Areas in the United States. The index is published monthly by Standard & Poor's. | |
|
| Barclays Capital U.S. Aggregate Bond Index | | An unmanaged index of publicly issued investment grade U.S. Government, mortgage-backed, asset-backed and corporate debt securities. | |
|
| Barclays Capital U.S. Treasury Index | | An unmanaged index that includes public obligations of the U.S. Treasury. Treasury bills, certain special issues, such as state and local government series bonds (SLGs), as well as U.S. Treasury TIPS and STRIPS, are excluded. | |
|
| Barclays Capital Corporate Investment Grade Bond Index | | The corporate component of the Barclays Capital U.S. Credit Index. The U.S. Credit Index includes publicly-issued U.S. corporate and specified foreign debentures and secured notes that meet the specified maturity, liquidity, and quality requirements. The index includes both corporate and non-corporate sectors. The corporate sectors are industrial, utility and finance, which includes both U.S. and non-U.S. corporations. | |
|
| Barclays Capital High Yield Bond — 2% Issuer Constrained Composite Index | | An unmanaged index that includes all fixed income securities having a maximum quality rating of Ba1, a minimum amount outstanding of $150 million, and at least one year to maturity. | |
|
| S&P 500® Index | | An unmanaged index that measures the performance of securities of approximately 500 large-capitalization companies whose securities are traded on major U.S. stock markets. | |
|
| MSCI Japan® Index | | A free float-adjusted market capitalization index that is designed to measure developed market market equity performance in Japan. | |
|
| MSCI Europe ex UK® Index | | A free float-adjusted market capitalization index that is designed to measure developed market equity performance in Europe, excluding the UK. | |
|
| MSCI UK® Index | | A free float-adjusted market capitalization index that is designed to measure developed market equity performance in the UK. | |
|
| Russell 2500TM Value Index | | Measures the performance of those Russell 2500 companies with lower price-to-book ratios and lower forecasted growth values. | |
|
| S&P Small Cap 600/Citigroup Value Index | | Measures the performance of those S&P 600 Index companies with lower price-to-book ratios. | |
|
| Russell 2000® Growth Index | | An unmanaged index that measures the performance of securities of smaller U.S. companies with greater than average growth orientation. | |
|
| Russell 2000® Index | | An unmanaged index that measures the performance of securities of small U.S. companies. | |
|
| Russell 2000® Value Index | | An unmanaged index that measures the performance of those Russell 2000® companies with lower price-to-book ratios and lower than forecasted growth values. | |
|
| Russell Midcap® Value Index | | Measures the performance of those Russell Midcap companies with lower price-to-book ratios and lower forecasted growth values. | |
|
| Russell 3000® Growth Index | | An unmanaged index that measures performance of broad growth segment of the U.S. Equity universe. It includes those Russell 3000® companies with higher price-to-book ratios and higher forecasted growth values. | |
|
| MSCI All Country World IndexSM | | A broad-based unmanaged index comprised of equity securities in countries around the world, including the United States, other developed countries and emerging markets. | |
|
| S&P/Citigroup World Government Bond Index | | S&P/Citigroup World Government Bond Index is an unmanaged index of bonds from 14 world government bond markets with maturities of at least one year. | |
|
| Bank of America/Merrill Lynch High Yield Master II Index | | A broad-based index consisting of all U.S. dollar-denominated high-yield bonds with a minimum outstanding amount of $100 million and with a maturity of greater than one year period. The quality rating is less than BBB by Standard & Poor's. | |
|
| Bank of America/Merrill Lynch All U.S. Convertibles (Speculative Grade) Index | | An unmanaged index that includes about 270 convertible securities and represents the non-investment-grade convertible market. | |
|
| S&P MidCap 400 Index | | A broad-based unmanaged capitalization weighted index of mid-capitalization companies. | |
|
4
BENCHMARK DESCRIPTIONS (CONTINUED)
| Index | | Description | |
| Russell Midcap® Growth Index | | An unmanaged index that measures the performance of those companies included in the Russell Midcap® Index with relatively higher price-to-book ratios and higher forecasted growth values. | |
|
| MSCI All Country World ex U.S. IndexSM | | A free float-adjusted market capitalization index that is designed to measure equity market performance in the global developed and emerging markets, excluding the U.S. It includes the reinvestment of dividends and distributions net of withholding taxes, but does not reflect fees, brokerage commissions or other expenses of investing. | |
|
| Russell 1000® Index | | An unmanaged, comprehensive large-cap index measuring the performance of the largest 1,000 U.S. incorporated companies. | |
|
| Russell 1000 Value® Index | | An unmanaged index that measures the performance of those Russell 1000® securities with lower price-to-book ratios and lower forecasted growth values. | |
|
| Barclays Capital U.S. Government/Credit Bond Index | | An index made up of the Barclays Capital Government and Credit indices, including securities issued by the U.S. government and its agencies and publicly issued U.S. corporate and foreign debentures and secured notes that meet specified maturity, liquidity and quality requirements. | |
|
5
ING AMERICAN CENTURY SMALL-MID CAP VALUE PORTFOLIO
PORTFOLIO MANAGERS' REPORT
ING American Century Small-Mid Cap Value Portfolio (the "Portfolio") seeks long-term capital growth. Income is a secondary objective. The Portfolio is managed by a team of portfolio managers comprised of Benjamin Z. Giele and James Pitman (responsible for the management of the Small Cap Value portion of the Portfolio) and Kevin Toney, Phillip N. Davidson, and Michael Liss (responsible for the Mid Cap Value portion of the Portfolio), Portfolio Managers of American Century Investment Management, Inc. — the Sub-Adviser.
Performance: For the year ended December 31, 2010, the Portfolio's Class S shares provided a total return of 22.02% compared to the Russell 2500TM Value Index and the S&P Small Cap 600/Citigroup Value Index, which returned 24.82% and 24.72%, respectively, for the same period.
Portfolio Specifics: The stock market posted double-digit gains for the one-year reporting period, its second-straight annual increase. Although the economy expanded in response to government stimulus spending, growth slowed during the spring, raising concern about the sustainability of the recovery. Although unemployment remained high, consumers modestly increased their spending. As fears of a double-dip recession eased, investors generally favored higher-risk stocks. They sought out higher-yielding securities because of very low interest rates. Growth stocks beat value stocks across the capitalization spectrum.
Small Cap Value* — In this environment, the portfolio provided a positive total return and outperformed on a relative basis. Contributing the most to relative results were positions in the information technology and energy sectors. In information technology, the software industry was a significant source of strength. Key holdings were Quest Software, Inc., a developer of enterprise management solutions; Sybase, Inc., a maker of mobile and database software; and Motricity, Inc., a provider of wireless data services. In energy, the portfolio benefited from security selection among oil and gas companies. A notable contributor was exploration company Mariner Energy, Inc. The industrials and consumer discretionary sectors detracted. In industrials, investments in the construction and engineering industry dampened relative results. A notable detractor was Granite Construction, Inc., a well-capitalized builder of highways, dams, airport infrastructure, and mass transit facilities. In consumer discretionary, the portfolio's mix of diversified consumer services companies hampered relative performance. Key detractors were Corinthian Colleges, Inc. and Lincoln Educational Services Corp., both of which are post-secondary career-oriented education companies.
Mid Cap Value* — Although the portfolio provided a positive total return in this environment, it underperformed in relative terms. Detracting the most from relative results were positions in the financials, energy, and consumer discretionary sectors. In financials, the portfolio was hampered by an underweight in commercial banks. Its mix of capital markets names also dampened relative performance. Two notable detractors were Northern Trust Corp. and State Street Corp. In energy, investments among oil and gas companies slowed progress versus the benchmark. Key detractors were Imperial Oil Ltd., a Canadian energy company and EQT Corp., a low-cost producer of unconventional tight-shale natural gas. In consumer discretionary, security selection among hotel, leisure, restaurant, and specialty retailing stocks dampened relative results. Home improvement retailer Lowe's Cos., Inc. was a notable detractor. Specialty retailing also provided the portfolio's top contributor PetSmart, Inc. Also adding to relative performance were the utilities and information technology sectors. In utilities, security selection among high-quality regulated utilities boosted results. In information technology, an underweight position was advantageous. A key contributor was Teradyne, Inc., a semiconductor test equipment maker.
Current Strategy and Outlook: The portfolio management team takes a fundamental, bottom-up approach, evaluating each company individually on its own merits and building the portfolio from the ground up, one stock at a time.
Small Cap Value* — As of December 31, 2010, the portfolio was broadly diversified, with overweight positions relative to the benchmark in consumer discretionary, industrials, and information technology and underweights in financials and utilities.
Mid Cap Value* — As of December 31, 2010, the portfolio was broadly diversified, with overweight positions relative to the benchmark in industrials, consumer staples, and healthcare, and underweights in financials and utilities.
Industry Allocation
as of December 31, 2010
(as a percent of net assets)
| Financials | | | 27.2 | % | |
| Industrials | | | 15.0 | % | |
| Consumer Discretionary | | | 11.1 | % | |
| Energy | | | 8.3 | % | |
| Health Care | | | 7.5 | % | |
| Information Technology | | | 7.4 | % | |
| Consumer Staples | | | 6.9 | % | |
| Utilities | | | 6.8 | % | |
| Materials | | | 4.4 | % | |
| Exchange-Traded Funds | | | 2.7 | % | |
| Telecommunication Services | | | 1.4 | % | |
| Other Assets and Liabilities — Net* | | | 1.3 | % | |
| Net Assets | | | 100.0 | % | |
* Includes short-term investments related to Blackrock Liquidity Funds TempFund Portfolio — Class I and securities lending collateral.
Portfolio holdings are subject to change daily.
Top Ten Holdings*
as of December 31, 2010
(as a percent of net assets)
| Republic Services, Inc. | | | 1.8 | % | |
| Imperial Oil Ltd. | | | 1.6 | % | |
| iShares Russell Midcap Value Index Fund | | | 1.6 | % | |
| Northern Trust Corp. | | | 1.4 | % | |
| HCC Insurance Holdings, Inc. | | | 1.3 | % | |
| Lowe's Cos., Inc. | | | 1.3 | % | |
| Kimberly-Clark Corp. | | | 1.2 | % | |
| ConAgra Foods, Inc. | | | 1.1 | % | |
| Beckman Coulter, Inc. | | | 1.1 | % | |
| Zimmer Holdings, Inc. | | | 1.0 | % | |
* Excludes short-term investments related to Blackrock Liquidity Funds TempFund Portfolio — Class I and securities lending collateral.
Portfolio holdings are subject to change daily.
* For purposes of these discussions, "the portfolio" refers to each respectively managed portion of ING American Century Small-Mid Cap Value Portfolio.
Portfolio holdings and characteristics are subject to change and may not be representative of current holdings and characteristics. The outlook for this Portfolio may differ from that presented for other ING Funds. Performance for the different classes of shares will vary based on differences in fees associated with each class.
6
PORTFOLIO MANAGERS' REPORT
ING AMERICAN CENTURY SMALL-MID CAP VALUE PORTFOLIO

| Average Annual Total Returns for the Periods Ended December 31, 2010 | |
| | | 1 Year | | 5 Year | | Since Inception
of Classes ADV, I and S
May 1, 2002 | | Since Inception
of Class S2
February 27, 2009 | |
| Class ADV | | | 21.80 | % | | | 6.12 | % | | | 7.86 | % | | | — | | |
| Class I | | | 22.36 | % | | | 6.65 | % | | | 8.40 | % | | | — | | |
| Class S | | | 22.02 | % | | | 6.38 | % | | | 8.13 | % | | | — | | |
| Class S2 | | | 21.87 | % | | | — | | | | — | | | | 47.39 | % | |
| Russell 2500TM Value Index | | | 24.82 | % | | | 3.85 | % | | | 7.51 | % | | | 48.74 | %(1) | |
| S&P SmallCap 600/Citigroup Value Index | | | 24.72 | % | | | 4.06 | % | | | 6.45 | % | | | 47.66 | %(1) | |
Based on a $10,000 initial investment, the graph and table above illustrate the total return of ING American Century Small-Mid Cap Value Portfolio against the indices indicated. An index is unmanaged and has no cash in its portfolio, imposes no sales charges and incurs no operating expenses. An investor cannot invest directly in an index. The Portfolio's performance is shown without the imposition of any expenses or charges which are, or may be, imposed under your annuity contract. Total returns would have been lower if such expenses or charges were included.
The performance graph and table do not reflect the deduction of taxes that a shareholder will pay on portfolio distributions or the redemption of portfolio shares.
The performance shown may include the effect of fee waivers and/or expense reimbursements by the Investment Adviser and/or other service providers, which have the effect of increasing total return. Had all fees and expenses been considered, the total returns would have been lower.
The performance update illustrates performance for a variable investment option available through a variable annuity contract. The performance shown indicates past performance and is not a projection or prediction of future results. Actual investment returns and principal value will fluctuate so that shares and/or units, at redemption, may be worth more or less than their original cost. Please call (800) 262-3862 to get performance through the most recent month end.
This report contains statements that may be "forward-looking" statements. Actual results may differ materially from those projected in the "forward-looking" statements.
The views expressed in this report reflect those of the portfolio manager only through the end of the period as stated on the cover. The portfolio manager's views are subject to change at any time based on marked and other conditions.
Portfolio holdings are subject to change daily.
(1) Since inception performance of the indices is shown from March 1, 2009.
7
ING BARON SMALL CAP GROWTH PORTFOLIO
PORTFOLIO MANAGERS' REPORT
ING Baron Small Cap Growth Portfolio (the "Portfolio") seeks capital appreciation. The Portfolio is managed by Ronald Baron, Founder, Chief Executive Officer, Chief Investment Officer, Chairman, and Portfolio Manager of BAMCO, Inc. ("BAMCO") — the Sub-Adviser.
Performance: For the year ended December 31, 2010, the Portfolio's Class S shares provided a total return of 26.50% compared to the Russell 2000® Growth Index and the Russell 2000® Index, which returned 29.09% and 26.85%, respectively, for the same period.
Portfolio Specifics: The Portfolio provided positive returns in 2010 in a year of market volatility. The U.S. economy delivered positive quarterly GDP growth since the third quarter of 2009, avoiding double-dip recession. The equity markets were volatile, spurred in part by the sovereign debt crisis in Europe and investor sentiment favoring fixed income securities and cash. For most of the year there were outflows from the U.S. equity markets and many businesses continued to keep significant cash on the sidelines. With this as a backdrop, the U.S. Federal Reserve provided additional stimulus in the form of quantitative easing which buoyed the stock market in September and through the fourth quarter, achieving its 52-week high in December.
The sector weightings of this Portfolio typically differ significantly from those of the Russell 2000® Growth Index. There are important trends occurring in several industries that we believe offer growth opportunities over the next few years independent of normal business cycles. In our search for new companies, we seek businesses with visionary leaders that are separating themselves from competitors through efficient operations, strong balance sheets, unique assets or properties and, in many cases, innovative and game changing technology.
The sectors that contributed the most to absolute performance were consumer discretionary, energy, and healthcare. Given the strength of the market during the fourth quarter, there were no detractors at the sector level for the year. Specific stocks that contributed the most to absolute performance were Under Armour, Inc. ("Under Armour"), Edwards Lifesciences Corp. ("Edwards") and Molycorp, Inc. ("Molycorp"). In addition to improved consumer sentiment and spending, Under Armour performed well due to its successful sneaker launch, improved merchandizing, and online sales growth. In addition to solid operating results, Edwards, a leading manufacturer of tissue heart valves, reported that its recent trial exceeded expectations and its upcoming trial will include two of its products. In our view, Edwards has a significant advantage over its competitors. Molycorp, producer of rare earths, is a company with a unique asset and barriers to entry, and we believe it is poised to grow due to favorable supply-demand trends in the rare earths market.
The individual stocks that detracted from absolute performance in a meaningful way were few; the three that hurt performance the most were Equinix, Inc. ("Equinix"), DeVry, Inc. ("DeVry") and Strayer Education, Inc. ("Strayer"). Equinix declined for the year due primarily to its earnings preannouncement in early October in which management lowered revenue guidance. U.S. education stocks, including DeVry and Strayer, languished all year. Most recently, post-secondary stocks came under pressure due to uncertainty around proposed tough new regulations. We continue to own these stocks because we are bullish on the long-term fundamentals of the industries and markets in which they operate and believe the companies are addressing their short-term issues and have solid multi-year growth prospects.
Relative to the Russell 2000® Growth Index, the Portfolio's investments in healthcare, energy and materials had a positive impact on relative performance. In addition to Edwards and Molycorp discussed above, Concho Resources, Inc., whose shares rose this year, contributed the most to relative performance within the energy sector. In addition to higher oil prices, the company benefitted from improving operational performance and a well timed and large acquisition.
The Portfolio's sectors that lagged relative to those of the Russell 2000® Growth Index were information technology, consumer discretionary and industrials. In addition to Equinix, DeVry and Strayer discussed above, Tetra Tech, Inc. ("Teta Tech"), a leading environmental engineering and consulting firm, was a detractor from relative performance in 2010. The company's shares came under pressure on fears of slowing infrastructure spending. After a rare earnings miss during the company's first quarter, Tetra Tech recovered strongly during the balance of the year.
Current Strategy and Outlook: The Portfolio invests in small-sized U.S. growth companies that we believe have the potential for producing outsized returns within four or five years. The Portfolio may retain companies whose market capitalizations rise beyond their original purchase price range. We think the stock market continues to undervalue many publicly traded companies relative to their prospects and relative to competitive fixed income instruments. Based upon our daily conversations with business executives, we believe the economy is now providing support for those businesses rather than serving as a headwind. We believe confidence is building and should translate into differentiated valuations and higher earnings multiples. Ultimately we believe investors make the most money when earnings multiples increase, not just when earnings increase. In our opinion, with current historically low interest rates, attractive stock price valuations and economic growth increasing, this could occur.
We believe that stock markets, commodity prices and interest rates, among other things, are unpredictable. We also believe that businesses' values over the long term are determined by their growth opportunities, financial strength and earnings, sustainable competitive advantages, and management talent. These analyses, valuations and comparisons are how we decide whether our fast growing, publicly owned businesses are attractively priced, not by guessing whether stock markets will rise or fall in the near term. We believe the growth prospects for the businesses in which we have invested are favorable. Our research remains focused on the long-term potential of the businesses in which we invest, and the Portfolio will remain focused on a select number of growth companies.
Industry Allocation
as of December 31, 2010
(as a percent of net assets)
| Consumer Discretionary | | | 26.9 | % | |
| Health Care | | | 13.3 | % | |
| Information Technology | | | 11.4 | % | |
| Financials | | | 11.3 | % | |
| Energy | | | 11.2 | % | |
| Industrials | | | 11.1 | % | |
| Consumer Staples | | | 6.0 | % | |
| Materials | | | 2.7 | % | |
| Utilities | | | 1.2 | % | |
| Telecommunication Services | | | 0.8 | % | |
| Other Assets and Liabilities — Net* | | | 4.1 | % | |
| Net Assets | | | 100.0 | % | |
* Includes short-term investments related to Blackrock Liquidity Funds TempFund Portfolio — Class I.
Portfolio holdings are subject to change daily.
Top Ten Holdings*
as of December 31, 2010
(as a percent of net assets)
| Vail Resorts, Inc. | | | 2.9 | % | |
| MSCI, Inc. — Class A | | | 2.9 | % | |
| Dick's Sporting Goods, Inc. | | | 2.6 | % | |
| Choice Hotels International, Inc. | | | 2.5 | % | |
| Mettler Toledo International, Inc. | | | 2.4 | % | |
| Molycorp, Inc. | | | 2.3 | % | |
| Genesee & Wyoming, Inc. | | | 2.2 | % | |
| Core Laboratories NV | | | 2.1 | % | |
| AMERIGROUP Corp. | | | 2.1 | % | |
| Edwards Lifesciences Corp. | | | 1.9 | % | |
* Excludes short-term investments related to Blackrock Liquidity Funds TempFund Portfolio — Class I.
Portfolio holdings are subject to change daily.
Portfolio holdings and characteristics are subject to change and may not be representative of current holdings and characteristics. The outlook for this Portfolio may differ from that presented for other ING Funds. Performance for the different classes of shares will vary based on differences in fees associated with each class.
8
PORTFOLIO MANAGERS' REPORT
ING BARON SMALL CAP GROWTH PORTFOLIO

| Average Annual Total Returns for the Periods Ended December 31, 2010 | |
| | | 1 Year | | 5 Year | | Since Inception
of Classes ADV, I and S
May 1, 2002 | | Since Inception
of Class S2
February 27, 2009 | |
| Class ADV | | | 26.24 | % | | | 3.95 | % | | | 7.87 | % | | | — | | |
| Class I | | | 26.85 | % | | | 4.45 | % | | | 8.42 | % | | | — | | |
| Class S | | | 26.50 | % | | | 4.20 | % | | | 8.15 | % | | | — | | |
| Class S2 | | | 26.28 | % | | | — | | | | — | | | | 45.42 | % | |
| Russell 2000® Growth Index | | | 29.09 | % | | | 5.30 | % | | | 6.05 | % | | | 49.72 | %(1) | |
| Russell 2000® Index | | | 26.85 | % | | | 4.47 | % | | | 6.44 | % | | | 48.56 | %(1) | |
Based on a $10,000 initial investment, the graph and table above illustrate the total return of ING Baron Small Cap Growth Portfolio against the indices indicated. An index is unmanaged and has no cash in its portfolio, imposes no sales charges and incurs no operating expenses. An investor cannot invest directly in an index. The Portfolio's performance is shown without the imposition of any expenses or charges which are, or may be, imposed under your annuity contract. Total returns would have been lower if such expenses or charges were included.
The performance graph and table do not reflect the deduction of taxes that a shareholder will pay on portfolio distributions or the redemption of portfolio shares.
The performance shown may include the effect of fee waivers and/or expense reimbursements by the Investment Adviser and/or other service providers, which have the effect of increasing total return. Had all fees and expenses been considered, the total returns would have been lower.
The performance update illustrates performance for a variable investment option available through a variable annuity contract. The performance shown indicates past performance and is not a projection or prediction of future results. Actual investment returns and principal value will fluctuate so that shares and/or units, at redemption, may be worth more or less than their original cost. Please call (800) 262-3862 to get performance through the most recent month end.
This report contains statements that may be "forward-looking" statements. Actual results may differ materially from those projected in the "forward-looking" statements.
The views expressed in this report reflect those of the portfolio manager only through the end of the period as stated on the cover. The portfolio manager's views are subject to change at any time based on marked and other conditions.
Portfolio holdings are subject to change daily.
(1) Since inception performance of the index is shown from March 1, 2009.
9
ING COLUMBIA SMALL CAP VALUE PORTFOLIO
PORTFOLIO MANAGERS' REPORT
ING Columbia Small Cap Value Portfolio (the "Portfolio") seeks long-term growth of capital. The Portfolio is managed by Christian Stadlinger and Jarl Ginsberg, Portfolio Managers, of Columbia Management Investment Advisers, LLC — the Sub-Adviser.*
Performance: For the year ended December 31, 2010, the Portfolio's Class I shares provided a total return of 25.48% compared to the Russell 2000® Value Index, which returned 24.50% for the same period.
Portfolio Specifics: The "risk on vs. risk off" trade characterized much of 2010, as investors either believed that global growth prospects were good and European risks were contained, or they believed that growth prospects were deteriorating and risk was high. In November, the Federal Reserve launched round two of quantitative easing through purchases of government bonds. Equity markets responded positively to this announced monetary stimulus. The economy also received a fiscal policy boost for 2011, as tax cuts of previous years were extended for another two years. Meanwhile, companies continued to report strong earnings and economic data towards the end of the year also came in slightly better than expected.
The small cap market provided strong absolute returns in 2010 as measured by the Russell 2000® Value Index. The Portfolio also outperformed its benchmark, the Russell 2000® Value Index. On an absolute basis, most sectors in the Portfolio saw positive double digit performance. The Portfolio benefited from both the choices in sector allocation as well as stock selection. Overall, the largest contributions came from information technology, consumer staples and consumer discretionary sectors. The Portfolio's largest detractors were due to stock selection in the financials and materials sectors.
Stock selection in the information technology sector drove contributions. The most meaningful contributions came from semiconductor companies Cirrus Logic and Atmel Corporation. Cirrus Logic, Inc. which provides audio chips for products such as the iPhone and iPad, saw its shares more than double. Atmel rose on exposure to a stronger emergence of smart phones and touch screen applications. Stock selection in food products contributed to performance in the consumer staples sector with contributions by pasta maker American Italian Pasta Co. Our investments in specialty retail were positives, such as retail footwear companies and Pier 1 Imports, Inc. Auto supply companies and parts suppliers to the trucking industry were strong contributors in the consumer discretionary sector.
While the Portfolio did benefit from an underweight position to the financials sector for the third year in a row, this was offset by stock selection as the Portfolio had focused on conservatively managed banking and real estate investment trust companies while the market focused on credit recovery stories.
Current Strategy and Outlook: Our investment process is to focus our research on those companies which we believe are attractively valued and where we believe the valuation gap is likely to shrink in the near term. We accomplish this by focusing on what we call an "upward inflection point," which essentially means we want stocks that are both inexpensive and are showing improving operating performance metrics. In thinking about the types of situations that are attractive to us, our opportunities typically encompass one or more of the following: 1) "Out-of-the-limelight" companies missed by the Wall Street research community; 2) cyclically-driven opportunities in industries that have been out of favor and show signs of resurgence; and 3) companies with compressed operating margins that we believe are poised to expand within a reasonable timeframe.
That said, moving into 2011 the Portfolio begins the year with a cyclical tilt — overweight the industrials and information technology sectors. The interest rate sensitive sectors of financials and utilities sectors are underweighted.
Industry Allocation
as of December 31, 2010
(as a percent of net assets)
| Financials | | | 28.9 | % | |
| Industrials | | | 19.9 | % | |
| Information Technology | | | 14.6 | % | |
| Consumer Discretionary | | | 10.6 | % | |
| Energy | | | 7.3 | % | |
| Materials | | | 6.4 | % | |
| Health Care | | | 5.4 | % | |
| Utilities | | | 3.6 | % | |
| Consumer Staples | | | 2.9 | % | |
| Telecommunication Services | | | 0.5 | % | |
| Other Assets and Liabilities — Net* | | | (0.1 | )% | |
| Net Assets | | | 100.0 | % | |
* Includes short-term investments related to Blackrock Liquidity Funds TempFund Portfolio — Class I.
Portfolio holdings are subject to change daily.
Top Ten Holdings*
as of December 31, 2010
(as a percent of net assets)
| United Rentals, Inc. | | | 1.2 | % | |
| New Jersey Resources Corp. | | | 1.2 | % | |
| Kindred Healthcare, Inc. | | | 1.1 | % | |
| U-Store-It Trust | | | 1.1 | % | |
| Swift Energy Co. | | | 1.1 | % | |
| IBERIABANK Corp. | | | 1.1 | % | |
| Textainer Group Holdings Ltd. | | | 1.1 | % | |
| Boise, Inc. | | | 1.0 | % | |
| LaSalle Hotel Properties | | | 1.0 | % | |
| Wabash National Corp. | | | 1.0 | % | |
* Excludes short-term investments related to Blackrock Liquidity Funds TempFund Portfolio — Class I.
Portfolio holdings are subject to change daily.
* Prior to April 30, 2010, the Portfolio was managed by investment sleeves. Effective April 30, 2010, the investment sleeve managed by Stephen Barbaro and Jeremy Javidi was eliminated and the assets of that sleeve were redeployed into the sleeve managed by Mr. Stadlinger and Mr. Ginsberg.
The Portfolio holdings and characteristics are subject to change and may not be representative of current holdings and characteristics. The outlook for this Portfolio may differ from that presented for other ING Funds. Performance for the different classes of shares will vary based on differences in fees associated with each class.
10
PORTFOLIO MANAGERS' REPORT
ING COLUMBIA SMALL CAP VALUE PORTFOLIO

| Average Annual Total Returns for the Periods Ended December 31, 2010 | |
| | | 1 Year | | Since Inception
of Class ADV
December 29, 2006 | | Since Inception
of Class I
April 28, 2006 | | Since Inception
of Class S
May 1, 2006 | | Since Inception
of Class S2
February 27, 2009 | |
| Class ADV | | | 24.98 | % | | | 1.21 | % | | | — | | | | — | | | | — | | |
| Class I | | | 25.48 | % | | | — | | | | 1.85 | % | | | — | | | | — | | |
| Class S | | | 25.28 | % | | | — | | | | — | | | | 1.70 | % | | | — | | |
| Class S2 | | | 25.04 | % | | | — | | | | — | | | | — | | | | 46.93 | % | |
| Russell 2000® Value Index | | | 24.50 | % | | | (0.95 | )%(1) | | | 0.94 | %(2) | | | 0.94 | % | | | 47.29 | %(3) | |
Based on a $10,000 initial investment, the graph and table above illustrate the total return of ING Columbia Small Cap Value Portfolio against the index indicated. An index is unmanaged and has no cash in its portfolio, imposes no sales charges and incurs no operating expenses. An investor cannot invest directly in an index. The Portfolio's performance is shown without the imposition of any expenses or charges which are, or may be, imposed under your annuity contract. Total returns would have been lower if such expenses or charges were included.
The performance graph and table do not reflect the deduction of taxes that a shareholder will pay on portfolio distributions or the redemption of portfolio shares.
The performance shown may include the effect of fee waivers and/or expense reimbursements by the Investment Adviser and/or other service providers, which have the effect of increasing total return. Had all fees and expenses been considered, the total returns would have been lower.
The performance update illustrates performance for a variable investment option available through a variable annuity contract. The performance shown indicates past performance and is not a projection or prediction of future results. Actual investment returns and principal value will fluctuate so that shares and/or units, at redemption, may be worth more or less than their original cost. Please call (800) 262-3862 to get performance through the most recent month end.
This report contains statements that may be "forward-looking" statements. Actual results may differ materially from those projected in the "forward-looking" statements.
The views expressed in this report reflect those of the portfolio manager only through the end of the period as stated on the cover. The portfolio manager's views are subject to change at any time based on marked and other conditions.
Portfolio holdings are subject to change daily.
(1) Since inception performance of the index is shown from January 1, 2007.
(2) Since inception performance of the index is shown from May 1, 2006.
(3) Since inception performance of the index is shown from March 1, 2009.
11
ING DAVIS NEW YORK VENTURE PORTFOLIO
PORTFOLIO MANAGERS' REPORT
ING Davis New York Venture Portfolio (the "Portfolio") seeks long-term growth of capital. The Portfolio is managed by Christopher C. Davis and Kenneth C. Feinberg, Portfolio Managers, with Davis Selected Advisers, L.P. ("Davis Advisers") — the Sub-Adviser.
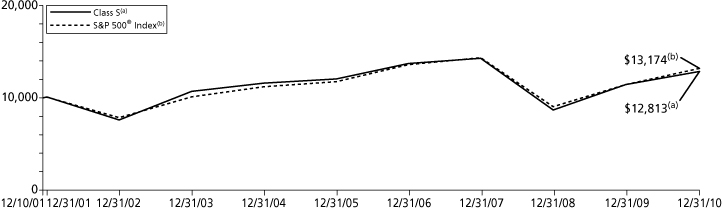
Performance: For the year ended December 31, 2010, the Portfolio's Class S shares provided a total return of 11.99% compared to the S&P 500® Index, which returned 15.06% for the same period.
Portfolio Specifics: The Portfolio had more invested in financials than any other sector and they were the most important contributor to the Portfolio's absolute performance. The Portfolio's financial companies outperformed the corresponding sector within the S&P 500® Index ("Index") and had a higher relative average weighting. Berkshire Hathaway, Inc., Wells Fargo & Co., and Progressive Corp. were among the most important contributors to performance while JPMorgan Chase Bank was among the most important detractors from performance.
Consumer staple companies were the second most important contributor to absolute performance. The Portfolio's consumer staple companies outperformed the corresponding sector within the Index and had a higher relative average weighting. Costco Wholesale Corp. and Coca-Cola Co. were among the most important contributors to performance.
While energy companies made positive contributions to absolute performance, they were the most important reason that the Portfolio lagged the Index. The Portfolio's energy companies under-performed the corresponding sector within the Index but had a higher relative average weighting in this stronger performing sector. Occidental Petroleum Corp. and Canadian Natural Resources Ltd. were among the most important contributors to performance while EOG Resources, Inc., Transocean, Inc., and China Coal Energy Co. were among the most important detractors from performance.
Industrial companies also made positive contributions to absolute performance but were the second most important detractor from relative performance versus the Index. The Portfolio's industrial companies underperformed the corresponding sector within the Index and had a lower relative average weighting in this stronger performing sector.
Other companies detracting from performance included Hewlett-Packard Co., Visa, Inc., and H&R Block, Inc. The Fund no longer owns H&R Block, Inc.
The Portfolio held approximately 19% of its assets in foreign companies (including american depositary receipts) at December 31, 2010. As a whole, these companies outperformed the domestic companies held by the Portfolio during 2010.
Current Strategy and Outlook: Our long-term focus usually results in low portfolio turnover. We try not to overreact to past short-term performance from individual holdings on either the upside or the downside. The Portfolio's investment strategy is to perform extensive research to buy durable companies at what we believe is a discount to their intrinsic values and to hold them for the long term. We focus deliberately on the future, considering each company's long-term business fundamentals.
As of December 31, 2010, only two companies had dropped out of the Portfolio's top 10 holdings from the end of 2009. This is consistent with our low-turnover strategy. The Portfolio continues to own both companies that dropped out, Berkshire Hathaway, Inc. and JPMorgan Chase Bank, but in reduced amounts. The two new additions to the Portfolio's top 10 holdings, CVS Caremark Corp. and Loews Corp., were both among the Portfolio's top 20 holdings as of the end of 2009.
Industry Allocation
as of December 31, 2010
(as a percent of net assets)
| Financials | | | 27.2 | % | |
| Consumer Staples | | | 16.7 | % | |
| Energy | | | 15.3 | % | |
| Health Care | | | 13.7 | % | |
| Materials | | | 8.4 | % | |
| Information Technology | | | 5.8 | % | |
| Consumer Discretionary | | | 5.7 | % | |
| Industrials | | | 5.0 | % | |
| Telecommunication Services | | | 0.4 | % | |
| Other Assets and Liabilities — Net* | | | 1.8 | % | |
| Net Assets | | | 100.0 | % | |
* Includes short-term investments related to commercial paper.
Portfolio holdings are subject to change daily.
Top Ten Holdings
as of December 31, 2010
(as a percent of net assets)
| Costco Wholesale Corp. | | | 4.3 | % | |
| Wells Fargo & Co. | | | 4.3 | % | |
| American Express Co. | | | 4.1 | % | |
| Bank of New York Mellon Corp. | | | 3.9 | % | |
| Occidental Petroleum Corp. | | | 3.8 | % | |
| CVS Caremark Corp. | | | 3.5 | % | |
| Devon Energy Corp. | | | 3.2 | % | |
| Canadian Natural Resources Ltd. | | | 3.1 | % | |
| EOG Resources, Inc. | | | 3.0 | % | |
| Loews Corp. | | | 3.0 | % | |
Portfolio holdings are subject to change daily.
Portfolio holdings and characteristics are subject to change and may not be representative of current holdings and characteristics. The outlook for this Portfolio may differ from that presented for other ING Funds. Performance for the different classes of shares will vary based on differences in fees associated with each class.
12
PORTFOLIO MANAGERS' REPORT
ING DAVIS NEW YORK VENTURE PORTFOLIO
| Average Annual Total Returns for the Periods Ended December 31, 2010 | |
| | | 1 Year | | 5 Year | | Since Inception
of Classes ADV, I and S
December 10, 2001 | |
| Class ADV | | | 11.79 | % | | | 0.98 | % | | | 2.53 | % | |
| Class I | | | 12.33 | % | | | 1.50 | % | | | 3.04 | % | |
| Class S | | | 11.99 | % | | | 1.22 | % | | | 2.77 | % | |
| S&P 500® Index | | | 15.06 | % | | | 2.29 | % | | | 3.08 | %(1) | |
Based on a $10,000 initial investment, the graph and table above illustrate the total return of ING Davis New York Venture Portfolio against the index indicated. An index is unmanaged and has no cash in its portfolio, imposes no sales charges and incurs no operating expenses. An investor cannot invest directly in an index. The Portfolio's performance is shown without the imposition of any expenses or charges which are, or may be, imposed under your annuity contract. Total returns would have been lower if such expenses or charges were included.
The performance graph and table do not reflect the deduction of taxes that a shareholder will pay on portfolio distributions or the redemption of portfolio shares.
The performance shown may include the effect of fee waivers and/or expense reimbursements by the Investment Adviser and/or other service providers, which have the effect of increasing total return. Had all fees and expenses been considered, the total returns would have been lower.
The performance update illustrates performance for a variable investment option available through a variable annuity contract. The performance shown indicates past performance and is not a projection or prediction of future results. Actual investment returns and principal value will fluctuate so that shares and/or units, at redemption, may be worth more or less than their original cost. Please call (800) 262-3862 to get performance through the most recent month end.
This report contains statements that may be "forward-looking" statements. Actual results may differ materially from those projected in the "forward-looking" statements.
The views expressed in this report reflect those of the portfolio manager only through the end of the period as stated on the cover. The portfolio manager's views are subject to change at any time based on marked and other conditions.
Portfolio holdings are subject to change daily.
(1) Since inception performance of the index is shown as of December 1, 2001.
Prior to October 31, 2005, the Portfolio was sub-advised by Salomon Brothers Asset Management Inc. Effective October 31, 2005, the Portfolio's principal investment strategies and name changed.
13
ING JPMORGAN MID CAP VALUE PORTFOLIO
PORTFOLIO MANAGERS' REPORT
ING JPMorgan Mid Cap Value Portfolio (the "Portfolio") seeks growth from capital appreciation. The Portfolio is managed by Jonathan K.L. Simon, Lawrence Playford and Gloria Fu, Portfolio Managers of J.P. Morgan Investment Management Inc. — the Sub-Adviser.
Performance: For the year ended December 31, 2010, the Portfolio's Class S shares provided a total return of 22.97% compared to the Russell Midcap® Value Index, which returned 24.75% for the same period.
Portfolio Specifics: Despite a year marred by various economic and political concerns, not to mention considerable market volatility, U.S. stocks manage to post healthy gains in 2010. While the Portfolio participated in much of the market's advance, the Portfolio underperformed its benchmark due mostly to stock selection in the energy, healthcare and consumer discretionary sectors. Alternatively, stock selection in the information technology, materials and utilities sectors contributed to results.
A top contributor to performance was the diversified insurance company, Old Republic International Corp. The stock was a strong performer on improving trends in its mortgage guaranty segment while its title insurance business has benefited from brisk refinancing activity.
Another contributor was Tyco Electronics Ltd., a global provider of engineered electronic components, network solutions, specialty products and undersea telecommunication systems. The company delivered solid results throughout the year. Tyco aggressively cut costs during the downturn and appears to be benefiting from the broad-based economic recovery.
H&R Block, Inc., a provider of tax, banking, and business and consulting services, was a top detractor from performance. The stock came under pressure as higher levels of unemployment led to a decline in tax returns and investor concerns over the continuing trend of individuals shifting to do-it-yourself tax preparation products. Given these headwinds, as well as significant turnover of senior management, we sold the stock and redeployed proceeds to what we believe are more attractive investment opportunities.
Another detractor from performance was Wilmington Trust Corp., a mid-Atlantic financial services and banking firm. Shares of the stock declined significantly as severe credit losses began to accelerate across a greater portion of its loan portfolio. This resulted in the company announcing that it would merge with Buffalo-based M&T Bank Corp. To eliminate the risk of the merger not materializing, the stock was removed from the Portfolio.
Current Strategy and Outlook: Our strategy employs a bottom-up approach to stock selection, constructing the Portfolio based on company fundamentals, quantitative screening and proprietary fundamental analysis. Our aim is to identify what we believe are undervalued companies that have the potential to increase their intrinsic values per share and to purchase these companies at a discount.
Industry Allocation
as of December 31, 2010
(as a percent of net assets)
| Financials | | | 24.0 | % | |
| Consumer Discretionary | | | 18.4 | % | |
| Utilities | | | 10.4 | % | |
| Industrials | | | 8.8 | % | |
| Energy | | | 8.6 | % | |
| Materials | | | 6.6 | % | |
| Health Care | | | 6.0 | % | |
| Consumer Staples | | | 5.6 | % | |
| Information Technology | | | 5.4 | % | |
| Telecommunication Services | | | 2.3 | % | |
| Other Assets and Liabilities — Net* | | | 3.9 | % | |
| Net Assets | | | 100.0 | % | |
* Includes short-term investments related to Blackrock Liquidity Funds TempFund Portfolio — Class I and securities lending collateral.
Portfolio holdings are subject to change daily.
Top Ten Holdings*
as of December 31, 2010
(as a percent of net assets)
| Gap, Inc. | | | 2.0 | % | |
| Loews Corp. | | | 1.9 | % | |
| Republic Services, Inc. | | | 1.8 | % | |
| Tyco Electronics Ltd. | | | 1.7 | % | |
| Energen Corp. | | | 1.6 | % | |
| Becton Dickinson & Co. | | | 1.6 | % | |
| Williams Cos., Inc. | | | 1.6 | % | |
| CMS Energy Corp. | | | 1.6 | % | |
| Devon Energy Corp. | | | 1.6 | % | |
| Ball Corp. | | | 1.5 | % | |
* Excludes short-term investments related to Blackrock Liquidity Funds TempFund Portfolio — Class I and securities lending collateral.
Portfolio holdings are subject to change daily.
Portfolio holdings and characteristics are subject to change and may not be representative of current holdings and characteristics. The outlook for this Portfolio may differ from that presented for other ING Funds. Performance for the different classes of shares will vary based on differences in fees associated with each class.
14
PORTFOLIO MANAGERS' REPORT
ING JPMORGAN MID CAP VALUE PORTFOLIO

| Average Annual Total Returns for the Periods Ended December 31, 2010 | |
| | | 1 Year | | 5 Year | | Since Inception
of Classes ADV, I and S
May 1, 2002 | | Since Inception
of Class S2
February 27, 2009 | |
| Class ADV | | | 22.63 | % | | | 4.03 | % | | | 7.67 | % | | | — | | |
| Class I | | | 23.30 | % | | | 4.55 | % | | | 8.22 | % | | | — | | |
| Class S | | | 22.97 | % | | | 4.29 | % | | | 7.95 | % | | | — | | |
| Class S2 | | | 22.75 | % | | | — | | | | — | | | | 41.20 | % | |
| Russell Midcap® Value Index | | | 24.75 | % | | | 4.08 | % | | | 8.13 | % | | | 51.18 | %(1) | |
Based on a $10,000 initial investment, the graph and table above illustrate the total return of ING JPMorgan Mid Cap Value Portfolio against the index indicated. An index is unmanaged and has no cash in its portfolio, imposes no sales charges and incurs no operating expenses. An investor cannot invest directly in an index. The Portfolio's performance is shown without the imposition of any expenses or charges which are, or may be, imposed under your annuity contract. Total returns would have been lower if such expenses or charges were included.
The performance graph and table do not reflect the deduction of taxes that a shareholder will pay on portfolio distributions or the redemption of portfolio shares.
The performance shown may include the effect of fee waivers and/or expense reimbursements by the Investment Adviser and/or other service providers, which have the effect of increasing total return. Had all fees and expenses been considered, the total returns would have been lower.
The performance update illustrates performance for a variable investment option available through a variable annuity contract. The performance shown indicates past performance and is not a projection or prediction of future results. Actual investment returns and principal value will fluctuate so that shares and/or units, at redemption, may be worth more or less than their original cost. Please call (800) 262-3862 to get performance through the most recent month end.
This report contains statements that may be "forward-looking" statements. Actual results may differ materially from those projected in the "forward-looking" statements.
The views expressed in this report reflect those of the portfolio manager only through the end of the period as stated on the cover. The portfolio manager's views are subject to change at any time based on marked and other conditions.
Portfolio holdings are subject to change daily.
(1) Since inception performance of the index is shown from March 1, 2009.
15
ING LEGG MASON CLEARBRIDGE AGGRESSIVE GROWTH PORTFOLIO
PORTFOLIO MANAGERS' REPORT
ING Legg Mason ClearBridge Aggressive Growth Portfolio (the "Portfolio") seeks long-term growth of capital. The Portfolio is managed by Richard Freeman, Managing Director, Senior Portfolio Manager and Evan Bauman, Managing Director, Portfolio Manager, of ClearBridge Advisors, LLC — the Sub-Adviser.
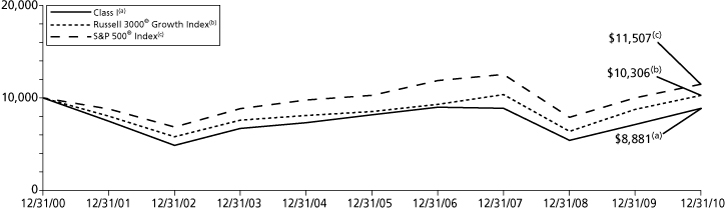
Performance: For the year ended December 31, 2010, the Portfolio's Class I shares provided a total return of 24.47% compared to the Russell 3000® Growth Index and the S&P 500® Index, which returned 17.64% and 15.06%, respectively, for the same period.
Portfolio Specifics: The year began well for the stock market, continuing the previous year's rally into January, but it soon stumbled over fears about the potential impact of the European sovereign debt crisis and fell to new lows in February. The market managed to recover over the remainder of the first quarter and rose into the start of the second, but was shaken badly by the dramatic May 6th intraday point drop known as the "Flash Crash" and driven to new lows for the year in July by weaker-than-expected employment data. Those lows were tested over the summer as investors continued to forgo stocks for the relative safety of U.S. Treasuries, which fell to record low yields after weak housing sales data fueled fears that the fragile economy would collapse into a "double-dip" recession.
But following indications from the Fed in late August of a second round of monetary stimulus, known as Quantitative Easing Part II ("QE2"), the market reversed course and began to rally at the start of September. The advance continued into the fourth quarter as stocks reacted positively to the midterm election results and the start of QE2 in November, the extension of the Bush-era tax package in December and improving economic and corporate earnings data.
The Portfolio's overall stock selection helped its performance relative to the benchmark index, while overall sector allocation detracted from relative performance. In particular, stock selection in the healthcare, information technology ("IT"), consumer discretionary, energy and materials sectors helped the Portfolio's relative performance, while stock selection in the industrials sector detracted from performance. The Portfolio's overweight positions in the healthcare and energy sectors and its underweight positions in the industrials and materials sectors detracted from relative performance, while underweight positions in the IT and consumer staples sectors and an overweight in the consumer discretionary sector helped relative performance. The leading individual contributors to Portfolio performance included Genzyme Corp., Biogen Idec, Inc. and UnitedHealth Group, Inc. in the healthcare sector, Cablevision Systems Corp. in the consumer discretionary sector and Weatherford International Ltd. in the energy sector. The leading detractors from relative performance included L-3 Communications Holdings, Inc. in the industrials sector, Seagate Technology, Inc. in the IT sector and Vertex Pharmaceuticals Inc., Amgen, Inc. and Covidien PLC in the healthcare sector.
Current Strategy and Outlook: Stock market valuations and corporate balance sheet strength is driving merger and acquisition activity, which is very positive in terms of big cash deals. We continue to view earnings health for companies as fairly good, while stocks on a price-to-earnings basis are still not expensive in comparison to other asset classes. That said, the market is up a lot off the bottom in March 2009 — that's where the yin-and-yang of our outlook lies — and we simply can't be as bullish as we were two years ago, but again we think the preconditions are just not present for any type of significant bear market to start anytime soon. Our focus is on what we believe are high quality growth equities with strong balance sheets, and in this type of slow growth domestic environment we have clearly seen this past year that those companies can out-execute the average company. Looking ahead, we still want to own companies we believe can grow in a challenging economy, with strong balance sheets and significant free cash flows.
Industry Allocation
as of December 31, 2010
(as a percent of net assets)
| Health Care | | | 35.9 | % | |
| Consumer Discretionary | | | 20.1 | % | |
| Energy | | | 18.8 | % | |
| Information Technology | | | 15.9 | % | |
| Industrials | | | 7.5 | % | |
| Materials | | | 1.8 | % | |
| Financials | | | 0.8 | % | |
| Other Assets and Liabilities — Net* | | | (0.8 | )% | |
| Net Assets | | | 100.0 | % | |
* Includes short-term investments related to Blackrock Liquidity Funds TempFund Portfolio — Class I and securities lending collateral.
Portfolio holdings are subject to change daily.
Top Ten Holdings
as of December 31, 2010
(as a percent of net assets)
| Anadarko Petroleum Corp. | | | 8.4 | % | |
| Weatherford International Ltd. | | | 7.8 | % | |
| Biogen Idec, Inc. | | | 7.5 | % | |
| Genzyme Corp. | | | 6.2 | % | |
| UnitedHealth Group, Inc. | | | 6.1 | % | |
| Cablevision Systems Corp. | | | 5.5 | % | |
| Amgen, Inc. | | | 5.3 | % | |
| Comcast Corp. — Special Class A | | | 4.5 | % | |
| Forest Laboratories, Inc. | | | 4.3 | % | |
| Sandisk Corp. | | | 3.3 | % | |
Portfolio holdings are subject to change daily.
Portfolio holdings and characteristics are subject to change and may not be representative of current holdings and characteristics. The outlook for this Portfolio may differ from that presented for other ING Funds. Performance for the different classes of shares will vary based on differences in fees associated with each class.
16
PORTFOLIO MANAGERS' REPORT
ING LEGG MASON CLEARBRIDGE AGGRESSIVE GROWTH PORTFOLIO
| Average Annual Total Returns for the Periods Ended December 31, 2010 | |
| | | 1 Year | | 5 Year | | 10 Year | | Since Inception
of Classes ADV and S
December 10, 2001 | | Since Inception
of Class S2
March 8, 2010 | |
| Class ADV | | | 23.84 | % | | | 1.16 | % | | | — | | | | 1.31 | % | | | — | | |
| Class I | | | 24.47 | % | | | 1.67 | % | | | (1.18 | )% | | | — | | | | — | | |
| Class S | | | 24.15 | % | | | 1.42 | % | | | — | | | | 1.56 | % | | | — | | |
| Class S2 | | | — | | | | — | | | | — | | | | — | | | | 16.01 | % | |
| Russell 3000® Growth Index | | | 17.64 | % | | | 3.88 | % | | | 0.30 | % | | | 2.80 | %(1) | | | 18.85 | %(2) | |
| S&P 500® Index | | | 15.06 | % | | | 2.29 | % | | | 1.41 | % | | | 3.08 | %(1) | | | 15.77 | %(2) | |
Based on a $10,000 initial investment, the graph and table above illustrate the total return of ING Legg Mason ClearBridge Aggressive Growth Portfolio against the indices indicated. An index is unmanaged and has no cash in its portfolio, imposes no sales charges and incurs no operating expenses. An investor cannot invest directly in an index. The Portfolio's performance is shown without the imposition of any expenses or charges which are, or may be, imposed under your annuity contract. Total returns would have been lower if such expenses or charges were included.
The performance graph and table do not reflect the deduction of taxes that a shareholder will pay on portfolio distributions or the redemption of portfolio shares.
The performance shown may include the effect of fee waivers and/or expense reimbursements by the Investment Adviser and/or other service providers, which have the effect of increasing total return. Had all fees and expenses been considered, the total returns would have been lower.
The performance update illustrates performance for a variable investment option available through a variable annuity contract. The performance shown indicates past performance and is not a projection or prediction of future results. Actual investment returns and principal value will fluctuate so that shares and/or units, at redemption, may be worth more or less than their original cost. Please call (800) 262-3862 to get performance through the most recent month end.
This report contains statements that may be "forward-looking" statements. Actual results may differ materially from those projected in the "forward-looking" statements.
The views expressed in this report reflect those of the portfolio manager only through the end of the period as stated on the cover. The portfolio manager's views are subject to change at any time based on marked and other conditions.
Portfolio holdings are subject to change daily.
(1) Since inception performance for the indices is shown from December 1, 2001.
(2) Since inception performance for the indices is shown from March 1, 2010.
Prior to December 16, 2002, the Portfolio was managed by Massachusetts Financial Services Company. Effective December 16, 2002, the Portfolio's name changed.
17
ING OPPENHEIMER GLOBAL PORTFOLIO
PORTFOLIO MANAGERS' REPORT
ING Oppenheimer Global Portfolio (the "Portfolio") seeks capital appreciation. The Portfolio is managed by Rajeev Bhaman, Senior Vice President of OppenheimerFunds, Inc. — the Sub-Adviser.
Performance: For the year ended December 31, 2010, the Portfolio's Class S shares provided a total return of 15.80% compared to the MSCI World IndexSM and the MSCI All Country World IndexSM, which returned 11.76% and 12.67%, respectively, for the same period.
Portfolio Specifics: Over the reporting period, events on the global economic scale unfolded much as we expected. We have seen a two-speed recovery, with slow, sub-par growth in the developed world and continued rapid growth in the emerging economies. We believe this is likely to persist for some time. Consumer debt in the U.S. generally continued to fall. Unemployment figures remained stubbornly high and housing markets in many economies, most significantly in the United States, continued to struggle. Understandably, consumer confidence remained low. To add to the tumult, the Eurozone's debt crisis sent markets sharply lower over the spring and summer.
In contrast, emerging markets continued to witness very strong growth during the period. Indeed, growth was so strong that we saw a tightening of monetary policy in order to rein in growth to sustainable levels and to keep a lid on inflation. High inflation, particularly in food prices, can put great pressure on economic, political and market stability in developing nations.
Our bottom-up approach of investing led us to overweight positions in the information technology and consumer discretionary sectors, where we have, in the past, consistently found the most companies that have the potential to grow faster over the long term compared to the overall market. These two sectors were the top two positive contributors to performance this reporting period. Within information technology, the largest contributors were U.S.-based companies Intuit, Inc., Altera Corp., and Juniper Networks, Inc., the Indian business software and outsourcing giant Infosys Technologies Ltd., and Swedish telecommunications giant Telefonaktiebolaget LM Ericsson. In consumer discretionary, the greatest contributors to performance included French luxury goods group LVMH Moet Hennessy Louis Vuitton SA, cruise and vacation company Carnival Corp., German automobile manufacturer BMW AG, Spanish company Industria de Diseno Textil SA, which is known worldwide for its Zara brand, and Tod's SpA, the Italian footwear manufacturer.
On the negative side, the greatest detractor from performance during the period was materials, where our underweight position in the sector hurt performance. Despite the recent run up in some commodity prices, we do not foresee overall prices continuing to rise and, as a consequence, believe most materials stocks to be overvalued. We currently plan to remain underweight this sector. Energy also provided negative results due to investments in Transocean Ltd. and Total SA.
At the country level, the United States was the strongest performer for the Portfolio closely followed by Sweden and Germany. As a result of its exposure to BMW AG and electronics and electrical engineering company Siemens AG, Germany outperformed the benchmark. The Fund's exposure to Sweden outperformed with contributions from Telefonaktiebolaget LM Ericsson and Assay Abloy AB. Switzerland was the greatest detractor to Portfolio performance because of poor showings by Credit Suisse Group AG and Transocean Ltd.
Current Strategy and Outlook: We believe the Portfolio is very well positioned at period end, and also believe our long-term, thematic based investment process as described earlier, is well suited in the current environment. In our opinion, growth companies will become more valuable in a world where growth is a scarce commodity. We anticipate overall growth, particularly in the developed world, will continue to be sub-par in the near term. Valuations are low by historic standards, particularly when measured against bonds. We are optimistic about the Portfolio's holdings given present equity valuations.
Country Allocation
as of December 31, 2010
(as a percent of net assets)
| United States | | | 37.1 | % | |
| Japan | | | 11.6 | % | |
| Germany | | | 9.0 | % | |
| Sweden | | | 6.7 | % | |
| Switzerland | | | 5.1 | % | |
| United Kingdom | | | 5.1 | % | |
| France | | | 5.0 | % | |
| Mexico | | | 3.6 | % | |
| Netherlands | | | 3.2 | % | |
| Spain | | | 2.3 | % | |
| India | | | 2.2 | % | |
| Italy | | | 2.2 | % | |
| Countries less than 2.2%(1) | | | 5.9 | % | |
| Other Assets and Liabilities — Net* | | | 1.0 | % | |
| Net Assets | | | 100.0 | % | |
* Includes short-term investments related to Blackrock Liquidity Funds TempFund Portfolio — Class I and securities lending collateral.
(1) Includes five countries, which each represents less than 2.2% of net assets.
Portfolio holdings are subject to change daily.
Top Ten Holdings
as of December 31, 2010
(as a percent of net assets)
| Telefonaktiebolaget LM Ericsson | | | 4.0 | % | |
| Siemens AG | | | 2.9 | % | |
| eBay, Inc. | | | 2.5 | % | |
| Credit Suisse Group | | | 2.2 | % | |
| Juniper Networks, Inc. | | | 2.1 | % | |
| Altera Corp. | | | 2.0 | % | |
| LVMH Moet Hennessy Louis Vuitton S.A. | | | 1.9 | % | |
| Tiffany & Co. | | | 1.9 | % | |
| Intuit, Inc. | | | 1.8 | % | |
| Carnival Corp. | | | 1.8 | % | |
Portfolio holdings are subject to change daily.
Portfolio holdings and characteristics are subject to change and may not be representative of current holdings and characteristics. The outlook for this Portfolio may differ from that presented for other ING Funds. Performance for the different classes of shares will vary based on differences in fees associated with each class.
18
PORTFOLIO MANAGERS' REPORT
ING OPPENHEIMER GLOBAL PORTFOLIO

| Average Annual Total Returns for the Periods Ended December 31, 2010 | |
| | | 1 Year | | 5 Year | | Since Inception
of Classes ADV, I and S
May 1, 2002 | | Since Inception
of Class S2
February 27, 2009 | |
| Class ADV | | | 15.42 | % | | | 3.46 | % | | | 6.27 | % | | | — | | |
| Class I | | | 16.06 | % | | | 3.98 | % | | | 6.93 | % | | | — | | |
| Class S | | | 15.80 | % | | | 3.73 | % | | | 6.53 | % | | | — | | |
| Class S2 | | | 15.63 | % | | | — | | | | — | | | | 42.70 | % | |
| MSCI World IndexSM | | | 11.76 | % | | | 2.43 | % | | | 5.25 | % | | | 36.70 | %(1) | |
| MSCI All Country World IndexSM | | | 12.67 | % | | | 3.44 | % | | | 6.14 | % | | | 39.40 | %(1) | |
Based on a $10,000 initial investment, the graph and table above illustrate the total return of ING Oppenheimer Global Portfolio against the indices indicated. An index is unmanaged and has no cash in its portfolio, imposes no sales charges and incurs no operating expenses. An investor cannot invest directly in an index. The Portfolio's performance is shown without the imposition of any expenses or charges which are, or may be, imposed under your annuity contract. Total returns would have been lower if such expenses or charges were included.
The performance graph and table do not reflect the deduction of taxes that a shareholder will pay on portfolio distributions or the redemption of portfolio shares.
The performance shown may include the effect of fee waivers and/or expense reimbursements by the Investment Adviser and/or other service providers, which have the effect of increasing total return. Had all fees and expenses been considered, the total returns would have been lower.
The performance update illustrates performance for a variable investment option available through a variable annuity contract. The performance shown indicates past performance and is not a projection or prediction of future results. Actual investment returns and principal value will fluctuate so that shares and/or units, at redemption, may be worth more or less than their original cost. Please call (800) 262-3862 to get performance through the most recent month end.
This report contains statements that may be "forward-looking" statements. Actual results may differ materially from those projected in the "forward-looking" statements.
The views expressed in this report reflect those of the portfolio manager only through the end of the period as stated on the cover. The portfolio manager's views are subject to change at any time based on marked and other conditions.
Portfolio holdings are subject to change daily.
(1) Since inception performance of the indices is shown from March 1, 2009.
Prior to November 8, 2004, the Portfolio was sub-advised by Massachusetts Financial Services Company. Effective November 8, 2004, the Portfolio's principal investment strategies and name changed.
19
ING OPPENHEIMER GLOBAL STRATEGIC INCOME PORTFOLIO
PORTFOLIO MANAGERS' REPORT
ING Oppenheimer Global Strategic Income Portfolio (the "Portfolio") seeks a high level of current income principally derived from interest on debt securities.* The Portfolio is managed by Arthur P. Steinmetz, Chief Investment Officer of Fixed Income and Senior Vice President; Krishna Memani, Senior Vice President and Head of the Investment Grade Fixed Income Team; Joseph Welsh, CFA, Vice President and Head of the High Yield Corporate Debt Team, Caleb Wong, Vice President, and Sara J. Zervos, Vice President and Director of International Research, Portfolio Managers, of OppenheimerFunds, Inc. — the Sub-Adviser.**
Performance: For the year ended December 31, 2010, the Portfolio's Class S shares provided a total return of 15.54% compared to the Barclays Capital U.S. Aggregate Bond Index and the S&P/Citigroup World Government Bond Index, which returned 6.54% and 5.17%, respectively, for the same period.
Portfolio Specifics: Although the U.S. and global economies continued to recover from a recession and worldwide financial crisis, the recovery proved to be choppy. Over the first half of 2010 in Europe, Greece and, later, Ireland struggled to finance heavy debt loads, sparking fears of contagion to other markets and compelling national governments throughout the region to adopt fiscal austerity measures. At the same time, inflationary pressures in China prompted local government authorities to raise short-term interest rates, which fueled new concerns in the spring of 2010 regarding a major engine of global economic growth. Japan encountered a drop in export activity when the yen appreciated sharply against most major currencies. Finally, demand for goods and services in the United States remained under pressure from persistently high levels of unemployment and troubled domestic housing markets.
Economic conditions generally continued to improve in Europe and the U.S. over the second half of 2010, and investor sentiment was bolstered when the U.S. Federal Reserve announced a new round of quantitative easing in the fall. Corporate earnings continued to exceed analysts' forecasts, commodity process rose amid robust demand for construction materials in the emerging markets, and the U.S. and global economies continued to expand at moderate rates.
During the reporting period, we generally maintained overweight exposure to markets and sectors that we expected to benefit from falling yield spreads, declining longer-term interest rates and robust investor demand. The Portfolio achieved particularly strong results from its emphasis on emerging-market bonds denominated in U.S. dollars, while those denominated in local currencies advanced to a lesser degree. The Portfolio's holdings from South Africa, Brazil, Indonesia, Mexico and Turkey fared particularly well. We generally focused on securities toward the lower end of the below-investment-grade range, as lower-rated bonds benefited more substantially than their higher-rated counterparts from the economic recovery. To help manage risks, we maintained a diversified mix of high yield bonds from a broad range of industry groups.
The Portfolio's more disappointing positions during 2010 included foreign bonds from the developed markets, particularly peripheral European nations at the center of the sovereign debt crisis. Egyptian T-bills and a short position in the euro also ranked among the Portfolio's laggards. We successfully employed futures contracts and other derivative instruments to help establish the Portfolio's duration position.
Current Strategy and Outlook: Looking forward, we believe 2011 will provide a generally favorable environment for global fixed-income securities. The world's major central banks appear likely to keep short-term interest rates near historically low levels due to the European sovereign debt crisis, deflationary pressures in Japan and persistently high U.S. unemployment. These factors suggest to us that global investors will continue to focus on higher-yielding securities. Therefore, we have maintained the Portfolio's emphasis on mortgage-backed securities ("MBS") over U.S. Treasury securities, and we recently found what we believe are new opportunities among commercial MBS and non-agency residential MBS. We have continued to focus the Portfolio's high yield investments on bonds with lower credit ratings, and we have complemented its high yield positions with senior bank loans that appear attractively valued to us. Although we believe that emerging-market bonds denominated in local currencies may benefit from a weakening U.S. dollar, we have maintained a blend of local and external debt securities to manage the risk that unforeseen developments may cause relative values to change.
Investment Type Allocation
as of December 31, 2010
(as a percent of net assets)
| Corporate Bonds/Notes | | | 34.7 | % | |
| Other Bonds | | | 24.8 | % | |
| U.S. Government Agency Obligations | | | 8.9 | % | |
| Collateralized Mortgage Obligations | | | 7.7 | % | |
| Mutual Funds | | | 4.1 | % | |
| Common Stock | | | 1.1 | % | |
| Structured Products | | | 1.0 | % | |
| Asset-Backed Securities | | | 0.9 | % | |
| Preferred Stock | | | 0.4 | % | |
| U.S. Treasury Obligations | | | 0.1 | % | |
| Positions in Purchased Options | | | 0.0 | % | |
| Warrants | | | 0.0 | % | |
| Other Assets and Liabilities — Net* | | | 16.3 | % | |
| Net Assets | | | 100.0 | % | |
* Includes short-term investments related to Blackrock Liquidity Funds TempFund Portfolio — Class I, securities lending collateral and U.S. Treasury Bill.
Portfolio holdings are subject to change daily.
Top Ten Holdings*
as of December 31, 2010
(as a percent of net assets)
| Oppenheimer Master Loan Fund | | | 4.1 | % | |
Brazil Notas do Tesouro Nacional Series F,
10.000%, due 01/01/17 | | | 2.3 | % | |
Brazil Notas do Tesouro Nacional Series F,
10.000%, due 01/01/21 | | | 0.9 | % | |
Poland Government International Bond,
5.500%, due 04/25/15 | | | 0.8 | % | |
South Africa Government International Bond,
7.250%, due 01/15/20 | | | 0.7 | % | |
Federal National Mortgage Association,
4.500%, due 01/25/39 | | | 0.7 | % | |
Japan Government Five Year Bond,
0.500%, due 12/20/14 | | | 0.7 | % | |
Turkey Government International Bond,
11.000%, due 08/06/14 | | | 0.7 | % | |
Federal Home Loan Mortgage Corporation,
1.125%, due 07/27/12 | | | 0.6 | % | |
Eastman Kodak Co.,
9.750%, due 03/01/18 | | | 0.6 | % | |
* Excludes short-term investments related to Blackrock Liquidity Funds TempFund Portfolio — Class I and securities lending collateral.
Portfolio holdings are subject to change daily.
* Effective January 21, 2011, the Portfolio's name, sub-adviser, investment objective and principal investment strategies were changed. Effective January 21, 2011, ING Investment Management Co. began managing the Portfolio under an interim sub-advisory agreement and the Portfolio's name changed to "ING Global Bond Portfolio."
** Effective October 6, 2010, Ms. Zervos was added as a portfolio manager to the Portfolio.
Portfolio holdings and characteristics are subject to change and may not be representative of current holdings and characteristics. The outlook for this Portfolio may differ from that presented for other ING Funds. Performance for the different classes of shares will vary based on differences in fees associated with each class.
20
PORTFOLIO MANAGERS' REPORT
ING OPPENHEIMER GLOBAL STRATEGIC INCOME PORTFOLIO
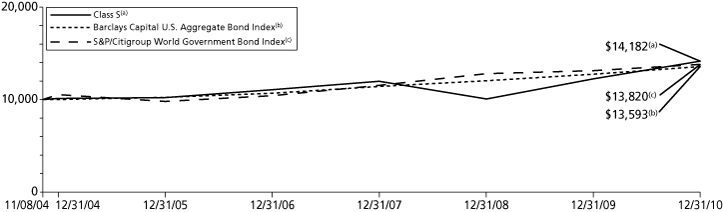
| Average Annual Total Returns for the Periods Ended December 31, 2010 | |
| | | 1 Year | | 5 Year | | Since Inception
of Classes ADV, I and S
November 8, 2004 | | Since Inception
of Class S2
March 8, 2010 | |
| Class ADV | | | 15.22 | % | | | 6.50 | % | | | 5.58 | % | | | — | | |
| Class I | | | 15.86 | % | | | 7.01 | % | | | 6.09 | % | | | — | | |
| Class S | | | 15.54 | % | | | 6.78 | % | | | 5.84 | % | | | — | | |
| Class S2 | | | — | | | | — | | | | — | | | | 12.31 | % | |
| Barclays Capital U.S. Aggregate Bond Index | | | 6.54 | % | | | 5.80 | % | | | 5.10 | %(1) | | | 4.55 | %(2) | |
| S&P/Citigroup World Government Bond Index | | | 5.17 | % | | | 7.09 | % | | | 5.39 | %(1) | | | 4.77 | %(2) | |
Based on a $10,000 initial investment, the graph and table above illustrate the total return of ING Oppenheimer Global Strategic Income Portfolio against the indices indicated. An index is unmanaged and has no cash in its portfolio, imposes no sales charges and incurs no operating expenses. An investor cannot invest directly in an index. The Portfolio's performance is shown without the imposition of any expenses or charges which are, or may be, imposed under your annuity contract. Total returns would have been lower if such expenses or charges were included.
The performance graph and table do not reflect the deduction of taxes that a shareholder will pay on portfolio distributions or the redemption of portfolio shares.
The performance shown may include the effect of fee waivers and/or expense reimbursements by the Investment Adviser and/or other service providers, which have the effect of increasing total return. Had all fees and expenses been considered, the total returns would have been lower.
The performance update illustrates performance for a variable investment option available through a variable annuity contract. The performance shown indicates past performance and is not a projection or prediction of future results. Actual investment returns and principal value will fluctuate so that shares and/or units, at redemption, may be worth more or less than their original cost. Please call (800) 262-3862 to get performance through the most recent month end.
This report contains statements that may be "forward-looking" statements. Actual results may differ materially from those projected in the "forward-looking" statements.
The views expressed in this report reflect those of the portfolio manager only through the end of the period as stated on the cover. The portfolio manager's views are subject to change at any time based on marked and other conditions.
Portfolio holdings are subject to change daily.
(1) Since inception performance for the indices is shown from November 1, 2004.
(2) Since inception performance for the indices is shown from March 1, 2010.
21
ING PIMCO TOTAL RETURN PORTFOLIO
PORTFOLIO MANAGERS' REPORT
ING PIMCO Total Return Portfolio (the "Portfolio") seeks maximum total return, consistent with preservation of capital and prudent investment management. The Portfolio is managed by William H. Gross, CFA, Managing Director, Co-Chief Investment Officer and Portfolio Manager, of Pacific Investment Management Company LLC — the Sub-Adviser.
Performance: For year ended December 31, 2010, the Portfolio's Class S shares provided a total return of 7.56% compared to the Barclays Capital U.S. Aggregate Bond Index, which returned 6.54% for the same period.
Portfolio Specifics: Tactical duration positioning in the U.S. was positive for portfolio performance as rates fell after a volatile year in yields.
An overweight to agency mortgage-backed securities ("MBS"), which outperformed Treasuries on like-duration basis for the full year, was positive for performance as higher mortgage rates later in the year tended to mute prepayment risk and helped mortgages' relative returns. An underweight to investment-grade corporate securities detracted from performance as this sector outperformed like-duration Treasuries as corporate credit fundamentals improved. However, a focus on financials helped in offsetting this negative contribution. Modest exposure to high yield bonds added to performance as the sector outperformed like-duration Treasuries amid investor shift towards riskier assets. Finally, a curve steepening position in the U.S., implemented via Eurodollar futures, added to returns.
Beyond core sectors, an overweight to emerging market ("EM") local instruments was positive for performance. For the full year, both EM local and external bonds outpaced Treasuries. Exposure to a variety of foreign currencies, with an emphasis on the Brazilian real and a basket of Asian currencies, added to returns as these appreciated relative to the U.S. dollar. Additionally, exposure to Treasury Inflation-Protected Securities ("TIPS") during 2010 outperformed their nominal counterparts for the full year. Breakeven inflation levels (the difference between nominal and real yields) for TIPS widened during the final period, a sign that the Fed's second round of quantitative easing was having some success. An allocation to municipal bonds, both tax-exempt and taxable Build America Bonds ("BABs"), had a difficult fourth quarter, though the asset class overall managed a positive total return for the full year. A modest exposure to BABs detracted from returns as taxable municipal supply spiked amid the rush by local governments to tap the federal government subsidy before it expires at the end of this year.
Current Strategy and Outlook: Our global cyclical forecast calls for differentiated growth and inflation across regions in 2011. We believe the strong growth and the potential for rising inflation in emerging economies will likely be offset by weaker growth in most developed economies, especially peripheral Europe. We believe that the tax compromise between the Obama Administration and Congress, especially the payroll tax cut and business tax credit, should boost U.S. growth over a cyclical time frame.
With regard to Portfolio's strategy, we plan to focus on what we believe are high-quality income producing strategies that are positively leveraged to the cyclical upswing that we expect in the U.S. in 2011. We plan to reduce U.S. duration exposure, targeting flat to slightly overweight duration overall with the intent to adjust duration tactically. We also plan to retain overweight agency mortgages as an important source of high quality yield in an effort to take advantage of relative value opportunities across mortgage coupons. We are targeting modest exposure to TIPS to obtain long term inflation protection as well as reap potential gains from "rolling down" the relatively steep real yield curve. Finally, we plan on taking EM currency exposure, including Brazil, China and other Asian currencies that could gain vs. the U.S. dollar.
Investment Type Allocation
as of December 31, 2010
(as a percent of net assets)
| U.S. Government Agency Obligations | | | 53.6 | % | |
| U.S. Treasury Obligations | | | 38.5 | % | |
| Corporate Bonds/Notes | | | 25.1 | % | |
| Other Bonds | | | 8.0 | % | |
| Collateralized Mortgage Obligations | | | 6.9 | % | |
| Municipal Bonds | | | 2.8 | % | |
| Preferred Stock | | | 1.4 | % | |
| Asset-Backed Securities | | | 0.4 | % | |
| Positions In Purchased Options | | | 0.0 | % | |
| Other Assets and Liabilities — Net* | | | (36.7 | )% | |
| Net Assets | | | 100.0 | % | |
* Includes short-term investments related to securities lending collateral and U.S. Treasury Bill.
Portfolio holdings are subject to change daily.
Top Ten Holdings*
as of December 31, 2010
(as a percent of net assets)
U.S. Treasury Note,
0.500%, due 10/15/13 | | | 21.9 | % | |
Federal National Mortgage Association,
4.500%, due 01/25/39 | | | 12.5 | % | |
Federal National Mortgage Association,
4.000%, due 08/25/40 | | | 7.0 | % | |
Japan Treasury Discount Bill,
0.090%, due 01/31/11 | | | 4.9 | % | |
Federal National Mortgage Association,
5.000%, due 01/13/40 | | | 2.9 | % | |
Federal National Mortgage Association,
5.500%, due 01/25/39 | | | 2.8 | % | |
Federal National Mortgage Association,
0.750%, due 12/18/13 | | | 2.5 | % | |
U.S. Treasury Note,
1.000%, due 07/15/13 | | | 2.2 | % | |
U.S. Treasury Note,
0.750%, due 08/15/13 | | | 2.0 | % | |
U.S. Treasury Note,
2.125%, due 05/31/15 | | | 1.9 | % | |
* Excludes short-term investments related to securities lending collateral.
Portfolio holdings are subject to change daily.
Portfolio holdings and characteristics are subject to change and may not be representative of current holdings and characteristics. The outlook for this Portfolio may differ from that presented for other ING Funds. Performance for the different classes of shares will vary based on differences in fees associated with each class.
22
PORTFOLIO MANAGERS' REPORT
ING PIMCO TOTAL RETURN PORTFOLIO

| Average Annual Total Returns for the Periods Ended December 31, 2010 | |
| | | 1 Year | | 5 Year | | Since Inception
of Classes ADV, I and S
May 1, 2002 | | Since Inception
of Class S2
February 27, 2009 | |
| Class ADV | | | 7.30 | % | | | 6.31 | % | | | 5.66 | % | | | — | | |
| Class I | | | 7.84 | % | | | 6.84 | % | | | 6.19 | % | | | — | | |
| Class S | | | 7.56 | % | | | 6.58 | % | | | 5.93 | % | | | — | | |
| Class S2 | | | 7.38 | % | | | — | | | | — | | | | 12.86 | % | |
| Barclays Capital U.S. Aggregate Bond Index | | | 6.54 | % | | | 5.80 | % | | | 5.52 | % | | | 7.56 | %(1) | |
Based on a $10,000 initial investment, the graph and table above illustrate the total return of ING PIMCO Total Return Portfolio against the index indicated. An index is unmanaged and has no cash in its portfolio, imposes no sales charges and incurs no operating expenses. An investor cannot invest directly in an index. The Portfolio's performance is shown without the imposition of any expenses or charges which are, or may be, imposed under your annuity contract. Total returns would have been lower if such expenses or charges were included.
The performance graph and table do not reflect the deduction of taxes that a shareholder will pay on portfolio distributions or the redemption of portfolio shares.
The performance shown may include the effect of fee waivers and/or expense reimbursements by the Investment Adviser and/or other service providers, which have the effect of increasing total return. Had all fees and expenses been considered, the total returns would have been lower.
The performance update illustrates performance for a variable investment option available through a variable annuity contract. The performance shown indicates past performance and is not a projection or prediction of future results. Actual investment returns and principal value will fluctuate so that shares and/or units, at redemption, may be worth more or less than their original cost. Please call (800) 262-3862 to get performance through the most recent month end.
This report contains statements that may be "forward-looking" statements. Actual results may differ materially from those projected in the "forward-looking" statements.
The views expressed in this report reflect those of the portfolio manager only through the end of the period as stated on the cover. The portfolio manager's views are subject to change at any time based on marked and other conditions.
Portfolio holdings are subject to change daily.
(1) Since inception performance of the index is shown from March 1, 2009.
23
ING PIONEER HIGH YIELD PORTFOLIO
PORTFOLIO MANAGERS' REPORT
ING Pioneer High Yield Portfolio (the "Portfolio") seeks to maximize total return through income and capital appreciation. The Portfolio is managed by Andrew Feltus and Tracy Wright, Portfolio Managers, Pioneer Investment Management, Inc. — the Sub-Adviser.
Performance: For the year ended December 31, 2010, the Portfolio's Class I shares provided a total return of 19.02% compared to the Bank of America/Merrill Lynch High Yield Master II Index and the Bank of America/ Merrill Lynch All U.S. Convertibles (Speculative Grade) Index, which returned 15.19% and 20.47%, respectively, for the same period.
Portfolio Specifics: Risk markets rallied in 2010, buoyed by accommodative monetary policy and continued post-recession global growth, albeit at a mostly tame pace. Thus, the Portfolio's three allocations to fixed income, equities, and convertible bonds were the key drivers to outperformance versus the Bank of America/Merrill Lynch High Yield Master II Index. The high yield and equity markets both performed well, as the Bank of America/Merrill Lynch High Yield Master II Index and the S&P 500® Index returned 15.19% and 15.06%, respectively. Convertibles, however, did even better, gaining 20.47% as measured by the Bank of America/Merrill Lynch All U.S. Convertibles (Speculative Grade) Index. At year-end, the Portfolio had a 16.04% weighting in stocks, 22.53% allocation to convertibles, and the balance in high yield fixed income. From a sector perspective, capital goods and consumer non-cyclicals were two of the Portfolio's top performers, especially in the convertibles segment. On the other hand, the services sector was one of the weakest for the Portfolio. Overall security selection was a major portion of outperformance versus the Bank of America/Merrill Lynch High Yield Master II Index. In fixed income, media and basic industry contributed to returns, while certain names in insurance and real estate detracted. Security selection in the equity and convertible bonds space was a large contributor as well, including companies in the materials and capital goods segments. Concerning credit quality, BB rated securities were the worst performing, while non-rated ones were the best.
Notable investments boosting performance included the convertible bonds of Wesco International, Inc., an electrical product producer, the common stock of Freeport-McMoRan Copper & Gold Co., a copper miner, and the convertible preferred stock and bonds of real estate concern, Forest City Enterprises, Inc. Securities subtracting from performance included the common stocks of gaming companies Scientific Games Corp. and driller Hercules Offshore, and the corporate bonds of Mashantucket Western Pequot Tribe, a hotel and casino enterprise.
We believe the global economic recovery will benefit commodities, energy, capital goods, and basic materials companies and have positioned the Portfolio accordingly.
Current Strategy and Outlook: We believe the U.S. will achieve gross domestic product growth of over 3% in 2011, led by the corporate sector. Inflation is not an immediate concern, but could pose a significant intermediate threat, if monetary and fiscal stimulus and the deteriorating government debt situation are not managed effectively. Given the reduced expected global growth outlook and continued high levels of unemployment in the U.S., we believe the Federal Reserve will probably extend the low rate environment through most of 2011. We continue to see value in high yield, given the generally strong financial position of corporations and low default expectations over the coming year. We continue to focus on security selection, which we see as a core strength.
The quality of the fixed income portion of the Portfolio maintains a higher quality bias, focusing in the BB and B sectors; the equity-linked portion of the Portfolio acts as the high beta portion of the Portfolio. We do not believe duration is a key driver of high yield performance, and maintain a relatively short duration relative to the benchmark. The yields in the high yield market have decreased over the year due to a rally in risk markets buoyed by accommodative U.S. monetary policy, solid corporate profits, and declining default rates.
Investment Type Allocation
as of December 31, 2010
(as a percent of net assets)
| Corporate Bonds/Notes | | | 75.9 | % | |
| Common Stock | | | 16.3 | % | |
| Preferred Stock | | | 3.4 | % | |
| Mutual Funds | | | 1.7 | % | |
| Collateralized Mortgage Obligations | | | 1.0 | % | |
| Real Estate Investment Trusts | | | 0.3 | % | |
| Asset-Backed Securities | | | 0.2 | % | |
| Warrants | | | 0.0 | % | |
| Other Assets and Liabilities — Net | | | 1.2 | % | |
| Net Assets | | | 100.0 | % | |
Portfolio holdings are subject to change daily.
Top Ten Holdings*
as of December 31, 2010
(as a percent of net assets)
Wesco International, Inc.,
6.000%, due 09/15/29 | | | 2.4 | % | |
Forest City Enterprises, Inc.,
6.500%, due 02/01/17 | | | 1.9 | % | |
| Forest City Enterprises, Inc. | | | 1.9 | % | |
Tesoro Corp.,
6.500%, due 06/01/17 | | | 1.8 | % | |
Nova Chemicals Corp.,
7.875%, due 09/15/25 | | | 1.3 | % | |
| LyondellBasell Industries NV | | | 1.3 | % | |
Roper Industries, Inc.,
0.180%, due 01/15/34 | | | 1.1 | % | |
| Freeport-McMoRan Copper & Gold, Inc. | | | 1.0 | % | |
Anixter International, Inc.,
5.950%, due 03/01/15 | | | 1.0 | % | |
Commscope, Inc.,
0.000%, due 10/26/11 | | | 1.0 | % | |
* Excludes short-term investments related to Blackrock Liquidity Funds TempFund Portfolio — Class I.
Portfolio holdings are subject to change daily.
Portfolio holdings and characteristics are subject to change and may not be representative of current holdings and characteristics. The outlook for this Portfolio may differ from that presented for other ING Funds. Performance for the different classes of shares will vary based on differences in fees associated with each class.
24
PORTFOLIO MANAGERS' REPORT
ING PIONEER HIGH YIELD PORTFOLIO

| Average Annual Total Returns for the Periods Ended December 31, 2010 | |
| | | 1 Year | | Since Inception
of Class I
January 3, 2006 | | Since Inception
of Classes ADV and S
January 20, 2006 | |
| Class ADV | | | 18.38 | % | | | — | | | | 9.57 | % | |
| Class I | | | 19.02 | % | | | 10.04 | % | | | — | | |
| Class S | | | 18.73 | % | | | — | | | | 9.87 | % | |
| Bank of America/Merrill Lynch High Yield Master II Index | | | 15.19 | % | | | 8.81 | %(1) | | | 8.62 | %(2) | |
| Bank of America/Merrill Lynch All U.S. Convertibles (Speculative Grade) Index | | | 20.47 | % | | | 7.82 | %(1) | | | 6.74 | %(2) | |
Based on a $10,000 initial investment, the graph and table above illustrate the total return of ING Pioneer High Yield Portfolio against the indices indicated. An index is unmanaged and has no cash in its portfolio, imposes no sales charges and incurs no operating expenses. An investor cannot invest directly in an index. The Portfolio's performance is shown without the imposition of any expenses or charges which are, or may be, imposed under your annuity contract. Total returns would have been lower if such expenses or charges were included.
The performance graph and table do not reflect the deduction of taxes that a shareholder will pay on portfolio distributions or the redemption of portfolio shares.
The performance shown may include the effect of fee waivers and/or expense reimbursements by the Investment Adviser and/or other service providers, which have the effect of increasing total return. Had all fees and expenses been considered, the total returns would have been lower.
The performance update illustrates performance for a variable investment option available through a variable annuity contract. The performance shown indicates past performance and is not a projection or prediction of future results. Actual investment returns and principal value will fluctuate so that shares and/or units, at redemption, may be worth more or less than their original cost. Please call (800) 262-3862 to get performance through the most recent month end.
This report contains statements that may be "forward-looking" statements. Actual results may differ materially from those projected in the "forward-looking" statements.
The views expressed in this report reflect those of the portfolio manager only through the end of the period as stated on the cover. The portfolio manager's views are subject to change at any time based on marked and other conditions.
Portfolio holdings are subject to change daily.
(1) Since inception performance of the indices is shown from January 1, 2006.
(2) Since inception performance of the indices is shown from February 1, 2006.
25
ING T. ROWE PRICE DIVERSIFIED MID CAP GROWTH PORTFOLIO
PORTFOLIO MANAGERS' REPORT
ING T. Rowe Price Diversified Mid Cap Growth Portfolio (the "Portfolio") seeks long-term capital appreciation. The Portfolio is managed by Donald Peters and Donald Easley, CFA, Portfolio Managers, of T. Rowe Price Associates, Inc. — the Sub-Adviser.
Performance: For the year ended December 31, 2010, the Portfolio's Class S shares provided a total return of 28.12% compared to the S&P MidCap 400 Index and the Russell Midcap® Growth Index, which returned 26.64% and 26.38%, respectively, for the same period.
Portfolio Specifics: The Portfolio outpaced the Russell Midcap® Growth Index for the year. Broadly speaking, stock selection drove the outperformance and sector allocation had limited impact. Energy, information technology, and materials helped relative returns, while financials detracted.
Energy was a primary driver of outperformance, due to stock choices. Our holdings in the oil, gas, and consumable fuels industry proved particularly helpful, most notably Concho Resources, Inc., Peabody Energy Corp., and Forest Oil Corp. Elsewhere in the sector, our position in Core Laboratories NV added value, as the company has very little competition in its specialized niche. Our exposure in energy does not represent a play on commodity prices. Instead, we seek differentiated service or exploration companies that are less closely leveraged to movements in commodities.
Stock selection in information technology added relative value as well. Data center firm Rackspace Hosting, Inc. benefited from increased demand, while McAfee, Inc. ("McAfee") was acquired by Intel Corp. at a significant premium. We eliminated our position in McAfee on strength. In information technology, our focus is on companies with strong business models in industries with high barriers to entry and low commodification risk.
In materials, our stock holdings also outpaced their benchmark peers. Increased potash demand drove results for Sociedad Quimica y Minera de Chile SA. In the mining and metals industry, commodity prices boosted returns for a wide range of holdings, including Walter Energy and Cliffs Natural Resources, Inc. We tend to have limited exposure in materials, preferring to focus on differentiated businesses that are less susceptible to fluctuations in commodity prices.
A key detractor was financials, where our stock holdings underperformed. Our positions in U.S. options exchange CBOE Holdings, Inc. and asset manager Artio Global Investors, Inc. both proved detrimental here. Within financials, we favor capital markets companies, particularly asset managers and trust banks, due to their strong long-term prospects and risk-reward trade-off. In diversified financial services, our preference is for companies that own a variety of securities and commodities exchanges. We have been increasing our exposure in insurance, as we see a favorable pricing environment coming out of the financial crisis.
Current Strategy and Outlook: The economy continued its slow recovery during the fourth quarter. As consumers tried to shore up their balance sheets, the Federal Reserve attempted to compensate with a new round of quantitative easing; however, we question the effectiveness of the move as it contributes to currency volatility. We are mindful that the recent rally focused on a relatively narrow group of high-momentum stocks, but we believe that in the long run, mid-cap growth investors are better served by focusing on reasonably priced companies with enduring franchises. Equity valuations are attractive compared to bonds, particularly in light of the recent Federal Reserve action. Ultimately, we believe the only long-term path to economic growth for the U.S. is to produce more domestically, leading us to seek out what we believe are high-value-added manufacturing firms that stand to benefit from a decrease in offshore production. Meanwhile, we are cautious on consumer discretionary, due to weak consumer spending.
Industry Allocation
as of December 31, 2010
(as a percent of net assets)
| Information Technology | | | 23.4 | % | |
| Consumer Discretionary | | | 18.5 | % | |
| Industrials | | | 17.0 | % | |
| Health Care | | | 12.8 | % | |
| Financials | | | 8.2 | % | |
| Energy | | | 7.8 | % | |
| Materials | | | 6.3 | % | |
| Consumer Staples | | | 3.7 | % | |
| Telecommunication Services | | | 1.5 | % | |
| Utilities | | | 0.6 | % | |
| Other Assets and Liabilities — Net* | | | 0.2 | % | |
| Net Assets | | | 100.0 | % | |
* Includes short-term investments related to T. Rowe Price Reserve Investment Fund and securities lending collateral.
Portfolio holdings are subject to change daily.
Top Ten Holdings*
as of December 31, 2010
(as a percent of net assets)
| Cummins, Inc. | | | 1.1 | % | |
| Priceline.com, Inc. | | | 1.0 | % | |
| Coach, Inc. | | | 1.0 | % | |
| FMC Technologies, Inc. | | | 0.9 | % | |
| Western Union Co. | | | 0.8 | % | |
| Concho Resources, Inc. | | | 0.7 | % | |
| Starwood Hotels & Resorts Worldwide, Inc. | | | 0.7 | % | |
| CH Robinson Worldwide, Inc. | | | 0.7 | % | |
| Precision Castparts Corp. | | | 0.7 | % | |
| Compass Minerals International, Inc. | | | 0.7 | % | |
* Excludes short-term investments related to securities lending collateral.
Portfolio holdings are subject to change daily.
Portfolio holdings and characteristics are subject to change and may not be representative of current holdings and characteristics. The outlook for this Portfolio may differ from that presented for other ING Funds. Performance for the different classes of shares will vary based on differences in fees associated with each class.
26
PORTFOLIO MANAGERS' REPORT
ING T. ROWE PRICE DIVERSIFIED MID CAP GROWTH PORTFOLIO
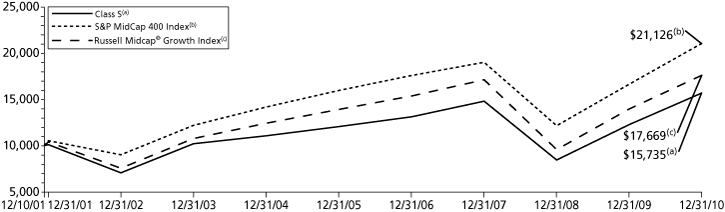
| Average Annual Total Returns for the Periods Ended December 31, 2010 | |
| | | 1 Year | | 5 Year | | Since Inception
of Classes ADV, I and S
December 10, 2001 | | Since Inception
of Class S2
February 27, 2009 | |
| Class ADV | | | 27.79 | % | | | 5.24 | % | | | 4.88 | % | | | — | | |
| Class I | | | 28.51 | % | | | 5.76 | % | | | 5.41 | % | | | — | | |
| Class S | | | 28.12 | % | | | 5.50 | % | | | 5.13 | % | | | — | | |
| Class S2 | | | 27.99 | % | | | — | | | | — | | | | 49.53 | % | |
| S&P MidCap 400 Index | | | 26.64 | % | | | 5.74 | % | | | 8.58 | %(1) | | | 48.98 | %(2) | |
| Russell Midcap® Growth Index | | | 26.38 | % | | | 4.88 | % | | | 6.47 | %(1) | | | 49.71 | %(2) | |
Based on a $10,000 initial investment, the graph and table above illustrate the total return of ING T. Rowe Price Diversified Mid Cap Growth Portfolio against the indices indicated. An index is unmanaged and has no cash in its portfolio, imposes no sales charges and incurs no operating expenses. An investor cannot invest directly in an index. The Portfolio's performance is shown without the imposition of any expenses or charges which are, or may be, imposed under your annuity contract. Total returns would have been lower if such expenses or charges were included.
The performance graph and table do not reflect the deduction of taxes that a shareholder will pay on portfolio distributions or the redemption of portfolio shares.
The performance shown may include the effect of fee waivers and/or expense reimbursements by the Investment Adviser and/or other service providers, which have the effect of increasing total return. Had all fees and expenses been considered, the total returns would have been lower.
The performance update illustrates performance for a variable investment option available through a variable annuity contract. The performance shown indicates past performance and is not a projection or prediction of future results. Actual investment returns and principal value will fluctuate so that shares and/or units, at redemption, may be worth more or less than their original cost. Please call (800) 262-3862 to get performance through the most recent month end.
This report contains statements that may be "forward-looking" statements. Actual results may differ materially from those projected in the "forward-looking" statements.
The views expressed in this report reflect those of the portfolio manager only through the end of the period as stated on the cover. The portfolio manager's views are subject to change at any time based on marked and other conditions.
Portfolio holdings are subject to change daily.
(1) Since inception performance for the indices is shown from December 1, 2001.
(2) Since inception performance of the indices is shown from March 1, 2009.
Prior to November 8, 2004, the Portfolio was sub-advised by Fred Alger Management, Inc. Effective November 8, 2004, T. Rowe Price became the sub-adviser and the Portfolio's principal investment strategies and name changed.
27
ING T. ROWE PRICE GROWTH EQUITY PORTFOLIO
PORTFOLIO MANAGERS' REPORT
ING T. Rowe Price Growth Equity Portfolio (the "Portfolio") seeks long-term capital growth, and secondarily, increasing dividend income. The Portfolio is managed by Robert Bartolo, Portfolio Manager of T. Rowe Price Associates, Inc. — the Sub-Adviser.
Performance: For the year ended December 31, 2010, the Portfolio's Class I shares, provided a total return of 16.86% compared to the S&P 500® Index, which returned 15.06% for the same period.
Portfolio Specifics: Stock selection was the primary reason for relative outperformance by the Portfolio, but sector weighting overall aided relative results. The consumer discretionary sector was by far the leading outperformer, due to stock selection and a significant overweight position. Information technology and healthcare also outperformed. The financials and energy sectors relatively underperformed.
The consumer discretionary outperformed on stock selection and a favorable overweight position. Amazon.com, Inc. continued to outperform due to strong earnings and a positive impact of its new Kindle eReader. The stock price recently reached a new high, and the Internet retailer continues to gain more market share. Share prices of AutoZone, Inc. continued to climb steadily as reports show Americans are keeping their cars longer, leading to higher demand for parts and maintenance. Luxury leather goods maker Coach, Inc. benefited from increased earnings, sales, and profit margins.
The information technology sector outperformed on stock selection, offsetting an unfavorable overweight position. Apple, Inc. was the top contributor to the Portfolio for the year, experiencing tremendous growth in all three major products (iPhones, iPods, Macs) and the new iPad shows signs of having a similar impact on future earnings. The share price of Baidu.com ADR, China's dominant Internet search engine, more than doubled in the 12 months, as earnings continued to grow.
The financials sector was by far the leading detractor, due to stock selection. Not owning Citigroup, Inc. hurt relative results as the company rebounded strongly in the year. Charles Schwab Corp. underperformed due to a larger exposure to money-market funds. In this low-interest environment, asset managers such as Charles Schwab Corp. were forced to waive fees on these funds so investors would not lose money.
Current Strategy and Outlook: U.S. stocks rose briskly in the fourth quarter of 2010, closing near their highest levels of the year and capping a second consecutive year of strong gains. Equities advanced as the economy showed signs of improvement and the Federal Reserve signaled that it would purchase more Treasury securities in an attempt to keep long-term interest rates low. The rally was supported by late-year bipartisan legislation to extend for two years the Bush-era tax cuts that were set to expire. We are modestly positive on the equities market. We believe earnings and cash flow should improve, boosting investor confidence. We favor exposure to companies that can benefit from more robust growth in emerging markets. We believe there is also a good chance for multiple expansion in U.S. equities, as cash sitting on the sidelines is reallocated back into stocks. U.S. equities seem attractively valued and corporate fundamentals appear very strong. We believe the Portfolio is positioned for growth with an overweight in the information technology and consumer discretionary sectors.
Industry Allocation
as of December 31, 2010
(as a percent of net assets)
| Information Technology | | | 31.3 | % | |
| Consumer Discretionary | | | 18.8 | % | |
| Industrials | | | 15.3 | % | |
| Energy | | | 8.8 | % | |
| Financials | | | 7.5 | % | |
| Health Care | | | 6.0 | % | |
| Materials | | | 5.5 | % | |
| Telecommunication Services | | | 3.8 | % | |
| Consumer Staples | | | 2.4 | % | |
| Other Assets and Liabilities — Net* | | | 0.6 | % | |
| Net Assets | | | 100.0 | % | |
* Includes short-term investments related to T. Rowe Price Reserve Investment Fund and securities lending collateral.
Portfolio holdings are subject to change daily.
Top Ten Holdings
as of December 31, 2010
(as a percent of net assets)
| Apple, Inc. | | | 7.3 | % | |
| Google, Inc. — Class A | | | 5.2 | % | |
| Amazon.com, Inc. | | | 4.2 | % | |
| Danaher Corp. | | | 3.0 | % | |
| Praxair, Inc. | | | 2.2 | % | |
| Crown Castle International Corp. | | | 2.2 | % | |
| Qualcomm, Inc. | | | 2.0 | % | |
| Visa, Inc. | | | 1.9 | % | |
| Baidu.com ADR | | | 1.9 | % | |
| Schlumberger Ltd. | | | 1.8 | % | |
Portfolio holdings are subject to change daily.
Portfolio holdings and characteristics are subject to change and may not be representative of current holdings and characteristics. The outlook for this Portfolio may differ from that presented for other ING Funds. Performance for the different classes of shares will vary based on differences in fees associated with each class.
28
PORTFOLIO MANAGERS' REPORT
ING T. ROWE PRICE GROWTH EQUITY PORTFOLIO

| Average Annual Total Returns for the Periods Ended December 31, 2010 | |
| | | 1 Year | | 5 Year | | 10 Year | | Since Inception
of Classes ADV and S
December 10, 2001 | | Since Inception
of Class S2
February 27, 2009 | |
| Class ADV | | | 16.27 | % | | | 3.23 | % | | | — | | | | 3.32 | % | | | — | | |
| Class I | | | 16.86 | % | | | 3.75 | % | | | 2.39 | % | | | — | | | | — | | |
| Class S | | | 16.58 | % | | | 3.49 | % | | | — | | | | 3.58 | % | | | — | | |
| Class S2 | | | 16.39 | % | | | — | | | | — | | | | — | | | | 37.56 | % | |
| S&P 500® Index | | | 15.06 | % | | | 2.29 | % | | | 1.41 | % | | | 3.08 | %(1) | | | 36.89 | %(2) | |
Based on a $10,000 initial investment, the graph and table above illustrate the total return of ING T. Rowe Price Growth Equity Portfolio against the index indicated. An index is unmanaged and has no cash in its portfolio, imposes no sales charges and incurs no operating expenses. An investor cannot invest directly in an index. The Portfolio's performance is shown without the imposition of any expenses or charges which are, or may be, imposed under your annuity contract. Total returns would have been lower if such expenses or charges were included.
The performance graph and table do not reflect the deduction of taxes that a shareholder will pay on portfolio distributions or the redemption of portfolio shares.
The performance shown may include the effect of fee waivers and/or expense reimbursements by the Investment Adviser and/or other service providers, which have the effect of increasing total return. Had all fees and expenses been considered, the total returns would have been lower.
The performance update illustrates performance for a variable investment option available through a variable annuity contract. The performance shown indicates past performance and is not a projection or prediction of future results. Actual investment returns and principal value will fluctuate so that shares and/or units, at redemption, may be worth more or less than their original cost. Please call (800) 262-3862 to get performance through the most recent month end.
This report contains statements that may be "forward-looking" statements. Actual results may differ materially from those projected in the "forward-looking" statements.
The views expressed in this report reflect those of the portfolio manager only through the end of the period as stated on the cover. The portfolio manager's views are subject to change at any time based on marked and other conditions.
Portfolio holdings are subject to change daily.
(1) Since inception performance for the index is shown from December 1, 2001.
(2) Since inception performance of the index is shown from March 1, 2009.
29
ING TEMPLETON FOREIGN EQUITY PORTFOLIO
PORTFOLIO MANAGERS' REPORT
ING Templeton Foreign Equity Portfolio (the "Portfolio") seeks long-term capital growth. The Portfolio is managed by Gary P. Motyl, Cindy L. Sweeting, Antonio T. Docal and Peter A. Nori of Templeton Investment Counsel, LLC, — the Sub-Adviser.
Performance: For the year ended December 31, 2010, the Portfolio's Class I shares provided a total return of 8.87% compared MSCI All Country World ex U.S. IndexSM ("MSCI ACWI ex-U.S."), which returned 11.15% for the same period.
Portfolio Specifics: From a geographic perspective, the Portfolio's Asian position contributed to relative performance, particularly stock selection in India, China and Hong Kong. Holdings in the U.K. and Germany were also leading contributors.
Stock selection in an overweighted information technology sector contributed to absolute and relative performance, led by semiconductor manufacturers like Germany's Infineon Technologies AG and Taiwan's Taiwan Semiconductor Manufacturing Co., Ltd. which benefited from their high sensitivity to global economic growth.
Overweighted industrials stocks also added to relative returns as companies throughout the global supply chain, including capital goods manufacturers like Germany's Siemens AG and Sweden's Atlas Copco, transportation companies like British Airways PLC, and infrastructure equipment developers like China's Shanghai Electric Group Co., Ltd., all benefited from the global economic recovery. Stock selection in the consumer discretionary sector also contributed, with retailers like the U.K.'s Burberry Group PLC and carmakers like Germany's BMW benefiting from increased demand for luxury goods, particularly from Asian and emerging markets.
Key detractors included overweighting in Europe, where sovereign debt concerns and austerity programs hindered the economic recovery. Our stock selection in France, Denmark and Italy was also detrimental. Underweighted exposure to Canada also detracted from relative performance. The Portfolio's underweighting and stock selection in the economically sensitive materials sector was a major detractor from performance as supply constraints, demand recovery and inflation concerns supported commodity prices throughout the year. Stock selection in energy also detracted, mostly on account of exposure to France's Total SA, Italy's Eni S.p.A. and BP, the British energy producer at the center of the Gulf of Mexico oil spill. After a thorough re-evaluation of our position during the period, we remained holders of the troubled BP stock and ultimately recouped a substantial portion of losses by year-end.
An overweighted position and stock selection in the healthcare sector hurt relative performance during a period when European governments undertaking fiscal austerity measures considered reducing pharmaceutical industry reimbursements and U.S. politicians debated sweeping health care reforms. French pharmaceuticals manufacturer Sanofi-Aventis lagged despite delivering strong earnings as investors focused on impending patent expirations and the company's hostile bid for biotechnology firm Genzyme Corp.
Current Strategy and Outlook: At year-end, we believe current valuations in the materials sector leave little room for continued outperformance over our long-term investment horizon, and in the absence of compelling fundamental values, we maintain our underweighted exposure. We remain positive toward the healthcare sector in general, in our view the world's cheapest despite strengthening corporate fundamentals, significant restructuring potential and advantageous global demographics.
Sir John Templeton defined investors as "the people who buy for fundamental values" and speculators as "those who buy in the hope of selling later to someone else at high prices." These have been high times for speculators and trend-followers, but with some international equities nearly doubling in the last 20 months alone, merely buying in the hope of selling at a higher price no longer seems a viable strategy to us. Ultimately, we believe businesses compound shareholder value by growing sales, increasing earnings, amplifying cash flows and managing capital — critical fundamentals that we think remain lowly valued by a market still focused on tomorrow's headlines. Such undervaluation is not likely to last indefinitely, and we believe investors who take advantage of the opportunities available in the current market environment will be well served over the long term. Although we may still be trapped in a speculator's market, we believe there has scarcely been a better time to be an investor.
Country Allocation
as of December 31, 2010
(as a percent of net assets)
| United Kingdom | | | 15.5 | % | |
| Germany | | | 10.2 | % | |
| France | | | 8.2 | % | |
| Switzerland | | | 6.7 | % | |
| Netherlands | | | 5.9 | % | |
| South Korea | | | 4.0 | % | |
| Hong Kong | | | 3.9 | % | |
| Spain | | | 3.5 | % | |
| Japan | | | 3.2 | % | |
| Singapore | | | 3.2 | % | |
| China | | | 3.1 | % | |
| India | | | 3.1 | % | |
| Countries between 2.2% — 2.8%(1) | | | 9.6 | % | |
| Countries less than 2.2%(2) | | | 6.5 | % | |
| Other Assets and Liabilities — Net* | | | 13.4 | % | |
| Net Assets | | | 100.0 | % | |
* Includes short-term investments related to U.S. government agency obligation.
(1) Includes four countries, which each represents 2.2% — 2.8% of net assets.
(2) Includes seven countries, which each represents less than 2.2% of net assets.
Portfolio holdings are subject to change daily.
Top Ten Holdings
as of December 31, 2010
(as a percent of net assets)
| Siemens AG | | | 1.9 | % | |
| Samsung Electronics Co., Ltd. GDR | | | 1.7 | % | |
| Talisman Energy, Inc. | | | 1.7 | % | |
| Burberry Group PLC | | | 1.7 | % | |
| Housing Development Finance Corp. | | | 1.7 | % | |
| DBS Group Holdings Ltd. | | | 1.6 | % | |
| Novartis AG | | | 1.6 | % | |
| Telefonica S.A. | | | 1.5 | % | |
| Telenor ASA | | | 1.5 | % | |
| China Telecom Corp., Ltd. | | | 1.5 | % | |
Portfolio holdings are subject to change daily.
Portfolio holdings and characteristics are subject to change and may not be representative of current holdings and characteristics. The outlook for this Portfolio may differ from that presented for other ING Funds. Performance for the different classes of shares will vary based on differences in fees associated with each class.
30
PORTFOLIO MANAGERS' REPORT
ING TEMPLETON FOREIGN EQUITY PORTFOLIO

| Average Annual Total Returns for the Periods Ended December 31, 2010 | |
| | | 1 Year | | Since Inception
of Class ADV
December 20, 2006 | | Since Inception
of Class I
January 3, 2006 | | Since Inception
of Class S
January 12, 2006 | | Since Inception
of Class S2
February 27, 2009 | |
| Class ADV | | | 8.25 | % | | | (0.44 | )% | | | — | | | | — | | | | — | | |
| Class I | | | 8.87 | % | | | — | | | | 3.80 | % | | | — | | | | — | | |
| Class S | | | 8.59 | % | | | — | | | | — | | | | 3.51 | % | | | — | | |
| Class S2 | | | 8.53 | % | | | — | | | | — | | | | — | | | | 36.93 | % | |
| MSCI ACWI (ex-U.S.) | | | 11.15 | % | | | (0.02 | )%(1) | | | 4.82 | %(2) | | | 4.82 | %(2) | | | 42.01 | %(3) | |
Based on a $10,000 initial investment, the graph and table above illustrate the total return of ING Templeton Foreign Equity Portfolio against the index indicated. An index is unmanaged and has no cash in its portfolio, imposes no sales charges and incurs no operating expenses. An investor cannot invest directly in an index. The Portfolio's performance is shown without the imposition of any expenses or charges which are, or may be, imposed under your annuity contract. Total returns would have been lower if such expenses or charges were included.
The performance graph and table do not reflect the deduction of taxes that a shareholder will pay on portfolio distributions or the redemption of portfolio shares.
The performance shown may include the effect of fee waivers and/or expense reimbursements by the Investment Adviser and/or other service providers, which have the effect of increasing total return. Had all fees and expenses been considered, the total returns would have been lower.
The performance update illustrates performance for a variable investment option available through a variable annuity contract. The performance shown indicates past performance and is not a projection or prediction of future results. Actual investment returns and principal value will fluctuate so that shares and/or units, at redemption, may be worth more or less than their original cost. Please call (800) 262-3862 to get performance through the most recent month end.
This report contains statements that may be "forward-looking" statements. Actual results may differ materially from those projected in the "forward-looking" statements.
The views expressed in this report reflect those of the portfolio manager only through the end of the period as stated on the cover. The portfolio manager's views are subject to change at any time based on marked and other conditions.
Portfolio holdings are subject to change daily.
(1) Since inception performance for the index is shown from January 1, 2007.
(2) Since inception performance of the index is shown from January 1, 2006.
(3) Since inception performance of the index is shown from March 1, 2009.
31
ING THORNBURG VALUE PORTFOLIO
PORTFOLIO MANAGERS' REPORT
ING Thornburg Value Portfolio (the "Portfolio") seeks long-term capital appreciation and secondarily, current income. The Portfolio is managed by Edward Maran, CFA, Managing Director and Connor Browne, CFA Managing Director, of Thornburg Investment Management, Inc. ("Thornburg") — the Sub-Adviser*.
Performance: For the year ended December 31, 2010, the Portfolio's Class I shares provided a total return of 11.37% compared to the S&P 500® Index, which returned 15.06% for the same period.
Portfolio Specifics: During 2010, companies that contributed positively to performance included energy stocks such as Smith International, Inc., ConocoPhillips, Ensco PLC, and Baker Hughes, Inc. We remain overweight energy and materials as we enter 2011. Select consumer discretionary stocks such as Comcast Corp., Life Time Fitness, Inc., and DirectTV performed well. Finally, we had strong performance in the financial sector with Hartford Financial Services Group, Inc., ACE Ltd., US Bancorp. and JP Morgan Chase & Co. all contributing positively. However, this was offset by adverse stock selection in an overweight technology sector.
Additionally, in order to illustrate why we believe the Portfolio has unusual promise and discount, we will discuss two stocks that exemplify what we look for in investments, but which delivered below average returns in 2010.
Transocean Ltd. ("Transocean"), a detractor to performance over the year, operated the Deepwater Horizon rig that was drilling BP's Macando well in the Gulf of Mexico. We believe that Transocean is the industry leader in deepwater drilling, is globally diversified, has a strong balance sheet and an unusually large number of rigs under long-term contracts that provide relative certainty regarding future cash flows. As events unfolded, we worked to determine the economic impact of the event on Transocean, including potential legal liabilities. We met with many of the companies involved. We concluded that Transocean's legal liability would be manageable. Since then, the actual contract between Transocean and BP has been released. The contract includes language indemnifying Transocean even in the case of gross negligence. While Transocean has recovered dramatically from its lows, we believe it remains significantly undervalued. As the legal liability question became clearer and Transocean stock failed to fully recover, we increased our position in the company.
Gilead Sciences, Inc. ("Gilead") another detractor to performance for the year. The stock declined 16.2% during 2010 despite growing revenues by 15% and earnings per share by over 20%. Gilead is the leader in treatments for HIV — their treatment is taken by around three quarters of all patients on treatment worldwide. Even in the U.S., a highly penetrated market, estimates are that of the 1.2 million patients infected only 600 thousand are taking medication. Patent cliff issues could affect earnings materially in the 2018 to 2020 time frame, but with a valuation of less than 10 times forward earnings, we believe the company is dramatically undervalued anyway. Gilead bought back over 10% of its outstanding shares in 2010. As the share price declined in 2010, we added to our position.
Current Strategy and Outlook: Using our bottom-up research approach, we are often overweight or underweight different sectors within the Portfolio. Over the long term, the impact of relative sector weights is diminished by our three basket approach. But, over shorter timeframes, sector positioning can hurt the Portfolio. In 2010, we were overweight healthcare and information technology and underweight consumer staples and industrials. Unfortunately, healthcare meaningfully underperformed consumer staples and information technology lagged relative to industrials. Based on the valuations, growth prospects and business models of our holdings in healthcare and technology, we are optimistic that the sector-related underperformance of 2010 is unlikely to be sustained long term.
We are contrarian investors. We do our best to buy low and sell high. In environments where high goes higher and cheap stocks get cheaper, we can struggle. The good news is that these periods do not last forever, and we believe valuation will matter again at some point in the future. We remain optimistic that our approach of buying what we believe are promising companies selling at a discount to their underlying value has the potential to deliver results in the future similar to what we have achieved since the inception of the Portfolio.
Industry Allocation
as of December 31, 2010
(as a percent of net assets)
| Information Technology | | | 22.0 | % | |
| Energy | | | 19.4 | % | |
| Financials | | | 16.3 | % | |
| Health Care | | | 15.8 | % | |
| Materials | | | 8.5 | % | |
| Consumer Discretionary | | | 8.2 | % | |
| Industrials | | | 5.5 | % | |
| Telecommunication Services | | | 4.5 | % | |
| Consumer Staples | | | 0.2 | % | |
| Other Assets and Liabilities — Net* | | | (0.4 | )% | |
| Net Assets | | | 100.0 | % | |
* Includes short-term investments related to securities lending collateral.
Portfolio holdings are subject to change daily.
Top Ten Holdings
as of December 31, 2010
(as a percent of net assets)
| JPMorgan Chase & Co. | | | 4.6 | % | |
| Gilead Sciences, Inc. | | | 3.9 | % | |
| General Electric Co. | | | 3.9 | % | |
| Transocean Ltd. | | | 3.9 | % | |
| US Bancorp. | | | 3.8 | % | |
| Inpex Holdings, Inc. | | | 3.8 | % | |
| Dell, Inc. | | | 3.7 | % | |
| Mitsubishi UFJ Financial Group, Inc. | | | 3.6 | % | |
| Fiserv, Inc. | | | 3.5 | % | |
| Google, Inc. — Class A | | | 3.5 | % | |
Portfolio holdings are subject to change daily.
* Effective January 4, 2011, the Portfolio's principal investment objective was changed. Effective January 1, 2010, William Fries is no longer a portfolio manager to the Portfolio.
Portfolio holdings and characteristics are subject to change and may not be representative of current holdings and characteristics. The outlook for this Portfolio may differ from that presented for other ING Funds. Performance for the different classes of shares will vary based on differences in fees associated with each class.
32
PORTFOLIO MANAGERS' REPORT
ING THORNBURG VALUE PORTFOLIO
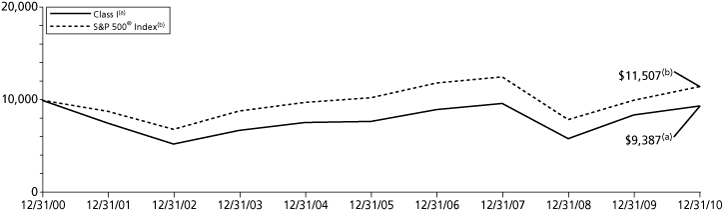
| Average Annual Total Returns for the Periods Ended December 31, 2010 | |
| | | 1 Year | | 5 Year | | 10 Year | | Since Inception
of Classes ADV and S
December 10, 2001 | | Since Inception
of Class S2
March 8, 2010 | |
| Class ADV | | | 10.86 | % | | | 3.50 | % | | | — | | | | 1.93 | % | | | — | | |
| Class I | | | 11.37 | % | | | 4.01 | % | | | (0.63 | )% | | | — | | | | — | | |
| Class S | | | 11.13 | % | | | 3.76 | % | | | — | | | | 2.18 | % | | | — | | |
| Class S2 | | | — | | | | — | | | | — | | | | — | | | | 7.09 | % | |
| S&P 500® Index | | | 15.06 | % | | | 2.29 | % | | | 1.41 | % | | | 3.08 | %(1) | | | 15.77 | %(2) | |
Based on a $10,000 initial investment, the graph and table above illustrate the total return of ING Thornburg Value Portfolio against the index indicated. An index is unmanaged and has no cash in its portfolio, imposes no sales charges and incurs no operating expenses. An investor cannot invest directly in an index. The Portfolio's performance is shown without the imposition of any expenses or charges which are, or may be, imposed under your annuity contract. Total returns would have been lower if such expenses or charges were included.
The performance graph and table do not reflect the deduction of taxes that a shareholder will pay on portfolio distributions or the redemption of portfolio shares.
The performance shown may include the effect of fee waivers and/or expense reimbursements by the Investment Adviser and/or other service providers, which have the effect of increasing total return. Had all fees and expenses been considered, the total returns would have been lower.
The performance update illustrates performance for a variable investment option available through a variable annuity contract. The performance shown indicates past performance and is not a projection or prediction of future results. Actual investment returns and principal value will fluctuate so that shares and/or units, at redemption, may be worth more or less than their original cost. Please call (800) 262-3862 to get performance through the most recent month end.
This report contains statements that may be "forward-looking" statements. Actual results may differ materially from those projected in the "forward-looking" statements.
The views expressed in this report reflect those of the portfolio manager only through the end of the period as stated on the cover. The portfolio manager's views are subject to change at any time based on marked and other conditions.
Portfolio holdings are subject to change daily.
(1) Since inception performance for the index is shown from December 1, 2001.
(2) Since inception performance for the indices is shown from March 1, 2010.
Prior to August 7, 2006, the Portfolio was sub-advised by Massachusetts Financial Services Company and was known as MFS Capital Opportunities Portfolio. Effective August 7, 2006, Thornburg became the sub–adviser and the Portfolio's principal investment strategies changed.
33
ING UBS U.S. LARGE CAP EQUITY PORTFOLIO
PORTFOLIO MANAGERS' REPORT
ING UBS U.S. Large Cap Equity Portfolio (the "Portfolio") seeks long-term growth of capital and future income. The Portfolio is managed by the North American Equities Investment Management Team ("N.A. Equities Team") consisting of Thomas M. Cole, CFA, Head of North American Equities, Research Director and Managing Director, John C. Leonard, CFA and Thomas J. Digenan, CFA, Portfolio Managers for North American Equities of UBS Global Asset Management (Americas) Inc. — the Sub-Adviser.
Performance: For the year ended December 31, 2010, the Portfolio's Class I shares provided a total return of 13.44% compared to the S&P 500® Index and the Russell 1000® Index, which returned 15.06% and 16.10%, respectively, for the same period.
Portfolio Specifics: Large capitalization stocks, as measured by the Russell 1000® Index (the "Index") generated strong results during 2010. The Index's second consecutive year of producing strong results was due to a variety of factors, including generally better-than-expected corporate profits and overall solid investor demand. In addition, the U.S. equity market was supported by expectations for strengthening economic growth in 2011. Also boosting the market was improving investor sentiment attributable to another round of quantitative easing by the Federal Reserve Board, the extension of the Bush-era tax cuts and a temporary reduction in the payroll tax. The market's rally was broad based, as all ten sectors in the Index generated positive results during the year. The best performing sectors in the Index were consumer discretionary, industrials and materials. In contrast, the worst relative performers were the healthcare, utilities and information technology sectors. During 2010, large capitalization growth stocks generally outperformed large capitalization value stocks.
Turning to the Portfolio, stock selection was the largest contributor of negative performance. Holdings in industrials and utilities were the worst two performing sectors. This more than offset the positive results from stock selection in the information technology and healthcare sectors.
In terms of individual stocks, the largest detractors from performance included the Portfolio's positioning in Apollo Group, Inc., Covidien PLC, Bank of America Corp., FirstEnergy Corp. and Hewlett-Packard Co. Conversely, the Portfolio 's positions in VMware, Inc., Paccar, Inc., Intuit, Inc., Carnival Corp. and BorgWarner, Inc. were the largest contributors to performance.
Current Strategy and Outlook: We believe that the economic recovery is underway, particularly given the recent constructive economic data, and we see no evidence of a double-dip recession. In fact, near the end of the quarter, there were signs of improvement, including a strong reading from the leading indicators barometer and a modest reduction in jobless claims. In aggregate, we see considerable scope for strong equity returns, as productivity holds at a high level, corporate profit margins are strong and balance sheets are flush with cash. As a result, we believe that corporate earnings reports will be supportive of valuations.
The Portfolio currently has a beta slightly above the market's, in line with our view that the market is attractively priced. Factor positioning is a byproduct of stock selection, but something that we pay close attention to. The largest factor view currently in the Portfolio is an underweight towards momentum. In our view, this is logical, as the market was not focused on bottom-up fundamentals for most of last year. We feel the Portfolio is well-positioned for the eventual move towards fundamentals. Overall risk policy is an outcome of stock, industry and country decisions, and our strategies' ex-ante tracking errors are at the bottom end of their guideline ranges. This could increase quickly if we perceive greater opportunities from a sector positioning standpoint.
Two of the Portfolio's largest active sector positions are overweights to information technology and healthcare. The Portfolio is underweight the defensive sectors telecom and utilities sectors. We also are cautious in our approach to industrials and materials, two of the more cyclical sectors.
Industry Allocation
as of December 31, 2010
(as a percent of net assets)
| Information Technology | | | 19.5 | % | |
| Consumer Discretionary | | | 15.0 | % | |
| Financials | | | 14.5 | % | |
| Health Care | | | 13.2 | % | |
| Energy | | | 11.1 | % | |
| Industrials | | | 10.8 | % | |
| Consumer Staples | | | 7.5 | % | |
| Utilities | | | 2.6 | % | |
| Telecommunication Services | | | 2.1 | % | |
| Materials | | | 2.1 | % | |
| Exchange-Traded Funds | | | 1.1 | % | |
| Other Assets and Liabilities — Net* | | | 0.5 | % | |
| Net Assets | | | 100.0 | % | |
* Includes short-term investments related to Blackrock Liquidity Funds TempFund Portfolio — Class I and securities lending collateral.
Portfolio holdings are subject to change daily.
Top Ten Holdings*
as of December 31, 2010
(as a percent of net assets)
| ExxonMobil Corp. | | | 4.2 | % | |
| Apple, Inc. | | | 3.2 | % | |
| Wells Fargo & Co. | | | 2.4 | % | |
| JPMorgan Chase & Co. | | | 2.3 | % | |
| AT&T, Inc. | | | 2.1 | % | |
| Carnival Corp. | | | 2.0 | % | |
| Comcast Corp. — Class A | | | 2.0 | % | |
| Johnson & Johnson | | | 2.0 | % | |
| General Dynamics Corp. | | | 1.9 | % | |
| Aflac, Inc. | | | 1.9 | % | |
* Excludes short-term investments related to securities lending collateral.
Portfolio holdings are subject to change daily.
Portfolio holdings and characteristics are subject to change and may not be representative of current holdings and characteristics. The outlook for this Portfolio may differ from that presented for other ING Funds. Performance for the different classes of shares will vary based on differences in fees associated with each class.
34
PORTFOLIO MANAGERS' REPORT
ING UBS U.S. LARGE CAP EQUITY PORTFOLIO
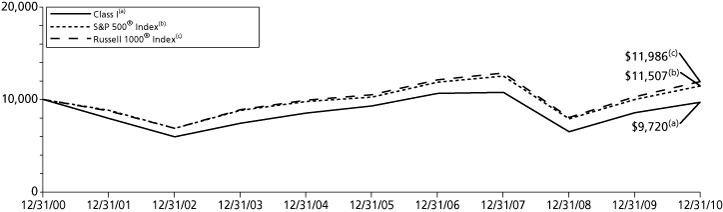
| Average Annual Total Returns for the Periods Ended December 31, 2010 | |
| | | 1 Year | | 5 Year | | 10 Year | | Since Inception
of Classes ADV and S
December 10, 2001 | |
| Class ADV | | | 12.73 | % | | | 0.34 | % | | | — | | | | 1.75 | % | |
| Class I | | | 13.44 | % | | | 0.85 | % | | | (0.28 | )% | | | — | | |
| Class S | | | 13.01 | % | | | 0.58 | % | | | — | | | | 1.99 | % | |
| S&P 500® Index | | | 15.06 | % | | | 2.29 | % | | | 1.41 | % | | | 3.08 | %(1) | |
| Russell 1000® Index | | | 16.10 | % | | | 2.59 | % | | | 1.83 | % | | | 3.64 | %(1) | |
Based on a $10,000 initial investment, the graph and table above illustrate the total return of ING UBS U.S. Large Cap Equity Portfolio against the indices indicated. An index is unmanaged and has no cash in its portfolio, imposes no sales charges and incurs no operating expenses. An investor cannot invest directly in an index. The Portfolio's performance is shown without the imposition of any expenses or charges which are, or may be, imposed under your annuity contract. Total returns would have been lower if such expenses or charges were included.
The performance graph and table do not reflect the deduction of taxes that a shareholder will pay on portfolio distributions or the redemption of portfolio shares.
The performance shown may include the effect of fee waivers and/or expense reimbursements by the Investment Adviser and/or other service providers, which have the effect of increasing total return. Had all fees and expenses been considered, the total returns would have been lower.
The performance update illustrates performance for a variable investment option available through a variable annuity contract. The performance shown indicates past performance and is not a projection or prediction of future results. Actual investment returns and principal value will fluctuate so that shares and/or units, at redemption, may be worth more or less than their original cost. Please call (800) 262-3862 to get performance through the most recent month end.
This report contains statements that may be "forward-looking" statements. Actual results may differ materially from those projected in the "forward-looking" statements.
The views expressed in this report reflect those of the portfolio manager only through the end of the period as stated on the cover. The portfolio manager's views are subject to change at any time based on marked and other conditions.
Portfolio holdings are subject to change daily.
(1) Since inception performance for the indices is shown from December 1, 2001.
35
ING VAN KAMPEN COMSTOCK PORTFOLIO
PORTFOLIO MANAGERS' REPORT
ING Van Kampen Comstock Portfolio (the "Portfolio") seeks capital growth and income. The Portfolio is managed by Kevin Holt, Managing Director, Jason Leder, Managing Director, Devin E. Armstrong, CFA, Vice President, James N. Warwick, Executive Director, and Matthew Seinsheimer of Invesco Advisers, Inc. — the Sub-Adviser.*
Performance: For the year ended December 31, 2010, the Portfolio's Class S shares, provided a total return of 15.13% compared to the Russell 1000® Value Index and the S&P 500® Index, which returned 15.51% and 15.06%, respectively, for the same period.
Portfolio Specifics: Equity markets were choppy during 2010 as investors weighed the competing issues of solid corporate profits and soft macro-economic data. Corporate earnings were largely positive, but often overshadowed by concerns about high unemployment, a lack of consumer spending, soft housing data and the possibility of additional Federal Reserve accommodation. After rising through April, the major equity indices sold off precipitously in May as the sovereign debt crisis unfolded in the Eurozone while U.S. economic indicators remained weak, prompting fears of a "double-dip" recession. Uncertainty created by the debt crisis combined with subdued employment, consumer spending and housing data added to concerns that the recovery was slowing to a sub-normal growth rate. Just as abruptly, however, the markets reversed course starting in September and rallied through the end of the year on modestly better economic news. The major equity indices garnered positive returns for the fiscal year, and all ten sectors within the S&P posted gains.
The Portfolio's consumer discretionary exposure acted as the largest contributor to relative and absolute returns. The Portfolio's notable overweight combined with strong stock selection positively impacted performance. Specifically, the fund's holdings in media companies Comcast Corp. and Viacom, Inc. made significant contributions to results as both stocks posted strong double-digit returns during the year.
Financials acted as another primary driver of relative performance when measured against the Russell 1000® Value Index. Specifically, the Portfolio's material overweight in the property and casualty insurance industry enhanced shareholder returns. Chubb Corp. ("Chubb"), a property and casualty insurance company, was one of the largest holdings in the Portfolio for much of the previous year. The company's strong performance is reflective of a strong balance sheet and a well diversified, conservative underwriting platform. Chubb has done an admirable job of returning cash to shareowners through buybacks and dividends, while operating in a difficult pricing environment.
The technology sector was the largest detractor from relative performance. Among technology stocks, the Portfolio's overweight exposure combined with unfavorable stock selection among hardware and select internet related companies dampened shareholder returns. More specifically, the unexpected departure of Hewlett-Packard Co.'s CEO temporarily weighed heavily on the shares. Shares of Yahoo!, Inc., a relatively new addition to the Portfolio, were weak as investors questioned the rate and sustainability of the recovery in advertising and the economic environment in general.
Stock selection in materials and a small overweight position in healthcare also detracted from our results relative to the Russell 1000® Value Index.
Current Strategy and Outlook: Towards the end of the period, we pared down exposure to select insurance and media names, using the proceeds to opportunistically increase the Portfolio's energy and industrials exposure. We believe that market volatility and the market correction that began in the second quarter of 2010 have created opportunities to invest in companies with attractive valuations. Our contrarian philosophy and deep value approach of buying what we believe are extremely undervalued companies attempt to capitalize on market volatility and periods of down markets as value is created for new investment opportunities.
Industry Allocation
as of December 31, 2010
(as a percent of net assets)
| Financials | | | 21.0 | % | |
| Consumer Discretionary | | | 17.1 | % | |
| Health Care | | | 12.2 | % | |
| Energy | | | 10.6 | % | |
| Information Technology | | | 10.4 | % | |
| Consumer Staples | | | 8.9 | % | |
| Industrials | | | 7.1 | % | |
| Materials | | | 5.2 | % | |
| Telecommunication Services | | | 4.1 | % | |
| Utilities | | | 1.6 | % | |
| Other Assets and Liabilities — Net* | | | 1.8 | % | |
| Net Assets | | | 100.0 | % | |
* Includes short-term investments related to Blackrock Liquidity Funds TempFund Portfolio — Class I and securities lending collateral.
Portfolio holdings are subject to change daily.
Top Ten Holdings*
as of December 31, 2010
(as a percent of net assets)
| Comcast Corp. — Class A | | | 4.9 | % | |
| Viacom — Class B | | | 3.3 | % | |
| International Paper Co. | | | 3.0 | % | |
| JPMorgan Chase & Co. | | | 3.0 | % | |
| Pfizer, Inc. | | | 2.7 | % | |
| Halliburton Co. | | | 2.4 | % | |
| Chubb Corp. | | | 2.2 | % | |
| Chevron Corp. | | | 2.2 | % | |
| Bank of New York Mellon Corp. | | | 2.1 | % | |
| Kraft Foods, Inc. | | | 2.1 | % | |
* Excludes short-term investments related to securities lending collateral.
Portfolio holdings are subject to change daily.
* Effective June 1, 2010, pursuant to a change of control from Morgan Stanley Investment Management Inc. (d/b/a/ "Van Kampen") to Invesco Ltd. ("Invesco"), the Portfolio entered into a new sub-advisory agreement with Invesco Advisers, Inc., a direct subsidiary of Invesco, on the same terms, compensation structure and portfolio management teams as was in place under the Portfolios' previous Sub-Advisory Agreement with Van Kampen. Effective June 25, 2010, Matthew Seinsheimer has been added to the Portfolio as a Portfolio Manager.
Portfolio holdings and characteristics are subject to change and may not be representative of current holdings and characteristics. The outlook for this Portfolio may differ from that presented for other ING Funds. Performance for the different classes of shares will vary based on differences in fees associated with each class.
36
PORTFOLIO MANAGERS' REPORT
ING VAN KAMPEN COMSTOCK PORTFOLIO

| Average Annual Total Returns for the Periods Ended December 31, 2010 | |
| | | 1 Year | | 5 Year | | Since Inception
of Classes ADV, I and S
May 1, 2002 | |
| Class ADV | | | 14.81 | % | | | 1.00 | % | | | 3.66 | % | |
| Class I | | | 15.38 | % | | | 1.50 | % | | | 4.17 | % | |
| Class S | | | 15.13 | % | | | 1.25 | % | | | 3.93 | % | |
| Russell 1000® Value Index | | | 15.51 | % | | | 1.28 | % | | | 4.40 | % | |
| S&P 500® Index | | | 15.06 | % | | | 2.29 | % | | | 3.84 | % | |
Based on a $10,000 initial investment, the graph and table above illustrate the total return of ING Van Kampen Comstock Portfolio against the indices indicated. An index is unmanaged and has no cash in its portfolio, imposes no sales charges and incurs no operating expenses. An investor cannot invest directly in an index. The Portfolio's performance is shown without the imposition of any expenses or charges which are, or may be, imposed under your annuity contract. Total returns would have been lower if such expenses or charges were included.
The performance graph and table do not reflect the deduction of taxes that a shareholder will pay on portfolio distributions or the redemption of portfolio shares.
The performance shown may include the effect of fee waivers and/or expense reimbursements by the Investment Adviser and/or other service providers, which have the effect of increasing total return. Had all fees and expenses been considered, the total returns would have been lower.
The performance update illustrates performance for a variable investment option available through a variable annuity contract. The performance shown indicates past performance and is not a projection or prediction of future results. Actual investment returns and principal value will fluctuate so that shares and/or units, at redemption, may be worth more or less than their original cost. Please call (800) 262-3862 to get performance through the most recent month end.
This report contains statements that may be "forward-looking" statements. Actual results may differ materially from those projected in the "forward-looking" statements.
The views expressed in this report reflect those of the portfolio manager only through the end of the period as stated on the cover. The portfolio manager's views are subject to change at any time based on marked and other conditions.
Portfolio holdings are subject to change daily.
37
ING VAN KAMPEN EQUITY AND INCOME PORTFOLIO
PORTFOLIO MANAGERS' REPORT
ING Van Kampen Equity and Income Portfolio (the "Portfolio") seeks total return, consisting of long-term capital appreciation and current income. The Portfolio is managed by Thomas B. Bastian, James O. Roeder, Sergio Marcheli, Mark J. Laskin, Mary Jayne Maly, Chuck Burge and Cynthia Brien of Invesco Advisers, Inc. — the Sub-Adviser.*
Performance: For the year ended December 31, 2010, the Portfolio's Class S shares provided a total return of 12.05% compared to the Russell 1000® Value Index, Barclays Capital U.S. Government/Credit Bond Index and the Composite Index (60% Russell 1000® Value Index/40% Barclays Capital U.S. Government/Credit Bond Index), which returned 15.51%, 6.59% and 12.43%, respectively, for the same period.
Portfolio Specifics: Equity markets were choppy during the fiscal year. After rising through April, the major equity indices sold off precipitously in May as the sovereign debt crisis unfolded in the Eurozone while U.S. economic indicators remained weak, prompting fears of a "double-dip" recession. Uncertainty created by the debt crisis combined with subdued employment, consumer spending and housing data added to concerns that the recovery was slowing to a sub-normal growth rate. Just as abruptly, however, the markets reversed course starting in September and rallied through the end of the year on modestly better economic news. The major equity indices garnered positive returns for the fiscal year, and all ten sectors within the S&P posted gains.
The broad U.S. bond market (as measured by the Barclays Capital U.S. Aggregate Bond Index) generated positive total return for the twelve months ended December 31, 2010. At the beginning of the time period, falling interest rates across maturities combined with tighter credit spreads (the difference between the yields of U.S. Treasuries and other types of fixed income securities that carry credit risk) caused bond prices to rise. Conversely, during the 4th quarter, a marked rise in rates late in the year negatively affected bond prices, particularly in U.S. Treasuries.
The Portfolio benefited from an overweight position and stock selection in the consumer discretionary sector. The Portfolio's overweight in the sector was an emphasis mainly within the media stocks, which benefited from an increase in advertising revenue during the period. Viacom, a top holding, performed well throughout the period.
Stock selection within the healthcare sector also contributed to relative performance. The Portfolio owned Genzyme Corp., a biotechnology company that received a takeover offer from Sanofi-Anentis (not held in the portfolio). The stock rose significantly on the news and the team eliminated the position.
However, offsetting the positive results was the negative impact of the technology sector and the financial services sector. The Portfolio had an overweight in technology stocks throughout the period, most of the exposure was in hardware/equipment stocks and software services. Stock selection in hardware and equipment detracted the most from relative performance. Hewlett-Packard Co. was the notable stock in the sector. The stock sold off on the news the CEO was leaving the company due to expense related improprieties. The Portfolio's holdings in the financials sector detracted from relative performance. The under weighting during the period was beneficial as the sector lagged the benchmark as a whole. But this was more than offset by the disadvantage of a zero weighting in real estate, the strongest industry group in the sector and adverse stock selection among the diversified financials.
The Portfolio's fixed income holdings also produced positive returns for the full period despite a marked rise in rates late in the year that negatively affected bond prices. Outperformance was mainly due to a sustained overweight position in investment grade corporate bonds. A consistent underweight position in U.S. government securities also aided both absolute and relative performance as investor preference for credit risk and rising interest rates late in the year dampened returns for U.S. government bonds.
Current Strategy and Outlook: Equity markets experienced a strong recovery during the period covered by this report. We believe that market volatility that occurred during 2010 will continue to create opportunities to invest in companies with attractive valuations and strong fundamentals. We believe that ultimately those valuations and fundamentals will be reflected in those companies' stock prices.
Investment Type Allocation
as of December 31, 2010
(as a percent of net assets)
| Common Stock | | | 64.4 | % | |
| Corporate Bonds/Notes | | | 21.9 | % | |
| U.S. Treasury Obligations | | | 7.1 | % | |
| Mutual Funds | | | 3.1 | % | |
| Preferred Stock | | | 2.2 | % | |
| U.S. Government Agency Obligations | | | 0.8 | % | |
| Other Bonds | | | 0.2 | % | |
| Collateralized Mortgage Obligations | | | 0.1 | % | |
| Municipal Bonds | | | 0.1 | % | |
| Asset-Backed Securities | | | 0.0 | % | |
| Other Assets and Liabilities — Net | | | 0.1 | % | |
| Net Assets | | | 100.0 | % | |
Portfolio holdings are subject to change daily.
Top Ten Holdings*
as of December 31, 2010
(as a percent of net assets)
| JPMorgan Chase & Co. | | | 3.0 | % | |
| General Electric Co. | | | 2.5 | % | |
| U.S. Treasury Note, 1.000%, due 04/30/12 | | | 2.3 | % | |
| Marsh & McLennan Cos., Inc. | | | 2.2 | % | |
| Viacom — Class B | | | 1.9 | % | |
| Occidental Petroleum Corp. | | | 1.7 | % | |
| Anadarko Petroleum Corp. | | | 1.5 | % | |
| eBay, Inc. | | | 1.5 | % | |
| American Electric Power Co., Inc. | | | 1.3 | % | |
| Royal Dutch Shell PLC ADR — Class A | | | 1.3 | % | |
* Excludes short-term investments related to Blackrock Liquidity Funds TempFund Portfolio — Class I.
Portfolio holdings are subject to change daily.
* Effective June 1, 2010, pursuant to a change of control from Morgan Stanley Investment Management Inc. (d/b/a/ "Van Kampen") to Invesco Ltd. ("Invesco"), the Portfolio entered into a new sub-advisory agreement with Invesco Advisers, Inc., a direct subsidiary of Invesco, on the same terms and compensation structure as was in place under the Portfolios' previous Sub-Advisory Agreement with Van Kampen. In conjunction with this change, Invesco has named Chuck Burge and Cynthia Brien, as replacements (on the fixed-income side of the Portfolio) for Sanjay Verma.
Portfolio holdings and characteristics are subject to change and may not be representative of current holdings and characteristics. The outlook for this Portfolio may differ from that presented for other ING Funds. Performance for the different classes of shares will vary based on differences in fees associated with each class.
38
PORTFOLIO MANAGERS' REPORT
ING VAN KAMPEN EQUITY AND INCOME PORTFOLIO

| Average Annual Total Returns for the Periods Ended December 31, 2010 | |
| | | 1 Year | | 5 Year | | Since Inception
of Classes ADV, I and S
December 10, 2001 | | Since Inception
of Class S2
February 27, 2009 | |
| Class ADV | | | 11.77 | % | | | 3.74 | % | | | 3.55 | % | | | — | | |
| Class I | | | 12.32 | % | | | 4.26 | % | | | 4.07 | % | | | — | | |
| Class S | | | 12.05 | % | | | 4.00 | % | | | 3.81 | % | | | — | | |
| Class S2 | | | 11.88 | % | | | — | | | | — | | | | 27.69 | % | |
| Russell 1000® Value Index | | | 15.51 | % | | | 1.28 | % | | | 4.52 | %(1) | | | 37.92 | %(2) | |
| Barclays Capital U.S. Government/Credit Bond Index | | | 6.59 | % | | | 5.56 | % | | | 5.39 | %(1) | | | 7.46 | %(2) | |
| Composite Index | | | 12.43 | % | | | 3.42 | % | | | 5.26 | %(1) | | | 25.40 | %(2) | |
Based on a $10,000 initial investment, the graph and table above illustrate the total return of ING Van Kampen Equity and Income Portfolio against the indices indicated. An index is unmanaged and has no cash in its portfolio, imposes no sales charges and incurs no operating expenses. An investor cannot invest directly in an index. The Portfolio's performance is shown without the imposition of any expenses or charges which are, or may be, imposed under your annuity contract. Total returns would have been lower if such expenses or charges were included.
The performance graph and table do not reflect the deduction of taxes that a shareholder will pay on portfolio distributions or the redemption of portfolio shares.
The performance shown may include the effect of fee waivers and/or expense reimbursements by the Investment Adviser and/or other service providers, which have the effect of increasing total return. Had all fees and expenses been considered, the total returns would have been lower.
The performance update illustrates performance for a variable investment option available through a variable annuity contract. The performance shown indicates past performance and is not a projection or prediction of future results. Actual investment returns and principal value will fluctuate so that shares and/or units, at redemption, may be worth more or less than their original cost. Please call (800) 262-3862 to get performance through the most recent month end.
This report contains statements that may be "forward-looking" statements. Actual results may differ materially from those projected in the "forward-looking" statements.
The views expressed in this report reflect those of the portfolio manager only through the end of the period as stated on the cover. The portfolio manager's views are subject to change at any time based on marked and other conditions.
Portfolio holdings are subject to change daily.
(1) Since inception performance for the indices is shown from December 1, 2001.
(2) Since inception performance of the indices is shown from March 1, 2009.
39
SHAREHOLDER EXPENSE EXAMPLES (UNAUDITED)
As a shareholder of a Portfolio, you incur two types of costs: (1) transaction costs, redemption fees, and exchange fees; and (2) ongoing costs, including management fees, distribution and/or service (12b-1) fees, and other Portfolio expenses. These Examples are intended to help you understand your ongoing costs (in dollars) of investing in a Fund and to compare these costs with the ongoing costs of investing in other mutual funds.
The Examples are based on an investment of $1,000 invested at the beginning of the period and held for the entire period from July 1, 2010 to December 31, 2010. The Portfolios' expenses are shown without the imposition of any charges which are, or may be, imposed under your variable annuity contract, variable life insurance contract, qualified pension or retirement plan. Expenses would have been higher if such charges were included.
Actual Expenses
The left section of the table shown below, "Actual Portfolio Return," provides information about actual account values and actual expenses. You may use the information in this section, together with the amount you invested, to estimate the expenses that you paid over the period. Simply divide your account value by $1,000 (for example, an $8,600 account value divided by $1,000 = 8.6), then multiply the result by the number in the first section under the heading entitled "Expenses Paid During the Period'' to estimate the expenses you paid on your account during this period.
Hypothetical Example for Comparison Purposes
The right section of the table shown below, "Hypothetical (5% return before expenses)," provides information about hypothetical account values and hypothetical expenses based on a Portfolio's actual expense ratio and an assumed rate of return of 5% per year before expenses, which is not a Portfolio's actual return. The hypothetical account values and expenses may not be used to estimate the actual ending account balance or expenses you paid for the period. You may use this information to compare the ongoing costs of investing in a Portfolio and other mutual funds. To do so, compare this 5% hypothetical example with the 5% hypothetical examples that appear in the shareholder reports of the other mutual funds.
Please note that the expenses shown in the table are meant to highlight your ongoing costs only and do not reflect any transactional costs, redemption fees, or exchange fees. Therefore, the hypothetical lines of the table are useful in comparing ongoing costs only, and will not help you determine the relative total costs of owning different funds. In addition, if these transactional costs were included, your costs would have been higher.
| | | Actual Portfolio Return | | Hypothetical (5% return before expenses) | |
ING American Century
Small-Mid Cap Value Portfolio | | Beginning
Account
Value
July 1,
2010 | | Ending
Account
Value
December 31,
2010 | | Annualized
Expense
Ratio | | Expenses Paid
During the
Period Ended
December 31,
2010* | | Beginning
Account
Value
July 1,
2010 | | Ending
Account
Value
December 31,
2010 | | Annualized
Expense
Ratio | | Expenses Paid
During the
Period Ended
December 31,
2010* | |
| Class ADV | | $ | 1,000.00 | | | $ | 1,232.10 | | | | 1.44 | % | | $ | 8.10 | | | $ | 1,000.00 | | | $ | 1,017.95 | | | | 1.44 | % | | $ | 7.32 | | |
| Class I | | | 1,000.00 | | | | 1,234.90 | | | | 0.94 | | | | 5.30 | | | | 1,000.00 | | | | 1,020.47 | | | | 0.94 | | | | 4.79 | | |
| Class S | | | 1,000.00 | | | | 1,232.80 | | | | 1.19 | | | | 6.70 | | | | 1,000.00 | | | | 1,019.21 | | | | 1.19 | | | | 6.06 | | |
| Class S2 | | | 1,000.00 | | | | 1,232.80 | | | | 1.34 | | | | 7.54 | | | | 1,000.00 | | | | 1,018.45 | | | | 1.34 | | | | 6.82 | | |
| ING Baron Small Cap Growth Portfolio | |
| Class ADV | | $ | 1,000.00 | | | $ | 1,268.50 | | | | 1.58 | % | | $ | 9.03 | | | $ | 1,000.00 | | | $ | 1,017.24 | | | | 1.58 | % | | $ | 8.03 | | |
| Class I | | | 1,000.00 | | | | 1,271.80 | | | | 1.08 | | | | 6.18 | | | | 1,000.00 | | | | 1,019.76 | | | | 1.08 | | | | 5.50 | | |
| Class S | | | 1,000.00 | | | | 1,270.10 | | | | 1.31 | | | | 7.50 | | | | 1,000.00 | | | | 1,018.60 | | | | 1.31 | | | | 6.67 | | |
| Class S2 | | | 1,000.00 | | | | 1,268.80 | | | | 1.48 | | | | 8.46 | | | | 1,000.00 | | | | 1,017.74 | | | | 1.48 | | | | 7.53 | | |
* Expenses are equal to each Portfolio's respective annualized expense ratios multiplied by the average account value over the period, multiplied by 184/365 to reflect the most recent fiscal half-year.
40
SHAREHOLDER EXPENSE EXAMPLES (UNAUDITED) (CONTINUED)
| | | Actual Portfolio Return | | Hypothetical (5% return before expenses) | |
ING Columbia Small Cap
Value Portfolio | | Beginning
Account
Value
July 1,
2010 | | Ending
Account
Value
December 31,
2010 | | Annualized
Expense
Ratio | | Expenses Paid
During the
Period Ended
December 31,
2010* | | Beginning
Account
Value
July 1,
2010 | | Ending
Account
Value
December 31,
2010 | | Annualized
Expense
Ratio | | Expenses Paid
During the
Period Ended
December 31,
2010* | |
| Class ADV | | $ | 1,000.00 | | | $ | 1,304.40 | | | | 1.40 | % | | $ | 8.13 | | | $ | 1,000.00 | | | $ | 1,018.15 | | | | 1.40 | % | | $ | 7.12 | | |
| Class I | | | 1,000.00 | | | | 1,307.40 | | | | 0.90 | | | | 5.23 | | | | 1,000.00 | | | | 1,020.67 | | | | 0.90 | | | | 4.58 | | |
| Class S | | | 1,000.00 | | | | 1,307.20 | | | | 1.15 | | | | 6.69 | | | | 1,000.00 | | | | 1,019.41 | | | | 1.15 | | | | 5.85 | | |
| Class S2 | | | 1,000.00 | | | | 1,305.20 | | | | 1.30 | | | | 7.55 | | | | 1,000.00 | | | | 1,018.65 | | | | 1.30 | | | | 6.61 | | |
| ING Davis New York Venture Portfolio | |
| Class ADV | | $ | 1,000.00 | | | $ | 1,210.80 | | | | 1.38 | % | | $ | 7.69 | | | $ | 1,000.00 | | | $ | 1,018.25 | | | | 1.38 | % | | $ | 7.02 | | |
| Class I | | | 1,000.00 | | | | 1,214.40 | | | | 0.88 | | | | 4.91 | | | | 1,000.00 | | | | 1,020.77 | | | | 0.88 | | | | 4.48 | | |
| Class S | | | 1,000.00 | | | | 1,211.90 | | | | 1.13 | | | | 6.30 | | | | 1,000.00 | | | | 1,019.51 | | | | 1.13 | | | | 5.75 | | |
| ING JPMorgan Mid Cap Value Portfolio | |
| Class ADV | | $ | 1,000.00 | | | $ | 1,230.70 | | | | 1.50 | % | | $ | 8.43 | | | $ | 1,000.00 | | | $ | 1,017.64 | | | | 1.50 | % | | $ | 7.63 | | |
| Class I | | | 1,000.00 | | | | 1,234.00 | | | | 1.00 | | | | 5.63 | | | | 1,000.00 | | | | 1,020.16 | | | | 1.00 | | | | 5.09 | | |
| Class S | | | 1,000.00 | | | | 1,232.90 | | | | 1.25 | | | | 7.04 | | | | 1,000.00 | | | | 1,018.90 | | | | 1.25 | | | | 6.36 | | |
| Class S2 | | | 1,000.00 | | | | 1,231.90 | | | | 1.40 | | | | 7.88 | | | | 1,000.00 | | | | 1,018.15 | | | | 1.40 | | | | 7.12 | | |
| ING Legg Mason ClearBridge Aggressive Growth Portfolio | |
| Class ADV | | $ | 1,000.00 | | | $ | 1,349.70 | | | | 1.33 | % | | $ | 7.88 | | | $ | 1,000.00 | | | $ | 1,018.50 | | | | 1.33 | % | | $ | 6.77 | | |
| Class I | | | 1,000.00 | | | | 1,353.00 | | | | 0.83 | | | | 4.92 | | | | 1,000.00 | | | | 1,021.02 | | | | 0.83 | | | | 4.23 | | |
| Class S | | | 1,000.00 | | | | 1,351.50 | | | | 1.08 | | | | 6.40 | | | | 1,000.00 | | | | 1,019.76 | | | | 1.08 | | | | 5.50 | | |
| Class S2 | | | 1,000.00 | | | | 1,350.60 | | | | 1.23 | | | | 7.29 | | | | 1,000.00 | | | | 1,019.00 | | | | 1.23 | | | | 6.26 | | |
| ING Oppenheimer Global Portfolio | |
| Class ADV | | $ | 1,000.00 | | | $ | 1,252.70 | | | | 1.16 | % | | $ | 6.59 | | | $ | 1,000.00 | | | $ | 1,019.36 | | | | 1.16 | % | | $ | 5.90 | | |
| Class I | | | 1,000.00 | | | | 1,256.70 | | | | 0.66 | | | | 3.75 | | | | 1,000.00 | | | | 1,021.88 | | | | 0.66 | | | | 3.36 | | |
| Class S | | | 1,000.00 | | | | 1,255.50 | | | | 0.91 | | | | 5.17 | | | | 1,000.00 | | | | 1,020.62 | | | | 0.91 | | | | 4.63 | | |
| Class S2 | | | 1,000.00 | | | | 1,253.60 | | | | 1.06 | | | | 6.02 | | | | 1,000.00 | | | | 1,019.86 | | | | 1.06 | | | | 5.40 | | |
| ING Oppenheimer Global Strategic Income Portfolio | |
| Class ADV | | $ | 1,000.00 | | | $ | 1,088.70 | | | | 1.02 | % | | $ | 5.37 | | | $ | 1,000.00 | | | $ | 1,020.06 | | | | 1.02 | % | | $ | 5.19 | | |
| Class I | | | 1,000.00 | | | | 1,091.90 | | | | 0.52 | | | | 2.74 | | | | 1,000.00 | | | | 1,022.58 | | | | 0.52 | | | | 2.65 | | |
| Class S | | | 1,000.00 | | | | 1,090.00 | | | | 0.77 | | | | 4.06 | | | | 1,000.00 | | | | 1,021.32 | | | | 0.77 | | | | 3.92 | | |
| Class S2 | | | 1,000.00 | | | | 1,090.60 | | | | 0.92 | | | | 4.85 | | | | 1,000.00 | | | | 1,020.57 | | | | 0.92 | | | | 4.69 | | |
| ING PIMCO Total Return Portfolio | |
| Class ADV | | $ | 1,000.00 | | | $ | 1,020.50 | | | | 1.08 | % | | $ | 5.50 | | | $ | 1,000.00 | | | $ | 1,019.76 | | | | 1.08 | % | | $ | 5.50 | | |
| Class I | | | 1,000.00 | | | | 1,023.20 | | | | 0.58 | | | | 2.96 | | | | 1,000.00 | | | | 1,022.28 | | | | 0.58 | | | | 2.96 | | |
| Class S | | | 1,000.00 | | | | 1,021.80 | | | | 0.83 | | | | 4.23 | | | | 1,000.00 | | | | 1,021.02 | | | | 0.83 | | | | 4.23 | | |
| Class S2 | | | 1,000.00 | | | | 1,020.30 | | | | 0.98 | | | | 4.99 | | | | 1,000.00 | | | | 1,020.27 | | | | 0.98 | | | | 4.99 | | |
* Expenses are equal to each Portfolio's respective annualized expense ratios multiplied by the average account value over the period, multiplied by 184/365 to reflect the most recent fiscal half-year.
41
SHAREHOLDER EXPENSE EXAMPLES (UNAUDITED) (CONTINUED)
| | | Actual Portfolio Return | | Hypothetical (5% return before expenses) | |
ING Pioneer High Yield Portfolio | | Beginning
Account
Value
July 1,
2010 | | Ending
Account
Value
December 31,
2010 | | Annualized
Expense
Ratio | | Expenses Paid
During the
Period Ended
December 31,
2010* | | Beginning
Account
Value
July 1,
2010 | | Ending
Account
Value
December 31,
2010 | | Annualized
Expense
Ratio | | Expenses Paid
During the
Period Ended
December 31,
2010* | |
| Class ADV | | $ | 1,000.00 | | | $ | 1,172.60 | | | | 1.21 | % | | $ | 6.63 | | | $ | 1,000.00 | | | $ | 1,019.11 | | | | 1.21 | % | | $ | 6.16 | | |
| Class I | | | 1,000.00 | | | | 1,176.10 | | | | 0.71 | | | | 3.89 | | | | 1,000.00 | | | | 1,021.63 | | | | 0.71 | | | | 3.62 | | |
| Class S | | | 1,000.00 | | | | 1,174.60 | | | | 0.96 | | | | 5.26 | | | | 1,000.00 | | | | 1,020.37 | | | | 0.96 | | | | 4.89 | | |
| ING T. Rowe Price Diversified Mid Cap Growth Portfolio | |
| Class ADV | | $ | 1,000.00 | | | $ | 1,316.60 | | | | 1.16 | % | | $ | 6.77 | | | $ | 1,000.00 | | | $ | 1,019.36 | | | | 1.16 | % | | $ | 5.90 | | |
| Class I | | | 1,000.00 | | | | 1,320.60 | | | | 0.66 | | | | 3.86 | | | | 1,000.00 | | | | 1,021.88 | | | | 0.66 | | | | 3.36 | | |
| Class S | | | 1,000.00 | | | | 1,317.10 | | | | 0.91 | | | | 5.31 | | | | 1,000.00 | | | | 1,020.62 | | | | 0.91 | | | | 4.63 | | |
| Class S2 | | | 1,000.00 | | | | 1,316.70 | | | | 1.06 | | | | 6.19 | | | | 1,000.00 | | | | 1,019.86 | | | | 1.06 | | | | 5.40 | | |
| ING T. Rowe Price Growth Equity Portfolio | |
| Class ADV | | $ | 1,000.00 | | | $ | 1,267.20 | | | | 1.25 | % | | $ | 7.14 | | | $ | 1,000.00 | | | $ | 1,018.90 | | | | 1.25 | % | | $ | 6.36 | | |
| Class I | | | 1,000.00 | | | | 1,270.40 | | | | 0.75 | | | | 4.29 | | | | 1,000.00 | | | | 1,021.42 | | | | 0.75 | | | | 3.82 | | |
| Class S | | | 1,000.00 | | | | 1,268.90 | | | | 1.00 | | | | 5.72 | | | | 1,000.00 | | | | 1,020.16 | | | | 1.00 | | | | 5.09 | | |
| Class S2 | | | 1,000.00 | | | | 1,267.90 | | | | 1.15 | | | | 6.57 | | | | 1,000.00 | | | | 1,019.41 | | | | 1.15 | | | | 5.85 | | |
| ING Templeton Foreign Equity Portfolio | |
| Class ADV | | $ | 1,000.00 | | | $ | 1,231.00 | | | | 1.46 | % | | $ | 8.21 | | | $ | 1,000.00 | | | $ | 1,017.85 | | | | 1.46 | % | | $ | 7.43 | | |
| Class I | | | 1,000.00 | | | | 1,233.40 | | | | 0.96 | | | | 5.40 | | | | 1,000.00 | | | | 1,020.37 | | | | 0.96 | | | | 4.89 | | |
| Class S | | | 1,000.00 | | | | 1,232.20 | | | | 1.21 | | | | 6.81 | | | | 1,000.00 | | | | 1,019.11 | | | | 1.21 | | | | 6.16 | | |
| Class S2 | | | 1,000.00 | | | | 1,232.70 | | | | 1.36 | | | | 7.65 | | | | 1,000.00 | | | | 1,018.35 | | | | 1.36 | | | | 6.92 | | |
| ING Thornburg Value Portfolio | |
| Class ADV | | $ | 1,000.00 | | | $ | 1,209.50 | | | | 1.40 | % | | $ | 7.80 | | | $ | 1,000.00 | | | $ | 1,018.15 | | | | 1.40 | % | | $ | 7.12 | | |
| Class I | | | 1,000.00 | | | | 1,212.60 | | | | 0.90 | | | | 5.02 | | | | 1,000.00 | | | | 1,020.67 | | | | 0.90 | | | | 4.58 | | |
| Class S | | | 1,000.00 | | | | 1,211.10 | | | | 1.15 | | | | 6.41 | | | | 1,000.00 | | | | 1,019.41 | | | | 1.15 | | | | 5.85 | | |
| Class S2 | | | 1,000.00 | | | | 1,210.50 | | | | 1.30 | | | | 7.24 | | | | 1,000.00 | | | | 1,018.65 | | | | 1.30 | | | | 6.61 | | |
| ING UBS U.S. Large Cap Equity Portfolio | |
| Class ADV | | $ | 1,000.00 | | | $ | 1,231.10 | | | | 1.35 | % | | $ | 7.59 | | | $ | 1,000.00 | | | $ | 1,018.40 | | | | 1.35 | % | | $ | 6.87 | | |
| Class I | | | 1,000.00 | | | | 1,233.90 | | | | 0.85 | | | | 4.79 | | | | 1,000.00 | | | | 1,020.92 | | | | 0.85 | | | | 4.33 | | |
| Class S | | | 1,000.00 | | | | 1,231.80 | | | | 1.10 | | | | 6.19 | | | | 1,000.00 | | | | 1,019.66 | | | | 1.10 | | | | 5.60 | | |
| ING Van Kampen Comstock Portfolio | |
| Class ADV | | $ | 1,000.00 | | | $ | 1,226.50 | | | | 1.31 | % | | $ | 7.35 | | | $ | 1,000.00 | | | $ | 1,018.60 | | | | 1.31 | % | | $ | 6.67 | | |
| Class I | | | 1,000.00 | | | | 1,230.60 | | | | 0.81 | | | | 4.55 | | | | 1,000.00 | | | | 1,021.12 | | | | 0.81 | | | | 4.13 | | |
| Class S | | | 1,000.00 | | | | 1,228.00 | | | | 1.06 | | | | 5.95 | | | | 1,000.00 | | | | 1,019.86 | | | | 1.06 | | | | 5.40 | | |
* Expenses are equal to each Portfolio's respective annualized expense ratios multiplied by the average account value over the period, multiplied by 184/365 to reflect the most recent fiscal half-year.
42
SHAREHOLDER EXPENSE EXAMPLES (UNAUDITED) (CONTINUED)
| | | Actual Portfolio Return | | Hypothetical (5% return before expenses) | |
ING Van Kampen Equity
and Income Portfolio | | Beginning
Account
Value
July 1,
2010 | | Ending
Account
Value
December 31,
2010 | | Annualized
Expense
Ratio | | Expenses Paid
During the
Period Ended
December 31,
2010* | | Beginning
Account
Value
July 1,
2010 | | Ending
Account
Value
December 31,
2010 | | Annualized
Expense
Ratio | | Expenses Paid
During the
Period Ended
December 31,
2010* | |
| Class ADV | | $ | 1,000.00 | | | $ | 1,174.80 | | | | 1.15 | % | | $ | 6.30 | | | $ | 1,000.00 | | | $ | 1,019.41 | | | | 1.15 | % | | $ | 5.85 | | |
| Class I | | | 1,000.00 | | | | 1,177.40 | | | | 0.65 | | | | 3.57 | | | | 1,000.00 | | | | 1,021.93 | | | | 0.65 | | | | 3.31 | | |
| Class S | | | 1,000.00 | | | | 1,175.80 | | | | 0.90 | | | | 4.94 | | | | 1,000.00 | | | | 1,020.67 | | | | 0.90 | | | | 4.58 | | |
| Class S2 | | | 1,000.00 | | | | 1,175.20 | | | | 1.05 | | | | 5.76 | | | | 1,000.00 | | | | 1,019.91 | | | | 1.05 | | | | 5.35 | | |
* Expenses are equal to each Portfolio's respective annualized expense ratios multiplied by the average account value over the period, multiplied by 184/365 to reflect the most recent fiscal half-year.
43
REPORT OF INDEPENDENT REGISTERED PUBLIC ACCOUNTING FIRM
The Shareholders and Board of Trustees
ING Partners, Inc.
We have audited the accompanying statements of assets and liabilities, including the summary portfolios of investments, of ING American Century Small-Mid Cap Value Portfolio, ING Baron Small Cap Growth Portfolio, ING Columbia Small Cap Value Portfolio, ING Davis New York Venture Portfolio, ING JPMorgan Mid Cap Value Portfolio, ING Legg Mason ClearBridge Aggressive Growth Portfolio (formerly, ING Legg Mason Partners Aggressive Growth Portfolio), ING Oppenheimer Global Portfolio, ING Oppenheimer Global Strategic Income Portfolio (formerly, ING Oppenheimer Strategic Income Portfolio), ING PIMCO Total Return Portfolio, ING Pioneer High Yield Portfolio, ING T. Rowe Price Diversified Mid Cap Growth Portfolio, ING T. Rowe Price Growth Equity Portfolio, ING Templeton Foreign Equity Portfolio, ING Thornburg Value Portfolio, ING UBS U.S. Large Cap Equity Portfolio, ING Van Kampen Comstock Portfolio, and ING Van Kampen Equity and Income Portfolio, each a series of ING Partners, Inc., as of December 31, 2010, and the related statements of operations for the year then ended, the statements of changes in net assets for each of the years in the two-year period then ended, and the financial highlights for each of the years or periods in the five-year period then ended. These financial statements and financial highlights are the responsibility of management. Our responsibility is to express an opinion on these financial statements and financial highlights based on our audits.
We conducted our audits in accordance with the standards of the Public Company Accounting Oversight Board (United States). Those standards require that we plan and perform the audit to obtain reasonable assurance about whether the financial statements and financial highlights are free of material misstatement. An audit includes examining, on a test basis, evidence supporting the amounts and disclosures in the financial statements. Our procedures included confirmation of securities owned as of December 31, 2010, by correspondence with the custodian, transfer agent, and brokers, or by other appropriate auditing procedures when replies from brokers were not received. An audit also includes assessing the accounting principles used and significant estimates made by management, as well as evaluating the overall financial statement presentation. We believe that our audits provide a reasonable basis for our opinion.
In our opinion, the financial statements and financial highlights referred to above present fairly, in all material respects, the financial position of the aforementioned portfolios of ING Partners, Inc. as of December 31, 2010, and the results of their operations, the changes in their net assets, and the financial highlights for the periods specified in the first paragraph above, in conformity with U.S. generally accepted accounting principles.

Boston, Massachusetts
February 24, 2011
44
STATEMENTS OF ASSETS AND LIABILITIES AS OF DECEMBER 31, 2010
| | | ING
American Century
Small-Mid Cap Value
Portfolio | | ING
Baron Small
Cap Growth
Portfolio | | ING
Columbia Small
Cap Value
Portfolio | | ING
Davis
New York
Venture
Portfolio | |
| ASSETS: | |
| Investments in securities at value+* | | $ | 191,170,578 | | | $ | 808,435,012 | | | $ | 225,488,743 | | | $ | 471,840,263 | | |
| Short-term investments at value** | | | 8,764,164 | | | | 59,409,221 | | | | 3,368,174 | | | | — | | |
| Short-term investments at amortized cost | | | — | | | | — | | | | — | | | | 10,554,903 | | |
| Cash | | | 1,763 | | | | — | | | | — | | | | 104,832 | | |
| Receivables: | |
| Investment securities sold | | | 1,877,139 | | | | 1,875,522 | | | | 960,057 | | | | 24,586 | | |
| Fund shares sold | | | 182,677 | | | | 45,579 | | | | 97,156 | | | | 25,173 | | |
| Dividends and interest | | | 379,545 | | | | 371,552 | | | | 232,222 | | | | 460,407 | | |
| Prepaid expenses | | | — | | | | — | | | | 2,027 | | | | — | | |
| Reimbursement due from manager | | | 36,803 | | | | — | | | | — | | | | — | | |
| Total assets | | | 202,412,669 | | | | 870,136,886 | | | | 230,148,379 | | | | 483,010,164 | | |
| LIABILITIES: | |
| Payable for investment securities purchased | | | 2,950,140 | | | | 18,935,395 | | | | 1,517,597 | | | | 282,874 | | |
| Payable for fund shares redeemed | | | 502,324 | | | | 7,581,347 | | | | 3,108,097 | | | | 1,760,859 | | |
| Payable upon receipt of securities loaned | | | 4,997,061 | | | | — | | | | — | | | | — | | |
Unrealized depreciation on forward foreign
currency contracts | | | 15,701 | | | | — | | | | — | | | | — | | |
| Payable to affiliates | | | 212,160 | | | | 888,543 | | | | 201,160 | | | | 430,535 | | |
| Payable for directors fees | | | — | | | | — | | | | 2,914 | | | | — | | |
| Other accrued expenses and liabilities | | | — | | | | — | | | | 82,517 | | | | — | | |
| Total liabilities | | | 8,677,386 | | | | 27,405,285 | | | | 4,912,285 | | | | 2,474,268 | | |
| NET ASSETS | | $ | 193,735,283 | | | $ | 842,731,601 | | | $ | 225,236,094 | | | $ | 480,535,896 | | |
| NET ASSETS WERE COMPRISED OF: | |
| Paid-in capital | | $ | 173,444,412 | | | $ | 660,170,901 | | | $ | 276,450,604 | | | $ | 495,744,220 | | |
| Undistributed net investment income | | | 2,409,521 | | | | — | | | | 784,083 | | | | 4,864,358 | | |
| Accumulated net realized loss | | | (6,032,302 | ) | | | (115,677,632 | ) | | | (101,299,426 | ) | | | (83,189,179 | ) | |
| Net unrealized appreciation | | | 23,913,652 | | | | 298,238,332 | | | | 49,300,833 | | | | 63,116,497 | | |
| NET ASSETS | | $ | 193,735,283 | | | $ | 842,731,601 | | | $ | 225,236,094 | | | $ | 480,535,896 | | |
| + Including securities loaned at value | | $ | 4,834,113 | | | $ | — | | | $ | — | | | $ | — | | |
| * Cost of investments in securities | | $ | 167,211,072 | | | $ | 510,197,705 | | | $ | 176,187,910 | | | $ | 408,729,259 | | |
| ** Cost of short-term investments | | $ | 8,794,404 | | | $ | 59,409,221 | | | $ | 3,368,174 | | | $ | — | | |
See Accompanying Notes to Financial Statements
45
STATEMENTS OF ASSETS AND LIABILITIES AS OF DECEMBER 31, 2010 (CONTINUED)
| | | ING
American Century
Small-Mid Cap Value
Portfolio | | ING
Baron Small
Cap Growth
Portfolio | | ING
Columbia Small
Cap Value
Portfolio | | ING
Davis
New York
Venture
Portfolio | |
| Class ADV: | |
| Net Assets | | $ | 26,711,741 | | | $ | 51,457,542 | | | $ | 2,071,086 | | | $ | 8,442,263 | | |
| Shares authorized | | | 100,000,000 | | | | 100,000,000 | | | | 100,000,000 | | | | 100,000,000 | | |
| Par value | | $ | 0.001 | | | $ | 0.001 | | | $ | 0.001 | | | $ | 0.001 | | |
| Shares outstanding | | | 2,297,302 | | | | 2,779,185 | | | | 201,244 | | | | 480,628 | | |
| Net asset value and redemption price per share | | $ | 11.63 | | | $ | 18.52 | | | $ | 10.29 | | | $ | 17.57 | | |
| Class I: | |
| Net Assets | | $ | 91,413,281 | | | $ | 231,263,659 | | | $ | 55,866,220 | | | $ | 143,679,021 | | |
| Shares authorized | | | 100,000,000 | | | | 100,000,000 | | | | 100,000,000 | | | | 100,000,000 | | |
| Par value | | $ | 0.001 | | | $ | 0.001 | | | $ | 0.001 | | | $ | 0.001 | | |
| Shares outstanding | | | 7,677,090 | | | | 11,939,279 | | | | 5,350,083 | | | | 7,988,822 | | |
| Net asset value and redemption price per share | | $ | 11.91 | | | $ | 19.37 | | | $ | 10.44 | | | $ | 17.99 | | |
| Class S: | |
| Net Assets | | $ | 75,284,511 | | | $ | 560,004,421 | | | $ | 167,292,864 | | | $ | 328,414,612 | | |
| Shares authorized | | | 100,000,000 | | | | 100,000,000 | | | | 100,000,000 | | | | 100,000,000 | | |
| Par value | | $ | 0.001 | | | $ | 0.001 | | | $ | 0.001 | | | $ | 0.001 | | |
| Shares outstanding | | | 6,369,414 | | | | 29,545,408 | | | | 16,106,466 | | | | 18,487,807 | | |
| Net asset value and redemption price per share | | $ | 11.82 | | | $ | 18.95 | | | $ | 10.39 | | | $ | 17.76 | | |
| Class S2: | |
| Net Assets | | $ | 325,750 | | | $ | 5,979 | | | $ | 5,924 | | | | n/a | | |
| Shares authorized | | | 100,000,000 | | | | 100,000,000 | | | | 100,000,000 | | | | n/a | | |
| Par value | | $ | 0.001 | | | $ | 0.001 | | | $ | 0.001 | | | | n/a | | |
| Shares outstanding | | | 28,095 | | | | 322 | | | | 577 | | | | n/a | | |
| Net asset value and redemption price per share | | $ | 11.59 | | | $ | 18.55 | | | $ | 10.27 | | | | n/a | | |
See Accompanying Notes to Financial Statements
46
STATEMENTS OF ASSETS AND LIABILITIES AS OF DECEMBER 31, 2010
| | | ING
JPMorgan
Mid Cap Value
Portfolio | | ING
Legg Mason
ClearBridge
Aggressive Growth
Portfolio | | ING
Oppenheimer
Global
Portfolio | | ING
Oppenheimer
Global
Strategic Income
Portfolio | |
| ASSETS: | |
| Investments in securities at value+* | | $ | 313,560,917 | | | $ | 398,288,111 | | | $ | 1,718,735,818 | | | $ | 426,834,506 | | |
| Investments in affiliates** | | | — | | | | — | | | | — | | | | 397,900 | | |
| Short-term investments at value*** | | | 19,623,161 | | | | 5,674,510 | | | | 24,657,502 | | | | 126,837,612 | | |
| Cash | | | 20,176 | | | | — | | | | — | | | | 358 | | |
| Cash collateral for futures | | | — | | | | — | | | | — | | | | 303,187 | | |
| Foreign currencies at value**** | | | — | | | | — | | | | 1,598,519 | | | | 891,013 | | |
| Receivables: | |
| Investment securities sold | | | 247,791 | | | | — | | | | 2,167,457 | | | | 2,552,320 | | |
Investment securities sold on a delayed-delivery
or when-issued basis | | | — | | | | — | | | | — | | | | 1,590,212 | | |
| Fund shares sold | | | 41,522 | | | | 17,245 | | | | 49,822 | | | | 161,423 | | |
| Dividends and interest | | | 404,841 | | | | 17,814 | | | | 2,170,308 | | | | 6,167,629 | | |
| Foreign cash collateral for futures***** | | | — | | | | — | | | | — | | | | 10,009 | | |
Unrealized appreciation on forward foreign
currency contracts | | | — | | | | — | | | | — | | | | 1,627,524 | | |
| Upfront payments made on swap agreements | | | — | | | | — | | | | — | | | | 354,697 | | |
| Unrealized appreciation on swap agreements | | | — | | | | — | | | | — | | | | 1,010,757 | | |
| Total assets | | | 333,898,408 | | | | 403,997,680 | | | | 1,749,379,426 | | | | 568,739,147 | | |
| LIABILITIES: | |
| Payable for investment securities purchased | | | 78,564 | | | | — | | | | — | | | | 1,536,589 | | |
Payable for investment securities purchased on a
delayed-delivery or when-issued basis | | | — | | | | — | | | | — | | | | 17,727,754 | | |
| Payable for fund shares redeemed | | | 1,195,328 | | | | 2,815,354 | | | | 7,635,840 | | | | 2,138,927 | | |
| Payable upon receipt of securities loaned | | | 6,018,647 | | | | 5,499,052 | | | | 4,815,976 | | | | 31,148,871 | | |
Unrealized depreciation on forward foreign
currency contracts | | | — | | | | — | | | | — | | | | 3,860,839 | | |
| Upfront payments received on swap agreements | | | — | | | | — | | | | — | | | | 854,437 | | |
| Unrealized depreciation on swap agreements | | | — | | | | — | | | | — | | | | 585,913 | | |
| Payable to affiliates | | | 317,424 | | | | 302,587 | | | | 1,038,900 | | | | 266,150 | | |
| Accrued foreign taxes on capital gains | | | — | | | | — | | | | 435 | | | | — | | |
| Total liabilities | | | 7,609,963 | | | | 8,616,993 | | | | 13,491,151 | | | | 58,119,480 | | |
| NET ASSETS | | $ | 326,288,445 | | | $ | 395,380,687 | | | $ | 1,735,888,275 | | | $ | 510,619,667 | | |
| NET ASSETS WERE COMPRISED OF: | |
| Paid-in capital | | $ | 301,021,353 | | | $ | 297,528,577 | | | $ | 1,493,164,875 | | | $ | 480,353,126 | | |
| Undistributed net investment income | | | 522,764 | | | | 1,102,562 | | | | 23,528,229 | | | | 35,545,997 | | |
| Accumulated net realized loss | | | (34,619,166 | ) | | | (685,371 | ) | | | (89,305,921 | ) | | | (19,629,348 | ) | |
| Net unrealized appreciation | | | 59,363,494 | | | | 97,434,919 | | | | 308,501,092 | | | | 14,349,892 | | |
| NET ASSETS | | $ | 326,288,445 | | | $ | 395,380,687 | | | $ | 1,735,888,275 | | | $ | 510,619,667 | | |
| + Including securities loaned at value | | $ | 5,849,258 | | | $ | 5,331,883 | | | $ | 4,579,808 | | | $ | 30,413,826 | | |
| * Cost of investments in securities | | $ | 254,084,240 | | | $ | 300,822,266 | | | $ | 1,409,635,562 | | | $ | 409,493,059 | | |
| ** Cost of investments in affiliates | | $ | — | | | $ | — | | | $ | — | | | $ | 417,172 | | |
| *** Cost of short-term investments | | $ | 19,736,344 | | | $ | 5,705,436 | | | $ | 25,421,672 | | | $ | 126,924,649 | | |
| **** Cost of foreign currencies | | $ | — | | | $ | — | | | $ | 1,575,059 | | | $ | 890,292 | | |
| ***** Cost of foreign cash collateral for futures | | $ | — | | | $ | — | | | $ | — | | | $ | 10,009 | | |
See Accompanying Notes to Financial Statements
47
STATEMENTS OF ASSETS AND LIABILITIES AS OF DECEMBER 31, 2010 (CONTINUED)
| | | ING
JPMorgan
Mid Cap Value
Portfolio | | ING
Legg Mason
ClearBridge
Aggressive Growth
Portfolio | | ING
Oppenheimer
Global
Portfolio | | ING
Oppenheimer
Global
Strategic Income
Portfolio | |
| Class ADV: | |
| Net Assets | | $ | 26,954,338 | | | $ | 8,001,543 | | | $ | 71,602,512 | | | $ | 30,887,126 | | |
| Shares authorized | | | 100,000,000 | | | | 100,000,000 | | | | 100,000,000 | | | | 100,000,000 | | |
| Par value | | $ | 0.001 | | | $ | 0.001 | | | $ | 0.001 | | | $ | 0.001 | | |
| Shares outstanding | | | 1,955,458 | | | | 173,028 | | | | 5,317,791 | | | | 2,646,386 | | |
| Net asset value and redemption price per share | | $ | 13.78 | | | $ | 46.24 | | | $ | 13.46 | | | $ | 11.67 | | |
| Class I: | |
| Net Assets | | $ | 126,863,728 | | | $ | 280,465,608 | | | $ | 1,479,318,996 | | | $ | 386,383,040 | | |
| Shares authorized | | | 100,000,000 | | | | 100,000,000 | | | | 250,000,000 | | | | 100,000,000 | | |
| Par value | | $ | 0.001 | | | $ | 0.001 | | | $ | 0.001 | | | $ | 0.001 | | |
| Shares outstanding | | | 9,092,185 | | | | 5,798,469 | | | | 106,555,971 | | | | 32,837,570 | | |
| Net asset value and redemption price per share | | $ | 13.95 | | | $ | 48.37 | | | $ | 13.88 | | | $ | 11.77 | | |
| Class S: | |
| Net Assets | | $ | 172,464,892 | | | $ | 106,910,056 | | | $ | 184,961,314 | | | $ | 93,346,235 | | |
| Shares authorized | | | 100,000,000 | | | | 100,000,000 | | | | 100,000,000 | | | | 100,000,000 | | |
| Par value | | $ | 0.001 | | | $ | 0.001 | | | $ | 0.001 | | | $ | 0.001 | | |
| Shares outstanding | | | 12,424,162 | | | | 2,260,721 | | | | 13,705,622 | | | | 7,937,725 | | |
| Net asset value and redemption price per share | | $ | 13.88 | | | $ | 47.29 | | | $ | 13.50 | | | $ | 11.76 | | |
| Class S2: | |
| Net Assets | | $ | 5,487 | | | $ | 3,480 | | | $ | 5,453 | | | $ | 3,266 | | |
| Shares authorized | | | 100,000,000 | | | | 100,000,000 | | | | 100,000,000 | | | | 100,000,000 | | |
| Par value | | $ | 0.001 | | | $ | 0.001 | | | $ | 0.001 | | | $ | 0.001 | | |
| Shares outstanding | | | 398 | | | | 75 | | | | 408 | | | | 279 | | |
| Net asset value and redemption price per share | | $ | 13.79 | | | $ | 46.30 | | | $ | 13.36 | | | $ | 11.69 | | |
See Accompanying Notes to Financial Statements
48
STATEMENTS OF ASSETS AND LIABILITIES AS OF DECEMBER 31, 2010
| | | ING
PIMCO
Total Return
Portfolio | | ING
Pioneer
High Yield
Portfolio | | ING
T. Rowe Price
Diversified Mid Cap
Growth
Portfolio | | ING
T. Rowe Price
Growth Equity
Portfolio | |
| ASSETS: | |
| Investments in securities at value+* | | $ | 1,588,820,634 | | | $ | 97,834,590 | | | $ | 816,353,677 | | | $ | 1,075,798,929 | | |
| Short-term investments at value** | | | 51,806,183 | | | | 1,747,848 | | | | 43,583,251 | | | | 16,020,135 | | |
| Short-term investments at amortized cost | | | 1,299,960 | | | | — | | | | — | | | | — | | |
| Cash | | | 7,258,499 | | | | 958 | | | | 502,869 | | | | 2,398,449 | | |
| Cash collateral for futures | | | 305,702 | | | | — | | | | — | | | | — | | |
| Foreign currencies at value*** | | | 1,674,745 | | | | — | | | | — | | | | — | | |
| Receivables: | |
| Investment securities sold | | | 14,293 | | | | 47,801 | | | | 227,714 | | | | 1,233,537 | | |
Investment securities sold on a delayed-delivery
or when-issued basis | | | 24,582,641 | | | | — | | | | — | | | | — | | |
| Fund shares sold | | | 1,093,913 | | | | 91,081 | | | | 239,253 | | | | 89,037 | | |
| Dividends and interest | | | 6,716,743 | | | | 1,229,952 | | | | 366,960 | | | | 596,005 | | |
| Foreign cash collateral for futures**** | | | 16,137 | | | | — | | | | — | | | | — | | |
Unrealized appreciation on forward foreign
currency contracts | | | 3,429,891 | | | | — | | | | — | | | | — | | |
| Upfront payments made on swap agreements | | | 4,674,404 | | | | — | | | | — | | | | — | | |
| Unrealized appreciation on swap agreements | | | 3,755,537 | | | | — | | | | — | | | | — | | |
Unrealized appreciation on unfunded
loan commitments | | | — | | | | 2,603 | | | | — | | | | — | | |
| Prepaid expenses | | | — | | | | 942 | | | | — | | | | — | | |
| Reimbursement due from manager | | | — | | | | 10,175 | | | | — | | | | — | | |
| Total assets | | | 1,695,449,282 | | | | 100,965,950 | | | | 861,273,724 | | | | 1,096,136,092 | | |
| LIABILITIES: | |
| Payable for investment securities purchased | | | 29,978 | | | | — | | | | 198,437 | | | | — | | |
Payable for investment securities purchased on a
delayed-delivery or when-issued basis | | | 466,971,797 | | | | — | | | | — | | | | — | | |
| Payable for fund shares redeemed | | | 1,564,609 | | | | 30,099 | | | | 906,827 | | | | 2,632,229 | | |
| Payable for collateral due to counterparties | | | 5,805,000 | | | | — | | | | — | | | | — | | |
| Payable upon receipt of securities loaned | | | 51,850,480 | | | | — | | | | 41,455,217 | | | | 10,585,550 | | |
Unrealized depreciation on forward foreign
currency contracts | | | 1,226,764 | | | | — | | | | — | | | | — | | |
| Upfront payments received on swap agreements | | | 566,425 | | | | — | | | | — | | | | — | | |
| Unrealized depreciation on swap agreements | | | 334,451 | | | | — | | | | — | | | | — | | |
| Payable to affiliates | | | 733,039 | | | | 59,793 | | | | 470,735 | | | | 760,706 | | |
| Payable for directors fees | | | — | | | | 3,902 | | | | — | | | | — | | |
| Other accrued expenses and liabilities | | | — | | | | 51,763 | | | | — | | | | — | | |
| Written options^ | | | 4,059,392 | | | | — | | | | — | | | | — | | |
| Total liabilities | | | 533,141,935 | | | | 145,557 | | | | 43,031,216 | | | | 13,978,485 | | |
| NET ASSETS | | $ | 1,162,307,347 | | | $ | 100,820,393 | | | $ | 818,242,508 | | | $ | 1,082,157,607 | | |
| NET ASSETS WERE COMPRISED OF: | |
| Paid-in capital | | $ | 1,086,448,375 | | | $ | 116,463,355 | | | $ | 674,343,721 | | | $ | 985,617,207 | | |
| Undistributed net investment income | | | 31,290,180 | | | | 427,328 | | | | 875,058 | | | | — | | |
| Accumulated net realized gain (loss) | | | 37,649,966 | | | | (30,863,086 | ) | | | (9,381,346 | ) | | | (182,905,709 | ) | |
| Net unrealized appreciation | | | 6,918,826 | | | | 14,792,796 | | | | 152,405,075 | | | | 279,446,109 | | |
| NET ASSETS | | $ | 1,162,307,347 | | | $ | 100,820,393 | | | $ | 818,242,508 | | | $ | 1,082,157,607 | | |
| + Including securities loaned at value | | $ | 50,769,467 | | | $ | — | | | $ | 40,465,726 | | | $ | 10,345,653 | | |
| * Cost of investments in securities | | $ | 1,585,467,995 | | | $ | 83,044,397 | | | $ | 663,471,648 | | | $ | 796,013,675 | | |
| ** Cost of short-term investments | | $ | 51,850,480 | | | $ | 1,747,848 | | | $ | 44,060,205 | | | $ | 16,359,280 | | |
| *** Cost of foreign currencies | | $ | 1,594,528 | | | $ | — | | | $ | — | | | $ | — | | |
| **** Cost of foreign cash collateral for futures | | $ | 16,048 | | | $ | — | | | $ | — | | | $ | — | | |
| ^ Premiums received on written options | | $ | 2,854,527 | | | $ | — | | | $ | — | | | $ | — | | |
See Accompanying Notes to Financial Statements
49
STATEMENTS OF ASSETS AND LIABILITIES AS OF DECEMBER 31, 2010 (CONTINUED)
| | | ING
PIMCO
Total Return
Portfolio | | ING
Pioneer
High Yield
Portfolio | | ING
T. Rowe Price
Diversified Mid Cap
Growth
Portfolio | | ING
T. Rowe Price
Growth Equity
Portfolio | |
| Class ADV: | |
| Net Assets | | $ | 152,733,141 | | | $ | 119,706 | | | $ | 31,927,014 | | | $ | 102,241,847 | | |
| Shares authorized | | | 100,000,000 | | | | 100,000,000 | | | | 100,000,000 | | | | 100,000,000 | | |
| Par value | | $ | 0.001 | | | $ | 0.001 | | | $ | 0.001 | | | $ | 0.001 | | |
| Shares outstanding | | | 12,849,148 | | | | 10,695 | | | | 3,870,785 | | | | 1,913,691 | | |
| Net asset value and redemption price per share | | $ | 11.89 | | | $ | 11.19 | | | $ | 8.25 | | | $ | 53.43 | | |
| Class I: | |
| Net Assets | | $ | 534,495,159 | | | $ | 98,393,616 | | | $ | 762,608,208 | | | $ | 808,031,964 | | |
| Shares authorized | | | 100,000,000 | | | | 100,000,000 | | | | 250,000,000 | | | | 100,000,000 | | |
| Par value | | $ | 0.001 | | | $ | 0.001 | | | $ | 0.001 | | | $ | 0.001 | | |
| Shares outstanding | | | 44,005,157 | | | | 8,754,471 | | | | 88,724,561 | | | | 14,828,636 | | |
| Net asset value and redemption price per share | | $ | 12.15 | | | $ | 11.24 | | | $ | 8.60 | | | $ | 54.49 | | |
| Class S: | |
| Net Assets | | $ | 474,075,595 | | | $ | 2,307,071 | | | $ | 23,701,007 | | | $ | 171,878,402 | | |
| Shares authorized | | | 100,000,000 | | | | 100,000,000 | | | | 100,000,000 | | | | 100,000,000 | | |
| Par value | | $ | 0.001 | | | $ | 0.001 | | | $ | 0.001 | | | $ | 0.001 | | |
| Shares outstanding | | | 39,386,301 | | | | 205,463 | | | | 2,804,951 | | | | 3,187,841 | | |
| Net asset value and redemption price per share | | $ | 12.04 | | | $ | 11.23 | | | $ | 8.45 | | | $ | 53.92 | | |
| Class S2: | |
| Net Assets | | $ | 1,003,452 | | | | n/a | | | $ | 6,279 | | | $ | 5,394 | | |
| Shares authorized | | | 100,000,000 | | | | n/a | | | | 100,000,000 | | | | 100,000,000 | | |
| Par value | | $ | 0.001 | | | | n/a | | | $ | 0.001 | | | $ | 0.001 | | |
| Shares outstanding | | | 84,657 | | | | n/a | | | | 761 | | | | 101 | | |
| Net asset value and redemption price per share | | $ | 11.85 | | | | n/a | | | $ | 8.25 | | | $ | 53.51 | | |
See Accompanying Notes to Financial Statements
50
STATEMENTS OF ASSETS AND LIABILITIES AS OF DECEMBER 31, 2010
| | | ING
Templeton
Foreign Equity
Portfolio | | ING
Thornburg
Value
Portfolio | | ING
UBS U.S.
Large Cap Equity
Portfolio | |
| ASSETS: | |
| Investments in securities at value+* | | $ | 599,814,876 | | | $ | 295,909,892 | | | $ | 175,565,853 | | |
| Short-term investments at value** | | | — | | | | 9,075,984 | | | | 8,635,944 | | |
| Short-term investments at amortized cost | | | 2,400,000 | | | | — | | | | — | | |
| Cash | | | 90,345,556 | | | | — | | | | — | | |
| Foreign currencies at value*** | | | 429,435 | | | | — | | | | — | | |
| Receivables: | |
| Investment securities sold | | | 1,848 | | | | 668,274 | | | | 112,682 | | |
| Fund shares sold | | | 1,633,208 | | | | 116,664 | | | | 5,561 | | |
| Dividends and interest | | | 1,491,001 | | | | 294,941 | | | | 123,430 | | |
| Prepaid expenses | | | 5,744 | | | | — | | | | — | | |
| Reimbursement due from manager | | | 25 | | | | — | | | | — | | |
| Total assets | | | 696,121,693 | | | | 306,065,755 | | | | 184,443,470 | | |
| LIABILITIES: | |
| Payable for investment securities purchased | | | 271,814 | | | | 64,904 | | | | 330,527 | | |
| Payable for fund shares redeemed | | | 2,277,143 | | | | 1,858,956 | | | | 491,312 | | |
| Payable upon receipt of securities loaned | | | — | | | | 9,183,945 | | | | 7,080,048 | | |
| Payable to affiliates | | | 592,170 | | | | 237,879 | | | | 134,021 | | |
| Payable to custodian due to bank overdraft | | | — | | | | 121,808 | | | | — | | |
| Payable for directors fees | | | 6,829 | | | | — | | | | — | | |
| Other accrued expenses and liabilities | | | 218,200 | | | | — | | | | — | | |
| Accrued foreign taxes on capital gains | | | 71,314 | | | | — | | | | — | | |
| Total liabilities | | | 3,437,470 | | | | 11,467,492 | | | | 8,035,908 | | |
| NET ASSETS | | $ | 692,684,223 | | | $ | 294,598,263 | | | $ | 176,407,562 | | |
| NET ASSETS WERE COMPRISED OF: | |
| Paid-in capital | | $ | 811,625,321 | | | $ | 338,579,229 | | | $ | 274,646,862 | | |
| Undistributed net investment income | | | 10,551,560 | | | | 2,067,409 | | | | 280,179 | | |
| Accumulated net realized loss | | | (169,486,202 | ) | | | (73,348,848 | ) | | | (127,614,249 | ) | |
| Net unrealized appreciation | | | 39,993,544 | | | | 27,300,473 | | | | 29,094,770 | | |
| NET ASSETS | | $ | 692,684,223 | | | $ | 294,598,263 | | | $ | 176,407,562 | | |
| + Including securities loaned at value | | $ | — | | | $ | 8,992,162 | | | $ | 6,868,436 | | |
| * Cost of investments in securities | | $ | 559,813,226 | | | $ | 268,508,510 | | | $ | 146,307,333 | | |
| ** Cost of short-term investments | | $ | — | | | $ | 9,183,945 | | | $ | 8,799,694 | | |
| *** Cost of foreign currencies | | $ | 424,222 | | | $ | — | | | $ | — | | |
See Accompanying Notes to Financial Statements
51
STATEMENTS OF ASSETS AND LIABILITIES AS OF DECEMBER 31, 2010 (CONTINUED)
| | | ING
Templeton
Foreign Equity
Portfolio | | ING
Thornburg
Value
Portfolio | | ING
UBS U.S.
Large Cap Equity
Portfolio | |
| Class ADV: | |
| Net Assets | | $ | 15,177,663 | | | $ | 15,360,919 | | | $ | 8,693,399 | | |
| Shares authorized | | | 100,000,000 | | | | 100,000,000 | | | | 100,000,000 | | |
| Par value | | $ | 0.001 | | | $ | 0.001 | | | $ | 0.001 | | |
| Shares outstanding | | | 1,380,871 | | | | 492,697 | | | | 974,097 | | |
| Net asset value and redemption price per share | | $ | 10.99 | | | $ | 31.18 | | | $ | 8.92 | | |
| Class I: | |
| Net Assets | | $ | 401,997,271 | | | $ | 260,671,348 | | | $ | 148,525,811 | | |
| Shares authorized | | | 100,000,000 | | | | 100,000,000 | | | | 100,000,000 | | |
| Par value | | $ | 0.001 | | | $ | 0.001 | | | $ | 0.001 | | |
| Shares outstanding | | | 36,374,388 | | | | 8,150,054 | | | | 16,397,789 | | |
| Net asset value and redemption price per share | | $ | 11.05 | | | $ | 31.98 | | | $ | 9.06 | | |
| Class S: | |
| Net Assets | | $ | 275,407,633 | | | $ | 18,562,836 | | | $ | 19,188,352 | | |
| Shares authorized | | | 100,000,000 | | | | 100,000,000 | | | | 100,000,000 | | |
| Par value | | $ | 0.001 | | | $ | 0.001 | | | $ | 0.001 | | |
| Shares outstanding | | | 25,036,282 | | | | 584,483 | | | | 2,135,791 | | |
| Net asset value and redemption price per share | | $ | 11.00 | | | $ | 31.76 | | | $ | 8.98 | | |
| Class S2: | |
| Net Assets | | $ | 101,656 | | | $ | 3,160 | | | | n/a | | |
| Shares authorized | | | 100,000,000 | | | | 100,000,000 | | | | n/a | | |
| Par value | | $ | 0.001 | | | $ | 0.001 | | | | n/a | | |
| Shares outstanding | | | 9,235 | | | | 101 | | | | n/a | | |
| Net asset value and redemption price per share | | $ | 11.01 | | | $ | 31.16 | | | | n/a | | |
See Accompanying Notes to Financial Statements
52
STATEMENTS OF ASSETS AND LIABILITIES AS OF DECEMBER 31, 2010
| | | ING
Van Kampen
Comstock
Portfolio | | ING
Van Kampen
Equity and Income
Portfolio | |
| ASSETS: | |
| Investments in securities at value+* | | $ | 324,895,120 | | | $ | 823,501,954 | | |
| Short-term investments at value** | | | 27,306,413 | | | | 26,753,200 | | |
| Foreign currencies at value*** | | | — | | | | 4,408 | | |
| Receivables: | |
| Investment securities sold | | | 304,513 | | | | — | | |
| Fund shares sold | | | 22,697 | | | | 543,025 | | |
| Dividends and interest | | | 373,172 | | | | 2,431,799 | | |
| Reimbursement due from manager | | | 9,948 | | | | — | | |
| Total assets | | | 352,911,863 | | | | 853,234,386 | | |
| LIABILITIES: | |
| Payable for investment securities purchased | | | 511,655 | | | | 98,444 | | |
| Payable for fund shares redeemed | | | 559,850 | | | | 1,630,908 | | |
| Payable upon receipt of securities loaned | | | 20,689,724 | | | | — | | |
| Payable to affiliates | | | 297,028 | | | | 520,710 | | |
| Total liabilities | | | 22,058,257 | | | | 2,250,062 | | |
| NET ASSETS | | $ | 330,853,606 | | | $ | 850,984,324 | | |
| NET ASSETS WERE COMPRISED OF: | |
| Paid-in capital | | $ | 553,589,949 | | | $ | 808,777,387 | | |
| Undistributed net investment income | | | 567,416 | | | | 3,335,536 | | |
| Accumulated net realized loss | | | (288,452,036 | ) | | | (69,599,724 | ) | |
| Net unrealized appreciation | | | 65,148,277 | | | | 108,471,125 | | |
| NET ASSETS | | $ | 330,853,606 | | | $ | 850,984,324 | | |
| + Including securities loaned at value | | $ | 20,127,816 | | | $ | — | | |
| * Cost of investments in securities | | $ | 259,553,524 | | | $ | 715,032,053 | | |
| ** Cost of short-term investments | | $ | 27,499,732 | | | $ | 26,753,200 | | |
| *** Cost of foreign currencies | | $ | — | | | $ | 3,184 | | |
See Accompanying Notes to Financial Statements
53
STATEMENTS OF ASSETS AND LIABILITIES AS OF DECEMBER 31, 2010 (CONTINUED)
| | | ING
Van Kampen
Comstock
Portfolio | | ING
Van Kampen
Equity and Income
Portfolio | |
| Class ADV: | |
| Net Assets | | $ | 17,040,886 | | | $ | 14,994,596 | | |
| Shares authorized | | | 100,000,000 | | | | 100,000,000 | | |
| Par value | | $ | 0.001 | | | $ | 0.001 | | |
| Shares outstanding | | | 1,682,604 | | | | 444,289 | | |
| Net asset value and redemption price per share | | $ | 10.13 | | | $ | 33.75 | | |
| Class I: | |
| Net Assets | | $ | 49,022,149 | | | $ | 594,281,699 | | |
| Shares authorized | | | 100,000,000 | | | | 100,000,000 | | |
| Par value | | $ | 0.001 | | | $ | 0.001 | | |
| Shares outstanding | | | 4,813,109 | | | | 17,364,877 | | |
| Net asset value and redemption price per share | | $ | 10.19 | | | $ | 34.22 | | |
| Class S: | |
| Net Assets | | $ | 264,790,571 | | | $ | 240,865,080 | | |
| Shares authorized | | | 100,000,000 | | | | 100,000,000 | | |
| Par value | | $ | 0.001 | | | $ | 0.001 | | |
| Shares outstanding | | | 26,019,073 | | | | 7,090,021 | | |
| Net asset value and redemption price per share | | $ | 10.18 | | | $ | 33.97 | | |
| Class S2: | |
| Net Assets | | | n/a | | | $ | 842,949 | | |
| Shares authorized | | | n/a | | | | 100,000,000 | | |
| Par value | | | n/a | | | $ | 0.001 | | |
| Shares outstanding | | | n/a | | | | 25,012 | | |
| Net asset value and redemption price per share | | | n/a | | | $ | 33.70 | | |
See Accompanying Notes to Financial Statements
54
STATEMENTS OF OPERATIONS FOR THE YEAR ENDED DECEMBER 31, 2010
| | | ING
American Century
Small-Mid Cap Value
Portfolio | | ING
Baron Small
Cap Growth
Portfolio | | ING
Columbia Small
Cap Value
Portfolio | | ING
Davis
New York
Venture
Portfolio | |
| INVESTMENT INCOME: | |
| Dividends, net of foreign taxes withheld*(1) | | $ | 4,251,551 | | | $ | 6,528,483 | | | $ | 3,194,454 | | | $ | 7,322,114 | | |
| Interest | | | — | | | | — | | | | — | | | | 347,443 | | |
| Securities lending income, net | | | 55,219 | | | | — | | | | — | | | | — | | |
| Total investment income | | | 4,306,770 | | | | 6,528,483 | | | | 3,194,454 | | | | 7,669,557 | | |
| EXPENSES: | |
| Investment management fees | | | 1,503,268 | | | | 6,164,169 | | | | 1,559,040 | | | | 3,750,713 | | |
| Distribution and service fees: | | | | | | | | | |
| Class ADV | | | 81,496 | | | | 208,120 | | | | 5,504 | | | | 32,064 | | |
| Class S | | | 168,263 | | | | 1,217,077 | | | | 392,682 | | | | 770,096 | | |
| Class S2 | | | 220 | | | | 24 | | | | 26 | | | | — | | |
| Transfer agent fees: | | | | | | | | | |
| Class ADV | | | — | | | | — | | | | 2 | | | | — | | |
| Class I | | | — | | | | — | | | | 88 | | | | — | | |
| Class S | | | — | | | | — | | | | 280 | | | | — | | |
| Administrative service fees | | | 375,816 | | | | 1,667,958 | | | | 207,870 | | | | 468,835 | | |
| Shareholder reporting expense | | | — | | | | — | | | | 27,865 | | | | — | | |
| Professional fees | | | — | | | | — | | | | 16,221 | | | | — | | |
| Custody and accounting expense | | | — | | | | — | | | | 40,635 | | | | — | | |
| Directors fees | | | — | | | | — | | | | 7,285 | | | | — | | |
| Miscellaneous expense | | | 465 | | | | 2,473 | | | | 12,113 | | | | 1,722 | | |
| Interest expense | | | — | | | | — | | | | 48 | | | | 962 | | |
| Total expenses | | | 2,129,528 | | | | 9,259,821 | | | | 2,269,659 | | | | 5,024,392 | | |
| Net waived and reimbursed fees | | | (472,081 | ) | | | (119,668 | ) | | | (3,400 | ) | | | (102,718 | ) | |
| Brokerage commission recapture | | | — | | | | (3,151 | ) | | | (54,911 | ) | | | — | | |
| Net expenses | | | 1,657,447 | | | | 9,137,002 | | | | 2,211,348 | | | | 4,921,674 | | |
| Net investment income (loss) | | | 2,649,323 | | | | (2,608,519 | ) | | | 983,106 | | | | 2,747,883 | | |
| REALIZED AND UNREALIZED GAIN (LOSS): | |
| Net realized gain (loss) on: | |
| Investments | | | 19,922,647 | | | | 41,510,980 | | | | 27,323,769 | | | | 3,249,141 | | |
| Foreign currency related transactions | | | (59,323 | ) | | | (364,331 | ) | | | — | | | | (62,719 | ) | |
| Net realized gain | | | 19,863,324 | | | | 41,146,649 | | | | 27,323,769 | | | | 3,186,422 | | |
| Net change in unrealized appreciation or depreciation on: | |
| Investments | | | 9,444,450 | | | | 136,691,508 | | | | 20,234,096 | | | | 46,883,442 | | |
| Foreign currency related transactions | | | (31,679 | ) | | | 1,025 | | | | — | | | | 3,220 | | |
| Net change in unrealized appreciation or depreciation | | | 9,412,771 | | | | 136,692,533 | | | | 20,234,096 | | | | 46,886,662 | | |
| Net realized and unrealized gain | | | 29,276,095 | | | | 177,839,182 | | | | 47,557,865 | | | | 50,073,084 | | |
| Increase in net assets resulting from operations | | $ | 31,925,418 | | | $ | 175,230,663 | | | $ | 48,540,971 | | | $ | 52,820,967 | | |
| * Foreign taxes withheld | | $ | 6,506 | | | $ | 52,944 | | | $ | 3,053 | | | $ | 109,452 | | |
| (1) Dividends from affiliates | | $ | 4,499 | | | $ | 45,184 | | | $ | 7,209 | | | $ | — | | |
See Accompanying Notes to Financial Statements
55
STATEMENTS OF OPERATIONS FOR THE YEAR ENDED DECEMBER 31, 2010
| | | ING
JPMorgan
Mid Cap Value
Portfolio | | ING
Legg Mason
ClearBridge
Aggressive Growth
Portfolio | | ING
Oppenheimer
Global
Portfolio | | ING
Oppenheimer
Global
Strategic Income
Portfolio | |
| INVESTMENT INCOME: | |
| Dividends, net of foreign taxes withheld*(1) | | $ | 5,926,658 | | | $ | 4,301,582 | | | $ | 31,971,009 | | | $ | 158,068 | | |
| Interest | | | — | | | | — | | | | 26,293 | | | | 35,396,653 | | |
| Securities lending income, net | | | 18,332 | | | | 49,553 | | | | 1,510,376 | | | | 130,735 | | |
| Total investment income | | | 5,944,990 | | | | 4,351,135 | | | | 33,507,678 | | | | 35,685,456 | | |
| EXPENSES: | |
| Investment management fees | | | 2,040,973 | | | | 2,503,395 | | | | 9,750,084 | | | | 2,432,114 | | |
| Distribution and service fees: | | | | | | | | | |
| Class ADV | | | 102,204 | | | | 32,910 | | | | 306,310 | | | | 138,656 | | |
| Class S | | | 355,489 | | | | 243,985 | | | | 443,194 | | | | 253,460 | | |
| Class S2 | | | 24 | | | | 12 | | | | 24 | | | | 12 | | |
| Administrative service fees | | | 680,324 | | | | 464,910 | | | | 974,985 | | | | 194,571 | | |
| Miscellaneous expense | | | 2,521 | | | | 1,227 | | | | 5,585 | | | | 1,615 | | |
| Interest expense | | | 119 | | | | 2,454 | | | | — | | | | 509 | | |
| Total expenses | | | 3,181,654 | | | | 3,248,893 | | | | 11,480,182 | | | | 3,020,937 | | |
| Net waived and reimbursed fees | | | (5,952 | ) | | | (312 | ) | | | (10,758 | ) | | | (86,368 | ) | |
| Net expenses | | | 3,175,702 | | | | 3,248,581 | | | | 11,469,424 | | | | 2,934,569 | | |
| Net investment income | | | 2,769,288 | | | | 1,102,554 | | | | 22,038,254 | | | | 32,750,887 | | |
| REALIZED AND UNREALIZED GAIN (LOSS): | |
| Net realized gain (loss) on: | |
| Investments (net of Indian capital gains tax withheld)** | | | 6,253,583 | | | | (659,722 | ) | | | 1,386,762 | | | | 8,476,093 | | |
| Foreign currency related transactions | | | — | | | | — | | | | (802,076 | ) | | | (2,294,888 | ) | |
| Futures | | | — | | | | — | | | | — | | | | 6,311,957 | | |
| Swaps | | | — | | | | — | | | | — | | | | 4,363,938 | | |
| Written options | | | — | | | | — | | | | — | | | | 872,568 | | |
| Net realized gain (loss) | | | 6,253,583 | | | | (659,722 | ) | | | 584,686 | | | | 17,729,668 | | |
| Net change in unrealized appreciation or depreciation on: | |
| Investments (net of Indian capital gains tax accrued)*** | | | 48,763,588 | | | | 79,221,888 | | | | 220,314,317 | | | | 23,296,492 | | |
| Foreign currency related transactions | | | — | | | | — | | | | 117,899 | | | | (1,506,543 | ) | |
| Futures | | | — | | | | — | | | | — | | | | (607,493 | ) | |
| Swaps | | | — | | | | — | | | | — | | | | (1,371,605 | ) | |
| Written options | | | — | | | | — | | | | — | | | | (1,200 | ) | |
| Unfunded commitments | | | — | | | | — | | | | — | | | | 56,875 | | |
| Net change in unrealized appreciation or depreciation | | | 48,763,588 | | | | 79,221,888 | | | | 220,432,216 | | | | 19,866,526 | | |
| Net realized and unrealized gain | | | 55,017,171 | | | | 78,562,166 | | | | 221,016,902 | | | | 37,596,194 | | |
| Increase in net assets resulting from operations | | $ | 57,786,459 | | | $ | 79,664,720 | | | $ | 243,055,156 | | | $ | 70,347,081 | | |
| * Foreign taxes withheld | | $ | 13,686 | | | $ | 37,652 | | | $ | 2,887,274 | | | $ | 30,969 | | |
| ** Foreign tax on sale of Indian investments | | $ | — | | | $ | — | | | $ | 140,545 | | | $ | — | | |
| *** Foreign tax accrued on Indian investments | | $ | — | | | $ | — | | | $ | 435 | | | $ | — | | |
| (1) Dividends from affiliates | | $ | 12,244 | | | $ | 508 | | | $ | 20,799 | | | $ | 67,124 | | |
See Accompanying Notes to Financial Statements
56
STATEMENTS OF OPERATIONS FOR THE YEAR ENDED DECEMBER 31, 2010
| | | ING
PIMCO
Total Return
Portfolio | | ING
Pioneer
High Yield
Portfolio | | ING
T. Rowe Price
Diversified Mid Cap
Growth
Portfolio | | ING
T. Rowe Price
Growth Equity
Portfolio | |
| INVESTMENT INCOME: | |
| Dividends, net of foreign taxes withheld*(1) | | $ | 5,788,339 | | | $ | 428,159 | | | $ | 7,120,341 | | | $ | 7,438,296 | | |
| Interest | | | 26,318,953 | | | | 6,139,241 | | | | — | | | | 427 | | |
| Securities lending income, net | | | 19,129 | | | | — | | | | 285,031 | | | | 38,538 | | |
| Total investment income | | | 32,126,421 | | | | 6,567,400 | | | | 7,405,372 | | | | 7,477,261 | | |
| EXPENSES: | |
| Investment management fees | | | 5,329,736 | | | | 567,626 | | | | 4,610,100 | | | | 5,871,021 | | |
| Distribution and service fees: | | | | | | | | | |
| Class ADV | | | 634,606 | | | | 364 | | | | 136,014 | | | | 423,464 | | |
| Class S | | | 1,077,291 | | | | 6,766 | | | | 51,161 | | | | 369,566 | | |
| Class S2 | | | 1,576 | | | | — | | | | 26 | | | | 24 | | |
| Transfer agent fees: | | | | | | | | | |
| Class I | | | — | | | | 132 | | | | — | | | | — | | |
| Class S | | | — | | | | 4 | | | | — | | | | — | | |
| Administrative service fees | | | 959,782 | | | | 94,603 | | | | 144,054 | | | | 1,467,755 | | |
| Shareholder reporting expense | | | — | | | | 16,652 | | | | — | | | | — | | |
| Professional fees | | | — | | | | 12,641 | | | | — | | | | — | | |
| Custody and accounting expense | | | — | | | | 8,171 | | | | — | | | | — | | |
| Directors fees | | | — | | | | 1,922 | | | | — | | | | — | | |
| Miscellaneous expense | | | 3,678 | | | | 6,375 | | | | 2,439 | | | | 3,338 | | |
| Interest expense | | | 372 | | | | 2,446 | | | | 328 | | | | 200 | | |
| Total expenses | | | 8,007,041 | | | | 717,702 | | | | 4,944,122 | | | | 8,135,368 | | |
| Net waived and reimbursed fees | | | (106,054 | ) | | | (34,486 | ) | | | (5 | ) | | | (33,053 | ) | |
| Brokerage commission recapture | | | — | | | | (442 | ) | | | (209 | ) | | | (14,904 | ) | |
| Net expenses | | | 7,900,987 | | | | 682,774 | | | | 4,943,908 | | | | 8,087,411 | | |
| Net investment income (loss) | | | 24,225,434 | | | | 5,884,626 | | | | 2,461,464 | | | | (610,150 | ) | |
| REALIZED AND UNREALIZED GAIN (LOSS): | |
| Net realized gain (loss) on: | |
| Investments | | | 17,561,867 | | | | 7,168,451 | | | | 28,371,564 | | | | 39,928,411 | | |
| Foreign currency related transactions | | | 793,081 | | | | — | | | | (227 | ) | | | 8,177 | | |
| Futures | | | 22,129,962 | | | | — | | | | — | | | | — | | |
| Swaps | | | 1,667,101 | | | | — | | | | — | | | | — | | |
| Written options | | | 4,864,094 | | | | — | | | | — | | | | — | | |
| Net realized gain | | | 47,016,105 | | | | 7,168,451 | | | | 28,371,337 | | | | 39,936,588 | | |
| Net change in unrealized appreciation or depreciation on: | |
| Investments | | | 2,497,665 | | | | 3,350,122 | | | | 153,334,180 | | | | 115,590,569 | | |
| Foreign currency related transactions | | | 1,490,602 | | | | — | | | | (41 | ) | | | (88 | ) | |
| Futures | | | (1,913,281 | ) | | | — | | | | — | | | | — | | |
| Swaps | | | 2,990,434 | | | | — | | | | — | | | | — | | |
| Written options | | | (1,990,053 | ) | | | — | | | | — | | | | — | | |
| Sales commitments | | | (66,444 | ) | | | — | | | | — | | | | — | | |
| Unfunded loan commitments | | | — | | | | 2,603 | | | | — | | | | — | | |
| Net change in unrealized appreciation or depreciation | | | 3,008,923 | | | | 3,352,725 | | | | 153,334,139 | | | | 115,590,481 | | |
| Net realized and unrealized gain | | | 50,025,028 | | | | 10,521,176 | | | | 181,705,476 | | | | 155,527,069 | | |
| Increase in net assets resulting from operations | | $ | 74,250,462 | | | $ | 16,405,802 | | | $ | 184,166,940 | | | $ | 154,916,919 | | |
| * Foreign taxes withheld | | $ | — | | | $ | — | | | $ | 41,001 | | | $ | 47,008 | | |
| (1) Dividends from affiliates | | $ | — | | | $ | 2,049 | | | $ | — | | | $ | — | | |
See Accompanying Notes to Financial Statements
57
STATEMENTS OF OPERATIONS FOR THE YEAR ENDED DECEMBER 31, 2010
| | | ING
Templeton
Foreign Equity
Portfolio | | ING
Thornburg
Value
Portfolio | | ING
UBS U.S.
Large Cap Equity
Portfolio | |
| INVESTMENT INCOME: | |
| Dividends, net of foreign taxes withheld*(1) | | $ | 15,905,025 | | | $ | 4,131,441 | | | $ | 2,980,125 | | |
| Interest | | | 26,778 | | | | 781,662 | | | | — | | |
| Securities lending income, net | | | — | | | | 67,680 | | | | 396 | | |
| Total investment income | | | 15,931,803 | | | | 4,980,783 | | | | 2,980,521 | | |
| EXPENSES: | |
| Investment management fees | | | 4,420,841 | | | | 1,953,570 | | | | 1,206,023 | | |
| Distribution and service fees: | |
| Class ADV | | | 58,686 | | | | 58,506 | | | | 40,578 | | |
| Class S | | | 644,269 | | | | 43,151 | | | | 46,949 | | |
| Class S2 | | | 220 | | | | 12 | | | | — | | |
| Transfer agent fees: | | | | | | | |
| Class ADV | | | 15 | | | | — | | | | — | | |
| Class I | | | 320 | | | | — | | | | — | | |
| Class S | | | 291 | | | | — | | | | — | | |
| Administrative service fees | | | 556,116 | | | | 751,372 | | | | 258,434 | | |
| Shareholder reporting expense | | | 55,160 | | | | — | | | | — | | |
| Professional fees | | | 50,197 | | | | — | | | | — | | |
| Custody and accounting expense | | | 215,191 | | | | — | | | | — | | |
| Directors fees | | | 18,072 | | | | — | | | | — | | |
| Miscellaneous expense | | | 26,469 | | | | 703 | | | | 607 | | |
| Interest expense | | | 766 | | | | 382 | | | | 385 | | |
| Total expenses | | | 6,046,613 | | | | 2,807,696 | | | | 1,552,976 | | |
| Net waived and reimbursed fees | | | (43 | ) | | | (5,739 | ) | | | (1,199 | ) | |
| Brokerage commission recapture | | | (7,849 | ) | | | (6,175 | ) | | | (21,820 | ) | |
| Net expenses | | | 6,038,721 | | | | 2,795,782 | | | | 1,529,957 | | |
| Net investment income | | | 9,893,082 | | | | 2,185,001 | | | | 1,450,564 | | |
| REALIZED AND UNREALIZED GAIN (LOSS): | |
| Net realized gain (loss) on: | |
| Investments (net of Indian capital gains tax withheld)** | | | 1,587,274 | | | | 31,893,768 | | | | 15,780,319 | | |
| Foreign currency related transactions | | | 79,715 | | | | (117,504 | ) | | | — | | |
| Net realized gain | | | 1,666,989 | | | | 31,776,264 | | | | 15,780,319 | | |
| Net change in unrealized appreciation or depreciation on: | |
| Investments (net of Indian capital gains tax accrued)*** | | | 35,234,393 | | | | (1,408,356 | ) | | | 4,176,714 | | |
| Foreign currency related transactions | | | (32,080 | ) | | | 6,984 | | | | — | | |
| Net change in unrealized appreciation or depreciation | | | 35,202,313 | | | | (1,401,372 | ) | | | 4,176,714 | | |
| Net realized and unrealized gain | | | 36,869,302 | | | | 30,374,892 | | | | 19,957,033 | | |
| Increase in net assets resulting from operations | | $ | 46,762,384 | | | $ | 32,559,893 | | | $ | 21,407,597 | | |
| * Foreign taxes withheld | | $ | 1,767,221 | | | $ | 80,142 | | | $ | — | | |
| ** Foreign tax on sale of Indian investments | | $ | 88,016 | | | $ | — | | | $ | — | | |
| *** Foreign tax accrued on Indian investments | | $ | 71,314 | | | $ | — | | | $ | — | | |
| (1) Dividends from affiliates | | $ | — | | | $ | 12,158 | | | $ | 2,663 | | |
See Accompanying Notes to Financial Statements
58
STATEMENTS OF OPERATIONS FOR THE YEAR ENDED DECEMBER 31, 2010
| | | ING
Van Kampen
Comstock
Portfolio | | ING
Van Kampen
Equity and Income
Portfolio | |
| INVESTMENT INCOME: | |
| Dividends, net of foreign taxes withheld*(1) | | $ | 6,774,096 | | | $ | 11,832,214 | | |
| Interest | | | 887 | | | | 9,138,266 | | |
| Securities lending income, net | | | 27,261 | | | | — | | |
| Total investment income | | | 6,802,244 | | | | 20,970,480 | | |
| EXPENSES: | |
| Investment management fees | | | 1,850,252 | | | | 4,433,267 | | |
| Distribution and service fees: | | | | | |
| Class ADV | | | 79,806 | | | | 57,034 | | |
| Class S | | | 612,519 | | | | 563,019 | | |
| Class S2 | | | — | | | | 2,286 | | |
| Administrative service fees | | | 770,935 | | | | 806,041 | | |
| Miscellaneous expense | | | 1,056 | | | | 2,757 | | |
| Interest expense | | | 41 | | | | — | | |
| Total expenses | | | 3,314,609 | | | | 5,864,404 | | |
| Net waived and reimbursed fees | | | (123,602 | ) | | | (9,280 | ) | |
| Brokerage commission recapture | | | (13,037 | ) | | | (33,718 | ) | |
| Net expenses | | | 3,177,970 | | | | 5,821,406 | | |
| Net investment income | | | 3,624,274 | | | | 15,149,074 | | |
| REALIZED AND UNREALIZED GAIN: | |
| Net realized gain | | | 11,728,931 | | | | 31,235,346 | | |
| Net change in unrealized appreciation or depreciation on: | |
| Investments | | | 27,784,878 | | | | 47,214,010 | | |
| Foreign currency related transactions | | | — | | | | 381 | | |
| Net change in unrealized appreciation or depreciation | | | 27,784,878 | | | | 47,214,391 | | |
| Net realized and unrealized gain | | | 39,513,809 | | | | 78,449,737 | | |
| Increase in net assets resulting from operations | | $ | 43,138,083 | | | $ | 93,598,811 | | |
| * Foreign taxes withheld | | $ | 94,749 | | | $ | 194,470 | | |
| (1) Dividends from affiliates | | $ | 9,548 | | | $ | 21,028 | | |
See Accompanying Notes to Financial Statements
59
STATEMENTS OF CHANGES IN NET ASSETS
| | | ING American Century
Small-Mid Cap Value Portfolio | | ING Baron Small Cap
Growth Portfolio | |
| | | Year
Ended
December 31,
2010 | | Year
Ended
December 31,
2009 | | Year
Ended
December 31,
2010 | | Year
Ended
December 31,
2009 | |
| FROM OPERATIONS: | |
| Net investment income (loss) | | $ | 2,649,323 | | | $ | 1,867,646 | | | $ | (2,608,519 | ) | | $ | (4,103,095 | ) | |
| Net realized gain (loss) | | | 19,863,324 | | | | (2,824,837 | ) | | | 41,146,649 | | | | (15,439,981 | ) | |
| Net change in unrealized appreciation or depreciation | | | 9,412,771 | | | | 30,236,822 | | | | 136,692,533 | | | | 188,509,736 | | |
| Increase in net assets resulting from operations | | | 31,925,418 | | | | 29,279,631 | | | | 175,230,663 | | | | 168,966,660 | | |
| FROM DISTRIBUTIONS TO SHAREHOLDERS: | |
| Net investment income: | | | | | | | | | |
| Class ADV | | | (174,774 | ) | | | (119,950 | ) | | | — | | | | — | | |
| Class I | | | (822,603 | ) | | | (777,526 | ) | | | — | | | | — | | |
| Class S | | | (817,115 | ) | | | (715,006 | ) | | | — | | | | — | | |
| Class S2 | | | (52 | ) | | | (81 | ) | | | — | | | | — | | |
| Total distributions | | | (1,814,544 | ) | | | (1,612,563 | ) | | | — | | | | — | | |
| FROM CAPITAL SHARE TRANSACTIONS: | |
| Net proceeds from sale of shares | | | 77,282,915 | | | | 25,317,364 | | | | 119,161,393 | | | | 157,878,300 | | |
| Reinvestment of distributions | | | 1,814,492 | | | | 1,612,482 | | | | — | | | | — | | |
| | | | 79,097,407 | | | | 26,929,846 | | | | 119,161,393 | | | | 157,878,300 | | |
| Cost of shares redeemed | | | (31,239,269 | ) | | | (13,873,396 | ) | | | (138,764,305 | ) | | | (86,315,173 | ) | |
Net increase (decrease) in net assets resulting from
capital share transactions | | | 47,858,138 | | | | 13,056,450 | | | | (19,602,912 | ) | | | 71,563,127 | | |
| Net increase in net assets | | | 77,969,012 | | | | 40,723,518 | | | | 155,627,751 | | | | 240,529,787 | | |
| NET ASSETS: | |
| Beginning of year | | | 115,766,271 | | | | 75,042,753 | | | | 687,103,850 | | | | 446,574,063 | | |
| End of year | | $ | 193,735,283 | | | $ | 115,766,271 | | | $ | 842,731,601 | | | $ | 687,103,850 | | |
| Undistributed net investment income at end of year | | $ | 2,409,521 | | | $ | 1,735,034 | | | $ | — | | | $ | — | | |
See Accompanying Notes to Financial Statements
60
STATEMENTS OF CHANGES IN NET ASSETS
| | | ING Columbia Small Cap
Value Portfolio | | ING Davis New York
Venture Portfolio | |
| | | Year
Ended
December 31,
2010 | | Year
Ended
December 31,
2009 | | Year
Ended
December 31,
2010 | | Year
Ended
December 31,
2009 | |
| FROM OPERATIONS: | |
| Net investment income | | $ | 983,106 | | | $ | 2,925,743 | | | $ | 2,747,883 | | | $ | 2,311,980 | | |
| Net realized gain (loss) | | | 27,323,769 | | | | (79,142,358 | ) | | | 3,186,422 | | | | (58,443,187 | ) | |
| Net change in unrealized appreciation or depreciation | | | 20,234,096 | | | | 144,371,314 | | | | 46,886,662 | | | | 170,414,135 | | |
| Increase in net assets resulting from operations | | | 48,540,971 | | | | 68,154,699 | | | | 52,820,967 | | | | 114,282,928 | | |
| FROM DISTRIBUTIONS TO SHAREHOLDERS: | |
| Net investment income: | | | | | | | | | |
| Class ADV | | | (18,339 | ) | | | (3,053 | ) | | | (22,413 | ) | | | — | | |
| Class I | | | (758,673 | ) | | | (2,839,892 | ) | | | (952,452 | ) | | | (1,219,435 | ) | |
| Class S | | | (1,943,880 | ) | | | (1,987,504 | ) | | | (1,288,733 | ) | | | (1,715,544 | ) | |
| Class S2 | | | (67 | ) | | | (61 | ) | | | — | | | | — | | |
| Total distributions | | | (2,720,959 | ) | | | (4,830,510 | ) | | | (2,263,598 | ) | | | (2,934,979 | ) | |
| FROM CAPITAL SHARE TRANSACTIONS: | |
| Net proceeds from sale of shares | | | 18,258,681 | | | | 60,094,020 | | | | 62,825,024 | | | | 78,245,206 | | |
| Reinvestment of distributions | | | 2,720,892 | | | | 4,830,449 | | | | 2,263,598 | | | | 2,934,979 | | |
| | | | 20,979,573 | | | | 64,924,469 | | | | 65,088,622 | | | | 81,180,185 | | |
| Cost of shares redeemed | | | (54,624,055 | ) | | | (291,613,709 | ) | | | (109,181,308 | ) | | | (71,740,481 | ) | |
Net increase (decrease) in net assets resulting from
capital share transactions | | | (33,644,482 | ) | | | (226,689,240 | ) | | | (44,092,686 | ) | | | 9,439,704 | | |
| Net increase (decrease) in net assets | | | 12,175,530 | | | | (163,365,051 | ) | | | 6,464,683 | | | | 120,787,653 | | |
| NET ASSETS: | |
| Beginning of year | | | 213,060,564 | | | | 376,425,615 | | | | 474,071,213 | | | | 353,283,560 | | |
| End of year | | $ | 225,236,094 | | | $ | 213,060,564 | | | $ | 480,535,896 | | | $ | 474,071,213 | | |
| Undistributed net investment income at end of year | | $ | 784,083 | | | $ | 2,719,427 | | | $ | 4,864,358 | | | $ | 2,263,201 | | |
See Accompanying Notes to Financial Statements
61
STATEMENTS OF CHANGES IN NET ASSETS
| | | ING JPMorgan Mid Cap
Value Portfolio | | ING Legg Mason ClearBridge
Aggressive Growth Portfolio | |
| | | Year
Ended
December 31,
2010 | | Year
Ended
December 31,
2009 | | Year
Ended
December 31,
2010 | | Year
Ended
December 31,
2009 | |
| FROM OPERATIONS: | |
| Net investment income (loss) | | $ | 2,769,288 | | | $ | 3,229,541 | | | $ | 1,102,554 | | | $ | (741,650 | ) | |
| Net realized gain (loss) | | | 6,253,583 | | | | (29,530,603 | ) | | | (659,722 | ) | | | 1,056,575 | | |
| Net change in unrealized appreciation or depreciation | | | 48,763,588 | | | | 75,273,683 | | | | 79,221,888 | | | | 124,361,202 | | |
| Increase in net assets resulting from operations | | | 57,786,459 | | | | 48,972,621 | | | | 79,664,720 | | | | 124,676,127 | | |
| FROM DISTRIBUTIONS TO SHAREHOLDERS: | |
| Net investment income: | | | | | | | | | |
| Class ADV | | | (141,753 | ) | | | (155,594 | ) | | | — | | | | — | | |
| Class I | | | (1,148,457 | ) | | | (1,321,193 | ) | | | — | | | | — | | |
| Class S | | | (1,215,265 | ) | | | (1,261,341 | ) | | | — | | | | — | | |
| Class S2 | | | (31 | ) | | | (47 | ) | | | — | | | | — | | |
| Net realized gains: | | | | | | | | | |
| Class ADV | | | — | | | | (216,618 | ) | | | — | | | | — | | |
| Class I | | | — | | | | (1,347,517 | ) | | | — | | | | — | | |
| Class S | | | — | | | | (1,656,223 | ) | | | — | | | | — | | |
| Class S2 | | | — | | | | (63 | ) | | | — | | | | — | | |
| Total distributions | | | (2,505,506 | ) | | | (5,958,596 | ) | | | — | | | | — | | |
| FROM CAPITAL SHARE TRANSACTIONS: | |
| Net proceeds from sale of shares | | | 104,595,538 | | | | 51,481,100 | | | | 14,513,268 | | | | 29,848,460 | | |
| Reinvestment of distributions | | | 2,505,475 | | | | 5,958,486 | | | | — | | | | — | | |
| | | | 107,101,013 | | | | 57,439,586 | | | | 14,513,268 | | | | 29,848,460 | | |
| Cost of shares redeemed | | | (65,975,070 | ) | | | (43,315,053 | ) | | | (51,876,653 | ) | | | (347,268,738 | ) | |
Net increase (decrease) in net assets resulting from
capital share transactions | | | 41,125,943 | | | | 14,124,533 | | | | (37,363,385 | ) | | | (317,420,278 | ) | |
| Net increase (decrease) in net assets | | | 96,406,896 | | | | 57,138,558 | | | | 42,301,335 | | | | (192,744,151 | ) | |
| NET ASSETS: | |
| Beginning of year | | | 229,881,549 | | | | 172,742,991 | | | | 353,079,352 | | | | 545,823,503 | | |
| End of year | | $ | 326,288,445 | | | $ | 229,881,549 | | | $ | 395,380,687 | | | $ | 353,079,352 | | |
| Undistributed net investment income at end of year | | $ | 522,764 | | | $ | 357,303 | | | $ | 1,102,562 | | | $ | — | | |
See Accompanying Notes to Financial Statements
62
STATEMENTS OF CHANGES IN NET ASSETS
| | | ING Oppenheimer Global Portfolio | | ING Oppenheimer Global
Strategic Income Portfolio | |
| | | Year
Ended
December 31,
2010 | | Year
Ended
December 31,
2009 | | Year
Ended
December 31,
2010 | | Year
Ended
December 31,
2009 | |
| FROM OPERATIONS: | |
| Net investment income | | $ | 22,038,254 | | | $ | 22,472,074 | | | $ | 32,750,887 | | | $ | 24,330,072 | | |
| Net realized gain (loss) | | | 584,686 | | | | (48,561,051 | ) | | | 17,729,668 | | | | (24,180,126 | ) | |
| Net change in unrealized appreciation or depreciation | | | 220,432,216 | | | | 505,314,226 | | | | 19,866,526 | | | | 92,294,343 | | |
| Increase in net assets resulting from operations | | | 243,055,156 | | | | 479,225,249 | | | | 70,347,081 | | | | 92,444,289 | | |
| FROM DISTRIBUTIONS TO SHAREHOLDERS: | |
| Net investment income: | | | | | | | | | |
| Class ADV | | | (845,780 | ) | | | (721,917 | ) | | | (928,779 | ) | | | (550,508 | ) | |
| Class I | | | (22,588,655 | ) | | | (30,130,203 | ) | | | (10,977,055 | ) | | | (13,616,424 | ) | |
| Class S | | | (2,475,668 | ) | | | (3,432,349 | ) | | | (3,226,945 | ) | | | (3,333,453 | ) | |
| Class S2 | | | (71 | ) | | | (106 | ) | | | (100 | ) | | | — | | |
| Net realized gains: | | | | | | | | | |
| Class ADV | | | — | | | | (780,934 | ) | | | — | | | | — | | |
| Class I | | | — | | | | (21,766,494 | ) | | | — | | | | — | | |
| Class S | | | — | | | | (2,852,448 | ) | | | — | | | | — | | |
| Class S2 | | | — | | | | (77 | ) | | | — | | | | — | | |
| Total distributions | | | (25,910,174 | ) | | | (59,684,528 | ) | | | (15,132,879 | ) | | | (17,500,385 | ) | |
| FROM CAPITAL SHARE TRANSACTIONS: | |
| Net proceeds from sale of shares | | | 56,805,327 | | | | 50,068,049 | | | | 87,584,205 | | | | 63,598,990 | | |
| Reinvestment of distributions | | | 25,910,103 | | | | 59,684,344 | | | | 15,132,779 | | | | 17,500,385 | | |
| | | | 82,715,430 | | | | 109,752,393 | | | | 102,716,984 | | | | 81,099,375 | | |
| Cost of shares redeemed | | | (215,389,499 | ) | | | (200,076,847 | ) | | | (99,604,133 | ) | | | (259,933,143 | ) | |
Net increase (decrease) in net assets resulting from
capital share transactions | | | (132,674,069 | ) | | | (90,324,454 | ) | | | 3,112,851 | | | | (178,833,768 | ) | |
| Net increase (decrease) in net assets | | | 84,470,913 | | | | 329,216,267 | | | | 58,327,053 | | | | (103,889,864 | ) | |
| NET ASSETS: | |
| Beginning of year | | | 1,651,417,362 | | | | 1,322,201,095 | | | | 452,292,614 | | | | 556,182,478 | | |
| End of year | | $ | 1,735,888,275 | | | $ | 1,651,417,362 | | | $ | 510,619,667 | | | $ | 452,292,614 | | |
| Undistributed net investment income at end of year | | $ | 23,528,229 | | | $ | 25,854,441 | | | $ | 35,545,997 | | | $ | 15,181,088 | | |
See Accompanying Notes to Financial Statements
63
STATEMENTS OF CHANGES IN NET ASSETS
| | | ING PIMCO Total Return Portfolio | | ING Pioneer High Yield Portfolio | |
| | | Year
Ended
December 31,
2010 | | Year
Ended
December 31,
2009 | | Year
Ended
December 31,
2010 | | Year
Ended
December 31,
2009 | |
| FROM OPERATIONS: | |
| Net investment income | | $ | 24,225,434 | | | $ | 23,133,927 | | | $ | 5,884,626 | | | $ | 14,585,666 | | |
| Net realized gain (loss) | | | 47,016,105 | | | | 15,911,280 | | | | 7,168,451 | | | | (22,988,813 | ) | |
| Net change in unrealized appreciation or depreciation | | | 3,008,923 | | | | 39,281,265 | | | | 3,352,725 | | | | 86,724,954 | | |
| Increase in net assets resulting from operations | | | 74,250,462 | | | | 78,326,472 | | | | 16,405,802 | | | | 78,321,807 | | |
| FROM DISTRIBUTIONS TO SHAREHOLDERS: | |
| Net investment income: | | | | | | | | | |
| Class ADV | | | (4,338,828 | ) | | | (1,830,772 | ) | | | (4,181 | ) | | | (106,263 | ) | |
| Class I | | | (17,589,023 | ) | | | (10,725,881 | ) | | | (5,723,733 | ) | | | (14,151,585 | ) | |
| Class S | | | (14,499,792 | ) | | | (9,128,837 | ) | | | (161,579 | ) | | | (220,813 | ) | |
| Class S2 | | | (11,515 | ) | | | (111 | ) | | | — | | | | — | | |
| Net realized gains: | | | | | | | | | |
| Class ADV | | | (180,044 | ) | | | (2,164,114 | ) | | | — | | | | — | | |
| Class I | | | (682,333 | ) | | | (11,356,493 | ) | | | — | | | | — | | |
| Class S | | | (588,861 | ) | | | (10,107,362 | ) | | | — | | | | — | | |
| Class S2 | | | (447 | ) | | | (118 | ) | | | — | | | | — | | |
| Total distributions | | | (37,890,843 | ) | | | (45,313,688 | ) | | | (5,889,493 | ) | | | (14,478,661 | ) | |
| FROM CAPITAL SHARE TRANSACTIONS: | |
| Net proceeds from sale of shares | | | 333,869,537 | | | | 366,550,027 | | | | 22,670,528 | | | | 46,787,109 | | |
| Reinvestment of distributions | | | 37,890,719 | | | | 45,313,459 | | | | 5,889,493 | | | | 14,476,843 | | |
| | | | 371,760,256 | | | | 411,863,486 | | | | 28,560,021 | | | | 61,263,952 | | |
| Cost of shares redeemed | | | (122,062,898 | ) | | | (70,794,459 | ) | | | (33,995,064 | ) | | | (311,478,496 | ) | |
Net increase (decrease) in net assets resulting from
capital share transactions | | | 249,697,358 | | | | 341,069,027 | | | | (5,435,043 | ) | | | (250,214,544 | ) | |
| Net increase (decrease) in net assets | | | 286,056,977 | | | | 374,081,811 | | | | 5,081,266 | | | | (186,371,398 | ) | |
| NET ASSETS: | |
| Beginning of year | | | 876,250,370 | | | | 502,168,559 | | | | 95,739,127 | | | | 282,110,525 | | |
| End of year | | $ | 1,162,307,347 | | | $ | 876,250,370 | | | $ | 100,820,393 | | | $ | 95,739,127 | | |
| Undistributed net investment income at end of year | | $ | 31,290,180 | | | $ | 35,495,467 | | | $ | 427,328 | | | $ | 386,902 | | |
See Accompanying Notes to Financial Statements
64
STATEMENTS OF CHANGES IN NET ASSETS
| | | ING T. Rowe Price Diversified
Mid Cap Growth Portfolio | | ING T. Rowe Price
Growth Equity Portfolio | |
| | | Year
Ended
December 31,
2010 | | Year
Ended
December 31,
2009 | | Year
Ended
December 31,
2010 | | Year
Ended
December 31,
2009 | |
| FROM OPERATIONS: | |
| Net investment income (loss) | | $ | 2,461,464 | | | $ | 2,717,742 | | | $ | (610,150 | ) | | $ | 1,540,711 | | |
| Net realized gain (loss) | | | 28,371,337 | | | | (21,412,992 | ) | | | 39,936,588 | | | | (113,603,265 | ) | |
| Net change in unrealized appreciation or depreciation | | | 153,334,139 | | | | 246,604,304 | | | | 115,590,481 | | | | 431,857,452 | | |
| Increase in net assets resulting from operations | | | 184,166,940 | | | | 227,909,054 | | | | 154,916,919 | | | | 319,794,898 | | |
| FROM DISTRIBUTIONS TO SHAREHOLDERS: | |
| Net investment income: | | | | | | | | | |
| Class ADV | | | (16,555 | ) | | | (7,178 | ) | | | (31,137 | ) | | | — | | |
| Class I | | | (1,970,693 | ) | | | (2,449,524 | ) | | | (274,344 | ) | | | (1,115,490 | ) | |
| Class S | | | (13,597 | ) | | | (41,999 | ) | | | (51,974 | ) | | | (9,477 | ) | |
| Class S2 | | | (3 | ) | | | (5 | ) | | | (2 | ) | | | — | | |
| Total distributions | | | (2,000,848 | ) | | | (2,498,706 | ) | | | (357,457 | ) | | | (1,124,967 | ) | |
| FROM CAPITAL SHARE TRANSACTIONS: | |
| Net proceeds from sale of shares | | | 27,654,044 | | | | 31,300,495 | | | | 113,699,227 | | | | 171,923,140 | | |
| Reinvestment of distributions | | | 2,000,845 | | | | 2,498,706 | | | | 357,455 | | | | 1,124,967 | | |
| | | | 29,654,889 | | | | 33,799,201 | | | | 114,056,682 | | | | 173,048,107 | | |
| Cost of shares redeemed | | | (97,867,239 | ) | | | (67,298,213 | ) | | | (170,670,840 | ) | | | (372,742,708 | ) | |
Net decrease in net assets resulting from
capital share transactions | | | (68,212,350 | ) | | | (33,499,012 | ) | | | (56,614,158 | ) | | | (199,694,601 | ) | |
| Net increase in net assets | | | 113,953,742 | | | | 191,911,336 | | | | 97,945,304 | | | | 118,975,330 | | |
| NET ASSETS: | |
| Beginning of year | | | 704,288,766 | | | | 512,377,430 | | | | 984,212,303 | | | | 865,236,973 | | |
| End of year | | $ | 818,242,508 | | | $ | 704,288,766 | | | $ | 1,082,157,607 | | | $ | 984,212,303 | | |
| Undistributed net investment income at end of year | | $ | 875,058 | | | $ | 431,213 | | | $ | — | | | $ | 357,483 | | |
See Accompanying Notes to Financial Statements
65
STATEMENTS OF CHANGES IN NET ASSETS
| | | ING Templeton
Foreign Equity Portfolio | | ING Thornburg Value Portfolio | |
| | | Year
Ended
December 31,
2010 | | Year
Ended
December 31,
2009 | | Year
Ended
December 31,
2010 | | Year
Ended
December 31,
2009 | |
| FROM OPERATIONS: | |
| Net investment income | | $ | 9,893,082 | | | $ | 12,850,458 | | | $ | 2,185,001 | | | $ | 4,765,670 | | |
| Net realized gain (loss) | | | 1,666,989 | | | | (135,289,133 | ) | | | 31,776,264 | | | | (34,252,870 | ) | |
| Net change in unrealized appreciation or depreciation | | | 35,202,313 | | | | 302,762,649 | | | | (1,401,372 | ) | | | 131,962,911 | | |
| Increase in net assets resulting from operations | | | 46,762,384 | | | | 180,323,974 | | | | 32,559,893 | | | | 102,475,711 | | |
| FROM DISTRIBUTIONS TO SHAREHOLDERS: | |
| Net investment income: | | | | | | | | | |
| Class ADV | | | (226,608 | ) | | | — | | | | (183,003 | ) | | | (25,124 | ) | |
| Class I | | | (7,199,119 | ) | | | — | | | | (4,222,751 | ) | | | (3,404,235 | ) | |
| Class S | | | (5,422,278 | ) | | | — | | | | (249,052 | ) | | | (69,033 | ) | |
| Class S2 | | | (102 | ) | | | — | | | | (45 | ) | | | — | | |
| Total distributions | | | (12,848,107 | ) | | | — | | | | (4,654,851 | ) | | | (3,498,392 | ) | |
| FROM CAPITAL SHARE TRANSACTIONS: | |
| Net proceeds from sale of shares | | | 247,561,111 | | | | 185,405,629 | | | | 96,147,812 | | | | 116,017,787 | | |
| Reinvestment of distributions | | | 12,848,005 | | | | — | | | | 4,654,806 | | | | 3,498,392 | | |
| | | | 260,409,116 | | | | 185,405,629 | | | | 100,802,618 | | | | 119,516,179 | | |
| Cost of shares redeemed | | | (141,150,451 | ) | | | (409,147,924 | ) | | | (78,733,299 | ) | | | (239,122,449 | ) | |
Net increase (decrease) in net assets resulting from
capital share transactions | | | 119,258,665 | | | | (223,742,295 | ) | | | 22,069,319 | | | | (119,606,270 | ) | |
| Net increase (decrease) in net assets | | | 153,172,942 | | | | (43,418,321 | ) | | | 49,974,361 | | | | (20,628,951 | ) | |
| NET ASSETS: | |
| Beginning of year | | | 539,511,281 | | | | 582,929,602 | | | | 244,623,902 | | | | 265,252,853 | | |
| End of year | | $ | 692,684,223 | | | $ | 539,511,281 | | | $ | 294,598,263 | | | $ | 244,623,902 | | |
| Undistributed net investment income at end of year | | $ | 10,551,560 | | | $ | 12,840,032 | | | $ | 2,067,409 | | | $ | 4,654,763 | | |
See Accompanying Notes to Financial Statements
66
STATEMENTS OF CHANGES IN NET ASSETS
| | | ING UBS U.S. Large Cap
Equity Portfolio | | ING Van Kampen
Comstock Portfolio | |
| | | Year
Ended
December 31,
2010 | | Year
Ended
December 31,
2009 | | Year
Ended
December 31,
2010 | | Year
Ended
December 31,
2009 | |
| FROM OPERATIONS: | |
| Net investment income | | $ | 1,450,564 | | | $ | 2,206,322 | | | $ | 3,624,274 | | | $ | 7,142,748 | | |
| Net realized gain (loss) | | | 15,780,319 | | | | (86,226,315 | ) | | | 11,728,931 | | | | (145,769,955 | ) | |
| Net change in unrealized appreciation or depreciation | | | 4,176,714 | | | | 140,290,481 | | | | 27,784,878 | | | | 233,343,635 | | |
| Increase in net assets resulting from operations | | | 21,407,597 | | | | 56,270,488 | | | | 43,138,083 | | | | 94,716,428 | | |
| FROM DISTRIBUTIONS TO SHAREHOLDERS: | |
| Net investment income: | | | | | | | | | |
| Class ADV | | | (39,903 | ) | | | (67,697 | ) | | | (175,261 | ) | | | (312,120 | ) | |
| Class I | | | (1,330,636 | ) | | | (2,051,531 | ) | | | (741,072 | ) | | | (1,759,042 | ) | |
| Class S | | | (126,214 | ) | | | (221,412 | ) | | | (3,403,234 | ) | | | (5,001,841 | ) | |
| Total distributions | | | (1,496,753 | ) | | | (2,340,640 | ) | | | (4,319,567 | ) | | | (7,073,003 | ) | |
| FROM CAPITAL SHARE TRANSACTIONS: | |
| Net proceeds from sale of shares | | | 12,183,502 | | | | 51,241,562 | | | | 41,252,690 | | | | 59,181,712 | | |
| Reinvestment of distributions | | | 1,496,753 | | | | 2,340,640 | | | | 4,319,567 | | | | 7,073,003 | | |
| | | | 13,680,255 | | | | 53,582,202 | | | | 45,572,257 | | | | 66,254,715 | | |
| Cost of shares redeemed | | | (39,560,188 | ) | | | (186,190,195 | ) | | | (57,670,926 | ) | | | (418,531,170 | ) | |
Net decrease in net assets resulting from
capital share transactions | | | (25,879,933 | ) | | | (132,607,993 | ) | | | (12,098,669 | ) | | | (352,276,455 | ) | |
| Net increase (decrease) in net assets | | | (5,969,089 | ) | | | (78,678,145 | ) | | | 26,719,847 | | | | (264,633,030 | ) | |
| NET ASSETS: | |
| Beginning of year | | | 182,376,651 | | | | 261,054,796 | | | | 304,133,759 | | | | 568,766,789 | | |
| End of year | | $ | 176,407,562 | | | $ | 182,376,651 | | | $ | 330,853,606 | | | $ | 304,133,759 | | |
| Undistributed net investment income at end of year | | $ | 280,179 | | | $ | 326,086 | | | $ | 567,416 | | | $ | 1,261,466 | | |
See Accompanying Notes to Financial Statements
67
STATEMENTS OF CHANGES IN NET ASSETS
| | | ING Van Kampen
Equity and Income Portfolio | |
| | | Year
Ended
December 31,
2010 | | Year
Ended
December 31,
2009 | |
| FROM OPERATIONS: | |
| Net investment income | | $ | 15,149,074 | | | $ | 15,158,392 | | |
| Net realized gain (loss) | | | 31,235,346 | | | | (30,032,416 | ) | |
| Net change in unrealized appreciation or depreciation | | | 47,214,391 | | | | 166,600,095 | | |
| Increase in net assets resulting from operations | | | 93,598,811 | | | | 151,726,071 | | |
| FROM DISTRIBUTIONS TO SHAREHOLDERS: | |
| Net investment income: | | | | | |
| Class ADV | | | (195,092 | ) | | | (143,246 | ) | |
| Class I | | | (10,643,870 | ) | | | (10,243,047 | ) | |
| Class S | | | (3,780,796 | ) | | | (3,459,054 | ) | |
| Class S2 | | | (13,909 | ) | | | (64 | ) | |
| Total distributions | | | (14,633,667 | ) | | | (13,845,411 | ) | |
| FROM CAPITAL SHARE TRANSACTIONS: | |
| Net proceeds from sale of shares | | | 50,386,797 | | | | 34,273,166 | | |
| Reinvestment of distributions | | | 14,633,667 | | | | 13,845,347 | | |
| | | | 65,020,464 | | | | 48,118,513 | | |
| Cost of shares redeemed | | | (94,064,905 | ) | | | (104,789,464 | ) | |
| Net decrease in net assets resulting from capital share transactions | | | (29,044,441 | ) | | | (56,670,951 | ) | |
| Net increase in net assets | | | 49,920,703 | | | | 81,209,709 | | |
| NET ASSETS: | |
| Beginning of year | | | 801,063,621 | | | | 719,853,912 | | |
| End of year | | $ | 850,984,324 | | | $ | 801,063,621 | | |
| Undistributed net investment income at end of year | | $ | 3,335,536 | | | $ | 2,817,785 | | |
See Accompanying Notes to Financial Statements
68
FINANCIAL HIGHLIGHTS
Selected data for a share of beneficial interest outstanding throughout each year or period.
| | | | | Income (loss)
from investment
operations | | | | Less distributions | |
| | | Net asset value, beginning of year or period | | Net investment income (loss) | | Net realized and unrealized gain (loss) | | Total from investment operations | | From net investment income | | From net realized gains | | From return of capital | |
| | | | | | | | | | | | | | | | |
| Year or period ended | | ($) | | ($) | | ($) | | ($) | | ($) | | ($) | | ($) | |
| ING American Century Small-Mid Cap Value Portfolio | | | |
| Class ADV | | | |
| 12-31-10 | | | 9.65 | | | | 0.15 | • | | | 1.93 | | | | 2.08 | | | | 0.10 | | | | — | | | | — | | |
| 12-31-09 | | | 7.23 | | | | 0.14 | | | | 2.39 | | | | 2.53 | | | | 0.11 | | | | — | | | | — | | |
| 12-31-08 | | | 11.24 | | | | 0.15 | | | | (2.80 | ) | | | (2.65 | ) | | | 0.05 | | | | 1.31 | | | | — | | |
| 12-31-07 | | | 13.35 | | | | 0.08 | • | | | (0.42 | ) | | | (0.34 | ) | | | 0.03 | | | | 1.74 | | | | — | | |
| 12-31-06 | | | 11.63 | | | | 0.02 | | | | 1.73 | | | | 1.75 | | | | 0.00 | * | | | 0.03 | | | | — | | |
| Class I | | | |
| 12-31-10 | | | 9.86 | | | | 0.20 | • | | | 1.98 | | | | 2.18 | | | | 0.13 | | | | — | | | | — | | |
| 12-31-09 | | | 7.38 | | | | 0.17 | | | | 2.47 | | | | 2.64 | | | | 0.16 | | | | — | | | | — | | |
| 12-31-08 | | | 11.46 | | | | 0.20 | • | | | (2.86 | ) | | | (2.66 | ) | | | 0.11 | | | | 1.31 | | | | — | | |
| 12-31-07 | | | 13.58 | | | | 0.14 | • | | | (0.43 | ) | | | (0.29 | ) | | | 0.09 | | | | 1.74 | | | | — | | |
| 12-31-06 | | | 11.77 | | | | 0.09 | • | | | 1.75 | | | | 1.84 | | | | 0.00 | * | | | 0.03 | | | | — | | |
| Class S | | | |
| 12-31-10 | | | 9.80 | | | | 0.14 | | | | 1.99 | | | | 2.13 | | | | 0.11 | | | | — | | | | — | | |
| 12-31-09 | | | 7.34 | | | | 0.16 | • | | | 2.44 | | | | 2.60 | | | | 0.14 | | | | — | | | | — | | |
| 12-31-08 | | | 11.40 | | | | 0.17 | • | | | (2.84 | ) | | | (2.67 | ) | | | 0.08 | | | | 1.31 | | | | — | | |
| 12-31-07 | | | 13.51 | | | | 0.11 | • | | | (0.42 | ) | | | (0.31 | ) | | | 0.06 | | | | 1.74 | | | | — | | |
| 12-31-06 | | | 11.74 | | | | 0.05 | | | | 1.75 | | | | 1.80 | | | | 0.00 | * | | | 0.03 | | | | — | | |
| Class S2 | | | |
| 12-31-10 | | | 9.61 | | | | 0.22 | • | | | 1.86 | | | | 2.08 | | | | 0.10 | | | | — | | | | — | | |
| 02-27-09(4)-12-31-09 | | | 5.84 | | | | 0.14 | • | | | 3.79 | | | | 3.93 | | | | 0.16 | | | | — | | | | — | | |
| ING Baron Small Cap Growth Portfolio | | | |
| Class ADV | | | |
| 12-31-10 | | | 14.67 | | | | (0.10 | ) | | | 3.95 | | | | 3.85 | | | | — | | | | — | | | | — | | |
| 12-31-09 | | | 10.88 | | | | (0.12 | ) | | | 3.91 | | | | 3.79 | | | | — | | | | — | | | | — | | |
| 12-31-08 | | | 19.16 | | | | (0.14 | ) | | | (7.62 | ) | | | (7.76 | ) | | | — | | | | 0.52 | | | | — | | |
| 12-31-07 | | | 18.11 | | | | (0.12 | ) | | | 1.17 | | | | 1.05 | | | | — | | | | — | | | | — | | |
| 12-31-06 | | | 15.90 | | | | (0.10 | ) | | | 2.46 | | | | 2.36 | | | | — | | | | 0.15 | | | | — | | |
| Class I | | | |
| 12-31-10 | | | 15.27 | | | | (0.03 | ) | | | 4.13 | | | | 4.10 | | | | — | | | | — | | | | — | | |
| 12-31-09 | | | 11.27 | | | | (0.07 | ) | | | 4.07 | | | | 4.00 | | | | — | | | | — | | | | — | | |
| 12-31-08 | | | 19.73 | | | | (0.05 | )• | | | (7.89 | ) | | | (7.94 | ) | | | — | | | | 0.52 | | | | — | | |
| 12-31-07 | | | 18.55 | | | | (0.02 | ) | | | 1.20 | | | | 1.18 | | | | — | | | | — | | | | — | | |
| 12-31-06 | | | 16.21 | | | | (0.02 | ) | | | 2.51 | | | | 2.49 | | | | — | | | | 0.15 | | | | — | | |
| Class S | | | |
| 12-31-10 | | | 14.98 | | | | (0.07 | ) | | | 4.04 | | | | 3.97 | | | | — | | | | — | | | | — | | |
| 12-31-09 | | | 11.08 | | | | (0.09 | ) | | | 3.99 | | | | 3.90 | | | | — | | | | — | | | | — | | |
| 12-31-08 | | | 19.45 | | | | (0.08 | )• | | | (7.77 | ) | | | (7.85 | ) | | | — | | | | 0.52 | | | | — | | |
| 12-31-07 | | | 18.33 | | | | (0.06 | ) | | | 1.18 | | | | 1.12 | | | | — | | | | — | | | | — | | |
| 12-31-06 | | | 16.06 | | | | (0.06 | ) | | | 2.48 | | | | 2.42 | | | | — | | | | 0.15 | | | | — | | |
| Class S2 | | | |
| 12-31-10 | | | 14.69 | | | | (0.09 | ) | | | 3.95 | | | | 3.86 | | | | — | | | | — | | | | — | | |
| 02-27-09(4)-12-31-09 | | | 9.31 | | | | (0.10 | ) | | | 5.48 | | | | 5.38 | | | | — | | | | — | | | | — | | |
| ING Columbia Small Cap Value Portfolio | | | |
| Class ADV | | | |
| 12-31-10 | | | 8.36 | | | | 0.02 | • | | | 2.04 | | | | 2.06 | | | | 0.13 | | | | — | | | | — | | |
| 12-31-09 | | | 6.78 | | | | 0.05 | | | | 1.59 | | | | 1.64 | | | | 0.06 | | | | — | | | | — | | |
| 12-31-08 | | | 10.41 | | | | 0.09 | • | | | (3.62 | ) | | | (3.53 | ) | | | 0.02 | | | | 0.08 | | | | — | | |
| 12-31-07 | | | 10.15 | | | | 0.05 | • | | | 0.23 | | | | 0.28 | | | | 0.02 | | | | — | | | | — | | |
| 12-29-06(4)-12-31-06 | | | 10.15 | | | | (0.00 | )* | | | — | | | | (0.00 | )* | | | — | | | | — | | | | — | | |
| | | | | Ratios to average net assets | | Supplemental data | |
| | | Total distributions | | Net asset value, end of year or period | | Total Return(1) | | Expenses before reductions/additions(2)(3) | | Expenses net of fee waivers and/or recoupments, if any(2)(3) | | Expenses net of all reductions/additions(2)(3) | | Net investment income (loss)(2)(3) | | Net assets, end of year or period | | Portfolio turnover rate | |
| | | | | | | | | | | | | | | | | | | | |
| Year or period ended | | ($) | | ($) | | (%) | | (%) | | (%) | | (%) | | (%) | | ($000's) | | (%) | |
| ING American Century Small-Mid Cap Value Portfolio | |
| Class ADV | |
| 12-31-10 | | | 0.10 | | | | 11.63 | | | | 21.80 | | | | 1.75 | | | | 1.44 | † | | | 1.44 | † | | | 1.47 | † | | | 26,712 | | | | 98 | | |
| 12-31-09 | | | 0.11 | | | | 9.65 | | | | 35.20 | | | | 1.75 | | | | 1.44 | † | | | 1.44 | † | | | 1.82 | † | | | 10,511 | | | | 135 | | |
| 12-31-08 | | | 1.36 | | | | 7.23 | | | | (26.69 | ) | | | 1.75 | | | | 1.52 | | | | 1.52 | | | | 1.50 | | | | 7,861 | | | | 191 | | |
| 12-31-07 | | | 1.77 | | | | 11.24 | | | | (3.17 | ) | | | 1.75 | | | | 1.52 | | | | 1.52 | | | | 0.58 | | | | 12,309 | | | | 146 | | |
| 12-31-06 | | | 0.03 | | | | 13.35 | | | | 15.14 | | | | 1.75 | | | | 1.72 | | | | 1.72 | | | | 0.18 | | | | 12,602 | | | | 156 | | |
| Class I | |
| 12-31-10 | | | 0.13 | | | | 11.91 | | | | 22.36 | | | | 1.25 | | | | 0.94 | † | | | 0.94 | † | | | 1.92 | † | | | 91,413 | | | | 98 | | |
| 12-31-09 | | | 0.16 | | | | 9.86 | | | | 36.02 | | | | 1.25 | | | | 0.94 | † | | | 0.94 | † | | | 2.28 | † | | | 51,654 | | | | 135 | | |
| 12-31-08 | | | 1.42 | | | | 7.38 | | | | (26.37 | ) | | | 1.25 | | | | 1.02 | | | | 1.02 | | | | 2.04 | | | | 35,922 | | | | 191 | | |
| 12-31-07 | | | 1.83 | | | | 11.46 | | | | (2.70 | ) | | | 1.25 | | | | 1.02 | | | | 1.02 | | | | 1.09 | | | | 47,079 | | | | 146 | | |
| 12-31-06 | | | 0.03 | | | | 13.58 | | | | 15.75 | | | | 1.25 | | | | 1.22 | | | | 1.22 | | | | 0.71 | | | | 48,088 | | | | 156 | | |
| Class S | |
| 12-31-10 | | | 0.11 | | | | 11.82 | | | | 22.02 | | | | 1.50 | | | | 1.19 | † | | | 1.19 | † | | | 1.68 | † | | | 75,285 | | | | 98 | | |
| 12-31-09 | | | 0.14 | | | | 9.80 | | | | 35.68 | | | | 1.50 | | | | 1.19 | † | | | 1.19 | † | | | 2.03 | † | | | 53,596 | | | | 135 | | |
| 12-31-08 | | | 1.39 | | | | 7.34 | | | | (26.56 | ) | | | 1.50 | | | | 1.27 | | | | 1.27 | | | | 1.80 | | | | 31,260 | | | | 191 | | |
| 12-31-07 | | | 1.80 | | | | 11.40 | | | | (2.90 | ) | | | 1.50 | | | | 1.27 | | | | 1.27 | | | | 0.82 | | | | 40,309 | | | | 146 | | |
| 12-31-06 | | | 0.03 | | | | 13.51 | | | | 15.43 | | | | 1.50 | | | | 1.47 | | | | 1.47 | | | | 0.39 | | | | 47,839 | | | | 156 | | |
| Class S2 | |
| 12-31-10 | | | 0.10 | | | | 11.59 | | | | 21.87 | | | | 1.75 | | | | 1.34 | † | | | 1.34 | † | | | 2.01 | † | | | 326 | | | | 98 | | |
| 02-27-09(4)-12-31-09 | | | 0.16 | | | | 9.61 | | | | 67.61 | | | | 1.75 | | | | 1.34 | † | | | 1.34 | † | | | 2.06 | † | | | 5 | | | | 135 | | |
| ING Baron Small Cap Growth Portfolio | |
| Class ADV | |
| 12-31-10 | | | — | | | | 18.52 | | | | 26.24 | | | | 1.58 | | | | 1.58 | † | | | 1.58 | † | | | (0.65 | )† | | | 51,458 | | | | 19 | | |
| 12-31-09 | | | — | | | | 14.67 | | | | 34.83 | | | | 1.58 | | | | 1.57 | | | | 1.57 | | | | (1.07 | ) | | | 36,133 | | | | 13 | | |
| 12-31-08 | | | 0.52 | | | | 10.88 | | | | (41.41 | ) | | | 1.58 | | | | 1.58 | † | | | 1.58 | † | | | (0.80 | )† | | | 23,542 | | | | 30 | | |
| 12-31-07 | | | — | | | | 19.16 | | | | 5.80 | | | | 1.58 | | | | 1.58 | | | | 1.58 | | | | (0.61 | ) | | | 48,449 | | | | 23 | | |
| 12-31-06 | | | 0.15 | | | | 18.11 | | | | 15.02 | | | | 1.58 | | | | 1.58 | | | | 1.58 | | | | (0.63 | ) | | | 45,591 | | | | 15 | | |
| Class I | |
| 12-31-10 | | | — | | | | 19.37 | | | | 26.85 | | | | 1.08 | | | | 1.08 | † | | | 1.08 | † | | | (0.17 | )† | | | 231,264 | | | | 19 | | |
| 12-31-09 | | | — | | | | 15.27 | | | | 35.49 | | | | 1.08 | | | | 1.07 | | | | 1.07 | | | | (0.57 | ) | | | 184,220 | | | | 13 | | |
| 12-31-08 | | | 0.52 | | | | 11.27 | | | | (41.12 | ) | | | 1.08 | | | | 1.08 | † | | | 1.08 | † | | | (0.29 | )† | | | 131,199 | | | | 30 | | |
| 12-31-07 | | | — | | | | 19.73 | | | | 6.36 | | | | 1.08 | | | | 1.08 | | | | 1.08 | | | | (0.10 | ) | | | 181,259 | | | | 23 | | |
| 12-31-06 | | | 0.15 | | | | 18.55 | | | | 15.54 | | | | 1.08 | | | | 1.08 | | | | 1.08 | | | | (0.13 | ) | | | 130,780 | | | | 15 | | |
| Class S | |
| 12-31-10 | | | — | | | | 18.95 | | | | 26.50 | | | | 1.33 | | | | 1.31 | † | | | 1.31 | † | | | (0.41 | )† | | | 560,004 | | | | 19 | | |
| 12-31-09 | | | — | | | | 14.98 | | | | 35.20 | | | | 1.33 | | | | 1.30 | | | | 1.30 | | | | (0.80 | ) | | | 466,746 | | | | 13 | | |
| 12-31-08 | | | 0.52 | | | | 11.08 | | | | (41.25 | ) | | | 1.33 | | | | 1.31 | † | | | 1.31 | † | | | (0.52 | )† | | | 291,833 | | | | 30 | | |
| 12-31-07 | | | — | | | | 19.45 | | | | 6.11 | | | | 1.33 | | | | 1.32 | | | | 1.32 | | | | (0.34 | ) | | | 415,539 | | | | 23 | | |
| 12-31-06 | | | 0.15 | | | | 18.33 | | | | 15.24 | | | | 1.33 | | | | 1.33 | | | | 1.33 | | | | (0.38 | ) | | | 299,287 | | | | 15 | | |
| Class S2 | |
| 12-31-10 | | | — | | | | 18.55 | | | | 26.28 | | | | 1.58 | | | | 1.48 | † | | | 1.48 | † | | | (0.58 | )† | | | 6 | | | | 19 | | |
| 02-27-09(4)-12-31-09 | | | — | | | | 14.69 | | | | 57.79 | | | | 1.58 | | | | 1.47 | | | | 1.47 | | | | (0.97 | ) | | | 5 | | | | 13 | | |
| ING Columbia Small Cap Value Portfolio | |
| Class ADV | |
| 12-31-10 | | | 0.13 | | | | 10.29 | | | | 24.98 | | | | 1.40 | | | | 1.40 | † | | | 1.37 | † | | | 0.25 | † | | | 2,071 | | | | 62 | | |
| 12-31-09 | | | 0.06 | | | | 8.36 | | | | 24.28 | | | | 1.45 | | | | 1.44 | † | | | 1.44 | † | | | 0.52 | † | | | 534 | | | | 86 | | |
| 12-31-08 | | | 0.10 | | | | 6.78 | | | | (34.22 | ) | | | 1.41 | | | | 1.41 | † | | | 1.38 | † | | | 1.03 | † | | | 444 | | | | 73 | | |
| 12-31-07 | | | 0.02 | | | | 10.41 | | | | 2.73 | | | | 1.38 | | | | 1.38 | | | | 1.35 | | | | 0.50 | | | | 330 | | | | 50 | | |
| 12-29-06(4)-12-31-06 | | | — | | | | 10.15 | | | | — | | | | 1.49 | | | | 1.49 | | | | 1.46 | | | | (1.46 | ) | | | 1 | | | | 48 | | |
See Accompanying Notes to Financial Statements
69
FINANCIAL HIGHLIGHTS (CONTINUED)
Selected data for a share of beneficial interest outstanding throughout each year or period.
| | | | | Income (loss)
from investment
operations | | | | Less distributions | |
| | | Net asset value, beginning of year or period | | Net investment income (loss) | | Net realized and unrealized gain (loss) | | Total from investment operations | | From net investment income | | From net realized gains | | From return of capital | |
| | | | | | | | | | | | | | | | |
| Year or period ended | | ($) | | ($) | | ($) | | ($) | | ($) | | ($) | | ($) | |
| ING Columbia Small Cap Value Portfolio (continued) | | | |
| Class I | | | |
| 12-31-10 | | | 8.46 | | | | 0.06 | | | | 2.06 | | | | 2.12 | | | | 0.14 | | | | — | | | | — | | |
| 12-31-09 | | | 6.85 | | | | 0.07 | • | | | 1.65 | | | | 1.72 | | | | 0.11 | | | | — | | | | — | | |
| 12-31-08 | | | 10.48 | | | | 0.14 | • | | | (3.67 | ) | | | (3.53 | ) | | | 0.02 | | | | 0.08 | | | | — | | |
| 12-31-07 | | | 10.17 | | | | 0.10 | • | | | 0.23 | | | | 0.33 | | | | 0.02 | | | | — | | | | — | | |
| 04-28-06(4)-12-31-06 | | | 10.00 | | | | 0.05 | | | | 0.12 | | | | 0.17 | | | | — | | | | — | | | | — | | |
| Class S | | | |
| 12-31-10 | | | 8.41 | | | | 0.04 | • | | | 2.06 | | | | 2.10 | | | | 0.12 | | | | — | | | | — | | |
| 12-31-09 | | | 6.82 | | | | 0.06 | | | | 1.62 | | | | 1.68 | | | | 0.09 | | | | — | | | | — | | |
| 12-31-08 | | | 10.44 | | | | 0.11 | • | | | (3.64 | ) | | | (3.53 | ) | | | 0.01 | | | | 0.08 | | | | — | | |
| 12-31-07 | | | 10.15 | | | | 0.07 | • | | | 0.23 | | | | 0.30 | | | | 0.01 | | | | — | | | | — | | |
| 05-01-06(4)-12-31-06 | | | 9.95 | | | | 0.04 | • | | | 0.16 | | | | 0.20 | | | | — | | | | — | | | | — | | |
| Class S2 | | | |
| 12-31-10 | | | 8.33 | | | | 0.03 | | | | 2.03 | | | | 2.06 | | | | 0.12 | | | | — | | | | — | | |
| 02-27-09(4)-12-31-09 | | | 5.20 | | | | 0.04 | • | | | 3.20 | | | | 3.24 | | | | 0.11 | | | | — | | | | — | | |
| ING Davis New York Venture Portfolio | | | |
| Class ADV | | | |
| 12-31-10 | | | 15.77 | | | | 0.05 | • | | | 1.80 | | | | 1.85 | | | | 0.05 | | | | — | | | | — | | |
| 12-31-09 | | | 12.02 | | | | 0.04 | • | | | 3.71 | | | | 3.75 | | | | — | | | | — | | | | — | | |
| 12-31-08 | | | 20.07 | | | | 0.09 | | | | (7.92 | ) | | | (7.83 | ) | | | 0.04 | | | | 0.18 | | | | — | | |
| 12-31-07 | | | 19.39 | | | | 0.19 | • | | | 0.57 | | | | 0.76 | | | | — | | | | 0.08 | | | | — | | |
| 12-31-06 | | | 18.46 | | | | 0.07 | | | | 2.29 | | | | 2.36 | | | | — | | | | 1.43 | | | | — | | |
| Class I | | | |
| 12-31-10 | | | 16.12 | | | | 0.12 | • | | | 1.85 | | | | 1.97 | | | | 0.10 | | | | — | | | | — | | |
| 12-31-09 | | | 12.32 | | | | 0.10 | • | | | 3.82 | | | | 3.92 | | | | 0.12 | | | | — | | | | — | | |
| 12-31-08 | | | 20.60 | | | | 0.15 | • | | | (8.09 | ) | | | (7.94 | ) | | | 0.16 | | | | 0.18 | | | | — | | |
| 12-31-07 | | | 19.87 | | | | 0.31 | • | | | 0.57 | | | | 0.88 | | | | 0.07 | | | | 0.08 | | | | — | | |
| 12-31-06 | | | 18.79 | | | | 0.18 | • | | | 2.34 | | | | 2.52 | | | | 0.01 | | | | 1.43 | | | | — | | |
| Class S | | | |
| 12-31-10 | | | 15.93 | | | | 0.09 | | | | 1.81 | | | | 1.90 | | | | 0.07 | | | | — | | | | — | | |
| 12-31-09 | | | 12.18 | | | | 0.06 | | | | 3.78 | | | | 3.84 | | | | 0.09 | | | | — | | | | — | | |
| 12-31-08 | | | 20.39 | | | | 0.11 | • | | | (8.02 | ) | | | (7.91 | ) | | | 0.12 | | | | 0.18 | | | | — | | |
| 12-31-07 | | | 19.70 | | | | 0.25 | • | | | 0.57 | | | | 0.82 | | | | 0.05 | | | | 0.08 | | | | — | | |
| 12-31-06 | | | 18.69 | | | | 0.13 | • | | | 2.31 | | | | 2.44 | | | | — | | | | 1.43 | | | | — | | |
| ING JPMorgan Mid Cap Value Portfolio | | | |
| Class ADV | | | |
| 12-31-10 | | | 11.30 | | | | 0.07 | | | | 2.48 | | | | 2.55 | | | | 0.07 | | | | — | | | | — | | |
| 12-31-09 | | | 9.24 | | | | 0.12 | | | | 2.21 | | | | 2.33 | | | | 0.11 | | | | 0.16 | | | | — | | |
| 12-31-08 | | | 15.50 | | | | 0.14 | | | | (4.90 | ) | | | (4.76 | ) | | | 0.18 | | | | 1.32 | | | | — | | |
| 12-31-07 | | | 16.03 | | | | 0.09 | | | | 0.25 | | | | 0.34 | | | | 0.07 | | | | 0.80 | | | | — | | |
| 12-31-06 | | | 13.89 | | | | 0.07 | | | | 2.18 | | | | 2.25 | | | | 0.00 | * | | | 0.11 | | | | — | | |
| Class I | | | |
| 12-31-10 | | | 11.42 | | | | 0.14 | | | | 2.52 | | | | 2.66 | | | | 0.13 | | | | — | | | | — | | |
| 12-31-09 | | | 9.33 | | | | 0.17 | | | | 2.23 | | | | 2.40 | | | | 0.15 | | | | 0.16 | | | | — | | |
| 12-31-08 | | | 15.77 | | | | 0.22 | | | | (5.00 | ) | | | (4.78 | ) | | | 0.34 | | | | 1.32 | | | | — | | |
| 12-31-07 | | | 16.26 | | | | 0.19 | • | | | 0.24 | | | | 0.43 | | | | 0.12 | | | | 0.80 | | | | — | | |
| 12-31-06 | | | 14.02 | | | | 0.14 | | | | 2.21 | | | | 2.35 | | | | 0.00 | * | | | 0.11 | | | | — | | |
| Class S | | | |
| 12-31-10 | | | 11.37 | | | | 0.11 | | | | 2.50 | | | | 2.61 | | | | 0.10 | | | | — | | | | — | | |
| 12-31-09 | | | 9.29 | | | | 0.15 | | | | 2.22 | | | | 2.37 | | | | 0.13 | | | | 0.16 | | | | — | | |
| 12-31-08 | | | 15.67 | | | | 0.16 | • | | | (4.94 | ) | | | (4.78 | ) | | | 0.28 | | | | 1.32 | | | | — | | |
| 12-31-07 | | | 16.17 | | | | 0.15 | | | | 0.24 | | | | 0.39 | | | | 0.09 | | | | 0.80 | | | | — | | |
| 12-31-06 | | | 13.98 | | | | 0.12 | | | | 2.18 | | | | 2.30 | | | | 0.00 | * | | | 0.11 | | | | — | | |
| Class S2 | | | |
| 12-31-10 | | | 11.30 | | | | 0.09 | | | | 2.48 | | | | 2.57 | | | | 0.08 | | | | — | | | | — | | |
| 02-27-09(4)-12-31-09 | | | 7.54 | | | | 0.12 | | | | 3.92 | | | | 4.04 | | | | 0.12 | | | | 0.16 | | | | — | | |
| | | | | Ratios to average net assets | | Supplemental data | |
| | | Total distributions | | Net asset value, end of year or period | | Total Return(1) | | Expenses before reductions/additions(2)(3) | | Expenses net of fee waivers and/or recoupments, if any(2)(3) | | Expenses net of all reductions/additions(2)(3) | | Net investment income (loss)(2)(3) | | Net assets, end of year or period | | Portfolio turnover rate | |
| | | | | | | | | | | | | | | | | | | | |
| Year or period ended | | ($) | | ($) | | (%) | | (%) | | (%) | | (%) | | (%) | | ($000's) | | (%) | |
| ING Columbia Small Cap Value Portfolio (continued) | |
| Class I | |
| 12-31-10 | | | 0.14 | | | | 10.44 | | | | 25.48 | | | | 0.90 | | | | 0.90 | † | | | 0.87 | † | | | 0.67 | † | | | 55,866 | | | | 62 | | |
| 12-31-09 | | | 0.11 | | | | 8.46 | | | | 25.20 | | | | 0.95 | | | | 0.94 | † | | | 0.94 | † | | | 1.09 | † | | | 46,600 | | | | 86 | | |
| 12-31-08 | | | 0.10 | | | | 6.85 | | | | (33.93 | ) | | | 0.91 | | | | 0.91 | † | | | 0.88 | † | | | 1.63 | † | | | 225,673 | | | | 73 | | |
| 12-31-07 | | | 0.02 | | | | 10.48 | | | | 3.21 | | | | 0.88 | | | | 0.88 | | | | 0.85 | | | | 0.94 | | | | 46,922 | | | | 50 | | |
| 04-28-06(4)-12-31-06 | | | — | | | | 10.17 | | | | 1.70 | | | | 0.99 | | | | 0.99 | | | | 0.96 | | | | 0.78 | | | | 11,698 | | | | 48 | | |
| Class S | |
| 12-31-10 | | | 0.12 | | | | 10.39 | | | | 25.28 | | | | 1.15 | | | | 1.15 | † | | | 1.12 | † | | | 0.41 | † | | | 167,293 | | | | 62 | | |
| 12-31-09 | | | 0.09 | | | | 8.41 | | | | 24.72 | | | | 1.20 | | | | 1.19 | † | | | 1.19 | † | | | 0.75 | † | | | 165,922 | | | | 86 | | |
| 12-31-08 | | | 0.09 | | | | 6.82 | | | | (34.08 | ) | | | 1.16 | | | | 1.16 | † | | | 1.13 | † | | | 1.22 | † | | | 150,309 | | | | 73 | | |
| 12-31-07 | | | 0.01 | | | | 10.44 | | | | 2.97 | | | | 1.13 | | | | 1.13 | | | | 1.10 | | | | 0.65 | | | | 161,301 | | | | 50 | | |
| 05-01-06(4)-12-31-06 | | | — | | | | 10.15 | | | | 2.01 | | | | 1.24 | | | | 1.24 | | | | 1.21 | | | | 0.53 | | | | 76,010 | | | | 48 | | |
| Class S2 | |
| 12-31-10 | | | 0.12 | | | | 10.27 | | | | 25.04 | | | | 1.40 | | | | 1.30 | † | | | 1.27 | † | | | 0.29 | † | | | 6 | | | | 62 | | |
| 02-27-09(4)-12-31-09 | | | 0.11 | | | | 8.33 | | | | 62.42 | | | | 1.45 | | | | 1.34 | † | | | 1.34 | † | | | 0.60 | † | | | 5 | | | | 86 | | |
| ING Davis New York Venture Portfolio | |
| Class ADV | |
| 12-31-10 | | | 0.05 | | | | 17.57 | | | | 11.79 | | | | 1.40 | | | | 1.38 | | | | 1.38 | | | | 0.30 | | | | 8,442 | | | | 15 | | |
| 12-31-09 | | | — | | | | 15.77 | | | | 31.20 | | | | 1.40 | | | | 1.39 | | | | 1.39 | | | | 0.31 | | | | 4,844 | | | | 23 | | |
| 12-31-08 | | | 0.22 | | | | 12.02 | | | | (39.35 | ) | | | 1.40 | | | | 1.40 | | | | 1.40 | | | | 0.41 | | | | 5,662 | | | | 20 | | |
| 12-31-07 | | | 0.08 | | | | 20.07 | | | | 3.91 | | | | 1.40 | | | | 1.40 | | | | 1.40 | | | | 0.94 | | | | 10,214 | | | | 10 | | |
| 12-31-06 | | | 1.43 | | | | 19.39 | | | | 13.58 | | | | 1.40 | | | | 1.40 | | | | 1.40 | | | | 0.44 | | | | 13,203 | | | | 6 | | |
| Class I | |
| 12-31-10 | | | 0.10 | | | | 17.99 | | | | 12.33 | | | | 0.90 | | | | 0.88 | | | | 0.88 | | | | 0.74 | | | | 143,679 | | | | 15 | | |
| 12-31-09 | | | 0.12 | | | | 16.12 | | | | 31.96 | | | | 0.90 | | | | 0.89 | | | | 0.89 | | | | 0.76 | | | | 165,713 | | | | 23 | | |
| 12-31-08 | | | 0.34 | | | | 12.32 | | | | (39.06 | ) | | | 0.90 | | | | 0.90 | | | | 0.90 | | | | 0.92 | | | | 133,936 | | | | 20 | | |
| 12-31-07 | | | 0.15 | | | | 20.60 | | | | 4.43 | | | | 0.90 | | | | 0.90 | | | | 0.90 | | | | 1.49 | | | | 101,763 | | | | 10 | | |
| 12-31-06 | | | 1.44 | | | | 19.87 | | | | 14.19 | | | | 0.90 | | | | 0.90 | | | | 0.90 | | | | 0.94 | | | | 59,749 | | | | 6 | | |
| Class S | |
| 12-31-10 | | | 0.07 | | | | 17.76 | | | | 11.99 | | | | 1.15 | | | | 1.13 | | | | 1.13 | | | | 0.51 | | | | 328,415 | | | | 15 | | |
| 12-31-09 | | | 0.09 | | | | 15.93 | | | | 31.62 | | | | 1.15 | | | | 1.14 | | | | 1.14 | | | | 0.49 | | | | 303,513 | | | | 23 | | |
| 12-31-08 | | | 0.30 | | | | 12.18 | | | | (39.22 | ) | | | 1.15 | | | | 1.15 | | | | 1.15 | | | | 0.67 | | | | 213,686 | | | | 20 | | |
| 12-31-07 | | | 0.13 | | | | 20.39 | | | | 4.16 | | | | 1.15 | | | | 1.15 | | | | 1.15 | | | | 1.23 | | | | 231,511 | | | | 10 | | |
| 12-31-06 | | | 1.43 | | | | 19.70 | | | | 13.85 | | | | 1.15 | | | | 1.15 | | | | 1.15 | | | | 0.69 | | | | 134,821 | | | | 6 | | |
| ING JPMorgan Mid Cap Value Portfolio | |
| Class ADV | |
| 12-31-10 | | | 0.07 | | | | 13.78 | | | | 22.63 | | | | 1.50 | | | | 1.50 | † | | | 1.50 | † | | | 0.69 | † | | | 26,954 | | | | 40 | | |
| 12-31-09 | | | 0.27 | | | | 11.30 | | | | 25.34 | | | | 1.50 | | | | 1.50 | † | | | 1.50 | † | | | 1.33 | † | | | 16,622 | | | | 40 | | |
| 12-31-08 | | | 1.50 | | | | 9.24 | | | | (33.17 | ) | | | 1.50 | | | | 1.50 | † | | | 1.50 | † | | | 0.94 | † | | | 13,624 | | | | 58 | | |
| 12-31-07 | | | 0.87 | | | | 15.50 | | | | 2.06 | | | | 1.50 | | | | 1.50 | | | | 1.50 | | | | 0.64 | | | | 24,824 | | | | 52 | | |
| 12-31-06 | | | 0.11 | | | | 16.03 | | | | 16.26 | | | | 1.53 | | | | 1.53 | | | | 1.53 | | | | 0.61 | | | | 22,123 | | | | 44 | | |
| Class I | |
| 12-31-10 | | | 0.13 | | | | 13.95 | | | | 23.30 | | | | 1.00 | | | | 1.00 | † | | | 1.00 | † | | | 1.18 | † | | | 126,864 | | | | 40 | | |
| 12-31-09 | | | 0.31 | | | | 11.42 | | | | 25.90 | | | | 1.00 | | | | 1.00 | † | | | 1.00 | † | | | 1.83 | † | | | 100,239 | | | | 40 | | |
| 12-31-08 | | | 1.66 | | | | 9.33 | | | | (32.86 | ) | | | 1.00 | | | | 1.00 | † | | | 1.00 | † | | | 1.46 | † | | | 80,515 | | | | 58 | | |
| 12-31-07 | | | 0.92 | | | | 15.77 | | | | 2.61 | | | | 1.00 | | | | 1.00 | | | | 1.00 | | | | 1.15 | | | | 145,638 | | | | 52 | | |
| 12-31-06 | | | 0.11 | | | | 16.26 | | | | 16.84 | | | | 1.03 | | | | 1.03 | | | | 1.03 | | | | 1.08 | | | | 125,602 | | | | 44 | | |
| Class S | |
| 12-31-10 | | | 0.10 | | | | 13.88 | | | | 22.97 | | | | 1.25 | | | | 1.25 | † | | | 1.25 | † | | | 0.94 | † | | | 172,465 | | | | 40 | | |
| 12-31-09 | | | 0.29 | | | | 11.37 | | | | 25.65 | | | | 1.25 | | | | 1.25 | † | | | 1.25 | † | | | 1.58 | † | | | 113,016 | | | | 40 | | |
| 12-31-08 | | | 1.60 | | | | 9.29 | | | | (33.04 | ) | | | 1.25 | | | | 1.25 | † | | | 1.25 | † | | | 1.29 | † | | | 78,604 | | | | 58 | | |
| 12-31-07 | | | 0.89 | | | | 15.67 | | | | 2.34 | | | | 1.25 | | | | 1.25 | | | | 1.25 | | | | 0.89 | | | | 89,851 | | | | 52 | | |
| 12-31-06 | | | 0.11 | | | | 16.17 | | | | 16.52 | | | | 1.28 | | | | 1.28 | | | | 1.28 | | | | 0.81 | | | | 91,338 | | | | 44 | | |
| Class S2 | |
| 12-31-10 | | | 0.08 | | | | 13.79 | | | | 22.75 | | | | 1.50 | | | | 1.40 | † | | | 1.40 | † | | | 0.76 | † | | | 5 | | | | 40 | | |
| 02-27-09(4)-12-31-09 | | | 0.28 | | | | 11.30 | | | | 53.76 | | | | 1.50 | | | | 1.40 | † | | | 1.40 | † | | | 1.51 | † | | | 4 | | | | 40 | | |
See Accompanying Notes to Financial Statements
70
FINANCIAL HIGHLIGHTS (CONTINUED)
Selected data for a share of beneficial interest outstanding throughout each year or period.
| | | | | Income (loss)
from investment
operations | | | | Less distributions | |
| | | Net asset value, beginning of year or period | | Net investment income (loss) | | Net realized and unrealized gain (loss) | | Total from investment operations | | From net investment income | | From net realized gains | | From return of capital | |
| | | | | | | | | | | | | | | | |
| Year or period ended | | ($) | | ($) | | ($) | | ($) | | ($) | | ($) | | ($) | |
| ING Legg Mason ClearBridge Aggressive Growth Portfolio | | | |
| Class ADV | | | |
| 12-31-10 | | | 37.34 | | | | (0.03 | ) | | | 8.93 | | | | 8.90 | | | | — | | | | — | | | | — | | |
| 12-31-09 | | | 28.37 | | | | (0.19 | ) | | | 9.16 | | | | 8.97 | | | | — | | | | — | | | | — | | |
| 12-31-08 | | | 46.88 | | | | (0.25 | ) | | | (18.26 | ) | | | (18.51 | ) | | | — | | | | — | | | | — | | |
| 12-31-07 | | | 47.89 | | | | (0.29 | ) | | | (0.72 | ) | | | (1.01 | ) | | | — | | | | — | | | | — | | |
| 12-31-06 | | | 43.64 | | | | (0.27 | )• | | | 4.52 | | | | 4.25 | | | | — | | | | — | | | | — | | |
| Class I | | | |
| 12-31-10 | | | 38.86 | | | | 0.16 | • | | | 9.35 | | | | 9.51 | | | | — | | | | — | | | | — | | |
| 12-31-09 | | | 29.37 | | | | (0.03 | )• | | | 9.52 | | | | 9.49 | | | | — | | | | — | | | | — | | |
| 12-31-08 | | | 48.31 | | | | (0.01 | ) | | | (18.93 | ) | | | (18.94 | ) | | | — | | | | — | | | | — | | |
| 12-31-07 | | | 49.10 | | | | (0.05 | ) | | | (0.74 | ) | | | (0.79 | ) | | | — | | | | — | | | | — | | |
| 12-31-06 | | | 44.52 | | | | (0.02 | )• | | | 4.60 | | | | 4.58 | | | | — | | | | — | | | | — | | |
| Class S | | | |
| 12-31-10 | | | 38.09 | | | | 0.06 | | | | 9.14 | | | | 9.20 | | | | — | | | | — | | | | — | | |
| 12-31-09 | | | 28.86 | | | | (0.12 | )• | | | 9.35 | | | | 9.23 | | | | — | | | | — | | | | — | | |
| 12-31-08 | | | 47.58 | | | | (0.11 | ) | | | (18.61 | ) | | | (18.72 | ) | | | — | | | | — | | | | — | | |
| 12-31-07 | | | 48.49 | | | | (0.18 | ) | | | (0.73 | ) | | | (0.91 | ) | | | — | | | | — | | | | — | | |
| 12-31-06 | | | 44.08 | | | | (0.18 | )• | | | 4.59 | | | | 4.41 | | | | — | | | | — | | | | — | | |
| Class S2 | | | |
| 03-08-10(4)-12-31-10 | | | 39.91 | | | | 0.04 | | | | 6.35 | | | | 6.39 | | | | — | | | | — | | | | — | | |
| ING Oppenheimer Global Portfolio | | | |
| Class ADV | | | |
| 12-31-10 | | | 11.83 | | | | 0.11 | • | | | 1.69 | | | | 1.80 | | | | 0.17 | | | | — | | | | — | | |
| 12-31-09 | | | 8.80 | | | | 0.11 | • | | | 3.28 | | | | 3.39 | | | | 0.17 | | | | 0.19 | | | | — | | |
| 12-31-08 | | | 16.38 | | | | 0.30 | | | | (6.53 | ) | | | (6.23 | ) | | | 0.23 | | | | 1.12 | | | | — | | |
| 12-31-07 | | | 16.22 | | | | 0.17 | • | | | 0.81 | | | | 0.98 | | | | 0.11 | | | | 0.71 | | | | — | | |
| 12-31-06 | | | 13.85 | | | | 0.07 | • | | | 2.33 | | | | 2.40 | | | | 0.01 | | | | 0.02 | | | | — | | |
| Class I | | | |
| 12-31-10 | | | 12.17 | | | | 0.18 | • | | | 1.74 | | | | 1.92 | | | | 0.21 | | | | — | | | | — | | |
| 12-31-09 | | | 9.07 | | | | 0.17 | • | | | 3.38 | | | | 3.55 | | | | 0.26 | | | | 0.19 | | | | — | | |
| 12-31-08 | | | 16.87 | | | | 0.32 | | | | (6.67 | ) | | | (6.35 | ) | | | 0.33 | | | | 1.12 | | | | — | | |
| 12-31-07 | | | 16.68 | | | | 0.27 | • | | | 0.82 | | | | 1.09 | | | | 0.19 | | | | 0.71 | | | | — | | |
| 12-31-06 | | | 14.17 | | | | 0.15 | • | | | 2.39 | | | | 2.54 | | | | 0.01 | | | | 0.02 | | | | — | | |
| Class S | | | |
| 12-31-10 | | | 11.84 | | | | 0.14 | • | | | 1.70 | | | | 1.84 | | | | 0.18 | | | | — | | | | — | | |
| 12-31-09 | | | 8.82 | | | | 0.14 | • | | | 3.30 | | | | 3.44 | | | | 0.23 | | | | 0.19 | | | | — | | |
| 12-31-08 | | | 16.46 | | | | 0.23 | • | | | (6.46 | ) | | | (6.23 | ) | | | 0.29 | | | | 1.12 | | | | — | | |
| 12-31-07 | | | 16.31 | | | | 0.23 | • | | | 0.80 | | | | 1.03 | | | | 0.17 | | | | 0.71 | | | | — | | |
| 12-31-06 | | | 13.90 | | | | 0.10 | • | | | 2.34 | | | | 2.44 | | | | 0.01 | | | | 0.02 | | | | — | | |
| Class S2 | | | |
| 12-31-10 | | | 11.73 | | | | 0.12 | | | | 1.68 | | | | 1.80 | | | | 0.17 | | | | — | | | | — | | |
| 02-27-09(4)-12-31-09 | | | 7.35 | | | | 0.12 | • | | | 4.71 | | | | 4.83 | | | | 0.26 | | | | 0.19 | | | | — | | |
| ING Oppenheimer Global Strategic Income Portfolio | | | |
| Class ADV | | | |
| 12-31-10 | | | 10.45 | | | | 0.70 | • | | | 0.88 | | | | 1.58 | | | | 0.36 | | | | — | | | | — | | |
| 12-31-09 | | | 8.84 | | | | 0.40 | | | | 1.51 | | | | 1.91 | | | | 0.30 | | | | — | | | | — | | |
| 12-31-08 | | | 11.12 | | | | 0.55 | • | | | (2.28 | ) | | | (1.73 | ) | | | 0.51 | | | | 0.04 | | | | — | | |
| 12-31-07 | | | 10.76 | | | | 0.59 | • | | | 0.28 | | | | 0.87 | | | | 0.51 | | | | — | | | | — | | |
| 12-31-06 | | | 9.98 | | | | 0.62 | • | | | 0.18 | | | | 0.80 | | | | 0.02 | | | | — | | | | — | | |
| Class I | | | |
| 12-31-10 | | | 10.48 | | | | 0.75 | | | | 0.90 | | | | 1.65 | | | | 0.36 | | | | — | | | | — | | |
| 12-31-09 | | | 8.92 | | | | 0.48 | • | | | 1.49 | | | | 1.97 | | | | 0.41 | | | | — | | | | — | | |
| 12-31-08 | | | 11.20 | | | | 0.54 | • | | | (2.22 | ) | | | (1.68 | ) | | | 0.56 | | | | 0.04 | | | | — | | |
| 12-31-07 | | | 10.80 | | | | 0.64 | • | | | 0.28 | | | | 0.92 | | | | 0.52 | | | | — | | | | — | | |
| 12-31-06 | | | 10.00 | | | | 0.66 | • | | | 0.18 | | | | 0.84 | | | | 0.04 | | | | — | | | | — | | |
| | | | | Ratios to average net assets | | Supplemental data | |
| | | Total distributions | | Net asset value, end of year or period | | Total Return(1) | | Expenses before reductions/additions(2)(3) | | Expenses net of fee waivers and/or recoupments, if any(2)(3) | | Expenses net of all reductions/additions(2)(3) | | Net investment income (loss)(2)(3) | | Net assets, end of year or period | | Portfolio turnover rate | |
| | | | | | | | | | | | | | | | | | | | |
| Year or period ended | | ($) | | ($) | | (%) | | (%) | | (%) | | (%) | | (%) | | ($000's) | | (%) | |
| ING Legg Mason ClearBridge Aggressive Growth Portfolio | |
| Class ADV | |
| 12-31-10 | | | — | | | | 46.24 | | | | 23.84 | | | | 1.33 | | | | 1.33 | † | | | 1.33 | † | | | (0.09 | )† | | | 8,002 | | | | — | | |
| 12-31-09 | | | — | | | | 37.34 | | | | 31.62 | | | | 1.33 | | | | 1.33 | † | | | 1.33 | † | | | (0.62 | )† | | | 5,570 | | | | 1 | | |
| 12-31-08 | | | — | | | | 28.37 | | | | (39.48 | ) | | | 1.31 | | | | 1.31 | † | | | 1.31 | † | | | (0.54 | )† | | | 3,631 | | | | 4 | | |
| 12-31-07 | | | — | | | | 46.88 | | | | (2.11 | ) | | | 1.30 | | | | 1.30 | | | | 1.30 | | | | (0.60 | ) | | | 8,325 | | | | 5 | | |
| 12-31-06 | | | — | | | | 47.89 | | | | 9.74 | | | | 1.30 | | | | 1.30 | | | | 1.30 | | | | (0.59 | ) | | | 8,459 | | | | 6 | | |
| Class I | |
| 12-31-10 | | | — | | | | 48.37 | | | | 24.47 | | | | 0.83 | | | | 0.83 | † | | | 0.83 | † | | | 0.39 | † | | | 280,466 | | | | — | | |
| 12-31-09 | | | — | | | | 38.86 | | | | 32.31 | | | | 0.83 | | | | 0.83 | † | | | 0.83 | † | | | (0.11 | )† | | | 250,454 | | | | 1 | | |
| 12-31-08 | | | — | | | | 29.37 | | | | (39.21 | ) | | | 0.81 | | | | 0.81 | † | | | 0.81 | † | | | (0.03 | )† | | | 455,682 | | | | 4 | | |
| 12-31-07 | | | — | | | | 48.31 | | | | (1.61 | ) | | | 0.80 | | | | 0.80 | | | | 0.80 | | | | (0.11 | ) | | | 1,103,033 | | | | 5 | | |
| 12-31-06 | | | — | | | | 49.10 | | | | 10.29 | | | | 0.80 | | | | 0.80 | | | | 0.80 | | | | (0.05 | ) | | | 1,155,244 | | | | 6 | | |
| Class S | |
| 12-31-10 | | | — | | | | 47.29 | | | | 24.15 | | | | 1.08 | | | | 1.08 | † | | | 1.08 | † | | | 0.14 | † | | | 106,910 | | | | — | | |
| 12-31-09 | | | — | | | | 38.09 | | | | 31.98 | | | | 1.08 | | | | 1.08 | † | | | 1.08 | † | | | (0.37 | )† | | | 97,055 | | | | 1 | | |
| 12-31-08 | | | — | | | | 28.86 | | | | (39.34 | ) | | | 1.06 | | | | 1.06 | † | | | 1.06 | † | | | (0.26 | )† | | | 86,511 | | | | 4 | | |
| 12-31-07 | | | — | | | | 47.58 | | | | (1.88 | ) | | | 1.05 | | | | 1.05 | | | | 1.05 | | | | (0.36 | ) | | | 169,485 | | | | 5 | | |
| 12-31-06 | | | — | | | | 48.49 | | | | 10.00 | | | | 1.05 | | | | 1.05 | | | | 1.05 | | | | (0.40 | ) | | | 186,363 | | | | 6 | | |
| Class S2 | |
| 03-08-10(4)-12-31-10 | | | — | | | | 46.30 | | | | 16.01 | | | | 1.33 | | | | 1.23 | † | | | 1.23 | † | | | 0.12 | † | | | 3 | | | | — | | |
| ING Oppenheimer Global Portfolio | |
| Class ADV | |
| 12-31-10 | | | 0.17 | | | | 13.46 | | | | 15.42 | | | | 1.16 | | | | 1.16 | † | | | 1.16 | † | | | 0.88 | † | | | 71,603 | | | | 15 | | |
| 12-31-09 | | | 0.36 | | | | 11.83 | | | | 39.04 | | | | 1.16 | | | | 1.16 | † | | | 1.16 | † | | | 1.09 | † | | | 54,626 | | | | 12 | | |
| 12-31-08 | | | 1.35 | | | | 8.80 | | | | (40.65 | ) | | | 1.16 | | | | 1.16 | † | | | 1.16 | † | | | 1.60 | † | | | 40,813 | | | | 12 | | |
| 12-31-07 | | | 0.82 | | | | 16.38 | | | | 6.04 | | | | 1.16 | | | | 1.15 | | | | 1.15 | | | | 1.08 | | | | 99,669 | | | | 14 | | |
| 12-31-06 | | | 0.03 | | | | 16.22 | | | | 17.36 | | | | 1.16 | | | | 1.15 | | | | 1.15 | | | | 0.51 | | | | 95,286 | | | | 23 | | |
| Class I | |
| 12-31-10 | | | 0.21 | | | | 13.88 | | | | 16.06 | | | | 0.66 | | | | 0.66 | † | | | 0.66 | † | | | 1.40 | † | | | 1,479,319 | | | | 15 | | |
| 12-31-09 | | | 0.45 | | | | 12.17 | | | | 39.73 | | | | 0.66 | | | | 0.66 | † | | | 0.66 | † | | | 1.63 | † | | | 1,414,460 | | | | 12 | | |
| 12-31-08 | | | 1.45 | | | | 9.07 | | | | (40.38 | ) | | | 0.66 | | | | 0.66 | † | | | 0.66 | † | | | 2.07 | † | | | 1,124,127 | | | | 12 | | |
| 12-31-07 | | | 0.90 | | | | 16.87 | | | | 6.57 | | | | 0.66 | | | | 0.66 | | | | 0.66 | | | | 1.57 | | | | 2,289,589 | | | | 14 | | |
| 12-31-06 | | | 0.03 | | | | 16.68 | | | | 17.98 | | | | 0.66 | | | | 0.66 | | | | 0.66 | | | | 0.96 | | | | 2,518,662 | | | | 23 | | |
| Class S | |
| 12-31-10 | | | 0.18 | | | | 13.50 | | | | 15.80 | | | | 0.91 | | | | 0.91 | † | | | 0.91 | † | | | 1.17 | † | | | 184,961 | | | | 15 | | |
| 12-31-09 | | | 0.42 | | | | 11.84 | | | | 39.51 | | | | 0.91 | | | | 0.91 | † | | | 0.91 | † | | | 1.45 | † | | | 182,326 | | | | 12 | | |
| 12-31-08 | | | 1.41 | | | | 8.82 | | | | (40.55 | ) | | | 0.91 | | | | 0.91 | † | | | 0.91 | † | | | 1.80 | † | | | 157,261 | | | | 12 | | |
| 12-31-07 | | | 0.88 | | | | 16.46 | | | | 6.35 | | | | 0.91 | | | | 0.91 | | | | 0.91 | | | | 1.37 | | | | 232,651 | | | | 14 | | |
| 12-31-06 | | | 0.03 | | | | 16.31 | | | | 17.60 | | | | 0.91 | | | | 0.91 | | | | 0.91 | | | | 0.66 | | | | 145,060 | | | | 23 | | |
| Class S2 | |
| 12-31-10 | | | 0.17 | | | | 13.36 | | | | 15.63 | | | | 1.16 | | | | 1.06 | † | | | 1.06 | † | | | 0.98 | † | | | 5 | | | | 15 | | |
| 02-27-09(4)-12-31-09 | | | 0.45 | | | | 11.73 | | | | 66.43 | | | | 1.16 | | | | 1.06 | † | | | 1.06 | † | | | 1.34 | † | | | 5 | | | | 12 | | |
| ING Oppenheimer Global Strategic Income Portfolio | |
| Class ADV | |
| 12-31-10 | | | 0.36 | | | | 11.67 | | | | 15.22 | | | | 1.04 | | | | 1.02 | | | | 1.02 | | | | 6.27 | | | | 30,887 | | | | 117 | | |
| 12-31-09 | | | 0.30 | | | | 10.45 | | | | 21.66 | | | | 1.04 | | | | 1.01 | | | | 1.01 | | | | 4.79 | | | | 20,170 | | | | 136 | | |
| 12-31-08 | | | 0.55 | | | | 8.84 | | | | (16.38 | ) | | | 1.04 | | | | 1.00 | † | | | 1.00 | † | | | 5.19 | † | | | 16,393 | | | | 108 | | |
| 12-31-07 | | | 0.51 | | | | 11.12 | | | | 8.28 | | | | 1.04 | | | | 1.00 | | | | 1.00 | | | | 5.41 | | | | 20,460 | | | | 104 | | |
| 12-31-06 | | | 0.02 | | | | 10.76 | | | | 7.99 | | | | 1.04 | | | | 1.00 | | | | 1.00 | | | | 6.09 | | | | 9,266 | | | | 140 | | |
| Class I | |
| 12-31-10 | | | 0.36 | | | | 11.77 | | | | 15.86 | | | | 0.54 | | | | 0.52 | | | | 0.52 | | | | 6.82 | | | | 386,383 | | | | 117 | | |
| 12-31-09 | | | 0.41 | | | | 10.48 | | | | 22.14 | | | | 0.54 | | | | 0.53 | | | | 0.53 | | | | 4.99 | | | | 334,527 | | | | 136 | | |
| 12-31-08 | | | 0.60 | | | | 8.92 | | | | (15.89 | ) | | | 0.54 | | | | 0.54 | † | | | 0.54 | † | | | 5.12 | † | | | 451,197 | | | | 108 | | |
| 12-31-07 | | | 0.52 | | | | 11.20 | | | | 8.76 | | | | 0.54 | | | | 0.54 | | | | 0.54 | | | | 5.80 | | | | 415,035 | | | | 104 | | |
| 12-31-06 | | | 0.04 | | | | 10.80 | | | | 8.42 | | | | 0.54 | | | | 0.54 | | | | 0.54 | | | | 6.39 | | | | 359,888 | | | | 140 | | |
See Accompanying Notes to Financial Statements
71
FINANCIAL HIGHLIGHTS (CONTINUED)
Selected data for a share of beneficial interest outstanding throughout each year or period.
| | | | | Income (loss)
from investment
operations | | | | Less distributions | |
| | | Net asset value, beginning of year or period | | Net investment income (loss) | | Net realized and unrealized gain (loss) | | Total from investment operations | | From net investment income | | From net realized gains | | From return of capital | |
| | | | | | | | | | | | | | | | |
| Year or period ended | | ($) | | ($) | | ($) | | ($) | | ($) | | ($) | | ($) | |
| ING Oppenheimer Global Strategic Income Portfolio (continued) | | | |
| Class S | | | |
| 12-31-10 | | | 10.50 | | | | 0.74 | • | | | 0.88 | | | | 1.62 | | | | 0.36 | | | | — | | | | — | | |
| 12-31-09 | | | 8.92 | | | | 0.49 | • | | | 1.45 | | | | 1.94 | | | | 0.36 | | | | — | | | | — | | |
| 12-31-08 | | | 11.21 | | | | 0.48 | • | | | (2.19 | ) | | | (1.71 | ) | | | 0.54 | | | | 0.04 | | | | — | | |
| 12-31-07 | | | 10.81 | | | | 0.62 | • | | | 0.27 | | | | 0.89 | | | | 0.49 | | | | — | | | | — | | |
| 12-31-06 | | | 9.99 | | | | 0.64 | • | | | 0.19 | | | | 0.83 | | | | 0.01 | | | | — | | | | — | | |
| Class S2 | |
| 03-08-10(4)-12-31-10 | | | 10.74 | | | | 0.57 | • | | | 0.74 | | | | 1.31 | | | | 0.36 | | | | — | | | | — | | |
| ING PIMCO Total Return Portfolio | | | |
| Class ADV | | | |
| 12-31-10 | | | 11.46 | | | | 0.23 | • | | | 0.61 | | | | 0.84 | | | | 0.39 | | | | 0.02 | | | | — | | |
| 12-31-09 | | | 10.91 | | | | 0.35 | • | | | 0.96 | | | | 1.31 | | | | 0.35 | | | | 0.41 | | | | — | | |
| 12-31-08 | | | 11.66 | | | | 0.46 | • | | | (0.52 | ) | | | (0.06 | ) | | | 0.52 | | | | 0.17 | | | | — | | |
| 12-31-07 | | | 11.03 | | | | 0.44 | • | | | 0.55 | | | | 0.99 | | | | 0.36 | | | | — | | | | — | | |
| 12-31-06 | | | 10.81 | | | | 0.36 | • | | | 0.03 | | | | 0.39 | | | | 0.17 | | | | — | | | | — | | |
| Class I | | | |
| 12-31-10 | | | 11.67 | | | | 0.29 | • | | | 0.63 | | | | 0.92 | | | | 0.42 | | | | 0.02 | | | | — | | |
| 12-31-09 | | | 11.08 | | | | 0.42 | • | | | 0.97 | | | | 1.39 | | | | 0.39 | | | | 0.41 | | | | — | | |
| 12-31-08 | | | 11.81 | | | | 0.53 | • | | | (0.54 | ) | | | (0.01) | | | | 0.55 | | | | 0.17 | | | | — | | |
| 12-31-07 | | | 11.16 | | | | 0.51 | • | | | 0.55 | | | | 1.06 | | | | 0.41 | | | | — | | | | — | | |
| 12-31-06 | | | 10.92 | | | | 0.42 | • | | | 0.03 | | | | 0.45 | | | | 0.21 | | | | — | | | | — | | |
| Class S | | | |
| 12-31-10 | | | 11.58 | | | | 0.26 | • | | | 0.62 | | | | 0.88 | | | | 0.40 | | | | 0.02 | | | | — | | |
| 12-31-09 | | | 11.01 | | | | 0.39 | • | | | 0.96 | | | | 1.35 | | | | 0.37 | | | | 0.41 | | | | — | | |
| 12-31-08 | | | 11.75 | | | | 0.49 | • | | | (0.52 | ) | | | (0.03 | ) | | | 0.54 | | | | 0.17 | | | | — | | |
| 12-31-07 | | | 11.11 | | | | 0.48 | • | | | 0.55 | | | | 1.03 | | | | 0.39 | | | | — | | | | — | | |
| 12-31-06 | | | 10.87 | | | | 0.39 | • | | | 0.04 | | | | 0.43 | | | | 0.19 | | | | — | | | | — | | |
| Class S2 | | | |
| 12-31-10 | | | 11.44 | | | | 0.29 | • | | | 0.56 | | | | 0.85 | | | | 0.42 | | | | 0.02 | | | | — | | |
| 02-27-09(4)-12-31-09 | | | 10.55 | | | | 0.35 | • | | | 1.34 | | | | 1.69 | | | | 0.39 | | | | 0.41 | | | | — | | |
| ING Pioneer High Yield Portfolio | | | |
| Class ADV | | | |
| 12-31-10 | | | 10.01 | | | | 0.56 | | | | 1.21 | | | | 1.77 | | | | 0.59 | | | | — | | | | — | | |
| 12-31-09 | | | 6.51 | | | | 0.58 | • | | | 3.52 | | | | 4.10 | | | | 0.60 | | | | — | | | | — | | |
| 12-31-08 | | | 10.23 | | | | 0.66 | | | | (3.50 | ) | | | (2.84 | ) | | | 0.65 | | | | 0.23 | | | | — | | |
| 12-31-07 | | | 10.22 | | | | 0.54 | • | | | 0.01 | | | | 0.55 | | | | 0.54 | | | | — | | | | — | | |
| 01-20-06(4)-12-31-06 | | | 9.99 | | | | 0.47 | • | | | 0.30 | | | | 0.77 | | | | 0.51 | | | | 0.03 | | | | — | | |
| Class I | | | |
| 12-31-10 | | | 10.05 | | | | 0.65 | | | | 1.19 | | | | 1.84 | | | | 0.65 | | | | — | | | | — | | |
| 12-31-09 | | | 6.52 | | | | 0.67 | • | | | 3.49 | | | | 4.16 | | | | 0.63 | | | | — | | | | — | | |
| 12-31-08 | | | 10.25 | | | | 0.74 | • | | | (3.54 | ) | | | (2.80 | ) | | | 0.70 | | | | 0.23 | | | | — | | |
| 12-31-07 | | | 10.22 | | | | 0.59 | • | | | 0.03 | | | | 0.62 | | | | 0.59 | | | | — | | | | — | | |
| 01-03-06(4)-12-31-06 | | | 10.00 | | | | 0.57 | • | | | 0.23 | | | | 0.80 | | | | 0.55 | | | | 0.03 | | | | — | | |
| Class S | | | |
| 12-31-10 | | | 10.04 | | | | 0.62 | • | | | 1.19 | | | | 1.81 | | | | 0.62 | | | | — | | | | — | | |
| 12-31-09 | | | 6.52 | | | | 0.61 | • | | | 3.52 | | | | 4.13 | | | | 0.61 | | | | — | | | | — | | |
| 12-31-08 | | | 10.25 | | | | 0.67 | • | | | (3.49 | ) | | | (2.82 | ) | | | 0.68 | | | | 0.23 | | | | — | | |
| 12-31-07 | | | 10.22 | | | | 0.57 | • | | | 0.03 | | | | 0.60 | | | | 0.57 | | | | — | | | | — | | |
| 01-20-06(4)-12-31-06 | | | 9.99 | | | | 0.54 | • | | | 0.24 | | | | 0.78 | | | | 0.52 | | | | 0.03 | | | | — | | |
| ING T. Rowe Price Diversified Mid Cap Growth Portfolio | | | |
| Class ADV | | | |
| 12-31-10 | | | 6.46 | | | | (0.01 | ) | | | 1.80 | | | | 1.79 | | | | 0.00 | * | | | — | | | | — | | |
| 12-31-09 | | | 4.44 | | | | (0.00 | )* | | | 2.02 | | | | 2.02 | | | | 0.00 | * | | | — | | | | — | | |
| 12-31-08 | | | 9.22 | | | | (0.02 | ) | | | (3.48 | ) | | | (3.50 | ) | | | — | | | | 1.28 | | | | — | | |
| 12-31-07 | | | 8.99 | | | | (0.03 | ) | | | 1.14 | | | | 1.11 | | | | — | | | | 0.88 | | | | — | | |
| 12-31-06 | | | 8.47 | | | | (0.03 | ) | | | 0.74 | | | | 0.71 | | | | — | | | | 0.19 | | | | — | | |
| | | | | Ratios to average net assets | | Supplemental data | |
| | | Total distributions | | Net asset value, end of year or period | | Total Return(1) | | Expenses before reductions/additions(2)(3) | | Expenses net of fee waivers and/or recoupments, if any(2)(3) | | Expenses net of all reductions/additions(2)(3) | | Net investment income (loss)(2)(3) | | Net assets, end of year or period | | Portfolio turnover rate | |
| | | | | | | | | | | | | | | | | | | | |
| Year or period ended | | ($) | | ($) | | (%) | | (%) | | (%) | | (%) | | (%) | | ($000's) | | (%) | |
| ING Oppenheimer Global Strategic Income Portfolio (continued) | |
| Class S | |
| 12-31-10 | | | 0.36 | | | | 11.76 | | | | 15.54 | | | | 0.79 | | | | 0.77 | | | | 0.77 | | | | 6.57 | | | | 93,346 | | | | 117 | | |
| 12-31-09 | | | 0.36 | | | | 10.50 | | | | 21.85 | | | | 0.79 | | | | 0.76 | | | | 0.76 | | | | 5.04 | | | | 97,596 | | | | 136 | | |
| 12-31-08 | | | 0.58 | | | | 8.92 | | | | (16.10 | ) | | | 0.79 | | | | 0.75 | † | | | 0.75 | † | | | 4.53 | † | | | 88,592 | | | | 108 | | |
| 12-31-07 | | | 0.49 | | | | 11.21 | | | | 8.50 | | | | 0.79 | | | | 0.75 | | | | 0.75 | | | | 5.61 | | | | 83,977 | | | | 104 | | |
| 12-31-06 | | | 0.01 | | | | 10.81 | | | | 8.33 | | | | 0.79 | | | | 0.75 | | | | 0.75 | | | | 6.20 | | | | 56,054 | | | | 140 | | |
| Class S2 | |
| 03-08-10(4)-12-31-10 | | | 0.36 | | | | 11.69 | | | | 12.31 | | | | 1.04 | | | | 0.92 | | | | 0.92 | | | | 6.16 | | | | 3 | | | | 117 | | |
| ING PIMCO Total Return Portfolio | |
| Class ADV | |
| 12-31-10 | | | 0.41 | | | | 11.89 | | | | 7.30 | | | | 1.09 | | | | 1.08 | | | | 1.08 | | | | 1.96 | | | | 152,733 | | | | 558 | | |
| 12-31-09 | | | 0.76 | | | | 11.46 | | | | 12.32 | | | | 1.13 | | | | 1.12 | | | | 1.12 | | | | 3.10 | | | | 93,043 | | | | 737 | | |
| 12-31-08 | | | 0.69 | | | | 10.91 | | | | (0.54 | ) | | | 1.16 | | | | 1.15 | | | | 1.15 | | | | 4.04 | | | | 44,599 | | | | 872 | | |
| 12-31-07 | | | 0.36 | | | | 11.66 | | | | 9.25 | | | | 1.21 | (a) | | | 1.21 | (a) | | | 1.21 | (a) | | | 3.98 | (a) | | | 33,445 | | | | 863 | | |
| 12-31-06 | | | 0.17 | | | | 11.03 | | | | 3.71 | | | | 1.27 | (a) | | | 1.27 | (a) | | | 1.27 | (a) | | | 3.36 | (a) | | | 25,603 | | | | 826 | | |
| Class I | |
| 12-31-10 | | | 0.44 | | | | 12.15 | | | | 7.84 | | | | 0.59 | | | | 0.58 | | | | 0.58 | | | | 2.43 | | | | 534,495 | | | | 558 | | |
| 12-31-09 | | | 0.80 | | | | 11.67 | | | | 12.89 | | | | 0.63 | | | | 0.62 | | | | 0.62 | | | | 3.67 | | | | 430,220 | | | | 737 | | |
| 12-31-08 | | | 0.72 | | | | 11.08 | | | | (0.04 | ) | | | 0.66 | | | | 0.65 | | | | 0.65 | | | | 4.55 | | | | 265,311 | | | | 872 | | |
| 12-31-07 | | | 0.41 | | | | 11.81 | | | | 9.79 | | | | 0.71 | (a) | | | 0.71 | (a) | | | 0.71 | (a) | | | 4.49 | (a) | | | 320,725 | | | | 863 | | |
| 12-31-06 | | | 0.21 | | | | 11.16 | | | | 4.21 | | | | 0.77 | (a) | | | 0.77 | (a) | | | 0.77 | (a) | | | 3.86 | (a) | | | 213,734 | | | | 826 | | |
| Class S | |
| 12-31-10 | | | 0.42 | | | | 12.04 | | | | 7.56 | | | | 0.84 | | | | 0.83 | | | | 0.83 | | | | 2.18 | | | | 474,076 | | | | 558 | | |
| 12-31-09 | | | 0.78 | | | | 11.58 | | | | 12.62 | | | | 0.88 | | | | 0.87 | | | | 0.87 | | | | 3.42 | | | | 352,984 | | | | 737 | | |
| 12-31-08 | | | 0.71 | | | | 11.01 | | | | (0.28 | ) | | | 0.91 | | | | 0.90 | | | | 0.90 | | | | 4.30 | | | | 192,259 | | | | 872 | | |
| 12-31-07 | | | 0.39 | | | | 11.75 | | | | 9.51 | | | | 0.96 | (a) | | | 0.96 | (a) | | | 0.96 | (a) | | | 4.23 | (a) | | | 122,274 | | | | 863 | | |
| 12-31-06 | | | 0.19 | | | | 11.11 | | | | 4.00 | | | | 1.02 | (a) | | | 1.02 | (a) | | | 1.02 | (a) | | | 3.61 | (a) | | | 93,487 | | | | 826 | | |
| Class S2 | |
| 12-31-10 | | | 0.44 | | | | 11.85 | | | | 7.38 | | | | 1.09 | | | | 0.98 | | | | 0.98 | | | | 2.42 | | | | 1,003 | | | | 558 | | |
| 02-27-09(4)-12-31-09 | | | 0.80 | | | | 11.44 | | | | 16.38 | | | | 1.13 | | | | 1.02 | | | | 1.02 | | | | 3.67 | | | | 3 | | | | 737 | | |
| ING Pioneer High Yield Portfolio | |
| Class ADV | |
| 12-31-10 | | | 0.59 | | | | 11.19 | | | | 18.38 | | | | 1.25 | | | | 1.21 | † | | | 1.21 | † | | | 5.75 | † | | | 120 | | | | 41 | | |
| 12-31-09 | | | 0.60 | | | | 10.01 | | | | 65.71 | | | | 1.28 | | | | 1.22 | † | | | 1.21 | † | | | 6.91 | † | | | 30 | | | | 53 | | |
| 12-31-08 | | | 0.88 | | | | 6.51 | | | | (29.60 | )(b) | | | 1.24 | | | | 1.23 | † | | | 1.23 | † | | | 7.25 | † | | | 773 | | | | 38 | | |
| 12-31-07 | | | 0.54 | | | | 10.23 | | | | 5.43 | | | | 1.28 | | | | 1.27 | | | | 1.27 | | | | 5.22 | | | | 1,018 | | | | 68 | | |
| 01-20-06(4)-12-31-06 | | | 0.54 | | | | 10.22 | | | | 7.98 | | | | 1.30 | | | | 1.23 | | | | 1.23 | | | | 4.97 | | | | 510 | | | | 20 | | |
| Class I | |
| 12-31-10 | | | 0.65 | | | | 11.24 | | | | 19.02 | | | | 0.75 | | | | 0.71 | † | | | 0.71 | † | | | 6.23 | † | | | 98,394 | | | | 41 | | |
| 12-31-09 | | | 0.63 | | | | 10.05 | | | | 66.75 | | | | 0.78 | | | | 0.72 | † | | | 0.71 | † | | | 8.88 | † | | | 92,714 | | | | 53 | | |
| 12-31-08 | | | 0.93 | | | | 6.52 | | | | (29.27 | )(b) | | | 0.74 | | | | 0.73 | † | | | 0.72 | † | | | 8.82 | † | | | 279,168 | | | | 38 | | |
| 12-31-07 | | | 0.59 | | | | 10.25 | | | | 6.15 | | | | 0.78 | | | | 0.77 | | | | 0.77 | | | | 5.67 | | | | 105,105 | | | | 68 | | |
| 01-03-06(4)-12-31-06 | | | 0.58 | | | | 10.22 | | | | 8.24 | | | | 0.80 | | | | 0.73 | | | | 0.73 | | | | 5.70 | | | | 119,959 | | | | 20 | | |
| Class S | |
| 12-31-10 | | | 0.62 | | | | 11.23 | | | | 18.73 | | | | 1.00 | | | | 0.96 | † | | | 0.96 | † | | | 5.97 | † | | | 2,307 | | | | 41 | | |
| 12-31-09 | | | 0.61 | | | | 10.04 | | | | 66.30 | | | | 1.03 | | | | 0.97 | † | | | 0.96 | † | | | 7.50 | † | | | 2,995 | | | | 53 | | |
| 12-31-08 | | | 0.91 | | | | 6.52 | | | | (29.45 | )(b) | | | 0.99 | | | | 0.98 | † | | | 0.98 | † | | | 7.32 | † | | | 2,170 | | | | 38 | | |
| 12-31-07 | | | 0.57 | | | | 10.25 | | | | 5.89 | | | | 1.03 | | | | 1.02 | | | | 1.02 | | | | 5.43 | | | | 5,899 | | | | 68 | | |
| 01-20-06(4)-12-31-06 | | | 0.55 | | | | 10.22 | | | | 8.01 | | | | 1.05 | | | | 0.98 | | | | 0.98 | | | | 5.43 | | | | 8,280 | | | | 20 | | |
| ING T. Rowe Price Diversified Mid Cap Growth Portfolio | |
| Class ADV | |
| 12-31-10 | | | 0.00 | * | | | 8.25 | | | | 27.79 | | | | 1.16 | | | | 1.16 | | | | 1.16 | | | | (0.13 | ) | | | 31,927 | | | | 28 | | |
| 12-31-09 | | | — | | | | 6.46 | | | | 45.55 | | | | 1.16 | | | | 1.16 | | | | 1.16 | | | | (0.01 | ) | | | 24,468 | | | | 27 | | |
| 12-31-08 | | | 1.28 | | | | 4.44 | | | | (43.35 | ) | | | 1.16 | | | | 1.16 | | | | 1.16 | | | | (0.25 | ) | | | 15,401 | | | | 28 | | |
| 12-31-07 | | | 0.88 | | | | 9.22 | | | | 12.71 | | | | 1.16 | | | | 1.15 | | | | 1.15 | | | | (0.31 | ) | | | 40,695 | | | | 31 | | |
| 12-31-06 | | | 0.19 | | | | 8.99 | | | | 8.70 | | | | 1.16 | | | | 1.15 | | | | 1.15 | | | | (0.23 | ) | | | 48,165 | | | | 37 | | |
See Accompanying Notes to Financial Statements
72
FINANCIAL HIGHLIGHTS (CONTINUED)
Selected data for a share of beneficial interest outstanding throughout each year or period.
| | | | | Income (loss)
from investment
operations | | | | Less distributions | |
| | | Net asset value, beginning of year or period | | Net investment income (loss) | | Net realized and unrealized gain (loss) | | Total from investment operations | | From net investment income | | From net realized gains | | From return of capital | |
| | | | | | | | | | | | | | | | |
| Year or period ended | | ($) | | ($) | | ($) | | ($) | | ($) | | ($) | | ($) | |
| ING T. Rowe Price Diversified Mid Cap Growth Portfolio (continued) | | | |
| Class I | | | |
| 12-31-10 | | | 6.71 | | | | 0.03 | | | | 1.88 | | | | 1.91 | | | | 0.02 | | | | — | | | | — | | |
| 12-31-09 | | | 4.60 | | | | 0.03 | | | | 2.10 | | | | 2.13 | | | | 0.02 | | | | — | | | | — | | |
| 12-31-08 | | | 9.52 | | | | 0.02 | | | | (3.63 | ) | | | (3.61 | ) | | | 0.03 | | | | 1.28 | | | | — | | |
| 12-31-07 | | | 9.22 | | | | 0.02 | | | | 1.18 | | | | 1.20 | | | | 0.02 | | | | 0.88 | | | | — | | |
| 12-31-06 | | | 8.65 | | | | 0.02 | | | | 0.74 | | | | 0.76 | | | | — | | | | 0.19 | | | | — | | |
| Class S | | | |
| 12-31-10 | | | 6.60 | | | | 0.01 | | | | 1.84 | | | | 1.85 | | | | 0.00 | * | | | — | | | | — | | |
| 12-31-09 | | | 4.53 | | | | 0.01 | | | | 2.07 | | | | 2.08 | | | | 0.01 | | | | — | | | | — | | |
| 12-31-08 | | | 9.37 | | | | (0.00 | )* | | | (3.56 | ) | | | (3.56 | ) | | | 0.00 | * | | | 1.28 | | | | — | | |
| 12-31-07 | | | 9.10 | | | | (0.01 | ) | | | 1.16 | | | | 1.15 | | | | — | | | | 0.88 | | | | — | | |
| 12-31-06 | | | 8.55 | | | | (0.01 | ) | | | 0.75 | | | | 0.74 | | | | — | | | | 0.19 | | | | — | | |
| Class S2 | | | |
| 12-31-10 | | | 6.45 | | | | (0.00 | )* | | | 1.80 | | | | 1.80 | | | | 0.00 | * | | | — | | | | — | | |
| 02-27-09(4)-12-31-09 | | | 3.94 | | | | 0.01 | | | | 2.51 | | | | 2.52 | | | | 0.01 | | | | — | | | | — | | |
| ING T. Rowe Price Growth Equity Portfolio | | | |
| Class ADV | | | |
| 12-31-10 | | | 45.97 | | | | (0.21 | ) | | | 7.69 | | | | 7.48 | | | | 0.02 | | | | — | | | | — | | |
| 12-31-09 | | | 32.31 | | | | (0.10 | ) | | | 13.76 | | | | 13.66 | | | | — | | | | — | | | | — | | |
| 12-31-08 | | | 60.78 | | | | (0.04 | )• | | | (24.38 | ) | | | (24.42 | ) | | | 0.08 | | | | 3.92 | | | | 0.05 | | |
| 12-31-07 | | | 58.37 | | | | 0.03 | • | | | 5.34 | | | | 5.37 | | | | 0.03 | | | | 2.93 | | | | — | | |
| 12-31-06 | | | 51.87 | | | | 0.05 | | | | 6.54 | | | | 6.59 | | | | — | | | | 0.09 | | | | — | | |
| Class I | | | |
| 12-31-10 | | | 46.65 | | | | 0.01 | | | | 7.85 | | | | 7.86 | | | | 0.02 | | | | — | | | | — | | |
| 12-31-09 | | | 32.68 | | | | 0.09 | • | | | 13.95 | | | | 14.04 | | | | 0.07 | | | | — | | | | — | | |
| 12-31-08 | | | 61.89 | | | | 0.26 | | | | (24.86 | ) | | | (24.60 | ) | | | 0.64 | | | | 3.92 | | | | 0.05 | | |
| 12-31-07 | | | 59.36 | | | | 0.32 | | | | 5.45 | | | | 5.77 | | | | 0.31 | | | | 2.93 | | | | — | | |
| 12-31-06 | | | 52.62 | | | | 0.33 | • | | | 6.64 | | | | 6.97 | | | | 0.14 | | | | 0.09 | | | | — | | |
| Class S | | | |
| 12-31-10 | | | 46.27 | | | | (0.11 | ) | | | 7.78 | | | | 7.67 | | | | 0.02 | | | | — | | | | — | | |
| 12-31-09 | | | 32.45 | | | | (0.01 | ) | | | 13.83 | | | | 13.82 | | | | 0.00 | * | | | — | | | | — | | |
| 12-31-08 | | | 61.35 | | | | 0.07 | • | | | (24.56 | ) | | | (24.49 | ) | | | 0.44 | | | | 3.92 | | | | 0.05 | | |
| 12-31-07 | | | 58.85 | | | | 0.15 | • | | | 5.41 | | | | 5.56 | | | | 0.13 | | | | 2.93 | | | | — | | |
| 12-31-06 | | | 52.16 | | | | 0.28 | • | | | 6.50 | | | | 6.78 | | | | — | | | | 0.09 | | | | — | | |
| Class S2 | | | |
| 12-31-10 | | | 45.99 | | | | (0.18 | ) | | | 7.72 | | | | 7.54 | | | | 0.02 | | | | — | | | | — | | |
| 02-27-09(4)-12-31-09 | | | 29.76 | | | | (0.05 | ) | | | 16.28 | | | | 16.23 | | | | — | | | | — | | | | — | | |
| ING Templeton Foreign Equity Portfolio | | | |
| Class ADV | | | |
| 12-31-10 | | | 10.36 | | | | 0.13 | • | | | 0.70 | | | | 0.83 | | | | 0.20 | | | | — | | | | — | | |
| 12-31-09 | | | 7.84 | | | | 0.14 | | | | 2.38 | | | | 2.52 | | | | — | | | | — | | | | — | | |
| 12-31-08 | | | 13.65 | | | | 0.23 | • | | | (5.81 | ) | | | (5.58 | ) | | | 0.23 | | | | — | | | | — | | |
| 12-31-07 | | | 12.03 | | | | 0.18 | • | | | 1.68 | | | | 1.86 | | | | 0.13 | | | | 0.11 | | | | — | | |
| 12-20-06(4)-12-31-06 | | | 12.09 | | | | 0.00 | * | | | 0.08 | | | | 0.08 | | | | 0.13 | | | | 0.01 | | | | — | | |
| Class I | | | |
| 12-31-10 | | | 10.40 | | | | 0.19 | • | | | 0.70 | | | | 0.89 | | | | 0.24 | | | | — | | | | — | | |
| 12-31-09 | | | 7.83 | | | | 0.20 | • | | | 2.37 | | | | 2.57 | | | | — | | | | — | | | | — | | |
| 12-31-08 | | | 13.66 | | | | 0.29 | • | | | (5.85 | ) | | | (5.56 | ) | | | 0.27 | | | | — | | | | — | | |
| 12-31-07 | | | 12.03 | | | | 0.24 | • | | | 1.63 | | | | 1.87 | | | | 0.13 | | | | 0.11 | | | | — | | |
| 01-03-06(4)-12-31-06 | | | 10.00 | | | | 0.27 | | | | 1.90 | | | | 2.17 | | | | 0.13 | | | | 0.01 | | | | — | | |
| Class S | |
| 12-31-10 | | | 10.36 | | | | 0.17 | | | | 0.69 | | | | 0.86 | | | | 0.22 | | | | — | | | | — | | |
| 12-31-09 | | | 7.81 | | | | 0.14 | | | | 2.41 | | | | 2.55 | | | | — | | | | — | | | | — | | |
| 12-31-08 | | | 13.63 | | | | 0.28 | • | | | (5.87 | ) | | | (5.59 | ) | | | 0.23 | | | | — | | | | — | | |
| 12-31-07 | | | 12.01 | | | | 0.20 | • | | | 1.63 | | | | 1.83 | | | | 0.10 | | | | 0.11 | | | | — | | |
| 01-12-06(4)-12-31-06 | | | 10.02 | | | | 0.17 | • | | | 1.95 | | | | 2.12 | | | | 0.12 | | | | 0.01 | | | | — | | |
| | | | | Ratios to average net assets | | Supplemental data | |
| | | Total distributions | | Net asset value, end of year or period | | Total Return(1) | | Expenses before reductions/additions(2)(3) | | Expenses net of fee waivers and/or recoupments, if any(2)(3) | | Expenses net of all reductions/additions(2)(3) | | Net investment income (loss)(2)(3) | | Net assets, end of year or period | | Portfolio turnover rate | |
| | | | | | | | | | | | | | | | | | | | |
| Year or period ended | | ($) | | ($) | | (%) | | (%) | | (%) | | (%) | | (%) | | ($000's) | | (%) | |
| ING T. Rowe Price Diversified Mid Cap Growth Portfolio (continued) | |
| Class I | |
| 12-31-10 | | | 0.02 | | | | 8.60 | | | | 28.51 | | | | 0.66 | | | | 0.66 | | | | 0.66 | | | | 0.37 | | | | 762,608 | | | | 28 | | |
| 12-31-09 | | | 0.02 | | | | 6.71 | | | | 46.41 | | | | 0.66 | | | | 0.66 | | | | 0.66 | | | | 0.48 | | | | 659,322 | | | | 27 | | |
| 12-31-08 | | | 1.31 | | | | 4.60 | | | | (43.15 | ) | | | 0.66 | | | | 0.66 | | | | 0.66 | | | | 0.26 | | | | 487,968 | | | | 28 | | |
| 12-31-07 | | | 0.90 | | | | 9.52 | | | | 13.39 | | | | 0.66 | | | | 0.66 | | | | 0.66 | | | | 0.18 | | | | 995,471 | | | | 31 | | |
| 12-31-06 | | | 0.19 | | | | 9.22 | | | | 9.10 | | | | 0.66 | | | | 0.66 | | | | 0.66 | | | | 0.19 | | | | 1,067,515 | | | | 37 | | |
| Class S | |
| 12-31-10 | | | 0.00 | * | | | 8.45 | | | | 28.12 | | | | 0.91 | | | | 0.91 | | | | 0.91 | | | | 0.12 | | | | 23,701 | | | | 28 | | |
| 12-31-09 | | | 0.01 | | | | 6.60 | | | | 46.00 | | | | 0.91 | | | | 0.91 | | | | 0.91 | | | | 0.25 | | | | 20,494 | | | | 27 | | |
| 12-31-08 | | | 1.28 | | | | 4.53 | | | | (43.27 | ) | | | 0.91 | | | | 0.91 | | | | 0.91 | | | | 0.03 | | | | 9,009 | | | | 28 | | |
| 12-31-07 | | | 0.88 | | | | 9.37 | | | | 13.01 | | | | 0.91 | | | | 0.91 | | | | 0.91 | | | | (0.07 | ) | | | 13,319 | | | | 31 | | |
| 12-31-06 | | | 0.19 | | | | 9.10 | | | | 8.97 | | | | 0.91 | | | | 0.91 | | | | 0.91 | | | | (0.07 | ) | | | 10,100 | | | | 37 | | |
| Class S2 | |
| 12-31-10 | | | 0.00 | * | | | 8.25 | | | | 27.99 | | | | 1.16 | | | | 1.06 | | | | 1.06 | | | | (0.03 | ) | | | 6 | | | | 28 | | |
| 02-27-09(4)-12-31-09 | | | 0.01 | | | | 6.45 | | | | 63.88 | | | | 1.16 | | | | 1.06 | | | | 1.06 | | | | 0.09 | | | | 5 | | | | 27 | | |
| ING T. Rowe Price Growth Equity Portfolio | |
| Class ADV | |
| 12-31-10 | | | 0.02 | | | | 53.43 | | | | 16.27 | | | | 1.25 | | | | 1.25 | | | | 1.25 | | | | (0.48 | ) | | | 102,242 | | | | 41 | | |
| 12-31-09 | | | — | | | | 45.97 | | | | 42.28 | | | | 1.25 | | | | 1.25 | | | | 1.25 | | | | (0.27 | ) | | | 73,747 | | | | 64 | | |
| 12-31-08 | | | 4.05 | | | | 32.31 | | | | (42.51 | ) | | | 1.25 | | | | 1.24 | | | | 1.24 | | | | (0.09 | ) | | | 49,551 | | | | 54 | | |
| 12-31-07 | | | 2.96 | | | | 60.78 | | | | 9.36 | | | | 1.25 | | | | 1.24 | | | | 1.24 | | | | 0.05 | | | | 103,588 | | | | 58 | | |
| 12-31-06 | | | 0.09 | | | | 58.37 | | | | 12.73 | | | | 1.25 | | | | 1.25 | | | | 1.25 | | | | 0.11 | | | | 105,821 | | | | 43 | | |
| Class I | |
| 12-31-10 | | | 0.02 | | | | 54.49 | | | | 16.86 | | | | 0.75 | | | | 0.75 | | | | 0.75 | | | | 0.02 | | | | 808,032 | | | | 41 | | |
| 12-31-09 | | | 0.07 | | | | 46.65 | | | | 42.96 | | | | 0.75 | | | | 0.75 | | | | 0.75 | | | | 0.24 | | | | 758,453 | | | | 64 | | |
| 12-31-08 | | | 4.61 | | | | 32.68 | | | | (42.21 | ) | | | 0.75 | | | | 0.74 | | | | 0.74 | | | | 0.42 | | | | 745,790 | | | | 54 | | |
| 12-31-07 | | | 3.24 | | | | 61.89 | | | | 9.91 | | | | 0.75 | | | | 0.74 | | | | 0.74 | | | | 0.55 | | | | 1,442,336 | | | | 58 | | |
| 12-31-06 | | | 0.23 | | | | 59.36 | | | | 13.30 | | | | 0.75 | | | | 0.75 | | | | 0.75 | | | | 0.60 | | | | 1,271,481 | | | | 43 | | |
| Class S | |
| 12-31-10 | | | 0.02 | | | | 53.92 | | | | 16.58 | | | | 1.00 | | | | 1.00 | | | | 1.00 | | | | (0.24 | ) | | | 171,878 | | | | 41 | | |
| 12-31-09 | | | — | | | | 46.27 | | | | 42.60 | | | | 1.00 | | | | 1.00 | | | | 1.00 | | | | (0.03 | ) | | | 152,008 | | | | 64 | | |
| 12-31-08 | | | 4.41 | | | | 32.45 | | | | (42.35 | ) | | | 1.00 | | | | 0.99 | | | | 0.99 | | | | 0.15 | | | | 69,896 | | | | 54 | | |
| 12-31-07 | | | 3.06 | | | | 61.35 | | | | 9.62 | | | | 1.00 | | | | 0.99 | | | | 0.99 | | | | 0.25 | | | | 101,503 | | | | 58 | | |
| 12-31-06 | | | 0.09 | | | | 58.85 | | | | 13.03 | | | | 1.00 | | | | 1.00 | | | | 1.00 | | | | 0.51 | | | | 37,306 | | | | 43 | | |
| Class S2 | |
| 12-31-10 | | | 0.02 | | | | 53.51 | | | | 16.39 | | | | 1.25 | | | | 1.15 | | | | 1.15 | | | | (0.37 | ) | | | 5 | | | | 41 | | |
| 02-27-09(4)-12-31-09 | | | — | | | | 45.99 | | | | 54.54 | | | | 1.25 | | | | 1.15 | | | | 1.15 | | | | (0.16 | ) | | | 5 | | | | 64 | | |
| ING Templeton Foreign Equity Portfolio | |
| Class ADV | |
| 12-31-10 | | | 0.20 | | | | 10.99 | | | | 8.25 | | | | 1.46 | | | | 1.46 | | | | 1.46 | | | | 1.33 | | | | 15,178 | | | | 14 | | |
| 12-31-09 | | | — | | | | 10.36 | | | | 32.14 | | | | 1.47 | | | | 1.47 | | | | 1.47 | | | | 1.63 | | | | 11,334 | | | | 27 | | |
| 12-31-08 | | | 0.23 | | | | 7.84 | | | | (40.88 | ) | | | 1.46 | | | | 1.47 | | | | 1.47 | | | | 2.22 | | | | 9,418 | | | | 11 | | |
| 12-31-07 | | | 0.24 | | | | 13.65 | | | | 15.42 | | | | 1.49 | | | | 1.48 | | | | 1.48 | | | | 1.40 | | | | 1 | | | | 20 | | |
| 12-20-06(4)-12-31-06 | | | 0.14 | | | | 12.03 | | | | 0.66 | | | | 1.74 | | | | 1.48 | | | | 1.48 | | | | 0.00 | * | | | 1 | | | | 5 | | |
| Class I | |
| 12-31-10 | | | 0.24 | | | | 11.05 | | | | 8.87 | | | | 0.96 | | | | 0.96 | | | | 0.96 | | | | 1.89 | | | | 401,997 | | | | 14 | | |
| 12-31-09 | | | — | | | | 10.40 | | | | 32.82 | | | | 0.97 | | | | 0.97 | | | | 0.97 | | | | 2.42 | | | | 273,992 | | | | 27 | | |
| 12-31-08 | | | 0.27 | | | | 7.83 | | | | (40.72 | ) | | | 0.96 | | | | 0.97 | | | | 0.97 | | | | 2.77 | | | | 405,874 | | | | 11 | | |
| 12-31-07 | | | 0.24 | | | | 13.66 | | | | 15.50 | | | | 0.99 | | | | 0.98 | | | | 0.98 | | | | 1.85 | | | | 46,781 | | | | 20 | | |
| 01-03-06(4)-12-31-06 | | | 0.14 | | | | 12.03 | | | | 21.70 | | | | 1.24 | | | | 0.98 | | | | 0.98 | | | | 2.53 | | | | 10,991 | | | | 5 | | |
| Class S | |
| 12-31-10 | | | 0.22 | | | | 11.00 | | | | 8.59 | | | | 1.21 | | | | 1.21 | | | | 1.21 | | | | 1.68 | | | | 275,408 | | | | 14 | | |
| 12-31-09 | | | — | | | | 10.36 | | | | 32.65 | | | | 1.22 | | | | 1.22 | | | | 1.22 | | | | 1.81 | | | | 254,180 | | | | 27 | | |
| 12-31-08 | | | 0.23 | | | | 7.81 | | | | (40.97 | ) | | | 1.21 | | | | 1.22 | | | | 1.22 | | | | 2.56 | | | | 167,638 | | | | 11 | | |
| 12-31-07 | | | 0.21 | | | | 13.63 | | | | 15.23 | | | | 1.24 | | | | 1.23 | | | | 1.23 | | | | 1.49 | | | | 131,882 | | | | 20 | | |
| 01-12-06(4)-12-31-06 | | | 0.13 | | | | 12.01 | | | | 21.14 | | | | 1.49 | | | | 1.23 | | | | 1.23 | | | | 1.57 | | | | 36,200 | | | | 5 | | |
See Accompanying Notes to Financial Statements
73
FINANCIAL HIGHLIGHTS (CONTINUED)
Selected data for a share of beneficial interest outstanding throughout each year or period.
| | | | | Income (loss)
from investment
operations | | | | Less distributions | |
| | | Net asset value, beginning of year or period | | Net investment income (loss) | | Net realized and unrealized gain (loss) | | Total from investment operations | | From net investment income | | From net realized gains | | From return of capital | |
| | | | | | | | | | | | | | | | |
| Year or period ended | | ($) | | ($) | | ($) | | ($) | | ($) | | ($) | | ($) | |
| ING Templeton Foreign Equity Portfolio (continued) | |
| Class S2 | | | |
| 12-31-10 | | | 10.37 | | | | 0.07 | • | | | 0.78 | | | | 0.85 | | | | 0.21 | | | | — | | | | — | | |
| 02-27-09(4)-12-31-09 | | | 6.31 | | | | 0.14 | | | | 3.92 | | | | 4.06 | | | | — | | | | — | | | | — | | |
| ING Thornburg Value Portfolio | | | |
| Class ADV | | | |
| 12-31-10 | | | 28.55 | | | | 0.06 | • | | | 2.98 | | | | 3.04 | | | | 0.41 | | | | — | | | | — | | |
| 12-31-09 | | | 19.96 | | | | 0.34 | • | | | 8.42 | | | | 8.76 | | | | 0.17 | | | | — | | | | — | | |
| 12-31-08 | | | 33.36 | | | | 0.18 | | | | (13.52 | ) | | | (13.34 | ) | | | 0.06 | | | | — | | | | — | | |
| 12-31-07 | | | 31.38 | | | | 0.18 | • | | | 1.93 | | | | 2.11 | | | | 0.13 | | | | — | | | | — | | |
| 12-31-06 | | | 27.03 | | | | 0.05 | • | | | 4.34 | | | | 4.39 | | | | 0.04 | | | | — | | | | — | | |
| Class I | | | |
| 12-31-10 | | | 29.18 | | | | 0.22 | • | | | 3.03 | | | | 3.25 | | | | 0.45 | | | | — | | | | — | | |
| 12-31-09 | | | 20.38 | | | | 0.42 | • | | | 8.67 | | | | 9.09 | | | | 0.29 | | | | — | | | | — | | |
| 12-31-08 | | | 34.00 | | | | 0.32 | • | | | (13.79 | ) | | | (13.47 | ) | | | 0.15 | | | | — | | | | — | | |
| 12-31-07 | | | 31.85 | | | | 0.28 | | | | 2.02 | | | | 2.30 | | | | 0.15 | | | | — | | | | — | | |
| 12-31-06 | | | 27.40 | | | | 0.15 | • | | | 4.44 | | | | 4.59 | | | | 0.14 | | | | — | | | | — | | |
| Class S | | | |
| 12-31-10 | | | 29.01 | | | | 0.14 | • | | | 3.02 | | | | 3.16 | | | | 0.41 | | | | — | | | | — | | |
| 12-31-09 | | | 20.26 | | | | 0.40 | • | | | 8.56 | | | | 8.96 | | | | 0.21 | | | | — | | | | — | | |
| 12-31-08 | | | 33.75 | | | | 0.30 | | | | (13.76 | ) | | | (13.46 | ) | | | 0.03 | | | | — | | | | — | | |
| 12-31-07 | | | 31.68 | | | | 0.19 | • | | | 2.03 | | | | 2.22 | | | | 0.15 | | | | — | | | | — | | |
| 12-31-06 | | | 27.24 | | | | 0.36 | • | | | 4.14 | | | | 4.50 | | | | 0.06 | | | | — | | | | — | | |
| Class S2 | | | |
| 03-08-10(4)-12-31-10 | | | 29.58 | | | | 0.03 | • | | | 2.00 | | | | 2.03 | | | | 0.45 | | | | — | | | | — | | |
| ING UBS U.S. Large Cap Equity Portfolio | | | |
| Class ADV | | | |
| 12-31-10 | | | 7.95 | | | | 0.03 | | | | 0.98 | | | | 1.01 | | | | 0.04 | | | | — | | | | — | | |
| 12-31-09 | | | 6.12 | | | | 0.04 | | | | 1.86 | | | | 1.90 | | | | 0.07 | | | | — | | | | — | | |
| 12-31-08 | | | 10.40 | | | | 0.08 | | | | (4.23 | ) | | | (4.15 | ) | | | 0.13 | | | | — | | | | — | | |
| 12-31-07 | | | 10.40 | | | | 0.06 | • | | | 0.01 | | | | 0.07 | | | | 0.07 | | | | — | | | | — | | |
| 12-31-06 | | | 9.19 | | | | 0.06 | • | | | 1.22 | | | | 1.28 | | | | 0.07 | | | | — | | | | — | | |
| Class I | | | |
| 12-31-10 | | | 8.06 | | | | 0.08 | | | | 1.00 | | | | 1.08 | | | | 0.08 | | | | — | | | | — | | |
| 12-31-09 | | | 6.20 | | | | 0.12 | | | | 1.85 | | | | 1.97 | | | | 0.11 | | | | — | | | | — | | |
| 12-31-08 | | | 10.61 | | | | 0.13 | • | | | (4.32 | ) | | | (4.19 | ) | | | 0.22 | | | | — | | | | — | | |
| 12-31-07 | | | 10.56 | | | | 0.11 | | | | 0.02 | | | | 0.13 | | | | 0.08 | | | | — | | | | — | | |
| 12-31-06 | | | 9.30 | | | | 0.09 | | | | 1.25 | | | | 1.34 | | | | 0.08 | | | | — | | | | — | | |
| Class S | | | |
| 12-31-10 | | | 8.00 | | | | 0.06 | | | | 0.98 | | | | 1.04 | | | | 0.06 | | | | — | | | | — | | |
| 12-31-09 | | | 6.15 | | | | 0.06 | | | | 1.88 | | | | 1.94 | | | | 0.09 | | | | — | | | | — | | |
| 12-31-08 | | | 10.48 | | | | 0.10 | • | | | (4.27 | ) | | | (4.17 | ) | | | 0.16 | | | | — | | | | — | | |
| 12-31-07 | | | 10.45 | | | | 0.08 | • | | | 0.02 | | | | 0.10 | | | | 0.07 | | | | — | | | | — | | |
| 12-31-06 | | | 9.21 | | | | 0.08 | • | | | 1.23 | | | | 1.31 | | | | 0.07 | | | | — | | | | — | | |
| ING Van Kampen Comstock Portfolio | | | |
| Class ADV | | | |
| 12-31-10 | | | 8.92 | | | | 0.09 | | | | 1.23 | | | | 1.32 | | | | 0.11 | | | | — | | | | — | | |
| 12-31-09 | | | 7.09 | | | | 0.09 | | | | 1.91 | | | | 2.00 | | | | 0.17 | | | | — | | | | — | | |
| 12-31-08 | | | 12.34 | | | | 0.17 | • | | | (4.47 | ) | | | (4.30 | ) | | | 0.30 | | | | 0.65 | | | | — | | |
| 12-31-07 | | | 13.17 | | | | 0.17 | • | | | (0.48 | ) | | | (0.31 | ) | | | 0.16 | | | | 0.36 | | | | — | | |
| 12-31-06 | | | 12.08 | | | | 0.18 | • | | | 1.62 | | | | 1.80 | | | | 0.09 | | | | 0.62 | | | | — | | |
| | | | | Ratios to average net assets | | Supplemental data | |
| | | Total distributions | | Net asset value, end of year or period | | Total Return(1) | | Expenses before reductions/additions(2)(3) | | Expenses net of fee waivers and/or recoupments, if any(2)(3) | | Expenses net of all reductions/additions(2)(3) | | Net investment income (loss)(2)(3) | | Net assets, end of year or period | | Portfolio turnover rate | |
| | | | | | | | | | | | | | | | | | | | |
| Year or period ended | | ($) | | ($) | | (%) | | (%) | | (%) | | (%) | | (%) | | ($000's) | | (%) | |
| ING Templeton Foreign Equity Portfolio (continued) | |
| Class S2 | |
| 12-31-10 | | | 0.21 | | | | 11.01 | | | | 8.53 | | | | 1.46 | | | | 1.36 | | | | 1.36 | | | | 0.69 | | | | 102 | | | | 14 | | |
| 02-27-09(4)-12-31-09 | | | — | | | | 10.37 | | | | 64.34 | | | | 1.47 | | | | 1.37 | | | | 1.37 | | | | 1.93 | | | | 5 | | | | 27 | | |
| ING Thornburg Value Portfolio | |
| Class ADV | |
| 12-31-10 | | | 0.41 | | | | 31.18 | | | | 10.86 | | | | 1.40 | | | | 1.40 | † | | | 1.40 | † | | | 0.22 | † | | | 15,361 | | | | 86 | | |
| 12-31-09 | | | 0.17 | | | | 28.55 | | | | 43.99 | | | | 1.40 | | | | 1.40 | † | | | 1.39 | † | | | 1.40 | † | | | 7,417 | | | | 100 | | |
| 12-31-08 | | | 0.06 | | | | 19.96 | | | | (40.04 | ) | | | 1.40 | | | | 1.40 | † | | | 1.40 | † | | | 0.53 | † | | | 2,281 | | | | 77 | | |
| 12-31-07 | | | 0.13 | | | | 33.36 | | | | 6.73 | | | | 1.40 | | | | 1.40 | | | | 1.40 | | | | 0.54 | | | | 4,196 | | | | 88 | | |
| 12-31-06 | | | 0.04 | | | | 31.38 | | | | 16.26 | | | | 1.40 | | | | 1.40 | | | | 1.40 | | | | 0.18 | | | | 673 | | | | 171 | | |
| Class I | |
| 12-31-10 | | | 0.45 | | | | 31.98 | | | | 11.37 | | | | 0.90 | | | | 0.90 | † | | | 0.90 | † | | | 0.76 | † | | | 260,671 | | | | 86 | | |
| 12-31-09 | | | 0.29 | | | | 29.18 | | | | 44.77 | | | | 0.90 | | | | 0.90 | † | | | 0.89 | † | | | 1.79 | † | | | 222,957 | | | | 100 | | |
| 12-31-08 | | | 0.15 | | | | 20.38 | | | | (39.75 | ) | | | 0.90 | | | | 0.90 | † | | | 0.90 | † | | | 1.16 | † | | | 256,369 | | | | 77 | | |
| 12-31-07 | | | 0.15 | | | | 34.00 | | | | 7.24 | | | | 0.90 | | | | 0.90 | | | | 0.90 | | | | 0.92 | | | | 216,408 | | | | 88 | | |
| 12-31-06 | | | 0.14 | | | | 31.85 | | | | 16.84 | | | | 0.90 | | | | 0.90 | | | | 0.90 | | | | 0.51 | | | | 186,115 | | | | 171 | | |
| Class S | |
| 12-31-10 | | | 0.41 | | | | 31.76 | | | | 11.13 | | | | 1.15 | | | | 1.15 | † | | | 1.15 | † | | | 0.49 | † | | | 18,563 | | | | 86 | | |
| 12-31-09 | | | 0.21 | | | | 29.01 | | | | 44.36 | | | | 1.15 | | | | 1.15 | † | | | 1.14 | † | | | 1.68 | † | | | 14,251 | | | | 100 | | |
| 12-31-08 | | | 0.03 | | | | 20.26 | | | | (39.90 | ) | | | 1.15 | | | | 1.15 | † | | | 1.15 | † | | | 0.78 | † | | | 6,604 | | | | 77 | | |
| 12-31-07 | | | 0.15 | | | | 33.75 | | | | 7.00 | | | | 1.15 | | | | 1.15 | | | | 1.15 | | | | 0.56 | | | | 13,719 | | | | 88 | | |
| 12-31-06 | | | 0.06 | | | | 31.68 | | | | 16.57 | | | | 1.15 | | | | 1.15 | | | | 1.15 | | | | 1.19 | | | | 6,795 | | | | 171 | | |
| Class S2 | |
| 03-08-10(4)-12-31-10 | | | 0.45 | | | | 31.16 | | | | 7.09 | | | | 1.40 | | | | 1.30 | † | | | 1.30 | † | | | 0.11 | † | | | 3 | | | | 86 | | |
| ING UBS U.S. Large Cap Equity Portfolio | |
| Class ADV | |
| 12-31-10 | | | 0.04 | | | | 8.92 | | | | 12.73 | | | | 1.35 | | | | 1.35 | † | | | 1.34 | † | | | 0.39 | † | | | 8,693 | | | | 55 | | |
| 12-31-09 | | | 0.07 | | | | 7.95 | | | | 31.14 | | | | 1.35 | | | | 1.35 | † | | | 1.31 | † | | | 0.51 | † | | | 7,438 | | | | 73 | | |
| 12-31-08 | | | 0.13 | | | | 6.12 | | | | (40.07 | ) | | | 1.35 | | | | 1.35 | † | | | 1.33 | † | | | 0.92 | † | | | 6,041 | | | | 65 | | |
| 12-31-07 | | | 0.07 | | | | 10.40 | | | | 0.65 | | | | 1.35 | | | | 1.35 | | | | 1.34 | | | | 0.52 | | | | 10,494 | | | | 48 | | |
| 12-31-06 | | | 0.07 | | | | 10.40 | | | | 14.05 | | | | 1.35 | | | | 1.35 | | | | 1.34 | | | | 0.58 | | | | 4,033 | | | | 39 | | |
| Class I | |
| 12-31-10 | | | 0.08 | | | | 9.06 | | | | 13.44 | | | | 0.85 | | | | 0.85 | † | | | 0.84 | † | | | 0.89 | † | | | 148,526 | | | | 55 | | |
| 12-31-09 | | | 0.11 | | | | 8.06 | | | | 31.76 | | | | 0.85 | | | | 0.85 | † | | | 0.81 | † | | | 1.08 | † | | | 155,093 | | | | 73 | | |
| 12-31-08 | | | 0.22 | | | | 6.20 | | | | (39.76 | ) | | | 0.85 | | | | 0.85 | † | | | 0.83 | † | | | 1.43 | † | | | 235,657 | | | | 65 | | |
| 12-31-07 | | | 0.08 | | | | 10.61 | | | | 1.18 | | | | 0.85 | | | | 0.85 | | | | 0.84 | | | | 1.02 | | | | 365,084 | | | | 48 | | |
| 12-31-06 | | | 0.08 | | | | 10.56 | | | | 14.51 | | | | 0.85 | | | | 0.85 | | | | 0.84 | | | | 0.99 | | | | 355,204 | | | | 39 | | |
| Class S | |
| 12-31-10 | | | 0.06 | | | | 8.98 | | | | 13.01 | | | | 1.10 | | | | 1.10 | † | | | 1.09 | † | | | 0.64 | † | | | 19,188 | | | | 55 | | |
| 12-31-09 | | | 0.09 | | | | 8.00 | | | | 31.56 | | | | 1.10 | | | | 1.10 | † | | | 1.06 | † | | | 0.75 | † | | | 19,846 | | | | 73 | | |
| 12-31-08 | | | 0.16 | | | | 6.15 | | | | (40.00 | ) | | | 1.10 | | | | 1.10 | † | | | 1.08 | † | | | 1.13 | † | | | 19,357 | | | | 65 | | |
| 12-31-07 | | | 0.07 | | | | 10.48 | | | | 0.93 | | | | 1.10 | | | | 1.10 | | | | 1.09 | | | | 0.75 | | | | 45,303 | | | | 48 | | |
| 12-31-06 | | | 0.07 | | | | 10.45 | | | | 14.32 | | | | 1.10 | | | | 1.10 | | | | 1.09 | | | | 0.79 | | | | 28,207 | | | | 39 | | |
| ING Van Kampen Comstock Portfolio | |
| Class ADV | |
| 12-31-10 | | | 0.11 | | | | 10.13 | | | | 14.81 | | | | 1.35 | | | | 1.31 | † | | | 1.31 | † | | | 0.90 | † | | | 17,041 | | | | 23 | | |
| 12-31-09 | | | 0.17 | | | | 8.92 | | | | 28.22 | | | | 1.35 | | | | 1.31 | | | | 1.31 | | | | 1.16 | | | | 16,306 | | | | 27 | | |
| 12-31-08 | | | 0.95 | | | | 7.09 | | | | (36.64 | ) | | | 1.35 | | | | 1.31 | | | | 1.31 | | | | 1.66 | | | | 13,778 | | | | 47 | | |
| 12-31-07 | | | 0.52 | | | | 12.34 | | | | (2.51 | ) | | | 1.35 | | | | 1.34 | | | | 1.34 | | | | 1.27 | | | | 40,111 | | | | 26 | | |
| 12-31-06 | | | 0.71 | | | | 13.17 | | | | 15.57 | | | | 1.38 | | | | 1.34 | | | | 1.34 | | | | 1.42 | | | | 37,431 | | | | 27 | | |
See Accompanying Notes to Financial Statements
74
FINANCIAL HIGHLIGHTS (CONTINUED)
Selected data for a share of beneficial interest outstanding throughout each year or period.
| | | | | Income (loss)
from investment
operations | | | | Less distributions | |
| | | Net asset value, beginning of year or period | | Net investment income (loss) | | Net realized and unrealized gain (loss) | | Total from investment operations | | From net investment income | | From net realized gains | | From return of capital | |
| | | | | | | | | | | | | | | | |
| Year or period ended | | ($) | | ($) | | ($) | | ($) | | ($) | | ($) | | ($) | |
| ING Van Kampen Comstock Portfolio (continued) | | | |
| Class I | | | |
| 12-31-10 | | | 8.97 | | | | 0.14 | | | | 1.23 | | | | 1.37 | | | | 0.15 | | | | — | | | | — | | |
| 12-31-09 | | | 7.12 | | | | 0.13 | • | | | 1.93 | | | | 2.06 | | | | 0.21 | | | | — | | | | — | | |
| 12-31-08 | | | 12.55 | | | | 0.23 | | | | (4.55 | ) | | | (4.32 | ) | | | 0.46 | | | | 0.65 | | | | — | | |
| 12-31-07 | | | 13.37 | | | | 0.24 | | | | (0.49 | ) | | | (0.25 | ) | | | 0.21 | | | | 0.36 | | | | — | | |
| 12-31-06 | | | 12.22 | | | | 0.24 | • | | | 1.66 | | | | 1.90 | | | | 0.13 | | | | 0.62 | | | | — | | |
| Class S | | | |
| 12-31-10 | | | 8.96 | | | | 0.11 | | | | 1.24 | | | | 1.35 | | | | 0.13 | | | | — | | | | — | | |
| 12-31-09 | | | 7.12 | | | | 0.11 | | | | 1.92 | | | | 2.03 | | | | 0.19 | | | | — | | | | — | | |
| 12-31-08 | | | 12.49 | | | | 0.21 | | | | (4.53 | ) | | | (4.32 | ) | | | 0.40 | | | | 0.65 | | | | — | | |
| 12-31-07 | | | 13.30 | | | | 0.21 | | | | (0.49 | ) | | | (0.28 | ) | | | 0.17 | | | | 0.36 | | | | — | | |
| 12-31-06 | | | 12.16 | | | | 0.21 | • | | | 1.64 | | | | 1.85 | | | | 0.09 | | | | 0.62 | | | | — | | |
| ING Van Kampen Equity and Income Portfolio | | | |
| Class ADV | | | |
| 12-31-10 | | | 30.64 | | | | 0.46 | • | | | 3.13 | | | | 3.59 | | | | 0.48 | | | | — | | | | — | | |
| 12-31-09 | | | 25.44 | | | | 0.44 | • | | | 5.17 | | | | 5.61 | | | | 0.41 | | | | — | | | | — | | |
| 12-31-08 | | | 37.09 | | | | 0.71 | • | | | (9.08 | ) | | | (8.37 | ) | | | 1.37 | | | | 1.91 | | | | — | | |
| 12-31-07 | | | 37.82 | | | | 0.74 | • | | | 0.41 | | | | 1.15 | | | | 0.78 | | | | 1.10 | | | | — | | |
| 12-31-06 | | | 35.55 | | | | 0.72 | • | | | 3.43 | | | | 4.15 | | | | 0.59 | | | | 1.29 | | | | — | | |
| Class I | | | |
| 12-31-10 | | | 31.03 | | | | 0.63 | • | | | 3.18 | | | | 3.81 | | | | 0.62 | | | | — | | | | — | | |
| 12-31-09 | | | 25.75 | | | | 0.59 | • | | | 5.25 | | | | 5.84 | | | | 0.56 | | | | — | | | | — | | |
| 12-31-08 | | | 37.76 | | | | 1.03 | | | | (9.38 | ) | | | (8.35 | ) | | | 1.75 | | | | 1.91 | | | | — | | |
| 12-31-07 | | | 38.47 | | | | 0.95 | • | | | 0.41 | | | | 1.36 | | | | 0.97 | | | | 1.10 | | | | — | | |
| 12-31-06 | | | 36.09 | | | | 0.92 | • | | | 3.48 | | | | 4.40 | | | | 0.73 | | | | 1.29 | | | | — | | |
| Class S | | | |
| 12-31-10 | | | 30.81 | | | | 0.54 | • | | | 3.16 | | | | 3.70 | | | | 0.54 | | | | — | | | | — | | |
| 12-31-09 | | | 25.58 | | | | 0.51 | • | | | 5.21 | | | | 5.72 | | | | 0.49 | | | | — | | | | — | | |
| 12-31-08 | | | 37.50 | | | | 0.79 | • | | | (9.16 | ) | | | (8.37 | ) | | | 1.64 | | | | 1.91 | | | | — | | |
| 12-31-07 | | | 38.24 | | | | 0.83 | • | | | 0.42 | | | | 1.25 | | | | 0.89 | | | | 1.10 | | | | — | | |
| 12-31-06 | | | 35.93 | | | | 0.82 | • | | | 3.47 | | | | 4.29 | | | | 0.69 | | | | 1.29 | | | | — | | |
| Class S2 | | | |
| 12-31-10 | | | 30.62 | | | | 0.50 | • | | | 3.12 | | | | 3.62 | | | | 0.54 | | | | — | | | | — | | |
| 02-27-09(4)-12-31-09 | | | 22.18 | | | | 0.33 | | | | 8.58 | | | | 8.91 | | | | 0.47 | | | | — | | | | — | | |
| | | | | Ratios to average net assets | | Supplemental data | |
| | | Total distributions | | Net asset value, end of year or period | | Total Return(1) | | Expenses before reductions/additions(2)(3) | | Expenses net of fee waivers and/or recoupments, if any(2)(3) | | Expenses net of all reductions/additions(2)(3) | | Net investment income (loss)(2)(3) | | Net assets, end of year or period | | Portfolio turnover rate | |
| | | | | | | | | | | | | | | | | | | | |
| Year or period ended | | ($) | | ($) | | (%) | | (%) | | (%) | | (%) | | (%) | | ($000's) | | (%) | |
| ING Van Kampen Comstock Portfolio (continued) | |
| Class I | |
| 12-31-10 | | | 0.15 | | | | 10.19 | | | | 15.38 | | | | 0.85 | | | | 0.81 | † | | | 0.81 | † | | | 1.40 | † | | | 49,022 | | | | 23 | | |
| 12-31-09 | | | 0.21 | | | | 8.97 | | | | 28.92 | | | | 0.85 | | | | 0.81 | | | | 0.81 | | | | 1.78 | | | | 50,240 | | | | 27 | | |
| 12-31-08 | | | 1.11 | | | | 7.12 | | | | (36.36 | ) | | | 0.85 | | | | 0.81 | | | | 0.81 | | | | 2.20 | | | | 357,863 | | | | 47 | | |
| 12-31-07 | | | 0.57 | | | | 12.55 | | | | (2.04 | ) | | | 0.85 | | | | 0.84 | | | | 0.84 | | | | 1.78 | | | | 608,951 | | | | 26 | | |
| 12-31-06 | | | 0.75 | | | | 13.37 | | | | 16.19 | | | | 0.88 | | | | 0.84 | | | | 0.84 | | | | 1.91 | | | | 634,470 | | | | 27 | | |
| Class S | |
| 12-31-10 | | | 0.13 | | | | 10.18 | | | | 15.13 | | | | 1.10 | | | | 1.06 | † | | | 1.06 | † | | | 1.15 | † | | | 264,791 | | | | 23 | | |
| 12-31-09 | | | 0.19 | | | | 8.96 | | | | 28.53 | | | | 1.10 | | | | 1.06 | | | | 1.06 | | | | 1.42 | | | | 237,588 | | | | 27 | | |
| 12-31-08 | | | 1.05 | | | | 7.12 | | | | (36.48 | ) | | | 1.10 | | | | 1.06 | | | | 1.06 | | | | 1.95 | | | | 197,126 | | | | 47 | | |
| 12-31-07 | | | 0.53 | | | | 12.49 | | | | (2.28 | ) | | | 1.10 | | | | 1.09 | | | | 1.09 | | | | 1.52 | | | | 342,155 | | | | 26 | | |
| 12-31-06 | | | 0.71 | | | | 13.30 | | | | 15.86 | | | | 1.13 | | | | 1.09 | | | | 1.09 | | | | 1.67 | | | | 358,431 | | | | 27 | | |
| ING Van Kampen Equity and Income Portfolio | |
| Class ADV | |
| 12-31-10 | | | 0.48 | | | | 33.75 | | | | 11.77 | | | | 1.15 | | | | 1.15 | † | | | 1.15 | † | | | 1.44 | † | | | 14,995 | | | | 38 | | |
| 12-31-09 | | | 0.41 | | | | 30.64 | | | | 22.06 | | | | 1.13 | | | | 1.13 | † | | | 1.12 | † | | | 1.66 | † | | | 10,735 | | | | 74 | | |
| 12-31-08 | | | 3.28 | | | | 25.44 | | | | (23.76 | ) | | | 1.07 | | | | 1.07 | | | | 1.07 | | | | 2.21 | | | | 10,334 | | | | 111 | | |
| 12-31-07 | | | 1.88 | | | | 37.09 | | | | 3.06 | | | | 1.07 | | | | 1.07 | | | | 1.07 | | | | 1.92 | | | | 14,242 | | | | 89 | | |
| 12-31-06 | | | 1.88 | | | | 37.82 | | | | 12.12 | | | | 1.07 | | | | 1.07 | | | | 1.07 | | | | 1.98 | | | | 18,385 | | | | 57 | | |
| Class I | |
| 12-31-10 | | | 0.62 | | | | 34.22 | | | | 12.32 | | | | 0.65 | | | | 0.65 | † | | | 0.65 | † | | | 1.96 | † | | | 594,282 | | | | 38 | | |
| 12-31-09 | | | 0.56 | | | | 31.03 | | | | 22.69 | | | | 0.63 | | | | 0.63 | † | | | 0.62 | † | | | 2.16 | † | | | 572,527 | | | | 74 | | |
| 12-31-08 | | | 3.66 | | | | 25.75 | | | | (23.38 | ) | | | 0.57 | | | | 0.57 | | | | 0.57 | | | | 2.70 | | | | 516,378 | | | | 111 | | |
| 12-31-07 | | | 2.07 | | | | 37.76 | | | | 3.56 | | | | 0.57 | | | | 0.57 | | | | 0.57 | | | | 2.42 | | | | 811,810 | | | | 89 | | |
| 12-31-06 | | | 2.02 | | | | 38.47 | | | | 12.67 | | | | 0.57 | | | | 0.57 | | | | 0.57 | | | | 2.49 | | | | 925,305 | | | | 57 | | |
| Class S | |
| 12-31-10 | | | 0.54 | | | | 33.97 | | | | 12.05 | | | | 0.90 | | | | 0.90 | † | | | 0.90 | † | | | 1.71 | † | | | 240,865 | | | | 38 | | |
| 12-31-09 | | | 0.49 | | | | 30.81 | | | | 22.37 | | | | 0.88 | | | | 0.88 | † | | | 0.87 | † | | | 1.91 | † | | | 217,798 | | | | 74 | | |
| 12-31-08 | | | 3.55 | | | | 25.58 | | | | (23.56 | ) | | | 0.82 | | | | 0.82 | | | | 0.82 | | | | 2.49 | | | | 193,142 | | | | 111 | | |
| 12-31-07 | | | 1.99 | | | | 37.50 | | | | 3.29 | | | | 0.82 | | | | 0.82 | | | | 0.82 | | | | 2.16 | | | | 133,013 | | | | 89 | | |
| 12-31-06 | | | 1.98 | | | | 38.24 | | | | 12.40 | | | | 0.82 | | | | 0.82 | | | | 0.82 | | | | 2.25 | | | | 88,409 | | | | 57 | | |
| Class S2 | |
| 12-31-10 | | | 0.54 | | | | 33.70 | | | | 11.88 | | | | 1.15 | | | | 1.05 | † | | | 1.05 | † | | | 1.61 | † | | | 843 | | | | 38 | | |
| 02-27-09(4)-12-31-09 | | | 0.47 | | | | 30.62 | | | | 40.18 | | | | 1.13 | | | | 1.03 | † | | | 1.02 | † | | | 1.65 | † | | | 4 | | | | 74 | | |
(1) Total return is calculated assuming reinvestment of all dividends, capital gain distributions and return of capital distributions, if any, at net asset value and does not reflect the effect of insurance contract charges. Total return for periods less than one year is not annualized.
(2) Annualized for periods less than one year.
(3) Expense ratios reflect operating expenses of a Portfolio. Expenses before reductions/additions do not reflect amounts reimbursed by the Investment Adviser and/or Distributor or reductions from brokerage service arrangements or other expense offset arrangements and do not represent the amount paid by a Portfolio during periods when reimbursements or reductions occur. Expenses net of fee waivers reflect expenses after reimbursement by the Investment Adviser and/or Distributor but prior to reductions from brokerage service arrangements or other expense offset arrangements. Expenses net of all reductions/additions represent the net expenses paid by a Portfolio. Net investment income (loss) is net of all such additions or reductions.
(4) Commencement of operations.
• Calculated using average number of shares outstanding throughout the period.
* Amount is less than $0.005 or 0.005% or more than $(0.005).
† Impact of waiving the advisory fee for the ING Institutional Prime Money Market Fund holding has less than 0.005% impact on the expense ratio and net investment income or loss ratio (Note 4).
(a) Includes impact of interest expense on inverse floating rate securities.
(b) There was no impact on total return by the affiliate payment.
See Accompanying Notes to Financial Statements
75
NOTES TO FINANCIAL STATEMENTS AS OF DECEMBER 31, 2010
NOTE 1 — ORGANIZATION
ING Partners, Inc. (the "Company") is an open-end management investment company registered under the Investment Company Act of 1940, as amended (the "1940 Act" or "Act"). It was incorporated under the laws of Maryland on May 7, 1997. The Articles of Incorporation permit the Company to offer separate series (each, a "Portfolio" and collectively, the "Portfolios"), each of which has its own investment objective, policies and restrictions. The Company serves as an investment option in underlying variable insurance products offered by Directed Services LLC ("DSL" or the "Investment Adviser").
The Company currently consists of thirty-six Portfolios of which seventeen diversified Portfolios are included in this report. The Portfolios are: ING American Century Small-Mid Cap Value Portfolio ("American Century Small-Mid Cap Value"), ING Baron Small Cap Growth Portfolio ("Baron Small Cap Growth"), ING Columbia Small Cap Value Portfolio ("Columbia Small Cap Value"), ING Davis New York Venture Portfolio ("Davis New York Venture"), ING JPMorgan Mid Cap Value Portfolio ("JPMorgan Mid Cap Value"), ING Legg Mason ClearBridge Aggressive Growth Portfolio ("Legg Mason ClearBridge Aggressive Growth"), ING Oppenheimer Global Portfolio ("Oppenheimer Global"), ING Oppenheimer Global Strategic Income Portfolio ("Oppenheimer Global Strategic Income"), ING PIMCO Total Return Portfolio ("PIMCO Total Return"), ING Pioneer High Yield Portfolio ("Pioneer High Yield"), ING T. Rowe Price Diversified Mid Cap Growth Portfolio ("T. Rowe Price Diversified Mid Cap Growth"), ING T. Rowe Price Growth Equity Portfolio ("T. Rowe Price Growth Equity"), ING Templeton Foreign Equity Portfolio ("Templeton Foreign Equity"), ING Thornburg Value Portfolio ("Thornburg Value"), ING UBS U.S. Large Cap Equity Portfolio ("UBS U.S. Large Cap Equity"), ING Van Kampen Comstock Portfolio ("Van Kampen Comstock"), and ING Van Kampen Equity and Income Portfolio ("Van Kampen Equity and Income").
Each class has equal rights as to class and voting privileges. The classes differ principally in the applicable distribution and shareholder service fees. Shareholders of each class also bear certain expenses that pertain to that particular class. All shareholders bear the common expenses of the Portfolios and earn income and realized gains/losses from the Portfolios pro rata based on the average daily net assets of each class, without distinction between share classes. Dividends are determined separately for each class based on income and expenses allocable to each class. Expenses that are specific to a Portfolio or a class are charged directly to that Portfolio or class. Other operating expenses shared by several Portfolios are generally allocated among those Portfolios based on average net assets. Realized gain distributions are allocated to each class pro rata based on the shares outstanding of each class on the date of distribution. Differences in per share dividend rates generally result from differences in separate class expenses, including distribution and shareholder service fees, if applicable.
Each Portfolio's shares may be offered to variable annuity and variable life insurance separate accounts, qualified pension and retirement plans outside the separate account context, custodial accounts, certain investment advisers and their affiliates in connection with the creation or management of the Portfolios and certain other investment management companies.
Directed Services LLC serves as the investment adviser ("DSL" or the "Investment Adviser") to the Portfolios. ING Funds Services, LLC serves as the administrator ("IFS" or the "Administrator") for the Portfolios. ING Investments Distributor, LLC ("IID" or the "Distributor") serves as the principal underwriter to the Portfolios.
The Investment Adviser, IFS and IID are indirect, wholly-owned subsidiaries of ING Groep N.V. ("ING Groep"). ING Groep is a global financial institution of Dutch origin offering banking, investments, life insurance and retirement services.
ING Groep has adopted a formal restructuring plan that was approved by the European Commission in November 2009 under which the ING life insurance businesses, including the retirement services and investment management businesses, which include the Investment Adviser and its affiliates, would be divested by ING Groep by the end of 2013. While there can be no assurance that it will be carried out, the restructuring plan presents certain risks, including uncertainty about the effect on the businesses of the ING entities that service the Portfolios and potential termination of the Portfolios' existing advisory agreement, which may trigger the need for shareholder approval of new agreements.
NOTE 2 — SIGNIFICANT ACCOUNTING POLICIES
The following significant accounting policies are consistently followed by the Portfolios in the preparation of their financial statements. Such policies are in conformity with U.S. generally accepted accounting principles for investment companies.
A. Security Valuation. All investments in securities are recorded at their estimated fair value, as described below. Investments in equity securities traded on a national securities exchange are valued at the last
76
NOTES TO FINANCIAL STATEMENTS AS OF DECEMBER 31, 2010 (CONTINUED)
NOTE 2 — SIGNIFICANT ACCOUNTING POLICIES (continued)
reported sale price. Securities reported by NASDAQ are valued at the NASDAQ official closing prices. Securities traded on an exchange or NASDAQ for which there has been no sale and securities traded in the over-the-counter-market are valued at the mean between the last reported bid and ask prices. All investments quoted in foreign currencies will be valued daily in U.S. dollars on the basis of the foreign currency exchange rates prevailing at that time. Debt securities with more than 60 days to maturity are valued using matrix pricing methods determined by an independent pricing service which takes into consideration such factors as yields, maturities, liquidity, ratings and traded prices in similar or identical securities. Securities for which valuations are not readily available from an independent pricing service may be valued by brokers which use prices provided by market makers or estimates of fair market value obtained from yield data relating to investments or securities with similar characteristics. U.S. government obligations are valued by using market quotations or independent pricing services that use prices provided by market-makers or estimates of market values obtained from yield data relating to instruments or securities with similar characteristics. Investments in open-end mutual funds are valued at net asset value. Investments in securities of sufficient credit quality, maturing in 60 days or less are valued at amortized cost which approximates fair value.
Securities and assets for which market quotations are not readily available (which may include certain restricted securities, which are subject to limitations as to their sale) are valued at their fair values, as defined by the 1940 Act, and as determined in good faith by or under the supervision of the Portfolios' Board of Directors ("Board"), in accordance with methods that are specifically authorized by the Board. Securities traded on exchanges, including foreign exchanges, which close earlier than the time that a Portfolio calculates its NAV may also be valued at their fair values, as defined by the Act, and as determined in good faith by or under the supervision of the Board, in accordance with methods that are specifically authorized by the Board. All such fair valuations are made in accordance with valuation procedures of the Portfolios (the "Valuation Procedures") which have been approved by the Board. The valuation techniques applied in any specific instance are set forth in the Valuation Procedures and may vary from case to case. With respect to a restricted security, for example, consideration is generally given to the cost of the investment, the market value of any unrestricted securities of the same class at the time of valuation, the potential expiration of restrictions on the security, the existence of any registration rights, the costs to the Portfolios related to registration of the security, as well as factors relevant to the issuer itself. Consideration may also be given to the price and extent of any public trading in similar securities of the issuer or comparable companies' securities. If an event occurs after the time at which the market for foreign securities held by a Portfolio closes but before the time that a Portfolio's NAV is calculated, such event may cause the closing price on the foreign exchange to not represent a readily available reliable market value quotation for such securities at the time a Portfolio determines its NAV. In such a case, a Portfolio will use the fair value of such securities as determined under a Portfolio's valuation procedures. Events after the close of trading on a foreign market that could require a Portfolio to fair value some or all of its foreign securities include, among others, securities trading in the U.S. and other markets, corporate announcements, natural and other disasters, and political and other events. Among other elements of analysis in the determination of a security's fair value, the Board has authorized the use of one or more independent research services to assist with such determinations. An independent research service may use statistical analyses and quantitative models to help determine fair value as of the time a Portfolio calculates its NAV. There can be no assurance that such models accurately reflect the behavior of the applicable markets or the effect of the behavior of such markets on the fair value of securities, or that such markets will continue to behave in a fashion that is consistent with such models. Unlike the closing price of a security on an exchange, fair value determinations employ elements of judgment. Consequently, the fair value assigned to a security may not represent the actual value that a Portfolio could obtain if it were to sell the security at the time of the close of the NYSE. Pursuant to procedures adopted by the Board, a Portfolio is not obligated to use the fair valuations suggested by any research service, and valuation recommendations provided by such research services may be overridden if other events have occurred or if other fair valuations are determined in good faith to be more accurate. Unless an event is such that it causes a Portfolio to determine that the closing prices for one or more securities do not represent readily available reliable market value quotations at the time a Portfolio determines its NAV, events that occur between the time of the close of the foreign market on which they are traded and the close of regular trading on the NYSE will not be reflected in a Portfolio's NAV.
77
NOTES TO FINANCIAL STATEMENTS AS OF DECEMBER 31, 2010 (CONTINUED)
NOTE 2 — SIGNIFICANT ACCOUNTING POLICIES (continued)
Fair value is defined as the price that the Portfolios would receive to sell an asset or pay to transfer a liability in an orderly transaction between market participants at the measurement date. Each investment asset or liability of the Portfolios is assigned a level at measurement date based on the significance and source of the inputs to its valuation. Quoted prices in active markets for identical securities are classified as "Level 1," inputs other than quoted prices for an asset or liability that are observable are classified as "Level 2" and unobservable inputs, including the sub-adviser's judgment about the assumptions that a market participant would use in pricing an asset or liability are classified as "Level 3." The inputs used for valuing securities are not necessarily an indication of the risks associated with investing in those securities. Short-term securities of sufficient credit quality which are valued at amortized costs, which approximates fair value, are generally considered to be Level 2 securities under applicable accounting rules. A table summarizing the Portfolios' investments under these levels of classification is included following the Summary Portfolios of Investments. For the year ended December 31, 2010, there have been no significant changes to the fair valuation methodologies.
B. Security Transactions and Revenue Recognition. Securities transactions are accounted for on the trade date. Realized gains and losses are reported on the basis of identified cost of securities sold. Interest income is recorded on an accrual basis. Dividend income is recorded on the ex-dividend date, or for certain foreign securities, when the information becomes available to the Portfolios. Premium amortization and discount accretion are determined by the effective yield method.
C. Foreign Currency Translation. The books and records of the Portfolios are maintained in U.S. dollars. Any foreign currency amounts are translated into U.S. dollars on the following basis:
(1) Market value of investment securities, other assets and liabilities — at the exchange rates prevailing at the end of the day.
(2) Purchases and sales of investment securities, income and expenses — at the rates of exchange prevailing on the respective dates of such transactions.
Although the net assets and the market values are presented at the foreign exchange rates at the end of the day, the Portfolios do not isolate the portion of the results of operations resulting from changes in foreign exchange rates on investments from the fluctuations arising from changes in market prices of securities held. Such fluctuations are included with the net realized and unrealized gains or losses from investments. For securities, which are subject to foreign withholding tax upon disposition, liabilities are recorded on the Statements of Assets and Liabilities for the estimated tax withholding based on the securities' current market value. Upon disposition, realized gains or losses on such securities are recorded net of foreign withholding tax. Reported net realized foreign exchange gains or losses arise from sales of foreign currencies, currency gains or losses realized between the trade and settlement dates on securities transactions, the difference between the amounts of dividends, interest, and foreign withholding taxes recorded on the Portfolios' books, and the U.S. dollar equivalent of the amounts actually received or paid. Net unrealized foreign exchange gains and losses arise from changes in the value of assets and liabilities other than investments in securities at fiscal year end, resulting from changes in the exchange rate. Foreign security and currency transactions may involve certain considerations and risks not typically associated with investing in U.S. companies and U.S. government securities. These risks include, but are not limited to, revaluation of currencies and future adverse political and economic developments, which could cause securities and their markets to be less liquid and prices more volatile than those of comparable U.S. companies and U.S. government securities.
D. Distributions to Shareholders. The Portfolios record distributions to their shareholders on the ex-dividend date. Dividends from net investment income and capital gains, if any, are declared and paid annually. The Portfolios may make distributions on a more frequent basis to comply with the distribution requirements of subchapter M of the Internal Revenue Code. The characteristics of income and gains to be distributed are determined in accordance with income tax regulations, which may differ from U.S. generally accepted accounting principles for investment companies.
E. Federal Income Taxes. It is the policy of each Portfolio to comply with the requirements of subchapter M of the Internal Revenue Code that are applicable to regulated investment companies and to distribute substantially all of its net investment income and any net realized capital gains to its shareholders. Therefore, a federal income tax or excise tax provision is not required. Management has considered the sustainability of the Portfolios' tax positions taken on
78
NOTES TO FINANCIAL STATEMENTS AS OF DECEMBER 31, 2010 (CONTINUED)
NOTE 2 — SIGNIFICANT ACCOUNTING POLICIES (continued)
federal income tax returns for all open tax years in making this determination. No capital gain distributions shall be made until the capital loss carryforwards have been fully utilized or expire.
F. Use of Estimates. Management of the Portfolios has made certain estimates and assumptions relating to the reporting of assets, liabilities, income, and expenses to prepare these financial statements in conformity with U.S. generally accepted accounting principles for investment companies. Actual results could differ from these estimates.
G. Risk Exposures and the use of Derivative Instruments. The Portfolios' investment objectives permit the Portfolios to enter into various types of derivatives contracts, including, but not limited to, futures contracts, forward foreign currency exchange contracts, credit default swaps, interest rate swaps, total return swaps, and purchased and written options. In doing so, a Portfolio will employ strategies in differing combinations to permit them to increase or decrease the level of risk, or change the level or types of exposure to market risk factors. This may allow a Portfolio to pursue its objectives more quickly, and efficiently than if it were to make direct purchases or sales of securities capable of affecting a similar response to market factors.
Market Risk Factors. In pursuit of its investment objectives, a Portfolio may seek to use derivatives to increase or decrease its exposure to the following market risk factors:
Credit Risk. Credit risk relates to the ability of the issuer to meet interest and principal payments, or both, as they come due. In general, lower-grade, higher-yield bonds are subject to credit risk to a greater extent than lower-yield, higher-quality bonds.
Equity Risk. Equity risk relates to the change in value of equity securities as they relate to increases or decreases in the general market.
Foreign Exchange Rate Risk. Foreign exchange rate risk relates to the change in U.S. dollar value of a security held that is denominated in a foreign currency. The U.S. dollar value of a foreign currency denominated security will decrease as the dollar appreciates against the currency, while the U.S. dollar value will increase as the dollar depreciates against the currency.
Interest Rate Risk. Interest rate risk refers to the fluctuations in value of fixed-income securities resulting from the inverse relationship between price and yield. For example, an increase in general interest rates will tend to reduce the market value of already issued fixed-income investments, and a decline in general interest rates will tend to increase their value. In addition, debt securities with longer durations, which tend to have higher yields, are subject to potentially greater fluctuations in value from changes in interest rates than obligations with shorter durations.
Volatility Risk. Volatility risk refers to the magnitude of the movement, but not the direction of the movement, in a financial instrument's price over a defined time period. Large increases or decreases in a financial instrument's price over a relative time period typically indicate greater volatility risk, while small increases or decreases in its price typically indicate lower volatility risk.
Risks of Investing in Derivatives. A Portfolio's use of derivatives can result in losses due to unanticipated changes in the market risk factors and the overall market. In instances where a Portfolio is using derivatives to decrease, or hedge, exposures to market risk factors for securities held by a Portfolio, there are also risks that those derivatives may not perform as expected resulting in losses for the combined or hedged positions.
The use of these strategies involves certain special risks, including a possible imperfect correlation, or even no correlation, between price movements of derivative instruments and price movements of related investments. While some strategies involving derivative instruments can reduce the risk of loss, they can also reduce the opportunity for gain or even result in losses by offsetting favorable price movements in related investments or otherwise, due to the possible inability of a Portfolio to purchase or sell a portfolio security at a time that otherwise would be favorable or the possible need to sell a portfolio security at a disadvantageous time because the Portfolio is required to maintain asset coverage or offsetting positions in connection with transactions in derivative instruments. Additional associated risks from investing in derivatives also exist and potentially could have significant effects on the valuation of the derivative and a Portfolio. Associated risks are not the risks that a Portfolio is attempting to increase or decrease exposure to, per their investment objectives, but are the additional risks from investing in derivatives. Examples of these associated risks are liquidity risk, which is the risk that a Portfolio will not be able to sell the derivative in the open market in a timely manner, and counterparty credit risk, which is the risk that the
79
NOTES TO FINANCIAL STATEMENTS AS OF DECEMBER 31, 2010 (CONTINUED)
NOTE 2 — SIGNIFICANT ACCOUNTING POLICIES (continued)
counterparty will not fulfill its obligation to a Portfolio. Associated risks can be different for each type of derivative and are discussed by each derivative type in the following notes.
Counterparty Credit Risk and Credit Related Contingent Features. Certain derivative positions are subject to counterparty credit risk, which is the risk that the counterparty will not fulfill its obligation to a Portfolio. Each Portfolio's derivative counterparties are financial institutions who are subject to market conditions that may weaken their financial position. A Portfolio intends to enter into financial transactions with counterparties that they believe to be creditworthy at the time of the transaction. To reduce this risk, a Portfolio has entered into master netting arrangements, established within each Portfolio's International Swap and Derivatives Association, Inc. ("ISDA") Master Agreements ("Master Agreements"). These agreements are with select counterparties and they govern transactions, including certain over-the-counter ("OTC") derivative and forward foreign currency contracts, entered into by a Portfolio and the counterparty. The Master Agreements maintain provisions for general obligations, representations, agreements, collateral, and events of default or termination. The occurrence of a specified event of termination may give a counterparty the right to terminate all of its contracts and affect settlement of all outstanding transactions under the applicable Master Agreement.
A Portfolio may also enter into collateral agreements with certain counterparties to further mitigate counterparty risk on OTC derivative and forward foreign currency contracts. Subject to established minimum levels, collateral is generally determined based on the net aggregate unrealized gain or loss on contracts with a certain counterparty. Collateral pledged to or from a Portfolio is held in a segregated account by a third-party agent and can be in the form of cash or debt securities issued by the U.S. government or related agencies.
As of December 31, 2010, the maximum amount of loss that Oppenheimer Global Strategic Income and PIMCO Total Return would incur if the counterparties to its derivative transactions failed to perform would be $3,142,714 and $11,508,762, respectively, which represents the gross payments to be received by the Portfolio's on open credit default swaps, interest rate swaps, forward foreign currency transactions, and purchased options were they to be unwound as of December 31, 2010. To reduce the amount of potential loss to PIMCO Total Return, various counterparties have posted $5,810,000 in cash collateral and $2,500,000 principal amount in U.S. Treasury Bills as collateral for open OTC transactions.
Each Portfolio has credit related contingent features that if triggered would allow its derivative counterparties to close out and demand payment or additional collateral to cover their exposure from a Portfolio. Credit related contingent features are established between each Portfolio and their derivatives counterparties to reduce the risk that a Portfolio will not fulfill its payment obligations to its counterparties. These triggering features include, but are not limited to, a percentage decrease in a Portfolio's net assets and or a percentage decrease in a Portfolio's NAV, which could cause a Portfolio to accelerate payment of any net liability owed to the counterparty. The contingent features are established within each Portfolio's Master Agreements.
As of December 31, 2010, American Century Small-Mid Cap Value, Oppenheimer Global Strategic Income and PIMCO Total Return had a net liability position of $15,701, $5,265,660 and $5,835,962 on open swaps, forward foreign currency contracts and written options with credit related contingent features. If a contingent feature would have been triggered as of December 31, 2010, the Portfolio's could have been required to pay this amount in cash to its counterparties. As of December 31, 2010, there was no collateral posted by either Portfolio.
H. Forward Foreign Currency Contracts. Certain Portfolios may enter into forward foreign currency contracts primarily to hedge against foreign currency exchange rate risks on their non-U.S. dollar denominated investment securities. When entering into a forward currency contract, a Portfolio agrees to receive or deliver a fixed quantity of foreign currency for an agreed-upon price on an agreed future date. These contracts are valued daily and a Portfolio's net equity therein, representing unrealized gain or loss on the contracts as measured by the difference between the forward foreign exchange rates at the dates of entry into the contracts and the forward rates at the reporting date, is included in the Statement of Assets and Liabilities. Realized and unrealized gains and losses are included in the Statement of Operations. These instruments involve market and/or credit risk in excess of the amount recognized in the Statement of Assets and Liabilities. Risks arise from the possible inability of counterparties to meet the terms of their contracts and from movement in currency and securities values and interest rates. Open forward
80
NOTES TO FINANCIAL STATEMENTS AS OF DECEMBER 31, 2010 (CONTINUED)
NOTE 2 — SIGNIFICANT ACCOUNTING POLICIES (continued)
foreign currency contracts are presented following the Summary Portfolio of Investments.
During the year ended December 31, 2010, the following Portfolios had average contract amounts on forward foreign currency contracts to buy and sell as disclosed below:
| | | Buy | | Sell | |
American Century Small-Mid
Cap Value* | | $ | — | | | $ | 1,661,359 | | |
Oppenheimer Global Strategic
Income** | | | 123,870,557 | | | | 110,641,114 | | |
| PIMCO Total Return** | | | 54,594,402 | | | | 81,720,188 | | |
* For the year ended December 31, 2010, American Century Small-Mid Cap Value used forward foreign currency contracts primarily to protect its non-U.S. dollar denominated holdings from adverse currency movements. Please refer to the table following the Summary Portfolio of Investments for open forward foreign currency contracts at December 31, 2010.
** For the year ended December 31, 2010, Oppenheimer Global Strategic Income and PIMCO Total Return used forward foreign currency contracts to protect its non-U.S. dollar denominated holdings from adverse currency movements and to gain exposure to currencies for the purposes of risk management or enhanced return. Please refer to the tables following the Summary Portfolio of Investments for each respective Portfolio for open forward foreign currency contract at December 31, 2010.
I. Futures Contracts. Certain Portfolios may enter into futures contracts involving foreign currency, interest rates, securities and security indices. A futures contract is a commitment to buy or sell a specific amount of a financial instrument at a negotiated price on a stipulated future date. A Portfolio may buy and sell futures contracts. Futures contracts traded on a commodities or futures exchange will be valued at the final settlement price or official closing price on the principal exchange as reported by such principal exchange at its trading session ending at, or most recently prior to, the time when each Portfolio's assets are valued.
Upon entering into a futures contract, a Portfolio is required to deposit either cash or securities (initial margin) in an amount equal to a certain percentage of the contract value. Subsequent payments (variation margin) are made or received by a Portfolio each day. The variation margin payments are equal to the daily changes in the contract value and are recorded as unrealized gains and losses. Open futures contracts are reported on a table following each Portfolio's Summary Portfolio of Investments. Securities held in collateralized accounts to cover initial margin requirements on open futures contracts are footnoted in the Summary Portfolio of Investments. Cash collateral held by the broker to cover initial margin requirements on open futures contracts are noted in the Statements of Assets and Liabilities. The net change in unrealized appreciation and depreciation is reported in the Statements of Operations. Realized gains (losses) are reported in the Statements of Operations at the closing or expiration of futures contracts.
As of December 31, 2010, Oppenheimer Global Strategic Income has posted $2,733,800 principal value in Federal National Mortgage Association securities and $1,065,000 principal value in U.S. Treasury Bills with their respective broker for open futures contracts. In addition, the Portfolio has segregated $1,564,869 principal value in Federal National Mortgage Association securities with its custodian and is footnoted in the Summary Portfolio of Investments.
As of December 31, 2010, PIMCO Total Return has posted $2,047,000 principal value in U.S. Treasury Bills and $5,000 in cash as collateral with their respective broker for open futures contracts.
Futures contracts are exposed to the market risk factor of the underlying financial instrument. During the year ended December 31, 2010, certain Portfolios have both purchased and sold futures contracts on equity indices, bonds, and notes to increase and decrease exposure to both equity and interest rate risk. Additional associated risks of entering into futures contracts include the possibility that there may be an illiquid market where each Portfolio is unable to liquidate the contract or enter into an offsetting position and, if used for hedging purposes, the risk that the price of the contract will correlate imperfectly with the prices of each Portfolios securities. With futures, there is minimal counterparty credit risk to the Portfolios since futures are exchange traded and the exchange's clearinghouse, as counterparty to all exchange traded futures, guarantees the futures against default.
During the year ended December 31, 2010, the Portfolios had average notional values on futures contracts purchased and sold as disclosed below:
| | | Purchased | | Sold | |
| Oppenheimer Global Strategic Income | | $ | 92,176,552 | | | $ | 30,435,235 | | |
| PIMCO Total Return | | | 583,367,573 | | | | — | | |
Both Portfolios use futures as part of their duration strategy.
J. Securities Lending. Each Portfolio has the option to temporarily loan up to 331/3% of its total assets to brokers, dealers or other financial institutions in exchange for a negotiated lender's fee. The borrower is required to fully collateralize the loans with cash or
81
NOTES TO FINANCIAL STATEMENTS AS OF DECEMBER 31, 2010 (CONTINUED)
NOTE 2 — SIGNIFICANT ACCOUNTING POLICIES (continued)
U.S. government securities. Generally, in the event of counterparty default, the Portfolio has the right to use collateral to offset losses incurred. There would be potential loss to the Portfolio in the event a Portfolio is delayed or prevented from exercising its right to dispose of the collateral. A Portfolio bears the risk of loss with respect to the investment of collateral. Engaging in securities lending could have a leveraging effect, which may intensify the credit, market and other risks associated with investing in a Portfolio.
K. Illiquid and Restricted Securities. The Portfolios may not invest more than 15% of their net assets in illiquid securities. Illiquid securities are not readily marketable. Disposing of illiquid investments may involve time consuming negotiation and legal expenses, and it may be difficult or impossible for the Portfolios to sell them promptly at an acceptable price. The Portfolios may also invest in restricted securities, which include those sold under Rule 144A of the Securities Act of 1933 ("1933 Act") or securities offered pursuant to Section 4(2) of the 1933 Act, and/or are subject to legal or contractual restrictions on resale and may not be publicly sold without registration under the 1933 Act. Certain restricted securities may be considered liquid pursuant to guidelines approved by the Board or may be deemed to be illiquid because they may not be readily marketable. Illiquid and restricted securities are valued using market quotations when readily available. In the absence of market quotations, the securities are valued based upon their fair value, as defined by the Act, determined under procedures approved by the Board.
L. When-Issued and Delayed-Delivery Transactions. Certain Portfolios may purchase or sell securities on a when-issued or forward commitment basis. The price of the underlying securities and date when the securities will be delivered and paid for are fixed at the time the transaction is negotiated. The market value of such is identified in the Portfolios' Summary Portfolio of Investments. Losses may arise due to changes in the market value of the securities or from the inability of counterparties to meet the terms of the contract. In connection with such purchases, the Portfolios are required to hold liquid assets as collateral with the Portfolios' custodian sufficient to cover the purchase price.
M. Mortgage Dollar Roll Transactions. Certain Portfolios may engage in dollar roll transactions with respect to mortgage-backed securities issued by Government National Mortgage Association, Federal National Mortgage Association and Federal Home Loan Mortgage Corp. In a dollar roll transaction, a Portfolio sells a mortgage-backed security to a financial institution, such as a bank or broker/dealer, and simultaneously agrees to repurchase a substantially similar (i.e., same type, coupon, and maturity) security from the institution on a delayed delivery basis at an agreed upon price. The mortgage-backed securities that are repurchased will bear the same interest rate as those sold, but generally will be collateralized by different pools of mortgages with different prepayment histories. The Portfolios account for dollar roll transactions as purchases and sales. For fee based dollar roll transactions, the fee is recorded as income.
N. Options Contracts. Certain Portfolios may purchase put and call options and may write (sell) put options and covered call options on futures, swaps ("swaptions"), securities, commodities or foreign currencies. The Portfolios may engage in option transactions as a hedge against adverse movements in the value of portfolio holdings or to increase market exposure. Option contracts are valued daily and unrealized gains or losses are recorded based upon the last sales price on the principal exchange on which the options are traded. An amount equal to the proceeds of the premium received by the Portfolios upon the writing of a put or call option is included in the Statements of Assets and Liabilities as an asset and equivalent liability which is subsequently marked-to-market until it is exercised or closed, or it expires. The Portfolios will realize a gain or loss upon the expiration or closing of the option contract. When an option is exercised, the proceeds on sales of the underlying security for a written call option, the purchase cost of the security for a written put option, or the cost of the security for a purchased put or call option is adjusted by the amount of premium received or paid. Realized and unrealized gains or losses on option contracts are reflected in the accompanying financial statements. The risk in writing a covered call option is that the Portfolios give up the opportunity for profit if the market price of the security increases and the option is exercised. The risk in writing a put option is that the Portfolios may incur a loss if the market price of the security decreases and the option is exercised. The risk in buying an option is that the Portfolios pay a premium whether or not the option is exercised. Risks may also arise from an illiquid secondary market or from the inability of counterparties to meet the terms of the contract.
82
NOTES TO FINANCIAL STATEMENTS AS OF DECEMBER 31, 2010 (CONTINUED)
NOTE 2 — SIGNIFICANT ACCOUNTING POLICIES (continued)
During the year ended December 31, 2010, Oppenheimer Global Strategic Income had purchased and written foreign currency options to gain exposure to currencies and to generate income. Please refer to the Summary Portfolio of Investments for open purchased foreign currency options at December 31, 2010. There were no open written foreign currency options at December 31, 2010.
During the year ended December 31, 2010, Oppenheimer Global Strategic Income had purchased options on exchange-traded futures contracts on various bonds and notes as part of their duration strategy. There were no open purchased options on exchange-traded futures contracts at December 31, 2010.
During the year ended December 31, 2010, PIMCO Total Return had purchased and written foreign currency options to gain exposure to currencies and to generate income. Please refer to the Summary Portfolio of Investments for open purchased foreign currency options at December 31, 2010. There were no open purchased or written foreign currency options at December 31, 2010.
During the year ended December 31, 2010, PIMCO Total Return had purchased and written options on exchange-traded futures contracts on various bonds and notes as part of their duration strategy and to generate income. Please refer to the Summary Portfolio of Investments for open purchased options on exchange-traded futures contracts and the table following for open written options on exchange-traded futures contracts at December 31, 2010.
During the year ended December 31, 2010, PIMCO Total Return had written swaptions on interest rate swaps to generate income. There were no open interest rate swaptions at December 31, 2010.
During the year ended December 31, 2010, PIMCO Total Return had written swaptions on credit default swap indices "CDX" to generate income. There were no open CDX swaptions at December 31, 2010.
During the year ended December 31, 2010, PIMCO Total Return had written inflation floors to generate income. Please refer to the table following the Summary Portfolio of Investments for open written inflation floors at December 31, 2010.
During the year ended December 31, 2010, PIMCO Total Return had written forward volatility options to generate income. Please refer to the table following the Summary Portfolio of Investments for open written forward volatility options at December 31, 2010.
Please refer to Note 8 for the volume of both purchased and written option activity during the year ended December 31, 2010.
O. Swap Agreements. Certain Portfolios may enter into swap agreements. A swap is an agreement between two parties pursuant to which each party agrees to make one or more payments to the other at specified future intervals based on the return of an asset (such as a stock, bond or currency) or non-asset reference (such as an interest rate or index). The swap agreement will specify the "notional" amount of the asset or non-asset reference to which the contract relates. Subsequent changes in fair value, if any, are calculated based upon changes in the performance of the asset or non-asset reference multiplied by the notional value of the contract. A Portfolio may enter into credit default, interest rate, total return and currency swaps to manage its exposure to credit, currency and interest rate risk. All outstanding swap agreements are reported following each Portfolio's Summary Portfolio of Investments.
Swaps are marked to market daily using quotations primarily from third party pricing services, counterparties or brokers. The value of the swap contract is recorded on each Portfolio's Statements of Assets or Liabilities. During the term of the swap, changes in the value of the swap, if any, are recorded as unrealized gains or losses on the Statements of Operations. Upfront payments paid or received by a Portfolio when entering into the agreements are reported on the Statements of Assets and Liabilities and as a component of the changes in unrealized gains or losses on the Statements of Operations. These upfront payments represent the amounts paid or received when initially entering into the swap agreement to compensate for differences between the stated terms of the swap agreement and the prevailing market conditions. The upfront payments are included as a component in the realized gains or losses on each Portfolio's Statement of Operations upon termination or maturity of the swap. A Portfolio also records net periodic payments paid or received on the swap contract as a realized gain or loss on the Statements of Operations.
Entering into swap agreements involves the risk that the maximum potential loss of an investment exceeds the current value of the investment as reported on each Portfolio's Statements of Assets and Liabilities. Other risks involve the possibility that the
83
NOTES TO FINANCIAL STATEMENTS AS OF DECEMBER 31, 2010 (CONTINUED)
NOTE 2 — SIGNIFICANT ACCOUNTING POLICIES (continued)
counterparty to the agreements may default on its obligation to perform, that there will be no liquid market for these investments and that unfavorable changes in the market will have a negative impact on the value of the index or securities underlying the respective swap agreement.
Credit Default Swap Contracts. A credit default swap is a bilateral agreement between counterparties in which the buyer of the protection agrees to make a stream of periodic payments to the seller of protection in exchange for the right to receive a specified return in the event of a default or other credit event for a referenced entity, obligation or index. As a seller of protection on credit default swaps, a Portfolio will generally receive from the buyer a fixed payment stream based on the notional amount of the swap contract. This fixed payment stream will continue until the swap contract expires or a defined credit event occurs.
A Portfolio is subject to credit risk in the normal course of pursuing its investment objectives. As a seller of protection in a credit default swap, a Portfolio may execute these contracts to manage its exposure to the market or certain sectors of the market. Certain Portfolios may also enter into credit default swaps to speculate on changes in an issuer's credit quality, to take advantage of perceived spread advantages, or to offset an existing short equivalent (i.e. buying protection on an equivalent reference entity).
Certain Portfolios may sell credit default swaps which expose these Portfolios to the risk of loss from credit risk- related events specified in the contract. Although contract specific, credit events are generally defined as bankruptcy, failure to pay, restructuring, obligation acceleration, obligation default or repudiation/moratorium. If a Portfolio is a seller of protection, and a credit event occurs, as defined under the terms of that particular swap agreement, a Portfolio will generally either (i) pay to the buyer an amount equal to the notional amount of the swap and take delivery of the referenced obligation, other deliverable obligations, or underlying securities comprising a referenced index or (ii) pay a net settlement amount in the form of cash or securities equal to the notional amount of the swap less the recovery value of the referenced obligation or underlying securities comprising a referenced index. If a Portfolio is a buyer of protection and a credit event occurs, as defined under the terms of that particular swap agreement, a Portfolio will either (i) receive from the seller of protection an amount equal to the notional amount of the swap and deliver the referenced obligation, other deliverable obligations or underlying securities comprising the referenced index or (ii) receive a net settlement amount in the form of cash or securities equal to the notional amount of the swap less the recovery value of the referenced obligation or underlying securities comprising the referenced index. Recovery values are assumed by market makers considering either industry standard recovery rates or entity specific factors and considerations until a credit event occurs. If a credit event has occurred, the recovery value is determined by a facilitated auction whereby a minimum number of allowable broker bids, together with a specified valuation method, are used to calculate the settlement value.
Implied credit spreads, represented in absolute terms, utilized in determining the market value of credit default swap agreements on corporate issues or sovereign issues are disclosed in each Portfolio's Summary Portfolio of Investments and serve as an indicator of the current status of the payment/performance risk and represent the likelihood or risk of default for the credit derivative. The implied credit spread of a particular referenced entity reflects the cost of buying/selling protection and may include upfront payments required to be made to enter into the agreement. For credit default swaps on asset-backed securities or credit indices, the quoted market prices and resulting market values serve as the indicator of the current status of the payment/performance risk. Wider credit spreads and increasing market values, in absolute terms when compared to the notional amount of the swap, represent a deterioration of the referenced entity's credit soundness and a greater likelihood or risk of default or other credit event occurring as defined under the terms of the agreement.
The maximum amount of future payments (undiscounted) that a Portfolio as seller of protection could be required to make under a credit default swap agreement would be an amount equal to the notional amount of the agreement. Notional amounts of all credit default swap agreements outstanding as of December 31, 2010, for which a Portfolio is seller of protection are disclosed following each Summary Portfolio of Investments. These potential amounts would be partially offset by any recovery values of the respective referenced obligations, upfront payments received upon entering into the agreements, or net amounts received from the settlement of buy protection credit
84
NOTES TO FINANCIAL STATEMENTS AS OF DECEMBER 31, 2010 (CONTINUED)
NOTE 2 — SIGNIFICANT ACCOUNTING POLICIES (continued)
default swap agreements entered into by a Portfolio for the same referenced entity or entities
For the year ended December 31, 2010, certain Portfolios have purchased credit protection through credit default swaps to decrease exposure to the credit risk of individual securities and to hedge against anticipated potential credit events.
For the year ended December 31, 2010, certain Portfolios have sold credit protection through credit default swaps to gain exposure to the credit risk of individual securities and credit default indices that are either unavailable or considered to be less attractive in the bond market and to hedge against anticipated potential credit events.
For the year ended December 31, 2010, Oppenheimer Global Strategic Income and PIMCO Total Return had average notional amounts of $6,586,000 and $18,800 on credit default swaps to buy protection and average notional amounts of $14,054,360 and $64,857,630 on credit default swaps to sell protection, respectively.
Interest Rate Swap Contracts. An interest rate swap involves the agreement between counterparties to exchange periodic payments based on interest rates. One payment will be based on a floating rate of a specified interest rate while the other will be a fixed rate. Risks involve the future fluctuations of interest rates in which a Portfolio may make payments that are greater than what a Portfolio received from the counterparty. Other risks include credit, liquidity and market risk.
For the year ended December 31, 2010, Oppenheimer Global Strategic Income and PIMCO Total Return had entered into interest rate swaps in which they pay a floating interest rate and receives a fixed interest rate ("Long interest rate swap") in order to increase exposure to interest rate risk. Average notional amounts on long interest rate swaps were $26,668,767 and $153,946,848, respectively.
For the year ended December 31, 2010, Oppenheimer Global Strategic Income and PIMCO Total Return had entered into interest rate swaps in which they pay a fixed interest rate and receives a floating interest rate ("Short interest rate swap") in order to decrease exposure to interest rate risk. Average notional amounts on short interest rate swaps were $4,657,530 and $3,460,000, respectively.
Oppenheimer Global Strategic Income and PIMCO Total Return enter into interest rate swaps to adjust interest rate and yield curve exposures and to substitute for physical fixed-income securities. Please refer to the tables following each respective Summary Portfolio of Investments for open interest rate swaps at December 31, 2010.
Total Return Swap Contracts. A total return swap involves the agreement between counterparties to exchange periodic payments based on an asset (such as a basket of securities) or non-asset (such as an index) reference. The periodic payments or cash flows, are usually based on the non-asset reference versus the total return or the asset-based reference. The asset-based reference generally includes unrealized appreciation or depreciation and to the extent that the total return falls short of or exceeds the non-asset reference, a Portfolio will make or receive a payment to the counterparty. Risks of total return swaps include credit, liquidity and market risks.
Certain Portfolios have entered into total return swap contracts which are exposed to the market risk factor of the specific underlying financial instrument, or instruments. As of December 31, 2010, certain Portfolios have entered into total return swaps on various equity indexes to increase exposure to equity risk.
During the year ended December 31, 2010, Oppenheimer Global Strategic Income has entered into total return swaps with an average contract amount of $249,964 on various baskets of securities to increase exposure to equity risk. Oppenheimer Global Strategic Income also entered into a total return swap with an average notional value of $1,496,680.
Volatility Swap Contracts. A volatility swap is an agreement between counterparties to exchange periodic payments based on the measured volatility of a reference security, index, currency or other reference investment over a specified time frame. One cash flow is typically based on the volatility of the reference investment as measured by changes in its price or level while the other cash flow is based on an interest rate or the measured volatility of a different reference investment. The appreciation or depreciation on a volatility swap will typically depend on the magnitude of the reference investment's volatility, or size of the movement, rather than general directional increases or decreases in its price. Volatility swaps are less standard in structure than other types of swaps and provide pure, or isolated, exposure to volatility risk of the specific underlying reference investment. Volatility swaps are typically used to speculate on future volatility levels, to trade the spread between realized and expected volatility, or to decrease the volatility exposure of investments held by the Portfolio.
85
NOTES TO FINANCIAL STATEMENTS AS OF DECEMBER 31, 2010 (UNAUDITED) (CONTINUED)
NOTE 2 — SIGNIFICANT ACCOUNTING POLICIES (continued)
Oppenheimer Global Strategic Income has entered into volatility swaps to increase exposure to the volatility risk of foreign exchange risk. These types of volatility swaps require the Portfolio to pay the measured volatility and receive a fixed interest payment over the period of the contract. If the measured volatility of the related reference investment increases over the period, the swaps will depreciate in value. Conversely, if the measured volatility of the related reference investment decreases over the period, the swaps will appreciate in value.
Oppenheimer Global Strategic Income has entered into volatility swaps to decrease exposure to the volatility risk of foreign exchange risk. These types of volatility swaps require the Portfolio to pay a fixed interest payment and receive the measured volatility over the period of the contract. If the measured volatility of the related reference investment increases over the period, the swaps will appreciate in value. Conversely, if the measured volatility of the related reference investment decreases over the period, the swaps will depreciate in value.
During the year ended December 31, 2010, the Portfolio averaged 31,304 contracts.
P. Structured Products. Oppenheimer Global Strategic Income invests in structured products which are specially-designed derivative investments whose principal payments or interest payments are linked to the performance of underlying foreign currencies, interest rate spreads, stock market indices, prices of individual securities, commodities or other financial instruments or the occurrence of other specific events. The terms and conditions of these products may be 'structured' by the purchaser (a Portfolio) and the borrower issuing the note. The market value of these products will increase or decrease based on the performance of the underlying asset or reference. A Portfolio records the net change in the market value of the structured product on the accompanying Statements of Operations as a change in unrealized appreciation or depreciation on investments. A Portfolio records a realized gain or loss on the Statements of Operations upon the sale or maturity of the structured product. Please refer to the Summary Portfolio of Investments for structured products held by Oppenheimer Global Strategic Income at December 31, 2010.
Q. Event-Linked Bonds. Oppenheimer Global Strategic Income invests in event-linked bonds, which are fixed income securities for which the return of principal and payment of interest is contingent on the non-occurrence of a specific trigger event, such as a hurricane, earthquake, or other occurrence that leads to physical or economic loss. If the specific trigger event occurs prior to maturity of the event-linked bond, the Portfolio may lose all or a portion of its principal in addition to interest otherwise due from the bond. Event-linked bonds may expose the Portfolio to certain other risks, including issuer default, adverse regulatory or jurisdictional interpretations, liquidity risk and adverse tax consequences. The Portfolio records the net change in the market value of the bonds on the accompanying Statements of Operations as a change in unrealized appreciation or depreciation on investments. The Portfolio records a realized gain or loss on the Statements of Operations upon the sale or maturity of the event-linked bond. Please refer to the Summary Portfolio of Investments for event-linked bonds held by Oppenheimer Global Strategic Income at December 31, 2010.
R. Sale Commitments. Sale commitments involve commitments where the unit price and the estimated principal amount are established upon entering into the contract, with the actual principal amount being within a specified range of the estimate. A Portfolio will enter into sale commitments to hedge its portfolio positions or to sell mortgage-backed securities it owns under delayed delivery arrangements. Proceeds of sale commitments are not received until the contractual settlement date. During the time a sale commitment is outstanding, a Portfolio will maintain, in a segregated account, cash or marketable securities in an amount sufficient to meet the purchase price. Unsettled sale commitments are valued at current market value of the underlying securities. If the sale commitment is closed through the acquisition of an offsetting purchase commitment, a Portfolio realizes a gain or loss on the commitment without regard to any unrealized gain or loss on the underlying security. If a Portfolio delivers securities under the commitment, a Portfolio realizes a gain or loss from the sale of the securities, based upon the unit price established at the date the commitment was entered into. There were no sales commitments outstanding at December 31, 2010 for any Portfolio.
S. Indemnifications. In the normal course of business, the Company may enter into contracts that provide certain indemnifications. The Company's maximum exposure under these arrangements is dependent on future claims that may be made against the Portfolios and, therefore, cannot be estimated; however, based on experience, management considers the risk of loss from such claims remote.
86
NOTES TO FINANCIAL STATEMENTS AS OF DECEMBER 31, 2010 (UNAUDITED) (CONTINUED)
NOTE 3 — INVESTMENT TRANSACTIONS
For the year ended December 31, 2010, the cost of purchases and the proceeds from the sales of securities, excluding U.S. government and short-term securities, were as follows:
| | | Purchases | | Sales | |
American Century Small-Mid
Cap Value | | $ | 191,629,507 | | | $ | 143,429,405 | | |
| Baron Small Cap Growth | | | 131,630,956 | | | | 150,254,251 | | |
| Columbia Small Cap Value | | | 124,256,256 | | | | 152,708,627 | | |
| Davis New York Venture | | | 67,175,146 | | | | 99,432,395 | | |
| Jpmorgan Mid Cap Value | | | 140,581,018 | | | | 104,278,325 | | |
Legg Mason Clearbridge
Aggressive Growth | | | 117,278 | | | | 30,622,747 | | |
| Oppenheimer Global | | | 232,718,317 | | | | 367,085,615 | | |
Oppenheimer Global Strategic
Income | | | 339,147,076 | | | | 387,021,208 | | |
| Pimco Total Return | | | 466,946,196 | | | | 297,867,117 | | |
| Pioneer High Yield | | | 38,191,386 | | | | 45,680,095 | | |
T. Rowe Price Diversified Midcap
Growth | | | 197,435,206 | | | | 268,040,098 | | |
| T. Rowe Price Growth Equity | | | 397,249,472 | | | | 463,788,384 | | |
| Templeton Foreign Equity | | | 141,849,299 | | | | 74,809,842 | | |
| Thornburg Value | | | 275,499,673 | | | | 246,116,648 | | |
| UBS U.S. Large Cap Equity | | | 93,118,776 | | | | 117,588,128 | | |
| Van Kampen Comstock | | | 69,058,649 | | | | 81,436,890 | | |
| Van Kampen Equity and Income | | | 236,324,151 | | | | 257,137,995 | | |
U.S. government securities not included above were as follows:
| | | Purchases | | Sales | |
Oppenheimer Global Strategic
Income | | $ | 187,866,301 | | | $ | 167,269,253 | | |
| Pimco Total Return | | | 5,840,358,834 | | | | 5,028,791,615 | | |
| Van Kampen Equity and Income | | | 58,642,409 | | | | 64,618,616 | | |
NOTE 4 — INVESTMENT ADVISORY AND ADMINISTRATIVE FEES
For its services, each Portfolio pays the Investment Adviser a monthly fee in arrears equal to the following as a percentage of each Portfolio's average daily net assets during the month:
| Portfolio | | Fee | |
| American Century Small-Mid Cap Value | | 1.00% | |
| Baron Small Cap Growth(1) | | 0.85% on the first $2 billion | |
| | | 0.80% on assets over $2 billion | |
| Columbia Small Cap Value | | 0.75% | |
| Davis New York Venture | | 0.80% | |
| JPMorgan Mid Cap Value | | 0.75% | |
| Legg Mason ClearBridge Aggressive Growth | | 0.70% on the first $500 million | |
| | | 0.65% on assets over $500 million | |
| Oppenheimer Global(1) | | 0.60% on the first $4 billion | |
| | | 0.58% on the next $4 billion | |
| | | 0.56% on assets over
$8 billion | |
| Portfolio | | Fee | |
| Oppenheimer Global Strategic Income(1) | | 0.50% on the first $4 billion | |
| | | 0.475% on the next $1 billion | |
| | | 0.45% on the next $1 billion | |
| | | 0.43% on assets over $6 billion | |
| PIMCO Total Return | | 0.50% | |
| Pioneer High Yield(1) | | 0.60% on the first $2 billion | |
| | | 0.50% on the next $1 billion | |
| | | 0.40% on the next $1 billion | |
| | | 0.30% on assets over $4 billion | |
| T. Rowe Price Diversified Mid Cap Growth | | 0.64% | |
| T. Rowe Price Growth Equity | | 0.60% | |
| Templeton Foreign Equity | | 0.80% on the first $500 million | |
| | | 0.75% on assets over $500 million | |
| Thornburg Value | | 0.65% | |
| UBS U.S. Large Cap Equity | | 0.70% on the first $500 million | |
| | | 0.65% on assets over $500 million | |
| Van Kampen Comstock | | 0.60% | |
| Van Kampen Equity and Income | | 0.55% | |
(1) Effective January 1, 2010, the advisory fee breakpoints for purposes of calculating the advisory fee were modified.
DSL has contractually agreed to waive a portion of the advisory fee for American Century Small-Mid Cap Value, Columbia Small Cap Value, Davis New York Venture, PIMCO Total Return, T. Rowe Price Growth Equity(1) and Van Kampen Comstock.
Waiver = 50% x (former sub-advisory fee minus new sub-advisory fee)
For the year ended December 31, 2010, DSL waived $125,336, $—, $102,718, $105,739, $33,049 and $12,059 for American Century Small-Mid Cap Value, Columbia Small Cap Value, Davis New York Venture, PIMCO Total Return, T. Rowe Price Growth Equity and Van Kampen Comstock, respectively.
These waivers will continue through at least May 1, 2011. There is no guarantee that the waivers will continue after said dates. The waiver only renews at the election of DSL.
(1) Effective June 1, 2010, DSL has contractually agreed to waive a portion of the advisory fee for the Portfolio. The waiver for T. Rowe Price Growth Equity is based on the total aggregated savings in excess of $500,000 as a result of the sub-advisory fee schedule effective June 1, 2010 with respect to T. Rowe Price Growth Equity and ING T. Rowe Price Equity Income, which is not in this report, pro rata based on each Portfolio's contribution to the amount saved.
87
NOTES TO FINANCIAL STATEMENTS AS OF DECEMBER 31, 2010 (CONTINUED)
NOTE 4 — INVESTMENT ADVISORY AND ADMINISTRATIVE FEES (continued)
During the period, ING Portfolios were permitted to invest end-of-day cash balances into ING Institutional Prime Money Market Fund. Investment management fees paid by the Portfolios were reduced by an amount equal to the management fees paid indirectly to the ING Institutional Prime Money Market Fund with respect to assets invested by the Portfolios. For the year ended December 31, 2010, the Investment Adviser for American Century Small-Mid Cap Value, Baron Small Cap Growth, Columbia Small Cap Value, JPMorgan Mid Cap Value, Legg Mason ClearBridge Aggressive Growth, Oppenheimer Global, Oppenheimer Global Strategic Income, Pioneer High Yield, Thornburg Value, UBS U.S. Large Cap Equity, Van Kampen Comstock and Van Kampen Equity and Income waived $2,126, $22,306, $3,396, $5,948, $309, $10,754, $27,496, $945, $5,736, $1,199, $3,576 and $8,823 of such management fees, respectively. These fees are not subject to recoupment.
Effective December 20, 2010, ING Institutional Prime Money Market Fund was liquidated. As a result of this liquidation, the Portfolios will no longer invest end-of-day cash balances into ING Institutional Prime Money Market Fund.
Oppenheimer Global Strategic Income may invest its assets in Oppenheimer Master Loan Fund. Oppenheimer Global Strategic Income's purchase of shares of Oppenheimer Master Loan Fund will result in Oppenheimer Global Strategic Income paying a proportionate share of the expenses of Oppenheimer Master Loan Fund. DSL will waive its management fee in an amount equal to the advisory fee received by the adviser of the Oppenheimer Master Loan Fund resulting from the Oppenheimer Global Strategic Income's investment into the Oppenheimer Master Loan Fund. For the year ended December 31, 2010, the Investment Adviser waived $58,869 of such management fees. These fees are not subject to recoupment.
Effective June 1, 2009, Templeton Foreign Equity may invest its assets in Templeton Smaller Companies Fund. Templeton Foreign Equity's purchase of shares of Templeton Smaller Companies Fund will result in Templeton Foreign Equity paying a proportionate share of the expenses of Templeton Smaller Companies Fund. DSL will waive its management fee in an amount equal to the advisory fee received by the adviser of the Templeton Smaller Companies Fund resulting from the Templeton Foreign Equity's investment into the Templeton Smaller Companies Fund. There were no such waivers for the year ended December 31, 2010.
The Company and DSL have entered into Portfolio Management Agreements with each sub-adviser. These sub-advisers provide investment advice for the various Portfolios and are paid by DSL based on the average daily net assets of the respective Portfolios. The sub-adviser of each of the Portfolios are as follows:
| Portfolio | | Sub-Adviser | |
| American Century Small-Mid Cap Value | | American Century Investment Management, Inc. | |
|
| Baron Small Cap Growth | | BAMCO, Inc. | |
|
| Columbia Small Cap Value | | Columbia Management Investment Advisers, LLC | |
|
| Davis New York Venture | | Davis Selected Advisers, L.P. | |
|
| JPMorgan Mid Cap Value | | J.P. Morgan Investment Management Inc. | |
|
| Legg Mason ClearBridge Aggressive Growth | | ClearBridge Advisors, LLC | |
|
| Oppenheimer Global & Oppenheimer Global Strategic Income | | Oppenheimer Funds, Inc. | |
|
| PIMCO Total Return | | Pacific Investment Management Company LLC | |
|
| Pioneer High Yield | | Pioneer Investment Management, Inc. | |
|
| T. Rowe Price Diversified Mid Cap Growth & T. Rowe Price Growth Equity | | T. Rowe Price Associates, Inc. | |
|
| Templeton Foreign Equity | | Templeton Investment Counsel, LLC | |
|
| Thornburg Value | | Thornburg Investment Management, Inc. | |
|
| UBS U.S. Large Cap Equity | | UBS Global Asset Management (Americas) Inc. | |
|
| Van Kampen Comstock & Van Kampen Equity and Income | | Invesco Advisers, Inc. | |
|
Under an Administrative Services Agreement, ING Funds Services, LLC (the "Administrator"), an indirect, wholly-owned subsidiary of ING Groep, acts as administrator and provides certain administrative and shareholder services necessary for the following Portfolios' operations and is responsible for the supervision of other service providers. For its services, the Administrator is entitled to receive from each of the following Portfolios a fee at an annual rate based on the average daily net assets of each Portfolio as follows:
| Portfolio | | Fee | |
| Columbia Small Cap Value | | | | 0.10% | |
| Pioneer High Yield | | | | 0.10% | |
| Templeton Foreign Equity | | | | 0.10% | |
In addition to providing all administrative services necessary for the Portfolios' operations, the administrator also assumes all ordinary recurring direct costs of the Portfolios below, such as custodian fees, director's fees, transfer agency fees and accounting fees. As compensation for these services, the
88
NOTES TO FINANCIAL STATEMENTS AS OF DECEMBER 31, 2010 (CONTINUED)
NOTE 4 — INVESTMENT ADVISORY AND ADMINISTRATIVE FEES (continued)
Administrator receives a monthly fee from each Portfolio below at an annual rate based on the average daily net assets of each Portfolio as follows:
| Portfolio | | Fee | |
| American Century Small-Mid Cap Value | | 0.25% | |
| Baron Small Cap Growth | | 0.23% | |
| Davis New York Venture | | 0.10% | |
| JPMorgan Mid Cap Value | | 0.25% | |
| Legg Mason ClearBridge Aggressive Growth | | 0.13% | |
| Oppenheimer Global | | 0.06% | |
| Oppenheimer Global Strategic Income | | 0.04% | |
| PIMCO Total Return | | 0.25% on the first $250 million | |
| | | 0.10% on next $100 million | |
| | | 0.05% on next $100 million | |
| | | 0.03% on assets over $450 million | |
| T. Rowe Price Diversified Mid Cap Growth | | 0.02% | |
| T. Rowe Price Growth Equity | | 0.15% | |
| Thornburg Value | | 0.25% | |
| UBS U.S. Large Cap Equity | | 0.15% | |
| Van Kampen Comstock | | 0.25% on the first $1.1 billion | |
| | | 0.20% on assets over $1.1 billion | |
| Van Kampen Equity and Income | | 0.10% | |
In placing equity security transactions, each sub-adviser is required to use its best efforts to choose a broker capable of providing brokerage services necessary to obtain the best execution for each transaction. Subject to this requirement, each sub-adviser may allocate equity security transactions through certain designated broker-dealers. Some of these broker-dealers participate in commission recapture programs that have been established for the benefit of the Portfolios. Under these programs, the participating broker-dealers will return to a Portfolio a portion of the brokerage commissions (in the form of a credit to a Portfolio) paid to the broker-dealers to pay certain expenses of a Portfolio. These commission recapture payments benefit the Portfolios and not the sub-adviser. Any amount credited to a Portfolio is recognized as brokerage commission recapture in the Statements of Operations.
NOTE 5 — DISTRIBUTION AND SERVICE FEES
The Company has adopted a plan of Distribution pursuant to Rule 12b-1 ("the Plan") for the Class ADV and Class S2 shares of each respective Portfolio. The Plan provides for a distribution fee, payable to the Distributor. The Distributor may pay, on behalf of each Portfolio, out of its distribution fee, compensation to certain financial institutions for providing distribution assistance. Under the Plan, a Portfolio makes payments at an annual rate of 0.25% of the Portfolio's average daily net assets attributable to its Class ADV and Class S2 shares. The Distributor has contractually agreed to waive a portion of its fee equal to 0.10% of the average daily net assets attributable to the distribution fee paid by Class S2 of the Portfolios, so that the actual fee paid by a Portfolio is an annual rate of 0.15%. The expense waiver will continue through at least May 1, 2011.
Class ADV, Class S and Class S2 shares are further subject to a shareholder servicing fee payable to Shareholder Organizations pursuant to the Shareholder Servicing Plan adopted for Class ADV, Class S and Class S2 which shall not exceed an annual rate of 0.25% of the average daily net assets of each class, respectively. The Distributor has contractually agreed to waive all or a portion of the servicing fee for Baron Small Cap Growth so that total net operating expenses do not exceed 1.31% for Class S shares through May 1, 2011.
Fees paid to the Distributor and Shareholder Organizations by class during the year ended December 31, 2010 are shown in the accompanying Statements of Operations.
NOTE 6 — OTHER TRANSACTIONS WITH AFFILIATES AND RELATED PARTIES
At December 31, 2010, the Portfolios had the following amounts recorded as payable to affiliates on the accompanying Statements of Assets and Liabilities (See Note 4):
| Portfolio | | Accrued
Investment
Management
Fees | | Accrued
Administrative
Fees | | Accrued
Shareholder
Service and
Distribution
Fees | | Total | |
American Century
Small-Mid Cap Value | | $ | 145,807 | | | $ | 39,873 | | | $ | 26,480 | | | $ | 212,160 | | |
| Baron Small Cap Growth | | | 597,827 | | | | 161,914 | | | | 128,802 | | | | 888,543 | | |
| Columbia Small Cap Value | | | 145,224 | | | | 19,370 | | | | 36,566 | | | | 201,160 | | |
| Davis New York Venture | | | 317,413 | | | | 40,786 | | | | 72,336 | | | | 430,535 | | |
| JPMorgan Mid Cap Value | | | 202,952 | | | | 67,710 | | | | 46,762 | | | | 317,424 | | |
Legg Mason ClearBridge
Aggressive Growth | | | 233,222 | | | | 43,312 | | | | 26,053 | | | | 302,587 | | |
| Oppenheimer Global | | | 881,396 | | | | 88,163 | | | | 69,341 | | | | 1,038,900 | | |
Oppenheimer Global
Strategic Income | | | 215,746 | | | | 17,349 | | | | 33,055 | | | | 266,150 | | |
| PIMCO Total Return | | | 484,140 | | | | 83,998 | | | | 164,901 | | | | 733,039 | | |
| Pioneer High Yield | | | 50,765 | | | | 8,462 | | | | 566 | | | | 59,793 | | |
T. Rowe Price Diversified
Mid Cap Growth | | | 438,834 | | | | 13,727 | | | | 18,174 | | | | 470,735 | | |
| T. Rowe Price Growth Equity | | | 543,682 | | | | 137,900 | | | | 79,124 | | | | 760,706 | | |
| Templeton Foreign Equity | | | 477,270 | | | | 51,247 | | | | 63,653 | | | | 592,170 | | |
| Thornburg Value | | | 164,339 | | | | 63,215 | | | | 10,325 | | | | 237,879 | | |
| UBS U.S. Large Cap Equity | | | 103,991 | | | | 22,292 | | | | 7,738 | | | | 134,021 | | |
| Van Kampen Comstock | | | 165,193 | | | | 69,324 | | | | 62,511 | | | | 297,028 | | |
Van Kampen Equity and
Income | | | 392,509 | | | | 71,408 | | | | 56,793 | | | | 520,710 | | |
The Company has adopted a Deferred Compensation Plan (the "Plan"), which allows eligible non-affiliated directors as described in the Plan to defer the receipt of all or a portion of the directors fees payable.
89
NOTES TO FINANCIAL STATEMENTS AS OF DECEMBER 31, 2010 (CONTINUED)
NOTE 6 — OTHER TRANSACTIONS WITH AFFILIATES AND RELATED PARTIES (continued)
Amounts deferred are treated as though invested in various "notional" funds advised by DSL until distribution in accordance with the Plan.
At December 31, 2010, the following ING Portfolios or indirect, wholly-owned subsidiaries of ING Groep owned more than 5% of the following Portfolios:
| Subsidiary | | Portfolio | | Percentage | |
ING Life Insurance and
Annuity Company | | American Century
Small-Mid Cap Value | | | 71.07 | % | |
| | | Baron Small Cap Growth | | | 39.82 | % | |
| | | Davis New York Venture | | | 7.11 | % | |
| | | JPMorgan Mid Cap Value | | | 43.24 | % | |
| | | Legg Mason ClearBridge
Aggressive Growth | | | 66.22 | % | |
| | | Oppenheimer Global | | | 79.18 | % | |
| | | Oppenheimer Global
Strategic Income | | | 78.69 | % | |
| | | PIMCO Total Return | | | 77.76 | % | |
| | | Pioneer High Yield | | | 40.75 | % | |
| | | T. Rowe Price Diversified
Mid Cap Growth | | | 74.46 | % | |
| | | T. Rowe Price Growth Equity | | | 57.15 | % | |
| | | Templeton Foreign Equity | | | 27.97 | % | |
| | | Thornburg Value | | | 63.81 | % | |
| | | UBS U.S. Large Cap Value | | | 75.24 | % | |
| | | Van Kampen Comstock | | | 28.89 | % | |
| | | Van Kampen Equity
and Income | | | 70.45 | % | |
| ING National Trust | | American Century
Small-Mid Cap Value | | | 25.45 | % | |
| | | Baron Small Cap Growth | | | 9.20 | % | |
| | | JPMorgan Mid Cap Value | | | 9.49 | % | |
| | | Oppenheimer Global | | | 5.63 | % | |
| | | Oppenheimer Global
Strategic Income | | | 12.03 | % | |
| | | PIMCO Total Return | | | 17.09 | % | |
| | | T. Rowe Price Growth Equity | | | 15.25 | % | |
| | | Thornburg Value | | | 5.78 | % | |
| | | UBS U.S. Large Cap Value | | | 6.49 | % | |
| | | Van Kampen Comstock | | | 6.89 | % | |
| ING Solution 2015 Portfolio | | Davis New York Venture | | | 5.84 | % | |
| | | Thornburg Value | | | 5.47 | % | |
| ING Solution 2025 Portfolio | | Davis New York Venture | | | 9.06 | % | |
| | | T. Rowe Price Growth Equity | | | 5.19 | % | |
| | | Templeton Foreign Equity | | | 8.18 | % | |
| | | Thornburg Value | | | 8.49 | % | |
| ING Solution 2035 Portfolio | | Columbia Small Cap Value | | | 9.30 | % | |
| | | Davis New York Venture | | | 6.61 | % | |
| | | Templeton Foreign Equity | | | 10.06 | % | |
| | | Thornburg Value | | | 7.23 | % | |
| ING Solution 2045 Portfolio | | Columbia Small Cap Value | | | 5.96 | % | |
| | | Templeton Foreign Equity | | | 6.95 | % | |
ING USA Annuity and Life
Insurance Company | | Baron Small Cap Growth | | | 41.03 | % | |
| | | Columbia Small Cap Value | | | 68.74 | % | |
| | | Davis New York Venture | | | 60.81 | % | |
| | | JPMorgan Mid Cap Value | | | 37.37 | % | |
| | | Legg Mason ClearBridge
Aggressive Growth | | | 25.02 | % | |
| | | Oppenheimer Global | | | 7.74 | % | |
| | | T. Rowe Price Growth Equity | | | 10.14 | % | |
| | | Templeton Foreign Equity | | | 37.50 | % | |
| | | Van Kampen Comstock | | | 57.27 | % | |
| | | Van Kampen Equity
and Income | | | 24.84 | % | |
| Subsidiary | | Portfolio | | Percentage | |
Reliastar Life Insurance
Company | | Oppenheimer Global | | | 5.29 | % | |
| | | Pioneer High Yield | | | 31.74 | % | |
| | | T. Rowe Price Diversified
Mid Cap Growth | | | 14.07 | % | |
| | | UBS U.S. Large Cap Value | | | 9.41 | % | |
Security Life Insurance
Company | | Columbia Small Cap Value | | | 5.21 | % | |
| | | JPMorgan Mid Cap Value | | | 5.13 | % | |
| | | Pioneer High Yield | | | 27.12 | % | |
| | | T. Rowe Price Diversified
Mid Cap Growth | | | 5.73 | % | |
Control is defined by the 1940 Act as the beneficial ownership, either directly or through one or more controlled companies, of more than 25% of the voting securities of a company. The 1940 Act defines affiliates as companies that are under common control. Therefore, because the Portfolios have a common owner that owns over 25% of the outstanding securities of the Portfolios, they may be deemed to be affiliates of each other. Investment activities of these shareholders could have a material impact on the Portfolios.
NOTE 7 — EXPENSE LIMITATION AGREEMENTS
The Investment Adviser has entered into a written expense limitation agreement ("Expense Limitation Agreement") with certain of the Portfolios, whereby the Investment Adviser has agreed to limit expenses, excluding interest, taxes, brokerage commissions, extraordinary expenses, and acquired fund fees and expenses to the following annual expenses to average daily net assets:
| Portfolio | | Class ADV | | Class I | | Class S | | Class S2 | |
American Century
Small-Mid Cap Value | | | 1.52 | % | | | 1.02 | % | | | 1.27 | % | | | 1.42 | % | |
Columbia Small Cap
Value | | | 1.65 | % | | | 1.15 | % | | | 1.40 | % | | | 1.55 | % | |
| Pioneer High Yield | | | 1.21 | % | | | 0.71 | % | | | 0.96 | % | | | N/A | | |
| Templeton Foreign Equity | | | 1.48 | % | | | 0.98 | % | | | 1.23 | % | | | 1.38 | % | |
The Expense Limitation Agreement is contractual and shall renew automatically unless DSL provides written notice of the termination of the Expense Limitation Agreement within 90 days of the end of the then current term.
Pursuant to a side agreement, DSL implemented expense limits for Van Kampen Comstock through at least May 1, 2011 to the following annual expenses to average daily net assets:
| Portfolio | | Class ADV | | Class I | | Class S | |
| Van Kampen Comstock | | | 1.31 | % | | | 0.81 | % | | | 1.06 | % | |
If, after May 1, 2011, DSL elects not to renew the side agreement, the Portfolio will no longer have an expense limitation. There is no guarantee that this side agreement will continue after this date. The side
90
NOTES TO FINANCIAL STATEMENTS AS OF DECEMBER 31, 2010 (CONTINUED)
NOTE 7 — EXPENSE LIMITATION AGREEMENTS (continued)
agreement will only renew if DSL elects to renew it. Any fees waived pursuant to the side agreements shall not be eligible for recoupment.
The Investment Adviser may, at a later date, recoup from a Portfolio for management fees waived and other expenses assumed by the Investment Adviser during the previous 36 months, but only if, after such recoupment, the Portfolio's expense ratio does not exceed the percentage described above. Waived and reimbursed fees by, and any recoupment to the Investment Adviser of such waived and reimbursed fees are reflected on the accompanying Statements of Operations for each Portfolio. Amounts payable by the Investment Adviser are reflected on the accompanying Statements of Assets and Liabilities for each Portfolio.
At December 31, 2010, the amounts of waived and reimbursed fees that are subject to possible recoupment by the Investment Adviser, and the related expiration dates are as follows:
| | | December 31, | | | |
| Portfolio | | 2011 | | 2012 | | 2013 | | Total | |
American Century
Small-Mid Cap
Value | | $ | 137,295 | | | $ | 202,907 | | | $ | 344,578 | | | $ | 684,780 | | |
| Pioneer High Yield | | | 13,292 | | | | 104,634 | | | | 33,547 | | | | 151,473 | | |
NOTE 8 — PURCHASED AND WRITTEN OPTIONS
Transactions in purchased foreign currency options for Oppenheimer Global Strategic Income during the year ended December 31, 2010 were as follows:
| | | USD
Notional | | EUR
Notional | | JPY
Notional | | PLN
Notional | |
Cost | |
| Balance at 12/31/09 | | | 10,000,000 | | | | 21,855,000 | | | | — | | | | — | | | $ | 824,320 | | |
| Options Purchased | | | 5,260,000 | | | | 710,000 | | | | 417,000,000 | | | | 78,720,000 | | | | 549,266 | | |
| Options Terminated in Closing Sell Transactions | | | — | | | | (21,855,000 | ) | | | — | | | | — | | | | (815,760 | ) | |
| Options Exercised | | | — | | | | — | | | | — | | | | — | | | | — | | |
| Options Expired | | | (15,260,000 | ) | | | (710,000 | ) | | | (417,000,000 | ) | | | — | | | | (182,877 | ) | |
| Balance at 12/31/10 | | | — | | | | — | | | | — | | | | 78,720,000 | | | $ | 374,949 | | |
Transactions in purchased options on exchange-traded futures contracts for Oppenheimer Global Strategic Income during the year ended December 31, 2010 were as follows:
| | | Number of
Contracts | | Cost | |
| Balance at 12/31/09 | | | — | | | $ | — | | |
| Options Purchased | | | 983 | | | | 1,624,216 | | |
| Options Terminated in Closing Sell Transactions | | | — | | | | — | | |
| Options Exercised | | | — | | | | — | | |
| Options Expired | | | (983 | ) | | | (1,624,216 | ) | |
| Balance at 12/31/10 | | | — | | | $ | — | | |
Transactions in written foreign currency options for Oppenheimer Global Strategic Income during the year ended December 31, 2010 were as follows:
| | | USD
Notional | | EUR
Notional | | GBP
Notional | | JPY
Notional | | Premiums
Received | |
| Balance at 12/31/09 | | | 11,200,000 | | | | — | | | | — | | | | — | | | $ | 10,952 | | |
| Options Written | | | 500,085,000 | | | | 44,350,000 | | | | 2,600,000 | | | | 777,000,000 | | | | 879,096 | | |
| Options Terminated in Closing Purchase Transactions | | | (730,000 | ) | | | — | | | | — | | | | — | | | | (7,206 | ) | |
| Options Exercised | | | — | | | | — | | | | — | | | | — | | | | — | | |
| Options Expired | | | (510,555,000 | ) | | | (44,350,000 | ) | | | (2,600,000 | ) | | | (777,000,000 | ) | | | (882,842 | ) | |
| Balance at 12/31/10 | | | — | | | | — | | | | — | | | | — | | | $ | — | | |
Transactions in purchased options on exchange-traded futures contracts for PIMCO Total Return during the year ended December 31, 2010 were as follows:
| | | Number of
Contracts | | Cost | |
| Balance at 12/31/09 | | | — | | | $ | — | | |
| Options Purchased | | | 1,707 | | | | 17,643 | | |
| Options Terminated in Closing Sell Transactions | | | — | | | | — | | |
| Options Exercised | | | — | | | | — | | |
| Options Expired | | | (800 | ) | | | (9,707 | ) | |
| Balance at 12/31/10 | | | 907 | | | $ | 7,936 | | |
91
NOTES TO FINANCIAL STATEMENTS AS OF DECEMBER 31, 2010 (CONTINUED)
NOTE 8 — PURCHASED AND WRITTEN OPTIONS (continued)
Transactions in purchased foreign currency options for PIMCO Total Return during the year ended December 31, 2010 were as follows:
| | | USD
Notional | |
Cost | |
| Balance at 12/31/09 | | | 6,000,000 | | | $ | 255,570 | | |
| Options Purchased | | | — | | | | — | | |
| Options Terminated in Closing Sell Transactions | | | — | | | | — | | |
| Options Exercised | | | — | | | | — | | |
| Options Expired | | | (6,000,000 | ) | | | (255,570 | ) | |
| Balance at 12/31/10 | | | — | | | $ | — | | |
Transactions in written interest rate swaptions for PIMCO Total Return during the year ended December 31, 2010 were as follows:
| | | USD
Notional | | EUR
Notional | | Premiums
Received | |
| Balance at 12/31/09 | | | 230,600,000 | | | | 1,400,000 | | | $ | 2,158,234 | | |
| Options Written | | | 644,200,000 | | | | — | | | | 4,294,377 | | |
| Options Terminated in Closing Purchase Transactions | | | (26,200,000 | ) | | | — | | | | (136,341 | ) | |
| Options Exercised | | | (139,700,000 | ) | | | — | | | | (519,587 | ) | |
| Options Expired | | | (471,200,000 | ) | | | (1,400,000 | ) | | | (3,579,026 | ) | |
| Balance at 12/31/10 | | | 237,700,000 | | | | — | | | $ | 2,217,657 | | |
Transactions in written swaptions on CDX indices for PIMCO Total Return during the year ended December 31, 2010 were as follows:
| | | USD
Notional | | Premiums
Received | |
| Balance at 12/31/09 | | | — | | | $ | — | | |
| Options Written | | | 2,000,000 | | | | 4,100 | | |
| Options Terminated in Closing Purchase Transactions | | | — | | | | — | | |
| Options Exercised | | | — | | | | — | | |
| Options Expired | | | (2,000,000 | ) | | | (4,100 | ) | |
| Balance at 12/31/10 | | | — | | | $ | — | | |
Transactions in written inflation floors for PIMCO Total Return during the year ended December 31, 2010 were as follows:
| | | USD
Notional | | Premiums
Received | |
| Balance at 12/31/09 | | | — | | | $ | — | | |
| Options Written | | | 6,800,000 | | | | 67,240 | | |
| Options Terminated in Closing Purchase Transactions | | | — | | | | — | | |
| Options Exercised | | | — | | | | — | | |
| Options Expired | | | — | | | | — | | |
| Balance at 12/31/10 | | | 6,800,000 | | | $ | 67,240 | | |
Transactions in written forward volatility options for PIMCO Total Return during the year ended December 31, 2010 were as follows:
| | | USD
Notional | | Premiums
Received | |
| Balance at 12/31/09 | | | 42,200,000 | | | $ | 464,543 | | |
| Options Written | | | — | | | | — | | |
| Options Terminated in Closing Purchase Transactions | | | — | | | | — | | |
| Options Exercised | | | — | | | | — | | |
| Options Expired | | | — | | | | — | | |
| Balance at 12/31/10 | | | 42,200,000 | | | $ | 464,543 | | |
92
NOTES TO FINANCIAL STATEMENTS AS OF DECEMBER 31, 2010 (CONTINUED)
NOTE 8 — PURCHASED AND WRITTEN OPTIONS (continued)
Transactions in written options on exchange-traded futures contracts for PIMCO Total Return during the year ended December 31, 2010 were as follows:
| | | Number of
Contracts | | Premiums
Received | |
| Balance at 12/31/09 | | | 688 | | | $ | 342,092 | | |
| Options Written | | | 3,147 | | | | 1,060,218 | | |
| Options Terminated in Closing Purchase Transactions | | | (252 | ) | | | (79,614 | ) | |
| Options Exercised | | | (270 | ) | | | (102,968 | ) | |
| Options Expired | | | (3,115 | ) | | | (1,114,641 | ) | |
| Balance at 12/31/10 | | | 198 | | | $ | 105,087 | | |
Transactions in written foreign currency options for PIMCO Total Return during the year ended December 31, 2010 were as follows:
| | | USD
Notional | | Premiums
Received | |
| Balance at 12/31/09 | | | 2,600,000 | | | $ | 20,540 | | |
| Options Written | | | 8,200,000 | | | | 75,551 | | |
| Options Terminated in Closing Purchase Transactions | | | | | |
| Options Exercised | | | (8,200,000 | ) | | | (75,551 | ) | |
| Options Expired | | | (2,600,000 | ) | | | (20,540 | ) | |
| Balance at 12/31/10 | | | — | | | $ | — | | |
NOTE 9 — CAPITAL SHARES
Transactions in capital shares and dollars were as follows:
| | | Shares sold | | Reinvestment
of
distributions | | Shares
redeemed | | Net increase
(decrease)
in shares
outstanding | | Shares sold | | Reinvestment
of
distributions | | Shares
redeemed | | Net increase
(decrease) | |
| Year or period ended | | # | | # | | # | | # | | ($) | | ($) | | ($) | | ($) | |
| American Century Small-Mid Cap Value | | | |
| Class ADV | | | |
| 12-31-10 | | | 1,396,420 | | | | 18,111 | | | | (206,217 | ) | | | 1,208,314 | | | | 14,545,558 | | | | 174,774 | | | | (2,109,987 | ) | | | 12,610,345 | | |
| 12-31-09 | | | 394,129 | | | | 14,013 | | | | (406,746 | ) | | | 1,396 | | | | 3,144,178 | | | | 119,950 | | | | (3,240,502 | ) | | | 23,626 | | |
| Class I | | | |
| 12-31-10 | | | 3,266,101 | | | | 83,428 | | | | (912,100 | ) | | | 2,437,429 | | | | 34,934,441 | | | | 822,603 | | | | (9,663,599 | ) | | | 26,093,445 | | |
| 12-31-09 | | | 1,090,518 | | | | 89,064 | | | | (805,727 | ) | | | 373,855 | | | | 8,955,308 | | | | 777,526 | | | | (6,103,000 | ) | | | 3,629,834 | | |
| Class S | | | |
| 12-31-10 | | | 2,640,237 | | | | 83,379 | | | | (1,824,382 | ) | | | 899,234 | | | | 27,496,086 | | | | 817,115 | | | | (19,455,397 | ) | | | 8,857,804 | | |
| 12-31-09 | | | 1,689,013 | | | | 82,374 | | | | (558,946 | ) | | | 1,212,441 | | | | 13,214,878 | | | | 715,006 | | | | (4,529,894 | ) | | | 9,399,990 | | |
| Class S2 | | | |
| 12-31-10 | | | 28,517 | | | | — | | | | (936 | ) | | | 27,581 | | | | 306,830 | | | | — | | | | (10,286 | ) | | | 296,544 | | |
| 02-27-09(1) - 12-31-09 | | | 514 | | | | — | | | | — | | | | 514 | | | | 3,000 | | | | — | | | | — | | | | 3,000 | | |
| Baron Small Cap Growth | | | |
| Class ADV | | | |
| 12-31-10 | | | 901,938 | | | | — | | | | (585,808 | ) | | | 316,130 | | | | 14,361,830 | | | | — | | | | (9,308,085 | ) | | | 5,053,745 | | |
| 12-31-09 | | | 797,738 | | | | — | | | | (498,281 | ) | | | 299,457 | | | | 10,151,993 | | | | — | | | | (5,889,828 | ) | | | 4,262,165 | | |
| Class I | | | |
| 12-31-10 | | | 1,911,265 | | | | — | | | | (2,035,614 | ) | | | (124,349 | ) | | | 32,498,235 | | | | — | | | | (33,983,816 | ) | | | (1,485,581 | ) | |
| 12-31-09 | | | 3,119,432 | | | | — | | | | (2,697,653 | ) | | | 421,779 | | | | 39,211,553 | | | | — | | | | (30,909,876 | ) | | | 8,301,677 | | |
| Class S | | | |
| 12-31-10 | | | 4,427,284 | | | | — | | | | (6,045,466 | ) | | | (1,618,182 | ) | | | 72,301,328 | | | | — | | | | (95,472,404 | ) | | | (23,171,076 | ) | |
| 12-31-09 | | | 8,724,074 | | | | — | | | | (3,902,837 | ) | | | 4,821,237 | | | | 108,511,754 | | | | — | | | | (49,515,469 | ) | | | 58,996,285 | | |
| Class S2 | | | |
| 12-31-10 | | | — | | | | — | | | | — | | | | — | | | | — | | | | — | | | | — | | | | — | | |
| 02-27-09(1) - 12-31-09 | | | 322 | | | | — | | | | — | | | | 322 | | | | 3,000 | | | | — | | | | — | | | | 3,000 | | |
| Columbia Small Cap Value | | | |
| Class ADV | | | |
| 12-31-10 | | | 166,932 | | | | 2,247 | | | | (31,726 | ) | | | 137,453 | | | | 1,507,438 | | | | 18,339 | | | | (279,576 | ) | | | 1,246,201 | | |
| 12-31-09 | | | 25,774 | | | | 399 | | | | (27,827 | ) | | | (1,654 | ) | | | 185,658 | | | | 3,053 | | | | (181,788 | ) | | | 6,923 | | |
(1) Commencement of operations.
93
NOTES TO FINANCIAL STATEMENTS AS OF DECEMBER 31, 2010 (CONTINUED)
NOTE 9 — CAPITAL SHARES (continued)
| | | Shares sold | | Reinvestment
of
distributions | | Shares
redeemed | | Net increase
(decrease)
in shares
outstanding | | Shares sold | | Reinvestment
of
distributions | | Shares
redeemed | | Net increase
(decrease) | |
| Year or period ended | | # | | # | | # | | # | | ($) | | ($) | | ($) | | ($) | |
| Columbia Small Cap Value (continued) | | | |
| Class I | | | |
| 12-31-10 | | | 1,354,637 | | | | 91,738 | | | | (1,607,667 | ) | | | (161,292 | ) | | | 12,127,309 | | | | 758,673 | | | | (15,038,488 | ) | | | (2,152,506 | ) | |
| 12-31-09 | | | 5,287,255 | | | | 367,862 | | | | (33,066,771 | ) | | | (27,411,654 | ) | | | 32,530,456 | | | | 2,839,892 | | | | (241,148,837 | ) | | | (205,778,489 | ) | |
| Class S | | | |
| 12-31-10 | | | 510,795 | | | | 236,194 | | | | (4,373,988 | ) | | | (3,626,999 | ) | | | 4,623,934 | | | | 1,943,880 | | | | (39,305,991 | ) | | | (32,738,177 | ) | |
| 12-31-09 | | | 4,400,905 | | | | 258,453 | | | | (6,959,765 | ) | | | (2,300,407 | ) | | | 27,374,906 | | | | 1,987,504 | | | | (50,283,084 | ) | | | (20,920,674 | ) | |
| Class S2 | | | |
| 12-31-10 | | | — | | | | — | | | | — | | | | — | | | | — | | | | — | | | | — | | | | — | | |
| 02-27-09(1) - 12-31-09 | | | 577 | | | | — | | | | — | | | | 577 | | | | 3,000 | | | | — | | | | — | | | | 3,000 | | |
| Davis New York Venture | | | |
| Class ADV | | | |
| 12-31-10 | | | 287,594 | | | | 1,492 | | | | (115,548 | ) | | | 173,538 | | | | 4,543,915 | | | | 22,413 | | | | (1,849,160 | ) | | | 2,717,168 | | |
| 12-31-09 | | | 121,777 | | | | — | | | | (285,795 | ) | | | (164,018 | ) | | | 1,636,162 | | | | — | | | | (3,570,053 | ) | | | (1,933,891 | ) | |
| Class I | | | |
| 12-31-10 | | | 1,848,390 | | | | 62,049 | | | | (4,203,407 | ) | | | (2,292,968 | ) | | | 30,371,078 | | | | 952,452 | | | | (69,593,638 | ) | | | (38,270,108 | ) | |
| 12-31-09 | | | 2,382,904 | | | | 85,275 | | | | (3,057,783 | ) | | | (589,604 | ) | | | 29,853,977 | | | | 1,219,435 | | | | (38,863,289 | ) | | | (7,789,877 | ) | |
| Class S | | | |
| 12-31-10 | | | 1,735,252 | | | | 84,897 | | | | (2,382,997 | ) | | | (562,848 | ) | | | 27,910,031 | | | | 1,288,733 | | | | (37,738,510 | ) | | | (8,539,746 | ) | |
| 12-31-09 | | | 3,634,122 | | | | 121,240 | | | | (2,243,216 | ) | | | 1,512,146 | | | | 46,755,067 | | | | 1,715,544 | | | | (29,307,139 | ) | | | 19,163,472 | | |
| JPMorgan Mid Cap Value | | | |
| Class ADV | | | |
| 12-31-10 | | | 712,397 | | | | 10,622 | | | | (238,824 | ) | | | 484,195 | | | | 8,732,450 | | | | 141,753 | | | | (2,908,617 | ) | | | 5,965,586 | | |
| 12-31-09 | | | 327,771 | | | | 34,804 | | | | (366,146 | ) | | | (3,571 | ) | | | 3,164,490 | | | | 372,212 | | | | (3,429,559 | ) | | | 107,143 | | |
| Class I | | | |
| 12-31-10 | | �� | 1,560,001 | | | | 83,932 | | | | (1,328,171 | ) | | | 315,762 | | | | 19,354,570 | | | | 1,148,457 | | | | (16,292,736 | ) | | | 4,210,291 | | |
| 12-31-09 | | | 1,288,359 | | | | 244,493 | | | | (1,390,069 | ) | | | 142,783 | | | | 12,330,173 | | | | 2,668,710 | | | | (13,098,883 | ) | | | 1,900,000 | | |
| Class S | | | |
| 12-31-10 | | | 6,223,032 | | | | 89,791 | | | | (3,829,696 | ) | | | 2,483,127 | | | | 76,508,518 | | | | 1,215,265 | | | | (46,773,717 | ) | | | 30,950,066 | | |
| 12-31-09 | | | 3,838,782 | | | | 270,619 | | | | (2,631,920 | ) | | | 1,477,481 | | | | 35,983,437 | | | | 2,917,564 | | | | (26,786,611 | ) | | | 12,114,390 | | |
| Class S2 | | | |
| 12-31-10 | | | — | | | | — | | | | — | | | | — | | | | — | | | | — | | | | — | | | | — | | |
| 02-27-09(1) - 12-31-09 | | | 398 | | | | — | | | | — | | | | 398 | | | | 3,000 | | | | — | | | | — | | | | 3,000 | | |
| Legg Mason ClearBridge Aggressive Growth | | | |
| Class ADV | | | |
| 12-31-10 | | | 71,163 | | | | — | | | | (47,296 | ) | | | 23,867 | | | | 2,814,950 | | | | — | | | | (1,821,603 | ) | | | 993,347 | | |
| 12-31-09 | | | 72,050 | | | | — | | | | (50,901 | ) | | | 21,149 | | | | 2,285,794 | | | | — | | | | (1,674,524 | ) | | | 611,270 | | |
| Class I | | | |
| 12-31-10 | | | 168,170 | | | | — | | | | (814,216 | ) | | | (646,046 | ) | | | 6,992,632 | | | | — | | | | (33,436,687 | ) | | | (26,444,055 | ) | |
| 12-31-09 | | | 919,073 | | | | — | | | | (9,987,337 | ) | | | (9,068,264 | ) | | | 25,454,683 | | | | — | | | | (329,277,174 | ) | | | (303,822,491 | ) | |
| Class S | | | |
| 12-31-10 | | | 119,463 | | | | — | | | | (406,673 | ) | | | (287,210 | ) | | | 4,702,686 | | | | — | | | | (16,618,363 | ) | | | (11,915,677 | ) | |
| 12-31-09 | | | 63,453 | | | | — | | | | (512,854 | ) | | | (449,401 | ) | | | 2,107,983 | | | | — | | | | (16,317,040 | ) | | | (14,209,057 | ) | |
| Class S2 | | | |
| 03-08-10(1) - 12-31-10 | | | 75 | | | | — | | | | — | | | | 75 | | | | 3,000 | | | | — | | | | — | | | | 3,000 | | |
| Oppenheimer Global | | | |
| Class ADV | | | |
| 12-31-10 | | | 1,685,165 | | | | 73,867 | | | | (1,059,767 | ) | | | 699,265 | | | | 20,405,739 | | | | 845,780 | | | | (12,891,926 | ) | | | 8,359,593 | | |
| 12-31-09 | | | 1,152,132 | | | | 142,585 | | | | (1,315,322 | ) | | | (20,605 | ) | | | 12,171,697 | | | | 1,502,850 | | | | (12,353,228 | ) | | | 1,321,319 | | |
| Class I | | | |
| 12-31-10 | | | 1,763,905 | | | | 1,917,543 | | | | (13,327,518 | ) | | | (9,646,070 | ) | | | 22,441,764 | | | | 22,588,655 | | | | (165,741,630 | ) | | | (120,711,211 | ) | |
| 12-31-09 | | | 2,052,553 | | | | 4,791,939 | | | | (14,584,992 | ) | | | (7,740,500 | ) | | | 20,500,304 | | | | 51,896,697 | | | | (141,693,730 | ) | | | (69,296,729 | ) | |
| Class S | | | |
| 12-31-10 | | | 1,135,031 | | | | 215,839 | | | | (3,047,501 | ) | | | (1,696,631 | ) | | | 13,957,824 | | | | 2,475,668 | | | | (36,755,943 | ) | | | (20,322,451 | ) | |
| 12-31-09 | | | 1,722,578 | | | | 596,281 | | | | (4,737,063 | ) | | | (2,418,204 | ) | | | 17,393,048 | | | | 6,284,797 | | | | (46,029,889 | ) | | | (22,352,044 | ) | |
(1) Commencement of operations.
94
NOTES TO FINANCIAL STATEMENTS AS OF DECEMBER 31, 2010 (CONTINUED)
NOTE 9 — CAPITAL SHARES (continued)
| | | Shares sold | | Reinvestment
of
distributions | | Shares
redeemed | | Net increase
(decrease)
in shares
outstanding | | Shares sold | | Reinvestment
of
distributions | | Shares
redeemed | | Net increase
(decrease) | |
| Year or period ended | | # | | # | | # | | # | | ($) | | ($) | | ($) | | ($) | |
| Oppenheimer Global (continued) | | | |
| Class S2 | | | |
| 12-31-10 | | | — | | | | — | | | | — | | | | — | | | | — | | | | — | | | | — | | | | — | | |
| 02-27-09(1) - 12-31-09 | | | 408 | | | | — | | | | — | | | | 408 | | | | 3,000 | | | | — | | | | — | | | | 3,000 | | |
| Oppenheimer Global Strategic Income | | | |
| Class ADV | | | |
| 12-31-10 | | | 1,159,875 | | | | 82,852 | | | | (527,020 | ) | | | 715,707 | | | | 12,849,351 | | | | 928,779 | | | | (6,045,269 | ) | | | 7,732,861 | | |
| 12-31-09 | | | 487,421 | | | | 53,204 | | | | (463,426 | ) | | | 77,199 | | | | 4,931,393 | | | | 550,508 | | | | (4,126,489 | ) | | | 1,355,412 | | |
| Class I | | | |
| 12-31-10 | | | 3,757,899 | | | | 973,037 | | | | (3,819,469 | ) | | | 911,467 | | | | 43,279,872 | | | | 10,977,055 | | | | (42,984,301 | ) | | | 11,272,626 | | |
| 12-31-09 | | | 4,271,694 | | | | 1,323,637 | | | | (24,263,487 | ) | | | (18,668,156 | ) | | | 40,380,177 | | | | 13,616,424 | | | | (227,872,557 | ) | | | (173,875,956 | ) | |
| Class S | | | |
| 12-31-10 | | | 2,754,182 | | | | 286,102 | | | | (4,399,165 | ) | | | (1,358,881 | ) | | | 31,451,982 | | | | 3,226,945 | | | | (50,574,563 | ) | | | (15,895,636 | ) | |
| 12-31-09 | | | 1,885,106 | | | | 322,662 | | | | (2,843,836 | ) | | | (636,068 | ) | | | 18,287,420 | | | | 3,333,453 | | | | (27,934,097 | ) | | | (6,313,224 | ) | |
| Class S2 | | | |
| 03-08-10(1) - 12-31-10 | | | 279 | | | | — | | | | — | | | | 279 | | | | 3,000 | | | | — | | | | — | | | | 3,000 | | |
| PIMCO Total Return | | | |
| Class ADV | | | |
| 12-31-10 | | | 6,006,717 | | | | 380,376 | | | | (1,654,988 | ) | | | 4,732,105 | | | | 71,281,320 | | | | 4,518,872 | | | | (19,699,661 | ) | | | 56,100,531 | | |
| 12-31-09 | | | 4,800,156 | | | | 362,184 | | | | (1,134,942 | ) | | | 4,027,398 | | | | 54,259,087 | | | | 3,994,886 | | | | (12,391,672 | ) | | | 45,862,301 | | |
| Class I | | | |
| 12-31-10 | | | 10,278,804 | | | | 1,507,538 | | | | (4,639,438 | ) | | | 7,146,904 | | | | 124,111,320 | | | | 18,271,355 | | | | (56,505,250 | ) | | | 85,877,425 | | |
| 12-31-09 | | | 13,635,753 | | | | 1,969,882 | | | | (2,701,629 | ) | | | 12,904,006 | | | | 156,677,219 | | | | 22,082,374 | | | | (30,662,588 | ) | | | 148,097,005 | | |
| Class S | | | |
| 12-31-10 | | | 11,438,296 | | | | 1,255,296 | | | | (3,784,958 | ) | | | 8,908,634 | | | | 137,078,715 | | | | 15,088,653 | | | | (45,460,536 | ) | | | 106,706,832 | | |
| 12-31-09 | | | 13,706,052 | | | | 1,726,768 | | | | (2,423,739 | ) | | | 13,009,081 | | | | 155,610,721 | | | | 19,236,199 | | | | (27,740,199 | ) | | | 147,106,721 | | |
| Class S2 | | | |
| 12-31-10 | | | 116,786 | | | | 1,000 | | | | (33,413 | ) | | | 84,373 | | | | 1,398,182 | | | | 11,839 | | | | (397,451 | ) | | | 1,012,570 | | |
| 02-27-09(1) - 12-31-09 | | | 284 | | | | — | | | | — | | | | 284 | | | | 3,000 | | | | — | | | | — | | | | 3,000 | | |
| Pioneer High Yield | | | |
| Class ADV | | | |
| 12-31-10 | | | 9,759 | | | | 400 | | | | (2,486 | ) | | | 7,673 | | | | 99,278 | | | | 4,180 | | | | (25,951 | ) | | | 77,507 | | |
| 12-31-09 | | | 228,227 | | | | 12,846 | | | | (356,727 | ) | | | (115,654 | ) | | | 1,774,762 | | | | 103,323 | | | | (3,327,652 | ) | | | (1,449,567 | ) | |
| Class I | | | |
| 12-31-10 | | | 2,088,911 | | | | 550,259 | | | | (3,108,077 | ) | | | (468,907 | ) | | | 21,686,531 | | | | 5,723,733 | | | | (31,988,737 | ) | | | (4,578,473 | ) | |
| 12-31-09 | | | 5,785,109 | | | | 1,922,664 | | | | (41,311,511 | ) | | | (33,603,738 | ) | | | 43,491,871 | | | | 14,152,308 | | | | (305,942,091 | ) | | | (248,297,912 | ) | |
| Class S | | | |
| 12-31-10 | | | 84,561 | | | | 15,599 | | | | (192,928 | ) | | | (92,768 | ) | | | 884,719 | | | | 161,580 | | | | (1,980,376 | ) | | | (934,077 | ) | |
| 12-31-09 | | | 185,894 | | | | 27,833 | | | | (248,059 | ) | | | (34,332 | ) | | | 1,520,476 | | | | 221,212 | | | | (2,208,753 | ) | | | (467,065 | ) | |
| T. Rowe Price Diversified Mid Cap Growth | | | |
| Class ADV | | | |
| 12-31-10 | | | 1,061,333 | | | | 2,528 | | | | (981,763 | ) | | | 82,098 | | | | 7,448,938 | | | | 16,555 | | | | (6,794,250 | ) | | | 671,243 | | |
| 12-31-09 | | | 1,580,127 | | | | 1,255 | | | | (1,265,064 | ) | | | 316,318 | | | | 8,799,096 | | | | 7,178 | | | | (6,631,129 | ) | | | 2,175,145 | | |
| Class I | | | |
| 12-31-10 | | | 2,227,521 | | | | 240,936 | | | | (12,003,854 | ) | | | (9,535,397 | ) | | | 16,798,421 | | | | 1,970,693 | | | | (85,547,112 | ) | | | (66,777,998 | ) | |
| 12-31-09 | | | 2,697,184 | | | | 365,655 | | | | (10,864,344 | ) | | | (7,801,505 | ) | | | 14,516,087 | | | | 2,449,529 | | | | (58,494,999 | ) | | | (41,529,383 | ) | |
| Class S | | | |
| 12-31-10 | | | 480,466 | | | | 1,994 | | | | (782,508 | ) | | | (300,048 | ) | | | 3,406,685 | | | | 13,597 | | | | (5,525,877 | ) | | | (2,105,595 | ) | |
| 12-31-09 | | | 1,501,967 | | | | 6,414 | | | | (392,147 | ) | | | 1,116,234 | | | | 7,982,312 | | | | 41,999 | | | | (2,172,085 | ) | | | 5,852,226 | | |
| Class S2 | | | |
| 12-31-10 | | | — | | | | — | | | | — | | | | — | | | | — | | | | — | | | | — | | | | — | | |
| 02-27-09(1) - 12-31-09 | | | 761 | | | | — | | | | — | | | | 761 | | | | 3,000 | | | | — | | | | — | | | | 3,000 | | |
| T. Rowe Price Growth Equity | | | |
| Class ADV | | | |
| 12-31-10 | | | 582,797 | | | | 703 | | | | (274,182 | ) | | | 309,318 | | | | 27,415,126 | | | | 31,137 | | | | (13,126,887 | ) | | | 14,319,376 | | |
| 12-31-09 | | | 387,687 | | | | — | | | | (316,813 | ) | | | 70,874 | | | | 14,939,655 | | | | — | | | | (12,026,401 | ) | | | 2,913,254 | | |
(1) Commencement of operations.
95
NOTES TO FINANCIAL STATEMENTS AS OF DECEMBER 31, 2010 (CONTINUED)
NOTE 9 — CAPITAL SHARES (continued)
| | | Shares sold | | Reinvestment
of
distributions | | Shares
redeemed | | Net increase
(decrease)
in shares
outstanding | | Shares sold | | Reinvestment
of
distributions | | Shares
redeemed | | Net increase
(decrease) | |
| Year or period ended | | # | | # | | # | | # | | ($) | | ($) | | ($) | | ($) | |
| T. Rowe Price Growth Equity (continued) | | | |
| Class I | | | |
| 12-31-10 | | | 954,377 | | | | 6,088 | | | | (2,390,396 | ) | | | (1,429,931 | ) | | | 45,470,812 | | | | 274,344 | | | | (114,665,943 | ) | | | (68,920,787 | ) | |
| 12-31-09 | | | 2,322,970 | | | | 23,754 | | | | (8,911,087 | ) | | | (6,564,363 | ) | | | 86,541,202 | | | | 1,115,497 | | | | (333,985,164 | ) | | | (246,328,465 | ) | |
| Class S | | | |
| 12-31-10 | | | 833,938 | | | | 1,165 | | | | (932,307 | ) | | | (97,204 | ) | | | 40,813,289 | | | | 51,974 | | | | (42,878,010 | ) | | | (2,012,747 | ) | |
| 12-31-09 | | | 1,850,337 | | | | 203 | | | | (719,559 | ) | | | 1,130,981 | | | | 70,439,283 | | | | 9,470 | | | | (26,731,143 | ) | | | 43,717,610 | | |
| Class S2 | | | |
| 12-31-10 | | | — | | | | — | | | | — | | | | — | | | | — | | | | — | | | | — | | | | — | | |
| 02-27-09(1) - 12-31-09 | | | 101 | | | | — | | | | — | | | | 101 | | | | 3,000 | | | | — | | | | — | | | | 3,000 | | |
| Templeton Foreign Equity | | | |
| Class ADV | | | |
| 12-31-10 | | | 468,290 | | | | 23,458 | | | | (205,465 | ) | | | 286,283 | | | | 4,807,487 | | | | 226,608 | | | | (2,049,331 | ) | | | 2,984,764 | | |
| 12-31-09 | | | 144,462 | | | | — | | | | (251,810 | ) | | | (107,348 | ) | | | 1,243,789 | | | | — | | | | (2,025,621 | ) | | | (781,832 | ) | |
| Class I | | | |
| 12-31-10 | | | 15,810,589 | | | | 742,177 | | | | (6,518,153 | ) | | | 10,034,613 | | | | 166,257,143 | | | | 7,199,119 | | | | (65,696,451 | ) | | | 107,759,811 | | |
| 12-31-09 | | | 12,807,554 | | | | — | | | | (38,332,837 | ) | | | (25,525,283 | ) | | | 117,548,641 | | | | — | | | | (371,301,632 | ) | | | (253,752,991 | ) | |
| Class S | | | |
| 12-31-10 | | | 7,396,784 | | | | 561,312 | | | | (7,453,377 | ) | | | 504,719 | | | | 76,185,878 | | | | 5,422,278 | | | | (73,171,326 | ) | | | 8,436,830 | | |
| 12-31-09 | | | 7,298,979 | | | | — | | | | (4,237,115 | ) | | | 3,061,864 | | | | 66,610,193 | | | | — | | | | (35,820,665 | ) | | | 30,789,528 | | |
| Class S2 | | | |
| 12-31-10 | | | 31,345 | | | | — | | | | (22,585 | ) | | | 8,760 | | | | 310,603 | | | | — | | | | (233,343 | ) | | | 77,260 | | |
| 02-27-09(1) - 12-31-09 | | | 476 | | | | — | | | | (1 | ) | | | 475 | | | | 3,006 | | | | — | | | | (6 | ) | | | 3,000 | | |
| Thornburg Value | | | |
| Class ADV | | | |
| 12-31-10 | | | 268,869 | | | | 6,793 | | | | (42,720 | ) | | | 232,942 | | | | 7,786,475 | | | | 183,003 | | | | (1,217,143 | ) | | | 6,752,335 | | |
| 12-31-09 | | | 166,110 | | | | 985 | | | | (21,614 | ) | | | 145,481 | | | | 4,297,065 | | | | 25,124 | | | | (450,897 | ) | | | 3,871,292 | | |
| Class I | | | |
| 12-31-10 | | | 2,809,171 | | | | 153,054 | | | | (2,453,686 | ) | | | 508,539 | | | | 82,081,301 | | | | 4,222,751 | | | | (73,656,449 | ) | | | 12,647,603 | | |
| 12-31-09 | | | 4,362,493 | | | | 130,831 | | | | (9,429,523 | ) | | | (4,936,199 | ) | | | 105,850,122 | | | | 3,404,235 | | | | (237,367,398 | ) | | | (128,113,041 | ) | |
| Class S | | | |
| 12-31-10 | | | 213,465 | | | | 9,083 | | | | (129,274 | ) | | | 93,274 | | | | 6,277,036 | | | | 249,052 | | | | (3,859,707 | ) | | | 2,666,381 | | |
| 12-31-09 | | | 219,296 | | | | 2,665 | | | | (56,695 | ) | | | 165,266 | | | | 5,870,600 | | | | 69,033 | | | | (1,304,154 | ) | | | 4,635,479 | | |
| Class S2 | | | |
| 03-08-10(1) - 12-31-10 | | | 101 | | | | — | | | | — | | | | 101 | | | | 3,000 | | | | — | | | | — | | | | 3,000 | | |
| UBS U.S. Large Cap Equity | | | |
| Class ADV | | | |
| 12-31-10 | | | 286,682 | | | | 4,778 | | | | (253,249 | ) | | | 38,211 | | | | 2,292,505 | | | | 39,903 | | | | (2,067,298 | ) | | | 265,110 | | |
| 12-31-09 | | | 173,020 | | | | 8,739 | | | | (233,152 | ) | | | (51,393 | ) | | | 1,199,718 | | | | 67,697 | | | | (1,515,387 | ) | | | (247,972 | ) | |
| Class I | | | |
| 12-31-10 | | | 1,100,320 | | | | 151,781 | | | | (4,095,285 | ) | | | (2,843,184 | ) | | | 8,889,048 | | | | 1,330,636 | | | | (33,557,910 | ) | | | (23,338,226 | ) | |
| 12-31-09 | | | 8,629,008 | | | | 258,486 | | | | (27,670,542 | ) | | | (18,783,048 | ) | | | 48,391,574 | | | | 2,051,531 | | | | (178,737,941 | ) | | | (128,294,836 | ) | |
| Class S | | | |
| 12-31-10 | | | 123,580 | | | | 14,704 | | | | (484,459 | ) | | | (346,175 | ) | | | 1,001,949 | | | | 126,214 | | | | (3,934,980 | ) | | | (2,806,817 | ) | |
| 12-31-09 | | | 251,175 | | | | 28,269 | | | | (943,535 | ) | | | (664,091 | ) | | | 1,650,270 | | | | 221,412 | | | | (5,936,867 | ) | | | (4,065,185 | ) | |
| Van Kampen Comstock | | | |
| Class ADV | | | |
| 12-31-10 | | | 306,680 | | | | 18,246 | | | | (470,485 | ) | | | (145,559 | ) | | | 2,827,981 | | | | 175,261 | | | | (4,267,116 | ) | | | (1,263,874 | ) | |
| 12-31-09 | | | 452,119 | | | | 35,135 | | | | (602,105 | ) | | | (114,851 | ) | | | 3,534,732 | | | | 312,120 | | | | (4,826,218 | ) | | | (979,366 | ) | |
| Class I | | | |
| 12-31-10 | | | 328,721 | | | | 75,512 | | | | (1,194,353 | ) | | | (790,120 | ) | | | 3,044,494 | | | | 741,072 | | | | (10,998,830 | ) | | | (7,213,264 | ) | |
| 12-31-09 | | | 5,760,512 | | | | 202,162 | | | | (50,586,981 | ) | | | (44,624,307 | ) | | | 37,882,745 | | | | 1,759,042 | | | | (383,559,474 | ) | | | (343,917,687 | ) | |
| Class S | | | |
| 12-31-10 | | | 3,764,510 | | | | 349,684 | | | | (4,609,011 | ) | | | (494,817 | ) | | | 35,380,215 | | | | 3,403,234 | | | | (42,404,980 | ) | | | (3,621,531 | ) | |
| 12-31-09 | | | 2,372,617 | | | | 559,418 | | | | (4,098,237 | ) | | | (1,166,202 | ) | | | 17,764,235 | | | | 5,001,841 | | | | (30,145,478 | ) | | | (7,379,402 | ) | |
(1) Commencement of operations.
96
NOTES TO FINANCIAL STATEMENTS AS OF DECEMBER 31, 2010 (CONTINUED)
NOTE 9 — CAPITAL SHARES (continued)
| | | Shares sold | | Reinvestment
of
distributions | | Shares
redeemed | | Net increase
(decrease)
in shares
outstanding | | Shares sold | | Reinvestment
of
distributions | | Shares
redeemed | | Net increase
(decrease) | |
| Year or period ended | | # | | # | | # | | # | | ($) | | ($) | | ($) | | ($) | |
| Van Kampen Equity and Income | | | |
| Class ADV | | | |
| 12-31-10 | | | 189,379 | | | | 5,909 | | | | (101,377 | ) | | | 93,911 | | | | 5,985,601 | | | | 195,092 | | | | (3,227,620 | ) | | | 2,953,073 | | |
| 12-31-09 | | | 96,255 | | | | 4,706 | | | | (156,821 | ) | | | (55,860 | ) | | | 2,528,958 | | | | 143,246 | | | | (4,228,300 | ) | | | (1,556,096 | ) | |
| Class I | | | |
| 12-31-10 | | | 501,284 | | | | 317,540 | | | | (1,904,712 | ) | | | (1,085,888 | ) | | | 16,008,586 | | | | 10,643,886 | | | | (60,580,845 | ) | | | (33,928,373 | ) | |
| 12-31-09 | | | 284,385 | | | | 330,873 | | | | (2,216,547 | ) | | | (1,601,289 | ) | | | 7,721,030 | | | | 10,243,047 | | | | (59,375,778 | ) | | | (41,411,701 | ) | |
| Class S | | | |
| 12-31-10 | | | 860,252 | | | | 113,975 | | | | (952,848 | ) | | | 21,379 | | | | 27,421,353 | | | | 3,780,796 | | | | (30,038,766 | ) | | | 1,163,383 | | |
| 12-31-09 | | | 897,870 | | | | 112,678 | | | | (1,492,377 | ) | | | (481,829 | ) | | | 24,020,178 | | | | 3,459,054 | | | | (41,185,386 | ) | | | (13,706,154 | ) | |
| Class S2 | | | |
| 12-31-10 | | | 31,463 | | | | 423 | | | | (7,009 | ) | | | 24,877 | | | | 971,257 | | | | 13,893 | | | | (217,674 | ) | | | 767,476 | | |
| 02-27-09(1) - 12-31-09 | | | 135 | | | | — | | | | — | | | | 135 | | | | 3,000 | | | | — | | | | — | | | | 3,000 | | |
| | | | |
(1) Commencement of operations.
NOTE 10 — LINE OF CREDIT
The Portfolios, in addition to certain other funds managed by the Investment Advisers, have entered into an unsecured committed revolving line of credit agreement (the "Credit Agreement") with The Bank of New York Mellon for an aggregate amount of $125,000,000. The proceeds may be used to: (1) temporarily finance the purchase and sale of securities; or (2) finance the redemption of shares of an investor in the funds. The funds pay a commitment fee equal to 0.15% per annum on the daily unused portion of the committed line amount payable quarterly in arrears.
Generally, borrowings under the Credit Agreement accrue interest at the federal funds rate plus a specified margin. Repayments generally must be made within 60 days after the date of a revolving credit advance. The following Portfolios utilized the line of credit during the year ended December 31, 2010:
| Portfolio | | Days
Utilized | | Approximate
Average Daily
Balance | | Approximate
Weighted
Average
Interest Rate | |
| Columbia Small Cap Value | | | 2 | | | $ | 600,000 | | | | 1.45 | % | |
| Davis New York Venture | | | 12 | | | | 2,032,083 | | | | 1.44 | | |
| JPMorgan Mid Cap Value | | | 4 | | | | 755,000 | | | | 1.44 | | |
Legg Mason ClearBridge
Aggressive Growth | | | 106 | | | | 586,745 | | | | 1.44 | | |
Oppenheimer Global
Strategic Income | | | 6 | | | | 2,245,000 | | | | 1.38 | | |
| PIMCO Total Return | | | 2 | | | | 4,752,500 | | | | 1.43 | | |
| Pioneer High Yield | | | 36 | | | | 1,721,944 | | | | 1.44 | | |
T. Rowe Price Diversified
Mid Cap Growth | | | 7 | | | | 1,222,525 | | | | 1.40 | | |
| T. Rowe Price Growth Equity | | | 3 | | | | 1,726,667 | | | | 1.41 | | |
| Templeton Foreign Equity | | | 12 | | | | 1,665,000 | | | | 1.40 | | |
| Thornburg Value | | | 10 | | | | 969,000 | | | | 1.44 | | |
| UBS U.S. Large Cap Equity | | | 13 | | | | 760,769 | | | | 1.42 | | |
| Van Kampen Comstock | | | 1 | | | | 1,040,000 | | | | 1.43 | | |
NOTE 11 — CONCENTRATION OF RISKS
All mutual funds involve risk — some more than others — and there is always the chance that you could lose money or not earn as much as you hope. Each Portfolio's risk profile is largely a factor of the principal securities in which it invests and investment techniques that it uses. For more information regarding the types of securities and investment techniques that may be used by each Portfolio and its corresponding risks, see the Portfolios' most recent Prospectus and/or the Statement of Additional Information.
Foreign Securities. Investments in foreign securities may entail risks not present in domestic investments. Since securities in which a Portfolio may invest are denominated in foreign currencies, changes in the relationship of these foreign currencies to the U.S. dollar can significantly affect the value of the investments and earnings of a Portfolio. Foreign investments may also subject a Portfolio to foreign government exchange restrictions, expropriation, taxation or other political, social or economic developments, as well as changes vis-a-vis the U.S. dollar from movements in currency, and changes in security value and interest rate, all of which could affect the market and/or credit risk of a Portfolio investments.
Emerging Markets Risk. Emerging market countries are generally defined as countries in the initial stage of their industrialization cycles with low per capita income. Investments in emerging market countries present risks in a greater degree than, and in addition to, those presented by investments in foreign issuers in general as these countries may be less politically and economically stable than other countries. A number of emerging market countries restrict, to varying degrees, foreign investment in stocks. Repatriation of
97
NOTES TO FINANCIAL STATEMENTS AS OF DECEMBER 31, 2010 (CONTINUED)
NOTE 11 — CONCENTRATION OF RISKS (continued)
investment income, capital and proceeds of sales by foreign investors may require governmental registration and/or approval in some emerging market countries. A number of the currencies of developing countries have experienced significant declines against the U.S. dollar from time to time, and devaluation may occur after investments in those currencies by a Portfolio. Inflation and rapid fluctuations in inflation rates have had, and may continue to have, negative effects on the economies and securities markets of certain emerging market countries.
NOTE 12 — SECURITIES LENDING
Under an agreement with The Bank of New York Mellon ("BNY"), the Portfolios can lend their securities to approved brokers, dealers and other financial institutions. Loans are collateralized by cash and U.S. government securities. The collateral is equal to at least 105% of the market value of non-U.S. securities loaned and 102% of the market value of U.S. securities loaned. The market value of the loaned securities is determined at the close of business of the Portfolios at their last sale price or official closing price on the principal exchange or system on which they are traded and any additional collateral is delivered to the Portfolios on the next business day. The cash collateral received is invested in approved investments as defined in the Securities Lending Agreement with BNY (the "Agreement"). The Portfolios bear the risk of loss with respect to the investment of collateral. Currently, the cash collateral is invested in the BNY Mellon Overnight Government Fund (formerly, The BNY Institutional Cash Reserves Fund — Series A) and the BNY Institutional Cash Reserves Fund — Series B ("BICR — Series B"), each a series within the BNY Institutional Cash Reserves Trust (collectively, the "BICR Fund"). BNY serves as investment manager, custodian and operational trustee of the BICR Fund. As of December 31, 2010, and throughout the period covered by this report, BICR-Series B held certain defaulted securities issued by Lehman Brothers Holdings, Inc. (the "Lehman Securities"). The Lehman Securities have market values significantly below amortized cost. On May 22, 2009, the Portfolios agreed to the terms of a capital support agreement (the "Capital Support Agreement") extended by The Bank of New York Mellon Corporation ("BNYC"), an affiliated company of BNY, for the Lehman Securities held by BICR- Series B. Under the terms of the Capital Support Agreement, BNYC will support the value of the Lehman Securities up to 80% of the par value (the remaining 20% of the par value represents an unrealized loss to the Portfolios) and subject, in part, to the Portfolios' continued participation in the BNY securities lending program through September 15, 2011. At September 15, 2011, if the Portfolios have complied with the requirements under the Capital Support Agreement to continue to participate in the BNY securities lending program and if such securities have not otherwise been sold, the Portfolios will have the right to sell the defaulted securities to BNYC at a price equal to 80% of par value. The recorded value of each Portfolio's investment in BICR-Series B includes the value of the underlying securities held by BICR-Series B and the estimated value of the support to be provided by BNYC. The investments in the BNY Mellon Overnight Government Fund and in BICR-Series B are included in the Summary Portfolio of Investments under Securities Lending Collateral and the unrealized loss on BICR-Series B is included in Net Unrealized Depreciation on the Statements of Assets and Liabilities.
Generally, in the event of counterparty default, the Portfolios have the right to use the collateral to offset losses incurred. The Agreement contains certain guarantees by BNY in the event of counterparty default and/or a borrower's failure to return a loaned security; however, there would be a potential loss to the Portfolios in the event the Portfolios are delayed or prevented from exercising their right to dispose of the collateral. Engaging in securities lending could have a leveraging effect, which may intensify the credit, market and other risks associated with investing in a Portfolio. At December 31, 2010, the following Portfolios had securities on loan with the following market values:
| Portfolio | | Value of
Securities
Loaned | | Cash
Collateral
Received* | |
American Century
Small-Mid Cap Value | | $ | 4,834,113 | | | $ | 4,997,061 | | |
| JPMorgan Mid Cap Value | | | 5,849,258 | | | | 6,018,647 | | |
Legg Mason ClearBridge
Aggressive Growth | | | 5,331,883 | | | | 5,499,052 | | |
| Oppenheimer Global | | | 4,579,808 | | | | 4,815,976 | | |
Oppenheimer Global
Strategic Income | | | 30,413,826 | | | | 31,148,871 | | |
| PIMCO Total Return | | | 50,769,467 | | | | 51,850,480 | | |
T. Rowe Price Diversified
Mid Cap Growth | | | 40,465,726 | | | | 41,455,217 | | |
| T. Rowe Price Growth Equity | | | 10,345,653 | | | | 10,585,550 | | |
| Thornburg Value | | | 8,992,162 | | | | 9,183,945 | | |
| UBS U.S. Large Cap Equity | | | 6,868,436 | | | | 7,080,048 | | |
| Van Kampen Comstock | | | 20,127,816 | | | | 20,689,724 | | |
* Cash Collateral received was invested in the BICR Fund, the fair value of which is presented in the respective Portfolios' Summary Portfolio of Investments.
98
NOTES TO FINANCIAL STATEMENTS AS OF DECEMBER 31, 2010 (CONTINUED)
NOTE 13 — UNFUNDED LOAN COMMITMENTS
Certain Portfolios may enter in credit agreements, all or a portion of which may be unfunded. The Portfolios are obligated to fund these loan commitments at the borrower's discretion. Funded portions of the credit agreements are presented in the Portfolio of Investments.
At December 31, 2010, Pioneer High Yield had the following unfunded loan commitments:
| Loan | | Unfunded
Commitments | | Unrealized
Appreciation
at 12/31/10* | |
| Commscope, Inc. | | $ | 1,000,000 | | | $ | 870 | | |
| Del Monte Foods Co. | | | 385,000 | | | | 1,733 | | |
| Polymer Group, Inc. | | | 250,000 | | | | — | | |
| | | $ | 1,635,000 | | | $ | 2,603 | | |
* Unfunded loan commitments are marked to market daily and any unrealized appreciation or depreciation is included in the Portfolio's Statement of Assets and Liabilities and Statement of Operations.
NOTE 14 — FEDERAL INCOME TAXES
The amount of distributions from net investment income and net realized capital gains are determined in accordance with federal income tax regulations, which may differ from U.S. generally accepted accounting principles for investment companies. These book/tax differences may be either temporary or permanent. Permanent differences are reclassified within the capital accounts based on their federal tax-basis treatment; temporary differences are not reclassified. Key differences include the treatment of short-term capital gains, foreign currency transactions, income from passive foreign investment companies (PFICs), and wash sale deferrals. Distributions in excess of net investment income and/or net realized capital gains for tax purposes are reported as return of capital.
The following permanent tax differences have been reclassified as of December 31, 2010:
| | | Paid-in
Capital | | Undistributed
Net
Investment
Income | | Accumulated
Net Realized
Gains/
(Losses) | |
American Century
Small-Mid Cap
Value | | $ | — | | | $ | (160,292 | ) | | $ | 160,292 | | |
Baron Small Cap
Growth | | | (3,200,563 | ) | | | 2,608,519 | | | | 592,044 | | |
Columbia Small Cap
Value | | | — | | | | (197,491 | ) | | | 197,491 | | |
Davis New York
Venture | | | — | | | | 2,116,872 | | | | (2,116,872 | ) | |
JPMorgan Mid Cap
Value | | | — | | | | (98,321 | ) | | | 98,321 | | |
| | | Paid-in
Capital | | Undistributed
Net
Investment
Income | | Accumulated
Net Realized
Gains/
(Losses) | |
Legg Mason
ClearBridge
Aggressive
Growth(1) | | $ | (173,495,258 | ) | | $ | 8 | | | $ | 173,495,250 | | |
| Oppenheimer Global | | | — | | | | 1,545,708 | | | | (1,545,708 | ) | |
Oppenheimer Global
Strategic Income | | | (2,205 | ) | | | 2,746,901 | | | | (2,744,696 | ) | |
| PIMCO Total Return | | | — | | | | 8,008,437 | | | | (8,008,437 | ) | |
| Pioneer High Yield | | | — | | | | 45,293 | | | | (45,293 | ) | |
T. Rowe Price
Diversified Mid
Cap Growth | | | — | | | | (16,771 | ) | | | 16,771 | | |
T. Rowe Price
Growth Equity | | | (601,947 | ) | | | 610,124 | | | | (8,177 | ) | |
Templeton Foreign
Equity | | | — | | | | 666,553 | | | | (666,553 | ) | |
| Thornburg Value(2) | | | (87,200,741 | ) | | | (117,504 | ) | | | 87,318,245 | | |
UBS U.S. Large Cap
Equity(3) | | | (21,915,614 | ) | | | 282 | | | | 21,915,332 | | |
Van Kampen
Comstock | | | — | | | | 1,243 | | | | (1,243 | ) | |
Van Kampen Equity
and Income | | | — | | | | 2,344 | | | | (2,344 | ) | |
(1) $173,495,258 relates to the expiration of capital loss carryforwards.
(2) $87,200,557 relates to the expiration of capital loss carryforwards.
(3) $21,915,614 relates to the expiration of capital loss carryforwards.
Dividends paid by the Portfolios from net investment income and distributions of net realized short-term capital gains are, for federal income tax purposes, taxable as ordinary income to shareholders.
The tax composition of dividends and distributions to shareholders was as follows:
| | | Year Ended
December 31, 2010 | | Year Ended
December 31, 2009 | |
| | | Ordinary
Income | | Ordinary
Income | | Long-Term
Capital Gains | |
American Century
Small-Mid Cap Value | | $ | 1,814,544 | | | $ | 1,612,563 | | | $ | — | | |
Columbia Small Cap
Value | | | 2,720,959 | | | | 4,830,510 | | | | — | | |
| Davis New York Venture | | | 2,263,598 | | | | 2,934,979 | | | | — | | |
| JPMorgan Mid Cap Value | | | 2,505,506 | | | | 2,752,613 | | | | 3,205,983 | | |
| Oppenheimer Global | | | 25,910,174 | | | | 34,288,307 | | | | 25,396,221 | | |
Oppenheimer Global
Strategic Income | | | 15,132,879 | | | | 17,500,385 | | | | — | | |
| PIMCO Total Return | | | 37,890,843 | | | | 33,533,236 | | | | 11,780,452 | | |
| Pioneer High Yield | | | 5,889,493 | | | | 14,478,661 | | | | — | | |
T. Rowe Price Diversified
Mid Cap Growth | | | 2,000,848 | | | | 2,498,706 | | | | — | | |
T. Rowe Price Growth
Equity | | | 357,457 | | | | 1,124,967 | | | | — | | |
Templeton Foreign
Equity | | | 12,848,107 | | | | — | | | | — | | |
| Thornburg Value | | | 4,654,851 | | | | 3,498,392 | | | | — | | |
UBS U.S. Large Cap
Equity | | | 1,496,753 | | | | 2,340,640 | | | | — | | |
| Van Kampen Comstock | | | 4,319,567 | | | | 7,073,003 | | | | — | | |
Van Kampen Equity and
Income | | | 14,633,667 | | | | 13,845,411 | | | | — | | |
99
NOTES TO FINANCIAL STATEMENTS AS OF DECEMBER 31, 2010 (CONTINUED)
NOTE 14 — FEDERAL INCOME TAXES (continued)
The tax-basis components of distributable earnings and the expiration dates of the capital loss carryforwards which may be used to offset future realized capital gains for federal income tax purposes as of December 31, 2010 were:
| | | Undistributed
Ordinary Income | | Undistributed
Long-Term
Capital
Gains | | Unrealized
Appreciation/
(Depreciation) | | Post-October
Capital Loss
Deferred | | Post-October
Currency Loss
Deferred | | Capital Loss
Carryforwards | | Expiration
Dates | |
American Century
Small-Mid Cap Value | | $ | 2,427,720 | | | $ | — | | | $ | 19,083,973 | | | $ | — | | | $ | (34,077 | ) | | $ | (1,186,745 | ) | | | 2017 | | |
| Baron Small Cap Growth | | | — | | | | — | | | | 298,324,591 | | | | — | | | | — | | | | (100,469,299 | ) | | | 2016 | | |
| | | | | | | | | | | | | | (15,294,592 | ) | | | 2017 | | |
| | | | | | | | | | | | | $ | (115,763,891 | ) | | | | | |
| Columbia Small Cap Value | | | 784,083 | | | | — | | | | 44,124,700 | | | | — | | | | — | | | | (372,659 | ) | | | 2016 | | |
| | | | | | | | | | | | | | (95,750,634 | ) | | | 2017 | | |
| | | | | | | | | | | | | $ | (96,123,293 | ) | | | | | |
| Davis New York Venture | | | 4,864,358 | | | | — | | | | 58,281,915 | | | | — | | | | — | | | | (20,459,304 | ) | | | 2016 | | |
| | | | | | | | | | | | | | (57,895,293 | ) | | | 2017 | | |
| | | | | | | | | | | | | $ | (78,354,597 | ) | | | | | |
| JPMorgan Mid Cap Value | | | 522,764 | | | | — | | | | 52,038,933 | | | | (1,796,242 | ) | | | — | | | $ | (25,498,363 | ) | | | 2017 | | |
Legg Mason ClearBridge
Aggressive Growth | | | 1,102,562 | | | | — | | | | 97,409,275 | | | | — | | | | — | | | $ | (659,727 | ) | | | 2018 | | |
| Oppenheimer Global | | | 23,608,438 | | | | — | | | | 283,953,883 | | | | — | | | | (79,642 | ) | | | (64,660,749 | ) | | | 2017 | | |
| | | | | | | | | | | | | | (98,529 | ) | | | 2018 | | |
| | | | | | | | | | | | | $ | (64,759,278 | ) | | | | | |
Oppenheimer Global
Strategic Income | | | 33,907,193 | | | | — | | | | 16,264,220 | | | | — | | | | — | | | $ | (19,904,872 | ) | | | 2017 | | |
| PIMCO Total Return | | | 60,657,940 | | | | 14,063,613 | | | | 1,137,419 | | | | — | | | | — | | | | — | | | | | | |
| Pioneer High Yield | | | 431,688 | | | | — | | | | 14,732,706 | | | | — | | | | — | | | | (325,965 | ) | | | 2015 | | |
| | | | | | | | | | | | | | (7,221,768 | ) | | | 2016 | | |
| | | | | | | | | | | | | | (23,259,623 | ) | | | 2017 | | |
| | | | | | | | | | | | | $ | (30,807,356 | )* | | | | | |
T. Rowe Price Diversified
Mid Cap Growth | | | 875,058 | | | | — | | | | 151,919,191 | | | | — | | | | — | | | $ | (8,895,462 | ) | | | 2017 | | |
| T. Rowe Price Growth Equity | | | — | | | | — | | | | 274,338,654 | | | | — | | | | — | | | | (70,044,161 | ) | | | 2016 | | |
| | | | | | | | | | | | | | (107,754,093 | ) | | | 2017 | | |
| | | | | | | | | | | | | $ | (177,798,254 | ) | | | | | |
| Templeton Foreign Equity | | | 10,553,110 | | | | — | | | | 36,820,058 | | | | — | | | | — | | | | (32,605,130 | ) | | | 2016 | | |
| | | | | | | | | | | | | | (133,709,136 | ) | | | 2017 | | |
| | | | | | | | | | | | | $ | (166,314,266 | ) | | | | | |
| Thornburg Value | | | 2,067,409 | | | | — | | | | 23,338,915 | | | | — | | | | — | | | | (43,249,649 | ) | | | 2016 | | |
| | | | | | | | | | | | | | (26,137,641 | ) | | | 2017 | | |
| | | | | | | | | | | | | $ | (69,387,290 | ) | | | | | |
| UBS U.S. Large Cap Equity | | | 280,179 | | | | — | | | | 26,074,144 | | | | — | | | | — | | | | (39,939,281 | ) | | | 2016 | | |
| | | | | | | | | | | | | | (84,654,342 | ) | | | 2017 | | |
| | | | | | | | | | | | | $ | (124,593,623 | ) | | | | | |
| Van Kampen Comstock | | | 567,416 | | | | — | | | | 28,244,260 | | | | — | | | | — | | | | (120,639,599 | ) | | | 2016 | | |
| | | | | | | | | | | | | | (130,908,420 | ) | | | 2017 | | |
| | | | | | | | | | | | | $ | (251,548,019 | ) | | | | | |
Van Kampen
Equity and Income | | | 3,335,536 | | | | — | | | | 106,731,165 | | | | — | | | | — | | | | (36,468,122 | ) | | | 2016 | | |
| | | | | | | | | | | | | | (31,391,642 | ) | | | 2017 | | |
| | | | | | | | | | | | | $ | (67,859,764 | ) | | | | | |
* Utilization of these capital losses is subject to annual limitations under Section 382 of the Internal Revenue Code. Amounts and years of expiration may be adjusted to reflect future gain/loss activity to comply with the limitation rules.
100
NOTES TO FINANCIAL STATEMENTS AS OF DECEMBER 31, 2010 (UNAUDITED) (CONTINUED)
NOTE 14 — FEDERAL INCOME TAXES (continued)
The Regulated Investment Company Modernization Act of 2010 (the "Act") was enacted on December 22, 2010. The Act makes changes to several tax rules impacting the Portfolios. In general, the provisions of the Act will be effective for the Portfolios' fiscal year ending December 31, 2011. Although the Act provides several benefits, including the unlimited carryforward of future capital losses, there may be a greater likelihood that all or a portion of each Portfolio's pre-enactment capital loss carryforwards may expire without being utilized due to the fact that post-enactment capital losses get utilized before pre-enactment capital loss carryforwards. Relevant information regarding the impact of the Act on the Portfolios, if any, will be contained within the Federal Income Taxes section of the notes to financial statements for the fiscal year ending December 31, 2011.
The Portfolios' major tax jurisdictions are federal and Arizona. The earliest tax year that remains subject to examination by these jurisdictions is 2006.
As of December 31, 2010, no provisions for income tax would be required in the Portfolios' financial statements as a result of tax positions taken on federal and state income tax returns for open tax years. The Portfolios' federal and state income and federal excise tax returns for tax years for which the applicable statutes of limitations have not expired are subject to examination by the Internal Revenue Service and state department of revenue.
NOTE 15 — SUBSEQUENT EVENTS
Effective January 1, 2011, an expense limitation agreement was implemented via a side letter for UBS U.S. Large Cap Equity. Effective January 21, 2011, Oppenheimer Global Strategic Income's name, sub-adviser, investment objective and principal investment strategies were changed. ING Investment Management Co. began managing the Portfolio under an interim sub-advisory agreement and the Portfolio's name changed to "ING Global Bond Portfolio." The Portfolio's principal investment strategy was changed to investing at least 80% of its net assets in bonds of issuers in a number of different countries. Concurrent with these changes, an advisory fee waiver, a revised administrative service fee and an expense limitation agreement were implemented for the Portfolio. Effective January 21, 2011, Legg Mason ClearBridge Aggressive Growth merged into ING Large Cap Growth Portfolio, which is not included in this report.
Subsequent to December 31, 2010, the following Portfolios paid dividends and distributions of:
| | | Per Share Amount | | | | | |
| | | Net
Investment
Income | | Long-Term
Capital
Gains | | Payable Date | | Record Date | |
| Legg Mason ClearBridge Aggressive Growth | |
| Class ADV | | $ | 0.0000 | | | $ | 11.4106 | | | January 21, 2011 | | January 19, 2011 | |
| Class I | | $ | 0.1678 | | | $ | 11.4106 | | | January 21, 2011 | | January 19, 2011 | |
| Class S | | $ | 0.0594 | | | $ | 11.4106 | | | January 21, 2011 | | January 19, 2011 | |
| Class S2 | | $ | 0.0495 | | | $ | 11.4106 | | | January 21, 2011 | | January 19, 2011 | |
| Pioneer High Yield | |
| Class ADV | | $ | 0.0475 | | | $ | 0.0000 | | | February 1, 2011 | | Daily | |
| Class I | | $ | 0.0526 | | | $ | 0.0000 | | | February 1, 2011 | | Daily | |
| Class S | | $ | 0.0501 | | | $ | 0.0000 | | | February 1, 2011 | | Daily | |
The Portfolios have evaluated events occurring after the Statements of Assets and Liabilities date (subsequent events) to determine whether any subsequent events necessitated adjustment to or disclosure in the financial statements. Other than the above, no such subsequent events were identified.
101
ING AMERICAN CENTURY SUMMARY PORTFOLIO OF INVESTMENTS
SMALL-MID CAP VALUE PORTFOLIO AS OF DECEMBER 31, 2010
Shares | |
| |
| | Value | | Percent of
Net Assets | |
| COMMON STOCK: 89.1% | | | |
| | | Consumer Discretionary: 10.9% | | | |
| | 35,900 | | | @ | | CEC Entertainment, Inc. | | $ | 1,393,997 | | | | 0.7 | | |
| | 99,500 | | | | | Lowe's Cos., Inc. | | | 2,495,460 | | | | 1.3 | | |
| | 66,000 | | | | | Staples, Inc. | | | 1,502,820 | | | | 0.8 | | |
| | | | | | | Other Securities | | | 15,800,487 | | | | 8.1 | | |
| | | | | | | | | | 21,192,764 | | | | 10.9 | | |
| | | Consumer Staples: 6.8% | | | |
| | 91,678 | | | | | | | ConAgra Foods, Inc. | | | 2,070,089 | | | | 1.1 | | |
| | 39,900 | | | | | | | CVS Caremark Corp. | | | 1,387,323 | | | | 0.7 | | |
| | 28,000 | | | | | | | HJ Heinz Co. | | | 1,384,880 | | | | 0.7 | | |
| | 35,900 | | | | | | | Kellogg Co. | | | 1,833,772 | | | | 1.0 | | |
| | 37,823 | | | | | | | Kimberly-Clark Corp. | | | 2,384,362 | | | | 1.2 | | |
| | | | | | | | | Other Securities | | | 4,025,565 | | | | 2.1 | | |
| | | | | | | | | | 13,085,991 | | | | 6.8 | | |
| | | Energy: 8.3% | | | |
| | 14,200 | | | | | | | Devon Energy Corp. | | | 1,114,842 | | | | 0.6 | | |
| | 42,597 | | | | | | | EQT Corp. | | | 1,910,049 | | | | 1.0 | | |
| | 78,700 | | | | | | | Imperial Oil Ltd. | | | 3,211,954 | | | | 1.6 | | |
| | 15,300 | | | | | | | Murphy Oil Corp. | | | 1,140,615 | | | | 0.6 | | |
| | | | | | | | | Other Securities | | | 8,738,303 | | | | 4.5 | | |
| | | | | | | | | | 16,115,763 | | | | 8.3 | | |
| | | Financials: 20.6% | | | |
| | 22,800 | | | | | | | ACE Ltd. | | | 1,419,300 | | | | 0.7 | | |
| | 34,900 | | | | | | | Allstate Corp. | | | 1,112,612 | | | | 0.6 | | |
| | 39,500 | | | | | | | AON Corp. | | | 1,817,395 | | | | 0.9 | | |
| | 37,136 | | | | | | | Comerica, Inc. | | | 1,568,625 | | | | 0.8 | | |
| | 38,401 | | | | | | | Commerce
Bancshares, Inc. | | | 1,525,672 | | | | 0.8 | | |
| | 87,689 | | | | | | | HCC Insurance
Holdings, Inc. | | | 2,537,719 | | | | 1.3 | | |
| | 116,700 | | | | | | | Hudson City Bancorp., Inc. | | | 1,486,758 | | | | 0.8 | | |
| | 61,876 | | | | | | | Marsh & McLennan
Cos., Inc. | | | 1,691,690 | | | | 0.9 | | |
| | 49,305 | | | | | | | Northern Trust Corp. | | | 2,731,990 | | | | 1.4 | | |
| | 117,378 | | | | | | | People's United
Financial, Inc. | | | 1,644,466 | | | | 0.9 | | |
| | 27,223 | | | | | | | Transatlantic
Holdings, Inc. | | | 1,405,251 | | | | 0.7 | | |
| | 26,000 | | | | | | | Travelers Cos., Inc. | | | 1,448,460 | | | | 0.7 | | |
| | | | | | | | | Other Securities | | | 19,473,777 | | | | 10.1 | | |
| | | | | | | | | | 39,863,715 | | | | 20.6 | | |
| | | Health Care: 7.5% | | | |
| | 27,401 | | | | | Beckman Coulter, Inc. | | | 2,061,377 | | | | 1.1 | | |
| | 42,900 | | | @ | | LifePoint Hospitals, Inc. | | | 1,576,575 | | | | 0.8 | | |
| | 51,300 | | | | | Patterson Cos., Inc. | | | 1,571,319 | | | | 0.8 | | |
| | 36,100 | | | @ | | Zimmer Holdings, Inc. | | | 1,937,848 | | | | 1.0 | | |
| | | | | | | | | Other Securities | | | 7,392,073 | | | | 3.8 | | |
| | | | | | | | | | 14,539,192 | | | | 7.5 | | |
Shares | |
| |
| | Value | | Percent of
Net Assets | |
| | | Industrials: 15.0% | | | |
| | 33,100 | | | | | Curtiss-Wright Corp. | | $ | 1,098,920 | | | | 0.6 | | |
| | 24,842 | | | | | Hubbell, Inc. | | | 1,493,749 | | | | 0.8 | | |
| | 21,300 | | | | | ITT Corp. | | | 1,109,943 | | | | 0.6 | | |
| | 37,134 | | | | | Kaydon Corp. | | | 1,512,096 | | | | 0.8 | | |
| | 115,817 | | | | | Republic Services, Inc. | | | 3,458,296 | | | | 1.8 | | |
| | 36,900 | | | @ | | Thomas & Betts Corp. | | | 1,782,270 | | | | 0.9 | | |
| | 32,700 | | | | | Tyco International Ltd. | | | 1,355,088 | | | | 0.7 | | |
| | | | | | | Other Securities | | | 17,155,817 | | | | 8.8 | | |
| | | | | | | | | | 28,966,179 | | | | 15.0 | | |
| | | Information Technology: 7.4% | | | |
| | 115,900 | | | | | | | Applied Materials, Inc. | | | 1,628,395 | | | | 0.9 | | |
| | | | | | | | | Other Securities | | | 12,634,254 | | | | 6.5 | | |
| | | | | | | | | | 14,262,649 | | | | 7.4 | | |
| | | Materials: 4.4% | | | |
| | 49,783 | | | | | | | Bemis Co. | | | 1,625,913 | | | | 0.8 | | |
| | 17,324 | | | | | | | Newmont Mining Corp. | | | 1,064,213 | | | | 0.6 | | |
| | | | | | | | | Other Securities | | | 5,793,264 | | | | 3.0 | | |
| | | | | | | | | | 8,483,390 | | | | 4.4 | | |
| | | Telecommunication Services: 1.4% | | | |
| | 186,200 | | | | | | | Qwest Communications
International, Inc. | | | 1,416,982 | | | | 0.7 | | |
| | | | | | | | | Other Securities | | | 1,347,112 | | | | 0.7 | | |
| | | | | | | | | | 2,764,094 | | | | 1.4 | | |
| | | Utilities: 6.8% | | | |
| | 32,896 | | | | | | | Northeast Utilities | | | 1,048,724 | | | | 0.5 | | |
| | 112,700 | | | | | | | NV Energy, Inc. | | | 1,583,435 | | | | 0.8 | | |
| | 31,700 | | | | | | | Pacific Gas & Electric Co. | | | 1,516,528 | | | | 0.8 | | |
| | 52,015 | | | | | | | Portland General
Electric Co. | | | 1,128,726 | | | | 0.6 | | |
| | 67,726 | | | | | | | Westar Energy, Inc. | | | 1,703,986 | | | | 0.9 | | |
| | 46,600 | | | | | | | Xcel Energy, Inc. | | | 1,097,430 | | | | 0.5 | | |
| | | | | | | | | Other Securities | | | 5,185,203 | | | | 2.7 | | |
| | | | | | | | | | 13,264,032 | | | | 6.8 | | |
| | | | | | | Total Common Stock
( Cost $150,706,333 ) | | | 172,537,769 | | | | 89.1 | | |
| REAL ESTATE INVESTMENT TRUSTS: 5.4% | | | |
| | | Financials: 5.4% | | | |
| | 54,935 | | | L | | Government Properties
Income Trust | | | 1,471,709 | | | | 0.8 | | |
| | 83,268 | | | L | | Piedmont Office Realty
Trust, Inc. | | | 1,677,018 | | | | 0.9 | | |
| | | | | | | | | Other Securities | | | 7,219,672 | | | | 3.7 | | |
| | | | | | | Total Real Estate
Investment Trusts
( Cost $8,912,503 ) | | | 10,368,399 | | | | 5.4 | | |
See Accompanying Notes to Financial Statements
102
ING AMERICAN CENTURY SUMMARY PORTFOLIO OF INVESTMENTS
SMALL-MID CAP VALUE PORTFOLIO AS OF DECEMBER 31, 2010 (CONTINUED)
Shares | |
| |
| | Value | | Percent of
Net Assets | |
| EXCHANGE-TRADED FUNDS: 2.7% | | | |
| | | Exchange-Traded Funds: 2.7% | | | |
| | 9,500 | | | | | | | iShares Russell 2000 Index
Fund | | $ | 743,185 | | | | | | |
| | 21,200 | | | | | | | iShares Russell 2000 Value
Index Fund | | | 1,507,108 | | | | 2.7 | | |
| | 67,500 | | | | | | | iShares Russell Midcap
Value Index Fund | | | 3,038,175 | | | | | | |
| | | | | | | Total Exchange-Traded
Funds
( Cost $4,991,103 ) | | | 5,288,468 | | | | 2.7 | | |
| PREFERRED STOCK: 1.5% | | | |
| | | Consumer Discretionary: 0.2% | | | |
| | 128 | | | # | | LodgeNet
Interactive Corp. | | | 180,160 | | | | 0.1 | | |
| | | | | | | | | Other Securities | | | 211,472 | | | | 0.1 | | |
| | | | | | | | | | 391,632 | | | | 0.2 | | |
| | | Consumer Staples: 0.1% | | | |
| | | | | | | | | Other Securities | | | 179,045 | | | | 0.1 | | |
| | | Financials: 1.2% | | | |
| | 29,914 | | | | | | | Aspen Insurance
Holdings Ltd. | | | 1,643,176 | | | | 0.8 | | |
| | | | | | | | | Other Securities | | | 762,089 | | | | 0.4 | | |
| | | | | | | | | | 2,405,265 | | | | 1.2 | | |
| | | | | | | Total Preferred Stock
( Cost $2,601,133 ) | | | 2,975,942 | | | | 1.5 | | |
| | | | | | | Total Long-Term
Investments
( Cost $167,211,072 ) | | | 191,170,578 | | | | 98.7 | | |
| SHORT-TERM INVESTMENTS: 4.5% | | | |
| | | Mutual Funds: 1.9% | | | |
| | 3,797,343 | | | | | | | Blackrock Liquidity Funds
TempFund
Portfolio - Class I | | | 3,797,343 | | | | 1.9 | | |
| | | | | | | Total Mutual Funds
( Cost $3,797,343 ) | | | 3,797,343 | | | | 1.9 | | |
Shares | |
| |
| | Value | | Percent of
Net Assets | |
| | | Securities Lending Collateralcc: 2.6% | | | |
| | 4,845,859 | | | | | | | BNY Mellon Overnight
Government Fund (1) | | $ | 4,845,859 | | | | 2.5 | | |
| | 151,202 | | | R | | BNY Institutional Cash
Reserves Fund,
Series B (1)(2) | | | 120,962 | | | | 0.1 | | |
| | | | | | | Total Securities Lending
Collateral
( Cost $4,997,061 ) | | | 4,966,821 | | | | 2.6 | | |
| | | | | | | Total Short-Term
Investments
( Cost $8,794,404 ) | | | 8,764,164 | | | | 4.5 | | |
| | | | | | | | | Total Investments in
Securities
( Cost $176,005,476 ) * | | $ | 199,934,742 | | | | 103.2 | | |
| | | | | | | | | Other Assets and
Liabilities - Net | | | (6,199,459 | ) | | | (3.2 | ) | |
| | | | | | | | | Net Assets | | $ | 193,735,283 | | | | 100.0 | | |
"Other Securities" represents issues not identified as the top 50 holdings in terms of market value and issues or issuers not exceeding 1% of net assets individually or in aggregate respectively as of December 31, 2010.
The following footnotes apply to either the individual securities noted or one or more of the securities aggregated and listed as a single line item.
@ Non-income producing security
# Securities with purchases pursuant to Rule 144A or section 4(2), under the Securities Act of 1933 and may not be resold subject to that rule except to qualified institutional buyers. Unless otherwise noted, these securities have been determined to be liquid under the guidelines established by the Funds' Board of Directors/Trustees.
cc Securities purchased with cash collateral for securities loaned.
(1) Collateral received from brokers for securities lending was invested in these short-term investments.
(2) On September 12, 2008, BNY established a separate sleeve of the Institutional Cash Reserves Fund (Series B) to hold certain Lehman Brothers defaulted debt obligations. The Portfolio's position in Series B is being fair valued daily. Please see the accompanying Notes to Financial Statements for additional details on securities lending.
R Restricted security
L Loaned security, a portion or all of the security is on loan at December 31, 2010.
* Cost for federal income tax purposes is $180,851,033.
| Net unrealized appreciation consists of: | |
| Gross Unrealized Appreciation | | $ | 20,391,840 | | |
| Gross Unrealized Depreciation | | | (1,308,131 | ) | |
| Net Unrealized Appreciation | | $ | 19,083,709 | | |
See Accompanying Notes to Financial Statements
103
ING AMERICAN CENTURY SUMMARY PORTFOLIO OF INVESTMENTS
SMALL-MID CAP VALUE PORTFOLIO AS OF DECEMBER 31, 2010 (CONTINUED)
Fair Value Measurements^
The following is a summary of the fair valuations according to the inputs used as of December 31, 2010 in valuing the Portfolio's assets and liabilities:
| | | Quoted Prices
in Active Markets
for Identical Investments
(Level 1) | | Other
Observable
Inputs
(Level 2) | | Significant
Unobservable
Inputs
(Level 3) | | Fair Value
at
12/31/10 | |
| Asset Table | |
| Investments, at value | |
| Common Stock* | | $ | 172,537,769 | | | $ | — | | | $ | — | | | $ | 172,537,769 | | |
| Real Estate Investment Trusts | | | 10,368,399 | | | | — | | | | — | | | | 10,368,399 | | |
| Exchange-Traded Funds | | | 5,288,468 | | | | — | | | | — | | | | 5,288,468 | | |
| Preferred Stock | | | 275,196 | | | | 2,700,746 | | | | — | | | | 2,975,942 | | |
| Short-Term Investments | | | 8,643,202 | | | | — | | | | 120,962 | | | | 8,764,164 | | |
| Total Investments, at value | | $ | 197,113,034 | | | $ | 2,700,746 | | | $ | 120,962 | | | $ | 199,934,742 | | |
| Liabilities Table | |
| Other Financial Instruments+: | |
| Forward foreign currency contracts | | $ | — | | | $ | (15,701 | ) | | $ | — | | | $ | (15,701 | ) | |
| Total Liabilities | | $ | — | | | $ | (15,701 | ) | | $ | — | | | $ | (15,701 | ) | |
The following is a reconciliation of the fair valuations using significant unobservable inputs (Level 3) for the Portfolio's assets and liabilities during the period ended December 31, 2010:
| | | Beginning
Balance
12/31/09 | | Purchases | | Sales | | Accrued
Discounts/
(Premiums) | | Total
Realized
Gain/(Loss) | | Total
Unrealized
Appreciation/
(Depreciation) | | Transfers
Into
Level 3 | | Transfers
Out of
Level 3 | | Ending
Balance
12/31/10 | |
| Asset Table | |
| Investments, at value | |
Short-Term
Investments | | $ | 120,962 | | | $ | — | | | $ | — | | | $ | — | | | $ | — | | | $ | — | | | $ | — | | | $ | — | | | $ | 120,962 | | |
Total Investments,
at value | | $ | 120,962 | | | $ | — | | | $ | — | | | $ | — | | | $ | — | | | $ | — | | | $ | — | | | $ | — | | | $ | 120,962 | | |
As of December 31, 2010, total change in unrealized gain (loss) on Level 3 securities still held at period end and included in the change in net assets was $0.
^ See Note 2, "Significant Accounting Policies" in the Notes to Financial Statements for additional information.
+ Other Financial Instruments are derivatives not reflected in the Summary Portfolio of Investments and may include open forward foreign currency contracts, futures, swaps, and written options. Forward foreign currency contracts and futures are reported at their unrealized gain/loss at measurement date which represents the amount due to/from the Portfolio. Swaps and written options are reported at their market value at measurement date.
Transfers in or out of Level 3 represents either the beginning value (for transfers in), or the ending value (for transfers out) of any security or derivative instrument where a change in the pricing level occurred from the beginning to the end of the period. It is the policy of the Portfolio to recognize transfers at the end of the reporting period.
* For further breakdown of Common Stock by Industry type, please refer to the Portfolio of Investments.
At December 31, 2010 the following forward foreign currency contracts were outstanding for the ING American Century Small-Mid Cap Value Portfolio :
| Counterparty | | Currency | | Buy/Sell | | Settlement
Date | | In
Exchange
For | | Fair Value | | Unrealized
Appreciation
(Depreciation) | |
| Bank of America | | Canadian Dollar
CAD 2,553,600 | | SELL | | 1/31/11 | | | 2,550,985 | | | | $2,566,686 | | | $ | (15,701 | ) | |
| | | $ | (15,701 | ) | |
See Accompanying Notes to Financial Statements
104
ING AMERICAN CENTURY SUMMARY PORTFOLIO OF INVESTMENTS
SMALL-MID CAP VALUE PORTFOLIO AS OF DECEMBER 31, 2010 (CONTINUED)
A summary of derivative instruments by primary risk exposure is outlined in the following tables.
The fair value of derivative instruments as of December 31, 2010 was as follows:
Derivatives not accounted
for as hedging instruments | | Location on Statement of Assets and Liabilities | | Fair Value | |
| Liability Derivatives | |
| Foreign exchange contracts | | Unrealized depreciation on forward foreign currency contracts | | $ | 15,701 | | |
| Total Liability Derivatives | | | | $ | 15,701 | | |
The effect of derivative instruments on the Portfolio's Statement of Operations for the year ended December 31, 2010 was as follows:
| | | Amount of Realized Gain or (Loss) on Derivatives Recognized in Income | |
Derivatives not accounted
for as hedging instruments | | Foreign currency related transactions* | |
| Foreign exchange contracts | | $ | (58,288 | ) | |
| Total | | $ | (58,288 | ) | |
| | | Change in Unrealized Appreciation or (Depreciation) on Derivatives Recognized in Income | |
Derivatives not accounted
for as hedging instruments | | Foreign currency related transactions* | |
| Foreign exchange contracts | | $ | (31,593 | ) | |
| Total | | $ | (31,593 | ) | |
* Amounts recognized for forward foreign currency contracts are included in net realized gain (loss) on foreign currency related transactions and net change in unrealized appreciation or depreciation on foreign currency related transactions.
See Accompanying Notes to Financial Statements
105
ING BARON SUMMARY PORTFOLIO OF INVESTMENTS
SMALL CAP GROWTH PORTFOLIO AS OF DECEMBER 31, 2010
Shares | |
| |
| | Value | | Percent of
Net Assets | |
| COMMON STOCK: 92.4% | | | |
| | | Consumer Discretionary: 26.9% | | | |
| | 605,000 | | | | | Anhanguera
Educacional
Participacoes SA | | $ | 14,578,313 | | | | 1.7 | | |
| | 540,000 | | | | | Choice Hotels
International, Inc. | | | 20,665,802 | | | | 2.5 | | |
| | 325,000 | | | | | DeVry, Inc. | | | 15,593,500 | | | | 1.8 | | |
| | 575,000 | | | @ | | Dick's Sporting
Goods, Inc. | | | 21,562,500 | | | | 2.6 | | |
| | 672,500 | | | @ | | LKQ Corp. | | | 15,279,200 | | | | 1.8 | | |
| | 239,000 | | | | | Morningstar, Inc. | | | 12,686,120 | | | | 1.5 | | |
| | 123,000 | | | @ | | Panera Bread Co. | | | 12,448,830 | | | | 1.5 | | |
| | 200,000 | | | @ | | Peet's Coffee &
Tea, Inc. | | | 8,348,000 | | | | 1.0 | | |
| | 420,000 | | | @ | | Penn National
Gaming, Inc. | | | 14,763,000 | | | | 1.8 | | |
| | 63,750 | | | | | Strayer Education, Inc. | | | 9,704,025 | | | | 1.1 | | |
| | 260,000 | | | @ | | Under Armour, Inc. | | | 14,258,400 | | | | 1.7 | | |
| | 475,000 | | | @ | | Vail Resorts, Inc. | | | 24,719,000 | | | | 2.9 | | |
| | | | | | | Other Securities | | | 42,170,781 | | | | 5.0 | | |
| | | | | | | | | | 226,777,471 | | | | 26.9 | | |
| | | Consumer Staples: 6.0% | | | |
| | 114,000 | | | | | | | Church & Dwight
Co., Inc. | | | 7,868,280 | | | | 0.9 | | |
| | 215,000 | | | | | | | Diamond Foods, Inc. | | | 11,433,700 | | | | 1.4 | | |
| | 655,000 | | | @ | | Dole Food Co., Inc. | | | 8,849,050 | | | | 1.0 | | |
| | 144,379 | | | @ | | Ralcorp Holdings, Inc. | | | 9,386,079 | | | | 1.1 | | |
| | 190,000 | | | @ | | TreeHouse Foods, Inc. | | | 9,707,100 | | | | 1.2 | | |
| | | | | | | Other Securities | | | 3,335,490 | | | | 0.4 | | |
| | | | | | | | | | 50,579,699 | | | | 6.0 | | |
| | | Energy: 11.2% | | | |
| | 112,575 | | | | | | | CARBO Ceramics, Inc. | | | 11,656,016 | | | | 1.4 | | |
| | 96,933 | | | @ | | Concho Resources, Inc. | | | 8,498,116 | | | | 1.0 | | |
| | 200,000 | | | @ | | Core Laboratories NV | | | 17,810,000 | | | | 2.1 | | |
| | 160,000 | | | | | Helmerich & Payne, Inc. | | | 7,756,800 | | | | 0.9 | | |
| | 115,000 | | | @ | | SEACOR Holdings, Inc. | | | 11,625,350 | | | | 1.4 | | |
| | 192,500 | | | | | | | SM Energy Co. | | | 11,344,025 | | | | 1.4 | | |
| | 400,000 | | | | | | | Southern Union Co. | | | 9,628,000 | | | | 1.1 | | |
| | | | | | | | | Other Securities | | | 16,115,074 | | | | 1.9 | | |
| | | | | | | | | | 94,433,381 | | | | 11.2 | | |
| | | Financials: 7.8% | | | |
| | 622,440 | | | @ | | MSCI, Inc. - Class A | | | 24,250,262 | | | | 2.9 | | |
| | | | | | | | | Other Securities | | | 41,597,724 | | | | 4.9 | | |
| | | | | | | | | | 65,847,986 | | | | 7.8 | | |
Shares | |
| |
| | Value | | Percent of
Net Assets | |
| | | Health Care: 13.3% | | | |
| | 400,000 | | | @ | | AMERIGROUP Corp. | | $ | 17,568,000 | | | | 2.1 | | |
| | 400,000 | | | @ | | Community Health
Systems, Inc. | | | 14,948,000 | | | | 1.8 | | |
| | 200,000 | | | @ | | Edwards
Lifesciences Corp. | | | 16,168,000 | | | | 1.9 | | |
| | 175,000 | | | @ | | Gen-Probe, Inc. | | | 10,211,250 | | | | 1.2 | | |
| | 160,000 | | | @ | | Idexx Laboratories, Inc. | | | 11,075,200 | | | | 1.3 | | |
| | 135,000 | | | @ | | Mettler Toledo
International, Inc. | | | 20,413,350 | | | | 2.4 | | |
| | | | | | | Other Securities | | | 21,859,723 | | | | 2.6 | | |
| | | | | | | | | | 112,243,523 | | | | 13.3 | | |
| | | Industrials: 11.1% | | | |
| | 275,000 | | | @ | | Aecom Technology Corp. | | | 7,691,750 | | | | 0.9 | | |
| | 275,000 | | | @ | | Copart, Inc. | | | 10,271,250 | | | | 1.2 | | |
| | 504,261 | | | @ | | Generac Holdings, Inc. | | | 8,153,900 | | | | 1.0 | | |
| | 350,000 | | | @ | | Genesee &
Wyoming, Inc. | | | 18,532,500 | | | | 2.2 | | |
| | 115,000 | | | | | MSC Industrial
Direct Co. | | | 7,439,350 | | | | 0.9 | | |
| | 410,000 | | | | | Ritchie Brothers
Auctioneers, Inc. | | | 9,450,500 | | | | 1.1 | | |
| | 400,000 | | | @ | | Tetra Tech, Inc. | | | 10,024,000 | | | | 1.2 | | |
| | | | | | | Other Securities | | | 22,261,350 | | | | 2.6 | | |
| | | | | | | | | | 93,824,600 | | | | 11.1 | | |
| | | Information Technology: 11.4% | | | |
| | 250,000 | | | @ | | Ansys, Inc. | | | 13,017,500 | | | | 1.5 | | |
| | 120,000 | | | @ | | Equinix, Inc. | | | 9,751,200 | | | | 1.2 | | |
| | 85,000 | | | | | Factset Research
Systems, Inc. | | | 7,969,600 | | | | 0.9 | | |
| | 430,000 | | | @ | | Gartner, Inc. | | | 14,276,000 | | | | 1.7 | | |
| | 230,500 | | | | | Pegasystems, Inc. | | | 8,443,215 | | | | 1.0 | | |
| | 99,500 | | | | | Totvs S.A. | | | 10,129,819 | | | | 1.2 | | |
| | 190,000 | | | @ | | WebMD Health Corp. | | | 9,701,400 | | | | 1.2 | | |
| | | | | | | | | Other Securities | | | 22,835,302 | | | | 2.7 | | |
| | | | | | | | | | 96,124,036 | | | | 11.4 | | |
| | | Materials: 2.7% | | | |
| | 389,977 | | | @ | | Molycorp, Inc. | | | 19,459,852 | | | | 2.3 | | |
| | | | | | | | | Other Securities | | | 2,980,142 | | | | 0.4 | | |
| | | | | | | | | | 22,439,994 | | | | 2.7 | | |
| | | Telecommunication Services: 0.8% | | | |
| | | | | | | | | Other Securities | | | 6,213,218 | | | | 0.8 | | |
| | | Utilities: 1.2% | | | |
| | 160,000 | | | | | | | ITC Holdings Corp. | | | 9,916,800 | | | | 1.2 | | |
| | | | | | | | | Total Common Stock
( Cost $488,830,903 ) | | | 778,400,708 | | | | 92.4 | | |
See Accompanying Notes to Financial Statements
106
ING BARON SUMMARY PORTFOLIO OF INVESTMENTS
SMALL CAP GROWTH PORTFOLIO AS OF DECEMBER 31, 2010 (CONTINUED)
Shares | |
| |
| | Value | | Percent of
Net Assets | |
| REAL ESTATE INVESTMENT TRUSTS: 3.5% | | | |
| | | Financials: 3.5% | | | |
| | 24,300 | | | | | | | Alexander's, Inc. | | $ | 10,018,404 | | | | 1.2 | | |
| | 490,500 | | | | | | | Douglas Emmett, Inc. | | | 8,142,300 | | | | 0.9 | | |
| | | | | | | | | Other Securities | | | 11,873,600 | | | | 1.4 | | |
| | | | | | | | | Total Real Estate
Investment Trusts
( Cost $21,366,802 ) | | | 30,034,304 | | | | 3.5 | | |
| | | | | | | | | Total Long-Term
Investments
( Cost $510,197,705 ) | | | 808,435,012 | | | | 95.9 | | |
| SHORT-TERM INVESTMENTS: 7.1% | | | |
| | | Mutual Funds: 7.1% | | | |
| | 59,409,221 | | | | | | | Blackrock Liquidity
Funds TempFund
Portfolio - Class I | | | 59,409,221 | | | | 7.1 | | |
| | | | | | | | | Total Short-Term
Investments
( Cost $59,409,221 ) | | | 59,409,221 | | | | 7.1 | | |
| | | | | | | | | Total Investments in
Securities
( Cost $569,606,926 ) * | | $ | 867,844,233 | | | | 103.0 | | |
| | | | | | | | | Other Assets and
Liabilities - Net | | | (25,112,632 | ) | | | (3.0 | ) | |
| | | | | | | | | Net Assets | | $ | 842,731,601 | | | | 100.0 | | |
"Other Securities" represents issues not identified as the top 50 holdings in terms of market value and issues or issuers not exceeding 1% of net assets individually or in aggregate respectively as of December 31, 2010.
The following footnotes apply to either the individual securities noted or one or more of the securities aggregated and listed as a single line item.
@ Non-income producing security
* Cost for federal income tax purposes is $569,520,667.
| Net unrealized appreciation consists of: | |
| Gross Unrealized Appreciation | | $ | 300,672,737 | | |
| Gross Unrealized Depreciation | | | (2,349,171 | ) | |
| Net Unrealized Appreciation | | $ | 298,323,566 | | |
Fair Value Measurements^
The following is a summary of the fair valuations according to the inputs used as of December 31, 2010 in valuing the Portfolio's assets and liabilities:
| | | Quoted Prices
in Active Markets
for Identical Investments
(Level 1) | | Other
Observable
Inputs
(Level 2) | | Significant
Unobservable
Inputs
(Level 3) | | Fair Value
at
12/31/10 | |
| Asset Table | |
| Investments, at value | |
| Common Stock* | | $ | 778,400,708 | | | $ | — | | | $ | — | | | $ | 778,400,708 | | |
| Real Estate Investment Trusts | | | 30,034,304 | | | | — | | | | — | | | | 30,034,304 | | |
| Short-Term Investments | | | 59,409,221 | | | | — | | | | — | | | | 59,409,221 | | |
| Total Investments, at value | | $ | 867,844,233 | | | $ | — | | | $ | — | | | $ | 867,844,233 | | |
^ See Note 2, "Significant Accounting Policies" in the Notes to Financial Statements for additional information.
* For further breakdown of Common Stock by Industry type, please refer to the Portfolio of Investments.
See Accompanying Notes to Financial Statements
107
ING COLUMBIA SUMMARY PORTFOLIO OF INVESTMENTS
SMALL CAP VALUE PORTFOLIO AS OF DECEMBER 31, 2010
Shares | |
| |
| | Value | | Percent of
Net Assets | |
| COMMON STOCK: 92.0% | | | |
| | | Consumer Discretionary: 10.6% | | | |
| | 117,000 | | | @ | | Dana Holding Corp. | | $ | 2,013,570 | | | | 0.9 | | |
| | 136,000 | | | @ | | Domino's Pizza, Inc. | | | 2,169,200 | | | | 0.9 | | |
| | 78,000 | | | @ | | Helen of Troy Ltd. | | | 2,319,720 | | | | 1.0 | | |
| | 295,000 | | | | | Stewart Enterprises, Inc. | | | 1,973,550 | | | | 0.9 | | |
| | 118,000 | | | @ | | Texas Roadhouse, Inc. | | | 2,026,060 | | | | 0.9 | | |
| | 115,000 | | | @ | | Tower International, Inc. | | | 2,034,350 | | | | 0.9 | | |
| | | | | | | Other Securities | | | 11,434,025 | | | | 5.1 | | |
| | | | | | | | | | 23,970,475 | | | | 10.6 | | |
| | | Consumer Staples: 2.9% | | | |
| | | | | | | | | Other Securities | | | 6,430,707 | | | | 2.9 | | |
| | | Energy: 7.3% | | | |
| | 230,000 | | | @ | | ION Geophysical Corp. | | | 1,950,400 | | | | 0.8 | | |
| | 113,000 | | | @ | | Patriot Coal Corp. | | | 2,188,810 | | | | 1.0 | | |
| | 62,000 | | | @ | | Swift Energy Co. | | | 2,427,300 | | | | 1.1 | | |
| | | | | | | Other Securities | | | 9,976,060 | | | | 4.4 | | |
| | | | | | | | | | 16,542,570 | | | | 7.3 | | |
| | | Financials: 20.8% | | | |
| | 82,000 | | | | | Community Bank
System, Inc. | | | 2,277,140 | | | | 1.0 | | |
| | 75,000 | | | | | Delphi Financial Group | | | 2,163,000 | | | | 1.0 | | |
| | 40,500 | | | | | IBERIABANK Corp. | | | 2,394,765 | | | | 1.1 | | |
| | 80,000 | | | | | Independent Bank Corp. | | | 2,164,000 | | | | 1.0 | | |
| | 205,000 | | | @ | | MGIC Investment Corp. | | | 2,088,950 | | | | 0.9 | | |
| | 45,000 | | | | | Platinum Underwriters
Holdings Ltd. | | | 2,023,650 | | | | 0.9 | | |
| | 54,000 | | | | | Prosperity Bancshares, Inc. | | | 2,121,120 | | | | 0.9 | | |
| | 202,000 | | | | | Sterling Bancorp. | | | 2,114,940 | | | | 0.9 | | |
| | 91,000 | | | @ | | Texas Capital
Bancshares, Inc. | | | 1,935,570 | | | | 0.8 | | |
| | 163,000 | | | | | Umpqua Holdings Corp. | | | 1,985,340 | | | | 0.9 | | |
| | | | | | | Other Securities | | | 25,620,622 | | | | 11.4 | | |
| | | | | | | | | | 46,889,097 | | | | 20.8 | | |
| | | Health Care: 5.4% | | | |
| | 80,500 | | | @ | | Centene Corp. | | | 2,039,870 | | | | 0.9 | | |
| | 81,000 | | | @ | | Conmed Corp. | | | 2,140,830 | | | | 1.0 | | |
| | 78,000 | | | @ | | Healthspring, Inc. | | | 2,069,340 | | | | 0.9 | | |
| | 71,121 | | | | | Invacare Corp. | | | 2,145,009 | | | | 1.0 | | |
| | 140,000 | | | @ | | Kindred Healthcare, Inc. | | | 2,571,799 | | | | 1.1 | | |
| | | | | | | | | Other Securities | | | 1,183,140 | | | | 0.5 | | |
| | | | | | | | | | 12,149,988 | | | | 5.4 | | |
| | | Industrials: 19.9% | | | |
| | 106,000 | | | @ | | ArvinMeritor, Inc. | | | 2,175,120 | | | | 1.0 | | |
| | 35,000 | | | @ | | Atlas Air Worldwide
Holdings, Inc. | | | 1,954,050 | | | | 0.9 | | |
| | 101,000 | | | | | Deluxe Corp. | | | 2,325,020 | | | | 1.0 | | |
| | 34,000 | | | @ | | Esterline
Technologies Corp. | | | 2,332,060 | | | | 1.0 | | |
Shares | |
| |
| | Value | | Percent of
Net Assets | |
| | 86,662 | | | | | IESI-BFC Ltd. | | $ | 2,105,887 | | | | 0.9 | | |
| | 84,000 | | | | | Textainer Group
Holdings Ltd. | | | 2,393,160 | | | | 1.1 | | |
| | 110,000 | | | @ | | Titan Machinery, Inc. | | | 2,123,000 | | | | 0.9 | | |
| | 116,000 | | | @ | | United Rentals, Inc. | | | 2,639,000 | | | | 1.2 | | |
| | 34,500 | | | @ | | United Stationers, Inc. | | | 2,201,445 | | | | 1.0 | | |
| | 200,000 | | | @ | | Wabash National Corp. | | | 2,370,000 | | | | 1.0 | | |
| | | | | | | Other Securities | | | 22,245,456 | | | | 9.9 | | |
| | | | | | | | | | 44,864,198 | | | | 19.9 | | |
| | | Information Technology: 14.6% | | | |
| | 118,000 | | | @ | | Cardtronics, Inc. | | | 2,088,600 | | | | 0.9 | | |
| | 92,000 | | | @ | | Ciena Corp. | | | 1,936,600 | | | | 0.9 | | |
| | 121,500 | | | @ | | Cirrus Logic, Inc. | | | 1,941,570 | | | | 0.9 | | |
| | 130,000 | | | @ | | ELSTER GROUP SE - ADR | | | 2,197,000 | | | | 1.0 | | |
| | 185,000 | | | @ | | Mentor Graphics Corp. | | | 2,220,000 | | | | 1.0 | | |
| | 58,734 | | | @ | | Rogers Corp. | | | 2,246,576 | | | | 1.0 | | |
| | | | | | | Other Securities | | | 20,141,117 | | | | 8.9 | | |
| | | | | | | | | | 32,771,463 | | | | 14.6 | | |
| | | Materials: 6.4% | | | |
| | 300,000 | | | @ | | Boise, Inc. | | | 2,379,000 | | | | 1.0 | | |
| | 31,000 | | | | | Schnitzer Steel
Industries, Inc. | | | 2,058,090 | | | | 0.9 | | |
| | | | | | | | | Other Securities | | | 10,089,290 | | | | 4.5 | | |
| | | | | | | | | | 14,526,380 | | | | 6.4 | | |
| | | Telecommunication Services: 0.5% | | | |
| | | | | | | | | Other Securities | | | 1,036,000 | | | | 0.5 | | |
| | | Utilities: 3.6% | | | |
| | 70,000 | | | | | | | Atmos Energy Corp. | | | 2,184,000 | | | | 1.0 | | |
| | 60,000 | | | | | | | New Jersey
Resources Corp. | | | 2,586,600 | | | | 1.2 | | |
| | | | | | | | | Other Securities | | | 3,260,160 | | | | 1.4 | | |
| | | | | | | | | | 8,030,760 | | | | 3.6 | | |
| | | | | | | | | Total Common Stock
( Cost $161,563,237 ) | | | 207,211,638 | | | | 92.0 | | |
| REAL ESTATE INVESTMENT TRUSTS: 8.1% | | | |
| | | Financials: 8.1% | | | |
| | 110,000 | | | | | | | BioMed Realty Trust, Inc. | | | 2,051,500 | | | | 0.9 | | |
| | 123,000 | | | | | | | CBL & Associates
Properties, Inc. | | | 2,152,500 | | | | 1.0 | | |
| | 90,000 | | | | | | | LaSalle Hotel Properties | | | 2,376,000 | | | | 1.0 | | |
| | 36,000 | | | | | | | Mid-America Apartment
Communities, Inc. | | | 2,285,640 | | | | 1.0 | | |
| | 255,000 | | | | | | | U-Store-It Trust | | | 2,430,150 | | | | 1.1 | | |
| | | | | | | | | Other Securities | | | 6,981,315 | | | | 3.1 | | |
| | | | | | | | | Total Real Estate
Investment Trusts
( Cost $14,624,673 ) | | | 18,277,105 | | | | 8.1 | | |
| | | | | | | | | Total Long-Term
Investments
( Cost $176,187,910 ) | | | 225,488,743 | | | | 100.1 | | |
See Accompanying Notes to Financial Statements
108
ING COLUMBIA SUMMARY PORTFOLIO OF INVESTMENTS
SMALL CAP VALUE PORTFOLIO AS OF DECEMBER 31, 2010 (CONTINUED)
Shares | |
| |
| | Value | | Percent of
Net Assets | |
| SHORT-TERM INVESTMENTS: 1.5% | | | |
| | | Mutual Funds: 1.5% | | | |
| | 3,368,174 | | | | | | | Blackrock Liquidity
Funds TempFund
Portfolio - Class I | | $ | 3,368,174 | | | | 1.5 | | |
| | | | | | | | | Total Short-Term
Investments
( Cost $3,368,174 ) | | | 3,368,174 | | | | 1.5 | | |
| | | | | | | | | Total Investments in
Securities
( Cost $179,556,084 ) * | | $ | 228,856,917 | | | | 101.6 | | |
| | | | | | | | | Other Assets and
Liabilities - Net | | | (3,620,823 | ) | | | (1.6 | ) | |
| | | | | | | | | Net Assets | | $ | 225,236,094 | | | | 100.0 | | |
"Other Securities" represents issues not identified as the top 50 holdings in terms of market value and issues or issuers not exceeding 1% of net assets individually or in aggregate respectively as of December 31, 2010.
The following footnotes apply to either the individual securities noted or one or more of the securities aggregated and listed as a single line item.
@ Non-income producing security
ADR American Depositary Receipt
* Cost for federal income tax purposes is $184,732,217.
| Net unrealized appreciation consists of: | |
| Gross Unrealized Appreciation | | $ | 51,064,816 | | |
| Gross Unrealized Depreciation | | | (6,940,116 | ) | |
| Net Unrealized Appreciation | | $ | 44,124,700 | | |
Fair Value Measurements^
The following is a summary of the fair valuations according to the inputs used as of December 31, 2010 in valuing the Portfolio's assets and liabilities:
| | | Quoted Prices
in Active Markets
for Identical Investments
(Level 1) | | Other
Observable
Inputs
(Level 2) | | Significant
Unobservable
Inputs
(Level 3) | | Fair Value
at
12/31/10 | |
| Asset Table | |
| Investments, at value | |
| Common Stock* | | $ | 207,211,638 | | | $ | — | | | $ | — | | | $ | 207,211,638 | | |
| Real Estate Investment Trusts | | | 18,277,105 | | | | — | | | | — | | | | 18,277,105 | | |
| Short-Term Investments | | | 3,368,174 | | | | — | | | | — | | | | 3,368,174 | | |
| Total Investments, at value | | $ | 228,856,917 | | | $ | — | | | $ | — | | | $ | 228,856,917 | | |
^ See Note 2, "Significant Accounting Policies" in the Notes to Financial Statements for additional information.
* For further breakdown of Common Stock by Industry type, please refer to the Portfolio of Investments.
See Accompanying Notes to Financial Statements
109
ING DAVIS SUMMARY PORTFOLIO OF INVESTMENTS
NEW YORK VENTURE PORTFOLIO AS OF DECEMBER 31, 2010
Shares | |
| |
| | Value | | Percent of
Net Assets | |
| COMMON STOCK: 98.0% | | | |
| | | Consumer Discretionary: 5.7% | | | |
| | 183,300 | | | @ | | Bed Bath &
Beyond, Inc. | | $ | 9,009,195 | | | | 1.9 | | |
| | 187,499 | | | @ | | Carmax, Inc. | | | 5,977,468 | | | | 1.2 | | |
| | 149,650 | | | | | Harley-Davidson, Inc. | | | 5,188,366 | | | | 1.1 | | |
| | | | | | | | | Other Securities | | | 7,194,787 | | | | 1.5 | | |
| | | | | | | | | | 27,369,816 | | | | 5.7 | | |
| | | Consumer Staples: 16.7% | | | |
| | 151,950 | | | | | | | Coca-Cola Co. | | | 9,993,752 | | | | 2.1 | | |
| | 287,125 | | | | | | | Costco Wholesale Corp. | | | 20,733,296 | | | | 4.3 | | |
| | 484,727 | | | | | | | CVS Caremark Corp. | | | 16,853,958 | | | | 3.5 | | |
| | 64,100 | | | | | | | Diageo PLC ADR | | | 4,764,553 | | | | 1.0 | | |
| | 123,700 | | | | | | | Heineken Holding NV | | | 5,379,646 | | | | 1.1 | | |
| | 90,602 | | | | | | | Philip Morris
International, Inc. | | | 5,302,935 | | | | 1.1 | | |
| | 116,410 | | | | | | | Procter & Gamble Co. | | | 7,488,655 | | | | 1.6 | | |
| | | | | | | | | Other Securities | | | 9,817,826 | | | | 2.0 | | |
| | | | | | | | | | 80,334,621 | | | | 16.7 | | |
| | | Energy: 15.3% | | | |
| | 334,420 | | | | | | | Canadian Natural
Resources Ltd. | | | 14,854,936 | | | | 3.1 | | |
| | 1,938,500 | | | | | | | China Coal Energy
Co. - Class H | | | 3,023,708 | | | | 0.6 | | |
| | 194,320 | | | | | | | Devon Energy Corp. | | | 15,256,063 | | | | 3.2 | | |
| | 159,200 | | | | | | | EOG Resources, Inc. | | | 14,552,472 | | | | 3.0 | | |
| | 186,030 | | | | | | | Occidental
Petroleum Corp. | | | 18,249,543 | | | | 3.8 | | |
| | 270,000 | | | @ | | OGX Petroleo e Gas
Participacoes S.A. | | | 3,253,012 | | | | 0.7 | | |
| | 44,276 | | | @ | | Transocean Ltd. | | | 3,077,625 | | | | 0.7 | | |
| | | | | | | Other Securities | | | 1,077,150 | | | | 0.2 | | |
| | | | | | | | | | 73,344,509 | | | | 15.3 | | |
| | | Financials: 27.2% | | | |
| | 462,220 | | | | | | | American Express Co. | | | 19,838,482 | | | | 4.1 | | |
| | 81,330 | | | | | | | Ameriprise
Financial, Inc. | | | 4,680,541 | | | | 1.0 | | |
| | 625,090 | | | | | | | Bank of New York
Mellon Corp. | | | 18,877,718 | | | | 3.9 | | |
| | 94 | | | @ | | Berkshire Hathaway,
Inc. - Class A | | | 11,322,300 | | | | 2.3 | | |
| | 565,000 | | | | | | | Hang Lung Group Ltd. | | | 3,712,143 | | | | 0.8 | | |
| | 133,310 | | | | | | | Julius Baer Group Ltd. | | | 6,241,981 | | | | 1.3 | | |
| | 365,099 | | | | | | | Loews Corp. | | | 14,206,002 | | | | 3.0 | | |
| | 131,700 | | | | | | | Moody's Corp. | | | 3,495,318 | | | | 0.7 | | |
| | 550,980 | | | | | | | Progressive Corp. | | | 10,947,973 | | | | 2.3 | | |
| | 90,070 | | | | | | | Transatlantic
Holdings, Inc. | | | 4,649,413 | | | | 1.0 | | |
| | 665,667 | | | | | | | Wells Fargo & Co. | | | 20,629,019 | | | | 4.3 | | |
| | | | | | | | | Other Securities | | | 12,040,942 | | | | 2.5 | | |
| | | | | | | | | | 130,641,832 | | | | 27.2 | | |
Shares | |
| |
| | Value | | Percent of
Net Assets | |
| | | Health Care: 13.7% | | | |
| | 134,568 | | | @ | | Agilent
Technologies, Inc. | | $ | 5,575,152 | | | | 1.2 | | |
| | 80,900 | | | | | Baxter
International, Inc. | | | 4,095,158 | | | | 0.9 | | |
| | 51,700 | | | | | Becton Dickinson & Co. | | | 4,369,684 | | | | 0.9 | | |
| | 181,640 | | | @ | | Express Scripts, Inc. | | | 9,817,642 | | | | 2.0 | | |
| | 181,700 | | | | | Johnson & Johnson | | | 11,238,145 | | | | 2.3 | | |
| | 391,615 | | | | | Merck & Co., Inc. | | | 14,113,805 | | | | 2.9 | | |
| | 506,300 | | | | | Pfizer, Inc. | | | 8,865,313 | | | | 1.9 | | |
| | 51,400 | | | | | | | Roche Holding
AG - Genusschein | | | 7,534,872 | | | | 1.6 | | |
| | | | | | | | | | 65,609,771 | | | | 13.7 | | |
| | | Industrials: 5.0% | | | |
| | 1,281,598 | | | | | | | China Merchants
Holdings
International Co., Ltd. | | | 5,059,014 | | | | 1.1 | | |
| | 285,250 | | | | | | | Iron Mountain, Inc. | | | 7,134,103 | | | | 1.5 | | |
| | 25,157 | | | | | | | Kuehne & Nagel
International AG | | | 3,500,061 | | | | 0.7 | | |
| | 44,040 | | | | | | | Lockheed Martin Corp. | | | 3,078,836 | | | | 0.6 | | |
| | 79,115 | | | | | | | Tyco International Ltd. | | | 3,278,526 | | | | 0.7 | | |
| | | | | | | | | Other Securities | | | 1,794,787 | | | | 0.4 | | |
| | | | | | | | | | 23,845,327 | | | | 5.0 | | |
| | | Information Technology: 5.8% | | | |
| | 8,099 | | | @ | | Google, Inc. - Class A | | | 4,810,563 | | | | 1.0 | | |
| | 93,200 | | | | | Hewlett-Packard Co. | | | 3,923,720 | | | | 0.8 | | |
| | 213,370 | | | | | Microsoft Corp. | | | 5,957,290 | | | | 1.2 | | |
| | 302,250 | | | | | | | Texas Instruments, Inc. | | | 9,823,125 | | | | 2.0 | | |
| | | | | | | | | Other Securities | | | 3,596,732 | | | | 0.8 | | |
| | | | | | | | | | 28,111,430 | | | | 5.8 | | |
| | | Materials: 8.2% | | | |
| | 98,240 | | | | | | | Monsanto Co. | | | 6,841,434 | | | | 1.4 | | |
| | 21,485 | | | | | | | Potash Corp.
of Saskatchewan | | | 3,326,523 | | | | 0.7 | | |
| | 402,494 | | | | | Sealed Air Corp. | | | 10,243,472 | | | | 2.1 | | |
| | 298,480 | | | @ | | Sino-Forest Corp. | | | 6,991,450 | | | | 1.5 | | |
| | 8,100 | | | @,# | | SINO-FOREST
CORP. 144A | | | 189,730 | | | | 0.0 | | |
| | | | | | | | | Other Securities | | | 12,023,722 | | | | 2.5 | | |
| | | | | | | | | | 39,616,331 | | | | 8.2 | | |
| | | Telecommunication Services: 0.4% | | | |
| | | | | | | | | Other Securities | | | 2,092,910 | | | | 0.4 | | |
| | | | | | | | | Total Common Stock
( Cost $408,080,259 ) | | | 470,966,547 | | | | 98.0 | | |
See Accompanying Notes to Financial Statements
110
ING DAVIS SUMMARY PORTFOLIO OF INVESTMENTS
NEW YORK VENTURE PORTFOLIO AS OF DECEMBER 31, 2010 (CONTINUED)
Principal
Amount | |
| |
| | Value | | Percent of
Net Assets | |
| CORPORATE BONDS/NOTES: 0.2% | | | |
| | | Materials: 0.2% | | | |
| $ | 649,000 | | | # | | Sino-Forest Corp.,
5.000%,
due 08/01/13 | | $ | 873,716 | | | | 0.2 | | |
| | | | | | | Total Corporate
Bonds/Notes
( Cost $649,000 ) | | | 873,716 | | | | 0.2 | | |
| | | | | | | Total Long-Term
Investments
( Cost $408,729,259 ) | | | 471,840,263 | | | | 98.2 | | |
| SHORT-TERM INVESTMENTS: 2.2% | | | |
| | | Commercial Paper: 2.2% | | | |
| | 10,555,000 | | | | | | | Societe Generale,
0.110%, due 01/03/11 | | | 10,554,903 | | | | 2.2 | | |
| | | | | | | Total Short-Term
Investments
( Cost $10,554,903 ) | | | 10,554,903 | | | | 2.2 | | |
| | | | | | | | | Total Investments in
Securities
( Cost $419,284,162 ) * | | $ | 482,395,166 | | | | 100.4 | | |
| | | | | | | | | Other Assets and
Liabilities - Net | | | (1,859,270 | ) | | | (0.4 | ) | |
| | | | | | | | | Net Assets | | $ | 480,535,896 | | | | 100.0 | | |
"Other Securities" represents issues not identified as the top 50 holdings in terms of market value and issues or issuers not exceeding 1% of net assets individually or in aggregate respectively as of December 31, 2010.
The following footnotes apply to either the individual securities noted or one or more of the securities aggregated and listed as a single line item.
@ Non-income producing security
ADR American Depositary Receipt
# Securities with purchases pursuant to Rule 144A or section 4(2), under the Securities Act of 1933 and may not be resold subject to that rule except to qualified institutional buyers. Unless otherwise noted, these securities have been determined to be liquid under the guidelines established by the Funds' Board of Directors/Trustees.
* Cost for federal income tax purposes is $424,118,744.
| Net unrealized appreciation consists of: | |
| Gross Unrealized Appreciation | | $ | 71,115,857 | | |
| Gross Unrealized Depreciation | | | (12,839,435 | ) | |
| Net Unrealized Appreciation | | $ | 58,276,422 | | |
Fair Value Measurements^
The following is a summary of the fair valuations according to the inputs used as of December 31, 2010 in valuing the Portfolio's assets and liabilities:
| | | Quoted Prices
in Active Markets
for Identical Investments
(Level 1) | | Other
Observable
Inputs#
(Level 2) | | Significant
Unobservable
Inputs
(Level 3) | | Fair Value
at
12/31/10 | |
| Asset Table | |
| Investments, at value | |
| Common Stock | |
| Consumer Discretionary | | $ | 27,369,761 | | | $ | — | | | $ | 55 | | | $ | 27,369,816 | | |
| Consumer Staples | | | 72,154,675 | | | | 8,179,946 | | | | — | | | | 80,334,621 | | |
| Energy | | | 70,320,801 | | | | 3,023,708 | | | | — | | | | 73,344,509 | | |
| Financials | | | 119,446,160 | | | | 11,195,672 | | | | — | | | | 130,641,832 | | |
| Health Care | | | 58,074,899 | | | | 7,534,872 | | | | — | | | | 65,609,771 | | |
| Industrials | | | 14,010,834 | | | | 9,834,493 | | | | — | | | | 23,845,327 | | |
| Information Technology | | | 28,111,430 | | | | — | | | | — | | | | 28,111,430 | | |
| Materials | | | 34,053,803 | | | | 5,562,528 | | | | — | | | | 39,616,331 | | |
| Telecommunication Services | | | 2,092,910 | | | | — | | | | — | | | | 2,092,910 | | |
| Total Common Stock | | | 425,635,273 | | | | 45,331,219 | | | | 55 | | | | 470,966,547 | | |
| Corporate Bonds/Notes | | | — | | | | 873,716 | | | | — | | | | 873,716 | | |
| Short-Term Investments | | | — | | | | 10,554,903 | | | | — | | | | 10,554,903 | | |
| Total Investments, at value | | $ | 425,635,273 | | | $ | 56,759,838 | | | $ | 55 | | | $ | 482,395,166 | | |
See Accompanying Notes to Financial Statements
111
ING DAVIS SUMMARY PORTFOLIO OF INVESTMENTS
NEW YORK VENTURE PORTFOLIO AS OF DECEMBER 31, 2010 (CONTINUED)
The following is a reconciliation of the fair valuations using significant unobservable inputs (Level 3) for the Portfolio's assets and liabilities during the period ended December 31, 2010:
| | | Beginning
Balance
12/31/09 | | Purchases | | Sales | | Accrued
Discounts/
(Premiums) | | Total
Realized
Gain/(Loss) | | Total
Unrealized
Appreciation/
(Depreciation) | | Transfers
Into
Level 3 | | Transfers
Out of
Level 3 | | Ending
Balance
12/31/10 | |
| Asset Table | |
| Investments, at value | |
| Common Stock | | $ | 55 | | | $ | — | | | $ | — | | | $ | — | | | $ | — | | | $ | — | | | $ | — | | | $ | — | | | $ | 55 | | |
Total Investments,
at value | | $ | 55 | | | $ | — | | | $ | — | | | $ | — | | | $ | — | | | $ | — | | | $ | — | | | $ | — | | | $ | 55 | | |
As of December 31, 2010, total change in unrealized gain (loss) on Level 3 securities still held at period end and included in the change in net assets was $0.
^ See Note 2, "Significant Accounting Policies" in the Notes to Financial Statements for additional information.
Transfers in or out of Level 3 represents either the beginning value (for transfers in), or the ending value (for transfers out) of any security or derivative instrument where a change in the pricing level occurred from the beginning to the end of the period. It is the policy of the Portfolio to recognize transfers at the end of the reporting period.
# The earlier close of the foreign markets gives rise to the possibility that significant events, including broad market moves, may have occurred in the interim and may materially affect the value of those securities. To account for this, the Portfolio may frequently value many of its foreign equity securities using fair value prices based on third party vendor modeling tools to the extent available. Accordingly, a significant portion of the Portfolio's investments are categorized as Level 2 investments.
See Accompanying Notes to Financial Statements
112
ING JPMORGAN SUMMARY PORTFOLIO OF INVESTMENTS
MID CAP VALUE PORTFOLIO AS OF DECEMBER 31, 2010
Shares | |
| |
| | Value | | Percent of
Net Assets | |
| COMMON STOCK: 92.8% | | | |
| | | Consumer Discretionary: 18.4% | | | |
| | 76,500 | | | @ | | Bed Bath &
Beyond, Inc. | | $ | 3,759,975 | | | | 1.2 | | |
| | 151,300 | | | @ | | Dish Network Corp. | | | 2,974,558 | | | | 0.9 | | |
| | 70,400 | | | | | Fortune Brands, Inc. | | | 4,241,600 | | | | 1.3 | | |
| | 290,400 | | | | | Gap, Inc. | | | 6,429,454 | | | | 2.0 | | |
| | 59,100 | | | | | Genuine Parts Co. | | | 3,034,194 | | | | 0.9 | | |
| | 127,500 | | | | | Macy's, Inc. | | | 3,225,750 | | | | 1.0 | | |
| | 47,700 | | | | | Tiffany & Co. | | | 2,970,279 | | | | 0.9 | | |
| | 76,700 | | | | | TJX Cos., Inc. | | | 3,404,713 | | | | 1.0 | | |
| | | | | | | Other Securities | | | 29,944,088 | | | | 9.2 | | |
| | | | | | | | | | 59,984,611 | | | | 18.4 | | |
| | | Consumer Staples: 5.6% | | | |
| | 72,900 | | | | | | | JM Smucker Co. | | | 4,785,885 | | | | 1.5 | | |
| | 177,700 | | | | | | | Safeway, Inc. | | | 3,996,473 | | | | 1.2 | | |
| | | | | | | | | Other Securities | | | 9,336,653 | | | | 2.9 | | |
| | | | | | | | | | 18,119,011 | | | | 5.6 | | |
| | | Energy: 8.6% | | | |
| | 65,000 | | | | | | | Devon Energy Corp. | | | 5,103,150 | | | | 1.6 | | |
| | 209,281 | | | | | | | El Paso Corp. | | | 2,879,707 | | | | 0.9 | | |
| | 86,200 | | | | | EQT Corp. | | | 3,865,208 | | | | 1.2 | | |
| | 52,200 | | | @ | | Newfield Exploration Co. | | | 3,764,142 | | | | 1.1 | | |
| | 89,600 | | | | | | | Teekay Shipping Corp. | | | 2,963,968 | | | | 0.9 | | |
| | 212,697 | | | | | | | Williams Cos., Inc. | | | 5,257,870 | | | | 1.6 | | |
| | | | | | | | | Other Securities | | | 4,339,191 | | | | 1.3 | | |
| | | | | | | | | | 28,173,236 | | | | 8.6 | | |
| | | Financials: 20.7% | | | |
| | 58,500 | | | | | | | Ameriprise Financial, Inc. | | | 3,366,675 | | | | 1.0 | | |
| | 124,361 | | | | | | | Cincinnati
Financial Corp. | | | 3,941,000 | | | | 1.2 | | |
| | 157,200 | | | | | | | Loews Corp. | | | 6,116,652 | | | | 1.9 | | |
| | 42,161 | | | | | | | M&T Bank Corp. | | | 3,670,115 | | | | 1.1 | | |
| | 309,850 | | | | | | | Old Republic
International Corp. | | | 4,223,256 | | | | 1.3 | | |
| | 98,300 | | | | | | | SunTrust Bank | | | 2,900,833 | | | | 0.9 | | |
| | 51,000 | | | | | | | T. Rowe Price
Group, Inc. | | | 3,291,540 | | | | 1.0 | | |
| | 84,400 | | | | | | | Transatlantic
Holdings, Inc. | | | 4,356,728 | | | | 1.4 | | |
| | 144,400 | | | | | | | WR Berkley Corp. | | | 3,953,672 | | | | 1.2 | | |
| | | | | | | | | Other Securities | | | 31,746,890 | | | | 9.7 | | |
| | | | | | | | | | 67,567,361 | | | | 20.7 | | |
| | | Health Care: 6.0% | | | |
| | 62,500 | | | | | | | Becton
Dickinson & Co. | | | 5,282,500 | | | | 1.6 | | |
| | 175,700 | | | | | | | Lincare Holdings, Inc. | | | 4,714,031 | | | | 1.4 | | |
| | | | | | | | | Other Securities | | | 9,731,530 | | | | 3.0 | | |
| | | | | | | | | | 19,728,061 | | | | 6.0 | | |
Shares | |
| |
| | Value | | Percent of
Net Assets | |
| | | Industrials: 8.8% | | | |
| | 73,500 | | | | | | | Carlisle Cos., Inc. | | $ | 2,920,890 | | | | 0.9 | | |
| | 195,817 | | | | | | | Republic Services, Inc. | | | 5,847,096 | | | | 1.8 | | |
| | 39,300 | | | | | | | Roper Industries, Inc. | | | 3,003,699 | | | | 0.9 | | |
| | 66,041 | | | | | | | Snap-On, Inc. | | | 3,736,600 | | | | 1.1 | | |
| | | | | | | | | Other Securities | | | 13,231,544 | | | | 4.1 | | |
| | | | | | | | | | 28,739,829 | | | | 8.8 | | |
| | | Information Technology: 5.4% | | | |
| | 110,100 | | | | | | | Jack Henry &
Associates, Inc. | | | 3,209,415 | | | | 1.0 | | |
| | 118,700 | | | @ | | Synopsys, Inc. | | | 3,194,217 | | | | 1.0 | | |
| | 163,800 | | | | | | | Tyco Electronics Ltd. | | | 5,798,520 | | | | 1.7 | | |
| | | | | | | | | Other Securities | | | 5,491,076 | | | | 1.7 | | |
| | | | | | | | | | 17,693,228 | | | | 5.4 | | |
| | | Materials: 6.6% | | | |
| | 70,508 | | | | | | | Albemarle Corp. | | | 3,932,936 | | | | 1.2 | | |
| | 70,700 | | | | | | | Ball Corp. | | | 4,811,135 | | | | 1.5 | | |
| | 46,800 | | | | | | | PPG Industries, Inc. | | | 3,934,476 | | | | 1.2 | | |
| | 45,000 | | | | | | | Sherwin-Williams Co. | | | 3,768,750 | | | | 1.2 | | |
| | 50,800 | | | | | | | Sigma-Aldrich Corp. | | | 3,381,248 | | | | 1.0 | | |
| | | | | | | | | Other Securities | | | 1,596,920 | | | | 0.5 | | |
| | | | | | | | | | 21,425,465 | | | | 6.6 | | |
| | | Telecommunication Services: 2.3% | | | |
| | 73,800 | | | L | | CenturyTel, Inc. | | | 3,407,346 | | | | 1.0 | | |
| | | | | | | | | Other Securities | | | 4,151,829 | | | | 1.3 | | |
| | | | | | | | | | 7,559,175 | | | | 2.3 | | |
| | | Utilities: 10.4% | | | |
| | 277,100 | | | | | | | CMS Energy Corp. | | | 5,154,060 | | | | 1.6 | | |
| | 110,800 | | | | | | | Energen Corp. | | | 5,347,208 | | | | 1.6 | | |
| | 73,700 | | | | | | | NSTAR | | | 3,109,403 | | | | 0.9 | | |
| | 72,300 | | | | | | | Oneok, Inc. | | | 4,010,481 | | | | 1.2 | | |
| | 152,000 | | | | | | | Westar Energy, Inc. | | | 3,824,320 | | | | 1.2 | | |
| | 65,600 | | | | | | | Wisconsin Energy Corp. | | | 3,861,216 | | | | 1.2 | | |
| | 189,400 | | | | | | | Xcel Energy, Inc. | | | 4,460,370 | | | | 1.4 | | |
| | | | | | | | | Other Securities | | | 4,174,818 | | | | 1.3 | | |
| | | | | | | | | | 33,941,876 | | | | 10.4 | | |
| | | | | | | | | Total Common Stock
( Cost $245,350,387 ) | | | 302,931,853 | | | | 92.8 | | |
| REAL ESTATE INVESTMENT TRUSTS: 3.3% | | | |
| | | Financials: 3.3% | | | |
| | 72,600 | | | | | | | Regency Centers Corp. | | | 3,066,624 | | | | 0.9 | | |
| | 37,276 | | | | | | | Vornado Realty Trust | | | 3,106,209 | | | | 1.0 | | |
| | | | | | | | | Other Securities | | | 4,456,231 | | | | 1.4 | | |
| | | | | | | | | Total Real Estate
Investment Trusts
( Cost $8,733,853 ) | | | 10,629,064 | | | | 3.3 | | |
| | | | | | | | | Total Long-Term
Investments
( Cost $254,084,240 ) | | | 313,560,917 | | | | 96.1 | | |
See Accompanying Notes to Financial Statements
113
ING JPMORGAN SUMMARY PORTFOLIO OF INVESTMENTS
MID CAP VALUE PORTFOLIO AS OF DECEMBER 31, 2010 (CONTINUED)
Shares | |
| |
| | Value | | Percent of
Net Assets | |
| SHORT-TERM INVESTMENTS: 6.0% | | | |
| | | Mutual Funds: 4.2% | | | |
| | 13,717,697 | | | | | | | Blackrock Liquidity
Funds TempFund
Portfolio - Class I | | $ | 13,717,697 | | | | 4.2 | | |
| | | | | | | | | Total Mutual Funds
( Cost $13,717,697 ) | | | 13,717,697 | | | | 4.2 | | |
| | | Securities Lending Collateralcc: 1.8% | | | |
| | 5,452,732 | | | | | BNY Mellon Overnight
Government Fund (1) | | | 5,452,732 | | | | 1.7 | | |
| | 565,915 | | | R | | BNY Institutional Cash
Reserves Fund,
Series B (1)(2) | | | 452,732 | | | | 0.1 | | |
| | | | | | | Total Securities Lending
Collateral
( Cost $6,018,647 ) | | | 5,905,464 | | | | 1.8 | | |
| | | | | | | Total Short-Term
Investments
( Cost $19,736,344 ) | | | 19,623,161 | | | | 6.0 | | |
| | | | | | | Total Investments in
Securities
( Cost $273,820,584 ) * | | $ | 333,184,078 | | | | 102.1 | | |
| | | | | | | Other Assets and
Liabilities - Net | | | (6,895,633 | ) | | | (2.1 | ) | |
| | | | | | | Net Assets | | $ | 326,288,445 | | | | 100.0 | | |
"Other Securities" represents issues not identified as the top 50 holdings in terms of market value and issues or issuers not exceeding 1% of net assets individually or in aggregate respectively as of December 31, 2010.
The following footnotes apply to either the individual securities noted or one or more of the securities aggregated and listed as a single line item.
@ Non-income producing security
cc Securities purchased with cash collateral for securities loaned.
(1) Collateral received from brokers for securities lending was invested in these short-term investments.
(2) On September 12, 2008, BNY established a separate sleeve of the Institutional Cash Reserves Fund (Series B) to hold certain Lehman Brothers defaulted debt obligations. The Portfolio's position in Series B is being fair valued daily. Please see the accompanying Notes to Financial Statements for additional details on securities lending.
R Restricted security
L Loaned security, a portion or all of the security is on loan at December 31, 2010.
* Cost for federal income tax purposes is $281,145,145.
| Net unrealized appreciation consists of: | |
| Gross Unrealized Appreciation | | $ | 61,975,859 | | |
| Gross Unrealized Depreciation | | | (9,936,926 | ) | |
| Net Unrealized Appreciation | | $ | 52,038,933 | | |
Fair Value Measurements^
The following is a summary of the fair valuations according to the inputs used as of December 31, 2010 in valuing the Portfolio's assets and liabilities:
| | | Quoted Prices
in Active Markets
for Identical Investments
(Level 1) | | Other
Observable
Inputs
(Level 2) | | Significant
Unobservable
Inputs
(Level 3) | | Fair Value
at
12/31/10 | |
| Asset Table | |
| Investments, at value | |
| Common Stock* | | $ | 302,931,853 | | | $ | — | | | $ | — | | | $ | 302,931,853 | | |
| Real Estate Investment Trusts | | | 10,629,064 | | | | — | | | | — | | | | 10,629,064 | | |
| Short-Term Investments | | | 19,170,429 | | | | — | | | | 452,732 | | | | 19,623,161 | | |
| Total Investments, at value | | $ | 332,731,346 | | | $ | — | | | $ | 452,732 | | | $ | 333,184,078 | | |
The following is a reconciliation of the fair valuations using significant unobservable inputs (Level 3) for the Portfolio's assets and liabilities during the period ended December 31, 2010:
| | | Beginning
Balance
12/31/09 | | Purchases | | Sales | | Accrued
Discounts/
(Premiums) | | Total
Realized
Gain/(Loss) | | Total
Unrealized
Appreciation/
(Depreciation) | | Transfers
Into
Level 3 | | Transfers
Out of
Level 3 | | Ending
Balance
12/31/10 | |
| Asset Table | |
| Investments, at value | |
Short-Term
Investments | | $ | 452,732 | | | $ | — | | | $ | — | | | $ | — | | | $ | — | | | $ | — | | | $ | — | | | $ | — | | | $ | 452,732 | | |
Total Investments,
at value | | $ | 452,732 | | | $ | — | | | $ | — | | | $ | — | | | $ | — | | | $ | — | | | $ | — | | | $ | — | | | $ | 452,732 | | |
See Accompanying Notes to Financial Statements
114
ING JPMORGAN SUMMARY PORTFOLIO OF INVESTMENTS
MID CAP VALUE PORTFOLIO AS OF DECEMBER 31, 2010 (CONTINUED)
As of December 31, 2010, total change in unrealized gain (loss) on Level 3 securities still held at period end and included in the change in net assets was $0.
^ See Note 2, "Significant Accounting Policies" in the Notes to Financial Statements for additional information.
Transfers in or out of Level 3 represents either the beginning value (for transfers in), or the ending value (for transfers out) of any security or derivative instrument where a change in the pricing level occurred from the beginning to the end of the period. It is the policy of the Portfolio to recognize transfers at the end of the reporting period.
* For further breakdown of Common Stock by Industry type, please refer to the Portfolio of Investments.
See Accompanying Notes to Financial Statements
115
ING LEGG MASON CLEARBRIDGE SUMMARY PORTFOLIO OF INVESTMENTS
AGGRESSIVE GROWTH PORTFOLIO AS OF DECEMBER 31, 2010
Shares | |
| |
| | Value | | Percent of
Net Assets | |
| COMMON STOCK: 100.8% | | | |
| | | Consumer Discretionary: 20.1% | | | |
| | 646,000 | | | | | | | Cablevision
Systems Corp. | | $ | 21,860,640 | | | | 5.5 | | |
| | 68,235 | | | | | | | CBS Corp. - Class B | | | 1,299,877 | | | | 0.3 | | |
| | 184,500 | | | @ | | Charming Shoppes, Inc. | | | 654,975 | | | | 0.2 | | |
| | 143,090 | | | | | Comcast Corp. - Class A | | | 3,143,687 | | | | 5.3 | | |
| | 851,635 | | | | | Comcast Corp. -
Special Class A | | | 17,722,524 | | | | | | |
| | 157,148 | | | @ | | DIRECTV | | | 6,274,920 | | | | 1.6 | | |
| | 62,205 | | | @ | | Discovery
Communications,
Inc. - Class A | | | 2,593,949 | | | | 0.7 | | |
| | 62,205 | | | @ | | Discovery
Communications,
Inc. - Class C | | | 2,282,301 | | | | 0.6 | | |
| | 53,146 | | | @,L | | Liberty Global, Inc. | | | 1,880,305 | | | | 0.5 | | |
| | 53,003 | | | @ | | Liberty Global,
Inc. - Series C | | | 1,796,272 | | | | 0.4 | | |
| | 66,735 | | | @,L | | Liberty Media Corp. -
Capital Shares A | | | 4,174,942 | | | | 1.1 | | |
| | 358,315 | | | @ | | Liberty Media Corp. -
Interactive - Class A | | | 5,650,628 | | | | 1.4 | | |
| | 28,710 | | | @ | | Liberty Media
Corp. - Starz | | | 1,908,641 | | | | 0.5 | | |
| | 167,750 | | | @ | | Madison Square
Garden, Inc. | | | 4,324,595 | | | | 1.1 | | |
| | 61,295 | | | | | Viacom - Class B | | | 2,427,895 | | | | 0.6 | | |
| | 74,460 | | | L | | World Wrestling
Entertainment, Inc. | | | 1,060,310 | | | | 0.3 | | |
| | | | | | | Other Securities | | | 202,327 | | | | 0.0 | | |
| | | | | | | | | | 79,258,788 | | | | 20.1 | | |
| | | Energy: 18.8% | | | |
| | 437,095 | | | | | | | Anadarko
Petroleum Corp. | | | 33,289,155 | | | | 8.4 | | |
| | 149,919 | | | | | National Oilwell
Varco, Inc. | | | 10,082,053 | | | | 2.6 | | |
| | 1,354,430 | | | @ | | Weatherford
International Ltd. | | | 30,881,003 | | | | 7.8 | | |
| | | | | | | | | | 74,252,211 | | | | 18.8 | | |
| | | Financials: 0.8% | | | |
| | 100,750 | | | L | | Cohen & Steers, Inc. | | | 2,629,575 | | | | 0.7 | | |
| | 1,646 | | | | | | | Goldman Sachs
Group, Inc. | | | 276,791 | | | | 0.1 | | |
| | | | | | | | | | 2,906,366 | | | | 0.8 | | |
| | | Health Care: 35.9% | | | |
| | 79,830 | | | @ | | Alkermes, Inc. | | | 980,312 | | | | 0.2 | | |
| | 379,420 | | | @ | | Amgen, Inc. | | | 20,830,158 | | | | 5.3 | | |
| | 445,390 | | | @ | | Biogen Idec, Inc. | | | 29,863,400 | | | | 7.5 | | |
| | 212,520 | | | @ | | BioMimetic
Therapeutics, Inc. | | | 2,699,004 | | | | 0.7 | | |
| | 235,748 | | | | | Covidien PLC | | | 10,764,254 | | | | 2.7 | | |
Shares | |
| |
| | Value | | Percent of
Net Assets | |
| | 526,504 | | | @ | | Forest Laboratories, Inc. | | $ | 16,837,598 | | | | 4.3 | | |
| | 346,000 | | | @ | | Genzyme Corp. | | | 24,635,200 | | | | 6.2 | | |
| | 70,540 | | | @,L | | Isis Pharmaceuticals, Inc. | | | 713,865 | | | | 0.2 | | |
| | 51,392 | | | | | Teva Pharmaceutical
Industries Ltd. ADR | | | 2,679,065 | | | | 0.7 | | |
| | 666,190 | | | | | UnitedHealth Group, Inc. | | | 24,056,121 | | | | 6.1 | | |
| | 128,813 | | | | | Valeant Pharmaceuticals
International, Inc. | | | 3,644,120 | | | | 0.9 | | |
| | 124,160 | | | @,L | | Vertex
Pharmaceuticals, Inc. | | | 4,349,325 | | | | 1.1 | | |
| | | | | | | | | | 142,052,422 | | | | 35.9 | | |
| | | Industrials: 7.5% | | | |
| | 17,870 | | | | | | | Fluor Corp. | | | 1,184,066 | | | | 0.3 | | |
| | 120,370 | | | | | | | L-3 Communications
Holdings, Inc. | | | 8,484,881 | | | | 2.1 | | |
| | 192,420 | | | | | | | Pall Corp. | | | 9,540,184 | | | | 2.4 | | |
| | 252,588 | | | | | | | Tyco International Ltd. | | | 10,467,247 | | | | 2.7 | | |
| | | | | | | | | | 29,676,378 | | | | 7.5 | | |
| | | Information Technology: 15.9% | | | |
| | 73,870 | | | @ | | Advent Software, Inc. | | | 4,278,550 | | | | 1.1 | | |
| | 87,217 | | | @ | | Arris Group, Inc. | | | 978,575 | | | | 0.3 | | |
| | 116,970 | | | @ | | Autodesk, Inc. | | | 4,468,254 | | | | 1.1 | | |
| | 291,320 | | | | | Broadcom Corp. | | | 12,686,986 | | | | 3.2 | | |
| | 84,200 | | | @,L | | Cree, Inc. | | | 5,547,938 | | | | 1.4 | | |
| | 19,190 | | | @ | | Dolby Laboratories, Inc. | | | 1,279,973 | | | | 0.3 | | |
| | 52,890 | | | @ | | DSP Group, Inc. | | | 430,525 | | | | 0.1 | | |
| | 192,240 | | | | | Intel Corp. | | | 4,042,807 | | | | 1.0 | | |
| | 203,160 | | | L | | Nokia OYJ ADR | | | 2,096,611 | | | | 0.5 | | |
| | 259,300 | | | @ | | Sandisk Corp. | | | 12,928,698 | | | | 3.3 | | |
| | 352,356 | | | @ | | Seagate Technology, Inc. | | | 5,295,911 | | | | 1.3 | | |
| | 252,558 | | | | | Tyco Electronics Ltd. | | | 8,940,553 | | | | 2.3 | | |
| | | | | | | | | | 62,975,381 | | | | 15.9 | | |
| | | Materials: 1.8% | | | |
| | 47,460 | | | | | | | Freeport-McMoRan
Copper & Gold, Inc. | | | 5,699,471 | | | | 1.4 | | |
| | 33,480 | | | | | | | Nucor Corp. | | | 1,467,094 | | | | 0.4 | | |
| | | | | | | | | | 7,166,565 | | | | 1.8 | | |
| | | | | | | Total Common Stock
( Cost $300,822,266 ) | | | 398,288,111 | | | | 100.8 | | |
| SHORT-TERM INVESTMENTS: 1.4% | | | |
| | | Mutual Funds: 0.0% | | | |
| | 206,384 | | | | | | | Blackrock Liquidity Funds
TempFund
Portfolio - Class I | | | 206,384 | | | | 0.0 | | |
| | | | | | | Total Mutual Funds
( Cost $206,384 ) | | | 206,384 | | | | 0.0 | | |
See Accompanying Notes to Financial Statements
116
ING LEGG MASON CLEARBRIDGE SUMMARY PORTFOLIO OF INVESTMENTS
AGGRESSIVE GROWTH PORTFOLIO AS OF DECEMBER 31, 2010 (CONTINUED)
Shares | |
| |
| | Value | | Percent of
Net Assets | |
| | | Securities Lending Collateralcc: 1.4% | |
| | 5,344,424 | | | | | BNY Mellon Overnight
Government Fund (1) | | $ | 5,344,424 | | | | 1.4 | | |
| | 154,628 | | | R | | BNY Institutional Cash
Reserves Fund,
Series B (1)(2) | | | 123,702 | | | | 0.0 | | |
| | | | | Total Securities Lending
Collateral
( Cost $5,499,052 ) | | | 5,468,126 | | | | 1.4 | | |
| | | | | Total Short-Term
Investments
( Cost $5,705,436 ) | | | 5,674,510 | | | | 1.4 | | |
| | | | | Total Investments in
Securities
( Cost $306,527,702 ) * | | $ | 403,962,621 | | | | 102.2 | | |
| | | | | Other Assets and
Liabilities - Net | | | (8,581,934 | ) | | | (2.2 | ) | |
| | | | | Net Assets | | $ | 395,380,687 | | | | 100.0 | | |
"Other Securities" represents issues not identified as the
top 50 holdings in terms of market value and issues or issuers not exceeding 1% of net assets individually or in aggregate respectively as of December 31, 2010.
The following footnotes apply to either the individual securities noted or one or more of the securities aggregated and listed as a single line item.
@ Non-income producing security
ADR American Depositary Receipt
cc Securities purchased with cash collateral for securities loaned.
(1) Collateral received from brokers for securities lending was invested in these short-term investments.
(2) On September 12, 2008, BNY established a separate sleeve of the Institutional Cash Reserves Fund (Series B) to hold certain Lehman Brothers defaulted debt obligations. The Portfolio's position in Series B is being fair valued daily. Please see the accompanying Notes to Financial Statements for additional details on securities lending.
R Restricted security
L Loaned security, a portion or all of the security is on loan at December 31, 2010.
* Cost for federal income tax purposes is $306,553,346.
| Net unrealized appreciation consists of: | |
| Gross Unrealized Appreciation | | $ | 112,372,948 | | |
| Gross Unrealized Depreciation | | | (14,963,673 | ) | |
| Net Unrealized Appreciation | | $ | 97,409,275 | | |
Fair Value Measurements^
The following is a summary of the fair valuations according to the inputs used as of December 31, 2010 in valuing the Portfolio's assets and liabilities:
| | | Quoted Prices
in Active Markets
for Identical Investments
(Level 1) | | Other
Observable
Inputs
(Level 2) | | Significant
Unobservable
Inputs
(Level 3) | | Fair Value
at
12/31/10 | |
| Asset Table | |
| Investments, at value | |
| Common Stock* | | $ | 398,288,111 | | | $ | — | | | $ | — | | | $ | 398,288,111 | | |
| Short-Term Investments | | | 5,550,808 | | | | — | | | | 123,702 | | | | 5,674,510 | | |
| Total Investments, at value | | $ | 403,838,919 | | | $ | — | | | $ | 123,702 | | | $ | 403,962,621 | | |
The following is a reconciliation of the fair valuations using significant unobservable inputs (Level 3) for the Portfolio's assets and liabilities during the period ended December 31, 2010:
| | | Beginning
Balance
12/31/09 | | Purchases | | Sales | |
Accrued
Discounts/
(Premiums) | | Total
Realized
Gain/
(Loss) | | Total
Unrealized
Appreciation/
(Depreciation) | | Transfers
Into
Level 3 | |
Transfers
Out of
Level 3 | |
Ending
Balance
12/31/10 | |
| Asset Table | |
| Investments, at value | |
Short-Term
Investments | | $ | 123,702 | | | $ | — | | | $ | — | | | $ | — | | | $ | — | | | $ | — | | | $ | — | | | $ | — | | | $ | 123,702 | | |
Total Investments,
at value | | $ | 123,702 | | | $ | — | | | $ | — | | | $ | — | | | $ | — | | | $ | — | | | $ | — | | | $ | — | | | $ | 123,702 | | |
As of December 31, 2010, total change in unrealized gain (loss) on Level 3 securities still held at period end and included in the change in net assets was $0.
^ See Note 2, "Significant Accounting Policies" in the Notes to Financial Statements for additional information.
Transfers in or out of Level 3 represents either the beginning value (for transfers in), or the ending value (for transfers out) of any security or derivative instrument where a change in the pricing level occurred from the beginning to the end of the period. It is the policy of the Portfolio to recognize transfers at the end of the reporting period.
* For further breakdown of Common Stock by Industry type, please refer to the Portfolio of Investments.
See Accompanying Notes to Financial Statements
117
SUMMARY PORTFOLIO OF INVESTMENTS
ING OPPENHEIMER GLOBAL PORTFOLIO AS OF DECEMBER 31, 2010
| Shares | |
| |
| | Value | | Percent of
Net Assets | |
| COMMON STOCK: 99.0% | | | |
| | | Bermuda: 0.9% | | | |
| | | | | | | Other Securities | | $ | 16,304,122 | | | | 0.9 | | |
| | | Brazil: 2.0% | | | |
| | 576,000 | | | | | | | Cia de Bebidas das
Americas ADR | | | 17,873,280 | | | | 1.0 | | |
| | | | | | | | | Other Securities | | | 16,237,914 | | | | 1.0 | | |
| | | | | | | | | | 34,111,194 | | | | 2.0 | | |
| | | Finland: 0.9% | | | |
| | | | | | | | | Other Securities | | | 14,810,252 | | | | 0.9 | | |
| | | France: 5.0% | | | |
| | 198,848 | | | | | | | LVMH Moet Hennessy
Louis Vuitton S.A. | | | 32,751,197 | | | | 1.9 | | |
| | 256,414 | | | | | | | Technip S.A. | | | 23,701,247 | | | | 1.4 | | |
| | 362,784 | | | | | | | Total S.A. | | | 19,322,793 | | | | 1.1 | | |
| | | | | | | | | Other Securities | | | 10,777,294 | | | | 0.6 | | |
| | | | | | | | | | 86,552,531 | | | | 5.0 | | |
| | | Germany: 9.0% | | | |
| | 191,160 | | | | | | | Allianz AG | | | 22,712,809 | | | | 1.3 | | |
| | 435,474 | | | | | | | Bayerische Motoren
Werke AG -
Preference Shares | | | 22,390,418 | | | | 1.5 | | |
| | 47,078 | | | | | | | Bayerische Motoren
Werke AG | | | 3,709,136 | | | | | | |
| | 568,907 | | | | | | | SAP AG | | | 29,015,773 | | | | 1.7 | | |
| | 413,269 | | | | | | | Siemens AG | | | 51,193,549 | | | | 2.9 | | |
| | | | | | | | | Other Securities | | | 27,750,320 | | | | 1.6 | | |
| | | | | | | | | | 156,772,005 | | | | 9.0 | | |
| | | India: 2.2% | | | |
| | 390,980 | | | | | | | Infosys
Technologies Ltd. | | | 30,066,853 | | | | 1.7 | | |
| | | | | | | | | Other Securities | | | 8,727,897 | | | | 0.5 | | |
| | | | | | | | | | 38,794,750 | | | | 2.2 | | |
| | | Italy: 2.2% | | | |
| | | | | | | | | Other Securities | | | 38,696,215 | | | | 2.2 | | |
| | | Japan: 11.6% | | | |
| | 12,876 | | | | | | | Dai-ichi Life Insurance
Co., Ltd. | | | 20,838,159 | | | | 1.2 | | |
| | 59,483 | | | | | | | Keyence Corp. | | | 17,162,932 | | | | 1.0 | | |
| | 330,900 | | | | | | | Murata
Manufacturing
Co., Ltd. | | | 23,098,684 | | | | 1.3 | | |
| | 798,100 | | | | | | | Sony Corp. | | | 28,543,772 | | | | 1.6 | | |
| | | | | | | | | Other Securities | | | 112,127,943 | | | | 6.5 | | |
| | | | | | | | | | 201,771,490 | | | | 11.6 | | |
| Shares | |
| |
| | Value | | Percent of
Net Assets | |
| | | Mexico: 3.6% | | | |
| | 4,212,921 | | | @ | | Fomento Economico
Mexicano SA de
CV ADR | | $ | 23,554,834 | | | | 1.3 | | |
| | 850,014 | | | @ | | Grupo Televisa
S.A. ADR | | | 22,040,863 | | | | 1.3 | | |
| | | | | | | Other Securities | | | 17,509,165 | | | | 1.0 | | |
| | | | | | | | | | 63,104,862 | | | | 3.6 | | |
| | | Netherlands: 3.2% | | | |
| | 866,273 | | | @ | | European Aeronautic
Defence and Space
Co. NV | | | 20,214,518 | | | | 1.2 | | |
| | 725,377 | | | | | | | Koninklijke Philips
Electronics NV | | | 22,238,124 | | | | 1.3 | | |
| | | | | | | | | Other Securities | | | 12,229,202 | | | | 0.7 | | |
| | | | | | | | | | 54,681,844 | | | | 3.2 | | |
| | | South Korea: 0.2% | | | |
| | | | | | | | | Other Securities | | | 3,539,873 | | | | 0.2 | | |
| | | Spain: 2.3% | | | |
| | 1,700,880 | | | L | | Banco Bilbao Vizcaya
Argentaria S.A. | | | 17,334,143 | | | | 1.0 | | |
| | 298,695 | | | | | | | Inditex S.A. | | | 22,358,379 | | | | 1.3 | | |
| | | | | | | | | | 39,692,522 | | | | 2.3 | | |
| | | Sweden: 6.7% | | | |
| | 981,154 | | | | | | | Assa Abloy AB | | | 27,677,063 | | | | 1.6 | | |
| | 882,350 | | | | | | | Investor AB | | | 18,880,740 | | | | 1.1 | | |
| | 6,067,604 | | | | | | | Telefonaktiebolaget
LM Ericsson | | | 70,316,357 | | | | 4.0 | | |
| | | | | | | | | | 116,874,160 | | | | 6.7 | | |
| | | Switzerland: 5.1% | | | |
| | 923,954 | | | | | | | Credit Suisse Group | | | 37,212,191 | | | | 2.2 | | |
| | 325,327 | | | | | | | Nestle S.A. | | | 19,058,850 | | | | 1.1 | | |
| | 1,306,969 | | | @ | | UBS AG - Reg | | | 21,458,682 | | | | 1.2 | | |
| | | | | | | | | Other Securities | | | 10,281,434 | | | | 0.6 | | |
| | | | | | | | | | 88,011,157 | | | | 5.1 | | |
| | | Taiwan: 1.9% | | | |
| | 8,251,111 | | | | | | | Taiwan Semiconductor
Manufacturing
Co., Ltd. | | | 20,085,678 | | | | 1.1 | | |
| | | | | | | | | Other Securities | | | 13,667,669 | | | | 0.8 | | |
| | | | | | | | | | 33,753,347 | | | | 1.9 | | |
| | | United Kingdom: 5.1% | | | |
| | 2,180,698 | | | | | | | HSBC Holdings PLC | | | 22,268,137 | | | | 1.3 | | |
| | 1,761,116 | | | | | | | Prudential PLC | | | 18,398,709 | | | | 1.1 | | |
| | 703,167 | | | | | | | Unilever PLC | | | 21,598,558 | | | | 1.2 | | |
See Accompanying Notes to Financial Statements
118
SUMMARY PORTFOLIO OF INVESTMENTS
ING OPPENHEIMER GLOBAL PORTFOLIO AS OF DECEMBER 31, 2010 (CONTINUED)
| Shares | |
| |
| | Value | | Percent of
Net Assets | |
| | | United Kingdom (continued) | | | |
| | 6,640,676 | | | | | | | Vodafone Group PLC | | $ | 17,432,696 | | | | 1.0 | | |
| | | | | | | | | Other Securities | | | 8,269,519 | | | | 0.5 | | |
| | | | | | | | | | 87,967,619 | | | | 5.1 | | |
| | | United States: 37.1% | | | |
| | 265,390 | | | | | | | 3M Co. | | | 22,903,157 | | | | 1.3 | | |
| | 673,683 | | | @ | | Adobe Systems, Inc. | | | 20,735,963 | | | | 1.2 | | |
| | 633,200 | | | | | | | Aetna, Inc. | | | 19,318,932 | | | | 1.1 | | |
| | 950,480 | | | | | | | Altera Corp. | | | 33,818,078 | | | | 2.0 | | |
| | 678,440 | | | | | | | Carnival Corp. | | | 31,282,868 | | | | 1.8 | | |
| | 297,810 | | | | | | | Colgate-Palmolive Co. | | | 23,934,990 | | | | 1.4 | | |
| | 1,567,570 | | | @ | | eBay, Inc. | | | 43,625,473 | | | | 2.5 | | |
| | 111,030 | | | | | | | Goldman Sachs
Group, Inc. | | | 18,670,805 | | | | 1.1 | | |
| | 644,680 | | | @ | | Intuit, Inc. | | | 31,782,724 | | | | 1.8 | | |
| | 984,490 | | | @ | | Juniper Networks, Inc. | | | 36,347,371 | | | | 2.1 | | |
| | 884,290 | | | | | | | Maxim Integrated
Products | | | 20,886,930 | | | | 1.2 | | |
| | 356,090 | | | | | | | McDonald's Corp. | | | 27,333,468 | | | | 1.6 | | |
| | 1,059,250 | | | | | | | Microsoft Corp. | | | 29,574,260 | | | | 1.7 | | |
| | 524,710 | | | | | | | Tiffany & Co. | | | 32,673,692 | | | | 1.9 | | |
| | 295,779 | | | @ | | Transocean Ltd. | | | 20,559,598 | | | | 1.2 | | |
| | 388,060 | | | | | | | Wal-Mart Stores, Inc. | | | 20,928,076 | | | | 1.2 | | |
| | 734,950 | | | | | | | Walt Disney Co. | | | 27,567,975 | | | | 1.6 | | |
| | 379,300 | | | @ | | WellPoint, Inc. | | | 21,566,998 | | | | 1.2 | | |
| | 332,780 | | | @ | | Zimmer Holdings, Inc. | | | 17,863,630 | | | | 1.0 | | |
| | | | | | | | | Other Securities | | | 141,922,887 | | | | 8.2 | | |
| | | | | | | | | | 643,297,875 | | | | 37.1 | | |
| | | | | | | | | Total Common Stock
( Cost $1,409,635,562 ) | | | 1,718,735,818 | | | | 99.0 | | |
| SHORT-TERM INVESTMENTS: 1.4% | | | |
| | | Mutual Funds: 1.2% | | | |
| | 20,605,696 | | | | | | | Blackrock Liquidity
Funds TempFund
Portfolio - Class I | | | 20,605,696 | | | | 1.2 | | |
| | | | | | | | | Total Mutual Funds
( Cost $20,605,696 ) | | | 20,605,696 | | | | 1.2 | | |
| Shares | |
| |
| | Value | | Percent of
Net Assets | |
| | | Securities Lending Collateralcc: 0.2% | | | |
| | 995,126 | | | | | | | BNY Mellon
Overnight
Government Fund (1) | | $ | 995,126 | | | | 0.0 | | |
| | 3,820,850 | | | R | | BNY Institutional Cash
Reserves Fund,
Series B (1)(2) | | | 3,056,680 | | | | 0.2 | | |
| | | | | | | | | Total Securities
Lending Collateral
( Cost $4,815,976 ) | | | 4,051,806 | | | | 0.2 | | |
| | | | | | | | | Total Short-Term
Investments
( Cost $25,421,672 ) | | | 24,657,502 | | | | 1.4 | | |
| | | | | | | | | Total Investments in
Securities
( Cost $1,435,057,234 ) * | | $ | 1,743,393,320 | | | | 100.4 | | |
| | | | | | | | | Other Assets and
Liabilities - Net | | | (7,505,045 | ) | | | (0.4 | ) | |
| | | | | | | | | Net Assets | | $ | 1,735,888,275 | | | | 100.0 | | |
"Other Securities" represents issues not identified as the top 50 holdings in terms of market value and issues or issuers not exceeding 1% of net assets individually or in aggregate respectively as of December 31, 2010.
The following footnotes apply to either the individual securities noted or one or more of the securities aggregated and listed as a single line item.
@ Non-income producing security
ADR American Depositary Receipt
cc Securities purchased with cash collateral for securities loaned.
(1) Collateral received from brokers for securities lending was invested in these short-term investments.
(2) On September 12, 2008, BNY established a separate sleeve of the Institutional Cash Reserves Fund (Series B) to hold certain Lehman Brothers defaulted debt obligations. The Portfolio's position in Series B is being fair valued daily. Please see the accompanying Notes to Financial Statements for additional details on securities lending.
R Restricted security
L Loaned security, a portion or all of the security is on loan at December 31, 2010.
* Cost for federal income tax purposes is $1,459,603,876.
| Net unrealized appreciation consists of: | |
| Gross Unrealized Appreciation | | $ | 352,596,323 | | |
| Gross Unrealized Depreciation | | | (68,806,879 | ) | |
| Net Unrealized Appreciation | | $ | 283,789,444 | | |
| Industry | | Percentage of
Net Assets | |
| Consumer Discretionary | | | 17.4 | % | |
| Consumer Staples | | | 8.3 | | |
| Energy | | | 3.7 | | |
| Financials | | | 16.4 | | |
| Health Care | | | 7.2 | | |
| Industrials | | | 14.1 | | |
| Information Technology | | | 28.2 | | |
| Materials | | | 0.7 | | |
| Telecommunication Services | | | 2.2 | | |
| Utilities | | | 0.8 | | |
| Short-Term Investments | | | 1.4 | | |
| Other Assets and Liabilities - Net | | | (0.4 | ) | |
| Net Assets | | | 100.0 | % | |
See Accompanying Notes to Financial Statements
119
SUMMARY PORTFOLIO OF INVESTMENTS
ING OPPENHEIMER GLOBAL PORTFOLIO AS OF DECEMBER 31, 2010 (CONTINUED)
Fair Value Measurements^
The following is a summary of the fair valuations according to the inputs used as of December 31, 2010 in valuing the Portfolio's assets and liabilities:
| | | Quoted Prices
in Active Markets
for Identical Investments
(Level 1) | | Other
Observable
Inputs#
(Level 2) | | Significant
Unobservable
Inputs
(Level 3) | | Fair Value
at
12/31/10 | |
| Asset Table | |
| Investments, at value | |
| Common Stock | |
| Bermuda | | $ | 16,304,122 | | | $ | — | | | $ | — | | | $ | 16,304,122 | | |
| Brazil | | | 34,111,194 | | | | — | | | | — | | | | 34,111,194 | | |
| Finland | | | — | | | | 14,810,252 | | | | — | | | | 14,810,252 | | |
| France | | | — | | | | 86,552,531 | | | | — | | | | 86,552,531 | | |
| Germany | | | — | | | | 156,772,005 | | | | — | | | | 156,772,005 | | |
| India | | | 189,326 | | | | 38,605,424 | | | | — | | | | 38,794,750 | | |
| Italy | | | — | | | | 38,696,215 | | | | — | | | | 38,696,215 | | |
| Japan | | | — | | | | 201,771,490 | | | | — | | | | 201,771,490 | | |
| Mexico | | | 63,104,862 | | | | — | | | | — | | | | 63,104,862 | | |
| Netherlands | | | — | | | | 54,681,844 | | | | — | | | | 54,681,844 | | |
| South Korea | | | 3,539,873 | | | | — | | | | — | | | | 3,539,873 | | |
| Spain | | | — | | | | 39,692,522 | | | | — | | | | 39,692,522 | | |
| Sweden | | | — | | | | 116,874,160 | | | | — | | | | 116,874,160 | | |
| Switzerland | | | — | | | | 88,011,157 | | | | — | | | | 88,011,157 | | |
| Taiwan | | | — | | | | 33,753,347 | | | | — | | | | 33,753,347 | | |
| United Kingdom | | | — | | | | 87,967,619 | | | | — | | | | 87,967,619 | | |
| United States | | | 643,297,875 | | | | — | | | | — | | | | 643,297,875 | | |
| Total Common Stock | | | 760,547,252 | | | | 958,188,566 | | | | — | | | | 1,718,735,818 | | |
| Short-Term Investments | | | 21,600,822 | | | | — | | | | 3,056,680 | | | | 24,657,502 | | |
| Total Investments, at value | | $ | 782,148,074 | | | $ | 958,188,566 | | | $ | 3,056,680 | | | $ | 1,743,393,320 | | |
The following is a reconciliation of the fair valuations using significant unobservable inputs (Level 3) for the Portfolio's assets and liabilities during the period ended December 31, 2010:
| | | Beginning
Balance
12/31/09 | | Purchases | | Sales | | Accrued
Discounts/
(Premiums) | | Total
Realized
Gain/(Loss) | | Total
Unrealized
Appreciation/
(Depreciation) | | Transfers
Into
Level 3 | | Transfers
Out of
Level 3 | | Ending
Balance
12/31/10 | |
| Asset Table | |
| Investments, at value | |
Short-Term
Investments | | $ | 3,056,680 | | | $ | — | | | $ | — | | | $ | — | | | $ | — | | | $ | — | | | $ | — | | | $ | — | | | $ | 3,056,680 | | |
Total Investments,
at value | | $ | 3,056,680 | | | $ | — | | | $ | — | | | $ | — | | | $ | — | | | $ | — | | | $ | — | | | $ | — | | | $ | 3,056,680 | | |
As of December 31, 2010, total change in unrealized gain (loss) on Level 3 securities still held at period end and included in the change in net assets was $0.
^ See Note 2, "Significant Accounting Policies" in the Notes to Financial Statements for additional information.
Transfers in or out of Level 3 represents either the beginning value (for transfers in), or the ending value (for transfers out) of any security or derivative instrument where a change in the pricing level occurred from the beginning to the end of the period. It is the policy of the Portfolio to recognize transfers at the end of the reporting period.
# The earlier close of the foreign markets gives rise to the possibility that significant events, including broad market moves, may have occurred in the interim and may materially affect the value of those securities. To account for this, the Portfolio may frequently value many of its foreign equity securities using fair value prices based on third party vendor modeling tools to the extent available. Accordingly, a significant portion of the Portfolio's investments are categorized as Level 2 investments.
See Accompanying Notes to Financial Statements
120
ING OPPENHEIMER GLOBAL SUMMARY PORTFOLIO OF INVESTMENTS
STRATEGIC INCOME PORTFOLIO AS OF DECEMBER 31, 2010
Principal
Amount | |
| |
| | Value | | Percent of
Net Assets | |
| CORPORATE BONDS/NOTES: 34.7% | | | |
| | | Consumer Discretionary: 5.2% | | | |
| $ | 560,000 | | | #,S | | Affinion Group
Holdings, Inc.,
11.625%,
due 11/15/15 | | $ | 583,800 | | | | 0.1 | | |
| | 3,295,000 | | | L | | Caesars
Entertainment
Operating Co.,
Inc., 10.000%,
due 12/15/18 | | | 3,023,163 | | | | 0.6 | | |
| | 730,000 | | | #,S | | Cequel
Communications
Holdings I, LLC
and Cequel
Capital Corp.,
8.625%,
due 11/15/17 | | | 766,500 | | | | 0.2 | | |
| | 3,050,000 | | | #,L | | Eastman Kodak
Co., 9.750%,
due 03/01/18 | | | 3,126,250 | | | | 0.6 | | |
| | 190,000 | | | # | | Entravision
Communications
Corp., 8.750%,
due 08/01/17 | | | 201,400 | | | | 0.0 | | |
| | 685,000 | | | # | | Equinox Holdings,
Inc., 9.500%,
due 02/01/16 | | | 726,956 | | | | 0.2 | | |
| | 220,000 | | | #,S | | Grupo Posadas
S.A.B de CV,
9.250%,
due 01/15/15 | | | 203,500 | | | | 0.0 | | |
| | 335,000 | | | # | | inVentiv Health,
Inc., 10.000%,
due 08/15/18 | | | 336,675 | | | | 0.1 | | |
| | 825,000 | | | #,±,S | | Mashantucket
Western
Pequot Tribe,
8.500%,
due 11/15/15 | | | 112,406 | | | | 0.0 | | |
| | 780,000 | | | #,L,S | | Mohegan
Tribal Gaming
Authority,
11.500%,
due 11/01/17 | | | 723,450 | | | | 0.5 | | |
| | 2,020,000 | | | L,S | | Mohegan
Tribal Gaming
Authority,
6.125%-8.000%,
due 04/01/12-
02/15/13 | | | 1,692,525 | | | | | | |
| | 495,000 | | | # | | Nexstar
Broadcasting,
Inc. / Mission
Broadcasting,
Inc., 8.875%,
due 04/15/17 | | | 528,413 | | | | 0.1 | | |
| | 85,500 | | | &,# | | Radio One,
Inc., 12.500%,
due 05/24/16 | | | 84,218 | | | | 0.0 | | |
Principal
Amount | |
| |
| | Value | | Percent of
Net Assets | |
| $ | 460,000 | | | # | | Sinclair Television
Group, Inc.,
8.375%,
due 10/15/18 | | $ | 477,250 | | | | 0.1 | | |
| | 1,670,000 | | | #,S | | TL Acquisitions,
Inc., 10.500%,
due 01/15/15 | | | 1,732,625 | | | | 0.3 | | |
| | 185,000 | | | # | | Visant Corp.,
10.000%,
due 10/01/17 | | | 197,025 | | | | 0.0 | | |
| | 700,000 | | | # | | Wallace Theater
Holdings, Inc.,
12.500%,
due 06/15/13 | | | 715,750 | | | | 0.1 | | |
| | | | | | | Other Securities (a) | | | 11,539,855 | | | | 2.3 | | |
| | | | | | | | | | 26,771,761 | | | | 5.2 | | |
| | | Consumer Staples: 1.6% | | | |
| | 920,000 | | | #,S | | Altegrity, Inc.,
10.500%,
due 11/01/15 | | | 948,750 | | | | 0.2 | | |
| | 1,160,000 | | | #,S | | American
Seafoods Group
LLC/American
Seafoods
Finance, Inc.,
10.750%,
due 05/15/16 | | | 1,241,200 | | | | 0.2 | | |
| | 1,304,783 | | | &,#,S | | ASG Consolidated
LLC/ASG
Finance, Inc.,
15.000%,
due 05/15/17 | | | 1,259,116 | | | | 0.3 | | |
| | 290,000 | | | #,S | | Ashtead
Capital, Inc.,
9.000%,
due 08/15/16 | | | 303,775 | | | | 0.1 | | |
| | 1,675,000 | | | #,L | | Hertz Corp.,
7.500%,
due 10/15/18 | | | 1,746,188 | | | | 0.3 | | |
| | 320,000 | | | # | | MHP S.A.,
10.250%,
due 04/29/15 | | | 338,816 | | | | 0.1 | | |
| | 125,000 | | | #,S | | RSC Equipment
Rental, Inc.,
10.000%,
due 07/15/17 | | | 141,250 | | | | 0.0 | | |
| | 775,000 | | | # | | Southern States
Cooperative,
Inc., 11.250%,
due 05/15/15 | | | 825,375 | | | | 0.2 | | |
| | 190,000 | | | # | | Trans Union LLC/
TransUnion
Financing Corp.,
11.375%,
due 06/15/18 | | | 217,550 | | | | 0.0 | | |
| | | | | | | | | Other Securities | | | 1,245,135 | | | | 0.2 | | |
| | | | | | | | | | 8,267,155 | | | | 1.6 | | |
See Accompanying Notes to Financial Statements
121
ING OPPENHEIMER GLOBAL SUMMARY PORTFOLIO OF INVESTMENTS
STRATEGIC INCOME PORTFOLIO AS OF DECEMBER 31, 2010 (CONTINUED)
Principal
Amount | |
| |
| | Value | | Percent of
Net Assets | |
| | | Energy: 6.2% | | | |
| $ | 420,000 | | | #,S | | Adaro
Indonesia PT,
7.625%,
due 10/22/19 | | $ | 460,950 | | | | 0.1 | | |
| | 300,000 | | | #,L | | Alliance Oil Co.,
Ltd., 9.875%,
due 03/11/15 | | | 316,860 | | | | 0.0 | | |
| | 1,395,000 | | | S | | Atlas Energy
Operating
Co., LLC / Atlas
Energy Finance
Corp., 10.750%,
due 02/01/18 | | | 1,710,619 | | | | 0.3 | | |
| | 2,330,000 | | | #,L,S | | ATP Oil & Gas
Corp., 11.875%,
due 05/01/15 | | | 2,213,500 | | | | 0.4 | | |
| | 870,000 | | | #,S | | BreitBurn Energy
Partners L.P.,
8.625%,
due 10/15/20 | | | 878,700 | | | | 0.2 | | |
| | 835,000 | | | #,L,S | | Chaparral Energy,
Inc., 9.875%,
due 10/01/20 | | | 885,100 | | | | 0.2 | | |
| | 170,000 | | | # | | Empresa Nacional
del Petroleo,
5.250%,
due 08/10/20 | | | 170,589 | | | | 0.0 | | |
| | 1,625,000 | | | # | | Foresight
Energy LLC /
Foresight
Energy Corp.,
9.625%,
due 08/15/17 | | | 1,738,750 | | | | 0.3 | | |
| | 550,000 | | | # | | Gaz Capital for
Gazprom,
6.212%,
due 11/22/16 | | | 585,750 | | | | | | |
| | 1,430,000 | | | #,S | | Gaz Capital for
Gazprom,
7.288%,
due 08/16/37 | | | 1,494,350 | | | | | | |
| | 300,000 | | | #,S | | Gaz Capital for
Gazprom,
8.125%,
due 07/31/14 | | | 340,500 | | | | 0.9 | | |
| | 350,000 | | | #,S | | Gaz Capital for
Gazprom,
8.625%,
due 04/28/34 | | | 421,750 | | | | | | |
| | 890,000 | | | #,S | | Gaz Capital for
Gazprom,
9.250%,
due 04/23/19 | | | 1,098,082 | | | | | | |
| | 460,000 | | | S | | Gaz Capital for
Gazprom,
8.146%,
due 04/11/18 | | | 534,750 | | | | | | |
Principal
Amount | |
| |
| | Value | | Percent of
Net Assets | |
| $ | 200,000 | | | # | | KazMunaiGaz
Finance Sub
BV, 7.000%,
due 05/05/20 | | $ | 209,000 | | | | | | |
| | 790,000 | | | #,S | | KazMunaiGaz
Finance Sub
BV, 9.125%,
due 07/02/18 | | | 928,250 | | | | 0.4 | | |
| | 590,000 | | | #,S | | KazMunaiGaz
Finance Sub
BV, 11.750%,
due 01/23/15 | | | 735,258 | | | | | | |
| | 101 | | | #,S | | Kern River
Funding Corp.,
4.893%,
due 04/30/18 | | | 105 | | | | 0.0 | | |
| | 1,275,000 | | | # | | Linn Energy
LLC/Linn Energy
Finance Corp.,
8.625%,
due 04/15/20 | | | 1,380,188 | | | | 0.3 | | |
| | 1,530,000 | | | # | | Murray Energy
Corp., 10.250%,
due 10/15/15 | | | 1,614,150 | | | | 0.3 | | |
| | 300,000 | | | # | | Pan American
Energy LLC/
Argentine
Branch, 7.875%,
due 05/07/21 | | | 320,250 | | | | 0.1 | | |
| | 510,000 | | | #,S | | Petroleum Co.
of Trinidad &
Tobago Ltd.,
9.750%,
due 08/14/19 | | | 614,550 | | | | 0.1 | | |
| | 925,000 | | | # | | PHI, Inc.,
8.625%,
due 10/15/18 | | | 952,750 | | | | 0.2 | | |
| | 395,000 | | | #,S | | SandRidge
Energy, Inc.,
9.875%,
due 05/15/16 | | | 419,688 | | | | 0.1 | | |
| | 327,080 | | | #,S | | Tengizchevroil
Finance Co.
S.A.RL, 6.124%,
due 11/15/14 | | | 344,252 | | | | 0.1 | | |
| | 740,000 | | | # | | Thermon
Industries,
Inc., 9.500%,
due 05/01/17 | �� | | 791,800 | | | | 0.1 | | |
| | | | | | | Other Securities | | | 10,651,409 | | | | 2.1 | | |
| | | | | | | | | | 31,811,900 | | | | 6.2 | | |
| | | Financials: 7.0% | | | |
| | 500,000 | | | #,L | | 1Malaysia Sukuk
Global Bhd,
3.928%,
due 06/04/15 | | | 520,068 | | | | 0.1 | | |
See Accompanying Notes to Financial Statements
122
ING OPPENHEIMER GLOBAL SUMMARY PORTFOLIO OF INVESTMENTS
STRATEGIC INCOME PORTFOLIO AS OF DECEMBER 31, 2010 (CONTINUED)
Principal
Amount | |
| |
| | Value | | Percent of
Net Assets | |
| | | Financials (continued) | | | |
| $ | 690,000 | | | #,S | | ABI Escrow Corp.,
10.250%,
due 10/15/18 | | $ | 759,000 | | | | 0.1 | | |
| | 425,000 | | | #,S | | Akbank TAS,
5.125%,
due 07/22/15 | | | 431,375 | | | | 0.1 | | |
| | 350,000 | | | #,S | | Alfa Bank OJSC
Via Alfa Bond
Issuance PLC,
7.875%,
due 09/25/17 | | | 356,227 | | | | 0.1 | | |
| | 1,020,000 | | | S | | Ally Financial,
Inc., 8.000%,
due 11/01/31 | | | 1,104,150 | | | | 0.2 | | |
| | 930,000 | | | #,S | | Banco BMG
S.A., 9.150%,
due 01/15/16 | | | 1,000,215 | | | | 0.2 | | |
| | 200,000 | | | #,S | | Banco BMG
S.A., 9.950%,
due 11/05/19 | | | 213,500 | | | | | | |
| | 170,000 | | | #,S | | Banco Cruzeiro
do Sul S.A./
Brazil, 8.875%,
due 09/22/20 | | | 170,170 | | | | 0.0 | | |
| | 260,000 | | | # | | Banco de Credito
del Peru,
5.375%,
due 09/16/20 | | | 257,400 | | | | | | |
| | 160,000 | | | #,S | | Banco de Credito
del Peru,
6.950%,
due 11/07/21 | | | 168,000 | | | | 0.1 | | |
| | 150,000 | | | #,S | | Banco de Credito
del Peru,
9.750%,
due 11/06/69 | | | 174,750 | | | | | | |
| | 315,000 | | | #,S | | Banco do Brasil
Cayman,
8.500%,
due 10/29/49 | | | 364,203 | | | | 0.1 | | |
| | 310,000 | | | #,S | | Banco do Brasil
S.A., 5.375%,
due 01/15/21 | | | 305,350 | | | | 0.1 | | |
| | 140,000 | | | #,S | | Banco
Hipotecario
S.A., 9.750%,
due 04/27/16 | | | 144,900 | | | | 0.0 | | |
| | 300,000 | | | #,S | | Banco
Panamericano
S.A., 8.500%,
due 04/23/20 | | | 296,400 | | | | 0.1 | | |
| | 480,000 | | | #,S | | Bankrate, Inc.,
11.750%,
due 07/15/15 | | | 535,200 | | | | 0.1 | | |
| | 340,000 | | | # | | BM&FBovespa
SA, 5.500%,
due 07/16/20 | | | 347,672 | | | | 0.1 | | |
Principal
Amount | |
| |
| | Value | | Percent of
Net Assets | |
| $ | 240,000 | | | #,S | | Cemex Finance,
LLC, 9.500%,
due 12/14/16 | | $ | 248,700 | | | | 0.1 | | |
| | 2,165,000 | | | S | | CIT Group, Inc.,
7.000%,
due 05/01/17 | | | 2,175,825 | | | | 0.4 | | |
| | 230,000 | | | # | | DJO Finance
LLC / DJO
Finance Corp.,
9.750%,
due 10/15/17 | | | 238,050 | | | | 0.0 | | |
| | 25,000 | | | #,S | | Fox Acquisition
Sub LLC,
13.375%,
due 07/15/16 | | | 27,500 | | | | 0.0 | | |
| | 200,000 | | | # | | Grupo Papelero
Scribe S.A.,
8.875%,
due 04/07/20 | | | 198,000 | | | | 0.0 | | |
| | 210,000 | | | #,S | | Halyk Savings
Bank of
Kazakhstan JSC,
7.250%,
due 05/03/17 | | | 214,200 | | | | 0.3 | | |
| | 1,010,000 | | | #,S | | Halyk Savings
Bank of
Kazakhstan JSC,
9.250%,
due 10/16/13 | | | 1,108,475 | | | | | | |
| | 625,000 | | | #,S | | ICICI Bank Ltd.,
5.500%,
due 03/25/15 | | | 651,036 | | | | 0.3 | | |
| | 635,000 | | | #,S | | ICICI Bank Ltd.,
6.375%,
due 04/30/22 | | | 638,264 | | | | | | |
| | 825,869 | | | # | | IIRSA Norte
Finance Ltd.,
8.750%,
due 05/30/24 | | | 922,908 | | | | 0.2 | | |
| | 460,000 | | | ** | | ING Groep NV,
5.775%,
due 12/31/49 | | | 397,900 | | | | 0.1 | | |
| | 485,000 | | | # | | International
Lease Finance
Corp., 8.625%,
due 09/15/15 | | | 522,588 | | | | | | |
| | 465,000 | | | # | | International
Lease Finance
Corp., 8.750%,
due 03/15/17 | | | 499,875 | | | | 0.2 | | |
| | 95,000 | | | | | International
Lease Finance
Corp., 8.875%,
due 09/01/17 | | | 102,956 | | | | | | |
| MXN | 419,692 | | | | | | | JPMorgan
Hipotecaria
su Casita,
6.100%,
due 09/25/35 | | | 61,037 | | | | 0.0 | | |
See Accompanying Notes to Financial Statements
123
ING OPPENHEIMER GLOBAL SUMMARY PORTFOLIO OF INVESTMENTS
STRATEGIC INCOME PORTFOLIO AS OF DECEMBER 31, 2010 (CONTINUED)
Principal
Amount | |
| |
| | Value | | Percent of
Net Assets | |
| | | Financials (continued) | | | |
| $ | 200,000 | | | # | | Kazakhstan
Temir Zholy
Finance BV,
6.375%,
due 10/06/20 | | $ | 209,760 | | | | 0.0 | | |
| | 260,000 | | | # | | Lukoil
International
Finance BV,
6.656%,
due 06/07/22 | | | 264,550 | | | | 0.1 | | |
| | 130,000 | | | # | | Lukoil
International
Finance BV,
7.250%,
due 11/05/19 | | | 141,050 | | | | | | |
| | 1,730,000 | | | # | | Nationstar
Mortgage/
Nationstar
Capital Corp.,
10.875%,
due 04/01/15 | | | 1,708,375 | | | | 0.3 | | |
| | 230,000 | | | # | | Navios Maritime
Acquisition
Corp./Navios
Acquisition
Finance US, Inc.,
8.625%,
due 11/01/17 | | | 236,325 | | | | 0.0 | | |
| | 785,000 | | | # | | Offshore Group
Investments
Ltd., 11.500%,
due 08/01/15 | | | 855,650 | | | | 0.2 | | |
| | 925,000 | | | # | | Pinafore LLC/
Pinafore, Inc.,
9.000%,
due 10/01/18 | | | 1,003,625 | | | | 0.2 | | |
| | 300,000 | | | #,S | | Power Sector
Assets &
Liabilities
Management
Corp., 7.250%,
due 05/27/19 | | | 354,000 | | | | 0.1 | | |
| | 240,000 | | | #,S | | Power Sector
Assets &
Liabilities
Management
Corp., 7.390%,
due 12/02/24 | | | 285,600 | | | | | | |
| | 365,000 | | | # | | Reynolds
Group Issuer,
Inc., 9.000%,
due 04/15/19 | | | 380,056 | | | | | | |
| | 480,000 | | | #
| | Reynolds
Group Issuer,
Inc. / Reynolds
Group Issuer
LLC / Reynolds
Group Issuer
Lu, 8.500%,
due 05/15/18 | | | 484,800 | | | | 0.2
| | |
Principal
Amount | |
| |
| | Value | | Percent of
Net Assets | |
| $ | 660,000 | | | +,#,S | | Tiers Trust,
8.790%
(step rate
8.600%),
due 06/15/97 | | $ | 370,686 | | | | 0.1 | | |
| | 745,000 | | | # | | TMX Finance
LLC/TitleMax
Finance Corp.,
13.250%,
due 07/15/15 | | | 823,225 | | | | 0.2 | | |
| | 100,000 | | | # | | TNK-BP Finance
S.A., 7.250%,
due 02/02/20 | | | 109,250 | | | | 0.0 | | |
| | 1,605,000 | | | #,L | | Tower
Automotive
Holdings
USA LLC /
TA Holdings
Finance, Inc.,
10.625%,
due 09/01/17 | | | 1,733,400 | | | | 0.3 | | |
| | 200,000 | | | # | | UK SPV Credit
Finance PLC
for JSC
Commercial
Bank
Privatbank,
8.000%,
due 02/06/12 | | | 200,000 | | | | 0.0 | | |
| | 780,000 | | | # | | Vnesheconombank
Via VEB Finance
Ltd., 6.902%,
due 07/09/20 | | | 819,000 | | | | 0.2 | | |
| | 340,000 | | | # | | VTB Bank Via
VTB Capital SA,
6.551%,
due 10/13/20 | | | 335,750 | | | | | | |
| | 400,000 | | | # | | VTB Capital S.A.,
6.465%,
due 03/04/15 | | | 418,480 | | | | 0.2 | | |
| | 145,000 | | | # | | VTB Capital S.A.,
6.875%,
due 05/29/18 | | | 154,063 | | | | | | |
| | 250,000 | | | # | | Yapi ve Kredi
Bankasi Via
Unicredit
Luxembourg
SA, 5.188%,
due 10/13/15 | | | 258,800 | | | | 0.1 | | |
| | | | | | | | | Other Securities (a) | | | 9,315,678 | | | | 1.8 | | |
| | | | | | | | | | 35,618,017 | | | | 7.0 | | |
| | | Health Care: 1.7% | | | |
| | 320,000 | | | #,S | | Alere, Inc.,
8.625%,
due 10/01/18 | | | 325,600 | | | | 0.1 | | |
| | 120,000 | | | #,S | | Capella
Healthcare,
Inc., 9.250%,
due 07/01/17 | | | 127,500 | | | | 0.0 | | |
See Accompanying Notes to Financial Statements
124
ING OPPENHEIMER GLOBAL SUMMARY PORTFOLIO OF INVESTMENTS
STRATEGIC INCOME PORTFOLIO AS OF DECEMBER 31, 2010 (CONTINUED)
Principal
Amount | |
| |
| | Value | | Percent of
Net Assets | |
| | | Health Care (continued) | | | |
| $ | 575,000 | | | # | | Multiplan, Inc.,
9.875%,
due 09/01/18 | | $ | 612,375 | | | | 0.1 | | |
| | 330,000 | | | # | | OnCure Holdings,
Inc., 11.750%,
due 05/15/17 | | | 313,500 | | | | 0.1 | | |
| | 305,000 | | | # | | Radiation
Therapy
Services, Inc.,
9.875%,
due 04/15/17 | | | 305,763 | | | | 0.0 | | |
| | 70,000 | | | # | | UHS Escrow
Corp., 7.000%,
due 10/01/18 | | | 72,100 | | | | 0.0 | | |
| | 1,035,000 | | | # | | Warner Chilcott
Co. LLC/Warner
Chilcott
Finance LLC,
7.750%,
due 09/15/18 | | | 1,050,525 | | | | 0.2 | | |
| | | | | | | Other Securities | | | 5,967,969 | | | | 1.2 | | |
| | | | | | | | | | 8,775,332 | | | | 1.7 | | |
| | | Industrials: 2.9% | | | |
| | 407,000 | | | #,L,S | | Cemex Espana
Luxembourg,
9.250%,
due 05/12/20 | | | 401,913 | | | | 0.1 | | |
| | 760,000 | | | # | | Cleaver-Brooks,
Inc., 12.250%,
due 05/01/16 | | | 810,350 | | | | 0.2 | | |
| | 1,205,000 | | | # | | Delta Airlines,
Inc., 12.250%,
due 03/15/15 | | | 1,364,663 | | | | 0.3 | | |
| | 1,500,000 | | | # | | DynCorp
International,
Inc., 10.375%,
due 07/01/17 | | | 1,545,000 | | | | 0.3 | | |
| | 730,000 | | | #,S | | Marquette
Transportation
Co. / Marquette
Transportation
Finance Corp.,
10.875%,
due 01/15/17 | | | 748,250 | | | | 0.1 | | |
| | 160,000 | | | #,S | | Odebrecht
Finance Ltd.,
7.000%,
due 04/21/20 | | | 172,800 | | | | 0.0 | | |
| | 290,780 | | | #,S | | Panama Canal
Railway Co.,
7.000%,
due 11/01/26 | | | 263,156 | | | | 0.0 | | |
| | 200,000 | | | #,L | | Rearden G
Holdings EINS
GmbH, 7.875%,
due 03/30/20 | | | 212,000 | | | | 0.0 | | |
Principal
Amount | |
| |
| | Value | | Percent of
Net Assets | |
| $ | 780,000 | | | # | | Sequa Corp.,
11.750%,
due 12/01/15 | | $ | 838,500 | | | | 0.2 | | |
| | 270,000 | | | # | | TGI International
Ltd., 9.500%,
due 10/03/17 | | | 304,425 | | | | 0.1 | | |
| | 1,207,000 | | | # | | Western Express,
Inc., 12.500%,
due 04/15/15 | | | 1,074,230 | | | | 0.2 | | |
| | | | | | | Other Securities | | | 7,111,535 | | | | 1.4 | | |
| | | | | | | | | | 14,846,822 | | | | 2.9 | | |
| | | Information Technology: 1.7% | | | |
| | 410,000 | | | #,S | | Advanced Micro
Devices, Inc.,
7.750%,
due 08/01/20 | | | 427,425 | | | | 0.1 | | |
| | 715,000 | | | # | | First Data Corp.,
8.875%,
due 08/15/20 | | | 757,900 | | | | 0.5 | | |
| | 1,715,000 | | | S | | First Data Corp.,
9.875%,
due 09/24/15 | | | 1,642,113 | | | | | | |
| | 490,000 | | | #,S | | Freescale
Semiconductor,
Inc., 9.250%,
due 04/15/18 | | | 541,450 | | | | 0.4 | | |
| | 1,390,000 | | | #,L | | Freescale
Semiconductor,
Inc., 10.750%,
due 08/01/20 | | | 1,522,050 | | | | | | |
| | 285,000 | | | # | | Interactive Data
Corp., 10.250%,
due 08/01/18 | | | 313,500 | | | | 0.0 | | |
| | 335,000 | | | # | | NXP BV/NXP
Funding, LLC,
9.750%,
due 08/01/18 | | | 378,550 | | | | 0.1 | | |
| | 860,000 | | | # | | Seagate HDD
Cayman,
6.875%,
due 05/01/20 | | | 825,600 | | | | 0.2 | | |
| | | | | | | Other Securities | | | 2,168,051 | | | | 0.4 | | |
| | | | | | | | | | 8,576,639 | | | | 1.7 | | |
| | | Materials: 3.6% | | | |
| | 978,875 | | | &,#,S | | Ainsworth
Lumber Co.,
Ltd., 11.000%,
due 07/29/15 | | | 925,037 | | | | 0.2 | | |
| | 1,585,000 | | | #,S | | Appleton
Papers, Inc.,
10.500%,
due 06/15/15 | | | 1,577,075 | | | | 0.3 | | |
| | 350,000 | | | #,S | | Associated
Materials LLC,
9.125%,
due 11/01/17 | | | 366,625 | | | | 0.1 | | |
See Accompanying Notes to Financial Statements
125
ING OPPENHEIMER GLOBAL SUMMARY PORTFOLIO OF INVESTMENTS
STRATEGIC INCOME PORTFOLIO AS OF DECEMBER 31, 2010 (CONTINUED)
Principal
Amount | |
| |
| | Value | | Percent of
Net Assets | |
| | | Materials (continued) | | | |
| $ | 200,000 | | | #,L | | Braskem Finance
Ltd., 7.000%,
due 05/07/20 | | $ | 207,500 | | | | 0.2 | | |
| | 800,000 | | | #,S | | Braskem Finance
Ltd., 7.250%,
due 06/05/18 | | | 844,000 | | | | | | |
| | 1,094,000 | | | #,S | | Catalyst Paper
Corp., 11.000%,
due 12/15/16 | | | 1,036,565 | | | | 0.2 | | |
| | 100,000 | | | #,S | | CSN Islands XI
Corp., 6.875%,
due 09/21/19 | | | 108,500 | | | | 0.0 | | |
| | 90,000 | | | # | | Huntsman
International,
LLC, 8.625%,
due 03/15/21 | | | 97,650 | | | | 0.0 | | |
| | 1,935,000 | | | S | | NewPage Corp.,
11.375%,
due 12/31/14 | | | 1,828,575 | | | | 0.4 | | |
| | 890,000 | | | # | | Rhodia S.A.,
6.875%,
due 09/15/20 | | | 906,688 | | | | 0.2 | | |
| | 430,000 | | | # | | Severstal OAO
Via Steel
Capital SA,
6.700%,
due 10/25/17 | | | 426,775 | | | | 0.2 | | |
| | 470,000 | | | # | | Steel Capital S.A.
for OAO
Severstal,
9.750%,
due 07/29/13 | | | 525,836 | | | | | | |
| | | | | | | Other Securities (a) | | | 9,435,095 | | | | 1.8 | | |
| | | | | | | | | | 18,285,921 | | | | 3.6 | | |
| | | Telecommunication Services: 3.0% | | | |
| | 460,000 | | | #,S | | Axtel S.A.B de
CV, 9.000%,
due 09/22/19 | | | 439,300 | | | | 0.1 | | |
| | 235,000 | | | # | | Intelsat Jackson
Holdings Ltd.,
7.250%,
due 10/15/20 | | | 238,525 | | | | 0.1 | | |
| | 1,610,000 | | | | | ITC Deltacom,
Inc., 10.500%,
due 04/01/16 | | | 1,758,925 | | | | 0.3 | | |
| | 1,650,000 | | | | | MetroPCS
Wireless, Inc.,
7.875%,
due 09/01/18 | | | 1,720,125 | | | | 0.3 | | |
| | 350,000 | | | # | | MTS International
Funding Ltd.,
8.625%,
due 06/22/20 | | | 399,420 | | | | 0.1 | | |
| | 1,220,000 | | | # | | Telcordia
Technologies,
Inc., 11.000%,
due 05/01/18 | | | 1,232,200 | | | | 0.2 | | |
Principal
Amount | |
| |
| | Value | | Percent of
Net Assets | |
| $ | 791,000 | | | # | | Telemar Norte
Leste S.A.,
5.500%,
due 10/23/20 | | $ | 765,293 | | | | 0.2 | | |
| | 960,000 | | | #,S | | Vimpel
Communications
Via VIP Finance
Ireland Ltd.
OJSC, 9.125%,
due 04/30/18 | | | 1,096,800 | | | | 0.2 | | |
| | 835,000 | | | # | | West Corp.,
8.625%,
due 10/01/18 | | | 889,275 | | | | 0.2 | | |
| | | | | | | Other Securities | | | 6,747,685 | | | | 1.3 | | |
| | | | | | | | | | 15,287,548 | | | | 3.0 | | |
| | | Utilities: 1.8% | | | |
| | 300,000 | | | #,S | | Centrais Eletricas
Brasileiras
S.A., 6.875%,
due 07/30/19 | | | 340,500 | | | | 0.1 | | |
| | 310,000 | | | #,S | | Colbun S.A.,
6.000%,
due 01/21/20 | | | 323,545 | | | | 0.1 | | |
| | 300,000 | | | #,S | | Empresas
Publicas de
Medellin ESP,
7.625%,
due 07/29/19 | | | 345,000 | | | | 0.1 | | |
| | 1,235,000 | | | #,L | | Energy Future
Holdings Corp.,
10.000%,
due 01/15/20 | | | 1,276,710 | | | | 0.2 | | |
| | 465,000 | | | # | | GenOn Escrow
Corp., 9.500%,
due 10/15/18 | | | 464,419 | | | | 0.2 | | |
| | 465,000 | | | # | | GenOn Escrow
Corp., 9.875%,
due 10/15/20 | | | 463,838 | | | | | | |
| | 940,000 | | | #,S | | Israel Electric
Corp., Ltd.,
7.250%,
due 01/15/19 | | | 1,036,102 | | | | 0.2 | | |
| | 200,000 | | | #,S | | Listrindo
Capital BV,
9.250%,
due 01/29/15 | | | 225,767 | | | | 0.0 | | |
| | 470,000 | | | #,S | | Majapahit
Holding BV,
7.750%,
due 10/17/16 | | | 545,200 | | | | 0.2 | | |
| | 300,000 | | | #,S | | Majapahit
Holding BV,
8.000%,
due 08/07/19 | | | 352,125 | | | | | | |
See Accompanying Notes to Financial Statements
126
ING OPPENHEIMER GLOBAL SUMMARY PORTFOLIO OF INVESTMENTS
STRATEGIC INCOME PORTFOLIO AS OF DECEMBER 31, 2010 (CONTINUED)
Principal
Amount | |
| |
| | Value | | Percent of
Net Assets | |
| | | Utilities (continued) | | | |
| $ | 3,635,000 | | | L,S | | Texas
Competitive
Electric
Holdings Co.,
LLC, 10.250%,
due 11/01/15 | | $ | 2,069,192 | | | | 0.4 | | |
| | | | | | | Other Securities | | | 1,522,557 | | | | 0.3 | | |
| | | | | | | | | | 8,964,955 | | | | 1.8 | | |
| | | | | | | Total Corporate
Bonds/Notes
( Cost
$169,772,423 ) | | | 177,206,050 | | | | 34.7 | | |
| U.S. GOVERNMENT AGENCY OBLIGATIONS: 8.9% | | | | | |
| | | Federal Home Loan Mortgage
Corporation##: 2.4% | | | |
| | 3,285,000 | | | | | | | 1.125%,
due 07/27/12 | | | 3,315,872 | | | | | | |
| | 4,512,972 | | | S | | 5.000%,
due 02/16/17-
03/15/35 | | | 4,868,560 | | | | 2.4 | | |
| | 5,486,173 | | | ^,S | | 0.710%-23.796%,
due 05/15/17-
08/15/35 | | | 4,009,940 | | | | | | |
| | | | | | | | | | 12,194,372 | | | | 2.4 | | |
| | | Federal National Mortgage
Association##: 6.2% | | | |
| | 3,030,000 | | | L | | 1.125%,
due 07/30/12 | | | 3,057,685 | | | | | | |
| | 2,115,000 | | | W | | 3.500%,
due 01/25/26-
10/25/40 | | | 2,102,968 | | | | | | |
| | 2,880,000 | | | W | | 4.000%,
due 08/25/40 | | | 2,865,600 | | | | | | |
| | 4,114,000 | | | W | | 4.500%,
due 01/25/24-
01/25/39 | | | 4,241,072 | | | | | | |
| | 2,950,000 | | | W | | 5.000%,
due 01/13/40 | | | 3,101,648 | | | | 6.2 | | |
| | 2,000,000 | | | | | | | 5.375%,
due 06/12/17 | | | 2,305,946 | | | | | | |
| | 2,843,000 | | | W | | 5.500%,
due 01/25/24-
01/25/39 | | | 3,042,422 | | | | | | |
| | 2,142,570 | | | S | | 6.000%,
due 03/25/17-
04/01/35 | | | 2,348,236 | | | | | | |
| | 16,431,201 | | | W,^,S | | 0.661%-27.013%,
due 09/01/14-
06/25/37 | | | 8,501,678 | | | | | | |
| | | | | | | | | | 31,567,255 | | | | 6.2 | | |
Principal
Amount | |
| |
| | Value | | Percent of
Net Assets | |
| | | Government National Mortgage
Association: 0.3% | | | |
| | | | | | | Other Securities | | $ | 1,733,024 | | | | 0.3 | | |
| | | | | | | Total U.S.
Government
Agency
Obligations
( Cost
$43,424,513 ) | | | 45,494,651 | | | | 8.9 | | |
| U.S. TREASURY OBLIGATIONS: 0.1% | | | | | |
| | | U.S. Treasury Notes: 0.1% | | | |
| | | | | | | Other Securities | | | 418,876 | | | | 0.1 | | |
| | | | | | | Total U.S.
Treasury
Obligations
( Cost $391,134 ) | | | 418,876 | | | | 0.1 | | |
| ASSET-BACKED SECURITIES: 0.9% | | | | | |
| | | Automobile Asset-Backed Securities: 0.4% | | | |
| $ | 60,979 | | | #,S | | Ford Credit Auto
Lease Trust,
1.040%,
due 03/15/13 | | | 61,034 | | | | 0.0 | | |
| | | | | | | Other Securities | | | 1,849,155 | | | | 0.4 | | |
| | | | | | | | | | 1,910,189 | | | | 0.4 | | |
| | | Credit Card Asset-Backed Securities: 0.2% | | | |
| | 150,000 | | | # | | Citibank Omni
Master Trust,
2.360%,
due 05/16/16 | | | 151,916 | | | | 0.1 | | |
| | | | | | | Other Securities | | | 621,305 | | | | 0.1 | | |
| | | | | | | | | | 773,221 | | | | 0.2 | | |
| | | Home Equity Asset-Backed Securities: 0.1% | | | |
| | 30,860 | | | #,S | | Terwin Mortgage
Trust, 4.151%,
due 05/25/37 | | | 9,685 | | | | 0.0 | | |
| | | | | | | Other Securities | | | 565,675 | | | | 0.1 | | |
| | | | | | | | | | 575,360 | | | | 0.1 | | |
| | | Other Asset-Backed Securities: 0.2% | | | |
| | 10,790 | | | S | | Citigroup
Mortgage Loan
Trust, Inc.,
0.361%,
due 10/25/36 | | | 10,768 | | | | 0.0 | | |
| | 180,000 | | | # | | GE Equipment
Midticket LLC,
0.610%,
due 01/14/13 | | | 180,052 | | | | 0.0 | | |
See Accompanying Notes to Financial Statements
127
ING OPPENHEIMER GLOBAL SUMMARY PORTFOLIO OF INVESTMENTS
STRATEGIC INCOME PORTFOLIO AS OF DECEMBER 31, 2010 (CONTINUED)
Principal
Amount | |
| |
| | Value | | Percent of
Net Assets | |
| | | Other Asset-Backed Securities (continued) | | | |
| $ | 65,000 | | | # | | Volvo Financial
Equipment LLC,
1.560%, due
06/17/13 | | $ | 65,330 | | | | 0.0 | | |
| | | | | | | Other Securities | | | 782,947 | | | | 0.2 | | |
| | | | | | | | | | 1,039,097 | | | | 0.2 | | |
| | | | | | | Total
Asset-Backed
Securities
( Cost
$4,599,988 ) | | | 4,297,867 | | | | 0.9 | | |
| COLLATERALIZED MORTGAGE OBLIGATIONS: 7.7% | | | |
| | 2,790,000 | | | S | | Banc of America
Commercial
Mortgage, Inc.,
5.482%-6.195%,
due 01/15/49-
02/10/51 | | | 2,816,706 | | | | 0.5 | | |
| | 3,273,311 | | | S | | Citigroup
Mortgage Loan
Trust, Inc.,
2.630%-5.126%,
due 05/25/35-
03/25/36 | | | 2,662,730 | | | | 0.5 | | |
| | 3,755,226 | | | S | | Countrywide
Home Loan
Mortgage
Pass-through
Trust,
3.789%-5.837%,
due 09/25/35-
09/25/47 | | | 2,953,233 | | | | 0.6 | | |
| | 241,680 | | | #,S | | Deutsche
Alternative-A
Securities, Inc.
Alternate Loan
Trust, 0.761%,
due 01/27/37 | | | 67,346 | | | | 0.0 | | |
| | 130,532 | | | S | | Deutsche
Alternative-A
Securities, Inc.
Alternate Loan
Trust, 6.005%,
due 10/25/36 | | | 76,992 | | | | | | |
| | 1,725,000 | | | S | | Greenwich
Capital
Commercial
Funding Corp.,
5.444%-5.736%,
due 03/10/39-
12/10/49 | | | 1,823,992 | | | | 0.4 | | |
Principal
Amount | |
| |
| | Value | | Percent of
Net Assets | |
| $ | 190,000 | | | # | | JPMorgan Chase
Commercial
Mortgage
Securities Corp.,
3.616%,
due 11/15/43 | | $ | 184,233 | | | | 1.1 | | |
| | 5,705,910 | | | S | | JPMorgan
Mortgage
Trust,
5.290%-6.570%,
due 07/25/35-
02/12/51 | | | 5,477,365 | | | | | | |
| | 2,170,000 | | | S | | LB-UBS
Commercial
Mortgage Trust,
6.154%-6.166%,
due 04/15/41-
09/15/45 | | | 2,099,038 | | | | 0.4 | | |
| | 2,460,001 | | | S | | Washington
Mutual
Mortgage
Pass-through
Certificates,
5.000%,
due 02/25/37 | | | 1,947,015 | | | | | | |
| 5,787,888
| | | S
| | Washington
Mutual
Mortgage
Pass-through
Certificates,
1.168%-5.854%,
due 10/25/35-
04/25/47 | | | 4,449,432 | | | | 1.3
| | |
| | 2,234,411 | | | S | | Wells Fargo
Mortgage-
Backed
Securities Trust,
2.761%-5.067%,
due 11/25/34-
04/25/36 | | | 1,930,096 | | | | 0.4 | | |
| | | | | | | Other Securities | | | 12,661,775 | | | | 2.5 | | |
| | | | | | | Total
Collateralized
Mortgage
Obligations
( Cost
$40,263,434 ) | | | 39,149,953 | | | | 7.7 | | |
| OTHER BONDS: 24.8% | | | |
| | | Event-Linked Notes: 1.8% | | | |
| | 500,000 | | | #,S | | Akibare Ltd. -
Catastrophe
Linked Floating
Rate Note,
3-month
USD-LIBOR
+2.950%,
due 05/22/12 | | | 502,425 | | | | 0.1 | | |
See Accompanying Notes to Financial Statements
128
ING OPPENHEIMER GLOBAL SUMMARY PORTFOLIO OF INVESTMENTS
STRATEGIC INCOME PORTFOLIO AS OF DECEMBER 31, 2010 (CONTINUED)
Principal
Amount | |
| |
| | Value | | Percent of
Net Assets | |
| | | Event-Linked Notes (continued) | | | |
| $ | 250,000 | | | #,S | | Atlas V Capital -
Catastrophe
Linked Floating
Rate Note, US
Hurricane and
US Earthquake,
3-month
USD-LIBOR
+ 11.500%,
due 02/24/12 | | $ | 262,450 | | | | 0.1 | | |
| | 250,000 | | | #,S | | Blue Fin Ltd. -
Class B
Catastrophe
Linked Floating
Rate Note, US
Hurricane and
US Earthquake,
3-month
U.S. T-Bill
+ 9.250%,
due 05/28/13 | | | 255,800 | | | | 0.1 | | |
| | 250,000 | | | #,S | | Caelus Re II
Ltd. - Class A
Catastrophe
Linked Floating
Rate Note, US
Hurricane and
US Earthquake,
3-month
U.S. T-Bill
+ 6.500%,
due 05/24/13 | | | 253,400 | | | | 0.1 | | |
| | 479,000 | | | #,S | | East Lane Re II
Ltd. - Series C
Catastrophe
Linked Floating
Rate Note,
3-month
USD-LIBOR
+ 14.500%,
due 03/16/12 | | | 498,639 | | | | 0.1 | | |
| | 282,000 | | | # | | East Lane Re III
Ltd. -
Catastrophe
Linked Floating
Rate Note, US
Hurricane,
3-month
USD-LIBOR
+ 10.250%,
due 04/07/11 | | | 287,619 | | | | 0.1 | | |
Principal
Amount | |
| |
| | Value | | Percent of
Net Assets | |
| $ | 610,000 | | | #,S | | Fhu-Jin Ltd. -
Class B Floating
Rate
Catastrophe
Linked Nts.,
3-month
USD-LIBOR
+3.900%,
due 08/10/11 | | $ | 614,514 | | | | 0.1 | | |
| | 518,000 | | | #,S | | Foundation
Re III Ltd. -
Series 2010-1
Catastrophe
Linked Floating
Rate Note, US
Hurricane,
3-month
U.S. T-Bill
+ 5.750%,
due 02/03/14 | | | 515,514 | | | | 0.1 | | |
| | 250,000 | | | # | | Lodestone Re
Ltd. - Class A
Catastrophe
Linked Floating
Rate Note, US
Hurricane and
US Earthquake,
3-month U.S.
T-Bill + 6.250%,
due 05/17/13 | | | 250,350 | | | | 0.0 | | |
| | 250,000 | | | #,S | | Longpoint Re II
Ltd. - Class B
Catastrophe
Linked Floating
Rate Note,
Northeast
US Hurricane,
3-month
U.S. T-Bill
+ 5.400%,
12/24/13,
5.537%,
due 12/24/13 | | | 253,075 | | | | 0.0 | | |
| | 250,000 | | | # | | Merna
Reinsurance II
Ltd. - Central
US Earthquake
Catastrophe
Linked Floating
Rate Note,
3-month
U.S. T-Bill
+ 3.650%,
04/08/13,
3.787%,
due 04/08/13 | | | 253,200 | | | | 0.0 | | |
See Accompanying Notes to Financial Statements
129
ING OPPENHEIMER GLOBAL SUMMARY PORTFOLIO OF INVESTMENTS
STRATEGIC INCOME PORTFOLIO AS OF DECEMBER 31, 2010 (CONTINUED)
Principal
Amount | |
| |
| | Value | | Percent of
Net Assets | |
| | | Event-Linked Notes (continued) | | | |
| $ | 500,000 | | | #,S | | Midori Ltd. -
Japan
Earthquake
Catastrophe
Floating Rate
Nts., 3-month
USD-LIBOR
+2.750%,
10/24/12,
3.039%,
due 10/24/12 | | $ | 499,550 | | | | 0.1 | | |
| | 250,000 | | | # | | Multicat Mexico
09 Ltd. -
Series A Mexico
Earthquake
Catastrophe
Linked Floating
Rate Note,
3-month
U.S. T-Bill
+ 11.500%,
10/19/12,
11.637%,
due 10/19/12 | | | 267,550 | | | | 0.1 | | |
| | 500,000 | | | #,S | | Muteki Ltd. -
Catastrophe
Linked Floating
Rate Nts., Japan
Earthquake,
3-month
USD-LIBOR
+4.400%,
05/24/11,
4.673%,
due 05/24/11,
4.684%,
due 05/24/11 | | | 502,500 | | | | 0.1 | | |
| EUR | 250,000 | | | # | | Queen Street
Ltd., 9.028%,
due 03/21/11 | | | 332,841 | | | | 0.1 | | |
| $ | 250,000 | | | #,S | | Redwood
Capital XI
Ltd. - Series
2009-1
California
Earthquake
Catastrophe
Linked Floating
Rate Note,
3-month
U.S. T-Bill
+ 6.250%,
due 01/07/11 | | | 250,128 | | | | 0.0 | | |
Principal
Amount | |
| |
| | Value | | Percent of
Net Assets | |
| $ | 250,000 | | | # | | Residential
Reinsurance
Ltd. - Class 1
Catastrophe
Linked Floating
Rate Note,
3-month
US T-Bill
+ 6.600%,
due 06/06/13 | | $ | 250,663 | | | | | | |
| | 250,000 | | | # | | Residential
Reinsurance
Ltd. - Class 2
Catastrophe
Linked Floating
Rate Note,
3-month
US T-Bill
+ 8.900%,
due 06/06/13 | | | 257,413 | | | | | | |
| | 700,000 | | | #,S | | Residential
Reinsurance
Ltd. - Class 2
Floating Rate
Catastrophe
Linked Nts., US
Hurricane and
US Earthquake,
3-month
USD-LIBOR
+11.500%,
due 06/06/11 | | | 720,160 | | | | 0.3 | | |
| | 250,000 | | | # | | Residential
Reinsurance
Ltd. - Class 3
Catastrophe
Linked Floating
Rate Note,
3-month
US T-Bill
+ 13.000%,
due 06/06/13 | | | 259,338 | | | | | | |
| | 250,000 | | | # | | Residential
Reinsurance
Ltd. - Class 4
Catastrophe
Linked Floating
Rate Note,
3-month
US T-Bill
+ 13.000%,
due 06/06/13 | | | 254,675 | | | | | | |
See Accompanying Notes to Financial Statements
130
ING OPPENHEIMER GLOBAL SUMMARY PORTFOLIO OF INVESTMENTS
STRATEGIC INCOME PORTFOLIO AS OF DECEMBER 31, 2010 (CONTINUED)
Principal
Amount | |
| |
| | Value | | Percent of
Net Assets | |
| | | Event-Linked Notes (continued) | | | |
| $ | 250,000 | | | # | | Successor X Ltd. -
Class II-BY3
Catastrophe
Linked Floating
Rate Note,
3-month
U.S. T-Bill
+ 16.750%,
due 04/04/13 | | $ | 233,775 | | | | 0.0 | | |
| | 701,000 | | | Z,#,S | | Vega Capital
LTD. - Class D
Catastrophe
Linked Nts.,
0.000%,
due 06/24/11 | | | 1,365,198 | | | | 0.3 | | |
| | | | | | | | | | 9,140,777 | | | | 1.8 | | |
| | | Foreign Government Bonds: 23.0% | | | |
| | 200,000 | | | #,S | | Arab Republic
of Egypt,
5.750%,
due 04/29/20 | | | 207,000 | | | | 0.1 | | |
| | 200,000 | | | #,S | | Arab Republic
of Egypt,
6.875%,
due 04/30/40 | | | 212,000 | | | | | | |
| ARS | 280,000 | | | | | Argentina Bonos,
8.250%,
due 01/30/14 | | | 70,120 | | | | | | |
| $ | 2,590,000 | | | L | | Argentina
Government
International
Bond, 7.000%,
due 10/03/15 | | | 2,499,350 | | | | 0.8 | | |
| | 4,400,000 | | | S | | Argentina
Government
International
Bond, 0.000%-
7.000%, due
09/12/13-
12/31/38 | | | 1,613,820 | | | | | | |
| EUR | 130,000 | | | # | | Austria
Government
International
Bond, 4.350%,
due 03/15/19 | | | 187,587 | | | | 0.1 | | |
| EUR | 130,000 | | | | | Austria
Government
International
Bond, 4.650%,
due 01/15/18 | | | 191,878 | | | | | | |
Principal
Amount | |
| |
| | Value | | Percent of
Net Assets | |
| $ | 160,000 | | | +,#,S | | Belize
Government
International
Bond, 6.000%
(step rate
8.500%),
due 02/20/29 | | $ | 141,600 | | | | 0.0 | | |
| COP | 516,000,000 | | | # | | Bogota Distrito
Capital,
9.750%,
due 07/26/28 | | | 356,833 | | | | 0.1 | | |
| BRL | 705,000 | | | | | Brazil Notas
do Tesouro
Nacional
Series F,
6.000%,
due 05/15/45 | | | 910,312 | | | | | | |
| BRL | 21,637,000 | | | | | Brazil Notas
do Tesouro
Nacional
Series F,
10.000%,
due 01/01/17 | | | 11,958,027 | | | | 3.4 | | |
| BRL | 8,278,000 | | | | | Brazil Notas
do Tesouro
Nacional
Series F,
10.000%,
due 01/01/21 | | | 4,419,405 | | | | | | |
| $ | 1,620,000 | | | S | | Colombia
Government
International
Bond, 6.125%-
7.375%,
due 01/27/17-
01/18/41 | | | 1,828,250 | | | | 0.3 | | |
| | 300,000 | | | # | | Dominican
Republic
International
Bond, 7.500%,
due 05/06/21 | | | 324,750 | | | | 0.1 | | |
| EGP | 800,000 | | | Z | | Egypt Treasury
Bills, 8.030%,
due 02/15/11 | | | 136,412 | | | | | | |
| EGP | 50,000 | | | Z | | Egypt Treasury
Bills, 8.870%,
due 05/10/11 | | | 8,346 | | | | | | |
| EGP | 1,275,000 | | | Z | | Egypt Treasury
Bills, 9.270%,
due 03/22/11 | | | 215,149 | | | | | | |
| EGP | 3,725,000 | | | Z | | Egypt Treasury
Bills, 9.410%,
due 04/05/11 | | | 627,853 | | | | 0.5 | | |
| EGP | 2,400,000 | | | Z | | Egypt Treasury
Bills, 9.570%,
due 07/05/11 | | | 393,960 | | | | | | |
| EGP | 2,500,000 | | | Z | | Egypt Treasury
Bills, 9.860%,
due 07/12/11 | | | 409,539 | | | | | | |
| EGP | 4,900,000 | | | | | | | Egypt Treasury
Bills, 6.880%-
8.200%, due
01/18/11-
03/08/11 | | | 836,172 | | | | | | |
See Accompanying Notes to Financial Statements
131
ING OPPENHEIMER GLOBAL SUMMARY PORTFOLIO OF INVESTMENTS
STRATEGIC INCOME PORTFOLIO AS OF DECEMBER 31, 2010 (CONTINUED)
Principal
Amount | |
| |
| | Value | | Percent of
Net Assets | |
| | | Foreign Government Bonds (continued) | | | |
| $ | 300,000 | | | #,L | | Indonesia
Government
International
Bond, 5.875%,
due 03/13/20 | | $ | 330,750 | | | | | | |
| | 465,000 | | | # | | Indonesia
Government
International
Bond, 6.625%,
due 02/17/37 | | | 511,500 | | | | | | |
| | 1,050,000 | | | #,S | | Indonesia
Government
International
Bond, 6.875%,
due 01/17/18 | | | 1,228,500 | | | | 0.6 | | |
| | 555,000 | | | #,S | | Indonesia
Government
International
Bond, 7.750%,
due 01/17/38 | | | 679,875 | | | | | | |
| | 330,000 | | | #,S | | Indonesia
Government
International
Bond, 8.500%,
due 10/12/35 | | | 435,600 | | | | | | |
| ILS | 6,620,000 | | | | | Israel
Government
International
Bond, 5.000%,
due 01/31/20 | | | 1,994,582 | | | | 0.7 | | |
| ILS | 5,350,000 | | | | | Israel
Government
International
Bond, 6.000%,
due 02/28/19 | | | 1,740,967 | | | | | | |
| EUR | 615,000 | | | | | Italy Buoni
Poliennali Del
Tesoro, 3.750%,
due 12/15/13 | | | 831,950 | | | | | | |
| EUR | 385,000 | | | | | Italy Buoni
Poliennali Del
Tesoro, 3.750%,
due 03/01/21 | | | 472,736 | | | | 0.4 | | |
| EUR | 595,000 | | | | | Italy Buoni
Poliennali Del
Tesoro, 4.000%,
due 09/01/20 | | | 754,030 | | | | | | |
| EUR | 155,000 | | | | | Italy Buoni
Poliennali Del
Tesoro, 5.000%,
due 09/01/40 | | | 195,079 | | | | | | |
| JPY | 175,000,000 | | | | | Japan
Government
Two Year Bond,
0.200%,
due 01/15/12 | | | 2,156,076 | | | | 2.7 | | |
| JPY | 252,000,000 | | | | | Japan
Government
Five Year Bond,
0.400%,
due 09/20/15 | | | 3,105,292 | | | | | | |
Principal
Amount | |
| |
| | Value | | Percent of
Net Assets | |
| JPY | 271,000,000 | | | | | | | Japan
Government
Five Year Bond,
0.500%,
due 12/20/14 | | $ | 3,362,439 | | | | | | |
| JPY | 64,000,000 | | | | | | | Japan
Government
Ten Year Bond,
0.800%,
due 09/20/20 | | | 767,188 | | | | 2.7 | | |
| JPY | 177,000,000 | | | | | | | Japan
Government
Ten Year Bond,
1.300%,
due 06/20/20 | | | 2,227,294 | | | | | | |
| JPY | 157,000,000 | | | | | | | Japan
Government
Twenty Year
Bond, 2.100%,
due 06/20/29 | | | 2,019,760 | | | | | | |
| KRW | 1,046,000,000 | | | | | | | Korea Monetary
Stabilization
Bond, 3.280%,
due 10/02/12 | | | 922,331 | | | | 0.7 | | |
| KRW | 2,784,000,000 | | | | | | | Korea Monetary
Stabilization
Bond, 3.810%,
due 08/02/12 | | | 2,477,463 | | | | | | |
| KRW | 2,458,000,000 | | | | | | | Korea Treasury
Bond, 5.000%,
due 06/10/20 | | | 2,253,126 | | | | 0.4 | | |
| MXN | 1,340,000 | | | | | | | Mexican Bonos,
7.250%,
due 12/15/16 | | | 112,886 | | | | | | |
| MXN | 36,040,000 | | | | | | | Mexican Bonos,
7.500%,
due 06/03/27 | | | 2,924,055 | | | | | | |
| MXN | 25,980,000 | | | | | | | Mexican Bonos,
7.750%,
due 12/14/17 | | | 2,241,012 | | | | 1.8 | | |
| MXN | 12,200,000 | | | | | | | Mexican Bonos,
8.000%,
due 12/17/15 | | | 1,055,473 | | | | | | |
| MXN | 9,670,000 | | | | | | | Mexican Bonos,
8.500%,
due 12/13/18 | | | 866,241 | | | | | | |
| MXN | 17,670,000 | | | | | | | Mexican Bonos,
10.000%,
due 12/05/24 | | | 1,787,174 | | | | | | |
| PLN | 85,000 | | | | | | | Poland
Government
International
Bond, 5.250%,
due 10/25/17 | | | 28,072 | | | | 1.4 | | |
| PLN | 4,270,000 | | | | | | | Poland
Government
International
Bond, 5.250%,
due 10/25/20 | | | 1,368,898 | | | | | | |
See Accompanying Notes to Financial Statements
132
ING OPPENHEIMER GLOBAL SUMMARY PORTFOLIO OF INVESTMENTS
STRATEGIC INCOME PORTFOLIO AS OF DECEMBER 31, 2010 (CONTINUED)
Principal
Amount | |
| |
| | Value | | Percent of
Net Assets | |
| | | Foreign Government Bonds (continued) | | | |
| PLN | 12,650,000 | | | | | | | Poland
Government
International
Bond, 5.500%,
due 04/25/15 | | $ | 4,308,294 | | | | 1.4 | | |
| PLN | 3,555,000 | | | | | | | Poland
Government
International
Bond, 6.250%,
due 10/24/15 | | | 1,245,143 | | | | | | |
| $ | 375,000 | | | # | | Qatar
Government
International
Bond, 5.250%,
due 01/20/20 | | | 397,500 | | | | 0.1 | | |
| COP | 2,699,000,000 | | | | | | | Republic of
Colombia,
12.000%,
due 10/22/15 | | | 1,879,741 | | | | 0.5 | | |
| COP | 937,000,000 | | | | | | | Republic of
Colombia,
7.750%-9.850%,
due 04/14/21-
06/28/27 | | | 634,113 | | | | | | |
| $ | 460,000 | | | #,S | | Republic of
Ghana, 8.500%,
due 10/04/17 | | | 518,650 | | | | 0.1 | | |
| | 400,000 | | | | | | | South Africa
Government
International
Bond, 5.500%,
due 03/09/20 | | | 427,500 | | | | | | |
| ZAR | 6,950,000 | | | | | | | South Africa
Government
International
Bond, 6.750%,
due 03/31/21 | | | 955,372 | | | | | | |
| ZAR | 24,040,000 | | | | | | | South Africa
Government
International
Bond, 7.250%,
due 01/15/20 | | | 3,452,553 | | | | 1.8 | | |
| ZAR | 9,330,000 | | | | | | | South Africa
Government
International
Bond, 8.000%,
due 12/21/18 | | | 1,414,199 | | | | | | |
| ZAR | 16,220,000 | | | | | | | South Africa
Government
International
Bond,
10.500%,
due 12/21/26 | | | 2,938,978 | | | | | | |
| $ | 310,000 | | | #,S | | Sri Lanka
Government
International
Bond, 6.250%,
due 10/04/20 | | | 315,813 | | | | 0.1 | | |
Principal
Amount | |
| |
| | Value | | Percent of
Net Assets | |
| TRY | 1,580,000 | | | | | | | Turkey
Government
International
Bond, 10.500%,
due 01/15/20 | | $ | 1,145,602 | | | | | | |
| TRY | 4,660,000 | | | | | | | Turkey
Government
International
Bond, 11.000%,
due 08/06/14 | | | 3,324,958 | | | | | | |
| TRY | 950,000 | | | | | | | Turkey
Government
International
Bond, 12.000%,
due 08/14/13 | | | 788,488 | | | | 1.9 | | |
| TRY | 2,620,000 | | | | | | | Turkey
Government
International
Bond, 16.000%,
due 03/07/12 | | | 1,874,267 | | | | | | |
| $ | 2,430,000 | | | S | | Turkey
Government
International
Bond,
6.750%-7.500%,
due 07/14/17-
05/30/40 | | | 2,818,013 | | | | | | |
| | 500,000 | | | # | | Ukraine
Government
International
Bond, 6.750%,
due 11/14/17 | | | 501,000 | | | | 0.2 | | |
| | 430,000 | | | # | | Ukraine
Government
International
Bond, 7.750%,
due 09/23/20 | | | 439,675 | | | | | | |
| GBP | 315,000 | | | | | United Kingdom
Gilt, 2.250%,
due 03/07/14 | | | 501,577 | | | | | | |
| GBP | 420,000 | | | | | | | United Kingdom
Gilt, 4.750%,
due 03/07/20 | | | 724,576 | | | | 0.3 | | |
| GBP | 305,000 | | | | | | | United Kingdom
Gilt, 4.750%,
due 12/07/38 | | | 520,113 | | | | | | |
| $ | 1,565,000 | | | S | | Uruguay
Government
International
Bond,
6.875%-8.000%,
due 11/18/22-
03/21/36 | | | 1,883,288 | | | | 0.4 | | |
| | 970,000 | | | # | | Venezuela
Government
International
Bond, 13.625%,
due 08/15/18 | | | 950,600 | | | | 0.9 | | |
See Accompanying Notes to Financial Statements
133
ING OPPENHEIMER GLOBAL SUMMARY PORTFOLIO OF INVESTMENTS
STRATEGIC INCOME PORTFOLIO AS OF DECEMBER 31, 2010 (CONTINUED)
Principal
Amount | |
| |
| | Value | | Percent of
Net Assets | |
| | | Foreign Government Bonds (continued) | | | |
| $ | 5,405,000 | | | S | | Venezuela
Government
International
Bond, 7.000%-
12.750%,
due 10/08/14-
03/31/38 | | $ | 3,553,839 | | | | | | |
| | | | | | | Other Securities | | | 13,501,438 | | | | 2.6 | | |
| | | | | | | | | | 117,414,002 | | | | 23.0 | | |
| | | | | | | Total Other
Bonds
( Cost
$117,696,606 ) | | | 126,554,779 | | | | 24.8 | | |
| STRUCTURED PRODUCTS: 1.0% | | | |
| | | Structured Products: 1.0% | | | |
| RUB | 11,097,000 | | | ± | | Credit Suisse
International -
Moitk Total
Return Linked
Nts., 8.990%,
03/26/11 | | | 1,090 | | | | | | |
| RUB | 19,450,000 | | | ±
| | Credit Suisse
International -
Spetsstroy-2
Credit Linked
Fully Funded
Total Return
Linked Nts.,
8.590%, 5/20/15 | | | 64 | | | | 0.0
| | |
| MXN | 97,743 | | | | | | | Deutsche Bank
AG, London -
Arrendadora
Capita
Corporation
SA de CV and
The Capita
Corporation
de Mexico,
SA de CV Credit
Linked Nts.,
9.090%,
01/05/11 | | | 7,578 | | | | | | |
| MXN | 63,897 | | | | | | | Deutsche Bank
AG, London -
Arrendadora
Capita
Corporation
SA de CV and
The Capita
Corporation
de Mexico,
SA de CV Credit
Linked Nts.,
9.520%,
01/05/11 | | | 4,954 | | | | 0.3
| | |
Principal
Amount | |
| |
| | Value | | Percent of
Net Assets | |
| MXN | 64,104 | | | | | | | Deutsche Bank
AG, London -
Arrendadora
Capita
Corporation
SA de CV and
The Capita
Corporation
de Mexico,
SA de CV Credit
Linked Nts.,
9.650%,
01/05/11 | | $ | 4,970 | | | | | | |
| $ | 420,000 | | | | | | | Deutsche Bank
AG, London -
Ukrtelecom
Floating Rate
Credit Linked
Total Return
Nts., 6-month
USD-LIBOR
+3.500%,
02/25/11 | | | 407,458 | | | | | | |
| | 420,000 | | | | | | | Deutsche Bank
AG, London -
Ukrtelecom
Floating Rate
Credit Linked
Total Return
Nts., 6-month
USD-LIBOR
+3.600%,
08/25/11 | | | 360,956 | | | | 0.3 | | |
| | 420,000 | | | | | | | Deutsche Bank
AG, London -
Ukrtelecom
Floating Rate
Credit Linked
Total Return
Nts., 6-month
USD-LIBOR
+3.680%,
02/27/12 | | | 320,074 | | | | | | |
| | 420,000 | | | | | | | Deutsche Bank
AG, London -
Ukrtelecom
Floating Rate
Credit Linked
Total Return
Nts., 6-month
USD-LIBOR
+3.750%,
08/28/12 | | | 288,448 | | | | | | |
See Accompanying Notes to Financial Statements
134
ING OPPENHEIMER GLOBAL SUMMARY PORTFOLIO OF INVESTMENTS
STRATEGIC INCOME PORTFOLIO AS OF DECEMBER 31, 2010 (CONTINUED)
Principal
Amount | |
| |
| | Value | | Percent of
Net Assets | |
| | | Structured Products (continued) | | | |
| $ | 2,158,750 | | | #,S | | Hallertau SPC
2008-2A - Doux
Frangosul S.A.
ARGO Avicola
Credit Linked
Nts., 9.264%,
09/17/13 | | $ | 2,206,458 | | | | | | |
| BRL | 2,448,926 | | | #,±,S | | Hallertau SPC,
Series 2008-1,
Certificado de
Direitos
Creditorios do
Agronegocio/
Frigorifico
Margen Ltda.
Fully Funded
Total Return
Linked Nts.,
9.888%,
08/02/10 | | | 147,526 | | | | 0.5
| | |
| $ | 356,901 | | | S | | Lehman
Brothers -
MicroFinance
Institutional
Loans, Credit
Linked Nts.,
7.550%,
5/24/12 | | | 216,210 | | | | 0.0 | | |
| RUB | 13,015,580 | | | | | | | Morgan
Stanley & Co.
International
PLC - EM Whole
Loan SA /Russian
Federation
Total Return
Linked Bonds,
Series 007, Cl.
VR, 5.000%,
08/22/34 | | | 201,149 | | | | | | |
| EUR | 1,317,500 | | | ± | | Morgan
Stanley & Co.
International
PLC - Gisad
Dıs Ticaret
A.S., Synthetic
Loan Participation.,
7.670%,
04/02/13 | | | 88,029 | | | | 0.0
| | |
| MXN | 2,070,000 | | | R | | OPIC Reforma
BLN-Backed I -
Class 1A
Asset-Backed
Variable
Funding Notes,
TIIE +2.000%,
07/31/14 | | | 167,985 | | | | 0.2 | | |
Principal
Amount | |
| |
| | Value | | Percent of
Net Assets | |
| MXN | 414,000 | | | R | | OPIC Reforma
BLN-Backed I -
Class 1B
Asset-Backed
Variable
Funding Notes,
TIIE +2.000%,
07/31/14 | | $ | 33,597 | | | | | | |
| MXN | 690,000 | | | R | | OPIC Reforma
BLN-Backed I -
Class 1C
Asset-Backed
Variable
Funding Notes,
TIIE +2.000%,
07/31/14 | | | 55,995 | | | | | | |
| MXN | 345,000 | | | R | | OPIC Reforma
BLN-Backed I -
Class 1D
Asset-Backed
Variable
Funding Notes,
TIIE +2.000%,
07/31/14 | | | 27,998 | | | | | | |
| MXN | 483,000 | | | R | | OPIC Reforma
BLN-Backed I -
Class 1E
Asset-Backed
Variable
Funding Notes,
TIIE +2.000%,
07/31/14 | | | 39,197 | | | | 0.2 | | |
| MXN | 197,523 | | | R | | OPIC Reforma
BLN-Backed I -
Class 2A
Asset-Backed
Variable
Funding Notes,
TIIE +3.500%,
05/20/15 | | | 16,029 | | | | | | |
| MXN | 345,571 | | | R | | OPIC Reforma
BLN-Backed I -
Class 2B
Asset-Backed
Variable
Funding Notes,
TIIE +3.500%,
05/20/15 | | | 28,044 | | | | | | |
| MXN | 5,210,380 | | | R | | OPIC Reforma
BLN-Backed I -
Class 2C
Asset-Backed
Variable
Funding Notes,
TIIE +3.500%,
05/20/15 | | | 422,835 | | | | | | |
| MXN | 379,725 | | | R | | OPIC Reforma
BLN-Backed I -
Class 2D
Asset-Backed
Variable
Funding Notes,
TIIE +3.500%,
05/20/15 | | | 30,816 | | | �� | | | |
See Accompanying Notes to Financial Statements
135
ING OPPENHEIMER GLOBAL SUMMARY PORTFOLIO OF INVESTMENTS
STRATEGIC INCOME PORTFOLIO AS OF DECEMBER 31, 2010 (CONTINUED)
Principal
Amount | |
| |
| | Value | | Percent of
Net Assets | |
| | | Structured Products (continued) | | | |
| MXN | 275,878 | | | R | | OPIC Reforma
BLN-Backed I -
Class 2E
Asset-Backed
Variable
Funding Notes,
TIIE +3.500%,
05/20/15 | | $ | 22,388 | | | | | | |
| MXN | 176,189 | | | R | | OPIC Reforma
BLN-Backed I -
Class 2F
Asset-Backed
Variable
Funding Notes,
TIIE +3.500%,
05/20/15 | | | 14,298 | | | | 0.2 | | |
| MXN | 32,447 | | | R | | OPIC Reforma
BLN-Backed I -
Class 2G
Asset-Backed
Variable
Funding Notes,
TIIE +3.500%,
05/20/15 | | | 2,633 | | | | | | |
| GHS | 160,000 | | | | | | | Standard Bank
PLC - Ghana
T-Bond Credit
Linked
Unsecured
Notes,
12.606%*,
01/05/11 | | | 107,506 | | | | 0.0 | | |
| | | | | | | Total Structured
Products
( Cost
$8,550,450 ) | | | 5,224,285 | | | | 1.0 | | |
| Shares | |
| |
| | Value | | Percent of
Net Assets | |
| COMMON STOCK: 1.1% | | | |
| | | Consumer Discretionary: 0.4% | | | |
| | 43,084 | | | #,±,L | | American Media
Operations, Inc. | | $ | 702,509 | | | | 0.1 | | |
| | | | | | | Other Securities | | | 1,364,150 | | | | 0.3 | | |
| | | | | | | | | | 2,066,659 | | | | 0.4 | | |
| | | Consumer Staples: 0.1% | | | |
| | | | | | | Other Securities | | | 207,662 | | | | 0.1 | | |
| | | Materials: 0.6% | | | |
| | 87,748 | | | @ | | Smurfit-Stone
Container Corp. | | | 2,246,349 | | | | 0.4 | | |
| | | | | | | Other Securities | | | 804,854 | | | | 0.2 | | |
| | | | | | | | | | 3,051,203 | | | | 0.6 | | |
| | | | | | | Total Common
Stock
( Cost
$4,681,306 ) | | | 5,325,524 | | | | 1.1 | | |
| Shares | |
| |
| | Value | | Percent of
Net Assets | |
| MUTUAL FUNDS: 4.1% | | | |
| | | Open-End Funds: 4.1% | | | |
| | 1,808,566 | | | @ | | Oppenheimer
Master Loan
Fund | | $ | 20,967,939 | | | | 4.1 | | |
| | | | | | | Total Mutual
Funds
( Cost
$17,992,953 ) | | | 20,967,939 | | | | 4.1 | | |
| PREFERRED STOCK: 0.4% | | | |
| | | Consumer Discretionary: 0.1% | | | |
| | 7,250 | | | @,R,X | | Greektown
Holdings, LLC | | | 623,500 | | | | 0.1 | | |
| | | Financials: 0.3% | | | |
| | 1,710 | | | #,P | | Ally Financial, Inc. | | | 1,616,217 | | | | 0.3 | | |
| | | | | | | Total Preferred
Stock
( Cost $2,092,325 ) | | | 2,239,717 | | | | 0.4 | | |
| WARRANTS: 0.0% | | | |
| | | Consumer Staples: 0.0% | | | |
| | | | | | | Other Securities | | | 167,500 | | | | 0.0 | | |
| | | | | | | Total Warrants
( Cost $70,150 ) | | | 167,500 | | | | 0.0 | | |
Notional
Amount | |
| |
| | Value | | Percent of
Net Assets | |
| POSITIONS IN PURCHASED OPTIONS: 0.0% | | | |
| | | Foreign Currency Options: 0.0% | | | |
| PLN | 26,020,000 | | | @ | | Put Option OTC -
Goldman
Sachs & Co.
PLN vs USD
Strike @ 2.970
(PLN)-Exp
01/06/11 | | $ | 66,027 | | | | 0.0 | | |
| PLN | 26,300,000 | | | @ | | Put Option OTC -
Goldman
Sachs & Co.
PLN vs USD
Strike @ 3.000
(PLN)-Exp
01/06/11 | | | 34,553 | | | | 0.0 | | |
| PLN | 26,400,000 | | | @ | | Put Option OTC -
JPMorgan
Chase & Co.
PLN vs USD
Strike @ 3.000
(PLN)-Exp
01/14/11 | | | 84,685 | | | | 0.0 | | |
| | | | | | | Total Positions
in Purchased
Options
( Cost $374,949 ) | | | 185,265 | | | | 0.0 | | |
| | | | | | | Total Long-Term
Investments
( Cost
$409,910,231 ) | | | 427,232,406 | | | | 83.7 | | |
See Accompanying Notes to Financial Statements
136
ING OPPENHEIMER GLOBAL SUMMARY PORTFOLIO OF INVESTMENTS
STRATEGIC INCOME PORTFOLIO AS OF DECEMBER 31, 2010 (CONTINUED)
| Shares | |
| |
| | Value | | Percent of
Net Assets | |
| SHORT-TERM INVESTMENTS: 24.8% | | | |
| | | Mutual Funds: 18.5% | |
| | 94,776,053 | | | | | | | Blackrock
Liquidity Funds
TempFund
Portfolio -
Class I | | $ | 94,776,053 | | | | 18.5 | | |
| | | | | | | Total Mutual
Funds
( Cost
$94,776,053 ) | | | 94,776,053 | | | | 18.5 | | |
| | | U.S. Treasury Bills: 0.2% | |
| | | | | | | Other
Securities | | | 999,816 | | | | 0.2 | | |
| | | | | | | Total U.S.
Treasury Bills
( Cost $999,725 ) | | | 999,816 | | | | 0.2 | | |
| | | Securities Lending Collateralcc: 6.1% | |
| | 30,713,231 | | | | | | | BNY Mellon
Overnight
Government
Fund (1) | | | 30,713,231 | | | | 6.0 | | |
| | 435,640 | | | R | | BNY
Institutional
Cash Reserves
Fund,
Series B (1)(2) | | | 348,512 | | | | 0.1 | | |
| | | | | | | Total Securities
Lending
Collateral
( Cost
$31,148,871 ) | | | 31,061,743 | | | | 6.1 | | |
| | | | | | | Total Short-Term
Investments
( Cost
$126,924,649 ) | | | 126,837,612 | | | | 24.8 | | |
| | | | | | | Total Investments
in Securities
( Cost
$536,834,880 ) * | | $ | 554,070,018 | | | | 108.5 | | |
| | | | | | | Other Assets and
Liabilities - Net | | | (43,450,351 | ) | | | (8.5 | ) | |
| | | | | | | Net Assets | | $ | 510,619,667 | | | | 100.0 | | |
"Other Securities" represents issues not identified as the top 50 holdings in terms of market value and issues or issuers not exceeding 1% of net assets individually or in aggregate respectively as of December 31, 2010.
The following footnotes apply to either the individual securities noted or one or more of the securities aggregated and listed as a single line item.
@ Non-income producing security
& Payment-in-kind
+ Step-up basis bonds. Interest rates shown reflect current and next coupon rates.
# Securities with purchases pursuant to Rule 144A or section 4(2), under the Securities Act of 1933 and may not be resold subject to that rule except to qualified institutional buyers. Unless otherwise noted, these securities have been determined to be liquid under the guidelines established by the Funds' Board of Directors/Trustees.
P Preferred Stock may be called prior to convertible date.
cc Securities purchased with cash collateral for securities loaned.
(1) Collateral received from brokers for securities lending was invested in these short-term investments.
(2) On September 12, 2008, BNY established a separate sleeve of the Institutional Cash Reserves Fund (Series B) to hold certain Lehman Brothers defaulted debt obligations. The Portfolio's position in Series B is being fair valued daily. Please see the accompanying Notes to Financial Statements for additional details on securities lending.
## On September 7, 2008, the Federal Housing Finance Agency placed the Federal National Mortgage Association and the Federal Home Loan Mortgage Corporation into conservatorship and the U.S. Treasury guaranteed the debt issued by those organizations.
W Settlement is on a when-issued or delayed-delivery basis.
R Restricted security
L Loaned security, a portion or all of the security is on loan at December 31, 2010.
** Investment in affiliate
± Defaulted security
^ Interest only securities represent the right to receive the monthly interest payments on an underlying pool of mortgage loans. Principal amount shown represents the notional amount on which current interest is calculated. Payments of principal on the pool reduce the value of the interest only security.
Z Indicates Zero Coupon Bond; rate shown reflects current effective yield.
S All or a portion of this security has been identified by the Portfolio to cover future collateral requirements for applicable futures, options, swaps, foreign currency contracts and/or when-issued or delayed-delivery securities.
ARS Argentine Peso
AUD Australian Dollar
BRL Brazilian Real
COP Colombian Peso
EGP Egyptian Pound
EUR EU Euro
GBP British Pound
GHS Ghanian Cedi
ILS Israeli New Shekel
JPY Japanese Yen
KRW South Korean Won
MXN Mexican Peso
PLN Polish Zloty
RUB Russian Ruble
TRY Turkish Lira
ZAR South African Rand
(a) The grouping contains securities in default.
* Cost for federal income tax purposes is $537,680,051.
| Net unrealized appreciation consists of: | |
| Gross Unrealized Appreciation | | $ | 29,712,205 | | |
| Gross Unrealized Depreciation | | | (13,322,238 | ) | |
| Net Unrealized Appreciation | | $ | 16,389,967 | | |
See Accompanying Notes to Financial Statements
137
ING OPPENHEIMER GLOBAL SUMMARY PORTFOLIO OF INVESTMENTS
STRATEGIC INCOME PORTFOLIO AS OF DECEMBER 31, 2010 (CONTINUED)
The following is a summary of the fair valuations according to the inputs used as of December 31, 2010 in valuing the Portfolio's assets and liabilities:
| | | Quoted Prices
in Active Markets
for Identical Investments
(Level 1) | | Other
Observable
Inputs
(Level 2) | | Significant
Unobservable
Inputs
(Level 3) | | Fair Value
at
12/31/10 | |
| Asset Table | |
| Investments, at value | |
| Common Stock | |
| Consumer Discretionary | | $ | 1,320,477 | | | $ | — | | | $ | 746,182 | | | $ | 2,066,659 | | |
| Consumer Staples | | | 207,662 | | | | — | | | | — | | | | 207,662 | | |
| Materials | | | 3,051,203 | | | | — | | | | — | | | | 3,051,203 | | |
| Total Common Stock | | | 4,579,342 | | | | — | | | | 746,182 | | | | 5,325,524 | | |
| Mutual Funds | | | 20,967,939 | | | | — | | | | — | | | | 20,967,939 | | |
| Preferred Stock | | | — | | | | 1,616,217 | | | | 623,500 | | | | 2,239,717 | | |
| Warrants | | | — | | | | — | | | | 167,500 | | | | 167,500 | | |
| Positions In Purchased Options | | | — | | | | 185,265 | | | | — | | | | 185,265 | | |
| Corporate Bonds/Notes | | | — | | | | 176,586,792 | | | | 619,258 | | | | 177,206,050 | | |
| U.S. Government Agency Obligations | | | — | | | | 45,494,651 | | | | — | | | | 45,494,651 | | |
| U.S. Treasury Obligations | | | — | | | | 418,876 | | | | — | | | | 418,876 | | |
| Asset-Backed Securities | | | — | | | | 4,297,867 | | | | — | | | | 4,297,867 | | |
| Collateralized Mortgage Obligations | | | — | | | | 39,082,607 | | | | 67,346 | | | | 39,149,953 | | |
| Other Bonds | | | — | | | | 114,767,404 | | | | 11,787,375 | | | | 126,554,779 | | |
| Structured Products | | | — | | | | — | | | | 5,224,285 | | | | 5,224,285 | | |
| Short-Term Investments | | | 125,489,284 | | | | 999,816 | | | | 348,512 | | | | 126,837,612 | | |
| Total Investments, at value | | $ | 151,036,565 | | | $ | 383,449,495 | | | $ | 19,583,958 | | | $ | 554,070,018 | | |
| Other Financial Instruments+: | |
| Forward foreign currency contracts | | | — | | | | 1,627,524 | | | | — | | | | 1,627,524 | | |
| Futures | | | 63,319 | | | | — | | | | — | | | | 63,319 | | |
| Swaps, at fair value | | | — | | | | 937,337 | | | | 392,588 | | | | 1,329,925 | | |
| Total Assets | | $ | 151,099,884 | | | $ | 386,014,356 | | | $ | 19,976,546 | | | $ | 557,090,786 | | |
| Liabilities Table | |
| Other Financial Instruments+: | |
| Forward foreign currency contracts | | $ | — | | | $ | (3,860,839 | ) | | $ | — | | | $ | (3,860,839 | ) | |
| Futures | | | (1,213,502 | ) | | | — | | | | — | | | | (1,213,502 | ) | |
| Swaps, at fair value | | | — | | | | (1,195,027 | ) | | | (209,794 | ) | | | (1,404,821 | ) | |
| Total Liabilities | | $ | (1,213,502 | ) | | $ | (5,055,866 | ) | | $ | (209,794 | ) | | $ | (6,479,162 | ) | |
See Accompanying Notes to Financial Statements
138
ING OPPENHEIMER GLOBAL SUMMARY PORTFOLIO OF INVESTMENTS
STRATEGIC INCOME PORTFOLIO AS OF DECEMBER 31, 2010 (CONTINUED)
The following is a reconciliation of the fair valuations using significant unobservable inputs (Level 3) for the Portfolio's assets and liabilities during the period ended December 31, 2010:
| | | Beginning
Balance
12/31/09 | | Purchases | | Sales | | Accrued
Discounts/
(Premiums) | | Total
Realized
Gain/(Loss) | | Total
Unrealized
Appreciation/
(Depreciation) | | Transfers
Into
Level 3 | | Transfers
Out of
Level 3 | | Ending
Balance
12/31/10 | |
| Asset Table | |
| Investments, at value | |
| Common Stock | | $ | 361,245 | | | $ | 49,410 | | | $ | (144,498 | ) | | $ | — | | | $ | (2,022,972 | ) | | $ | 1,800,488 | | | $ | 702,509 | | | $ | — | | | $ | 746,182 | | |
| Preferred Stock | | | — | | | | 725,000 | | | | — | | | | — | | | | — | | | | (101,500 | ) | | | — | | | | — | | | | 623,500 | | |
| Warrants | | | — | | | | 70,150 | | | | — | | | | — | | | | — | | | | 97,350 | | | | — | | | | — | | | | 167,500 | | |
Positions In
Purchased Options | | | 6,120 | | | | — | | | | — | | | | — | | | | (824,320 | ) | | | 818,200 | | | | — | | | | — | | | | — | | |
Corporate
Bonds/Notes | | | 3,923,505 | | | | — | | | | (833,664 | ) | | | (11,119 | ) | | | 193,314 | | | | (223,308 | ) | | | 86 | | | | (2,429,556 | ) | | | 619,258 | | |
Asset-Backed
Securities | | | 1,321,789 | | | | — | | | | (1,413,224 | ) | | | (28,749 | ) | | | (786,279 | ) | | | 906,463 | | | | — | | | | — | | | | — | | |
Collateralized
Mortgage
Obligations | | | 599,621 | | | | — | | | | (526,711 | ) | | | 1,257 | | | | (414,357 | ) | | | 464,172 | | | | — | | | | (56,636 | ) | | | 67,346 | | |
| Other Bonds | | | 35,098,171 | | | | 8,652,749 | | | | (5,660,202 | ) | | | (7,238 | ) | | | 215,181 | | | | 395,727 | | | | 904,353 | | | | (27,811,366 | ) | | | 11,787,375 | | |
| Structured Products | | | 30,481,749 | | | | 602,100 | | | | (28,074,821 | ) | | | (1,321,720 | ) | | | (401,428 | ) | | | 3,938,405 | | | | — | | | | — | | | | 5,224,285 | | |
Short-Term
Investments | | | 348,512 | | | | — | | | | — | | | | — | | | | — | | | | — | | | | — | | | | — | | | | 348,512 | | |
Total Investments,
at value | | $ | 72,140,712 | | | $ | 10,099,409 | | | $ | (36,653,120 | ) | | $ | (1,367,569 | ) | | $ | (4,040,861 | ) | | $ | 8,095,997 | | | $ | 1,606,948 | | | $ | (30,297,558 | ) | | $ | 19,583,958 | | |
| Other Financial Instruments+: | |
| Swaps, at fair value | | | 258,165 | | | | — | | | | (862,759 | ) | | | (7,484 | ) | | | 860,853 | | | | 143,813 | | | | — | | | | — | | | | 392,588 | | |
| Total Assets | | $ | 72,398,877 | | | $ | 10,099,409 | | | $ | (37,515,879 | ) | | $ | (1,375,053 | ) | | $ | (3,180,008 | ) | | $ | 8,239,810 | | | $ | 1,606,948 | | | $ | (30,297,558 | ) | | $ | 19,976,546 | | |
| Liabilities Table | |
| Other Financial Instruments+: | |
| Swaps, at fair value | | $ | (629,123 | ) | | $ | — | | | $ | 527,873 | | | $ | 73 | | | $ | (525,967 | ) | | $ | 417,350 | | | $ | — | | | $ | — | | | $ | (209,794 | ) | |
| Written options | | | (9,752 | ) | | | — | | | | — | | | | — | | | | 10,952 | | | | (1,200 | ) | | | — | | | | — | | | | — | | |
Unfunded
Commitment | | | (56,875 | ) | | | — | | | | — | | | | — | | | | — | | | | 56,875 | | | | — | | | | — | | | | — | | |
| Total Liabilities | | $ | (695,750 | ) | | $ | — | | | $ | 527,873 | | | $ | 73 | | | $ | (515,015 | ) | | $ | 473,025 | | | $ | — | | | $ | — | | | $ | (209,794 | ) | |
As of December 31, 2010, total change in unrealized gain (loss) on Level 3 securities still held at period end and included in the change in net assets was $1,178,118.
^ See Note 2, "Significant Accounting Policies" in the Notes to Financial Statements for additional information.
+ Other Financial Instruments are derivatives not reflected in the Summary Portfolio of Investments and may include open forward foreign currency contracts, futures, swaps, and written options. Forward foreign currency contracts and futures are reported at their unrealized gain/loss at measurement date which represents the amount due to/from the Portfolio. Swaps and written options are reported at their market value at measurement date.
Transfers in or out of Level 3 represents either the beginning value (for transfers in), or the ending value (for transfers out) of any security or derivative instrument where a change in the pricing level occurred from the beginning to the end of the period. It is the policy of the Portfolio to recognize transfers at the end of the reporting period.
At December 31, 2010 the following forward foreign currency contracts were outstanding for the ING Oppenheimer Global Strategic Income Portfolio:
| Counterparty | | Currency | | Buy/Sell | | Settlement
Date | | In Exchange
For | | Fair Value | | Unrealized
Appreciation
(Depreciation) | |
Bank of America
| | Argentine Peso
ARS 1,475,000 | | BUY | | 3/29/11 | | $ | 355,850 | | | $ | 364,013 | | | $ | 8,163 | | |
| Bank of America | | Argentine Peso
ARS 4,100,000 | | BUY | | 1/18/11 | | | 1,023,465 | | | | 1,028,137 | | | | 4,672 | | |
Bank of America
| | Chinese Yuan
CNY 9,700,000 | | BUY | | 6/7/11 | | | 1,433,003 | | | | 1,473,518 | | | | 40,515 | | |
Bank of America
| | Chinese Yuan
CNY 200,000 | | BUY | | 6/7/11 | | | 29,940 | | | | 30,382 | | | | 442 | | |
Bank of America
| | Chinese Yuan
CNY 600,000 | | BUY | | 6/7/11 | | | 91,634 | | | | 91,145 | | | | (489 | ) | |
Bank of America
| | EU Euro
EUR 3,800,000 | | BUY | | 1/7/11 | | | 4,966,220 | | | | 5,077,910 | | | | 111,690 | | |
Bank of America
| | Indonesian Rupiah
IDR 710,000,000 | | BUY | | 1/10/11 | | | 78,933 | | | | 78,677 | | | | (256 | ) | |
See Accompanying Notes to Financial Statements
139
ING OPPENHEIMER GLOBAL SUMMARY PORTFOLIO OF INVESTMENTS
STRATEGIC INCOME PORTFOLIO AS OF DECEMBER 31, 2010 (CONTINUED)
| Counterparty | | Currency | | Buy/Sell | | Settlement
Date | | In Exchange
For | | Fair Value | | Unrealized
Appreciation
(Depreciation) | |
| Bank of America | | Indonesian Rupiah
IDR 262,000,000 | | BUY | | 1/10/11 | | $ | 29,030 | | | $ | 29,033 | | | $ | 3 | | |
| Bank of America | | Indian Rupee
INR 47,000,000 | | BUY | | 1/13/11 | | | 1,047,704 | | | | 1,048,594 | | | | 890 | | |
| Bank of America | | South Korean Won
KRW 1,285,000,000 | | BUY | | 1/24/11 | | | 1,133,707 | | | | 1,130,625 | | | | (3,082 | ) | |
| Bank of America | | South Korean Won
KRW 2,558,000,000 | | BUY | | 1/3/11 | | | 2,216,638 | | | | 2,253,537 | | | | 36,899 | | |
| Bank of America | | Kazakhstani Tenge
KZT 18,700,000 | | BUY | | 2/28/11 | | | 127,471 | | | | 127,129 | | | | (342 | ) | |
| Bank of America | | Kazakhstani Tenge
KZT 19,000,000 | | BUY | | 3/10/11 | | | 129,604 | | | | 129,199 | | | | (405 | ) | |
| Bank of America | | Malaysian Ringgit
MYR 5,640,000 | | BUY | | 2/18/11 | | | 1,784,923 | | | | 1,823,139 | | | | 38,216 | | |
| Bank of America | | Swedish Krona
SEK 1,600,000 | | BUY | | 2/22/11 | | | 233,046 | | | | 237,459 | | | | 4,413 | | |
| Bank of America | | Singapore Dollar
SGD 1,375,000 | | BUY | | 1/13/11 | | | 1,040,760 | | | | 1,071,436 | | | | 30,676 | | |
| Barclays Bank PLC | | Australian Dollar
AUD 710,000 | | BUY | | 2/4/11 | | | 718,754 | | | | 722,804 | | | | 4,050 | | |
| Barclays Bank PLC | | Colombian Peso
COP 413,000,000 | | BUY | | 7/5/11 | | | 217,942 | | | | 216,569 | | | | (1,373 | ) | |
| Barclays Bank PLC | | EU Euro
EUR 390,000 | | BUY | | 2/22/11 | | | 515,307 | | | | 521,079 | | | | 5,772 | | |
| Barclays Bank PLC | | Hungarian Forint
HUF 425,000,000 | | BUY | | 2/10/11 | | | 2,131,394 | | | | 2,034,060 | | | | (97,334 | ) | |
| Barclays Bank PLC | | Norwegian Krone
NOK 1,500,000 | | BUY | | 2/22/11 | | | 249,921 | | | | 256,397 | | | | 6,476 | | |
| Barclays Bank PLC | | South African Rand
ZAR 60,200,000 | | BUY | | 2/9/11 | | | 8,763,311 | | | | 9,084,538 | | | | 321,227 | | |
| BNP Paribas Bank | | Danish Krone
DKK 1,230,000 | | BUY | | 5/10/11 | | | 229,027 | | | | 220,383 | | | | (8,644 | ) | |
| BNP Paribas Bank | | Swedish Krona
SEK 28,865,000 | | BUY | | 2/9/11 | | | 4,373,601 | | | | 4,285,885 | | | | (87,716 | ) | |
| Citigroup, Inc. | | Australian Dollar
AUD 40,000 | | BUY | | 1/20/11 | | | 39,222 | | | | 40,801 | | | | 1,579 | | |
| Citigroup, Inc. | | Chilean Peso
CLP 101,000,000 | | BUY | | 1/7/11 | | | 209,990 | | | | 215,689 | | | | 5,699 | | |
| Citigroup, Inc. | | Chilean Peso
CLP 53,000,000 | | BUY | | 1/14/11 | | | 111,345 | | | | 113,118 | | | | 1,773 | | |
| Citigroup, Inc. | | Chilean Peso
CLP 152,000,000 | | BUY | | 2/3/11 | | | 324,267 | | | | 323,884 | | | | (383 | ) | |
| Citigroup, Inc. | | Chilean Peso
CLP 102,000,000 | | BUY | | 2/4/11 | | | 218,369 | | | | 217,326 | | | | (1,043 | ) | |
| Citigroup, Inc. | | Chilean Peso
CLP 68,000,000 | | BUY | | 2/4/11 | | | 145,610 | | | | 144,884 | | | | (726 | ) | |
| Citigroup, Inc. | | Chinese Yuan
CNY 6,800,000 | | BUY | | 1/4/11 | | | 1,018,727 | | | | 1,031,830 | | | | 13,103 | | |
| Citigroup, Inc. | | Colombian Peso
COP 270,000,000 | | BUY | | 2/18/11 | | | 144,231 | | | | 141,959 | | | | (2,272 | ) | |
| Citigroup, Inc. | | Colombian Peso
COP 2,129,000,000 | | BUY | | 2/18/11 | | | 1,138,198 | | | | 1,119,371 | | | | (18,827 | ) | |
| Citigroup, Inc. | | Colombian Peso
COP 275,000,000 | | BUY | | 7/5/11 | | | 145,889 | | | | 144,204 | | | | (1,685 | ) | |
| Citigroup, Inc. | | EU Euro
EUR 195,000 | | BUY | | 5/10/11 | | | 260,520 | | | | 260,443 | | | | (77 | ) | |
| Citigroup, Inc. | | EU Euro
EUR 130,000 | | BUY | | 5/10/11 | | | 173,680 | | | | 173,628 | | | | (52 | ) | |
| Citigroup, Inc. | | EU Euro
EUR 75,000 | | BUY | | 5/10/11 | | | 99,150 | | | | 100,170 | | | | 1,020 | | |
| Citigroup, Inc. | | EU Euro
EUR 950,000 | | BUY | | 5/10/11 | | | 1,267,096 | | | | 1,268,823 | | | | 1,727 | | |
| Citigroup, Inc. | | British Pound
GBP 76,000 | | BUY | | 1/20/11 | | | 119,138 | | | | 118,472 | | | | (666 | ) | |
| Citigroup, Inc. | | Indonesian Rupiah
IDR 15,797,000,000 | | BUY | | 2/18/11 | | | 1,747,842 | | | | 1,740,150 | | | | (7,692 | ) | |
| Citigroup, Inc. | | Indonesian Rupiah
IDR 55,580,000,000 | | BUY | | 2/18/11 | | | 6,165,280 | | | | 6,122,526 | | | | (42,754 | ) | |
| Citigroup, Inc. | | Indian Rupee
INR 44,000,000 | | BUY | | 1/3/11 | | | 979,737 | | | | 983,468 | | | | 3,731 | | |
| Citigroup, Inc. | | Indian Rupee
INR 122,500,000 | | BUY | | 3/3/11 | | | 2,689,352 | | | | 2,708,905 | | | | 19,553 | | |
See Accompanying Notes to Financial Statements
140
ING OPPENHEIMER GLOBAL SUMMARY PORTFOLIO OF INVESTMENTS
STRATEGIC INCOME PORTFOLIO AS OF DECEMBER 31, 2010 (CONTINUED)
| Counterparty | | Currency | | Buy/Sell | | Settlement
Date | | In Exchange
For | | Fair Value | | Unrealized
Appreciation
(Depreciation) | |
| Citigroup, Inc. | | Japanese Yen
JPY 42,000,000 | | BUY | | 1/20/11 | | $ | 508,053 | | | $ | 517,427 | | | $ | 9,374 | | |
| Citigroup, Inc. | | Mexican Peso
MXN 28,290,000 | | BUY | | 1/18/11 | | | 2,301,497 | | | | 2,287,884 | | | | (13,613 | ) | |
| Citigroup, Inc. | | Mexican Peso
MXN 1,300,000 | | BUY | | 1/18/11 | | | 105,331 | | | | 105,134 | | | | (197 | ) | |
| Credit Suisse First Boston | | Swiss Franc
CHF 350,000 | | BUY | | 2/22/11 | | | 360,825 | | | | 374,583 | | | | 13,758 | | |
| Credit Suisse First Boston | | Swiss Franc
CHF 130,000 | | BUY | | 2/22/11 | | | 134,021 | | | | 139,131 | | | | 5,110 | | |
| Credit Suisse First Boston | | Swiss Franc
CHF 220,000 | | BUY | | 2/22/11 | | | 227,077 | | | | 235,452 | | | | 8,375 | | |
| Credit Suisse First Boston | | Swiss Franc
CHF 10,000 | | BUY | | 2/22/11 | | | 10,322 | | | | 10,702 | | | | 380 | | |
| Credit Suisse First Boston | | Swiss Franc
CHF 680,000 | | BUY | | 2/22/11 | | | 709,760 | | | | 727,761 | | | | 18,001 | | |
| Credit Suisse First Boston | | Swiss Franc
CHF 10,000 | | BUY | | 2/22/11 | | | 10,730 | | | | 10,702 | | | | (28 | ) | |
| Credit Suisse First Boston | | Swiss Franc
CHF 10,000 | | BUY | | 2/22/11 | | | 10,730 | | | | 10,702 | | | | (28 | ) | |
| Credit Suisse First Boston | | Swiss Franc
CHF 10,000 | | BUY | | 2/22/11 | | | 10,730 | | | | 10,702 | | | | (28 | ) | |
| Credit Suisse First Boston | | Swiss Franc
CHF 10,000 | | BUY | | 2/22/11 | | | 10,730 | | | | 10,702 | | | | (28 | ) | |
| Credit Suisse First Boston | | Egyptian Pound
EGP 3,895,000 | | BUY | | 1/10/11 | | | 668,211 | | | | 669,390 | | | | 1,179 | | |
| Credit Suisse First Boston | | Egyptian Pound
EGP 2,005,000 | | BUY | | 1/10/11 | | | 343,675 | | | | 344,577 | | | | 902 | | |
| Credit Suisse First Boston | | EU Euro
EUR 310,000 | | BUY | | 2/10/11 | | | 422,732 | | | | 414,213 | | | | (8,519 | ) | |
| Credit Suisse First Boston | | British Pound
GBP 310,000 | | BUY | | 3/22/11 | | | 483,795 | | | | 483,007 | | | | (788 | ) | |
| Credit Suisse First Boston | | Hungarian Forint
HUF 402,000,000 | | BUY | | 2/10/11 | | | 2,014,028 | | | | 1,923,982 | | | | (90,046 | ) | |
| Credit Suisse First Boston | | Hungarian Forint
HUF 23,000,000 | | BUY | | 2/10/11 | | | 113,833 | | | | 110,079 | | | | (3,754 | ) | |
| Credit Suisse First Boston | | Hungarian Forint
HUF 8,000,000 | | BUY | | 2/10/11 | | | 36,508 | | | | 38,288 | | | | 1,780 | | |
| Credit Suisse First Boston | | Polish Zloty
PLN 550,000 | | BUY | | 2/2/11 | | | 190,265 | | | | 185,387 | | | | (4,878 | ) | |
| Credit Suisse First Boston | | Swedish Krona
SEK 1,000,000 | | BUY | | 5/10/11 | | | 148,619 | | | | 147,933 | | | | (686 | ) | |
| Credit Suisse First Boston | | Swedish Krona
SEK 4,500,000 | | BUY | | 2/22/11 | | | 655,700 | | | | 667,855 | | | | 12,155 | | |
| Credit Suisse First Boston | | Turkish Lira
TRY 1,475,000 | | BUY | | 1/3/11 | | | 1,019,350 | | | | 954,971 | | | | (64,379 | ) | |
| Credit Suisse First Boston | | Turkish Lira
TRY 12,220,000 | | BUY | | 2/9/11 | | | 8,627,506 | | | | 7,876,763 | | | | (750,743 | ) | |
| Credit Suisse First Boston | | Turkish Lira
TRY 5,335,000 | | BUY | | 2/10/11 | | | 3,510,330 | | | | 3,438,413 | | | | (71,917 | ) | |
| Credit Suisse First Boston | | South African Rand
ZAR 1,080,000 | | BUY | | 1/7/11 | | | 156,473 | | | | 163,771 | | | | 7,298 | | |
| Credit Suisse First Boston | | South African Rand
ZAR 400,000 | | BUY | | 1/7/11 | | | 58,034 | | | | 60,656 | | | | 2,622 | | |
| Dermott W. Clancy Corp. | | Russian Ruble
RUB 2,900,000 | | BUY | | 1/12/11 | | | 96,667 | | | | 94,840 | | | | (1,827 | ) | |
| Deutsche Bank AG | | Canadian Dollar
CAD 200,000 | | BUY | | 2/22/11 | | | 198,551 | | | | 200,929 | | | | 2,378 | | |
| Deutsche Bank AG | | Canadian Dollar
CAD 110,000 | | BUY | | 2/22/11 | | | 109,203 | | | | 110,511 | | | | 1,308 | | |
| Deutsche Bank AG | | Canadian Dollar
CAD 240,000 | | BUY | | 2/22/11 | | | 240,382 | | | | 241,114 | | | | 732 | | |
| Deutsche Bank AG | | Kazakhstani Tenge
KZT 18,700,000 | | BUY | | 2/28/11 | | | 127,645 | | | | 127,129 | | | | (516 | ) | |
| Deutsche Bank AG | | Russian Ruble
RUB 44,190,000 | | BUY | | 1/12/11 | | | 1,457,959 | | | | 1,445,159 | | | | (12,800 | ) | |
| Deutsche Bank AG | | Russian Ruble
RUB 2,200,000 | | BUY | | 1/12/11 | | | 70,513 | | | | 71,947 | | | | 1,434 | | |
| Deutsche Bank AG | | Russian Ruble
RUB 38,100,000 | | BUY | | 1/12/11 | | | 1,223,114 | | | | 1,245,996 | | | | 22,882 | | |
| Goldman Sachs & Co. | | Brazilian Real
BRL 1,700,000 | | BUY | | 1/4/11 | | | 979,206 | | | | 1,023,124 | | | | 43,918 | | |
See Accompanying Notes to Financial Statements
141
ING OPPENHEIMER GLOBAL SUMMARY PORTFOLIO OF INVESTMENTS
STRATEGIC INCOME PORTFOLIO AS OF DECEMBER 31, 2010 (CONTINUED)
| Counterparty | | Currency | | Buy/Sell | | Settlement
Date | | In Exchange
For | | Fair Value | | Unrealized
Appreciation
(Depreciation) | |
| Goldman Sachs & Co. | | Brazilian Real
BRL 130,000 | | BUY | | 1/4/11 | | $ | 76,403 | | | $ | 78,239 | | | $ | 1,836 | | |
| Goldman Sachs & Co. | | Brazilian Real
BRL 50,000 | | BUY | | 1/4/11 | | | 29,129 | | | | 30,092 | | | | 963 | | |
| Goldman Sachs & Co. | | Brazilian Real
BRL 180,000 | | BUY | | 2/2/11 | | | 106,070 | | | | 107,597 | | | | 1,527 | | |
| Goldman Sachs & Co. | | Brazilian Real
BRL 1,700,000 | | BUY | | 2/2/11 | | | 1,001,768 | | | | 1,016,191 | | | | 14,423 | | |
| Goldman Sachs & Co. | | Mexican Peso
MXN 28,300,000 | | BUY | | 2/16/11 | | | 2,295,867 | | | | 2,283,819 | | | | (12,048 | ) | |
| Goldman Sachs & Co. | | Mexican Peso
MXN 6,510,000 | | BUY | | 2/16/11 | | | 523,754 | | | | 525,359 | | | | 1,605 | | |
| Goldman Sachs & Co. | | South African Rand
ZAR 1,840,000 | | BUY | | 2/1/11 | | | 276,912 | | | | 277,959 | | | | 1,047 | | |
| JPMorgan Chase & Co. | | Argentine Peso
ARS 1,475,000 | | BUY | | 3/29/11 | | | 355,850 | | | | 364,013 | | | | 8,163 | | |
| JPMorgan Chase & Co. | | Chilean Peso
CLP 51,000,000 | | BUY | | 1/7/11 | | | 105,754 | | | | 108,912 | | | | 3,158 | | |
| JPMorgan Chase & Co. | | Chinese Yuan
CNY 9,700,000 | | BUY | | 6/7/11 | | | 1,432,792 | | | | 1,473,518 | | | | 40,726 | | |
| JPMorgan Chase & Co. | | Chinese Yuan
CNY 2,780,000 | | BUY | | 6/20/11 | | | 411,395 | | | | 422,409 | | | | 11,014 | | |
| JPMorgan Chase & Co. | | EU Euro
EUR 6,220,000 | | BUY | | 2/9/11 | | | 8,756,827 | | | | 8,311,027 | | | | (445,800 | ) | |
| JPMorgan Chase & Co. | | EU Euro
EUR 355,000 | | BUY | | 2/10/11 | | | 483,741 | | | | 474,341 | | | | (9,400 | ) | |
| JPMorgan Chase & Co. | | Indonesian Rupiah
IDR 9,611,000,000 | | BUY | | 1/13/11 | | | 1,063,281 | | | | 1,064,514 | | | | 1,233 | | |
| JPMorgan Chase & Co. | | Mexican Peso
MXN 7,700,000 | | BUY | | 2/22/11 | | | 615,508 | | | | 621,104 | | | | 5,596 | | |
| JPMorgan Chase & Co. | | Malaysian Ringgit
MYR 1,110,000 | | BUY | | 1/6/11 | | | 359,806 | | | | 359,820 | | | | 14 | | |
| JPMorgan Chase & Co. | | Malaysian Ringgit
MYR 5,320,000 | | BUY | | 2/18/11 | | | 1,690,875 | | | | 1,719,699 | | | | 28,824 | | |
| JPMorgan Chase & Co. | | Malaysian Ringgit
MYR 1,110,000 | | BUY | | 2/18/11 | | | 359,514 | | | | 358,809 | | | | (705 | ) | |
| JPMorgan Chase & Co. | | Norwegian Krone
NOK 25,210,000 | | BUY | | 2/9/11 | | | 4,359,706 | | | | 4,311,861 | | | | (47,845 | ) | |
| JPMorgan Chase & Co. | | Philippine Peso
PHP 18,000,000 | | BUY | | 1/4/11 | | | 408,998 | | | | 410,884 | | | | 1,886 | | |
| JPMorgan Chase & Co. | | Philippine Peso
PHP 61,000,000 | | BUY | | 1/4/11 | | | 1,403,590 | | | | 1,392,440 | | | | (11,150 | ) | |
| JPMorgan Chase & Co. | | Philippine Peso
PHP 2,000,000 | | BUY | | 1/4/11 | | | 45,767 | | | | 45,654 | | | | (113 | ) | |
| JPMorgan Chase & Co. | | Philippine Peso
PHP 81,000,000 | | BUY | | 3/4/11 | | | 1,835,486 | | | | 1,848,851 | | | | 13,365 | | |
| JPMorgan Chase & Co. | | Singapore Dollar
SGD 110,000 | | BUY | | 5/10/11 | | | 85,414 | | | | 85,716 | | | | 302 | | |
| Morgan Stanley | | Indian Rupee
INR 75,500,000 | | BUY | | 1/3/11 | | | 1,681,514 | | | | 1,687,542 | | | | 6,028 | | |
| Morgan Stanley | | Indian Rupee
INR 75,500,000 | | BUY | | 2/1/11 | | | 1,674,615 | | | | 1,678,583 | | | | 3,968 | | |
| Morgan Stanley | | Indian Rupee
INR 3,000,000 | | BUY | | 1/3/11 | | | 65,488 | | | | 67,055 | | | | 1,567 | | |
| Morgan Stanley | | Kazakhstani Tenge
KZT 18,700,000 | | BUY | | 2/28/11 | | | 127,776 | | | | 127,129 | | | | (647 | ) | |
| Nomura Group | | Japanese Yen
JPY 11,000,000 | | BUY | | 2/22/11 | | | 130,641 | | | | 135,561 | | | | 4,920 | | |
| Nomura Group | | Japanese Yen
JPY 10,000,000 | | BUY | | 2/22/11 | | | 119,181 | | | | 123,237 | | | | 4,056 | | |
| Nomura Group | | Japanese Yen
JPY 1,000,000 | | BUY | | 2/22/11 | | | 11,918 | | | | 12,324 | | | | 406 | | |
| Nomura Group | | Japanese Yen
JPY 434,000,000 | | BUY | | 3/22/11 | | | 5,318,204 | | | | 5,350,122 | | | | 31,918 | | |
| Nomura Group | | Norwegian Krone
NOK 25,190,000 | | BUY | | 2/9/11 | | | 4,362,698 | | | | 4,308,440 | | | | (54,258 | ) | |
| Nomura Group | | New Zealand Dollar
NZD 270,000 | | BUY | | 2/22/11 | | | 198,045 | | | | 209,489 | | | | 11,444 | | |
| Nomura Group | | New Zealand Dollar
NZD 40,000 | | BUY | | 2/22/11 | | | 29,378 | | | | 31,035 | | | | 1,657 | | |
| Nomura Group | | New Zealand Dollar
NZD 20,000 | | BUY | | 2/22/11 | | | 15,482 | | | | 15,518 | | | | 36 | | |
See Accompanying Notes to Financial Statements
142
ING OPPENHEIMER GLOBAL SUMMARY PORTFOLIO OF INVESTMENTS
STRATEGIC INCOME PORTFOLIO AS OF DECEMBER 31, 2010 (CONTINUED)
| Counterparty | | Currency | | Buy/Sell | | Settlement
Date | | In Exchange
For | | Fair Value | | Unrealized
Appreciation
(Depreciation) | |
| Nomura Group | | Polish Zloty
PLN 18,200,000 | | BUY | | 2/9/11 | | $ | 6,527,322 | | | $ | 6,132,032 | | | $ | (395,290 | ) | |
| Nomura Group | | Polish Zloty
PLN 6,080,000 | | BUY | | 2/9/11 | | | 2,180,556 | | | | 2,048,503 | | | | (132,053 | ) | |
| Nomura Group | | South African Rand
ZAR 580,000 | | BUY | | 2/1/11 | | | 87,231 | | | | 87,617 | | | | 386 | | |
| Nomura Group | | South African Rand
ZAR 1,840,000 | | BUY | | 2/1/11 | | | 276,837 | | | | 277,959 | | | | 1,122 | | |
Royal Bank of Scotland
Group PLC | | Swiss Franc
CHF 120,000 | | BUY | | 5/10/11 | | | 124,611 | | | | 128,567 | | | | 3,956 | | |
Royal Bank of Scotland
Group PLC | | Swedish Krona
SEK 28,865,000 | | BUY | | 2/9/11 | | | 4,372,259 | | | | 4,285,885 | | | | (86,374 | ) | |
| Standard Bank | | South African Rand
ZAR 1,500,000 | | BUY | | 2/1/11 | | | 211,658 | | | | 226,597 | | | | 14,939 | | |
| State Street Bank | | Australian Dollar
AUD 200,000 | | BUY | | 2/22/11 | | | 195,438 | | | | 203,178 | | | | 7,740 | | |
| State Street Bank | | Australian Dollar
AUD 110,000 | | BUY | | 2/22/11 | | | 107,491 | | | | 111,748 | | | | 4,257 | | |
| State Street Bank | | Australian Dollar
AUD 830,000 | | BUY | | 2/22/11 | | | 811,068 | | | | 843,187 | | | | 32,119 | | |
| State Street Bank | | Australian Dollar
AUD 40,000 | | BUY | | 2/22/11 | | | 39,236 | | | | 40,636 | | | | 1,400 | | |
| State Street Bank | | Australian Dollar
AUD 10,000 | | BUY | | 2/22/11 | | | 10,119 | | | | 10,159 | | | | 40 | | |
| State Street Bank | | British Pound
GBP 170,000 | | BUY | | 2/22/11 | | | 263,634 | | | | 264,936 | | | | 1,302 | | |
| State Street Bank | | Polish Zloty
PLN 5,630,000 | | BUY | | 2/2/11 | | | 1,962,288 | | | | 1,897,689 | | | | (64,599 | ) | |
| State Street Bank | | South African Rand
ZAR 7,400,000 | | BUY | | 2/1/11 | | | 1,033,572 | | | | 1,117,878 | | | | 84,306 | | |
| | | $ | (1,391,751 | ) | |
| Bank of America | | Kazakhstani Tenge
KZT 18,700,000 | | SELL | | 2/28/11 | | | 126,651 | | | | 127,129 | | | | (478 | ) | |
| Bank of America | | Kazakhstani Tenge
KZT 19,000,000 | | SELL | | 3/10/11 | | | 128,726 | | | | 129,199 | | | | (473 | ) | |
| Bank of America | | EU Euro
EUR 3,800,000 | | SELL | | 1/7/11 | | | 5,272,500 | | | | 5,077,910 | | | | 194,590 | | |
| Bank of America | | Chinese Yuan
CNY 500,000 | | SELL | | 6/7/11 | | | 76,511 | | | | 75,955 | | | | 556 | | |
| Bank of America | | Singapore Dollar
SGD 1,375,000 | | SELL | | 1/13/11 | | | 1,062,071 | | | | 1,071,436 | | | | (9,365 | ) | |
| Bank of America | | Chinese Yuan
CNY 100,000 | | SELL | | 6/7/11 | | | 15,328 | | | | 15,191 | | | | 137 | | |
| Bank of America | | South Korean Won
KRW 678,000,000 | | SELL | | 1/3/11 | | | 579,983 | | | | 597,302 | | | | (17,319 | ) | |
| Bank of America | | Philippine Peso
PHP 46,000,000 | | SELL | | 1/13/11 | | | 1,040,253 | | | | 1,050,144 | | | | (9,891 | ) | |
| Bank of America | | South Korean Won
KRW 2,558,000,000 | | SELL | | 1/24/11 | | | 2,213,760 | | | | 2,250,692 | | | | (36,932 | ) | |
| Barclays Bank PLC | | Hungarian Forint
HUF 286,000,000 | | SELL | | 2/10/11 | | | 1,307,847 | | | | 1,368,803 | | | | (60,956 | ) | |
| Barclays Bank PLC | | Japanese Yen
JPY 65,000,000 | | SELL | | 1/7/11 | | | 771,697 | | | | 800,657 | | | | (28,960 | ) | |
| Barclays Bank PLC | | EU Euro
EUR 30,000 | | SELL | | 2/22/11 | | | 39,511 | | | | 40,083 | | | | (572 | ) | |
| Barclays Bank PLC | | Hong Kong Sar Dollar
HKD 7,600,000 | | SELL | | 2/28/11 | | | 976,864 | | | | 978,253 | | | | (1,389 | ) | |
| Barclays Bank PLC | | British Pound
GBP 150,000 | | SELL | | 2/22/11 | | | 234,291 | | | | 233,767 | | | | 524 | | |
| BOCI Securities Limited | | EU Euro
EUR 630,000 | | SELL | | 4/6/11 | | | 862,086 | | | | 841,578 | | | | 20,508 | | |
| Citigroup, Inc. | | Chinese Yuan
CNY 6,800,000 | | SELL | | 1/4/11 | | | 1,024,868 | | | | 1,031,830 | | | | (6,962 | ) | |
| Citigroup, Inc. | | EU Euro
EUR 360,000 | | SELL | | 5/10/11 | | | 499,320 | | | | 480,817 | | | | 18,503 | | |
| Citigroup, Inc. | | Colombian Peso
COP 268,000,000 | | SELL | | 2/18/11 | | | 142,402 | | | | 140,907 | | | | 1,495 | | |
| Citigroup, Inc. | | EU Euro
EUR 2,285,000 | | SELL | | 1/7/11 | | | 2,995,635 | | | | 3,053,428 | | | | (57,793 | ) | |
| Citigroup, Inc. | | Swiss Franc
CHF 1,030,000 | | SELL | | 1/14/11 | | | 1,031,733 | | | | 1,101,819 | | | | (70,086 | ) | |
See Accompanying Notes to Financial Statements
143
ING OPPENHEIMER GLOBAL SUMMARY PORTFOLIO OF INVESTMENTS
STRATEGIC INCOME PORTFOLIO AS OF DECEMBER 31, 2010 (CONTINUED)
| Counterparty | | Currency | | Buy/Sell | | Settlement
Date | | In Exchange
For | | Fair Value | | Unrealized
Appreciation
(Depreciation) | |
| Citigroup, Inc. | | EU Euro
EUR 2,450,000 | | SELL | | 3/22/11 | | $ | 3,221,701 | | | $ | 3,273,038 | | | $ | (51,337 | ) | |
| Citigroup, Inc. | | Chilean Peso
CLP 3,000,000 | | SELL | | 1/14/11 | | | 6,346 | | | | 6,403 | | | | (57 | ) | |
| Citigroup, Inc. | | Indian Rupee
INR 122,500,000 | | SELL | | 1/3/11 | | | 2,714,982 | | | | 2,738,065 | | | | (23,083 | ) | |
| Citigroup, Inc. | | Chilean Peso
CLP 152,000,000 | | SELL | | 1/7/11 | | | 324,786 | | | | 324,601 | | | | 185 | | |
| Credit Suisse First Boston | | EU Euro
EUR 1,500,000 | | SELL | | 2/10/11 | | | 2,089,530 | | | | 2,004,258 | | | | 85,272 | | |
| Credit Suisse First Boston | | EU Euro
EUR 175,000 | | SELL | | 2/10/11 | | | 243,778 | | | | 233,830 | | | | 9,948 | | |
| Credit Suisse First Boston | | Japanese Yen
JPY 85,000,000 | | SELL | | 1/12/11 | | | 1,033,705 | | | | 1,047,075 | | | | (13,370 | ) | |
| Credit Suisse First Boston | | EU Euro
EUR 360,000 | | SELL | | 2/10/11 | | | 486,891 | | | | 481,022 | | | | 5,869 | | |
| Credit Suisse First Boston | | Hungarian Forint
HUF 203,000,000 | | SELL | | 2/10/11 | | | 929,232 | | | | 971,563 | | | | (42,331 | ) | |
| Credit Suisse First Boston | | Turkish Lira
TRY 1,475,000 | | SELL | | 1/3/11 | | | 973,951 | | | | 954,971 | | | | 18,980 | | |
| Credit Suisse First Boston | | Swiss Franc
CHF 120,000 | | SELL | | 2/22/11 | | | 123,711 | | | | 128,428 | | | | (4,717 | ) | |
| Credit Suisse First Boston | | Swedish Krona
SEK 800,000 | | SELL | | 2/22/11 | | | 116,569 | | | | 118,730 | | | | (2,161 | ) | |
| Credit Suisse First Boston | | Swiss Franc
CHF 260,000 | | SELL | | 2/22/11 | | | 268,041 | | | | 278,262 | | | | (10,221 | ) | |
| Credit Suisse First Boston | | Swiss Franc
CHF 400,000 | | SELL | | 2/22/11 | | | 412,371 | | | | 428,095 | | | | (15,724 | ) | |
| Credit Suisse First Boston | | Swedish Krona
SEK 1,400,000 | | SELL | | 2/22/11 | | | 203,996 | | | | 207,777 | | | | (3,781 | ) | |
| Credit Suisse First Boston | | Swiss Franc
CHF 700,000 | | SELL | | 2/22/11 | | | 722,519 | | | | 749,166 | | | | (26,647 | ) | |
| Credit Suisse First Boston | | Swedish Krona
SEK 2,100,000 | | SELL | | 2/22/11 | | | 305,960 | | | | 311,666 | | | | (5,706 | ) | |
| Credit Suisse First Boston | | Turkish Lira
TRY 740,000 | | SELL | | 2/10/11 | | | 471,407 | | | | 476,931 | | | | (5,524 | ) | |
| Credit Suisse First Boston | | Turkish Lira
TRY 690,000 | | SELL | | 2/10/11 | | | 440,655 | | | | 444,706 | | | | (4,051 | ) | |
| Credit Suisse First Boston | | Swiss Franc
CHF 230,000 | | SELL | | 2/22/11 | | | 240,066 | | | | 246,155 | | | | (6,089 | ) | |
| Credit Suisse First Boston | | Swiss Franc
CHF 10,000 | | SELL | | 2/22/11 | | | 10,730 | | | | 10,702 | | | | 28 | | |
| Deutsche Bank AG | | Kazakhstani Tenge
KZT 18,700,000 | | SELL | | 2/28/11 | | | 126,694 | | | | 127,129 | | | | (435 | ) | |
| Deutsche Bank AG | | Australian Dollar
AUD 134,000 | | SELL | | 1/7/11 | | | 128,184 | | | | 136,925 | | | | (8,741 | ) | |
| Deutsche Bank AG | | Canadian Dollar
CAD 545,000 | | SELL | | 1/7/11 | | | 533,138 | | | | 548,050 | | | | (14,912 | ) | |
| Deutsche Bank AG | | Swiss Franc
CHF 129,000 | | SELL | | 1/7/11 | | | 128,723 | | | | 137,981 | | | | (9,258 | ) | |
| Deutsche Bank AG | | British Pound
GBP 335,000 | | SELL | | 1/7/11 | | | 521,428 | | | | 522,266 | | | | (838 | ) | |
| Deutsche Bank AG | | Canadian Dollar
CAD 130,000 | | SELL | | 2/22/11 | | | 129,058 | | | | 130,604 | | | | (1,546 | ) | |
| Deutsche Bank AG | | Canadian Dollar
CAD 410,000 | | SELL | | 2/22/11 | | | 407,029 | | | | 411,904 | | | | (4,875 | ) | |
| Deutsche Bank AG | | Canadian Dollar
CAD 470,000 | | SELL | | 2/22/11 | | | 463,824 | | | | 472,182 | | | | (8,358 | ) | |
| Goldman Sachs & Co. | | Mexican Peso
MXN 5,800,000 | | SELL | | 2/2/11 | | | 449,473 | | | | 468,569 | | | | (19,096 | ) | |
| Goldman Sachs & Co. | | Brazilian Real
BRL 7,405,000 | | SELL | | 1/4/11 | | | 4,265,307 | | | | 4,456,610 | | | | (191,303 | ) | |
| Goldman Sachs & Co. | | Brazilian Real
BRL 2,100,000 | | SELL | | 1/4/11 | | | 1,209,608 | | | | 1,263,860 | | | | (54,252 | ) | |
| Goldman Sachs & Co. | | Mexican Peso
MXN4,105,000 | | SELL | | 2/16/11 | | | 324,634 | | | | 331,275 | | | | (6,641 | ) | |
| Goldman Sachs & Co. | | South Korean Won
KRW 860,000,000 | | SELL | | 1/3/11 | | | 736,301 | | | | 757,639 | | | | (21,338 | ) | |
| Goldman Sachs & Co. | | Brazilian Real
BRL 7,405,000 | | SELL | | 2/2/11 | | | 4,363,583 | | | | 4,426,407 | | | | (62,824 | ) | |
| Goldman Sachs & Co. | | Brazilian Real
BRL 2,100,000 | | SELL | | 2/2/11 | | | 1,237,478 | | | | 1,255,294 | | | | (17,816 | ) | |
See Accompanying Notes to Financial Statements
144
ING OPPENHEIMER GLOBAL SUMMARY PORTFOLIO OF INVESTMENTS
STRATEGIC INCOME PORTFOLIO AS OF DECEMBER 31, 2010 (CONTINUED)
| Counterparty | | Currency | | Buy/Sell | | Settlement
Date | | In Exchange
For | | Fair Value | | Unrealized
Appreciation
(Depreciation) | |
| Goldman Sachs & Co. | | Brazilian Real
BRL 980,000 | | SELL | | 2/2/11 | | $ | 585,075 | | | $ | 585,804 | | | $ | (729 | ) | |
| Goldman Sachs & Co. | | Brazilian Real
BRL 1,210,000 | | SELL | | 2/2/11 | | | 722,841 | | | | 723,289 | | | | (448 | ) | |
| HSBC | | Israeli New Shekel
ILS 3,560,000 | | SELL | | 1/31/11 | | | 975,877 | | | | 1,002,751 | | | | (26,874 | ) | |
| HSBC | | Brazilian Real
BRL 975,000 | | SELL | | 2/2/11 | | | 582,263 | | | | 582,815 | | | | (552 | ) | |
| HSBC | | Brazilian Real
BRL 1,215,000 | | SELL | | 2/2/11 | | | 725,590 | | | | 726,277 | | | | (687 | ) | |
| JPMorgan Chase & Co. | | Malaysian Ringgit
MYR 280,000 | | SELL | | 2/10/11 | | | 90,688 | | | | 90,550 | | | | 138 | | |
| JPMorgan Chase & Co. | | EU Euro
EUR 1,505,000 | | SELL | | 2/10/11 | | | 2,096,465 | | | | 2,010,939 | | | | 85,526 | | |
| JPMorgan Chase & Co. | | Taiwan New Dollar
TWD 30,000,000 | | SELL | | 1/12/11 | | | 998,502 | | | | 1,029,312 | | | | (30,810 | ) | |
| JPMorgan Chase & Co. | | EU Euro
EUR 360,000 | | SELL | | 2/10/11 | | | 487,282 | | | | 481,022 | | | | 6,260 | | |
| JPMorgan Chase & Co. | | South Korean Won
KRW 680,000,000 | | SELL | | 1/3/11 | | | 583,691 | | | | 599,064 | | | | (15,373 | ) | |
| JPMorgan Chase & Co. | | South Korean Won
KRW 340,000,000 | | SELL | | 1/3/11 | | | 290,598 | | | | 299,532 | | | | (8,934 | ) | |
| JPMorgan Chase & Co. | | Norwegian Krone
NOK 800,000 | | SELL | | 2/22/11 | | | 133,357 | | | | 136,745 | | | | (3,388 | ) | |
| JPMorgan Chase & Co. | | Norwegian Krone
NOK 700,000 | | SELL | | 2/22/11 | | | 116,687 | | | | 119,652 | | | | (2,965 | ) | |
| JPMorgan Chase & Co. | | Mexican Peso
MXN 100,000 | | SELL | | 2/22/11 | | | 8,019 | | | | 8,066 | | | | (47 | ) | |
| JPMorgan Chase & Co. | | Philippine Peso
PHP 81,000,000 | | SELL | | 1/4/11 | | | 1,832,165 | | | | 1,848,977 | | | | (16,812 | ) | |
| JPMorgan Chase & Co. | | Malaysian Ringgit
MYR 1,110,000 | | SELL | | 1/6/11 | | | 360,039 | | | | 359,820 | | | | 219 | | |
| Morgan Stanley | | Kazakhstani Tenge
KZT 11,860,000 | | SELL | | 2/28/11 | | | 80,325 | | | | 80,629 | | | | (304 | ) | |
| Morgan Stanley | | Kazakhstani Tenge
KZT 6,840,000 | | SELL | | 2/28/11 | | | 46,326 | | | | 46,501 | | | | (175 | ) | |
| Nomura Group | | Polish Zloty
PLN 2,040,000 | | SELL | | 2/2/11 | | | 684,989 | | | | 687,617 | | | | (2,628 | ) | |
| Nomura Group | | New Zealand Dollar
NZD 520,000 | | SELL | | 2/22/11 | | | 381,420 | | | | 403,461 | | | | (22,041 | ) | |
| Nomura Group | | Japanese Yen
JPY 10,000,000 | | SELL | | 2/22/11 | | | 118,765 | | | | 123,237 | | | | (4,472 | ) | |
| Nomura Group | | Japanese Yen
JPY 23,000,000 | | SELL | | 2/22/11 | | | 273,159 | | | | 283,446 | | | | (10,287 | ) | |
| Nomura Group | | Japanese Yen
JPY 21,000,000 | | SELL | | 2/22/11 | | | 250,280 | | | | 258,798 | | | | (8,518 | ) | |
| Nomura Group | | Japanese Yen
JPY 220,000,000 | | SELL | | 3/22/11 | | | 2,618,736 | | | | 2,712,044 | | | | (93,308 | ) | |
| Nomura Group | | New Zealand Dollar
NZD 10,000 | | SELL | | 2/22/11 | | | 7,741 | | | | 7,759 | | | | (18 | ) | |
Royal Bank of Scotland
Group PLC | | EU Euro
EUR 250,000 | | SELL | | 2/17/11 | | | 340,500 | | | | 334,033 | | | | 6,467 | | |
| Standard Bank | | South African Rand
ZAR 3,070,000 | | SELL | | 2/1/11 | | | 427,095 | | | | 463,768 | | | | (36,673 | ) | |
| Standard Bank | | South African Rand
ZAR 990,000 | | SELL | | 2/1/11 | | | 139,092 | | | | 149,554 | | | | (10,462 | ) | |
| State Street Bank | | Hong Kong Sar Dollar
HKD 7,600,000 | | SELL | | 1/3/11 | | | 980,784 | | | | 977,798 | | | | 2,986 | | |
| State Street Bank | | South African Rand
ZAR 4,220,000 | | SELL | | 2/1/11 | | | 588,646 | | | | 637,492 | | | | (48,846 | ) | |
| State Street Bank | | Australian Dollar
AUD 400,000 | | SELL | | 2/22/11 | | | 390,876 | | | | 406,355 | | | | (15,479 | ) | |
| State Street Bank | | British Pound
GBP 170,000 | | SELL | | 2/22/11 | | | 265,078 | | | | 264,936 | | | | 142 | | |
| State Street Bank | | British Pound
GBP 80,000 | | SELL | | 2/22/11 | | | 124,743 | | | | 124,676 | | | | 67 | | |
| State Street Bank | | British Pound
GBP 70,000 | | SELL | | 2/22/11 | | | 108,555 | | | | 109,091 | | | | (536 | ) | |
| State Street Bank | | Australian Dollar
AUD 10,000 | | SELL | | 2/22/11 | | | 9,809 | | | | 10,159 | | | | (350 | ) | |
See Accompanying Notes to Financial Statements
145
ING OPPENHEIMER GLOBAL SUMMARY PORTFOLIO OF INVESTMENTS
STRATEGIC INCOME PORTFOLIO AS OF DECEMBER 31, 2010 (CONTINUED)
| Counterparty | | Currency | | Buy/Sell | | Settlement
Date | | In Exchange
For | | Fair Value | | Unrealized
Appreciation
(Depreciation) | |
| State Street Bank | | Australian Dollar
AUD 10,000 | | SELL | | 2/22/11 | | $ | 10,119 | | | $ | 10,159 | | | $ | (40 | ) | |
| | | $ | (841,564 | ) | |
ING Oppenheimer Global Strategic Income Portfolio Open Futures Contracts on December 31, 2010:
| Contract Description | | Number
of Contracts | | Expiration Date | | Notional
Value | | Unrealized
Appreciation/
(Depreciation) | |
| Long Contracts | |
| DAX Index | | | 4 | | | 03/18/11 | | $ | 925,661 | | | $ | (9,775 | ) | |
| Euro-Bund | | | 25 | | | 03/08/11 | | | 4,186,322 | | | | (24,686 | ) | |
| Long Gilt | | | 2 | | | 03/29/11 | | | 372,591 | | | | 337 | | |
| NASDAQ 100 E-Mini | | | 45 | | | 03/18/11 | | | 1,994,400 | | | | 1,472 | | |
| NIKKEI 225 (SGX) | | | 3 | | | 03/10/11 | | | 188,632 | | | | (1,100 | ) | |
| U.S. Treasury 5-Year Note | | | 38 | | | 03/31/11 | | | 4,473,312 | | | | (56,962 | ) | |
| U.S. Treasury 10-Year Note | | | 644 | | | 03/22/11 | | | 77,561,750 | | | | (1,018,751 | ) | |
| U.S. Treasury Long Bond | | | 12 | | | 03/22/11 | | | 1,465,500 | | | | 13,021 | | |
| U.S. Treasury Ultra Long Bond | | | 8 | | | 03/22/11 | | | 1,016,750 | | | | 24,574 | | |
| | | | | | | $ | 92,184,918 | | | $ | (1,071,870 | ) | |
| Short Contracts | |
| FTSE 100 Index | | | 13 | | | 03/18/11 | | $ | 1,194,403 | | | $ | (13,339 | ) | |
| Japanese Government Bonds 10-Year Mini | | | 2 | | | 03/09/11 | | | 346,373 | | | | (58 | ) | |
| NIKKEI 225 (OSE) | | | 13 | | | 03/10/11 | | | 1,634,807 | | | | (399 | ) | |
| S&P 500 E-Mini | | | 109 | | | 03/18/11 | | | 6,828,850 | | | | (88,432 | ) | |
| U.S. Treasury 2-Year Note | | | 100 | | | 03/31/11 | | | 21,890,626 | | | | 23,915 | | |
| | | | | | | $ | 31,895,059 | | | $ | (78,313 | ) | |
ING Oppenheimer Global Strategic Income Portfolio Credit Default Swap Agreements Outstanding on December 31, 2010:
Credit Default Swaps on Credit Indices — Buy Protection(1)
| Counterparty | | Reference
Entity/Obligation | | Buy/Sell
Protection | | (Pay)/
Receive
Fixed
Rate (%) | | Termination
Date | | Notional
Amount(4) | | Fair
Value(5) | | Upfront
Premium
Paid/
(Received) | | Unrealized
Appreciation/
(Depreciation) | |
Barclays
Bank PLC | | CDX.EM.14 Index | | Buy | | | (5.000 | ) | | 12/20/15 | | USD | 5,000,000 | | | $ | (682,203 | ) | | $ | (591,248 | ) | | $ | (90,955 | ) | |
| | | | | | | | | | | | | $ | (682,203 | ) | | $ | (591,248 | ) | | $ | (90,955 | ) | |
Credit Default Swaps on Corporate and Sovereign Issues — Buy Protection(1)
| Counterparty | | Reference
Entity/Obligation | | Buy/Sell
Protection | | (Pay)/
Receive
Fixed
Rate (%) | | Termination
Date | | Notional
Amount(4) | | Fair
Value(5) | | Upfront
Premium
Paid/
(Received) | | Unrealized
Appreciation/
(Depreciation) | |
Credit Suisse
First Boston | | Campbell Soup Co.,
4.875%, 10/01/2013 | | Buy
| | (1.000)
| | 12/20/15
| | USD1,030,000
| | $ | (27,308 | )
| | $ | (27,505 | )
| | $ | 197 |
| |
Barclays
Bank PLC | | Cisco Systems Inc.,
5.500%, 02/22/2016 | | Buy
| | (1.000)
| | 12/20/15
| | USD1,030,000
| | | (25,253 | )
| | | (22,930 | )
| | | (2,323 | )
| |
Credit Suisse
First Boston | | Lockheed Martin Corp.,
7.650%, 05/01/16 | | Buy
| | (1.000)
| | 12/20/15
| | USD1,030,000
| | | (33,013 | )
| | | (31,801 | )
| | | (1,212 | )
| |
| Morgan Stanley | | McKesson Corp.,
7.650%, 03/01/2027 | |
Buy | | (1.000) | |
12/20/15 | | USD1,030,000 | | | (25,524 | ) | | | (23,983 | ) | | | (1,541 | ) | |
| Citigroup, Inc. | | Raytheon Co.,
7.200%, 08/15/2027 | |
Buy | | (1.000) | |
12/20/15 | | USD1,030,000 | | | (27,678 | ) | | | (25,111 | ) | | | (2,567 | ) | |
| | | | | | | | | | | | | $ | (138,776 | ) | | $ | (131,330 | ) | | $ | (7,446 | ) | |
See Accompanying Notes to Financial Statements
146
ING OPPENHEIMER GLOBAL SUMMARY PORTFOLIO OF INVESTMENTS
STRATEGIC INCOME PORTFOLIO AS OF DECEMBER 31, 2010 (CONTINUED)
Credit Default Swaps on Credit Indices — Sell Protection(2)
| Counterparty | | Reference
Entity/Obligation | | Buy/Sell
Protection | | (Pay)/
Receive
Fixed
Rate (%) | | Termination
Date | | Notional
Amount(4) | | Fair
Value(5) | | Upfront
Premium
Paid/
(Received) | | Unrealized
Appreciation/
(Depreciation) | |
Barclays
Bank PLC | |
CDX.NA.HY.15 Index | |
Sell | | | 5.000 | | |
12/20/15 | | USD | 10,000,000 | | | $ | 294,418 | | | $ | 105,548 | | | $ | 188,870 | | |
| Citigroup, Inc. | | CDX.NA.HY.15 Index | | Sell | | | 5.000 | | | 12/20/15 | | USD | 10,000,000 | | | | 294,418 | | | | 233,156 | | | | 61,262 | | |
| | | | | | | | | | | | | $ | 588,836 | | | $ | 338,704 | | | $ | 250,132 | | |
Credit Default Swaps on Corporate and Sovereign Issues — Sell Protection(2)
| Counterparty | | Reference
Entity/Obligation | | Buy/Sell
Protection | | (Pay)/
Receive
Fixed
Rate (%) | | Termination
Date | | Implied
Credit Spread
At 12/31/10
(%)(3) | | Notional
Amount(4) | | Fair
Value(5) | | Upfront
Premium
Paid/
(Received) | | Unrealized
Appreciation/
(Depreciation) | |
| JPMorgan Chase & Co. | | American International Group
6.250%, 05/01/2036 | | Sell | | | 1.000 | | | 12/20/15 | | | 2.126 | | | USD | 1,030,000 | | | $ | (52,512 | ) | | $ | (66,608 | ) | | $ | 14,096 | | |
| Morgan Stanley | | Caterpillar Inc.,
5.700%, 08/15/2016 | | Sell | | | 1.000 | | | 12/20/15 | | | 0.752 | | | USD | 1,030,000 | | | | 12,116 | | | | 9,992 | | | | 2,124 | | |
Credit Suisse
First Boston | | Fortune Brands, Inc.,
5.375%, 01/15/2016 | | Sell | | | 1.000 | | | 12/20/15 | | | 1.610 | | | USD | 1,030,000 | | | | (29,253 | ) | | | (42,805 | ) | | | 13,552 | | |
| Citigroup, Inc. | | SLM Corp.,
5.000%, 10/01/2013 | | Sell | | | 5.000 | | | 12/20/15 | | | 3.440 | | | USD | 810,000 | | | | 55,484 | | | | 4,662 | | | | 50,822 | | |
| UBS Warburg LLC | | SLM Corp.,
5.000%, 10/01/2013 | | Sell | | | 5.000 | | | 12/20/15 | | | 3.440 | | | USD | 220,000 | | | | 15,070 | | | | 1,266 | | | | 13,804 | | |
| Citigroup, Inc. | | Xerox Corporation,
6.750%, 02/01/2017 | | Sell | | | 1.000 | | | 12/20/15 | | | 1.308 | | | USD | 1,030,000 | | | | (14,835 | ) | | | (14,861 | ) | | | 26 | | |
| | | $ | (13,930 | ) | | $ | (108,354 | ) | | $ | 94,424 | | |
(1) If a Portfolio is a buyer of protection and a credit event occurs, as defined under the terms of that particular swap agreement, a Portfolio will either 1.) receive from the seller of protection an amount equal to the notional amount of the swap and deliver the referenced obligation, other deliverable obligations or underlying securities comprising the referenced index or 2.) receive a net settlement amount in the form of cash or securities equal to the notional amount of the swap less the recovery value of the referenced obligation or underlying securities comprising the referenced index.
(2) If the Portfolio is a seller of protection, and a credit event occurs, as defined under the terms of that particular swap agreement, the Portfolio will generally either 1.) Pay to the buyer an amount equal to the notional amount of the swap and take delivery of the referenced obligation, other deliverable obligations, or underlying securities comprising a referenced index or 2.) Pay a net settlement amount in the form of cash or securities equal to the notional amount of the swap less the recovery value of the referenced obligation or underlying securities comprising a referenced index.
(3) Implied credit spreads, represented in absolute terms, utilized in determining the fair value of credit default swap agreements on corporate issues or sovereign issues are disclosed in each Portfolio's Portfolio of Investment and serve as an indicator of the current status of the payment/performance risk and represent the likelihood or risk of default for the credit derivative. The implied credit spread of a particular referenced entity reflects the cost of buying/selling protection and may include upfront payments required to be made to enter into the agreement. For credit default swaps on asset-backed securities or credit indices, the quoted fair prices and resulting fair values serve as the indicator of the current status of the payment/performance risk. Wider credit spreads and increasing fair values, in absolute terms when compared to the notional amount of the swap, represent a deterioration of the referenced entity's credit soundness and a greater likelihood or risk of default or other credit event occurring as defined under the terms of the agreement.
(4) The maximum amount of future payments (undiscounted) that a Portfolio as a seller of protection could be required to make or receive as a buyer of credit protection under a credit default swap agreement would be an amount equal to the notional amount of the agreement.
(5) The fair values for credit default swap agreements serve as an indicator of the current status of the payment/performance risk and represent the likelihood or risk of default for the credit derivative. Increasing fair values, in absolute terms, when compared to the notional amount of the agreement, represent a deterioration of the referenced obligation's credit soundness and a greater likelihood or risk of default or other credit event occurring.
ING Oppenheimer Global Strategic Income Portfolio Interest Rate Swap Agreements Outstanding on December 31, 2010:
| | | Termination
Date | | Notional
Amount | | Fair
Value | | Upfront Premium
Paid/(Received) | | Unrealized
Appreciation/
(Depreciation) | |
Receive a floating rate based on 6-month AUD-BBR-BBSW and
pay a fixed rate equal to 5.660%
Counterparty: Westpac Banking Corp. | | 08/04/20 | | AUD | 2,630,000 | | | $ | 84,947 | | | $ | — | | | $ | 84,947 | | |
Receive a fixed rate equal to 12.320% and pay a floating rate
based on the Brazil Cetip Interbank Deposit Rate Annualized
Counterparty: Banco Santander, S.A. | | 01/02/17 | | BRL | 840,000 | | | | 10,059 | | | | — | | | | 10,059 | | |
Receive a fixed rate equal to 11.490% and pay a floating rate
based on the Brazil Cetip Interbank Deposit Rate Annualized
Counterparty: Goldman Sachs & Co. | | 01/02/17 | | BRL | 2,795,000 | | | | (17,538 | ) | | | — | | | | (17,538 | ) | |
Receive a fixed rate equal to 12.800% and pay a floating rate
based on the Brazil Cetip Interbank Deposit Rate Annualized
Counterparty: Goldman Sachs & Co. | | 01/02/17 | | BRL | 1,410,000 | | | | 41,614 | | | | — | | | | 41,614 | | |
Receive a fixed rate equal to 13.900% and pay a floating rate
based on the Brazil Cetip Interbank Deposit Rate Annualized
Counterparty: JPMorgan Chase & Co. | | 01/02/17 | | BRL | 2,500,000 | | | | 125,924 | | | | — | | | | 125,924 | | |
See Accompanying Notes to Financial Statements
147
ING OPPENHEIMER GLOBAL SUMMARY PORTFOLIO OF INVESTMENTS
STRATEGIC INCOME PORTFOLIO AS OF DECEMBER 31, 2010 (CONTINUED)
| | | Termination
Date | | Notional
Amount | | Fair
Value | | Upfront Premium
Paid/(Received) | | Unrealized
Appreciation/
(Depreciation) | |
Receive a fixed rate equal to 3.328% and pay a floating rate
based on 6-month GBP-LIBOR-BBA
Counterparty: Barclays Bank PLC | | 08/03/20 | | GBP | 1,510,000 | | | $ | (32,891 | ) | | $ | — | | | $ | (32,891 | ) | |
Receive a floating rate based on 6-month JPY-LIBOR-BBA and
pay a fixed rate equal to 1.391%
Counterparty: Citigroup, Inc. | | 10/06/19 | | JPY | 24,000,000 | | | | (9,386 | ) | | | — | | | | (9,386 | ) | |
Receive a floating rate based on 6-month JPY-LIBOR-BBA and
pay a fixed rate equal to 1.563%
Counterparty: JPMorgan Chase & Co. | | 11/09/19 | | JPY | 77,000,000 | | | | (43,946 | ) | | | — | | | | (43,946 | ) | |
Receive a floating rate based on 6-month JPY-LIBOR-BBA and
pay a fixed rate equal to 1.077%
Counterparty: JPMorgan Chase & Co. | | 08/05/20 | | JPY | 106,000,000 | | | | 3,287 | | | | — | | | | 3,287 | | |
Receive a fixed rate equal to 2.500% and pay a floating rate
based on 3-month USD-LIBOR-BBA
Counterparty: Barclays Bank PLC | | 09/02/20 | | USD | 2,500,000 | | | | (173,687 | ) | | | — | | | | (173,687 | ) | |
| | | | | | | $ | (11,617 | ) | | $ | — | | | $ | (11,617 | ) | |
ING Oppenheimer Global Strategic Income Portfolio Total Return Swap Agreements Outstanding on December 31, 2010:
| | | Termination
Date | | Number of
Contracts | | Fair
Value | | Upfront Premium
Paid/(Received) | | Unrealized
Appreciation/
(Depreciation) | |
Receive the total return of custom basket of securities plus 85%
of the dividends from the basket, if positive.
Pay one-month CHF-LIBOR-BBA plus 30 basis pts. and,
if negative, the absolute value of the total return of
custom basket of securities.
Counterparty: Citigroup, Inc. | | 01/12/11 | | CHF | 4,160 | | | $ | 1,159 | | | $ | — | | | $ | 1,159 | | |
Receive the price return on Novo Nordisk A/S plus 85% of
dividends, if positive.
Pay one-month DKK-LIBOR-BBA plus spread of 30 basis
pts. and, if negative, the absolute value of the price
return of Novo Nordisk A/S.
Counterparty: Citigroup, Inc. | | 04/06/11 | | DKK | 407 | | | | 3,812 | | | | — | | | | 3,812 | | |
Receive the total return of custom basket of securities
plus 85% of the dividends from the basket, if positive.
Pay one-month EUR-EURIBOR-Telerate plus 30 basis pts.
and, if negative, the absolute value of the total return
of custom basket of securities.
Counterparty: Citigroup, Inc. | | 01/12/11 | | EUR | 6,977 | | | | 13,220 | | | | — | | | | 13,220 | | |
Receive the total return of a custom basket of securities plus
the dividends from the basket, if positive.
Pay one-month GBP-LIBOR-BBA plus 30 basis pts. and, if
negative, the absolute value of the total return of custom
basket of securities.
Counterparty: Citigroup, Inc. | | 01/12/11 | | GBP | 3,492 | | | | 21,811 | | | | — | | | | 21,811 | | |
Receive one-month EUR-EURIBOR-Telerate minus 3 basis pts.
and, if negative, the absolute value of the price return of
the MSCI Daily TR Gross Europe EUR Index.
Pay the price return on MSCI Daily TR Gross Europe EUR
Index, if positive.
Counterparty: Goldman Sachs & Co. | | 01/07/11 | | EUR | 7,140 | | | | (5,069 | ) | | | — | | | | (5,069 | ) | |
Receive one-month EUR-EURIBOR-Telerate minus 30 basis pts.
and, if negative, the absolute value of the price return of
the MSCI Daily TR Gross Europe EUR Index.
Pay the price return on MSCI Daily TR Gross Europe EUR
Index, if positive.
Counterparty: Morgan Stanley | | 01/07/11 | | EUR | 3,172 | | | | (7,281 | ) | | | — | | | | (7,281 | ) | |
Receive the total return of a custom basket of securities plus
the dividends from the basket, if positive.
Pay one-month GBP-LIBOR plus 50 basis pts. and,
if negative, the absolute value of the total return of
custom basket of securities.
Counterparty: Morgan Stanley | | 10/07/10 | | GBP | 10,093 | | | | 58,464 | | | | — | | | | 58,464 | | |
Receive the total return of custom basket of securities
plus 93% of the dividends from the basket, if positive.
Pay one-month JPY-LIBOR-BBA plus 80 basis pts. and,
if negative, the absolute value of the total return of
custom basket of securities.
Counterparty: Citigroup, Inc. | | 04/14/11 | | JPY | 115,331 | | | | 27,723 | | | | — | | | | 27,723 | | |
See Accompanying Notes to Financial Statements
148
ING OPPENHEIMER GLOBAL SUMMARY PORTFOLIO OF INVESTMENTS
STRATEGIC INCOME PORTFOLIO AS OF DECEMBER 31, 2010 (CONTINUED)
| | | Termination
Date | | Number of
Contracts | | Fair
Value | | Upfront Premium
Paid/(Received) | | Unrealized
Appreciation/
(Depreciation) | |
Receive the total return of custom basket of securities
plus 85% of the dividends from the basket, if positive.
Pay one-month SEK-LIBOR plus spread of 30 basis pts.
and, if negative, the absolute value of the price return
of custom basket of securities.
Counterparty: Citigroup, Inc. | | 01/07/11 | | SEK | 11,595 | | | $ | 1,908 | | | $ | — | | | $ | 1,908 | | |
Receive one-month USD-LIBOR-BBA plus 15 basis pts. and,
if negative, the absolute value of the price return of
the MSCI Daily TR Gross EAFE USD Index.
Pay the price return on MSCI Daily TR Gross EAFE USD
Index, if positive.
Counterparty: Citigroup, Inc. | | 10/07/11 | | USD | 69 | | | | (26,927 | ) | | | — | | | | (26,927 | ) | |
Receive the price return on MSCI Daily TR Net Japan USD
Index, if positive.
Pay one-month USD-LIBOR-BBA plus 20 basis pts. and,
if negative, the abosulte value of the price return of
the MSCI Daily TR Net Japan USD Index.
Counterparty: Deutsche Bank AG | | 12/07/11 | | USD | 133 | | | | 28,428 | | | | — | | | | 28,428 | | |
Receive the price return on MSCI Daily TR Net Italy USD
Index, if positive.
Pay one-month USD-LIBOR-BBA minus 25 basis pts.
and, if negative, the absolute value of the price
return of the MSCI Daily TR Net Italy USD Index.
Counterparty: Goldman Sachs & Co. | | 03/01/11 | | USD | 74 | | | | 3,106 | | | | (26 | ) | | | 3,132 | | |
Receive the price return on MSCI Daily TR Net Italy USD
Index, if positive.
Pay one-month USD-LIBOR-BBA minus 25 basis pts.
and, if negative, the abosulte value of the price
return of the MSCI Daily TR Net Italy USD Index.
Counterparty: Goldman Sachs & Co. | | 03/01/11 | | USD | 100 | | | | 4,197 | | | | — | | | | 4,197 | | |
Receive the price return on MSCI Daily TR Net Italy USD
Index, if positive.
Pay one-month USD-LIBOR-BBA plus 25 basis pts. and,
if negative, the absolute value of the price return of
the MSCI Daily TR Net Italy USD Index.
Counterparty: Goldman Sachs & Co. | | 03/04/11 | | USD | 581 | | | | 24,385 | | | | — | | | | 24,385 | | |
Receive one-month USD-LIBOR-BBA plus 10 basis pts. and,
if negative, the absolute value of the price return of
the MSCI Daily TR Gross EAFE USD Index.
Pay the price return on MSCI Daily TR Gross EAFE USD
Index, if positive.
Counterparty: Goldman Sachs & Co. | | 05/06/11 | | USD | 39 | | | | (5,259 | ) | | | — | | | | (5,259 | ) | |
Receive one-month USD-LIBOR-BBA minus 5 basis pts. and,
if negative, the absolute value of the price return of
the MSCI Daily TR Gross EAFE USD Index.
Pay the price return on MSCI Daily TR Gross EAFE USD
Index, if positive.
Counterparty: Goldman Sachs & Co. | | 07/01/11 | | USD | 76 | | | | (14,272 | ) | | | 38 | | | | (14,310 | ) | |
Receive the total return of custom basket of
securities, if positive.
Pay one-month USD-LIBOR-BBA plus 18 basis pts. and,
if negative, the absolute value of the price return of
custom basket of securities.
Counterparty: Goldman Sachs & Co. | | 08/05/11 | | USD | 61,511 | | | | 52,978 | | | | (6,229 | ) | | | 59,207 | | |
Receive one-month USD-LIBOR-BBA plus 5 basis pts. and,
if negative, the absolute value of the price return of
the MSCI Daily TR Gross EAFE USD Index.
Pay the price return on MSCI Daily TR Gross EAFE USD
Index, if positive.
Counterparty: Goldman Sachs & Co. | | 09/02/11 | | USD | 13 | | | | (2,441 | ) | | | — | | | | (2,441 | ) | |
Receive one-month USD-LIBOR-BBA minus 5 basis pts. and,
if negative, the absolute value of the price return of the
MSCI Daily TR Gross EAFE USD Index.
Pay the price return on MSCI Daily TR Gross EAFE USD
Index, if positive.
Counterparty: Goldman Sachs & Co. | | 11/07/11 | | USD | 6 | | | | (1,127 | ) | | | — | | | | (1,127 | ) | |
Receive one-month USD-LIBOR-BBA minus 35 basis pts. and,
if negative, the absolute value of the price return of the
S&P Barra Value Index.
Pay the price return on S&P Barra Value Index, if positive.
Counterparty: Goldman Sachs & Co. | | 12/08/11 | | USD | 2,275 | | | | (60,747 | ) | | | — | | | | (60,747 | ) | |
See Accompanying Notes to Financial Statements
149
ING OPPENHEIMER GLOBAL SUMMARY PORTFOLIO OF INVESTMENTS
STRATEGIC INCOME PORTFOLIO AS OF DECEMBER 31, 2010 (CONTINUED)
| | | Termination
Date | | Number of
Contracts | | Fair
Value | | Upfront Premium
Paid/(Received) | | Unrealized
Appreciation/
(Depreciation) | |
Receive the price return on AMEX Consumer Staples Select
Sector Index, if positive.
Pay one-month USD-LIBOR-BBA plus 15 basis pts. and,
if negative, the absolute value of the price return of
the AMEX Consumers Staples Select Sector Index.
Counterparty: Morgan Stanley | | 03/04/11 | | USD | 1,346 | | | $ | 10,424 | | | $ | (560 | ) | | $ | 10,984 | | |
Receive the price return on AMEX Consumer Staples
Select Sector Index, if positive.
Pay one-month USD-LIBOR-BBA and, if negative,
the absolute value of the price return of the AMEX
Consumer Staples Select Sector Index.
Counterparty: Morgan Stanley | | 09/03/11 | | USD | 154 | | | | 1,160 | | | | — | | | | 1,160 | | |
Receive the price return on AMEX Energy Select
Sector Index, if positive.
Pay one-month USD-LIBOR-BBA plus 10 basis pts.
and, if negative, the absolute value of the price
return of the AMEX Energy Select Sector Index.
Counterparty: Morgan Stanley | | 10/07/11 | | USD | 653 | | | | 19,319 | | | | (155 | ) | | | 19,474 | | |
Receive one-month USD-LIBOR-BBA minus 35 basis pts.
and, if negative, the absolute value of the price
return of the MSCI Daily TR Gross EAFE USD Index.
Pay the price return on MSCI Daily TR Gross EAFE USD
Index, if positive.
Counterparty: Morgan Stanley | | 10/07/11 | | USD | 115 | | | | (20,977 | ) | | | — | | | | (20,977 | ) | |
Receive the price return on AMEX Energy Select Sector
Index, if positive.
Pay one-month USD-LIBOR-BBA plus 10 basis pts. and,
if negative, the absolute value of the price return of
the AMEX Energy Select Sector Index.
Counterparty: Morgan Stanley | | 11/04/11 | | USD | 4 | | | | 118 | | | | (1 | ) | | | 119 | | |
Receive the price return on MSCI Daily TR Net Singapore USD
Index, if positive.
Pay one-month USD-LIBOR-BBA plus 39 basis pts. and,
if negative, the abosulte value of the price return of
the MSCI Daily TR Net Singapore USD Index.
Counterparty: Morgan Stanley | | 12/07/11 | | USD | 52 | | | | 11,520 | | | | — | | | | 11,520 | | |
Receive the price return on MSCI Daily TR Net Emerging
Markets Korea USD Index, if positive.
Pay one-month USD-LIBOR-BBA plus 30 basis pts. and,
if negative, the absolute value of the price return of
the MSCI Daily TR Net Emerging Markets Korea USD Index.
Counterparty: UBS Warburg LLC | | 08/03/11 | | USD | 958 | | | | 46,938 | | | | (392 | ) | | | 47,330 | | |
Receive one-month USD-LIBOR-BBA minus 10 basis pts.
and, if negative, the absolute value of the price
return of the MSCI Daily TR Gross EAFE USD Index.
Pay the price return on MSCI Daily TR Gross EAFE USD
Index, if positive.
Counterparty: UBS Warburg LLC | | 10/07/11 | | USD | 149 | | | | (46,283 | ) | | | 35 | | | | (46,318 | ) | |
Receive the price return on Health Care Select Sector
Index, if positive.
Pay one-month USD-LIBOR-BBA plus 8 basis pts. and,
if negative, the absolute value of the price return of
the Health Care Select Sector Index.
Counterparty: UBS Warburg LLC | | 11/07/11 | | USD | 1,383 | | | | 10,283 | | | | (222 | ) | | | 10,505 | | |
Receive the price return on MSCI Daily TR Net
Hong Kong USD Index, if positive.
Pay one-month USD-LIBOR-BBA plus 46 basis pts.
and, if negative, the abosulte value of the price
return of the MSCI Daily TR Net Hong Kong USD Index.
Counterparty: UBS Warburg LLC | | 12/07/11 | | USD | 13 | | | | (11,137 | ) | | | — | | | | (11,137 | ) | |
Receive the price return on S&P 600 SmallCap Index
plus dividends, if positive.
Pay one-month USD-LIBOR-BBA minus 16 basis pts.
and, if negative, the absolute value of the price
return of the S&P 600 SmallCap Index.
Counterparty: UBS Warburg LLC | | 12/08/11 | | USD | 3,230 | | | | 47,962 | | | | — | | | | 47,962 | | |
| | | | | | | $ | 187,395 | | | $ | (7,512 | ) | | $ | 194,907 | | |
See Accompanying Notes to Financial Statements
150
ING OPPENHEIMER GLOBAL SUMMARY PORTFOLIO OF INVESTMENTS
STRATEGIC INCOME PORTFOLIO AS OF DECEMBER 31, 2010 (CONTINUED)
ING Oppenheimer Global Strategic Income Portfolio Volatility Swap Agreements Outstanding on December 31, 2010:
Reference Entity/
Swap Counterparty | | Termination
Date | | Number of
Contracts | | Fair
Value | | Upfront Premium
Paid/(Received) | | Unrealized
Appreciation/
(Depreciation) | |
Pay the Historic Volatility of the mid CHF/SEK spot exchange
rate during the Observation Period.
Receive a fixed rate of 10.30%
Counterparty: Citigroup, Inc. | | 01/12/11 | | CHF | 2,600 | | | $ | (289 | ) | | $ | — | | | $ | (289 | ) | |
Pay the Historic Volatility of the mid CHF/SEK spot exchange
rate during the Observation Period.
Receive a fixed rate of 10.55%
Counterparty: Credit Suisse First Boston | | 01/11/11 | | CHF | 2,600 | | | | 311 | | | | — | | | | 311 | | |
Pay the Historic Volatility of the mid CHF/SEK spot exchange
rate during the Observation Period.
Receive a fixed rate of 10.55%
Counterparty: Deutsche Bank AG | | 01/14/11 | | CHF | 2,500 | | | | (2,271 | ) | | | — | | | | (2,271 | ) | |
Pay the Historic Volatility of the mid CHF/SEK spot exchange
rate during the Observation Period.
Receive a fixed rate of 11.60%
Counterparty: Deutsche Bank AG | | 01/06/11 | | CHF | 2,600 | | | | 3,362 | | | | — | | | | 3,362 | | |
Pay the Historic Volatility of the mid EUR/NZD spot exchange
rate during the Observation Period.
Receive a fixed rate of 9.50%
Counterparty: Citigroup, Inc. | | 01/06/11 | | EUR | 2,000 | | | | (2,070 | ) | | | — | | | | (2,070 | ) | |
Pay the Historic Volatility of the mid EUR/NZD spot exchange
rate during the Observation Period.
Receive a fixed rate of 10.01%
Counterparty: Credit Suisse First Boston | | 01/04/11 | | EUR | 2,000 | | | | (371 | ) | | | — | | | | (371 | ) | |
Pay the Historic Volatility of the mid EUR/NZD spot exchange
rate during the Observation Period.
Receive a fixed rate of 9.60%
Counterparty: Deutsche Bank AG | | 01/05/11 | | EUR | 1,900 | | | | (1,701 | ) | | | — | | | | (1,701 | ) | |
Pay the Historic Volatility of the mid EUR/NZD spot exchange
rate during the Observation Period.
Receive a fixed rate of 9.30%
Counterparty: Merrill Lynch & Co., Inc. | | 01/06/11 | | EUR | 2,000 | | | | (1,572 | ) | | | — | | | | (1,572 | ) | |
| | | | | | | $ | (4,601 | ) | | $ | — | | | $ | (4,601 | ) | |
A summary of derivative instruments by primary risk exposure is outlined in the following tables.
The fair value of derivative instruments as of December 31, 2010 was as follows:
Derivatives not accounted
for as hedging instruments | | Location on Statement of Assets and Liabilities | | Fair Value | |
| Asset Derivatives | |
| Foreign exchange contracts | | Investments in securities at value* | | $ | 185,265 | | |
| Foreign exchange contracts | | Unrealized appreciation on forward foreign currency contracts | | | 1,627,524 | | |
| Credit contracts | | Swaps, at fair value | | | 671,506 | | |
| Equity contracts | | Swaps, at fair value | | | 388,915 | | |
| Foreign exchange contracts | | Swaps, at fair value | | | 3,673 | | |
| Interest rate contracts | | Swaps, at fair value | | | 265,831 | | |
| Equity contracts | | Net Assets — Unrealized appreciation** | | | 1,472 | | |
| Interest rate contracts | | Net Assets — Unrealized appreciation** | | | 61,847 | | |
| Total Asset Derivatives | | | | $ | 3,206,033 | | |
| Liability Derivatives | |
| Foreign exchange contracts | | Unrealized depreciation on forward foreign currency contracts | | $ | 3,860,839 | | |
| Credit contracts | | Swaps, at fair value | | | 917,579 | | |
| Equity contracts | | Swaps, at fair value | | | 201,520 | | |
| Foreign exchange contracts | | Swaps, at fair value | | | 8,274 | | |
| Interest rate contracts | | Swaps, at fair value | | | 277,448 | | |
| Equity contracts | | Net Assets — Unrealized depreciation** | | | 113,045 | | |
| Interest rate contracts | | Net Assets — Unrealized depreciation** | | | 1,100,457 | | |
| Total Liability Derivatives | | | | $ | 6,479,162 | | |
* Includes purchased options.
** Includes cumulative appreciation/depreciation of futures contracts as reported in the table following the Summary Portfolio of Investments.
See Accompanying Notes to Financial Statements
151
ING OPPENHEIMER GLOBAL SUMMARY PORTFOLIO OF INVESTMENTS
STRATEGIC INCOME PORTFOLIO AS OF DECEMBER 31, 2010 (CONTINUED)
The effect of derivative instruments on the Portfolio's Statement of Operations for the year ended December 31, 2010 was as follows:
| | | Amount of Realized Gain or (Loss) on Derivatives Recognized in Income | |
Derivatives not
accounted for as
hedging instruments | | Investments* | | Foreign currency
related transactions** | | Futures | | Swaps | | Written
options | | Total | |
| Credit contracts | | $ | — | | | $ | — | | | $ | — | | | $ | 1,734,671 | | | $ | — | | | $ | 1,734,671 | | |
| Equity contracts | | | 21,178 | | | | — | | | | (848,474 | ) | | | 151,250 | | | | (17,480 | ) | | | (693,526 | ) | |
| Foreign exchange contracts | | | (998,637 | ) | | | (91,714 | ) | | | — | | | | 147,398 | | | | 890,048 | | | | (52,905 | ) | |
| Interest rate contracts | | | (1,624,216 | ) | | | — | | | | 7,160,431 | | | | 2,330,619 | | | | — | | | | 7,866,834 | | |
| Total | | $ | (2,601,675 | ) | | $ | (91,714 | ) | | $ | 6,311,957 | | | $ | 4,363,938 | | | $ | 872,568 | | | $ | 8,855,074 | | |
| | | Change in Unrealized Appreciation or (Depreciation) on Derivatives Recognized in Income | |
Derivatives not
accounted for as
hedging instruments | | Investments* | | Foreign currency
related transactions** | | Futures | | Swaps | | Written
options | | Total | |
| Credit contracts | | $ | — | | | $ | — | | | $ | — | | | $ | (105,591 | ) | | $ | — | | | $ | (105,591 | ) | |
| Equity contracts | | | — | | | | — | | | | (57,580 | ) | | | 401,067 | | | | — | | | | 343,487 | | |
| Foreign exchange contracts | | | 5,784,542 | | | | (1,541,759 | ) | | | — | | | | (4,601 | ) | | | (1,200 | ) | | | 4,236,982 | | |
| Interest rate contracts | | | — | | | | — | | | | (549,913 | ) | | | (1,662,480 | ) | | | — | | | | (2,212,393 | ) | |
| Total | | $ | 5,784,542 | | | $ | (1,541,759 | ) | | $ | (607,493 | ) | | $ | (1,371,605 | ) | | $ | (1,200 | ) | | $ | 2,262,485 | | |
* Amounts recognized for purchased options are included in net realized gain (loss) on investments and net change in unrealized appreciation or depreciation on investments.
** Amounts recognized for forward foreign currency contracts are included in net realized gain (loss) on foreign currency related transactions and net change in unrealized appreciation or depreciation on foreign currency related transactions.
See Accompanying Notes to Financial Statements
152
SUMMARY PORTFOLIO OF INVESTMENTS
ING PIMCO TOTAL RETURN PORTFOLIO AS OF DECEMBER 31, 2010
Principal
Amount | |
| |
| | Value | | Percent of
Net Assets | |
| CORPORATE BONDS/NOTES: 25.1% | | | |
| | | Consumer Discretionary: 0.1% | | | |
| | | | | | | | | Other Securities | | $ | 1,097,094 | | | | 0.1 | | |
| | | Consumer Staples: 0.6% | | | |
| $ | 6,000,000 | | | S | | Anheuser-Busch
InBev
Worldwide,
Inc., 4.125%-
5.375%,
due 01/15/15-
01/15/20 | | | 6,419,199 | | | | 0.5 | | |
| | | | | | | | | Other Securities | | | 800,719 | | | | 0.1 | | |
| | | | | | | | | | 7,219,918 | | | | 0.6 | | |
| | | Energy: 1.4% | | | |
| | 300,000 | | | #,L | | Odebrecht
Drilling Norbe
VIII/IX Ltd.,
6.350%,
due 06/30/21 | | | 313,500 | | | | 0.0 | | |
| | 3,800,000 | | | L,S | | Petroleos
Mexicanos,
6.000%-
8.000%,
due 05/03/19-
03/05/20 | | | 4,409,500 | | | | 0.4 | | |
| | 5,400,000 | | | S | | Transocean, Inc.,
1.500%,
due 12/15/37 | | | 5,346,000 | | | | 0.4 | | |
| | | | | | | | | Other Securities | | | 6,606,074 | | | | 0.6 | | |
| | | | | | | | | | 16,675,074 | | | | 1.4 | | |
| | | Financials: 19.4% | | | |
| | 5,100,000 | | | S | | Ally Financial,
Inc., 6.875%,
due 09/15/11 | | | 5,265,750 | | | | | | |
| | 100,000 | | | #,S | | Ally Financial,
Inc., 7.500%,
due 09/15/20 | | | 105,375 | | | | 0.9 | | |
| | 4,629,000 | | | S | | Ally Financial,
Inc., 5.375%-
7.250%,
due 03/02/11-
05/23/12 | | | 4,730,451 | | | | | | |
| EUR | 6,100,000 | | | S | | American
General
Finance Corp.,
4.125%,
due 11/29/13 | | | 6,855,887 | | | | 1.0 | | |
| $ | 5,000,000 | | | S | | American
General
Finance Corp.,
4.875%-6.900%,
due 08/17/11-
12/15/17 | | | 4,754,750 | | | | | | |
Principal
Amount | |
| |
| | Value | | Percent of
Net Assets | |
| CAD | 1,000,000 | | | | | | | American
International
Group, Inc.,
4.900%,
due 06/02/14 | | $ | 998,190 | | | | 0.4 | | |
| $ | 3,300,000 | | | S | | American
International
Group, Inc.,
5.850%,
due 01/16/18 | | | 3,412,540 | | | | | | |
| | 800,000 | | | #,S | | ANZ National
International
Ltd., 6.200%,
due 07/19/13 | | | 881,301 | | | | 0.1 | | |
| | 1,700,000 | | | #,S | | Banco Santander
Chile, 1.539%,
due 04/20/12 | | | 1,700,017 | | | | 0.2 | | |
| | 5,600,000 | | | S | | Bank of America
Corp., 0.616%-
6.500%,
due 08/01/16-
12/01/17 | | | 5,981,721 | | | | 0.5 | | |
| | 300,000 | | | #,L | | Bank of China
Hong Kong
Ltd., 5.550%,
due 02/11/20 | | | 313,984 | | | | 0.0 | | |
| | 600,000 | | | #,S | | Bank of
Montreal,
2.850%,
due 06/09/15 | | | 610,107 | | | | 0.1 | | |
| | 800,000 | | | # | | Bank of Nova
Scotia, 1.650%,
due 10/29/15 | | | 765,580 | | | | 0.1 | | |
| | 700,000 | | | #,S | | Barclays Bank
PLC, 6.050%,
due 12/04/17 | | | 719,070 | | | | 0.4 | | |
| | 4,100,000 | | | S | | Barclays Bank
PLC, 5.450%,
due 09/12/12 | | | 4,395,647 | | | | | | |
| | 4,000,000 | | | S | | Bear Stearns Cos.,
Inc., 6.400%-
6.950%,
due 08/10/12-
10/02/17 | | | 4,461,053 | | | | 0.4 | | |
| | 2,200,000 | | | #,S | | BNP Paribas,
5.186%,
due 06/29/49 | | | 2,018,500 | | | | 0.2 | | |
| | 300,000 | | | # | | BPCE S.A.,
2.375%,
due 10/04/13 | | | 299,301 | | | | 0.0 | | |
| | 8,400,000 | | | S | | Citigroup, Inc.,
5.300%-8.500%,
due 08/27/12-
05/22/19 | | | 9,037,924 | | | | 0.8 | | |
| | 6,300,000 | | | #,S | | Commonwealth
Bank of
Australia,
0.723%,
due 07/12/13 | | | 6,315,989 | | | | 0.6 | | |
See Accompanying Notes to Financial Statements
153
SUMMARY PORTFOLIO OF INVESTMENTS
ING PIMCO TOTAL RETURN PORTFOLIO AS OF DECEMBER 31, 2010 (CONTINUED)
Principal
Amount | |
| |
| | Value | | Percent of
Net Assets | |
| | | Financials (continued) | | | |
| $ | 1,100,000 | | | #,S | | Commonwealth
Bank of
Australia,
6.024%,
due 03/29/49 | | $ | 1,077,870 | | | | 0.6 | | |
| | 700,000 | | | #,S | | Corp. Nacional
del Cobre de
Chile - CODELCO,
7.500%,
due 01/15/19 | | | 854,799 | | | | 0.1 | | |
| | 5,700,000 | | | #,S | | Credit Agricole
S.A., 8.375%,
due 12/13/49 | | | 5,885,250 | | | | 0.5 | | |
| | 3,300,000 | | | #,S | | Dexia Credit
Local, 0.768%,
due 04/29/14 | | | 3,290,338 | | | | 0.4 | | |
| | 1,400,000 | | | #,S | | Dexia Credit
Local, 0.953%,
due 09/23/11 | | | 1,403,951 | | | | | | |
| | 11,900,000 | | | #,S | | FIH Erhvervsbank
A/S, 0.672%,
due 06/13/13 | | | 11,896,632 | | | | 1.0 | | |
| EUR | 4,800,000 | | | S | | General Electric
Capital Corp.,
5.500%,
due 09/15/67 | | | 5,580,426 | | | | 0.6 | | |
| $ | 1,700,000 | | | S | | General Electric
Capital Corp.,
5.875%-6.875%,
due 01/14/38-
01/10/39 | | | 1,865,082 | | | | | | |
| | 6,050,000 | | | S | | Goldman Sachs
Group, Inc.,
5.950%-6.750%,
due 09/01/17-
10/01/37 | | | 6,428,590 | | | | 0.6 | | |
| EUR | 3,200,000 | | | S | | International
Lease Finance
Corp., 1.425%,
due 08/15/11 | | | 4,209,300 | | | | | | |
| $ | 700,000 | | | #,S | | International
Lease Finance
Corp., 6.750%,
due 09/01/16 | | | 750,750 | | | | 1.1 | | |
| | 7,300,000 | | | S | | International
Lease Finance
Corp., 5.300%-
5.450%,
due 03/24/11-
05/01/12 | | | 7,401,500 | | | | | | |
| | 5,600,000 | | | S | | Intesa Sanpaolo/
New York,
2.375%,
due 12/21/12 | | | 5,623,010 | | | | 0.5 | | |
| | 1,900,000 | | | S | | JPMorgan Chase
Bank NA,
0.632%-6.000%,
due 06/13/16-
01/15/18 | | | 1,967,756 | | | | 0.2 | | |
Principal
Amount | |
| |
| | Value | | Percent of
Net Assets | |
| $ | 6,700,000 | | | #,S | | Lloyds TSB Bank
PLC, 5.800%,
due 01/13/20 | | $ | 6,626,816 | | | | 0.6 | | |
| | 3,000,000 | | | #,S | | Macquarie Group
Ltd., 7.300%,
due 08/01/14 | | | 3,278,757 | | | | 0.3 | | |
| | 5,400,000 | | | #,S | | Metropolitan
Life Global
Funding I,
0.689%,
due 07/13/11 | | | 5,406,977 | | | | 0.5 | | |
| | 500,000 | | | #,S | | Monumental
Global Funding
Ltd., 5.500%,
due 04/22/13 | | | 535,351 | | | | 0.0 | | |
| | 3,400,000 | | | S | | National City
Corp., 4.000%,
due 02/01/11 | | | 3,413,377 | | | | 0.3 | | |
| | 1,400,000 | | | #,S | | Nationwide
Building
Society, 6.250%,
due 02/25/20 | | | 1,461,435 | | | | 0.1 | | |
| | 4,800,000 | | | S | | Nomura
Holdings, Inc.,
6.700%,
due 03/04/20 | | | 5,146,258 | | | | 0.4 | | |
| | 600,000 | | | #,S | | Royal Bank of
Scotland Group
PLC, 6.990%,
due 10/29/49 | | | 465,000 | | | | 0.0 | | |
| | 4,100,000 | | | #,S | | Royal Bank of
Scotland PLC,
0.686%,
due 04/08/11 | | | 4,102,009 | | | | 0.4 | | |
| | 8,400,000 | | | #,S | | Royal Bank of
Scotland PLC,
1.450%,
due 10/20/11 | | | 8,448,829 | | | | 0.7 | | |
| | 1,600,000 | | | #,S | | Royal Bank of
Scotland PLC,
2.625%,
due 05/11/12 | | | 1,638,402 | | | | | | |
| | 1,600,000 | | | #,S | | Royal Bank of
Scotland PLC,
3.000%,
due 12/09/11 | | | 1,633,682 | | | | 0.3 | | |
| | 200,000 | | | #,S | | Royal Bank of
Scotland PLC,
4.875%,
due 08/25/14 | | | 205,004 | | | | | | |
| | 6,400,000 | | | #,S | | Santander US
Debt S.A.
Unipersonal,
1.103%,
due 03/30/12 | | | 6,327,968 | | | | 0.5 | | |
| EUR | 2,800,000 | | | S | | SLM Corp.,
3.125%,
due 09/17/12 | | | 3,651,652 | | | | 0.5 | | |
See Accompanying Notes to Financial Statements
154
SUMMARY PORTFOLIO OF INVESTMENTS
ING PIMCO TOTAL RETURN PORTFOLIO AS OF DECEMBER 31, 2010 (CONTINUED)
Principal
Amount | |
| |
| | Value | | Percent of
Net Assets | |
| | | Financials (continued) | | | |
| $ | 2,400,000 | | | S | | SLM Corp.,
0.502%,
due 03/15/11 | | $ | 2,391,487 | | | | | | |
| | 200,000 | | | #,S | | Societe Generale,
5.922%,
due 12/31/49 | | | 176,870 | | | | 0.0 | | |
| | 1,000,000 | | | #,S | | State Bank of
India/London,
4.500%,
due 07/27/15 | | | 1,023,315 | | | | 0.1 | | |
| | 400,000 | | | #,S | | Sydney Air,
5.125%,
due 02/22/21 | | | 386,093 | | | | 0.0 | | |
| | 700,000 | | | #,S | | Temasek
Financial I Ltd.,
4.300%,
due 10/25/19 | | | 715,788 | | | | 0.1 | | |
| | 300,000 | | | #,S | | TransCapitalInvest
Ltd. for OJSC AK
Transneft,
8.700%,
due 08/07/18 | | | 371,979 | | | | 0.0 | | |
| | 400,000 | | | # | | Vnesheconombank
Via VEB Finance
Ltd., 5.450%,
due 11/22/17 | | | 401,000 | | | | 0.0 | | |
| EUR | 1,200,000 | | | S | | Wells Fargo &
Company,
1.222%,
due 03/23/16 | | | 1,524,077 | | | | 0.2 | | |
| $ | 1,200,000 | | | S | | Wells Fargo &
Co., 5.625%,
due 12/11/17 | | | 1,330,544 | | | | | | |
| | 3,400,000 | | | #,S | | Westpac Banking
Corp., 3.585%,
due 08/14/14 | | | 3,627,038 | | | | 0.3 | | |
| | 146,000 | | | #,S | | ZFS Finance USA
Trust IV,
5.875%,
due 05/09/32 | | | 143,026 | | | | 0.0 | | |
| | | | | | | Other
Securities (a) | | | 39,307,932 | | | | 3.4 | | |
| | | | | | | | | | 225,599,057 | | | | 19.4 | | |
| | | Health Care: 0.7% | | | |
| | 1,400,000 | | | #,S | | Roche Holdings,
Inc., 7.000%,
due 03/01/39 | | | 1,771,491 | | | | 0.2 | | |
| | | | | | | Other Securities | | | 6,118,535 | | | | 0.5 | | |
| | | | | | | | | | 7,890,026 | | | | 0.7 | | |
| | | Industrials: 0.2% | | | |
| | 700,000 | | | #,S | | C8 Capital SPV
Ltd., 6.640%,
due 12/31/49 | | | 495,223 | | | | 0.0 | | |
| | | | | | | Other Securities | | | 1,798,776 | | | | 0.2 | | |
| | | | | | | | | | 2,293,999 | | | | 0.2 | | |
Principal
Amount | |
| |
| | Value | | Percent of
Net Assets | |
| | | Information Technology: 0.7% | | | |
| $ | 5,700,000 | | | S | | International
Business
Machines Corp.,
5.700%,
due 09/14/17 | | $ | 6,551,438 | | | | 0.6 | | |
| | | | | | | | | Other Securities | | | 1,396,261 | | | | 0.1 | | |
| | | | | | | | | | 7,947,699 | | | | 0.7 | | |
| | | Materials: 0.3% | | | |
| | 1,500,000 | | | #,S | | CSN Resources
S.A., 6.500%,
due 07/21/20 | | | 1,590,000 | | | | 0.2 | | |
| | 300,000 | | | # | | Gerdau Trade,
Inc., 5.750%,
due 01/30/21 | | | 302,250 | | | | 0.0 | | |
| | | | | | | Other Securities | | | 1,216,869 | | | | 0.1 | | |
| | | | | | | | | | 3,109,119 | | | | 0.3 | | |
| | | Telecommunication Services: 1.2% | | | |
| | 5,516,000 | | | S | | AT&T, Inc.,
4.950%-6.300%,
due 01/15/13-
01/15/38 | | | 5,918,491 | | | | 0.5 | | |
| | 4,900,000 | | | S | | Cellco
Partnership /
Verizon
Wireless Capital,
LLC, 2.884%,
due 05/20/11 | | | 4,949,593 | | | | 0.4 | | |
| | 200,000 | | | #,S | | Qtel
International
Finance Ltd.,
4.750%,
due 02/16/21 | | | 191,568 | | | | 0.0 | | |
| | | | | | | Other Securities | | | 2,973,629 | | | | 0.3 | | |
| | | | | | | | | | 14,033,281 | | | | 1.2 | | |
| | | Utilities: 0.5% | | | |
| | 600,000 | | | #,S | | EDF S.A.,
5.500%,
due 01/26/14 | | | 659,066 | | | | | | |
| | 600,000 | | | #,S | | EDF S.A.,
6.500%,
due 01/26/19 | | | 701,183 | | | | 0.2 | | |
| | 600,000 | | | #,S | | Electricite de
France SA,
6.950%,
due 01/26/39 | | | 712,364 | | | | | | |
| | 2,100,000 | | | #,S | | Enel Finance
International
S.A., 6.250%,
due 09/15/17 | | | 2,296,776 | | | | 0.2 | | |
| | | | | | | Other Securities | | | 1,913,353 | | | | 0.1 | | |
| | | | | | | | | | 6,282,742 | | | | 0.5 | | |
| | | | | | | Total Corporate
Bonds/Notes
( Cost
$281,339,659 ) | | | 292,148,009 | | | | 25.1 | | |
See Accompanying Notes to Financial Statements
155
SUMMARY PORTFOLIO OF INVESTMENTS
ING PIMCO TOTAL RETURN PORTFOLIO AS OF DECEMBER 31, 2010 (CONTINUED)
Principal
Amount | |
| |
| | Value | | Percent of
Net Assets | |
| U.S. GOVERNMENT AGENCY OBLIGATIONS: 53.6% | | | | | |
| | | Federal Home Loan Bank: 0.1% | | | |
| | | | | | | Other Securities | | $ | 925,911 | | | | 0.1 | | |
| | | Federal Home Loan Mortgage
Corporation##: 6.5% | | | |
| $ | 9,200,000 | | | S | | 0.515%,
due 11/26/12 | | | 9,174,746 | | | | | | |
| | 5,600,000 | | | S | | 2.500%,
due 01/07/14-
04/23/14 | | | 5,818,285 | | | | | | |
| | 16,993,212 | | | S | | 4.500%,
due 01/15/13-
08/01/40 | | | 18,049,244 | | | | | | |
| | 8,389,407 | | | S | | 5.500%,
due 07/18/16-
07/01/38 | | | 9,009,548 | | | | | | |
| | 10,755,594 | | | S | | 6.000%,
due 10/01/17-
08/01/39 | | | 11,670,718 | | | | | | |
| | 21,291,198 | | | W,L,^,S | | 0.410%-5.250%,
due 05/29/13-
10/25/44 | | | 22,298,657 | | | | | | |
| | | | | | | | | | 76,021,198 | | | | 6.5 | | |
| | | Federal National Mortgage
Association##: 46.9% | | | |
| | 9,500,000 | | | S | | 0.500%,
due 10/30/12 | | | 9,462,029 | | | | | | |
| | 29,200,000 | | | L | | 0.750%,
due 12/18/13 | | | 28,894,889 | | | | | | |
| | 13,900,000 | | | S | | 1.000%,
due 09/23/13 | | | 13,888,268 | | | | | | |
| | 7,300,000 | | | S | | 1.125%,
due 09/30/13 | | | 7,320,725 | | | | | | |
| | 86,300,000 | | | W | | 4.000%,
due 01/25/24-
08/25/40 | | | 86,009,114 | | | | | | |
| | 13,500,000 | | | S | | 4.125%,
due 04/15/14 | | | 14,734,805 | | | | | | |
| | 157,300,000 | | | W | | 4.500%,
due 01/25/24-
01/25/39 | | | 161,852,899 | | | | | | |
| | 66,761,036 | | | S | | 4.500%,
due 06/01/38-
09/01/40 | | | 68,617,785 | | | | | | |
| | 32,200,000 | | | W | | 5.000%,
due 01/13/40 | | | 33,855,273 | | | | | | |
| | 6,172,234 | | | | | | | 5.000%,
due 03/15/16-
07/01/39 | | | 6,674,570 | | | | | | |
| | 30,900,000 | | | W | | 5.500%,
due 01/25/39 | | | 33,063,000 | | | | | | |
| | 9,000,000 | | | W | | 6.000%,
due 01/15/33 | | | 9,783,288 | | | | | | |
| | 28,826,922 | | | S | | 6.000%,
due 06/01/17-
10/01/38 | | | 31,411,980 | | | | | | |
Principal
Amount | |
| |
| | Value | | Percent of
Net Assets | |
| $ | 37,671,945 | | | W,L,S | | 0.321%-6.500%,
due 09/24/12-
10/01/44 | | $ | 39,234,861 | | | | 46.9 | | |
| | | | | | | | | | 544,803,486 | | | | 46.9 | | |
| | | Government National Mortgage
Association: 0.1% | | | |
| | | | | | | | | Other Securities (b) | | | 1,125,910 | | | | 0.1 | | |
| | | | | | | | | Total U.S.
Government
Agency
Obligations
( Cost
$626,847,826 ) | | | 622,876,505 | | | | 53.6 | | |
| U.S. TREASURY OBLIGATIONS: 38.5% | | | | | |
| | | U.S. Treasury Notes: 36.9% | | | |
| | 15,100,000 | | | L | | 0.500%, due
11/30/12 | | | 15,082,892 | | | | | | |
| | 275,100,000 | | | | | | | 0.500%,
due 10/15/13-
11/15/13 | | | 272,038,316 | | | | | | |
| | 41,000,000 | | | S | | 0.750%,
due 08/15/13-
09/15/13 | | | 40,902,732 | | | | | | |
| | 26,000,000 | | | S | | 1.000%,
due 07/15/13 | | | 26,132,002 | | | | | | |
| | 11,200,000 | | | S | | 1.125%,
due 06/15/13 | | | 11,293,587 | | | | | | |
| | 8,900,000 | | | S | | 1.875%,
due 06/30/15 | | | 8,936,855 | | | | | | |
| | 31,100,000 | | | S | | 2.125%,
due 11/30/14-
05/31/15 | | | 31,679,031 | | | | | | |
| | 8,800,000 | | | | | | | 2.375%,
due 09/30/14-
10/31/14 | | | 9,112,529 | | | | | | |
| | 7,300,000 | | | | | | | 2.500%,
due 04/30/15 | | | 7,548,091 | | | | | | |
| | 6,300,000 | | | | | | | 1.375%-2.625%,
due 12/31/14-
11/30/15 | | | 6,456,713 | | | | | | |
| | | | | | | | | | 429,182,748 | | | | 36.9 | | |
| | | Treasury Inflation Indexed Protected
Securitiesip: 1.6% | | | |
| | 5,556,629 | | | S | | 2.375%,
due 01/15/25-
01/15/27 | | | 6,194,643 | | | | | | |
| | 5,297,136 | | | S | | 2.500%,
due 01/15/29 | | | 6,027,150 | | | | | | |
| | 5,918,924 | | | S | | 1.250%-3.875%,
due 07/15/20-
04/15/29 | | | 6,600,336 | | | | | | |
| | | | | | | | | | 18,822,129 | | | | 1.6 | | |
| | | | | | | | | Total U.S. Treasury
Obligations
( Cost
$450,141,981 ) | | | 448,004,877 | | | | 38.5 | | |
See Accompanying Notes to Financial Statements
156
SUMMARY PORTFOLIO OF INVESTMENTS
ING PIMCO TOTAL RETURN PORTFOLIO AS OF DECEMBER 31, 2010 (CONTINUED)
Principal
Amount | |
| |
| | Value | | Percent of
Net Assets | |
| ASSET-BACKED SECURITIES: 0.4% | | | |
| | | Automobile Asset-Backed Securities: 0.1% | | | |
| $ | 294,663 | | | #,S | | Ally Auto
Receivables
Trust, 1.320%,
due 03/15/12 | | $ | 295,138 | | | | 0.1 | | |
| | | | | | | | | Other Securities | | | 225,663 | | | | 0.0 | | |
| | | | | | | | | | 520,801 | | | | 0.1 | | |
| | | Credit Card Asset-Backed Securities: 0.1% | | | |
| | | | | | | | | Other Securities | | | 1,407,613 | | | | 0.1 | | |
| | | Home Equity Asset-Backed Securities: 0.0% | | | |
| | | | | | | | | Other Securities | | | 496,327 | | | | 0.0 | | |
| | | Other Asset-Backed Securities: 0.2% | | | |
| | 274,110 | | | S | | JPMorgan
Mortgage
Acquisition
Corp., 0.321%,
due 03/25/47 | | | 214,457 | | | | 0.0 | | |
| | | | | | | | | Other Securities | | | 1,962,454 | | | | 0.2 | | |
| | | | | | | | | | 2,176,911 | | | | 0.2 | | |
| | | | | | | | | Total Asset-
Backed
Securities
( Cost
$4,969,424 ) | | | 4,601,652 | | | | 0.4 | | |
| COLLATERALIZED MORTGAGE OBLIGATIONS: 6.9% | | | |
| | 16,800,000 | | | #,S | | Arkle Master
Issuer PLC,
0.374%,
due 02/17/52 | | | 16,619,618 | | | | 1.4 | | |
| EUR | 1,000,000 | | | # | | Arran Residential
Mortgages
Funding PLC,
2.203%,
due 05/16/47 | | | 1,335,213 | | | | 0.3 | | |
| EUR | 1,700,000 | | | # | | Arran Residential
Mortgages
Funding PLC,
2.403%,
due 05/16/47 | | | 2,264,048 | | | | | | |
| $ | 1,600,000 | | | #,S | | BCRR Trust,
5.858%,
due 07/17/40 | | | 1,688,751 | | | | 0.1 | | |
| | 5,020,314 | | | S | | Bear Stearns
Adjustable Rate
Mortgage Trust,
2.730%-5.380%,
due 11/25/34-
02/25/36 | | | 4,718,057 | | | | 0.4 | | |
Principal
Amount | |
| |
| | Value | | Percent of
Net Assets | |
| $ | 806,571 | | | #,S | | Countrywide
Home Loan
Mortgage
Pass-through
Trust, 0.601%,
due 06/25/35 | | $ | 696,677 | | | | 0.2 | | |
| | 1,263,130 | | | S | | Countrywide
Home Loan
Mortgage
Pass-through
Trust, 2.920%-
3.121%,
due 11/25/34-
02/20/35 | | | 1,073,644 | | | | | | |
| | 2,385,382 | | | #,S | | Credit Suisse
Mortgage
Capital
Certificates,
0.490%,
due 10/15/21 | | | 2,256,128 | | | | 0.4 | | |
| | 2,400,000 | | | S | | Credit Suisse
Mortgage
Capital
Certificates,
5.659%-5.695%,
due 03/15/39-
09/15/40 | | | 2,470,814 | | | | | | |
| | 8,698,141 | | | S | | Granite Master
Issuer PLC,
0.351%,
due 12/20/54 | | | 8,097,969 | | | | 0.7 | | |
| | 695,778 | | | #,S | | GS Mortgage
Securities
Corp. II, 0.351%,
due 03/06/20 | | | 679,094 | | | | 0.1 | | |
| | 1,700,000 | | | #,S | | JPMorgan Chase
Commercial
Mortgage
Securities Corp.,
4.070%,
due 11/15/43 | | | 1,620,006 | | | | 1.0 | | |
| | 9,164,638 | | | S | | JPMorgan
Mortgage Trust,
3.112%-5.882%,
due 02/25/35-
02/15/51 | | | 9,533,919 | | | | | | |
| | 4,800,000 | | | S | | Morgan Stanley
Capital I,
5.809%-5.879%,
due 06/11/49-
12/12/49 | | | 5,147,373 | | | | 0.4 | | |
| | 209,732 | | | #,S | | Structured Asset
Securities Corp.,
2.856%,
due 10/25/35 | | | 168,656 | | | | 0.0 | | |
| | 805,876 | | | #,S | | Wachovia Bank
Commercial
Mortgage Trust,
0.340%,
due 06/15/20 | | | 754,192 | | | | 0.1 | | |
See Accompanying Notes to Financial Statements
157
SUMMARY PORTFOLIO OF INVESTMENTS
ING PIMCO TOTAL RETURN PORTFOLIO AS OF DECEMBER 31, 2010 (CONTINUED)
Principal
Amount | |
| |
| | Value | | Percent of
Net Assets | |
| COLLATERALIZED MORTGAGE OBLIGATIONS (continued) | | | |
| $ | 400,000 | | | S | | Wachovia Bank
Commercial
Mortgage Trust,
5.509%,
due 04/15/47 | | $ | 408,531 | | | | | | |
| | 354,536 | | | #,R,X,^,S | | Washington
Mutual
Mortgage
Pass-through
Certificates,
0.000%,
due 12/25/27 | | | 19,499 | | | | 0.4 | | |
| | 5,119,089 | | | S | | Washington
Mutual
Mortgage
Pass-through
Certificates,
0.571%-5.752%,
due 12/25/27-
08/25/46 | | | 4,113,512 | | | | | | |
| | | | | | | | | Other Securities | | | 15,916,791 | | | | 1.4 | | |
| | | | | | | | | Total
Collateralized
Mortgage
Obligations
( Cost
$78,929,117 ) | | | 79,582,492 | | | | 6.9 | | |
| MUNICIPAL BONDS: 2.8% | | | |
| | | California: 1.0% | | | |
| | 6,000,000 | | | S | | Southern
California
Public Power
Authority,
5.943%,
due 07/01/40 | | | 5,601,120 | | | | 0.5 | | |
| | | | | | | | | Other Securities | | | 5,578,393 | | | | 0.5 | | |
| | | | | | | | | | 11,179,513 | | | | 1.0 | | |
| | | Illinois: 0.3% | | | |
| | | | | | | | | Other Securities | | | 3,683,317 | | | | 0.3 | | |
| | | Nebraska: 0.0% | | | |
| | | | | | | | | Other Securities | | | 494,255 | | | | 0.0 | | |
| | | Nevada: 0.3% | | | |
| | | | | | | | | Other Securities | | | 3,941,784 | | | | 0.3 | | |
| | | New Jersey: 0.1% | | | |
| | | | | | | | | Other Securities | | | 599,370 | | | | 0.1 | | |
Principal
Amount | |
| |
| | Value | | Percent of
Net Assets | |
| | | New York: 0.6% | | | |
| $ | 6,800,000 | | | S | | New York City
Municipal
Water Finance
Authority,
5.882%-6.282%,
due 06/15/42-
06/15/44 | | $ | 6,789,592 | | | | 0.6 | | |
| | | | | | | | | Other Securities | | | 274,824 | | | | 0.0 | | |
| | | | | | | | | | 7,064,416 | | | | 0.6 | | |
| | | Ohio: 0.0% | | | |
| | | | | | | | | Other Securities | | | 287,640 | | | | 0.0 | | |
| | | Texas: 0.5% | | | |
| | 5,100,000 | | | | | | | City of San
Antonio TX,
5.808%-6.308%,
due 02/01/37-
02/01/41 | | | 5,133,063 | | | | 0.5 | | |
| | | | | | | | | Other Securities | | | 396,664 | | | | 0.0 | | |
| | | | | | | | | | 5,529,727 | | | | 0.5 | | |
| | | Wisconsin: 0.0% | | | |
| | | | | | | | | Other Securities | | | 110,772 | | | | 0.0 | | |
| | | | | | | | | Total Municipal
Bonds
( Cost
$33,459,359 ) | | | 32,890,794 | | | | 2.8 | | |
| OTHER BONDS: 8.0% | | | |
| | | Foreign Government Bonds: 8.0% | | | |
| CAD | 1,800,000 | | | S | | Canadian
Government
International
Bond, 2.000%,
due 12/01/14 | | | 1,797,665 | | | | | | |
| CAD | 2,600,000 | | | | | | | Canadian
Government
International
Bond, 2.500%,
due 09/01/13 | | | 2,657,476 | | | | 0.5 | | |
| CAD | 300,000 | | | | | | | Canadian
Government
International
Bond, 3.000%,
due 12/01/15 | | | 309,866 | | | | | | |
| CAD | 900,000 | | | S | | Canadian
Government
International
Bond, 4.500%,
due 06/01/15 | | | 988,796 | | | | | | |
| $ | 600,000 | | | #,S | | Export-Import
Bank of China,
4.875%,
due 07/21/15 | | | 646,369 | | | | 0.1 | | |
See Accompanying Notes to Financial Statements
158
SUMMARY PORTFOLIO OF INVESTMENTS
ING PIMCO TOTAL RETURN PORTFOLIO AS OF DECEMBER 31, 2010 (CONTINUED)
Principal
Amount | |
| |
| | Value | | Percent of
Net Assets | |
| | | Foreign Government Bonds (continued) | | | |
| JPY | 4,620,000,000 | | | Z | | Japan Treasury
Discount Bill,
0.090%,
due 01/31/11 | | $ | 56,899,224 | | | | 5.1 | | |
| JPY | 160,000,000 | | | Z | | Japan Treasury
Discount Bill,
0.110%,
due 03/14/11 | | | 1,970,231 | | | | | | |
| $ | 400,000 | | | #,S | | Korea Housing
Finance Corp.,
4.125%,
due 12/15/15 | | | 404,166 | | | | 0.0 | | |
| | 5,000,000 | | | S | | Mexico
Government
International
Bond, 8.125%,
due 12/30/19 | | | 6,387,500 | | | | 0.6 | | |
| | 600,000 | | | S | | Mexico
Government
International
Bond, 6.050%,
due 01/11/40 | | | 616,500 | | | | | | |
| CAD | 200,000 | | | | | | | Province of
Ontario,
4.200%,
due 03/08/18 | | | 211,600 | | | | | | |
| CAD | 1,000,000 | | | | | | | Province of
Ontario,
4.200%,
due 06/02/20 | | | 1,037,453 | | | | | | |
| CAD | 400,000 | | | | | | | Province of
Ontario,
4.300%,
due 03/08/17 | | | 428,422 | | | | | | |
| CAD | 1,000,000 | | | | | | | Province of
Ontario,
4.400%,
due 06/02/19 | | | 1,061,309 | | | | 1.0 | | |
| CAD | 600,000 | | | | | | | Province of
Ontario,
4.600%,
due 06/02/39 | | | 628,513 | | | | | | |
| CAD | 7,900,000 | | | | | | | Province of
Ontario,
4.700%,
due 06/02/37 | | | 8,360,429 | | | | | | |
| CAD | 300,000 | | | | | | | Province of
Ontario,
5.500%,
due 06/02/18 | | | 341,474 | | | | | | |
| $ | 1,000,000 | | | #,S | | Societe
Financement
de l'Economie
Francaise,
0.489%,
due 07/16/12 | | | 1,002,770 | | | | 0.2 | | |
| EUR | 700,000 | | | S | | Societe
Financement
de l'Economie
Francaise,
2.125%,
due 05/20/12 | | | 949,261 | | | | | | |
Principal
Amount | |
| |
| | Value | | Percent of
Net Assets | |
| $ | 200,000 | | | #,S | | Societe
Financement
de l'Economie
Francaise,
3.375%,
due 05/05/14 | | $ | 210,808 | | | | 0.2 | | |
| | | | | | | | | Other Securities | | | 6,026,774 | | | | 0.5 | | |
| | | | | | | | | Total Other
Bonds
( Cost
$90,541,669 ) | | | 92,936,606 | | | | 8.0 | | |
| Shares | |
| |
| | Value | | Percent of
Net Assets | |
| PREFERRED STOCK: 1.4% | | | | | |
| | | Consumer Discretionary: 0.1% | | | |
| | | | | | | | | Other Securities | | $ | 495,750 | | | | 0.1 | | |
| | | Financials: 1.3% | | | |
| | 77,500 | | | S | | American
International
Group, Inc. | | | 681,225 | | | | 0.0 | | |
| | 858,000 | | | S | | Citigroup, Inc. | | | 11,195,184 | | | | 1.0 | | |
| | 3,400 | | | S | | Wells Fargo & Co. | | | 3,401,870 | | | | 0.3 | | |
| | | | | | | | | | 15,278,279 | | | | 1.3 | | |
| | | | | | | | | Total Preferred
Stock
( Cost
$19,231,024 ) | | | 15,774,029 | | | | 1.4 | | |
# of
Contracts | |
| |
| | Value | | Percent of
Net Assets | |
| POSITIONS IN PURCHASED OPTIONS: 0.0% | | | | | |
| | | Options on Exchange-Traded
Futures Contracts: 0.0% | | | |
| | 450 | | | @ | | Put Option CME
90-Day
Eurodollar
March Futures
Strike @
$95.625 -
Exp 03/14/11 | | $ | 2,813 | | | | 0.0 | | |
| | 23 | | | @ | | Put Option CME
90-Day
Eurodollar
March Futures
Strike @
$96.875 -
Exp 03/14/11 | | | 144 | | | | 0.0 | | |
| | 4 | | | @ | | Put Option CME
90-Day
Eurodollar
March Futures
Strike @
$97.000 -
Exp 03/14/11 | | | 25 | | | | 0.0 | | |
See Accompanying Notes to Financial Statements
159
SUMMARY PORTFOLIO OF INVESTMENTS
ING PIMCO TOTAL RETURN PORTFOLIO AS OF DECEMBER 31, 2010 (CONTINUED)
# of
Contracts | |
| |
| | Value | | Percent of
Net Assets | |
| | | Options on Exchange-Traded
Futures Contracts (continued) | | | |
| | 30 | | | @ | | Put Option CME
90-Day
Eurodollar
March Futures
Strike @
$97.125 -
Exp 03/14/11 | | $ | 188 | | | | 0.0 | | |
| | 400 | | | @ | | Put Option CME
90-Day
Eurodollar
June Futures
Strike @
$95.000 -
Exp 06/13/11 | | | 2,500 | | | | 0.0 | | |
| | | | | | | | | Total Purchased
Options
( Cost $7,936 ) | | | 5,670 | | | | 0.0 | | |
| | | | | | | | | Total Long-Term
Investments
( Cost
$1,585,467,995 ) | | | 1,588,820,634 | | | | 136.7 | | |
Principal
Amount | |
| |
| | Value | | Percent of
Net Assets | |
| SHORT-TERM INVESTMENTS: 4.6% | | | | | |
| | | U.S. Treasury Bills: 0.1% | | | |
| $ | 1,300,000 | | | | | | | 0.030%,
due 01/20/11 | | $ | 1,299,960 | | | | 0.1 | | |
| | | | | | | | | Total
U.S. Treasury
Bills
( Cost
$1,299,960 ) | | | 1,299,960 | | | | 0.1 | | |
| Shares | |
| |
| | Value | | Percent of
Net Assets | |
| | | Securities Lending Collateralcc: 4.5% | | | |
| | 51,628,996 | | | | | | | BNY Mellon
Overnight
Government
Fund (1) | | $ | 51,628,996 | | | | 4.5 | | |
| | 221,484 | | | R | | BNY Institutional
Cash Reserves
Fund,
Series B (1)(2) | | | 177,187 | | | | 0.0 | | |
| | | | | | | | | Total Securities
Lending
Collateral
( Cost
$51,850,480 ) | | | 51,806,183 | | | | 4.5 | | |
| | | | | | | | | Total Short-Term
Investments
( Cost
$53,150,440 ) | | | 53,106,143 | | | | 4.6 | | |
| | | | | | | Value | | Percent of
Net Assets | |
| | | | | | | Total Investments
in Securities
( Cost
$1,638,618,435 ) * | | $ | 1,641,926,777 | | | | 141.3 | | |
| | | | | | | | | Other Assets and
Liabilities - Net | | | (479,619,430 | ) | | | (41.3 | ) | |
| | | | | | | | | Net Assets | | $ | 1,162,307,347 | | | | 100.0 | | |
"Other Securities" represents issues not identified as the top 50 holdings in terms of market value and issues or issuers not exceeding 1% of net assets individually or in aggregate respectively as of December 31, 2010.
The following footnotes apply to either the individual securities noted or one or more of the securities aggregated and listed as a single line item.
@ Non-income producing security
# Securities with purchases pursuant to Rule 144A or section 4(2), under the Securities Act of 1933 and may not be resold subject to that rule except to qualified institutional buyers. Unless otherwise noted, these securities have been determined to be liquid under the guidelines established by the Funds' Board of Directors/Trustees.
cc Securities purchased with cash collateral for securities loaned.
(1) Collateral received from brokers for securities lending was invested in these short-term investments.
(2) On September 12, 2008, BNY established a separate sleeve of the Institutional Cash Reserves Fund (Series B) to hold certain Lehman Brothers defaulted debt obligations. The Portfolio's position in Series B is being fair valued daily. Please see the accompanying Notes to Financial Statements for additional details on securities lending.
ip Treasury inflation indexed protected security whose principal value is adjusted in accordance with changes to the Consumer Price Index.
## On September 7, 2008, the Federal Housing Finance Agency placed the Federal National Mortgage Association and the Federal Home Loan Mortgage Corporation into conservatorship and the U.S. Treasury guaranteed the debt issued by those organizations.
W Settlement is on a when-issued or delayed-delivery basis.
S All or a portion of this security has been identified by the Portfolio to cover future collateral requirements for applicable futures, options, swaps, foreign currency contracts and/or when-issued or delayed-delivery securities.
R Restricted security
L Loaned security, a portion or all of the security is on loan at December 31, 2010.
X Fair value determined by ING Funds Valuation Committee appointed by the Funds' Board of Directors/Trustees.
^ Interest only securities represent the right to receive the monthly interest payments on an underlying pool of mortgage loans. Principal amount shown represents the notional amount on which current interest is calculated. Payments of principal on the pool reduce the value of the interest only security.
Z Indicates Zero Coupon Bond; rate shown reflects current effective yield.
CAD Canadian Dollar
EUR EU Euro
JPY Japanese Yen
(a) The grouping contains securities in default.
(b) The grouping contains when-issued securities.
* Cost for federal income tax purposes is $1,641,275,580.
| Net unrealized appreciation consists of: | |
| Gross Unrealized Appreciation | | $ | 26,669,123 | | |
| Gross Unrealized Depreciation | | | (26,017,926 | ) | |
| Net Unrealized Appreciation | | $ | 651,197 | | |
See Accompanying Notes to Financial Statements
160
SUMMARY PORTFOLIO OF INVESTMENTS
ING PIMCO TOTAL RETURN PORTFOLIO AS OF DECEMBER 31, 2010 (CONTINUED)
Fair Value Measurements^
The following is a summary of the fair valuations according to the inputs used as of December 31, 2010 in valuing the Portfolio's assets and liabilities:
| | | Quoted Prices
in Active Markets
for Identical Investments
(Level 1) | | Other
Observable
Inputs
(Level 2) | | Significant
Unobservable
Inputs
(Level 3) | | Fair Value
at
12/31/10 | |
| Asset Table | |
| Investments, at value | |
| Preferred Stock | | $ | 3,401,870 | | | $ | 12,372,159 | | | $ | — | | | $ | 15,774,029 | | |
| Positions In Purchased Options | | | 5,670 | | | | — | | | | — | | | | 5,670 | | |
| Corporate Bonds/Notes | | | 999,426 | | | | 288,753,332 | | | | 2,395,251 | | | | 292,148,009 | | |
| U.S. Government Agency Obligations | | | — | | | | 622,876,505 | | | | — | | | | 622,876,505 | | |
| U.S. Treasury Obligations | | | — | | | | 448,004,877 | | | | — | | | | 448,004,877 | | |
| Asset-Backed Securities | | | — | | | | 4,601,652 | | | | — | | | | 4,601,652 | | |
| Collateralized Mortgage Obligations | | | — | | | | 79,582,492 | | | | — | | | | 79,582,492 | | |
| Municipal Bonds | | | — | | | | 32,890,794 | | | | — | | | | 32,890,794 | | |
| Other Bonds | | | — | | | | 91,933,836 | | | | 1,002,770 | | | | 92,936,606 | | |
| Short-Term Investments | | | 51,628,996 | | | | 1,299,960 | | | | 177,187 | | | | 53,106,143 | | |
| Total Investments, at value | | $ | 56,035,962 | | | $ | 1,582,315,607 | | | $ | 3,575,208 | | | $ | 1,641,926,777 | | |
| Other Financial Instruments+: | |
| Forward foreign currency contracts | | | — | | | | 3,429,891 | | | | — | | | | 3,429,891 | | |
| Futures | | | 297,093 | | | | — | | | | — | | | | 297,093 | | |
| Swaps, at fair value | | | — | | | | 8,078,871 | | | | — | | | | 8,078,871 | | |
| Total Assets | | $ | 56,333,055 | | | $ | 1,593,824,369 | | | $ | 3,575,208 | | | $ | 1,653,732,632 | | |
| Liabilities Table | |
| Other Financial Instruments+: | |
| Forward foreign currency contracts | | $ | — | | | $ | (1,226,764 | ) | | $ | — | | | $ | (1,226,764 | ) | |
| Futures | | | (1,189,282 | ) | | | — | | | | — | | | | (1,189,282 | ) | |
| Swaps, at fair value | | | — | | | | (549,806 | ) | | | — | | | | (549,806 | ) | |
| Written options | | | — | | | | (4,059,392 | ) | | | — | | | | (4,059,392 | ) | |
| Total Liabilities | | $ | (1,189,282 | ) | | $ | (5,835,962 | ) | | $ | — | | | $ | (7,025,244 | ) | |
The following is a reconciliation of the fair valuations using significant unobservable inputs (Level 3) for the Portfolio's assets and liabilities during the period ended December 31, 2010:
| | | Beginning
Balance
12/31/2009 | | Purchases | | Sales | | Accrued
Discounts/
(Premiums) | | Total
Realized
Gain/(Loss) | | Total
Unrealized
Appreciation/
(Depreciation) | | Transfers
Into
Level 3 | | Transfers
Out of
Level 3 | | Ending
Balance
12/31/10 | |
| Asset Table | |
| Investments, at value | |
| Corporate Bonds/Notes | | $ | — | | | $ | 2,354,375 | | | $ | — | | | $ | (41,145 | ) | | $ | — | | | $ | 82,021 | | | $ | — | | | $ | — | | | $ | 2,395,251 | | |
| Other Bonds | | | 999,254 | | | | — | | | | — | | | | — | | | | — | | | | 3,516 | | | | — | | | | — | | | | 1,002,770 | | |
Short-Term
Investments | | | 177,187 | | | | — | | | | — | | | | — | | | | — | | | | — | | | | — | | | | — | | | | 177,187 | | |
Total Investments,
at value | | $ | 1,176,441 | | | $ | 2,354,375 | | | $ | — | | | $ | (41,145 | ) | | $ | — | | | $ | 85,537 | | | $ | — | | | $ | — | | | $ | 3,575,208 | | |
| Other Financial Instruments+: | |
| Swaps, at fair value | | $ | 72,803 | | | $ | — | | | $ | — | | | $ | — | | | $ | — | | | $ | — | | | $ | — | | | $ | (72,803 | ) | | $ | — | | |
| Total Assets | | $ | 1,249,244 | | | $ | 2,354,375 | | | $ | — | | | $ | (41,145 | ) | | $ | — | | | $ | 85,537 | | | $ | — | | | $ | (72,803 | ) | | $ | 3,575,208 | | |
As of December 31, 2010, total change in unrealized gain (loss) on Level 3 securities still held at period end and included in the change in net assets was $85,537.
^ See Note 2, "Significant Accounting Policies" in the Notes to Financial Statements for additional information.
'+ Other Financial Instruments are derivatives not reflected in the Summary Portfolio of Investments and may include open forward foreign currency contracts, futures, swaps, and written options. Forward foreign currency contracts and futures are reported at their unrealized gain/loss at measurement date which represents the amount due to/from the Portfolio. Swaps and written options are reported at their market value at measurement date.
Transfers in or out of Level 3 represents either the beginning value (for transfers in), or the ending value (for transfers out) of any security or derivative instrument where a change in the pricing level occurred from the beginning to the end of the period. It is the policy of the Portfolio to recognize transfers at the end of the reporting period.
See Accompanying Notes to Financial Statements
161
SUMMARY PORTFOLIO OF INVESTMENTS
ING PIMCO TOTAL RETURN PORTFOLIO AS OF DECEMBER 31, 2010 (CONTINUED)
At December 31, 2010 the following forward foreign currency contracts were outstanding for the ING PIMCO Total Return Portfolio:
| Counterparty | | Currency | | Buy/Sell | | Settlement
Date | | In Exchange
For | | Fair Value | | Unrealized
Appreciation
(Depreciation) | |
| Barclays Bank PLC | | South Korean Won
KRW 223,800,000 | | BUY | | 5/9/11 | | $ | 200,000 | | | $ | 196,086 | | | $ | (3,914 | ) | |
| Barclays Bank PLC | | Australian Dollar
AUD 400,000 | | BUY | | 1/28/11 | | | 395,669 | | | | 407,563 | | | | 11,894 | | |
| Barclays Bank PLC | | Japanese Yen
JPY 24,946,000 | | BUY | | 1/14/11 | | | 299,554 | | | | 307,305 | | | | 7,751 | | |
| Barclays Bank PLC | | Mexican Peso
MXN 6,247,000 | | BUY | | 2/22/11 | | | 500,000 | | | | 503,901 | | | | 3,901 | | |
| Barclays Bank PLC | | South African Rand
ZAR 760,150 | | BUY | | 9/13/11 | | | 100,000 | | | | 111,285 | | | | 11,285 | | |
| Barclays Bank PLC | | South African Rand
ZAR 1,456,800 | | BUY | | 1/28/11 | | | 200,000 | | | | 220,196 | | | | 20,196 | | |
| Barclays Bank PLC | | Chinese Yuan
CNY 643,000 | | BUY | | 11/15/11 | | | 100,078 | | | | 98,075 | | | | (2,003 | ) | |
| Barclays Bank PLC | | Chinese Yuan
CNY 12,550,000 | | BUY | | 2/13/12 | | | 1,962,900 | | | | 1,916,265 | | | | (46,635 | ) | |
| Barclays Bank PLC | | Indonesian Rupiah
IDR 2,817,096,000 | | BUY | | 7/27/11 | | | 305,046 | | | | 302,232 | | | | (2,814 | ) | |
| Barclays Bank PLC | | Indian Rupee
INR 45,660,000 | | BUY | | 1/12/11 | | | 1,000,000 | | | | 1,018,885 | | | | 18,885 | | |
| Barclays Bank PLC | | Indian Rupee
INR 11,632,000 | | BUY | | 3/9/11 | | | 257,402 | | | | 256,905 | | | | (497 | ) | |
| Barclays Bank PLC | | Indian Rupee
INR 72,948,000 | | BUY | | 5/9/11 | | | 1,574,531 | | | | 1,592,878 | | | | 18,347 | | |
| Barclays Bank PLC | | South Korean Won
KRW 70,000,000 | | BUY | | 5/9/11 | | | 62,316 | | | | 61,331 | | | | (985 | ) | |
| Barclays Bank PLC | | Mexican Peso
MXN 2,606,180 | | BUY | | 2/22/11 | | | 200,000 | | | | 210,222 | | | | 10,222 | | |
| Barclays Bank PLC | | Mexican Peso
MXN 12,932,500 | | BUY | | 2/22/11 | | | 1,000,000 | | | | 1,043,172 | | | | 43,172 | | |
| Barclays Bank PLC | | Mexican Peso
MXN 1,282,850 | | BUY | | 2/22/11 | | | 100,000 | | | | 103,478 | | | | 3,478 | | |
| Barclays Bank PLC | | Mexican Peso
MXN 7,503,900 | | BUY | | 2/22/11 | | | 600,000 | | | | 605,286 | | | | 5,286 | | |
| Barclays Bank PLC | | Malaysian Ringgit
MYR 620,000 | | BUY | | 2/7/11 | | | 199,569 | | | | 200,535 | | | | 966 | | |
| Barclays Bank PLC | | Malaysian Ringgit
MYR 990,000 | | BUY | | 2/7/11 | | | 319,098 | | | | 320,209 | | | | 1,111 | | |
| Barclays Bank PLC | | Philippine Peso
PHP 4,485,000 | | BUY | | 6/15/11 | | | 100,000 | | | | 102,124 | | | | 2,124 | | |
| Barclays Bank PLC | | Philippine Peso
PHP 8,937,000 | | BUY | | 6/15/11 | | | 200,000 | | | | 203,497 | | | | 3,497 | | |
| Barclays Bank PLC | | Philippine Peso
PHP 4,450,000 | | BUY | | 6/15/11 | | | 100,000 | | | | 101,327 | | | | 1,327 | | |
| Barclays Bank PLC | | Philippine Peso
PHP 22,225,000 | | BUY | | 6/15/11 | | | 500,000 | | | | 506,067 | | | | 6,067 | | |
| Barclays Bank PLC | | Philippine Peso
PHP 17,748,000 | | BUY | | 6/15/11 | | | 400,000 | | | | 404,125 | | | | 4,125 | | |
| Barclays Bank PLC | | Philippine Peso
PHP 4,248,000 | | BUY | | 4/15/11 | | | 100,000 | | | | 96,900 | | | | (3,100 | ) | |
| Barclays Bank PLC | | Turkish Lira
TRY 151,510 | | BUY | | 1/27/11 | | | 100,000 | | | | 97,814 | | | | (2,186 | ) | |
| Barclays Bank PLC | | Turkish Lira
TRY 574,712 | | BUY | | 1/27/11 | | | 400,000 | | | | 371,032 | | | | (28,968 | ) | |
| Barclays Bank PLC | | Turkish Lira
TRY 310,410 | | BUY | | 1/27/11 | | | 200,000 | | | | 200,399 | | | | 399 | | |
| Barclays Bank PLC | | Indonesian Rupiah
IDR 1,494,400,000 | | BUY | | 7/27/11 | | | 160,000 | | | | 160,327 | | | | 327 | | |
| Barclays Bank PLC | | Mexican Peso
MXN 10,926,930 | | BUY | | 2/22/11 | | | 851,073 | | | | 881,397 | | | | 30,324 | | |
| Barclays Bank PLC | | Mexican Peso
MXN 1,649,785 | | BUY | | 2/22/11 | | | 124,700 | | | | 133,076 | | | | 8,376 | | |
| Citigroup, Inc. | | Brazilian Real
BRL 31,469,761 | | BUY | | 3/2/11 | | | 18,453,009 | | | | 18,705,204 | | | | 252,195 | | |
| Citigroup, Inc. | | Chinese Yuan
CNY 3,866,231 | | BUY | | 11/15/11 | | | 595,125 | | | | 589,703 | | | | (5,422 | ) | |
| Citigroup, Inc. | | Indonesian Rupiah
IDR 668,500,000 | | BUY | | 7/27/11 | | | 70,000 | | | | 71,720 | | | | 1,720 | | |
| Citigroup, Inc. | | Indonesian Rupiah
IDR 1,048,300,000 | | BUY | | 7/27/11 | | | 110,000 | | | | 112,467 | | | | 2,467 | | |
See Accompanying Notes to Financial Statements
162
SUMMARY PORTFOLIO OF INVESTMENTS
ING PIMCO TOTAL RETURN PORTFOLIO AS OF DECEMBER 31, 2010 (CONTINUED)
| Counterparty | | Currency | | Buy/Sell | | Settlement
Date | | In Exchange
For | | Fair Value | | Unrealized
Appreciation
(Depreciation) | |
| Citigroup, Inc. | | Indonesian Rupiah
IDR 1,654,740,000 | | BUY | | 4/15/11 | | $ | 180,000 | | | $ | 180,646 | | | $ | 646 | | |
| Citigroup, Inc. | | Indonesian Rupiah
IDR 2,888,200,000 | | BUY | | 7/27/11 | | | 310,659 | | | | 309,861 | | | | (798 | ) | |
| Citigroup, Inc. | | Indonesian Rupiah
IDR 3,856,000,000 | | BUY | | 7/27/11 | | | 422,344 | | | | 413,691 | | | | (8,653 | ) | |
| Citigroup, Inc. | | Indian Rupee
INR 27,288,000 | | BUY | | 1/12/11 | | | 600,000 | | | | 608,921 | | | | 8,921 | | |
| Citigroup, Inc. | | South Korean Won
KRW 245,000,000 | | BUY | | 5/9/11 | | | 218,399 | | | | 214,660 | | | | (3,739 | ) | |
| Citigroup, Inc. | | South Korean Won
KRW 271,800,000 | | BUY | | 5/9/11 | | | 240,637 | | | | 238,141 | | | | (2,496 | ) | |
| Citigroup, Inc. | | South Korean Won
KRW 168,000,000 | | BUY | | 5/9/11 | | | 150,000 | | | | 147,196 | | | | (2,804 | ) | |
| Citigroup, Inc. | | South Korean Won
KRW 224,400,000 | | BUY | | 5/9/11 | | | 200,000 | | | | 196,611 | | | | (3,389 | ) | |
| Citigroup, Inc. | | South Korean Won
KRW 166,890,000 | | BUY | | 5/9/11 | | | 150,000 | | | | 146,223 | | | | (3,777 | ) | |
| Citigroup, Inc. | | South Korean Won
KRW 168,750,000 | | BUY | | 5/9/11 | | | 150,000 | | | | 147,853 | | | | (2,147 | ) | |
| Citigroup, Inc. | | South Korean Won
KRW 228,040,000 | | BUY | | 5/9/11 | | | 200,000 | | | | 199,800 | | | | (200 | ) | |
| Citigroup, Inc. | | South Korean Won
KRW 230,820,000 | | BUY | | 1/19/11 | | | 200,000 | | | | 203,151 | | | | 3,151 | | |
| Citigroup, Inc. | | Mexican Peso
MXN 1,304,400 | | BUY | | 2/22/11 | | | 100,000 | | | | 105,217 | | | | 5,217 | | |
| Citigroup, Inc. | | Mexican Peso
MXN 1,269,650 | | BUY | | 2/22/11 | | | 100,000 | | | | 102,414 | | | | 2,414 | | |
| Citigroup, Inc. | | Mexican Peso
MXN 5,076,600 | | BUY | | 2/22/11 | | | 400,000 | | | | 409,493 | | | | 9,493 | | |
| Citigroup, Inc. | | Mexican Peso
MXN 2,538,400 | | BUY | | 2/22/11 | | | 200,000 | | | | 204,755 | | | | 4,755 | | |
| Citigroup, Inc. | | Mexican Peso
MXN 2,461,000 | | BUY | | 2/22/11 | | | 200,000 | | | | 198,511 | | | | (1,489 | ) | |
| Citigroup, Inc. | | Mexican Peso
MXN 4,927,200 | | BUY | | 2/22/11 | | | 400,000 | | | | 397,442 | | | | (2,558 | ) | |
| Citigroup, Inc. | | Mexican Peso
MXN 1,239,500 | | BUY | | 2/22/11 | | | 100,000 | | | | 99,982 | | | | (18 | ) | |
| Citigroup, Inc. | | Mexican Peso
MXN 2,477,000 | | BUY | | 2/22/11 | | | 200,000 | | | | 199,802 | | | | (198 | ) | |
| Citigroup, Inc. | | Mexican Peso
MXN 1,257,100 | | BUY | | 2/22/11 | | | 100,000 | | | | 101,401 | | | | 1,401 | | |
| Citigroup, Inc. | | Malaysian Ringgit
MYR 570,000 | | BUY | | 2/7/11 | | | 183,871 | | | | 184,363 | | | | 492 | | |
| Citigroup, Inc. | | Philippine Peso
PHP 6,840,000 | | BUY | | 6/15/11 | | | 155,561 | | | | 155,748 | | | | 187 | | |
| Citigroup, Inc. | | Philippine Peso
PHP 7,300,000 | | BUY | | 6/15/11 | | | 166,211 | | | | 166,222 | | | | 11 | | |
| Citigroup, Inc. | | Philippine Peso
PHP 2,137,500 | | BUY | | 4/15/11 | | | 50,000 | | | | 48,758 | | | | (1,242 | ) | |
| Citigroup, Inc. | | Philippine Peso
PHP 4,270,000 | | BUY | | 6/15/11 | | | 100,000 | | | | 97,229 | | | | (2,771 | ) | |
| Citigroup, Inc. | | Philippine Peso
PHP 4,310,000 | | BUY | | 11/15/11 | | | 100,000 | | | | 97,867 | | | | (2,133 | ) | |
| Citigroup, Inc. | | Philippine Peso
PHP 4,339,500 | | BUY | | 11/15/11 | | | 100,000 | | | | 98,537 | | | | (1,463 | ) | |
| Citigroup, Inc. | | Philippine Peso
PHP 6,525,000 | | BUY | | 11/15/11 | | | 150,000 | | | | 148,164 | | | | (1,836 | ) | |
| Citigroup, Inc. | | Philippine Peso
PHP 8,722,000 | | BUY | | 4/15/11 | | | 200,000 | | | | 198,955 | | | | (1,045 | ) | |
| Citigroup, Inc. | | Philippine Peso
PHP 8,910,000 | | BUY | | 11/15/11 | | | 200,000 | | | | 202,320 | | | | 2,320 | | |
| Citigroup, Inc. | | Philippine Peso
PHP 10,296,985 | | BUY | | 2/7/11 | | | 233,333 | | | | 235,096 | | | | 1,763 | | |
| Citigroup, Inc. | | Philippine Peso
PHP 13,263,000 | | BUY | | 11/15/11 | | | 300,000 | | | | 301,164 | | | | 1,164 | | |
| Citigroup, Inc. | | Singapore Dollar
SGD 257,280 | | BUY | | 6/9/11 | | | 200,000 | | | | 200,478 | | | | 478 | | |
| Citigroup, Inc. | | Turkish Lira
TRY 303,000 | | BUY | | 1/27/11 | | | 200,000 | | | | 195,615 | | | | (4,385 | ) | |
See Accompanying Notes to Financial Statements
163
SUMMARY PORTFOLIO OF INVESTMENTS
ING PIMCO TOTAL RETURN PORTFOLIO AS OF DECEMBER 31, 2010 (CONTINUED)
| Counterparty | | Currency | | Buy/Sell | | Settlement
Date | | In Exchange
For | | Fair Value | | Unrealized
Appreciation
(Depreciation) | |
| Citigroup, Inc. | | EU Euro
EUR 10,062,000 | | BUY | | 1/6/11 | | $ | 13,628,577 | | | $ | 13,445,796 | | | $ | (182,781 | ) | |
| Citigroup, Inc. | | Japanese Yen
JPY 58,630,000 | | BUY | | 1/14/11 | | | 696,299 | | | | 722,253 | | | | 25,954 | | |
| Citigroup, Inc. | | Japanese Yen
JPY 41,221,000 | | BUY | | 1/14/11 | | | 504,158 | | | | 507,794 | | | | 3,636 | | |
| Citigroup, Inc. | | Singapore Dollar
SGD 132,160 | | BUY | | 3/9/11 | | | 100,000 | | | | 102,986 | | | | 2,986 | | |
| Citigroup, Inc. | | Singapore Dollar
SGD 128,466 | | BUY | | 2/24/11 | | | 100,000 | | | | 100,107 | | | | 107 | | |
| Credit Suisse First Boston | | Australian Dollar
AUD 2,680,000 | | BUY | | 1/28/11 | | | 2,548,165 | | | | 2,730,675 | | | | 182,510 | | |
| Credit Suisse First Boston | | Turkish Lira
TRY 150,910 | | BUY | | 1/27/11 | | | 100,000 | | | | 97,427 | | | | (2,573 | ) | |
| Credit Suisse First Boston | | Japanese Yen
JPY 124,138,000 | | BUY | | 1/14/11 | | | 1,474,043 | | | | 1,529,234 | | | | 55,191 | | |
| Credit Suisse First Boston | | Japanese Yen
JPY 33,131,000 | | BUY | | 1/14/11 | | | 393,405 | | | | 408,135 | | | | 14,730 | | |
| Deutsche Bank AG | | Taiwan New Dollar
TWD 1,336,000 | | BUY | | 1/14/11 | | | 43,187 | | | | 45,842 | | | | 2,655 | | |
| Deutsche Bank AG | | Taiwan New Dollar
TWD 406,749 | | BUY | | 1/14/11 | | | 12,921 | | | | 13,957 | | | | 1,036 | | |
| Deutsche Bank AG | | Indonesian Rupiah
IDR 3,902,000,000 | | BUY | | 10/31/11 | | | 420,701 | | | | 412,285 | | | | (8,416 | ) | |
| Deutsche Bank AG | | Malaysian Ringgit
MYR 1,000,000 | | BUY | | 2/7/11 | | | 322,217 | | | | 323,443 | | | | 1,226 | | |
| Deutsche Bank AG | | Philippine Peso
PHP 6,858,000 | | BUY | | 6/15/11 | | | 156,361 | | | | 156,158 | | | | (203 | ) | |
| Deutsche Bank AG | | Philippine Peso
PHP 4,321,000 | | BUY | | 6/15/11 | | | 100,000 | | | | 98,390 | | | | (1,610 | ) | |
| Deutsche Bank AG | | Philippine Peso
PHP 6,607,500 | | BUY | | 11/15/11 | | | 150,000 | | | | 150,037 | | | | 37 | | |
| Deutsche Bank AG | | Taiwan New Dollar
TWD 3,000,000 | | BUY | | 4/6/11 | | | 97,800 | | | | 103,174 | | | | 5,374 | | |
| Deutsche Bank AG | | Taiwan New Dollar
TWD 3,100,000 | | BUY | | 4/6/11 | | | 104,202 | | | | 106,613 | | | | 2,411 | | |
| Deutsche Bank AG | | Taiwan New Dollar
TWD 2,240,749 | | BUY | | 4/6/11 | | | 75,586 | | | | 77,062 | | | | 1,476 | | |
| Deutsche Bank AG | | Canadian Dollar
CAD 9,710,000 | | BUY | | 2/17/11 | | | 9,640,779 | | | | 9,756,148 | | | | 115,369 | | |
| Deutsche Bank AG | | Singapore Dollar
SGD 860,000 | | BUY | | 6/9/11 | | | 659,196 | | | | 670,129 | | | | 10,933 | | |
| Deutsche Bank AG | | Singapore Dollar
SGD 473,400 | | BUY | | 6/9/11 | | | 363,846 | | | | 368,883 | | | | 5,037 | | |
| Goldman Sachs & Co. | | South Korean Won
KRW 56,327,500 | | BUY | | 5/9/11 | | | 49,636 | | | | 49,352 | | | | (284 | ) | |
| Goldman Sachs & Co. | | Philippine Peso
PHP 8,784,000 | | BUY | | 11/15/11 | | | 200,000 | | | | 199,459 | | | | (541 | ) | |
| Goldman Sachs & Co. | | Singapore Dollar
SGD 128,530 | | BUY | | 3/9/11 | | | 100,000 | | | | 100,157 | | | | 157 | | |
| Goldman Sachs & Co. | | South Korean Won
KRW 111,900,000 | | BUY | | 5/9/11 | | | 100,000 | | | | 98,043 | | | | (1,957 | ) | |
| Goldman Sachs & Co. | | Singapore Dollar
SGD 129,180 | | BUY | | 6/9/11 | | | 100,000 | | | | 100,660 | | | | 660 | | |
| Goldman Sachs & Co. | | Singapore Dollar
SGD 257,380 | | BUY | | 6/9/11 | | | 200,000 | | | | 200,556 | | | | 556 | | |
| Goldman Sachs & Co. | | Singapore Dollar
SGD 194,370 | | BUY | | 6/9/11 | | | 150,000 | | | | 151,457 | | | | 1,457 | | |
| Goldman Sachs & Co. | | Singapore Dollar
SGD 130,000 | | BUY | | 6/9/11 | | | 100,000 | | | | 101,299 | | | | 1,299 | | |
| HSBC | | Chinese Yuan
CNY 10,541,712 | | BUY | | 11/15/11 | | | 1,641,883 | | | | 1,607,891 | | | | (33,992 | ) | |
| HSBC | | Indonesian Rupiah
IDR 1,711,800,000 | | BUY | | 7/27/11 | | | 180,000 | | | | 183,650 | | | | 3,650 | | |
| HSBC | | Indonesian Rupiah
IDR 1,488,000,000 | | BUY | | 7/27/11 | | | 160,000 | | | | 159,640 | | | | (360 | ) | |
| HSBC | | Indonesian Rupiah
IDR 2,082,300,000 | | BUY | | 7/27/11 | | | 220,000 | | | | 223,400 | | | | 3,400 | | |
| HSBC | | Indonesian Rupiah
IDR 699,500,000 | | BUY | | 7/27/11 | | | 75,312 | | | | 75,046 | | | | (266 | ) | |
See Accompanying Notes to Financial Statements
164
SUMMARY PORTFOLIO OF INVESTMENTS
ING PIMCO TOTAL RETURN PORTFOLIO AS OF DECEMBER 31, 2010 (CONTINUED)
| Counterparty | | Currency | | Buy/Sell | | Settlement
Date | | In Exchange
For | | Fair Value | | Unrealized
Appreciation
(Depreciation) | |
| HSBC | | Indonesian Rupiah
IDR 2,971,500,000 | | BUY | | 7/27/11 | | $ | 320,412 | | | $ | 318,797 | | | $ | (1,615 | ) | |
| HSBC | | South Korean Won
KRW 133,000,000 | | BUY | | 5/9/11 | | | 118,475 | | | | 116,530 | | | | (1,945 | ) | |
| HSBC | | South Korean Won
KRW 229,500,000 | | BUY | | 5/9/11 | | | 200,000 | | | | 201,080 | | | | 1,080 | | |
| HSBC | | Malaysian Ringgit
MYR 620,000 | | BUY | | 2/7/11 | | | 200,000 | | | | 200,535 | | | | 535 | | |
| HSBC | | Philippine Peso
PHP 27,510,000 | | BUY | | 6/15/11 | | | 628,513 | | | | 626,408 | | | | (2,105 | ) | |
| HSBC | | Singapore Dollar
SGD 264,340 | | BUY | | 3/9/11 | | | 200,000 | | | | 205,987 | | | | 5,987 | | |
| HSBC | | Singapore Dollar
SGD 263,812 | | BUY | | 3/9/11 | | | 200,000 | | | | 205,575 | | | | 5,575 | | |
| HSBC | | Singapore Dollar
SGD 258,192 | | BUY | | 3/9/11 | | | 200,000 | | | | 201,196 | | | | 1,196 | | |
| HSBC | | Singapore Dollar
SGD 130,180 | | BUY | | 2/24/11 | | | 100,000 | | | | 101,442 | | | | 1,442 | | |
| HSBC | | Singapore Dollar
SGD 260,662 | | BUY | | 2/24/11 | | | 200,000 | | | | 203,120 | | | | 3,120 | | |
| HSBC | | Singapore Dollar
SGD 394,520 | | BUY | | 3/9/11 | | | 300,000 | | | | 307,429 | | | | 7,429 | | |
| HSBC | | Turkish Lira
TRY 301,700 | | BUY | | 1/27/11 | | | 200,000 | | | | 194,776 | | | | (5,224 | ) | |
| HSBC | | Turkish Lira
TRY 453,360 | | BUY | | 1/27/11 | | | 300,000 | | | | 292,687 | | | | (7,313 | ) | |
| HSBC | | Turkish Lira
TRY 299,390 | | BUY | | 1/27/11 | | | 200,000 | | | | 193,285 | | | | (6,715 | ) | |
| HSBC | | Turkish Lira
TRY 147,550 | | BUY | | 1/27/11 | | | 100,000 | | | | 95,258 | | | | (4,742 | ) | |
| HSBC | | Turkish Lira
TRY 155,150 | | BUY | | 1/27/11 | | | 100,000 | | | | 100,164 | | | | 164 | | |
| HSBC | | South African Rand
ZAR 18,239,798 | | BUY | | 1/28/11 | | | 2,602,525 | | | | 2,756,959 | | | | 154,434 | | |
| HSBC | | South African Rand
ZAR 3,488,500 | | BUY | | 1/28/11 | | | 500,000 | | | | 527,289 | | | | 27,289 | | |
| JPMorgan Chase & Co. | | Chinese Yuan
CNY 1,579,000 | | BUY | | 11/15/11 | | | 245,835 | | | | 240,839 | | | | (4,996 | ) | |
| JPMorgan Chase & Co. | | Chinese Yuan
CNY 10,352,000 | | BUY | | 11/15/11 | | | 1,608,952 | | | | 1,578,955 | | | | (29,997 | ) | |
| JPMorgan Chase & Co. | | Indonesian Rupiah
IDR 849,600,000 | | BUY | | 7/27/11 | | | 90,000 | | | | 91,149 | | | | 1,149 | | |
| JPMorgan Chase & Co. | | Indonesian Rupiah
IDR 923,000,000 | | BUY | | 4/15/11 | | | 100,000 | | | | 100,763 | | | | 763 | | |
| JPMorgan Chase & Co. | | Indonesian Rupiah
IDR 2,012,000,000 | | BUY | | 7/27/11 | | | 219,196 | | | | 215,857 | | | | (3,339 | ) | |
| JPMorgan Chase & Co. | | South Korean Won
KRW 305,400,000 | | BUY | | 5/9/11 | | | 269,305 | | | | 267,580 | | | | (1,725 | ) | |
| JPMorgan Chase & Co. | | South Korean Won
KRW 334,920,000 | | BUY | | 5/9/11 | | | 300,000 | | | | 293,445 | | | | (6,555 | ) | |
| JPMorgan Chase & Co. | | South Korean Won
KRW 333,930,000 | | BUY | | 5/9/11 | | | 300,000 | | | | 292,577 | | | | (7,423 | ) | |
| JPMorgan Chase & Co. | | South Korean Won
KRW 342,780,000 | | BUY | | 5/9/11 | | | 300,000 | | | | 300,332 | | | | 332 | | |
| JPMorgan Chase & Co. | | South Korean Won
KRW 227,200,000 | | BUY | | 5/9/11 | | | 200,000 | | | | 199,064 | | | | (936 | ) | |
| JPMorgan Chase & Co. | | South Korean Won
KRW 191,883,717 | | BUY | | 1/19/11 | | | 166,667 | | | | 168,882 | | | | 2,215 | | |
| JPMorgan Chase & Co. | | South Korean Won
KRW 193,333,720 | | BUY | | 1/19/11 | | | 166,667 | | | | 170,159 | | | | 3,492 | | |
| JPMorgan Chase & Co. | | South Korean Won
KRW 4,139,071,437 | | BUY | | 5/9/11 | | | 3,573,710 | | | | 3,626,505 | | | | 52,795 | | |
| JPMorgan Chase & Co. | | Mexican Peso
MXN 2,538,900 | | BUY | | 2/22/11 | | | 200,000 | | | | 204,795 | | | | 4,795 | | |
| JPMorgan Chase & Co. | | Mexican Peso
MXN 2,472,900 | | BUY | | 2/22/11 | | | 200,000 | | | | 199,471 | | | | (529 | ) | |
| JPMorgan Chase & Co. | | Mexican Peso
MXN 1,490,000 | | BUY | | 2/22/11 | | | 120,560 | | | | 120,188 | | | | (372 | ) | |
| JPMorgan Chase & Co. | | Malaysian Ringgit
MYR 310,250 | | BUY | | 2/7/11 | | | 100,000 | | | | 100,348 | | | | 348 | | |
See Accompanying Notes to Financial Statements
165
SUMMARY PORTFOLIO OF INVESTMENTS
ING PIMCO TOTAL RETURN PORTFOLIO AS OF DECEMBER 31, 2010 (CONTINUED)
| Counterparty | | Currency | | Buy/Sell | | Settlement
Date | | In Exchange
For | | Fair Value | | Unrealized
Appreciation
(Depreciation) | |
| JPMorgan Chase & Co. | | Malaysian Ringgit
MYR 617,200 | | BUY | | 2/7/11 | | $ | 200,000 | | | $ | 199,629 | | | $ | (371 | ) | |
| JPMorgan Chase & Co. | | Malaysian Ringgit
MYR 470,512 | | BUY | | 2/7/11 | | | 151,597 | | | | 152,184 | | | | 587 | | |
| JPMorgan Chase & Co. | | Philippine Peso
PHP 8,960,000 | | BUY | | 6/15/11 | | | 200,000 | | | | 204,021 | | | | 4,021 | | |
| JPMorgan Chase & Co. | | Philippine Peso
PHP 8,984,000 | | BUY | | 6/15/11 | | | 200,000 | | | | 204,567 | | | | 4,567 | | |
| JPMorgan Chase & Co. | | Philippine Peso
PHP 8,640,000 | | BUY | | 6/15/11 | | | 200,000 | | | | 196,734 | | | | (3,266 | ) | |
| JPMorgan Chase & Co. | | Philippine Peso
PHP 2,134,000 | | BUY | | 4/15/11 | | | 50,000 | | | | 48,678 | | | | (1,322 | ) | |
| JPMorgan Chase & Co. | | Philippine Peso
PHP 8,750,000 | | BUY | | 4/15/11 | | | 200,000 | | | | 199,593 | | | | (407 | ) | |
| JPMorgan Chase & Co. | | Philippine Peso
PHP 8,820,000 | | BUY | | 11/15/11 | | | 200,000 | | | | 200,276 | | | | 276 | | |
| JPMorgan Chase & Co. | | Philippine Peso
PHP 10,280,652 | | BUY | | 2/7/11 | | | 233,333 | | | | 234,723 | | | | 1,390 | | |
| JPMorgan Chase & Co. | | Philippine Peso
PHP 13,062,000 | | BUY | | 6/15/11 | | | 300,000 | | | | 297,424 | | | | (2,576 | ) | |
| JPMorgan Chase & Co. | | Singapore Dollar
SGD 305,736 | | BUY | | 1/14/11 | | | 233,333 | | | | 238,238 | | | | 4,905 | | |
| JPMorgan Chase & Co. | | Singapore Dollar
SGD 307,696 | | BUY | | 1/14/11 | | | 233,333 | | | | 239,765 | | | | 6,432 | | |
| JPMorgan Chase & Co. | | Turkish Lira
TRY 302,260 | | BUY | | 1/27/11 | | | 200,000 | | | | 195,138 | | | | (4,862 | ) | |
| JPMorgan Chase & Co. | | Turkish Lira
TRY 302,500 | | BUY | | 1/27/11 | | | 200,000 | | | | 195,293 | | | | (4,707 | ) | |
| JPMorgan Chase & Co. | | Turkish Lira
TRY 299,140 | | BUY | | 1/27/11 | | | 200,000 | | | | 193,123 | | | | (6,877 | ) | |
| JPMorgan Chase & Co. | | Turkish Lira
TRY 147,560 | | BUY | | 1/27/11 | | | 100,000 | | | | 95,264 | | | | (4,736 | ) | |
| JPMorgan Chase & Co. | | Turkish Lira
TRY 287,420 | | BUY | | 1/27/11 | | | 200,000 | | | | 185,557 | | | | (14,443 | ) | |
| JPMorgan Chase & Co. | | Taiwan New Dollar
TWD 8,762,286 | | BUY | | 4/6/11 | | | 289,567 | | | | 301,345 | | | | 11,778 | | |
| JPMorgan Chase & Co. | | Danish Krone
DKK 314,000 | | BUY | | 2/7/11 | | | 58,449 | | | | 56,286 | | | | (2,163 | ) | |
| JPMorgan Chase & Co. | | Singapore Dollar
SGD 128,820 | | BUY | | 6/9/11 | | | 100,000 | | | | 100,379 | | | | 379 | | |
| JPMorgan Chase & Co. | | Singapore Dollar
SGD 128,710 | | BUY | | 3/9/11 | | | 100,000 | | | | 100,297 | | | | 297 | | |
| JPMorgan Chase & Co. | | Singapore Dollar
SGD 192,885 | | BUY | | 6/9/11 | | | 150,000 | | | | 150,300 | | | | 300 | | |
| JPMorgan Chase & Co. | | Singapore Dollar
SGD 129,970 | | BUY | | 6/9/11 | | | 100,000 | | | | 101,275 | | | | 1,275 | | |
| JPMorgan Chase & Co. | | Singapore Dollar
SGD 262,000 | | BUY | | 6/9/11 | | | 200,000 | | | | 204,156 | | | | 4,156 | | |
| JPMorgan Chase & Co. | | Singapore Dollar
SGD 395,160 | | BUY | | 1/14/11 | | | 300,000 | | | | 307,920 | | | | 7,920 | | |
| JPMorgan Chase & Co. | | South African Rand
ZAR 728,400 | | BUY | | 1/28/11 | | | 100,000 | | | | 110,098 | | | | 10,098 | | |
| JPMorgan Chase & Co. | | South African Rand
ZAR 696,950 | | BUY | | 4/28/11 | | | 100,000 | | | | 104,025 | | | | 4,025 | | |
| JPMorgan Chase & Co. | | South Korean Won
KRW 224,540,000 | | BUY | | 5/9/11 | | | 200,000 | | | | 196,734 | | | | (3,266 | ) | |
| JPMorgan Chase & Co. | | Philippine Peso
PHP 7,045,000 | | BUY | | 6/15/11 | | | 160,661 | | | | 160,416 | | | | (245 | ) | |
| JPMorgan Chase & Co. | | Philippine Peso
PHP 4,310,000 | | BUY | | 11/15/11 | | | 100,000 | | | | 97,867 | | | | (2,133 | ) | |
| JPMorgan Chase & Co. | | Taiwan New Dollar
TWD 1,067,000 | | BUY | | 1/14/11 | | | 33,787 | | | | 36,611 | | | | 2,824 | | |
| Morgan Stanley | | Indonesian Rupiah
IDR 921,000,000 | | BUY | | 4/15/11 | | | 100,000 | | | | 100,545 | | | | 545 | | |
| Morgan Stanley | | Indonesian Rupiah
IDR 1,818,000,000 | | BUY | | 4/15/11 | | | 200,000 | | | | 198,469 | | | | (1,531 | ) | |
| Morgan Stanley | | South Korean Won
KRW 115,110,000 | | BUY | | 1/19/11 | | | 100,000 | | | | 101,312 | | | | 1,312 | | |
| Morgan Stanley | | South Korean Won
KRW 345,330,000 | | BUY | | 1/19/11 | | | 300,000 | | | | 303,935 | | | | 3,935 | | |
See Accompanying Notes to Financial Statements
166
SUMMARY PORTFOLIO OF INVESTMENTS
ING PIMCO TOTAL RETURN PORTFOLIO AS OF DECEMBER 31, 2010 (CONTINUED)
| Counterparty | | Currency | | Buy/Sell | | Settlement
Date | | In Exchange
For | | Fair Value | | Unrealized
Appreciation
(Depreciation) | |
| Morgan Stanley | | South Korean Won
KRW 230,320,000 | | BUY | | 1/19/11 | | $ | 200,000 | | | $ | 202,711 | | | $ | 2,711 | | |
| Morgan Stanley | | South Korean Won
KRW 230,416,000 | | BUY | | 1/19/11 | | | 200,000 | | | | 202,796 | | | | 2,796 | | |
| Morgan Stanley | | South Korean Won
KRW 457,840,000 | | BUY | | 1/19/11 | | | 400,000 | | | | 402,958 | | | | 2,958 | | |
| Morgan Stanley | | South Korean Won
KRW 455,640,000 | | BUY | | 1/19/11 | | | 400,000 | | | | 401,022 | | | | 1,022 | | |
| Morgan Stanley | | South Korean Won
KRW 225,920,000 | | BUY | | 1/19/11 | | | 200,000 | | | | 198,839 | | | | (1,161 | ) | |
| Morgan Stanley | | South Korean Won
KRW 113,060,000 | | BUY | | 1/19/11 | | | 100,000 | | | | 99,507 | | | | (493 | ) | |
| Morgan Stanley | | South Korean Won
KRW 452,160,000 | | BUY | | 1/19/11 | | | 400,000 | | | | 397,959 | | | | (2,041 | ) | |
| Morgan Stanley | | South Korean Won
KRW 339,075,000 | | BUY | | 1/19/11 | | | 300,000 | | | | 298,430 | | | | (1,570 | ) | |
| Morgan Stanley | | South Korean Won
KRW 336,075,000 | | BUY | | 1/19/11 | | | 300,000 | | | | 295,789 | | | | (4,211 | ) | |
| Morgan Stanley | | South Korean Won
KRW 222,088,000 | | BUY | | 1/19/11 | | | 200,000 | | | | 195,466 | | | | (4,534 | ) | |
| Morgan Stanley | | Mexican Peso
MXN 1,303,220 | | BUY | | 2/22/11 | | | 100,000 | | | | 105,121 | | | | 5,121 | | |
| Morgan Stanley | | Mexican Peso
MXN 2,548,700 | | BUY | | 2/22/11 | | | 200,000 | | | | 205,585 | | | | 5,585 | | |
| Morgan Stanley | | Mexican Peso
MXN 1,269,940 | | BUY | | 2/22/11 | | | 100,000 | | | | 102,437 | | | | 2,437 | | |
| Morgan Stanley | | Mexican Peso
MXN 2,537,880 | | BUY | | 2/22/11 | | | 200,000 | | | | 204,713 | | | | 4,713 | | |
| Morgan Stanley | | Mexican Peso
MXN 2,532,700 | | BUY | | 2/22/11 | | | 200,000 | | | | 204,295 | | | | 4,295 | | |
| Morgan Stanley | | Mexican Peso
MXN 2,531,300 | | BUY | | 2/22/11 | | | 200,000 | | | | 204,182 | | | | 4,182 | | |
| Morgan Stanley | | Mexican Peso
MXN 1,268,950 | | BUY | | 2/22/11 | | | 100,000 | | | | 102,357 | | | | 2,357 | | |
| Morgan Stanley | | Mexican Peso
MXN 1,242,900 | | BUY | | 2/22/11 | | | 100,000 | | | | 100,256 | | | | 256 | | |
| Morgan Stanley | | Mexican Peso
MXN 1,243,000 | | BUY | | 2/22/11 | | | 100,000 | | | | 100,264 | | | | 264 | | |
| Morgan Stanley | | Mexican Peso
MXN 2,475,700 | | BUY | | 2/22/11 | | | 200,000 | | | | 199,697 | | | | (303 | ) | |
| Morgan Stanley | | Mexican Peso
MXN 1,230,600 | | BUY | | 2/22/11 | | | 100,000 | | | | 99,264 | | | | (736 | ) | |
| Morgan Stanley | | Mexican Peso
MXN 2,474,700 | | BUY | | 2/22/11 | | | 200,000 | | | | 199,616 | | | | (384 | ) | |
| Morgan Stanley | | Mexican Peso
MXN 1,247,150 | | BUY | | 2/22/11 | | | 100,000 | | | | 100,599 | | | | 599 | | |
| Morgan Stanley | | Mexican Peso
MXN 2,496,600 | | BUY | | 2/22/11 | | | 200,000 | | | | 201,383 | | | | 1,383 | | |
| Morgan Stanley | | Mexican Peso
MXN 3,721,890 | | BUY | | 2/22/11 | | | 300,000 | | | | 300,218 | | | | 218 | | |
| Morgan Stanley | | Mexican Peso
MXN 3,774,000 | | BUY | | 2/22/11 | | | 300,000 | | | | 304,422 | | | | 4,422 | | |
| Morgan Stanley | | Mexican Peso
MXN 1,257,320 | | BUY | | 2/22/11 | | | 100,000 | | | | 101,419 | | | | 1,419 | | |
| Morgan Stanley | | Turkish Lira
TRY 155,150 | | BUY | | 1/27/11 | | | 100,000 | | | | 100,164 | | | | 164 | | |
| Morgan Stanley | | Taiwan New Dollar
TWD 1,642,000 | | BUY | | 1/14/11 | | | 52,251 | | | | 56,341 | | | | 4,090 | | |
| Morgan Stanley | | Mexican Peso
MXN 2,466,400 | | BUY | | 2/22/11 | | | 200,000 | | | | 198,947 | | | | (1,053 | ) | |
| Morgan Stanley | | Mexican Peso
MXN 2,472,200 | | BUY | | 2/22/11 | | | 200,000 | | | | 199,415 | | | | (585 | ) | |
| Morgan Stanley | | Mexican Peso
MXN 1,253,150 | | BUY | | 2/22/11 | | | 100,000 | | | | 101,083 | | | | 1,083 | | |
| Morgan Stanley | | Mexican Peso
MXN 4,996,000 | | BUY | | 2/22/11 | | | 400,000 | | | | 402,992 | | | | 2,992 | | |
| Morgan Stanley | | Mexican Peso
MXN 3,715,950 | | BUY | | 2/22/11 | | | 300,000 | | | | 299,739 | | | | (261 | ) | |
| Morgan Stanley | | Singapore Dollar
SGD 132,170 | | BUY | | 3/9/11 | | | 100,000 | | | | 102,993 | | | | 2,993 | | |
See Accompanying Notes to Financial Statements
167
SUMMARY PORTFOLIO OF INVESTMENTS
ING PIMCO TOTAL RETURN PORTFOLIO AS OF DECEMBER 31, 2010 (CONTINUED)
| Counterparty | | Currency | | Buy/Sell | | Settlement
Date | | In Exchange
For | | Fair Value | | Unrealized
Appreciation
(Depreciation) | |
| Morgan Stanley | | South African Rand
ZAR 759,900 | | BUY | | 9/13/11 | | $ | 100,000 | | | $ | 111,248 | | | $ | 11,248 | | |
| Morgan Stanley | | South African Rand
ZAR 3,483,750 | | BUY | | 1/28/11 | | | 500,000 | | | | 526,571 | | | | 26,571 | | |
| Morgan Stanley | | South African Rand
ZAR 697,650 | | BUY | | 4/28/11 | | | 100,000 | | | | 104,129 | | | | 4,129 | | |
| RBC Capital Markets | | Canadian Dollar
CAD 235,000 | | BUY | | 2/17/11 | | | 230,563 | | | | 236,117 | | | | 5,554 | | |
| RBC Capital Markets | | Japanese Yen
JPY 41,932,000 | | BUY | | 1/14/11 | | | 500,294 | | | | 516,553 | | | | 16,259 | | |
Royal Bank of Scotland
Group PLC | | Australian Dollar
AUD 2,680,000 | | BUY | | 1/28/11 | | | 2,551,130 | | | | 2,730,675 | | | | 179,545 | | |
Royal Bank of Scotland
Group PLC | | Indonesian Rupiah
IDR 850,500,000 | | BUY | | 7/27/11 | | | 90,000 | | | | 91,246 | | | | 1,246 | | |
Royal Bank of Scotland
Group PLC | | Indian Rupee
INR 7,000,000 | | BUY | | 3/9/11 | | | 155,556 | | | | 154,602 | | | | (954 | ) | |
Royal Bank of Scotland
Group PLC | | South Korean Won
KRW 266,000,000 | | BUY | | 5/9/11 | | | 235,117 | | | | 233,060 | | | | (2,057 | ) | |
Royal Bank of Scotland
Group PLC | | Malaysian Ringgit
MYR 530,000 | | BUY | | 2/7/11 | | | 171,150 | | | | 171,425 | | | | 275 | | |
Royal Bank of Scotland
Group PLC | | Canadian Dollar
CAD 703,000 | | BUY | | 2/17/11 | | | 694,321 | | | | 706,341 | | | | 12,020 | | |
Royal Bank of Scotland
Group PLC | | Indonesian Rupiah
IDR 8,237,000,000 | | BUY | | 10/31/11 | | | 887,417 | | | | 870,321 | | | | (17,096 | ) | |
Royal Bank of Scotland
Group PLC | | Singapore Dollar
SGD 1,008,592 | | BUY | | 6/9/11 | | | 766,250 | | | | 785,916 | | | | 19,666 | | |
| UBS Warburg LLC | | South Korean Won
KRW 348,450,000 | | BUY | | 5/9/11 | | | 300,000 | | | | 305,299 | | | | 5,299 | | |
| UBS Warburg LLC | | Mexican Peso
MXN 1,273,200 | | BUY | | 2/22/11 | | | 100,000 | | | | 102,700 | | | | 2,700 | | |
| UBS Warburg LLC | | Taiwan New Dollar
TWD 889,000 | | BUY | | 1/14/11 | | | 28,049 | | | | 30,504 | | | | 2,455 | | |
| UBS Warburg LLC | | Japanese Yen
JPY 8,375,100 | | BUY | | 1/14/11 | | | 100,000 | | | | 103,171 | | | | 3,171 | | |
| UBS Warburg LLC | | Japanese Yen
JPY 25,149,000 | | BUY | | 1/14/11 | | | 303,551 | | | | 309,806 | | | | 6,255 | | |
| UBS Warburg LLC | | Japanese Yen
JPY 25,053,000 | | BUY | | 1/14/11 | | | 302,392 | | | | 308,624 | | | | 6,232 | | |
| UBS Warburg LLC | | Mexican Peso
MXN 7,484,400 | | BUY | | 2/22/11 | | | 600,000 | | | | 603,713 | | | | 3,713 | | |
| UBS Warburg LLC | | Mexican Peso
MXN 4,953,400 | | BUY | | 2/22/11 | | | 400,000 | | | | 399,555 | | | | (445 | ) | |
| UBS Warburg LLC | | Turkish Lira
TRY 155,365 | | BUY | | 1/27/11 | | | 100,000 | | | | 100,303 | | | | 303 | | |
| | | $ | 1,110,597 | | |
| Barclays Bank PLC | | EU Euro
EUR 44,000 | | SELL | | 1/25/11 | | | 57,638 | | | | 58,795 | | | | (1,157 | ) | |
| Barclays Bank PLC | | EU Euro
EUR 1,150,000 | | SELL | | 1/25/11 | | | 1,506,454 | | | | 1,536,687 | | | | (30,233 | ) | |
| Barclays Bank PLC | | EU Euro
EUR 200,000 | | SELL | | 1/25/11 | | | 267,356 | | | | 267,250 | | | | 106 | | |
| Barclays Bank PLC | | EU Euro
EUR 200,000 | | SELL | | 1/25/11 | | | 264,160 | | | | 267,250 | | | | (3,090 | ) | |
| Barclays Bank PLC | | EU Euro
EUR 200,000 | | SELL | | 1/25/11 | | | 262,393 | | | | 267,250 | | | | (4,857 | ) | |
| Barclays Bank PLC | | Indian Rupee
INR 72,948,000 | | SELL | | 1/12/11 | | | 1,603,958 | | | | 1,627,807 | | | | (23,849 | ) | |
| Citigroup, Inc. | | Japanese Yen
JPY 4,620,000,000 | | SELL | | 1/31/11 | | | 56,855,590 | | | | 56,924,235 | | | | (68,645 | ) | |
| Citigroup, Inc. | | EU Euro
EUR 30,360,000 | | SELL | | 1/25/11 | | | 42,211,178 | | | | 40,568,530 | | | | 1,642,648 | | |
| Citigroup, Inc. | | EU Euro
EUR 238,000 | | SELL | | 1/25/11 | | | 310,120 | | | | 318,027 | | | | (7,907 | ) | |
| Citigroup, Inc. | | Japanese Yen
JPY 160,000,000 | | SELL | | 3/14/11 | | | 1,917,086 | | | | 1,972,215 | | | | (55,129 | ) | |
| Citigroup, Inc. | | Australian Dollar
AUD 2,680,000 | | SELL | | 1/28/11 | | | 2,596,472 | | | | 2,730,675 | | | | (134,203 | ) | |
| Citigroup, Inc. | | EU Euro
EUR 200,000 | | SELL | | 1/25/11 | | | 264,954 | | | | 267,250 | | | | (2,296 | ) | |
See Accompanying Notes to Financial Statements
168
SUMMARY PORTFOLIO OF INVESTMENTS
ING PIMCO TOTAL RETURN PORTFOLIO AS OF DECEMBER 31, 2010 (CONTINUED)
| Counterparty | | Currency | | Buy/Sell | | Settlement
Date | | In Exchange
For | | Fair Value | | Unrealized
Appreciation
(Depreciation) | |
| Credit Suisse First Boston | | EU Euro
EUR 528,000 | | SELL | | 1/25/11 | | $ | 705,302 | | | $ | 705,540 | | | $ | (238 | ) | |
| Credit Suisse First Boston | | EU Euro
EUR 399,000 | | SELL | | 1/25/11 | | | 527,421 | | | | 533,163 | | | | (5,742 | ) | |
| Credit Suisse First Boston | | EU Euro
EUR 500,000 | | SELL | | 1/25/11 | | | 670,605 | | | | 668,125 | | | | 2,480 | | |
| Credit Suisse First Boston | | Australian Dollar
AUD 9,000 | | SELL | | 1/28/11 | | | 8,957 | | | | 9,170 | | | | (213 | ) | |
| Credit Suisse First Boston | | EU Euro
EUR 200,000 | | SELL | | 1/25/11 | | | 265,251 | | | | 267,250 | | | | (1,999 | ) | |
| Deutsche Bank AG | | Taiwan New Dollar
TWD 3,100,000 | | SELL | | 1/14/11 | | | 103,402 | | | | 106,369 | | | | (2,967 | ) | |
| Deutsche Bank AG | | Taiwan New Dollar
TWD 2,240,749 | | SELL | | 1/14/11 | | | 75,004 | | | | 76,886 | | | | (1,882 | ) | |
| Goldman Sachs & Co. | | Japanese Yen
JPY 189,806,000 | | SELL | | 1/14/11 | | | 2,255,005 | | | | 2,338,187 | | | | (83,182 | ) | |
| JPMorgan Chase & Co. | | South Korean Won
KRW 4,139,071,437 | | SELL | | 1/19/11 | | | 3,584,543 | | | | 3,642,917 | | | | (58,374 | ) | |
| RBC Capital Markets | | EU Euro
EUR 152,000 | | SELL | | 1/25/11 | | | 198,890 | | | | 203,110 | | | | (4,220 | ) | |
Royal Bank of Scotland
Group PLC | | Danish Krone
DKK 16,516,000 | | SELL | | 2/7/11 | | | 3,073,653 | | | | 2,960,576 | | | | 113,077 | | |
Royal Bank of Scotland
Group PLC | | Japanese Yen
JPY 112,979,000 | | SELL | | 1/14/11 | | | 1,341,777 | | | | 1,391,768 | | | | (49,991 | ) | |
Royal Bank of Scotland
Group PLC | | EU Euro
EUR 89,000 | | SELL | | 1/25/11 | | | 123,298 | | | | 118,926 | | | | 4,372 | | |
Royal Bank of Scotland
Group PLC | | Japanese Yen
JPY 225,958,000 | | SELL | | 1/14/11 | | | 2,688,344 | | | | 2,783,537 | | | | (95,193 | ) | |
Royal Bank of Scotland
Group PLC | | British Pound
GBP 707,000 | | SELL | | 3/21/11 | | | 1,105,221 | | | | 1,101,578 | | | | 3,643 | | |
Royal Bank of Scotland
Group PLC | | Singapore Dollar
SGD 1,008,592 | | SELL | | 1/14/11 | | | 766,291 | | | | 785,923 | | | | (19,632 | ) | |
Royal Bank of Scotland
Group PLC | | EU Euro
EUR 497,000 | | SELL | | 1/25/11 | | | 653,815 | | | | 664,116 | | | | (10,301 | ) | |
| UBS Warburg LLC | | EU Euro
EUR 200,000 | | SELL | | 1/25/11 | | | 264,408 | | | | 267,250 | | | | (2,842 | ) | |
| UBS Warburg LLC | | EU Euro
EUR 226,000 | | SELL | | 1/25/11 | | | 296,338 | | | | 301,992 | | | | (5,654 | ) | |
| | | $ | 1,092,530 | | |
ING PIMCO Total Return Portfolio Open Futures Contracts on December 31, 2010:
| Contract Description | | Number
of Contracts | | Expiration Date | | Notional
Value | | Unrealized
Appreciation/
(Depreciation) | |
| Long Contracts | |
| 90-Day Eurodollar | | | 698 | | | 03/14/11 | | $ | 173,863,075 | | | $ | 92,839 | | |
| 90-Day Eurodollar | | | 423 | | | 06/13/11 | | | 105,284,700 | | | | 142,523 | | |
| 90-Day Eurodollar | | | 99 | | | 09/19/11 | | | 24,612,638 | | | | 53,167 | | |
| 90-Day Eurodollar | | | 177 | | | 12/19/11 | | | 43,926,975 | | | | (23,271 | ) | |
| 90-Day Eurodollar | | | 270 | | | 03/19/12 | | | 66,858,750 | | | | (111,519 | ) | |
| 90-Day Eurodollar | | | 253 | | | 06/18/12 | | | 62,478,350 | | | | (177,575 | ) | |
| 90-Day Eurodollar | | | 238 | | | 09/17/12 | | | 58,610,475 | | | | (375,587 | ) | |
| 90-Day Eurodollar | | | 76 | | | 12/17/12 | | | 18,660,850 | | | | (158,465 | ) | |
| 90-Day Eurodollar | | | 53 | | | 03/18/13 | | | 12,976,387 | | | | (128,063 | ) | |
| 90-Day Eurodollar | | | 8 | | | 06/17/13 | | | 1,953,000 | | | | (20,382 | ) | |
| 90-Day Eurodollar | | | 29 | | | 09/16/13 | | | 7,060,050 | | | | (81,380 | ) | |
| 90-Day Sterling | | | 18 | | | 12/21/11 | | | 3,464,102 | | | | (7,443 | ) | |
| 90-Day Sterling | | | 17 | | | 03/21/12 | | | 3,263,700 | | | | (10,771 | ) | |
| 90-Day Sterling | | | 19 | | | 06/20/12 | | | 3,637,668 | | | | (16,362 | ) | |
| 90-Day Sterling | | | 18 | | | 09/19/12 | | | 3,436,389 | | | | (19,769 | ) | |
| U.S. Treasury 2-Year Note | | | 153 | | | 03/31/11 | | | 33,492,658 | | | | 8,564 | | |
| U.S. Treasury 5-Year Note | | | 33 | | | 03/31/11 | | | 3,884,719 | | | | (58,695 | ) | |
| | | | | | | $ | 627,464,486 | | | $ | (892,189 | ) | |
See Accompanying Notes to Financial Statements
169
SUMMARY PORTFOLIO OF INVESTMENTS
ING PIMCO TOTAL RETURN PORTFOLIO AS OF DECEMBER 31, 2010 (CONTINUED)
ING PIMCO Total Return Portfolio Credit Default Swap Agreements Outstanding on December 31, 2010:
Credit Default Swaps on Credit Indices — Sell Protection(1)
| Counterparty | | Reference
Entity/Obligation | | Buy/Sell
Protection | | (Pay)/
Receive
Fixed
Rate(%) | | Termination
Date | | Notional
Amount(3) | | Fair
Value(4) | | Upfront
Premium
Paid/
(Received) | | Unrealized
Appreciation/
(Depreciation) | |
Citigroup, Inc.
| | CDX.NA.HY.8 Index
(35-100% Tranche) | |
Sell | | | 0.401 | | |
06/20/12 | | USD | 962,940 | | | $ | 4,662 | | | $ | — | | | $ | 4,662 | | |
Deutsche
Bank AG
| | CDX.NA.IG.9 Index
(30-100% Tranche) | |
Sell | | |
0.708 | | |
12/20/12 | | USD | 2,893,497 | | | | 34,969 | | | | — | | | | 34,969 | | |
Goldman Sachs
& Co.
| | CDX.NA.IG.9 Index
(30-100% Tranche) | |
Sell | | |
0.548 | | |
12/20/17 | | USD | 675,149 | | | | 7,266 | | | | — | | | | 7,266 | | |
Deutsche
Bank AG
| | CDX.NA.IG.10 Index
(30-100% Tranche) | |
Sell | | |
0.530 | | |
06/20/13 | | USD | 964,499 | | | | 8,776 | | | | — | | | | 8,776 | | |
Barclays
Bank PLC | | CDX.EM.13 Index | | Sell | | | 5.000 | | | 06/20/15 | | USD | 8,700,000 | | | | 1,099,764 | | | | 1,007,270 | | | | 92,494 | | |
Deutsche
Bank AG | | CDX.EM.13 Index | | Sell | | | 5.000 | | | 06/20/15 | | USD | 900,000 | | | | 113,769 | | | | 102,014 | | | | 11,755 | | |
Goldman Sachs
& Co. | | CDX.EM.13 Index | | Sell | | | 5.000 | | | 06/20/15 | | USD | 200,000 | | | | 25,282 | | | | 21,593 | | | | 3,689 | | |
| HSBC Bank USA | | CDX.EM.13 Index | | Sell | | | 5.000 | | | 06/20/15 | | USD | 5,600,000 | | | | 707,894 | | | | 601,228 | | | | 106,666 | | |
| Morgan Stanley | | CDX.EM.13 Index | | Sell | | | 5.000 | | | 06/20/15 | | USD | 3,000,000 | | | | 379,229 | | | | 315,742 | | | | 63,487 | | |
Barclays
Bank PLC | | CDX.EM.14 Index | | Sell | | | 5.000 | | | 12/20/15 | | USD | 8,100,000 | | | | 1,105,168 | | | | 1,057,111 | | | | 48,057 | | |
Deutsche
Bank AG | | CDX.EM.14 Index | | Sell | | | 5.000 | | | 12/20/15 | | USD | 1,000,000 | | | | 136,441 | | | | 116,025 | | | | 20,416 | | |
| HSBC Bank USA | | CDX.EM.14 Index | | Sell | | | 5.000 | | | 12/20/15 | | USD | 700,000 | | | | 95,508 | | | | 86,804 | | | | 8,704 | | |
| Morgan Stanley | | CDX.EM.14 Index | | Sell | | | 5.000 | | | 12/20/15 | | USD | 1,400,000 | | | | 191,017 | | | | 172,943 | | | | 18,074 | | |
| Citigroup, Inc. | | CDX.EM.14 Index | | Sell | | | 5.000 | | | 12/20/15 | | USD | 4,900,000 | | | | 668,559 | | | | 629,179 | | | | 39,380 | | |
UBS
Warburg LLC | | CDX.EM.14 Index | | Sell | | | 5.000 | | | 12/20/15 | | USD | 300,000 | | | | 40,932 | | | | 39,648 | | | | 1,284 | | |
| Citigroup, Inc. | | CDX.NA.HY.15 Index | | Sell | | | 5.000 | | | 12/20/15 | | USD | 1,300,000 | | | | 38,274 | | | | (13,852 | ) | | | 52,126 | | |
Deutsche
Bank AG | | CDX.NA.HY.15 Index | | Sell | | | 5.000 | | | 12/20/15 | | USD | 10,200,000 | | | | 300,306 | | | | 92,390 | | | | 207,916 | | |
| Morgan Stanley | | CDX.NA.HY.15 Index | | Sell | | | 5.000 | | | 12/20/15 | | USD | 23,500,000 | | | | 691,882 | | | | 56,036 | | | | 635,846 | | |
Royal Bank of
Scotland
Group PLC | | CDX.NA.HY.15 Index | | Sell | | | 5.000 | | | 12/20/15 | | USD | 2,600,000 | | | | 76,549 | | | | 26,989 | | | | 49,560 | | |
UBS
Warburg LLC | | CDX.NA.HY.15 Index | | Sell | | | 5.000 | | | 12/20/15 | | USD | 1,400,000 | | | | 41,219 | | | | (13,373 | ) | | | 54,592 | | |
| Citigroup, Inc. | | CDX.NA.IG.15 Index | | Sell | | | 1.000 | | | 12/20/15 | | USD | 4,100,000 | | | | 28,535 | | | | (7,780 | ) | | | 36,315 | | |
Deutsche
Bank AG | | CDX.NA.IG.15 Index | | Sell | | | 1.000 | | | 12/20/15 | | USD | 7,500,000 | | | | 52,198 | | | | (8,938 | ) | | | 61,136 | | |
Goldman Sachs
& Co. | | CDX.NA.IG.15 Index | | Sell | | | 1.000 | | | 12/20/15 | | USD | 4,100,000 | | | | 28,535 | | | | (7,415 | ) | | | 35,950 | | |
| Morgan Stanley | | CDX.NA.IG.15 Index | | Sell | | | 1.000 | | | 12/20/15 | | USD | 3,400,000 | | | | 23,663 | | | | (1,772 | ) | | | 25,435 | | |
UBS
Warburg LLC | | CDX.NA.IG.15 Index | | Sell | | | 1.000 | | | 12/20/15 | | USD | 1,500,000 | | | | 10,440 | | | | 9,044 | | | | 1,396 | | |
| | | | | | | | | | | | | | | $ | 5,910,837 | | | $ | 4,280,886 | | | $ | 1,629,951 | | |
Credit Default Swaps on Corporate and Sovereign Issues — Sell Protection(1)
| Counterparty | | Reference
Entity/Obligation | | Buy/Sell
Protection | | (Pay)/
Receive
Fixed
Rate(%) | | Termination
Date | | Implied
Credit
Spread at
12/31/10(%)(2) | | Notional
Amount(3) | | Fair
Value(4) | | Upfront
Premium
Paid/
(Received) | | Unrealized
Appreciation/
(Depreciation) | |
Barclays
Bank PLC | | Citigroup Inc.
6.500%, 01/18/11 | | Sell | | | 1.000 | | | 03/20/11 | | | 0.538 | | | USD | 100,000 | | | $ | 101 | | | $ | (113 | ) | | $ | 214 | | |
Goldman Sachs
& Co. | | Citigroup Inc.
6.500%, 01/18/11 | | Sell | | | 1.000 | | | 03/20/11 | | | 0.538 | | | USD | 400,000 | | | | 405 | | | | (426 | ) | | | 831 | | |
UBS
Warburg LLC | | Citigroup Inc.
6.500%, 01/18/11 | | Sell | | | 1.000 | | | 03/20/11 | | | 0.538 | | | USD | 500,000 | | | | 506 | | | | (533 | ) | | | 1,039 | | |
Barclays
Bank PLC
| | Federative Republic
of Brazil
12.250%, 03/06/30 | |
Sell | | | 1.000 | | |
06/20/15 | | | 1.033 | | | USD | 500,000 | | | | (712 | ) | | | (6,150 | ) | | | 5,438 | | |
See Accompanying Notes to Financial Statements
170
SUMMARY PORTFOLIO OF INVESTMENTS
ING PIMCO TOTAL RETURN PORTFOLIO AS OF DECEMBER 31, 2010 (CONTINUED)
| Counterparty | | Reference
Entity/Obligation | | Buy/Sell
Protection | | (Pay)/
Receive
Fixed
Rate(%) | | Termination
Date | | Implied
Credit
Spread at
12/31/10(%)(2) | | Notional
Amount(3) | | Fair
Value(4) | | Upfront
Premium
Paid/
(Received) | | Unrealized
Appreciation/
(Depreciation) | |
Citigroup, Inc.
| | Federative Republic
of Brazil
12.250%, 03/06/30 | |
Sell | | | 1.000 | | |
06/20/15 | | | 1.033 | | | USD | 500,000 | | | $ | (712 | ) | | $ | (12,292 | ) | | $ | 11,580 | | |
Citigroup, Inc.
| | Federative Republic
of Brazil
12.250%, 03/06/30 | |
Sell | | | 1.000 | | |
09/20/15 | | | 1.061 | | | USD | 1,000,000 | | | | (2,734 | ) | | | (14,656 | ) | | | 11,922 | | |
Goldman Sachs
& Co.
| | Federative Republic
of Brazil
12.250%, 03/06/30 | |
Sell | | | 1.000 | | |
06/20/15 | | | 1.033 | | | USD | 500,000 | | | | (712 | ) | | | (5,744 | ) | | | 5,032 | | |
HSBC
Bank USA
| | Federative Republic
of Brazil
12.250%, 03/06/30 | |
Sell | | | 1.000 | | |
06/20/15 | | | 1.033 | | | USD | 1,600,000 | | | | (2,277 | ) | | | (15,122 | ) | | | 12,845 | | |
HSBC
Bank USA
| | Federative Republic
of Brazil
12.250%, 03/06/30 | |
Sell | | | 1.000 | | |
06/20/15 | | | 1.033 | | | USD | 800,000 | | | | (1,139 | ) | | | (19,023 | ) | | | 17,884 | | |
HSBC
Bank USA
| | Federative Republic
of Brazil
12.250%, 03/06/30 | |
Sell | | | 1.000 | | |
09/20/15 | | | 1.061 | | | USD | 900,000 | | | | (2,461 | ) | | | (8,419 | ) | | | 5,958 | | |
UBS
Warburg LLC
| | Federative Republic
of Brazil
12.250%, 03/06/30 | |
Sell | | | 1.000 | | |
09/20/15 | | | 1.061 | | | USD | 500,000 | | | | (1,367 | ) | | | (4,449 | ) | | | 3,082 | | |
BNP Paribas
Bank
| | General Electric
Capital Corp.
5.625%, 09/15/17 | |
Sell | | | 4.700 | | |
12/20/13 | | | 1.079 | | | USD | 600,000 | | | | 63,210 | | | | — | | | | 63,210 | | |
Citigroup, Inc.
| | General Electric
Capital Corp.
5.625%, 09/15/17 | |
Sell | | | 5.000 | | |
06/20/11 | | | 0.520 | | | USD | 1,000,000 | | | | 21,213 | | | | (10,855 | ) | | | 32,068 | | |
Citigroup, Inc.
| | General Electric
Capital Corp.
5.625%, 09/15/17 | |
Sell | | | 4.325 | | |
12/20/13 | | | 1.079 | | | USD | 300,000 | | | | 28,332 | | | | — | | | | 28,332 | | |
Morgan Stanley
| | General Electric
Capital Corp.
5.625%, 09/15/17 | |
Sell | | | 1.000 | | |
09/20/11 | | | 0.520 | | | USD | 1,000,000 | | | | 3,492 | | | | (5,955 | ) | | | 9,447 | | |
Morgan Stanley
| | General Electric
Capital Corp.
5.625%, 09/15/17 | |
Sell | | | 1.000 | | |
12/20/15 | | | 1.434 | | | USD | 1,700,000 | | | | (34,159 | ) | | | (32,871 | ) | | | (1,288 | ) | |
Barclays
Bank PLC
| | General Electric
Capital Corp.
6.000%, 06/15/12 | |
Sell | | | 0.620 | | |
03/20/11 | | | 0.529 | | | USD | 1,200,000 | | | | 239 | | | | — | | | | 239 | | |
Barclays
Bank PLC
| | General Electric
Capital Corp.
6.000%, 06/15/12 | |
Sell | | | 0.640 | | |
12/20/12 | | | 0.890 | | | USD | 1,200,000 | | | | (5,897 | ) | | | — | | | | (5,897 | ) | |
Deutsche
Bank AG
| | General Electric
Capital Corp.
6.000%, 06/15/12 | |
Sell | | | 1.500 | | |
09/20/11 | | | 0.529 | | | USD | 200,000 | | | | 1,412 | | | | — | | | | 1,412 | | |
Goldman Sachs
& Co.
| | Government of
France O.A.T.
4.250%, 04/25/2019 | |
Sell | | | 0.250 | | |
03/20/15 | | | 0.968 | | | USD | 1,700,000 | | | | (49,491 | ) | | | (24,582 | ) | | | (24,909 | ) | |
Goldman Sachs
& Co.
| | Government of
France O.A.T.
4.250%, 04/25/2019 | |
Sell | | | 0.250 | | |
12/20/15 | | | 1.062 | | | USD | 300,000 | | | | (11,434 | ) | | | (5,653 | ) | | | (5,781 | ) | |
Royal Bank of
Scotland
Group PLC | | Government of
France O.A.T.
4.250%, 04/25/2019 | |
Sell | | | 0.250 | | |
12/20/15 | | | 1.062 | | | USD | 700,000 | | | | (26,678 | ) | | | (13,353 | ) | | | (13,325 | ) | |
Deutsche
Bank AG
| | Japanese
Government
20-Year Issue
2.000%, 03/21/2022 | |
Sell | | | 1.000 | | |
03/20/15 | | | 0.590 | | | USD | 1,000,000 | | | | 16,847 | | | | 9,673 | | | | 7,174 | | |
See Accompanying Notes to Financial Statements
171
SUMMARY PORTFOLIO OF INVESTMENTS
ING PIMCO TOTAL RETURN PORTFOLIO AS OF DECEMBER 31, 2010 (CONTINUED)
| Counterparty | | Reference
Entity/Obligation | | Buy/Sell
Protection | | (Pay)/
Receive
Fixed
Rate(%) | | Termination
Date | | Implied
Credit
Spread at
12/31/10(%)(2) | | Notional
Amount(3) | | Fair
Value(4) | | Upfront
Premium
Paid/
(Received) | | Unrealized
Appreciation/
(Depreciation) | |
Barclays
Bank PLC | | Merrill Lynch & Co.
5.000%, 01/15/15 | | Sell | | | 1.000 | | | 12/20/11 | | | 0.846 | | | USD | 1,800,000 | | | $ | 2,698 | | | $ | (4,696 | ) | | $ | 7,394 | | |
Citigroup, Inc.
| | Metlife Inc.
5.000%, 06/15/15 | |
Sell | | | 1.000 | | |
12/20/15 | | | 1.605 | | | USD | 2,900,000 | | | | (81,114 | ) | | | (104,389 | ) | | | 23,275 | | |
UBS
Warburg LLC | | Metlife Inc.
5.000%, 06/15/15 | | Sell | | | 1.000 | | | 12/20/15 | | | 1.605 | | | USD | 1,600,000 | | | | (44,752 | ) | | | (85,752 | ) | | | 41,000 | | |
Deutsche
Bank AG
| | People's Republic
of China
4.750%, 10/29/2013 | |
Sell | | | 1.000 | | |
03/20/15 | | | 0.578 | | | USD | 5,000,000 | | | | 86,526 | | | | 23,501 | | | | 63,025 | | |
Deutsche
Bank AG
| | Reynolds
American Inc.
7.625%, 06/01/16 | |
Sell | | | 1.280 | | |
06/20/17 | | | 1.216 | | | USD | 600,000 | | | | 2,270 | | | | — | | | | 2,270 | | |
Citigroup, Inc.
| | SLM Corp.
5.125%, 08/27/12 | |
Sell | | | 4.850 | | |
03/20/13 | | | 1.606 | | | USD | 700,000 | | | | 49,540 | | | | — | | | | 49,540 | | |
BNP Paribas
Bank | | United Kingdom Gilt
4.250%, 06/07/2032 | | Sell | | | 1.000 | | | 12/20/14 | | | 0.616 | | | USD | 100,000 | | | | 1,487 | | | | 592 | | | | 895 | | |
Deutsche
Bank AG | | United Kingdom Gilt
4.250%, 06/07/2032 | | Sell | | | 1.000 | | | 12/20/14 | | | 0.616 | | | USD | 200,000 | | | | 2,975 | | | | 1,111 | | | | 1,864 | | |
Goldman Sachs
& Co. | | United Kingdom Gilt
4.250%, 06/07/2032 | | Sell | | | 1.000 | | | 06/20/15 | | | 0.666 | | | USD | 4,600,000 | | | | 66,295 | | | | 36,199 | | | | 30,096 | | |
Goldman Sachs
& Co. | | United Kingdom Gilt
4.250%, 06/07/2032 | | Sell | | | 1.000 | | | 12/20/15 | | | 0.715 | | | USD | 800,000 | | | | 10,839 | | | | 17,653 | | | | (6,814 | ) | |
Goldman Sachs
& Co. | | United Kingdom Gilt
4.250%, 06/07/2032 | | Sell | | | 1.000 | | | 12/20/15 | | | 0.715 | | | USD | 1,000,000 | | | | 13,549 | | | | 22,285 | | | | (8,736 | ) | |
Morgan Stanley
| | United Kingdom Gilt
4.250%, 06/07/2032 | |
Sell | | | 1.000 | | |
12/20/14 | | | 0.616 | | | USD | 100,000 | | | | 1,487 | | | | 592 | | | | 895 | | |
Barclays
Bank PLC | | United Mexican States
7.500%, 04/08/33 | |
Sell | | | 1.000 | | |
03/20/15 | | | 1.017 | | | USD | 600,000 | | | | (422 | ) | | | (11,116 | ) | | | 10,694 | | |
Citigroup, Inc.
| | United Mexican States
7.500%, 04/08/33 | |
Sell | | | 1.000 | | |
03/20/15 | | | 1.017 | | | USD | 600,000 | | | | (422 | ) | | | (11,343 | ) | | | 10,921 | | |
Citigroup, Inc.
| | United Mexican States
7.500%, 04/08/33 | |
Sell | | | 1.000 | | |
09/20/15 | | | 1.080 | | | USD | 1,000,000 | | | | (3,618 | ) | | | (14,182 | ) | | | 10,564 | | |
Deutsche
Bank AG | | United Mexican States
7.500%, 04/08/33 | |
Sell | | | 1.000 | | |
03/20/15 | | | 1.017 | | | USD | 200,000 | | | | (141 | ) | | | (3,781 | ) | | | 3,640 | | |
UBS
Warburg LLC
| | United States
Treasury Note
4.875%, 08/15/16 | |
Sell | | | 0.250 | | |
09/20/15 | | | 0.384 | | | EUR | 5,000,000 | | | | (40,734 | ) | | | (68,903 | ) | | | 28,169 | | |
| | | | | | | | | | | | | | | $ | 62,447 | | | $ | (372,752 | ) | | $ | 435,199 | | |
(1) If the Portfolio is a seller of protection, and a credit event occurs, as defined under the terms of that particular swap agreement, the Portfolio will generally either 1.) Pay to the buyer an amount equal to the notional amount of the swap and take delivery of the referenced obligation, other deliverable obligations, or underlying securities comprising a referenced index or 2.) Pay a net settlement amount in the form of cash or securities equal to the notional amount of the swap less the recovery value of the referenced obligation or underlying securities comprising a referenced index.
(2) Implied credit spreads, represented in absolute terms, utilized in determining the fair value of credit default swap agreements on corporate issues or sovereign issues are disclosed in each Portfolio's Portfolio of Investment and serve as an indicator of the current status of the payment/performance risk and represent the likelihood or risk of default for the credit derivative. The implied credit spread of a particular referenced entity reflects the cost of buying/selling protection and may include upfront payments required to be made to enter into the agreement. For credit default swaps on asset-backed securities or credit indices, the quoted fair prices and resulting fair values serve as the indicator of the current status of the payment/performance risk. Wider credit spreads and increasing fair values, in absolute terms when compared to the notional amount of the swap, represent a deterioration of the referenced entity's credit soundness and a greater likelihood or risk of default or other credit event occurring as defined under the terms of the agreement.
(3) The maximum amount of future payments (undiscounted) that a Portfolio as a seller of protection could be required to make or receive as a buyer of credit protection under a credit default swap agreement would be an amount equal to the notional amount of the agreement.
(4) The fair values for credit default swap agreements serve as an indicator of the current status of the payment/performance risk and represent the likelihood or risk of default for the credit derivative. Increasing fair values, in absolute terms, when compared to the notional amount of the agreement, represent a deterioration of the referenced obligation's credit soundness and a greater likelihood or risk of default or other credit event occurring.
See Accompanying Notes to Financial Statements
172
SUMMARY PORTFOLIO OF INVESTMENTS
ING PIMCO TOTAL RETURN PORTFOLIO AS OF DECEMBER 31, 2010 (CONTINUED)
ING PIMCO Total Return Portfolio Interest Rate Swap Agreements Outstanding on December 31, 2010:
| | | Termination
Date | | Notional
Amount | | Fair
Value | | Upfront Premium
Paid/(Received) | | Unrealized
Appreciation/
(Depreciation) | |
Receive a fixed rate equal to 4.500% and pay a floating rate
based on 3-month AUD-BBR-BBSW
Counterparty: Deutsche Bank AG | | 06/15/11 | | AUD | 800,000 | | | $ | (2,153 | ) | | $ | 25 | | | $ | (2,178 | ) | |
Receive a fixed rate equal to 4.500% and pay a floating rate
based on 3-month AUD-BBR-BBSW
Counterparty: UBS Warburg LLC | | 06/15/11 | | AUD | 9,100,000 | | | | (24,499 | ) | | | 61 | | | | (24,560 | ) | |
Receive a fixed rate equal to 6.000% and pay a floating rate
based on 6-month AUD-BBR-BBSW
Counterparty: UBS Warburg LLC | | 09/15/12 | | AUD | 6,300,000 | | | | 65,145 | | | | — | | | | 65,145 | | |
Receive a fixed rate equal to 10.600% and pay a floating rate
based on the Brazil Cetip Interbank Deposit Rate Annualized
Counterparty: Barclays Bank PLC | | 01/02/12 | | BRL | 1,500,000 | | | | 3,182 | | | | — | | | | 3,182 | | |
Receive a fixed rate equal to 11.910% and pay a floating rate
based on the Brazil Cetip Interbank Deposit Rate Annualized
Counterparty: Barclays Bank PLC | | 01/02/13 | | BRL | 3,900,000 | | | | 14,287 | | | | 6,948 | | | | 7,339 | | |
Receive a fixed rate equal to 12.285% and pay a floating rate
based on the Brazil Cetip Interbank Deposit Rate Annualized
Counterparty: Barclays Bank PLC | | 01/02/13 | | BRL | 12,500,000 | | | | 120,050 | | | | 19,701 | | | | 100,349 | | |
Receive a fixed rate equal to 11.990% and pay a floating rate
based on the Brazil Cetip Interbank Deposit Rate Annualized
Counterparty: Barclays Bank PLC, London | | 01/02/14 | | BRL | 3,200,000 | | | | 14,666 | | | | 12,350 | | | | 2,316 | | |
Receive a fixed rate equal to 10.835% and pay a floating rate
based on the Brazil Cetip Interbank Deposit Rate Annualized
Counterparty: Goldman Sachs Bank USA | | 01/02/12 | | BRL | 11,100,000 | | | | 60,459 | | | | 3,869 | | | | 56,590 | | |
Receive a fixed rate equal to 10.990% and pay a floating rate
based on the Brazil Cetip Interbank Deposit Rate Annualized
Counterparty: Goldman Sachs Bank USA | | 01/02/12 | | BRL | 1,900,000 | | | | 9,900 | | | | 1,722 | | | | 8,178 | | |
Receive a fixed rate equal to 11.890% and pay a floating rate
based on the Brazil Cetip Interbank Deposit Rate Annualized
Counterparty: Goldman Sachs Bank USA | | 01/02/13 | | BRL | 8,500,000 | | | | 36,694 | | | | 1,218 | | | | 35,476 | | |
Receive a fixed rate equal to 11.930% and pay a floating rate
based on the Brazil Cetip Interbank Deposit Rate Annualized
Counterparty: Goldman Sachs Bank USA | | 01/02/13 | | BRL | 3,500,000 | | | | 15,832 | | | | (3,773 | ) | | | 19,605 | | |
Receive a fixed rate equal to 12.650% and pay a floating rate
based on the Brazil Cetip Interbank Deposit Rate Annualized
Counterparty: Goldman Sachs Bank USA | | 01/02/14 | | BRL | 4,200,000 | | | | 65,864 | | | | 25,496 | | | | 40,368 | | |
Receive a fixed rate equal to 10.610% and pay a floating rate
based on the Brazil Cetip Interbank Deposit Rate Annualized
Counterparty: HSBC Bank USA | | 01/02/12 | | BRL | 1,400,000 | | | | 3,160 | | | | — | | | | 3,160 | | |
Receive a fixed rate equal to 11.140% and pay a floating rate
based on the Brazil Cetip Interbank Deposit Rate Annualized
Counterparty: HSBC Bank USA | | 01/02/12 | | BRL | 16,100,000 | | | | 150,142 | | | | 9,564 | | | | 140,578 | | |
Receive a fixed rate equal to 11.360% and pay a floating rate
based on the Brazil Cetip Interbank Deposit Rate Annualized
Counterparty: HSBC Bank USA | | 01/02/12 | | BRL | 13,000,000 | | | | 104,624 | | | | 35,269 | | | | 69,355 | | |
Receive a fixed rate equal to 11.880% and pay a floating rate
based on the Brazil Cetip Interbank Deposit Rate Annualized
Counterparty: HSBC Bank USA | | 01/02/13 | | BRL | 5,300,000 | | | | 14,853 | | | | (3,089 | ) | | | 17,942 | | |
Receive a fixed rate equal to 11.890% and pay a floating rate
based on the Brazil Cetip Interbank Deposit Rate Annualized
Counterparty: HSBC Bank USA | | 01/02/13 | | BRL | 11,200,000 | | | | 48,350 | | | | 13,150 | | | | 35,200 | | |
Receive a fixed rate equal to 12.300% and pay a floating rate
based on the Brazil Cetip Interbank Deposit Rate Annualized
Counterparty: HSBC Bank USA | | 01/02/13 | | BRL | 5,000,000 | | | | 49,552 | | | | 11,264 | | | | 38,288 | | |
Receive a fixed rate equal to 12.830% and pay a floating rate
based on the Brazil Cetip Interbank Deposit Rate Annualized
Counterparty: HSBC Bank USA | | 01/02/13 | | BRL | 14,300,000 | | | | 166,800 | | | | — | | | | 166,800 | | |
Receive a fixed rate equal to 12.540% and pay a floating rate
based on the Brazil Cetip Interbank Deposit Rate Annualized
Counterparty: HSBC Bank USA | | 01/02/14 | | BRL | 400,000 | | | | 5,616 | | | | 1,989 | | | | 3,627 | | |
Receive a fixed rate equal to 11.980% and pay a floating rate
based on the Brazil Cetip Interbank Deposit Rate Annualized
Counterparty: Merrill Lynch & Co., Inc. | | 01/02/12 | | BRL | 2,100,000 | | | | 41,123 | | | | — | | | | 41,123 | | |
Receive a fixed rate equal to 12.540% and pay a floating rate
based on the Brazil Cetip Interbank Deposit Rate Annualized
Counterparty: Merrill Lynch & Co., Inc. | | 01/02/12 | | BRL | 2,900,000 | | | | 84,032 | | | | (5,728 | ) | | | 89,760 | | |
Receive a fixed rate equal to 14.765% and pay a floating rate
based on the Brazil Cetip Interbank Deposit Rate Annualized
Counterparty: Merrill Lynch & Co., Inc. | | 01/02/12 | | BRL | 400,000 | | | | 23,701 | | | | 637 | | | | 23,064 | | |
See Accompanying Notes to Financial Statements
173
SUMMARY PORTFOLIO OF INVESTMENTS
ING PIMCO TOTAL RETURN PORTFOLIO AS OF DECEMBER 31, 2010 (CONTINUED)
| | | Termination
Date | | Notional
Amount | | Fair
Value | | Upfront Premium
Paid/(Received) | | Unrealized
Appreciation/
(Depreciation) | |
Receive a fixed rate equal to 11.630% and pay a floating rate
based on the Brazil Cetip Interbank Deposit Rate Annualized
Counterparty: Morgan Stanley | | 01/02/12 | | BRL | 20,600,000 | | | $ | 69,123 | | | $ | (5,018 | ) | | $ | 74,141 | | |
Receive a fixed rate equal to 11.980% and pay a floating rate
based on the Brazil Cetip Interbank Deposit Rate Annualized
Counterparty: Morgan Stanley | | 01/02/13 | | BRL | 2,500,000 | | | | 13,108 | | | | 2,982 | | | | 10,126 | | |
Receive a fixed rate equal to 12.590% and pay a floating rate
based on the Brazil Cetip Interbank Deposit Rate Annualized
Counterparty: Morgan Stanley | | 01/02/13 | | BRL | 9,200,000 | | | | 81,039 | | | | 26,521 | | | | 54,518 | | |
Receive a fixed rate equal to 11.890% and pay a floating rate
based on the Brazil Cetip Interbank Deposit Rate Annualized
Counterparty: Morgan Stanley | | 01/02/14 | | BRL | 3,100,000 | | | | 1,362 | | | | (477 | ) | | | 1,839 | | |
Receive a fixed rate equal to 12.510% and pay a floating rate
based on the Brazil Cetip Interbank Deposit Rate Annualized
Counterparty: Morgan Stanley | | 01/02/14 | | BRL | 1,600,000 | | | | 21,772 | | | | 6,035 | | | | 15,737 | | |
Receive a fixed rate equal to 12.080% and pay a floating rate
based on the Brazil Cetip Interbank Deposit Rate Annualized
Counterparty: Royal Bank of Scotland Group PLC | | 01/02/12 | | BRL | 2,500,000 | | | | 15,613 | | | | 2,992 | | | | 12,621 | | |
Receive a fixed rate equal to 11.950% and pay a floating rate
based on the Brazil Cetip Interbank Deposit Rate Annualized
Counterparty: Royal Bank of Scotland Group PLC | | 01/02/13 | | BRL | 3,200,000 | | | | 244 | | | | 2,879 | | | | (2,635 | ) | |
Receive a fixed rate equal to 10.575% and pay a floating rate
based on the Brazil Cetip Interbank Deposit Rate Annualized
Counterparty: UBS Warburg LLC, London | | 01/02/12 | | BRL | 2,500,000 | | | | (25,703 | ) | | | (8,771 | ) | | | (16,932 | ) | |
Receive a fixed rate equal to 11.420% and pay a floating rate
based on the Brazil Cetip Interbank Deposit Rate Annualized
Counterparty: UBS Warburg LLC | | 01/02/12 | | BRL | 1,800,000 | | | | 5,886 | | | | — | | | | 5,886 | | |
Receive a fixed rate equal to 12.070% and pay a floating rate
based on the Brazil Cetip Interbank Deposit Rate Annualized
Counterparty: UBS Warburg LLC | | 01/02/13 | | BRL | 2,100,000 | | | | 14,038 | | | | 3,646 | | | | 10,392 | | |
Receive a fixed rate equal to 12.250% and pay a floating rate
based on the Brazil Cetip Interbank Deposit Rate Annualized
Counterparty: UBS Warburg LLC | | 01/02/14 | | BRL | 2,600,000 | | | | 24,717 | | | | 5,543 | | | | 19,174 | | |
Receive a fixed rate equal to 7.340% and pay a floating rate
based on 28-day MXN-TIIE-BANXICO
Counterparty: Barclays Bank PLC | | 01/28/15 | | MXN | 104,200,000 | | | | 336,870 | | | | (979 | ) | | | 337,849 | | |
Receive a fixed rate equal to 7.330% and pay a floating rate
based on 28-day MXN-TIIE-BANXICO
Counterparty: Citigroup, Inc. | | 01/28/15 | | MXN | 19,900,000 | | | | 63,732 | | | | (1,102 | ) | | | 64,834 | | |
Receive a fixed rate equal to 8.860% and pay a floating rate
based on 28-day MXN-TIIE-BANXICO
Counterparty: Citigroup, Inc. | | 09/12/16 | | MXN | 5,700,000 | | | | 49,075 | | | | — | | | | 49,075 | | |
Receive a fixed rate equal to 1.250% and pay a floating rate
based on 3-month USD-LIBOR-BBA
Counterparty: Goldman Sachs & Co. | | 12/19/13 | | USD | 7,800,000 | | | | (68,606 | ) | | | 358 | | | | (68,964 | ) | |
Receive a floating rate based on 3-month USD-LIBOR-BBA and
pay a fixed rate equal to 4.250%
Counterparty: Morgan Stanley | | 06/15/41 | | USD | 17,300,000 | | | | (117,869 | ) | | | 34,563 | | | | (152,432 | ) | |
| | | | | $1,555,781 | | $199,845 | | $1,355,936 | |
ING PIMCO Total Return Portfolio Written Inflation Floors Outstanding on December 31, 2010:
Inflation Floors
| Counterparty | | Reference Entity/Obligation | | Strike
Index | | Floor
Rate | | Termination
Date | | Notional
Amount | | Premiums
Received | | Fair
Value | |
| Deutsche Bank AG | | OTC Inflation Floor — CPURNSA Index | | | 215.949 | | | | 0.000 | % | | 03/10/20 | | USD | 1,000,000 | | | $ | 7,500 | | | $ | (10,351 | ) | |
| Citigroup, Inc. | | OTC Inflation Floor — CPURNSA Index | | | 215.949 | | | | 0.000 | % | | 03/12/20 | | USD | 1,600,000 | | | | 13,760 | | | | (15,676 | ) | |
| Citigroup, Inc. | | OTC Inflation Floor — CPURNSA Index | | | 216.687 | | | | 0.000 | % | | 04/07/20 | | USD | 2,000,000 | | | | 17,600 | | | | (19,931 | ) | |
| Citigroup, Inc. | | OTC Inflation Floor — CPURNSA Index | | | 217.965 | | | | 0.000 | % | | 09/29/20 | | USD | 2,200,000 | | | | 28,380 | | | | (22,396 | ) | |
| | | | | | | | | | | | | $ | 67,240 | | | $ | (68,354 | ) | |
See Accompanying Notes to Financial Statements
174
SUMMARY PORTFOLIO OF INVESTMENTS
ING PIMCO TOTAL RETURN PORTFOLIO AS OF DECEMBER 31, 2010 (CONTINUED)
ING PIMCO Total Return Portfolio Written Swaptions Open on December 31, 2010:
Interest Rate Swaptions
| Description | | Counterparty | | Floating Rate
Index/Underlying
Reference Entity | | Pay/Receive
Floating | | Exercise
Rate | | Expiration
Date | | Notional
Amount | | Premiums
Received | | Fair
Value | |
| Put OTC Swaption | | Barclays
Bank PLC | | 3-month USD-LIBOR-BBA | | Pay | | | 3.000 | % | | 06/18/12 | | USD | 21,800,000 | | | $ | 197,358 | | | $ | (275,243 | ) | |
| Put OTC Swaption | | Barclays
Bank PLC | | 3-month USD-LIBOR-BBA | | Pay | | | 4.000 | % | | 06/13/11 | | USD | 1,700,000 | | | | 23,885 | | | | (25,923 | ) | |
| Put OTC Swaption | | Royal Bank of
Scotland
Group PLC | | 3-month USD-LIBOR-BBA | | Pay | | | 1.800 | % | | 11/21/13 | | USD | 19,700,000 | | | | 74,368 | | | | (148,813 | ) | |
| Put OTC Swaption | | Citigroup, Inc. | | 3-month USD-LIBOR-BBA | | Pay | | | 2.250 | % | | 09/24/12 | | USD | 2,900,000 | | | | 19,756 | | | | (39,293 | ) | |
| Put OTC Swaption | | Citigroup, Inc. | | 3-month USD-LIBOR-BBA | | Pay | | | 3.000 | % | | 06/18/12 | | USD | 16,900,000 | | | | 182,931 | | | | (213,376 | ) | |
| Put OTC Swaption | | Citigroup, Inc. | | 3-month USD-LIBOR-BBA | | Pay | | | 3.250 | % | | 07/16/12 | | USD | 9,100,000 | | | | 224,982 | | | | (280,626 | ) | |
| Put OTC Swaption | | Deutsche
Bank AG | | 3-month USD-LIBOR-BBA | | Pay | | | 2.750 | % | | 06/18/12 | | USD | 11,800,000 | | | | 122,491 | | | | (178,216 | ) | |
| Put OTC Swaption | | Deutsche
Bank AG | | 3-month USD-LIBOR-BBA | | Pay | | | 3.000 | % | | 06/18/12 | | USD | 13,000,000 | | | | 141,396 | | | | (164,136 | ) | |
| Put OTC Swaption | | Deutsche
Bank AG | | 3-month USD-LIBOR-BBA | | Pay | | | 4.000 | % | | 06/13/11 | | USD | 6,000,000 | | | | 81,900 | | | | (91,493 | ) | |
| Put OTC Swaption | | Morgan Stanley | | 3-month USD-LIBOR-BBA | | Pay | | | 2.250 | % | | 09/24/12 | | USD | 18,400,000 | | | | 112,916 | | | | (249,309 | ) | |
| Put OTC Swaption | | Morgan Stanley | | 3-month USD-LIBOR-BBA | | Pay | | | 10.000 | % | | 07/10/12 | | USD | 4,900,000 | | | | 29,523 | | | | (3,341 | ) | |
| Put OTC Swaption | | Royal Bank of
Scotland
Group PLC | | 3-month USD-LIBOR-BBA | | Pay | | | 2.250 | % | | 09/24/12 | | USD | 60,000,000 | | | | 470,204 | | | | (812,964 | ) | |
| Put OTC Swaption | | Royal Bank of
Scotland
Group PLC | | 3-month USD-LIBOR-BBA | | Pay | | | 2.750 | % | | 06/18/12 | | USD | 10,800,000 | | | | 105,840 | | | | (163,113 | ) | |
| Put OTC Swaption | | Royal Bank of
Scotland
Group PLC | | 3-month USD-LIBOR-BBA | | Pay | | | 3.000 | % | | 06/18/12 | | USD | 31,100,000 | | | | 274,720 | | | | (392,663 | ) | |
| Put OTC Swaption | | Royal Bank of
Scotland
Group PLC | | 3-month USD-LIBOR-BBA | | Pay | | | 3.250 | % | | 07/16/12 | | USD | 3,000,000 | | | | 75,330 | | | | (92,514 | ) | |
| Put OTC Swaption | | Royal Bank of
Scotland
Group PLC | | 3-month USD-LIBOR-BBA | | Pay | | | 4.000 | % | | 06/13/11 | | USD | 3,400,000 | | | | 48,057 | | | | (51,846 | ) | |
| Put OTC Swaption | | Royal Bank of
Scotland
Group PLC | | 3-month USD-LIBOR-BBA | | Pay | | | 5.000 | % | | 01/24/11 | | USD | 3,200,000 | | | | 32,000 | | | | (1 | ) | |
| | | | | | | | | | | | | | | $ | 2,217,657 | | | $ | (3,182,870 | ) | |
ING PIMCO Total Return Portfolio Written Options Open on December 31, 2010:
Options on Exchange-Traded Futures Contracts
| Description/Name of Issuer | | Exercise
Price | | Expiration
Date | | # of
Contracts | | Premiums
Received | | Value | |
Call Option CME
90-Day Eurodollar September Futures | | | 99.375 | USD | | 09/19/11 | | | 99 | | | $ | 40,816 | | | $ | (58,163 | ) | |
Put Option CME
90-Day Eurodollar September Futures | | | 99.375 | USD | | 09/19/11 | | | 99 | | | | 64,271 | | | | (40,838 | ) | |
| | | | | | | | | $ | 105,087 | | | $ | (99,001 | ) | |
ING PIMCO Total Return Portfolio Written Forward Volatility Options Open on December 31, 2010:
| Description | | Counterparty | | Exercise
Price(3) | | Expiration
Date | | Notional
Amount | | Premiums
Received | | Fair
Value | |
Swaption Straddle —
OTC 1-Year vs. 2-Year
Forward Swap Rate
(10/15/12-10/15/14)(1) | | Morgan Stanley | | | 0.000 | | | 10/11/12 | | USD | 23,400,000 | | | $ | 260,071 | | | $ | (393,618 | ) | |
Swaption Straddle —
OTC 1-Year vs. 2-Year
Forward Swap Rate
(11/16/12-11/16/14)(2) | | Morgan Stanley | | | 0.000 | | | 11/14/12 | | USD | 18,800,000 | | | | 204,472 | | | | (315,549 | ) | |
| | | | | | | | | | | $ | 464,543 | | | $ | (709,167 | ) | |
(1) The observation date ends October 11, 2011 on which date the Portfolio will enter into the swaption straddle with the counterparty. The swaption straddle expires October 11, 2012.
(2) The observation date ends November 14, 2011 on which date the Portfolio will enter into the swaption straddle with the counterparty. The swaption straddle expires November 14, 2012.
(3) Exercise price determined on the observation date, based upon implied volatility parameters.
See Accompanying Notes to Financial Statements
175
SUMMARY PORTFOLIO OF INVESTMENTS
ING PIMCO TOTAL RETURN PORTFOLIO AS OF DECEMBER 31, 2010 (CONTINUED)
A summary of derivative instruments by primary risk exposure is outlined in the following tables.
The fair value of derivative instruments as of December 31, 2010 was as follows:
Derivatives not accounted
for as hedging instruments | | Location on Statement of Assets and Liabilities | | Fair Value | |
| Asset Derivatives | |
| Interest rate contracts | | Investments in securities at value* | | $ | 5,670 | | |
| Foreign exchange contracts | | Unrealized appreciation on forward foreign currency contracts | | | 3,429,891 | | |
| Credit contracts | | Swaps, at fair value | | | 6,284,260 | | |
| Interest rate contracts | | Swaps, at fair value | | | 1,794,611 | | |
| Interest rate contracts | | Net Assets — Unrealized appreciation** | | | 297,093 | | |
| Total Asset Derivatives | | | | $ | 11,811,525 | | |
| Liability Derivatives | |
| Foreign exchange contracts | | Unrealized depreciation on forward foreign currency contracts | | $ | 1,226,764 | | |
| Credit contracts | | Swaps, at fair value | | | 310,976 | | |
| Interest rate contracts | | Swaps, at fair value | | | 238,830 | | |
| Interest rate contracts | | Net Assets — Unrealized depreciation** | | | 1,189,282 | | |
| Interest rate contracts | | Written options, at fair value | | | 4,059,392 | | |
| Total Liability Derivatives | | | | $ | 7,025,244 | | |
* Includes purchased options.
** Includes cumulative appreciation/depreciation of futures contracts as reported in the table following the Summary Portfolio of Investments.
The effect of derivative instruments on the Portfolio's Statement of Operations for the year ended December 31, 2010 was as follows:
| | Amount of Realized Gain or (Loss) on Derivatives Recognized in Income | |
Derivatives not
accounted for as
hedging instruments | | Investments* | | Foreign currency
related transactions** | | Futures | | Swaps | | Written
options | | Total | |
| Credit contracts | | $ | — | | | $ | — | | | $ | — | | | $ | 497,607 | | | $ | 4,100 | | | $ | 501,707 | | |
| Foreign exchange contracts | | | (255,570 | ) | | | (2,163,708 | ) | | | — | | | | — | | | | 96,091 | | | | (2,323,187 | ) | |
| Interest rate contracts | | | (18,755 | ) | | | — | | | | 22,129,962 | | | | 1,169,494 | | | | 4,763,903 | | | | 28,044,604 | | |
| Total | | $ | (274,325 | ) | | $ | (2,163,708 | ) | | $ | 22,129,962 | | | $ | 1,667,101 | | | $ | 4,864,094 | | | $ | 26,223,124 | | |
| | Change in Unrealized Appreciation or (Depreciation) on Derivatives Recognized in Income | |
Derivatives not
accounted for as
hedging instruments | | Investments* | | Foreign currency
related transactions** | | Futures | | Swaps | | Written
options | | Total | |
| Credit contracts | | $ | — | | | $ | — | | | $ | — | | | $ | 1,811,676 | | | $ | — | | | $ | 1,811,676 | | |
| Foreign exchange contracts | | | (112,290 | ) | | | 1,448,481 | | | | — | | | | — | | | | 640 | | | | 1,336,831 | | |
| Interest rate contracts | | | (2,266 | ) | | | — | | | | (1,913,281 | ) | | | 1,178,758 | | | | (1,990,693 | ) | | | (2,727,482 | ) | |
| Total | | $ | (114,556 | ) | | $ | 1,448,481 | | | $ | (1,913,281 | ) | | $ | 2,990,434 | | | $ | (1,990,053 | ) | | $ | 421,025 | | |
* Amounts recognized for purchased options are included in net realized gain (loss) on investments and net change in unrealized appreciation or depreciation on investments.
** Amounts recognized for forward foreign currency contracts are included in net realized gain (loss) on foreign currency related transactions and net change in unrealized appreciation or depreciation on foreign currency related transactions.
See Accompanying Notes to Financial Statements
176
SUMMARY PORTFOLIO OF INVESTMENTS
ING PIONEER HIGH YIELD PORTFOLIO AS OF DECEMBER 31, 2010
| Shares | |
| |
| | Value | | Percent of
Net Assets | |
| COMMON STOCK: 16.3% | | | |
| | | Consumer Discretionary: 1.4% | | | |
| | 17,647 | | | | | | | Sonic
Automotive, Inc. | | $ | 233,646 | | | | 0.2 | | |
| | | | | | | Other Securities | | | 1,152,352 | | | | 1.2 | | |
| | | | | | | | | | 1,385,998 | | | | 1.4 | | |
| | | Consumer Staples: 0.2% | | | |
| | 43,400 | | | @ | | Alliance One
International, Inc. | | | 184,016 | | | | 0.2 | | |
| | | Energy: 1.0% | | | |
| | 17,091 | | | @ | | SandRidge
Energy, Inc. | | | 125,106 | | | | 0.1 | | |
| | | | | | | Other Securities | | | 864,092 | | | | 0.9 | | |
| | | | | | | | | | 989,198 | | | | 1.0 | | |
| | | Financials: 0.2% | | | |
| | | | | | | Other Securities | | | 216,956 | | | | 0.2 | | |
| | | Health Care: 2.9% | | | |
| | 2,303 | | | | | Alere, Inc. -
Preference Shares | | | 573,447 | | | | 0.6 | | |
| | 1,400 | | | @ | | Alere, Inc. | | | 51,240 | | | | | | |
| | 5,604 | | | @ | | Bio-Rad
Laboratories, Inc. | | | 581,975 | | | | 0.6 | | |
| | 11,045 | | | @ | | Thermo Fisher
Scientific, Inc. | | | 611,451 | | | | 0.6 | | |
| | | | | | | Other Securities | | | 1,115,804 | | | | 1.1 | | |
| | | | | | | | | | 2,933,917 | | | | 2.9 | | |
| | | Industrials: 3.6% | | | |
| | 18,148 | | | @ | | BE Aerospace, Inc. | | | 672,020 | | | | 0.7 | | |
| | 4,100 | | | @ | | General Cable Corp. | | | 143,869 | | | | 0.1 | | |
| | 5,841 | | | @ | | GeoEye, Inc. | | | 247,600 | | | | 0.2 | | |
| | | | | | | Other Securities | | | 2,610,377 | | | | 2.6 | | |
| | | | | | | | | | 3,673,866 | | | | 3.6 | | |
| | | Information Technology: 1.7% | | | |
| | 5,412 | | | @ | | CommScope, Inc. | | | 168,963 | | | | 0.2 | | |
| | | | | | | Other Securities | | | 1,552,142 | | | | 1.5 | | |
| | | | | | | | | | 1,721,105 | | | | 1.7 | | |
| | | Materials: 4.0% | | | |
| | 8,400 | | | | | Freeport-McMoRan
Copper & Gold, Inc. | | | 1,008,756 | | | | 1.0 | | |
| | 41,050 | | | @ | | Georgia Gulf Corp. | | | 987,663 | | | | 1.0 | | |
| | 38,063 | | | @ | | LyondellBasell
Industries NV | | | 1,309,367 | | | | 1.3 | | |
| | 5,400 | | | | | Texas Industries, Inc. | | | 247,212 | | | | 0.2 | | |
| | | | | | | Other Securities | | | 455,400 | | | | 0.5 | | |
| | | | | | | | | | 4,008,398 | | | | 4.0 | | |
| Shares | |
| |
| | Value | | Percent of
Net Assets | |
| | | Telecommunication Services: 0.4% | | | |
| | 28,800 | | | | | | | Windstream Corp. | | $ | 401,472 | | | | 0.4 | | |
| | | Utilities: 0.9% | | | |
| | 15,964 | | | | | | | CMS Energy Corp. | | | 296,930 | | | | 0.3 | | |
| | | | | | | Other Securities | | | 600,857 | | | | 0.6 | | |
| | | | | | | | | | 897,787 | | | | 0.9 | | |
| | | | | | | Total Common Stock
( Cost $10,789,818 ) | | | 16,412,713 | | | | 16.3 | | |
| REAL ESTATE INVESTMENT TRUSTS: 0.3% | | | |
| | | Financials: 0.3% | | | |
| | | | | | | Other Securities | | | 280,538 | | | | 0.3 | | |
| | | | | | | Total Real Estate
Investment Trusts
( Cost $224,078 ) | | | 280,538 | | | | 0.3 | | |
| PREFERRED STOCK: 3.4% | | | |
| | | Consumer Staples: 0.1% | | | |
| | 11,500 | | | @,# | | 2009 Dole Food
Automatic
Common Exchange
Security Trust | | | 149,859 | | | | 0.1 | | |
| | | Energy: 0.7% | | | |
| | 1,400 | | | | | | | SandRidge Energy, Inc. | | | 167,748 | | | | 0.2 | | |
| | | | | | | Other Securities | | | 488,750 | | | | 0.5 | | |
| | | | | | | | | | 656,498 | | | | 0.7 | | |
| | | Financials: 2.2% | | | |
| | 31,880 | | | P | | Forest City
Enterprises, Inc. | | | 1,931,673 | | | | 1.9 | | |
| | | | | | | Other Securities | | | 331,906 | | | | 0.3 | | |
| | | | | | | | | | 2,263,579 | | | | 2.2 | | |
| | | Industrials: 0.4% | | | |
| | 2,200 | | | P | | General Cable Corp. | | | 387,613 | | | | 0.4 | | |
| | | | | | | Total Preferred Stock
( Cost $2,573,555 ) | | | 3,457,549 | | | | 3.4 | | |
| WARRANTS: 0.0% | | | |
| | | Information Technology: 0.0% | | | |
| | | | | | | Other Securities | | | — | | | | 0.0 | | |
| | | | | | | Total Warrants
( Cost $13 ) | | | — | | | | 0.0 | | |
See Accompanying Notes to Financial Statements
177
SUMMARY PORTFOLIO OF INVESTMENTS
ING PIONEER HIGH YIELD PORTFOLIO AS OF DECEMBER 31, 2010 (CONTINUED)
Principal
Amount | |
| |
| | Value | | Percent of
Net Assets | |
| CORPORATE BONDS/NOTES: 75.9% | | | |
| | | Consumer Discretionary: 7.7% | | | |
| $ | 530,000 | | | &,# | | Allison
Transmission, Inc.,
11.250%,
due 11/01/15 | | $ | 580,350 | | | | 0.6 | | |
| | 100,000 | | | # | | Ferrellgas L.P. /
Ferrellgas
Finance Corp.,
6.500%,
due 05/01/21 | | | 98,000 | | | | 0.1 | | |
| | 472,000 | | | | | Ford Motor Co.,
4.250%,
due 11/15/16 | | | 945,770 | | | | 1.0 | | |
| | 575,000 | | | | | Interpublic Group
of Cos., Inc.,
10.000%,
due 07/15/17 | | | 675,625 | | | | 0.7 | | |
| | 104,000 | | | # | | Lennar Corp.,
2.750%,
due 12/15/20 | | | 114,140 | | | | 0.1 | | |
| | 1,010,000 | | | #,± | | Mashantucket
Western Pequot
Tribe, 8.500%,
due 11/15/15 | | | 137,613 | | | | 0.1 | | |
| | 509,352 | | | &,#,R,X | | Pegasus
Solutions, Inc.,
13.000%,
due 04/15/14 | | | 382,014 | | | | 0.4 | | |
| | 500,000 | | | # | | Sitel LLC/Sitel
Finance Corp.,
11.500%,
due 04/01/18 | | | 415,000 | | | | 0.4 | | |
| | 523,000 | | | | | Sonic
Automotive, Inc.,
5.000%-9.000%,
due
03/15/18-10/01/29 | | | 621,473 | | | | 0.6 | | |
| | 117,000 | | | # | | Star Gas
Partners L.P. /
Star Gas Finance
Co., 8.875%,
due 12/01/17 | | | 118,170 | | | | 0.1 | | |
| | 120,000 | | | # | | TRW Automotive,
Inc., 8.875%,
due 12/01/17 | | | 135,000 | | | | 0.1 | | |
| | 480,157 | | | &,# | | Umbrella
Acquisition,
Inc., 9.750%,
due 03/15/15 | | | 520,970 | | | | 0.5 | | |
| | 980,000 | | | | | Wesco
Distribution, Inc.,
7.500%,
due 10/15/17 | | | 995,925 | | | | 1.0 | | |
| | | | | | | Other Securities | | | 2,015,694 | | | | 2.0 | | |
| | | | | | | | | | 7,755,744 | | | | 7.7 | | |
Principal
Amount | |
| |
| | Value | | Percent of
Net Assets | |
| | | Consumer Staples: 6.6% | | | |
| $ | 825,000 | | | | | Alliance One
International, Inc.,
10.000%,
due 07/15/16 | | $ | 849,750 | | | | 1.3 | | |
| | 430,000 | | | | | Alliance One
International, Inc.,
5.500%,
due 07/15/14 | | | 486,438 | | | | | | |
| | 287,000 | | | # | | C&S Group
Enterprises LLC,
8.375%,
due 05/01/17 | | | 275,520 | | | | 0.3 | | |
| | 100,000 | | | # | | NBTY, Inc.,
9.000%,
due 10/01/18 | | | 107,250 | | | | 0.1 | | |
| | 650,000 | | | | | NCO Group, Inc.,
5.161%,
due 11/15/13 | | | 562,250 | | | | 0.9 | | |
| | 294,841 | | | | | NCO Group, Inc.,
7.500%,
due 05/15/13 | | | 290,787 | | | | | | |
| | 530,000 | | | | | Ticketmaster
Entertainment,
Inc., 10.750%,
due 08/01/16 | | | 576,375 | | | | 0.6 | | |
| | 736,842 | | | | | Web Service Co.
LLC, 7.000%,
due 08/04/14 | | | 735,921 | | | | 0.7 | | |
| | 830,000 | | | | | Yankee Acquisition
Corp., 9.750%,
due 02/15/17 | | | 869,425 | | | | 0.9 | | |
| | | | | | | Other Securities | | | 1,860,776 | | | | 1.8 | | |
| | | | | | | | | | 6,614,492 | | | | 6.6 | | |
| | | Energy: 11.2% | | | |
| | 217,000 | | | # | | American Petroleum
Tankers LLC/AP
Tankers Co.,
10.250%,
due 05/01/15 | | | 225,680 | | | | 0.2 | | |
| | 150,000 | | | # | | Calfrac Holdings L.P.,
7.500%,
due 12/01/20 | | | 152,250 | | | | 0.1 | | |
| | 89,000 | | | # | | Carrizo Oil & Gas,
Inc., 8.625%,
due 10/15/18 | | | 92,115 | | | | 0.1 | | |
| | 620,000 | | | | | Chesapeake Energy
Corp., 2.500%,
due 05/15/37 | | | 556,450 | | | | 0.8 | | |
| | 300,000 | | | | | Chesapeake Energy
Corp., 2.250%,
due 12/15/38 | | | 235,125 | | | | | | |
| | 170,000 | | | # | | Coffeyville Resources
LLC / Coffeyville
Finance, Inc.,
9.000%,
due 04/01/15 | | | 182,750 | | | | 0.2 | | |
See Accompanying Notes to Financial Statements
178
SUMMARY PORTFOLIO OF INVESTMENTS
ING PIONEER HIGH YIELD PORTFOLIO AS OF DECEMBER 31, 2010 (CONTINUED)
Principal
Amount | |
| |
| | Value | | Percent of
Net Assets | |
| | | Energy (continued) | | | |
| $ | 520,000 | | | | | Denbury Resources,
Inc., 9.750%,
due 03/01/16 | | $ | 582,400 | | | | 0.6 | | |
| | 500,000 | | | # | | Expro Finance
Luxembourg SCA,
8.500%,
due 12/15/16 | | | 480,000 | | | | 0.5 | | |
| | 700,000 | | | # | | Foresight Energy
LLC / Foresight
Energy Corp.,
9.625%,
due 08/15/17 | | | 749,000 | | | | 0.7 | | |
| | 450,000 | | | # | | Hilcorp Energy I LP,
7.750%,
due 11/01/15 | | | 466,875 | | | | 0.5 | | |
| | 730,000 | | | | | Massey Energy Co.,
3.250%,
due 08/01/15 | | | 716,313 | | | | 0.7 | | |
| | 250,000 | | | # | | Precision Drilling
Corp., 6.625%,
due 11/15/20 | | | 255,000 | | | | 0.3 | | |
| | 785,000 | | | | | Quicksilver
Resources, Inc.,
7.125%,
due 04/01/16 | | | 755,563 | | | | 0.7 | | |
| | 525,000 | | | & | | SandRidge Energy,
Inc., 8.625%,
due 04/01/15 | | | 540,094 | | | | 0.5 | | |
| | 1,835,000 | | | | | Tesoro Corp.,
6.500%,
due 06/01/17 | | | 1,848,763 | | | | 2.1 | | |
| | 250,000 | | | | | Tesoro Corp.,
9.750%,
due 06/01/19 | | | 278,125 | | | | | | |
| | | | | | | Other Securities | | | 3,215,176 | | | | 3.2 | | |
| | | | | | | | | | 11,331,679 | | | | 11.2 | | |
| | | Financials: 8.9% | | | |
| | 378,000 | | | # | | ABI Escrow Corp.,
10.250%,
due 10/15/18 | | | 415,800 | | | | 0.4 | | |
| | 545,000 | | | # | | Alliant Holdings I,
Inc., 11.000%,
due 05/01/15 | | | 570,888 | | | | 0.6 | | |
| | 460,000 | | | #,± | | Buffalo Thunder
Development
Authority, 9.375%,
due 12/15/14 | | | 134,550 | | | | 0.1 | | |
| | 300,000 | | | # | | CEVA Group PLC,
11.500%,
due 04/01/18 | | | 325,500 | | | | 0.5 | | |
| | 145,000 | | | # | | CEVA Group PLC,
11.625%,
due 10/01/16 | | | 159,863 | | | | | | |
Principal
Amount | |
| |
| | Value | | Percent of
Net Assets | |
| $ | 2,225,000 | | | | | Forest City
Enterprises, Inc.,
6.500%,
due 02/01/17 | | $ | 1,935,730 | | | | 2.0 | | |
| | 40,000 | | | | | Forest City
Enterprises, Inc.,
7.625%,
due 06/01/15 | | | 37,450 | | | | | | |
| | 219,000 | | | # | | Hexion US Finance
Corp. / Hexion
Nova Scotia
Finance ULC,
9.000%,
due 11/15/20 | | | 232,140 | | | | 0.2 | | |
| | 100,000 | | | # | | Holly Energy
Partners L.P./Holly
Energy Finance
Corp., 8.250%,
due 03/15/18 | | | 105,000 | | | | 0.1 | | |
| | 150,000 | | | # | | Host Hotels &
Resorts L.P.,
2.500%,
due 10/15/29 | | | 212,063 | | | | 0.2 | | |
| | 360,000 | | | # | | HUB International
Holdings, Inc.,
10.250%,
due 06/15/15 | | | 362,700 | | | | 0.4 | | |
| | 273,000 | | | # | | Lexington Realty
Trust, 6.000%,
due 01/15/30 | | | 334,425 | | | | 0.3 | | |
| | 1,000,000 | | | # | | Liberty Mutual
Group, Inc.,
7.000%,
due 03/15/37 | | | 899,345 | | | | 0.9 | | |
| | 540,000 | | | # | | Offshore Group
Investments Ltd.,
11.500%,
due 08/01/15 | | | 588,600 | | | | 0.6 | | |
| | 200,000 | | | # | | Pinafore
LLC/Pinafore, Inc.,
9.000%,
due 10/01/18 | | | 217,000 | | | | 0.2 | | |
| | 335,000 | | | # | | Reynolds Group
Issuer, Inc. /
Reynolds Group
Issuer LLC /
Reynolds Group
Issuer Lu, 8.500%,
due 05/15/18 | | | 338,350 | | | | 0.3 | | |
| | 150,000 | | | # | | Sabra Health Care
L.P. / Sabra Capital
Corp., 8.125%,
due 11/01/18 | | | 155,625 | | | | 0.1 | | |
| | 440,000 | | | # | | Tower Automotive
Holdings USA
LLC / TA Holdings
Finance, Inc.,
10.625%,
due 09/01/17 | | | 475,200 | | | | 0.5 | | |
See Accompanying Notes to Financial Statements
179
SUMMARY PORTFOLIO OF INVESTMENTS
ING PIONEER HIGH YIELD PORTFOLIO AS OF DECEMBER 31, 2010 (CONTINUED)
Principal
Amount | |
| |
| | Value | | Percent of
Net Assets | |
| | | Financials (continued) | | | |
| $ | 525,000 | | | # | | USB Realty Corp.,
6.091%,
due 12/22/49 | | $ | 398,344 | | | | 0.4 | | |
| | 110,000 | | | # | | USI Holdings Corp.,
4.161%,
due 11/15/14 | | | 96,800 | | | | 0.1 | | |
| | | | | | | Other Securities | | | 980,082 | | | | 1.0 | | |
| | | | | | | | | | 8,975,455 | | | | 8.9 | | |
| | | Health Care: 7.4% | | | |
| | 710,000 | | | | | Alere, Inc., 3.000%,
due 05/15/16 | | | 755,263 | | | | 0.9 | | |
| | 189,000 | | | | | Alere, Inc., 9.000%,
due 05/15/16 | | | 195,615 | | | | | | |
| | 200,000 | | | # | | ConvaTec
Healthcare SA,
10.500%,
due 12/15/18 | | | 203,750 | | | | 0.2 | | |
| | 625,500 | | | | | Gentiva Health
Services, Inc.,
6.750%-11.500%,
due
05/23/16-09/01/18 | | | 651,632 | | | | 0.6 | | |
| | 175,000 | | | # | | HCA Holdings, Inc.,
7.750%,
due 05/15/21 | | | 175,438 | | | | 0.2 | | |
| | 332,000 | | | # | | Lantheus Medical
Imaging, Inc.,
9.750%,
due 05/15/17 | | | 348,600 | | | | 0.3 | | |
| | 878,852 | | | &,# | | Surgical Care
Affiliates, Inc.,
8.875%,
due 07/15/15 | | | 892,035 | | | | 0.9 | | |
| | 846,000 | | | | | Vertex
Pharmaceuticals,
Inc., 3.350%,
due 10/01/15 | | | 859,748 | | | | 0.9 | | |
| | | | | | | Other Securities | | | 3,383,842 | | | | 3.4 | | |
| | | | | | | | | | 7,465,923 | | | | 7.4 | | |
| | | Industrials: 12.7% | | | |
| | 100,000 | | | # | | AMGH Merger Sub,
Inc., 9.250%,
due 11/01/18 | | | 105,500 | | | | 0.1 | | |
| | 477,000 | | | # | | DynCorp
International, Inc.,
10.375%,
due 07/01/17 | | | 491,310 | | | | 0.5 | | |
| | 509,000 | | | + | | General Cable
Corp., 4.500%
(step rate 2.250%),
due 11/15/29 | | | 607,619 | | | | 0.6 | | |
| | 445,000 | | | | | GeoEye, Inc.,
9.625%,
due 10/01/15 | | | 505,075 | | | | 0.5 | | |
Principal
Amount | |
| |
| | Value | | Percent of
Net Assets | |
| $ | 535,000 | | | | | Greenbrier Cos.,
Inc., 8.375%,
due 05/15/15 | | $ | 544,363 | | | | 0.8 | | |
| | 285,000 | | | | | Greenbrier Cos.,
Inc., 2.375%,
due 05/15/26 | | | 266,119 | | | | | | |
| | 623,000 | | | | | Horizon Lines, Inc.,
4.250%,
due 08/15/12 | | | 577,054 | | | | 0.6 | | |
| | 100,000 | | | # | | Interline Brands,
Inc., 7.000%,
due 11/15/18 | | | 102,000 | | | | 0.1 | | |
| | 190,000 | | | # | | Liberty Tire
Recycling,
11.000%,
due 10/01/16 | | | 204,725 | | | | 0.2 | | |
| | 665,000 | | | | | Mastec, Inc.,
4.000%,
due 06/15/14 | | | 804,650 | | | | 0.8 | | |
| | 675,000 | | | | | Mueller Water
Products, 7.375%,
due 06/01/17 | | | 654,750 | | | | 0.6 | | |
| | 620,000 | | | | | Navistar
International
Corp., 3.000%,
due 10/15/14 | | | 830,800 | | | | 0.8 | | |
| | 355,000 | | | # | | New Enterprise
Stone & Lime Co.,
11.000%,
due 09/01/18 | | | 339,025 | | | | 0.3 | | |
| | 75,000 | | | # | | Polypore
International, Inc.,
7.500%,
due 11/15/17 | | | 76,875 | | | | 0.1 | | |
| | 1,165,000 | | | Z | | Roper Industries,
Inc., 0.180%,
due 01/15/34 | | | 1,116,944 | | | | 1.1 | | |
| | 205,000 | | | # | | SunPower Corp.,
4.500%,
due 03/15/15 | | | 184,890 | | | | 0.2 | | |
| | 53,000 | | | # | | USG Corp., 8.375%,
due 10/15/18 | | | 52,205 | | | | 0.1 | | |
| | 1,166,000 | | | | | Wesco International,
Inc., 6.000%,
due 09/15/29 | | | 2,410,705 | | | | 2.4 | | |
| | | | | | | Other Securities | | | 2,909,615 | | | | 2.9 | | |
| | | | | | | | | | 12,784,224 | | | | 12.7 | | |
| | | Information Technology: 5.9% | | | |
| | 316,000 | | | # | | Allen Systems
Group, Inc.,
10.500%,
due 11/15/16 | | | 319,950 | | | | 0.3 | | |
| | 1,000,000 | | | | | Anixter
International, Inc.,
5.950%,
due 03/01/15 | | | 1,006,250 | | | | 1.0 | | |
See Accompanying Notes to Financial Statements
180
SUMMARY PORTFOLIO OF INVESTMENTS
ING PIONEER HIGH YIELD PORTFOLIO AS OF DECEMBER 31, 2010 (CONTINUED)
Principal
Amount | |
| |
| | Value | | Percent of
Net Assets | |
| | | Information Technology (continued) | | | |
| $ | 89,000 | | | # | | First Data Corp.,
8.250%,
due 01/15/21 | | $ | 85,885 | | | | | | |
| | 89,000 | | | # | | First Data Corp.,
12.625%,
due 01/15/21 | | | 85,440 | | | | 0.2 | | |
| | 21,000 | | | | | First Data Corp.,
9.875%,
due 09/24/15 | | | 20,108 | | | | | | |
| | 750,000 | | | # | | Newport Corp.,
2.500%,
due 02/15/12 | | | 774,375 | | | | 0.8 | | |
| | 556,000 | | | | | ON Semiconductor
Corp., 2.625%,
due 12/15/26 | | | 653,995 | | | | 0.6 | | |
| | 310,000 | | | # | | Seagate HDD
Cayman, 7.750%,
due 12/15/18 | | | 315,425 | | | | 0.3 | | |
| | 254,000 | | | # | | SunGard Data
Systems, Inc.,
7.375%,
due 11/15/18 | | | 256,540 | | | | 0.3 | | |
| | | | | | | Other Securities | | | 2,397,747 | | | | 2.4 | | |
| | | | | | | | | | 5,915,715 | | | | 5.9 | | |
| | | Materials: 7.0% | | | |
| | 550,000 | | | # | | Algoma Acquisition
Corp., 9.875%,
due 06/15/15 | | | 497,750 | | | | 0.5 | | |
| | 640,000 | | | | | Crown Cork & Seal
Co., Inc., 7.375%,
due 12/15/26 | | | 638,400 | | | | 0.6 | | |
| | 625,000 | | | | | Graham Packaging
Co., Inc.,
8.250%-9.875%,
due
10/15/14-01/01/17 | | | 652,000 | | | | 0.7 | | |
| | 475,000 | | | | | Hexion US Finance
Corp. / Hexion
Nova Scotia
Finance ULC,
8.875%,
due 02/01/18 | | | 510,031 | | | | 0.5 | | |
| | 215,000 | | | # | | Ineos Finance PLC,
9.000%,
due 05/15/15 | | | 229,781 | | | | 0.2 | | |
| | 235,000 | | | # | | Ineos Group
Holdings PLC,
8.500%,
due 02/15/16 | | | 225,013 | | | | 0.2 | | |
| | 264,000 | | | # | | Momentive
Performance
Materials, Inc.,
9.000%,
due 01/15/21 | | | 279,180 | | | | 0.3 | | |
| | 1,400,000 | | | | | Nova Chemicals
Corp., 7.875%,
due 09/15/25 | | | 1,342,250 | | | | 1.3 | | |
Principal
Amount | |
| |
| | Value | | Percent of
Net Assets | |
| $ | 675,000 | | | # | | Novelis, Inc.,
8.750%,
due 12/15/20 | | $ | 703,688 | | | | 0.7 | | |
| | 370,000 | | | # | | Texas Industries,
Inc., 9.250%,
due 08/15/20 | | | 394,975 | | | | 0.4 | | |
| | | | | | | Other Securities | | | 1,622,577 | | | | 1.6 | | |
| | | | | | | | | | 7,095,645 | | | | 7.0 | | |
| | | Telecommunication Services: 7.1% | | | |
| | 920,000 | | | | | Cincinnati Bell, Inc.,
8.250%-8.750%,
due
10/15/17-10/15/20 | | | 895,325 | | | | 0.9 | | |
| | 850,000 | | | # | | Cricket
Communications,
Inc., 7.750%,
due 10/15/20 | | | 811,750 | | | | 0.8 | | |
| | 775,000 | | | | | Frontier
Communications
Corp.,
8.250%-8.750%,
due
04/15/17-04/15/22 | | | 849,951 | | | | 0.8 | | |
| | 500,000 | | | | | Intelsat Corp.,
9.250%,
due 06/15/16 | | | 542,500 | | | | 0.7 | | |
| | 150,000 | | | | | Intelsat Corp.,
3.254%,
due 02/01/14 | | | 142,922 | | | | | | |
| | 700,000 | | | | | PAETEC Holding
Corp., 8.875%,
due 06/30/17 | | | 750,750 | | | | 0.9 | | |
| | 100,000 | | | # | | PAETEC Holding
Corp., 9.875%,
due 12/01/18 | | | 103,250 | | | | | | |
| | 410,000 | | | | | Windstream Corp.,
7.750%-7.875%,
due
11/01/17-10/15/20 | | | 428,813 | | | | 0.4 | | |
| | | | | | | Other Securities | | | 2,629,918 | | | | 2.6 | | |
| | | | | | | | | | 7,155,179 | | | | 7.1 | | |
| | | Utilities: 1.4% | | | |
| | 320,000 | | | | | CMS Energy Corp.,
5.500%,
due 06/15/29 | | | 450,400 | | | | 0.5 | | |
| | 430,000 | | | # | | Intergen NV,
9.000%,
due 06/30/17 | | | 457,950 | | | | 0.5 | | |
See Accompanying Notes to Financial Statements
181
SUMMARY PORTFOLIO OF INVESTMENTS
ING PIONEER HIGH YIELD PORTFOLIO AS OF DECEMBER 31, 2010 (CONTINUED)
Principal
Amount | |
| |
| | Value | | Percent of
Net Assets | |
| | | Utilities (continued) | | | |
| $ | 375,000 | | | # | | Texas Competitive
Electric Holdings
Co., LLC, 15.000%,
due 04/01/21 | | $ | 330,000 | | | | 0.3 | | |
| | | | | | | Other Securities | | | 144,300 | | | | 0.1 | | |
| | | | | | | | | | 1,382,650 | | | | 1.4 | | |
| | | | | | | Total Corporate
Bonds/Notes
( Cost $68,240,474 ) | | | 76,476,706 | | | | 75.9 | | |
| ASSET-BACKED SECURITIES: 0.2% | | | |
| | | Other Asset-Backed Securities: 0.2% | | | |
| | 150,000 | | | # | | Dominos Pizza
Master Issuer LLC,
5.261%,
due 04/25/37 | | | 154,116 | | | | 0.1 | | |
| | | | | | | Other Securities | | | 54,523 | | | | 0.1 | | |
| | | | | | | Total Asset-Backed
Securities
( Cost $207,871 ) | | | 208,639 | | | | 0.2 | | |
| COLLATERALIZED MORTGAGE OBLIGATIONS: 1.0% | | | |
| | 1,000,000 | | | # | | Timberstar Trust,
7.530%,
due 10/15/36 | | | 998,445 | | | | 1.0 | | |
| | | | | | | Total Collateralized
Mortgage
Obligations
( Cost $1,008,588 ) | | | 998,445 | | | | 1.0 | | |
| | | | | | | Total Long-Term
Investments
( Cost $83,044,397 ) | | | 97,834,590 | | | | 97.1 | | |
| SHORT-TERM INVESTMENTS: 1.7% | | | |
| | | Mutual Funds: 1.7% | | | |
| | 1,747,848 | | | | | | | Blackrock Liquidity
Funds TempFund
Portfolio - Class I | | | 1,747,848 | | | | 1.7 | | |
| | | | | | | Total Short-Term
Investments
( Cost $1,747,848 ) | | | 1,747,848 | | | | 1.7 | | |
| | | | | | | Total Investments in
Securities
( Cost $84,792,245 ) * | | $ | 99,582,438 | | | | 98.8 | | |
| | | | | | | Other Assets and
Liabilities - Net | | | 1,237,955 | | | | 1.2 | | |
| | | | | | | Net Assets | | $ | 100,820,393 | | | �� | 100.0 | | |
"Other Securities" represents issues not identified as the top 50 holdings in terms of market value and issues or issuers not exceeding 1% of net assets individually or in aggregate respectively as of December 31, 2010.
The following footnotes apply to either the individual securities noted or one or more of the securities aggregated and listed as a single line item.
@ Non-income producing security
& Payment-in-kind
+ Step-up basis bonds. Interest rates shown reflect current and next coupon rates.
# Securities with purchases pursuant to Rule 144A or section 4(2), under the Securities Act of 1933 and may not be resold subject to that rule except to qualified institutional buyers. Unless otherwise noted, these securities have been determined to be liquid under the guidelines established by the Funds' Board of Directors/Trustees.
P Preferred Stock may be called prior to convertible date.
± Defaulted security
X Fair value determined by ING Funds Valuation Committee appointed by the Funds' Board of Directors/Trustees.
Z Indicates Zero Coupon Bond; rate shown reflects current effective yield.
* Cost for federal income tax purposes is $84,852,335.
| Net unrealized appreciation consists of: | |
| Gross Unrealized Appreciation | | $ | 18,112,643 | | |
| Gross Unrealized Depreciation | | | (3,382,540 | ) | |
| Net Unrealized Appreciation | | $ | 14,730,103 | | |
See Accompanying Notes to Financial Statements
182
SUMMARY PORTFOLIO OF INVESTMENTS
ING PIONEER HIGH YIELD PORTFOLIO AS OF DECEMBER 31, 2010 (CONTINUED)
Fair Value Measurements^
The following is a summary of the fair valuations according to the inputs used as of December 31, 2010 in valuing the Portfolio's assets and liabilities:
| | | Quoted Prices
in Active Markets
for Identical Investments
(Level 1) | | Other
Observable
Inputs#
(Level 2) | | Significant
Unobservable
Inputs
(Level 3) | | Fair Value
at
12/31/10 | |
| Asset Table | |
| Investments, at value | |
| Common Stock | |
| Consumer Discretionary | | $ | 1,385,998 | | | $ | — | | | $ | — | | | $ | 1,385,998 | | |
| Consumer Staples | | | 184,016 | | | | — | | | | — | | | | 184,016 | | |
| Energy | | | 989,198 | | | | — | | | | — | | | | 989,198 | | |
| Financials | | | 207,936 | | | | 9,020 | | | | — | | | | 216,956 | | |
| Health Care | | | 2,933,917 | | | | — | | | | — | | | | 2,933,917 | | |
| Industrials | | | 3,673,866 | | | | — | | | | — | | | | 3,673,866 | | |
| Information Technology | | | 1,721,105 | | | | — | | | | — | | | | 1,721,105 | | |
| Materials | | | 4,008,398 | | | | — | | | | — | | | | 4,008,398 | | |
| Telecommunication Services | | | 401,472 | | | | — | | | | — | | | | 401,472 | | |
| Utilities | | | 897,787 | | | | — | | | | — | | | | 897,787 | | |
| Total Common Stock | | | 16,403,693 | | | | 9,020 | | | | — | | | | 16,412,713 | | |
| Real Estate Investment Trusts | | | 280,538 | | | | — | | | | — | | | | 280,538 | | |
| Preferred Stock | | | — | | | | 1,525,876 | | | | 1,931,673 | | | | 3,457,549 | | |
| Corporate Bonds/Notes | | | — | | | | 76,476,706 | | | | — | | | | 76,476,706 | | |
| Asset-Backed Securities | | | — | | | | 208,639 | | | | — | | | | 208,639 | | |
| Collateralized Mortgage Obligations | | | — | | | | 998,445 | | | | — | | | | 998,445 | | |
| Short-Term Investments | | | 1,747,848 | | | | — | | | | — | | | | 1,747,848 | | |
| Total Investments, at value | | $ | 18,432,079 | | | $ | 79,218,686 | | | $ | 1,931,673 | | | $ | 99,582,438 | | |
| Other Financial Instruments+ | |
| Unfunded Commitments | | $ | — | | | $ | 2,603 | | | $ | — | | | $ | 2,603 | | |
| Total Assets | | $ | 18,432,079 | | | $ | 79,221,289 | | | $ | 1,931,673 | | | $ | 99,585,041 | | |
The following is a reconciliation of the fair valuations using significant unobservable inputs (Level 3) for the Portfolio's assets and liabilities during the period ended December 31, 2010:
| | | Beginning
Balance
12/31/09 | | Purchases | | Sales | | Accrued
Discounts/
(Premiums) | | Total
Realized
Gain/(Loss) | | Total
Unrealized
Appreciation/
(Depreciation) | | Transfers
Into
Level 3 | | Transfers
Out of
Level 3 | | Ending
Balance
12/31/10 | |
| Asset Table | |
| Investments, at value | |
| Preferred Stock | | $ | — | | | $ | 828,100 | | | $ | (308,805 | ) | | $ | — | | | $ | 191,719 | | | $ | 1,220,659 | | | $ | — | | | $ | — | | | $ | 1,931,673 | | |
Corporate
Bonds/Notes | | | — | | | | — | | | | (15,462 | ) | | | — | | | | 15,462 | | | | — | | | | — | | | | — | | | | — | | |
Total Investments,
at value | | $ | — | | | $ | 828,100 | | | $ | (324,267 | ) | | $ | — | | | $ | 207,181 | | | $ | 1,220,659 | | | $ | — | | | $ | — | | | $ | 1,931,673 | | |
As of December 31, 2010, total change in unrealized gain (loss) on Level 3 securities still held at period end and included in the change in net assets was $1,220,659.
^ See Note 2, "Significant Accounting Policies" in the Notes to Financial Statements for additional information.
+ Other Financial Instruments are derivatives not reflected in the Summary Portfolio of Investments and may include open forward foreign currency contracts, futures, swaps, unfunded commitments and written options. Forward foreign currency contracts, futures and unfunded commitments are reported at their unrealized gain/loss at measurement date which represents the amount due to/from the Portfolio. Swaps and written options are reported at their market value at measurement date.
Transfers in or out of Level 3 represents either the beginning value (for transfers in), or the ending value (for transfers out) of any security or derivative instrument where a change in the pricing level occurred from the beginning to the end of the period. It is the policy of the Portfolio to recognize transfers at the end of the reporting period.
# The earlier close of the foreign markets gives rise to the possibility that significant events, including broad market moves, may have occurred in the interim and may materially affect the value of those securities. To account for this, the Portfolio may frequently value many of its foreign equity securities using fair value prices based on third party vendor modeling tools to the extent available. Accordingly, a significant portion of the Portfolio's investments are categorized as Level 2 investments.
See Accompanying Notes to Financial Statements
183
ING T. ROWE PRICE SUMMARY PORTFOLIO OF INVESTMENTS
DIVERSIFIED MID CAP GROWTH PORTFOLIO AS OF DECEMBER 31, 2010
| Shares | |
| |
| | Value | | Percent of
Net Assets | |
| COMMON STOCK: 99.2% | | | |
| | | Consumer Discretionary: 18.5% | | | |
| | 107,900 | | | @ | | Bed Bath &
Beyond, Inc. | | $ | 5,303,285 | | | | 0.6 | | |
| | 142,100 | | | @ | | Carmax, Inc. | | | 4,530,148 | | | | 0.5 | | |
| | 141,300 | | | | | Coach, Inc. | | | 7,815,303 | | | | 1.0 | | |
| | 147,350 | | | @ | | Discovery
Communications,
Inc. - Class C | | | 5,406,272 | | | | 0.7 | | |
| | 129,112 | | | | | Marriott
International, Inc. | | | 5,363,312 | | | | 0.7 | | |
| | 193,300 | | | | | Mattel, Inc. | | | 4,915,619 | | | | 0.6 | | |
| | 129,400 | | | | | McGraw-Hill Cos., Inc. | | | 4,711,454 | | | | 0.6 | | |
| | 20,600 | | | @ | | Priceline.com, Inc. | | | 8,230,730 | | | | 1.0 | | |
| | 87,700 | | | | | Ross Stores, Inc. | | | 5,547,025 | | | | 0.7 | | |
| | 96,000 | | | | | Starwood
Hotels & Resorts
Worldwide, Inc. | | | 5,834,880 | | | | 0.7 | | |
| | 72,000 | | | | | Tiffany & Co. | | | 4,483,440 | | | | 0.5 | | |
| | | | | | | Other Securities | | | 89,092,003 | | | | 10.9 | | |
| | | | | | | | | | 151,233,471 | | | | 18.5 | | |
| | | Consumer Staples: 3.7% | | | |
| | 184,500 | | | | | Avon Products, Inc. | | | 5,361,570 | | | | 0.7 | | |
| | 87,200 | | | @ | | Whole Foods
Market, Inc. | | | 4,411,448 | | | | 0.5 | | |
| | | | | | | Other Securities | | | 20,497,076 | | | | 2.5 | | |
| | | | | | | | | | 30,270,094 | | | | 3.7 | | |
| | | Energy: 7.8% | | | |
| | 110,800 | | | @ | | Cameron
International Corp. | | | 5,620,884 | | | | 0.7 | | |
| | 67,300 | | | @ | | Concho Resources, Inc. | | | 5,900,191 | | | | 0.7 | | |
| | 82,600 | | | @ | | FMC Technologies, Inc. | | | 7,343,966 | | | | 0.9 | | |
| | 70,900 | | | | | Peabody Energy Corp. | | | 4,536,182 | | | | 0.5 | | |
| | | | | | | Other Securities | | | 40,746,463 | | | | 5.0 | | |
| | | | | | | | | | 64,147,686 | | | | 7.8 | | |
| | | Financials: 7.8% | | | |
| | 37,500 | | | @ | | Intercontinental
Exchange, Inc. | | | 4,468,125 | | | | 0.6 | | |
| | | | | | | Other Securities | | | 59,265,037 | | | | 7.2 | | |
| | | | | | | | | | 63,733,162 | | | | 7.8 | | |
| | | Health Care: 12.8% | | | |
| | 50,200 | | | @ | | Alexion
Pharmaceuticals, Inc. | | | 4,043,610 | | | | 0.5 | | |
| | 147,900 | | | | | AmerisourceBergen
Corp. | | | 5,046,348 | | | | 0.6 | | |
| | 44,700 | | | @ | | Cerner Corp. | | | 4,234,878 | | | | 0.5 | | |
| | 48,300 | | | | | CR Bard, Inc. | | | 4,432,491 | | | | 0.6 | | |
| | 84,800 | | | @ | | Life Technologies Corp. | | | 4,706,400 | | | | 0.6 | | |
| | | | | | | Other Securities | | | 81,914,078 | | | | 10.0 | | |
| | | | | | | | | | 104,377,805 | | | | 12.8 | | |
| Shares | |
| |
| | Value | | Percent of
Net Assets | |
| | | Industrials: 17.0% | | | |
| | 71,300 | | | | | CH Robinson
Worldwide, Inc. | | $ | 5,717,547 | | | | 0.7 | | |
| | 72,300 | | | | | Cooper Industries PLC | | | 4,214,367 | | | | 0.5 | | |
| | 82,800 | | | | | Cummins, Inc. | | | 9,108,828 | | | | 1.1 | | |
| | 92,700 | | | | | Expeditors
International
Washington, Inc. | | | 5,061,420 | | | | 0.6 | | |
| | 83,300 | | | | | Fluor Corp. | | | 5,519,458 | | | | 0.7 | | |
| | 49,600 | | | | | Joy Global, Inc. | | | 4,302,800 | | | | 0.5 | | |
| | 40,500 | | | | | Precision
Castparts Corp. | | | 5,638,005 | | | | 0.7 | | |
| | 56,500 | | | | | Rockwell
Automation, Inc. | | | 4,051,615 | | | | 0.5 | | |
| | 32,900 | | | | | WW Grainger, Inc. | | | 4,543,819 | | | | 0.6 | | |
| | | | | | | Other Securities | | | 90,839,866 | | | | 11.1 | | |
| | | | | | | | | | 138,997,725 | | | | 17.0 | | |
| | | Information Technology: 23.2% | | | |
| | 118,100 | | | | | Altera Corp. | | | 4,201,998 | | | | 0.5 | | |
| | 110,800 | | | @ | | Autodesk, Inc. | | | 4,232,560 | | | | 0.5 | | |
| | 92,100 | | | @ | | Intuit, Inc. | | | 4,540,530 | | | | 0.6 | | |
| | 129,800 | | | @ | | Juniper Networks, Inc. | | | 4,792,216 | | | | 0.6 | | |
| | 128,400 | | | | | Linear
Technology Corp. | | | 4,441,356 | | | | 0.5 | | |
| | 242,300 | | | @ | | Marvell Technology
Group Ltd. | | | 4,494,665 | | | | 0.5 | | |
| | 92,300 | | | @ | | NetApp, Inc. | | | 5,072,808 | | | | 0.6 | | |
| | 252,000 | | | @ | | Nuance
Communications, Inc. | | | 4,581,360 | | | | 0.6 | | |
| | 140,700 | | | L | | Paychex, Inc. | | | 4,349,037 | | | | 0.5 | | |
| | 73,700 | | | @ | | Rovi Corp. | | | 4,570,137 | | | | 0.6 | | |
| | 108,200 | | | @,L | | Trimble Navigation Ltd. | | | 4,320,426 | | | | 0.5 | | |
| | 331,000 | | | | | Western Union Co. | | | 6,146,670 | | | | 0.8 | | |
| | 173,400 | | | | | Xilinx, Inc. | | | 5,025,132 | | | | 0.6 | | |
| | | | | | | Other Securities | | | 129,473,450 | | | | 15.8 | | |
| | | | | | | | | | 190,242,345 | | | | 23.2 | | |
| | | Materials: 6.3% | | | |
| | 51,400 | | | | | Cliffs Natural
Resources, Inc. | | | 4,009,714 | | | | 0.5 | | |
| | 63,100 | | | | | Compass Minerals
International, Inc. | | | 5,632,937 | | | | 0.7 | | |
| | 81,800 | | | L | | Sociedad Quimica y
Minera de Chile
SA ADR | | | 4,778,756 | | | | 0.6 | | |
| | 40,300 | | | L | | Walter Industries, Inc. | | | 5,151,952 | | | | 0.6 | | |
| | | | | | | Other Securities | | | 31,933,775 | | | | 3.9 | | |
| | | | | | | | | | 51,507,134 | | | | 6.3 | | |
| | | Telecommunication Services: 1.5% | | | |
| | 126,400 | | | @ | | Crown Castle
International Corp. | | | 5,540,112 | | | | 0.7 | | |
| | | | | | | Other Securities | | | 6,337,959 | | | | 0.8 | | |
| | | | | | | | | | 11,878,071 | | | | 1.5 | | |
See Accompanying Notes to Financial Statements
184
ING T. ROWE PRICE SUMMARY PORTFOLIO OF INVESTMENTS
DIVERSIFIED MID CAP GROWTH PORTFOLIO AS OF DECEMBER 31, 2010 (CONTINUED)
| Shares | |
| |
| | Value | | Percent of
Net Assets | |
| | | Utilities: 0.6% | | | |
| | | | | | | Other Securities | | $ | 4,861,218 | | | | 0.6 | | |
| | | | | | | Total Common Stock
( Cost $658,974,106 ) | | | 811,248,711 | | | | 99.2 | | |
| REAL ESTATE INVESTMENT TRUSTS: 0.4% | | | |
| | | Financials: 0.4% | | | |
| | | | | | | Other Securities | | | 3,257,899 | | | | 0.4 | | |
| | | | | | | Total Real Estate
Investment Trusts
( Cost $2,650,475 ) | | | 3,257,899 | | | | 0.4 | | |
| PREFERRED STOCK: 0.2% | | | |
| | | Information Technology: 0.2% | | | |
| | | | | | | Other Securities | | | 1,847,067 | | | | 0.2 | | |
| | | | | | | Total Preferred Stock
( Cost $1,847,067 ) | | | 1,847,067 | | | | 0.2 | | |
| | | | | | | Total Long-Term
Investments
( Cost $663,471,648 ) | | | 816,353,677 | | | | 99.8 | | |
| SHORT-TERM INVESTMENTS: 5.3% | | | |
| | | Mutual Funds: 0.3% | | | |
| | 2,604,988 | | | | | T. Rowe Price Reserve
Investment Fund | | | 2,604,988 | | | | 0.3 | | |
| | | | | | | Total Mutual Funds
( Cost $2,604,988 ) | | | 2,604,988 | | | | 0.3 | | |
| | | Securities Lending Collateralcc: 5.0% | | | |
| | 39,070,449 | | | | | BNY Mellon Overnight
Government Fund (1) | | | 39,070,449 | | | | 4.8 | | |
| | 2,384,768 | | | R | | BNY Institutional
Cash Reserves Fund,
Series B (1)(2) | | | 1,907,814 | | | | 0.2 | | |
| | | | | | | Total Securities Lending
Collateral
( Cost $41,455,217 ) | | | 40,978,263 | | | | 5.0 | | |
| | | | | | | Total Short-Term
Investments
( Cost $44,060,205 ) | | | 43,583,251 | | | | 5.3 | | |
| | | | | | | Total Investments in
Securities
( Cost $707,531,853 ) * | | $ | 859,936,928 | | | | 105.1 | | |
| | | | | | | Other Assets and
Liabilities - Net | | | (41,694,420 | ) | | | (5.1 | ) | |
| | | | | | | Net Assets | | $ | 818,242,508 | | | | 100.0 | | |
"Other Securities" represents issues not identified as the top 50 holdings in terms of market value and issues or issuers not exceeding 1% of net assets individually or in aggregate respectively as of December 31, 2010.
The following footnotes apply to either the individual securities noted or one or more of the securities aggregated and listed as a single line item.
@ Non-income producing security
ADR American Depositary Receipt
cc Securities purchased with cash collateral for securities loaned.
(1) Collateral received from brokers for securities lending was invested in these short-term investments.
(2) On September 12, 2008, BNY established a separate sleeve of the Institutional Cash Reserves Fund (Series B) to hold certain Lehman Brothers defaulted debt obligations. The Portfolio's position in Series B is being fair valued daily. Please see the accompanying Notes to Financial Statements for additional details on securities lending.
R Restricted security
L Loaned security, a portion or all of the security is on loan at December 31, 2010.
* Cost for federal income tax purposes is $708,017,737.
| Net unrealized appreciation consists of: | |
| Gross Unrealized Appreciation | | $ | 198,913,472 | | |
| Gross Unrealized Depreciation | | | (46,994,281 | ) | |
| Net Unrealized Appreciation | | $ | 151,919,191 | | |
See Accompanying Notes to Financial Statements
185
ING T. ROWE PRICE SUMMARY PORTFOLIO OF INVESTMENTS
DIVERSIFIED MID CAP GROWTH PORTFOLIO AS OF DECEMBER 31, 2010 (CONTINUED)
Fair Value Measurements^
The following is a summary of the fair valuations according to the inputs used as of December 31, 2010 in valuing the Portfolio's assets and liabilities:
| | | Quoted Prices
in Active Markets
for Identical Investments
(Level 1) | | Other
Observable
Inputs#
(Level 2) | | Significant
Unobservable
Inputs
(Level 3) | | Fair Value
at
12/31/10 | |
| Asset Table | |
| Investments, at value | |
| Common Stock | |
| Consumer Discretionary | | $ | 151,233,471 | | | $ | — | | | $ | — | | | $ | 151,233,471 | | |
| Consumer Staples | | | 30,270,094 | | | | — | | | | — | | | | 30,270,094 | | |
| Energy | | | 64,147,686 | | | | — | | | | — | | | | 64,147,686 | | |
| Financials | | | 63,733,162 | | | | — | | | | — | | | | 63,733,162 | | |
| Health Care | | | 104,377,805 | | | | — | | | | — | | | | 104,377,805 | | |
| Industrials | | | 138,997,725 | | | | — | | | | — | | | | 138,997,725 | | |
| Information Technology | | | 190,242,345 | | | | — | | | | — | | | | 190,242,345 | | |
| Materials | | | 46,728,378 | | | | 4,778,756 | | | | — | | | | 51,507,134 | | |
| Telecommunication Services | | | 11,878,071 | | | | — | | | | — | | | | 11,878,071 | | |
| Utilities | | | 4,861,218 | | | | — | | | | — | | | | 4,861,218 | | |
| Total Common Stock | | | 806,469,955 | | | | 4,778,756 | | | | — | | | | 811,248,711 | | |
| Real Estate Investment Trusts | | | 3,257,899 | | | | — | | | | — | | | | 3,257,899 | | |
| Preferred Stock | | | — | | | | 1,847,067 | | | | — | | | | 1,847,067 | | |
| Short-Term Investments | | | 41,675,437 | | | | — | | | | 1,907,814 | | | | 43,583,251 | | |
| Total Investments, at value | | $ | 851,403,291 | | | $ | 6,625,823 | | | $ | 1,907,814 | | | $ | 859,936,928 | | |
The following is a reconciliation of the fair valuations using significant unobservable inputs (Level 3) for the Portfolio's assets and liabilities during the period ended December 31, 2010:
| | | Beginning
Balance
12/31/09 | | Purchases | | Sales | | Accrued
Discounts/
(Premiums) | | Total
Realized
Gain/(Loss) | | Total
Unrealized
Appreciation/
(Depreciation) | | Transfers
Into
Level 3 | | Transfers
Out of
Level 3 | | Ending
Balance
12/31/10 | |
| Asset Table | |
| Investments, at value | |
Short-Term
Investments | | $ | 1,907,814 | | | $ | — | | | $ | — | | | $ | — | | | $ | — | | | $ | — | | | $ | — | | | $ | — | | | $ | 1,907,814 | | |
Total Investments,
at value | | $ | 1,907,814 | | | $ | — | | | $ | — | | | $ | — | | | $ | — | | | $ | — | | | $ | — | | | $ | — | | | $ | 1,907,814 | | |
As of December 31, 2010, total change in unrealized gain (loss) on Level 3 securities still held at period end and included in the change in net assets was $0.
^ See Note 2, "Significant Accounting Policies" in the Notes to Financial Statements for additional information.
Transfers in or out of Level 3 represents either the beginning value (for transfers in), or the ending value (for transfers out) of any security or derivative instrument where a change in the pricing level occurred from the beginning to the end of the period. It is the policy of the Portfolio to recognize transfers at the end of the reporting period.
# The earlier close of the foreign markets gives rise to the possibility that significant events, including broad market moves, may have occurred in the interim and may materially affect the value of those securities. To account for this, the Portfolio may frequently value many of its foreign equity securities using fair value prices based on third party vendor modeling tools to the extent available. Accordingly, a significant portion of the Portfolio's investments are categorized as Level 2 investments.
See Accompanying Notes to Financial Statements
186
ING T. ROWE PRICE SUMMARY PORTFOLIO OF INVESTMENTS
GROWTH EQUITY PORTFOLIO AS OF DECEMBER 31, 2010
| Shares | |
| |
| | Value | | Percent of
Net Assets | |
| COMMON STOCK: 99.2% | | | |
| | | Consumer Discretionary: 18.8% | | | |
| | 251,000 | | | @ | | Amazon.com, Inc. | | $ | 45,180,000 | | | | 4.2 | | |
| | 257,600 | | | | | Coach, Inc. | | | 14,247,856 | | | | 1.3 | | |
| | 296,311 | | | | | Marriott
International, Inc. | | | 12,308,759 | | | | 1.1 | | |
| | 124,100 | | | | | Nike, Inc. | | | 10,600,622 | | | | 1.0 | | |
| | 24,759 | | | @ | | Priceline.com, Inc. | | | 9,892,457 | | | | 0.9 | | |
| | 485,400 | | | | | Starbucks Corp. | | | 15,595,902 | | | | 1.4 | | |
| | 147,700 | | | | | Starwood
Hotels & Resorts
Worldwide, Inc. | | | 8,977,206 | | | | 0.8 | | |
| | 273,100 | | | | | Walt Disney Co. | | | 10,243,981 | | | | 1.0 | | |
| | | | | | | Other Securities | | | 76,318,366 | | | | 7.1 | | |
| | | | | | | | | | 203,365,149 | | | | 18.8 | | |
| | | Consumer Staples: 2.4% | | | |
| | 119,400 | | | | | Costco Wholesale Corp. | | | 8,621,874 | | | | 0.8 | | |
| | | | | | | Other Securities | | | 17,334,276 | | | | 1.6 | | |
| | | | | | | | | | 25,956,150 | | | | 2.4 | | |
| | | Energy: 8.8% | | | |
| | 173,100 | | | @ | | Cameron
International Corp. | | | 8,781,363 | | | | 0.8 | | |
| | 116,700 | | | | | EOG Resources, Inc. | | | 10,667,547 | | | | 1.0 | | |
| | 95,200 | | | @ | | FMC Technologies, Inc. | | | 8,464,232 | | | | 0.8 | | |
| | 123,900 | | | | | Occidental
Petroleum Corp. | | | 12,154,590 | | | | 1.1 | | |
| | 122,600 | | | | | Peabody Energy Corp. | | | 7,843,948 | | | | 0.7 | | |
| | 234,500 | | | | | Schlumberger Ltd. | | | 19,580,750 | | | | 1.8 | | |
| | 289,800 | | | | | Suncor Energy, Inc. | | | 11,096,442 | | | | 1.1 | | |
| | | | | | | Other Securities | | | 16,186,912 | | | | 1.5 | | |
| | | | | | | | | | 94,775,784 | | | | 8.8 | | |
| | | Financials: 7.5% | | | |
| | 323,100 | | | | | American Express Co. | | | 13,867,452 | | | | 1.3 | | |
| | 141,308 | | | | | Franklin Resources, Inc. | | | 15,714,863 | | | | 1.5 | | |
| | 76,500 | | | @,L | | Intercontinental
Exchange, Inc. | | | 9,114,975 | | | | 0.8 | | |
| | 416,400 | | | | | Invesco Ltd. | | | 10,018,584 | | | | 0.9 | | |
| | 332,100 | | | | | JPMorgan Chase & Co. | | | 14,087,682 | | | | 1.3 | | |
| | | | | | | Other Securities | | | 18,218,172 | | | | 1.7 | | |
| | | | | | | | | | 81,021,728 | | | | 7.5 | | |
| | | Health Care: 6.0% | | | |
| | 357,000 | | | @ | | Express Scripts, Inc. | | | 19,295,850 | | | | 1.7 | | |
| | 151,700 | | | | | McKesson Corp. | | | 10,676,646 | | | | 1.0 | | |
| | | | | | | Other Securities | | | 35,534,052 | | | | 3.3 | | |
| | | | | | | | | | 65,506,548 | | | | 6.0 | | |
| | | Industrials: 15.3% | | | |
| | 112,900 | | | | | 3M Co. | | | 9,743,270 | | | | 0.9 | | |
| | 682,200 | | | | | Danaher Corp. | | | 32,179,373 | | | | 3.0 | | |
| Shares | |
| |
| | Value | | Percent of
Net Assets | |
| | 180,200 | | | | | Emerson Electric Co. | | $ | 10,302,034 | | | | 0.9 | | |
| | 167,000 | | | | | Expeditors
International
Washington, Inc. | | | 9,118,200 | | | | 0.8 | | |
| | 177,000 | | | L | | Fastenal Co. | | | 10,604,070 | | | | 1.0 | | |
| | 208,700 | | | | | FedEx Corp. | | | 19,411,187 | | | | 1.8 | | |
| | 93,400 | | | | | Precision
Castparts Corp. | | | 13,002,214 | | | | 1.2 | | |
| | 110,600 | | | | | Union Pacific Corp. | | | 10,248,196 | | | | 0.9 | | |
| | 144,000 | | | | | United Parcel Service,
Inc. - Class B | | | 10,451,520 | | | | 1.0 | | |
| | | | | | | Other Securities | | | 40,996,181 | | | | 3.8 | | |
| | | | | | | | | | 166,056,245 | | | | 15.3 | | |
| | | Information Technology: 31.1% | | | |
| | 218,900 | | | | | Accenture PLC | | | 10,614,461 | | | | 1.0 | | |
| | 245,100 | | | @ | | Apple, Inc. | | | 79,059,456 | | | | 7.3 | | |
| | 209,900 | | | @ | | Baidu.com ADR | | | 20,261,647 | | | | 1.9 | | |
| | 266,900 | | | | | Broadcom Corp. | | | 11,623,495 | | | | 1.1 | | |
| | 748,000 | | | | | Corning, Inc. | | | 14,451,360 | | | | 1.3 | | |
| | 159,700 | | | @ | | Dolby Laboratories, Inc. | | | 10,651,990 | | | | 1.0 | | |
| | 341,000 | | | @ | | eBay, Inc. | | | 9,490,030 | | | | 0.9 | | |
| | 94,250 | | | @ | | Google, Inc. - Class A | | | 55,981,673 | | | | 5.2 | | |
| | 393,000 | | | @ | | Juniper Networks, Inc. | | | 14,509,560 | | | | 1.3 | | |
| | 7,000 | | | @,# | | Mail.ru Group Ltd. GDR | | | 252,000 | | | | 0.0 | | |
| | 55,700 | | | | | Mastercard, Inc. | | | 12,482,927 | | | | 1.2 | | |
| | 440,800 | | | | | Qualcomm, Inc. | | | 21,815,192 | | | | 2.0 | | |
| | 411,700 | | | | | Tencent Holdings Ltd. | | | 8,937,778 | | | | 0.8 | | |
| | 298,900 | | | | | Visa, Inc. | | | 21,036,582 | | | | 1.9 | | |
| | | | | | | Other Securities | | | 45,462,919 | | | | 4.2 | | |
| | | | | | | | | | 336,631,070 | | | | 31.1 | | |
| | | Materials: 5.5% | | | |
| | 241,847 | | | | | BHP Billiton Ltd. | | | 11,246,137 | | | | 1.0 | | |
| | 71,200 | | | | | Freeport-McMoRan
Copper & Gold, Inc. | | | 8,550,408 | | | | 0.8 | | |
| | 249,500 | | | | | Praxair, Inc. | | | 23,819,765 | | | | 2.2 | | |
| | | | | | | Other Securities | | | 15,690,283 | | | | 1.5 | | |
| | | | | | | | | | 59,306,593 | | | | 5.5 | | |
| | | Telecommunication Services: 3.8% | | | |
| | 339,200 | | | @ | | American Tower Corp. | | | 17,516,288 | | | | 1.6 | | |
| | 540,112 | | | @ | | Crown Castle
International Corp. | | | 23,673,109 | | | | 2.2 | | |
| | | | | | | | | | 41,189,397 | | | | 3.8 | | |
| | | | | | | Total Common Stock
( Cost $794,023,410 ) | | | 1,073,808,664 | | | | 99.2 | | |
See Accompanying Notes to Financial Statements
187
ING T. ROWE PRICE SUMMARY PORTFOLIO OF INVESTMENTS
GROWTH EQUITY PORTFOLIO AS OF DECEMBER 31, 2010 (CONTINUED)
| Shares | |
| |
| | Value | | Percent of
Net Assets | |
| PREFERRED STOCK: 0.2% | | | |
| | | Information Technology: 0.2% | | | |
| | | | | | | Other Securities | | $ | 1,990,265 | | | | 0.2 | | |
| | | | | | | Total Preferred Stock
( Cost $1,990,265 ) | | | 1,990,265 | | | | 0.2 | | |
| | | | | | | Total Long-Term
Investments
( Cost $796,013,675 ) | | | 1,075,798,929 | | | | 99.4 | | |
| SHORT-TERM INVESTMENTS: 1.5% | | | |
| | | Mutual Funds: 0.5% | | | |
| | 5,773,730 | | | | | T. Rowe Price Reserve
Investment Fund | | | 5,773,730 | | | | 0.5 | | |
| | | | | | | Total Mutual Funds
( Cost $5,773,730 ) | | | 5,773,730 | | | | 0.5 | | |
| | | Securities Lending Collateralcc: 1.0% | | | |
| | 8,889,825 | | | | | BNY Mellon Overnight
Government Fund (1) | | | 8,889,825 | | | | 0.8 | | |
| | 1,695,725 | | | R | | BNY Institutional Cash
Reserves Fund,
Series B (1)(2) | | | 1,356,580 | | | | 0.2 | | |
| | | | | | | Total Securities
Lending Collateral
( Cost $10,585,550 ) | | | 10,246,405 | | | | 1.0 | | |
| | | | | | | Total Short-Term
Investments
( Cost $16,359,280 ) | | | 16,020,135 | | | | 1.5 | | |
| | | | | | | Total Investments in
Securities
( Cost $812,372,955 ) * | | $ | 1,091,819,064 | | | | 100.9 | | |
| | | | | | | Other Assets and
Liabilities - Net | | | (9,661,457 | ) | | | (0.9 | ) | |
| | | | | | | Net Assets | | $ | 1,082,157,607 | | | | 100.0 | | |
"Other Securities" represents issues not identified as the top 50 holdings in terms of market value and issues or issuers not exceeding 1% of net assets individually or in aggregate respectively as of December 31, 2010.
The following footnotes apply to either the individual securities noted or one or more of the securities aggregated and listed as a single line item.
@ Non-income producing security
ADR American Depositary Receipt
GDR Global Depositary Receipt
# Securities with purchases pursuant to Rule 144A or section 4(2), under the Securities Act of 1933 and may not be resold subject to that rule except to qualified institutional buyers. Unless otherwise noted, these securities have been determined to be liquid under the guidelines established by the Funds' Board of Directors/Trustees.
cc Securities purchased with cash collateral for securities loaned.
(1) Collateral received from brokers for securities lending was invested in these short-term investments.
(2) On September 12, 2008, BNY established a separate sleeve of the Institutional Cash Reserves Fund (Series B) to hold certain Lehman Brothers defaulted debt obligations. The Portfolio's position in Series B is being fair valued daily. Please see the accompanying Notes to Financial Statements for additional details on securities lending.
R Restricted security
L Loaned security, a portion or all of the security is on loan at December 31, 2010.
* Cost for federal income tax purposes is $817,480,410.
| Net unrealized appreciation consists of: | |
| Gross Unrealized Appreciation | | $ | 282,105,482 | | |
| Gross Unrealized Depreciation | | | (7,766,828 | ) | |
| Net Unrealized Appreciation | | $ | 274,338,654 | | |
See Accompanying Notes to Financial Statements
188
ING T. ROWE PRICE SUMMARY PORTFOLIO OF INVESTMENTS
GROWTH EQUITY PORTFOLIO AS OF DECEMBER 31, 2010 (CONTINUED)
Fair Value Measurements^
The following is a summary of the fair valuations according to the inputs used as of December 31, 2010 in valuing the Portfolio's assets and liabilities:
| | | Quoted Prices
in Active Markets
for Identical Investments
(Level 1) | | Other
Observable
Inputs#
(Level 2) | | Significant
Unobservable
Inputs
(Level 3) | | Fair Value
at
12/31/10 | |
| Asset Table | |
| Investments, at value | |
| Common Stock | |
| Consumer Discretionary | | $ | 195,978,988 | | | $ | 7,386,161 | | | $ | — | | | $ | 203,365,149 | | |
| Consumer Staples | | | 25,956,150 | | | | — | | | | — | | | | 25,956,150 | | |
| Energy | | | 94,775,784 | | | | — | | | | — | | | | 94,775,784 | | |
| Financials | | | 81,021,728 | | | | — | | | | — | | | | 81,021,728 | | |
| Health Care | | | 65,506,548 | | | | — | | | | — | | | | 65,506,548 | | |
| Industrials | | | 166,056,245 | | | | — | | | | — | | | | 166,056,245 | | |
| Information Technology | | | 321,493,739 | | | | 15,137,331 | | | | — | | | | 336,631,070 | | |
| Materials | | | 48,060,456 | | | | 11,246,137 | | | | — | | | | 59,306,593 | | |
| Telecommunication Services | | | 41,189,397 | | | | — | | | | — | | | | 41,189,397 | | |
| Total Common Stock | | | 1,040,039,035 | | | | 33,769,629 | | | | — | | | | 1,073,808,664 | | |
| Preferred Stock | | | — | | | | 1,990,265 | | | | — | | | | 1,990,265 | | |
| Short-Term Investments | | | 14,663,555 | | | | — | | | | 1,356,580 | | | | 16,020,135 | | |
| Total Investments, at value | | $ | 1,054,702,590 | | | $ | 35,759,894 | | | $ | 1,356,580 | | | $ | 1,091,819,064 | | |
The following is a reconciliation of the fair valuations using significant unobservable inputs (Level 3) for the Portfolio's assets and liabilities during the period ended December 31, 2010:
| | | Beginning
Balance
12/31/09 | | Purchases | | Sales | | Accrued
Discounts/
(Premiums) | | Total
Realized
Gain/(Loss) | | Total
Unrealized
Appreciation/
(Depreciation) | | Transfers
Into
Level 3 | | Transfers
Out of
Level 3 | | Ending
Balance
12/31/10 | |
| Asset Table | |
| Investments, at value | |
Short-Term
Investments | | $ | 1,356,580 | | | $ | — | | | $ | — | | | $ | — | | | $ | — | | | $ | — | | | $ | — | | | $ | — | | | $ | 1,356,580 | | |
Total Investments,
at value | | $ | 1,356,580 | | | $ | — | | | $ | — | | | $ | — | | | $ | — | | | $ | — | | | $ | — | | | $ | — | | | $ | 1,356,580 | | |
As of December 31, 2010, total change in unrealized gain (loss) on Level 3 securities still held at period end and included in the change in net assets was $0.
^ See Note 2, "Significant Accounting Policies" in the Notes to Financial Statements for additional information.
Transfers in or out of Level 3 represents either the beginning value (for transfers in), or the ending value (for transfers out) of any security or derivative instrument where a change in the pricing level occurred from the beginning to the end of the period. It is the policy of the Portfolio to recognize transfers at the end of the reporting period.
# The earlier close of the foreign markets gives rise to the possibility that significant events, including broad market moves, may have occurred in the interim and may materially affect the value of those securities. To account for this, the Portfolio may frequently value many of its foreign equity securities using fair value prices based on third party vendor modeling tools to the extent available. Accordingly, a significant portion of the Portfolio's investments are categorized as Level 2 investments.
See Accompanying Notes to Financial Statements
189
ING TEMPLETON SUMMARY PORTFOLIO OF INVESTMENTS
FOREIGN EQUITY PORTFOLIO AS OF DECEMBER 31, 2010
Shares | |
| |
| | Value | | Percent of
Net Assets | |
| COMMON STOCK: 86.6% | | | |
| | | Austria: 0.6% | | | |
| | | | | | | Other Securities | | $ | 4,029,181 | | | | 0.6 | | |
| | | Bermuda: 0.8% | | | |
| | | | | | | | | Other Securities | | | 5,603,609 | | | | 0.8 | | |
| | | Brazil: 2.2% | | | |
| | 184,274 | | | | | | | Petroleo Brasileiro
SA ADR | | | 6,972,928 | | | | 1.0 | | |
| | | | | | | | | Other Securities | | | 8,402,452 | | | | 1.2 | | |
| | | | | | | | | | 15,375,380 | | | | 2.2 | | |
| | | Canada: 2.2% | | | |
| | 531,300 | | | | | | | Talisman Energy, Inc. | | | 11,819,728 | | | | 1.7 | | |
| | | | | | | | | Other Securities | | | 3,268,350 | | | | 0.5 | | |
| | | | | | | | | | 15,088,078 | | | | 2.2 | | |
| | | China: 3.1% | | | |
| | 19,862,000 | | | | | | | China Telecom
Corp., Ltd. | | | 10,378,209 | | | | 1.5 | | |
| | 13,026,153 | | | | | | | Shanghai Electric
Group Co., Ltd. | | | 8,593,857 | | | | 1.2 | | |
| | | | | | | | | Other Securities | | | 2,512,467 | | | | 0.4 | | |
| | | | | | | | | | 21,484,533 | | | | 3.1 | | |
| | | Denmark: 0.5% | | | |
| | | | | | | | | Other Securities | | | 3,381,120 | | | | 0.5 | | |
| | | France: 8.2% | | | |
| | 424,911 | | | | | | | AXA S.A. | | | 7,072,830 | | | | 1.0 | | |
| | 98,650 | | | | | | | Cie Generale des
Etablissements
Michelin | | | 7,081,658 | | | | 1.0 | | |
| | 397,550 | | | | | | | France Telecom S.A. | | | 8,319,075 | | | | 1.2 | | |
| | 138,888 | | | | | | | Sanofi-Aventis | | | 8,904,220 | | | | 1.3 | | |
| | 153,638 | | | | | | | Total S.A. | | | 8,183,148 | | | | 1.2 | | |
| | | | | | | | | Other Securities | | | 16,941,398 | | | | 2.5 | | |
| | | | | | | | | | 56,502,329 | | | | 8.2 | | |
| | | Germany: 10.2% | | | |
| | 350,450 | | | | | Deutsche Post AG | | | 5,945,455 | | | | 0.9 | | |
| | 215,412 | | | | | E.ON AG | | | 6,578,434 | | | | 0.9 | | |
| | 916,844 | | | @ | | Infineon
Technologies AG | | | 8,546,170 | | | | 1.2 | | |
| | 59,230 | | | | | MAN AG | | | 7,054,644 | | | | 1.0 | | |
| | 41,570 | | | | | Muenchener
Rueckversicherungs AG | | | 6,295,973 | | | | 0.9 | | |
| | 172,576 | | | | | SAP AG | | | 8,801,836 | | | | 1.3 | | |
| | 103,733 | | | | | Siemens AG | | | 12,849,888 | | | | 1.9 | | |
| | | | | | | Other Securities | | | 14,282,832 | | | | 2.1 | | |
| | | | | | | | | | 70,355,232 | | | | 10.2 | | |
Shares | |
| |
| | Value | | Percent of
Net Assets | |
| | | Hong Kong: 3.9% | | | |
| | 2,151,100 | | | @ | | AIA Group Ltd. | | $ | 6,046,925 | | | | 0.9 | | |
| | 708,500 | | | | | China Mobile Ltd. | | | 7,024,679 | | | | 1.0 | | |
| | 361,500 | | | | | Swire Pacific Ltd. | | | 5,939,457 | | | | 0.8 | | |
| | | | | | | Other Securities | | | 8,021,280 | | | | 1.2 | | |
| | | | | | | | | | 27,032,341 | | | | 3.9 | | |
| | | India: 3.1% | | | |
| | 711,953 | | | | | | | Housing Development
Finance Corp. | | | 11,590,738 | | | | 1.7 | | |
| | 195,050 | | | | | | | ICICI Bank Ltd. ADR | | | 9,877,332 | | | | 1.4 | | |
| | | | | | | | | | 21,468,070 | | | | 3.1 | | |
| | | Ireland: 0.6% | | | |
| | | | | | | | | Other Securities | | | 4,342,425 | | | | 0.6 | | |
| | | Italy: 2.4% | | | |
| | 344,844 | | | | | | | ENI S.p.A. | | | 7,558,089 | | | | 1.1 | | |
| | | | | | | | | Other Securities | | | 9,177,306 | | | | 1.3 | | |
| | | | | | | | | | 16,735,395 | | | | 2.4 | | |
| | | Japan: 3.2% | | | |
| | | | | | | | | Other Securities | | | 22,058,602 | | | | 3.2 | | |
| | | Netherlands: 5.9% | | | |
| | 269,105 | | | | | | | Koninklijke Philips
Electronics NV | | | 8,250,042 | | | | 1.2 | | |
| | 310,440 | | | | | | | Royal Dutch Shell
PLC - Class B | | | 10,280,075 | | | | 1.5 | | |
| | 211,190 | | | | | | | Unilever NV | | | 6,588,620 | | | | 0.9 | | |
| | | | | | | | | Other Securities | | | 15,829,526 | | | | 2.3 | | |
| | | | | | | | | | 40,948,263 | | | | 5.9 | | |
| | | Norway: 2.8% | | | |
| | 381,570 | | | | | | | Statoil ASA | | | 9,088,253 | | | | 1.3 | | |
| | 637,490 | | | | | | | Telenor ASA | | | 10,388,118 | | | | 1.5 | | |
| | | | | | | | | | 19,476,371 | | | | 2.8 | | |
| | | Portugal: 0.9% | | | |
| | 517,580 | | | | | | | Portugal Telecom
SGPS S.A. | | | 5,908,214 | | | | 0.9 | | |
| | | Singapore: 3.2% | | | |
| | 1,028,500 | | | | | | | DBS Group
Holdings Ltd. | | | 11,479,664 | | | | 1.6 | | |
| | 2,430,000 | | | | | | | Singapore
Telecommunications
Ltd. | | | 5,774,512 | | | | 0.8 | | |
| | | | | | | | | Other Securities | | | 5,250,659 | | | | 0.8 | | |
| | | | | | | | | | 22,504,835 | | | | 3.2 | | |
See Accompanying Notes to Financial Statements
190
ING TEMPLETON SUMMARY PORTFOLIO OF INVESTMENTS
FOREIGN EQUITY PORTFOLIO AS OF DECEMBER 31, 2010 (CONTINUED)
Shares | |
| |
| | Value | | Percent of
Net Assets | |
| | | South Korea: 4.0% | | | |
| | 129,728 | | | | | KB Financial Group,
Inc. ADR | | $ | 6,861,314 | | | | 1.0 | | |
| | 86,118 | | | | | LG Electronics, Inc. | | | 8,933,964 | | | | 1.3 | | |
| | 28,943 | | | | | Samsung Electronics
Co., Ltd. GDR | | | 12,101,025 | | | | 1.7 | | |
| | | | | | | | | | 27,896,303 | | | | 4.0 | | |
| | | Spain: 3.5% | | | |
| | 473,255 | | | | | Telefonica S.A. | | | 10,804,432 | | | | 1.5 | | |
| | | | | | | Other Securities | | | 13,579,658 | | | | 2.0 | | |
| | | | | | | | | | 24,384,090 | | | | 3.5 | | |
| | | Sweden: 1.1% | | | |
| | 663,420 | | | | | Telefonaktiebolaget
LM Ericsson | | | 7,688,253 | | | | 1.1 | | |
| | | Switzerland: 6.7% | | | |
| | 115,149 | | | | | Adecco S.A. | | | 7,551,398 | | | | 1.1 | | |
| | 153,740 | | | | | Nestle S.A. | | | 9,006,654 | | | | 1.3 | | |
| | 191,006 | | | | | Novartis AG | | | 11,243,684 | | | | 1.6 | | |
| | 45,800 | | | | | Roche Holding AG -
Genusschein | | | 6,713,952 | | | | 1.0 | | |
| | 163,681 | | | | | Swiss Reinsurance | | | 8,780,968 | | | | 1.2 | | |
| | | | | | | Other Securities | | | 3,259,301 | | | | 0.5 | | |
| | | | | | | | | | 46,555,957 | | | | 6.7 | | |
| | | Taiwan: 2.0% | | | |
| | 2,437,627 | | | | | Taiwan Semiconductor
Manufacturing Co.,
Ltd. ADR | | | 9,808,198 | | | | 1.4 | | |
| | | | | | | Other Securities | | | 3,701,168 | | | | 0.6 | | |
| | | | | | | | | | 13,509,366 | | | | 2.0 | | |
| | | United Kingdom: 15.5% | | | |
| | 1,365,890 | | | | | BAE Systems PLC | | | 7,035,403 | | | | 1.0 | | |
| | 931,060 | | | | | BP PLC | | | 6,862,780 | | | | 1.0 | | |
| | 666,327 | | | | | Burberry Group PLC | | | 11,710,638 | | | | 1.7 | | |
| | 485,427 | | | | | GlaxoSmithKline PLC | | | 9,413,793 | | | | 1.4 | | |
| | 754,000 | | | | | HSBC Holdings PLC | | | 7,699,450 | | | | 1.1 | | |
| | 1,424,335 | | | | | Kingfisher PLC | | | 5,867,852 | | | | 0.8 | | |
| | 483,080 | | | | | Pearson PLC | | | 7,612,908 | | | | 1.1 | | |
| | 633,400 | | | @ | | Rolls-Royce Group PLC | | | 6,171,361 | | | | 0.9 | | |
| | 40,537,600 | | | @ | | Rolls-Royce Group
PLC - C Shares | | | 63,202 | | | | | | |
| | 937,220 | | | | | Tesco PLC | | | 6,214,721 | | | | 0.9 | | |
| | 3,365,836 | | | | | Vodafone Group PLC | | | 8,835,787 | | | | 1.3 | | |
| | | | | | | Other Securities | | | 29,999,034 | | | | 4.3 | | |
| | | | | | | | | | 107,486,929 | | | | 15.5 | | |
| | | | | | | Total Common Stock
( Cost $559,813,226 ) | | | 599,814,876 | | | | 86.6 | | |
Principal
Amount | |
| |
| | Value | | Percent of
Net Assets | |
| SHORT-TERM INVESTMENTS: 0.3% | | | |
| | | U.S. Government Agency Obligations: 0.3% | | | |
| $ | | | | | | | | Other Securities | | $ | 2,400,000 | | | | 0.3 | | |
| | | | | | | | | Total Short-Term
Investments
( Cost $2,400,000 ) | | | 2,400,000 | | | | 0.3 | | |
| | | | | | | | | Total Investments in
Securities
( Cost $562,213,226 ) * | | $ | 602,214,876 | | | | 86.9 | | |
| | | | | | | | | Other Assets and
Liabilities - Net | | | 90,469,347 | | | | 13.1 | | |
| | | | | | | | | Net Assets | | $ | 692,684,223 | | | | 100.0 | | |
"Other Securities" represents issues not identified as the top 50 holdings in terms of market value and issues or issuers not exceeding 1% of net assets individually or in aggregate respectively as of December 31, 2010.
The following footnotes apply to either the individual securities noted or one or more of the securities aggregated and listed as a single line item.
@ Non-income producing security
ADR American Depositary Receipt
GDR Global Depositary Receipt
* Cost for federal income tax purposes is $565,385,162.
| Net unrealized appreciation consists of: | |
| Gross Unrealized Appreciation | | $ | 91,497,472 | | |
| Gross Unrealized Depreciation | | | (54,667,758 | ) | |
| Net Unrealized Appreciation | | $ | 36,829,714 | | |
| Industry | | Percentage of
Net Assets | |
| Consumer Discretionary | | | 8.3 | % | |
| Consumer Staples | | | 3.1 | | |
| Energy | | | 10.9 | | |
| Financials | | | 18.8 | | |
| Health Care | | | 6.8 | | |
| Industrials | | | 14.9 | | |
| Information Technology | | | 9.2 | | |
| Materials | | | 1.9 | | |
| Telecommunication Services | | | 10.3 | | |
| Utilities | | | 2.4 | | |
| Short-Term Investments | | | 0.3 | | |
| Other Assets and Liabilities - Net | | | 13.1 | | |
| Net Assets | | | 100.0 | % | |
See Accompanying Notes to Financial Statements
191
ING TEMPLETON SUMMARY PORTFOLIO OF INVESTMENTS
FOREIGN EQUITY PORTFOLIO AS OF DECEMBER 31, 2010 (CONTINUED)
Fair Value Measurements^
The following is a summary of the fair valuations according to the inputs used as of December 31, 2010 in valuing the Portfolio's assets and liabilities:
| | | Quoted Prices
in Active Markets
for Identical Investments
(Level 1) | | Other
Observable
Inputs#
(Level 2) | | Significant
Unobservable
Inputs
(Level 3) | | Fair Value
at
12/31/10 | |
| Asset Table | |
| Investments, at value | |
| Common Stock | |
| Austria | | $ | — | | | $ | 4,029,181 | | | $ | — | | | $ | 4,029,181 | | |
| Bermuda | | | 5,603,609 | | | | — | | | | — | | | | 5,603,609 | | |
| Brazil | | | 15,375,380 | | | | — | | | | — | | | | 15,375,380 | | |
| Canada | | | 15,088,078 | | | | — | | | | — | | | | 15,088,078 | | |
| China | | | — | | | | 21,484,533 | | | | — | | | | 21,484,533 | | |
| Denmark | | | — | | | | 3,381,120 | | | | — | | | | 3,381,120 | | |
| France | | | — | | | | 56,502,329 | | | | — | | | | 56,502,329 | | |
| Germany | | | — | | | | 70,355,232 | | | | — | | | | 70,355,232 | | |
| Hong Kong | | | 10,261,905 | | | | 16,770,436 | | | | — | | | | 27,032,341 | | |
| India | | | 9,877,332 | | | | 11,590,738 | | | | — | | | | 21,468,070 | | |
| Ireland | | | — | | | | 4,342,425 | | | | — | | | | 4,342,425 | | |
| Italy | | | — | | | | 16,735,395 | | | | — | | | | 16,735,395 | | |
| Japan | | | — | | | | 22,058,602 | | | | — | | | | 22,058,602 | | |
| Netherlands | | | — | | | | 40,948,263 | | | | — | | | | 40,948,263 | | |
| Norway | | | — | | | | 19,476,371 | | | | — | | | | 19,476,371 | | |
| Portugal | | | — | | | | 5,908,214 | | | | — | | | | 5,908,214 | | |
| Singapore | | | — | | | | 22,504,835 | | | | — | | | | 22,504,835 | | |
| South Korea | | | 18,962,339 | | | | 8,933,964 | | | | — | | | | 27,896,303 | | |
| Spain | | | — | | | | 24,384,090 | | | | — | | | | 24,384,090 | | |
| Sweden | | | — | | | | 7,688,253 | | | | — | | | | 7,688,253 | | |
| Switzerland | | | — | | | | 46,555,957 | | | | — | | | | 46,555,957 | | |
| Taiwan | | | 8,508,703 | | | | 5,000,663 | | | | — | | | | 13,509,366 | | |
| United Kingdom | | | — | | | | 107,486,929 | | | | — | | | | 107,486,929 | | |
| Total Common Stock | | | 83,677,346 | | | | 516,137,530 | | | | — | | | | 599,814,876 | | |
| Short-Term Investments | | | — | | | | 2,400,000 | | | | — | | | | 2,400,000 | | |
| Total Investments, at value | | $ | 83,677,346 | | | $ | 518,537,530 | | | $ | — | | | $ | 602,214,876 | | |
^ See Note 2, "Significant Accounting Policies" in the Notes to Financial Statements for additional information.
# The earlier close of the foreign markets gives rise to the possibility that significant events, including broad market moves, may have occurred in the interim and may materially affect the value of those securities. To account for this, the Portfolio may frequently value many of its foreign equity securities using fair value prices based on third party vendor modeling tools to the extent available. Accordingly, a significant portion of the Portfolio's investments are categorized as Level 2 investments.
See Accompanying Notes to Financial Statements
192
SUMMARY PORTFOLIO OF INVESTMENTS
ING THORNBURG VALUE PORTFOLIO AS OF DECEMBER 31, 2010
Shares | |
| |
| | Value | | Percent of
Net Assets | |
| COMMON STOCK: 97.5% | | | |
| | | Consumer Discretionary: 8.2% | | | |
| | 164,300 | | | | | Best Buy Co., Inc. | | $ | 5,633,847 | | | | 1.9 | | |
| | 291,578 | | | | | Comcast Corp. -
Special Class A | | | 6,067,738 | | | | 2.1 | | |
| | 210,775 | | | @ | | Dish Network Corp. | | | 4,143,837 | | | | 1.4 | | |
| | 118,096 | | | @ | | Life Time Fitness, Inc. | | | 4,840,755 | | | | 1.7 | | |
| | 442,400 | | | @ | | Pulte Homes, Inc. | | | 3,326,848 | | | | 1.1 | | |
| | | | | | | | | | 24,013,025 | | | | 8.2 | | |
| | | Consumer Staples: 0.2% | | | |
| | 756,115 | | | @ | | Rite Aid Corp. | | | 667,801 | | | | 0.2 | | |
| | | Energy: 19.4% | | | |
| | 156,300 | | | | | Baker Hughes, Inc. | | | 8,935,671 | | | | 3.0 | | |
| | 89,642 | | | | | ConocoPhillips | | | 6,104,620 | | | | 2.1 | | |
| | 261,480 | | | | | Gazprom OAO ADR | | | 6,652,051 | | | | 2.3 | | |
| | 1,900 | | | | | Inpex Holdings, Inc. | | | 11,094,843 | | | | 3.8 | | |
| | 201,035 | | | | | Marathon Oil Corp. | | | 7,444,326 | | | | 2.5 | | |
| | 727,780 | | | @ | | SandRidge Energy, Inc. | | | 5,327,350 | | | | 1.8 | | |
| | 166,100 | | | @ | | Transocean Ltd. | | | 11,545,611 | | | | 3.9 | | |
| | | | | | | | | | 57,104,472 | | | | 19.4 | | |
| | | Financials: 15.1% | | | |
| | 182,500 | | | | | Hartford Financial
Services Group, Inc. | | | 4,834,425 | | | | 1.6 | | |
| | 319,550 | | | | | JPMorgan Chase & Co. | | | 13,555,311 | | | | 4.6 | | |
| | 1,972,042 | | | | | Mitsubishi UFJ
Financial Group, Inc. | | | 10,633,489 | | | | 3.6 | | |
| | 83,549 | | | | | Transatlantic
Holdings, Inc. | | | 4,312,799 | | | | 1.5 | | |
| | 416,305 | | | | | US Bancorp. | | | 11,227,746 | | | | 3.8 | | |
| | | | | | | | | | 44,563,770 | | | | 15.1 | | |
| | | Health Care: 15.8% | | | |
| | 139,600 | | | @ | | Alere, Inc. | | | 5,109,360 | | | | 1.7 | | |
| | 52,116 | | | @ | | Community Health
Systems, Inc. | | | 1,947,575 | | | | 0.7 | | |
| | 213,115 | | | | | Eli Lilly & Co. | | | 7,467,550 | | | | 2.5 | | |
| | 320,380 | | | @ | | Gilead Sciences, Inc. | | | 11,610,571 | | | | 3.9 | | |
| | 33,100 | | | | | Roche Holding AG -
Genusschein | | | 4,852,223 | | | | 1.7 | | |
| | 80,800 | | | @ | | Talecris Biotherapeutics
Holdings Corp. | | | 1,882,640 | | | | 0.6 | | |
| | 119,844 | | | @ | | Thermo Fisher
Scientific, Inc. | | | 6,634,564 | | | | 2.3 | | |
| | 99,775 | | | @ | | Varian Medical
Systems, Inc. | | | 6,912,412 | | | | 2.4 | | |
| | | | | | | | | | 46,416,895 | | | | 15.8 | | |
| | | Industrials: 5.5% | | | |
| | 632,200 | | | | | General Electric Co. | | | 11,562,938 | | | | 3.9 | | |
| | 67,700 | | | | | Lockheed Martin Corp. | | | 4,732,907 | | | | 1.6 | | |
| | | | | | | | | | 16,295,845 | | | | 5.5 | | |
Shares | |
| |
| | Value | | Percent of
Net Assets | |
| | | Information Technology: 22.0% | | | |
| | 192,600 | | | @ | | Adobe Systems, Inc. | | $ | 5,928,228 | | | | 2.0 | | |
| | 210,329 | | | @ | | Amdocs Ltd. | | | 5,777,738 | | | | 1.9 | | |
| | 68,106 | | | @ | | Ansys, Inc. | | | 3,546,279 | | | | 1.2 | | |
| | 109,523 | | | | | Corning, Inc. | | | 2,115,984 | | | | 0.7 | | |
| | 805,797 | | | @ | | Dell, Inc. | | | 10,918,549 | | | | 3.7 | | |
| | 175,487 | | | @ | | Fiserv, Inc. | | | 10,276,519 | | | | 3.5 | | |
| | 17,250 | | | @ | | Google, Inc. - Class A | | | 10,245,983 | | | | 3.5 | | |
| | 437,202 | | | @ | | MEMC Electronic
Materials, Inc. | | | 4,922,895 | | | | 1.7 | | |
| | 154,474 | | | | | Microsoft Corp. | | | 4,312,914 | | | | 1.5 | | |
| | 225,752 | | | @ | | NCR Corp. | | | 3,469,808 | | | | 1.2 | | |
| | 343,638 | | | @ | | ON Semiconductor
Corp. | | | 3,395,143 | | | | 1.1 | | |
| | | | | | | | | | 64,910,040 | | | | 22.0 | | |
| | | Materials: 8.5% | | | |
| | 130,000 | | | | | Monsanto Co. | | | 9,053,200 | | | | 3.1 | | |
| | 651,500 | | | | | Tokyo Steel
Manufacturing
Co., Ltd. | | | 7,077,948 | | | | 2.4 | | |
| | 149,637 | | | L | | United States
Steel Corp. | | | 8,741,794 | | | | 3.0 | | |
| | | | | | | | | | 24,872,942 | | | | 8.5 | | |
| | | Telecommunication Services: 2.8% | | | |
| | 553,328 | | | | | China Mobile Ltd. | | | 5,486,170 | | | | 1.8 | | |
| | 2,931,950 | | | @,L | | Level 3
Communications, Inc. | | | 2,873,311 | | | | 1.0 | | |
| | | | | | | | | | 8,359,481 | | | | 2.8 | | |
| | | | | | | Total Common Stock
( Cost $260,846,816 ) | | | 287,204,271 | | | | 97.5 | | |
Principal
Amount | |
| |
| | Value | | Percent of
Net Assets | |
| CORPORATE BONDS/NOTES: 2.9% | | | |
| | | Financials: 1.2% | | | |
| $ | 3,000,000 | | | #,L | | AngloGold Ashanti
Holdings Finance
PLC, 3.500%,
due 05/22/14 | | | 3,750,000 | | | | 1.2 | | |
| | | Telecommunication Services: 1.7% | | | |
| | 891,000 | | | L | | Level 3
Communications,
Inc., 6.500%,
due 10/01/16 | | | 965,621 | | | | 0.3 | | |
| | 4,000,000 | | | | | Level 3 Financing,
Inc., 9.250%,
due 11/01/14 | | | 3,990,000 | | | | 1.4 | | |
| | | | | | | | | | 4,955,621 | | | | 1.7 | | |
| | | | | | | Total Corporate
Bonds/Notes
( Cost $7,661,694 ) | | | 8,705,621 | | | | 2.9 | | |
| | | | | | | Total Long-Term
Investments
( Cost $268,508,510 ) | | | 295,909,892 | | | | 100.4 | | |
See Accompanying Notes to Financial Statements
193
SUMMARY PORTFOLIO OF INVESTMENTS
ING THORNBURG VALUE PORTFOLIO AS OF DECEMBER 31, 2010 (CONTINUED)
Shares | |
| |
| | Value | | Percent of
Net Assets | |
| SHORT-TERM INVESTMENTS: 3.1% | | | |
| | | Securities Lending Collateralcc: 3.1% | | | |
| | 8,644,142 | | | | | BNY Mellon Overnight
Government Fund (1) | | $ | 8,644,142 | | | | 2.9 | | |
| | 539,803 | | | R | | BNY Institutional
Cash Reserves Fund,
Series B (1)(2) | | | 431,842 | | | | 0.2 | | |
| | | | | | | Total Short-Term
Investments
( Cost $9,183,945 ) | | | 9,075,984 | | | | 3.1 | | |
| | | | | | | Total Investments in
Securities
( Cost $277,692,455 ) * | | $ | 304,985,876 | | | | 103.5 | | |
| | | | | | | Other Assets and
Liabilities - Net | | | (10,387,613 | ) | | | (3.5 | ) | |
| | | | | | | Net Assets | | $ | 294,598,263 | | | | 100.0 | | |
@ Non-income producing security
ADR American Depositary Receipt
# Securities with purchases pursuant to Rule 144A or section 4(2), under the Securities Act of 1933 and may not be resold subject to that rule except to qualified institutional buyers. Unless otherwise noted, these securities have been determined to be liquid under the guidelines established by the Funds' Board of Directors/Trustees.
cc Securities purchased with cash collateral for securities loaned.
(1) Collateral received from brokers for securities lending was invested in these short-term investments.
(2) On September 12, 2008, BNY established a separate sleeve of the Institutional Cash Reserves Fund (Series B) to hold certain Lehman Brothers defaulted debt obligations. The Portfolio's position in Series B is being fair valued daily. Please see the accompanying Notes to Financial Statements for additional details on securities lending.
R Restricted security
L Loaned security, a portion or all of the security is on loan at December 31, 2010.
* Cost for federal income tax purposes is $281,654,013.
| Net unrealized appreciation consists of: | |
| Gross Unrealized Appreciation | | $ | 35,988,323 | | |
| Gross Unrealized Depreciation | | | (12,656,460 | ) | |
| Net Unrealized Appreciation | | $ | 23,331,863 | | |
See Accompanying Notes to Financial Statements
194
SUMMARY PORTFOLIO OF INVESTMENTS
ING THORNBURG VALUE PORTFOLIO AS OF DECEMBER 31, 2010 (CONTINUED)
Fair Value Measurements^
The following is a summary of the fair valuations according to the inputs used as of December 31, 2010 in valuing the Portfolio's assets and liabilities:
| | | Quoted Prices
in Active Markets
for Identical Investments
(Level 1) | | Other
Observable
Inputs#
(Level 2) | | Significant
Unobservable
Inputs
(Level 3) | | Fair Value
at
12/31/10 | |
| Asset Table | |
| Investments, at value | |
| Common Stock | |
| Consumer Discretionary | | $ | 24,013,025 | | | $ | — | | | $ | — | | | $ | 24,013,025 | | |
| Consumer Staples | | | 667,801 | | | | — | | | | — | | | | 667,801 | | |
| Energy | | | 46,009,629 | | | | 11,094,843 | | | | — | | | | 57,104,472 | | |
| Financials | | | 33,930,281 | | | | 10,633,489 | | | | — | | | | 44,563,770 | | |
| Health Care | | | 41,564,672 | | | | 4,852,223 | | | | — | | | | 46,416,895 | | |
| Industrials | | | 16,295,845 | | | | — | | | | — | | | | 16,295,845 | | |
| Information Technology | | | 64,910,040 | | | | — | | | | — | | | | 64,910,040 | | |
| Materials | | | 17,794,994 | | | | 7,077,948 | | | | — | | | | 24,872,942 | | |
| Telecommunication Services | | | 2,873,311 | | | | 5,486,170 | | | | — | | | | 8,359,481 | | |
| Total Common Stock | | | 248,059,598 | | | | 39,144,673 | | | | — | | | | 287,204,271 | | |
| Corporate Bonds/Notes | | | — | | | | 8,705,621 | | | | — | | | | 8,705,621 | | |
| Short-Term Investments | | | 8,644,142 | | | | — | | | | 431,842 | | | | 9,075,984 | | |
| Total Investments, at value | | $ | 256,703,740 | | | $ | 47,850,294 | | | $ | 431,842 | | | $ | 304,985,876 | | |
The following is a reconciliation of the fair valuations using significant unobservable inputs (Level 3) for the Portfolio's assets and liabilities during the period ended December 31, 2010:
| | | Beginning
Balance
12/31/09 | | Purchases | | Sales | | Accrued
Discounts/
(Premiums) | | Total
Realized
Gain/(Loss) | | Total
Unrealized
Appreciation/
(Depreciation) | | Transfers
Into
Level 3 | | Transfers
Out of
Level 3 | | Ending
Balance
12/31/10 | |
| Asset Table | |
| Investments, at value | |
Short-Term
Investments | | $ | 431,842 | | | $ | — | | | $ | — | | | $ | — | | | $ | — | | | $ | — | | | $ | — | | | $ | — | | | $ | 431,842 | | |
Total Investments,
at value | | $ | 431,842 | | | $ | — | | | $ | — | | | $ | — | | | $ | — | | | $ | — | | | $ | — | | | $ | — | | | $ | 431,842 | | |
As of December 31, 2010, total change in unrealized gain (loss) on Level 3 securities still held at period end and included in the change in net assets was $0.
^ See Note 2, "Significant Accounting Policies" in the Notes to Financial Statements for additional information.
Transfers in or out of Level 3 represents either the beginning value (for transfers in), or the ending value (for transfers out) of any security or derivative instrument where a change in the pricing level occurred from the beginning to the end of the period. It is the policy of the Portfolio to recognize transfers at the end of the reporting period.
# The earlier close of the foreign markets gives rise to the possibility that significant events, including broad market moves, may have occurred in the interim and may materially affect the value of those securities. To account for this, the Portfolio may frequently value many of its foreign equity securities using fair value prices based on third party vendor modeling tools to the extent available. Accordingly, a significant portion of the Portfolio's investments are categorized as Level 2 investments.
See Accompanying Notes to Financial Statements
195
ING UBS SUMMARY PORTFOLIO OF INVESTMENTS
U.S. LARGE CAP EQUITY PORTFOLIO AS OF DECEMBER 31, 2010
Shares | |
| |
| | Value | | Percent of
Net Assets | |
| COMMON STOCK: 98.4% | | | |
| | | Consumer Discretionary: 15.0% | | | |
| | 76,900 | | | | | Carnival Corp. | | $ | 3,545,859 | | | | 2.0 | | |
| | 161,000 | | | | | Comcast Corp. - Class A | | | 3,537,170 | | | | 2.0 | | |
| | 51,500 | | | L | | Fortune Brands, Inc. | | | 3,102,875 | | | | 1.8 | | |
| | 54,300 | | | @ | | General Motors Co. | | | 2,001,498 | | | | 1.1 | | |
| | 66,600 | | | | | Johnson Controls, Inc. | | | 2,544,120 | | | | 1.4 | | |
| | 92,300 | | | | | Lowe's Cos., Inc. | | | 2,314,884 | | | | 1.3 | | |
| | 85,300 | | | | | Time Warner, Inc. | | | 2,744,101 | | | | 1.6 | | |
| | 48,800 | | | | | Viacom - Class B | | | 1,932,968 | | | | 1.1 | | |
| | | | | | | Other Securities | | | 4,683,497 | | | | 2.7 | | |
| | | | | | | | | | 26,406,972 | | | | 15.0 | | |
| | | Consumer Staples: 7.5% | | | |
| | 81,100 | | | | | Avon Products, Inc. | | | 2,356,766 | | | | 1.3 | | |
| | 36,400 | | | | | Kellogg Co. | | | 1,859,312 | | | | 1.1 | | |
| | 111,900 | | | | | Kroger Co. | | | 2,502,084 | | | | 1.4 | | |
| | 50,700 | | | | | PepsiCo, Inc. | | | 3,312,231 | | | | 1.9 | | |
| | 48,800 | | | | | Procter & Gamble Co. | | | 3,139,304 | | | | 1.8 | | |
| | | | | | | | | | 13,169,697 | | | | 7.5 | | |
| | | Energy: 11.1% | | | |
| | 40,800 | | | | | Baker Hughes, Inc. | | | 2,332,536 | | | | 1.3 | | |
| | 101,100 | | | | | ExxonMobil Corp. | | | 7,392,432 | | | | 4.2 | | |
| | 31,700 | | | | | Hess Corp. | | | 2,426,318 | | | | 1.4 | | |
| | 55,200 | | | | | Marathon Oil Corp. | | | 2,044,056 | | | | 1.1 | | |
| | 72,000 | | | @ | | Noble Corp. | | | 2,575,440 | | | | 1.5 | | |
| | 59,100 | | | @ | | Ultra Petroleum Corp. | | | 2,823,207 | | | | 1.6 | | |
| | | | | | | | | | 19,593,989 | | | | 11.1 | | |
| | | Financials: 14.5% | | | |
| | 59,100 | | | | | Aflac, Inc. | | | 3,335,013 | | | | 1.9 | | |
| | 67,492 | | | | | Bank of New York
Mellon Corp. | | | 2,038,258 | | | | 1.1 | | |
| | 371,700 | | | @ | | Citigroup, Inc. | | | 1,758,141 | | | | 1.0 | | |
| | 13,500 | | | | | Goldman Sachs
Group, Inc. | | | 2,270,160 | | | | 1.3 | | |
| | 94,000 | | | | | JPMorgan Chase & Co. | | | 3,987,480 | | | | 2.3 | | |
| | 56,700 | | | | | Metlife, Inc. | | | 2,519,748 | | | | 1.4 | | |
| | 98,300 | | | | | US Bancorp. | | | 2,651,151 | | | | 1.5 | | |
| | 138,500 | | | | | Wells Fargo & Co. | | | 4,292,115 | | | | 2.4 | | |
| | | | | | | Other Securities | | | 2,817,307 | | | | 1.6 | | |
| | | | | | | | | | 25,669,373 | | | | 14.5 | | |
| | | Health Care: 13.2% | | | |
| | 39,400 | | | | | Allergan, Inc. | | | 2,705,598 | | | | 1.5 | | |
| | 61,700 | | | | | Covidien PLC | | | 2,817,222 | | | | 1.6 | | |
| | 57,100 | | | | | Johnson & Johnson | | | 3,531,635 | | | | 2.0 | | |
| | 62,800 | | | | | Medtronic, Inc. | | | 2,329,252 | | | | 1.3 | | |
| | 66,200 | | | | | Merck & Co., Inc. | | | 2,385,848 | | | | 1.4 | | |
Shares | |
| |
| | Value | | Percent of
Net Assets | |
| | 79,600 | | | | | UnitedHealth
Group, Inc. | | $ | 2,874,356 | | | | 1.6 | | |
| | | | | | | Other Securities | | | 6,718,032 | | | | 3.8 | | |
| | | | | | | | | | 23,361,943 | | | | 13.2 | | |
| | | Industrials: 10.8% | | | |
| | 46,000 | | | | | Dover Corp. | | | 2,688,700 | | | | 1.5 | | |
| | 26,500 | | | | | FedEx Corp. | | | 2,464,765 | | | | 1.4 | | |
| | 48,500 | | | | | General
Dynamics Corp. | | | 3,441,560 | | | | 1.9 | | |
| | 61,500 | | | | | Illinois Tool
Works, Inc. | | | 3,284,100 | | | | 1.9 | | |
| | | | | | | Other Securities | | | 7,188,449 | | | | 4.1 | | |
| | | | | | | | | | 19,067,574 | | | | 10.8 | | |
| | | Information Technology: 19.5% | | | |
| | 106,500 | | | @ | | Adobe Systems, Inc. | | | 3,278,070 | | | | 1.9 | | |
| | 17,400 | | | @ | | Apple, Inc. | | | 5,612,544 | | | | 3.2 | | |
| | 51,200 | | | @ | | Autodesk, Inc. | | | 1,955,840 | | | | 1.1 | | |
| | 43,800 | | | | | Broadcom Corp. | | | 1,907,490 | | | | 1.1 | | |
| | 147,400 | | | @ | | Cisco Systems, Inc. | | | 2,981,902 | | | | 1.7 | | |
| | 64,100 | | | | | Hewlett-Packard Co. | | | 2,698,610 | | | | 1.5 | | |
| | 101,800 | | | | | Microsoft Corp. | | | 2,842,256 | | | | 1.6 | | |
| | 57,500 | | | | | Qualcomm, Inc. | | | 2,845,675 | | | | 1.6 | | |
| | 107,500 | | | @ | | Symantec Corp. | | | 1,799,550 | | | | 1.0 | | |
| | | | | | | Other Securities | | | 8,435,633 | | | | 4.8 | | |
| | | | | | | | | | 34,357,570 | | | | 19.5 | | |
| | | Materials: 2.1% | | | |
| | | | | | | Other Securities | | | 3,809,005 | | | | 2.1 | | |
| | | Telecommunication Services: 2.1% | | | |
| | 124,700 | | | | | AT&T, Inc. | | | 3,663,686 | | | | 2.1 | | |
| | | Utilities: 2.6% | | | |
| | 81,900 | | | | | American Electric
Power Co., Inc. | | | 2,946,762 | | | | 1.7 | | |
| | | | | | | Other Securities | | | 1,632,582 | | | | 0.9 | | |
| | | | | | | | | | 4,579,344 | | | | 2.6 | | |
| | | | | | | Total Common Stock
( Cost $144,422,056 ) | | | 173,679,153 | | | | 98.4 | | |
| EXCHANGE-TRADED FUNDS: 1.1% | | | |
| | | Exchange-Traded Funds: 1.1% | | | |
| | 15,000 | | | | | SPDR Trust Series 1 | | | 1,886,700 | | | | 1.1 | | |
| | | | | | | Total Exchange-
Traded Funds
( Cost $1,885,277 ) | | | 1,886,700 | | | | 1.1 | | |
| | | | | | | Total Long-Term
Investments
( Cost $146,307,333 ) | | | 175,565,853 | | | | 99.5 | | |
See Accompanying Notes to Financial Statements
196
ING UBS SUMMARY PORTFOLIO OF INVESTMENTS
U.S. LARGE CAP EQUITY PORTFOLIO AS OF DECEMBER 31, 2010 (CONTINUED)
Shares | |
| |
| | Value | | Percent of
Net Assets | |
| SHORT-TERM INVESTMENTS: 4.9% | | | |
| | | Mutual Funds: 1.0% | | | |
| | 1,719,646 | | | | | Blackrock Liquidity
Funds TempFund
Portfolio - Class I | | $ | 1,719,646 | | | | 1.0 | | |
| | | | | | | Total Mutual Funds
( Cost $1,719,646 ) | | | 1,719,646 | | | | 1.0 | | |
| | | Securities Lending Collateralcc: 3.9% | | | |
| | 6,261,298 | | | | | BNY Mellon Overnight
Government Fund (1) | | | 6,261,298 | | | | 3.5 | | |
| | 818,750 | | | R | | BNY Institutional
Cash Reserves Fund,
Series B (1)(2) | | | 655,000 | | | | 0.4 | | |
| | | | | | | Total Securities
Lending Collateral
( Cost $7,080,048 ) | | | 6,916,298 | | | | 3.9 | | |
| | | | | | | Total Short-Term
Investments
( Cost $8,799,694 ) | | | 8,635,944 | | | | 4.9 | | |
| | | | | | | Total Investments in
Securities
( Cost $155,107,027 ) * | | $ | 184,201,797 | | | | 104.4 | | |
| | | | | | | Other Assets and
Liabilities - Net | | | (7,794,235 | ) | | | (4.4 | ) | |
| | | | | | | Net Assets | | $ | 176,407,562 | | | | 100.0 | | |
"Other Securities" represents issues not identified as the top 50 holdings in terms of market value and issues or issuers not exceeding 1% of net assets individually or in aggregate respectively as of December 31, 2010.
The following footnotes apply to either the individual securities noted or one or more of the securities ggregated and listed as a single line item.
@ Non-income producing security
cc Securities purchased with cash collateral for securities loaned.
(1) Collateral received from brokers for securities lending was invested in these short-term investments.
(2) On September 12, 2008, BNY established a separate sleeve of the Institutional Cash Reserves Fund (Series B) to hold certain Lehman Brothers defaulted debt obligations. The Portfolio's position in Series B is being fair valued daily. Please see the accompanying Notes to Financial Statements for additional details on securities lending.
R Restricted security
L Loaned security, a portion or all of the security is on loan at December 31, 2010.
* Cost for federal income tax purposes is $158,127,653.
| Net unrealized appreciation consists of: | |
| Gross Unrealized Appreciation | | $ | 31,434,069 | | |
| Gross Unrealized Depreciation | | | (5,359,925 | ) | |
| Net Unrealized Appreciation | | $ | 26,074,144 | | |
See Accompanying Notes to Financial Statements
197
ING UBS SUMMARY PORTFOLIO OF INVESTMENTS
U.S. LARGE CAP EQUITY PORTFOLIO AS OF DECEMBER 31, 2010 (CONTINUED)
Fair Value Measurements^
The following is a summary of the fair valuations according to the inputs used as of December 31, 2010 in valuing the Portfolio's assets and liabilities:
| | | Quoted Prices
in Active Markets
for Identical Investments
(Level 1) | | Other
Observable
Inputs
(Level 2) | | Significant
Unobservable
Inputs
(Level 3) | | Fair Value
at
12/31/10 | |
| Asset Table | |
| Investments, at value | |
| Common Stock* | | $ | 173,679,153 | | | $ | — | | | $ | — | | | $ | 173,679,153 | | |
| Exchange-Traded Funds | | | 1,886,700 | | | | — | | | | — | | | | 1,886,700 | | |
| Short-Term Investments | | | 7,980,944 | | | | — | | | | 655,000 | | | | 8,635,944 | | |
| Total Investments, at value | | $ | 183,546,797 | | | $ | — | | | $ | 655,000 | | | $ | 184,201,797 | | |
The following is a reconciliation of the fair valuations using significant unobservable inputs (Level 3) for the Portfolio's assets and liabilities during the period ended December 31, 2010:
| | | Beginning
Balance
12/31/09 | | Purchases | | Sales | | Accrued
Discounts/
(Premiums) | | Total
Realized
Gain/(Loss) | | Total
Unrealized
Appreciation/
(Depreciation) | | Transfers
Into
Level 3 | | Transfers
Out of
Level 3 | | Ending
Balance
12/31/10 | |
| Asset Table | |
| Investments, at value | |
Short-Term
Investments | | $ | 655,000 | | | $ | — | | | $ | — | | | $ | — | | | $ | — | | | $ | — | | | $ | — | | | $ | — | | | $ | 655,000 | | |
Total Investments,
at value | | $ | 655,000 | | | $ | — | | | $ | — | | | $ | — | | | $ | — | | | $ | — | | | $ | — | | | $ | — | | | $ | 655,000 | | |
As of December 31, 2010, total change in unrealized gain (loss) on Level 3 securities still held at period end and included in the change in net assets was $0.
^ See Note 2, "Significant Accounting Policies" in the Notes to Financial Statements for additional information.
Transfers in or out of Level 3 represents either the beginning value (for transfers in), or the ending value (for transfers out) of any security or derivative instrument where a change in the pricing level occurred from the beginning to the end of the period. It is the policy of the Portfolio to recognize transfers at the end of the reporting period.
* For further breakdown of Common Stock by Industry type, please refer to the Portfolio of Investments.
See Accompanying Notes to Financial Statements
198
ING VAN KAMPEN SUMMARY PORTFOLIO OF INVESTMENTS
COMSTOCK PORTFOLIO AS OF DECEMBER 31, 2010
| Shares | |
| |
| | Value | | Percent of
Net Assets | |
| COMMON STOCK: 98.2% | | | |
| | | Consumer Discretionary: 17.1% | | | |
| | 740,981 | | | | | Comcast Corp. -
Class A | | $ | 16,279,353 | | | | 4.9 | | |
| | 91,432 | | | | | Home Depot, Inc. | | | 3,205,606 | | | | 1.0 | | |
| | 132,391 | | | | | Lowe's Cos., Inc. | | | 3,320,366 | | | | 1.0 | | |
| | 283,110 | | | L | | News Corp. - Class B | | | 4,648,666 | | | | 1.4 | | |
| | 85,723 | | | | | Time Warner
Cable, Inc. | | | 5,660,290 | | | | 1.7 | | |
| | 130,625 | | | | | Time Warner, Inc. | | | 4,202,206 | | | | 1.3 | | |
| | 273,056 | | | | | Viacom - Class B | | | 10,815,748 | | | | 3.3 | | |
| | | | | | | Other Securities | | | 8,481,373 | | | | 2.5 | | |
| | | | | | | | | | 56,613,608 | | | | 17.1 | | |
| | | Consumer Staples: 8.9% | | | |
| | 54,394 | | | | | Coca-Cola Co. | | | 3,577,493 | | | | 1.1 | | |
| | 152,584 | | | | | CVS Caremark Corp. | | | 5,305,346 | | | | 1.6 | | |
| | 221,364 | | | | | Kraft Foods, Inc. | | | 6,975,180 | | | | 2.1 | | |
| | 146,751 | | | | | Unilever NV ADR | | | 4,607,981 | | | | 1.4 | | |
| | 98,592 | | | | | Wal-Mart Stores, Inc. | | | 5,317,067 | | | | 1.6 | | |
| | | | | | | Other Securities | | | 3,659,896 | | | | 1.1 | | |
| | | | | | | | | | 29,442,963 | | | | 8.9 | | |
| | | Energy: 10.6% | | | |
| | 71,636 | | | | | BP PLC ADR | | | 3,164,162 | | | | 1.0 | | |
| | 79,411 | | | | | Chevron Corp. | | | 7,246,254 | | | | 2.2 | | |
| | 46,907 | | | | | ConocoPhillips | | | 3,194,367 | | | | 1.0 | | |
| | 197,535 | | | | | Halliburton Co. | | | 8,065,354 | | | | 2.4 | | |
| | 81,562 | | | | | Royal Dutch Shell
PLC ADR - Class A | | | 5,446,710 | | | | 1.6 | | |
| | 170,401 | | | @ | | Weatherford
International Ltd. | | | 3,885,143 | | | | 1.2 | | |
| | | | | | | Other Securities | | | 4,119,672 | | | | 1.2 | | |
| | | | | | | | | | 35,121,662 | | | | 10.6 | | |
| | | Financials: 21.0% | | | |
| | 479,780 | | | | | Bank of America Corp. | | | 6,400,265 | | | | 1.9 | | |
| | 234,647 | | | L | | Bank of New York
Mellon Corp. | | | 7,086,339 | | | | 2.1 | | |
| | 124,379 | | | | | Chubb Corp. | | | 7,417,964 | | | | 2.2 | | |
| | 1,051,554 | | | @ | | Citigroup, Inc. | | | 4,973,850 | | | | 1.5 | | |
| | 20,551 | | | | | Goldman Sachs
Group, Inc. | | | 3,455,856 | | | | 1.1 | | |
| | 232,610 | | | | | JPMorgan Chase & Co. | | | 9,867,316 | | | | 3.0 | | |
| | 108,878 | | | | | Metlife, Inc. | | | 4,838,538 | | | | 1.5 | | |
| | 131,574 | | | | | Morgan Stanley | | | 3,580,129 | | | | 1.1 | | |
| | 76,681 | | | | | PNC Financial Services
Group, Inc. | | | 4,656,070 | | | | 1.4 | | |
| | 52,006 | | | | | Torchmark Corp. | | | 3,106,838 | | | | 0.9 | | |
| | 83,357 | | | L | | Travelers Cos., Inc. | | | 4,643,818 | | | | 1.4 | | |
| | 119,224 | | | | | Wells Fargo & Co. | | | 3,694,752 | | | | 1.1 | | |
| | | | | | | Other Securities | | | 5,795,848 | | | | 1.8 | | |
| | | | | | | | | | 69,517,583 | | | | 21.0 | | |
| Shares | |
| |
| | Value | | Percent of
Net Assets | |
| | | Health Care: 12.2% | | | |
| | 254,510 | | | | | Bristol-Myers
Squibb Co. | | $ | 6,739,425 | | | | 2.0 | | |
| | 117,541 | | | | | Cardinal Health, Inc. | | | 4,502,996 | | | | 1.4 | | |
| | 162,630 | | | | | Merck & Co., Inc. | | | 5,861,185 | | | | 1.8 | | |
| | 508,423 | | | | | Pfizer, Inc. | | | 8,902,487 | | | | 2.7 | | |
| | 155,861 | | | | | UnitedHealth
Group, Inc. | | | 5,628,141 | | | | 1.7 | | |
| | | | | | | Other Securities | | | 8,756,521 | | | | 2.6 | | |
| | | | | | | | | | 40,390,755 | | | | 12.2 | | |
| | | Industrials: 7.1% | | | |
| | 260,036 | | | | | General Electric Co. | | | 4,756,058 | | | | 1.5 | | |
| | 82,632 | | | | | Honeywell
International, Inc. | | | 4,392,717 | | | | 1.3 | | |
| | 97,038 | | | L | | Ingersoll-Rand PLC | | | 4,569,519 | | | | 1.4 | | |
| | 112,100 | | | | | Tyco International Ltd. | | | 4,645,424 | | | | 1.4 | | |
| | | | | | | Other Securities | | | 4,930,483 | | | | 1.5 | | |
| | | | | | | | | | 23,294,201 | | | | 7.1 | | |
| | | Information Technology: 10.4% | | | |
| | 258,625 | | | @,L | | Dell, Inc. | | | 3,504,369 | | | | 1.0 | | |
| | 241,971 | | | @ | | eBay, Inc. | | | 6,734,053 | | | | 2.0 | | |
| | 141,189 | | | | | Hewlett-Packard Co. | | | 5,944,057 | | | | 1.8 | | |
| | 152,228 | | | | | Intel Corp. | | | 3,201,355 | | | | 1.0 | | |
| | 334,300 | | | @,L | | Yahoo!, Inc. | | | 5,559,409 | | | | 1.7 | | |
| | | | | | | Other Securities | | | 9,589,255 | | | | 2.9 | | |
| | | | | | | | | | 34,532,498 | | | | 10.4 | | |
| | | Materials: 5.2% | | | |
| | 390,334 | | | L | | Alcoa, Inc. | | | 6,007,240 | | | | 1.8 | | |
| | 365,587 | | | | | International Paper Co. | | | 9,958,590 | | | | 3.0 | | |
| | | | | | | Other Securities | | | 1,344,765 | | | | 0.4 | | |
| | | | | | | | | | 17,310,595 | | | | 5.2 | | |
| | | Telecommunication Services: 4.1% | | | |
| | 148,592 | | | | | AT&T, Inc. | | | 4,365,633 | | | | 1.3 | | |
| | 164,670 | | | | | Verizon
Communications, Inc. | | | 5,891,893 | | | | 1.8 | | |
| | 118,464 | | | L | | Vodafone Group
PLC ADR | | | 3,131,004 | | | | 1.0 | | |
| | | | | | | | | | 13,388,530 | | | | 4.1 | | |
| | | Utilities: 1.6% | | | |
| | | | | | | Other Securities | | | 5,282,725 | | | | 1.6 | | |
| | | | | | | Total Common Stock
( Cost $259,553,524 ) | | | 324,895,120 | | | | 98.2 | | |
See Accompanying Notes to Financial Statements
199
ING VAN KAMPEN SUMMARY PORTFOLIO OF INVESTMENTS
COMSTOCK PORTFOLIO AS OF DECEMBER 31, 2010 (CONTINUED)
| Shares | |
| |
| | Value | | Percent of
Net Assets | |
| SHORT-TERM INVESTMENTS: 8.3% | | | |
| | | Mutual Funds: 2.1% | | | |
| | 6,810,008 | | | | | | | Blackrock Liquidity
Funds TempFund
Portfolio - Class I | | $ | 6,810,008 | | | | 2.1 | | |
| | | | | | | Total Mutual Funds
( Cost $6,810,008 ) | | | 6,810,008 | | | | 2.1 | | |
| | | Securities Lending Collateralcc: 6.2% | | | |
| | 19,723,129 | | | | | BNY Mellon Overnight
Government Fund (1) | | | 19,723,129 | | | | 6.0 | | |
| | 966,595 | | | R | | BNY Institutional Cash
Reserves Fund,
Series B (1)(2) | | | 773,276 | | | | 0.2 | | |
| | | | | | | Total Securities
Lending Collateral
( Cost $20,689,724 ) | | | 20,496,405 | | | | 6.2 | | |
| | | | | | | Total Short-Term
Investments
( Cost $27,499,732 ) | | | 27,306,413 | | | | 8.3 | | |
| | | | | | | Total Investments in
Securities
( Cost $287,053,256 ) * | | $ | 352,201,533 | | | | 106.5 | | |
| | | | | | | Other Assets and
Liabilities - Net | | | (21,347,927 | ) | | | (6.5 | ) | |
| | | | | | | Net Assets | | $ | 330,853,606 | | | | 100.0 | | |
"Other Securities" represents issues not identified as the top 50 holdings in terms of market value and issues or issuers not exceeding 1% of net assets individually or in aggregate respectively as of December 31, 2010.
The following footnotes apply to either the individual securities noted or one or more of the securities aggregated and listed as a single line item.
@ Non-income producing security
ADR American Depositary Receipt
cc Securities purchased with cash collateral for securities loaned.
(1) Collateral received from brokers for securities lending was invested in these short-term investments.
(2) On September 12, 2008, BNY established a separate sleeve of the Institutional Cash Reserves Fund (Series B) to hold certain Lehman Brothers defaulted debt obligations. The Portfolio's position in Series B is being fair valued daily. Please see the accompanying Notes to Financial Statements for additional details on securities lending.
R Restricted security
L Loaned security, a portion or all of the security is on loan at December 31, 2010.
* Cost for federal income tax purposes is $323,957,273.
| Net unrealized appreciation consists of: | |
| Gross Unrealized Appreciation | | $ | 68,484,005 | | |
| Gross Unrealized Depreciation | | | (40,239,745 | ) | |
| Net Unrealized Appreciation | | $ | 28,244,260 | | |
See Accompanying Notes to Financial Statements
200
ING VAN KAMPEN SUMMARY PORTFOLIO OF INVESTMENTS
COMSTOCK PORTFOLIO AS OF DECEMBER 31, 2010 (CONTINUED)
Fair Value Measurements^
The following is a summary of the fair valuations according to the inputs used as of December 31, 2010 in valuing the Portfolio's assets and liabilities:
| | | Quoted Prices
in Active Markets
for Identical Investments
(Level 1) | | Other
Observable
Inputs
(Level 2) | | Significant
Unobservable
Inputs
(Level 3) | | Fair Value
at
12/31/10 | |
| Asset Table | |
| Investments, at value | |
| Common Stock* | | $ | 324,895,120 | | | $ | — | | | $ | — | | | $ | 324,895,120 | | |
| Short-Term Investments | | | 26,533,137 | | | | — | | | | 773,276 | | | | 27,306,413 | | |
| Total Investments, at value | | $ | 351,428,257 | | | $ | — | | | $ | 773,276 | | | $ | 352,201,533 | | |
The following is a reconciliation of the fair valuations using significant unobservable inputs (Level 3) for the Portfolio's assets and liabilities during the period ended December 31, 2010:
| | | Beginning
Balance
12/31/09 | | Purchases | | Sales | | Accrued
Discounts/
(Premiums) | | Total
Realized
Gain/(Loss) | | Total
Unrealized
Appreciation/
(Depreciation) | | Transfers
Into
Level 3 | | Transfers
Out of
Level 3 | | Ending
Balance
12/31/10 | |
| Asset Table | |
| Investments, at value | |
Short-Term
Investments | | $ | 773,276 | | | $ | — | | | $ | — | | | $ | — | | | $ | — | | | $ | — | | | $ | — | | | $ | — | | | $ | 773,276 | | |
Total Investments,
at value | | $ | 773,276 | | | $ | — | | | $ | — | | | $ | — | | | $ | — | | | $ | — | | | $ | — | | | $ | — | | | $ | 773,276 | | |
As of December 31, 2010, total change in unrealized gain (loss) on Level 3 securities still held at period end and included in the change in net assets was $0.
^ See Note 2, "Significant Accounting Policies" in the Notes to Financial Statements for additional information.
Transfers in or out of Level 3 represents either the beginning value (for transfers in), or the ending value (for transfers out) of any security or derivative instrument where a change in the pricing level occurred from the beginning to the end of the period. It is the policy of the Portfolio to recognize transfers at the end of the reporting period.
* For further breakdown of Common Stock by Industry type, please refer to the Portfolio of Investments.
See Accompanying Notes to Financial Statements
201
ING VAN KAMPEN SUMMARY PORTFOLIO OF INVESTMENTS
EQUITY AND INCOME PORTFOLIO AS OF DECEMBER 31, 2010
| Shares | |
| |
| | Value | | Percent of
Net Assets | |
| COMMON STOCK: 64.4% | | | |
| | | Consumer Discretionary: 7.9% | | | |
| | 451,740 | | | | | | | Comcast Corp. -
Class A | | $ | 9,924,728 | | | | 1.2 | | |
| | 296,293 | | | @ | | Ford Motor Co. | | | 4,974,759 | | | | 0.6 | | |
| | 224,544 | | | | | | | Home Depot, Inc. | | | 7,872,513 | | | | 0.9 | | |
| | 180,754 | | | | | | | Sony Corp. ADR | | | 6,454,725 | | | | 0.7 | | |
| | 114,424 | | | | | | | Time Warner
Cable, Inc. | | | 7,555,417 | | | | 0.9 | | |
| | 308,145 | | | | | | | Time Warner, Inc. | | | 9,913,025 | | | | 1.2 | | |
| | 409,821 | | | | | | | Viacom - Class B | | | 16,233,010 | | | | 1.9 | | |
| | | | | | | | | Other Securities | | | 4,155,928 | | | | 0.5 | | |
| | | | | | | | | | 67,084,105 | | | | 7.9 | | |
| | | Consumer Staples: 7.0% | | | |
| | 292,579 | | | | | | | Avon Products, Inc. | | | 8,502,346 | | | | 1.0 | | |
| | 249,397 | | | | | | | Kraft Foods, Inc. | | | 7,858,499 | | | | 0.9 | | |
| | 160,452 | | | | | | | Procter & Gamble Co. | | | 10,321,877 | | | | 1.2 | | |
| | 225,348 | | | | | | | Unilever NV ADR | | | 7,075,927 | | | | 0.8 | | |
| | 213,316 | | | | | | | Walgreen Co. | | | 8,310,791 | | | | 1.0 | | |
| | 101,110 | | | | | | | Wal-Mart Stores, Inc. | | | 5,452,862 | | | | 0.7 | | |
| | | | | | | Other Securities | | | 12,014,924 | | | | 1.4 | | |
| | | | | | | | | | 59,537,226 | | | | 7.0 | | |
| | | Energy: 9.4% | | | |
| | 167,085 | | | | | | | Anadarko Petroleum
Corp. | | | 12,725,194 | | | | 1.5 | | |
| | 76,084 | | | | | | | Devon Energy Corp. | | | 5,973,355 | | | | 0.7 | | |
| | 80,819 | | | | | | | ExxonMobil Corp. | | | 5,909,485 | | | | 0.7 | | |
| | 125,134 | | | | | | | Hess Corp. | | | 9,577,756 | | | | 1.1 | | |
| | 147,373 | | | | | | | Occidental Petroleum
Corp. | | | 14,457,291 | | | | 1.7 | | |
| | 167,836 | | | | | | | Royal Dutch Shell PLC
ADR - Class A | | | 11,208,088 | | | | 1.3 | | |
| | 111,765 | | | | | | | Schlumberger Ltd. | | | 9,332,378 | | | | 1.1 | | |
| | | | | | | Other Securities | | | 11,237,761 | | | | 1.3 | | |
| | | | | | | | | | 80,421,308 | | | | 9.4 | | |
| | | Financials: 14.1% | | | |
| | 813,090 | | | | | | | Bank of America Corp. | | | 10,846,621 | | | | 1.3 | | |
| | 476,709 | | | | | | | Charles Schwab Corp. | | | 8,156,491 | | | | 1.0 | | |
| | 1,584,177 | | | @ | | Citigroup, Inc. | | | 7,493,157 | | | | 0.9 | | |
| | 612,355 | | | | | | | JPMorgan Chase & Co. | | | 25,976,099 | | | | 3.0 | | |
| | 677,619 | | | | | | | Marsh & McLennan
Cos., Inc. | | | 18,526,103 | | | | 2.2 | | |
| | 271,035 | | | | | | | Morgan Stanley | | | 7,374,862 | | | | 0.9 | | |
| | 167,633 | | | | | | | PNC Financial Services
Group, Inc. | | | 10,178,676 | | | | 1.2 | | |
| | 132,193 | | | | | | | State Street Corp. | | | 6,125,824 | | | | 0.7 | | |
| | 174,524 | | | | | | | Wells Fargo & Co. | | | 5,408,499 | | | | 0.6 | | |
| | | | | | | Other Securities | | | 19,583,838 | | | | 2.3 | | |
| | | | | | | | | | 119,670,170 | | | | 14.1 | | |
| Shares | |
| |
| | Value | | Percent of
Net Assets | |
| | | Health Care: 6.3% | | | |
| | 329,688 | | | | | | | Bristol-Myers
Squibb Co. | | $ | 8,730,138 | | | | 1.0 | | |
| | 152,500 | | | | | | | Covidien PLC | | | 6,963,150 | | | | 0.8 | | |
| | 565,829 | | | | | | | Pfizer, Inc. | | | 9,907,666 | | | | 1.2 | | |
| | 278,988 | | | | | | | UnitedHealth
Group, Inc. | | | 10,074,257 | | | | 1.2 | | |
| | | | | | | Other Securities | | | 17,757,605 | | | | 2.1 | | |
| | | | | | | | | | 53,432,816 | | | | 6.3 | | |
| | | Industrials: 7.1% | | | |
| | 1,178,806 | | | | | | | General Electric Co. | | | 21,560,351 | | | | 2.5 | | |
| | 136,630 | | | | | | | Ingersoll-Rand PLC | | | 6,433,907 | | | | 0.8 | | |
| | 269,195 | | | | | | | Tyco International Ltd. | | | 11,155,441 | | | | 1.3 | | |
| | | | | | | Other Securities | | | 20,946,588 | | | | 2.5 | | |
| | | | | | | | | | 60,096,287 | | | | 7.1 | | |
| | | Information Technology: 6.7% | | | |
| | 282,987 | | | @ | | Cisco Systems, Inc. | | | 5,724,827 | | | | 0.7 | | |
| | 495,130 | | | @ | | Dell, Inc. | | | 6,709,012 | | | | 0.8 | | |
| | 451,739 | | | @ | | eBay, Inc. | | | 12,571,896 | | | | 1.5 | | |
| | 201,369 | | | | | | | Hewlett-Packard Co. | | | 8,477,635 | | | | 1.0 | | |
| | 324,855 | | | | | | | Western Union Co. | | | 6,032,557 | | | | 0.7 | | |
| | 380,303 | | | @ | | Yahoo!, Inc. | | | 6,324,439 | | | | 0.7 | | |
| | | | | | | Other Securities | | | 11,559,559 | | | | 1.3 | | |
| | | | | | | | | | 57,399,925 | | | | 6.7 | | |
| | | Materials: 1.5% | | | |
| | | | | | | Other Securities | | | 12,729,342 | | | | 1.5 | | |
| | | Telecommunication Services: 1.8% | | | |
| | 173,395 | | | | | | | Verizon
Communications, Inc. | | | 6,204,073 | | | | 0.7 | | |
| | 350,591 | | | | | | | Vodafone Group
PLC ADR | | | 9,266,120 | | | | 1.1 | | |
| | | | | | | | | | 15,470,193 | | | | 1.8 | | |
| | | Utilities: 2.6% | | | |
| | 314,974 | | | | | | | American Electric
Power Co., Inc. | | | 11,332,765 | | | | 1.3 | | |
| | | | | | | Other Securities | | | 10,767,884 | | | | 1.3 | | |
| | | | | | | | | | 22,100,649 | | | | 2.6 | | |
| | | | | | | Total Common Stock
( Cost $463,084,931 ) | | | 547,942,021 | | | | 64.4 | | |
| PREFERRED STOCK: 2.2% | | | |
| | | Consumer Discretionary: 0.2% | | | |
| | | | | | | | | Other Securities | | | 1,421,874 | | | | 0.2 | | |
| | | Consumer Staples: 0.2% | | | |
| | | | | | | | | Other Securities | | | 1,852,191 | | | | 0.2 | | |
See Accompanying Notes to Financial Statements
202
ING VAN KAMPEN SUMMARY PORTFOLIO OF INVESTMENTS
EQUITY AND INCOME PORTFOLIO AS OF DECEMBER 31, 2010 (CONTINUED)
| Shares | |
| |
| | Value | | Percent of
Net Assets | |
| | | Energy: 0.5% | | | |
| | | | | | | | | Other Securities | | $ | 4,159,090 | | | | 0.5 | | |
| | | Financials: 0.4% | | | |
| | | | | | | | | Other Securities | | | 3,763,922 | | | | 0.4 | | |
| | | Health Care: 0.4% | | | |
| | | | | | | | | Other Securities | | | 3,707,604 | | | | 0.4 | | |
| | | Industrials: 0.2% | | | |
| | 121,631 | | | @,# | | Swift Mandatory
Common Exchange
Security Trust | | | 1,471,431 | | | | 0.2 | | |
| | | Utilities: 0.3% | | | |
| | | | | | | | | Other Securities | | | 2,555,334 | | | | 0.3 | | |
| | | | | | | | | Total Preferred Stock
( Cost $17,519,529 ) | | | 18,931,446 | | | | 2.2 | | |
Principal
Amount | |
| |
| | Value | | Percent of
Net Assets | |
| CORPORATE BONDS/NOTES: 21.9% | | | |
| | | Consumer Discretionary: 4.5% | | | |
| $ | 675,000 | | | | | Comcast Corp.,
5.150%-5.700%,
due 05/15/18-
03/01/20 | | $ | 737,740 | | | | 0.1 | | |
| | 60,000 | | | # | | Cox Communications,
Inc., 8.375%,
due 03/01/39 | | | 78,000 | | | | 0.0 | | |
| | 4,212,000 | | | | | Ford Motor Co.,
4.250%,
due 11/15/16 | | | 8,439,795 | | | | 1.0 | | |
| | 2,085,000 | | | # | | Gaylord
Entertainment Co.,
3.750%,
due 10/01/14 | | | 3,049,313 | | | | 0.4 | | |
| | 290,000 | | | | | Home Depot, Inc.,
5.875%,
due 12/16/36 | | | 302,663 | | | | 0.0 | | |
| | 3,048,000 | | | # | | MGM Resorts
International,
4.250%,
due 04/15/15 | | | 3,352,800 | | | | 0.4 | | |
| | 200,000 | | | # | | NBC Universal, Inc.,
2.100%,
due 04/01/14 | | | 199,563 | | | | 0.0 | | |
| | 210,000 | | | # | | NBC Universal, Inc.,
5.950%,
due 04/01/41 | | | 210,713 | | | | | | |
| | 825,000 | | | | | Time Warner Cable,
Inc., 5.875%-8.750%,
due 02/14/19-
11/15/40 | | | 903,634 | | | | 0.1 | | |
Principal
Amount | |
| |
| | Value | | Percent of
Net Assets | |
| $ | 160,000 | | | | | Time Warner, Inc.,
5.875%,
due 11/15/16 | | $ | 180,821 | | | | 0.0 | | |
| | | | | | | Other Securities | | | 21,125,936 | | | | 2.5 | | |
| | | | | | | | | | 38,580,978 | | | | 4.5 | | |
| | | Consumer Staples: 0.5% | | | |
| | 300,000 | | | # | | Anheuser-Busch InBev
Worldwide, Inc.,
7.200%,
due 01/15/14 | | | 343,315 | | | | 0.0 | | |
| | 68,312 | | | # | | CVS Lease
Pass-through,
8.353%,
due 07/10/31 | | | 81,585 | | | | 0.1 | | |
| | 396,373 | | | | | CVS Pass-Through
Trust, 6.036%,
due 12/10/28 | | | 407,640 | | | | | | |
| | 415,000 | | | # | | FBG Finance Ltd.,
5.125%,
due 06/15/15 | | | 440,840 | | | | 0.1 | | |
| | 295,000 | | | # | | Grupo Bimbo S.A.B
de CV, 4.875%,
due 06/30/20 | | | 297,629 | | | | 0.0 | | |
| | 795,000 | | | | | Kraft Foods, Inc.,
5.375%-7.000%,
due 02/10/20-
01/26/39 | | | 914,449 | | | | 0.1 | | |
| | 190,000 | | | | | Wal-Mart Stores, Inc.,
5.250%-6.500%,
due 09/01/35-
08/15/37 | | | 200,318 | | | | 0.0 | | |
| | | | | | | Other Securities | | | 1,724,883 | | | | 0.2 | | |
| | | | | | | | | | 4,410,659 | | | | 0.5 | | |
| | | Energy: 0.7% | | | |
| | 250,000 | | | | | Hess Corp., 5.600%,
due 02/15/41 | | | 249,080 | | | | 0.0 | | |
| | | | | | | Other Securities | | | 6,052,876 | | | | 0.7 | | |
| | | | | | | | | | 6,301,956 | | | | 0.7 | | |
| | | Financials: 6.3% | | | |
| | 290,000 | | | # | | Abbey National
Treasury Services
PLC/London,
3.875%,
due 11/10/14 | | | 287,626 | | | | 0.0 | | |
| | 635,000 | | | # | | AIG SunAmerica
Global Financing VI,
6.300%,
due 05/10/11 | | | 647,700 | | | | 0.1 | | |
| | 1,350,000 | | | | | Bank of America
Corp., 5.650%-
5.750%, due
12/01/17-05/01/18 | | | 1,388,971 | | | | 0.2 | | |
| | 430,000 | | | # | | BPCE S.A., 2.375%,
due 10/04/13 | | | 428,998 | | | | 0.1 | | |
See Accompanying Notes to Financial Statements
203
ING VAN KAMPEN SUMMARY PORTFOLIO OF INVESTMENTS
EQUITY AND INCOME PORTFOLIO AS OF DECEMBER 31, 2010 (CONTINUED)
Principal
Amount | |
| |
| | Value | | Percent of
Net Assets | |
| | | Financials (continued) | | | |
| $ | 515,000 | | | | | Charles Schwab Corp.,
4.450%,
due 07/22/20 | | $ | 513,998 | | | | 0.1 | | |
| | 1,465,000 | | | | | Citigroup, Inc.,
6.125%-8.500%,
due 11/21/17-
05/22/19 | | | 1,657,945 | | | | 0.2 | | |
| | 385,000 | | | # | | Commonwealth Bank
of Australia, 5.000%,
due 10/15/19 | | | 403,703 | | | | 0.1 | | |
| | 590,000 | | | # | | Cooperatieve
Centrale Raiffeisen-
Boerenleenbank BA/
Netherlands,
4.750%,
due 01/15/20 | | | 612,009 | | | | 0.1 | | |
| | 340,000 | | | # | | Digital Realty
Trust L.P., 4.500%,
due 07/15/15 | | | 342,441 | | | | 0.0 | | |
| | 225,000 | | | # | | ERAC USA Finance
LLC, 2.750%,
due 07/01/13 | | | 229,155 | | | | 0.0 | | |
| | 5,880,000 | | | | | General Electric
Capital Corp.,
2.625%-5.875%,
due 12/28/12-
01/14/38 | | | 6,144,174 | | | | 0.7 | | |
| | 4,011,000 | | | # | | Goldman Sachs Group
Inc., 1.000%,
due 03/15/17 | | | 3,981,720 | | | | 0.6 | | |
| | 1,355,000 | | | | | Goldman Sachs
Group, Inc.,
6.150%-6.750%,
due 04/01/18-
10/01/37 | | | 1,467,672 | | | | | | |
| | 465,000 | | | # | | HBOS PLC, 6.750%,
due 05/21/18 | | | 436,014 | | | | 0.1 | | |
| | 450,000 | | | # | | HSBC Bank PLC,
4.125%,
due 08/12/20 | | | 433,349 | | | | 0.1 | | |
| | 170,000 | | | # | | Iberdrola Finance
Ireland Ltd.,
3.800%,
due 09/11/14 | | | 169,380 | | | | 0.0 | | |
| | 1,115,000 | | | | | JPMorgan Chase & Co.,
4.400%-6.000%,
due 01/15/18-
07/22/20 | | | 1,202,022 | | | | 0.2 | | |
| | 165,000 | | | # | | Lloyds TSB Bank PLC,
5.800%,
due 01/13/20 | | | 163,198 | | | | 0.0 | | |
| | 1,465,000 | | | | | Morgan Stanley,
3.450%-4.000%,
due 07/24/15-
11/02/15 | | | 1,450,262 | | | | 0.2 | | |
| | 205,000 | | | # | | National Australia
Bank Ltd., 3.750%,
due 03/02/15 | | | 212,214 | | | | 0.0 | | |
Principal
Amount | |
| |
| | Value | | Percent of
Net Assets | |
| $ | 570,000 | | | # | | Nationwide Building
Society, 6.250%,
due 02/25/20 | | $ | 595,013 | | | | 0.1 | | |
| | 290,000 | | | # | | Nordea Bank AB,
4.875%,
due 01/27/20 | | | 298,054 | | | | 0.0 | | |
| | 225,000 | | | # | | Pacific LifeCorp,
6.000%,
due 02/10/20 | | | 236,889 | | | | 0.0 | | |
| | 200,000 | | | # | | Santander US Debt
S.A. Unipersonal,
3.724%,
due 01/20/15 | | | 189,667 | | | | 0.0 | | |
| | 775,000 | | | # | | Societe Generale,
2.500%,
due 01/15/14 | | | 774,772 | | | | 0.1 | | |
| | 100,000 | | | # | | Standard Chartered
Bank, 6.400%,
due 09/26/17 | | | 107,149 | | | | 0.0 | | |
| | 315,000 | | | # | | Standard Chartered
PLC, 3.850%,
due 04/27/15 | | | 324,634 | | | | 0.0 | | |
| | 300,000 | | | # | | WEA Finance,
LLC / WT Finance
Aust Pty Ltd.,
6.750%,
due 09/02/19 | | | 334,763 | | | | 0.0 | | |
| | 935,000 | | | | | Wells Fargo & Co.,
5.625%,
due 12/11/17 | | | 1,036,716 | | | | 0.1 | | |
| | | | | | | Other Securities | | | 27,140,917 | | | | 3.2 | | |
| | | | | | | | | | 53,211,125 | | | | 6.3 | | |
| | | Health Care: 3.5% | | | |
| | 5,261,000 | | | # | | Gilead Sciences, Inc.,
1.625%,
due 05/01/16 | | | 5,497,745 | | | | 0.6 | | |
| | 885,000 | | | | | Pfizer, Inc., 6.200%,
due 03/15/19 | | | 1,038,359 | | | | 0.1 | | |
| | | | | | | Other Securities | | | 23,494,870 | | | | 2.8 | | |
| | | | | | | | | | 30,030,974 | | | | 3.5 | | |
| | | Industrials: 1.1% | | | |
| | 4,300,000 | | | # | | Cemex S.A.
de CV ADR, 4.875%,
due 03/15/15 | | | 4,719,250 | | | | 0.6 | | |
| | 285,000 | | | | | General Electric Co.,
5.250%,
due 12/06/17 | | | 308,275 | | | | 0.0 | | |
| | 120,000 | | | # | | Holcim US Finance
Sarl & Cie SCS,
6.000%,
due 12/30/19 | | | 124,829 | | | | 0.0 | | |
| | | | | | | Other Securities | | | 3,984,656 | | | | 0.5 | | |
| | | | | | | | | | 9,137,010 | | | | 1.1 | | |
See Accompanying Notes to Financial Statements
204
ING VAN KAMPEN SUMMARY PORTFOLIO OF INVESTMENTS
EQUITY AND INCOME PORTFOLIO AS OF DECEMBER 31, 2010 (CONTINUED)
Principal
Amount | |
| |
| | Value | | Percent of
Net Assets | |
| | | Information Technology: 3.6% | | | |
| $ | 2,000,000 | | | # | | JDS Uniphase Corp.,
1.000%,
due 05/15/26 | | $ | 1,905,000 | | | | 0.2 | | |
| | 1,927,000 | | | # | | Linear Technology
Corp., 3.000%,
due 05/01/27 | | | 2,052,255 | | | | 0.3 | | |
| | 716,000 | | | | | Linear Technology
Corp., 3.000%,
due 05/01/27 | | | 762,540 | | | | | | |
| | 6,649,000 | | | | | SanDisk Corp.,
1.000%,
due 05/15/13 | | | 6,432,908 | | | | 0.8 | | |
| | 2,208,000 | | | # | | Xilinx, Inc., 3.125%,
due 03/15/37 | | | 2,307,360 | | | | 0.4 | | |
| | 764,000 | | | | | Xilinx, Inc., 3.125%,
due 03/15/37 | | | 798,380 | | | | | | |
| | | | | | | Other Securities | | | 15,947,085 | | | | 1.9 | | |
| | | | | | | | | | 30,205,528 | | | | 3.6 | | |
| | | Materials: 0.8% | | | |
| | 300,000 | | | # | | Anglo American
Capital PLC, 9.375%,
due 04/08/19 | | | 404,162 | | | | 0.0 | | |
| | 735,000 | | | # | | Gold Fields Ltd.,
4.875%,
due 10/07/20 | | | 704,467 | | | | 0.1 | | |
| | | | | | | Other Securities | | | 5,859,957 | | | | 0.7 | | |
| | | | | | | | | | 6,968,586 | | | | 0.8 | | |
| | | Telecommunication Services: 0.7% | | | |
| | 101,000 | | | # | | AT&T, Inc., 5.350%,
due 09/01/40 | | | 95,328 | | | | 0.1 | | |
| | 780,000 | | | | | AT&T, Inc.,
6.150%-6.300%,
due 09/15/34-
01/15/38 | | | 819,534 | | | | | | |
| | 800,000 | | | # | | Clearwire
Communications,
LLC/Clearwire
Finance, Inc.,
8.250%, due 12/01/40 | | | 816,000 | | | | 0.1 | | |
| | 595,000 | | | | | Verizon
Communications,
Inc., 6.350%-8.950%,
due 04/01/19-
03/01/39 | | | 764,451 | | | | 0.1 | | |
| | | | | | | Other Securities | | | 3,759,402 | | | | 0.4 | | |
| | | | | | | | | | 6,254,715 | | | | 0.7 | | |
| | | Utilities: 0.2% | | | |
| | 150,000 | | | # | | EDF S.A., 4.600%,
due 01/27/20 | | | 155,303 | | | | 0.0 | | |
Principal
Amount | |
| |
| | Value | | Percent of
Net Assets | |
| $ | 425,000 | | | # | | Enel Finance
International S.A.,
5.125%,
due 10/07/19 | | $ | 421,921 | | | | 0.1 | | |
| | | | | | | Other Securities | | | 626,412 | | | | 0.1 | | |
| | | | | | | | | | 1,203,636 | | | | 0.2 | | |
| | | | | | | Total Corporate
Bonds/Notes
( Cost $165,513,992 ) | | | 186,305,167 | | | | 21.9 | | |
| U.S. GOVERNMENT AGENCY OBLIGATIONS: 0.8% | | | |
| | | Federal Home Loan Mortgage Corporation##: 0.4% | | | |
| | | | | | | | | Other Securities | | | 3,267,709 | | | | 0.4 | | |
| | | Federal National Mortgage Association##:0.4% | | | |
| | | | | | | | | Other Securities | | | 3,505,126 | | | | 0.4 | | |
| | | | | | | | | Total U.S. Government
Agency Obligations
( Cost $6,492,658 ) | | | 6,772,835 | | | | 0.8 | | |
| U.S. TREASURY OBLIGATIONS: 7.1% | | | |
| | | U.S. Treasury Notes: 7.1% | | | |
| | 19,000,000 | | | | | | | 1.000%, due 04/30/12 | | | 19,156,674 | | | | | | |
| | 6,900,000 | | | | | | | 2.625%,
due 06/30/14-
11/15/20 | | | 6,968,853 | | | | | | |
| | 10,000,000 | | | | | | | 2.750%, due 10/31/13 | | | 10,513,280 | | | | 7.1 | | |
| | 23,766,000 | | | | | | | 0.750%-6.875%,
due 11/30/11-
11/15/40 | | | 23,864,015 | | | | | | |
| | | | | | | | | Total U.S. Treasury
Obligations
( Cost $59,499,380 ) | | | 60,502,822 | | | | 7.1 | | |
| ASSET-BACKED SECURITIES: 0.0% | | | |
| | | Automobile Asset-Backed Securities: 0.0% | | | |
| | 171,818 | | | # | | ARI Fleet Lease Trust,
1.710%,
due 08/15/18 | | | 173,253 | | | | 0.0 | | |
| | | | | | | Total Asset-Backed
Securities
( Cost $171,818 ) | | | 173,253 | | | | 0.0 | | |
| COLLATERALIZED MORTGAGE OBLIGATIONS: 0.1% | | | |
| | 350,000 | | | # | | GE Dealer Floorplan
Master Note Trust,
1.811%,
due 10/20/14 | | | 355,251 | | | | 0.1 | | |
| | | | | | | Total Collateralized
Mortgage
Obligations
( Cost $350,000 ) | | | 355,251 | | | | 0.1 | | |
| MUNICIPAL BONDS: 0.1% | | | |
| | | California: 0.0% | | | |
| | | | | | | Other Securities | | | 158,693 | | | | 0.0 | | |
See Accompanying Notes to Financial Statements
205
ING VAN KAMPEN SUMMARY PORTFOLIO OF INVESTMENTS
EQUITY AND INCOME PORTFOLIO AS OF DECEMBER 31, 2010 (CONTINUED)
Principal
Amount | |
| |
| | Value | | Percent of
Net Assets | |
| | | Georgia: 0.1% | | | |
| | | | | Other Securities | | $ | 486,366 | | | | 0.1 | | |
| | | Texas: 0.0% | | | |
| | | | | Other Securities | | | 226,803 | | | | 0.0 | | |
| | | | | Total Municipal Bonds
( Cost $884,665 ) | | | 871,862 | | | | 0.1 | | |
| OTHER BONDS: 0.2% | |
| | | Foreign Government Bonds: 0.2% | | | |
| | | | | Other Securities | | | 1,647,297 | | | | 0.2 | | |
| | | | | Total Other Bonds
( Cost $1,515,080 ) | | | 1,647,297 | | | | 0.2 | | |
| | | | | Total Long-Term
Investments
( Cost $715,032,053 ) | | | 823,501,954 | | | | 96.8 | | |
| SHORT-TERM INVESTMENTS: 3.1% | |
| | | Mutual Funds: 3.1% | | | |
| $ | 26,753,200 | | | | | Blackrock Liquidity
Funds TempFund
Portfolio - Class I | | | 26,753,200 | | | | 3.1 | | |
| | | | | Total Short-Term
Investments
( Cost $26,753,200 ) | | | 26,753,200 | | | | 3.1 | | |
| | | | | Total Investments in
Securities
( Cost $741,785,253 ) * | | $ | 850,255,154 | | | | 99.9 | | |
| | | | | Other Assets and
Liabilities - Net | | | 729,170 | | | | 0.1 | | |
| | | | | Net Assets | | $ | 850,984,324 | | | | 100.0 | | |
"Other Securities" represents issues not identified as the top 50 holdings in terms of market value and issues or issuers not exceeding 1% of net assets individually or in aggregate respectively as of December 31, 2010.
The following footnotes apply to either the individual securities noted or one or more of the securities aggregated and listed as a single line item.
@ Non-income producing security
ADR American Depositary Receipt
# Securities with purchases pursuant to Rule 144A or section 4(2), under the Securities Act of 1933 and may not be resold subject to that rule except to qualified institutional buyers. Unless otherwise noted, these securities have been determined to be liquid under the guidelines established by the Funds' Board of Directors/Trustees.
## On September 7, 2008, the Federal Housing Finance Agency placed the Federal National Mortgage Association and the Federal Home Loan Mortgage Corporation into conservatorship and the U.S. Treasury guaranteed the debt issued by those organizations.
* Cost for federal income tax purposes is $743,525,213.
| Net unrealized appreciation consists of: | |
| Gross Unrealized Appreciation | | $ | 114,148,942 | | |
| Gross Unrealized Depreciation | | | (7,419,001 | ) | |
| Net Unrealized Appreciation | | $ | 106,729,941 | | |
See Accompanying Notes to Financial Statements
206
ING VAN KAMPEN SUMMARY PORTFOLIO OF INVESTMENTS
EQUITY AND INCOME PORTFOLIO AS OF DECEMBER 31, 2010 (CONTINUED)
Fair Value Measurements^
The following is a summary of the fair valuations according to the inputs used as of December 31, 2010 in valuing the Portfolio's assets and liabilities:
| | | Quoted Prices
in Active Markets
for Identical Investments
(Level 1) | | Other
Observable
Inputs
(Level 2) | | Significant
Unobservable
Inputs
(Level 3) | | Fair Value
at
12/31/10 | |
| Asset Table | |
| Investments, at value | |
| Common Stock* | | $ | 547,942,021 | | | $ | — | | | $ | — | | | $ | 547,942,021 | | |
| Preferred Stock | | | 5,185,796 | | | | 13,745,650 | | | | — | | | | 18,931,446 | | |
| Corporate Bonds/Notes | | | — | | | | 182,323,447 | | | | 3,981,720 | | | | 186,305,167 | | |
| U.S. Government Agency Obligations | | | — | | | | 6,772,835 | | | | — | | | | 6,772,835 | | |
| U.S. Treasury Obligations | | | — | | | | 60,502,822 | | | | — | | | | 60,502,822 | | |
| Asset-Backed Securities | | | — | | | | 173,253 | | | | — | | | | 173,253 | | |
| Collateralized Mortgage Obligations | | | — | | | | 355,251 | | | | — | | | | 355,251 | | |
| Municipal Bonds | | | — | | | | 871,862 | | | | — | | | | 871,862 | | |
| Other Bonds | | | — | | | | 1,647,297 | | | | — | | | | 1,647,297 | | |
| Short-Term Investments | | | 26,753,200 | | | | — | | | | — | | | | 26,753,200 | | |
| Total Investments, at value | | $ | 579,881,017 | | | $ | 266,392,417 | | | $ | 3,981,720 | | | $ | 850,255,154 | | |
The following is a reconciliation of the fair valuations using significant unobservable inputs (Level 3) for the Portfolio's assets and liabilities during the period ended December 31, 2010:
| | | Beginning
Balance
12/31/09 | | Purchases | | Sales | | Accrued
Discounts/
(Premiums) | | Total
Realized
Gain/(Loss) | | Total
Unrealized
Appreciation/
(Depreciation) | | Transfers
Into
Level 3 | | Transfers
Out of
Level 3 | | Ending
Balance
12/31/10 | |
| Asset Table | |
| Investments, at value | |
| Corporate Bonds/Notes | | $ | — | | | $ | 4,011,000 | | | $ | — | | | $ | — | | | $ | — | | | $ | (29,280 | ) | | $ | — | | | $ | — | | | $ | 3,981,720 | | |
Total Investments,
at value | | $ | — | | | $ | 4,011,000 | | | $ | — | | | $ | — | | | $ | — | | | $ | (29,280 | ) | | $ | — | | | $ | — | | | $ | 3,981,720 | | |
As of December 31, 2010, total change in unrealized gain (loss) on Level 3 securities still held at period end and included in the change in net assets was $(29,280).
^ See Note 2, "Significant Accounting Policies" in the Notes to Financial Statements for additional information.
Transfers in or out of Level 3 represents either the beginning value (for transfers in), or the ending value (for transfers out) of any security or derivative instrument where a change in the pricing level occurred from the beginning to the end of the period. It is the policy of the Portfolio to recognize transfers at the end of the reporting period.
* For further breakdown of Common Stock by Industry type, please refer to the Portfolio of Investments.
See Accompanying Notes to Financial Statements
207
TAX INFORMATION (UNAUDITED)
Dividends paid during the year ended December 31, 2010 were as follows:
| Portfolio Name | | Type | | Per Share Amount | |
| ING American Century Small-Mid Cap Value Portfolio | |
| Class ADV | | NII | | $ | 0.1030 | | |
| Class I | | NII | | $ | 0.1282 | | |
| Class S | | NII | | $ | 0.1143 | | |
| Class S2 | | NII | | $ | 0.1007 | | |
| ING Columbia Small Cap Value Portfolio | |
| Class ADV | | NII | | $ | 0.1255 | | |
| Class I | | NII | | $ | 0.1393 | | |
| Class S | | NII | | $ | 0.1156 | | |
| Class S2 | | NII | | $ | 0.1153 | | |
| ING Davis New York Venture Portfolio | |
| Class ADV | | NII | | $ | 0.0501 | | |
| Class I | | NII | | $ | 0.1001 | | |
| Class S | | NII | | $ | 0.0678 | | |
| ING JPMorgan Mid Cap Value Portfolio | |
| Class ADV | | NII | | $ | 0.0747 | | |
| Class I | | NII | | $ | 0.1276 | | |
| Class S | | NII | | $ | 0.0986 | | |
| Class S2 | | NII | | $ | 0.0782 | | |
| ING Oppenheimer Global Portfolio | |
| Class ADV | | NII | | $ | 0.1656 | | |
| Class I | | NII | | $ | 0.2077 | | |
| Class S | | NII | | $ | 0.1786 | | |
| Class S2 | | NII | | $ | 0.1732 | | |
| ING Oppenheimer Global Strategic Income Portfolio | |
| Class ADV | | NII | | $ | 0.3561 | | |
| Class I | | NII | | $ | 0.3563 | | |
| Class S | | NII | | $ | 0.3561 | | |
| Class S2 | | NII | | $ | 0.3563 | | |
| ING PIMCO Total Return Portfolio | |
| Class ADV | | NII | | $ | 0.3904 | | |
| Class I | | NII | | $ | 0.4176 | | |
| Class S | | NII | | $ | 0.3989 | | |
| Class S2 | | NII | | $ | 0.4172 | | |
| All Classes | | STCG | | $ | 0.0162 | | |
| ING Pioneer High Yield Portfolio | |
| Class ADV | | NII | | $ | 0.5944 | | |
| Class I | | NII | | $ | 0.6492 | | |
| Class S | | NII | | $ | 0.6212 | | |
| Portfolio Name | | Type | | Per Share Amount | |
| ING T. Rowe Price Diversified Mid Cap Growth Portfolio | |
| Class ADV | | NII | | $ | 0.0042 | | |
| Class I | | NII | | $ | 0.0221 | | |
| Class S | | NII | | $ | 0.0047 | | |
| Class S2 | | NII | | $ | 0.0043 | | |
| ING T. Rowe Price Growth Equity Portfolio | |
| Class ADV | | NII | | $ | 0.0169 | | |
| Class I | | NII | | $ | 0.0180 | | |
| Class S | | NII | | $ | 0.0173 | | |
| Class S2 | | NII | | $ | 0.0170 | | |
| ING Templeton Foreign Equity Portfolio | |
| Class ADV | | NII | | $ | 0.1975 | | |
| Class I | | NII | | $ | 0.2390 | | |
| Class S | | NII | | $ | 0.2196 | | |
| Class S2 | | NII | | $ | 0.2148 | | |
| ING Thornburg Value Portfolio | |
| Class ADV | | NII | | $ | 0.4077 | | |
| Class I | | NII | | $ | 0.4473 | | |
| Class S | | NII | | $ | 0.4129 | | |
| Class S2 | | NII | | $ | 0.4473 | | |
| ING UBS U.S. Large Cap Equity Portfolio | |
| Class ADV | | NII | | $ | 0.0397 | | |
| Class I | | NII | | $ | 0.0806 | | |
| Class S | | NII | | $ | 0.0584 | | |
| ING Van Kampen Comstock Portfolio | |
| Class ADV | | NII | | $ | 0.1052 | | |
| Class I | | NII | | $ | 0.1533 | | |
| Class S | | NII | | $ | 0.1295 | | |
| ING Van Kampen Equity and Income Portfolio | |
| Class ADV | | NII | | $ | 0.4815 | | |
| Class I | | NII | | $ | 0.6174 | | |
| Class S | | NII | | $ | 0.5367 | | |
| Class S2 | | NII | | $ | 0.5439 | | |
NII — Net investment income
STCG — Short-term capital gain
Of the ordinary distributions made during the year ended December 31, 2010, the following percentages qualify for the dividends received deduction (DRD) available to corporate shareholders:
| ING American Century Small-Mid Cap Value Portfolio | | | 100.00 | % | |
| ING Columbia Small Cap Value Portfolio | | | 100.00 | % | |
| ING Davis New York Venture Portfolio | | | 100.00 | % | |
| ING JPMorgan Mid Cap Value Portfolio | | | 100.00 | % | |
| ING Oppenheimer Global Portfolio | | | 27.49 | % | |
| ING Pioneer High Yield Portfolio | | | 5.78 | % | |
| ING T. Rowe Price Diversified Mid Cap Growth Portfolio | | | 100.00 | % | |
| ING T. Rowe Price Growth Equity Portfolio | | | 100.00 | % | |
| ING Thornburg Value Portfolio | | | 78.35 | % | |
| ING UBS U.S. Large Cap Equity Portfolio | | | 100.00 | % | |
| ING Van Kampen Comstock Portfolio | | | 100.00 | % | |
| ING Van Kampen Equity and Income Portfolio | | | 66.08 | % | |
Pursuant to Section 853 of the Internal Revenue Code, the Portfolios designate the following amounts as foreign taxes paid for the year ended December 31, 2010. Foreign taxes paid for purposes of Section 853 may be less than actual foreign taxes paid for financial statement purposes.
| | | Creditable
Foreign
Taxes Paid | | Per Share
Amount | | Portion of Ordinary
Income Distribution
Derived from Foreign
Sourced Income* | |
| ING Oppenheimer Global Portfolio | | $ | 2,885,551 | | | $ | 0.0229 | | | | 69.22 | % | |
| ING Templeton Foreign Equity Portfolio | | $ | 1,700,902 | | | $ | 0.0271 | | | | 95.97 | % | |
* None of the Portfolios listed above derived any income from ineligible foreign sources as defined under Section 901(j) of the Internal Revenue Code.
208
TAX INFORMATION (UNAUDITED) (CONTINUED)
Foreign taxes paid or withheld should be included in taxable income with an offsetting deduction from gross income or as a credit for taxes paid to foreign governments. Shareholders are strongly advised to consult their own tax advisors regarding the appropriate treatment of foreign taxes paid.
Above figures may differ from those cited elsewhere in this report due to differences in the calculation of income and gains under U.S. generally accepted accounting principles (book) purposes and Internal Revenue Service (tax) purposes.
Shareholders are strongly advised to consult their own tax advisers with respect to the tax consequences of their investments in the Portfolios. In January, shareholders, excluding corporate shareholders, receive an IRS 1099-DIV regarding the federal tax status of the dividends and distributions they received in the calendar year.
209
DIRECTOR AND OFFICER INFORMATION (UNAUDITED)
The business and affairs of the Company are managed under the direction of the Board. A Director who is not an interested person of the Registrants, as defined in the 1940 Act, is an independent director ("Independent Director"). The Directors and Officers of the Company are listed below. The Statement of Additional Information includes additional information about directors of the Company and is available, without charge, upon request at (800) 992-0180.
Name, Address
and Age | | Position(s)
Held with the
Company | | Term of
Office and
Length of
Time
Served(1) | | Principal
Occupation(s) -
During the
Past 5 Years | | Number of
Funds in
Fund Complex
Overseen
by Director(2) | | Other
Directorships
Held by
Director | |
Colleen D. Baldwin
7337 E. Doubletree Ranch Rd.
Suite 100
Scottsdale, Arizona 85258
Age: 50 | | Director | | November 2007 - Present | | President, Glantuam Partners, LLC (January 2009 - Present); and Consultant (January 2005 - Present). | | | 138 | | | None. | |
|
John V. Boyer(4)
7337 E. Doubletree Ranch Rd.
Suite 100
Scottsdale, Arizona 85258
Age: 57 | | Director | | November 1997 - Present | | President and Chief Executive Officer, Bechtler Arts Foundation, an arts and education foundation, (January 2008 - Present). Formerly, Consultant (July 2007 - February 2008); President and Chief Executive Officer, Franklin and Eleanor Roosevelt Institute, a public policy foundation, (March 2006 - July 2007); and Executive Director, The Mark Twain House & Museum (September 1989 - March 2006). | | | 138 | | | None. | |
|
Patricia W. Chadwick
7337 E. Doubletree Ranch Rd.
Suite 100
Scottsdale, Arizona 85258
Age: 62 | | Director | | January 2006 - Present | | Consultant and President, Ravengate Partners LLC, a consulting firm that provides advice regarding financial markets and the global economy (January 2000 - Present). | | | 138 | | | Wisconsin Energy Corporation (June 2006 - Present) and The Royce Fund (December 2009 - Present). | |
|
Peter S. Drotch
7337 E. Doubletree Ranch Rd.
Suite 100
Scottsdale, Arizona 85258
Age: 68 | | Director | | November 2007 - Present | | Retired. Formerly, Partner, Price Waterhouse Coopers LLP, an accounting firm, until July 2000. | | | 138 | | | First Marblehead Corporation (September 2003 - Present). | |
|
J. Michael Earley
7337 E. Doubletree Ranch Rd.
Suite 100
Scottsdale, Arizona 85258
Age: 65 | | Director | | January 2005 - Present | | Retired. Formerly, Banking President and Chief Executive Officer, Bankers Trust Company, N.A., Des Moines (June 1992 - December 2008). | | | 138 | | | None. | |
|
Patrick W. Kenny
7337 E. Doubletree Ranch Rd.
Suite 100
Scottsdale, Arizona 85258
Age: 67 | | Director | | March 2002 - Present | | Retired. Formerly, President and Chief Executive Officer, International Insurance Society (June 2001 - June 2009). | | | 138 | | | Assured Guaranty Ltd. (April 2004 - Present). | |
|
Sheryl K. Pressler
7337 E. Doubletree Ranch Rd.
Suite 100
Scottsdale, Arizona 85258
Age: 60 | | Director | | January 2006 - Present | | Consultant (May 2001 - Present). | | | 138 | | | Stillwater Mining Company (May 2002 - Present). | |
|
Roger B. Vincent
7337 E. Doubletree Ranch Rd.
Suite 100
Scottsdale, Arizona 85258
Age: 65 | | Chairman and Director | | January 2005 - Present | | President, Springwell Corporation, a corporate finance firm (March 1989 - Present). | | | 138 | | | UGI Corporation (February 2006 - Present) and UGI Utilities, Inc. (February 2006 - Present). | |
|
210
DIRECTOR AND OFFICER INFORMATION (UNAUDITED) (CONTINUED)
Name, Address
and Age | | Position(s)
Held with the
Company | | Term of
Office and
Length of
Time
Served(1) | | Principal
Occupation(s) -
During the
Past 5 Years | | Number of
Funds in
Fund Complex
Overseen
by Director(2) | | Other
Directorships
Held by
Director | |
| Directors who are "Interested Persons": | |
|
Robert W. Crispin(5)
7337 E. Doubletree Ranch Rd.
Suite 100
Scottsdale, Arizona 85258
Age: 64 | | Director | | November 2007 - Present | | Retired. Chairman and Chief Executive Officer, ING Investment Management Co. (July 2001 - December 2007). | | | 138 | | | Intact Financial Corporation (December 2004 - Present) and PFM Group (November 2010 - Present). | |
|
Shaun P. Mathews(3)(5)
7337 E. Doubletree Ranch Rd.
Suite 100
Scottsdale, Arizona 85258
Age: 55 | | Director | | November 2007 - Present | | President and Chief Executive Officer, ING Investments, LLC (November 2006 - Present). Formerly, Head of ING Mutual Funds and Investment Products (November 2004 - November 2006). | | | 175 | | | ING Retirement Holdings, Inc. (September 1998 - Present); ING Services Holding Company, Inc. (May 2000 - Present); ING Financial Advisers, LLC (April 2002 - Present); Southland Life Insurance Company (June 2002 - Present); ING Capital Corporation, LLC and ING Investments Distributor, LLC(7) (December 2005 - Present); ING Funds Services, LLC(8), ING Investments, LLC and ING Pilgrim Funding, Inc. (March 2006 - Present); and Directed Services LLC (December 2006 - Present)(9). | |
|
(1) The tenure of each Director is subject to the Board's retirement policy, which states that each Independent Director shall retire from service as a Director at the conclusion of the first regularly scheduled meeting of the Board that is held after the Director reaches the age of 72. A unanimous vote of the Board may extend the retirement date of a Director for up to one year. An extension may be permitted if the retirement would trigger a requirement to hold a meeting of shareholders of the Fund under applicable law, whether for purposes of appointing a successor to the Director or if otherwise necessary under applicable law, in which case the extension would apply until such time as the shareholder meeting can be held or is no longer needed.
(2) For the purposes of this table (except for Mr. Mathews),"Fund Complex" means the following investment companies: ING Asia Pacific High Dividend Equity Income Fund, ING Emerging Markets High Dividend Equity Fund; ING Emerging Markets Local Bond Fund; ING Equity Trust; ING Funds Trust; ING Global Equity Dividend and Premium Opportunity Fund; ING Global Advantage and Premium Opportunity Fund; ING Infrastructure, Industrials, and Materials Fund; ING International High Dividend Equity Income Fund; ING Investors Trust; ING Mayflower Trust; ING Mutual Funds; ING Prime Rate Trust; ING Risk Managed Natural Resources Fund; ING Senior Income Fund; ING Separate Portfolios Trust; ING Variable Insurance Trust; ING Variable Products Trust; and ING Partners, Inc.
(3) For Mr. Mathews, the Fund Complex also includes the following investment companies: ING Series Fund, Inc.; ING Strategic Allocation Portfolios, Inc.; ING Variable Funds; ING Variable Portfolios, Inc.; ING Balanced Portfolio, Inc.; ING Intermediate Bond Portfolio; and ING Money Market Portfolio.
(4) Mr. Boyer held a seat on the Board of Directors of The Mark Twain House & Museum from September 1989 to November 2005. ING Groep N.V. makes non-material, charitable contributions to The Mark Twain House & Museum.
(5) Messrs. Mathews and Crispin are deemed to be "interested persons" of the Fund as defined in the 1940 Act because of their relationship with ING Groep, N.V., the parent corporation of the Investment Adviser, Directed Services LLC and the Distributor, ING Investments Distributor, LLC.
(6) ING Investments, LLC was previously named ING Pilgrim Investments, LLC. ING Pilgrim Investments, LLC is the successor in interest to ING Pilgrim Investments, Inc., which was previously known as Pilgrim Investments, Inc. and before it was known as Pilgrim America Investments, Inc.
(7) ING Investments Distributor, LLC was previously named ING Funds Distributor, LLC. ING Funds Distributor, LLC is the successor in interest to ING Funds Distributor, Inc., which was previously known as ING Pilgrim Securities, Inc., and before that, was known as Pilgrim Securities, Inc., and before that was known as Pilgrim America Securities, Inc.
(8) ING Funds Services, LLC was previously named ING Pilgrim Group, LLC. ING Pilgrim Group, LLC is the successor in interest to ING Pilgrim Group, Inc., which was previously known as Pilgrim Group, Inc. and before that, was known as Pilgrim America Group, Inc.
(9) Directed Services LLC is the successor in interest to Directed Services, Inc.
211
DIRECTOR AND OFFICER INFORMATION (UNAUDITED) (CONTINUED)
Name, Address
and Age | | Position(s)
Held with Company | | Term of Office and
Length of Time Served(1) | | Principal Occupation(s) - During the
Past 5 Years | |
Shaun P. Mathews(5)
7337 East Doubletree Ranch Rd.
Suite 100
Scottsdale, Arizona 85258
Age: 55 | | President and Chief Executive Officer | | November 2006 - Present | | President and Chief Executive Officer, ING Investments, LLC (November 2006 - Present). Formerly, Head of ING Mutual Funds and Investment Products (November 2004 - November 2006). | |
|
Michael J. Roland
7337 East Doubletree Ranch Rd.
Suite 100
Scottsdale, Arizona 85258
Age: 52 | | Executive Vice President | | January 2005 - Present | | Executive Vice President and Chief Operating Officer, ING Investments, LLC(2) and ING Funds Services, LLC(3) (January 207 - Present). Formerly, Executive Vice President, Head of Product Management (January 2005 - January 2007). | |
|
Stanley D. Vyner
230 Park Avenue
New York, New York 10169
Age: 60 | | Executive Vice President and Chief Investment Risk Officer | | January 2005 - Present September 2009 - Present | | Executive Vice President, ING Investments, LLC(2) (July 2000 - Present) and Chief Investment Risk Officer, ING Investments, LLC(2) (January 2003 - Present). | |
|
Joseph M. O'Donnell
7337 East Doubletree Ranch Rd.
Suite 100
Scottsdale, Arizona 85258
Age: 56 | | Executive Vice President and Chief Compliance Officer | | March 2006 - Present January 2005 - Present | | Chief Compliance Officer of the ING Funds (November 2004 - Present); Executive Vice President of the ING Funds (March 2006 - Present); Chief Compliance Officer of ING Investments, LLC(2) (March 2006 - July 2008 and October 2009 - Present); and Investment Advisor Chief Compliance Officer, Directed Services LLC(6) (March 2006 - July 2008 and October 2009 - Present). Formerly, Investment Advisor Chief Compliance Officer, ING Life Insurance and Annuity Company (March 2006 - December 2006). | |
|
Todd Modic
7337 East Doubletree Ranch Rd.
Suite 100
Scottsdale, Arizona 85258
Age: 43 | | Senior Vice President, Chief/Principal Financial Officer and Assistant Secretary | | March 2005 - Present | | Senior Vice President, ING Funds Services, LLC(3) (March 2005 - Present). | |
|
Kimberly A. Anderson
7337 East Doubletree Ranch Rd.
Suite 100
Scottsdale, Arizona 85258
Age: 46 | | Senior Vice President | | January 2005 - Present | | Senior Vice President, ING Investments, LLC(2) (October 2003 - Present). | |
|
Robert Terris
7337 East Doubletree Ranch Rd.
Suite 100
Scottsdale, Arizona 85258
Age: 40 | | Senior Vice President | | May 2006 - Present | | Senior Vice President, Head of Division Operations, ING Funds Services, LLC(3) (May 2006 - Present). Formerly, Vice President of Administration, ING Funds Services, LLC(3) (October 2001 - May 2006). | |
|
Robyn L. Ichilov
7337 East Doubletree Ranch Rd.
Suite 100
Scottsdale, Arizona 85258
Age: 43 | | Vice President and Treasurer | | January 2005 - Present | | Vice President and Treasurer, ING Funds Services, LLC(3) (November 1995 - Present) and ING Investments, LLC(2) (August 1997 - Present). | |
|
Lauren D. Bensinger
7337 East Doubletree Ranch Rd.
Suite 100
Scottsdale, Arizona 85258
Age: 56 | | Vice President | | January 2005 - Present | | Vice President, ING Investments, LLC(2) and ING Funds Services, LLC(3) (February 1996 - Present); Director of Compliance, ING Investments, LLC(2) (October 2004 - Present); and Vice President and Money Laundering Reporting Officer, ING Investments Distributor, LLC(4) - April 2010 - Present). Formerly, Chief Compliance Officer, ING Investments Distributor, LLC(4) (August 1995 - April 2010). | |
|
William Evans
10 State House Square
Hartford, Connecticut 06103
Age: 38 | | Vice President | | September 2007 - Present | | Senior Vice President (March 2010 - Present) and Head of Manager Research and Selection Group (April 2007 - Present). Formerly, Vice President, U.S. Mutual Funds and Investment Products (May 2005 - April 2007). | |
|
212
DIRECTOR AND OFFICER INFORMATION (UNAUDITED) (CONTINUED)
Name, Address
and Age | | Position(s)
Held with Company | | Term of Office and
Length of Time Served(1) | | Principal Occupation(s) - During the
Past 5 Years | |
Maria M. Anderson
7337 East Doubletree Ranch Rd.
Suite 100
Scottsdale, Arizona 85258
Age: 52 | | Vice President | | January 2005 - Present | | Vice President, ING Funds Services, LLC(3) (September 2004 - Present). | |
|
Denise Lewis
7337 East Doubletree Ranch Rd.
Suite 100
Scottsdale, Arizona 85258
Age: 47 | | Vice President | | January 2007 - Present | | Vice President, ING Funds Services, LLC (December 2006 - Present). Formerly, Senior Vice President, UMB Investment Services Group, LLC (November 2003 - December 2006). | |
|
Kimberly K. Springer
7337 East Doubletree Ranch Rd.
Suite 100
Scottsdale, Arizona 85258
Age: 53 | | Vice President | | March 2006 - Present | | Vice President, ING Investment Management - ING Funds (March 2010 - Present); Vice President, ING Funds Services, LLC(3) (March 2006 - Present) and Managing Paralegal, Registration Statements (June 2003 - Present). Formerly, Assistant Vice President, ING Funds Services, LLC(3) (August 2004 - March 2006). | |
|
Craig Wheeler
7337 East Doubletree Ranch Rd.
Suite 100
Scottsdale, Arizona 85258
Age: 41 | | Assistant Vice President | | May 2008 - Present | | Assistant Vice President - Director of Tax, ING Funds Services (March 2008 - Present). Formerly, Tax Manager, ING Funds Services (March 2005 - March 2008). | |
|
Huey P. Falgout, Jr.
7337 East Doubletree Ranch Rd.
Suite 100
Scottsdale, Arizona 85258
Age: 47 | | Secretary | | August 2003 - Present | | Senior Vice President and Chief Counsel, ING Investment Management - ING Funds (March 2010 - Present). Formerly, Chief Counsel, ING Americas, U.S. Legal Services (October 2003 - March 2010). | |
|
Theresa K. Kelety
7337 East Doubletree Ranch Rd.
Suite 100
Scottsdale, Arizona 85258
Age: 47 | | Assistant Secretary | | August 2003 - Present | | Vice President and Senior Counsel, ING Investment Management - ING Funds (March 2010 - Present). Formerly, Senior Counsel, ING Americas, U.S. Legal Services (April 2008 - March 2010) and Counsel, ING Americas, U.S. Legal Services (April 2003 - April 2008). | |
|
Kathleen Nichols
7337 East Doubletree Ranch Rd.
Suite 100
Scottsdale, Arizona 85258
Age: 35 | | Assistant Secretary | | May 2008 - Present | | Vice President and Counsel, ING Investment Management - ING Funds (March 2010 - Present). Formerly, Counsel, ING Americas, U.S. Legal Services (February 2008 - March 2010) and Associate, Ropes & Gray LLP (September 2005 - February 2008) | |
|
Paul Caldarelli
7337 East Doubletree Ranch Rd.
Suite 100
Scottsdale, Arizona 85258
Age: 59 | | Assistant Secretary | | June 2010 - Present | | Vice President and Senior Counsel, ING Investment Management - ING Funds (March 2010 - Present). Formerly, Senior Counsel, ING Americas, U.S. Legal Services (April 2008 - March 2010) and Counsel, ING Americas, U.S. Legal Services (May 2005 - April 2008). | |
|
(1) The officers hold office until the next annual meeting of the Trustees and until their successors shall have been elected and qualified.
(2) ING Investments, LLC was previously named ING Pilgrim Investments, LLC. ING Pilgrim Investments, LLC is the successor in interest to ING Pilgrim Investments, Inc., which was previously known as Pilgrim Investments, Inc. and before that was known as Pilgrim America Investments, Inc.
(3) ING Funds Services, LLC was previously named ING Pilgrim Group, LLC. ING Pilgrim Group, LLC is the successor in interest to ING Pilgrim Group, Inc., which was previously known as Pilgrim Group, Inc. and before that was known as Pilgrim America Group, Inc.
(4) ING Investments Distributor, LLC was previously named ING Funds Distributor, LLC. ING Funds Distributor, LLC is the successor in interest to ING Funds Distributor, Inc., which was previously known as ING Pilgrim Securities, Inc., and before that, was known as Pilgrim Securities, Inc., and before that was known as Pilgrim America Securities, Inc.
(5) Mr. Mathews commenced services as CEO and President of the ING Funds on November 11, 2006.
(6) Directed Services LLC is the successor in interest to Directed Services, Inc.
213
ADVISORY CONTRACT APPROVAL DISCUSSION (UNAUDITED)
BOARD CONSIDERATION AND RE-APPROVAL OF INVESTMENT ADVISORY AND SUB-ADVISORY CONTRACTS
Section 15(c) of the Investment Company Act of 1940, as amended (the "1940 Act") provides that, after an initial period, the Portfolios' existing investment advisory and sub-advisory contracts will remain in effect only if the Board of Directors (the "Board") of ING Partners, Inc. (the "Company"), including a majority of Board members who have no direct or indirect interest in the advisory and sub-advisory contracts, and who are not "interested persons" of the Portfolios, as such term is defined under the 1940 Act (the "Independent Directors"), annually review and approve them. Thus, at a meeting held on November 18, 2010, the Board, including a majority of the Independent Directors, considered whether to renew the investment advisory contracts (the "Advisory Contracts") between Directed Services LLC (the "Adviser") and the Portfolios and the sub-advisory contracts ("Sub-Advisory Contracts") with the sub-adviser to each Portfolio (the "Sub-Advisers").
The Independent Directors also held separate meetings on October 21 and November 16, 2010 to consider the renewal of the Advisory Contracts and Sub-Advisory Contracts. As a result, subsequent references herein to factors considered and determinations made by the Independent Directors include, as applicable, factors considered and determinations made on those earlier dates by the Independent Directors.
At its November 18, 2010 meeting, the Board voted to renew the Advisory and Sub-Advisory Contracts for the Portfolios. In reaching these decisions, the Board took into account information furnished to it throughout the year at regular meetings of the Board and the Board's committees, as well as information prepared specifically in connection with the annual renewal process. Determinations by the Independent Directors also took into account various factors that they believed, in light of the legal advice furnished to them by K&L Gates LLP ("K&L Gates"), their independent legal counsel, and their own business judgment, to be relevant. Further, while the Advisory Contracts and Sub-Advisory Contracts for all the Portfolios were considered at the same Board meeting, the Directors considered each Portfolio's advisory and sub-advisory relationships separately.
Provided below is an overview of the Board's contract approval process in general, as well as a discussion of certain specific factors that the Board considered at its renewal meeting. While the Board gave its attention to the information furnished, at its request, that was most relevant to its considerations, discussed below are a number of the primary factors relevant to the Board's consideration as to whether to renew the Advisory and Sub-Advisory Contracts for the one-year period ending November 30, 2011. Each Board member may have accorded different weight to the various factors in reaching his or her conclusions with respect to each Portfolio's advisory and sub-advisory arrangements.
Overview of the Contract Renewal and Approval Process
Several years ago, the Independent Directors instituted a revised process by which they seek and consider relevant information when they decide whether to approve new or existing advisory and sub-advisory arrangements for the investment companies in the ING Funds complex under their jurisdiction, including the Portfolios' existing Advisory and Sub-Advisory Contracts. Among other actions, the Independent Directors: retained the services of independent consultants with experience in the mutual fund industry to assist the Independent Directors in working with the personnel employed by the Adviser or its affiliates who administer the Portfolios ("Management") to identify the types of information presented to the Board to inform its deliberations with respect to advisory and sub-advisory relationships and to help evaluate that information; established a specific format in which certain requested information is provided to the Board; and determined the process for reviewing such information in connection with Advisory and Sub-Advisory Contract renewals and approvals. The end result was an enhanced process which is currently employed by the Independent Directors to review and analyze information in connection with their annual renewal of the ING Funds' advisory and sub-advisory contracts, as well as their review and approval of new advisory relationships.
Since the current renewal and approval process was first implemented, the Board's membership has changed substantially through periodic retirements of some Directors and the appointment and election of new Directors. In addition, throughout this period the Independent Directors have reviewed and refined the renewal and approval process at least annually. The Board also established a Contracts Committee and two Investment Review Committees IRCs. Among other matters, the Contracts Committee provides oversight with respect to the contracts renewal and approval process, and each Portfolio is assigned to an IRC, which provides oversight regarding, among other matters, investment performance. The Investment Review
214
ADVISORY CONTRACT APPROVAL DISCUSSION (UNAUDITED) (CONTINUED)
Committees may apply a heightened level of scrutiny in cases where performance has lagged an ING Fund's relevant benchmark and/or selected peer group of investment companies ("Selected Peer Groups").
The type and format of the information provided to the Board or to legal counsel for the Independent Directors in connection with the contract approval and renewal process has been codified in the ING Funds' 15(c) Methodology Guide. This Guide was developed under the direction of the Independent Directors and sets out a blueprint pursuant to which the Independent Directors request certain information that they deem important to facilitate an informed review in connection with initial and annual approvals of advisory and sub-advisory contracts.
Management provides certain of the information requested by the 15(c) Methodology Guide in Fund Analysis and Comparison Tables ("FACT sheets") prior to the Independent Directors' review of advisory and sub-advisory arrangements (including the Portfolios' Advisory and Sub-Advisory Contracts). The Independent Directors previously retained an independent firm to verify and test the accuracy of certain FACT sheet data for a representative sample of funds in the ING Funds complex. In addition, in recent years the Contracts Committee employed the services of an independent consultant to assist in its review and analysis of, among other matters, the 15(c) Methodology Guide, the content and format of the FACT sheets, and proposed Selected Peer Groups to be used by the Portfolios for certain comparison purposes during the renewal process. As part of an ongoing process, the Contracts Committee recommends or considers recommendations from Management for refinements to the 15(c) Methodology Guide and other aspects of the review process, and the Board's IRCs review benchmarks used to assess the performance of funds in the ING Funds complex.
The Board employed its process for reviewing contracts when considering the renewals of the Portfolios' Advisory and Sub-Advisory Contracts that would be effective through November 30, 2011. Set forth below is a discussion of many of the Board's primary considerations and conclusions resulting from this process.
Nature, Extent and Quality of Service
In determining whether to approve the Advisory and Sub-Advisory Contracts for the Portfolios for the year ending November 30, 2011, the Independent Directors received and evaluated such information as they deemed necessary regarding the nature, extent and quality of services provided to the Portfolios by the Adviser and Sub-Advisers. This included information regarding the Adviser and Sub-Advisers provided throughout the year at regular meetings of the Board and its committees, as well as information furnished in connection with the contract renewal meetings.
The materials requested by and provided to the Board and/or to K&L Gates prior to the November 18, 2010 Board meeting included, among other information, the following items for each Portfolio: (1) FACT sheets that provided information regarding the performance and expenses of the Portfolio and other similarly managed funds in its Selected Peer Group, as well as information regarding the Portfolio's investment portfolio, objective and strategies; (2) reports providing risk and attribution analyses of the Portfolio; (3) the 15(c) Methodology Guide, which describes how the FACT sheets were prepared, including the manner in which each Portfolio's benchmark and Selected Peer Group were selected and how profitability was determined; (4) responses from the Adviser and relevant Sub-Adviser or Sub-Advisers to a series of questions posed by K&L Gates on behalf of the Directors; (5) copies of the forms of Advisory and Sub-Advisory Contracts; (6) copies of the Forms ADV for the Adviser and Sub-Advisers; (7) financial statements for the Adviser and Sub-Adviser; (8) a draft of a narrative summary addressing key factors the Board customarily considers in evaluating the renewals of the ING Funds' (including the Portfolio's) advisory contracts and sub-advisory contracts, including a written analysis for the Portfolio of how performance, fees and expenses compare to its Selected Peer Group and/or designated benchmark; (9) independent analyses of Portfolio performance by the Company's Chief Investment Risk Officer; (10) information regarding net asset flows into and out of the Portfolio; and (11) other information relevant to the Board's evaluations.
For each Portfolio Institutional Class ("Class I") shares were used for purposes of certain comparisons between the Portfolios and their Selected Peer Groups. Class I shares generally were selected so that a Portfolio's share class with the longest performance history was compared to the analogous class of shares for each fund in its Selected Peer Groups. The mutual funds included in the Portfolios' Selected Peer Groups were selected based upon criteria designed to mirror the Portfolio share class being compared to the Selected Peer Group.
In arriving at its conclusions with respect to the Advisory Contracts, the Board was mindful of the "manager-of-managers" platform of the ING Funds that has been developed by Management. The Board also considered the techniques that the Adviser has developed, at the Board's direction, to screen and perform due diligence on the Sub-Advisers that are
215
ADVISORY CONTRACT APPROVAL DISCUSSION (UNAUDITED) (CONTINUED)
recommended to the Board to manage the investment portfolios of the funds in the ING Funds complex. The Board noted the resources that the Adviser has committed to the Board and the IRCs to assist the Board and the IRCs with their assessment of the investment performance of the Portfolios on an on-going basis throughout the year. This includes the appointment of a Chief Investment Risk Officer and his staff, who report directly to the Board and who have developed attribution analyses and other metrics used by the Board's Investment Review Committees to analyze the key factors underlying investment performance for the funds in the ING Funds complex.
The Board also noted the techniques used by the Adviser to monitor the performance of the Sub-Advisers and the proactive approach that the Adviser, working in cooperation with the I/B/F IRC, has taken to advocate or recommend, when it believed appropriate, changes designed to assist in improving the Portfolios' performance.
In considering the Portfolios' Advisory Contracts, the Board also considered the extent of benefits provided to the Portfolios' shareholders, beyond advisory services, from being part of the ING family of funds. This includes, in most cases, the right to exchange or transfer investments, without a sales charge, between the same class of shares of such funds or among ING Funds available on a product platform, and the wide range of ING Funds available for exchange or transfer. The Board also took into account the Adviser's efforts in recent years to reduce the expenses of the ING Funds through renegotiated arrangements with the ING Funds' service providers. In addition, the Board considered the efforts of the Adviser and the expenses that it incurred in recent years to help make the ING Funds complex more efficient by combinations of similar funds.
Further, the Board received periodic reports showing that the investment policies and restrictions for each Portfolio were consistently complied with and other periodic reports covering matters such as compliance by Adviser and Sub-Adviser personnel with codes of ethics. The Board considered reports from the Company's Chief Compliance Officer ("CCO") evaluating whether the regulatory compliance systems and procedures of the Adviser and each Sub-Adviser are reasonably designed to assure compliance with the federal securities laws, including those related to, among others, late trading and market timing, best execution, fair value pricing, proxy voting and trade allocation practices. The Board also took into account the CCO's annual and periodic reports and recommendations with respect to service provider compliance programs. In this regard, the Board also considered the policies and procedures developed by the CCO in consultation with the Board's Compliance Committee that guide the CCO's compliance oversight function.
The Board reviewed the level of staffing, quality and experience of each Portfolio's portfolio management team. The Board took into account the respective resources and reputations of the Adviser and Sub-Advisers, and evaluated the ability of the Adviser and the Sub-Advisers to attract and retain qualified investment advisory personnel. The Board also considered the adequacy of the resources committed to the Portfolios (and other relevant funds in the ING Funds complex) by the Adviser and Sub-Advisers, and whether those resources are commensurate with the needs of the Portfolios and are sufficient to sustain appropriate levels of performance and compliance needs. In this regard, the Board considered the financial stability of the Adviser and the Sub-Advisers.
Based on their deliberations and the materials presented to them, the Board concluded that the advisory and related services provided by the Adviser and each Sub-Adviser are appropriate in light of the Portfolios' operations, the competitive landscape of the investment company business, and investor needs, and that the nature and quality of the overall services provided by the Adviser and the Sub-Advisers were appropriate.
Portfolio Performance
In assessing advisory and sub-advisory relationships, the Board placed emphasis on the net investment returns of each Portfolio. While the Board considered the performance reports and discussions with portfolio managers at Board and committee meetings during the year, particular attention in assessing performance was given to the FACT sheets furnished in connection with the renewal process. The FACT sheet prepared for each Portfolio included its investment performance compared to the Portfolio's Morningstar category median and/or Lipper category median, Selected Peer Group and primary benchmark. The FACT sheet performance data was as of June 30, 2010. In addition, the Board also considered at its November 18, 2010 meeting certain additional data regarding performance and Portfolio asset levels as of September 30, 2010. The Board's findings specific to each Portfolio's performance are discussed under "Portfolio-by-Portfolio Analysis" below.
216
ADVISORY CONTRACT APPROVAL DISCUSSION (UNAUDITED) (CONTINUED)
Economies of Scale
When evaluating the reasonableness of advisory fee rates, the Board also considered whether economies of scale will be realized by the Adviser and Sub-Adviser as a Portfolio grows larger and the extent to which any such economies are reflected in contractual fee rates. In this regard, the Board noted any breakpoints in advisory fee schedules that will result in a lower advisory fee rate when a Portfolio achieves sufficient asset levels to receive a breakpoint discount. In the case of sub-advisory fees, the Board considered that breakpoints would inure to the benefit of the Adviser, except to the extent that there are corresponding advisory fee breakpoints or waivers. The Board also considered that some of the Portfolios do not have advisory fee breakpoints do have fee waiver or expense reimbursement arrangements. In this connection, the Board considered the extent to which economies of scale could be realized through such fee waivers, expense reimbursements or other expense reductions. In evaluating fee breakpoint arrangements and economies of scale, the Independent Trustees also considered prior periodic management reports and industry information on this topic.
The Board considered that there has not been a full year recovery for many Portfolios from the substantial decline in assets caused by adverse economic conditions in recent years. As a result of these asset declines, the Board considered that there were fewer opportunities for certain of the Portfolios to realize economies of scale.
Information Regarding Services to Other Clients
The Board requested and considered information regarding the nature of services and fee rates offered by the Adviser and Sub-Advisers to other clients, including other registered investment companies and institutional accounts. When fee rates offered to other clients differed materially from those charged to the Portfolios, the Board considered any underlying rationale provided by the Adviser or a Sub-Adviser for these differences. For unaffiliated Sub-Advisers, the Board did not view this information as being a key factor in its deliberations because of the arms-length nature of negotiations between the Adviser and unaffiliated Sub-Advisers with respect to sub-advisory fee rates. The Board also noted that the fee rates charged to the Portfolios and other institutional clients of the Adviser or a Sub-Adviser (including other investment companies) may differ materially due to, among other reasons: differences in services; different regulatory requirements associated with registered investment companies, such as the Portfolios, as compared to non-registered investment company clients; market differences in fee rates that existed when a Portfolio first was organized; differences in the original sponsors of Portfolios that now are managed by the Adviser; investment capacity constraints that existed when certain contracts were first agreed upon or that might exist at present; and different pricing structures that are necessary to be competitive in different marketing channels.
Fee Rates and Profitability
The Board reviewed and considered each contractual investment advisory fee rate, combined with the administrative fee rate, payable by each Portfolio to the Adviser. The Board also considered the contractual sub-advisory fee rate payable by the Adviser to each Sub-Adviser for sub-advisory services for each Portfolio. In addition, the Board considered fee waivers and expense limitations applicable to the fees payable by the Portfolios.
The Board considered: (1) the fee structure of each Portfolio as it relates to the services provided under the contracts; and (2) the potential fall-out benefits to the Adviser and the Sub-Advisers and their respective affiliates from their association with the Portfolios. For each Portfolio, the Board determined that the fees payable to the Adviser and the Sub-Advisers are reasonable for the services that each performs, which were considered in light of the nature and quality of the services that each has performed and is expected to perform.
For each Portfolio, the Board considered information on revenues, costs and profits realized by the Adviser and each affiliated Sub-Adviser, which was prepared by Management in accordance with the allocation methodology (including related assumptions) specified in the 15(c) Methodology Guide. In analyzing the profitability of the Adviser in connection with its services to a Portfolio, the Board took into account the sub-advisory fee rate payable by the Adviser to each Sub-Adviser. The Board also considered that there has not yet been a full recovery for many Portfolios from the substantial decline in assets caused by adverse economic conditions in recent years, which, in many cases, has adversely impacted profits realized by the Adviser and Sub-Advisers affiliated with the Adviser. In addition, the Board considered information that it requested and was provided by Management with respect to the profitability of service providers affiliated with the Adviser. The Board did not request profitability data from the Sub-Advisers that were not affiliated with the Adviser because the Board did not view this data as imperative to its deliberations, given the arm's-length
217
ADVISORY CONTRACT APPROVAL DISCUSSION (UNAUDITED) (CONTINUED)
nature of the relationship between the Adviser and these non-affiliated Sub-Advisers with respect to the negotiation of sub-advisory fee rates, as well as the fact that many of the Portfolios' Sub-Advisers traditionally have not accounted for their profits on an account-by-account basis.
The Board recognized that profitability analysis is not an exact science and there is no uniform methodology for determining profitability for this purpose. In this context, the Board realized that Management's calculations regarding its costs incurred in establishing the infrastructure necessary for the Portfolios' operations may not be fully reflected in the expenses allocated to each Portfolio in determining profitability, and that the information presented may not portray all of the costs borne by Management or capture Management's entrepreneurial risk associated with offering and managing a mutual fund complex in the current regulatory and market environment. In addition, the Board recognized that the use of different methodologies for purposes of calculating profit data can give rise to dramatically different profit and loss results.
At the request of the Board, the Adviser has from time to time agreed to implement remedial actions for certain Portfolios. These remedial actions have included, among others: reductions in fee rates; changes in Sub-Advisers or portfolio managers; and strategy modifications.
In making its determinations, the Board based its conclusions on the reasonableness of the advisory and sub-advisory fees of the Adviser and affiliated Sub-Adviser primarily on the factors described for each Portfolio below.
Portfolio-by-Portfolio Analysis
The following paragraphs outline certain of the specific factors that the Board considered, and the conclusions reached, at its November 18, 2010 meeting in relation to renewing each Portfolio's current Advisory and Sub-Advisory Contracts. These specific factors are in addition to those considerations discussed above. In each case, the Portfolio's performance was compared to its Morningstar category median and its primary benchmark, a broad-based securities market index that appears in the Portfolio's prospectus. With respect to Morningstar quintile rankings, the first quintile represents the highest (best) performance and the fifth quintile represents the lowest performance. Each Portfolio's management fee and expense ratio were compared to the fees and expense ratios of the funds in its Selected Peer Group.
ING American Century Small-Mid Cap Value Portfolio
In considering whether to approve the renewal of the Advisory and Sub-Advisory Contracts for ING American Century Small-Mid Cap Value Portfolio, the Board considered that, based on performance data for the periods ended June 30, 2010: (1) the Portfolio outperformed its Morningstar category median for all periods presented, with the exception of the year-to-date period, during which its performance equaled the Morningstar category median's performance; (2) the Portfolio outperformed its primary benchmark for all periods presented; and (3) the Portfolio is ranked in the first (highest) quintile of its Morningstar category for the three-year and five-year periods, the second quintile for the most recent calendar quarter and one-year periods, and the third quintile for the year-to-date period.
In considering the fees payable under the Advisory and Sub-Advisory Contracts for the Portfolio, the Board took into account the factors described above and also considered: (1) the fairness of the compensation under an Advisory Contract with a level fee rate that does not include breakpoints; and (2) the pricing structure (including the expense ratio to be borne by shareholders) of the Portfolio, as compared to its Selected Peer Group, including that: (a) the management fee for the Portfolio is above the median and the average management fees of the funds in its Selected Peer Group; and (b) the expense ratio for the Portfolio is below the median and the average expense ratios of the funds in its Selected Peer Group.
In analyzing this fee data, the Board took into account Management's representations regarding advisory fee expense waivers that had been put into place at the Board's request, which lower the effective management fee rate payable by the Portfolio.
After its deliberation, the Board reached the following conclusions: (1) the Portfolio's management fee rate is reasonable in the context of all factors considered by the Board; (2) the Portfolio's expense ratio is reasonable in the context of all factors considered by the Board; (3) the Portfolio's performance is reasonable in the context of all factors considered by the Board; and (4) the sub-advisory fee rate payable by the Adviser to the Sub-Adviser is reasonable in the context of all factors considered by the Board. Based on these conclusions and other factors, the Board voted to renew the Advisory and Sub-Advisory Contracts for the Portfolio for the year
218
ADVISORY CONTRACT APPROVAL DISCUSSION (UNAUDITED) (CONTINUED)
ending November 30, 2011. During this renewal process, different Board members may have given different weight to different individual factors and related conclusions.
ING Baron Small Cap Growth Portfolio
In considering whether to approve the renewal of the Advisory and Sub-Advisory Contracts for ING Baron Small Cap Growth Portfolio, the Board considered that, based on performance data for the periods ended June 30, 2010: (1) the Portfolio outperformed its Morningstar category median for all periods presented, with the exception of the five-year period, during which it underperformed; (2) the Portfolio outperformed its primary benchmark for all periods presented, with the exception of the three-year and five-year periods, during which it underperformed; and (3) the Portfolio is ranked in the first (highest) quintile of its Morningstar category for the most recent calendar quarter and year-to-date periods, and the third quintile for the one-year, three-year, and five-year periods.
In considering the fees payable under the Advisory and Sub-Advisory Contracts for the Portfolio, the Board took into account the factors described above and also considered: (1) the fairness of the compensation under an Advisory Contract with a breakpoint fee rate schedule where the asset level necessary to achieve a breakpoint discount had not been reached by the Portfolio; and (2) the pricing structure (including the expense ratio to be borne by shareholders) of the Portfolio, as compared to its Selected Peer Group, including that: (a) the management fee for the Portfolio is above the median and the average management fees of the funds in its Selected Peer Group; and (b) the expense ratio for the Portfolio is above the median and the average expense ratios of the funds in its Selected Peer Group.
In analyzing the fee data, the Board took into account that the advisory fee breakpoint levels were reduced at the request of the Board in January 1, 2010.
After its deliberation, the Board reached the following conclusions: (1) the Portfolio's management fee rate is reasonable in the context of all factors considered by the Board; (2) the Portfolio's expense ratio is reasonable in the context of all factors considered by the Board; (3) the Portfolio's performance is reasonable in the context of all factors considered by the Board; and (4) the sub-advisory fee rate payable by the Adviser to the Sub-Adviser is reasonable in the context of all factors considered by the Board. Based on these conclusions and other factors, the Board voted to renew the Advisory and Sub-Advisory Contracts for the Portfolio for the year ending November 30, 2011. During this renewal process, different Board members may have given different weight to different individual factors and related conclusions.
ING Columbia Small Cap Value Portfolio
In considering whether to approve the renewal of the Advisory and Sub-Advisory Contracts for ING Columbia Small Cap Value Portfolio (formerly ING Columbia Small Cap Value II Portfolio), the Board considered that, based on performance data for the periods ended June 30, 2010: (1) the Portfolio underperformed its Morningstar category median for all periods presented; (2) the Portfolio underperformed its primary benchmark for all periods presented, with the exception of the three-year period, during which it outperformed; and (3) the Portfolio is ranked in the third quintile of its Morningstar category for the three-year period, the fourth quintile for the most recent calendar quarter, and the fifth (lowest) quintile for the year-to-date and one-year periods.
In analyzing this performance data, the Board took into account: (1) that in April 2010, the Portfolio's management team was modified; and (2) that Management would continue to monitor, and the Board or its Investment Review Committee would periodically review, the Portfolio's investment performance.
In considering the fees payable under the Advisory and Sub-Advisory Contracts for the Portfolio, the Board took into account the factors described above and also considered: (1) the fairness of the compensation under an Advisory Contract with a level fee rate that does not include breakpoints; and (2) the pricing structure (including the expense ratio to be borne by shareholders) of the Portfolio, as compared to its Selected Peer Group, including that: (a) the management fee (inclusive of 0.10% administration fee) for the Portfolio is above the median and the average management fees of the funds in its Selected Peer Group; and (b) the expense ratio for the Portfolio is above the median and equal to the average expense ratios of the funds in its Selected Peer Group.
In analyzing this fee data, the Board took into account Management's representations regarding the competitiveness of the Portfolio's management fee and expense ratio.
After its deliberation, the Board reached the following conclusions: (1) the Portfolio's management fee rate is reasonable in the context of all factors
219
ADVISORY CONTRACT APPROVAL DISCUSSION (UNAUDITED) (CONTINUED)
considered by the Board; (2) the Portfolio's expense ratio is reasonable in the context of all factors considered by the Board; (3) the Potrfolio's management team was modified in April 2010 and it is reasonable to permit the Portfolio time to establish a longer record for the purposes of evaluating performance; and (4) the sub-advisory fee rate payable by the Adviser to the Sub-Adviser is reasonable in the context of all factors considered by the Board. Based on these conclusions and other factors, the Board voted to renew the Advisory and Sub-Advisory Contracts for the Portfolio for the year ending November 30, 2011. During this renewal process, different Board members may have given different weight to different individual factors and related conclusions.
ING Davis New York Venture Portfolio
In considering whether to approve the renewal of the Advisory and Sub-Advisory Contracts for ING Davis New York Venture Portfolio (formerly, ING Davis Venture Value Portfolio), the Board considered that, based on performance data for the periods ended June 30, 2010: (1) the Portfolio underperformed its Morningstar category median for all periods presented, with the exceptions of the most recent calendar quarter and one-year period, during which it outperformed; (2) the Portfolio underperformed its primary benchmark for all periods presented, with the exception of the most recent calendar quarter and one-year period, during which it outperformed; and (3) the Portfolio is ranked in the second quintile of its Morningstar category for the most recent calendar quarter and one-year periods, and the third quintile for the year-to-date, three-year, and five-year periods.
In analyzing this performance data, the Board took into account: (1) Management's analysis of the negative effect that sector allocation had on the Portfolio's performance; and (2) that Management would continue to monitor, and the Board or its Investment Review Committee would periodically review, the Portfolio's performance
In considering the fees payable under the Advisory and Sub-Advisory Contracts for the Portfolio, the Board took into account the factors described above and also considered: (1) the fairness of the compensation under an Advisory Contract with a level fee rate that does not include breakpoints; (2) the pricing structure (including the expense ratio to be borne by shareholders) of the Portfolio, as compared to its Selected Peer Group, including that: (a) the management fee (inclusive of a 0.10% administration fee) for the Portfolio is above the median and the average management fees of the funds in its Selected Peer Group; and (b) the expense ratio for the Portfolio is above the median and the average expense ratios of the funds in its Selected Peer Group.
In analyzing this fee data, the Board took into account: (1) Management's representations regarding advisory fee waivers that had been put into place at the request of the Board, which lower the effective management fee rate payable by the Portfolio; and (2) Managements' analysis regarding the competitiveness of the Portfolio's expense ratio.
After its deliberation, the Board reached the following conclusions: (1) the Portfolio's management fee rate is reasonable in the context of all factors considered by the Board; (2) the Portfolio's expense ratio is reasonable in the context of all factors considered by the Board; (3) that Management would continue to monitor, and the Board or its Investment Review Committee would periodically review, the Portfolio's investment performance; and (4) the sub-advisory fee rate payable by the Adviser to the Sub-Adviser is reasonable in the context of all factors considered by the Board. Based on these conclusions and other factors, the Board voted to renew the Advisory and Sub-Advisory Contracts for the Portfolio for the year ending November 30, 2011. During this renewal process, different Board members may have given different weight to different individual factors and related conclusions.
ING JPMorgan Mid Cap Value Portfolio
In considering whether to approve the renewal of the Advisory and Sub-Advisory Contracts for ING JPMorgan Mid Cap Value Portfolio, the Board considered that, based on performance data for the periods ended June 30, 2010: (1) the Portfolio outperformed its Morningstar category median for all periods presented; (2) the Portfolio outperformed its primary benchmark for all periods presented, with the exception of the one-year period, during which it underperformed; and (3) the Portfolio is ranked in the first (highest) quintile of its Morningstar category for the most recent calendar quarter, year-to-date, and three-year periods, and the second quintile for the one-year and five-year periods.
In considering the fees payable under the Advisory and Sub-Advisory Contracts for the Portfolio, the Board took into account the factors described above and also considered: (1) the fairness of the compensation under an Advisory Contract with a level fee rate that does not include breakpoints; and (2) the pricing structure (including the expense ratio to be
220
ADVISORY CONTRACT APPROVAL DISCUSSION (UNAUDITED) (CONTINUED)
borne by shareholders) of the Portfolio, as compared to its Selected Peer Group, including that: (a) the management fee for the Portfolio is equal to the median and above the average management fees of the funds in its Selected Peer Group; and (b) the expense ratio for the Portfolio is above the median and the average expense ratios of the funds in its Selected Peer Group.
After its deliberation, the Board reached the following conclusions: (1) the Portfolio's management fee rate is reasonable in the context of all factors considered by the Board; (2) the Portfolio's expense ratio is reasonable in the context of all factors considered by the Board; (3) the Portfolio's performance is reasonable in the context of all factors considered by the Board; and (4) the sub-advisory fee rate payable by the Adviser to the Sub-Adviser is reasonable in the context of all factors considered by the Board. Based on these conclusions and other factors, the Board voted to renew the Advisory and Sub-Advisory Contracts for the Portfolio for the year ending November 30, 2011. During this renewal process, different Board members may have given different weight to different individual factors and related conclusions.
ING Legg Mason ClearBridge Aggressive Growth Portfolio
In considering whether to approve the renewal of the Advisory and Sub-Advisory Contracts for ING Legg Mason ClearBridge Aggressive Growth Portfolio (formerly, ING Legg Mason Partners Aggressive Growth Portfolio), the Board considered that, based on performance data for the periods ended June 30, 2010: (1) the Portfolio underperformed its Morningstar category median for all periods presented, with the exceptions of the year-to-date and one-year periods, during which it outperformed; (2) the Portfolio underperformed its primary benchmark for all periods presented; and (3) the Portfolio is ranked in the third quintile of its Morningstar category for the year-to-date and one-year periods, the fourth quintile for the five-year period, and the fifth (lowest) quintile for the most recent calendar quarter, three-year, and ten-year periods.
In analyzing this performance data, the Board took into account that the Board, at its September 2010 meeting, had approved the merger of the Portfolio into the ING Large Cap Growth Portfolio, and this merger occurred on January 21, 2011 upon approval by the Portfolio's shareholders.
In considering the fees payable under the Advisory and Sub-Advisory Contracts for the Portfolio, the Board took into account the factors described above and also considered: (1) the fairness of the compensation under an Advisory Contract with a breakpoint fee rate schedule where the asset level necessary to achieve a breakpoint discount had not been reached by the Portfolio; and (2) the pricing structure (including the expense ratio to be borne by shareholders) of the Portfolio, as compared to its Selected Peer Group, including that: (a) the management fee for the Portfolio is below the median and above the average management fees of the funds in its Selected Peer Group; and (b) the expense ratio for the Portfolio is equal to the median and below the average expense ratios of the funds in its Selected Peer Group.
After its deliberation, the Board reached the following conclusions: (1) the Portfolio's management fee rate is reasonable in the context of all factors considered by the Board; (2) the Portfolio's expense ratio is reasonable in the context of all factors considered by the Board; (3) that the Portfolio will likely merge into the ING Large Cap Growth Portfolio in January 2011; and (4) the sub-advisory fee rate payable by the Adviser to the Sub-Adviser is reasonable in the context of all factors considered by the Board. Based on these conclusions and other factors, the Board voted to renew the Advisory and Sub-Advisory Contracts for the Portfolio for the year ending November 30, 2011. During this renewal process, different Board members may have given different weight to different individual factors and related conclusions.
ING Oppenheimer Global Portfolio
In considering whether to approve the renewal of the Advisory and Sub-Advisory Contracts for ING Oppenheimer Global Portfolio, the Board considered that, based on performance data for the periods ended June 30, 2010: (1) the Portfolio outperformed its Morningstar category median for all periods presented, with the exception of the most recent calendar quarter, during which it underperformed; (2) the Portfolio outperformed its primary benchmark for all periods presented, with the exception of the most recent calendar quarter, during which it underperformed; and (3) the Portfolio is ranked in the second quintile of its Morningstar category for the year-to-date, one-year, three-year, and five-year periods, and the fourth quintile for the most recent calendar quarter.
221
ADVISORY CONTRACT APPROVAL DISCUSSION (UNAUDITED) (CONTINUED)
In considering the fees payable under the Advisory and Sub-Advisory Contracts for the Portfolio, the Board took into account the factors described above and also considered: (1) the fairness of the compensation under an Advisory Contract with a breakpoint fee rate schedule where the asset level necessary to achieve a breakpoint discount had not been reached by the Portfolio; and (2) the pricing structure (including the expense ratio to be borne by shareholders) of the Portfolio, as compared to its Selected Peer Group, including that: (a) the management fee (inclusive of a 0.06% administration fee) for the Portfolio is below the median and the average management fees of the funds in its Selected Peer Group; and (b) the expense ratio for the Portfolio is below the median and the average expense ratios of the funds in its Selected Peer Group.
After its deliberation, the Board reached the following conclusions: (1) the Portfolio's management fee rate is reasonable in the context of all factors considered by the Board; (2) the Portfolio's expense ratio is reasonable in the context of all factors considered by the Board; (3) the Portfolio's performance is reasonable in the context of all factors considered by the Board; and (4) the sub-advisory fee rate payable by the Adviser to the Sub-Adviser is reasonable in the context of all factors considered by the Board. Based on these conclusions and other factors, the Board voted to renew the Advisory and Sub-Advisory Contracts for the Portfolio for the year ending November 30, 2011. During this renewal process, different Board members may have given different weight to different individual factors and related conclusions.
ING Oppenheimer Global Strategic Income Portfolio
In considering whether to approve the renewal of the Advisory and Sub-Advisory Contracts for ING Oppenheimer Global Strategic Income Portfolio (formerly, ING Oppenheimer Strategic Income Portfolio), the Board considered that, based on performance data for the periods ended June 30, 2010: (1) the Portfolio outperformed its Morningstar category median for all periods presented, with the exception of the three-year and five-year periods, during which it underperformed; (2) the Portfolio outperformed its primary benchmark for the year-to-date and one-year periods, but underperformed for the most recent calendar quarter, three-year, and five-year periods; and (3) the Portfolio is ranked in the first (highest) quintile of its Morningstar category for the year-to-date period, the second quintile for the most recent calendar quarter and one-year periods, the third quintile for the five-year period, and the fourth quintile for the three-year period.
In analyzing this performance data, the Board took into account that: (1) in October 2010, the Board approved a change in the Sub-Adviser and investment strategy of the Portfolio; and (2) Management would continue to monitor, and the Board or its Investment Review Commottee would periodically review, the Portfolio's performance.
In considering the fees payable under the Advisory and Sub-Advisory Contracts for the Portfolio, the Board took into account the factors described above and also considered: (1) the fairness of the compensation under an Advisory Contract with a breakpoint fee rate schedule where the asset level necessary to achieve a breakpoint discount had not been reached by the Portfolio; and (2) the pricing structure (including the expense ratio to be borne by shareholders) of the Portfolio, as compared to its Selected Peer Group, including that: (a) the management fee for the Portfolio is below the median and the average management fees of the funds in its Selected Peer Group; and (b) the expense ratio for the Portfolio is below the median and the average expense ratios of the funds in its Selected Peer Group.
After its deliberation, the Board reached the following conclusions: (1) the Portfolio's management fee rate is reasonable in the context of all factors considered by the Board; (2) the Portfolio's expense ratio is reasonable in the context of all factors considered by the Board; (3) the Board in October 2010 approved a change in the Portfolio's sub-adviser and investment strategy and it is reasonable to permit the Portfolio time to establish a longer performance record for the purposes of evaluating performance; and (4) the sub-advisory fee rate payable by the Adviser to the Sub-Adviser is reasonable in the context of all factors considered by the Board. Based on these conclusions and other factors, the Board voted to renew the Advisory and Sub-Advisory Contracts for the Portfolio for the year ending November 30, 2011. During this renewal process, different Board members may have given different weight to different individual factors and related conclusions.
BOARD CONSIDERATION AND APPROVAL OF NEW SUB-ADVISORY CONTRACTS FOR ING OPPENHEIMER GLOBAL STRATEGIC INCOME PORTFOLIO
ING Oppenheimer Global Strategic Income Portfolio had been sub-advised by OppenheimerFunds, Inc.
222
ADVISORY CONTRACT APPROVAL DISCUSSION (UNAUDITED) (CONTINUED)
("Oppenheimer") since its inception in November 2004. At a meeting of the Board held on September 30, 2010 the Board, including a majority of the Independent Directors, determined to: (1) terminate Oppenheimer as sub-adviser to the Portfolio following a notice period; (2) appoint each of ING Investment Management Co. ("IIM US"), ING Investment Management Advisors B.V. ("IIM Europe"), ING Investment Management Asia/Pacific (Hong Kong) Limited ("IIM Asia/Pacific" and collectively, "ING IM") as a sub-adviser to the Portfolio; and (3) approve Sub-Advisory Contracts with IIM US, IIM Europe and IIM Asia Pacific under which each would serve as a Sub-Adviser to the Portfolio. The Sub-Advisory Contracts are expected become effective on or about January 21, 2010.
In determining whether to approve the Sub-Advisory Contract with IIM US, the Board received and evaluated such information as it deemed necessary for an informed determination of whether the Sub-Advisory Contract should be approved for the Portfolio. The materials provided to the Board to inform its consideration of whether to approve the Sub-Advisory Contract with IIM US included the following: (1) IIM US's presentation before the IRCs at its September 29, 2010 meeting; (2) memoranda and related materials provided to the Board in advance of its September 30, 2010 meeting discussing: (a) Management's rationale for recommending that IIM US serve as Sub-Adviser to the Portfolio, (b) the performance of IIM US in managing the ING Global Bond Fund, which is managed in an investment style that is similar to its proposed management of the Portfolio (with such performance being compared against relevant benchmark indices and Morningstar Category averages), and (c) IIM US's considerable firm-wide resources, investment philosophy, and the firm's overall investment process; (3) Portfolio Analysis and Comparison Tables for the Portfolio that provide information about the performance of the ING Global Bond Fund and the performance of the Portfolio's proposed Selected Peer Group; (4) IIM US's responses to inquiries from K&L Gates, counsel to the Independent Directors; (5) supporting documentation, including copies of the forms of the Sub-Advisory Contract with IIM US; and (6) other information relevant to the Board's evaluation.
In determining whether to approve the Sub-Advisory Contracts with IIM Asia/Pacific and IIM Europe, the Board received and evaluated such information as it deemed necessary for an informed determination of whether the Sub-Advisory Contracts should be approved for the Portfolio. The materials provided to the Board to inform its consideration of whether to approve the Sub-Advisory Contracts with IIM Asia/Pacific and IIM Europe included the following: (1) memoranda and related materials provided to the Board in advance of its September 30, 2010 meeting discussing: (a) Management's rationale for recommending that IIM Asia/Pacific and IIM Europe each serve as a Sub-Adviser to the Portfolio and (b) the "global ING IM multi-manager" approach utilized when engaging ING-affiliated sub-advisers to manage the assets of an ING Fund; (2) responses from each of IIM Asia/Pacific and IIM Europe to inquiries from K&L Gates LLP; (3) supporting documentation, including copies of the forms of the Sub-Advisory Contracts with IIM Asia/Pacific and IIM Europe; and (4) other information relevant to the Board's evaluation. The Board also considered Management's representations that there was no immediate intention to allocate assets of the Portfolio to be managed on a day-to-day by IIM Asia/Pacific and IIM Europe and that at such time as either IIM Asia/Pacific or IIM Europe is directed by the Adviser to provide investment advisory services to all or a portion of the assets of the Portfolio, Management will undertake to provide the Board and counsel to the Independent Directors with additional information regarding its services relevant to the Board's evaluation.
In reaching its decision to engage ING IM, the Board, including a majority of the Independent Directors, considered a number of factors, including, but not limited to, the following: (1) the Adviser's view with respect to the reputation of ING IM as a manager to other portfolios in the ING Funds complex; (2) the strength and reputation of ING IM in the industry; (3) the nature and quality of the services to be provided by ING IM under the proposed Sub-Advisory Contracts; (4) the personnel, operations, financial condition, and investment management capabilities, methodologies and resources of ING IM and their fit among the stable of managers in the ING Funds line-up; (5) the fairness of the compensation under the Sub-Advisory Contracts in light of the services to be provided by ING IM and the projected profitability of ING IM as a Sub-Adviser to the Portfolio; (6) the costs for the services to be provided by ING IM, including that the proposed fee structure will move from a mod-unified fee structure to a traditional advisory fee structure under the Advisory Contract; (7) the sub-advisory fee payable by the Adviser to ING IM; (8) ING IM's operations and compliance programs, including the policies and procedures intended to assure compliance with the Federal securities laws; (9) the appropriateness of the selection of ING IM in light of the Portfolio's proposed investment objective
223
ADVISORY CONTRACT APPROVAL DISCUSSION (UNAUDITED) (CONTINUED)
and investor base; and (10) ING IM's Codes of Ethics, which had previously been approved by the Board and related procedures for complying with those Codes.
After its deliberation, the Board reached the following conclusions: (1) ING IM should be appointed to serve as a Sub-Adviser to the Portfolio under the Sub-Advisory Contracts with the Adviser; (2) the sub-advisory fee rate payable by the Adviser to ING IM is reasonable in the context of all factors considered by the Board; and (3) ING IM maintains appropriate compliance programs, with this conclusion based upon, among other things, a representation from the Portfolio's CCO that ING IM's compliance policies and procedures are reasonably designed to assure compliance with the Federal securities laws. Based on these conclusions and other factors, the Board voted to approve the Sub-Advisory Contracts for the Portfolio. During their deliberations, different Board members may have given different weight to different individual factors and related conclusions.
ING PIMCO Total Return Portfolio
In considering whether to approve the renewal of the Advisory and Sub-Advisory Contracts for ING PIMCO Total Return Portfolio, the Board considered that, based on performance data for the periods ended June 30, 2010: (1) the Portfolio outperformed its Morningstar category median for all periods presented, with the exception of the one-year period, during which it underperformed; (2) the Portfolio outperformed its primary benchmark for all periods presented, with the exception of the most recent calendar quarter, during which it underperformed; and (3) the Portfolio is ranked in the first (highest) quintile of its Morningstar category for the three-year and five-year periods, the second quintile for the year-to-date period, and the third quintile for the most recent calendar quarter and one-year periods.
In considering the fees payable under the Advisory and Sub-Advisory Contracts for the Portfolio, the Board took into account the factors described above and also considered: (1) the fairness of the compensation under an Advisory Contract with a level fee rate that does not include breakpoints; and (2) the pricing structure (including the expense ratio to be borne by shareholders) of the Portfolio, as compared to its Selected Peer Group, including that: (a) the management fee for the Portfolio is above the median and the average management fees of the funds in its Selected Peer Group; and (b) the expense ratio for the Portfolio is above the median and the average expense ratios of the funds in its Selected Peer Group.
In analyzing this fee data, the Board took into account Management's analysis regarding the competitiveness of the fees payable by the Portfolio.
After its deliberation, the Board reached the following conclusions: (1) the Portfolio's management fee rate is reasonable in the context of all factors considered by the Board; (2) the Portfolio's expense ratio is reasonable in the context of all factors considered by the Board; (3) the Portfolio's performance is reasonable in the context of all factors considered by the Board; and (4) the sub-advisory fee rate payable by the Adviser to the Sub-Adviser is reasonable in the context of all factors considered by the Board. Based on these conclusions and other factors, the Board voted to renew the Advisory and Sub-Advisory Contracts for the Portfolio for the year ending November 30, 2011. During this renewal process, different Board members may have given different weight to different individual factors and related conclusions.
ING Pioneer High Yield Portfolio
In considering whether to approve the renewal of the Advisory and Sub-Advisory Contracts for ING Pioneer High Yield Portfolio, the Board considered that, based on performance data for the periods ended June 30, 2010: (1) the Portfolio outperformed its Morningstar category median for the one-year and three-year periods and underperformed for the most recent calendar quarter and year-to-date periods; (2) the Portfolio underperformed its primary benchmark for all periods presented, with the exception of the one-year period, during which it outperformed; and (3) the Portfolio is ranked in the first (highest) quintile of its Morningstar category for the one-year and three-year periods, and the fifth (lowest) quintile for the most calendar recent quarter and year-to-date periods.
In considering the fees payable under the Advisory and Sub-Advisory Contracts for the Portfolio, the Board took into account the factors described above and also considered: (1) the fairness of the compensation under an Advisory Contract with a breakpoint fee rate schedule where the asset level necessary to achieve a breakpoint discount had not been reached by the Portfolio; and (2) the pricing structure (including the expense ratio to be borne by shareholders) of the Portfolio, as compared to its Selected Peer Group, including that: (a) the management fee (inclusive of a 0.10% administration fee) for the Portfolio is above the median and the average management fees of the funds in its Selected Peer Group; and (b) the expense ratio for the Portfolio
224
ADVISORY CONTRACT APPROVAL DISCUSSION (UNAUDITED) (CONTINUED)
is below the median and the average expense ratios of the funds in its Selected Peer Group.
In analyzing this fee data, the Board took into account Management's analysis regarding the competitiveness of the fees payable by the Portfolio.
After its deliberation, the Board reached the following conclusions: (1) the Portfolio's management fee rate is reasonable in the context of all factors considered by the Board; (2) the Portfolio's expense ratio is reasonable in the context of all factors considered by the Board; (3) the Portfolio's performance is reasonable in the context of all factors considered by the Board; and (4) the sub-advisory fee rate payable by the Adviser to the Sub-Adviser is reasonable in the context of all factors considered by the Board. Based on these conclusions and other factors, the Board voted to renew the Advisory and Sub-Advisory Contracts for the Portfolio for the year ending November 30, 2011. During this renewal process, different Board members may have given different weight to different individual factors and related conclusions.
ING T. Rowe Price Diversified Mid Cap Growth Portfolio
In considering whether to approve the renewal of the Advisory and Sub-Advisory Contracts for ING T. Rowe Price Diversified Mid Cap Growth Portfolio, the Board considered that, based on performance data for the periods ended June 30, 2010: (1) the Portfolio outperformed its Morningstar category median for all periods presented; (2) the Portfolio underperformed its primary benchmark for all periods presented, with the exception of the most recent calendar quarter, during which it outperformed; and (3) the Portfolio is ranked in the second quintile of its Morningstar category for the year-to-date, one-year, three-year, and five-year periods, and the third quintile for the most recent calendar quarter.
In considering the fees payable under the Advisory and Sub-Advisory Contracts for the Portfolio, the Board took into account the factors described above and also considered: (1) the fairness of the compensation under an Advisory Contract with a level fee rate that does not include breakpoints; and (2) the pricing structure (including the expense ratio to be borne by shareholders) of the Portfolio, as compared to its Selected Peer Group, including that: (a) the management fee for the Portfolio is below the median and the average management fees of the funds in its Selected Peer Group; and (b) the expense ratio for the Portfolio is below the median and the average expense ratios of the funds in its Selected Peer Group.
After its deliberation, the Board reached the following conclusions: (1) the Portfolio's management fee rate is reasonable in the context of all factors considered by the Board; (2) the Portfolio's expense ratio is reasonable in the context of all factors considered by the Board; (3) the Portfolio's performance is reasonable in the context of all factors considered by the Board; and (4) the sub-advisory fee rate payable by the Adviser to the Sub-Adviser is reasonable in the context of all factors considered by the Board. Based on these conclusions and other factors, the Board voted to renew the Advisory and Sub-Advisory Contracts for the Portfolio for the year ending November 30, 2011. During this renewal process, different Board members may have given different weight to different individual factors and related conclusions.
ING T. Rowe Price Growth Equity Portfolio
In considering whether to approve the renewal of the Advisory and Sub-Advisory Contracts for ING T. Rowe Price Growth Equity Portfolio, the Board considered that, based on performance data for the periods ended June 30, 2010: (1) the Portfolio outperformed its Morningstar category median for all periods presented, with the exception of the three-year period, during which it underperformed; (2) the Portfolio outperformed its primary benchmark for the three-year, five-year, and ten-year periods, but underperformed for the most recent calendar quarter, year-to-date, and one-year periods; and (3) the Portfolio is ranked in the first (highest) quintile of its Morningstar category for the ten-year period, the second quintile for the most recent calendar quarter, one-year, and five-year periods, and the third quintile for the year-to-date and three-year periods.
In analyzing this performance data, the Board took into account: (1) that there was a change in the portfolio manager to the Portfolio in 2007; (2) that Management would continue to monitor, and the Board or its Investment Review Committee would periodically review, the Portfolio's performance; and (3) Management's continued confidence in the Sub-Adviser's ability to execute on the Portfolio's investment strategy.
In considering the fees payable under the Advisory and Sub-Advisory Contracts for the Portfolio, the Board took into account the factors described above and also considered: (1) the fairness of the compensation under an Advisory Contract with a level
225
ADVISORY CONTRACT APPROVAL DISCUSSION (UNAUDITED) (CONTINUED)
fee rate that does not include breakpoints; and (2) the pricing structure (including the expense ratio to be borne by shareholders) of the Portfolio, as compared to its Selected Peer Group, including that: (a) the management fee for the Portfolio is below the median and the average management fees of the funds in its Selected Peer Group; and (b) the expense ratio for the Portfolio is below the median and the average expense ratios of the funds in its Selected Peer Group.
After its deliberation, the Board reached the following conclusions: (1) the Portfolio's management fee rate is reasonable in the context of all factors considered by the Board; (2) the Portfolio's expense ratio is reasonable in the context of all factors considered by the Board; (3) Management would continue to monitor, and the Board or its Investment Review Committee would periodically review the Portfolio's investment performance; and (4) the sub-advisory fee rate payable by the Adviser to the Sub-Adviser is reasonable in the context of all factors considered by the Board. Based on these conclusions and other factors, the Board voted to renew the Advisory and Sub-Advisory Contracts for the Portfolio for the year ending November 30, 2011. During this renewal process, different Board members may have given different weight to different individual factors and related conclusions.
ING Templeton Foreign Equity Portfolio
In considering whether to approve the renewal of the Advisory and Sub-Advisory Contracts for ING Templeton Foreign Equity Portfolio, the Board considered that, based on performance data for the periods ended June 30, 2010: (1) the Portfolio outperformed its Morningstar category median for all periods presented; (2) the Portfolio outperformed its primary benchmark for the most recent calendar quarter and three-year period, but underperformed for the year-to-date and one-year periods; and (3) the Portfolio is ranked in the first (highest) quintile of its Morningstar category for the most recent calendar quarter and three-year periods, and the second quintile for the year-to-date and one-year periods.
In considering the fees payable under the Advisory and Sub-Advisory Contracts for the Portfolio, the Board took into account the factors described above and also considered: (1) the fairness of the compensation under an Advisory Contract with a breakpoint fee rate schedule where the asset level necessary to achieve a breakpoint discount had not been reached by the Portfolio; and (2) the pricing structure (including the expense ratio to be borne by shareholders) of the Portfolio, as compared to its Selected Peer Group, including that: (a) the management fee (inclusive of a 0.10% administration fee) for the Portfolio is above the median and the average management fees of the funds in its Selected Peer Group; and (b) the expense ratio for the Portfolio is above the median and the average expense ratios of the funds in its Selected Peer Group.
In analyzing this fee data, the Board took into consideration Management's representations regarding the competitiveness of the fees payable by the Portfolio.
After its deliberation, the Board reached the following conclusions: (1) the Portfolio's management fee rate is reasonable in the context of all factors considered by the Board; (2) the Portfolio's expense ratio is reasonable in the context of all factors considered by the Board; (3) the Portfolio's performance is reasonable in the context of all factors considered by the Board; and (4) the sub-advisory fee rate payable by the Adviser to the Sub-Adviser is reasonable in the context of all factors considered by the Board. Based on these conclusions and other factors, the Board voted to renew the Advisory and Sub-Advisory Contracts for the Portfolio for the year ending November 30, 2011. During this renewal process, different Board members may have given different weight to different individual factors and related conclusions.
ING Thornburg Value Portfolio
In considering whether to approve the renewal of the Advisory and Sub-Advisory Contracts for ING Thornburg Value Portfolio, the Board considered that, based on performance data for the periods ended June 30, 2010: (1) the Portfolio underperformed its Morningstar category median for all periods presented, with the exceptions of the three-year and five-year periods, during which it outperformed; (2) the Portfolio underperformed its primary benchmark for all periods presented, with the exceptions of the three-year and five-year periods, during which it outperformed; and (3) the Portfolio is ranked in the first (highest) quintile of its Morningstar category for the five-year period, the second quintile for the three-year period, the third quintile for the one-year period, the fourth quintile for the year-to-date period, and the fifth (lowest) quintile for the most recent calendar quarter and ten-year periods.
In analyzing this performance data, the Board took into account that: (1) in January 2010, there was a change to the Portfolio's portfolio management team; (2) the Board approved a change in the Portfolio's investment objective at its meeting in
226
ADVISORY CONTRACT APPROVAL DISCUSSION (UNAUDITED) (CONTINUED)
September 2010; and (3) that Management would continue to monitor, and the Board or its Investment Review Committee would periodically review, the Portfolio's performance.
In considering the fees payable under the Advisory and Sub-Advisory Contracts for the Portfolio, the Board took into account the factors described above and also considered: (1) the fairness of the compensation under an Advisory Contract with a level fee rate that does not include breakpoints; and (2) the pricing structure (including the expense ratio to be borne by shareholders) of the Portfolio, as compared to its Selected Peer Group, including that: (a) the management fee for the Portfolio is below the median and the average management fees of the funds in its Selected Peer Group; and (b) the expense ratio for the Portfolio is above the median and below the average expense ratios of the funds in its Selected Peer Group.
After its deliberation, the Board reached the following conclusions: (1) the Portfolio's management fee rate is reasonable in the context of all factors considered by the Board; (2) the Portfolio's expense ratio is reasonable in the context of all factors considered by the Board; (3) there was a change in the Portfolio's management team in January 2010 and the Portfolio's investment objetcive in September 20201, and it is reasonable to permit the Portfolio time to establish a longer performance record for the purposes of valuating investment performance; and (4) the sub-advisory fee rate payable by the Adviser to the Sub-Adviser is reasonable in the context of all factors considered by the Board. Based on these conclusions and other factors, the Board voted to renew the Advisory and Sub-Advisory Contracts for the Portfolio for the year ending November 30, 2011. During this renewal process, different Board members may have given different weight to different individual factors and related conclusions.
ING UBS U.S. Large Cap Equity Portfolio
In considering whether to approve the renewal of the Advisory and Sub-Advisory Contracts for ING UBS U.S. Large Cap Equity Portfolio, the Board considered that, based on performance data for the periods ended June 30, 2010: (1) the Portfolio underperformed its Morningstar category median for all periods presented, with the exception of the one-year period, during which it outperformed; (2) the Portfolio underperformed its primary benchmark for all periods presented; and (3) the Portfolio is ranked in the second quintile of its Morningstar category for the one-year period, the fourth quintile for the year-to-date and five-year periods, and the fifth (lowest) quintile for the most recent calendar quarter, three-year, and ten-year periods.
In analyzing this performance data, the Board took into account: (1) in October 2009, the Portfolio's portfolio management team was modified; (2) Management's analysis of the negative effect that sector allocation had on the Portfolio's performance; (3) Management's confidence in the Sub-Adviser's ability to execute the Portfolio's investment strategy; and (4) Management would continue to monitor, and the Board or its Investment Review Committee would periodically review, the Portfolio's performance.
In considering the fees payable under the Advisory and Sub-Advisory Contracts for the Portfolio, the Board took into account the factors described above and also considered: (1) the fairness of the compensation under an Advisory Contract with a breakpoint fee rate schedule where the asset level necessary to achieve a breakpoint discount had not been reached by the Portfolio; and (2) the pricing structure (including the expense ratio to be borne by shareholders) of the Portfolio, as compared to its Selected Peer Group, including that: (a) the management fee for the Portfolio is above the median and the average management fees of the funds in its Selected Peer Group; and (b) the expense ratio for the Portfolio is above the median and the average expense ratios of the funds in its Selected Peer Group.
In analyzing this fee data, the Board took into account that Management agreed to implement an expense limitation agreement with respect to each class of the Portfolio effectively lowering the Portfolio's expense ratio.
After its deliberation, the Board reached the following conclusions: (1) the Portfolio's management fee rate is reasonable in the context of all factors considered by the Board; (2) the Portfolio's expense ratio is reasonable in the context of all factors considered by the Board; (3) the Portfolio's portfolio management team was modified in October 2009 and it is reasonable to permit the Portfolio time to establish a longer performance record for the purposes of evaluating performance; and (4) the sub-advisory fee rate payable by the Adviser to the Sub-Adviser is reasonable in the context of all factors considered by the Board. Based on these conclusions and other factors, the Board voted to renew the Advisory and Sub-Advisory Contracts for the Portfolio for the year ending November 30, 2011. During this renewal process, different Board members may have given
227
ADVISORY CONTRACT APPROVAL DISCUSSION (UNAUDITED) (CONTINUED)
different weight to different individual factors and related conclusions.
ING Van Kampen Comstock Portfolio
In considering whether to approve the renewal of the Advisory and Sub-Advisory Contracts for ING Van Kampen Comstock Portfolio, the Board considered that, based on performance data for the periods ended June 30, 2010: (1) the Portfolio outperformed its Morningstar category median for all periods presented, with the exception of the five-year period, during which it underperformed; (2) the Portfolio outperformed its primary benchmark for the one-year and three-year periods, but underperformed for the most recent calendar quarter, year-to-date, and five-year periods; and (3) the Portfolio is ranked in the first (highest) quintile of its Morningstar category for the one-year period, the second quintile for the year-to-date and three-year periods, and the third quintile for the most recent calendar quarter and five-year periods.
In considering the fees payable under the Advisory and Sub-Advisory Contracts for the Portfolio, the Board took into account the factors described above and also considered: (1) the fairness of the compensation under an Advisory Contract with a level fee rate that does not include breakpoints; and (2) the pricing structure (including the expense ratio to be borne by shareholders) of the Portfolio, as compared to its Selected Peer Group, including that: (a) the management fee for the Portfolio is below the median and the average management fees of the funds in its Selected Peer Group; and (b) the expense ratio for the Portfolio is above the median and the average expense ratios of the funds in its Selected Peer Group.
In analyzing this fee data, the Board took into consideration Management's representations regarding the competitiveness of the Portfolio's expense ratio.
After its deliberation, the Board reached the following conclusions: (1) the Portfolio's management fee rate is reasonable in the context of all factors considered by the Board; (2) the Portfolio's expense ratio is reasonable in the context of all factors considered by the Board; (3) the Portfolio's performance is reasonable in the context of all factors considered by the Board; and (4) the sub-advisory fee rate payable by the Adviser to the Sub-Adviser is reasonable in the context of all factors considered by the Board. Based on these conclusions and other factors, the Board voted to renew the Advisory and Sub-Advisory Contracts for the Portfolio for the year ending November 30, 2011. During this renewal process, different Board members may have given different weight to different individual factors and related conclusions.
ING Van Kampen Equity and Income Portfolio
In considering whether to approve the renewal of the Advisory and Sub-Advisory Contracts for ING Van Kampen Equity and Income Portfolio, the Board considered that, based on performance data for the periods ended June 30, 2010: (1) the Portfolio outperformed its Morningstar category median for all periods presented, with the exception of the most recent calendar quarter and year-to-date periods, during which it underperformed; (2) the Portfolio outperformed its primary benchmark for all periods presented, with the exception of the one-year period, during which it underperformed; and (3) the Portfolio is ranked in the first (highest) quintile of its Morningstar category for the one-year period, the second quintile for the five-year period, the third quintile for the three-year period, and the fifth (lowest) quintile for the most recent calendar quarter and year-to-date periods.
In considering the fees payable under the Advisory and Sub-Advisory Contracts for the Portfolio, the Board took into account the factors described above and also considered: (1) the fairness of the compensation under an Advisory Contract with a level fee rate that does not include breakpoints; and (2) the pricing structure (including the expense ratio to be borne by shareholders) of the Portfolio, as compared to its Selected Peer Group, including that: (a) the management fee for the Portfolio is below the median and the average management fees of the funds in its Selected Peer Group; and (b) the expense ratio for the Portfolio is below the median and the average expense ratios of the funds in its Selected Peer Group.
After its deliberation, the Board reached the following conclusions: (1) the Portfolio's management fee rate is reasonable in the context of all factors considered by the Board; (2) the Portfolio's expense ratio is reasonable in the context of all factors considered by the Board; (3) the Portfolio's performance is reasonable in the context of all factors considered by the Board; and (4) the sub-advisory fee rate payable by the Adviser to the Sub-Adviser is reasonable in the context of all factors considered by the Board. Based on these conclusions and other factors, the Board voted to renew the Advisory and Sub-Advisory Contracts for the Portfolio for the year
228
ADVISORY CONTRACT APPROVAL DISCUSSION (UNAUDITED) (CONTINUED)
ending November 30, 2011. During this renewal process, different Board members may have given different weight to different individual factors and related conclusions.
229

Annual Report
December 31, 2010
Adviser Class ("Class ADV"), Service Class ("Class S") and Service 2 Class ("Class S2")
ING Partners, Inc.
n ING Fidelity® VIP Contrafund® Portfolio*
n ING Fidelity® VIP Equity-Income Portfolio*
n ING Fidelity® VIP Mid Cap Portfolio*
This report is submitted for general information to shareholders of the ING Funds. It is not authorized for distribution to prospective shareholders unless accompanied or preceded by a prospectus which includes details regarding the funds' investment objectives, risks, charges, expenses and other information. This information should be read carefully.
* Fidelity and Contrafund are registered trademarks of FMR Corp.
MUTUAL FUNDS

TABLE OF CONTENTS
| President's Letter | | | 1 | | |
|
| Market Perspective | | | 2 | | |
|
| Portfolio Managers' Report | | | 4 | | |
|
| Shareholder Expense Examples | | | 7 | | |
|
| Report of Independent Registered Public Accounting Firm | | | 8 | | |
|
| Statements of Assets and Liabilities | | | 9 | | |
|
| Statements of Operations | | | 10 | | |
|
| Statements of Changes in Net Assets | | | 11 | | |
|
| Financial Highlights | | | 13 | | |
|
| Notes to Financial Statements | | | 15 | | |
|
| Portfolios of Investments | | | 21 | | |
|
| Tax Information | | | 24 | | |
|
| Director and Officer Information | | | 25 | | |
|
| Advisory Contract Approval Discussion | | | 29 | | |
|
PROXY VOTING INFORMATION
A description of the policies and procedures that the Portfolios use to determine how to vote proxies related to portfolio securities is available: (1) without charge, upon request, by calling Shareholder Services toll-free at (800) 992-0180; (2) on the ING Funds' website at www.ingfunds.com; and (3) on the U.S. Securities and Exchange Commission's ("SEC") website at www.sec.gov. Information regarding how the Portfolios voted proxies related to portfolio securities during the most recent 12-month period ended June 30 is available without charge on the ING Funds' website at www.ingfunds.com and on the SEC's website at www.sec.gov.
QUARTERLY PORTFOLIO HOLDINGS
The Portfolios file their complete schedule of portfolio holdings with the SEC for the first and third quarters of each fiscal year on Form N-Q. The Portfolio's Forms N-Q are available on the SEC's website at www.sec.gov. The Portfolio's Forms N-Q may be reviewed and copied at the SEC's Public Reference Room in Washington, DC, and information on the operation of the Public Reference Room may be obtained by calling (800) SEC-0330; and is available upon request from the Portfolio by calling Shareholder Services toll-free at (800) 992-0180.
PRESIDENT'S LETTER

Big Picture vs. Details
Dear Shareholder,
On January 25, 2011, President Obama delivered his second State of the Union address. He called on Americans to put aside partisan differences and harness the nation's creativity to adapt and thrive in a rapidly changing global economy. The president's challenge is timely: the United States is approaching a nexus of intermediate- and long-term concerns, and the choices we make over the next two years could determine the nation's competitiveness in the global economy for decades to come.
There are reasons to be optimistic — the International Monetary Fund ("IMF") predicts the U.S. economy will grow about 3% in 2011. China and India are expected to grow at about 9% and even the euro zone appears to be recovering from crisis; this growth, however, is being accompanied by mounting inflation pressures in certain regions, suggesting that many economies are expanding at unsustainable rates.
As I write this, the World Economic Forum is getting underway in Davos, Switzerland, and there are numerous concerns to deal with. Chief among them are the still-present risk of sovereign debt defaults in the euro zone; high unemployment and banking problems in the advanced economies; and inflationary pressures in emerging markets, especially with regard to food, fuel and commodities.
As we've noted before, uncertainty is a defining characteristic of our age and, in our opinion, is likely to remain so beyond this year. How should you respond within your investment portfolio? Remember that the most important consideration is your long-term goals, not the outlook for 2011. With investment hazards and opportunities everywhere, we believe it makes sense to cast as broad a net as possible around the globe. In our opinion, you want your portfolio to be well diversified so that it is not harmed too much by the trouble spots, and has some exposure to positive trends.
As always, we believe the best approach is a well-diversified portfolio and a well-defined investment plan. As we've noted many times before, it's important to discuss any proposed changes thoroughly with your advisor before taking any action. Thank you for your continued confidence in ING Funds. We look forward to serving your investment needs in the future.
Sincerely,

Shaun Mathews
President and Chief Executive Officer
ING Funds
January 26, 2011
The views expressed in the President's Letter reflect those of the President as of the date of the letter. Any such views are subject to change at any time based upon market or other conditions and ING Funds disclaim any responsibility to update such views. These views may not be relied on as investment advice and because investment decisions for an ING Fund are based on numerous factors, may not be relied on as an indication of investment intent on behalf of any ING Fund. Reference to specific company securities should not be construed as recommendations or investment advice. Consider the fund's investment objectives, risks, and charges and expenses carefully before investing. The prospectus contains this information and other information about the fund.
International investing poses special risks including currency fluctuation, economic and political risks not found in investments that are solely domestic.
1
MARKET PERSPECTIVE: YEAR ENDED DECEMBER 31, 2010
In our semi-annual report we described how, after a 13-month advance through mid-April, a confluence of local and world issues sent global equities, in the form of the MSCI World IndexSM measured in local currencies, including net reinvested dividends ("MSCI" for regions discussed below), reeling to a loss for the first half of the fiscal year. In the second half of the year, the MSCI World IndexSM bounced back and for 2010 returned 10.01%. (The MSCI World IndexSM returned 11.76% for the one year ended December 31, 2010, measured in U.S. dollars.) By year end, investor sentiment had turned distinctly positive, despite the grave concerns that remained.
It was a bumpy ride. Markets from stocks to bonds to currencies were continually buffeted by news and events relating to three main themes: the stuttering U.S. economic recovery, the sovereign debt crisis in the Eurozone and growth dynamics in China.
In the U.S., quarterly gross domestic product ("GDP") growth decelerated from 2.7% (annualized) in the first quarter of 2010 to 1.7% in the second, before recovering to 2.6% in the third. But attention was focused more on employment and housing. The 18-month recession which ended in June of 2009 had cost some 8.7 million jobs. But since then, the unemployment rate had been stuck between 9.4% and 10.1%, barely dented by private sector new jobs averaging 107,000 per month as 2010 ended.
The other weakening link was housing. Sales of new and existing homes collapsed after the expiry in April of a program of tax credits for home buyers and languished thereafter. House prices (based on the S&P/Case-Shiller 20-City Composite Home Price Index), having shown annual increases from February, resumed a downward trend in October with the index still 30% below the peak recorded in April 2006.
To be sure, there were some grounds for optimism as 2010 drew to a close. Consumer spending had risen for five straight months. Investment in equipment and software was growing at double-digit annual percentage rates. On December 30, new unemployment claims were reported below 400,000 for the first time since July 2008. The Federal Reserve in November announced a second round of quantitative easing and would buy $600 billion in Treasury notes and bonds. The mixed mid-term election results forced a "compromise" stimulus package worth an estimated $858 billion for 2011. In combination, these two measures increased the attractiveness of riskier asset classes like equities at the expense of high grade bonds, which sold off.
In the Eurozone, after default was narrowly averted on Greece's maturing bonds, the creation in May of a European Financial Stabilization "mechanism", funded with up to €750 billion seemed to calm nerves for a while. But in October, attention turned to Ireland, where the Irish government had injected huge sums into local banks, rendering its own fiscal position untenable. The November 29, 2010 European Union/International Monetary Fund bail-out worth €67.5 billion left markets unimpressed. Suddenly it was May again with downgrades, soaring yields on peripheral Eurozone bonds, fears of contagion, falling stock markets and doubts about the viability of the euro itself. The European Central Bank aggressively bought sovereign bonds and the mood settled. But with Spain's banks needing to refinance €85 billion of debt in 2011, the issue remains unresolved.
Investors watched nervously as China, the source of much of the world's growth, wrestled with inflation, which reached 5.1% in November, and a housing bubble. The authorities tightened mortgage requirements, raised banks' reserve ratio requirements six times in 2010 and interest rates twice in the last quarter. More interest rate increases seem inevitable.
In U.S. fixed income markets, the Barclays Capital U.S. Aggregate Bond Index of investment grade bonds returned 6.54% in 2010. A slight balance towards risk aversion in the first half gave way to improved risk appetite in the second. For the whole year, the Barclays Capital U.S. Treasury index returned 5.87%, underperforming the Barclays Capital Corporate Investment Grade Bond Index with a return of 9.00%, but both fell well short of the Barclays Capital High Yield Bond — 2% Issuer Constrained Composite Index which gained 14.94% for the one year period.
U.S. equities, represented by the S&P 500® Index including dividends, rose 15.06% in 2010, including its best September, a return of 8.92%, since 1939 and best December, a return of 6.68%, since 1991. Prices were supported by strong earnings reports, with operating earnings per share for S&P 500® companies recording four straight quarters of annual growth. Equities also benefited from improved risk appetite through the quantitative easing initiative and stimulus package referred to above.
In currencies, the worst of the gloom about the Eurozone in early June was replaced by renewed pessimism about the dollar in a stalling economy, before markets were seized by another bout of Eurozone angst. For the year, the dollar gained 8.15% against the euro and 2.95% against the pound, but lost 11.59% to the yen, which was sold in the market by the Bank of Japan after breaching 15-year high levels.
In international markets, the MSCI Japan® Index returned just 0.57% for the year after a strong last quarter, as quarterly GDP growth bounced back to 1.1% and the yen retreated from multi-year peaks. The tone of the market was generally poor with household spending fragile and consumer prices down for 21 months. The MSCI Europe ex UK® Index returned 4.84%, with Germany up 15.97% and Portugal, Italy, Ireland, Greece and Spain all falling. This broadly reflected the two-tier economy that has developed, with economic statistics favoring more soundly based countries at the expense of the peripherals. The MSCI UK® Index advanced 12.18%, despite the prospect of severe public spending cuts intended to eliminate an 11% budget deficit. Supporting sentiment was resilient, if perhaps temporary, quarterly GDP growth averaging 0.9% in the second half of the year.
Parentheses denote a negative number.
Past performance does not guarantee future results. The performance quoted represents past performance. Investment return and principal value of an investment will fluctuate, and shares, when redeemed, may be worth more or less than their original cost. The Portfolios' performance is subject to change since the period's end and may be lower of higher than the performance data shown. Please call (800) 262-3862 or log on to www.ingfunds.com to obtain performance data current to the most recent month end.
Market Perspective reflects the views of ING's Chief Investment Risk Officer only through the end of the period, and is subject to change based on market and other conditions.
2
BENCHMARK DESCRIPTIONS
| Index | | Description | |
| MSCI World IndexSM | | An unmanaged index that measures the performance of over 1,400 securities listed on exchanges in the U.S., Europe, Canada, Australia, New Zealand and the Far East. | |
|
| S&P/Case-Shiller 20-City Composite Home Price Index | | A composite index of the home price index for the top 20 Metropolitan Statistical Areas in the United States. The index is published monthly by Standard & Poor's. | |
|
| Barclays Capital U.S. Aggregate Bond Index | | An unmanaged index of publicly issued investment grade U.S. Government, mortgage-backed, asset-backed and corporate debt securities. | |
|
| Barclays Capital U.S. Treasury Index | | An unmanaged index that includes public obligations of the U.S. Treasury. Treasury bills, certain special issues, such as state and local government series bonds (SLGs), as well as U.S. Treasury TIPS and STRIPS, are excluded. | |
|
| Barclays Capital Corporate Investment Grade Bond Index | | The corporate component of the Barclays Capital U.S. Credit Index. The U.S. Credit Index includes publicly-issued U.S. corporate and specified foreign debentures and secured notes that meet the specified maturity, liquidity, and quality requirements. The index includes both corporate and non-corporate sectors. The corporate sectors are industrial, utility and finance, which includes both U.S. and non-U.S. corporations. | |
|
| Barclays Capital High Yield Bond — 2% Issuer Constrained Composite Index | | An unmanaged index that includes all fixed income securities having a maximum quality rating of Ba1, a minimum amount outstanding of $150 million, and at least one year to maturity. | |
|
| S&P 500® Index | | An unmanaged index that measures the performance of securities of approximately 500 large-capitalization companies whose securities are traded on major U.S. stock markets. | |
|
| MSCI Japan® Index | | A free float-adjusted market capitalization index that is designed to measure developed market equity performance in Japan. | |
|
| MSCI Europe ex UK® Index | | A free float-adjusted market capitalization index that is designed to measure developed market equity performance in Europe, excluding the UK. | |
|
| MSCI UK® Index | | A free float-adjusted market capitalization index that is designed to measure developed market equity performance in the UK. | |
|
| Russell 3000® Value Index | | A market capitalization-weighted index of stocks of the 3,000 largest U.S. domiciled companies that exhibit value oriented companies. | |
|
| S&P MidCap 400 Index | | An unmanaged index that measures the performance of the mid-size company segment of the U.S. market. | |
|
3
ING FIDELITY® VIP CONTRAFUND® PORTFOLIO
PORTFOLIO MANAGERS' REPORT
ING Fidelity® VIP Contrafund® Portfolio (the "Portfolio") seeks long-term capital appreciation by investing all of its assets in the Service Class 2 shares of the Fidelity® VIP Contrafund® Portfolio, a series of Fidelity Variable Insurance Products Fund II, a registered open-end investment company. Please refer to Management's Discussion of Fund Performance on page 4 of the included Fidelity® Variable Insurance Products: Contrafund® Portfolio Annual Report.
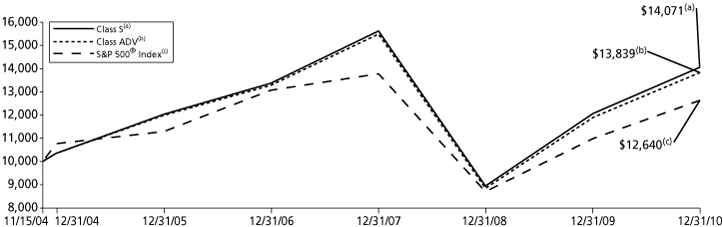
| Average Annual Total Returns for the Periods Ended December 31, 2010 | |
| | | 1 Year | | 5 Year | | Since Inception
of Classes S and ADV
November 15, 2004 | | Since Inception
of Class S2
May 28, 2009 | |
| Class S | | | 16.63 | % | | | 3.18 | % | | | 5.73 | % | | | — | | |
| Class ADV | | | 16.29 | % | | | 2.91 | % | | | 5.44 | % | | | — | | |
| Class S2 | | | 16.32 | % | | | — | | | | — | | | | 26.87 | % | |
| S&P 500® Index | | | 15.06 | % | | | 2.29 | % | | | 3.87 | %(1) | | | 24.42 | %(2) | |
Based on a $10,000 initial investment, the graph and table above illustrate the total return of ING Fidelity® VIP Contrafund® Portfolio against the index indicated. An index is unmanaged, has no cash in its portfolio, imposes no sales charges and incurs no operating expenses. An investor cannot invest directly in the index. The Portfolio's performance is shown without the imposition of any expenses or charges which are, or may be, imposed under your annuity contract. Total returns would have been lower if such expenses or charges were included.
The performance graph and table do not reflect the deduction of taxes that a shareholder will pay on Portfolio distributions or the redemption of Portfolio Shares.
The performance shown may include the effect of fee waivers and/or expense reimbursements by the Investment Adviser and/or other service providers, which have the effect of increasing total return. Had all fees and expenses been considered, the total returns would have been lower.
The performance update illustrates performance for a variable investment option available through a variable annuity contract. The performance shown indicates past performance and is not a projection or prediction of future results. Actual investment returns and principal value will fluctuate so that shares and/or units, at redemption, may be worth more or less than their original cost. Please call (800) 262-3862 to get performance through the most recent month end.
It is important to note that the Portfolio has a limited operating history. Performance over a longer period of time may be more meaningful than short-term performance.
(1) Since inception performance of the index is shown from November 1, 2004.
(2) Since inception performance of the index is shown from June 1, 2009.
This report contains statements that may be "forward-looking" statements. Actual results may differ materially from those projected in the "forward-looking" statements.
The views expressed in this report reflect those of the portfolio managers, only through the end of the period as stated on the cover. The portfolio managers' views are subject to change at any time based on market and other conditions.
4
PORTFOLIO MANAGERS' REPORT
ING FIDELITY® VIP EQUITY-INCOME PORTFOLIO
ING Fidelity® VIP Equity-Income Portfolio (the "Portfolio") seeks reasonable income by investing all of its assets in the Service Class 2 shares of the Fidelity® VIP Equity-Income Portfolio, a series of Fidelity Variable Insurance Products Fund, a registered open-end investment company. Please refer to Management's Discussion of Fund Performance on page 4 of the included Fidelity® Variable Insurance Products: Equity-Income Portfolio Annual Report.

| Average Annual Total Returns for the Periods Ended December 31, 2010 | |
| | | 1 Year | | 5 Year | | Since Inception
of Classes S and ADV
November 15, 2004 | | Since Inception
of Class S2
May 28, 2009 | |
| Class S | | | 14.68 | % | | | 0.43 | % | | | 1.67 | % | | | — | | |
| Class ADV | | | 14.21 | % | | | 0.15 | % | | | 1.35 | % | | | — | | |
| Class S2 | | | 14.46 | % | | | — | | | | — | | | | 25.02 | % | |
| Russell 3000® Value Index | | | 16.23 | % | | | 1.45 | % | | | 3.68 | %(1) | | | 25.11 | %(2) | |
Based on a $10,000 initial investment, the graph and table above illustrate the total return of ING Fidelity® VIP Equity-Income Portfolio against the index indicated. An index is unmanaged, has no cash in its portfolio, imposes no sales charges and incurs no operating expenses. An investor cannot invest directly in the index. The Portfolio's performance is shown without the imposition of any expenses or charges which are, or may be, imposed under your annuity contract. Total returns would have been lower if such expenses or charges were included.
The performance graph and table do not reflect the deduction of taxes that a shareholder will pay on Portfolio distributions or the redemption of Portfolio Shares.
The performance shown may include the effect of fee waivers and/or expense reimbursements by the Investment Adviser and/or other service providers, which have the effect of increasing total return. Had all fees and expenses been considered, the total returns would have been lower.
The performance update illustrates performance for a variable investment option available through a variable annuity contract. The performance shown indicates past performance and is not a projection or prediction of future results. Actual investment returns and principal value will fluctuate so that shares and/or units, at redemption, may be worth more or less than their original cost. Please call (800) 262-3862 to get performance through the most recent month end.
It is important to note that the Portfolio has a limited operating history. Performance over a longer period of time may be more meaningful than short-term performance.
(1) Since inception performance of the index is shown from November 1, 2004.
(2) Since inception performance of the index is shown from June 1, 2009.
This report contains statements that may be "forward-looking" statements. Actual results may differ materially from those projected in the "forward-looking" statements.
The views expressed in this report reflect those of the portfolio managers, only through the end of the period as stated on the cover. The portfolio managers' views are subject to change at any time based on market and other conditions.
5
ING FIDELITY® VIP MID CAP PORTFOLIO
PORTFOLIO MANAGERS' REPORT
ING Fidelity® VIP Mid Cap Portfolio (the "Portfolio") seeks long-term growth of capital by investing all of its assets in the Service Class 2 shares of the Fidelity® VIP Mid Cap Portfolio, a series of Fidelity Variable Insurance Products Fund III, a registered open-end investment company. Please refer to Management's Discussion of Fund Performance on page 4 of the included Fidelity® Variable Insurance Products: Mid Cap Portfolio Annual Report.

| Average Annual Total Returns for the Periods Ended December 31, 2010 | |
| | | 1 Year | | 5 Year | | Since Inception
of Classes S and ADV
November 15, 2004 | | Since Inception
of Class S2
May 28, 2009 | |
| Class S | | | 28.16 | % | | | 6.75 | % | | | 9.27 | % | | | — | | |
| Class ADV | | | 27.88 | % | | | 6.46 | % | | | 8.99 | % | | | — | | |
| Class S2 | | | 28.02 | % | | | — | | | | — | | | | 33.09 | % | |
| S&P MidCap 400® Index | | | 26.64 | % | | | 5.74 | % | | | 8.38 | %(1) | | | 35.30 | %(2) | |
Based on a $10,000 initial investment, the graph and table above illustrate the total return of ING Fidelity® VIP Mid Cap Portfolio against the index indicated. An index is unmanaged, has no cash in its portfolio, imposes no sales charges and incurs no operating expenses. An investor cannot invest directly in the index. The Portfolio's performance is shown without the imposition of any expenses or charges which are, or may be, imposed under your annuity contract. Total returns would have been lower if such expenses or charges were included.
The performance graph and table do not reflect the deduction of taxes that a shareholder will pay on Portfolio distributions or the redemption of Portfolio Shares.
The performance shown may include the effect of fee waivers and/or expense reimbursements by the Investment Adviser and/or other service providers, which have the effect of increasing total return. Had all fees and expenses been considered, the total returns would have been lower.
The performance update illustrates performance for a variable investment option available through a variable annuity contract. The performance shown indicates past performance and is not a projection or prediction of future results. Actual investment returns and principal value will fluctuate so that shares and/or units, at redemption, may be worth more or less than their original cost. Please call (800) 262-3862 to get performance through the most recent month end.
It is important to note that the Portfolio has a limited operating history. Performance over a longer period of time may be more meaningful than short-term performance.
(1) Since inception performance of the index is shown from November 1, 2004.
(2) Since inception performance of the index is shown from June 1, 2009.
This report contains statements that may be "forward-looking" statements. Actual results may differ materially from those projected in the "forward-looking" statements.
The views expressed in this report reflect those of the portfolio managers, only through the end of the period as stated on the cover. The portfolio managers' views are subject to change at any time based on market and other conditions.
6
SHAREHOLDER EXPENSE EXAMPLES (UNAUDITED)
As a shareholder of a Portfolio, you incur two types of costs: (1) transaction costs, including redemption fees and exchange fees; and (2) ongoing costs, including management fees, distribution and/or service (12b-1) fees, and other Portfolio expenses. These Examples are intended to help you understand your ongoing costs (in dollars) of investing in a Portfolio and to compare these costs with the ongoing costs of investing in other mutual funds.
The Examples are based on an investment of $1,000 invested at the beginning of the period and held for the entire period from July 1, 2010 to December 31, 2010, unless otherwise indicated. The Portfolios' expenses are shown without the imposition of any charges which are, or may be, imposed under your variable annuity contract, variable life insurance policy, qualified pension or retirement plan. Expenses would have been higher if such charges were included.
Actual Expenses
The left section of the table shown below, "Actual Portfolio Return," provides information about actual account values and actual expenses. You may use the information in this section, together with the amount you invested, to estimate the expenses that you paid over the period. Simply divide your account value by $1,000 (for example, an $8,600 account value divided by $1,000 = 8.6), then multiply the result by the number in the first section under the heading entitled "Expenses Paid During the Period" to estimate the expenses you paid on your account during this period.
Hypothetical Example for Comparison Purposes
The right section of the table shown below, "Hypothetical (5% return before expenses)," provides information about hypothetical account values and hypothetical expenses based on a Portfolio's actual expense ratio and an assumed rate of return of 5% per year before expenses, which is not a Portfolio's actual return. The hypothetical account values and expenses may not be used to estimate the actual ending account balance or expenses you paid for the period. You may use this information to compare the ongoing costs of investing in a Portfolio and other mutual funds. To do so, compare this 5% hypothetical example with the 5% hypothetical examples that appear in the shareholder reports of the other mutual funds.
Please note that the expenses shown in the table are meant to highlight your ongoing costs only and do not reflect any transactional costs, such as redemption fees or exchange fees. Therefore, the hypothetical lines of the table are useful in comparing ongoing costs only, and will not help you determine the relative total costs of owning different funds. In addition, if these transactional costs were included, your costs would have been higher.
| | | Actual Portfolio Return | | Hypothetical (5% return before expenses) | |
ING Fidelity® VIP Contrafund®
Portfolio | | Beginning
Account
Value
July 1,
2010 | | Ending
Account
Value
December 31,
2010 | | Annualized
Expense
Ratio | | Expenses Paid
During the
Period Ended
December 31,
2010* | | Beginning
Account
Value
July 1,
2010 | | Ending
Account
Value
December 31,
2010 | | Annualized
Expense
Ratio | | Expenses Paid
During the
Period Ended
December 31,
2010* | |
| Class ADV | | $ | 1,000.00 | | | $ | 1,250.20 | | | | 1.44 | % | | $ | 8.17 | | | $ | 1,000.00 | | | $ | 1,017.95 | | | | 1.44 | % | | $ | 7.32 | | |
| Class S | | | 1,000.00 | | | | 1,251.80 | | | | 1.19 | | | | 6.75 | | | | 1,000.00 | | | | 1,019.21 | | | | 1.19 | | | | 6.06 | | |
| Class S2 | | | 1,000.00 | | | | 1,251.10 | | | | 1.34 | | | | 7.60 | | | | 1,000.00 | | | | 1,018.45 | | | | 1.34 | | | | 6.82 | | |
| ING Fidelity® VIP Equity-Income Portfolio | |
| Class ADV | | $ | 1,000.00 | | | $ | 1,235.40 | | | | 1.35 | % | | $ | 7.61 | | | $ | 1,000.00 | | | $ | 1,018.40 | | | | 1.35 | % | | $ | 6.87 | | |
| Class S | | | 1,000.00 | | | | 1,238.20 | | | | 1.10 | | | | 6.21 | | | | 1,000.00 | | | | 1,019.66 | | | | 1.10 | | | | 5.60 | | |
| Class S2 | | | 1,000.00 | | | | 1,236.90 | | | | 1.25 | | | | 7.05 | | | | 1,000.00 | | | | 1,018.90 | | | | 1.25 | | | | 6.36 | | |
| ING Fidelity® VIP Mid Cap Portfolio | |
| Class ADV | | $ | 1,000.00 | | | $ | 1,265.20 | | | | 1.45 | % | | $ | 8.28 | | | $ | 1,000.00 | | | $ | 1,017.90 | | | | 1.45 | % | | $ | 7.37 | | |
| Class S | | | 1,000.00 | | | | 1,266.90 | | | | 1.20 | | | | 6.86 | | | | 1,000.00 | | | | 1,019.16 | | | | 1.20 | | | | 6.11 | | |
| Class S2 | | | 1,000.00 | | | | 1,265.30 | | | | 1.35 | | | | 7.71 | | | | 1,000.00 | | | | 1,018.40 | | | | 1.35 | | | | 6.87 | | |
* Expenses are equal to each Portfolio's respective annualized expense ratios, including the expenses of the master fund, multiplied by the average account value over the period, multiplied by 184/365 to reflect the most recent fiscal half-year.
7
REPORT OF INDEPENDENT REGISTERED PUBLIC ACCOUNTING FIRM
The Shareholders and Board of Directors
ING Partners, Inc.
We have audited the accompanying statements of assets and liabilities, including the portfolios of investments, of ING Fidelity® VIP Contrafund® Portfolio, ING Fidelity® VIP Equity-Income Portfolio, and ING Fidelity® VIP Mid Cap Portfolio, each a series of ING Partners, Inc., as of December 31, 2010, and the related statements of operations for the year then ended, the statements of changes in net assets for each of the years in the two-year period then ended, and the financial highlights for each of the years or periods in the five-year period then ended. These financial statements and financial highlights are the responsibility of management. Our responsibility is to express an opinion on these financial statements and financial highlights based on our audits.
We conducted our audits in accordance with the standards of the Public Company Accounting Oversight Board (United States). Those standards require that we plan and perform the audit to obtain reasonable assurance about whether the financial statements and financial highlights are free of material misstatement. An audit includes examining, on a test basis, evidence supporting the amounts and disclosures in the financial statements. Our procedures included confirmation of securities owned as of December 31, 2010, by correspondence with the transfer agent of the master funds. An audit also includes assessing the accounting principles used and significant estimates made by management, as well as evaluating the overall financial statement presentation. We believe that our audits provide a reasonable basis for our opinion.
In our opinion, the financial statements and financial highlights referred to above present fairly, in all material respects, the financial position of the aforementioned portfolios as of December 31, 2010, and the results of their operations, the changes in their net assets, and the financial highlights for the periods specified in the first paragraph above, in conformity with U.S. generally accepted accounting principles.

Boston, Massachusetts
February 24, 2011
8
STATEMENTS OF ASSETS AND LIABILITIES AS OF DECEMBER 31, 2010
| | | ING
Fidelity® VIP
Contrafund®
Portfolio | | ING
Fidelity® VIP
Equity-Income
Portfolio | | ING
Fidelity® VIP
Mid Cap
Portfolio | |
| ASSETS: | |
| Investments in master fund(1) at value* | | $ | 359,033,660 | | | $ | 24,461,899 | | | $ | 75,483,257 | | |
| Cash | | | 99,076 | | | | 975 | | | | 264 | | |
| Receivables: | |
| Investments in master fund sold | | | 3,650,773 | | | | 891,934 | | | | 739,977 | | |
| Fund shares sold | | | 1,988 | | | | 154 | | | | 1,183 | | |
| Total assets | | | 362,785,497 | | | | 25,354,962 | | | | 76,224,681 | | |
| LIABILITIES: | |
| Payable for investments in master fund purchased | | | — | | | | — | | | | 1,183 | | |
| Payable for fund shares redeemed | | | 3,652,761 | | | | 892,088 | | | | 739,977 | | |
| Payable to affiliates | | | 92,044 | | | | 6,674 | | | | 20,139 | | |
| Total liabilities | | | 3,744,805 | | | | 898,762 | | | | 761,299 | | |
| NET ASSETS | | $ | 359,040,692 | | | $ | 24,456,200 | | | $ | 75,463,382 | | |
| NET ASSETS WERE COMPRISED OF: | |
| Paid-in capital | | $ | 480,664,122 | | | $ | 42,662,980 | | | $ | 78,667,493 | | |
| Undistributed net investment income | | | 2,542,563 | | | | 305,814 | | | | 96,074 | | |
| Accumulated net realized loss on master fund | | | (115,920,661 | ) | | | (20,303,685 | ) | | | (11,042,741 | ) | |
| Net unrealized appreciation or depreciation on master fund | | | (8,245,332 | ) | | | 1,791,091 | | | | 7,742,556 | | |
| NET ASSETS | | $ | 359,040,692 | | | $ | 24,456,200 | | | $ | 75,463,382 | | |
| * Cost of investments in master fund | | $ | 367,278,992 | | | $ | 22,670,808 | | | $ | 67,740,701 | | |
| Class ADV: | |
| Net Assets | | $ | 4,023,730 | | | $ | 472,983 | | | $ | 3,452,859 | | |
| Shares authorized | | | 100,000,000 | | | | 100,000,000 | | | | 100,000,000 | | |
| Par value | | $ | 0.001 | | | $ | 0.001 | | | $ | 0.001 | | |
| Shares outstanding | | | 427,197 | | | | 55,832 | | | | 263,495 | | |
| Net asset value and redemption price per share | | $ | 9.42 | | | $ | 8.47 | | | $ | 13.10 | | |
| Class S: | |
| Net Assets | | $ | 355,012,783 | | | $ | 23,979,155 | | | $ | 72,006,596 | | |
| Shares authorized | | | 100,000,000 | | | | 100,000,000 | | | | 100,000,000 | | |
| Par value | | $ | 0.001 | | | $ | 0.001 | | | $ | 0.001 | | |
| Shares outstanding | | | 37,502,384 | | | | 2,808,893 | | | | 5,442,521 | | |
| Net asset value and redemption price per share | | $ | 9.47 | | | $ | 8.54 | | | $ | 13.23 | | |
| Class S2: | |
| Net Assets | | $ | 4,179 | | | $ | 4,062 | | | $ | 3,927 | | |
| Shares authorized | | | 100,000,000 | | | | 100,000,000 | | | | 100,000,000 | | |
| Par value | | $ | 0.001 | | | $ | 0.001 | | | $ | 0.001 | | |
| Shares outstanding | | | 448 | | | | 483 | | | | 302 | | |
| Net asset value and redemption price per share | | $ | 9.33 | | | $ | 8.41 | | | $ | 13.02 | | |
(1) The master funds for the ING Fidelity® VIP Contrafund®, ING Fidelity® VIP Equity-Income and ING Fidelity® VIP Mid Cap Portfolios are the Fidelity® VIP Contrafund®, Fidelity® VIP Equity-Income and Fidelity® VIP Mid Cap Portfolios, respectively. These financial statements should be read in conjunction with the master Fidelity funds' financial statements.
See Accompanying Notes to Financial Statements
9
STATEMENTS OF OPERATIONS FOR THE YEAR ENDED DECEMBER 31, 2010
| | | ING
Fidelity® VIP
Contrafund®
Portfolio | | ING
Fidelity® VIP
Equity-Income
Portfolio | | ING
Fidelity® VIP
Mid Cap
Portfolio | |
| INVESTMENT INCOME: | |
| Dividends from master fund(1) | | $ | 3,387,281 | | | $ | 397,095 | | | $ | 82,738 | | |
| Total investment income | | | 3,387,281 | | | | 397,095 | | | | 82,738 | | |
| EXPENSES: | |
| Distribution and service fees: | |
| Class ADV | | | 19,524 | | | | 2,448 | | | | 13,666 | | |
| Class S | | | 812,404 | | | | 73,705 | | | | 164,530 | | |
| Class S2 | | | 20 | | | | 18 | | | | 16 | | |
| Administrative service fees | | | 164,439 | | | | 14,990 | | | | 34,277 | | |
| Total expenses | | | 996,387 | | | | 91,161 | | | | 212,489 | | |
| Net waived and reimbursed fees | | | (4 | ) | | | (4 | ) | | | (4 | ) | |
| Net expenses | | | 996,383 | | | | 91,157 | | | | 212,485 | | |
| Net investment income (loss) | | | 2,390,898 | | | | 305,938 | | | | (129,747 | ) | |
| REALIZED AND UNREALIZED GAIN (LOSS): | |
| Net realized gain (loss) on: | |
| Sale of master fund | | | (55,974,168 | ) | | | (8,396,056 | ) | | | (3,026,054 | ) | |
| Capital gain distributions from master fund | | | 153,584 | | | | — | | | | 226,101 | | |
| Net realized loss | | | (55,820,584 | ) | | | (8,396,056 | ) | | | (2,799,953 | ) | |
| Net change in unrealized appreciation or depreciation | | | 106,791,767 | | | | 11,852,949 | | | | 20,142,578 | | |
| Net realized and unrealized gain | | | 50,971,183 | | | | 3,456,893 | | | | 17,342,625 | | |
| Increase in net assets resulting from operations | | $ | 53,362,081 | | | $ | 3,762,831 | | | $ | 17,212,878 | | |
(1) The master funds for the ING Fidelity® VIP Contrafund®, ING Fidelity® VIP Equity-Income and ING Fidelity® VIP Mid Cap Portfolios are the Fidelity® VIP Contrafund®, Fidelity® VIP Equity-Income and Fidelity® VIP Mid Cap Portfolios, respectively. These financial statements should be read in conjunction with the master Fidelity funds' financial statements.
See Accompanying Notes to Financial Statements
10
STATEMENTS OF CHANGES IN NET ASSETS
| | | ING Fidelity® VIP
Contrafund® Portfolio | | ING Fidelity® VIP
Equity-Income Portfolio | |
| | | Year
Ended
December 31,
2010 | | Year
Ended
December 31,
2009 | | Year
Ended
December 31,
2010 | | Year
Ended
December 31,
2009 | |
| FROM OPERATIONS: | |
| Net investment income | | $ | 2,390,898 | | | $ | 2,782,270 | | | $ | 305,938 | | | $ | 534,554 | | |
| Net realized loss | | | (55,820,584 | ) | | | (42,896,633 | ) | | | (8,396,056 | ) | | | (8,632,445 | ) | |
| Net change in unrealized appreciation or depreciation | | | 106,791,767 | | | | 147,488,731 | | | | 11,852,949 | | | | 17,236,054 | | |
| Increase in net assets resulting from operations | | | 53,362,081 | | | | 107,374,368 | | | | 3,762,831 | | | | 9,138,163 | | |
| FROM DISTRIBUTIONS TO SHAREHOLDERS: | |
| Net investment income: | |
| Class ADV | | | (26,135 | ) | | | (8,410 | ) | | | (8,551 | ) | | | (10,736 | ) | |
| Class S | | | (2,831,482 | ) | | | (2,522,807 | ) | | | (513,963 | ) | | | (979,518 | ) | |
| Class S2 | | | (39 | ) | | | (32 | ) | | | (72 | ) | | | (106 | ) | |
| Net realized gains: | |
| Class ADV | | | — | | | | (112,930 | ) | | | — | | | | (327 | ) | |
| Class S | | | — | | | | (10,037,131 | ) | | | — | | | | (25,000 | ) | |
| Class S2 | | | — | | | | (91 | ) | | | — | | | | (2 | ) | |
| Total distributions | | | (2,857,656 | ) | | | (12,681,401 | ) | | | (522,586 | ) | | | (1,015,689 | ) | |
| FROM CAPITAL SHARE TRANSACTIONS: | |
| Net proceeds from sale of shares | | | 15,683,612 | | | | 35,464,616 | | | | 2,141,736 | | | | 4,022,810 | | |
| Proceeds from shares issued in merger (Note 8) | | | 17,716,925 | | | | — | | | | — | | | | — | | |
| Reinvestment of distributions | | | 2,857,617 | | | | 12,681,278 | | | | 522,514 | | | | 1,015,581 | | |
| | | | 36,258,154 | | | | 48,145,894 | | | | 2,664,250 | | | | 5,038,391 | | |
| Cost of shares redeemed | | | (103,256,389 | ) | | | (61,371,221 | ) | | | (16,006,300 | ) | | | (11,761,236 | ) | |
Net decrease in net assets resulting from capital
share transactions | | | (66,998,235 | ) | | | (13,225,327 | ) | | | (13,342,050 | ) | | | (6,722,845 | ) | |
| Net increase (decrease) in net assets | | | (16,493,810 | ) | | | 81,467,640 | | | | (10,101,805 | ) | | | 1,399,629 | | |
| NET ASSETS: | |
| Beginning of year | | | 375,534,502 | | | | 294,066,862 | | | | 34,558,005 | | | | 33,158,376 | | |
| End of year | | $ | 359,040,692 | | | $ | 375,534,502 | | | $ | 24,456,200 | | | $ | 34,558,005 | | |
| Undistributed net investment income at end of year | | $ | 2,542,563 | | | $ | 2,855,734 | | | $ | 305,814 | | | $ | 522,462 | | |
See Accompanying Notes to Financial Statements
11
STATEMENTS OF CHANGES IN NET ASSETS
| | | ING Fidelity® VIP Mid Cap Portfolio | |
| | | Year
Ended
December 31,
2010 | | Year
Ended
December 31,
2009 | |
| FROM OPERATIONS: | |
| Net investment income (loss) | | $ | (129,747 | ) | | $ | 81,007 | | |
| Net realized loss | | | (2,799,953 | ) | | | (5,773,844 | ) | |
| Net change in unrealized appreciation or depreciation | | | 20,142,578 | | | | 25,601,177 | | |
| Increase in net assets resulting from operations | | | 17,212,878 | | | | 19,908,340 | | |
| FROM DISTRIBUTIONS TO SHAREHOLDERS: | |
| Net investment income: | |
| Class ADV | | | (9,077 | ) | | | (103,441 | ) | |
| Class S | | | (346,740 | ) | | | (2,811,959 | ) | |
| Class S2 | | | (19 | ) | | | (162 | ) | |
| Net realized gains: | |
| Class ADV | | | — | | | | (282,960 | ) | |
| Class S | | | — | | | | (7,176,418 | ) | |
| Class S2 | | | — | | | | (389 | ) | |
| Total distributions | | | (355,836 | ) | | | (10,375,329 | ) | |
| FROM CAPITAL SHARE TRANSACTIONS: | |
| Net proceeds from sale of shares | | | 8,499,751 | | | | 7,345,946 | | |
| Reinvestment of distributions | | | 355,817 | | | | 10,374,779 | | |
| | | | 8,855,568 | | | | 17,720,725 | | |
| Cost of shares redeemed | | | (16,019,751 | ) | | | (12,674,035 | ) | |
| Net increase (decrease) in net assets resulting from capital share transactions | | | (7,164,183 | ) | | | 5,046,690 | | |
| Net increase in net assets | | | 9,692,859 | | | | 14,579,701 | | |
| NET ASSETS: | |
| Beginning of year | | | 65,770,523 | | | | 51,190,822 | | |
| End of year | | $ | 75,463,382 | | | $ | 65,770,523 | | |
| Undistributed net investment income at end of year | | $ | 96,074 | | | $ | 355,556 | | |
See Accompanying Notes to Financial Statements
12
FINANCIAL HIGHLIGHTS
Selected data for a share of beneficial interest outstanding throughout each year or period.
| | | | | Income (loss)
from investment
operations | | | | Less distributions | | | |
| | | Net asset value, beginning of year or period | | Net investment income (loss) | | Net realized and unrealized gain (loss) on master fund | | Total from investment operations | | From net investment income | | From net realized gains from master fund | | From return of capital from master fund | | Total distributions | | Net asset value, end of year or period | | Total Return(1) | |
| | | | | | | | | | | | | | | | | | | | | | |
Year or period
ended | | ($) | | ($) | | ($) | | ($) | | ($) | | ($) | | ($) | | ($) | | ($) | | (%) | |
| ING Fidelity® VIP Contrafund® Portfolio | | | |
| Class ADV | | | |
| 12-31-10 | | | 8.16 | | | | 0.03 | • | | | 1.29 | | | | 1.32 | | | | 0.06 | | | | — | | | | — | | | | 0.06 | | | | 9.42 | | | | 16.29 | | |
| 12-31-09 | | | 6.24 | | | | 0.05 | | | | 2.09 | | | | 2.14 | | | | 0.02 | | | | 0.20 | | | | — | | | | 0.22 | | | | 8.16 | | | | 34.71 | | |
| 12-31-08 | | | 14.62 | | | | 0.05 | • | | | (5.34 | ) | | | (5.29 | ) | | | 0.58 | | | | 2.51 | | | | — | | | | 3.09 | | | | 6.24 | | | | (43.00 | ) | |
| 12-31-07 | | | 13.28 | | | | 0.03 | | | | 2.12 | | | | 2.15 | | | | 0.02 | | | | 0.79 | | | | — | | | | 0.81 | | | | 14.62 | | | | 16.69 | | |
| 12-31-06 | | | 11.99 | | | | 0.07 | • | | | 1.22 | | | | 1.29 | | | | — | | | | 0.00 | * | | | — | | | | 0.00 | * | | | 13.28 | | | | 10.78 | | |
| Class S | | | |
| 12-31-10 | | | 8.20 | | | | 0.06 | • | | | 1.29 | | | | 1.35 | | | | 0.08 | | | | — | | | | — | | | | 0.08 | | | | 9.47 | | | | 16.63 | | |
| 12-31-09 | | | 6.28 | | | | 0.06 | | | | 2.12 | | | | 2.18 | | | | 0.06 | | | | 0.20 | | | | — | | | | 0.26 | | | | 8.20 | | | | 35.13 | | |
| 12-31-08 | | | 14.72 | | | | 0.06 | • | | | (5.37 | ) | | | (5.31 | ) | | | 0.62 | | | | 2.51 | | | | — | | | | 3.13 | | | | 6.28 | | | | (42.90 | ) | |
| 12-31-07 | | | 13.37 | | | | 0.09 | | | | 2.11 | | | | 2.20 | | | | 0.06 | | | | 0.79 | | | | — | | | | 0.85 | | | | 14.72 | | | | 16.92 | | |
| 12-31-06 | | | 12.03 | | | | 0.11 | • | | | 1.23 | | | | 1.34 | | | | — | | | | 0.00 | * | | | — | | | | 0.00 | * | | | 13.37 | | | | 11.16 | | |
| Class S2 | | | |
| 12-31-10 | | | 8.11 | | | | 0.05 | | | | 1.26 | | | | 1.31 | | | | 0.09 | | | | — | | | | — | | | | 0.09 | | | | 9.33 | | | | 16.32 | | |
05-28-09(6)-
12-31-09 | | | 6.70 | | | | 0.06 | • | | | 1.62 | | | | 1.68 | | | | 0.07 | | | | 0.20 | | | | — | | | | 0.27 | | | | 8.11 | | | | 25.65 | | |
| ING Fidelity® VIP Equity-Income Portfolio | | | |
| Class ADV | | | |
| 12-31-10 | | | 7.55 | | | | 0.08 | | | | 0.97 | | | | 1.05 | | | | 0.13 | | | | — | | | | — | | | | 0.13 | | | | 8.47 | | | | 14.21 | | |
| 12-31-09 | | | 5.99 | | | | 0.10 | | | | 1.63 | | | | 1.73 | | | | 0.16 | | | | 0.01 | | | | — | | | | 0.17 | | | | 7.55 | | | | 29.15 | | |
| 12-31-08 | | | 11.94 | | | | 0.22 | | | | (4.97 | ) | | | (4.75 | ) | | | 0.18 | | | | 1.02 | | | | — | | | | 1.20 | | | | 5.99 | | | | (43.07 | ) | |
| 12-31-07 | | | 12.83 | | | | 0.13 | • | | | (0.01 | ) | | | 0.12 | | | | 0.21 | | | | 0.80 | | | | — | | | | 1.01 | | | | 11.94 | | | | 0.69 | | |
| 12-31-06 | | | 10.78 | | | | 0.33 | • | | | 1.73 | | | | 2.06 | | | | — | | | | 0.01 | | | | — | | | | 0.01 | | | | 12.83 | | | | 19.14 | | |
| Class S | | | |
| 12-31-10 | | | 7.59 | | | | 0.08 | • | | | 1.01 | | | | 1.09 | | | | 0.14 | | | | — | | | | — | | | | 0.14 | | | | 8.54 | | | | 14.68 | | |
| 12-31-09 | | | 6.04 | | | | 0.10 | • | | | 1.65 | | | | 1.75 | | | | 0.19 | | | | 0.01 | | | | — | | | | 0.20 | | | | 7.59 | | | | 29.32 | | |
| 12-31-08 | | | 12.06 | | | | 0.20 | • | | | (4.98 | ) | | | (4.78 | ) | | | 0.22 | | | | 1.02 | | | | — | | | | 1.24 | | | | 6.04 | | | | (42.96 | ) | |
| 12-31-07 | | | 12.94 | | | | 0.21 | | | | (0.05 | ) | | | 0.16 | | | | 0.24 | | | | 0.80 | | | | — | | | | 1.04 | | | | 12.06 | | | | 0.97 | | |
| 12-31-06 | | | 10.83 | | | | 0.33 | • | | | 1.79 | | | | 2.12 | | | | — | | | | 0.01 | | | | — | | | | 0.01 | | | | 12.94 | | | | 19.61 | | |
| Class S2 | | | |
| 12-31-10 | | | 7.50 | | | | 0.09 | | | | 0.97 | | | | 1.06 | | | | 0.15 | | | | — | | | | — | | | | 0.15 | | | | 8.41 | | | | 14.46 | | |
05-28-09(6)-
12-31-09 | | | 6.21 | | | | 0.11 | • | | | 1.40 | | | | 1.51 | | | | 0.21 | | | | 0.01 | | | | — | | | | 0.22 | | | | 7.50 | | | | 24.73 | | |
| | | Ratios to average
net assets | | Supplemental data | | Ratios and supplemental
data including the master fund | |
| | | Gross expenses excluding expenses of the master fund(2)(3)(4) | | Net expenses excluding expenses of the master fund(2)(3)(4) | | Net investment income (loss) excluding expenses of the master fund(2)(3)(4) | | Net assets, end of year or period | | Portfolio turnover rate(5) | | Expenses including gross expenses of the master fund(2)(4) | | Expenses including expenses net of voluntary waivers, if any, of the master fund(2)(4) | | Expenses including expenses net of all reductions of the master fund(2)(4) | | Portfolio turnover rate of the master fund | |
| | | | | | | | | | | | | | | | | | | | |
Year or period
ended | | (%) | | (%) | | (%) | | ($000's) | | (%) | | (%) | | (%) | | (%) | | (%) | |
| ING Fidelity® VIP Contrafund® Portfolio | |
| Class ADV | |
| 12-31-10 | | | 0.55 | | | | 0.55 | | | | 0.40 | | | | 4,024 | | | | 5 | | | | 1.45 | | | | 1.45 | | | | 1.43 | | | | 117 | | |
| 12-31-09 | | | 0.55 | | | | 0.55 | | | | 0.57 | | | | 4,268 | | | | 12 | | | | 1.47 | | | | 1.47 | | | | 1.45 | | | | 145 | | |
| 12-31-08 | | | 0.55 | | | | 0.55 | | | | 0.51 | | | | 3,897 | | | | 8 | | | | 1.46 | | | | 1.46 | | | | 1.45 | | | | 172 | | |
| 12-31-07 | | | 0.55 | | | | 0.55 | | | | 0.24 | | | | 7,741 | | | | 35 | | | | 1.45 | | | | 1.45 | | | | 1.44 | | | | 134 | | |
| 12-31-06 | | | 0.55 | | | | 0.55 | | | | 0.53 | | | | 6,317 | | | | 16 | | | | 1.46 | | | | 1.46 | | | | 1.45 | | | | 75 | | |
| Class S | |
| 12-31-10 | | | 0.30 | | | | 0.30 | | | | 0.73 | | | | 355,013 | | | | 5 | | | | 1.20 | | | | 1.20 | | | | 1.18 | | | | 117 | | |
| 12-31-09 | | | 0.30 | | | | 0.30 | | | | 0.83 | | | | 371,263 | | | | 12 | | | | 1.22 | | | | 1.22 | | | | 1.20 | | | | 145 | | |
| 12-31-08 | | | 0.30 | | | | 0.30 | | | | 0.58 | | | | 290,170 | | | | 8 | | | | 1.21 | | | | 1.21 | | | | 1.20 | | | | 172 | | |
| 12-31-07 | | | 0.30 | | | | 0.30 | | | | 0.63 | | | | 414,723 | | | | 35 | | | | 1.20 | | | | 1.20 | | | | 1.19 | | | | 134 | | |
| 12-31-06 | | | 0.30 | | | | 0.30 | | | | 0.84 | | | | 217,927 | | | | 16 | | | | 1.21 | | | | 1.21 | | | | 1.20 | | | | 75 | | |
| Class S2 | |
| 12-31-10 | | | 0.55 | | | | 0.45 | | | | 0.59 | | | | 4 | | | | 5 | | | | 1.45 | | | | 1.35 | | | | 1.33 | | | | 117 | | |
05-28-09(6)-
12-31-09 | | | 0.55 | | | | 0.45 | | | | 1.27 | | | | 4 | | | | 12 | | | | 1.47 | | | | 1.37 | | | | 1.35 | | | | 145 | | |
| ING Fidelity® VIP Equity-Income Portfolio | |
| Class ADV | |
| 12-31-10 | | | 0.55 | | | | 0.55 | | | | 0.90 | | | | 473 | | | | 8 | | | | 1.36 | | | | 1.35 | | | | 1.35 | | | | 29 | | |
| 12-31-09 | | | 0.55 | | | | 0.55 | | | | 1.65 | �� | | | 510 | | | | 14 | | | | 1.38 | | | | 1.38 | | | | 1.38 | | | | 29 | | |
| 12-31-08 | | | 0.55 | | | | 0.55 | | | | 1.83 | | | | 399 | | | | 23 | | | | 1.37 | | | | 1.37 | | | | 1.37 | | | | 34 | | |
| 12-31-07 | | | 0.55 | | | | 0.55 | | | | 1.01 | | | | 944 | | | | 24 | | | | 1.35 | | | | 1.35 | | | | 1.35 | | | | 20 | | |
| 12-31-06 | | | 0.55 | | | | 0.55 | | | | 2.80 | | | | 1,002 | | | | 25 | | | | 1.37 | | | | 1.37 | | | | 1.37 | | | | 22 | | |
| Class S | |
| 12-31-10 | | | 0.30 | | | | 0.30 | | | | 1.02 | | | | 23,979 | | | | 8 | | | | 1.11 | | | | 1.10 | | | | 1.10 | | | | 29 | | |
| 12-31-09 | | | 0.30 | | | | 0.30 | | | | 1.62 | | | | 34,044 | | | | 14 | | | | 1.13 | | | | 1.13 | | | | 1.13 | | | | 29 | | |
| 12-31-08 | | | 0.30 | | | | 0.30 | | | | 2.14 | | | | 32,759 | | | | 23 | | | | 1.12 | | | | 1.12 | | | | 1.12 | | | | 34 | | |
| 12-31-07 | | | 0.30 | | | | 0.30 | | | | 1.61 | | | | 53,573 | | | | 24 | | | | 1.10 | | | | 1.10 | | | | 1.10 | | | | 20 | | |
| 12-31-06 | | | 0.30 | | | | 0.30 | | | | 2.77 | | | | 33,038 | | | | 25 | | | | 1.12 | | | | 1.12 | | | | 1.12 | | | | 22 | | |
| Class S2 | |
| 12-31-10 | | | 0.55 | | | | 0.45 | | | | 1.20 | | | | 4 | | | | 8 | | | | 1.36 | | | | 1.25 | | | | 1.25 | | | | 29 | | |
05-28-09(6)-
12-31-09 | | | 0.55 | | | | 0.45 | | | | 2.66 | | | | 4 | | | | 14 | | | | 1.38 | | | | 1.28 | | | | 1.28 | | | | 29 | | |
See Accompanying Notes to Financial Statements
13
FINANCIAL HIGHLIGHTS (CONTINUED)
Selected data for a share of beneficial interest outstanding throughout each year or period.
| | | | | Income (loss)
from investment
operations | | | | Less distributions | | | |
| | | Net asset value, beginning of year or period | | Net investment income (loss) | | Net realized and unrealized gain (loss) on master fund | | Total from investment operations | | From net investment income | | From net realized gains from master fund | | From return of capital from master fund | | Total distributions | | Net asset value, end of year or period | | Total Return(1) | |
| | | | | | | | | | | | | | | | | | | | | | |
Year or period
ended | | ($) | | ($) | | ($) | | ($) | | ($) | | ($) | | ($) | | ($) | | ($) | | (%) | |
| ING Fidelity® VIP Mid Cap Portfolio | | | |
| Class ADV | | | |
| 12-31-10 | | | 10.28 | | | | (0.04 | ) | | | 2.90 | | | | 2.86 | | | | 0.04 | | | | — | | | | — | | | | 0.04 | | | | 13.10 | | | | 27.88 | | |
| 12-31-09 | | | 8.81 | | | | (0.01 | ) | | | 3.24 | | | | 3.23 | | | | 0.47 | | | | 1.29 | | | | — | | | | 1.76 | | | | 10.28 | | | | 38.89 | | |
| 12-31-08 | | | 15.59 | | | | (0.03 | )• | | | (5.91 | ) | | | (5.94 | ) | | | — | | | | 0.84 | | | | — | | | | 0.84 | | | | 8.81 | | | | (39.90 | ) | |
| 12-31-07 | | | 13.84 | | | | (0.01 | ) | | | 2.03 | | | | 2.02 | | | | — | | | | 0.27 | | | | — | | | | 0.27 | | | | 15.59 | | | | 14.64 | | |
| 12-31-06 | | | 12.39 | | | | (0.05 | )• | | | 1.51 | | | | 1.46 | | | | — | | | | 0.01 | | | | — | | | | 0.01 | | | | 13.84 | | | | 11.77 | | |
| Class S | | | |
| 12-31-10 | | | 10.38 | | | | (0.02 | ) | | | 2.93 | | | | 2.91 | | | | 0.06 | | | | — | | | | — | | | | 0.06 | | | | 13.23 | | | | 28.16 | | |
| 12-31-09 | | | 8.88 | | | | 0.01 | | | | 3.29 | | | | 3.30 | | | | 0.51 | | | | 1.29 | | | | — | | | | 1.80 | | | | 10.38 | | | | 39.40 | | |
| 12-31-08 | | | 15.72 | | | | (0.01 | )• | | | (5.95 | ) | | | (5.96 | ) | | | 0.04 | | | | 0.84 | | | | — | | | | 0.88 | | | | 8.88 | | | | (39.82 | ) | |
| 12-31-07 | | | 13.92 | | | | 0.03 | • | | | 2.05 | | | | 2.08 | | | | 0.01 | | | | 0.27 | | | | — | | | | 0.28 | | | | 15.72 | | | | 15.00 | | |
| 12-31-06 | | | 12.42 | | | | (0.03 | )• | | | 1.54 | | | | 1.51 | | | | — | | | | 0.01 | | | | — | | | | 0.01 | | | | 13.92 | | | | 12.15 | | |
| Class S2 | | | |
| 12-31-10 | | | 10.23 | | | | (0.04 | ) | | | 2.89 | | | | 2.85 | | | | 0.06 | | | | — | | | | — | | | | 0.06 | | | | 13.02 | | | | 28.02 | | |
05-28-09(6)-
12-31-09 | | | 9.95 | | | | 0.01 | • | | | 2.10 | | | | 2.11 | | | | 0.54 | | | | 1.29 | | | | — | | | | 1.83 | | | | 10.23 | | | | 23.22 | | |
| | | Ratios to average
net assets | | Supplemental data | | Ratios and supplemental
data including the master fund | |
| | | Gross expenses excluding expenses of the master fund(2)(3)(4) | | Net expenses excluding expenses of the master fund(2)(3)(4) | | Net investment income (loss) excluding expenses of the master fund(2)(3)(4) | | Net assets, end of year or period | | Portfolio turnover rate(5) | | Expenses including gross expenses of the master fund(2)(4) | | Expenses including expenses net of voluntary waivers, if any, of the master fund(2)(4) | | Expenses including expenses net of all reductions of the master fund(2)(4) | | Portfolio turnover rate of the master fund | |
| | | | | | | | | | | | | | | | | | | | |
Year or period
ended | | (%) | | (%) | | (%) | | ($000's) | | (%) | | (%) | | (%) | | (%) | | (%) | |
| ING Fidelity® VIP Mid Cap Portfolio | |
| Class ADV | |
| 12-31-10 | | | 0.55 | | | | 0.55 | | | | (0.41 | ) | | | 3,453 | | | | 13 | | | | 1.46 | | | | 1.46 | | | | 1.45 | | | | 25 | | |
| 12-31-09 | | | 0.55 | | | | 0.55 | | | | (0.10 | ) | | | 2,613 | | | | 13 | | | | 1.48 | | | | 1.48 | | | | 1.48 | | | | 57 | | |
| 12-31-08 | | | 0.55 | | | | 0.55 | | | | (0.20 | ) | | | 1,953 | | | | 13 | | | | 1.48 | | | | 1.48 | | | | 1.47 | | | | 145 | | |
| 12-31-07 | | | 0.55 | | | | 0.55 | | | | (0.06 | ) | | | 3,315 | | | | 12 | | | | 1.46 | | | | 1.46 | | | | 1.45 | | | | 113 | | |
| 12-31-06 | | | 0.55 | | | | 0.55 | | | | (0.40 | ) | | | 2,190 | | | | 12 | | | | 1.48 | | | | 1.48 | | | | 1.46 | | | | 149 | | |
| Class S | |
| 12-31-10 | | | 0.30 | | | | 0.30 | | | | (0.18 | ) | | | 72,007 | | | | 13 | | | | 1.21 | | | | 1.21 | | | | 1.20 | | | | 25 | | |
| 12-31-09 | | | 0.30 | | | | 0.30 | | | | 0.15 | | | | 63,154 | | | | 13 | | | | 1.23 | | | | 1.23 | | | | 1.23 | | | | 57 | | |
| 12-31-08 | | | 0.30 | | | | 0.30 | | | | (0.06 | ) | | | 49,238 | | | | 13 | | | | 1.23 | | | | 1.23 | | | | 1.22 | | | | 145 | | |
| 12-31-07 | | | 0.30 | | | | 0.30 | | | | 0.20 | | | | 77,608 | | | | 12 | | | | 1.21 | | | | 1.21 | | | | 1.20 | | | | 113 | | |
| 12-31-06 | | | 0.30 | | | | 0.30 | | | | (0.24 | ) | | | 38,562 | | | | 12 | | | | 1.23 | | | | 1.23 | | | | 1.21 | | | | 149 | | |
| Class S2 | |
| 12-31-10 | | | 0.55 | | | | 0.45 | | | | (0.33 | ) | | | 4 | | | | 13 | | | | 1.46 | | | | 1.36 | | | | 1.35 | | | | 25 | | |
05-28-09(6)-
12-31-09 | | | 0.55 | | | | 0.45 | | | | 0.11 | | | | 3 | | | | 13 | | | | 1.48 | | | | 1.38 | | | | 1.38 | | | | 57 | | |
(1) Total return is calculated assuming reinvestment of all dividends, capital gain distributions and return of capital, if any, at net asset value. Total return for periods less than one year is not annualized. The Portfolio's performance is shown without the imposition of any expenses or charges, which are, or may be, imposed under your annuity contract. Total returns would have been lower if such expenses or charges were included.
(2) Annualized for periods less than one year.
(3) Expense ratios do not include fees and expenses charged under the variable annuity contract or variable life insurance policy.
(4) Expense ratios reflect operating expenses of a Portfolio. Expenses before reductions/additions do not reflect amounts reimbursed by the Investment Adviser and/or Distributor or reductions from brokerage commission recapture arrangements or other expense offset arrangements and do not represent the amount paid by a Portfolio during periods when reimbursements or reductions occur. Expenses net of fee waivers reflect expenses after reimbursement by the Investment Adviser and/or Distributor but prior to reductions from brokerage commission recapture arrangements or other expense offset arrangements. Expenses net of all reductions/ additions represent the net expenses paid by a Portfolio. Net investment income (loss) is net of all such additions or reductions.
(5) Portfolio turnover rate is calculated based on the Portfolio's purchases or sales of the master fund.
(6) Commencement of operations.
(7) Class ADV was fully redeemed on May 5, 2006 and recommenced operations on October 30, 2006.
• Calculated using average number of shares outstanding throughout the period.
* Amount is less than $0.005.
See Accompanying Notes to Financial Statements
14
NOTES TO FINANCIAL STATEMENTS AS OF DECEMBER 31, 2010
NOTE 1 — ORGANIZATION
ING Partners, Inc. (the "Company") is an open-end management investment company registered under the Investment Company Act of 1940, as amended (the "1940 Act"). It was incorporated under the laws of Maryland on May 7, 1997. The Articles of Incorporation permit the Company to offer separate series ("Portfolios"), each of which has its own investment objective, policies and restrictions. The Portfolios serve as investment options underlying variable insurance products offered by Directed Services LLC ("DSL" or the "Investment Adviser") and its insurance company affiliates. The Company currently consists of thirty-six active separate investment series. The three Portfolios included in this report are: ING Fidelity® VIP Contrafund® Portfolio* ("Contrafund"); ING Fidelity® VIP Equity-Income Portfolio ("Equity-Income") and ING Fidelity® VIP Mid Cap Portfolio ("Mid Cap") (each, a "Portfolio" and collectively, the "Portfolios").
Each Portfolio in this report operates as a "feeder fund" and seeks to achieve its investment objective by investing all its investable assets in a separate mutual fund ("Master Fund"). Each Master Fund is a registered open-end management investment company that has the same investment objective and substantially similar policies as each corresponding Portfolio. As of December 31, 2010, Contrafund, Equity-Income and Mid Cap Portfolios each held 2.14%, 0.41% and 0.95% of their respective Master Fund. Each Master Fund directly acquires securities and a Portfolio investing in the Master Fund acquires an indirect interest in those securities.
The Portfolios offer three classes of shares, referred to as Adviser Class ("Class ADV"), Service Class ("Class S"), and Service 2 Class ("Class S2"). Each share class represents interests in the same portfolio of investments of the particular Portfolio, and shall be identical in all respects, except for the impact of expenses, voting, exchange privileges, and any different shareholder services relating to a class of shares. Shares of the Portfolios may be offered to separate accounts ("Separate Accounts") of insurance companies as investment options in connection with variable annuity contracts and variable life insurance policies ("Variable Contracts") and to certain of the Portfolios' investment advisers and their affiliates. In the future, shares may also be offered to qualified pension and retirement plans ("Qualified Plans") outside the Separate Account context. Shares of the Portfolios are not currently offered directly to Qualified Plans or custodial accounts.
DSL serves as the investment adviser to the Portfolios. ING Funds Services, LLC serves as the administrator ("IFS" or the "Administrator") for the Portfolios. ING Investments Distributor, LLC ("IID" or the "Distributor") serves as the principal underwriter to the Portfolios.
The Investment Adviser, IFS and IID are indirect, wholly-owned subsidiaries of ING Groep N.V. ("ING Groep"). ING Groep is a global financial institution of Dutch origin offering banking, investments, life insurance and retirement services.
ING Groep has adopted a formal restructuring plan that was approved by the European Commission in November 2009 under which the ING life insurance businesses, including the retirement services and investment management businesses, which include the Investment Adviser and its affiliates, would be divested by ING Groep by the end of 2013. While there can be no assurance that it will be carried out, the restructuring plan presents certain risks, including uncertainty about the effect on the businesses of the ING entities that service the Portfolios and potential termination of the Portfolios' existing advisory agreement, which may trigger the need for shareholder approval of new agreements.
NOTE 2 — SIGNIFICANT ACCOUNTING POLICIES
The following significant accounting policies are consistently followed by the Portfolios in the preparation of their financial statements. Such policies are in conformity with U.S. generally accepted accounting principles for investment companies.
A. Security Valuation. All investments held by the Master Funds are recorded at their estimated fair value, as described below. The valuation of each Portfolio's investment in its corresponding Master Fund is based on the net asset value of that Master Fund each business day. Valuation of the investments by the Master Funds is discussed in the Master Funds' notes to their financial statements, which accompany this report.
* Fidelity and Contrafund are registered trademarks of FMR Corp.
15
NOTES TO FINANCIAL STATEMENTS AS OF DECEMBER 31, 2010 (CONTINUED)
NOTE 2 — SIGNIFICANT ACCOUNTING POLICIES (continued)
Fair value is defined as the price that the Portfolios would receive to sell an asset or pay to transfer a liability in an orderly transaction between market participants at the measurement date. Each investment asset or liability of the Portfolios is assigned a level at measurement date based on the significance and source of the inputs to its valuation. Quoted prices in active markets for identical securities are classified as "Level 1," inputs other than quoted prices for an asset or liability that are observable are classified as "Level 2" and unobservable inputs, including the adviser's or sub-adviser's judgment about the assumptions that a market participant would use in pricing an asset or liability are classified as "Level 3." The inputs used for valuing securities are not necessarily an indication of the risks associated with investing in those securities. Securities valued at amortized cost are generally considered to be Level 2 securities under applicable accounting rules. A table summarizing the Portfolios' investments under these levels of classification is included following the Portfolios of Investments.
For the year ended December 31, 2010, there have been no significant changes to the fair valuation methodologies.
B. Security Transactions and Revenue Recognition. Security transactions are accounted for on the trade date. Dividend income received from the funds is recognized on the ex-dividend date and is recorded as income distributions in the Statement of Operations. Capital gain distributions received from the funds are recognized on the ex-dividend date and are recorded on the Statement of Operations as such. Costs used in determining realized gains and losses on the sales of investment securities are on the basis of specific identification.
C. Distributions to Shareholders. The Portfolios record distributions to their shareholders on the ex-dividend date. Each Portfolio distributes dividends and capital gains, if any, annually. The Portfolios may make distributions on a more frequent basis to comply with the distribution requirements of the Internal Revenue Code. The characteristics of income and gains to be distributed are determined in accordance with income tax regulations, which may differ from U.S. generally accepted accounting principles for investment companies.
D. Federal Income Taxes. It is the policy of each Portfolio to comply with the requirements of subchapter M of the Internal Revenue Code that are applicable to regulated investment companies and to distribute substantially all of its net investment income and any net realized capital gains to its shareholders. Therefore, a federal income tax or excise tax provision is not required. Management has considered the sustainability of the Portfolios' tax positions taken on federal income tax returns for all open tax years in making this determination. No capital gain distributions shall be made until the capital loss carryforwards have been fully utilized or expire.
E. Use of Estimates. The preparation of financial statements in conformity with U.S. generally accepted accounting principles requires management to make estimates and assumptions that affect the reported amounts of assets and liabilities and disclosure of contingent assets and liabilities at the date of the financial statements and the reported amounts of increases and decreases in net assets from operations during the reporting period. Actual results could differ from those estimates.
F. Indemnifications. In the normal course of business, the Company may enter into contracts that provide certain indemnifications. The Company's maximum exposure under these arrangements is dependent on future claims that may be made against the Portfolios and, therefore, cannot be estimated; however, based on experience, management considers risk of loss from such claims remote.
NOTE 3 — INVESTMENT MANAGEMENT ADMINISTRATIVE FEES, AND MASTER FUNDS EXPENSES
Fidelity Management & Research Company ("FMR") serves as investment adviser to each Master Fund. FMR has day-to-day responsibility for choosing investments for each Master Fund. As shareholders of the Master Funds, the Portfolios indirectly pay a portion of the master-level management fee(1).
Each Master Fund, VIP Contrafund® Portfolio, VIP Equity-Income Portfolio and VIP Mid Cap Portfolio, pays FMR a management fee for advisory services at annual rates of 0.56%, 0.46% and 0.56%, of each respective Master Fund's current average daily net assets. Pursuant to its Investment Management Agreement with the Company, if the respective
(1) Investors in the Portfolios should recognize that an investment in the Portfolios bears not only a proportionate share of the expenses of the Portfolios (including operating costs and management fees, if any), but also indirectly similar expenses of the Master Funds in which each Portfolio invests. Investors also bear their proportionate share of any sales charges incurred by the Portfolios related to the purchase of shares of the mutual fund investments.
16
NOTES TO FINANCIAL STATEMENTS AS OF DECEMBER 31, 2010 (CONTINUED)
NOTE 3 — INVESTMENT MANAGEMENT ADMINISTRATIVE FEES, AND MASTER FUNDS EXPENSES (continued)
Portfolio does not invest substantially all of its assets in another investment company, DSL may charge an annual advisory fee at annual rates equal to 0.58%, 0.48% and 0.58% of average daily net assets for Contrafund, Equity-Income and Mid Cap, respectively. If a Portfolio invests substantially all of its assets in another investment company, DSL does not charge an advisory fee. Each Portfolio anticipates investing substantially all of its assets in another investment company.
If a Portfolio invests substantially all of its assets in another investment company, IFS will charge an administration fee of 0.05% of average daily net assets for that Portfolio. Pursuant to its administration agreement with the Portfolios, if the respective Portfolio does not invest substantially all of its assets in another investment company, ING Funds Services, LLC may receive an annual administration fee equal to 0.15%, 0.15% and 0.17% of average daily net assets for Contrafund, Equity-Income and Mid Cap, respectively.
For the year ended December 31, 2010, each Portfolio invested substantially all of its assets in its respective Master Fund.
NOTE 4 — INVESTMENT IN UNDERLYING PORTFOLIOS
For the year ended December 31, 2010, the cost of purchases and proceeds from sales of the Master Funds were as follows:
| | | Purchases | | Sales | |
| Contrafund | | $ | 18,010,816 | | | $ | 103,316,489 | | |
| Equity-Income | | | 2,413,176 | | | | 15,974,116 | | |
| Mid Cap | | | 8,590,381 | | | | 16,237,406 | | |
NOTE 5 — DISTRIBUTION AND SERVICE FEES
Each Portfolio has adopted a Shareholder Servicing Plan ("Service Plan") for the Class S, Class S2 and Class ADV shares of each Portfolio. Under the Service Plan, a Portfolio makes payments at an annual rate of 0.25% of the Portfolio's average daily net assets attributable to its Class S, Class S2, and Class ADV shares.
Each Portfolio has adopted a Plan of Distribution pursuant to Rule 12b-1 under the 1940 Act ("Distribution Plan") for the Classes ADV and S2 shares of each Portfolio. The Distribution Plan provides for a distribution fee, payable to IFD as the Distributor at an annual rate of 0.25% of each Portfolio's average daily net assets attributable to Class ADV and Class S2 shares. The Distributor has contractually agreed to waive a portion of each distribution fee equal to 0.10% of each Portfolio's average daily net assets attributable to the distribution fee paid by Class S2 shares, so that the actual fee paid is an annual rate of 0.15%. The expense waiver will continue through at least May 1, 2011.
Fidelity Distributors Corporation ("FDC") distributes Service Class 2 shares of each Master Fund. Service Class 2 of each Master Fund currently pays FDC a 12b-1 (service) fee at an annual rate of 0.25% of its average net assets throughout the month. Shareholders of Class S and Class ADV of each respective Portfolio pay only their proportionate share of the Master Fund 12b-1 plan expenses.
NOTE 6 — OTHER TRANSACTIONS WITH AFFILIATES AND RELATED PARTIES
At December 31, 2010, the Portfolios had the following amounts recorded as payable to affiliates on the accompanying Statements of Assets and Liabilities:
| Fund | | Accrued
Administrative
Fees | | Accrued
Shareholder
Service and
Distribution
Fees | | Total | |
| Contrafund | | $ | 15,203 | | | $ | 76,841 | | | $ | 92,044 | | |
| Equity-Income | | | 1,095 | | | | 5,579 | | | | 6,674 | | |
| Mid Cap | | | 3,235 | | | | 16,904 | | | | 20,139 | | |
At December 31, 2010, the following indirect, wholly-owned subsidiary of ING Groep owned more than 5% of the following Portfolios:
| Subsidiary | | Portfolio | | Percentage | |
ING Life Insurance and
Annuity Company | | Contrafund | | | 99.54 | % | |
| | | Equity-Income | | | 98.66 | % | |
| | | Mid Cap | | | 99.34 | % | |
Control is defined by the 1940 Act as the beneficial ownership, either directly or through one or more controlled companies, of more than 25% of the voting securities of a company. The 1940 Act defines affiliates as companies that are under common control. Therefore, because the Portfolios have a common owner that owns over 25% of the outstanding securities of the Portfolios, they may be deemed to be affiliates of each other. Investment activities of these shareholders could have a material impact on the Portfolios.
The Company has adopted a Deferred Compensation Plan (the "Plan"), which allows eligible non-affiliated directors as described in the Plan to defer the receipt of all or a portion of the directors fees payable. Amounts deferred are treated as though invested in various "notional" funds advised by DSL until distribution in accordance with the Plan.
17
NOTES TO FINANCIAL STATEMENTS AS OF DECEMBER 31, 2010 (CONTINUED)
NOTE 7 — CAPITAL SHARES
Transactions in capital shares and dollars were as follows:
| | | Shares sold | | Shares
issued
in merger | | Reinvestment
of
distributions | | Shares
redeemed | | Net increase
(decrease)
in shares
outstanding | | Shares sold | | Shares
issued
in merger | | Reinvestment
of
distributions | | Shares
redeemed | | Net increase
(decrease) | |
| Year or period ended | | # | | # | | # | | # | | # | | ($) | | ($) | | ($) | | ($) | | ($) | |
| Contrafund | | | |
| Class ADV | | | |
| 12-31-10 | | | 52,094 | | | | 2,701 | | | | 3,300 | | | | (153,998 | ) | | | (95,903 | ) | | | 443,515 | | | | 21,192 | | | | 26,135 | | | | (1,280,629 | ) | | | (789,787 | ) | |
| 12-31-09 | | | 114,322 | | | | — | | | | 16,668 | | | | (232,426 | ) | | | (101,436 | ) | | | 774,738 | | | | — | | | | 121,340 | | | | (1,570,664 | ) | | | (674,586 | ) | |
| Class S | | | |
| 12-31-10 | | | 1,785,342 | | | | 2,245,900 | | | | 356,161 | | | | (12,154,730 | ) | | | (7,767,327 | ) | | | 15,240,097 | | | | 17,692,250 | | | | 2,831,482 | | | | (101,972,277 | ) | | | (66,208,448 | ) | |
| 12-31-09 | | | 5,343,698 | | | | — | | | | 1,718,186 | | | | (7,965,981 | ) | | | (904,097 | ) | | | 34,686,878 | | | | — | | | | 12,559,938 | | | | (59,800,557 | ) | | | (12,553,741 | ) | |
| Class S2 | | | |
| 12-31-10 | | | — | | | | 448 | | | | — | | | | (448 | ) | | | — | | | | — | | | | 3,483 | | | | — | | | | (3,483 | ) | | | — | | |
| 05-28-09(1) - 12-31-09 | | | 448 | | | | — | | | | — | | | | — | | | | 448 | | | | 3,000 | | | | — | | | | — | | | | — | | | | 3,000 | | |
| Equity-Income | | | |
| Class ADV | | | |
| 12-31-10 | | | 8,525 | | | | — | | | | 1,184 | | | | (21,524 | ) | | | (11,815 | ) | | | 66,577 | | | | — | | | | 8,551 | | | | (163,527 | ) | | | (88,399 | ) | |
| 12-31-09 | | | 11,366 | | | | — | | | | 1,610 | | | | (11,995 | ) | | | 981 | | | | 73,490 | | | | — | | | | 11,063 | | | | (71,077 | ) | | | 13,476 | | |
| Class S | | | |
| 12-31-10 | | | 267,791 | | | | — | | | | 70,696 | | | | (2,012,615 | ) | | | (1,674,128 | ) | | | 2,075,159 | | | | — | | | | 513,963 | | | | (15,842,773 | ) | | | (13,253,651 | ) | |
| 12-31-09 | | | 621,776 | | | | — | | | | 145,582 | | | | (1,712,434 | ) | | | (945,076 | ) | | | 3,946,320 | | | | — | | | | 1,004,518 | | | | (11,690,159 | ) | | | (6,739,321 | ) | |
| Class S2 | | | |
| 12-31-10 | | | — | | | | — | | | | — | | | | — | | | | — | | | | — | | | | — | | | | — | | | | — | | | | — | | |
| 05-28-09(1) - 12-31-09 | | | 483 | | | | — | | | | — | | | | — | | | | 483 | | | | 3,000 | | | | — | | | | — | | | | — | | | | 3,000 | | |
| Mid Cap | | | |
| Class ADV | | | |
| 12-31-10 | | | 57,905 | | | | — | | | | 827 | | | | (49,373 | ) | | | 9,359 | | | | 691,352 | | | | — | | | | 9,077 | | | | (552,787 | ) | | | 147,642 | | |
| 12-31-09 | | | 57,437 | | | | — | | | | 41,728 | | | | (66,763 | ) | | | 32,402 | | | | 551,154 | | | | — | | | | 386,401 | | | | (637,804 | ) | | | 299,751 | | |
| Class S | | | |
| 12-31-10 | | | 664,061 | | | | — | | | | 31,323 | | | | (1,338,499 | ) | | | (643,115 | ) | | | 7,808,399 | | | | — | | | | 346,740 | | | | (15,466,964 | ) | | | (7,311,825 | ) | |
| 12-31-09 | | | 705,590 | | | | — | | | | 1,070,566 | | | | (1,234,439 | ) | | | 541,717 | | | | 6,791,792 | | | | — | | | | 9,988,378 | | | | (12,036,231 | ) | | | 4,743,939 | | |
| Class S2 | | | |
| 12-31-10 | | | — | | | | — | | | | — | | | | — | | | | — | | | | — | | | | — | | | | — | | | | — | | | | — | | |
| 05-28-09(1) - 12-31-09 | | | 302 | | | | — | | | | — | | | | — | | | | 302 | | | | 3,000 | | | | — | | | | — | | | | — | | | | 3,000 | | |
(1) Commencement of operations.
NOTE 8 — REORGANIZATIONS
On August 20, 2010, Contrafund ("Acquiring Portfolio") acquired all of the net assets of ING Fidelity® VIP Growth Portfolio ("Acquired Portfolio"), an open-end investment company in a tax-free reorganization in exchange for shares of the Acquiring Portfolio, pursuant to a plan of reorganization approved by the Acquired Portfolio's shareholders on August 10, 2010. The primary purpose of the transaction was to lower the overall gross and net expense ratios for all classes. For financial reporting purposes, assets received and shares issued by the Acquiring Portfolio were recorded at fair value; however, the cost basis of the investments received from the Acquired Portfolio was carried forward to align ongoing reporting of the Acquiring Portfolio's realized and unrealized gains and losses with amounts distributable to shareholders for tax purposes.
Assuming the acquisition had been completed on January 1, 2010, the beginning of the annual reporting period of the Acquiring Portfolio, the Acquiring Portfolio's pro forma results of operations for the period ended December 31, 2010, are as follows:
| Net investment income | | $ | 2,332,990 | | |
| Net realized and unrealized gain on investments | | $ | 50,855,304 | | |
| Net increase in net assets resulting from operations | | $ | 53,188,294 | | |
18
NOTES TO FINANCIAL STATEMENTS AS OF DECEMBER 31, 2010 (CONTINUED)
NOTE 8 — REORGANIZATIONS (continued)
Because the combined investment Portfolios have been managed as a single integrated Portfolio since the acquisition was completed, it is not practicable to separate the amounts of revenue and earnings of the Acquired Portfolio that have been included in the Acquiring Portfolio's statement of operations since August 20, 2010. Net assets and unrealized appreciation as of the reorganization date were as follows:
Acquiring
Portfolio | | Acquired
Portfolio | | Total Net
Assets of Acquired
Portfolio (000s) | | Total Net
Assets of Acquiring
Portfolio (000s) | | Acquired
Capital Loss
Carryforwards (000s) | | Acquired Portfolio
Unrealized
Appreciation (000s) | | Conversion
Ratio | |
| | | ING | | | | | | | | | | | | | | | | | |
| |
| | | Fidelity® | | | | | | | | | | | | | | | | | |
| |
| | | VIP Growth | | | | | | | | | | | | | | | | | |
| |
| Contrafund | | Portfolio | | $ | 17,717 | | | $ | 288,953 | | | $ | 9,054 | | | $ | (387 | ) | | | 1.1190 | | |
The net assets of Contrafund after the acquisition were $306,670,363.
NOTE 9 — FEDERAL INCOME TAXES
The amount of distributions from net investment income and net realized capital gains are determined in accordance with federal income tax regulations, which may differ from U.S. generally accepted accounting principles for investment companies. These book/tax differences may be either temporary or permanent. Permanent differences are reclassified within the capital accounts based on their federal tax-basis treatment; temporary differences are not reclassified. Key differences include the treatment of short-term capital gains, foreign currency transactions, and wash sale deferrals. Distributions in excess of net investment income and/or net realized capital gains for tax purposes are reported as return of capital.
The following permanent tax differences have been reclassified as of December 31, 2010:
| | | Paid-in
Capital | | Undistributed
Net Investment
Income | | Accumulated
Net Realized
Gains/(Losses) | |
| Contrafund | | $ | (3,824,450 | ) | | $ | 153,587 | | | $ | 3,670,863 | | |
| Mid Cap | | | — | | | | 226,101 | | | | (226,101 | ) | |
Dividends paid by the Portfolios from net investment income and distributions of net realized short-term capital gains are, for federal income tax purposes, taxable as ordinary income to shareholders.
The tax composition of dividends and distributions to shareholders was as follows:
| | | Year Ended
December 31, 2010 | | Year Ended
December 31, 2009 | |
| | | Ordinary
Income | | Ordinary
Income | | Long-Term
Capital
Gains | |
| Contrafund | | $ | 2,857,656 | | | $ | 2,540,833 | | | $ | 10,140,568 | | |
| Equity-Income | | | 522,586 | | | | 991,263 | | | | 24,426 | | |
| Mid Cap | | | 355,836 | | | | 2,930,392 | | | | 7,444,937 | | |
The tax-basis components of distributable earnings and the expiration dates of the capital loss carryforwards which may be used to offset future realized capital gains for federal income tax purposes as of December 31, 2010 were:
| | | Undistributed
Ordinary
Income | | Unrealized
Appreciation/
(Depreciation) | | Post-October
Capital Loss
Deferred | | Capital Loss
Carryforwards | | Expiration
Dates | |
| Contrafund | | $ | 2,542,563 | | | $ | (51,220,594 | ) | | $ | (1,218,864 | ) | | $ | (895,347 | ) | | | 2016 | | |
| | | | | | | | | | (13,374,108 | ) | | | 2017 | | |
| | | | | | | | | | (57,457,080 | ) | | | 2018 | | |
| | | | | | | | | $ | (71,726,535 | )* | | | | | |
| Equity-Income | | | 305,814 | | | | (7,096,379 | ) | | | (1,306,071 | ) | | | (4,401,655 | ) | | | 2017 | | |
| | | | | | | | | | (5,708,489 | ) | | | 2018 | | |
| | | | | | | | | $ | (10,110,144 | ) | | | | | |
| Mid Cap | | | 96,074 | | | | 206,694 | | | | — | | | | (1,491,245 | ) | | | 2017 | | |
| | | | | | | | | | (2,015,634 | ) | | | 2018 | | |
| | | | | | | | | $ | (3,506,879 | ) | | | | | |
* Utilization of these capital losses is subject to annual limitations under Section 382 of the Internal Revenue Code.
19
NOTES TO FINANCIAL STATEMENTS AS OF DECEMBER 31, 2010 (CONTINUED)
NOTE 9 — FEDERAL INCOME TAXES (continued)
The Portfolios' major tax jurisdictions are federal and Arizona. The earliest tax year that remains subject to examination by these jurisdictions is 2006.
As of December 31, 2010, no provisions for income tax would be required in the Portfolios' financial statements as a result of tax positions taken on federal and state income tax returns for open tax years. The Portfolios' federal and state income and federal excise tax returns for tax years for which the applicable statutes of limitations have not expired are subject to examination by the Internal Revenue Service and state department of revenue.
NOTE 10 — CONCENTRATION OF INVESTMENT RISKS
All mutual funds involve risk — some more than others — and there is always the chance that you could lose money or not earn as much as you hope. A Portfolio's risk profile is largely a factor of the principal securities in which it invests and investment techniques that it uses. For more information regarding the types of securities and investment techniques that may be used by each Portfolio and their corresponding risks, see the Portfolios' most recent Prospectus and/or the Statement of Additional Information.
The value of your investment in Contrafund, Equity-Income and Mid Cap changes with the values of the corresponding Master Fund and its investments.
Foreign Securities (All Portfolios). Investments in foreign securities may entail risks not present in domestic investments. Since securities in which a Master Fund may invest are denominated in foreign currencies, changes in the relationship of these foreign currencies to the U.S. dollar can significantly affect the value of the investments and earnings of a Master Fund. Foreign investments may also subject a Master Fund to foreign government exchange restrictions, expropriation, taxation or other political, social or economic developments, as well as changes vis-a-vis the U.S. dollar from movements in currency, and changes in security value and interest rate, all of which could affect the market and/or credit risk of a Master Fund's investments.
NOTE 11 — SUBSEQUENT EVENTS
The Portfolios have evaluated events occurring after the Statements of Assets and Liabilities date (subsequent events), to determine whether any subsequent events necessitated adjustment to or disclosure in the financial statements. No such subsequent events were identified.
20
PORTFOLIO OF INVESTMENTS
ING FIDELITY® VIP CONTRAFUND® PORTFOLIO AS OF DECEMBER 31, 2010
| Shares | | | | Value | | Percent of
Net Assets | |
| MASTER FUND: 100.0% | |
| | 15,284,532 | | | Fidelity VIP Contrafund Portfolio | | $ | 359,033,660 | | | | 100.0 | | |
| | | Total Investments in Master Fund
(Cost $367,278,992)* | | $ | 359,033,660 | | | | 100.0 | | |
| | | Other Assets and Liabilities - Net | | | 7,032 | | | | — | | |
| | | Net Assets | | $ | 359,040,692 | | | | 100.0 | | |
* Cost for federal income tax purposes is $410,254,184.
Net unrealized depreciation consists of:
| Gross Unrealized Appreciation | | $ | — | | |
| Gross Unrealized Depreciation | | | (51,220,594 | ) | |
| Net Unrealized Depreciation | | $ | (51,220,594 | ) | |
Fair Value Measurements^
The following is a summary of the fair valuations according to the inputs used as of December 31, 2010 in valuing the Portfolio's assets and liabilities:
| | | Quoted Prices
in Active Markets
for Identical Investments
(Level 1) | | Other
Observable
Inputs
(Level 2) | | Significant
Unobservable
Inputs
(Level 3) | | Fair Value
at
12/31/10 | |
| Asset Table | |
| Investments, at value | |
| Master Fund | | $ | 359,033,660 | | | $ | — | | | $ | — | | | $ | 359,033,660 | | |
| Total Investments, at value | | $ | 359,033,660 | | | $ | — | | | $ | — | | | $ | 359,033,660 | | |
^ See Note 2, "Significant Accounting Policies" in the Notes to Financial Statements for additional information.
See Accompanying Notes to Financial Statements
21
PORTFOLIO OF INVESTMENTS
ING FIDELITY® VIP EQUITY-INCOME PORTFOLIO AS OF DECEMBER 31, 2010
| Shares | | | | Value | | Percent of
Net Assets | |
| MASTER FUND: 100.0% | |
| | 1,304,635 | | | Fidelity VIP Equity-Income Portfolio | | $ | 24,461,899 | | | | 100.0 | | |
| | | Total Investments in Master Fund
(Cost $22,670,808)* | | $ | 24,461,899 | | | | 100.0 | | |
| | | Other Assets and Liabilities - Net | | | (5,699 | ) | | | — | | |
| | | Net Assets | | $ | 24,456,200 | | | | 100.0 | | |
* Cost for federal income tax purposes is $31,558,278.
Net unrealized depreciation consists of:
| Gross Unrealized Appreciation | | $ | — | | |
| Gross Unrealized Depreciation | | | (7,096,379 | ) | |
| Net Unrealized Depreciation | | $ | (7,096,379 | ) | |
Fair Value Measurements^
The following is a summary of the fair valuations according to the inputs used as of December 31, 2010 in valuing the Portfolio's assets and liabilities:
| | | Quoted Prices
in Active Markets
for Identical Investments
(Level 1) | | Other
Observable
Inputs
(Level 2) | | Significant
Unobservable
Inputs
(Level 3) | | Fair Value
at
12/31/10 | |
| Asset Table | |
| Investments, at value | |
| Master Fund | | $ | 24,461,899 | | | $ | — | | | $ | — | | | $ | 24,461,899 | | |
| Total Investments, at value | | $ | 24,461,899 | | | $ | — | | | $ | — | | | $ | 24,461,899 | | |
^ See Note 2, "Significant Accounting Policies" in the Notes to Financial Statements for additional information.
See Accompanying Notes to Financial Statements
22
PORTFOLIO OF INVESTMENTS
ING FIDELITY® VIP MID CAP PORTFOLIO AS OF DECEMBER 31, 2010
| Shares | | | | Value | | Percent of
Net Assets | |
| MASTER FUND: 100.0% | |
| | 2,349,308 | | | Fidelity VIP Mid Cap Portfolio | | $ | 75,483,257 | | | | 100.0 | | |
| | | Total Investments in Master Fund
(Cost $67,740,701)* | | $ | 75,483,257 | | | | 100.0 | | |
| | | Other Assets and Liabilities - Net | | | (19,875 | ) | | | — | | |
| | | Net Assets | | $ | 75,463,382 | | | | 100.0 | | |
* Cost for federal income tax purposes is $75,276,563.
Net unrealized appreciation consists of:
| Gross Unrealized Appreciation | | $ | 206,694 | | |
| Gross Unrealized Depreciation | | | — | | |
| Net Unrealized Appreciation | | $ | 206,694 | | |
Fair Value Measurements^
The following is a summary of the fair valuations according to the inputs used as of December 31, 2010 in valuing the Portfolio's assets and liabilities:
| | | Quoted Prices
in Active Markets
for Identical Investments
(Level 1) | | Other
Observable
Inputs
(Level 2) | | Significant
Unobservable
Inputs
(Level 3) | | Fair Value
at
12/31/10 | |
| Asset Table | |
| Investments, at value | |
| Master Fund | | $ | 75,483,257 | | | $ | — | | | $ | — | | | $ | 75,483,257 | | |
| Total Investments, at value | | $ | 75,483,257 | | | $ | — | | | $ | — | | | $ | 75,483,257 | | |
^ See Note 2, "Significant Accounting Policies" in the Notes to Financial Statements for additional information.
See Accompanying Notes to Financial Statements
23
TAX INFORMATION (UNAUDITED)
Dividends paid during the year ended December 31, 2010 were as follows:
| Portfolio Name | | Type | | Per Share Amount | |
ING Fidelity®
VIP Contrafund® Portfolio | |
| Class ADV | | NII | | $ | 0.0581 | | |
| Class S | | NII | | $ | 0.0787 | | |
| Class S2 | | NII | | $ | 0.0871 | | |
ING Fidelity®
VIP Equity-Income Portfolio | |
| Class ADV | | NII | | $ | 0.1306 | | |
| Class S | | NII | | $ | 0.1401 | | |
| Class S2 | | NII | | $ | 0.1485 | | |
| Portfolio Name | | Type | | Per Share Amount | |
| ING Fidelity® VIP Mid Cap Portfolio | |
| Class ADV | | NII | | $ | 0.0383 | | |
| Class S | | NII | | $ | 0.0608 | | |
| Class S2 | | NII | | $ | 0.0639 | | |
NII — Net investment income
LTCG — Long-term capital gain
Of the ordinary distributions made during the year ended December 31, 2010, the following percentages qualify for the dividends received deduction (DRD) available to corporate shareholders:
| ING Fidelity® VIP Contrafund® Portfolio | | | 100.00 | % | |
| ING Fidelity® VIP Equity-Income Portfolio | | | 100.00 | % | |
| ING Fidelity® VIP Mid Cap Portfolio | | | 100.00 | % | |
Above figures may differ from those cited elsewhere in this report due to differences in the calculation of income and gains under U.S. generally accepted accounting principles (book) purposes and Internal Revenue Service (tax) purposes.
Shareholders are strongly advised to consult their own tax advisers with respect to the tax consequences of their investments in the Portfolios. In January, shareholders, excluding corporate shareholders, receive an IRS 1099-DIV regarding the federal tax status of the dividends and distributions they received in the calendar year.
24
DIRECTOR AND OFFICER INFORMATION (UNAUDITED)
The business and affairs of the Company are managed under the direction of the Board. A Director who is not an interested person of the Registrants, as defined in the 1940 Act, is an independent director ("Independent Director"). The Directors and Officers of the Company are listed below. The Statement of Additional Information includes additional information about directors of the Company and is available, without charge, upon request at (800) 992-0180.
Name, Address
and Age | | Position(s)
Held with the
Company | | Term of
Office and
Length of
Time
Served(1) | | Principal
Occupation(s) -
During the
Past 5 Years | | Number of
Funds in
Fund Complex
Overseen
by Director(2) | | Other
Directorships
Held by
Director | |
Colleen D. Baldwin
7337 E. Doubletree Ranch Rd. Suite 100
Scottsdale, Arizona 85258
Age: 50 | | Director | | November 2007 -Present | | President, Glantuam Partners, LLC (January 2009 - Present); and Consultant (January 2005 - Present). | | | 138 | | | None | |
|
John V. Boyer(4)
7337 E. Doubletree Ranch Rd. Suite 100
Scottsdale, Arizona 85258
Age: 57 | | Director | | November 1997 - Present | | President and Chief Executive Officer, Bechtler Arts Foundation, an arts and education foundation, (January 2008 - Present). Formerly, Consultant (July 2007 - February 2008); President and Chief Executive Officer, Franklin and Eleanor Roosevelt Institute, a public policy foundation, (March 2006 - July 2007); and Executive Director, The Mark Twain House & Museum (September 1989 - March 2006). | | | 138 | | | None | |
|
Patricia W. Chadwick
7337 E. Doubletree Ranch Rd.
Suite 100
Scottsdale, Arizona 85258
Age:62 | | Director | | January 2006 - Present | | Consultant and President, Ravengate Partners LLC, a consulting firm that provides advice regarding financial markets and the global economy (January 2000 - Present). | | | 138 | | | Wisconsin Energy Corporation (June 2006 - Present) and The Royce Fund (December 2009 - Present). | |
|
Peter S. Drotch
7337 E. Doubletree Ranch Rd.
Suite 100
Scottsdale, Arizona 85258
Age:68 | | Director | | November 2007 - Present | | Retired. Formerly, Partner, PricewaterhouseCoopers LLP, an accounting firm, until July 2000. | | | 138 | | | First Marblehead Corporation (September 2003 - Present). | |
|
J. Michael Earley
7337 E. Doubletree Ranch Rd.
Suite 100
Scottsdale, Arizona 85258
Age:65 | | Director | | January 2005 - Present | | Retired. Formerly, Banking President and Chief Executive Officer, Bankers Trust Company, N.A., Des Moines (June 1992 - December 2008). | | | 138 | | | None. | |
|
Patrick W. Kenny
7337 E. Doubletree Ranch Rd.
Suite 100
Scottsdale, Arizona 85258
Age:67 | | Director | | March 2002 - Present | | Retired. Formerly, President and Chief Executive Officer, International Insurance Society (June 2001 - June 2009). | | | 138 | | | Assured Guaranty Ltd. (April 2004 - Present). | |
|
Sheryl K. Pressler
7337 E. Doubletree Ranch Rd.
Suite 100
Scottsdale, Arizona 85258
Age:60 | | Director | | January 2006 - Present | | Consultant (May 2001 - Present). | | | 138 | | | Stillwater Mining Company (May 2002 - Present). | |
|
25
DIRECTOR AND OFFICER INFORMATION (UNAUDITED) (CONTINUED)
Name, Address
and Age | | Position(s)
Held with the
Company | | Term of
Office and
Length of
Time
Served(1) | | Principal
Occupation(s) -
During the
Past 5 Years | | Number of
Funds in
Fund Complex
Overseen
by Director(2) | | Other
Directorships
Held by
Director | |
Roger B. Vincent
7337 E. Doubletree Ranch Rd.
Suite 100
Scottsdale, Arizona 85258
Age:65 | | Chairman and Director | | January 2005 - Present | | President, Springwell Corporation, a corporate finance firm (March 1989 - Present). | | | 138 | | | UGI Corporation (February 2006 - Present) and UGI Utilities, Inc. (February 2006 - Present). | |
|
| Directors who are "Interested Persons": | |
|
Robert W. Crispin(5)
7337 E. Doubletree Ranch Rd.
Suite 100
Scottsdale, Arizona 85258
Age:64 | | Director | | November 2007 - Present | | Retired. Chairman and Chief Executive Officer, ING Investment Management Co. (July 2001 - December 2007). | | | 138 | | | Intact Financial Corporation (December 2004 - Present) and PFM Group (November 2010 - Present). | |
|
Shaun P. Mathews(3)(5)
7337 E. Doubletree Ranch Rd.
Suite 100
Scottsdale, Arizona 85258
Age:55 | | Director | | November 2007 - Present | | President and Chief Executive Officer, ING Investments, LLC (November 2006 - Present). Formerly, Head of ING Mutual Funds and Investment Products (November 2004 - November 2006). | | | 175 | | | ING Retirement Holdings, Inc. (September 1998 - Present); ING Services Holding Company, Inc. (May 2000 - Present); ING Financial Advisers, LLC (April 2002 - Present); Southland Life Insurance Company (June 2002 - Present); ING Capital Corporation, LLC and ING Investments Distributor, LLC(7) (December 2005 - Present); ING Funds Services, LLC(8), ING Investments, LLC and ING Pilgrim Funding, Inc. (March 2006 - Present); and Directed Services LLC (December 2006 - Present)(9). | |
|
(1) The tenure of each Director is subject to the Board's retirement policy, which states that each Independent Director shall retire from service as a Director at the conclusion of the first regularly scheduled meeting of the Board that is held after the Director reaches the Age of 72. A unanimous vote of the Board may extend the retirement date of a Director for up to one year. An extension may be permitted if the retirement would trigger a requirement to hold a meeting of shareholders of the Fund under applicable law, whether for purposes of appointing a successor to the Director or if otherwise necessary under applicable law, in which case the extension would apply until such time as the shareholder meeting can be held or is no longer needed.
(2) For the purposes of this table (except for Mr. Mathews),"Fund Complex" means the following investment companies: ING Asia Pacific High Dividend Equity Income Fund, ING Emerging Markets High Dividend Equity Fund; ING Emerging Markets Local Bond Fund; ING Equity Trust; ING Funds Trust; ING Global Equity Dividend and Premium Opportunity Fund; ING Global Advantage and Premium Opportunity Fund; ING Infrastructure, Industrials, and Materials Fund; ING International High Dividend Equity Income Fund; ING Investors Trust; ING Mayflower Trust; ING Mutual Funds; ING Prime Rate Trust; ING Risk Managed Natural Resources Fund; ING Senior Income Fund; ING Separate Portfolios Trust; ING Variable Insurance Trust; ING Variable Products Trust; and ING Partners, Inc.
(3) For Mr. Mathews, the Fund Complex also includes the following investment companies: ING Series Fund, Inc.; ING Strategic Allocation Portfolios, Inc.; ING Variable Funds; ING Variable Portfolios, Inc.; ING Balanced Portfolio, Inc.; ING Intermediate Bond Portfolio; and ING Money Market Portfolio.
(4) Mr. Boyer held a seat on the Board of Directors of The Mark Twain House & Museum from September 1989 to November 2005. ING Groep N.V. makes non-material, charitable contributions to The Mark Twain House & Museum.
(5) Messrs. Mathews and Crispin are deemed to be "interested persons" of the Fund as defined in the 1940 Act because of their relationship with ING Groep, N.V., the parent corporation of the Investment Adviser, Directed Services LLC and the Distributor, ING Investments Distributor, LLC.
(6) ING Investments, LLC was previously named ING Pilgrim Investments, LLC. ING Pilgrim Investments, LLC is the successor in interest to ING Pilgrim Investments, Inc., which was previously known as Pilgrim Investments, Inc. and before it was known as Pilgrim America Investments, Inc.
(7) ING Investments Distributor, LLC was previously named ING Funds Distributor, LLC. ING Funds Distributor, LLC is the successor in interest to ING Funds Distributor, Inc., which was previously known as ING Pilgrim Securities, Inc., and before that, was known as Pilgrim Securities, Inc., and before that was known as Pilgrim America Securities, Inc.
(8) ING Funds Services, LLC was previously named ING Pilgrim Group, LLC. ING Pilgrim Group, LLC is the successor in interest to ING Pilgrim Group, Inc., which was previously known as Pilgrim Group, Inc. and before that, was known as Pilgrim America Group, Inc.
(9) Directed Services LLC is the successor in interest to Directed Services, Inc.
26
DIRECTOR AND OFFICER INFORMATION (UNAUDITED) (CONTINUED)
Name, Address
and Age | | Position(s)
Held with Company | | Term of Office and
Length of Time Served(1) | | Principal Occupation(s) - During the
Past 5 Years | |
Shaun P. Mathews(5)
7337 East Doubletree Ranch Rd.
Suite 100
Scottsdale, Arizona 85258
Age: 55 | | President and Chief Executive Officer | | November 2006 - Present | | President and Chief Executive Officer, ING Investments, LLC (November 2006 - Present). Formerly, Head of ING Mutual Funds and Investment Products (November 2004 - November 2006). | |
|
Michael J. Roland
7337 East Doubletree Ranch Rd.
Suite 100
Scottsdale, Arizona 85258
Age: 52 | | Executive Vice President | | January 2005 - Present | | Executive Vice President and Chief Operating Officer, ING Investments, LLC(2) and ING Funds Services, LLC(3) (January 207 - Present). Formerly, Executive Vice President, Head of Product Management (January 2005 - January 2007). | |
|
Stanley D. Vyner
230 Park Avenue
New York, New York 10169
Age: 60 | | Executive Vice President and Chief Investment Risk Officer | | January 2005 - Present September 2009 - Present | | Executive Vice President, ING Investments, LLC(2) (July 2000 - Present) and Chief Investment Risk Officer, ING Investments, LLC(2) (January 2003 - Present). | |
|
Joseph M. O'Donnell
7337 East Doubletree Ranch Rd.
Suite 100
Scottsdale, Arizona 85258
Age: 56 | | Executive Vice President and Chief Compliance Officer | | March 2006 - Present January 2005 - Present | | Chief Compliance Officer of the ING Funds (November 2004 - Present); Executive Vice President of the ING Funds (March 2006 - Present); Chief Compliance Officer of ING Investments, LLC(2) (March 2006 - July 2008 and October 2009 - Present); and Investment Advisor Chief Compliance Officer, Directed Services LLC(6) (March 2006 - July 2008 and October 2009 - Present). Formerly, Investment Advisor Chief Compliance Officer, ING Life Insurance and Annuity Company (March 2006 - December 2006). | |
|
Todd Modic
7337 East Doubletree Ranch Rd.
Suite 100
Scottsdale, Arizona 85258
Age: 43 | | Senior Vice President, Chief/Principal Financial Officer and Assistant Secretary | | March 2005 - Present | | Senior Vice President, ING Funds Services, LLC(3) (March 2005 - Present). | |
|
Kimberly A. Anderson
7337 East Doubletree Ranch Rd.
Suite 100
Scottsdale, Arizona 85258
Age: 46 | | Senior Vice President | | January 2005 - Present | | Senior Vice President, ING Investments, LLC(2) (October 2003 - Present). | |
|
Robert Terris
7337 East Doubletree Ranch Rd.
Suite 100
Scottsdale, Arizona 85258
Age: 40 | | Senior Vice President | | May 2006 - Present | | Senior Vice President, Head of Division Operations, ING Funds Services, LLC(3) (May 2006 - Present). Formerly, Vice President of Administration, ING Funds Services, LLC(3) (October 2001 - May 2006). | |
|
Robyn L. Ichilov
7337 East Doubletree Ranch Rd.
Suite 100
Scottsdale, Arizona 85258
Age: 43 | | Vice President and Treasurer | | January 2005 - Present | | Vice President and Treasurer, ING Funds Services, LLC(3) (November 1995 - Present) and ING Investments, LLC(2) (August 1997 - Present). | |
|
Lauren D. Bensinger
7337 East Doubletree Ranch Rd.
Suite 100
Scottsdale, Arizona 85258
Age: 56 | | Vice President | | January 2005 - Present | | Vice President, ING Investments, LLC(2) and ING Funds Services, LLC(3) (February 1996 - Present); Director of Compliance, ING Investments, LLC(2) (October 2004 - Present); and Vice President and Money Laundering Reporting Officer, ING Investments Distributor, LLC(4) - April 2010 - Present). Formerly, Chief Compliance Officer, ING Investments Distributor, LLC(4) (August 1995 - April 2010). | |
|
William Evans
10 State House Square
Hartford, Connecticut 06103
Age: 38 | | Vice President | | September 2007 - Present | | Senior Vice President (March 2010 - Present) and Head of Manager Research and Selection Group (April 2007 - Present). Formerly, Vice President, U.S. Mutual Funds and Investment Products (May 2005 - April 2007). | |
|
27
DIRECTOR AND OFFICER INFORMATION (UNAUDITED) (CONTINUED)
Name, Address
and Age | | Position(s)
Held with Company | | Term of Office and
Length of Time Served(1) | | Principal Occupation(s) - During the
Past 5 Years | |
Maria M. Anderson
7337 East Doubletree Ranch Rd.
Suite 100
Scottsdale, Arizona 85258
Age: 52 | | Vice President | | January 2005 - Present | | Vice President, ING Funds Services, LLC(3) (September 2004 - Present). | |
|
Denise Lewis
7337 East Doubletree Ranch Rd.
Suite 100
Scottsdale, Arizona 85258
Age: 47 | | Vice President | | January 2007 - Present | | Vice President, ING Funds Services, LLC (December 2006 - Present). Formerly, Senior Vice President, UMB Investment Services Group, LLC (November 2003 - December 2006). | |
|
Kimberly K. Springer
7337 East Doubletree Ranch Rd.
Suite 100
Scottsdale, Arizona 85258
Age: 53 | | Vice President | | March 2006 - Present | | Vice President, ING Investment Management - ING Funds (March 2010 - Present); Vice President, ING Funds Services, LLC(3) (March 2006 - Present) and Managing Paralegal, Registration Statements (June 2003 - Present). Formerly, Assistant Vice President, ING Funds Services, LLC(3) (August 2004 - March 2006). | |
|
Craig Wheeler
7337 East Doubletree Ranch Rd.
Suite 100
Scottsdale, Arizona 85258
Age: 41 | | Assistant Vice President | | May 2008 - Present | | Assistant Vice President - Director of Tax, ING Funds Services (March 2008 - Present). Formerly, Tax Manager, ING Funds Services (March 2005 - March 2008). | |
|
Huey P. Falgout, Jr.
7337 East Doubletree Ranch Rd.
Suite 100
Scottsdale, Arizona 85258
Age: 47 | | Secretary | | August 2003 - Present | | Senior Vice President and Chief Counsel, ING Investment Management - ING Funds (March 2010 - Present). Formerly, Chief Counsel, ING Americas, U.S. Legal Services (October 2003 - March 2010). | |
|
Theresa K. Kelety
7337 East Doubletree Ranch Rd.
Suite 100
Scottsdale, Arizona 85258
Age: 47 | | Assistant Secretary | | August 2003 - Present | | Vice President and Senior Counsel, ING Investment Management - ING Funds (March 2010 - Present). Formerly, Senior Counsel, ING Americas, U.S. Legal Services (April 2008 - March 2010) and Counsel, ING Americas, U.S. Legal Services (April 2003 - April 2008). | |
|
Kathleen Nichols
7337 East Doubletree Ranch Rd.
Suite 100
Scottsdale, Arizona 85258
Age: 35 | | Assistant Secretary | | May 2008 - Present | | Vice President and Counsel, ING Investment Management - ING Funds (March 2010 - Present). Formerly, Counsel, ING Americas, U.S. Legal Services (February 2008 - March 2010) and Associate, Ropes & Gray LLP (September 2005 - February 2008) | |
|
Paul Caldarelli
7337 East Doubletree Ranch Rd.
Suite 100
Scottsdale, Arizona 85258
Age: 59 | | Assistant Secretary | | June 2010 - Present | | Vice President and Senior Counsel, ING Investment Management - ING Funds (March 2010 - Present). Formerly, Senior Counsel, ING Americas, U.S. Legal Services (April 2008 - March 2010) and Counsel, ING Americas, U.S. Legal Services (May 2005 - April 2008). | |
|
(1) The officers hold office until the next annual meeting of the Trustees and until their successors shall have been elected and qualified.
(2) ING Investments, LLC was previously named ING Pilgrim Investments, LLC. ING Pilgrim Investments, LLC is the successor in interest to ING Pilgrim Investments, Inc., which was previously known as Pilgrim Investments, Inc. and before that was known as Pilgrim America Investments, Inc.
(3) ING Funds Services, LLC was previously named ING Pilgrim Group, LLC. ING Pilgrim Group, LLC is the successor in interest to ING Pilgrim Group, Inc., which was previously known as Pilgrim Group, Inc. and before that was known as Pilgrim America Group, Inc.
(4) ING Investments Distributor, LLC was previously named ING Funds Distributor, LLC. ING Funds Distributor, LLC is the successor in interest to ING Funds Distributor, Inc., which was previously known as ING Pilgrim Securities, Inc., and before that, was known as Pilgrim Securities, Inc., and before that was known as Pilgrim America Securities, Inc.
(5) Mr. Mathews commenced services as CEO and President of the ING Funds on November 11, 2006.
(6) Directed Services LLC is the successor in interest to Directed Services, Inc.
28
ADVISORY CONTRACT APPROVAL DISCUSSION (UNAUDITED)
BOARD CONSIDERATION AND RE-APPROVAL OF INVESTMENT ADVISORY CONTRACTS
Section 15(c) of the Investment Company Act of 1940, as amended (the "1940 Act") provides that, after an initial period, the Portfolios' existing investment advisory contracts will remain in effect only if the Board of Directors (the "Board") of ING Partners, Inc. (the "Company"), including a majority of Board members who have no direct or indirect interest in the advisory contracts, and who are not "interested persons" of the Portfolios, as such term is defined under the 1940 Act (the "Independent Directors"), annually review and approve them. Thus, at a meeting held on November 18, 2010, the Board, including a majority of the Independent Directors, considered whether to renew the investment advisory contracts (the "Advisory Contracts") between Directed Services LLC (the "Adviser") and the Portfolios.
The Independent Directors also held separate meetings on October 21 and November 16, 2010 to consider the renewal of the Advisory Contracts. As a result, subsequent references herein to factors considered and determinations made by the Independent Directors include, as applicable, factors considered and determinations made on those earlier dates by the Independent Directors.
At its November 18, 2010 meeting, the Board voted to renew the Advisory Contracts for the Portfolios. In reaching these decisions, the Board took into account information furnished to it throughout the year at regular meetings of the Board and the Board's committees, as well as information prepared specifically in connection with the annual renewal process. Determinations by the Independent Directors also took into account various factors that they believed, in light of the legal advice furnished to them by K&L Gates LLP ("K&L Gates"), their independent legal counsel, and their own business judgment, to be relevant. Further, while the advisory contracts for all the ING Funds were considered at the same Board meeting, the Directors considered each Portfolio's advisory relationship separately.
Provided below is an overview of the Board's contract approval process in general, as well as a discussion of certain specific factors that the Board considered at its renewal meeting. While the Board gave its attention to the information furnished, at its request, that was most relevant to its considerations, discussed below are a number of the primary factors relevant to the Board's consideration as to whether to renew the Advisory Contracts for the one-year period ending November 30, 2011. Each Board member may have accorded different weight to the various factors in reaching his or her conclusions with respect to each Portfolio's advisory arrangement.
Overview of the Contract Renewal and Approval Process
Several years ago, the Independent Directors instituted a revised process by which they seek and consider relevant information when they decide whether to approve new or existing advisory and arrangements for the investment companies in the ING Funds complex under their jurisdiction, including the Portfolios' existing Advisory Contract. Among other actions, the Independent Directors: retained the services of independent consultants with experience in the mutual fund industry to assist the Independent Directors in working with the personnel employed by the Adviser or its affiliates who administer the Portfolios ("Management") to identify the types of information presented to the Board to inform its deliberations with respect to advisory relationships and to help evaluate that information; established a specific format in which certain requested information is provided to the Board; and determined the process for reviewing such information in connection with Advisory Contract renewals and approvals. The end result was an enhanced process which is currently employed by the Independent Directors to review and analyze information in connection with their annual renewal of the ING Funds' advisory contracts, as well as their review and approval of new advisory relationships.
Since the current renewal and approval process was first implemented, the Board's membership has changed substantially through periodic retirements of some Directors and the appointment and election of new Directors. In addition, throughout this period the Independent Directors have reviewed and refined the renewal and approval process at least annually. The Board also established a Contracts Committee and two Investment Review Committees, including the Domestic Equity Funds Investment Review Committee (the "DE IRC"). Among other matters, the Contracts Committee provides oversight with respect to the contracts renewal and approval process, and each Portfolio is assigned to the DE IRC, which provides oversight regarding, among other matters, investment performance. The Investment Review Committees may apply a heightened level of scrutiny in cases where performance has lagged an ING Fund's relevant benchmark.
The type and format of the information provided to the Board or to legal counsel for the Independent Directors in connection with the contract approval
29
ADVISORY CONTRACT APPROVAL DISCUSSION (UNAUDITED) (CONTINUED)
and renewal process has been codified in the ING Funds' 15(c) Methodology Guide. This Guide was developed under the direction of the Independent Directors and sets out a blueprint pursuant to which the Independent Directors request certain information that they deem important to facilitate an informed review in connection with initial and annual approvals of advisory contracts.
Management provides certain of the information requested by the 15(c) Methodology Guide in Fund Analysis and Comparison Tables ("FACT sheets") prior to the Independent Directors' review of advisory arrangements (including the Portfolios' Advisory Contracts). The Independent Directors previously retained an independent firm to verify and test the accuracy of certain FACT sheet data for a representative sample of funds in the ING Funds complex. In addition, in recent years the Contracts Committee employed the services of an independent consultant to assist in its review and analysis of, among other matters, the 15(c) Methodology Guide, and the content and format of the FACT sheets. As part of an ongoing process, the Contracts Committee recommends or considers recommendations from Management for refinements to the 15(c) Methodology Guide and other aspects of the review process, and the Board's DE IRC reviews benchmarks used to assess the performance of funds in the ING Funds complex.
The Board employed its process for reviewing contracts when considering the renewals of the Portfolios' Advisory Contracts that would be effective through November 30, 2011. Set forth below is a discussion of many of the Board's primary considerations and conclusions resulting from this process.
Nature, Extent and Quality of Service
In determining whether to approve the Advisory Contracts for the Portfolios for the year ending November 30, 2011, the Independent Directors received and evaluated such information as they deemed necessary regarding the nature, extent and quality of services provided to the Portfolios by the Adviser. This included information regarding the Adviser provided throughout the year at regular meetings of the Board and its committees, as well as information furnished in connection with the contract renewal meetings.
The materials requested by and provided to the Board and/or to K&L Gates prior to the November 18, 2010 Board meeting included, among other information, the following items for each Portfolio: (1) FACT sheets that provided information regarding the performance and expenses of the Portfolio, as well as information regarding the Portfolio's investment portfolio, objective and strategies; (2) reports providing risk and attribution analyses of the Portfolio; (3) the 15(c) Methodology Guide, which describes how the FACT sheets were prepared, including the manner in which each Portfolio's benchmark was selected and how profitability was determined; (4) responses from the Adviser to a series of questions posed by K&L Gates on behalf of the Independent Directors; (5) copies of the forms of Advisory Contracts; (6) copies of the Forms ADV for the Adviser; (7) financial statements for the Adviser; (8) a draft of a narrative summary addressing key factors the Board customarily considers in evaluating the renewals of the ING Funds' (including the Portfolio's) advisory contracts, including a written analysis for the Portfolio of how the Portfolios' fees and expenses and how its performance compares to its designated benchmark; (9) independent analyses of Portfolio performance by the Company's Chief Investment Risk Officer; (10) information regarding net asset flows into and out of the Portfolio; and (11) other information relevant to the Board's evaluations.
Each Portfolio operates as a master-feeder fund and fully invests in a corresponding master fund (each a "Master Fund") advised by Fidelity Management and Research Company ("Fidelity"). The Board and/or K&L Gates received the following items with respect to Fidelity: (1) responses from Fidelity to a series of questions posed by K&L Gates on behalf of the Trustees; (2) copies of the Form ADV for Fidelity; (3) financial statements for Fidelity; and (4) other information relevant to the Board's evaluations.
For each Portfolio, Class S shares were used for purposes of certain comparisons. Class S shares generally were selected because it is a Portfolio's share class with the longest performance history. It should be noted that the performance of a Portfolio primarily reflects the performance of the Master Fund in which it invests.
In arriving at its conclusions with respect to the Advisory Contract, the Board was mindful of the "manager-of-managers" platform of the ING Funds that has been developed by Management. The Board noted the resources that the Adviser has committed to the Board and the DE IRC to assist the Board and the DE IRC with their assessment of the investment performance of the Portfolios on an on-going basis throughout the year. This includes the appointment of a Chief Investment Risk Officer and his staff, who report directly to the Board and who have developed attribution analyses and other metrics used by the
30
ADVISORY CONTRACT APPROVAL DISCUSSION (UNAUDITED) (CONTINUED)
Board's Investment Review Committees to analyze the key factors underlying investment performance for the funds in the ING Funds complex. The Board also noted the proactive approach that the Adviser, working in cooperation with the DE IRC, has taken to advocate or recommend, when it believed appropriate, changes designed to assist in improving the Portfolios' performance.
In considering the Portfolios' Advisory Contracts, the Board also considered the extent of benefits provided to the Portfolios' shareholders, beyond advisory services, from being part of the ING family of funds. This includes, in most cases, the right to exchange or transfer investments, without a sales charge, between the same class of shares of such funds or among ING Funds available on a product platform, and the wide range of ING Funds available for exchange or transfer. The Board also took into account the Adviser's efforts in recent years to reduce the expenses of the ING Funds through renegotiated arrangements with the ING Funds' service providers. In addition, the Board considered the efforts of the Adviser and the expenses that it incurred in recent years to help make the ING Funds complex more efficient by combinations of similar funds.
Further, the Board received periodic reports showing that the investment policies and restrictions for each Portfolio were consistently complied with and other periodic reports covering matters such as compliance by Adviser personnel with codes of ethics. The Board considered reports from the Company's Chief Compliance Officer ("CCO") evaluating whether the regulatory compliance systems and procedures of the Adviser are reasonably designed to assure compliance with the federal securities laws. The Board also took into account the CCO's annual and periodic reports and recommendations with respect to service provider compliance programs. In this regard, the Board also considered the policies and procedures developed by the CCO in consultation with the Board's Compliance Committee that guide the CCO's compliance oversight function.
The Board reviewed the level of staffing, quality and experience of each Portfolio's portfolio management team. The Board took into account the respective resources and reputations of the Adviser, and evaluated the ability of the Adviser to attract and retain qualified investment advisory personnel. The Board also considered the adequacy of the resources committed to the Portfolios (and other relevant funds in the ING Funds complex) by the Adviser, and whether those resources are commensurate with the needs of the Portfolios and are sufficient to sustain appropriate levels of performance and compliance needs. In this regard, the Board considered the financial stability of the Adviser.
Based on their deliberations and the materials presented to them, the Board concluded that the advisory and related services provided by the Adviser are appropriate in light of the Portfolios' operations, the competitive landscape of the investment company business, and investor needs, and that the nature and quality of the overall services provided by the Adviser were appropriate.
Portfolio Performance
In assessing advisory relationships, the Board placed emphasis on the net investment returns of each Portfolio. While the Board considered the performance reports and discussions with portfolio managers at Board and committee meetings during the year and discussions with portfolio managers at Board and committee meetings during the year, particular attention in assessing performance was given to the FACT sheets furnished in connection with the renewal process. The FACT sheet prepared for each Portfolio included its investment performance compared to the Portfolio's Morningstar category median and/or Lipper category median, and primary benchmark. The FACT sheet performance data was as of June 30, 2010. In addition, the Board also considered at its November 18, 2010 meeting certain additional data regarding performance and Portfolio asset levels as of September 30, 2010. The Board's findings specific to each Portfolio's performance are discussed under "Portfolio-by-Portfolio Analysis" below.
Economies of Scale
When evaluating the reasonableness of advisory fee rates, the Board also considered whether economies of scale will be realized by the Adviser as a Portfolio grows larger and the extent to which any such economies are reflected in contractual fee rates. In this regard, the Board noted that any breakpoints in the advisory fee schedules applicable to the underlying Master Fund in which each Portfolio invests results in a lower, aggregate advisory fee payable by Portfolio shareholders. As the Portfolio does not have advisory fee breakpoints, but may benefit from waivers or reimbursements of advisory or other fees, the Board also considered the extent to which economies of scale could be realized through waivers, reimbursements or expense reductions. In evaluating fee breakpoint arrangements and economies of scale, the Independent Directors also
31
ADVISORY CONTRACT APPROVAL DISCUSSION (UNAUDITED) (CONTINUED)
considered prior periodic management reports and industry information on this topic.
The Board considered that in recent years many of the Portfolios experienced material declines in assets due to general market declines precipitated by the credit crises and other generally adverse market developments. As a result of these asset declines, the Board considered that there were fewer opportunities for certain of the Portfolios to realize economies of scale.
Information Regarding Services to Other Clients
The Board requested and considered information regarding the nature of services and fee rates offered by the Adviser to other clients, including other registered investment companies and institutional accounts. When fee rates offered to other clients differed materially from those charged to a Portfolio, the Board considered any underlying rationale provided by the Adviser for these differences. The Board also noted that the fee rates charged to the Portfolios and other institutional clients of the Adviser (including other investment companies) may differ materially due to, among other reasons: differences in services; different regulatory requirements associated with registered investment companies, such as the Portfolios, as compared to non-registered investment company clients; market differences in fee rates that existed when a Portfolio first was organized; differences in the original sponsors of Portfolios that now are managed by the Adviser; investment capacity constraints that existed when certain contracts were first agreed upon or that might exist at present; and different pricing structures that are necessary to be competitive in different marketing channels.
Fee Rates and Profitability
The Board reviewed and considered each contractual investment advisory fee rate, combined with the administrative fee rate, payable by each Portfolio to the Adviser. In addition, the Board considered fee waivers and expense limitations applicable to the fees payable by the Portfolios.
The Board considered: (1) the fee structure of each Portfolio as it relates to the services provided under the contracts; and (2) the potential fall-out benefits to the Adviser and its respective affiliates from their association with the Portfolios. For each Portfolio, the Board determined that the fees payable to the Adviser are reasonable for the services that each performs, which were considered in light of the nature and quality of the services that each has performed and is expected to perform.
For each Portfolio, the Board considered information on revenues, costs and profits realized by the Adviser, which was prepared by Management in accordance with the allocation methodology (including related assumptions) specified in the 15(c) Methodology Guide. The Board also considered that there has not yet been a full recovery for many Portfolios from the substantial decline in assets caused by adverse economic conditions in recent years, which, in many cases, has adversely impacted profits realized by the Adviser. In addition, the Board considered information that it requested and was provided by Management with respect to the profitability of service providers affiliated with the Adviser.
The Board recognized that profitability analysis is not an exact science and there is no uniform methodology for determining profitability for this purpose. In this context, the Board realized that Management's calculations regarding its costs incurred in establishing the infrastructure necessary for the Portfolios' operations may not be fully reflected in the expenses allocated to each Portfolio in determining profitability, and that the information presented may not portray all of the costs borne by Management or capture Management's entrepreneurial risk associated with offering and managing a mutual fund complex in the current regulatory and market environment. In addition, the Board recognized that the use of different methodologies for purposes of calculating profit data can give rise to dramatically different profit and loss results.
At the request of the Board, the Adviser has from time to time agreed to implement remedial actions for certain Portfolios. These remedial actions have included, among others: reductions in fee rates; changes in portfolio managers; and strategy modifications.
In making its determinations, the Board based its conclusions on the reasonableness of the advisory fees of the Adviser primarily on the factors described for each Portfolio below.
Portfolio-by-Portfolio Analysis
The following paragraphs outline certain of the specific factors that the Board considered, and the conclusions reached, at its November 18, 2010 meeting in relation to renewing each Portfolio's current Advisory. These specific factors are in addition to those considerations discussed above. In each case, the Portfolio's performance was compared to its Morningstar category median and its primary benchmark, a broad-based securities market index that appears in the Portfolio's prospectus. With
32
ADVISORY CONTRACT APPROVAL DISCUSSION (UNAUDITED) (CONTINUED)
respect to Morningstar quintile rankings, the first quintile represents the highest (best) performance and the fifth quintile represents the lowest performance.
ING Fidelity VIP Contrafund Portfolio
In considering whether to approve the renewal of the Advisory Contract for ING Fidelity VIP Contrafund Portfolio, the Board considered that, based on performance data for the periods ended June 30, 2010: (1) the Portfolio outperformed its Morningstar category median for all periods presented; (2) the Portfolio outperformed its primary benchmark for all periods presented, with the exception of the year-to-date period, during which it underperformed; and (3) the Portfolio is ranked in the first (highest) quintile of its Morningstar category for the one-year and five-year periods, and the second quintile for the most recent calendar quarter, year-to-date, and three-year periods.
In considering the fees payable under the Advisory Contract for the Portfolio, the Board took into account the factors described above and also considered: (1) the fairness of the compensation under an Advisory Contract: (a) under which no advisory fees are charged when the Portfolio is fully invested in Fidelity's VIP Contrafund Portfolio (the "Contrafund Master Fund"); (b) advisory fees are charged by the Contrafund Master Fund and indirectly borne by Portfolio shareholders; and (c) under which an advisory fee would be charged directly to the Portfolio if the Portfolio manages its assets directly rather than through a master-feeder structure; and (2) the pricing structure (including the expense ratio to be borne by shareholders) of the Portfolio.
After its deliberation, the Board reached the following conclusions: (1) the Portfolio's management fee rate is reasonable in the context of all factors considered by the Board; (2) the Portfolio's expense ratio is reasonable in the context of all factors considered by the Board; and (3) the Portfolio's performance is reasonable in the context of all factors considered by the Board. Based on these conclusions and other factors, the Board voted to renew the Advisory Contract for the Portfolio for the year ending November 30, 2011. During this renewal process, different Board members may have given different weight to different individual factors and related conclusions.
ING Fidelity VIP Equity-Income Portfolio
In considering whether to approve the renewal of the Advisory Contract for ING Fidelity VIP Equity-Income Portfolio, the Board considered that, based on performance data for the periods ended June 30, 2010: (1) the Portfolio outperformed its Morningstar category median for the one-year period, but underperformed for all other periods; (2) the Portfolio underperformed its primary benchmark for all periods presented; and (3) the Portfolio is ranked in the second quintile of its Morningstar category for the one-year period, the third quintile for the most recent calendar quarter and year-to-date periods, the fourth quintile for the five-year period, and the fifth (lowest) quintile for the three-year period.
In analyzing this performance data, the Board took into account: (1) Management's analysis of the effect that the Portfolio's underperformance in calendar year 2008 on the Portfolio's performance; (2) Management's expectation that the Portfolio's longer-term performance will improve; and (3) that Management would continue to monitor, and the Board or its Investment Review Committee would periodically review, the Portfolio's investment performance.
In considering the fees payable under the Advisory and Sub-Advisory Contracts for the Portfolio, the Board took into account the factors described above and also considered: (1) the fairness of the compensation under an Advisory Contract: (a) under which no advisory fees are charged when the Portfolio is fully invested in Fidelity's VIP Equity-Income Portfolio (the "Equity-Income Master Fund"); (b) advisory fees are charged by the Equity-Income Master Fund and indirectly borne by Portfolio shareholders; and (c) under which an advisory fee would be charged directly to the Portfolio if the Portfolio manages its assets directly rather than through a master-feeder structure; and (2) the pricing structure (including the expense ratio to be borne by shareholders) of the Portfolio.
After its deliberation, the Board reached the following conclusions: (1) the Portfolio's management fee rate is reasonable in the context of all factors considered by the Board; (2) the Portfolio's expense ratio is reasonable in the context of all factors considered by the Board; and (3) that Management would continue to monitor, and the Board or its Investment Review Committee would periodically review, the Portfolio's investment performance. Based on these conclusions and other factors, the Board voted to renew the Advisory Contract for the Portfolio for the year ending November 30, 2011. During this renewal process, different Board members may have given different weight to different individual factors and related conclusions.
33
ADVISORY CONTRACT APPROVAL DISCUSSION (UNAUDITED) (CONTINUED)
ING Fidelity VIP Mid Cap Portfolio
In considering whether to approve the renewal of the Advisory Contract for ING Fidelity VIP MidCap Portfolio, the Board considered that, based on performance data for the periods ended June 30, 2010: (1) the Portfolio outperformed its Morningstar category median for all periods presented; (2) the Portfolio outperformed its primary benchmark for all periods presented, with the exception of the one-year period, during which it underperformed; and (3) the Portfolio is ranked in the first (highest) quintile of its Morningstar category for the most recent calendar quarter, year-to-date and five-year periods, and the second quintile for the one-year period and three-year periods.
In considering the fees payable under the Advisory Contract for the Portfolio, the Board took into account the factors described above and also considered: (1) the fairness of the compensation under an Advisory Contract: (a) under which no advisory fees are charged when the Portfolio is fully invested in Fidelity's VIP Mid Cap Portfolio (the "Mid Cap Master Fund"); (b) advisory fees are charged by the Mid Cap Master Fund and indirectly borne by Portfolio shareholders; and (c) under which an advisory fee would be charged directly to the Portfolio if the Portfolio manages its assets directly rather than through a master-feeder structure; and (2) the pricing structure (including the expense ratio to be borne by shareholders) of the Portfolio.
After its deliberation, the Board reached the following conclusions: (1) the Portfolio's management fee rate is reasonable in the context of all factors considered by the Board; (2) the Portfolio's expense ratio is reasonable in the context of all factors considered by the Board; and (3) the Portfolio's performance is reasonable in the context of all factors considered by the Board. Based on these conclusions and other factors, the Board voted to renew the Advisory Contract for the Portfolio for the year ending November 30, 2011. During this renewal process, different Board members may have given different weight to different individual factors and related conclusions.
34
Investment Adviser
Directed Services LLC
1475 Dunwoody Drive
West Chester, Pennsylvania 19380
ING Investments, LLC
7337 East Doubletree Ranch Road, Suite 100
Scottsdale, Arizona 85258
Distributor
ING Investments Distributor, LLC
7337 East Doubletree Ranch Road, Suite 100
Scottsdale, Arizona 85258
Transfer Agent
BNY Mellon Investment Servicing (U.S.) Inc.
301 Bellevue Parkway
Wilmington, Delaware 19809
Independent Registered Public Accounting Firm
KPMG LLP
Two Financial Center
60 South Street
Boston, Massachusetts 02111
Custodian
The Bank of New York Mellon
One Wall Street
New York, New York 10286
Legal Counsel
Dechert LLP
1775 I Street, N.W.
Washington, D.C. 20006
Before investing, carefully consider the investment objectives, risks, charges and expenses of the variable annuity contract and the underlying variable investment options. This and other information is contained in the prospectus for the variable annuity contract and the underlying variable investment options. Obtain these prospectuses from your agent/registered representative and read them carefully before investing.
VPAR-UFID (1210-021611)


Annual Report
December 31, 2010
Adviser Class (“ADV”), Initial Class (“I”),
Service Class (“S”), Service 2 Class (“S2”) and Class T
ING Partners, Inc.
| n | ING Solution Aggressive Growth Portfolio |
| n | ING Solution Conservative Portfolio |
| n | ING Solution Growth Portfolio |
| n | ING Solution Income Portfolio |
| n | ING Solution Moderate Portfolio |
| n | ING Solution 2015 Portfolio |
| n | ING Solution 2025 Portfolio |
| n | ING Solution 2035 Portfolio |
| n | ING Solution 2045 Portfolio |
| n | ING Solution 2055 Portfolio |
This report is submitted for general information to shareholders of the ING Funds. It is not authorized for distribution to prospective shareholders unless accompanied or preceded by a prospectus which includes details regarding the funds’ investment objectives, risks, charges, expenses and other information. This information should be read carefully.
MUTUAL FUNDS | 
|
TABLE OF CONTENTS
PROXY VOTING INFORMATION
A description of the policies and procedures that the Portfolios use to determine how to vote proxies related to portfolio securities is available: (1) without charge, upon request, by calling Shareholder Services toll-free at (800) 992-0180; (2) on the ING Funds’ website at www.ingfunds.com; and (3) on the U.S. Securities and Exchange Commission’s (“SEC”) website at www.sec.gov. Information regarding how the Portfolios voted proxies related to portfolio securities during the most recent 12-month period ended June 30 is available without charge on the ING Funds’ website at www.ingfunds.com and on the SEC’s website at www.sec.gov.
QUARTERLY PORTFOLIO HOLDINGS
The Portfolios file their complete schedule of portfolio holdings with the SEC for the first and third quarters of each fiscal year on Form N-Q. The Portfolios’ Forms N-Q are available on the SEC’s website at www.sec.gov. The Portfolios’ Forms N-Q may be reviewed and copied at the SEC’s Public Reference Room in Washington, DC, and information on the operation of the Public Reference Room may be obtained by calling (800) SEC-0330; and is available upon request from the Portfolios by calling Shareholder Services toll-free at (800) 992-0180.
PRESIDENT’S LETTER

Big Picture vs. Details
Dear Shareholder,
On January 25, 2011, President Obama delivered his second State of the Union address. He called on Americans to put aside partisan differences and harness the nation’s creativity to adapt and thrive in a rapidly changing global economy. The president’s challenge is timely: the United States is approaching a nexus of intermediate- and long-term concerns, and the choices we make over the next two years could determine the nation’s competitiveness in the global economy for decades to come.
There are reasons to be optimistic — the International Monetary Fund (“IMF”) predicts the U.S. economy will grow about 3% in 2011. China and India are expected to grow at about 9% and even the euro zone appears to be recovering from crisis; this growth,
however, is being accompanied by mounting inflation pressures in certain regions, suggesting that many economies are expanding at unsustainable rates.
As I write this, the World Economic Forum is getting underway in Davos, Switzerland, and there are numerous concerns to deal with. Chief among them are the still-present risk of sovereign debt defaults in the euro zone; high unemployment and banking problems in the advanced economies; and inflationary pressures in emerging markets, especially with regard to food, fuel and commodities.
As we’ve noted before, uncertainty is a defining characteristic of our age and, in our opinion, is likely to remain so beyond this year. How should you respond within your investment portfolio? Remember that the most important consideration is your long-term goals, not the outlook for 2011. With investment hazards and opportunities everywhere, we believe it makes sense to cast as broad a net as possible around the globe. In our opinion, you want your portfolio to be well diversified so that it is not harmed too much by the trouble spots, and has some exposure to positive trends.
As always, we believe the best approach is a well-diversified portfolio and a well-defined investment plan. As we’ve noted many times before, it’s important to discuss any proposed changes thoroughly with your advisor before taking any action. Thank you for your continued confidence in ING Funds. We look forward to serving your investment needs in the future.
Sincerely,

Shaun Mathews
President and Chief Executive Officer
ING Funds
January 26, 2011
The views expressed in the President’s Letter reflect those of the President as of the date of the letter. Any such views are subject to change at any time based upon market or other conditions and ING Funds disclaims any responsibility to update such views. These views may not be relied on as investment advice and because investment decisions for an ING Fund are based on numerous factors, may not be relied on as an indication of investment intent on behalf of any ING Fund. Reference to specific company securities should not be construed as recommendations or investment advice.
International investing poses special risks including currency fluctuation, economic and political risks not found in investments that are solely domestic.
1
MARKET PERSPECTIVE: YEAR ENDED DECEMBER 31, 2010
In our semi-annual report we described how, after a 13-month advance through mid-April, a confluence of local and world issues sent global equities, in the form of the MSCI World IndexSM measured in local currencies, including net reinvested dividends (“MSCI” for regions discussed below), reeling to a loss for the first half of the fiscal year. In the second half of the year, the MSCI World IndexSM bounced back and for 2010 returned 10.01%. (The MSCI World IndexSM returned 11.76% for the one year ended December 31, 2010, measured in U.S. dollars.) By year end, investor sentiment had turned distinctly positive, despite the grave concerns that remained.
It was a bumpy ride. Markets from stocks to bonds to currencies were continually buffeted by news and events relating to three main themes: the stuttering U.S. economic recovery, the sovereign debt crisis in the Eurozone and growth dynamics in China.
In the U.S., quarterly gross domestic product (“GDP”) growth decelerated from 2.7% (annualized) in the first quarter of 2010 to 1.7% in the second, before recovering to 2.6% in the third. But attention was focused more on employment and housing. The 18-month recession which ended in June of 2009 had cost some 8.7 million jobs. But since then, the unemployment rate had been stuck between 9.4% and 10.1%, barely dented by private sector new jobs averaging 107,000 per month as 2010 ended.
The other weakening link was housing. Sales of new and existing homes collapsed after the expiry in April of a program of tax credits for home buyers and languished thereafter. House prices (based on the S&P/Case-Shiller 20-City Composite Home Price Index), having shown annual increases from February, resumed a downward trend in October with the index still 30% below the peak recorded in April 2006.
To be sure, there were some grounds for optimism as 2010 drew to a close. Consumer spending had risen for five straight months. Investment in equipment and software was growing at double-digit annual percentage rates. On December 30, new unemployment claims were reported below 400,000 for the first time since July 2008. The Federal Reserve in November announced a second round of quantitative easing and would buy $600 billion in Treasury notes and bonds. The mixed mid-term election results forced a “compromise” stimulus package worth an estimated $858 billion for 2011. In combination, these two measures increased the attractiveness of riskier asset classes like equities at the expense of high grade bonds, which sold off.
In the Eurozone, after default was narrowly averted on Greece’s maturing bonds, the creation in May of a European Financial Stabilization “mechanism”, funded with up to €750 billion seemed to calm nerves for a while. But in October, attention turned to Ireland, where the Irish government had injected huge sums into local banks, rendering its own fiscal position untenable. The November 29, 2010 European Union/International Monetary Fund bail-out worth €67.5 billion left markets unimpressed. Suddenly it was May again with downgrades, soaring yields on peripheral Eurozone bonds, fears of contagion, falling stock markets and doubts about the viability of the euro itself. The European Central Bank aggressively bought sovereign bonds and the mood settled. But with Spain’s banks needing to refinance €85 billion of debt in 2011, the issue remains unresolved.
Investors watched nervously as China, the source of much of the world’s growth, wrestled with inflation, which reached 5.1% in November, and a housing bubble. The authorities tightened mortgage requirements, raised banks’ reserve ratio requirements six times in 2010 and interest rates twice in the last quarter. More interest rate increases seem inevitable.
In U.S. fixed income markets, the Barclays Capital U.S. Aggregate Bond Index of investment grade bonds returned 6.54% in 2010. A slight balance towards risk aversion in the first half gave way to improved risk appetite in the second. For the whole year, the Barclays Capital U.S. Treasury index returned 5.87%, underperforming the Barclays Capital Corporate Investment Grade Bond Index with a return of 9.00%, but both fell well short of the Barclays Capital High Yield Bond – 2% Issuer Constrained Composite Index which gained 14.94% for the one year period.
U.S. equities, represented by the S&P 500® Index including dividends, rose 15.06% in 2010, including its best September, a return of 8.92%, since 1939 and best December, a return of 6.68%, since 1991. Prices were supported by strong earnings reports, with operating earnings per share for S&P 500® companies recording four straight quarters of annual growth. Equities also benefited from improved risk appetite through the quantitative easing initiative and stimulus package referred to above.
In currencies, the worst of the gloom about the Eurozone in early June was replaced by renewed pessimism about the dollar in a stalling economy, before markets were seized by another bout of Eurozone angst. For the year, the dollar gained 8.15% against the euro and 2.95% against the pound, but lost 11.59% to the yen, which was sold in the market by the Bank of Japan after breaching 15-year high levels.
In international markets, the MSCI Japan® Index returned just 0.57% for the year after a strong last quarter, as quarterly GDP growth bounced back to 1.1% and the yen retreated from multi-year peaks. The tone of the market was generally poor with household spending fragile and consumer prices down for 21 months. The MSCI Europe ex UK® Index returned 4.84%, with Germany up 15.97% and Portugal, Italy, Ireland, Greece and Spain all falling. This broadly reflected the two-tier economy that has developed, with economic statistics favoring more soundly based countries at the expense of the peripherals. The MSCI UK® Index advanced 12.18%, despite the prospect of severe public spending cuts intended to eliminate an 11% budget deficit. Supporting sentiment was resilient, if perhaps temporary, quarterly GDP growth averaging 0.9% in the second half of the year.
Parentheses denote a negative number.
Past performance does not guarantee future results. The performance quoted represents past performance. Investment return and principal value of an investment will fluctuate, and shares, when redeemed, may be worth more or less than their original cost. The Portfolios’ performance is subject to change since the period’s end and may be lower or higher than the performance data shown. Please call (800) 262-3862 or log on to www.ingfunds.com to obtain performance data current to the most recent month end.
Market Perspective reflects the views of ING’s Chief Investment Risk Officer only through the end of the period, and is subject to change based on market and other conditions.
2
BENCHMARK DESCRIPTIONS
| | |
| Index | | Description |
| MSCI World IndexSM | | An unmanaged index that measures the performance of over 1,400 securities listed on exchanges in the U.S., Europe, Canada, Australia, New Zealand and the Far East. |
S&P/Case-Shiller 20-City Composite Home Price Index | | A composite index of the home price index for the top 20 Metropolitan Statistical Areas in the United States. The index is published monthly by Standard & Poor’s. |
| Barclays Capital U.S. Aggregate Bond Index | | An unmanaged index of publicly issued investment grade U.S. Government, mortgage-backed, asset-backed and corporate debt securities. |
| Barclays Capital U.S. Treasury Index | | An unmanaged index that includes public obligations of the U.S. Treasury. Treasury bills, certain special issues, such as state and local government series bonds (SLGs), as well as U.S. Treasury TIPS and STRIPS, are excluded. |
| Barclays Capital Corporate Investment Grade Bond Index | | The corporate component of the Barclays Capital U.S. Credit Index. The U.S. Credit Index includes publicly-issued U.S. corporate and specified foreign debentures and secured notes that meet the specified maturity, liquidity, and quality requirements. The index includes both corporate and non-corporate sectors. The corporate sectors are industrial, utility and finance, which includes both U.S. and non-U.S. corporations. |
| Barclays Capital High Yield Bond — 2% Issuer Constrained Composite Index | | An unmanaged index that includes all fixed income securities having a maximum quality rating of Ba1, a minimum amount outstanding of $150 million, and at least one year to maturity. |
| S&P 500® Index | | An unmanaged index that measures the performance of securities of approximately 500 large-capitalization companies whose securities are traded on major U.S. stock markets. |
| MSCI Japan® Index | | A free float-adjusted market capitalization index that is designed to measure developed market equity performance in Japan. |
| MSCI Europe ex UK® Index | | A free float-adjusted market capitalization index that is designed to measure developed market equity performance in Europe, excluding the UK. |
| MSCI UK® Index | | A free float-adjusted market capitalization index that is designed to measure developed market equity performance in the UK. |
| S&P Target Risk Moderate Index | | Seeks to measure the performance of an asset allocation strategy targeted to a moderate risk profile. |
| S&P Target Risk Growth Index | | Seeks to measure the performance of an asset allocation strategy targeted to a growth focused risk profile. |
| S&P Target Date Retirement Income Index | | Seeks to represent asset allocations which target an immediate retirement horizon. |
S&P Target Date 2015 Index, S&P Target Date 2025 Index, S&P Target Date 2035 Index, S&P Target Date 2045 Index and S&P Target Date 2045+ Index | | Each seeks to represent the market consensus for asset allocations which target an approximate 2015, 2025, 2035, 2045 and beyond 2045 retirement horizon, respectively. |
3
| | |
| ING SOLUTION PORTFOLIOS | | PORTFOLIO MANAGERS’ REPORT |
The ING Solution Portfolios consist of ING Solution Aggressive Growth Portfolio, ING Solution Conservative Portfolio, ING Solution Growth Portfolio, ING Solution Income Portfolio, ING Solution Moderate Portfolio, ING Solution 2015 Portfolio, ING Solution 2025 Portfolio, ING Solution 2035 Portfolio, ING Solution 2045 Portfolio, and ING Solution 2055 Portfolio (each a “Portfolio” or collectively, the “Portfolios” or the “Solution Portfolios”). Each Portfolio seeks to achieve its investment objective by investing in a combination of other ING Funds (“Underlying Funds”) according to target allocations determined by Directed Services LLC (“DSL” or “Investment Adviser”), under the guidance of an Investment Committee(1)(2). ING Investment Management Co. (“Consultant”) is a consultant to the Investment Adviser. Both the Investment Adviser and the Consultant are indirect, wholly-owned subsidiaries of ING Groep.
Portfolio Specifics: The Investment Adviser uses an asset allocation process to determine each Portfolio’s investment mix. This asset allocation process can be found in the Prospectus. Each Portfolio’s approximate target investment allocations (expressed as a percentage of its net assets) among the asset classes in which the Portfolios invest are set out on page 7. As these are target allocations, the actual allocations of the Portfolios’ assets may deviate from the percentages shown.
Assets will be allocated among the Underlying Funds and markets based on judgments made by DSL. The performance of the Portfolios reflects the performance of the Underlying Funds in which each Portfolio invests and the weightings of each Portfolio’s assets in each Underlying Fund.
There is a risk that the Portfolios may allocate assets to an Underlying Fund or market that underperforms other asset classes. The Portfolios may be underweighted in assets or a market that is experiencing significant returns (or relative outperformance) or overweighted in assets or a market with significant declines (or relative underperformance).
The Investment Committee allocates each Portfolio’s assets among the Underlying Funds based on advice from the Consultant.
2010 was another good year for global equities, although there was a clear performance division between the nations of the “old world” and those that comprise the “new world.” Asia and Latin America served as the world’s growth engine in 2010. Economic growth in developing nations was so strong that inflation started to reemerge as a policy problem. As a consequence of this strong economic activity, emerging markets and developing Asia posted the strongest returns.
Overall, tactical and strategic moves contributed to performance results in 2010. We opened the reporting period with a tactical overweight to commodities. During the first quarter, we moved to a tactical overweight to high-yield bonds and large cap U.S. equity using core fixed income as the funding source. In April, we removed our large cap overweight holding, and moved to neutral, placing the proceeds back into core bonds.
In May, we made a strategic asset allocation change by adding commodities as a long-term holding. This was initiated at a 3% allocation and was funded from equity holdings. Also in May, following the announcement of the joint effort to curb the sovereign debt crisis in Europe, we resumed our overweight position in large cap U.S. equity, selling core bonds. News of continued improvement in the fundamentals of the U.S. economy was overshadowed by the disappointing employment figures, pointing to a potentially slower growth trajectory. It was our view that it was safer, at this juncture, to move back to a neutral equity position in June.
In the third quarter, we made a few tactical moves. In August, we increased exposure to risky asset classes by increasing an already overweight position in high yield bonds using short-duration and core bonds as the funding source. In September, we initiated a modest overweight position in MSCI Europe, Australasia and Far East® (“MSCI EAFE®”) Index growth stocks offset by an underweight in MSCI EAFE® Index value stocks. On a strategic asset allocation basis, bank loans were added to the portfolio in September using core fixed income and short-duration bonds as the funding source.
In the fourth quarter, we decided to close our MSCI EAFE® Index growth overweight and take profits. We closed the period with an overweight position in high yield and an underweight in short duration. We continue to see the overall economic environment of the U.S. economy developing in the direction of a sustainable recovery through an expansion driven more broadly by final demand. Therefore, we continue to favor risky asset classes. We believe high yield offers an attractive income return and is likely to benefit from better-than-expected default performance and credit upgrades.
In ING Solution 2015 Portfolio, we continued to decrease the equity weight as part of our risk mitigating “step down” process throughout the year. These allocation changes are strategic in nature, and are not considered tactical moves.
During the year, ING Solution Income, ING Solution 2025(3), ING Solution Growth and ING Solution Moderate Portfolios outperformed their respective S&P Target Date Indices, while ING Solution 2015, 2035, and 2045 Portfolios lagged, albeit marginally. ING Solution Aggressive Growth, ING Solution Conservative and ING Solution 2055 Portfolios had less than one-year of operating history as of December 31, 2010. Generally, core and short-term bond and emerging market equity investments outperformed their respective asset class benchmarks; high-yield bond and global bond investments underperformed; and domestic equity and developed international equity investment performance was mixed relative to corresponding market indices.
A majority of underlying domestic equity investment of the ING Solution Portfolios underperformed their respective asset class benchmarks during the year. In general, stock selection was a detractor from relative performance, particularly in the financials, consumer discretionary, information technology and materials sectors, offset by positive contributions realized in the consumer staples sector. Overall sector positioning among the underlying investments contributed to relative performance, notably in the health care, materials, telecommunications, industrials and consumer discretionary sectors. The underlying domestic equity funds with the strongest performance relative to their style specific market index included ING Marsico Growth Portfolio and ING MidCap Opportunities Portfolio while the underlying funds with the greatest margin of relative underperformance included ING Pioneer Mid Cap Value Portfolio, ING Thornburg Value Portfolio, ING Davis New York Venture Value Portfolio and ING BlackRock Large Cap Value Portfolio. Allocations to ING BlackRock Large Cap Value Portfolio were eliminated from the Portfolios in August.
Performance among underlying international equity investments was divided in 2010. ING Marsico International Opportunities Portfolio, ING Templeton Foreign Equity Portfolio and ING JPMorgan Emerging Markets Equity Portfolio outperformed their corresponding asset class benchmarks, while ING Artio Foreign Portfolio and ING International Value Portfolio underperformed. Allocations to ING International Value Portfolio were eliminated from the Portfolios in December. Commodities were a positive contributor during the year as the diversified Dow Jones UBS Commodity Index outperformed and/or kept pace with the major equity indices.
Within fixed income, all asset classes contributed on an absolute basis. Core and short-term investments outperformed relative to their respective market indices, while high-yield bond, global bond, and TIPS underperformed.
| (1) | The members of the Investment Committee are: William A. Evans, Paul Zemsky and Heather Hackett. |
| (2) | The investment objective of each Portfolio is described in the Portfolios’ prospectuses, each dated April 30, 2010. |
| (3) | ING Solution 2025 outperformed prior to deduction of expenses. |
Portfolio holdings and characteristics are subject to change and may not be representative of current holdings and characteristics. The outlook for these Portfolios may differ from that presented for other ING Funds. Performance for the different classes of shares will vary based on differences in fees associated with each class.
4
| | |
| PORTFOLIO MANAGERS’ REPORT | | ING SOLUTION PORTFOLIOS |
Current Strategy and Outlook: We believe the base-case scenario for 2011 is that the global economy continues to muddle through an unclear and ever-shifting environment. We believe the divergence between developed and emerging economies will continue, with the former continuing to rebuild while the latter increase their influence on the global stage. However, in our opinion, while the economic expansion is unlikely to feel strong to observers — particularly given recent experiences of more robust post-recession growth — it will be enough to grow earnings and to keep default rates for corporate borrowers low, supporting a variety of risky assets.
Therefore, we believe 2011 will be a positive year for equities, with performance driven by earnings growth, attractive valuations, abundant liquidity and a pickup in corporate spending. In the fixed income space, meanwhile, we think certain strong performers from 2010 — including high yield bonds — will continue their rallies in 2011.
| | | | | | | | | | | | |
| | | |
| | | | | Average Annual Total Returns for the Period Ended December 31, 2010 | | | | | |
| | | | | | 1 Year | | | | |
| | | | | ING Solution Aggressive Growth Portfolio, Class S | | | 9.20 | %(1) | | | | |
| | | | | S&P Target Risk Aggressive Index | | | 9.56 | %(2) | | | | |
| | | | | ING Solution Aggressive Growth Composite Index(3) | | | 9.70 | %(2) | | | | |
| | | | | ING Solution Conservative Portfolio, Class S(1) | | | 5.30 | %(1) | | | | |
| | | | | S&P Target Risk Conservative Index | | | 4.00 | %(2) | | | | |
| | | | | ING Solution Conservative Composite Index(3) | | | 5.60 | %(2) | | | | |
| | | | | ING Solution Growth Portfolio, Class S | | | 12.74 | % | | | | |
| | | | | S&P Target Risk Growth Index | | | 11.18 | % | | | | |
| | | | | ING Solution Growth Composite Index(3) | | | 13.34 | % | | | | |
| | | | | ING Solution Income Portfolio, Class S | | | 9.60 | % | | | | |
| | | | | S&P Target Date Retirement Income Index | | | 9.09 | % | | | | |
| | | | | ING Solution Income Composite Index(3) | | | 9.37 | % | | | | |
| | | | | ING Solution Moderate Portfolio, Class S | | | 11.19 | % | | | | |
| | | | | S&P Target Risk Moderate Index | | | 8.22 | % | | | | |
| | | | | ING Solution Moderate Composite Index(3) | | | 11.30 | % | | | | |
| | | | | ING Solution 2015 Portfolio, Class S | | | 11.25 | % | | | | |
| | | | | S&P Target Date 2015 Index | | | 11.85 | % | | | | |
| | | | | ING Solution 2015 Composite Index(3) | | | 11.53 | % | | | | |
| | | | | ING Solution 2025 Portfolio, Class S | | | 13.79 | % | | | | |
| | | | | S&P Target Date 2025 Index | | | 13.82 | % | | | | |
| | | | | ING Solution 2025 Composite Index(3) | | | 14.48 | % | | | | |
| | | | | ING Solution 2035 Portfolio, Class S | | | 14.56 | % | | | | |
| | | | | S&P Target Date 2035 Index | | | 15.02 | % | | | | |
| | | | | ING Solution 2035 Composite Index(3) | | | 15.49 | % | | | | |
| | | | | ING Solution 2045 Portfolio, Class S | | | 15.12 | % | | | | |
| | | | | S&P Target Date 2045 Index | | | 15.62 | % | | | | |
| | | | | ING Solution 2045 Composite Index(3) | | | 16.33 | % | | | | |
| | | | | ING Solution 2055 Portfolio, Class S | | | 13.27 | %(4) | | | | |
| | | | | S&P Target Date 2045 Index | | | 16.77 | %(2) | | | | |
| | | | | ING Solution 2055 Composite Index(3) | | | 18.19 | %(2) | | | | |
| (1) | Return is for the period from inception on April 30, 2010 through December 31, 2010. |
| (2) | Reflects index performance since the date closest to the Class’ inception for which data is available. |
| (3) | The ING Solution Aggressive Growth Composite Index, ING Solution Conservative Composite Index, ING Solution Growth Composite Index, ING Solution Income Composite Index, ING Solution Moderate Composite Index, ING Solution 2015 Composite Index, ING Solution 2025 Composite Index, ING Solution 2035 Composite Index, ING Solution 2045 Composite Index and ING Solution 2055 Composite Index are each comprised of the asset class indices that correspond to the particular asset classes in which each Portfolio invests and their benchmark weightings. |
| (4) | Return is for the period from inception on March 8, 2010 through December 31, 2010. |
5
| | |
| ING SOLUTION PORTFOLIOS | | PORTFOLIO MANAGERS’ REPORT |
Asset Allocation
as of December 31, 2010
(as a percentage of net assets)
The following table illustrates the net asset allocation of the underlying portfolios as of December 31, 2010 (as a percent of net assets).
| | | | | | | | | | | | | | | | | | | | | | | | | | | | | | | | | | | | | | | | | | | | |
| Affiliated Underlying Funds | | | | | ING
Solution
Aggressive
Growth
Portfolio | | | ING Solution
Conservative
Portfolio | | | ING
Solution
Growth
Portfolio | | | ING
Solution
Income
Portfolio | | | ING
Solution
Moderate
Portfolio | | | ING
Solution
2015
Portfolio | | | ING
Solution
2025
Portfolio | | | ING
Solution
2035
Portfolio | | | ING
Solution
2045
Portfolio | | | ING
Solution
2055
Portfolio | |
ING Artio Foreign Portfolio - Class I | | | % | | | | 9.0 | | | | 2.0 | | | | 6.0 | | | | 2.0 | | | | 5.0 | | | | 4.0 | | | | 7.5 | | | | 7.5 | | | | 9.0 | | | | 9.0 | |
ING Baron Small Cap Growth Portfolio - Class I | | | % | | | | 2.0 | | | | 0.0 | | | | 0.0 | | | | 0.0 | | | | 0.0 | | | | 0.0 | | | | 0.0 | | | | 2.0 | | | | 2.0 | | | | 2.0 | |
ING BlackRock Inflation Protected Bond Portfolio - Class I | | | % | | | | 0.0 | | | | 5.0 | | | | 0.0 | | | | 5.0 | | | | 3.0 | | | | 5.0 | | | | 0.0 | | | | 0.0 | | | | 0.0 | | | | 0.0 | |
ING Clarion Global Real Estate Portfolio - Class I | | | % | | | | 5.0 | | | | 0.0 | | | | 1.5 | | | | 0.0 | | | | 0.0 | | | | 1.5 | | | | 3.5 | | | | 3.5 | | | | 5.0 | | | | 5.0 | |
ING Clarion Real Estate Portfolio - Class I | | | % | | | | 0.0 | | | | 2.9 | | | | 1.5 | | | | 2.9 | | | | 3.0 | | | | 1.5 | | | | 0.5 | | | | 1.5 | | | | 0.0 | | | | 0.0 | |
ING Columbia Small Cap Value Portfolio - Class I | | | % | | | | 2.0 | | | | 0.0 | | | | 0.0 | | | | 0.0 | | | | 0.0 | | | | 0.0 | | | | 0.0 | | | | 2.0 | | | | 2.0 | | | | 2.0 | |
ING Davis New York Venture Portfolio - Class I | | | % | | | | 3.0 | | | | 3.2 | | | | 3.7 | | | | 3.4 | | | | 3.2 | | | | 3.5 | | | | 3.5 | | | | 3.0 | | | | 2.5 | | | | 2.5 | |
ING Equity Dividend Fund - Class I | | | % | | | | 5.5 | | | | 0.0 | | | | 0.0 | | | | 0.0 | | | | 0.0 | | | | 0.0 | | | | 2.5 | | | | 3.5 | | | | 3.5 | | | | 3.5 | |
ING Floating Rate Fund - Class I | | | % | | | | 0.0 | | | | 5.0 | | | | 3.0 | | | | 5.0 | | | | 5.0 | | | | 5.0 | | | | 4.0 | | | | 3.0 | | | | 0.0 | | | | 0.0 | |
ING Global Bond Fund - Class I | | | % | | | | 3.0 | | | | 5.0 | | | | 5.0 | | | | 5.0 | | | | 5.0 | | | | 5.0 | | | | 5.0 | | | | 2.5 | | | | 3.5 | | | | 3.5 | |
ING Goldman Sachs Commodity Strategy Portfolio - Class I | | | % | | | | 3.0 | | | | 3.0 | | | | 3.0 | | | | 3.0 | | | | 3.0 | | | | 3.0 | | | | 3.0 | | | | 3.0 | | | | 3.0 | | | | 3.0 | |
ING Growth and Income Portfolio - Class I | | | % | | | | 7.0 | | | | 7.7 | | | | 9.0 | | | | 8.5 | | | | 7.7 | | | | 8.5 | | | | 8.5 | | | | 7.0 | | | | 6.0 | | | | 6.0 | |
ING Intermediate Bond Portfolio - Class I | | | % | | | | 0.0 | | | | 10.6 | | | | 2.6 | | | | 10.4 | | | | 6.3 | | | | 7.3 | | | | 0.0 | | | | 0.0 | | | | 0.0 | | | | 0.0 | |
ING JPMorgan Emerging Markets Equity Portfolio - Class I | | | % | | | | 7.0 | | | | 0.0 | | | | 2.0 | | | | 0.0 | | | | 0.0 | | | | 0.0 | | | | 3.0 | | | | 5.0 | | | | 7.0 | | | | 7.0 | |
ING Large Cap Growth Portfolio - Class I | | | % | | | | 4.0 | | | | 0.0 | | | | 4.0 | | | | 0.0 | | | | 2.5 | | | | 2.0 | | | | 4.0 | | | | 5.0 | | | | 5.0 | | | | 5.0 | |
ING Limited Maturity Bond Portfolio - Class I | | | % | | | | 0.0 | | | | 13.8 | | | | 3.0 | | | | 12.9 | | | | 8.9 | | | | 3.5 | | | | 0.0 | | | | 0.0 | | | | 0.0 | | | | 0.0 | |
ING Marsico Growth Portfolio - Class I | | | % | | | | 5.0 | | | | 0.0 | | | | 4.0 | | | | 0.0 | | | | 2.5 | | | | 2.0 | | | | 4.5 | | | | 5.0 | | | | 5.0 | | | | 5.0 | |
ING Marsico International Opportunities Portfolio - Class I | | | % | | | | 5.0 | | | | 2.0 | | | | 3.0 | | | | 2.0 | | | | 2.0 | | | | 1.0 | | | | 3.0 | | | | 4.0 | | | | 5.0 | | | | 5.0 | |
ING MidCap Opportunities Portfolio - Class I | | | % | | | | 4.0 | | | | 0.0 | | | | 2.0 | | | | 0.0 | | | | 1.0 | | | | 1.2 | | | | 3.0 | | | | 3.5 | | | | 4.5 | | | | 4.5 | |
ING PIMCO High Yield Portfolio - Class I | | | % | | | | 7.0 | | | | 9.0 | | | | 6.0 | | | | 9.0 | | | | 6.0 | | | | 9.0 | | | | 8.0 | | | | 6.0 | | | | 0.0 | | | | 0.0 | |
ING PIMCO Total Return Bond Portfolio - Class I | | | % | | | | 0.0 | | | | 21.8 | | | | 8.0 | | | | 21.9 | | | | 13.9 | | | | 15.9 | | | | 4.0 | | | | 1.0 | | | | 0.0 | | | | 0.0 | |
ING Pioneer Mid Cap Value Portfolio - Class I | | | % | | | | 4.0 | | | | 0.0 | | | | 2.0 | | | | 0.0 | | | | 1.0 | | | | 1.2 | | | | 3.0 | | | | 3.5 | | | | 4.5 | | | | 4.5 | |
ING Small Company Portfolio - Class I | | | % | | | | 2.9 | | | | 0.0 | | | | 3.9 | | | | 0.0 | | | | 2.0 | | | | 1.9 | | | | 5.9 | | | | 2.9 | | | | 4.9 | | | | 4.9 | |
ING T Rowe Price Capital Appreciation Portfolio - Class I | | | % | | | | 0.0 | | | | 0.0 | | | | 6.5 | | | | 0.0 | | | | 5.0 | | | | 5.0 | | | | 5.0 | | | | 2.0 | | | | 3.5 | | | | 3.5 | |
ING T. Rowe Price Equity Income Portfolio - Class I | | | % | | | | 8.6 | | | | 3.0 | | | | 8.1 | | | | 3.0 | | | | 5.0 | | | | 6.0 | | | | 7.6 | | | | 10.1 | | | | 10.1 | | | | 10.1 | |
ING T. Rowe Price Growth Equity Portfolio - Class I | | | % | | | | 5.0 | | | | 2.0 | | | | 4.0 | | | | 2.0 | | | | 3.0 | | | | 2.5 | | | | 4.5 | | | | 5.0 | | | | 5.5 | | | | 5.5 | |
ING Templeton Foreign Equity Portfolio - Class I | | | % | | | | 6.0 | | | | 2.0 | | | | 6.0 | | | | 2.0 | | | | 4.0 | | | | 2.5 | | | | 4.5 | | | | 6.5 | | | | 7.0 | | | | 7.0 | |
ING Thornburg Value Portfolio - Class I | | | % | | | | 2.0 | | | | 2.0 | | | | 2.2 | | | | 2.0 | | | | 2.0 | | | | 2.0 | | | | 2.0 | | | | 2.0 | | | | 1.5 | | | | 1.5 | |
Other assets and liabilities - Net | | | % | | | | (0.0 | )* | | | (0.0 | )* | | | (0.0 | )* | | | (0.0 | )* | | | (0.0 | )* | | | (0.0 | )* | | | (0.0 | )* | | | (0.0 | )* | | | (0.0 | )* | | | (0.0 | )* |
| | | | | | | | | | | | | | | | | | | | | | | | | | | | | | | | | | | | | | | | | | | | |
| | | % | | | | 100.0 | | | | 100.0 | | | | 100.0 | | | | 100.0 | | | | 100.0 | | | | 100.0 | | | | 100.0 | | | | 100.0 | | | | 100.0 | | | | 100.0 | |
| | | | | | | | | | | | | | | | | | | | | | | | | | | | | | | | | | | | | | | | | | | | |
| * | | Amount is more than (0.05)% |
Portfolio holdings are subject to change daily.
6
| | |
| PORTFOLIO MANAGERS’ REPORT | | ING SOLUTION PORTFOLIOS |
Target Allocations
as of December 31, 2010
(as a percentage of net assets)
| | | | | | | | | | | | | | | | | | | | | | | | | | | | | | | | | | | | | | | | | | | | |
| Target Allocations(1) | | | | | ING
Solution
Aggressive Growth Portfolio | | | ING Solution
Conservative
Portfolio | | | ING
Solution
Growth
Portfolio | | | ING
Solution
Income
Portfolio | | | ING
Solution
Moderate
Portfolio | | | ING
Solution
2015
Portfolio | | | ING
Solution
2025
Portfolio | | | ING
Solution
2035
Portfolio | | | ING
Solution
2045
Portfolio | | | ING
Solution
2055
Portfolio | |
U.S. Large Cap Stocks | | | % | | | | 40.00 | | | | 19.00 | | | | 38.25 | | | | 19.00 | | | | 28.50 | | | | 29.00 | | | | 39.50 | | | | 41.50 | | | | 40.75 | | | | 40.75 | |
U.S. Mid Cap Stocks | | | % | | | | 8.00 | | | | 0.00 | | | | 4.00 | | | | 0.00 | | | | 2.00 | | | | 2.50 | | | | 6.00 | | | | 7.00 | | | | 9.00 | | | | 9.00 | |
U.S. Small Cap Stocks | | | % | | | | 7.00 | | | | 0.00 | | | | 4.00 | | | | 0.00 | | | | 2.00 | | | | 2.00 | | | | 6.00 | | | | 7.00 | | | | 9.00 | | | | 9.00 | |
Non-U.S./International Stocks | | | % | | | | 20.00 | | | | 6.00 | | | | 15.00 | | | | 6.00 | | | | 11.00 | | | | 7.50 | | | | 15.00 | | | | 18.00 | | | | 21.00 | | | | 21.00 | |
Emerging Markets Equity | | | % | | | | 7.00 | | | | 0.00 | | | | 2.00 | | | | 0.00 | | | | 0.00 | | | | 0.00 | | | | 3.00 | | | | 5.00 | | | | 7.00 | | | | 7.00 | |
Domestic Real Estate Investment Trusts (“REITs”) | | | % | | | | 0.00 | | | | 3.00 | | | | 1.50 | | | | 3.00 | | | | 3.00 | | | | 1.50 | | | | 0.50 | | | | 1.50 | | | | 0.00 | | | | 0.00 | |
International REITs | | | % | | | | 5.00 | | | | 0.00 | | | | 1.50 | | | | 0.00 | | | | 0.00 | | | | 1.50 | | | | 3.50 | | | | 3.50 | | | | 5.00 | | | | 5.00 | |
Core Fixed-Income | | | % | | | | 0.00 | | | | 32.00 | | | | 13.75 | | | | 32.00 | | | | 22.50 | | | | 25.50 | | | | 6.50 | | | | 2.00 | | | | 1.75 | | | | 1.75 | |
High Yield Bonds | | | % | | | | 7.00 | | | | 9.00 | | | | 6.00 | | | | 9.00 | | | | 6.00 | | | | 9.00 | | | | 8.00 | | | | 6.00 | | | | 0.00 | | | | 0.00 | |
Short-Term Bonds | | | % | | | | 0.00 | | | | 13.00 | | | | 3.00 | | | | 13.00 | | | | 9.00 | | | | 3.50 | | | | 0.00 | | | | 0.00 | | | | 0.00 | | | | 0.00 | |
Treasury Inflation Protected Securities | | | % | | | | 0.00 | | | | 5.00 | | | | 0.00 | | | | 5.00 | | | | 3.00 | | | | 5.00 | | | | 0.00 | | | | 0.00 | | | | 0.00 | | | | 0.00 | |
Non-U.S. Bond | | | % | | | | 3.00 | | | | 5.00 | | | | 5.00 | | | | 5.00 | | | | 5.00 | | | | 5.00 | | | | 5.00 | | | | 2.50 | | | | 3.50 | | | | 3.50 | |
Commodities | | | % | | | | 3.00 | | | | 3.00 | | | | 3.00 | | | | 3.00 | | | | 3.00 | | | | 3.00 | | | | 3.00 | | | | 3.00 | | | | 3.00 | | | | 3.00 | |
Floating Rate Bonds | | | % | | | | 0.00 | | | | 5.00 | | | | 3.00 | | | | 5.00 | | | | 5.00 | | | | 5.00 | | | | 4.00 | | | | 3.00 | | | | 0.00 | | | | 0.00 | |
| | | | | | | | | | | | | | | | | | | | | | | | | | | | | | | | | | | | | | | | | | | | |
| | | % | | | | 100.00 | | | | 100.00 | | | | 100.00 | | | | 100.00 | | | | 100.00 | | | | 100.00 | | | | 100.00 | | | | 100.00 | | | | 100.00 | | | | 100.00 | |
| | | | | | | | | | | | | | | | | | | | | | | | | | | | | | | | | | | | | | | | | | | | |
| (1) | | Although the Solution Portfolios expect to be fully invested at all times, they may maintain liquidity reserves to meet redemption requests. |
Portfolio holdings are subject to change daily.
7
| | |
| ING SOLUTION AGGRESSIVE GROWTH PORTFOLIO | | PORTFOLIO MANAGERS’ REPORT |
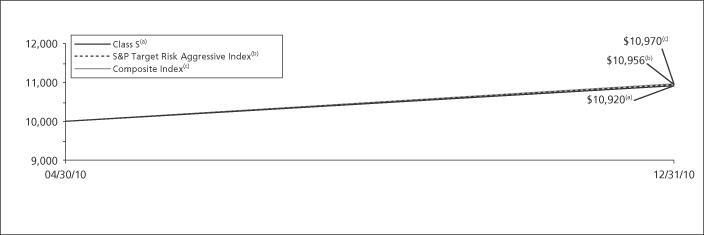
| | | | | | | | | | | | |
| | | |
| | | | | Cumulative Total Returns for the Period Ended December 31, 2010 | | | | | |
| | | | | | Since Inception
of Classes ADV, I, S, and S2
April 30, 2010 | | | | |
| | | | | Class ADV | | | 8.90 | % | | | | |
| | | | | Class I | | | 9.40 | % | | | | |
| | | | | Class S | | | 9.20 | % | | | | |
| | | | | Class S2 | | | 9.10 | % | | | | |
| | | | | S&P Target Risk Aggressive Index | | | 9.56 | %(1) | | | | |
| | | | | Composite Index | | | 9.70 | %(1) | | | | |
Based on a $10,000 initial investment, the graph and table above illustrate the total return of ING Solution Growth and Income Portfolio against the indices indicated. An index is unmanaged and has no cash in its portfolio, imposes no sales charges and incurs no operating expenses. An investor cannot invest directly in an index.
The performance graph and table do not reflect the deduction of taxes that a shareholder will pay on Portfolio distributions or the redemption of Portfolio shares.
The performance shown may include the effect of fee waivers and/or expense reimbursements by the Investment Adviser and/or other service providers, which have the effect of increasing total return. Had all fees and expenses been considered, the total returns would have been lower.
Performance data represents past performance and is no assurance of future results. Investment return and principal value of an investment in the Portfolio will fluctuate. Shares, when sold, may be worth more or less than their original cost. The Portfolio’s current
performance may be lower or higher than the performance data shown. Please log on to www.ingfunds.com or call (800) 262-3862 to get performance through the most recent month end.
It is important to note that the Portfolio has a limited operating history. Performance over a longer period of time may be more meaningful than short-term performance.
This report contains statements that may be “forward-looking” statements. Actual results may differ materially from those projected in the “forward-looking” statements.
The views expressed in this report reflect those of the Investment Adviser, only through the end of the period as stated on the cover. The Investment Adviser’s views are subject to change at any time based on market and other conditions.
Portfolio holdings are subject to change daily.
| (1) | | Since inception performance for the indices is shown from May 1, 2010. |
8
| | |
| PORTFOLIO MANAGERS’ REPORT | | ING SOLUTION CONSERVATIVE PORTFOLIO |
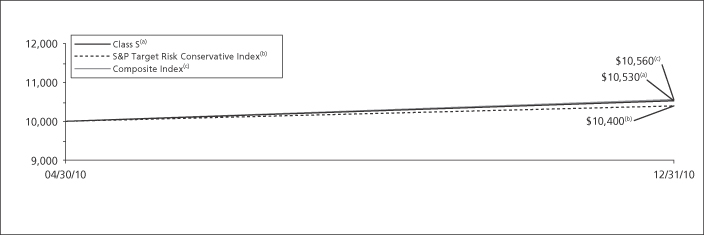
| | | | | | | | | | | | |
| | |
| | | | | Cumulative Total Returns for the Period Ended December 31, 2010 | |
| | | | | | Since Inception
of Classes ADV, I, S, and S2
April 30, 2010 | | | | |
| | | | | Class ADV | | | 5.00 | % | | | | |
| | | | | Class I | | | 5.40 | % | | | | |
| | | | | Class S | | | 5.30 | % | | | | |
| | | | | Class S2 | | | 5.10 | % | | | | |
| | | | | S&P Target Risk Conservative Index | | | 4.00 | %(1) | | | | |
| | | | | Composite Index | | | 5.60 | %(1) | | | | |
Based on a $10,000 initial investment, the graph and table above illustrate the total return of ING Solution Growth and Income Portfolio against the indices indicated. An index is unmanaged and has no cash in its portfolio, imposes no sales charges and incurs no operating expenses. An investor cannot invest directly in an index.
The performance graph and table do not reflect the deduction of taxes that a shareholder will pay on Portfolio distributions or the redemption of Portfolio shares.
The performance shown may include the effect of fee waivers and/or expense reimbursements by the Investment Adviser and/or other service providers, which have the effect of increasing total return. Had all fees and expenses been considered, the total returns would have been lower.
Performance data represents past performance and is no assurance of future results. Investment return and principal value of an investment in the Portfolio will fluctuate. Shares, when sold, may be worth more or less than their original cost. The Portfolio’s current
performance may be lower or higher than the performance data shown. Please log on to www.ingfunds.com or call (800) 262-3862 to get performance through the most recent month end.
It is important to note that the Portfolio has a limited operating history. Performance over a longer period of time may be more meaningful than short-term performance.
This report contains statements that may be “forward-looking” statements. Actual results may differ materially from those projected in the “forward-looking” statements.
The views expressed in this report reflect those of the Investment Adviser, only through the end of the period as stated on the cover. The Investment Adviser’s views are subject to change at any time based on market and other conditions.
Portfolio holdings are subject to change daily.
| (1) | | Since inception performance for the indices is shown from May 1, 2010. |
9
| | |
| ING SOLUTION GROWTH PORTFOLIO | | PORTFOLIO MANAGERS’ REPORT |
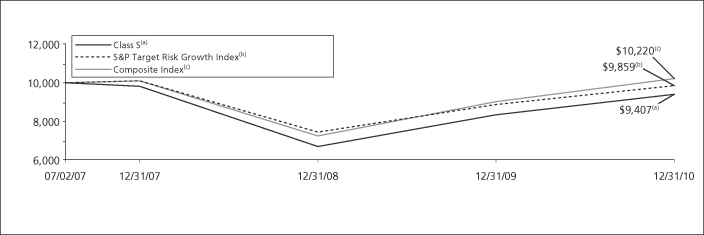
| | | | | | | | | | | | | | | | | | | | |
| | | |
| | | | | Average Annual Total Returns for the Periods Ended December 31, 2010 | | | | | |
| | | | | | 1 Year | | | Since Inception
of Classes ADV, I and S
July 2, 2007 | | | Since Inception
of Class S2
April 30, 2010 | | | | |
| | | | | Class ADV | | | 12.07 | % | | | (2.14 | )% | | | — | | | | | |
| | | | | Class I | | | 13.11 | % | | | (1.44 | )% | | | — | | | | | |
| | | | | Class S | | | 12.74 | % | | | (1.73 | )% | | | — | | | | | |
| | | | | Class S2 | | | — | | | | — | | | | 7.28 | % | | | | |
| | | | | S&P Target Risk Growth Index | | | 11.18 | % | | | (0.41 | )%(1) | | | 6.67 | %(2) | | | | |
| | | | | Composite Index | | | 13.34 | % | | | 0.63 | %(1) | | | 8.02 | %(2) | | | | |
Based on a $10,000 initial investment, the graph and table above illustrate the total return of ING Solution Growth Portfolio against the indices indicated. An index is unmanaged and has no cash in its portfolio, imposes no sales charges and incurs no operating expenses. An investor cannot invest directly in an index.
The performance graph and table do not reflect the deduction of taxes that a shareholder will pay on Portfolio distributions or the redemption of Portfolio shares.
The performance shown may include the effect of fee waivers and/or expense reimbursements by the Investment Adviser and/or other service providers, which have the effect of increasing total return. Had all fees and expenses been considered, the total returns would have been lower.
Performance data represents past performance and is no assurance of future results. Investment return and principal value of an investment in the Portfolio will fluctuate. Shares, when sold, may be worth more or less than their original cost. The Portfolio’s current performance may be lower or higher than the performance data
shown. Please log on to www.ingfunds.com or call (800) 262-3862 to get performance through the most recent month end.
It is important to note that the Portfolio has a limited operating history. Performance over a longer period of time may be more meaningful than short-term performance.
This report contains statements that may be “forward-looking” statements. Actual results may differ materially from those projected in the “forward-looking” statements.
The views expressed in this report reflect those of the Investment Adviser, only through the end of the period as stated on the cover. The Investment Adviser’s views are subject to change at any time based on market and other conditions.
Portfolio holdings are subject to change daily.
| (1) | | Since inception performance for the indices is shown from July 1, 2007. |
| (2) | | Since inception performance for the indices is shown from May 1, 2010. |
10
| | |
| PORTFOLIO MANAGERS’ REPORT | | ING SOLUTION INCOME PORTFOLIO |
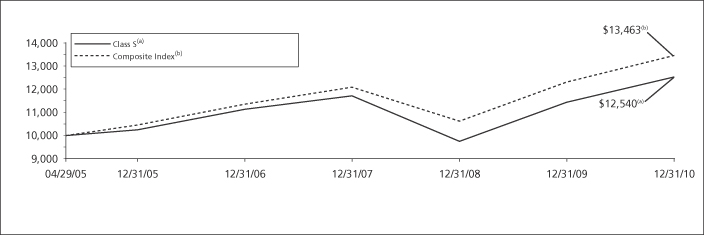
| | | | | | | | | | | | | | | | | | | | | | | | |
| | | |
| | | | | Average Annual Total Returns for the Periods Ended December 31, 2010 | | | | | |
| | | | | | 1 Year | | | Since Inception
of Classes ADV, I and S
April 29, 2005 | | | Since Inception
of Class S2
May 28, 2009 | | | Since Inception
of Class T
August 31, 2005 | | | | |
| | | | | Class ADV | | | 9.26 | % | | | 3.78 | % | | | — | | | | — | | | | | |
| | | | | Class I | | | 9.86 | % | | | 4.34 | % | | | — | | | | — | | | | | |
| | | | | Class S | | | 9.60 | % | | | 4.07 | % | | | — | | | | — | | | | | |
| | | | | Class S2 | | | 9.39 | % | | | — | | | | 14.38 | % | | | — | | | | | |
| | | | | Class T | | | 8.95 | % | | | — | | | | — | | | | 3.28 | % | | | | |
| | | | | S&P Target Date Retirement Income Index | | | 9.09 | % | | | — | | | | 12.11 | %(2) | | | 3.96 | %(3) | | | | |
| | | | | Composite Index | | | 9.37 | % | | | 5.39 | %(1) | | | 12.93 | %(2) | | | 5.06 | %(3) | | | | |
Based on a $10,000 initial investment, the graph and table above illustrate the total return of ING Solution Income Portfolio against the indices indicated. An index is unmanaged and has no cash in its portfolio, imposes no sales charges and incurs no operating expenses. An investor cannot invest directly in an index.
The performance graph and table do not reflect the deduction of taxes that a shareholder will pay on Portfolio distributions or the redemption of Portfolio shares.
The performance shown may include the effect of fee waivers and/or expense reimbursements by the Investment Adviser and/or other service providers, which have the effect of increasing total return. Had all fees and expenses been considered, the total returns would have been lower.
Performance data represents past performance and is no assurance of future results. Investment return and principal value of an investment in the Portfolio will fluctuate. Shares, when sold, may be worth more or less than their original cost. The Portfolio’s current performance may be lower or higher than the performance data shown. Please log on to www.ingfunds.com or call (800) 262-3862 to get performance through the most recent month end.
It is important to note that the Portfolio has a limited operating history. Performance over a longer period of time may be more meaningful than short-term performance.
This report contains statements that may be “forward-looking” statements. Actual results may differ materially from those projected in the “forward-looking” statements.
The views expressed in this report reflect those of the Investment Adviser, only through the end of the period as stated on the cover. The Investment Adviser’s views are subject to change at any time based on market and other conditions.
Portfolio holdings are subject to change daily.
| (1) | | Since inception performance for the indices is shown from May 1, 2005. |
| (2) | | Since inception performance for the indices is shown from June 1, 2009. |
| (3) | | Since inception performance for the indices is shown from September 1, 2005. |
11
| | |
| ING SOLUTION MODERATE PORTFOLIO | | PORTFOLIO MANAGERS’ REPORT |
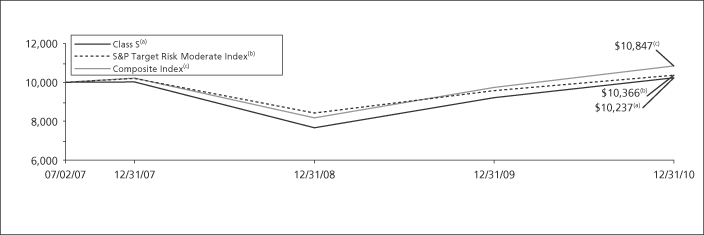
| | | | | | | | | | | | | | | | | | | | |
| | | |
| | | | | Average Annual Total Returns for the Periods Ended December 31, 2010 | | | | | |
| | | | | | 1 Year | | | Since Inception
of Classes ADV, I and S
July 2, 2007 | | | Since Inception
of Class S2
April 30, 2010 | | | | |
| | | | | Class ADV | | | 10.35 | % | | | 0.16 | % | | | — | | | | | |
| | | | | Class I | | | 11.66 | % | | | 1.00 | % | | | — | | | | | |
| | | | | Class S | | | 11.19 | % | | | 0.67 | % | | | — | | | | | |
| | | | | Class S2 | | | — | | | | — | | | | 6.30 | % | | | | |
| | | | | S&P Target Risk Moderate Index | | | 8.22 | % | | | 1.03 | %(1) | | | 5.12 | %(2) | | | | |
| | | | | Composite Index | | | 11.30 | % | | | 2.35 | %(1) | | | 6.73 | %(2) | | | | |
Based on a $10,000 initial investment, the graph and table above illustrate the total return of ING Solution Growth and Income Portfolio against the indices indicated. An index is unmanaged and has no cash in its portfolio, imposes no sales charges and incurs no operating expenses. An investor cannot invest directly in an index.
The performance graph and table do not reflect the deduction of taxes that a shareholder will pay on Portfolio distributions or the redemption of Portfolio shares.
The performance shown may include the effect of fee waivers and/or expense reimbursements by the Investment Adviser and/or other service providers, which have the effect of increasing total return. Had all fees and expenses been considered, the total returns would have been lower.
Performance data represents past performance and is no assurance of future results. Investment return and principal value of an investment in the Portfolio will fluctuate. Shares, when sold, may be worth more or less than their original cost. The Portfolio’s current performance may be lower or higher than the performance data
shown. Please log on to www.ingfunds.com or call (800) 262-3862 to get performance through the most recent month end.
It is important to note that the Portfolio has a limited operating history. Performance over a longer period of time may be more meaningful than short-term performance.
This report contains statements that may be “forward-looking” statements. Actual results may differ materially from those projected in the “forward-looking” statements.
The views expressed in this report reflect those of the Investment Adviser, only through the end of the period as stated on the cover. The Investment Adviser’s views are subject to change at any time based on market and other conditions.
Portfolio holdings are subject to change daily.
| (1) | | Since inception performance for the indices is shown from July 1, 2007. |
| (2) | | Since inception performance for the indices is shown from May 1, 2010. |
12
| | |
| PORTFOLIO MANAGERS’ REPORT | | ING SOLUTION 2015 PORTFOLIO |
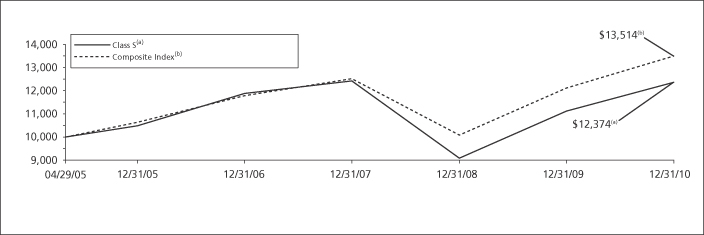
| | | | | | | | | | | | | | | | | | | | | | | | |
| | | |
| | | | | Average Annual Total Returns for the Periods Ended December 31, 2010 | | | | | |
| | | | | | 1 Year | | | Since Inception
of Classes ADV, I and S
April 29, 2005 | | | Since Inception
of Class S2
May 28, 2009 | | | Since Inception
of Class T
August 31, 2005 | | | | |
| | | | | Class ADV | | | 10.82 | % | | | 3.53 | % | | | — | | | | — | | | | | |
| | | | | Class I | | | 11.49 | % | | | 4.09 | % | | | — | | | | — | | | | | |
| | | | | Class S | | | 11.25 | % | | | 3.82 | % | | | — | | | | — | | | | | |
| | | | | Class S2 | | | 11.05 | % | | | — | | | | 18.18 | % | | | — | | | | | |
| | | | | Class T | | | 10.65 | % | | | — | | | | — | | | | 2.65 | % | | | | |
| | | | | S&P Target Date 2015 Index | | | 11.85 | % | | | — | | | | 17.09 | %(2) | | | 4.28 | %(3) | | | | |
| | | | | Composite Index | | | 11.53 | % | | | 5.46 | %(1) | | | 16.41 | %(2) | | | 4.91 | %(3) | | | | |
Based on a $10,000 initial investment, the graph and table above illustrate the total return of ING Solution 2015 Portfolio against the indices indicated. An index is unmanaged and has no cash in its portfolio, imposes no sales charges and incurs no operating expenses. An investor cannot invest directly in an index.
The performance graph and table do not reflect the deduction of taxes that a shareholder will pay on Portfolio distributions or the redemption of Portfolio shares.
The performance shown may include the effect of fee waivers and/or expense reimbursements by the Investment Adviser and/or other service providers, which have the effect of increasing total return. Had all fees and expenses been considered, the total returns would have been lower.
Performance data represents past performance and is no assurance of future results. Investment return and principal value of an investment in the Portfolio will fluctuate. Shares, when sold, may be worth more or less than their original cost. The Portfolio’s current performance may be lower or higher than the performance data shown. Please log on to www.ingfunds.com or call (800) 262-3862 to get performance through the most recent month end.
It is important to note that the Portfolio has a limited operating history. Performance over a longer period of time may be more meaningful than short-term performance.
This report contains statements that may be “forward-looking” statements. Actual results may differ materially from those projected in the “forward-looking” statements.
The views expressed in this report reflect those of the Investment Adviser, only through the end of the period as stated on the cover. The Investment Adviser’s views are subject to change at any time based on market and other conditions.
Portfolio holdings are subject to change daily.
| (1) | | Since inception performance for the indices is shown from May 1, 2005. |
| (2) | | Since inception performance for the indices is shown from June 1, 2009. |
| (3) | | Since inception performance for the indices is shown from September 1, 2005. |
13
| | |
| ING SOLUTION 2025 PORTFOLIO | | PORTFOLIO MANAGERS’ REPORT |
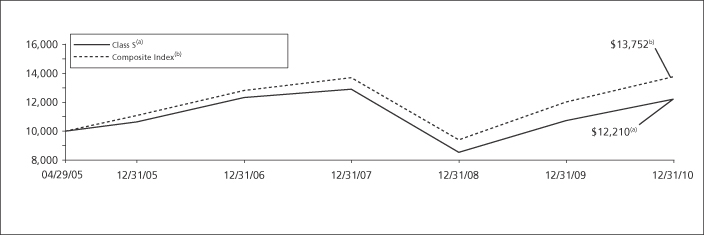
| | | | | | | | | | | | | | | | | | | | | | |
| | | |
| | | | | Average Annual Total Returns for the Periods Ended December 31, 2010 | | | |
| | | | | | 1 Year | | | Since Inception
of Classes ADV, I and S
April 29, 2005 | | | Since Inception
of Class S2
May 28, 2009 | | | Since Inception
of Class T
August 31, 2005 | | | |
| | | | | Class ADV | | | 13.50 | % | | | 3.29 | % | | | — | | | | — | | | |
| | | | | Class I | | | 14.10 | % | | | 3.86 | % | | | — | | | | — | | | |
| | | | | Class S | | | 13.79 | % | | | 3.57 | % | | | — | | | | — | | | |
| | | | | Class S2 | | | 13.59 | % | | | — | | | | 21.57 | % | | | — | | | |
| | | | | Class T | | | 13.28 | % | | | — | | | | — | | | | 2.13 | % | | |
| | | | | S&P Target Date 2025 Index | | | 13.82 | % | | | — | | | | 20.61 | %(2) | | | 4.22 | %(3) | | |
| | | | | Composite Index | | | 14.48 | % | | | 5.78 | %(1) | | | 21.98 | %(2) | | | 4.83 | %(3) | | |
Based on a $10,000 initial investment, the graph and table above illustrate the total return of ING Solution 2025 Portfolio against the indices indicated. An index is unmanaged and has no cash in its portfolio, imposes no sales charges and incurs no operating expenses. An investor cannot invest directly in an index.
The performance graph and table do not reflect the deduction of taxes that a shareholder will pay on Portfolio distributions or the redemption of Portfolio shares.
The performance shown may include the effect of fee waivers and/or expense reimbursements by the Investment Adviser and/or other service providers, which have the effect of increasing total return. Had all fees and expenses been considered, the total returns would have been lower.
Performance data represents past performance and is no assurance of future results. Investment return and principal value of an investment in the Portfolio will fluctuate. Shares, when sold, may be worth more or less than their original cost. The Portfolio’s current performance may be lower or higher than the performance data shown. Please log on to www.ingfunds.com or call (800) 262-3862 to get performance through the most recent month end.
It is important to note that the Portfolio has a limited operating history. Performance over a longer period of time may be more meaningful than short-term performance.
This report contains statements that may be “forward-looking” statements. Actual results may differ materially from those projected in the “forward-looking” statements.
The views expressed in this report reflect those of the Investment Adviser, only through the end of the period as stated on the cover. The Investment Adviser’s views are subject to change at any time based on market and other conditions.
Portfolio holdings are subject to change daily.
| (1) | | Since inception performance for the indices is shown from May 1, 2005. |
| (2) | | Since inception performance for the indices is shown from June 1, 2009. |
| (3) | | Since inception performance for the indices is shown from September 1, 2005. |
14
| | |
| PORTFOLIO MANAGERS’ REPORT | | ING SOLUTION 2035 PORTFOLIO |
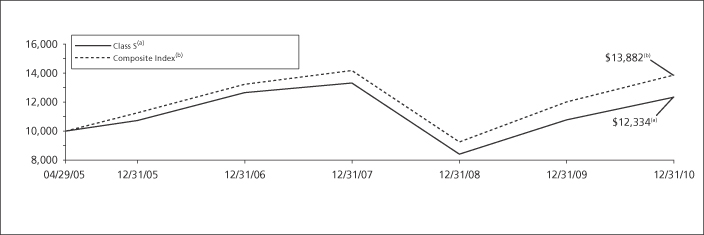
| | | | | | | | | | | | | | | | | | | | | | | | |
| | | |
| | | | | Average Annual Total Returns for the Periods Ended December 31, 2010 | | | | | |
| | | | | | 1 Year | | | Since Inception
of Classes ADV, I and S
April 29, 2005 | | | Since Inception
of Class S2
May 28, 2009 | | | Since Inception
of Class T
August 31, 2005 | | | | |
| | | | | Class ADV | | | 14.29 | % | | | 3.49 | % | | | — | | | | — | | | | | |
| | | | | Class I | | | 14.77 | % | | | 4.03 | % | | | — | | | | — | | | | | |
| | | | | Class S | | | 14.56 | % | | | 3.77 | % | | | — | | | | — | | | | | |
| | | | | Class S2 | | | 14.44 | % | | | — | | | | 23.18 | % | | | — | | | | | |
| | | | | Class T | | | 14.04 | % | | | — | | | | — | | | | 2.22 | % | | | | |
| | | | | S&P Target Date 2035 Index | | | 15.02 | % | | | — | | | | 22.70 | %(2) | | | 3.91 | %(3) | | | | |
| | | | | Composite Index | | | 15.49 | % | | | 5.96 | %(1) | | | 23.89 | %(2) | | | 4.84 | %(3) | | | | |
Based on a $10,000 initial investment, the graph and table above illustrate the total return of ING Solution 2035 Portfolio against the indices indicated. An index is unmanaged and has no cash in its portfolio, imposes no sales charges and incurs no operating expenses. An investor cannot invest directly in an index.
The performance graph and table do not reflect the deduction of taxes that a shareholder will pay on Portfolio distributions or the redemption of Portfolio shares.
The performance shown may include the effect of fee waivers and/or expense reimbursements by the Investment Adviser and/or other service providers, which have the effect of increasing total return. Had all fees and expenses been considered, the total returns would have been lower.
Performance data represents past performance and is no assurance of future results. Investment return and principal value of an investment in the Portfolio will fluctuate. Shares, when sold, may be worth more or less than their original cost. The Portfolio’s current performance may be lower or higher than the performance data shown. Please log on to www.ingfunds.com or call (800) 262-3862 to get performance through the most recent month end.
It is important to note that the Portfolio has a limited operating history. Performance over a longer period of time may be more meaningful than short-term performance.
This report contains statements that may be “forward-looking” statements. Actual results may differ materially from those projected in the “forward-looking” statements.
The views expressed in this report reflect those of the Investment Adviser, only through the end of the period as stated on the cover. The Investment Adviser’s views are subject to change at any time based on market and other conditions.
Portfolio holdings are subject to change daily.
| (1) | | Since inception performance for the indices is shown from May 1, 2005. |
| (2) | | Since inception performance for the indices is shown from June 1, 2009. |
| (3) | | Since inception performance for the indices is shown from September 1, 2005. |
15
| | |
| ING SOLUTION 2045 PORTFOLIO | | PORTFOLIO MANAGERS’ REPORT |
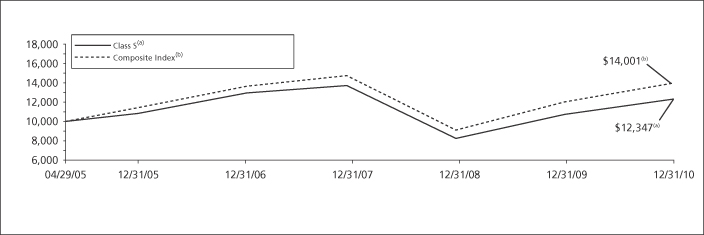
| | | | | | | | | | | | | | | | | | | | | | | | |
| | | |
| | | | | Average Annual Total Returns for the Periods Ended December 31, 2010 | | | | | |
| | | | | | 1 Year | | | Since Inception
of Classes ADV, I and S
April 29, 2005 | | | Since Inception
of Class S2
May 28, 2009 | | | Since Inception
of Class T
August 31, 2005 | | | | |
| | | | | Class ADV | | | 14.92 | % | | | 3.53 | % | | | — | | | | — | | | | | |
| | | | | Class I | | | 15.51 | % | | | 4.06 | % | | | — | | | | — | | | | | |
| | | | | Class S | | | 15.12 | % | | | 3.78 | % | | | — | | | | — | | | | | |
| | | | | Class S2 | | | 15.00 | % | | | — | | | | 24.11 | % | | | — | | | | | |
| | | | | Class T | | | 14.68 | % | | | — | | | | — | | | | 2.02 | % | | | | |
| | | | | S&P Target Date 2045 Index | | | 15.62 | % | | | — | | | | 23.54 | %(2) | | | 3.69 | %(3) | | | | |
| | | | | Composite Index | | | 16.33 | % | | | 6.12 | %(1) | | | 25.47 | %(2) | | | 4.84 | %(3) | | | | |
Based on a $10,000 initial investment, the graph and table above illustrate the total return of ING Solution 2045 Portfolio against the indices indicated. An index is unmanaged and has no cash in its portfolio, imposes no sales charges and incurs no operating expenses. An investor cannot invest directly in an index.
The performance graph and table do not reflect the deduction of taxes that a shareholder will pay on Portfolio distributions or the redemption of Portfolio shares.
The performance shown may include the effect of fee waivers and/or expense reimbursements by the Investment Adviser and/or other service providers, which have the effect of increasing total return. Had all fees and expenses been considered, the total returns would have been lower.
Performance data represents past performance and is no assurance of future results. Investment return and principal value of an investment in the Portfolio will fluctuate. Shares, when sold, may be worth more or less than their original cost. The Portfolio’s current performance may be lower or higher than the performance data shown. Please log on to www.ingfunds.com or call (800) 262-3862 to get performance through the most recent month end.
It is important to note that the Portfolio has a limited operating history. Performance over a longer period of time may be more meaningful than short-term performance.
This report contains statements that may be “forward-looking” statements. Actual results may differ materially from those projected in the “forward-looking” statements.
The views expressed in this report reflect those of the Investment Adviser, only through the end of the period as stated on the cover. The Investment Adviser’s views are subject to change at any time based on market and other conditions.
Portfolio holdings are subject to change daily.
| (1) | | Since inception performance for the indices is shown from May 1, 2005. |
| (2) | | Since inception performance for the indices is shown from June 1, 2009. |
| (3) | | Since inception performance for the indices is shown from September 1, 2005. |
16
| | |
| PORTFOLIO MANAGERS’ REPORT | | ING SOLUTION 2055 PORTFOLIO |
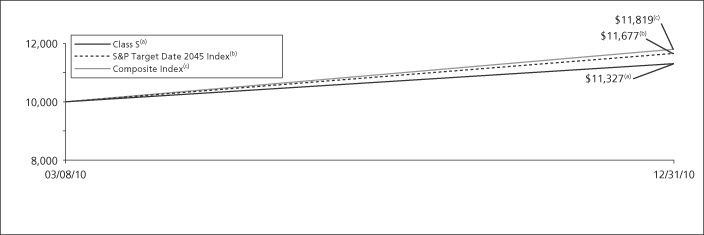
| | | | | | | | | | | | |
| | |
| | | | | Cumulative Total Returns for the Period Ended December 31, 2010 | |
| | | | | | Since Inception
of Classes ADV, I, S, S2 and T
March 8, 2010 | | | | |
| | | | | Class ADV | | | 13.17 | % | | | | |
| | | | | Class I | | | 13.47 | % | | | | |
| | | | | Class S | | | 13.27 | % | | | | |
| | | | | Class S2 | | | 13.17 | % | | | | |
| | | | | Class T | | | 12.87 | % | | | | |
| | | | | S&P Target Date 2045 Index | | | 16.77 | %(1) | | | | |
| | | | | Composite Index | | | 18.19 | %(1) | | | | |
Based on a $10,000 initial investment, the graph and table above illustrate the total return of ING Solution Growth and Income Portfolio against the indices indicated. An index is unmanaged and has no cash in its portfolio, imposes no sales charges and incurs no operating expenses. An investor cannot invest directly in an index.
The performance graph and table do not reflect the deduction of taxes that a shareholder will pay on Portfolio distributions or the redemption of Portfolio shares.
The performance shown may include the effect of fee waivers and/or expense reimbursements by the Investment Adviser and/or other service providers, which have the effect of increasing total return. Had all fees and expenses been considered, the total returns would have been lower.
Performance data represents past performance and is no assurance of future results. Investment return and principal value of an investment in the Portfolio will fluctuate. Shares, when sold, may be worth more or less than their original cost. The Portfolio’s current performance may be lower or higher than the performance data shown. Please log on to www.ingfunds.com or call (800) 262-3862 to get performance through the most recent month end.
It is important to note that the Portfolio has a limited operating history. Performance over a longer period of time may be more meaningful than short-term performance.
This report contains statements that may be “forward-looking” statements. Actual results may differ materially from those projected in the “forward-looking” statements.
The views expressed in this report reflect those of the Investment Adviser, only through the end of the period as stated on the cover. The Investment Adviser’s views are subject to change at any time based on market and other conditions.
Portfolio holdings are subject to change daily.
| (1) | | Since inception performance for the indices is shown from March 1, 2010. |
17
SHAREHOLDER EXPENSE EXAMPLE
| | | | | | | | | | | | | | | | | | | | | | | | | | | | | | | | |
| | | Actual Portfolio Return | | | Hypothetical (5% return before expenses) | |
| | | Beginning
Account
Value
July 1, 2010 | | | Ending
Account
Value
December 31, 2010 | | | Annualized
Expense
Ratio* | | | Expenses Paid
During the
Period Ended
December 31, 2010** | | | Beginning
Account
Value
July 1, 2010 | | | Ending
Account
Value
December 31, 2010 | | | Annualized
Expense
Ratio* | | | Expenses Paid
During the
Period Ended
December 31, 2010** | |
ING Solution Aggressive Growth Portfolio | | | | | | | | | | | | | | | | | |
Class ADV | | $ | 1,000.00 | | | $ | 1,229.10 | | | | 0.62 | % | | $ | 3.48 | | | $ | 1,000.00 | | | $ | 1,022.08 | | | | 0.62 | % | | $ | 3.16 | |
Class I | | | 1,000.00 | | | | 1,233.40 | | | | 0.12 | | | | 0.68 | | | | 1,000.00 | | | | 1,024.60 | | | | 0.12 | | | | 0.61 | |
Class S | | | 1,000.00 | | | | 1,232.50 | | | | 0.37 | | | | 2.08 | | | | 1,000.00 | | | | 1,023.34 | | | | 0.37 | | | | 1.89 | |
Class S2 | | | 1,000.00 | | | | 1,231.40 | | | | 0.52 | | | | 2.92 | | | | 1,000.00 | | | | 1,022.58 | | | | 0.52 | | | | 2.65 | |
ING Solution Conservative Portfolio | | | | | | | | | | | | | | | | | |
Class ADV | | $ | 1,000.00 | | | $ | 1,088.10 | | | | 0.62 | % | | $ | 3.26 | | | $ | 1,000.00 | | | $ | 1,022.08 | | | | 0.62 | % | | $ | 3.16 | |
Class I | | | 1,000.00 | | | | 1,091.10 | | | | 0.12 | | | | 0.63 | | | | 1,000.00 | | | | 1,024.60 | | | | 0.12 | | | | 0.61 | |
Class S | | | 1,000.00 | | | | 1,090.10 | | | | 0.37 | | | | 1.95 | | | | 1,000.00 | | | | 1,023.34 | | | | 0.37 | | | | 1.89 | |
Class S2 | | | 1,000.00 | | | | 1,089.10 | | | | 0.52 | | | | 2.74 | | | | 1,000.00 | | | | 1,022.58 | | | | 0.52 | | | | 2.65 | |
ING Solution Growth Portfolio | | | | | | | | | | | | | | | | | |
Class ADV | | $ | 1,000.00 | | | $ | 1,177.90 | | | | 0.62 | % | | $ | 3.40 | | | $ | 1,000.00 | | | $ | 1,022.08 | | | | 0.62 | % | | $ | 3.16 | |
Class I | | | 1,000.00 | | | | 1,183.60 | | | | 0.12 | | | | 0.66 | | | | 1,000.00 | | | | 1,024.60 | | | | 0.12 | | | | 0.61 | |
Class S | | | 1,000.00 | | | | 1,181.70 | | | | 0.37 | | | | 2.03 | | | | 1,000.00 | | | | 1,023.34 | | | | 0.37 | | | | 1.89 | |
Class S2 | | | 1,000.00 | | | | 1,181.80 | | | | 0.52 | | | | 2.86 | | | | 1,000.00 | | | | 1,022.58 | | | | 0.52 | | | | 2.65 | |
ING Solution Income Portfolio | | | | | | | | | | | | | | | | | |
Class ADV | | $ | 1,000.00 | | | $ | 1,088.40 | | | | 0.62 | % | | $ | 3.26 | | | $ | 1,000.00 | | | $ | 1,022.08 | | | | 0.62 | % | | $ | 3.16 | |
Class I | | | 1,000.00 | | | | 1,092.40 | | | | 0.12 | | | | 0.63 | | | | 1,000.00 | | | | 1,024.60 | | | | 0.12 | | | | 0.61 | |
Class S | | | 1,000.00 | | | | 1,090.70 | | | | 0.37 | | | | 1.95 | | | | 1,000.00 | | | | 1,023.34 | | | | 0.37 | | | | 1.89 | |
Class S2 | | | 1,000.00 | | | | 1,089.70 | | | | 0.52 | | | | 2.74 | | | | 1,000.00 | | | | 1,022.58 | | | | 0.52 | | | | 2.65 | |
Class T | | | 1,000.00 | | | | 1,087.40 | | | | 0.82 | | | | 4.31 | | | | 1,000.00 | | | | 1,021.07 | | | | 0.82 | | | | 4.18 | |
ING Solution Moderate Portfolio | | | | | | | | | | | | | | | | | |
Class ADV | | $ | 1,000.00 | | | $ | 1,129.70 | | | | 0.62 | % | | $ | 3.33 | | | $ | 1,000.00 | | | $ | 1,022.08 | | | | 0.62 | % | | $ | 3.16 | |
Class I | | | 1,000.00 | | | | 1,136.40 | | | | 0.12 | | | | 0.65 | | | | 1,000.00 | | | | 1,024.60 | | | | 0.12 | | | | 0.61 | |
Class S | | | 1,000.00 | | | | 1,134.40 | | | | 0.37 | | | | 1.99 | | | | 1,000.00 | | | | 1,023.34 | | | | 0.37 | | | | 1.89 | |
Class S2 | | | 1,000.00 | | | | 1,134.50 | | | | 0.52 | | | | 2.80 | | | | 1,000.00 | | | | 1,022.58 | | | | 0.52 | | | | 2.65 | |
ING Solution 2015 Portfolio | | | | | | | | | | | | | | | | | |
Class ADV | | $ | 1,000.00 | | | $ | 1,131.80 | | | | 0.62 | % | | $ | 3.33 | | | $ | 1,000.00 | | | $ | 1,022.08 | | | | 0.62 | % | | $ | 3.16 | |
Class I | | | 1,000.00 | | | | 1,136.00 | | | | 0.12 | | | | 0.65 | | | | 1,000.00 | | | | 1,024.60 | | | | 0.12 | | | | 0.61 | |
Class S | | | 1,000.00 | | | | 1,134.80 | | | | 0.37 | | | | 1.99 | | | | 1,000.00 | | | | 1,023.34 | | | | 0.37 | | | | 1.89 | |
Class S2 | | | 1,000.00 | | | | 1,133.10 | | | | 0.52 | | | | 2.80 | | | | 1,000.00 | | | | 1,022.58 | | | | 0.52 | | | | 2.65 | |
Class T | | | 1,000.00 | | | | 1,131.00 | | | | 0.82 | | | | 4.40 | | | | 1,000.00 | | | | 1,021.07 | | | | 0.82 | | | | 4.18 | |
ING Solution 2025 Portfolio | | | | | | | | | | | | | | | | | |
Class ADV | | $ | 1,000.00 | | | $ | 1,198.50 | | | | 0.62 | % | | $ | 3.44 | | | $ | 1,000.00 | | | $ | 1,022.08 | | | | 0.62 | % | | $ | 3.16 | |
Class I | | | 1,000.00 | | | | 1,202.30 | | | | 0.12 | | | | 0.67 | | | | 1,000.00 | | | | 1,024.60 | | | | 0.12 | | | | 0.61 | |
Class S | | | 1,000.00 | | | | 1,200.80 | | | | 0.37 | | | | 2.05 | | | | 1,000.00 | | | | 1,023.34 | | | | 0.37 | | | | 1.89 | |
Class S2 | | | 1,000.00 | | | | 1,199.50 | | | | 0.52 | | | | 2.88 | | | | 1,000.00 | | | | 1,022.58 | | | | 0.52 | | | | 2.65 | |
Class T | | | 1,000.00 | | | | 1,196.90 | | | | 0.82 | | | | 4.54 | | | | 1,000.00 | | | | 1,021.07 | | | | 0.82 | | | | 4.18 | |
| * | | Expense ratios do not include expenses of underlying funds. |
| ** | | Expenses are equal to each Portfolio’s respective annualized expense ratios multiplied by the average account value over the period, multiplied by 184/365 to reflect the most recent fiscal half-year. |
18
SHAREHOLDER EXPENSE EXAMPLE (CONTINUED)
| | | | | | | | | | | | | | | | | | | | | | | | | | | | | | | | |
| | | Actual Portfolio Return | | | Hypothetical (5% return before expenses) | |
| | | Beginning
Account
Value
July 1, 2010 | | | Ending
Account
Value
December 31, 2010 | | | Annualized
Expense
Ratio* | | | Expenses Paid
During the
Period Ended
December 31, 2010** | | | Beginning
Account
Value
July 1, 2010 | | | Ending
Account
Value
December 31, 2010 | | | Annualized
Expense
Ratio* | | | Expenses Paid
During the
Period Ended
December 31, 2010** | |
ING Solution 2035 Portfolio | | | | | | | | | | | | | | | | | |
Class ADV | | $ | 1,000.00 | | | $ | 1,221.90 | | | | 0.62 | % | | $ | 3.47 | | | $ | 1,000.00 | | | $ | 1,022.08 | | | | 0.62 | % | | $ | 3.16 | |
Class I | | | 1,000.00 | | | | 1,225.40 | | | | 0.12 | | | | 0.67 | | | | 1,000.00 | | | | 1,024.60 | | | | 0.12 | | | | 0.61 | |
Class S | | | 1,000.00 | | | | 1,223.80 | | | | 0.37 | | | | 2.07 | | | | 1,000.00 | | | | 1,023.34 | | | | 0.37 | | | | 1.89 | |
Class S2 | | | 1,000.00 | | | | 1,221.50 | | | | 0.52 | | | | 2.91 | | | | 1,000.00 | | | | 1,022.58 | | | | 0.52 | | | | 2.65 | |
Class T | | | 1,000.00 | | | | 1,220.80 | | | | 0.82 | | | | 4.59 | | | | 1,000.00 | | | | 1,021.07 | | | | 0.82 | | | | 4.18 | |
ING Solution 2045 Portfolio | | | | | | | | | | | | | | | | | |
Class ADV | | $ | 1,000.00 | | | $ | 1,239.40 | | | | 0.62 | % | | $ | 3.50 | | | $ | 1,000.00 | | | $ | 1,022.08 | | | | 0.62 | % | | $ | 3.16 | |
Class I | | | 1,000.00 | | | | 1,242.60 | | | | 0.12 | | | | 0.68 | | | | 1,000.00 | | | | 1,024.60 | | | | 0.12 | | | | 0.61 | |
Class S | | | 1,000.00 | | | | 1,240.50 | | | | 0.37 | | | | 2.09 | | | | 1,000.00 | | | | 1,023.34 | | | | 0.37 | | | | 1.89 | |
Class S2 | | | 1,000.00 | | | | 1,240.30 | | | | 0.52 | | | | 2.94 | | | | 1,000.00 | | | | 1,022.58 | | | | 0.52 | | | | 2.65 | |
Class T | | | 1,000.00 | | | | 1,239.00 | | | | 0.82 | | | | 4.63 | | | | 1,000.00 | | | | 1,021.07 | | | | 0.82 | | | | 4.18 | |
ING Solution 2055 Portfolio | | | | | | | | | | | | | | | | | |
Class ADV | | $ | 1,000.00 | | | $ | 1,239.30 | | | | 0.62 | % | | $ | 3.50 | | | $ | 1,000.00 | | | $ | 1,022.08 | | | | 0.62 | % | | $ | 3.16 | |
Class I | | | 1,000.00 | | | | 1,242.60 | | | | 0.12 | | | | 0.68 | | | | 1,000.00 | | | | 1,024.60 | | | | 0.12 | | | | 0.61 | |
Class S | | | 1,000.00 | | | | 1,240.40 | | | | 0.37 | | | | 2.09 | | | | 1,000.00 | | | | 1,023.34 | | | | 0.37 | | | | 1.89 | |
Class S2 | | | 1,000.00 | | | | 1,239.30 | | | | 0.52 | | | | 2.94 | | | | 1,000.00 | | | | 1,022.58 | | | | 0.52 | | | | 2.65 | |
Class T | | | 1,000.00 | | | | 1,237.40 | | | | 0.82 | | | | 4.62 | | | | 1,000.00 | | | | 1,021.07 | | | | 0.82 | | | | 4.18 | |
| * | | Expense ratios do not include expenses of underlying funds. |
| ** | | Expenses are equal to each Portfolio’s respective annualized expense ratios multiplied by the average account value over the period, multiplied by 184/365 to reflect the most recent fiscal half-year. |
19
REPORT OF INDEPENDENT REGISTERED PUBLIC ACCOUNTING FIRM
The Shareholders and Board of Directors
ING Partners, Inc.
We have audited the accompanying statements of assets and liabilities, including the portfolios of investments, of ING Solution Aggressive Growth Portfolio, ING Solution Conservative Portfolio, ING Solution Growth Portfolio, ING Solution Income Portfolio, ING Solution Moderate Portfolio, ING Solution 2015 Portfolio, ING Solution 2025 Portfolio, ING Solution 2035 Portfolio, ING Solution 2045 Portfolio, and ING Solution 2055 Portfolio, each a series of ING Partners, Inc., as of December 31, 2010, and the related statements of operations for the year then ended, the statements of changes in net assets for each of the years in the two-year period then ended, and the financial highlights for each of the years or periods in the five-year period then ended. These financial statements and financial highlights are the responsibility of management. Our responsibility is to express an opinion on these financial statements and financial highlights based on our audits.
We conducted our audits in accordance with the standards of the Public Company Accounting Oversight Board (United States). Those standards require that we plan and perform the audit to obtain reasonable assurance about whether the financial statements and financial highlights are free of material misstatement. An audit includes examining, on a test basis, evidence supporting the amounts and disclosures in the financial statements. Our procedures included confirmation of securities owned as of December 31, 2010, by correspondence with the transfer agent of the underlying funds. An audit also includes assessing the accounting principles used and significant estimates made by management, as well as evaluating the overall financial statement presentation. We believe that our audits provide a reasonable basis for our opinion.
In our opinion, the financial statements and financial highlights referred to above present fairly, in all material respects, the financial position of the aforementioned portfolios as of December 31, 2010, and the results of their operations, the changes in their net assets, and the financial highlights for the periods specified in the first paragraph above, in conformity with U.S. generally accepted accounting principles.
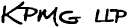
Boston, Massachusetts
February 24, 2011
20
STATEMENTS OF ASSETS AND LIABILITIESASOF DECEMBER 31, 2010
| | | | | | | | | | | | | | | | |
| | | ING
Solution
Aggressive
Growth
Portfolio | | | ING
Solution
Conservative
Portfolio | | | ING
Solution
Growth
Portfolio | | | ING
Solution
Income
Portfolio | |
ASSETS: | | | | | | | | | | | | | | | | |
Investments in affiliated underlying funds* | | $ | 6,259,900 | | | $ | 3,077,003 | | | $ | 9,862,167 | | | $ | 234,866,745 | |
Receivables: | | | | | | | | | | | | | | | | |
Investment securities sold | | | — | | | | — | | | | — | | | | 2,226,693 | |
Fund shares sold | | | 705 | | | | 173 | | | | 2,670 | | | | 105,694 | |
Dividends and interest | | | 4,866 | | | | 2,199 | | | | 4,383 | | | | 179,082 | |
| | | | | | | | | | | | | | | | |
Total assets | | | 6,265,471 | | | | 3,079,375 | | | | 9,869,220 | | | | 237,378,214 | |
| | | | | | | | | | | | | | | | |
LIABILITIES: | | | | | | | | | | | | | | | | |
Payable for investments in affiliated underlying funds | | | 5,560 | | | | 2,333 | | | | 6,981 | | | | 175,986 | |
Payable for fund shares redeemed | | | — | | | | — | | | | — | | | | 2,332,387 | |
Payable to affiliates | | | 2,697 | | | | 1,263 | | | | 3,761 | | | | 93,534 | |
| | | | | | | | | | | | | | | | |
Total liabilities | | | 8,257 | | | | 3,596 | | | | 10,742 | | | | 2,601,907 | |
| | | | | | | | | | | | | | | | |
NET ASSETS | | $ | 6,257,214 | | | $ | 3,075,779 | | | $ | 9,858,478 | | | $ | 234,776,307 | |
| | | | | | | | | | | | | | | | |
NET ASSETS WERE COMPRISED OF: | | | | | | | | | | | | | | | | |
Paid-in capital | | $ | 5,913,537 | | | $ | 3,018,240 | | | $ | 9,299,637 | | | $ | 240,231,304 | |
Undistributed net investment income | | | 20,519 | | | | 29,471 | | | | 67,566 | | | | 9,062,920 | |
Accumulated net realized gain (loss) on investments | | | 44,192 | | | | 14,274 | | | | 85,529 | | | | (30,629,758 | ) |
Net unrealized appreciation on investments | | | 278,966 | | | | 13,794 | | | | 405,746 | | | | 16,111,841 | |
| | | | | | | | | | | | | | | | |
NET ASSETS | | $ | 6,257,214 | | | $ | 3,075,779 | | | $ | 9,858,478 | | | $ | 234,776,307 | |
| | | | | | | | | | | | | | | | |
| | | | | | | | | | | | | | | | |
* Cost of investments in affiliated underlying funds | | $ | 5,980,934 | | | $ | 3,063,209 | | | $ | 9,456,421 | | | $ | 218,754,904 | |
| | | | | | | | | | | | | | | | |
Class ADV: | | | | | | | | | | | | | | | | |
Net assets | | $ | 4,677,267 | | | $ | 1,910,752 | | | $ | 4,836,776 | | | $ | 110,351,954 | |
Shares authorized | | | 100,000,000 | | | | 100,000,000 | | | | 100,000,000 | | | | 100,000,000 | |
Par value | | $ | 0.001 | | | $ | 0.001 | | | $ | 0.001 | | | $ | 0.001 | |
Shares outstanding | | | 429,506 | | | | 181,892 | | | | 527,918 | | | | 10,188,713 | |
Net asset value and redemption price per share | | $ | 10.89 | | | $ | 10.50 | | | $ | 9.16 | | | $ | 10.83 | |
Class I: | | | | | | | | | | | | | | | | |
Net assets | | $ | 3,292 | | | $ | 3,174 | | | $ | 933 | | | $ | 24,509,223 | |
Shares authorized | | | 100,000,000 | | | | 100,000,000 | | | | 100,000,000 | | | | 100,000,000 | |
Par value | | $ | 0.001 | | | $ | 0.001 | | | $ | 0.001 | | | $ | 0.001 | |
Shares outstanding | | | 301 | | | | 301 | | | | 100 | | | | 2,218,755 | |
Net asset value and redemption price per share | | $ | 10.94 | | | $ | 10.54 | | | $ | 9.33 | | | $ | 11.05 | |
Class S: | | | | | | | | | | | | | | | | |
Net assets | | $ | 1,438,417 | | | $ | 1,097,526 | | | $ | 4,729,335 | | | $ | 93,940,072 | |
Shares authorized | | | 100,000,000 | | | | 100,000,000 | | | | 100,000,000 | | | | 100,000,000 | |
Par value | | $ | 0.001 | | | $ | 0.001 | | | $ | 0.001 | | | $ | 0.001 | |
Shares outstanding | | | 131,753 | | | | 104,275 | | | | 512,844 | | | | 8,573,891 | |
Net asset value and redemption price per share | | $ | 10.92 | | | $ | 10.53 | | | $ | 9.22 | | | $ | 10.96 | |
Class S2: | | | | | | | | | | | | | | | | |
Net assets | | $ | 138,238 | | | $ | 64,327 | | | $ | 291,434 | | | $ | 5,542,884 | |
Shares authorized | | | 100,000,000 | | | | 100,000,000 | | | | 100,000,000 | | | | 100,000,000 | |
Par value | | $ | 0.001 | | | $ | 0.001 | | | $ | 0.001 | | | $ | 0.001 | |
Shares outstanding | | | 12,672 | | | | 6,120 | | | | 31,687 | | | | 515,669 | |
Net asset value and redemption price per share | | $ | 10.91 | | | $ | 10.51 | | | $ | 9.20 | | | $ | 10.75 | |
Class T: | | | | | | | | | | | | | | | | |
Net assets | | | n/a | | | | n/a | | | | n/a | | | $ | 432,174 | |
Shares authorized | | | n/a | | | | n/a | | | | n/a | | | | 100,000,000 | |
Par value | | | n/a | | | | n/a | | | | n/a | | | $ | 0.001 | |
Shares outstanding | | | n/a | | | | n/a | | | | n/a | | | | 39,165 | |
Net asset value and redemption price per share | | | n/a | | | | n/a | | | | n/a | | | $ | 11.03 | |
21
STATEMENTS OF ASSETS AND LIABILITIESASOF DECEMBER 31, 2010
| | | | | | | | | | | | |
| | | ING
Solution
Moderate
Portfolio | | | ING Solution 2015
Portfolio | | | ING Solution 2025 Portfolio | |
ASSETS: | | | | | | | | | | | | |
Investments in affiliated underlying funds* | | $ | 9,637,739 | | | $ | 810,295,682 | | | $ | 1,250,624,064 | |
Receivables: | | | | | | | | | | | | |
Investment securities sold | | | — | | | | 8,731,486 | | | | 15,452,272 | |
Fund shares sold | | | 1,758 | | | | 144,222 | | | | 360,740 | |
Dividends and interest | | | 4,931 | | | | 602,441 | | | | 1,000,241 | |
| | | | | | | | | | | | |
Total assets | | | 9,644,428 | | | | 819,773,831 | | | | 1,267,437,317 | |
| | | | | | | | | | | | |
LIABILITIES: | | | | | | | | | | | | |
Payable for investments in affiliated underlying funds | | | 6,584 | | | | 591,915 | | | | 987,342 | |
Payable for fund shares redeemed | | | — | | | | 8,875,708 | | | | 15,813,012 | |
Payable to affiliates | | | 3,233 | | | | 311,897 | | | | 478,186 | |
| | | | | | | | | | | | |
Total liabilities | | | 9,817 | | | | 9,779,520 | | | | 17,278,540 | |
| | | | | | | | | | | | |
NET ASSETS | | $ | 9,634,611 | | | $ | 809,994,311 | | | $ | 1,250,158,777 | |
| | | | | | | | | | | | |
NET ASSETS WERE COMPRISED OF: | | | | | | | | | | | | |
Paid-in capital | | $ | 9,032,503 | | | $ | 836,342,728 | | | $ | 1,276,476,953 | |
Undistributed net investment income | | | 107,704 | | | | 24,308,661 | | | | 25,174,969 | |
Accumulated net realized gain (loss) on investments | | | 150,533 | | | | (143,639,845 | ) | | | (231,654,200 | ) |
Net unrealized appreciation on investments | | | 343,871 | | | | 92,982,767 | | | | 180,161,055 | |
| | | | | | | | | | | | |
NET ASSETS | | $ | 9,634,611 | | | $ | 809,994,311 | | | $ | 1,250,158,777 | |
| | | | | | | | | | | | |
| | | | | | | | | | | | |
* Cost of investments in affiliated underlying funds | | $ | 9,293,868 | | | $ | 717,312,915 | | | $ | 1,070,463,009 | |
| | | | | | | | | | | | |
Class ADV: | | | | | | | | | | | | |
Net assets | | $ | 2,690,206 | | | $ | 336,038,054 | | | $ | 522,320,714 | |
Shares authorized | | | 100,000,000 | | | | 100,000,000 | | | | 100,000,000 | |
Par value | | $ | 0.001 | | | $ | 0.001 | | | $ | 0.001 | |
Shares outstanding | | | 274,726 | | | | 30,760,371 | | | | 47,576,185 | |
Net asset value and redemption price per share | | $ | 9.79 | | | $ | 10.92 | | | $ | 10.98 | |
Class I: | | | | | | | | | | | | |
Net assets | | $ | 1,004 | | | $ | 75,819,782 | | | $ | 126,678,074 | |
Shares authorized | | | 100,000,000 | | | | 100,000,000 | | | | 100,000,000 | |
Par value | | $ | 0.001 | | | $ | 0.001 | | | $ | 0.001 | |
Shares outstanding | | | 100 | | | | 6,808,325 | | | | 11,304,293 | |
Net asset value and redemption price per share | | $ | 10.04 | | | $ | 11.14 | | | $ | 11.21 | |
Class S: | | | | | | | | | | | | |
Net assets | | $ | 6,911,412 | | | $ | 380,318,387 | | | $ | 574,267,191 | |
Shares authorized | | | 100,000,000 | | | | 100,000,000 | | | | 100,000,000 | |
Par value | | $ | 0.001 | | | $ | 0.001 | | | $ | 0.001 | |
Shares outstanding | | | 697,218 | | | | 34,429,075 | | | | 51,702,228 | |
Net asset value and redemption price per share | | $ | 9.91 | | | $ | 11.05 | | | $ | 11.11 | |
Class S2: | | | | | | | | | | | | |
Net assets | | $ | 31,989 | | | $ | 15,289,463 | | | $ | 20,677,572 | |
Shares authorized | | | 100,000,000 | | | | 100,000,000 | | | | 100,000,000 | |
Par value | | $ | 0.001 | | | $ | 0.001 | | | $ | 0.001 | |
Shares outstanding | | | 3,232 | | | | 1,410,806 | | | | 1,893,964 | |
Net asset value and redemption price per share | | $ | 9.90 | | | $ | 10.84 | | | $ | 10.92 | |
Class T: | | | | | | | | | | | | |
Net assets | | | n/a | | | $ | 2,528,625 | | | $ | 6,215,226 | |
Shares authorized | | | n/a | | | | 100,000,000 | | | | 100,000,000 | |
Par value | | | n/a | | | $ | 0.001 | | | $ | 0.001 | |
Shares outstanding | | | n/a | | | | 229,037 | | | | 561,745 | |
Net asset value and redemption price per share | | | n/a | | | $ | 11.04 | | | $ | 11.06 | |
See Accompanying Notes to Financial Statements
22
STATEMENTS OF ASSETS AND LIABILITIESASOF DECEMBER 31, 2010
| | | | | | | | | | | | |
| | | ING Solution 2035 Portfolio | | | ING Solution 2045
Portfolio | | | ING
Solution
2055
Portfolio | |
ASSETS: | | | | | | | | | | | | |
Investments in affiliated underlying funds* | | $ | 1,069,858,766 | | | $ | 686,913,131 | | | $ | 10,571,816 | |
Receivables: | | | | | | | | | | | | |
Investment securities sold | | | 7,390,083 | | | | 3,452,134 | | | | — | |
Fund shares sold | | | 250,316 | | | | 182,349 | | | | 37,595 | |
Dividends and interest | | | 755,814 | | | | 169,872 | | | | 2,594 | |
| | | | | | | | | | | | |
Total assets | | | 1,078,254,979 | | | | 690,717,486 | | | | 10,612,005 | |
| | | | | | | | | | | | |
LIABILITIES: | | | | | | | | | | | | |
Payable for investments in affiliated underlying funds | | | 747,613 | | | | 169,872 | | | | 26,237 | |
Payable for fund shares redeemed | | | 7,640,400 | | | | 3,634,483 | | | | 13,953 | |
Payable to affiliates | | | 406,952 | | | | 251,797 | | | | 3,488 | |
| | | | | | | | | | | | |
Total liabilities | | | 8,794,965 | | | | 4,056,152 | | | | 43,678 | |
| | | | | | | | | | | | |
NET ASSETS | | $ | 1,069,460,014 | | | $ | 686,661,334 | | | $ | 10,568,327 | |
| | | | | | | | | | | | |
NET ASSETS WERE COMPRISED OF: | | | | | | | | | | | | |
Paid-in capital | | $ | 1,074,060,494 | | | $ | 675,166,090 | | | $ | 9,627,117 | |
Undistributed net investment income | | | 15,789,353 | | | | 7,691,967 | | | | 67,633 | |
Accumulated net realized gain (loss) on investments | | | (175,420,058 | ) | | | (109,595,316 | ) | | | 17,028 | |
Net unrealized appreciation on investments | | | 155,030,225 | | | | 113,398,593 | | | | 856,549 | |
| | | | | | | | | | | | |
NET ASSETS | | $ | 1,069,460,014 | | | $ | 686,661,334 | | | $ | 10,568,327 | |
| | | | | | | | | | | | |
| | | | | | | | | | | | |
* Cost of investments in affiliated underlying funds | | $ | 914,828,541 | | | $ | 573,514,538 | | | $ | 9,715,267 | |
| | | | | | | | | | | | |
Class ADV: | | | | | | | | | | | | |
Net assets | | $ | 453,363,208 | | | $ | 262,652,634 | | | $ | 3,923,049 | |
Shares authorized | | | 100,000,000 | | | | 100,000,000 | | | | 100,000,000 | |
Par value | | $ | 0.001 | | | $ | 0.001 | | | $ | 0.001 | |
Shares outstanding | | | 40,503,591 | | | | 23,266,479 | | | | 345,964 | |
Net asset value and redemption price per share | | $ | 11.19 | | | $ | 11.29 | | | $ | 11.34 | |
Class I: | | | | | | | | | | | | |
Net assets | | $ | 115,744,052 | | | $ | 88,176,043 | | | $ | 1,647,962 | |
Shares authorized | | | 100,000,000 | | | | 100,000,000 | | | | 100,000,000 | |
Par value | | $ | 0.001 | | | $ | 0.001 | | | $ | 0.001 | |
Shares outstanding | | | 10,142,411 | | | | 7,663,415 | | | | 144,883 | |
Net asset value and redemption price per share | | $ | 11.41 | | | $ | 11.51 | | | $ | 11.37 | |
Class S: | | | | | | | | | | | | |
Net assets | | $ | 477,985,052 | | | $ | 319,162,898 | | | $ | 4,716,619 | |
Shares authorized | | | 100,000,000 | | | | 100,000,000 | | | | 100,000,000 | |
Par value | | $ | 0.001 | | | $ | 0.001 | | | $ | 0.001 | |
Shares outstanding | | | 42,217,264 | | | | 27,989,423 | | | | 415,407 | |
Net asset value and redemption price per share | | $ | 11.32 | | | $ | 11.40 | | | $ | 11.35 | |
Class S2: | | | | | | | | | | | | |
Net assets | | $ | 18,369,401 | | | $ | 14,340,974 | | | $ | 274,851 | |
Shares authorized | | | 100,000,000 | | | | 100,000,000 | | | | 100,000,000 | |
Par value | | $ | 0.001 | | | $ | 0.001 | | | $ | 0.001 | |
Shares outstanding | | | 1,657,163 | | | | 1,276,312 | | | | 24,231 | |
Net asset value and redemption price per share | | $ | 11.08 | | | $ | 11.24 | | | $ | 11.34 | |
Class T: | | | | | | | | | | | | |
Net assets | | $ | 3,998,301 | | | $ | 2,328,785 | | | $ | 5,846 | |
Shares authorized | | | 100,000,000 | | | | 100,000,000 | | | | 100,000,000 | |
Par value | | $ | 0.001 | | | $ | 0.001 | | | $ | 0.001 | |
Shares outstanding | | | 352,825 | | | | 205,240 | | | | 517 | |
Net asset value and redemption price per share | | $ | 11.33 | | | $ | 11.35 | | | $ | 11.31 | |
See Accompanying Notes to Financial Statements
23
STATEMENTS OF OPERATIONS
| | | | | | | | | | | | | | | | |
| | | ING Solution Aggressive Growth Portfolio | | | ING Solution Conservative Portfolio | | | ING Solution Growth Portfolio | | | ING Solution Income Portfolio | |
| | | April 30,
2010(1) to December 31, 2010 | | | April 30,
2010(1) to December 31, 2010 | | | Year Ended December 31, 2010 | | | Year Ended December 31, 2010 | |
INVESTMENT INCOME: | | | | | | | | | | | | | | | | |
Dividends from affiliated underlying funds | | $ | 24,984 | | | $ | 30,985 | | | $ | 72,702 | | | $ | 8,522,489 | |
| | | | | | | | | | | | | | | | |
Total investment income | | | 24,984 | | | | 30,985 | | | | 72,702 | | | | 8,522,489 | |
| | | | | | | | | | | | | | | | |
EXPENSES: | | | | | | | | | | | | | | | | |
Investment management fees | | | 1,189 | | | | 577 | | | | 2,481 | | | | 225,953 | |
Distribution and service fees: | | | | | | | | | | | | | | | | |
Class ADV | | | 4,092 | | | | 1,584 | | | | 3,804 | | | | 537,970 | |
Class S | | | 827 | | | | 622 | | | | 4,121 | | | | 230,113 | |
Class S2 | | | 188 | | | | 48 | | | | 352 | | | | 19,380 | |
Class T | | | — | | | | — | | | | — | | | | 3,768 | |
Administrative service fees | | | 238 | | | | 116 | | | | 496 | | | | 45,188 | |
Miscellaneous expense | | | — | | | | — | | | | — | | | | 303 | |
| | | | | | | | | | | | | | | | |
Total expenses | | | 6,534 | | | | 2,947 | | | | 11,254 | | | | 1,062,675 | |
Net waived and reimbursed fees | | | (38 | ) | | | (10 | ) | | | (71 | ) | | | (4,127 | ) |
| | | | | | | | | | | | | | | | |
Net expenses | | | 6,496 | | | | 2,937 | | | | 11,183 | | | | 1,058,548 | |
| | | | | | | | | | | | | | | | |
Net investment income | | | 18,488 | | | | 28,048 | | | | 61,519 | | | | 7,463,941 | |
| | | | | | | | | | | | | | | | |
REALIZED AND UNREALIZED GAIN ON INVESTMENTS AND FUTURES | | | | | | | | | | | | | | | | |
Capital gain distributions from affiliated underlying funds | | | 2,071 | | | | 1,421 | | | | 7,342 | | | | 1,731,267 | |
Net realized gain on sale of affiliated underlying funds | | | 44,144 | | | | 14,268 | | | | 126,365 | | | | 8,830,175 | |
| | | | | | | | | | | | | | | | |
Net realized gain on affiliated underlying funds | | | 46,215 | | | | 15,689 | | | | 133,707 | | | | 10,561,442 | |
Net change in unrealized appreciation or depreciation on affiliated underlying funds | | | 278,966 | | | | 13,794 | | | | 338,985 | | | | 2,468,751 | |
| | | | | | | | | | | | | | | | |
Net realized and unrealized gain on affiliated underlying funds | | | 325,181 | | | | 29,483 | | | | 472,692 | | | | 13,030,193 | |
| | | | | | | | | | | | | | | | |
Increase in net assets resulting from operations | | $ | 343,669 | | | $ | 57,531 | | | $ | 534,211 | | | $ | 20,494,134 | |
| | | | | | | | | | | | | | | | |
| (1) | | Commencement of operations |
See Accompanying Notes to Financial Statements
24
STATEMENTS OF OPERATIONSFORTHE YEAR ENDED DECEMBER 31, 2010
| | | | | | | | | | | | |
| | | ING
Solution
Moderate
Portfolio | | | ING
Solution
2015
Portfolio | | | ING Solution
2025
Portfolio | |
INVESTMENT INCOME: | | | | | | | | | | | | |
Dividends from affiliated underlying funds | | $ | 107,794 | | | $ | 24,060,980 | | | $ | 27,918,155 | |
| | | | | | | | | | | | |
Total investment income | | | 107,794 | | | | 24,060,980 | | | | 27,918,155 | |
| | | | | | | | | | | | |
EXPENSES: | | | | | | | | | | | | |
Investment management fees | | | 3,260 | | | | 755,742 | | | | 1,128,610 | |
Distribution and service fees: | | | | | | | | | | | | |
Class ADV | | | 1,720 | | | | 1,588,458 | | | | 2,378,724 | |
Class S | | | 7,276 | | | | 888,131 | | | | 1,302,739 | |
Class S2 | | | 36 | | | | 49,370 | | | | 64,980 | |
Class T | | | — | | | | 19,524 | | | | 41,869 | |
Administrative service fees | | | 652 | | | | 151,137 | | | | 225,705 | |
Miscellaneous expense | | | — | | | | 1,010 | | | | 1,506 | |
| | | | | | | | | | | | |
Total expenses | | | 12,944 | | | | 3,453,372 | | | | 5,144,133 | |
Net waived and reimbursed fees | | | (8 | ) | | | (11,176 | ) | | | (15,787 | ) |
| | | | | | | | | | | | |
Net expenses | | | 12,936 | | | | 3,442,196 | | | | 5,128,346 | |
| | | | | | | | | | | | |
Net investment income | | | 94,858 | | | | 20,618,784 | | | | 22,789,809 | |
| | | | | | | | | | | | |
REALIZED AND UNREALIZED GAIN (LOSS) ON INVESTMENTS AND FUTURES | | | | | | | | | | | | |
Capital gain distributions from affiliated underlying funds | | | 13,615 | | | | 3,992,685 | | | | 4,531,263 | |
Net realized gain (loss) on sale of affiliated underlying funds | | | 177,349 | | | | 5,799,853 | | | | (20,935,707 | ) |
| | | | | | | | | | | | |
Net realized gain (loss) on affiliated underlying funds | | | 190,964 | | | | 9,792,538 | | | | (16,404,444 | ) |
Net change in unrealized appreciation or depreciation on affiliated
underlying funds | | | 210,078 | | | | 50,621,705 | | | | 143,939,861 | |
| | | | | | | | | | | | |
Net realized and unrealized gain on affiliated underlying funds | | | 401,042 | | | | 60,414,243 | | | | 127,535,417 | |
| | | | | | | | | | | | |
Increase in net assets resulting from operations | | $ | 495,900 | | | $ | 81,033,027 | | | $ | 150,325,226 | |
| | | | | | | | | | | | |
See Accompanying Notes to Financial Statements
25
STATEMENTS OF OPERATIONS
| | | | | | | | | | | | |
| | | ING Solution
2035
Portfolio | | | ING Solution
2045
Portfolio | | | ING Solution
2055
Portfolio | |
| | | Year Ended December 31, 2010 | | | Year Ended December 31, 2010 | | | March 8, 2010(1) to December 31, 2010 | |
INVESTMENT INCOME: | | | | | | | | | | | | |
Dividends from affiliated underlying funds | | $ | 19,107,367 | | | $ | 10,072,270 | | | $ | 78,567 | |
| | | | | | | | | | | | |
Total investment income | | | 19,107,367 | | | | 10,072,270 | | | | 78,567 | |
| | | | | | | | | | | | |
EXPENSES: | | | | | | | | | | | | |
Investment management fees | | | 944,662 | | | | 595,319 | | | | 3,481 | |
Distribution and service fees: | | | | | | | | | | | | |
Class ADV | | | 2,040,760 | | | | 1,174,154 | | | | 7,325 | |
Class S | | | 1,063,545 | | | | 679,022 | | | | 3,414 | |
Class S2 | | | 57,276 | | | | 43,806 | | | | 492 | |
Class T | | | 27,623 | | | | 16,128 | | | | 32 | |
Administrative service fees | | | 188,919 | | | | 119,055 | | | | 696 | |
Miscellaneous expense | | | 1,258 | | | | 793 | | | | — | |
| | | | | | | | | | | | |
Total expenses | | | 4,324,043 | | | | 2,628,277 | | | | 15,440 | |
Net waived and reimbursed fees | | | (13,297 | ) | | | (9,836 | ) | | | (102 | ) |
| | | | | | | | | | | | |
Net expenses | | | 4,310,746 | | | | 2,618,441 | | | | 15,338 | |
| | | | | | | | | | | | |
Net investment income | | | 14,796,621 | | | | 7,453,829 | | | | 63,229 | |
| | | | | | | | | | | | |
REALIZED AND UNREALIZED GAIN (LOSS) ON INVESTMENTS AND FUTURES | | | | | | | | | | | | |
Capital gain distributions from affiliated underlying funds | | | 3,805,403 | | | | 2,650,843 | | | | 17,182 | |
Net realized gain (loss) on sale of affiliated underlying funds | | | (20,424,206 | ) | | | (26,231,666 | ) | | | 3,333 | |
| | | | | | | | | | | | |
Net realized gain (loss) on affiliated underlying funds | | | (16,618,803 | ) | | | (23,580,823 | ) | | | 20,515 | |
Net change in unrealized appreciation or depreciation on affiliated
underlying funds | | | 135,520,456 | | | | 105,521,003 | | | | 856,549 | |
| | | | | | | | | | | | |
Net realized and unrealized gain on affiliated underlying funds | | | 118,901,653 | | | | 81,940,180 | | | | 877,064 | |
| | | | | | | | | | | | |
Increase in net assets resulting from operations | | $ | 133,698,274 | | | $ | 89,394,009 | | | $ | 940,293 | |
| | | | | | | | | | | | |
| (1) | | Commencement of operations |
See Accompanying Notes to Financial Statements
26
STATEMENTS OF CHANGES IN NET ASSETS
| | | | | | | | |
| | | ING
Solution Aggressive Growth Portfolio | | | ING Solution Conservative Portfolio | |
| | | April 30, 2010(1) to December 31, 2010 | | | April 30, 2010(1) to December 31, 2010 | |
FROM OPERATIONS: | | | | | | | | |
Net investment income | | $ | 18,488 | | | $ | 28,048 | |
Net realized gain on investments | | | 46,215 | | | | 15,689 | |
Net change in unrealized appreciation or depreciation on investments | | | 278,966 | | | | 13,794 | |
| | | | | | | | |
Increase in net assets resulting from operations | | | 343,669 | | | | 57,531 | |
| | | | | | | | |
FROM CAPITAL SHARE TRANSACTIONS: | | | | | | | | |
Net proceeds from sale of shares | | | 6,178,037 | | | | 3,386,632 | |
Cost of shares redeemed | | | (264,492 | ) | | | (368,384 | ) |
| | | | | | | | |
Net increase in net assets resulting from capital share transactions | | | 5,913,545 | | | | 3,018,248 | |
| | | | | | | | |
Net increase in net assets | | | 6,257,214 | | | | 3,075,779 | |
| | | | | | | | |
NET ASSETS: | | | | | | | | |
End of period | | $ | 6,257,214 | | | $ | 3,075,779 | |
| | | | | | | | |
Undistributed net investment income at end of period | | $ | 20,519 | | | $ | 29,471 | |
| | | | | | | | |
| (1) | | Commencement of operations |
See Accompanying Notes to Financial Statements
27
STATEMENTS OF CHANGES IN NET ASSETS
| | | | | | | | | | | | | | | | |
| | | ING Solution Growth Portfolio | | | ING Solution Income Portfolio | |
| | | Year Ended December 31, 2010 | | | Year Ended December 31, 2009 | | | Year Ended December 31, 2010 | | | Year Ended December 31, 2009 | |
FROM OPERATIONS: | | | | | | | | | | | | | | | | |
Net investment income | | $ | 61,519 | | | $ | 9,840 | | | $ | 7,463,941 | | | $ | 6,377,820 | |
Net realized gain (loss) on investments | | | 133,707 | | | | 15,100 | | | | 10,561,442 | | | | (31,383,019 | ) |
Net change in unrealized appreciation or depreciation | | | 338,985 | | | | 74,841 | | | | 2,468,751 | | | | 55,775,085 | |
| | | | | | | | | | | | | | | | |
Increase in net assets resulting from operations | | | 534,211 | | | | 99,781 | | | | 20,494,134 | | | | 30,769,886 | |
| | | | | | | | | | | | | | | | |
FROM DISTRIBUTIONS TO SHAREHOLDERS: | | | | | | | | | | | | | | | | |
Net investment income: | | | | | | | | | | | | | | | | |
Class ADV | | | (7 | ) | | | (2 | ) | | | (3,340,664 | ) | | | (4,974,452 | ) |
Class I | | | (9 | ) | | | (5 | ) | | | (778,507 | ) | | | (897,124 | ) |
Class S | | | (10,571 | ) | | | (3,104 | ) | | | (3,083,437 | ) | | | (4,489,339 | ) |
Class S2 | | | (34 | ) | | | — | | | | (186,747 | ) | | | (181 | ) |
Class T | | | — | | | | — | | | | (14,106 | ) | | | (21,668 | ) |
Net realized gains: | | | | | | | | | | | | | | | | |
Class ADV | | | — | | | | (1 | ) | | | — | | | | (377,854 | ) |
Class I | | | — | | | | (1 | ) | | | — | | | | (61,892 | ) |
Class S | | | — | | | | (507 | ) | | | — | | | | (325,138 | ) |
Class S2 | | | — | | | | — | | | | — | | | | (13 | ) |
Class T | | | — | | | | — | | | | — | | | | (2,046 | ) |
| | | | | | | | | | | | | | | | |
Total distributions | | | (10,621 | ) | | | (3,620 | ) | | | (7,403,461 | ) | | | (11,149,707 | ) |
| | | | | | | | | | | | | | | | |
FROM CAPITAL SHARE TRANSACTIONS: | | | | | | | | | | | | | | | | |
Net proceeds from sale of shares | | | 8,861,777 | | | | 587,687 | | | | 59,189,253 | | | | 55,681,254 | |
Reinvestment of distributions | | | 10,572 | | | | 3,620 | | | | 7,403,461 | | | | 11,149,515 | |
| | | | | | | | | | | | | | | | |
| | | 8,872,349 | | | | 591,307 | | | | 66,592,714 | | | | 66,830,769 | |
Cost of shares redeemed | | | (278,201 | ) | | | (121,577 | ) | | | (62,005,929 | ) | | | (56,811,907 | ) |
| | | | | | | | | | | | | | | | |
Net increase in net assets resulting from capital share transactions | | | 8,594,148 | | | | 469,730 | | | | 4,586,785 | | | | 10,018,862 | |
| | | | | | | | | | | | | | | | |
Net increase in net assets | | | 9,117,738 | | | | 565,891 | | | | 17,677,458 | | | | 29,639,041 | |
| | | | | | | | | | | | | | | | |
NET ASSETS: | | | | | | | | | | | | | | | | |
Beginning of year | | | 740,740 | | | | 174,849 | | | | 217,098,849 | | | | 187,459,808 | |
| | | | | | | | | | | | | | | | |
End of year | | $ | 9,858,478 | | | $ | 740,740 | | | $ | 234,776,307 | | | $ | 217,098,849 | |
| | | | | | | | | | | | | | | | |
Undistributed net investment income at end of year | | $ | 67,566 | | | $ | 10,620 | | | $ | 9,062,920 | | | $ | 7,403,111 | |
| | | | | | | | | | | | | | | | |
See Accompanying Notes to Financial Statements
28
STATEMENTS OF CHANGES IN NET ASSETS
| | | | | | | | | | | | | | | | |
| | | ING Solution Moderate Portfolio | | | ING Solution 2015 Portfolio | |
| | | Year Ended December 31, 2010 | | | Year Ended December 31, 2009 | | | Year Ended December 31, 2010 | | | Year Ended December 31, 2009 | |
FROM OPERATIONS: | | | | | | | | | | | | | | | | |
Net investment income | | $ | 94,858 | | | $ | 27,708 | | | $ | 20,618,784 | | | $ | 14,967,893 | |
Net realized gain (loss) on investments | | | 190,964 | | | | 16,859 | | | | 9,792,538 | | | | (134,029,293 | ) |
Net change in unrealized appreciation or depreciation | | | 210,078 | | | | 148,904 | | | | 50,621,705 | | | | 246,416,622 | |
| | | | | | | | | | | | | | | | |
Increase in net assets resulting from operations | | | 495,900 | | | | 193,471 | | | | 81,033,027 | | | | 127,355,222 | |
| | | | | | | | | | | | | | | | |
FROM DISTRIBUTIONS TO SHAREHOLDERS: | | | | | | | | | | | | | | | | |
Net investment income: | | | | | | | | | | | | | | | | |
Class ADV | | | (1,717 | ) | | | (3 | ) | | | (6,560,701 | ) | | | (9,909,077 | ) |
Class I | | | (13 | ) | | | (7 | ) | | | (1,657,246 | ) | | | (2,244,561 | ) |
Class S | | | (29,511 | ) | | | (9,598 | ) | | | (8,189,236 | ) | | | (11,677,306 | ) |
Class S2 | | | (45 | ) | | | — | | | | (346,966 | ) | | | (132 | ) |
Class T | | | — | | | | — | | | | (48,315 | ) | | | (72,184 | ) |
Net realized gains: | | | | | | | | | | | | | | | | |
Class ADV | | | (585 | ) | | | (1 | ) | | | — | | | | (2,460,204 | ) |
Class I | | | (5 | ) | | | (1 | ) | | | — | | | | (492,778 | ) |
Class S | | | (10,815 | ) | | | (1,460 | ) | | | — | | | | (2,729,965 | ) |
Class S2 | | | (15 | ) | | | — | | | | — | | | | (29 | ) |
Class T | | | — | | | | — | | | | — | | | | (20,405 | ) |
| | | | | | | | | | | | | | | | |
Total distributions | | | (42,706 | ) | | | (11,070 | ) | | | (16,802,464 | ) | | | (29,606,641 | ) |
| | | | | | | | | | | | | | | | |
FROM CAPITAL SHARE TRANSACTIONS: | | | | | | | | | | | | | | | | |
Net proceeds from sale of shares | | | 7,982,370 | | | | 1,093,295 | | | | 153,395,299 | | | | 126,247,706 | |
Reinvestment of distributions | | | 42,609 | | | | 11,070 | | | | 16,802,464 | | | | 29,606,479 | |
| | | | | | | | | | | | | | | | |
| | | 8,024,979 | | | | 1,104,365 | | | | 170,197,763 | | | | 155,854,185 | |
Cost of shares redeemed | | | (374,409 | ) | | | (382,768 | ) | | | (148,326,550 | ) | | | (81,775,213 | ) |
| | | | | | | | | | | | | | | | |
Net increase in net assets resulting from capital share transactions | | | 7,650,570 | | | | 721,597 | | | | 21,871,213 | | | | 74,078,972 | |
| | | | | | | | | | | | | | | | |
Net increase in net assets | | | 8,103,764 | | | | 903,998 | | | | 86,101,776 | | | | 171,827,553 | |
| | | | | | | | | | | | | | | | |
NET ASSETS: | | | | | | | | | | | | | | | | |
Beginning of year | | | 1,530,847 | | | | 626,849 | | | | 723,892,535 | | | | 552,064,982 | |
| | | | | | | | | | | | | | | | |
End of year | | $ | 9,634,611 | | | $ | 1,530,847 | | | $ | 809,994,311 | | | $ | 723,892,535 | |
| | | | | | | | | | | | | | | | |
Undistributed net investment income at end of year | | $ | 107,704 | | | $ | 31,269 | | | $ | 24,308,661 | | | $ | 16,800,953 | |
| | | | | | | | | | | | | | | | |
See Accompanying Notes to Financial Statements
29
STATEMENTS OF CHANGES IN NET ASSETS
| | | | | | | | | | | | | | | | |
| | | ING Solution 2025 Portfolio | | | ING Solution 2035 Portfolio | |
| | | Year Ended December 31, 2010 | | | Year Ended December 31, 2009 | | | Year Ended December 31, 2010 | | | Year Ended December 31, 2009 | |
FROM OPERATIONS: | | | | | | | | | | | | | | | | |
Net investment income | | $ | 22,789,809 | | | $ | 16,351,987 | | | $ | 14,796,621 | | | $ | 10,535,240 | |
Net realized loss on investments | | | (16,404,444 | ) | | | (198,680,103 | ) | | | (16,618,803 | ) | | | (146,040,591 | ) |
Net change in unrealized appreciation or depreciation | | | 143,939,861 | | | | 395,089,937 | | | | 135,520,456 | | | | 324,639,345 | |
| | | | | | | | | | | | | | | | |
Increase in net assets resulting from operations | | | 150,325,226 | | | | 212,761,821 | | | | 133,698,274 | | | | 189,133,994 | |
| | | | | | | | | | | | | | | | |
FROM DISTRIBUTIONS TO SHAREHOLDERS: | | | | | | | | | | | | | | | | |
Net investment income: | | | | | | | | | | | | | | | | |
Class ADV | | | (6,781,215 | ) | | | (11,632,342 | ) | | | (4,272,162 | ) | | | (8,393,679 | ) |
Class I | | | (1,991,643 | ) | | | (2,778,255 | ) | | | (1,325,539 | ) | | | (2,023,495 | ) |
Class S | | | (8,486,689 | ) | | | (13,581,325 | ) | | | (5,254,947 | ) | | | (9,389,908 | ) |
Class S2 | | | (335,207 | ) | | | (109 | ) | | | (238,633 | ) | | | (97 | ) |
Class T | | | (68,878 | ) | | | (114,293 | ) | | | (29,900 | ) | | | (52,233 | ) |
Net realized gains: | | | | | | | | | | | | | | | | |
Class ADV | | | — | | | | (321,165 | ) | | | — | | | | (299,905 | ) |
Class I | | | — | | | | (66,192 | ) | | | — | | | | (61,637 | ) |
Class S | | | — | | | | (347,995 | ) | | | — | | | | (310,723 | ) |
Class S2 | | | — | | | | (3 | ) | | | — | | | | (3 | ) |
Class T | | | — | | | | (3,843 | ) | | | — | | | | (2,894 | ) |
| | | | | | | | | | | | | | | | |
Total distributions | | | (17,663,632 | ) | | | (28,845,522 | ) | | | (11,121,181 | ) | | | (20,534,574 | ) |
| | | | | | | | | | | | | | | | |
FROM CAPITAL SHARE TRANSACTIONS: | | | | | | | | | | | | | | | | |
Net proceeds from sale of shares | | | 203,590,100 | | | | 203,666,643 | | | | 181,862,931 | | | | 173,435,719 | |
Reinvestment of distributions | | | 17,663,632 | | | | 28,845,409 | | | | 11,121,181 | | | | 20,534,474 | |
| | | | | | | | | | | | | | | | |
| | | 221,253,732 | | | | 232,512,052 | | | | 192,984,112 | | | | 193,970,193 | |
Cost of shares redeemed | | | (171,803,895 | ) | | | (88,701,129 | ) | | | (130,975,091 | ) | | | (52,796,575 | ) |
| | | | | | | | | | | | | | | | |
Net increase in net assets resulting from capital share transactions | | | 49,449,837 | | | | 143,810,923 | | | | 62,009,021 | | | | 141,173,618 | |
| | | | | | | | | | | | | | | | |
Net increase in net assets | | | 182,111,431 | | | | 327,727,222 | | | | 184,586,114 | | | | 309,773,038 | |
| | | | | | | | | | | | | | | | |
NET ASSETS: | | | | | | | | | | | | | | | | |
Beginning of year | | | 1,068,047,346 | | | | 740,320,124 | | | | 884,873,900 | | | | 575,100,862 | |
| | | | | | | | | | | | | | | | |
End of year | | $ | 1,250,158,777 | | | $ | 1,068,047,346 | | | $ | 1,069,460,014 | | | $ | 884,873,900 | |
| | | | | | | | | | | | | | | | |
Undistributed net investment income at end of year | | $ | 25,174,969 | | | $ | 17,656,223 | | | $ | 15,789,353 | | | $ | 11,119,180 | |
| | | | | | | | | | | | | | | | |
See Accompanying Notes to Financial Statements
30
STATEMENTS OF CHANGES IN NET ASSETS
| | | | | | | | | | | | |
| | | ING Solution 2045 Portfolio | | | ING Solution
2055
Portfolio | |
| | | Year Ended December 31, 2010 | | | Year Ended December 31, 2009 | | | March 8, 2010(1) to December 31, 2010 | |
FROM OPERATIONS: | | | | | | | | | | | | |
Net investment income | | $ | 7,453,829 | | | $ | 5,218,022 | | | $ | 63,229 | |
Net realized gain (loss) on investments | | | (23,580,823 | ) | | | (80,312,417 | ) | | | 20,515 | |
Net change in unrealized appreciation or depreciation | | | 105,521,003 | | | | 197,672,505 | | | | 856,549 | |
| | | | | | | | | | | | |
Increase in net assets resulting from operations | | | 89,394,009 | | | | 122,578,110 | | | | 940,293 | |
| | | | | | | | | | | | |
FROM DISTRIBUTIONS TO SHAREHOLDERS: | | | | | | | | | | | | |
Net investment income: | | | | | | | | | | | | |
Class ADV | | | (1,692,814 | ) | | | (4,016,064 | ) | | | — | |
Class I | | | (767,598 | ) | | | (1,190,507 | ) | | | — | |
Class S | | | (2,628,850 | ) | | | (4,909,164 | ) | | | — | |
Class S2 | | | (140,124 | ) | | | (81 | ) | | | — | |
Class T | | | (10,767 | ) | | | (29,466 | ) | | | — | |
Net realized gains: | | | | | | | | | | | | |
Class ADV | | | — | | | | (1,563,571 | ) | | | — | |
Class I | | | — | | | | (388,748 | ) | | | — | |
Class S | | | — | | | | (1,753,783 | ) | | | — | |
Class S2 | | | — | | | | (27 | ) | | | — | |
Class T | | | — | | | | (15,680 | ) | | | — | |
| | | | | | | | | | | | |
Total distributions | | | (5,240,153 | ) | | | (13,867,091 | ) | | | — | |
| | | | | | | | | | | | |
FROM CAPITAL SHARE TRANSACTIONS: | | | | | | | | | | | | |
Net proceeds from sale of shares | | | 125,521,705 | | | | 133,206,911 | | | | 11,460,549 | |
Reinvestment of distributions | | | 5,240,153 | | | | 13,866,982 | | | | — | |
| | | | | | | | | | | | |
| | | 130,761,858 | | | | 147,073,893 | | | | 11,460,549 | |
Cost of shares redeemed | | | (80,728,582 | ) | | | (30,831,594 | ) | | | (1,832,515 | ) |
| | | | | | | | | | | | |
Net increase in net assets resulting from capital share transactions | | | 50,033,276 | | | | 116,242,299 | | | | 9,628,034 | |
| | | | | | | | | | | | |
Net increase in net assets | | | 134,187,132 | | | | 224,953,318 | | | | 10,568,327 | |
| | | | | | | | | | | | |
NET ASSETS: | | | | | | | | | | | | |
Beginning of period | | | 552,474,202 | | | | 327,520,884 | | | | — | |
| | | | | | | | | | | | |
End of period | | $ | 686,661,334 | | | $ | 552,474,202 | | | $ | 10,568,327 | |
| | | | | | | | | | | | |
Undistributed net investment income at end of year | | $ | 7,691,967 | | | $ | 5,239,474 | | | $ | 67,633 | |
| | | | | | | | | | | | |
| (1) | | Commencement of operations |
See Accompanying Notes to Financial Statements
31
FINANCIAL HIGHLIGHTS
Selected data for a share of beneficial interest outstanding throughout each year or period.
| | | | | | | | | | | | | | | | | | | | | | | | | | | | | | | | | | | | | | | | | | | | | | | | | | | | | | | | | | | | | | | | |
| | | | | | Income (loss)
from
investment
operations | | | | | | Less distributions | | | | | | | | | | | | Ratios to average net
assets | | | Supplemental
data | |
| | | | | | | | | | | | | | | | | | | | | | | | | | | | | | | | | | | | | | | | | | | | | | | | | | | | | | | | | | | | | | | | |
| | | Net asset value, beginning of year or period | | | Net investment income (loss) | | | Net realized and unrealized gain (loss) | | | Total from investment operations | | | From net investment income | | | From net realized gains | | | From return of capital | | | Total distributions | | | Net asset value, end of year or period | | | Total Return(1) | | | Expenses before reductions/ additions(2)(3)(4) | | | Expenses net of fee waivers and/or recoupments, if any(2)(3)(4) | | | Expenses net of all reductions/ additions(2)(3)(4) | | | Net investment income (loss)(2)(3)(4) | | | Net assets, end of year or period | | | Portfolio turnover rate | |
| | | | | | | | | | | | | | | | | | | | | | | | | | | | | | | | | | | | | | | | | | | | | | | | | | | | | | | | | | | | | | | | |
Year or period ended | | ($) | | | ($) | | | ($) | | | ($) | | | ($) | | | ($) | | | ($) | | | ($) | | | ($) | | | (%) | | | (%) | | | (%) | | | (%) | | | (%) | | | ($000's) | | | (%) | |
ING Solution Aggressive Growth Portfolio | | | | | | | | | | | | | | | | | | | | | | | | | | | | | | | | | | | | | | | | | | | | | | | | | | | | | | | | | | | | | | | | |
Class ADV | | | | | | | | | | | | | | | | | | | | | | | | | | | | | | | | | | | | | | | | | | | | | | | | | | | | | | | | | | | | | | | | |
04-30-10(5) - 12-31-10 | | | 10.00 | | | | 0.11 | · | | | 0.78 | | | | 0.89 | | | | — | | | | — | | | | — | | | | — | | | | 10.89 | | | | 8.90 | | | | 0.62 | | | | 0.62 | | | | 0.62 | | | | 1.57 | | | | 4,677 | | | | 26 | |
Class I | | | | | | | | | | | | | | | | | | | | | | | | | | | | | | | | | | | | | | | | | | | | | | | | | | | | | | | | | | | | | | | | |
04-30-10(5) - 12-31-10 | | | 10.00 | | | | 0.16 | | | | 0.78 | | | | 0.94 | | | | — | | | | — | | | | — | | | | — | | | | 10.94 | | | | 9.40 | | | | 0.12 | | | | 0.12 | | | | 0.12 | | | | 2.50 | | | | 3 | | | | 26 | |
Class S | | | | | | | | | | | | | | | | | | | | | | | | | | | | | | | | | | | | | | | | | | | | | | | | | | | | | | | | | | | | | | | | |
04-30-10(5) - 12-31-10 | | | 10.00 | | | | 0.10 | · | | | 0.82 | | | | 0.92 | | | | — | | | | — | | | | — | | | | — | | | | 10.92 | | | | 9.20 | | | | 0.37 | | | | 0.37 | | | | 0.37 | | | | 1.46 | | | | 1,438 | | | | 26 | |
Class S2 | | | | | | | | | | | | | | | | | | | | | | | | | | | | | | | | | | | | | | | | | | | | | | | | | | | | | | | | | | | | | | | | |
04-30-10(5) - 12-31-10 | | | 10.00 | | | | 0.09 | · | | | 0.82 | | | | 0.91 | | | | — | | | | — | | | | — | | | | — | | | | 10.91 | | | | 9.10 | | | | 0.62 | | | | 0.52 | | | | 0.52 | | | | 1.29 | | | | 138 | | | | 26 | |
| | | | | | | | | | | | | | | | |
ING Solution Conservative Portfolio | | | | | | | | | | | | | | | | | | | | | | | | | | | | | | | | | | | | | | | | | | | | | | | | | | | | | | | | | | | | | | | | |
Class ADV | | | | | | | | | | | | | | | | | | | | | | | | | | | | | | | | | | | | | | | | | | | | | | | | | | | | | | | | | | | | | | | | |
04-30-10(5) - 12-31-10 | | | 10.00 | | | | 0.36 | · | | | 0.14 | | | | 0.50 | | | | — | | | | — | | | | — | | | | — | | | | 10.50 | | | | 5.00 | | | | 0.62 | | | | 0.62 | | | | 0.62 | | | | 5.24 | | | | 1,911 | | | | 51 | |
Class I | | | | | | | | | | | | | | | | | | | | | | | | | | | | | | | | | | | | | | | | | | | | | | | | | | | | | | | | | | | | | | | | |
04-30-10(5) - 12-31-10 | | | 10.00 | | | | 0.34 | | | | 0.20 | | | | 0.54 | | | | — | | | | — | | | | — | | | | — | | | | 10.54 | | | | 5.40 | | | | 0.12 | | | | 0.12 | | | | 0.12 | | | | 5.03 | | | | 3 | | | | 51 | |
Class S | | | | | | | | | | | | | | | | | | | | | | | | | | | | | | | | | | | | | | | | | | | | | | | | | | | | | | | | | | | | | | | | |
04-30-10(5) - 12-31-10 | | | 10.00 | | | | 0.29 | · | | | 0.24 | | | | 0.53 | | | | — | | | | — | | | | — | | | | — | | | | 10.53 | | | | 5.30 | | | | 0.37 | | | | 0.37 | | | | 0.37 | | | | 4.23 | | | | 1,098 | | | | 51 | |
Class S2 | | | | | | | | | | | | | | | | | | | | | | | | | | | | | | | | | | | | | | | | | | | | | | | | | | | | | | | | | | | | | | | | |
04-30-10(5) - 12-31-10 | | | 10.00 | | | | 0.44 | · | | | 0.07 | | | | 0.51 | | | | — | | | | — | | | | — | | | | — | | | | 10.51 | | | | 5.10 | | | | 0.62 | | | | 0.52 | | | | 0.52 | | | | 6.35 | | | | 64 | | | | 51 | |
| | | | | | | | | | | | | | | | |
ING Solution Growth Portfolio | | | | | | | | | | | | | | | | | | | | | | | | | | | | | | | | | | | | | | | | | | | | | | | | | | | | | | | | | | | | | | | | |
Class ADV | | | | | | | | | | | | | | | | | | | | | | | | | | | | | | | | | | | | | | | | | | | | | | | | | | | | | | | | | | | | | | | | |
12-31-10 | | | 8.24 | | | | 0.26 | · | | | 0.73 | | | | 0.99 | | | | 0.07 | | | | — | | | | — | | | | 0.07 | | | | 9.16 | | | | 12.07 | | | | 0.62 | | | | 0.62 | | | | 0.62 | | | | 2.95 | | | | 4,837 | | | | 43 | |
12-31-09 | | | 6.67 | | | | 0.14 | | | | 1.46 | | | | 1.60 | | | | 0.02 | | | | 0.01 | | | | — | | | | 0.03 | | | | 8.24 | | | | 24.00 | | | | 0.62 | | | | 0.62 | | | | 0.62 | | | | 1.89 | | | | 1 | | | | 77 | |
12-31-08 | | | 9.81 | | | | 0.14 | · | | | (3.28 | ) | | | (3.14 | ) | | | — | | | | 0.00 | * | | | — | | | | — | | | | 6.67 | | | | (32.00 | ) | | | 0.62 | | | | 0.62 | | | | 0.62 | | | | 1.59 | | | | 1 | | | | 283 | |
07-02-07(5) - 12-31-07 | | | 10.00 | | | | 0.08 | | | | (0.27 | ) | | | (0.19 | ) | | | — | | | | — | | | | — | | | | — | | | | 9.81 | | | | (1.90 | ) | | | 0.62 | | | | 0.62 | | | | 0.62 | | | | 1.58 | | | | 1 | | | | 8 | |
Class I | | | | | | | | | | | | | | | | | | | | | | | | | | | | | | | | | | | | | | | | | | | | | | | | | | | | | | | | | | | | | | | | |
12-31-10 | | | 8.34 | | | | 0.18 | | | | 0.90 | | | | 1.08 | | | | 0.09 | | | | — | | | | — | | | | 0.09 | | | | 9.33 | | | | 13.11 | | | | 0.12 | | | | 0.12 | | | | 0.12 | | | | 2.10 | | | | 1 | | | | 43 | |
12-31-09 | | | 6.74 | | | | 0.18 | | | | 1.48 | | | | 1.66 | | | | 0.05 | | | | 0.01 | | | | — | | | | 0.06 | | | | 8.34 | | | | 24.68 | | | | 0.12 | | | | 0.12 | | | | 0.12 | | | | 2.50 | | | | 1 | | | | 77 | |
12-31-08 | | | 9.85 | | | | 0.19 | · | | | (3.30 | ) | | | (3.11 | ) | | | — | | | | 0.00 | * | | | — | | | | — | | | | 6.74 | | | | (31.57 | ) | | | 0.12 | | | | 0.12 | | | | 0.12 | | | | 2.19 | | | | 1 | | | | 283 | |
07-02-07(5) - 12-31-07 | | | 10.00 | | | | 0.11 | | | | (0.26 | ) | | | (0.15 | ) | | | — | | | | — | | | | — | | | | — | | | | 9.85 | | | | (1.50 | ) | | | 0.12 | | | | 0.12 | | | | 0.12 | | | | 2.28 | | | | 1 | | | | 8 | |
Class S | | | | | | | | | | | | | | | | | | | | | | | | | | | | | | | | | | | | | | | | | | | | | | | | | | | | | | | | | | | | | | | | |
12-31-10 | | | 8.27 | | | | 0.20 | · | | | 0.84 | | | | 1.04 | | | | 0.09 | | | | — | | | | — | | | | 0.09 | | | | 9.22 | | | | 12.74 | | | | 0.37 | | | | 0.37 | | | | 0.37 | | | | 2.28 | | | | 4,729 | | | | 43 | |
12-31-09 | | | 6.70 | | | | 0.20 | · | | | 1.44 | | | | 1.64 | | | | 0.06 | | | | 0.01 | | | | — | | | | 0.07 | | | | 8.27 | | | | 24.48 | | | | 0.37 | | | | 0.37 | | | | 0.37 | | | | 2.67 | | | | 739 | | | | 77 | |
12-31-08 | | | 9.83 | | | | 0.22 | · | | | (3.35 | ) | | | (3.13 | ) | | | 0.00 | * | | | 0.00 | * | | | — | | | | — | | | | 6.70 | | | | (31.81 | ) | | | 0.37 | | | | 0.37 | | | | 0.37 | | | | 3.14 | | | | 173 | | | | 283 | |
07-02-07(5) - 12-31-07 | | | 10.00 | | | | 0.09 | | | | (0.26 | ) | | | (0.17 | ) | | | — | | | | — | | | | — | | | | — | | | | 9.83 | | | | (1.70 | ) | | | 0.37 | | | | 0.37 | | | | 0.37 | | | | 1.83 | | | | 1 | | | | 8 | |
Class S2 | | | | | | | | | | | | | | | | | | | | | | | | | | | | | | | | | | | | | | | | | | | | | | | | | | | | | | | | | | | | | | | | |
04-30-10(5) - 12-31-10 | | | 8.68 | | | | 0.12 | · | | | 0.50 | | | | 0.62 | | | | 0.10 | | | | — | | | | — | | | | 0.10 | | | | 9.20 | | | | 7.28 | | | | 0.62 | | | | 0.52 | | | | 0.52 | | | | 2.10 | | | | 291 | | | | 43 | |
See Accompanying Notes to Financial Statements
32
FINANCIAL HIGHLIGHTS (CONTINUED)
Selected data for a share of beneficial interest outstanding throughout each year or period.
| | | | | | | | | | | | | | | | | | | | | | | | | | | | | | | | | | | | | | | | | | | | | | | | | | | | | | | | | | | | | | | | |
| | | | | | Income (loss)
from
investment
operations | | | | | | Less distributions | | | | | | | | | | | | Ratios to average net assets | | | Supplemental
data | |
| | | | | | | | | | | | | | | | | | | | | | | | | | | | | | | | | | | | | | | | | | | | | | | | | |
| | | Net asset value, beginning of year or period | | | Net investment income (loss) | | | Net realized and unrealized gain (loss) | | | Total from investment operations | | | From net investment income | | | From net realized gains | | | From return of capital | | | Total distributions | | | Net asset value, end of year or period | | | Total Return (1) | | | Expenses before reductions/ additions(2)(4) | | | Expenses net of fee waivers and/or recoupments, if any (2)(3)(4) | | | Expenses net of all reductions/additions(2)(3)(4) | | | Net investment income (loss)(2)(3)(4) | | | Net assets, end of year or period | | | Portfolio turnover rate | |
| | | | | | | | | | | | | | | | | | | | | | | | | | | | | | | | | | | | | | | | | | | | | | | | | | | | | | | | | | | | | | | | |
Year or period ended | | ($) | | | ($) | | | ($) | | | ($) | | | ($) | | | ($) | | | ($) | | | ($) | | | ($) | | | (%) | | | (%) | | | (%) | | | (%) | | | (%) | | | ($000's) | | | (%) | |
ING Solution Income Portfolio | | | | | | | | | | | | | | | | | | | | | | | | | | | | | | | | | | | | | | | | | | | | | | | | | | | | | | | | | | | | | | | | |
Class ADV | | | | | | | | | | | | | | | | | | | | | | | | | | | | | | | | | | | | | | | | | | | | | | | | | | | | | | | | | | | | | | | | |
12-31-10 | | | 10.24 | | | | 0.33 | · | | | 0.60 | | | | 0.93 | | | | 0.34 | | | | — | | | | — | | | | 0.34 | | | | 10.83 | | | | 9.26 | | | | 0.62 | | | | 0.62 | | | | 0.62 | | | | 3.11 | | | | 110,352 | | | | 64 | |
12-31-09 | | | 9.27 | | | | 0.31 | • | | | 1.23 | | | | 1.54 | | | | 0.53 | | | | 0.04 | | | | — | | | | 0.57 | | | | 10.24 | | | | 16.98 | | | | 0.62 | | | | 0.62 | | | | 0.62 | | | | 3.24 | | | | 107,684 | | | | 70 | |
12-31-08 | | | 11.54 | | | | 0.37 | · | | | (2.27 | ) | | | (1.90 | ) | | | 0.19 | | | | 0.18 | | | | — | | | | 0.37 | | | | 9.27 | | | | (16.93 | ) | | | 0.62 | | | | 0.62 | | | | 0.62 | | | | 3.46 | | | | 85,343 | | | | 84 | |
12-31-07 | | | 11.08 | | | | 0.32 | · | | | 0.22 | | | | 0.54 | | | | 0.07 | | | | 0.01 | | | | — | | | | 0.08 | | | | 11.54 | | | | 4.91 | | | | 0.62 | | | | 0.62 | | | | 0.62 | | | | 2.80 | | | | 93,760 | | | | 35 | |
12-31-06 | | | 10.36 | | | | 0.57 | · | | | 0.17 | | | | 0.74 | | | | 0.02 | | | | 0.00 | * | | | — | | | | 0.02 | | | | 11.08 | | | | 7.21 | | | | 0.62 | | | | 0.62 | | | | 0.62 | | | | 5.29 | | | | 20,477 | | | | 32 | |
Class I | | | | | | | | | | | | | | | | | | | | | | | | | | | | | | | | | | | | | | | | | | | | | | | | | | | | | | | | | | | | | | | | |
12-31-10 | | | 10.43 | | | | 0.39 | · | | | 0.62 | | | | 1.01 | | | | 0.39 | | | | — | | | | — | | | | 0.39 | | | | 11.05 | | | | 9.86 | | | | 0.12 | | | | 0.12 | | | | 0.12 | | | | 3.69 | | | | 24,509 | | | | 64 | |
12-31-09 | | | 9.43 | | | | 0.28 | • | | | 1.34 | | | | 1.62 | | | | 0.58 | | | | 0.04 | | | | — | | | | 0.62 | | | | 10.43 | | | | 17.62 | | | | 0.12 | | | | 0.12 | | | | 0.12 | | | | 2.87 | | | | 18,772 | | | | 70 | |
12-31-08 | | | 11.70 | | | | 0.48 | · | | | (2.35 | ) | | | (1.87 | ) | | | 0.22 | | | | 0.18 | | | | — | | | | 0.40 | | | | 9.43 | | | | (16.49 | ) | | | 0.12 | | | | 0.12 | | | | 0.12 | | | | 4.41 | | | | 24,417 | | | | 84 | |
12-31-07 | | | 11.18 | | | | 0.37 | · | | | 0.24 | | | | 0.61 | | | | 0.08 | | | | 0.01 | | | | — | | | | 0.09 | | | | 11.70 | | | | 5.44 | | | | 0.12 | | | | 0.12 | | | | 0.12 | | | | 3.20 | | | | 18,104 | | | | 35 | |
12-31-06 | | | 10.41 | | | | 0.42 | · | | | 0.37 | | | | 0.79 | | | | 0.02 | | | | 0.00 | * | | | — | | | | 0.02 | | | | 11.18 | | | | 7.66 | | | | 0.12 | | | | 0.12 | | | | 0.12 | | | | 3.89 | | | | 3,053 | | | | 32 | |
Class S | | | | | | | | | | | | | | | | | | | | | | | | | | | | | | | | | | | | | | | | | | | | | | | | | | | | | | | | | | | | | | | | |
12-31-10 | | | 10.35 | | | | 0.36 | · | | | 0.61 | | | | 0.97 | | | | 0.36 | | | | — | | | | — | | | | 0.36 | | | | 10.96 | | | | 9.60 | | | | 0.37 | | | | 0.37 | | | | 0.37 | | | | 3.40 | | | | 93,940 | | | | 64 | |
12-31-09 | | | 9.37 | | | | 0.33 | | | | 1.24 | | | | 1.57 | | | | 0.55 | | | | 0.04 | | | | — | | | | 0.59 | | | | 10.35 | | | | 17.20 | | | | 0.37 | | | | 0.37 | | | | 0.37 | | | | 3.41 | | | | 90,135 | | | | 70 | |
12-31-08 | | | 11.63 | | | | 0.40 | · | | | (2.29 | ) | | | (1.89 | ) | | | 0.19 | | | | 0.18 | | | | — | | | | 0.37 | | | | 9.37 | | | | (16.66 | ) | | | 0.37 | | | | 0.37 | | | | 0.37 | | | | 3.70 | | | | 77,076 | | | | 84 | |
12-31-07 | | | 11.13 | | | | 0.30 | · | | | 0.28 | | | | 0.58 | | | | 0.07 | | | | 0.01 | | | | — | | | | 0.08 | | | | 11.63 | | | | 5.23 | | | | 0.37 | | | | 0.37 | | | | 0.37 | | | | 2.61 | | | | 88,723 | | | | 35 | |
12-31-06 | | | 10.39 | | | | 0.36 | · | | | 0.40 | | | | 0.76 | | | | 0.02 | | | | 0.00 | * | | | — | | | | 0.02 | | | | 11.13 | | | | 7.37 | | | | 0.37 | | | | 0.37 | | | | 0.37 | | | | 3.28 | | | | 54,634 | | | | 32 | |
Class S2 | | | | | | | | | | | | | | | | | | | | | | | | | | | | | | | | | | | | | | | | | | | | | | | | | | | | | | | | | | | | | | | | |
12-31-10 | | | 10.20 | | | | 0.43 | · | | | 0.51 | | | | 0.94 | | | | 0.39 | | | | — | | | | — | | | | 0.39 | | | | 10.75 | | | | 9.39 | | | | 0.62 | | | | 0.52 | | | | 0.52 | | | | 4.17 | | | | 5,543 | | | | 64 | |
05-28-09(5)- 12-31-09 | | | 9.59 | | | | 0.31 | • | | | 0.92 | | | | 1.23 | | | | 0.58 | | | | 0.04 | | | | — | | | | 0.62 | | | | 10.20 | | | | 13.26 | | | | 0.62 | | | | 0.52 | | | | 0.52 | | | | 5.29 | | | | 3 | | | | 70 | |
Class T | | | | | | | | | | | | | | | | | | | | | | | | | | | | | | | | | | | | | | | | | | | | | | | | | | | | | | | | | | | | | | | | |
12-31-10 | | | 10.42 | | | | 0.30 | · | | | 0.61 | | | | 0.91 | | | | 0.30 | | | | — | | | | — | | | | 0.30 | | | | 11.03 | | | | 8.95 | | | | 0.87 | | | | 0.82 | | | | 0.82 | | | | 2.83 | | | | 432 | | | | 64 | |
12-31-09 | | | 9.34 | | | | 0.28 | • | | | 1.26 | | | | 1.54 | | | | 0.42 | | | | 0.04 | | | | — | | | | 0.46 | | | | 10.42 | | | | 16.85 | | | | 0.87 | | | | 0.82 | | | | 0.82 | | | | 2.93 | | | | 505 | | | | 70 | |
12-31-08 | | | 11.54 | | | | 0.31 | · | | | (2.25 | ) | | | (1.94 | ) | | | 0.08 | | | | 0.18 | | | | — | | | | 0.26 | | | | 9.34 | | | | (17.14 | ) | | | 0.87 | | | | 0.82 | | | | 0.82 | | | | 2.89 | | | | 623 | | | | 84 | |
12-31-07 | | | 11.03 | | | | 0.20 | | | | 0.32 | | | | 0.52 | | | | — | | | | 0.01 | | | | — | | | | 0.01 | | | | 11.54 | | | | 4.72 | | | | 0.87 | | | | 0.82 | | | | 0.82 | | | | 1.75 | | | | 1,636 | | | | 35 | |
12-31-06 | | | 10.34 | | | | 0.10 | · | | | 0.61 | | | | 0.71 | | | | 0.02 | | | | 0.00 | * | | | — | | | | 0.02 | | | | 11.03 | | | | 6.93 | | | | 0.87 | | | | 0.82 | | | | 0.82 | | | | 0.94 | | | | 2,245 | | | | 32 | |
| | | | | | | | | | | | | | | | |
ING Solution Moderate Portfolio | | | | | | | | | | | | | | | | | | | | | | | | | | | | | | | | | | | | | | | | | | | | | | | | | | | | | | | | | | | | | | | | |
Class ADV | | | | | | | | | | | | | | | | | | | | | | | | | | | | | | | | | | | | | | | | | | | | | | | | | | | | | | | | | | | | | | | | |
12-31-10 | | | 9.06 | | | | 0.41 | · | | | 0.51 | | | | 0.92 | | | | 0.14 | | | | 0.05 | | | | — | | | | 0.19 | | | | 9.79 | | | | 10.35 | | | | 0.62 | | | | 0.62 | | | | 0.62 | | | | 4.34 | | | | 2,690 | | | | 47 | |
12-31-09 | | | 7.61 | | | | 0.20 | | | | 1.29 | | | | 1.49 | | | | 0.03 | | | | 0.01 | | | | — | | | | 0.04 | | | | 9.06 | | | | 19.69 | | | | 0.62 | | | | 0.62 | | | | 0.62 | | | | 2.47 | | | | 1 | | | | 87 | |
12-31-08 | | | 10.00 | | | | 0.16 | | | | (2.55 | ) | | | (2.39 | ) | | | — | | | | 0.00 | * | | | — | | | | — | | | | 7.61 | | | | (23.88 | ) | | | 0.62 | | | | 0.62 | | | | 0.62 | | | | 1.78 | | | | 1 | | | | 212 | |
07-02-07(5) - 12-31-07 | | | 10.00 | | | | 0.13 | | | | (0.13 | ) | | | — | | | | — | | | | — | | | | — | | | | — | | | | 10.00 | | | | 0.00 | * | | | 0.62 | | | | 0.62 | | | | 0.62 | | | | 2.55 | | | | 1 | | | | 7 | |
See Accompanying Notes to Financial Statements
33
FINANCIAL HIGHLIGHTS (CONTINUED)
Selected data for a share of beneficial interest outstanding throughout each year or period.
| | | | | | | | | | | | | | | | | | | | | | | | | | | | | | | | | | | | | | | | | | | | | | | | | | | | | | | | | | | | | | | | |
| | | | | | Income (loss)
from
investment
operations | | | | | | Less distributions | | | | | | | | | | | | Ratios to average net assets | | | Supplemental
data | |
| | | | | | | | | | | | | | | | | | | | | | | | | | | | | | | | | | | | | | | | | | | | | | | | | |
| | | Net asset value, beginning of year or period | | | Net investment income (loss) | | | Net realized and unrealized gain (loss) | | | Total from investment operations | | | From net investment income | | | From net realized gains | | | From return of capital | | | Total distributions | | | Net asset value, end of year or period | | | Total Return(1) | | | Expenses before reductions/additions(2)(4) | | | Expenses net of fee waivers and/or recoupments, if any(2)(3)(4) | | | Expenses net of all reductions/additions(2)(3)(4) | | | Net investment income (loss)(2)(3)(4) | | | Net assets, end of year or period | | | Portfolio turnover rate | |
| | | | | | | | | | | | | | | | | | | | | | | | | | | | | | | | | | | | | | | | | | | | | | | | | | | | | | | | | | | | | | | | |
Year or period ended | | ($) | | | ($) | | | ($) | | | ($) | | | ($) | | | ($) | | | ($) | | | ($) | | | ($) | | | (%) | | | (%) | | | (%) | | | (%) | | | (%) | | | ($000's) | | | (%) | |
ING Solution Moderate Portfolio (Continued) | | | | | | | | | | | | | | | | | | | | | | | | | | | | | | | | | | | | | | | | | | | | | | | | | | | | | | | | | | | | | | | | |
Class I | | | | | | | | | | | | | | | | | | | | | | | | | | | | | | | | | | | | | | | | | | | | | | | | | | | | | | | | | | | | | | | | |
12-31-10 | | | 9.17 | | | | 0.26 | | | | 0.79 | | | | 1.05 | | | | 0.13 | | | | 0.05 | | | | — | | | | 0.18 | | | | 10.04 | | | | 11.66 | | | | 0.12 | | | | 0.12 | | | | 0.12 | | | | 2.75 | | | | 1 | | | | 47 | |
12-31-09 | | | 7.69 | | | | 0.24 | • | | | 1.32 | | | | 1.56 | | | | 0.07 | | | | 0.01 | | | | — | | | | 0.08 | | | | 9.17 | | | | 20.46 | | | | 0.12 | | | | 0.12 | | | | 0.12 | | | | 2.93 | | | | 1 | | | | 87 | |
12-31-08 | | | 10.04 | | | | 0.21 | · | | | (2.55 | ) | | | (2.34 | ) | | | 0.01 | | | | 0.00 | * | | | — | | | | 0.01 | | | | 7.69 | | | | (23.32 | ) | | | 0.12 | | | | 0.12 | | | | 0.12 | | | | 2.26 | | | | 1 | | | | 212 | |
07-02-07(5) - 12-31-07 | | | 10.00 | | | | 0.15 | | | | (0.11 | ) | | | 0.04 | | | | — | | | | — | | | | — | | | | — | | | | 10.04 | | | | 0.40 | | | | 0.12 | | | | 0.12 | | | | 0.12 | | | | 3.04 | | | | 1 | | | | 7 | |
Class S | | | | | | | | | | | | | | | | | | | | | | | | | | | | | | | | | | | | | | | | | | | | | | | | | | | | | | | | | | | | | | | | |
12-31-10 | | | 9.09 | | | | 0.26 | · | | | 0.74 | | | | 1.00 | | | | 0.13 | | | | 0.05 | | | | — | | | | 0.18 | | | | 9.91 | | | | 11.19 | | | | 0.37 | | | | 0.37 | | | | 0.37 | | | | 2.74 | | | | 6,911 | | | | 47 | |
12-31-09 | | | 7.64 | | | | 0.25 | • | | | 1.29 | | | | 1.54 | | | | 0.08 | | | | 0.01 | | | | — | | | | 0.09 | | | | 9.09 | | | | 20.31 | | | | 0.37 | | | | 0.37 | | | | 0.37 | | | | 2.98 | | | | 1,529 | | | | 87 | |
12-31-08 | | | 10.02 | | | | 0.46 | · | | | (2.82 | ) | | | (2.36 | ) | | | 0.02 | | | | 0.00 | * | | | — | | | | 0.02 | | | | 7.64 | | | | (23.63 | ) | | | 0.37 | | | | 0.37 | | | | 0.37 | | | | 6.07 | | | | 625 | | | | 212 | |
07-02-07(5) - 12-31-07 | | | 10.00 | | | | 0.14 | | | | (0.12 | ) | | | 0.02 | | | | — | | | | — | | | | — | | | | — | | | | 10.02 | | | | 0.20 | | | | 0.37 | | | | 0.37 | | | | 0.37 | | | | 2.79 | | | | 1 | | | | 7 | |
Class S2 | | | | | | | | | | | | | | | | | | | | | | | | | | | | | | | | | | | | | | | | | | | | | | | | | | | | | | | | | | | | | | | | |
04-30-10(5) - 12-31-10 | | | 9.51 | | | | 0.21 | · | | | 0.37 | | | | 0.58 | | | | 0.14 | | | | 0.05 | | | | — | | | | 0.19 | | | | 9.90 | | | | 6.30 | | | | 0.62 | | | | 0.52 | | | | 0.52 | | | | 3.30 | | | | 32 | | | | 47 | |
| | | | | | | | | | | | | | | | |
ING Solution 2015 Portfolio | | | | | | | | | | | | | | | | | | | | | | | | | | | | | | | | | | | | | | | | | | | | | | | | | | | | | | | | | | | | | | | | |
Class ADV | | | | | | | | | | | | | | | | | | | | | | | | | | | | | | | | | | | | | | | | | | | | | | | | | | | | | | | | | | | | | | | | |
12-31-10 | | | 10.07 | | | | 0.27 | | | | 0.80 | | | | 1.07 | | | | 0.22 | | | | — | | | | — | | | | 0.22 | | | | 10.92 | | | | 10.82 | | | | 0.62 | | | | 0.62 | | | | 0.62 | | | | 2.54 | | | | 336,038 | | | | 61 | |
12-31-09 | | | 8.63 | | | | 0.21 | • | | | 1.67 | | | | 1.88 | | | | 0.35 | | | | 0.09 | | | | — | | | | 0.44 | | | | 10.07 | | | | 22.16 | | | | 0.62 | | | | 0.62 | | | | 0.62 | | | | 2.32 | | | | 310,244 | | | | 60 | |
12-31-08 | | | 12.26 | | | | 0.28 | · | | | (3.51 | ) | | | (3.23 | ) | | | 0.17 | | | | 0.23 | | | | — | | | | 0.40 | | | | 8.63 | | | | (27.05 | ) | | | 0.62 | | | | 0.62 | | | | 0.62 | | | | 2.56 | | | | 231,719 | | | | 59 | |
12-31-07 | | | 11.84 | | | | 0.24 | · | | | 0.27 | | | | 0.51 | | | | 0.07 | | | | 0.02 | | | | — | | | | 0.09 | | | | 12.26 | | | | 4.30 | | | | 0.62 | | | | 0.62 | | | | 0.62 | | | | 1.99 | | | | 237,369 | | | | 39 | |
12-31-06 | | | 10.74 | | | | 0.40 | · | | | 0.73 | | | | 1.13 | | | | 0.02 | | | | 0.01 | | | | — | | | | 0.03 | | | | 11.84 | | | | 10.54 | | | | 0.62 | | | | 0.62 | | | | 0.62 | | | | 3.49 | | | | 71,923 | | | | 14 | |
Class I | | | | | | | | | | | | | | | | | | | | | | | | | | | | | | | | | | | | | | | | | | | | | | | | | | | | | | | | | | | | | | | | |
12-31-10 | | | 10.25 | | | | 0.32 | | | | 0.83 | | | | 1.15 | | | | 0.26 | | | | — | | | | — | | | | 0.26 | | | | 11.14 | | | | 11.49 | | | | 0.12 | | | | 0.12 | | | | 0.12 | | | | 3.03 | | | | 75,820 | | | | 61 | |
12-31-09 | | | 8.78 | | | | 0.25 | | | | 1.70 | | | | 1.95 | | | | 0.39 | | | | 0.09 | | | | — | | | | 0.48 | | | | 10.25 | | | | 22.70 | | | | 0.12 | | | | 0.12 | | | | 0.12 | | | | 2.68 | | | | 65,252 | | | | 60 | |
12-31-08 | | | 12.44 | | | | 0.34 | · | | | (3.57 | ) | | | (3.23 | ) | | | 0.20 | | | | 0.23 | | | | — | | | | 0.43 | | | | 8.78 | | | | (26.71 | ) | | | 0.12 | | | | 0.12 | | | | 0.12 | | | | 3.10 | | | | 51,793 | | | | 59 | |
12-31-07 | | | 11.95 | | | | 0.30 | · | | | 0.28 | | | | 0.58 | | | | 0.07 | | | | 0.02 | | | | — | | | | 0.09 | | | | 12.44 | | | | 4.90 | | | | 0.12 | | | | 0.12 | | | | 0.12 | | | | 2.41 | | | | 41,863 | | | | 39 | |
12-31-06 | | | 10.80 | | | | 0.33 | · | | | 0.85 | | | | 1.18 | | | | 0.02 | | | | 0.01 | | | | — | | | | 0.03 | | | | 11.95 | | | | 10.96 | | | | 0.12 | | | | 0.12 | | | | 0.12 | | | | 2.85 | | | | 14,384 | | | | 14 | |
Class S | | | | | | | | | | | | | | | | | | | | | | | | | | | | | | | | | | | | | | | | | | | | | | | | | | | | | | | | | | | | | | | | |
12-31-10 | | | 10.17 | | | | 0.29 | | | | 0.83 | | | | 1.12 | | | | 0.24 | | | | — | | | | — | | | | 0.24 | | | | 11.05 | | | | 11.25 | | | | 0.37 | | | | 0.37 | | | | 0.37 | | | | 2.82 | | | | 380,318 | | | | 61 | |
12-31-09 | | | 8.72 | | | | 0.21 | | | | 1.70 | | | | 1.91 | | | | 0.37 | | | | 0.09 | | | | — | | | | 0.46 | | | | 10.17 | | | | 22.32 | | | | 0.37 | | | | 0.37 | | | | 0.37 | | | | 2.53 | | | | 345,876 | | | | 60 | |
12-31-08 | | | 12.36 | | | | 0.30 | · | | | (3.53 | ) | | | (3.23 | ) | | | 0.18 | | | | 0.23 | | | | — | | | | 0.41 | | | | 8.72 | | | | (26.86 | ) | | | 0.37 | | | | 0.37 | | | | 0.37 | | | | 2.78 | | | | 265,937 | | | | 59 | |
12-31-07 | | | 11.90 | | | | 0.24 | · | | | 0.31 | | | | 0.55 | | | | 0.07 | | | | 0.02 | | | | — | | | | 0.09 | | | | 12.36 | | | | 4.60 | | | | 0.37 | | | | 0.37 | | | | 0.37 | | | | 1.96 | | | | 300,704 | | | | 39 | |
12-31-06 | | | 10.77 | | | | 0.29 | · | | | 0.87 | | | | 1.16 | | | | 0.02 | | | | 0.01 | | | | — | | | | 0.03 | | | | 11.90 | | | | 10.78 | | | | 0.37 | | | | 0.37 | | | | 0.37 | | | | 2.52 | | | | 191,100 | | | | 14 | |
Class S2 | | | | | | | | | | | | | | | | | | | | | | | | | | | | | | | | | | | | | | | | | | | | | | | | | | | | | | | | | | | | | | | | |
12-31-10 | | | 10.02 | | | | 0.36 | · | | | 0.72 | | | | 1.08 | | | | 0.26 | | | | — | | | | — | | | | 0.26 | | | | 10.84 | | | | 11.05 | | | | 0.62 | | | | 0.52 | | | | 0.52 | | | | 3.54 | | | | 15,289 | | | | 61 | |
05-28-09(5)- 12-31-09 | | | 8.97 | | | | 0.21 | • | | | 1.32 | | | | 1.53 | | | | 0.39 | | | | 0.09 | | | | — | | | | 0.48 | | | | 10.02 | | | | 17.53 | | | | 0.62 | | | | 0.52 | | | | 0.52 | | | | 3.70 | | | | 3 | | | | 60 | |
See Accompanying Notes to Financial Statements
34
FINANCIAL HIGHLIGHTS (CONTINUED)
Selected data for a share of beneficial interest outstanding throughout each year or period.
| | | | | | | | | | | | | | | | | | | | | | | | | | | | | | | | | | | | | | | | | | | | | | | | | | | | | | | | | | | | | | | | |
| | | | | | Income (loss)
from
investment
operations | | | | | | Less distributions | | | | | | | | | | | | Ratios to average net assets | | | Supplemental
data | |
| | | | | | | | | | | | | | | | | | | | | | | | | | | | | | | | | | | | | | | | | | | | | | | | | |
| | | Net asset value, beginning of year or period | | | Net investment income (loss) | | | Net realized and unrealized gain (loss) | | | Total from investment operations | | | From net investment income | | | From net realized gains | | | From return of capital | | | Total distributions | | | Net asset value, end of year or period | | | Total Return(1) | | | Expenses before reductions/ additions(2)(4) | | | Expenses net of fee waivers and/or recoupments, if any (2)(3)(4) | | | Expenses net of all reductions/ additions(2)(3)(4) | | | Net investment income (loss)(2)(3)(4) | | | Net assets, end of year or period | | | Portfolio turnover rate | |
| | | | | | | | | | | | | | | | | | | | | | | | | | | | | | | | | | | | | | | | | | | | | | | | | | | | | | | | | | | | | | | | |
Year or period ended | | ($) | | | ($) | | | ($) | | | ($) | | | ($) | | | ($) | | | ($) | | | ($) | | | ($) | | | (%) | | | (%) | | | (%) | | | (%) | | | (%) | | | ($000's) | | | (%) | |
ING Solution 2015 Portfolio (Continued) | | | | | | | | | | | | | | | | | | | | | | | | | | | | | | | | | | | | | | | | | | | | | | | | | | | | | | | | | | | | | | | | |
Class T | | | | | | | | | | | | | | | | | | | | | | | | | | | | | | | | | | | | | | | | | | | | | | | | | | | | | | | | | | | | | | | | |
12-31-10 | | | 10.17 | | | | 0.24 | · | | | 0.83 | | | | 1.07 | | | | 0.20 | | | | — | | | | — | | | | 0.20 | | | | 11.04 | | | | 10.65 | | | | 0.87 | | | | 0.82 | | | | 0.82 | | | | 2.30 | | | | 2,529 | | | | 61 | |
12-31-09 | | | 8.70 | | | | 0.18 | • | | | 1.69 | | | | 1.87 | | | | 0.31 | | | | 0.09 | | | | — | | | | 0.40 | | | | 10.17 | | | | 21.79 | | | | 0.87 | | | | 0.82 | | | | 0.82 | | | | 1.95 | | | | 2,517 | | | | 60 | |
12-31-08 | | | 12.28 | | | | 0.27 | | | | (3.54 | ) | | | (3.27 | ) | | | 0.08 | | | | 0.23 | | | | — | | | | 0.31 | | | | 8.70 | | | | (27.17 | ) | | | 0.87 | | | | 0.82 | | | | 0.82 | | | | 2.27 | | | | 2,615 | | | | 59 | |
12-31-07 | | | 11.81 | | | | 0.17 | | | | 0.32 | | | | 0.49 | | | | — | | | | 0.02 | | | | — | | | | 0.02 | | | | 12.28 | | | | 4.15 | | | | 0.87 | | | | 0.82 | | | | 0.82 | | | | 1.38 | | | | 4,220 | | | | 39 | |
12-31-06 | | | 10.74 | | | | 0.04 | · | | | 1.06 | | | | 1.10 | | | | 0.02 | | | | 0.01 | | | | — | | | | 0.03 | | | | 11.81 | | | | 10.26 | | | | 0.87 | | | | 0.82 | | | | 0.82 | | | | 0.38 | | | | 4,661 | | | | 14 | |
| | | | | | | | | | | | | | | | |
ING Solution 2025 Portfolio | | | | | | | | | | | | | | | | | | | | | | | | | | | | | | | | | | | | | | | | | | | | | | | | | | | | | | | | | | | | | | | | |
Class ADV | | | | | | | | | | | | | | | | | | | | | | | | | | | | | | | | | | | | | | | | | | | | | | | | | | | | | | | | | | | | | | | | |
12-31-10 | | | 9.82 | | | | 0.18 | | | | 1.12 | | | | 1.30 | | | | 0.14 | | | | — | | | | — | | | | 0.14 | | | | 10.98 | | | | 13.50 | | | | 0.62 | | | | 0.62 | | | | 0.62 | | | | 1.84 | | | | 522,321 | | | | 56 | |
12-31-09 | | | 8.06 | | | | 0.15 | • | | | 1.88 | | | | 2.03 | | | | 0.26 | | | | 0.01 | | | | — | | | | 0.27 | | | | 9.82 | | | | 25.54 | | | | 0.62 | | | | 0.62 | | | | 0.62 | | | | 1.73 | | | | 457,213 | | | | 51 | |
12-31-08 | | | 12.71 | | | | 0.20 | · | | | (4.41 | ) | | | (4.21 | ) | | | 0.13 | | | | 0.31 | | | | — | | | | 0.44 | | | | 8.06 | | | | (34.05 | ) | | | 0.62 | | | | 0.62 | | | | 0.62 | | | | 1.87 | | | | 321,460 | | | | 62 | |
12-31-07 | | | 12.28 | | | | 0.15 | · | | | 0.37 | | | | 0.52 | | | | 0.05 | | | | 0.04 | | | | — | | | | 0.09 | | | | 12.71 | | | | 4.28 | | | | 0.62 | | | | 0.62 | | | | 0.62 | | | | 1.16 | | | | 345,763 | | | | 39 | |
12-31-06 | | | 10.97 | | | | 0.27 | · | | | 1.08 | | | | 1.35 | | | | 0.02 | | | | 0.02 | | | | — | | | | 0.04 | | | | 12.28 | | | | 12.37 | | | | 0.62 | | | | 0.62 | | | | 0.62 | | | | 2.29 | | | | 100,091 | | | | 23 | |
Class I | | | | | | | | | | | | | | | | | | | | | | | | | | | | | | | | | | | | | | | | | | | | | | | | | | | | | | | | | | | | | | | | |
12-31-10 | | | 10.01 | | | | 0.23 | | | | 1.15 | | | | 1.38 | | | | 0.18 | | | | — | | | | — | | | | 0.18 | | | | 11.21 | | | | 14.10 | | | | 0.12 | | | | 0.12 | | | | 0.12 | | | | 2.34 | | | | 126,678 | | | | 56 | |
12-31-09 | | | 8.21 | | | | 0.17 | | | | 1.95 | | | | 2.12 | | | | 0.31 | | | | 0.01 | | | | — | | | | 0.32 | | | | 10.01 | | | | 26.13 | | | | 0.12 | | | | 0.12 | | | | 0.12 | | | | 2.15 | | | | 102,548 | | | | 51 | |
12-31-08 | | | 12.91 | | | | 0.26 | · | | | (4.49 | ) | | | (4.23 | ) | | | 0.16 | | | | 0.31 | | | | — | | | | 0.47 | | | | 8.21 | | | | (33.72 | ) | | | 0.12 | | | | 0.12 | | | | 0.12 | | | | 2.41 | | | | 72,518 | | | | 62 | |
12-31-07 | | | 12.41 | | | | 0.22 | · | | | 0.38 | | | | 0.60 | | | | 0.06 | | | | 0.04 | | | | — | | | | 0.10 | | | | 12.91 | | | | 4.84 | | | | 0.12 | | | | 0.12 | | | | 0.12 | | | | 1.74 | | | | 59,212 | | | | 39 | |
12-31-06 | | | 11.03 | | | | 0.22 | · | | | 1.21 | | | | 1.43 | | | | 0.03 | | | | 0.02 | | | | — | | | | 0.05 | | | | 12.41 | | | | 12.94 | | | | 0.12 | | | | 0.12 | | | | 0.12 | | | | 1.87 | | | | 17,540 | | | | 23 | |
Class S | | | | | | | | | | | | | | | | | | | | | | | | | | | | | | | | | | | | | | | | | | | | | | | | | | | | | | | | | | | | | | | | |
12-31-10 | | | 9.93 | | | | 0.21 | | | | 1.13 | | | | 1.34 | | | | 0.16 | | | | — | | | | — | | | | 0.16 | | | | 11.11 | | | | 13.79 | | | | 0.37 | | | | 0.37 | | | | 0.37 | | | | 2.11 | | | | 574,267 | | | | 56 | |
12-31-09 | | | 8.15 | | | | 0.17 | • | | | 1.90 | | | | 2.07 | | | | 0.28 | | | | 0.01 | | | | — | | | | 0.29 | | | | 9.93 | | | | 25.78 | | | | 0.37 | | | | 0.37 | | | | 0.37 | | | | 1.98 | | | | 502,884 | | | | 51 | |
12-31-08 | | | 12.82 | | | | 0.22 | · | | | (4.44 | ) | | | (4.22 | ) | | | 0.14 | | | | 0.31 | | | | — | | | | 0.45 | | | | 8.15 | | | | (33.87 | ) | | | 0.37 | | | | 0.37 | | | | 0.37 | | | | 2.06 | | | | 341,919 | | | | 62 | |
12-31-07 | | | 12.34 | | | | 0.15 | · | | | 0.42 | | | | 0.57 | | | | 0.05 | | | | 0.04 | | | | — | | | | 0.09 | | | | 12.82 | | | | 4.64 | | | | 0.37 | | | | 0.37 | | | | 0.37 | | | | 1.18 | | | | 446,724 | | | | 39 | |
12-31-06 | | | 11.00 | | | | 0.19 | · | | | 1.19 | | | | 1.38 | | | | 0.02 | | | | 0.02 | | | | — | | | | 0.04 | | | | 12.34 | | | | 12.59 | | | | 0.37 | | | | 0.37 | | | | 0.37 | | | | 1.58 | | | | 282,074 | | | | 23 | |
Class S2 | | | | | | | | | | | | | | | | | | | | | | | | | | | | | | | | | | | | | | | | | | | | | | | | | | | | | | | | | | | | | | | | |
12-31-10 | | | 9.80 | | | | 0.26 | · | | | 1.04 | | | | 1.30 | | | | 0.18 | | | | — | | | | — | | | | 0.18 | | | | 10.92 | | | | 13.59 | | | | 0.62 | | | | 0.52 | | | | 0.52 | | | | 2.59 | | | | 20,678 | | | | 56 | |
05-28-09(5)- 12-31-09 | | | 8.44 | | | | 0.16 | • | | | 1.52 | | | | 1.68 | | | | 0.31 | | | | 0.01 | | | | — | | | | 0.32 | | | | 9.80 | | | | 20.20 | | | | 0.62 | | | | 0.52 | | | | 0.52 | | | | 2.84 | | | | 3 | | | | 51 | |
Class T | | | | | | | | | | | | | | | | | | | | | | | | | | | | | | | | | | | | | | | | | | | | | | | | | | | | | | | | | | | | | | | | |
12-31-10 | | | 9.89 | | | | 0.16 | | | | 1.14 | | | | 1.30 | | | | 0.13 | | | | — | | | | — | | | | 0.13 | | | | 11.06 | | | | 13.28 | | | | 0.87 | | | | 0.82 | | | | 0.82 | | | | 1.65 | | | | 6,215 | | | | 56 | |
12-31-09 | | | 8.10 | | | | 0.13 | | | | 1.89 | | | | 2.02 | | | | 0.22 | | | | 0.01 | | | | — | | | | 0.23 | | | | 9.89 | | | | 25.14 | | | | 0.87 | | | | 0.82 | | | | 0.82 | | | | 1.48 | | | | 5,399 | | | | 51 | |
12-31-08 | | | 12.72 | | | | 0.16 | · | | | (4.41 | ) | | | (4.25 | ) | | | 0.06 | | | | 0.31 | | | | — | | | | 0.37 | | | | 8.10 | | | | (34.18 | ) | | | 0.87 | | | | 0.82 | | | | 0.82 | | | | 1.45 | | | | 4,423 | | | | 62 | |
12-31-07 | | | 12.25 | | | | 0.07 | · | | | 0.44 | | | | 0.51 | | | | — | | | | 0.04 | | | | — | | | | 0.04 | | | | 12.72 | | | | 4.17 | | | | 0.87 | | | | 0.82 | | | | 0.82 | | | | 0.53 | | | | 7,917 | | | | 39 | |
12-31-06 | | | 10.97 | | | | 0.02 | · | | | 1.31 | | | | 1.33 | | | | 0.03 | | | | 0.02 | | | | — | | | | 0.05 | | | | 12.25 | | | | 12.09 | | | | 0.87 | | | | 0.82 | | | | 0.82 | | | | 0.19 | | | | 9,588 | | | | 23 | |
See Accompanying Notes to Financial Statements
35
FINANCIAL HIGHLIGHTS (CONTINUED)
Selected data for a share of beneficial interest outstanding throughout each year or period.
| | | | | | | | | | | | | | | | | | | | | | | | | | | | | | | | | | | | | | | | | | | | | | | | | | | | | | | | | | | | | | | | |
| | | | | | Income (loss)
from
investment
operations | | | | | | Less distributions | | | | | | | | | | | | Ratios to average net assets | | | Supplemental
data | |
| | | | | | | | | | | | | | | | | | | | | | | | | | | | | | | | | | | | | | | | | | | | | | | | | |
| | | Net asset value, beginning of year or period | | | Net investment income (loss) | | | Net realized and unrealized gain (loss) | | | Total from investment operations | | | From net investment income | | | From net realized gains | | | From return of capital | | | Total distributions | | | Net asset value, end of year or period | | | Total Return(1) | | | Expenses before reductions/ additions(2)(3)(4) | | | Expenses net of fee waivers and/or recoupments, if any(2)(3)(4) | | | Expenses net of all reductions/ additions(2)(3)(4) | | | Net investment income (loss)(2)(3)(4) | | | Net assets, end of year or period | | | Portfolio turnover rate | |
| | | | | | | | | | | | | | | | | | | | | | | | | | | | | | | | | | | | | | | | | | | | | | | | | | | | | | | | | | | | | | | | |
Year or period ended | | ($) | | | ($) | | | ($) | | | ($) | | | ($) | | | ($) | | | ($) | | | ($) | | | ($) | | | (%) | | | (%) | | | (%) | | | (%) | | | (%) | | | ($000's) | | | (%) | |
ING Solution 2035 Portfolio | | | | | | | | | | | | | | | | | | | | | | | | | | | | | | | | | | | | | | | | | | | | | | | | | | | | | | | | | | | | | | | | |
Class ADV | | | | | | | | | | | | | | | | | | | | | | | | | | | | | | | | | | | | | | | | | | | | | | | | | | | | | | | | | | | | | | | | |
12-31-10 | | | 9.90 | | | | 0.14 | | | | 1.26 | | | | 1.40 | | | | 0.11 | | | | — | | | | — | | | | 0.11 | | | | 11.19 | | | | 14.29 | | | | 0.62 | | | | 0.62 | | | | 0.62 | | | | 1.39 | | | | 453,363 | | | | 56 | |
12-31-09 | | | 7.94 | | | | 0.12 | • | | | 2.08 | | | | 2.20 | | | | 0.23 | | | | 0.01 | | | | — | | | | 0.24 | | | | 9.90 | | | | 28.00 | | | | 0.62 | | | | 0.62 | | | | 0.62 | | | | 1.35 | | | | 389,542 | | | | 46 | |
12-31-08 | | | 13.19 | | | | 0.15 | · | | | (4.91 | ) | | | (4.76 | ) | | | 0.14 | | | | 0.35 | | | | — | | | | 0.49 | | | | 7.94 | | | | (37.18 | ) | | | 0.62 | | | | 0.62 | | | | 0.62 | | | | 1.38 | | | | 252,226 | | | | 62 | |
12-31-07 | | | 12.65 | | | | 0.12 | · | | | 0.51 | | | | 0.63 | | | | 0.05 | | | | 0.04 | | | | — | | | | 0.09 | | | | 13.19 | | | | 5.03 | | | | 0.62 | | | | 0.62 | | | | 0.62 | | | | 0.88 | | | | 279,171 | | | | 32 | |
12-31-06 | | | 11.13 | | | | 0.31 | · | | | 1.23 | | | | 1.54 | | | | 0.01 | | | | 0.01 | | | | — | | | | 0.02 | | | | 12.65 | | | | 13.91 | | | | 0.62 | | | | 0.62 | | | | 0.62 | | | | 2.60 | | | | 73,683 | | | | 15 | |
Class I | | | | | | | | | | | | | | | | | | | | | | | | | | | | | | | | | | | | | | | | | | | | | | | | | | | | | | | | | | | | | | | | |
12-31-10 | | | 10.09 | | | | 0.20 | · | | | 1.27 | | | | 1.47 | | | | 0.15 | | | | — | | | | — | | | | 0.15 | | | | 11.41 | | | | 14.77 | | | | 0.12 | | | | 0.12 | | | | 0.12 | | | | 1.90 | | | | 115,744 | | | | 56 | |
12-31-09 | | | 8.08 | | | | 0.16 | • | | | 2.13 | | | | 2.29 | | | | 0.27 | | | | 0.01 | | | | — | | | | 0.28 | | | | 10.09 | | | | 28.68 | | | | 0.12 | | | | 0.12 | | | | 0.12 | | | | 1.82 | | | | 85,142 | | | | 46 | |
12-31-08 | | | 13.38 | | | | 0.21 | · | | | (4.99 | ) | | | (4.78 | ) | | | 0.17 | | | | 0.35 | | | | — | | | | 0.52 | | | | 8.08 | | | | (36.85 | ) | | | 0.12 | | | | 0.12 | | | | 0.12 | | | | 1.96 | | | | 50,607 | | | | 62 | |
12-31-07 | | | 12.76 | | | | 0.19 | · | | | 0.53 | | | | 0.72 | | | | 0.06 | | | | 0.04 | | | | — | | | | 0.10 | | | | 13.38 | | | | 5.66 | | | | 0.12 | | | | 0.12 | | | | 0.12 | | | | 1.43 | | | | 44,254 | | | | 32 | |
12-31-06 | | | 11.19 | | | | 0.22 | · | | | 1.37 | | | | 1.59 | | | | 0.01 | | | | 0.01 | | | | — | | | | 0.02 | | | | 12.76 | | | | 14.29 | | | | 0.12 | | | | 0.12 | | | | 0.12 | | | | 1.84 | | | | 16,647 | | | | 15 | |
Class S | | | | | | | | | | | | | | | | | | | | | | | | | | | | | | | | | | | | | | | | | | | | | | | | | | | | | | | | | | | | | | | | |
12-31-10 | | | 10.01 | | | | 0.16 | | | | 1.28 | | | | 1.44 | | | | 0.13 | | | | — | | | | — | | | | 0.13 | | | | 11.32 | | | | 14.56 | | | | 0.37 | | | | 0.37 | | | | 0.37 | | | | 1.65 | | | | 477,985 | | | | 56 | |
12-31-09 | | | 8.02 | | | | 0.14 | • | | | 2.11 | | | | 2.25 | | | | 0.25 | | | | 0.01 | | | | — | | | | 0.26 | | | | 10.01 | | | | 28.35 | | | | 0.37 | | | | 0.37 | | | | 0.37 | | | | 1.59 | | | | 406,568 | | | | 46 | |
12-31-08 | | | 13.29 | | | | 0.17 | · | | | (4.94 | ) | | | (4.77 | ) | | | 0.15 | | | | 0.35 | | | | — | | | | 0.50 | | | | 8.02 | | | | (37.01 | ) | | | 0.37 | | | | 0.37 | | | | 0.37 | | | | 1.59 | | | | 269,288 | | | | 62 | |
12-31-07 | | | 12.71 | | | | 0.12 | · | | | 0.55 | | | | 0.67 | | | | 0.05 | | | | 0.04 | | | | — | | | | 0.09 | | | | 13.29 | | | | 5.30 | | | | 0.37 | | | | 0.37 | | | | 0.37 | | | | 0.93 | | | | 347,197 | | | | 32 | |
12-31-06 | | | 11.16 | | | | 0.22 | · | | | 1.35 | | | | 1.57 | | | | 0.01 | | | | 0.01 | | | | — | | | | 0.02 | | | | 12.71 | | | | 14.13 | | | | 0.37 | | | | 0.37 | | | | 0.37 | | | | 1.85 | | | | 222,502 | | | | 15 | |
Class S2 | | | | | | | | | | | | | | | | | | | | | | | | | | | | | | | | | | | | | | | | | | | | | | | | | | | | | | | | | | | | | | | | |
12-31-10 | | | 9.83 | | | | 0.21 | · | | | 1.19 | | | | 1.40 | | | | 0.15 | | | | — | | | | — | | | | 0.15 | | | | 11.08 | | | | 14.44 | | | | 0.62 | | | | 0.52 | | | | 0.52 | | | | 2.08 | | | | 18,369 | | | | 56 | |
05-28-09(5)- 12-31-09 | | | 8.32 | | | | 0.13 | • | | | 1.66 | | | | 1.79 | | | | 0.27 | | | | 0.01 | | | | — | | | | 0.28 | | | | 9.83 | | | | 21.84 | | | | 0.62 | | | | 0.52 | | | | 0.52 | | | | 2.35 | | | | 4 | | | | 46 | |
Class T | | | | | | | | | | | | | | | | | | | | | | | | | | | | | | | | | | | | | | | | | | | | | | | | | | | | | | | | | | | | | | | | |
12-31-10 | | | 10.02 | | | | 0.12 | | | | 1.27 | | | | 1.39 | | | | 0.08 | | | | — | | | | — | | | | 0.08 | | | | 11.33 | | | | 14.04 | | | | 0.87 | | | | 0.82 | | | | 0.82 | | | | 1.18 | | | | 3,998 | | | | 56 | |
12-31-09 | | | 7.98 | | | | 0.09 | • | | | 2.11 | | | | 2.20 | | | | 0.15 | | | | 0.01 | | | | — | | | | 0.16 | | | | 10.02 | | | | 27.73 | | | | 0.87 | | | | 0.82 | | | | 0.82 | | | | 1.10 | | | | 3,618 | | | | 46 | |
12-31-08 | | | 13.18 | | | | 0.09 | · | | | (4.89 | ) | | | (4.80 | ) | | | 0.05 | | | | 0.35 | | | | — | | | | 0.40 | | | | 7.98 | | | | (37.30 | ) | | | 0.87 | | | | 0.82 | | | | 0.82 | | | | 0.78 | | | | 2,979 | | | | 62 | |
12-31-07 | | | 12.60 | | | | 0.05 | | | | 0.57 | | | | 0.62 | | | | — | | | | 0.04 | | | | — | | | | 0.04 | | | | 13.18 | | | | 4.89 | | | | 0.87 | | | | 0.82 | | | | 0.82 | | | | 0.38 | | | | 8,774 | | | | 32 | |
12-31-06 | | | 11.12 | | | | 0.02 | · | | | 1.48 | | | | 1.50 | | | | 0.01 | | | | 0.01 | | | | — | | | | 0.02 | | | | 12.60 | | | | 13.56 | | | | 0.87 | | | | 0.82 | | | | 0.82 | | | | 0.18 | | | | 8,525 | | | | 15 | |
| | | | | | | | | | | | | | | | |
ING Solution 2045 Portfolio | | | | | | | | | | | | | | | | | | | | | | | | | | | | | | | | | | | | | | | | | | | | | | | | | | | | | | | | | | | | | | | | |
Class ADV | | | | | | | | | | | | | | | | | | | | | | | | | | | | | | | | | | | | | | | | | | | | | | | | | | | | | | | | | | | | | | | | |
12-31-10 | | | 9.90 | | | | 0.11 | | | | 1.35 | | | | 1.46 | | | | 0.07 | | | | — | | | | — | | | | 0.07 | | | | 11.29 | | | | 14.92 | | | | 0.62 | | | | 0.62 | | | | 0.62 | | | | 1.04 | | | | 262,653 | | | | 40 | |
12-31-09 | | | 7.87 | | | | 0.09 | • | | | 2.20 | | | | 2.29 | | | | 0.19 | | | | 0.07 | | | | — | | | | 0.26 | | | | 9.90 | | | | 29.50 | | | | 0.62 | | | | 0.62 | | | | 0.62 | | | | 1.07 | | | | 229,164 | | | | 36 | |
12-31-08 | | | 13.66 | | | | 0.12 | · | | | (5.44 | ) | | | (5.32 | ) | | | 0.11 | | | | 0.36 | | | | — | | | | 0.47 | | | | 7.87 | | | | (40.02 | ) | | | 0.62 | | | | 0.62 | | | | 0.62 | | | | 1.14 | | | | 136,526 | | | | 57 | |
12-31-07 | | | 13.01 | | | | 0.05 | | | | 0.66 | | | | 0.71 | | | | 0.03 | | | | 0.03 | | | | — | | | | 0.06 | | | | 13.66 | | | | 5.51 | | | | 0.62 | | | | 0.62 | | | | 0.62 | | | | 0.33 | | | | 148,649 | | | | 39 | |
12-31-06 | | | 11.35 | | | | 0.15 | · | | | 1.53 | | | | 1.68 | | | | 0.00 | * | | | 0.02 | | | | — | | | | 0.02 | | | | 13.01 | | | | 14.82 | | | | 0.62 | | | | 0.62 | | | | 0.62 | | | | 1.22 | | | | 36,741 | | | | 20 | |
See Accompanying Notes to Financial Statements
36
FINANCIAL HIGHLIGHTS (CONTINUED)
Selected data for a share of beneficial interest outstanding throughout each year or period.
| | | | | | | | | | | | | | | | | | | | | | | | | | | | | | | | | | | | | | | | | | | | | | | | | | | | | | | | | | | | | | | | |
| | | | | | Income (loss)
from
investment
operations | | | | | | Less distributions | | | | | | | | | | | | Ratios to average net assets | | | Supplemental
data | |
| | | | | | | | | | | | | | | | | | | | | | | | | | | | | | | | | | | | | | | | | | | | | | | | | |
| | | Net asset value, beginning of year or period | | | Net investment income (loss) | | | Net realized and unrealized gain (loss) | | | Total from investment operations | | | From net investment income | | | From net realized gains | | | From return of capital | | | Total distributions | | | Net asset value, end of year or period | | | Total Return(1) | | | Expenses before reductions/ additions(2)(3)(4) | | | Expenses net of fee waivers and/or recoupments, if any(2)(3)(4) | | | Expenses net of all reductions/ additions(2)(3)(4) | | | Net investment income (loss)(2)(3)(4) | | | Net assets, end of year or period | | | Portfolio turnover rate | |
| | | | | | | | | | | | | | | | | | | | | | | | | | | | | | | | | | | | | | | | | | | | | | | | | | | | | | | | | | | | | | | | |
Year or period ended | | ($) | | | ($) | | | ($) | | | ($) | | | ($) | | | ($) | | | ($) | | | ($) | | | ($) | | | (%) | | | (%) | | | (%) | | | (%) | | | (%) | | | ($000's) | | | (%) | |
ING Solution 2045 Portfolio (Continued) | | | | | | | | | | | | | | | | | | | | | | | | | | | | | | | | | | | | | | | | | | | | | | | | | | | | | | | | | | | | | | | | |
Class I | | | | | | | | | | | | | | | | | | | | | | | | | | | | | | | | | | | | | | | | | | | | | | | | | | | | | | | | | | | | | | | | |
12-31-10 | | | 10.08 | | | | 0.16 | · | | | 1.38 | | | | 1.54 | | | | 0.11 | | | | — | | | | — | | | | 0.11 | | | | 11.51 | | | | 15.51 | | | | 0.12 | | | | 0.12 | | | | 0.12 | | | | 1.59 | | | | 88,176 | | | | 40 | |
12-31-09 | | | 8.00 | | | | 0.13 | • | | | 2.25 | | | | 2.38 | | | | 0.23 | | | | 0.07 | | | | — | | | | 0.30 | | | | 10.08 | | | | 30.16 | | | | 0.12 | | | | 0.12 | | | | 0.12 | | | | 1.54 | | | | 61,035 | | | | 36 | |
12-31-08 | | | 13.84 | | | | 0.19 | · | | | (5.53 | ) | | | (5.34 | ) | | | 0.14 | | | | 0.36 | | | | — | | | | 0.50 | | | | 8.00 | | | | (39.70 | ) | | | 0.12 | | | | 0.12 | | | | 0.12 | | | | 1.71 | | | | 33,161 | | | | 57 | |
12-31-07 | | | 13.13 | | | | 0.12 | | | | 0.66 | | | | 0.78 | | | | 0.04 | | | | 0.03 | | | | — | | | | 0.07 | | | | 13.84 | | | | 5.96 | | | | 0.12 | | | | 0.12 | | | | 0.12 | | | | 0.84 | | | | 28,381 | | | | 39 | |
12-31-06 | | | 11.40 | | | | 0.12 | · | | | 1.64 | | | | 1.76 | | | | 0.01 | | | | 0.02 | | | | — | | | | 0.03 | | | | 13.13 | | | | 15.38 | | | | 0.12 | | | | 0.12 | | | | 0.12 | | | | 0.98 | | | | 10,442 | | | | 20 | |
Class S | | | | | | | | | | | | | | | | | | | | | | | | | | | | | | | | | | | | | | | | | | | | | | | | | | | | | | | | | | | | | | | | |
12-31-10 | | | 10.00 | | | | 0.13 | | | | 1.36 | | | | 1.49 | | | | 0.09 | | | | — | | | | — | | | | 0.09 | | | | 11.40 | | | | 15.12 | | | | 0.37 | | | | 0.37 | | | | 0.37 | | | | 1.33 | | | | 319,163 | | | | 40 | |
12-31-09 | | | 7.94 | | | | 0.11 | • | | | 2.23 | | | | 2.34 | | | | 0.21 | | | | 0.07 | | | | — | | | | 0.28 | | | | 10.00 | | | | 29.86 | | | | 0.37 | | | | 0.37 | | | | 0.37 | | | | 1.32 | | | | 260,130 | | | | 36 | |
12-31-08 | | | 13.75 | | | | 0.15 | · | | | (5.48 | ) | | | (5.33 | ) | | | 0.12 | | | | 0.36 | | | | — | | | | 0.48 | | | | 7.94 | | | | (39.86 | ) | | | 0.37 | | | | 0.37 | | | | 0.37 | | | | 1.32 | | | | 156,122 | | | | 57 | |
12-31-07 | | | 13.06 | | | | 0.07 | | | | 0.68 | | | | 0.75 | | | | 0.03 | | | | 0.03 | | | | — | | | | 0.06 | | | | 13.75 | | | | 5.79 | | | | 0.37 | | | | 0.37 | | | | 0.37 | | | | 0.54 | | | | 199,688 | | | | 39 | |
12-31-06 | | | 11.37 | | | | 0.11 | · | | | 1.60 | | | | 1.71 | | | | 0.00 | * | | | 0.02 | | | | — | | | | 0.02 | | | | 13.06 | | | | 15.06 | | | | 0.37 | | | | 0.37 | | | | 0.37 | | | | 0.90 | | | | 114,650 | | | | 20 | |
Class S2 | | | | | | | | | | | | | | | | | | | | | | | | | | | | | | | | | | | | | | | | | | | | | | | | | | | | | | | | | | | | | | | | |
12-31-10 | | | 9.89 | | | | 0.18 | · | | | 1.28 | | | | 1.46 | | | | 0.11 | | | | — | | | | — | | | | 0.11 | | | | 11.24 | | | | 15.00 | | | | 0.62 | | | | 0.52 | | | | 0.52 | | | | 1.74 | | | | 14,341 | | | | 40 | |
05-28-09(5) - 12-31-09 | | | 8.33 | | | | 0.11 | • | | | 1.75 | | | | 1.86 | | | | 0.23 | | | | 0.07 | | | | — | | | | 0.30 | | | | 9.89 | | | | 22.72 | | | | 0.62 | | | | 0.52 | | | | 0.52 | | | | 1.93 | | | | 4 | | | | 36 | |
Class T | | | | | | | | | | | | | | | | | | | | | | | | | | | | | | | | | | | | | | | | | | | | | | | | | | | | | | | | | | | | | | | | |
12-31-10 | | | 9.95 | | | | 0.09 | | | | 1.36 | | | | 1.45 | | | | 0.05 | | | | — | | | | — | | | | 0.05 | | | | 11.35 | | | | 14.68 | | | | 0.87 | | | | 0.82 | | | | 0.82 | | | | 0.83 | | | | 2,329 | | | | 40 | |
12-31-09 | | | 7.88 | | | | 0.07 | | | | 2.21 | | | | 2.28 | | | | 0.14 | | | | 0.07 | | | | — | | | | 0.21 | | | | 9.95 | | | | 29.26 | | | | 0.87 | | | | 0.82 | | | | 0.82 | | | | 0.80 | | | | 2,142 | | | | 36 | |
12-31-08 | | | 13.62 | | | | 0.10 | | | | (5.44 | ) | | | (5.34 | ) | | | 0.04 | | | | 0.36 | | | | — | | | | 0.40 | | | | 7.88 | | | | (40.12 | ) | | | 0.87 | | | | 0.82 | | | | 0.82 | | | | 0.73 | | | | 1,712 | | | | 57 | |
12-31-07 | | | 12.97 | | | | 0.01 | | | | 0.67 | | | | 0.68 | | | | — | | | | 0.03 | | | | — | | | | 0.03 | | | | 13.62 | | | | 5.27 | | | | 0.87 | | | | 0.82 | | | | 0.82 | | | | 0.06 | | | | 3,306 | | | | 39 | |
12-31-06 | | | 11.34 | | | | (0.04 | )· | | | 1.69 | | | �� | 1.65 | | | | 0.00 | * | | | 0.02 | | | | — | | | | 0.02 | | | | 12.97 | | | | 14.57 | | | | 0.87 | | | | 0.82 | | | | 0.82 | | | | (0.29 | ) | | | 3,247 | | | | 20 | |
| | | | | | | | | | | | | | | | |
ING Solution 2055 Portfolio | | | | | | | | | | | | | | | | | | | | | | | | | | | | | | | | | | | | | | | | | | | | | | | | | | | | | | | | | | | | | | | | |
Class ADV | | | | | | | | | | | | | | | | | | | | | | | | | | | | | | | | | | | | | | | | | | | | | | | | | | | | | | | | | | | | | | | | |
03-08-10(5) - 12-31-10 | | | 10.02 | | | | 0.15 | · | | | 1.17 | | | | 1.32 | | | | — | | | | — | | | | — | | | | — | | | | 11.34 | | | | 13.17 | | | | 0.62 | | | | 0.62 | | | | 0.62 | | | | 1.72 | | | | 3,923 | | | | 33 | |
Class I | | | | | | | | | | | | | | | | | | | | | | | | | | | | | | | | | | | | | | | | | | | | | | | | | | | | | | | | | | | | | | | | |
03-08-10(5) - 12-31-10 | | | 10.02 | | | | 0.18 | · | | | 1.17 | | | | 1.35 | | | | — | | | | — | | | | — | | | | — | | | | 11.37 | | | | 13.47 | | | | 0.12 | | | | 0.12 | | | | 0.12 | | | | 2.11 | | | | 1,648 | | | | 33 | |
Class S | | | | | | | | | | | | | | | | | | | | | | | | | | | | | | | | | | | | | | | | | | | | | | | | | | | | | | | | | | | | | | | | |
03-08-10(5) - 12-31-10 | | | 10.02 | | | | 0.15 | · | | | 1.18 | | | | 1.33 | | | | — | | | | — | | | | — | | | | — | | | | 11.35 | | | | 13.27 | | | | 0.37 | | | | 0.37 | | | | 0.37 | | | | 1.80 | | | | 4,717 | | | | 33 | |
Class S2 | | | | | | | | | | | | | | | | | | | | | | | | | | | | | | | | | | | | | | | | | | | | | | | | | | | | | | | | | | | | | | | | |
03-08-10(5) - 12-31-10 | | | 10.02 | | | | 0.15 | · | | | 1.17 | | | | 1.32 | | | | — | | | | — | | | | — | | | | — | | | | 11.34 | | | | 13.17 | | | | 0.62 | | | | 0.52 | | | | 0.52 | | | | 1.73 | | | | 275 | | | | 33 | |
Class T | | | | | | | | | | | | | | | | | | | | | | | | | | | | | | | | | | | | | | | | | | | | | | | | | | | | | | | | | | | | | | | | |
03-08-10(5) - 12-31-10 | | | 10.02 | | | | 0.09 | | | | 1.20 | | | | 1.29 | | | | — | | | | — | | | | — | | | | — | | | | 11.31 | | | | 12.87 | | | | 0.87 | | | | 0.82 | | | | 0.82 | | | | 1.08 | | | | 6 | | | | 33 | |
See Accompanying Notes to Financial Statements
37
FINANCIAL HIGHLIGHTS (CONTINUED)
| (1) | | Total return is calculated assuming reinvestment of all dividends, capital gain distributions and return of capital distributions, if any, at net asset value and does not reflect the effect of insurance contract charges. Total return for periods less than one year is not annualized. |
| (2) | | Annualized for periods less than one year. |
| (3) | | Expense ratios reflect operating expenses of a Portfolio. Expenses before reductions/additions do not reflect amounts reimbursed by the Investment Adviser and/or Distributor or reductions from brokerage commission recapture arrangements or other expense offset arrangements and do not represent the amount paid by a Portfolio during periods when reimbursements or reductions occur. Expenses net of fee waivers reflect expenses after reimbursement by the Investment Adviser and/or Distributor but prior to reductions from brokerage commission recapture arrangements or other expense offset arrangements. Expenses net of all reductions/additions represent the net expenses paid by a Portfolio. Net investment income (loss) is net of all such additions or reductions. |
| (4) | | Expense ratios do not include expenses of underlying funds and do not include fees and expenses charged under the variable annuity contract or variable life insurance policy. |
| (5) | | Commencement of operations. |
| • | | Calculated using average number of shares outstanding throughout the period. |
| * | | Amount is less than $0.005 or 0.005% or more than $(0.005). |
See Accompanying Notes to Financial Statements
38
NOTES TO FINANCIAL STATEMENTSASOF DECEMBER 31, 2010
NOTE 1 — ORGANIZATION
Organization. ING Partners, Inc. (the “Company”) is an open-end management investment company registered under the Investment Company Act of 1940, as amended (the “1940 Act”). It was incorporated under the laws of Maryland on May 7, 1997. The Articles of Incorporation permit the Company to offer separate series, each of which has its own investment objective, policies and restrictions. The Company currently consists of thirty-six active separate investment series. The ten Portfolios included in this report are: ING Solution Aggressive Growth Portfolio (“Solution Aggressive Growth”), ING Solution Conservative Portfolio (“Solution Conservative”), ING Solution Growth Portfolio (“Solution Growth”), ING Solution Income Portfolio (“Solution Income”), ING Solution Moderate Portfolio (“Solution Moderate”), ING Solution 2015 Portfolio (“Solution 2015”), ING Solution 2025 Portfolio (“Solution 2025”), ING Solution 2035 Portfolio (“Solution 2035”), ING Solution 2045 Portfolio (“Solution 2045”) and ING Solution 2055 Portfolio (“Solution 2055”) (each, a “Portfolio” and collectively, the “Portfolios”). With the exception of Solution Aggressive Growth, Solution Conservative, Solution Growth, Solution Income and Solution Moderate each Portfolio is structured and managed around a specific target retirement or financial goal date (“Target Date”). When Solution 2015, 2025, 2035, 2045 and 2055 Portfolios reach their respective Target Date, they may be combined with the Solution Income Portfolio, without a vote of shareholders, if approved by the Board of Directors (the “Board”). The Portfolios serve as an investment option in underlying variable insurance products offered by Directed Services LLC.
The Portfolios offer at least four of the following five classes: Adviser Class (“Class ADV”), Initial Class (“Class I”), Service Class (“Class S”), Service 2 Class (“Class S2”) and Class T. Each class has equal rights as to class and voting privileges. The classes differ principally in the applicable distribution and shareholder service fees. Shareholders of each class also bear certain expenses that pertain to that particular class. All shareholders bear the common expenses of the Portfolios and earn income and realized gains/losses from the Portfolios pro rata based on the average daily net assets of each class, without distinction between share classes. Expenses that are specific to a Portfolio or a class are charged directly to that Portfolio or class. Other operating expenses shared by several Portfolios are generally allocated among those Portfolios based on average net assets. Dividends are determined separately for each class based on income and expenses allocable to each
class. Realized gain distributions are allocated to each class pro rata based on the shares outstanding of each class on the date of distribution. Differences in per share dividend rates generally result from differences in separate class expenses, including distribution and shareholder service fees, if applicable.
Each Portfolio’s shares may be offered to variable annuity and variable life insurance separate accounts, qualified pension and retirement plans outside the separate account context, custodial accounts, certain investment advisers and their affiliates in connection with the creation or management of the Portfolios and certain other investment management companies.
Directed Services LLC serves as the investment adviser (“DSL” or the “Investment Adviser”) to the Portfolios. ING Investment Management Co. serves as the consultant (“IIM” or the “Consultant”) to the Investment Adviser. ING Funds Services, LLC serves as the administrator (“IFS” or the “Administrator”) for the Portfolios. ING Investments Distributor, LLC (“IID” or the “Distributor”) serves as the principal underwriter to the Portfolios.
The Investment Adviser, the Consultant, IFS and IID are indirect, wholly-owned subsidiaries of ING Groep N.V. (“ING Groep”). ING Groep is a global financial institution of Dutch origin offering banking, investments, life insurance and retirement services.
ING Groep has adopted a formal restructuring plan that was approved by the European Commission in November 2009 under which the ING life insurance businesses, including the retirement services and investment management businesses, which include the Investment Adviser and its affiliates, would be divested by ING Groep by the end of 2013. While there can be no assurance that it will be carried out, the restructuring plan presents certain risks, including uncertainty about the effect on the businesses of the ING entities that service the Portfolios and potential termination of the Portfolios’ existing advisory agreement, which may trigger the need for shareholder approval of new agreements.
Each Portfolio seeks to achieve its investment objective by investing in other ING Funds (“Underlying Funds”) and uses asset allocation strategies to determine how much to invest in the Underlying Funds.
NOTE 2 — SIGNIFICANT ACCOUNTING POLICIES
The following significant accounting policies are consistently followed by the Portfolios in the preparation of their financial statements. Such policies
39
NOTES TO FINANCIAL STATEMENTSASOF DECEMBER 31, 2010 (CONTINUED)
NOTE 2 — SIGNIFICANT ACCOUNTING POLICIES (continued)
are in conformity with U.S. generally accepted accounting principles for investment companies.
A. Security Valuation. All investments in securities are recorded at their estimated fair value, as described below. The valuation of each Portfolio’s investments in its Underlying Funds is based on the net asset values of the Underlying Funds each business day.
Fair value is defined as the price that the Portfolios would receive to sell an asset or pay to transfer a liability in an orderly transaction between market participants at the measurement date. Each investment asset or liability of the Portfolios is assigned a level at measurement date based on the significance and source of the inputs to its valuation. Quoted prices in active markets for identical securities are classified as “Level 1,” inputs other than quoted prices for an asset or liability that are observable are classified as “Level 2” and unobservable inputs, including the investment adviser’s judgment about the assumptions that a market participant would use in pricing an asset or liability are classified as “Level 3.” The inputs used for valuing securities are not necessarily an indication of the risks associated with investing in those securities. Short-term securities of sufficient credit quality which are valued at amortized cost, which approximates fair value, are generally considered to be Level 2 securities under applicable accounting rules. The Portfolios classify each of their investments in the Underlying Funds as Level 1, without consideration as to the classification level of the specific investments held by the Underlying Funds. A table summarizing the Portfolios’ investments under these levels of classification is included following each Portfolio’s Summary Portfolio of Investments. For the year ended December 31, 2010, there have been no significant changes to the fair valuation methodologies.
B. Security Transactions and Revenue Recognition. Security transactions are accounted for on the trade date. Dividend income received from the affiliated funds is recognized on the ex-dividend date and is recorded as income distributions in the Statement of Operations. Capital gain distributions received from the affiliated funds are recognized on the ex-dividend date and are recorded on the Statement of Operations as such. Costs used in determining realized gains and losses on the sales of investment securities are on the basis of specific identification.
C. Distributions to Shareholders. The Portfolios record distributions to their shareholders on the ex-dividend date. Each Portfolio distributes dividends and capital
gains, if any, annually. The Portfolios may make distributions on a more frequent basis to comply with the distribution requirements of the Internal Revenue Code. The characteristics of income and gains to be distributed are determined in accordance with income tax regulations, which may differ from U.S. generally accepted accounting principles for investment companies.
D. Federal Income Taxes. It is the policy of each Portfolio to comply with the requirements of subchapter M of the Internal Revenue Code that are applicable to regulated investment companies and to distribute substantially all of its net investment income and any net realized capital gains to its shareholders. Therefore, a federal income tax or excise tax provision is not required. Management has considered the sustainability of the Portfolios’ tax positions taken on federal income tax returns for all open tax years in making this determination. No capital gain distributions shall be made until the capital loss carryforwards have been fully utilized or expire.
E. Use of Estimates. The preparation of financial statements in conformity with U.S. generally accepted accounting principles requires management to make estimates and assumptions that affect the reported amounts of assets and liabilities and disclosure of contingent assets and liabilities at the date of the financial statements and the reported amounts of increases and decreases in net assets from operations during the reporting period. Actual results could differ from those estimates.
F. Indemnifications. In the normal course of business, the Company may enter into contracts that provide certain indemnifications. The Company’s maximum exposure under these arrangements is dependent on future claims that may be made against the Portfolios and, therefore, cannot be estimated; however, based on experience, management considers the risk of loss from such claims remote.
NOTE 3 — INVESTMENT ADVISER AND ADMINISTRATIVE SERVICE FEES
The Portfolios entered into an investment management agreement with the Investment Adviser. For its services, each Portfolio pays the Investment Adviser a monthly fee in arrears equal to 0.10% of each Portfolio’s average daily net assets during the month.
DSL pays the Consultant a consulting fee of 0.030% of the first $500 million, 0.025% of the next $500 million, 0.020% of the next $1 billion and 0.010% of amounts over $2 billion based on each Portfolio’s average daily net assets.
40
NOTES TO FINANCIAL STATEMENTSASOF DECEMBER 31, 2010 (CONTINUED)
NOTE 3 — INVESTMENT ADVISER AND ADMINISTRATIVE SERVICE FEES (continued)
The Consultant will provide tactical allocation recommendations to the Investment Adviser. The Investment Adviser has set up an Investment Committee made up of a team of professionals to consider, review and implement the recommendations of the Consultant, and will retain discretion over implementation of the Consultant’s recommendations. The Consultant will provide ongoing recommendations to the Investment Committee of the Investment Adviser quarterly or as warranted by market conditions.
Under an Administrative Services Agreement between the Portfolios and IFS, IFS provides all administrative services necessary for the Portfolios’ operations and is responsible for the supervision of the Portfolios’ other service providers. IFS also assumes all ordinary recurring direct costs of the Portfolios, such as custodian fees, director fees, transfer agency fees and accounting fees. As compensation for these services, IFS receives a monthly fee from each portfolio at an annual rate of 0.02% based on the average daily net assets of each Portfolio.
NOTE 4 — INVESTMENTS IN AFFILIATED UNDERLYING FUNDS
For the year ended December 31, 2010, the cost of purchases and the proceeds from sales of the Underlying Funds were as follows:
| | | | | | | | |
| | | Purchases | | | Sales | |
Solution Aggressive Growth | | $ | 6,508,635 | | | $ | 573,915 | |
Solution Conservative | | | 3,570,072 | | | | 522,552 | |
Solution Growth | | | 9,812,721 | | | | 1,164,207 | |
Solution Income | | | 149,130,371 | | | | 144,478,766 | |
Solution Moderate | | | 9,273,448 | | | | 1,568,064 | |
Solution 2015 | | | 486,577,663 | | | | 460,868,231 | |
Solution 2025 | | | 682,515,626 | | | | 627,883,489 | |
Solution 2035 | | | 589,131,529 | | | | 523,388,493 | |
Solution 2045 | | | 286,308,556 | | | | 234,036,857 | |
Solution 2055 | | | 11,247,012 | | | | 1,552,259 | |
NOTE 5 — DISTRIBUTION AND SERVICE FEES
Class ADV, Class S2 and Class T of the Portfolios have adopted a plan of Distribution pursuant to Rule 12b-1 under the 1940 Act (the “12b-1 Plans”), whereby IID is reimbursed or compensated by the Portfolios for expenses incurred in the distribution of each Portfolio’s shares (“Distribution Fees”). The Distributor may pay, on behalf of each Portfolio, out of its distribution fee, compensation to certain financial institutions for providing distribution assistance pursuant to a Distribution Services Agreement. Under the Rule 12b-1
Plan, each Portfolio makes payments to IID at an annual rate of 0.25%, 0.25% and 0.50% of each Portfolio’s average daily net assets attributable to its Class ADV, Class S2 and Class T shares, respectively. The Distributor has contractually agreed to waive a portion of this fee equal to 0.05% of each Portfolio’s average daily net assets attributable to the distribution fee paid by Class T shares, so that the actual fee paid is an annual rate of 0.45%. The expense waiver will continue through at least May 1, 2011. The Distributor has contractually agreed to waive a portion of its fee equal to 0.10% of each Portfolio’s average daily net assets attributable to the distribution fee paid by Class S2 shares, so that the actual fee paid is an annual rate of 0.15%. The expense waiver will continue through at least May 1, 2011.
The Company has also adopted a Shareholder Servicing Plan (“Service Plan”) for the Classes ADV, S, S2 and T shares of each Portfolio. The Service Plan allows the Distributor to enter into shareholder servicing agreements with insurance companies, broker dealers or other financial intermediaries that provide administrative services related to Classes ADV, S, S2 and T shares and their shareholders including Variable Contract owners or Qualified Plan participants with interests in the Portfolios. Under the Service Plan, each Portfolio makes payments to IID which shall not exceed an annual rate of 0.25% of each Portfolio’s average daily net assets attributable to its Classes ADV, S, S2 and T shares.
NOTE 6 — OTHER TRANSACTIONS WITH AFFILIATES AND RELATED PARTIES
At December 31, 2010, the Portfolios had the following amounts recorded as payable to affiliates on the accompanying Statements of Assets and Liabilities (see Notes 3 and 5):
| | | | | | | | | | | | | | | | | | | | |
Fund | | Accrued
Investment
Management
Fees | | | Accrued
Administrative
Fees | | | Accrued
Shareholder
Service and
Distribution
Fees | | | Accrued
Recoupment | | | Total | |
Solution Aggressive Growth | | $ | 485 | | | $ | 97 | | | $ | 2,115 | | | $ | — | | | $ | 2,697 | |
Solution Conservative | | | 245 | | | | 49 | | | | 969 | | | | — | | | | 1,263 | |
Solution Growth | | | 769 | | | | 153 | | | | 2,839 | | | | — | | | | 3,761 | |
Solution Income | | | 20,109 | | | | 4,021 | | | | 69,404 | | | | — | | | | 93,534 | |
Solution Moderate | | | 752 | | | | 151 | | | | 2,330 | | | | — | | | | 3,233 | |
Solution 2015 | | | 68,760 | | | | 13,751 | | | | 229,386 | | | | — | | | | 311,897 | |
41
NOTES TO FINANCIAL STATEMENTSASOF DECEMBER 31, 2010 (CONTINUED)
NOTE 6 — OTHER TRANSACTIONS WITH AFFILIATES AND RELATED PARTIES (continued)
| | | | | | | | | | | | | | | | | | | | |
Fund | | Accrued
Investment
Management
Fees | | | Accrued
Administrative
Fees | | | Accrued
Shareholder
Service and
Distribution
Fees | | | Accrued
Recoupment | | | Total | |
Solution 2025 | | $ | 105,586 | | | $ | 21,116 | | | $ | 351,484 | | | $ | — | | | $ | 478,186 | |
Solution 2035 | | | 89,786 | | | | 17,956 | | | | 299,210 | | | | — | | | | 406,952 | |
Solution 2045 | | | 57,421 | | | | 11,484 | | | | 182,892 | | | | — | | | | 251,797 | |
Solution 2055 | | | 816 | | | | 163 | | | | 2,509 | | | | — | | | | 3,488 | |
The Company has adopted a Deferred Compensation Plan (the “Plan”), which allows eligible non-affiliated directors as described in the Plan to defer the receipt of all or a portion of the directors fees payable. Amounts deferred are treated as though invested in various “notional” funds advised by DSL until distribution in accordance with the Plan.
At December 31, 2010, the following indirect, wholly-owned subsidiaries of ING Groep owned more than 5% of the following Portfolios:
ING Life Insurance and Annuity Company — Solution Aggressive Growth (99.93%); Solution Conservative (87.33%); Solution Growth (91.63%); Solution Income (72.90%); Solution Moderate (90.57%); Solution 2015 (79.01%); Solution 2025 (78%); Solution 2035 (80.06%); Solution 2045 (81.86%); and Solution 2055 (85.27%).
ING National Trust — Solution Conservative (12.57%); Solution Growth (8.37%); Solution Income (22.53%); Solution Moderate (9.43%); Solution 2015 (17.68%); Solution 2025 (19.25%); Solution 2035 (18.10%); Solution 2045 (17.30%); and Solution 2055 (14.68%).
Control is defined by the 1940 Act as the beneficial ownership, either directly or through one or more controlled companies, of more than 25% of the voting securities of a company. The 1940 Act defines affiliates as companies that are under common control. Therefore, because the Portfolios have a common owner that owns over 25% of the outstanding securities of the Portfolios, they may be deemed to be affiliates of each other. Investment activities of these shareholders could have a material impact on the Portfolios.
NOTE 7 — EXPENSE LIMITATION AGREEMENT
The Investment Adviser has agreed to limit expenses, excluding interest, taxes, brokerage commissions and extraordinary expenses to the levels listed below:
| | | | | | | | | | | | | | | | | | | | |
Portfolio(1) | | Class ADV | | | Class I | | | Class S | | | Class S2 | | | Class T | |
Solution Aggressive Growth | | | 0.62 | % | | | 0.12 | % | | | 0.37 | % | | | 0.52 | % | | | N/A | |
Solution Conservative | | | 0.62 | % | | | 0.12 | % | | | 0.37 | % | | | 0.52 | % | | | N/A | |
Solution Growth | | | 0.62 | % | | | 0.12 | % | | | 0.37 | % | | | 0.52 | % | | | N/A | |
Solution Income | | | 0.62 | % | | | 0.12 | % | | | 0.37 | % | | | 0.52 | % | | | 0.82 | % |
Solution Moderate | | | 0.62 | % | | | 0.12 | % | | | 0.37 | % | | | 0.52 | % | | | N/A | |
Solution 2015 | | | 0.62 | % | | | 0.12 | % | | | 0.37 | % | | | 0.52 | % | | | 0.82 | % |
Solution 2025 | | | 0.62 | % | | | 0.12 | % | | | 0.37 | % | | | 0.52 | % | | | 0.82 | % |
Solution 2035 | | | 0.62 | % | | | 0.12 | % | | | 0.37 | % | | | 0.52 | % | | | 0.82 | % |
Solution 2045 | | | 0.62 | % | | | 0.12 | % | | | 0.37 | % | | | 0.52 | % | | | 0.82 | % |
Solution 2055 | | | 0.62 | % | | | 0.12 | % | | | 0.37 | % | | | 0.52 | % | | | 0.82 | % |
| (1) | The operating expense limits apply only at the Portfolio level and do not limit the fees payable by the underlying investment companies in which the Portfolios invest. The amount of fees and expenses of an Underlying Fund borne by each Portfolio will vary based on each Portfolio’s allocation of assets to, and the net expenses of, a particular Underlying Fund. |
The Investment Adviser may at a later date recoup from a Portfolio management fees waived and other expenses assumed by the Investment Adviser during the previous 36 months, but only if, after such recoupment, the Portfolio’s expense ratio does not exceed the percentage described above. Waived and reimbursed fees and any recoupment by the Investment Adviser of such waived and reimbursed fees are reflected on the accompanying Statements of Operations for each Portfolio.
As of December 31, 2010, the Portfolios did not have any waived or reimbursed fees subject to recoupment.
Outstanding reimbursement balances due to the Portfolios, if any, under their respective expense limitation agreements are reflected in Reimbursement Due from manager on the accompanying Statements of Assets and Liabilities.
The expense limitation agreement is contractual and shall renew automatically for one-year terms unless the Investment Adviser provides written notice of the termination of the expense limitation agreement within 90 days of the end of the then current term.
42
NOTES TO FINANCIAL STATEMENTSASOF DECEMBER 31, 2010 (CONTINUED)
NOTE 8 — CAPITAL SHARES
Transactions in capital shares and dollars were as follows:
| | | | | | | | | | | | | | | | | | | | | | | | | | | | | | | | | | | | | | | | | | | | | | | | |
| | | Shares
sold | | | Shares
issued in
merger | | | Reinvestment
of
distributions | | | Shares
redeemed | | | Net increase
(decrease) in
shares
outstanding | | | | | | Shares
sold | | | Shares
issued in
merger | | | Reinvestment
of
distributions | | | Redemption
fee
proceeds | | | Shares
redeemed | | | Net
increase
(decrease) | |
Year or period ended | | # | | | # | | | # | | | # | | | # | | | | | | ($) | | | ($) | | | ($) | | | ($) | | | ($) | | | ($) | |
Solution Aggressive Growth | |
Class ADV | | | | | | | | | | | | | | | | | | | | | | | | | | | | | | | | | | | | | | | | | | | | | | | | |
04-30-10(1)-12-31-10 | | | 448,990 | | | | — | | | | — | | | | (19,484 | ) | | | 429,506 | | | | | | | | 4,658,208 | | | | — | | | | — | | | | — | | | | (205,363 | ) | | | 4,452,845 | |
Class I | | | | | | | | | | | | | | | | | | | | | | | | | | | | | | | | | | | | | | | | | | | | | | | | |
04-30-10(1)-12-31-10 | | | 301 | | | | — | | | | — | | | | — | | | | 301 | | | | | | | | 3,010 | | | | — | | | | — | | | | — | | | | — | | | | 3,010 | |
Class S | | | | | | | | | | | | | | | | | | | | | | | | | | | | | | | | | | | | | | | | | | | | | | | | |
04-30-10(1)-12-31-10 | | | 137,087 | | | | — | | | | — | | | | (5,334 | ) | | | 131,753 | | | | | | | | 1,388,032 | | | | — | | | | — | | | | — | | | | (56,057 | ) | | | 1,331,975 | |
Class S2 | | | | | | | | | | | | | | | | | | | | | | | | | | | | | | | | | | | | | | | | | | | | | | | | |
04-30-10(1)-12-31-10 | | | 12,972 | | | | — | | | | — | | | | (300 | ) | | | 12,672 | | | | | | | | 128,787 | | | | — | | | | — | | | | — | | | | (3,072 | ) | | | 125,715 | |
Solution Conservative | |
Class ADV | | | | | | | | | | | | | | | | | | | | | | | | | | | | | | | | | | | | | | | | | | | | | | | | |
04-30-10(1)-12-31-10 | | | 192,046 | | | | — | | | | — | | | | (10,154 | ) | | | 181,892 | | | | | | | | 1,990,136 | | | | — | | | | — | | | | — | | | | (105,598 | ) | | | 1,884,538 | |
Class S | | | | | | | | | | | | | | | | | | | | | | | | | | | | | | | | | | | | | | | | | | | | | | | | |
04-30-10(1)-12-31-10 | | | 127,851 | | | | — | | | | — | | | | (23,576 | ) | | | 104,275 | | | | | | | | 1,313,367 | | | | — | | | | — | | | | — | | | | (246,410 | ) | | | 1,066,957 | |
Class I | | | | | | | | | | | | | | | | | | | | | | | | | | | | | | | | | | | | | | | | | | | | | | | | |
04-30-10(1)-12-31-10 | | | 301 | | | | — | | | | — | | | | — | | | | 301 | | | | | | | | 3,010 | | | | — | | | | — | | | | — | | | | — | | | | 3,010 | |
Class S2 | | | | | | | | | | | | | | | | | | | | | | | | | | | | | | | | | | | | | | | | | | | | | | | | |
04-30-10(1)-12-31-10 | | | 7,702 | | | | — | | | | — | | | | (1,582 | ) | | | 6,120 | | | | | | | | 80,119 | | | | — | | | | — | | | | — | | | | (16,376 | ) | | | 63,743 | |
Solution Growth | |
Class ADV | | | | | | | | | | | | | | | | | | | | | | | | | | | | | | | | | | | | | | | | | | | | | | | | |
12-31-10 | | | 535,887 | | | | — | | | | — | | | | (8,069 | ) | | | 527,818 | | | | | | | | 4,732,134 | | | | — | | | | — | | | | — | | | | (72,017 | ) | | | 4,660,117 | |
12-31-09 | | | — | | | | — | | | | — | | | | (1 | ) | | | (1 | ) | | | | | | | — | | | | — | | | | — | | | | — | | | | (7 | ) | | | (7 | ) |
Class S | | | | | | | | | | | | | | | | | | | | | | | | | | | | | | | | | | | | | | | | | | | | | | | | |
12-31-10 | | | 445,258 | | | | — | | | | 1,299 | | | | (23,095 | ) | | | 423,462 | | | | | | | | 3,854,100 | | | | — | | | | 10,571 | | | | — | | | | (203,134 | ) | | | 3,661,537 | |
12-31-09 | | | 80,108 | | | | — | | | | 478 | | | | (17,084 | ) | | | 63,502 | | | | | | | | 587,687 | | | | — | | | | 3,620 | | | | — | | | | (121,562 | ) | | | 469,745 | |
Class I | | | | | | | | | | | | | | | | | | | | | | | | | | | | | | | | | | | | | | | | | | | | | | | | |
12-31-10 | | | — | | | | — | | | | — | | | | — | | | | — | | | | | | | | — | | | | — | | | | — | | | | — | | | | — | | | | — | |
12-31-09 | | | — | | | | — | | | | — | | | | (1 | ) | | | (1 | ) | | | | | | | — | | | | — | | | | — | | | | — | | | | (8 | ) | | | (8 | ) |
Class S2 | | | | | | | | | | | | | | | | | | | | | | | | | | | | | | | | | | | | | | | | | | | | | | | | |
04-30-10(1)-12-31-10 | | | 32,036 | | | | — | | | | — | | | | (349 | ) | | | 31,687 | | | | | | | | 275,544 | | | | — | | | | — | | | | — | | | | (3,050 | ) | | | 272,494 | |
| (1) | | Commencement of operations. |
43
NOTES TO FINANCIAL STATEMENTSASOF DECEMBER 31, 2010 (CONTINUED)
NOTE 8 — CAPITAL SHARES (continued)
| | | | | | | | | | | | | | | | | | | | | | | | | | | | | | | | | | | | | | | | | | | | | | | | |
| | | Shares
sold | | | Shares
issued in
merger | | | Reinvestment
of
distributions | | | Shares
redeemed | | | Net increase
(decrease) in
shares
outstanding | | | | | | Shares
sold | | | Shares
issued in
merger | | | Reinvestment
of
distributions | | | Redemption
fee
proceeds | | | Shares
redeemed | | | Net
increase
(decrease) | |
| | | # | | | # | | | # | | | # | | | # | | | | | | ($) | | | ($) | | | ($) | | | ($) | | | ($) | | | ($) | |
Solution Income | |
Class ADV | | | | | | | | | | | | | | | | | | | | | | | | | | | | | | | | | | | | | | | | | | | | | | | | |
12-31-10 | | | 2,157,211 | | | | — | | | | 326,875 | | | | (2,809,720 | ) | | | (325,634 | ) | | | | | | | 22,580,623 | | | | — | | | | 3,340,664 | | | | — | | | | (29,675,732 | ) | | | (3,754,445 | ) |
12-31-09 | | | 2,626,077 | | | | — | | | | 556,952 | | | | (1,875,696 | ) | | | 1,307,333 | | | | | | | | 25,269,300 | | | | — | | | | 5,352,307 | | | | — | | | | (17,699,496 | ) | | | 12,922,111 | |
Class S | | | | | | | | | | | | | | | | | | | | | | | | | | | | | | | | | | | | | | | | | | | | | | | | |
12-31-10 | | | 1,669,294 | | | | — | | | | 298,493 | | | | (2,099,800 | ) | | | (132,013 | ) | | | | | | | 17,651,340 | | | | — | | | | 3,083,437 | | | | — | | | | (22,248,192 | ) | | | (1,513,415 | ) |
12-31-09 | | | 2,251,681 | | | | — | | | | 496,338 | | | | (2,271,870 | ) | | | 476,149 | | | | | | | | 21,831,739 | | | | — | | | | 4,814,477 | | | | — | | | | (21,732,539 | ) | | | 4,913,677 | |
Class I | | | | | | | | | | | | | | | | | | | | | | | | | | | | | | | | | | | | | | | | | | | | | | | | |
12-31-10 | | | 948,026 | | | | — | | | | 74,784 | | | | (603,409 | ) | | | 419,401 | | | | | | | | 10,108,136 | | | | — | | | | 778,507 | | | | — | | | | (6,444,161 | ) | | | 4,442,482 | |
12-31-09 | | | 854,323 | | | | — | | | | 98,159 | | | | (1,741,984 | ) | | | (789,502 | ) | | | | | | | 8,323,196 | | | | — | | | | 959,016 | | | | — | | | | (16,924,055 | ) | | | (7,641,843 | ) |
Class T | | | | | | | | | | | | | | | | | | | | | | | | | | | | | | | | | | | | | | | | | | | | | | | | |
12-31-10 | | | 3,699 | | | | — | | | | 1,354 | | | | (14,344 | ) | | | (9,291 | ) | | | | | | | 39,384 | | | | — | | | | 14,106 | | | | — | | | | (154,873 | ) | | | (101,383 | ) |
12-31-09 | | | 27,237 | | | | — | | | | 2,425 | | | | (47,888 | ) | | | (18,226 | ) | | | | | | | 254,019 | | | | — | | | | 23,715 | | | | — | | | | (455,817 | ) | | | (178,083 | ) |
Class S2 | | | | | | | | | | | | | | | | | | | | | | | | | | | | | | | | | | | | | | | | | | | | | | | | |
12-31-10 | | | 832,047 | | | | — | | | | 18,417 | | | | (335,108 | ) | | | 515,356 | | | | | | | | 8,809,770 | | | | — | | | | 186,747 | | | | — | | | | (3,482,971 | ) | | | 5,513,546 | |
05-28-09(1)-12-31-09 | | | 313 | | | | — | | | | — | | | | — | | | | 313 | | | | | | | | 3,000 | | | | — | | | | — | | | | — | | | | — | | | | 3,000 | |
Solution Moderate | | | | | | | | | | | | | | | | | | | | | | | | | | | | | |
Class ADV | | | | | | | | | | | | | | | | | | | | | | | | | | | | | | | | | | | | | | | | | | | | | | | | |
12-31-10 | | | 294,439 | | | | — | | | | 255 | | | | (20,068 | ) | | | 274,626 | | | | | | | | 2,811,307 | | | | — | | | | 2,283 | | | | — | | | | (183,017 | ) | | | 2,630,573 | |
12-31-09 | | | — | | | | — | | | | — | | | | (1 | ) | | | (1 | ) | | | | | | | — | | | | — | | | | — | | | | — | | | | (8 | ) | | | (8 | ) |
Class S | | | | | | | | | | | | | | | | | | | | | | | | | | | | | | | | | | | | | | | | | | | | | | | | |
12-31-10 | | | 544,371 | | | | — | | | | 4,456 | | | | (19,806 | ) | | | 529,021 | | | | | | | | 5,134,975 | | | | — | | | | 40,326 | | | | — | | | | (186,286 | ) | | | 4,989,015 | |
12-31-09 | | | 134,973 | | | | — | | | | 1,313 | | | | (49,912 | ) | | | 86,374 | | | | | | | | 1,093,295 | | | | — | | | | 11,070 | | | | — | | | | (382,752 | ) | | | 721,613 | |
Class I | | | | | | | | | | | | | | | | | | | | | | | | | | | | | | | | | | | | | | | | | | | | | | | | |
12-31-10 | | | — | | | | — | | | | — | | | | — | | | | — | | | | | | | | — | | | | — | | | | — | | | | — | | | | — | | | | — | |
12-31-09 | | | — | | | | — | | | | — | | | | (1 | ) | | | (1 | ) | | | | | | | — | | | | — | | | | — | | | | — | | | | (8 | ) | | | (8 | ) |
Class S2 | | | | | | | | | | | | | | | | | | | | | | | | | | | | | | | | | | | | | | | | | | | | | | | | |
04-30-10(1)-12-31-10 | | | 3,758 | | | | — | | | | — | | | | (526 | ) | | | 3,232 | | | | | | | | 36,088 | | | | — | | | | — | | | | — | | | | (5,106 | ) | | | 30,982 | |
Solution 2015 | | | | | | | | | | | | | | | | | | | | | | | | | | | | | |
Class ADV | | | | | | | | | | | | | | | | | | | | | | | | | | | | | | | | | | | | | | | | | | | | | | | | |
12-31-10 | | | 5,738,694 | | | | — | | | | 656,727 | | | | (6,455,159 | ) | | | (59,738 | ) | | | | | | | 59,287,791 | | | | — | | | | 6,560,701 | | | | — | | | | (67,377,039 | ) | | | (1,528,547 | ) |
12-31-09 | | | 5,807,067 | | | | — | | | | 1,334,335 | | | | (3,158,916 | ) | | | 3,982,486 | | | | | | | | 52,687,614 | | | | — | | | | 12,369,281 | | | | — | | | | (28,146,311 | ) | | | 36,910,584 | |
Class S | | | | | | | | | | | | | | | | | | | | | | | | | | | | | | | | | | | | | | | | | | | | | | | | |
12-31-10 | | | 4,576,846 | | | | — | | | | 811,619 | | | | (4,959,273 | ) | | | 429,192 | | | | | | | | 47,828,398 | | | | — | | | | 8,189,236 | | | | — | | | | (51,709,693 | ) | | | 4,307,941 | |
12-31-09 | | | 6,024,180 | | | | — | | | | 1,539,238 | | | | (4,063,361 | ) | | | 3,500,057 | | | | | | | | 54,335,084 | | | | — | | | | 14,407,271 | | | | — | | | | (35,840,832 | ) | | | 32,901,523 | |
Class I | | | | | | | | | | | | | | | | | | | | | | | | | | | | | | | | | | | | | | | | | | | | | | | | |
12-31-10 | | | 2,642,468 | | | | — | | | | 163,115 | | | | (2,363,588 | ) | | | 441,995 | | | | | | | | 27,713,388 | | | | — | | | | 1,657,246 | | | | — | | | | (24,990,082 | ) | | | 4,380,552 | |
12-31-09 | | | 2,055,567 | | | | — | | | | 290,588 | | | | (1,877,498 | ) | | | 468,657 | | | | | | | | 18,906,061 | | | | — | | | | 2,737,338 | | | | — | | | | (16,922,310 | ) | | | 4,721,089 | |
Class T | | | | | | | | | | | | | | | | | | | | | | | | | | | | | | | | | | | | | | | | | | | | | | | | |
12-31-10 | | | 41,941 | | | | — | | | | 4,784 | | | | (65,254 | ) | | | (18,529 | ) | | | | | | | 435,589 | | | | — | | | | 48,315 | | | | — | | | | (694,660 | ) | | | (210,756 | ) |
12-31-09 | | | 35,316 | | | | — | | | | 9,881 | | | | (98,358 | ) | | | (53,161 | ) | | | | | | | 315,947 | | | | — | | | | 92,589 | | | | — | | | | (865,760 | ) | | | (457,224 | ) |
| (1) | | Commencement of operations. |
44
NOTES TO FINANCIAL STATEMENTSASOF DECEMBER 31, 2010 (CONTINUED)
NOTE 8 — CAPITAL SHARES (continued)
| | | | | | | | | | | | | | | | | | | | | | | | | | | | | | | | | | | | | | | | | | | | | | | | |
| | | Shares
sold | | | Shares
issued in
merger | | | Reinvestment
of
distributions | | | Shares
redeemed | | | Net increase
(decrease) in
shares
outstanding | | | | | | Shares
sold | | | Shares
issued in
merger | | | Reinvestment
of
distributions | | | Redemption
fee
proceeds | | | Shares
redeemed | | | Net
increase
(decrease) | |
| | | # | | | # | | | # | | | # | | | # | | | | | | ($) | | | ($) | | | ($) | | | ($) | | | ($) | | | ($) | |
Solution 2015 (Continued) | | | | | | | | | | | | | | | | | | | | | | | | | | | | | |
Class S2 | | | | | | | | | | | | | | | | | | | | | | | | | | | | | | | | | | | | | | | | | | | | | | | | |
12-31-10 | | | 1,724,852 | | | | — | | | | 35,047 | | | | (349,427 | ) | | | 1,410,472 | | | | | | | | 18,130,133 | | | | — | | | | 346,966 | | | | — | | | | (3,555,076 | ) | | | 14,922,023 | |
05-28-09(1)-12-31-09 | | | 334 | | | | — | | | | — | | | | — | | | | 334 | | | | | | | | 3,000 | | | | — | | | | — | | | | — | | | | — | | | | 3,000 | |
Solution 2025 | | | | | | | | | | | | | | | | | | | | | | | | | | | | | |
Class ADV | | | | | | | | | | | | | | | | | | | | | | | | | | | | | | | | | | | | | | | | | | | | | | | | |
12-31-10 | | | 8,023,508 | | | | — | | | | 708,591 | | | | (7,717,341 | ) | | | 1,014,758 | | | | | | | | 80,554,293 | | | | — | | | | 6,781,215 | | | | — | | | | (78,391,571 | ) | | | 8,943,937 | |
12-31-09 | | | 9,955,515 | | | | — | | | | 1,337,081 | | | | (4,591,620 | ) | | | 6,700,976 | | | | | | | | 84,630,776 | | | | — | | | | 11,953,507 | | | | — | | | | (38,468,408 | ) | | | 58,115,875 | |
Class S | | | | | | | | | | | | | | | | | | | | | | | | | | | | | | | | | | | | | | | | | | | | | | | | |
12-31-10 | | | 6,396,101 | | | | — | | | | 877,631 | | | | (6,222,436 | ) | | | 1,051,296 | | | | | | | | 65,201,618 | | | | — | | | | 8,486,689 | | | | — | | | | (63,540,590 | ) | | | 10,147,717 | |
12-31-09 | | | 10,557,972 | | | | — | | | | 1,542,560 | | | | (3,407,186 | ) | | | 8,693,346 | | | | | | | | 88,731,616 | | | | — | | | | 13,929,319 | | | | — | | | | (29,701,666 | ) | | | 72,959,269 | |
Class I | | | | | | | | | | | | | | | | | | | | | | | | | | | | | | | | | | | | | | | | | | | | | | | | |
12-31-10 | | | 3,413,151 | | | | — | | | | 204,271 | | | | (2,556,890 | ) | | | 1,060,532 | | | | | | | | 34,946,969 | | | | — | | | | 1,991,643 | | | | — | | | | (26,411,316 | ) | | | 10,527,296 | |
12-31-09 | | | 3,439,452 | | | | — | | | | 312,577 | | | | (2,338,764 | ) | | | 1,413,265 | | | | | | | | 29,493,079 | | | | — | | | | 2,844,447 | | | | — | | | | (19,605,223 | ) | | | 12,732,303 | |
Class T | | | | | | | | | | | | | | | | | | | | | | | | | | | | | | | | | | | | | | | | | | | | | | | | |
12-31-10 | | | 85,837 | | | | — | | | | 7,138 | | | | (76,892 | ) | | | 16,083 | | | | | | | | 876,268 | | | | — | | | | 68,878 | | | | — | | | | (776,364 | ) | | | 168,782 | |
12-31-09 | | | 95,420 | | | | — | | | | 13,097 | | | | (108,942 | ) | | | (425 | ) | | | | | | | 808,172 | | | | — | | | | 118,136 | | | | — | | | | (925,832 | ) | | | 476 | |
Class S2 | | | | | | | | | | | | | | | | | | | | | | | | | | | | | | | | | | | | | | | | | | | | | | | | |
12-31-10 | | | 2,131,339 | | | | — | | | | 35,248 | | | | (272,978 | ) | | | 1,893,609 | | | | | | | | 22,010,952 | | | | — | | | | 335,207 | | | | — | | | | (2,684,054 | ) | | | 19,662,105 | |
05-28-09(1)-12-31-09 | | | 355 | | | | — | | | | — | | | | — | | | | 355 | | | | | | | | 3,000 | | | | — | | | | — | | | | — | | | | — | | | | 3,000 | |
Solution 2035 | | | | | | | | | | | | | | | | | | | | | | | | | | | | | |
Class ADV | | | | | | | | | | | | | | | | | | | | | | | | | | | | | | | | | | | | | | | | | | | | | | | | |
12-31-10 | | | 6,691,048 | | | | — | | | | 444,092 | | | | (5,960,040 | ) | | | 1,175,100 | | | | | | | | 67,599,113 | | | | — | | | | 4,272,162 | | | | — | | | | (61,170,800 | ) | | | 10,700,475 | |
12-31-09 | | | 8,913,961 | | | | — | | | | 971,350 | | | | (2,316,980 | ) | | | 7,568,331 | | | | | | | | 74,566,986 | | | | — | | | | 8,693,584 | | | | — | | | | (19,921,848 | ) | | | 63,338,722 | |
Class S | | | | | | | | | | | | | | | | | | | | | | | | | | | | | | | | | | | | | | | | | | | | | | | | |
12-31-10 | | | 5,843,315 | | | | — | | | | 540,632 | | | | (4,774,208 | ) | | | 1,609,739 | | | | | | | | 59,889,155 | | | | — | | | | 5,254,947 | | | | — | | | | (48,977,856 | ) | | | 16,166,246 | |
12-31-09 | | | 8,281,922 | | | | — | | | | 1,073,079 | | | | (2,319,723 | ) | | | 7,035,278 | | | | | | | | 69,562,797 | | | | — | | | | 9,700,631 | | | | — | | | | (19,710,559 | ) | | | 59,552,869 | |
Class I | | | | | | | | | | | | | | | | | | | | | | | | | | | | | | | | | | | | | | | | | | | | | | | | |
12-31-10 | | | 3,263,052 | | | | — | | | | 135,397 | | | | (1,698,124 | ) | | | 1,700,325 | | | | | | | | 33,817,013 | | | | — | | | | 1,325,539 | | | | — | | | | (17,192,641 | ) | | | 17,949,911 | |
12-31-09 | | | 3,365,905 | | | | — | | | | 229,135 | | | | (1,418,696 | ) | | | 2,176,344 | | | | | | | | 28,560,407 | | | | — | | | | 2,085,132 | | | | — | | | | (12,237,029 | ) | | | 18,408,510 | |
Class T | | | | | | | | | | | | | | | | | | | | | | | | | | | | | | | | | | | | | | | | | | | | | | | | |
12-31-10 | | | 42,525 | | | | — | | | | 3,067 | | | | (53,780 | ) | | | (8,188 | ) | | | | | | | 435,071 | | | | — | | | | 29,900 | | | | — | | | | (554,927 | ) | | | (89,956 | ) |
12-31-09 | | | 89,244 | | | | — | | | | 6,078 | | | | (107,731 | ) | | | (12,409 | ) | | | | | | | 742,529 | | | | — | | | | 55,127 | | | | — | | | | (927,139 | ) | | | (129,483 | ) |
Class S2 | | | | | | | | | | | | | | | | | | | | | | | | | | | | | | | | | | | | | | | | | | | | | | | | |
12-31-10 | | | 1,941,298 | | | | — | | | | 25,067 | | | | (309,563 | ) | | | 1,656,802 | | | | | | | | 20,122,579 | | | | — | | | | 238,633 | | | | — | | | | (3,078,867 | ) | | | 17,282,345 | |
05-28-09(1)-12-31-09 | | | 361 | | | | — | | | | — | | | | — | | | | 361 | | | | | | | | 3,000 | | | | — | | | | — | | | | — | | | | — | | | | 3,000 | |
Solution 2045 | | | | | | | | | | | | | | | | | | | | | | | | | | | | | |
Class ADV | | | | | | | | | | | | | | | | | | | | | | | | | | | | | | | | | | | | | | | | | | | | | | | | |
12-31-10 | | | 3,732,520 | | | | — | | | | 176,703 | | | | (3,787,757 | ) | | | 121,466 | | | | | | | | 37,827,956 | | | | — | | | | 1,692,814 | | | | — | | | | (39,033,768 | ) | | | 487,002 | |
12-31-09 | | | 6,604,312 | | | | — | | | | 625,520 | | | | (1,423,173 | ) | | | 5,806,659 | | | | | | | | 54,201,899 | | | | — | | | | 5,579,634 | | | | — | | | | (12,379,627 | ) | | | 47,401,906 | |
Class S | | | | | | | | | | | | | | | | | | | | | | | | | | | | | | | | | | | | | | | | | | | | | | | | |
12-31-10 | | | 4,500,943 | | | | — | | | | 271,856 | | | | (2,804,431 | ) | | | 1,968,368 | | | | | | | | 45,943,903 | | | | — | | | | 2,628,850 | | | | — | | | | (28,978,763 | ) | | | 19,593,990 | |
12-31-09 | | | 6,708,834 | | | | — | | | | 740,327 | | | | (1,084,016 | ) | | | 6,365,145 | | | | | | | | 55,694,948 | | | | — | | | | 6,662,947 | | | | — | | | | (9,642,626 | ) | | | 52,715,269 | |
| (1) | | Commencement of operations. |
45
NOTES TO FINANCIAL STATEMENTSASOF DECEMBER 31, 2010 (CONTINUED)
NOTE 8 — CAPITAL SHARES (continued)
| | | | | | | | | | | | | | | | | | | | | | | | | | | | | | | | | | | | | | | | | | | | | | | | |
| | | Shares
sold | | | Shares
issued in
merger | | | Reinvestment
of
distributions | | | Shares
redeemed | | | Net increase
(decrease) in
shares
outstanding | | | | | | Shares
sold | | | Shares
issued in
merger | | | Reinvestment
of
distributions | | | Redemption
fee
proceeds | | | Shares
redeemed | | | Net
increase
(decrease) | |
| | | # | | | # | | | # | | | # | | | # | | | | | | ($) | | | ($) | | | ($) | | | ($) | | | ($) | | | ($) | |
Solution 2045 (Continued) | | | | | | | | | | | | | | | | | | | | | | | | | | | | | |
Class I | | | | | | | | | | | | | | | | | | | | | | | | | | | | | | | | | | | | | | | | | | | | | | | | |
12-31-10 | | | 2,596,391 | | | | — | | | | 78,728 | | | | (1,066,766 | ) | | | 1,608,353 | | | | | | | | 26,969,936 | | | | — | | | | 767,598 | | | | — | | | | (11,003,559 | ) | | | 16,733,975 | |
12-31-09 | | | 2,706,874 | | | | — | | | | 174,119 | | | | (969,338 | ) | | | 1,911,655 | | | | | | | | 22,833,926 | | | | — | | | | 1,579,255 | | | | — | | | | (8,271,533 | ) | | | 16,141,648 | |
Class T | | | | | | | | | | | | | | | | | | | | | | | | | | | | | | | | | | | | | | | | | | | | | | | | |
12-31-10 | | | 36,668 | | | | — | | | | 1,117 | | | | (47,900 | ) | | | (10,115 | ) | | | | | | | 374,597 | | | | — | | | | 10,767 | | | | — | | | | (488,046 | ) | | | (102,682 | ) |
12-31-09 | | | 57,359 | | | | — | | | | 5,033 | | | | (64,173 | ) | �� | | (1,781 | ) | | | | | | | 473,138 | | | | — | | | | 45,146 | | | | — | | | | (537,808 | ) | | | (19,524 | ) |
Class S2 | | | | | | | | | | | | | | | | | | | | | | | | | | | | | | | | | | | | | | | | | | | | | | | | |
12-31-10 | | | 1,381,646 | | | | — | | | | 14,703 | | | | (120,397 | ) | | | 1,275,952 | | | | | | | | 14,405,313 | | | | — | | | | 140,124 | | | | — | | | | (1,224,446 | ) | | | 13,320,991 | |
05-28-09(1)-12-31-09 | | | 360 | | | | — | | | | — | | | | — | | | | 360 | | | | | | | | 3,000 | | | | — | | | | — | | | | — | | | | — | | | | 3,000 | |
Solution 2055 | | | | | | | | | | | | | | | | | | | | | | | | | | | | | |
Class ADV | | | | | | | | | | | | | | | | | | | | | | | | | | | | | | | | | | | | | | | | | | | | | | | | |
03-08-10(1)-12-31-10 | | | 450,025 | | | | — | | | | — | | | | (104,061 | ) | | | 345,964 | | | | | | | | 4,616,348 | | | | — | | | | — | | | | — | | | | (1,093,489 | ) | | | 3,522,859 | |
Class S | | | | | | | | | | | | | | | | | | | | | | | | | | | | | | | | | | | | | | | | | | | | | | | | |
03-08-10(1)-12-31-10 | | | 439,872 | | | | — | | | | — | | | | (24,465 | ) | | | 415,407 | | | | | | | | 4,575,358 | | | | — | | | | — | | | | — | | | | (249,120 | ) | | | 4,326,238 | |
Class I | | | | | | | | | | | | | | | | | | | | | | | | | | | | | | | | | | | | | | | | | | | | | | | | |
03-08-10(1)-12-31-10 | | | 193,170 | | | | — | | | | — | | | | (48,287 | ) | | | 144,883 | | | | | | | | 2,014,629 | | | | — | | | | — | | | | — | | | | (478,069 | ) | | | 1,536,560 | |
Class T | | | | | | | | | | | | | | | | | | | | | | | | | | | | | | | | | | | | | | | | | | | | | | | | |
03-08-10(1)-12-31-10 | | | 730 | | | | — | | | | — | | | | (213 | ) | | | 517 | | | | | | | | 7,475 | | | | — | | | | — | | | | — | | | | (2,055 | ) | | | 5,420 | |
Class S2 | | | | | | | | | | | | | | | | | | | | | | | | | | | | | | | | | | | | | | | | | | | | | | | | |
03-08-10(1)-12-31-10 | | | 25,172 | | | | — | | | | — | | | | (941 | ) | | | 24,231 | | | | | | | | 246,739 | | | | — | | | | — | | | | — | | | | (9,782 | ) | | | 236,957 | |
| (1) | | Commencement of operations. |
NOTE 9 — LINE OF CREDIT
Effective June 1, 2010, the Portfolios, in addition to certain other funds managed by the Investment Adviser, have entered into an unsecured committed revolving line of credit agreement (the “Credit Agreement”) with The Bank of New York Mellon for an aggregate amount of $125,000,000. The proceeds may be used to: (1) temporarily finance the purchase and sale of securities; or (2) finance the redemption of shares of an investor in the funds. The funds pay a commitment fee equal to 0.15% per annum on the daily unused portion of the committed line amount payable quarterly in arrears.
Generally, borrowings under the Credit Agreement accrue interest at the federal funds rate plus a specified margin. Repayments generally must be made within 60 days after the date of a revolving credit advance. The Portfolios did not utilize the line of credit during the year ended December 31, 2010.
NOTE 10 — FEDERAL INCOME TAXES
The amount of distributions from net investment income and net realized capital gains are determined in accordance with federal income tax regulations, which
may differ from U.S. generally accepted accounting principles for investment companies. These book/tax differences may be either temporary or permanent. Permanent differences are reclassified within the capital accounts based on their federal tax-basis treatment; temporary differences are not reclassified. Key differences include the treatment of short-term capital gains, foreign currency transactions, and wash sale deferrals. Distributions in excess of net investment income and/or net realized capital gains for tax purposes are reported as return of capital.
The following permanent tax differences have been reclassified as of December 31, 2010:
| | | | | | | | | | | | |
| | | Paid-in
Capital | | | Undistributed
Net
Investment
Income | | | Accumulated
Net Realized
Gains /
(Losses) | |
Solution Aggressive Growth | | $ | (8 | ) | | $ | 2,031 | | | $ | (2,023 | ) |
Solution Conservative | | | (8 | ) | | | 1,423 | | | | (1,415 | ) |
Solution Growth | | | — | | | | 6,048 | | | | (6,048 | ) |
Solution Income | | | — | | | | 1,599,329 | | | | (1,599,329 | ) |
Solution Moderate | | | — | | | | 12,863 | | | | (12,863 | ) |
Solution 2015 | | | — | | | | 3,691,388 | | | | (3,691,388 | ) |
Solution 2025 | | | — | | | | 2,392,569 | | | | (2,392,569 | ) |
Solution 2035 | | | — | | | | 994,733 | | | | (994,733 | ) |
Solution 2045 | | | — | | | | 238,817 | | | | (238,817 | ) |
Solution 2055 | | | (917 | ) | | | 4,404 | | | | (3,487 | ) |
46
NOTES TO FINANCIAL STATEMENTSASOF DECEMBER 31, 2010 (CONTINUED)
NOTE 10 — FEDERAL INCOME TAXES (continued)
Dividends paid by the Portfolios from net investment income and distributions of net realized short-term capital gains are, for federal income tax purposes, taxable as ordinary income to shareholders.
The tax composition of dividends and distributions to shareholders was as follows:
| | | | | | | | | | | | | | | | |
| | | Year Ended December 31, 2010 | | | Year Ended December 31, 2009 | |
| | | Ordinary
Income | | | Long-Term
Capital Gains | | | Ordinary
Income | | | Long-Term
Capital Gains | |
Solution Growth | | $ | 10,621 | | | $ | — | | | $ | 3,162 | | | $ | 458 | |
Solution Income | | | 7,403,461 | | | | — | | | | 10,392,860 | | | | 756,847 | |
Solution Moderate | | | 34,691 | | | | 8,015 | | | | 10,822 | | | | 248 | |
Solution 2015 | | | 16,802,464 | | | | — | | | | 23,919,337 | | | | 5,687,304 | |
Solution 2025 | | | 17,663,632 | | | | — | | | | 28,116,418 | | | | 729,104 | |
Solution 2035 | | | 11,121,181 | | | | — | | | | 19,868,436 | | | | 666,138 | |
Solution 2045 | | | 5,240,153 | | | | — | | | | 10,154,865 | | | | 3,712,226 | |
The tax-basis components of distributable earnings and the expiration dates of the capital loss carryforwards which may be used to offset future realized capital gains for federal income tax purposes as of December 31, 2010 were:
| | | | | | | | | | | | | | | | | | | | | | | | |
| | | Undistributed
Ordinary
Income | | | Undistributed
Long-Term
Capital Gains | | | Unrealized
Appreciation/
(Depreciation) | | | Post-October
Capital
Loss
Deferred | | | Capital Loss
Carryforwards | | | Expiration
Dates | |
Solution Aggressive Growth | | $ | 64,803 | | | $ | 47 | | | $ | 278,827 | | | $ | — | | | $ | — | | | | — | |
Solution Conservative | | | 50,358 | | | | 7 | | | | 7,174 | | | | — | | | | — | | | | — | |
Solution Growth | | | 94,037 | | | | 65,743 | | | | 399,061 | | | | — | | | | — | | | | — | |
Solution Income | | | 9,062,920 | | | | — | | | | 6,558,445 | | | | — | | | | (21,076,362 | ) | | | 2017 | |
Solution Moderate | | | 138,924 | | | | 130,080 | | | | 333,104 | | | | — | | | | — | | | | — | |
Solution 2015 | | | 24,308,661 | | | | — | | | | 54,194,636 | | | | — | | | | (100,617,905 | ) | | | 2017 | |
| | | | | | | | | | | | | | | | | | | (4,233,809 | ) | | | 2018 | |
| | | | | | | | | | | | | | | | | | | | | | | | |
| | | | | | | | | | | | | | | | | | $ | (104,851,714 | ) | | | | |
| | | | | | | | | | | | | | | | | | | | | | | | |
Solution 2025 | | | 25,174,969 | | | | — | | | | 120,391,929 | | | | — | | | | (145,502,158 | ) | | | 2017 | |
| | | | | | | | | | | | | | | | | | | (26,382,916 | ) | | | 2018 | |
| | | | | | | | | | | | | | | | | | | | | | | | |
| | | | | | | | | | | | | | | | | | $ | (171,885,074 | ) | | | | |
| | | | | | | | | | | | | | | | | | | | | | | | |
Solution 2035 | | | 15,789,353 | | | | — | | | | 102,269,374 | | | | — | | | | (96,281,112 | ) | | | 2017 | |
| | | | | | | | | | | | | | | | | | | (26,378,095 | ) | | | 2018 | |
| | | | | | | | | | | | | | | | | | | | | | | | |
| | | | | | | | | | | | | | | | | | $ | (122,659,207 | ) | | | | |
| | | | | | | | | | | | | | | | | | | | | | | | |
Solution 2045 | | | 7,691,967 | | | | — | | | | 77,662,076 | | | | (1,661,130 | ) | | | (44,479,569 | ) | | | 2017 | |
| | | | | | | | | | | | | | | | | | | (27,718,100 | ) | | | 2018 | |
| | | | | | | | | | | | | | | | | | | | | | | | |
| | | | | | | | | | | | | | | | | | $ | (72,197,669 | ) | | | | |
| | | | | | | | | | | | | | | | | | | | | | | | |
Solution 2055 | | | 115,204 | | | | 837 | | | | 825,169 | | | | — | | | | — | | | | — | |
The Regulated Investment Company Modernization Act of 2010 (the “Act”) was enacted on December 22, 2010. The Act makes changes to several tax rules impacting the Portfolios. In general, the provisions of the Act will be effective for the Portfolios’ fiscal year ending December 31, 2011. Although the Act provides several benefits, including the unlimited carryforward of future capital losses, there may be greater likelihood that all or a portion of each Portfolio’s pre-enactment capital loss carryforwards may expire without being utilized due to the fact that post-enactment capital losses get utilized before pre-enactment capital loss carryforwards. Relevant information regarding the
impact of the Act on the Portfolios, if any, will be contained within the Federal Income Taxes section of the notes to financial statements for the fiscal year ending December 31, 2011.
The Portfolios’ major tax jurisdictions are federal and Arizona. The earliest tax year that remains subject to examination by these jurisdictions is 2006.
As of December 31, 2010, no provisions for income tax would be required in the Portfolios’ financial statements as a result of tax positions taken on federal and state income tax returns for open tax years. The Portfolios’ federal and state income and federal excise
47
NOTES TO FINANCIAL STATEMENTSASOF DECEMBER 31, 2010 (CONTINUED)
NOTE 11 — CONCENTRATION OF INVESTMENT RISK
tax returns for tax years for which the applicable statutes of limitations have not expired are subject to examination by the Internal Revenue Service and state department of revenue.
All mutual funds involve risk — some more than others — and there is always the chance that you could lose money or not earn as much as you hope. Each Portfolio’s risk profile is largely a factor of the principal securities in which it invests and investment techniques that it uses. For more information regarding the types of securities and investment techniques that may be used by each Portfolio and its corresponding risks, see the Portfolios’ most recent Prospectus and/or the Statement of Additional Information.
The Portfolios are also affected by other kinds of risks, depending on the types of securities held or strategies used by an Underlying Fund.
Asset Allocation. Assets will be allocated among Underlying Funds and markets based on judgements by
the Adviser or Consultant. There is a risk that the Portfolios may allocate assets to as Underlying Fund or market that underperforms other funds or asset classes.
Foreign Securities. Investments in foreign securities may entail risks not present in domestic investments. Since securities in which an Underlying Fund may invest are denominated in foreign currencies, changes in the relationship of these foreign currencies to the U.S. dollar can significantly affect the value of the investments and earnings of the Underlying Funds. Foreign investments may also subject the Underlying Funds to foreign government exchange restrictions, expropriation, taxation or other political, social or economic developments, as well as changes vis-à-vis the U.S. dollar from movements in currency, and changes in security value and interest rate, all of which could affect the market and/or credit risk of the Underlying Funds’ investments.
NOTE 12 — SUBSEQUENT EVENTS
The Portfolios have evaluated events occurring after the Statements of Assets and Liabilities date (subsequent events) to determine whether any subsequent events necessitated adjustment to or disclosure in the financial statements. No such subsequent events were identified.
48
| | |
ING SOLUTION AGGRESSIVE GROWTH
PORTFOLIO | | PORTFOLIO OF INVESTMENTS ASOF DECEMBER 31, 2010 |
| | | | | | | | | | | | | | | | |
| Shares | | | | | | | | Value | | | Percent
of Net
Assets | |
| | | | | | | | | | | | | | | | |
| | | | | | | | | | | | | | | | |
| | | | | | | | AFFILIATED INVESTMENT COMPANIES: 100.0% | | | | | | | | |
| | 48,212 | | | | @ | | | ING Artio Foreign Portfolio - Class I | | $ | 563,112 | | | | 9.0 | |
| | 6,401 | | | | @ | | | ING Baron Small Cap Growth Portfolio - Class I | | | 123,985 | | | | 2.0 | |
| | 32,037 | | | | | | | ING Clarion Global Real Estate Portfolio - Class I | | | 312,362 | | | | 5.0 | |
| | 11,864 | | | | | | | ING Columbia Small Cap Value Portfolio - Class I | | | 123,863 | | | | 2.0 | |
| | 10,401 | | | | | | | ING Davis New York Venture Portfolio - Class I | | | 187,110 | | | | 3.0 | |
| | 33,293 | | | | | | | ING Equity Dividend Fund - Class I | | | 342,250 | | | | 5.5 | |
| | 16,037 | | | | | | | ING Global Bond Fund - Class I | | | 188,439 | | | | 3.0 | |
| | 24,541 | | | | | | | ING Goldman Sachs Commodity Strategy Portfolio - Class I | | | 189,453 | | | | 3.0 | |
| | 20,080 | | | | | | | ING Growth and Income Portfolio - Class I | | | 440,562 | | | | 7.0 | |
| | 19,224 | | | | | | | ING JPMorgan Emerging Markets Equity Portfolio - Class I | | | 440,624 | | | | 7.0 | |
| | 18,754 | | | | | | | ING Large Cap Growth Portfolio - Class I | | | 248,869 | | | | 4.0 | |
| | 18,026 | | | | | | | ING Marsico Growth Portfolio - Class I | | | 311,670 | | | | 5.0 | |
| | 26,661 | | | | | | | ING Marsico International Opportunities Portfolio - Class I | | | 311,928 | | | | 5.0 | |
| | 21,330 | | | | | | | ING MidCap Opportunities Portfolio - Class I | | | 249,351 | | | | 4.0 | |
| | 43,067 | | | | | | | ING PIMCO High Yield Portfolio - Class I | | | 440,146 | | | | 7.0 | |
| | 22,884 | | | | | | | ING Pioneer Mid Cap Value Portfolio - Class I | | | 251,265 | | | | 4.0 | |
| | 10,125 | | | | | | | ING Small Company Portfolio - Class I | | | 185,694 | | | | 2.9 | |
| | 45,758 | | | | | | | ING T. Rowe Price Equity Income Portfolio - Class I | | | 538,568 | | | | 8.6 | |
| | 5,706 | | | | | | | ING T. Rowe Price Growth Equity Portfolio - Class I | | | 310,937 | | | | 5.0 | |
| | 33,939 | | | | | | | ING Templeton Foreign Equity Portfolio - Class I | | | 375,021 | | | | 6.0 | |
| | 3,899 | | | | | | | ING Thornburg Value Portfolio - Class I | | | 124,691 | | | | 2.0 | |
| | | | | | | | Total Investments in Affiliated Investment Companies
(Cost $5,980,934)* | | $ | 6,259,900 | | | | 100.0 | |
| | | | | | | | Other Assets and Liabilities - Net | | | (2,686 | ) | | | — | |
| | | | | | | | | | | | | | | | |
| | | | | | | | Net Assets | | $ | 6,257,214 | | | | 100.0 | |
| | | | | | | | | | | | | | | | |
| @ | Non-income producing security |
| * | Cost for federal income tax purposes is $5,981,073. |
| | | | |
Net unrealized appreciation consists of: | | | | |
Gross Unrealized Appreciation | | $ | 287,013 | |
Gross Unrealized Depreciation | | | (8,186 | ) |
| | | | |
Net Unrealized Appreciation | | $ | 278,827 | |
| | | | |
Fair Value Measurements^
The following is a summary of the fair valuations according to the inputs used as of December 31, 2010 in valuing the Portfolio’s assets and liabilities:
| | | | | | | | | | | | | | | | |
| | | Quoted Prices
in Active Markets
for Identical Investments
(Level 1) | | | Other
Observable
Inputs
(Level 2) | | | Significant
Unobservable
Inputs
(Level 3) | | | Fair Value
at
12/31/2010 | |
Asset Table | | | | | | | | | | | | | | | | |
Investments, at value | | | | | | | | | | | | | | | | |
Affiliated Investment Companies | | $ | 6,259,900 | | | $ | — | | | $ | — | | | $ | 6,259,900 | |
| | | | | | | | | | | | | | | | |
Total Investments, at value | | $ | 6,259,900 | | | $ | — | | | $ | — | | | $ | 6,259,900 | |
| | | | | | | | | | | | | | | | |
| ^ | See Note 2, “Significant Accounting Policies” in the Notes to Financial Statements for additional information. |
See Accompanying Notes to Financial Statements
49
| | |
ING SOLUTION CONSERVATIVE
PORTFOLIO | | PORTFOLIO OF INVESTMENTS ASOF DECEMBER 31, 2010 (CONTINUED) |
| | | | | | | | | | | | | | | | |
| Shares | | | | | | | | Value | | | Percent
of Net
Assets | |
| | | | | | | | | | | | | | | | |
| | | | | | | | | | | | | | | | |
| | | | | | | | AFFILIATED INVESTMENT COMPANIES: 100.0% | | | | | | | | |
| | 5,224 | | | | @ | | | ING Artio Foreign Portfolio - Class I | | $ | 61,011 | | | | 2.0 | |
| | 14,713 | | | | | | | ING BlackRock Inflation Protected Bond Portfolio - Class I | | | 153,013 | | | | 5.0 | |
| | 4,153 | | | | | | | ING Clarion Real Estate Portfolio - Class I | | | 91,250 | | | | 2.9 | |
| | 5,493 | | | | | | | ING Davis New York Venture Portfolio - Class I | | | 98,821 | | | | 3.2 | |
| | 14,995 | | | | | | | ING Floating Rate Fund - Class I | | | 152,946 | | | | 5.0 | |
| | 13,036 | | | | | | | ING Global Bond Fund - Class I | | | 153,169 | | | | 5.0 | |
| | 11,963 | | | | | | | ING Goldman Sachs Commodity Strategy Portfolio - Class I | | | 92,353 | | | | 3.0 | |
| | 10,845 | | | | | | | ING Growth and Income Portfolio - Class I | | | 237,931 | | | | 7.7 | |
| | 27,003 | | | | | | | ING Intermediate Bond Portfolio - Class I | | | 325,928 | | | | 10.6 | |
| | 41,319 | | | | | | | ING Limited Maturity Bond Portfolio - Class I | | | 426,406 | | | | 13.8 | |
| | 5,201 | | | | | | | ING Marsico International Opportunities Portfolio - Class I | | | 60,854 | | | | 2.0 | |
| | 27,012 | | | | | | | ING PIMCO High Yield Portfolio - Class I | | | 276,067 | | | | 9.0 | |
| | 55,051 | | | | | | | ING PIMCO Total Return Bond Portfolio - Class I | | | 672,171 | | | | 21.8 | |
| | 7,880 | | | | | | | ING T. Rowe Price Equity Income Portfolio - Class I | | | 92,747 | | | | 3.0 | |
| | 1,113 | | | | | | | ING T. Rowe Price Growth Equity Portfolio - Class I | | | 60,638 | | | | 2.0 | |
| | 5,512 | | | | | | | ING Templeton Foreign Equity Portfolio - Class I | | | 60,908 | | | | 2.0 | |
| | 1,901 | | | | | | | ING Thornburg Value Portfolio - Class I | | | 60,790 | | | | 2.0 | |
| | | | | | | | Total Investments in Affiliated Investment Companies (Cost $3,063,209)* | | $ | 3,077,003 | | | | 100.0 | |
| | | | | | | | | | | | | | | | |
| | | | | | | | Other Assets and Liabilities - Net | | | (1,224 | ) | | | — | |
| | | | | | | | | | | | | | | | |
| | | | | | | | Net Assets | | $ | 3,075,779 | | | | 100.0 | |
| | | | | | | | | | | | | | | | |
| @ | Non-income producing security |
| * | Cost for federal income tax purposes is $3,069,829. |
| | | | |
Net unrealized appreciation consists of: | | | | |
Gross Unrealized Appreciation | | $ | 46,245 | |
Gross Unrealized Depreciation | | | (39,071 | ) |
| | | | |
Net Unrealized Appreciation | | $ | 7,174 | |
| | | | |
Fair Value Measurements^
The following is a summary of the fair valuations according to the inputs used as of December 31, 2010 in valuing the Portfolio’s assets and liabilities:
| | | | | | | | | | | | | | | | |
| | | Quoted Prices
in Active Markets
for Identical Investments
(Level 1) | | | Other
Observable
Inputs
(Level 2) | | | Significant
Unobservable
Inputs
(Level 3) | | | Fair Value
at
12/31/2010 | |
Asset Table | | | | | | | | | | | | | | | | |
Investments, at value | | | | | | | | | | | | | | | | |
Affiliated Investment Companies | | $ | 3,077,003 | | | $ | — | | | $ | — | | | $ | 3,077,003 | |
| | | | | | | | | | | | | | | | |
Total Investments, at value | | $ | 3,077,003 | | | $ | — | | | $ | — | | | $ | 3,077,003 | |
| | | | | | | | | | | | | | | | |
| ^ | See Note 2, “Significant Accounting Policies” in the Notes to Financial Statements for additional information. |
See Accompanying Notes to Financial Statements
50
| | |
ING SOLUTION GROWTH PORTFOLIO | | PORTFOLIO OF INVESTMENTS ASOF DECEMBER 31, 2010 (CONTINUED) |
| | | | | | | | | | | | | | | | |
| Shares | | | | | | | | Value | | | Percent
of Net
Assets | |
| | | | | | | | | | | | | | | | |
| | | | | | | | | | | | | | | | |
| | | | | | | | AFFILI1ATED INVESTMENT COMPANIES: 100.0% | | | | | | | | |
| | 50,507 | | | | @ | | | ING Artio Foreign Portfolio - Class I | | $ | 589,926 | | | | 6.0 | |
| | 15,103 | | | | | | | ING Clarion Global Real Estate Portfolio - Class I | | | 147,255 | | | | 1.5 | |
| | 6,692 | | | | | | | ING Clarion Real Estate Portfolio - Class I | | | 147,033 | | | | 1.5 | |
| | 20,430 | | | | | | | ING Davis New York Venture Portfolio - Class I | | | 367,540 | | | | 3.7 | |
| | 28,988 | | | | | | | ING Floating Rate Fund - Class I | | | 295,680 | | | | 3.0 | |
| | 42,007 | | | | | | | ING Global Bond Fund - Class I | | | 493,585 | | | | 5.0 | |
| | 38,562 | | | | | | | ING Goldman Sachs Commodity Strategy Portfolio - Class I | | | 297,697 | | | | 3.0 | |
| | 40,574 | | | | | | | ING Growth and Income Portfolio - Class I | | | 890,196 | | | | 9.0 | |
| | 21,347 | | | | | | | ING Intermediate Bond Portfolio - Class I | | | 257,661 | | | | 2.6 | |
| | 8,632 | | | | | | | ING JPMorgan Emerging Markets Equity Portfolio - Class I | | | 197,854 | | | | 2.0 | |
| | 29,471 | | | | | | | ING Large Cap Growth Portfolio - Class I | | | 391,078 | | | | 4.0 | |
| | 28,536 | | | | | | | ING Limited Maturity Bond Portfolio - Class I | | | 294,490 | | | | 3.0 | |
| | 22,662 | | | | | | | ING Marsico Growth Portfolio - Class I | | | 391,820 | | | | 4.0 | |
| | 25,131 | | | | | | | ING Marsico International Opportunities Portfolio - Class I | | | 294,033 | | | | 3.0 | |
| | 16,760 | | | | | | | ING MidCap Opportunities Portfolio - Class I | | | 195,927 | | | | 2.0 | |
| | 58,016 | | | | | | | ING PIMCO High Yield Portfolio - Class I | | | 592,923 | | | | 6.0 | |
| | 64,518 | | | | | | | ING PIMCO Total Return Bond Portfolio - Class I | | | 787,770 | | | | 8.0 | |
| | 17,981 | | | | | | | ING Pioneer Mid Cap Value Portfolio - Class I | | | 197,437 | | | | 2.0 | |
| | 21,215 | | | | | | | ING Small Company Portfolio - Class I | | | 389,078 | | | | 3.9 | |
| | 28,518 | | | | | | | ING T Rowe Price Capital Appreciation Portfolio - Class I | | | 645,930 | | | | 6.5 | |
| | 67,682 | | | | | | | ING T. Rowe Price Equity Income Portfolio - Class I | | | 796,620 | | | | 8.1 | |
| | 7,174 | | | | | | | ING T. Rowe Price Growth Equity Portfolio - Class I | | | 390,891 | | | | 4.0 | |
| | 53,331 | | | | | | | ING Templeton Foreign Equity Portfolio - Class I | | | 589,310 | | | | 6.0 | |
| | 6,893 | | | | | | | ING Thornburg Value Portfolio - Class I | | | 220,433 | | | | 2.2 | |
| | | | | | | | Total Investments in Affiliated Investment Companies (Cost $9,456,421)* | | $ | 9,862,167 | | | | 100.0 | |
| | | | | | | | | | | | | | | | |
| | | | | | | | Other Assets and Liabilities - Net | | | (3,689 | ) | | | — | |
| | | | | | | | | | | | | | | | |
| | | | | | | | Net Assets | | $ | 9,858,478 | | | | 100.0 | |
| | | | | | | | | | | | | | | | |
| @ | Non-income producing security |
| * | Cost for federal income tax purposes is $9,463,106. |
| | | | |
Net unrealized appreciation consists of: | | | | |
Gross Unrealized Appreciation | | $ | 439,636 | |
Gross Unrealized Depreciation | | | (40,575 | ) |
| | | | |
Net Unrealized Appreciation | | $ | 399,061 | |
| | | | |
Fair Value Measurements^
The following is a summary of the fair valuations according to the inputs used as of December 31, 2010 in valuing the Portfolio’s assets and liabilities:
| | | | | | | | | | | | | | | | |
| | | Quoted Prices
in Active Markets for
Identical Investments
(Level 1) | | | Other
Observable
Inputs
(Level 2) | | | Significant
Unobservable
Inputs
(Level 3) | | | Fair Value
at
12/31/2010 | |
Asset Table | | | | | | | | | | | | | | | | |
Investments, at value | | | | | | | | | | | | | | | | |
Affiliated Investment Companies | | $ | 9,862,167 | | | $ | — | | | $ | — | | | $ | 9,862,167 | |
| | | | | | | | | | | | | | | | |
Total Investments, at value | | $ | 9,862,167 | | | $ | — | | | $ | — | | | $ | 9,862,167 | |
| | | | | | | | | | | | | | | | |
| ^ | See Note 2, “Significant Accounting Policies” in the Notes to Financial Statements for additional information. |
See Accompanying Notes to Financial Statements
51
| | |
ING SOLUTION INCOME PORTFOLIO | | PORTFOLIO OF INVESTMENTS ASOF DECEMBER 31, 2010 (CONTINUED) |
| | | | | | | | | | | | | | | | |
| Shares | | | | | | | | Value | | | Percent
of Net
Assets | |
| | | | | | | | | | | | | | | | |
| | | | | | | | | | | | | | | | |
| | | | | | | | AFFILIATED INVESTMENT COMPANIES: 100.0% | | | | | | | | |
| | 399,390 | | | | @ | | | ING Artio Foreign Portfolio - Class I | | $ | 4,664,874 | | | | 2.0 | |
| | 1,124,961 | | | | | | | ING BlackRock Inflation Protected Bond Portfolio - Class I | | | 11,699,591 | | | | 5.0 | |
| | 317,577 | | | | | | | ING Clarion Real Estate Portfolio - Class I | | | 6,977,168 | | | | 2.9 | |
| | 452,319 | | | | | | | ING Davis New York Venture Portfolio - Class I | | | 8,137,223 | | | | 3.4 | |
| | 1,146,688 | | | | | | | ING Floating Rate Fund - Class I | | | 11,696,213 | | | | 5.0 | |
| | 996,684 | | | | | | | ING Global Bond Fund - Class I | | | 11,711,042 | | | | 5.0 | |
| | 914,668 | | | | | | | ING Goldman Sachs Commodity Strategy Portfolio - Class I | | | 7,061,236 | | | | 3.0 | |
| | 909,514 | | | | | | | ING Growth and Income Portfolio - Class I | | | 19,954,741 | | | | 8.5 | |
| | 2,029,270 | | | | | | | ING Intermediate Bond Portfolio - Class I | | | 24,493,294 | | | | 10.4 | |
| | 2,933,502 | | | | | | | ING Limited Maturity Bond Portfolio - Class I | | | 30,273,739 | | | | 12.9 | |
| | 397,668 | | | | | | | ING Marsico International Opportunities Portfolio - Class I | | | 4,652,710 | | | | 2.0 | |
| | 2,066,172 | | | | | | | ING PIMCO High Yield Portfolio - Class I | | | 21,116,280 | | | | 9.0 | |
| | 4,209,241 | | | | | | | ING PIMCO Total Return Bond Portfolio - Class I | | | 51,394,830 | | | | 21.9 | |
| | 602,669 | | | | | | | ING T. Rowe Price Equity Income Portfolio - Class I | | | 7,093,412 | | | | 3.0 | |
| | 85,080 | | | | | | | ING T. Rowe Price Growth Equity Portfolio - Class I | | | 4,635,994 | | | | 2.0 | |
| | 421,442 | | | | | | | ING Templeton Foreign Equity Portfolio - Class I | | | 4,656,934 | | | | 2.0 | |
| | 145,324 | | | | | | | ING Thornburg Value Portfolio - Class I | | | 4,647,464 | | | | 2.0 | |
| | | | | | | | Total Investments in Affiliated Investment Companies
(Cost $218,754,904)* | | $ | 234,866,745 | | | | 100.0 | |
| | | | | | | | | | | | | | | | |
| | | | | | | | Other Assets and Liabilities - Net | | | (90,438 | ) | | | — | |
| | | | | | | | | | | | | | | | |
| | | | | | | | Net Assets | | $ | 234,776,307 | | | | 100.0 | |
| | | | | | | | | | | | | | | | |
| @ | Non-income producing security |
| * | Cost for federal income tax purposes is $228,308,300. |
| | | | |
Net unrealized appreciation consists of: | | | | |
Gross Unrealized Appreciation | | $ | 16,774,970 | |
Gross Unrealized Depreciation | | | (10,216,525 | ) |
| | | | |
Net Unrealized Appreciation | | $ | 6,558,445 | |
| | | | |
Fair Value Measurements^
The following is a summary of the fair valuations according to the inputs used as of December 31, 2010 in valuing the Portfolio’s assets and liabilities:
| | | | | | | | | | | | | | | | |
| | | Quoted Prices
in Active Markets for
Identical Investments
(Level 1) | | | Other
Observable
Inputs
(Level 2) | | | Significant
Unobservable
Inputs
(Level 3) | | | Fair Value
at 12/31/2010 | |
Asset Table | | | | | | | | | | | | | | | | |
Investments, at value | | | | | | | | | | | | | | | | |
Affiliated Investment Companies | | $ | 234,866,745 | | | $ | — | | | $ | — | | | $ | 234,866,745 | |
| | | | | | | | | | | | | | | | |
Total Investments, at value | | $ | 234,866,745 | | | $ | — | | | $ | — | | | $ | 234,866,745 | |
| | | | | | | | | | | | | | | | |
| ^ | See Note 2, “Significant Accounting Policies” in the Notes to Financial Statements for additional information. |
See Accompanying Notes to Financial Statements
52
| | |
ING SOLUTION MODERATE PORTFOLIO | | PORTFOLIO OF INVESTMENTS ASOF DECEMBER 31, 2010 (CONTINUED) |
| | | | | | | | | | | | | | |
| Shares | | | | | | | Value | | | Percent
of Net
Assets | |
| | | | | | | | | | | | | | |
| | | | | | AFFILIATED INVESTMENT COMPANIES: 100.0% | | | | | | | | |
| | 41,064 | | | @ | | ING Artio Foreign Portfolio - Class I | | $ | 479,629 | | | | 5.0 | |
| | 27,758 | | | | | ING BlackRock Inflation Protected Bond Portfolio - Class I | | | 288,679 | | | | 3.0 | |
| | 13,060 | | | | | ING Clarion Real Estate Portfolio - Class I | | | 286,924 | | | | 3.0 | |
| | 17,275 | | | | | ING Davis New York Venture Portfolio - Class I | | | 310,775 | | | | 3.2 | |
| | 47,141 | | | | | ING Floating Rate Fund - Class I | | | 480,836 | | | | 5.0 | |
| | 40,987 | | | | | ING Global Bond Fund - Class I | | | 481,598 | | | | 5.0 | |
| | 37,619 | | | | | ING Goldman Sachs Commodity Strategy Portfolio - Class I | | | 290,418 | | | | 3.0 | |
| | 34,094 | | | | | ING Growth and Income Portfolio - Class I | | | 748,027 | | | | 7.7 | |
| | 50,018 | | | | | ING Intermediate Bond Portfolio - Class I | | | 603,720 | | | | 6.3 | |
| | 17,970 | | | | | ING Large Cap Growth Portfolio - Class I | | | 238,466 | | | | 2.5 | |
| | 83,524 | | | | | ING Limited Maturity Bond Portfolio - Class I | | | 861,967 | | | | 8.9 | |
| | 13,819 | | | | | ING Marsico Growth Portfolio - Class I | | | 238,927 | | | | 2.5 | |
| | 16,348 | | | | | ING Marsico International Opportunities Portfolio - Class I | | | 191,271 | | | | 2.0 | |
| | 8,177 | | | | | ING MidCap Opportunities Portfolio - Class I | | | 95,585 | | | | 1.0 | |
| | 56,611 | | | | | ING PIMCO High Yield Portfolio - Class I | | | 578,564 | | | | 6.0 | |
| | 110,159 | | | | | ING PIMCO Total Return Bond Portfolio - Class I | | | 1,345,047 | | | | 13.9 | |
| | 8,773 | | | | | ING Pioneer Mid Cap Value Portfolio - Class I | | | 96,328 | | | | 1.0 | |
| | 10,349 | | | | | ING Small Company Portfolio - Class I | | | 189,802 | | | | 2.0 | |
| | 21,407 | | | | | ING T Rowe Price Capital Appreciation Portfolio - Class I | | | 484,875 | | | | 5.0 | |
| | 41,281 | | | | | ING T. Rowe Price Equity Income Portfolio - Class I | | | 485,880 | | | | 5.0 | |
| | 5,249 | | | | | ING T. Rowe Price Growth Equity Portfolio - Class I | | | 286,021 | | | | 3.0 | |
| | 34,682 | | | | | ING Templeton Foreign Equity Portfolio - Class I | | | 383,237 | | | | 4.0 | |
| | 5,978 | | | | | ING Thornburg Value Portfolio - Class I | | | 191,163 | | | | 2.0 | |
| | | | | | Total Investments in Affiliated Investment Companies
(Cost $9,293,868)* | | $ | 9,637,739 | | | | 100.0 | |
| | | | | | Other Assets and Liabilities - Net | | | (3,128 | ) | | | — | |
| | | | | | | | | | | | | | |
| | | | | | Net Assets | | $ | 9,634,611 | | | | 100.0 | |
| | | | | | | | | | | | | | |
| @ | Non-income producing security |
| * | Cost for federal income tax purposes is $9,304,635. |
| | | | |
Net unrealized appreciation consists of: | | | | |
Gross Unrealized Appreciation | | $ | 392,081 | |
Gross Unrealized Depreciation | | | (58,977 | ) |
| | | | |
Net Unrealized Appreciation | | $ | 333,104 | |
| | | | |
Fair Value Measurements^
The following is a summary of the fair valuations according to the inputs used as of December 31, 2010 in valuing the Portfolio’s assets and liabilities:
| | | | | | | | | | | | | | | | |
| | | Quoted Prices
in Active Markets for
Identical Investments
(Level 1) | | | Other
Observable
Inputs
(Level 2) | | | Significant
Unobservable
Inputs
(Level 3) | | | Fair Value
at
12/31/2010 | |
Asset Table | | | | | | | | | | | | | | | | |
Investments, at value | | | | | | | | | | | | | | | | |
Affiliated Investment Companies | | $ | 9,637,739 | | | $ | — | | | $ | — | | | $ | 9,637,739 | |
| | | | | | | | | | | | | | | | |
Total Investments, at value | | $ | 9,637,739 | | | $ | — | | | $ | — | | | $ | 9,637,739 | |
| | | | | | | | | | | | | | | | |
| ^ | See Note 2, “Significant Accounting Policies” in the Notes to Financial Statements for additional information. |
See Accompanying Notes to Financial Statements
53
| | |
ING SOLUTION 2015 PORTFOLIO | | PORTFOLIO OF INVESTMENTS ASOF DECEMBER 31, 2010 (CONTINUED) |
| | | | | | | | | | | | | | |
| Shares | | | | | | | Value | | | Percent
of Net
Assets | |
| | | | | | | | | | | | | | |
| | | | | | AFFILIATED INVESTMENT COMPANIES: 100.0% | | | | | | | | |
| | 2,758,560 | | | @ | | ING Artio Foreign Portfolio - Class I | | $ | 32,219,980 | | | | 4.0 | |
| | 3,884,796 | | | | | ING BlackRock Inflation Protected Bond Portfolio - Class I | | | 40,401,879 | | | | 5.0 | |
| | 1,237,289 | | | | | ING Clarion Global Real Estate Portfolio - Class I | | | 12,063,569 | | | | 1.5 | |
| | 548,328 | | | | | ING Clarion Real Estate Portfolio - Class I | | | 12,046,765 | | | | 1.5 | |
| | 1,562,086 | | | | | ING Davis New York Venture Portfolio - Class I | | | 28,101,935 | | | | 3.5 | |
| | 3,959,441 | | | | | ING Floating Rate Fund - Class I | | | 40,386,300 | | | | 5.0 | |
| | 3,441,726 | | | | | ING Global Bond Fund - Class I | | | 40,440,275 | | | | 5.0 | |
| | 3,159,079 | | | | | ING Goldman Sachs Commodity Strategy Portfolio - Class I | | | 24,388,088 | | | | 3.0 | |
| | 3,140,497 | | | | | ING Growth and Income Portfolio - Class I | | | 68,902,505 | | | | 8.5 | |
| | 4,900,823 | | | | | ING Intermediate Bond Portfolio - Class I | | | 59,152,928 | | | | 7.3 | |
| | 1,207,074 | | | | | ING Large Cap Growth Portfolio - Class I | | | 16,017,878 | | | | 2.0 | |
| | 2,727,450 | | | | | ING Limited Maturity Bond Portfolio - Class I | | | 28,147,279 | | | | 3.5 | |
| | 928,261 | | | | | ING Marsico Growth Portfolio - Class I | | | 16,049,638 | | | | 2.0 | |
| | 686,664 | | | | | ING Marsico International Opportunities Portfolio - Class I | | | 8,033,971 | | | | 1.0 | |
| | 858,234 | | | | | ING MidCap Opportunities Portfolio - Class I | | | 10,032,750 | | | | 1.2 | |
| | 7,133,929 | | | | | ING PIMCO High Yield Portfolio - Class I | | | 72,908,750 | | | | 9.0 | |
| | 10,571,789 | | | | | ING PIMCO Total Return Bond Portfolio - Class I | | | 129,081,549 | | | | 15.9 | |
| | 920,985 | | | | | ING Pioneer Mid Cap Value Portfolio - Class I | | | 10,112,410 | | | | 1.2 | |
| | 868,909 | | | | | ING Small Company Portfolio - Class I | | | 15,935,788 | | | | 1.9 | |
| | 1,798,120 | | | | | ING T Rowe Price Capital Appreciation Portfolio - Class I | | | 40,727,424 | | | | 5.0 | |
| | 4,161,131 | | | | | ING T. Rowe Price Equity Income Portfolio - Class I | | | 48,976,517 | | | | 6.0 | |
| | 367,278 | | | | | ING T. Rowe Price Growth Equity Portfolio - Class I | | | 20,012,997 | | | | 2.5 | |
| | 1,819,330 | | | | | ING Templeton Foreign Equity Portfolio - Class I | | | 20,103,601 | | | | 2.5 | |
| | 501,904 | | | | | ING Thornburg Value Portfolio - Class I | | | 16,050,906 | | | | 2.0 | |
| | | | | | Total Investments in Affiliated Investment Companies
(Cost $717,312,915)* | | $ | 810,295,682 | | | | 100.0 | |
| | | | | | Other Assets and Liabilities - Net | | | (301,371 | ) | | | — | |
| | | | | | | | | | | | | | |
| | | | | | Net Assets | | $ | 809,994,311 | | | | 100.0 | |
| | | | | | | | | | | | | | |
| @ | Non-income producing security |
| * | Cost for federal income tax purposes is $756,101,046. |
| | | | | | | | |
Net unrealized appreciation consists of: | | | | | | | | |
Gross Unrealized Appreciation | | $ | 93,208,674 | | | | | |
Gross Unrealized Depreciation | | | (39,014,038 | ) | | | | |
| | | | | | | | |
Net Unrealized Appreciation | | $ | 54,194,636 | | | | | |
| | | | | | | | |
Fair Value Measurements^
The following is a summary of the fair valuations according to the inputs used as of December 31, 2010 in valuing the Portfolio’s assets and liabilities:
| | | | | | | | | | | | | | | | |
| | | Quoted Prices
in Active Markets for
Identical Investments
(Level 1) | | | Other
Observable
Inputs
(Level 2) | | | Significant
Unobservable
Inputs
(Level 3) | | | Fair Value
at
12/31/2010 | |
Asset Table | | | | | | | | | | | | | | | | |
Investments, at value | | | | | | | | | | | | | | | | |
Affiliated Investment Companies | | $ | 810,295,682 | | | $ | — | | | $ | — | | | $ | 810,295,682 | |
| | | | | | | | | | | | | | | | |
Total Investments, at value | | $ | 810,295,682 | | | $ | — | | | $ | — | | | $ | 810,295,682 | |
| | | | | | | | | | | | | | | | |
| ^ | See Note 2, “Significant Accounting Policies” in the Notes to Financial Statements for additional information. |
See Accompanying Notes to Financial Statements
54
| | |
ING SOLUTION 2025 PORTFOLIO | | PORTFOLIO OF INVESTMENTS ASOF DECEMBER 31, 2010 (CONTINUED) |
| | | | | | | | | | | | | | |
| Shares | | | | | | | Value | | | Percent
of Net
Assets | |
| | | | | | | | | | | | | | |
| | | | | | AFFILIATED INVESTMENT COMPANIES: 100.0% | | | | | | | | |
| | 8,019,044 | | | @ | | ING Artio Foreign Portfolio - Class I | | $ | 93,662,437 | | | | 7.5 | |
| | 4,475,981 | | | | | ING Clarion Global Real Estate Portfolio - Class I | | | 43,640,818 | | | | 3.5 | |
| | 283,341 | | | | | ING Clarion Real Estate Portfolio - Class I | | | 6,224,999 | | | | 0.5 | |
| | 2,421,843 | | | | | ING Davis New York Venture Portfolio - Class I | | | 43,568,960 | | | | 3.5 | |
| | 3,020,310 | | | | | ING Equity Dividend Fund - Class I | | | 31,048,786 | | | | 2.5 | |
| | 4,909,898 | | | | | ING Floating Rate Fund - Class I | | | 50,080,963 | | | | 4.0 | |
| | 5,335,302 | | | | | ING Global Bond Fund - Class I | | | 62,689,798 | | | | 5.0 | |
| | 4,898,422 | | | | | ING Goldman Sachs Commodity Strategy Portfolio - Class I | | | 37,815,818 | | | | 3.0 | |
| | 4,867,262 | | | | | ING Growth and Income Portfolio - Class I | | | 106,787,725 | | | | 8.5 | |
| | 1,644,679 | | | | | ING JPMorgan Emerging Markets Equity Portfolio - Class I | | | 37,696,040 | | | | 3.0 | |
| | 3,742,958 | | | | | ING Large Cap Growth Portfolio - Class I | | | 49,669,054 | | | | 4.0 | |
| | 3,237,997 | | | | | ING Marsico Growth Portfolio - Class I | | | 55,984,969 | | | | 4.5 | |
| | 3,191,921 | | | | | ING Marsico International Opportunities Portfolio - Class I | | | 37,345,471 | | | | 3.0 | |
| | 3,193,042 | | | | | ING MidCap Opportunities Portfolio - Class I | | | 37,326,656 | | | | 3.0 | |
| | 9,828,721 | | | | | ING PIMCO High Yield Portfolio - Class I | | | 100,449,532 | | | | 8.0 | |
| | 4,097,469 | | | | | ING PIMCO Total Return Bond Portfolio - Class I | | | 50,030,101 | | | | 4.0 | |
| | 3,426,033 | | | | | ING Pioneer Mid Cap Value Portfolio - Class I | | | 37,617,842 | | | | 3.0 | |
| | 4,041,319 | | | | | ING Small Company Portfolio - Class I | | | 74,117,785 | | | | 5.9 | |
| | 2,786,458 | | | | | ING T Rowe Price Capital Appreciation Portfolio - Class I | | | 63,113,274 | | | | 5.0 | |
| | 8,060,056 | | | | | ING T. Rowe Price Equity Income Portfolio - Class I | | | 94,866,857 | | | | 7.6 | |
| | 1,024,974 | | | | | ING T. Rowe Price Growth Equity Portfolio - Class I | | | 55,850,831 | | | | 4.5 | |
| | 5,081,412 | | | | | ING Templeton Foreign Equity Portfolio - Class I | | | 56,149,603 | | | | 4.5 | |
| | 778,166 | | | | | ING Thornburg Value Portfolio - Class I | | | 24,885,745 | | | | 2.0 | |
| | | | | | Total Investments in Affiliated Investment Companies (Cost $1,070,463,009)* | | $ | 1,250,624,064 | | | | 100.0 | |
| | | | | | Other Assets and Liabilities - Net | | | (465,287 | ) | | | — | |
| | | | | | | | | | | | | | |
| | | | | | Net Assets | | $ | 1,250,158,777 | | | | 100.0 | |
| | | | | | | | | | | | | | |
| @ | Non-income producing security |
| * | Cost for federal income tax purposes is $1,130,232,135. |
| | | | |
Net unrealized appreciation consists of: | | | | |
Gross Unrealized Appreciation | | $ | 181,604,641 | |
Gross Unrealized Depreciation | | | (61,212,712 | ) |
| | | | |
Net Unrealized Appreciation | | $ | 120,391,929 | |
| | | | |
Fair Value Measurements^
The following is a summary of the fair valuations according to the inputs used as of December 31, 2010 in valuing the Portfolio’s assets and liabilities:
| | | | | | | | | | | | | | | | |
| | | Quoted Prices
in Active Markets for
Identical Investments
(Level 1) | | | Other
Observable
Inputs
(Level 2) | | | Significant
Unobservable
Inputs
(Level 3) | | | Fair Value
at
12/31/2010 | |
Asset Table | | | | | | | | | | | | | | | | |
Investments, at value | | | | | | | | | | | | | | | | |
Affiliated Investment Companies | | $ | 1,250,624,064 | | | $ | — | | | $ | — | | | $ | 1,250,624,064 | |
| | | | | | | | | | | | | | | | |
Total Investments, at value | | $ | 1,250,624,064 | | | $ | — | | | $ | — | | | $ | 1,250,624,064 | |
| | | | | | | | | | | | | | | | |
| ^ | See Note 2, “Significant Accounting Policies” in the Notes to Financial Statements for additional information. |
See Accompanying Notes to Financial Statements
55
| | |
ING SOLUTION 2035 PORTFOLIO | | PORTFOLIO OF INVESTMENTS ASOF DECEMBER 31, 2010 (CONTINUED) |
| | | | | | | | | | | | | | |
| Shares | | | | | | | Value | | | Percent
of Net
Assets | |
| | | | | | | | | | | | | | |
| | | | | | AFFILIATED INVESTMENT COMPANIES: 100.0% | | | | | | | | |
| | 6,863,940 | | | @ | | ING Artio Foreign Portfolio - Class I | | $ | 80,170,820 | | | | 7.5 | |
| | 1,093,490 | | | @ | | ING Baron Small Cap Growth Portfolio - Class I | | | 21,180,908 | | | | 2.0 | |
| | 3,831,276 | | | | | ING Clarion Global Real Estate Portfolio - Class I | | | 37,354,937 | | | | 3.5 | |
| | 727,576 | | | | | ING Clarion Real Estate Portfolio - Class I | | | 15,984,840 | | | | 1.5 | |
| | 2,026,808 | | | | | ING Columbia Small Cap Value Portfolio - Class I | | | 21,159,879 | | | | 2.0 | |
| | 1,776,887 | | | | | ING Davis New York Venture Portfolio - Class I | | | 31,966,206 | | | | 3.0 | |
| | 3,619,461 | | | | | ING Equity Dividend Fund - Class I | | | 37,208,055 | | | | 3.5 | |
| | 3,151,810 | | | | | ING Floating Rate Fund - Class I | | | 32,148,465 | | | | 3.0 | |
| | 2,283,158 | | | | | ING Global Bond Fund - Class I | | | 26,827,105 | | | | 2.5 | |
| | 4,192,727 | | | | | ING Goldman Sachs Commodity Strategy Portfolio - Class I | | | 32,367,854 | | | | 3.0 | |
| | 3,430,674 | | | | | ING Growth and Income Portfolio - Class I | | | 75,268,987 | | | | 7.0 | |
| | 2,346,116 | | | | | ING JPMorgan Emerging Markets Equity Portfolio - Class I | | | 53,772,984 | | | | 5.0 | |
| | 4,004,900 | | | | | ING Large Cap Growth Portfolio - Class I | | | 53,145,023 | | | | 5.0 | |
| | 3,079,576 | | | | | ING Marsico Growth Portfolio - Class I | | | 53,245,871 | | | | 5.0 | |
| | 3,643,452 | | | | | ING Marsico International Opportunities Portfolio - Class I | | | 42,628,385 | | | | 4.0 | |
| | 3,188,606 | | | | | ING MidCap Opportunities Portfolio - Class I | | | 37,274,809 | | | | 3.5 | |
| | 6,309,149 | | | | | ING PIMCO High Yield Portfolio - Class I | | | 64,479,506 | | | | 6.0 | |
| | 876,799 | | | | | ING PIMCO Total Return Bond Portfolio - Class I | | | 10,705,721 | | | | 1.0 | |
| | 3,421,031 | | | | | ING Pioneer Mid Cap Value Portfolio - Class I | | | 37,562,918 | | | | 3.5 | |
| | 1,729,692 | | | | | ING Small Company Portfolio - Class I | | | 31,722,544 | | | | 2.9 | |
| | 953,892 | | | | | ING T Rowe Price Capital Appreciation Portfolio - Class I | | | 21,605,643 | | | | 2.0 | |
| | 9,197,126 | | | | | ING T. Rowe Price Equity Income Portfolio - Class I | | | 108,250,175 | | | | 10.1 | |
| | 974,851 | | | | | ING T. Rowe Price Growth Equity Portfolio - Class I | | | 53,119,607 | | | | 5.0 | |
| | 6,281,057 | | | | | ING Templeton Foreign Equity Portfolio - Class I | | | 69,405,675 | | | | 6.5 | |
| | 666,099 | | | | | ING Thornburg Value Portfolio - Class I | | | 21,301,849 | | | | 2.0 | |
| | | | | | Total Investments in Affiliated Investment Companies (Cost $914,828,541)* | | $ | 1,069,858,766 | | | | 100.0 | |
| | | | | | Other Assets and Liabilities - Net | | | (398,752 | ) | | | — | |
| | | | | | | | | | | | | | |
| | | | | | Net Assets | | $ | 1,069,460,014 | | | | 100.0 | |
| | | | | | | | | | | | | | |
| @ | Non-income producing security |
| * | Cost for federal income tax purposes is $967,589,392. |
| | | | |
Net unrealized appreciation consists of: | | | | |
Gross Unrealized Appreciation | | $ | 155,104,974 | |
Gross Unrealized Depreciation | | | (52,835,600 | ) |
| | | | |
Net Unrealized Appreciation | | $ | 102,269,374 | |
| | | | |
Fair Value Measurements^
The following is a summary of the fair valuations according to the inputs used as of December 31, 2010 in valuing the Portfolio’s assets and liabilities:
| | | | | | | | | | | | | | | | |
| | | Quoted Prices
in Active Markets for
Identical Investments
(Level 1) | | | Other
Observable
Inputs
(Level 2) | | | Significant
Unobservable
Inputs
(Level 3) | | | Fair Value
at
12/31/2010 | |
Asset Table | | | | | | | | | | | | | | | | |
Investments, at value | | | | | | | | | | | | | | | | |
Affiliated Investment Companies | | $ | 1,069,858,766 | | | $ | — | | | $ | — | | | $ | 1,069,858,766 | |
| | | | | | | | | | | | | | | | |
Total Investments, at value | | $ | 1,069,858,766 | | | $ | — | | | $ | — | | | $ | 1,069,858,766 | |
| | | | | | | | | | | | | | | | |
| ^ | See Note 2, “Significant Accounting Policies” in the Notes to Financial Statements for additional information. |
See Accompanying Notes to Financial Statements
56
| | |
ING SOLUTION 2045 PORTFOLIO | | PORTFOLIO OF INVESTMENTS ASOF DECEMBER 31, 2010 (CONTINUED) |
| | | | | | | | | | | | | | | | |
| Shares | | | | | | | | Value | | | Percent
of Net
Assets | |
| | | | | | | | | | | | | | | | |
| | | | | | | | AFFILIATED INVESTMENT COMPANIES: 100.0% | | | | | | | | |
| | 5,290,564 | | | | @ | | | ING Artio Foreign Portfolio - Class I | | $ | 61,793,789 | | | | 9.0 | |
| | 702,370 | | | | @ | | | ING Baron Small Cap Growth Portfolio - Class I | | | 13,604,911 | | | | 2.0 | |
| | 3,515,559 | | | | | | | ING Clarion Global Real Estate Portfolio - Class I | | | 34,276,697 | | | | 5.0 | |
| | 1,301,865 | | | | | | | ING Columbia Small Cap Value Portfolio - Class I | | | 13,591,475 | | | | 2.0 | |
| | 951,109 | | | | | | | ING Davis New York Venture Portfolio - Class I | | | 17,110,444 | | | | 2.5 | |
| | 2,324,856 | | | | | | | ING Equity Dividend Fund - Class I | | | 23,899,515 | | | | 3.5 | |
| | 2,053,145 | | | | | | | ING Global Bond Fund - Class I | | | 24,124,456 | | | | 3.5 | |
| | 2,693,055 | | | | | | | ING Goldman Sachs Commodity Strategy Portfolio - Class I | | | 20,790,384 | | | | 3.0 | |
| | 1,888,620 | | | | | | | ING Growth and Income Portfolio - Class I | | | 41,436,332 | | | | 6.0 | |
| | 2,109,629 | | | | | | | ING JPMorgan Emerging Markets Equity Portfolio - Class I | | | 48,352,702 | | | | 7.0 | |
| | 2,572,441 | | | | | | | ING Large Cap Growth Portfolio - Class I | | | 34,136,292 | | | | 5.0 | |
| | 1,978,058 | | | | | | | ING Marsico Growth Portfolio - Class I | | | 34,200,624 | | | | 5.0 | |
| | 2,925,572 | | | | | | | ING Marsico International Opportunities Portfolio - Class I | | | 34,229,189 | | | | 5.0 | |
| | 2,633,210 | | | | | | | ING MidCap Opportunities Portfolio - Class I | | | 30,782,226 | | | | 4.5 | |
| | 2,825,008 | | | | | | | ING Pioneer Mid Cap Value Portfolio - Class I | | | 31,018,591 | | | | 4.5 | |
| | 1,851,710 | | | | | | | ING Small Company Portfolio - Class I | | | 33,960,360 | | | | 4.9 | |
| | 1,072,077 | | | | | | | ING T Rowe Price Capital Appreciation Portfolio - Class I | | | 24,282,551 | | | | 3.5 | |
| | 5,906,608 | | | | | | | ING T. Rowe Price Equity Income Portfolio - Class I | | | 69,520,782 | | | | 10.1 | |
| | 688,787 | | | | | | | ING T. Rowe Price Growth Equity Portfolio - Class I | | | 37,531,988 | | | | 5.5 | |
| | 4,344,598 | | | | | | | ING Templeton Foreign Equity Portfolio - Class I | | | 48,007,811 | | | | 7.0 | |
| | 320,888 | | | | | | | ING Thornburg Value Portfolio - Class I | | | 10,262,012 | | | | 1.5 | |
| | | | | | | | Total Investments in Affiliated Investment Companies (Cost $573,514,538)* | | $ | 686,913,131 | | | | 100.0 | |
| | | | | | | | Other Assets and Liabilities - Net | | | (251,797 | ) | | | — | |
| | | | | | | | | | | | | | | | |
| | | | | | | | Net Assets | | $ | 686,661,334 | | | | 100.0 | |
| | | | | | | | | | | | | | | | |
| @ | Non-income producing security |
| * | Cost for federal income tax purposes is $609,251,055. |
| | | | |
Net unrealized appreciation consists of: | | | | |
Gross Unrealized Appreciation | | $ | 77,662,076 | |
Gross Unrealized Depreciation | | | — | |
| | | | |
Net Unrealized Appreciation | | $ | 77,662,076 | |
| | | | |
Fair Value Measurements^
The following is a summary of the fair valuations according to the inputs used as of December 31, 2010 in valuing the Portfolio’s assets and liabilities:
| | | | | | | | | | | | | | | | |
| | | Quoted Prices
in Active Markets
for Identical Investments
(Level 1) | | | Other
Observable
Inputs
(Level 2) | | | Significant
Unobservable
Inputs
(Level 3) | | | Fair Value
at
12/31/2010 | |
Asset Table | | | | | | | | | | | | | | | | |
Investments, at value | | | | | | | | | | | | | | | | |
Affiliated Investment Companies | | $ | 686,913,131 | | | $ | — | | | $ | — | | | $ | 686,913,131 | |
| | | | | | | | | | | | | | | | |
Total Investments, at value | | $ | 686,913,131 | | | $ | — | | | $ | — | | | $ | 686,913,131 | |
| | | | | | | | | | | | | | | | |
| ^ | See Note 2, “Significant Accounting Policies” in the Notes to Financial Statements for additional information. |
See Accompanying Notes to Financial Statements
57
| | |
ING SOLUTION 2055 PORTFOLIO | | PORTFOLIO OF INVESTMENTS ASOF DECEMBER 31, 2010 (CONTINUED) |
| | | | | | | | | | | | | | | | |
| Shares | | | | | | | | Value | | | Percent
of Net
Assets | |
| | | | | | | | | | | | | | | | |
| | | | | | | | AFFILIATED INVESTMENT COMPANIES: 100.0% | | | | | | | | |
| | 81,425 | | | | @ | | | ING Artio Foreign Portfolio - Class I | | $ | 951,039 | | | | 9.0 | |
| | 10,810 | | | | @ | | | ING Baron Small Cap Growth Portfolio - Class I | | | 209,399 | | | | 2.0 | |
| | 54,107 | | | | | | | ING Clarion Global Real Estate Portfolio - Class I | | | 527,543 | | | | 5.0 | |
| | 20,038 | | | | | | | ING Columbia Small Cap Value Portfolio - Class I | | | 209,196 | | | | 2.0 | |
| | 14,638 | | | | | | | ING Davis New York Venture Portfolio - Class I | | | 263,346 | | | | 2.5 | |
| | 35,782 | | | | | | | ING Equity Dividend Fund - Class I | | | 367,841 | | | | 3.5 | |
| | 31,600 | | | | | | | ING Global Bond Fund - Class I | | | 371,301 | | | | 3.5 | |
| | 41,447 | | | | | | | ING Goldman Sachs Commodity Strategy Portfolio - Class I | | | 319,969 | | | | 3.0 | |
| | 29,064 | | | | | | | ING Growth and Income Portfolio - Class I | | | 637,667 | | | | 6.0 | |
| | 32,467 | | | | | | | ING JPMorgan Emerging Markets Equity Portfolio - Class I | | | 744,142 | | | | 7.0 | |
| | 39,593 | | | | | | | ING Large Cap Growth Portfolio - Class I | | | 525,405 | | | | 5.0 | |
| | 30,444 | | | | | | | ING Marsico Growth Portfolio - Class I | | | 526,380 | | | | 5.0 | |
| | 45,027 | | | | | | | ING Marsico International Opportunities Portfolio - Class I | | | 526,819 | | | | 5.0 | |
| | 40,526 | | | | | | | ING MidCap Opportunities Portfolio - Class I | | | 473,751 | | | | 4.5 | |
| | 43,475 | | | | | | | ING Pioneer Mid Cap Value Portfolio - Class I | | | 477,351 | | | | 4.5 | |
| | 28,501 | | | | | | | ING Small Company Portfolio - Class I | | | 522,711 | | | | 4.9 | |
| | 16,498 | | | | | | | ING T Rowe Price Capital Appreciation Portfolio - Class I | | | 373,678 | | | | 3.5 | |
| | 90,891 | | | | | | | ING T. Rowe Price Equity Income Portfolio - Class I | | | 1,069,792 | | | | 10.1 | |
| | 10,601 | | | | | | | ING T. Rowe Price Growth Equity Portfolio - Class I | | | 577,672 | | | | 5.5 | |
| | 66,866 | | | | | | | ING Templeton Foreign Equity Portfolio - Class I | | | 738,870 | | | | 7.0 | |
| | 4,939 | | | | | | | ING Thornburg Value Portfolio - Class I | | | 157,944 | | | | 1.5 | |
| | | | | | | | Total Investments in Affiliated Investment Companies (Cost $9,715,267)* | | $ | 10,571,816 | | | | 100.0 | |
| | | | | | | | Other Assets and Liabilities - Net | | | (3,489 | ) | | | — | |
| | | | | | | | | | | | | | | | |
| | | | | | | | Net Assets | | $ | 10,568,327 | | | | 100.0 | |
| | | | | | | | | | | | | | | | |
| @ | Non-income producing security |
| * | Cost for federal income tax purposes is $9,746,647. |
| | | | |
Net unrealized appreciation consists of: | | | | |
Gross Unrealized Appreciation | | $ | 860,772 | |
Gross Unrealized Depreciation | | | (35,603 | ) |
| | | | |
Net Unrealized Appreciation | | $ | 825,169 | |
| | | | |
Fair Value Measurements^
The following is a summary of the fair valuations according to the inputs used as of December 31, 2010 in valuing the Portfolio’s assets and liabilities:
| | | | | | | | | | | | | | | | |
| | | Quoted Prices
in Active Markets
for Identical Investments
(Level 1) | | | Other
Observable
Inputs
(Level 2) | | | Significant
Unobservable
Inputs
(Level 3) | | | Fair Value at 12/31/2010 | |
Asset Table | | | | | | | | | | | | | | | | |
Investments, at value | | | | | | | | | | | | | | | | |
Affiliated Investment Companies | | $ | 10,571,816 | | | $ | — | | | $ | — | | | $ | 10,571,816 | |
| | | | | | | | | | | | | | | | |
Total Investments, at value | | $ | 10,571,816 | | | $ | — | | | $ | — | | | $ | 10,571,816 | |
| | | | | | | | | | | | | | | | |
| ^ | See Note 2, “Significant Accounting Policies” in the Notes to Financial Statements for additional information. |
See Accompanying Notes to Financial Statements
58
TAX INFORMATION (UNAUDITED)
Dividends paid during the year ended December 31, 2010 were as follows:
| | | | | | |
Portfolio Name | | Type | | Per Share Amount | |
| | |
ING Solution Growth Portfolio | | | | | | |
Class ADV | | NII | | $ | 0.0661 | |
Class I | | NII | | $ | 0.0913 | |
Class S | | NII | | $ | 0.0912 | |
Class S2 | | NII | | $ | 0.0991 | |
| | |
ING Solution Income Portfolio | | | | | | |
Class ADV | | NII | | $ | 0.3384 | |
Class I | | NII | | $ | 0.3852 | |
Class S | | NII | | $ | 0.3614 | |
Class S2 | | NII | | $ | 0.3851 | |
Class T | | NII | | $ | 0.3044 | |
| | |
ING Solution Moderate Portfolio | | | | | | |
Class ADV | | NII | | $ | 0.1419 | |
Class I | | NII | | $ | 0.1333 | |
Class S | | NII | | $ | 0.1318 | |
Class S2 | | NII | | $ | 0.1422 | |
All Classes | | STCG | | $ | 0.0144 | |
All Classes | | LTCG | | $ | 0.0339 | |
| | |
ING Solution 2015 Portfolio | | | | | | |
Class ADV | | NII | | $ | 0.2193 | |
Class I | | NII | | $ | 0.2625 | |
Class S | | NII | | $ | 0.2410 | |
Class S2 | | NII | | $ | 0.2625 | |
Class T | | NII | | $ | 0.1951 | |
| | |
ING Solution 2025 Portfolio | | | | | | |
Class ADV | | NII | | $ | 0.1447 | |
Class I | | NII | | $ | 0.1843 | |
Class S | | NII | | $ | 0.1646 | |
Class S2 | | NII | | $ | 0.1843 | |
Class T | | NII | | $ | 0.1251 | |
| | |
ING Solution 2035 Portfolio | | | | | | |
Class ADV | | NII | | $ | 0.1072 | |
Class I | | NII | | $ | 0.1457 | |
Class S | | NII | | $ | 0.1263 | |
Class S2 | | NII | | $ | 0.1457 | |
Class T | | NII | | $ | 0.0836 | |
| | |
ING Solution 2045 Portfolio | | | | | | |
Class ADV | | NII | | $ | 0.0743 | |
Class I | | NII | | $ | 0.1129 | |
Class S | | NII | | $ | 0.0949 | |
Class S2 | | NII | | $ | 0.1129 | |
Class T | | NII | | $ | 0.0516 | |
NII - Net investment income
STCG - Short-term capital gain
LTCG - Long-term capital gain
59
TAX INFORMATION (UNAUDITED) (CONTINUED)
Of the ordinary distributions made during the year ended December 31, 2010, the following percentages qualify for the dividends received deduction (DRD) available to corporate shareholders:
| | | | |
| |
ING Solution Growth Portfolio | | | 30.43 | % |
| |
ING Solution Income Portfolio | | | 7.93 | % |
| |
ING Solution Moderate Portfolio | | | 15.74 | % |
| |
ING Solution 2015 Portfolio | | | 18.80 | % |
| |
ING Solution 2025 Portfolio | | | 31.56 | % |
| |
ING Solution 2035 Portfolio | | | 45.91 | % |
| |
ING Solution 2045 Portfolio | | | 56.26 | % |
Above figures may differ from those cited elsewhere in this report due to differences in the calculation of income and gains under U.S. generally accepted accounting principles (book) purposes and Internal Revenue Service (tax) purposes.
Shareholders are strongly advised to consult their own tax advisers with respect to the tax consequences of their investments in the Portfolios. In January, shareholders, excluding corporate shareholders, receive an IRS 1099-DIV regarding the federal tax status of the dividends and distributions they received in the calendar year.
60
DIRECTOR AND OFFICER INFORMATION (UNAUDITED)
The business and affairs of the Company are managed under the direction of the Board. A Director who is not an interested person of the Registrants, as defined in the 1940 Act, is an independent director (“Independent Director”). The Directors and Officers of the Company are listed below. The Statement of Additional Information includes additional information about directors of the Company and is available, without charge, upon request at (800) 992-0180.
| | | | | | | | | | |
Name, Address and Age | | Position(s)
held with
the Company | | Term of Office
and Length of
Time Served(1) | | Principal Occupation(s) - during the Past 5 Years | | Number of
Funds in
Fund
Complex
Overseen
by Director(2) | | Other Directorships
held by Director |
| | | | | |
Colleen D. Baldwin 7337 E. Doubletree Ranch Rd. Suite 100 Scottsdale, Arizona 85258 Age: 50 | | Director | | November 2007 - Present | | President, Glantuam Partners, LLC (January 2009 - Present); and Consultant (January 2005 - Present). | | 138 | | None. |
| | | | | |
John V. Boyer(4) 7337 E. Doubletree Ranch Rd. Suite 100 Scottsdale, Arizona 85258 Age: 57 | | Director | | November 1997 - Present | | President and Chief Executive Officer, Bechtler Arts Foundation, an arts and education foundation, (January 2008 - Present). Formerly, Consultant (July 2007 - February 2008); President and Chief Executive Officer, Franklin and Eleanor Roosevelt Institute, a public policy foundation, (March 2006 - July 2007); and Executive Director, The Mark Twain House & Museum (September 1989 - March 2006). | | 138 | | None. |
| | | | | |
Patricia W. Chadwick
7337 E. Doubletree Ranch Rd. Suite 100 Scottsdale, Arizona 85258 Age: 62 | | Director | | January 2006 - Present | | Consultant and President, Ravengate Partners LLC, a consulting firm that provides advice regarding financial markets and the global economy (January 2000 - Present). | | 138 | | Wisconsin Energy Corporation (June 2006 - Present) and The Royce Fund (December 2009 - Present). |
| | | | | |
Peter S. Drotch 7337 E. Doubletree Ranch Rd. Suite 100 Scottsdale, Arizona 85258 Age: 68 | | Director | | November 2007 - Present | | Retired. Formerly, Partner, PricewaterhouseCoopers LLP, an accounting firm, until July 2000. | | 138 | | First Marblehead Corporation (September 2003 - Present). |
| | | | | |
J. Michael Earley 7337 E. Doubletree Ranch Rd. Suite 100 Scottsdale, Arizona 85258 Age: 65 | | Director | | January 2005 - Present | | Retired. Formerly, Banking President and Chief Executive Officer, Bankers Trust Company, N.A., Des Moines (June 1992 - December 2008). | | 138 | | None. |
| | | | | |
Patrick W. Kenny 7337 E. Doubletree Ranch Rd. Suite 100 Scottsdale, Arizona 85258 Age: 67 | | Director | | March 2002 - Present | | Retired. Formerly, President and Chief Executive Officer, International Insurance Society (June 2001 - June 2009). | | 138 | | Assured Guaranty Ltd. (April 2004 - Present). |
| | | | | |
Sheryl K. Pressler 7337 E. Doubletree Ranch Rd. Suite 100 Scottsdale, Arizona 85258 Age: 60 | | Director | | January 2006 - Present | | Consultant (May 2001 - Present). | | 138 | | Stillwater Mining Company (May 2002 - Present). |
| | | | | |
Roger B. Vincent 7337 E. Doubletree Ranch Rd. Suite 100 Scottsdale, Arizona 85258 Age: 65 | | Chairman and Director | | January 2005 - Present | | President, Springwell Corporation, a corporate finance firm (March 1989 - Present). | | 138 | | UGI Corporation (February 2006 - Present) and UGI Utilities, Inc. (February 2006 - Present). |
61
DIRECTOR AND OFFICER INFORMATION (UNAUDITED) (CONTINUED)
| | | | | | | | | | |
Name, Address and Age | | Position(s)
held with
the Company | | Term of Office
and Length of
Time Served(1) | | Principal Occupation(s) - during the Past 5 Years | | Number of
Funds in
Fund
Complex
Overseen
by Director(2) | | Other Directorships
held by Director |
Directors who are “Interested Persons”: |
| | | | | |
Robert W. Crispin(5) 7337 E. Doubletree Ranch Rd. Suite 100 Scottsdale, Arizona 85258 Age: 64 | | Director | | November 2007 - Present | | Retired. Chairman and Chief Executive Officer, ING Investment Management Co. (July 2001 - December 2007). | | 138 | | Intact Financial Corporation (December 2004 - Present) and PFM Group (November 2010 - Present). |
| | | | | |
Shaun P. Mathews(3)(5) 7337 E. Doubletree Ranch Rd. Suite 100 Scottsdale, Arizona 85258 Age: 55 | | Director | | November 2007 - Present | | President and Chief Executive Officer, ING Investments, LLC (November 2006 - Present). Formerly, Head of ING Mutual Funds and Investment Products (November 2004 - November 2006). | | 175 | | ING Retirement Holdings, Inc. (September 1998 - Present); ING Services Holding Company, Inc. (May 2000 - Present); ING Financial Advisers, LLC (April 2002 - Present); Southland Life Insurance Company (June 2002 - Present); ING Capital Corporation, LLC and ING Investments Distributor, LLC(7) (December 2005 - Present); ING Funds Services, LLC(8), ING Investments, LLC and ING Pilgrim Funding, Inc. (March 2006 - Present); and Directed Services LLC (December 2006 - Present)(9). |
| (1) | | The tenure of each Director is subject to the Board’s retirement policy, which states that each Independent Director shall retire from service as a Director at the conclusion of the first regularly scheduled meeting of the Board that is held after the Director reaches the age of 72. A unanimous vote of the Board may extend the retirement date of a Director for up to one year. An extension may be permitted if the retirement would trigger a requirement to hold a meeting of shareholders of the Fund under applicable law, whether for purposes of appointing a successor to the Director or if otherwise necessary under applicable law, in which case the extension would apply until such time as the shareholder meeting can be held or is no longer needed. |
| (2) | | For the purposes of this table (except for Mr. Mathews),” Fund Complex” means the following investment companies: ING Asia Pacific High Dividend Equity Income Fund, ING Emerging Markets High Dividend Equity Fund; ING Emerging Markets Local Bond Fund; ING Equity Trust; ING Funds Trust; ING Global Equity Dividend and Premium Opportunity Fund; ING Global Advantage and Premium Opportunity Fund; ING Infrastructure, Industrials, and Materials Fund; ING International High Dividend Equity Income Fund; ING Investors Trust; ING Mayflower Trust; ING Mutual Funds; ING Prime Rate Trust; ING Risk Managed Natural Resources Fund; ING Senior Income Fund; ING Separate Portfolios Trust; ING Variable Insurance Trust; ING Variable Products Trust; and ING Partners, Inc. |
| (3) | | For Mr. Mathews, the Fund Complex also includes the following investment companies: ING Series Fund, Inc.; ING Strategic Allocation Portfolios, Inc.; ING Variable Funds; ING Variable Portfolios, Inc.; ING Balanced Portfolio, Inc.; ING Intermediate Bond Portfolio; and ING Money Market Portfolio. |
| (4) | | Mr. Boyer held a seat on the Board of Directors of The Mark Twain House & Museum from September 1989 to November 2005. ING Groep N.V. makes non-material, charitable contributions to The Mark Twain House & Museum. |
| (5) | | Messrs. Mathews and Crispin are deemed to be “interested persons” of the Fund as defined in the 1940 Act because of their relationship with ING Groep, N.V., the parent corporation of the Investment Adviser, Directed Services LLC and the Distributor, ING Investments Distributor, LLC. |
| (6) | | ING Investments, LLC was previously named ING Pilgrim Investments, LLC. ING Pilgrim Investments, LLC is the successor in interest to ING Pilgrim Investments, Inc., which was previously known as Pilgrim Investments, Inc. and before it was known as Pilgrim America Investments, Inc. |
| (7) | | ING Investments Distributor, LLC was previously named ING Funds Distributor, LLC. ING Funds Distributor, LLC is the successor in interest to ING Funds Distributor, Inc., which was previously known as ING Pilgrim Securities, Inc., and before that, was known as Pilgrim Securities, Inc., and before that was known as Pilgrim America Securities, Inc. |
| (8) | | ING Funds Services, LLC was previously named ING Pilgrim Group, LLC. ING Pilgrim Group, LLC is the successor in interest to ING Pilgrim Group, Inc., which was previously known as Pilgrim Group, Inc. and before that, was known as Pilgrim America Group, Inc. |
| (9) | | Directed Services LLC is the successor in interest to Directed Services, Inc. |
62
DIRECTOR AND OFFICER INFORMATION (UNAUDITED) (CONTINUED)
| | | | | | |
Name, Address and Age | | Position(s) Held
with Company | | Term of Office
and Length of
Time Served(1) | | Principal Occupation(s) - during the Past 5 Years |
| | | |
Shaun P. Mathews(5) 7337 East Doubletree Ranch Rd. Suite 100 Scottsdale, Arizona 85258 Age: 55 | | President and Chief Executive Officer | | November 2006 - Present | | President and Chief Executive Officer, ING Investments, LLC (November 2006 - Present). Formerly, Head of ING Mutual Funds and Investment Products (November 2004 - November 2006). |
| | | |
Michael J. Roland 7337 East Doubletree Ranch Rd. Suite 100 Scottsdale, Arizona 85258 Age: 52 | | Executive Vice President | | January 2005 - Present | | Executive Vice President and Chief Operating Officer, ING Investments, LLC(2) and ING Funds Services, LLC(3) (January 207 - Present). Formerly, Executive Vice President, Head of Product Management (January 2005 - January 2007). |
| | | |
Stanley D. Vyner 230 Park Avenue New York, New York 10169 Age: 60 | | Executive Vice President and Chief Investment Risk Officer | | January 2005 - Present September 2009 - Present | | Executive Vice President, ING Investments, LLC(2) (July 2000 - Present) and Chief Investment Risk Officer, ING Investments, LLC(2) (January 2003 - Present). |
| | | |
Joseph M. O’Donnell 7337 East Doubletree Ranch Rd. Suite 100 Scottsdale, Arizona 85258 Age: 56 | | Executive Vice President and Chief Compliance Officer | | March 2006 - Present January 2005 - Present | | Chief Compliance Officer of the ING Funds (November 2004 - Present); Executive Vice President of the ING Funds (March 2006 - Present); Chief Compliance Officer of ING Investments, LLC(2) (March 2006 - July 2008 and October 2009- Present); and Investment Advisor Chief Compliance Officer, Directed Services LLC(6) (March 2006 - July 2008 and October 2009- Present). Formerly, Investment Advisor Chief Compliance Officer, ING Life Insurance and Annuity Company (March 2006 - December 2006). |
| | | |
Todd Modic 7337 East Doubletree Ranch Rd. Suite 100 Scottsdale, Arizona 85258 Age: 43 | | Senior Vice President, Chief/Principal Financial Officer and Assistant Secretary | | March 2005 - Present | | Senior Vice President, ING Funds Services, LLC(3) (March 2005 - Present). |
| | | |
Kimberly A. Anderson 7337 East Doubletree Ranch Rd. Suite 100 Scottsdale, Arizona 85258 Age: 46 | | Senior Vice President | | January 2005 - Present | | Senior Vice President, ING Investments, LLC(2) (October 2003 - Present). |
| | | |
Robert Terris 7337 East Doubletree Ranch Rd. Suite 100 Scottsdale, Arizona 85258 Age: 40 | | Senior Vice President | | May 2006 - Present | | Senior Vice President, Head of Division Operations, ING Funds Services, LLC(3) (May 2006 - Present). Formerly, Vice President of Administration, ING Funds Services, LLC(3) (October 2001 - May 2006). |
| | | |
Robyn L. Ichilov 7337 East Doubletree Ranch Rd. Suite 100 Scottsdale, Arizona 85258 Age: 43 | | Vice President and Treasurer | | January 2005 - Present | | Vice President and Treasurer, ING Funds Services, LLC(3) (November 1995 - Present) and ING Investments, LLC(2) (August 1997 - Present). |
| | | |
Lauren D. Bensinger 7337 East Doubletree Ranch Rd. Suite 100 Scottsdale, Arizona 85258 Age: 56 | | Vice President | | January 2005 - Present | | Vice President, ING Investments, LLC(2) and ING Funds Services, LLC(3)(February 1996 - Present); Director of Compliance, ING Investments, LLC(2) (October 2004 - Present); and Vice President and Money Laundering Reporting Officer, ING Investments Distributor, LLC(4) (April 2010 - Present). Formerly, Chief Compliance Officer, ING Investments Distributor, LLC(4) (August 1995 - April 2010). |
| | | |
William Evans 10 State House Square Hartford, Connecticut 06103 Age: 38 | | Vice President | | September 2007 - Present | | Senior Vice President (March 2010 - Present) and Head of Manager Research and Selection Group (April 2007 - Present). Formerly, Vice President, U.S. Mutual Funds and Investment Products (May 2005 - April 2007). |
| | | |
Maria M. Anderson 7337 East Doubletree Ranch Rd. Suite 100 Scottsdale, Arizona 85258 Age: 52 | | Vice President | | January 2005 - Present | | Vice President, ING Funds Services, LLC(3) (September 2004 - Present). |
| | | |
Denise Lewis 7337 East Doubletree Ranch Rd. Suite 100 Scottsdale, Arizona 85258 Age: 47 | | Vice President | | January 2007 - Present | | Vice President, ING Funds Services, LLC (December 2006 - Present). Formerly, Senior Vice President, UMB Investment Services Group, LLC (November 2003 - December 2006). |
63
DIRECTOR AND OFFICER INFORMATION (UNAUDITED) (CONTINUED)
| | | | | | |
Name, Address and Age | | Position(s) Held
with Company | | Term of Office
and Length of
Time Served(1) | | Principal Occupation(s) - during the Past 5 Years |
| | | |
Kimberly K. Springer 7337 East Doubletree Ranch Rd. Suite 100 Scottsdale, Arizona 85258 Age: 53 | | Vice President | | March 2006 - Present | | Vice President, ING Investment Management - ING Funds (March 2010 - Present); Vice President, ING Funds Services, LLC(3) (March 2006 - Present) and Managing Paralegal, Registration Statements (June 2003 - Present). Formerly, Assistant Vice President, ING Funds Services, LLC(3) (August 2004 - March 2006). |
| | | |
Craig Wheeler 7337 East Doubletree Ranch Rd. Suite 100 Scottsdale, Arizona 85258 Age: 41 | | Assistant Vice President | | May 2008 - Present | | Assistant Vice President - Director of Tax, ING Funds Services (March 2008 - Present). Formerly, Tax Manager, ING Funds Services (March 2005 - March 2008). |
| | | |
Huey P. Falgout, Jr. 7337 East Doubletree Ranch Rd. Suite 100 Scottsdale, Arizona 85258 Age: 47 | | Secretary | | August 2003 - Present | | Senior Vice President and Chief Counsel, ING Investment Management - ING Funds (March 2010 - Present). Formerly, Chief Counsel, ING Americas, U.S. Legal Services (October 2003 - March 2010). |
| | | |
Theresa K. Kelety 7337 East Doubletree Ranch Rd. Suite 100 Scottsdale, Arizona 85258 Age: 47 | | Assistant Secretary | | August 2003 - Present | | Vice President and Senior Counsel, ING Investment Management - ING Funds (March 2010 - Present). Formerly, Senior Counsel, ING Americas, U.S. Legal Services (April 2008 - March 2010) and Counsel, ING Americas, U.S. Legal Services (April 2003 - April 2008). |
| | | |
Kathleen Nichols 7337 East Doubletree Ranch Rd. Suite 100 Scottsdale, Arizona 85258 Age: 35 | | Assistant Secretary | | May 2008 - Present | | Vice President and Counsel, ING Investment Management - ING Funds (March 2010 - Present). Formerly, Counsel, ING Americas, U.S. Legal Services (February 2008 - March 2010) and Associate, Ropes & Gray LLP (September 2005 - February 2008) |
| | | |
Paul Caldarelli 7337 East Doubletree Ranch Rd. Suite 100 Scottsdale, Arizona 85258 Age: 59 | | Assistant Secretary | | June 2010 - Present | | Vice President and Senior Counsel, ING Investment Management - ING Funds (March 2010 - Present). Formerly, Senior Counsel, ING Americas, U.S. Legal Services (April 2008 - March 2010) and Counsel, ING Americas, U.S. Legal Services (May 2005 - April 2008). |
| (1) | | The officers hold office until the next annual meeting of the Trustees and until their successors shall have been elected and qualified. |
| (2) | | ING Investments, LLC was previously named ING Pilgrim Investments, LLC. ING Pilgrim Investments, LLC is the successor in interest to ING Pilgrim Investments, Inc., which was previously known as Pilgrim Investments, Inc. and before that was known as Pilgrim America Investments, Inc. |
| (3) | | ING Funds Services, LLC was previously named ING Pilgrim Group, LLC. ING Pilgrim Group, LLC is the successor in interest to ING Pilgrim Group, Inc., which was previously known as Pilgrim Group, Inc. and before that was known as Pilgrim America Group, Inc. |
| (4) | | ING Investments Distributor, LLC was previously named ING Funds Distributor, LLC. ING Funds Distributor, LLC is the successor in interest to ING Funds Distributor, Inc., which was previously known as ING Pilgrim Securities, Inc., and before that, was known as Pilgrim Securities, Inc., and before that was known as Pilgrim America Securities, Inc. |
| (5) | | Mr. Mathews commenced services as CEO and President of the ING Funds on November 11, 2006. |
| (6) | | Directed Services LLC is the successor in interest to Directed Services, Inc. |
64
ADVISORY CONTRACT APPROVAL DISCUSSION (UNAUDITED)
BOARD CONSIDERATION AND RE-APPROVAL OF INVESTMENT ADVISORY CONTRACTS
Section 15(c) of the Investment Company Act of 1940, as amended (the “1940 Act”) provides that, after an initial period, the Portfolios’ existing investment advisory contracts will remain in effect only if the Board of Directors (the “Board”) of ING Partners, Inc. (the “Company”), including a majority of Board members who have no direct or indirect interest in the advisory contracts, and who are not “interested persons” of the Portfolios, as such term is defined under the 1940 Act (the “Independent Directors”), annually review and approve them. Thus, at a meeting held on November 18, 2010, the Board, including a majority of the Independent Directors, considered whether to renew the investment advisory contracts (the “Advisory Contracts”) between Directed Services LLC (the “Adviser”) and the Portfolios.
The Independent Directors also held separate meetings on October 21 and November 16, 2010 to consider the renewal of the Advisory Contracts. As a result, subsequent references herein to factors considered and determinations made by the Independent Directors include, as applicable, factors considered and determinations made on those earlier dates by the Independent Directors.
At its November 18, 2010 meeting, the Board voted to renew the Advisory Contracts for the Portfolios. In reaching these decisions, the Board took into account information furnished to it throughout the year at regular meetings of the Board and the Board’s committees, as well as information prepared specifically in connection with the annual renewal process. Determinations by the Independent Directors also took into account various factors that they believed, in light of the legal advice furnished to them by K&L Gates LLP (“K&L Gates”), their independent legal counsel, and their own business judgment, to be relevant. Further, while the Advisory Contracts for all the Portfolios were considered at the same Board meeting, the Directors considered each Portfolio’s advisory relationship separately.
Provided below is an overview of the Board’s contract approval process in general, as well as a discussion of certain specific factors that the Board considered at its renewal meeting. While the Board gave its attention to the information furnished, at its request, that was most relevant to its considerations, discussed below are a number of the primary factors relevant to the Board’s consideration as to whether to renew the Advisory Contracts for the one-year period ending November 30,
2011. Each Board member may have accorded different weight to the various factors in reaching his or her conclusions with respect to each Portfolio’s advisory arrangement.
Overview of the Contract Renewal and Approval Process
Several years ago, the Independent Directors instituted a revised process by which they seek and consider relevant information when they decide whether to approve new or existing advisory and arrangements for the investment companies in the ING Funds complex under their jurisdiction, including the Portfolios’ existing Advisory Contract. Among other actions, the Independent Directors: retained the services of independent consultants with experience in the mutual fund industry to assist the Independent Directors in working with the personnel employed by the Adviser or its affiliates who administer the Portfolios (“Management”) to identify the types of information presented to the Board to inform its deliberations with respect to advisory relationships and to help evaluate that information; established a specific format in which certain requested information is provided to the Board; and determined the process for reviewing such information in connection with Advisory Contract renewals and approvals. The end result was an enhanced process which is currently employed by the Independent Directors to review and analyze information in connection with their annual renewal of the ING Funds’ contracts, as well as their review and approval of new advisory relationships.
Since the current renewal and approval process was first implemented, the Board’s membership has changed substantially through periodic retirements of some Directors and the appointment and election of new Directors. In addition, throughout this period the Independent Directors have reviewed and refined the renewal and approval process at least annually. The Board also established a Contracts Committee and two Investment Review Committees, including the International/Balanced/Fixed Income Funds Investment Review Committee (the “I/B/F IRC”). Among other matters, the Contracts Committee provides oversight with respect to the contracts renewal and approval process, and each Portfolio is assigned to the I/B/F IRC, which provides oversight regarding, among other matters, investment performance. The Investment Review Committees may apply a heightened level of scrutiny in cases where performance has lagged an ING Fund’s relevant benchmark and/or and proposed
65
ADVISORY CONTRACT APPROVAL DISCUSSION (UNAUDITED) (CONTINUED)
selected peer groups of investment companies (“Selected Peer Groups”).
The type and format of the information provided to the Board or to legal counsel for the Independent Directors in connection with the contract approval and renewal process has been codified in the ING Funds’ 15(c) Methodology Guide. This Guide was developed under the direction of the Independent Directors and sets out a blueprint pursuant to which the Independent Directors request certain information that they deem important to facilitate an informed review in connection with initial and annual approvals of advisory contracts.
Management provides certain of the information requested by the 15(c) Methodology Guide in Fund Analysis and Comparison Tables (“FACT sheets”) prior to the Independent Directors’ review of advisory arrangements (including the Portfolios’ Advisory Contracts). The Independent Directors previously retained an independent firm to verify and test the accuracy of certain FACT sheet data for a representative sample of funds in the ING Funds complex. In addition, in recent years the Contracts Committee employed the services of an independent consultant to assist in its review and analysis of, among other matters, the 15(c) Methodology Guide, the content and format of the FACT sheets, and Selected Peer Groups to be used by the Portfolios for certain comparison purposes during the renewal process. As part of an ongoing process, the Contracts Committee recommends or considers recommendations from Management for refinements to the 15(c) Methodology Guide and other aspects of the review process, and the Board’s I/B/F IRC reviews benchmarks used to assess the performance of funds in the ING Funds complex.
The Board employed its process for reviewing contracts when considering the renewals of the Portfolios’ Advisory Contracts that would be effective through November 30, 2011. Set forth below is a discussion of many of the Board’s primary considerations and conclusions resulting from this process.
Nature, Extent and Quality of Service
In determining whether to approve the Advisory Contracts for the Portfolios for the year ending November 30, 2011, the Independent Directors received and evaluated such information as they deemed necessary regarding the nature, extent and quality of services provided to the Portfolios by the Adviser. This included information regarding the Adviser provided throughout the year at regular meetings of the Board
and its committees, as well as information furnished in connection with the contract renewal meetings.
The materials requested by and provided to the Board and/or to K&L Gates prior to the November 18, 2010 Board meeting included, among other information, the following items for each Portfolio: (1) FACT sheets that provided information regarding the performance and expenses of the Portfolio and other similarly managed funds in its Selected Peer Group, as well as information regarding the Portfolio’s investment portfolio, objective and strategies; (2) reports providing risk and attribution analyses of the Portfolio; (3) the 15(c) Methodology Guide, which describes how the FACT sheets were prepared, including the manner in which each Portfolio’s benchmark and Selected Peer Group were selected and how profitability was determined; (4) responses from the Adviser to a series of questions posed by K&L Gates on behalf of the Independent Directors; (5) copies of the forms of Advisory Contracts; (6) copies of the Forms ADV for the Adviser; (7) financial statements for the Adviser; (8) a draft of a narrative summary addressing key factors the Board customarily considers in evaluating the renewals of the ING Funds’ (including the Portfolio’s) advisory contracts, including a written analysis for the Portfolio of how performance, fees and expenses compare to its Selected Peer Group and/or designated benchmark; (9) independent analyses of Portfolio performance by the Company’s Chief Investment Risk Officer; (10) information regarding net asset flows into and out of the Portfolio; and (11) other information relevant to the Board’s evaluations.
Institutional Class (Class I) shares of the Portfolios were used for purposes of certain comparisons between a Portfolio and its Selected Peer Group. Class I shares generally were selected so that the Portfolio’s share class with the longest performance history was compared to the analogous class of shares for each fund in its Selected Peer Group. It should be noted that the performance of the Portfolio primarily reflects the performance of the Underlying Funds in which it invests. Mutual funds chosen for inclusion in a Portfolio’s Selected Peer Group were selected based upon criteria designed to mirror the Portfolio’s share class being compared to the funds in the Selected Peer Group.
The Board noted the resources that the Adviser has committed to the Board and the I/B/F IRC to assist the Board and the I/B/F IRC with their assessment of the investment performance of the Portfolios on an on-going basis throughout the year. This includes the
66
ADVISORY CONTRACT APPROVAL DISCUSSION (UNAUDITED) (CONTINUED)
appointment of a Chief Investment Risk Officer and his staff, who report directly to the Board and who have developed attribution analyses and other metrics used by the Board’s Investment Review Committees to analyze the key factors underlying investment performance for the funds in the ING Funds complex.
The Board also noted the proactive approach that the Adviser, working in cooperation with the I/B/F IRC, has taken to advocate or recommend, when it believed appropriate, changes designed to assist in improving the Portfolios’ performance.
In considering the Portfolios’ Advisory Contracts, the Board also considered the extent of benefits provided to the Portfolios’ shareholders, beyond advisory services, from being part of the ING family of funds. This includes, in most cases, the right to exchange or transfer investments, without a sales charge, between the same class of shares of such funds or among ING Funds available on a product platform, and the wide range of ING Funds available for exchange or transfer. The Board also took into account the Adviser’s efforts in recent years to reduce the expenses of the ING Funds through renegotiated arrangements with the ING Funds’ service providers. In addition, the Board considered the efforts of the Adviser and the expenses that it incurred in recent years to help make the ING Funds complex more efficient by combinations of similar funds.
Further, the Board received periodic reports showing that the investment policies and restrictions for each Portfolio were consistently complied with and other periodic reports covering matters such as compliance by Adviser personnel with codes of ethics. The Board considered reports from the Company’s Chief Compliance Officer (“CCO”) evaluating whether the regulatory compliance systems and procedures of the Adviser are reasonably designed to assure compliance with the federal securities laws, including those related to, among others, late trading and market timing, best execution, fair value pricing, proxy voting and trade allocation practices. The Board also took into account the CCO’s annual and periodic reports and recommendations with respect to service provider compliance programs. In this regard, the Board also considered the policies and procedures developed by the CCO in consultation with the Board’s Compliance Committee that guide the CCO’s compliance oversight function.
The Board reviewed the level of staffing, quality and experience of each Portfolio’s portfolio management team. The Board took into account the respective
resources and reputation of the Adviser, and evaluated the ability of the Adviser to attract and retain qualified investment advisory personnel. The Board also considered the adequacy of the resources committed to the Portfolios (and other relevant funds in the ING Funds complex) by the Adviser, and whether those resources are commensurate with the needs of the Portfolios and are sufficient to sustain appropriate levels of performance and compliance needs. In this regard, the Board considered the financial stability of the Adviser.
Based on their deliberations and the materials presented to them, the Board concluded that the advisory and related services provided by the Adviser are appropriate in light of the Portfolios’ operations, the competitive landscape of the investment company business, and investor needs, and that the nature and quality of the overall services provided by the Adviser were appropriate.
Portfolio Performance
In assessing advisory relationships, the Board placed emphasis on the net investment returns of each Portfolio. While the Board considered the performance reports and discussions with portfolio managers at Board and committee meetings during the year, particular attention in assessing performance was given to the FACT sheets furnished in connection with the renewal process. The FACT sheet prepared for each Portfolio included its investment performance compared to the Portfolio’s Morningstar category median and/or Lipper category median, Selected Peer Group and primary benchmark. The FACT sheet performance data was as of June 30, 2010. In addition, the Board also considered at its November 18, 2010 meeting certain additional data regarding performance and Portfolio asset levels as of September 30, 2010. The Board’s findings specific to each Portfolio’s performance are discussed under “Portfolio-by-Portfolio Analysis” below.
Economies of Scale
When evaluating the reasonableness of advisory fee rates, the Board also considered whether economies of scale will be realized by the Adviser as a Portfolio grows larger and the extent to which any such economies are reflected in contractual fee rates. In this regard, the Board noted a Portfolio would benefit from waivers to fees payable at the Portfolio level, and considered the extent to which economies of scale could effectively be realized through expense reductions resulting from
67
ADVISORY CONTRACT APPROVAL DISCUSSION (UNAUDITED) (CONTINUED)
such waivers or breakpoint discounts. In evaluating fee breakpoint arrangements and economies of scale, the Independent Directors also considered prior periodic management reports and industry information on this topic.
The Board considered that in recent years many of the Portfolios experienced material declines in assets due to general market declines precipitated by the credit crises and other generally adverse market developments. As a result of these asset declines, the Board considered that there were fewer opportunities for certain of the Portfolios to realize economies of scale.
Information Regarding Services to Other Clients
The Board requested and considered information regarding the nature of services and fee rates offered by the Adviser to other clients, including other registered investment companies and institutional accounts. When fee rates offered to other clients differed materially from those charged to a Portfolio, the Board considered any underlying rationale provided by the Adviser for these differences. The Board also noted that the fee rates charged to the Portfolios and other institutional clients of the Adviser (including other investment companies) may differ materially due to, among other reasons: differences in services; different regulatory requirements associated with registered investment companies, such as the Portfolios, as compared to non-registered investment company clients; market differences in fee rates that existed when a Portfolio first was organized; differences in the original sponsors of Portfolios that now are managed by the Adviser; investment capacity constraints that existed when certain contracts were first agreed upon or that might exist at present; and different pricing structures that are necessary to be competitive in different marketing channels.
Fee Rates and Profitability
The Board reviewed and considered each contractual investment advisory fee rate, combined with the administrative fee rate, payable by each Portfolio to the Adviser. In addition, the Board considered fee waivers and expense limitations applicable to the fees payable by the Portfolios.
The Board considered: (1) the fee structure of each Portfolio as it relates to the services provided under the contracts; and (2) the potential fall-out benefits to the Adviser and its respective affiliates from their association with the Portfolios. For each Portfolio, the Board determined that the fees payable to the Adviser
are reasonable for the services that it performs, which were considered in light of the nature and quality of the services that it has performed and is expected to perform.
For each Portfolio, the Board considered information on revenues, costs and profits realized by the Adviser, which was prepared by Management in accordance with the allocation methodology (including related assumptions) specified in the 15(c) Methodology Guide. The Board also considered that there has not yet been a full recovery for many Portfolios from the substantial decline in assets caused by adverse economic conditions in recent years, which, in many cases, has adversely impacted profits realized by the Adviser. In addition, the Board considered information that it requested and was provided by Management with respect to the profitability of service providers affiliated with the Adviser.
The Board recognized that profitability analysis is not an exact science and there is no uniform methodology for determining profitability for this purpose. In this context, the Board realized that Management’s calculations regarding its costs incurred in establishing the infrastructure necessary for the Portfolios’ operations may not be fully reflected in the expenses allocated to each Portfolio in determining profitability, and that the information presented may not portray all of the costs borne by Management or capture Management’s entrepreneurial risk associated with offering and managing a mutual fund complex in the current regulatory and market environment. In addition, the Board recognized that the use of different methodologies for purposes of calculating profit data can give rise to dramatically different profit and loss results.
At the request of the Board, the Adviser has from time to time agreed to implement remedial actions for certain Portfolios. These remedial actions have included, among others: reductions in fee rates; changes in portfolio managers; and strategy modifications.
In making its determinations, the Board based its conclusions on the reasonableness of the advisory fees of the Adviser primarily on the factors described for each Portfolio below.
Portfolio-by-Portfolio Analysis
The following paragraphs outline certain of the specific factors that the Board considered, and the
68
ADVISORY CONTRACT APPROVAL DISCUSSION (UNAUDITED) (CONTINUED)
conclusions reached, at its November 18, 2010 meeting in relation to renewing each Portfolio’s current Advisory Contract. These specific factors are in addition to those considerations discussed above. In each case, the Portfolio’s performance was compared to its Morningstar category median and its primary benchmark, a broad-based securities market index that appears in the Portfolio’s prospectus. With respect to Morningstar quintile rankings, the first quintile represents the highest (best) performance and the fifth quintile represents the lowest performance. Each Portfolio’s management fee and expense ratio were compared to the fees and expense ratios of the funds in its Selected Peer Group.
ING Solution Growth Portfolio
In considering whether to approve the renewal of the Advisory Contract for ING Solution Growth Portfolio, the Board considered that, based on performance data for the periods ended June 30, 2010: (1) the Portfolio underperformed its Morningstar category median for the most recent calendar quarter and year-to-date periods, but outperformed for the one-year period; (2) the Portfolio underperformed its primary benchmark for the most recent calendar quarter and year-to-date periods, but outperformed for the one-year period; and (3) the Portfolio is ranked in the third quintile of its Morningstar category for the one-year period, and the fourth quintile for the most recent calendar quarter and year-to-date periods.
In analyzing this performance data, the Board took into account: (1) Management’s analysis regarding the rationale for underperformance, including its analysis regarding the underperformance of certain of these underlying funds in which the Portfolio invests; and (2) that Management would continue to monitor, and the Board or its Investment Review Committee would periodically review, the Portfolio’s investment performance.
In considering the fees payable under the Advisory Contract for the Portfolio, the Board took into account the factors described above and also considered: (1) the fairness of the compensation under an Advisory Contract with a level fee rate that does not include breakpoints; and (2) the pricing structure (including the expense ratio to be borne by shareholders) of the Portfolio, as compared to its Selected Peer Group, including that: (a) the management fee for the Portfolio is below the median and the average management fees of the funds in its Selected Peer Group; and (b) the expense ratio for the Portfolio is
below the median and the average expense ratios of the funds in its Selected Peer Group.
In analyzing the fee data, the Board took into account that the Portfolio indirectly bears the fees payable by the underlying funds in which the Portfolio invests.
After its deliberation, the Board reached the following conclusions: (1) the Portfolio’s management fee rate is reasonable in the context of all factors considered by the Board; (2) the Portfolio’s expense ratio is reasonable in the context of all factors considered by the Board; and (3) that Management would continue to monitor, and the Board or its Investment Review Committee would periodically review, the Portfolio’s investment performance. Based on these conclusions and other factors, the Board voted to renew the Advisory Contract for the Portfolio for the year ending November 30, 2011. During this renewal process, different Board members may have given different weight to different individual factors and related conclusions.
ING Solution Income Portfolio
In considering whether to approve the renewal of the Advisory Contract for ING Solution Income Portfolio, the Board considered that, based on performance data for the periods ended June 30, 2010: (1) the Portfolio outperformed its Morningstar category median for all periods presented, with the exception of the most recent calendar quarter and year-to-date periods, during which it underperformed; (2) the Portfolio outperformed its primary benchmark for the one-year and three-year periods, but underperformed in the most recent calendar quarter and year-to-date periods; and (3) the Portfolio is ranked in the second quintile of its Morningstar category for the one-year and three-year periods, the third quintile for the year-to-date and five-year periods, and the fourth quintile for the most recent calendar quarter.
In considering the fees payable under the Advisory Contract for the Portfolio, the Board took into account the factors described above and also considered: (1) the fairness of the compensation under an Advisory Contract with a level fee rate that does not include breakpoints; and (2) the pricing structure (including the expense ratio to be borne by shareholders) of the Portfolio, as compared to its Selected Peer Group, including that: (a) the management fee for the Portfolio is below the median and the average management fees of the funds in its Selected Peer Group; and (b) the expense ratio for the Portfolio is below the median and the
69
ADVISORY CONTRACT APPROVAL DISCUSSION (UNAUDITED) (CONTINUED)
average expense ratios of the funds in its Selected Peer Group.
In analyzing the fee data, the Board took into account that the Portfolio indirectly bears the fees payable by the underlying funds in which the Portfolio invests.
After its deliberation, the Board reached the following conclusions: (1) the Portfolio’s management fee rate is reasonable in the context of all factors considered by the Board; (2) the Portfolio’s expense ratio is reasonable in the context of all factors considered by the Board; and (3) the Portfolio’s performance is reasonable in the context of all factors considered by the Board. Based on these conclusions and other factors, the Board voted to renew the Advisory Contract for the Portfolio for the year ending November 30, 2011. During this renewal process, different Board members may have given different weight to different individual factors and related conclusions.
ING Solution Moderate Portfolio
In considering whether to approve the renewal of the Advisory Contract for ING Solution Moderate Portfolio (formerly, ING Solution Growth and Income Portfolio), the Board considered that, based on performance data for the periods ended June 30, 2010: (1) the Portfolio underperformed its Morningstar category median for the most recent calendar quarter and year-to-date periods, but outperformed for the one-year period; (2) the Portfolio underperformed its primary benchmark for the most recent calendar quarter and year-to-date periods, but outperformed for the one-year period; and (3) the Portfolio is ranked in the third quintile of its Morningstar category for the one-year period, and the fifth (lowest) quintile for the most recent calendar quarter and year-to-date periods.
In analyzing this performance data, the Board took into account: (1) Management’s analysis regarding the rationale for underperformance, including its analysis regarding the underperformance of certain of these underlying funds in which the Portfolio invests; and (2) that Management would continue to monitor, and the Board or its Investment Review Committee would periodically review, the Portfolio’s investment performance.
In considering the fees payable under the Advisory Contract for the Portfolio, the Board took into account the factors described above and also considered: (1) the fairness of the compensation under an Advisory Contract with a level fee rate that does not include
breakpoints; and (2) the pricing structure (including the expense ratio to be borne by shareholders) of the Portfolio, as compared to its Selected Peer Group, including that: (a) the management fee for the Portfolio is below the median and the average management fees of the funds in its Selected Peer Group; and (b) the expense ratio for the Portfolio is below the median and the average expense ratios of the funds in its Selected Peer Group.
In analyzing the fee data, the Board took into account that the Portfolio indirectly bears the fees payable by the underlying funds in which the Portfolio invests.
After its deliberation, the Board reached the following conclusions: (1) the Portfolio’s management fee rate is reasonable in the context of all factors considered by the Board; (2) the Portfolio’s expense ratio is reasonable in the context of all factors considered by the Board; and (3) that Management would continue to monitor, and the Board or its Investment Review Committee would periodically review, the Portfolio’s investment performance. Based on these conclusions and other factors, the Board voted to renew the Advisory Contract for the Portfolio for the year ending November 30, 2011. During this renewal process, different Board members may have given different weight to different individual factors and related conclusions.
ING Solution 2015 Portfolio
In considering whether to approve the renewal of the Advisory Contract for ING Solution 2015 Portfolio, the Board considered that, based on performance data for the periods ended June 30, 2010: (1) the Portfolio outperformed its Morningstar category median for all periods presented, with the exception of the five-year period, during which it underperformed; (2) the Portfolio outperformed its primary benchmark for all periods presented, with the exception of the three-year period, during which it underperformed; and (3) the Portfolio is ranked in the second quintile of its Morningstar category for the most recent calendar quarter, year-to-date, one-year, and three-year periods, and the third quintile for the five-year period.
In considering the fees payable under the Advisory Contract for the Portfolio, the Board took into account the factors described above and also considered: (1) the fairness of the compensation under an Advisory Contract with a level fee rate that does not include breakpoints; and (2) the pricing structure (including the expense ratio to be borne by shareholders) of the
70
ADVISORY CONTRACT APPROVAL DISCUSSION (UNAUDITED) (CONTINUED)
Portfolio, as compared to its Selected Peer Group, including that: (a) the management fee for the Portfolio is below the median and the average management fees of the funds in its Selected Peer Group; and (b) the expense ratio for the Portfolio is below the median and the average expense ratios of the funds in its Selected Peer Group.
In analyzing the fee data, the Board took into account that the Portfolio indirectly bears the fees payable by the underlying funds in which the Portfolio invests.
After its deliberation, the Board reached the following conclusions: (1) the Portfolio’s management fee rate is reasonable in the context of all factors considered by the Board; (2) the Portfolio’s expense ratio is reasonable in the context of all factors considered by the Board; and (3) the Portfolio’s performance is reasonable in the context of all factors considered by the Board. Based on these conclusions and other factors, the Board voted to renew the Advisory Contract for the Portfolio for the year ending November 30, 2011. During this renewal process, different Board members may have given different weight to different individual factors and related conclusions.
ING Solution 2025 Portfolio
In considering whether to approve the renewal of the Advisory Contract for ING Solution 2025 Portfolio, the Board considered that, based on performance data for the periods ended June 30, 2010: (1) the Portfolio underperformed its Morningstar category median for all periods presented; (2) the Portfolio underperformed its primary benchmark for all periods presented; and (3) the Portfolio is ranked in the third quintile of its Morningstar category for the one-year and three-year periods, the fourth quintile for the most recent calendar quarter and year-to-date periods, and the fifth (lowest) quintile for the five-year period.
In analyzing this performance data, the Board took into account: (1) Management’s analysis regarding the rationale for underperformance, including its analysis regarding the underperformance of certain of these underlying funds in which the Portfolio invests; and (2) that Management would continue to monitor, and the Board or its Investment Review Committee would periodically review, the Portfolio’s investment performance.
In considering the fees payable under the Advisory Contract for the Portfolio, the Board took into account the factors described above and also considered: (1) the
fairness of the compensation under an Advisory Contract with a level fee rate that does not include breakpoints; and (2) the pricing structure (including the expense ratio to be borne by shareholders) of the Portfolio, as compared to its Selected Peer Group, including that: (a) the management fee for the Portfolio is below the median and the average management fees of the funds in its Selected Peer Group; and (b) the expense ratio for the Portfolio is below the median and the average expense ratios of the funds in its Selected Peer Group.
In analyzing the fee data, the Board took into account that the Portfolio indirectly bears the fees payable by the underlying funds in which the Portfolio invests.
After its deliberation, the Board reached the following conclusions: (1) the Portfolio’s management fee rate is reasonable in the context of all factors considered by the Board; (2) the Portfolio’s expense ratio is reasonable in the context of all factors considered by the Board; and (3) that Management would continue to monitor, and the Board or its Investment Review Committee would periodically review, the Portfolio’s investment performance. Based on these conclusions and other factors, the Board voted to renew the Advisory Contract for the Portfolio for the year ending November 30, 2011. During this renewal process, different Board members may have given different weight to different individual factors and related conclusions.
ING Solution 2035 Portfolio
In considering whether to approve the renewal of the Advisory Contract for ING Solution 2035 Portfolio, the Board considered that, based on performance data for the periods ended June 30, 2010: (1) the Portfolio outperformed its Morningstar category median for the most recent calendar quarter and one-year period, but underperformed for the year-to-date, three-year, and five-year periods; (2) the Portfolio underperformed its primary benchmark for all periods presented; and (3) the Portfolio is ranked in the third quintile of its Morningstar category for the most recent calendar quarter, year-to-date, one-year, and three-year periods, and the fourth quintile for the five-year period.
In analyzing this performance data, the Board took into account: (1) Management’s analysis regarding the rationale for underperformance, including its analysis regarding the underperformance of certain of these underlying funds in which the Portfolio invests; and (2) that Management would continue to monitor, and the Board or its Investment Review Committee would
71
ADVISORY CONTRACT APPROVAL DISCUSSION (UNAUDITED) (CONTINUED)
periodically review, the Portfolio’s investment performance.
In considering the fees payable under the Advisory Contract for the Portfolio, the Board took into account the factors described above and also considered: (1) the fairness of the compensation under an Advisory Contract with a level fee rate that does not include breakpoints; and (2) the pricing structure (including the expense ratio to be borne by shareholders) of the Portfolio, as compared to its Selected Peer Group, including that: (a) the management fee for the Portfolio is below the median and the average management fees of the funds in its Selected Peer Group; and (b) the expense ratio for the Portfolio is below the median and the average expense ratios of the funds in its Selected Peer Group.
In analyzing the fee data, the Board took into account that the Portfolio indirectly bears the fees payable by the underlying funds in which the Portfolio invests.
After its deliberation, the Board reached the following conclusions: (1) the Portfolio’s management fee ratio is reasonable in the context of all factors considered by the Board; (2) the Portfolio’s expense ratio is reasonable in the context of all factors considered by the Board; and (3) that Management would continue to monitor, and the Board or its Investment Review Committee would periodically review, the Portfolio’s investment performance. Based on these conclusions and other factors, the Board voted to renew the Advisory Contract for the Portfolio for the year ending November 30, 2011. During this renewal process, different Board members may have given different weight to different individual factors and related conclusions.
ING Solution 2045 Portfolio
In considering whether to approve the renewal of the Advisory Contract for ING Solution 2045 Portfolio, the Board considered that, based on performance data for the periods ended June 30, 2010: (1) the Portfolio underperformed its Morningstar category median for all periods presented; (2) the Portfolio underperformed its primary benchmark for all periods presented; and (3) the Portfolio is ranked in the fourth quintile of its Morningstar category for all periods presented.
In analyzing this performance data, the Board took into account: (1) Management’s analysis regarding the rationale for underperformance, including its analysis regarding the underperformance of certain of these underlying funds in which the Portfolio invests; and
(2) that Management would continue to monitor, and the Board or its Investment Review Committee would periodically review, the Portfolio’s investment performance.
In considering the fees payable under the Advisory Contract for the Portfolio, the Board took into account the factors described above and also considered: (1) the fairness of the compensation under an Advisory Contract with a level fee rate that does not include breakpoints; (2) the pricing structure (including the expense ratio to be borne by shareholders) of the Portfolio, as compared to its Selected Peer Group, including that: (a) the management fee for the Portfolio is below the median and the average management fees of the funds in its Selected Peer Group; and (b) the expense ratio for the Portfolio is below the median and the average expense ratios of the funds in its Selected Peer Group.
In analyzing the fee data, the Board took into account that the Portfolio indirectly bears the fees payable by the underlying funds in which the Portfolio invests.
After its deliberation, the Board reached the following conclusions: (1) the Portfolio’s management fee rate is reasonable in the context of all factors considered by the Board; (2) the Portfolio’s expense ratio is reasonable in the context of all factors considered by the Board; and (3) that Management would continue to monitor, and the Board or its Investment Review Committee would periodically review, the Portfolio’s investment performance. Based on these conclusions and other factors, the Board voted to renew the Advisory Contract for the Portfolio for the year ending November 30, 2011. During this renewal process, different Board members may have given different weight to different individual factors and related conclusions.
ING Solution 2055 Portfolio
In considering whether to approve the renewal of the Advisory Contract for ING Solution 2055 Portfolio, the Board considered that, based on performance data for the periods ended June 30, 2010: (1) the Portfolio is equal to its Morningstar category median for all periods presented; (2) the Portfolio underperformed its primary benchmark for all periods presented; and (3) the Portfolio is ranked in the third quintile of its Morningstar category for the most recent calendar quarter.
In analyzing this performance data, the Board took into account that the Portfolio commenced operations in
72
ADVISORY CONTRACT APPROVAL DISCUSSION (UNAUDITED) (CONTINUED)
March 2010, and therefore has a limited operating history for the purpose of analyzing its investment performance.
In considering the fees payable under the Advisory Contract for the Portfolio, the Board took into account the factors described above and also considered: (1) the fairness of the compensation under an Advisory Contract with a level fee rate that does not include breakpoints; and (2) the pricing structure (including the expense ratio to be borne by shareholders) of the Portfolio, as compared to its Selected Peer Group, including that: (a) the management fee for the Portfolio is below the median and the average management fees of the funds in its Selected Peer Group; and (b) the expense ratio for the Portfolio is below the median and the average expense ratios of the funds in its Selected Peer Group.
In analyzing the fee data, the Board took into account that the Portfolio indirectly bears the fees payable by the underlying funds in which the Portfolio invests.
After its deliberation, the Board reached the following conclusions: (1) the Portfolio’s management fee rate is reasonable in the context of all factors considered by the Board; (2) the Portfolio’s expense ratio is reasonable in the context of all factors considered by the Board; and (3) the Portfolio commenced operations in March 2010, and it is reasonable to permit the Portfolio time to establish a longer performance record for the purposes of evaluating performance. Based on these conclusions and other factors, the Board voted to renew the Advisory Contract for the Portfolio for the year ending November 30, 2011. During this renewal process, different Board members may have given different weight to different individual factors and related conclusions.
73
Investment Adviser
Directed Services LLC
1475 Dunwoody Drive
West Chester, Pennsylvania 19380
Administrator
ING Funds Services, LLC
7337 East Doubletree Ranch Road, Suite 100
Scottsdale, Arizona 85258
Distributor
ING Investments Distributor, LLC
7337 East Doubletree Ranch Road, Suite 100
Scottsdale, Arizona 85258
Transfer Agent
BNY Mellon Investment Servicing (U.S.) Inc.
301 Bellevue Parkway
Wilmington, Delaware 19809
Independent Registered Public Accounting Firm
KPMG LLP
Two Financial Center
60 South Street
Boston, Massachusetts 02111
Custodian
The Bank of New York Mellon
One Wall Street
New York, New York 10286
Legal Counsel
Dechert LLP
1775 I Street, N.W.
Washington, D.C. 20006
Before investing, carefully consider the investment objectives, risks, charges and expenses of the variable universal life insurance policy or variable annuity contract and the underlying variable investment options. This and other information is contained in the prospectus for the variable universal life policy or variable annuity contract and the underlying variable investment options. Obtain these prospectuses from your agent/registered representative and read them carefully before investing.
| | | | |
 | | VPAR-USOL | | (1210-021611) |

Annual Report
December 31, 2010
Adviser Class (“ADV”), Initial Class (“I”),
Service Class (“S”), Service 2 Class (“S2”) and Class T
ING Partners, Inc.
| n | ING Index Solution Income Portfolio |
| n | ING Index Solution 2015 Portfolio |
| n | ING Index Solution 2025 Portfolio |
| n | ING Index Solution 2035 Portfolio |
��
| n | ING Index Solution 2045 Portfolio |
| n | ING Index Solution 2055 Portfolio |
This report is submitted for general information to shareholders of the ING Funds. It is not authorized for distribution to prospective shareholders unless accompanied or preceded by a prospectus which includes details regarding the funds’ investment objectives, risks, charges, expenses and other information. This information should be read carefully.
MUTUAL FUNDS 
| |
TABLE OF CONTENTS
PROXY VOTING INFORMATION
A description of the policies and procedures that the Portfolios use to determine how to vote proxies related to portfolio securities is available: (1) without charge, upon request, by calling Shareholder Services toll-free at (800) 992-0180; (2) on the ING Funds’ website at www.ingfunds.com; and (3) on the U.S. Securities and Exchange Commission’s (“SEC”) website at www.sec.gov. Information regarding how the Portfolios voted proxies related to portfolio securities during the most recent 12-month period ended June 30 is available without charge on the ING Funds’ website at www.ingfunds.com and on the SEC’s website at www.sec.gov.
QUARTERLY PORTFOLIO HOLDINGS
The Portfolios file their complete schedule of portfolio holdings with the SEC for the first and third quarters of each fiscal year on Form N-Q. The Portfolios’ Forms N-Q are available on the SEC’s website at www.sec.gov. The Portfolios’ Forms N-Q may be reviewed and copied at the SEC’s Public Reference Room in Washington, DC, and information on the operation of the Public Reference Room may be obtained by calling (800) SEC-0330; and is available upon request from the Portfolios by calling Shareholder Services toll-free at (800) 992-0180.
PRESIDENT’S LETTER

Big Picture vs. Details
Dear Shareholder,
On January 25, 2011, President Obama delivered his second State of the Union address. He called on Americans to put aside partisan differences and harness the nation’s creativity to adapt and thrive in a rapidly changing global economy. The president’s challenge is timely: the United States is approaching a nexus of intermediate- and long-term concerns, and the choices we make over the next two years could determine the nation’s competitiveness in the global economy for decades to come.
There are reasons to be optimistic — the International Monetary Fund (“IMF”) predicts the U.S. economy will grow about 3% in 2011. China and India are expected to grow at about 9% and even the euro zone appears to be recovering from crisis; this growth,
however, is being accompanied by mounting inflation pressures in certain regions, suggesting that many economies are expanding at unsustainable rates.
As I write this, the World Economic Forum is getting underway in Davos, Switzerland, and there are numerous concerns to deal with. Chief among them are the still-present risk of sovereign debt defaults in the euro zone; high unemployment and banking problems in the advanced economies; and inflationary pressures in emerging markets, especially with regard to food, fuel and commodities.
As we’ve noted before, uncertainty is a defining characteristic of our age and, in our opinion, is likely to remain so beyond this year. How should you respond within your investment portfolio? Remember that the most important consideration is your long-term goals, not the outlook for 2011. With investment hazards and opportunities everywhere, we believe it makes sense to cast as broad a net as possible around the globe. In our opinion, you want your portfolio to be well diversified so that it is not harmed too much by the trouble spots, and has some exposure to positive trends.
As always, we believe the best approach is a well-diversified portfolio and a well-defined investment plan. As we’ve noted many times before, it’s important to discuss any proposed changes thoroughly with your advisor before taking any action. Thank you for your continued confidence in ING Funds. We look forward to serving your investment needs in the future.
Sincerely,

Shaun Mathews
President and Chief Executive Officer
ING Funds
January 26, 2011
The views expressed in the President’s Letter reflect those of the President as of the date of the letter. Any such views are subject to change at any time based upon market or other conditions and ING Funds disclaims any responsibility to update such views. These views may not be relied on as investment advice and because investment decisions for an ING Fund are based on numerous factors, may not be relied on as an indication of investment intent on behalf of any ING Fund. Reference to specific company securities should not be construed as recommendations or investment advice.
International investing poses special risks including currency fluctuation, economic and political risks not found in investments that are solely domestic.
1
MARKET PERSPECTIVE FORTHE YEAR ENDED DECEMBER 31, 2010
In our semi-annual report we described how, after a 13-month advance through mid-April, a confluence of local and world issues sent global equities, in the form of the MSCI World IndexSM measured in local currencies, including net reinvested dividends (“MSCI” for regions discussed below), reeling to a loss for the first half of the fiscal year. In the second half of the year, the MSCI World IndexSM bounced back and for 2010 returned 10.01%. (The MSCI World IndexSM returned 11.76% for the one year ended December 31, 2010, measured in U.S. dollars.) By year end, investor sentiment had turned distinctly positive, despite the grave concerns that remained.
It was a bumpy ride. Markets from stocks to bonds to currencies were continually buffeted by news and events relating to three main themes: the stuttering U.S. economic recovery, the sovereign debt crisis in the Eurozone and growth dynamics in China.
In the U.S., quarterly gross domestic product (“GDP”) growth decelerated from 2.7% (annualized) in the first quarter of 2010 to 1.7% in the second, before recovering to 2.6% in the third. But attention was focused more on employment and housing. The 18-month recession which ended in June of 2009 had cost some 8.7 million jobs. But since then, the unemployment rate had been stuck between 9.4% and 10.1%, barely dented by private sector new jobs averaging 107,000 per month as 2010 ended.
The other weakening link was housing. Sales of new and existing homes collapsed after the expiry in April of a program of tax credits for home buyers and languished thereafter. House prices (based on the S&P/Case-Shiller 20-City Composite Home Price Index), having shown annual increases from February, resumed a downward trend in October with the index still 30% below the peak recorded in April 2006.
To be sure, there were some grounds for optimism as 2010 drew to a close. Consumer spending had risen for five straight months. Investment in equipment and software was growing at double-digit annual percentage rates. On December 30, new unemployment claims were reported below 400,000 for the first time since July 2008. The Federal Reserve in November announced a second round of quantitative easing and would buy $600 billion in Treasury notes and bonds. The mixed mid-term election results forced a “compromise” stimulus package worth an estimated $858 billion for 2011. In combination, these two measures increased the attractiveness of riskier asset classes like equities at the expense of high grade bonds, which sold off.
In the Eurozone, after default was narrowly averted on Greece’s maturing bonds, the creation in May of a European Financial Stabilization “mechanism”, funded with up to €750 billion seemed to calm nerves for a while. But in October, attention turned to Ireland, where the Irish government had injected huge sums into local banks, rendering its own fiscal position untenable. The November 29, 2010 European Union/International Monetary Fund bail-out worth €67.5 billion left markets unimpressed. Suddenly it was May again with downgrades, soaring yields on peripheral Eurozone bonds, fears of contagion, falling stock markets and doubts about the viability of the euro itself. The European Central Bank aggressively bought sovereign bonds and the mood settled. But with Spain’s banks needing to refinance €85 billion of debt in 2011, the issue remains unresolved.
Investors watched nervously as China, the source of much of the world’s growth, wrestled with inflation, which reached 5.1% in
November, and a housing bubble. The authorities tightened mortgage requirements, raised banks’ reserve ratio requirements six times in 2010 and interest rates twice in the last quarter. More interest rate increases seem inevitable.
In U.S. fixed income markets, the Barclays Capital U.S. Aggregate Bond Index of investment grade bonds returned 6.54% in 2010. A slight balance towards risk aversion in the first half gave way to improved risk appetite in the second. For the whole year, the Barclays Capital U.S. Treasury index returned 5.87%, underperforming the Barclays Capital Corporate Investment Grade Bond Index with a return of 9.00%, but both fell well short of the Barclays Capital High Yield Bond — 2% Issuer Constrained Composite Index which gained 14.94% for the one year period.
U.S. equities, represented by the S&P 500® Index including dividends, rose 15.06% in 2010, including its best September, a return of 8.92%, since 1939 and best December, a return of 6.68%, since 1991. Prices were supported by strong earnings reports, with operating earnings per share for S&P 500® companies recording four straight quarters of annual growth. Equities also benefited from improved risk appetite through the quantitative easing initiative and stimulus package referred to above.
In currencies, the worst of the gloom about the Eurozone in early June was replaced by renewed pessimism about the dollar in a stalling economy, before markets were seized by another bout of Eurozone angst. For the year, the dollar gained 8.15% against the euro and 2.95% against the pound, but lost 11.59% to the yen, which was sold in the market by the Bank of Japan after breaching 15-year high levels.
In international markets, the MSCI Japan® Index returned just 0.57% for the year after a strong last quarter, as quarterly GDP growth bounced back to 1.1% and the yen retreated from multi-year peaks. The tone of the market was generally poor with household spending fragile and consumer prices down for 21 months. The MSCI Europe ex UK® Index returned 4.84%, with Germany up 15.97% and Portugal, Italy, Ireland, Greece and Spain all falling. This broadly reflected the two-tier economy that has developed, with economic statistics favoring more soundly based countries at the expense of the peripherals. The MSCI UK® Index advanced 12.18%, despite the prospect of severe public spending cuts intended to eliminate an 11% budget deficit. Supporting sentiment was resilient, if perhaps temporary, quarterly GDP growth averaging 0.9% in the second half of the year.
Parentheses denote a negative number.
Past performance does not guarantee future results. The performance quoted represents past performance. Investment return and principal value of an investment will fluctuate, and shares, when redeemed, may be worth more or less than their original cost. The Portfolios’ performance is subject to change since the period’s end and may be lower or higher than the performance data shown. Please call (800) 262-3862 or log on to www.ingfunds.com to obtain performance data current to the most recent month end.
Market Perspective reflects the views of ING’s Chief Investment Risk Officer only through the end of the period, and is subject to change based on market and other conditions.
2
BENCHMARK DESCRIPTIONS
| | |
| Index | | Description |
| MSCI World IndexSM | | An unmanaged index that measures the performance of over 1,400 securities listed on exchanges in the U.S., Europe, Canada, Australia, New Zealand and the Far East. |
S&P/Case-Shiller 20-City Composite Home Price Index | | A composite index of the home price index for the top 20 Metropolitan Statistical Areas in the United States. The index is published monthly by Standard & Poor’s. |
| Barclays Capital U.S. Aggregate Bond Index | | An unmanaged index of publicly issued investment grade U.S. Government, mortgage-backed, asset-backed and corporate debt securities. |
| Barclays Capital U.S. Treasury Index | | An unmanaged index that includes public obligations of the U.S. Treasury. Treasury bills, certain special issues, such as state and local government series bonds (SLGs), as well as U.S. Treasury TIPS and STRIPS, are excluded. |
Barclays Capital Corporate Investment Grade Bond Index | | The corporate component of the Barclays Capital U.S. Credit Index. The U.S. Credit Index includes publicly-issued U.S. corporate and specified foreign debentures and secured notes that meet the specified maturity, liquidity, and quality requirements. The index includes both corporate and non-corporate sectors. The corporate sectors are industrial, utility and finance, which includes both U.S. and non-U.S. corporations. |
Barclays Capital High Yield Bond — 2% Issuer Constrained Composite Index | | An unmanaged index that includes all fixed income securities having a maximum quality rating of Ba1, a minimum amount outstanding of $150 million, and at least one year to maturity. |
| S&P 500® Index | | An unmanaged index that measures the performance of securities of approximately 500 large-capitalization companies whose securities are traded on major U.S. stock markets. |
| MSCI Japan® Index | | A free float-adjusted market capitalization index that is designed to measure developed market equity performance in Japan. |
| MSCI Europe ex UK® Index | | A free float-adjusted market capitalization index that is designed to measure developed market equity performance in Europe, excluding the UK. |
| MSCI UK® Index | | A free float-adjusted market capitalization index that is designed to measure developed market equity performance in the UK. |
| S&P Target Date Retirement Income Index | | Seeks to represent asset allocations which target an immediate retirement horizon. |
S&P Target Date 2015 Index, S&P Target Date 2025 Index, S&P Target Date 2035 Index, S&P Target Date 2045 Index and S&P Target Date 2045+ Index | | Each seeks to represent the market consensus for asset allocations which target an approximate 2015, 2025, 2035, 2045 and beyond 2045 retirement horizon, respectively. |
3
| | |
| ING INDEX SOLUTION PORTFOLIOS | | PORTFOLIO MANAGERS’ REPORT |
The ING Index Solution Portfolios consist of ING Index Solution Income Portfolio, ING Index Solution 2015 Portfolio, ING Index Solution 2025 Portfolio, ING Index Solution 2035 Portfolio, ING Index Solution 2045 Portfolio and Index Solution 2055 Portfolio (each a “Portfolio” or collectively, the “Portfolios” or the “Index Solution Portfolios”). Each Portfolio seeks to achieve its investment objective by investing in a combination of other ING Funds and other non-affiliated funds (“Underlying Funds”) according to target allocations determined by Directed Services LLC (“DSL” or “Investment Adviser”), under the guidance of an Investment Committee(1)(2) . ING Investment Management Co. (“Consultant”) is a consultant to the Investment Adviser. Both the Investment Adviser and the Consultant are indirect, wholly-owned subsidiaries of ING Groep.
Portfolio Specifics: 2010 was another good year for global equities, although there was a clear performance division between the nations of the “old world” and those that comprise the “new world.” Asia and Latin America served as the world’s growth engine in 2010. Economic growth in developing nations was so strong that inflation started to reemerge as a policy problem. As a consequence of this strong economic activity, emerging markets and developing Asia posted the strongest returns.
The Portfolios are comprised of the following five passive funds, and a newly added exchange traded fund (“ETF”):
ING Russell Large Cap Index Portfolio
ING Russell Mid Cap Index Portfolio
ING Russell Small Cap Index Portfolio
ING International Index Portfolio
ING U.S. Bond Index Portfolio
Vanguard I-Shares Emerging Markets ETF
We began the year with a neutral position in all asset classes. In the first quarter we saw the market recovery was following typical cyclical patterns and expected earnings and revenue growth to be driven by the previous year’s cost cutting. Therefore, we moved to an overweight position in U.S. large cap equity and underweighted fixed income.
During the second quarter we added exposure to emerging markets as a strategic holding through the use of the ETF. We removed the Portfolios’ large cap overweight in April and moved to neutral, placing the proceeds back into core bonds. While our medium-term view on cyclical economic prospects was optimistic, the intensifying sovereign debt crisis in Europe threatened to offset the expected imminent positive economic and earnings news.
In May, following the announcement of the joint effort to contain the issues in Europe, we resumed our overweight position in large cap U.S. equity and sold core bonds. News of continued improvement in the fundamentals of the U.S. economy was overshadowed by the disappointing employment figures, pointing to a potentially slower growth trajectory. It was our view that it was safer, at this juncture, to move back to a neutral position on equity in June.
In August we started to see a continued easing of global financial conditions, which is essential for the broader cyclical transition to occur. We believed improvement in economic conditions would bring about a virtuous cycle of easing financial conditions and more robust economic growth. As a result, we decided to overweight risky asset classes such as large cap U.S. equity, with a corresponding underweight to core bonds.
In November, we decided to remove our overweight to large cap given the resurfacing of sovereign solvency issues in peripheral Europe and the acceleration in China’s inflation. Both of these issues, however, became less worrisome as the quarter progressed; the European Central Bank announced that the bank was prepared to act, subsequently easing tensions with respect to sovereign risk and yield spreads in Europe. Furthermore, we expected any further tightening measures by the Chinese authorities to be gradual, leading to a soft landing.
In December, economic data in the U.S. turned more positive with the PMI numbers, initial jobless claims, and retail sales data suggesting the economy is gaining momentum. As a result, we made the decision, on a tactical basis, to reestablish our U.S. large cap equity overweight position by underweighting core fixed income. Overall, tactical positions slightly detracted from performance during the year.
The ING Index Solution Portfolios underperformed the S&P Target Date Index series this year, partially due to not having exposure to U.S. real estate investment trusts. Additionally, having a lower allocation to U.S. mid- and small-capitalization equities within the ING Index Solution Income Portfolio and ING Index Solution 2015 Portfolios also detracted from relative benchmark performance. Furthermore, the ING Index Solution 2025, ING Index Solution 2035 and ING Index Solution 2045 Portfolios’ overweight to international developed equities was a performance drag relative to their respective S&P Target Date indices.
Current Strategy and Outlook: The Portfolios currently are underweight bonds, overweight large cap equities, and neutral with respect to mid-cap, small-cap and non-U.S. equities. In the ING Index Solution 2015 Portfolio, we have begun to decrease the equity weight as part of our risk mitigating “step down” process. These allocation changes are strategic in nature, and are not considered tactical moves.
(1) The members of the Investment Committee are: William A. Evans, Paul Zemsky and Heather Hackett.
(2) The investment objective of each Portfolio is described in the Portfolios’ prospectuses, each dated April 30, 2010.
Portfolio holdings and characteristics are subject to change and may not be representative of current holdings and characteristics. The outlook for this Portfolio may differ from that presented for other ING Funds. Performance for the different classes of shares will vary based on differences in fees associated with each class.
4
| | |
| PORTFOLIO MANAGERS’ REPORT | | ING INDEX SOLUTION PORTFOLIOS |
Asset Allocation
as of December 31, 2010
(as a percentage of net assets)
| | | | | | | | | | | | | | | | | | | | | | | | | | | | |
| Underlying Funds | | | | | ING Index Solution Income Portfolio | | | ING Index Solution 2015 Portfolio | | | ING Index Solution 2025 Portfolio | | | ING Index Solution 2035 Portfolio | | | ING Index Solution 2045 Portfolio | | | ING Index Solution 2055 Portfolio | |
ING International Index Portfolio—Class I | | | % | | | | 5.0 | | | | 10.2 | | | | 16.9 | | | | 21.0 | | | | 28.0 | | | | 28.3 | |
ING Russell Large Cap Index Portfolio—Class I | | | % | | | | 20.9 | | | | 27.6 | | | | 38.0 | | | | 37.0 | | | | 34.1 | | | | 34.1 | |
ING Russell Mid Cap Index Portfolio—
Class I | | | % | | | | 3.9 | | | | 6.0 | | | | 14.0 | | | | 16.0 | | | | 20.0 | | | | 20.0 | |
ING Russell Small Cap Index Portfolio—Class I | | | % | | | | 0.0 | | | | 2.0 | | | | 4.9 | | | | 8.9 | | | | 10.9 | | | | 10.9 | |
ING U.S. Bond Index Portfolio—Class I | | | % | | | | 68.2 | | | | 52.2 | | | | 23.2 | | | | 13.1 | | | | 3.0 | | | | 3.0 | |
Vanguard Emerging Markets ETF | | | % | | | | 2.0 | | | | 2.0 | | | | 3.0 | | | | 4.0 | | | | 4.0 | | | | 3.7 | |
Other assets and liabilities—Net | | | % | | | | (0.0 | )* | | | (0.0 | )* | | | (0.0 | )* | | | (0.0 | )* | | | (0.0 | )* | | | (0.0 | )* |
| | | | | | | | | | | | | | | | | | | | | | | | | | | | |
| | | % | | | | 100.0 | | | | 100.0 | | | | 100.0 | | | | 100.0 | | | | 100.0 | | | | 100.0 | |
| | | | | | | | | | | | | | | | | | | | | | | | | | | | |
| * | | Amount is more than (0.05)% |
Portfolio holdings are subject to change.
Target Allocations
as of December 31, 2010
(as a percentage of net assets)
| | | | | | | | | | | | | | | | | | | | | | | | | | | | |
| | | | | | ING Index
Solution Income
Portfolio | | | ING Index
Solution 2015
Portfolio | | | ING Index
Solution 2025
Portfolio | | | ING Index
Solution 2035
Portfolio | | | ING Index
Solution 2045
Portfolio | | | ING Index
Solution 2055
Portfolio | |
U.S. Large-Cap Stocks | | | % | | | | 21.00 | | | | 27.75 | | | | 38.00 | | | | 37.00 | | | | 34.00 | | | | 34.00 | |
U.S. Mid-Cap Stocks | | | % | | | | 4.00 | | | | 6.00 | | | | 14.00 | | | | 16.00 | | | | 20.00 | | | | 20.00 | |
U.S. Small-Cap Stocks | | | % | | | | 0.00 | | | | 2.00 | | | | 5.00 | | | | 9.00 | | | | 11.00 | | | | 11.00 | |
Non-U.S./International Stocks | | | % | | | | 5.00 | | | | 10.25 | | | | 17.00 | | | | 21.00 | | | | 28.00 | | | | 28.00 | |
Core Fixed-Income | | | % | | | | 68.00 | | | | 52.00 | | | | 23.00 | | | | 13.00 | | | | 3.00 | | | | 3.00 | |
Vanguard Emerging Markets ETF | | | % | | | | 2.00 | | | | 2.00 | | | | 3.00 | | | | 4.00 | | | | 4.00 | | | | 4.00 | |
| | | | | | | | | | | | | | | | | | | | | | | | | | | | |
| | | % | | | | 100 | | | | 100 | | | | 100 | | | | 100 | | | | 100 | | | | 100 | |
| | | | | | | | | | | | | | | | | | | | | | | | | | | | |
5
| | |
| ING INDEX SOLUTION PORTFOLIOS | | PORTFOLIO MANAGERS’ REPORT |
| | | | |
| Average Annual Total Returns for the Period Ended December 31, 2010 | |
| | | 1 Year | |
ING Index Solution Income Portfolio, Class S | | | 7.61 | % |
S&P Target Date Retirement Income Index | | | 9.09 | % |
ING Index Solution Income Composite Index(1) | | | 9.16 | % |
ING Index Solution 2015 Portfolio, Class S | | | 8.97 | % |
S&P Target Date 2015 Index | | | 11.85 | % |
ING Index Solution 2015 Composite Index(1) | | | 10.50 | % |
ING Index Solution 2025 Portfolio, Class S | | | 11.72 | % |
S&P Target Date 2025 Index | | | 13.82 | % |
ING Index Solution 2025 Composite Index(1) | | | 13.29 | % |
ING Index Solution 2035 Portfolio, Class S | | | 12.89 | % |
S&P Target Date 2035 Index | | | 15.02 | % |
ING Index Solution 2035 Composite Index(1) | | | 14.47 | % |
ING Index Solution 2045 Portfolio, Class S | | | 13.88 | % |
S&P Target Date 2045 Index | | | 15.62 | % |
ING Index Solution 2045 Composite Index(1) | | | 15.36 | % |
ING Index Solution 2055 Portfolio, Class S | | | 12.10 | %(2) |
S&P Target Date 2045+ Index | | | 16.77 | %(3) |
ING Index Solution 2055 Composite Index(1) | | | 17.16 | %(3) |
| (1) | | The ING Index Solution Income Composite Index, ING Index Solution 2015 Composite Index, ING Index Solution 2025 Composite Index, ING Index Solution 2035 Composite Index, ING Index Solution 2045 Composite Index and ING Index Solution 2055 Composite Index are each comprised of the asset class indices that correspond to the particular asset classes in which each Portfolio invests and their benchmark weightings. |
| (2) | | Return is for the period from inception on March 8, 2010 through December 31, 2010. |
| (3) | | Reflects index performance since the date closest to the Class’ inception for which data is available. |
6
| | |
| PORTFOLIO MANAGERS’ REPORT | | ING INDEX SOLUTION INCOME PORTFOLIO |
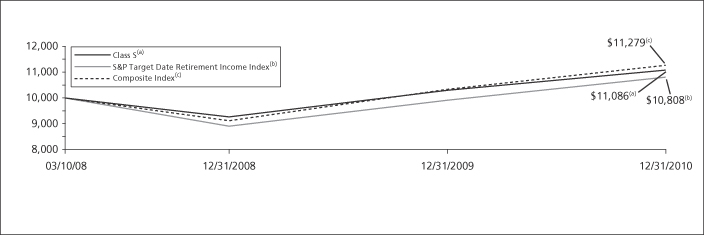
| | | | | | | | | | | | | | | | | | | | |
| | | |
| | | | | Average Annual Total Returns for the Periods Ended December 31, 2010 | | | | | |
| | | | | | 1 Year | | | Since Inception of Classes ADV, S, I and T March 10, 2008 | | | Since Inception of Class S2 May 28, 2009 | | | | |
| | | | | Class ADV | | | 7.37 | % | | | 3.50 | % | | | — | | | | | |
| | | | | Class I | | | 7.96 | % | | | 4.05 | % | | | — | | | | | |
| | | | | Class S | | | 7.61 | % | | | 3.74 | % | | | — | | | | | |
| | | | | Class T | | | 7.16 | % | | | 3.26 | % | | | — | | | | | |
| | | | | Class S2 | | | 7.54 | % | | | — | | | | 11.28 | % | | | | |
| | | | | S&P Target Date Retirement Income Index | | | 9.09 | % | | | 2.78 | %(1) | | | 12.11 | %(2) | | | | |
| | | | | Composite Index | | | 9.16 | % | | | 4.33 | %(1) | | | 12.17 | %(2) | | | | |
Based on a $10,000 initial investment, the graph and table above illustrate the total return of ING Index Solution Income Portfolio against the indices indicated. An index is unmanaged and has no cash in its portfolio, imposes no sales charges and incurs no operating expenses. An investor cannot invest directly in an index.
The performance graph and table do not reflect the deduction of taxes that a shareholder will pay on Portfolio distributions or the redemption of Portfolio shares.
The performance shown may include the effect of fee waivers and/or expense reimbursements by the Investment Adviser and/or other service providers, which have the effect of increasing total return. Had all fees and expenses been considered, the total returns would have been lower.
Performance data represents past performance and is no assurance of future results. Investment return and principal value of an investment in the Portfolio will fluctuate. Shares, when sold, may be worth more or less than their original cost. The Portfolio’s current performance may be lower or higher than the performance data shown. Please log on to www.ingfunds.com or call (800) 992-0180 to get performance through the most recent month end.
It is important to note that the Portfolio has a limited operating history. Performance over a longer period of time may be more meaningful than short-term performance.
This report contains statements that may be “forward-looking” statements. Actual results may differ materially from those projected in the “forward-looking” statements.
The views expressed in this report reflect those of the Investment Adviser, only through the end of the period as stated on the cover. The Investment Adviser’s views are subject to change at any time based on market and other conditions.
Portfolio holdings are subject to change daily.
| (1) | | Since inception performance for the indices is shown from March 1, 2008. |
| (2) | | Since inception performance for the indices is shown from June 1, 2009. |
7
| | |
| ING INDEX SOLUTION 2015 PORTFOLIO | | PORTFOLIO MANAGERS’ REPORT |
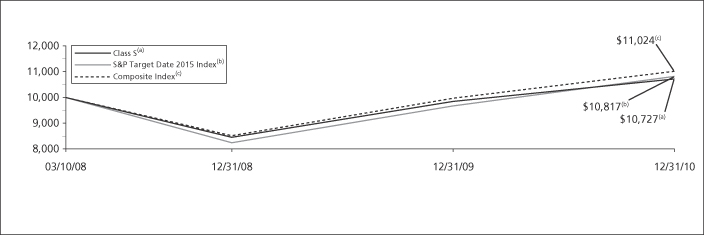
| | | | | | | | | | | | | | | | | | | | |
| | | |
| | | | | Average Annual Total Returns for the Periods Ended December 31, 2010 | | | | | |
| | | | | | 1 Year | | | Since Inception
of Classes ADV, I, S and T
March 10, 2008 | | | Since Inception
of Class S2
May 28, 2009 | | | | |
| | | | | Class ADV | | | 8.68 | % | | | 2.28 | % | | | — | | | | | |
| | | | | Class I | | | 9.11 | % | | | 2.77 | % | | | — | | | | | |
| | | | | Class S | | | 8.97 | % | | | 2.53 | % | | | — | | | | | |
| | | | | Class T | | | 8.31 | % | | | 2.00 | % | | | — | | | | | |
| | | | | Class S2 | | | 8.68 | % | | | — | | | | 15.08 | % | | | | |
| | | | | S&P Target Date 2015 Index | | | 11.85 | % | | | 2.81 | %(1) | | | 17.09 | %(2) | | | | |
| | | | | Composite Index | | | 10.50% | | | | 3.50 | %(1) | | | 14.93 | %(2) | | | | |
Based on a $10,000 initial investment, the graph and table above illustrate the total return of ING Index Solution 2015 Portfolio against the indices indicated. An index is unmanaged and has no cash in its portfolio, imposes no sales charges and incurs no operating expenses. An investor cannot invest directly in an index.
The performance graph and table do not reflect the deduction of taxes that a shareholder will pay on Portfolio distributions or the redemption of Portfolio shares.
The performance shown may include the effect of fee waivers and/or expense reimbursements by the Investment Adviser and/or other service providers, which have the effect of increasing total return. Had all fees and expenses been considered, the total returns would have been lower.
Performance data represents past performance and is no assurance of future results. Investment return and principal value of an investment in the Portfolio will fluctuate. Shares, when sold, may be worth more or less than their original cost. The Portfolio’s current performance may be lower or higher than the performance data shown. Please log on to www.ingfunds.com or call (800) 992-0180 to get performance through the most recent month end.
It is important to note that the Portfolio has a limited operating history. Performance over a longer period of time may be more meaningful than short-term performance.
This report contains statements that may be “forward-looking” statements. Actual results may differ materially from those projected in the “forward-looking” statements.
The views expressed in this report reflect those of the Investment Adviser, only through the end of the period as stated on the cover. The Investment Adviser’s views are subject to change at any time based on market and other conditions.
Portfolio holdings are subject to change daily.
| (1) | | Since inception performance for the indices is shown from March 1, 2008. |
| (2) | | Since inception performance for the indices is shown from June 1, 2009. |
8
| | |
| PORTFOLIO MANAGERS’ REPORT | | ING INDEX SOLUTION 2025 PORTFOLIO |
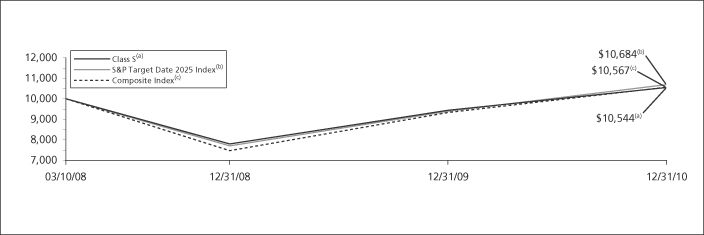
| | | | | | | | | | | | | | | | | | | | |
| | | |
| | | | | Average Annual Total Returns for the Periods Ended December 31, 2010 | | | | | |
| | | | | | 1 Year | | | Since Inception of Classes ADV, S, I and T March 10, 2008 | | | Since Inception of Class S2 May 28, 2009 | | | | |
| | | | | Class ADV | | | 11.43 | % | | | 1.64 | % | | | — | | | | | |
| | | | | Class I | | | 11.96 | % | | | 2.13 | % | | | — | | | | | |
| | | | | Class S | | | 11.72 | % | | | 1.89 | % | | | — | | | | | |
| | | | | Class T | | | 10.99 | % | | | 1.37 | % | | | — | | | | | |
| | | | | Class S2 | | | 11.63 | % | | | — | | | | 19.47 | % | | | | |
| | | | | S&P Target Date 2025 Index | | | 13.82 | % | | | 2.36 | %(1) | | | 20.61 | %(2) | | | | |
| | | | | Composite Index | | | 13.29 | % | | | 1.97 | %(1) | | | 20.48 | %(2) | | | | |
Based on a $10,000 initial investment, the graph and table above illustrate the total return of ING Index Solution 2025 Portfolio against the indices indicated. An index is unmanaged and has no cash in its portfolio, imposes no sales charges and incurs no operating expenses. An investor cannot invest directly in an index.
The performance graph and table do not reflect the deduction of taxes that a shareholder will pay on Portfolio distributions or the redemption of Portfolio shares.
The performance shown may include the effect of fee waivers and/or expense reimbursements by the Investment Adviser and/or other service providers, which have the effect of increasing total return. Had all fees and expenses been considered, the total returns would have been lower.
Performance data represents past performance and is no assurance of future results. Investment return and principal value of an investment in the Portfolio will fluctuate. Shares, when sold, may be worth more or less than their original cost. The Portfolio’s current performance may be lower or higher than the performance data shown. Please log on to www.ingfunds.com or call (800) 992-0180 to get performance through the most recent month end.
It is important to note that the Portfolio has a limited operating history. Performance over a longer period of time may be more meaningful than short-term performance.
This report contains statements that may be “forward-looking” statements. Actual results may differ materially from those projected in the “forward-looking” statements.
The views expressed in this report reflect those of the Investment Adviser, only through the end of the period as stated on the cover. The Investment Adviser’s views are subject to change at any time based on market and other conditions.
Portfolio holdings are subject to change daily.
| (1) | | Since inception performance for the indices is shown from March 1, 2008. |
| (2) | | Since inception performance for the indices is shown from June 1, 2009. |
9
| | |
| ING INDEX SOLUTION 2035 PORTFOLIO | | PORTFOLIO MANAGERS’ REPORT |
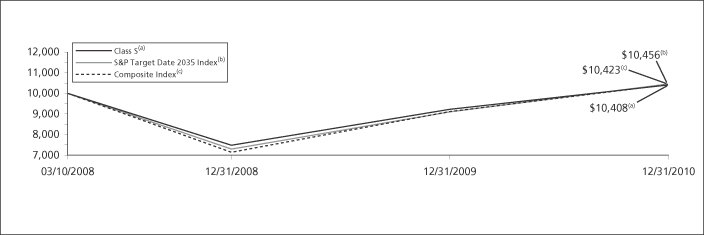
| | | | | | | | | | | | | | | | | | | | |
| | | |
| | | | | Average Annual Total Returns for the Periods Ended December 31, 2010 | | | | | |
| | | | | | 1 Year | | | Since Inception of Classes ADV, S, I and T March 10, 2008 | | | Since Inception of Class S2 May 28, 2009 | | | | |
| | | | | Class ADV | | | 12.56 | % | | | 1.16 | % | | | — | | | | | |
| | | | | Class I | | | 13.10 | % | | | 1.66 | % | | | — | | | | | |
| | | | | Class S | | | 12.89 | % | | | 1.43 | % | | | — | | | | | |
| | | | | Class T | | | 12.23 | % | | | 0.91 | % | | | — | | | | | |
| | | | | Class S2 | | | 12.76 | % | | | — | | | | 21.48 | % | | | | |
| | | | | S&P Target Date 2035 Index | | | 15.02 | % | | | 1.58 | %(1) | | | 22.70 | %(2) | | | | |
| | | | | Composite Index | | | 14.47 | % | | | 1.47 | %(1) | | | 22.65 | %(2) | | | | |
Based on a $10,000 initial investment, the graph and table above illustrate the total return of ING Index Solution 2035 Portfolio against the indices indicated. An index is unmanaged and has no cash in its portfolio, imposes no sales charges and incurs no operating expenses. An investor cannot invest directly in an index.
The performance graph and table do not reflect the deduction of taxes that a shareholder will pay on Portfolio distributions or the redemption of Portfolio shares.
The performance shown may include the effect of fee waivers and/or expense reimbursements by the Investment Adviser and/or other service providers, which have the effect of increasing total return. Had all fees and expenses been considered, the total returns would have been lower.
Performance data represents past performance and is no assurance of future results. Investment return and principal value of an investment in the Portfolio will fluctuate. Shares, when sold, may be worth more or less than their original cost. The Portfolio’s current performance may be lower or higher than the performance data shown. Please log on to www.ingfunds.com or call (800) 992-0180 to get performance through the most recent month end.
It is important to note that the Portfolio has a limited operating history. Performance over a longer period of time may be more meaningful than short-term performance.
This report contains statements that may be “forward-looking” statements. Actual results may differ materially from those projected in the “forward-looking” statements.
The views expressed in this report reflect those of the Investment Adviser, only through the end of the period as stated on the cover. The Investment Adviser’s views are subject to change at any time based on market and other conditions.
Portfolio holdings are subject to change daily.
| (1) | | Since inception performance for the indices is shown from March 1, 2008. |
| (2) | | Since inception performance for the indices is shown from June 1, 2009. |
10
| | |
| PORTFOLIO MANAGERS’ REPORT | | ING INDEX SOLUTION 2045 PORTFOLIO |
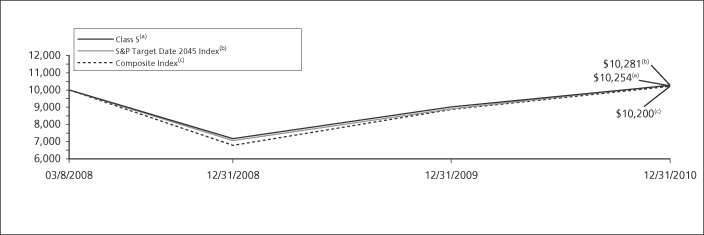
| | | | | | | | | | | | | | | | | | | | |
| | | |
| | | | | Average Annual Total Returns for the Period Ended December 31, 2010 | | | | | |
| | | | | | 1 Year | | | Since Inception
of Classes ADV, I, S and T
March 10, 2008 | | | Since Inception
of Class S2
May 28, 2009 | | | | |
| | | | | Class ADV | | | 13.73 | % | | | 0.64 | % | | | — | | | | | |
| | | | | Class I | | | 14.28 | % | | | 1.14 | % | | | — | | | | | |
| | | | | Class S | | | 13.88 | % | | | 0.89 | % | | | — | | | | | |
| | | | | Class T | | | 13.40 | % | | | 0.41 | % | | | — | | | | | |
| | | | | Class S2 | | | 13.83 | % | | | — | | | | 23.48 | % | | | | |
| | | | | S&P Target Date 2045 Index | | | 15.62 | % | | | 0.98 | %(1) | | | 23.54 | %(2) | | | | |
| | | | | Composite Index | | | 15.36 | % | | | 0.70 | %(1) | | | 24.62 | %(2) | | | | |
Based on a $10,000 initial investment, the graph and table above illustrate the total return of ING Index Solution 2045 Portfolio against the indices indicated. An index is unmanaged and has no cash in its portfolio, imposes no sales charges and incurs no operating expenses. An investor cannot invest directly in an index.
The performance graph and table do not reflect the deduction of taxes that a shareholder will pay on Portfolio distributions or the redemption of Portfolio shares.
The performance shown may include the effect of fee waivers and/or expense reimbursements by the Investment Adviser and/or other service providers, which have the effect of increasing total return. Had all fees and expenses been considered, the total returns would have been lower.
Performance data represents past performance and is no assurance of future results. Investment return and principal value of an investment in the Portfolio will fluctuate. Shares, when sold, may be worth more or less than their original cost. The Portfolio’s current performance may be lower or higher than the performance data shown. Please log on to www.ingfunds.com or call (800) 992-0180 to get performance through the most recent month end.
It is important to note that the Portfolio has a limited operating history. Performance over a longer period of time may be more meaningful than short-term performance.
This report contains statements that may be “forward-looking” statements. Actual results may differ materially from those projected in the “forward-looking” statements.
The views expressed in this report reflect those of the Investment Adviser, only through the end of the period as stated on the cover. The Investment Adviser’s views are subject to change at any time based on market and other conditions.
Portfolio holdings are subject to change daily.
| (1) | | Since inception performance for the indices is shown from March 1, 2008. |
| (2) | | Since inception performance for the indices is shown from June 1, 2009. |
11
| | |
| ING INDEX SOLUTION 2055 PORTFOLIO | | PORTFOLIO MANAGERS’ REPORT |
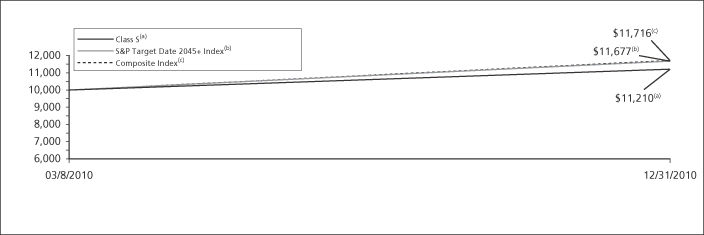
| | | | | | | | | | | | |
| | |
| | | | Cumulative Total Returns for the Period Ended December 31, 2010 | |
| | | | | | Since Inception
of Classes ADV, I, S, T and S2
March 8, 2010 | | | | |
| | | | | Class ADV | | | 11.90 | % | | | | |
| | | | | Class I | | | 12.40 | % | | | | |
| | | | | Class S | | | 12.10 | % | | | | |
| | | | | Class T | | | 11.70 | % | | | | |
| | | | | Class S2 | | | 12.00 | % | | | | |
| | | | | S&P Target Date 2045+ Index | | | 16.77 | %(1) | | | | |
| | | | | Composite Index | | | 17.16 | %(1) | | | | |
Based on a $10,000 initial investment, the graph and table above illustrate the total return of ING Index Solution 2055 Portfolio against the indices indicated. An index is unmanaged and has no cash in its portfolio, imposes no sales charges and incurs no operating expenses. An investor cannot invest directly in an index.
The performance graph and table do not reflect the deduction of taxes that a shareholder will pay on Portfolio distributions or the redemption of Portfolio shares.
The performance shown may include the effect of fee waivers and/or expense reimbursements by the Investment Adviser and/or other service providers, which have the effect of increasing total return. Had all fees and expenses been considered, the total returns would have been lower.
Performance data represents past performance and is no assurance of future results. Investment return and principal value of an investment in the Portfolio will fluctuate. Shares, when sold, may be worth more or less than their original cost. The Portfolio’s current performance may be lower or higher than the performance data shown. Please log on to www.ingfunds.com or call (800) 992-0180 to get performance through the most recent month end.
It is important to note that the Portfolio has a limited operating history. Performance over a longer period of time may be more meaningful than short-term performance.
This report contains statements that may be “forward-looking” statements. Actual results may differ materially from those projected in the “forward-looking” statements.
The views expressed in this report reflect those of the Investment Adviser, only through the end of the period as stated on the cover. The Investment Adviser’s views are subject to change at any time based on market and other conditions.
Portfolio holdings are subject to change daily.
| (1) | | Since inception performance for the indices is shown from March 1, 2010. |
12
SHAREHOLDER EXPENSE EXAMPLES (UNAUDITED)
As a shareholder of a Portfolio, you incur two types of costs: (1) transaction costs, including redemption and exchange fees; and (2) ongoing costs including management fees, distribution and/or service (12b-1) fees, and other Portfolio expenses. These Examples are intended to help you understand your ongoing costs (in dollars) of investing in a Portfolio and to compare these costs with the ongoing costs of investing in other mutual funds.
The Examples are based on an investment of $1,000 invested at the beginning of the period (except as noted) and held for the entire period from July 1, 2010 to December 31, 2010. The Portfolios’ expenses are shown without the imposition of any charges which are, or may be, imposed under your variable annuity contract, variable life insurance policy, qualified pension or retirement plan. Expenses would have been higher if such charges were included.
Actual Expenses
The left section of the table shown below, “Actual Portfolio Return,” provides information about actual account values and actual expenses. You may use the information in this section, together with the amount you invested, to estimate the expenses that you paid over the period. Simply divide your account value by $1,000 (for example, an $8,600 account value divided by $1,000 = 8.6), then multiply the result by the number in the first section under the heading entitled “Expenses Paid During the Period” to estimate the expenses you paid on your account during this period.
Hypothetical Example for Comparison Purposes
The right section of the table shown below, “Hypothetical (5% return before expenses),” provides information about hypothetical account values and hypothetical expenses based on a Portfolio’s actual expense ratio and an assumed rate of return of 5% per year before expenses, which is not a Portfolio’s actual return. The hypothetical account values and expenses may not be used to estimate the actual ending account balance or expenses you paid for the period. You may use this information to compare the ongoing costs of investing in a Portfolio and other mutual funds. To do so, compare this 5% hypothetical example with the 5% hypothetical examples that appear in the shareholder reports of the other mutual funds.
Please note that the expenses shown in the table are meant to highlight your ongoing costs only and do not reflect any transactional costs, such as redemption fees or exchange fees. Therefore, the hypothetical lines of the table are useful in comparing ongoing costs only, and will not help you determine the relative total costs of owning different mutual funds. In addition, if these transactional costs were included, your costs would have been higher.
| | | | | | | | | | | | | | | | | | | | | | | | | | | | | | | | |
| | | Actual Portfolio Return | | | Hypothetical (5% return before expenses) | |
| | | Beginning Account Value
July 1, 2010 | | | Ending
Account Value
December 31, 2010 | | | Annualized Expense Ratio* | | | Expenses Paid
During the
Period Ended
December 31, 2010** | | | Beginning Account Value
July 1, 2010 | | | Ending
Account Value
December 31, 2010 | | | Annualized Expense Ratio* | | | Expenses Paid During
the Period Ended
December 31, 2010** | |
ING Index Solution Income Portfolio | | | | | | | | | | | | | | | | | | | | | |
Class ADV | | $ | 1,000.00 | | | $ | 1,071.60 | | | | 0.62 | % | | $ | 3.24 | | | $ | 1,000.00 | | | $ | 1,022.08 | | | | 0.62 | % | | $ | 3.16 | |
Class I | | | 1,000.00 | | | | 1,074.40 | | | | 0.12 | | | | 0.63 | | | | 1,000.00 | | | | 1,024.60 | | | | 0.12 | | | | 0.61 | |
Class S | | | 1,000.00 | | | | 1,071.90 | | | | 0.37 | | | | 1.93 | | | | 1,000.00 | | | | 1,023.34 | | | | 0.37 | | | | 1.89 | |
Class S2 | | | 1,000.00 | | | | 1,071.20 | | | | 0.52 | | | | 2.71 | | | | 1,000.00 | | | | 1,022.58 | | | | 0.52 | | | | 2.65 | |
Class T | | | 1,000.00 | | | | 1,070.50 | | | | 0.82 | | | | 4.28 | | | | 1,000.00 | | | | 1,021.07 | | | | 0.82 | | | | 4.18 | |
ING Index Solution 2015 Portfolio | | | | | | | | | | | | | | | | | | | | | | | | | |
Class ADV | | $ | 1,000.00 | | | $ | 1,113.00 | | | | 0.62 | % | | $ | 3.30 | | | $ | 1,000.00 | | | $ | 1,022.08 | | | | 0.62 | % | | $ | 3.16 | |
Class I | | | 1,000.00 | | | | 1,116.10 | | | | 0.12 | | | | 0.64 | | | | 1,000.00 | | | | 1,024.60 | | | | 0.12 | | | | 0.61 | |
Class S | | | 1,000.00 | | | | 1,114.80 | | | | 0.37 | | | | 1.97 | | | | 1,000.00 | | | | 1,023.34 | | | | 0.37 | | | | 1.89 | |
Class S2 | | | 1,000.00 | | | | 1,113.00 | | | | 0.52 | | | | 2.77 | | | | 1,000.00 | | | | 1,022.58 | | | | 0.52 | | | | 2.65 | |
Class T | | | 1,000.00 | | | | 1,111.60 | | | | 0.82 | | | | 4.36 | | | | 1,000.00 | | | | 1,021.07 | | | | 0.82 | | | | 4.18 | |
13
| * | | Expense ratios do not include expense of the Underlying Funds. |
| ** | | Expenses are equal to each Portfolio’s respective annualized expense ratios multiplied by the average account value over the period, multiplied by 184/365 to reflect the most recent fiscal half-year. |
SHAREHOLDER EXPENSE EXAMPLES (UNAUDITED) (CONTINUED)
| | | | | | | | | | | | | | | | | | | | | | | | | | | | | | | | |
| | | Actual Portfolio Return | | | Hypothetical (5% return before expenses) | |
| | | Beginning Account Value
July 1, 2010 | | | Ending
Account Value
December 31, 2010 | | | Annualized Expense Ratio | | | Expenses Paid
During the
Period Ended
December 31, 2010** | | | Beginning Account Value
July 1, 2010 | | | Ending
Account Value
December 31, 2010 | | | Annualized Expense Ratio* | | | Expenses Paid During
the Period Ended
December 31, 2010** | |
ING Index Solution 2025 Portfolio | | | | | | | | | | | | | | | | | | | | | | | | | |
Class ADV | | $ | 1,000.00 | | | $ | 1,179.90 | | | | 0.62 | % | | $ | 3.41 | | | $ | 1,000.00 | | | $ | 1,022.08 | | | | 0.62 | % | | $ | 3.16 | |
Class I | | | 1,000.00 | | | | 1,182.20 | | | | 0.12 | | | | 0.66 | | | | 1,000.00 | | | | 1,024.60 | | | | 0.12 | | | | 0.61 | |
Class S | | | 1,000.00 | | | | 1,181.30 | | | | 0.37 | | | | 2.03 | | | | 1,000.00 | | | | 1,023.34 | | | | 0.37 | | | | 1.89 | |
Class S2 | | | 1,000.00 | | | | 1,180.60 | | | | 0.52 | | | | 2.86 | | | | 1,000.00 | | | | 1,022.58 | | | | 0.52 | | | | 2.65 | |
Class T | | | 1,000.00 | | | | 1,176.50 | | | | 0.82 | | | | 4.50 | | | | 1,000.00 | | | | 1,021.07 | | | | 0.82 | | | | 4.18 | |
ING Index Solution 2035 Portfolio | | | | | | | | | | | | | | | | | | | | | | | | | |
Class ADV | | $ | 1,000.00 | | | $ | 1,207.50 | | | | 0.62 | % | | $ | 3.45 | | | $ | 1,000.00 | | | $ | 1,022.08 | | | | 0.62 | % | | $ | 3.16 | |
Class I | | | 1,000.00 | | | | 1,209.70 | | | | 0.12 | | | | 0.67 | | | | 1,000.00 | | | | 1,024.60 | | | | 0.12 | | | | 0.61 | |
Class S | | | 1,000.00 | | | | 1,209.30 | | | | 0.37 | | | | 2.06 | | | | 1,000.00 | | | | 1,023.34 | | | | 0.37 | | | | 1.89 | |
Class S2 | | | 1,000.00 | | | | 1,208.10 | | | | 0.52 | | | | 2.89 | | | | 1,000.00 | | | | 1,022.58 | | | | 0.52 | | | | 2.65 | |
Class T | | | 1,000.00 | | | | 1,205.40 | | | | 0.82 | | | | 4.56 | | | | 1,000.00 | | | | 1,021.07 | | | | 0.82 | | | | 4.18 | |
ING Index Solution 2045 Portfolio | | | | | | | | | | | | | | | | | | | | | | | | | |
Class ADV | | $ | 1,000.00 | | | $ | 1,237.20 | | | | 0.62 | % | | $ | 3.50 | | | $ | 1,000.00 | | | $ | 1,022.08 | | | | 0.62 | % | | $ | 3.16 | |
Class I | | | 1,000.00 | | | | 1,239.20 | | | | 0.12 | | | | 0.68 | | | | 1,000.00 | | | | 1,024.60 | | | | 0.12 | | | | 0.61 | |
Class S | | | 1,000.00 | | | | 1,236.70 | | | | 0.37 | | | | 2.09 | | | | 1,000.00 | | | | 1,023.34 | | | | 0.37 | | | | 1.89 | |
Class S2 | | | 1,000.00 | | | | 1,236.60 | | | | 0.52 | | | | 2.93 | | | | 1,000.00 | | | | 1,022.58 | | | | 0.52 | | | | 2.65 | |
Class T | | | 1,000.00 | | | | 1,235.00 | | | | 0.82 | | | | 4.62 | | | | 1,000.00 | | | | 1,021.07 | | | | 0.82 | | | | 4.18 | |
ING Index Solution 2055 Portfolio | | | | | | | | | | | | | | | | | | | | | | | | | |
Class ADV | | $ | 1,000.00 | | | $ | 1,236.50 | | | | 0.62 | % | | $ | 3.50 | | | $ | 1,000.00 | | | $ | 1,022.08 | | | | 0.62 | % | | $ | 3.16 | |
Class I | | | 1,000.00 | | | | 1,239.30 | | | | 0.12 | | | | 0.68 | | | | 1,000.00 | | | | 1,024.60 | | | | 0.12 | | | | 0.61 | |
Class S | | | 1,000.00 | | | | 1,237.30 | | | | 0.37 | | | | 2.09 | | | | 1,000.00 | | | | 1,023.34 | | | | 0.37 | | | | 1.89 | |
Class S2 | | | 1,000.00 | | | | 1,237.60 | | | | 0.52 | | | | 2.93 | | | | 1,000.00 | | | | 1,022.58 | | | | 0.52 | | | | 2.65 | |
Class T | | | 1,000.00 | | | | 1,235.60 | | | | 0.82 | | | | 4.62 | | | | 1,000.00 | | | | 1,021.07 | | | | 0.82 | | | | 4.18 | |
| * | | Expense ratios do not include expense of the Underlying Funds. |
| ** | | Expenses are equal to each Portfolio’s respective annualized expense ratios multiplied by the average account value over the period, multiplied by 184/365 to reflect the most recent fiscal half-year. |
14
REPORT OF INDEPENDENT REGISTERED PUBLIC ACCOUNTING FIRM
The Shareholders and Board of Directors
ING Partners, Inc.
We have audited the accompanying statements of assets and liabilities, including the portfolios of investments, of ING Index Solution Income Portfolio, ING Index Solution 2015 Portfolio, ING Index Solution 2025 Portfolio, ING Index Solution 2035 Portfolio, ING Index Solution 2045 Portfolio, and ING Index Solution 2055 Portfolio, each a series of ING Partners, Inc., as of December 31, 2010, and the related statements of operations for the year or period then ended, the statements of changes in net assets for each of the years or periods in the two year period then ended, and the financial highlights for the years or periods in the three-year period then ended. These financial statements and financial highlights are the responsibility of management. Our responsibility is to express an opinion on these financial statements and financial highlights based on our audits.
We conducted our audits in accordance with the standards of the Public Company Accounting Oversight Board (United States). Those standards require that we plan and perform the audit to obtain reasonable assurance about whether the financial statements and financial highlights are free of material misstatement. An audit includes examining, on a test basis, evidence supporting the amounts and disclosures in the financial statements. Our procedures included confirmation of securities owned as of December 31, 2010, by correspondence with the transfer agent of the underlying funds. An audit also includes assessing the accounting principles used and significant estimates made by management, as well as evaluating the overall financial statement presentation. We believe that our audits provide a reasonable basis for our opinion.
In our opinion, the financial statements and financial highlights referred to above present fairly, in all material respects, the financial position of the aforementioned portfolios as of December 31, 2010, and the results of their operations, the changes in their net assets, and the financial highlights for the periods specified in the first paragraph above, in conformity with U.S. generally accepted accounting principles.

Boston, Massachusetts
February 21, 2011
15
STATEMENTS OF ASSETS AND LIABILITIESASOF DECEMBER 31, 2010
| | | | | | | | | | | | |
| | | ING
Index Solution Income Portfolio | | | ING
Index Solution
2015 Portfolio | | | ING
Index Solution
2025 Portfolio | |
ASSETS: | | | | | | | | | | | | |
Investments in affiliated underlying funds* | | $ | 172,172,865 | | | $ | 166,008,733 | | | $ | 195,442,905 | |
Investments in securities at value** | | | 3,495,449 | | | | 3,425,391 | | | | 6,105,564 | |
Cash | | | 940 | | | | 66,159 | | | | 274,234 | |
Receivables: | | | | | | | | | | | | |
Fund shares sold | | | 311,773 | | | | 93,440 | | | | 86,775 | |
| | | | | | | | | | | | |
Total assets | | | 175,981,027 | | | | 169,593,723 | | | | 201,909,478 | |
| | | | | | | | | | | | |
LIABILITIES: | | | | | | | | | | | | |
Payable for investments in affiliated underlying funds purchased | | | 307,578 | | | | 158,917 | | | | 344,245 | |
Payable for fund shares redeemed | | | 4,195 | | | | — | | | | 15,470 | |
Payable to affiliates | | | 58,611 | | | | 64,040 | | | | 80,106 | |
| | | | | | | | | | | | |
Total liabilities | | | 370,384 | | | | 222,957 | | | | 439,821 | |
| | | | | | | | | | | | |
NET ASSETS | | $ | 175,610,643 | | | $ | 169,370,766 | | | $ | 201,469,657 | |
| | | | | | | | | | | | |
NET ASSETS WERE COMPRISED OF: | | | | | | | | | | | | |
Paid-in capital | | $ | 159,041,831 | | | $ | 151,314,878 | | | $ | 173,584,121 | |
Undistributed net investment income | | | 4,119,914 | | | | 3,401,871 | | | | 3,402,421 | |
Accumulated net realized gain | | | 5,060,282 | | | | 6,407,257 | | | | 9,637,104 | |
Net unrealized appreciation | | | 7,388,616 | | | | 8,246,760 | | | | 14,846,011 | |
| | | | | | | | | | | | |
NET ASSETS | | $ | 175,610,643 | | | $ | 169,370,766 | | | $ | 201,469,657 | |
| | | | | | | | | | | | |
| | | | | | | | | | | | |
* Cost of investments in affiliated underlying funds | | $ | 165,230,454 | | | $ | 158,169,901 | | | $ | 181,267,073 | |
** Cost of investments in securities | | $ | 3,049,244 | | | $ | 3,017,463 | | | $ | 5,435,385 | |
| | | | | | | | | | | | |
Class ADV: | | | | | | | | | | | | |
Net assets | | $ | 19,549,532 | | | $ | 62,077,298 | | | $ | 96,651,976 | |
Shares authorized | | | 100,000,000 | | | | 100,000,000 | | | | 100,000,000 | |
Par value | | $ | 0.001 | | | $ | 0.001 | | | $ | 0.001 | |
Shares outstanding | | | 1,816,864 | | | | 5,941,706 | | | | 9,297,161 | |
Net asset value and redemption price per share | | $ | 10.76 | | | $ | 10.45 | | | $ | 10.40 | |
Class I: | | | | | | | | | | | | |
Net assets | | $ | 1,702,219 | | | $ | 4,813,061 | | | $ | 7,248,233 | |
Shares authorized | | | 100,000,000 | | | | 100,000,000 | | | | 100,000,000 | |
Par value | | $ | 0.001 | | | $ | 0.001 | | | $ | 0.001 | |
Shares outstanding | | | 156,154 | | | | 455,315 | | | | 689,250 | |
Net asset value and redemption price per share | | $ | 10.90 | | | $ | 10.57 | | | $ | 10.52 | |
Class S: | | | | | | | | | | | | |
Net assets | | $ | 153,900,415 | | | $ | 99,940,802 | | | $ | 92,769,923 | |
Shares authorized | | | 100,000,000 | | | | 100,000,000 | | | | 100,000,000 | |
Par value | | $ | 0.001 | | | $ | 0.001 | | | $ | 0.001 | |
Shares outstanding | | | 14,217,941 | | | | 9,512,588 | | | | 8,871,537 | |
Net asset value and redemption price per share | | $ | 10.82 | | | $ | 10.51 | | | $ | 10.46 | |
Class S2: | | | | | | | | | | | | |
Net assets | | $ | 455,242 | | | $ | 2,536,466 | | | $ | 4,796,413 | |
Shares authorized | | | 100,000,000 | | | | 100,000,000 | | | | 100,000,000 | |
Par value | | $ | 0.001 | | | $ | 0.001 | | | $ | 0.001 | |
Shares outstanding | | | 42,329 | | | | 243,097 | | | | 461,382 | |
Net asset value and redemption price per share | | $ | 10.75 | | | $ | 10.43 | | | $ | 10.40 | |
Class T: | | | | | | | | | | | | |
Net assets | | $ | 3,235 | | | $ | 3,139 | | | $ | 3,112 | |
Shares authorized | | | 100,000,000 | | | | 100,000,000 | | | | 100,000,000 | |
Par value | | $ | 0.001 | | | $ | 0.001 | | | $ | 0.001 | |
Shares outstanding | | | 300 | | | | 300 | | | | 300 | |
Net asset value and redemption price per share | | $ | 10.78 | | | $ | 10.46 | | | $ | 10.37 | |
See Accompanying Notes to Financial Statements
16
STATEMENTS OF ASSETS AND LIABILITIESASOF DECEMBER 31, 2010
| | | | | | | | | | | | |
| | | ING Index Solution 2035 Portfolio | | | ING Index Solution 2045 Portfolio | | | ING Index Solution 2055 Portfolio | |
ASSETS: | | | | | | | | | | | | |
Investments in affiliated underlying funds* | | $ | 139,020,455 | | | $ | 74,480,085 | | | $ | 3,592,191 | |
Investments in securities at value** | | | 5,855,329 | | | | 3,144,291 | | | | 139,057 | |
Cash | | | 320,781 | | | | 149,594 | | | | 18,156 | |
Receivables: | | | | | | | | | | | | |
Fund shares sold | | | 331,225 | | | | 80,556 | | | | 288,536 | |
| | | | | | | | | | | | |
Total assets | | | 145,527,790 | | | | 77,854,526 | | | | 4,037,940 | |
| | | | | | | | | | | | |
LIABILITIES: | | | | | | | | | | | | |
Payable for investments in affiliated underlying funds purchased | | | 640,698 | | | | 200,810 | | | | 306,308 | |
Payable for fund shares redeemed | | | 10,237 | | | | 28,661 | | | | — | |
Payable to affiliates | | | 58,996 | | | | 30,617 | | | | 1,448 | |
| | | | | | | | | | | | |
Total liabilities | | | 709,931 | | | | 260,088 | | | | 307,756 | |
| | | | | | | | | | | | |
NET ASSETS | | $ | 144,817,859 | | | $ | 77,594,438 | | | $ | 3,730,184 | |
| | | | | | | | | | | | |
NET ASSETS WERE COMPRISED OF: | | | | | | | | | | | | |
Paid-in capital | | $ | 122,804,214 | | | $ | 65,945,436 | | | $ | 3,343,632 | |
Undistributed net investment income | | | 2,107,456 | | | | 920,307 | | | | 1,672 | |
Accumulated net realized gain | | | 6,832,969 | | | | 3,210,571 | | | | 43,727 | |
Net unrealized appreciation | | | 13,073,220 | | | | 7,518,124 | | | | 341,153 | |
| | | | | | | | | | | | |
NET ASSETS | | $ | 144,817,859 | | | $ | 77,594,438 | | | $ | 3,730,184 | |
| | | | | | | | | | | | |
| | | | | | | | | | | | |
* Cost of investments in affiliated underlying funds | | $ | 126,576,222 | | | $ | 67,285,598 | | | $ | 3,269,368 | |
** Cost of investments in securities | | $ | 5,226,342 | | | $ | 2,820,654 | | | $ | 120,727 | |
| | | | | | | | | | | | |
Class ADV: | | | | | | | | | | | | |
Net assets | | $ | 77,134,606 | | | $ | 39,798,922 | | | $ | 2,381,195 | |
Shares authorized | | | 100,000,000 | | | | 100,000,000 | | | | 100,000,000 | |
Par value | | $ | 0.001 | | | $ | 0.001 | | | $ | 0.001 | |
Shares outstanding | | | 7,510,222 | | | | 3,934,611 | | | | 212,874 | |
Net asset value and redemption price per share | | $ | 10.27 | | | $ | 10.12 | | | $ | 11.19 | |
Class I: | | | | | | | | | | | | |
Net assets | | $ | 5,521,309 | | | $ | 6,553,379 | | | $ | 46,050 | |
Shares authorized | | | 100,000,000 | | | | 100,000,000 | | | | 100,000,000 | |
Par value | | $ | 0.001 | | | $ | 0.001 | | | $ | 0.001 | |
Shares outstanding | | | 531,018 | | | | 638,616 | | | | 4,098 | |
Net asset value and redemption price per share | | $ | 10.40 | | | $ | 10.26 | | | $ | 11.24 | |
Class S: | | | | | | | | | | | | |
Net assets | | $ | 58,655,641 | | | $ | 29,555,100 | | | $ | 1,208,653 | |
Shares authorized | | | 100,000,000 | | | | 100,000,000 | | | | 100,000,000 | |
Par value | | $ | 0.001 | | | $ | 0.001 | | | $ | 0.001 | |
Shares outstanding | | | 5,674,455 | | | | 2,899,384 | | | | 107,785 | |
Net asset value and redemption price per share | | $ | 10.34 | | | $ | 10.19 | | | $ | 11.21 | |
Class S2: | | | | | | | | | | | | |
Net assets | | $ | 3,503,232 | | | $ | 1,684,009 | | | $ | 90,925 | |
Shares authorized | | | 100,000,000 | | | | 100,000,000 | | | | 100,000,000 | |
Par value | | $ | 0.001 | | | $ | 0.001 | | | $ | 0.001 | |
Shares outstanding | | | 340,572 | | | | 166,103 | | | | 8,121 | |
Net asset value and redemption price per share | | $ | 10.29 | | | $ | 10.14 | | | $ | 11.20 | |
Class T: | | | | | | | | | | | | |
Net assets | | $ | 3,071 | | | $ | 3,028 | | | $ | 3,361 | |
Shares authorized | | | 100,000,000 | | | | 100,000,000 | | | | 100,000,000 | |
Par value | | $ | 0.001 | | | $ | 0.001 | | | $ | 0.001 | |
Shares outstanding | | | 300 | | | | 300 | | | | 301 | |
Net asset value and redemption price per share | | $ | 10.24 | | | $ | 10.09 | | | $ | 11.17 | |
See Accompanying Notes to Financial Statements
17
STATEMENTS OF OPERATIONSFORTHE YEAR ENDED DECEMBER 31, 2010
| | | | | | | | | | | | |
| | | ING Index Solution Income Portfolio | | | ING Index Solution 2015 Portfolio | | | ING Index Solution
2025 Portfolio | |
INVESTMENT INCOME: | | | | | | | | | | | | |
Dividends from affiliated underlying funds | | $ | 4,733,327 | | | $ | 3,981,071 | | | $ | 4,043,938 | |
Dividends from securities | | | 62,431 | | | | 56,858 | | | | 98,683 | |
| | | | | | | | | | | | |
Total investment income | | | 4,795,758 | | | | 4,037,929 | | | | 4,142,621 | |
| | | | | | | | | | | | |
EXPENSES: | | | | | | | | | | | | |
Investment management fees | | | 172,948 | | | | 140,768 | | | | 152,913 | |
Distribution and service fees: | | | | | | | | | | | | |
Class ADV | | | 76,256 | | | | 249,098 | | | | 372,474 | |
Class S | | | 390,253 | | | | 214,694 | | | | 177,450 | |
Class S2 | | | 434 | | | | 3,364 | | | | 7,708 | |
Class T | | | 22 | | | | 22 | | | | 22 | |
Administrative service fees | | | 34,587 | | | | 28,152 | | | | 30,580 | |
Miscellaneous expense | | | 235 | | | | 193 | | | | 210 | |
| | | | | | | | | | | | |
Total expenses | | | 674,735 | | | | 636,291 | | | | 741,357 | |
Net waived and reimbursed fees | | | (87 | ) | | | (673 | ) | | | (1,542 | ) |
| | | | | | | | | | | | |
Net expenses | | | 674,648 | | | | 635,618 | | | | 739,815 | |
| | | | | | | | | | | | |
Net investment income | | | 4,121,110 | | | | 3,402,311 | | | | 3,402,806 | |
| | | | | | | | | | | | |
REALIZED AND UNREALIZED GAIN (LOSS): | | | | | | | | | | | | |
Net realized gain (loss) on: | | | | | | | | | | | | |
Sale of affiliated underlying funds | | | 5,090,199 | | | | 7,384,262 | | | | 10,847,692 | |
Investments | | | 11,195 | | | | (15,314 | ) | | | (21,025 | ) |
| | | | | | | | | | | | |
Net realized gain | | | 5,101,394 | | | | 7,368,948 | | | | 10,826,667 | |
| | | | | | | | | | | | |
Net change in unrealized appreciation or depreciation on: | | | | | | | | | | | | |
Affiliated underlying funds | | | 3,086,710 | | | | 1,361,590 | | | | 3,872,251 | |
Investments | | | 446,206 | | | | 407,928 | | | | 670,179 | |
| | | | | | | | | | | | |
Net change in unrealized appreciation or depreciation | | | 3,532,916 | | | | 1,769,518 | | | | 4,542,430 | |
| | | | | | | | | | | | |
Net realized and unrealized gain | | | 8,634,310 | | | | 9,138,466 | | | | 15,369,097 | |
| | | | | | | | | | | | |
Increase in net assets resulting from operations | | $ | 12,755,420 | | | $ | 12,540,777 | | | $ | 18,771,903 | |
| | | | | | | | | | | | |
See Accompanying Notes to Financial Statements
18
STATEMENTS OF OPERATIONSFORTHE YEAR ENDED DECEMBER 31, 2010
| | | | | | | | | | | | |
| | | ING Index Solution
2035 Portfolio | | | ING Index Solution 2045 Portfolio | | | ING Index Solution
2055 Portfolio | |
| | | Year Ended December 31, 2010 | | | Year Ended December 31, 2010 | | | March 8, 2010(1) to December 31,
2010 | |
INVESTMENT INCOME: | | | | | | | | | | | | |
Dividends from affiliated underlying funds | | $ | 2,541,128 | | | $ | 1,123,825 | | | $ | 6,249 | |
Dividends from securities | | | 93,655 | | | | 50,681 | | | | 2,051 | |
| | | | | | | | | | | | |
Total investment income | | | 2,634,783 | | | | 1,174,506 | | | | 8,300 | |
| | | | | | | | | | | | |
EXPENSES: | | | | | | | | | | | | |
Investment management fees | | | 104,637 | | | | 51,066 | | | | 1,293 | |
Distribution and service fees: | | | | | | | | | | | | |
Class ADV | | | 292,706 | | | | 140,427 | | | | 4,216 | |
Class S | | | 104,679 | | | | 50,371 | | | | 998 | |
Class S2 | | | 4,952 | | | | 2,542 | | | | 68 | |
Class T | | | 22 | | | | 20 | | | | 18 | |
Administrative service fees | | | 20,926 | | | | 10,213 | | | | 258 | |
Miscellaneous expense | | | 142 | | | | 68 | | | | — | |
| | | | | | | | | | | | |
Total expenses | | | 528,064 | | | | 254,707 | | | | 6,851 | |
Net waived and reimbursed fees | | | (991 | ) | | | (508 | ) | | | (14 | ) |
| | | | | | | | | | | | |
Net expenses | | | 527,073 | | | | 254,199 | | | | 6,837 | |
| | | | | | | | | | | | |
Net investment income | | | 2,107,710 | | | | 920,307 | | | | 1,463 | |
| | | | | | | | | | | | |
REALIZED AND UNREALIZED GAIN (LOSS): | | | | | | | | | | | | |
Net realized gain (loss) on: | | | | | | | | | | | | |
Sale of affiliated underlying funds | | | 7,858,686 | | | | 3,929,127 | | | | 43,761 | |
Investments | | | (12,544 | ) | | | (2,000 | ) | | | (34 | ) |
| | | | | | | | | | | | |
Net realized gain | | | 7,846,142 | | | | 3,927,127 | | | | 43,727 | |
| | | | | | | | | | | | |
Net change in unrealized appreciation or depreciation on: | | | | | | | | | | | | |
Affiliated underlying funds | | | 4,125,945 | | | | 3,268,914 | | | | 322,823 | |
Investments | | | 628,987 | | | | 323,637 | | | | 18,330 | |
| | | | | | | | | | | | |
Net change in unrealized appreciation or depreciation | | | 4,754,932 | | | | 3,592,551 | | | | 341,153 | |
| | | | | | | | | | | | |
Net realized and unrealized gain | | | 12,601,074 | | | | 7,519,678 | | | | 384,880 | |
| | | | | | | | | | | | |
Increase in net assets resulting from operations | | $ | 14,708,784 | | | $ | 8,439,985 | | | $ | 386,343 | |
| | | | | | | | | | | | |
| (1) | Commencement of operations |
See Accompanying Notes to Financial Statements
19
STATEMENTS OF CHANGES IN NET ASSETS
| | | | | | | | | | | | | | | | |
| | | ING Index Solution Income Portfolio | | | ING Index Solution 2015 Portfolio | |
| | | Year Ended December 31, 2010 | | | Year Ended December 31, 2009 | | | Year Ended December 31,
2010 | | | Year Ended December 31, 2009 | |
FROM OPERATIONS: | | | | | | | | | | | | | | | | |
Net investment income | | $ | 4,121,110 | | | $ | 1,174,211 | | | $ | 3,402,311 | | | $ | 419,448 | |
Net realized gain | | | 5,101,394 | | | | 2,292,529 | | | | 7,368,948 | | | | 1,102,836 | |
Net change in unrealized appreciation or depreciation | | | 3,532,916 | | | | 3,863,874 | | | | 1,769,518 | | | | 7,081,633 | |
| | | | | | | | | | | | | | | | |
Increase in net assets resulting from operations | | | 12,755,420 | | | | 7,330,614 | | | | 12,540,777 | | | | 8,603,917 | |
| | | | | | | | | | | | | | | | |
FROM DISTRIBUTIONS TO SHAREHOLDERS: | | | | | | | | | | | | | | | | |
Net investment income: | | | | | | | | | | | | | | | | |
Class ADV | | | (166,909 | ) | | | (18,633 | ) | | | (225,105 | ) | | | (84,558 | ) |
Class I | | | (17,358 | ) | | | (4,136 | ) | | | (25,888 | ) | | | (7,864 | ) |
Class S | | | (1,653,227 | ) | | | (20,807 | ) | | | (474,216 | ) | | | (49,556 | ) |
Class S2 | | | (742 | ) | | | (13 | ) | | | (1,526 | ) | | | (15 | ) |
Class T | | | (17 | ) | | | — | | | | — | | | | — | |
Net realized gains: | | | | | | | | | | | | | | | | |
Class ADV | | | (155,425 | ) | | | (2,045 | ) | | | (536,188 | ) | | | (2,651 | ) |
Class I | | | (14,023 | ) | | | (384 | ) | | | (42,896 | ) | | | (220 | ) |
Class S | | | (1,445,476 | ) | | | (1,992 | ) | | | (893,715 | ) | | | (1,468 | ) |
Class S2 | | | (605 | ) | | | (1 | ) | | | (2,537 | ) | | | — | |
Class T | | | (30 | ) | | | (1 | ) | | | (31 | ) | | | — | |
| | | | | | | | | | | | | | | | |
Total distributions | | | (3,453,812 | ) | | | (48,012 | ) | | | (2,202,102 | ) | | | (146,332 | ) |
| | | | | | | | | | | | | | | | |
FROM CAPITAL SHARE TRANSACTIONS: | | | | | | | | | | | | | | | | |
Net proceeds from sale of shares | | | 27,423,913 | | | | 181,821,987 | | | | 70,184,214 | | | | 98,889,050 | |
Reinvestment of distributions | | | 3,453,766 | | | | 47,985 | | | | 2,202,072 | | | | 146,317 | |
| | | | | | | | | | | | | | | | |
| | | 30,877,679 | | | | 181,869,972 | | | | 72,386,286 | | | | 99,035,367 | |
Cost of shares redeemed | | | (29,104,876 | ) | | | (28,770,134 | ) | | | (22,681,593 | ) | | | (11,176,075 | ) |
| | | | | | | | | | | | | | | | |
Net increase in net assets resulting from capital share transactions | | | 1,772,803 | | | | 153,099,838 | | | | 49,704,693 | | | | 87,859,292 | |
| | | | | | | | | | | | | | | | |
Net increase in net assets | | | 11,074,411 | | | | 160,382,440 | | | | 60,043,368 | | | | 96,316,877 | |
| | | | | | | | | | | | | | | | |
NET ASSETS: | | | | | | | | | | | | | | | | |
Beginning of year | | | 164,536,232 | | | | 4,153,792 | | | | 109,327,398 | | | | 13,010,521 | |
| | | | | | | | | | | | | | | | |
End of year | | $ | 175,610,643 | | | $ | 164,536,232 | | | $ | 169,370,766 | | | $ | 109,327,398 | |
| | | | | | | | | | | | | | | | |
Undistributed net investment income at end of year | | $ | 4,119,914 | | | $ | 1,837,057 | | | $ | 3,401,871 | | | $ | 726,295 | |
| | | | | | | | | | | | | | | | |
See Accompanying Notes to Financial Statements
20
STATEMENTS OF CHANGES IN NET ASSETS
| | | | | | | | | | | | | | | | |
| | | ING Index Solution 2025 Portfolio | | | ING Index Solution 2035 Portfolio | |
| | | Year Ended December 31, 2010 | | | Year Ended
December 31, 2009 | | | Year Ended
December 31, 2010 | | | Year Ended December 31, 2009 | |
FROM OPERATIONS: | | | | | | | | | | | | | | | | |
Net investment income (loss) | | $ | 3,402,806 | | | $ | 95,126 | | | $ | 2,107,710 | | | $ | (38,065 | ) |
Net realized gain (loss) | | | 10,826,667 | | | | (652,172 | ) | | | 7,846,142 | | | | (654,031 | ) |
Net change in unrealized appreciation or depreciation | | | 4,542,430 | | | | 11,634,181 | | | | 4,754,932 | | | | 9,287,711 | |
| | | | | | | | | | | | | | | | |
Increase in net assets resulting from operations | | | 18,771,903 | | | | 11,077,135 | | | | 14,708,784 | | | | 8,595,615 | |
| | | | | | | | | | | | | | | | |
FROM DISTRIBUTIONS TO SHAREHOLDERS: | | | | | | | | | | | | | | | | |
Net investment income: | | | | | | | | | | | | | | | | |
Class ADV | | | (83,801 | ) | | | (98,063 | ) | | | — | | | | (89,284 | ) |
Class I | | | (16,224 | ) | | | (8,744 | ) | | | (2,616 | ) | | | (4,316 | ) |
Class S | | | (155,258 | ) | | | (56,683 | ) | | | (21,917 | ) | | | (47,565 | ) |
Class S2 | | | (2,165 | ) | | | (13 | ) | | | (447 | ) | | | (15 | ) |
Net realized gains: | | | | | | | | | | | | | | | | |
Class ADV | | | (134,739 | ) | | | (968 | ) | | | (104,795 | ) | | | (519 | ) |
Class I | | | (9,928 | ) | | | (77 | ) | | | (5,072 | ) | | | (23 | ) |
Class S | | | (124,816 | ) | | | (518 | ) | | | (75,756 | ) | | | (264 | ) |
Class S2 | | | (1,325 | ) | | | — | | | | (877 | ) | | | — | |
Class T | | | (5 | ) | | | — | | | | (5 | ) | | | — | |
| | | | | | | | | | | | | | | | |
Total distributions | | | (528,261 | ) | | | (165,066 | ) | | | (211,485 | ) | | | (141,986 | ) |
| | | | | | | | | | | | | | | | |
FROM CAPITAL SHARE TRANSACTIONS: | | | | | | | | | | | | | | | | |
Net proceeds from sale of shares | | | 97,167,450 | | | | 85,460,140 | | | | 73,849,414 | | | | 52,463,712 | |
Reinvestment of distributions | | | 528,257 | | | | 165,054 | | | | 211,479 | | | | 141,971 | |
| | | | | | | | | | | | | | | | |
| | | 97,695,707 | | | | 85,625,194 | | | | 74,060,893 | | | | 52,605,683 | |
Cost of shares redeemed | | | (19,863,896 | ) | | | (8,260,281 | ) | | | (12,271,559 | ) | | | (5,877,248 | ) |
| | | | | | | | | | | | | | | | |
Net increase in net assets resulting from capital share transactions | | | 77,831,811 | | | | 77,364,913 | | | | 61,789,334 | | | | 46,728,435 | |
| | | | | | | | | | | | | | | | |
Net increase in net assets | | | 96,075,453 | | | | 88,276,982 | | | | 76,286,633 | | | | 55,182,064 | |
| | | | | | | | | | | | | | | | |
NET ASSETS: | | | | | | | | | | | | | | | | |
Beginning of year | | | 105,394,204 | | | | 17,117,222 | | | | 68,531,226 | | | | 13,349,162 | |
| | | | | | | | | | | | | | | | |
End of year | | $ | 201,469,657 | | | $ | 105,394,204 | | | $ | 144,817,859 | | | $ | 68,531,226 | |
| | | | | | | | | | | | | | | | |
Undistributed net investment income at end of year | | $ | 3,402,421 | | | $ | 257,063 | | | $ | 2,107,456 | | | $ | 24,726 | |
| | | | | | | | | | | | | | | | |
See Accompanying Notes to Financial Statements
21
STATEMENTS OF CHANGES IN NET ASSETS
| | | | | | | | | | | | |
| | | ING Index Solution 2045 Portfolio | | | ING Index Solution 2055 Portfolio | |
| | | Year Ended December 31, 2010 | | | Year Ended December 31, 2009 | | | March 8, 2010(1) to December
31, 2010 | |
FROM OPERATIONS: | | | | | | | | | | | | |
Net investment income (loss) | | $ | 920,307 | | | $ | (54,630 | ) | | $ | 1,463 | |
Net realized gain (loss) | | | 3,927,127 | | | | (482,995 | ) | | | 43,727 | |
Net change in unrealized appreciation or depreciation | | | 3,592,551 | | | | 4,736,132 | | | | 341,153 | |
| | | | | | | | | | | | |
Increase in net assets resulting from operations | | | 8,439,985 | | | | 4,198,507 | | | | 386,343 | |
| | | | | | | | | | | | |
FROM DISTRIBUTIONS TO SHAREHOLDERS: | | | | | | | | | | | | |
Net investment income: | | | | | | | | | | | | |
Class ADV | | | — | | | | (32,859 | ) | | | — | |
Class I | | | — | | | | (1,900 | ) | | | — | |
Class S | | | — | | | | (19,751 | ) | | | — | |
Class S2 | | | — | | | | (13 | ) | | | — | |
Net realized gains: | | | | | | | | | | | | |
Class ADV | | | (72,397 | ) | | | (238 | ) | | | — | |
Class I | | | (4,239 | ) | | | (12 | ) | | | — | |
Class S | | | (50,155 | ) | | | (136 | ) | | | — | |
Class S2 | | | (605 | ) | | | — | | | | — | |
Class T | | | (6 | ) | | | — | | | | — | |
| | | | | | | | | | | | |
Total distributions | | | (127,402 | ) | | | (54,909 | ) | | | — | |
| | | | | | | | | | | | |
FROM CAPITAL SHARE TRANSACTIONS: | | | | | | | | | | | | |
Net proceeds from sale of shares | | | 44,969,895 | | | | 26,934,646 | | | | 4,196,453 | |
Reinvestment of distributions | | | 127,396 | | | | 54,896 | | | | — | |
| | | | | | | | | | | | |
| | | 45,097,291 | | | | 26,989,542 | | | | 4,196,453 | |
Cost of shares redeemed | | | (7,525,241 | ) | | | (4,381,717 | ) | | | (852,612 | ) |
| | | | | | | | | | | | |
Net increase in net assets resulting from capital share transactions | | | 37,572,050 | | | | 22,607,825 | | | | 3,343,841 | |
| | | | | | | | | | | | |
Net increase in net assets | | | 45,884,633 | | | | 26,751,423 | | | | 3,730,184 | |
| | | | | | | | | | | | |
NET ASSETS: | | | | | | | | | | | | |
Beginning of year or period | | | 31,709,805 | | | | 4,958,382 | | | | — | |
| | | | | | | | | | | | |
End of year or period | | $ | 77,594,438 | | | $ | 31,709,805 | | | $ | 3,730,184 | |
| | | | | | | | | | | | |
Undistributed net investment income at end of year or period | | $ | 920,307 | | | $ | — | | | $ | 1,672 | |
| | | | | | | | | | | | |
| (1) | | Commencement of operations |
See Accompanying Notes to Financial Statements
22
FINANCIAL HIGHLIGHTS
Selected data for a share of beneficial interest outstanding throughout each year or period.
| | | | | | | | | | | | | | | | | | | | | | | | | | | | | | | | | | | | | | | | | | | | | | | | | | | | | | | | | | | | | | | | |
| | | | | | Income (loss)
from
investment
operations | | | | | | Less distributions | | | | | | | | | | | | Ratios to average net assets | | | Supplemental
data | |
| | | | | | | | | | | | | | | | | | | | | | | | | | | | | | | | | | | | | | | | | | | | | | | | | |
| | | Net asset value, beginning of year or period | | | Net investment income (loss) | | | Net realized and unrealized gain (loss) | | | Total from investment operations | | | From net investment income | | | From net realized gains | | | From return of capital | | | Total distributions | | | Net asset value, end of year or period | | | Total Return (1) | | | Expenses before reductions/additions(2)(3)(4) | | | Expenses net of fee waivers and/or recoupments, if any (2)(3)(4) | | | Expenses net of all reductions/additions(2)(3)(4) | | | Investment income (loss) net of all reductions/additions(2)(3)(4) | | | Net assets, end of year or period | | | Portfolio turnover rate | |
| | | | | | | | | | | | | | | | | | | | | | | | | | | | | | | | | | | | | | | | | | | | | | | | | | | | | | | | | | | | | | | | |
Year or period ended | | ($) | | | ($) | | | ($) | | | ($) | | | ($) | | | ($) | | | ($) | | | ($) | | | ($) | | | (%) | | | (%) | | | (%) | | | (%) | | | (%) | | | ($000's) | | | (%) | |
ING Index Solution Income Portfolio | | | | | | | | | | | | | | | | | | | | | | | | | | | | | | | | | | | | | | | | | | | | | | | | | | | | | | | | | | | | | | | | |
Class ADV | | | | | | | | | | | | | | | | | | | | | | | | | | | | | | | | | | | | | | | | | | | | | | | | | | | | | | | | | | | | | | | | |
12-31-10 | | | 10.22 | | | | 0.23 | · | | | 0.52 | | | | 0.75 | | | | 0.11 | | | | 0.10 | | | | — | | | | 0.21 | | | | 10.76 | | | | 7.37 | | | | 0.62 | | | | 0.62 | | | | 0.62 | | | | 2.24 | | | | 19,550 | | | | 45 | |
12-31-09 | | | 9.24 | | | | 0.12 | · | | | 0.89 | | | | 1.01 | | | | 0.03 | | | | 0.00 | * | | | — | | | | 0.03 | | | | 10.22 | | | | 11.02 | | | | 0.62 | | | | 0.62 | | | | 0.62 | | | | 1.26 | | | | 9,310 | | | | 51 | |
03-10-08(5) - 12-31-08 | | | 10.00 | | | | 0.26 | · | | | (1.02 | ) | | | (0.76 | ) | | | — | | | | — | | | | — | | | | — | | | | 9.24 | | | | (7.60 | ) | | | 0.62 | | | | 0.62 | | | | 0.62 | | | | 3.48 | | | | 2,543 | | | | 50 | |
Class I | | | | | | | | | | | | | | | | | | | | | | | | | | | | | | | | | | | | | | | | | | | | | | | | | | | | | | | | | | | | | | | | |
12-31-10 | | | 10.31 | | | | 0.28 | · | | | 0.53 | | | | 0.81 | | | | 0.12 | | | | 0.10 | | | | — | | | | 0.22 | | | | 10.90 | | | | 7.96 | | | | 0.12 | | | | 0.12 | | | | 0.12 | | | | 2.67 | | | | 1,702 | | | | 45 | |
12-31-09 | | | 9.29 | | | | 0.16 | · | | | 0.90 | | | | 1.06 | | | | 0.04 | | | | 0.00 | * | | | — | | | | 0.04 | | | | 10.31 | | | | 11.46 | | | | 0.12 | | | | 0.12 | | | | 0.12 | | | | 1.66 | | | | 1,198 | | | | 51 | |
03-10-08(5) - 12-31-08 | | | 10.00 | | | | 0.17 | | | | (0.88 | ) | | | (0.71 | ) | | | — | | | | — | | | | — | | | | — | | | | 9.29 | | | | (7.10 | ) | | | 0.12 | | | | 0.12 | | | | 0.12 | | | | 2.16 | | | | 3 | | | | 50 | |
Class S | | | | | | | | | | | | | | | | | | | | | | | | | | | | | | | | | | | | | | | | | | | | | | | | | | | | | | | | | | | | | | | | |
12-31-10 | | | 10.26 | | | | 0.25 | · | | | 0.52 | | | | 0.77 | | | | 0.11 | | | | 0.10 | | | | — | | | | 0.21 | | | | 10.82 | | | | 7.61 | | | | 0.37 | | | | 0.37 | | | | 0.37 | | | | 2.39 | | | | 153,900 | | | | 45 | |
12-31-09 | | | 9.26 | | | | 0.20 | · | | | 0.84 | | | | 1.04 | | | | 0.04 | | | | 0.00 | * | | | — | | | | 0.04 | | | | 10.26 | | | | 11.27 | | | | 0.37 | | | | 0.37 | | | | 0.37 | | | | 2.01 | | | | 154,022 | | | | 51 | |
03-10-08(5) - 12-31-08 | | | 10.00 | | | | 0.39 | · | | | (1.13 | ) | | | (0.74 | ) | | | — | | | | — | | | | — | | | | — | | | | 9.26 | | | | (7.40 | ) | | | 0.37 | | | | 0.37 | | | | 0.37 | | | | 5.38 | | | | 1,606 | | | | 50 | |
Class S2 | | | | | | | | | | | | | | | | | | | | | | | | | | | | | | | | | | | | | | | | | | | | | | | | | | | | | | | | | | | | | | | | |
12-31-10 | | | 10.21 | | | | 0.37 | · | | | 0.39 | | | | 0.76 | | | | 0.12 | | | | 0.10 | | | | — | | | | 0.22 | | | | 10.75 | | | | 7.54 | | | | 0.62 | | | | 0.52 | | | | 0.52 | | | | 3.53 | | | | 455 | | | | 45 | |
05-28-09(5) - 12-31-09 | | | 9.30 | | | | 0.11 | · | | | 0.84 | | | | 0.95 | | | | 0.04 | | | | 0.00 | * | | | — | | | | 0.04 | | | | 10.21 | | | | 10.26 | | | | 0.62 | | | | 0.52 | | | | 0.52 | | | | 1.87 | | | | 3 | | | | 51 | |
Class T | | | | | | | | | | | | | | | | | | | | | | | | | | | | | | | | | | | | | | | | | | | | | | | | | | | | | | | | | | | | | | | | |
12-31-10 | | | 10.21 | | | | 0.20 | | | | 0.53 | | | | 0.73 | | | | 0.06 | | | | 0.10 | | | | — | | | | 0.16 | | | | 10.78 | | | | 7.16 | | | | 0.87 | | | | 0.82 | | | | 0.82 | | | | 1.95 | | | | 3 | | | | 45 | |
12-31-09 | | | 9.23 | | | | 0.08 | | | | 0.90 | | | | 0.98 | | | | — | | | | 0.00 | * | | | — | | | | — | | | | 10.21 | | | | 10.66 | | | | 0.87 | | | | 0.82 | | | | 0.82 | | | | 0.79 | | | | 3 | | | | 51 | |
03-10-08(5) - 12-31-08 | | | 10.00 | | | | 0.11 | | | | (0.88 | ) | | | (0.77 | ) | | | — | | | | — | | | | — | | | | — | | | | 9.23 | | | | (7.70 | ) | | | 0.87 | | | | 0.82 | | | | 0.82 | | | | 1.47 | | | | 3 | | | | 50 | |
| | | | | | | | | | | | | | | | |
ING Index Solution 2015 Portfolio | | | | | | | | | | | | | | | | | | | | | | | | | | | | | | | | | | | | | | | | | | | | | | | | | | | | | | | | | | | | | | | | |
Class ADV | | | | | | | | | | | | | | | | | | | | | | | | | | | | | | | | | | | | | | | | | | | | | | | | | | | | | | | | | | | | | | | | |
12-31-10 | | | 9.76 | | | | 0.22 | · | | | 0.61 | | | | 0.83 | | | | 0.04 | | | | 0.10 | | | | — | | | | 0.14 | | | | 10.45 | | | | 8.68 | | | | 0.62 | | | | 0.62 | | | | 0.62 | | | | 2.25 | | | | 62,077 | | | | 49 | |
12-31-09 | | | 8.43 | | | | 0.05 | · | | | 1.32 | | | | 1.37 | | | | 0.04 | | | | 0.00 | * | | | — | | | | 0.04 | | | | 9.76 | | | | 16.28 | | | | 0.62 | | | | 0.62 | | | | 0.62 | | | | 0.60 | | | | 35,768 | | | | 28 | |
03-10-08(5) - 12-31-08 | | | 10.00 | | | | 0.30 | · | | | (1.87 | ) | | | (1.57 | ) | | | — | | | | — | | | | — | | | | — | | | | 8.43 | | | | (15.70 | ) | | | 0.62 | | | | 0.62 | | | | 0.62 | | | | 4.34 | | | | 8,877 | | | | 39 | |
Class I | | | | | | | | | | | | | | | | | | | | | | | | | | | | | | | | | | | | | | | | | | | | | | | | | | | | | | | | | | | | | | | | |
12-31-10 | | | 9.85 | | | | 0.27 | · | | | 0.61 | | | | 0.88 | | | | 0.06 | | | | 0.10 | | | | — | | | | 0.16 | | | | 10.57 | | | | 9.11 | | | | 0.12 | | | | 0.12 | | | | 0.12 | | | | 2.72 | | | | 4,813 | | | | 49 | |
12-31-09 | | | 8.46 | | | | 0.10 | · | | | 1.33 | | | | 1.43 | | | | 0.04 | | | | 0.00 | * | | | — | | | | 0.04 | | | | 9.85 | | | | 16.99 | | | | 0.12 | | | | 0.12 | | | | 0.12 | | | | 1.05 | | | | 3,331 | | | | 28 | |
03-10-08(5) - 12-31-08 | | | 10.00 | | | | 0.26 | · | | | (1.80 | ) | | | (1.54 | ) | | | — | | | | — | | | | — | | | | — | | | | 8.46 | | | | (15.40 | ) | | | 0.12 | | | | 0.12 | | | | 0.12 | | | | 3.72 | | | | 183 | | | | 39 | |
Class S | | | | | | | | | | | | | | | | | | | | | | | | | | | | | | | | | | | | | | | | | | | | | | | | | | | | | | | | | | | | | | | | |
12-31-10 | | | 9.80 | | | | 0.25 | · | | | 0.61 | | | | 0.86 | | | | 0.05 | | | | 0.10 | | | | — | | | | 0.15 | | | | 10.51 | | | | 8.97 | | | | 0.37 | | | | 0.37 | | | | 0.37 | | | | 2.50 | | | | 99,941 | | | | 49 | |
12-31-09 | | | 8.45 | | | | 0.10 | · | | | 1.29 | | | | 1.39 | | | | 0.04 | | | | 0.00 | * | | | — | | | | 0.04 | | | | 9.80 | | | | 16.50 | | | | 0.37 | | | | 0.37 | | | | 0.37 | | | | 1.09 | | | | 70,222 | | | | 28 | |
03-10-08(5) - 12-31-08 | | | 10.00 | | | | 0.27 | · | | | (1.82 | ) | | | (1.55 | ) | | | — | | | | — | | | | — | | | | — | | | | 8.45 | | | | (15.50 | ) | | | 0.37 | | | | 0.37 | | | | 0.37 | | | | 3.92 | | | | 3,949 | | | | 39 | |
Class S2 | | | | | | | | | | | | | | | | | | | | | | | | | | | | | | | | | | | | | | | | | | | | | | | | | | | | | | | | | | | | | | | | |
12-31-10 | | | 9.76 | | | | 0.25 | · | | | 0.58 | | | | 0.83 | | | | 0.06 | | | | 0.10 | | | | — | | | | 0.16 | | | | 10.43 | | | | 8.68 | | | | 0.62 | | | | 0.52 | | | | 0.52 | | | | 2.48 | | | | 2,536 | | | | 49 | |
05-28-09(5) - 12-31-09 | | | 8.52 | | | | 0.06 | · | | | 1.22 | | | | 1.28 | | | | 0.04 | | | | 0.00 | * | | | — | | | | 0.04 | | | | 9.76 | | | | 15.11 | | | | 0.62 | | | | 0.52 | | | | 0.52 | | | | 1.05 | | | | 3 | | | | 28 | |
See Accompanying Notes to Financial Statements
23
FINANCIAL HIGHLIGHTS (CONTINUED)
Selected data for a share of beneficial interest outstanding throughout each year or period.
| | | | | | | | | | | | | | | | | | | | | | | | | | | | | | | | | | | | | | | | | | | | | | | | | | | | | | | | | | | | | | | | |
| | | | | | Income (loss)
from
investment
operations | | | | | | Less distributions | | | | | | | | | | | | Ratios to average net assets | | | Supplemental
data | |
| | | | | | | | | | | | | | | | | | | | | | | | | | | | | | | | | | | | | | | | | | | | | | | | | |
| | | Net asset value, beginning of year or period | | | Net investment income (loss) | | | Net realized and unrealized gain (loss) | | | Total from investment operations | | | From net investment income | | | From net realized gains | | | From return of capital | | | Total distributions | | | Net asset value, end of year or period | | | Total Return (1) | | | Expenses before reductions/ additions(2)(3)(4) | | | Expenses net of fee waivers and/or recoupments, if any(2)(3)(4) | | | Expenses net of all reductions/ additions(2)(3)(4) | | | Net investment income (loss)(2)(3)(4) | | | Net assets, end of year or period | | | Portfolio turnover rate | |
| | | | | | | | | | | | | | | | | | | | | | | | | | | | | | | | | | | | | | | | | | | | | | | | | | | | | | | | | | | | | | | | |
Year or period ended | | ($) | | | ($) | | | ($) | | | ($) | | | ($) | | | ($) | | | ($) | | | ($) | | | ($) | | | (%) | | | (%) | | | (%) | | | (%) | | | (%) | | | ($000's) | | | (%) | |
ING Index Solution 2015 Portfolio (Continued) | | | | | | | | | | | | | | | | | | | | | | | | | | | | | | | | | | | | | | | | | | | | | | | | | | | | | | | | | | | | | | | | |
Class T | | | | | | | | | | | | | | | | | | | | | | | | | | | | | | | | | | | | | | | | | | | | | | | | | | | | | | | | | | | | | | | | |
12-31-10 | | | 9.76 | | | | 0.20 | | | | 0.60 | | | | 0.80 | | | | 0.00 | * | | | 0.10 | | | | — | | | | 0.10 | | | | 10.46 | | | | 8.31 | | | | 0.87 | | | | 0.82 | | | | 0.82 | | | | 2.05 | | | | 3 | | | | 49 | |
12-31-09 | | | 8.41 | | | | 0.02 | | | | 1.33 | | | | 1.35 | | | | — | | | | 0.00 | * | | | — | | | | — | | | | 9.76 | | | | 16.07 | | | | 0.87 | | | | 0.82 | | | | 0.82 | | | | 0.21 | | | | 3 | | | | 28 | |
03-10-08(5) - 12-31-08 | | | 10.00 | | | | 0.09 | | | | (1.68 | ) | | | (1.59 | ) | | | — | | | | — | | | | — | | | | — | | | | 8.41 | | | | (15.90 | ) | | | 0.87 | | | | 0.82 | | | | 0.82 | | | | 1.12 | | | | 3 | | | | 39 | |
| | | | | | | | | | | | | | | | |
ING Index Solution 2025 Portfolio | | | | | | | | | | | | | | | | | | | | | | | | | | | | | | | | | | | | | | | | | | | | | | | | | | | | | | | | | | | | | | | | |
Class ADV | | | | | | | | | | | | | | | | | | | | | | | | | | | | | | | | | | | | | | | | | | | | | | | | | | | | | | | | | | | | | | | | |
12-31-10 | | | 9.36 | | | | 0.20 | · | | | 0.87 | | | | 1.07 | | | | 0.01 | | | | 0.02 | | | | — | | | | 0.03 | | | | 10.40 | | | | 11.43 | | | | 0.62 | | | | 0.62 | | | | 0.62 | | | | 2.12 | | | | 96,652 | | | | 48 | |
12-31-09 | | | 7.79 | | | | 0.00 | ·,* | | | 1.60 | | | | 1.60 | | | | 0.03 | | | | 0.00 | * | | | — | | | | 0.03 | | | | 9.36 | | | | 20.58 | | | | 0.62 | | | | 0.62 | | | | 0.62 | | | | 0.04 | | | | 52,508 | | | | 15 | |
03-10-08(5) - 12-31-08 | | | 10.00 | | | | 0.28 | · | | | (2.49 | ) | | | (2.21 | ) | | | — | | | | — | | | | — | | | | — | | | | 7.79 | | | | (22.10 | ) | | | 0.62 | | | | 0.62 | | | | 0.62 | | | | 4.29 | | | | 12,557 | | | | 17 | |
Class I | | | | | | | | | | | | | | | | | | | | | | | | | | | | | | | | | | | | | | | | | | | | | | | | | | | | | | | | | | | | | | | | |
12-31-10 | | | 9.44 | | | | 0.25 | · | | | 0.88 | | | | 1.13 | | | | 0.03 | | | | 0.02 | | | | — | | | | 0.05 | | | | 10.52 | | | | 11.96 | | | | 0.12 | | | | 0.12 | | | | 0.12 | | | | 2.63 | | | | 7,248 | | | | 48 | |
12-31-09 | | | 7.82 | | | | 0.05 | · | | | 1.60 | | | | 1.65 | | | | 0.03 | | | | 0.00 | * | | | — | | | | 0.03 | | | | 9.44 | | | | 21.20 | | | | 0.12 | | | | 0.12 | | | | 0.12 | | | | 0.52 | | | | 4,105 | | | | 15 | |
03-10-08(5) - 12-31-08 | | | 10.00 | | | | 0.11 | | | | (2.29 | ) | | | (2.18 | ) | | | — | | | | — | | | | — | | | | — | | | | 7.82 | | | | (21.80 | ) | | | 0.12 | | | | 0.12 | | | | 0.12 | | | | 1.50 | | | | 2 | | | | 17 | |
Class S | | | | | | | | | | | | | | | | | | | | | | | | | | | | | | | | | | | | | | | | | | | | | | | | | | | | | | | | | | | | | | | | |
12-31-10 | | | 9.40 | | | | 0.22 | · | | | 0.88 | | | | 1.10 | | | | 0.02 | | | | 0.02 | | | | — | | | | 0.04 | | | | 10.46 | | | | 11.72 | | | | 0.37 | | | | 0.37 | | | | 0.37 | | | | 2.31 | | | | 92,770 | | | | 48 | |
12-31-09 | | | 7.80 | | | | 0.03 | · | | | 1.60 | | | | 1.63 | | | | 0.03 | | | | 0.00 | * | | | — | | | | 0.03 | | | | 9.40 | | | | 20.97 | | | | 0.37 | | | | 0.37 | | | | 0.37 | | | | 0.37 | | | | 48,775 | | | | 15 | |
03-10-08(5) - 12-31-08 | | | 10.00 | | | | 0.35 | · | | | (2.55 | ) | | | (2.20 | ) | | | — | | | | — | | | | — | | | | — | | | | 7.80 | | | | (22.00 | ) | | | 0.37 | | | | 0.37 | | | | 0.37 | | | | 5.36 | | | | 4,555 | | | | 17 | |
Class S2 | | | | | | | | | | | | | | | | | | | | | | | | | | | | | | | | | | | | | | | | | | | | | | | | | | | | | | | | | | | | | | | | |
12-31-10 | | | 9.36 | | | | 0.17 | · | | | 0.92 | | | | 1.09 | | | | 0.03 | | | | 0.02 | | | | — | | | | 0.05 | | | | 10.40 | | | | 11.63 | | | | 0.62 | | | | 0.52 | | | | 0.52 | | | | 1.76 | | | | 4,796 | | | | 48 | |
05-28-09(5) - 12-31-09 | | | 7.90 | | | | 0.02 | · | | | 1.47 | | | | 1.49 | | | | 0.03 | | | | 0.00 | * | | | — | | | | 0.03 | | | | 9.36 | | | | 18.96 | | | | 0.62 | | | | 0.52 | | | | 0.52 | | | | 0.34 | | | | 4 | | | | 15 | |
Class T | | | | | | | | | | | | | | | | | | | | | | | | | | | | | | | | | | | | | | | | | | | | | | | | | | | | | | | | | | | | | | | | |
12-31-10 | | | 9.36 | | | | 0.18 | | | | 0.85 | | | | 1.03 | | | | — | | | | 0.02 | | | | — | | | | 0.02 | | | | 10.37 | | | | 10.99 | | | | 0.87 | | | | 0.82 | | | | 0.82 | | | | 1.90 | | | | 3 | | | | 48 | |
12-31-09 | | | 7.78 | | | | (0.02 | ) | | | 1.60 | | | | 1.58 | | | | — | | | | 0.00 | * | | | — | | | | — | | | | 9.36 | | | | 20.31 | | | | 0.87 | | | | 0.82 | | | | 0.82 | | | | (0.25 | ) | | | 3 | | | | 15 | |
03-10-08(5) - 12-31-08 | | | 10.00 | | | | 0.06 | | | | (2.28 | ) | | | (2.22 | ) | | | — | | | | — | | | | — | | | | — | | | | 7.78 | | | | (22.20 | ) | | | 0.87 | | | | 0.82 | | | | 0.82 | | | | 0.80 | | | | 2 | | | | 17 | |
| | | | | | | | | | | | | | | | |
ING Index Solution 2035 Portfolio | | | | | | | | | | | | | | | | | | | | | | | | | | | | | | | | | | | | | | | | | | | | | | | | | | | | | | | | | | | | | | | | |
Class ADV | | | | | | | | | | | | | | | | | | | | | | | | | | | | | | | | | | | | | | | | | | | | | | | | | | | | | | | | | | | | | | | | |
12-31-10 | | | 9.14 | | | | 0.18 | · | | | 0.97 | | | | 1.15 | | | | — | | | | 0.02 | | | | — | | | | 0.02 | | | | 10.27 | | | | 12.56 | | | | 0.62 | | | | 0.62 | | | | 0.62 | | | | 1.91 | | | | 77,135 | | | | 45 | |
12-31-09 | | | 7.45 | | | | (0.02 | )· | | | 1.74 | | | | 1.72 | | | | 0.03 | | | | 0.00 | * | | | — | | | | 0.03 | | | | 9.14 | | | | 23.19 | | | | 0.62 | | | | 0.62 | | | | 0.62 | | | | (0.22 | ) | | | 41,570 | | | | 14 | |
03-10-08(5) - 12-31-08 | | | 10.00 | | | | 0.33 | · | | | (2.88 | ) | | | (2.55 | ) | | | — | | | | — | | | | — | | | | — | | | | 7.45 | | | | (25.50 | ) | | | 0.62 | | | | 0.62 | | | | 0.62 | | | | 5.29 | | | | 9,139 | | | | 19 | |
Class I | | | | | | | | | | | | | | | | | | | | | | | | | | | | | | | | | | | | | | | | | | | | | | | | | | | | | | | | | | | | | | | | |
12-31-10 | | | 9.22 | | | | 0.23 | · | | | 0.98 | | | | 1.21 | | | | 0.01 | | | | 0.02 | | | | — | | | | 0.03 | | | | 10.40 | | | | 13.10 | | | | 0.12 | | | | 0.12 | | | | 0.12 | | | | 2.40 | | | | 5,521 | | | | 45 | |
12-31-09 | | | 7.48 | | | | 0.02 | · | | | 1.76 | | | | 1.78 | | | | 0.04 | | | | 0.00 | * | | | — | | | | 0.04 | | | | 9.22 | | | | 23.81 | | | | 0.12 | | | | 0.12 | | | | 0.12 | | | | 0.25 | | | | 1,947 | | | | 14 | |
03-10-08(5) - 12-31-08 | | | 10.00 | | | | 0.24 | · | | | (2.76 | ) | | | (2.52 | ) | | | — | | | | — | | | | — | | | | — | | | | 7.48 | | | | (25.20 | ) | | | 0.12 | | | | 0.12 | | | | 0.12 | | | | 3.87 | | | | 170 | | | | 19 | |
See Accompanying Notes to Financial Statements
24
FINANCIAL HIGHLIGHTS (CONTINUED)
Selected data for a share of beneficial interest outstanding throughout each year or period.
| | | | | | | | | | | | | | | | | | | | | | | | | | | | | | | | | | | | | | | | | | | | | | | | | | | | | | | | | | | | | | | | |
| | | | | | Income (loss)
from
investment
operations | | | | | | Less distributions | | | | | | | | | | | | Ratios to average net assets | | | Supplemental
data | |
| | | | | | | | | | | | | | | | | | | | | | | | | | | | | | | | | | | | | | | | | | | | | | | | | |
| | | Net asset value, beginning of year or period | | | Net investment income (loss) | | | Net realized and unrealized gain (loss) | | | Total from investment operations | | | From net investment income | | | From net realized gains | | | From return of capital | | | Total distributions | | | Net asset value, end of year or period | | | Total Return (1) | | | Expenses before reductions/ additions(2)(3)(4) | | | Expenses net of fee waivers and/or recoupments, if any(2)(3)(4) | | | Expenses net of all reductions/ additions(2)(3)(4) | | | Net investment income (loss)(2)(3)(4) | | | Net assets, end of year or period | | | Portfolio turnover rate | |
| | | | | | | | | | | | | | | | | | | | | | | | | | | | | | | | | | | | | | | | | | | | | | | | | | | | | | | | | | | | | | | | |
Year or period ended | | ($) | | | ($) | | | ($) | | | ($) | | | ($) | | | ($) | | | ($) | | | ($) | | | ($) | | | (%) | | | (%) | | | (%) | | | (%) | | | (%) | | | ($000's) | | | (%) | |
ING Index Solution 2035 Portfolio (Continued) | | | | | | | | | | | | | | | | | | | | | | | | | | | | | | | | | | | | | | | | | | | | | | | | | | | | | | | | | | | | | | | | |
Class S | | | | | | | | | | | | | | | | | | | | | | | | | | | | | | | | | | | | | | | | | | | | | | | | | | | | | | | | | | | | | | | | |
12-31-10 | | | 9.18 | | | | 0.20 | · | | | 0.98 | | | | 1.18 | | | | 0.00 | * | | | 0.02 | | | | — | | | | 0.02 | | | | 10.34 | | | | 12.89 | | | | 0.37 | | | | 0.37 | | | | 0.37 | | | | 2.15 | | | | 58,656 | | | | 45 | |
12-31-09 | | | 7.47 | | | | 0.00 | ·,* | | | 1.75 | | | | 1.75 | | | | 0.04 | | | | 0.00 | * | | | — | | | | 0.04 | | | | 9.18 | | | | 23.42 | | | | 0.37 | | | | 0.37 | | | | 0.37 | | | | 0.05 | | | | 25,008 | | | | 14 | |
03-10-08(5) - 12-31-08 | | | 10.00 | | | | 0.37 | · | | | (2.90 | ) | | | (2.53 | ) | | | — | | | | — | | | | — | | | | — | | | | 7.47 | | | | (25.30 | ) | | | 0.37 | | | | 0.37 | | | | 0.37 | | | | 6.06 | | | | 4,038 | | | | 19 | |
Class S2 | | | | | | | | | | | | | | | | | | | | | | | | | | | | | | | | | | | | | | | | | | | | | | | | | | | | | | | | | | | | | | | | |
12-31-10 | | | 9.15 | | | | 0.11 | · | | | 1.06 | | | | 1.17 | | | | 0.01 | | | | 0.02 | | | | — | | | | 0.03 | | | | 10.29 | | | | 12.76 | | | | 0.62 | | | | 0.52 | | | | 0.52 | | | | 1.11 | | | | 3,503 | | | | 45 | |
05-28-09(5) - 12-31-09 | | | 7.60 | | | | 0.00 | ·,* | | | 1.59 | | | | 1.59 | | | | 0.04 | | | | 0.00 | * | | | — | | | | 0.04 | | | | 9.15 | | | | 20.94 | | | | 0.62 | | | | 0.52 | | | | 0.52 | | | | (0.01 | ) | | | 4 | | | | 14 | |
Class T | | | | | | | | | | | | | | | | | | | | | | | | | | | | | | | | | | | | | | | | | | | | | | | | | | | | | | | | | | | | | | | | |
12-31-10 | | | 9.14 | | | | 0.17 | | | | 0.95 | | | | 1.12 | | | | — | | | | 0.02 | | | | — | | | | 0.02 | | | | 10.24 | | | | 12.23 | | | | 0.87 | | | | 0.82 | | | | 0.82 | | | | 1.82 | | | | 3 | | | | 45 | |
12-31-09 | | | 7.44 | | | | (0.04 | ) | | | 1.74 | | | | 1.70 | | | | — | | | | 0.00 | * | | | — | | | | — | | | | 9.14 | | | | 22.85 | | | | 0.87 | | | | 0.82 | | | | 0.82 | | | | (0.48 | ) | | | 3 | | | | 14 | |
03-10-08(5) - 12-31-08 | | | 10.00 | | | | 0.05 | | | | (2.61 | ) | | | (2.56 | ) | | | — | | | | — | | | | — | | | | — | | | | 7.44 | | | | (25.60 | ) | | | 0.87 | | | | 0.82 | | | | 0.82 | | | | 0.64 | | | | 2 | | | | 19 | |
| | | | | | | | | | | | | | | | |
ING Index Solution 2045 Portfolio | | | | | | | | | | | | | | | | | | | | | | | | | | | | | | | | | | | | | | | | | | | | | | | | | | | | | | | | | | | | | | | | |
Class ADV | | | | | | | | | | | | | | | | | | | | | | | | | | | | | | | | | | | | | | | | | | | | | | | | | | | | | | | | | | | | | | | | |
12-31-10 | | | 8.92 | | | | 0.16 | · | | | 1.06 | | | | 1.22 | | | | — | | | | 0.02 | | | | — | | | | 0.02 | | | | 10.12 | | | | 13.73 | | | | 0.62 | | | | 0.62 | | | | 0.62 | | | | 1.71 | | | | 39,799 | | | | 45 | |
12-31-09 | | | 7.11 | | | | (0.04 | )· | | | 1.88 | | | | 1.84 | | | | 0.03 | | | | 0.00 | * | | | — | | | | 0.03 | | | | 8.92 | | | | 25.89 | | | | 0.62 | | | | 0.62 | | | | 0.62 | | | | (0.48 | ) | | | 18,520 | | | | 22 | |
03-10-08(5) - 12-31-08 | | | 10.00 | | | | 0.24 | · | | | (3.13 | ) | | | (2.89 | ) | | | — | | | | — | | | | — | | | | — | | | | 7.11 | | | | (28.90 | ) | | | 0.62 | | | | 0.62 | | | | 0.62 | | | | 3.81 | | | | 3,069 | | | | 12 | |
Class I | | | | | | | | | | | | | | | | | | | | | | | | | | | | | | | | | | | | | | | | | | | | | | | | | | | | | | | | | | | | | | | | |
12-31-10 | | | 9.00 | | | | 0.19 | · | | | 1.09 | | | | 1.28 | | | | — | | | | 0.02 | | | | — | | | | 0.02 | | | | 10.26 | | | | 14.28 | | | | 0.12 | | | | 0.12 | | | | 0.12 | | | | 2.03 | | | | 6,553 | | | | 45 | |
12-31-09 | | | 7.14 | | | | 0.00 | ·,* | | | 1.89 | | | | 1.89 | | | | 0.03 | | | | 0.00 | * | | | — | | | | 0.03 | | | | 9.00 | | | | 26.53 | | | | 0.12 | | | | 0.12 | | | | 0.12 | | | | 0.00 | * | | | 1,143 | | | | 22 | |
03-10-08(5) - 12-31-08 | | | 10.00 | | | | 0.20 | · | | | (3.06 | ) | | | (2.86 | ) | | | — | | | | — | | | | — | | | | — | | | | 7.14 | | | | (28.60 | ) | | | 0.12 | | | | 0.12 | | | | 0.12 | | | | 3.32 | | | | 115 | | | | 12 | |
Class S | | | | | | | | | | | | | | | | | | | | | | | | | | | | | | | | | | | | | | | | | | | | | | | | | | | | | | | | | | | | | | | | |
12-31-10 | | | 8.97 | | | | 0.18 | · | | | 1.06 | | | | 1.24 | | | | — | | | | 0.02 | | | | — | | | | 0.02 | | | | 10.19 | | | | 13.88 | | | | 0.37 | | | | 0.37 | | | | 0.37 | | | | 1.93 | | | | 29,555 | | | | 45 | |
12-31-09 | | | 7.13 | | | | (0.02 | )· | | | 1.89 | | | | 1.87 | | | | 0.03 | | | | 0.00 | * | | | — | | | | 0.03 | | | | 8.97 | | | | 26.26 | | | | 0.37 | | | | 0.37 | | | | 0.37 | | | | (0.23 | ) | | | 12,040 | | | | 22 | |
03-10-08(5) - 12-31-08 | | | 10.00 | | | | 0.28 | · | | | (3.15 | ) | | | (2.87 | ) | | | — | | | | — | | | | — | | | | — | | | | 7.13 | | | | (28.70 | ) | | | 0.37 | | | | 0.37 | | | | 0.37 | | | | 4.44 | | | | 1,772 | | | | 12 | |
Class S2 | | | | | | | | | | | | | | | | | | | | | | | | | | | | | | | | | | | | | | | | | | | | | | | | | | | | | | | | | | | | | | | | |
12-31-10 | | | 8.93 | | | | 0.07 | · | | | 1.16 | | | | 1.23 | | | | — | | | | 0.02 | | | | — | | | | 0.02 | | | | 10.14 | | | | 13.83 | | | | 0.62 | | | | 0.52 | | | | 0.52 | | | | 0.71 | | | | 1,684 | | | | 45 | |
05-28-09(5) - 12-31-09 | | | 7.29 | | | | (0.02 | )· | | | 1.69 | | | | 1.67 | | | | 0.03 | | | | 0.00 | * | | | — | | | | 0.03 | | | | 8.93 | | | | 22.97 | | | | 0.62 | | | | 0.52 | | | | 0.52 | | | | (0.35 | ) | | | 4 | | | | 22 | |
Class T | | | | | | | | | | | | | | | | | | | | | | | | | | | | | | | | | | | | | | | | | | | | | | | | | | | | | | | | | | | | | | | | |
12-31-10 | | | 8.92 | | | | 0.16 | | | | 1.03 | | | | 1.19 | | | | — | | | | 0.02 | | | | — | | | | 0.02 | | | | 10.09 | | | | 13.40 | | | | 0.87 | | | | 0.82 | | | | 0.82 | | | | 1.75 | | | | 3 | | | | 45 | |
12-31-09 | | | 7.10 | | | | (0.06 | ) | | | 1.88 | | | | 1.82 | | | | — | | | | 0.00 | * | | | — | | | | — | | | | 8.92 | | | | 25.64 | | | | 0.87 | | | | 0.82 | | | | 0.82 | | | | (0.74 | ) | | | 3 | | | | 22 | |
03-10-08(5) - 12-31-08 | | | 10.00 | | | | 0.03 | | | | (2.93 | ) | | | (2.90 | ) | | | — | | | | — | | | | — | | | | — | | | | 7.10 | | | | (29.00 | ) | | | 0.87 | | | | 0.82 | | | | 0.82 | | | | 0.47 | | | | 2 | | | | 12 | |
See Accompanying Notes to Financial Statements
25
FINANCIAL HIGHLIGHTS (CONTINUED)
Selected data for a share of beneficial interest outstanding throughout each year or period.
| | | | | | | | | | | | | | | | | | | | | | | | | | | | | | | | | | | | | | | | | | | | | | | | | | | | | | | | | | | | | | | | |
| | | | | | Income (loss)
from
investment
operations | | | | | | Less distributions | | | | | | | | | | | | Ratios to average net assets | | | Supplemental
data | |
| | | | | | | | | | | | | | | | | | | | | | | | | | | | | | | | | | | | | | | | | | | | | | | | | |
| | | Net asset value, beginning of year or period | | | Net investment income (loss) | | | Net realized and unrealized gain (loss) | | | Total from investment operations | | | From net investment income | | | From net realized gains | | | From return of capital | | | Total distributions | | | Net asset value, end of year or period | | | Total Return (1) | | | Expenses before reductions/ additions(2)(3)(4) | | | Expenses net of fee waivers and/or recoupments, if any(2)(3)(4) | | | Expenses net of all reductions/ additions(2)(3)(4) | | | Net investment income (loss)(2)(3)(4) | | | Net assets, end of year or period | | | Portfolio turnover rate | |
| | | | | | | | | | | | | | | | | | | | | | | | | | | | | | | | | | | | | | | | | | | | | | | | | | | | | | | | | | | | | | | | |
Year or period ended | | ($) | | | ($) | | | ($) | | | ($) | | | ($) | | | ($) | | | ($) | | | ($) | | | ($) | | | (%) | | | (%) | | | (%) | | | (%) | | | (%) | | | ($000's) | | | (%) | |
ING Index Solution 2055 Portfolio | | | | | | | | | | | | | | | | | | | | | | | | | | | | | | | | | | | | | | | | | | | | | | | | | | | | | | | | | | | | | | | | |
Class ADV | | | | | | | | | | | | | | | | | | | | | | | | | | | | | | | | | | | | | | | | | | | | | | | | | | | | | | | | | | | | | | | | |
03-08-10(5) - 12-31-10 | | | 10.00 | | | | (0.00 | )* | | | 1.19 | | | | 1.19 | | | | — | | | | — | | | | — | | | | — | | | | 11.19 | | | | 11.90 | | | | 0.62 | | | | 0.62 | | | | 0.62 | | | | (0.06 | ) | | | 2,381 | | | | 80 | |
Class I | | | | | | | | | | | | | | | | | | | | | | | | | | | | | | | | | | | | | | | | | | | | | | | | | | | | | | | | | | | | | | | | |
03-08-10(5) - 12-31-10 | | | 10.00 | | | | 0.26 | | | | 0.98 | | | | 1.24 | | | | — | | | | — | | | | — | | | | — | | | | 11.24 | | | | 12.40 | | | | 0.12 | | | | 0.12 | | | | 0.12 | | | | 3.32 | | | | 46 | | | | 80 | |
Class S | | | | | | | | | | | | | | | | | | | | | | | | | | | | | | | | | | | | | | | | | | | | | | | | | | | | | | | | | | | | | | | | |
03-08-10(5) - 12-31-10 | | | 10.00 | | | | 0.01 | | | | 1.20 | | | | 1.21 | | | | — | | | | — | | | | — | | | | — | | | | 11.21 | | | | 12.10 | | | | 0.37 | | | | 0.37 | | | | 0.37 | | | | 0.19 | | | | 1,209 | | | | 80 | |
Class S2 | | | | | | | | | | | | | | | | | | | | | | | | | | | | | | | | | | | | | | | | | | | | | | | | | | | | | | | | | | | | | | | | |
03-08-10(5) - 12-31-10 | | | 10.00 | | | | 0.05 | · | | | 1.15 | | | | 1.20 | | | | — | | | | — | | | | — | | | | — | | | | 11.20 | | | | 12.00 | | | | 0.62 | | | | 0.52 | | | | 0.52 | | | | 0.54 | | | | 91 | | | | 80 | |
Class T | | | | | | | | | | | | | | | | | | | | | | | | | | | | | | | | | | | | | | | | | | | | | | | | | | | | | | | | | | | | | | | | |
03-08-10(5) - 12-31-10 | | | 10.00 | | | | 0.19 | | | | 0.98 | | | | 1.17 | | | | — | | | | — | | | | — | | | | — | | | | 11.17 | | | | 11.70 | | | | 0.87 | | | | 0.82 | | | | 0.82 | | | | 2.28 | | | | 3 | | | | 80 | |
| (1) | | Total return is calculated assuming reinvestment of all dividends, capital gain distributions and return of capital distributions, if any, at net asset value and does not reflect the effect of insurance contract charges. Total return for periods less than one year is not annualized. |
| (2) | | Annualized for periods less than one year. |
| (3) | | Expense ratios reflect operating expenses of a Portfolio. Expenses before reductions/additions do not reflect amounts reimbursed by the Investment Adviser and/or Distributor or reductions from brokerage commission recapture arrangements or other expense offset arrangements and do not represent the amount paid by a Portfolio during periods when reimbursements or reductions occur. Expenses net of fee waivers reflect expenses after reimbursement by the Investment Adviser and/or Distributor but prior to reductions from brokerage commission recapture arrangements or other expense offset arrangements. Expenses net of all reductions/additions represent the net expenses paid by a Portfolio. Net investment income (loss) is net of all such additions or reductions. |
| (4) | | Expense ratios do not include expenses of underlying funds and do not include fees and expenses charged under the variable annuity contract or variable life insurance policy. |
| (5) | | Commencement of operations. |
| · | | Calculated using average number of shares outstanding throughout the period. |
| * | | Amount is less than $0.005 or less than 0.005% or more than $(0.005). |
See Accompanying Notes to Financial Statements
26
NOTES TO FINANCIAL STATEMENTSASOF DECEMBER 31, 2010
NOTE 1 — ORGANIZATION
Organization. ING Partners, Inc. (the “Company”) is an open-end management investment company registered under the Investment Company Act of 1940, as amended (the “1940 Act”). It was incorporated under the laws of Maryland on May 7, 1997. The Articles of Incorporation permit the Company to offer separate series, each of which has its own investment objective, policies and restrictions. The Company currently consists of thirty-six active separate investment series. The six Portfolios included in this report are: ING Index Solution Income Portfolio (“Index Solution Income”), ING Index Solution 2015 Portfolio (“Index Solution 2015”), ING Index Solution 2025 Portfolio (“Index Solution 2025”), ING Index Solution 2035 Portfolio (“Index Solution 2035”), ING Index Solution 2045 Portfolio (“Index Solution 2045”) and ING Index Solution 2055 Portfolio (“Index Solution 2055”) (each, a “Portfolio” and collectively, the “Portfolios”). With the exception of Index Solution Income, each Portfolio is structured and managed around a specific target retirement or financial goal date (“Target Date”). When Index Solution 2015, 2025, 2035, 2045 and 2055 Portfolios reach their respective Target Date, they may be combined with the Index Solution Income, without a vote of shareholders, if approved by the Board of Directors (the “Board”). The Portfolios serve as an investment option in underlying variable insurance products offered by Directed Services LLC.
The Portfolios offer the following five classes: Adviser Class (“Class ADV”), Initial Class (“Class I”), Service Class (“Class S”), Service 2 Class (“Class S2”) and Class T. Each class has equal rights as to class and voting privileges. The classes differ principally in the applicable distribution and shareholder service fees. Shareholders of each class also bear certain expenses that pertain to that particular class. All shareholders bear the common expenses of the Portfolios and earn income and realized gains/losses from the Portfolios pro rata based on the average daily net assets of each class, without distinction between share classes. Expenses that are specific to a portfolio or a class are charged directly to that portfolio or class. Other operating expenses shared by several portfolios are generally allocated among those portfolios based on average net assets. Dividends are determined separately for each class based on income and expenses allocable to each class. Realized gain distributions are allocated to each class pro rata based on the shares outstanding of each class on the date of distribution. Differences in per share dividend rates generally result from differences in separate class
expenses, including distribution and shareholder service fees, if applicable.
Each Portfolio’s shares may be offered to variable annuity and variable life insurance separate accounts, qualified pension and retirement plans outside the separate account context, custodial accounts, certain investment advisers and their affiliates in connection with the creation or management of the Portfolios and certain other investment management companies.
Directed Services LLC serves as the investment adviser (“DSL” or the “Investment Adviser”) to the Portfolios. ING Investment Management Co. serves as the consultant (“IIM” or the “Consultant”) to the Investment Adviser. ING Funds Services, LLC serves as the administrator (“IFS” or the “Administrator”) for the Portfolios. ING Investments Distributor, LLC (“IID” or the “Distributor”) serves as the principal underwriter to the Portfolios.
The Investment Adviser, the Consultant, IFS and IID are indirect, wholly-owned subsidiaries of ING Groep N.V. (“ING Groep”). ING Groep is a global financial institution of Dutch origin offering banking, investments, life insurance and retirement services.
ING Groep has adopted a formal restructuring plan that was approved by the European Commission in November 2009 under which the ING life insurance businesses, including the retirement services and investment management businesses, which include the Investment Adviser and its affiliates, would be divested by ING Groep by the end of 2013. While there can be no assurance that it will be carried out, the restructuring plan presents certain risks, including uncertainty about the effect on the businesses of the ING entities that service the Portfolios and potential termination of the Portfolios’ existing advisory agreement, which may trigger the need for shareholder approval of new agreements.
Each Portfolio seeks to achieve its investment objective by investing in other ING Funds (“Underlying Funds”) and uses asset allocation strategies to determine how much to invest in the Underlying Funds.
NOTE 2 — SIGNIFICANT ACCOUNTING POLICIES
The following significant accounting policies are consistently followed by the Portfolios in the preparation of their financial statements. Such policies are in conformity with U.S. generally accepted accounting principles for investment companies.
A. Security Valuation. All investments in Underlying Funds and securities are recorded at their estimated fair
27
NOTES TO FINANCIAL STATEMENTSASOF DECEMBER 31, 2010 (CONTINUED)
NOTE 2 — SIGNIFICANT ACCOUNTING POLICIES
(continued)
value, as described below. The valuations of the Portfolios’ investments in Underlying Funds are based on the NAVs of the Underlying Funds each business day. In general, assets of the Underlying Funds are valued based on actual or estimated market value, with special provisions for assets not having readily available market quotations and short-term debt securities, and for situations where market quotations are deemed unreliable.
Investments in securities held in the Portfolios or the Underlying Funds maturing in 60 days or less are valued at amortized cost which generally approximates fair value. Securities prices may be obtained from automated pricing services. Investments in equity securities held by the Portfolios or the Underlying Funds and traded on a national securities exchange are valued at the last reported sale price. Securities reported by NASDAQ will be valued at the NASDAQ official closing prices. Securities traded on an exchange or NASDAQ for which there has been no sale and securities traded in the over-the-counter-market are valued at the mean between the last reported bid and ask prices. All investments quoted in foreign currencies will be valued daily in U.S. dollars on the basis of the foreign currency exchange rates prevailing at that time. Debt securities are valued at prices obtained from independent services or from one or more dealers making markets in the securities and may be adjusted based on the Portfolios’ valuation procedures. U.S. government obligations are valued by using market quotations or independent pricing services that use prices provided by market-makers or estimates of market values obtained from yield data relating to instruments or securities with similar characteristics. Investments in open-end mutual funds are valued at the net asset value (“NAV”).
Securities and assets for which market quotations are not readily available (which may include certain restricted securities which are subject to limitations as to their sale) are valued at their fair values as defined by the 1940 Act and as determined in good faith by or under the supervision of the Portfolios’ Board of Directors (the “Board”), in accordance with methods that are specifically authorized by the Board. Securities traded on exchanges, including foreign exchanges, which close earlier than the time that the Portfolios calculate their next NAV may also be valued at their fair values as defined by the 1940 Act and as determined in good faith by or under the supervision
of the Board, in accordance with methods that are specifically authorized by the Board. The valuation techniques applied in any specific instance are likely to vary from case to case. With respect to a restricted security, for example, consideration is generally given to the cost of the investment, the market value of any unrestricted securities of the same class at the time of valuation, the potential expiration of restrictions on the security, the existence of any registration rights, the costs to the Portfolios related to registration of the security, as well as factors relevant to the issuer itself. Consideration may also be given to the price and extent of any public trading in similar securities of the issuer or comparable companies’ securities.
Fair value is defined as the price that the Portfolios would receive to sell an asset or pay to transfer a liability in an orderly transaction between market participants at the measurement data. Each investment asset or liability of the Portfolios is assigned a level at measurement date based on the significance and source of the inputs to its valuation. Quoted prices in active markets for identical securities are classified as “Level 1,” inputs other than quoted prices for an asset or liability that are observable are classified as “Level 2” and unobservable inputs, including the investment adviser’s judgment about the assumptions that a market participant would use in pricing an asset or liability, are classified as “Level 3.” The inputs used for valuing securities are not necessarily an indication of the risks associated with investing in those securities. Short-term securities of sufficient credit quality which are valued at amortized cost, which approximates fair value, are generally considered to be Level 2 securities under applicable accounting rules. A table summarizing the Portfolios’ investments under these levels of classification is included following the Portfolio of Investments.
The Portfolios classify each of its investments in the Underlying Funds as Level 1, without consideration as to the classification level of the specific investments held by the Underlying Funds.
For the year ended December 31, 2010, there have been no significant changes to the fair valuation methodologies.
B. Security Transactions and Revenue Recognition. Security transactions are accounted for on the trade date. Dividend income received from the underlying funds is recognized on the ex-dividend date and is recorded as income distributions in the Statement of Operations. Capital gain distributions received from the underlying funds are recognized on the ex-dividend
28
NOTES TO FINANCIAL STATEMENTSASOF DECEMBER 31, 2010 (CONTINUED)
NOTE 2 — SIGNIFICANT ACCOUNTING POLICIES
(continued)
date and are recorded on the Statement of Operations as such. Realized gains and losses are reported on the basis of identified cost of securities sold.
C. Distributions to Shareholders. The Portfolios record distributions to their shareholders on the ex-dividend date. Dividends from net investment income and capital gains, if any, are declared and paid annually by the Portfolios. The Portfolios may make distributions on a more frequent basis to comply with the distribution requirements of the Internal Revenue Code. The characteristics of income and gains to be distributed are determined in accordance with income tax regulations, which may differ from U.S. generally accepted accounting principles for investment companies.
D. Federal Income Taxes. It is the policy of each Portfolio to comply with the requirements of subchapter M of the Internal Revenue Code that are applicable to regulated investment companies and to distribute substantially all of its net investment income and any net realized capital gains to its shareholders. Therefore, a federal income tax or excise tax provision is not required. Management has considered the sustainability of the Portfolios’ tax positions taken on federal income tax returns for all open tax years in making this determination. No capital gain distributions shall be made until the capital loss carryforwards have been fully utilized or expire.
E. Use of Estimates. The preparation of financial statements in conformity with U.S. generally accepted accounting principles requires management to make estimates and assumptions that affect the reported amounts of assets and liabilities and disclosure of contingent assets and liabilities at the date of the financial statements and the reported amounts of increases and decreases in net assets from operations during the reporting period. Actual results could differ from those estimates.
F. Indemnifications. In the normal course of business, the Company may enter into contracts that provide certain indemnifications. The Company’s maximum exposure under these arrangements is dependent on future claims that may be made against the Portfolios and, therefore, cannot be estimated; however, based on experience, management considers the risk of loss from such claims remote.
NOTE 3 — INVESTMENT ADVISER AND ADMINISTRATIVE SERVICE FEES
The Portfolios each have entered into an investment management agreement with the Investment Adviser. For its services, each Portfolio pays the Investment Adviser a monthly fee in arrears equal to 0.10% of each Portfolio’s average daily net assets during the month.
DSL pays the Consultant a consulting fee of 0.03% based on the average daily net assets of each Portfolio.
The Consultant will provide tactical allocation recommendations to the Investment Adviser. The Investment Adviser has set up an Investment Committee made up of a team of professionals to consider, review and implement the recommendations of the Consultant, and will retain discretion over implementation of the Consultant’s recommendations. The Consultant will provide ongoing recommendations to the Investment Committee of the Investment Adviser quarterly or as warranted by market conditions.
Under an Administrative Services Agreement between the Portfolios and IFS provides all administrative services necessary for the Portfolios’ operations and is responsible for the supervision of the Portfolios’ other service providers. IFS also assumes all ordinary recurring direct costs of the Portfolios, such as custodian fees, director fees, transfer agency fees and accounting fees. As compensation for these services, IFS receives a monthly fee from each portfolio at an annual rate of 0.02% based on the average daily net assets of each Portfolio.
NOTE 4 — INVESTMENTS IN UNDERLYING FUNDS
For the year ended December 31, 2010, the cost of purchases and the proceeds from sales of the Underlying Funds were as follows:
| | | | | | | | |
| | | Purchases | | | Sales | |
Index Solution Income | | $ | 79,844,817 | | | $ | 77,401,436 | |
Index Solution 2015 | | | 119,085,049 | | | | 68,157,243 | |
Index Solution 2025 | | | 152,996,132 | | | | 72,252,226 | |
Index Solution 2035 | | | 110,520,512 | | | | 47,074,810 | |
Index Solution 2045 | | | 61,332,415 | | | | 23,002,249 | |
Index Solution 2055 | | | 4,687,189 | | | | 1,340,820 | |
NOTE 5 — DISTRIBUTION AND SERVICE FEES
Classes ADV, S2 and T of the Portfolios have adopted a Plan of Distribution pursuant to Rule 12b-1 under the 1940 Act (the “12b-1 Plans”), whereby IID is reimbursed or compensated by the Portfolios for expenses incurred in the distribution of each Portfolio’s shares (“Distribution Fees”). The Distributor may pay, on
29
NOTES TO FINANCIAL STATEMENTSASOF DECEMBER 31, 2010 (CONTINUED)
NOTE 5 — DISTRIBUTION AND SERVICE FEES
(continued)
behalf of each Portfolio, out of its distribution fee, compensation to certain financial institutions for providing distribution assistance pursuant to a Distribution Services Agreement. Under the 12b-1 Plans each Portfolio makes payments to IID at an annual rate of 0.25%, 0.25% and 0.50% of each Portfolio’s average daily net assets attributable to its Class ADV, Class S2 and Class T shares, respectively. The Distributor has contractually agreed to waive a portion of its fee equal to 0.05% of each Portfolio’s average daily net assets attributable to the distribution fee paid by Class T shares, so that the actual fee paid is an annual rate of 0.45%. The expense waiver will continue through at least May 1, 2011. The Distributor has contractually agreed to waive a portion of its fee equal to 0.10% of each Portfolio’s average daily net assets attributable to the distribution fee paid by Class S2 shares, so that the actual fee paid is an annual rate of 0.15%. The expense waiver will continue through at least May 1, 2011.
The Company has also adopted a Shareholder Servicing Plan (“Service Plan”) for the Classes ADV, S, S2 and T shares of each Portfolio. The Service Plan allows the Distributor to enter into shareholder servicing agreements with insurance companies, broker dealers or other financial intermediaries that provide administrative services related to Classes ADV, S, S2 and T shares and their shareholders including Variable Contract owners or Qualified Plan participants with interests in the Portfolios. Under the Service Plan, each Portfolio makes payments to IID which shall not exceed an annual rate of 0.25% of each Portfolio’s average daily net assets attributable to its Classes ADV, S, S2 and T shares.
NOTE 6 — OTHER TRANSACTIONS WITH AFFILIATES AND RELATED PARTIES
At December 31, 2010, the Portfolios had the following amounts recorded as payable to affiliates on the accompanying Statements of Assets and Liabilities (see Note 5):
| | | | | | | | | | | | | | | | |
Portfolio | | Accrued
Investment
Management
Fees | | | Accrued
Administrative
Fees | | | Accrued
Shareholder
Service and
Distribution
Fees | | | Total | |
Index Solution Income | | $ | 14,858 | | | $ | 2,971 | | | $ | 40,782 | | | $ | 58,611 | |
Index Solution 2015 | | | 14,044 | | | | 2,809 | | | | 47,187 | | | | 64,040 | |
Index Solution 2025 | | | 16,563 | | | | 3,312 | | | | 60,231 | | | | 80,106 | |
Index Solution 2035 | | | 11,873 | | | | 2,375 | | | | 44,748 | | | | 58,996 | |
Index Solution 2045 | | | 6,393 | | | | 1,279 | | | | 22,945 | | | | 30,617 | |
Index Solution 2055 | | | 274 | | | | 55 | | | | 1,119 | | | | 1,448 | |
The Company has adopted a Deferred Compensation Plan (the “Plan”), which allows eligible non-affiliated directors as described in the Plan to defer the receipt of all or a portion of the directors fees payable. Amounts deferred are treated as though invested in various “notional” funds advised by Directed Services LLC until distribution in accordance with the Plan.
At December 31, 2010, the following indirect, wholly-owned subsidiaries of ING Groep owned more than 5% of the following Portfolios:
| | | | | | |
Subsidiary | | Portfolio | | Percentage | |
ING Life Insurance and Annuity Company | | Index Solution Income | | | 19.52 | % |
| | Index Solution 2015 | | | 62.69 | % |
| | Index Solution 2025 | | | 79.73 | % |
| | Index Solution 2035 | | | 85.29 | % |
| | Index Solution 2045 | | | 89.85 | % |
| | Index Solution 2055 | | | 95.58 | % |
ING National Trust | | Index Solution Income | | | 79.48 | % |
| | Index Solution 2015 | | | 35.74 | % |
| | Index Solution 2025 | | | 18.15 | % |
| | Index Solution 2035 | | | 12.75 | % |
| | Index Solution 2045 | | | 9.50 | % |
Control is defined by the 1940 Act as the beneficial ownership, either directly or through one or more controlled companies, of more than 25% of the voting securities of a company. The 1940 Act defines affiliates as companies that are under common control. Therefore, because the Portfolios have a common owner that owns over 25% of the outstanding securities of the Portfolios, they may be deemed to be affiliates of each other. Investment activities of these shareholders could have a material impact on the Portfolios.
NOTE 7 — EXPENSE LIMITATION AGREEMENT
The Investment Adviser has agreed to limit expenses, excluding interest, taxes, brokerage commissions and extraordinary expenses to the levels listed below:
| | | | | | | | | | | | | | | | | | | | |
Portfolio(1) | | Class ADV | | | Class I | | | Class S | | | Class S2 | | | Class T | |
Index Solution Income | | | 0.62 | % | | | 0.12 | % | | | 0.37 | % | | | 0.52 | % | | | 0.82 | % |
Index Solution 2015 | | | 0.62 | % | | | 0.12 | % | | | 0.37 | % | | | 0.52 | % | | | 0.82 | % |
Index Solution 2025 | | | 0.62 | % | | | 0.12 | % | | | 0.37 | % | | | 0.52 | % | | | 0.82 | % |
Index Solution 2035 | | | 0.62 | % | | | 0.12 | % | | | 0.37 | % | | | 0.52 | % | | | 0.82 | % |
Index Solution 2045 | | | 0.62 | % | | | 0.12 | % | | | 0.37 | % | | | 0.52 | % | | | 0.82 | % |
Index Solution 2055 | | | 0.62 | % | | | 0.12 | % | | | 0.37 | % | | | 0.52 | % | | | 0.82 | % |
| (1) | The operating expense limits apply only at the Portfolio level and do not limit the fees payable by the underlying investment companies in which the Portfolios invest. The amount of fees and expenses of an Underlying Fund borne by each Portfolio will vary based on each Portfolio’s allocation of assets to, and the net expenses of a particular Underlying Fund. |
30
NOTES TO FINANCIAL STATEMENTSASOF DECEMBER 31, 2010 (CONTINUED)
NOTE 7 — EXPENSE LIMITATION AGREEMENT
(continued)
The Investment Adviser may at a later date recoup from a Portfolio management fees waived and other expenses assumed by the Investment Adviser during the previous 36 months, but only if, after such recoupment, the Portfolio’s expense ratio does not exceed the percentage described above. Waived and reimbursed fees and any recoupment by the Investment Adviser of such waived and reimbursed fees are reflected on the accompanying Statements of Operations for each Portfolio.
As of December 31, 2010, the Portfolios did not have any waived or reimbursed fees subject to recoupment.
Outstanding reimbursement balances due to the Portfolios, if any, under their respective expense limitation agreements are reflected in Reimbursement Due from manager on the accompanying Statements of Assets and Liabilities.
The expense limitation agreement is contractual and shall renew automatically for one-year terms unless the
Investment Adviser provides written notice of the
termination of the expense limitation agreement within 90 days of the end of the then current term.
NOTE 8 — LINE OF CREDIT
Effective June 1, 2010, the Portfolios, in addition to certain other funds managed by the Investment Adviser, have entered into an unsecured committed revolving line of credit agreement (the “Credit Agreement”) with The Bank of New York Mellon for an aggregate amount of $125,000,000. The proceeds may be used to: (1) temporarily finance the purchase and sale of securities; or (2) finance the redemption of shares of an investor in the funds. The funds pay a commitment fee equal to 0.15% per annum on the daily unused portion of the committed line amount payable quarterly in arrears.
Generally, borrowings under the Credit Agreement accrue interest at the federal funds rate plus a specified margin. Repayments generally must be made within 60 days after the date of a revolving credit advance. The Portfolios did not utilize the line of credit during the year ended December 31, 2010.
NOTE 9 — CAPITAL SHARES
Transactions in capital shares and dollars were as follows:
| | | | | | | | | | | | | | | | | | | | | | | | | | | | | | | | | | | | |
| | | Shares
sold | | | Reinvestment
of
distributions | | | Shares
redeemed | | | Net increase
(decrease)
in shares
outstanding | | | | | | Shares
sold | | | Reinvestment
of
distributions | | | Shares
redeemed | | | Net
increase
(decrease) | |
Year or period ended | | # | | | # | | | # | | | # | | | | | | ($) | | | ($) | | | ($) | | | ($) | |
Index Solution Income | | | | | | | | | | | | | | | | | | | | | | | | | | | | | | | | | | | | |
Class ADV | | | | | | | | | | | | | | | | | | | | | | | | | | | | | | | | | | | | |
12-31-10 | | | 1,204,165 | | | | 31,234 | | | | (329,474 | ) | | | 905,925 | | | | | | | | 12,568,680 | | | | 322,334 | | | | (3,450,635 | ) | | | 9,440,379 | |
12-31-09 | | | 772,182 | | | | 2,119 | | | | (138,430 | ) | | | 635,871 | | | | | | | | 7,510,831 | | | | 20,679 | | | | (1,322,935 | ) | | | 6,208,575 | |
Class I | | | | | | | | | | | | | | | | | | | | | | | | | | | | | | | | | | | | |
12-31-10 | | | 54,028 | | | | 3,009 | | | | (17,002 | ) | | | 40,035 | | | | | | | | 570,057 | | | | 31,381 | | | | (181,676 | ) | | | 419,762 | |
12-31-09 | | | 121,780 | | | | 458 | | | | (6,420 | ) | | | 115,818 | | | | | | | | 1,128,020 | | | | 4,507 | | | | (63,806 | ) | | | 1,068,721 | |
Class S | | | | | | | | | | | | | | | | | | | | | | | | | | | | | | | | | | | | |
12-31-10 | | | 1,312,314 | | | | 298,814 | | | | (2,403,816 | ) | | | (792,688 | ) | | | | | | | 13,802,237 | | | | 3,098,704 | | | | (25,433,475 | ) | | | (8,532,534 | ) |
12-31-09 | | | 17,546,706 | | | | 2,329 | | | | (2,711,738 | ) | | | 14,837,297 | | | | | | | | 173,180,136 | | | | 22,799 | | | | (27,383,383 | ) | | | 145,819,552 | |
Class S2 | | | | | | | | | | | | | | | | | | | | | | | | | | | | | | | | | | | | |
12-31-10 | | | 45,641 | | | | 131 | | | | (3,766 | ) | | | 42,006 | | | | | | | | 482,939 | | | | 1,347 | | | | (39,090 | ) | | | 445,196 | |
05-28-09(1)-12-31-09 | | | 323 | | | | — | | | | — | | | | 323 | | | | | | | | 3,000 | | | | — | | | | — | | | | 3,000 | |
Class T | | | | | | | | | | | | | | | | | | | | | | | | | | | | | | | | | | | | |
12-31-10 | | | — | | | | — | | | | — | | | | — | | | | | | | | — | | | | — | | | | — | | | | — | |
12-31-09 | | | — | | | | — | | | | (1 | ) | | | (1 | ) | | | | | | | — | | | | — | | | | (10 | ) | | | (10 | ) |
Index Solution 2015 | | | | | | | | | | | | | | | | | | | | | | | | | | | | | | | | | | | | |
Class ADV | | | | | | | | | | | | | | | | | | | | | | | | | | | | | | | | | | | | |
12-31-10 | | | 3,083,418 | | | | 78,242 | | | | (883,146 | ) | | | 2,278,514 | | | | | | | | 30,735,636 | | | | 761,293 | | | | (8,802,403 | ) | | | 22,694,526 | |
12-31-09 | | | 3,154,772 | | | | 9,541 | | | | (554,169 | ) | | | 2,610,144 | | | | | | | | 28,444,576 | | | | 87,208 | | | | (4,991,890 | ) | | | 23,539,894 | |
31
NOTES TO FINANCIAL STATEMENTSASOF DECEMBER 31, 2010 (CONTINUED)
NOTE 9 — CAPITAL SHARES (continued)
| | | | | | | | | | | | | | | | | | | | | | | | | | | | | | | | | | | | |
| | | Shares
sold | | | Reinvestment
of
distributions | | | Shares
redeemed | | | Net increase
(decrease)
in shares
outstanding | | | | | | Shares
sold | | | Reinvestment
of
distributions | | | Shares
redeemed | | | Net
increase
(decrease) | |
Year or period ended | | # | | | # | | | # | | | # | | | | | | ($) | | | ($) | | | ($) | | | ($) | |
Index Solution 2015 (Continued) | | | | | | | | | | | | | | | | | | | | | | | | | | | | | | | | | | | | |
Class I | | | | | | | | | | | | | | | | | | | | | | | | | | | | | | | | | | | | |
12-31-10 | | | 249,011 | | | | 7,005 | | | | (139,044 | ) | | | 116,972 | | | | | | | | 2,494,366 | | | | 68,784 | | | | (1,387,005 | ) | | | 1,176,145 | |
12-31-09 | | | 342,004 | | | | 879 | | | | (26,139 | ) | | | 316,744 | | | | | | | | 3,029,659 | | | | 8,085 | | | | (230,071 | ) | | | 2,807,673 | |
Class S | | | | | | | | | | | | | | | | | | | | | | | | | | | | | | | | | | | | |
12-31-10 | | | 3,427,170 | | | | 140,013 | | | | (1,216,538 | ) | | | 2,350,645 | | | | | | | | 34,268,647 | | | | 1,367,932 | | | | (12,254,371 | ) | | | 23,382,208 | |
12-31-09 | | | 7,333,111 | | | | 5,564 | | | | (644,277 | ) | | | 6,694,398 | | | | | | | | 67,411,815 | | | | 51,024 | | | | (5,954,105 | ) | | | 61,508,734 | |
Class S2 | | | | | | | | | | | | | | | | | | | | | | | | | | | | | | | | | | | | |
12-31-10 | | | 265,934 | | | | 418 | | | | (23,607 | ) | | | 242,745 | | | | | | | | 2,685,565 | | | | 4,063 | | | | (237,814 | ) | | | 2,451,814 | |
05-28-09(1)-12-31-09 | | | 352 | | | | — | | | | — | | | | 352 | | | | | | | | 3,000 | | | | — | | | | — | | | | 3,000 | |
Class T | | | | | | | | | | | | | | | | | | | | | | | | | | | | | | | | | | | | |
12-31-10 | | | — | | | | — | | | | — | | | | — | | | | | | | | — | | | | — | | | | — | | | | — | |
12-31-09 | | | — | | | | — | | | | (1 | ) | | | (1 | ) | | | | | | | — | | | | — | | | | (9 | ) | | | (9 | ) |
Index Solution 2025 | | | | | | | | | | | | | | | | | | | | | | | | | | | | | | | | | | | | |
Class ADV | | | | | | | | | | | | | | | | | | | | | | | | | | | | | | | | | | | | |
12-31-10 | | | 4,845,664 | | | | 23,677 | | | | (1,180,899 | ) | | | 3,688,442 | | | | | | | | 46,545,839 | | | | 218,541 | | | | (11,219,965 | ) | | | 35,544,415 | |
12-31-09 | | | 4,746,621 | | | | 11,489 | | | | (761,986 | ) | | | 3,996,124 | | | | | | | | 40,181,589 | | | | 99,031 | | | | (6,234,718 | ) | | | 34,045,902 | |
Class I | | | | | | | | | | | | | | | | | | | | | | | | | | | | | | | | | | | | |
12-31-10 | | | 323,556 | | | | 2,806 | | | | (71,966 | ) | | | 254,396 | | | | | | | | 3,161,728 | | | | 26,153 | | | | (700,594 | ) | | | 2,487,287 | |
12-31-09 | | | 439,166 | | | | 1,017 | �� | | | (5,630 | ) | | | 434,553 | | | | | | | | 3,570,146 | | | | 8,821 | | | | (48,827 | ) | | | 3,530,140 | |
Class S | | | | | | | | | | | | | | | | | | | | | | | | | | | | | | | | | | | | |
12-31-10 | | | 4,442,478 | | | | 30,180 | | | | (788,246 | ) | | | 3,684,412 | | | | | | | | 42,621,154 | | | | 280,074 | | | | (7,597,032 | ) | | | 35,304,196 | |
12-31-09 | | | 4,824,138 | | | | 6,613 | | | | (227,500 | ) | | | 4,603,251 | | | | | | | | 41,705,404 | | | | 57,202 | | | | (1,976,728 | ) | | | 39,785,878 | |
Class S2 | | | | | | | | | | | | | | | | | | | | | | | | | | | | | | | | | | | | |
12-31-10 | | | 497,056 | | | | 378 | | | | (36,432 | ) | | | 461,002 | | | | | | | | 4,838,729 | | | | 3,489 | | | | (346,305 | ) | | | 4,495,913 | |
05-28-09(1)-12-31-09 | | | 380 | | | | — | | | | — | | | | 380 | | | | | | | | 3,001 | | | | — | | | | — | | | | 3,001 | |
Class T | | | | | | | | | | | | | | | | | | | | | | | | | | | | | | | | | | | | |
12-31-10 | | | — | | | | — | | | | — | | | | — | | | | | | | | — | | | | — | | | | — | | | | — | |
12-31-09 | | | — | | | | — | | | | (1 | ) | | | (1 | ) | | | | | | | — | | | | — | | | | (8 | ) | | | (8 | ) |
Index Solution 2035 | | | | | | | | | | | | | | | | | | | | | | | | | | | | | | | | | | | | |
Class ADV | | | | | | | | | | | | | | | | | | | | | | | | | | | | | | | | | | | | |
12-31-10 | | | 3,731,423 | | | | 11,709 | | | | (779,606 | ) | | | 2,963,526 | | | | | | | | 34,955,652 | | | | 104,795 | | | | (7,351,284 | ) | | | 27,709,163 | |
12-31-09 | | | 3,883,685 | | | | 10,742 | | | | (574,424 | ) | | | 3,320,003 | | | | | | | | 31,741,315 | | | | 89,803 | | | | (4,644,626 | ) | | | 27,186,492 | |
Class I | | | | | | | | | | | | | | | | | | | | | | | | | | | | | | | | | | | | |
12-31-10 | | | 350,726 | | | | 850 | | | | (31,736 | ) | | | 319,840 | | | | | | | | 3,420,529 | | | | 7,687 | | | | (305,115 | ) | | | 3,123,101 | |
12-31-09 | | | 202,344 | | | | 516 | | | | (14,355 | ) | | | 188,505 | | | | | | | | 1,619,835 | | | | 4,339 | | | | (126,275 | ) | | | 1,497,899 | |
Class S | | | | | | | | | | | | | | | | | | | | | | | | | | | | | | | | | | | | |
12-31-10 | | | 3,399,002 | | | | 10,865 | | | | (458,665 | ) | | | 2,951,202 | | | | | | | | 31,941,475 | | | | 97,673 | | | | (4,341,227 | ) | | | 27,697,921 | |
12-31-09 | | | 2,314,774 | | | | 5,701 | | | | (138,104 | ) | | | 2,182,371 | | | | | | | | 19,099,562 | | | | 47,829 | | | | (1,106,339 | ) | | | 18,041,052 | |
Class S2 | | | | | | | | | | | | | | | | | | | | | | | | | | | | | | | | | | | | |
12-31-10 | | | 367,762 | | | | 148 | | | | (27,733 | ) | | | 340,177 | | | | | | | | 3,531,758 | | | | 1,324 | | | | (273,933 | ) | | | 3,259,149 | |
05-28-09(1)-12-31-09 | | | 395 | | | | — | | | | — | | | | 395 | | | | | | | | 3,000 | | | | — | | | | — | | | | 3,000 | |
32
NOTES TO FINANCIAL STATEMENTSASOF DECEMBER 31, 2010 (CONTINUED)
NOTE 9 — CAPITAL SHARES (continued)
| | | | | | | | | | | | | | | | | | | | | | | | | | | | | | | | | | | | |
| | | Shares
sold | | | Reinvestment
of
distributions | | | Shares
redeemed | | | Net increase
(decrease)
in shares
outstanding | | | | | | Shares
sold | | | Reinvestment
of
distributions | | | Shares
redeemed | | | Net
increase
(decrease) | |
Year or period ended | | # | | | # | | | # | | | # | | | | | | ($) | | | ($) | | | ($) | | | ($) | |
Index Solution 2035 (Continued) | | | | | | | | | | | | | | | | | | | | | | | | | | | | | | | | | | | | |
Class T | | | | | | | | | | | | | | | | | | | | | | | | | | | | | | | | | | | | |
12-31-10 | | | — | | | | — | | | | — | | | | — | | | | | | | | — | | | | — | | | | — | | | | — | |
12-31-09 | | | — | | | | — | | | | (1 | ) | | | (1 | ) | | | | | | | — | | | | — | | | | (8 | ) | | | (8 | ) |
Index Solution 2045 | | | | | | | | | | | | | | | | | | | | | | | | | | | | | | | | | | | | |
Class ADV | | | | | | | | | | | | | | | | | | | | | | | | | | | | | | | | | | | | |
12-31-10 | | | 2,253,659 | | | | 8,370 | | | | (403,917 | ) | | | 1,858,112 | | | | | | | | 20,484,970 | | | | 72,397 | | | | (3,708,060 | ) | | | 16,849,307 | |
12-31-09 | | | 2,094,077 | | | | 4,086 | | | | (453,470 | ) | | | 1,644,693 | | | | | | | | 16,501,497 | | | | 33,097 | | | | (3,635,361 | ) | | | 12,899,233 | |
Class I | | | | | | | | | | | | | | | | | | | | | | | | | | | | | | | | | | | | |
12-31-10 | | | 545,424 | | | | 484 | | | | (34,328 | ) | | | 511,580 | | | | | | | | 5,287,731 | | | | 4,239 | | | | (323,230 | ) | | | 4,968,740 | |
12-31-09 | | | 120,614 | | | | 234 | | | | (9,962 | ) | | | 110,886 | | | | | | | | 957,678 | | | | 1,912 | | | | (84,757 | ) | | | 874,833 | |
Class S | | | | | | | | | | | | | | | | | | | | | | | | | | | | | | | | | | | | |
12-31-10 | | | 1,919,817 | | | | 5,758 | | | | (369,078 | ) | | | 1,556,497 | | | | | | | | 17,544,739 | | | | 50,155 | | | | (3,371,992 | ) | | | 14,222,902 | |
12-31-09 | | | 1,173,686 | | | | 2,443 | | | | (81,706 | ) | | | 1,094,423 | | | | | | | | 9,472,471 | | | | 19,887 | | | | (661,591 | ) | | | 8,830,767 | |
Class S2 | | | | | | | | | | | | | | | | | | | | | | | | | | | | | | | | | | | | |
12-31-10 | | | 178,235 | | | | 70 | | | | (12,614 | ) | | | 165,691 | | | | | | | | 1,652,455 | | | | 605 | | | | (121,959 | ) | | | 1,531,101 | |
05-28-09(1)-12-31-09 | | | 412 | | | | — | | | | — | | | | 412 | | | | | | | | 3,000 | | | | — | | | | — | | | | 3,000 | |
Class T | | | | | | | | | | | | | | | | | | | | | | | | | | | | | | | | | | | | |
12-31-10 | | | — | | | | — | | | | — | | | | — | | | | | | | | — | | | | — | | | | — | | | | — | |
12-31-09 | | | — | | | | — | | | | (1 | ) | | | (1 | ) | | | | | | | — | | | | — | | | | (8 | ) | | | (8 | ) |
Index Solution 2055 | | | | | | | | | | | | | | | | | | | | | | | | | | | | | | | | | | | | |
Class ADV | | | | | | | | | | | | | | | | | | | | | | | | | | | | | | | | | | | | |
03-08-10(1)-12-31-10 | | | 279,899 | | | | — | | | | (67,025 | ) | | | 212,874 | | | | | | | | 2,798,256 | | | | — | | | | (666,354 | ) | | | 2,131,902 | |
Class I | | | | | | | | | | | | | | | | | | | | | | | | | | | | | | | | | | | | |
03-08-10(1)-12-31-10 | | | 6,235 | | | | — | | | | (2,137 | ) | | | 4,098 | | | | | | | | 65,200 | | | | — | | | | (23,085 | ) | | | 42,115 | |
Class S | | | | | | | | | | | | | | | | | | | | | | | | | | | | | | | | | | | | |
03-08-10(1)-12-31-10 | | | 124,390 | | | | — | | | | (16,605 | ) | | | 107,785 | | | | | | | | 1,241,429 | | | | — | | | | (160,537 | ) | | | 1,080,892 | |
Class S2 | | | | | | | | | | | | | | | | | | | | | | | | | | | | | | | | | | | | |
03-08-10(1)-12-31-10 | | | 8,368 | | | | — | | | | (247 | ) | | | 8,121 | | | | | | | | 88,558 | | | | — | | | | (2,636 | ) | | | 85,922 | |
Class T | | | | | | | | | | | | | | | | | | | | | | | | | | | | | | | | | | | | |
03-08-10(1)-12-31-10 | | | 301 | | | | — | | | | — | | | | 301 | | | | | | | | 3,010 | | | | — | | | | — | | | | 3,010 | |
| (1) | | Commencement of operations. |
NOTE 10 — FEDERAL INCOME TAXES
The amount of distributions from net investment income and net realized capital gains are determined in accordance with federal income tax regulations, which may differ from U.S. generally accepted accounting principles for investment companies. These book/tax differences may be either temporary or permanent. Permanent differences are reclassified within the capital accounts based on their federal tax-basis treatment; temporary differences are not reclassified. Key differences include the treatment of short-term
capital gains, foreign currency transactions, and wash sale deferrals. Distributions in excess of net investment income and/or net realized capital gains for tax purposes are reported as return of capital.
The following permanent tax differences have been reclassified as of December 31, 2010:
| | | | | | | | |
| | | Paid-in Capital | | | Undistributed Net Investment Income | |
Index Solution 2055 | | $ | (209 | ) | | $ | 209 | |
33
NOTES TO FINANCIAL STATEMENTSASOF DECEMBER 31, 2010 (CONTINUED)
NOTE 10 — FEDERAL INCOME TAXES (continued)
Dividends paid by the Portfolios from net investment income and distributions of net realized short-term capital gains are, for federal income tax purposes, taxable as ordinary income to shareholders.
The tax composition of dividends and distributions to shareholders was as follows:
| | | | | | | | | | | | | | | | |
| | | Year Ended December 31, 2010 | | | Year Ended December 31, 2009 | |
| | | Ordinary Income | | | Long-Term Capital Gains | | | Ordinary Income | | | Long-Term Capital Gains | |
Index Solution Income | | $ | 3,435,825 | | | $ | 17,987 | | | $ | 48,012 | | | $ | — | |
Index Solution 2015 | | | 1,285,912 | | | | 916,190 | | | | 146,332 | | | | — | |
Index Solution 2025 | | | 277,264 | | | | 250,997 | | | | 165,066 | | | | — | |
Index Solution 2035 | | | 40,229 | | | | 171,256 | | | | 141,986 | | | | — | |
Index Solution 2045 | | | — | | | | 127,402 | | | | 53,759 | | | | 1,150 | |
The tax-basis components of distributable earnings as of December 31, 2010 were:
| | | | | | | | | | | | |
| | | Undistributed Ordinary Income | | | Undistributed
Long-Term
Capital Gains | | | Unrealized
Appreciation/
(Depreciation) | |
Index Solution Income | | $ | 6,621,986 | | | $ | 2,646,026 | | | $ | 7,300,800 | |
Index Solution 2015 | | | 5,778,613 | | | | 4,402,220 | | | | 7,875,055 | |
Index Solution 2025 | | | 4,400,372 | | | | 9,216,373 | | | | 14,268,791 | |
Index Solution 2035 | | | 2,412,575 | | | | 7,045,448 | | | | 12,555,622 | |
Index Solution 2045 | | | 1,290,008 | | | | 3,184,077 | | | | 7,174,917 | |
Index Solution 2055 | | | 81,761 | | | | — | | | | 304,791 | |
The Portfolios’ major tax jurisdictions are federal and Arizona. The earliest tax year that remains subject to examination by these jurisdictions is 2008.
As of December 31, 2010, no provisions for income tax would be required in the Portfolios’ financial statements as a result of tax positions taken on federal income tax returns for open tax years. The Portfolios’ federal and state income and federal excise tax returns for tax years for which the applicable statutes of limitations have not expired are subject to examination by the Internal Revenue Service and state department of revenue.
NOTE 11 — CONCENTRATION OF INVESTMENT RISK
All mutual funds involve risk — some more than others — and there is always the chance that you could lose money or not earn as much as you hope. A Fund’s risk profile is largely a factor of the principal securities in which it invests and investment techniques that it uses. For more information regarding the types of securities and investment techniques that may be used by the Funds and their corresponding risks, see the Funds’ most recent Prospectus and/or the Statement of Additional Information.
The Portfolios are also affected by other kinds of risks, depending on the types of securities held or strategies used by an Underlying Fund.
Asset Allocation. Assets will be allocated among Underlying Funds and markets based on judgements by the Adviser or Consultant. There is a risk that the Portfolios may allocate assets to an Underlying Fund or market that underperforms other funds or asset classes.
Foreign Securities. Investments in foreign securities may entail risks not present in domestic investments. Since securities in which an Underlying Fund may invest are denominated in foreign currencies, changes in the relationship of these foreign currencies to the U.S. dollar can significantly affect the value of the investments and earnings of the Underlying Funds. Foreign investments may also subject the Underlying Funds to foreign government exchange restrictions, expropriation, taxation or other political, social or economic developments, as well as changes vis-à-vis the U.S. dollar from movements in currency, and changes in security value and interest rate, all of which could affect the market and/or credit risk of the Underlying Funds’ investments.
NOTE 12 — SUBSEQUENT EVENTS
The Portfolios have evaluated events occurring after the Statements of Assets and Liabilities date (subsequent events) to determine whether any subsequent events necessitated adjustment to or disclosure in the financial statements. No such subsequent events were identified.
34
| | |
ING INDEX SOLUTION INCOME
PORTFOLIO | | PORTFOLIO OF INVESTMENTS ASOF DECEMBER 31, 2010 |
| | | | | | | | | | | | |
| Shares | | | | | Value | | | Percent
of Net
Assets | |
| | | | | | | | | | | | |
| | | | EXCHANGE-TRADED FUNDS: 2.0% | | | | | | | | |
| | 72,595 | | | Vanguard Emerging Markets ETF | | $ | 3,495,449 | | | | 2.0 | |
| | | | Total Exchange-Traded Funds (Cost $3,049,244) | | | 3,495,449 | | | | 2.0 | |
| | | | | | | | | | | | |
| | | | AFFILIATED INVESTMENT COMPANIES: 98.0% | | | | | | | | |
| | 1,024,722 | | | ING International Index Portfolio - Class I | | | 8,751,125 | | | | 5.0 | |
| | 3,786,725 | | | ING Russell™ Large Cap Index Portfolio - Class I | | | 36,655,500 | | | | 20.9 | |
| | 602,543 | | | ING Russell™ Mid Cap Index Portfolio - Class I | | | 6,971,425 | | | | 3.9 | |
| | 11,154,080 | | | ING U.S. Bond Index Portfolio - Class I | | | 119,794,815 | | | | 68.2 | |
| | | | Total Affiliated Investment Companies (Cost $165,230,454) | | | 172,172,865 | | | | 98.0 | |
| | | | | | | | | | | | |
| | | | Total Investments in Securities (Cost $168,279,698)* | | $ | 175,668,314 | | | | 100.0 | |
| | | | Other Assets and Liabilities - Net | | | (57,671 | ) | | | — | |
| | | | | | | | | | | | |
| | | | Net Assets | | $ | 175,610,643 | | | | 100.0 | |
| | | | | | | | | | | | |
| * | Cost for federal income tax purposes is $168,367,514. |
| | | | |
Net unrealized appreciation consists of: | | | | |
Gross Unrealized Appreciation | | $ | 7,300,800 | |
Gross Unrealized Depreciation | | | — | |
| | | | |
Net Unrealized Appreciation | | $ | 7,300,800 | |
| | | | |
Fair Value Measurements^
The following is a summary of the fair valuations according to the inputs used as of December 31, 2010 in valuing the Portfolio’s assets and liabilities:
| | | | | | | | | | | | | | | | |
| | | Quoted Prices in Active Markets
for Identical Investments
(Level 1) | | | Other
Observable
Inputs
(Level 2) | | | Significant
Unobservable
Inputs
(Level 3) | | | Fair Value at 12/31/2010 | |
Asset Table | | | | | | | | | | | | | | | | |
Investments, at value | | | | | | | | | | | | | | | | |
Exchange-Traded Funds | | $ | 3,495,449 | | | $ | — | | | $ | — | | | $ | 3,495,449 | |
Affiliated Investment Companies | | | 172,172,865 | | | | — | | | | — | | | | 172,172,865 | |
| | | | | | | | | | | | | | | | |
Total Investments, at value | | $ | 175,668,314 | | | $ | — | | | $ | — | | | $ | 175,668,314 | |
| | | | | | | | | | | | | | | | |
| ^ | See Note 2, “Significant Accounting Policies” in the Notes to Financial Statements for additional information. |
See Accompanying Notes to Financial Statements
35
| | |
| ING INDEX SOLUTION 2015 PORTFOLIO | | PORTFOLIO OF INVESTMENTS ASOF DECEMBER 31, 2010 (CONTINUED) |
| | | | | | | | | | | | |
| Shares | | | | | Value | | | Percent of
Net Assets | |
| | | | | | | | | | | | |
| | | | EXCHANGE-TRADED FUNDS: 2.0% | | | | | | | | |
| | 71,140 | | | Vanguard Emerging Markets ETF | | $ | 3,425,391 | | | | 2.0 | |
| | | | Total Exchange-Traded Funds (Cost $ 3,017,463) | | | 3,425,391 | | | | 2.0 | |
| | | | | | | | | | | | |
| | | | AFFILIATED INVESTMENT COMPANIES: 98.0% | | | | | | | | |
| | 2,018,395 | | | ING International Index Portfolio - Class I | | | 17,237,094 | | | | 10.2 | |
| | 4,835,027 | | | ING Russell™ Large Cap Index Portfolio - Class I | | | 46,803,059 | | | | 27.6 | |
| | 873,313 | | | ING Russell™ Mid Cap Index Portfolio - Class I | | | 10,104,233 | | | | 6.0 | |
| | 271,218 | | | ING Russell™ Small Cap Index Portfolio - Class I | | | 3,346,829 | | | | 2.0 | |
| | 8,241,855 | | | ING U.S. Bond Index Portfolio - Class I | | | 88,517,518 | | | | 52.2 | |
| | | | Total Affiliated Investment Companies (Cost $ 158,169,901) | | | 166,008,733 | | | | 98.0 | |
| | | | | | | | | | | | |
| | | | Total Investments in Securities (Cost $ 161,187,364)* | | $ | 169,434,124 | | | | 100.0 | |
| | | | Other Assets and Liabilities - Net | | | (63,358 | ) | | | — | |
| | | | | | | | | | | | |
| | | | Net Assets | | $ | 169,370,766 | | | | 100.0 | |
| | | | | | | | | | | | |
| * | Cost for federal income tax purposes is $161,559,069. |
| | | | |
Net unrealized appreciation consists of: | | | | |
Gross Unrealized Appreciation | | $ | 7,875,055 | |
Gross Unrealized Depreciation | | | — | |
| | | | |
Net Unrealized Appreciation | | $ | 7,875,055 | |
| | | | |
Fair Value Measurements^
The following is a summary of the fair valuations according to the inputs used as of December 31, 2010 in valuing the Portfolio's assets and liabilities:
| | | | | | | | | | | | | | | | |
| | | Quoted Prices
in Active Markets
for Identical Investments
(Level 1) | | | Other
Observable
Inputs
(Level 2) | | | Significant
Unobservable
Inputs
(Level 3) | | | Fair Value at 12/31/2010 | |
Asset Table | | | | | | | | | | | | | | | | |
Investments, at value | | | | | | | | | | | | | | | | |
Exchange-Traded Funds | | $ | 3,425,391 | | | $ | — | | | $ | — | | | $ | 3,425,391 | |
Affiliated Investment Companies | | | 166,008,733 | | | | — | | | | — | | | | 166,008,733 | |
| | | | | | | | | | | | | | | | |
Total Investments, at value | | $ | 169,434,124 | | | $ | — | | | $ | — | | | $ | 169,434,124 | |
| | | | | | | | | | | | | | | | |
| ^ | See Note 2, "Significant Accounting Policies" in the Notes to Financial Statements for additional information. |
See Accompanying Notes to Financial Statements
36
| | |
| ING INDEX SOLUTION 2025 PORTFOLIO | | PORTFOLIO OF INVESTMENTS ASOF DECEMBER 31, 2010 (CONTINUED) |
| | | | | | | | | | | | | | | | |
| Shares | | | | | Value | | | Percent
of Net
Assets | |
| | | | | | | | | | | | | | | | |
| | | | EXCHANGE-TRADED FUNDS: 3.0% | | | | | | | | | | | | |
| | 126,803 | | | Vanguard Emerging Markets ETF | | | | | | $ | 6,105,564 | | | | 3.0 | |
| | | | Total Exchange-Traded Funds (Cost $ 5,435,385) | | | | | | | 6,105,564 | | | | 3.0 | |
| | | | | | | | | | | | | | | | |
| | | | AFFILIATED INVESTMENT COMPANIES: 97.0% | | | | | | | | | | | | |
| | 3,997,865 | | | ING International Index Portfolio - Class I | | | | | | | 34,141,765 | | | | 16.9 | |
| | 7,900,349 | | | ING Russell™ Large Cap Index Portfolio - Class I | | | | | | | 76,475,381 | | | | 38.0 | |
| | 2,431,430 | | | ING Russell™ Mid Cap Index Portfolio - Class I | | | | | | | 28,131,648 | | | | 14.0 | |
| | 809,064 | | | ING Russell™ Small Cap Index Portfolio - Class I | | | | | | | 9,983,846 | | | | 4.9 | |
| | 4,349,187 | | | ING U.S. Bond Index Portfolio - Class I | | | | | | | 46,710,265 | | | | 23.2 | |
| | | | Total Affiliated Investment Companies (Cost $ 181,267,073) | | | | | | | 195,442,905 | | | | 97.0 | |
| | | | | | | | | | | | | | | | |
| | | | |
| | | | Total Investments in Securities | | | | | | | | | | | | |
| | | | (Cost $ 186,702,458)* | | | | | | $ | 201,548,469 | | | | 100.0 | |
| | | | Other Assets and Liabilities - Net | | | | | | | (78,812 | ) | | | — | |
| | | | | | | | | | | | | | | | |
| | | | Net Assets | | | | | | $ | 201,469,657 | | | | 100.0 | |
| | | | | | | | | | | | | | | | |
| * | Cost for federal income tax purposes is $187,279,678. |
| | | | |
Net unrealized appreciation consists of: | | | | |
Gross Unrealized Appreciation | | $ | 14,268,791 | |
Gross Unrealized Depreciation | | | — | |
| | | | |
Net Unrealized Appreciation | | $ | 14,268,791 | |
| | | | |
Fair Value Measurements^
The following is a summary of the fair valuations according to the inputs used as of December 31, 2010 in valuing the Portfolio’s assets and liabilities:
| | | | | | | | | | | | | | | | |
| | | Quoted Prices in Active Markets
for Identical Investments (Level 1) | | | Other
Observable
Inputs
(Level 2) | | | Significant Unobservable Inputs (Level 3) | | | Fair Value
at
12/31/2010 | |
Asset Table | | | | | | | | | | | | | | | | |
Investments, at value | | | | | | | | | | | | | | | | |
Exchange-Traded Funds | | $ | 6,105,564 | | | $ | — | | | $ | — | | | $ | 6,105,564 | |
Affiliated Investment Companies | | | 195,442,905 | | | | — | | | | — | | | | 195,442,905 | |
| | | | | | | | | | | | | | | | |
Total Investments, at value | | $ | 201,548,469 | | | $ | — | | | $ | — | | | $ | 201,548,469 | |
| | | | | | | | | | | | | | | | |
| ^ | See Note 2, “Significant Accounting Policies” in the Notes to Financial Statements for additional information. |
See Accompanying Notes to Financial Statements
37
| | |
| ING INDEX SOLUTION 2035 PORTFOLIO | | PORTFOLIO OF INVESTMENTS ASOF DECEMBER 31, 2010 (CONTINUED) |
| | | | | | | | | | | | |
| Shares | | | | | Value | | | Percent
of Net
Assets | |
| | | | | | | | | | | | |
| | | | EXCHANGE-TRADED FUNDS: 4.0% | | | | | | | | |
| | 121,606 | | | Vanguard Emerging Markets ETF | | $ | 5,855,329 | | | | 4.0 | |
| | | | Total Exchange-Traded Funds (Cost $ 5,226,342) | | | 5,855,329 | | | | 4.0 | |
| | | | | | | | | | | | |
| | | | AFFILIATED INVESTMENT COMPANIES: 96.0% | | | | | | | | |
| | 3,554,864 | | | ING International Index Portfolio - Class I | | | 30,358,535 | | | | 21.0 | |
| | 5,536,190 | | | ING Russell™ Large Cap Index Portfolio - Class I | | | 53,590,322 | | | | 37.0 | |
| | 1,999,856 | | | ING Russell™ Mid Cap Index Portfolio - Class I | | | 23,138,338 | | | | 16.0 | |
| | 1,048,112 | | | ING Russell™ Small Cap Index Portfolio - Class I | | | 12,933,708 | | | | 8.9 | |
| | 1,769,046 | | | ING U.S. Bond Index Portfolio - Class I | | | 18,999,552 | | | | 13.1 | |
| | | | Total Affiliated Investment Companies (Cost $ 126,576,222) | | | 139,020,455 | | | | 96.0 | |
| | | | | | | | | | | | |
| | | | Total Investments in Securities (Cost $ 131,802,564)* | | $ | 144,875,784 | | | | 100.0 | |
| | | | Other Assets and Liabilities - Net | | | (57,925 | ) | | | — | |
| | | | | | | | | | | | |
| | | | Net Assets | | $ | 144,817,859 | | | | 100.0 | |
| | | | | | | | | | | | |
| * | Cost for federal income tax purposes is $132,320,162. |
| | | | |
Net unrealized appreciation consists of: | | | | |
Gross Unrealized Appreciation | | $ | 12,555,622 | |
Gross Unrealized Depreciation | | | — | |
| | | | |
Net Unrealized Appreciation | | $ | 12,555,622 | |
| | | | |
Fair Value Measurements^
The following is a summary of the fair valuations according to the inputs used as of December 31, 2010 in valuing the Portfolio's assets and liabilities:
| | | | | | | | | | | | | | | | |
| | | Quoted Prices
in Active Markets
for Identical Investments
(Level 1) | | | Other Observable
Inputs (Level 2) | | | Significant
Unobservable
Inputs
(Level 3) | | | Fair Value at 12/31/2010 | |
Asset Table | | | | | | | | | | | | | | | | |
Investments, at value | | | | | | | | | | | | | | | | |
Exchange-Traded Funds | | $ | 5,855,329 | | | $ | — | | | $ | — | | | $ | 5,855,329 | |
Affiliated Investment Companies | | | 139,020,455 | | | | — | | | | — | | | | 139,020,455 | |
| | | | | | | | | | | | | | | | |
Total Investments, at value | | $ | 144,875,784 | | | $ | — | | | $ | — | | | $ | 144,875,784 | |
| | | | | | | | | | | | | | | | |
| ^ | See Note 2, "Significant Accounting Policies" in the Notes to Financial Statements for additional information. |
See Accompanying Notes to Financial Statements
38
| | |
| ING INDEX SOLUTION 2045 PORTFOLIO | | PORTFOLIO OF INVESTMENTS ASOF DECEMBER 31, 2010 (CONTINUED) |
| | | | | | | | | | | | |
| Shares | | | | | Value | | | Percent
of Net
Assets | |
| | | | | | | | | | | | |
| | | | EXCHANGE-TRADED FUNDS: 4.0% | | | | | | | | |
| | 65,302 | | | Vanguard Emerging Markets ETF | | $ | 3,144,291 | | | | 4.0 | |
| | | | Total Exchange-Traded Funds (Cost $2,820,654) | | | 3,144,291 | | | | 4.0 | |
| | | | | | | | | | | | |
| | | | AFFILIATED INVESTMENT COMPANIES: 96.0% | | | | | | | | |
| | 2,542,290 | | | ING International Index Portfolio - Class I | | | 21,711,155 | | | | 28.0 | |
| | 2,729,304 | | | ING Russell™ Large Cap Index Portfolio - Class I | | | 26,419,664 | | | | 34.1 | |
| | 1,341,121 | | | ING Russell™ Mid Cap Index Portfolio - Class I | | | 15,516,767 | | | | 20.0 | |
| | 687,252 | | | ING Russell™ Small Cap Index Portfolio - Class I | | | 8,480,693 | | | | 10.9 | |
| | 218,976 | | | ING U.S. Bond Index Portfolio - Class I | | | 2,351,806 | | | | 3.0 | |
| | | | Total Affiliated Investment Companies (Cost $ 67,285,598) | | | 74,480,085 | | | | 96.0 | |
| | | | | | | | | | | | |
| | | | Total Investments in Securities (Cost $ 70,106,252)* | | $ | 77,624,376 | | | | 100.0 | |
| | | | Other Assets and Liabilities - Net | | | (29,938 | ) | | | — | |
| | | | | | | | | | | | |
| | | | Net Assets | | $ | 77,594,438 | | | | 100.0 | |
| | | | | | | | | | | | |
| * | Cost for federal income tax purposes is $70,449,459. |
| | | | |
Net unrealized appreciation consists of: | | | | |
Gross Unrealized Appreciation | | $ | 7,545,158 | |
Gross Unrealized Depreciation | | | (370,241 | ) |
| | | | |
Net Unrealized Appreciation | | $ | 7,174,917 | |
| | | | |
Fair Value Measurements^
The following is a summary of the fair valuations according to the inputs used as of December 31, 2010 in valuing the Portfolio’s assets and liabilities:
| | | | | | | | | | | | | | | | |
| | | Quoted Prices in Active Markets
for Identical Investments
(Level 1) | | | Other
Observable
Inputs
(Level 2) | | | Significant
Unobservable
Inputs
(Level 3) | | | Fair Value at
12/31/2010 | |
Asset Table | | | | | | | | | | | | | | | | |
Investments, at value | | | | | | | | | | | | | | | | |
Exchange-Traded Funds | | $ | 3,144,291 | | | $ | — | | | $ | — | | | $ | 3,144,291 | |
Affiliated Investment Companies | | | 74,480,085 | | | | — | | | | — | | | | 74,480,085 | |
| | | | | | | | | | | | | | | | |
Total Investments, at value | | $ | 77,624,376 | | | $ | — | | | $ | — | | | $ | 77,624,376 | |
| | | | | | | | | | | | | | | | |
| ^ | See Note 2, “Significant Accounting Policies” in the Notes to Financial Statements for additional information. |
See Accompanying Notes to Financial Statements
39
| | |
| ING INDEX SOLUTION 2055 PORTFOLIO | | PORTFOLIO OF INVESTMENTS ASOF DECEMBER 31, 2010 (CONTINUED) |
| | | | | | | | | | | | |
| Shares | | | | | Value | | | Percent of
Net Assets | |
| | | | | | | | | | | | |
| | - | | | EXCHANGE-TRADED FUNDS: 3.7% | | | | | | | | |
| | 2,888 | | | Vanguard Emerging Markets ETF | | $ | 139,057 | | | | 3.7 | |
| | | | Total Exchange-Traded Funds (Cost $120,727) | | | 139,057 | | | | 3.7 | |
| | | | | | | | | | | | |
| | | | AFFILIATED INVESTMENT COMPANIES: 96.3% | | | | | | | | |
| | 123,596 | | | ING International Index Portfolio - Class I | | | 1,055,507 | | | | 28.3 | |
| | 131,189 | | | ING Russell™ Large Cap Index Portfolio - Class I | | | 1,269,905 | | | | 34.1 | |
| | 64,471 | | | ING Russell™ Mid Cap Index Portfolio - Class I | | | 745,926 | | | | 20.0 | |
| | 33,054 | | | ING Russell™ Small Cap Index Portfolio - Class I | | | 407,885 | | | | 10.9 | |
| | 10,518 | | | ING U.S. Bond Index Portfolio - Class I | | | 112,968 | | | | 3.0 | |
| | | | Total Affiliated Investment Companies (Cost $3,269,368) | | | 3,592,191 | | | | 96.3 | |
| | | | | | | | | | | | |
| | | | Total Investments in Securities (Cost $3,390,095)* | | $ | 3,731,248 | | | | 100.0 | |
| | | | Other Assets and Liabilities - Net | | | (1,064 | ) | | | — | |
| | | | | | | | | | | | |
| | | | Net Assets | | $ | 3,730,184 | | | | 100.0 | |
| | | | | | | | | | | | |
| * | Cost for federal income tax purposes is $3,426,457. |
| | | | |
Net unrealized appreciation consists of: | | | | |
Gross Unrealized Appreciation | | $ | 342,226 | |
Gross Unrealized Depreciation | | | (37,435 | ) |
| | | | |
Net Unrealized Appreciation | | $ | 304,791 | |
| | | | |
Fair Value Measurements^
The following is a summary of the fair valuations according to the inputs used as of December 31, 2010 in valuing the Portfolio’s assets and liabilities:
| | | | | | | | | | | | | | | | |
| | | Quoted Prices in Active Markets
for Identical Investments (Level 1) | | | Other
Observable
Inputs
(Level 2) | | | Significant Unobservable Inputs (Level 3) | | | Fair Value
at
12/31/2010 | |
Asset Table | | | | | | | | | | | | | | | | |
Investments, at value | | | | | | | | | | | | | | | | |
Exchange-Traded Funds | | $ | 139,057 | | | $ | — | | | $ | — | | | $ | 139,057 | |
Affiliated Investment Companies | | | 3,592,191 | | | | — | | | | — | | | | 3,592,191 | |
| | | | | | | | | | | | | | | | |
Total Investments, at value | | $ | 3,731,248 | | | $ | — | | | $ | — | | | $ | 3,731,248 | |
| | | | | | | | | | | | | | | | |
| ^ | See Note 2, “Significant Accounting Policies” in the Notes to Financial Statements for additional information. |
See Accompanying Notes to Financial Statements
40
TAX INFORMATION (UNAUDITED)
Dividends paid during the year ended December 31, 2010 were as follows:
| | | | | | |
Portfolio Name | | Type | | Per Share Amount | |
| | |
ING Index Solution Income Portfolio | | | | | | |
Class ADV | | NII | | $ | 0.1061 | |
Class I | | NII | | $ | 0.1223 | |
Class S | | NII | | $ | 0.1130 | |
Class S2 | | NII | | $ | 0.1212 | |
Class T | | NII | | $ | 0.0556 | |
All Classes | | STCG | | $ | 0.0977 | |
All Classes | | LTCG | | $ | 0.0011 | |
| | |
ING Index Solution 2015 Portfolio | | | | | | |
Class ADV | | NII | | $ | 0.0432 | |
Class I | | NII | | $ | 0.0621 | |
Class S | | NII | | $ | 0.0546 | |
Class S2 | | NII | | $ | 0.0619 | |
Class T | | NII | | $ | 0.0005 | |
All Classes | | STCG | | $ | 0.0390 | |
All Classes | | LTCG | | $ | 0.0639 | |
| | |
ING Index Solution 2025 Portfolio | | | | | | |
Class ADV | | NII | | $ | 0.0102 | |
Class I | | NII | | $ | 0.0268 | |
Class S | | NII | | $ | 0.0204 | |
Class S2 | | NII | | $ | 0.0268 | |
Class T | | NII | | $ | — | |
All Classes | | STCG | | $ | 0.0012 | |
All Classes | | LTCG | | $ | 0.0152 | |
| | |
ING Index Solution 2035 Portfolio | | | | | | |
Class ADV | | NII | | $ | — | |
Class I | | NII | | $ | 0.0082 | |
Class S | | NII | | $ | 0.0046 | |
Class S2 | | NII | | $ | 0.0081 | |
Class T | | NII | | $ | — | |
All Classes | | STCG | | $ | 0.0013 | |
All Classes | | LTCG | | $ | 0.0146 | |
| | |
ING Index Solution 2045 Portfolio | | | | | | |
All Classes | | LTCG | | $ | 0.0214 | |
NII - Net investment income
STCG - Short-term capital gain
LTCG - Long-term capital gain
Of the ordinary distributions made during the year ended December 31, 2010, the following percentages qualify for the dividends received deduction (DRD) available to corporate shareholders:
| | | | |
| |
ING Index Solution Income Portfolio | | | 0.03 | % |
| |
ING Index Solution 2015 Portfolio | | | 0.10 | % |
| |
ING Index Solution 2025 Portfolio | | | 0.73 | % |
| |
ING Index Solution 2035 Portfolio | | | 4.36 | % |
41
TAX INFORMATION (UNAUDITED) (CONTINUED)
Above figures may differ from those cited elsewhere in this report due to differences in the calculation of income and gains under U.S. generally accepted accounting principles (book) purposes and Internal Revenue Service (tax) purposes.
Shareholders are strongly advised to consult their own tax advisers with respect to the tax consequences of their investments in the Portfolios. In January, shareholders, excluding corporate shareholders, receive an IRS 1099-DIV regarding the federal tax status of the dividends and distributions they received in the calendar year.
42
DIRECTOR AND OFFICER INFORMATION (UNAUDITED)
The business and affairs of the Company are managed under the direction of the Board. A Director who is not an interested person of the Registrants, as defined in the 1940 Act, is an independent director (“Independent Director”). The Directors and Officers of the Company are listed below. The Statement of Additional Information includes additional information about directors of the Company and is available, without charge, upon request at (800) 992-0180.
| | | | | | | | | | |
Name, Address and Age | | Position(s) Held with the Company | | Term of Office and Length of Time Served(1) | | Principal Occupation(s) – During the Past 5 Years | | Number of Funds in Fund Complex Overseen by Director(2) | | Other Directorships Held by Director |
| | | | | |
Colleen D. Baldwin 7337 E. Doubletree Ranch Rd. Suite 100 Scottsdale, Arizona 85258 Age: 50 | | Director | | November 2007 -Present | | President, Glantuam Partners, LLC (January 2009 - Present); and Consultant (January 2005 - Present). | | 138 | | None. |
| | | | | |
John V. Boyer(4) 7337 E. Doubletree Ranch Rd. Suite 100 Scottsdale, Arizona 85258 Age: 57 | | Director | | November 1997 - Present | | President and Chief Executive Officer, Bechtler Arts Foundation, an arts and education foundation, (January 2008 - Present). Formerly, Consultant (July 2007 - February 2008); President and Chief Executive Officer, Franklin and Eleanor Roosevelt Institute, a public policy foundation, (March 2006 - July 2007); and Executive Director, The Mark Twain House & Museum (September 1989 - March 2006). | | 138 | | None. |
| | | | | |
Patricia W. Chadwick 7337 E. Doubletree Ranch Rd. Suite 100 Scottsdale, Arizona 85258 Age: 62 | | Director | | January 2006 - Present | | Consultant and President, Ravengate Partners LLC, a consulting firm that provides advice regarding financial markets and the global economy (January 2000 - Present). | | 138 | | Wisconsin Energy Corporation (June 2006 - Present) and The Royce Fund (December 2009 - Present). |
| | | | | |
Peter S. Drotch 7337 E. Doubletree Ranch Rd. Suite 100 Scottsdale, Arizona 85258 Age: 68 | | Director | | November 2007 – Present | | Retired. Formerly, Partner, Pricewaterhouse Coopers LLP, an accounting firm, until July 2000. | | 138 | | First Marblehead Corporation (September 2003- Present). |
| | | | | |
J. Michael Earley 7337 E. Doubletree Ranch Rd. Suite 100 Scottsdale, Arizona 85258 Age: 65 | | Director | | January 2005 - Present | | Retired. Formerly, Banking President and Chief Executive Officer, Bankers Trust Company, N.A., Des Moines (June 1992 - December 2008). | | 138 | | None. |
| | | | | |
Patrick W. Kenny 7337 E. Doubletree Ranch Rd. Suite 100 Scottsdale, Arizona 85258 Age: 67 | | Director | | March 2002 - Present | | Retired. Formerly, President and Chief Executive Officer, International Insurance Society (June 2001 - June 2009). | | 138 | | Assured Guaranty Ltd. (April 2004 - Present). |
| | | | | |
Sheryl K. Pressler 7337 E. Doubletree Ranch Rd. Suite 100 Scottsdale, Arizona 85258 Age: 60 | | Director | | January 2006- Present | | Consultant (May 2001 - Present). | | 138 | | Stillwater Mining Company (May 2002 - Present). |
| | | | | |
Roger B. Vincent 7337 E. Doubletree Ranch Rd. Suite 100 Scottsdale, Arizona 85258 Age: 65 | | Chairman and Director | | January 2005 - Present | | President, Springwell Corporation, a corporate finance firm (March 1989 - Present). | | 138 | | UGI Corporation (February 2006 - Present) and UGI Utilities, Inc. (February 2006 - Present). |
43
DIRECTOR AND OFFICER INFORMATION (UNAUDITED) (CONTINUED)
| | | | | | | | | | |
Name, Address and Age | | Position(s) Held with the Company | | Term of Office and Length of Time Served(1) | | Principal Occupation(s) – During the Past 5 Years | | Number of Funds in Fund Complex Overseen by Director(2) | | Other Directorships Held by Director |
Directors who are “Interested Persons”: |
| | | | | |
Robert W. Crispin(5) 7337 E. Doubletree Ranch Rd. Suite 100 Scottsdale, Arizona 85258 Age: 64 | | Director | | November 2007- Present | | Retired. Chairman and Chief Executive Officer, ING Investment Management Co. (July 2001 - December 2007). | | 138 | | Intact Financial Corporation (December 2004 - Present) and PFM Group (November 2010 - Present). |
| | | | | |
Shaun P. Mathews (3)(5) 7337 E. Doubletree Ranch Rd. Suite 100 Scottsdale, Arizona 85258 Age: 55 | | Director | | November 2007- Present | | President and Chief Executive Officer, ING Investments, LLC (November 2006 - Present). Formerly, Head of ING Mutual Funds and Investment Products (November 2004 - November 2006). | | 175 | | ING Retirement Holdings, Inc. (September 1998 - Present); ING Services Holding Company, Inc. (May 2000 - Present); ING Financial Advisers, LLC (April 2002 - Present); Southland Life Insurance Company (June 2002 - Present); ING Capital Corporation, LLC and ING Investments Distributor, LLC(7) (December 2005 - Present); ING Funds Services, LLC(8), ING Investments, LLC and ING Pilgrim Funding, Inc. (March 2006 - Present); and Directed Services LLC (December 2006 - Present)(9). |
| (1) | | The tenure of each Director is subject to the Board’s retirement policy, which states that each Independent Director shall retire from service as a Director at the conclusion of the first regularly scheduled meeting of the Board that is held after the Director reaches the age of 72. A unanimous vote of the Board may extend the retirement date of a Director for up to one year. An extension may be permitted if the retirement would trigger a requirement to hold a meeting of shareholders of the Fund under applicable law, whether for purposes of appointing a successor to the Director or if otherwise necessary under applicable law, in which case the extension would apply until such time as the shareholder meeting can be held or is no longer needed. |
| (2) | | For the purposes of this table (except for Mr. Mathews), ”Fund Complex” means the following investment companies: ING Asia Pacific High Dividend Equity Income Fund, ING Emerging Markets High Dividend Equity Fund; ING Emerging Markets Local Bond Fund; ING Equity Trust; ING Funds Trust; ING Global Equity Dividend and Premium Opportunity Fund; ING Global Advantage and Premium Opportunity Fund; ING Infrastructure, Industrials, and Materials Fund; ING International High Dividend Equity Income Fund; ING Investors Trust; ING Mayflower Trust; ING Mutual Funds; ING Prime Rate Trust; ING Risk Managed Natural Resources Fund; ING Senior Income Fund; ING Separate Portfolios Trust; ING Variable Insurance Trust; ING Variable Products Trust; and ING Partners, Inc. |
| (3) | | For Mr. Mathews, the Fund Complex also includes the following investment companies: ING Series Fund, Inc.; ING Strategic Allocation Portfolios, Inc.; ING Variable Funds; ING Variable Portfolios, Inc.; ING Balanced Portfolio, Inc.; ING Intermediate Bond Portfolio; and ING Money Market Portfolio. |
| (4) | | Mr. Boyer held a seat on the Board of Directors of The Mark Twain House & Museum from September 1989 to November 2005. ING Groep N.V. makes non-material, charitable contributions to The Mark Twain House & Museum. |
| (5) | | Messrs. Mathews and Crispin are deemed to be “interested persons” of the Fund as defined in the 1940 Act because of their relationship with ING Groep, N.V., the parent corporation of the Investment Adviser, Directed Services LLC and the Distributor, ING Investments Distributor, LLC. |
| (6) | | ING Investments, LLC was previously named ING Pilgrim Investments, LLC. ING Pilgrim Investments, LLC is the successor in interest to ING Pilgrim Investments, Inc., which was previously known as Pilgrim Investments, Inc. and before it was known as Pilgrim America Investments, Inc. |
| (7) | | ING Investments Distributor, LLC was previously named ING Funds Distributor, LLC. ING Funds Distributor, LLC is the successor in interest to ING Funds Distributor, Inc., which was previously known as ING Pilgrim Securities, Inc., and before that, was known as Pilgrim Securities, Inc., and before that was known as Pilgrim America Securities, Inc. |
| (8) | | ING Funds Services, LLC was previously named ING Pilgrim Group, LLC. ING Pilgrim Group, LLC is the successor in interest to ING Pilgrim Group, Inc., which was previously known as Pilgrim Group, Inc. and before that, was known as Pilgrim America Group, Inc. |
| (9) | | Directed Services LLC is the successor in interest to Directed Services, Inc. |
44
DIRECTOR AND OFFICER INFORMATION (UNAUDITED) (CONTINUED)
| | | | | | |
Name, Address and Age | | Position(s) Held with Company | | Term of Office and Length of Time Served(1) | | Principal Occupation(s) – During the Past 5 Years |
| | | |
Shaun P. Mathews(5) 7337 East Doubletree Ranch Rd. Suite 100 Scottsdale, Arizona 85258 Age: 55 | | President and Chief Executive Officer | | November 2006 - Present | | President and Chief Executive Officer, ING Investments, LLC (November 2006 - Present). Formerly, Head of ING Mutual Funds and Investment Products (November 2004 - November 2006). |
| | | |
Michael J. Roland 7337 East Doubletree Ranch Rd. Suite 100 Scottsdale, Arizona 85258 Age: 52 | | Executive Vice President | | January 2005 - Present | | Executive Vice President and Chief Operating Officer, ING Investments, LLC(2) and ING Funds Services, LLC(3) (January 207 - Present). Formerly, Executive Vice President, Head of Product Management (January 2005 - January 2007). |
| | | |
Stanley D. Vyner 230 Park Avenue New York, New York 10169 Age: 60 | | Executive Vice President and Chief Investment Risk Officer | | January 2005 - Present September 2009 - Present | | Executive Vice President, ING Investments, LLC(2) (July 2000 - Present) and Chief Investment Risk Officer, ING Investments, LLC(2) (January 2003 ? Present). |
| | | |
Joseph M. O’Donnell 7337 East Doubletree Ranch Rd. Suite 100 Scottsdale, Arizona 85258 Age: 56 | | Executive Vice President and Chief Compliance Officer | | March 2006 - Present January 2005 - Present | | Chief Compliance Officer of the ING Funds (November 2004 - Present); Executive Vice President of the ING Funds (March 2006 - Present); Chief Compliance Officer of ING Investments, LLC(2) (March 2006 - July 2008 and October 2009- Present); and Investment Advisor Chief Compliance Officer, Directed Services LLC(6) (March 2006 - July 2008 and October 2009- Present). Formerly, Investment Advisor Chief Compliance Officer, ING Life Insurance and Annuity Company (March 2006 - December 2006). |
| | | |
Todd Modic 7337 East Doubletree Ranch Rd. Suite 100 Scottsdale, Arizona 85258 Age: 43 | | Senior Vice President, Chief/Principal Financial Officer and Assistant Secretary | | March 2005 - Present | | Senior Vice President, ING Funds Services, LLC(3) (March 2005 - Present). |
| | | |
Kimberly A. Anderson 7337 East Doubletree Ranch Rd. Suite 100 Scottsdale, Arizona 85258 Age: 46 | | Senior Vice President | | January 2005 - Present | | Senior Vice President, ING Investments, LLC(2) (October 2003 - Present). |
| | | |
Robert Terris 7337 East Doubletree Ranch Rd. Suite 100 Scottsdale, Arizona 85258 Age: 40 | | Senior Vice President | | May 2006 - Present | | Senior Vice President, Head of Division Operations, ING Funds Services, LLC(3) (May 2006 ? Present). Formerly, Vice President of Administration, ING Funds Services, LLC(3) (October 2001 - May 2006). |
| | | |
Robyn L. Ichilov 7337 East Doubletree Ranch Rd. Suite 100 Scottsdale, Arizona 85258 Age: 43 | | Vice President and Treasurer | | January 2005 - Present | | Vice President and Treasurer, ING Funds Services, LLC(3) (November 1995 - Present) and ING Investments, LLC(2) (August 1997 - Present). |
| | | |
Lauren D. Bensinger 7337 East Doubletree Ranch Rd. Suite 100 Scottsdale, Arizona 85258 Age: 56 | | Vice President | | January 2005 - Present | | Vice President, ING Investments, LLC(2) and ING Funds Services, LLC (3) (February 1996 - Present); Director of Compliance, ING Investments, LLC(2) (October 2004 - Present); and Vice President and Money Laundering Reporting Officer, ING Investments Distributor, LLC(4) (April 2010 - Present). Formerly, Chief Compliance Officer, ING Investments Distributor, LLC (4) (August 1995 - April 2010). |
| | | |
William Evans 10 State House Square Hartford, Connecticut 06103 Age: 38 | | Vice President | | September 2007 - Present | | Senior Vice President (March 2010 - Present) and Head of Manager Research and Selection Group (April 2007 - Present). Formerly, Vice President, U.S. Mutual Funds and Investment Products (May 2005 - April 2007). |
45
DIRECTOR AND OFFICER INFORMATION (UNAUDITED) (CONTINUED)
| | | | | | |
Name, Address and Age | | Position(s) Held with Company | | Term of Office and Length of Time Served(1) | | Principal Occupation(s) – During the Past 5 Years |
| | | |
Maria M. Anderson 7337 East Doubletree Ranch Rd. Suite 100 Scottsdale, Arizona 85258 Age: 52 | | Vice President | | January 2005 - Present | | Vice President, ING Funds Services, LLC(3) (September 2004 - Present). |
| | | |
Denise Lewis 7337 East Doubletree Ranch Rd. Suite 100 Scottsdale, Arizona 85258 Age: 47 | | Vice President | | January 2007 - Present | | Vice President, ING Funds Services, LLC (December 2006 - Present). Formerly, Senior Vice President, UMB Investment Services Group, LLC (November 2003 - December 2006). |
| | | |
Kimberly K. Springer 7337 East Doubletree Ranch Rd. Suite 100 Scottsdale, Arizona 85258 Age: 53 | | Vice President | | March 2006 - Present | | Vice President, ING Investment Management -ING Funds (March 2010 - Present); Vice President, ING Funds Services, LLC(3) (March 2006 - Present) and Managing Paralegal, Registration Statements (June 2003 - Present). Formerly, Assistant Vice President, ING Funds Services, LLC(3) (August 2004 - March 2006). |
| | | |
Craig Wheeler 7337 East Doubletree Ranch Rd. Suite 100 Scottsdale, Arizona 85258 Age: 41 | | Assistant Vice President | | May 2008 - Present | | Assistant Vice President - Director of Tax, ING Funds Services (March 2008 - Present). Formerly, Tax Manager, ING Funds Services (March 2005 - March 2008). |
| | | |
Huey P. Falgout, Jr. 7337 East Doubletree Ranch Rd. Suite 100 Scottsdale, Arizona 85258 Age: 47 | | Secretary | | August 2003 - Present | | Senior Vice President and Chief Counsel, ING Investment Management -ING Funds (March 2010- Present). Formerly, Chief Counsel, ING Americas, U.S. Legal Services (October 2003 - March 2010). |
| | | |
Theresa K. Kelety 7337 East Doubletree Ranch Rd. Suite 100 Scottsdale, Arizona 85258 Age: 47 | | Assistant Secretary | | August 2003 - Present | | Vice President and Senior Counsel, ING Investment Management - ING Funds (March 2010-Present). Formerly, Senior Counsel, ING Americas, U.S. Legal Services (April 2008 - March 2010) and Counsel, ING Americas, U.S. Legal Services (April 2003 - April 2008). |
| | | |
Kathleen Nichols 7337 East Doubletree Ranch Rd. Suite 100 Scottsdale, Arizona 85258 Age: 35 | | Assistant Secretary | | May 2008 - Present | | Vice President and Counsel, ING Investment Management - ING Funds (March 2010 – Present). Formerly, Counsel, ING Americas, U.S. Legal Services (February 2008 - March 2010) and Associate, Ropes & Gray LLP (September 2005 - February 2008) |
| | | |
Paul Caldarelli 7337 East Doubletree Ranch Rd. Suite 100 Scottsdale, Arizona 85258 Age: 59 | | Assistant Secretary | | June 2010 - Present | | Vice President and Senior Counsel, ING Investment Management -ING Funds (March 2010-Present). Formerly, Senior Counsel, ING Americas, U.S. Legal Services (April 2008 - March 2010) and Counsel, ING Americas, U.S. Legal Services (May 2005 - April 2008). |
| (1) | | The officers hold office until the next annual meeting of the Trustees and until their successors shall have been elected and qualified. |
| (2) | | ING Investments, LLC was previously named ING Pilgrim Investments, LLC. ING Pilgrim Investments, LLC is the successor in interest to ING Pilgrim Investments, Inc., which was previously known as Pilgrim Investments, Inc. and before that was known as Pilgrim America Investments, Inc. |
| (3) | | ING Funds Services, LLC was previously named ING Pilgrim Group, LLC. ING Pilgrim Group, LLC is the successor in interest to ING Pilgrim Group, Inc., which was previously known as Pilgrim Group, Inc. and before that was known as Pilgrim America Group, Inc. |
| (4) | | ING Investments Distributor, LLC was previously named ING Funds Distributor, LLC. ING Funds Distributor, LLC is the successor in interest to ING Funds Distributor, Inc., which was previously known as ING Pilgrim Securities, Inc., and before that, was known as Pilgrim Securities, Inc., and before that was known as Pilgrim America Securities, Inc. |
| (5) | | Mr. Mathews commenced services as CEO and President of the ING Funds on November 11, 2006. |
| (6) | | Directed Services LLC is the successor in interest to Directed Services, Inc. |
46
ADVISORY CONTRACT APPROVAL DISCUSSION (UNAUDITED)
BOARD CONSIDERATION AND RE-APPROVAL OF INVESTMENT ADVISORY CONTRACTS
Section 15(c) of the Investment Company Act of 1940, as amended (the “1940 Act”) provides that, after an initial period, the Portfolios’ existing investment advisory contracts will remain in effect only if the Board of Directors (the “Board”) of ING Partners, Inc. (the “Company”), including a majority of Board members who have no direct or indirect interest in the advisory contracts, and who are not “interested persons” of the Portfolios, as such term is defined under the 1940 Act (the “Independent Directors”), annually review and approve them. Thus, at a meeting held on November 18, 2010, the Board, including a majority of the Independent Directors, considered whether to renew the investment advisory contracts (the “Advisory Contracts”) between Directed Services LLC (the “Adviser”) and the Portfolios.
The Independent Directors also held separate meetings on October 21 and November 16, 2010 to consider the renewal of the Advisory Contracts. As a result, subsequent references herein to factors considered and determinations made by the Independent Directors include, as applicable, factors considered and determinations made on those earlier dates by the Independent Directors.
At its November 18, 2010 meeting, the Board voted to renew the Advisory Contracts for the Portfolios. In reaching these decisions, the Board took into account information furnished to it throughout the year at regular meetings of the Board and the Board’s committees, as well as information prepared specifically in connection with the annual renewal process. Determinations by the Independent Directors also took into account various factors that they believed, in light of the legal advice furnished to them by K&L Gates LLP (“K&L Gates”), their independent legal counsel, and their own business judgment, to be relevant. Further, while the Advisory Contracts for all the Portfolios were considered at the same Board meeting, the Directors considered each Portfolio’s advisory relationship separately.
Provided below is an overview of the Board’s contract approval process in general, as well as a discussion of certain specific factors that the Board considered at its renewal meeting. While the Board gave its attention to the information furnished, at its request, that was most relevant to its considerations, discussed below are a number of the primary factors relevant to the Board’s consideration as to whether to renew the Advisory
Contracts for the one-year period ending November 30, 2011. Each Board member may have accorded different weight to the various factors in reaching his or her conclusions with respect to each Portfolio’s advisory arrangement.
Overview of the Contract Renewal and Approval Process
Several years ago, the Independent Directors instituted a revised process by which they seek and consider relevant information when they decide whether to approve new or existing advisory and arrangements for the investment companies in the ING Funds complex under their jurisdiction, including the Portfolios’ existing Advisory Contract. Among other actions, the Independent Directors: retained the services of independent consultants with experience in the mutual fund industry to assist the Independent Directors in working with the personnel employed by the Adviser or its affiliates who administer the Portfolios (“Management”) to identify the types of information presented to the Board to inform its deliberations with respect to advisory relationships and to help evaluate that information; established a specific format in which certain requested information is provided to the Board; and determined the process for reviewing such information in connection with Advisory Contract renewals and approvals. The end result was an enhanced process which is currently employed by the Independent Directors to review and analyze information in connection with their annual renewal of the ING Funds’ contracts, as well as their review and approval of new advisory relationships.
Since the current renewal and approval process was first implemented, the Board’s membership has changed substantially through periodic retirements of some Directors and the appointment and election of new Directors. In addition, throughout this period the Independent Directors have reviewed and refined the renewal and approval process at least annually. The Board also established a Contracts Committee and two Investment Review Committees, including the International/Balanced/Fixed Income Funds Investment Review Committee (the “I/B/F IRC”). Among other matters, the Contracts Committee provides oversight with respect to the contracts renewal and approval process, and each Portfolio is assigned to the I/B/F IRC, which provides oversight regarding, among other matters, investment performance. The Investment Review Committees may apply a heightened level of scrutiny in cases where performance has lagged an ING
47
ADVISORY CONTRACT APPROVAL DISCUSSION (UNAUDITED) (CONTINUED)
Fund’s relevant benchmark and/or selected peer groups of investment companies (“Selected Peer Groups”).
The type and format of the information provided to the Board or to legal counsel for the Independent Directors in connection with the contract approval and renewal process has been codified in the ING Funds’ 15(c) Methodology Guide. This Guide was developed under the direction of the Independent Directors and sets out a blueprint pursuant to which the Independent Directors request certain information that they deem important to facilitate an informed review in connection with initial and annual approvals of advisory contracts.
Management provides certain of the information requested by the 15(c) Methodology Guide in Fund Analysis and Comparison Tables (“FACT sheets”) prior to the Independent Directors’ review of advisory arrangements (including the Portfolios’ Advisory Contracts). The Independent Directors previously retained an independent firm to verify and test the accuracy of certain FACT sheet data for a representative sample of funds in the ING Funds complex. In addition, in recent years the Contracts Committee employed the services of an independent consultant to assist in its review and analysis of, among other matters, the 15(c) Methodology Guide, the content and format of the FACT sheets, and proposed Selected Peer Groups to be used by the Portfolios for certain comparison purposes during the renewal process. As part of an ongoing process, the Contracts Committee recommends or considers recommendations from Management for refinements to the 15(c) Methodology Guide and other aspects of the review process, and the Board’s I/B/F IRC reviews benchmarks used to assess the performance of funds in the ING Funds complex.
The Board employed its process for reviewing contracts when considering the renewals of the Portfolios’ Advisory Contracts that would be effective through November 30, 2011. Set forth below is a discussion of many of the Board’s primary considerations and conclusions resulting from this process.
Nature, Extent and Quality of Service
In determining whether to approve the Advisory Contracts for the Portfolios for the year ending November 30, 2011, the Independent Directors received and evaluated such information as they deemed necessary regarding the nature, extent and quality of services provided to the Portfolios by the Adviser. This included information regarding the Adviser provided
throughout the year at regular meetings of the Board and its committees, as well as information furnished in connection with the contract renewal meetings.
The materials requested by and provided to the Board and/or to K&L Gates prior to the November 18, 2010 Board meeting included, among other information, the following items for each Portfolio: (1) FACT sheets that provided information regarding the performance and expenses of the Portfolio and other similarly managed funds in its Selected Peer Group, as well as information regarding the Portfolio’s investment portfolio, objective and strategies; (2) reports providing risk and attribution analyses of the Portfolio; (3) the 15(c) Methodology Guide, which describes how the FACT sheets were prepared, including the manner in which each Portfolio’s benchmark and Selected Peer Group were selected and how profitability was determined; (4) responses from the Adviser to a series of questions posed by K&L Gates on behalf of the Independent Directors; (5) copies of the forms of Advisory Contracts; (6) copies of the Forms ADV for the Adviser; (7) financial statements for the Adviser; (8) a draft of a narrative summary addressing key factors the Board customarily considers in evaluating the renewals of the ING Funds’ (including the Portfolio’s) advisory contracts, including a written analysis for the Portfolio of how performance, fees and expenses compare to its Selected Peer Group and/or designated benchmark; (9) independent analyses of Portfolio performance by the Company’s Chief Investment Risk Officer; (10) information regarding net asset flows into and out of the Portfolio; and (11) other information relevant to the Board’s evaluations.
Institutional Class (Class I) shares of the Portfolios were used for purposes of certain comparisons between a Portfolio and its Selected Peer Group. Class I shares generally were selected so that the Portfolio’s share class with the longest performance history was compared to the analogous class of shares for each fund in its Selected Peer Group. It should be noted that the performance of the Portfolio primarily reflects the performance of the Underlying Funds in which it invests. Mutual funds chosen for inclusion in a Portfolio’s Selected Peer Group were selected based upon criteria designed to mirror the Portfolio’s share class being compared to the funds in the Selected Peer Group.
The Board noted the resources that the Adviser has committed to the Board and the I/B/F IRC to assist the Board and the I/B/F IRC with their assessment of the investment performance of the Portfolios on an
48
ADVISORY CONTRACT APPROVAL DISCUSSION (UNAUDITED) (CONTINUED)
on-going basis throughout the year. This includes the appointment of a Chief Investment Risk Officer and his staff, who report directly to the Board and who have developed attribution analyses and other metrics used by the Board’s Investment Review Committees to analyze the key factors underlying investment performance for the funds in the ING Funds complex.
The Board also noted the proactive approach that the Adviser, working in cooperation with the I/B/F IRC, has taken to advocate or recommend, when it believed appropriate, changes designed to assist in improving the Portfolios’ performance.
In considering the Portfolios’ Advisory Contracts, the Board also considered the extent of benefits provided to the Portfolios’ shareholders, beyond advisory services, from being part of the ING family of funds. This includes, in most cases, the right to exchange or transfer investments, without a sales charge, between the same class of shares of such funds or among ING Funds available on a product platform, and the wide range of ING Funds available for exchange or transfer. The Board also took into account the Adviser’s efforts in recent years to reduce the expenses of the ING Funds through renegotiated arrangements with the ING Funds’ service providers. In addition, the Board considered the efforts of the Adviser and the expenses that it incurred in recent years to help make the ING Funds complex more efficient by combinations of similar funds.
Further, the Board received periodic reports showing that the investment policies and restrictions for each Portfolio were consistently complied with and other periodic reports covering matters such as compliance by Adviser personnel with codes of ethics. The Board considered reports from the Company’s Chief Compliance Officer (“CCO”) evaluating whether the regulatory compliance systems and procedures of the Adviser are reasonably designed to assure compliance with the federal securities laws, including those related to, among others, late trading and market timing, best execution, fair value pricing, proxy voting and trade allocation practices. The Board also took into account the CCO’s annual and periodic reports and recommendations with respect to service provider compliance programs. In this regard, the Board also considered the policies and procedures developed by the CCO in consultation with the Board’s Compliance Committee that guide the CCO’s compliance oversight function.
The Board reviewed the level of staffing, quality and experience of each Portfolio’s portfolio management
team. The Board took into account the respective resources and reputation of the Adviser, and evaluated the ability of the Adviser to attract and retain qualified investment advisory personnel. The Board also considered the adequacy of the resources committed to the Portfolios (and other relevant funds in the ING Funds complex) by the Adviser, and whether those resources are commensurate with the needs of the Portfolios and are sufficient to sustain appropriate levels of performance and compliance needs. In this regard, the Board considered the financial stability of the Adviser.
Based on their deliberations and the materials presented to them, the Board concluded that the advisory and related services provided by the Adviser are appropriate in light of the Portfolios’ operations, the competitive landscape of the investment company business, and investor needs, and that the nature and quality of the overall services provided by the Adviser were appropriate.
Portfolio Performance
In assessing advisory relationships, the Board placed emphasis on the net investment returns of each Portfolio. While the Board considered the performance reports and discussions with portfolio managers at Board and committee meetings during the year, particular attention in assessing performance was given to the FACT sheets furnished in connection with the renewal process. The FACT sheet prepared for each Portfolio included its investment performance compared to the Portfolio’s Morningstar category median and/or Lipper category median, Selected Peer Group and primary benchmark. The FACT sheet performance data was as of June 30, 2010. In addition, the Board also considered at its November 18, 2010 meeting certain additional data regarding performance and Portfolio asset levels as of September 30, 2010. The Board’s findings specific to each Portfolio’s performance are discussed under “Portfolio-by-Portfolio Analysis” below.
Economies of Scale
When evaluating the reasonableness of advisory fee rates, the Board also considered whether economies of scale will be realized by the Adviser as a Portfolio grows larger and the extent to which any such economies are reflected in contractual fee rates. In this regard, the Board noted a Portfolio would benefit from waivers to fees payable at the Portfolio level, and considered the extent to which economies of scale could effectively be realized through expense reductions resulting from
49
ADVISORY CONTRACT APPROVAL DISCUSSION (UNAUDITED) (CONTINUED)
such waivers or breakpoint discounts. In evaluating fee breakpoint arrangements and economies of scale, the Independent Directors also considered prior periodic management reports and industry information on this topic.
The Board considered that in recent years many of the Portfolios experienced material declines in assets due to general market declines precipitated by the credit crises and other generally adverse market developments. As a result of these asset declines, the Board considered that there were fewer opportunities for certain of the Portfolios to realize economies of scale.
Information Regarding Services to Other Clients
The Board requested and considered information regarding the nature of services and fee rates offered by the Adviser to other clients, including other registered investment companies and institutional accounts. When fee rates offered to other clients differed materially from those charged to a Portfolio, the Board considered any underlying rationale provided by the Adviser for these differences. The Board also noted that the fee rates charged to the Portfolios and other institutional clients of the Adviser (including other investment companies) may differ materially due to, among other reasons: differences in services; different regulatory requirements associated with registered investment companies, such as the Portfolios, as compared to non-registered investment company clients; market differences in fee rates that existed when a Portfolio first was organized; differences in the original sponsors of Portfolios that now are managed by the Adviser; investment capacity constraints that existed when certain contracts were first agreed upon or that might exist at present; and different pricing structures that are necessary to be competitive in different marketing channels.
Fee Rates and Profitability
The Board reviewed and considered each contractual investment advisory fee rate, combined with the administrative fee rate, payable by each Portfolio to the Adviser. In addition, the Board considered fee waivers and expense limitations applicable to the fees payable by the Portfolios.
The Board considered: (1) the fee structure of each Portfolio as it relates to the services provided under the contracts; and (2) the potential fall-out benefits to the Adviser and its respective affiliates from their association with the Portfolios. For each Portfolio, the
Board determined that the fees payable to the Adviser are reasonable for the services that it performs, which were considered in light of the nature and quality of the services that it has performed and is expected to perform.
For each Portfolio, the Board considered information on revenues, costs and profits realized by the Adviser, which was prepared by Management in accordance with the allocation methodology (including related assumptions) specified in the 15(c) Methodology Guide. The Board also considered that there has not yet been a full recovery for many Portfolios from the substantial decline in assets caused by adverse economic conditions in recent years, which, in many cases, has adversely impacted profits realized by the Adviser. In addition, the Board considered information that it requested and was provided by Management with respect to the profitability of service providers affiliated with the Adviser.
The Board recognized that profitability analysis is not an exact science and there is no uniform methodology for determining profitability for this purpose. In this context, the Board realized that Management’s calculations regarding its costs incurred in establishing the infrastructure necessary for the Portfolios’ operations may not be fully reflected in the expenses allocated to each Portfolio in determining profitability, and that the information presented may not portray all of the costs borne by Management or capture Management’s entrepreneurial risk associated with offering and managing a mutual fund complex in the current regulatory and market environment. In addition, the Board recognized that the use of different methodologies for purposes of calculating profit data can give rise to dramatically different profit and loss results.
At the request of the Board, the Adviser has from time to time agreed to implement remedial actions for certain Portfolios. These remedial actions have included, among others: reductions in fee rates; changes in portfolio managers; and strategy modifications.
In making its determinations, the Board based its conclusions on the reasonableness of the advisory fees of the Adviser primarily on the factors described for each Portfolio below.
Portfolio-by-Portfolio Analysis
The following paragraphs outline certain of the specific factors that the Board considered, and the conclusions
50
ADVISORY CONTRACT APPROVAL DISCUSSION (UNAUDITED) (CONTINUED)
reached, at its November 18, 2010 meeting in relation to renewing each Portfolio’s current Advisory Contract. These specific factors are in addition to those considerations discussed above. In each case, the Portfolio’s performance was compared to its Morningstar category median and its primary benchmark, a broad-based securities market index that appears in the Portfolio’s prospectus. With respect to Morningstar quintile rankings, the first quintile represents the highest (best) performance and the fifth quintile represents the lowest performance. Each Portfolio’s management fee and expense ratio were compared to the fees and expense ratios of the funds in its Selected Peer Group.
ING Index Solution Income Portfolio
In considering whether to approve the renewal of the Advisory Contract for ING Index Solution Income Portfolio, the Board considered that, based on performance data for the periods ended June 30, 2010: (1) the Portfolio underperformed its Morningstar category median for all periods presented; (2) the Portfolio underperformed its primary benchmark for all periods presented; and (3) the Portfolio is ranked in the third quintile of its Morningstar category for the most recent calendar quarter and year-to-date periods, and the fifth (lowest) quintile for the one-year period.
In analyzing this performance data, the Board took into account: (1) the Portfolio commenced operations in March 2008, and therefore had a limited operating history for the purpose of analyzing its performance; (2) Management’s analysis of the negative effect that sector allocation in the underlying index funds in which the Portfolio invests had on the Portfolio’s performance; and (3) Management would continue to monitor, and the Board or its Investment Review Committee would periodically review, the Portfolio’s performance.
In considering the fees payable under the Advisory Contract for the Portfolio, the Board took into account the factors described above and also considered: (1) the fairness of the compensation under an Advisory Contract with a level fee rate that does not include breakpoints; and (2) the pricing structure (including the expense ratio to be borne by shareholders) of the Portfolio, as compared to its Selected Peer Group, including that: (a) the management fee for the Portfolio is below the median and the average management fees of the funds in its Selected Peer Group; and (b) the expense ratio for the Portfolio is below the median and the average expense ratios of the funds in its Selected Peer Group.
In analyzing the fee data, the Board took into account that the Portfolio indirectly bears the fees payable by the underlying index funds in which the Portfolio invests.
After its deliberation, the Board reached the following conclusions: (1) the Portfolio’s management fee rate is reasonable in the context of all factors considered by the Board; (2) the Portfolio’s expense ratio is reasonable in the context of all factors considered by the Board; and (3) the Portfolio commenced operations in March 2008, and it is reasonable to permit the Portfolio time to establish a longer performance record for the purposes of evaluating performance. Based on these conclusions and other factors, the Board voted to renew the Advisory Contract for the Portfolio for the year ending November 30, 2011. During this renewal process, different Board members may have given different weight to different individual factors and related conclusions.
ING Index Solution 2015 Portfolio
In considering whether to approve the renewal of the Advisory Contract for ING Index Solution 2015 Portfolio, the Board considered that, based on performance data for the periods ended June 30, 2010: (1) the Portfolio outperformed its Morningstar category median for all periods presented, with the exception of the one-year period, during which it underperformed; (2) the Portfolio underperformed its primary benchmark for all periods presented, with the exception of the most recent calendar quarter period, during which it outperformed; and (3) the Portfolio is ranked in the second quintile of its Morningstar category for the most recent calendar quarter and year-to-date periods, and the fifth (lowest) quintile for the one-year period.
In analyzing this performance data, the Board took into account: (1) the Portfolio commenced operations in March 2008, and therefore had a limited operating history for the purpose of analyzing its performance; (2) Management’s analysis of the negative effect that sector allocation in the underlying index funds in which the Portfolio invests had on the Portfolio’s performance; and (3) Management would continue to monitor, and the Board or its Investment Review Committee would periodically review, the Portfolio’s performance.
In considering the fees payable under the Advisory Contract for the Portfolio, the Board took into account the factors described above and also considered: (1) the fairness of the compensation under an Advisory
51
ADVISORY CONTRACT APPROVAL DISCUSSION (UNAUDITED) (CONTINUED)
Contract with a level fee rate that does not include breakpoints; and (2) the pricing structure (including the expense ratio to be borne by shareholders) of the Portfolio, as compared to its Selected Peer Group, including that: (a) the management fee for the Portfolio is below the median and the average management fees of the funds in its Selected Peer Group; and (b) the expense ratio for the Portfolio is below the median and the average expense ratios of the funds in its Selected Peer Group.
In analyzing the fee data, the Board took into account that the Portfolio indirectly bears the fees payable by the underlying funds in which the Portfolio invests.
After its deliberation, the Board reached the following conclusions: (1) the Portfolio’s management fee rate is reasonable in the context of all factors considered by the Board; (2) the Portfolio’s expense ratio is reasonable in the context of all factors considered by the Board; and (3) the Portfolio commenced operations in March 2008, and it is reasonable to permit the Portfolio time to establish a longer performance record for the purposes of evaluating performance. Based on these conclusions and other factors, the Board voted to renew the Advisory Contract for the Portfolio for the year ending November 30, 2011. During this renewal process, different Board members may have given different weight to different individual factors and related conclusions.
ING Index Solution 2025 Portfolio
In considering whether to approve the renewal of the Advisory Contract for ING Index Solution 2025 Portfolio, the Board considered that, based on performance data for the periods ended June 30, 2010: (1) the Portfolio underperformed its Morningstar category median for all periods; (2) the Portfolio underperformed its primary benchmark for all periods presented; and (3) the Portfolio is ranked in the fourth quintile of its Morningstar category for the most recent calendar quarter and year-to-date periods, and the fifth (lowest) quintile for the one-year period.
In analyzing this performance data, the Board took into account: (1) the Portfolio commenced operations in March 2008, and therefore had a limited operating history for the purpose of analyzing its performance; (2) Management’s analysis of the negative effect that sector allocation in the underlying index funds in which the Portfolio invests had on the Portfolio’s performance; and (3) Management would continue to monitor, and the Board or its Investment Review
Committee would periodically review, the Portfolio’s performance.
In considering the fees payable under the Advisory Contract for the Portfolio, the Board took into account the factors described above and also considered: (1) the fairness of the compensation under an Advisory Contract with a level fee rate that does not include breakpoints; and (2) the pricing structure (including the expense ratio to be borne by shareholders) of the Portfolio, as compared to its Selected Peer Group, including that: (a) the management fee for the Portfolio is below the median and the average management fees of the funds in its Selected Peer Group; and (b) the expense ratio for the Portfolio is below the median and the average expense ratios of the funds in its Selected Peer Group.
In analyzing the fee data, the Board took into account that the Portfolio indirectly bears the fees payable by the underlying index funds in which the Portfolio invests.
After its deliberation, the Board reached the following conclusions: (1) the Portfolio’s management fee rate is reasonable in the context of all factors considered by the Board; (2) the Portfolio’s expense ratio is reasonable in the context of all factors considered by the Board; and (3) the Portfolio commenced operations in March 2008, and it is reasonable to permit the Portfolio time to establish a longer performance record for the purposes of evaluating performance. Based on these conclusions and other factors, the Board voted to renew the Advisory Contract for the Portfolio for the year ending November 30, 2011. During this renewal process, different Board members may have given different weight to different individual factors and related conclusions.
ING Index Solution 2035 Portfolio
In considering whether to approve the renewal of the Advisory Contract for ING Index Solution 2035 Portfolio, the Board considered that, based on performance data for the periods ended June 30, 2010: (1) the Portfolio underperformed its Morningstar category median for all periods presented; (2) the Portfolio underperformed its primary benchmark for all periods presented; and (3) the Portfolio is ranked in the third quintile of its Morningstar category for the most recent calendar quarter, the fourth quintile for the year-to-date period, and the fifth (lowest) quintile for the one-year period.
In analyzing this performance data, the Board took into account: (1) the Portfolio commenced operations
52
ADVISORY CONTRACT APPROVAL DISCUSSION (UNAUDITED) (CONTINUED)
in March 2008, and therefore had a limited operating history for the purpose of analyzing its performance; (2) Management’s analysis of the negative effect that sector allocation in the underlying index funds in which the Portfolio invests had on the Portfolio’s performance; and (3) Management would continue to monitor, and the Board or its Investment Review Committee would periodically review, the Portfolio’s performance.
In considering the fees payable under the Advisory Contract for the Portfolio, the Board took into account the factors described above and also considered: (1) the fairness of the compensation under an Advisory Contract with a level fee rate that does not include breakpoints; and (2) the pricing structure (including the expense ratio to be borne by shareholders) of the Portfolio, as compared to its Selected Peer Group, including that: (a) the management fee for the Portfolio is below the median and the average management fees of the funds in its Selected Peer Group; and (b) the expense ratio for the Portfolio is below the median and the average expense ratios of the funds in its Selected Peer Group.
In analyzing the fee data, the Board took into account that the Portfolio indirectly bears the fees payable by the underlying index funds in which the Portfolio invests.
After its deliberation, the Board reached the following conclusions: (1) the Portfolio’s management fee rate is reasonable in the context of all factors considered by the Board; (2) the Portfolio’s expense ratio is reasonable in the context of all factors considered by the Board; and (3) the Portfolio commenced operations in March 2008, and it is reasonable to permit the Portfolio time to establish a longer performance record for the purposes of evaluating performance. Based on these conclusions and other factors, the Board voted to renew the Advisory Contract for the Portfolio for the year ending November 30, 2011. During this renewal process, different Board members may have given different weight to different individual factors and related conclusions.
ING Index Solution 2045 Portfolio
In considering whether to approve the renewal of the Advisory Contract for ING Index Solution 2045 Portfolio, the Board considered that, based on performance data for the periods ended June 30, 2010: (1) the Portfolio underperformed its Morningstar category median for all periods presented; (2) the Portfolio underperformed its primary benchmark for all periods presented; and
(3) the Portfolio is ranked in the fifth (lowest) quintile of its Morningstar category for all periods presented.
In analyzing this performance data, the Board took into account: (1) the Portfolio commenced operations in March 2008, and therefore had a limited operating history for the purpose of analyzing its performance; (2) Management’s analysis of the negative effect that sector allocation in the underlying index funds in which the Portfolio invests had on the Portfolio’s performance; and (3) Management would continue to monitor, and the Board or its Investment Review Committee would periodically review, the Portfolio’s performance.
In considering the fees payable under the Advisory Contract for the Portfolio, the Board took into account the factors described above and also considered: (1) the fairness of the compensation under an Advisory Contract with a level fee rate that does not include breakpoints; and (2) the pricing structure (including the expense ratio to be borne by shareholders) of the Portfolio, as compared to its Selected Peer Group, including that: (a) the management fee for the Portfolio is below the median and the average management fees of the funds in its Selected Peer Group; and (b) the expense ratio for the Portfolio is below the median and the average expense ratios of the funds in its Selected Peer Group.
In analyzing the fee data, the Board took into account that the Portfolio indirectly bears the fees payable by the underlying index funds in which the Portfolio invests.
After its deliberation, the Board reached the following conclusions: (1) the Portfolio’s management fee rate is reasonable in the context of all factors considered by the Board; (2) the Portfolio’s expense ratio is reasonable in the context of all factors considered by the Board; and (3) the Portfolio commenced operations in March 2008, and it is reasonable to permit the Portfolio time to establish a longer performance record for the purposes of evaluating performance. Based on these conclusions and other factors, the Board voted to renew the Advisory Contract for the Portfolio for the year ending November 30, 2011. During this renewal process, different Board members may have given different weight to different individual factors and related conclusions.
53
ADVISORY CONTRACT APPROVAL DISCUSSION (UNAUDITED) (CONTINUED)
ING Index Solution 2055 Portfolio
In considering whether to approve the renewal of the Advisory Contract for ING Index Solution 2055 Portfolio, the Board considered that, based on performance data for the periods ended June 30, 2010: (1) the Portfolio underperformed its Morningstar category median for all periods presented; (2) the Portfolio underperformed its primary benchmark for all periods presented; and (3) the Portfolio is ranked in the fifth (lowest) quintile of its Morningstar category for the most recent calendar quarter.
In analyzing this performance data, the Board took into account: (1) the Portfolio commenced operations in March 2010, and therefore had a limited operating history for the purpose of analyzing its performance; and (2) Management would continue to monitor, and the Board or its Investment Review Committee would periodically review, the Portfolio’s performance.
In considering the fees payable under the Advisory Contract for the Portfolio, the Board took into account the factors described above and also considered: (1) the fairness of the compensation under an Advisory Contract with a level fee rate that does not include breakpoints; and (2) the pricing structure (including the expense ratio to be borne by shareholders) of the Portfolio, as compared to its Selected Peer Group, including that: (a) the management fee for the Portfolio is below the median and the average management fees of the funds in its Selected Peer Group; and (b) the expense ratio for the Portfolio is below the median and the average expense ratios of the funds in its Selected Peer Group.
In analyzing the fee data, the Board took into account that the Portfolio indirectly bears the fees payable by the underlying funds in which the Portfolio invests.
After its deliberation, the Board reached the following conclusions: (1) the Portfolio’s management fee rate is reasonable in the context of all factors considered by the Board; (2) the Portfolio’s expense ratio is reasonable in the context of all factors considered by the Board; and (3) the Portfolio commenced operations in March 2010, and it is reasonable to permit the Portfolio time to establish a longer performance record for the purposes of evaluating performance. Based on these conclusions and other factors, the Board voted to renew the Advisory Contract for the Portfolio for the year ending November 30, 2011. During this renewal process, different Board members may have given different weight to different individual factors and related conclusions.
54
Investment Adviser
Directed Services LLC
1475 Dunwoody Drive
West Chester, Pennsylvania 19380
Administrator
ING Funds Services, LLC
7337 East Doubletree Ranch Road, Suite 100
Scottsdale, Arizona 85258
Distributor
ING Investments Distributor, LLC
7337 East Doubletree Ranch Road, Suite 100
Scottsdale, Arizona 85258
Transfer Agent
BNY Mellon Investment Servicing (U.S.) Inc.
301 Bellevue Parkway
Wilmington, Delaware 19809
Independent Registered Public
Accounting Firm
KPMG LLP
Two Financial Center
60 South Street
Boston, Massachusetts 02111
Custodian
The Bank of New York Mellon
One Wall Street
New York, New York 10286
Legal Counsel
Dechert LLP
1775 I Street, N.W.
Washington, D.C. 20006
Before investing, carefully consider the investment objectives, risks, charges and expenses of the variable universal life insurance policy or variable annuity contract and the underlying variable investment options. This and other information is contained in the prospectus for the variable universal life policy or variable annuity contract and the underlying variable investment options. Obtain these prospectuses from your agent/registered representative and read them carefully before investing.
| | | | | | | | |
 | | | | | | VAR-UISOL | | (1210-021611) |
Item 2. Code of Ethics.
As of the end of the period covered by this report, Registrant had adopted a code of ethics, as defined in Item 2 of Form N-CSR, that applies to the Registrant’s principal executive officer and principal financial officer. There were no amendments to the Code during the period covered by the report. The Registrant did not grant any waivers, including implicit waivers, from any provisions of the Code during the period covered by this report. The code of ethics is filed herewith pursuant to Item 10(a)(1), Exhibit 99.CODE ETH.
Item 3. Audit Committee Financial Expert.
The Board of Trustees has determined that J. Michael Earley and Peter Drotch are audit committee financial experts, as defined in Item 3 of Form N-CSR. Mr. Earley and Mr. Drotch are “independent” for purposes of Item 3 of Form N-CSR.
Item 4. Principal Accountant Fees and Services.
(a) Audit Fees: The aggregate fees billed for each of the last two fiscal years for professional services rendered by KPMG LLP (“KPMG”), the principal accountant for the audit of the registrant’s annual financial statements, for services that are normally provided by the accountant in connection with statutory and regulatory filings or engagements for those fiscal years were $709,000 for year ended December 31, 2010 and $610,000 for year ended December 31, 2009.
(b) Audit-Related Fees: The aggregate fees billed in each of the last two fiscal years for assurance and related services by KPMG that are reasonably related to the performance of the audit of the registrant’s financial statements and are not reported under paragraph (a) of this Item were $77,400 for year ended December 31, 2010 and $73,100 for year ended December 31, 2009.
(c) Tax Fees: The aggregate fees billed in each of the last two fiscal years for professional services rendered by KPMG for tax compliance, tax advice, and tax planning were $161,189 in the year ended December 31, 2010 and $150,850 in the year ended December 31, 2009. Such services included review of excise distribution calculations (if applicable), preparation of the Funds’ federal, state and excise tax returns, tax services related to mergers and routine consulting.
(d) All Other Fees: The aggregate fees billed in each of the last two fiscal years for products and services provided by KPMG, other than the services reported in paragraphs (a) through (c) of this Item were $0 in the year ended December 31, 2010 and $2,500 in the year ended December 31, 2009.
(e) (1) Audit Committee Pre-Approval Policies and Procedures
2
AUDIT AND NON-AUDIT SERVICES
PRE-APPROVAL POLICY
I. Statement of Principles
Under the Sarbanes-Oxley Act of 2002 (the “Act”), the Audit Committee of the Board of Directors or Trustees (the “Committee”) of the ING Funds (each a “Fund,” collectively, the “Funds”) set out on Exhibit A to this Audit and Non-Audit Services Pre-Approval Policy (“Policy”) is responsible for the oversight of the work of the Funds’ independent auditors. As part of its responsibilities, the Committee must pre-approve the audit and non-audit services performed by the auditors in order to assure that the provision of these services does not impair the auditors’ independence from the Funds. The Committee has adopted, and the Board has ratified, this Policy, which sets out the procedures and conditions under which the services of the independent auditors may be pre-approved.
Under Securities and Exchange Commission (“SEC”) rules promulgated in accordance with the Act, the Funds may establish two different approaches to pre-approving audit and non-audit services. The Committee may approve services without consideration of specific case-by-case services (“general pre-approval”) or it may pre-approve specific services (“specific pre-approval”). The Committee believes that the combination of these approaches contemplated in this Policy results in an effective and efficient method for pre-approving audit and non-audit services to be performed by the Funds’ independent auditors. Under this Policy, services that are not of a type that may receive general pre-approval require specific pre-approval by the Committee. Any proposed services that exceed pre-approved cost levels or budgeted amounts will also require the Committee’s specific pre-approval.
For both types of approval, the Committee considers whether the subject services are consistent with the SEC’s rules on auditor independence and that such services are compatible with maintaining the auditors independence. The Committee also considers whether a particular audit firm is in the best position to provide effective and efficient services to the Funds. Reasons that the auditors are in the best position include the auditors’ familiarity with the Funds’ business, personnel, culture, accounting systems, risk profile, and other factors, and whether the services will enhance the Funds’ ability to manage and control risk or improve audit quality. Such factors will be considered as a whole, with no one factor being determinative.
The appendices attached to this Policy describe the audit, audit-related, tax-related, and other services that have the Committee’s general pre-approval. For any service that has been approved through general pre-approval, the general pre-approval will remain in place for a period 12 months from the date of pre-approval, unless the Committee determines that a different period is appropriate. The Committee will annually review and pre-approve the services that may be provided by the independent auditors without specific pre-approval. The Committee will revise the list of services subject to general pre-approval as appropriate. This Policy does not serve as a delegation to Fund management of the Committee’s duty to pre-approve services performed by the Funds’ independent auditors.
3
II. Audit Services
The annual audit services engagement terms and fees are subject to the Committee’s specific pre-approval. Audit services are those services that are normally provided by auditors in connection with statutory and regulatory filings or engagements or those that generally only independent auditors can reasonably provide. They include the Funds’ annual financial statement audit and procedures that the independent auditors must perform in order to form an opinion on the Funds’ financial statements (e.g., information systems and procedural reviews and testing). The Committee will monitor the audit services engagement and approve any changes in terms, conditions or fees deemed by the Committee to be necessary or appropriate.
The Committee may grant general pre-approval to other audit services, such as statutory audits and services associated with SEC registration statements, periodic reports and other documents filed with the SEC or issued in connection with securities offerings.
The Committee has pre-approved the audit services listed on Appendix A. The Committee must specifically approve all audit services not listed on Appendix A.
III. Audit-related Services
Audit-related services are assurance and related services that are reasonably related to the performance of the audit or the review of the Funds’ financial statements or are traditionally performed by the independent auditors. The Committee believes that the provision of audit-related services will not impair the independent auditors’ independence, and therefore may grant pre-approval to audit-related services. Audit-related services include accounting consultations related to accounting, financial reporting or disclosure matters not classified as “audit services;” assistance with understanding and implementing new accounting and financial reporting guidance from rulemaking authorities; agreed-upon or expanded audit procedures relating to accounting and/or billing records required to respond to or comply with financial, accounting or regulatory reporting matters; and assistance with internal control reporting requirements under Form N-SAR or Form N-CSR.
The Committee has pre-approved the audit-related services listed on Appendix B. The Committee must specifically approve all audit-related services not listed on Appendix B.
IV. Tax Services
The Committee believes the independent auditors can provide tax services to the Funds, including tax compliance, tax planning, and tax advice, without compromising the auditors’ independence. Therefore, the Committee may grant general pre-approval with respect to tax services historically provided by the Funds’ independent auditors that do not, in the Committee’s view, impair auditor independence and that are consistent with the SEC’s rules on auditor independence.
The Committee will not grant pre-approval if the independent auditors initially recommends a transaction the sole business purpose of which is tax avoidance and the tax treatment of which may not be supported in the Internal Revenue Code and related regulations. The Committee may consult
4
outside counsel to determine that tax planning and reporting positions are consistent with this Policy.
The Committee has pre-approved the tax-related services listed on Appendix C. The Committee must specifically approve all tax-related services not listed on Appendix C.
V. Other Services
The Committee believes it may grant approval of non-audit services that are permissible services for independent auditors to a Fund. The Committee has determined to grant general pre-approval to other services that it believes are routine and recurring, do not impair auditor independence, and are consistent with SEC rules on auditor independence.
The Committee has pre-approved the non-audit services listed on Appendix D. The Committee must specifically approve all non-audit services not listed on Appendix D.
A list of the SEC’s prohibited non-audit services is attached to this Policy as Appendix E. The SEC’s rules and relevant guidance should be consulted to determine the precise definitions of these impermissible services and the applicability of exceptions to certain of the SEC’s prohibitions.
VI. Pre-approval of Fee levels and Budgeted Amounts
The Committee will annually establish pre-approval fee levels or budgeted amounts for audit, audit-related, tax and non-audit services to be provided to the Funds by the independent auditors. Any proposed services exceeding these levels or amounts require the Committee’s specific pre-approval. The Committee considers fees for audit and non-audit services when deciding whether to pre-approve services. The Committee may determine, for a pre-approval period of 12 months, the appropriate ratio between the total amount of fees for the Fund’s audit, audit-related, and tax services (including fees for services provided to Fund affiliates that are subject to pre-approval), and the total amount of fees for certain permissible non-audit services for the Fund classified as other services (including any such services provided to Fund affiliates that are subject to pre-approval).
VII. Procedures
Requests or applications for services to be provided by the independent auditors will be submitted to management. If management determines that the services do not fall within those services generally pre-approved by the Committee and set out in the appendices to these procedures, management will submit the services to the Committee or its delagee. Any such submission will include a detailed description of the services to be rendered. Notwithstanding this paragraph, the Committee will, on a quarterly basis, receive from the independent auditors a list of services provided for the previous calendar quarter on a cumulative basis by the auditors during the Pre-Approval Period.
5
VIII. Delegation
The Committee may delegate pre-approval authority to one or more of the Committee’s members. Any member or members to whom such pre-approval authority is delegated must report any pre-approval decisions, including any pre-approved services, to the Committee at its next scheduled meeting. The Committee will identify any member to whom pre-approval authority is delegated in writing. The member will retain such authority for a period of 12 months from the date of pre-approval unless the Committee determines that a different period is appropriate. The period of delegated authority may be terminated by the Committee or at the option of the member.
IX. Additional Requirements
The Committee will take any measures the Committee deems necessary or appropriate to oversee the work of the independent auditors and to assure the auditors’ independence from the Funds. This may include reviewing a formal written statement from the independent auditors delineating all relationships between the auditors and the Funds, consistent with Independence Standards Board No. 1, and discussing with the auditors their methods and procedures for ensuring independence.
Effective April 23, 2008, the KPMG LLP (“KPMG”) audit team for the ING Funds accepted the global responsibility for monitoring the auditor independence for KPMG relative to the ING Funds. Using a proprietary system called Sentinel, the audit team is able to identify and manage potential conflicts of interest across the member firms of the KPMG International Network and prevent the provision of prohibited services to the ING entities that would impair KPMG independence with the respect to the ING Funds. In addition to receiving pre-approval from the ING Funds Audit Committee for services provided to the ING Funds and for services for ING entities in the Investment Company Complex, the audit team has developed a process for periodic notification via email to the ING Funds’ Audit Committee Chairpersons regarding requests to provide services to ING Groep NV and its affiliates from KPMG offices worldwide. Additionally, KPMG provides a quarterly summary of the fees for services that have commenced for ING Groep NV and Affiliates at each Audit Committee Meeting.
6
Last Approved: September 29, 2010
7
Appendix A
Pre-Approved Audit Services for the Pre-Approval Period September 29, 2010 through December 31, 2011
Service
| | The Fund(s) | | Fee Range |
| | | | |
Statutory audits or financial audits (including tax services associated with audit services) | | �� | | As presented to Audit Committee(1) |
| | | | |
Services associated with SEC registration statements, periodic reports and other documents filed with the SEC or other documents issued in connection with securities offerings (e.g., consents), and assistance in responding to SEC comment letters. | | Ö | | Not to exceed $9,750 per filing |
| | | | |
Consultations by Fund management with respect to accounting or disclosure treatment of transactions or events and/or the actual or potential effect of final or proposed rules, standards or interpretations by the SEC, Financial Accounting Standards Board, or other regulatory or standard setting bodies. | | Ö | | Not to exceed $8,000 during the Pre-Approval Period |
| | | | |
Seed capital audit and related review and issuance of consent on the N-2 registration statement | | Ö | | Not to exceed $13,000 per audit |
(1) For new Funds launched during the Pre-Approval Period, the fee ranges pre-approved will be the same as those for existing Funds, pro-rated in accordance with inception dates as provided in the auditors’ Proposal or any Engagement Letter covering the period at issue. Fees in the Engagement Letter will be controlling.
8
Appendix B
Pre-Approved Audit-Related Services for the Pre-Approval Period September 29, 2010 through December 31, 2011
Service
| | The Fund(s) | | Fund Affiliates | | Fee Range |
| | | | | | |
Services related to Fund mergers (Excludes tax services - See Appendix C for tax services associated with Fund mergers) | | Ö | | Ö | | Not to exceed $10,000 per merger |
| | | | | | |
Consultations by Fund management with respect to accounting or disclosure treatment of transactions or events and/or the actual or potential effect of final or proposed rules, standards or interpretations by the SEC, Financial Accounting Standards Board, or other regulatory or standard setting bodies. [Note: Under SEC rules some consultations may be “audit” services and others may be “audit-related” services.] | | Ö | | | | Not to exceed $5,000 per occurrence during the Pre-Approval Period |
| | | | | | |
Review of the Funds’ semi-annual and quarterly financial statements | | Ö | | | | Not to exceed $2,400 per set of financial statements per fund |
| | | | | | |
Reports to regulatory or government agencies related to the annual engagement | | Ö | | | | Up to $5,000 per occurrence during the Pre-Approval Period |
| | | | | | |
Regulatory compliance assistance | | Ö | | Ö | | Not to exceed $5,000 per quarter |
| | | | | | |
Training courses | | | | Ö | | Not to exceed $2,000 per course |
| | | | | | |
For Prime Rate Trust, agreed upon procedures for quarterly reports to rating agencies | | Ö | | | | Not to exceed $9,450 per quarter |
9
Appendix C
Pre-Approved Tax Services for the Pre-Approval Period September 29, 2010 through December 31, 2011
Service
| | The Fund(s) | | Fund
Affiliates | | Fee Range |
| | | | | | |
Preparation of federal and state income tax returns and federal excise tax returns for the Funds including assistance and review with excise tax distributions | | Ö | | | | As presented to Audit Committee(2) |
| | | | | | |
Review of IRC Sections 851(b) and 817(h) diversification testing on a real-time basis | | Ö | | | | As presented to Audit Committee(2) |
| | | | | | |
Assistance and advice regarding year-end reporting for 1099’s | | Ö | | | | As presented to Audit Committee(2) |
| | | | | | |
Tax assistance and advice regarding statutory, regulatory or administrative developments | | Ö | | Ö | | Not to exceed $5,000 for the Funds or for the Funds’ investment adviser during the Pre-Approval Period |
(2) For new Funds launched during the Pre-Approval Period, the fee ranges pre-approved will be the same as those for existing Funds, pro-rated in accordance with inception dates as provided in the auditors’ Proposal or any Engagement Letter covering the period at issue. Fees in the Engagement Letter will be controlling.
10
Service
| | The Fund(s) | | Fund
Affiliates | | Fee Range |
| | | | | | |
Tax training courses | | | | Ö | | Not to exceed $2,000 per course during the Pre-Approval Period |
| | | | | | |
Tax services associated with Fund mergers | | Ö | | Ö | | Not to exceed $4,000 per fund per merger during the Pre-Approval Period |
| | | | | | |
Other tax-related assistance and consultation, including, without limitation, assistance in evaluating derivative financial instruments and international tax issues, qualification and distribution issues, and similar routine tax consultations. | | Ö | | | | Not to exceed $120,000 during the Pre-Approval Period |
11
Appendix D
Pre-Approved Other Services for the Pre-Approval Period September 29 , 2010 through December 31, 2011
Service
| | The Fund(s) | | Fund Affiliates | | Fee Range |
| | | | | | |
Agreed-upon procedures for Class B share 12b-1 programs | | | | Ö | | Not to exceed $60,000 during the Pre-Approval Period |
| | | | | | |
Security counts performed pursuant to Rule 17f-2 of the 1940 Act (i.e., counts for Funds holding securities with affiliated sub-custodians) Cost to be borne 50% by the Funds and 50% by ING Investments, LLC. | | Ö | | Ö | | Not to exceed $5,000 per Fund during the Pre-Approval Period |
| | | | | | |
Agreed upon procedures for 15 (c) FACT Books | | Ö | | | | Not to exceed $35,000 during the Pre-Approval Period |
12
Appendix E
Prohibited Non-Audit Services
Dated: September 29. 2010 to December 31, 2011
· Bookkeeping or other services related to the accounting records or financial statements of the Funds
· Financial information systems design and implementation
· Appraisal or valuation services, fairness opinions, or contribution-in-kind reports
· Actuarial services
· Internal audit outsourcing services
· Management functions
· Human resources
· Broker-dealer, investment adviser, or investment banking services
· Legal services
· Expert services unrelated to the audit
· Any other service that the Public Company Accounting Oversight Board determines, by regulation, is impermissible
13
EXHIBIT A
ING EQUITY TRUST
ING FUNDS TRUST
ING ASIA PACIFIC HIGH DIVIDEND EQUITY INCOME FUND
ING GLOBAL ADVANTAGE AND PREMIUM OPPORTUNITY FUND
ING GLOBAL EQUITY DIVIDEND AND PREMIUM OPPORTUNITY FUND
ING INTERNATIONAL HIGH DIVIDEND EQUITY INCOME FUND
ING INFRASTRUCTURE, INDUSTRIALS, AND MATERIALS FUND
ING RISK MANAGED NATURAL RESOURCES FUNDING INVESTORS TRUST
ING MAYFLOWER TRUST
ING MUTUAL FUNDS
ING PARTNERS, INC.
ING PRIME RATE TRUST
ING SENIOR INCOME FUND
ING SEPARATE PORTFOLIOS TRUST
ING VARIABLE INSURANCE TRUST
ING VARIABLE PRODUCTS TRUST
14
(e) (2) Percentage of services referred to in 4(b) — (4)(d) that were approved by the audit committee
100% of the services were approved by the audit committee.
(f) Percentage of hours expended attributable to work performed by other than full time employees of KPMG if greater than 50%.
Not applicable.
(g) Non-Audit Fees: The non-audit fees billed by the registrant’s accountant for services rendered to the registrant, and rendered to the registrant’s investment adviser, and any entity controlling, controlled by, or under common control with the adviser that provides ongoing services to the registrant for each of the last two fiscal years of the registrant were $1,220,728 for year ended December 31, 2010 and $2,106,219 for year ended December 31, 2009.
(h) Principal Accountants Independence: The Registrant’s Audit committee has considered whether the provision of non-audit services that were rendered to the registrant’s investment adviser and any entity controlling, controlled by, or under common control with the investment adviser that provides ongoing services to the registrant that were not pre-approved pursuant to Rule 2-01(c)(7)(ii) of Regulation S-X is compatible with maintaining KPMG’s independence.
15
Item 5. Audit Committee of Listed Registrants.
Not applicable.
16
Item 6. Schedule of Investments
Summary Schedule is included as part of the report to shareholders filed under Item 1 of this Form, if applicable.
17
Report of Independent Registered Public Accounting Firm
The Shareholders and Board of Trustees
ING Partners, Inc.
We have audited, in accordance with the standards of the Public Company Accounting Oversight Board (United States), the statements of assets and liabilities, including the summary portfolios of investments, of ING American Century Small-Mid Cap Value Portfolio, ING Baron Small Cap Growth Portfolio, ING Columbia Small Cap Value Portfolio, ING Davis New York Venture Portfolio, ING JPMorgan Mid Cap Value Portfolio, ING Legg Mason ClearBridge Aggressive Growth Portfolio (formerly, ING Legg Mason Partners Aggressive Growth Portfolio), ING Oppenheimer Global Portfolio, ING Oppenheimer Global Strategic Income Portfolio (formerly, ING Oppenheimer Strategic Income Portfolio), ING PIMCO Total Return Portfolio, ING Pioneer High Yield Portfolio, ING T. Rowe Price Diversified Mid Cap Growth Portfolio, ING T. Rowe Price Growth Equity Portfolio, ING Templeton Foreign Equity Portfolio, ING UBS U.S. Large Cap Equity Portfolio, ING Van Kampen Comstock Portfolio, and ING Van Kampen Equity and Income Portfolio, each a series of ING Partners, Inc., as of December 31, 2010, and the related statements of operations for the year then ended, the statements of changes in net assets for each of the years in the two-year period then ended, and the financial highlights for each of the years or periods in the five-year period then ended and have issued our unqualified report thereon dated February 24, 2011 (which report and financial statements are included in Item 1 of this Certified Shareholder Report on Form N-CSR). In connection with our audits of the aforementioned financial statements and financial highlights, we also audited the related portfolios of investments included in Item 6 of this Form N-CSR. The portfolios of investments are the responsibility of management. Our responsibility is to express an opinion on the portfolios of investments based on our audits.
In our opinion, the portfolios of investments, when considered in relation to the basic financial statements taken as a whole, present fairly, in all material respects, the information set forth therein.

Boston, Massachusetts
March 7, 2011
| | PORTFOLIO OF INVESTMENTS |
ING American Century Small-Mid Cap Value Portfolio | | as of December 31, 2010 |
Shares | | | | | | Value | |
| | | | | | | |
COMMON STOCK: 89.1% | | | | | |
| | | | Consumer Discretionary: 10.9% | | | |
10,300 | | @ | | Aeropostale, Inc. | | $ | 253,792 | |
14,900 | | | | American Eagle Outfitters | | 217,987 | |
10,700 | | @ | | Arctic Cat, Inc. | | 156,648 | |
3,000 | | @ | | Bally Technologies, Inc. | | 126,570 | |
41,300 | | @ | | Belo Corp. | | 292,404 | |
22,000 | | | | Best Buy Co., Inc. | | 754,380 | |
11,800 | | @ | | Big Lots, Inc. | | 359,428 | |
4,600 | | | | Bob Evans Farms, Inc. | | 151,616 | |
15,800 | | | | Brinker International, Inc. | | 329,904 | |
12,700 | | | | Brown Shoe Co., Inc. | | 176,911 | |
7,700 | | @ | | Cabela’s, Inc. | | 167,475 | |
3,800 | | | | Cato Corp. | | 104,158 | |
35,900 | | @ | | CEC Entertainment, Inc. | | 1,393,997 | |
32,800 | | @ | | Charming Shoppes, Inc. | | 116,440 | |
33,900 | | | | Christopher & Banks Corp. | | 208,485 | |
43,300 | | @ | | Coldwater Creek, Inc. | | 137,261 | |
18,100 | | @ | | Collective Brands, Inc. | | 381,910 | |
5,300 | | | | Cooper Tire & Rubber Co. | | 124,974 | |
5,600 | | @ | | Core-Mark Holding Co., Inc. | | 199,304 | |
7,200 | | L | | CSS Industries, Inc. | | 148,392 | |
15,100 | | @ | | Culp, Inc. | | 156,436 | |
20,600 | | @ | | Dana Holding Corp. | | 354,526 | |
10,700 | | @ | | Dress Barn, Inc. | | 282,694 | |
10,456 | | @ | | Entercom Communications Corp. | | 121,080 | |
86,400 | | @ | | Entravision Communications Corp. | | 222,048 | |
6,200 | | | | Ethan Allen Interiors, Inc. | | 124,062 | |
46,200 | | @ | | EW Scripps Co. | | 468,930 | |
12,500 | | | | Finish Line | | 214,875 | |
15,600 | | | | Fred’s, Inc. | | 214,656 | |
36,700 | | @, L | | Furniture Brands International, Inc. | | 188,638 | |
28,200 | | | | Gannett Co., Inc. | | 425,538 | |
8,400 | | @ | | Genesco, Inc. | | 314,916 | |
7,959 | | | | Genuine Parts Co. | | 408,615 | |
2,800 | | L | | Group 1 Automotive, Inc. | | 116,928 | |
10,000 | | | | Harte-Hanks, Inc. | | 127,700 | |
4,300 | | @ | | Helen of Troy Ltd. | | 127,882 | |
18,000 | | | | HOT Topic, Inc. | | 112,860 | |
22,417 | | | | International Speedway Corp. | | 586,653 | |
9,400 | | @ | | Jack in the Box, Inc. | | 198,622 | |
17,200 | | | | Jones Group, Inc. | | 267,288 | |
31,900 | | @ | | Journal Communications, Inc. | | 161,095 | |
11,900 | | @ | | Knology, Inc. | | 185,997 | |
54,600 | | @ | | Lin TV Corp. | | 289,380 | |
99,500 | | | | Lowe’s Cos., Inc. | | 2,495,460 | |
9,400 | | | | Mattel, Inc. | | 239,042 | |
5,500 | | | | MDC Holdings, Inc. | | 158,235 | |
7,300 | | L | | Men’s Wearhouse, Inc. | | 182,354 | |
31,500 | | @, L | | New York & Co., Inc. | | 139,230 | |
10,500 | | @ | | Orient-Express Hotels Ltd. | | 136,395 | |
7,500 | | @ | | Penske Auto Group, Inc. | | 130,650 | |
7,700 | | | | PEP Boys-Manny Moe & Jack | | 103,411 | |
20,400 | | | | RadioShack Corp. | | 377,196 | |
10,400 | | @ | | Red Robin Gourmet Burgers, Inc. | | 223,288 | |
6,900 | | | | Regis Corp. | | 114,540 | |
2,300 | | | | Rent-A-Center, Inc. | | 74,244 | |
6,600 | | @ | | Ruby Tuesday, Inc. | | 86,196 | |
24,988 | | | | Speedway Motorsports, Inc. | | 382,816 | |
7,500 | | | | Stage Stores, Inc. | | 130,050 | |
12,600 | | | | Standard Motor Products, Inc. | | 172,620 | |
8,300 | | | | Stanley Black & Decker, Inc. | | 555,021 | |
66,000 | | | | Staples, Inc. | | 1,502,820 | |
8,600 | | @, L | | Systemax, Inc. | | 121,260 | |
7,900 | | | | Target Corp. | | 475,027 | |
25,200 | | @ | | Toll Brothers, Inc. | | 478,800 | |
14,100 | | @ | | True Religion Apparel, Inc. | | 313,866 | |
3,900 | | @ | | Vail Resorts, Inc. | | 202,956 | |
10,400 | | | | Whirlpool Corp. | | 923,832 | |
| | | | | | 21,192,764 | |
| | | | Consumer Staples: 6.8% | | | |
11,500 | | | | Clorox Co. | | 727,720 | |
91,678 | | | | ConAgra Foods, Inc. | | 2,070,089 | |
| | | | | | | | |
39,900 | | | | CVS Caremark Corp. | | 1,387,323 | |
9,200 | | | | Farmer Bros Co. | | 163,760 | |
25,700 | | | | General Mills, Inc. | | 914,663 | |
28,000 | | | | HJ Heinz Co. | | 1,384,880 | |
35,900 | | | | Kellogg Co. | | 1,833,772 | |
37,823 | | | | Kimberly-Clark Corp. | | 2,384,362 | |
14,000 | | @ | | Prestige Brands Holdings, Inc. | | 167,300 | |
10,300 | | @ | | Primo Water Corp. | | 146,363 | |
5,200 | | @ | | Ralcorp Holdings, Inc. | | 338,052 | |
2,900 | | | | Ruddick Corp. | | 106,836 | |
6,600 | | @, L | | Seneca Foods Corp. | | 178,068 | |
13,200 | | | | Sysco Corp. | | 388,080 | |
5,200 | | @ | | TreeHouse Foods, Inc. | | 265,668 | |
4,400 | | L | | Village Super Market | | 145,200 | |
2,100 | | | | WD-40 Co. | | 84,588 | |
9,900 | | | | Weis Markets, Inc. | | 399,267 | |
| | | | | | 13,085,991 | |
| | | | Energy: 8.3% | | | |
2,100 | | @ | | Alpha Natural Resources, Inc. | | 126,063 | |
9,600 | | | | Baker Hughes, Inc. | | 548,832 | |
7,100 | | | | Berry Petroleum Co. | | 310,270 | |
6,200 | | @ | | Bill Barrett Corp. | | 255,006 | |
4,400 | | @ | | Bristow Group, Inc. | | 208,340 | |
43,900 | | @ | | Cal Dive International, Inc. | | 248,913 | |
14,200 | | | | Devon Energy Corp. | | 1,114,842 | |
34,100 | | @ | | DHT Maritime, Inc. | | 158,565 | |
3,700 | | | | EOG Resources, Inc. | | 338,217 | |
42,597 | | | | EQT Corp. | | 1,910,049 | |
3,300 | | @ | | Forest Oil Corp. | | 125,301 | |
19,100 | | @ | | Frontier Oil Corp. | | 343,991 | |
17,700 | | @ | | Global Industries Ltd. | | 122,661 | |
10,900 | | @, L | | Goodrich Petroleum Corp. | | 192,276 | |
15,400 | | @ | | Helix Energy Solutions Group, Inc. | | 186,956 | |
6,000 | | | | Hugoton Royalty Trust | | 123,120 | |
78,700 | | | | Imperial Oil Ltd. | | 3,211,954 | |
20,200 | | @ | | Key Energy Services, Inc. | | 262,196 | |
15,300 | | | | Murphy Oil Corp. | | 1,140,615 | |
5,100 | | | | Noble Energy, Inc. | | 439,008 | |
17,600 | | L | | Nordic American Tanker Shipping | | 457,952 | |
12,900 | | @ | | North American Energy Partners, Inc. | | 158,154 | |
19,472 | | L | | Overseas Shipholding Group | | 689,698 | |
21,400 | | | | Penn Virginia Corp. | | 359,948 | |
4,300 | | @ | | Petroleum Development Corp. | | 181,503 | |
3,200 | | @ | | Rosetta Resources, Inc. | | 120,448 | |
3,400 | | @ | | Rowan Cos., Inc. | | 118,694 | |
25,000 | | @ | | SandRidge Energy, Inc. | | 183,000 | |
16,500 | | @ | | Southwestern Energy Co. | | 617,595 | |
18,200 | | | | Spectra Energy Partners L.P. | | 597,870 | |
3,600 | | @ | | Superior Energy Services | | 125,964 | |
9,600 | | @ | | Swift Energy Co. | | 375,840 | |
31,000 | | @ | | Tetra Technologies, Inc. | | 367,970 | |
5,400 | | @ | | Unit Corp. | | 250,992 | |
8,000 | | L | | W&T Offshore, Inc. | | 142,960 | |
| | | | | | 16,115,763 | |
| | | | Financials: 20.6% | | | |
22,800 | | | | ACE Ltd. | | 1,419,300 | |
34,900 | | | | Allstate Corp. | | 1,112,612 | |
16,500 | | | | Alterra Capital Holdings Ltd. | | 357,060 | |
10,400 | | | | American Equity Investment Life Holding Co. | | 130,520 | |
6,300 | | L | | American National Bankshares I | | 148,365 | |
39,500 | | | | AON Corp. | | 1,817,395 | |
32,800 | | | | Apollo Investment Corp. | | 363,096 | |
17,300 | | | | Ares Capital Corp. | | 285,104 | |
22,100 | | | | Artio Global Investors, Inc. | | 325,975 | |
16,500 | | L | | Associated Banc-Corp. | | 249,975 | |
7,400 | | | | Baldwin & Lyons, Inc. | | 174,122 | |
11,300 | | L | | Bancorpsouth, Inc. | | 180,235 | |
1,500 | | | | Blackrock, Inc. | | 285,870 | |
38,800 | | | | Boston Private Financial Holdings, Inc. | | 254,140 | |
11,700 | | L | | Brookline Bancorp., Inc. | | 126,945 | |
14,600 | | | | Calamos Asset Management, Inc. | | 204,400 | |
49,061 | | | | Capitol Federal Financial, Inc. | | 584,317 | |
31,100 | | | | Charles Schwab Corp. | | 532,121 | |
14,200 | | | | Chubb Corp. | | 846,888 | |
37,136 | | | | Comerica, Inc. | | 1,568,625 | |
38,401 | | | | Commerce Bancshares, Inc. | | 1,525,672 | |
4,800 | | | | Community Bank System, Inc. | | 133,296 | |
11,500 | | | | Compass Diversified Trust | | 203,435 | |
2,900 | | | | Cullen/Frost Bankers, Inc. | | 177,248 | |
13,000 | | | | CVB Financial Corp. | | 112,710 | |
6,200 | | | | East-West Bancorp., Inc. | | 121,210 | |
13,100 | | | | Fifth Street Finance Corp. | | 159,034 | |
14,200 | | | | First Commonwealth Financial Corp. | | 100,536 | |
13,700 | | | | First Financial Holdings, Inc. | | 157,687 | |
26,200 | | L | | First Financial Northwest, Inc. | | 105,062 | |
56,359 | | @ | | First Horizon National Corp. | | 663,909 | |
8,900 | | | | First Interstate Bancsystem, Inc. | | 135,636 | |
17,200 | | | | First Midwest Bancorp., Inc. | | 198,144 | |
21,900 | | L | | First Niagara Financial Group, Inc. | | 306,162 | |
4,973 | | @ | | First Republic Bank | | 144,814 | |
15,700 | | | | FirstMerit Corp. | | 310,703 | |
8,600 | | | | Flushing Financial Corp. | | 120,400 | |
22,100 | | | | FNB Corp. | | 217,022 | |
5,100 | | | | Franklin Resources, Inc. | | 567,171 | |
37,900 | | | | Fulton Financial Corp. | | 391,886 | |
5,200 | | | | Hanover Insurance Group, Inc. | | 242,944 | |
87,689 | | | | HCC Insurance Holdings, Inc. | | 2,537,719 | |
16,200 | | | | Hercules Technology Growth Capital, Inc. | | 167,832 | |
14,820 | | @ | | Heritage Financial Corp. | | 206,294 | |
15,500 | | @ | | HFF, Inc. | | 149,730 | |
116,700 | | | | Hudson City Bancorp., Inc. | | 1,486,758 | |
3,700 | | | | IBERIABANK Corp. | | 218,781 | |
10,200 | | @ | | Investment Technology Group, Inc. | | 166,974 | |
11,459 | | | | Kaiser Federal Financial Group, Inc. | | 132,695 | |
10,000 | | @ | | Knight Capital Group, Inc. | | 137,900 | |
8,600 | | | | Lakeland Financial Corp. | | 184,556 | |
61,876 | | | | Marsh & McLennan Cos., Inc. | | 1,691,690 | |
24,000 | | | | Marshall & Ilsley Corp. | | 166,080 | |
7,300 | | | | MB Financial Corp. | | 126,436 | |
18,000 | | | | MCG Capital Corp. | | 125,460 | |
13,200 | | | | Mercer Insurance Group, Inc. | | 369,468 | |
4,500 | | | | National Bankshares, Inc. | | 141,705 | |
49,305 | | | | Northern Trust Corp. | | 2,731,990 | |
17,100 | | | | Old National Bancorp. | | 203,319 | |
11,800 | | | | Oritani Financial Corp. | | 144,432 | |
12,100 | | L | | Pacific Continental Corp. | | 121,726 | |
32,400 | | @ | | Park Sterling Bank | | 199,584 | |
17,000 | | | | PennantPark Investment Corp. | | 208,080 | |
117,378 | | | | People’s United Financial, Inc. | | 1,644,466 | |
7,000 | | @, L | | Piper Jaffray Cos. | | 245,070 | |
5,900 | | | | Platinum Underwriters Holdings Ltd. | | 265,323 | |
25,500 | | @ | | PMI Group, Inc. | | 84,150 | |
3,500 | | @ | | ProAssurance Corp. | | 212,100 | |
11,000 | | | | Prospect Capital Corp. | | 118,800 | |
15,600 | | | | Provident Financial Services, Inc. | | 236,028 | |
6,400 | | | | Pzena Investment Management, Inc. | | 47,040 | |
25,400 | | | | Radian Group, Inc. | | 204,978 | |
10,000 | | | | State Street Corp. | | 463,400 | |
36,900 | | | | Sterling Bancshares, Inc. | | 259,038 | |
22,700 | | | | SunTrust Bank | | 669,877 | |
53,767 | | | | Symetra Financial Corp. | | 736,608 | |
48,900 | | L | | Synovus Financial Corp. | | 129,096 | |
35,700 | | @ | | TradeStation Group, Inc. | | 240,975 | |
27,223 | | | | Transatlantic Holdings, Inc. | | 1,405,251 | |
26,000 | | | | Travelers Cos., Inc. | | 1,448,460 | |
10,500 | | | | Trico Bancshares | | 169,575 | |
6,100 | | | | Trustmark Corp. | | 151,524 | |
4,900 | | L | | United Bankshares, Inc. | | 143,080 | |
5,800 | | | | United Fire & Casualty Co. | | 129,456 | |
18,800 | | | | UnumProvident Corp. | | 455,336 | |
4,667 | | @ | | Validus Holdings Ltd. | | 142,857 | |
5,500 | | | | Waddell & Reed Financial, Inc. | | 194,095 | |
10,500 | | | | Washington Banking Co. | | 143,955 | |
9,500 | | | | Washington Federal, Inc. | | 160,740 | |
22,400 | | | | Webster Financial Corp. | | 441,280 | |
20,700 | | | | Whitney Holding Corp. | | 292,905 | |
6,700 | | L | | Wintrust Financial Corp. | | 221,301 | |
5,200 | | | | Zions Bancorp. | | 125,996 | |
| | | | | | 39,863,715 | |
| | | | Health Care: 7.5% | | | |
50,719 | | @ | | Alliance Imaging, Inc. | | 215,049 | |
3,200 | | @ | | Almost Family, Inc. | | 122,944 | |
3,400 | | @ | | AMERIGROUP Corp. | | 149,328 | |
11,200 | | @ | | Amsurg Corp. | | 234,640 | |
2,187 | | | | Analogic Corp. | | 108,278 | |
4,700 | | @ | | Assisted Living Concepts, Inc. | | 152,891 | |
27,401 | | | | Beckman Coulter, Inc. | | 2,061,377 | |
76,800 | | @ | | Boston Scientific Corp. | | 581,376 | |
38,351 | | @ | | CareFusion Corp. | | 985,621 | |
2,500 | | | | Chemed Corp. | | 158,775 | |
3,200 | | @ | | Community Health Systems, Inc. | | 119,584 | |
12,100 | | | | Covidien PLC | | 552,486 | |
23,800 | | @ | | Cutera, Inc. | | 197,302 | |
16,800 | | @ | | Health Management Associates, Inc. | | 160,272 | |
4,000 | | @, L | | ICU Medical, Inc. | | 146,000 | |
11,200 | | @ | | Impax Laboratories, Inc. | | 225,232 | |
7,700 | | @ | | Kindred Healthcare, Inc. | | 141,449 | |
42,900 | | @ | | LifePoint Hospitals, Inc. | | 1,576,575 | |
7,400 | | | | Medicis Pharmaceutical Corp. | | 198,246 | |
11,100 | | | | National Healthcare Corp. | | 513,597 | |
12,100 | | | | Owens & Minor, Inc. | | 356,103 | |
51,300 | | | | Patterson Cos., Inc. | | 1,571,319 | |
7,700 | | | | Pharmaceutical Product Development, Inc. | | 208,978 | |
37,586 | | @ | | Select Medical Holdings Corp. | | 274,754 | |
6,200 | | @ | | Sun Healthcare Group, Inc. | | 78,492 | |
18,124 | | @ | | Symmetry Medical, Inc. | | 167,647 | |
10,600 | | @ | | Talecris Biotherapeutics Holdings Corp. | | 246,980 | |
10,000 | | @ | | US Physical Therapy, Inc. | | 198,200 | |
6,300 | | | | Utah Medical Products, Inc. | | 168,021 | |
22,800 | | | | Young Innovations, Inc. | | 729,828 | |
36,100 | | @ | | Zimmer Holdings, Inc. | | 1,937,848 | |
| | | | | | 14,539,192 | |
| | | | Industrials: 15.0% | | | |
8,000 | | @ | | AAR Corp. | | 219,760 | |
4,200 | | | | Actuant Corp. | | 111,804 | |
2,300 | | | | Acuity Brands, Inc. | | 132,641 | |
4,200 | | @ | | Aerovironment, Inc. | | 112,686 | |
3,600 | | @ | | Alaska Air Group, Inc. | | 204,084 | |
3,900 | | | | Alexander & Baldwin, Inc. | | 156,117 | |
2,500 | | @, L | | Allegiant Travel Co. | | 123,100 | |
4,658 | | @ | | Alliant Techsystems, Inc. | | 346,695 | |
39,922 | | @ | | Altra Holdings, Inc. | | 792,851 | |
10,300 | | | | Apogee Enterprises, Inc. | | 138,741 | |
5,800 | | | | Arkansas Best Corp. | | 159,036 | |
7,600 | | | | Barnes Group, Inc. | | 157,092 | |
42,400 | | @ | | Beacon Roofing Supply, Inc. | | 757,688 | |
5,400 | | | | Belden CDT, Inc. | | 198,828 | |
11,400 | | | | Brady Corp. | | 371,754 | |
6,300 | | | | Briggs & Stratton Corp. | | 124,047 | |
8,300 | | | | Brink’s Co. | | 223,104 | |
10,700 | | | | CDI Corp. | | 198,913 | |
4,000 | | @ | | Ceradyne, Inc. | | 126,120 | |
26,100 | | | | Cintas Corp. | | 729,756 | |
9,100 | | @ | | Colfax Corp. | | 167,531 | |
9,500 | | | | Comfort Systems USA, Inc. | | 125,115 | |
33,100 | | | | Curtiss-Wright Corp. | | 1,098,920 | |
27,800 | | @ | | Diana Shipping, Inc. | | 334,156 | |
5,900 | | | | Douglas Dynamics, Inc. | | 89,385 | |
10,300 | | | | Dynamic Materials Corp. | | 232,471 | |
11,800 | | @ | | EMCOR Group, Inc. | | 341,964 | |
15,000 | | | | Encore Wire Corp. | | 376,200 | |
2,600 | | @ | | Esterline Technologies Corp. | | 178,334 | |
3,100 | | | | Freightcar America, Inc. | | 89,714 | |
3,600 | | | | GATX Corp. | | 127,008 | |
15,100 | | @, L | | Genco Shipping & Trading Ltd. | | 217,440 | |
33,500 | | | | Granite Construction, Inc. | | 918,905 | |
3,400 | | @ | | Griffon Corp. | | 43,316 | |
31,600 | | | | Harsco Corp. | | 894,912 | |
8,500 | | L | | Heidrick & Struggles International, Inc. | | 243,525 | |
24,842 | | | | Hubbell, Inc. | | 1,493,749 | |
9,200 | | | | IESI-BFC Ltd. | | 223,560 | |
21,300 | | | | ITT Corp. | | 1,109,943 | |
45,200 | | @, L | | JetBlue Airways Corp. | | 298,772 | |
5,800 | | | | Kaman Corp. | | 168,606 | |
37,134 | | | | Kaydon Corp. | | 1,512,096 | |
11,300 | | @ | | Kforce, Inc. | | 182,834 | |
13,400 | | @ | | Korn/Ferry International | | 309,674 | |
9,300 | | | | Lawson Products | | 231,477 | |
2,900 | | | | Lincoln Electric Holdings, Inc. | | 189,283 | |
20,700 | | | | LSI Industries, Inc. | | 175,122 | |
18,100 | | @ | | Mistras Group, Inc. | | 243,988 | |
6,300 | | @ | | Moog, Inc. | | 250,740 | |
15,300 | | | | Mueller Industries, Inc. | | 500,310 | |
56,700 | | | | Mueller Water Products, Inc. | | 236,439 | |
4,200 | | @ | | Old Dominion Freight Line | | 134,358 | |
6,700 | | @ | | Orbital Sciences Corp. | | 114,771 | |
4,600 | | @ | | Oshkosh Truck Corp. | | 162,104 | |
29,200 | | @, L | | Pike Electric Corp. | | 250,536 | |
23,000 | | | | Pitney Bowes, Inc. | | 556,140 | |
2,100 | | | | Regal-Beloit Corp. | | 140,196 | |
115,817 | | | | Republic Services, Inc. | | 3,458,296 | |
6,700 | | L | | Robbins & Myers, Inc. | | 239,726 | |
3,600 | | | | Simpson Manufacturing Co., Inc. | | 111,276 | |
6,400 | | | | Skywest, Inc. | | 99,968 | |
35,500 | | | | Southwest Airlines Co. | | 460,790 | |
17,100 | | @ | | SYKES Enterprises, Inc. | | 346,446 | |
36,900 | | @ | | Thomas & Betts Corp. | | 1,782,270 | |
3,100 | | | | Towers Watson & Co. | | 161,386 | |
5,900 | | | | Tredegar Corp. | | 114,342 | |
1,800 | | | | Triumph Group, Inc. | | 160,938 | |
32,700 | | | | Tyco International Ltd. | | 1,355,088 | |
16,600 | | | | US Ecology, Inc. | | 288,508 | |
5,600 | | | | UTI Worldwide, Inc. | | 118,720 | |
22,232 | | | | Waste Management, Inc. | | 819,694 | |
1,900 | | @ | | Wesco International, Inc. | | 100,320 | |
| | | | | | 28,966,179 | |
| | | | Information Technology: 7.4% | | | |
115,900 | | | | Applied Materials, Inc. | | 1,628,395 | |
7,500 | | | | Automatic Data Processing, Inc. | | 347,100 | |
8,700 | | | | Bel Fuse, Inc. | | 207,930 | |
10,600 | | @ | | Benchmark Electronics, Inc. | | 192,496 | |
5,300 | | @ | | Blue Coat Systems, Inc. | | 158,311 | |
14,089 | | @ | | Booz Allen Hamilton Holding Corp. | | 273,749 | |
1,789 | | @ | | CACI International, Inc. | | 95,533 | |
84,800 | | @ | | Cadence Design Systems, Inc. | | 700,448 | |
3,000 | | L | | Cass Information Systems, Inc. | | 113,820 | |
2,500 | | @ | | Coherent, Inc. | | 112,850 | |
10,500 | | @ | | Compuware Corp. | | 122,535 | |
4,300 | | @ | | Cymer, Inc. | | 193,801 | |
7,400 | | @ | | DG FastChannel, Inc. | | 213,712 | |
10,300 | | | | DST Systems, Inc. | | 456,805 | |
18,500 | | @ | | Electro Scientific Industries, Inc. | | 296,555 | |
16,200 | | @ | | Electronics for Imaging | | 231,822 | |
66,600 | | @ | | Emulex Corp. | | 776,556 | |
35,900 | | @ | | Integrated Device Technology, Inc. | | 239,094 | |
29,300 | | @ | | Internap Network Services Corp. | | 178,144 | |
14,100 | | | | Intersil Corp. | | 215,307 | |
12,600 | | @ | | Lawson Software, Inc. | | 116,550 | |
3,200 | | | | Littelfuse, Inc. | | 150,592 | |
12,200 | | | | Methode Electronics, Inc. | | 158,234 | |
4,400 | | @ | | MKS Instruments, Inc. | | 107,756 | |
39,189 | | | | Molex, Inc. | | 890,374 | |
14,600 | | | | National Semiconductor Corp. | | 200,896 | |
8,000 | | @ | | NCR Corp. | | 122,960 | |
3,700 | | @ | | Netgear, Inc. | | 124,616 | |
6,700 | | @ | | NeuStar, Inc. | | 174,535 | |
3,230 | | @ | | Novatel Wireless, Inc. | | 30,847 | |
12,900 | | @ | | Parametric Technology Corp. | | 290,637 | |
7,500 | | | | Park Electrochemical Corp. | | 225,000 | |
11,700 | | @ | | PC Connection, Inc. | | 103,662 | |
12,700 | | @ | | Plexus Corp. | | 392,938 | |
3,100 | | @ | | Polycom, Inc. | | 120,838 | |
21,500 | | @ | | Quest Software, Inc. | | 596,410 | |
6,100 | | @ | | Rogers Corp. | | 233,325 | |
48,100 | | @ | | S1 Corp. | | 331,890 | |
21,000 | | @, L | | Sigma Designs, Inc. | | 297,570 | |
9,600 | | @ | | Standard Microsystems Corp. | | 276,768 | |
4,300 | | @ | | Synopsys, Inc. | | 115,713 | |
3,300 | | @ | | Tech Data Corp. | | 145,266 | |
31,700 | | | | Tellabs, Inc. | | 214,926 | |
58,400 | | @ | | Teradyne, Inc. | | 819,936 | |
20,400 | | | | Total System Services, Inc. | | 313,752 | |
6,900 | | @ | | Varian Semiconductor Equipment Associates, Inc. | | 255,093 | |
15,100 | | @ | | Verigy Ltd. | | 196,602 | |
16,000 | | @, L | | Websense, Inc. | | 324,000 | |
20,000 | | @ | | Zoran Corp. | | 176,000 | |
| | | | | | 14,262,649 | |
| | | | Materials: 4.4% | | | |
5,700 | | | | A Schulman, Inc. | | 130,473 | |
3,000 | | | | Arch Chemicals, Inc. | | 113,790 | |
49,783 | | | | Bemis Co. | | 1,625,913 | |
2,700 | | @ | | Brush Engineered Materials, Inc. | | 104,328 | |
8,800 | | @ | | Century Aluminum Co. | | 136,664 | |
11,000 | | @ | | Coeur d’Alene Mines Corp. | | 300,520 | |
11,100 | | | | Commercial Metals Co. | | 184,149 | |
2,600 | | | | Cytec Industries, Inc. | | 137,956 | |
7,700 | | @ | | Georgia Gulf Corp. | | 185,262 | |
3,200 | | | | Haynes International, Inc. | | 133,856 | |
8,500 | | | | HB Fuller Co. | | 174,420 | |
31,100 | | @, L | | Hecla Mining Co. | | 350,185 | |
3,400 | | @ | | Intrepid Potash, Inc. | | 126,786 | |
2,600 | | | | Kaiser Aluminum Corp. | | 130,234 | |
1,300 | | | | Martin Marietta Materials, Inc. | | 119,912 | |
25,400 | | | | MeadWestvaco Corp. | | 664,464 | |
11,005 | | | | Minerals Technologies, Inc. | | 719,837 | |
17,324 | | | | Newmont Mining Corp. | | 1,064,213 | |
5,700 | | | | Olin Corp. | | 116,964 | |
5,300 | | @ | | OM Group, Inc. | | 204,103 | |
9,900 | | | | PH Glatfelter Co. | | 121,473 | |
2,200 | | | | Royal Gold, Inc. | | 120,186 | |
4,000 | | @ | | RTI International Metals, Inc. | | 107,920 | |
2,100 | | | | Schnitzer Steel Industries, Inc. | | 139,419 | |
4,700 | | | | Sensient Technologies Corp. | | 172,631 | |
6,500 | | | | Silgan Holdings, Inc. | | 232,765 | |
8,300 | | | | Sonoco Products Co. | | 279,461 | |
4,100 | | | | Texas Industries, Inc. | | 187,698 | |
18,400 | | @ | | Thompson Creek Metals Co., Inc. | | 270,848 | |
6,900 | | | | Worthington Industries | | 126,960 | |
| | | | | | 8,483,390 | |
| | | | Telecommunication Services: 1.4% | | | |
6,600 | | | | Atlantic Tele-Network, Inc. | | 253,044 | |
22,700 | | | | Consolidated Communications Holdings, Inc. | | 438,110 | |
186,200 | | | | Qwest Communications International, Inc. | | 1,416,982 | |
12,200 | | | | Rogers Communications, Inc. - Class B (Canadian Denominated Security) | | 424,540 | |
16,601 | | | | Windstream Corp. | | 231,418 | |
| | | | | | 2,764,094 | |
| | | | Utilities: 6.8% | | | |
24,000 | | | | AGL Resources, Inc. | | 860,400 | |
18,434 | | | | American Electric Power Co., Inc. | | 663,255 | |
9,300 | | | | Artesian Resources Corp. | | 176,235 | |
5,200 | | | | Atmos Energy Corp. | | 162,240 | |
7,300 | | | | Avista Corp. | | 164,396 | |
4,300 | | | | Black Hills Corp. | | 129,000 | |
9,800 | | | | Central Vermont Public Service Corp. | | 214,228 | |
4,600 | | | | Chesapeake Utilities Corp. | | 190,992 | |
7,400 | | | | Consolidated Edison, Inc. | | 366,818 | |
24,151 | | | | Great Plains Energy, Inc. | | 468,288 | |
9,533 | | | | Idacorp, Inc. | | 352,530 | |
22,600 | | | | MDU Resources Group, Inc. | | 458,102 | |
32,896 | | | | Northeast Utilities | | 1,048,724 | |
4,900 | | | | NorthWestern Corp. | | 141,267 | |
112,700 | | | | NV Energy, Inc. | | 1,583,435 | |
31,700 | | | | Pacific Gas & Electric Co. | | 1,516,528 | |
52,015 | | | | Portland General Electric Co. | | 1,128,726 | |
2,091 | | | | Southwest Gas Corp. | | 76,677 | |
7,300 | | L | | Unitil Corp. | | 166,002 | |
67,726 | | | | Westar Energy, Inc. | | 1,703,986 | |
5,300 | | | | WGL Holdings, Inc. | | 189,581 | |
6,884 | | | | Wisconsin Energy Corp. | | 405,192 | |
46,600 | | | | Xcel Energy, Inc. | | 1,097,430 | |
| | | | | | 13,264,032 | |
| | | | Total Common Stock
(Cost $150,706,333) | | 172,537,769 | |
| | | | | | | |
REAL ESTATE INVESTMENT TRUSTS: 5.4% | | | |
| | | | Financials: 5.4% | | | |
6,700 | | | | American Campus Communities, Inc. | | 212,792 | |
19,517 | | | | Annaly Capital Management, Inc. | | 349,745 | |
18,700 | | @ | | Ashford Hospitality Trust, Inc. | | 180,455 | |
18,400 | | | | Associated Estates Realty Corp. | | 281,336 | |
41,400 | | | | Capstead Mortgage Corp. | | 521,226 | |
13,800 | | | | CBL & Associates Properties, Inc. | | 241,500 | |
82,800 | | | | Chimera Investment Corp. | | 340,308 | |
4,600 | | | | CommonWealth REIT | | 117,346 | |
32,800 | | | | DCT Industrial Trust, Inc. | | 174,168 | |
17,500 | | | | Duke Realty Corp. | | 218,050 | |
19,400 | | @, L | | First Industrial Realty Trust, Inc. | | 169,944 | |
12,200 | | | | First Potomac Realty Trust | | 205,204 | |
6,600 | | | | Getty Realty Corp. | | 206,448 | |
54,935 | | L | | Government Properties Income Trust | | 1,471,709 | |
4,000 | | | | Hatteras Financial Corp. | | 121,080 | |
5,600 | | | | Healthcare Realty Trust, Inc. | | 118,552 | |
5,100 | | | | Hersha Hospitality Trust | | 33,660 | |
7,700 | | | | Highwoods Properties, Inc. | | 245,245 | |
17,442 | | | | Host Hotels & Resorts, Inc. | | 311,689 | |
11,600 | | | | Inland Real Estate Corp. | | 102,080 | |
7,100 | | | | Kilroy Realty Corp. | | 258,937 | |
25,700 | | | | Lexington Realty Trust | | 204,315 | |
9,300 | | | | Medical Properties Trust, Inc. | | 100,719 | |
31,800 | | | | MFA Mortgage Investments, Inc. | | 259,488 | |
3,800 | | | | National Health Investors, Inc. | | 171,076 | |
10,600 | | L | | National Retail Properties, Inc. | | 280,900 | |
7,200 | | | | Omega Healthcare Investors, Inc. | | 161,568 | |
83,268 | | L | | Piedmont Office Realty Trust, Inc. | | 1,677,018 | |
3,100 | | | | PS Business Parks, Inc. | | 172,732 | |
7,100 | | | | Sabra Healthcare REIT, Inc. | | 130,640 | |
2,400 | | | | Saul Centers, Inc. | | 113,640 | |
7,400 | | �� | | Urstadt Biddle Properties, Inc. | | 143,930 | |
4,300 | | | | Washington Real Estate Investment Trust | | 133,257 | |
43,181 | | | | Weyerhaeuser Co. | | 817,416 | |
9,400 | | | | Winthrop Realty Trust | | 120,226 | |
| | | | | | | |
| | | | Total Real Estate Investment Trusts
(Cost $8,912,503) | | 10,368,399 | |
| | | | | | | |
EXCHANGE-TRADED FUNDS: 2.7% | | | |
| | | | Exchange-Traded Funds: 2.7% | | | |
9,500 | | | | iShares Russell 2000 Index Fund | | 743,185 | |
21,200 | | | | iShares Russell 2000 Value Index Fund | | 1,507,108 | |
67,500 | | | | iShares Russell Midcap Value Index Fund | | 3,038,175 | |
| | | | | | | |
| | | | Total Exchange-Traded Funds
(Cost $4,991,103) | | 5,288,468 | |
| | | | | | | |
PREFERRED STOCK: 1.5% | | | |
| | | | Consumer Discretionary: 0.2% | | | |
1,600 | | P | | Callaway Golf Co. | | 211,472 | |
128 | | # | | LodgeNet Interactive Corp. | | 180,160 | |
| | | | | | 391,632 | |
| | | | Consumer Staples: 0.1% | | | |
179 | | P | | Universal Corp. | | 179,045 | |
| | | | | | 179,045 | |
| | | | Financials: 1.2% | | | |
29,914 | | | | Aspen Insurance Holdings Ltd. | | 1,643,176 | |
5,053 | | P | | DuPont Fabros Technology, Inc. | | 126,123 | |
5,400 | | | | Entertainment Properties | | 151,308 | |
2,900 | | | | Lexington Realty Trust | | 123,888 | |
10,600 | | P | | National Retail Properties | | 264,152 | |
3,831 | | P | | PS Business Parks, Inc. | | 96,618 | |
| | | | | | 2,405,265 | |
| | | | Total Preferred Stock
(Cost $2,601,133) | | 2,975,942 | |
| | | | | | | |
| | | | Total Long-Term Investments
(Cost $167,211,072) | | 191,170,578 | |
| | | | | | | |
SHORT-TERM INVESTMENTS: 4.5% | | | |
| | | | Mutual Funds: 1.9% | | | |
3,797,343 | | | | Blackrock Liquidity Funds TempFund Portfolio - Class I | | 3,797,343 | |
| | | | | | | |
| | | | Total Mutual Funds
(Cost $3,797,343) | | 3,797,343 | |
| | | | | | | |
| | | | Securities Lending Collateral(cc): 2.6% | | | |
4,845,859 | | | | BNY Mellon Overnight Government Fund (1) | | 4,845,859 | |
151,202 | | R | | BNY Institutional Cash Reserves Fund, Series B (1)(2) | | 120,962 | |
| | | | | | | |
| | | | Total Securities Lending Collateral
(Cost $4,997,061) | | 4,966,821 | |
| | | | | | | |
| | | | Total Short-Term Investments
(Cost $8,794,404) | | 8,764,164 | |
| | | | | | | |
| | | | Total Investments in Securities
(Cost $176,005,476) * | 103.2 | % | $ | 199,934,742 | |
| | | | Other Assets and Liabilities - Net | (3.2 | ) | (6,199,459 | ) |
| | | | Net Assets | 100.0 | % | $ | 193,735,283 | |
| | @ | | Non-income producing security |
| | # | | Securities with purchases pursuant to Rule 144A or section 4(2), under the Securities Act of 1933 and may not be resold subject to that rule except to qualified institutional buyers. Unless otherwise |
| | | | noted, these securities have been determined to be liquid under the guidelines established |
| | | | by the Funds’ Board of Directors/Trustees. |
| | P | | Preferred Stock may be called prior to convertible date. |
| | (cc) | | Securities purchased with cash collateral for securities loaned. |
| | (1) | | Collateral received from brokers for securities lending was invested in these short-term investments. |
| | (2) | | On September 12, 2008, BNY established a separate sleeve of the Institutional Cash Reserves Fund (Series B) to hold certain Lehman Brothers defaulted debt obligations. The Portfolio’s position in Series B is being fair valued daily. Please see the accompanying Notes to Financial Statements for additional details on securities lending. |
| | R | | Restricted security |
| | L | | Loaned security, a portion or all of the security is on loan at December 31, 2010. |
| | PORTFOLIO OF INVESTMENTS |
ING Baron Small Cap Growth Portfolio | | as of December 31, 2010 |
Shares | | | | | | Value | |
| | | | | | | |
COMMON STOCK: 92.4% | | | |
| | | | Consumer Discretionary: 26.9% | | | |
605,000 | | | | Anhanguera Educacional Participacoes SA | | $ | 14,578,313 | |
80,000 | | @ | | Blue Nile, Inc. | | 4,564,800 | |
70,000 | | @ | | Carmax, Inc. | | 2,231,600 | |
540,000 | | | | Choice Hotels International, Inc. | | 20,665,802 | |
325,000 | | | | DeVry, Inc. | | 15,593,500 | |
575,000 | | @ | | Dick’s Sporting Goods, Inc. | | 21,562,500 | |
159,526 | | @ | | J Crew Group, Inc. | | 6,881,952 | |
165,000 | | @ | | Lamar Advertising Co. | | 6,573,600 | |
672,500 | | @ | | LKQ Corp. | | 15,279,200 | |
130,000 | | @ | | Lumber Liquidators | | 3,238,300 | |
95,000 | | @ | | Mohawk Industries, Inc. | | 5,392,200 | |
239,000 | | | | Morningstar, Inc. | | 12,686,120 | |
503,000 | | @ | | New York Times Co. | | 4,929,400 | |
123,000 | | @ | | Panera Bread Co. | | 12,448,830 | |
200,000 | | @ | | Peet’s Coffee & Tea, Inc. | | 8,348,000 | |
420,000 | | @ | | Penn National Gaming, Inc. | | 14,763,000 | |
135,000 | | @ | | Penske Auto Group, Inc. | | 2,351,700 | |
10,000 | | | | Polo Ralph Lauren Corp. | | 1,109,200 | |
63,750 | | | | Strayer Education, Inc. | | 9,704,025 | |
260,000 | | @ | | Under Armour, Inc. | | 14,258,400 | |
475,000 | | @ | | Vail Resorts, Inc. | | 24,719,000 | |
47,169 | | | | Wynn Resorts Ltd. | | 4,898,029 | |
| | | | | | 226,777,471 | |
| | | | Consumer Staples: 6.0% | | | |
114,000 | | | | Church & Dwight Co., Inc. | | 7,868,280 | |
215,000 | | | | Diamond Foods, Inc. | | 11,433,700 | |
655,000 | | @ | | Dole Food Co., Inc. | | 8,849,050 | |
144,379 | | @ | | Ralcorp Holdings, Inc. | | 9,386,079 | |
58,000 | | @ | | Seneca Foods Corp. | | 1,564,840 | |
190,000 | | @ | | TreeHouse Foods, Inc. | | 9,707,100 | |
35,000 | | @ | | Whole Foods Market, Inc. | | 1,770,650 | |
| | | | | | 50,579,699 | |
| | | | Energy: 11.2% | | | |
250,000 | | @ | | Brigham Exploration Co. | | 6,810,000 | |
112,575 | | | | CARBO Ceramics, Inc. | | 11,656,016 | |
96,933 | | @ | | Concho Resources, Inc. | | 8,498,116 | |
200,000 | | @ | | Core Laboratories NV | | 17,810,000 | |
355,000 | | @ | | Denbury Resources, Inc. | | 6,776,950 | |
160,000 | | | | Helmerich & Payne, Inc. | | 7,756,800 | |
24,719 | | @ | | Oasis Petroleum, Inc. | | 670,379 | |
115,000 | | @ | | SEACOR Holdings, Inc. | | 11,625,350 | |
192,500 | | | | SM Energy Co. | | 11,344,025 | |
400,000 | | | | Southern Union Co. | | 9,628,000 | |
69,293 | | @ | | Targa Resources Corp. | | 1,857,745 | |
| | | | | | 94,433,381 | |
| | | | Financials: 7.8% | | | |
65,000 | | @ | | Arch Capital Group Ltd. | | 5,723,250 | |
55,000 | | @ | | CB Richard Ellis Group, Inc. | | 1,126,400 | |
175,000 | | | | Cohen & Steers, Inc. | | 4,567,500 | |
216,500 | | | | Eaton Vance Corp. | | 6,544,795 | |
131,000 | | @ | | Financial Engines, Inc. | | 2,597,730 | |
9,194 | | @ | | Green Dot Corp. | | 521,668 | |
400,000 | | @ | | Interactive Brokers Group, Inc. | | 7,128,000 | |
160,000 | | | | Jefferies Group, Inc. | | 4,260,800 | |
622,440 | | @ | | MSCI, Inc. - Class A | | 24,250,262 | |
153,965 | | @ | | Netspend Holdings, Inc. | | 1,973,831 | |
295,000 | | | | Primerica, Inc. | | 7,153,750 | |
| | | | | | 65,847,986 | |
| | | | Health Care: 13.3% | | | |
130,000 | | @ | | Allscripts Healthcare Solutions, Inc. | | 2,505,100 | |
400,000 | | @ | | AMERIGROUP Corp. | | 17,568,000 | |
95,246 | | | | Chemed Corp. | | 6,049,073 | |
400,000 | | @ | | Community Health Systems, Inc. | | 14,948,000 | |
200,000 | | @ | | Edwards Lifesciences Corp. | | 16,168,000 | |
175,000 | | @ | | Gen-Probe, Inc. | | 10,211,250 | |
160,000 | | @ | | Idexx Laboratories, Inc. | | 11,075,200 | |
135,000 | | @ | | Mettler Toledo International, Inc. | | 20,413,350 | |
20,000 | | @ | | Neogen Corp. | | 820,600 | |
105,000 | | | | Techne Corp. | | 6,895,350 | |
240,000 | | @ | | VCA Antech, Inc. | | 5,589,600 | |
| | | | | | 112,243,523 | |
| | | | | | | | |
| | | | Industrials: 11.1% | | | |
275,000 | | @ | | Aecom Technology Corp. | | 7,691,750 | |
275,000 | | @ | | Copart, Inc. | | 10,271,250 | |
120,000 | | @ | | CoStar Group, Inc. | | 6,907,200 | |
504,261 | | @ | | Generac Holdings, Inc. | | 8,153,900 | |
350,000 | | @ | | Genesee & Wyoming, Inc. | | 18,532,500 | |
60,000 | | | | Landstar System, Inc. | | 2,456,400 | |
250,000 | | @ | | Mistras Group, Inc. | | 3,370,000 | |
115,000 | | | | MSC Industrial Direct Co. | | 7,439,350 | |
125,000 | | @ | | Polypore International, Inc. | | 5,091,250 | |
410,000 | | | | Ritchie Brothers Auctioneers, Inc. | | 9,450,500 | |
400,000 | | @ | | Tetra Tech, Inc. | | 10,024,000 | |
50,000 | | | | Valmont Industries, Inc. | | 4,436,500 | |
| | | | | | 93,824,600 | |
| | | | Information Technology: 11.4% | | | |
125,225 | | @ | | Advent Software, Inc. | | 7,253,032 | |
250,000 | | @ | | Ansys, Inc. | | 13,017,500 | |
85,000 | | @ | | Blackboard, Inc. | | 3,510,500 | |
49,368 | | @ | | Booz Allen Hamilton Holding Corp. | | 959,220 | |
135,000 | | @ | | Concur Technologies, Inc. | | 7,010,550 | |
120,000 | | @ | | Equinix, Inc. | | 9,751,200 | |
85,000 | | | | Factset Research Systems, Inc. | | 7,969,600 | |
430,000 | | @ | | Gartner, Inc. | | 14,276,000 | |
230,500 | | | | Pegasystems, Inc. | | 8,443,215 | |
200,000 | | @ | | SS&C Technologies Holdings, Inc. | | 4,102,000 | |
99,500 | | | | Totvs S.A. | | 10,129,819 | |
190,000 | | @ | | WebMD Health Corp. | | 9,701,400 | |
| | | | | | 96,124,036 | |
| | | | Materials: 2.7% | | | |
79,918 | | @ | | Intrepid Potash, Inc. | | 2,980,142 | |
389,977 | | @ | | Molycorp, Inc. | | 19,459,852 | |
| | | | | | 22,439,994 | |
| | | | Telecommunication Services: 0.8% | | | |
151,764 | | @ | | SBA Communications Corp. | | 6,213,218 | |
| | | | | | 6,213,218 | |
| | | | Utilities: 1.2% | | | |
160,000 | | | | ITC Holdings Corp. | | 9,916,800 | |
| | | | | | 9,916,800 | |
| | | | Total Common Stock
(Cost $488,830,903) | | 778,400,708 | |
| | | | | | | |
REAL ESTATE INVESTMENT TRUSTS: 3.5% | | | |
| | | | Financials: 3.5% | | | |
24,300 | | | | Alexander’s, Inc. | | 10,018,404 | |
100,000 | | | | Alexandria Real Estate Equities, Inc. | | 7,326,000 | |
85,000 | | | | American Campus Communities, Inc. | | 2,699,600 | |
490,500 | | | | Douglas Emmett, Inc. | | 8,142,300 | |
70,000 | | | | LaSalle Hotel Properties | | 1,848,000 | |
| | | | | | | |
| | | | Total Real Estate Investment Trusts
(Cost $21,366,802) | | 30,034,304 | |
| | | | | | | |
| | | | Total Long-Term Investments
(Cost $510,197,705) | | 808,435,012 | |
| | | | | | | |
SHORT-TERM INVESTMENTS: 7.1% | | | |
| | | | Mutual Funds: 7.1% | | | |
59,409,221 | | | | Blackrock Liquidity Funds TempFund Portfolio - Class I | | 59,409,221 | |
| | | | | | | |
| | | | Total Short-Term Investments
(Cost $59,409,221) | | 59,409,221 | |
| | | | | | | |
| | | | Total Investments in Securities
(Cost $569,606,926) * | 103.0 | % | $ | 867,844,233 | |
| | | | Other Assets and Liabilities - Net | (3.0 | ) | (25,112,632 | ) |
| | | | Net Assets | 100.0 | % | $ | 842,731,601 | |
| | @ | | Non-income producing security | | | |
| PORTFOLIO OF INVESTMENTS |
ING Columbia Small Cap Value Portfolio | as of December 31, 2010 |
Shares | | | | | | Value | |
| | | | | | | |
COMMON STOCK: 92.0% | | | |
| | | | Consumer Discretionary: 10.6% | | | |
22,000 | | | | Columbia Sportswear Co. | | $ | 1,326,600 | |
74,000 | | | | Cooper Tire & Rubber Co. | | 1,744,920 | |
14,627 | | @ | | Core-Mark Holding Co., Inc. | | 520,575 | |
117,000 | | @ | | Dana Holding Corp. | | 2,013,570 | |
136,000 | | @ | | Domino’s Pizza, Inc. | | 2,169,200 | |
98,000 | | | | Finish Line | | 1,684,620 | |
46,000 | | | | Foot Locker, Inc. | | 902,520 | |
47,000 | | @ | | Genesco, Inc. | | 1,762,030 | |
78,000 | | @ | | Helen of Troy Ltd. | | 2,319,720 | |
108,000 | | @ | | Pier 1 Imports, Inc. | | 1,134,000 | |
88,000 | | | | Sonic Automotive, Inc. | | 1,165,120 | |
295,000 | | | | Stewart Enterprises, Inc. | | 1,973,550 | |
29,000 | | @ | | Tenneco, Inc. | | 1,193,640 | |
118,000 | | @ | | Texas Roadhouse, Inc. | | 2,026,060 | |
115,000 | | @ | | Tower International, Inc. | | 2,034,350 | |
| | | | | | 23,970,475 | |
| | | | Consumer Staples: 2.9% | | | |
150,000 | | @ | | Dean Foods Co. | | 1,326,000 | |
63,000 | | | | Nu Skin Enterprises, Inc. | | 1,906,380 | |
75,000 | | @ | | Pantry, Inc. | | 1,489,500 | |
55,137 | | @ | | Prestige Brands Holdings, Inc. | | 658,887 | |
28,500 | | | | Ruddick Corp. | | 1,049,940 | |
| | | | | | 6,430,707 | |
| | | | Energy: 7.3% | | | |
46,000 | | @ | | Bill Barrett Corp. | | 1,891,980 | |
68,000 | | @ | | Hornbeck Offshore Services, Inc. | | 1,419,840 | |
230,000 | | @ | | ION Geophysical Corp. | | 1,950,400 | |
104,000 | | @ | | Key Energy Services, Inc. | | 1,349,920 | |
57,000 | | @ | | Knightsbridge Tankers Ltd. | | 1,269,390 | |
27,000 | | @ | | Oil States International, Inc. | | 1,730,430 | |
15,000 | | | | Overseas Shipholding Group | | 531,300 | |
113,000 | | @ | | Patriot Coal Corp. | | 2,188,810 | |
80,000 | | @ | | Stone Energy Corp. | | 1,783,200 | |
62,000 | | @ | | Swift Energy Co. | | 2,427,300 | |
| | | | | | 16,542,570 | |
| | | | Financials: 20.8% | | | |
64,000 | | | | Alterra Capital Holdings Ltd. | | 1,384,960 | |
70,000 | | | | American Equity Investment Life Holding Co. | | 878,500 | |
100,000 | | | | Apollo Investment Corp. | | 1,107,000 | |
46,000 | | | | Argo Group International Holdings Ltd. | | 1,722,700 | |
64,000 | | | | Assured Guaranty Ltd. | | 1,132,800 | |
82,000 | | | | Community Bank System, Inc. | | 2,277,140 | |
75,000 | | | | Delphi Financial Group | | 2,163,000 | |
90,000 | | | | East-West Bancorp., Inc. | | 1,759,500 | |
90,000 | | | | First Niagara Financial Group, Inc. | | 1,258,200 | |
40,500 | | | | IBERIABANK Corp. | | 2,394,765 | |
80,000 | | | | Independent Bank Corp. | | 2,164,000 | |
170,000 | | | | MCG Capital Corp. | | 1,184,900 | |
205,000 | | @ | | MGIC Investment Corp. | | 2,088,950 | |
137,000 | | @ | | National Financial Partners Corp. | | 1,835,800 | |
163,000 | | | | Northwest Bancshares, Inc. | | 1,916,880 | |
130,000 | | @ | | Ocwen Financial Corp. | | 1,240,200 | |
91,343 | | | | Oritani Financial Corp. | | 1,118,038 | |
45,000 | | | | Platinum Underwriters Holdings Ltd. | | 2,023,650 | |
54,000 | | | | Prosperity Bancshares, Inc. | | 2,121,120 | |
205,000 | | | | Radian Group, Inc. | | 1,654,350 | |
84,893 | | | | Sandy Spring Bancorp, Inc. | | 1,564,578 | |
202,000 | | | | Sterling Bancorp. | | 2,114,940 | |
210,000 | | | | Sterling Bancshares, Inc. | | 1,474,200 | |
26,000 | | @ | | Stifel Financial Corp. | | 1,613,040 | |
25,451 | | @ | | SVB Financial Group | | 1,350,176 | |
104,000 | | | | Symetra Financial Corp. | | 1,424,800 | |
91,000 | | @ | | Texas Capital Bancshares, Inc. | | 1,935,570 | |
163,000 | | | | Umpqua Holdings Corp. | | 1,985,340 | |
| | | | | | 46,889,097 | |
| | | | Health Care: 5.4% | | | |
80,500 | | @ | | Centene Corp. | | 2,039,870 | |
81,000 | | @ | | Conmed Corp. | | 2,140,830 | |
21,000 | | | | Cooper Cos., Inc. | | 1,183,140 | |
78,000 | | @ | | Healthspring, Inc. | | 2,069,340 | |
71,121 | | | | Invacare Corp. | | 2,145,009 | |
| | | | | | | | |
140,000 | | @ | | Kindred Healthcare, Inc. | | 2,571,799 | |
| | | | | | 12,149,988 | |
| | | | Industrials: 19.9% | | | |
19,500 | | @ | | Advisory Board Co. | | 928,785 | |
28,000 | | @ | | Alaska Air Group, Inc. | | 1,587,320 | |
106,000 | | @ | | ArvinMeritor, Inc. | | 2,175,120 | |
35,000 | | @ | | Atlas Air Worldwide Holdings, Inc. | | 1,954,050 | |
90,000 | | | | Barnes Group, Inc. | | 1,860,300 | |
56,000 | | | | Brady Corp. | | 1,826,160 | |
90,000 | | @ | | CBIZ, Inc. | | 561,600 | |
270,000 | | @ | | Cenveo, Inc. | | 1,441,800 | |
101,000 | | | | Deluxe Corp. | | 2,325,020 | |
59,000 | | @ | | EMCOR Group, Inc. | | 1,709,820 | |
34,000 | | @ | | Esterline Technologies Corp. | | 2,332,060 | |
16,500 | | | | Gardner Denver, Inc. | | 1,135,530 | |
74,000 | | @ | | Geo Group, Inc. | | 1,824,840 | |
112,000 | | | | Houston Wire & Cable Co. | | 1,505,280 | |
86,662 | | | | IESI-BFC Ltd. | | 2,105,887 | |
124,000 | | @ | | Navigant Consulting, Inc. | | 1,140,800 | |
210,000 | | @ | | SatCon Technology Corp. | | 945,000 | |
130,000 | | @ | | SFN Group, Inc. | | 1,268,800 | |
68,373 | | @ | | Sterling Construction Co., Inc. | | 891,584 | |
84,000 | | | | Textainer Group Holdings Ltd. | | 2,393,160 | |
110,000 | | @ | | Titan Machinery, Inc. | | 2,123,000 | |
61,700 | | | | Trinity Industries, Inc. | | 1,641,837 | |
116,000 | | @ | | United Rentals, Inc. | | 2,639,000 | |
34,500 | | @ | | United Stationers, Inc. | | 2,201,445 | |
80,000 | | @ | | US Airways Group, Inc. | | 800,800 | |
200,000 | | @ | | Wabash National Corp. | | 2,370,000 | |
52,000 | | | | Werner Enterprises, Inc. | | 1,175,200 | |
| | | | | | 44,864,198 | |
| | | | Information Technology: 14.6% | | | |
74,000 | | @ | | Acxiom Corp. | | 1,269,100 | |
32,000 | | @ | | Anixter International, Inc. | | 1,911,360 | |
70,000 | | @ | | Ariba, Inc. | | 1,644,300 | |
118,000 | | @ | | Cardtronics, Inc. | | 2,088,600 | |
92,000 | | @ | | Ciena Corp. | | 1,936,600 | |
121,500 | | @ | | Cirrus Logic, Inc. | | 1,941,570 | |
130,000 | | @ | | ELSTER GROUP SE - ADR | | 2,197,000 | |
89,000 | | @ | | Fairchild Semiconductor International, Inc. | | 1,389,290 | |
74,294 | | | | iGate Corp. | | 1,464,335 | |
120,000 | | @ | | IXYS Corp. | | 1,394,400 | |
167,000 | | @ | | Kulicke & Soffa Industries, Inc. | | 1,202,400 | |
193,000 | | @ | | Lawson Software, Inc. | | 1,785,250 | |
185,000 | | @ | | Mentor Graphics Corp. | | 2,220,000 | |
124,000 | | | | Micrel, Inc. | | 1,610,760 | |
39,965 | | @ | | NeuStar, Inc. | | 1,041,088 | |
207,100 | | | | Pulse Electronics Corp. | | 1,101,772 | |
45,000 | | @ | | Rofin-Sinar Technologies, Inc. | | 1,594,800 | |
58,734 | | @ | | Rogers Corp. | | 2,246,576 | |
65,708 | | @ | | Standard Microsystems Corp. | | 1,894,362 | |
90,000 | | @ | | Ultra Clean Holdings | | 837,900 | |
| | | | | | 32,771,463 | |
| | | | Materials: 6.4% | | | |
300,000 | | @ | | Boise, Inc. | | 2,379,000 | |
60,000 | | @ | | Georgia Gulf Corp. | | 1,443,600 | |
60,906 | | @ | | Graham Packaging Co., Inc. | | 794,214 | |
78,900 | | @ | | Metals USA Holdings Corp. | | 1,202,436 | |
32,000 | | | | Rock-Tenn Co. | | 1,726,400 | |
23,000 | | @ | | Rockwood Holdings, Inc. | | 899,760 | |
38,000 | | @ | | RTI International Metals, Inc. | | 1,025,240 | |
31,000 | | | | Schnitzer Steel Industries, Inc. | | 2,058,090 | |
26,000 | | | | Schweitzer-Mauduit International, Inc. | | 1,635,920 | |
59,000 | | @ | | Solutia, Inc. | | 1,361,720 | |
| | | | | | 14,526,380 | |
| | | | Telecommunication Services: 0.5% | | | |
370,000 | | @ | | Cincinnati Bell, Inc. | | 1,036,000 | |
| | | | | | 1,036,000 | |
| | | | Utilities: 3.6% | | | |
70,000 | | | | Atmos Energy Corp. | | 2,184,000 | |
60,000 | | | | New Jersey Resources Corp. | | 2,586,600 | |
36,000 | | | | South Jersey Industries, Inc. | | 1,901,520 | |
54,000 | | | | Westar Energy, Inc. | | 1,358,640 | |
| | | | | | 8,030,760 | |
| | | | Total Common Stock
(Cost $161,563,237) | | 207,211,638 | |
REAL ESTATE INVESTMENT TRUSTS: 8.1% | | | |
| | | | Financials: 8.1% | | | |
110,000 | | | | BioMed Realty Trust, Inc. | | 2,051,500 | |
160,000 | | | | Brandywine Realty Trust | | 1,864,000 | |
123,000 | | | | CBL & Associates Properties, Inc. | | 2,152,500 | |
69,500 | | | | DuPont Fabros Technology, Inc. | | 1,478,265 | |
140,000 | | @ | | First Industrial Realty Trust, Inc. | | 1,226,400 | |
37,000 | | | | Highwoods Properties, Inc. | | 1,178,450 | |
90,000 | | | | LaSalle Hotel Properties | | 2,376,000 | |
36,000 | | | | Mid-America Apartment Communities, Inc. | | 2,285,640 | |
55,000 | | | | Omega Healthcare Investors, Inc. | | 1,234,200 | |
255,000 | | | | U-Store-It Trust | | 2,430,150 | |
| | | | | | | |
| | | | Total Real Estate Investment Trusts
(Cost $14,624,673) | | 18,277,105 | |
| | | | | | | |
| | | | Total Long-Term Investments
(Cost $176,187,910) | | 225,488,743 | |
| | | | | | | |
SHORT-TERM INVESTMENTS: 1.5% | | | |
| | | | Mutual Funds: 1.5% | | | |
3,368,174 | | | | Blackrock Liquidity Funds TempFund Portfolio - Class I | | 3,368,174 | |
| | | | | | | |
| | | | Total Short-Term Investments
(Cost $3,368,174) | | 3,368,174 | |
| | | | | | | |
| | | | Total Investments in Securities
(Cost $179,556,084) * | 101.6 | % | $ | 228,856,917 | |
| | | | Other Assets and Liabilities - Net | (1.6 | ) | (3,620,823 | ) |
| | | | Net Assets | 100.0 | % | $ | 225,236,094 | |
| | @ | | Non-income producing security | | | |
| | ADR | | American Depositary Receipt | | | |
| PORTFOLIO OF INVESTMENTS |
ING Davis New York Venture Portfolio | as of December 31, 2010 |
Shares | | | | | | Value | |
| | | | | | | |
COMMON STOCK: 98.0% | | | |
| | | | Consumer Discretionary: 5.7% | | | |
183,300 | | @ | | Bed Bath & Beyond, Inc. | | $ | 9,009,195 | |
187,499 | | @ | | Carmax, Inc. | | 5,977,468 | |
5,486 | | @, R, X | | FHC Delaware, Inc. | | 55 | |
96,700 | | @ | | Grupo Televisa S.A. ADR | | 2,507,431 | |
149,650 | | | | Harley-Davidson, Inc. | | 5,188,366 | |
16,400 | | | | Hunter Douglas NV | | 867,195 | |
84,700 | | @ | | Liberty Media Corp. - Interactive - Class A | | 1,335,719 | |
7,416 | | @ | | Liberty Media Corp. - Starz | | 493,016 | |
136,770 | | | | News Corp. - Class A | | 1,991,371 | |
| | | | | | 27,369,816 | |
| | | | Consumer Staples: 16.7% | | | |
151,950 | | | | Coca-Cola Co. | | 9,993,752 | |
287,125 | | | | Costco Wholesale Corp. | | 20,733,296 | |
484,727 | | | | CVS Caremark Corp. | | 16,853,958 | |
64,100 | | | | Diageo PLC ADR | | 4,764,553 | |
123,700 | | | | Heineken Holding NV | | 5,379,646 | |
21,650 | | | | Hershey Co. | | 1,020,798 | |
44,900 | | | | Kraft Foods, Inc. | | 1,414,799 | |
21,830 | | | | Mead Johnson Nutrition Co. | | 1,358,918 | |
27,700 | | | | Natura Cosmeticos S.A. | | 795,791 | |
47,800 | | | | Nestle S.A. | | 2,800,300 | |
90,602 | | | | Philip Morris International, Inc. | | 5,302,935 | |
116,410 | | | | Procter & Gamble Co. | | 7,488,655 | |
77,300 | | | | Unilever NV ADR | | 2,427,220 | |
| | | | | | 80,334,621 | |
| | | | Energy: 15.3% | | | |
334,420 | | | | Canadian Natural Resources Ltd. | | 14,854,936 | |
1,938,500 | | | | China Coal Energy Co. - Class H | | 3,023,708 | |
194,320 | | | | Devon Energy Corp. | | 15,256,063 | |
159,200 | | | | EOG Resources, Inc. | | 14,552,472 | |
186,030 | | | | Occidental Petroleum Corp. | | 18,249,543 | |
270,000 | | @ | | OGX Petroleo e Gas Participacoes S.A. | | 3,253,012 | |
12,900 | | | | Schlumberger Ltd. | | 1,077,150 | |
44,276 | | @ | | Transocean Ltd. | | 3,077,625 | |
| | | | | | 73,344,509 | |
| | | | Financials: 27.2% | | | |
462,220 | | | | American Express Co. | | 19,838,482 | |
81,330 | | | | Ameriprise Financial, Inc. | | 4,680,541 | |
10,680 | | | | AON Corp. | | 491,387 | |
34,819 | | | | Bank of America Corp. | | 464,485 | |
625,090 | | | | Bank of New York Mellon Corp. | | 18,877,718 | |
94 | | @ | | Berkshire Hathaway, Inc. - Class A | | 11,322,300 | |
62,848 | | | | Brookfield Asset Management, Inc. - Class A | | 2,092,210 | |
16,300 | | | | Charles Schwab Corp. | | 278,893 | |
9,335 | | | | Everest Re Group Ltd. | | 791,795 | |
6,820 | | | | Fairfax Financial Holdings Ltd. | | 2,797,352 | |
75,110 | | @ | | GAM Holding AG | | 1,241,548 | |
16,200 | | | | Goldman Sachs Group, Inc. | | 2,724,192 | |
565,000 | | | | Hang Lung Group Ltd. | | 3,712,143 | |
16,850 | | | | JPMorgan Chase & Co. | | 714,777 | |
133,310 | | | | Julius Baer Group Ltd. | | 6,241,981 | |
365,099 | | | | Loews Corp. | | 14,206,002 | |
1,175 | | @ | | Markel Corp. | | 444,303 | |
131,700 | | | | Moody’s Corp. | | 3,495,318 | |
550,980 | | | | Progressive Corp. | | 10,947,973 | |
90,070 | | | | Transatlantic Holdings, Inc. | | 4,649,413 | |
665,667 | | | | Wells Fargo & Co. | | 20,629,019 | |
| | | | | | 130,641,832 | |
| | | | Health Care: 13.7% | | | |
134,568 | | @ | | Agilent Technologies, Inc. | | 5,575,152 | |
80,900 | | | | Baxter International, Inc. | | 4,095,158 | |
51,700 | | | | Becton Dickinson & Co. | | 4,369,684 | |
181,640 | | @ | | Express Scripts, Inc. | | 9,817,642 | |
181,700 | | | | Johnson & Johnson | | 11,238,145 | |
391,615 | | | | Merck & Co., Inc. | | 14,113,805 | |
506,300 | | | | Pfizer, Inc. | | 8,865,313 | |
51,400 | | | | Roche Holding AG - Genusschein | | 7,534,872 | |
| | | | | | 65,609,771 | |
| | | | Industrials: 5.0% | | | |
1,281,598 | | | | China Merchants Holdings International Co., Ltd. | | 5,059,014 | |
958,000 | | | | China Shipping Development Co., Ltd. | | 1,275,418 | |
285,250 | | | | Iron Mountain, Inc. | | 7,134,103 | |
25,157 | | | | Kuehne & Nagel International AG | | 3,500,061 | |
96,700 | | @ | | LLX Logistica S.A. | | 275,537 | |
44,040 | | | | Lockheed Martin Corp. | | 3,078,836 | |
109,100 | | @ | | PortX Operacoes Portuarias SA | | 243,832 | |
79,115 | | | | Tyco International Ltd. | | 3,278,526 | |
| | | | | | 23,845,327 | |
| | | | Information Technology: 5.8% | | | |
202,000 | | | | Activision Blizzard, Inc. | | 2,512,880 | |
8,099 | | @ | | Google, Inc. - Class A | | 4,810,563 | |
93,200 | | | | Hewlett-Packard Co. | | 3,923,720 | |
213,370 | | | | Microsoft Corp. | | 5,957,290 | |
302,250 | | | | Texas Instruments, Inc. | | 9,823,125 | |
15,400 | | | | Visa, Inc. | | 1,083,852 | |
| | | | | | 28,111,430 | |
| | | | | | | | |
| | | | Materials: 8.2% | | | |
11,960 | | | | Air Products & Chemicals, Inc. | | 1,087,762 | |
64,500 | | | | BHP Billiton PLC | | 2,594,943 | |
22,300 | | | | Martin Marietta Materials, Inc. | | 2,056,952 | |
98,240 | | | | Monsanto Co. | | 6,841,434 | |
21,485 | | | | Potash Corp. of Saskatchewan | | 3,326,523 | |
19,800 | | | | Praxair, Inc. | | 1,890,306 | |
41,632 | | | | Rio Tinto PLC | | 2,967,585 | |
402,494 | | | | Sealed Air Corp. | | 10,243,472 | |
298,480 | | @ | | Sino-Forest Corp. | | 6,991,450 | |
8,100 | | @, # | | SINO-FOREST CORP. 144A | | 189,730 | |
32,150 | | | | Vulcan Materials Co. | | 1,426,174 | |
| | | | | | 39,616,331 | |
| | | | Telecommunication Services: 0.4% | | | |
36,500 | | | | America Movil SA de CV - Series L ADR | | 2,092,910 | |
| | | | | | 2,092,910 | |
| | | | Total Common Stock
(Cost $408,080,259) | | 470,966,547 | |
Principal Amount | | | | | | | |
| | | | | | | |
CORPORATE BONDS/NOTES: 0.2% | | | |
| | | | Materials: 0.2% | | | |
$ | 649,000 | | # | | Sino-Forest Corp., 5.000%, due 08/01/13 | | $ | 873,716 | |
| | | | | | | |
| | | | Total Corporate Bonds/Notes
(Cost $649,000) | | 873,716 | |
| | | | | | | |
| | | | Total Long-Term Investments
(Cost $408,729,259) | | 471,840,263 | |
| | | | | | | |
SHORT-TERM INVESTMENTS: 2.2% | | | |
| | | | Commercial Paper: 2.2% | | | |
10,555,000 | | | | Societe Generale, 0.110%, due 01/03/11 | | 10,554,903 | |
| | | | | | | |
| | | | Total Short-Term Investments
(Cost $10,554,903) | | 10,554,903 | |
| | | | | | | |
| | | | Total Investments in Securities
(Cost $419,284,162) * | 100.4 | % | $ | 482,395,166 | |
| | | | Other Assets and Liabilities - Net | (0.4 | ) | (1,859,270 | ) |
| | | | Net Assets | 100.0 | % | $ | 480,535,896 | |
| | | | | | | | | | |
| | @ | | Non-income producing security | |
| | ADR | | American Depositary Receipt | |
| | # | | Securities with purchases pursuant to Rule 144A or section 4(2), under the Securities Act of 1933 and may not be resold subject to that rule except to qualified institutional buyers. Unless otherwise noted, these securities have been determined to be liquid under the guidelines established by the Funds’ Board of Directors/Trustees. | |
| | X | | Fair value determined by ING Funds Valuation Committee appointed by the Funds’ Board of Directors/Trustees. | |
| | PORTFOLIO OF INVESTMENTS |
ING Fidelity® VIP Contrafund® Portfolio | | as of December 31, 2010 |
Shares | | | | | | Value | |
| | | | | | | |
MASTER FUND: 100.0% | | | |
| | | | 100.0% | | | |
15,284,532 | | | | Fidelity VIP Contrafund Portfolio | | $ | 359,033,660 | |
| | | | | | | |
| | | | Total Investments in Master Fund
(Cost $367,278,992) * | | 100.0 | % | | $ | 359,033,660 | |
| | | | Other Assets and Liabilities - Net | | 0.0 | | | 7,032 | |
| | | | Net Assets | | 100.0 | % | | $ | 359,040,692 | |
| | PORTFOLIO OF INVESTMENTS |
ING Fidelity® VIP Equity-Income Portfolio | | as of December 31, 2010 |
Shares | | | | | | Value | |
| | | | | | | |
MASTER FUND: 100.0% | | | |
| | | | 100.0% | | | |
1,304,635 | | | | Fidelity VIP Equity-Income Portfolio | | $ | 24,461,899 | |
| | | | | | | |
| | | | Total Investments in Master Fund
(Cost $22,670,808) * | 100.0 | % | | $ | 24,461,899 | |
| | | | Other Assets and Liabilities - Net | (0.0 | ) | | (5,699 | ) |
| | | | Net Assets | 100.0 | % | | $ | 24,456,200 | |
| | PORTFOLIO OF INVESTMENTS |
ING Fidelity® VIP Mid Cap Portfolio | | as of December 31, 2010 |
Shares | | | | | | Value | |
| | | | | | | |
MASTER FUND: 100.0% | | | |
| | | | 100.0% | | | |
2,349,308 | | | | Fidelity VIP Mid Cap Portfolio | | $ | 75,483,257 | |
| | | | | | | |
| | | | Total Investments in Master Fund
(Cost $67,740,701) * | 100.0 | % | | $ | 75,483,257 | |
| | | | Other Assets and Liabilities - Net | (0.0 | ) | | (19,875 | ) |
| | | | Net Assets | 100.0 | % | | $ | 75,463,382 | |
| | PORTFOLIO OF INVESTMENTS |
ING Index Solution 2015 Portfolio | | as of December 31, 2010 |
Shares | | | | | | Value | |
| | | | | | | |
EXCHANGE-TRADED FUNDS: 2.0% | | | |
| | | | Exchange-Traded Funds: 2.0% | | | |
71,140 | | | | Vanguard Emerging Markets ETF | | $ | 3,425,391 | |
| | | | | | | |
| | | | Total Exchange-Traded Funds
(Cost $3,017,463) | | 3,425,391 | |
| | | | | | | |
AFFILIATED INVESTMENT COMPANIES: 98.0% | | | |
| | | | Affiliated Investment Companies: 98.0% | | | |
2,018,395 | | | | ING International Index Portfolio - Class I | | 17,237,094 | |
4,835,027 | | | | ING Russell Large Cap Index Portfolio - Class I | | 46,803,059 | |
873,313 | | | | ING Russell Mid Cap Index Portfolio - Class I | | 10,104,233 | |
271,218 | | | | ING Russell Small Cap Index Portfolio - Class I | | 3,346,829 | |
8,241,855 | | | | ING U.S. Bond Index Portfolio - Class I | | 88,517,518 | |
| | | | | | | |
| | | | Total Affiliated Investment Companies
(Cost $158,169,901) | | 166,008,733 | |
| | | | | | | |
| | | | Total Investments in Securities
(Cost $161,187,364) * | 100.0 | % | | $ | 169,434,124 | |
| | | | Other Assets and Liabilities - Net | (0.0 | ) | | (63,358 | ) |
| | | | Net Assets | 100.0 | % | | $ | 169,370,766 | |
| PORTFOLIO OF INVESTMENTS |
ING Index Solution 2025 Portfolio | as of December 31, 2010 |
Shares | | | | | | Value | |
| | | | | | | |
EXCHANGE-TRADED FUNDS: 3.0% | | | |
| | | | Exchange-Traded Funds: 3.0% | | | |
126,803 | | | | Vanguard Emerging Markets ETF | | $ | 6,105,564 | |
| | | | | | | |
| | | | Total Exchange-Traded Funds
(Cost $5,435,385) | | 6,105,564 | |
| | | | | | | |
AFFILIATED INVESTMENT COMPANIES: 97.0% | | | |
| | | | Affiliated Investment Companies: 97.0% | | | |
3,997,865 | | | | ING International Index Portfolio - Class I | | 34,141,765 | |
7,900,349 | | | | ING Russell Large Cap Index Portfolio - Class I | | 76,475,381 | |
2,431,430 | | | | ING Russell Mid Cap Index Portfolio - Class I | | 28,131,648 | |
809,064 | | | | ING Russell Small Cap Index Portfolio - Class I | | 9,983,846 | |
4,349,187 | | | | ING U.S. Bond Index Portfolio - Class I | | 46,710,265 | |
| | | | | | | |
| | | | Total Affiliated Investment Companies
(Cost $181,267,073) | | 195,442,905 | |
| | | | | | | |
| | | | Total Investments in Securities
(Cost $186,702,458) * | 100.0 | % | | $ | 201,548,469 | |
| | | | Other Assets and Liabilities - Net | (0.0 | ) | | (78,812 | ) |
| | | | Net Assets | 100.0 | % | | $ | 201,469,657 | |
| PORTFOLIO OF INVESTMENTS |
ING Index Solution 2035 Portfolio | as of December 31, 2010 |
Shares | | | | | | Value | |
| | | | | | | |
EXCHANGE-TRADED FUNDS: 4.0% | | | |
| | | | Exchange-Traded Funds: 4.0% | | | |
121,606 | | | | Vanguard Emerging Markets ETF | | $ | 5,855,329 | |
| | | | | | | |
| | | | Total Exchange-Traded Funds
(Cost $5,226,342) | | 5,855,329 | |
| | | | | | | |
AFFILIATED INVESTMENT COMPANIES: 96.0% | | | |
| | | | Affiliated Investment Companies: 96.0% | | | |
3,554,864 | | | | ING International Index Portfolio - Class I | | 30,358,535 | |
5,536,190 | | | | ING Russell Large Cap Index Portfolio - Class I | | 53,590,322 | |
1,999,856 | | | | ING Russell Mid Cap Index Portfolio - Class I | | 23,138,338 | |
1,048,112 | | | | ING Russell Small Cap Index Portfolio - Class I | | 12,933,708 | |
1,769,046 | | | | ING U.S. Bond Index Portfolio - Class I | | 18,999,552 | |
| | | | | | | |
| | | | Total Affiliated Investment Companies
(Cost $126,576,222) | | 139,020,455 | |
| | | | | | | |
| | | | Total Investments in Securities
(Cost $131,802,564) * | 100.0 | % | | $ | 144,875,784 | |
| | | | Other Assets and Liabilities - Net | (0.0 | ) | | (57,925 | ) |
| | | | Net Assets | 100.0 | % | | $ | 144,817,859 | |
| PORTFOLIO OF INVESTMENTS |
ING Index Solution 2045 Portfolio | as of December 31, 2010 |
Shares | | | | | | Value | |
| | | | | | | |
EXCHANGE-TRADED FUNDS: 4.0% | | | |
| | | | Exchange-Traded Funds: 4.0% | | | |
65,302 | | | | Vanguard Emerging Markets ETF | | $ | 3,144,291 | |
| | | | | | | |
| | | | Total Exchange-Traded Funds
(Cost $2,820,654) | | 3,144,291 | |
| | | | | | | |
AFFILIATED INVESTMENT COMPANIES: 96.0% | | | |
| | | | Affiliated Investment Companies: 96.0% | | | |
2,542,290 | | | | ING International Index Portfolio - Class I | | 21,711,155 | |
2,729,304 | | | | ING Russell Large Cap Index Portfolio - Class I | | 26,419,664 | |
1,341,121 | | | | ING Russell Mid Cap Index Portfolio - Class I | | 15,516,767 | |
687,252 | | | | ING Russell Small Cap Index Portfolio - Class I | | 8,480,693 | |
218,976 | | | | ING U.S. Bond Index Portfolio - Class I | | 2,351,806 | |
| | | | | | | |
| | | | Total Affiliated Investment Companies
(Cost $67,285,598) | | 74,480,085 | |
| | | | | | | |
| | | | Total Investments in Securities
(Cost $70,106,252) * | 100.0 | % | | $ | 77,624,376 | |
| | | | Other Assets and Liabilities - Net | (0.0 | ) | | (29,938 | ) |
| | | | Net Assets | 100.0 | % | | $ | 77,594,438 | |
| PORTFOLIO OF INVESTMENTS |
ING Index Solution 2055 Portfolio | as of December 31, 2010 |
Shares | | | | | | Value | |
| | | | | | | |
EXCHANGE-TRADED FUNDS: 3.7% | | | |
| | | | Exchange-Traded Funds: 3.7% | | | |
2,888 | | | | Vanguard Emerging Markets ETF | | $ | 139,057 | |
| | | | | | | |
| | | | Total Exchange-Traded Funds
(Cost $120,727) | | 139,057 | |
| | | | | | | |
AFFILIATED INVESTMENT COMPANIES: 96.3% | | | |
| | | | Affiliated Investment Companies: 96.3% | | | |
123,596 | | | | ING International Index Portfolio - Class I | | 1,055,507 | |
131,189 | | | | ING Russell Large Cap Index Portfolio - Class I | | 1,269,905 | |
64,471 | | | | ING Russell Mid Cap Index Portfolio - Class I | | 745,926 | |
33,054 | | | | ING Russell Small Cap Index Portfolio - Class I | | 407,885 | |
10,518 | | | | ING U.S. Bond Index Portfolio - Class I | | 112,968 | |
| | | | | | | |
| | | | Total Affiliated Investment Companies
(Cost $3,269,368) | | 3,592,191 | |
| | | | | | | |
| | | | Total Investments in Securities
(Cost $3,390,095) * | 100.0 | % | | $ | 3,731,248 | |
| | | | Other Assets and Liabilities - Net | (0.0 | ) | | (1,064 | ) |
| | | | Net Assets | 100.0 | % | | $ | 3,730,184 | |
| PORTFOLIO OF INVESTMENTS |
ING Index Solution Income Portfolio | as of December 31, 2010 |
Shares | | | | | | Value | |
| | | | | | | |
EXCHANGE-TRADED FUNDS: 2.0% | | | |
| | | | Exchange-Traded Funds: 2.0% | | | |
72,595 | | | | Vanguard Emerging Markets ETF | | $ | 3,495,449 | |
| | | | | | | |
| | | | Total Exchange-Traded Funds
(Cost $3,049,244) | | 3,495,449 | |
| | | | | | | |
AFFILIATED INVESTMENT COMPANIES: 98.0% | | | |
| | | | Affiliated Investment Companies: 98.0% | | | |
1,024,722 | | | | ING International Index Portfolio - Class I | | 8,751,125 | |
3,786,725 | | | | ING Russell Large Cap Index Portfolio - Class I | | 36,655,500 | |
602,543 | | | | ING Russell Mid Cap Index Portfolio - Class I | | 6,971,425 | |
11,154,080 | | | | ING U.S. Bond Index Portfolio - Class I | | 119,794,815 | |
| | | | | | | |
| | | | Total Affiliated Investment Companies
(Cost $165,230,454) | | 172,172,865 | |
| | | | | | | |
| | | | Total Investments in Securities
(Cost $168,279,698) * | 100.0 | % | | $ | 175,668,314 | |
| | | | Other Assets and Liabilities - Net | (0.0 | ) | | (57,671 | ) |
| | | | Net Assets | 100.0 | % | | $ | 175,610,643 | |
| | PORTFOLIO OF INVESTMENTS | |
ING JPMorgan Mid Cap Value Portfolio | | as of December 31, 2010 | |
Shares | | | | | | Value | |
| | | | | | | |
COMMON STOCK: 92.8% | | | |
| | | | Consumer Discretionary: 18.4% | | | |
9,550 | | @ | | Autozone, Inc. | | $ | 2,603,235 | |
76,500 | | @ | | Bed Bath & Beyond, Inc. | | 3,759,975 | |
45,400 | | | | Cablevision Systems Corp. | | 1,536,336 | |
136,000 | | | | CBS Corp. - Class B | | 2,590,800 | |
115,001 | | @ | | Clear Channel Outdoor Holdings, Inc. | | 1,614,614 | |
49,453 | | | | Darden Restaurants, Inc. | | 2,296,597 | |
151,300 | | @ | | Dish Network Corp. | | 2,974,558 | |
100,500 | | | | Expedia, Inc. | | 2,521,545 | |
70,400 | | | | Fortune Brands, Inc. | | 4,241,600 | |
183,600 | | | | Gannett Co., Inc. | | 2,770,524 | |
290,400 | | | | Gap, Inc. | | 6,429,454 | |
59,100 | | | | Genuine Parts Co. | | 3,034,194 | |
62,100 | | | | Jarden Corp. | | 1,917,027 | |
127,500 | | | | Macy’s, Inc. | | 3,225,750 | |
63,206 | | | | Marriott International, Inc. | | 2,625,577 | |
36,900 | | | | Omnicom Group | | 1,690,020 | |
41,800 | | | | Phillips-Van Heusen | | 2,633,818 | |
72,000 | | | | Staples, Inc. | | 1,639,440 | |
47,700 | | | | Tiffany & Co. | | 2,970,279 | |
76,700 | | | | TJX Cos., Inc. | | 3,404,713 | |
2,550 | | L | | Washington Post | | 1,120,725 | |
48,600 | | | | Yum! Brands, Inc. | | 2,383,830 | |
| | | | | | 59,984,611 | |
| | | | Consumer Staples: 5.6% | | | |
38,775 | | | | Brown-Forman Corp. | | 2,699,516 | |
26,200 | | | | Dr Pepper Snapple Group, Inc. | | 921,192 | |
27,000 | | @ | | Energizer Holdings, Inc. | | 1,968,300 | |
72,900 | | | | JM Smucker Co. | | 4,785,885 | |
12,000 | | | | Lorillard, Inc. | | 984,720 | |
42,500 | | @ | | Ralcorp Holdings, Inc. | | 2,762,925 | |
177,700 | | | | Safeway, Inc. | | 3,996,473 | |
| | | | | | 18,119,011 | |
| | | | Energy: 8.6% | | | |
146,300 | | @ | | CVR Energy, Inc. | | 2,220,834 | |
65,000 | | | | Devon Energy Corp. | | 5,103,150 | |
209,281 | | | | El Paso Corp. | | 2,879,707 | |
86,200 | | | | EQT Corp. | | 3,865,208 | |
31,674 | | @ | | Kinder Morgan Management, LLC | | 2,118,357 | |
52,200 | | @ | | Newfield Exploration Co. | | 3,764,142 | |
89,600 | | | | Teekay Shipping Corp. | | 2,963,968 | |
212,697 | | | | Williams Cos., Inc. | | 5,257,870 | |
| | | | | | 28,173,236 | |
| | | | Financials: 20.7% | | | |
58,500 | | | | Ameriprise Financial, Inc. | | 3,366,675 | |
57,100 | | | | AON Corp. | | 2,627,171 | |
12,800 | | @ | | Arch Capital Group Ltd. | | 1,127,040 | |
100,687 | | L | | Bancorpsouth, Inc. | | 1,605,958 | |
52,500 | | | | BB&T Corp. | | 1,380,225 | |
159,850 | | | | Brookfield Properties Co. | | 2,802,171 | |
11,000 | | | | Capitol Federal Financial, Inc. | | 131,010 | |
124,361 | | | | Cincinnati Financial Corp. | | 3,941,000 | |
30,900 | | | | City National Corp. | | 1,896,024 | |
30,200 | | | | Cullen/Frost Bankers, Inc. | | 1,845,824 | |
176,100 | | | | Fifth Third Bancorp. | | 2,585,148 | |
157,200 | | | | Loews Corp. | | 6,116,652 | |
18,400 | | @ | | LPL Investment Holdings, Inc. | | 669,208 | |
42,161 | | | | M&T Bank Corp. | | 3,670,115 | |
40,900 | | | | Northern Trust Corp. | | 2,266,269 | |
309,850 | | | | Old Republic International Corp. | | 4,223,256 | |
117,396 | | @ | | OneBeacon Insurance Group Ltd. | | 1,779,723 | |
192,400 | | | | People’s United Financial, Inc. | | 2,695,524 | |
79,100 | | | | Principal Financial Group, Inc. | | 2,575,496 | |
98,300 | | | | SunTrust Bank | | 2,900,833 | |
31,900 | | | | Symetra Financial Corp. | | 437,030 | |
51,000 | | | | T. Rowe Price Group, Inc. | | 3,291,540 | |
54,600 | | | | TCF Financial Corp. | | 808,626 | |
84,400 | | | | Transatlantic Holdings, Inc. | | 4,356,728 | |
144,400 | | | | WR Berkley Corp. | | 3,953,672 | |
123,500 | | | | XL Group PLC | | 2,694,770 | |
75,100 | | | | Zions Bancorp. | | 1,819,673 | |
| | | | | | 67,567,361 | |
| | | | | | | | |
| | | | Health Care: 6.0% | | | |
46,700 | | | | AmerisourceBergen Corp. | | 1,593,404 | |
62,500 | | | | Becton Dickinson & Co. | | 5,282,500 | |
52,700 | | @ | | Community Health Systems, Inc. | | 1,969,399 | |
90,200 | | @ | | Coventry Health Care, Inc. | | 2,381,280 | |
44,300 | | @ | | Humana, Inc. | | 2,424,982 | |
175,700 | | | | Lincare Holdings, Inc. | | 4,714,031 | |
58,500 | | @ | | VCA Antech, Inc. | | 1,362,465 | |
| | | | | | 19,728,061 | |
| | | | Industrials: 8.8% | | | |
32,800 | | @ | | Alliant Techsystems, Inc. | | 2,441,304 | |
59,200 | | | | Ametek, Inc. | | 2,323,600 | |
73,500 | | | | Carlisle Cos., Inc. | | 2,920,890 | |
44,679 | | @ | | Cooper Industries PLC | | 2,604,339 | |
37,100 | | | | L-3 Communications Holdings, Inc. | | 2,615,179 | |
15,600 | | | | Regal-Beloit Corp. | | 1,041,456 | |
195,817 | | | | Republic Services, Inc. | | 5,847,096 | |
39,300 | | | | Roper Industries, Inc. | | 3,003,699 | |
66,041 | | | | Snap-On, Inc. | | 3,736,600 | |
36,200 | | @ | | WABCO Holdings, Inc. | | 2,205,666 | |
| | | | | | 28,739,829 | |
| | | | Information Technology: 5.4% | | | |
54,200 | | | | Amphenol Corp. | | 2,860,676 | |
76,800 | | @ | | Arrow Electronics, Inc. | | 2,630,400 | |
110,100 | | | | Jack Henry & Associates, Inc. | | 3,209,415 | |
118,700 | | @ | | Synopsys, Inc. | | 3,194,217 | |
163,800 | | | | Tyco Electronics Ltd. | | 5,798,520 | |
| | | | | | 17,693,228 | |
| | | | Materials: 6.6% | | | |
70,508 | | | | Albemarle Corp. | | 3,932,936 | |
70,700 | | | | Ball Corp. | | 4,811,135 | |
46,800 | | | | PPG Industries, Inc. | | 3,934,476 | |
29,600 | | | | Rock-Tenn Co. | | 1,596,920 | |
45,000 | | | | Sherwin-Williams Co. | | 3,768,750 | |
50,800 | | | | Sigma-Aldrich Corp. | | 3,381,248 | |
| | | | | | 21,425,465 | |
| | | | Telecommunication Services: 2.3% | | | |
73,800 | | L | | CenturyTel, Inc. | | 3,407,346 | |
89,387 | | | | Telephone & Data Systems, Inc. | | 2,817,478 | |
95,721 | | | | Windstream Corp. | | 1,334,351 | |
| | | | | | 7,559,175 | |
| | | | Utilities: 10.4% | | | |
57,800 | | | | American Water Works Co., Inc. | | 1,461,762 | |
277,100 | | | | CMS Energy Corp. | | 5,154,060 | |
110,800 | | | | Energen Corp. | | 5,347,208 | |
34,400 | | | | Northeast Utilities | | 1,096,672 | |
73,700 | | | | NSTAR | | 3,109,403 | |
72,300 | | | | Oneok, Inc. | | 4,010,481 | |
30,800 | | | | Sempra Energy | | 1,616,384 | |
152,000 | | | | Westar Energy, Inc. | | 3,824,320 | |
65,600 | | | | Wisconsin Energy Corp. | | 3,861,216 | |
189,400 | | | | Xcel Energy, Inc. | | 4,460,370 | |
| | | | | | 33,941,876 | |
| | | | Total Common Stock (Cost $245,350,387) | | 302,931,853 | |
| | | | | | | |
REAL ESTATE INVESTMENT TRUSTS: 3.3% | | | |
| | | | Financials: 3.3% | | | |
47,500 | | | | HCP, Inc. | | 1,747,525 | |
81,000 | | | | Kimco Realty Corp. | | 1,461,240 | |
12,300 | | | | Public Storage, Inc. | | 1,247,466 | |
72,600 | | | | Regency Centers Corp. | | 3,066,624 | |
37,276 | | | | Vornado Realty Trust | | 3,106,209 | |
| | | | | | | |
| | | | Total Real Estate Investment Trusts (Cost $8,733,853) | | 10,629,064 | |
| | | | | | | |
| | | | Total Long-Term Investments (Cost $254,084,240) | | 313,560,917 | |
| | | |
SHORT-TERM INVESTMENTS: 6.0% | | | |
| | | | Mutual Funds: 4.2% | | | |
13,717,697 | | | | Blackrock Liquidity Funds TempFund Portfolio - Class I | | 13,717,697 | |
| | | | | | | |
| | | | Total Mutual Funds (Cost $13,717,697) | | 13,717,697 | |
| | | | | | | |
| | | | Securities Lending Collateral(cc): 1.8% | | | |
5,452,732 | | | | BNY Mellon Overnight Government Fund (1) | | 5,452,732 | |
565,915 | | R | | BNY Institutional Cash Reserves Fund, Series B (1)(2) | | 452,732 | |
| | | | Total Securities Lending Collateral (Cost $6,018,647) | | 5,905,464 | |
| | | | | | | |
| | | | Total Short-Term Investments (Cost $19,736,344) | | 19,623,161 | |
| | | | | | | |
| | | | Total Investments in Securities (Cost $273,820,584)* | 102.1 | % | $ | 333,184,078 | |
| | | | Other Assets and Liabilities - Net | (2.1 | ) | (6,895,633 | ) |
| | | | Net Assets | 100.0 | % | $ | 326,288,445 | |
| | @ | | Non-income producing security |
| | (cc) | | Securities purchased with cash collateral for securities loaned. |
| | (1) | | Collateral received from brokers for securities lending was invested in these short-term investments. |
| | (2) | | On September 12, 2008, BNY established a separate sleeve of the Institutional Cash Reserves Fund (Series B) to hold certain Lehman Brothers defaulted debt obligations. The Portfolio’s position in Series B is being fair valued daily. Please see the accompanying Notes to Financial Statements for additional details on securities lending. |
| | R | | Restricted security |
| | L | | Loaned security, a portion or all of the security is on loan at December 31, 2010. |
| PORTFOLIO OF INVESTMENTS |
ING Legg Mason ClearBridge Aggressive Growth Portfolio | as of December 31, 2010 |
Shares | | | | | | Value | |
| | | | | | | |
COMMON STOCK: 100.8% | | | |
| | | | Consumer Discretionary: 20.1% | | | |
5,220 | | @ | | Ascent Media Corp. | | $ | 202,327 | |
646,000 | | | | Cablevision Systems Corp. | | 21,860,640 | |
68,235 | | | | CBS Corp. - Class B | | 1,299,877 | |
184,500 | | @ | | Charming Shoppes, Inc. | | 654,975 | |
143,090 | | | | Comcast Corp. — Class A | | 3,143,687 | |
851,635 | | | | Comcast Corp. — Special Class A | | 17,722,524 | |
157,148 | | @ | | DIRECTV | | 6,274,920 | |
62,205 | | @ | | Discovery Communications, Inc. - Class A | | 2,593,949 | |
62,205 | | @ | | Discovery Communications, Inc. - Class C | | 2,282,301 | |
53,146 | | @, L | | Liberty Global, Inc. | | 1,880,305 | |
53,003 | | @ | | Liberty Global, Inc. - Series C | | 1,796,272 | |
66,735 | | @, L | | Liberty Media Corp. - Capital Shares A | | 4,174,942 | |
358,315 | | @ | | Liberty Media Corp. - Interactive - Class A | | 5,650,628 | |
28,710 | | @ | | Liberty Media Corp. - Starz | | 1,908,641 | |
167,750 | | @ | | Madison Square Garden, Inc. | | 4,324,595 | |
61,295 | | | | Viacom - Class B | | 2,427,895 | |
74,460 | | L | | World Wrestling Entertainment, Inc. | | 1,060,310 | |
| | | | | | 79,258,788 | |
| | | | Energy: 18.8% | | | |
437,095 | | | | Anadarko Petroleum Corp. | | 33,289,155 | |
149,919 | | | | National Oilwell Varco, Inc. | | 10,082,053 | |
1,354,430 | | @ | | Weatherford International Ltd. | | 30,881,003 | |
| | | | | | 74,252,211 | |
| | | | Financials: 0.8% | | | |
100,750 | | L | | Cohen & Steers, Inc. | | 2,629,575 | |
1,646 | | | | Goldman Sachs Group, Inc. | | 276,791 | |
| | | | | | 2,906,366 | |
| | | | Health Care: 35.9% | | | |
79,830 | | @ | | Alkermes, Inc. | | 980,312 | |
379,420 | | @ | | Amgen, Inc. | | 20,830,158 | |
445,390 | | @ | | Biogen Idec, Inc. | | 29,863,400 | |
212,520 | | @ | | BioMimetic Therapeutics, Inc. | | 2,699,004 | |
235,748 | | | | Covidien PLC | | 10,764,254 | |
526,504 | | @ | | Forest Laboratories, Inc. | | 16,837,598 | |
346,000 | | @ | | Genzyme Corp. | | 24,635,200 | |
70,540 | | @, L | | Isis Pharmaceuticals, Inc. | | 713,865 | |
51,392 | | | | Teva Pharmaceutical Industries Ltd. ADR | | 2,679,065 | |
666,190 | | | | UnitedHealth Group, Inc. | | 24,056,121 | |
128,813 | | @ | | Valeant Pharmaceuticals International, Inc. | | 3,644,120 | |
124,160 | | @, L | | Vertex Pharmaceuticals, Inc. | | 4,349,325 | |
| | | | | | 142,052,422 | |
| | | | Industrials: 7.5% | | | |
17,870 | | | | Fluor Corp. | | 1,184,066 | |
120,370 | | | | L-3 Communications Holdings, Inc. | | 8,484,881 | |
192,420 | | | | Pall Corp. | | 9,540,184 | |
252,588 | | | | Tyco International Ltd. | | 10,467,247 | |
| | | | | | 29,676,378 | |
| | | | Information Technology: 15.9% | | | |
73,870 | | @ | | Advent Software, Inc. | | 4,278,550 | |
87,217 | | @ | | Arris Group, Inc. | | 978,575 | |
116,970 | | @ | | Autodesk, Inc. | | 4,468,254 | |
291,320 | | | | Broadcom Corp. | | 12,686,986 | |
84,200 | | @, L | | Cree, Inc. | | 5,547,938 | |
19,190 | | @ | | Dolby Laboratories, Inc. | | 1,279,973 | |
52,890 | | @ | | DSP Group, Inc. | | 430,525 | |
192,240 | | | | Intel Corp. | | 4,042,807 | |
203,160 | | L | | Nokia OYJ ADR | | 2,096,611 | |
259,300 | | @ | | Sandisk Corp. | | 12,928,698 | |
352,356 | | @ | | Seagate Technology, Inc. | | 5,295,911 | |
252,558 | | | | Tyco Electronics Ltd. | | 8,940,553 | |
| | | | | | 62,975,381 | |
| | | | Materials: 1.8% | | | |
47,460 | | | | Freeport-McMoRan Copper & Gold, Inc. | | 5,699,471 | |
33,480 | | | | Nucor Corp. | | 1,467,094 | |
| | | | | | 7,166,565 | |
| | | | Total Common Stock (Cost $300,822,266) | | 398,288,111 | |
| | | | | | | | |
SHORT-TERM INVESTMENTS: 1.4% | | | |
| | | | Mutual Funds: 0.0% | | | |
206,384 | | | | Blackrock Liquidity Funds TempFund Portfolio - Class I | | 206,384 | |
| | | | | | | |
| | | | Total Mutual Funds (Cost $206,384) | | 206,384 | |
| | | | | | | |
| | | | Securities Lending Collateral(cc): 1.4% | | | |
5,344,424 | | | | BNY Mellon Overnight Government Fund (1) | | 5,344,424 | |
154,628 | | R | | BNY Institutional Cash Reserves Fund, Series B (1)(2) | | 123,702 | |
| | | | | | | |
| | | | Total Securities Lending Collateral (Cost $5,499,052) | | 5,468,126 | |
| | | | | | | |
| | | | Total Short-Term Investments (Cost $5,705,436) | | 5,674,510 | |
| | | | | | | |
| | | | Total Investments in Securities (Cost $306,527,702)* | 102.2 | % | $ | 403,962,621 | |
| | | | Other Assets and Liabilities - Net | (2.2 | ) | (8,581,934 | ) |
| | | | Net Assets | 100.0 | % | $ | 395,380,687 | |
| | @ | | Non-income producing security |
| | ADR | | American Depositary Receipt |
| | (cc) | | Securities purchased with cash collateral for securities loaned. |
| | (1) | | Collateral received from brokers for securities lending was invested in these short-term investments. |
| | (2) | | On September 12, 2008, BNY established a separate sleeve of the Institutional Cash Reserves Fund (Series B) to hold certain Lehman Brothers defaulted debt obligations. The Portfolio’s position in Series B is being fair valued daily. Please see the accompanying Notes to Financial Statements for additional details on securities lending. |
| |
| |
| |
| | R | | Restricted security |
| | L | | Loaned security, a portion or all of the security is on loan at December 31, 2010. |
| PORTFOLIO OF INVESTMENTS |
ING Oppenheimer Global Portfolio | as of December 31, 2010 |
Shares | | | | | | Value | |
| | | | | | | |
COMMON STOCK: 99.0% | | | |
| | | | Bermuda: 0.9% | | | |
747,210 | | | | XL Group PLC | | $ | 16,304,122 | |
| | | | | | 16,304,122 | |
| | | | Brazil: 2.0% | | | |
576,000 | | | | Cia de Bebidas das Americas ADR | | 17,873,280 | |
552,310 | | | | Embraer SA ADR | | 16,237,914 | |
| | | | | | 34,111,194 | |
| | | | Finland: 0.9% | | | |
491,000 | | | | Fortum OYJ | | 14,810,252 | |
| | | | | | 14,810,252 | |
| | | | France: 5.0% | | | |
198,848 | | | | LVMH Moet Hennessy Louis Vuitton S.A. | | 32,751,197 | |
200,296 | | | | Societe Generale | | 10,777,294 | |
256,414 | | | | Technip S.A. | | 23,701,247 | |
362,784 | | | | Total S.A. | | 19,322,793 | |
| | | | | | 86,552,531 | |
| | | | Germany: 9.0% | | | |
191,160 | | | | Allianz AG | | 22,712,809 | |
221,110 | | | | Bayer AG | | 16,390,299 | |
435,474 | | | | Bayerische Motoren Werke AG - Preference Shares | | 22,390,418 | |
47,078 | | | | Bayerische Motoren Werke AG | | 3,709,136 | |
75,093 | | | | Linde AG | | 11,360,021 | |
568,907 | | | | SAP AG | | 29,015,773 | |
413,269 | | | | Siemens AG | | 51,193,549 | |
| | | | | | 156,772,005 | |
| | | | India: 2.2% | | | |
390,980 | | | | Infosys Technologies Ltd. | | 30,066,853 | |
1,576,003 | | @ | | Wire and Wireless India Ltd. | | 429,964 | |
307,844 | | @ | | Zee Learn Ltd. | | 189,326 | |
2,462,752 | | | | Zee Telefilms Ltd. | | 8,108,607 | |
| | | | | | 38,794,750 | |
| | | | Italy: 2.2% | | | |
1,079,000 | | L | | Bulgari S.p.A. | | 11,681,645 | |
261,800 | | L | | Lottomatica S.p.A. | | 3,255,629 | |
425,779 | | | | Prysmian S.p.A. | | 7,256,401 | |
166,810 | | | | Tod’s S.p.A. | | 16,502,540 | |
| | | | | | 38,696,215 | |
| | | | Japan: 11.6% | | | |
12,876 | | | | Dai-ichi Life Insurance Co., Ltd. | | 20,838,159 | |
82,100 | | | | Fanuc Ltd. | | 12,549,505 | |
642,800 | | | | Hoya Corp. | | 15,542,387 | |
2,968 | | | | KDDI Corp. | | 17,115,683 | |
59,483 | | | | Keyence Corp. | | 17,162,932 | |
101,000 | | | | Kyocera Corp. | | 10,261,344 | |
501,000 | | | | Mitsubishi Tanabe Pharma Corp. | | 8,445,547 | |
330,900 | | | | Murata Manufacturing Co., Ltd. | | 23,098,684 | |
107,500 | | | | Nidec Corp. | | 10,839,670 | |
37,800 | | | | Nintendo Co., Ltd. | | 11,035,775 | |
253,400 | | | | Secom Co., Ltd. | | 11,973,359 | |
798,100 | | | | Sony Corp. | | 28,543,772 | |
405,700 | | | | Sumitomo Mitsui Financial Group, Inc. | | 14,364,673 | |
| | | | | | 201,771,490 | |
| | | | Mexico: 3.6% | | | |
75,350 | | | | America Movil SA de CV - Series L ADR | | 4,320,569 | |
4,212,921 | | @ | | Fomento Economico Mexicano SA de CV ADR | | 23,554,834 | |
2,122,204 | | @ | | Grupo Modelo S.A. | | 13,188,596 | |
850,014 | | @ | | Grupo Televisa S.A. ADR | | 22,040,863 | |
| | | | | | 63,104,862 | |
| | | | Netherlands: 3.2% | | | |
866,273 | | @ | | European Aeronautic Defence and Space Co. NV | | 20,214,518 | |
725,377 | | | | Koninklijke Philips Electronics NV | | 22,238,124 | |
462,425 | | | | TNT NV | | 12,229,202 | |
| | | | | | 54,681,844 | |
| | | | South Korea: 0.2% | | | |
6,543 | | @ | | Shinsegae Co., Ltd. | | 3,539,873 | |
| | | | | | 3,539,873 | |
| | | | Spain: 2.3% | | | |
1,700,880 | | L | | Banco Bilbao Vizcaya Argentaria S.A. | | 17,334,143 | |
298,695 | | | | Inditex S.A. | | 22,358,379 | |
| | | | | | 39,692,522 | |
| | | | Sweden: 6.7% | | | |
981,154 | | | | Assa Abloy AB | | 27,677,063 | |
882,350 | | | | Investor AB | | 18,880,740 | |
6,067,604 | | | | Telefonaktiebolaget LM Ericsson | | 70,316,357 | |
| | | | | | 116,874,160 | |
| | | | Switzerland: 5.1% | | | |
12,018 | | @ | | Basilea Pharmaceutica - Reg | | 835,724 | |
923,954 | | | | Credit Suisse Group | | 37,212,191 | |
325,327 | | | | Nestle S.A. | | 19,058,850 | |
64,435 | | | | Roche Holding AG - Genusschein | | 9,445,710 | |
1,306,969 | | @ | | UBS AG - Reg | | 21,458,682 | |
| | | | | | 88,011,157 | |
| | | | Taiwan: 1.9% | | | |
954,902 | | | | MediaTek, Inc. | | 13,667,669 | |
8,251,111 | | | | Taiwan Semiconductor Manufacturing Co., Ltd. | | 20,085,678 | |
| | | | | | 33,753,347 | |
| | | | | | | | |
| | | | United Kingdom: 5.1% | | | |
1,609,700 | | | | 3i Group PLC | | 8,269,519 | |
2,180,698 | | | | HSBC Holdings PLC | | 22,268,137 | |
1,761,116 | | | | Prudential PLC | | 18,398,709 | |
703,167 | | | | Unilever PLC | | 21,598,558 | |
6,640,676 | | | | Vodafone Group PLC | | 17,432,696 | |
| | | | | | 87,967,619 | |
| | | | United States: 37.1% | | | |
265,390 | | | | 3M Co. | | 22,903,157 | |
673,683 | | @ | | Adobe Systems, Inc. | | 20,735,963 | |
633,200 | | | | Aetna, Inc. | | 19,318,932 | |
297,360 | | | | Aflac, Inc. | | 16,780,025 | |
950,480 | | | | Altera Corp. | | 33,818,078 | |
679,200 | | @ | | Amylin Pharmaceuticals, Inc. | | 9,991,032 | |
355,640 | | | | Automatic Data Processing, Inc. | | 16,459,019 | |
678,440 | | | | Carnival Corp. | | 31,282,868 | |
297,810 | | | | Colgate-Palmolive Co. | | 23,934,990 | |
862,300 | | | | Corning, Inc. | | 16,659,636 | |
129,300 | | @ | | Dendreon Corp. | | 4,515,156 | |
1,567,570 | | @ | | eBay, Inc. | | 43,625,473 | |
277,270 | | | | Emerson Electric Co. | | 15,851,526 | |
599,100 | | | | Fidelity National Title Group, Inc. | | 8,195,688 | |
149,230 | | @ | | Gilead Sciences, Inc. | | 5,408,095 | |
111,030 | | | | Goldman Sachs Group, Inc. | | 18,670,805 | |
644,680 | | @ | | Intuit, Inc. | | 31,782,724 | |
984,490 | | @ | | Juniper Networks, Inc. | | 36,347,371 | |
101,930 | | L | | Lockheed Martin Corp. | | 7,125,926 | |
884,290 | | | | Maxim Integrated Products | | 20,886,930 | |
356,090 | | | | McDonald’s Corp. | | 27,333,468 | |
173,390 | | | | McGraw-Hill Cos., Inc. | | 6,313,130 | |
1,059,250 | | | | Microsoft Corp. | | 29,574,260 | |
159,820 | | | | Raytheon Co. | | 7,406,059 | |
59,920 | | @, L | | Regeneron Pharmaceuticals, Inc. | | 1,967,174 | |
404,200 | | @ | | Shuffle Master, Inc. | | 4,628,090 | |
920,740 | | @ | | SLM Corp. | | 11,592,117 | |
360,200 | | @ | | Theravance, Inc. | | 9,030,214 | |
524,710 | | | | Tiffany & Co. | | 32,673,692 | |
295,779 | | @ | | Transocean Ltd. | | 20,559,598 | |
388,060 | | | | Wal-Mart Stores, Inc. | | 20,928,076 | |
734,950 | | | | Walt Disney Co. | | 27,567,975 | |
379,300 | | @ | | WellPoint, Inc. | | 21,566,998 | |
332,780 | | @ | | Zimmer Holdings, Inc. | | 17,863,630 | |
| | | | | | 643,297,875 | |
| | | | Total Common Stock (Cost $1,409,635,562) | | 1,718,735,818 | |
| | | | | | | |
SHORT-TERM INVESTMENTS: 1.4% | | | |
| | | | Mutual Funds: 1.2% | | | |
20,605,696 | | | | Blackrock Liquidity Funds TempFund Portfolio - Class I | | 20,605,696 | |
| | | | | | | |
| | | | Total Mutual Funds (Cost $20,605,696) | | 20,605,696 | |
| | | | | | | |
| | | | Securities Lending Collateral(cc): 0.2% | | | |
995,126 | | | | BNY Mellon Overnight Government Fund (1) | | 995,126 | |
3,820,850 | | R | | BNY Institutional Cash Reserves Fund, Series B (1)(2) | | 3,056,680 | |
| | | | | | | |
| | | | Total Securities Lending Collateral (Cost $4,815,976) | | 4,051,806 | |
| | | | | | | |
| | | | Total Short-Term Investments (Cost $25,421,672) | | 24,657,502 | |
| | | | | | | |
| | | | Total Investments in Securities (Cost $1,435,057,234)* | 100.4 | % | $ | 1,743,393,320 | |
| | | | Other Assets and Liabilities - Net | (0.4 | ) | | (7,505,045 | ) |
| | | | Net Assets | 100.0 | % | $ | 1,735,888,275 | |
| | @ | | Non-income producing security |
| | ADR | | American Depositary Receipt |
| | (cc) | | Securities purchased with cash collateral for securities loaned. |
| | (1) | | Collateral received from brokers for securities lending was invested in these short-term investments. |
| | (2) | | On September 12, 2008, BNY established a separate sleeve of the Institutional Cash Reserves Fund (Series B) to hold certain Lehman Brothers defaulted debt obligations. The Portfolio’s position in Series B is being fair valued daily. Please see the accompanying Notes to Financial Statements for additional details on securities lending. |
| | R | | Restricted security |
| | L | | Loaned security, a portion or all of the security is on loan at December 31, 2010. |
| PORTFOLIO OF INVESTMENTS |
ING Oppenheimer Global Strategic Income Portfolio | as of December 31, 2010 |
Principal Amount | | | | | | Value | |
| | | | | | | |
CORPORATE BONDS/NOTES: 34.7% | | | |
| | | | Consumer Discretionary: 5.2% | | | |
$ | 560,000 | | #, S | | Affinion Group Holdings, Inc., 11.625%, due 11/15/15 | | $ | 583,800 | |
895,000 | | S | | Beazer Homes USA, Inc., 6.875%, due 07/15/15 | | 870,388 | |
145,000 | | S | | Belo Corp., 7.250%, due 09/15/27 | | 126,513 | |
899,000 | | S | | Belo Corp., 7.750%, due 06/01/27 | | 813,595 | |
145,000 | | | | Bon-Ton Stores, Inc., 10.250%, due 03/15/14 | | 148,625 | |
3,295,000 | | L | | Caesars Entertainment Operating Co., Inc., 10.000%, due 12/15/18 | | 3,023,163 | |
730,000 | | #, S | | Cequel Communications Holdings I, LLC and Cequel Capital Corp., 8.625%, due 11/15/17 | | 766,500 | |
895,000 | | S | | Clear Channel Communications, Inc., 10.750%, due 08/01/16 | | 805,500 | |
3,050,000 | | #, L | | Eastman Kodak Co., 9.750%, due 03/01/18 | | 3,126,250 | |
190,000 | | # | | Entravision Communications Corp., 8.750%, due 08/01/17 | | 201,400 | |
685,000 | | # | | Equinox Holdings, Inc., 9.500%, due 02/01/16 | | 726,956 | |
85,000 | | S | | Fisher Communications, Inc., 8.625%, due 09/15/14 | | 86,700 | |
715,000 | | L | | Goodyear Tire & Rubber Co., 8.250%, due 08/15/20 | | 743,600 | |
1,655,000 | | L | | Gray Television, Inc., 10.500%, due 06/29/15 | | 1,675,688 | |
725,000 | | R, X | | Greektown LLC Escrow | | — | |
220,000 | | #, S | | Grupo Posadas S.A.B de CV, 9.250%, due 01/15/15 | | 203,500 | |
335,000 | | # | | inVentiv Health, Inc., 10.000%, due 08/15/18 | | 336,675 | |
682,000 | | L, S | | Isle of Capri Casinos, Inc., 7.000%, due 03/01/14 | | 671,770 | |
625,000 | | S | | K Hovnanian Enterprises, Inc., 8.875%, due 04/01/12 | | 587,500 | |
325,000 | | | | Landry’s Restaurants, Inc., 11.625%, due 12/01/15 | | 348,563 | |
825,000 | | #, ±, S | | Mashantucket Western Pequot Tribe, 8.500%, due 11/15/15 | | 112,406 | |
860,000 | | ±, S | | Medianews Group, Inc., 6.875%, due 10/01/13 | | 86 | |
495,000 | | L | | MGM Resorts International, 5.875%, due 02/27/14 | | 459,113 | |
1,225,000 | | S | | MGM Resorts International, 6.750%, due 04/01/13 | | 1,223,775 | |
855,000 | | L, S | | Mohegan Tribal Gaming Authority, 6.125%, due 02/15/13 | | 713,925 | |
1,165,000 | | L, S | | Mohegan Tribal Gaming Authority, 8.000%, due 04/01/12 | | 978,600 | |
780,000 | | #, L, S | | Mohegan Tribal Gaming Authority, 11.500%, due 11/01/17 | | 723,450 | |
495,000 | | # | | Nexstar Broadcasting, Inc. / Mission Broadcasting, Inc., 8.875%, due 04/15/17 | | 528,413 | |
780,000 | | | | Penn National Gaming, Inc., 8.750%, due 08/15/19 | | 863,850 | |
85,500 | | &, # | | Radio One, Inc., 12.500%, due 05/24/16 | | 84,218 | |
460,000 | | # | | Sinclair Television Group, Inc., 8.375%, due 10/15/18 | | 477,250 | |
1,510,000 | | ±, S | | Station Casinos, Inc., 6.500%, due 02/01/14 | | 151 | |
1,670,000 | | #, S | | TL Acquisitions, Inc., 10.500%, due 01/15/15 | | 1,732,625 | |
670,000 | | L, S | | Travelport, LLC, 11.875%, due 09/01/16 | | 661,625 | |
185,000 | | # | | Visant Corp., 10.000%, due 10/01/17 | | 197,025 | |
700,000 | | # | | Wallace Theater Holdings, Inc., 12.500%, due 06/15/13 | | 715,750 | |
775,000 | | L | | WMG Holdings Corp., 9.500%, due 12/15/14 | | 745,938 | |
650,000 | | | | Wynn Las Vegas LLC / Wynn Las Vegas Capital Corp., 7.750%, due 08/15/20 | | 706,875 | |
| | | | | | 26,771,761 | |
| | | | Consumer Staples: 1.6% | | | |
920,000 | | #, S | | Altegrity, Inc., 10.500%, due 11/01/15 | | 948,750 | |
BRL | 610,000 | | S | | AmBev International Finance Co., Ltd., 9.500%, due 07/24/17 | | 367,470 | |
$ | 1,160,000 | | #, S | | American Seafoods Group LLC/American Seafoods Finance, Inc., 10.750%, due 05/15/16 | | 1,241,200 | |
1,304,783 | | &, #, S | | ASG Consolidated LLC/ASG Finance, Inc., 15.000%, due 05/15/17 | | 1,259,116 | |
290,000 | | #, S | | Ashtead Capital, Inc., 9.000%, due 08/15/16 | | 303,775 | |
359,842 | | &, S | | Catalent Pharma Solutions, Inc., 9.500%, due 04/15/15 | | 365,240 | |
515,000 | | S | | Ceridian Corp., 11.250%, due 11/15/15 | | 512,425 | |
1,675,000 | | #, L | | Hertz Corp., 7.500%, due 10/15/18 | | 1,746,188 | |
320,000 | | # | | MHP S.A., 10.250%, due 04/29/15 | | 338,816 | |
125,000 | | #, S | | RSC Equipment Rental, Inc., 10.000%, due 07/15/17 | | 141,250 | |
775,000 | | # | | Southern States Cooperative, Inc., 11.250%, due 05/15/15 | | 825,375 | |
190,000 | | # | | Trans Union LLC/TransUnion Financing Corp., 11.375%, due 06/15/18 | | 217,550 | |
| | | | | | 8,267,155 | |
| | | | Energy: 6.2% | | | |
420,000 | | #, S | | Adaro Indonesia PT, 7.625%, due 10/22/19 | | 460,950 | |
300,000 | | #, L | | Alliance Oil Co., Ltd., 9.875%, due 03/11/15 | | 316,860 | |
260,000 | | | | Alon Refining Krotz Springs, Inc., 13.500%, due 10/15/14 | | 250,900 | |
785,000 | | S | | Antero Resources Finance Corp., 9.375%, due 12/01/17 | | 825,231 | |
1,395,000 | | S | | Atlas Energy Operating Co., LLC / Atlas Energy Finance Corp., 10.750%, due 02/01/18 | | 1,710,619 | |
295,000 | | S | | Atlas Pipeline Partners LP, 8.125%, due 12/15/15 | | 305,325 | |
2,330,000 | | #, L, S | | ATP Oil & Gas Corp., 11.875%, due 05/01/15 | | 2,213,500 | |
775,000 | | S | | Berry Petroleum Co., 8.250%, due 11/01/16 | | 811,813 | |
705,000 | | S | | Bill Barrett Co., 9.875%, due 07/15/16 | | 777,263 | |
870,000 | | #, S | | BreitBurn Energy Partners L.P., 8.625%, due 10/15/20 | | 878,700 | |
795,000 | | S | | Chaparral Energy, Inc., 8.875%, due 02/01/17 | | 810,900 | |
835,000 | | #, L, S | | Chaparral Energy, Inc., 9.875%, due 10/01/20 | | 885,100 | |
60,000 | | | | Crosstex Energy L.P. / Crosstex Energy Finance Corp., 8.875%, due 02/15/18 | | 64,575 | |
965,000 | | S | | Dynegy Holdings, Inc., 8.375%, due 05/01/16 | | 726,163 | |
170,000 | | # | | Empresa Nacional del Petroleo, 5.250%, due 08/10/20 | | 170,589 | |
230,000 | | | | Energy Transfer Equity L.P., 7.500%, due 10/15/20 | | 238,050 | |
1,625,000 | | # | | Foresight Energy LLC / Foresight Energy Corp., 9.625%, due 08/15/17 | | 1,738,750 | |
550,000 | | # | | Gaz Capital for Gazprom, 6.212%, due 11/22/16 | | 585,750 | |
1,430,000 | | #, S | | Gaz Capital for Gazprom, 7.288%, due 08/16/37 | | 1,494,350 | |
300,000 | | #, S | | Gaz Capital for Gazprom, 8.125%, due 07/31/14 | | 340,500 | |
460,000 | | S | | Gaz Capital for Gazprom, 8.146%, due 04/11/18 | | 534,750 | |
350,000 | | #, S | | Gaz Capital for Gazprom, 8.625%, due 04/28/34 | | 421,750 | |
890,000 | | #, S | | Gaz Capital for Gazprom, 9.250%, due 04/23/19 | | 1,098,082 | |
815,000 | | | | Global Geophysical Services, Inc., 10.500%, due 05/01/17 | | 815,000 | |
200,000 | | # | | KazMunaiGaz Finance Sub BV, 7.000%, due 05/05/20 | | 209,000 | |
790,000 | | #, S | | KazMunaiGaz Finance Sub BV, 9.125%, due 07/02/18 | | 928,250 | |
590,000 | | #, S | | KazMunaiGaz Finance Sub BV, 11.750%, due 01/23/15 | | 735,258 | |
101 | | #, S | | Kern River Funding Corp., 4.893%, due 04/30/18 | | 105 | |
1,275,000 | | # | | Linn Energy LLC/Linn Energy Finance Corp., 8.625%, due 04/15/20 | | 1,380,188 | |
1,530,000 | | # | | Murray Energy Corp., 10.250%, due 10/15/15 | | 1,614,150 | |
300,000 | | # | | Pan American Energy LLC/Argentine Branch, 7.875%, due 05/07/21 | | 320,250 | |
610,000 | | | | Pemex Project Funding Master Trust, 6.625%, due 06/15/38 | | 622,643 | |
190,000 | | S | | Petrobras International Finance Co., 5.750%, due 01/20/20 | | 198,088 | |
140,000 | | S | | Petrobras International Finance Co., 5.875%, due 03/01/18 | | 149,775 | |
620,000 | | S | | Petrobras International Finance Co., 7.875%, due 03/15/19 | | 736,045 | |
180,000 | | | | Petroleos de Venezuela S.A., 5.250%, due 04/12/17 | | 103,500 | |
340,000 | | | | Petroleos Mexicanos, 5.500%, due 01/21/21 | | 345,950 | |
190,000 | | L | | Petroleos Mexicanos, 6.000%, due 03/05/20 | | 202,350 | |
305,000 | | | | Petroleos Mexicanos, 8.000%, due 05/03/19 | | 369,050 | |
510,000 | | #, S | | Petroleum Co. of Trinidad & Tobago Ltd., 9.750%, due 08/14/19 | | 614,550 | |
925,000 | | # | | PHI, Inc., 8.625%, due 10/15/18 | | 952,750 | |
775,000 | | S | | Quicksilver Resources, Inc., 11.750%, due 01/01/16 | | 906,750 | |
130,000 | | S | | Range Resources Corp., 7.500%, due 10/01/17 | | 137,638 | |
420,000 | | S | | Range Resources Corp., 8.000%, due 05/15/19 | | 459,375 | |
770,000 | | L | | SandRidge Energy, Inc., 8.750%, due 01/15/20 | | 795,025 | |
| | | | | | | | | | |
395,000 | | #, S | | SandRidge Energy, Inc., 9.875%, due 05/15/16 | | 419,688 | |
327,080 | | #, S | | Tengizchevroil Finance Co. S.A.RL, 6.124%, due 11/15/14 | | 344,252 | |
740,000 | | # | | Thermon Industries, Inc., 9.500%, due 05/01/17 | | 791,800 | |
| | | | | | 31,811,900 | |
| | | | Financials: 7.0% | | | |
500,000 | | #, L | | 1Malaysia Sukuk Global Bhd, 3.928%, due 06/04/15 | | 520,068 | |
690,000 | | #, S | | ABI Escrow Corp., 10.250%, due 10/15/18 | | 759,000 | |
425,000 | | #, S | | Akbank TAS, 5.125%, due 07/22/15 | | 431,375 | |
350,000 | | #, S | | Alfa Bank OJSC Via Alfa Bond Issuance PLC, 7.875%, due 09/25/17 | | 356,227 | |
1,020,000 | | S | | Ally Financial, Inc., 8.000%, due 11/01/31 | | 1,104,150 | |
790,000 | | S | | American General Finance Corp., 6.900%, due 12/15/17 | | 641,875 | |
EUR | 112,000 | | | | BA Covered Bond Issuer, 4.250%, due 04/05/17 | | 152,213 | |
$ | 930,000 | | #, S | | Banco BMG S.A., 9.150%, due 01/15/16 | | 1,000,215 | |
200,000 | | #, S | | Banco BMG S.A., 9.950%, due 11/05/19 | | 213,500 | |
170,000 | | #, S | | Banco Cruzeiro do Sul S.A./Brazil, 8.875%, due 09/22/20 | | 170,170 | |
260,000 | | # | | Banco de Credito del Peru, 5.375%, due 09/16/20 | | 257,400 | |
160,000 | | #, S | | Banco de Credito del Peru, 6.950%, due 11/07/21 | | 168,000 | |
150,000 | | #, S | | Banco de Credito del Peru, 9.750%, due 11/06/69 | | 174,750 | |
315,000 | | #, S | | Banco do Brasil Cayman, 8.500%, due 10/29/49 | | 364,203 | |
310,000 | | #, S | | Banco do Brasil S.A., 5.375%, due 01/15/21 | | 305,350 | |
140,000 | | #, S | | Banco Hipotecario S.A., 9.750%, due 04/27/16 | | 144,900 | |
MXN | 1,007,479 | | | | Banco Invex S.A., 6.450%, due 03/13/34 | | 257,372 | |
$ | 300,000 | | #, S | | Banco Panamericano S.A., 8.500%, due 04/23/20 | | 296,400 | |
EUR | 435,000 | | | | Bank of Scotland PLC, 4.375%, due 07/13/16 | | 596,485 | |
EUR | 305,000 | | | | Bank of Scotland PLC, 4.500%, due 07/13/21 | | 401,904 | |
$ | 480,000 | | #, S | | Bankrate, Inc., 11.750%, due 07/15/15 | | 535,200 | |
340,000 | | # | | BM&FBovespa SA, 5.500%, due 07/16/20 | | 347,672 | |
240,000 | | #, S | | Cemex Finance, LLC, 9.500%, due 12/14/16 | | 248,700 | |
2,165,000 | | S | | CIT Group, Inc., 7.000%, due 05/01/17 | | 2,175,825 | |
230,000 | | # | | DJO Finance LLC / DJO Finance Corp., 9.750%, due 10/15/17 | | 238,050 | |
2,000,000 | | | | Eskom Holdings, Ltd., 9.250%, due 04/20/18 | | 313,715 | |
6,000,000 | | | | Eskom Holdings, Ltd., 10.000%, due 01/25/23 | | 993,917 | |
25,000 | | #, S | | Fox Acquisition Sub LLC, 13.375%, due 07/15/16 | | 27,500 | |
200,000 | | # | | Grupo Papelero Scribe S.A., 8.875%, due 04/07/20 | | 198,000 | |
210,000 | | #, S | | Halyk Savings Bank of Kazakhstan JSC, 7.250%, due 05/03/17 | | 214,200 | |
1,010,000 | | #, S | | Halyk Savings Bank of Kazakhstan JSC, 9.250%, due 10/16/13 | | 1,108,475 | |
1,355,000 | | L | | Hawker Beechcraft Acquisition Co. LLC / Hawker Beechcraft Notes Co., 8.500%, due 04/01/15 | | 1,012,863 | |
625,000 | | #, S | | ICICI Bank Ltd., 5.500%, due 03/25/15 | | 651,036 | |
635,000 | | #, S | | ICICI Bank Ltd., 6.375%, due 04/30/22 | | 638,264 | |
825,869 | | # | | IIRSA Norte Finance Ltd., 8.750%, due 05/30/24 | | 922,908 | |
460,000 | | ** | | ING Groep NV, 5.775%, due 12/31/49 | | 397,900 | |
375,000 | | S | | International Lease Finance Corp., 5.875%, due 05/01/13 | | 381,094 | |
485,000 | | # | | International Lease Finance Corp., 8.625%, due 09/15/15 | | 522,588 | |
465,000 | | # | | International Lease Finance Corp., 8.750%, due 03/15/17 | | 499,875 | |
95,000 | | | | International Lease Finance Corp., 8.875%, due 09/01/17 | | 102,956 | |
MXN | 419,692 | | | | JPMorgan Hipotecaria su Casita, 6.100%, due 09/25/35 | | 61,037 | |
$ | 1,500,000 | | ± | | JSC Astana Finance, 9.160%, due 03/14/12 | | 193,800 | |
200,000 | | # | | Kazakhstan Temir Zholy Finance BV, 6.375%, due 10/06/20 | | 209,760 | |
260,000 | | # | | Lukoil International Finance BV, 6.656%, due 06/07/22 | | 264,550 | |
130,000 | | # | | Lukoil International Finance BV, 7.250%, due 11/05/19 | | 141,050 | |
390,000 | | | | MCE Finance Ltd., 10.250%, due 05/15/18 | | 448,988 | |
1,070,000 | | | | NAK Naftogaz Ukraine, 9.500%, due 09/30/14 | | 1,171,650 | |
1,730,000 | | # | | Nationstar Mortgage/Nationstar Capital Corp., 10.875%, due 04/01/15 | | 1,708,375 | |
230,000 | | # | | Navios Maritime Acquisition Corp./Navios Acquisition Finance US, Inc., 8.625%, due 11/01/17 | | 236,325 | |
160,000 | | | | Navios Maritime Holdings, Inc. / Navios Maritime Finance US, Inc., 8.875%, due 11/01/17 | | 174,000 | |
785,000 | | # | | Offshore Group Investments Ltd., 11.500%, due 08/01/15 | | 855,650 | |
925,000 | | # | | Pinafore LLC/Pinafore, Inc., 9.000%, due 10/01/18 | | 1,003,625 | |
300,000 | | #, S | | Power Sector Assets & Liabilities Management Corp., 7.250%, due 05/27/19 | | 354,000 | |
240,000 | | #, S | | Power Sector Assets & Liabilities Management Corp., 7.390%, due 12/02/24 | | 285,600 | |
1,360,000 | | L, S | | Realogy Corp., 10.500%, due 04/15/14 | | 1,343,000 | |
365,000 | | # | | Reynolds Group Issuer, Inc., 9.000%, due 04/15/19 | | 380,056 | |
480,000 | | # | | Reynolds Group Issuer, Inc. / Reynolds Group Issuer LLC / Reynolds Group Issuer Lu, 8.500%, due 05/15/18 | | 484,800 | |
430,000 | | | | SLM Corp., 8.000%, due 03/25/20 | | 436,684 | |
660,000 | | +, #, S | | Tiers Trust, 8.790% (step rate 8.600%), due 06/15/97 | | 370,686 | |
745,000 | | # | | TMX Finance LLC/TitleMax Finance Corp., 13.250%, due 07/15/15 | | 823,225 | |
100,000 | | # | | TNK-BP Finance S.A., 7.250%, due 02/02/20 | | 109,250 | |
1,605,000 | | #, L | | Tower Automotive Holdings USA LLC / TA Holdings Finance, Inc., 10.625%, due 09/01/17 | | 1,733,400 | |
200,000 | | # | | UK SPV Credit Finance PLC for JSC Commercial Bank Privatbank, 8.000%, due 02/06/12 | | 200,000 | |
780,000 | | # | | Vnesheconombank Via VEB Finance Ltd., 6.902%, due 07/09/20 | | 819,000 | |
340,000 | | # | | VTB Bank Via VTB Capital SA, 6.551%, due 10/13/20 | | 335,750 | |
400,000 | | # | | VTB Capital S.A., 6.465%, due 03/04/15 | | 418,480 | |
145,000 | | # | | VTB Capital S.A., 6.875%, due 05/29/18 | | 154,063 | |
EUR | 585,000 | | | | WM Covered Bond Program, 4.000%, due 09/27/16 | | 796,118 | |
$ | 250,000 | | # | | Yapi ve Kredi Bankasi Via Unicredit Luxembourg SA, 5.188%, due 10/13/15 | | 258,800 | |
| | | | | | 35,618,017 | |
| | | | Health Care: 1.7% | | | |
220,000 | | | | Alere, Inc., 7.875%, due 02/01/16 | | 221,650 | |
320,000 | | #, S | | Alere, Inc., 8.625%, due 10/01/18 | | 325,600 | |
595,000 | | &, S | | Biomet, Inc., 10.375%, due 10/15/17 | | 653,013 | |
708,000 | | S | | Biomet, Inc., 11.625%, due 10/15/17 | | 785,880 | |
120,000 | | #, S | | Capella Healthcare, Inc., 9.250%, due 07/01/17 | | 127,500 | |
715,000 | | | | Gentiva Health Services, Inc., 11.500%, due 09/01/18 | | 782,925 | |
710,000 | | S | | HCA, Inc., 6.375%, due 01/15/15 | | 701,125 | |
465,000 | | | | Healthsouth Corp., 7.250%, due 10/01/18 | | 475,463 | |
175,000 | | | | Healthsouth Corp., 7.750%, due 09/15/22 | | 181,125 | |
575,000 | | # | | Multiplan, Inc., 9.875%, due 09/01/18 | | 612,375 | |
330,000 | | # | | OnCure Holdings, Inc., 11.750%, due 05/15/17 | | 313,500 | |
305,000 | | # | | Radiation Therapy Services, Inc., 9.875%, due 04/15/17 | | 305,763 | |
930,000 | | S | | Select Medical Corp., 7.625%, due 02/01/15 | | 934,650 | |
70,000 | | # | | UHS Escrow Corp., 7.000%, due 10/01/18 | | 72,100 | |
320,000 | | &, S | | Universal Hospital Services, Inc., 8.500%, due 06/01/15 | | 330,400 | |
325,000 | | S | | US Oncology, Inc., 9.125%, due 08/15/17 | | 402,188 | |
485,000 | | | | Vanguard Health Holding Co. II LLC/Vanguard Holding Co. II, Inc., 8.000%, due 02/01/18 | | 499,550 | |
1,035,000 | | # | | Warner Chilcott Co. LLC/Warner Chilcott Finance LLC, 7.750%, due 09/15/18 | | 1,050,525 | |
| | | | | | 8,775,332 | |
| | | | Industrials: 2.9% | | | |
561,945 | | | | Autopistas Del Nordeste, 9.390%, due 04/15/24 | | 508,560 | |
185,000 | | S | | BE Aerospace, Inc., 6.875%, due 10/01/20 | | 191,938 | |
407,000 | | #, L, S | | Cemex Espana Luxembourg, 9.250%, due 05/12/20 | | 401,913 | |
760,000 | | # | | Cleaver-Brooks, Inc., 12.250%, due 05/01/16 | | 810,350 | |
1,205,000 | | # | | Delta Airlines, Inc., 12.250%, due 03/15/15 | | 1,364,663 | |
1,500,000 | | # | | DynCorp International, Inc., 10.375%, due 07/01/17 | | 1,545,000 | |
810,000 | | R, X | | Jefferson Smurfit Escrow | | — | |
245,000 | | R, X | | Jefferson Smurfit Escrow | | — | |
380,000 | | | | Kratos Defense & Security Solutions, Inc., 10.000%, due 06/01/17 | | 422,750 | |
230,000 | | | | Manitowoc Co., Inc., 8.500%, due 11/01/20 | | 245,525 | |
730,000 | | #, S | | Marquette Transportation Co. / Marquette Transportation Finance Corp., 10.875%, due 01/15/17 | | 748,250 | |
23,800,000 | | | | National Power Corp., 5.875%, due 12/19/16 | | 582,967 | |
160,000 | | #, S | | Odebrecht Finance Ltd., 7.000%, due 04/21/20 | | 172,800 | |
290,780 | | #, S | | Panama Canal Railway Co., 7.000%, due 11/01/26 | | 263,156 | |
835,000 | | L, S | | RBS Global, Inc. and Rexnord Corp., 11.750%, due 08/01/16 | | 899,713 | |
200,000 | | #, L | | Rearden G Holdings EINS GmbH, 7.875%, due 03/30/20 | | 212,000 | |
780,000 | | # | | Sequa Corp., 11.750%, due 12/01/15 | | 838,500 | |
475,000 | | R, X | | Smurfit-Stone Container Corp. Escrow | | — | |
245,000 | | R, L, X | | Stone Webster Escrow | | — | |
1,370,000 | | | | Terex Corp., 8.000%, due 11/15/17 | | 1,390,550 | |
270,000 | | # | | TGI International Ltd., 9.500%, due 10/03/17 | | 304,425 | |
ZAR | 1,000,000 | | | | Transnet Ltd., 10.800%, due 11/06/23 | | 166,541 | |
$ | 1,135,000 | | | | Triumph Group, Inc., 8.625%, due 07/15/18 | | 1,245,663 | |
1,147,000 | | | | United Maritime Group LLC/United Maritime Group Finance Corp., 11.750%, due 06/15/15 | | 1,155,603 | |
270,000 | | S | | United Rentals North America, Inc., 9.250%, due 12/15/19 | | 301,725 | |
1,207,000 | | # | | Western Express, Inc., 12.500%, due 04/15/15 | | 1,074,230 | |
| | | | | | 14,846,822 | |
| | | | Information Technology: 1.7% | | | |
410,000 | | #, S | | Advanced Micro Devices, Inc., 7.750%, due 08/01/20 | | 427,425 | |
430,000 | | L | | Amkor Technology, Inc., 7.375%, due 05/01/18 | | 449,350 | |
405,000 | | | | CDW LLC / CDW Finance Corp., 11.000%, due 10/12/15 | | 422,213 | |
715,000 | | # | | First Data Corp., 8.875%, due 08/15/20 | | 757,900 | |
1,715,000 | | S | | First Data Corp., 9.875%, due 09/24/15 | | 1,642,113 | |
490,000 | | #, S | | Freescale Semiconductor, Inc., 9.250%, due 04/15/18 | | 541,450 | |
1,390,000 | | #, L | | Freescale Semiconductor, Inc., 10.750%, due 08/01/20 | | 1,522,050 | |
285,000 | | # | | Interactive Data Corp., 10.250%, due 08/01/18 | | 313,500 | |
435,000 | | S | | NXP BV / NXP Funding, LLC, 7.875%, due 10/15/14 | | 454,575 | |
785,000 | | | | NXP BV/NXP Funding, LLC, 9.500%, due 10/15/15 | | 841,913 | |
335,000 | | # | | NXP BV/NXP Funding, LLC, 9.750%, due 08/01/18 | | 378,550 | |
860,000 | | # | | Seagate HDD Cayman, 6.875%, due 05/01/20 | | 825,600 | |
| | | | | | 8,576,639 | |
| | | | Materials: 3.6% | | | |
540,000 | | | | Abitibi-Consolidated Escrow | | — | |
270,000 | | | | Abitibi-Consolidated Escrow | | — | |
225,000 | | | | Abitibi-Consolidated Escrow | | — | |
260,000 | | | | Abitibi-Consolidated Escrow | | — | |
540,000 | | | | Abitibi-Consolidated Escrow | | — | |
978,875 | | &, #, S | | Ainsworth Lumber Co., Ltd., 11.000%, due 07/29/15 | | 925,037 | |
1,585,000 | | #, S | | Appleton Papers, Inc., 10.500%, due 06/15/15 | | 1,577,075 | |
350,000 | | #, S | | Associated Materials LLC, 9.125%, due 11/01/17 | | 366,625 | |
330,000 | | S | | Berry Plastics Corp., 10.250%, due 03/01/16 | | 325,463 | |
875,000 | | ±, R, X | | Bowater, Inc. Escrow | | — | |
200,000 | | #, L | | Braskem Finance Ltd., 7.000%, due 05/07/20 | | 207,500 | |
800,000 | | #, S | | Braskem Finance Ltd., 7.250%, due 06/05/18 | | 844,000 | |
1,094,000 | | #, S | | Catalyst Paper Corp., 11.000%, due 12/15/16 | | 1,036,565 | |
100,000 | | #, S | | CSN Islands XI Corp., 6.875%, due 09/21/19 | | 108,500 | |
935,000 | | L | | Edgen Murray Corp., 12.250%, due 01/15/15 | | 818,125 | |
835,000 | | | | Ferro Corp., 7.875%, due 08/15/18 | | 885,100 | |
1,215,000 | | | | Hexion US Finance Corp. / Hexion Nova Scotia Finance ULC, 8.875%, due 02/01/18 | | 1,304,606 | |
90,000 | | # | | Huntsman International, LLC, 8.625%, due 03/15/21 | | 97,650 | |
775,000 | | L | | Momentive Performance Materials, Inc., 11.500%, due 12/01/16 | | 844,750 | |
1,935,000 | | S | | NewPage Corp., 11.375%, due 12/31/14 | | 1,828,575 | |
1,175,000 | | | | Ply Gem Industries, Inc., 13.125%, due 07/15/14 | | 1,254,313 | |
890,000 | | # | | Rhodia S.A., 6.875%, due 09/15/20 | | 906,688 | |
430,000 | | # | | Severstal OAO Via Steel Capital SA, 6.700%, due 10/25/17 | | 426,775 | |
940,000 | | L | | Solo Cup Co., 8.500%, due 02/15/14 | | 850,700 | |
470,000 | | # | | Steel Capital S.A. for OAO Severstal, 9.750%, due 07/29/13 | | 525,836 | |
1,530,000 | | S | | Vedanta Resources PLC, 9.500%, due 07/18/18 | | 1,681,088 | |
1,460,000 | | L, S | | Verso Paper Holdings, LLC and Verson Paper, Inc., 11.375%, due 08/01/16 | | 1,470,950 | |
| | | | | | 18,285,921 | |
| | | | Telecommunication Services: 3.0% | | | |
MXN | 8,400,000 | | | | America Movil S.A.B de CV, 8.460%, due 12/18/36 | | 630,075 | |
$ | 460,000 | | #, S | | Axtel S.A.B de CV, 9.000%, due 09/22/19 | | 439,300 | |
395,000 | | S | | Broadview Networks Holdings, Inc., 11.375%, due 09/01/12 | | 388,088 | |
360,000 | | S | | Cincinnati Bell, Inc., 8.250%, due 10/15/17 | | 358,200 | |
610,000 | | | | Cincinnati Bell, Inc., 8.750%, due 03/15/18 | | 574,925 | |
235,000 | | # | | Intelsat Jackson Holdings Ltd., 7.250%, due 10/15/20 | | 238,525 | |
730,000 | | S | | Intelsat Luxembourg S.A., 11.250%, due 02/04/17 | | 799,350 | |
409,062 | | & | | Intelsat Luxembourg S.A., 11.500%, due 02/04/17 | | 454,059 | |
1,610,000 | | | | ITC Deltacom, Inc., 10.500%, due 04/01/16 | | 1,758,925 | |
1,445,000 | | S | | Level 3 Financing, Inc., 9.250%, due 11/01/14 | | 1,441,388 | |
1,650,000 | | | | MetroPCS Wireless, Inc., 7.875%, due 09/01/18 | | 1,720,125 | |
350,000 | | # | | MTS International Funding Ltd., 8.625%, due 06/22/20 | | 399,420 | |
1,615,000 | | S | | PAETEC Holding Corp., 9.500%, due 07/15/15 | | 1,679,600 | |
1,220,000 | | # | | Telcordia Technologies, Inc., 11.000%, due 05/01/18 | | 1,232,200 | |
791,000 | | # | | Telemar Norte Leste S.A., 5.500%, due 10/23/20 | | 765,293 | |
960,000 | | #, S | | Vimpel Communications Via VIP Finance Ireland Ltd. OJSC, 9.125%, due 04/30/18 | | 1,096,800 | |
835,000 | | # | | West Corp., 8.625%, due 10/01/18 | | 889,275 | |
400,000 | | | | Windstream Corp., 8.125%, due 09/01/18 | | 422,000 | |
| | | | | | 15,287,548 | |
| | | | Utilities: 1.8% | | | |
300,000 | | #, S | | Centrais Eletricas Brasileiras S.A., 6.875%, due 07/30/19 | | 340,500 | |
310,000 | | #, S | | Colbun S.A., 6.000%, due 01/21/20 | | 323,545 | |
1,175,000 | | S | | Edison Mission Energy, 7.000%, due 05/15/17 | | 937,063 | |
300,000 | | #, S | | Empresas Publicas de Medellin ESP, 7.625%, due 07/29/19 | | 345,000 | |
1,235,000 | | #, L | | Energy Future Holdings Corp., 10.000%, due 01/15/20 | | 1,276,710 | |
565,000 | | | | Energy Future Intermediate Holding Co. LLC / EFIH Finance, Inc., 10.000%, due 12/01/20 | | 585,494 | |
465,000 | | # | | GenOn Escrow Corp., 9.500%, due 10/15/18 | | 464,419 | |
465,000 | | # | | GenOn Escrow Corp., 9.875%, due 10/15/20 | | 463,838 | |
940,000 | | #, S | | Israel Electric Corp., Ltd., 7.250%, due 01/15/19 | | 1,036,102 | |
200,000 | | #, S | | Listrindo Capital BV, 9.250%, due 01/29/15 | | 225,767 | |
470,000 | | #, S | | Majapahit Holding BV, 7.750%, due 10/17/16 | | 545,200 | |
300,000 | | #, S | | Majapahit Holding BV, 8.000%, due 08/07/19 | | 352,125 | |
3,635,000 | | L, S | | Texas Competitive Electric Holdings Co., LLC, 10.250%, due 11/01/15 | | 2,069,192 | |
| | | | | | 8,964,955 | |
| | | | Total Corporate Bonds/Notes (Cost $169,772,423) | | 177,206,050 | |
| | | |
U.S. GOVERNMENT AGENCY OBLIGATIONS: 8.9% | | | |
| | | | Federal Home Loan Mortgage Corporation##: 2.4% | | | |
144,174 | | S | | 0.710%, due 02/15/29 | | 144,561 | |
373,743 | | S | | 0.760%, due 03/15/32-01/15/33 | | 376,028 | |
3,285,000 | | | | 1.125%, due 07/27/12 | | 3,315,872 | |
130,741 | | S | | 1.210%, due 08/15/31-02/15/32 | | 133,178 | |
143,883 | | S | | 1.260%, due 02/15/32-03/15/32 | | 146,817 | |
123,861 | | | | 4.500%, due 12/15/21 | | 127,054 | |
4,512,972 | | S | | 5.000%, due 02/16/17-03/15/35 | | 4,868,560 | |
102,928 | | S | | 5.500%, due 01/01/18 | | 111,011 | |
446,855 | | ^, S | | 5.890%, due 07/15/35 | | 63,328 | |
226,463 | | S | | 6.000%, due 05/15/17-02/01/34 | | 247,468 | |
1,091,173 | | S | | 6.500%, due 04/01/18-07/01/34 | | 1,208,754 | |
226,936 | | S | | 6.750%, due 02/15/24 | | 254,037 | |
330,895 | | ^, S | | 7.000%, due 03/15/28-04/15/28 | | 66,507 | |
284,456 | | S | | 7.000%, due 09/15/26 | | 321,684 | |
434,840 | | ^, S | | 7.390%, due 03/15/29 | | 76,167 | |
435,620 | | ^, S | | 7.440%, due 03/15/29 | | 74,824 | |
235,426 | | S | | 7.500%, due 09/15/22 | | 266,028 | |
564,391 | | ^, S | | 8.690%, due 08/15/29 | | 133,694 | |
72,113 | | S | | 23.429%, due 06/15/34 | | 94,748 | |
117,674 | | S | | 23.796%, due 08/15/35 | | 164,052 | |
| | | | | | 12,194,372 | |
| | | | Federal National Mortgage Association##: 6.2% | | | |
26,015 | | S | | 0.661%, due 11/25/33 | | 26,138 | |
42,233 | | S | | 0.761%, due 10/18/32 | | 42,513 | |
3,030,000 | | L | | 1.125%, due 07/30/12 | | 3,057,685 | |
56,305 | | S | | 1.260%, due 02/15/32 | | 57,570 | |
565,285 | | S | | 1.261%, due 12/25/31-12/25/32 | | 579,982 | |
2,115,000 | | W | | 3.500%, due 01/25/26-10/25/40 | | 2,102,968 | |
2,880,000 | | W | | 4.000%, due 08/25/40 | | 2,865,600 | |
162,485 | | | | 4.000%, due 07/25/17 | | 166,864 | |
4,114,000 | | W | | 4.500%, due 01/25/24-01/25/39 | | 4,241,072 | |
400,000 | | S | | 4.500%, due 08/25/25 | | 426,023 | |
768,023 | | S | | 4.571%, due 10/01/36 | | 805,028 | |
2,950,000 | | W | | 5.000%, due 01/13/40 | | 3,101,648 | |
2,000,000 | | | | 5.375%, due 06/12/17 | | 2,305,946 | |
2,843,000 | | W | | 5.500%, due 01/25/24-01/25/39 | | 3,042,422 | |
500,078 | | ^, S | | 5.500%, due 07/01/33-06/01/35 | | 95,794 | |
524,788 | | S | | 5.500%, due 09/01/19-11/25/25 | | 567,497 | |
650,000 | | W | | 6.000%, due 01/15/33 | | 706,571 | |
1,337,798 | | ^, S | | 6.000%, due 12/01/32-09/01/35 | | 260,154 | |
2,142,570 | | S | | 6.000%, due 03/25/17-04/01/35 | | 2,348,236 | |
576,338 | | ^ | | 6.279%, due 06/25/37 | | 80,381 | |
2,174,338 | | ^, S | | 6.309%, due 06/25/36 | | 313,938 | |
83,258 | | ^, S | | 6.489%, due 05/25/35 | | 13,177 | |
942,237 | | ^, S | | 6.500%, due 02/01/32 | | 193,025 | |
1,014,706 | | S | | 6.500%, due 04/25/29-01/01/34 | | 1,140,766 | |
410,578 | | ^ | | 6.789%, due 10/25/22 | | 40,794 | |
185,119 | | ^, S | | 6.839%, due 06/25/23 | | 28,157 | |
386,778 | | ^, S | | 6.969%, due 09/25/36 | | 75,461 | |
386,965 | | ^, S | | 7.000%, due 02/01/28-04/25/33 | | 77,843 | |
1,118,185 | | S | | 7.000%, due 09/01/14-04/01/34 | | 1,269,789 | |
867,405 | | ^, S | | 7.289%, due 10/25/33 | | 143,198 | |
1,285,027 | | ^, S | | 7.369%, due 03/25/23 | | 169,272 | |
913,239 | | ^, S | | 7.489%, due 07/25/31-02/25/32 | | 172,391 | |
169,951 | | ^, S | | 7.500%, due 01/01/24 | | 34,444 | |
298,561 | | S | | 7.500%, due 09/01/32-01/01/33 | | 342,493 | |
143,929 | | ^, S | | 7.689%, due 07/25/32 | | 28,702 | |
197,130 | | S | | 23.244%, due 06/25/36 | | 273,070 | |
117,013 | | S | | 23.611%, due 03/25/36 | | 165,229 | |
127,434 | | S | | 27.013%, due 04/25/35 | | 205,414 | |
| | | | | | 31,567,255 | |
| | | | Government National Mortgage Association: 0.3% | | | |
275,609 | | S | | 5.000%, due 04/15/34 | | 293,939 | |
308,798 | | S | | 5.500%, due 04/15/33-04/15/34 | | 335,535 | |
171,957 | | | | 6.000%, due 07/20/39 | | 190,002 | |
52,979 | | S | | 6.500%, due 02/20/35 | | 59,841 | |
713,336 | | S | | 8.000%, due 01/16/30-02/16/30 | | 853,707 | |
| | | | | | 1,733,024 | |
| | | | Total U.S. Government Agency Obligations (Cost $43,424,513) | | 45,494,651 | |
U.S. TREASURY OBLIGATIONS: 0.1% | | | |
| | | | U.S. Treasury Notes: 0.1% | | | |
55,000 | | | | 4.500%, due 02/15/36 | | 56,951 | |
310,000 | | | | 5.375%, due 02/15/31 | | 361,925 | |
| | | | | | | |
| | | | Total U.S. Treasury Obligations (Cost $391,134) | | 418,876 | |
ASSET-BACKED SECURITIES: 0.9% | | | |
| | | | Automobile Asset-Backed Securities: 0.4% | | | |
110,000 | | S | | Ally Auto Receivables Trust, 2.090%, due 05/15/15 | | 111,467 | |
136,546 | | S | | AmeriCredit Automobile Receivables Trust, 0.970%, due 01/15/13 | | 136,607 | |
221,000 | | S | | Americredit Prime Automobile Receivables, 5.620%, due 09/08/14 | | 226,019 | |
70,000 | | S | | Bank of America Auto Trust, 1.940%, due 06/15/17 | | 70,781 | |
85,000 | | S | | BMW Vehicle Owner Trust, 1.390%, due 04/25/14 | | 85,668 | |
44,000 | | S | | Capital Auto Receivables Asset Trust, 5.150%, due 09/17/12 | | 45,315 | |
105,428 | | S | | Capital One Auto Finance Trust, 0.290%, due 05/15/13 | | 104,864 | |
200,000 | | S | | CarMax Auto Owner Trust, 1.410%, due 02/16/15 | | 201,428 | |
60,979 | | #, S | | Ford Credit Auto Lease Trust, 1.040%, due 03/15/13 | | 61,034 | |
165,000 | | S | | Ford Credit Auto Owner Trust, 2.150%, due 06/15/15 | | 168,122 | |
125,000 | | | | Honda Auto Receivables Owner Trust, 1.340%, due 03/18/14 | | 125,970 | |
65,000 | | | | Hyundai Auto Receivables Trust, 1.500%, due 10/15/14 | | 65,671 | |
148,207 | | | | Merrill Auto Trust Securitization, 0.320%, due 12/15/13 | | 147,818 | |
125,000 | | | | Nissan Auto Lease Trust, 1.390%, due 01/15/16 | | 125,745 | |
140,000 | | | | Toyota Auto Receivables Owner Trust, 0.740%, due 08/15/12 | | 140,208 | |
91,705 | | | | Wachovia Auto Owner Trust, 5.490%, due 04/22/13 | | 93,472 | |
| | | | | | 1,910,189 | |
| | | | Credit Card Asset-Backed Securities: 0.2% | | | |
115,000 | | S | | BA Credit Card Trust, 0.560%, due 09/15/15 | | 115,031 | |
145,000 | | S | | Capital One Multi-Asset Execution Trust, 4.850%, due 02/18/14 | | 146,814 | |
150,000 | | # | | Citibank Omni Master Trust, 2.360%, due 05/16/16 | | 151,916 | |
115,000 | | | | Discover Card Master Trust, 1.560%, due 12/15/14 | | 116,560 | |
115,000 | | | | GE Capital Credit Card Master Note Trust, 3.690%, due 07/15/15 | | 119,503 | |
120,000 | | | | World Financial Network Credit Card Master Trust, 4.600%, due 09/15/15 | | 123,397 | |
| | | | | | 773,221 | |
| | | | Home Equity Asset-Backed Securities: 0.1% | | | |
90,098 | | S | | Argent Securities, Inc., 0.447%, due 10/25/36 | | 33,769 | |
226,496 | | S | | Argent Securities, Inc., 1.221%, due 05/25/34 | | 201,026 | |
176,000 | | S | | Home Equity Mortgage Trust, 5.863%, due 06/25/35 | | 92,088 | |
34,371 | | S | | Household Home Equity Loan Trust, 0.371%, due 03/20/36 | | 34,240 | |
63,304 | | S | | HSBC Home Equity Loan Trust, 0.521%, due 01/20/35 | | 60,794 | |
297,327 | | S | | MASTR Asset-Backed Securities Trust, 0.361%, due 08/25/36 | | 110,911 | |
33,026 | | S | | Residential Asset Securities Corp., 0.361%, due 09/25/36 | | 32,847 | |
30,860 | | #, S | | Terwin Mortgage Trust, 4.151%, due 05/25/37 | | 9,685 | |
| | | | | | 575,360 | |
| | | | Other Asset-Backed Securities: 0.2% | | | |
34,738 | | S | | Chase Funding Mortgage Loan Asset-Backed Certificates, 0.821%, due 02/25/33 | | 29,811 | |
10,790 | | S | | Citigroup Mortgage Loan Trust, Inc., 0.361%, due 10/25/36 | | 10,768 | |
111,761 | | S | | CNH Equipment Trust, 0.810%, due 08/15/12 | | 111,813 | |
42,680 | | S | | CNH Equipment Trust, 2.970%, due 03/15/13 | | 42,866 | |
230,000 | | S | | Countrywide Asset-Backed Certificates, 0.381%, due 06/25/47 | | 205,922 | |
38,467 | | S | | Countrywide Asset-Backed Certificates, 5.363%, due 05/25/36 | | 30,949 | |
279,039 | | S | | Countrywide Asset-Backed Certificates, 5.382%, due 05/25/36 | | 239,027 | |
12,214 | | S | | Countrywide Home Equity Loan Trust, 0.410%, due 11/15/36 | | 4,591 | |
32,306 | | S | | Countrywide Home Equity Loan Trust, 0.490%, due 12/15/35 | | 17,514 | |
33,165 | | S | | First Franklin Mortgage Loan Asset-Backed Certificates, 0.351%, due 07/25/36 | | 32,618 | |
17,710 | | S | | First Franklin Mortgage Loan Asset-Backed Certificates, 0.371%, due 06/25/36 | | 16,869 | |
180,000 | | # | | GE Equipment Midticket LLC, 0.610%, due 01/14/13 | | 180,052 | |
55,311 | | S | | Popular Mortgage Pass-through Trust, 5.680%, due 01/25/36 | | 50,967 | |
65,000 | | # | | Volvo Financial Equipment LLC, 1.560%, due 06/17/13 | | 65,330 | |
| | | | | | 1,039,097 | |
| | | | | | | |
| | | | Total Asset-Backed Securities (Cost $4,599,988) | | 4,297,867 | |
| | | | | | | |
COLLATERALIZED MORTGAGE OBLIGATIONS: 7.7% | | | |
650,000 | | S | | Banc of America Commercial Mortgage, Inc., 5.482%, due 01/15/49 | | 636,501 | |
1,130,000 | | S | | Banc of America Commercial Mortgage, Inc., 5.809%, due 02/10/51 | | 1,127,770 | |
590,000 | | S | | Banc of America Commercial Mortgage, Inc., 6.152%, due 02/10/51 | | 635,764 | |
420,000 | | S | | Banc of America Commercial Mortgage, Inc., 6.195%, due 02/10/51 | | 416,671 | |
598,930 | | S | | Bear Stearns Adjustable Rate Mortgage Trust, 3.020%, due 05/25/34 | | 541,871 | |
208,858 | | S | | Bear Stearns Adjustable Rate Mortgage Trust, 4.963%, due 11/25/34 | | 207,588 | |
235,011 | | S | | Chase Mortgage Finance Corp., 3.939%, due 02/25/37 | | 237,092 | |
842,369 | | S | | Citigroup Mortgage Loan Trust, Inc., 2.630%, due 10/25/35 | | 743,889 | |
1,029,572 | | S | | Citigroup Mortgage Loan Trust, Inc., 4.877%, due 03/25/36 | | 810,016 | |
491,878 | | S | | Citigroup Mortgage Loan Trust, Inc., 4.957%, due 05/25/35 | | 439,044 | |
909,491 | | S | | Citigroup Mortgage Loan Trust, Inc., 5.126%, due 08/25/35 | | 669,781 | |
265,000 | | S | | Citigroup/Deutsche Bank Commercial Mortgage Trust, 5.322%, due 12/11/49 | | 275,091 | |
970,000 | | S | | Citigroup/Deutsche Bank Commercial Mortgage Trust, 5.366%, due 12/11/49 | | 930,177 | |
297,453 | | S | | Citimortgage Alternative Loan Trust, 5.500%, due 10/25/21 | | 253,267 | |
1,784,638 | | S | | Countrywide Alternative Loan Trust, 6.000%, due 02/25/37 | | 1,233,993 | |
363,196 | | S | | Countrywide Home Loan Mortgage Pass-through Trust, 3.789%, due 06/25/47 | | 240,501 | |
30,443 | | S | | Countrywide Home Loan Mortgage Pass-through Trust, 5.303%, due 12/20/35 | | 24,981 | |
511,429 | | S | | Countrywide Home Loan Mortgage Pass-through Trust, 5.500%, due 09/25/35 | | 453,781 | |
430,654 | | S | | Countrywide Home Loan Mortgage Pass-through Trust, 5.500%, due 11/25/35 | | 408,617 | |
306,759 | | S | | Countrywide Home Loan Mortgage Pass-through Trust, 5.500%, due 11/25/35 | | 252,386 | |
2,112,745 | | S | | Countrywide Home Loan Mortgage Pass-through Trust, 5.837%, due 09/25/47 | | 1,572,967 | |
250,000 | | S | | Credit Suisse Mortgage Capital Certificates, 5.721%, due 06/15/39 | | 256,924 | |
241,680 | | #, S | | Deutsche Alternative-A Securities, Inc. Alternate Loan Trust, 0.761%, due 01/27/37 | | 67,346 | |
130,532 | | S | | Deutsche Alternative-A Securities, Inc. Alternate Loan Trust, 6.005%, due 10/25/36 | | 76,992 | |
112,409 | | S | | First Horizon Alternative Mortgage Securities, 5.500%, due 04/25/37 | | 81,364 | |
636,400 | | S | | First Horizon Mortgage Pass-through Trust, 6.052%, due 11/25/37 | | 520,476 | |
99,492 | | S | | GE Capital Commercial Mortgage Corp., 4.433%, due 07/10/39 | | 100,064 | |
233,000 | | S | | GMAC Commercial Mortgage Securities, Inc., 6.975%, due 05/15/30 | | 233,701 | |
490,000 | | | | Greenwich Capital Commercial Funding Corp., 5.444%, due 03/10/39 | | 516,986 | |
1,235,000 | | S | | Greenwich Capital Commercial Funding Corp., 5.736%, due 12/10/49 | | 1,307,006 | |
765,000 | | S | | GS Mortgage Securities Corp. II, 5.560%, due 11/10/39 | | 812,558 | |
368,905 | | S | | GSR Mortgage Loan Trust, 2.864%, due 09/25/35 | | 366,419 | |
119,963 | | S | | GSR Mortgage Loan Trust, 2.899%, due 05/25/34 | | 103,165 | |
530,045 | | S | | GSR Mortgage Loan Trust, 5.317%, due 11/25/35 | | 442,737 | |
29,593 | | S | | Indymac Index Mortgage Loan Trust, 2.829%, due 01/25/36 | | 935 | |
190,000 | | # | | JPMorgan Chase Commercial Mortgage Securities Corp., 3.616%, due 11/15/43 | | 184,233 | |
205,000 | | S | | JPMorgan Chase Commercial Mortgage Securities Corp., 5.305%, due 01/15/49 | | 209,943 | |
490,000 | | | | JPMorgan Chase Commercial Mortgage Securities Corp., 5.336%, due 05/15/47 | | 509,291 | |
700,000 | | S | | JPMorgan Chase Commercial Mortgage Securities Corp., 5.420%, due 01/15/49 | | 729,151 | |
490,000 | | | | JPMorgan Chase Commercial Mortgage Securities Corp., 5.440%, due 06/12/47 | | 514,234 | |
1,090,000 | | S | | JPMorgan Chase Commercial Mortgage Securities Corp., 5.466%, due 06/12/47 | | 1,074,739 | |
1,205,000 | | S | | JPMorgan Chase Commercial Mortgage Securities Corp., 6.068%, due 02/12/51 | | 1,254,651 | |
850,000 | | S | | JPMorgan Chase Commercial Mortgage Securities Corp., 6.570%, due 02/12/51 | | 567,907 | |
599,482 | | S | | JPMorgan Mortgage Trust, 5.290%, due 07/25/35 | | 560,119 | |
76,428 | | S | | JPMorgan Mortgage Trust, 5.723%, due 01/25/37 | | 57,330 | |
450,000 | | S | | LB-UBS Commercial Mortgage Trust, 6.154%, due 04/15/41 | | 443,109 | |
1,720,000 | | S | | LB-UBS Commercial Mortgage Trust, 6.166%, due 09/15/45 | | 1,655,929 | |
487,552 | | S | | MASTR Adjustable Rate Mortgages Trust, 3.005%, due 04/25/36 | | 387,759 | |
22,942 | | | | Merrill Lynch Mortgage Investors, Inc., 2.838%, due 12/25/34 | | 22,344 | |
560,074 | | S | | MLCC Mortgage Investors, Inc., 6.024%, due 10/25/36 | | 519,111 | |
680,000 | | S | | Morgan Stanley Capital I, 5.360%, due 11/12/41 | | 678,453 | |
540,000 | | S | | Morgan Stanley Capital I, 5.809%, due 12/12/49 | | 577,877 | |
21,472 | | S | | Residential Accredit Loans, Inc., 3.359%, due 04/25/35 | | 4,080 | |
43,000 | | S | | Residential Accredit Loans, Inc., 5.750%, due 01/25/33 | | 43,322 | |
10,739 | | S | | Residential Accredit Loans, Inc., 6.000%, due 09/25/36 | | 6,813 | |
590,082 | | S | | Residential Asset Securitization Trust, 5.500%, due 12/25/35 | | 477,807 | |
859,163 | | S | | Residential Asset Securitization Trust, 6.000%, due 06/25/35 | | 747,463 | |
138,457 | | S | | Residential Asset Securitization Trust, 6.250%, due 11/25/36 | | 98,721 | |
417,000 | | S | | SLM Student Loan Trust, 0.702%, due 06/15/39 | | 186,613 | |
1,754,058 | | S | | Suntrust Adjustable Rate Mortgage Loan Trust, 5.834%, due 02/25/37 | | 1,367,841 | |
910,000 | | S | | Wachovia Bank Commercial Mortgage Trust, 5.902%, due 02/15/51 | | 946,149 | |
210,162 | | | | WaMu Mortgage Pass-through Certificates, 5.743%, due 05/25/37 | | 192,225 | |
216,239 | | S | | Washington Mutual Mortgage Pass-through Certificates, 1.168%, due 11/25/46 | | 153,030 | |
433,167 | | S | | Washington Mutual Mortgage Pass-through Certificates, 2.721%, due 10/25/35 | | 376,624 | |
154,261 | | S | | Washington Mutual Mortgage Pass-through Certificates, 2.904%, due 04/25/47 | | 86,796 | |
2,460,001 | | S | | Washington Mutual Mortgage Pass-through Certificates, 5.000%, due 02/25/37 | | 1,947,015 | |
1,679,377 | | S | | Washington Mutual Mortgage Pass-through Certificates, 5.302%, due 12/25/36 | | 1,292,151 | |
1,639,747 | | S | | Washington Mutual Mortgage Pass-through Certificates, 5.532%, due 02/25/37 | | 1,197,410 | |
707,803 | | S | | Washington Mutual Mortgage Pass-through Certificates, 5.549%, due 06/25/37 | | 558,101 | |
430,776 | | S | | Washington Mutual Mortgage Pass-through Certificates, 5.628%, due 07/25/37 | | 303,397 | |
316,356 | | S | | Washington Mutual Mortgage Pass-through Certificates, 5.854%, due 09/25/36 | | 289,698 | |
180,627 | | S | | Wells Fargo Mortgage-Backed Securities Trust, 2.761%, due 11/25/34 | | 39,007 | |
690,825 | | S | | Wells Fargo Mortgage-Backed Securities Trust, 2.838%, due 02/25/35 | | 634,217 | |
413,586 | | S | | Wells Fargo Mortgage-Backed Securities Trust, 2.845%, due 04/25/36 | | 393,345 | |
235,267 | | S | | Wells Fargo Mortgage-Backed Securities Trust, 2.847%, due 10/25/35 | | 224,021 | |
303,818 | | S | | Wells Fargo Mortgage-Backed Securities Trust, 2.904%, due 04/25/36 | | 266,453 | |
302,347 | | S | | Wells Fargo Mortgage-Backed Securities Trust, 3.203%, due 03/25/36 | | 269,371 | |
107,940 | | | | Wells Fargo Mortgage-Backed Securities Trust, 5.067%, due 09/25/35 | | 103,682 | |
| | | | | | | |
| | | | Total Collateralized Mortgage Obligations (Cost $40,263,434) | | 39,149,953 | |
OTHER BONDS: 24.8% | | | |
| | | | | Event-Linked Notes: 1.8% | | | |
| 500,000 | | #, S | | Akibare Ltd. - Catastrophe Linked Floating Rate Note, 3-month USD-LIBOR +2.950%, 05/22/12, 3.234%, due 05/22/12 | | 502,425 | |
| 250,000 | | #, S | | Atlas V Capital - Catastrophe Linked Floating Rate Note, US Hurricane and US Earthquake, 3-month USD-LIBOR + 11.500%, 02/24/12, 11.803%, due 02/24/12 | | 262,450 | |
| 250,000 | | #, S | | Blue Fin Ltd. - Class B Catastrophe Linked Floating Rate Note, US Hurricane and US Earthquake, 3-month U.S. T-Bill + 9.250%, 05/28/13, 9.387%, due 05/28/13 | | 255,800 | |
| 250,000 | | #, S | | Caelus Re II Ltd. - Class A Catastrophe Linked Floating Rate Note, US Hurricane and US Earthquake, 3-month U.S. T-Bill + 6.500%, 05/24/13, 6.645%, due 05/24/13 | | 253,400 | |
| 479,000 | | #, S | | East Lane Re II Ltd. - Series C Catastrophe Linked Floating Rate Note, 3-month USD-LIBOR + 14.500%, 04/07/11, 10.553%, due 03/16/12 | | 498,639 | |
| 282,000 | | # | | East Lane Re III Ltd. - Catastrophe Linked Floating Rate Note, US Hurricane, 3-month USD-LIBOR + 10.250%, 03/16/12, 14.803%, due 04/07/11 | | 287,619 | |
| 610,000 | | #, S | | Fhu-Jin Ltd. - Class B Floating Rate Catastrophe Linked Nts., 3-month USD-LIBOR +3.900%, 08/10/11, 4.186%, due 08/10/11 | | 614,514 | |
| 518,000 | | #, S | | Foundation Re III Ltd. - Series 2010-1 Catastrophe Linked Floating Rate Note, US Hurricane, 3-month U.S. T-Bill + 5.750%, 02/03/14, 5.895%, due 02/03/14 | | 515,514 | |
| 250,000 | | # | | Lodestone Re Ltd. - Class A Catastrophe Linked Floating Rate Note, US Hurricane and US Earthquake, 3-month U.S. T-Bill + 6.250%, 05/17/13, 6.387%, due 05/17/13 | | 250,350 | |
| 250,000 | | #, S | | Longpoint Re II Ltd. - Class B Catastrophe Linked Floating Rate Note, Northeast US Hurricane, 3-month U.S. T-Bill + 5.400%, 12/24/13, 5.537%, due 12/24/13 | | 253,075 | |
| 250,000 | | # | | Merna Reinsurance II Ltd. - Central US Earthquake Catastrophe Linked Floating Rate Note, 3-month U.S. T-Bill + 3.650%, 04/08/13, 3.787%, due 04/08/13 | | 253,200 | |
| 500,000 | | #, S | | Midori Ltd. - Japan Earthquake Catastrophe Floating Rate Nts., 3-month USD-LIBOR +2.750%, 10/24/12, 3.039%, due 10/24/12 | | 499,550 | |
| 250,000 | | # | | Multicat Mexico 09 Ltd. - Series A Mexico Earthquake Catastrophe Linked Floating Rate Note, 3-month U.S. T-Bill + 11.500%, 10/19/12, 11.637%, due 10/19/12 | | 267,550 | |
| 500,000 | | #, S | | Muteki Ltd. - Catastrophe Linked Floating Rate Nts., Japan Earthquake, 3-month USD-LIBOR +4.400%, 05/24/11, 4.673%, due 05/24/11, 4.684%, due 05/24/11 | | 502,500 | |
EUR | 250,000 | | # | | Queen Street Ltd., 9.028%, due 03/21/11 | | 332,841 | |
$ | 250,000 | | #, S | | Redwood Capital XI Ltd. - Series 2009-1 California Earthquake Catastrophe Linked Floating Rate Note, 3-month U.S. T-Bill + 6.250%, 01/07/11, 6.387%, due 01/07/11 | | 250,128 | |
| 250,000 | | # | | Residential Reinsurance Ltd. - Class 1 Catastrophe Linked Floating Rate Note, 3-month US T-Bill + 6.600%, 06/06/13, 6.745%, due 06/06/13 | | 250,663 | |
| 250,000 | | # | | Residential Reinsurance Ltd. - Class 2 Catastrophe Linked Floating Rate Note, 3-month US T-Bill + 8.900%, 06/06/13, 9.045%, due 06/06/13 | | 257,413 | |
| 700,000 | | #, S | | Residential Reinsurance Ltd. - Class 2 Floating Rate Catastrophe Linked Nts., US Hurricane and US Earthquake, 3-month USD-LIBOR +11.500%, 06/06/11, 11.756%, due 06/06/11, 11.796%, due 06/06/11 | | 720,160 | |
| 250,000 | | # | | Residential Reinsurance Ltd. - Class 3 Catastrophe Linked Floating Rate Note, 3-month US T-Bill + 13.000%, 06/06/13, 13.145%, due 06/06/13 | | 259,338 | |
| 250,000 | | # | | Residential Reinsurance Ltd. - Class 4 Catastrophe Linked Floating Rate Note, 3-month US T-Bill + 13.000%, 06/06/13, 13.137%, due 06/06/13 | | 254,675 | |
| 250,000 | | # | | Successor X Ltd. - Class II-BY3 Catastrophe Linked Floating Rate Note, 3-month U.S. T-Bill + 16.750%, 04/04/13, 16.887%, due 04/04/13 | | 233,775 | |
| 701,000 | | #, S, Z | | Vega Capital LTD. - Class D Catastrophe Linked Nts., 0.000%*, 06/24/11, 0.000%, due 06/24/11 | | 1,365,198 | |
| | | | | | | 9,140,777 | |
| | | | | Foreign Government Bonds: 23.0% | | | |
| 200,000 | | #, S | | Arab Republic of Egypt, 5.750%, due 04/29/20 | | 207,000 | |
| 200,000 | | #, S | | Arab Republic of Egypt, 6.875%, due 04/30/40 | | 212,000 | |
ARS | 280,000 | | | | Argentina Bonos, 8.250%, due 01/30/14 | | 70,120 | |
$ | 2,475,000 | | S | | Argentina Government International Bond, due 12/15/35 | | 406,494 | |
| 1,315,000 | | +, S | | Argentina Government International Bond, 2.500% (step rate 3.750%), due 12/31/38 | | 595,038 | |
| 610,000 | | | | Argentina Government International Bond, 7.000%, due 09/12/13 | | 612,288 | |
| 2,590,000 | | L | | Argentina Government International Bond, 7.000%, due 10/03/15 | | 2,499,350 | |
AUD | 70,000 | | | | Australia Government International Bond, 6.000%, due 02/15/17 | | 73,730 | |
AUD | 130,000 | | | | Australia Government International Bond, 6.250%, due 04/15/15 | | 137,612 | |
EUR | 130,000 | | # | | Austria Government International Bond, 4.350%, due 03/15/19 | | 187,587 | |
EUR | 130,000 | | | | Austria Government International Bond, 4.650%, due 01/15/18 | | 191,878 | |
EUR | 200,000 | | | | Belgium Government International Bond, 5.500%, due 09/28/17 | | 296,972 | |
$ | 160,000 | | +, #, S | | Belize Government International Bond, 6.000% (step rate 8.500%), due 02/20/29 | | 141,600 | |
COP | 516,000,000 | | #, S | | Bogota Distrito Capital, 9.750%, due 07/26/28 | | 356,833 | |
$ | 410,000 | | S | | Brazil Government International Bond, 5.625%, due 01/07/41 | | 408,975 | |
| 120,000 | | | | Brazil Government International Bond, 7.125%, due 01/20/37 | | 143,700 | |
BRL | 705,000 | | | | Brazil Notas do Tesouro Nacional Series F, 6.000%, due 05/15/45 | | 910,312 | |
BRL | 21,637,000 | | | | Brazil Notas do Tesouro Nacional Series F, 10.000%, due 01/01/17 | | 11,958,027 | |
$ | 8,278,000 | | | | Brazil Notas do Tesouro Nacional Series F, 10.000%, due 01/01/21 | | 4,419,405 | |
EUR | 495,000 | | | | Bundesobligation, 2.250%, due 04/10/15 | | 676,797 | |
EUR | 460,000 | | | | Bundesrepublik Deutschland, 3.500%, due 07/04/19 | | 645,593 | |
EUR | 155,000 | | | | Bundesrepublik Deutschland, 4.250%, due 07/04/39 | | 236,700 | |
EUR | 305,000 | | | | Bundesschatzanweisungen, 0.500%, due 06/15/12 | | 406,470 | |
CAD | 990,000 | | | | Canadian Government International Bond, 3.000%, due 12/01/15 | | 1,022,559 | |
CAD | 245,000 | | | | Canadian Government International Bond, 3.750%, due 06/01/19 | | 259,735 | |
CAD | 365,000 | | | | Canadian Government International Bond, 4.000%, due 06/01/17 | | 394,977 | |
$ | 650,000 | | S | | Colombia Government International Bond, 6.125%, due 01/18/41 | | 669,500 | |
| 280,000 | | S | | Colombia Government International Bond, 7.375%, due 01/27/17 | | 331,800 | |
| 390,000 | | S | | Colombia Government International Bond, 7.375%, due 03/18/19 | | 469,950 | |
| 300,000 | | S | | Colombia Government International Bond, 7.375%, due 09/18/37 | | 357,000 | |
| 300,000 | | # | | Dominican Republic International Bond, 7.500%, due 05/06/21 | | 324,750 | |
EGP | 1,000,000 | | | | Egypt Treasury Bills, 6.880%, due 01/18/11 | | 171,674 | |
EGP | 1,925,000 | | | | Egypt Treasury Bills, 8.020%, due 03/08/11 | | 326,736 | |
EGP | 800,000 | | Z | | Egypt Treasury Bills, 8.030%, due 02/15/11 | | 136,412 | |
EGP | 1,975,000 | | | | Egypt Treasury Bills, 8.200%, due 02/01/11 | | 337,762 | |
EGP | 50,000 | | Z | | Egypt Treasury Bills, 8.870%, due 05/10/11 | | 8,346 | |
EGP | 1,275,000 | | Z | | Egypt Treasury Bills, 9.270%, due 03/22/11 | | 215,149 | |
EGP | 3,725,000 | | Z | | Egypt Treasury Bills, 9.410%, due 04/05/11 | | 627,853 | |
EGP | 2,400,000 | | Z | | Egypt Treasury Bills, 9.570%, due 07/05/11 | | 393,960 | |
EGP | 2,500,000 | | Z | | Egypt Treasury Bills, 9.860%, due 07/12/11 | | 409,539 | |
$ | 200,000 | | | | EXIM of Ukraine CJSC/The Via Credit Suisse First Boston International, 7.650%, due 09/07/11 | | 203,500 | |
EUR | 85,000 | | | | Finland Government International Bond, 3.875%, due 09/15/17 | | 122,537 | |
EUR | 80,000 | | | | France Government International Bond OAT, 4.000%, due 04/25/60 | | 108,527 | |
EUR | 270,000 | | | | Hellenic Republic Government International Bond, 4.300%, due 03/20/12 | | 332,552 | |
EUR | 630,000 | | | | Hellenic Republic Government International Bond, 4.500%, due 09/20/37 | | 457,433 | |
EUR | 295,000 | | L | | Hellenic Republic Government International Bond, 4.600%, due 09/20/40 | | 213,426 | |
HUF | 117,000,000 | | | | Hungary Government International Bond, 6.500%, due 06/24/19 | | 510,073 | |
HUF | 106,900,000 | | | | Hungary Government International Bond, 6.750%, due 02/24/17 | | 486,236 | |
$ | 300,000 | | #, L | | Indonesia Government International Bond, 5.875%, due 03/13/20 | | 330,750 | |
| 465,000 | | # | | Indonesia Government International Bond, 6.625%, due 02/17/37 | | 511,500 | |
| 1,050,000 | | #, S | | Indonesia Government International Bond, 6.875%, due 01/17/18 | | 1,228,500 | |
| 555,000 | | #, S | | Indonesia Government International Bond, 7.750%, due 01/17/38 | | 679,875 | |
| 330,000 | | #, S | | Indonesia Government International Bond, 8.500%, due 10/12/35 | | 435,600 | |
ILS | 6,620,000 | | | | Israel Government International Bond, 5.000%, due 01/31/20 | | 1,994,582 | |
ILS | 5,350,000 | | | | Israel Government International Bond, 6.000%, due 02/28/19 | | 1,740,967 | |
EUR | 615,000 | | | | Italy Buoni Poliennali Del Tesoro, 3.750%, due 12/15/13 | | 831,950 | |
EUR | 385,000 | | | | Italy Buoni Poliennali Del Tesoro, 3.750%, due 03/01/21 | | 472,736 | |
EUR | 595,000 | | | | Italy Buoni Poliennali Del Tesoro, 4.000%, due 09/01/20 | | 754,030 | |
EUR | 155,000 | | | | Italy Buoni Poliennali Del Tesoro, 5.000%, due 09/01/40 | | 195,079 | |
JPY | 175,000,000 | | | | Japan Government Two Year Bond, 0.200%, due 01/15/12 | | 2,156,076 | |
JPY | 252,000,000 | | | | Japan Government Five Year Bond, 0.400%, due 09/20/15 | | 3,105,292 | |
JPY | 271,000,000 | | | | Japan Government Five Year Bond, 0.500%, due 12/20/14 | | 3,362,439 | |
JPY | 64,000,000 | | | | Japan Government Ten Year Bond, 0.800%, due 09/20/20 | | 767,188 | |
JPY | 177,000,000 | | | | Japan Government Ten Year Bond, 1.300%, due 06/20/20 | | 2,227,294 | |
JPY | 157,000,000 | | | | Japan Government Twenty Year Bond, 2.100%, due 06/20/29 | | 2,019,760 | |
KRW | 1,046,000,000 | | | | Korea Monetary Stabilization Bond, 3.280%, due 10/02/12 | | 922,331 | |
KRW | 2,784,000,000 | | | | Korea Monetary Stabilization Bond, 3.810%, due 08/02/12 | | 2,477,463 | |
KRW | 2,458,000,000 | | | | Korea Treasury Bond, 5.000%, due 06/10/20 | | 2,253,126 | |
MYR | 620,000 | | | | Malaysia Government International Bond, 3.835%, due 08/12/15 | | 204,525 | |
MXN | 1,340,000 | | | | Mexican Bonos, 7.250%, due 12/15/16 | | 112,886 | |
MXN | 36,040,000 | | | | Mexican Bonos, 7.500%, due 06/03/27 | | 2,924,055 | |
MXN | 25,980,000 | | | | Mexican Bonos, 7.750%, due 12/14/17 | | 2,241,012 | |
MXN | 12,200,000 | | | | Mexican Bonos, 8.000%, due 12/17/15 | | 1,055,473 | |
MXN | 9,670,000 | | | | Mexican Bonos, 8.500%, due 12/13/18 | | 866,241 | |
MXN | 17,670,000 | | | | Mexican Bonos, 10.000%, due 12/05/24 | | 1,787,174 | |
$ | 130,000 | | | | Mexico Government International Bond, 5.625%, due 01/15/17 | | 144,430 | |
| 260,000 | | | | Mexico Government International Bond, 5.750%, due 10/12/10 | | 232,050 | |
EUR | 120,000 | | | | Netherlands Government International Bond, 4.000%, due 07/15/18 | | 173,099 | |
EUR | 70,000 | | | | Netherlands Government International Bond, 4.500%, due 07/15/17 | | 104,184 | |
NZD | 1,275,000 | | | | New Zealand Government International Bond, 6.000%, due 04/15/15 | | 1,040,675 | |
NOK | 415,000 | | | | Norway Government International Bond, 5.000%, due 05/15/15 | | 77,068 | |
$ | 235,000 | | S | | Panama Government International Bond, 7.125%, due 01/29/26 | | 283,763 | |
| 335,000 | | S | | Panama Government International Bond, 7.250%, due 03/15/15 | | 388,600 | |
| 110,000 | | | | Panama Government International Bond, 8.875%, due 09/30/27 | | 151,800 | |
| 240,000 | | | | Panama Government International Bond, 9.375%, due 04/01/29 | | 337,800 | |
PHP | 8,000,000 | | | | Philippine Government International Bond, 4.950%, due 01/15/21 | | 191,281 | |
PLN | 85,000 | | | | Poland Government International Bond, 5.250%, due 10/25/17 | | 28,072 | |
PLN | 4,270,000 | | | | Poland Government International Bond, 5.250%, due 10/25/20 | | 1,368,898 | |
PLN | 12,650,000 | | | | Poland Government International Bond, 5.500%, due 04/25/15 | | 4,308,294 | |
PLN | 3,555,000 | | | | Poland Government International Bond, 6.250%, due 10/24/15 | | 1,245,143 | |
$ | 375,000 | | # | | Qatar Government International Bond, 5.250%, due 01/20/20 | | 397,500 | |
AUD | 1,035,000 | | | | Queensland Treasury Corp., 6.000%, due 04/21/16 | | 1,059,918 | |
COP | 492,000,000 | | | | Republic of Colombia, 7.750%, due 04/14/21 | | 305,578 | |
COP | 445,000,000 | | | | Republic of Colombia, 9.850%, due 06/28/27 | | 328,535 | |
COP | 2,699,000,000 | | | | Republic of Colombia, 12.000%, due 10/22/15 | | 1,879,741 | |
| 460,000 | | #, S | | Republic of Ghana, 8.500%, due 10/04/17 | | 518,650 | |
| 355,000 | | | | Republic of Korea, 5.125%, due 12/07/16 | | 382,632 | |
| 530,000 | | | | Republic of Korea, 7.125%, due 04/16/19 | | 633,216 | |
| 400,000 | | | | South Africa Government International Bond, 5.500%, due 03/09/20 | | 427,500 | |
ZAR | 6,950,000 | | | | South Africa Government International Bond, 6.750%, due 03/31/21 | | 955,372 | |
ZAR | 24,040,000 | | | | South Africa Government International Bond, 7.250%, due 01/15/20 | | 3,452,553 | |
ZAR | 9,330,000 | | | | South Africa Government International Bond, 8.000%, due 12/21/18 | | 1,414,199 | |
ZAR | 16,220,000 | | | | South Africa Government International Bond, 10.500%, due 12/21/26 | | 2,938,978 | |
EUR | 270,000 | | | | Spain Government International Bond, 4.100%, due 07/30/18 | | 337,459 | |
EUR | 450,000 | | | | Spain Government International Bond, 5.500%, due 07/30/17 | | 620,834 | |
$ | 310,000 | | # | | Sri Lanka Government International Bond, 6.250%, due 10/04/20 | | 315,813 | |
TRY | 1,580,000 | | | | Turkey Government International Bond, 10.500%, due 01/15/20 | | 1,145,602 | |
TRY | 4,660,000 | | | | Turkey Government International Bond, 11.000%, due 08/06/14 | | 3,324,958 | |
TRY | 950,000 | | | | Turkey Government International Bond, 12.000%, due 08/14/13 | | 788,488 | |
TRY | 2,620,000 | | | | Turkey Government International Bond, 16.000%, due 03/07/12 | | 1,874,267 | |
$ | 685,000 | | | | Turkey Government International Bond, 6.750%, due 04/03/18 | | 784,325 | |
| 200,000 | | S | | Turkey Government International Bond, 6.750%, due 05/30/40 | | 219,000 | |
| 160,000 | | | | Turkey Government International Bond, 6.875%, due 03/17/36 | | 179,200 | |
| 310,000 | | S | | Turkey Government International Bond, 7.000%, due 03/11/19 | | 359,600 | |
| 230,000 | | S | | Turkey Government International Bond, 7.250%, due 03/05/38 | | 268,813 | |
| 360,000 | | S | | Turkey Government International Bond, 7.500%, due 07/14/17 | | 427,500 | |
| 485,000 | | S | | Turkey Government International Bond, 7.500%, due 11/07/19 | | 579,575 | |
| 500,000 | | # | | Ukraine Government International Bond, 6.750%, due 11/14/17 | | 501,000 | |
| 430,000 | | # | | Ukraine Government International Bond, 7.750%, due 09/23/20 | | 439,675 | |
GBP | 315,000 | | | | United Kingdom Gilt, 2.250%, due 03/07/14 | | 501,577 | |
GBP | 420,000 | | | | United Kingdom Gilt, 4.750%, due 03/07/20 | | 724,576 | |
GBP | 305,000 | | | | United Kingdom Gilt, 4.750%, due 12/07/38 | | 520,113 | |
$ | 410,000 | | S | | Uruguay Government International Bond, 6.875%, due 09/28/25 | | 469,450 | |
| 425,000 | | | | Uruguay Government International Bond, 7.625%, due 03/21/36 | | 506,813 | |
| 730,000 | | S | | Uruguay Government International Bond, 8.000%, due 11/18/22 | | 907,025 | |
| 1,085,000 | | S | | Venezuela Government International Bond, 7.000%, due 03/31/38 | | 611,723 | |
| 1,560,000 | | | | Venezuela Government International Bond, 7.650%, due 04/21/25 | | 986,700 | |
| 630,000 | | S | | Venezuela Government International Bond, 7.750%, due 10/13/19 | | 424,494 | |
| 250,000 | | S | | Venezuela Government International Bond, 8.250%, due 10/13/24 | | 160,025 | |
| 225,000 | | | | Venezuela Government International Bond, 8.500%, due 10/08/14 | | 191,250 | |
| 775,000 | | S | | Venezuela Government International Bond, 9.000%, due 05/07/23 | | 540,563 | |
| 320,000 | | | | Venezuela Government International Bond, 9.250%, due 09/15/27 | | 240,000 | |
| 470,000 | | | | Venezuela Government International Bond, 9.375%, due 01/13/34 | | 320,775 | |
| 90,000 | | S | | Venezuela Government International Bond, 12.750%, due 08/23/22 | | 78,309 | |
| 970,000 | | # | | Venezuela Government International Bond, 13.625%, due 08/15/18 | | 950,600 | |
| | | | | | | 117,414,002 | |
| | | | | Total Other Bonds (Cost $117,696,606) | | 126,554,779 | |
| | | | | | | | |
STRUCTURED PRODUCTS: 1.0% | | | |
| | | | | Structured Products: 1.0% | | | |
RUB | 11,097,000 | | ± | | Credit Suisse International - Moitk Total Return Linked Nts., 8.990%, 03/26/11 | | 1,090 | |
RUB | 19,450,000 | | ± | | Credit Suisse International - SPETSSTROY-2 Credit Linked Fully Funded Total Return Linked Nts., 8.590%, 5/20/15 | | 64 | |
MXN | 97,743 | | | | Deutsche Bank AG, London - Arrendadora Capita Corporation SA de CV and The Capita Corporation de Mexico, SA de CV Credit Linked Nts., 9.090%, 01/05/11 | | 7,578 | |
MXN | 63,897 | | | | Deutsche Bank AG, London - Arrendadora Capita Corporation SA de CV and The Capita Corporation de Mexico, SA de CV Credit Linked Nts., 9.520%, 01/05/11 | | 4,954 | |
MXN | 64,104 | | | | Deutsche Bank AG, London - Arrendadora Capita Corporation SA de CV and The Capita Corporation de Mexico, SA de CV Credit Linked Nts., 9.650%, 01/05/11 | | 4,970 | |
$ | 420,000 | | | | Deutsche Bank AG, London - Ukrtelecom Floating Rate Credit Linked Total Return Nts., 6-month USD-LIBOR +3.500%, 02/25/11 | | 407,458 | |
| 420,000 | | | | Deutsche Bank AG, London - Ukrtelecom Floating Rate Credit Linked Total Return Nts., 6-month USD-LIBOR +3.600%, 08/25/11 | | 360,956 | |
| 420,000 | | | | Deutsche Bank AG, London - Ukrtelecom Floating Rate Credit Linked Total Return Nts., 6-month USD-LIBOR +3.680%, 02/27/12 | | 320,074 | |
| 420,000 | | | | Deutsche Bank AG, London - Ukrtelecom Floating Rate Credit Linked Total Return Nts., 6-month USD-LIBOR +3.750%, 08/28/12 | | 288,448 | |
| 2,158,750 | | #, S | | Hallertau SPC 2008-2A - Doux Frangosul S.A. ARGO Avicola Credit Linked Nts., 9.264%, 09/17/13 | | 2,206,458 | |
BRL | 2,448,926 | | #, S, ± | | Hallertau SPC, Series 2008-1, Certificado de Direitos Creditorios do Agronegocio/Frigorifico Margen Ltda. Credit Linked Nts., 9.888%*, 08/02/10 | | 147,526 | |
| 356,901 | | S | | MicroAccess Trust 2007 - MicroFinance Institutional Loans, Credit Linked Nts., 7.550%, 5/24/12 | | 216,210 | |
RUB | 13,015,580 | | | | Morgan Stanley & Co. International PLC - EM Whole Loan SA /Russian Federation Total Return Linked Bonds, Series 007, Cl. VR, 5.000%, 08/22/34 | | 201,149 | |
EUR | 1,317,500 | | ± | | Morgan Stanley & Co. International PLC - Gisad DIş Ticaret A.Ş. Credit Linked Nts., 7.670% , 04/02/13 | | 88,029 | |
MXN | 2,070,000 | | R | | Reforma BLN-Backed I - Class 1A Asset-Backed Variable Funding Notes, TIIE +2.000%, 07/31/14 | | 167,985 | |
MXN | 414,000 | | R | | Reforma BLN-Backed I - Class 1B Asset-Backed Variable Funding Notes, TIIE +2.000%, 07/31/14 | | 33,597 | |
MXN | 690,000 | | R | | Reforma BLN-Backed I - Class 1C Asset-Backed Variable Funding Notes, TIIE +2.000%, 07/31/14 | | 55,995 | |
MXN | 345,000 | | R | | Reforma BLN-Backed I - Class 1D Asset-Backed Variable Funding Notes, TIIE +2.000%, 07/31/14 | | 27,998 | |
MXN | 483,000 | | R | | Reforma BLN-Backed I - Class 1E Asset-Backed Variable Funding Notes, TIIE +2.000%, 07/31/14 | | 39,197 | |
MXN | 197,523 | | R | | Reforma BLN-Backed I - Class 2A Asset-Backed Variable Funding Notes, TIIE +3.500%, 05/20/15 | | 16,029 | |
MXN | 345,571 | | R | | Reforma BLN-Backed I - Class 2B Asset-Backed Variable Funding Notes, TIIE +3.500%, 05/20/15 | | 28,044 | |
MXN | 5,210,380 | | R | | Reforma BLN-Backed I - Class 2C Asset-Backed Variable Funding Notes, TIIE +3.500%, 05/20/15 | | 422,835 | |
MXN | 379,725 | | R | | Reforma BLN-Backed I - Class 2D Asset-Backed Variable Funding Notes, TIIE +3.500%, 05/20/15 | | 30,816 | |
MXN | 275,878 | | R | | Reforma BLN-Backed I - Class 2E Asset-Backed Variable Funding Notes, TIIE +3.500%, 05/20/15 | | 22,388 | |
MXN | 176,189 | | R | | Reforma BLN-Backed I - Class 2F Asset-Backed Variable Funding Notes, TIIE +3.500%, 05/20/15 | | 14,298 | |
MXN | 32,447 | | R | | Reforma BLN-Backed I - Class 2G Asset-Backed Variable Funding Notes, TIIE +3.500%, 05/20/15 | | 2,633 | |
GHS | 160,000 | | R | | Standard Bank PLC - Ghana T-Bond Credit Linked Unsecured Notes, 12.606%*, 01/05/11 | | 107,506 | |
| | | | | | | | |
| | | | | Total Structured Products
(Cost $8,550,450) | | 5,224,285 | |
| | | | | | | | |
Shares | | | | | | | |
| | | | | | | |
COMMON STOCK: 1.1% | | | |
| | | | Consumer Discretionary: 0.4% | | | |
43,084 | | #, ±, L | | American Media Operations, Inc. | | | 702,509 | |
6,758 | | @ | | Charter Communications, Inc. | | 263,157 | |
549 | | @, R, X | | Greektown Super Holding | | 43,673 | |
14,240 | | @ | | Visteon Corp. | | 1,057,320 | |
| | | | | | 2,066,659 | |
| | | | Consumer Staples: 0.1% | | | |
12,144 | | @ | | MHP SA GDR | | 207,662 | |
| | | | | | 207,662 | |
| | | | | | | | | |
| | | | Materials: 0.6% | | | |
34,049 | | @, L | | AbitibiBowater, Inc. | | 804,854 | |
87,748 | | @ | | Smurfit-Stone Container Corp. | | 2,246,349 | |
| | | | | | 3,051,203 | |
| | | | Total Common Stock (Cost $4,681,306) | | 5,325,524 | |
| | | | | | | |
MUTUAL FUNDS: 4.1% | | | |
| | | | Open-End Funds: 4.1% | | | |
1,808,566 | | @ | | Oppenheimer Master Loan Fund | | 20,967,939 | |
| | | | | | | |
| | | | Total Mutual Funds (Cost $17,992,953) | | 20,967,939 | |
| | | | | | | |
PREFERRED STOCK: 0.4% | | | |
| | | | Consumer Discretionary: 0.1% | | | |
7,250 | | @, R, X | | Greektown Holdings, LLC | | 623,500 | |
| | | | | | | |
| | | | Financials: 0.3% | | | |
1,710 | | #, P | | Ally Financial, Inc. | | 1,616,217 | |
| | | | | | | |
| | | | Total Preferred Stock (Cost $2,092,325) | | 2,239,717 | |
| | | | | | | |
WARRANTS: 0.0% | | | |
| | | | Consumer Staples: 0.0% | | | |
1,340 | | | | ASG Warrant Corp. | | 167,500 | |
| | | | | | | |
| | | | Total Warrants (Cost $70,150) | | 167,500 | |
| | | | | | | |
Notional | | | | | | | |
Amount | | | | | | | |
| | | | | | | |
POSITIONS IN PURCHASED OPTIONS: 0.0% | | | |
| | | | Foreign Currency Options: 0.0% | | | |
$ | 26,020,000 | | @ | | Put Option OTC - Goldman Sachs & Co. | | | |
| | | | PLN vs USD | | | |
| | | | Strike @ 2.970 (PLN)-Exp 01/06/11 | | | 66,027 | |
26,300,000 | | @ | | Put Option OTC - Goldman Sachs & Co. | | | |
| | | | PLN vs USD | | | |
| | | | Strike @ 3.000 (PLN)-Exp 01/06/11 | | 34,553 | |
26,400,000 | | @ | | Put Option OTC - JPMorgan Chase & Co. | | | |
| | | | PLN vs USD | | | |
| | | | Strike @ 3.000 (PLN)-Exp 01/14/11 | | 84,685 | |
| | | | | | | |
| | | | Total Positions in Purchased Options
(Cost $374,949) | | 185,265 | |
| | | | | | | |
| | | | Total Long-Term Investments
(Cost $409,910,231) | | 427,232,406 | |
| | | | | | | |
Shares | | | | | | | |
| | | | | | | |
SHORT-TERM INVESTMENTS: 24.8% | | | |
| | | | Mutual Funds: 18.5% | | | |
94,776,053 | | | | Blackrock Liquidity Funds TempFund Portfolio - Class I | | | 94,776,053 | |
| | | | | | | |
| | | | Total Mutual Funds (Cost $94,776,053) | | 94,776,053 | |
| | | | | | | |
Principal Amount | | | | | | | |
| | | | | | | |
| | | | U.S. Treasury Bills: 0.2% | | | |
$ | 1,000,000 | | | | 0.110%, due 03/03/11 | | | 999,816 | |
| | | | | | | |
| | | | Total U.S. Treasury Bills (Cost $999,725) | | 999,816 | |
| | | | | | | |
Shares | | | | | | | |
| | | | | | | |
| | | | Securities Lending Collateral(cc): 6.1% | | | |
30,713,231 | | | | BNY Mellon Overnight Government Fund (1) | | | 30,713,231 | |
435,640 | | R | | BNY Institutional Cash Reserves Fund, Series B (1)(2) | | 348,512 | |
| | | | | | | |
| | | | Total Securities Lending Collateral (Cost $31,148,871) | | 31,061,743 | |
| | | | | | | |
| | | | Total Short-Term Investments (Cost $126,924,649) | | 126,837,612 | |
| | | | | | | |
| | | | Total Investments in Securities | | | | |
| | | | (Cost $536,834,880) * | 108.5 | % | $ | 554,070,018 | |
| | | | Other Assets and Liabilities - Net | (8.5 | ) | (43,450,351 | ) |
| | | | Net Assets | 100.0 | % | $ | 510,619,667 | |
| | @ | | Non-income producing security |
| | & | | Payment-in-kind |
| | S | | All or a portion of this security has been identified by the Fund to cover future collateral requirements for applicable futures, options, swaps, foreign currency contracts and/or when-issued or delayed-delivery securities. |
| | GDR | | Global Depositary Receipt |
| | MASTR | | Mortgage Asset Securitization Transaction, Inc. |
| | + | | Step-up basis bonds. Interest rates shown reflect current and next coupon rates. |
| | # | | Securities with purchases pursuant to Rule 144A or section 4(2), under the Securities Act of 1933 and may not be resold subject to that rule except to qualified institutional buyers. Unless otherwise noted, these securities have been determined to be liquid under the guidelines established by the Funds’ Board of Directors/Trustees. |
| | P | | Preferred Stock may be called prior to convertible date. |
| | (cc) | | Securities purchased with cash collateral for securities loaned. |
| | (1) | | Collateral received from brokers for securities lending was invested in these short-term investments. |
| | (2) | | On September 12, 2008, BNY established a separate sleeve of the Institutional Cash Reserves Fund (Series B) to hold certain Lehman Brothers defaulted debt obligations. The Portfolio’s position in Series B is being fair valued daily. Please see the accompanying Notes to Financial Statements for additional details on securities lending. |
| | ## | | On September 7, 2008, the Federal Housing Finance Agency placed the Federal National Mortgage Association and the Federal Home Loan Mortgage Corporation into conservatorship and the U.S. Treasury guaranteed the debt issued by those organizations. |
| | W | | Settlement is on a when-issued or delayed-delivery basis. |
| | R | | Restricted security |
| | L | | Loaned security, a portion or all of the security is on loan at December 31, 2010. |
| | ** | | Investment in affiliate |
| | ± | | Defaulted security |
| | X | | Fair value determined by ING Funds Valuation Committee appointed by the Funds’ Board of Directors/Trustees. |
| | ^ | | Interest only securities represent the right to receive the monthly interest payments on an underlying pool of mortgage loans. Principal amount shown represents the notional amount on which current interest is calculated. Payments of principal on the pool reduce the value of the interest only security. |
| | Z | | Indicates Zero Coupon Bond; rate shown reflects current effective yield. |
| | ARS | | Argentine Peso |
| | AUD | | Australian Dollar |
| | BRL | | Brazilian Real |
| | CAD | | Canadian Dollar |
| | COP | | Colombian Peso |
| | EGP | | Egyptian Pound |
| | EUR | | EU Euro |
| | GBP | | British Pound |
| | GHS | | Ghanian Cedi |
| | HUF | | Hungarian Forint |
| | ILS | | Israeli New Shekel |
| | JPY | | Japanese Yen |
| | KRW | | South Korean Won |
| | MXN | | Mexican Peso |
| | MYR | | Malaysian Ringgit |
| | NOK | | Norwegian Krone |
| | NZD | | New Zealand Dollar |
| | PHP | | Philippine Peso |
| | PLN | | Polish Zloty |
| | RUB | | Russian Ruble |
| | TRY | | Turkish Lira |
| | ZAR | | South African Rand |
| PORTFOLIO OF INVESTMENTS |
ING PIMCO Total Return Portfolio | as of December 31, 2010 |
Principal Amount | | | | | | Value | |
| | | | | | | | |
CORPORATE BONDS/NOTES: 25.1% | | | |
| | | | | Consumer Discretionary: 0.1% | | | |
$ | 1,100,000 | | | | Ford Motor Co., 3.040%, due 11/29/13 | | $ | 1,097,094 | |
| | | | | | | 1,097,094 | |
| | | | | Consumer Staples: 0.6% | | | |
| 3,000,000 | | S | | Anheuser-Busch InBev Worldwide, Inc., 4.125%, due 01/15/15 | | 3,162,582 | |
| 3,000,000 | | S | | Anheuser-Busch InBev Worldwide, Inc., 5.375%, due 01/15/20 | | 3,256,617 | |
| 400,000 | | S | | Philip Morris International, Inc., 5.650%, due 05/16/18 | | 451,658 | |
| 300,000 | | S | | Reynolds American, Inc., 7.625%, due 06/01/16 | | 349,061 | |
| | | | | | | 7,219,918 | |
| | | | | Energy: 1.4% | | | |
| 115,941 | | S | | Gazprom OAO, 7.201%, due 02/01/20 | | 123,680 | |
| 2,600,000 | | S | | Kinder Morgan Energy Partners LP, 5.950%, due 02/15/18 | | 2,867,602 | |
| 2,000,000 | | S | | Morgan Stanley Bank AG for OAO Gazprom, 9.625%, due 03/01/13 | | 2,272,500 | |
| 300,000 | | #, L | | Odebrecht Drilling Norbe VIII/IX Ltd., 6.350%, due 06/30/21 | | 313,500 | |
| 1,300,000 | | L | | Petroleos Mexicanos, 6.000%, due 03/05/20 | | 1,384,500 | |
| 2,500,000 | | S | | Petroleos Mexicanos, 8.000%, due 05/03/19 | | 3,025,000 | |
| 500,000 | | S | | Shell International Finance BV, 5.500%, due 03/25/40 | | 537,665 | |
| 400,000 | | S | | Total Capital S.A., 4.450%, due 06/24/20 | | 415,412 | |
| 300,000 | | S | | Trans-Canada Pipelines, 7.625%, due 01/15/39 | | 389,215 | |
| 5,400,000 | | S | | Transocean, Inc., 1.500%, due 12/15/37 | | 5,346,000 | |
| | | | | | | 16,675,074 | |
| | | | | Financials: 19.4% | | | |
| 700,000 | | S | | Allstate Life Global Funding Trusts, 5.375%, due 04/30/13 | | 762,691 | |
| 2,129,000 | | S | | Ally Financial, Inc., 5.375%, due 06/06/11 | | 2,152,951 | |
| 2,100,000 | | S | | Ally Financial, Inc., 6.000%, due 05/23/12 | | 2,173,500 | |
| 5,100,000 | | S | | Ally Financial, Inc., 6.875%, due 09/15/11 | | 5,265,750 | |
| 400,000 | | S | | Ally Financial, Inc., 7.250%, due 03/02/11 | | 404,000 | |
| 100,000 | | #, S | | Ally Financial, Inc., 7.500%, due 09/15/20 | | 105,375 | |
| 200,000 | | S | | American Express Bank FSB, 6.000%, due 09/13/17 | | 223,191 | |
| 200,000 | | S | | American Express Centurion Bank, 6.000%, due 09/13/17 | | 223,191 | |
| 700,000 | | S | | American Express Co., 7.000%, due 03/19/18 | | 816,520 | |
| 600,000 | | S | | American Express Credit Corp., 5.875%, due 05/02/13 | | 652,880 | |
EUR | 6,100,000 | | S | | American General Finance Corp., 4.125%, due 11/29/13 | | 6,855,887 | |
$ | 300,000 | | S | | American General Finance Corp., 4.875%, due 07/15/12 | | 283,875 | |
| 3,700,000 | | S | | American General Finance Corp., 5.625%, due 08/17/11 | | 3,658,375 | |
| 1,000,000 | | S | | American General Finance Corp., 6.900%, due 12/15/17 | | 812,500 | |
CAD | 1,000,000 | | | | American International Group, Inc., 4.900%, due 06/02/14 | | 998,190 | |
$ | 3,300,000 | | S | | American International Group, Inc., 5.850%, due 01/16/18 | | 3,412,540 | |
| 800,000 | | #, S | | ANZ National International Ltd., 6.200%, due 07/19/13 | | 881,301 | |
| 1,700,000 | | #, S | | Banco Santander Chile, 1.539%, due 04/20/12 | | 1,700,017 | |
| 300,000 | | S | | Bank of America Corp., 0.616%, due 08/15/16 | | 263,816 | |
| 900,000 | | S | | Bank of America Corp., 5.750%, due 12/01/17 | | 937,895 | |
| 4,400,000 | | S | | Bank of America Corp., 6.500%, due 08/01/16 | | 4,780,010 | |
| 300,000 | | #, L | | Bank of China Hong Kong Ltd., 5.550%, due 02/11/20 | | 313,984 | |
| 600,000 | | #, S | | Bank of Montreal, 2.850%, due 06/09/15 | | 610,107 | |
| 800,000 | | # | | Bank of Nova Scotia, 1.650%, due 10/29/15 | | 765,580 | |
| 4,100,000 | | S | | Barclays Bank PLC, 5.450%, due 09/12/12 | | 4,395,647 | |
| 700,000 | | #, S | | Barclays Bank PLC, 6.050%, due 12/04/17 | | 719,070 | |
| 1,900,000 | | S | | Bear Stearns Cos., Inc., 6.400%, due 10/02/17 | | 2,169,084 | |
| 2,100,000 | | S | | Bear Stearns Cos., Inc., 6.950%, due 08/10/12 | | 2,291,969 | |
| 2,200,000 | | #, S | | BNP Paribas, 5.186%, due 06/29/49 | | 2,018,500 | |
| 300,000 | | # | | BPCE S.A., 2.375%, due 10/04/13 | | 299,301 | |
| 3,000,000 | | S | | Caterpillar Financial Services Corp., 4.850%, due 12/07/12 | | 3,219,750 | |
| 298,730 | | S | | CIT Group, Inc., 7.000%, due 05/01/13 | | 305,451 | |
| 148,098 | | S | | CIT Group, Inc., 7.000%, due 05/01/14 | | 149,949 | |
| 448,096 | | S | | CIT Group, Inc., 7.000%, due 05/01/15 | | 450,336 | |
| 246,829 | | S | | CIT Group, Inc., 7.000%, due 05/01/16 | | 248,372 | |
| 345,563 | | S | | CIT Group, Inc., 7.000%, due 05/01/17 | | 347,291 | |
| 400,000 | | S | | CitiFinancial, 6.625%, due 06/01/15 | | 435,170 | |
| 3,200,000 | | S | | Citigroup Capital XXI, 8.300%, due 12/21/57 | | 3,344,000 | |
| 700,000 | | S | | Citigroup, Inc., 5.300%, due 10/17/12 | | 741,645 | |
| 1,900,000 | | S | | Citigroup, Inc., 5.500%, due 08/27/12 | | 2,015,100 | |
| 2,300,000 | | S | | Citigroup, Inc., 5.500%, due 04/11/13 | | 2,450,418 | |
| 500,000 | | S | | Citigroup, Inc., 5.625%, due 08/27/12 | | 524,884 | |
| 500,000 | | S | | Citigroup, Inc., 5.850%, due 07/02/13 | | 539,962 | |
| 1,900,000 | | S | | Citigroup, Inc., 6.000%, due 08/15/17 | | 2,063,752 | |
| 300,000 | | S | | Citigroup, Inc., 6.125%, due 05/15/18 | | 329,149 | |
| 300,000 | | S | | Citigroup, Inc., 8.500%, due 05/22/19 | | 373,014 | |
| 6,300,000 | | #, S | | Commonwealth Bank of Australia, 0.723%, due 07/12/13 | | 6,315,989 | |
| 1,100,000 | | #, S | | Commonwealth Bank of Australia, 6.024%, due 03/29/49 | | 1,077,870 | |
| 700,000 | | #, S | | Corp. Nacional del Cobre de Chile - CODELCO, 7.500%, due 01/15/19 | | 854,799 | |
| 5,700,000 | | #, S | | Credit Agricole S.A., 8.375%, due 12/13/49 | | 5,885,250 | |
| 1,600,000 | | S | | Deutsche Bank AG/London, 6.000%, due 09/01/17 | | 1,794,853 | |
| 3,300,000 | | #, S | | Dexia Credit Local, 0.768%, due 04/29/14 | | 3,290,338 | |
| 1,400,000 | | #, S | | Dexia Credit Local, 0.953%, due 09/23/11 | | 1,403,951 | |
| 1,800,000 | | S | | Export-Import Bank of Korea, 4.125%, due 09/09/15 | | 1,833,205 | |
| 500,000 | | S | | Export-Import Bank of Korea, 5.125%, due 06/29/20 | | 516,763 | |
| 11,900,000 | | #, S | | FIH Erhvervsbank A/S, 0.672%, due 06/13/13 | | 11,896,632 | |
| 200,000 | | S | | Ford Motor Credit Co., LLC, 7.250%, due 10/25/11 | | 206,750 | |
| 1,100,000 | | S | | Ford Motor Credit Co., LLC, 7.375%, due 02/01/11 | | 1,103,361 | |
EUR | 300,000 | | S | | Fortis Bank Nederland Holding NV, 3.000%, due 04/17/12 | | 409,953 | |
EUR | 4,800,000 | | S | | General Electric Capital Corp., 5.500%, due 09/15/67 | | 5,580,426 | |
$ | 900,000 | | S | | General Electric Capital Corp., 5.875%, due 01/14/38 | | 937,455 | |
| 800,000 | | S | | General Electric Capital Corp., 6.875%, due 01/10/39 | | 927,627 | |
| 50,000 | | S | | Goldman Sachs Group, Inc., 5.950%, due 01/18/18 | | 54,323 | |
| 800,000 | | S | | Goldman Sachs Group, Inc., 6.150%, due 04/01/18 | | 882,253 | |
| 2,000,000 | | S | | Goldman Sachs Group, Inc., 6.250%, due 09/01/17 | | 2,210,132 | |
| | | | | | | | | |
| 3,200,000 | | S | | Goldman Sachs Group, Inc., 6.750%, due 10/01/37 | | 3,281,882 | |
EUR | 3,200,000 | | S | | International Lease Finance Corp., 1.425%, due 08/15/11 | | 4,209,300 | |
$ | 4,400,000 | | S | | International Lease Finance Corp., 5.300%, due 05/01/12 | | 4,471,500 | |
| 1,100,000 | | S | | International Lease Finance Corp., 5.400%, due 02/15/12 | | 1,116,500 | |
| 1,800,000 | | S | | International Lease Finance Corp., 5.450%, due 03/24/11 | | 1,813,500 | |
| 700,000 | | #, S | | International Lease Finance Corp., 6.750%, due 09/01/16 | | 750,750 | |
| 5,600,000 | | S | | Intesa Sanpaolo/New York, 2.375%, due 12/21/12 | | 5,623,010 | |
| 1,000,000 | | S | | JPMorgan Chase & Co., 6.000%, due 01/15/18 | | 1,118,365 | |
| 900,000 | | S | | JPMorgan Chase Bank NA, 0.632%, due 06/13/16 | | 849,391 | |
| 2,700,000 | | S | | Korea Development Bank, 4.375%, due 08/10/15 | | 2,781,383 | |
| 2,000,000 | | ±, S | | Lehman Brothers Holdings, Inc., 2.951%, due 05/25/10 | | 467,500 | |
| 2,700,000 | | ±, S | | Lehman Brothers Holdings, Inc., 6.200%, due 09/26/14 | | 637,875 | |
| 300,000 | | ±, S | | Lehman Brothers Holdings, Inc., 6.875%, due 05/02/18 | | 75,750 | |
EUR | 2,364,000 | | ±, S | | Lehman Brothers Holdings, Inc., 0.000%, due 06/12/13 | | 750,271 | |
$ | 6,700,000 | | #, S | | Lloyds TSB Bank PLC, 5.800%, due 01/13/20 | | 6,626,816 | |
| 3,000,000 | | #, S | | Macquarie Group Ltd., 7.300%, due 08/01/14 | | 3,278,757 | |
| 300,000 | | S | | Merrill Lynch & Co., Inc., 6.050%, due 08/15/12 | | 317,792 | |
| 1,900,000 | | S | | Merrill Lynch & Co., Inc., 6.875%, due 04/25/18 | | 2,082,290 | |
| 5,400,000 | | #, S | | Metropolitan Life Global Funding I, 0.689%, due 07/13/11 | | 5,406,977 | |
| 500,000 | | #, S | | Monumental Global Funding Ltd., 5.500%, due 04/22/13 | | 535,351 | |
| 100,000 | | S | | Morgan Stanley, 0.560%, due 04/19/12 | | 99,814 | |
| 800,000 | | S | | Morgan Stanley, 5.950%, due 12/28/17 | | 847,641 | |
| 1,600,000 | | S | | Morgan Stanley, 6.250%, due 08/28/17 | | 1,725,818 | |
| 3,400,000 | | S | | National City Corp., 4.000%, due 02/01/11 | | 3,413,377 | |
| 1,400,000 | | #, S | | Nationwide Building Society, 6.250%, due 02/25/20 | | 1,461,435 | |
| 4,800,000 | | S | | Nomura Holdings, Inc., 6.700%, due 03/04/20 | | 5,146,258 | |
DKK | 2,762,051 | | | | Nykredit Realkredit A/S, 2.359%, due 04/01/38 | | 474,367 | |
DKK | 3,089,151 | | | | Nykredit Realkredit A/S, 2.359%, due 10/01/38 | | 528,330 | |
$ | 600,000 | | S | | Principal Life Income Funding Trusts, 5.300%, due 04/24/13 | | 649,651 | |
| 900,000 | | S | | Principal Life Income Funding Trusts, 5.550%, due 04/27/15 | | 963,347 | |
DKK | 8,592,107 | | | | Realkredit Danmark A/S, 2.340%, due 01/01/38 | | 1,468,716 | |
DKK | 2,743,005 | | | | Realkredit Danmark A/S, 2.340%, due 01/01/38 | | 471,096 | |
| 600,000 | | #, S | | Royal Bank of Scotland Group PLC, 6.990%, due 10/29/49 | | 465,000 | |
| 4,100,000 | | #, S | | Royal Bank of Scotland PLC, 0.686%, due 04/08/11 | | 4,102,009 | |
| 8,400,000 | | #, S | | Royal Bank of Scotland PLC, 1.450%, due 10/20/11 | | 8,448,829 | |
| 1,600,000 | | #, S | | Royal Bank of Scotland PLC, 2.625%, due 05/11/12 | | 1,638,402 | |
| 1,600,000 | | #, S | | Royal Bank of Scotland PLC, 3.000%, due 12/09/11 | | 1,633,682 | |
| 100,000 | | S | | Royal Bank of Scotland PLC, 3.950%, due 09/21/15 | | 98,408 | |
| 200,000 | | #, S | | Royal Bank of Scotland PLC, 4.875%, due 08/25/14 | | 205,004 | |
| 6,400,000 | | #, S | | Santander US Debt S.A. Unipersonal, 1.103%, due 03/30/12 | | 6,327,968 | |
| 2,400,000 | | S | | SLM Corp., 0.502%, due 03/15/11 | | 2,391,487 | |
EUR | 2,800,000 | | S | | SLM Corp., 3.125%, due 09/17/12 | | 3,651,652 | |
$ | 200,000 | | #, S | | Societe Generale, 5.922%, due 12/31/49 | | 176,870 | |
| 1,000,000 | | #, S | | State Bank of India/London, 4.500%, due 07/27/15 | | 1,023,315 | |
| 400,000 | | #, S | | Sydney Air, 5.125%, due 02/22/21 | | 386,093 | |
| 700,000 | | #, S | | Temasek Financial I Ltd., 4.300%, due 10/25/19 | | 715,788 | |
| 300,000 | | #, S | | TransCapitalInvest Ltd. for OJSC AK Transneft, 8.700%, due 08/07/18 | | 371,979 | |
| 500,000 | | S | | UBS AG, 5.750%, due 04/25/18 | | 544,181 | |
| 1,000,000 | | S | | UBS AG/Stamford CT, 1.384%, due 02/23/12 | | 1,008,777 | |
| 1,100,000 | | S | | UBS Preferred Funding Trust V, 6.243%, due 05/29/49 | | 1,067,000 | |
| 800,000 | | S | | Union Planters Corp., 7.750%, due 03/01/11 | | 807,521 | |
| 400,000 | | # | | Vnesheconombank Via VEB Finance Ltd., 5.450%, due 11/22/17 | | 401,000 | |
| 1,800,000 | | S | | Wachovia Corp., 5.750%, due 02/01/18 | | 2,001,476 | |
| 1,200,000 | | S | | Wells Fargo & Co., 5.625%, due 12/11/17 | | 1,330,544 | |
EUR | 1,200,000 | | S | | Wells Fargo & Company, 1.222%, due 03/23/16 | | 1,524,077 | |
$ | 3,400,000 | | #, S | | Westpac Banking Corp., 3.585%, due 08/14/14 | | 3,627,038 | |
| 500,000 | | | | White Nights Finance BV for Gazprom, 10.500%, due 03/08/14 | | 598,596 | |
| 1,500,000 | | L, S | | White Nights Finance BV for Gazprom, 10.500%, due 03/25/14 | | 1,796,655 | |
| 146,000 | | #, S | | ZFS Finance USA Trust IV, 5.875%, due 05/09/32 | | 143,026 | |
| | | | | | | 225,599,057 | |
| | | | | Health Care: 0.7% | | | |
| 2,400,000 | | S | | Amgen, Inc., 6.150%, due 06/01/18 | | 2,803,267 | |
| 300,000 | | S | | AstraZeneca PLC, 5.900%, due 09/15/17 | | 347,898 | |
| 200,000 | | S | | AstraZeneca PLC, 6.450%, due 09/15/37 | | 238,262 | |
| 1,900,000 | | S | | HCA, Inc., 8.500%, due 04/15/19 | | 2,090,000 | |
| 1,400,000 | | #, S | | Roche Holdings, Inc., 7.000%, due 03/01/39 | | 1,771,491 | |
| 600,000 | | S | | UnitedHealth Group, Inc., 4.875%, due 02/15/13 | | 639,108 | |
| | | | | | | 7,890,026 | |
| | | | | Industrials: 0.2% | | | |
| 700,000 | | #, S | | C8 Capital SPV Ltd., 6.640%, due 12/31/49 | | 495,223 | |
| 1,600,000 | | S | | Union Pacific Corp., 5.700%, due 08/15/18 | | 1,798,776 | |
| | | | | | | 2,293,999 | |
| | | | | Information Technology: 0.7% | | | |
| 1,300,000 | | S | | Dell, Inc., 4.700%, due 04/15/13 | | 1,396,261 | |
| 5,700,000 | | S | | International Business Machines Corp., 5.700%, due 09/14/17 | | 6,551,438 | |
| | | | | | | 7,947,699 | |
| | | | | Materials: 0.3% | | | |
| 1,500,000 | | #, S | | CSN Resources S.A., 6.500%, due 07/21/20 | | 1,590,000 | |
| 300,000 | | # | | Gerdau Trade, Inc., 5.750%, due 01/30/21 | | 302,250 | |
| 400,000 | | S | | Rohm & Haas Co., 6.000%, due 09/15/17 | | 438,383 | |
| 200,000 | | S | | Vale Overseas Ltd., 6.250%, due 01/23/17 | | 223,521 | |
| 500,000 | | S | | Vale Overseas Ltd., 6.875%, due 11/10/39 | | 554,965 | |
| | | | | | | 3,109,119 | |
| | | | | Telecommunication Services: 1.2% | | | |
| 3,416,000 | | S | | AT&T, Inc., 4.950%, due 01/15/13 | | 3,663,291 | |
| 600,000 | | S | | AT&T, Inc., 5.500%, due 02/01/18 | | 667,516 | |
| 1,500,000 | | S | | AT&T, Inc., 6.300%, due 01/15/38 | | 1,587,684 | |
| 24,000 | | S | | AT&T, Inc., 7.300%, due 11/15/11 | | 25,359 | |
| 2,500,000 | | S | | BellSouth Corp., 5.200%, due 09/15/14 | | 2,731,520 | |
| 4,900,000 | | S | | Cellco Partnership / Verizon Wireless Capital, LLC, 2.884%, due 05/20/11 | | 4,949,593 | |
| 200,000 | | #, S | | Qtel International Finance Ltd., 4.750%, due 02/16/21 | | 191,568 | |
| 200,000 | | S | | Qwest Corp., 8.875%, due 03/15/12 | | 216,750 | |
| | | | | | | 14,033,281 | |
| | | | | Utilities: 0.5% | | | |
| 300,000 | | S | | Columbus Southern Power Co., 6.600%, due 03/01/33 | | 334,675 | |
| 600,000 | | #, S | | EDF S.A., 5.500%, due 01/26/14 | | 659,066 | |
| 600,000 | | #, S | | EDF S.A., 6.500%, due 01/26/19 | | 701,183 | |
| 600,000 | | #, S | | Electricite de France SA, 6.950%, due 01/26/39 | | 712,364 | |
| 2,100,000 | | #, S | | Enel Finance International S.A., 6.250%, due 09/15/17 | | 2,296,776 | |
| 500,000 | | | | Majapahit Holding BV, 7.250%, due 06/28/17 | | 568,678 | |
| 1,000,000 | | | | NV Energy, Inc., 6.250%, due 11/15/20 | | 1,010,000 | |
| | | | | | | 6,282,742 | |
| | | | | Total Corporate Bonds/Notes (Cost $281,339,659) | | 292,148,009 | |
| | | | | | | | |
U.S. GOVERNMENT AGENCY OBLIGATIONS: 53.6% | | | |
| | | | | Federal Home Loan Bank: 0.1% | | | |
| 400,000 | | L | | 0.875%, due 12/27/13 | | 396,783 | |
| 400,000 | | | | 3.125%, due 12/13/13 | | 422,276 | |
| 100,000 | | | | 3.625%, due 10/18/13 | | 106,852 | |
| | | | | | | 925,911 | |
| | | | | Federal Home Loan Mortgage Corporation##: 6.5% | | | |
| 1,480,310 | | S | | 0.410%, due 07/15/19-08/15/19 | | 1,478,518 | |
| 9,200,000 | | S | | 0.515%, due 11/26/12 | | 9,174,746 | |
| 4,400,000 | | L | | 0.875%, due 10/28/13 | | 4,380,024 | |
| 267,075 | | S | | 1.542%, due 10/25/44 | | 261,633 | |
| 1,315,918 | | S | | 1.742%, due 07/25/44 | | 1,290,685 | |
| 418,575 | | S | | 1.875%, due 03/25/24 | | 433,730 | |
| 5,600,000 | | S | | 2.500%, due 01/07/14-04/23/14 | | 5,818,285 | |
| 81,697 | | S | | 2.520%, due 09/01/35 | | 84,892 | |
| 13,420 | | S | | 2.615%, due 04/01/32 | | 13,981 | |
| 1,100,000 | | L | | 3.000%, due 07/28/14 | | 1,158,928 | |
| 1,014,204 | | | | 3.500%, due 05/29/13-07/15/32 | | 1,077,626 | |
| 400,000 | | | | 4.125%, due 09/27/13 | | 433,736 | |
| 1,700,000 | | ^, S | | 4.375%, due 07/17/15 | | 1,877,075 | |
| 4,000,000 | | W | | 4.500%, due 02/15/40 | | 4,100,000 | |
| 16,993,212 | | S | | 4.500%, due 01/15/13-08/01/40 | | 18,049,244 | |
| 2,300,000 | | S | | 4.875%, due 11/15/13 | | 2,551,158 | |
| 1,200,000 | | ^ | | 5.000%, due 07/15/14 | | 1,346,112 | |
| 1,200,000 | | | | 5.000%, due 01/30/14-04/18/17 | | 1,352,470 | |
| 400,000 | | S | | 5.250%, due 04/18/16 | | 458,089 | |
| 8,389,407 | | S | | 5.500%, due 07/18/16-07/01/38 | | 9,009,548 | |
| 10,755,594 | | S | | 6.000%, due 10/01/17-08/01/39 | | 11,670,718 | |
| | | | | | | 76,021,198 | |
| | | | | Federal National Mortgage Association##: 46.9% | | | |
| 469,795 | | S | | 0.321%, due 07/25/37 | | 463,678 | |
| 97,597 | | S | | 0.381%, due 03/25/34 | | 96,745 | |
| 9,500,000 | | S | | 0.500%, due 10/30/12 | | 9,462,029 | |
| 788,996 | | S | | 0.571%, due 04/25/37 | | 791,050 | |
| 3,800,000 | | S | | 0.625%, due 09/24/12 | | 3,805,552 | |
| 1,531,967 | | S | | 0.711%, due 09/25/35 | | 1,533,130 | |
| 29,200,000 | | L | | 0.750%, due 12/18/13 | | 28,894,889 | |
| 13,900,000 | | S | | 1.000%, due 09/23/13 | | 13,888,268 | |
| 7,300,000 | | S | | 1.125%, due 09/30/13 | | 7,320,725 | |
| 300,000 | | | | 1.250%, due 08/20/13 | | 302,155 | |
| 224,302 | | S | | 1.530%, due 10/01/44 | | 224,407 | |
| 3,700,000 | | S | | 1.625%, due 10/26/15 | | 3,610,456 | |
| 770,637 | | S | | 1.629%, due 02/01/33 | | 788,336 | |
| 2,300,000 | | S | | 1.750%, due 02/22/13 | | 2,349,795 | |
| 91,158 | | S | | 1.781%, due 04/25/24 | | 94,182 | |
| 5,290 | | S | | 2.000%, due 02/01/20 | | 5,437 | |
| 564,458 | | S | | 2.127%, due 09/01/35 | | 581,697 | |
| 3,000,000 | | S | | 2.500%, due 05/15/14 | | 3,115,056 | |
| 10,966 | | S | | 2.560%, due 09/01/31 | | 11,465 | |
| 77,146 | | S | | 2.585%, due 04/01/32 | | 76,988 | |
| 216,406 | | S | | 2.606%, due 08/01/35 | | 224,346 | |
| 1,239,119 | | S | | 2.688%, due 11/01/34-02/01/35 | | 1,295,752 | |
| 4,500,000 | | S | | 2.750%, due 02/05/14-03/13/14 | | 4,706,436 | |
| 400,000 | | L | | 2.875%, due 12/11/13 | | 420,786 | |
| 2,100,000 | | | | 3.000%, due 09/16/14 | | 2,213,845 | |
| 86,300,000 | | W | | 4.000%, due 01/25/24-08/25/40 | | 86,009,114 | |
| 13,500,000 | | S | | 4.125%, due 04/15/14 | | 14,734,805 | |
| 200,000 | | S | | 4.375%, due 10/15/15 | | 220,388 | |
| 157,300,000 | | W | | 4.500%, due 01/25/24-01/25/39 | | 161,852,899 | |
| 66,761,036 | | S | | 4.500%, due 06/01/38-09/01/40 | | 68,617,785 | |
| 80,298 | | S | | 4.617%, due 12/01/36 | | 83,878 | |
| 2,600,000 | | S | | 4.625%, due 10/15/13 | | 2,855,770 | |
| 100,000 | | S | | 4.875%, due 12/15/16 | | 112,252 | |
| 330,081 | | S | | 4.989%, due 09/01/34 | | 345,399 | |
| 32,200,000 | | W | | 5.000%, due 01/13/40 | | 33,855,273 | |
| 6,172,234 | | S | | 5.000%, due 03/15/16-07/01/39 | | 6,674,570 | |
| 600,000 | | S | | 5.375%, due 06/12/17 | | 691,784 | |
| 30,900,000 | | W | | 5.500%, due 01/25/39 | | 33,063,000 | |
| 4,776,525 | | S | | 5.500%, due 04/01/21-08/01/38 | | 5,141,318 | |
| 9,000,000 | | W | | 6.000%, due 01/15/33 | | 9,783,288 | |
| 28,826,922 | | S | | 6.000%, due 06/01/17-10/01/38 | | 31,411,980 | |
| 1,000,000 | | W | | 6.500%, due 01/15/32 | | 1,111,406 | |
| 1,797,205 | | S | | 6.500%, due 03/01/17-06/17/38 | | 1,961,372 | |
| | | | | | | 544,803,486 | |
| | | | | Government National Mortgage Association: 0.1% | | | |
| 26,132 | | S | | 0.661%, due 03/16/32 | | 26,222 | |
| 1,000,000 | | W | | 6.000%, due 01/15/39 | | 1,099,688 | |
| | | | | | | 1,125,910 | |
| | | | | Total U.S. Government Agency Obligations (Cost $626,847,826) | | 622,876,505 | |
U.S. TREASURY OBLIGATIONS: 38.5% | | | |
| | | | | U.S. Treasury Notes: 36.9% | | | |
| 15,100,000 | | L | | 0.500%, due 11/30/12 | | 15,082,892 | |
| 275,100,000 | | | | 0.500%, due 10/15/13-11/15/13 | | 272,038,316 | |
| 41,000,000 | | S | | 0.750%, due 08/15/13-09/15/13 | | 40,902,732 | |
| 26,000,000 | | S | | 1.000%, due 07/15/13 | | 26,132,002 | |
| 11,200,000 | | S | | 1.125%, due 06/15/13 | | 11,293,587 | |
| 1,600,000 | | | | 1.375%, due 11/30/15 | | 1,555,125 | |
| 8,900,000 | | S | | 1.875%, due 06/30/15 | | 8,936,855 | |
| 31,100,000 | | S | | 2.125%, due 11/30/14-05/31/15 | | 31,679,031 | |
| 8,800,000 | | | | 2.375%, due 09/30/14-10/31/14 | | 9,112,529 | |
| 7,300,000 | | | | 2.500%, due 04/30/15 | | 7,548,091 | |
| 4,700,000 | | | | 2.625%, due 12/31/14 | | 4,901,588 | |
| | | | | | | 429,182,748 | |
| | | | | Treasury Inflation Indexed Protected Securities(ip): 1.6% | | | |
| 501,435 | | S | | 1.250%, due 07/15/20 | | 514,128 | |
| 626,388 | | S | | 1.750%, due 01/15/28 | | 639,210 | |
| 3,305,820 | | S | | 2.000%, due 01/15/26 | | 3,518,374 | |
| 5,556,629 | | S | | 2.375%, due 01/15/25-01/15/27 | | 6,194,643 | |
| 5,297,136 | | S | | 2.500%, due 01/15/29 | | 6,027,150 | |
| 1,352,240 | | S | | 3.625%, due 04/15/28 | | 1,749,777 | |
| 133,041 | | S | | 3.875%, due 04/15/29 | | 178,847 | |
| | | | | | | 18,822,129 | |
| | | | | Total U.S. Treasury Obligations (Cost $450,141,981) | | 448,004,877 | |
| | | | | | | | |
ASSET-BACKED SECURITIES: 0.4% | | | |
| | | | | Automobile Asset-Backed Securities: 0.1% | | | |
| 294,663 | | #, S | | Ally Auto Receivables Trust, 1.320%, due 03/15/12 | | 295,138 | |
| 225,018 | | S | | Daimler Chrysler Auto Trust, 1.741%, due 09/10/12 | | 225,663 | |
| | | | | | | 520,801 | |
| | | | | Credit Card Asset-Backed Securities: 0.1% | | | |
| 1,400,000 | | S | | BA Credit Card Trust, 1.460%, due 12/16/13 | | 1,407,613 | |
| | | | | | | 1,407,613 | |
| | | | | Home Equity Asset-Backed Securities: 0.0% | | | |
| 543,435 | | S | | Household Home Equity Loan Trust, 0.551%, due 01/20/34 | | 496,327 | |
| | | | | | | 496,327 | |
| | | | | Other Asset-Backed Securities: 0.2% | | | |
| 303,597 | | S | | Countrywide Asset-Backed Certificates, 0.341%, due 10/25/47 | | 299,413 | |
| 1,737,760 | | S | | Countrywide Asset-Backed Certificates, 0.441%, due 09/25/36 | | 1,474,766 | |
| 274,110 | | S | | JPMorgan Mortgage Acquisition Corp., 0.321%, due 03/25/47 | | 214,457 | |
| 58,753 | | S | | Long Beach Mortgage Loan Trust, 0.541%, due 10/25/34 | | 48,611 | |
| 10,214 | | S | | Morgan Stanley Capital, Inc., 0.311%, due 11/25/36 | | 10,200 | |
| 132,951 | | S | | WAMU Asset-Backed Certificates, 0.311%, due 01/25/37 | | 129,464 | |
| | | | | | | 2,176,911 | |
| | | | | Total Asset-Backed Securities (Cost $4,969,424) | | 4,601,652 | |
| | | | | | | | |
COLLATERALIZED MORTGAGE OBLIGATIONS: 6.9% | | | |
| 2,438,077 | | S | | Access Group, Inc., 1.588%, due 10/27/25 | | 2,494,315 | |
| 81,510 | | S | | Adjustable Rate Mortgage Trust, 3.038%, due 05/25/35 | | 81,353 | |
| 384,302 | | S | | American Home Mortgage Investment Trust, 2.261%, due 02/25/45 | | 344,754 | |
| 16,800,000 | | #, S | | Arkle Master Issuer PLC, 0.374%, due 02/17/52 | | 16,619,618 | |
EUR | 1,000,000 | | # | | Arran Residential Mortgages Funding PLC, 2.203%, due 05/16/47 | | 1,335,213 | |
EUR | 1,700,000 | | # | | Arran Residential Mortgages Funding PLC, 2.403%, due 05/16/47 | | 2,264,048 | |
$ | 800,000 | | S | | Banc of America Commercial Mortgage, Inc., 5.740%, due 05/10/45 | | 876,880 | |
| 549,561 | | S | | Banc of America Funding Corp., 2.861%, due 05/25/35 | | 535,849 | |
| 446,009 | | S | | Banc of America Funding Corp., 5.893%, due 01/20/47 | | 324,046 | |
| 327,660 | | S | | Banc of America Mortgage Securities, Inc., 2.923%, due 07/25/33 | | 320,190 | |
| 90,714 | | S | | Banc of America Mortgage Securities, Inc., 5.000%, due 05/25/34 | | 90,924 | |
| 1,600,000 | | #, S | | BCRR Trust, 5.858%, due 07/17/40 | | 1,688,751 | |
| 2,661,874 | | S | | Bear Stearns Adjustable Rate Mortgage Trust, 2.730%, due 03/25/35 | | 2,541,167 | |
| 1,567,535 | | S | | Bear Stearns Adjustable Rate Mortgage Trust, 2.934%, due 03/25/35 | | 1,503,026 | |
| 679,413 | | S | | Bear Stearns Adjustable Rate Mortgage Trust, 3.106%, due 11/25/34 | | 578,334 | |
| 111,491 | | S | | Bear Stearns Adjustable Rate Mortgage Trust, 5.380%, due 02/25/36 | | 95,530 | |
| 328,473 | | S | | Bear Stearns Alternative-A Trust, 2.875%, due 05/25/35 | | 257,036 | |
| 198,826 | | S | | Bear Stearns Alternative-A Trust, 2.955%, due 09/25/35 | | 152,407 | |
| 579,704 | | S | | Bear Stearns Alternative-A Trust, 5.305%, due 11/25/36 | | 363,136 | |
| 100,000 | | S | | Bear Stearns Commercial Mortgage Securities, 5.331%, due 02/11/44 | | 102,842 | |
| 300,000 | | S | | Bear Stearns Commercial Mortgage Securities, 5.471%, due 01/12/45 | | 320,637 | |
| 515,559 | | S | | Bear Stearns Structured Products, Inc., 2.360%, due 01/26/36 | | 338,495 | |
| 329,065 | | S | | Bear Stearns Structured Products, Inc., 5.339%, due 12/26/46 | | 231,736 | |
| 536,905 | | S | | Citigroup Mortgage Loan Trust, Inc., 2.930%, due 08/25/35 | | 509,786 | |
| 900,000 | | S | | Commercial Mortgage Pass-through Certificates, 5.306%, due 12/10/46 | | 940,033 | |
| 175,172 | | S | | Countrywide Home Loan Mortgage Pass-through Trust, 0.581%, due 03/25/35 | | 112,492 | |
| 806,571 | | #, S | | Countrywide Home Loan Mortgage Pass-through Trust, 0.601%, due 06/25/35 | | 696,677 | |
| 799,350 | | S | | Countrywide Home Loan Mortgage Pass-through Trust, 2.920%, due 02/20/35 | | 696,778 | |
| 463,780 | | S | | Countrywide Home Loan Mortgage Pass-through Trust, 3.121%, due 11/25/34 | | 376,866 | |
| 2,385,382 | | #, S | | Credit Suisse Mortgage Capital Certificates, 0.490%, due 10/15/21 | | 2,256,128 | |
| 100,000 | | S | | Credit Suisse Mortgage Capital Certificates, 5.659%, due 03/15/39 | | 105,218 | |
| 2,300,000 | | S | | Credit Suisse Mortgage Capital Certificates, 5.695%, due 09/15/40 | | 2,365,596 | |
| 150,522 | | S | | Downey Savings & Loan Association Mortgage Loan Trust, 2.470%, due 07/19/44 | | 120,333 | |
| 293,467 | | S | | First Horizon Mortgage Pass-through Trust, 2.924%, due 08/25/35 | | 240,261 | |
| 9,854 | | S | | GMAC Mortgage Corp. Loan Trust, 5.500%, due 09/25/34 | | 9,990 | |
| 8,698,141 | | S | | Granite Master Issuer PLC, 0.351%, due 12/20/54 | | 8,097,969 | |
| 282,275 | | S | | Greenpoint Mortgage Pass-through Certificates, 3.117%, due 10/25/33 | | 243,351 | |
| 100,000 | | S | | Greenwich Capital Commercial Funding Corp., 4.799%, due 08/10/42 | | 105,664 | |
| 600,000 | | S | | Greenwich Capital Commercial Funding Corp., 5.444%, due 03/10/39 | | 633,044 | |
| 695,778 | | #, S | | GS Mortgage Securities Corp. II, 0.351%, due 03/06/20 | | 679,094 | |
| 61,008 | | S | | GSR Mortgage Loan Trust, 2.574%, due 06/25/34 | | 56,110 | |
| 567,149 | | S | | GSR Mortgage Loan Trust, 2.825%, due 09/25/35 | | 543,995 | |
| 1,215 | | S | | GSR Mortgage Loan Trust, 6.000%, due 03/25/32 | | 1,216 | |
| 213,962 | | S | | Harborview Mortgage Loan Trust, 0.481%, due 05/19/35 | | 140,621 | |
| 407,355 | | S | | Harborview Mortgage Loan Trust, 2.960%, due 07/19/35 | | 325,651 | |
| 226,208 | | S | | Indymac Index Mortgage Loan Trust, 2.690%, due 12/25/34 | | 167,031 | |
| 1,700,000 | | #, S | | JPMorgan Chase Commercial Mortgage Securities Corp., 4.070%, due 11/15/43 | | 1,620,006 | |
| 800,000 | | S | | JPMorgan Chase Commercial Mortgage Securities Corp., 5.336%, due 05/15/47 | | 831,496 | |
| 2,600,000 | | S | | JPMorgan Chase Commercial Mortgage Securities Corp., 5.420%, due 01/15/49 | | 2,708,275 | |
| 4,300,000 | | S | | JPMorgan Chase Commercial Mortgage Securities Corp., 5.440%, due 06/12/47 | | 4,512,669 | |
| 300,000 | | S | | JPMorgan Chase Commercial Mortgage Securities Corp., 5.882%, due 02/15/51 | | 318,133 | |
| 925,711 | | S | | JPMorgan Mortgage Trust, 3.112%, due 07/25/35 | | 923,567 | |
| 238,927 | | S | | JPMorgan Mortgage Trust, 5.036%, due 02/25/35 | | 239,779 | |
| 247,887 | | S | | Merrill Lynch Mortgage Investors Trust, 0.471%, due 02/25/36 | | 191,851 | |
| 293,633 | | S | | Merrill Lynch Mortgage Investors Trust, 2.456%, due 05/25/33 | | 292,781 | |
| 300,000 | | S | | Merrill Lynch/Countrywide Commercial Mortgage Trust, 5.485%, due 03/12/51 | | 306,398 | |
| 196,628 | | S | | MLCC Mortgage Investors, Inc., 0.511%, due 11/25/35 | | 176,355 | |
| 110,833 | | S | | MLCC Mortgage Investors, Inc., 1.258%, due 10/25/35 | | 96,466 | |
| 100,000 | | S | | Morgan Stanley Capital I, 5.809%, due 12/12/49 | | 107,014 | |
| 4,700,000 | | S | | Morgan Stanley Capital I, 5.879%, due 06/11/49 | | 5,040,359 | |
| 14,934 | | S | | RAAC Series, 5.000%, due 09/25/34 | | 14,976 | |
| 89,896 | | S | | Residential Accredit Loans, Inc., 0.661%, due 03/25/33 | | 80,791 | |
| 70,147 | | S | | Residential Asset Securitization Trust, 0.661%, due 05/25/33 | | 61,318 | |
| 11,327 | | S | | Residential Funding Mortgage Securities I, 6.500%, due 03/25/32 | | 11,656 | |
| 193,420 | | S | | Sequoia Mortgage Trust, 0.611%, due 07/20/33 | | 183,580 | |
| 382,522 | | S | | Sequoia Mortgage Trust, 2.823%, due 04/20/35 | | 359,656 | |
| 117,461 | | S | | SLM Student Loan Trust, 0.588%, due 01/25/15 | | 117,527 | |
| 212,387 | | S | | Structured Adjustable Rate Mortgage Loan Trust, 2.714%, due 08/25/35 | | 172,431 | |
| 504,303 | | S | | Structured Asset Mortgage Investments, Inc., 0.511%, due 07/19/35 | | 472,346 | |
| 209,732 | | #, S | | Structured Asset Securities Corp., 2.856%, due 10/25/35 | | 168,656 | |
| 877,020 | | S | | Thornburg Mortgage Securities Trust, 0.381%, due 10/25/46 | | 869,492 | |
| 805,876 | | #, S | | Wachovia Bank Commercial Mortgage Trust, 0.340%, due 06/15/20 | | 754,192 | |
| 400,000 | | S | | Wachovia Bank Commercial Mortgage Trust, 5.509%, due 04/15/47 | | 408,531 | |
| 2,500,000 | | S | | WaMu Mortgage Pass-Through Certificates, 5.752%, due 02/25/37 | | 2,056,563 | |
| 354,536 | | #, R, X, ^, S | Washington Mutual Mortgage Pass-through Certificates, 0.000%, due 12/25/27 | | 19,499 | |
| 149,231 | | S | | Washington Mutual Mortgage Pass-through Certificates, 0.571%, due 01/25/45 | | 128,603 | |
| 150,988 | | S | | Washington Mutual Mortgage Pass-through Certificates, 0.581%, due 01/25/45 | | 127,840 | |
| 348,730 | | S | | Washington Mutual Mortgage Pass-through Certificates, 0.801%, due 12/25/27 | | 309,608 | |
| 20,334 | | S | | Washington Mutual Mortgage Pass-through Certificates, 1.728%, due 08/25/42 | | 18,490 | |
| 45,372 | | S | | Washington Mutual Mortgage Pass-through Certificates, 2.904%, due 02/27/34 | | 46,408 | |
| 912,444 | | S | | Washington Mutual Mortgage Pass-through Certificates, 3.154%, due 07/25/46 | | 670,408 | |
| 991,991 | | S | | Washington Mutual Mortgage Pass-through Certificates, 3.154%, due 08/25/46 | | 755,592 | |
| 684,159 | | S | | Wells Fargo Mortgage-Backed Securities Trust, 2.856%, due 12/25/34 | | 664,769 | |
| 307,568 | | S | | Wells Fargo Mortgage-Backed Securities Trust, 2.906%, due 05/25/35 | | 293,124 | |
| 447,385 | | S | | Wells Fargo Mortgage-Backed Securities Trust, 4.911%, due 01/25/35 | | 451,525 | |
| 116,420 | | S | | Wells Fargo Mortgage-Backed Securities Trust, 5.251%, due 08/25/36 | | 115,571 | |
| | | | | | | | |
| | | | | Total Collateralized Mortgage Obligations (Cost $78,929,117) | | 79,582,492 | |
| | | | | | | | |
MUNICIPAL BONDS: 2.8% | | | |
| | | | | California: 1.0% | | | |
| 1,000,000 | | S | | California Infrastructure & Economic Development Bank, 6.486%, due 05/15/49 | | 1,013,780 | |
| 1,200,000 | | S | | California State Public Works Board, 7.804%, due 03/01/35 | | 1,184,736 | |
| 500,000 | | S | | California State University, 6.434%, due 11/01/30 | | 510,395 | |
| 200,000 | | | | Los Angeles County Public Works Financing Authority, 7.488%, due 08/01/33 | | 196,610 | |
| 300,000 | | | | Los Angeles County Public Works Financing Authority, 7.618%, due 08/01/40 | | 294,510 | |
| 450,000 | | S | | Orange County Sanitation District, 9.220%, due 02/01/33 | | 431,109 | |
| 6,000,000 | | S | | Southern California Public Power Authority, 5.943%, due 07/01/40 | | 5,601,120 | |
| 500,000 | | S | | State of California, 7.500%, due 04/01/34 | | 517,305 | |
| 400,000 | | S | | State of California, 5.650%, due 04/01/39 | | 422,520 | |
| 500,000 | | S | | State of California, 7.550%, due 04/01/39 | | 520,305 | |
| 200,000 | | | | University of California, 6.398%, due 05/15/31 | | 194,164 | |
| 300,000 | | | | University of California, 6.548%, due 05/15/48 | | 292,959 | |
| | | | | | | 11,179,513 | |
| | | | | Illinois: 0.3% | | | |
| 1,000,000 | | S | | Chicago Transit Authority, 6.200%, due 12/01/40 | | 912,850 | |
| 1,400,000 | | S | | Chicago Transit Authority, 6.899%, due 12/01/40 | | 1,390,200 | |
| 100,000 | | S | | Chicago Transit Authority, 6.300%, due 12/01/21 | | 104,119 | |
| 400,000 | | S | | State of Illinois, 6.725%, due 04/01/35 | | 367,544 | |
| 900,000 | | S | | State of Illinois, 4.071%, due 01/01/14 | | 908,604 | |
| | | | | | | 3,683,317 | |
| | | | | Nebraska: 0.0% | | | |
| 500,000 | | S | | Public Power Generation Agency, 7.242%, due 01/01/41 | | 494,255 | |
| | | | | | | 494,255 | |
| | | | | Nevada: 0.3% | | | |
| 3,300,000 | | S | | City of North Las Vegas NV, 6.572%, due 06/01/40 | | 3,326,400 | |
| 600,000 | | S | | County of Clark NV, 6.820%, due 07/01/45 | | 615,384 | |
| | | | | | | 3,941,784 | |
| | | | | New Jersey: 0.1% | | | |
| 600,000 | | S | | New Jersey Economic Development Authority, 1.302%, due 06/15/13 | | 599,370 | |
| | | | | | | 599,370 | |
| | | | | New York: 0.6% | | | |
| 2,900,000 | | | | New York City Municipal Water Finance Authority, 5.882%, due 06/15/44 | | 2,900,696 | |
| 1,000,000 | | S | | New York City Municipal Water Finance Authority, 6.011%, due 06/15/42 | | 1,000,090 | |
| 2,900,000 | | | | New York City Municipal Water Finance Authority, 6.282%, due 06/15/42 | | 2,888,806 | |
| 100,000 | | S | | Tobacco Settlement Financing Corp., 5.875%, due 05/15/39 | | 95,420 | |
| 200,000 | | S | | Tobacco Settlement Financing Corp., 6.250%, due 06/01/42 | | 179,404 | |
| | | | | | | 7,064,416 | |
| | | | | Ohio: 0.0% | | | |
| 400,000 | | S | | Buckeye Tobacco Settlement Financing Authority, 5.875%, due 06/01/30 | | 287,640 | |
| | | | | | | 287,640 | |
| | | | | Texas: 0.5% | | | |
| 2,200,000 | | | | City of San Antonio TX, 5.808%, due 02/01/41 | | 2,211,748 | |
| 2,900,000 | | | | City of San Antonio TX, 6.308%, due 02/01/37 | | 2,921,315 | |
| 400,000 | | S | | Texas State Transportation Commission, 5.178%, due 04/01/30 | | 396,664 | |
| | | | | | | 5,529,727 | |
| | | | | Wisconsin: 0.0% | | | |
| 105,000 | | S | | Badger TOB Asset Securitization Corp., 6.125%, due 06/01/27 | | 110,772 | |
| | | | | | | 110,772 | |
| | | | | Total Municipal Bonds (Cost $33,459,359) | | 32,890,794 | |
| | | | | | | | |
OTHER BONDS: 8.0% | | | |
| | | | | Foreign Government Bonds: 8.0% | | | |
BRL | 2,000,000 | | S | | Brazil Government International Bond, 10.250%, due 01/10/28 | | 1,257,229 | |
CAD | 700,000 | | | | Canada Housing Trust No 1, 2.750%, due 12/15/15 | | 706,414 | |
CAD | 2,400,000 | | | | Canada Housing Trust No 1, 3.350%, due 12/15/20 | | 2,388,124 | |
CAD | 1,800,000 | | S | | Canadian Government International Bond, 2.000%, due 12/01/14 | | 1,797,665 | |
CAD | 2,600,000 | | | | Canadian Government International Bond, 2.500%, due 09/01/13 | | 2,657,476 | |
CAD | 300,000 | | | | Canadian Government International Bond, 3.000%, due 12/01/15 | | 309,866 | |
CAD | 900,000 | | S | | Canadian Government International Bond, 4.500%, due 06/01/15 | | 988,796 | |
$ | 600,000 | | #, S | | Export-Import Bank of China, 4.875%, due 07/21/15 | | 646,369 | |
| 900,000 | | S | | Federative Republic of Brazil, 12.500%, due 01/05/22 | | 643,825 | |
| 499,999 | | S | | Federative Republic of Brazil, 8.000%, due 01/15/18 | | 587,499 | |
JPY | 4,620,000,000 | | Z | | Japan Treasury Discount Bill, 0.090%, due 01/31/11 | | 56,899,224 | |
JPY | 160,000,000 | | Z | | Japan Treasury Discount Bill, 0.110%, due 03/14/11 | | 1,970,231 | |
$ | 400,000 | | #, S | | Korea Housing Finance Corp., 4.125%, due 12/15/15 | | 404,166 | |
| 600,000 | | S | | Mexico Government International Bond, 6.050%, due 01/11/40 | | 616,500 | |
| 5,000,000 | | S | | Mexico Government International Bond, 8.125%, due 12/30/19 | | 6,387,500 | |
| 250,000 | | S | | Panama Government International Bond, 8.875%, due 09/30/27 | | 343,750 | |
| 71,000 | | S | | Panama Government International Bond, 9.375%, due 04/01/29 | | 99,933 | |
CAD | 200,000 | | | | Province of Ontario, 4.200%, due 03/08/18 | | 211,600 | |
CAD | 1,000,000 | | | | Province of Ontario, 4.200%, due 06/02/20 | | 1,037,453 | |
CAD | 400,000 | | | | Province of Ontario, 4.300%, due 03/08/17 | | 428,422 | |
CAD | 1,000,000 | | | | Province of Ontario, 4.400%, due 06/02/19 | | 1,061,309 | |
CAD | 600,000 | | | | Province of Ontario, 4.600%, due 06/02/39 | | 628,513 | |
CAD | 7,900,000 | | | | Province of Ontario, 4.700%, due 06/02/37 | | 8,360,429 | |
CAD | 300,000 | | | | Province of Ontario, 5.500%, due 06/02/18 | | 341,474 | |
$ | 1,000,000 | | #, S | | Societe Financement de l’Economie Francaise, 0.489%, due 07/16/12 | | 1,002,770 | |
EUR | 700,000 | | S | | Societe Financement de l’Economie Francaise, 2.125%, due 05/20/12 | | 949,261 | |
$ | 200,000 | | #, S | | Societe Financement de l’Economie Francaise, 3.375%, due 05/05/14 | | 210,808 | |
| | | | | | | | |
| | | | | Total Other Bonds (Cost $90,541,669) | | 92,936,606 | |
| | | | | | | | |
Shares | | | | | | | |
| | | | | | | | |
PREFERRED STOCK: 1.4% | | | |
| | | | | Consumer Discretionary: 0.1% | | | |
| 60,000 | | @, P, S | | Motors Liquidation Co. | | $ | 495,750 | |
| | | | | | | 495,750 | |
| | | | | Financials: 1.3% | | | |
| 77,500 | | S | | American International Group, Inc. | | 681,225 | |
| 858,000 | | S | | Citigroup, Inc. | | 11,195,184 | |
| 3,400 | | S | | Wells Fargo & Co. | | 3,401,870 | |
| | | | | | | 15,278,279 | |
| | | | | Total Preferred Stock (Cost $19,231,024) | | 15,774,029 | |
| | | | | | | | |
POSITIONS IN PURCHASED OPTIONS: 0.0% | | | |
| | | | | Options on Exchange-Traded Futures Contracts: 0.0% | | | |
| 450 | | | | Put Option CME | | | |
| | | | | 90-Day Eurodollar March Futures | | | |
| | | | | Strike @ $95.625 - Exp 03/14/11 | | $ | 2,813 | |
| 23 | | | | Put Option CME | | | |
| | | | | 90-Day Eurodollar March Futures | | | |
| | | | | Strike @ $96.875 - Exp 03/14/11 | | 144 | |
| 4 | | | | Put Option CME | | | |
| | | | | 90-Day Eurodollar March Futures | | | |
| | | | | Strike @ $97.000 - Exp 03/14/11 | | 25 | |
| 30 | | | | Put Option CME | | | |
| | | | | 90-Day Eurodollar March Futures | | | |
| | | | | Strike @ $97.125 - Exp 03/14/11 | | 188 | |
| 400 | | | | Put Option CME | | | |
| | | | | 90-Day Eurodollar June Futures | | | |
| | | | | Strike @ $95.000 - Exp 06/13/11 | | 2,500 | |
| | | | | | | | |
| | | | | Total Purchased Options (Cost $7,936) | | 5,670 | |
| | | | | | | | |
| | | | | Total Long-Term Investments (Cost $1,585,467,995) | | 1,588,820,634 | |
| | | | | | | | |
Principal Amount | | | | | | | |
| | | | | | | | |
SHORT-TERM INVESTMENTS: 4.6% | | | |
| | | | | U.S. Treasury Bills: 0.1% | | | |
$ | 1,300,000 | | | | 0.030%, due 01/20/11 | | $ | 1,299,960 | |
| | | | | | | | |
| | | | | Total U.S. Treasury Bills (Cost $1,299,960) | | 1,299,960 | |
Shares | | | | | | Value | |
| | | | | Securities Lending Collateral(cc): 4.5% | | | |
| 51,628,996 | | | | BNY Mellon Overnight Government Fund (1) | | $ | 51,628,996 | |
| 221,484 | | R | | BNY Institutional Cash Reserves Fund, Series B (1)(2) | | 177,187 | |
| | | | | | | | |
| | | | | Total Securities Lending Collateral (Cost $51,850,480) | | 51,806,183 | |
| | | | | | | | |
| | | | | Total Short-Term Investments (Cost $53,150,440) | | 53,106,143 | |
| | | | | | | | |
| | | | | Total Investments in Securities (Cost $ 1,638,618,435) * | 141.3 | % | | $ | 1,641,926,777 | |
| | | | | Other Assets and Liabilities - Net | (41.3 | ) | | (479,619,430 | ) |
| | | | | Net Assets | 100.0 | % | | $ | 1,162,307,347 | |
| | | @ | | Non-income producing security |
| | | # | | Securities with purchases pursuant to Rule 144A or section 4(2), under the Securities Act of 1933 and may not be resold subject to that rule except to qualified institutional buyers. Unless otherwise noted, these securities have been determined to be liquid under the guidelines established by the Funds’ Board of Directors/Trustees. |
| | | P | | Preferred Stock may be called prior to convertible date. |
| | | (cc) | | Securities purchased with cash collateral for securities loaned. |
| | | (1) | | Collateral received from brokers for securities lending was invested in these short-term investments. |
| | | (2) | | On September 12, 2008, BNY established a separate sleeve of the Institutional Cash Reserves Fund (Series B) to hold certain Lehman Brothers defaulted debt obligations. The Portfolio’s position in Series B is being fair valued daily. Please see the accompanying Notes to Financial Statements for additional details on securities lending. |
| | | (ip) | | Treasury inflation indexed protected security whose principal value is adjusted in accordance with changes to the Consumer Price Index. |
| | | ## | | On September 7, 2008, the Federal Housing Finance Agency placed the Federal National Mortgage Association and the Federal Home Loan Mortgage Corporation into conservatorship and the U.S. Treasury guaranteed the debt issued by those organizations. |
| | | W | | Settlement is on a when-issued or delayed-delivery basis. |
| | | R | | Restricted security |
| | | L | | Loaned security, a portion or all of the security is on loan at December 31, 2010. |
| | | ± | | Defaulted security |
| | | X | | Fair value determined by ING Funds Valuation Committee appointed by the Funds’ Board of Directors/Trustees. |
| | | ^ | | Interest only securities represent the right to receive the monthly interest payments on an underlying pool of mortgage loans. Principal amount shown represents the notional amount on which current interest is calculated. Payments of principal on the pool reduce the value of the interest only security. |
| | | Z | | Indicates Zero Coupon Bond; rate shown reflects current effective yield. |
| | | S | | All or a portion of this security has been identified by the Fund to cover future collateral requirements for applicable futures, options, swaps, foreign currency contracts and/or when-issued or delayed-delivery securities. |
| | | BRL | | Brazilian Real |
| | | CAD | | Canadian Dollar |
| | | DKK | | Danish Krone |
| | | EUR | | EU Euro |
| | | JPY | | Japanese Yen |
| | PORTFOLIO OF INVESTMENTS |
ING Pioneer High Yield Portfolio | | as of December 31, 2010 |
Shares | | | | | | Value | |
| | | | | | | |
COMMON STOCK: 16.3% | | | |
| | | | Consumer Discretionary: 1.4% | | | |
8,548 | | | | International Game Technology | | $ | 151,214 | |
1,560 | | @ | | Lear Corp. | | 153,988 | |
7,460 | | @ | | Scientific Games Corp. | | 74,302 | |
34,923 | | | | Service Corp. International | | 288,115 | |
17,647 | | | | Sonic Automotive, Inc. | | 233,646 | |
10,909 | | | | Starbucks Corp. | | 350,506 | |
2,967 | | @ | | WMS Industries, Inc. | | 134,227 | |
| | | | | | 1,385,998 | |
| | | | Consumer Staples: 0.2% | | | |
43,400 | | @ | | Alliance One International, Inc. | | 184,016 | |
| | | | | | 184,016 | |
| | | | Energy: 1.0% | | | |
72,281 | | @ | | Hercules Offshore, Inc. | | 250,092 | |
6,900 | | | | Marathon Oil Corp. | | 255,507 | |
4,400 | | | | QEP Resources, Inc. | | 159,764 | |
17,091 | | @ | | SandRidge Energy, Inc. | | 125,106 | |
2,859 | | @ | | Transocean Ltd. | | 198,729 | |
| | | | | | 989,198 | |
| | | | Financials: 0.2% | | | |
1,162 | | @, R, X | | KNIA Holdings | | 9,020 | |
5,733 | | | | Legg Mason, Inc. | | 207,936 | |
1,476 | | @, R, X | | Perseus Holding Corp. | | — | |
| | | | | | 216,956 | |
| | | | Health Care: 2.9% | | | |
8,638 | | | | Aetna, Inc. | | 263,545 | |
1,400 | | @ | | Alere, Inc. | | 51,240 | |
2,303 | | | | Alere, Inc. - Preference Shares | | 573,447 | |
5,604 | | @ | | Bio-Rad Laboratories, Inc. | | 581,975 | |
5,800 | | | | Cigna Corp. | | 212,628 | |
11,045 | | @ | | Thermo Fisher Scientific, Inc. | | 611,451 | |
6,200 | | | | UnitedHealth Group, Inc. | | 223,882 | |
5,350 | | @ | | Waters Corp. | | 415,749 | |
| | | | | | 2,933,917 | |
| | | | Industrials: 3.6% | | | |
18,148 | | @ | | BE Aerospace, Inc. | | 672,020 | |
8,180 | | @ | | Cooper Industries PLC | | 476,812 | |
13,112 | | @ | | DigitalGlobe, Inc. | | 415,782 | |
8,420 | | | | ESCO Technologies, Inc. | | 318,613 | |
4,100 | | @ | | General Cable Corp. | | 143,869 | |
5,841 | | @ | | GeoEye, Inc. | | 247,600 | |
6,900 | | | | ITT Corp. | | 359,559 | |
11,600 | | | | Kennametal, Inc. | | 457,736 | |
6,400 | | | | Lennox International, Inc. | | 302,656 | |
16,300 | | @ | | Orbital Sciences Corp. | | 279,219 | |
| | | | | | 3,673,866 | |
| | | | Information Technology: 1.7% | | | |
6,500 | | @ | | Blackboard, Inc. | | 268,450 | |
5,412 | | @ | | CommScope, Inc. | | 168,963 | |
7,319 | | @ | | Itron, Inc. | | 405,839 | |
168 | | @ | | Magnachip Semiconductors S.A. | | — | |
35,300 | | @ | | PMC - Sierra, Inc. | | 303,227 | |
4,000 | | @ | | Research In Motion Ltd. | | 232,520 | |
9,664 | | | | Tyco Electronics Ltd. | | 342,106 | |
| | | | | | 1,721,105 | |
| | | | Materials: 4.0% | | | |
2,971 | | | | FMC Corp. | | 237,353 | |
8,400 | | | | Freeport-McMoRan Copper & Gold, Inc. | | 1,008,756 | |
41,050 | | @ | | Georgia Gulf Corp. | | 987,663 | |
38,063 | | @ | | LyondellBasell Industries NV | | 1,309,367 | |
91,233 | | @ | | Polymet Mining Corp. | | 218,047 | |
5,400 | | | | Texas Industries, Inc. | | 247,212 | |
| | | | | | 4,008,398 | |
| | | | Telecommunication Services: 0.4% | | | |
28,800 | | | | Windstream Corp. | | 401,472 | |
| | | | | | 401,472 | |
| | | | Utilities: 0.9% | | | |
15,964 | | | | CMS Energy Corp. | | 296,930 | |
15,800 | | @ | | NRG Energy, Inc. | | 308,732 | |
4,564 | | | | Public Service Enterprise Group, Inc. | | 145,181 | |
2,800 | | | | Sempra Energy | | 146,944 | |
| | | | | | 897,787 | |
| | | | Total Common Stock
(Cost $10,789,818) | | 16,412,713 | |
| | | |
REAL ESTATE INVESTMENT TRUSTS: 0.3% | | | |
| | | | Financials: 0.3% | | | |
15,655 | | | | Annaly Capital Management, Inc. | | 280,538 | |
| | | | | | | |
| | | | Total Real Estate Investment Trusts
(Cost $224,078) | | 280,538 | |
| | | |
PREFERRED STOCK: 3.4% | | | |
| | | | Consumer Staples: 0.1% | | | |
11,500 | | @, # | | 2009 Dole Food Automatic Common Exchange Security Trust | | 149,859 | |
| | | | | | 149,859 | |
| | | | | | | | |
| | | | Energy: 0.7% | | | |
11,500 | | | | Petroquest Energy, Inc. | | 488,750 | |
1,400 | | | | SandRidge Energy, Inc. | | 167,748 | |
| | | | | | 656,498 | |
| | | | Financials: 2.2% | | | |
130 | | | | Bank of America Corp. | | 124,406 | |
31,880 | | P | | Forest City Enterprises, Inc. | | 1,931,673 | |
775 | | @, R, X | | Perseus Holding Corp. | | — | |
5,000 | | | | Sovereign Capital Trust | | 207,500 | |
| | | | | | 2,263,579 | |
| | | | Industrials: 0.4% | | | |
2,200 | | P | | General Cable Corp. | | 387,613 | |
| | | | | | 387,613 | |
| | | | Total Preferred Stock
(Cost $2,573,555) | | 3,457,549 | |
| | | |
WARRANTS: 0.0% | | | |
| | | | Information Technology: 0.0% | | | |
840 | | | | Magnachip Semiconductors S.A. | | — | |
| | | | | | | |
| | | | Total Warrants
(Cost $13) | | — | |
| | | | | | | |
Principal Amount | | | | | | | |
| | | | | | | |
CORPORATE BONDS/NOTES: 75.9% | | | |
| | | | Consumer Discretionary: 7.7% | | | |
$ | 530,000 | | &, # | | Allison Transmission, Inc., 11.250%, due 11/01/15 | | $ | 580,350 | |
385,000 | | | | Beazer Homes USA, Inc., 9.125%, due 06/15/18 | | 375,375 | |
350,000 | | | | DR Horton, Inc., 2.000%, due 05/15/14 | | 397,250 | |
131,416 | | | | Federal Mogul Corp., 2.198%, due 12/29/14 | | 122,898 | |
67,049 | | | | Federal Mogul Corp., 2.198%, due 12/28/15 | | 62,703 | |
100,000 | | # | | Ferrellgas L.P. / Ferrellgas Finance Corp., 6.500%, due 05/01/21 | | 98,000 | |
472,000 | | | | Ford Motor Co., 4.250%, due 11/15/16 | | 945,770 | |
160,000 | | | | Goodyear Tire & Rubber Co., 10.500%, due 05/15/16 | | 183,200 | |
575,000 | | | | Interpublic Group of Cos., Inc., 10.000%, due 07/15/17 | | 675,625 | |
2,600,000 | | R, X | | Lear Corp. Escrow | | — | |
104,000 | | # | | Lennar Corp., 2.750%, due 12/15/20 | | 114,140 | |
1,010,000 | | #, ± | | Mashantucket Western Pequot Tribe, 8.500%, due 11/15/15 | | 137,613 | |
270,000 | | | | Meritage Homes Corp., 6.250%, due 03/15/15 | | 272,700 | |
310,003 | | | | Nexstar Finance Holdings, LLC, 11.375%, due 04/01/13 | | 315,040 | |
509,352 | | &, #, R, X | | Pegasus Solutions, Inc., 13.000%, due 04/15/14 | | 382,014 | |
71,000 | | | | Pinnacle Entertainment, Inc., 8.750%, due 05/15/20 | | 73,840 | |
205,000 | | | | Scientific Games International, Inc., 9.250%, due 06/15/19 | | 212,688 | |
500,000 | | # | | Sitel LLC/Sitel Finance Corp., 11.500%, due 04/01/18 | | 415,000 | |
360,000 | | | | Sonic Automotive, Inc., 5.000%, due 10/01/29 | | 449,100 | |
163,000 | | | | Sonic Automotive, Inc., 9.000%, due 03/15/18 | | 172,373 | |
117,000 | | # | | Star Gas Partners L.P. / Star Gas Finance Co., 8.875%, due 12/01/17 | | 118,170 | |
120,000 | | # | | TRW Automotive, Inc., 8.875%, due 12/01/17 | | 135,000 | |
480,157 | | &, # | | Umbrella Acquisition, Inc., 9.750%, due 03/15/15 | | 520,970 | |
980,000 | | | | Wesco Distribution, Inc., 7.500%, due 10/15/17 | | 995,925 | |
| | | | | | 7,755,744 | |
| | | | Consumer Staples: 6.6% | | | |
229,501 | | | | ACE Cash Express, Inc., 3.261%, due 10/05/13 | | 200,814 | |
430,000 | | | | Alliance One International, Inc., 5.500%, due 07/15/14 | | 486,438 | |
825,000 | | | | Alliance One International, Inc., 10.000%, due 07/15/16 | | 849,750 | |
267,975 | | | | Ardent Health Services, 6.500%, due 09/15/15 | | 268,087 | |
287,000 | | # | | C&S Group Enterprises LLC, 8.375%, due 05/01/17 | | 275,520 | |
125,000 | | & | | Catalent Pharma Solutions, Inc., 9.500%, due 04/15/15 | | 126,875 | |
— | | | | Del Monte Foods Co., 0.000%, due 12/26/11 | | — | |
250,000 | | | | Green Mountain Coffee Roasters, Inc., 5.500%, due 09/14/16 | | 250,886 | |
100,000 | | # | | NBTY, Inc., 9.000%, due 10/01/18 | | 107,250 | |
650,000 | | | | NCO Group, Inc., 5.161%, due 11/15/13 | | 562,250 | |
294,841 | | | | NCO Group, Inc., 7.500%, due 05/15/13 | | 290,787 | |
500,000 | | | | Pierre Foods, Inc., 7.000%, due 07/29/16 | | 498,542 | |
253,000 | | | | Revlon Consumer Products Corp., 9.750%, due 11/15/15 | | 268,813 | |
247,222 | | | | SHG Services, Inc., 8.000%, due 09/23/16 | | 246,759 | |
530,000 | | | | Ticketmaster Entertainment, Inc., 10.750%, due 08/01/16 | | 576,375 | |
736,842 | | | | Web Service Co. LLC, 7.000%, due 08/04/14 | | 735,921 | |
830,000 | | | | Yankee Acquisition Corp., 9.750%, due 02/15/17 | | 869,425 | |
| | | | | | 6,614,492 | |
| | | | Energy: 11.2% | | | |
217,000 | | # | | American Petroleum Tankers LLC/AP Tankers Co., 10.250%, due 05/01/15 | | 225,680 | |
221,098 | | | | Aquilex Holdings LLC, 5.500%, due 03/11/16 | | 220,729 | |
402,000 | | | | Bill Barrett Corp., 5.000%, due 03/15/28 | | 415,065 | |
150,000 | | # | | Calfrac Holdings L.P., 7.500%, due 12/01/20 | | 152,250 | |
89,000 | | # | | Carrizo Oil & Gas, Inc., 8.625%, due 10/15/18 | | 92,115 | |
300,000 | | | | Chesapeake Energy Corp., 2.250%, due 12/15/38 | | 235,125 | |
620,000 | | | | Chesapeake Energy Corp., 2.500%, due 05/15/37 | | 556,450 | |
170,000 | | # | | Coffeyville Resources LLC / Coffeyville Finance, Inc., 9.000%, due 04/01/15 | | 182,750 | |
390,000 | | | | Concho Resources, Inc., 7.000%, due 01/15/21 | | 400,725 | |
520,000 | | | | Denbury Resources, Inc., 9.750%, due 03/01/16 | | 582,400 | |
200,000 | | | | Enterprise Products Operating L.P., 7.000%, due 06/01/67 | | 197,934 | |
110,000 | | | | Enterprise Products Operating L.P., 8.375%, due 08/01/66 | | 118,244 | |
500,000 | | # | | Expro Finance Luxembourg SCA, 8.500%, due 12/15/16 | | 480,000 | |
400,000 | | | | Exterran Holdings, Inc., 4.250%, due 06/15/14 | | 499,000 | |
700,000 | | # | | Foresight Energy LLC / Foresight Energy Corp., 9.625%, due 08/15/17 | | 749,000 | |
450,000 | | # | | Hilcorp Energy I LP, 7.750%, due 11/01/15 | | 466,875 | |
500,000 | | | | Holly Energy Partners LP, 6.250%, due 03/01/15 | | 497,500 | |
100,000 | | | | International Coal Group, Inc., 9.125%, due 04/01/18 | | 108,500 | |
300,000 | | | | Linn Energy LLC/Linn Energy Finance Corp., 11.750%, due 05/15/17 | | 345,000 | |
730,000 | | | | Massey Energy Co., 3.250%, due 08/01/15 | | 716,313 | |
71,000 | | | | Newpark Resources, Inc., 4.000%, due 10/01/17 | | 64,166 | |
| | | | | | | | | |
135,000 | | | | Parker Drilling Co., 9.125%, due 04/01/18 | | 141,750 | |
75,000 | | | | Pioneer Drilling Co., 9.875%, due 03/15/18 | | 79,688 | |
250,000 | | # | | Precision Drilling Corp., 6.625%, due 11/15/20 | | 255,000 | |
785,000 | | | | Quicksilver Resources, Inc., 7.125%, due 04/01/16 | | 755,563 | |
525,000 | | & | | SandRidge Energy, Inc., 8.625%, due 04/01/15 | | 540,094 | |
1,835,000 | | | | Tesoro Corp., 6.500%, due 06/01/17 | | 1,848,763 | |
250,000 | | | | Tesoro Corp., 9.750%, due 06/01/19 | | 278,125 | |
125,000 | | | | Whiting Petroleum Corp., 6.500%, due 10/01/18 | | 126,875 | |
| | | | | | 11,331,679 | |
| | | | Financials: 8.9% | | | |
378,000 | | # | | ABI Escrow Corp., 10.250%, due 10/15/18 | | 415,800 | |
709 | | | | AES Red Oak, LLC, 8.540%, due 11/30/19 | | 709 | |
545,000 | | # | | Alliant Holdings I, Inc., 11.000%, due 05/01/15 | | 570,888 | |
143,460 | | | | Alliant Insurance Services, 3.303%, due 08/21/14 | | 140,591 | |
304,509 | | | | Amwins Group, Inc., 2.810%, due 06/11/13 | | 287,000 | |
140,000 | | | | BAC Capital Trust VI, 5.625%, due 03/08/35 | | 118,906 | |
460,000 | | #, ± | | Buffalo Thunder Development Authority, 9.375%, due 12/15/14 | | 134,550 | |
300,000 | | # | | CEVA Group PLC, 11.500%, due 04/01/18 | | 325,500 | |
145,000 | | # | | CEVA Group PLC, 11.625%, due 10/01/16 | | 159,863 | |
2,225,000 | | | | Forest City Enterprises, Inc., 6.500%, due 02/01/17 | | 1,935,730 | |
40,000 | | | | Forest City Enterprises, Inc., 7.625%, due 06/01/15 | | 37,450 | |
219,000 | | # | | Hexion US Finance Corp. / Hexion Nova Scotia Finance ULC, 9.000%, due 11/15/20 | | 232,140 | |
100,000 | | # | | Holly Energy Partners L.P./Holly Energy Finance Corp., 8.250%, due 03/15/18 | | 105,000 | |
150,000 | | # | | Host Hotels & Resorts L.P., 2.500%, due 10/15/29 | | 212,063 | |
217,250 | | | | HUB International Holdings, Inc., 6.750%, due 06/13/14 | | 217,630 | |
360,000 | | # | | HUB International Holdings, Inc., 10.250%, due 06/15/15 | | 362,700 | |
17,000 | | | | iStar Financial, Inc., 10.000%, due 06/15/14 | | 17,043 | |
190,000 | | | | Janus Capital Group, Inc., 6.950%, due 06/15/17 | | 198,203 | |
273,000 | | # | | Lexington Realty Trust, 6.000%, due 01/15/30 | | 334,425 | |
1,000,000 | | # | | Liberty Mutual Group, Inc., 7.000%, due 03/15/37 | | 899,345 | |
540,000 | | # | | Offshore Group Investments Ltd., 11.500%, due 08/01/15 | | 588,600 | |
200,000 | | # | | Pinafore LLC/Pinafore, Inc., 9.000%, due 10/01/18 | | 217,000 | |
335,000 | | # | | Reynolds Group Issuer, Inc. / Reynolds Group Issuer LLC / Reynolds Group Issuer Lu, 8.500%, due 05/15/18 | | 338,350 | |
150,000 | | # | | Sabra Health Care L.P. / Sabra Capital Corp., 8.125%, due 11/01/18 | | 155,625 | |
440,000 | | # | | Tower Automotive Holdings USA LLC / TA Holdings Finance, Inc., 10.625%, due 09/01/17 | | 475,200 | |
525,000 | | # | | USB Realty Corp., 6.091%, due 12/22/49 | | 398,344 | |
110,000 | | # | | USI Holdings Corp., 4.161%, due 11/15/14 | | 96,800 | |
| | | | | | 8,975,455 | |
| | | | Health Care: 7.4% | | | |
710,000 | | | | Alere, Inc., 3.000%, due 05/15/16 | | 755,263 | |
189,000 | | | | Alere, Inc., 9.000%, due 05/15/16 | | 195,615 | |
275,000 | | | | BioMarin Pharmaceuticals, Inc., 1.875%, due 04/23/17 | | 396,344 | |
253,000 | | | | BioScrip, Inc., 10.250%, due 10/01/15 | | 261,855 | |
200,000 | | # | | ConvaTec Healthcare SA, 10.500%, due 12/15/18 | | 203,750 | |
250,000 | | | | Cubist Pharmaceuticals, Inc., 2.250%, due 06/15/13 | | 253,438 | |
132,000 | | | | Cubist Pharmaceuticals, Inc., 2.500%, due 11/01/17 | | 128,865 | |
397,500 | | | | Gentiva Health Services, Inc., 6.750%, due 05/23/16 | | 401,972 | |
228,000 | | | | Gentiva Health Services, Inc., 11.500%, due 09/01/18 | | 249,660 | |
175,000 | | # | | HCA Holdings, Inc., 7.750%, due 05/15/21 | | 175,438 | |
454,000 | | & | | HCA, Inc., 9.625%, due 11/15/16 | | 487,483 | |
425,000 | | + | | Hologic, Inc., 2.000% (step rate 0.000%), due 12/15/37 | | 446,250 | |
332,000 | | # | | Lantheus Medical Imaging, Inc., 9.750%, due 05/15/17 | | 348,600 | |
690,000 | | | | MannKind Corp., 3.750%, due 12/15/13 | | 451,950 | |
287,000 | | | | Omnicare, Inc., 3.250%, due 12/15/35 | | 264,758 | |
85,667 | | | | RehabCare Group, Inc., 6.000%, due 11/01/15 | | 86,266 | |
878,852 | | &, # | | Surgical Care Affiliates, Inc., 8.875%, due 07/15/15 | | 892,035 | |
846,000 | | | | Vertex Pharmaceuticals, Inc., 3.350%, due 10/01/15 | | 859,748 | |
148,295 | | | | Warner Chilcott PLC, 6.000%, due 10/30/14 | | 148,805 | |
251,284 | | | | Warner Chilcott PLC, 6.250%, due 04/30/15 | | 253,252 | |
202,941 | | | | Warner Chilcott PLC, 6.500%, due 01/30/16 | | 204,576 | |
| | | | | | 7,465,923 | |
| | | | Industrials: 12.7% | | | |
390,000 | | | | American Airlines Pass-Through Trust, 8.608%, due 04/01/11 | | 393,900 | |
195,000 | | | | American Railcar Industries, Inc., 7.500%, due 03/01/14 | | 199,388 | |
100,000 | | # | | AMGH Merger Sub, Inc., 9.250%, due 11/01/18 | | 105,500 | |
475,000 | | | | Baldor Electric Co., 8.625%, due 02/15/17 | | 534,375 | |
603,033 | | & | | Blaze Recycling & Metals LLC / Blaze Finance Corp., 13.000%, due 07/16/12 | | 514,086 | |
225,000 | | | | Coleman Cable, Inc., 9.000%, due 02/15/18 | | 234,000 | |
85,000 | | | | Continental Airlines, Inc., 4.500%, due 01/15/15 | | 124,844 | |
35,238 | | | | Continental Airlines, Inc., 7.461%, due 04/01/13 | | 35,502 | |
249,051 | | | | DAE Aviation Holdings, 4.040%, due 07/31/14 | | 246,561 | |
477,000 | | # | | DynCorp International, Inc., 10.375%, due 07/01/17 | | 491,310 | |
509,000 | | + | | General Cable Corp., 4.500% (step rate 2.250%), due 11/15/29 | | 607,619 | |
445,000 | | | | GeoEye, Inc., 9.625%, due 10/01/15 | | 505,075 | |
285,000 | | | | Greenbrier Cos., Inc., 2.375%, due 05/15/26 | | 266,119 | |
535,000 | | | | Greenbrier Cos., Inc., 8.375%, due 05/15/15 | | 544,363 | |
623,000 | | | | Horizon Lines, Inc., 4.250%, due 08/15/12 | | 577,054 | |
263,077 | | | | Hudson Product Corp., 8.500%, due 08/24/15 | | 254,856 | |
246,649 | | | | Hunter Defense Technologies, 3.310%, due 08/01/14 | | 235,550 | |
100,000 | | # | | Interline Brands, Inc., 7.000%, due 11/15/18 | | 102,000 | |
190,000 | | # | | Liberty Tire Recycling, 11.000%, due 10/01/16 | | 204,725 | |
665,000 | | | | Mastec, Inc., 4.000%, due 06/15/14 | | 804,650 | |
675,000 | | | | Mueller Water Products, 7.375%, due 06/01/17 | | 654,750 | |
620,000 | | | | Navistar International Corp., 3.000%, due 10/15/14 | | 830,800 | |
355,000 | | # | | New Enterprise Stone & Lime Co., 11.000%, due 09/01/18 | | 339,025 | |
69,831 | | | | Niagara Corp., 10.500%, due 06/29/14 | | 60,753 | |
— | | | | Polymer Group, Inc., 0.000%, due 10/04/11 | | — | |
75,000 | | # | | Polypore International, Inc., 7.500%, due 11/15/17 | | 76,875 | |
1,165,000 | | Z | | Roper Industries, Inc., 0.180%, due 01/15/34 | | 1,116,944 | |
80,000 | | | | SunPower Corp., 1.250%, due 02/15/27 | | 75,800 | |
205,000 | | # | | SunPower Corp., 4.500%, due 03/15/15 | | 184,890 | |
53,000 | | # | | USG Corp., 8.375%, due 10/15/18 | | 52,205 | |
1,166,000 | | | | Wesco International, Inc., 6.000%, due 09/15/29 | | 2,410,705 | |
| | | | | | 12,784,224 | |
| | | | Information Technology: 5.9% | | | |
198,217 | | | | Aeroflex, Inc., 4.313%, due 08/15/14 | | 196,854 | |
316,000 | | # | | Allen Systems Group, Inc., 10.500%, due 11/15/16 | | 319,950 | |
1,000,000 | | | | Anixter International, Inc., 5.950%, due 03/01/15 | | 1,006,250 | |
250,000 | | | | Ciena Corp., 0.875%, due 06/15/17 | | 206,250 | |
— | | | | Commscope, Inc., 0.000%, due 10/26/11 | | — | |
232,709 | | | | Dealer Computer Services, Inc., 5.250%, due 04/01/17 | | 234,636 | |
89,000 | | # | | First Data Corp., 8.250%, due 01/15/21 | | 85,885 | |
21,000 | | | | First Data Corp., 9.875%, due 09/24/15 | | 20,108 | |
89,000 | | # | | First Data Corp., 12.625%, due 01/15/21 | | 85,440 | |
149,250 | | | | Interactive Data Corp., 6.750%, due 11/03/16 | | 151,581 | |
140,000 | | | | L-1 Identity Solutions, Inc., 3.750%, due 05/15/27 | | 140,350 | |
305,000 | | | | National Money Mart Co., 10.375%, due 12/15/16 | | 330,925 | |
750,000 | | # | | Newport Corp., 2.500%, due 02/15/12 | | 774,375 | |
250,000 | | | | Nuance Communications, Inc., 2.750%, due 08/15/27 | | 294,688 | |
556,000 | | | | ON Semiconductor Corp., 2.625%, due 12/15/26 | | 653,995 | |
324,188 | | | | SAVVIS, Inc., 6.750%, due 07/09/16 | | 329,608 | |
310,000 | | # | | Seagate HDD Cayman, 7.750%, due 12/15/18 | | 315,425 | |
254,000 | | # | | SunGard Data Systems, Inc., 7.375%, due 11/15/18 | | 256,540 | |
324,000 | | | | Sunpower Corp. - Class A, 4.750%, due 04/15/14 | | 300,105 | |
185,000 | | | | Terremark Worldwide, Inc., 12.000%, due 06/15/17 | | 212,750 | |
| | | | | | 5,915,715 | |
| | | | Materials: 7.0% | | | |
550,000 | | # | | Algoma Acquisition Corp., 9.875%, due 06/15/15 | | 497,750 | |
640,000 | | | | Crown Cork & Seal Co., Inc., 7.375%, due 12/15/26 | | 638,400 | |
350,000 | | | | Exopack Holding Corp., 11.250%, due 02/01/14 | | 364,875 | |
299,250 | | | | Goodman Global, Inc., 5.750%, due 10/06/16 | | 301,281 | |
400,000 | | | | Graham Packaging Co. L.P. / GPC Capital Corp. I, 8.250%, due 01/01/17 | | 418,000 | |
225,000 | | | | Graham Packaging Co., Inc., 9.875%, due 10/15/14 | | 234,000 | |
100,000 | | | | Graphic Packaging International Corp., 7.875%, due 10/01/18 | | 105,250 | |
261,000 | | | | Graphic Packaging International Corp., 9.500%, due 08/15/13 | | 267,525 | |
475,000 | | | | Hexion US Finance Corp. / Hexion Nova Scotia Finance ULC, 8.875%, due 02/01/18 | | 510,031 | |
215,000 | | # | | Ineos Finance PLC, 9.000%, due 05/15/15 | | 229,781 | |
235,000 | | # | | Ineos Group Holdings PLC, 8.500%, due 02/15/16 | | 225,013 | |
264,000 | | # | | Momentive Performance Materials, Inc., 9.000%, due 01/15/21 | | 279,180 | |
390,202 | | & | | Noranda Aluminium Acquisition Corp., 5.193%, due 05/15/15 | | 354,596 | |
1,400,000 | | | | Nova Chemicals Corp., 7.875%, due 09/15/25 | | 1,342,250 | |
675,000 | | # | | Novelis, Inc., 8.750%, due 12/15/20 | | 703,688 | |
180,000 | | | | Steel Dynamics, Inc., 5.125%, due 06/15/14 | | 229,050 | |
370,000 | | # | | Texas Industries, Inc., 9.250%, due 08/15/20 | | 394,975 | |
| | | | | | 7,095,645 | |
| | | | Telecommunication Services: 7.1% | | | |
242,956 | | | | BCE, Inc., 3.270%, due 10/31/14 | | 242,349 | |
200,000 | | | | CCO Holdings LLC / CCO Holdings Capital Corp., 7.250%, due 10/30/17 | | 204,000 | |
248,077 | | | | Cengage Learning Acquisitions, Inc., 2.550%, due 07/04/14 | | 233,968 | |
450,000 | | | | Cincinnati Bell, Inc., 8.250%, due 10/15/17 | | 447,750 | |
230,000 | | | | Cincinnati Bell, Inc., 8.375%, due 10/15/20 | | 221,375 | |
240,000 | | | | Cincinnati Bell, Inc., 8.750%, due 03/15/18 | | 226,200 | |
850,000 | | # | | Cricket Communications, Inc., 7.750%, due 10/15/20 | | 811,750 | |
95,000 | | | | Frontier Communications Corp., 8.250%, due 04/15/17 | | 104,738 | |
245,000 | | | | Frontier Communications Corp., 8.500%, due 04/15/20 | | 268,888 | |
435,000 | | | | Frontier Communications Corp., 8.750%, due 04/15/22 | | 476,325 | |
190,000 | | | | GCI, Inc., 8.625%, due 11/15/19 | | 206,625 | |
262,000 | | | | Global Crossing Ltd., 12.000%, due 09/15/15 | | 296,715 | |
285,000 | | | | Hughes Network Systems LLC/HNS Finance Corp., 9.500%, due 04/15/14 | | 295,331 | |
150,000 | | | | Intelsat Corp., 3.254%, due 02/01/14 | | 142,922 | |
500,000 | | | | Intelsat Corp., 9.250%, due 06/15/16 | | 542,500 | |
332,031 | | & | | Intelsat Luxembourg S.A., 11.500%, due 02/04/17 | | 368,554 | |
225,000 | | | | MetroPCS Wireless, Inc., 6.625%, due 11/15/20 | | 214,875 | |
1,445,000 | | R, X | | Millicom International Cellular S.A. Escrow | | — | |
700,000 | | | | PAETEC Holding Corp., 8.875%, due 06/30/17 | | 750,750 | |
100,000 | | # | | PAETEC Holding Corp., 9.875%, due 12/01/18 | | 103,250 | |
20,870 | | | | Telesat Canada / Telesat LLC, 3.270%, due 10/31/14 | | 20,818 | |
270,000 | | | | Telesat Canada / Telesat LLC, 11.000%, due 11/01/15 | | 304,425 | |
246,887 | | | | Wide Open West, 8.750%, due 06/18/14 | | 242,258 | |
200,000 | | | | Windstream Corp., 7.750%, due 10/15/20 | | 207,000 | |
210,000 | | | | Windstream Corp., 7.875%, due 11/01/17 | | 221,813 | |
| | | | | | 7,155,179 | |
| | | | Utilities: 1.4% | | | |
320,000 | | | | CMS Energy Corp., 5.500%, due 06/15/29 | | 450,400 | |
430,000 | | # | | Intergen NV, 9.000%, due 06/30/17 | | 457,950 | |
130,000 | | | | PNM Resources, Inc., 9.250%, due 05/15/15 | | 144,300 | |
375,000 | | # | | Texas Competitive Electric Holdings Co., LLC, 15.000%, due 04/01/21 | | 330,000 | |
| | | | | | 1,382,650 | |
| | | | Total Corporate Bonds/Notes
(Cost $68,240,474) | | 76,476,706 | |
| | | |
ASSET-BACKED SECURITIES: 0.2% | | | |
| | | | Other Asset-Backed Securities: 0.2% | | | |
120,000 | | | | Bear Stearns Asset-Backed Securities, Inc., 0.711%, due 01/25/47 | | 54,523 | |
150,000 | | # | | Dominos Pizza Master Issuer LLC, 5.261%, due 04/25/37 | | 154,116 | |
| | | | | | | |
| | | | Total Asset-Backed Securities
(Cost $207,871) | | 208,639 | |
| | | |
COLLATERALIZED MORTGAGE OBLIGATIONS: 1.0% | | | |
1,000,000 | | # | | Timberstar Trust, 7.530%, due 10/15/36 | | 998,445 | |
| | | | | | | |
| | | | Total Collateralized Mortgage Obligations
(Cost $1,008,588) | | 998,445 | |
| | | | | | | |
| | | | Total Long-Term Investments
(Cost $83,044,397) | | 97,834,590 | |
SHORT-TERM INVESTMENTS: 1.7% | | | |
| | | | Mutual Funds: 1.7% | | | |
1,747,848 | | | | Blackrock Liquidity Funds TempFund Portfolio - Class I | | 1,747,848 | |
| | | | | | | |
| | | | Total Mutual Funds
(Cost $1,747,848) | | 1,747,848 | |
| | | | | | | |
| | | | Total Short-Term Investments
(Cost $1,747,848) | | 1,747,848 | |
| | | | | | | |
| | | | Total Investments in Securities
(Cost $84,792,245) * | 98.8 | % | | $ | 99,582,438 | |
| | | | Other Assets and Liabilities - Net | 1.2 | | | 1,237,955 | |
| | | | Net Assets | 100.0 | % | | $ | 100,820,393 | |
| | @ | | Non-income producing security |
| | & | | Payment-in-kind |
| | + | | Step-up basis bonds. Interest rates shown reflect current and next coupon rates. |
| | # | | Securities with purchases pursuant to Rule 144A or section 4(2), under the Securities Act of 1933 and may not be resold subject to that rule except to qualified institutional buyers. Unless otherwise noted, these securities have been determined to be liquid under the guidelines established by the Funds’ Board of Directors/Trustees. |
| | P | | Preferred Stock may be called prior to convertible date. |
| | ± | | Defaulted security |
| | X | | Fair value determined by ING Funds Valuation Committee appointed by the Funds’ Board of Directors/Trustees. |
| | Z | | Indicates Zero Coupon Bond; rate shown reflects current effective yield. |
| | PORTFOLIO OF INVESTMENTS |
ING Solution 2015 Portfolio | | as of December 31, 2010 |
Shares | | | | | | Value | |
| | | |
AFFILIATED INVESTMENT COMPANIES: 100.0% | | | |
| | | | Affiliated Investment Companies: 100.0% | | | |
2,758,560 | | @ | | ING Artio Foreign Portfolio - Class I | | $ | 32,219,980 | |
3,884,796 | | | | ING BlackRock Inflation Protected Bond Portfolio - Class I | | 40,401,879 | |
1,237,289 | | | | ING Clarion Global Real Estate Portfolio - Class I | | 12,063,569 | |
548,328 | | | | ING Clarion Real Estate Portfolio - Class I | | 12,046,765 | |
1,562,086 | | | | ING Davis New York Venture Portfolio - Class I | | 28,101,935 | |
3,959,441 | | | | ING Floating Rate Fund - Class I | | 40,386,300 | |
3,441,726 | | | | ING Global Bond Fund - Class I | | 40,440,275 | |
3,159,079 | | | | ING Goldman Sachs Commodity Strategy Portfolio - Class I | | 24,388,088 | |
3,140,497 | | | | ING Growth and Income Portfolio - Class I | | 68,902,505 | |
4,900,823 | | | | ING Intermediate Bond Portfolio - Class I | | 59,152,928 | |
1,207,074 | | | | ING Large Cap Growth Portfolio - Class I | | 16,017,878 | |
2,727,450 | | | | ING Limited Maturity Bond Portfolio - Class I | | 28,147,279 | |
928,261 | | | | ING Marsico Growth Portfolio - Class I | | 16,049,638 | |
686,664 | | | | ING Marsico International Opportunities Portfolio - Class I | | 8,033,971 | |
858,234 | | | | ING MidCap Opportunities Portfolio - Class I | | 10,032,750 | |
7,133,929 | | | | ING PIMCO High Yield Portfolio - Class I | | 72,908,750 | |
10,571,789 | | | | ING PIMCO Total Return Bond Portfolio - Class I | | 129,081,549 | |
920,985 | | | | ING Pioneer Mid Cap Value Portfolio - Class I | | 10,112,410 | |
868,909 | | | | ING Small Company Portfolio - Class I | | 15,935,788 | |
1,798,120 | | | | ING T Rowe Price Capital Appreciation Portfolio - Class I | | 40,727,424 | |
4,161,131 | | | | ING T. Rowe Price Equity Income Portfolio - Class I | | 48,976,517 | |
367,278 | | | | ING T. Rowe Price Growth Equity Portfolio - Class I | | 20,012,997 | |
1,819,330 | | | | ING Templeton Foreign Equity Portfolio - Class I | | 20,103,601 | |
501,904 | | | | ING Thornburg Value Portfolio - Class I | | 16,050,906 | |
| | | | | | | |
| | | | Total Investments in Affiliated Investment Companies
(Cost $717,312,915) * | 100.0 | % | | $ | 810,295,682 | |
| | | | Other Assets and Liabilities - Net | (0.0 | ) | | (301,371 | ) |
| | | | Net Assets | 100.0 | % | | $ | 809,994,311 | |
| | @ | | Non-income producing security | | | |
| | PORTFOLIO OF INVESTMENTS |
ING Solution 2025 Portfolio | | as of December 31, 2010 |
Shares | | | | | | Value | |
| | | | | | | |
AFFILIATED INVESTMENT COMPANIES: 100.0% | | | |
| | | | Affiliated Investment Companies: 100.0% | | | |
8,019,044 | | @ | | ING Artio Foreign Portfolio - Class I | | $ | 93,662,437 | |
4,475,981 | | | | ING Clarion Global Real Estate Portfolio - Class I | | 43,640,818 | |
283,341 | | | | ING Clarion Real Estate Portfolio - Class I | | 6,224,999 | |
2,421,843 | | | | ING Davis New York Venture Portfolio - Class I | | 43,568,960 | |
3,020,310 | | | | ING Equity Dividend Fund - Class I | | 31,048,786 | |
4,909,898 | | | | ING Floating Rate Fund - Class I | | 50,080,963 | |
5,335,302 | | | | ING Global Bond Fund - Class I | | 62,689,798 | |
4,898,422 | | | | ING Goldman Sachs Commodity Strategy Portfolio - Class I | | 37,815,818 | |
4,867,262 | | | | ING Growth and Income Portfolio - Class I | | 106,787,725 | |
1,644,679 | | | | ING JPMorgan Emerging Markets Equity Portfolio - Class I | | 37,696,040 | |
3,742,958 | | | | ING Large Cap Growth Portfolio - Class I | | 49,669,054 | |
3,237,997 | | | | ING Marsico Growth Portfolio - Class I | | 55,984,969 | |
3,191,921 | | | | ING Marsico International Opportunities Portfolio - Class I | | 37,345,471 | |
3,193,042 | | | | ING MidCap Opportunities Portfolio - Class I | | 37,326,656 | |
9,828,721 | | | | ING PIMCO High Yield Portfolio - Class I | | 100,449,532 | |
4,097,469 | | | | ING PIMCO Total Return Bond Portfolio - Class I | | 50,030,101 | |
3,426,033 | | | | ING Pioneer Mid Cap Value Portfolio - Class I | | 37,617,842 | |
4,041,319 | | | | ING Small Company Portfolio - Class I | | 74,117,785 | |
2,786,458 | | | | ING T Rowe Price Capital Appreciation Portfolio - Class I | | 63,113,274 | |
8,060,056 | | | | ING T. Rowe Price Equity Income Portfolio - Class I | | 94,866,857 | |
1,024,974 | | | | ING T. Rowe Price Growth Equity Portfolio - Class I | | 55,850,831 | |
5,081,412 | | | | ING Templeton Foreign Equity Portfolio - Class I | | 56,149,603 | |
778,166 | | | | ING Thornburg Value Portfolio - Class I | | 24,885,745 | |
| | | | | | | |
| | | | Total Investments in Affiliated Investment Companies
(Cost $1,070,463,009) * | 100.0 | % | | $ | 1,250,624,064 | |
| | | | Other Assets and Liabilities - Net | (0.0 | ) | | (465,287 | ) |
| | | | Net Assets | 100.0 | % | | $ | 1,250,158,777 | |
| | @ | | Non-income producing security | | | |
| | PORTFOLIO OF INVESTMENTS |
ING Solution 2035 Portfolio | | as of December 31, 2010 |
Shares | | | | | | Value | |
| | | | | | | |
AFFILIATED INVESTMENT COMPANIES: 100.0% | | | |
| | | | Affiliated Investment Companies: 100.0% | | | |
6,863,940 | | @ | | ING Artio Foreign Portfolio - Class I | | $ | 80,170,820 | |
1,093,490 | | @ | | ING Baron Small Cap Growth Portfolio - Class I | | 21,180,908 | |
3,831,276 | | | | ING Clarion Global Real Estate Portfolio - Class I | | 37,354,937 | |
727,576 | | | | ING Clarion Real Estate Portfolio - Class I | | 15,984,840 | |
2,026,808 | | | | ING Columbia Small Cap Value Portfolio - Class I | | 21,159,879 | |
1,776,887 | | | | ING Davis New York Venture Portfolio - Class I | | 31,966,206 | |
3,619,461 | | | | ING Equity Dividend Fund - Class I | | 37,208,055 | |
3,151,810 | | | | ING Floating Rate Fund - Class I | | 32,148,465 | |
2,283,158 | | | | ING Global Bond Fund - Class I | | 26,827,105 | |
4,192,727 | | | | ING Goldman Sachs Commodity Strategy Portfolio - Class I | | 32,367,854 | |
3,430,674 | | | | ING Growth and Income Portfolio - Class I | | 75,268,987 | |
2,346,116 | | | | ING JPMorgan Emerging Markets Equity Portfolio - Class I | | 53,772,984 | |
4,004,900 | | | | ING Large Cap Growth Portfolio - Class I | | 53,145,023 | |
3,079,576 | | | | ING Marsico Growth Portfolio - Class I | | 53,245,871 | |
3,643,452 | | | | ING Marsico International Opportunities Portfolio - Class I | | 42,628,385 | |
3,188,606 | | | | ING MidCap Opportunities Portfolio - Class I | | 37,274,809 | |
6,309,149 | | | | ING PIMCO High Yield Portfolio - Class I | | 64,479,506 | |
876,799 | | | | ING PIMCO Total Return Bond Portfolio - Class I | | 10,705,721 | |
3,421,031 | | | | ING Pioneer Mid Cap Value Portfolio - Class I | | 37,562,918 | |
1,729,692 | | | | ING Small Company Portfolio - Class I | | 31,722,544 | |
953,892 | | | | ING T Rowe Price Capital Appreciation Portfolio - Class I | | 21,605,643 | |
9,197,126 | | | | ING T. Rowe Price Equity Income Portfolio - Class I | | 108,250,175 | |
974,851 | | | | ING T. Rowe Price Growth Equity Portfolio - Class I | | 53,119,607 | |
6,281,057 | | | | ING Templeton Foreign Equity Portfolio - Class I | | 69,405,675 | |
666,099 | | | | ING Thornburg Value Portfolio - Class I | | 21,301,849 | |
| | | | | | | |
| | | | Total Investments in Affiliated Investment Companies
(Cost $914,828,541) * | 100.0 | % | | $ | 1,069,858,766 | |
| | | | Other Assets and Liabilities - Net | (0.0 | ) | | (398,752 | ) |
| | | | Net Assets | 100.0 | % | | $ | 1,069,460,014 | |
| | @ | | Non-income producing security | | | |
| | PORTFOLIO OF INVESTMENTS |
ING Solution 2045 Portfolio | | as of December 31, 2010 |
Shares | | | | | | Value | |
| | | | | | | |
AFFILIATED INVESTMENT COMPANIES: 100.0% | | | |
| | | | Affiliated Investment Companies: 100.0% | | | |
5,290,564 | | @ | | ING Artio Foreign Portfolio - Class I | | $ | 61,793,789 | |
702,370 | | @ | | ING Baron Small Cap Growth Portfolio - Class I | | 13,604,911 | |
3,515,559 | | | | ING Clarion Global Real Estate Portfolio - Class I | | 34,276,697 | |
1,301,865 | | | | ING Columbia Small Cap Value Portfolio - Class I | | 13,591,475 | |
951,109 | | | | ING Davis New York Venture Portfolio - Class I | | 17,110,444 | |
2,324,856 | | | | ING Equity Dividend Fund - Class I | | 23,899,515 | |
2,053,145 | | | | ING Global Bond Fund - Class I | | 24,124,456 | |
2,693,055 | | | | ING Goldman Sachs Commodity Strategy Portfolio - Class I | | 20,790,384 | |
1,888,620 | | | | ING Growth and Income Portfolio - Class I | | 41,436,332 | |
2,109,629 | | | | ING JPMorgan Emerging Markets Equity Portfolio - Class I | | 48,352,702 | |
2,572,441 | | | | ING Large Cap Growth Portfolio - Class I | | 34,136,292 | |
1,978,058 | | | | ING Marsico Growth Portfolio - Class I | | 34,200,624 | |
2,925,572 | | | | ING Marsico International Opportunities Portfolio - Class I | | 34,229,189 | |
2,633,210 | | | | ING MidCap Opportunities Portfolio - Class I | | 30,782,226 | |
2,825,008 | | | | ING Pioneer Mid Cap Value Portfolio - Class I | | 31,018,591 | |
1,851,710 | | | | ING Small Company Portfolio - Class I | | 33,960,360 | |
1,072,077 | | | | ING T Rowe Price Capital Appreciation Portfolio - Class I | | 24,282,551 | |
5,906,608 | | | | ING T. Rowe Price Equity Income Portfolio - Class I | | 69,520,782 | |
688,787 | | | | ING T. Rowe Price Growth Equity Portfolio - Class I | | 37,531,988 | |
4,344,598 | | | | ING Templeton Foreign Equity Portfolio - Class I | | 48,007,811 | |
320,888 | | | | ING Thornburg Value Portfolio - Class I | | 10,262,012 | |
| | | | | | | |
| | | | Total Investments in Affiliated Investment Companies
(Cost $573,514,538) * | 100.0 | % | | $ | 686,913,131 | |
| | | | Other Assets and Liabilities - Net | (0.0 | ) | | (251,797 | ) |
| | | | Net Assets | 100.0 | % | | $ | 686,661,334 | |
| | @ | | Non-income producing security | | | |
| | PORTFOLIO OF INVESTMENTS |
ING Solution 2055 Portfolio | | as of December 31, 2010 |
Shares | | | | | | Value | |
| | | | | | | |
AFFILIATED INVESTMENT COMPANIES: 100.0% | | | |
| | | | Affiliated Investment Companies: 100.0% | | | |
81,425 | | @ | | ING Artio Foreign Portfolio - Class I | | $ | 951,039 | |
10,810 | | @ | | ING Baron Small Cap Growth Portfolio - Class I | | 209,399 | |
54,107 | | | | ING Clarion Global Real Estate Portfolio - Class I | | 527,543 | |
20,038 | | | | ING Columbia Small Cap Value Portfolio - Class I | | 209,196 | |
14,638 | | | | ING Davis New York Venture Portfolio - Class I | | 263,346 | |
35,782 | | | | ING Equity Dividend Fund - Class I | | 367,841 | |
31,600 | | | | ING Global Bond Fund - Class I | | 371,301 | |
41,447 | | | | ING Goldman Sachs Commodity Strategy Portfolio - Class I | | 319,969 | |
29,064 | | | | ING Growth and Income Portfolio - Class I | | 637,667 | |
32,467 | | | | ING JPMorgan Emerging Markets Equity Portfolio - Class I | | 744,142 | |
39,593 | | | | ING Large Cap Growth Portfolio - Class I | | 525,405 | |
30,444 | | | | ING Marsico Growth Portfolio - Class I | | 526,380 | |
45,027 | | | | ING Marsico International Opportunities Portfolio - Class I | | 526,819 | |
40,526 | | | | ING MidCap Opportunities Portfolio - Class I | | 473,751 | |
43,475 | | | | ING Pioneer Mid Cap Value Portfolio - Class I | | 477,351 | |
28,501 | | | | ING Small Company Portfolio - Class I | | 522,711 | |
16,498 | | | | ING T Rowe Price Capital Appreciation Portfolio - Class I | | 373,678 | |
90,891 | | | | ING T. Rowe Price Equity Income Portfolio - Class I | | 1,069,792 | |
10,601 | | | | ING T. Rowe Price Growth Equity Portfolio - Class I | | 577,672 | |
66,866 | | | | ING Templeton Foreign Equity Portfolio - Class I | | 738,870 | |
4,939 | | | | ING Thornburg Value Portfolio - Class I | | 157,944 | |
| | | | | | | |
| | | | Total Investments in Affiliated Investment Companies
(Cost $9,715,267) * | 100.0 | % | | $ | 10,571,816 | |
| | | | Other Assets and Liabilities - Net | (0.0 | ) | | (3,489 | ) |
| | | | Net Assets | 100.0 | % | | $ | 10,568,327 | |
| | @ | | Non-income producing security | | | |
| | PORTFOLIO OF INVESTMENTS |
ING Solution Aggressive Growth Portfolio | | as of December 31, 2010 |
Shares | | | | | | Value | |
| | | | | | | |
AFFILIATED INVESTMENT COMPANIES: 100.0% | | | |
| | | | Affiliated Investment Companies: 100.0% | | | |
48,212 | | @ | | ING Artio Foreign Portfolio - Class I | | $ | 563,112 | |
6,401 | | @ | | ING Baron Small Cap Growth Portfolio - Class I | | 123,985 | |
32,037 | | | | ING Clarion Global Real Estate Portfolio - Class I | | 312,362 | |
11,864 | | | | ING Columbia Small Cap Value Portfolio - Class I | | 123,863 | |
10,401 | | | | ING Davis New York Venture Portfolio - Class I | | 187,110 | |
33,293 | | | | ING Equity Dividend Fund - Class I | | 342,250 | |
16,037 | | | | ING Global Bond Fund - Class I | | 188,439 | |
24,541 | | | | ING Goldman Sachs Commodity Strategy Portfolio - Class I | | 189,453 | |
20,080 | | | | ING Growth and Income Portfolio - Class I | | 440,562 | |
19,224 | | | | ING JPMorgan Emerging Markets Equity Portfolio - Class I | | 440,624 | |
18,754 | | | | ING Large Cap Growth Portfolio - Class I | | 248,869 | |
18,026 | | | | ING Marsico Growth Portfolio - Class I | | 311,670 | |
26,661 | | | | ING Marsico International Opportunities Portfolio - Class I | | 311,928 | |
21,330 | | | | ING MidCap Opportunities Portfolio - Class I | | 249,351 | |
43,067 | | | | ING PIMCO High Yield Portfolio - Class I | | 440,146 | |
22,884 | | | | ING Pioneer Mid Cap Value Portfolio - Class I | | 251,265 | |
10,125 | | | | ING Small Company Portfolio - Class I | | 185,694 | |
45,758 | | | | ING T. Rowe Price Equity Income Portfolio - Class I | | 538,568 | |
5,706 | | | | ING T. Rowe Price Growth Equity Portfolio - Class I | | 310,937 | |
33,939 | | | | ING Templeton Foreign Equity Portfolio - Class I | | 375,021 | |
3,899 | | | | ING Thornburg Value Portfolio - Class I | | 124,691 | |
| | | | | | | |
| | | | Total Investments in Affiliated Investment Companies
(Cost $5,980,934) * | 100.0 | % | | $ | 6,259,900 | |
| | | | Other Assets and Liabilities - Net | (0.0 | ) | | (2,686 | ) |
| | | | Net Assets | 100.0 | % | | $ | 6,257,214 | |
| | @ | | Non-income producing security | | | |
| | PORTFOLIO OF INVESTMENTS |
ING Solution Conservative Portfolio | | as of December 31, 2010 |
Shares | | | | | | Value | |
| | | | | | | |
AFFILIATED INVESTMENT COMPANIES: 100.0% | | | |
| | | | Affiliated Investment Companies: 100.0% | | | |
5,224 | | @ | | ING Artio Foreign Portfolio - Class I | | $ | 61,011 | |
14,713 | | | | ING BlackRock Inflation Protected Bond Portfolio - Class I | | 153,013 | |
4,153 | | | | ING Clarion Real Estate Portfolio - Class I | | 91,250 | |
5,493 | | | | ING Davis New York Venture Portfolio - Class I | | 98,821 | |
14,995 | | | | ING Floating Rate Fund - Class I | | 152,946 | |
13,036 | | | | ING Global Bond Fund - Class I | | 153,169 | |
11,963 | | | | ING Goldman Sachs Commodity Strategy Portfolio - Class I | | 92,353 | |
10,845 | | | | ING Growth and Income Portfolio - Class I | | 237,931 | |
27,003 | | | | ING Intermediate Bond Portfolio - Class I | | 325,928 | |
41,319 | | | | ING Limited Maturity Bond Portfolio - Class I | | 426,406 | |
5,201 | | | | ING Marsico International Opportunities Portfolio - Class I | | 60,854 | |
27,012 | | | | ING PIMCO High Yield Portfolio - Class I | | 276,067 | |
55,051 | | | | ING PIMCO Total Return Bond Portfolio - Class I | | 672,171 | |
7,880 | | | | ING T. Rowe Price Equity Income Portfolio - Class I | | 92,747 | |
1,113 | | | | ING T. Rowe Price Growth Equity Portfolio - Class I | | 60,638 | |
5,512 | | | | ING Templeton Foreign Equity Portfolio - Class I | | 60,908 | |
1,901 | | | | ING Thornburg Value Portfolio - Class I | | 60,790 | |
| | | | | | | |
| | | | Total Investments in Affiliated Investment Companies
(Cost $3,063,209) * | 100.0 | % | | $ | 3,077,003 | |
| | | | Other Assets and Liabilities - Net | (0.0 | ) | | (1,224 | ) |
| | | | Net Assets | 100.0 | % | | $ | 3,075,779 | |
| | @ | | Non-income producing security | | | |
| | PORTFOLIO OF INVESTMENTS |
ING Solution Growth Portfolio | | as of December 31, 2010 |
Shares | | | | | | Value | |
| | | | | | | |
AFFILIATED INVESTMENT COMPANIES: 100.0% | | | |
| | | | Affiliated Investment Companies: 100.0% | | | |
50,507 | | @ | | ING Artio Foreign Portfolio - Class I | | $ | 589,926 | |
15,103 | | | | ING Clarion Global Real Estate Portfolio - Class I | | 147,255 | |
6,692 | | | | ING Clarion Real Estate Portfolio - Class I | | 147,033 | |
20,430 | | | | ING Davis New York Venture Portfolio - Class I | | 367,540 | |
28,988 | | | | ING Floating Rate Fund - Class I | | 295,680 | |
42,007 | | | | ING Global Bond Fund - Class I | | 493,585 | |
38,562 | | | | ING Goldman Sachs Commodity Strategy Portfolio - Class I | | 297,697 | |
40,574 | | | | ING Growth and Income Portfolio - Class I | | 890,196 | |
21,347 | | | | ING Intermediate Bond Portfolio - Class I | | 257,661 | |
8,632 | | | | ING JPMorgan Emerging Markets Equity Portfolio - Class I | | 197,854 | |
29,471 | | | | ING Large Cap Growth Portfolio - Class I | | 391,078 | |
28,536 | | | | ING Limited Maturity Bond Portfolio - Class I | | 294,490 | |
22,662 | | | | ING Marsico Growth Portfolio - Class I | | 391,820 | |
25,131 | | | | ING Marsico International Opportunities Portfolio - Class I | | 294,033 | |
16,760 | | | | ING MidCap Opportunities Portfolio - Class I | | 195,927 | |
58,016 | | | | ING PIMCO High Yield Portfolio - Class I | | 592,923 | |
64,518 | | | | ING PIMCO Total Return Bond Portfolio - Class I | | 787,770 | |
17,981 | | | | ING Pioneer Mid Cap Value Portfolio - Class I | | 197,437 | |
21,215 | | | | ING Small Company Portfolio - Class I | | 389,078 | |
28,518 | | | | ING T Rowe Price Capital Appreciation Portfolio - Class I | | 645,930 | |
67,682 | | | | ING T. Rowe Price Equity Income Portfolio - Class I | | 796,620 | |
7,174 | | | | ING T. Rowe Price Growth Equity Portfolio - Class I | | 390,891 | |
53,331 | | | | ING Templeton Foreign Equity Portfolio - Class I | | 589,310 | |
6,893 | | | | ING Thornburg Value Portfolio - Class I | | 220,433 | |
| | | | | | | |
| | | | Total Investments in Affiliated Investment Companies
(Cost $9,456,421) * | 100.0 | % | | $ | 9,862,167 | |
| | | | Other Assets and Liabilities - Net | (0.0 | ) | | (3,689 | ) |
| | | | Net Assets | 100.0 | % | | $ | 9,858,478 | |
| | @ | | Non-income producing security | | | |
| | PORTFOLIO OF INVESTMENTS |
ING Solution Income Portfolio | | as of December 31, 2010 |
Shares | | | | | | Value | |
| | | | | | | |
AFFILIATED INVESTMENT COMPANIES: 100.0% | | | |
| | | | Affiliated Investment Companies: 100.0% | | | |
399,390 | | @ | | ING Artio Foreign Portfolio - Class I | | $ | 4,664,874 | |
1,124,961 | | | | ING BlackRock Inflation Protected Bond Portfolio - Class I | | 11,699,591 | |
317,577 | | | | ING Clarion Real Estate Portfolio - Class I | | 6,977,168 | |
452,319 | | | | ING Davis New York Venture Portfolio - Class I | | 8,137,223 | |
1,146,688 | | | | ING Floating Rate Fund - Class I | | 11,696,213 | |
996,684 | | | | ING Global Bond Fund - Class I | | 11,711,042 | |
914,668 | | | | ING Goldman Sachs Commodity Strategy Portfolio - Class I | | 7,061,236 | |
909,514 | | | | ING Growth and Income Portfolio - Class I | | 19,954,741 | |
2,029,270 | | | | ING Intermediate Bond Portfolio - Class I | | 24,493,294 | |
2,933,502 | | | | ING Limited Maturity Bond Portfolio - Class I | | 30,273,739 | |
397,668 | | | | ING Marsico International Opportunities Portfolio - Class I | | 4,652,710 | |
2,066,172 | | | | ING PIMCO High Yield Portfolio - Class I | | 21,116,280 | |
4,209,241 | | | | ING PIMCO Total Return Bond Portfolio - Class I | | 51,394,830 | |
602,669 | | | | ING T. Rowe Price Equity Income Portfolio - Class I | | 7,093,412 | |
85,080 | | | | ING T. Rowe Price Growth Equity Portfolio - Class I | | 4,635,994 | |
421,442 | | | | ING Templeton Foreign Equity Portfolio - Class I | | 4,656,934 | |
145,324 | | | | ING Thornburg Value Portfolio - Class I | | 4,647,464 | |
| | | | | | | |
| | | | Total Investments in Affiliated Investment Companies
(Cost $218,754,904) * | 100.0 | % | | $ | 234,866,745 | |
| | | | Other Assets and Liabilities - Net | (0.0 | ) | | (90,438 | ) |
| | | | Net Assets | 100.0 | % | | $ | 234,776,307 | |
| | @ | | Non-income producing security | | | |
| | PORTFOLIO OF INVESTMENTS |
ING Solution Moderate Portfolio | | as of December 31, 2010 |
Shares | | | | | | Value | |
| | | | | | | |
AFFILIATED INVESTMENT COMPANIES: 100.0% | | | |
| | | | Affiliated Investment Companies: 100.0% | | | |
41,064 | | @ | | ING Artio Foreign Portfolio - Class I | | $ | 479,629 | |
27,758 | | | | ING BlackRock Inflation Protected Bond Portfolio - Class I | | 288,679 | |
13,060 | | | | ING Clarion Real Estate Portfolio - Class I | | 286,924 | |
17,275 | | | | ING Davis New York Venture Portfolio - Class I | | 310,775 | |
47,141 | | | | ING Floating Rate Fund - Class I | | 480,836 | |
40,987 | | | | ING Global Bond Fund - Class I | | 481,598 | |
37,619 | | | | ING Goldman Sachs Commodity Strategy Portfolio - Class I | | 290,418 | |
34,094 | | | | ING Growth and Income Portfolio - Class I | | 748,027 | |
50,018 | | | | ING Intermediate Bond Portfolio - Class I | | 603,720 | |
17,970 | | | | ING Large Cap Growth Portfolio - Class I | | 238,466 | |
83,524 | | | | ING Limited Maturity Bond Portfolio - Class I | | 861,967 | |
13,819 | | | | ING Marsico Growth Portfolio - Class I | | 238,927 | |
16,348 | | | | ING Marsico International Opportunities Portfolio - Class I | | 191,271 | |
8,177 | | | | ING MidCap Opportunities Portfolio - Class I | | 95,585 | |
56,611 | | | | ING PIMCO High Yield Portfolio - Class I | | 578,564 | |
110,159 | | | | ING PIMCO Total Return Bond Portfolio - Class I | | 1,345,047 | |
8,773 | | | | ING Pioneer Mid Cap Value Portfolio - Class I | | 96,328 | |
10,349 | | | | ING Small Company Portfolio - Class I | | 189,802 | |
21,407 | | | | ING T Rowe Price Capital Appreciation Portfolio - Class I | | 484,875 | |
41,281 | | | | ING T. Rowe Price Equity Income Portfolio - Class I | | 485,880 | |
5,249 | | | | ING T. Rowe Price Growth Equity Portfolio - Class I | | 286,021 | |
34,682 | | | | ING Templeton Foreign Equity Portfolio - Class I | | 383,237 | |
5,978 | | | | ING Thornburg Value Portfolio - Class I | | 191,163 | |
| | | | | | | |
| | | | Total Investments in Affiliated Investment Companies
(Cost $9,293,868) * | 100.0 | % | | $ | 9,637,739 | |
| | | | Other Assets and Liabilities - Net | (0.0 | ) | | (3,128 | ) |
| | | | Net Assets | 100.0 | % | | $ | 9,634,611 | |
| | @ | | Non-income producing security | | | |
| | PORTFOLIO OF INVESTMENTS |
ING T. Rowe Price Diversified Mid Cap Growth Portfolio | | as of December 31, 2010 |
Shares | | | | | | Value | |
COMMON STOCK: 99.2% | | | |
| | | | Consumer Discretionary: 18.5% | | | |
24,900 | | | | Advance Auto Parts, Inc. | | $ | 1,647,135 | |
46,300 | | @, L | | Apollo Group, Inc. - Class A | | 1,828,387 | |
8,100 | | @ | | Autozone, Inc. | | 2,207,979 | |
107,900 | | @ | | Bed Bath & Beyond, Inc. | | 5,303,285 | |
36,800 | | @ | | Big Lots, Inc. | | 1,120,928 | |
79,900 | | | | Cablevision Systems Corp. | | 2,703,816 | |
142,100 | | @ | | Carmax, Inc. | | 4,530,148 | |
28,200 | | @ | | Central European Media Enterprises Ltd. | | 573,870 | |
11,100 | | @ | | Chipotle Mexican Grill, Inc. | | 2,360,526 | |
59,400 | | | | Choice Hotels International, Inc. | | 2,273,238 | |
141,300 | | | | Coach, Inc. | | 7,815,303 | |
79,000 | | | | CTC Media, Inc. | | 1,850,970 | |
42,200 | | @ | | Ctrip.com International Ltd. ADR | | 1,706,990 | |
35,500 | | | | DeVry, Inc. | | 1,703,290 | |
56,400 | | @ | | Dick’s Sporting Goods, Inc. | | 2,115,000 | |
147,350 | | @ | | Discovery Communications, Inc. - Class C | | 5,406,272 | |
67,500 | | @ | | Dollar General Corp. | | 2,070,225 | |
53,250 | | @ | | Dollar Tree, Inc. | | 2,986,260 | |
68,200 | | @ | | DreamWorks Animation SKG, Inc. | | 2,009,854 | |
70,000 | | | | Expedia, Inc. | | 1,756,300 | |
45,800 | | | | Family Dollar Stores, Inc. | | 2,276,718 | |
91,000 | | | | Gap, Inc. | | 2,014,740 | |
87,600 | | | | Gentex Corp. | | 2,589,456 | |
29,000 | | @ | | Hyatt Hotels Corp. | | 1,327,040 | |
134,800 | | | | International Game Technology | | 2,384,612 | |
17,900 | | @, L | | ITT Educational Services, Inc. | | 1,140,051 | |
41,700 | | L | | Lennar Corp. | | 781,875 | |
252,800 | | @ | | Liberty Media Corp. - Interactive - Class A | | 3,986,656 | |
24,700 | | @ | | Liberty Media Corp. - Starz | | 1,642,056 | |
62,150 | | @ | | Madison Square Garden, Inc. | | 1,602,227 | |
129,112 | | | | Marriott International, Inc. | | 5,363,312 | |
193,300 | | | | Mattel, Inc. | | 4,915,619 | |
129,400 | | | | McGraw-Hill Cos., Inc. | | 4,711,454 | |
41,600 | | L | | Men’s Wearhouse, Inc. | | 1,039,168 | |
11,800 | | @ | | New Oriental Education & Technology Group ADR | | 1,241,714 | |
69,300 | | | | Omnicom Group | | 3,173,940 | |
61,600 | | @ | | O’Reilly Automotive, Inc. | | 3,721,872 | |
28,600 | | @ | | Panera Bread Co. | | 2,894,606 | |
40,800 | | | | Petsmart, Inc. | | 1,624,656 | |
20,600 | | @ | | Priceline.com, Inc. | | 8,230,730 | |
79,562 | | @, L | | Pulte Homes, Inc. | | 598,306 | |
87,700 | | | | Ross Stores, Inc. | | 5,547,025 | |
73,800 | | @, L | | Royal Caribbean Cruises Ltd. | | 3,468,600 | |
56,055 | | | | Staples, Inc. | | 1,276,372 | |
96,000 | | | | Starwood Hotels & Resorts Worldwide, Inc. | | 5,834,880 | |
11,000 | | | | Strayer Education, Inc. | | 1,674,420 | |
72,000 | | | | Tiffany & Co. | | 4,483,440 | |
56,350 | | | | Tim Hortons, Inc. | | 2,323,311 | |
56,000 | | @ | | Toll Brothers, Inc. | | 1,064,000 | |
43,300 | | | | Tractor Supply Co. | | 2,099,617 | |
89,500 | | @ | | Urban Outfitters, Inc. | | 3,204,995 | |
45,700 | | | | Williams-Sonoma, Inc. | | 1,631,033 | |
87,950 | | @ | | WMS Industries, Inc. | | 3,978,858 | |
32,900 | | | | Wynn Resorts Ltd. | | 3,416,336 | |
| | | | | | 151,233,471 | |
| | | | Consumer Staples: 3.7% | | | |
184,500 | | | | Avon Products, Inc. | | 5,361,570 | |
41,200 | | | | Brown-Forman Corp. | | 2,868,344 | |
49,900 | | | | Campbell Soup Co. | | 1,734,025 | |
45,000 | | | | Church & Dwight Co., Inc. | | 3,105,900 | |
40,800 | | | | Clorox Co. | | 2,581,824 | |
50,400 | | | | Hershey Co. | | 2,376,360 | |
21,200 | | | | JM Smucker Co. | | 1,391,780 | |
31,500 | | | | Lorillard, Inc. | | 2,584,890 | |
45,100 | | | | McCormick & Co., Inc. | | 2,098,503 | |
28,200 | | | | Mead Johnson Nutrition Co. | | 1,755,450 | |
87,200 | | @ | | Whole Foods Market, Inc. | | 4,411,448 | |
| | | | | | 30,270,094 | |
| | | | Energy: 7.8% | | | |
99,469 | | | | Arch Coal, Inc. | | 3,487,383 | |
110,800 | | @ | | Cameron International Corp. | | 5,620,884 | |
71,600 | | @ | | Cobalt International Energy, Inc. | | 874,236 | |
67,300 | | @ | | Concho Resources, Inc. | | 5,900,191 | |
| | | | | | | | |
60,100 | | @ | | Continental Resources, Inc. | | 3,536,885 | |
37,100 | | @, L | | Core Laboratories NV | | 3,303,755 | |
27,500 | | L | | Diamond Offshore Drilling | | 1,838,925 | |
40,100 | | @ | | Dresser-Rand Group, Inc. | | 1,707,859 | |
22,700 | | @ | | Dril-Quip, Inc. | | 1,764,244 | |
82,600 | | @ | | FMC Technologies, Inc. | | 7,343,966 | |
25,500 | | @ | | Forest Oil Corp. | | 968,235 | |
177,400 | | @ | | McDermott International, Inc. | | 3,670,406 | |
20,800 | | | | Murphy Oil Corp. | | 1,550,640 | |
50,300 | | @ | | Nabors Industries Ltd. | | 1,180,038 | |
24,400 | | @ | | Newfield Exploration Co. | | 1,759,484 | |
94,800 | | | | Nexen, Inc. | | 2,170,920 | |
43,600 | | @ | | Oceaneering International, Inc. | | 3,210,268 | |
70,900 | | | | Peabody Energy Corp. | | 4,536,182 | |
71,500 | | | | Range Resources Corp. | | 3,216,070 | |
28,700 | | | | SM Energy Co. | | 1,691,291 | |
34,200 | | @ | | Southwestern Energy Co. | | 1,280,106 | |
121,600 | | @ | | Tetra Technologies, Inc. | | 1,443,392 | |
43,800 | | @ | | Ultra Petroleum Corp. | | 2,092,326 | |
| | | | | | 64,147,686 | |
| | | | Financials: 7.8% | | | |
15,700 | | @ | | Arch Capital Group Ltd. | | 1,382,385 | |
27,100 | | | | Assurant, Inc. | | 1,043,892 | |
41,600 | | | | Axis Capital Holdings Ltd. | | 1,492,608 | |
108,133 | | L | | CBOE Holdings, Inc. | | 2,471,920 | |
26,100 | | | | City National Corp. | | 1,601,496 | |
76,000 | | | | Eaton Vance Corp. | | 2,297,480 | |
96,900 | | | | Fifth Third Bancorp. | | 1,422,492 | |
127,413 | | @ | | First Horizon National Corp. | | 1,500,925 | |
104,400 | | @, L | | Forest City Enterprises, Inc. | | 1,742,436 | |
29,400 | | @ | | Green Dot Corp. | | 1,668,156 | |
47,200 | | | | HCC Insurance Holdings, Inc. | | 1,365,968 | |
37,500 | | @ | | IntercontinentalExchange, Inc. | | 4,468,125 | |
116,300 | | | | Janus Capital Group, Inc. | | 1,508,411 | |
156,900 | | | | Keycorp | | 1,388,565 | |
78,100 | | | | Lazard Ltd. | | 3,084,169 | |
182,100 | | | | Marshall & Ilsley Corp. | | 1,260,132 | |
145,100 | | | | Moody’s Corp. | | 3,850,954 | |
73,400 | | @ | | MSCI, Inc. - Class A | | 2,859,664 | |
63,400 | | | | Northern Trust Corp. | | 3,512,994 | |
100,600 | | | | NYSE Euronext | | 3,015,988 | |
70,000 | | @ | | OptionsXpress Holdings, Inc. | | 1,096,900 | |
581,833 | | @ | | Popular, Inc. | | 1,826,956 | |
50,100 | | | | Principal Financial Group, Inc. | | 1,631,256 | |
154,500 | | | | Regions Financial Corp. | | 1,081,500 | |
23,000 | | | | RenaissanceRe Holdings Ltd. | | 1,464,870 | |
65,300 | | | | SEI Investments Co. | | 1,553,487 | |
125,500 | | @ | | SLM Corp. | | 1,580,045 | |
27,500 | | @ | | SVB Financial Group | | 1,458,875 | |
97,100 | | | | TCF Financial Corp. | | 1,438,051 | |
184,000 | | | | TD Ameritrade Holding Corp. | | 3,494,160 | |
36,600 | | | | Waddell & Reed Financial, Inc. | | 1,291,614 | |
54,800 | | | | WR Berkley Corp. | | 1,500,424 | |
56,800 | | | | Zions Bancorp. | | 1,376,264 | |
| | | | | | 63,733,162 | |
| | | | Health Care: 12.8% | | | |
50,200 | | @ | | Alexion Pharmaceuticals, Inc. | | 4,043,610 | |
56,400 | | @ | | American Medical Systems Holdings, Inc. | | 1,063,704 | |
147,900 | | | | AmerisourceBergen Corp. | | 5,046,348 | |
24,200 | | @ | | Arthrocare Corp. | | 751,652 | |
45,500 | | @ | | BioMarin Pharmaceuticals, Inc. | | 1,225,315 | |
108,500 | | @ | | Bruker BioSciences Corp. | | 1,801,100 | |
25,800 | | @ | | Cephalon, Inc. | | 1,592,376 | |
44,700 | | @ | | Cerner Corp. | | 4,234,878 | |
36,700 | | @, L | | Charles River Laboratories International, Inc. | | 1,304,318 | |
41,800 | | | | Cigna Corp. | | 1,532,388 | |
66,000 | | @ | | Community Health Systems, Inc. | | 2,466,420 | |
22,000 | | @ | | Covance, Inc. | | 1,131,020 | |
48,300 | | | | CR Bard, Inc. | | 4,432,491 | |
41,400 | | @ | | DaVita, Inc. | | 2,876,886 | |
36,300 | | @ | | Dendreon Corp. | | 1,267,596 | |
58,100 | | | | Densply International, Inc. | | 1,985,277 | |
35,400 | | @ | | Edwards Lifesciences Corp. | | 2,861,736 | |
26,700 | | @, L | | Gen-Probe, Inc. | | 1,557,945 | |
47,500 | | @ | | Henry Schein, Inc. | | 2,916,025 | |
69,300 | | @, L | | Hologic, Inc. | | 1,304,226 | |
111,000 | | @ | | Human Genome Sciences, Inc. | | 2,651,790 | |
22,600 | | @ | | Humana, Inc. | | 1,237,124 | |
52,700 | | @, L | | Idexx Laboratories, Inc. | | 3,647,894 | |
58,500 | | @, L | | Illumina, Inc. | | 3,705,390 | |
8,600 | | @ | | Intuitive Surgical, Inc. | | 2,216,650 | |
43,000 | | @ | | Laboratory Corp. of America Holdings | | 3,780,560 | |
84,800 | | @ | | Life Technologies Corp. | | 4,706,400 | |
40,300 | | @ | | Masimo Corp. | | 1,171,521 | |
21,900 | | @ | | Mettler Toledo International, Inc. | | 3,311,499 | |
51,000 | | @ | | Myriad Genetics, Inc. | | 1,164,840 | |
44,900 | | | | Patterson Cos., Inc. | | 1,375,287 | |
62,000 | | @ | | Qiagen NV | | 1,212,100 | |
68,100 | | | | Quest Diagnostics | | 3,675,357 | |
79,800 | | @ | | Regeneron Pharmaceuticals, Inc. | | 2,619,834 | |
40,200 | | @, L | | Resmed, Inc. | | 1,392,528 | |
35,400 | | @ | | St. Jude Medical, Inc. | | 1,513,350 | |
50,800 | | @ | | SXC Health Solutions Corp. | | 2,177,288 | |
27,400 | | | | Techne Corp. | | 1,799,358 | |
41,200 | | @ | | Thoratec Corp. | | 1,166,784 | |
37,100 | | | | Universal Health Services, Inc. | | 1,610,882 | |
108,100 | | @ | | Valeant Pharmaceuticals International, Inc. | | 3,058,149 | |
37,600 | | @ | | Varian Medical Systems, Inc. | | 2,604,928 | |
81,600 | | @ | | Vertex Pharmaceuticals, Inc. | | 2,858,448 | |
39,900 | | @ | | Waters Corp. | | 3,100,629 | |
22,800 | | @ | | Zimmer Holdings, Inc. | | 1,223,904 | |
| | | | | | 104,377,805 | |
| | | | Industrials: 17.0% | | | |
82,600 | | @ | | American Reprographics Co. | | 626,934 | |
85,275 | | | | Ametek, Inc. | | 3,347,044 | |
104,550 | | @ | | Babcock & Wilcox Co. | | 2,675,435 | |
71,300 | | | | CH Robinson Worldwide, Inc. | | 5,717,547 | |
38,700 | | | | Clarcor, Inc. | | 1,659,843 | |
72,300 | | | | Cooper Industries PLC | | 4,214,367 | |
32,100 | | @ | | Copart, Inc. | | 1,198,935 | |
38,900 | | | | Corporate Executive Board Co. | | 1,460,695 | |
82,800 | | | | Cummins, Inc. | | 9,108,828 | |
46,900 | | | | Donaldson Co., Inc. | | 2,733,332 | |
17,200 | | | | Dun & Bradstreet Corp. | | 1,411,948 | |
21,300 | | | | Elbit Systems Ltd. | | 1,127,196 | |
53,700 | | | | Embraer SA ADR | | 1,578,780 | |
41,800 | | | | Equifax, Inc. | | 1,488,080 | |
92,700 | | | | Expeditors International Washington, Inc. | | 5,061,420 | |
65,000 | | L | | Fastenal Co. | | 3,894,150 | |
22,400 | | | | Flowserve Corp. | | 2,670,528 | |
83,300 | | | | Fluor Corp. | | 5,519,458 | |
77,700 | | @ | | Foster Wheeler AG | | 2,682,204 | |
68,600 | | @ | | General Cable Corp. | | 2,407,174 | |
44,700 | | | | Goodrich Corp. | | 3,936,729 | |
58,400 | | | | Graco, Inc. | | 2,303,880 | |
40,200 | | | | Harsco Corp. | | 1,138,464 | |
185,500 | | @, L | | Hertz Global Holdings, Inc. | | 2,687,895 | |
43,800 | | | | IDEX Corp. | | 1,713,456 | |
44,900 | | @ | | II-VI, Inc. | | 2,081,564 | |
58,600 | | | | Iron Mountain, Inc. | | 1,465,586 | |
49,600 | | | | Joy Global, Inc. | | 4,302,800 | |
51,200 | | @ | | Kansas City Southern | | 2,450,432 | |
64,100 | | | | Landstar System, Inc. | | 2,624,254 | |
24,400 | | | | Manpower, Inc. | | 1,531,344 | |
31,100 | | | | Paccar, Inc. | | 1,785,762 | |
45,800 | | | | Pall Corp. | | 2,270,764 | |
40,500 | | | | Precision Castparts Corp. | | 5,638,005 | |
71,600 | | @ | | Quanta Services, Inc. | | 1,426,272 | |
80,200 | | | | Republic Services, Inc. | | 2,394,772 | |
66,900 | | L | | Ritchie Brothers Auctioneers, Inc. | | 1,542,045 | |
79,400 | | | | Robert Half International, Inc. | | 2,429,640 | |
56,500 | | | | Rockwell Automation, Inc. | | 4,051,615 | |
44,400 | | | | Rockwell Collins, Inc. | | 2,586,744 | |
41,500 | | | | Roper Industries, Inc. | | 3,171,845 | |
103,400 | | | | Skywest, Inc. | | 1,615,108 | |
240,300 | | | | Southwest Airlines Co. | | 3,119,094 | |
22,800 | | @ | | Stericycle, Inc. | | 1,844,976 | |
48,000 | | @, L | | Terex Corp. | | 1,489,920 | |
25,500 | | @ | | TransDigm Group, Inc. | | 1,836,255 | |
21,600 | | | | Valmont Industries, Inc. | | 1,916,568 | |
54,600 | | @ | | Verisk Analytics, Inc. | | 1,860,768 | |
24,700 | | @ | | WABCO Holdings, Inc. | | 1,504,971 | |
65,800 | | | | Wabtec Corp. | | 3,480,162 | |
60,600 | | | | Waste Connections, Inc. | | 1,668,318 | |
32,900 | | | | WW Grainger, Inc. | | 4,543,819 | |
| | | | | | 138,997,725 | |
| | | | Information Technology: 23.2% | | | |
83,300 | | @ | | Adobe Systems, Inc. | | 2,563,974 | |
68,700 | | @ | | Akamai Technologies, Inc. | | 3,232,335 | |
118,100 | | | | Altera Corp. | | 4,201,998 | |
72,200 | | | | Amphenol Corp. | | 3,810,716 | |
96,000 | | | | Analog Devices, Inc. | | 3,616,320 | |
62,000 | | @ | | Ansys, Inc. | | 3,228,340 | |
61,300 | | @ | | Atheros Communications, Inc. | | 2,201,896 | |
110,800 | | @ | | Autodesk, Inc. | | 4,232,560 | |
78,700 | | @, L | | BMC Software, Inc. | | 3,709,918 | |
134,600 | | | | CA, Inc. | | 3,289,624 | |
85,500 | | @ | | Check Point Software Technologies | | 3,955,230 | |
76,400 | | @, L | | Ciena Corp. | | 1,608,220 | |
50,900 | | @ | | Citrix Systems, Inc. | | 3,482,069 | |
24,100 | | | | Computer Sciences Corp. | | 1,195,360 | |
37,900 | | @ | | Cymer, Inc. | | 1,708,153 | |
59,400 | | @ | | Dolby Laboratories, Inc. | | 3,961,980 | |
79,000 | | @ | | Electronic Arts, Inc. | | 1,294,020 | |
34,900 | | @ | | Equinix, Inc. | | 2,835,974 | |
18,700 | | @ | | F5 Networks, Inc. | | 2,433,992 | |
26,900 | | | | Factset Research Systems, Inc. | | 2,522,144 | |
63,200 | | @ | | Fairchild Semiconductor International, Inc. | | 986,552 | |
19,802 | | | | Fidelity National Information Services, Inc. | | 542,377 | |
23,300 | | @, L | | First Solar, Inc. | | 3,032,262 | |
35,000 | | @ | | Fiserv, Inc. | | 2,049,600 | |
51,300 | | @ | | Fortinet, Inc. | | 1,659,555 | |
84,800 | | @ | | Genpact Ltd. | | 1,288,960 | |
36,700 | | | | Global Payments, Inc. | | 1,695,907 | |
135,300 | | @ | | GT Solar International, Inc. | | 1,233,936 | |
74,500 | | @ | | Informatica Corp. | | 3,280,235 | |
69,200 | | | | Intersil Corp. | | 1,056,684 | |
92,100 | | @ | | Intuit, Inc. | | 4,540,530 | |
18,000 | | @, L | | Itron, Inc. | | 998,100 | |
123,100 | | | | Jabil Circuit, Inc. | | 2,473,079 | |
116,600 | | @, L | | JDS Uniphase Corp. | | 1,688,368 | |
129,800 | | @ | | Juniper Networks, Inc. | | 4,792,216 | |
38,000 | | | | KLA-Tencor Corp. | | 1,468,320 | |
42,500 | | @ | | Lam Research Corp. | | 2,200,650 | |
128,400 | | | | Linear Technology Corp. | | 4,441,356 | |
62,500 | | @, L | | Logitech International S.A. | | 1,159,375 | |
242,300 | | @ | | Marvell Technology Group Ltd. | | 4,494,665 | |
68,900 | | | | Maxim Integrated Products | | 1,627,418 | |
127,600 | | @ | | MEMC Electronic Materials, Inc. | | 1,436,776 | |
94,600 | | L | | Microchip Technology, Inc. | | 3,236,266 | |
52,800 | | @ | | Micros Systems, Inc. | | 2,315,808 | |
48,600 | | | | National Instruments Corp. | | 1,829,304 | |
192,400 | | | | National Semiconductor Corp. | | 2,647,424 | |
92,300 | | @ | | NetApp, Inc. | | 5,072,808 | |
252,000 | | @ | | Nuance Communications, Inc. | | 4,581,360 | |
248,500 | | @ | | Nvidia Corp. | | 3,826,900 | |
197,800 | | @ | | ON Semiconductor Corp. | | 1,954,264 | |
140,700 | | L | | Paychex, Inc. | | 4,349,037 | |
114,900 | | @ | | QLogic Corp. | | 1,955,598 | |
81,600 | | @, L | | Rackspace Hosting, Inc. | | 2,563,056 | |
74,900 | | @ | | Red Hat, Inc. | | 3,419,185 | |
73,700 | | @ | | Rovi Corp. | | 4,570,137 | |
21,600 | | @ | | Salesforce.com, Inc. | | 2,851,200 | |
185,100 | | @ | | Seagate Technology, Inc. | | 2,782,053 | |
39,700 | | @ | | Silicon Laboratories, Inc. | | 1,826,994 | |
39,200 | | @, L | | Sina Corp. | | 2,697,744 | |
47,300 | | | | Solera Holdings, Inc. | | 2,427,436 | |
55,800 | | @ | | Synopsys, Inc. | | 1,501,578 | |
74,000 | | @ | | Teradata Corp. | | 3,045,840 | |
108,200 | | @, L | | Trimble Navigation Ltd. | | 4,320,426 | |
77,400 | | @ | | Varian Semiconductor Equipment Associates, Inc. | | 2,861,478 | |
45,700 | | @ | | VeriSign, Inc. | | 1,493,019 | |
35,800 | | @ | | VistaPrint NV | | 1,646,800 | |
9,900 | | @ | | WebMD Health Corp. | | 505,494 | |
331,000 | | | | Western Union Co. | | 6,146,670 | |
173,400 | | | | Xilinx, Inc. | | 5,025,132 | |
41,000 | | @ | | Zebra Technologies Corp. | | 1,557,590 | |
| | | | | | 190,242,345 | |
| | | | Materials: 6.3% | | | |
35,800 | | | | Agnico-Eagle Mines Ltd. | | 2,745,860 | |
25,800 | | | | Air Products & Chemicals, Inc. | | 2,346,510 | |
27,100 | | | | Albemarle Corp. | | 1,511,638 | |
50,400 | | L | | Carpenter Technology Corp. | | 2,028,096 | |
20,200 | | | | CF Industries Holdings, Inc. | | 2,730,030 | |
51,400 | | | | Cliffs Natural Resources, Inc. | | 4,009,714 | |
63,100 | | | | Compass Minerals International, Inc. | | 5,632,937 | |
46,300 | | | | Ecolab, Inc. | | 2,334,446 | |
154,700 | | | | Eldorado Gold Corp. | | 2,872,779 | |
185,900 | | | | HudBay Minerals, Inc. | | 3,392,675 | |
51,200 | | @ | | Intrepid Potash, Inc. | | 1,909,248 | |
35,500 | | | | Sherwin-Williams Co. | | 2,973,125 | |
37,000 | | | | Sigma-Aldrich Corp. | | 2,462,720 | |
81,800 | | L | | Sociedad Quimica y Minera de Chile SA ADR | | 4,778,756 | |
38,800 | | L | | United States Steel Corp. | | 2,266,696 | |
53,200 | | L | | Vulcan Materials Co. | | 2,359,952 | |
40,300 | | L | | Walter Industries, Inc. | | 5,151,952 | |
| | | | | | 51,507,134 | |
| | | | Telecommunication Services: 1.5% | | | |
126,400 | | @ | | Crown Castle International Corp. | | 5,540,112 | |
61,200 | | @ | | NII Holdings, Inc. | | 2,733,192 | |
88,050 | | @ | | SBA Communications Corp. | | 3,604,767 | |
| | | | | | 11,878,071 | |
| | | | Utilities: 0.6% | | | |
217,200 | | @ | | Calpine Corp. | | 2,897,448 | |
100,500 | | @ | | NRG Energy, Inc. | | 1,963,770 | |
| | | | | | 4,861,218 | |
| | | | Total Common Stock
(Cost $658,974,106) | | 811,248,711 | |
| | | | | | | |
REAL ESTATE INVESTMENT TRUSTS: 0.4% | | | |
| | | | Financials: 0.4% | | | |
20,000 | | | | Federal Realty Investment Trust | | 1,558,600 | |
117,680 | �� | | | Prologis | | 1,699,299 | |
| | | | | | | |
| | | | Total Real Estate Investment Trusts
(Cost $2,650,475) | | 3,257,899 | |
| | | | | | | |
PREFERRED STOCK: 0.2% | | | |
| | | | Information Technology: 0.2% | | | |
58,470 | | @, R, X | | Groupon, Inc. | | 1,847,067 | |
| | | | | | | |
| | | | Total Preferred Stock
(Cost $1,847,067) | | 1,847,067 | |
| | | | | | | |
| | | | Total Long-Term Investments
(Cost $663,471,648) | | 816,353,677 | |
| | | |
SHORT-TERM INVESTMENTS: 5.3% | | | |
| | | | Mutual Funds: 0.3% | | | |
2,604,988 | | | | T. Rowe Price Reserve Investment Fund | | 2,604,988 | |
| | | | | | | |
| | | | Total Mutual Funds
(Cost $2,604,988) | | 2,604,988 | |
| | | | | | | |
| | | | Securities Lending Collateral(cc): 5.0% | | | |
39,070,449 | | | | BNY Mellon Overnight Government Fund (1) | | 39,070,449 | |
2,384,768 | | R | | BNY Institutional Cash Reserves Fund, Series B (1)(2) | | 1,907,814 | |
| | | | | | | |
| | | | Total Securities Lending Collateral
(Cost $41,455,217) | | 40,978,263 | |
| | | | | | | |
| | | | Total Short-Term Investments
(Cost $44,060,205) | | 43,583,251 | |
| | | | | | | |
| | | | Total Investments in Securities
(Cost $707,531,853) * | 105.1 | % | | $ | 859,936,928 | |
| | | | Other Assets and Liabilities - Net | (5.1 | ) | | (41,694,420 | ) |
| | | | Net Assets | 100.0 | % | | $ | 818,242,508 | |
| | @ | | Non-income producing security |
| | ADR | | American Depositary Receipt |
| | (cc) | | Securities purchased with cash collateral for securities loaned. |
| | (1) | | Collateral received from brokers for securities lending was invested in these short-term investments. |
| | (2) | | On September 12, 2008, BNY established a separate sleeve of the Institutional Cash Reserves Fund (Series B) to hold certain Lehman Brothers defaulted debt obligations. The Portfolio’s position in Series B is being fair valued daily. Please see the accompanying Notes to Financial Statements for additional details on securities lending. |
| | R | | Restricted security |
| | L | | Loaned security, a portion or all of the security is on loan at December 31, 2010. |
| | X | | Fair value determined by ING Funds Valuation Committee appointed by the Funds’ Board of Directors/Trustees. |
| | PORTFOLIO OF INVESTMENTS |
ING T. Rowe Price Growth Equity Portfolio | | as of December 31, 2010 |
Shares | | | | | | Value | |
| | | |
COMMON STOCK: 99.2% | | | |
| | | | Consumer Discretionary: 18.8% | | | |
251,000 | | @ | | Amazon.com, Inc. | | $ | 45,180,000 | |
22,000 | | @ | | Autozone, Inc. | | 5,996,980 | |
225,000 | | @ | | Carmax, Inc. | | 7,173,000 | |
158,800 | | | | Carnival PLC | | 7,386,161 | |
19,000 | | @ | | Chipotle Mexican Grill, Inc. | | 4,040,540 | |
257,600 | | | | Coach, Inc. | | 14,247,856 | |
144,200 | | @ | | Ctrip.com International Ltd. ADR | | 5,832,890 | |
104,500 | | @ | | Discovery Communications, Inc. - Class A | | 4,357,650 | |
149,300 | | @ | | Dollar General Corp. | | 4,579,031 | |
100,900 | | @ | | General Motors Co. | | 3,719,174 | |
128,400 | | @ | | Las Vegas Sands Corp. | | 5,899,980 | |
463,700 | | @ | | Liberty Media Corp. - Interactive - Class A | | 7,312,549 | |
262,600 | | | | Lowe’s Cos., Inc. | | 6,586,008 | |
296,311 | | | | Marriott International, Inc. | | 12,308,759 | |
123,600 | | @, L | | MGM Resorts International | | 1,835,460 | |
5,800 | | @ | | NetFlix, Inc. | | 1,019,060 | |
124,100 | | | | Nike, Inc. | | 10,600,622 | |
112,400 | | @ | | O’Reilly Automotive, Inc. | | 6,791,208 | |
24,759 | | @ | | Priceline.com, Inc. | | 9,892,457 | |
59,900 | | | | Ross Stores, Inc. | | 3,788,675 | |
485,400 | | | | Starbucks Corp. | | 15,595,902 | |
147,700 | | | | Starwood Hotels & Resorts Worldwide, Inc. | | 8,977,206 | |
273,100 | | | | Walt Disney Co. | | 10,243,981 | |
| | | | | | 203,365,149 | |
| | | | Consumer Staples: 2.4% | | | |
33,200 | | | | Colgate-Palmolive Co. | | 2,668,284 | |
119,400 | | | | Costco Wholesale Corp. | | 8,621,874 | |
109,400 | | | | PepsiCo, Inc. | | 7,147,102 | |
116,880 | | | | Procter & Gamble Co. | | 7,518,890 | |
| | | | | | 25,956,150 | |
| | | | Energy: 8.8% | | | |
173,100 | | @ | | Cameron International Corp. | | 8,781,363 | |
116,700 | | | | EOG Resources, Inc. | | 10,667,547 | |
95,200 | | @ | | FMC Technologies, Inc. | | 8,464,232 | |
205,400 | | @ | | McDermott International, Inc. | | 4,249,726 | |
94,900 | | | | Murphy Oil Corp. | | 7,074,795 | |
123,900 | | | | Occidental Petroleum Corp. | | 12,154,590 | |
122,600 | | | | Peabody Energy Corp. | | 7,843,948 | |
142,300 | | | | Petroleo Brasileiro SA ADR | | 4,862,391 | |
234,500 | | | | Schlumberger Ltd. | | 19,580,750 | |
289,800 | | | | Suncor Energy, Inc. | | 11,096,442 | |
| | | | | | 94,775,784 | |
| | | | Financials: 7.5% | | | |
323,100 | | | | American Express Co. | | 13,867,452 | |
247,200 | | | | Discover Financial Services | | 4,580,616 | |
141,308 | | | | Franklin Resources, Inc. | | 15,714,863 | |
76,500 | | @, L | | IntercontinentalExchange, Inc. | | 9,114,975 | |
416,400 | | @ | | Invesco Ltd. | | 10,018,584 | |
332,100 | | | | JPMorgan Chase & Co. | | 14,087,682 | |
131,300 | | | | Northern Trust Corp. | | 7,275,333 | |
235,900 | | | | US Bancorp. | | 6,362,223 | |
| | | | | | 81,021,728 | |
| | | | Health Care: 6.0% | | | |
93,800 | | | | Allergan, Inc. | | 6,441,246 | |
98,058 | | @ | | Celgene Corp. | | 5,799,150 | |
65,900 | | @ | | Edwards Lifesciences Corp. | | 5,327,356 | |
357,000 | | @ | | Express Scripts, Inc. | | 19,295,850 | |
152,800 | | @ | | Human Genome Sciences, Inc. | | 3,650,392 | |
114,700 | | @, L | | Illumina, Inc. | | 7,265,098 | |
151,700 | | | | McKesson Corp. | | 10,676,646 | |
131,300 | | | | Stryker Corp. | | 7,050,810 | |
| | | | | | 65,506,548 | |
| | | | Industrials: 15.3% | | | |
112,900 | | | | 3M Co. | | 9,743,270 | |
91,600 | | @ | | Babcock & Wilcox Co. | | 2,344,044 | |
45,000 | | | | Caterpillar, Inc. | | 4,214,700 | |
43,900 | | | | Cummins, Inc. | | 4,829,439 | |
682,200 | | | | Danaher Corp. | | 32,179,373 | |
65,600 | | | | Deere & Co. | | 5,448,080 | |
180,200 | | | | Emerson Electric Co. | | 10,302,034 | |
167,000 | | | | Expeditors International Washington, Inc. | | 9,118,200 | |
177,000 | | L | | Fastenal Co. | | 10,604,070 | |
| | | | | | | | |
208,700 | | | | FedEx Corp. | | 19,411,187 | |
51,200 | | | | Joy Global, Inc. | | 4,441,600 | |
130,800 | | | | Paccar, Inc. | | 7,510,536 | |
93,400 | | | | Precision Castparts Corp. | | 13,002,214 | |
82,800 | | | | Rockwell Automation, Inc. | | 5,937,588 | |
110,600 | | | | Union Pacific Corp. | | 10,248,196 | |
144,000 | | | | United Parcel Service, Inc. - Class B | | 10,451,520 | |
45,400 | | L | | WW Grainger, Inc. | | 6,270,194 | |
| | | | | | 166,056,245 | |
| | | | Information Technology: 31.1% | | | |
218,900 | | | | Accenture PLC | | 10,614,461 | |
147,168 | | @ | | Akamai Technologies, Inc. | | 6,924,254 | |
245,100 | | @ | | Apple, Inc. | | 79,059,456 | |
132,800 | | | | ASML Holding NV | | 5,091,552 | |
47,900 | | @ | | Autodesk, Inc. | | 1,829,780 | |
84,500 | | @ | | Autonomy Corp. PLC | | 1,987,961 | |
209,900 | | @ | | Baidu.com ADR | | 20,261,647 | |
266,900 | | | | Broadcom Corp. | | 11,623,495 | |
748,000 | | | | Corning, Inc. | | 14,451,360 | |
159,700 | | @ | | Dolby Laboratories, Inc. | | 10,651,990 | |
341,000 | | @ | | eBay, Inc. | | 9,490,030 | |
162,200 | | @ | | EMC Corp. | | 3,714,380 | |
94,250 | | @ | | Google, Inc. - Class A | | 55,981,673 | |
393,000 | | @ | | Juniper Networks, Inc. | | 14,509,560 | |
7,000 | | @, # | | Mail.ru Group Ltd. GDR | | 252,000 | |
120,200 | | @ | | Marvell Technology Group Ltd. | | 2,229,710 | |
55,700 | | | | Mastercard, Inc. | | 12,482,927 | |
120,800 | | @ | | NetApp, Inc. | | 6,639,168 | |
440,800 | | | | Qualcomm, Inc. | | 21,815,192 | |
96,400 | | @ | | Rovi Corp. | | 5,977,764 | |
3,016 | | @ | | Salesforce.com, Inc. | | 398,112 | |
5,043 | | | | Samsung Electronics Co., Ltd. | | 4,211,592 | |
411,700 | | | | Tencent Holdings Ltd. | | 8,937,778 | |
298,900 | | | | Visa, Inc. | | 21,036,582 | |
347,800 | | | | Western Union Co. | | 6,458,646 | |
| | | | | | 336,631,070 | |
| | | | Materials: 5.5% | | | |
48,700 | | | | Agnico-Eagle Mines Ltd. | | 3,735,290 | |
61,700 | | | | Air Products & Chemicals, Inc. | | 5,611,615 | |
241,847 | | | | BHP Billiton Ltd. | | 11,246,137 | |
71,200 | | | | Freeport-McMoRan Copper & Gold, Inc. | | 8,550,408 | |
83,072 | | | | Mosaic Co. | | 6,343,378 | |
249,500 | | | | Praxair, Inc. | | 23,819,765 | |
| | | | | | 59,306,593 | |
| | | | Telecommunication Services: 3.8% | | | |
339,200 | | @ | | American Tower Corp. | | 17,516,288 | |
540,112 | | @ | | Crown Castle International Corp. | | 23,673,109 | |
| | | | | | 41,189,397 | |
| | | | Total Common Stock
(Cost $794,023,410) | | 1,073,808,664 | |
| | | |
PREFERRED STOCK: 0.2% | | | |
| | | | Information Technology: 0.2% | | | |
63,003 | | @, R, X | | Groupon, Inc. | | 1,990,265 | |
| | | | | | | |
| | | | Total Preferred Stock
(Cost $1,990,265) | | 1,990,265 | |
| | | | | | | |
| | | | Total Long-Term Investments
(Cost $796,013,675) | | 1,075,798,929 | |
| | | | | | | |
SHORT-TERM INVESTMENTS: 1.5% | | | |
| | | | Mutual Funds: 0.5% | | | |
5,773,730 | | | | T. Rowe Price Reserve Investment Fund | | 5,773,730 | |
| | | | | | | |
| | | | Total Mutual Funds
(Cost $5,773,730) | | 5,773,730 | |
| | | | | | | |
| | | | Securities Lending Collateral(cc): 1.0% | | | |
8,889,825 | | | | BNY Mellon Overnight Government Fund (1) | | 8,889,825 | |
1,695,725 | | R | | BNY Institutional Cash Reserves Fund, Series B (1)(2) | | 1,356,580 | |
| | | | | | | |
| | | | Total Securities Lending Collateral
(Cost $10,585,550) | | 10,246,405 | |
| | | | | | | |
| | | | Total Short-Term Investments
(Cost $16,359,280) | | 16,020,135 | |
| | | | | | | |
| | | | Total Investments in Securities
(Cost $812,372,955) * | 100.9 | % | | $ | 1,091,819,064 | |
| | | | Other Assets and Liabilities - Net | (0.9 | ) | | (9,661,457 | ) |
| | | | Net Assets | 100.0 | % | | $ | 1,082,157,607 | |
| | @ | | Non-income producing security |
| | ADR | | American Depositary Receipt |
| | GDR | | Global Depositary Receipt |
| | # | | Securities with purchases pursuant to Rule 144A or section 4(2), under the Securities Act of 1933 and may not be resold subject to that rule except to qualified institutional buyers. Unless otherwise noted, these securities have been determined to be liquid under the guidelines established by the Funds’ Board of Directors/Trustees. |
| | (cc) | | Securities purchased with cash collateral for securities loaned. |
| | (1) | | Collateral received from brokers for securities lending was invested in these short-term investments. |
| | (2) | | On September 12, 2008, BNY established a separate sleeve of the Institutional Cash Reserves Fund (Series B) to hold certain Lehman Brothers defaulted debt obligations. The Portfolio’s position in Series B is being fair valued daily. Please see the accompanying Notes to Financial Statements for additional details on securities lending. |
| | R | | Restricted security |
| | L | | Loaned security, a portion or all of the security is on loan at December 31, 2010. |
| | X | | Fair value determined by ING Funds Valuation Committee appointed by the Funds’ Board of Directors/Trustees. |
| | PORTFOLIO OF INVESTMENTS |
ING Templeton Foreign Equity Portfolio | | as of December 31, 2010 |
Shares | | | | | | Value | |
COMMON STOCK: 86.6% | | | |
| | | | Austria: 0.6% | | | |
285,860 | | | | Telekom Austria AG | | $ | 4,029,181 | |
| | | | | | 4,029,181 | |
| | | | Bermuda: 0.8% | | | |
69,740 | | | | PartnerRe Ltd. | | 5,603,609 | |
| | | | | | 5,603,609 | |
| | | | Brazil: 2.2% | | | |
193,380 | | | | Embraer SA ADR | | 5,685,372 | |
184,274 | | | | Petroleo Brasileiro SA ADR | | 6,972,928 | |
89,910 | | | | Vale S.A. ADR | | 2,717,080 | |
| | | | | | 15,375,380 | |
| | | | Canada: 2.2% | | | |
122,400 | | | | Husky Energy, Inc. | | 3,268,350 | |
531,300 | | | | Talisman Energy, Inc. | | 11,819,728 | |
| | | | | | 15,088,078 | |
| | | | China: 3.1% | | | |
599,500 | | | | China Shenhua Energy Co., Ltd. | | 2,512,467 | |
19,862,000 | | | | China Telecom Corp., Ltd. | | 10,378,209 | |
13,026,153 | | | | Shanghai Electric Group Co., Ltd. | | 8,593,857 | |
| | | | | | 21,484,533 | |
| | | | Denmark: 0.5% | | | |
106,760 | | @ | | Vestas Wind Systems A/S | | 3,381,120 | |
| | | | | | 3,381,120 | |
| | | | France: 8.2% | | | |
71,260 | | | | Alstom | | 3,415,577 | |
424,911 | | | | AXA S.A. | | 7,072,830 | |
101,110 | | | | Capgemini S.A. | | 4,726,856 | |
98,650 | | | | Cie Generale des Etablissements Michelin | | 7,081,658 | |
397,550 | | | | France Telecom S.A. | | 8,319,075 | |
116,036 | | | | Gaz de France | | 4,167,453 | |
138,888 | | | | Sanofi-Aventis | | 8,904,220 | |
153,638 | | | | Total S.A. | | 8,183,148 | |
171,400 | | | | Vivendi | | 4,631,512 | |
| | | | | | 56,502,329 | |
| | | | Germany: 10.2% | | | |
40,910 | | | | Bayerische Motoren Werke AG | | 3,223,178 | |
224,150 | | | | Celesio AG | | 5,585,933 | |
350,450 | | | | Deutsche Post AG | | 5,945,455 | |
215,412 | | | | E.ON AG | | 6,578,434 | |
916,844 | | @ | | Infineon Technologies AG | | 8,546,170 | |
59,230 | | | | MAN AG | | 7,054,644 | |
68,370 | | | | Merck KGaA | | 5,473,721 | |
41,570 | | | | Muenchener Rueckversicherungs AG | | 6,295,973 | |
172,576 | | | | SAP AG | | 8,801,836 | |
103,733 | | | | Siemens AG | | 12,849,888 | |
| | | | | | 70,355,232 | |
| | | | Hong Kong: 3.9% | | | |
2,151,100 | | @ | | AIA Group Ltd. | | 6,046,925 | |
273,700 | | | | Cheung Kong Holdings Ltd. ADR | | 4,214,980 | |
708,500 | | | | China Mobile Ltd. | | 7,024,679 | |
370,000 | | | | Hutchison Whampoa Ltd. | | 3,806,300 | |
361,500 | | | | Swire Pacific Ltd. | | 5,939,457 | |
| | | | | | 27,032,341 | |
| | | | India: 3.1% | | | |
711,953 | | | | Housing Development Finance Corp. | | 11,590,738 | |
195,050 | | | | ICICI Bank Ltd. ADR | | 9,877,332 | |
| | | | | | 21,468,070 | |
| | | | Ireland: 0.6% | | | |
208,130 | | | | CRH PLC | | 4,342,425 | |
| | | | | | 4,342,425 | |
| | | | Italy: 2.4% | | | |
344,844 | | | | ENI S.p.A. | | 7,558,089 | |
1,525,592 | | | | Intesa Sanpaolo S.p.A. | | 4,147,536 | |
2,426,129 | | | | UniCredito Italiano S.p.A. | | 5,029,770 | |
| | | | | | 16,735,395 | |
| | | | Japan: 3.2% | | | |
86,900 | | | | Fuji Photo Film Co., Ltd. | | 3,130,024 | |
525,100 | | | | Itochu Corp. | | 5,290,772 | |
1,035,500 | | | | Mitsubishi UFJ Financial Group, Inc. | | 5,583,541 | |
16,800 | | | | Nintendo Co., Ltd. | | 4,904,789 | |
80,000 | | | | Toyota Motor Corp. | | 3,149,476 | |
| | | | | | 22,058,602 | |
| | | | Netherlands: 5.9% | | | |
82,860 | | | | Akzo Nobel NV | | 5,155,329 | |
269,105 | | | | Koninklijke Philips Electronics NV | | 8,250,042 | |
98,900 | | @ | | Randstad Holdings NV | | 5,226,773 | |
310,440 | | | | Royal Dutch Shell PLC - Class B | | 10,280,075 | |
242,792 | | | | SBM Offshore NV | | 5,447,424 | |
211,190 | | | | Unilever NV | | 6,588,620 | |
| | | | | | 40,948,263 | |
| | | | Norway: 2.8% | | | |
381,570 | | | | Statoil ASA | | 9,088,253 | |
637,490 | | | | Telenor ASA | | 10,388,118 | |
| | | | | | 19,476,371 | |
| | | | Portugal: 0.9% | | | |
517,580 | | | | Portugal Telecom SGPS S.A. | | 5,908,214 | |
| | | | | | 5,908,214 | |
| | | | Singapore: 3.2% | | | |
1,028,500 | | | | DBS Group Holdings Ltd. | | 11,479,664 | |
2,430,000 | | | | Singapore Telecommunications Ltd. | | 5,774,512 | |
370,000 | | | | United Overseas Bank Ltd. | | 5,250,659 | |
| | | | | | 22,504,835 | |
| | | | South Korea: 4.0% | | | |
129,728 | | | | KB Financial Group, Inc. ADR | | 6,861,314 | |
86,118 | | @ | | LG Electronics, Inc. | | 8,933,964 | |
28,943 | | | | Samsung Electronics Co., Ltd. GDR | | 12,101,025 | |
| | | | | | 27,896,303 | |
| | | | Spain: 3.5% | | | |
424,844 | | | | Banco Santander Central Hispano S.A. | | 4,527,064 | |
732,270 | | | | Iberdrola S.A. | | 5,677,738 | |
| | | | | | | | |
120,515 | | | | Repsol YPF S.A. | | 3,374,856 | |
473,255 | | | | Telefonica S.A. | | 10,804,432 | |
| | | | | | 24,384,090 | |
| | | | Sweden: 1.1% | | | |
663,420 | | | | Telefonaktiebolaget LM Ericsson | | 7,688,253 | |
| | | | | | 7,688,253 | |
| | | | Switzerland: 6.7% | | | |
115,149 | | | | Adecco S.A. | | 7,551,398 | |
153,740 | | | | Nestle S.A. | | 9,006,654 | |
191,006 | | | | Novartis AG | | 11,243,684 | |
45,800 | | | | Roche Holding AG - Genusschein | | 6,713,952 | |
163,681 | | | | Swiss Reinsurance | | 8,780,968 | |
198,512 | | @ | | UBS AG - Reg | | 3,259,301 | |
| | | | | | 46,555,957 | |
| | | | Taiwan: 2.0% | | | |
558,414 | | @ | | Compal Electronics, Inc. | | 3,701,168 | |
2,054,251 | | | | Taiwan Semiconductor Manufacturing Co., Ltd. | | 5,000,663 | |
383,376 | | | | Taiwan Semiconductor Manufacturing Co., Ltd. ADR | | 4,807,535 | |
| | | | | | 13,509,366 | |
| | | | United Kingdom: 15.5% | | | |
845,740 | | | | Aviva PLC | | 5,198,635 | |
1,365,890 | | | | BAE Systems PLC | | 7,035,403 | |
931,060 | | | | BP PLC | | 6,862,780 | |
1,344,490 | | @ | | British Airways PLC | | 5,730,898 | |
666,327 | | | | Burberry Group PLC | | 11,710,638 | |
485,427 | | | | GlaxoSmithKline PLC | | 9,413,793 | |
2,403,850 | | | | Hays PLC | | 4,853,847 | |
754,000 | | | | HSBC Holdings PLC | | 7,699,450 | |
1,424,335 | | | | Kingfisher PLC | | 5,867,852 | |
880,820 | | | | Marks & Spencer Group PLC | | 5,079,239 | |
483,080 | | | | Pearson PLC | | 7,612,908 | |
218,267 | | | | Rexam PLC | | 1,133,538 | |
633,400 | | @ | | Rolls-Royce Group PLC | | 6,171,361 | |
40,537,600 | | @ | | Rolls-Royce Group PLC - C Shares | | 63,202 | |
204,258 | | | | Standard Chartered PLC | | 5,514,064 | |
937,220 | | | | Tesco PLC | | 6,214,721 | |
3,365,836 | | | | Vodafone Group PLC | | 8,835,787 | |
77,746 | | @ | | Wolseley PLC | | 2,488,813 | |
| | | | | | 107,486,929 | |
| | | | Total Common Stock
(Cost $559,813,226) | | 599,814,876 | |
Principal Amount | | | | | | | |
| | | | | | | |
SHORT-TERM INVESTMENTS: 0.3% | | | |
| | | | U.S. Government Agency Obligations: 0.3% | | | |
$ | 2,400,000 | | Z | | Federal Home Loan Bank, 0.001%, due 01/03/11 | | | 2,400,000 | |
| | | | | | | |
| | | | Total Short-Term Investments
(Cost $2,400,000) | | 2,400,000 | |
| | | | | | | |
| | | | Total Investments in Securities
(Cost $562,213,226) * | 86.9 | % | | $ | 602,214,876 | |
| | | | Other Assets and Liabilities - Net | 13.1 | | | 90,469,347 | |
| | | | Net Assets | 100.0 | % | | $ | 692,684,223 | |
| | | | | | | | | | | |
| | @ | | Non-income producing security |
| | ADR | | American Depositary Receipt |
| | GDR | | Global Depositary Receipt |
| | Z | | Indicates Zero Coupon Bond; rate shown reflects current effective yield. |
| | PORTFOLIO OF INVESTMENTS |
ING Thornburg Value Portfolio | | as of December 31, 2010 |
Shares | | | | | | Value | |
| | | |
COMMON STOCK: 97.5% | | | |
| | | | Consumer Discretionary: 8.2% | | | |
164,300 | | | | Best Buy Co., Inc. | | $ | 5,633,847 | |
291,578 | | | | Comcast Corp. — Special Class A | | 6,067,738 | |
210,775 | | @ | | Dish Network Corp. | | 4,143,837 | |
118,096 | | @ | | Life Time Fitness, Inc. | | 4,840,755 | |
442,400 | | @ | | Pulte Homes, Inc. | | 3,326,848 | |
| | | | | | 24,013,025 | |
| | | | Consumer Staples: 0.2% | | | |
756,115 | | @ | | Rite Aid Corp. | | 667,801 | |
| | | | | | 667,801 | |
| | | | Energy: 19.4% | | | |
156,300 | | | | Baker Hughes, Inc. | | 8,935,671 | |
89,642 | | | | ConocoPhillips | | 6,104,620 | |
261,480 | | | | Gazprom OAO ADR | | 6,652,051 | |
1,900 | | | | Inpex Holdings, Inc. | | 11,094,843 | |
201,035 | | | | Marathon Oil Corp. | | 7,444,326 | |
727,780 | | @ | | SandRidge Energy, Inc. | | 5,327,350 | |
166,100 | | @ | | Transocean Ltd. | | 11,545,611 | |
| | | | | | 57,104,472 | |
| | | | Financials: 15.1% | | | |
182,500 | | | | Hartford Financial Services Group, Inc. | | 4,834,425 | |
319,550 | | | | JPMorgan Chase & Co. | | 13,555,311 | |
1,972,042 | | | | Mitsubishi UFJ Financial Group, Inc. | | 10,633,489 | |
83,549 | | | | Transatlantic Holdings, Inc. | | 4,312,799 | |
416,305 | | | | US Bancorp. | | 11,227,746 | |
| | | | | | 44,563,770 | |
| | | | Health Care: 15.8% | | | |
139,600 | | @ | | Alere, Inc. | | 5,109,360 | |
52,116 | | @ | | Community Health Systems, Inc. | | 1,947,575 | |
213,115 | | | | Eli Lilly & Co. | | 7,467,550 | |
320,380 | | @ | | Gilead Sciences, Inc. | | 11,610,571 | |
33,100 | | | | Roche Holding AG - Genusschein | | 4,852,223 | |
80,800 | | @ | | Talecris Biotherapeutics Holdings Corp. | | 1,882,640 | |
119,844 | | @ | | Thermo Fisher Scientific, Inc. | | 6,634,564 | |
99,775 | | @ | | Varian Medical Systems, Inc. | | 6,912,412 | |
| | | | | | 46,416,895 | |
| | | | Industrials: 5.5% | | | |
632,200 | | | | General Electric Co. | | 11,562,938 | |
67,700 | | | | Lockheed Martin Corp. | | 4,732,907 | |
| | | | | | 16,295,845 | |
| | | | Information Technology: 22.0% | | | |
192,600 | | @ | | Adobe Systems, Inc. | | 5,928,228 | |
210,329 | | @ | | Amdocs Ltd. | | 5,777,738 | |
68,106 | | @ | | Ansys, Inc. | | 3,546,279 | |
109,523 | | | | Corning, Inc. | | 2,115,984 | |
805,797 | | @ | | Dell, Inc. | | 10,918,549 | |
175,487 | | @ | | Fiserv, Inc. | | 10,276,519 | |
17,250 | | @ | | Google, Inc. - Class A | | 10,245,983 | |
437,202 | | @ | | MEMC Electronic Materials, Inc. | | 4,922,895 | |
154,474 | | | | Microsoft Corp. | | 4,312,914 | |
225,752 | | @ | | NCR Corp. | | 3,469,808 | |
343,638 | | @ | | ON Semiconductor Corp. | | 3,395,143 | |
| | | | | | 64,910,040 | |
| | | | Materials: 8.5% | | | |
130,000 | | | | Monsanto Co. | | 9,053,200 | |
651,500 | | | | Tokyo Steel Manufacturing Co., Ltd. | | 7,077,948 | |
149,637 | | L | | United States Steel Corp. | | 8,741,794 | |
| | | | | | 24,872,942 | |
| | | | Telecommunication Services: 2.8% | | | |
553,328 | | | | China Mobile Ltd. | | 5,486,170 | |
2,931,950 | | @, L | | Level 3 Communications, Inc. | | 2,873,311 | |
| | | | | | 8,359,481 | |
| | | | Total Common Stock
(Cost $260,846,816) | | 287,204,271 | |
| | | | | | | |
Principal Amount | | | | | | | |
| | | |
CORPORATE BONDS/NOTES: 2.9% | | | |
| | | | Financials: 1.2% | | | |
$ | 3,000,000 | | #, L | | AngloGold Ashanti Holdings Finance PLC, 3.500%, due 05/22/14 | | $ | 3,750,000 | |
| | | | | | 3,750,000 | |
| | | | Telecommunication Services: 1.7% | | | |
891,000 | | L | | Level 3 Communications, Inc., 6.500%, due 10/01/16 | | 965,621 | |
4,000,000 | | | | Level 3 Financing, Inc., 9.250%, due 11/01/14 | | 3,990,000 | |
| | | | | | 4,955,621 | |
| | | | Total Corporate Bonds/Notes
(Cost $7,661,694) | | 8,705,621 | |
| | | | | | | |
| | | | Total Long-Term Investments
(Cost $268,508,510) | | 295,909,892 | |
| | | | | | | | | |
Shares | | | | | | | |
| | | |
SHORT-TERM INVESTMENTS: 3.1% | | | |
| | | | Securities Lending Collateral(cc): 3.1% | | | |
8,644,142 | | | | BNY Mellon Overnight Government Fund (1) | | 8,644,142 | |
539,803 | | R | | BNY Institutional Cash Reserves Fund, Series B (1)(2) | | 431,842 | |
| | | | | | | |
| | | | Total Short-Term Investments
(Cost $9,183,945) | | 9,075,984 | |
| | | | | | | |
| | | | Total Investments in Securities
(Cost $277,692,455) * | 103.5 | % | | $ | 304,985,876 | |
| | | | Other Assets and Liabilities - Net | (3.5 | ) | | (10,387,613 | ) |
| | | | Net Assets | 100.0 | % | | $ | 294,598,263 | |
| | @ | | Non-income producing security |
| | ADR | | American Depositary Receipt |
| | # | | Securities with purchases pursuant to Rule 144A or section 4(2), under the Securities Act of 1933 and may not be resold subject to that rule except to qualified institutional buyers. Unless otherwise noted, these securities have been determined to be liquid under the guidelines established by the Funds’ Board of Directors/Trustees. |
| | (cc) | | Securities purchased with cash collateral for securities loaned. |
| | (1) | | Collateral received from brokers for securities lending was invested in these short-term investments. |
| | (2) | | On September 12, 2008, BNY established a separate sleeve of the Institutional Cash Reserves Fund (Series B) to hold certain Lehman Brothers defaulted debt obligations. The Portfolio’s position in Series B is being fair valued daily. Please see the accompanying Notes to Financial Statements for additional details on securities lending. |
| | R | | Restricted security |
| | L | | Loaned security, a portion or all of the security is on loan at December 31, 2010. |
| | PORTFOLIO OF INVESTMENTS |
ING UBS U.S. Large Cap Equity Portfolio | | as of December 31, 2010 |
Shares | | | | | | Value | |
| | | |
COMMON STOCK: 98.4% | | | |
| | | | Consumer Discretionary: 15.0% | | | |
29,800 | | @ | | Apollo Group, Inc. - Class A | | $ | 1,176,802 | |
76,900 | | | | Carnival Corp. | | 3,545,859 | |
161,000 | | | | Comcast Corp. — Class A | | 3,537,170 | |
51,500 | | L | | Fortune Brands, Inc. | | 3,102,875 | |
70,400 | | @, L | | GameStop Corp. | | 1,610,752 | |
54,300 | | @ | | General Motors Co. | | 2,001,498 | |
78,900 | | | | International Game Technology | | 1,395,741 | |
47,100 | | @, L | | Interpublic Group of Cos., Inc. | | 500,202 | |
66,600 | | | | Johnson Controls, Inc. | | 2,544,120 | |
92,300 | | | | Lowe’s Cos., Inc. | | 2,314,884 | |
85,300 | | | | Time Warner, Inc. | | 2,744,101 | |
48,800 | | | | Viacom - Class B | | 1,932,968 | |
| | | | | | 26,406,972 | |
| | | | Consumer Staples: 7.5% | | | |
81,100 | | | | Avon Products, Inc. | | 2,356,766 | |
36,400 | | | | Kellogg Co. | | 1,859,312 | |
111,900 | | | | Kroger Co. | | 2,502,084 | |
50,700 | | | | PepsiCo, Inc. | | 3,312,231 | |
48,800 | | | | Procter & Gamble Co. | | 3,139,304 | |
| | | | | | 13,169,697 | |
| | | | Energy: 11.1% | | | |
40,800 | | | | Baker Hughes, Inc. | | 2,332,536 | |
101,100 | | | | ExxonMobil Corp. | | 7,392,432 | |
31,700 | | | | Hess Corp. | | 2,426,318 | |
55,200 | | | | Marathon Oil Corp. | | 2,044,056 | |
72,000 | | @ | | Noble Corp. | | 2,575,440 | |
59,100 | | @ | | Ultra Petroleum Corp. | | 2,823,207 | |
| | | | | | 19,593,989 | |
| | | | Financials: 14.5% | | | |
59,100 | | | | Aflac, Inc. | | 3,335,013 | |
67,492 | | | | Bank of New York Mellon Corp. | | 2,038,258 | |
371,700 | | @ | | Citigroup, Inc. | | 1,758,141 | |
13,500 | | | | Goldman Sachs Group, Inc. | | 2,270,160 | |
94,000 | | | | JPMorgan Chase & Co. | | 3,987,480 | |
56,700 | | | | Metlife, Inc. | | 2,519,748 | |
46,700 | | | | Morgan Stanley | | 1,270,707 | |
47,500 | | | | Principal Financial Group, Inc. | | 1,546,600 | |
98,300 | | | | US Bancorp. | | 2,651,151 | |
138,500 | | | | Wells Fargo & Co. | | 4,292,115 | |
| | | | | | 25,669,373 | |
| | | | Health Care: 13.2% | | | |
12,300 | | @ | | Alexion Pharmaceuticals, Inc. | | 990,765 | |
39,400 | | | | Allergan, Inc. | | 2,705,598 | |
27,500 | | @ | | Amgen, Inc. | | 1,509,750 | |
29,800 | | @ | | Amylin Pharmaceuticals, Inc. | | 438,358 | |
32,100 | | | | Baxter International, Inc. | | 1,624,902 | |
118,100 | | @, L | | Boston Scientific Corp. | | 894,017 | |
61,700 | | | | Covidien PLC | | 2,817,222 | |
17,700 | | @ | | Genzyme Corp. | | 1,260,240 | |
57,100 | | | | Johnson & Johnson | | 3,531,635 | |
62,800 | | | | Medtronic, Inc. | | 2,329,252 | |
66,200 | | | | Merck & Co., Inc. | | 2,385,848 | |
79,600 | | | | UnitedHealth Group, Inc. | | 2,874,356 | |
| | | | | | 23,361,943 | |
| | | | Industrials: 10.8% | | | |
46,000 | | | | Dover Corp. | | 2,688,700 | |
26,500 | | | | FedEx Corp. | | 2,464,765 | |
48,500 | | | | General Dynamics Corp. | | 3,441,560 | |
61,500 | | | | Illinois Tool Works, Inc. | | 3,284,100 | |
15,350 | | | | Paccar, Inc. | | 881,397 | |
34,100 | | | | Pall Corp. | | 1,690,678 | |
29,400 | | | | Raytheon Co. | | 1,362,396 | |
32,300 | | L | | Ryder System, Inc. | | 1,700,272 | |
119,700 | | L | | Southwest Airlines Co. | | 1,553,706 | |
| | | | | | 19,067,574 | |
| | | | Information Technology: 19.5% | | | |
106,500 | | @ | | Adobe Systems, Inc. | | 3,278,070 | |
17,400 | | @ | | Apple, Inc. | | 5,612,544 | |
76,900 | | | | Applied Materials, Inc. | | 1,080,445 | |
51,200 | | @ | | Autodesk, Inc. | | 1,955,840 | |
43,800 | | | | Broadcom Corp. | | 1,907,490 | |
| | | | | | | | |
147,400 | | @ | | Cisco Systems, Inc. | | 2,981,902 | |
64,100 | | | | Hewlett-Packard Co. | | 2,698,610 | |
91,900 | | L | | Intersil Corp. | | 1,403,313 | |
71,900 | | @ | | Marvell Technology Group Ltd. | | 1,333,745 | |
101,800 | | | | Microsoft Corp. | | 2,842,256 | |
103,000 | | | | National Semiconductor Corp. | | 1,417,280 | |
57,500 | | | | Qualcomm, Inc. | | 2,845,675 | |
106,200 | | @ | | Seagate Technology, Inc. | | 1,596,186 | |
107,500 | | @ | | Symantec Corp. | | 1,799,550 | |
22,800 | | | | Visa, Inc. | | 1,604,664 | |
| | | | | | 34,357,570 | |
| | | | Materials: 2.1% | | | |
21,200 | | | | Celanese Corp. | | 872,805 | |
44,800 | | | | Dow Chemical Co. | | 1,529,472 | |
20,200 | | | | Monsanto Co. | | 1,406,728 | |
| | | | | | 3,809,005 | |
| | | | Telecommunication Services: 2.1% | | | |
124,700 | | | | AT&T, Inc. | | 3,663,686 | |
| | | | | | 3,663,686 | |
| | | | Utilities: 2.6% | | | |
81,900 | | | | American Electric Power Co., Inc. | | 2,946,762 | |
44,100 | | L | | FirstEnergy Corp. | | 1,632,582 | |
| | | | | | 4,579,344 | |
| | | | Total Common Stock
(Cost $144,422,056) | | 173,679,153 | |
| | | | | | | |
EXCHANGE-TRADED FUNDS: 1.1% | | | |
| | | | Exchange-Traded Funds: 1.1% | | | |
15,000 | | | | SPDR Trust Series 1 | | 1,886,700 | |
| | | | | | | |
| | | | Total Exchange-Traded Funds
(Cost $1,885,277) | | 1,886,700 | |
| | | | | | | |
| | | | Total Long-Term Investments
(Cost $146,307,333) | | 175,565,853 | |
| | | | | | | |
SHORT-TERM INVESTMENTS: 4.9% | | | |
| | | | Mutual Funds: 1.0% | | | |
1,719,646 | | | | Blackrock Liquidity Funds TempFund Portfolio - Class I | | 1,719,646 | |
| | | | | | | |
| | | | Total Mutual Funds
(Cost $1,719,646) | | 1,719,646 | |
| | | | | | | |
| | | | Securities Lending Collateral(cc): 3.9% | | | |
6,261,298 | | | | BNY Mellon Overnight Government Fund (1) | | 6,261,298 | |
818,750 | | R | | BNY Institutional Cash Reserves Fund, Series B (1)(2) | | 655,000 | |
| | | | | | | |
| | | | Total Securities Lending Collateral
(Cost $7,080,048) | | 6,916,298 | |
| | | | | | | |
| | | | Total Short-Term Investments
(Cost $8,799,694) | | 8,635,944 | |
| | | | | | | |
| | | | Total Investments in Securities
(Cost $155,107,027) * | 104.4 | % | | $ | 184,201,797 | |
| | | | Other Assets and Liabilities - Net | (4.4 | ) | | (7,794,235 | ) |
| | | | Net Assets | 100.0 | % | | $ | 176,407,562 | |
| | @ | | Non-income producing security |
| | (cc) | | Securities purchased with cash collateral for securities loaned. |
| | (1) | | Collateral received from brokers for securities lending was invested in these short-term investments. |
| | (2) | | On September 12, 2008, BNY established a separate sleeve of the Institutional Cash Reserves Fund (Series B) to hold certain Lehman Brothers defaulted debt obligations. The Portfolio’s position in Series B is being fair valued daily. Please see the accompanying Notes to Financial Statements for additional details on securities lending. |
| | R | | Restricted security |
| | L | | Loaned security, a portion or all of the security is on loan at December 31, 2010. |
| | PORTFOLIO OF INVESTMENTS |
ING Van Kampen Comstock Portfolio | | as of December 31, 2010 |
Shares | | | | | | Value | |
| | | | | | | |
COMMON STOCK: 98.2% | | | | | |
| | | | Consumer Discretionary: 17.1% | | | |
740,981 | | | | Comcast Corp. — Class A | | $ | 16,279,353 | |
51,529 | | @ | | DIRECTV | | 2,057,553 | |
67,133 | | @, L | | General Motors Co. | | 2,474,522 | |
91,432 | | | | Home Depot, Inc. | | 3,205,606 | |
49,230 | | | | JC Penney Co., Inc. | | 1,590,621 | |
132,391 | | | | Lowe’s Cos., Inc. | | 3,320,366 | |
43,936 | | | | Macy’s, Inc. | | 1,111,581 | |
283,110 | | L | | News Corp. - Class B | | 4,648,666 | |
20,740 | | | | Target Corp. | | 1,247,096 | |
85,723 | | | | Time Warner Cable, Inc. | | 5,660,290 | |
130,625 | | | | Time Warner, Inc. | | 4,202,206 | |
273,056 | | | | Viacom - Class B | | 10,815,748 | |
| | | | | | 56,613,608 | |
| | | | Consumer Staples: 8.9% | | | |
55,522 | | | | Avon Products, Inc. | | 1,613,469 | |
54,394 | | | | Coca-Cola Co. | | 3,577,493 | |
152,584 | | | | CVS Caremark Corp. | | 5,305,346 | |
221,364 | | | | Kraft Foods, Inc. | | 6,975,180 | |
15,078 | | | | PepsiCo, Inc. | | 985,046 | |
16,499 | | | | Procter & Gamble Co. | | 1,061,381 | |
146,751 | | | | Unilever NV ADR | | 4,607,981 | |
98,592 | | | | Wal-Mart Stores, Inc. | | 5,317,067 | |
| | | | | | 29,442,963 | |
| | | | Energy: 10.6% | | | |
71,636 | | | | BP PLC ADR | | 3,164,162 | |
79,411 | | | | Chevron Corp. | | 7,246,254 | |
46,907 | | | | ConocoPhillips | | 3,194,367 | |
197,535 | | | | Halliburton Co. | | 8,065,354 | |
47,220 | | @ | | Noble Corp. | | 1,689,059 | |
81,562 | | | | Royal Dutch Shell PLC ADR - Class A | | 5,446,710 | |
45,449 | | | | Total SA ADR | | 2,430,613 | |
170,401 | | @ | | Weatherford International Ltd. | | 3,885,143 | |
| | | | | | 35,121,662 | |
| | | | Financials: 21.0% | | | |
32,199 | | | | Aflac, Inc. | | 1,816,990 | |
479,780 | | | | Bank of America Corp. | | 6,400,265 | |
234,647 | | L | | Bank of New York Mellon Corp. | | 7,086,339 | |
124,379 | | | | Chubb Corp. | | 7,417,964 | |
1,051,554 | | @ | | Citigroup, Inc. | | 4,973,850 | |
20,551 | | | | Goldman Sachs Group, Inc. | | 3,455,856 | |
232,610 | | | | JPMorgan Chase & Co. | | 9,867,316 | |
108,878 | | | | Metlife, Inc. | | 4,838,538 | |
131,574 | | | | Morgan Stanley | | 3,580,129 | |
76,681 | | | | PNC Financial Services Group, Inc. | | 4,656,070 | |
31,427 | | | | State Street Corp. | | 1,456,327 | |
52,006 | | | | Torchmark Corp. | | 3,106,838 | |
83,357 | | L | | Travelers Cos., Inc. | | 4,643,818 | |
93,531 | | | | US Bancorp. | | 2,522,531 | |
119,224 | | | | Wells Fargo & Co. | | 3,694,752 | |
| | | | | | 69,517,583 | |
| | | | Health Care: 12.2% | | | |
50,486 | | | | Abbott Laboratories | | 2,418,784 | |
254,510 | | | | Bristol-Myers Squibb Co. | | 6,739,425 | |
117,541 | | | | Cardinal Health, Inc. | | 4,502,996 | |
49,032 | | L | | GlaxoSmithKline PLC ADR | | 1,923,035 | |
162,630 | | | | Merck & Co., Inc. | | 5,861,185 | |
508,423 | | | | Pfizer, Inc. | | 8,902,487 | |
59,095 | | L | | Roche Holding AG ADR | | 2,165,832 | |
155,861 | | | | UnitedHealth Group, Inc. | | 5,628,141 | |
39,551 | | @ | | WellPoint, Inc. | | 2,248,870 | |
| | | | | | 40,390,755 | |
| | | | Industrials: 7.1% | | | |
48,091 | | | | Emerson Electric Co. | | 2,749,362 | |
260,036 | | | | General Electric Co. | | 4,756,058 | |
82,632 | | | | Honeywell International, Inc. | | 4,392,717 | |
97,038 | | L | | Ingersoll-Rand PLC | | 4,569,519 | |
92,264 | | L | | Textron, Inc. | | 2,181,121 | |
112,100 | | | | Tyco International Ltd. | | 4,645,424 | |
| | | | | | 23,294,201 | |
| | | | Information Technology: 10.4% | | | |
43,137 | | | | Accenture PLC | | 2,091,713 | |
142,082 | | @ | | Cisco Systems, Inc. | | 2,874,319 | |
| | | | | | | | |
258,625 | | @, L | | Dell, Inc. | | 3,504,369 | |
241,971 | | @ | | eBay, Inc. | | 6,734,053 | |
141,189 | | | | Hewlett-Packard Co. | | 5,944,057 | |
152,228 | | | | Intel Corp. | | 3,201,355 | |
42,772 | | | | KLA-Tencor Corp. | | 1,652,710 | |
70,989 | | | | Microsoft Corp. | | 1,982,013 | |
53,231 | | | | Western Union Co. | | 988,500 | |
334,300 | | @, L | | Yahoo!, Inc. | | 5,559,409 | |
| | | | | | 34,532,498 | |
| | | | Materials: 5.2% | | | |
390,334 | | L | | Alcoa, Inc. | | 6,007,240 | |
26,960 | | | | EI Du Pont de Nemours & Co. | | 1,344,765 | |
365,587 | | | | International Paper Co. | | 9,958,590 | |
| | | | | | 17,310,595 | |
| | | | Telecommunication Services: 4.1% | | | |
148,592 | | | | AT&T, Inc. | | 4,365,633 | |
164,670 | | | | Verizon Communications, Inc. | | 5,891,893 | |
118,464 | | L | | Vodafone Group PLC ADR | | 3,131,004 | |
| | | | | | 13,388,530 | |
| | | | Utilities: 1.6% | | | |
41,120 | | L | | American Electric Power Co., Inc. | | 1,479,498 | |
66,788 | | L | | FirstEnergy Corp. | | 2,472,492 | |
25,357 | | | | Sempra Energy | | 1,330,735 | |
| | | | | | 5,282,725 | |
| | | | Total Common Stock
(Cost $259,553,524) | | 324,895,120 | |
| | | | | | | |
SHORT-TERM INVESTMENTS: 8.3% | | | |
| | | | Mutual Funds: 2.1% | | | |
6,810,008 | | | | Blackrock Liquidity Funds TempFund Portfolio - Class I | | 6,810,008 | |
| | | | | | | |
| | | | Total Mutual Funds
(Cost $6,810,008) | | 6,810,008 | |
| | | | | | | |
| | | | Securities Lending Collateral(cc): 6.2% | | | |
19,723,129 | | | | BNY Mellon Overnight Government Fund (1) | | 19,723,129 | |
966,595 | | R | | BNY Institutional Cash Reserves Fund, Series B (1)(2) | | 773,276 | |
| | | | | | | |
| | | | Total Securities Lending Collateral
(Cost $20,689,724) | | 20,496,405 | |
| | | | | | | |
| | | | Total Short-Term Investments
(Cost $27,499,732) | | 27,306,413 | |
| | | | | | | |
| | | | Total Investments in Securities
(Cost $287,053,256) * | 106.5 | % | | $ | 352,201,533 | |
| | | | Other Assets and Liabilities - Net | (6.5 | ) | | (21,347,927 | ) |
| | | | Net Assets | 100.0 | % | | $ | 330,853,606 | |
| | @ | | Non-income producing security |
| | ADR | | American Depositary Receipt |
| | (cc) | | Securities purchased with cash collateral for securities loaned. |
| | (1) | | Collateral received from brokers for securities lending was invested in these short-term investments. |
| | (2) | | On September 12, 2008, BNY established a separate sleeve of the Institutional Cash Reserves Fund (Series B) to hold certain Lehman Brothers defaulted debt obligations. The Portfolio’s position in Series B is being fair valued daily. Please see the accompanying Notes to Financial Statements for additional details on securities lending. |
| | R | | Restricted security |
| | L | | Loaned security, a portion or all of the security is on loan at December 31, 2010. |
| | PORTFOLIO OF INVESTMENTS |
ING Van Kampen Equity and Income Portfolio | | as of December 31, 2010 |
Shares | | | | | | Value | |
| | | | | | | |
COMMON STOCK: 64.4% | | | | | |
| | | | Consumer Discretionary: 7.9% | | | |
451,740 | | | | Comcast Corp. — Class A | | $ | 9,924,728 | |
296,293 | | @ | | Ford Motor Co. | | 4,974,759 | |
112,749 | | @ | | General Motors Co. | | 4,155,928 | |
224,544 | | | | Home Depot, Inc. | | 7,872,513 | |
180,754 | | | | Sony Corp. ADR | | 6,454,725 | |
114,424 | | | | Time Warner Cable, Inc. | | 7,555,417 | |
308,145 | | | | Time Warner, Inc. | | 9,913,025 | |
409,821 | | | | Viacom - Class B | | 16,233,010 | |
| | | | | | 67,084,105 | |
| | | | Consumer Staples: 7.0% | | | |
292,579 | | | | Avon Products, Inc. | | 8,502,346 | |
64,211 | | | | Coca-Cola Co. | | 4,223,157 | |
108,423 | | | | Coca-Cola Enterprises, Inc. | | 2,713,828 | |
249,397 | | | | Kraft Foods, Inc. | | 7,858,499 | |
160,452 | | | | Procter & Gamble Co. | | 10,321,877 | |
172,719 | | | | Sysco Corp. | | 5,077,939 | |
225,348 | | | | Unilever NV ADR | | 7,075,927 | |
213,316 | | | | Walgreen Co. | | 8,310,791 | |
101,110 | | | | Wal-Mart Stores, Inc. | | 5,452,862 | |
| | | | | | 59,537,226 | |
| | | | Energy: 9.4% | | | |
167,085 | | | | Anadarko Petroleum Corp. | | 12,725,194 | |
42,788 | | @ | | Cameron International Corp. | | 2,170,635 | |
63,940 | | | | ConocoPhillips | | 4,354,314 | |
76,084 | | | | Devon Energy Corp. | | 5,973,355 | |
80,819 | | | | ExxonMobil Corp. | | 5,909,485 | |
125,134 | | | | Hess Corp. | | 9,577,756 | |
34,736 | | | | Noble Energy, Inc. | | 2,990,075 | |
147,373 | | | | Occidental Petroleum Corp. | | 14,457,291 | |
167,836 | | | | Royal Dutch Shell PLC ADR - Class A | | 11,208,088 | |
111,765 | | | | Schlumberger Ltd. | | 9,332,378 | |
69,690 | | | | Williams Cos., Inc. | | 1,722,737 | |
| | | | | | 80,421,308 | |
| | | | Financials: 14.1% | | | |
813,090 | | | | Bank of America Corp. | | 10,846,621 | |
120,223 | | | | BB&T Corp. | | 3,160,663 | |
476,709 | | | | Charles Schwab Corp. | | 8,156,491 | |
69,198 | | | | Chubb Corp. | | 4,126,969 | |
1,584,177 | | @ | | Citigroup, Inc. | | 7,493,157 | |
216,748 | | | | Fifth Third Bancorp. | | 3,181,861 | |
612,355 | | | | JPMorgan Chase & Co. | | 25,976,099 | |
16,806 | | @ | | LPL Investment Holdings, Inc. | | 611,234 | |
677,619 | | | | Marsh & McLennan Cos., Inc. | | 18,526,103 | |
271,035 | | | | Morgan Stanley | | 7,374,862 | |
167,633 | | | | PNC Financial Services Group, Inc. | | 10,178,676 | |
147,087 | | | | Principal Financial Group, Inc. | | 4,789,153 | |
132,193 | | | | State Street Corp. | | 6,125,824 | |
137,707 | | | | US Bancorp. | | 3,713,958 | |
174,524 | | | | Wells Fargo & Co. | | 5,408,499 | |
| | | | | | 119,670,170 | |
| | | | Health Care: 6.3% | | | |
77,390 | | | | Abbott Laboratories | | 3,707,755 | |
329,688 | | | | Bristol-Myers Squibb Co. | | 8,730,138 | |
98,354 | | | | Cardinal Health, Inc. | | 3,767,942 | |
152,500 | | | | Covidien PLC | | 6,963,150 | |
139,499 | | | | Merck & Co., Inc. | | 5,027,544 | |
565,829 | | | | Pfizer, Inc. | | 9,907,666 | |
143,366 | | | | Roche Holding AG ADR | | 5,254,364 | |
278,988 | | | | UnitedHealth Group, Inc. | | 10,074,257 | |
| | | | | | 53,432,816 | |
| | | | Industrials: 7.1% | | | |
127,791 | | | | Avery Dennison Corp. | | 5,410,671 | |
108,157 | | | | Cintas Corp. | | 3,024,070 | |
49,754 | | | | Dover Corp. | | 2,908,121 | |
31,231 | | | | FedEx Corp. | | 2,904,795 | |
1,178,806 | | | | General Electric Co. | | 21,560,351 | |
136,630 | | | | Ingersoll-Rand PLC | | 6,433,907 | |
60,853 | | | | Manpower, Inc. | | 3,819,134 | |
94,111 | | | | Robert Half International, Inc. | | 2,879,797 | |
269,195 | | | | Tyco International Ltd. | | 11,155,441 | |
| | | | | | 60,096,287 | |
| | | | Information Technology: 6.7% | | | |
180,309 | | @ | | Amdocs Ltd. | | 4,953,088 | |
282,987 | | @ | | Cisco Systems, Inc. | | 5,724,827 | |
495,130 | | @ | | Dell, Inc. | | 6,709,012 | |
451,739 | | @ | | eBay, Inc. | | 12,571,896 | |
201,369 | | | | Hewlett-Packard Co. | | 8,477,635 | |
247,923 | | | | Intel Corp. | | 5,213,821 | |
49,880 | | | | Microsoft Corp. | | 1,392,650 | |
324,855 | | | | Western Union Co. | | 6,032,557 | |
380,303 | | @ | | Yahoo!, Inc. | | 6,324,439 | |
| | | | | | 57,399,925 | |
| | | | Materials: 1.5% | | | |
151,833 | | | | Dow Chemical Co. | | 5,183,579 | |
65,200 | | @ | | LyondellBasell Industries NV | | 2,242,880 | |
63,077 | | | | PPG Industries, Inc. | | 5,302,883 | |
| | | | | | 12,729,342 | |
| | | | | | | | |
| | | | Telecommunication Services: 1.8% | | | |
173,395 | | | | Verizon Communications, Inc. | | 6,204,073 | |
350,591 | | | | Vodafone Group PLC ADR | | 9,266,120 | |
| | | | | | 15,470,193 | |
| | | | Utilities: 2.6% | | | |
314,974 | | | | American Electric Power Co., Inc. | | 11,332,765 | |
90,309 | | | | Edison International | | 3,485,927 | |
47,811 | | | | Entergy Corp. | | 3,386,453 | |
105,227 | | | | FirstEnergy Corp. | | 3,895,504 | |
| | | | | | 22,100,649 | |
| | | | Total Common Stock
(Cost $463,084,931) | | 547,942,021 | |
PREFERRED STOCK: 2.2% | | | | | |
| | | | Consumer Discretionary: 0.2% | | | |
13,100 | | @ | | Stanley Black & Decker, Inc. | | 1,421,874 | |
| | | | | | 1,421,874 | |
| | | | Consumer Staples: 0.2% | | | |
47,700 | | | | Archer-Daniels-Midland Co. | | 1,852,191 | |
| | | | | | 1,852,191 | |
| | | | Energy: 0.5% | | | |
107,000 | | P | | El Paso Energy Capital Trust I | | 4,159,090 | |
| | | | | | 4,159,090 | |
| | | | Financials: 0.4% | | | |
35,144 | | | | Keycorp | | 3,763,922 | |
| | | | | | 3,763,922 | |
| | | | Health Care: 0.4% | | | |
2,600 | | | | Healthsouth Corp. | | 2,529,150 | |
30,451 | | P | | Omnicare, Inc. | | 1,178,454 | |
| | | | | | 3,707,604 | |
| | | | Industrials: 0.2% | | | |
121,631 | | @, # | | Swift Mandatory Common Exchange Security Trust | | 1,471,431 | |
| | | | | | 1,471,431 | |
| | | | Utilities: 0.3% | | | |
80,407 | | @, P | | CenterPoint Energy, Inc. | | 2,555,334 | |
| | | | | | 2,555,334 | |
| | | | | | | |
| | | | Total Preferred Stock
(Cost $17,519,529) | | 18,931,446 | |
Principal Amount | | | | | | | |
| | | | | | | |
CORPORATE BONDS/NOTES: 21.9% | | | |
| | | | Consumer Discretionary: 4.5% | | | |
$ | 580,000 | | | | Advance Auto Parts, Inc., 5.750%, due 05/01/20 | | $ | 606,984 | |
395,000 | | | | Autozone, Inc., 6.500%, due 01/15/14 | | 438,964 | |
2,235,000 | | | | BorgWarner, Inc., 3.500%, due 04/15/12 | | 5,009,194 | |
125,000 | | | | Comcast Corp., 5.150%, due 03/01/20 | | 131,533 | |
550,000 | | | | Comcast Corp., 5.700%, due 05/15/18 | | 606,207 | |
60,000 | | # | | Cox Communications, Inc., 8.375%, due 03/01/39 | | 78,000 | |
325,000 | | | | Daimler Finance NA, LLC, 7.750%, due 01/18/11 | | 326,018 | |
455,000 | | | | DirecTV Holdings, LLC, 7.625%, due 05/15/16 | | 505,041 | |
475,000 | | | | Expedia, Inc., 5.950%, due 08/15/20 | | 479,750 | |
4,212,000 | | | | Ford Motor Co., 4.250%, due 11/15/16 | | 8,439,795 | |
2,085,000 | | # | | Gaylord Entertainment Co., 3.750%, due 10/01/14 | | 3,049,313 | |
290,000 | | | | Home Depot, Inc., 5.875%, due 12/16/36 | | 302,663 | |
3,949,000 | | | | International Game Technology, 3.250%, due 05/01/14 | | 4,575,904 | |
2,333,000 | | | | Interpublic Group of Cos., Inc., 4.250%, due 03/15/23 | | 2,610,044 | |
1,065,000 | | | | Interpublic Group of Cos., Inc., 4.750%, due 03/15/23 | | 1,250,044 | |
3,965,100 | | | | Liberty Media Corp., 3.125%, due 03/30/23 | | 4,465,694 | |
255,000 | | | | Macys Retail Holdings, Inc., 5.350%, due 03/15/12 | | 264,563 | |
3,048,000 | | # | | MGM Resorts International, 4.250%, due 04/15/15 | | 3,352,800 | |
200,000 | | # | | NBC Universal, Inc., 2.100%, due 04/01/14 | | 199,563 | |
210,000 | | # | | NBC Universal, Inc., 5.950%, due 04/01/41 | | 210,713 | |
445,000 | | | | Time Warner Cable, Inc., 5.875%, due 11/15/40 | | 441,802 | |
135,000 | | | | Time Warner Cable, Inc., 6.750%, due 06/15/39 | | 149,601 | |
245,000 | | | | Time Warner Cable, Inc., 8.750%, due 02/14/19 | | 312,231 | |
160,000 | | | | Time Warner, Inc., 5.875%, due 11/15/16 | | 180,821 | |
200,000 | | | | WPP Finance UK, 8.000%, due 09/15/14 | | 230,276 | |
220,000 | | | | Yum! Brands, Inc., 5.300%, due 09/15/19 | | 233,424 | |
115,000 | | | | Yum! Brands, Inc., 6.250%, due 03/15/18 | | 130,036 | |
| | | | | | 38,580,978 | |
| | | | Consumer Staples: 0.5% | | | |
200,000 | | | | Anheuser-Busch InBev Worldwide, Inc., 2.500%, due 03/26/13 | | 204,772 | |
375,000 | | | | Anheuser-Busch InBev Worldwide, Inc., 3.625%, due 04/15/15 | | 387,448 | |
300,000 | | # | | Anheuser-Busch InBev Worldwide, Inc., 7.200%, due 01/15/14 | | 343,315 | |
240,000 | | | | Corn Products International, Inc., 6.625%, due 04/15/37 | | 251,671 | |
68,312 | | # | | CVS Lease Pass-through, 8.353%, due 07/10/31 | | 81,585 | |
396,373 | | | | CVS Pass-Through Trust, 6.036%, due 12/10/28 | | 407,640 | |
235,000 | | | | Delhaize Group, 5.875%, due 02/01/14 | | 259,520 | |
415,000 | | # | | FBG Finance Ltd., 5.125%, due 06/15/15 | | 440,840 | |
295,000 | | # | | Grupo Bimbo S.A.B de CV, 4.875%, due 06/30/20 | | 297,629 | |
170,000 | | | | Kraft Foods, Inc., 5.375%, due 02/10/20 | | 183,297 | |
100,000 | | | | Kraft Foods, Inc., 6.875%, due 02/01/38 | | 116,491 | |
355,000 | | | | Kraft Foods, Inc., 6.875%, due 01/26/39 | | 414,990 | |
170,000 | | | | Kraft Foods, Inc., 7.000%, due 08/11/37 | | 199,671 | |
655,000 | | | | Safeway, Inc., 3.950%, due 08/15/20 | | 621,472 | |
140,000 | | | | Wal-Mart Stores, Inc., 5.250%, due 09/01/35 | | 141,375 | |
50,000 | | | | Wal-Mart Stores, Inc., 6.500%, due 08/15/37 | | 58,943 | |
| | | | | | 4,410,659 | |
| | | | Energy: 0.7% | | | |
145,000 | | | | Enterprise Products Operating L.P., 5.250%, due 01/31/20 | | 151,099 | |
300,000 | | | | Enterprise Products Operating L.P., 6.500%, due 01/31/19 | | 341,180 | |
| | | | | | | | | |
1,555,000 | | | | Helix Energy Solutions Group, Inc., 3.250%, due 12/15/25 | | 1,508,350 | |
250,000 | | | | Hess Corp., 5.600%, due 02/15/41 | | 249,080 | |
3,295,000 | | | | Massey Energy Co., 3.250%, due 08/01/15 | | 3,233,219 | |
370,000 | | | | Petroleos Mexicanos, 5.500%, due 01/21/21 | | 376,475 | |
165,000 | | | | Spectra Energy Capital, LLC, 7.500%, due 09/15/38 | | 193,883 | |
215,000 | | | | Texas Eastern Transmission LP, 7.000%, due 07/15/32 | | 248,670 | |
| | | | | | 6,301,956 | |
| | | | Financials: 6.3% | | | |
290,000 | | # | | Abbey National Treasury Services PLC/London, 3.875%, due 11/10/14 | | 287,626 | |
300,000 | | | | Aegon NV, 4.625%, due 12/01/15 | | 309,541 | |
2,419,000 | | | | Affiliated Managers Group, Inc., 3.950%, due 08/15/38 | | 2,691,138 | |
330,000 | | | | Aflac, Inc., 6.450%, due 08/15/40 | | 339,107 | |
635,000 | | # | | AIG SunAmerica Global Financing VI, 6.300%, due 05/10/11 | | 647,700 | |
700,000 | | | | Ally Financial, Inc., 2.200%, due 12/19/12 | | 720,320 | |
665,000 | | | | American Express Co., 8.125%, due 05/20/19 | | 828,713 | |
950,000 | | | | Bank of America Corp., 5.650%, due 05/01/18 | | 972,129 | |
400,000 | | | | Bank of America Corp., 5.750%, due 12/01/17 | | 416,842 | |
305,000 | | | | Barclays Bank PLC, 5.140%, due 10/14/20 | | 274,934 | |
525,000 | | | | Barclays Bank PLC, 6.750%, due 05/22/19 | | 593,956 | |
260,000 | | | | Bear Stearns Cos., Inc., 7.250%, due 02/01/18 | | 308,553 | |
430,000 | | # | | BPCE S.A., 2.375%, due 10/04/13 | | 428,998 | |
240,000 | | | | Brookfield Asset Management, Inc., 7.125%, due 06/15/12 | | 256,025 | |
540,000 | | | | Capital One Bank USA NA, 8.800%, due 07/15/19 | | 665,262 | |
515,000 | | | | Charles Schwab Corp., 4.450%, due 07/22/20 | | 513,998 | |
1,500,000 | | | | Citibank NA, 1.750%, due 12/28/12 | | 1,531,095 | |
4,200,000 | | | | Citigroup Funding, Inc., 2.250%, due 12/10/12 | | 4,322,216 | |
575,000 | | | | Citigroup, Inc., 6.125%, due 11/21/17 | | 631,025 | |
545,000 | | | | Citigroup, Inc., 6.125%, due 05/15/18 | | 597,954 | |
345,000 | | | | Citigroup, Inc., 8.500%, due 05/22/19 | | 428,966 | |
325,000 | | | | CNA Financial Corp., 5.875%, due 08/15/20 | | 324,182 | |
385,000 | | # | | Commonwealth Bank of Australia, 5.000%, due 10/15/19 | | 403,703 | |
590,000 | | # | | Cooperatieve Centrale Raiffeisen-Boerenleenbank BA/Netherlands, 4.750%, due 01/15/20 | | 612,009 | |
130,000 | | | | Credit Suisse AG, 5.400%, due 01/14/20 | | 133,001 | |
95,000 | | | | Credit Suisse New York, 6.000%, due 02/15/18 | | 102,016 | |
440,000 | | | | Credit Suisse/New York NY, 4.375%, due 08/05/20 | | 432,828 | |
185,000 | | | | Credit Suisse/New York NY, 5.300%, due 08/13/19 | | 195,748 | |
340,000 | | # | | Digital Realty Trust L.P., 4.500%, due 07/15/15 | | 342,441 | |
225,000 | | # | | ERAC USA Finance LLC, 2.750%, due 07/01/13 | | 229,155 | |
4,950,000 | | | | General Electric Capital Corp., 2.625%, due 12/28/12 | | 5,136,551 | |
770,000 | | | | General Electric Capital Corp., 5.625%, due 05/01/18 | | 840,964 | |
160,000 | | | | General Electric Capital Corp., 5.875%, due 01/14/38 | | 166,659 | |
4,011,000 | | # | | Goldman Sachs Group, Inc., 1.000%, due 03/15/17 | | 3,981,720 | |
1,010,000 | | | | Goldman Sachs Group, Inc., 6.150%, due 04/01/18 | | 1,113,844 | |
345,000 | | | | Goldman Sachs Group, Inc., 6.750%, due 10/01/37 | | 353,828 | |
465,000 | | # | | HBOS PLC, 6.750%, due 05/21/18 | | 436,014 | |
460,000 | | | | Health Care REIT, Inc., 4.950%, due 01/15/21 | | 444,096 | |
450,000 | | # | | HSBC Bank PLC, 4.125%, due 08/12/20 | | 433,349 | |
150,000 | | | | HSBC Finance Corp., 6.375%, due 10/15/11 | | 156,406 | |
645,000 | | | | HSBC Finance Corp., 6.750%, due 05/15/11 | | 659,073 | |
170,000 | | # | | Iberdrola Finance Ireland Ltd., 3.800%, due 09/11/14 | | 169,380 | |
1,062,000 | | | | Janus Capital Group, Inc., 3.250%, due 07/15/14 | | 1,263,780 | |
1,793,800 | | | | Jefferies Group, Inc., 3.875%, due 11/01/29 | | 1,890,217 | |
595,000 | | | | Jefferies Group, Inc., 6.875%, due 04/15/21 | | 619,506 | |
340,000 | | | | JPMorgan Chase & Co., 4.400%, due 07/22/20 | | 335,289 | |
775,000 | | | | JPMorgan Chase & Co., 6.000%, due 01/15/18 | | 866,733 | |
220,000 | | | | Korea Development Bank, 4.375%, due 08/10/15 | | 226,631 | |
165,000 | | # | | Lloyds TSB Bank PLC, 5.800%, due 01/13/20 | | 163,198 | |
430,000 | | | | Merrill Lynch & Co., Inc., 6.875%, due 04/25/18 | | 471,255 | |
150,000 | | | | MetLife, Inc., 2.375%, due 02/06/14 | | 150,823 | |
455,000 | | | | MetLife, Inc., 4.750%, due 02/08/21 | | 465,493 | |
145,000 | | | | MetLife, Inc., 5.875%, due 02/06/41 | | 153,431 | |
625,000 | | | | MGIC Investment Corp., 5.000%, due 05/01/17 | | 721,094 | |
790,000 | | | | Morgan Stanley, 3.450%, due 11/02/15 | | 771,061 | |
675,000 | | | | Morgan Stanley, 4.000%, due 07/24/15 | | 679,201 | |
2,067,000 | | | | NASDAQ OMX Group, Inc., 2.500%, due 08/15/13 | | 2,056,665 | |
285,000 | | | | NASDAQ OMX Group, Inc., 5.550%, due 01/15/20 | | 288,464 | |
205,000 | | # | | National Australia Bank Ltd., 3.750%, due 03/02/15 | | 212,214 | |
570,000 | | # | | Nationwide Building Society, 6.250%, due 02/25/20 | | 595,013 | |
250,000 | | | | Nationwide Financial Services, 6.250%, due 11/15/11 | | 260,529 | |
290,000 | | # | | Nordea Bank AB, 4.875%, due 01/27/20 | | 298,054 | |
225,000 | | # | | Pacific LifeCorp, 6.000%, due 02/10/20 | | 236,889 | |
360,000 | | | | PNC Funding Corp., 5.125%, due 02/08/20 | | 375,907 | |
225,000 | | | | PNC Funding Corp., 6.700%, due 06/10/19 | | 259,477 | |
320,000 | | | | Prudential Financial, Inc., 4.750%, due 09/17/15 | | 338,912 | |
85,000 | | | | Prudential Financial, Inc., 7.375%, due 06/15/19 | | 100,380 | |
210,000 | | | | Reinsurance Group of America, Inc., 6.450%, due 11/15/19 | | 222,015 | |
495,000 | | | | Royal Bank of Scotland PLC, 4.875%, due 03/16/15 | | 506,825 | |
200,000 | | # | | Santander US Debt S.A. Unipersonal, 3.724%, due 01/20/15 | | 189,667 | |
775,000 | | # | | Societe Generale, 2.500%, due 01/15/14 | | 774,772 | |
100,000 | | # | | Standard Chartered Bank, 6.400%, due 09/26/17 | | 107,149 | |
315,000 | | # | | Standard Chartered PLC, 3.850%, due 04/27/15 | | 324,634 | |
195,000 | | | | Travelers Cos, Inc., 5.350%, due 11/01/40 | | 192,835 | |
305,000 | | | | UBS AG, 5.875%, due 12/20/17 | | 335,929 | |
500,000 | | | | US Bank NA/Cincinnati OH, 3.778%, due 04/29/20 | | 507,792 | |
300,000 | | # | | WEA Finance, LLC / WT Finance Aust Pty Ltd., 6.750%, due 09/02/19 | | 334,763 | |
935,000 | | | | Wells Fargo & Co., 5.625%, due 12/11/17 | | 1,036,716 | |
440,000 | | | | Westpac Banking Corp., 2.100%, due 08/02/13 | | 444,747 | |
| | | | | | 53,211,125 | |
| | | | Health Care: 3.5% | | | |
610,000 | | | | Aetna, Inc., 3.950%, due 09/01/20 | | 587,393 | |
455,000 | | | | Boston Scientific Corp., 5.450%, due 06/15/14 | | 483,278 | |
3,358,000 | | | | Cephalon, Inc., 2.500%, due 05/01/14 | | 3,823,923 | |
1,835,000 | | | | Endo Pharmaceuticals Holdings, Inc., 1.750%, due 04/15/15 | | 2,449,725 | |
930,000 | | | | Express Scripts, Inc., 5.250%, due 06/15/12 | | 981,916 | |
5,261,000 | | # | | Gilead Sciences, Inc., 1.625%, due 05/01/16 | | 5,497,745 | |
80,000 | | | | GlaxoSmithKline Capital, Inc., 6.375%, due 05/15/38 | | 94,884 | |
2,550,000 | | | | Life Technologies Corp., 1.500%, due 02/15/24 | | 3,091,875 | |
3,470,000 | | | | LifePoint Hospitals, Inc., 3.500%, due 05/15/14 | | 3,517,713 | |
210,000 | | | | Medco Health Solutions, Inc., 2.750%, due 09/15/15 | | 208,577 | |
3,122,000 | | | | Mylan, Inc., 1.250%, due 03/15/12 | | 3,321,028 | |
1,145,000 | | | | Omnicare, Inc., 3.250%, due 12/15/35 | | 1,056,263 | |
1,037,000 | | | | Omnicare, Inc., 3.750%, due 12/15/25 | | 1,161,440 | |
885,000 | | | | Pfizer, Inc., 6.200%, due 03/15/19 | | 1,038,359 | |
1,072,000 | | | | Teleflex, Inc., 3.875%, due 08/01/17 | | 1,130,960 | |
375,000 | | | | WellPoint, Inc., 4.350%, due 08/15/20 | | 372,802 | |
1,282,000 | | | | Wright Medical Group, Inc., 2.625%, due 12/01/14 | | 1,213,093 | |
| | | | | | 30,030,974 | |
| | | | Industrials: 1.1% | | | |
4,300,000 | | # | | Cemex S.A. de CV ADR, 4.875%, due 03/15/15 | | 4,719,250 | |
295,000 | | | | Continental Airlines Pass-Through Trust, 4.750%, due 01/12/21 | | 295,000 | |
330,000 | | | | CSX Corp., 5.500%, due 04/15/41 | | 325,425 | |
105,000 | | | | CSX Corp., 6.150%, due 05/01/37 | | 113,272 | |
260,000 | | | | Delta Air Lines, Inc., 6.200%, due 07/02/18 | | 276,250 | |
285,000 | | | | General Electric Co., 5.250%, due 12/06/17 | | 308,275 | |
120,000 | | # | | Holcim US Finance Sarl & Cie SCS, 6.000%, due 12/30/19 | | 124,829 | |
767,000 | | | | Navistar International Corp., 3.000%, due 10/15/14 | | 1,027,780 | |
175,000 | | | | Raytheon Co., 1.625%, due 10/15/15 | | 168,096 | |
616,000 | | | | Textron, Inc., 4.500%, due 05/01/13 | | 1,173,480 | |
170,000 | | | | Union Pacific Corp., 6.125%, due 02/15/20 | | 194,340 | |
380,000 | | | | Waste Management, Inc., 5.000%, due 03/15/14 | | 411,013 | |
| | | | | | 9,137,010 | |
| | | | Information Technology: 3.6% | | | |
4,825,000 | | | | Alcatel-Lucent USA, Inc., 2.875%, due 06/15/25 | | 4,577,719 | |
1,100,000 | | | | Cadence Design Systems, Inc., 1.500%, due 12/15/13 | | 1,039,500 | |
1,634,000 | | | | Ciena Corp., 0.250%, due 05/01/13 | | 1,503,280 | |
45,000 | | | | Corning, Inc., 6.625%, due 05/15/19 | | 52,021 | |
75,000 | | | | Corning, Inc., 7.250%, due 08/15/36 | | 85,617 | |
2,000,000 | | # | | JDS Uniphase Corp., 1.000%, due 05/15/26 | | 1,905,000 | |
1,927,000 | | # | | Linear Technology Corp., 3.000%, due 05/01/27 | | 2,052,255 | |
716,000 | | | | Linear Technology Corp., 3.000%, due 05/01/27 | | 762,540 | |
4,526,000 | | | | Micron Technology, Inc., 1.875%, due 06/01/14 | | 4,299,700 | |
6,649,000 | | | | SanDisk Corp., 1.000%, due 05/15/13 | | 6,432,908 | |
3,846,000 | | | | Symantec Corp., 1.000%, due 06/15/13 | | 4,389,248 | |
2,208,000 | | # | | Xilinx, Inc., 3.125%, due 03/15/37 | | 2,307,360 | |
764,000 | | | | Xilinx, Inc., 3.125%, due 03/15/37 | | 798,380 | |
| | | | | | 30,205,528 | |
| | | | Materials: 0.8% | | | |
2,084,000 | | | | Allegheny Technologies, Inc., 4.250%, due 06/01/14 | | 3,154,655 | |
300,000 | | # | | Anglo American Capital PLC, 9.375%, due 04/08/19 | | 404,162 | |
570,000 | | | | ArcelorMittal, 3.750%, due 08/05/15 | | 575,347 | |
460,000 | | | | ArcelorMittal, 9.850%, due 06/01/19 | | 582,235 | |
360,000 | | | | Freeport-McMoRan Copper & Gold, Inc., 8.375%, due 04/01/17 | | 398,739 | |
735,000 | | # | | Gold Fields Ltd., 4.875%, due 10/07/20 | | 704,467 | |
335,000 | | | | Rio Tinto Finance USA Ltd., 9.000%, due 05/01/19 | | 450,625 | |
75,000 | | | | Southern Copper Corp., 5.375%, due 04/16/20 | | 76,199 | |
105,000 | | | | Southern Copper Corp., 6.750%, due 04/16/40 | | 109,252 | |
220,000 | | | | Vale Overseas Ltd., 5.625%, due 09/15/19 | | 235,422 | |
250,000 | | | | Vale Overseas Ltd., 6.875%, due 11/10/39 | | 277,483 | |
| | | | | | 6,968,586 | |
| | | | Telecommunication Services: 0.7% | | | |
325,000 | | | | American Tower Corp., 4.500%, due 01/15/18 | | 322,642 | |
4,000 | | | | AT&T Corp., 8.000%, due 11/15/31 | | 5,042 | |
101,000 | | # | | AT&T, Inc., 5.350%, due 09/01/40 | | 95,328 | |
270,000 | | | | AT&T, Inc., 6.150%, due 09/15/34 | | 279,721 | |
510,000 | | | | AT&T, Inc., 6.300%, due 01/15/38 | | 539,813 | |
800,000 | | # | | Clearwire Communications, LLC/Clearwire Finance, Inc., 8.250%, due 12/01/40 | | 816,000 | |
165,000 | | | | Deutsche Telekom International Finance BV, 8.750%, due 06/15/30 | | 222,344 | |
2,245,000 | | | | SBA Communications Corp., 1.875%, due 05/01/13 | | 2,528,431 | |
435,000 | | | | Telecom Italia Capital S.A., 6.999%, due 06/04/18 | | 461,257 | |
205,000 | | | | Telecom Italia Capital S.A., 7.175%, due 06/18/19 | | 219,686 | |
315,000 | | | | Verizon Communications, Inc., 6.350%, due 04/01/19 | | 364,154 | |
280,000 | | | | Verizon Communications, Inc., 8.950%, due 03/01/39 | | 400,297 | |
| | | | | | 6,254,715 | |
| | | | Utilities: 0.2% | | | |
150,000 | | # | | EDF S.A., 4.600%, due 01/27/20 | | 155,303 | |
425,000 | | # | | Enel Finance International S.A., 5.125%, due 10/07/19 | | 421,921 | |
115,000 | | | | Nisource Finance Corp., 6.800%, due 01/15/19 | | 133,265 | |
415,000 | | | | Progress Energy, Inc., 7.050%, due 03/15/19 | | 493,147 | |
| | | | | | 1,203,636 | |
| | | | Total Corporate Bonds/Notes
(Cost $165,513,992) | | 186,305,167 | |
| | | | | | | |
U.S. GOVERNMENT AGENCY OBLIGATIONS: 0.8% | | | |
| | | | Federal Home Loan Mortgage Corporation##: 0.4% | | | |
550,000 | | | | 3.000%, due 07/28/14 | | 579,464 | |
2,400,000 | | | | 4.875%, due 06/13/18 | | 2,688,245 | |
| | | | | | 3,267,709 | |
| | | | Federal National Mortgage Association##: 0.4% | | | |
2,130,000 | | | | 4.375%, due 10/15/15 | | 2,347,132 | |
915,000 | | | | 6.625%, due 11/15/30 | | 1,157,994 | |
| | | | | | 3,505,126 | |
| | | | Total U.S. Government Agency Obligations
(Cost $6,492,658) | | 6,772,835 | |
U.S. TREASURY OBLIGATIONS: 7.1% | | | |
| | | | U.S. Treasury Notes: 7.1% | | | |
4,500,000 | | | | 0.750%, due 11/30/11 | | 4,518,459 | |
19,000,000 | | | | 1.000%, due 04/30/12 | | 19,156,674 | |
2,310,000 | | | | 1.750%, due 08/15/12-03/31/14 | | 2,357,449 | |
1,500,000 | | | | 1.875%, due 04/30/14 | | 1,534,337 | |
880,000 | | | | 2.125%, due 11/30/14 | | 901,587 | |
2,940,000 | | | | 2.250%, due 01/31/15 | | 3,018,554 | |
2,630,000 | | | | 2.375%, due 10/31/14 | | 2,722,668 | |
1,001,000 | | | | 2.500%, due 03/31/15 | | 1,036,271 | |
6,900,000 | | | | 2.625%, due 06/30/14-11/15/20 | | 6,968,853 | |
10,000,000 | | | | 2.750%, due 10/31/13 | | 10,513,280 | |
2,670,000 | | | | 3.500%, due 02/15/39 | | 2,301,206 | |
5,000 | | | | 4.125%, due 08/31/12 | | 5,300 | |
2,000,000 | | | | 4.250%, due 11/15/40 | | 1,967,812 | |
1,300,000 | | | | 4.375%, due 11/15/39 | | 1,307,110 | |
1,800,000 | | | | 4.625%, due 02/15/40 | | 1,885,781 | |
230,000 | | | | 6.875%, due 08/15/25 | | 307,481 | |
| | | | | | | |
| | | | Total U.S. Treasury Obligations
(Cost $59,499,380) | | 60,502,822 | |
| | | | | | | |
ASSET-BACKED SECURITIES: 0.0% | | | |
| | | | Automobile Asset-Backed Securities: 0.0% | | | |
171,818 | | # | | ARI Fleet Lease Trust, 1.710%, due 08/15/18 | | 173,253 | |
| | | | | | | |
| | | | Total Asset-Backed Securities
(Cost $171,818) | | 173,253 | |
| | | | | | | |
COLLATERALIZED MORTGAGE OBLIGATIONS: 0.1% | | | |
350,000 | | # | | GE Dealer Floorplan Master Note Trust, 1.811%, due 10/20/14 | | 355,251 | |
| | | | | | | |
| | | | Total Collateralized Mortgage Obligations
(Cost $350,000) | | 355,251 | |
| | | | | | | |
MUNICIPAL BONDS: 0.1% | | | |
| | | | California: 0.0% | | | |
150,000 | | | | State of California, 5.950%, due 04/01/16 | | 158,693 | |
| | | | | | 158,693 | |
| | | | Georgia: 0.1% | | | |
175,000 | | | | Municipal Electric Authority of Georgia, 6.637%, due 04/01/57 | | 171,694 | |
325,000 | | | | Municipal Electric Authority of Georgia, 6.655%, due 04/01/57 | | 314,672 | |
| | | | | | 486,366 | |
| | | | Texas: 0.0% | | | |
230,000 | | | | Texas State Transportation Commission, 5.028%, due 04/01/26 | | 226,803 | |
| | | | | | 226,803 | |
| | | | | | | |
| | | | Total Municipal Bonds
(Cost $884,665) | | 871,862 | |
| | | | | | | |
OTHER BONDS: 0.2% | | | |
| | | | Foreign Government Bonds: 0.2% | | | |
960,000 | | | | Brazil Government International Bond, 6.000%, due 01/17/17 | | 1,091,040 | |
100,000 | | | | Peruvian Government International Bond, 7.125%, due 03/30/19 | | 120,000 | |
395,000 | | | | Republic of Italy, 6.875%, due 09/27/23 | | 436,257 | |
| | | | | | | |
| | | | Total Other Bonds
(Cost $1,515,080) | | 1,647,297 | |
| | | | | | | |
| | | | Total Long-Term Investments
(Cost $715,032,053) | | 823,501,954 | |
| | | |
SHORT-TERM INVESTMENTS: 3.1% | | | |
| | | | Mutual Funds: 3.1% | | | |
26,753,200 | | | | Blackrock Liquidity Funds TempFund Portfolio - Class I | | 26,753,200 | |
| | | | | | | |
| | | | Total Short-Term Investments
(Cost $26,753,200) | | 26,753,200 | |
| | | | | | | |
| | | | Total Investments in Securities
(Cost $741,785,253) * | 99.9 | % | | $ | 850,255,154 | |
| | | | Other Assets and Liabilities - Net | 0.1 | | | 729,170 | |
| | | | Net Assets | 100.0 | % | | $ | 850,984,324 | |
| | @ | | Non-income producing security |
| | ADR | | American Depositary Receipt |
| | # | | Securities with purchases pursuant to Rule 144A or section 4(2), under the Securities Act of 1933 and may not be resold subject to that rule except to qualified institutional buyers. Unless otherwise noted, these securities have been determined to be liquid under the guidelines established by the Funds’ Board of Directors/Trustees. |
| | P | | Preferred Stock may be called prior to convertible date. |
| | ## | | On September 7, 2008, the Federal Housing Finance Agency placed the Federal National Mortgage Association and the Federal Home Loan Mortgage Corporation into conservatorship and the U.S. Treasury guaranteed the debt issued by those organizations. |
Item 7. Disclosure of Proxy Voting Policies and Procedures for Closed-End Management Investment Companies.
Not applicable.
Item 8. Portfolio Managers of Closed-End Management Investment Companies.
Not applicable.
Item 9. Purchases of Equity Securities by Closed-End Management Investment Company and Affiliated Purchasers
Not applicable.
Item 10. Submission of Matters to a Vote of Security Holders.
The Board has a Nominating Committee for the purpose of considering and presenting to the Board candidates it proposes for nomination to fill Independent Trustee vacancies on the Board. The Committee currently consists of all Independent Trustees of the Board (6 individuals). The Nominating Committee operates pursuant to a Charter approved by the Board. The primary purpose of the Nominating Committee is to consider and present to the Board the candidates it proposes for nomination to fill vacancies on the Board. In evaluating candidates, the Nominating Committee may consider a variety of factors, but it has not at this time set any specific minimum qualifications that must be met. Specific qualifications of candidates for Board membership will be based on the needs of the Board at the time of nomination.
The Nominating Committee is willing to consider nominations received from shareholders and shall assess shareholder nominees in the same manner as it reviews its own nominees. A shareholder nominee for director should be submitted in writing to the Fund’s Secretary. Any such shareholder nomination should include at a minimum the following information as to each individual proposed for nomination as trustee: such individual’s written consent to be named in the proxy statement as a nominee (if nominated) and to serve as a trustee (if elected), and all information relating to such individual that is required to be disclosed in the solicitation of proxies for election of trustees, or is otherwise required, in each case under applicable federal securities laws, rules and regulations.
The Secretary shall submit all nominations received in a timely manner to the Nominating Committee. To be timely, any such submission must be delivered to the Fund’s Secretary not earlier than the 90th day prior to such meeting and not later than the close of business on the later of the 60th day prior to such meeting or the 10th day following the day on which public announcement of the date of the meeting is first made, by either disclosure in a press release or in a document publicly filed by the Fund with the Securities and Exchange Commission.
Item 11. Controls and Procedures.
(a) Based on our evaluation conducted within 90 days of the filing date, hereof, the design and operation of the registrant’s disclosure controls and procedures are effective to ensure that material information relating to the registrant is made known to the certifying officers by others within the appropriate entities, particularly during the period in which Forms N-CSR are being prepared, and the registrant’s disclosure controls and procedures allow timely preparation and review of the information for the registrant’s Form N-CSR and the officer certifications of such Form N-CSR.
(b) There were no significant changes in the registrant’s internal controls that occurred during the second fiscal quarter of the period covered by this report that has materially affected, or is reasonably likely to materially affect, the registrant’s internal control over financial reporting.
Item 12. Exhibits.
(a)(1) Code of Ethics pursuant to Item 2 of Form N-CSR is filed and attached hereto as EX-99.CODE ETH.
(a)(2) A separate certification for each principal executive officer and principal financial officer of the registrant as required by Rule 30a-2 under the Act (17 CFR 270.30a-2) is attached hereto as EX-99.CERT.
(b) The officer certifications required by Section 906 of the Sarbanes-Oxley Act of 2002 are attached hereto as EX-99.906CERT.
(3) Not applicable.
18
SIGNATURES
Pursuant to the requirements of the Securities Exchange Act of 1934 and the Investment Company Act of 1940, the registrant has duly caused this report to be signed on its behalf by the undersigned, thereunto duly authorized.
(Registrant): ING Partners, Inc.
By | /s/ Shaun P. Mathews | |
| Shaun P. Mathews | |
| President and Chief Executive Officer | |
| | |
Date: | March 7, 2011 | |
| | |
| | |
Pursuant to the requirements of the Securities Exchange Act of 1934 and the Investment Company Act of 1940, this report has been signed below by the following persons on behalf of the registrant and in the capacities and on the dates indicated. |
| | |
| | |
By | /s/ Shaun P. Mathews | |
| Shaun P. Mathews | |
| President and Chief Executive Officer | |
| | |
Date: | March 7, 2011 | |
| | |
| | |
By | /s/ Todd Modic | |
| Todd Modic | |
| Senior Vice President and Chief Financial Officer | |
| | |
Date: | March 7, 2011 | |
19