UNITED STATES
SECURITIES AND EXCHANGE COMMISSION
Washington, D.C. 20549
Form N-CSR
CERTIFIED SHAREHOLDER REPORT OF
REGISTERED MANAGEMENT INVESTMENT COMPANIES
Investment Company Act file number: 811-08319
Voya Partners, Inc.
(Exact name of registrant as specified in charter)
| 7337 East Doubletree Ranch Road, Suite 100, Scottsdale, AZ | 85258 |
| (Address of principal executive offices) | (Zip code) |
The Corporation Trust Company, 1209 Orange Street, Wilmington, DE 19801
(Name and address of agent for service)
Registrant’s telephone number, including area code: 1-800-262-3862
Date of fiscal year end: December 31
Date of reporting period: December 31, 2016
Item 1. Reports to Stockholders.
The following is a copy of the report transmitted to stockholders pursuant to Rule 30e-1 under the Act (17 CFR 270.30e-1):


Voya Investment Management
Annual Report
December 31, 2016
Classes ADV, I, R6, S and S2
Voya Partners, Inc.
n Voya Global Bond Portfolio
n VY® American Century Small-Mid Cap Value Portfolio
n VY® Baron Growth Portfolio
n VY® Columbia Contrarian Core Portfolio
n VY® Columbia Small Cap Value II Portfolio
n VY® Invesco Comstock Portfolio
n VY® Invesco Equity and Income Portfolio
n VY® JPMorgan Mid Cap Value Portfolio
n VY® Oppenheimer Global Portfolio
n VY® Pioneer High Yield Portfolio
n VY® T. Rowe Price Diversified Mid Cap Growth Portfolio
n VY® T. Rowe Price Growth Equity Portfolio
n VY® Templeton Foreign Equity Portfolio
This report is submitted for general information to shareholders of the Voya mutual funds. It is not authorized for distribution to prospective shareholders unless accompanied or preceded by a prospectus which includes details regarding the funds' investment objectives, risks, charges, expenses and other information. This information should be read carefully.
INVESTMENT MANAGEMENT
voyainvestments.com

| President's Letter | | | 2 | | |
| Market Perspective | | | 3 | | |
| Portfolio Managers' Report | | | 6 | | |
Shareholder Expense Examples | | | 32 | | |
Report of Independent Registered Public Accounting Firm | | | 35 | | |
Statements of Assets and Liabilities | | | 36 | | |
Statements of Operations | | | 44 | | |
Statements of Changes in Net Assets | | | 48 | | |
Financial Highlights | | | 55 | | |
Notes to Financial Statements | | | 61 | | |
Summary Portfolio of Investments ("Portfolio of Investments") | | | 84 | | |
| Tax Information | | | 157 | | |
| Director and Officer Information | | | 159 | | |
| Advisory Contract Approval Discussion | | | 163 | | |
PROXY VOTING INFORMATION
A description of the policies and procedures that the Portfolios use to determine how to vote proxies related to portfolio securities is available: (1) without charge, upon request, by calling Shareholder Services toll-free at (800) 992-0180; (2) on the Portfolios' website at www.voyainvestments.com; and (3) on the U.S. Securities and Exchange Commission's ("SEC's") website at www.sec.gov. Information regarding how the Portfolios voted proxies related to portfolio securities during the most recent 12-month period ended June 30 is available without charge on the Portfolios' website at www.voyainvestments.com and on the SEC's website at www.sec.gov.
QUARTERLY PORTFOLIO HOLDINGS
The Portfolios file their complete schedule of portfolio holdings with the SEC for the first and third quarters of each fiscal year on Form N-Q. This report contains a summary portfolio of investments for the Portfolios. The Portfolios' Forms N-Q are available on the SEC's website at www.sec.gov. The Portfolios' Forms N-Q may be reviewed and copied at the SEC's Public Reference Room in Washington, D.C., and information on the operation of the Public Reference Room may be obtained by calling (800) SEC-0330. The Portfolios' Forms N-Q, as well as a complete portfolio of investments, are available without charge upon request from the Portfolios by calling Shareholder Services toll-free at (800) 992-0180.

New administration, new possibilities
Dear Shareholder,
During the presidential campaign, President Donald Trump promised to cut taxes and regulations; since the election, anticipation of these policies has driven a rally in the stock markets. As the Trump administration transitions into power, it's appropriate to consider how its policies might impact long-term investors.
The incoming president inherits a much better economy than the outgoing one did: job growth is accelerating, inflation is rising at an acceptable pace and corporate earnings have turned positive again. These trends were established enough in December that the U.S. Federal Reserve Board ("Fed") could justify increasing interest rates. In a recent update to its World Economic Outlook, the International Monetary Fund ("IMF") raised its near-term estimates of U.S. growth. Optimism about the pro-growth impacts of Trump policies is evident in surveys of small-business and consumer sentiment. We believe expectations of tax cuts, deregulation and increased fiscal policy stimulus will accelerate economic growth in the near term, leading to expectations of improved corporate revenue and earnings, which, if realized, could help sustain a stock market rally.
Greater fiscal stimulus also could help our trading partners, provided the new administration does not impose protectionist trade policies. Globally, near-term economic progress and easier fiscal policies should reduce the need to rely so heavily upon monetary policy. The IMF notes that the outlook for advanced economies has improved, though tighter financial conditions challenge the prospects for emerging and developing economies.
The potential benefits of Trump policies could be mitigated by longer-term trends in the economy: an aging population, consumers' reluctance to borrow and subdued productivity growth. Fiscal stimulus would increase demand, but if coupled with aggressive tax cuts could increase the federal budget deficit, raising inflation. Should inflation accelerate above the Fed's comfort threshold, we could see a faster than expected pace of interest rate increases, dampening growth potential.
Political uncertainty persists in this post-election world; the shift from monetary toward fiscal stimulus, while potentially beneficial, may also increase volatility. Investors should remain vigilant. True to our philosophy, we believe a globally diversified portfolio represents the best way to navigate the changing landscape of 2017. Before taking any action that could impact your long-term potential for investment success, thoroughly discuss with your investment advisor your circumstances and possible responses.
We seek to remain a reliable partner committed to reliable investing, helping you and your investment advisor achieve your goals. We appreciate your continued confidence in us, and we look forward to serving your investment needs in the future.
Sincerely,

Shaun Mathews
President and Chief Executive Officer
Voya Family of Funds
January 19, 2017
The views expressed in the President's Letter reflect those of the President as of the date of the letter. Any such views are subject to change at any time based upon market or other conditions and the Voya mutual funds disclaim any responsibility to update such views. These views may not be relied on as investment advice and because investment decisions for a Voya mutual fund are based on numerous factors, may not be relied on as an indication of investment intent on behalf of any Voya mutual fund. Reference to specific company securities should not be construed as recommendations or investment advice.
International investing poses special risks including currency fluctuation, economic and political risks not found in investments that are solely domestic.
2
MARKET PERSPECTIVE: YEAR ENDED DECEMBER 31, 2016
In our semi-annual report we described how markets in global equities, in the form of the MSCI World IndexSM (the "Index") measured in local currencies, including net reinvested dividends, recovered sharply after intensifying global concerns had driven them down into February. With much turmoil along the way, the Index managed to turn a 0.70% loss in the first half into a 9.00% gain for the whole fiscal year. (The Index returned 7.51% for the year ended December 31, 2016, measured in U.S. dollars.)
The U.S. Federal Open Market Committee ("FOMC") had started raising interest rates in December with the prospect of more to come in 2016 despite sluggish economic progress. It was worse in the rest of the developed world where negative bond yields were increasingly common.
China was an ongoing concern with declining growth, policy missteps and ballooning debt. Energy and commodities prices were falling, adding to deflationary pressures.
Many indices of risky assets seemed to reach their nadir on February 11. The Index, with no specific catalyst evident, rebounded by nearly 14% to the end of May.
As asset prices recovered, there were still many who doubted that the gains would be sustained. Yet by the end of May, the domestic economy was delivering some more encouraging data. FOMC officials started talking about two to three rate increases in 2016, as the faint growth in U.S. gross domestic product ("GDP") in late 2015 and early 2016 would soon improve and employment was nearly full.
A surprisingly weak U.S. employment report on June 3 put paid to an interest rate increase that month. But worse was to come. On June 23, the British electorate unexpectedly voted to leave the European Union ("EU"). The strident voices of anti-globalization in other EU countries were sure to demand their own referendum. The potential disintegration of the world's largest trading bloc had alarming implications for global demand and investment. Yet an initial 6% drop in the Index was mostly reversed by month end.
Indeed, the prices of risk assets resumed their recovery; the Index rose 4.56% in the two months through August. Two strong employment reports took the unemployment rate below 4.9%. Core inflation was holding above 2%. Slim second quarter annualized GDP growth of just 1.1% concealed real final sales growth of 2.4%. By the end of August, Federal Reserve officials were again warning of two interest rate increases before year end. In the event the FOMC did not act in September after a less strong employment report and listless purchasing managers' indices, but broadly hinted that they would do so in December.
By the end of October, one notable trend was the increase in government bond yields. There were various reasons. In the U.S., an interest rate hike in December was an increasingly likely prospect, not dimmed by GDP growth for the third quarter of 2016 reported at 2.9% and later revised even higher. In the euro zone, it was feared that the European Central Bank was about to "taper" its bond buying. In the U.K., the weakening pound made government bonds less attractive.
But this and other market trends were thrown into disarray when on November 8 a new U.S. President was unexpectedly elected on a platform of massive infrastructure spending, tax reductions, lighter financial regulation, trade protectionism and the repeal of the Affordable Care Act.
Having stumbled for two months, the Index danced 2.63% higher in November and 2.78% in December. But the music had changed. The platform was seen as reflationary and inflationary in the U.S. The yield curve rose and steepened faster than ever. This and the prospect of lighter regulation benefited banks. The promised infrastructure spending boosted sectors like industrials, energy and materials. However, sectors that had been "bond surrogates" like utilities and consumer staples suffered. The technology sector, on which the net effect was unclear, was little changed.
In U.S. fixed income markets, the Bloomberg Barclays U.S. Aggregate Bond Index ("Barclays Aggregate") gained 2.65% in the fiscal year, while the Bloomberg Barclays U.S. Treasury Bond sub-index added 1.04%. Indices of riskier classes generally outperformed Treasuries. The Bloomberg Barclays U.S. Corporate Investment Grade Bond sub-index advanced 6.11%; the Bloomberg Barclays High Yield Bond — 2% Issuer Constrained Composite Index (not a part of the Barclays Aggregate) soared 17.13%.
U.S. equities, represented by the S&P 500® index including dividends, rose 11.96% over the twelve months. The strongest sectors were energy and telecommunications, returning 27.36% and 23.49% respectively. Weakest were health care and consumer staples, which returned -2.69% and 5.38%, respectively. S&P 500® companies' earnings per share recorded a 3.13% year-over-year increase in the third quarter of 2016 after five straight year-over-year declines.
In currencies, the dollar was boosted by developments in November and on a trade-weighted basis reached a 14-year high. The dollar gained 3.21% against the euro and 19.38% on the pound in 2016, although in the latter case it was primarily due to Britain's vote to leave the EU. The dollar actually lost 2.71% against the yen, but this included a gain after November 8 of more than 11%.
In international markets, the MSCI Japan® Index, in a pattern that inversely reflected the yen, a driver of the value of non-yen export earnings, slipped 0.74% for the year, but rose nearly 15% in the last quarter. The MSCI Europe ex UK® Index added 2.31%, the balance of larger effects: industrials gained over 15% and made the largest contribution, while health care lost 10% and made the largest negative contribution. The MSCI UK® Index surged 19.16%, its big multinational members like HSBC, Shell and Glencore benefiting from the weaker pound, the currency in which their substantial overseas earnings would be reported.
All indices are unmanaged and investors cannot invest directly in an index. Past performance does not guarantee future results. The performance quoted represents past performance. Investment return and principal value of an investment will fluctuate, and shares, when redeemed, may be worth more or less than their original cost. The Portfolios' performance is subject to change since the period's end and may be lower or higher than the performance data shown. Please call (800) 262-3862 or log on to www.voyainvestments.com to obtain performance data current to the most recent month end.
Market Perspective reflects the views of Voya Investment Management's Chief Investment Risk Officer only through the end of the period, and is subject to change based on market and other conditions.
3
Index | | Description | |
Bank of America/Merrill Lynch All Convertibles (Speculative Grade) Index | | An index that includes about 270 convertible securities and represents the non-investment-grade convertible market. | |
Bank of America/Merrill Lynch High Yield Master II Index | | A broad-based index consisting of all U.S. dollar-denominated high-yield bonds with a minimum outstanding amount of $100 million and with a maturity of greater than one year period. The quality rating is less than BBB by Standard & Poor's. | |
Bloomberg Barclays Global Aggregate Index | | Provides a broad-based measure of the global investment-grade fixed-rate debt markets. | |
Bloomberg Barclays High Yield Bond — 2% Issuer Constrained Composite Index | | An index that includes all fixed-income securities having a maximum quality rating of Ba1, a minimum amount outstanding of $150 million, and at least one year to maturity. | |
Bloomberg Barclays U.S. Aggregate Bond Index | | An index of publicly issued investment grade U.S. Government, mortgage-backed, asset-backed and corporate debt securities. | |
Bloomberg Barclays U.S. Corporate Investment Grade Bond Index | | An index consisting of publicly issued, fixed rate, nonconvertible, investment grade debt securities. | |
Bloomberg Barclays U.S. Government/Credit Bond Index | | An index made up of the Barclays Government and Credit indices, including securities issued by the U.S. government and its agencies and publicly issued U.S. corporate and foreign debentures and secured notes that meet specified maturity, liquidity and quality requirements. | |
Bloomberg Barclays U.S. Treasury Bond Index | | A market capitalization-weighted index that measures the performance of public obligations of the U.S. Treasury that have a remaining maturity of one year or more. | |
MSCI All Country World IndexSM | | A broad-based index comprised of equity securities in countries around the world, including the United States, other developed countries and emerging markets. | |
MSCI All Country World ex-U.S. IndexSM | | A free float-adjusted market capitalization index that is designed to measure equity market performance in the global developed and emerging markets, excluding the U.S. It includes the reinvestment of dividends and distributions net of withholding taxes, but does not reflect fees, brokerage commissions or other expenses of investing. | |
MSCI EAFE® Index | | An index that measures the performance of securities listed on exchanges in Europe, Australasia and the Far East. | |
MSCI Europe ex UK® Index | | A free float-adjusted market capitalization index that is designed to measure developed market equity performance in Europe, excluding the UK. | |
MSCI Japan® Index | | A free float-adjusted market capitalization index that is designed to measure developed market equity performance in Japan. | |
MSCI UK® Index | | A free float-adjusted market capitalization index that is designed to measure developed market equity performance in the UK. | |
MSCI World IndexSM | | An index that measures the performance of over 1,400 securities listed on exchanges in the U.S., Europe, Canada, Australia, New Zealand and the Far East. | |
Russell 1000® Index | | A comprehensive large-cap index measuring the performance of the largest 1,000 U.S. incorporated companies. | |
Russell 1000® Growth Index | | Measures the performance of the 1,000 largest companies in the Russell 3000® Index with higher price-to-book ratios and higher forecasted growth. | |
Russell 1000® Value Index | | An index that measures the performance of those Russell 1000® securities with lower price-to-book ratios and lower forecasted growth values. | |
Russell 2000® Growth Index | | An index that measures the performance of securities of smaller U.S. companies with greater than average growth orientation. | |
Russell 2000® Value Index | | An index that measures the performance of those Russell 2000® companies with lower price-to-book ratios and lower than forecasted growth values. | |
Russell 2500TM Growth Index | | Measures the performance of the small- to mid-cap growth segment of the U.S. equity universe. It includes those Russell 2500TM Index companies with higher price-to-book ratios and higher forecasted growth values. | |
4
BENCHMARK DESCRIPTIONS (CONTINUED)
Index | | Description | |
Russell 2500TM Value Index | | Measures the performance of those Russell 2500 companies with lower price-to-book ratios and lower forecasted growth values. | |
Russell Midcap® Growth Index | | An index that measures the performance of those companies included in the Russell Midcap® Index with relatively higher price-to-book ratios and higher forecasted growth values. | |
Russell Midcap® Value Index | | Measures the performance of those Russell Midcap companies with lower price-to-book ratios and lower forecasted growth values. | |
S&P 500® Index | | An index that measures the performance of securities of approximately 500 large-capitalization companies whose securities are traded on major U.S. stock markets. | |
S&P MidCap 400 Index | | A broad-based capitalization weighted index of midcapitalization companies. | |
S&P Small Cap 600/Citigroup Value Index | | Measures the performance of those S&P 600 Index companies with lower price-to-book ratios. | |
5
VOYA GLOBAL BOND PORTFOLIO
PORTFOLIO MANAGERS' REPORT
Voya Global Bond Portfolio (the "Portfolio") seeks to maximize total return through a combination of current income and capital appreciation. The Portfolio is managed by Christine Hurtsellers, CFA, Mustafa Chowdhury and Brian Timberlake, Ph.D., CFA, Portfolio Managers of Voya Investment Management Co. LLC ("Voya IM") — the Sub-Adviser.
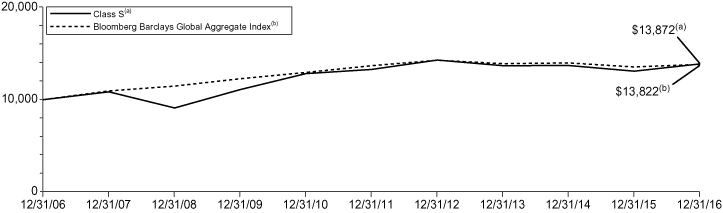
Performance: For the year ended December 31, 2016, the Portfolio's Class S shares provided a total return of 6.03% compared to the Bloomberg Barclays Global Aggregate Index, which returned 2.09% for the same period.
Portfolio Specifics: The Portfolio produced positive total return and outperformed the Bloomberg Barclays Global Aggregate Index for calendar year 2016. For the period, the Portfolio carried an overweight to U.S. based spread assets on the belief that the U.S. economy would continue to grow modestly, that unemployment numbers would remain low, and that globally the demand for yield would help support reductions in accommodation from the U.S. Federal Reserve Board ("Fed"). Return contributions arose from enhanced carry from credit and options on interest rates. The overweight to spread assets included positions in securitized credit (non-agency residential mortgage-backed securities, commercial mortgage-backed securities, asset-backed securities) and high yield corporates. All contributed positively to results on an absolute and relative basis for the year. Strong security selection in investment grade and high yield corporates helped outperform the Bloomberg Barclays Global Aggregate Index's respective sectors as well. Additionally, outperformance was driven by the Portfolio's positioning in global rate markets which benefited from the meaningful increase in interest rate volatility, particularly after the U.S. Presidential election on prospects of higher growth. In terms of currency positioning, the Portfolio was strategically short the Yen and Euro which contributed positively to performance in the last quarter as the dollar gained strength considerably. Exposure to emerging market hard currency and corporate bonds contributed to overall returns while allocation to emerging markets local currency bonds over the period was flat versus the Index.
To manage interest rate risk during the period, the Portfolio used government bond futures and interest rate swaps. To manage currency risk we employed currency forwards, occasionally using currency options to limit risk in adverse scenarios. Occasionally, we used index credit default swaps to manage exposure to spread sectors. The use of derivatives contributed to performance.
Current Strategy and Outlook: As 2016 comes to a close, we would like to look ahead to what should be another eventful year in 2017. With the Donald Trump administration set to be sworn into office in January, changes are most certainly on the horizon. Looking domestically, we believe the expectations of tax cuts, deregulation and fiscal policy will result in near-term acceleration of economic growth in the United States. In our opinion, this increase in incrementally higher nominal growth will likely lead to improved corporate revenues and earnings, creating a constructive environment for corporate credit and supporting tighter spreads. However, structural issues such as subdued productivity and the consumer's ongoing aversion to leverage will continue to limit the upside of potential growth. While we expect near-term global inflationary pressures will continue to build, demographics and the persistent savings glut should keep inflation expectations contained over the long term.
As expected, the Fed voted to increase interest rates by 25 basis points (0.25%) at its December Federal Open Market Committee meeting. Janet Yellen detailed the Fed's plan for 2017, projecting increased GDP and a lower employment rate, and highlighted by the possibility of three rate hikes for the year. While this may sound hawkish, this tone is in fact historically dovish. Therefore, we believe the Fed will maintain its cautious pace of rate normalization, as guided by market expectations. Globally, near-term cyclical tailwinds and easier fiscal policies should reduce the need to rely so heavily on global monetary policy accommodation.
Portfolio holdings and characteristics are subject to change and may not be representative of current holdings and characteristics. Portfolio holdings are subject to change daily. The outlook for this Portfolio may differ from that presented for other Voya mutual funds. The Portfolio's performance returns shown reflect applicable fee waivers and/or expense limits in effect during this period. Absent such fee waivers/expense limitations, if any, performance would have been lower. Performance for the different classes of shares will vary based on differences in fees associated with each class.
Geographic Diversification
as of December 31, 2016
(as a percentage of net assets)
United States(1) | | | 74.2 | % | |
Belgium | | | 7.2 | % | |
Cayman Islands | | | 3.8 | % | |
Italy | | | 2.9 | % | |
Spain | | | 1.7 | % | |
Austria | | | 1.5 | % | |
United Kingdom | | | 1.1 | % | |
Netherlands | | | 0.8 | % | |
France | | | 0.8 | % | |
Brazil | | | 0.7 | % | |
Countries between 0.0% — 0.6%^ | | | 2.8 | % | |
Assets in Excess of Other Liabilities* | | | 2.5 | % | |
Net Assets | | | 100.0 | % | |
* Includes short-term investments and purchased options.
^ Includes 12 countries, which each represents 0.0%-0.6% of net assets.
(1) Includes 21.1% total investment in Voya Emerging Markets Corporate Debt Fund, Voya Emerging Markets Hard Currency Debt Fund, Voya Emerging Markets Local Currency Debt Fund, and Voya High Yield Bond Fund.
Portfolio holdings are subject to change daily.
Top Ten Holdings
as of December 31, 2016*
(as a percentage of net assets)
Voya Emerging Markets Local Currency Debt
Fund — Class P | | | 9.3 | % | |
Kingdom of Belgium Government Bond,
0.800%, 06/22/25 | | | 7.2 | % | |
Voya Emerging Markets Hard Currency
Debt Fund — Class P | | | 6.3 | % | |
United States Treasury Note, 1.750%, 11/30/21 | | | 4.5 | % | |
Voya Emerging Markets Corporate
Debt Fund — Class P | | | 4.3 | % | |
Italy Buoni Poliennali Del Tesoro, 4.500%, 03/01/26 | | | 2.8 | % | |
United States Treasury Note, 2.125%, 11/30/23 | | | 2.4 | % | |
Spain Government Bond, 1.950%, 04/30/26 | | | 1.7 | % | |
United States Treasury Bond, 2.250%, 08/15/46 | | | 1.7 | % | |
Republic of Austria Government Bond,
1.650%, 10/21/24 | | | 1.5 | % | |
* Excludes short-term investments.
Portfolio holdings are subject to change daily.
6
PORTFOLIO MANAGERS' REPORT
VOYA GLOBAL BOND PORTFOLIO
Average Annual Total Returns for the Periods Ended December 31, 2016 | |
| | 1 Year | | 5 Year | | 10 Year | |
Class ADV | | | 5.82 | % | | | 0.63 | % | | | 3.06 | % | |
Class I | | | 6.30 | % | | | 1.14 | % | | | 3.57 | % | |
Class S | | | 6.03 | % | | | 0.88 | % | | | 3.32 | % | |
Blooomberg Barclays Global Aggregate Index | | | 2.09 | % | | | 0.21 | % | | | 3.29 | % | |
Based on a $10,000 initial investment, the graph and table above illustrate the total return of Voya Global Bond Portfolio against the index indicated. The index is unmanaged and has no cash in its portfolio, imposes no sales charges and incurs no operating expenses. An investor cannot invest directly in an index. The Portfolio's performance is shown without the imposition of any expenses or charges which are, or may be, imposed under your variable annuity contract or variable life insurance policy. Total returns would have been lower if such expenses or charges were included.
The performance graph and table do not reflect the deduction of taxes that a shareholder will pay on Portfolio distributions or the redemption of Portfolio shares.
The performance shown may include the effect of fee waivers and/or expense reimbursements by the Investment Adviser and/or other service providers, which have the effect of increasing total return. Had all fees and expenses been considered, the total returns would have been lower.
The performance update illustrates performance for a variable investment option available through a variable
annuity contract or a variable life insurance policy. The performance shown indicates past performance and is not a projection or prediction of future results. Actual investment returns and principal value will fluctuate so that shares and/or units, at redemption, may be worth more or less than their original cost. Please log on to www.voyainvestments.com or call (800) 262-3862 to get performance through the most recent month end.
This report contains statements that may be "forward-looking" statements. Actual results may differ materially from those projected in the "forward-looking" statements.
The views expressed in this report reflect those of the portfolio managers, only through the end of the period as stated on the cover. The portfolio managers' views are subject to change at any time based on market and other conditions.
Portfolio holdings are subject to change daily.
Prior to January 21, 2011, the Portfolio was managed by a different sub-adviser.
7
VY® AMERICAN CENTURY SMALL-MID CAP VALUE PORTFOLIO
PORTFOLIO MANAGERS' REPORT
VY® American Century Small-Mid Cap Value Portfolio (the "Portfolio") seeks long-term capital growth. Income is a secondary objective. The Portfolio is managed by a team of portfolio managers comprised of Miles Lewis, CFA, and Jeff John, CFA, Vice President (responsible for the management of the Small Cap Value portion of the Portfolio) and Kevin Toney, CFA, Senior Vice President, Phillip N. Davidson, CFA, Chief Investment Officer — Value Equity and Senior Vice President, Michael Liss, CFA, Vice President, and Brian Woglom, CFA, Vice President (responsible for the Mid Cap Value portion of the Portfolio) (each a "Sleeve"), Portfolio Managers of American Century Investment Management, Inc. — the Sub-Adviser.
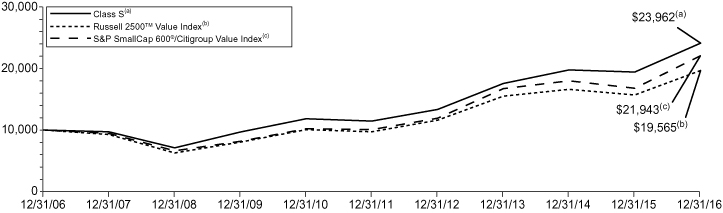
Performance: For the year ended December 31, 2016, the Portfolio's Class S shares provided a total return 24.06% compared to the Russell 2500TM Value Index and the S&P SmallCap 600®/Citigroup Value Index, which returned 25.20% and 31.32%, respectively, for the same period.
Portfolio Specifics: The Portfolio underperformed the Russell 2500 Value Index. Although the Russell 2500 Value is the overall portfolio benchmark, the Small Cap Value and Mid Cap Value sleeves are managed against the Russell 2000 Value and Russell Mid Cap Value benchmarks, respectively.
The Mid Cap Value sleeve outperformed the Russell Midcap Value Index over the year. Stock selection and overweight allocations in both the financials and industrials sectors contributed to the sleeve's relative performance. An underweight allocation to the materials sector, however, detracted from relative performance.
Among benchmarks, small-cap stocks outperformed both mid- and large-cap stocks. The Small Cap Value sleeve trailed the Russell 2000 Value Index in the period. Stock selection in the materials sector was a top detractor, as was stock selection and an overweight allocation in the health care sector. Stock selection in the financials sector boosted relative performance in the sleeve.
Within the overall Portfolio, stock selection and allocation effects in the industrials and financials sectors contributed to relative performance. An underweight position in the real estate sector also boosted returns. A Portfolio-only position in semiconductor supplier Applied Materials was a top contributor, rising after the company experienced order strength. Also, the company held an analyst day in mid-September that showed improvement in market share. Sysco Corp., another Portfolio-only holding, also boosted relative returns. The marketer and distributor of food products rose after reporting strong earnings.
On the other hand, stock selection and an underweight allocation in the materials sector detracted from relative returns. Among individual securities, hospital company LifePoint Health was a leading detractor. Shares of the health care provider struggled due to concerns over the benefit in volumes from the at-risk Affordable Care Act, and the company also reported earnings misses because of two one-time expenses. Information technology holding Verifone, one of the two leading providers of payment processing terminals, also weighed on performance. The Portfolio-only position dropped on poor financial results and lowered guidance. The company has benefited in the past from the transition to chip technology in payment processing terminals, but some investors are concerned that the initial ramp in the terminal replacement cycle is normalizing. The Portfolio team believes secular drivers of demand remain in place.
Current Strategy and Outlook: The team follows a stock-specific, valuation-driven strategy. The Portfolio's sector allocation is the result of the team's bottom-up investment process.
Relative to the Russell 2500TM Value Index, the Portfolio continues to have a substantial underweight in the real estate sector. The team believes that in general, valuations in the real estate sector are stretched. The Portfolio is also underweight in the financials sector.
Relative to the Russell 2500TM Value Index, the overall Portfolio is overweight in the health care sector, driven by overweight positioning among health care providers and the equipment and supplies industry. It is also overweight in the energy sector, driven by overweight positioning in the oil, gas, and consumable fuel industry.
Portfolio holdings and characteristics are subject to change and may not be representative of current holdings and characteristics. Portfolio holdings are subject to change daily. The outlook for this Portfolio may differ from that presented for other Voya mutual funds. The Portfolio's performance returns shown reflect applicable fee waivers and/or expense limits in effect during this period. Absent such fee waivers/expense limitations, if any, performance would have been lower. Performance for the different classes of shares will vary based on differences in fees associated with each class.
Sector Diversification
as of December 31, 2016
(as a percentage of net assets)
Financials | | | 25.4 | % | |
Industrials | | | 14.6 | % | |
Energy | | | 10.2 | % | |
Information Technology | | | 9.4 | % | |
Health Care | | | 7.7 | % | |
Consumer Discretionary | | | 7.6 | % | |
Utilities | | | 5.4 | % | |
Real Estate | | | 5.3 | % | |
Consumer Staples | | | 4.6 | % | |
Materials | | | 4.5 | % | |
Exchange-Traded Funds | | | 2.1 | % | |
Telecommunication Services | | | 0.5 | % | |
Assets in Excess of Other Liabilities* | | | 2.7 | % | |
Net Assets | | | 100.0 | % | |
* Includes short-term investments.
Portfolio holdings are subject to change daily.
Top Ten Holdings
as of December 31, 2016*
(as a percentage of net assets)
Northern Trust Corp. | | | 2.2 | % | |
iShares Russell Midcap Value Index Fund | | | 1.9 | % | |
Johnson Controls International plc | | | 1.9 | % | |
LifePoint Health, Inc. | | | 1.5 | % | |
Zimmer Biomet Holdings, Inc. | | | 1.2 | % | |
Imperial Oil Ltd. | | | 1.2 | % | |
Applied Materials, Inc. | | | 1.1 | % | |
EQT Corp. | | | 1.1 | % | |
Baker Hughes, Inc. | | | 1.1 | % | |
Noble Energy, Inc. | | | 1.1 | % | |
* Excludes short-term investments.
Portfolio holdings are subject to change daily.
8
VY® AMERICAN CENTURY SMALL-MID CAP VALUE PORTFOLIO
PORTFOLIO MANAGERS' REPORT
Average Annual Total Returns for the Periods Ended December 31, 2016 | |
| | 1 Year | | 5 Year | | 10 Year | | Since Inception
of Class S2
February 27, 2009 | |
Class ADV | | | 23.69 | % | | | 15.66 | % | | | 8.85 | % | | | — | | |
Class I | | | 24.38 | % | | | 16.24 | % | | | 9.40 | % | | | — | | |
Class S | | | 24.06 | % | | | 15.95 | % | | | 9.13 | % | | | — | | |
Class S2 | | | 23.92 | % | | | 15.79 | % | | | — | | | | 19.77 | % | |
Russell 2500TM Value Index | | | 25.20 | % | | | 15.04 | % | | | 6.94 | % | | | 19.48 | % | |
S&P SmallCap 600®/Citigroup Value Index | | | 31.32 | % | | | 16.88 | % | | | 8.18 | % | | | 20.80 | % | |
Based on a $10,000 initial investment, the graph and table above illustrate the total return of VY® American Century Small-Mid Cap Value Portfolio against the indices indicated. An index is unmanaged and has no cash in its portfolio, imposes no sales charges and incurs no operating expenses. An investor cannot invest directly in an index. The Portfolio's performance is shown without the imposition of any expenses or charges which are, or may be, imposed under your variable annuity contract or variable life insurance policy. Total returns would have been lower if such expenses or charges were included.
The performance graph and table do not reflect the deduction of taxes that a shareholder will pay on Portfolio distributions or the redemption of Portfolio shares.
The performance shown may include the effect of fee waivers and/or expense reimbursements by the Investment Adviser and/or other service providers, which have the effect of increasing total return. Had all fees and expenses been considered, the total returns would have been lower.
The performance update illustrates performance for a variable investment option available through a variable
annuity contract or a variable life insurance policy. The performance shown indicates past performance and is not a projection or prediction of future results. Actual investment returns and principal value will fluctuate so that shares and/or units, at redemption, may be worth more or less than their original cost. Please call (800) 262-3862 to get performance through the most recent month end.
This report contains statements that may be "forward-looking" statements. Actual results may differ materially from those projected in the "forward-looking" statements.
The views expressed in this report reflect those of the portfolio managers, only through the end of the period as stated on the cover. The portfolio managers' views are subject to change at any time based on market and other conditions.
Portfolio holdings are subject to change daily.
9
VY® BARON GROWTH PORTFOLIO
PORTFOLIO MANAGERS' REPORT
VY® Baron Growth Portfolio (the "Portfolio") seeks capital appreciation. The Portfolio is managed by Ronald Baron, Founder, Chief Executive Officer, Chief Investment Officer, Chairman, and Portfolio Manager of BAMCO, Inc. — the Sub-Adviser.
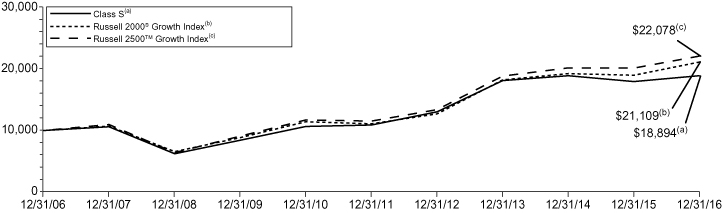
Performance: For the year ended December 31, 2016, the Portfolio's Class S shares provided a total return of 5.33% compared to the Russell 2000® Growth Index and the Russell 2500TM Growth Index, which returned 11.32% and 9.73%, respectively, for the same period.
Portfolio Specifics: The year started with a sell off driven by concerns around a possible tightening of the credit markets, signs of slowing growth, particularly in China, and continued low oil prices. As global concerns subsided, oil prices ticked up, domestic job numbers improved, and the Federal Reserve deferred interest rate hikes, the markets recovered. In late June, the U.K.'s vote to exit the European Union sent the markets into another sharp, but thankfully short-lived, decline. In November, post-election expectations of corporate tax reform, looser regulations, a stronger dollar, higher interest rates, and investment in infrastructure drove rotation into stocks, sectors, and asset classes that are expected to benefit from these developments.
Absolute Performance
Consumer discretionary, financials, and health care were the top sector performers in 2016. Within consumer discretionary, the leisure facilities, hotels resorts & cruise lines, specialty stores, and casinos & gaming sub-industries drove positive performance, led by top contributor Vail Resorts, Inc. The sector also included the top detractor in 2016, athletic apparel company Under Armour, Inc. Performance of the financials sector was driven primarily by life & health insurance company Primerica, Inc., the third biggest contributor during the period. Health care benefited from second biggest contributor IDEXX Laboratories, Inc., a manufacturer of veterinary diagnostics equipment.
Information technology ("IT") and consumer staples detracted the most during the period. Within IT, holdings in application software and internet software & services were the biggest detractors, led by financial software company SS&C Technologies, Inc., and real estate data and marketing services company CoStar Group, Inc., respectively. Weak performance of the consumer staples sector was led by retail grocer Smart & Final Stores, Inc. and leading craft beer company Boston Beer Company, Inc.
Relative Performance
The Portfolio trailed the Russell 2000® Growth Index due to stock selection and greater exposure to smaller mid-cap and mid-cap stocks, which trailed the smallest cap stocks in the Russell 2000® Growth Index during the period.
Health care, larger exposure to the outperforming utilities sector early in the year, and greater exposure to the strong performing real estate sector aided relative results. Within health care, lower exposure to declining biotechnology and pharmaceutical stocks added 518 basis points (5.18%) to relative performance. Strength was also attributable to outperformance of health care equipment and life sciences tools & services holdings.
IT, industrials, and consumer staples investments and lack of exposure to the top performing materials sector detracted the most from relative results. Within IT, underperformance of application software and internet software & services holdings and lack of exposure to the strong performing semiconductor, semiconductor equipment, and electronic equipment & instruments sub-industries hurt relative results. Within industrials, lack of exposure to the outperforming office services & supplies, construction & engineering, trucking, and airlines sub-industries and underperformance of Caesarstone Ltd., weighed on relative results. Weakness in consumer staples was mainly due to the underperformance of Smart & Final Stores, Inc. and TreeHouse Foods, Inc.
Current Strategy and Outlook: As long-term, fundamental, bottom-up investors, we are continuing to position the Portfolio to benefit from what we believe to be strong, long-term growth opportunities over the long term. We believe the rapid rate of growth in the post-recession equity markets will slow to single digits as multiples are now at the high end of the historical range.
Portfolio holdings and characteristics are subject to change and may not be representative of current holdings and characteristics. Portfolio holdings are subject to change daily. The outlook for this Portfolio may differ from that presented for other Voya mutual funds. The Portfolio's performance returns shown reflect applicable fee waivers and/or expense limits in effect during this period. Absent such fee waivers/expense limitations, if any, performance would have been lower. Performance for the different classes of shares will vary based on differences in fees associated with each class.
Sector Diversification
as of December 31, 2016
(as a percentage of net assets)
Consumer Discretionary | | | 34.5 | % | |
Information Technology | | | 20.9 | % | |
Financials | | | 16.2 | % | |
Health Care | | | 9.2 | % | |
Real Estate | | | 8.6 | % | |
Industrials | | | 4.3 | % | |
Consumer Staples | | | 4.2 | % | |
Telecommunication Services | | | 1.2 | % | |
Assets in Excess of Other Liabilities* | | | 0.9 | % | |
Net Assets | | | 100.0 | % | |
* Includes short-term investments.
Portfolio holdings are subject to change daily.
Top Ten Holdings
as of December 31, 2016
(as a percentage of net assets)
Vail Resorts, Inc. | | | 10.8 | % | |
Gartner, Inc. | | | 4.9 | % | |
Choice Hotels International, Inc. | | | 4.4 | % | |
CoStar Group, Inc. | | | 4.0 | % | |
Bright Horizons Family Solutions, Inc. | | | 3.6 | % | |
Idexx Laboratories, Inc. | | | 3.4 | % | |
Gaming and Leisure Properties, Inc. | | | 3.2 | % | |
Ansys, Inc. | | | 2.9 | % | |
SS&C Technologies Holdings, Inc. | | | 2.8 | % | |
Primerica, Inc. | | | 2.7 | % | |
Portfolio holdings are subject to change daily.
10
PORTFOLIO MANAGERS' REPORT
VY® BARON GROWTH PORTFOLIO
Average Annual Total Returns for the Periods Ended December 31, 2016 | |
| | 1 Year | | 5 Year | | 10 Year | | Since Inception
of Class S2
February 27, 2009 | |
Class ADV | | | 5.06 | % | | | 11.36 | % | | | 6.29 | % | | | — | | |
Class I | | | 5.57 | % | | | 11.92 | % | | | 6.83 | % | | | — | | |
Class R6(1) | | | 5.56 | % | | | 11.92 | % | | | 6.83 | % | | | — | | |
Class S | | | 5.33 | % | | | 11.64 | % | | | 6.57 | % | | | — | | |
Class S2 | | | 5.17 | % | | | 11.48 | % | | | — | | | | 17.34 | % | |
Russell 2000® Growth Index | | | 11.32 | % | | | 13.74 | % | | | 7.76 | % | | | 18.87 | % | |
Russell 2500TM Growth Index | | | 9.73 | % | | | 13.88 | % | | | 8.24 | % | | | 19.39 | % | |
Based on a $10,000 initial investment, the graph and table above illustrate the total return of VY® Baron Growth Portfolio against the indices indicated. An index is unmanaged and has no cash in its portfolio, imposes no sales charges and incurs no operating expenses. An investor cannot invest directly in an index. The Portfolio's performance is shown without the imposition of any expenses or charges which are, or may be, imposed under your variable annuity contract or variable life insurance policy. Total returns would have been lower if such expenses or charges were included.
The performance graph and table do not reflect the deduction of taxes that a shareholder will pay on Portfolio distributions or the redemption of Portfolio shares.
The performance shown may include the effect of fee waivers and/or expense reimbursements by the Investment Adviser and/or other service providers, which have the effect of increasing total return. Had all fees and expenses been considered, the total returns would have been lower.
The performance update illustrates performance for a variable investment option available through a variable annuity contract or a variable life insurance policy. The
performance shown indicates past performance and is not a projection or prediction of future results. Actual investment returns and principal value will fluctuate so that shares and/or units, at redemption, may be worth more or less than their original cost. Please call (800) 262-3862 to get performance through the most recent month end.
This report contains statements that may be "forward-looking" statements. Actual results may differ materially from those projected in the "forward-looking" statements.
The views expressed in this report reflect those of the portfolio manager, only through the end of the period as stated on the cover. The portfolio manager's views are subject to change at any time based on market and other conditions.
Portfolio holdings are subject to change daily.
(1) Class R6 incepted on May 3, 2016. The Class R6 shares performance shown for the period prior to their inception date is the performance of Class I shares without adjustment for any differences in the expenses between the two classes. If adjusted for such differences, returns would be different.
11
VY® COLUMBIA CONTRARIAN CORE PORTFOLIO
PORTFOLIO MANAGERS' REPORT
VY® Columbia Contrarian Core Portfolio (the "Portfolio") seeks total return consisting of long-term capital appreciation and current income. The Portfolio is managed by Guy W. Pope, CFA, Senior Portfolio Manager and Head of Contrarian Core Strategy with Columbia Management Investment Advisers, LLC ("CMIA") — the Sub-Adviser.
Performance: For the year ended December 31, 2016, the Portfolio's Class S shares provided a total return of 8.41% compared to the Russell 1000® Index, which returned 12.05% for the same period.
Portfolio Specifics: Stock selection was the primary driver of performance for the period, with strong stock selection in the consumer discretionary sector, which was more than offset by poor stock selection in the information technology, health care, industrials and consumer staples sectors. An overweight to the strong performing financials sector also contributed positively and an overweight to health care detracted.
In the financials sector, Morgan Stanley and JP Morgan Chase & Co. were two of the top contributors in the entire Portfolio, benefitting from the post-election rally in financials which was fueled by expectations that interest rates, tax policies and de-regulation will be significant tailwinds for the global financial services firms. Not owning Bank of America Corp., which rallied more than the other banks, proved to be the biggest detractor relative to the benchmark in the period.
Verizon Communications also contributed positively to performance following positive earnings results. The company is a leading provider of communications services within the United States. The nature of this business allows for a steady stream of cash flows. After a sluggish 2015, the stock benefited from investors' increased focus on value and yield during the period.
CVS Health Corporation ("CVS") was a top detractor in the period. Rumblings about the potential for increased regulation, especially regarding pharmaceutical pricing, put a damper on health care stocks in general. Both CVS and Walgreen's, with their link to health care, were vulnerable to the same concerns. After years of gaining significant market share in the pharmacy benefit management business, CVS/Caremark has run up against more stiff competition.
Another top detractor was auto parts manufacturer Delphi Automotive Plc. Early in the period the company reported solid earnings, profit margins and organic sales growth, but the UK-based company sold off on the outcome of the Brexit vote and concerns on the global auto cycle.
Video game maker Activision Blizzard detracted this period after being a top contributor for many previous periods. The stock sold off after the company reported disappointing sales of its latest Call of Duty game, impacted by a strong competition and some cannibalization from an online version.
Current Strategy and Outlook: The team hasn't made any significant position changes as a result of the election, instead planning to stick to its process and continue to monitor indications about things like interest rates, trade agreements, tax policy and regulations. As we await forthcoming details on President-elect Trump's administration and agenda, we continue to adhere to our bottom-up, fundamental research process, using pessimism as the starting point of our contrarian process to select potential investment candidates for a well-diversified portfolio where we see the ability for long-term value creation.
Portfolio holdings and characteristics are subject to change and may not be representative of current holdings and characteristics. Portfolio holdings are subject to change daily. The outlook for this Portfolio may differ from that presented for other Voya mutual funds. The Portfolio's performance returns shown reflect applicable fee waivers and/or expense limits in effect during this period. Absent such fee waivers/expense limitations, if any, performance would have been lower. Performance for the different classes of shares will vary based on differences in fees associated with each class.
Sector Diversification
as of December 31, 2016
(as a percentage of net assets)
Information Technology | | | 20.6 | % | |
Financials | | | 17.8 | % | |
Health Care | | | 14.1 | % | |
Consumer Discretionary | | | 12.5 | % | |
Industrials | | | 9.3 | % | |
Consumer Staples | | | 9.2 | % | |
Energy | | | 7.3 | % | |
Telecommunication Services | | | 3.5 | % | |
Materials | | | 1.9 | % | |
Real Estate | | | 1.4 | % | |
Utilities | | | 1.3 | % | |
Assets in Excess of Other Liabilities* | | | 1.1 | % | |
Net Assets | | | 100.0 | % | |
* Includes short-term investments.
Portfolio holdings are subject to change daily.
Top Ten Holdings
as of December 31, 2016
(as a percentage of net assets)
Apple, Inc. | | | 4.0 | % | |
Citigroup, Inc. | | | 3.7 | % | |
JPMorgan Chase & Co. | | | 3.5 | % | |
Berkshire Hathaway, Inc. — Class B | | | 3.1 | % | |
Alphabet, Inc. — Class C | | | 2.9 | % | |
Microsoft Corp. | | | 2.9 | % | |
Philip Morris International, Inc. | | | 2.7 | % | |
Comcast Corp. — Class A | | | 2.7 | % | |
Verizon Communications, Inc. | | | 2.7 | % | |
Morgan Stanley | | | 2.6 | % | |
Portfolio holdings are subject to change daily.
12
VY® COLUMBIA CONTRARIAN CORE PORTFOLIO
PORTFOLIO MANAGERS' REPORT

Average Annual Total Returns for the Periods Ended December 31, 2016 | |
| | 1 Year | | 5 Year | | 10 Year | |
Class ADV | | | 8.12 | % | | | 13.47 | % | | | 5.16 | % | |
Class I | | | 8.64 | % | | | 14.05 | % | | | 5.69 | % | |
Class S | | | 8.41 | % | | | 13.76 | % | | | 5.42 | % | |
Russell 1000® Index | | | 12.05 | % | | | 14.69 | % | | | 7.08 | % | |
Based on a $10,000 initial investment, the graph and table above illustrate the total return of VY® Columbia Contrarian Core Portfolio against the index indicated. The index is unmanaged and has no cash in its portfolio, imposes no sales charges and incurs no operating expenses. An investor cannot invest directly in an index. The Portfolio's performance is shown without the imposition of any expenses or charges which are, or may be, imposed under your variable annuity contract or variable life insurance policy. Total returns would have been lower if such expenses or charges were included.
The performance graph and table do not reflect the deduction of taxes that a shareholder will pay on Portfolio distributions or the redemption of Portfolio shares.
The performance shown may include the effect of fee waivers and/or expense reimbursements by the Investment Adviser and/or other service providers, which have the effect of increasing total return. Had all fees and expenses been considered, the total returns would have been lower.
The performance update illustrates performance for a variable investment option available through a variable
annuity contract or a variable life insurance policy. The performance shown indicates past performance and is not a projection or prediction of future results. Actual investment returns and principal value will fluctuate so that shares and/or units, at redemption, may be worth more or less than their original cost. Please call (800) 262-3862 to get performance through the most recent month end.
This report contains statements that may be "forward-looking" statements. Actual results may differ materially from those projected in the "forward-looking" statements.
The views expressed in this report reflect those of the portfolio manager, only through the end of the period as stated on the cover. The portfolio manager's views are subject to change at any time based on market and other conditions.
Portfolio holdings are subject to change daily.
Prior to April 30, 2013, the Portfolio was managed by a different sub-adviser.
13
VY® COLUMBIA SMALL CAP VALUE II PORTFOLIO
PORTFOLIO MANAGERS' REPORT
VY® Columbia Small Cap Value II Portfolio (the "Portfolio") seeks long-term growth of capital. The Portfolio is managed by Christian K. Stadlinger, Ph.D., CFA, and Jarl Ginsberg, CFA, CAIA, Portfolio Managers, of Columbia Management Investment Advisors, LLC — the Sub-Adviser.
Performance: For the year ended December 31, 2016, the Portfolio's Class I shares provided a total return of 24.00% compared to the Russell 2000® Value Index, which returned 31.74% for the same period.
Portfolio Specifics: The Portfolio had a strong year on an absolute basis, though relative performance was underwhelming as the Portfolio trailed the Russell 2000® Value Index. While the Portfolio's sector allocations were a slight detractor from relative performance during the period, the bulk of underperformance was derived from negative stock selection. We would anticipate that stock selection would be the primary driver of relative performance, either positive or negative, given the process by which the Portfolio is run which is by bottom up stock selection and fundamental research.
From an allocation standpoint, an overweight to materials, which was the best performing sector during the period, contributed to relative performance. However, an overweight to health care was the biggest detractor from relative performance on an allocation basis. The rest of the sector allocations had a minimal impact to overall performance.
The Portfolio benefitted from strong stock selection in the IT sector, particularly in communications equipment and IT services names. Strong stock selection in those areas more than made up for weaker stock selection in the semiconductor space.
The Portfolio also benefitted from strong stock selection in utilities. The utilities sector outperformed most other sectors for most of the year, but began to sell off in the late third and fourth quarter. Utilities are sensitive to changes in interest rates and as treasury rates began to rise, the sector gave back some gains.
Weak stock selection among financial companies was the biggest detractor from relative performance. Financials are the biggest sector in the Russell 2000® Value Index, accounting for more than 30% of the benchmark. Stock selection was weak among the banks, which enjoyed a strong year, particularly post presidential election. While the majority of our bank holdings enjoyed strong years, not owning some of the names that had outstanding years detracted from relative performance.
Lastly, positions in two personal beauty product companies hurt relative performance in consumer staples.
Current Strategy and Outlook: We continue to believe that our focus on small-cap value companies with strong underlying earnings prospects and attractively priced shares have the potential to reward investors. Our rigorous research continues to focus on a set of companies where we believe the valuation gap is likely to shrink in the near term and look for a company's upward inflection point. We seek out stocks that we believe are both inexpensive and show improving operating performance/metrics. As we do this, three types of opportunities typically come to light:
• Companies with compressed near-term operating fundamentals that the managers believe are poised to expand within a reasonable timeframe
• Opportunities in industries that may be out of favor
• Out-of-the-limelight companies missed by the Wall Street research community
Portfolio holdings and characteristics are subject to change and may not be representative of current holdings and characteristics. Portfolio holdings are subject to change daily. The outlook for this Portfolio may differ from that presented for other Voya mutual funds. The Portfolio's performance returns shown reflect applicable fee waivers and/or expense limits in effect during this period. Absent such fee waivers/expense limitations, if any, performance would have been lower. Performance for the different classes of shares will vary based on differences in fees associated with each class.
Sector Diversification
as of December 31, 2016
(as a percentage of net assets)
Financials | | | 31.8 | % | |
Industrials | | | 14.0 | % | |
Information Technology | | | 9.9 | % | |
Real Estate | | | 8.0 | % | |
Consumer Discretionary | | | 6.9 | % | |
Materials | | | 6.8 | % | |
Energy | | | 6.7 | % | |
Health Care | | | 4.8 | % | |
Utilities | | | 4.8 | % | |
Consumer Staples | | | 3.1 | % | |
Exchange-Traded Funds | | | 1.1 | % | |
Assets in Excess of Other Liabilities* | | | 2.1 | % | |
Net Assets | | | 100.0 | % | |
* Includes short-term investments.
Portfolio holdings are subject to change daily.
Top Ten Holdings
as of December 31, 2016*
(as a percentage of net assets)
Community Bank System, Inc. | | | 1.5 | % | |
Sterling Bancorp/DE | | | 1.5 | % | |
Independent Bank Corp. | | | 1.5 | % | |
EMCOR Group, Inc. | | | 1.4 | % | |
Renasant Corp. | | | 1.4 | % | |
Sandy Spring Bancorp, Inc. | | | 1.4 | % | |
Union Bankshares Corp. | | | 1.3 | % | |
MGIC Investment Corp. | | | 1.2 | % | |
Hope Bancorp, Inc. | | | 1.2 | % | |
Customers Bancorp, Inc. | | | 1.2 | % | |
* Excludes short-term investments.
Portfolio holdings are subject to change daily.
14
PORTFOLIO MANAGERS' REPORT
VY® COLUMBIA SMALL CAP VALUE II PORTFOLIO

Average Annual Total Returns for the Periods Ended December 31, 2016 | |
| | 1 Year | | 5 Year | | 10 Year | | Since Inception
of Class S2
February 27, 2009 | |
Class ADV | | | 23.41 | % | | | 14.63 | % | | | 7.26 | % | | | — | | |
Class I | | | 24.00 | % | | | 15.20 | % | | | 7.80 | % | | | — | | |
Class R6(1) | | | 23.99 | % | | | 15.20 | % | | | 7.80 | % | | | — | | |
Class S | | | 23.70 | % | | | 14.89 | % | | | 7.53 | % | | | — | | |
Class S2 | | | 23.57 | % | | | 14.73 | % | | | — | | | | 19.05 | % | |
Russell 2000® Value Index | | | 31.74 | % | | | 15.07 | % | | | 6.26 | % | | | 18.89 | % | |
Based on a $10,000 initial investment, the graph and table above illustrate the total return of VY® Columbia Small Cap Value II Portfolio against the index indicated. The index is unmanaged and has no cash in its portfolio, imposes no sales charges and incurs no operating expenses. An investor cannot invest directly in an index. The Portfolio's performance is shown without the imposition of any expenses or charges which are, or may be, imposed under your variable annuity contract or variable life insurance policy. Total returns would have been lower if such expenses or charges were included.
The performance graph and table do not reflect the deduction of taxes that a shareholder will pay on Portfolio distributions or the redemption of Portfolio shares.
The performance shown may include the effect of fee waivers and/or expense reimbursements by the Investment Adviser and/or other service providers, which have the effect of increasing total return. Had all fees and expenses been considered, the total returns would have been lower.
The performance update illustrates performance for a variable investment option available through a variable annuity contract or a variable life insurance policy. The
performance shown indicates past performance and is not a projection or prediction of future results. Actual investment returns and principal value will fluctuate so that shares and/or units, at redemption, may be worth more or less than their original cost. Please call (800) 262-3862 to get performance through the most recent month end.
This report contains statements that may be "forward-looking" statements. Actual results may differ materially from those projected in the "forward-looking" statements.
The views expressed in this report reflect those of the portfolio managers, only through the end of the period as stated on the cover. The portfolio managers' views are subject to change at any time based on market and other conditions.
Portfolio holdings are subject to change daily.
(1) Class R6 incepted on May 3, 2016. The Class R6 shares performance shown for the period prior to their inception date is the performance of Class I shares without adjustment for any differences in the expenses between the two classes. If adjusted for such differences, returns would be different.
15
VY® INVESCO COMSTOCK PORTFOLIO
PORTFOLIO MANAGERS' REPORT
VY® Invesco Comstock Portfolio (the "Portfolio") seeks capital growth and income. The Portfolio is managed by Kevin Holt, Lead Portfolio Manager, and Devin Armstrong, James Warwick, and Charles DyReyes each a Portfolio Manager of Invesco Advisers, Inc. — the Sub-Adviser.
Performance: For the year ended December 31, 2016, the Portfolio's Class S shares, provided a total return of 17.79% compared to the Russell 1000® Value Index and the S&P 500® Index, which returned 17.34% and 11.96%, respectively, for the same period.
Portfolio Specifics: On the positive side of sector performance, stock selection and an overweight exposure within financials contributed to relative performance. Within banks, Bank of America and JPMorgan Chase were large contributors on a relative and absolute basis. Within diversified financials, Morgan Stanley was a top performer for the period, outperforming the sector and benchmark. Financial stocks rallied during the second half of the year, notably post-election, as large banks rallied on expectations of a more lenient regulatory environment from the new presidential administration.
Strong stock selection and overweight exposure within information technology stocks also boosted relative performance for the year. Within software, Microsoft and Symantec Corp. were large contributors. Within hardware storage and peripherals, NetApp Inc. was a large contributor. Symantec stock rallied after they announced a deal to buy Blue Coat, a technology and cloud access security firm. In the second half of the year, NetApp reported smaller than expected declines in their mature product areas and growth in strategic solutions. Investors also welcomed strong expense management.
Having no exposure to real estate and a material underweight to consumer staples were large contributors to relative performance, as these sectors were the bottom performing sectors in the Russell 1000® Value Index for the year. The Portfolio has remained materially underweight these area of the market because management believes these sectors are generally overvalued, as investors have driven up stock prices in a quest for yield in a low-interest rate environment.
On the negative side, a material overweight allocation to consumer discretionary stocks was a detractor for the period. Having a material overweight to Carnival Corp. was a large detractor, followed by media company, Viacom Inc. The large cruise line operator stock sold off after the Brexit decision due to foreign exposure, even though the company beat earnings expectations during that time. Prior to the Brexit decision, investors were focused on oil prices and the impact on the cruise line's margin recovery.
Stock selection within telecommunication services also dampened performance. Frontier Communications was a large detractor, as well as not owning AT&T Inc. AT&T posted returns over 20% for the year, outperforming the sector and benchmark.
Stock selection within health care also dampened relative performance. Express Scripts, a pharmacy benefits manager, and Novartis, a major European pharmaceuticals firm, were large detractors, both posting negative double-digit returns for the period. Express Scripts was eliminated from the Portfolio due to projected pricing and margin pressure, given potential regulations on prescription drugs.
We used currency forward contracts during the reporting period for the purpose of hedging currency exposure of non-U.S.-based companies held in the Portfolio. Derivatives were used solely for the purpose of hedging and not for speculative purposes or leverage. The use of currency forward contracts had a positive impact on the Portfolio's performance relative to the Russell 1000® Value Index for the reporting period.
Current Strategy and Outlook: The Portfolio's financials weighting is overweight to the benchmark, as we have a favorable view of large banks within financials. We also are constructive on the long — term prospects for our energy holdings as we believe supply and demand for oil should balance over time. The Portfolio's exposure in each sector has a higher volatility than the Russell 1000® Value Index. Therefore, the Portfolio should be more sensitive to broad moves within these sectors for the foreseeable future.
Portfolio holdings and characteristics are subject to change and may not be representative of current holdings and characteristics. Portfolio holdings are subject to change daily. The outlook for this Portfolio may differ from that presented for other Voya mutual funds. The Portfolio's performance returns shown reflect applicable fee waivers and/or expense limits in effect during this period. Absent such fee waivers/expense limitations, if any, performance would have been lower. Performance for the different classes of shares will vary based on differences in fees associated with each class.
Sector Diversification
as of December 31, 2016
(as a percentage of net assets)
Financials | | | 36.2 | % | |
Energy | | | 17.2 | % | |
Consumer Discretionary | | | 10.4 | % | |
Health Care | | | 9.6 | % | |
Information Technology | | | 9.4 | % | |
Industrials | | | 9.2 | % | |
Consumer Staples | | | 3.0 | % | |
Materials | | | 1.8 | % | |
Telecommunication Services | | | 1.0 | % | |
Utilities | | | 0.6 | % | |
Assets in Excess of Other Liabilities* | | | 1.6 | % | |
Net Assets | | | 100.0 | % | |
* Includes short-term investments.
Portfolio holdings are subject to change daily.
Top Ten Holdings
as of December 31, 2016
(as a percentage of net assets)
Citigroup, Inc. | | | 5.8 | % | |
JPMorgan Chase & Co. | | | 4.6 | % | |
Bank of America Corp. | | | 4.1 | % | |
Carnival Corp. | | | 2.6 | % | |
Suncor Energy, Inc. | | | 2.5 | % | |
Cisco Systems, Inc. | | | 2.3 | % | |
PNC Financial Services Group, Inc. | | | 2.2 | % | |
Royal Dutch Shell PLC — Class A ADR | | | 2.0 | % | |
Wells Fargo & Co. | | | 2.0 | % | |
Morgan Stanley | | | 2.0 | % | |
Portfolio holdings are subject to change daily.
16
PORTFOLIO MANAGERS' REPORT
VY® INVESCO COMSTOCK PORTFOLIO

Average Annual Total Returns for the Periods Ended December 31, 2016 | |
| | 1 Year | | 5 Year | | 10 Year | |
Class ADV | | | 17.51 | % | | | 13.85 | % | | | 5.44 | % | |
Class I | | | 18.13 | % | | | 14.41 | % | | | 5.96 | % | |
Class S | | | 17.79 | % | | | 14.13 | % | | | 5.70 | % | |
Russell 1000® Value Index | | | 17.34 | % | | | 14.80 | % | | | 5.72 | % | |
S&P 500® Index | | | 11.96 | % | | | 14.66 | % | | | 6.95 | % | |
Based on a $10,000 initial investment, the graph and table above illustrate the total return of VY® Invesco Comstock Portfolio against the indices indicated. An index is unmanaged and has no cash in its portfolio, imposes no sales charges and incurs no operating expenses. An investor cannot invest directly in an index. The Portfolio's performance is shown without the imposition of any expenses or charges which are, or may be, imposed under your variable annuity contract or variable life insurance policy. Total returns would have been lower if such expenses or charges were included.
The performance graph and table do not reflect the deduction of taxes that a shareholder will pay on Portfolio distributions or the redemption of Portfolio shares.
The performance shown may include the effect of fee waivers and/or expense reimbursements by the Investment Adviser and/or other service providers, which have the effect of increasing total return. Had all fees and expenses been considered, the total returns would have been lower.
The performance update illustrates performance for a variable investment option available through a variable
annuity contract or a variable life insurance policy. The performance shown indicates past performance and is not a projection or prediction of future results. Actual investment returns and principal value will fluctuate so that shares and/or units, at redemption, may be worth more or less than their original cost. Please call (800) 262-3862 to get performance through the most recent month end.
This report contains statements that may be "forward-looking" statements. Actual results may differ materially from those projected in the "forward-looking" statements.
The views expressed in this report reflect those of the portfolio managers, only through the end of the period as stated on the cover. The portfolio managers' views are subject to change at any time based on market and other conditions.
Portfolio holdings are subject to change daily.
17
VY® INVESCO EQUITY AND INCOME PORTFOLIO
PORTFOLIO MANAGERS' REPORT
VY® Invesco Equity and Income Portfolio (the "Portfolio") seeks total return consisting of long-term capital appreciation and current income. The Portfolio is managed by Brian Jurkash, Thomas B. Bastian, CFA, James O. Roeder, Sergio Marcheli, Matthew Titus and Chuck Burge of Invesco Advisers, Inc. — the Sub-Adviser.*
Performance: For the year ended December 31, 2016, the Portfolio's Class S shares provided a total return of 15.00% compared to the Russell 1000® Value Index, Bloomberg Barclays U.S. Government/Credit Index and the 60% Russell 1000® Value Index/40% Bloomberg Barclays U.S. Government/Credit Index, which returned 17.34%, 3.05% and 11.62%, respectively, for the same period.
Portfolio Specifics: Strong stock selection and an overweight exposure to financials was the largest contributor to the Portfolio's relative performance for the period. Specifically, within banks and diversified financials, included a number of the Portfolio's top contributors including Comerica, Morgan Stanley, Citizens Financial Group and Bank of America. These companies benefitted from the strong rally in financials stocks following the election results, as investor optimism on future interest rates and the economy fueled returns. Also, not owning Wells Fargo helped performance, as the company was charged with fraudulent activity regarding clients' accounts.
Stock selection and an underweight to consumer staples sector also contributed to relative performance. Wal-Mart and Procter & Gamble were key contributors. During a time when competitors were struggling earlier in the year, Wal-Mart posted better than expected earnings and revenues and raised its guidance for the full year.
Having no exposure to real estate also enhanced relative returns. Although real estate posted positive returns for the year, it was a bottom performing sector within the Russell 1000® Value Index. The Portfolio has remained materially underweight this area of the market because management believes these sectors are generally overvalued, as investors have driven up stock prices in a quest for yield in a low-interest rate environment.
Weak stock selection within health care detracted from the Portfolio's relative return. Much of the Portfolio's underperformance within the sector was attributable to its pharmaceutical holdings, such as Novartis, Sanofi and Teva Pharmaceuticals. Sanofi's stock declined after the French drug maker reported that it does not expect meaningful earnings growth over the next few years as the company explores the possible sale of some businesses and seeks to cut costs. Teva's stock declined after company management announced a delay in the acquisition of a generics drug maker.
Stock selection within telecommunication services hurt relative performance. UK-based Vodafone Group was a large detractor within the sector. Vodafone was downgraded by analysts a few times during the period, based on lower profit margins and weak guidance. Also, not owning AT&T hurt performance, as AT&T posted returns over 20% for the period.
During the period, the Portfolio's allocation to high grade bonds was a valuable source of income that helped to dampen overall Portfolio volatility. However, these instruments detracted from relative performance versus the Russell 1000® Value Index, as bonds underperformed equities during the period. Similarly, the Portfolio's allocation to convertible securities posted double digit returns on an absolute basis, but detracted from relative performance as convertibles underperformed the Russell 1000® Value Index.
We used currency forward contracts during the reporting period for the purpose of hedging currency exposure of non-U.S.-based companies held in the Portfolio. Derivatives were used solely for the purpose of hedging and not for speculative purposes or leverage. The use of currency forward contracts had a positive impact on the Portfolio's performance relative to the Russell 1000® Value Index for the reporting period.
Current Strategy and Outlook: Equity markets were positive during the reporting period, but had significant volatility at times as macro events generally overshadowed company fundamentals in investors' minds. We believe that market volatility creates opportunities to invest in companies with attractive valuations and strong fundamentals. We believe that ultimately those valuations and fundamentals will be reflected in those companies' stock prices.
* Effective January 25, 2016, Matthew Titus was added as a portfolio manager of the Portfolio. Effective March 1, 2016, Mary Jayne Maly will be removed as a portfolio manager of the Portfolio.
Portfolio holdings and characteristics are subject to change and may not be representative of current holdings and characteristics. Portfolio holdings are subject to change daily. The outlook for this Portfolio may differ from that presented for other Voya mutual funds. The Portfolio's performance returns shown reflect applicable fee waivers and/or expense limits in effect during this period. Absent such fee waivers/expense limitations, if any, performance would have been lower. Performance for the different classes of shares will vary based on differences in fees associated with each class.
Top Ten Holdings
as of December 31, 2016*
(as a percentage of net assets)
Citigroup, Inc. | | | 3.3 | % | |
United States Treasury Note, 1.375%, 12/15/19 | | | 3.3 | % | |
United States Treasury Note, 1.000%, 11/30/18 | | | 3.2 | % | |
JPMorgan Chase & Co. | | | 2.8 | % | |
Bank of America Corp. | | | 2.7 | % | |
United States Treasury Note, 1.750%, 11/30/21 | | | 2.0 | % | |
Morgan Stanley | | | 2.0 | % | |
Apache Corp. | | | 1.8 | % | |
Citizens Financial Group, Inc. | | | 1.6 | % | |
Baker Hughes, Inc. | | | 1.5 | % | |
* Excludes short-term investments.
Portfolio holdings are subject to change daily.
Sector Diversification
as of December 31, 2016
(as a percentage of net assets)
Financials | | | 28.3 | % | |
Energy | | | 11.2 | % | |
U.S. Treasury Obligations | | | 9.4 | % | |
Information Technology | | | 8.5 | % | |
Health Care | | | 7.2 | % | |
Industrials | | | 5.9 | % | |
Consumer Discretionary | | | 5.2 | % | |
Communications | | | 3.3 | % | |
Consumer, Non-cyclical | | | 3.2 | % | |
Consumer Staples | | | 2.8 | % | |
Technology | | | 2.3 | % | |
Materials | | | 1.9 | % | |
Consumer, Cyclical | | | 1.2 | % | |
Telecommunication Services | | | 1.2 | % | |
Utilities | | | 0.9 | % | |
Basic Materials | | | 0.2 | % | |
Federal Home Loan Mortgage Corporation | | | 0.1 | % | |
Federal National Mortgage Association | | | 0.1 | % | |
Municipal | | | 0.1 | % | |
Assets in Excess of Other Liabilities* | | | 7.0 | % | |
Net Assets | | | 100.0 | % | |
* Includes short-term investments.
Portfolio holdings are subject to change daily.
18
VY® INVESCO EQUITY AND INCOME PORTFOLIO
PORTFOLIO MANAGERS' REPORT

Average Annual Total Returns for the Periods Ended December 31, 2016 | |
| | 1 Year | | 5 Year | | 10 Year | | Since Inception
of Class S2
February 27, 2009 | |
Class ADV | | | 14.69 | % | | | 11.08 | % | | | 5.96 | % | | | — | | |
Class I | | | 15.28 | % | | | 11.63 | % | | | 6.49 | % | | | — | | |
Class S | | | 15.00 | % | | | 11.36 | % | | | 6.22 | % | | | — | | |
Class S2 | | | 14.84 | % | | | 11.20 | % | | | — | | | | 13.12 | % | |
Russell 1000® Value Index | | | 17.34 | % | | | 14.80 | % | | | 5.72 | % | | | 17.80 | % | |
Bloomberg Barclays U.S. Government/Credit Index | | | 3.05 | % | | | 2.29 | % | | | 4.40 | % | | | 4.29 | % | |
60% Russell 1000® Value Index/40% Bloomberg Barclays U.S. Government/Credit Index | | | 11.62 | % | | | 9.81 | % | | | 5.55 | % | | | 12.50 | % | |
Based on a $10,000 initial investment, the graph and table above illustrate the total return of VY® Invesco Equity and Income Portfolio against the indices indicated. An index is unmanaged and has no cash in its portfolio, imposes no sales charges and incurs no operating expenses. An investor cannot invest directly in an index. The Portfolio's performance is shown without the imposition of any expenses or charges which are, or may be, imposed under your variable annuity contract or variable life insurance policy. Total returns would have been lower if such expenses or charges were included.
The performance graph and table do not reflect the deduction of taxes that a shareholder will pay on Portfolio distributions or the redemption of Portfolio shares.
The performance shown may include the effect of fee waivers and/or expense reimbursements by the Investment Adviser and/or other service providers, which have the effect of increasing total return. Had all fees and expenses been considered, the total returns would have been lower.
The performance update illustrates performance for a variable investment option available through a variable
annuity contract or a variable life insurance policy. The performance shown indicates past performance and is not a projection or prediction of future results. Actual investment returns and principal value will fluctuate so that shares and/or units, at redemption, may be worth more or less than their original cost. Please call (800) 262-3862 to get performance through the most recent month end.
This report contains statements that may be "forward-looking" statements. Actual results may differ materially from those projected in the "forward-looking" statements.
The views expressed in this report reflect those of the portfolio managers, only through the end of the period as stated on the cover. The portfolio managers' views are subject to change at any time based on market and other conditions.
Portfolio holdings are subject to change daily.
19
VY® JPMORGAN MID CAP VALUE PORTFOLIO
PORTFOLIO MANAGERS' REPORT
VY® JPMorgan Mid Cap Value Portfolio (the "Portfolio") seeks growth from capital appreciation. The Portfolio is managed by Jonathan K.L. Simon, Lawrence Playford, CFA, and Gloria Fu, CFA, Managing Directors and Portfolio Managers of J.P. Morgan Investment Management Inc. — the Sub-Adviser.
Performance: For the year ended December 31, 2016, the Portfolio's Class S shares provided a total return of 14.69% compared to the Russell Midcap® Value Index (the "Index" or "Russell Midcap® Value"), which returned 20.00% for the same period.
Portfolio Specifics: The Portfolio underperformed the Index during the year. The combination of weak stock selection as well as our underweight position in the materials and industrials sectors detracted from results. In these more cyclical areas of the market, the underperformance was mainly a story of what we don't own, rather than what we do own. We seek a less risky approach to these cyclical parts of the market by investing in companies with relatively steadier earnings patterns, healthy balance sheets, high levels of sustainable free cash flow, and management teams with an eye towards capital allocation. Strong stock selection in utilities and information technology contributed to Portfolio results.
Two stock-specific detractors from performance for the year were Coty and Kroger. Coty's share price slid following weak third-quarter earnings results. The company attributed weakness to the acquisition of several Procter & Gamble beauty brands, coupled with a previously announced management transition. In our view, Coty has an attractive portfolio of brands including OPI, CoverGirl and Calvin Klein fragrances. We are impressed with management and believe that the company has the ability to grow its top and bottom lines over time. Shares of Kroger trended down on investor concerns that the combination of deflation in food-at-home pricing and rising labor costs could create a difficult operating environment for grocers. Amidst this backdrop, Kroger stock has been under pressure for most of the year. However, Kroger enjoyed somewhat of a relief rally following the election as investors began to believe in reflation. Our positive outlook is based on the fact that Kroger has been investing in its omni-channel platform, growing its organic food selection, and successfully winning market share from its main competitors.
On the positive side we benefited from our exposure to financials, which represent the largest absolute weight in the portfolio. M&T Bank rallied along with other financials towards the end of the year as shares reacted positively to the U.S. presidential election. Investors are optimistic about higher interest rates, a less burdensome regulatory environment, and corporate tax reform under the new administration. While we've trimmed the position slightly to reflect current valuation levels, we continue to own shares given that the bank is an extremely high quality franchise. M&T Bank's fortress balance sheet, strong management, and commitment to generating strong returns to shareholders keep us optimistic over the long term. On a stock specific basis, Energen was also a top contributor to results in 2016. Energen shares benefited from the recovery in crude oil prices that occurred throughout the year. Over the past five years Energen has transitioned from a growth-by-acquisition story to a company focused on growing organically. Subsequent to the sale of Energen's distribution business, the company has formed itself into a pure-play Permian basin upstream business. We continue to have an optimistic view on Energen given its excellent acreage and inventory depth in the well-located Permian basin.
Current Strategy and Outlook: As we approach 2017, we are weighing the risks and opportunities we see from an unexpected election outcome and a rather well-expected interest rate hike. Overall, despite the risks and expected volatility, we are optimistic 2017 can be a strong year for U.S. equity markets, with both expanding earnings and improved sentiment driving healthy returns. We believe the Portfolio should benefit in 2017 from our exposure to financials, which represents the largest absolute weight in the Portfolio, as optimism continues around higher interest rates, a less burdensome regulatory environment, and corporate tax reform under the new administration. Additionally, our limited exposure to the yield-oriented sectors of the market, where valuations are stretched, should benefit as we enter a rising interest rate environment.
Portfolio holdings and characteristics are subject to change and may not be representative of current holdings and characteristics. Portfolio holdings are subject to change daily. The outlook for this Portfolio may differ from that presented for other Voya mutual funds. The Portfolio's performance returns shown reflect applicable fee waivers and/or expense limits in effect during this period. Absent such fee waivers/expense limitations, if any, performance would have been lower. Performance for the different classes of shares will vary based on differences in fees associated with each class.
Sector Diversification
as of December 31, 2016
(as a percentage of net assets)
Financials | | | 22.6 | % | |
Consumer Discretionary | | | 17.2 | % | |
Utilities | | | 11.3 | % | |
Real Estate | | | 10.2 | % | |
Information Technology | | | 9.8 | % | |
Industrials | | | 8.7 | % | |
Consumer Staples | | | 6.4 | % | |
Health Care | | | 4.4 | % | |
Materials | | | 4.1 | % | |
Energy | | | 3.3 | % | |
Assets in Excess of Other Liabilities* | | | 2.0 | % | |
Net Assets | | | 100.0 | % | |
* Includes short-term investments.
Portfolio holdings are subject to change daily.
Top Ten Holdings
as of December 31, 2016*
(as a percentage of net assets)
Energen Corp. | | | 2.3 | % | |
EQT Corp. | | | 2.0 | % | |
Loews Corp. | | | 1.9 | % | |
M&T Bank Corp. | | | 1.7 | % | |
Mohawk Industries, Inc. | | | 1.7 | % | |
Fifth Third Bancorp | | | 1.5 | % | |
SunTrust Banks, Inc. | | | 1.4 | % | |
Arrow Electronics, Inc. | | | 1.4 | % | |
WestRock Co. | | | 1.4 | % | |
Xcel Energy, Inc. | | | 1.4 | % | |
* Excludes short-term investments.
Portfolio holdings are subject to change daily.
20
VY® JPMORGAN MID CAP VALUE PORTFOLIO
PORTFOLIO MANAGERS' REPORT
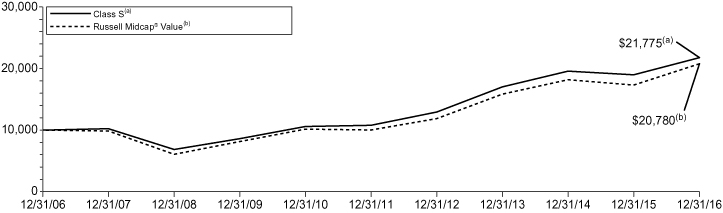
Average Annual Total Returns for the Periods Ended December 31, 2016 | |
| | 1 Year | | 5 Year | | 10 Year | | Since Inception
of Class S2
February 27, 2009 | |
Class ADV | | | 14.42 | % | | | 14.80 | % | | | 7.82 | % | | | — | | |
Class I | | | 14.94 | % | | | 15.37 | % | | | 8.36 | % | | | — | | |
Class S | | | 14.69 | % | | | 15.09 | % | | | 8.09 | % | | | — | | |
Class S2 | | | 14.56 | % | | | 14.92 | % | | | — | | | | 18.76 | % | |
Russell Midcap® Value | | | 20.00 | % | | | 15.70 | % | | | 7.59 | % | | | 20.69 | % | |
Based on a $10,000 initial investment, the graph and table above illustrate the total return of VY® JPMorgan Mid Cap Value Portfolio against the index indicated. The index is unmanaged and has no cash in its portfolio, imposes no sales charges and incurs no operating expenses. An investor cannot invest directly in an index. The Portfolio's performance is shown without the imposition of any expenses or charges which are, or may be, imposed under your variable annuity contract or variable life insurance policy. Total returns would have been lower if such expenses or charges were included.
The performance graph and table do not reflect the deduction of taxes that a shareholder will pay on Portfolio distributions or the redemption of Portfolio shares.
The performance shown may include the effect of fee waivers and/or expense reimbursements by the Investment Adviser and/or other service providers, which have the effect of increasing total return. Had all fees and expenses been considered, the total returns would have been lower.
The performance update illustrates performance for a variable investment option available through a variable
annuity contract or a variable life insurance policy. The performance shown indicates past performance and is not a projection or prediction of future results. Actual investment returns and principal value will fluctuate so that shares and/or units, at redemption, may be worth more or less than their original cost. Please call (800) 262-3862 to get performance through the most recent month end.
This report contains statements that may be "forward-looking" statements. Actual results may differ materially from those projected in the "forward-looking" statements.
The views expressed in this report reflect those of the portfolio managers, only through the end of the period as stated on the cover. The portfolio managers' views are subject to change at any time based on market and other conditions.
Portfolio holdings are subject to change daily.
21
VY® OPPENHEIMER GLOBAL PORTFOLIO
PORTFOLIO MANAGERS' REPORT
VY® Oppenheimer Global Portfolio (the "Portfolio") seeks capital appreciation. The Portfolio is managed by Rajeev Bhaman, CFA, Portfolio Manager of OppenheimerFunds, Inc. — the Sub-Adviser.
Performance: For the year ended December 31, 2016, the Portfolio's Class S shares provided a total return of -0.04% compared to the MSCI All Country World IndexSM, which returned 7.86% for the same period.
Portfolio Specifics: The Portfolio's underperformance stemmed largely from weaker relative stock selection in the financials and information technology sectors. Stock selection and an overweight position in health care and an underweight position in energy also had a negative impact on relative performance. The Portfolio outperformed the MSCI All Country World IndexSM in the consumer discretionary sector due to stock selection and the consumer staples sector as a result of an underweight position. On a country basis, stock selection in the U.S., Switzerland and United Kingdom detracted most from performance versus the MSCI All Country World IndexSM. Alternatively, stock selection in France and Japan contributed positively to relative performance, as did stock selection in Denmark. It is worth observing that the decisions we make in constructing the Portfolio are primarily a residual of individual stock preferences and investment themes, combined with prudent thinking about risk.
Top contributors to performance this period included LVMH Moet Hennessy Louis Vuitton SE ("LVMH") (Consumer Discretionary) (France), Keyence Corp. (Information Technology) (Japan), and Kering SA (Consumer Discretionary) (France).
LVMH is an iconic global luxury company with 70 brands across fashion and leather goods, watches and jewelry, wines and spirits, perfumes and cosmetics, and selective retailing. Brands include Louis Vuitton, Bulgari, Fendi, Givenchy, Tag Heuer, Hennessy, Moet & Chandon, Sephora and Benefit; LVMH also owns DFS, the airport duty-free retailer. Given the wide moat and exclusive nature of the brands LVMH owns, we believe the company is positioned to benefit from the growing demand for luxury goods, particularly in the emerging markets. Customers are willing to pay premium prices, enabling LVMH to earn above-average margins and deliver returns on invested capital in the low double digits. Keyence Corp. develops, produces and sells factory automation solutions, such as image processing equipment, control and measuring equipment, as well as sensors. The company reported strong operating results at the close of April for their fiscal third quarter. Kering SA is a global consumer and luxury brands company, with popular names such as Gucci, Bottega Veneta, Yves Saint Laurent and Puma. In our opinion, these brands tend to garner high margins and have timeless appeal even through fashion cycles.
The most significant detractors from performance this period included SunEdison, Inc. (Information Technology) (United States), Circassia Pharmaceuticals plc (Health Care) (United Kingdom) and Celldex Therapeutics, Inc. (Health Care) (United States). We exited our positions in SunEdison and Celldex.
SunEdison, Inc. owns and operates clean power generation assets and sells silicon wafers to the semiconductor industry. We purchased shares in SunEdison, Inc. in 2015 after the stock had fallen approximately 70%, presenting what we considered an attractive risk/reward. Our investment thesis was predicated on growth of solar demand, which in turn would increase demand for SunEdison's EPC (Engineering, Procurement and Construction) expertise. Moreover, low debt financing costs would allow for faster growth, and returns on SunEdison's 20-year contracts would rise. As an added incentive for the renewable energy space, the government extended investment tax credits for another few years. The reversal of low debt costs in the energy market that resulted from widening high yield spreads challenged SunEdison's growth rate. Further, obligations were supposed to be non-recourse to the parent segment; however, this did not turn out to be the case. SunEdison revealed that its accounting was unreliable and that the previously disclosed levels of cash on its balance sheet, which we believed gave us a margin of safety in our investment thesis, were unlikely to be correct. The company filed for bankruptcy. Pharma companies Circassia Pharmaceuticals and Celldex Therapeutics had disappointing results in Phase III drug trials during the reporting period.
Current Strategy and Outlook: At period end, the Portfolio had its largest overweight positions in information technology, consumer discretionary, health care, industrials and financials. The Portfolio had underweight positions in energy, consumer staples, materials, utilities, telecommunication services and real estate. On a country basis, the Portfolio had its largest overweight positions in Japan, Germany and France, with its most significant underweight positions in the United States, Canada and Australia. Despite being underweight the United States relative to the MSCI All Country World IndexSM, the Portfolio had its largest allocation to that country on an absolute basis at period end.
We are long-term investors in companies that we believe can sustainably monetize their exposure to growth streams within the world economy to provide us, as shareholders, with a meaningfully positive return on our capital. We manage the risk in our Portfolio through the diversity of the companies we hold and by limiting the size of individual stock positions. We hold companies in our Portfolio for an average of eight to ten years — some we have held even longer — to reap those capital returns as they compound over time.
Portfolio holdings and characteristics are subject to change and may not be representative of current holdings and characteristics. Portfolio holdings are subject to change daily. The outlook for this Portfolio may differ from that presented for other Voya mutual funds. The Portfolio's performance returns shown reflect applicable fee waivers and/or expense limits in effect during this period. Absent such fee waivers/expense limitations, if any, performance would have been lower. Performance for the different classes of shares will vary based on differences in fees associated with each class.
Geographic Diversification
as of December 31, 2016
(as a percentage of net assets)
United States | | | 45.5 | % | |
Japan | | | 14.2 | % | |
Germany | | | 9.1 | % | |
France | | | 6.5 | % | |
United Kingdom | | | 5.9 | % | |
Switzerland | | | 4.3 | % | |
India | | | 3.4 | % | |
Spain | | | 2.7 | % | |
Netherlands | | | 2.7 | % | |
Sweden | | | 1.4 | % | |
Countries between 0.4%-1.3%^ | | | 2.9 | % | |
Assets in Excess of Other Liabilities* | | | 1.4 | % | |
Net Assets | | | 100.0 | % | |
* Includes short-term investments.
^ Includes 3 countries, which each represents 0.4%-1.3% of net assets.
Portfolio holdings are subject to change daily.
Top Ten Holdings
as of December 31, 2016
(as a percentage of net assets)
S&P Global, Inc. | | | 3.1 | % | |
Citigroup, Inc. | | | 3.0 | % | |
Aetna, Inc. | | | 2.9 | % | |
Airbus Group SE | | | 2.7 | % | |
Alphabet, Inc. — Class C | | | 2.6 | % | |
Murata Manufacturing Co., Ltd. | | | 2.6 | % | |
Alphabet, Inc. — Class A | | | 2.6 | % | |
LVMH Moet Hennessy Louis Vuitton SE | | | 2.5 | % | |
Colgate-Palmolive Co. | | | 2.4 | % | |
SAP SE | | | 2.4 | % | |
Portfolio holdings are subject to change daily.
22
PORTFOLIO MANAGERS' REPORT
VY® OPPENHEIMER GLOBAL PORTFOLIO
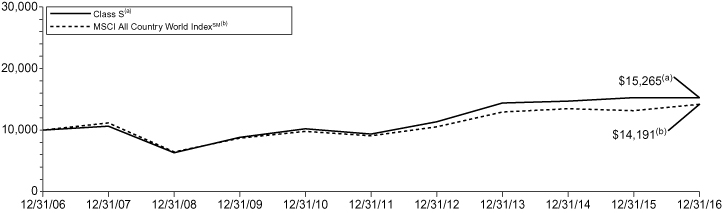
Average Annual Total Returns for the Periods Ended December 31, 2016 | |
| | 1 Year | | 5 Year | | 10 Year | | Since Inception
of Class S2
February 27, 2009 | |
Class ADV | | | -0.29 | % | | | 10.02 | % | | | 4.05 | % | | | — | | |
Class I | | | 0.22 | % | | | 10.56 | % | | | 4.57 | % | | | — | | |
Class S | | | -0.04 | % | | | 10.28 | % | | | 4.32 | % | | | — | | |
Class S2 | | | -0.20 | % | | | 10.12 | % | | | — | | | | 14.30 | % | |
MSCI All Country World IndexSM | | | 7.86 | % | | | 9.36 | % | | | 3.56 | % | | | 13.33 | % | |
Based on a $10,000 initial investment, the graph and table above illustrate the total return of VY® Oppenheimer Global Portfolio against the index indicated. The index is unmanaged and has no cash in its portfolio, imposes no sales charges and incurs no operating expenses. An investor cannot invest directly in an index. The Portfolio's performance is shown without the imposition of any expenses or charges which are, or may be, imposed under your variable annuity contract or variable life insurance policy. Total returns would have been lower if such expenses or charges were included.
The performance graph and table do not reflect the deduction of taxes that a shareholder will pay on Portfolio distributions or the redemption of Portfolio shares.
The performance shown may include the effect of fee waivers and/or expense reimbursements by the Investment Adviser and/or other service providers, which have the effect of increasing total return. Had all fees and expenses been considered, the total returns would have been lower.
The performance update illustrates performance for a variable investment option available through a variable
annuity contract or a variable life insurance policy. The performance shown indicates past performance and is not a projection or prediction of future results. Actual investment returns and principal value will fluctuate so that shares and/or units, at redemption, may be worth more or less than their original cost. Please call (800) 262-3862 to get performance through the most recent month end.
This report contains statements that may be "forward-looking" statements. Actual results may differ materially from those projected in the "forward-looking" statements.
The views expressed in this report reflect those of the portfolio manager, only through the end of the period as stated on the cover. The portfolio manager's views are subject to change at any time based on market and other conditions.
Portfolio holdings are subject to change daily.
23
VY® PIONEER HIGH YIELD PORTFOLIO
PORTFOLIO MANAGERS' REPORT
VY® Pioneer High Yield Portfolio (the "Portfolio") seeks to maximize total return through income and capital appreciation. The Portfolio is managed by Tracy Wright, Senior Vice President, Portfolio Manager, and Andrew Feltus, Director of High Yield and Senior Vice President of Pioneer Investment Management, Inc. — the Sub-Adviser.
Performance: For the year ended December 31, 2016, the Portfolio's Class I shares provided a total return of 14.29% compared to the Bank of America/Merrill Lynch High Yield Master II Index and the Bank of America/Merrill Lynch All Convertibles (Speculative Grade) Index, which returned 17.49% and 17.33%, respectively, for the same period.
Portfolio Specifics: Within high yield, the top contributors to sector allocation were found in the underweights to the banking, media and retail sectors. Underweights to energy and basic industries were the largest negative contributors to both sector allocation and security selection. At the onset of 2016, energy was poised to continue to drag down the Bank of America/Merrill Lynch High Yield Master II Index. The pace of defaults was expected to pick up significantly. Following the stabilization and recovery in oil prices, defaults have trended lower and the sector led the corporate high yield index. Security selection was positive within gaming, telecommunications and utilities.
The out-of-benchmark allocation to convertible bonds was a slight negative contributor to relative performance, as the asset class lagged high yield despite posting strong absolute returns. The negative returns within the healthcare sector offset the positive returns from the remaining sectors such as basic industries and technology. Bank loans also had a strong year, however it resulted in a slight drag on relative performance given high yield's annual return.
The Portfolio's underweight allocation to securities that were rated CCC and below, including distressed, quality tiers was a strong negative contributor to performance as the more speculative credits significantly outperformed during the period.
The Portfolio's allocation to equity was a detractor during the year. The equity allocation was hurt by its healthcare and consumer discretionary exposure. The financial, industrial and information technology sectors contributed to returns.
Securities contributing to performance included the convertible bond positions in Dycom Industries and Mentor Graphics. The corporate bond position in Scientific Games International was also a top contributor.
Securities detracting from performance, during the year, included the corporate bond positions in Linn Energy, Community Health Systems and Approach Resources.
Current Strategy and Outlook: We continue to remain overweight the healthcare sector. We believe there is increasing value in the healthcare space as the sector continues to trade at levels overly reflecting risks associated with a Trump administration. These risks include the repealing or replacement of the Affordable Care Act and legislation affecting drug pricing. The Portfolio is slightly underweight energy. Within the energy sector, the Portfolio is overweight exploration & production and underweight energy services. The default risk within energy continues to trend lower as commodity prices have stabilized, supporting the energy and metals & mining sectors. The Portfolio is overweight homebuilding, which is U.S. based and levered to the strong consumer. High yield has experienced a significant level of positive total returns in 2016, despite a weak start to the year. We do not expect similar returns going forward, but believe fundamentals remain strong and returns will be more consistent. We will continue to invest in out-of-benchmark sectors such as bank loans and convertible bonds. Bank loans are poised to benefit from higher LIBOR rates, which will result in higher coupons. Convertible bonds will continue to be utilized to enhance the Portfolio's total return without the need to invest further down in the lower quality rating tiers.
Portfolio holdings and characteristics are subject to change and may not be representative of current holdings and characteristics. Portfolio holdings are subject to change daily. The outlook for this Portfolio may differ from that presented for other Voya mutual funds. The Portfolio's performance returns shown reflect applicable fee waivers and/or expense limits in effect during this period. Absent such fee waivers/expense limitations, if any, performance would have been lower. Performance for the different classes of shares will vary based on differences in fees associated with each class.
Investment Type Allocation
as of December 31, 2016
(as a percentage of net assets)
Corporate Bonds/Notes | | | 85.4 | % | |
Common Stock | | | 4.6 | % | |
U.S. Treasury Obligations | | | 3.4 | % | |
Preferred Stock | | | 1.4 | % | |
Municipal Bonds | | | 0.6 | % | |
Warrants** | | | 0.0 | % | |
Foreign Government Bonds** | | | 0.0 | % | |
Assets in Excess of Other Liabilities* | | | 4.6 | % | |
Net Assets | | | 100.0 | % | |
* Includes short-term investments.
** Amount is less than 0.05%.
Portfolio holdings are subject to change daily.
Top Ten Holdings
as of December 31, 2016*
(as a percentage of net assets)
United States Treasury Floating Rate Note,
0.705%, 07/31/18 | | | 3.4 | % | |
Sprint Corp., 7.250%, 09/15/21 | | | 1.8 | % | |
Scientific Games International, Inc.,
10.000%, 12/01/22 | | | 1.0 | % | |
VRX Escrow Corp., 5.875%, 05/15/23 | | | 0.9 | % | |
CHS/Community Health Systems, Inc.,
8.000%, 11/15/19 | | | 0.7 | % | |
Crown Cork & Seal Co., Inc., 7.375%, 12/15/26 | | | 0.7 | % | |
Level 3 Financing, Inc., 5.250%, 03/15/26 | | | 0.7 | % | |
Forest City Realty Trust, Inc. | | | 0.7 | % | |
Fly Leasing Ltd, 6.375%, 10/15/21 | | | 0.6 | % | |
HCA, Inc., 5.250%, 06/15/26 | | | 0.6 | % | |
* Excludes short-term investments.
Portfolio holdings are subject to change daily.
24
VY® PIONEER HIGH YIELD PORTFOLIO
PORTFOLIO MANAGERS' REPORT
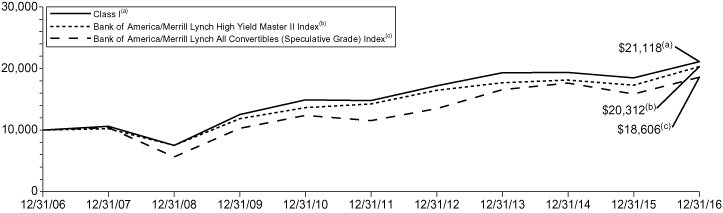
Average Annual Total Returns for the Periods Ended December 31, 2016 | |
| | 1 Year | | 5 Year | | 10 Year | |
Class I | | | 14.29 | % | | | 7.38 | % | | | 7.77 | % | |
Class S | | | 13.91 | % | | | 7.10 | % | | | 7.49 | % | |
Bank of America/Merrill Lynch High Yield Master II Index | | | 17.49 | % | | | 7.35 | % | | | 7.34 | % | |
Bank of American/Merrill Lynch All Convertibles (Speculative Grade) Index | | | 17.33 | % | | | 10.03 | % | | | 6.40 | % | |
Based on a $10,000 initial investment, the graph and table above illustrate the total return of VY® Pioneer High Yield Portfolio against the indices indicated. An index is unmanaged and has no cash in its portfolio, imposes no sales charges and incurs no operating expenses. An investor cannot invest directly in an index. The Portfolio's performance is shown without the imposition of any expenses or charges which are, or may be, imposed under your variable annuity contract or variable life insurance policy. Total returns would have been lower if such expenses or charges were included.
The performance graph and table do not reflect the deduction of taxes that a shareholder will pay on Portfolio distributions or the redemption of Portfolio shares.
The performance shown may include the effect of fee waivers and/or expense reimbursements by the Investment Adviser and/or other service providers, which have the effect of increasing total return. Had all fees and expenses been considered, the total returns would have been lower.
The performance update illustrates performance for a variable investment option available through a variable
annuity contract or a variable life insurance policy. The performance shown indicates past performance and is not a projection or prediction of future results. Actual investment returns and principal value will fluctuate so that shares and/or units, at redemption, may be worth more or less than their original cost. Please call (800) 262-3862 to get performance through the most recent month end.
This report contains statements that may be "forward-looking" statements. Actual results may differ materially from those projected in the "forward-looking" statements.
The views expressed in this report reflect those of the portfolio managers, only through the end of the period as stated on the cover. The portfolio managers' views are subject to change at any time based on market and other conditions.
Portfolio holdings are subject to change daily.
25
VY® T. ROWE PRICE DIVERSIFIED MID CAP GROWTH PORTFOLIO
PORTFOLIO MANAGERS' REPORT
VY® T. Rowe Price Diversified Mid Cap Growth Portfolio (the "Portfolio") seeks long-term capital appreciation. The Portfolio is managed by Donald J. Peters, Vice President, and Donald J. Easley, CFA, Vice President, Portfolio Managers of T. Rowe Price Associates, Inc. — the Sub-Adviser.
Performance: For the year ended December 31, 2016, the Portfolio's Class S shares provided a total return of 7.19% compared to the S&P MidCap 400 Index and the Russell Midcap® Growth Index, which returned 20.74% and 7.33%, respectively, for the same period.
Portfolio Specifics: The Portfolio outperformed the Russell Midcap® Growth Index before the deduction of fees and expenses, but underperformed net of fees and expenses during the reporting period. Industrials and business services boosted relative results, due to stock selection and a favorable overweight. Leading holdings within the sector included United Continental and Harris. The largest passenger air carrier in the U.S. by revenue, United Continental received a boost from the news that the president of a competing airline would be moving to the firm, supporting the belief that United will be able to close a profit margin gap with its competitors. Shares also benefited from improved bookings and lower-than-expected non-fuel costs, which led to an improved year-end outlook. Harris, which provides secure communications products, benefited from accelerating orders for tactical radios, several new contracts, and the divestiture of an underperforming business.
In consumer discretionary, our stock holdings also outpaced their benchmark peers, most notably Burlington Stores and Harman International Industries. Burlington Stores consistently exceeded analyst estimates with growth in traffic, units per transaction, and conversion driving higher-than-expected same-store sales, while higher markups and cost savings expanded margins. A manufacturer of audio systems and electronic systems, Harman International received a boost following Samsung's bid to acquire the company.
Information technology was an area of relative weakness, owing to stock choices and a detrimental underweight. Sabre and Atlassian both detracted here. Sabre, which provides global distribution systems for the travel and tourism industry, fell as falling airline capacity and weak U.S. corporate bookings weighed on the company's travel network business. A provider of enterprise software for application development, collaboration, and chat functions, Atlassian suffered from a broad sell-off of software stocks and from investor concerns about slowing revenue growth due to pricing issues.
Current Strategy and Outlook: In the wake of President Trump's inauguration, we would not be surprised to see more market turbulence as the more controversial elements of his agenda work their way through the political process. Many of his stated policy goals could introduce considerable uncertainty into prospects for some Portfolio holdings, but in that case, we hope to take advantage of short-term volatility to build up positions in firms with superior long-term prospects. We are also concerned about the effects of the extraordinary measures taken by regulators and central banks to depress interest rates. We believe this shift in monetary policy has complicated the capital markets' role in directing investment and led to greater risk taking. This is particularly true in the information technology sector, raising concerns that a number of large, privately funded companies in that market space may falter in the coming year.
Portfolio holdings and characteristics are subject to change and may not be representative of current holdings and characteristics. Portfolio holdings are subject to change daily. The outlook for this Portfolio may differ from that presented for other Voya mutual funds. The Portfolio's performance returns shown reflect applicable fee waivers and/or expense limits in effect during this period. Absent such fee waivers/expense limitations, if any, performance would have been lower. Performance for the different classes of shares will vary based on differences in fees associated with each class.
Sector Diversification
as of December 31, 2016
(as a percentage of net assets)
Consumer Discretionary | | | 21.4 | % | |
Information Technology | | | 20.4 | % | |
Industrials | | | 17.0 | % | |
Health Care | | | 15.2 | % | |
Financials | | | 7.8 | % | |
Consumer Staples | | | 5.6 | % | |
Materials | | | 5.5 | % | |
Real Estate | | | 4.0 | % | |
Energy | | | 1.8 | % | |
Telecommunication Services | | | 0.9 | % | |
Utilities | | | 0.5 | % | |
Liabilities in Excess of Other Assets* | | | (0.1 | )% | |
Net Assets | | | 100.0 | % | |
* Includes short-term investments.
Portfolio holdings are subject to change daily.
Top Ten Holdings
as of December 31, 2016*
(as a percentage of net assets)
Fiserv, Inc. | | | 1.0 | % | |
Ross Stores, Inc. | | | 1.0 | % | |
Autozone, Inc. | | | 0.9 | % | |
O'Reilly Automotive, Inc. | | | 0.9 | % | |
Dollar General Corp. | | | 0.9 | % | |
SBA Communications Corp. | | | 0.9 | % | |
Intuitive Surgical, Inc. | | | 0.9 | % | |
Zoetis, Inc. | | | 0.8 | % | |
Amphenol Corp. | | | 0.8 | % | |
Vulcan Materials Co. | | | 0.8 | % | |
* Excludes short-term investments.
Portfolio holdings are subject to change daily.
26
PORTFOLIO MANAGERS' REPORT
VY® T. ROWE PRICE DIVERSIFIED MID CAP GROWTH PORTFOLIO

Average Annual Total Returns for the Periods Ended December 31, 2016 | |
| | 1 Year | | 5 Year | | 10 Year | | Since Inception
of Class S2
February 27, 2009 | |
Class ADV | | | 6.93 | % | | | 13.45 | % | | | 7.89 | % | | | — | | |
Class I | | | 7.41 | % | | | 13.98 | % | | | 8.43 | % | | | — | | |
Class R6(1) | | | 7.52 | % | | | 14.00 | % | | | 8.44 | % | | | — | | |
Class S | | | 7.19 | % | | | 13.70 | % | | | 8.16 | % | | | — | | |
Class S2 | | | 6.99 | % | | | 13.53 | % | | | — | | | | 18.56 | % | |
S&P MidCap 400 Index | | | 20.74 | % | | | 15.33 | % | | | 9.16 | % | | | 19.97 | % | |
Russell Midcap® Growth Index | | | 7.33 | % | | | 13.51 | % | | | 7.83 | % | | | 18.91 | % | |
Based on a $10,000 initial investment, the graph and table above illustrate the total return of VY® T. Rowe Price Diversified Mid Cap Growth Portfolio against the indices indicated. An index is unmanaged and has no cash in its portfolio, imposes no sales charges and incurs no operating expenses. An investor cannot invest directly in an index. The Portfolio's performance is shown without the imposition of any expenses or charges which are, or may be, imposed under your variable annuity contract or variable life insurance policy. Total returns would have been lower if such expenses or charges were included.
The performance graph and table do not reflect the deduction of taxes that a shareholder will pay on Portfolio distributions or the redemption of Portfolio shares.
The performance shown may include the effect of fee waivers and/or expense reimbursements by the Investment Adviser and/or other service providers, which have the effect of increasing total return. Had all fees and expenses been considered, the total returns would have been lower.
The performance update illustrates performance for a variable investment option available through a variable annuity contract or a variable life insurance policy. The
performance shown indicates past performance and is not a projection or prediction of future results. Actual investment returns and principal value will fluctuate so that shares and/or units, at redemption, may be worth more or less than their original cost. Please call (800) 262-3862 to get performance through the most recent month end.
This report contains statements that may be "forward-looking" statements. Actual results may differ materially from those projected in the "forward-looking" statements.
The views expressed in this report reflect those of the portfolio managers, only through the end of the period as stated on the cover. The portfolio managers' views are subject to change at any time based on market and other conditions.
Portfolio holdings are subject to change daily.
(1) Class R6 incepted on May 3, 2016. The Class R6 shares performance shown for the period prior to their inception date is the performance of Class I shares without adjustment for any differences in the expenses between the two classes. If adjusted for such differences, returns would be different.
27
VY® T. ROWE PRICE GROWTH EQUITY PORTFOLIO
PORTFOLIO MANAGERS' REPORT
VY® T. Rowe Price Growth Equity Portfolio (the "Portfolio") seeks long-term growth through investments in stocks. The Portfolio is managed by Joseph B. Fath, Vice President and Portfolio Manager of T. Rowe Price Associates, Inc. — the Sub-Adviser.
Performance: For the year ended December 31, 2016, the Portfolio's Class I shares, provided a total return of 1.51% compared to the S&P 500® Index and the Russell 1000® Growth Index, which returned 11.96% and 7.08%, respectively, for the same period.
Portfolio Specifics: Stock selection was the main reason for relative underperformance by the Portfolio, but sector weighting was also negative. Health care was the largest relative detractor, primarily due to stock selection, though the Portfolio's overweight here was also detrimental. Information technology underperformed on stock selection. The Portfolio's lack of energy stocks also detracted, as this was the strongest sector in the S&P 500® Index. Consumer discretionary underperformed largely due to overweighting. Consumer staples was the leading relative outperformer, due to favorable significant underweighting.
Health care was the largest detractor. Shares of Allergan declined early in the year when its proposed merger with Pfizer was called off after the U.S. Treasury Department issued a notice aimed at curbing the benefits of tax inversions. While we still maintain a constructive view, we subsequently trimmed our position and continue to monitor competitive pressures on Restasis, a chronic dry-eye therapy, as well as sales growth of its Alzheimer's treatment, Namenda.
Early in the year, shares of Alexion Pharmaceuticals sold off along with other larger biotechnology stocks. The company issued disappointing guidance that fell below consensus analyst estimates in the first quarter and announced disappointing results from a phase III clinical trial that led to a sharp decline in the second quarter. The stock saw further volatility later in the year after delaying the filing of its quarterly financial statements and removing the CEO and CFO. Its financial statements have since been filed, without issue, and a new management team is on board.
Information technology relatively detracted. While shares of Alphabet lagged for the year, the stock remains a top holding and with strong prospects. Recent results continue to confirm our belief that the company remains very well positioned to keep capturing share of traditional ad-spending dollars. Mobile search continues to be the largest driver of growth, but YouTube, programmatic display, Play, and Cloud are all meaningful drivers as well.
Our substantial allocation to salesforce.com detracted from relative returns in the latter half of 2016, largely in response to a lack of clarity surrounding the company's acquisition strategy. Sentiment weighed on the stock based on its failed pursuit of acquiring LinkedIn, rumors of the CEO's interest in acquiring Twitter, and a leaked presentation highlighting numerous potential acquisition targets. Nonetheless, we believe the leading cloud-computing company's core business remains well positioned and it continues to execute well in both technology and sales.
Current Strategy and Outlook: In the fourth quarter, U.S. stocks advanced, resulting in strong full-year gains for many investors. Small-cap stocks outperformed large-caps, and value stocks surpassed growth stocks, as measured by Russell indexes. The U.S. Federal Reserve Board raised short-term rates in mid-December and is projecting three rate increases in 2017. Developed non-U.S. equity markets significantly underperformed U.S. shares, as returns to U.S. investors were hurt by a stronger dollar versus major currencies.
In our opinion, large-cap growth stock valuations appear relatively attractive versus their value counterparts and compared with small- and mid-cap stocks, which recorded strong fourth-quarter and 12-month gains. We are not concerned that interest rates are rising because moderately rising rates are a sign that the economy is growing. If President-elect Trump's agenda is pursued successfully, we believe multinational companies should benefit from improving global growth. Large-cap growth stocks would benefit from a rollback in corporate tax rates and an increase in infrastructure spending in 2017. However, policy initiatives take time to implement, and we intend to maintain our risk-aware investment approach to stock selection.
Portfolio holdings and characteristics are subject to change and may not be representative of current holdings and characteristics. Portfolio holdings are subject to change daily. The outlook for this Portfolio may differ from that presented for other Voya mutual funds. The Portfolio's performance returns shown reflect applicable fee waivers and/or expense limits in effect during this period. Absent such fee waivers/expense limitations, if any, performance would have been lower. Performance for the different classes of shares will vary based on differences in fees associated with each class.
Sector Diversification
as of December 31, 2016
(as a percentage of net assets)
Information Technology | | | 36.8 | % | |
Consumer Discretionary | | | 25.9 | % | |
Health Care | | | 15.4 | % | |
Industrials | | | 6.5 | % | |
Financials | | | 6.1 | % | |
Consumer Staples | | | 3.6 | % | |
Real Estate | | | 3.0 | % | |
Utilities | | | 0.7 | % | |
Materials | | | 0.7 | % | |
Telecommunication Services | | | 0.4 | % | |
Assets in Excess of Other Liabilities* | | | 0.9 | % | |
Net Assets | | | 100.0 | % | |
* Includes short-term investments.
Portfolio holdings are subject to change daily.
Top Ten Holdings
as of December 31, 2016
(as a percentage of net assets)
Amazon.com, Inc. | | | 7.6 | % | |
Priceline.com, Inc. | | | 4.3 | % | |
Facebook, Inc. | | | 4.1 | % | |
Microsoft Corp. | | | 4.0 | % | |
Alphabet, Inc. — Class A | | | 3.6 | % | |
Alphabet, Inc. — Class C | | | 3.1 | % | |
Visa, Inc. — Class A | | | 3.0 | % | |
Apple, Inc. | | | 2.9 | % | |
Mastercard, Inc. | | | 2.2 | % | |
PayPal Holdings, Inc. | | | 2.0 | % | |
Portfolio holdings are subject to change daily.
28
PORTFOLIO MANAGERS' REPORT
VY® T. ROWE PRICE GROWTH EQUITY PORTFOLIO

Average Annual Total Returns for the Periods Ended December 31, 2016 | |
| | 1 Year | | 5 Year | | 10 Year | | Since Inception
of Class S2
February 27, 2009 | |
Class ADV | | | 1.01 | % | | | 14.58 | % | | | 7.29 | % | | | — | | |
Class I | | | 1.51 | % | | | 15.15 | % | | | 7.83 | % | | | — | | |
Class S | | | 1.26 | % | | | 14.86 | % | | | 7.56 | % | | | — | | |
Class S2 | | | 1.10 | % | | | 14.69 | % | | | — | | | | 17.41 | % | |
S&P 500® Index | | | 11.96 | % | | | 14.66 | % | | | 6.95 | % | | | 17.76 | % | |
Russell 1000® Growth Index | | | 7.08 | % | | | 14.50 | % | | | 8.33 | % | | | 18.07 | % | |
Based on a $10,000 initial investment, the graph and table above illustrate the total return of VY® T. Rowe Price Growth Equity Portfolio against the indices indicated. An index is unmanaged and has no cash in its portfolio, imposes no sales charges and incurs no operating expenses. An investor cannot invest directly in an index. The Portfolio's performance is shown without the imposition of any expenses or charges which are, or may be, imposed under your variable annuity contract or variable life insurance policy. Total returns would have been lower if such expenses or charges were included.
The performance graph and table do not reflect the deduction of taxes that a shareholder will pay on Portfolio distributions or the redemption of Portfolio shares.
The performance shown may include the effect of fee waivers and/or expense reimbursements by the Investment Adviser and/or other service providers, which have the effect of increasing total return. Had all fees and expenses been considered, the total returns would have been lower.
The performance update illustrates performance for a variable investment option available through a variable
annuity contract or a variable life insurance policy. The performance shown indicates past performance and is not a projection or prediction of future results. Actual investment returns and principal value will fluctuate so that shares and/or units, at redemption, may be worth more or less than their original cost. Please call (800) 262-3862 to get performance through the most recent month end.
This report contains statements that may be "forward-looking" statements. Actual results may differ materially from those projected in the "forward-looking" statements.
The views expressed in this report reflect those of the portfolio manager, only through the end of the period as stated on the cover. The portfolio manager's views are subject to change at any time based on market and other conditions.
Portfolio holdings are subject to change daily.
29
VY® TEMPLETON FOREIGN EQUITY PORTFOLIO
PORTFOLIO MANAGERS' REPORT
VY® Templeton Foreign Equity Portfolio (the "Portfolio") seeks long-term capital growth. The Portfolio is managed by Cindy L. Sweeting, CFA and President of Templeton, Antonio T. Docal, CFA and Executive Vice President, and Peter A. Nori, CFA and Executive Vice President, Portfolio Managers of Templeton Investment Counsel, LLC — the Sub-Adviser.
Performance: For the year ended December 31, 2016, the Portfolio's Class I shares provided a total return of 1.85% compared to the MSCI All Country World ex-U.S. IndexSM ("MSCI ACWI ex-U.S.") and the MSCI EAFE® Index, which returned 4.50% and 1.00%, respectively, for the same period.
Portfolio Specifics: International equities advanced in 2016, an eventful year that began with fear and volatility and ended with renewed optimism and many major bourses hitting near-record highs. Portfolio performance improved sharply amid the second-half value rally, while full-year underperformance was largely attributable to adverse currency effects.
Financials stocks rebounded strongly near period-end as interest rates rose and growth expectations improved, though the late recovery failed to overcome earlier weakness. Stock selection in the sector detracted from the Portfolio's relative performance. European banks lagged but remained abundantly cheap in our assessment, relative to U.S. peers, and well placed to benefit from the potential for economic reflation, higher interest rates, falling loan-loss provisions and the end of re-regulation.
An overweighting in the health care sector detracted amid a sharp and sustained decline following political criticism during the U.S. election cycle. Israeli drug manufacturer Teva Pharmaceutical Industries performed poorly, though we believe the stock remained potentially well positioned for growth over a long-term horizon. Industry fundamentals more broadly continued to impress us, characterized by high returns on equity, strong cash flows and low leverage.
Turning to contributors, the Portfolio's significantly overweighted energy position benefited relative performance amid rebounding oil prices, and U.K. oil major BP was a top contributor, gaining as management continued to balance spending cuts with growth initiatives. Our current energy sector strategy involves selectively reducing exposure to some of the earlier cycle energy services and exploration and production stocks we believe have fuller valuations and rotating into more modestly valued integrated oil producers. Oil prices look well supported, in our view, given vast reductions in industry capital expenditures, a significant decline in the U.S. rig count and major oil producers' recent agreement to curtail a larger-than-expected amount of production.
Stock selection benefited results in the information technology sector, led by South Korean semiconductor and consumer electronics manufacturer Samsung Electronics. The company's shares rose as the firm recovered from a high-profile product recall and introduced more shareholder-friendly governance initiatives. The Portfolio's relative results also benefited from stock selection and its significant underweighting in what we considered the expensive and overcrowded consumer staples sector. Elsewhere, the materials sector contributed, led by Swiss miner Glencore, which rebounded off January 2016 lows amid balance sheet restructuring and commodity reflation.
From a regional standpoint, stock selection in North America detracted from the Portfolio's relative performance, while stock selection in Asia and Europe contributed.
During the period, the U.S. dollar appreciated against most foreign currencies, which also hurt the Portfolio's performance because investments in securities with non-U.S. currency exposure lost value as the dollar rose.
Current Strategy and Outlook: Value has been bouncing off an extremely low base and, notwithstanding the risk of temporary consolidation should stocks periodically get ahead of themselves, the longer term prospects for our investment philosophy remain attractive to us. We are watching specifically for any meaningful improvements in the earnings of value stocks, which could drive the next leg of performance for a style that has thus far benefited primarily from higher valuation multiples. Conversely, economic and interest-rate normalization represent significant challenges for bondholders with nominally fixed returns. Real assets that can adjust for, or pass through, price increases and sustainably generate cash flows — like equities — appear far better positioned to us. As the market refocuses on fundamentals, we are confident that this next cycle will again prove the virtue of value-oriented active investors capable of identifying selective bargains and mitigating downside risk over the long term.
Portfolio holdings and characteristics are subject to change and may not be representative of current holdings and characteristics. Portfolio holdings are subject to change daily. The outlook for this Portfolio may differ from that presented for other Voya mutual funds. The Portfolio's performance returns shown reflect applicable fee waivers and/or expense limits in effect during this period. Absent such fee waivers/expense limitations, if any, performance would have been lower. Performance for the different classes of shares will vary based on differences in fees associated with each class.
Geographic Diversification
as of December 31, 2016
(as a percentage of net assets)
United Kingdom | | | 19.2 | % | |
Germany | | | 12.3 | % | |
Japan | | | 11.9 | % | |
France | | | 10.3 | % | |
China | | | 6.8 | % | |
Switzerland | | | 6.3 | % | |
South Korea | | | 6.3 | % | |
Netherlands | | | 5.6 | % | |
Singapore | | | 3.5 | % | |
Hong Kong | | | 2.6 | % | |
Countries between 0.5% — 2.5%^ | | | 12.9 | % | |
Assets in Excess of Other Liabilities* | | | 2.3 | % | |
Net Assets | | | 100.0 | % | |
* Includes short-term investments.
^ Includes 10 countries, which each represents 0.5%-2.5% of net assets.
Portfolio holdings are subject to change daily.
Top Ten Holdings
as of December 31, 2016
(as a percentage of net assets)
Samsung Electronics Co., Ltd. GDR | | | 3.0 | % | |
| BP PLC | | | 2.8 | % | |
Royal Dutch Shell PLC — Class B | | | 2.7 | % | |
BNP Paribas | | | 2.0 | % | |
HSBC Holdings PLC | | | 2.0 | % | |
Roche Holding AG | | | 1.9 | % | |
SoftBank Group Corp. | | | 1.8 | % | |
ENI S.p.A. | | | 1.7 | % | |
Teva Pharmaceutical Industries Ltd. ADR | | | 1.8 | % | |
Sanofi | | | 1.8 | % | |
Portfolio holdings are subject to change daily.
30
PORTFOLIO MANAGERS' REPORT
VY® TEMPLETON FOREIGN EQUITY PORTFOLIO

Average Annual Total Returns for the Periods Ended December 31, 2016 | |
| | 1 Year | | 5 Year | | 10 Year | | Since Inception
of Class S2
February 27, 2009 | |
Class ADV | | | 1.33 | % | | | 5.11 | % | | | 0.93 | % | | | — | | |
Class I | | | 1.85 | % | | | 5.63 | % | | | 1.37 | % | | | — | | |
Class S | | | 1.63 | % | | | 5.36 | % | | | 1.11 | % | | | — | | |
Class S2 | | | 1.39 | % | | | 5.20 | % | | | — | | | | 9.35 | % | |
MSCI ACWI ex-U.S. | | | 4.50 | % | | | 5.00 | % | | | 0.96 | % | | | 9.90 | % | |
MSCI EAFE® Index | | | 1.00 | % | | | 6.53 | % | | | 0.75 | % | | | 10.04 | % | |
Based on a $10,000 initial investment, the graph and table above illustrate the total return of VY® Templeton Foreign Equity Portfolio against the indices indicated. An index is unmanaged and has no cash in its portfolio, imposes no sales charges and incurs no operating expenses. An investor cannot invest directly in an index. The Portfolio's performance is shown without the imposition of any expenses or charges which are, or may be, imposed under your variable annuity contract or variable life insurance policy. Total returns would have been lower if such expenses or charges were included.
The performance graph and table do not reflect the deduction of taxes that a shareholder will pay on Portfolio distributions or the redemption of Portfolio shares.
The performance shown may include the effect of fee waivers and/or expense reimbursements by the Investment Adviser and/or other service providers, which have the effect of increasing total return. Had all fees and expenses been considered, the total returns would have been lower.
The performance update illustrates performance for a variable investment option available through a variable
annuity contract or a variable life insurance policy. The performance shown indicates past performance and is not a projection or prediction of future results. Actual investment returns and principal value will fluctuate so that shares and/or units, at redemption, may be worth more or less than their original cost. Please log on to www.voyainvestments.com or call (800) 262-3862 to get performance through the most recent month end.
This report contains statements that may be "forward-looking" statements. Actual results may differ materially from those projected in the "forward-looking" statements.
The views expressed in this report reflect those of the portfolio managers, only through the end of the period as stated on the cover. The portfolio managers' views are subject to change at any time based on market and other conditions.
Portfolio holdings are subject to change daily.
31
SHAREHOLDER EXPENSE EXAMPLES (UNAUDITED)
As a shareholder of a Portfolio, you incur two types of costs: (1) transaction costs, including redemption fees and exchange fees; and (2) ongoing costs, including management fees, distribution and/or service (12b-1) fees, and other Portfolio expenses. These Examples are intended to help you understand your ongoing costs (in dollars) of investing in a Portfolio and to compare these costs with the ongoing costs of investing in other mutual funds.
The Examples are based on an investment of $1,000 invested at the beginning of the period and held for the entire period from July 1, 2016 to December 31, 2016. The Portfolios' expenses are shown without the imposition of any charges which are, or may be, imposed under your variable annuity contract, variable life insurance policy, qualified pension, or retirement plan. Expenses would have been higher if such charges were included.
Actual Expenses
The left section of the table shown below, "Actual Portfolio Return," provides information about actual account values and actual expenses. You may use the information in this section, together with the amount you invested, to estimate the expenses that you paid over the period. Simply divide your account value by $1,000 (for example, an $8,600 account value divided by $1,000 = 8.6), then multiply the result by the number in the first section under the heading entitled "Expenses Paid During the Period" to estimate the expenses you paid on your account during this period.
Hypothetical Example for Comparison Purposes
The right section of the table shown below, "Hypothetical (5% return before expenses)," provides information about hypothetical account values and hypothetical expenses based on a Portfolio's actual expense ratio and an assumed rate of return of 5% per year before expenses, which is not a Portfolio's actual return. The hypothetical account values and expenses may not be used to estimate the actual ending account balance or expenses you paid for the period. You may use this information to compare the ongoing costs of investing in a Portfolio and other mutual funds. To do so, compare this 5% hypothetical example with the 5% hypothetical examples that appear in the shareholder reports of the other mutual funds.
Please note that the expenses shown in the table are meant to highlight your ongoing costs only and do not reflect any transactional costs, such as redemption fees or exchange fees. Therefore, the hypothetical section of the table is useful in comparing ongoing costs only, and will not help you determine the relative total costs of owning different mutual funds. In addition, if these transactional costs were included, your costs would have been higher.
| | | Actual Portfolio Return | | Hypothetical (5% return before expenses) | |
Voya Global Bond Portfolio | | Beginning
Account
Value
July 1,
2016 | | Ending
Account
Value
December 31,
2016 | | Annualized
Expense
Ratio | | Expenses Paid
During the
Period Ended
December 31,
2016* | | Beginning
Account
Value
July 1,
2016 | | Ending
Account
Value
December 31,
2016 | | Annualized
Expense
Ratio | | Expenses Paid
During the
Period Ended
December 31,
2016* | |
Class ADV | | $ | 1,000.00 | | | $ | 975.10 | | | | 1.10 | % | | $ | 5.46 | | | $ | 1,000.00 | | | $ | 1,019.61 | | | | 1.10 | % | | $ | 5.58 | | |
Class I | | | 1,000.00 | | | | 978.10 | | | | 0.60 | | | | 2.98 | | | | 1,000.00 | | | | 1,022.12 | | | | 0.60 | | | | 3.05 | | |
Class S | | | 1,000.00 | | | | 976.90 | | | | 0.85 | | | | 4.22 | | | | 1,000.00 | | | | 1,020.86 | | | | 0.85 | | | | 4.32 | | |
VY® American Century Small-Mid Cap Value Portfolio | |
Class ADV | | $ | 1,000.00 | | | $ | 1,145.70 | | | | 1.36 | % | | $ | 7.34 | | | $ | 1,000.00 | | | $ | 1,018.30 | | | | 1.36 | % | | $ | 6.90 | | |
Class I | | | 1,000.00 | | | | 1,148.70 | | | | 0.86 | | | | 4.64 | | | | 1,000.00 | | | | 1,020.81 | | | | 0.86 | | | | 4.37 | | |
Class S | | | 1,000.00 | | | | 1,147.50 | | | | 1.11 | | | | 5.99 | | | | 1,000.00 | | | | 1,019.56 | | | | 1.11 | | | | 5.63 | | |
Class S2 | | | 1,000.00 | | | | 1,147.70 | | | | 1.26 | | | | 6.80 | | | | 1,000.00 | | | | 1,018.80 | | | | 1.26 | | | | 6.39 | | |
VY® Baron Growth Portfolio | |
Class ADV | | $ | 1,000.00 | | | $ | 1,011.10 | | | | 1.48 | % | | $ | 7.48 | | | $ | 1,000.00 | | | $ | 1,017.70 | | | | 1.48 | % | | $ | 7.51 | | |
Class I | | | 1,000.00 | | | | 1,013.60 | | | | 0.98 | | | | 4.96 | | | | 1,000.00 | | | | 1,020.21 | | | | 0.98 | | | | 4.98 | | |
Class R6 | | | 1,000.00 | | | | 1,013.60 | | | | 0.98 | | | | 4.96 | | | | 1,000.00 | | | | 1,020.21 | | | | 0.98 | | | | 4.98 | | |
Class S | | | 1,000.00 | | | | 1,012.20 | | | | 1.23 | | | | 6.22 | | | | 1,000.00 | | | | 1,018.95 | | | | 1.23 | | | | 6.24 | | |
Class S2 | | | 1,000.00 | | | | 1,011.50 | | | | 1.38 | | | | 6.98 | | | | 1,000.00 | | | | 1,018.20 | | | | 1.38 | | | | 7.00 | | |
32
SHAREHOLDER EXPENSE EXAMPLES (UNAUDITED) (CONTINUED)
| | | Actual Portfolio Return | | Hypothetical (5% return before expenses) | |
VY® Columbia Contrarian Core
Portfolio | | Beginning
Account
Value
July 1,
2016 | | Ending
Account
Value
December 31,
2016 | | Annualized
Expense
Ratio | | Expenses Paid
During the
Period Ended
December 31,
2016* | | Beginning
Account
Value
July 1,
2016 | | Ending
Account
Value
December 31,
2016 | | Annualized
Expense
Ratio | | Expenses Paid
During the
Period Ended
December 31,
2016* | |
Class ADV | | $ | 1,000.00 | | | $ | 1,060.70 | | | | 1.20 | % | | $ | 6.22 | | | $ | 1,000.00 | | | $ | 1,019.10 | | | | 1.20 | % | | $ | 6.09 | | |
Class I | | | 1,000.00 | | | | 1,062.90 | | | | 0.70 | | | | 3.63 | | | | 1,000.00 | | | | 1,021.62 | | | | 0.70 | | | | 3.56 | | |
Class S | | | 1,000.00 | | | | 1,062.10 | | | | 0.95 | | | | 4.92 | | | | 1,000.00 | | | | 1,020.36 | | | | 0.95 | | | | 4.82 | | |
VY® Columbia Small Cap Value II Portfolio | |
Class ADV | | $ | 1,000.00 | | | $ | 1,200.40 | | | | 1.36 | % | | $ | 7.52 | | | $ | 1,000.00 | | | $ | 1,018.30 | | | | 1.36 | % | | $ | 6.90 | | |
Class I | | | 1,000.00 | | | | 1,203.40 | | | | 0.86 | | | | 4.76 | | | | 1,000.00 | | | | 1,020.81 | | | | 0.86 | | | | 4.37 | | |
Class R6 | | | 1,000.00 | | | | 1,203.30 | | | | 0.86 | | | | 4.76 | | | | 1,000.00 | | | | 1,020.81 | | | | 0.86 | | | | 4.37 | | |
Class S | | | 1,000.00 | | | | 1,201.80 | | | | 1.11 | | | | 6.14 | | | | 1,000.00 | | | | 1,019.56 | | | | 1.11 | | | | 5.63 | | |
Class S2 | | | 1,000.00 | | | | 1,200.40 | | | | 1.26 | | | | 6.97 | | | | 1,000.00 | | | | 1,018.80 | | | | 1.26 | | | | 6.39 | | |
VY® Invesco Comstock Portfolio | |
Class ADV | | $ | 1,000.00 | | | $ | 1,175.90 | | | | 1.23 | % | | $ | 6.73 | | | $ | 1,000.00 | | | $ | 1,018.95 | | | | 1.23 | % | | $ | 6.24 | | |
Class I | | | 1,000.00 | | | | 1,178.90 | | | | 0.73 | | | | 4.00 | | | | 1,000.00 | | | | 1,021.47 | | | | 0.73 | | | | 3.71 | | |
Class S | | | 1,000.00 | | | | 1,177.10 | | | | 0.98 | | | | 5.36 | | | | 1,000.00 | | | | 1,020.21 | | | | 0.98 | | | | 4.98 | | |
VY® Invesco Equity and Income Portfolio | |
Class ADV | | $ | 1,000.00 | | | $ | 1,124.90 | | | | 1.14 | % | | $ | 6.09 | | | $ | 1,000.00 | | | $ | 1,019.41 | | | | 1.14 | % | | $ | 5.79 | | |
Class I | | | 1,000.00 | | | | 1,127.80 | | | | 0.64 | | | | 3.42 | | | | 1,000.00 | | | | 1,021.92 | | | | 0.64 | | | | 3.25 | | |
Class S | | | 1,000.00 | | | | 1,126.50 | | | | 0.89 | | | | 4.76 | | | | 1,000.00 | | | | 1,020.66 | | | | 0.89 | | | | 4.52 | | |
Class S2 | | | 1,000.00 | | | | 1,125.60 | | | | 1.02 | | | | 5.45 | | | | 1,000.00 | | | | 1,020.01 | | | | 1.02 | | | | 5.18 | | |
VY® JPMorgan Mid Cap Value Portfolio | |
Class ADV | | $ | 1,000.00 | | | $ | 1,075.10 | | | | 1.37 | % | | $ | 7.15 | | | $ | 1,000.00 | | | $ | 1,018.25 | | | | 1.37 | % | | $ | 6.95 | | |
Class I | | | 1,000.00 | | | | 1,077.00 | | | | 0.87 | | | | 4.54 | | | | 1,000.00 | | | | 1,020.76 | | | | 0.87 | | | | 4.42 | | |
Class S | | | 1,000.00 | | | | 1,076.20 | | | | 1.12 | | | | 5.85 | | | | 1,000.00 | | | | 1,019.51 | | | | 1.12 | | | | 5.69 | | |
Class S2 | | | 1,000.00 | | | | 1,075.60 | | | | 1.27 | | | | 6.63 | | | | 1,000.00 | | | | 1,018.75 | | | | 1.27 | | | | 6.44 | | |
VY® Oppenheimer Global Portfolio | |
Class ADV | | $ | 1,000.00 | | | $ | 1,087.00 | | | | 1.25 | % | | $ | 6.56 | | | $ | 1,000.00 | | | $ | 1,018.85 | | | | 1.25 | % | | $ | 6.34 | | |
Class I | | | 1,000.00 | | | | 1,090.20 | | | | 0.75 | | | | 3.94 | | | | 1,000.00 | | | | 1,021.37 | | | | 0.75 | | | | 3.81 | | |
Class S | | | 1,000.00 | | | | 1,088.60 | | | | 1.00 | | | | 5.25 | | | | 1,000.00 | | | | 1,020.11 | | | | 1.00 | | | | 5.08 | | |
Class S2 | | | 1,000.00 | | | | 1,087.70 | | | | 1.15 | | | | 6.03 | | | | 1,000.00 | | | | 1,019.36 | | | | 1.15 | | | | 5.84 | | |
VY® Pioneer High Yield Portfolio | |
Class I | | $ | 1,000.00 | | | $ | 1,072.40 | | | | 0.71 | % | | $ | 3.70 | | | $ | 1,000.00 | | | $ | 1,021.57 | | | | 0.71 | % | | $ | 3.61 | | |
Class S | | | 1,000.00 | | | | 1,071.10 | | | | 0.96 | | | | 5.00 | | | | 1,000.00 | | | | 1,020.31 | | | | 0.96 | | | | 4.88 | | |
VY® T. Rowe Price Diversified Mid Cap Growth Portfolio | |
Class ADV | | $ | 1,000.00 | | | $ | 1,053.30 | | | | 1.27 | % | | $ | 6.55 | | | $ | 1,000.00 | | | $ | 1,018.75 | | | | 1.27 | % | | $ | 6.44 | | |
Class I | | | 1,000.00 | | | | 1,055.20 | | | | 0.77 | | | | 3.98 | | | | 1,000.00 | | | | 1,021.27 | | | | 0.77 | | | | 3.91 | | |
Class R6 | | | 1,000.00 | | | | 1,055.20 | | | | 0.77 | | | | 3.98 | | | | 1,000.00 | | | | 1,021.27 | | | | 0.77 | | | | 3.91 | | |
Class S | | | 1,000.00 | | | | 1,054.50 | | | | 1.02 | | | | 5.27 | | | | 1,000.00 | | | | 1,020.01 | | | | 1.02 | | | | 5.18 | | |
Class S2 | | | 1,000.00 | | | | 1,053.90 | | | | 1.17 | | | | 6.04 | | | | 1,000.00 | | | | 1,019.25 | | | | 1.17 | | | | 5.94 | | |
33
SHAREHOLDER EXPENSE EXAMPLES (UNAUDITED) (CONTINUED)
| | | Actual Portfolio Return | | Hypothetical (5% return before expenses) | |
VY® T. Rowe Price Growth Equity
Portfolio | | Beginning
Account
Value
July 1,
2016 | | Ending
Account
Value
December 31,
2016 | | Annualized
Expense
Ratio | | Expenses Paid
During the
Period Ended
December 31,
2016* | | Beginning
Account
Value
July 1,
2016 | | Ending
Account
Value
December 31,
2016 | | Annualized
Expense
Ratio | | Expenses Paid
During the
Period Ended
December 31,
2016* | |
Class ADV | | $ | 1,000.00 | | | $ | 1,076.60 | | | | 1.23 | % | | $ | 6.42 | | | $ | 1,000.00 | | | $ | 1,018.95 | | | | 1.23 | % | | $ | 6.24 | | |
Class I | | | 1,000.00 | | | | 1,079.30 | | | | 0.73 | | | | 3.82 | | | | 1,000.00 | | | | 1,021.47 | | | | 0.73 | | | | 3.71 | | |
Class S | | | 1,000.00 | | | | 1,077.90 | | | | 0.98 | | | | 5.12 | | | | 1,000.00 | | | | 1,020.21 | | | | 0.98 | | | | 4.98 | | |
Class S2 | | | 1,000.00 | | | | 1,077.20 | | | | 1.13 | | | | 5.90 | | | | 1,000.00 | | | | 1,019.46 | | | | 1.13 | | | | 5.74 | | |
VY® Templeton Foreign Equity Portfolio | |
Class ADV | | $ | 1,000.00 | | | $ | 1,072.40 | | | | 1.41 | % | | $ | 7.35 | | | $ | 1,000.00 | | | $ | 1,018.05 | | | | 1.41 | % | | $ | 7.15 | | |
Class I | | | 1,000.00 | | | | 1,075.10 | | | | 0.91 | | | | 4.75 | | | | 1,000.00 | | | | 1,020.56 | | | | 0.91 | | | | 4.62 | | |
Class S | | | 1,000.00 | | | | 1,074.20 | | | | 1.16 | | | | 6.05 | | | | 1,000.00 | | | | 1,019.30 | | | | 1.16 | | | | 5.89 | | |
Class S2 | | | 1,000.00 | | | | 1,072.00 | | | | 1.31 | | | | 6.82 | | | | 1,000.00 | | | | 1,018.55 | | | | 1.31 | | | | 6.65 | | |
* Expenses are equal to each Portfolio's respective annualized expense ratios multiplied by the average account value over the period, multiplied by 184/366 to reflect the most recent fiscal half-year.
34
REPORT OF INDEPENDENT REGISTERED PUBLIC ACCOUNTING FIRM
The Shareholders and Board of Directors
Voya Partners, Inc.
We have audited the accompanying statements of assets and liabilities, including the summary portfolios of investments, of Voya Global Bond Portfolio, VY® American Century Small-Mid Cap Value Portfolio, VY® Baron Growth Portfolio, VY® Columbia Contrarian Core Portfolio, VY® Columbia Small Cap Value II Portfolio, VY® Invesco Comstock Portfolio, VY® Invesco Equity and Income Portfolio, VY® JPMorgan Mid Cap Value Portfolio, VY® Oppenheimer Global Portfolio, VY® Pioneer High Yield Portfolio, VY® T. Rowe Price Diversified Mid Cap Growth Portfolio, VY® T. Rowe Price Growth Equity Portfolio, and VY® Templeton Foreign Equity Portfolio, each a series of Voya Partners, Inc., as of December 31, 2016, and the related statements of operations for the year then ended, the statements of changes in net assets for each of the years in the two-year period then ended, and the financial highlights for each of the years or periods in the five-year period then ended. These financial statements and financial highlights are the responsibility of management. Our responsibility is to express an opinion on these financial statements and financial highlights based on our audits.
We conducted our audits in accordance with the standards of the Public Company Accounting Oversight Board (United States). Those standards require that we plan and perform the audit to obtain reasonable assurance about whether the financial statements and financial highlights are free of material misstatement. An audit includes examining, on a test basis, evidence supporting the amounts and disclosures in the financial statements. Our procedures included confirmation of securities owned as of December 31, 2016, by correspondence with the custodian and brokers, or by other appropriate auditing procedures when replies from brokers were not received. An audit also includes assessing the accounting principles used and significant estimates made by management, as well as evaluating the overall financial statement presentation. We believe that our audits provide a reasonable basis for our opinion.
In our opinion, the financial statements and financial highlights referred to above present fairly, in all material respects, the financial position of the aforementioned funds of Voya Partners, Inc. as of December 31, 2016, the results of their operations for the year then ended, the changes in their net assets for each of the years in the two-year period then ended, and the financial highlights for each of the years or periods in the five-year period then ended, in conformity with U.S. generally accepted accounting principles.

Boston, Massachusetts
February 23, 2017
35
STATEMENTS OF ASSETS AND LIABILITIES AS OF DECEMBER 31, 2016
| | | Voya
Global Bond
Portfolio | | VY®
American Century
Small-Mid Cap Value
Portfolio | | VY®
Baron
Growth
Portfolio | | VY®
Columbia
Contrarian Core
Portfolio | |
ASSETS: | |
Investments in securities at fair value+* | | $ | 194,783,139 | | | $ | 352,939,928 | | | $ | 703,402,760 | | | $ | 322,256,643 | | |
Investments in affiliates at fair value** | | | 48,212,598 | | | | — | | | | — | | | | — | | |
Short-term investments at fair value*** | | | 21,473,701 | | | | 18,122,918 | | | | 5,192,517 | | | | 3,610,640 | | |
Total investments at fair value | | $ | 264,469,438 | | | $ | 371,062,846 | | | $ | 708,595,277 | | | $ | 325,867,283 | | |
Cash | | | — | | | | — | | | | 1,015,000 | | | | — | | |
Cash collateral for futures | | | 1,059,894 | | | | — | | | | — | | | | — | | |
Cash pledged for centrally cleared swaps (Note 2) | | | 1,523,000 | | | | — | | | | — | | | | — | | |
Cash pledged as collateral for OTC derivatives (Note 2) | | | 2,810,000 | | | | — | | | | — | | | | — | | |
Foreign currencies at value**** | | | 127,235 | | | | — | | | | — | | | | — | | |
Foreign cash collateral for futures***** | | | 78,951 | | | | — | | | | — | | | | — | | |
Receivables: | |
Investment securities sold | | | 380,303 | | | | 826,257 | | | | — | | | | 4,049,932 | | |
Fund shares sold | | | 300,541 | | | | 196,913 | | | | 200,546 | | | | 75,445 | | |
Dividends | | | 730 | | | | 690,223 | | | | 941,057 | | | | 464,132 | | |
Interest | | | 1,406,451 | | | | — | | | | — | | | | — | | |
Foreign tax reclaims | | | — | | | | — | | | | — | | | | 3,769 | | |
Unrealized appreciation on forward foreign currency
contracts | | | 2,510,309 | | | | 11,678 | | | | — | | | | — | | |
Prepaid expenses | | | 1,016 | | | | 1,131 | | | | 3,349 | | | | 1,367 | | |
Reimbursement due from manager | | | 12,495 | | | | 34,484 | | | | — | | | | 55,916 | | |
Other assets | | | 11,344 | | | | 6,711 | | | | 23,238 | | | | 10,648 | | |
Total assets | | | 274,691,707 | | | | 372,830,243 | | | | 710,778,467 | | | | 330,528,492 | | |
LIABILITIES: | |
Payable for investment securities purchased | | | 2,219,825 | | | | 2,067,964 | | | | — | | | | 4,100,201 | | |
Payable for fund shares redeemed | | | — | | | | 446,344 | | | | 93,682 | | | | 119,716 | | |
Payable upon receipt of securities loaned | | | 15,731,207 | | | | 7,238,056 | | | | — | | | | — | | |
Unrealized depreciation on forward foreign currency
contracts | | | 5,919,220 | | | | 50,142 | | | | — | | | | — | | |
Variation margin payable on centrally cleared swaps | | | 136,792 | | | | — | | | | — | | | | — | | |
Cash received as collateral for OTC derivatives (Note 2) | | | 2,030,000 | | | | — | | | | — | | | | — | | |
Payable for investment management fees | | | 116,090 | | | | 329,555 | | | | 580,552 | | | | 251,631 | | |
Payable for distribution and shareholder service fees | | | 18,846 | | | | 65,235 | | | | 137,484 | | | | 72,986 | | |
Payable to custodian due to bank overdraft | | | 18,122 | | | | — | | | | — | | | | — | | |
Payable to directors under the deferred compensation
plan (Note 6) | | | 11,344 | | | | 6,711 | | | | 23,238 | | | | 10,648 | | |
Payable for directors fees | | | 1,208 | | | | 1,492 | | | | 3,866 | | | | 1,652 | | |
Other accrued expenses and liabilities | | | 50,097 | | | | 49,481 | | | | 104,982 | | | | 47,025 | | |
Written options, at fair value^ | | | 20,041,868 | | | | — | | | | — | | | | — | | |
Total liabilities | | | 46,294,619 | | | | 10,254,980 | | | | 943,804 | | | | 4,603,859 | | |
NET ASSETS | | $ | 228,397,088 | | | $ | 362,575,263 | | | $ | 709,834,663 | | | $ | 325,924,633 | | |
NET ASSETS WERE COMPRISED OF: | |
Paid-in capital | | $ | 238,033,075 | | | $ | 300,718,316 | | | $ | 244,314,440 | | | $ | 264,120,775 | | |
Undistributed net investment income | | | 2,763,579 | | | | 4,001,439 | | | | 5,804,645 | | | | 3,172,780 | | |
Accumulated net realized gain (loss) | | | (637,211 | ) | | | 9,152,134 | | | | 78,260,735 | | | | 17,698,993 | | |
Net unrealized appreciation (depreciation) | | | (11,762,355 | ) | | | 48,703,374 | | | | 381,454,843 | | | | 40,932,085 | | |
NET ASSETS | | $ | 228,397,088 | | | $ | 362,575,263 | | | $ | 709,834,663 | | | $ | 325,924,633 | | |
| + Including securities loaned at value | | $ | 15,412,472 | | | $ | 7,031,588 | | | $ | — | | | $ | — | | |
| * Cost of investments in securities | | $ | 191,517,371 | | | $ | 304,198,114 | | | $ | 321,947,917 | | | $ | 281,324,211 | | |
| ** Cost of investments in affiliates | | $ | 57,285,247 | | | $ | — | | | $ | — | | | $ | — | | |
| *** Cost of short-term investments | | $ | 21,510,566 | | | $ | 18,122,918 | | | $ | 5,192,517 | | | $ | 3,610,640 | | |
| **** Cost of foreign currencies | | $ | 172,025 | | | $ | — | | | $ | — | | | $ | — | | |
| ***** Cost of foreign cash collateral for futures | | $ | 78,951 | | | $ | — | | | $ | — | | | $ | — | | |
| ^ Premiums received on written options | | $ | 17,710,908 | | | $ | — | | | $ | — | | | $ | — | | |
See Accompanying Notes to Financial Statements
36
STATEMENTS OF ASSETS AND LIABILITIES AS OF DECEMBER 31, 2016 (CONTINUED)
| | | Voya
Global Bond
Portfolio | | VY®
American Century
Small-Mid Cap Value
Portfolio | | VY®
Baron
Growth
Portfolio | | VY®
Columbia
Contrarian Core
Portfolio | |
Class ADV: | |
Net assets | | $ | 24,365,119 | | | $ | 101,947,517 | | | $ | 77,655,016 | | | $ | 25,431,592 | | |
Shares authorized | | | 100,000,000 | | | | 100,000,000 | | | | 100,000,000 | | | | 100,000,000 | | |
Par value | | $ | 0.001 | | | $ | 0.001 | | | $ | 0.001 | | | $ | 0.001 | | |
Shares outstanding | | | 2,379,182 | | | | 8,471,086 | | | | 3,129,093 | | | | 1,230,913 | | |
Net asset value and redemption price per share | | $ | 10.24 | | | $ | 12.03 | | | $ | 24.82 | | | $ | 20.66 | | |
Class I: | |
Net assets | | $ | 163,396,895 | | | $ | 156,657,107 | | | $ | 150,672,284 | | | $ | 10,628,838 | | |
Shares authorized | | | 100,000,000 | | | | 100,000,000 | | | | 100,000,000 | | | | 100,000,000 | | |
Par value | | $ | 0.001 | | | $ | 0.001 | | | $ | 0.001 | | | $ | 0.001 | | |
Shares outstanding | | | 15,678,803 | | | | 12,313,526 | | | | 5,597,753 | | | | 491,756 | | |
Net asset value and redemption price per share | | $ | 10.42 | | | $ | 12.72 | | | $ | 26.92 | | | $ | 21.61 | | |
Class R6: | |
Net assets | | | n/a | | | | n/a | | | $ | 878,572 | | | | n/a | | |
Shares authorized | | | n/a | | | | n/a | | | | 100,000,000 | | | | n/a | | |
Par value | | | n/a | | | | n/a | | | $ | 0.001 | | | | n/a | | |
Shares outstanding | | | n/a | | | | n/a | | | | 32,628 | | | | n/a | | |
Net asset value and redemption price per share | | | n/a | | | | n/a | | | $ | 26.93 | | | | n/a | | |
Class S: | |
Net assets | | $ | 40,635,074 | | | $ | 99,089,312 | | | $ | 478,019,678 | | | $ | 289,864,203 | | |
Shares authorized | | | 100,000,000 | | | | 100,000,000 | | | | 100,000,000 | | | | 100,000,000 | | |
Par value | | $ | 0.001 | | | $ | 0.001 | | | $ | 0.001 | | | $ | 0.001 | | |
Shares outstanding | | | 3,903,801 | | | | 7,889,459 | | | | 18,438,480 | | | | 13,668,911 | | |
Net asset value and redemption price per share | | $ | 10.41 | | | $ | 12.56 | | | $ | 25.93 | | | $ | 21.21 | | |
Class S2: | |
Net assets | | | n/a | | | $ | 4,881,327 | | | $ | 2,609,113 | | | | n/a | | |
Shares authorized | | | n/a | | | | 100,000,000 | | | | 100,000,000 | | | | n/a | | |
Par value | | | n/a | | | $ | 0.001 | | | $ | 0.001 | | | | n/a | | |
Shares outstanding | | | n/a | | | | 406,592 | | | | 104,715 | | | | n/a | | |
Net asset value and redemption price per share | | | n/a | | | $ | 12.01 | | | $ | 24.92 | | | | n/a | | |
See Accompanying Notes to Financial Statements
37
STATEMENTS OF ASSETS AND LIABILITIES AS OF DECEMBER 31, 2016
| | | VY®
Columbia Small
Cap Value II
Portfolio | | VY®
Invesco
Comstock
Portfolio | | VY®
Invesco
Equity and Income
Portfolio | | VY®
JPMorgan
Mid Cap Value
Portfolio | |
ASSETS: | |
Investments in securities at fair value+* | | $ | 232,944,488 | | | $ | 512,193,593 | | | $ | 1,649,050,314 | | | $ | 597,053,478 | | |
Short-term investments at fair value** | | | 9,231,151 | | | | 13,337,082 | | | | 245,630,700 | | | | 25,237,209 | | |
Total investments at fair value | | $ | 242,175,639 | | | $ | 525,530,675 | | | $ | 1,894,681,014 | | | $ | 622,290,687 | | |
Foreign currencies at value*** | | | — | | | | 1,715 | | | | 392,644 | | | | — | | |
Receivables: | |
Investment securities sold | | | 71,445 | | | | — | | | | 776,429 | | | | — | | |
Fund shares sold | | | 312,672 | | | | 1,480,404 | | | | 117,275 | | | | 29,257 | | |
Dividends | | | 273,166 | | | | 536,057 | | | | 2,137,803 | | | | 964,752 | | |
Interest | | | — | | | | — | | | | 3,022,754 | | | | — | | |
Foreign tax reclaims | | | — | | | | 216,911 | | | | 305,269 | | | | — | | |
Unrealized appreciation on forward foreign currency
contracts | | | — | | | | 822,857 | | | | 1,883,232 | | | | — | | |
Prepaid expenses | | | 838 | | | | 2,123 | | | | 7,353 | | | | 2,506 | | |
Reimbursement due from manager | | | — | | | | — | | | | 31,037 | | | | — | | |
Other assets | | | 6,775 | | | | 17,693 | | | | 65,920 | | | | 13,720 | | |
Total assets | | | 242,840,535 | | | | 528,608,435 | | | | 1,903,420,730 | | | | 623,300,922 | | |
LIABILITIES: | |
Payable for investment securities purchased | | | 4,013,081 | | | | — | | | | 6,396,290 | | | | — | | |
Payable for fund shares redeemed | | | 575,582 | | | | 1,758,300 | | | | 3,796,468 | | | | 1,534,993 | | |
Payable upon receipt of securities loaned | | | — | | | | 6,159,852 | | | | 118,166,949 | | | | 11,668,889 | | |
Unrealized depreciation on forward foreign currency
contracts | | | — | | | | 1,731 | | | | — | | | | — | | |
Payable for investment management fees | | | 170,475 | | | | 312,633 | | | | 936,215 | | | | 434,761 | | |
Payable for distribution and shareholder service fees | | | 47,674 | | | | 76,913 | | | | 309,937 | | | | 105,916 | | |
Payable to directors under the deferred compensation
plan (Note 6) | | | 6,775 | | | | 17,693 | | | | 65,920 | | | | 13,720 | | |
Payable for directors fees | | | 1,035 | | | | 2,527 | | | | 8,616 | | | | 3,015 | | |
Other accrued expenses and liabilities | | | 30,904 | | | | 77,709 | | | | 194,179 | | | | 110,074 | | |
Total liabilities | | | 4,845,526 | | | | 8,407,358 | | | | 129,874,574 | | | | 13,871,368 | | |
NET ASSETS | | $ | 237,995,009 | | | $ | 520,201,077 | | | $ | 1,773,546,156 | | | $ | 609,429,554 | | |
NET ASSETS WERE COMPRISED OF: | |
Paid-in capital | | $ | 174,756,489 | | | $ | 522,204,336 | | | $ | 1,556,781,192 | | | $ | 419,865,263 | | |
Undistributed net investment income | | | 709,236 | | | | 1,270,256 | | | | 4,391,247 | | | | 178,023 | | |
Accumulated net realized gain (loss) | | | 8,605,969 | | | | (91,064,715 | ) | | | 35,389,261 | | | | 52,955,296 | | |
Net unrealized appreciation | | | 53,923,315 | | | | 87,791,200 | | | | 176,984,456 | | | | 136,430,972 | | |
NET ASSETS | | $ | 237,995,009 | | | $ | 520,201,077 | | | $ | 1,773,546,156 | | | $ | 609,429,554 | | |
| + Including securities loaned at value | | $ | — | | | $ | 5,922,116 | | | $ | 115,709,832 | | | $ | 11,371,819 | | |
| * Cost of investments in securities | | $ | 179,021,173 | | | $ | 425,209,667 | | | $ | 1,477,530,157 | | | $ | 460,622,506 | | |
| ** Cost of short-term investments | | $ | 9,231,151 | | | $ | 13,337,082 | | | $ | 242,031,419 | | | $ | 25,237,209 | | |
| *** Cost of foreign currencies | | $ | — | | | $ | 1,708 | | | $ | 389,651 | | | $ | — | | |
See Accompanying Notes to Financial Statements
38
STATEMENTS OF ASSETS AND LIABILITIES AS OF DECEMBER 31, 2016 (CONTINUED)
| | | VY®
Columbia Small
Cap Value II
Portfolio | | VY®
Invesco
Comstock
Portfolio | | VY®
Invesco
Equity and Income
Portfolio | | VY®
JPMorgan
Mid Cap Value
Portfolio | |
Class ADV: | |
Net assets | | $ | 36,303,748 | | | $ | 34,489,736 | | | $ | 49,628,241 | | | $ | 98,003,096 | | |
Shares authorized | | | 100,000,000 | | | | 100,000,000 | | | | 100,000,000 | | | | 100,000,000 | | |
Par value | | $ | 0.001 | | | $ | 0.001 | | | $ | 0.001 | | | $ | 0.001 | | |
Shares outstanding | | | 1,962,628 | | | | 1,990,680 | | | | 1,126,423 | | | | 5,075,712 | | |
Net asset value and redemption price per share | | $ | 18.50 | | | $ | 17.33 | | | $ | 44.06 | | | $ | 19.31 | | |
Class I: | |
Net assets | | $ | 49,625,486 | | | $ | 194,503,515 | | | $ | 594,455,567 | | | $ | 215,891,946 | | |
Shares authorized | | | 100,000,000 | | | | 100,000,000 | | | | 100,000,000 | | | | 100,000,000 | | |
Par value | | $ | 0.001 | | | $ | 0.001 | | | $ | 0.001 | | | $ | 0.001 | | |
Shares outstanding | | | 2,604,690 | | | | 11,135,262 | | | | 13,251,124 | | | | 10,928,664 | | |
Net asset value and redemption price per share | | $ | 19.05 | | | $ | 17.47 | | | $ | 44.86 | | | $ | 19.75 | | |
Class R6: | |
Net assets | | $ | 401,554 | | | | n/a | | | | n/a | | | | n/a | | |
Shares authorized | | | 100,000,000 | | | | n/a | | | | n/a | | | | n/a | | |
Par value | | $ | 0.001 | | | | n/a | | | | n/a | | | | n/a | | |
Shares outstanding | | | 21,067 | | | | n/a | | | | n/a | | | | n/a | | |
Net asset value and redemption price per share | | $ | 19.06 | | | | n/a | | | | n/a | | | | n/a | | |
Class S: | |
Net assets | | $ | 145,815,665 | | | $ | 291,207,826 | | | $ | 682,464,791 | | | $ | 291,724,733 | | |
Shares authorized | | | 100,000,000 | | | | 100,000,000 | | | | 100,000,000 | | | | 100,000,000 | | |
Par value | | $ | 0.001 | | | $ | 0.001 | | | $ | 0.001 | | | $ | 0.001 | | |
Shares outstanding | | | 7,689,966 | | | | 16,684,929 | | | | 15,344,205 | | | | 14,897,783 | | |
Net asset value and redemption price per share | | $ | 18.96 | | | $ | 17.45 | | | $ | 44.48 | | | $ | 19.58 | | |
Class S2: | |
Net assets | | $ | 5,848,556 | | | | n/a | | | $ | 446,997,557 | | | $ | 3,809,779 | | |
Shares authorized | | | 100,000,000 | | | | n/a | | | | 100,000,000 | | | | 100,000,000 | | |
Par value | | $ | 0.001 | | | | n/a | | | $ | 0.001 | | | $ | 0.001 | | |
Shares outstanding | | | 317,134 | | | | n/a | | | | 10,193,450 | | | | 197,900 | | |
Net asset value and redemption price per share | | $ | 18.44 | | | | n/a | | | $ | 43.85 | | | $ | 19.25 | | |
See Accompanying Notes to Financial Statements
39
STATEMENTS OF ASSETS AND LIABILITIES AS OF DECEMBER 31, 2016
| | | VY®
Oppenheimer
Global
Portfolio | | VY®
Pioneer
High Yield
Portfolio | | VY®
T. Rowe Price
Diversified Mid Cap
Growth
Portfolio | | VY®
T. Rowe Price
Growth Equity
Portfolio | |
ASSETS: | |
Investments in securities at fair value+* | | $ | 1,341,286,653 | | | $ | 99,063,003 | | | $ | 849,044,707 | | | $ | 1,515,156,709 | | |
Short-term investments at fair value** | | | 79,150,704 | | | | 3,249,444 | | | | 46,207,414 | | | | 59,179,509 | | |
Total investments at fair value | | $ | 1,420,437,357 | | | $ | 102,312,447 | | | $ | 895,252,121 | | | $ | 1,574,336,218 | | |
Cash | | | — | | | | 35,892 | | | | 415,226 | | | | 3,214,915 | | |
Cash collateral for futures | | | — | | | | 155,455 | | | | — | | | | — | | |
Cash pledged for centrally cleared swaps (Note 2) | | | — | | | | 310,000 | | | | — | | | | — | | |
Receivables: | |
Investment securities sold | | | 2,748,740 | | | | — | | | | 1,316,726 | | | | 12,492,055 | | |
Fund shares sold | | | 69,582 | | | | 990 | | | | 98,275 | | | | 273,917 | | |
Dividends | | | 368,646 | | | | 19,133 | | | | 543,905 | | | | 658,471 | | |
Interest | | | — | | | | 1,255,157 | | | | — | | | | — | | |
Foreign tax reclaims | | | 1,210,730 | | | | — | | | | — | | | | 27,170 | | |
Unrealized appreciation on unfunded corporate
loans (Note 12) | | | — | | | | 5,514 | | | | — | | | | — | | |
Variation margin receivable on centrally cleared swaps | | | — | | | | 841 | | | | — | | | | — | | |
Prepaid expenses | | | 6,275 | | | | 404 | | | | 3,386 | | | | 6,908 | | |
Reimbursement due from manager | | | — | | | | 7,159 | | | | — | | | | — | | |
Other assets | | | 54,980 | | | | 4,351 | | | | 27,373 | | | | 42,030 | | |
Total assets | | | 1,424,896,310 | | | | 104,107,343 | | | | 897,657,012 | | | | 1,591,051,684 | | |
LIABILITIES: | |
Payable for investment securities purchased | | | 885,179 | | | | 29,135 | | | | 242,487 | | | | 11,710,863 | | |
Payable for fund shares redeemed | | | 1,035,325 | | | | 158,340 | | | | 2,897,253 | | | | 1,664,377 | | |
Payable upon receipt of securities loaned | | | 61,772,209 | | | | — | | | | 45,142,497 | | | | 48,609,294 | | |
Payable for investment management fees | | | 815,833 | | | | 61,093 | | | | 540,732 | | | | 903,699 | | |
Payable for distribution and shareholder service fees | | | 77,959 | | | | 899 | | | | 34,854 | | | | 157,154 | | |
Payable to custodian due to foreign currency
overdraft*** | | | 10,847 | | | | — | | | | — | | | | — | | |
Payable to directors under the deferred compensation
plan (Note 6) | | | 54,980 | | | | 4,351 | | | | 27,373 | | | | 42,030 | | |
Payable for directors fees | | | 7,071 | | | | 493 | | | | 4,147 | | | | 7,870 | | |
Other accrued expenses and liabilities | | | 267,144 | | | | 17,316 | | | | 182,190 | | | | 177,314 | | |
Total liabilities | | | 64,926,547 | | | | 271,627 | | | | 49,071,533 | | | | 63,272,601 | | |
NET ASSETS | | $ | 1,359,969,763 | | | $ | 103,835,716 | | | $ | 848,585,479 | | | $ | 1,527,779,083 | | |
NET ASSETS WERE COMPRISED OF: | |
Paid-in capital | | $ | 815,162,947 | | | $ | 116,604,642 | | | $ | 582,710,915 | | | $ | 1,036,750,033 | | |
Undistributed net investment income | | | 16,291,321 | | | | 3,364,553 | | | | 5,589,834 | | | | 527,655 | | |
Accumulated net realized gain (loss) | | | (5,040,288 | ) | | | (18,241,386 | ) | | | 63,452,484 | | | | 168,899,423 | | |
Net unrealized appreciation | | | 533,555,783 | | | | 2,107,907 | | | | 196,832,246 | | | | 321,601,972 | | |
NET ASSETS | | $ | 1,359,969,763 | | | $ | 103,835,716 | | | $ | 848,585,479 | | | $ | 1,527,779,083 | | |
| + Including securities loaned at value | | $ | 58,873,574 | | | $ | — | | | $ | 44,133,447 | | | $ | 47,628,893 | | |
| * Cost of investments in securities | | $ | 807,643,031 | | | $ | 97,090,217 | | | $ | 652,212,461 | | | $ | 1,193,550,584 | | |
| ** Cost of short-term investments | | $ | 79,150,704 | | | $ | 3,252,170 | | | $ | 46,207,414 | | | $ | 59,179,509 | | |
| *** Cost of foreign currency overdraft | | $ | 10,847 | | | $ | — | | | $ | — | | | $ | — | | |
See Accompanying Notes to Financial Statements
40
STATEMENTS OF ASSETS AND LIABILITIES AS OF DECEMBER 31, 2016 (CONTINUED)
| | | VY®
Oppenheimer
Global
Portfolio | | VY®
Pioneer
High Yield
Portfolio | | VY®
T. Rowe Price
Diversified Mid Cap
Growth
Portfolio | | VY®
T. Rowe Price
Growth Equity
Portfolio | |
Class ADV: | |
Net assets | | $ | 90,659,770 | | | | n/a | | | $ | 49,418,405 | | | $ | 192,546,062 | | |
Shares authorized | | | 100,000,000 | | | | n/a | | | | 100,000,000 | | | | 100,000,000 | | |
Par value | | $ | 0.001 | | | | n/a | | | $ | 0.001 | | | $ | 0.001 | | |
Shares outstanding | | | 5,701,225 | | | | n/a | | | | 5,379,263 | | | | 2,654,633 | | |
Net asset value and redemption price per share | | $ | 15.90 | | | | n/a | | | $ | 9.19 | | | $ | 72.53 | | |
Class I: | |
Net assets | | $ | 1,091,477,928 | | | $ | 99,572,795 | | | $ | 737,054,121 | | | $ | 989,826,251 | | |
Shares authorized | | | 250,000,000 | | | | 100,000,000 | | | | 250,000,000 | | | | 100,000,000 | | |
Par value | | $ | 0.001 | | | $ | 0.001 | | | $ | 0.001 | | | $ | 0.001 | | |
Shares outstanding | | | 65,918,519 | | | | 8,518,718 | | | | 73,466,848 | | | | 12,781,425 | | |
Net asset value and redemption price per share | | $ | 16.56 | | | $ | 11.69 | | | $ | 10.03 | | | $ | 77.44 | | |
Class R6: | |
Net assets | | | n/a | | | | n/a | | | $ | 1,083,554 | | | | n/a | | |
Shares authorized | | | n/a | | | | n/a | | | | 100,000,000 | | | | n/a | | |
Par value | | | n/a | | | | n/a | | | $ | 0.001 | | | | n/a | | |
Shares outstanding | | | n/a | | | | n/a | | | | 107,983 | | | | n/a | | |
Net asset value and redemption price per share | | | n/a | | | | n/a | | | $ | 10.03 | | | | n/a | | |
Class S: | |
Net assets | | $ | 174,417,466 | | | $ | 4,262,921 | | | $ | 56,578,381 | | | $ | 336,809,888 | | |
Shares authorized | | | 100,000,000 | | | | 100,000,000 | | | | 100,000,000 | | | | 100,000,000 | | |
Par value | | $ | 0.001 | | | $ | 0.001 | | | $ | 0.001 | | | $ | 0.001 | | |
Shares outstanding | | | 10,915,108 | | | | 365,149 | | | | 5,827,580 | | | | 4,493,130 | | |
Net asset value and redemption price per share | | $ | 15.98 | | | $ | 11.67 | | | $ | 9.71 | | | $ | 74.96 | | |
Class S2: | |
Net assets | | $ | 3,414,599 | | | | n/a | | | $ | 4,451,018 | | | $ | 8,596,882 | | |
Shares authorized | | | 100,000,000 | | | | n/a | | | | 100,000,000 | | | | 100,000,000 | | |
Par value | | $ | 0.001 | | | | n/a | | | $ | 0.001 | | | $ | 0.001 | | |
Shares outstanding | | | 219,195 | | | | n/a | | | | 482,725 | | | | 117,326 | | |
Net asset value and redemption price per share | | $ | 15.58 | | | | n/a | | | $ | 9.22 | | | $ | 73.27 | | |
See Accompanying Notes to Financial Statements
41
STATEMENTS OF ASSETS AND LIABILITIES AS OF DECEMBER 31, 2016
| | | VY®
Templeton
Foreign Equity
Portfolio | |
ASSETS: | |
Investments in securities at fair value+* | | $ | 613,492,304 | | |
Short-term investments at fair value** | | | 26,977,186 | | |
Total investments at fair value | | $ | 640,469,490 | | |
Foreign currencies at value*** | | | 123,841 | | |
Receivables: | |
Investment securities sold | | | 127,563 | | |
Fund shares sold | | | 61,331 | | |
Dividends | | | 1,043,553 | | |
Foreign tax reclaims | | | 1,071,555 | | |
Prepaid expenses | | | 2,865 | | |
Reimbursement due from manager | | | 20,545 | | |
Other assets | | | 47,519 | | |
Total assets | | | 642,968,262 | | |
LIABILITIES: | |
Payable for investment securities purchased | | | 170,257 | | |
Payable for fund shares redeemed | | | 349,057 | | |
Payable upon receipt of securities loaned | | | 13,691,845 | | |
Payable for investment management fees | | | 475,407 | | |
Payable for distribution and shareholder service fees | | | 104,481 | | |
Payable to custodian due to bank overdraft | | | 92,961 | | |
Payable to directors under the deferred compensation plan (Note 6) | | | 47,519 | | |
Payable for directors fees | | | 3,283 | | |
Other accrued expenses and liabilities | | | 154,914 | | |
Total liabilities | | | 15,089,724 | | |
NET ASSETS | | $ | 627,878,538 | | |
NET ASSETS WERE COMPRISED OF: | |
Paid-in capital | | $ | 687,987,908 | | |
Undistributed net investment income | | | 11,585,457 | | |
Accumulated net realized loss | | | (139,725,247 | ) | |
Net unrealized appreciation | | | 68,030,420 | | |
NET ASSETS | | $ | 627,878,538 | | |
| + Including securities loaned at value | | $ | 13,003,961 | | |
| * Cost of investments in securities | | $ | 545,350,230 | | |
| ** Cost of short-term investments | | $ | 26,976,909 | | |
| *** Cost of foreign currencies | | $ | 124,128 | | |
See Accompanying Notes to Financial Statements
42
STATEMENTS OF ASSETS AND LIABILITIES AS OF DECEMBER 31, 2016 (CONTINUED)
| | | VY®
Templeton
Foreign Equity
Portfolio | |
Class ADV: | |
Net assets | | $ | 31,936,700 | | |
Shares authorized | | | 100,000,000 | | |
Par value | | $ | 0.001 | | |
Shares outstanding | | | 2,930,719 | | |
Net asset value and redemption price per share | | $ | 10.90 | | |
Class I: | |
Net assets | | $ | 170,231,088 | | |
Shares authorized | | | 100,000,000 | | |
Par value | | $ | 0.001 | | |
Shares outstanding | | | 15,462,663 | | |
Net asset value and redemption price per share | | $ | 11.01 | | |
Class S: | |
Net assets | | $ | 423,389,911 | | |
Shares authorized | | | 100,000,000 | | |
Par value | | $ | 0.001 | | |
Shares outstanding | | | 38,715,752 | | |
Net asset value and redemption price per share | | $ | 10.94 | | |
Class S2: | |
Net assets | | $ | 2,320,839 | | |
Shares authorized | | | 100,000,000 | | |
Par value | | $ | 0.001 | | |
Shares outstanding | | | 213,660 | | |
Net asset value and redemption price per share | | $ | 10.86 | | |
See Accompanying Notes to Financial Statements
43
STATEMENTS OF OPERATIONS FOR THE YEAR ENDED DECEMBER 31, 2016
| | | Voya
Global Bond
Portfolio | | VY®
American Century
Small-Mid Cap Value
Portfolio | | VY®
Baron
Growth
Portfolio | | VY®
Columbia
Contrarian Core
Portfolio | |
INVESTMENT INCOME: | |
Dividends, net of foreign taxes withheld* | | $ | 14,613 | | | $ | 6,297,838 | | | $ | 8,314,410 | | | $ | 6,298,764 | | |
Interest | | | 6,434,578 | | | | — | | | | — | | | | 431 | | |
Dividends from affiliated underlying funds | | | 1,699,327 | | | | — | | | | — | | | | — | | |
Securities lending income, net | | | 20,250 | | | | 111,402 | | | | — | | | | — | | |
Total investment income | | | 8,168,768 | | | | 6,409,240 | | | | 8,314,410 | | | | 6,299,195 | | |
EXPENSES: | |
Investment management fees | | | 1,448,743 | | | | 3,257,115 | | | | 7,344,494 | | | | 2,973,525 | | |
Distribution and shareholder service fees: | | | | | | | | | |
Class ADV | | | 131,392 | | | | 424,138 | | | | 414,926 | | | | 120,138 | | |
Class S | | | 106,145 | | | | 204,524 | | | | 1,282,526 | | | | 739,648 | | |
Class S2 | | | — | | | | 16,176 | | | | 14,291 | | | | — | | |
Transfer agent fees | | | 370 | | | | 993 | | | | 1,316 | | | | 737 | | |
Shareholder reporting expense | | | 29,106 | | | | 32,904 | | | | 72,078 | | | | 33,700 | | |
Professional fees | | | 19,581 | | | | 21,270 | | | | 48,219 | | | | 25,501 | | |
Custody and accounting expense | | | 77,180 | | | | 104,371 | | | | 73,288 | | | | 41,397 | | |
Directors fees | | | 7,244 | | | | 8,949 | | | | 23,194 | | | | 9,912 | | |
Miscellaneous expense | | | 13,190 | | | | 19,343 | | | | 46,855 | | | | 21,907 | | |
Interest expense | | | 1,472 | | | | 13 | | | | 10,103 | | | | 75 | | |
Total expenses | | | 1,834,423 | | | | 4,089,796 | | | | 9,331,290 | | | | 3,966,540 | | |
Net waived and reimbursed fees | | | (148,278 | ) | | | (871,848 | ) | | | (1,328 | ) | | | (785,696 | ) | |
Brokerage commission recapture | | | — | | | | — | | | | (4,072 | ) | | | (26,480 | ) | |
Net expenses | | | 1,686,145 | | | | 3,217,948 | | | | 9,325,890 | | | | 3,154,364 | | |
Net investment income (loss) | | | 6,482,623 | | | | 3,191,292 | | | | (1,011,480 | ) | | | 3,144,831 | | |
REALIZED AND UNREALIZED GAIN (LOSS): | |
Net realized gain (loss) on: | |
Investments | | | 8,908,621 | | | | 12,517,553 | | | | 85,922,795 | | | | 18,523,125 | | |
Sale of affiliated underlying funds | | | (917,367 | ) | | | — | | | | — | | | | — | | |
Foreign currency related transactions | | | (3,224,379 | ) | | | 161,117 | | | | 361 | | | | 357 | | |
Futures | | | 2,051,314 | | | | — | | | | — | | | | — | | |
Swaps | | | (2,596,365 | ) | | | — | | | | — | | | | — | | |
Written options | | | 292,921 | | | | — | | | | — | | | | — | | |
Net realized gain | | | 4,514,745 | | | | 12,678,670 | | | | 85,923,156 | | | | 18,523,482 | | |
Net change in unrealized appreciation (depreciation) on: | |
Investments | | | 5,141,422 | | | | 50,842,072 | | | | (46,286,719 | ) | | | 4,985,729 | | |
Affiliated underlying funds | | | 3,389,442 | | | | — | | | | — | | | | — | | |
Foreign currency related transactions | | | (3,396,293 | ) | | | (26,837 | ) | | | — | | | | (63 | ) | |
Futures | | | 465,130 | | | | — | | | | — | | | | — | | |
Swaps | | | 408,953 | | | | — | | | | — | | | | — | | |
Written options | | | (2,330,960 | ) | | | — | | | | — | | | | — | | |
Net change in unrealized appreciation (depreciation) | | | 3,677,694 | | | | 50,815,235 | | | | (46,286,719 | ) | | | 4,985,666 | | |
Net realized and unrealized gain | | | 8,192,439 | | | | 63,493,905 | | | | 39,636,437 | | | | 23,509,148 | | |
Increase in net assets resulting from operations | | $ | 14,675,062 | | | $ | 66,685,197 | | | $ | 38,624,957 | | | $ | 26,653,979 | | |
| * Foreign taxes withheld | | $ | — | | | $ | 36,118 | | | $ | — | | | $ | 14,100 | | |
See Accompanying Notes to Financial Statements
44
STATEMENTS OF OPERATIONS FOR THE YEAR ENDED DECEMBER 31, 2016
| | | VY®
Columbia Small
Cap Value II
Portfolio | | VY®
Invesco
Comstock
Portfolio | | VY®
Invesco
Equity and Income
Portfolio | | VY®
JPMorgan
Mid Cap Value
Portfolio | |
INVESTMENT INCOME: | |
Dividends, net of foreign taxes withheld* | | $ | 2,958,357 | | | $ | 14,484,976 | | | $ | 28,737,543 | | | $ | 10,605,266 | | |
Interest | | | — | | | | — | | | | 11,659,538 | | | | — | | |
Securities lending income, net | | | — | | | | 148,392 | | | | 769,187 | | | | 208,292 | | |
Total investment income | | | 2,958,357 | | | | 14,633,368 | | | | 41,166,268 | | | | 10,813,558 | | |
EXPENSES: | |
Investment management fees | | | 1,758,771 | | | | 3,537,763 | | | | 10,862,054 | | | | 5,024,021 | | |
Distribution and shareholder service fees: | | | | | | | | | |
Class ADV | | | 142,826 | | | | 162,738 | | | | 230,388 | | | | 463,883 | | |
Class S | | | 328,801 | | | | 698,986 | | | | 1,693,647 | | | | 724,437 | | |
Class S2 | | | 20,840 | | | | — | | | | 1,837,414 | | | | 17,352 | | |
Transfer agent fees | | | 757 | | | | 1,209 | | | | 2,734 | | | | 638 | | |
Shareholder reporting expense | | | 26,494 | | | | 62,515 | | | | 216,991 | | | | 64,982 | | |
Registration fees | | | — | | | | — | | | | 1,098 | | | | — | | |
Professional fees | | | 19,269 | | | | 33,468 | | | | 101,731 | | | | 42,417 | | |
Custody and accounting expense | | | 21,379 | | | | 96,371 | | | | 227,704 | | | | 71,480 | | |
Directors fees | | | 6,208 | | | | 15,162 | | | | 51,699 | | | | 18,096 | | |
Miscellaneous expense | | | 19,201 | | | | 37,212 | | | | 103,680 | | | | 43,861 | | |
Interest expense | | | — | | | | — | | | | — | | | | 174 | | |
Total expenses | | | 2,344,546 | | | | 4,645,424 | | | | 15,329,140 | | | | 6,471,341 | | |
Net waived and reimbursed fees | | | (54,534 | ) | | | (93,267 | ) | | | (726,914 | ) | | | (1,286 | ) | |
Brokerage commission recapture | | | (46,007 | ) | | | (5,290 | ) | | | (17,315 | ) | | | (6,290 | ) | |
Net expenses | | | 2,244,005 | | | | 4,546,867 | | | | 14,584,911 | | | | 6,463,765 | | |
Net investment income | | | 714,352 | | | | 10,086,501 | | | | 26,581,357 | | | | 4,349,793 | | |
REALIZED AND UNREALIZED GAIN (LOSS): | |
Net realized gain (loss) on: | |
Investments | | | 8,854,041 | | | | 25,695,131 | | | | 39,963,165 | | | | 54,144,082 | | |
Foreign currency related transactions | | | — | | | | 2,005,117 | | | | 5,097,514 | | | | — | | |
Net realized gain | | | 8,854,041 | | | | 27,700,248 | | | | 45,060,679 | | | | 54,144,082 | | |
Net change in unrealized appreciation (depreciation) on: | |
Investments | | | 35,484,324 | | | | 45,384,160 | | | | 167,013,334 | | | | 23,478,691 | | |
Foreign currency related transactions | | | — | | | | 168,589 | | | | 918,998 | | | | — | | |
Net change in unrealized appreciation (depreciation) | | | 35,484,324 | | | | 45,552,749 | | | | 167,932,332 | | | | 23,478,691 | | |
Net realized and unrealized gain | | | 44,338,365 | | | | 73,252,997 | | | | 212,993,011 | | | | 77,622,773 | | |
Increase in net assets resulting from operations | | $ | 45,052,717 | | | $ | 83,339,498 | | | $ | 239,574,368 | | | $ | 81,972,566 | | |
| * Foreign taxes withheld | | $ | 6,979 | | | $ | 287,783 | | | $ | 683,244 | | | $ | — | | |
See Accompanying Notes to Financial Statements
45
STATEMENTS OF OPERATIONS FOR THE YEAR ENDED DECEMBER 31, 2016
| | | VY®
Oppenheimer
Global
Portfolio | | VY®
Pioneer
High Yield
Portfolio | | VY®
T. Rowe Price
Diversified Mid Cap
Growth
Portfolio | | VY®
T. Rowe Price
Growth Equity
Portfolio | |
INVESTMENT INCOME: | |
Dividends, net of foreign taxes withheld* | | $ | 24,682,548 | | | $ | 221,315 | | | $ | 8,679,744 | | | $ | 13,012,110 | | |
Interest | | | — | | | | 5,442,627 | | | | — | | | | — | | |
Securities lending income, net | | | 1,078,555 | | | | — | | | | 566,114 | | | | 932,803 | | |
Total investment income | | | 25,761,103 | | | | 5,663,942 | | | | 9,245,858 | | | | 13,944,913 | | |
EXPENSES: | |
Investment management fees | | | 9,899,508 | | | | 690,820 | | | | 6,136,610 | | | | 11,017,734 | | |
Distribution and shareholder service fees: | | | | | | | | | |
Class ADV | | | 487,016 | | | | — | | | | 241,740 | | | | 960,837 | | |
Class S | | | 473,879 | | | | 10,031 | | | | 99,126 | | | | 868,471 | | |
Class S2 | | | 15,302 | | | | — | | | | 17,675 | | | | 31,056 | | |
Transfer agent fees | | | 2,158 | | | | 486 | | | | 1,504 | | | | 2,927 | | |
Shareholder reporting expense | | | 137,630 | | | | 16,885 | | | | 68,555 | | | | 126,590 | | |
Professional fees | | | 112,557 | | | | 14,831 | | | | 49,290 | | | | 80,566 | | |
Custody and accounting expense | | | 319,168 | | | | 32,090 | | | | 99,035 | | | | 177,573 | | |
Directors fees | | | 42,426 | | | | 2,961 | | | | 24,880 | | | | 47,219 | | |
Miscellaneous expense | | | 89,977 | | | | 10,181 | | | | 53,965 | | | | 98,242 | | |
Interest expense | | | — | | | | — | | | | 178 | | | | 304 | | |
Total expenses | | | 11,579,621 | | | | 778,285 | | | | 6,792,558 | | | | 13,411,519 | | |
Net waived and reimbursed fees | | | (1,262 | ) | | | (65,632 | ) | | | (1,231 | ) | | | (93,687 | ) | |
Brokerage commission recapture | | | — | | | | (95 | ) | | | (1,051 | ) | | | (6,787 | ) | |
Net expenses | | | 11,578,359 | | | | 712,558 | | | | 6,790,276 | | | | 13,311,045 | | |
Net investment income | | | 14,182,744 | | | | 4,951,384 | | | | 2,455,582 | | | | 633,868 | | |
REALIZED AND UNREALIZED GAIN (LOSS): | |
Net realized gain (loss) on: | |
Investments | | | 8,968,376 | | | | (3,186,494 | ) | | | 67,926,268 | | | | 171,328,712 | | |
Foreign currency related transactions | | | 12,190 | | | | 47 | | | | — | | | | 4,675 | | |
Futures | | | — | | | | (122,214 | ) | | | — | | | | — | | |
Swaps | | | — | | | | 141,185 | | | | — | | | | — | | |
Net realized gain (loss) | | | 8,980,566 | | | | (3,167,476 | ) | | | 67,926,268 | | | | 171,333,387 | | |
Net change in unrealized appreciation (depreciation) on: | |
Investments | | | (31,437,876 | ) | | | 11,140,165 | | | | (11,910,223 | ) | | | (159,760,721 | ) | |
Foreign currency related transactions | | | (46,458 | ) | | | (62 | ) | | | — | | | | 1,965 | | |
Futures | | | — | | | | 52,947 | | | | — | | | | — | | |
Swaps | | | — | | | | 146,722 | | | | — | | | | — | | |
Unfunded commitments | | | — | | | | 5,514 | | | | — | | | | — | | |
Net change in unrealized appreciation (depreciation) | | | (31,484,334 | ) | | | 11,345,286 | | | | (11,910,223 | ) | | | (159,758,756 | ) | |
Net realized and unrealized gain (loss) | | | (22,503,768 | ) | | | 8,177,810 | | | | 56,016,045 | | | | 11,574,631 | | |
Increase (decrease) in net assets resulting
from operations | | $ | (8,321,024 | ) | | $ | 13,129,194 | | | $ | 58,471,627 | | | $ | 12,208,499 | | |
| * Foreign taxes withheld | | $ | 1,998,608 | | | $ | — | | | $ | 13,145 | | | $ | 34,719 | | |
See Accompanying Notes to Financial Statements
46
STATEMENTS OF OPERATIONS FOR THE YEAR ENDED DECEMBER 31, 2016
| | | VY®
Templeton
Foreign Equity
Portfolio | |
INVESTMENT INCOME: | |
Dividends, net of foreign taxes withheld* | | $ | 20,844,496 | | |
Interest | | | 32,607 | | |
Securities lending income, net | | | 455,193 | | |
Total investment income | | | 21,332,296 | | |
EXPENSES: | |
Investment management fees | | | 5,831,237 | | |
Distribution and shareholder service fees: | | | |
Class ADV | | | 164,373 | | |
Class S | | | 1,119,383 | | |
Class S2 | | | 10,331 | | |
Transfer agent fees | | | 1,483 | | |
Shareholder reporting expense | | | 69,880 | | |
Professional fees | | | 42,680 | | |
Custody and accounting expense | | | 247,260 | | |
Directors fees | | | 19,698 | | |
Miscellaneous expense | | | 80,615 | | |
Interest expense | | | 139 | | |
Total expenses | | | 7,587,079 | | |
Net waived and reimbursed fees | | | (315,922 | ) | |
Brokerage commission recapture | | | (5,596 | ) | |
Net expenses | | | 7,265,561 | | |
Net investment income | | | 14,066,735 | | |
REALIZED AND UNREALIZED GAIN (LOSS): | |
Net realized gain (loss) on: | |
Investments | | | (4,064,326 | ) | |
Foreign currency related transactions | | | (277,834 | ) | |
Net realized loss | | | (4,342,160 | ) | |
Net change in unrealized appreciation (depreciation) on: | |
Investments | | | (1,891,989 | ) | |
Foreign currency related transactions | | | 29,547 | | |
Net change in unrealized appreciation (depreciation) | | | (1,862,442 | ) | |
Net realized and unrealized loss | | | (6,204,602 | ) | |
Increase in net assets resulting from operations | | $ | 7,862,133 | | |
| * Foreign taxes withheld | | $ | 2,019,681 | | |
See Accompanying Notes to Financial Statements
47
STATEMENTS OF CHANGES IN NET ASSETS
| | | Voya Global Bond Portfolio | | VY® American Century Small-Mid
Cap Value Portfolio | |
| | | Year
Ended
December 31,
2016 | | Year
Ended
December 31,
2015 | | Year
Ended
December 31,
2016 | | Year
Ended
December 31,
2015 | |
FROM OPERATIONS: | |
Net investment income | | $ | 6,482,623 | | | $ | 7,920,236 | | | $ | 3,191,292 | | | $ | 3,038,304 | | |
Net realized gain (loss) | | | 4,514,745 | | | | (18,018,009 | ) | | | 12,678,670 | | | | 27,210,391 | | |
Net change in unrealized appreciation (depreciation) | | | 3,677,694 | | | | (1,710,632 | ) | | | 50,815,235 | | | | (35,602,203 | ) | |
Increase (decrease) in net assets resulting from operations | | | 14,675,062 | | | | (11,808,405 | ) | | | 66,685,197 | | | | (5,353,508 | ) | |
FROM DISTRIBUTIONS TO SHAREHOLDERS: | |
Net investment income: | |
Class ADV | | | (154,504 | ) | | | — | | | | (995,310 | ) | | | (1,133,028 | ) | |
Class I | | | (1,633,644 | ) | | | — | | | | (2,077,708 | ) | | | (2,364,293 | ) | |
Class S | | | (327,519 | ) | | | — | | | | (1,101,144 | ) | | | (1,308,701 | ) | |
Class S2 | | | — | | | | — | | | | (48,274 | ) | | | (43,628 | ) | |
Net realized gains: | |
Class ADV | | | — | | | | — | | | | (7,579,332 | ) | | | (16,172,736 | ) | |
Class I | | | — | | | | — | | | | (11,110,668 | ) | | | (23,979,645 | ) | |
Class S | | | — | | | | — | | | | (7,061,817 | ) | | | (15,919,521 | ) | |
Class S2 | | | — | | | | — | | | | (327,339 | ) | | | (639,323 | ) | |
Return of capital: | |
Class ADV | | | (200,037 | ) | | | — | | | | — | | | | — | | |
Class I | | | (1,312,446 | ) | | | — | | | | — | | | | — | | |
Class S | | | (322,210 | ) | | | — | | | | — | | | | — | | |
Total distributions | | | (3,950,360 | ) | | | — | | | | (30,301,592 | ) | | | (61,560,875 | ) | |
FROM CAPITAL SHARE TRANSACTIONS: | |
Net proceeds from sale of shares | | | 11,918,890 | | | | 7,497,148 | | | | 61,787,440 | | | | 24,872,268 | | |
Reinvestment of distributions | | | 3,950,360 | | | | — | | | | 30,301,592 | | | | 61,560,875 | | |
| | | | 15,869,250 | | | | 7,497,148 | | | | 92,089,032 | | | | 86,433,143 | | |
Cost of shares redeemed | | | (36,478,785 | ) | | | (49,345,165 | ) | | | (43,296,396 | ) | | | (64,589,400 | ) | |
Net increase (decrease) in net assets resulting from capital
share transactions | | | (20,609,535 | ) | | | (41,848,017 | ) | | | 48,792,636 | | | | 21,843,743 | | |
Net increase (decrease) in net assets | | | (9,884,833 | ) | | | (53,656,422 | ) | | | 85,176,241 | | | | (45,070,640 | ) | |
NET ASSETS: | |
Beginning of year or period | | | 238,281,921 | | | | 291,938,343 | | | | 277,399,022 | | | | 322,469,662 | | |
End of year or period | | $ | 228,397,088 | | | $ | 238,281,921 | | | $ | 362,575,263 | | | $ | 277,399,022 | | |
Undistributed net investment income/Accumulated net
investment loss at end of year or period | | $ | 2,763,579 | | | $ | (515,854 | ) | | $ | 4,001,439 | | | $ | 4,090,003 | | |
See Accompanying Notes to Financial Statements
48
STATEMENTS OF CHANGES IN NET ASSETS
| | | VY® Baron Growth Portfolio | | VY® Columbia Contrarian
Core Portfolio | |
| | | Year
Ended
December 31,
2016 | | Year
Ended
December 31,
2015 | | Year
Ended
December 31,
2016 | | Year
Ended
December 31,
2015 | |
FROM OPERATIONS: | |
Net investment income (loss) | | $ | (1,011,480 | ) | | $ | (2,534,878 | ) | | $ | 3,144,831 | | | $ | 2,635,954 | | |
Net realized gain | | | 85,923,156 | | | | 86,253,062 | | | | 18,523,482 | | | | 30,338,522 | | |
Net change in unrealized appreciation (depreciation) | | | (46,286,719 | ) | | | (129,335,880 | ) | | | 4,985,666 | | | | (22,240,552 | ) | |
Increase (decrease) in net assets resulting from operations | | | 38,624,957 | | | | (45,617,696 | ) | | | 26,653,979 | | | | 10,733,924 | | |
FROM DISTRIBUTIONS TO SHAREHOLDERS: | |
Net investment income: | |
Class ADV | | | — | | | | (51,188 | ) | | | (818,094 | ) | | | (146,230 | ) | |
Class I | | | — | | | | (1,281,940 | ) | | | (372,081 | ) | | | (120,209 | ) | |
Class S | | | — | | | | (1,817,615 | ) | | | (9,970,524 | ) | | | (2,665,751 | ) | |
Class S2 | | | — | | | | (10,839 | ) | | | — | | | | — | | |
Net realized gains: | |
Class ADV | | | (9,413,716 | ) | | | (7,956,319 | ) | | | (2,225,263 | ) | | | (2,307,141 | ) | |
Class I | | | (17,990,751 | ) | | | (16,920,166 | ) | | | (901,673 | ) | | | (1,206,112 | ) | |
Class R6 | | | (324 | ) | | | — | | | | — | | | | — | | |
Class S | | | (56,573,883 | ) | | | (47,874,375 | ) | | | (26,093,897 | ) | | | (35,019,245 | ) | |
Class S2 | | | (318,426 | ) | | | (484,995 | ) | | | — | | | | — | | |
Total distributions | | | (84,297,100 | ) | | | (76,397,437 | ) | | | (40,381,532 | ) | | | (41,464,688 | ) | |
FROM CAPITAL SHARE TRANSACTIONS: | |
Net proceeds from sale of shares | | | 24,054,643 | | | | 34,281,041 | | | | 16,806,433 | | | | 18,857,402 | | |
Reinvestment of distributions | | | 84,297,100 | | | | 76,397,437 | | | | 40,381,532 | | | | 41,464,688 | | |
| | | | 108,351,743 | | | | 110,678,478 | | | | 57,187,965 | | | | 60,322,090 | | |
Cost of shares redeemed | | | (202,292,467 | ) | | | (203,226,667 | ) | | | (55,253,278 | ) | | | (53,225,750 | ) | |
Net increase (decrease) in net assets resulting from capital
share transactions | | | (93,940,724 | ) | | | (92,548,189 | ) | | | 1,934,687 | | | | 7,096,340 | | |
Net decrease in net assets | | | (139,612,867 | ) | | | (214,563,322 | ) | | | (11,792,866 | ) | | | (23,634,424 | ) | |
NET ASSETS: | |
Beginning of year or period | | | 849,447,530 | | | | 1,064,010,852 | | | | 337,717,499 | | | | 361,351,923 | | |
End of year or period | | $ | 709,834,663 | | | $ | 849,447,530 | | | $ | 325,924,633 | | | $ | 337,717,499 | | |
Undistributed (distributions in excess of) net investment
income at end of year or period | | $ | 5,804,645 | | | $ | (17,659 | ) | | $ | 3,172,780 | | | $ | 11,151,533 | | |
See Accompanying Notes to Financial Statements
49
STATEMENTS OF CHANGES IN NET ASSETS
| | | VY® Columbia Small Cap
Value II Portfolio | | VY® Invesco Comstock Portfolio | |
| | | Year
Ended
December 31,
2016 | | Year
Ended
December 31,
2015 | | Year
Ended
December 31,
2016 | | Year
Ended
December 31,
2015 | |
FROM OPERATIONS: | |
Net investment income | | $ | 714,352 | | | $ | 603,137 | | | $ | 10,086,501 | | | $ | 7,954,276 | | |
Net realized gain | | | 8,854,041 | | | | 21,134,398 | | | | 27,700,248 | | | | 46,586,258 | | |
Net change in unrealized appreciation (depreciation) | | | 35,484,324 | | | | (28,061,517 | ) | | | 45,552,749 | | | | (89,907,596 | ) | |
Increase (decrease) in net assets resulting from operations | | | 45,052,717 | | | | (6,323,982 | ) | | | 83,339,498 | | | | (35,367,062 | ) | |
FROM DISTRIBUTIONS TO SHAREHOLDERS: | |
Net investment income: | |
Class ADV | | | (15,674 | ) | | | (75,657 | ) | | | (738,151 | ) | | | (775,483 | ) | |
Class I | | | (230,012 | ) | | | (281,364 | ) | | | (5,061,532 | ) | | | (5,351,730 | ) | |
Class R6 | | | (17 | ) | | | — | | | | — | | | | — | | |
Class S | | | (349,701 | ) | | | (483,770 | ) | | | (6,796,359 | ) | | | (7,603,995 | ) | |
Class S2 | | | (8,597 | ) | | | (21,449 | ) | | | — | | | | — | | |
Net realized gains: | |
Class ADV | | | (1,236,527 | ) | | | — | | | | — | | | | — | | |
Class I | | | (1,752,923 | ) | | | — | | | | — | | | | — | | |
Class R6 | | | (131 | ) | | | — | | | | — | | | | — | | |
Class S | | | (5,529,745 | ) | | | — | | | | — | | | | — | | |
Class S2 | | | (214,304 | ) | | | — | | | | — | | | | — | | |
Total distributions | | | (9,337,631 | ) | | | (862,240 | ) | | | (12,596,042 | ) | | | (13,731,208 | ) | |
FROM CAPITAL SHARE TRANSACTIONS: | |
Net proceeds from sale of shares | | | 29,420,526 | | | | 26,522,023 | | | | 34,781,203 | | | | 116,065,545 | | |
Reinvestment of distributions | | | 9,337,631 | | | | 862,240 | | | | 12,596,042 | | | | 13,731,208 | | |
| | | | 38,758,157 | | | | 27,384,263 | | | | 47,377,245 | | | | 129,796,753 | | |
Cost of shares redeemed | | | (47,448,223 | ) | | | (54,259,618 | ) | | | (133,465,225 | ) | | | (114,041,864 | ) | |
Net increase (decrease) in net assets resulting from capital
share transactions | | | (8,690,066 | ) | | | (26,875,355 | ) | | | (86,087,980 | ) | | | 15,754,889 | | |
Net increase (decrease) in net assets | | | 27,025,020 | | | | (34,061,577 | ) | | | (15,344,524 | ) | | | (33,343,381 | ) | |
NET ASSETS: | |
Beginning of year or period | | | 210,969,989 | | | | 245,031,566 | | | | 535,545,601 | | | | 568,888,982 | | |
End of year or period | | $ | 237,995,009 | | | $ | 210,969,989 | | | $ | 520,201,077 | | | $ | 535,545,601 | | |
Undistributed net investment income at end of year or period | | $ | 709,236 | | | $ | 598,885 | | | $ | 1,270,256 | | | $ | 988,549 | | |
See Accompanying Notes to Financial Statements
50
STATEMENTS OF CHANGES IN NET ASSETS
| | | VY® Invesco Equity and
Income Portfolio | | VY® JPMorgan Mid Cap
Value Portfolio | |
| | | Year
Ended
December 31,
2016 | | Year
Ended
December 31,
2015 | | Year
Ended
December 31,
2016 | | Year
Ended
December 31,
2015 | |
FROM OPERATIONS: | |
Net investment income | | $ | 26,581,357 | | | $ | 26,587,452 | | | $ | 4,349,793 | | | $ | 4,232,708 | | |
Net realized gain | | | 45,060,679 | | | | 82,939,387 | | | | 54,144,082 | | | | 55,658,161 | | |
Net change in unrealized appreciation (depreciation) | | | 167,932,332 | | | | (151,461,029 | ) | | | 23,478,691 | | | | (79,176,650 | ) | |
Increase (decrease) in net assets resulting from operations | | | 239,574,368 | | | | (41,934,190 | ) | | | 81,972,566 | | | | (19,285,781 | ) | |
FROM DISTRIBUTIONS TO SHAREHOLDERS: | |
Net investment income: | |
Class ADV | | | (750,644 | ) | | | (921,211 | ) | | | (421,565 | ) | | | (377,888 | ) | |
Class I | | | (11,647,011 | ) | | | (14,265,378 | ) | | | (1,897,621 | ) | | | (2,143,085 | ) | |
Class S | | | (11,792,935 | ) | | | (15,265,238 | ) | | | (1,880,544 | ) | | | (1,937,538 | ) | |
Class S2 | | | (7,227,173 | ) | | | (8,811,979 | ) | | | (21,210 | ) | | | (19,270 | ) | |
Net realized gains: | |
Class ADV | | | (2,032,873 | ) | | | (4,055,040 | ) | | | (8,688,677 | ) | | | (13,223,638 | ) | |
Class I | | | (24,684,765 | ) | | | (50,510,479 | ) | | | (19,904,144 | ) | | | (35,398,660 | ) | |
Class S | | | (29,280,225 | ) | | | (62,177,273 | ) | | | (26,505,473 | ) | | | (45,650,719 | ) | |
Class S2 | | | (18,543,168 | ) | | | (38,137,778 | ) | | | (391,432 | ) | | | (649,788 | ) | |
Total distributions | | | (105,958,794 | ) | | | (194,144,376 | ) | | | (59,710,666 | ) | | | (99,400,586 | ) | |
FROM CAPITAL SHARE TRANSACTIONS: | |
Net proceeds from sale of shares | | | 25,992,017 | | | | 29,358,738 | | | | 35,302,031 | | | | 49,706,246 | | |
Reinvestment of distributions | | | 105,958,794 | | | | 194,144,376 | | | | 59,710,666 | | | | 99,400,586 | | |
| | | | 131,950,811 | | | | 223,503,114 | | | | 95,012,697 | | | | 149,106,832 | | |
Cost of shares redeemed | | | (305,107,611 | ) | | | (333,647,596 | ) | | | (129,110,564 | ) | | | (131,017,273 | ) | |
Net increase (decrease) in net assets resulting from capital
share transactions | | | (173,156,800 | ) | | | (110,144,482 | ) | | | (34,097,867 | ) | | | 18,089,559 | | |
Net decrease in net assets | | | (39,541,226 | ) | | | (346,223,048 | ) | | | (11,835,967 | ) | | | (100,596,808 | ) | |
NET ASSETS: | |
Beginning of year or period | | | 1,813,087,382 | | | | 2,159,310,430 | | | | 621,265,521 | | | | 721,862,329 | | |
End of year or period | | $ | 1,773,546,156 | | | $ | 1,813,087,382 | | | $ | 609,429,554 | | | $ | 621,265,521 | | |
Undistributed net investment income at end of year or period | | $ | 4,391,247 | | | $ | 3,193,599 | | | $ | 178,023 | | | $ | 3,516 | | |
See Accompanying Notes to Financial Statements
51
STATEMENTS OF CHANGES IN NET ASSETS
| | | VY® Oppenheimer Global Portfolio | | VY® Pioneer High Yield Portfolio | |
| | | Year
Ended
December 31,
2016 | | Year
Ended
December 31,
2015 | | Year
Ended
December 31,
2016 | | Year
Ended
December 31,
2015 | |
FROM OPERATIONS: | |
Net investment income | | $ | 14,182,744 | | | $ | 16,352,683 | | | $ | 4,951,384 | | | $ | 5,671,305 | | |
Net realized gain (loss) | | | 8,980,566 | | | | 100,576,095 | | | | (3,167,476 | ) | | | (1,280,826 | ) | |
Net change in unrealized appreciation (depreciation) | | | (31,484,334 | ) | | | (50,455,539 | ) | | | 11,345,286 | | | | (8,783,327 | ) | |
Increase (decrease) in net assets resulting from operations | | | (8,321,024 | ) | | | 66,473,239 | | | | 13,129,194 | | | | (4,392,848 | ) | |
FROM DISTRIBUTIONS TO SHAREHOLDERS: | |
Net investment income: | |
Class ADV | | | (687,804 | ) | | | (1,084,846 | ) | | | — | | | | — | | |
Class I | | | (13,873,563 | ) | | | (19,318,309 | ) | | | (4,907,706 | ) | | | (5,539,616 | ) | |
Class S | | | (1,776,290 | ) | | | (3,033,566 | ) | | | (197,859 | ) | | | (210,519 | ) | |
Class S2 | | | (25,099 | ) | | | (54,499 | ) | | | — | | | | — | | |
Net realized gains: | |
Class ADV | | | (6,897,082 | ) | | | (8,315,481 | ) | | | — | | | | — | | |
Class I | | | (77,745,290 | ) | | | (100,091,139 | ) | | | — | | | | — | | |
Class S | | | (13,294,926 | ) | | | (18,803,314 | ) | | | — | | | | — | | |
Class S2 | | | (242,723 | ) | | | (376,490 | ) | | | — | | | | — | | |
Total distributions | | | (114,542,777 | ) | | | (151,077,644 | ) | | | (5,105,565 | ) | | | (5,750,135 | ) | |
FROM CAPITAL SHARE TRANSACTIONS: | |
Net proceeds from sale of shares | | | 24,311,860 | | | | 94,529,991 | | | | 18,508,506 | | | | 12,634,324 | | |
Reinvestment of distributions | | | 114,542,777 | | | | 151,077,644 | | | | 5,105,565 | | | | 5,750,135 | | |
| | | | 138,854,637 | | | | 245,607,635 | | | | 23,614,071 | | | | 18,384,459 | | |
Cost of shares redeemed | | | (256,622,666 | ) | | | (202,359,715 | ) | | | (23,137,395 | ) | | | (34,934,776 | ) | |
Net increase (decrease) in net assets resulting from capital
share transactions | | | (117,768,029 | ) | | | 43,247,920 | | | | 476,676 | | | | (16,550,317 | ) | |
Net increase (decrease) in net assets | | | (240,631,830 | ) | | | (41,356,485 | ) | | | 8,500,305 | | | | (26,693,300 | ) | |
NET ASSETS: | |
Beginning of year or period | | | 1,600,601,593 | | | | 1,641,958,078 | | | | 95,335,411 | | | | 122,028,711 | | |
End of year or period | | $ | 1,359,969,763 | | | $ | 1,600,601,593 | | | $ | 103,835,716 | | | $ | 95,335,411 | | |
Undistributed net investment income at end of year or period | | $ | 16,291,321 | | | $ | 16,309,516 | | | $ | 3,364,553 | | | $ | 3,208,204 | | |
See Accompanying Notes to Financial Statements
52
STATEMENTS OF CHANGES IN NET ASSETS
| | | VY® T. Rowe Price Diversified
Mid Cap Growth Portfolio | | VY® T. Rowe Price Growth
Equity Portfolio | |
| | | Year
Ended
December 31,
2016 | | Year
Ended
December 31,
2015 | | Year
Ended
December 31,
2016 | | Year
Ended
December 31,
2015 | |
FROM OPERATIONS: | |
Net investment income (loss) | | $ | 2,455,582 | | | $ | 1,205,957 | | | $ | 633,868 | | | $ | (2,574,018 | ) | |
Net realized gain | | | 67,926,268 | | | | 99,490,810 | | | | 171,333,387 | | | | 184,078,366 | | |
Net change in unrealized appreciation (depreciation) | | | (11,910,223 | ) | | | (83,377,794 | ) | | | (159,758,756 | ) | | | (19,214,776 | ) | |
Increase in net assets resulting from operations | | | 58,471,627 | | | | 17,318,973 | | | | 12,208,499 | | | | 162,289,572 | | |
FROM DISTRIBUTIONS TO SHAREHOLDERS: | |
Net investment income: | |
Class ADV | | | (13,696 | ) | | | — | | | | — | | | | — | | |
Class I | | | (2,294,727 | ) | | | — | | | | — | | | | — | | |
Class R6 | | | (9 | ) | | | — | | | | — | | | | — | | |
Class S | | | (27,759 | ) | | | — | | | | — | | | | — | | |
Net realized gains: | |
Class ADV | | | (6,387,707 | ) | | | (4,928,655 | ) | | | (23,966,449 | ) | | | (28,240,157 | ) | |
Class I | | | (88,659,304 | ) | | | (119,999,747 | ) | | | (119,705,351 | ) | | | (150,611,865 | ) | |
Class R6 | | | (366 | ) | | | — | | | | — | | | | — | | |
Class S | | | (3,940,284 | ) | | | (4,330,538 | ) | | | (39,520,831 | ) | | | (60,500,345 | ) | |
Class S2 | | | (541,416 | ) | | | (689,460 | ) | | | (1,051,248 | ) | | | (740,378 | ) | |
Total distributions | | | (101,865,268 | ) | | | (129,948,400 | ) | | | (184,243,879 | ) | | | (240,092,745 | ) | |
FROM CAPITAL SHARE TRANSACTIONS: | |
Net proceeds from sale of shares | | | 43,577,227 | | | | 38,636,631 | | | | 112,814,677 | | | | 285,115,923 | | |
Proceeds from shares issued in merger (Note 13) | | | 29,183,887 | | | | — | | | | — | | | | — | | |
Reinvestment of distributions | | | 101,865,268 | | | | 129,948,400 | | | | 184,243,879 | | | | 240,092,745 | | |
| | | | 174,626,382 | | | | 168,585,031 | | | | 297,058,556 | | | | 525,208,668 | | |
Cost of shares redeemed | | | (111,164,436 | ) | | | (87,954,330 | ) | | | (356,518,739 | ) | | | (262,660,670 | ) | |
Net increase (decrease) in net assets resulting from capital
share transactions | | | 63,461,946 | | | | 80,630,701 | | | | (59,460,183 | ) | | | 262,547,998 | | |
Net increase (decrease) in net assets | | | 20,068,305 | | | | (31,998,726 | ) | | | (231,495,563 | ) | | | 184,744,825 | | |
NET ASSETS: | |
Beginning of year or period | | | 828,517,174 | | | | 860,515,900 | | | | 1,759,274,646 | | | | 1,574,529,821 | | |
End of year or period | | $ | 848,585,479 | | | $ | 828,517,174 | | | $ | 1,527,779,083 | | | $ | 1,759,274,646 | | |
Undistributed net investment income/Accumulated
net investment loss at end of year or period | | $ | 5,589,834 | | | $ | 2,304,604 | | | $ | 527,655 | | | $ | (32,269 | ) | |
See Accompanying Notes to Financial Statements
53
STATEMENTS OF CHANGES IN NET ASSETS
| | | VY® Templeton Foreign
Equity Portfolio | |
| | | Year
Ended
December 31,
2016 | | Year
Ended
December 31,
2015 | |
FROM OPERATIONS: | |
Net investment income | | $ | 14,066,735 | | | $ | 17,113,370 | | |
Net realized gain (loss) | | | (4,342,160 | ) | | | 28,451,749 | | |
Net change in unrealized appreciation (depreciation) | | | (1,862,442 | ) | | | (68,773,168 | ) | |
Increase (decrease) in net assets resulting from operations | | | 7,862,133 | | | | (23,208,049 | ) | |
FROM DISTRIBUTIONS TO SHAREHOLDERS: | |
Net investment income: | |
Class ADV | | | (947,058 | ) | | | (1,326,137 | ) | |
Class I | | | (6,016,205 | ) | | | (8,274,865 | ) | |
Class S | | | (14,104,724 | ) | | | (19,973,007 | ) | |
Class S2 | | | (76,613 | ) | | | (83,426 | ) | |
Total distributions | | | (21,144,600 | ) | | | (29,657,435 | ) | |
FROM CAPITAL SHARE TRANSACTIONS: | |
Net proceeds from sale of shares | | | 26,656,215 | | | | 27,587,391 | | |
Reinvestment of distributions | | | 21,144,600 | | | | 29,657,435 | | |
| | | | 47,800,815 | | | | 57,244,826 | | |
Cost of shares redeemed | | | (129,326,350 | ) | | | (124,914,543 | ) | |
Net decrease in net assets resulting from capital share transactions | | | (81,525,535 | ) | | | (67,669,717 | ) | |
Net decrease in net assets | | | (94,808,002 | ) | | | (120,535,201 | ) | |
NET ASSETS: | |
Beginning of year or period | | | 722,686,540 | | | | 843,221,741 | | |
End of year or period | | $ | 627,878,538 | | | $ | 722,686,540 | | |
Undistributed net investment income at end of year or period | | $ | 11,585,457 | | | $ | 21,744,257 | | |
See Accompanying Notes to Financial Statements
54
Selected data for a share of beneficial interest outstanding throughout each year or period.
| | | | | Income (loss)
from investment
operations | | | | Less distributions | |
| | | Net asset value, beginning of year or period | | Net investment income (loss) | | Net realized and unrealized gain (loss) | | Total from investment operations | | From net investment income | | From net realized gains | | From return of capital | |
Year or period ended | | ($) | | ($) | | ($) | | ($) | | ($) | | ($) | | ($) | |
Voya Global Bond Portfolio | | | |
Class ADV | | | |
12-31-16 | | | 9.81 | | | | 0.24 | • | | | 0.33 | | | | 0.57 | | | | 0.06 | | | | — | | | | 0.08 | | |
12-31-15 | | | 10.31 | | | | 0.26 | • | | | (0.76 | ) | | | (0.50 | ) | | | — | | | | — | | | | — | | |
12-31-14 | | | 10.35 | | | | 0.37 | • | | | (0.37 | ) | | | 0.00 | * | | | 0.04 | | | | — | | | | — | | |
12-31-13 | | | 11.35 | | | | 0.33 | • | | | (0.85 | ) | | | (0.52 | ) | | | 0.19 | | | | 0.29 | | | | — | | |
12-31-12 | | | 11.22 | | | | 0.41 | • | | | 0.39 | | | | 0.80 | | | | 0.67 | | | | — | | | | — | | |
Class I | | | |
12-31-16 | | | 9.97 | | | | 0.30 | • | | | 0.33 | | | | 0.63 | | | | 0.10 | | | | — | | | | 0.08 | | |
12-31-15 | | | 10.42 | | | | 0.32 | • | | | (0.77 | ) | | | (0.45 | ) | | | — | | | | — | | | | — | | |
12-31-14 | | | 10.46 | | | | 0.43 | • | | | (0.38 | ) | | | 0.05 | | | | 0.09 | | | | — | | | | — | | |
12-31-13 | | | 11.46 | | | | 0.40 | • | | | (0.87 | ) | | | (0.47 | ) | | | 0.24 | | | | 0.29 | | | | — | | |
12-31-12 | | | 11.32 | | | | 0.47 | • | | | 0.40 | | | | 0.87 | | | | 0.73 | | | | — | | | | — | | |
Class S | | | |
12-31-16 | | | 9.97 | | | | 0.27 | | | | 0.33 | | | | 0.60 | | | | 0.08 | | | | — | | | | 0.08 | | |
12-31-15 | | | 10.44 | | | | 0.29 | • | | | (0.76 | ) | | | (0.47 | ) | | | — | | | | — | | | | — | | |
12-31-14 | | | 10.48 | | | | 0.40 | • | | | (0.38 | ) | | | 0.02 | | | | 0.06 | | | | — | | | | — | | |
12-31-13 | | | 11.48 | | | | 0.37 | • | | | (0.87 | ) | | | (0.50 | ) | | | 0.21 | | | | 0.29 | | | | — | | |
12-31-12 | | | 11.33 | | | | 0.47 | • | | | 0.37 | | | | 0.84 | | | | 0.69 | | | | — | | | | — | | |
| VY® American Century Small-Mid Cap Value Portfolio | | | |
Class ADV | | | |
12-31-16 | | | 10.80 | | | | 0.08 | | | | 2.34 | | | | 2.42 | | | | 0.14 | | | | 1.05 | | | | — | | |
12-31-15 | | | 13.82 | | | | 0.08 | | | | (0.27 | ) | | | (0.19 | ) | | | 0.19 | | | | 2.64 | | | | — | | |
12-31-14 | | | 14.79 | | | | 0.12 | • | | | 1.49 | | | | 1.61 | | | | 0.18 | | | | 2.40 | | | | — | | |
12-31-13 | | | 11.76 | | | | 0.12 | • | | | 3.49 | | | | 3.61 | | | | 0.14 | | | | 0.44 | | | | — | | |
12-31-12 | | | 11.08 | | | | 0.18 | • | | | 1.53 | | | | 1.71 | | | | 0.12 | | | | 0.91 | | | | — | | |
Class I | | | |
12-31-16 | | | 11.35 | | | | 0.15 | • | | | 2.47 | | | | 2.62 | | | | 0.20 | | | | 1.05 | | | | — | | |
12-31-15 | | | 14.40 | | | | 0.16 | • | | | (0.31 | ) | | | (0.15 | ) | | | 0.26 | | | | 2.64 | | | | — | | |
12-31-14 | | | 15.30 | | | | 0.20 | • | | | 1.55 | | | | 1.75 | | | | 0.25 | | | | 2.40 | | | | — | | |
12-31-13 | | | 12.12 | | | | 0.19 | • | | | 3.61 | | | | 3.80 | | | | 0.18 | | | | 0.44 | | | | — | | |
12-31-12 | | | 11.38 | | | | 0.24 | • | | | 1.58 | | | | 1.82 | | | | 0.17 | | | | 0.91 | | | | — | | |
Class S | | | |
12-31-16 | | | 11.22 | | | | 0.11 | | | | 2.44 | | | | 2.55 | | | | 0.16 | | | | 1.05 | | | | — | | |
12-31-15 | | | 14.25 | | | | 0.13 | • | | | (0.30 | ) | | | (0.17 | ) | | | 0.22 | | | | 2.64 | | | | — | | |
12-31-14 | | | 15.16 | | | | 0.16 | • | | | 1.54 | | | | 1.70 | | | | 0.21 | | | | 2.40 | | | | — | | |
12-31-13 | | | 12.03 | | | | 0.15 | • | | | 3.57 | | | | 3.72 | | | | 0.15 | | | | 0.44 | | | | — | | |
12-31-12 | | | 11.30 | | | | 0.19 | | | | 1.59 | | | | 1.78 | | | | 0.14 | | | | 0.91 | | | | — | | |
Class S2 | | | |
12-31-16 | | | 10.78 | | | | 0.09 | | | | 2.35 | | | | 2.44 | | | | 0.16 | | | | 1.05 | | | | — | | |
12-31-15 | | | 13.79 | | | | 0.11 | • | | | (0.30 | ) | | | (0.19 | ) | | | 0.18 | | | | 2.64 | | | | — | | |
12-31-14 | | | 14.70 | | | | 0.13 | • | | | 1.49 | | | | 1.62 | | | | 0.13 | | | | 2.40 | | | | — | | |
12-31-13 | | | 11.70 | | | | 0.13 | • | | | 3.46 | | | | 3.59 | | | | 0.15 | | | | 0.44 | | | | — | | |
12-31-12 | | | 11.03 | | | | 0.19 | • | | | 1.53 | | | | 1.72 | | | | 0.14 | | | | 0.91 | | | | — | | |
| VY® Baron Growth Portfolio | | | |
Class ADV | | | |
12-31-16 | | | 26.58 | | | | (0.11 | ) | | | 1.50 | | | | 1.39 | | | | — | | | | 3.15 | | | | — | | |
12-31-15 | | | 30.35 | | | | (0.16 | ) | | | (1.23 | ) | | | (1.39 | ) | | | 0.02 | | | | 2.36 | | | | — | | |
12-31-14 | | | 29.66 | | | | (0.01 | ) | | | 1.17 | | | | 1.16 | | | | — | | | | 0.47 | | | | — | | |
12-31-13 | | | 22.53 | | | | (0.04 | )• | | | 8.55 | | | | 8.51 | | | | 0.32 | | | | 1.06 | | | | — | | |
12-31-12 | | | 18.87 | | | | 0.30 | • | | | 3.36 | | | | 3.66 | | | | — | | | | — | | | | — | | |
| | | | | Ratios to average net assets | | Supplemental
data | |
| | | Total distributions | | Payment by affiliate | | Net asset value, end of year or period | | Total Return(1) | | Expenses before reductions/additions(2)(3)(4) | | Expenses net of fee waivers and/or recoupments if any(2)(3)(4) | | Expense net of all reductions/additions(2)(3)(4) | | Net investment income (loss)(2)(3) | | Net assets, end of year or period | | Portfolio turnover rate | |
Year or period ended | | ($) | | ($) | | ($) | | (%) | | (%) | | (%) | | (%) | | (%) | | ($000's) | | (%) | |
Voya Global Bond Portfolio | |
Class ADV | |
12-31-16 | | | 0.14 | | | | — | | | | 10.24 | | | | 5.82 | | | | 1.16 | | | | 1.10 | | | | 1.10 | | | | 2.27 | | | | 24,365 | | | | 214 | | |
12-31-15 | | | — | | | | — | | | | 9.81 | | | | (4.85 | ) | | | 1.15 | | | | 1.10 | | | | 1.10 | | | | 2.58 | | | | 26,374 | | | | 335 | | |
12-31-14 | | | 0.04 | | | | — | | | | 10.31 | | | | (0.06 | ) | | | 1.16 | | | | 1.10 | | | | 1.10 | | | | 3.49 | | | | 32,874 | | | | 296 | | |
12-31-13 | | | 0.48 | | | | — | | | | 10.35 | | | | (4.50 | ) | | | 1.19 | | | | 1.08 | | | | 1.08 | | | | 3.09 | | | | 34,155 | | | | 394 | | |
12-31-12 | | | 0.67 | | | | — | | | | 11.35 | | | | 7.36 | | | | 1.18 | | | | 1.02 | | | | 1.02 | | | | 3.61 | | | | 34,927 | | | | 487 | | |
Class I | |
12-31-16 | | | 0.18 | | | | — | | | | 10.42 | | | | 6.30 | | | | 0.66 | | | | 0.60 | | | | 0.60 | | | | 2.78 | | | | 163,397 | | | | 214 | | |
12-31-15 | | | — | | | | — | | | | 9.97 | | | | (4.32 | ) | | | 0.65 | | | | 0.60 | | | | 0.60 | | | | 3.08 | | | | 168,739 | | | | 335 | | |
12-31-14 | | | 0.09 | | | | — | | | | 10.42 | | | | 0.42 | | | | 0.66 | | | | 0.60 | | | | 0.60 | | | | 3.99 | | | | 208,023 | | | | 296 | | |
12-31-13 | | | 0.53 | | | | — | | | | 10.46 | | | | (4.00 | ) | | | 0.69 | | | | 0.58 | | | | 0.58 | | | | 3.65 | | | | 237,646 | | | | 394 | | |
12-31-12 | | | 0.73 | | | | — | | | | 11.46 | | | | 7.91 | | | | 0.68 | | | | 0.52 | | | | 0.52 | | | | 4.09 | | | | 309,348 | | | | 487 | | |
Class S | |
12-31-16 | | | 0.16 | | | | — | | | | 10.41 | | | | 6.03 | | | | 0.91 | | | | 0.85 | | | | 0.85 | | | | 2.53 | | | | 40,635 | | | | 214 | | |
12-31-15 | | | — | | | | — | | | | 9.97 | | | | (4.50 | ) | | | 0.90 | | | | 0.85 | | | | 0.85 | | | | 2.83 | | | | 43,169 | | | | 335 | | |
12-31-14 | | | 0.06 | | | | — | | | | 10.44 | | | | 0.15 | | | | 0.91 | | | | 0.85 | | | | 0.85 | | | | 3.74 | | | | 51,041 | | | | 296 | | |
12-31-13 | | | 0.50 | | | | — | | | | 10.48 | | | | (4.28 | ) | | | 0.94 | | | | 0.83 | | | | 0.83 | | | | 3.39 | | | | 54,246 | | | | 394 | | |
12-31-12 | | | 0.69 | | | | — | | | | 11.48 | | | | 7.65 | | | | 0.93 | | | | 0.77 | | | | 0.77 | | | | 4.05 | | | | 66,533 | | | | 487 | | |
| VY® American Century Small-Mid Cap Value Portfolio | |
Class ADV | |
12-31-16 | | | 1.19 | | | | — | | | | 12.03 | | | | 23.69 | | | | 1.65 | | | | 1.36 | | | | 1.36 | | | | 0.78 | | | | 101,948 | | | | 68 | | |
12-31-15 | | | 2.83 | | | | — | | | | 10.80 | | | | (1.97 | ) | | | 1.66 | | | | 1.36 | | | | 1.36 | | | | 0.72 | | | | 79,901 | | | | 71 | | |
12-31-14 | | | 2.58 | | | | — | | | | 13.82 | | | | 12.15 | | | | 1.65 | | | | 1.36 | | | | 1.36 | | | | 0.82 | | | | 86,335 | | | | 79 | | |
12-31-13 | | | 0.58 | | | | — | | | | 14.79 | | | | 31.12 | | | | 1.66 | | | | 1.42 | | | | 1.42 | | | | 0.88 | | | | 95,563 | | | | 84 | | |
12-31-12 | | | 1.03 | | | | — | | | | 11.76 | | | | 16.07 | | | | 1.70 | | | | 1.43 | | | | 1.43 | | | | 1.55 | | | | 56,202 | | | | 95 | | |
Class I | |
12-31-16 | | | 1.25 | | | | — | | | | 12.72 | | | | 24.38 | | | | 1.15 | | | | 0.86 | | | | 0.86 | | | | 1.28 | | | | 156,657 | | | | 68 | | |
12-31-15 | | | 2.90 | | | | — | | | | 11.35 | | | | (1.54 | ) | | | 1.16 | | | | 0.86 | | | | 0.86 | | | | 1.21 | | | | 115,279 | | | | 71 | | |
12-31-14 | | | 2.65 | | | | — | | | | 14.40 | | | | 12.76 | | | | 1.15 | | | | 0.86 | | | | 0.86 | | | | 1.31 | | | | 138,605 | | | | 79 | | |
12-31-13 | | | 0.62 | | | | — | | | | 15.30 | | | | 31.78 | | | | 1.16 | | | | 0.92 | | | | 0.92 | | | | 1.38 | | | | 171,086 | | | | 84 | | |
12-31-12 | | | 1.08 | | | | — | | | | 12.12 | | | | 16.59 | | | | 1.20 | | | | 0.93 | | | | 0.93 | | | | 2.05 | | | | 116,175 | | | | 95 | | |
Class S | |
12-31-16 | | | 1.21 | | | | — | | | | 12.56 | | | | 24.06 | | | | 1.40 | | | | 1.11 | | | | 1.11 | | | | 1.03 | | | | 99,089 | | | | 68 | | |
12-31-15 | | | 2.86 | | | | — | | | | 11.22 | | | | (1.74 | ) | | | 1.41 | | | | 1.11 | | | | 1.11 | | | | 0.96 | | | | 78,646 | | | | 71 | | |
12-31-14 | | | 2.61 | | | | — | | | | 14.25 | | | | 12.47 | | | | 1.40 | | | | 1.11 | | | | 1.11 | | | | 1.06 | | | | 94,268 | | | | 79 | | |
12-31-13 | | | 0.59 | | | | — | | | | 15.16 | | | | 31.36 | | | | 1.41 | | | | 1.17 | | | | 1.17 | | | | 1.12 | | | | 116,117 | | | | 84 | | |
12-31-12 | | | 1.05 | | | | — | | | | 12.03 | | | | 16.35 | | | | 1.45 | | | | 1.18 | | | | 1.18 | | | | 1.76 | | | | 84,475 | | | | 95 | | |
Class S2 | |
12-31-16 | | | 1.21 | | | | — | | | | 12.01 | | | | 23.92 | | | | 1.58 | | | | 1.26 | | | | 1.26 | | | | 0.90 | | | | 4,881 | | | | 68 | | |
12-31-15 | | | 2.82 | | | | — | | | | 10.78 | | | | (1.91 | ) | | | 1.66 | | | | 1.26 | | | | 1.26 | | | | 0.85 | | | | 3,573 | | | | 71 | | |
12-31-14 | | | 2.53 | | | | — | | | | 13.79 | | | | 12.33 | | | | 1.65 | | | | 1.26 | | | | 1.26 | | | | 0.89 | | | | 3,262 | | | | 79 | | |
12-31-13 | | | 0.59 | | | | — | | | | 14.70 | | | | 31.15 | | | | 1.66 | | | | 1.32 | | | | 1.32 | | | | 0.98 | | | | 6,560 | | | | 84 | | |
12-31-12 | | | 1.05 | | | | — | | | | 11.70 | | | | 16.24 | | | | 1.70 | | | | 1.33 | | | | 1.33 | | | | 1.68 | | | | 3,205 | | | | 95 | | |
| VY® Baron Growth Portfolio | |
Class ADV | |
12-31-16 | | | 3.15 | | | | — | | | | 24.82 | | | | 5.06 | | | | 1.48 | | | | 1.48 | | | | 1.48 | | | | (0.41 | ) | | | 77,655 | | | | 4 | | |
12-31-15 | | | 2.38 | | | | — | | | | 26.58 | | | | (5.27 | ) | | | 1.49 | | | | 1.49 | | | | 1.49 | | | | (0.54 | ) | | | 90,914 | | | | 5 | | |
12-31-14 | | | 0.47 | | | | — | | | | 30.35 | | | | 4.06 | | | | 1.48 | | | | 1.48 | | | | 1.48 | | | | (0.04 | ) | | | 111,145 | | | | 10 | | |
12-31-13 | | | 1.38 | | | | — | | | | 29.66 | | | | 38.50 | | | | 1.49 | | | | 1.49 | | | | 1.49 | | | | (0.15 | ) | | | 110,486 | | | | 8 | | |
12-31-12 | | | — | | | | — | | | | 22.53 | | | | 19.40 | | | | 1.52 | | | | 1.52 | | | | 1.52 | | | | 1.45 | | | | 61,428 | | | | 15 | | |
See Accompanying Notes to Financial Statements
55
FINANCIAL HIGHLIGHTS (CONTINUED)
Selected data for a share of beneficial interest outstanding throughout each year or period.
| | | | | Income (loss)
from investment
operations | | | | Less distributions | |
| | | Net asset value, beginning of year or period | | Net investment income (loss) | | Net realized and unrealized gain (loss) | | Total from investment operations | | From net investment income | | From net realized gains | | From return of capital | |
Year or period ended | | ($) | | ($) | | ($) | | ($) | | ($) | | ($) | | ($) | |
| VY® Baron Growth Portfolio (continued) | | | |
Class I | | | |
12-31-16 | | | 28.45 | | | | 0.04 | | | | 1.58 | | | | 1.62 | | | | — | | | | 3.15 | | | | — | | |
12-31-15 | | | 32.31 | | | | (0.01 | ) | | | (1.31 | ) | | | (1.32 | ) | | | 0.18 | | | | 2.36 | | | | — | | |
12-31-14 | | | 31.49 | | | | 0.14 | | | | 1.24 | | | | 1.38 | | | | 0.09 | | | | 0.47 | | | | — | | |
12-31-13 | | | 23.80 | | | | 0.10 | • | | | 9.06 | | | | 9.16 | | | | 0.41 | | | | 1.06 | | | | — | | |
12-31-12 | | | 19.84 | | | | 0.43 | • | | | 3.53 | | | | 3.96 | | | | — | | | | — | | | | — | | |
Class R6 | | | |
| 05-03-16(5)-12-31-16 | | | 28.86 | | | | 0.23 | • | | | 0.99 | | | | 1.22 | | | | — | | | | 3.15 | | | | — | | |
Class S | | | |
12-31-16 | | | 27.57 | | | | (0.05 | ) | | | 1.56 | | | | 1.51 | | | | — | | | | 3.15 | | | | — | | |
12-31-15 | | | 31.39 | | | | (0.08 | ) | | | (1.29 | ) | | | (1.37 | ) | | | 0.09 | | | | 2.36 | | | | — | | |
12-31-14 | | | 30.60 | | | | 0.09 | | | | 1.19 | | | | 1.28 | | | | 0.02 | | | | 0.47 | | | | — | | |
12-31-13 | | | 23.18 | | | | 0.01 | | | | 8.83 | | | | 8.84 | | | | 0.36 | | | | 1.06 | | | | — | | |
12-31-12 | | | 19.37 | | | | 0.35 | • | | | 3.46 | | | | 3.81 | | | | — | | | | — | | | | — | | |
Class S2 | | | |
12-31-16 | | | 26.65 | | | | (0.10 | )• | | | 1.52 | | | | 1.42 | | | | — | | | | 3.15 | | | | — | | |
12-31-15 | | | 30.43 | | | | (0.13 | ) | | | (1.24 | ) | | | (1.37 | ) | | | 0.05 | | | | 2.36 | | | | — | | |
12-31-14 | | | 29.75 | | | | 0.02 | | | | 1.17 | | | | 1.19 | | | | 0.04 | | | | 0.47 | | | | — | | |
12-31-13 | | | 22.62 | | | | (0.03 | )• | | | 8.61 | | | | 8.58 | | | | 0.39 | | | | 1.06 | | | | — | | |
12-31-12 | | | 18.93 | | | | 0.36 | • | | | 3.33 | | | | 3.69 | | | | — | | | | — | | | | — | | |
| VY® Columbia Contrarian Core Portfolio | | | |
Class ADV | | | |
12-31-16 | | | 21.73 | | | | 0.15 | • | | | 1.55 | | | | 1.70 | | | | 0.74 | | | | 2.03 | | | | — | | |
12-31-15 | | | 24.00 | | | | 0.12 | • | | | 0.58 | | | | 0.70 | | | | 0.18 | | | | 2.79 | | | | — | | |
12-31-14 | | | 24.56 | | | | 0.14 | • | | | 2.70 | | | | 2.84 | | | | 0.17 | | | | 3.23 | | | | — | | |
12-31-13 | | | 18.49 | | | | 0.11 | | | | 6.23 | | | | 6.34 | | | | 0.27 | | | | — | | | | — | | |
12-31-12 | | | 16.53 | | | | 0.15 | | | | 1.83 | | | | 1.98 | | | | 0.02 | | | | — | | | | — | | |
Class I | | | |
12-31-16 | | | 22.59 | | | | 0.27 | • | | | 1.62 | | | | 1.89 | | | | 0.84 | | | | 2.03 | | | | — | | |
12-31-15 | | | 24.82 | | | | 0.24 | • | | | 0.60 | | | | 0.84 | | | | 0.28 | | | | 2.79 | | | | — | | |
12-31-14 | | | 25.24 | | | | 0.27 | | | | 2.79 | | | | 3.06 | | | | 0.25 | | | | 3.23 | | | | — | | |
12-31-13 | | | 18.96 | | | | 0.18 | • | | | 6.45 | | | | 6.63 | | | | 0.35 | | | | — | | | | — | | |
12-31-12 | | | 16.94 | | | | 0.25 | • | | | 1.87 | | | | 2.12 | | | | 0.10 | | | | — | | | | — | | |
Class S | | | |
12-31-16 | | | 22.21 | | | | 0.21 | • | | | 1.59 | | | | 1.80 | | | | 0.77 | | | | 2.03 | | | | — | | |
12-31-15 | | | 24.45 | | | | 0.18 | • | | | 0.58 | | | | 0.76 | | | | 0.21 | | | | 2.79 | | | | — | | |
12-31-14 | | | 24.93 | | | | 0.21 | | | | 2.75 | | | | 2.96 | | | | 0.21 | | | | 3.23 | | | | — | | |
12-31-13 | | | 18.75 | | | | 0.18 | • | | | 6.30 | | | | 6.48 | | | | 0.30 | | | | — | | | | — | | |
12-31-12 | | | 16.75 | | | | 0.20 | • | | | 1.85 | | | | 2.05 | | | | 0.05 | | | | — | | | | — | | |
| VY® Columbia Small Cap Value II Portfolio | | | |
Class ADV | | | |
12-31-16 | | | 15.67 | | | | 0.01 | | | | 3.55 | | | | 3.56 | | | | 0.01 | | | | 0.72 | | | | — | | |
12-31-15 | | | 16.23 | | | | 0.00 | * | | | (0.52 | ) | | | (0.52 | ) | | | 0.04 | | | | — | | | | — | | |
12-31-14 | | | 15.63 | | | | 0.03 | • | | | 0.61 | | | | 0.64 | | | | 0.04 | | | | — | | | | — | | |
12-31-13 | | | 11.28 | | | | 0.01 | • | | | 4.44 | | | | 4.45 | | | | 0.10 | | | | — | | | | — | | |
12-31-12 | | | 9.92 | | | | 0.06 | | | | 1.33 | | | | 1.39 | | | | 0.03 | | | | — | | | | — | | |
Class I | | | |
12-31-16 | | | 16.12 | | | | 0.10 | | | | 3.64 | | | | 3.74 | | | | 0.09 | | | | 0.72 | | | | — | | |
12-31-15 | | | 16.67 | | | | 0.09 | | | | (0.54 | ) | | | (0.45 | ) | | | 0.10 | | | | — | | | | — | | |
12-31-14 | | | 15.99 | | | | 0.11 | • | | | 0.63 | | | | 0.74 | | | | 0.06 | | | | — | | | | — | | |
12-31-13 | | | 11.51 | | | | 0.08 | • | | | 4.54 | | | | 4.62 | | | | 0.14 | | | | — | | | | — | | |
12-31-12 | | | 10.10 | | | | 0.12 | • | | | 1.35 | | | | 1.47 | | | | 0.06 | | | | — | | | | — | | |
| | | | | Ratios to average net assets | | Supplemental
data | |
| | | Total distributions | | Payment by affiliate | | Net asset value, end of year or period | | Total Return(1) | | Expenses before reductions/additions(2)(3)(4) | | Expenses net of fee waivers and/or recoupments if any(2)(3)(4) | | Expense net of all reductions/additions(2)(3)(4) | | Net investment income (loss)(2)(3) | | Net assets, end of year or period | | Portfolio turnover rate | |
Year or period ended | | ($) | | ($) | | ($) | | (%) | | (%) | | (%) | | (%) | | (%) | | ($000's) | | (%) | |
| VY® Baron Growth Portfolio (continued) | |
Class I | |
12-31-16 | | | 3.15 | | | | — | | | | 26.92 | | | | 5.57 | | | | 0.98 | | | | 0.98 | | | | 0.98 | | | | 0.12 | | | | 150,672 | | | | 4 | | |
12-31-15 | | | 2.54 | | | | — | | | | 28.45 | | | | (4.75 | ) | | | 0.99 | | | | 0.99 | | | | 0.99 | | | | (0.04 | ) | | | 193,601 | | | | 5 | | |
12-31-14 | | | 0.56 | | | | — | | | | 32.31 | | | | 4.55 | | | | 0.98 | | | | 0.98 | | | | 0.98 | | | | 0.45 | | | | 251,230 | | | | 10 | | |
12-31-13 | | | 1.47 | | | | — | | | | 31.49 | | | | 39.23 | | | | 0.99 | | | | 0.99 | | | | 0.99 | | | | 0.36 | | | | 270,788 | | | | 8 | | |
12-31-12 | | | — | | | | — | | | | 23.80 | | | | 19.96 | | | | 1.02 | | | | 1.02 | | | | 1.02 | | | | 1.95 | | | | 169,708 | | | | 15 | | |
Class R6 | |
| 05-03-16(5)-12-31-16 | | | 3.15 | | | | — | | | | 26.93 | | | | 4.10 | | | | 0.98 | | | | 0.98 | | | | 0.98 | | | | 1.39 | | | | 879 | | | | 4 | | |
Class S | |
12-31-16 | | | 3.15 | | | | — | | | | 25.93 | | | | 5.33 | | | | 1.23 | | | | 1.23 | | | | 1.23 | | | | (0.17 | ) | | | 478,020 | | | | 4 | | |
12-31-15 | | | 2.45 | | | | — | | | | 27.57 | | | | (5.03 | ) | | | 1.24 | | | | 1.24 | | | | 1.24 | | | | (0.29 | ) | | | 559,237 | | | | 5 | | |
12-31-14 | | | 0.49 | | | | — | | | | 31.39 | | | | 4.34 | | | | 1.23 | | | | 1.23 | | | | 1.23 | | | | 0.26 | | | | 694,762 | | | | 10 | | |
12-31-13 | | | 1.42 | | | | — | | | | 30.60 | | | | 38.85 | | | | 1.24 | | | | 1.24 | | | | 1.24 | | | | 0.09 | | | | 798,221 | | | | 8 | | |
12-31-12 | | | — | | | | — | | | | 23.18 | | | | 19.67 | | | | 1.27 | | | | 1.27 | | | | 1.27 | | | | 1.65 | | | | 551,582 | | | | 15 | | |
Class S2 | |
12-31-16 | | | 3.15 | | | | — | | | | 24.92 | | | | 5.17 | | | | 1.42 | | | | 1.38 | | | | 1.38 | | | | (0.38 | ) | | | 2,609 | | | | 4 | | |
12-31-15 | | | 2.41 | | | | — | | | | 26.65 | | | | (5.17 | ) | | | 1.49 | | | | 1.39 | | | | 1.39 | | | | (0.44 | ) | | | 5,696 | | | | 5 | | |
12-31-14 | | | 0.51 | | | | — | | | | 30.43 | | | | 4.17 | | | | 1.48 | | | | 1.38 | | | | 1.38 | | | | 0.05 | | | | 6,874 | | | | 10 | | |
12-31-13 | | | 1.45 | | | | — | | | | 29.75 | | | | 38.68 | | | | 1.49 | | | | 1.39 | | | | 1.39 | | | | (0.11 | ) | | | 6,312 | | | | 8 | | |
12-31-12 | | | — | | | | — | | | | 22.62 | | | | 19.49 | | | | 1.52 | | | | 1.42 | | | | 1.42 | | | | 1.70 | | | | 1,427 | | | | 15 | | |
| VY® Columbia Contrarian Core Portfolio | |
Class ADV | |
12-31-16 | | | 2.77 | | | | — | | | | 20.66 | | | | 8.12 | | | | 1.44 | | | | 1.20 | | | | 1.19 | | | | 0.71 | | | | 25,432 | | | | 53 | | |
12-31-15 | | | 2.97 | | | | — | | | | 21.73 | | | | 2.75 | | | | 1.44 | | | | 1.18 | | | | 1.17 | | | | 0.51 | | | | 22,738 | | | | 65 | | |
12-31-14 | | | 3.40 | | | | — | | | | 24.00 | | | | 12.50 | | | | 1.44 | | | | 1.18 | | | | 1.17 | | | | 0.56 | | | | 17,942 | | | | 72 | | |
12-31-13 | | | 0.27 | | | | — | | | | 24.56 | | | | 34.42 | | | | 1.46 | | | | 1.24 | | | | 1.23 | | | | 0.55 | | | | 15,554 | | | | 128 | | |
12-31-12 | | | 0.02 | | | | — | | | | 18.49 | | | | 11.99 | | | | 1.44 | | | | 1.25 | | | | 1.25 | | | | 0.86 | | | | 10,347 | | | | 20 | | |
Class I | |
12-31-16 | | | 2.87 | | | | — | | | | 21.61 | | | | 8.64 | | | | 0.94 | | | | 0.70 | | | | 0.69 | | | | 1.21 | | | | 10,629 | | | | 53 | | |
12-31-15 | | | 3.07 | | | | — | | | | 22.59 | | | | 3.25 | | | | 0.94 | | | | 0.68 | | | | 0.67 | | | | 1.01 | | | | 10,628 | | | | 65 | | |
12-31-14 | | | 3.48 | | | | — | | | | 24.82 | | | | 13.09 | | | | 0.94 | | | | 0.68 | | | | 0.67 | | | | 1.07 | | | | 11,751 | | | | 72 | | |
12-31-13 | | | 0.35 | | | | — | | | | 25.24 | | | | 35.18 | | | | 0.96 | | | | 0.74 | | | | 0.72 | | | | 0.87 | | | | 10,991 | | | | 128 | | |
12-31-12 | | | 0.10 | | | | — | | | | 18.96 | | | | 12.56 | | | | 0.94 | | | | 0.75 | | | | 0.75 | | | | 1.37 | | | | 92,694 | | | | 20 | | |
Class S | |
12-31-16 | | | 2.80 | | | | — | | | | 21.21 | | | | 8.41 | | | | 1.19 | | | | 0.95 | | | | 0.94 | | | | 0.96 | | | | 289,864 | | | | 53 | | |
12-31-15 | | | 3.00 | | | | — | | | | 22.21 | | | | 2.98 | | | | 1.19 | | | | 0.93 | | | | 0.92 | | | | 0.76 | | | | 304,352 | | | | 65 | | |
12-31-14 | | | 3.44 | | | | — | | | | 24.45 | | | | 12.81 | | | | 1.19 | | | | 0.93 | | | | 0.92 | | | | 0.82 | | | | 331,659 | | | | 72 | | |
12-31-13 | | | 0.30 | | | | — | | | | 24.93 | | | | 34.74 | | | | 1.21 | | | | 0.99 | | | | 0.98 | | | | 0.80 | | | | 327,459 | | | | 128 | | |
12-31-12 | | | 0.05 | | | | — | | | | 18.75 | | | | 12.27 | | | | 1.19 | | | | 1.00 | | | | 1.00 | | | | 1.09 | | | | 272,420 | | | | 20 | | |
| VY® Columbia Small Cap Value II Portfolio | |
Class ADV | |
12-31-16 | | | 0.73 | | | | — | | | | 18.50 | | | | 23.41 | | | | 1.39 | | | | 1.36 | | | | 1.34 | | | | 0.10 | | | | 36,304 | | | | 61 | | |
12-31-15 | | | 0.04 | | | | — | | | | 15.67 | | | | (3.21 | ) | | | 1.39 | | | | 1.36 | | | | 1.35 | | | | 0.00 | * | | | 27,978 | | | | 53 | | |
12-31-14 | | | 0.04 | | | | — | | | | 16.23 | | | | 4.12 | | | | 1.39 | | | | 1.36 | | | | 1.35 | | | | 0.18 | | | | 30,927 | | | | 52 | | |
12-31-13 | | | 0.10 | | | | — | | | | 15.63 | | | | 39.58 | | | | 1.38 | | | | 1.36 | | | | 1.36 | | | | 0.10 | | | | 12,246 | | | | 39 | | |
12-31-12 | | | 0.03 | | | | — | | | | 11.28 | | | | 14.01 | | | | 1.39 | | | | 1.39 | | | | 1.37 | | | | 0.69 | | | | 6,763 | | | | 44 | | |
Class I | |
12-31-16 | | | 0.81 | | | | — | | | | 19.05 | | | | 24.00 | | | | 0.89 | | | | 0.86 | | | | 0.84 | | | | 0.59 | | | | 49,625 | | | | 61 | | |
12-31-15 | | | 0.10 | | | | — | | | | 16.12 | | | | (2.74 | ) | | | 0.89 | | | | 0.86 | | | | 0.85 | | | | 0.50 | | | | 42,845 | | | | 53 | | |
12-31-14 | | | 0.06 | | | | — | | | | 16.67 | | | | 4.68 | | | | 0.89 | | | | 0.86 | | | | 0.85 | | | | 0.67 | | | | 49,412 | | | | 52 | | |
12-31-13 | | | 0.14 | | | | — | | | | 15.99 | | | | 40.27 | | | | 0.88 | | | | 0.86 | | | | 0.86 | | | | 0.60 | | | | 23,620 | | | | 39 | | |
12-31-12 | | | 0.06 | | | | — | | | | 11.51 | | | | 14.56 | | | | 0.89 | | | | 0.89 | | | | 0.87 | | | | 1.14 | | | | 16,180 | | | | 44 | | |
See Accompanying Notes to Financial Statements
56
FINANCIAL HIGHLIGHTS (CONTINUED)
Selected data for a share of beneficial interest outstanding throughout each year or period.
| | | | | Income (loss)
from investment
operations | | | | Less distributions | |
| | | Net asset value, beginning of year or period | | Net investment income (loss) | | Net realized and unrealized gain (loss) | | Total from investment operations | | From net investment income | | From net realized gains | | From return of capital | |
Year or period ended | | ($) | | ($) | | ($) | | ($) | | ($) | | ($) | | ($) | |
| VY® Columbia Small Cap Value II Portfolio (continued) | | | |
Class R6 | | | |
| 05-03-16(5)-12-31-16 | | | 16.28 | | | | 0.19 | • | | | 3.40 | | | | 3.59 | | | | 0.09 | | | | 0.72 | | | | — | | |
Class S | | | |
12-31-16 | | | 16.04 | | | | 0.06 | | | | 3.63 | | | | 3.69 | | | | 0.05 | | | | 0.72 | | | | — | | |
12-31-15 | | | 16.58 | | | | 0.05 | | | | (0.54 | ) | | | (0.49 | ) | | | 0.05 | | | | — | | | | — | | |
12-31-14 | | | 15.92 | | | | 0.06 | | | | 0.63 | | | | 0.69 | | | | 0.03 | | | | — | | | | — | | |
12-31-13 | | | 11.46 | | | | 0.05 | • | | | 4.52 | | | | 4.57 | | | | 0.11 | | | | — | | | | — | | |
12-31-12 | | | 10.06 | | | | 0.10 | • | | | 1.33 | | | | 1.43 | | | | 0.03 | | | | — | | | | — | | |
Class S2 | | | |
12-31-16 | | | 15.62 | | | | 0.03 | | | | 3.54 | | | | 3.57 | | | | 0.03 | | | | 0.72 | | | | — | | |
12-31-15 | | | 16.20 | | | | 0.02 | • | | | (0.53 | ) | | | (0.51 | ) | | | 0.07 | | | | — | | | | — | | |
12-31-14 | | | 15.59 | | | | 0.05 | • | | | 0.61 | | | | 0.66 | | | | 0.05 | | | | — | | | | — | | |
12-31-13 | | | 11.24 | | | | 0.02 | | | | 4.43 | | | | 4.45 | | | | 0.10 | | | | — | | | | — | | |
12-31-12 | | | 9.90 | | | | 0.07 | | | | 1.32 | | | | 1.39 | | | | 0.05 | | | | — | | | | — | | |
| VY® Invesco Comstock Portfolio | | | |
Class ADV | | | |
12-31-16 | | | 15.07 | | | | 0.28 | | | | 2.35 | | | | 2.63 | | | | 0.37 | | | | — | | | | — | | |
12-31-15 | | | 16.42 | | | | 0.17 | • | | | (1.18 | ) | | | (1.01 | ) | | | 0.34 | | | | — | | | | — | | |
12-31-14 | | | 15.34 | | | | 0.19 | | | | 1.17 | | | | 1.36 | | | | 0.28 | | | | — | | | | — | | |
12-31-13 | | | 11.44 | | | | 0.11 | | | | 3.87 | | | | 3.98 | | | | 0.08 | | | | — | | | | — | | |
12-31-12 | | | 9.77 | | | | 0.13 | | | | 1.66 | | | | 1.79 | | | | 0.12 | | | | — | | | | — | | |
Class I | | | |
12-31-16 | | | 15.18 | | | | 0.34 | • | | | 2.41 | | | | 2.75 | | | | 0.46 | | | | — | | | | — | | |
12-31-15 | | | 16.55 | | | | 0.26 | • | | | (1.20 | ) | | | (0.94 | ) | | | 0.43 | | | | — | | | | — | | |
12-31-14 | | | 15.45 | | | | 0.28 | | | | 1.17 | | | | 1.45 | | | | 0.35 | | | | — | | | | — | | |
12-31-13 | | | 11.51 | | | | 0.19 | | | | 3.89 | | | | 4.08 | | | | 0.14 | | | | — | | | | — | | |
12-31-12 | | | 9.83 | | | | 0.19 | • | | | 1.66 | | | | 1.85 | | | | 0.17 | | | | — | | | | — | | |
Class S | | | |
12-31-16 | | | 15.17 | | | | 0.30 | • | | | 2.39 | | | | 2.69 | | | | 0.41 | | | | — | | | | — | | |
12-31-15 | | | 16.53 | | | | 0.22 | • | | | (1.20 | ) | | | (0.98 | ) | | | 0.38 | | | | — | | | | — | | |
12-31-14 | | | 15.43 | | | | 0.24 | | | | 1.17 | | | | 1.41 | | | | 0.31 | | | | — | | | | — | | |
12-31-13 | | | 11.51 | | | | 0.15 | | | | 3.88 | | | | 4.03 | | | | 0.11 | | | | — | | | | — | | |
12-31-12 | | | 9.82 | | | | 0.16 | • | | | 1.67 | | | | 1.83 | | | | 0.14 | | | | — | | | | — | | |
| VY® Invesco Equity and Income Portfolio | | | |
Class ADV | | | |
12-31-16 | | | 40.80 | | | | 0.53 | | | | 5.28 | | | | 5.81 | | | | 0.68 | | | | 1.87 | | | | — | | |
12-31-15 | | | 46.25 | | | | 0.46 | | | | (1.47 | ) | | | (1.01 | ) | | | 0.79 | | | | 3.65 | | | | — | | |
12-31-14 | | | 44.34 | | | | 0.61 | • | | | 3.09 | | | | 3.70 | | | | 0.55 | | | | 1.24 | | | | — | | |
12-31-13 | | | 36.01 | | | | 0.49 | • | | | 8.27 | | | | 8.76 | | | | 0.43 | | | | — | | | | — | | |
12-31-12 | | | 32.57 | | | | 0.53 | • | | | 3.45 | | | | 3.98 | | | | 0.54 | | | | — | | | | — | | |
Class I | | | |
12-31-16 | | | 41.47 | | | | 0.74 | • | | | 5.41 | | | | 6.15 | | | | 0.89 | | | | 1.87 | | | | — | | |
12-31-15 | | | 46.93 | | | | 0.70 | • | | | (1.50 | ) | | | (0.80 | ) | | | 1.01 | | | | 3.65 | | | | — | | |
12-31-14 | | | 44.92 | | | | 0.87 | • | | | 3.11 | | | | 3.98 | | | | 0.73 | | | | 1.24 | | | | — | | |
12-31-13 | | | 36.43 | | | | 0.71 | • | | | 8.38 | | | | 9.09 | | | | 0.60 | | | | — | | | | — | | |
12-31-12 | | | 33.05 | | | | 0.71 | • | | | 3.51 | | | | 4.22 | | | | 0.84 | | | | — | | | | — | | |
Class S | | | |
12-31-16 | | | 41.14 | | | | 0.62 | • | | | 5.37 | | | | 5.99 | | | | 0.78 | | | | 1.87 | | | | — | | |
12-31-15 | | | 46.59 | | | | 0.58 | • | | | (1.49 | ) | | | (0.91 | ) | | | 0.89 | | | | 3.65 | | | | — | | |
12-31-14 | | | 44.65 | | | | 0.64 | • | | | 3.20 | | | | 3.84 | | | | 0.66 | | | | 1.24 | | | | — | | |
12-31-13 | | | 36.23 | | | | 0.60 | • | | | 8.32 | | | | 8.92 | | | | 0.50 | | | | — | | | | — | | |
12-31-12 | | | 32.81 | | | | 0.62 | • | | | 3.48 | | | | 4.10 | | | | 0.68 | | | | — | | | | — | | |
| | | | | Ratios to average net assets | | Supplemental
data | |
| | | Total distributions | | Payment by affiliate | | Net asset value, end of year or period | | Total Return(1) | | Expenses before reductions/additions(2)(3)(4) | | Expenses net of fee waivers and/or recoupments if any(2)(3)(4) | | Expense net of all reductions/additions(2)(3)(4) | | Net investment income (loss)(2)(3) | | Net assets, end of year or period | | Portfolio turnover rate | |
Year or period ended | | ($) | | ($) | | ($) | | (%) | | (%) | | (%) | | (%) | | (%) | | ($000's) | | (%) | |
| VY® Columbia Small Cap Value II Portfolio (continued) | |
Class R6 | |
| 05-03-16(5)-12-31-16 | | | 0.81 | | | | — | | | | 19.06 | | | | 22.85 | | | | 0.89 | | | | 0.86 | | | | 0.84 | | | | 1.57 | | | | 402 | | | | 61 | | |
Class S | |
12-31-16 | | | 0.77 | | | | — | | | | 18.96 | | | | 23.70 | | | | 1.14 | | | | 1.11 | | | | 1.09 | | | | 0.33 | | | | 145,816 | | | | 61 | | |
12-31-15 | | | 0.05 | | | | — | | | | 16.04 | | | | (2.95 | ) | | | 1.14 | | | | 1.11 | | | | 1.10 | | | | 0.24 | | | | 135,313 | | | | 53 | | |
12-31-14 | | | 0.03 | | | | — | | | | 16.58 | | | | 4.33 | | | | 1.14 | | | | 1.11 | | | | 1.10 | | | | 0.36 | | | | 160,726 | | | | 52 | | |
12-31-13 | | | 0.11 | | | | — | | | | 15.92 | | | | 39.97 | | | | 1.13 | | | | 1.11 | | | | 1.11 | | | | 0.34 | | | | 161,750 | | | | 39 | | |
12-31-12 | | | 0.03 | | | | — | | | | 11.46 | | | | 14.20 | | | | 1.14 | | | | 1.14 | | | | 1.12 | | | | 0.88 | | | | 135,653 | | | | 44 | | |
Class S2 | |
12-31-16 | | | 0.75 | | | | — | | | | 18.44 | | | | 23.57 | | | | 1.32 | | | | 1.26 | | | | 1.24 | | | | 0.18 | | | | 5,849 | | | | 61 | | |
12-31-15 | | | 0.07 | | | | — | | | | 15.62 | | | | (3.19 | ) | | | 1.39 | | | | 1.26 | | | | 1.25 | | | | 0.12 | | | | 4,834 | | | | 53 | | |
12-31-14 | | | 0.05 | | | | — | | | | 16.20 | | | | 4.28 | | | | 1.39 | | | | 1.26 | | | | 1.25 | | | | 0.30 | | | | 3,967 | | | | 52 | | |
12-31-13 | | | 0.10 | | | | — | | | | 15.59 | | | | 39.68 | | | | 1.38 | | | | 1.26 | | | | 1.26 | | | | 0.19 | | | | 978 | | | | 39 | | |
12-31-12 | | | 0.05 | | | | — | | | | 11.24 | | | | 14.07 | | | | 1.39 | | | | 1.29 | | | | 1.27 | | | | 0.76 | | | | 604 | | | | 44 | | |
| VY® Invesco Comstock Portfolio | |
Class ADV | |
12-31-16 | | | 0.37 | | | | — | | | | 17.33 | | | | 17.51 | | | | 1.25 | | | | 1.23 | | | | 1.23 | | | | 1.66 | | | | 34,490 | | | | 18 | | |
12-31-15 | | | 0.34 | | | | — | | | | 15.07 | | | | (6.19 | ) | | | 1.24 | | | | 1.22 | | | | 1.22 | | | | 1.08 | | | | 34,395 | | | | 24 | | |
12-31-14 | | | 0.28 | | | | — | | | | 16.42 | | | | 8.82 | | | | 1.24 | | | | 1.22 | | | | 1.22 | | | | 1.20 | | | | 41,258 | | | | 26 | | |
12-31-13 | | | 0.08 | | | | — | | | | 15.34 | | | | 34.79 | | | | 1.24 | | | | 1.24 | | | | 1.24 | | | | 0.87 | | | | 36,783 | | | | 15 | | |
12-31-12 | | | 0.12 | | | | — | | | | 11.44 | | | | 18.30 | | | | 1.28 | | | | 1.27 | | | | 1.26 | | | | 1.25 | | | | 22,633 | | | | 18 | | |
Class I | |
12-31-16 | | | 0.46 | | | | — | | | | 17.47 | | | | 18.13 | | | | 0.75 | | | | 0.73 | | | | 0.73 | | | | 2.16 | | | | 194,504 | | | | 18 | | |
12-31-15 | | | 0.43 | | | | — | | | | 15.18 | | | | (5.76 | ) | | | 0.74 | | | | 0.72 | | | | 0.72 | | | | 1.62 | | | | 198,367 | | | | 24 | | |
12-31-14 | | | 0.35 | | | | — | | | | 16.55 | | | | 9.39 | | | | 0.74 | | | | 0.72 | | | | 0.72 | | | | 1.70 | | | | 143,633 | | | | 26 | | |
12-31-13 | | | 0.14 | | | | — | | | | 15.45 | | | | 35.47 | | | | 0.74 | | | | 0.74 | | | | 0.74 | | | | 1.38 | | | | 58,373 | | | | 15 | | |
12-31-12 | | | 0.17 | | | | — | | | | 11.51 | | | | 18.83 | | | | 0.78 | | | | 0.77 | | | | 0.76 | | | | 1.74 | | | | 48,793 | | | | 18 | | |
Class S | |
12-31-16 | | | 0.41 | | | | — | | | | 17.45 | | | | 17.79 | | | | 1.00 | | | | 0.98 | | | | 0.98 | | | | 1.91 | | | | 291,208 | | | | 18 | | |
12-31-15 | | | 0.38 | | | | — | | | | 15.17 | | | | (5.97 | ) | | | 0.99 | | | | 0.97 | | | | 0.97 | | | | 1.33 | | | | 302,784 | | | | 24 | | |
12-31-14 | | | 0.31 | | | | — | | | | 16.53 | | | | 9.13 | | | | 0.99 | | | | 0.97 | | | | 0.97 | | | | 1.44 | | | | 383,997 | | | | 26 | | |
12-31-13 | | | 0.11 | | | | — | | | | 15.43 | | | | 35.00 | | | | 0.99 | | | | 0.99 | | | | 0.99 | | | | 1.13 | | | | 367,659 | | | | 15 | | |
12-31-12 | | | 0.14 | | | | — | | | | 11.51 | | | | 18.66 | | | | 1.03 | | | | 1.02 | | | | 1.01 | | | | 1.49 | | | | 259,717 | | | | 18 | | |
| VY® Invesco Equity and Income Portfolio | |
Class ADV | |
12-31-16 | | | 2.55 | | | | — | | | | 44.06 | | | | 14.69 | | | | 1.17 | | | | 1.14 | | | | 1.14 | | | | 1.24 | | | | 49,628 | | | | 134 | | |
12-31-15 | | | 4.44 | | | | — | | | | 40.80 | | | | (2.55 | ) | | | 1.16 | | | | 1.14 | | | | 1.14 | | | | 1.04 | | | | 49,572 | | | | 140 | | |
12-31-14 | | | 1.79 | | | | — | | | | 46.25 | | | | 8.43 | | | | 1.16 | | | | 1.14 | | | | 1.14 | | | | 1.34 | | | | 52,407 | | | | 157 | | |
12-31-13 | | | 0.43 | | | | — | | | | 44.34 | | | | 24.33 | | | | 1.18 | | | | 1.15 | | | | 1.15 | | | | 1.19 | | | | 32,942 | | | | 37 | | |
12-31-12 | | | 0.54 | | | | — | | | | 36.01 | | | | 12.23 | | | | 1.18 | | | | 1.15 | | | | 1.15 | | | | 1.52 | | | | 19,776 | | | | 27 | | |
Class I | |
12-31-16 | | | 2.76 | | | | — | | | | 44.86 | | | | 15.28 | | | | 0.67 | | | | 0.64 | | | | 0.64 | | | | 1.74 | | | | 594,456 | | | | 134 | | |
12-31-15 | | | 4.66 | | | | — | | | | 41.47 | | | | (2.06 | ) | | | 0.66 | | | | 0.64 | | | | 0.64 | | | | 1.53 | | | | 600,309 | | | | 140 | | |
12-31-14 | | | 1.97 | | | | — | | | | 46.93 | | | | 8.96 | | | | 0.66 | | | | 0.64 | | | | 0.64 | | | | 1.87 | | | | 694,569 | | | | 157 | | |
12-31-13 | | | 0.60 | | | | — | | | | 44.92 | | | | 24.96 | | | | 0.68 | | | | 0.65 | | | | 0.65 | | | | 1.70 | | | | 561,393 | | | | 37 | | |
12-31-12 | | | 0.84 | | | | — | | | | 36.43 | | | | 12.79 | | | | 0.68 | | | | 0.65 | | | | 0.65 | | | | 2.01 | | | | 499,847 | | | | 27 | | |
Class S | |
12-31-16 | | | 2.65 | | | | — | | | | 44.48 | | | | 15.00 | | | | 0.92 | | | | 0.89 | | | | 0.89 | | | | 1.49 | | | | 682,465 | | | | 134 | | |
12-31-15 | | | 4.54 | | | | — | | | | 41.14 | | | | (2.31 | ) | | | 0.91 | | | | 0.89 | | | | 0.89 | | | | 1.28 | | | | 720,086 | | | | 140 | | |
12-31-14 | | | 1.90 | | | | — | | | | 46.59 | | | | 8.69 | | | | 0.91 | | | | 0.89 | | | | 0.89 | | | | 1.39 | | | | 889,726 | | | | 157 | | |
12-31-13 | | | 0.50 | | | | — | | | | 44.65 | | | | 24.64 | | | | 0.93 | | | | 0.90 | | | | 0.90 | | | | 1.45 | | | | 271,953 | | | | 37 | | |
12-31-12 | | | 0.68 | | | | — | | | | 36.23 | | | | 12.52 | | | | 0.93 | | | | 0.90 | | | | 0.90 | | | | 1.76 | | | | 198,595 | | | | 27 | | |
See Accompanying Notes to Financial Statements
57
FINANCIAL HIGHLIGHTS (CONTINUED)
Selected data for a share of beneficial interest outstanding throughout each year or period.
| | | | | Income (loss)
from investment
operations | | | | Less distributions | |
| | | Net asset value, beginning of year or period | | Net investment income (loss) | | Net realized and unrealized gain (loss) | | Total from investment operations | | From net investment income | | From net realized gains | | From return of capital | |
Year or period ended | | ($) | | ($) | | ($) | | ($) | | ($) | | ($) | | ($) | |
| VY® Invesco Equity and Income Portfolio (continued) | | | |
Class S2 | | | |
12-31-16 | | | 40.60 | | | | 0.56 | • | | | 5.28 | | | | 5.84 | | | | 0.72 | | | | 1.87 | | | | — | | |
12-31-15 | | | 46.03 | | | | 0.51 | • | | | (1.46 | ) | | | (0.95 | ) | | | 0.83 | | | | 3.65 | | | | — | | |
12-31-14 | | | 44.13 | | | | 0.43 | • | | | 3.29 | | | | 3.72 | | | | 0.58 | | | | 1.24 | | | | — | | |
12-31-13 | | | 35.87 | | | | 0.54 | • | | | 8.24 | | | | 8.78 | | | | 0.52 | | | | — | | | | — | | |
12-31-12 | | | 32.52 | | | | 0.56 | • | | | 3.45 | | | | 4.01 | | | | 0.66 | | | | — | | | | — | | |
| VY® JPMorgan Mid Cap Value Portfolio | | | |
Class ADV | | | |
12-31-16 | | | 18.66 | | | | 0.08 | | | | 2.50 | | | | 2.58 | | | | 0.08 | | | | 1.85 | | | | — | | |
12-31-15 | | | 22.47 | | | | 0.06 | | | | (0.63 | ) | | | (0.57 | ) | | | 0.08 | | | | 3.16 | | | | — | | |
12-31-14 | | | 20.96 | | | | 0.11 | | | | 2.84 | | | | 2.95 | | | | 0.14 | | | | 1.30 | | | | — | | |
12-31-13 | | | 16.57 | | | | 0.06 | | | | 5.07 | | | | 5.13 | | | | 0.08 | | | | 0.66 | | | | — | | |
12-31-12 | | | 13.91 | | | | 0.09 | | | | 2.65 | | | | 2.74 | | | | 0.08 | | | | — | | | | — | | |
Class I | | | |
12-31-16 | | | 19.04 | | | | 0.18 | | | | 2.56 | | | | 2.74 | | | | 0.18 | | | | 1.85 | | | | — | | |
12-31-15 | | | 22.85 | | | | 0.17 | | | | (0.64 | ) | | | (0.47 | ) | | | 0.18 | | | | 3.16 | | | | — | | |
12-31-14 | | | 21.27 | | | | 0.23 | | | | 2.89 | | | | 3.12 | | | | 0.24 | | | | 1.30 | | | | — | | |
12-31-13 | | | 16.79 | | | | 0.16 | | | | 5.14 | | | | 5.30 | | | | 0.16 | | | | 0.66 | | | | — | | |
12-31-12 | | | 14.08 | | | | 0.17 | | | | 2.69 | | | | 2.86 | | | | 0.15 | | | | — | | | | — | | |
Class S | | | |
12-31-16 | | | 18.89 | | | | 0.13 | | | | 2.54 | | | | 2.67 | | | | 0.13 | | | | 1.85 | | | | — | | |
12-31-15 | | | 22.70 | | | | 0.12 | | | | (0.65 | ) | | | (0.53 | ) | | | 0.12 | | | | 3.16 | | | | — | | |
12-31-14 | | | 21.14 | | | | 0.18 | | | | 2.86 | | | | 3.04 | | | | 0.18 | | | | 1.30 | | | | — | | |
12-31-13 | | | 16.70 | | | | 0.11 | | | | 5.11 | | | | 5.22 | | | | 0.12 | | | | 0.66 | | | | — | | |
12-31-12 | | | 14.01 | | | | 0.13 | | | | 2.67 | | | | 2.80 | | | | 0.11 | | | | — | | | | — | | |
Class S2 | | | |
12-31-16 | | | 18.60 | | | | 0.10 | | | | 2.50 | | | | 2.60 | | | | 0.10 | | | | 1.85 | | | | — | | |
12-31-15 | | | 22.40 | | | | 0.08 | • | | | (0.63 | ) | | | (0.55 | ) | | | 0.09 | | | | 3.16 | | | | — | | |
12-31-14 | | | 20.89 | | | | 0.13 | | | | 2.84 | | | | 2.97 | | | | 0.16 | | | | 1.30 | | | | — | | |
12-31-13 | | | 16.52 | | | | 0.10 | • | | | 5.03 | | | | 5.13 | | | | 0.10 | | | | 0.66 | | | | — | | |
12-31-12 | | | 13.88 | | | | 0.14 | • | | | 2.62 | | | | 2.76 | | | | 0.12 | | | | — | | | | — | | |
| VY® Oppenheimer Global Portfolio | | | |
Class ADV | | | |
12-31-16 | | | 17.30 | | | | 0.09 | • | | | (0.17 | ) | | | (0.08 | ) | | | 0.12 | | | | 1.20 | | | | — | | |
12-31-15 | | | 18.21 | | | | 0.08 | | | | 0.69 | | | | 0.77 | | | | 0.19 | | | | 1.49 | | | | — | | |
12-31-14 | | | 18.28 | | | | 0.15 | | | | 0.19 | | | | 0.34 | | | | 0.15 | | | | 0.26 | | | | — | | |
12-31-13 | | | 14.60 | | | | 0.12 | • | | | 3.73 | | | | 3.85 | | | | 0.17 | | | | — | | | | — | | |
12-31-12 | | | 12.15 | | | | 0.14 | | | | 2.42 | | | | 2.56 | | | | 0.11 | | | | — | | | | — | | |
Class I | | | |
12-31-16 | | | 17.97 | | | | 0.20 | | | | (0.20 | ) | | | 0.00 | * | | | 0.21 | | | | 1.20 | | | | — | | |
12-31-15 | | | 18.84 | | | | 0.20 | • | | | 0.71 | | | | 0.91 | | | | 0.29 | | | | 1.49 | | | | — | | |
12-31-14 | | | 18.89 | | | | 0.25 | • | | | 0.19 | | | | 0.44 | | | | 0.23 | | | | 0.26 | | | | — | | |
12-31-13 | | | 15.06 | | | | 0.21 | • | | | 3.85 | | | | 4.06 | | | | 0.23 | | | | — | | | | — | | |
12-31-12 | | | 12.54 | | | | 0.21 | • | | | 2.49 | | | | 2.70 | | | | 0.18 | | | | — | | | | — | | |
Class S | | | |
12-31-16 | | | 17.38 | | | | 0.13 | • | | | (0.17 | ) | | | (0.04 | ) | | | 0.16 | | | | 1.20 | | | | — | | |
12-31-15 | | | 18.28 | | | | 0.15 | • | | | 0.68 | | | | 0.83 | | | | 0.24 | | | | 1.49 | | | | — | | |
12-31-14 | | | 18.34 | | | | 0.20 | • | | | 0.18 | | | | 0.38 | | | | 0.18 | | | | 0.26 | | | | — | | |
12-31-13 | | | 14.63 | | | | 0.15 | | | | 3.76 | | | | 3.91 | | | | 0.20 | | | | — | | | | — | | |
12-31-12 | | | 12.19 | | | | 0.17 | • | | | 2.41 | | | | 2.58 | | | | 0.14 | | | | — | | | | — | | |
| | | | | Ratios to average net assets | | Supplemental
data | |
| | | Total distributions | | Payment by affiliate | | Net asset value, end of year or period | | Total Return(1) | | Expenses before reductions/additions(2)(3)(4) | | Expenses net of fee waivers and/or recoupments if any(2)(3)(4) | | Expense net of all reductions/additions(2)(3)(4) | | Net investment income (loss)(2)(3) | | Net assets, end of year or period | | Portfolio turnover rate | |
Year or period ended | | ($) | | ($) | | ($) | | (%) | | (%) | | (%) | | (%) | | (%) | | ($000's) | | (%) | |
| VY® Invesco Equity and Income Portfolio (continued) | |
Class S2 | |
12-31-16 | | | 2.59 | | | | — | | | | 43.85 | | | | 14.84 | | | | 1.10 | | | | 1.02 | | | | 1.02 | | | | 1.36 | | | | 446,998 | | | | 134 | | |
12-31-15 | | | 4.48 | | | | — | | | | 40.60 | | | | (2.44 | ) | | | 1.16 | | | | 1.02 | | | | 1.02 | | | | 1.15 | | | | 443,119 | | | | 140 | | |
12-31-14 | | | 1.82 | | | | — | | | | 46.03 | | | | 8.54 | | | | 1.16 | | | | 1.02 | | | | 1.02 | | | | 0.95 | | | | 522,608 | | | | 157 | | |
12-31-13 | | | 0.52 | | | | — | | | | 44.13 | | | | 24.47 | | | | 1.18 | | | | 1.05 | | | | 1.05 | | | | 1.31 | | | | 4,078 | | | | 37 | | |
12-31-12 | | | 0.66 | | | | — | | | | 35.87 | | | | 12.34 | | | | 1.18 | | | | 1.05 | | | | 1.05 | | | | 1.60 | | | | 1,540 | | | | 27 | | |
| VY® JPMorgan Mid Cap Value Portfolio | |
Class ADV | |
12-31-16 | | | 1.93 | | | | — | | | | 19.31 | | | | 14.42 | | | | 1.37 | | | | 1.37 | | | | 1.37 | | | | 0.42 | | | | 98,003 | | | | 19 | | |
12-31-15 | | | 3.24 | | | | — | | | | 18.66 | | | | (3.27 | ) | | | 1.36 | | | | 1.36 | | | | 1.36 | | | | 0.31 | | | | 90,818 | | | | 14 | | |
12-31-14 | | | 1.44 | | | | — | | | | 22.47 | | | | 14.66 | | | | 1.36 | | | | 1.36 | | | | 1.36 | | | | 0.54 | | | | 91,446 | | | | 22 | | |
12-31-13 | | | 0.74 | | | | — | | | | 20.96 | | | | 31.26 | | | | 1.36 | | | | 1.36 | | | | 1.36 | | | | 0.39 | | | | 78,395 | | | | 25 | | |
12-31-12 | | | 0.08 | | | | — | | | | 16.57 | | | | 19.69 | | | | 1.43 | | | | 1.43 | | | | 1.43 | | | | 0.64 | | | | 42,637 | | | | 28 | | |
Class I | |
12-31-16 | | | 2.03 | | | | — | | | | 19.75 | | | | 14.94 | | | | 0.87 | | | | 0.87 | | | | 0.87 | | | | 0.92 | | | | 215,892 | | | | 19 | | |
12-31-15 | | | 3.34 | | | | — | | | | 19.04 | | | | (2.77 | ) | | | 0.86 | | | | 0.86 | | | | 0.86 | | | | 0.80 | | | | 227,935 | | | | 14 | | |
12-31-14 | | | 1.54 | | | | — | | | | 22.85 | | | | 15.27 | | | | 0.86 | | | | 0.86 | | | | 0.86 | | | | 1.02 | | | | 272,496 | | | | 22 | | |
12-31-13 | | | 0.82 | | | | — | | | | 21.27 | | | | 31.89 | | | | 0.86 | | | | 0.86 | | | | 0.86 | | | | 0.88 | | | | 256,705 | | | | 25 | | |
12-31-12 | | | 0.15 | | | | — | | | | 16.79 | | | | 20.33 | | | | 0.93 | | | | 0.93 | | | | 0.93 | | | | 1.15 | | | | 171,485 | | | | 28 | | |
Class S | |
12-31-16 | | | 1.98 | | | | — | | | | 19.58 | | | | 14.69 | | | | 1.12 | | | | 1.12 | | | | 1.12 | | | | 0.67 | | | | 291,725 | | | | 19 | | |
12-31-15 | | | 3.28 | | | | — | | | | 18.89 | | | | (3.04 | ) | | | 1.11 | | | | 1.11 | | | | 1.11 | | | | 0.55 | | | | 298,607 | | | | 14 | | |
12-31-14 | | | 1.48 | | | | — | | | | 22.70 | | | | 14.99 | | | | 1.11 | | | | 1.11 | | | | 1.11 | | | | 0.75 | | | | 352,277 | | | | 22 | | |
12-31-13 | | | 0.78 | | | | — | | | | 21.14 | | | | 31.54 | | | | 1.11 | | | | 1.11 | | | | 1.11 | | | | 0.63 | | | | 380,688 | | | | 25 | | |
12-31-12 | | | 0.11 | | | | — | | | | 16.70 | | | | 20.02 | | | | 1.18 | | | | 1.18 | | | | 1.18 | | | | 0.89 | | | | 248,115 | | | | 28 | | |
Class S2 | |
12-31-16 | | | 1.95 | | | | — | | | | 19.25 | | | | 14.56 | | | | 1.30 | | | | 1.27 | | | | 1.27 | | | | 0.52 | | | | 3,810 | | | | 19 | | |
12-31-15 | | | 3.25 | | | | — | | | | 18.60 | | | | (3.20 | ) | | | 1.36 | | | | 1.26 | | | | 1.26 | | | | 0.40 | | | | 3,906 | | | | 14 | | |
12-31-14 | | | 1.46 | | | | — | | | | 22.40 | | | | 14.81 | | | | 1.36 | | | | 1.26 | | | | 1.26 | | | | 0.63 | | | | 5,643 | | | | 22 | | |
12-31-13 | | | 0.76 | | | | — | | | | 20.89 | | | | 31.37 | | | | 1.36 | | | | 1.26 | | | | 1.26 | | | | 0.50 | | | | 5,066 | | | | 25 | | |
12-31-12 | | | 0.12 | | | | — | | | | 16.52 | | | | 19.86 | | | | 1.43 | | | | 1.33 | | | | 1.33 | | | | 0.86 | | | | 2,664 | | | | 28 | | |
| VY® Oppenheimer Global Portfolio | |
Class ADV | |
12-31-16 | | | 1.32 | | | | — | | | | 15.90 | | | | (0.29 | ) | | | 1.25 | | | | 1.25 | | | | 1.25 | | | | 0.58 | | | | 90,660 | | | | 6 | | |
12-31-15 | | | 1.68 | | | | — | | | | 17.30 | | | | 3.56 | | | | 1.25 | | | | 1.25 | | | | 1.25 | | | | 0.51 | | | | 110,372 | | | | 12 | | |
12-31-14 | | | 0.41 | | | | — | | | | 18.21 | | | | 1.86 | | | | 1.25 | | | | 1.25 | | | | 1.25 | | | | 0.81 | | | | 101,077 | | | | 12 | | |
12-31-13 | | | 0.17 | | | | — | | | | 18.28 | | | | 26.46 | | | | 1.26 | | | | 1.26 | | | | 1.26 | | | | 0.70 | | | | 102,691 | | | | 11 | | |
12-31-12 | | | 0.11 | | | | — | | | | 14.60 | | | | 21.18 | | | | 1.22 | | | | 1.22 | | | | 1.22 | | | | 1.00 | | | | 76,791 | | | | 13 | | |
Class I | |
12-31-16 | | | 1.41 | | | | — | | | | 16.56 | | | | 0.22 | | | | 0.75 | | | | 0.75 | | | | 0.75 | | | | 1.07 | | | | 1,091,478 | | | | 6 | | |
12-31-15 | | | 1.78 | | | | — | | | | 17.97 | | | | 4.13 | | | | 0.75 | | | | 0.75 | | | | 0.75 | | | | 1.04 | | | | 1,254,238 | | | | 12 | | |
12-31-14 | | | 0.49 | | | | — | | | | 18.84 | | | | 2.32 | | | | 0.75 | | | | 0.75 | | | | 0.75 | | | | 1.32 | | | | 1,320,671 | | | | 12 | | |
12-31-13 | | | 0.23 | | | | — | | | | 18.89 | | | | 27.12 | | | | 0.76 | | | | 0.76 | | | | 0.76 | | | | 1.22 | | | | 1,481,760 | | | | 11 | | |
12-31-12 | | | 0.18 | | | | — | | | | 15.06 | | | | 21.70 | | | | 0.72 | | | | 0.72 | | | | 0.72 | | | | 1.52 | | | | 1,324,037 | | | | 13 | | |
Class S | |
12-31-16 | | | 1.36 | | | | — | | | | 15.98 | | | | (0.04 | ) | | | 1.00 | | | | 1.00 | | | | 1.00 | | | | 0.82 | | | | 174,417 | | | | 6 | | |
12-31-15 | | | 1.73 | | | | — | | | | 17.38 | | | | 3.84 | | | | 1.00 | | | | 1.00 | | | | 1.00 | | | | 0.77 | | | | 231,621 | | | | 12 | | |
12-31-14 | | | 0.44 | | | | — | | | | 18.28 | | | | 2.09 | | | | 1.00 | | | | 1.00 | | | | 1.00 | | | | 1.08 | | | | 215,383 | | | | 12 | | |
12-31-13 | | | 0.20 | | | | — | | | | 18.34 | | | | 26.85 | | | | 1.01 | | | | 1.01 | | | | 1.01 | | | | 0.96 | | | | 252,672 | | | | 11 | | |
12-31-12 | | | 0.14 | | | | — | | | | 14.63 | | | | 21.33 | | | | 0.97 | | | | 0.97 | | | | 0.97 | | | | 1.26 | | | | 192,122 | | | | 13 | | |
See Accompanying Notes to Financial Statements
58
FINANCIAL HIGHLIGHTS (CONTINUED)
Selected data for a share of beneficial interest outstanding throughout each year or period.
| | | | | Income (loss)
from investment
operations | | | | Less distributions | |
| | | Net asset value, beginning of year or period | | Net investment income (loss) | | Net realized and unrealized gain (loss) | | Total from investment operations | | From net investment income | | From net realized gains | | From return of capital | |
Year or period ended | | ($) | | ($) | | ($) | | ($) | | ($) | | ($) | | ($) | |
| VY® Oppenheimer Global Portfolio (continued) | | | |
Class S2 | | | |
12-31-16 | | | 16.97 | | | | 0.10 | • | | | (0.17 | ) | | | (0.07 | ) | | | 0.12 | | | | 1.20 | | | | — | | |
12-31-15 | | | 17.88 | | | | 0.11 | • | | | 0.69 | | | | 0.80 | | | | 0.22 | | | | 1.49 | | | | — | | |
12-31-14 | | | 17.98 | | | | 0.16 | • | | | 0.18 | | | | 0.34 | | | | 0.18 | | | | 0.26 | | | | — | | |
12-31-13 | | | 14.37 | | | | 0.11 | • | | | 3.70 | | | | 3.81 | | | | 0.20 | | | | — | | | | — | | |
12-31-12 | | | 12.01 | | | | 0.13 | • | | | 2.39 | | | | 2.52 | | | | 0.16 | | | | — | | | | — | | |
| VY® Pioneer High Yield Portfolio | | | |
Class I | | | |
12-31-16 | | | 10.77 | | | | 0.56 | | | | 0.94 | | | | 1.50 | | | | 0.58 | | | | — | | | | — | | |
12-31-15 | | | 11.87 | | | | 0.59 | • | | | (1.10 | ) | | | (0.51 | ) | | | 0.59 | | | | — | | | | — | | |
12-31-14 | | | 12.41 | | | | 0.58 | | | | (0.53 | ) | | | 0.05 | | | | 0.59 | | | | — | | | | — | | |
12-31-13 | | | 11.60 | | | | 0.60 | • | | | 0.80 | | | | 1.40 | | | | 0.59 | | | | — | | | | — | | |
12-31-12 | | | 10.55 | | | | 0.63 | • | | | 1.04 | | | | 1.67 | | | | 0.62 | | | | — | | | | — | | |
Class S | | | |
12-31-16 | | | 10.76 | | | | 0.52 | | | | 0.94 | | | | 1.46 | | | | 0.55 | | | | — | | | | — | | |
12-31-15 | | | 11.86 | | | | 0.56 | • | | | (1.10 | ) | | | (0.54 | ) | | | 0.56 | | | | — | | | | — | | |
12-31-14 | | | 12.39 | | | | 0.56 | • | | | (0.53 | ) | | | 0.03 | | | | 0.56 | | | | — | | | | — | | |
12-31-13 | | | 11.58 | | | | 0.57 | • | | | 0.80 | | | | 1.37 | | | | 0.56 | | | | — | | | | — | | |
12-31-12 | | | 10.54 | | | | 0.57 | | | | 1.07 | | | | 1.64 | | | | 0.60 | | | | — | | | | — | | |
| VY® T. Rowe Price Diversified Mid Cap Growth Portfolio | | | |
Class ADV | | | |
12-31-16 | | | 9.83 | | | | (0.01 | )• | | | 0.68 | | | | 0.67 | | | | 0.00 | * | | | 1.31 | | | | — | | |
12-31-15 | | | 11.43 | | | | (0.04 | ) | | | 0.31 | | | | 0.27 | | | | — | | | | 1.87 | | | | — | | |
12-31-14 | | | 11.08 | | | | (0.03 | ) | | | 1.21 | | | | 1.18 | | | | 0.00 | * | | | 0.83 | | | | — | | |
12-31-13 | | | 8.35 | | | | (0.03 | ) | | | 2.90 | | | | 2.87 | | | | 0.02 | | | | 0.12 | | | | — | | |
12-31-12 | | | 7.89 | | | | 0.01 | | | | 1.19 | | | | 1.20 | | | | 0.00 | * | | | 0.74 | | | | — | | |
Class I | | | |
12-31-16 | | | 10.60 | | | | 0.04 | | | | 0.73 | | | | 0.77 | | | | 0.03 | | | | 1.31 | | | | — | | |
12-31-15 | | | 12.13 | | | | 0.02 | | | | 0.32 | | | | 0.34 | | | | — | | | | 1.87 | | | | — | | |
12-31-14 | | | 11.68 | | | | 0.03 | | | | 1.28 | | | | 1.31 | | | | 0.03 | | | | 0.83 | | | | — | | |
12-31-13 | | | 8.76 | | | | 0.02 | | | | 3.05 | | | | 3.07 | | | | 0.03 | | | | 0.12 | | | | — | | |
12-31-12 | | | 8.25 | | | | 0.06 | | | | 1.23 | | | | 1.29 | | | | 0.04 | | | | 0.74 | | | | — | | |
Class R6 | | | |
| 05-03-16(5)-12-31-16 | | | 10.58 | | | | 0.03 | • | | | 0.76 | | | | 0.79 | | | | 0.03 | | | | 1.31 | | | | — | | |
Class S | | | |
12-31-16 | | | 10.30 | | | | 0.01 | • | | | 0.72 | | | | 0.73 | | | | 0.01 | | | | 1.31 | | | | — | | |
12-31-15 | | | 11.87 | | | | (0.01 | ) | | | 0.31 | | | | 0.30 | | | | — | | | | 1.87 | | | | — | | |
12-31-14 | | | 11.44 | | | | (0.00 | )* | | | 1.26 | | | | 1.26 | | | | 0.00 | * | | | 0.83 | | | | — | | |
12-31-13 | | | 8.60 | | | | (0.00 | )* | | | 2.98 | | | | 2.98 | | | | 0.02 | | | | 0.12 | | | | — | | |
12-31-12 | | | 8.11 | | | | 0.03 | | | | 1.22 | | | | 1.25 | | | | 0.02 | | | | 0.74 | | | | — | | |
Class S2 | | | |
12-31-16 | | | 9.85 | | | | (0.01 | ) | | | 0.69 | | | | 0.68 | | | | — | | | | 1.31 | | | | — | | |
12-31-15 | | | 11.44 | | | | (0.02 | ) | | | 0.30 | | | | 0.28 | | | | — | | | | 1.87 | | | | — | | |
12-31-14 | | | 11.08 | | | | (0.01 | ) | | | 1.20 | | | | 1.19 | | | | 0.00 | * | | | 0.83 | | | | — | | |
12-31-13 | | | 8.34 | | | | (0.02 | ) | | | 2.90 | | | | 2.88 | | | | 0.02 | | | | 0.12 | | | | — | | |
12-31-12 | | | 7.89 | | | | 0.02 | | | | 1.19 | | | | 1.21 | | | | 0.02 | | | | 0.74 | | | | — | | |
| VY® T. Rowe Price Growth Equity Portfolio | | | |
Class ADV | | | |
12-31-16 | | | 81.69 | | | | (0.25 | ) | | | 0.93 | | | | 0.68 | | | | — | | | | 9.84 | | | | — | | |
12-31-15 | | | 86.54 | | | | (0.46 | )• | | | 9.58 | | | | 9.12 | | | | — | | | | 13.97 | | | | — | | |
12-31-14 | | | 86.20 | | | | (0.42 | ) | | | 7.08 | | | | 6.66 | | | | — | | | | 6.32 | | | | — | | |
12-31-13 | | | 62.23 | | | | (0.38 | )• | | | 24.36 | | | | 23.98 | | | | 0.01 | | | | — | | | | — | | |
12-31-12 | | | 52.59 | | | | (0.16 | )• | | | 9.80 | | | | 9.64 | | | | — | | | | — | | | | — | | |
| | | | | Ratios to average net assets | | Supplemental
data | |
| | | Total distributions | | Payment by affiliate | | Net asset value, end of year or period | | Total Return(1) | | Expenses before reductions/additions(2)(3)(4) | | Expenses net of fee waivers and/or recoupments if any(2)(3)(4) | | Expense net of all reductions/additions(2)(3)(4) | | Net investment income (loss)(2)(3) | | Net assets, end of year or period | | Portfolio turnover rate | |
Year or period ended | | ($) | | ($) | | ($) | | (%) | | (%) | | (%) | | (%) | | (%) | | ($000's) | | (%) | |
| VY® Oppenheimer Global Portfolio (continued) | |
Class S2 | |
12-31-16 | | | 1.32 | | | | — | | | | 15.58 | | | | (0.20 | ) | | | 1.18 | | | | 1.15 | | | | 1.15 | | | | 0.66 | | | | 3,415 | | | | 6 | | |
12-31-15 | | | 1.71 | | | | — | | | | 16.97 | | | | 3.74 | | | | 1.25 | | | | 1.15 | | | | 1.15 | | | | 0.61 | | | | 4,371 | | | | 12 | | |
12-31-14 | | | 0.44 | | | | — | | | | 17.88 | | | | 1.91 | | | | 1.25 | | | | 1.15 | | | | 1.15 | | | | 0.91 | | | | 4,827 | | | | 12 | | |
12-31-13 | | | 0.20 | | | | — | | | | 17.98 | | | | 26.66 | | | | 1.26 | | | | 1.16 | | | | 1.16 | | | | 0.67 | | | | 4,287 | | | | 11 | | |
12-31-12 | | | 0.16 | | | | — | | | | 14.37 | | | | 21.17 | | | | 1.22 | | | | 1.12 | | | | 1.12 | | | | 1.01 | | | | 2,082 | | | | 13 | | |
| VY® Pioneer High Yield Portfolio | |
Class I | |
12-31-16 | | | 0.58 | | | | — | | | | 11.69 | | | | 14.29 | | | | 0.78 | | | | 0.71 | | | | 0.71 | | | | 5.01 | | | | 99,573 | | | | 51 | | |
12-31-15 | | | 0.59 | | | | — | | | | 10.77 | | | | (4.55 | ) | | | 0.76 | | | | 0.71 | | | | 0.71 | | | | 4.98 | | | | 91,560 | | | | 28 | | |
12-31-14 | | | 0.59 | | | | — | | | | 11.87 | | | | 0.27 | | | | 0.76 | | | | 0.71 | | | | 0.71 | | | | 4.73 | | | | 117,617 | | | | 35 | | |
12-31-13 | | | 0.59 | | | | — | | | | 12.41 | | | | 12.33 | | | | 0.73 | | | | 0.71 | | | | 0.71 | | | | 4.93 | | | | 119,042 | | | | 51 | | |
12-31-12 | | | 0.62 | | | | — | | | | 11.60 | | | | 16.21 | | | | 0.75 | | | | 0.71 | | | | 0.71 | | | | 5.58 | | | | 104,882 | | | | 34 | | |
Class S | |
12-31-16 | | | 0.55 | | | | — | | | | 11.67 | | | | 13.91 | | | | 1.03 | | | | 0.96 | | | | 0.96 | | | | 4.76 | | | | 4,263 | | | | 51 | | |
12-31-15 | | | 0.56 | | | | — | | | | 10.76 | | | | (4.79 | ) | | | 1.01 | | | | 0.96 | | | | 0.96 | | | | 4.73 | | | | 3,776 | | | | 28 | | |
12-31-14 | | | 0.56 | | | | — | | | | 11.86 | | | | 0.10 | | | | 1.01 | | | | 0.96 | | | | 0.96 | | | | 4.50 | | | | 4,412 | | | | 35 | | |
12-31-13 | | | 0.56 | | | | — | | | | 12.39 | | | | 12.07 | | | | 0.98 | | | | 0.96 | | | | 0.96 | | | | 4.67 | | | | 3,406 | | | | 51 | | |
12-31-12 | | | 0.60 | | | | — | | | | 11.58 | | | | 15.84 | | | | 1.00 | | | | 0.96 | | | | 0.96 | | | | 5.39 | | | | 4,089 | | | | 34 | | |
| VY® T. Rowe Price Diversified Mid Cap Growth Portfolio | |
Class ADV | |
12-31-16 | | | 1.31 | | | | — | | | | 9.19 | | | | 6.93 | | | | 1.27 | | | | 1.27 | | | | 1.27 | | | | (0.15 | ) | | | 49,418 | | | | 26 | | |
12-31-15 | | | 1.87 | | | | — | | | | 9.83 | | | | 1.51 | | | | 1.27 | | | | 1.27 | | | | 1.27 | | | | (0.34 | ) | | | 27,217 | | | | 26 | | |
12-31-14 | | | 0.83 | | | | — | | | | 11.43 | | | | 11.29 | | | | 1.28 | | | | 1.27 | | | | 1.27 | | | | (0.28 | ) | | | 29,356 | | | | 27 | | |
12-31-13 | | | 0.14 | | | | — | | | | 11.08 | | | | 34.46 | | | | 1.27 | | | | 1.25 | | | | 1.25 | | | | (0.32 | ) | | | 27,222 | | | | 20 | | |
12-31-12 | | | 0.74 | | | | — | | | | 8.35 | | | | 15.70 | | | | 1.24 | | | | 1.22 | | | | 1.22 | | | | 0.14 | | | | 21,538 | | | | 17 | | |
Class I | |
12-31-16 | | | 1.34 | | | | — | | | | 10.03 | | | | 7.41 | | | | 0.77 | | | | 0.77 | | | | 0.77 | | | | 0.34 | | | | 737,054 | | | | 26 | | |
12-31-15 | | | 1.87 | | | | — | | | | 10.60 | | | | 2.02 | | | | 0.77 | | | | 0.77 | | | | 0.77 | | | | 0.17 | | | | 766,591 | | | | 26 | | |
12-31-14 | | | 0.86 | | | | — | | | | 12.13 | | | | 11.82 | | | | 0.78 | | | | 0.77 | | | | 0.77 | | | | 0.22 | | | | 796,856 | | | | 27 | | |
12-31-13 | | | 0.15 | | | | — | | | | 11.68 | | | | 35.18 | | | | 0.77 | | | | 0.75 | | | | 0.75 | | | | 0.17 | | | | 804,053 | | | | 20 | | |
12-31-12 | | | 0.78 | | | | — | | | | 8.76 | | | | 16.13 | | | | 0.74 | | | | 0.72 | | | | 0.72 | | | | 0.61 | | | | 668,143 | | | | 17 | | |
Class R6 | |
| 05-03-16(5)-12-31-16 | | | 1.34 | | | | — | | | | 10.03 | | | | 7.62 | | | | 0.77 | | | | 0.77 | | | | 0.77 | | | | 0.53 | | | | 1,084 | | | | 26 | | |
Class S | |
12-31-16 | | | 1.32 | | | | — | | | | 9.71 | | | | 7.19 | | | | 1.02 | | | | 1.02 | | | | 1.02 | | | | 0.12 | | | | 56,578 | | | | 26 | | |
12-31-15 | | | 1.87 | | | | — | | | | 10.30 | | | | 1.72 | | | | 1.02 | | | | 1.02 | | | | 1.02 | | | | (0.08 | ) | | | 30,614 | | | | 26 | | |
12-31-14 | | | 0.83 | | | | — | | | | 11.87 | | | | 11.65 | | | | 1.03 | | | | 1.02 | | | | 1.02 | | | | (0.02 | ) | | | 30,412 | | | | 27 | | |
12-31-13 | | | 0.14 | | | | — | | | | 11.44 | | | | 34.74 | | | | 1.02 | | | | 1.00 | | | | 1.00 | | | | (0.06 | ) | | | 29,284 | | | | 20 | | |
12-31-12 | | | 0.76 | | | | — | | | | 8.60 | | | | 15.87 | | | | 0.99 | | | | 0.97 | | | | 0.97 | | | | 0.35 | | | | 18,731 | | | | 17 | | |
Class S2 | |
12-31-16 | | | 1.31 | | | | — | | | | 9.22 | | | | 6.99 | | | | 1.20 | | | | 1.17 | | | | 1.17 | | | | (0.06 | ) | | | 4,451 | | | | 26 | | |
12-31-15 | | | 1.87 | | | | — | | | | 9.85 | | | | 1.60 | | | | 1.27 | | | | 1.17 | | | | 1.17 | | | | (0.23 | ) | | | 4,095 | | | | 26 | | |
12-31-14 | | | 0.83 | | | | — | | | | 11.44 | | | | 11.39 | | | | 1.28 | | | | 1.17 | | | | 1.17 | | | | (0.13 | ) | | | 3,893 | | | | 27 | | |
12-31-13 | | | 0.14 | | | | — | | | | 11.08 | | | | 34.62 | | | | 1.27 | | | | 1.15 | | | | 1.15 | | | | (0.23 | ) | | | 1,013 | | | | 20 | | |
12-31-12 | | | 0.76 | | | | — | | | | 8.34 | | | | 15.73 | | | | 1.24 | | | | 1.12 | | | | 1.12 | | | | 0.29 | | | | 1,025 | | | | 17 | | |
| VY® T. Rowe Price Growth Equity Portfolio | |
Class ADV | |
12-31-16 | | | 9.84 | | | | — | | | | 72.53 | | | | 1.01 | | | | 1.24 | | | | 1.23 | | | | 1.23 | | | | (0.34 | ) | | | 192,546 | | | | 40 | | |
12-31-15 | | | 13.97 | | | | — | | | | 81.69 | | | | 10.25 | | | | 1.24 | | | | 1.23 | | | | 1.23 | | | | (0.54 | ) | | | 202,307 | | | | 42 | | |
12-31-14 | | | 6.32 | | | | — | | | | 86.54 | | | | 8.16 | | | | 1.24 | | | | 1.23 | | | | 1.23 | | | | (0.50 | ) | | | 171,971 | | | | 35 | | |
12-31-13 | | | 0.01 | | | | — | | | | 86.20 | | | | 38.54 | | | | 1.24 | | | | 1.23 | | | | 1.23 | | | | (0.53 | ) | | | 164,865 | | | | 41 | | |
12-31-12 | | | — | | | | — | | | | 62.23 | | | | 18.33 | | | | 1.24 | | | | 1.23 | | | | 1.23 | | | | (0.26 | ) | | | 112,773 | | | | 38 | | |
See Accompanying Notes to Financial Statements
59
FINANCIAL HIGHLIGHTS (CONTINUED)
Selected data for a share of beneficial interest outstanding throughout each year or period.
| | | | | Income (loss)
from investment
operations | | | | Less distributions | |
| | | Net asset value, beginning of year or period | | Net investment income (loss) | | Net realized and unrealized gain (loss) | | Total from investment operations | | From net investment income | | From net realized gains | | From return of capital | |
Year or period ended | | ($) | | ($) | | ($) | | ($) | | ($) | | ($) | | ($) | |
| VY® T. Rowe Price Growth Equity Portfolio (continued) | | | |
Class I | | | |
12-31-16 | | | 86.14 | | | | 0.13 | | | | 1.01 | | | | 1.14 | | | | — | | | | 9.84 | | | | — | | |
12-31-15 | | | 90.15 | | | | (0.03 | ) | | | 9.99 | | | | 9.96 | | | | — | | | | 13.97 | | | | — | | |
12-31-14 | | | 89.11 | | | | 0.00 | * | | | 7.36 | | | | 7.36 | | | | — | | | | 6.32 | | | | — | | |
12-31-13 | | | 64.01 | | | | (0.02 | ) | | | 25.13 | | | | 25.11 | | | | 0.01 | | | | — | | | | — | | |
12-31-12 | | | 53.91 | | | | 0.14 | • | | | 10.06 | | | | 10.20 | | | | 0.10 | | | | — | | | | — | | |
Class S | | | |
12-31-16 | | | 83.90 | | | | (0.08 | ) | | | 0.98 | | | | 0.90 | | | | — | | | | 9.84 | | | | — | | |
12-31-15 | | | 88.33 | | | | (0.25 | )• | | | 9.79 | | | | 9.54 | | | | — | | | | 13.97 | | | | — | | |
12-31-14 | | | 87.65 | | | | (0.22 | ) | | | 7.22 | | | | 7.00 | | | | — | | | | 6.32 | | | | — | | |
12-31-13 | | | 63.12 | | | | (0.20 | )• | | | 24.74 | | | | 24.54 | | | | 0.01 | | | | — | | | | — | | |
12-31-12 | | | 53.21 | | | | (0.00 | )* | | | 9.91 | | | | 9.91 | | | | — | | | | — | | | | — | | |
Class S2 | | | |
12-31-16 | | | 82.35 | | | | (0.17 | )• | | | 0.93 | | | | 0.76 | | | | — | | | | 9.84 | | | | — | | |
12-31-15 | | | 87.05 | | | | (0.38 | )• | | | 9.65 | | | | 9.27 | | | | — | | | | 13.97 | | | | — | | |
12-31-14 | | | 86.59 | | | | (0.33 | )• | | | 7.11 | | | | 6.78 | | | | — | | | | 6.32 | | | | — | | |
12-31-13 | | | 62.45 | | | | (0.31 | )• | | | 24.46 | | | | 24.15 | | | | 0.01 | | | | — | | | | — | | |
12-31-12 | | | 52.72 | | | | (0.09 | ) | | | 9.82 | | | | 9.73 | | | | — | | | | — | | | | — | | |
| VY® Templeton Foreign Equity Portfolio | | | |
Class ADV | | | |
12-31-16 | | | 11.08 | | | | 0.20 | • | | | (0.07 | ) | | | 0.13 | | | | 0.31 | | | | — | | | | — | | |
12-31-15 | | | 11.91 | | | | 0.21 | • | | | (0.63 | ) | | | (0.42 | ) | | | 0.41 | | | | — | | | | — | | |
12-31-14 | | | 13.07 | | | | 0.36 | • | | | (1.26 | ) | | | (0.90 | ) | | | 0.26 | | | | — | | | | — | | |
12-31-13 | | | 11.05 | | | | 0.20 | • | | | 1.96 | | | | 2.16 | | | | 0.14 | | | | — | | | | — | | |
12-31-12 | | | 9.45 | | | | 0.17 | • | | | 1.55 | | | | 1.72 | | | | 0.12 | | | | — | | | | — | | |
Class I | | | |
12-31-16 | | | 11.20 | | | | 0.25 | • | | | (0.06 | ) | | | 0.19 | | | | 0.38 | | | | — | | | | — | | |
12-31-15 | | | 12.04 | | | | 0.28 | • | | | (0.64 | ) | | | (0.36 | ) | | | 0.48 | | | | — | | | | — | | |
12-31-14 | | | 13.21 | | | | 0.43 | • | | | (1.28 | ) | | | (0.85 | ) | | | 0.32 | | | | — | | | | — | | |
12-31-13 | | | 11.15 | | | | 0.29 | • | | | 1.95 | | | | 2.24 | | | | 0.18 | | | | — | | | | — | | |
12-31-12 | | | 9.52 | | | | 0.22 | • | | | 1.56 | | | | 1.78 | | | | 0.15 | | | | — | | | | — | | |
Class S | | | |
12-31-16 | | | 11.12 | | | | 0.22 | • | | | (0.05 | ) | | | 0.17 | | | | 0.35 | | | | — | | | | — | | |
12-31-15 | | | 11.95 | | | | 0.25 | • | | | (0.64 | ) | | | (0.39 | ) | | | 0.44 | | | | — | | | | — | | |
12-31-14 | | | 13.12 | | | | 0.40 | • | | | (1.28 | ) | | | (0.88 | ) | | | 0.29 | | | | — | | | | — | | |
12-31-13 | | | 11.08 | | | | 0.23 | • | | | 1.97 | | | | 2.20 | | | | 0.16 | | | | — | | | | — | | |
12-31-12 | | | 9.48 | | | | 0.14 | • | | | 1.60 | | | | 1.74 | | | | 0.14 | | | | — | | | | — | | |
Class S2 | | | |
12-31-16 | | | 11.06 | | | | 0.22 | | | | (0.08 | ) | | | 0.14 | | | | 0.34 | | | | — | | | | — | | |
12-31-15 | | | 11.90 | | | | 0.23 | • | | | (0.63 | ) | | | (0.40 | ) | | | 0.44 | | | | — | | | | — | | |
12-31-14 | | | 13.07 | | | | 0.34 | | | | (1.23 | ) | | | (0.89 | ) | | | 0.28 | | | | — | | | | — | | |
12-31-13 | | | 11.04 | | | | 0.21 | • | | | 1.97 | | | | 2.18 | | | | 0.15 | | | | — | | | | — | | |
12-31-12 | | | 9.45 | | | | 0.17 | | | | 1.55 | | | | 1.72 | | | | 0.13 | | | | — | | | | — | | |
| | | | | Ratios to average net assets | | Supplemental
data | |
| | | Total distributions | | Payment by affiliate | | Net asset value, end of year or period | | Total Return(1) | | Expenses before reductions/additions(2)(3)(4) | | Expenses net of fee waivers and/or recoupments if any(2)(3)(4) | | Expense net of all reductions/additions(2)(3)(4) | | Net investment income (loss)(2)(3) | | Net assets, end of year or period | | Portfolio turnover rate | |
Year or period ended | | ($) | | ($) | | ($) | | (%) | | (%) | | (%) | | (%) | | (%) | | ($000's) | | (%) | |
| VY® T. Rowe Price Growth Equity Portfolio (continued) | |
Class I | |
12-31-16 | | | 9.84 | | | | — | | | | 77.44 | | | | 1.51 | | | | 0.74 | | | | 0.73 | | | | 0.73 | | | | 0.16 | | | | 989,826 | | | | 40 | | |
12-31-15 | | | 13.97 | | | | — | | | | 86.14 | | | | 10.81 | | | | 0.74 | | | | 0.73 | | | | 0.73 | | | | (0.04 | ) | | | 1,124,421 | | | | 42 | | |
12-31-14 | | | 6.32 | | | | — | | | | 90.15 | | | | 8.69 | | | | 0.74 | | | | 0.73 | | | | 0.73 | | | | 0.00 | * | | | 1,036,976 | | | | 35 | | |
12-31-13 | | | 0.01 | | | | — | | | | 89.11 | | | | 39.24 | | | | 0.74 | | | | 0.73 | | | | 0.73 | | | | (0.03 | ) | | | 1,069,544 | | | | 41 | | |
12-31-12 | | | 0.10 | | | | — | | | | 64.01 | | | | 18.92 | | | | 0.74 | | | | 0.73 | | | | 0.73 | | | | 0.22 | | | | 801,969 | | | | 38 | | |
Class S | |
12-31-16 | | | 9.84 | | | | — | | | | 74.96 | | | | 1.26 | | | | 0.99 | | | | 0.98 | | | | 0.98 | | | | (0.10 | ) | | | 336,810 | | | | 40 | | |
12-31-15 | | | 13.97 | | | | — | | | | 83.90 | | | | 10.54 | | | | 0.99 | | | | 0.98 | | | | 0.98 | | | | (0.29 | ) | | | 427,186 | | | | 42 | | |
12-31-14 | | | 6.32 | | | | — | | | | 88.33 | | | | 8.42 | | | | 0.99 | | | | 0.98 | | | | 0.98 | | | | (0.25 | ) | | | 360,966 | | | | 35 | | |
12-31-13 | | | 0.01 | | | | — | | | | 87.65 | | | | 38.89 | | | | 0.99 | | | | 0.98 | | | | 0.98 | | | | (0.28 | ) | | | 367,958 | | | | 41 | | |
12-31-12 | | | — | | | | — | | | | 63.12 | | | | 18.62 | | | | 0.99 | | | | 0.98 | | | | 0.98 | | | | (0.00 | )* | | | 238,987 | | | | 38 | | |
Class S2 | |
12-31-16 | | | 9.84 | | | | — | | | | 73.27 | | | | 1.10 | | | | 1.17 | | | | 1.13 | | | | 1.13 | | | | (0.23 | ) | | | 8,597 | | | | 40 | | |
12-31-15 | | | 13.97 | | | | — | | | | 82.35 | | | | 10.38 | | | | 1.24 | | | | 1.13 | | | | 1.13 | | | | (0.44 | ) | | | 5,361 | | | | 42 | | |
12-31-14 | | | 6.32 | | | | — | | | | 87.05 | | | | 8.26 | | | | 1.24 | | | | 1.13 | | | �� | 1.13 | | | | (0.38 | ) | | | 4,616 | | | | 35 | | |
12-31-13 | | | 0.01 | | | | — | | | | 86.59 | | | | 38.68 | | | | 1.24 | | | | 1.13 | | | | 1.13 | | | | (0.43 | ) | | | 2,482 | | | | 41 | | |
12-31-12 | | | — | | | | — | | | | 62.45 | | | | 18.46 | | | | 1.24 | | | | 1.13 | | | | 1.13 | | | | (0.16 | ) | | | 1,534 | | | | 38 | | |
| VY® Templeton Foreign Equity Portfolio | |
Class ADV | |
12-31-16 | | | 0.31 | | | | — | | | | 10.90 | | | | 1.33 | | | | 1.46 | | | | 1.41 | | | | 1.41 | | | | 1.84 | | | | 31,937 | | | | 15 | | |
12-31-15 | | | 0.41 | | | | — | | | | 11.08 | | | | (3.83 | )(a) | | | 1.45 | | | | 1.43 | | | | 1.43 | | | | 1.76 | | | | 35,751 | | | | 10 | | |
12-31-14 | | | 0.26 | | | | — | | | | 11.91 | | | | (7.01 | ) | | | 1.44 | | | | 1.42 | | | | 1.42 | | | | 2.81 | | | | 40,973 | | | | 10 | | |
12-31-13 | | | 0.14 | | | | — | | | | 13.07 | | | | 19.68 | | | | 1.44 | | | | 1.42 | | | | 1.42 | | | | 1.64 | | | | 46,583 | | | | 12 | | |
12-31-12 | | | 0.12 | | | | — | | | | 11.05 | | | | 18.32 | | | | 1.46 | | | | 1.44 | | | | 1.44 | | | | 1.71 | | | | 36,360 | | | | 9 | | |
Class I | |
12-31-16 | | | 0.38 | | | | — | | | | 11.01 | | | | 1.85 | | | | 0.96 | | | | 0.91 | | | | 0.91 | | | | 2.33 | | | | 170,231 | | | | 15 | | |
12-31-15 | | | 0.48 | | | | — | | | | 11.20 | | | | (3.34 | )(a) | | | 0.95 | | | | 0.93 | | | | 0.93 | | | | 2.29 | | | | 186,602 | | | | 10 | | |
12-31-14 | | | 0.32 | | | | — | | | | 12.04 | | | | (6.59 | ) | | | 0.94 | | | | 0.92 | | | | 0.92 | | | | 3.27 | | | | 215,838 | | | | 10 | | |
12-31-13 | | | 0.18 | | | | — | | | | 13.21 | | | | 20.28 | | | | 0.94 | | | | 0.92 | | | | 0.92 | | | | 2.47 | | | | 277,773 | | | | 12 | | |
12-31-12 | | | 0.15 | | | | — | | | | 11.15 | | | | 18.89 | | | | 0.96 | | | | 0.94 | | | | 0.94 | | | | 2.15 | | | | 375,814 | | | | 9 | | |
Class S | |
12-31-16 | | | 0.35 | | | | — | | | | 10.94 | | | | 1.63 | | | | 1.21 | | | | 1.16 | | | | 1.16 | | | | 2.09 | | | | 423,390 | | | | 15 | | |
12-31-15 | | | 0.44 | | | | — | | | | 11.12 | | | | (3.57 | )(a) | | | 1.20 | | | | 1.18 | | | | 1.18 | | | | 2.03 | | | | 497,824 | | | | 10 | | |
12-31-14 | | | 0.29 | | | | — | | | | 11.95 | | | | (6.87 | ) | | | 1.19 | | | | 1.17 | | | | 1.17 | | | | 3.10 | | | | 584,346 | | | | 10 | | |
12-31-13 | | | 0.16 | | | | — | | | | 13.12 | | | | 20.05 | | | | 1.19 | | | | 1.17 | | | | 1.17 | | | | 1.91 | | | | 709,362 | | | | 12 | | |
12-31-12 | | | 0.14 | | | | — | | | | 11.08 | | | | 18.64 | | | | 1.21 | | | | 1.19 | | | | 1.19 | | | | 1.38 | | | | 648,985 | | | | 9 | | |
Class S2 | |
12-31-16 | | | 0.34 | | | | — | | | | 10.86 | | | | 1.39 | | | | 1.39 | | | | 1.31 | | | | 1.31 | | | | 1.94 | | | | 2,321 | | | | 15 | | |
12-31-15 | | | 0.44 | | | | — | | | | 11.06 | | | | (3.72 | )(a) | | | 1.45 | | | | 1.33 | | | | 1.33 | | | | 1.88 | | | | 2,510 | | | | 10 | | |
12-31-14 | | | 0.28 | | | | — | | | | 11.90 | | | | (6.99 | ) | | | 1.44 | | | | 1.32 | | | | 1.32 | | | | 2.80 | | | | 2,065 | | | | 10 | | |
12-31-13 | | | 0.15 | | | | — | | | | 13.07 | | | | 19.88 | | | | 1.44 | | | | 1.32 | | | | 1.32 | | | | 1.80 | | | | 2,158 | | | | 12 | | |
12-31-12 | | | 0.13 | | | | — | | | | 11.04 | | | | 18.40 | | | | 1.46 | | | | 1.34 | | | | 1.34 | | | | 1.89 | | | | 1,310 | | | | 9 | | |
(1) Total return is calculated assuming reinvestment of all dividends, capital gain distributions and return of capital distributions, if any, at net asset value and does not reflect the effect of insurance contract charges. Total return for periods less than one year is not annualized.
(2) Annualized for periods less than one year.
(3) Ratios reflect operating expenses of a Portfolio. Expenses before reductions/additions do not reflect amounts reimbursed by an Investment Adviser and/or Distributor or reductions from brokerage service arrangements or other expense offset arrangements and do not represent the amount paid by a Portfolio during periods when reimbursements or reductions occur. Expenses net of fee waivers reflect expenses after reimbursement by an Investment Adviser and/or Distributor but prior to reductions from brokerage
service arrangements or other expense offset arrangements. Expenses net of all reductions/additions represent the net expenses paid by a Portfolio. Net investment income (loss) is net of all such additions or reductions.
(4) Ratios do not include fees and expenses charged under the variable annuity contract or variable life insurance policy.
(5) Commencement of operations.
(a) Excluding amounts related to a foreign currency settlement recorded in the fiscal year ended December 31, 2015, Templeton Foreign Equity's total return would have been (4.09)%, (3.60)%, (3.83)% and (3.99)% for Classes ADV, I, S and S2, respectively.
• Calculated using average number of shares outstanding throughout the year or period.
* Amount is less than $0.005 or 0.005% or more than $(0.005) or (0.005)%.
See Accompanying Notes to Financial Statements
60
NOTES TO FINANCIAL STATEMENTS AS OF DECEMBER 31, 2016
Voya Partners, Inc. (the "Company") is an open-end management investment company registered under the Investment Company Act of 1940, as amended (the "1940 Act"). It was incorporated under the laws of Maryland on May 7, 1997. The Articles of Incorporation permit the Company to offer separate series, each of which has its own investment objective, policies and restrictions. The series of the Company serve as an investment option in underlying variable insurance products offered by Directed Services LLC. The Company currently consists of thirty-eight active separate investment series. The thirteen series (each, a "Portfolio" and collectively, the "Portfolios") included in this report are: Voya Global Bond Portfolio ("Global Bond"),VY® American Century Small-Mid Cap Value Portfolio ("American Century Small-Mid Cap Value"), VY® Baron Growth Portfolio ("Baron Growth"), VY® Columbia Contrarian Core Portfolio ("Columbia Contrarian Core"), VY® Columbia Small Cap Value II Portfolio ("Columbia Small Cap Value II"), VY® Invesco Comstock Portfolio ("Invesco Comstock"), VY® Invesco Equity and Income Portfolio ("Invesco Equity and Income"), VY® JPMorgan Mid Cap Value Portfolio ("JPMorgan Mid Cap Value"), VY® Oppenheimer Global Portfolio ("Oppenheimer Global"), VY® Pioneer High Yield Portfolio ("Pioneer High Yield"), VY® T. Rowe Price Diversified Mid Cap Growth Portfolio ("T. Rowe Price Diversified Mid Cap Growth"), VY® T. Rowe Price Growth Equity Portfolio ("T. Rowe Price Growth Equity"), and VY® Templeton Foreign Equity Portfolio ("Templeton Foreign Equity"), each a diversified series of the Company. The investment objective of the Portfolios is described in the respective Portfolio's Prospectus.
The classes of shares included in this report are: Adviser ("Class ADV"), Initial ("Class I"), Class R6, Service ("Class S") and Service 2 ("Class S2"); however, each Portfolio may not offer all share classes. Shares of the Portfolios may be offered to separate accounts ("Separate Accounts") of insurance companies as investment options in connection with variable annuity contracts and variable life insurance policies ("Variable Contracts") and to certain of the Portfolios' investment advisers and their affiliates. In the future, shares may also be offered to qualified pension and retirement plans ("Qualified Plans") outside the Separate Account context. With the exception of class specific matters, each class has equal voting rights as to voting privileges. For class specific proposals, only the applicable class would have voting privileges. The classes differ principally in the applicable distribution and shareholder service fees. Generally, shareholders of each class also bear certain expenses that pertain to that particular class. All
shareholders bear the common expenses of a portfolio and earn income and realized gains/losses from a portfolio pro rata based on the daily ending net assets of each class, without distinction between share classes. Distributions are determined separately for each class based on income and expenses allocated to each class. Expenses that are specific to a portfolio or a class are charged directly to that portfolio or class. Other operating expenses shared by several portfolios are generally allocated among those portfolios based on average net assets. Realized gain distributions are allocated to each class pro rata based on the shares outstanding of each class on the date of distribution. Differences in per share dividend rates generally result from differences in separate class expenses, including distribution and shareholder service fees, if applicable.
Directed Services LLC ("DSL" or the "Investment Adviser"), a Delaware limited liability company and an affiliate of Voya Investments, LLC, serves as the Investment Adviser to the Portfolios. Voya Investment Management Co. LLC ("Voya IM"), a Delaware limited liability company, serves as the sub-adviser to Global Bond. Voya Investments Distributor, LLC ("VID" or the "Distributor"), a Delaware limited liability company, serves as the principal underwriter to the Portfolios.
NOTE 2 — SIGNIFICANT ACCOUNTING POLICIES
The following significant accounting policies are consistently followed by the Portfolios in the preparation of their financial statements. Each Portfolio is considered an investment company under U.S. generally accepted accounting principles ("GAAP") and follows the accounting and reporting guidance applicable to investment companies.
A. Security Valuation. Each Portfolio is open for business every day the New York Stock Exchange ("NYSE") opens for regular trading (each such day, a "Business Day"). The net asset value ("NAV") per share for each class of each Portfolio is determined each Business Day as of the close of the regular trading session ("Market Close"), as determined by the Consolidated Tape Association ("CTA"), the central distributor of transaction prices for exchange-traded securities (normally 4:00 p.m. Eastern time unless otherwise designated by the CTA). The data reflected on the consolidated tape provided by the CTA is generated by various market centers, including all securities exchanges, electronic communications networks, and third-market broker-dealers. The NAV per share of each class of each Portfolio is calculated by taking the value of the Portfolio's assets attributable to that class, subtracting the Portfolio's liabilities attributable to that class, and dividing by the number of shares of that class
61
NOTES TO FINANCIAL STATEMENTS AS OF DECEMBER 31, 2016 (CONTINUED)
NOTE 2 — SIGNIFICANT ACCOUNTING POLICIES (continued)
that are outstanding. On days when a Portfolio is closed for business, Portfolio shares will not be priced and a Portfolio does not transact purchase and redemption orders. To the extent a Portfolio's assets are traded in other markets on days when a Portfolio does not price its shares, the value of a Portfolio's assets will likely change and you will not be able to purchase or redeem shares of a Portfolio.
Assets for which market quotations are readily available are valued at market value. A security listed or traded on an exchange is valued at its last sales price or official closing price as of the close of the regular trading session on the exchange where the security is principally traded or, if such price is not available, at the last sale price as of the Market Close for such security provided by the CTA. Bank loans are valued at the average of the averages of the bid and ask prices provided to an independent loan pricing service by brokers. Futures contracts are valued at the final settlement price set by an exchange on which they are principally traded. Listed options are valued at the mean between the last bid and ask prices from the exchange on which they are principally traded. Investments in open-end registered investment companies that do not trade on an exchange are valued at the end of day NAV per share. Investments in registered investment companies that trade on an exchange are valued at the last sales price or official closing price as of the close of the regular trading session on the exchange where the security is principally traded.
When a market quotation is not readily available or is deemed unreliable, each Portfolio will determine a fair value for the relevant asset in accordance with procedures adopted by the Portfolios' Board of Directors ("Board"). Such procedures provide, for example, that: (a) Exchange-traded securities are valued at the mean of the closing bid and ask; (b) Debt obligations are valued using an evaluated price provided by an independent pricing service. Evaluated prices provided by the pricing service may be determined without exclusive reliance on quoted prices, and may reflect factors such as institution-size trading in similar groups of securities, developments related to specific securities, benchmark yield, quality, type of issue, coupon rate, maturity, individual trading characteristics and other market data; (c) Securities traded in the over-the-counter market are valued based on prices provided by independent pricing services or market makers; (d) Options not listed on an exchange are valued by an independent source using an industry accepted model, such as Black-Scholes; (e) Centrally cleared swap agreements are valued using a price
provided by the central counterparty clearinghouse; (f) Over-the-counter swap agreements are valued using a price provided by an independent pricing service; (g) Forward foreign currency exchange contracts are valued utilizing current and forward rates obtained from an independent pricing service. Such prices from the third party pricing service are for specific settlement periods and each Portfolio's forward foreign currency exchange contracts are valued at an interpolated rate between the closest preceding and subsequent period reported by the independent pricing service and (h) Securities for which market prices are not provided by any of the above methods may be valued based upon quotes furnished by brokers.
The prospectuses of the open-end registered investment companies in which each Portfolio may invest explain the circumstances under which they will use fair value pricing and the effects of using fair value pricing.
Foreign securities' (including foreign exchange contracts) prices are converted into U.S. dollar amounts using the applicable exchange rates as of Market Close. If market quotations are available and believed to be reliable for foreign exchange-traded equity securities, the securities will be valued at the market quotations. Because trading hours for certain foreign securities end before Market Close, closing market quotations may become unreliable. An independent pricing service determines the degree of certainty, based on historical data, that the closing price in the principal market where a foreign security trades is not the current value as of Market Close. Foreign securities' prices meeting the approved degree of certainty that the price is not reflective of current value will be valued by the independent pricing service using pricing models designed to estimate likely changes in the values of those securities between the times in which the trading in those securities is substantially completed and Market Close. Multiple factors may be considered by the independent pricing service in determining the value of such securities and may include information relating to sector indices, American Depositary Receipts and domestic and foreign index futures.
All other assets for which market quotations are not readily available or became unreliable (or if the above fair valuation methods are unavailable or determined to be unreliable) are valued at fair value as determined in good faith by or under the supervision of the Board following procedures approved by the Board. The Board has delegated to the Investment Adviser responsibility for overseeing the implementation of the Portfolios' valuation procedures; a "Pricing Committee" comprised of employees of the Investment Adviser or its affiliates has responsibility for applying the fair valuation methods set forth in the procedures and, if a fair valuation cannot be
62
NOTES TO FINANCIAL STATEMENTS AS OF DECEMBER 31, 2016 (CONTINUED)
NOTE 2 — SIGNIFICANT ACCOUNTING POLICIES (continued)
determined pursuant to the fair valuation methods, determining the fair value of assets held by the Portfolios. Issuer specific events, transaction price, position size, nature and duration of restrictions on disposition of the security, market trends, bid/ask quotes of brokers and other market data may be reviewed in the course of making a good faith determination of a security's fair value. Valuations change in response to many factors including the historical and prospective earnings of the issuer, the value of the issuer's assets, general economic conditions, interest rates, investor perceptions and market liquidity. Because of the inherent uncertainties of fair valuation, the values used to determine each Portfolio's NAV may materially differ from the value received upon actual sale of those investments. Thus, fair valuation may have an unintended dilutive or accretive effect on the value of shareholders' investments in each Portfolio.
Each investment asset or liability of the Portfolios is assigned a level at measurement date based on the significance and source of the inputs to its valuation. Quoted prices in active markets for identical securities are classified as "Level 1," inputs other than quoted prices for an asset or liability that are observable are classified as "Level 2" and significant unobservable inputs, including the sub-advisers' or Pricing Committee's judgment about the assumptions that a market participant would use in pricing an asset or liability are classified as "Level 3." The inputs used for valuing securities are not necessarily an indication of the risks associated with investing in those securities. Short-term securities of sufficient credit quality are generally considered to be Level 2 securities under applicable accounting rules. A table summarizing the Portfolios' investments under these levels of classification is included following the Portfolio of Investments.
U.S. GAAP requires a reconciliation of the beginning to ending balances for reported fair values that presents changes attributable to total realized and unrealized gains or losses, purchases and sales, and transfers in or out of the Level 3 category during the period. The beginning of period timing recognition is used for the transfers between levels of the Portfolio's assets and liabilities. A reconciliation of Level 3 investments is presented only when a Portfolio has a significant amount of Level 3 investments.
For the year ended December 31, 2016, there have been no significant changes to the fair valuation methodologies.
B. Security Transactions and Revenue Recognition. Security transactions are accounted for on the trade date. Realized gains and losses are reported on the basis of identified cost of securities sold. Interest income is recorded on an accrual basis. Dividend income is recorded on the ex-dividend date, or for certain foreign securities, when the information becomes available to the Portfolios. Premium amortization and discount accretion are determined by the effective yield method.
C. Foreign Currency Translation. The books and records of the Portfolios are maintained in U.S. dollars. Any foreign currency amounts are translated into U.S. dollars on the following basis:
(1) Market value of investment securities, other assets and liabilities — at the exchange rates prevailing at Market Close.
(2) Purchases and sales of investment securities, income and expenses — at the rates of exchange prevailing on the respective dates of such transactions.
Although the net assets and the market values are presented at the foreign exchange rates at Market Close, the Portfolios do not isolate the portion of the results of operations resulting from changes in foreign exchange rates on investments from the fluctuations arising from changes in market prices of securities held. Such fluctuations are included with the net realized and unrealized gains or losses from investments. For securities, which are subject to foreign withholding tax upon disposition, liabilities are recorded on the Statements of Assets and Liabilities for the estimated tax withholding based on the securities' current market value. Upon disposition, realized gains or losses on such securities are recorded net of foreign withholding tax.
Reported net realized foreign exchange gains or losses arise from sales of foreign currencies, currency gains or losses realized between the trade and settlement dates on securities transactions, the difference between the amounts of dividends, interest, and foreign withholding tax reclaims recorded on the Portfolios' books, and the U.S. dollar equivalent of the amounts actually received or paid. Net unrealized foreign exchange gains and losses arise from changes in the value of assets and liabilities other than investments in securities, resulting from changes in the exchange rate. Foreign security and currency transactions may involve certain considerations and risks not typically associated with investing in U.S. companies and U.S. government securities. These risks include, but are not limited to, revaluation of currencies and future adverse political and economic developments, which could cause securities and their markets to be less liquid and prices more volatile than those of comparable
63
NOTES TO FINANCIAL STATEMENTS AS OF DECEMBER 31, 2016 (CONTINUED)
NOTE 2 — SIGNIFICANT ACCOUNTING POLICIES (continued)
U.S. companies and U.S. government securities. The foregoing risks are even greater with respect to securities of issuers in emerging markets.
D. Distributions to Shareholders. The Portfolios record distributions to their shareholders on the ex-dividend date. All Portfolios (except Pioneer High Yield and Global Bond) declare and pay dividends annually. Pioneer High Yield and Global Bond declare dividends on a daily basis and pay dividends monthly. The Portfolios distribute capital gains distributions, if any, annually. The Portfolios may make distributions on a more frequent basis to comply with the distribution requirements of subchapter M of the Internal Revenue Code. The characteristics of income and gains to be distributed are determined in accordance with income tax regulations, which may differ from U.S. GAAP for investment companies.
E. Federal Income Taxes. It is the policy of each Portfolio to comply with the requirements of subchapter M of the Internal Revenue Code that are applicable to regulated investment companies and to distribute substantially all of its net investment income and any net realized capital gains to its shareholders. Therefore, a federal income tax or excise tax provision is not required. Management has considered the sustainability of the Portfolios' tax positions taken on federal income tax returns for all open tax years in making this determination. No capital gain distributions shall be made until the capital loss carryforwards have been fully utilized or expire.
The Portfolios may utilize equalization accounting for tax purposes, whereby a portion of redemption payments are treated as distributions of income or gain.
F. Use of Estimates. Management of the Portfolios has made certain estimates and assumptions relating to the reporting of assets, liabilities, income, and expenses to prepare these financial statements in conformity with U.S. GAAP for investment companies. Actual results could differ from these estimates.
G. Risk Exposures and the Use of Derivative Instruments. The Portfolios' investment strategies permit the Portfolios to enter into various types of derivatives contracts, including, but not limited to, futures contracts, forward foreign currency exchange contracts, credit default swaps, interest rate swaps, total return swaps, and purchased and written options. In doing so, a Portfolio will employ strategies in differing combinations to permit it to increase or decrease the level of risk, or change the level or types of exposure to risk factors. This
may allow a Portfolio to pursue its objectives more quickly, and efficiently than if it were to make direct purchases or sales of securities capable of affecting a similar response to market or credit factors.
In pursuit of its investment objectives, a Portfolio may seek to increase or decrease its exposure to the following market or credit risk factors:
Credit Risk. The price of a bond or other debt instrument is likely to fall if the issuer's actual or perceived financial health deteriorates, whether because of broad economic or issuer-specific reasons. In certain cases, the issuer could be late in paying interest or principal, or could fail to pay its financial obligations altogether.
Equity Risk. Stock prices may be volatile or have reduced liquidity in response to real or perceived impacts of factors including, but not limited to, economic conditions, changes in market interest rates, and political events. Stock markets tend to be cyclical, with periods when stock prices generally rise and periods when stock prices generally decline. Any given stock market segment may remain out of favor with investors for a short or long period of time, and stocks as an asset class may underperform bonds or other asset classes during some periods. Additionally, legislative, regulatory or tax policies or developments in these areas may adversely impact the investment techniques available to a manager, add to costs and impair the ability of a Portfolio to achieve its investment objectives.
Foreign Exchange Rate Risk. To the extent that a Portfolio invests directly in foreign (non-U.S.) currencies or in securities denominated in, or that trade in, foreign (non-U.S.) currencies, it is subject to the risk that those foreign (non-U.S.) currencies will decline in value relative to the U.S. dollar or, in the case of hedging positions, that the U.S. dollar will decline in value relative to the currency being hedged by a Portfolio through foreign currency exchange transactions.
Currency rates may fluctuate significantly over short periods of time. Currency rates may be affected by changes in market interest rates, intervention (or the failure to intervene) by U.S. or foreign governments, central banks or supranational entities such as the International Monetary Fund, by the imposition of currency controls, or other political or economic developments in the United States or abroad.
Interest Rate Risk. With bonds and other fixed rate debt instruments, a rise in market interest rates generally causes values to fall; conversely, values generally rise as market interest rates fall. The higher the credit quality of the instrument, and the longer its maturity or duration, the more sensitive it is likely to be to interest rate risk. In the
64
NOTES TO FINANCIAL STATEMENTS AS OF DECEMBER 31, 2016 (CONTINUED)
NOTE 2 — SIGNIFICANT ACCOUNTING POLICIES (continued)
case of inverse securities, the interest rate paid by the securities is a floating rate, which generally will decrease when the market rate of interest to which the inverse security is indexed increases and will increase when the market rate of interest to which the inverse security is indexed decreases. As of the date of this report, market interest rates in the United States are at or near historic lows, which may increase a Portfolio's exposure to risks associated with rising market interest rates. Rising market interest rates could have unpredictable effects on the markets and may expose fixed-income and related markets to heightened volatility. For a fund that invests in fixed-income securities, an increase in market interest rates may lead to increased redemptions and increased portfolio turnover, which could reduce liquidity for certain investments, adversely affect values, and increase costs. If dealer capacity in fixed-income markets is insufficient for market conditions, it may further inhibit liquidity and increase volatility in the fixed-income markets. Further, recent and potential changes in government policy may affect interest rates.
Risks of Investing in Derivatives. A Portfolio's use of derivatives can result in losses due to unanticipated changes in the market or credit risk factors and the overall market. In instances where a Portfolio is using derivatives to decrease, or hedge, exposures to market or credit risk factors for securities held by a Portfolio, there are also risks that those derivatives may not perform as expected resulting in losses for the combined or hedged positions.
Derivative instruments are subject to a number of risks, including the risk of changes in the market price of the underlying securities, credit risk with respect to the counterparty, risk of loss due to changes in market interest rates and liquidity and volatility risk. The amounts required to purchase certain derivatives may be small relative to the magnitude of exposure assumed by a Portfolio. Therefore, the purchase of certain derivatives may have an economic leveraging effect on a Portfolio and exaggerate any increase or decrease in the net asset value. Derivatives may not perform as expected, so a Portfolio may not realize the intended benefits. When used for hedging purposes, the change in value of a derivative may not correlate as expected with the currency, security or other risk being hedged. When used as an alternative or substitute for direct cash investments, the return provided by the derivative may not provide the same return as direct cash investment. In addition, given their complexity, derivatives expose a Portfolio to the risk of improper valuation.
Generally, derivatives are sophisticated financial instruments whose performance is derived, at least in part, from the performance of an underlying asset or assets. Derivatives include, among other things, swap agreements, options, forwards and futures. Investments in derivatives are generally negotiated over-the-counter with a single counterparty and as a result are subject to credit risks related to the counterparty's ability or willingness to perform its obligations; any deterioration in the counterparty's creditworthiness could adversely affect the value of the derivative. In addition, derivatives and their underlying securities may experience periods of illiquidity which could cause a Portfolio to hold a security it might otherwise sell, or to sell a security it otherwise might hold at inopportune times or at an unanticipated price. A manager might imperfectly judge the direction of the market. For instance, if a derivative is used as a hedge to offset investment risk in another security, the hedge might not correlate to the market's movements and may have unexpected or undesired results such as a loss or a reduction in gains.
The U.S. government has enacted legislation that provides for new regulation of the derivatives market, including clearing, margin, reporting, and registration requirements. The European Union is (and other countries outside of the European Union are) implementing similar requirements, which will affect a Portfolio when it enters into a derivatives transaction with a counterparty organized in that country or otherwise subject to that country's derivatives regulations. Because these requirements are new and evolving (and some of the rules are not yet final), their ultimate impact remains unclear. Central clearing is expected to reduce counterparty risk and increase liquidity, however, there is no assurance that it will achieve that result, and in the meantime, central clearing and related requirements expose a Portfolio to new kinds of costs and risks.
Counterparty Credit Risk and Credit Related Contingent Features. Certain derivative positions are subject to counterparty credit risk, which is the risk that the counterparty will not fulfill its obligation to a Portfolio. Each Portfolio's derivative counterparties are financial institutions who are subject to market conditions that may weaken their financial position. A Portfolio intends to enter into financial transactions with counterparties it believes to be creditworthy at the time of the transaction. To reduce this risk, a Portfolio has entered into master netting arrangements, established within each Portfolio's International Swap and Derivatives Association, Inc. ("ISDA") Master Agreements ("Master Agreements"). These Master Agreements are with select counterparties and they govern transactions, including certain over-the-counter ("OTC") derivative and forward foreign currency
65
NOTES TO FINANCIAL STATEMENTS AS OF DECEMBER 31, 2016 (CONTINUED)
NOTE 2 — SIGNIFICANT ACCOUNTING POLICIES (continued)
contracts, entered into by a Portfolio and the counterparty. The Master Agreements maintain provisions for general obligations, representations, agreements, collateral, and events of default or termination. The occurrence of a specified event of termination may give a counterparty the right to terminate all of its contracts and affect settlement of all outstanding transactions under the applicable Master Agreement.
A Portfolio may also enter into collateral agreements with certain counterparties to further mitigate counterparty credit risk on OTC derivative and forward foreign currency contracts. Subject to established minimum levels, collateral is generally determined based on the net aggregate unrealized gain or loss on contracts with a certain counterparty. Collateral pledged to or from a Portfolio is held in a segregated account by a third-party agent and can be in the form of cash or debt securities issued by the U.S. government or related agencies.
As of December 31, 2016, the maximum amount of loss that Global Bond, Invesco Comstock, and Invesco Equity and Income would incur if the counterparties to its derivative transactions failed to perform would be $22,717,186, $822,857, and $1,883,232, respectively, which represents the gross payments to be received by the Portfolios on open forward foreign currency contracts and purchased options were they to be unwound as of December 31, 2016. To reduce the amount of potential loss to Global Bond, certain counterparties have posted $2,030,000 in cash collateral for open OTC transactions at December 31, 2016.
Each Portfolio has credit related contingent features that if triggered would allow its derivative counterparties to close out and demand payment or additional collateral to cover their exposure from a Portfolio. Credit related contingent features are established between each Portfolio and their derivatives counterparties to reduce the risk that a Portfolio will not fulfill its payment obligations to its counterparties. These triggering features include, but are not limited to, a percentage decrease in a Portfolio's net assets and or a percentage decrease in a Portfolio's NAV, which could cause a Portfolio to accelerate payment of any net liability owed to the counterparty. The contingent features are established within each Portfolio's Master Agreements. There were no credit events during the year ended December 31, 2016, that triggered any credit related contingent features for each respective Portfolio.
As of December 31, 2016, Global Bond, and Invesco Comstock had a liability position of $25,961,088 and $1,731 on open forward foreign currency contracts and
written options with credit related contingent features. If a contingent feature would have been triggered as of December 31, 2016, the Portfolios could have been required to pay this amount in cash to its counterparties. As of December 31, 2016, Global Bond had pledged $2,810,000 in cash collateral for open OTC derivative transactions with its respective counterparties.
H. Forward Foreign Currency Contracts. Certain Portfolios may enter into forward foreign currency contracts primarily to hedge against foreign currency exchange rate risks on their non-U.S. dollar denominated investment securities. When entering into a forward currency contract, a Portfolio agrees to receive or deliver a fixed quantity of foreign currency for an agreed-upon price on an agreed future date. These contracts are valued daily and a Portfolio's net equity therein, representing unrealized gain or loss on the contracts as measured by the difference between the forward foreign exchange rates at the dates of entry into the contracts and the forward rates at the reporting date, is included in the Statement of Assets and Liabilities. Realized and unrealized gains and losses are included in the Statement of Operations. These instruments involve market and/or credit risk in excess of the amount recognized in the Statement of Assets and Liabilities. Risks arise from the possible inability of counterparties to meet the terms of their contracts and from movement in currency and securities values and interest rates. Open forward foreign currency contracts are presented following the Portfolio of Investments.
During the year ended December 31, 2016, the following Portfolios had average contract amounts on forward foreign currency contracts to buy and sell as disclosed below:
| | | Buy | | Sell | |
Global Bond** | | $ | 269,255,104 | | | $ | 177,581,995 | | |
American Century Small-Mid Cap
Value* | | | 109,543 | | | | 7,023,631 | | |
Invesco Comstock* | | | 1,852,572 | | | | 45,179,028 | | |
Invesco Equity and Income* | | | 377,020 | | | | 103,443,755 | | |
* For the year ended December 31, 2016, the Portfolios used forward foreign currency contracts primarily to protect their non-U.S. dollar-denominated holdings from adverse currency movements. Please refer to the tables following each respective Portfolio of Investments for open forward foreign currency contracts at December 31, 2016.
** For the year ended December 31, 2016, the Portfolio used forward foreign currency contracts primarily to protect their non-U.S. dollar-denominated holdings from adverse currency movements and to gain exposure to currencies for the purposes of risk management or enhanced return. Please refer to the tables following each respective Portfolio of Investments for open forward foreign currency contracts at December 31, 2016.
I. Futures Contracts. Certain Portfolios may enter into futures contracts involving foreign currency, interest rates, securities and security indices. A futures contract is a
66
NOTES TO FINANCIAL STATEMENTS AS OF DECEMBER 31, 2016 (CONTINUED)
NOTE 2 — SIGNIFICANT ACCOUNTING POLICIES (continued)
commitment to buy or sell a specific amount of a financial instrument at a negotiated price on a stipulated future date. A Portfolio may buy and sell futures contracts. Futures contracts traded on a commodities or futures exchange will be valued at the final settlement price or official closing price on the principal exchange as reported by such principal exchange at its trading session ending at, or most recently prior to, the time when each Portfolio's assets are valued.
Upon entering into a futures contract, a Portfolio is required to deposit either cash or securities (initial margin) in an amount equal to a certain percentage of the contract value. Subsequent payments (variation margin) are made or received by a Portfolio each day. The variation margin payments are equal to the daily changes in the contract value and are recorded as unrealized gains and losses. Open futures contracts are reported on a table following each Portfolio's Portfolio of Investments. Securities held in collateralized accounts to cover initial margin requirements on open futures contracts are footnoted in the Portfolio of Investments. Cash collateral held by the broker to cover initial margin requirements on open futures contracts are noted in the Statements of Assets and Liabilities. The net change in unrealized appreciation and depreciation is reported in the Statements of Operations. Realized gains (losses) are reported in the Statements of Operations at the closing or expiration of futures contracts.
Futures contracts are exposed to the market risk factor of the underlying financial instrument. During the year ended December 31, 2016, Global Bond had purchased and sold futures contracts on various notes and bonds as part of their respective duration strategy. During the year ended December 31, 2016, Pioneer High Yield had sold futures contracts on equity indices to decrease exposure to equity risk. Additional associated risks of entering into futures contracts include the possibility that there may be an illiquid market where each Portfolio is unable to liquidate the contract or enter into an offsetting position and, if used for hedging purposes, the risk that the price of the contract will correlate imperfectly with the prices of each Portfolios' securities. With futures, there is minimal counterparty credit risk to the Portfolios since futures are exchange traded and the exchange's clearinghouse, as counterparty to all exchange traded futures, guarantees the futures against default.
During the year ended December 31, 2016, the following Portfolios had average notional values on futures contracts purchased and sold as disclosed below. Please refer to the tables following each respective Portfolio of
Investments for open futures contracts at December 31, 2016.
| | | Purchased | | Sold | |
Global Bond | | $ | 77,215,588 | | | $ | 46,170,173 | | |
Pioneer High Yield | | | — | | | | 2,007,554 | | |
J. Securities Lending. Each Portfolio may temporarily loan up to 331/3% of its total assets to brokers, dealers or other financial institutions in exchange for a negotiated lender's fee. Securities lending involves two primary risks: "investment risk" and "borrower default risk." When lending securities, the Portfolios will receive cash or U.S. government securities as collateral. Investment risk is the risk that the Portfolios will lose money from the investment of the cash collateral received from the borrower. Borrower default risk is the risk that the Portfolios will lose money due to the failure of a borrower to return a borrowed security. Loans are subject to termination at the option of the borrower or the Portfolios. Securities lending may result in leverage. The use of leverage may exaggerate any increase or decrease in the net asset value, causing the Portfolios to be more volatile. The use of leverage may increase expenses and increase the impact of the Portfolios' other risks.
K. Restricted Securities. The Portfolios may invest in restricted securities which include those sold under Rule 144A of the Securities Act of 1933, as amended ("1933 Act") or securities offered pursuant to Section 4(a)(2) of the 1933 Act, and/or are subject to legal or contractual restrictions on resale and may not be publicly sold without registration under the 1933 Act. Restricted securities are fair valued using market quotations when readily available. In the absence of market quotations, the securities are valued based upon their fair value determined in good faith under procedures approved by the Board.
Securities that are not registered for sale to the public under the Securities Act are referred to as "restricted securities." These securities may be sold in private placement transactions between issuers and their purchasers and may be neither listed on an exchange nor traded in other established markets. Many times these securities are subject to legal or contractual restrictions on resale. As a result of the absence of a public trading market, the prices of these securities may be more volatile, less liquid and more difficult to value than publicly traded securities. The price realized from the sale of these securities could be less than the amount originally paid or less than their fair value if they are resold in privately negotiated transactions. In addition, these securities may not be subject to disclosure and other investment protection requirements that are afforded to publicly traded securities. Certain investments may
67
NOTES TO FINANCIAL STATEMENTS AS OF DECEMBER 31, 2016 (CONTINUED)
NOTE 2 — SIGNIFICANT ACCOUNTING POLICIES (continued)
include investment in smaller, less seasoned issuers, which may involve greater risk.
L. Delayed-Delivery and When-Issued Transactions. Certain Portfolios may purchase or sell securities on a when-issued or forward commitment basis. The price of the underlying securities and date when the securities will be delivered and paid for are fixed at the time the transaction is negotiated. The fair value of such is identified in the Portfolios' Portfolio of Investments. Losses may arise due to changes in the fair value of the securities or from the inability of counterparties to meet the terms of the contract. In connection with such purchases, the Portfolios are required to hold liquid assets as collateral with the Portfolios' custodian sufficient to cover the purchase price.
To mitigate counterparty risk, certain Portfolios have entered into Master Securities Forward Transaction Agreements ("MSFTA") with their respective counterparties that provide for collateral and the right to offset amounts due to or from those counterparties under specified conditions. Subject to minimum transfer amounts, collateral requirements are determined and transfers made based on the net aggregate unrealized gain or loss on all the when-issued or delayed-delivery transactions with a particular counterparty. Cash collateral, if any, is presented on the Statement of Assets and Liabilities as an asset (Cash pledged as collateral for delayed-delivery or when-issued securities) and a liability (Cash received as collateral for delayed-delivery or when-issued securities). At December 31, 2016, there was no cash collateral pledged to or received by any Portfolio.
M. Mortgage Dollar Roll Transactions. Certain Portfolios may engage in dollar roll transactions with respect to mortgage-backed securities issued by Government National Mortgage Association, Federal National Mortgage Association and Federal Home Loan Mortgage Corp. In a dollar roll transaction, a Portfolio sells a mortgage-backed security to a financial institution, such as a bank or broker/dealer, and simultaneously agrees to repurchase a substantially similar (i.e., same type, coupon, and maturity) security from the institution on a delayed delivery basis at an agreed upon price. The mortgage-backed securities that are repurchased will bear the same interest rate as those sold, but generally will be collateralized by different pools of mortgages with different prepayment histories. The Portfolios account for dollar roll transactions as purchases and sales. For fee based dollar roll transactions, the fee is recorded as income.
N. Options Contracts. Certain Portfolios may purchase put and call options and may write (sell) put options and covered call options on futures, swaps ("swaptions"), securities, commodities or foreign currencies. The Portfolios may engage in option transactions as a hedge against adverse movements in the value of portfolio holdings or to increase market exposure. Option contracts are valued daily and unrealized gains or losses are recorded based upon the last sales price on the principal exchange on which the options are traded. An amount equal to the proceeds of the premium received by the Portfolios upon the writing of a put or call option is included in the Statements of Assets and Liabilities as an asset and equivalent liability which is subsequently marked-to-market until it is exercised or closed, or it expires. The Portfolios will realize a gain or loss upon the expiration or closing of the option contract. When an option is exercised, the proceeds on sales of the underlying security for a written call option, the purchase cost of the security for a written put option, or the cost of the security for a purchased put or call option is adjusted by the amount of premium received or paid. Realized and unrealized gains or losses on option contracts are reflected in the accompanying financial statements. The risk in writing a covered call option is that the Portfolios give up the opportunity for profit if the market price of the security increases and the option is exercised. The risk in writing a put option is that the Portfolios may incur a loss if the market price of the security decreases and the option is exercised. The risk in buying an option is that the Portfolios pay a premium whether or not the option is exercised. Risks may also arise from an illiquid secondary market or from the inability of counterparties to meet the terms of the contract.
During the year ended December 31, 2016, Global Bond had purchased credit default swaptions to increase exposure to credit risk. There were no open credit default swaptions at December 31, 2016.
During the year ended December 31, 2016, Global Bond had purchased and written foreign currency options to gain exposure to currencies and to generate income. Please refer to the Portfolio of Investments and the tables following for open purchased and written foreign currency options at December 31, 2016.
During the year ended December 31, 2016, Global Bond had purchased and written interest rate swaptions to gain exposure to interest rates and to generate income. Please refer to the Portfolio of Investments and the tables following for open purchased and written interest rate swaptions at December 31, 2016.
68
NOTES TO FINANCIAL STATEMENTS AS OF DECEMBER 31, 2016 (CONTINUED)
NOTE 2 — SIGNIFICANT ACCOUNTING POLICIES (continued)
Please refer to Note 8 for the volume of both purchased and written option activity during the year ended December 31, 2016.
O. Swap Agreements. Certain Portfolios may enter into swap agreements. A swap is an agreement between two parties pursuant to which each party agrees to make one or more payments to the other at specified future intervals based on the return of an asset (such as a stock, bond or currency) or non-asset reference (such as an interest rate or index). Swap agreements are privately negotiated in the OTC market and may be executed in a multilateral or other trade facility platform, such as a registered commodities exchange ("centrally cleared swaps").
The swap agreement will specify the "notional" amount of the asset or non-asset reference to which the contract relates. Subsequent changes in fair value, if any, are calculated based upon changes in the performance of the asset or non-asset reference multiplied by the notional value of the contract. A Portfolio may enter into credit default, interest rate, total return and currency swaps to manage its exposure to credit, currency and interest rate risk. All outstanding swap agreements are reported following each Portfolio's Portfolio of Investments.
Swaps are marked to market daily using quotations primarily from third party pricing services, registered commodities exchange(s), counterparties or brokers. The fair value of an OTC swap contract is recorded on each Portfolio's Statements of Assets and Liabilities. Daily changes in the value of centrally cleared swaps, if any, are recorded as variation margin receivable or payable on the Statement of Assets and Liabilities. During the term of the swap, changes in the value of the swap, if any, are recorded as unrealized gains or losses on the Statements of Operations. Upfront payments paid or received on OTC swaps by a Portfolio when entering into the agreements are reported on the Statements of Assets and Liabilities and as a component of the changes in unrealized gains or losses on the Statements of Operations. These upfront payments represent the amounts paid or received when initially entering into the swap agreement to compensate for differences between the stated terms of the swap agreement and the prevailing market conditions. The upfront payments are included as a component in the realized gains or losses on each Portfolio's Statement of Operations upon termination or maturity of the swap. A Portfolio also records net periodic payments paid or received on the swap contract as a realized gain or loss on the Statements of Operations.
In a centrally cleared swap, immediately following execution of the swap agreement, the swap agreement is novated to a central counterparty (the "CCP") and the Portfolio's counterparty on the swap agreement becomes the CCP. The Portfolios are required to interface with the CCP through a broker. Upon entering into a centrally cleared swap, the Portfolios are required to deposit initial margin with the broker in the form of cash or securities in an amount that varies depending on the size and risk profile of the particular swap. Securities deposited as initial margin are footnoted as pledged on the Portfolio of Investments and cash deposited is recorded on the Statements of Assets and Liabilities as cash pledged for centrally cleared swaps. The daily change in valuation of centrally cleared swaps is recorded as a receivable or payable for variation margin in the Statements of Assets and Liabilities. Payments received from (paid to) the counterparty, including at termination, are recorded as realized gain (loss) on the Statements of Operations.
Entering into swap agreements involves the risk that the maximum potential loss of an investment exceeds the current value of the investment as reported on each Portfolio's Statements of Assets and Liabilities. Other risks involve the possibility that the counterparty to the agreements may default on its obligation to perform, that there will be no liquid market for these investments and that unfavorable changes in the market will have a negative impact on the value of the index or securities underlying the respective swap agreement.
Credit Default Swap Contracts. A credit default swap is a bilateral agreement between counterparties in which the buyer of the protection agrees to make a stream of periodic payments to the seller of protection in exchange for the right to receive a specified return in the event of a default or other credit event for a referenced entity, obligation or index. As a seller of protection on credit default swaps, a Portfolio will generally receive from the buyer a fixed payment stream based on the notional amount of the swap contract. This fixed payment stream will continue until the swap contract expires or a defined credit event occurs.
A Portfolio is subject to credit risk in the normal course of pursuing its investment objectives. As a seller of protection in a credit default swap, a Portfolio may execute these contracts to manage its exposure to the market or certain sectors of the market. Certain Portfolios may also enter into credit default swaps to speculate on changes in an issuer's credit quality, to take advantage of perceived spread advantages, or to offset an existing short equivalent (i.e. buying protection on an equivalent reference entity).
69
NOTES TO FINANCIAL STATEMENTS AS OF DECEMBER 31, 2016 (CONTINUED)
NOTE 2 — SIGNIFICANT ACCOUNTING POLICIES (continued)
Certain Portfolios may sell credit default swaps which expose these Portfolios to the risk of loss from credit risk- related events specified in the contract. Although contract specific, credit events are generally defined as bankruptcy, failure to pay, restructuring, obligation acceleration, obligation default or repudiation/moratorium. If a Portfolio is a seller of protection, and a credit event occurs, as defined under the terms of that particular swap agreement, a Portfolio will generally either (i) pay to the buyer an amount equal to the notional amount of the swap and take delivery of the referenced obligation, other deliverable obligations, or underlying securities comprising a referenced index or (ii) pay a net settlement amount in the form of cash or securities equal to the notional amount of the swap less the recovery value of the referenced obligation or underlying securities comprising a referenced index. If a Portfolio is a buyer of protection and a credit event occurs, as defined under the terms of that particular swap agreement, a Portfolio will either (i) receive from the seller of protection an amount equal to the notional amount of the swap and deliver the referenced obligation, other deliverable obligations or underlying securities comprising the referenced index or (ii) receive a net settlement amount in the form of cash or securities equal to the notional amount of the swap less the recovery value of the referenced obligation or underlying securities comprising the referenced index. Recovery values are assumed by market makers considering either industry standard recovery rates or entity specific factors and considerations until a credit event occurs. If a credit event has occurred, the recovery value is determined by a facilitated auction whereby a minimum number of allowable broker bids, together with a specified valuation method, are used to calculate the settlement value.
Implied credit spreads, represented in absolute terms, utilized in determining the fair value of credit default swap agreements on corporate issues or sovereign issues are disclosed in each Portfolio's Portfolio of Investments and serve as an indicator of the current status of the payment/performance risk and represent the likelihood or risk of default for the credit derivative. The implied credit spread of a particular referenced entity reflects the cost of buying/selling protection and may include upfront payments required to be made to enter into the agreement. For credit default swaps on asset-backed securities or credit indices, the quoted market prices and resulting fair values serve as the indicator of the current status of the payment/performance risk. Wider credit spreads and increasing fair values, in absolute terms when compared to the notional amount of the swap,
represent a deterioration of the referenced entity's credit soundness and a greater likelihood or risk of default or other credit event occurring as defined under the terms of the agreement.
The maximum amount of future payments (undiscounted) that a Portfolio as seller of protection could be required to make under a credit default swap agreement would be an amount equal to the notional amount of the agreement. These potential amounts would be partially offset by any recovery values of the respective referenced obligations, upfront payments received upon entering into the agreements, or net amounts received from the settlement of buy protection credit default swap agreements entered into by a Portfolio for the same referenced entity or entities.
For the year ended December 31, 2016, Global Bond and Pioneer High Yield had sold credit protection on various credit default swap indices to gain additional exposure to the market or certain sectors of the markets. For the year ended December 31, 2016, Global Bond and Pioneer High Yield had an average notional amount of $11,700,000 and $3,154,288, respectively, on credit default swaps to sell protection. Please refer to the tables following the Portfolio of Investments for Global Bond and Pioneer High Yield for open credit default swaps to sell protection at December 31, 2016.
At December 31, 2016, Pioneer High Yield had pledged $310,000 in cash collateral for open centrally cleared credit default swaps outstanding at December 31, 2016.
Interest Rate Swap Contracts. An interest rate swap involves the agreement between counterparties to exchange periodic payments based on interest rates. One payment will be based on a floating rate of a specified interest rate while the other will be a fixed rate. Risks involve the future fluctuations of interest rates in which a Portfolio may make payments that are greater than what a Portfolio received from the counterparty. Other risks include credit, liquidity and market risk.
For the year ended December 31, 2016, Global Bond had entered into interest rate swaps in which it pays a floating interest rate and receives a fixed interest rate ("Long interest rate swap") in order to increase exposure to interest rate risk. Average notional amounts on long interest rate swaps was $1,520,772,109.
For the year ended December 31, 2016, Global Bond had entered into interest rate swaps in which it pays a fixed interest rate and receives a floating interest rate ("Short interest rate swap") in order to decrease exposure to interest rate risk. Average notional amounts on short interest rate swaps was $1,470,308,901.
70
NOTES TO FINANCIAL STATEMENTS AS OF DECEMBER 31, 2016 (CONTINUED)
NOTE 2 — SIGNIFICANT ACCOUNTING POLICIES (continued)
Global Bond entered into interest rate swaps to adjust interest rate and yield curve exposures and to substitute for physical fixed-income securities. Please refer to the table following the Portfolio of Investments for Global Bond for open centrally cleared interest rate swaps at December 31, 2016.
At December 31, 2016, Global Bond had pledged $1,523,000 in cash collateral for open centrally cleared interest rate swaps outstanding at December 31, 2016.
Volatility Swap Contracts. A volatility swap is an agreement between counterparties to exchange periodic payments based on the measured volatility of a reference security, index, currency or other reference investment over a specified time frame. One cash flow is typically based on the volatility of the reference investment as measured by changes in its price or level while the other cash flow is based on an interest rate or the measured volatility of a different reference investment. The unrealized appreciation or depreciation on a volatility swap will typically depend on the magnitude of the reference investment's volatility, or size of the movement, rather than general directional increases or decreases in its price. Volatility swaps are less standard in structure than other types of swaps and provide pure, or isolated, exposure to volatility risk of the specific underlying reference investment. Volatility swaps are typically used to speculate on future volatility levels, to trade the spread between realized and expected volatility, or to decrease the volatility exposure of investments held by the Portfolios.
For the year ended December 31, 2016, Global Bond had entered into one foreign currency volatility swap with a notional amount of $3,632,600. Global Bond entered into foreign currency volatility swaps to take a position on future expectations of volatility. There were no open volatility swaps at December 31, 2016 for Global Bond.
P. Structured Products. Global Bond invests in structured products which are specially-designed derivative investments whose principal payments or interest payments are linked to the performance of underlying foreign currencies, interest rate spreads, stock market indices, prices of individual securities, commodities or other financial instruments or the occurrence of other specific events. The terms and conditions of these products may be 'structured' by the purchaser (a Portfolio) and the borrower issuing the note. The market value of these products will increase or decrease based on the performance of the underlying asset or reference. A Portfolio records the net change in the market value of the structured product on the
accompanying Statements of Operations as a change in unrealized appreciation or depreciation on investments. A Portfolio records a realized gain or loss on the Statements of Operations upon the sale or maturity of the structured product. Please refer to the Portfolio of Investments for structured products held by Global Bond at December 31, 2016.
Q. Indemnifications. In the normal course of business, the Company may enter into contracts that provide certain indemnifications. The Company's maximum exposure under these arrangements is dependent on future claims that may be made against the Portfolios and, therefore, cannot be estimated; however, based on experience, management considers the risk of loss from such claims remote.
NOTE 3 — INVESTMENT TRANSACTIONS
For the year ended December 31, 2016, the cost of purchases and the proceeds from the sales of securities, excluding U.S. government and short-term securities, were as follows:
| | | Purchases | | Sales | |
Global Bond | | $ | 105,413,737 | | | $ | 87,445,401 | | |
American Century Small-Mid Cap
Value | | | 218,286,827 | �� | | | 199,580,297 | | |
Baron Growth | | | 32,053,672 | | | | 203,838,749 | | |
Columbia Contrarian Core | | | 170,843,396 | | | | 205,347,449 | | |
Columbia Small Cap Value II | | | 125,518,037 | | | | 142,715,645 | | |
Invesco Comstock | | | 87,375,708 | | | | 153,268,667 | | |
Invesco Equity and Income | | | 327,533,862 | | | | 506,798,185 | | |
JPMorgan Mid Cap Value | | | 114,015,869 | | | | 219,552,162 | | |
Oppenheimer Global | | | 85,624,250 | | | | 301,563,677 | | |
Pioneer High Yield | | | 46,972,978 | | | | 47,270,684 | | |
T. Rowe Price Diversified Mid Cap
Growth | | | 213,264,333 | | | | 247,112,034 | | |
T. Rowe Price Growth Equity | | | 634,259,675 | | | | 856,529,126 | | |
Templeton Foreign Equity | | | 98,371,632 | | | | 174,848,329 | | |
U.S. government securities not included above were as follows:
| | | Purchases | | Sales | |
Global Bond | | $ | 409,426,135 | | | $ | 427,316,915 | | |
Invesco Equity and Income | | | 1,888,239,205 | | | | 1,898,533,393 | | |
Pioneer High Yield | | | 3,500,775 | | | | — | | |
NOTE 4 — INVESTMENT MANAGEMENT FEES
The Portfolios have entered into an investment management agreement ("Management Agreement") with the Investment Adviser. The Investment Adviser has overall responsibility for the management of the Portfolios. The Investment Adviser oversees all investment management and portfolio management services for the Portfolios and assists in managing and supervising all aspects of the general day-to-day business activities and operations of the Portfolios, including custodial, transfer agency, dividend disbursing, accounting, auditing, compliance and related services.
71
NOTES TO FINANCIAL STATEMENTS AS OF DECEMBER 31, 2016 (CONTINUED)
NOTE 4 — INVESTMENT MANAGEMENT FEES (continued)
This Management Agreement compensates the Investment Adviser with a management fee, computed daily and payable monthly, based on the average daily net assets of each Portfolio, at the following annual rates:
Portfolio | | Fee | |
Global Bond | | 0.600% on the first $4 billion; | |
| | | 0.575% on the next $1 billion; | |
| | | 0.550% on the next $1 billion; | |
| | | 0.530% on assets over $6 billion | |
American Century Small-Mid
Cap Value | | 1.10% on the first $250 million; | |
| | | 1.05% on the next $250 million; | |
| | | 1.00% on assets over $500 million | |
Baron Growth | | 0.950% on the first $1 billion; | |
| | | 0.925% on the next $1 billion; | |
| | | 0.900% on assets over $2 billion | |
Columbia Contrarian Core | | 0.90% on the first $500 million; | |
| | | 0.85% on the next $500 million; | |
| | | 0.80% on assets over $1 billion | |
Columbia Small Cap Value II | | 0.85% | |
Invesco Comstock | | 0.70% | |
Invesco Equity and Income(1) | | 0.65% on the first $750 million; | |
| | | 0.63% on the next $250 million; | |
| | | 0.61% on assets over $1 billion | |
JPMorgan Mid Cap Value | | 0.85% on the first $500 million; | |
| | | 0.75% on the next $500 million; | |
| | | 0.70% on assets over $1 billion | |
Oppenheimer Global | | 0.70% on the first $3 billion; | |
| | | 0.68% on the next $1 billion; | |
| | | 0.67% on the next $4 billion; | |
| | | 0.66% on assets over $8 billion | |
Pioneer High Yield | | 0.70% on the first $2 billion; | |
| | | 0.60% on the next $1 billion; | |
| | | 0.50% on the next $1 billion; | |
| | | 0.40% on assets over $4 billion | |
T. Rowe Price Diversified
Mid Cap Growth | | 0.74% | |
T. Rowe Price Growth Equity | | 0.70% | |
Templeton Foreign Equity | | 0.90% on the first $500 million; | |
| | | 0.85% on assets over $500 million | |
(1) The Investment Adviser has contractually agreed to waive 0.01% of the management fee for Invesco Equity and Income.
The Investment Adviser has contractually agreed to waive a portion of the management fee for Global Bond, American Century Small-Mid Cap Value, Columbia Contrarian Core, Columbia Small Cap Value II, Invesco Comstock, T. Rowe Price Growth Equity and, effective January 1, 2016, Templeton Foreign Equity in connection with sub-advisory fee reductions for these Portfolios. The waiver is calculated as follows: Waiver = 50% x (former sub-advisory fee rate minus new sub-advisory fee rate) x average daily net assets as of the calculation date.
In addition, the Investment Adviser has agreed to further waive a portion of the advisory fee for T. Rowe Price Growth Equity. The waiver for T. Rowe Price Growth Equity is based on the total savings in excess of $500,000 as a result of the aggregated sub-advisory fee schedule of T. Rowe Price Growth Equity and VY® T. Rowe Price Equity Income Portfolio, which is not
included in this report. The aggregated amount of savings is allocated to the two Portfolios pro rata based on each Portfolio's contribution to the amount saved.
For the year ended December 31, 2016, the Investment Adviser waived $6,064, $473,064, $97,111, $53,042, $93,267, $92,054 and $113,652 for Global Bond, American Century Small-Mid Cap Value, Columbia Contrarian Core, Columbia Small Cap Value II, Invesco Comstock, T. Rowe Price Growth Equity and Templeton Foreign Equity, respectively. Termination or modification of these obligations requires approval by the Board.
Templeton Foreign Equity may invest its assets in Templeton Smaller Companies Fund. Templeton Foreign Equity's purchase of shares of Templeton Smaller Companies Fund will result in Templeton Foreign Equity paying a proportionate share of the expenses of Templeton Smaller Companies Fund. The Investment Adviser will waive its management fee in an amount equal to the advisory fee received by the adviser of the Templeton Smaller Companies Fund resulting from the Templeton Foreign Equity's investment into the Templeton Smaller Companies Fund. There were no such waivers for the year ended December 31, 2016.
The Company and DSL have entered into sub-advisory agreements with each sub-adviser. These sub-advisers provide investment advice for the various Portfolios and are paid by DSL based on the average daily net assets of the respective Portfolios. Subject to such policies as the Board or DSL may determine, the sub-advisers manage each respective Portfolio's assets in accordance with the Portfolio's investment objectives, policies, and limitations. The sub-advisers of the Portfolios are as follows (*denotes a related party sub-adviser):
Portfolio | | Sub-Adviser | |
Global Bond | | Voya Investment Management Co. LLC* | |
American Century Small-Mid Cap Value | | American Century Investment Management, Inc. | |
Baron Growth | | BAMCO, Inc. | |
Columbia Contrarian Core & Columbia Small Cap Value II | | Columbia Management Investment Advisers, LLC | |
Invesco Comstock & Invesco Equity and Income | | Invesco Advisers, Inc. | |
JPMorgan Mid Cap Value | | J.P. Morgan Investment Management Inc. | |
Oppenheimer Global | | OppenheimerFunds, Inc. | |
Pioneer High Yield | | Pioneer Investment Management, Inc. | |
T. Rowe Price Diversified Mid Cap Growth & T. Rowe Price Growth Equity | | T. Rowe Price Associates, Inc. | |
Templeton Foreign Equity | | Templeton Investment Counsel, LLC | |
72
NOTES TO FINANCIAL STATEMENTS AS OF DECEMBER 31, 2016 (CONTINUED)
NOTE 5 — DISTRIBUTION AND SERVICE FEES
Class ADV and Class S2 shares of each respective Portfolio have a plan of distribution pursuant to Rule 12b-1 under the 1940 Act (the "Plan"), whereby the Distributor is reimbursed or compensated by the Portfolios for expenses incurred in the distribution of each Portfolio's shares. The Distributor may pay, on behalf of each Portfolio, out of its distribution fee, compensation to certain financial institutions for providing distribution assistance. Under the Plan, a Portfolio makes payments at an annual rate of 0.25% of the Portfolio's average daily net assets attributable to its Class ADV shares and, effective May 1, 2016, a Portfolio makes payments at an annual rate of 0.15% of the Portfolio's average daily net assets attributable to its Class S2 shares. Prior to May 1, 2016, the distribution fee on Class S2 shares was 0.25% and the Distributor had contractually agreed to waive a portion of the fee equal to 0.10%, so that the actual fee paid by Class S2 shares of each applicable Portfolio was an annual rate of 0.15%. The Distributor has contractually agreed to waive 0.02% of the distribution fee for Class S2 shares of Invesco Equity and Income. Termination or modification of this obligation requires approval by the Board.
Class ADV, Class S and Class S2 shares are further subject to a shareholder servicing fee payable to shareholder organizations pursuant to the shareholder servicing plan adopted for Class ADV, Class S and Class S2 shares which shall not exceed an annual rate of 0.25% of the average daily net assets of each class, respectively. Prior to May 1, 2016, the Distributor had contractually agreed to waive a portion of the servicing fee for Baron Growth so that total net operating expenses did not exceed 1.31% for Class S shares.
NOTE 6 — OTHER TRANSACTIONS WITH AFFILIATES AND RELATED PARTIES
At December 31, 2016, the following direct or indirect, wholly-owned subsidiaries of Voya Financial, Inc. or affiliated investment companies owned more than 5% of the following Portfolios:
Subsidiary/Affiliated
Investment Company | | Portfolio | | Percentage | |
ReliaStar Life Insurance
Company | | Oppenheimer Global | | | 5.80 | % | |
| | | Pioneer High Yield | | | 23.96 | | |
| | | T. Rowe Price Diversified
Mid Cap Growth | | | 12.50 | | |
Security Life of Denver
Insurance Company | | Global Bond | | | 6.25 | | |
| | | Pioneer High Yield | | | 24.08 | | |
| | | T. Rowe Price Diversified
Mid Cap Growth | | | 5.51 | | |
Subsidiary/Affiliated
Investment Company | | Portfolio | | Percentage | |
Voya Institutional Trust
Company | | Global Bond | | | 20.30 | % | |
| | | American Century Small-Mid
Cap Value | | | 42.31 | | |
| | | Baron Growth | | | 13.86 | | |
| | | Columbia Contrarian Core | | | 7.65 | | |
| | | Columbia Small Cap Value II | | | 11.07 | | |
| | | Invesco Comstock | | | 7.06 | | |
| | | JPMorgan Mid Cap Value | | | 23.71 | | |
| | | Oppenheimer Global | | | 9.93 | | |
| | | T. Rowe Price Diversified Mid
Cap Growth | | | 7.37 | | |
| | | T. Rowe Price Growth Equity | | | 18.61 | | |
Voya Insurance and Annuity
Company | | Baron Growth | | | 40.95 | | |
| | | Columbia Contrarian Core | | | 81.00 | | |
| | | Columbia Small Cap Value II | | | 46.48 | | |
| | | Invesco Comstock | | | 39.11 | | |
| | | Invesco Equity and Income | | | 60.70 | | |
| | | JPMorgan Mid Cap Value | | | 23.71 | | |
| | | Oppenheimer Global | | | 9.29 | | |
| | | T. Rowe Price Growth Equity | | | 16.31 | | |
| | | Templeton Foreign Equity | | | 63.77 | | |
Voya Retirement Insurance
and Annuity Company | | Global Bond | | | 67.43 | | |
| | | American Century Small-Mid
Cap Value | | | 55.26 | | |
| | | Baron Growth | | | 40.53 | | |
| | | Columbia Contrarian Core | | | 8.48 | | |
| | | Columbia Small Cap Value II | | | 32.75 | | |
| | | Invesco Comstock | | | 19.14 | | |
| | | Invesco Equity and Income | | | 33.07 | | |
| | | JPMorgan Mid Cap Value | | | 46.55 | | |
| | | Oppenheimer Global | | | 73.10 | | |
| | | Pioneer High Yield | | | 49.53 | | |
| | | T. Rowe Price Diversified Mid
Cap Growth | | | 73.30 | | |
| | | T. Rowe Price Growth Equity | | | 51.16 | | |
| | | Templeton Foreign Equity | | | 25.21 | | |
Voya Solution 2025 Portfolio | | Invesco Comstock | | | 7.12 | | |
Voya Solution 2035 Portfolio | | Invesco Comstock | | | 8.49 | | |
Voya Solution 2045 Portfolio | | Invesco Comstock | | | 6.14 | | |
Voya Solution Moderately
Aggressive Portfolio | | Invesco Comstock | | | 5.45 | | |
Under the 1940 Act, the direct or indirect beneficial owner of more than 25% of the voting securities of a company (including a fund) is presumed to control such company. Companies under common control (e.g., companies with a common owner of greater than 25% of their respective voting securities) are affiliates under the 1940 Act.
The Investment Adviser may direct the Portfolios' sub-advisers to use their best efforts (subject to obtaining best execution of each transaction) to allocate a Portfolio's equity security transactions through certain designated broker-dealers. The designated broker-dealer, in turn, will reimburse a portion of the brokerage commissions to pay certain expenses of that Portfolio. Any amounts credited to the Portfolios are reflected as brokerage commission recapture on the accompanying Statements of Operations.
The Portfolios have adopted a deferred compensation plan (the "DC Plan"), which allows eligible independent
73
NOTES TO FINANCIAL STATEMENTS AS OF DECEMBER 31, 2016 (CONTINUED)
NOTE 6 — OTHER TRANSACTIONS WITH AFFILIATES AND RELATED PARTIES (continued)
directors, as described in the DC Plan, to defer the receipt of all or a portion of the directors' fees that they are entitled to receive from the Portfolios. For purposes of determining the amount owed to the director under the DC Plan, the amounts deferred are invested in shares of the funds selected by the director (the "Notional Funds"). The Portfolios purchase shares of the Notional Funds, which are all advised by Voya Investments, LLC, in amounts equal to the directors' deferred fees, resulting in a Portfolio asset equal to the deferred compensation liability. Such assets are included as a component of "Other assets" on the accompanying Statements of Assets and Liabilities. Deferral of directors' fees under the DC Plan will not affect net assets of the Portfolio, and will not materially affect the Portfolios' assets, liabilities or net investment income per share. Amounts will be deferred until distributed in accordance with the DC Plan.
The Portfolio(s) may engage in purchase and sale transactions with funds that have a common investment adviser (or affiliated investment advisers) and/or have a common sub-adviser. These interfund transactions are made pursuant to Rule 17a-7 of the Investment Company Act of 1940. For the year ended December 31, 2016, Pioneer High Yield engaged in such purchase and sales transactions totaling $3,750,205 and $1,037,638, respectively.
NOTE 7 — EXPENSE LIMITATION AGREEMENTS
The Investment Adviser has entered into a written expense limitation agreement ("Expense Limitation Agreement") with the following Portfolios, whereby the Investment Adviser has agreed to limit expenses, excluding interest, taxes, investment-related costs, leverage expenses, extraordinary expenses, and acquired fund fees and expenses to the levels listed below:
Portfolio | | Class ADV | | Class I | | Class R6 | | Class S | | Class S2 | |
Global Bond | | | 1.10 | % | | | 0.60 | % | | | N/A | | | | 0.85 | % | | | N/A | | |
American Century
Small-Mid Cap
Value | | | 1.52 | % | | | 1.02 | % | | | N/A | | | | 1.27 | % | | | 1.42 | % | |
Baron Growth(1) | | | 1.55 | % | | | 1.05 | % | | | 1.05 | % | | | 1.30 | % | | | 1.45 | % | |
Columbia Contrarian
Core(2) | | | N/A | | | | N/A | | | | N/A | | | | N/A | | | | N/A | | |
Columbia Small Cap
Value II | | | 1.65 | % | | | 1.15 | % | | | 1.15 | % | | | 1.40 | % | | | 1.55 | % | |
Invesco Comstock(3) | | | N/A | | | | N/A | | | | N/A | | | | N/A | | | | N/A | | |
Invesco Equity and
Income | | | 1.15 | % | | | 0.65 | % | | | N/A | | | | 0.90 | % | | | 1.05 | % | |
JPMorgan Mid Cap
Value | | | 1.50 | % | | | 1.00 | % | | | N/A | | | | 1.25 | % | | | 1.40 | % | |
Oppenheimer Global | | | 1.30 | % | | | 0.80 | % | | | N/A | | | | 1.05 | % | | | 1.20 | % | |
Pioneer High Yield | | | N/A | | | | 0.71 | % | | | N/A | | | | 0.96 | % | | | N/A | | |
Portfolio | | Class ADV | | Class I | | Class R6 | | Class S | | Class S2 | |
T. Rowe Price
Diversified Mid
Cap Growth | | | 1.30 | % | | | 0.80 | % | | | 0.80 | % | | | 1.05 | % | | | 1.20 | % | |
T. Rowe Price Growth
Equity | | | 1.25 | % | | | 0.75 | % | | | N/A | | | | 1.00 | % | | | 1.15 | % | |
Templeton Foreign
Equity(4) | | | 1.48 | % | | | 0.98 | % | | | N/A | | | | 1.23 | % | | | 1.38 | % | |
(1) Prior to January 1, 2016, the expense limits for Baron Growth were 1.59%, 1.09%, 1.34% and 1.49% for Class ADV, Class I, Class S and Class S2, respectively.
(2) Pursuant to a side letter agreement, through May 1, 2017, the Investment Adviser has agreed to waive all or a portion of the management fee and/or reimburse expenses so that the expense limits are 1.24%, 0.74% and 0.99% for Class ADV, Class I and Class S, respectively. Prior to May 1, 2016, the side letter expense limits were 1.21%, 0.71% and 0.96% for Class ADV, Class I and Class S, respectively. Termination or modification of this obligation requires approval by the Board. Any fees waived pursuant to the side letter agreement shall not be eligible for recoupment.
(3) Pursuant to a side letter agreement, through May 1, 2017, the Investment Adviser has agreed to waive all or a portion of the management fee and/or reimburse expenses so that the expense limits are 1.31%, 0.81% and 1.06% for Class ADV, Class I, and Class S, respectively. Termination or modification of this obligation requires approval by the Board. Any fees waived pursuant to the side letter agreement shall not be eligible for recoupment.
(4) Pursuant to a side letter agreement, through May 1, 2017, the Investment Adviser has agreed to waive all or a portion of the management fee and/or reimburse expenses so that the expense limits are 1.42%, 0.92%, 1.17% and 1.32% for Class ADV, Class I, Class S, and Class S2, respectively. Termination or modification of this obligation requires approval by the Board. Any fees waived pursuant to the side letter agreement shall not be eligible for recoupment.
Unless otherwise specified above, the Investment Adviser may, at a later date, recoup from a Portfolio for fees waived and/or other expenses assumed by the Investment Adviser during the previous 36 months, but only if, after such recoupment, a Portfolio's expense ratio does not exceed the percentage described above. Waived and reimbursed fees net of any recoupment by the Investment Adviser of such waived and reimbursed fees are reflected on the accompanying Statements of Operations. Amounts payable by the Investment Adviser are reflected on the accompanying Statements of Assets and Liabilities.
At December 31, 2016, the amounts of waived and/or reimbursed fees that are subject to possible recoupment by the Investment Adviser, and the related expiration dates are as follows:
| | | December 31, | | | |
Portfolio | | 2017 | | 2018 | | 2019 | | Total | |
Global Bond | | $ | 173,482 | | | $ | 135,581 | | | $ | 142,214 | | | $ | 451,277 | | |
American Century
Small-Mid Cap Value | | | 463,222 | | | | 430,902 | | | | 397,677 | | | | 1,291,801 | | |
Invesco Equity and
Income | | | 201,217 | | | | 207,075 | | | | 331,544 | | | | 739,836 | | |
Pioneer High Yield | | | 60,824 | | | | 55,577 | | | | 65,632 | | | | 182,033 | | |
T. Rowe Price Diversified
Mid Cap Growth | | | 67,420 | | | | — | | | | — | | | | 67,420 | | |
74
NOTES TO FINANCIAL STATEMENTS AS OF DECEMBER 31, 2016 (CONTINUED)
NOTE 7 — EXPENSE LIMITATION AGREEMENTS (continued)
The Expense Limitation Agreement is contractual through May 1, 2017, except for T. Rowe Price Diversified Mid Cap Growth, which is through May 1, 2018, and shall renew automatically for one-year terms. Termination or modification of this obligation requires approval by the Board.
NOTE 8 — PURCHASED AND WRITTEN OPTIONS
Transactions in purchased credit default swaptions for Global Bond during the year ended December 31, 2016 were as follows:
| | | USD
Notional | | Cost | |
Balance at 12/31/2015 | | | — | | | $ | — | | |
Options Purchased | | | 12,250,000 | | | | 15,313 | | |
Options Expired | | | (12,250,000 | ) | | | (15,313 | ) | |
Balance at 12/31/2016 | | | — | | | $ | — | | |
Transactions in purchased foreign currency options for Global Bond during the year ended December 31, 2016 were as follows:
| | | USD
Notional | | Cost | |
Balance at 12/31/2015 | | | — | | | $ | — | | |
Options Purchased | | | 1,376,602,000 | | | | 7,028,993 | | |
Options Terminated in Closing
Sell Transactions | | | (459,940,000 | ) | | | (2,765,444 | ) | |
Options Expired | | | (867,062,000 | ) | | | (3,633,530 | ) | |
Balance at 12/31/2016 | | | 49,600,000 | | | $ | 630,019 | | |
Transactions in purchased interest rate swaptions for Global Bond during the year ended December 31, 2016 were as follows:
| | | EUR
Notional | | USD
Notional | |
Cost | |
Balance at
12/31/2015 | | | — | | | | — | | | $ | — | | |
Options Purchased | | | 2,331,400,000 | | | | 2,227,636,000 | | | | 40,933,598 | | |
Options Terminated
in Closing Sell
Transactions | | | (1,165,700,000 | ) | | | (1,378,736,000 | ) | | | (23,151,845 | ) | |
Options Expired | | | (1,165,700,000 | ) | | | — | | | | (975,386 | ) | |
Balance at
12/31/2016 | | | — | | | | 848,900,000 | | | $ | 16,806,367 | | |
Transactions in written foreign currency options for Global Bond during the year ended December 31, 2016 were as follows:
| | | USD
Notional | | Premiums
Received | |
Balance at 12/31/2015 | | | — | | | $ | — | | |
Options Written | | | 1,209,562,000 | | | | 5,862,810 | | |
Options Terminated in Closing
Purchase Transactions | | | (478,700,000 | ) | | | (2,779,516 | ) | |
Options Expired | | | (730,862,000 | ) | | | (3,083,294 | ) | |
Balance at 12/31/2016 | | | — | | | $ | — | | |
Transactions in written interest rate swaptions for Global Bond Portfolio during the year ended December 31, 2016 were as follows:
| | | EUR
Notional | | USD
Notional | | Premiums
Received | |
Balance at 12/31/2015 | | | — | | | | — | | | $ | — | | |
Options Written | | | 717,800,000 | | | | 4,630,556,000 | | | | 45,258,739 | | |
Options Terminated in
Closing Purchase
Transactions | | | (351,800,000 | ) | | | (3,106,656,000 | ) | | | (25,198,790 | ) | |
Options Expired | | | (366,000,000 | ) | | | (982,400,000 | ) | | | (2,349,041 | ) | |
Balance at 12/31/2016 | | | — | | | | 541,500,000 | | | $ | 17,710,908 | | |
NOTE 9 — LINE OF CREDIT
Effective May 20, 2016, each Portfolio, in addition to certain other funds managed by the Investment Adviser, has entered into an unsecured committed revolving line of credit agreement (the "Credit Agreement") with The Bank of New York Mellon ("BNY") for an aggregate amount of $400,000,000. The proceeds may be used only to finance temporarily: (1) the purchase or sale of investment securities; or (2) the repurchase or redemption of shares of the Portfolios or certain other funds managed by the Investment Adviser. The funds to which the line of credit is available pay a commitment fee equal to 0.15% per annum on the daily unused portion of the committed line amount payable quarterly in arrears. Prior to May 20, 2016, the aggregate amount was $200,000,000 and the commitment fee was equal to 0.10% per annum on the daily unused portion of the committed line amount payable quarterly in arrears.
Borrowings under the Credit Agreement accrue interest at the federal funds rate plus a specified margin. Repayments generally must be made within 60 days after the date of a revolving credit advance.
The following Portfolios utilized the line of credit during the year ended December 31, 2016:
Portfolio | | Days
Utilized | | Approximate
Average Daily
Balance For
Days Utilized | | Approximate
Weighted
Average
Interest Rate
For Days
Utilized | |
Global Bond | | | 32 | | | $ | 900,094 | | | | 1.37 | % | |
Baron Growth | | | 96 | | | | 2,738,641 | | | | 1.40 | | |
Columbia Contrarian Core | | | 4 | | | | 485,750 | | | | 1.41 | | |
JPMorgan Mid Cap Value | | | 1 | | | | 4,689,000 | | | | 1.36 | | |
T. Rowe Price Diversified
Mid Cap Growth | | | 7 | | | | 673,571 | | | | 1.38 | | |
T. Rowe Price Growth Equity | | | 3 | | | | 2,685,333 | | | | 1.38 | | |
Templeton Foreign Equity | | | 2 | | | | 1,843,000 | | | | 1.38 | | |
75
NOTES TO FINANCIAL STATEMENTS AS OF DECEMBER 31, 2016 (CONTINUED)
NOTE 10 — CAPITAL SHARES
Transactions in capital shares and dollars were as follows:
| | | Shares sold | | Shares
issued
in merger | | Reinvestment
of
distributions | | Shares
redeemed | | Net increase
(decrease)
in shares
outstanding | | Shares sold | | Proceeds
from shares
issued
in merger | | Reinvestment
of
distributions | | Shares
redeemed | | Net increase
(decrease) | |
Year or period ended | | # | | # | | # | | # | | # | | ($) | | ($) | | ($) | | ($) | | ($) | |
Global Bond | |
Class ADV | |
12/31/16 | | | 107,392 | | | | — | | | | 33,630 | | | | (449,149 | ) | | | (308,127 | ) | | | 1,108,838 | | | | — | | | | 354,541 | | | | (4,679,862 | ) | | | (3,216,483 | ) | |
12/31/15 | | | 113,182 | | | | — | | | | — | | | | (614,527 | ) | | | (501,345 | ) | | | 1,149,434 | | | | — | | | | — | | | | (6,210,909 | ) | | | (5,061,475 | ) | |
Class I | |
12/31/16 | | | 653,116 | | | | — | | | | 274,656 | | | | (2,172,158 | ) | | | (1,244,386 | ) | | | 6,967,143 | | | | — | | | | 2,946,090 | | | | (22,923,095 | ) | | | (13,009,862 | ) | |
12/31/15 | | | 331,772 | | | | — | | | | — | | | | (3,368,908 | ) | | | (3,037,136 | ) | | | 3,408,954 | | | | — | | | | — | | | | (34,472,167 | ) | | | (31,063,213 | ) | |
Class S | |
12/31/16 | | | 360,024 | | | | — | | | | 60,641 | | | | (848,014 | ) | | | (427,349 | ) | | | 3,842,909 | | | | — | | | | 649,729 | | | | (8,875,828 | ) | | | (4,383,190 | ) | |
12/31/15 | | | 286,919 | | | | — | | | | — | | | | (842,940 | ) | | | (556,021 | ) | | | 2,938,760 | | | | — | | | | — | | | | (8,662,089 | ) | | | (5,723,329 | ) | |
American Century Small-Mid Cap Value | |
Class ADV | |
12/31/16 | | | 1,295,216 | | | | — | | | | 795,421 | | | | (1,020,127 | ) | | | 1,070,510 | | | | 14,704,948 | | | | — | | | | 8,574,642 | | | | (11,256,751 | ) | | | 12,022,839 | | |
12/31/15 | | | 473,429 | | | | — | | | | 1,557,675 | | | | (875,507 | ) | | | 1,155,597 | | | | 5,970,451 | | | | — | | | | 17,305,764 | | | | (10,683,402 | ) | | | 12,592,813 | | |
Class I | |
12/31/16 | | | 2,512,202 | | | | — | | | | 1,159,927 | | | | (1,514,853 | ) | | | 2,157,276 | | | | 29,961,101 | | | | — | | | | 13,188,376 | | | | (17,722,536 | ) | | | 25,426,941 | | |
12/31/15 | | | 926,534 | | | | — | | | | 2,261,282 | | | | (2,656,690 | ) | | | 531,126 | | | | 12,118,570 | | | | — | | | | 26,343,938 | | | | (33,327,530 | ) | | | 5,134,978 | | |
Class S | |
12/31/16 | | | 1,323,919 | | | | — | | | | 726,242 | | | | (1,172,038 | ) | | | 878,123 | | | | 15,736,354 | | | | — | | | | 8,162,961 | | | | (13,410,822 | ) | | | 10,488,493 | | |
12/31/15 | | | 410,728 | | | | — | | | | 1,494,208 | | | | (1,507,539 | ) | | | 397,397 | | | | 5,276,838 | | | | — | | | | 17,228,222 | | | | (19,488,659 | ) | | | 3,016,401 | | |
Class S2 | |
12/31/16 | | | 124,442 | | | | — | | | | 34,941 | | | | (84,336 | ) | | | 75,047 | | | | 1,385,037 | | | | — | | | | 375,613 | | | | (906,287 | ) | | | 854,363 | | |
12/31/15 | | | 118,990 | | | | — | | | | 61,638 | | | | (85,591 | ) | | | 95,037 | | | | 1,506,409 | | | | — | | | | 682,951 | | | | (1,089,809 | ) | | | 1,099,551 | | |
Baron Growth | |
Class ADV | |
12/31/16 | | | 109,364 | | | | — | | | | 373,857 | | | | (773,995 | ) | | | (290,774 | ) | | | 2,797,559 | | | | — | | | | 9,413,716 | | | | (19,855,399 | ) | | | (7,644,124 | ) | |
12/31/15 | | | 157,011 | | | | — | | | | 274,983 | | | | (674,427 | ) | | | (242,433 | ) | | | 4,531,491 | | | | — | | | | 8,007,507 | | | | (19,713,089 | ) | | | (7,174,091 | ) | |
Class I | |
12/31/16 | | | 417,307 | | | | — | | | | 660,211 | | | | (2,285,812 | ) | | | (1,208,294 | ) | | | 11,410,135 | | | | — | | | | 17,990,751 | | | | (63,974,158 | ) | | | (34,573,272 | ) | |
12/31/15 | | | 434,975 | | | | — | | | | 585,465 | | | | (1,988,870 | ) | | | (968,430 | ) | | | 13,911,453 | | | | — | | | | 18,202,106 | | | | (60,748,084 | ) | | | (28,634,525 | ) | |
Class R6 | |
5/3/16(1)-12/31/16 | | | 32,619 | | | | — | | | | 12 | | | | (3 | ) | | | 32,628 | | | | 891,979 | | | | — | | | | 324 | | | | (76 | ) | | | 892,227 | | |
Class S | |
12/31/16 | | | 314,847 | | | | — | | | | 2,153,555 | | | | (4,311,981 | ) | | | (1,843,579 | ) | | | 8,589,723 | | | | — | | | | 56,573,883 | | | | (114,899,359 | ) | | | (49,735,753 | ) | |
12/31/15 | | | 479,189 | | | | — | | | | 1,647,066 | | | | (3,978,855 | ) | | | (1,852,600 | ) | | | 14,697,709 | | | | — | | | | 49,691,990 | | | | (120,734,669 | ) | | | (56,344,970 | ) | |
Class S2 | |
12/31/16 | | | 14,243 | | | | — | | | | 12,601 | | | | (135,840 | ) | | | (108,996 | ) | | | 365,247 | | | | — | | | | 318,426 | | | | (3,563,475 | ) | | | (2,879,802 | ) | |
12/31/15 | | | 38,030 | | | | — | | | | 16,992 | | | | (67,220 | ) | | | (12,198 | ) | | | 1,140,388 | | | | — | | | | 495,834 | | | | (2,030,825 | ) | | | (394,603 | ) | |
Columbia Contrarian Core | |
Class ADV | |
12/31/16 | | | 206,108 | | | | — | | | | 150,661 | | | | (172,206 | ) | | | 184,563 | | | | 4,342,604 | | | | — | | | | 3,043,357 | | | | (3,618,361 | ) | | | 3,767,600 | | |
12/31/15 | | | 298,412 | | | | — | | | | 111,618 | | | | (111,160 | ) | | | 298,870 | | | | 6,867,135 | | | | — | | | | 2,453,372 | | | | (2,573,744 | ) | | | 6,746,763 | | |
Class I | |
12/31/16 | | | 52,290 | | | | — | | | | 60,396 | | | | (91,369 | ) | | | 21,317 | | | | 1,150,383 | | | | — | | | | 1,273,754 | | | | (2,028,475 | ) | | | 395,662 | | |
12/31/15 | | | 41,593 | | | | — | | | | 58,172 | | | | (102,770 | ) | | | (3,005 | ) | | | 990,276 | | | | — | | | | 1,326,321 | | | | (2,486,511 | ) | | | (169,914 | ) | |
Class S | |
12/31/16 | | | 510,533 | | | | — | | | | 1,741,401 | | | | (2,286,414 | ) | | | (34,480 | ) | | | 11,313,446 | | | | — | | | | 36,064,421 | | | | (49,606,442 | ) | | | (2,228,575 | ) | |
12/31/15 | | | 465,869 | | | | — | | | | 1,679,367 | | | | (2,008,544 | ) | | | 136,692 | | | | 10,999,991 | | | | — | | | | 37,684,995 | | | | (48,165,495 | ) | | | 519,491 | | |
Columbia Small Cap Value II | |
Class ADV | |
12/31/16 | | | 450,766 | | | | — | | | | 78,116 | | | | (352,261 | ) | | | 176,621 | | | | 7,702,073 | | | | — | | | | 1,252,201 | | | | (5,575,925 | ) | | | 3,378,349 | | |
12/31/15 | | | 408,608 | | | | — | | | | 4,520 | | | | (532,746 | ) | | | (119,618 | ) | | | 6,702,716 | | | | — | | | | 75,657 | | | | (8,642,955 | ) | | | (1,864,582 | ) | |
Class I | |
12/31/16 | | | 733,228 | | | | — | | | | 120,397 | | | | (907,546 | ) | | | (53,921 | ) | | | 12,450,314 | | | | — | | | | 1,982,935 | | | | (14,937,217 | ) | | | (503,968 | ) | |
12/31/15 | | | 609,948 | | | | — | | | | 16,368 | | | | (932,364 | ) | | | (306,048 | ) | | | 10,295,607 | | | | — | | | | 281,364 | | | | (15,562,223 | ) | | | (4,985,252 | ) | |
(1) Commencement of operations.
76
NOTES TO FINANCIAL STATEMENTS AS OF DECEMBER 31, 2016 (CONTINUED)
NOTE 10 — CAPITAL SHARES (continued)
| | | Shares sold | | Shares
issued
in merger | | Reinvestment
of
distributions | | Shares
redeemed | | Net increase
(decrease)
in shares
outstanding | | Shares sold | | Proceeds
from shares
issued
in merger | | Reinvestment
of
distributions | | Shares
redeemed | | Net increase
(decrease) | |
Year or period ended | | # | | # | | # | | # | | # | | ($) | | ($) | | ($) | | ($) | | ($) | |
Class R6 | |
5/3/16(1)-12/31/16 | | | 21,304 | | | | — | | | | 9 | | | | (246 | ) | | | 21,067 | | | | 397,901 | | | | — | | | | 148 | | | | (4,790 | ) | | | 393,259 | | |
Class S | |
12/31/16 | | | 411,446 | | | | — | | | | 358,284 | | | | (1,517,722 | ) | | | (747,992 | ) | | | 7,134,368 | | | | — | | | | 5,879,446 | | | | (25,165,493 | ) | | | (12,151,679 | ) | |
12/31/15 | | | 424,400 | | | | — | | | | 28,258 | | | | (1,706,752 | ) | | | (1,254,094 | ) | | | 7,082,409 | | | | — | | | | 483,770 | | | | (28,634,794 | ) | | | (21,068,615 | ) | |
Class S2 | |
12/31/16 | | | 105,603 | | | | — | | | | 13,958 | | | | (111,844 | ) | | | 7,717 | | | | 1,735,870 | | | | — | | | | 222,901 | | | | (1,764,798 | ) | | | 193,973 | | |
12/31/15 | | | 149,977 | | | | — | | | | 1,285 | | | | (86,774 | ) | | | 64,488 | | | | 2,441,291 | | | | — | | | | 21,449 | | | | (1,419,646 | ) | | | 1,043,094 | | |
Invesco Comstock | |
Class ADV | |
12/31/16 | | | 137,527 | | | | — | | | | 43,241 | | | | (472,936 | ) | | | (292,168 | ) | | | 2,173,379 | | | | — | | | | 738,151 | | | | (7,225,279 | ) | | | (4,313,749 | ) | |
12/31/15 | | | 113,278 | | | | — | | | | 49,774 | | | | (392,836 | ) | | | (229,784 | ) | | | 1,807,702 | | | | — | | | | 775,483 | | | | (6,343,359 | ) | | | (3,760,174 | ) | |
Class I | |
12/31/16 | | | 1,703,584 | | | | — | | | | 293,404 | | | | (3,927,834 | ) | | | (1,930,846 | ) | | | 25,537,401 | | | | — | | | | 5,061,532 | | | | (62,442,471 | ) | | | (31,843,538 | ) | |
12/31/15 | | | 6,421,704 | | | | — | | | | 342,384 | | | | (2,378,098 | ) | | | 4,385,990 | | | | 106,336,129 | | | | — | | | | 5,351,730 | | | | (38,383,357 | ) | | | 73,304,502 | | |
Class S | |
12/31/16 | | | 441,908 | | | | — | | | | 394,851 | | | | (4,109,040 | ) | | | (3,272,281 | ) | | | 7,070,423 | | | | — | | | | 6,796,359 | | | | (63,797,475 | ) | | | (49,930,693 | ) | |
12/31/15 | | | 492,751 | | | | — | | | | 485,164 | | | | (4,247,552 | ) | | | (3,269,637 | ) | | | 7,921,714 | | | | — | | | | 7,603,995 | | | | (69,315,148 | ) | | | (53,789,439 | ) | |
Invesco Equity and Income | |
Class ADV | |
12/31/16 | | | 117,019 | | | | — | | | | 67,141 | | | | (272,844 | ) | | | (88,684 | ) | | | 4,917,985 | | | | — | | | | 2,783,517 | | | | (11,060,798 | ) | | | (3,359,296 | ) | |
12/31/15 | | | 151,527 | | | | — | | | | 115,812 | | | | (185,467 | ) | | | 81,872 | | | | 6,762,682 | | | | — | | | | 4,976,251 | | | | (8,306,926 | ) | | | 3,432,007 | | |
Class I | |
12/31/16 | | | 140,124 | | | | — | | | | 855,589 | | | | (2,219,141 | ) | | | (1,223,428 | ) | | | 6,100,181 | | | | — | | | | 36,331,776 | | | | (93,520,850 | ) | | | (51,088,893 | ) | |
12/31/15 | | | 164,439 | | | | — | | | | 1,482,183 | | | | (1,971,650 | ) | | | (325,028 | ) | | | 7,496,933 | | | | — | | | | 64,775,858 | | | | (89,096,748 | ) | | | (16,823,957 | ) | |
Class S | |
12/31/16 | | | 168,617 | | | | — | | | | 979,188 | | | | (3,305,136 | ) | | | (2,157,331 | ) | | | 7,220,022 | | | | — | | | | 41,073,160 | | | | (138,071,848 | ) | | | (89,778,666 | ) | |
12/31/15 | | | 161,203 | | | | — | | | | 1,786,423 | | | | (3,542,858 | ) | | | (1,595,232 | ) | | | 7,164,577 | | | | — | | | | 77,442,510 | | | | (159,782,804 | ) | | | (75,175,717 | ) | |
Class S2 | |
12/31/16 | | | 180,004 | | | | — | | | | 623,733 | | | | (1,523,860 | ) | | | (720,123 | ) | | | 7,753,829 | | | | — | | | | 25,770,341 | | | | (62,454,115 | ) | | | (28,929,945 | ) | |
12/31/15 | | | 176,308 | | | | — | | | | 1,097,658 | | | | (1,714,178 | ) | | | (440,212 | ) | | | 7,934,546 | | | | — | | | | 46,949,757 | | | | (76,461,118 | ) | | | (21,576,815 | ) | |
JPMorgan Mid Cap Value | |
Class ADV | |
12/31/16 | | | 379,036 | | | | — | | | | 496,562 | | | | (667,514 | ) | | | 208,084 | | | | 7,178,861 | | | | — | | | | 9,110,242 | | | | (12,514,259 | ) | | | 3,774,844 | | |
12/31/15 | | | 579,033 | | | | — | | | | 689,418 | | | | (469,879 | ) | | | 798,572 | | | | 12,439,583 | | | | — | | | | 13,601,526 | | | | (9,908,503 | ) | | | 16,132,606 | | |
Class I | |
12/31/16 | | | 851,179 | | | | — | | | | 1,156,229 | | | | (3,052,791 | ) | | | (1,045,383 | ) | | | 16,553,193 | | | | — | | | | 21,801,765 | | | | (58,125,339 | ) | | | (19,770,381 | ) | |
12/31/15 | | | 916,659 | | | | — | | | | 1,862,198 | | | | (2,727,988 | ) | | | 50,869 | | | | 20,004,354 | | | | — | | | | 37,541,744 | | | | (57,873,448 | ) | | | (327,350 | ) | |
Class S | |
12/31/16 | | | 567,728 | | | | — | | | | 1,522,331 | | | | (3,001,207 | ) | | | (911,148 | ) | | | 10,935,631 | | | | — | | | | 28,386,017 | | | | (57,184,186 | ) | | | (17,862,538 | ) | |
12/31/15 | | | 754,919 | | | | — | | | | 2,381,009 | | | | (2,843,433 | ) | | | 292,495 | | | | 16,390,139 | | | | — | | | | 47,588,257 | | | | (60,718,665 | ) | | | 3,259,731 | | |
Class S2 | |
12/31/16 | | | 33,702 | | | | — | | | | 22,547 | | | | (68,319 | ) | | | (12,070 | ) | | | 634,346 | | | | — | | | | 412,642 | | | | (1,286,780 | ) | | | (239,792 | ) | |
12/31/15 | | | 41,003 | | | | — | | | | 34,000 | | | | (116,903 | ) | | | (41,900 | ) | | | 872,170 | | | | — | | | | 669,059 | | | | (2,516,657 | ) | | | (975,428 | ) | |
Oppenheimer Global | |
Class ADV | |
12/31/16 | | | 323,960 | | | | — | | | | 489,979 | | | | (1,491,343 | ) | | | (677,404 | ) | | | 5,108,110 | | | | — | | | | 7,584,886 | | | | (23,882,388 | ) | | | (11,189,392 | ) | |
12/31/15 | | | 960,893 | | | | — | | | | 502,423 | | | | (636,796 | ) | | | 826,520 | | | | 17,968,362 | | | | — | | | | 9,400,327 | | | | (12,029,300 | ) | | | 15,339,389 | | |
Class I | |
12/31/16 | | | 763,650 | | | | — | | | | 5,694,149 | | | | (10,331,521 | ) | | | (3,873,722 | ) | | | 12,607,200 | | | | — | | | | 91,618,853 | | | | (171,064,377 | ) | | | (66,838,324 | ) | |
12/31/15 | | | 1,382,462 | | | | — | | | | 6,158,301 | | | | (7,840,979 | ) | | | (300,216 | ) | | | 27,346,457 | | | | — | | | | 119,409,448 | | | | (149,839,229 | ) | | | (3,083,324 | ) | |
Class S | |
12/31/16 | | | 387,945 | | | | — | | | | 969,834 | | | | (3,768,813 | ) | | | (2,411,034 | ) | | | 6,216,476 | | | | — | | | | 15,071,216 | | | | (60,422,277 | ) | | | (39,134,585 | ) | |
12/31/15 | | | 2,501,221 | | | | — | | | | 1,162,773 | | | | (2,122,531 | ) | | | 1,541,463 | | | | 48,174,303 | | | | — | | | | 21,836,880 | | | | (38,875,357 | ) | | | 31,135,826 | | |
Class S2 | |
12/31/16 | | | 24,256 | | | | — | | | | 17,666 | | | | (80,329 | ) | | | (38,407 | ) | | | 380,074 | | | | — | | | | 267,822 | | | | (1,253,624 | ) | | | (605,728 | ) | |
12/31/15 | | | 55,320 | | | | — | | | | 23,500 | | | | (91,169 | ) | | | (12,349 | ) | | | 1,040,869 | | | | — | | | | 430,989 | | | | (1,615,829 | ) | | | (143,971 | ) | |
(1) Commencement of operations.
77
NOTES TO FINANCIAL STATEMENTS AS OF DECEMBER 31, 2016 (CONTINUED)
NOTE 10 — CAPITAL SHARES (continued)
| | | Shares sold | | Shares
issued
in merger | | Reinvestment
of
distributions | | Shares
redeemed | | Net increase
(decrease)
in shares
outstanding | | Shares sold | | Proceeds
from shares
issued
in merger | | Reinvestment
of
distributions | | Shares
redeemed | | Net increase
(decrease) | |
Year or period ended | | # | | # | | # | | # | | # | | ($) | | ($) | | ($) | | ($) | | ($) | |
Pioneer High Yield | |
Class I | |
12/31/16 | | | 1,586,910 | | | | — | | | | 437,270 | | | | (2,008,093 | ) | | | 16,087 | | | | 17,733,148 | | | | — | | | | 4,907,706 | | | | (22,326,804 | ) | | | 314,050 | | |
12/31/15 | | | 997,272 | | | | — | | | | 472,917 | | | | (2,873,020 | ) | | | (1,402,831 | ) | | | 11,695,730 | | | | — | | | | 5,539,616 | | | | (33,567,286 | ) | | | (16,331,940 | ) | |
Class S | |
12/31/16 | | | 69,562 | | | | — | | | | 17,639 | | | | (73,088 | ) | | | 14,113 | | | | 775,358 | | | | — | | | | 197,859 | | | | (810,591 | ) | | | 162,626 | | |
12/31/15 | | | 79,466 | | | | — | | | | 18,014 | | | | (118,390 | ) | | | (20,910 | ) | | | 938,594 | | | | — | | | | 210,519 | | | | (1,367,490 | ) | | | (218,377 | ) | |
T. Rowe Price Diversified Mid Cap Growth | |
Class ADV | |
12/31/16 | | | 2,584,781 | | | | 40,605 | | | | 703,451 | | | | (719,181 | ) | | | 2,609,656 | | | | 24,893,148 | | | | 370,917 | | | | 6,401,403 | | | | (6,749,217 | ) | | | 24,916,251 | | |
12/31/15 | | | 536,469 | | | | — | | | | 474,365 | | | | (809,175 | ) | | | 201,659 | | | | 6,094,705 | | | | — | | | | 4,928,655 | | | | (8,492,047 | ) | | | 2,531,313 | | |
Class I | |
12/31/16 | | | 1,137,024 | | | | — | | | | 9,178,005 | | | | (9,167,702 | ) | | | 1,147,327 | | | | 11,584,917 | | | | — | | | | 90,954,031 | | | | (93,257,764 | ) | | | 9,281,184 | | |
12/31/15 | | | 2,032,041 | | | | — | | | | 10,723,838 | | | | (6,103,326 | ) | | | 6,652,553 | | | | 24,643,747 | | | | — | | | | 119,999,748 | | | | (71,696,552 | ) | | | 72,946,943 | | |
Class R6 | |
5/3/16(1)-12/31/16 | | | 109,396 | | | | — | | | | 38 | | | | (1,451 | ) | | | 107,983 | | | | 1,094,354 | | | | — | | | | 375 | | | | (14,630 | ) | | | 1,080,099 | | |
Class S | |
12/31/16 | | | 504,140 | | | | 2,987,146 | | | | 413,338 | | | | (1,049,203 | ) | | | 2,855,421 | | | | 4,984,404 | | | | 28,812,970 | | | | 3,968,043 | | | | (10,214,524 | ) | | | 27,550,893 | | |
12/31/15 | | | 606,565 | | | | — | | | | 398,027 | | | | (594,730 | ) | | | 409,862 | | | | 6,742,873 | | | | — | | | | 4,330,538 | | | | (6,775,241 | ) | | | 4,298,170 | | |
Class S2 | |
12/31/16 | | | 104,820 | | | | — | | | | 59,301 | | | | (97,200 | ) | | | 66,921 | | | | 1,020,404 | | | | — | | | | 541,416 | | | | (928,301 | ) | | | 633,519 | | |
12/31/15 | | | 97,971 | | | | — | | | | 66,230 | | | | (88,614 | ) | | | 75,587 | | | | 1,155,306 | | | | — | | | | 689,459 | | | | (990,490 | ) | | | 854,275 | | |
T. Rowe Price Growth Equity | |
Class ADV | |
12/31/16 | | | 200,051 | | | | — | | | | 335,148 | | | | (357,035 | ) | | | 178,164 | | | | 14,888,541 | | | | — | | | | 23,966,449 | | | | (26,585,574 | ) | | | 12,269,416 | | |
12/31/15 | | | 312,835 | | | | — | | | | 339,629 | | | | (163,295 | ) | | | 489,169 | | | | 26,554,454 | | | | — | | �� | | 28,240,157 | | | | (13,937,412 | ) | | | 40,857,199 | | |
Class I | |
12/31/16 | | | 735,960 | | | | — | | | | 1,570,936 | | | | (2,578,497 | ) | | | (271,601 | ) | | | 58,374,400 | | | | — | | | | 119,705,351 | | | | (205,091,631 | ) | | | (27,011,880 | ) | |
12/31/15 | | | 1,690,630 | | | | — | | | | 1,721,278 | | | | (1,861,900 | ) | | | 1,550,008 | | | | 150,420,520 | | | | — | | | | 150,611,865 | | | | (169,614,232 | ) | | | 131,418,153 | | |
Class S | |
12/31/16 | | | 460,280 | | | | — | | | | 535,295 | | | | (1,594,203 | ) | | | (598,628 | ) | | | 35,025,413 | | | | — | | | | 39,520,831 | | | | (123,258,488 | ) | | | (48,712,244 | ) | |
12/31/15 | | | 1,201,876 | | | | — | | | | 709,182 | | | | (905,956 | ) | | | 1,005,102 | | | | 107,064,018 | | | | — | | | | 60,500,345 | | | | (78,301,743 | ) | | | 89,262,620 | | |
Class S2 | |
12/31/16 | | | 58,653 | | | | — | | | | 14,558 | | | | (20,988 | ) | | | 52,223 | | | | 4,526,323 | | | | — | | | | 1,051,248 | | | | (1,583,046 | ) | | | 3,994,525 | | |
12/31/15 | | | 12,276 | | | | — | | | | 8,837 | | | | (9,041 | ) | | | 12,072 | | | | 1,076,931 | | | | — | | | | 740,378 | | | | (807,283 | ) | | | 1,010,026 | | |
Templeton Foreign Equity | |
Class ADV | |
12/31/16 | | | 182,603 | | | | — | | | | 90,541 | | | | (569,378 | ) | | | (296,234 | ) | | | 1,931,568 | | | | — | | | | 947,058 | | | | (6,081,216 | ) | | | (3,202,590 | ) | |
12/31/15 | | | 306,681 | | | | — | | | | 108,700 | | | | (629,849 | ) | | | (214,468 | ) | | | 3,779,598 | | | | — | | | | 1,326,137 | | | | (7,589,183 | ) | | | (2,483,448 | ) | |
Class I | |
12/31/16 | | | 1,373,628 | | | | — | | | | 570,798 | | | | (3,140,085 | ) | | | (1,195,659 | ) | | | 14,865,872 | | | | — | | | | 6,016,205 | | | | (34,019,056 | ) | | | (13,136,979 | ) | |
12/31/15 | | | 629,508 | | | | — | | | | 672,207 | | | | (2,569,753 | ) | | | (1,268,038 | ) | | | 7,847,901 | | | | — | | | | 8,274,865 | | | | (30,862,697 | ) | | | (14,739,931 | ) | |
Class S | |
12/31/16 | | | 893,873 | | | | — | | | | 1,345,871 | | | | (8,286,273 | ) | | | (6,046,529 | ) | | | 9,497,019 | | | | — | | | | 14,104,724 | | | | (88,637,951 | ) | | | (65,036,208 | ) | |
12/31/15 | | | 1,281,336 | | | | — | | | | 1,633,116 | | | | (7,042,292 | ) | | | (4,127,840 | ) | | | 15,119,746 | | | | — | | | | 19,973,008 | | | | (86,161,662 | ) | | | (51,068,908 | ) | |
Class S2 | |
12/31/16 | | | 34,034 | | | | — | | | | 7,353 | | | | (54,647 | ) | | | (13,260 | ) | | | 361,756 | | | | — | | | | 76,613 | | | | (588,127 | ) | | | (149,758 | ) | |
12/31/15 | | | 71,716 | | | | — | | | | 6,855 | | | | (25,193 | ) | | | 53,378 | | | | 840,146 | | | | — | | | | 83,425 | | | | (301,001 | ) | | | 622,570 | | |
(1) Commencement of operations.
NOTE 11 — SECURITIES LENDING
Under a Master Securities Lending Agreement (the "Agreement") with BNY, the Portfolios can lend their securities to approved brokers, dealers and other financial institutions. Loans are collateralized by cash and U.S. government securities. The collateral is equal to at
least 105% of the market value of non-U.S. securities loaned and 102% of the market value of U.S. securities loaned. The market value of the loaned securities is determined at Market Close of the Portfolios at their last sale price or official closing price on the principal exchange or system on which they are traded and any
78
NOTES TO FINANCIAL STATEMENTS AS OF DECEMBER 31, 2016 (CONTINUED)
NOTE 11 — SECURITIES LENDING (continued)
additional collateral is delivered to the Portfolios on the next business day. The cash collateral received is invested in approved investments as defined in the Agreement with BNY. The Portfolios bear the risk of loss with respect to the investment of collateral with the following exception: BNY provides the Portfolios indemnification from loss with respect to the investment of collateral provided that the cash collateral is invested solely in overnight repurchase agreements.
The cash collateral is invested in overnight repurchase agreements that are collateralized at 102% with securities issued or fully guaranteed by the U.S. Treasury; U.S. government or any agency, instrumentality or authority of the U.S. government. The securities purchased with cash collateral received are reflected in the Portfolio of Investments under Securities Lending Collateral.
Generally, in the event of counterparty default, the Portfolios have the right to use the collateral to offset losses incurred. The Agreement contains certain guarantees by BNY in the event of counterparty default and/or a borrower's failure to return a loaned security; however, there would be a potential loss to the Portfolios in the event the Portfolios are delayed or prevented from exercising their right to dispose of the collateral. Engaging in securities lending could have a leveraging effect, which may intensify the credit, market and other risks associated with investing in a Portfolio.
The following is a summary of each respective Portfolio's securities lending agreements by counterparty which are subject to offset under the Agreement as of December 31, 2016:
Global Bond
Counterparty | | Securities
Loaned
at Value | | Cash
Collateral
Received(1) | | Net
Amount | |
BNP Paribas Prime
Brokerage, Inc. | | $ | 131,198 | | | $ | (131,198 | ) | | $ | — | | |
Barclays Capital Inc. | | | 10,335,086 | | | | (10,335,086 | ) | | | — | | |
Goldman, Sachs & Co. | | | 4,440,475 | | | | (4,440,475 | ) | | | — | | |
HSBC Securities (USA) Inc. | | | 94,778 | | | | (94,778 | ) | | | — | | |
J.P. Morgan Securities LLC | | | 384,023 | | | | (384,023 | ) | | | — | | |
RBC Dominion Securities Inc | | | 26,912 | | | | (26,912 | ) | | | — | | |
Total | | $ | 15,412,472 | | | $ | (15,412,472 | ) | | $ | — | | |
(1) Collateral with a fair value of $15,731,207 has been received in connection with the above securities lending transactions. Excess collateral received from the individual counterparty is not shown for financial reporting purposes.
American Century Small-Mid Cap Value
Counterparty | | Securities
Loaned
at Value | | Cash
Collateral
Received(1) | | Net
Amount | |
Barclays Capital Inc. | | $ | 331,843 | | | $ | (331,843 | ) | | $ | — | | |
BMO Capital Markets Corp | | | 467,477 | | | | (467,477 | ) | | | — | | |
BNP Paribas | | | 12,688 | | | | (12,688 | ) | | | — | | |
BNP Paribas Prime
Brokerage Intl Ltd | | | 41,357 | | | | (41,357 | ) | | | — | | |
Citadel Clearing LLC | | | 42,292 | | | | (42,292 | ) | | | — | | |
Credit Suisse Securities
(USA) LLC | | | 238,249 | | | | (238,249 | ) | | | — | | |
Deutsche Bank Securities
Inc. | | | 53,550 | | | | (53,550 | ) | | | — | | |
Goldman, Sachs & Co. | | | 1,509,617 | | | | (1,509,617 | ) | | | — | | |
HSBC Bank PLC | | | 463,186 | | | | (463,186 | ) | | | — | | |
J.P. Morgan Securities LLC | | | 2,152,862 | | | | (2,152,862 | ) | | | — | | |
Jefferies LLC | | | 39,780 | | | | (39,780 | ) | | | — | | |
Merrill Lynch, Pierce,
Fenner & Smith Inc. | | | 162,281 | | | | (162,281 | ) | | | — | | |
Morgan Stanley & Co. LLC | | | 788,458 | | | | (788,458 | ) | | | — | | |
National Financial
Services LLC | | | 111,240 | | | | (111,240 | ) | | | — | | |
Nomura Securities
International, Inc. | | | 211,831 | | | | (211,831 | ) | | | — | | |
RBC Dominion Securities
Inc | | | 5,802 | | | | (5,802 | ) | | | — | | |
Scotia Capital (USA) INC | | | 311,480 | | | | (311,480 | ) | | | — | | |
SG Americas Securities,
LLC | | | 82,240 | | | | (82,240 | ) | | | — | | |
UBS Securities LLC. | | | 3,570 | | | | (3,570 | ) | | | — | | |
Wells Fargo Securities
LLC | | | 1,785 | | | | (1,785 | ) | | | — | | |
Total | | $ | 7,031,588 | | | $ | (7,031,588 | ) | | $ | — | | |
(1) Collateral with a fair value of $7,238,056 has been received in connection with the above securities lending transactions. Excess collateral received from the individual counterparty is not shown for financial reporting purposes.
Invesco Comstock
Counterparty | | Securities
Loaned
at Value | | Cash
Collateral
Received(1) | | Net
Amount | |
Barclays Capital Inc. | | $ | 61,518 | | | $ | (61,518 | ) | | $ | — | | |
HSBC Bank PLC | | | 1,342,356 | | | | (1,342,356 | ) | | | — | | |
J.P. Morgan Securities LLC | | | 3,229,938 | | | | (3,229,938 | ) | | | — | | |
SG Americas Securities, LLC | | | 18,316 | | | | (18,316 | ) | | | — | | |
Scotia Capital (USA) INC | | | 1,269,988 | | | | (1,269,988 | ) | | | — | | |
Total | | $ | 5,922,116 | | | $ | (5,922,116 | ) | | $ | — | | |
(1) Collateral with a fair value of $6,159,852 has been received in connection with the above securities lending transactions. Excess collateral received from the individual counterparty is not shown for financial reporting purposes.
79
NOTES TO FINANCIAL STATEMENTS AS OF DECEMBER 31, 2016 (CONTINUED)
NOTE 11 — SECURITIES LENDING (continued)
Invesco Equity and Income
Counterparty | | Securities
Loaned
at Value | | Cash
Collateral
Received(1) | | Net
Amount | |
BNP Paribas Prime
Brokerage Intl Ltd | | $ | 19,273 | | | $ | (19,273 | ) | | $ | — | | |
Barclays Capital Inc. | | | 15,560,541 | | | | (15,560,541 | ) | | | — | | |
Citadel Clearing LLC | | | 1,322,360 | | | | (1,322,360 | ) | | | — | | |
Citigroup Global Markets Inc. | | | 8,208,291 | | | | (8,208,291 | ) | | | — | | |
Deutsche Bank Securities Inc. | | | 6,418,155 | | | | (6,418,155 | ) | | | — | | |
HSBC Securities (USA) Inc. | | | 12,315,643 | | | | (12,315,643 | ) | | | — | | |
Jefferies LLC | | | 1,345,667 | | | | (1,345,667 | ) | | | — | | |
Merrill Lynch, Pierce,
Fenner & Smith Inc. | | | 224,178 | | | | (224,178 | ) | | | — | | |
Nomura Securities
International, Inc. | | | 10,286,946 | | | | (10,286,946 | ) | | | — | | |
RBC Capital Markets, LLC | | | 2,875,502 | | | | (2,875,502 | ) | | | — | | |
RBS Securities Inc | | | 19,560,401 | | | | (19,560,401 | ) | | | — | | |
SG Americas Securities, LLC | | | 7,771,647 | | | | (7,771,647 | ) | | | — | | |
Societe Generale | | | 29,801,228 | | | | (29,801,228 | ) | | | — | | |
Total | | $ | 115,709,832 | | | $ | (115,709,832 | ) | | $ | — | | |
(1) Collateral with a fair value of $118,166,949 has been received in connection with the above securities lending transactions. Excess collateral received from the individual counterparty is not shown for financial reporting purposes.
JPMorgan Mid Cap Value
Counterparty | | Securities
Loaned
at Value | | Cash
Collateral
Received(1) | | Net
Amount | |
Citigroup Global Markets Inc. | | $ | 292,097 | | | $ | (292,097 | ) | | $ | — | | |
Morgan Stanley & Co. LLC | | | 6,194,074 | | | | (6,194,074 | ) | | | — | | |
SG Americas Securities, LLC | | | 3,020,008 | | | | (3,020,008 | ) | | | — | | |
Scotia Capital (USA) INC | | | 192,850 | | | | (192,850 | ) | | | — | | |
Wells Fargo Securities LLC | | | 1,672,790 | | | | (1,672,790 | ) | | | — | | |
Total | | $ | 11,371,819 | | | $ | (11,371,819 | ) | | $ | — | | |
(1) Collateral with a fair value of $11,668,889 has been received in connection with the above securities lending transactions. Excess collateral received from the individual counterparty is not shown for financial reporting purposes.
Oppenheimer Global
Counterparty | | Securities
Loaned
at Value | | Cash
Collateral
Received(1) | | Net
Amount | |
Citadel Clearing LLC | | $ | 835,742 | | | $ | (835,742 | ) | | $ | — | | |
Citigroup Global
Markets Limited | | | 911,561 | | | | (911,561 | ) | | | — | | |
Citigroup Global Markets Inc. | | | 577,749 | | | | (577,749 | ) | | | — | | |
Credit Suisse Securities
(Europe) Limited | | | 1,738,510 | | | | (1,738,510 | ) | | | — | | |
Deutsche Bank Securities Inc. | | | 2,819,340 | | | | (2,819,340 | ) | | | — | | |
Goldman, Sachs & Co. | | | 3,548,786 | | | | (3,548,786 | ) | | | — | | |
HSBC Bank PLC | | | 543,261 | | | | (543,261 | ) | | | — | | |
J.P. Morgan Securities LLC | | | 2,183,462 | | | | (2,183,462 | ) | | | — | | |
JP Morgan Securities, Plc. | | | 902 | | | | (902 | ) | | | — | | |
Morgan Stanley & Co.
International PLC | | | 840,311 | | | | (840,311 | ) | | | — | | |
Merrill Lynch, Pierce,
Fenner & Smith Inc. | | | 14,395 | | | | (14,395 | ) | | | — | | |
Merrill Lynch International | | | 860,139 | | | | (860,139 | ) | | | — | | |
Morgan Stanley & Co. LLC | | | 22,362,877 | | | | (22,362,877 | ) | | | — | | |
Natixis Securities America LLC | | | 62,100 | | | | (62,100 | ) | | | — | | |
RBC Capital Markets, LLC | | | 782,514 | | | | (782,514 | ) | | | — | | |
RBC Dominion Securities Inc | | | 3,506,957 | | | | (3,506,957 | ) | | | — | | |
Oppenheimer Global (continued)
Counterparty | | Securities
Loaned
at Value | | Cash
Collateral
Received(1) | | Net
Amount | |
SG Americas Securities, LLC | | $ | 17,133,802 | | | $ | (17,133,802 | ) | | $ | — | | |
Societe Generale | | | 61,277 | | | | (61,277 | ) | | | — | | |
UBS AG | | | 64 | | | | (64 | ) | | | — | | |
Wells Fargo Securities LLC | | | 89,825 | | | | (89,825 | ) | | | — | | |
Total | | $ | 58,873,574 | | | $ | (58,873,574 | ) | | $ | — | | |
(1) Collateral with a fair value of $61,772,209 has been received in connection with the above securities lending transactions. Excess collateral received from the individual counterparty is not shown for financial reporting purposes.
T. Rowe Price Diversified Mid Cap Growth
Counterparty | | Securities
Loaned
at Value | | Cash
Collateral
Received(1) | | Net
Amount | |
BMO Capital Markets Corp | | $ | 86,370 | | | $ | (86,370 | ) | | $ | — | | |
BNP Paribas Prime
Brokerage Intl Ltd | | | 6,070 | | | | (6,070 | ) | | | — | | |
BNP Paribas | | | 1,991,804 | | | | (1,991,804 | ) | | | — | | |
Barclays Capital Inc. | | | 281,429 | | | | (281,429 | ) | | | — | | |
Citadel Clearing LLC | | | 1,888,040 | | | | (1,888,040 | ) | | | — | | |
Citigroup Global Markets Inc. | | | 43 | | | | (43 | ) | | | — | | |
Credit Suisse Securities
(USA) LLC | | | 781,346 | | | | (781,346 | ) | | | — | | |
Deutsche Bank Securities Inc. | | | 1,867,728 | | | | (1,867,728 | ) | | | — | | |
Goldman, Sachs & Co. | | | 7,050,771 | | | | (7,050,771 | ) | | | — | | |
HSBC Bank PLC | | | 1,323,868 | | | | (1,323,868 | ) | | | — | | |
J.P. Morgan Securities LLC | | | 5,065,476 | | | | (5,065,476 | ) | | | — | | |
Morgan Stanley & Co. LLC | | | 3,874,191 | | | | (3,874,191 | ) | | | — | | |
National Financial
Services LLC | | | 217,699 | | | | (217,699 | ) | | | — | | |
Natixis Securities America LLC | | | 1,162,943 | | | | (1,162,943 | ) | | | — | | |
RBC Dominion Securities Inc | | | 5,447,408 | | | | (5,447,408 | ) | | | — | | |
SG Americas Securities, LLC | | | 3,547 | | | | (3,547 | ) | | | — | | |
Scotia Capital (USA) INC | | | 5,935,862 | | | | (5,935,862 | ) | | | — | | |
UBS AG | | | 777,096 | | | | (777,096 | ) | | | — | | |
UBS Securities LLC. | | | 4,580,673 | | | | (4,580,673 | ) | | | — | | |
Wells Fargo Securities LLC | | | 1,791,083 | | | | (1,791,083 | ) | | | — | | |
Total | | $ | 44,133,447 | | | $ | (44,133,447 | ) | | $ | — | | |
(1) Collateral with a fair value of $45,142,497 has been received in connection with the above securities lending transactions. Excess collateral received from the individual counterparty is not shown for financial reporting purposes.
T. Rowe Price Growth Equity
Counterparty | | Securities
Loaned
at Value | | Cash
Collateral
Received(1) | | Net
Amount | |
Goldman, Sachs & Co. | | $ | 7,271,348 | | | $ | (7,271,348 | ) | | $ | — | | |
J.P. Morgan Securities LLC | | | 21,014,167 | | | | (21,014,167 | ) | | | — | | |
Natixis Securities America LLC | | | 4,956,669 | | | | (4,956,669 | ) | | | — | | |
RBC Capital Markets, LLC | | | 11,116 | | | | (11,116 | ) | | | — | | |
RBC Dominion Securities Inc | | | 3,126,317 | | | | (3,126,317 | ) | | | — | | |
Scotia Capital (USA) INC | | | 9,137,583 | | | | (9,137,583 | ) | | | — | | |
UBS AG | | | 2,111,693 | | | | (2,111,693 | ) | | | — | | |
Total | | $ | 47,628,893 | | | $ | (47,628,893 | ) | | $ | — | | |
(1) Collateral with a fair value of $48,609,294 has been received in connection with the above securities lending transactions. Excess collateral received from the individual counterparty is not shown for financial reporting purposes.
80
NOTES TO FINANCIAL STATEMENTS AS OF DECEMBER 31, 2016 (CONTINUED)
NOTE 11 — SECURITIES LENDING (continued)
Templeton Foreign Equity
Counterparty | | Securities
Loaned
at Value | | Cash
Collateral
Received(1) | | Net
Amount | |
Credit Suisse Securities
(Europe) Limited | | $ | 6,242,065 | | | $ | (6,242,065 | ) | | $ | — | | |
JP Morgan Securities, Plc. | | | 6,453,860 | | | | (6,453,860 | ) | | | — | | |
Nomura Securities
International, Inc. | | | 308,036 | | | | (308,036 | ) | | | — | | |
Total | | $ | 13,003,961 | | | $ | (13,003,961 | ) | | $ | — | | |
(1) Collateral with a fair value of $13,691,845 has been received in connection with the above securities lending transactions. Excess collateral received from the individual counterparty is not shown for financial reporting purposes.
NOTE 12 — UNFUNDED LOAN COMMITMENTS
Certain Portfolios may enter in credit agreements, all or a portion of which may be unfunded. The Portfolios are obligated to fund these loan commitments at the borrower's discretion. Funded portions of the credit agreements are presented in the Portfolio of Investments. At December 31, 2016, Pioneer High Yield had the following unfunded loan commitments:
Loan | | Unfunded
Commitments | | Unrealized
Appreciation
at 12/31/16* | |
Camping World Term Loan | | $ | 222,628 | | | $ | 3,270 | | |
Virgin Media Bristol LLC Term Loan | | | 269,328 | | | | 2,244 | | |
| | | $ | 491,956 | | | $ | 5,514 | | |
* Unfunded loan commitments are marked to market daily and any unrealized appreciation or depreciation is included in the Portfolio's Statement of Assets and Liabilities and Statement of Operations.
NOTE 13 — REORGANIZATIONS
On August 26, 2016, T. Rowe Price Diversified Mid Cap Growth ("Acquiring Portfolio") acquired all of the assets of, and assumed all of the liabilities of VY® Fidelity® VIP Mid Cap Portfolio ("Acquired Portfolio"), which is not included in this report, an open-end investment company in a tax-free reorganization in exchange for shares of the Acquiring Portfolio, pursuant to a plan of reorganization approved by the shareholders of the Acquired Portfolio on August 9, 2016. The reorganization could provide the Acquired Portfolio's shareholders with the potential for improved performance and an immediate benefit through lower gross and net expenses. For financial reporting purposes, assets received and shares issued by the Acquiring Portfolio were recorded at fair value.
Assuming the acquisition had been completed on January 1, 2016, the beginning of the annual reporting period of the Acquiring Portfolio, the Acquiring Portfolio's pro forma results of operations for the year ended December 31, 2016, are as follows:
Net investment income | | $ | 2,396,290 | | |
Net realized and unrealized gain on investments | | $ | 57,917,138 | | |
Net increase in net assets resulting from operations | | $ | 60,313,428 | | |
Because the combined investment portfolios have been managed as a single integrated portfolio since the acquisition was completed, it is not practicable to separate the amounts of revenue and earnings of the Acquired Portfolio that have been included in the Acquiring Portfolio's statement of operations since August 26, 2016. Net assets and unrealized appreciation or depreciation as of the reorganization date were as follows:
Total Net Assets of
Acquired Portfolio (000s) | | Total Net Assets of
Acquiring Portfolio (000s) | | Acquired Portfolio's
Capital Loss
Carryforwards (000s) | | Acquired Portfolio's
Unrealized
Appreciation (000s) | | Portfolios'
Conversion
Ratio | |
| $ | 29,184 | | | $ | 850,426 | | | $ | — | | | $ | — | | | | 1.3397 | | |
The net assets of the Acquiring Portfolio after the acquisition were $879,610,125.
NOTE 14 — FEDERAL INCOME TAXES
The amount of distributions from net investment income and net realized capital gains are determined in accordance with federal income tax regulations, which may differ from U.S. GAAP for investment companies. These book/tax differences may be either temporary or permanent. Permanent differences are reclassified within the capital accounts based on their federal tax-basis
treatment; temporary differences are not reclassified. Key differences include the treatment of short-term capital gains, foreign currency transactions, paydowns, income from passive foreign investment companies (PFICs), and wash sale deferrals. Distributions in excess of net investment income and/or net realized capital gains for tax purposes are reported as return of capital.
81
NOTES TO FINANCIAL STATEMENTS AS OF DECEMBER 31, 2016 (CONTINUED)
NOTE 14 — FEDERAL INCOME TAXES (continued)
The following permanent tax differences have been reclassified as of December 31, 2016:
| | | Paid-in
Capital | | Undistributed
Net
Investment
Income | | Accumulated
Net Realized
Gains/
(Losses) | |
Global Bond | | $ | — | | | $ | (1,087,523 | ) | | $ | 1,087,523 | | |
American Century
Small-Mid Cap Value | | | (94 | ) | | | 942,580 | | | | (942,486 | ) | |
Baron Growth | | | 1,378,807 | | | | 6,833,784 | | | | (8,212,591 | ) | |
Columbia Contrarian
Core | | | — | | | | 37,115 | | | | (37,115 | ) | |
Invesco Comstock | | | — | | | | 2,791,248 | | | | (2,791,248 | ) | |
Invesco Equity and
Income | | | — | | | | 6,034,054 | | | | (6,034,054 | ) | |
JPMorgan Mid Cap
Value | | | — | | | | 45,654 | | | | (45,654 | ) | |
Oppenheimer Global | | | — | | | | 2,161,817 | | | | (2,161,817 | ) | |
Pioneer High Yield | | | — | | | | 310,530 | | | | (310,530 | ) | |
T. Rowe Price Diversified
Mid Cap Growth | | | — | | | | 3,167,104 | | | | (3,167,104 | ) | |
T. Rowe Price Growth
Equity | | | — | | | | (73,944 | ) | | | 73,944 | | |
Templeton Foreign
Equity | | | (22,498,473 | )(1) | | | (3,080,935 | ) | | | 25,579,408 | | |
(1) Relates to the expiration of capital loss carryforwards.
Dividends paid by the Portfolios from net investment income and distributions of net realized short-term capital gains are, for federal income tax purposes, taxable as ordinary income to shareholders.
The tax composition of dividends and distributions to shareholders was as follows:
| | | Year Ended December 31, 2016 | | Year Ended December 31, 2015 | |
| | | Ordinary
Income | | Long-term
Capital
Gains | | Return of
Capital | | Ordinary
Income | | Long-term
Capital
Gains | |
Global Bond | | $ | 2,115,667 | | | $ | — | | | $ | 1,834,693 | | | $ | — | | | $ | — | | |
American Century Small-Mid Cap Value | | | 11,518,051 | | | | 18,783,541 | | | | — | | | | 21,982,574 | | | | 39,578,301 | | |
Baron Growth | | | — | | | | 84,297,100 | | | | — | | | | 3,161,582 | | | | 73,235,855 | | |
Columbia Contrarian Core | | | 11,518,396 | | | | 28,863,136 | | | | — | | | | 15,220,880 | | | | 26,243,808 | | |
Columbia Small Cap Value II | | | 604,001 | | | | 8,733,630 | | | | — | | | | 862,240 | | | | — | | |
Invesco Comstock | | | 12,596,042 | | | | — | | | | — | | | | 13,731,208 | | | | — | | |
Invesco Equity and Income | | | 31,417,763 | | | | 74,541,031 | | | | — | | | | 43,306,600 | | | | 150,837,776 | | |
JPMorgan Mid Cap Value | | | 5,185,326 | | | | 54,525,340 | | | | — | | | | 7,256,199 | | | | 92,144,387 | | |
Oppenheimer Global | | | 19,489,360 | | | | 95,053,417 | | | | — | | | | 23,491,220 | | | | 127,586,424 | | |
Pioneer High Yield | | | 5,105,565 | | | | — | | | | — | | | | 5,750,135 | | | | — | | |
T. Rowe Price Diversified Mid Cap Growth | | | 7,800,802 | | | | 94,064,466 | | | | — | | | | 8,011,231 | | | | 121,937,169 | | |
T. Rowe Price Growth Equity | | | — | | | | 184,243,879 | | | | — | | | | 11,502,817 | | | | 228,589,928 | | |
Templeton Foreign Equity | | | 21,144,600 | | | | — | | | | — | | | | 29,657,435 | | | | — | | |
The tax-basis components of distributable earnings and the capital loss carryforwards which may be used to offset future realized capital gains for federal income tax purposes as of December 31, 2016 are detailed below. The Regulated Investment Company Modernization Act of 2010 (the "Act") provides an unlimited carryforward period for newly generated capital losses. Under the Act, there may be a greater likelihood that all or a portion of the Portfolios' pre-enactment capital loss carryforwards may expire without being utilized due to the fact that post-enactment capital losses are required to be utilized before pre-enactment capital loss carryforwards.
82
NOTES TO FINANCIAL STATEMENTS AS OF DECEMBER 31, 2016 (CONTINUED)
NOTE 14 — FEDERAL INCOME TAXES (continued)
| | | Undistributed | | Undistributed
Long-term | | Unrealized
Appreciation/ | | Capital Loss Carryforwards | |
| | | Ordinary Income | | Capital Gains | | (Depreciation) | | Amount | | Character | | Expiration | |
Global Bond | | $ | — | | | $ | — | | | $ | (8,552,280 | ) | | $ | (1,072,763 | ) | | Long-term | | | None | | |
American Century Small-Mid Cap Value | | | 9,418,708 | | | | 8,906,091 | | | | 43,537,839 | | | | — | | | | — | | | | — | | |
Baron Growth | | | 5,824,967 | | | | 84,257,199 | | | | 375,458,379 | | | | — | | | | — | | | | — | | |
Columbia Contrarian Core | | | 3,181,986 | | | | 18,673,466 | | | | 39,957,612 | | | | — | | | | — | | | | — | | |
Columbia Small Cap Value II | | | 714,975 | | | | 8,813,326 | | | | 53,715,958 | | | | — | | | | — | | | | — | | |
Invesco Comstock | | | 2,108,439 | | | | — | | | | 78,768,959 | | | | (82,863,600 | ) | | Short-term | | | 2017 | | |
Invesco Equity and Income | | | 7,133,101 | | | | 41,913,978 | | | | 167,778,265 | | | | — | | | | — | | | | — | | |
JPMorgan Mid Cap Value | | | 4,644,397 | | | | 50,367,921 | | | | 134,563,637 | | | | — | | | | — | | | | — | | |
Oppenheimer Global | | | 16,341,117 | | | | 2,474,881 | | | | 526,042,813 | | | | — | | | | — | | | | — | | |
Pioneer High Yield | | | 3,470,733 | | | | — | | | | 1,441,044 | | | | (12,856,704 | ) | | Short-term | | | 2017 | | |
| | | | | | | | | | (572,999 | ) | | Short-term | | | None | | |
| | | | | | | | | | (4,246,952 | ) | | Long-term | | | None | | |
| | | | | | | | | $ | (17,676,655 | ) | | | | | | | |
T. Rowe Price Diversified Mid Cap Growth | | | 9,271,794 | | | | 64,237,585 | | | | 192,390,478 | | | | — | | | | — | | | | — | | |
T. Rowe Price Growth Equity | | | 565,364 | | | | 172,932,777 | | | | 317,568,618 | | | | — | | | | — | | | | — | | |
Templeton Foreign Equity | | | 11,632,131 | | | | — | | | | 65,435,887 | | | | (133,709,136 | ) | | Short-term | | | 2017 | | |
| | | | | | | | | | (762,548 | ) | | Short-term | | | None | | |
| | | | | | | | | | (2,658,823 | ) | | Long-term | | | None | | |
| | | | | | | | | $ | (137,130,507 | ) | | | | | |
* Utilization of these capital losses is subject to annual limitations under Section 382 of the Internal Revenue Code. Amounts and years of expiration may be adjusted to reflect future gain/loss activity to comply with the limitation rules.
The Portfolios' major tax jurisdictions are U.S. federal and Arizona state.
As of December 31, 2016, no provision for income tax is required in the Portfolios' financial statements as a result of tax positions taken on federal and state income tax returns for open tax years. The Portfolios' federal and state income and federal excise tax returns for tax years for which the applicable statutes of limitations have not expired are subject to examination by the Internal Revenue Service and state department of revenue. The earliest tax year that remains subject to examination by these jurisdictions is 2012.
NOTE 15 — SUBSEQUENT EVENTS
Subsequent to December 31, 2016, the following Portfolios paid dividends from net investment income of:
| | | Per Share
Amount | | Payable Date | | Record Date | |
Global Bond | |
Class ADV | | $ | 0.0165 | | | February 1, 2017 | | Daily | |
Class I | | $ | 0.0212 | | | February 1, 2017 | | Daily | |
Class S | | $ | 0.0190 | | | February 1, 2017 | | Daily | |
Pioneer High Yield | |
Class I | | $ | 0.0503 | | | February 1, 2017 | | Daily | |
Class S | | $ | 0.0477 | | | February 1, 2017 | | Daily | |
Investment Adviser: On January 12, 2017, the Board approved a proposal to change the Investment Adviser for all Portfolios from DSL to Voya Investments, LLC with an effective date of May 1, 2017. There are no changes to the services provided or the fees charged to the
Portfolios upon the replacement of DSL with Voya Investments, LLC.
The Portfolios have evaluated events occurring after the Statements of Assets and Liabilities date ("subsequent events") to determine whether any subsequent events necessitated adjustment to or disclosure in the financial statements. Other than the above, no such subsequent events were identified.
83
SUMMARY PORTFOLIO OF INVESTMENTS
VOYA GLOBAL BOND PORTFOLIO AS OF DECEMBER 31, 2016
Principal
Amount† | |
| |
| | Value | | Percentage
of Net
Assets | |
CORPORATE BONDS/NOTES: 22.7% | | | |
| | | | | Brazil: 0.4% | |
| | 900,000 | | | | | | | Petrobras Global
Finance BV,
8.750%, 05/23/26 | | $ | 973,125 | | | | 0.4 | | |
| | | | | Canada: 0.2% | |
| | 454,000 | | | | | | | Other Securities | | | 447,161 | | | | 0.2 | | |
| | | | | China: 0.3% | |
| | 601,000 | | | | | | | Other Securities | | | 596,075 | | | | 0.3 | | |
| | | | | France: 0.8% | |
| | 287,000 | | | | # | | | BPCE SA,
5.150%, 07/21/24 | | | 291,888 | | | | 0.1 | | |
| | 226,000 | | | | # | | | Electricite de
France SA,
2.350%, 10/13/20 | | | 223,787 | | | | 0.1 | | |
| | 940,000 | | | | # | | | SFR Group SA,
6.000%, 05/15/22 | | | 968,200 | | | | 0.4 | | |
| | 294,000 | | | | | | | Other Securities | | | 296,602 | | | | 0.2 | | |
| | | | | | | | | | 1,780,477 | | | | 0.8 | | |
| | | | | Guernsey: 0.3% | |
| | 716,000 | | | | | | | Credit Suisse
Group Funding
Guernsey Ltd.,
2.750%, 03/26/20 | | | 709,863 | | | | 0.3 | | |
| | | | | Ireland: 0.3% | |
| | 652,000 | | | | | | | Other Securities | | | 641,594 | | | | 0.3 | | |
| | | | | Italy: 0.1% | |
| | 286,000 | | | | | | | Other Securities | | | 291,165 | | | | 0.1 | | |
| | | | | Japan: 0.6% | |
| | 790,000 | | | | # | | | Bank of
Tokyo-Mitsubishi
UFJ Ltd./The,
2.300%, 03/05/20 | | | 781,079 | | | | 0.4 | | |
| | 200,000 | | | | # | | | Mizuho Bank Ltd.,
3.200%, 03/26/25 | | | 198,781 | | | | 0.1 | | |
| | 300,000 | | | | | | | Other Securities | | | 306,617 | | | | 0.1 | | |
| | | | | | | | | | 1,286,477 | | | | 0.6 | | |
| | | | | Mexico: 0.0% | |
MXN | 1,152,227 | | | | | | | Other Securities(a) | | | 6,584 | | | | 0.0 | | |
| | | | | Netherlands: 0.8% | |
| | 690,000 | | | | | | | Shell International
Finance BV,
3.250%, 05/11/25 | | | 689,271 | | | | 0.3 | | |
Principal
Amount† | |
| |
| | Value | | Percentage
of Net
Assets | |
| | 701,000 | | | | | | | Shell International
Finance BV,
1.625%-4.000%,
11/10/18-05/10/46 | | $ | 686,011 | | | | 0.3 | | |
| | 300,000 | | | | # | | | Siemens
Financieringsmaatschappij NV,
2.350%, 10/15/26 | | | 277,604 | | | | 0.1 | | |
| | 269,000 | | | | | | | Other Securities | | | 289,008 | | | | 0.1 | | |
| | | | | | | | | | 1,941,894 | | | | 0.8 | | |
| | | | | Norway: 0.2% | |
| | 380,000 | | | | | | | Other Securities | | | 370,862 | | | | 0.2 | | |
| | | | | South Africa: 0.0% | |
ZAR | 1,000,000 | | | | | | | Other Securities | | | 74,075 | | | | 0.0 | | |
| | | | | Sweden: 0.1% | |
| | 298,000 | | | | #,L | | | Nordea Bank AB,
5.500%, 09/29/49 | | | 296,927 | | | | 0.1 | | |
| | | | | Switzerland: 0.3% | |
| | 400,000 | | | | # | | | Credit Suisse AG,
6.500%, 08/08/23 | | | 426,528 | | | | 0.2 | | |
| | 250,000 | | | | | | | UBS AG/Stamford CT,
7.625%, 08/17/22 | | | 284,063 | | | | 0.1 | | |
| | | | | | | | | | 710,591 | | | | 0.3 | | |
| | | | | United Kingdom: 1.1% | |
| | 1,002,000 | | | | | | | Santander UK PLC,
2.375%, 03/16/20 | | | 996,287 | | | | 0.4 | | |
| | 400,000 | | | | #,L | | | Standard Chartered
PLC,
4.300%, 02/19/27 | | | 381,159 | | | | 0.2 | | |
| | 344,000 | | | | # | | | UBS Group Funding
Jersey Ltd.,
4.125%, 04/15/26 | | | 351,999 | | | | 0.1 | | |
| | 813,000 | | | | | | | Other Securities | | | 818,082 | | | | 0.4 | | |
| | | | | | | | | | 2,547,527 | | | | 1.1 | | |
| | | | | United States: 17.2% | |
| | 762,000 | | | | | | | 21st Century Fox
America, Inc.,
4.500%-5.400%,
02/15/21-10/01/43 | | | 818,002 | | | | 0.4 | | |
| | 806,000 | | | | | | | AbbVie, Inc.,
2.500%-2.850%,
05/14/20-05/14/23 | | | 800,678 | | | | 0.4 | | |
| | 100,000 | | | | # | | | AMC Entertainment
Holdings, Inc.,
5.875%, 11/15/26 | | | 102,500 | | | | 0.0 | | |
| | 986,000 | | | | | | | Anheuser-Busch
InBev Finance, Inc.,
2.650%-3.300%,
02/01/21-02/01/23 | | | 998,389 | | | | 0.4 | | |
| | 710,000 | | | | | | | Apple, Inc.,
3.200%, 05/13/25 | | | 712,777 | | | | 0.3 | | |
See Accompanying Notes to Financial Statements
84
SUMMARY PORTFOLIO OF INVESTMENTS
VOYA GLOBAL BOND PORTFOLIO AS OF DECEMBER 31, 2016 (CONTINUED)
Principal
Amount† | |
| |
| | Value | | Percentage
of Net
Assets | |
| | | | | United States (continued) | |
| | 962,000 | | | | | | | AT&T, Inc.,
3.600%, 02/17/23 | | $ | 970,495 | | | | 0.4 | | |
| | 594,000 | | | | | | | AT&T, Inc.,
3.000%-5.150%,
06/30/22-03/15/42 | | | 588,008 | | | | 0.3 | | |
| | 1,361,000 | | | | | | | Bank of America
Corp.,
3.300%-4.100%,
01/11/23-08/01/25 | | | 1,396,710 | | | | 0.6 | | |
| | 540,000 | | | | # | | | Calpine Corp.,
6.000%, 01/15/22 | | | 566,325 | | | | 0.2 | | |
| | 1,048,000 | | | | | | | Citigroup, Inc.,
4.000%-5.500%,
08/05/24-09/13/25 | | | 1,099,419 | | | | 0.5 | | |
| | 758,000 | | | | | | | Citizens Bank
NA/Providence RI,
2.450%, 12/04/19 | | | 760,697 | | | | 0.3 | | |
| | 562,000 | | | | # | | | COX
Communications,
Inc., 2.950%,
06/30/23 | | | 529,067 | | | | 0.2 | | |
| | 777,000 | | | | | | | CVS Health Corp.,
2.800%, 07/20/20 | | | 788,883 | | | | 0.3 | | |
| | 320,000 | | | | # | | | Diamond 1 Finance
Corp. / Diamond 2
Finance Corp.,
4.420%, 06/15/21 | | | 331,165 | | | | 0.1 | | |
| | 337,000 | | | | # | | | Diamond 1 Finance
Corp. / Diamond 2
Finance Corp.,
5.450%, 06/15/23 | | | 357,579 | | | | 0.2 | | |
| | 313,000 | | | | # | | | Diamond 1 Finance
Corp. / Diamond 2
Finance Corp.,
6.020%, 06/15/26 | | | 339,234 | | | | 0.1 | | |
| | 1,026,000 | | | | | | | Energy Transfer
Partners L.P.,
4.900%, 02/01/24 | | | 1,061,649 | | | | 0.5 | | |
| | 165,000 | | | | # | | | ESH Hospitality, Inc.,
5.250%, 05/01/25 | | | 164,587 | | | | 0.1 | | |
| | 240,000 | | | | | | | Goldman Sachs
Group, Inc.,
2.625%, 04/25/21 | | | 238,292 | | | | 0.1 | | |
| | 627,000 | | | | | | | Goldman Sachs
Group, Inc.,
5.250%, 07/27/21 | | | 687,287 | | | | 0.3 | | |
| | 605,000 | | | | | | | Hartford Financial
Services Group, Inc.,
6.625%, 03/30/40 | | | 747,822 | | | | 0.3 | | |
| | 294,000 | | | | | | | Huntington
Bancshares,
Inc./OH,
2.600%, 08/02/18 | | | 296,924 | | | | 0.1 | | |
| | 570,000 | | | | | | | Huntington National
Bank,
2.200%, 11/06/18 | | | 571,751 | | | | 0.3 | | |
| | 1,041,000 | | | | | | | Indiana Michigan
Power Co.,
7.000%, 03/15/19 | | | 1,147,414 | | | | 0.5 | | |
Principal
Amount† | |
| |
| | Value | | Percentage
of Net
Assets | |
| | 570,000 | | | | # | | | JBS USA LLC / JBS
USA Finance, Inc.,
5.875%, 07/15/24 | | $ | 591,375 | | | | 0.3 | | |
| | 1,197,000 | | | | | | | JPMorgan
Chase & Co.,
1.625%-6.000%,
05/15/18-12/29/49 | | | 1,198,286 | | | | 0.5 | | |
| | 40 | | | | # | | | Kern River Funding
Corp., 4.893%,
04/30/18 | | | 41 | | | | 0.0 | | |
| | 990,000 | | | | | | | Morgan Stanley,
3.750%-4.100%,
02/25/23-05/22/23 | | | 1,016,868 | | | | 0.4 | | |
| | 1,048,000 | | | | | | | Mylan, Inc.,
2.600%, 06/24/18 | | | 1,054,279 | | | | 0.5 | | |
| | 625,000 | | | | | | | Netflix, Inc.,
5.750%, 03/01/24 | | | 670,312 | | | | 0.3 | | |
| | 200,000 | | | | # | | | Novelis Corp.,
5.875%, 09/30/26 | | | 202,500 | | | | 0.1 | | |
| | 110,000 | | | | # | | | Owens-Brockway
Glass Container, Inc.,
5.875%, 08/15/23 | | | 114,881 | | | | 0.1 | | |
| | 165,000 | | | | # | | | Post Holdings, Inc.,
5.000%, 08/15/26 | | | 158,400 | | | | 0.1 | | |
| | 272,000 | | | | | | | Time Warner Cable
LLC, 5.875%,
11/15/40 | | | 290,547 | | | | 0.1 | | |
| | 485,000 | | | | | | | Time Warner,
Inc., 6.500%,
11/15/36 | | | 587,480 | | | | 0.3 | | |
| | 505,000 | | | | # | | | Valeant
Pharmaceuticals
International,
7.250%, 07/15/22 | | | 415,363 | | | | 0.2 | | |
| | 270,000 | | | | | | | Verizon
Communications, Inc.,
5.012%, 08/21/54 | | | 270,063 | | | | 0.1 | | |
| | 1,071,000 | | | | | | | Verizon
Communications,
Inc., 5.150%,
09/15/23 | | | 1,184,706 | | | | 0.5 | | |
| | 599,000 | | | | | | | Wells Fargo & Co.,
4.100%, 06/03/26 | | | 606,747 | | | | 0.3 | | |
| | 14,797,000 | | | | | | | Other Securities(b) | | | 14,760,292 | | | | 6.5 | | |
| | | | | | | | | | 39,197,794 | | | | 17.2 | | |
| | | | | | | Total Corporate
Bonds/Notes
(Cost $51,389,388) | | | 51,872,191 | | | | 22.7 | | |
COLLATERALIZED MORTGAGE OBLIGATIONS: 16.7% | | | |
| | | | | United States: 16.7% | |
| | 217,548 | | | | | | | Banc of America
Alternative Loan
Trust 2004-1 4A1,
4.750%, 02/25/19 | | | 214,602 | | | | 0.1 | | |
| | 710,636 | | | | | | | Banc of America
Funding 2005-1
Trust 1A1,
5.500%, 02/25/35 | | | 713,563 | | | | 0.3 | | |
See Accompanying Notes to Financial Statements
85
SUMMARY PORTFOLIO OF INVESTMENTS
VOYA GLOBAL BOND PORTFOLIO AS OF DECEMBER 31, 2016 (CONTINUED)
Principal
Amount† | |
| |
| | Value | | Percentage
of Net
Assets | |
| | | | | United States (continued) | |
| | 176,668 | | | | | | | Citigroup Mortgage
Loan Trust, Inc.
2005-2 1A3,
3.074%, 05/25/35 | | $ | 174,738 | | | | 0.1 | | |
| | 471,126 | | | | | | | CitiMortgage
Alternative Loan
Trust Series
2006-A3 1A7,
6.000%, 07/25/36 | | | 423,126 | | | | 0.2 | | |
| | 35,187 | | | | # | | | Deutsche ALT-A
Securities, Inc.
Alternate Loan
Trust 2007-RS1 A2,
1.256%, 01/27/37 | | | 94,930 | | | | 0.0 | | |
| | 100,000 | | | | | | | Fannie Mae
Connecticut Avenue
Securities
2014-C01 M2,
5.156%, 01/25/24 | | | 106,715 | | | | 0.1 | | |
| | 320,000 | | | | | | | Fannie Mae
Connecticut Avenue
Securities
2014-C03 2M2,
3.656%, 07/25/24 | | | 321,614 | | | | 0.1 | | |
| | 400,000 | | | | | | | Fannie Mae
Connecticut Avenue
Securities
2014-CO3 1M2,
3.756%, 07/25/24 | | | 401,489 | | | | 0.2 | | |
| | 1,780,000 | | | | | | | Fannie Mae
Connecticut Avenue
Securities
2014-CO4 1M2,
5.656%, 11/25/24 | | | 1,934,926 | | | | 0.9 | | |
| | 80,000 | | | | | | | Fannie Mae
Connecticut Avenue
Securities
2015-C02 1M2,
4.756%, 05/25/25 | | | 83,526 | | | | 0.0 | | |
| | 500,000 | | | | | | | Fannie Mae
Connecticut Avenue
Securities
2015-C03 1M2,
5.756%, 07/25/25 | | | 539,551 | | | | 0.2 | | |
| | 122,747 | | | | | | | Fannie Mae
REMIC Trust
2005-74 DK,
20.976%, 07/25/35 | | | 168,540 | | | | 0.1 | | |
| | 165,645 | | | | | | | Fannie Mae
REMIC Trust
2005-87 SB,
21.061%, 10/25/35 | | | 285,353 | | | | 0.1 | | |
| | 387,165 | | | | | | | Fannie Mae
REMIC Trust
2006-104 ES,
29.670%, 11/25/36 | | | 688,119 | | | | 0.3 | | |
| | 1,759,907 | | | | ^ | | | Fannie Mae
REMIC Trust
2007-89 SB,
5.794%, 09/25/37 | | | 322,825 | | | | 0.2 | | |
Principal
Amount† | |
| |
| | Value | | Percentage
of Net
Assets | |
| | 2,870,295 | | | | ^ | | | Fannie Mae
REMIC Trust
2007-94 SG,
5.694%, 10/25/37 | | $ | 528,201 | | | | 0.2 | | |
| | 248,774 | | | | | | | Fannie Mae
REMIC Trust
2010-109 SN,
21.145%, 10/25/40 | | | 557,200 | | | | 0.3 | | |
| | 5,234,621 | | | | ^ | | | Fannie Mae
REMIC Trust
2011-55 SK,
5.804%, 06/25/41 | | | 1,003,892 | | | | 0.4 | | |
| | 602,582 | | | | ^ | | | Fannie Mae
REMIC Trust
2011-69 AI,
5.000%, 05/25/18 | | | 10,584 | | | | 0.0 | | |
| | 4,159,677 | | | | ^ | | | Fannie Mae
REMIC Trust
2011-86 NS,
5.194%, 09/25/41 | | | 663,788 | | | | 0.3 | | |
| | 3,193,101 | | | | ^ | | | Fannie Mae
REMIC Trust
2012-10 US,
5.694%, 02/25/42 | | | 482,383 | | | | 0.2 | | |
| | 1,963,455 | | | | ^ | | | Fannie Mae
REMIC Trust
2012-110 JI,
4.000%, 06/25/42 | | | 320,021 | | | | 0.1 | | |
| | 6,553,427 | | | | ^ | | | Fannie Mae
REMIC Trust
2012-133 PS,
5.444%, 03/25/42 | | | 980,715 | | | | 0.4 | | |
| | 2,963,226 | | | | ^ | | | Fannie Mae
REMIC Trust
2012-144 SB,
5.344%, 01/25/43 | | | 693,963 | | | | 0.3 | | |
| | 2,032,743 | | | | ^ | | | Fannie Mae,
3.000%, 06/25/33 | | | 272,276 | | | | 0.2 | | |
| | 1,039,896 | | | | ^ | | | Fannie Mae,
3.500%, 08/25/33 | | | 154,649 | | | | 0.1 | | |
| | 657,315 | | | | ^ | | | Fannie Mae,
3.500%, 08/25/43 | | | 145,278 | | | | 0.1 | | |
| | 2,579,901 | | | | ^ | | | Fannie Mae,
5.184%, 01/25/38 | | | 448,142 | | | | 0.2 | | |
| | 3,731,908 | | | | ^ | | | Fannie Mae,
5.224%, 11/25/41 | | | 716,467 | | | | 0.3 | | |
| | 54,786 | | | | ^ | | | Fannie Mae,
5.500%, 07/25/33 | | | 12,096 | | | | 0.0 | | |
| | 22,763 | | | | ^ | | | Fannie Mae,
5.500%, 06/25/35 | | | 5,126 | | | | 0.0 | | |
| | 113,915 | | | | ^ | | | Fannie Mae,
5.784%, 06/25/37 | | | 21,514 | | | | 0.0 | | |
| | 348,530 | | | | ^ | | | Fannie Mae,
5.814%, 06/25/36 | | | 62,907 | | | | 0.1 | | |
| | 20,479 | | | | ^ | | | Fannie Mae,
5.994%, 05/25/35 | | | 3,388 | | | | 0.0 | | |
| | 103,563 | | | | ^ | | | Fannie Mae,
6.000%, 12/25/32 | | | 23,238 | | | | 0.0 | | |
| | 44,730 | | | | ^ | | | Fannie Mae,
6.000%, 02/25/33 | | | 9,758 | | | | 0.0 | | |
| | 52,899 | | | | ^ | | | Fannie Mae,
6.000%, 03/25/33 | | | 12,300 | | | | 0.0 | | |
See Accompanying Notes to Financial Statements
86
SUMMARY PORTFOLIO OF INVESTMENTS
VOYA GLOBAL BOND PORTFOLIO AS OF DECEMBER 31, 2016 (CONTINUED)
Principal
Amount† | |
| |
| | Value | | Percentage
of Net
Assets | |
| | | | | United States (continued) | |
| | 43,640 | | | | ^ | | | Fannie Mae,
6.000%, 03/25/33 | | $ | 11,183 | | | | 0.0 | | |
| | 24,157 | | | | ^ | | | Fannie Mae,
6.000%, 09/25/35 | | | 5,367 | | | | 0.0 | | |
| | 27,013 | | | | ^ | | | Fannie Mae,
6.344%, 06/25/23 | | | 2,777 | | | | 0.0 | | |
| | 111,587 | | | | ^ | | | Fannie Mae,
6.474%, 09/25/36 | | | 22,713 | | | | 0.0 | | |
| | 181,173 | | | | ^ | | | Fannie Mae,
6.500%, 02/25/32 | | | 41,815 | | | | 0.0 | | |
| | 170,702 | | | | ^ | | | Fannie Mae,
6.794%, 10/25/33 | | | 37,898 | | | | 0.0 | | |
| | 20,492 | | | | ^ | | | Fannie Mae,
6.874%, 03/25/23 | | | 214 | | | | 0.0 | | |
| | 112,685 | | | | ^ | | | Fannie Mae,
6.994%, 07/25/31 | | | 24,949 | | | | 0.0 | | |
| | 61,750 | | | | ^ | | | Fannie Mae,
6.994%, 02/25/32 | | | 13,728 | | | | 0.0 | | |
| | 32,992 | | | | ^ | | | Fannie Mae,
7.000%, 02/25/28 | | | 7,631 | | | | 0.0 | | |
| | 40,341 | | | | ^ | | | Fannie Mae,
7.000%, 03/25/33 | | | 11,034 | | | | 0.0 | | |
| | 30,954 | | | | ^ | | | Fannie Mae,
7.000%, 04/25/33 | | | 7,464 | | | | 0.0 | | |
| | 39,387 | | | | ^ | | | Fannie Mae,
7.194%, 07/25/32 | | | 8,211 | | | | 0.0 | | |
| | 1,215,417 | | | | ^ | | | Fannie Mae,
7.264%, 12/18/32 | | | 265,270 | | | | 0.1 | | |
| | 217,418 | | | | ^ | | | Fannie Mae,
7.500%, 01/25/24 | | | 40,176 | | | | 0.0 | | |
| | 662,962 | | | | | | | Fannie Mae,
1.156%-24.833%,
08/25/25-05/25/43 | | | 773,530 | | | | 0.3 | | |
| | 12,897,440 | | | | ^ | | | Freddie Mac 3502 DL,
5.296%, 01/15/39 | | | 2,278,766 | | | | 1.0 | | |
| | 3,673,619 | | | | ^ | | | Freddie Mac REMIC
Trust 3505 SA,
5.296%, 01/15/39 | | | 611,050 | | | | 0.3 | | |
| | 4,294,538 | | | | ^ | | | Freddie Mac REMIC
Trust 3702 S,
3.746%, 05/15/36 | | | 393,713 | | | | 0.2 | | |
| | 4,214,389 | | | | ^ | | | Freddie Mac REMIC
Trust 3710 SL,
5.296%, 05/15/36 | | | 333,978 | | | | 0.1 | | |
| | 592,487 | | | | ^ | | | Freddie Mac REMIC
Trust 3803 SG,
5.896%, 08/15/28 | | | 28,308 | | | | 0.0 | | |
| | 4,067,833 | | | | ^ | | | Freddie Mac REMIC
Trust 3925 SD,
5.346%, 07/15/40 | | | 584,925 | | | | 0.2 | | |
| | 2,012,292 | | | | ^ | | | Freddie Mac REMIC
Trust 4136 SW,
5.546%, 11/15/32 | | | 365,246 | | | | 0.2 | | |
| | 853,151 | | | | ^ | | | Freddie Mac REMIC
Trust 4161 CI,
4.000%, 02/15/43 | | | 159,219 | | | | 0.1 | | |
| | 13,229,759 | | | | ^ | | | Freddie Mac REMIC
Trust 4194 GI,
4.000%, 04/15/43 | | | 2,415,533 | | | | 1.1 | | |
| | 1,565,159 | | | | ^ | | | Freddie Mac Series
4120 IK,
3.000%, 10/15/32 | | | 210,042 | | | | 0.1 | | |
Principal
Amount† | |
| |
| | Value | | Percentage
of Net
Assets | |
| | 530,000 | | | | | | | Freddie Mac
Structured Agency
Credit Risk Debt
Notes 2014-DN1
M3, 5.256%,
02/25/24 | | $ | 578,732 | | | | 0.2 | | |
| | 400,000 | | | | | | | Freddie Mac
Structured Agency
Credit Risk Debt
Notes 2014-DN3
M3, 4.756%,
08/25/24 | | | 416,823 | | | | 0.2 | | |
| | 1,100,000 | | | | | | | Freddie Mac
Structured Agency
Credit Risk Debt
Notes 2014-DN4
M3, 5.306%,
10/25/24 | | | 1,178,106 | | | | 0.5 | | |
| | 340,000 | | | | | | | Freddie Mac
Structured Agency
Credit Risk Debt
Notes 2014-HQ3
M3, 5.506%,
10/25/24 | | | 369,394 | | | | 0.2 | | |
| | 100,000 | | | | | | | Freddie Mac
Structured Agency
Credit Risk Debt
Notes 2015-DNA3
M3, 5.456%,
04/25/28 | | | 108,282 | | | | 0.0 | | |
| | 170,673 | | | | | | | Freddie Mac
Structured Agency
Credit Risk Debt
Notes 2015-HQ1
M2, 2.956%,
03/25/25 | | | 172,229 | | | | 0.1 | | |
| | 200,000 | | | | | | | Freddie Mac
Structured Agency
Credit Risk Debt
Notes 2016-DNA4
M3, 4.556%,
03/25/29 | | | 200,669 | | | | 0.1 | | |
| | 200,000 | | | | | | | Freddie Mac
Structured Agency
Credit Risk Debt
Notes 2016-HQA3
M3, 4.606%,
03/25/29 | | | 200,313 | | | | 0.1 | | |
| | 1,433,294 | | | | ^ | | | Freddie Mac,
5.246%, 10/15/36 | | | 193,974 | | | | 0.1 | | |
| | 103,087 | | | | ^ | | | Freddie Mac,
5.446%, 07/15/35 | | | 14,282 | | | | 0.0 | | |
| | 123,094 | | | | ^ | | | Freddie Mac,
6.946%, 03/15/29 | | | 23,140 | | | | 0.0 | | |
| | 113,968 | | | | ^ | | | Freddie Mac,
6.996%, 03/15/29 | | | 20,559 | | | | 0.0 | | |
| | 13,235 | | | | ^ | | | Freddie Mac,
7.000%, 03/15/28 | | | 3,106 | | | | 0.0 | | |
| | 70,732 | | | | ^ | | | Freddie Mac,
7.000%, 04/15/28 | | | 15,516 | | | | 0.0 | | |
| | 166,309 | | | | ^ | | | Freddie Mac,
8.246%, 08/15/29 | | | 37,206 | | | | 0.0 | | |
See Accompanying Notes to Financial Statements
87
SUMMARY PORTFOLIO OF INVESTMENTS
VOYA GLOBAL BOND PORTFOLIO AS OF DECEMBER 31, 2016 (CONTINUED)
Principal
Amount† | |
| |
| | Value | | Percentage
of Net
Assets | |
| | | | | United States (continued) | |
| | 1,751,652 | | | | | | | Freddie Mac,
1.154%-22.169%,
09/15/22-08/15/35 | | $ | 1,919,234 | | | | 0.8 | | |
| | 576,790 | | | | | | | Ginnie Mae
Series 2007-8 SP,
19.652%, 03/20/37 | | | 893,897 | | | | 0.4 | | |
| | 5,003,597 | | | | ^ | | | Ginnie Mae Series
2010-165 IP,
4.000%, 04/20/38 | | | 317,050 | | | | 0.2 | | |
| | 3,368,343 | | | | ^ | | | Ginnie Mae Series
2010-68 MS,
5.111%, 06/20/40 | | | 527,455 | | | | 0.2 | | |
| | 2,257,048 | | | | ^ | | | Ginnie Mae Series
2012-97 SC,
5.993%, 07/16/41 | | | 419,362 | | | | 0.2 | | |
| | 809,671 | | | | | | | IndyMac INDX
Mortgage Loan Trust
2006-AR2 1A1B,
0.966%, 04/25/46 | | | 670,487 | | | | 0.3 | | |
| | 720,699 | | | | | | | JP Morgan Mortgage
Trust 2005-A4 B1,
3.091%, 07/25/35 | | | 619,035 | | | | 0.3 | | |
| | 143,489 | | | | | | | JP Morgan Mortgage
Trust 2007-A1 7A1,
3.137%, 07/25/35 | | | 142,111 | | | | 0.0 | | |
| | 10,373,614 | | | | ^ | | | WaMu Mortgage
Pass-Through
Certificates Series
2005-AR11 X,
1.437%, 08/25/45 | | | 414,157 | | | | 0.2 | | |
| | 69,972 | | | | | | | WaMu Mortgage
Pass-Through
Certificates Series
2006-AR12 1A1,
2.850%, 10/25/36 | | | 61,520 | | | | 0.0 | | |
| | 1,093,899 | | | | | | | WaMu Mortgage
Pass-Through
Certificates Series
2006-AR16 Trust
3A1, 2.648%,
12/25/36 | | | 1,007,584 | | | | 0.4 | | |
| | 272,248 | | | | | | | WaMu Mortgage
Pass-Through
Certificates Series
2006-AR8 1A4,
2.804%, 08/25/46 | | | 238,751 | | | | 0.1 | | |
| | 513,329 | | | | | | | WaMu Mortgage
Pass-Through
Certificates Series
2007-HY2 1A1,
2.676%, 12/25/36 | | | 474,029 | | | | 0.2 | | |
| | 145,537 | | | | | | | WaMu Mortgage
Pass-Through
Certificates Series
2007-HY4 1A1,
2.361%, 04/25/37 | | | 127,152 | | | | 0.1 | | |
| | 188,519 | | | | | | | Wells Fargo
Alternative Loan
2007-PA2 2A1,
1.186%, 06/25/37 | | | 139,503 | | | | 0.1 | | |
Principal
Amount† | |
| |
| | Value | | Percentage
of Net
Assets | |
| | 80,123 | | | | | | | Wells Fargo Mortgage
Backed Securities
2005-AR16 Trust
2A1, 3.040%,
02/25/34 | | $ | 81,551 | | | | 0.0 | | |
| | 333,072 | | | | | | | Wells Fargo Mortgage
Backed Securities
2006-AR17 Trust A1,
3.048%, 10/25/36 | | | 318,144 | | | | 0.1 | | |
| | 71,839 | | | | | | | Wells Fargo Mortgage
Backed Securities
2006-AR17 Trust A2,
3.048%, 10/25/36 | | | 68,619 | | | | 0.0 | | |
| | 384,562 | | | | | | | Wells Fargo Mortgage
Backed Securities
2006-AR7 Trust 2A1,
3.089%, 05/25/36 | | | 366,972 | | | | 0.2 | | |
| | 361,278 | | | | | | | Wells Fargo Mortgage
Backed Securities
2006-AR8 Trust 3A2,
3.087%, 04/25/36 | | | 353,689 | | | | 0.2 | | |
| | 6,449,742 | | | | | | | Other Securities | | | 3,221,319 | | | | 1.4 | | |
| | | | | | | Total Collateralized
Mortgage
Obligations
(Cost $35,735,286) | | | 38,170,195 | | | | 16.7 | | |
STRUCTURED PRODUCTS: 0.0% | | | |
| | | | | Russia: 0.0% | |
RUB | 5,671,358 | | | | | | | Morgan
Stanley & Co.
International
PLC - EM Whole
Loan SA /Russian
Federation Total
Return Linked
Bonds, Series 007,
Cl. VR, 4.650%,
08/22/34 | | | 40,792 | | | | 0.0 | | |
| | | | | | | Total Structured
Products
(Cost $202,246) | | | 40,792 | | | | 0.0 | | |
FOREIGN GOVERNMENT BONDS: 14.0% | | | |
| | | | | Austria: 1.5% | |
EUR | 3,000,000 | | | | # | | | Republic of Austria
Government Bond,
1.650%, 10/21/24 | | | 3,541,347 | | | | 1.5 | | |
| | | | | Belgium: 7.2% | |
EUR | 15,100,000 | | | | # | | | Kingdom of Belgium
Government Bond,
0.800%, 06/22/25 | | | 16,478,421 | | | | 7.2 | | |
| | | | | Brazil: 0.3% | |
BRL | 705,000 | | | | | | | Brazil Notas do
Tesouro Nacional
Series F, 6.000%,
05/15/45 | | | 666,280 | | | | 0.3 | | |
See Accompanying Notes to Financial Statements
88
SUMMARY PORTFOLIO OF INVESTMENTS
VOYA GLOBAL BOND PORTFOLIO AS OF DECEMBER 31, 2016 (CONTINUED)
Principal
Amount† | |
| |
| | Value | | Percentage
of Net
Assets | |
| | | | | Germany: 0.1% | |
EUR | 140,000 | | | | | | | Other Securities | | $ | 204,812 | | | | 0.1 | | |
| | | | | Italy: 2.8% | |
EUR | 4,900,000 | | | | | | | Italy Buoni Poliennali
Del Tesoro,
4.500%, 03/01/26 | | | 6,364,202 | | | | 2.8 | | |
| | | | | Russia: 0.4% | |
RUB | 51,720,000 | | | | | | | Russian Federal
Bond - OFZ,
7.500%, 08/18/21 | | | 825,564 | | | | 0.4 | | |
| | | | | Spain: 1.7% | |
EUR | 3,500,000 | | | | # | | | Spain
Government Bond,
1.950%, 04/30/26 | | | 3,886,552 | | | | 1.7 | | |
| | | | | | | Total Foreign
Government Bonds
(Cost $32,935,157) | | | 31,967,178 | | | | 14.0 | | |
U.S. GOVERNMENT AGENCY OBLIGATIONS: 1.4% | | | | | |
| | | | | Federal Home Loan Mortgage
Corporation##: 0.7% | |
| | 1,466,374 | | | | | | | 4.000%-6.500%, due
01/01/18-05/01/46 | | | 1,549,514 | | | | 0.7 | | |
| | | | | Federal National Mortgage
Association##: 0.7% | |
| | 1,435,188 | | | | | | | 2.500%-7.500%, due
09/01/19-05/01/45 | | | 1,558,703 | | | | 0.7 | | |
| | | | | Government National Mortgage
Association: 0.0% | |
| | 75,814 | | | | | | | 5.000%-6.500%, due
04/15/34-02/20/35 | | | 85,310 | | | | 0.0 | | |
| | | | | | | Total U.S.
Government
Agency Obligations
(Cost $3,124,965) | | | 3,193,527 | | | | 1.4 | | |
COMMERCIAL MORTGAGE-BACKED SECURITIES: 8.3% | | | | | |
| | | | | United States: 8.3% | |
| | 810,000 | | | | | | | Banc of America
Commercial
Mortgage Trust
2007-3 AJ,
5.549%, 06/10/49 | | | 820,857 | | | | 0.4 | | |
| | 450,000 | | | | | | | Banc of America
Commercial
Mortgage Trust
2007-3 B,
5.602%, 06/10/49 | | | 451,543 | | | | 0.2 | | |
Principal
Amount† | |
| |
| | Value | | Percentage
of Net
Assets | |
| | 390,000 | | | | | | | Banc of America
Commercial
Mortgage Trust
2007-3 C,
5.602%, 06/10/49 | | $ | 387,250 | | | | 0.2 | | |
| | 540,000 | | | | | | | Banc of America
Commercial
Mortgage Trust
2007-4 AJ,
5.814%, 02/10/51 | | | 544,612 | | | | 0.2 | | |
| | 8,020,000 | | | | #,^ | | | BBCCRE Trust
2015-GTP XA,
0.597%, 08/10/33 | | | 359,850 | | | | 0.2 | | |
| | 440,000 | | | | # | | | Bear Stearns
Commercial
Mortgage Securities
Trust 2004-PWR6
5.406%, 11/11/41 | | | 458,185 | | | | 0.2 | | |
| | 71,656 | | | | | | | Bear Stearns
Commercial
Mortgage Securities
Trust 2005-TOP20 C,
5.124%, 10/12/42 | | | 71,577 | | | | 0.0 | | |
| | 140,000 | | | | # | | | Bear Stearns
Commercial
Mortgage Securities
Trust 2006-TOP22 E,
5.714%, 04/12/38 | | | 131,521 | | | | 0.1 | | |
| | 410,000 | | | | | | | Bear Stearns
Commercial
Mortgage Securities
Trust 2007-PWR17
AJ, 5.887%,
06/11/50 | | | 413,114 | | | | 0.2 | | |
| | 448,655 | | | | # | | | Beckman Coulter, Inc.
2000-A A,
7.498%, 12/15/18 | | | 450,008 | | | | 0.2 | | |
| | 1,885,802 | | | | ^ | | | CD 2016-CD1
Mortgage Trust,
1.446%, 08/10/49 | | | 186,287 | | | | 0.1 | | |
| | 280,000 | | | | # | | | Citigroup Commercial
Mortgage Trust
2016-GC36,
2.850%, 02/10/49 | | | 193,479 | | | | 0.1 | | |
| | 680,000 | | | | # | | | COMM 2004-LB2A H,
6.067%, 03/10/39 | | | 721,045 | | | | 0.3 | | |
| | 10,479,540 | | | | #,^ | | | COMM 2012 - LTRT
XA, 1.030%,
10/05/30 | | | 464,116 | | | | 0.2 | | |
| | 4,005,394 | | | | ^ | | | COMM 2012-CR1
XA, 2.023%,
05/15/45 | | | 289,136 | | | | 0.1 | | |
| | 6,512,726 | | | | ^ | | | COMM 2013-LC6
XA, 1.683%,
01/10/46 | | | 360,277 | | | | 0.1 | | |
| | 4,348,928 | | | | ^ | | | COMM 2014-CR17
XA, 1.163%,
05/10/47 | | | 234,058 | | | | 0.1 | | |
| | 200,000 | | | | # | | | COMM 2015-CR27 D,
3.472%, 10/10/48 | | | 152,887 | | | | 0.1 | | |
| | 240,000 | | | | | | | COMM 2015-PC1 D,
4.443%, 07/10/50 | | | 175,359 | | | | 0.1 | | |
See Accompanying Notes to Financial Statements
89
SUMMARY PORTFOLIO OF INVESTMENTS
VOYA GLOBAL BOND PORTFOLIO AS OF DECEMBER 31, 2016 (CONTINUED)
Principal
Amount† | |
| |
| | Value | | Percentage
of Net
Assets | |
| | | | | United States (continued) | |
| | 453,068 | | | | # | | | Commercial Mortgage
Trust 2004-GG1 F,
6.361%, 06/10/36 | | $ | 455,091 | | | | 0.2 | | |
| | 104,264 | | | | # | | | Credit Suisse
Commercial
Mortgage Trust
Series 2006-K1A K,
5.415%, 02/25/21 | | | 104,220 | | | | 0.1 | | |
| | 12,974 | | | | # | | | Credit Suisse First
Boston Mortgage
Securities Corp.
2003-C4 J,
5.322%, 08/15/36 | | | 12,954 | | | | 0.0 | | |
| | 300,000 | | | | # | | | CSAIL 2016-C7
Commercial
Mortgage Trust,
4.394%, 11/15/49 | | | 213,452 | | | | 0.1 | | |
| | 2,207,120 | | | | #,^ | | | DBUBS 2011-LC1A
XA, 0.748%,
11/10/46 | | | 48,588 | | | | 0.0 | | |
| | 210,000 | | | | # | | | DBUBS 2011-LC2A D,
5.543%, 07/10/44 | | | 215,076 | | | | 0.1 | | |
| | 565,385 | | | | # | | | EQTY 2014-INNS
Mortgage Trust,
4.216%, 05/08/31 | | | 554,567 | | | | 0.2 | | |
| | 3,560,000 | | | | ^ | | | Freddie Mac
Multifamily
Structured Pass
Through Certificates
K010 X3, 4.631%,
11/25/44 | | | 565,953 | | | | 0.2 | | |
| | 9,125,089 | | | | ^ | | | Freddie Mac
Multifamily
Structured Pass
Through Certificates
K704 X1, 1.964%,
08/25/18 | | | 217,966 | | | | 0.1 | | |
| | 4,423,190 | | | | ^ | | | Freddie Mac
Multifamily
Structured Pass
Through Certificates
K711 X3, 1.619%,
08/25/40 | | | 166,070 | | | | 0.1 | | |
| | 42,116,459 | | | | #,^ | | | FREMF Mortgage
Trust 2012-K17 X2A,
0.100%, 12/25/44 | | | 165,189 | | | | 0.1 | | |
| | 12,349 | | | | # | | | GE Capital
Commercial
Mortgage Series
2005-C2 H,
5.463%, 05/10/43 | | | 12,307 | | | | 0.0 | | |
| | 100,000 | | | | # | | | GS Mortgage
Securities Trust
2010-C2 F,
4.548%, 12/10/43 | | | 81,374 | | | | 0.0 | | |
| | 2,801,170 | | | | ^ | | | GS Mortgage
Securities Trust
2012-GCJ7 XA,
2.386%, 05/10/45 | | | 207,150 | | | | 0.1 | | |
Principal
Amount† | |
| |
| | Value | | Percentage
of Net
Assets | |
| | 75,000 | | | | # | | | GS Mortgage
Securities Trust
2016-GS3,
2.620%, 10/10/49 | | $ | 53,784 | | | | 0.0 | | |
| | 13,641,502 | | | | ^ | | | JPMBB Commercial
Mortgage Securities
Trust 2014-C24 XA,
1.072%, 11/15/47 | | | 682,060 | | | | 0.3 | | |
| | 250,000 | | | | # | | | JP Morgan Chase
Commercial
Mortgage Securities
Corp. 2004-CB8 J,
4.733%, 01/12/39 | | | 240,731 | | | | 0.1 | | |
| | 434,785 | | | | | | | JP Morgan Chase
Commercial
Mortgage Securities
Corp. 2006-LDP8 B,
5.520%, 05/15/45 | | | 434,389 | | | | 0.2 | | |
| | 2,940,000 | | | | #,^ | | | JP Morgan Chase
Commercial
Mortgage Securities
Corp. 2012-LC9 XB,
0.353%, 12/15/47 | | | 52,915 | | | | 0.0 | | |
| | 175,811 | | | | # | | | JP Morgan Chase
Commercial
Mortgage Securities
Trust 2003-LN1 H,
5.571%, 10/15/37 | | | 175,697 | | | | 0.1 | | |
| | 270,000 | | | | | | | JP Morgan Chase
Commercial
Mortgage Securities
Trust 2004-CIBC9 E,
5.373%, 06/12/41 | | | 260,846 | | | | 0.1 | | |
| | 460,000 | | | | | | | JP Morgan Chase
Commercial
Mortgage Securities
Trust 2007-LDP11
AM, 5.753%,
06/15/49 | | | 464,875 | | | | 0.2 | | |
| | 7,205,245 | | | | ^ | | | JP Morgan Chase
Commercial
Mortgage Securities
Trust 2012-CIBX XA,
1.660%, 06/15/45 | | | 414,954 | | | | 0.2 | | |
| | 360,000 | | | | | | | LB-UBS Commercial
Mortgage Trust
2005-C3 E,
4.983%, 07/15/40 | | | 362,037 | | | | 0.2 | | |
| | 360,000 | | | | | | | LB-UBS Commercial
Mortgage Trust
2005-C3 F,
5.013%, 07/15/40 | | | 344,684 | | | | 0.2 | | |
| | 50,000 | | | | | | | LB-UBS Commercial
Mortgage Trust
2006-C4 C,
5.872%, 06/15/38 | | | 50,052 | | | | 0.0 | | |
| | 780,000 | | | | | | | LB-UBS Commercial
Mortgage Trust
2006-C4 D,
5.872%, 06/15/38 | | | 780,780 | | | | 0.3 | | |
See Accompanying Notes to Financial Statements
90
SUMMARY PORTFOLIO OF INVESTMENTS
VOYA GLOBAL BOND PORTFOLIO AS OF DECEMBER 31, 2016 (CONTINUED)
Principal
Amount† | |
| |
| | Value | | Percentage
of Net
Assets | |
| | | | | United States (continued) | |
| | 310,000 | | | | | | | Morgan Stanley
Capital I Trust
2006-IQ11,
6.235%, 10/15/42 | | $ | 303,423 | | | | 0.1 | | |
| | 865,000 | | | | # | | | Morgan Stanley
Capital I Trust
2011-C1 C, 5.432%,
09/15/47 | | | 945,019 | | | | 0.4 | | |
| | 570,000 | | | | # | | | Morgan Stanley
Capital I Trust
2011-C1 D,
5.432%, 09/15/47 | | | 610,079 | | | | 0.3 | | |
| | 460,000 | | | | # | | | Morgan Stanley
Capital I Trust
2011-C1 E,
5.432%, 09/15/47 | | | 491,264 | | | | 0.2 | | |
| | 290,000 | | | | # | | | Morgan Stanley
Reremic Trust
2012-XA B,
0.250%, 07/27/49 | | | 267,522 | | | | 0.1 | | |
| | 6,404,433 | | | | #,^ | | | UBS-Barclays
Commercial
Mortgage Trust
2012-C3 XA,
2.043%, 08/10/49 | | | 496,505 | | | | 0.2 | | |
| | 5,896,031 | | | | #,^ | | | Wells Fargo
Commercial
Mortgage Trust
2012-LC5 XA,
2.018%, 10/15/45 | | | 419,426 | | | | 0.2 | | |
| | 50,000 | | | | # | | | Wells Fargo
Commercial
Mortgage Trust
2016-C34, 5.030%,
06/15/49 | | | 40,251 | | | | 0.0 | | |
| | 7,230,000 | | | | ^ | | | Wells Fargo
Commercial
Mortgage Trust
2016-C37, 1.047%,
12/15/49 | | | 455,842 | | | | 0.2 | | |
| | 3,892,934 | | | | #,^ | | | WFRBS Commercial
Mortgage Trust
2012-C8 XA,
1.989%, 08/15/45 | | | 285,475 | | | | 0.1 | | |
| | 390,000 | | | | | | | Other Securities | | | 397,513 | | | | 0.2 | | |
| | | | | | | Total Commercial
Mortgage-Backed
Securities
(Cost $18,996,542) | | | 18,915,241 | | | | 8.3 | | |
U.S. TREASURY OBLIGATIONS: 9.1% | | | |
| | | | | U.S. Treasury Bonds: 2.0% | |
| | 830,000 | | | | | | | 2.000%, due 11/15/26 | | | 797,403 | | | | 0.3 | | |
| | 4,597,000 | | | | L | | | 2.250%, due 08/15/46 | | | 3,855,555 | | | | 1.7 | | |
| | | | | | | | | | 4,652,958 | | | | 2.0 | | |
| | | | | U.S. Treasury Notes: 7.1% | |
| | 10,414,000 | | | | L | | | 1.750%, due 11/30/21 | | | 10,327,376 | | | | 4.5 | | |
| | 5,360,000 | | | | | | | 2.125%, due 11/30/23 | | | 5,318,605 | | | | 2.4 | | |
Principal
Amount† | |
| |
| | Value | | Percentage
of Net
Assets | |
| | 451,000 | | | | L | | | 1.000%-1.625%, due
11/30/18-10/31/23 | | $ | 440,882 | | | | 0.2 | | |
| | | | | | | | | | 16,086,863 | | | | 7.1 | | |
| | | | | | | Total U.S. Treasury
Obligations
(Cost $20,769,816) | | | 20,739,821 | | | | 9.1 | | |
ASSET-BACKED SECURITIES: 4.2% | | | |
| | | | | Cayman Islands: 3.8% | |
| | 350,000 | | | | # | | | ALM VII R-2 Ltd.,
2.887%, 10/15/27 | | | 349,966 | | | | 0.1 | | |
| | 240,000 | | | | # | | | Apidos CLO XI,
2.834%, 01/17/28 | | | 240,233 | | | | 0.1 | | |
| | 210,000 | | | | # | | | Apidos CLO XVII,
2.733%, 04/17/26 | | | 210,000 | | | | 0.1 | | |
| | 370,000 | | | | # | | | Apidos CLO XVII,
3.383%, 04/17/26 | | | 370,000 | | | | 0.2 | | |
| | 640,000 | | | | # | | | Ares XXVII CLO Ltd.
2013-2A B,
2.690%, 07/28/25 | | | 640,061 | | | | 0.3 | | |
| | 400,000 | | | | # | | | Blue Hill CLO
2013-1A B1,
2.830%, 01/15/26 | | | 400,317 | | | | 0.2 | | |
| | 510,000 | | | | # | | | BlueMountain CLO
2012-2 Ltd.,
2.784%, 11/20/28 | | | 509,994 | | | | 0.2 | | |
| | 330,000 | | | | # | | | BlueMountain CLO
2014-4 Ltd.,
2.737%, 11/30/26 | | | 329,996 | | | | 0.2 | | |
| | 300,000 | | | | # | | | BlueMountain CLO
2014-4 Ltd.,
3.437%, 11/30/26 | | | 299,994 | | | | 0.1 | | |
| | 1,000,000 | | | | # | | | Bluemountain CLO III
Ltd. 2007-3A C,
1.683%, 03/17/21 | | | 995,688 | | | | 0.4 | | |
| | 640,000 | | | | # | | | Bristol Park CLO Ltd.,
2.784%, 04/15/29 | | | 639,989 | | | | 0.3 | | |
| | 210,000 | | | | # | | | Carlyle Global
Market Strategies
CLO 2012-4 Ltd.,
2.330%, 01/20/29 | | | 210,591 | | | | 0.1 | | |
| | 290,000 | | | | # | | | Carlyle Global Market
Strategies CLO
2012-4 Ltd.,
2.780%, 01/20/29 | | | 289,998 | | | | 0.1 | | |
| | 620,000 | | | | # | | | Carlyle US CLO
2016-4 Ltd.,
2.732%, 10/20/27 | | | 619,987 | | | | 0.3 | | |
| | 520,000 | | | | # | | | Dryden 33 Senior
Loan Fund
2014-33A BR,
2.636%, 10/15/28 | | | 521,187 | | | | 0.2 | | |
| | 1,300,000 | | | | # | | | Madison Park
Funding Ltd.
2007-6A C,
1.884%, 07/26/21 | | | 1,274,384 | | | | 0.5 | | |
| | 160,000 | | | | # | | | Madison Park
Funding X Ltd.
2012-10A BR,
2.778%, 01/20/29 | | | 159,999 | | | | 0.1 | | |
See Accompanying Notes to Financial Statements
91
SUMMARY PORTFOLIO OF INVESTMENTS
VOYA GLOBAL BOND PORTFOLIO AS OF DECEMBER 31, 2016 (CONTINUED)
Principal
Amount† | |
| |
| | Value | | Percentage
of Net
Assets | |
| | | | | Cayman Islands (continued) | |
| | 250,000 | | | | # | | | Magnetite VIII Ltd.
2014-8A BR,
2.630%, 04/15/26 | | $ | 249,997 | | | | 0.1 | | |
| | 420,000 | | | | # | | | Shackleton 2016-IX
CLO Ltd., 2.364%,
10/20/28 | | | 419,987 | | | | 0.2 | | |
| | | | | | | | | | 8,732,368 | | | | 3.8 | | |
| | | | | United States: 0.4% | |
| | 387,880 | | | | | | | Citigroup Mortgage
Loan Trust
2006-WF1 A2E,
5.204%, 03/25/36 | | | 278,276 | | | | 0.1 | | |
| | 640,000 | | | | # | | | OHA Loan Funding
Ltd. 2016-1A B1,
2.686%, 01/20/28 | | | 639,987 | | | | 0.3 | | |
| | | | | | | | | | 918,263 | | | | 0.4 | | |
| | | | | | | Total Asset-Backed
Securities
(Cost $9,629,572) | | | 9,650,631 | | | | 4.2 | | |
Shares | |
| |
| | Value | | Percentage
of Net
Assets | |
COMMON STOCK: 0.0% | | | |
| | | | | United States: 0.0% | |
| | 48,071 | | | | | | | Other Securities(b) | | $ | 26,686 | | | | 0.0 | | |
| | | | | | | Total Common Stock
(Cost $1,298,013) | | | 26,686 | | | | 0.0 | | |
MUTUAL FUNDS: 21.1% | | | |
| | | | | United States: 21.1% | |
| | 1,016,577 | | | | | | | Voya Emerging
Markets Corporate
Debt Fund - Class P | | | 9,840,467 | | | | 4.3 | | |
| | 1,543,413 | | | | | | | Voya Emerging
Markets Hard
Currency Debt
Fund - Class P | | | 14,492,650 | | | | 6.3 | | |
| | 2,978,583 | | | | | | | Voya Emerging
Markets Local
Currency Debt
Fund - Class P | | | 21,177,722 | | | | 9.3 | | |
| | 336,040 | | | | | | | Voya High Yield Bond
Fund - Class P | | | 2,701,759 | | | | 1.2 | | |
| | | | | | | Total Mutual Funds
(Cost $57,285,247) | | | 48,212,598 | | | | 21.1 | | |
# of
Contracts | |
| |
| | Value | | Percentage
of Net
Assets | |
PURCHASED OPTIONS: 8.9% | | | |
| | | | | Options on Currencies: 0.3% | |
| | 49,600,000 | | | | @ | | | Call USD vs. Put JPY,
Strike @ 120.000,
Exp. 03/17/17
Counterparty:
Bank of
America N.A. | | $ | 558,589 | | | | 0.3 | | |
| | | | | OTC Interest Rate Swaptions: 8.6% | |
| | 19,100,000 | | | | @ | | | Call on 20-year
Interest Rate Swap,
Receive a fixed
rate equal to
2.610% and pay a
floating rate based
on the 3-month
USD-LIBOR-BBA,
Exp. 11/17/23
Counterparty:
Goldman Sachs
International | | | 1,760,489 | | | | 0.8 | | |
| | 15,950,000 | | | | @ | | | Call on 30-year
Interest Rate Swap,
Receive a fixed
rate equal to
2.540% and pay a
floating rate based
on the 3-month
USD-LIBOR-BBA,
Exp. 11/16/21
Counterparty:
Goldman Sachs
International | | | 1,767,671 | | | | 0.8 | | |
| | 283,200,000 | | | | @ | | | Put on 10-year
Interest Rate Swap,
Receive a floating
rate based
on the 3-month
USD-LIBOR-BBA
and pay a fixed rate
equal to 2.710%,
Exp. 11/15/17
Counterparty:
Bank of
America N.A. | | | 5,933,751 | | | | 2.6 | | |
| | 19,100,000 | | | | @ | | | Put on 20-year
Interest Rate
Swap, Receive a
floating rate based
on the 3-month
USD-LIBOR-BBA
and pay a fixed rate
equal to 2.610%,
Exp. 11/17/23
Counterparty:
Goldman Sachs
International | | | 2,229,128 | | | | 1.0 | | |
See Accompanying Notes to Financial Statements
92
SUMMARY PORTFOLIO OF INVESTMENTS
VOYA GLOBAL BOND PORTFOLIO AS OF DECEMBER 31, 2016 (CONTINUED)
# of
Contracts | |
| |
| | Value | | Percentage
of Net
Assets | |
| | | | | OTC Interest Rate Swaptions (continued) | |
| | 15,950,000 | | | | @ | | | Put on 30-year
Interest Rate Swap,
Receive a floating
rate based
on the 3-month
USD-LIBOR-BBA
and pay a fixed rate
equal to 2.540%,
Exp. 11/16/21
Counterparty:
Goldman Sachs
International | | $ | 2,395,374 | | | | 1.0 | | |
| | 495,600,000 | | | | @ | | | Put on 5-year
Interest Rate Swap,
Receive a floating
rate based
on the 3-month
USD-LIBOR-BBA
and pay a fixed rate
equal to 2.423%,
Exp. 11/15/17
Counterparty:
Bank of
America N.A. | | | 5,561,875 | | | | 2.4 | | |
| | | | | | | | | | 19,648,288 | | | | 8.6 | | |
| | | | | | | Total Purchased
Options
(Cost $17,436,386) | | | 20,206,877 | | | | 8.9 | | |
| | | | | | | Total Long-Term
Investments
(Cost $248,802,618) | | | 242,995,737 | | | | 106.4 | | |
Principal
Amount† | |
| |
| | Value | | Percentage
of Net
Assets | |
SHORT-TERM INVESTMENTS: 9.4% | | | | | |
| | | | | Corporate Bonds/Notes: 0.2% | |
| | 265,000 | | | | # | | | Barclays Bank PLC,
6.050%, 12/04/17 | | $ | 273,873 | | | | 0.1 | | |
| | 258,000 | | | | | | | Hewlett Packard
Enterprise Co.,
2.450%, 10/05/17 | | | 259,469 | | | | 0.1 | | |
| | | | | | | | | | 533,342 | | | | 0.2 | | |
| | | | | U.S. Government Agency
Obligations: 0.0% | |
| | 1,879 | | | | | | | Fannie Mae,
6.000%, 06/01/17 | | | 1,890 | | | | 0.0 | | |
| | 15 | | | | | | | Fannie Mae,
7.000%, 11/01/17 | | | 15 | | | | 0.0 | | |
| | | | | | | | | | 1,905 | | | | 0.0 | | |
Principal
Amount† | |
| |
| | Value | | Percentage
of Net
Assets | |
| | | | | Securities Lending Collateralcc: 6.9% | |
| | 3,736,204 | | | | | | | Bank of Nova Scotia,
Repurchase
Agreement dated
12/30/16, 0.51%,
due 01/03/17
(Repurchase
Amount $3,736,413,
collateralized by
various U.S.
Government/U.S.
Government
Agency Obligations,
1.000%-4.000%,
Market Value plus
accrued interest
$3,811,145, due
12/31/17-10/20/46) | | $ | 3,736,204 | | | | 1.6 | | |
| | 3,736,204 | | | | | | | Cantor Fitzgerald,
Repurchase
Agreement dated
12/30/16, 0.50%,
due 01/03/17
(Repurchase
Amount $3,736,409,
collateralized by
various U.S.
Government/U.S.
Government
Agency Obligations,
0.000%-10.000%,
Market Value plus
accrued interest
$3,810,928, due
01/25/17-10/20/66) | | | 3,736,204 | | | | 1.6 | | |
| | 3,736,204 | | | | | | | Daiwa Capital
Markets,
Repurchase
Agreement dated
12/30/16, 0.52%,
due 01/03/17
(Repurchase
Amount $3,736,417,
collateralized by
various U.S.
Government/U.S.
Government
Agency Obligations,
0.000%-6.500%,
Market Value plus
accrued interest
$3,810,928, due
03/02/17-02/01/49) | | | 3,736,204 | | | | 1.7 | | |
See Accompanying Notes to Financial Statements
93
SUMMARY PORTFOLIO OF INVESTMENTS
VOYA GLOBAL BOND PORTFOLIO AS OF DECEMBER 31, 2016 (CONTINUED)
Principal
Amount† | |
| |
| | Value | | Percentage
of Net
Assets | |
| | | | | Securities Lending Collateralcc (continued) | |
| | 786,391 | | | | | | | Merrill Lynch & Co.,
Inc., Repurchase
Agreement dated
12/30/16, 0.50%,
due 01/03/17
(Repurchase
Amount $786,434,
collateralized by
various U.S.
Government
Securities,
0.685%-2.000%,
Market Value plus
accrued interest
$802,119, due
10/31/18-11/30/22) | | $ | 786,391 | | | | 0.4 | | |
| | 3,736,204 | | | | | | | Nomura Securities,
Repurchase
Agreement dated
12/30/16, 0.50%,
due 01/03/17
(Repurchase
Amount $3,736,409,
collateralized by
various U.S.
Government/U.S.
Government
Agency Obligations,
0.000%-9.500%,
Market Value plus
accrued interest
$3,810,928, due
01/15/17-08/20/66) | | | 3,736,204 | | | | 1.6 | | |
| | | | | | | | | | 15,731,207 | | | | 6.9 | | |
| | | | | Collateralized Mortgage Obligations: 0.0% | |
| | 173 | | | | | | | Fannie Mae,
6.000%, 03/25/17 | | | 175 | | | | 0.0 | | |
| | 1,024 | | | | | | | Freddie Mac,
6.000%, 05/15/17 | | | 1,038 | | | | 0.0 | | |
| | | | | | | | | | 1,213 | | | | 0.0 | | |
| | | | | Foreign Government Bonds: 0.4% | |
EUR | 10,000 | | | | Z | | | Bundesschatzanweisungen,
-0.810%, 12/15/17 | | | 10,609 | | | | 0.0 | | |
EUR | 830,000 | | | | Z | | | Bundesschatzanweisungen,
-0.930%, 06/16/17 | | | 877,425 | | | | 0.4 | | |
| | | | | | | | | | 888,034 | | | | 0.4 | | |
Principal
Amount† | |
| |
| | Value | | Percentage
of Net
Assets | |
| | | | | Mutual Funds: 1.9% | |
| | 4,318,000 | | | | | | | BlackRock Liquidity
Funds, FedFund,
Institutional Class,
0.420%††
(Cost $4,318,000) | | $ | 4,318,000 | | | | 1.9 | | |
| | | | | Total Short-Term
Investments
(Cost $21,510,566) | | | 21,473,701 | | | | 9.4 | | |
| | | | | Total Investments in
Securities
(Cost
$270,313,184) | | $ | 264,469,438 | | | | 115.8 | | |
| | | | | Liabilities in Excess
of Other Assets | | | (36,072,350 | ) | | | (15.8 | ) | |
| | | | | Net Assets | | $ | 228,397,088 | | | | 100.0 | | |
"Other Securities" represents issues not identified as the top 50 holdings in terms of market value and issues or issuers not exceeding 1% of net assets individually or in aggregate respectively as of December 31, 2016.
The following footnotes apply to either the individual securities noted or one or more of the securities aggregated and listed as a single line item.
† Unless otherwise indicated, principal amount is shown in USD.
†† Rate shown is the 7-day yield as of December 31, 2016.
# Securities with purchases pursuant to Rule 144A or section 4(a)(2), under the Securities Act of 1933 and may not be resold subject to that rule except to qualified institutional buyers.
## The Federal Housing Finance Agency ("FHFA") placed the Federal Home Loan Mortgage Corporation and Federal National Mortgage Association into conservatorship with FHFA as the conservator. As such, the FHFA oversees the continuing affairs of these companies.
@ Non-income producing security.
cc Represents securities purchased with cash collateral received for securities on loan.
L Loaned security, a portion or all of the security is on loan at December 31, 2016.
^ Interest only securities represent the right to receive the monthly interest payments on an underlying pool of mortgage loans. Principal amount shown represents the notional amount on which current interest is calculated. Payments of principal on the pool reduce the value of the interest only security.
Z Indicates Zero Coupon Bond; rate shown reflects current effective yield.
(a) The grouping contains securities in default.
(b) This grouping contains securities on loan.
BRL Brazilian Real
EUR EU Euro
MXN Mexican Peso
RUB Russian Ruble
ZAR South African Rand
Cost for federal income tax purposes is $270,151,431.
Net unrealized depreciation consists of: | |
Gross Unrealized Appreciation | | $ | 7,774,906 | | |
Gross Unrealized Depreciation | | | (13,456,899 | ) | |
Net Unrealized Depreciation | | $ | (5,681,993 | ) | |
See Accompanying Notes to Financial Statements
94
SUMMARY PORTFOLIO OF INVESTMENTS
VOYA GLOBAL BOND PORTFOLIO AS OF DECEMBER 31, 2016 (CONTINUED)
Sector Diversification | | Percentage of
Net Assets | |
Affiliated Investment Companies | | | 21.1 | % | |
Collateralized Mortgage Obligations | | | 16.7 | | |
Foreign Government Bonds | | | 14.4 | | |
U.S. Treasury Obligations | | | 9.1 | | |
Purchased Options | | | 8.9 | | |
Commercial Mortgage-Backed Securities | | | 8.3 | | |
Financial | | | 8.2 | | |
Other Asset-Backed Securities | | | 4.2 | | |
Communications | | | 3.9 | | |
Consumer, Non-cyclical | | | 3.6 | | |
Energy | | | 2.9 | | |
Utilities | | | 1.6 | | |
Sector Diversification | | Percentage of
Net Assets | |
U.S. Government Agency Obligations | | | 1.4 | % | |
Technology | | | 1.2 | | |
Consumer, Cyclical | | | 0.8 | | |
Industrial | | | 0.5 | | |
Basic Materials | | | 0.2 | | |
Structured Products | | | 0.0 | | |
Materials | | | 0.0 | | |
Consumer Discretionary | | | 0.0 | | |
Short-Term Investments | | | 8.8 | | |
Liabilities in Excess of Other Assets | | | (15.8 | ) | |
Net Assets | | | 100.0 | % | |
Fair Value Measurements^
The following is a summary of the fair valuations according to the inputs used as of December 31, 2016 in valuing the assets and liabilities:
| | | Quoted Prices
in Active Markets
for Identical Investments
(Level 1) | | Significant Other
Observable
Inputs
(Level 2) | | Significant
Unobservable
Inputs
(Level 3) | | Fair Value
at
December 31, 2016 | |
Asset Table | |
Investments, at fair value | |
Common Stock | |
United States | | $ | 26,686 | | | $ | — | | | $ | — | | | $ | 26,686 | | |
Total Common Stock | | | 26,686 | | | | — | | | | — | | | | 26,686 | | |
Mutual Funds | | | 48,212,598 | | | | — | | | | — | | | | 48,212,598 | | |
Purchased Options | | | — | | | | 20,206,877 | | | | — | | | | 20,206,877 | | |
Corporate Bonds/Notes | | | — | | | | 51,865,607 | | | | 6,584 | | | | 51,872,191 | | |
Collateralized Mortgage Obligations | | | — | | | | 38,170,195 | | | | — | | | | 38,170,195 | | |
Structured Products | | | — | | | | — | | | | 40,792 | | | | 40,792 | | |
Short-Term Investments | | | 4,318,000 | | | | 17,155,701 | | | | — | | | | 21,473,701 | | |
Commercial Mortgage-Backed Securities | | | — | | | | 18,915,241 | | | | — | | | | 18,915,241 | | |
Asset-Backed Securities | | | — | | | | 9,650,631 | | | | — | | | | 9,650,631 | | |
Foreign Government Bonds | | | — | | | | 31,967,178 | | | | — | | | | 31,967,178 | | |
U.S. Treasury Obligations | | | — | | | | 20,739,821 | | | | — | | | | 20,739,821 | | |
U.S. Government Agency Obligations | | | — | | | | 3,193,527 | | | | — | | | | 3,193,527 | | |
Total Investments, at fair value | | $ | 52,557,284 | | | $ | 211,864,778 | | | $ | 47,376 | | | $ | 264,469,438 | | |
Other Financial Instruments+ | |
Centrally Cleared Swaps | | | — | | | | 9,338,677 | | | | — | | | | 9,338,677 | | |
Forward Foreign Currency Contracts | | | — | | | | 2,510,309 | | | | — | | | | 2,510,309 | | |
Futures | | | 428,249 | | | | — | | | | — | | | | 428,249 | | |
Total Assets | | $ | 52,985,533 | | | $ | 223,713,764 | | | $ | 47,376 | | | $ | 276,746,673 | | |
Liabilities Table | |
Other Financial Instruments+ | |
Centrally Cleared Swaps | | $ | — | | | $ | (9,668,135 | ) | | $ | — | | | $ | (9,668,135 | ) | |
Forward Foreign Currency Contracts | | | — | | | | (5,919,220 | ) | | | — | | | | (5,919,220 | ) | |
Futures | | | (225,417 | ) | | | — | | | | — | | | | (225,417 | ) | |
Written Options | | | — | | | | (20,041,868 | ) | | | — | | | | (20,041,868 | ) | |
Total Liabilities | | $ | (225,417 | ) | | $ | (35,629,223 | ) | | $ | — | | | $ | (35,854,640 | ) | |
^ See Note 2, "Significant Accounting Policies" in the Notes to Financial Statements for additional information.
+ Other Financial Instruments are derivatives not reflected in the Portfolio of Investments and may include open forward foreign currency contracts, futures, centrally cleared swaps, OTC swaps and written options. Forward foreign currency contracts, futures and centrally cleared swaps are valued at the unrealized gain (loss) on the instrument. OTC swaps and written options are valued at the fair value of the instrument.
At December 31, 2016, the following forward foreign currency contracts were outstanding for Voya Global Bond Portfolio:
Counterparty | | Currency | | Contract
Amount | | Buy/Sell | | Settlement
Date | | In Exchange
For | | Fair
Value | | Unrealized
Appreciation
(Depreciation) | |
Barclays Bank PLC | | Canadian Dollar | | | 1,315,087 | | | Buy | | 01/13/17 | | $ | 975,000 | | | $ | 979,595 | | | $ | 4,595 | | |
Barclays Bank PLC | | Swedish Krona | | | 6,106,729 | | | Buy | | 01/13/17 | | | 663,000 | | | | 670,752 | | | | 7,752 | | |
Barclays Bank PLC | | Swedish Krona | | | 6,137,938 | | | Buy | | 01/13/17 | | | 658,000 | | | | 674,180 | | | | 16,180 | | |
Barclays Bank PLC | | New Zealand Dollar | | | 708,662 | | | Buy | | 01/13/17 | | | 507,000 | | | | 492,125 | | | | (14,875 | ) | |
Barclays Bank PLC | | New Zealand Dollar | | | 741,201 | | | Buy | | 01/13/17 | | | 527,000 | | | | 514,722 | | | | (12,278 | ) | |
See Accompanying Notes to Financial Statements
95
SUMMARY PORTFOLIO OF INVESTMENTS
VOYA GLOBAL BOND PORTFOLIO AS OF DECEMBER 31, 2016 (CONTINUED)
Counterparty | | Currency | | Contract
Amount | | Buy/Sell | | Settlement
Date | | In Exchange
For | | Fair
Value | | Unrealized
Appreciation
(Depreciation) | |
Barclays Bank PLC | | Australian Dollar | | | 2,435,088 | | | Buy | | 01/13/17 | | $ | 1,811,000 | | | $ | 1,756,804 | | | $ | (54,196 | ) | |
Barclays Bank PLC | | Canadian Dollar | | | 5,044,846 | | | Buy | | 01/13/17 | | | 3,789,000 | | | | 3,757,856 | | | | (31,144 | ) | |
Barclays Bank PLC | | Norwegian Krone | | | 10,482,071 | | | Buy | | 01/13/17 | | | 1,245,000 | | | | 1,213,975 | | | | (31,025 | ) | |
Barclays Bank PLC | | Norwegian Krone | | | 5,131,642 | | | Buy | | 01/13/17 | | | 602,000 | | | | 594,318 | | | | (7,682 | ) | |
Barclays Bank PLC | | Norwegian Krone | | | 13,019,631 | | | Buy | | 01/13/17 | | | 1,526,000 | | | | 1,507,862 | | | | (18,138 | ) | |
Barclays Bank PLC | | Swedish Krona | | | 13,339,162 | | | Buy | | 01/13/17 | | | 1,452,000 | | | | 1,465,150 | | | | 13,150 | | |
Barclays Bank PLC | | British Pound | | | 1,430,154 | | | Buy | | 01/13/17 | | | 1,782,000 | | | | 1,763,047 | | | | (18,953 | ) | |
Barclays Bank PLC | | Norwegian Krone | | | 9,407,382 | | | Buy | | 01/13/17 | | | 1,116,000 | | | | 1,089,511 | | | | (26,489 | ) | |
Barclays Bank PLC | | South Korean Won | | | 596,663,700 | | | Buy | | 03/10/17 | | | 510,921 | | | | 494,125 | | | | (16,796 | ) | |
BNP Paribas | | Swedish Krona | | | 8,408,994 | | | Buy | | 01/13/17 | | | 914,000 | | | | 923,629 | | | | 9,629 | | |
BNP Paribas | | EU Euro | | | 674,301 | | | Buy | | 01/13/17 | | | 720,000 | | | | 710,195 | | | | (9,805 | ) | |
BNP Paribas | | EU Euro | | | 1,002,670 | | | Buy | | 01/13/17 | | | 1,061,000 | | | | 1,056,043 | | | | (4,957 | ) | |
BNP Paribas | | Australian Dollar | | | 635,596 | | | Buy | | 01/13/17 | | | 468,000 | | | | 458,553 | | | | (9,447 | ) | |
BNP Paribas | | Canadian Dollar | | | 2,636,040 | | | Buy | | 01/13/17 | | | 1,966,000 | | | | 1,963,560 | | | | (2,440 | ) | |
BNP Paribas | | Swiss Franc | | | 541,818 | | | Buy | | 01/13/17 | | | 540,000 | | | | 532,484 | | | | (7,516 | ) | |
BNP Paribas | | British Pound | | | 893,439 | | | Buy | | 01/13/17 | | | 1,114,000 | | | | 1,101,402 | | | | (12,598 | ) | |
BNP Paribas | | Japanese Yen | | | 4,122,084,888 | | | Buy | | 01/13/17 | | | 37,853,062 | | | | 35,290,282 | | | | (2,562,780 | ) | |
Citibank N.A. | | Australian Dollar | | | 932,046 | | | Buy | | 01/13/17 | | | 668,000 | | | | 672,429 | | | | 4,429 | | |
Citibank N.A. | | Swedish Krona | | | 10,220,910 | | | Buy | | 01/13/17 | | | 1,112,000 | | | | 1,122,646 | | | | 10,646 | | |
Citibank N.A. | | Japanese Yen | | | 16,316,087 | | | Buy | | 01/13/17 | | | 139,000 | | | | 139,686 | | | | 686 | | |
Citibank N.A. | | Australian Dollar | | | 1,397,722 | | | Buy | | 01/13/17 | | | 1,035,000 | | | | 1,008,392 | | | | (26,608 | ) | |
Citibank N.A. | | Danish Krone | | | 6,741,468 | | | Buy | | 01/13/17 | | | 974,381 | | | | 955,120 | | | | (19,261 | ) | |
Citibank N.A. | | Czech Koruna | | | 11,239,058 | | | Buy | | 01/27/17 | | | 450,362 | | | | 438,388 | | | | (11,974 | ) | |
Deutsche Bank AG | | New Zealand Dollar | | | 1,795,665 | | | Buy | | 01/13/17 | | | 1,241,000 | | | | 1,246,987 | | | | 5,987 | | |
Deutsche Bank AG | | Australian Dollar | | | 986,008 | | | Buy | | 01/13/17 | | | 735,000 | | | | 711,359 | | | | (23,641 | ) | |
Deutsche Bank AG | | EU Euro | | | 498,764 | | | Buy | | 01/13/17 | | | 531,000 | | | | 525,314 | | | | (5,686 | ) | |
Deutsche Bank AG | | New Zealand Dollar | | | 2,219,278 | | | Buy | | 01/09/17 | | | 1,561,000 | | | | 1,541,390 | | | | (19,610 | ) | |
Deutsche Bank AG | | New Zealand Dollar | | | 5,545,365 | | | Buy | | 01/13/17 | | | 3,894,000 | | | | 3,850,940 | | | | (43,060 | ) | |
Deutsche Bank AG | | Australian Dollar | | | 2,488,399 | | | Buy | | 01/13/17 | | | 1,843,000 | | | | 1,795,265 | | | | (47,735 | ) | |
Deutsche Bank AG | | New Zealand Dollar | | | 5,014,006 | | | Buy | | 01/09/17 | | | 3,665,143 | | | | 3,482,457 | | | | (182,686 | ) | |
Deutsche Bank AG | | New Zealand Dollar | | | 5,014,006 | | | Buy | | 01/09/17 | | | 3,665,143 | | | | 3,482,457 | | | | (182,686 | ) | |
Deutsche Bank AG | | Israeli New Shekel | | | 1,035,992 | | | Buy | | 01/27/17 | | | 269,441 | | | | 269,107 | | | | (334 | ) | |
Deutsche Bank AG | | New Zealand Dollar | | | 6,419,791 | | | Buy | | 03/15/17 | | | 4,601,000 | | | | 4,450,307 | | | | (150,693 | ) | |
Deutsche Bank AG | | New Zealand Dollar | | | 1,266,017 | | | Buy | | 01/13/17 | | | 890,000 | | | | 879,177 | | | | (10,823 | ) | |
Goldman Sachs
International | | New Zealand Dollar | | | 1,509,012 | | | Buy | | 01/13/17 | | | 1,042,000 | | | | 1,047,923 | | | | 5,923 | | |
Goldman Sachs
International | | EU Euro | | | 2,613,522 | | | Buy | | 01/13/17 | | | 2,726,000 | | | | 2,752,642 | | | | 26,642 | | |
Goldman Sachs
International | | EU Euro | | | 4,243,781 | | | Buy | | 01/13/17 | | | 4,513,000 | | | | 4,469,682 | | | | (43,318 | ) | |
Goldman Sachs
International | | Japanese Yen | | | 48,542,120 | | | Buy | | 01/13/17 | | | 440,000 | | | | 415,582 | | | | (24,418 | ) | |
Goldman Sachs
International | | Japanese Yen | | | 240,449,260 | | | Buy | | 01/10/17 | | | 2,341,531 | | | | 2,058,182 | | | | (283,349 | ) | |
HSBC Bank USA N.A. | | Hong Kong Sar Dollar | | | 762,813 | | | Buy | | 03/10/17 | | | 98,312 | | | | 98,398 | | | | 86 | | |
HSBC Bank USA N.A. | | Singapore Dollar | | | 648,988 | | | Buy | | 03/10/17 | | | 449,268 | | | | 447,992 | | | | (1,276 | ) | |
JPMorgan Chase
Bank N.A. | | Australian Dollar | | | 2,052,560 | | | Buy | | 01/13/17 | | | 1,474,000 | | | | 1,480,827 | | | | 6,827 | | |
JPMorgan Chase
Bank N.A. | | British Pound | | | 791,864 | | | Buy | | 01/13/17 | | | 973,000 | | | | 976,184 | | | | 3,184 | | |
JPMorgan Chase
Bank N.A. | | Japanese Yen | | | 122,351,660 | | | Buy | | 01/13/17 | | | 1,043,000 | | | | 1,047,486 | | | | 4,486 | | |
JPMorgan Chase
Bank N.A. | | Australian Dollar | | | 5,808,157 | | | Buy | | 01/13/17 | | | 4,187,000 | | | | 4,190,318 | | | | 3,318 | | |
JPMorgan Chase
Bank N.A. | | Swiss Franc | | | 1,951,019 | | | Buy | | 01/13/17 | | | 1,898,000 | | | | 1,917,409 | | | | 19,409 | | |
JPMorgan Chase
Bank N.A. | | New Zealand Dollar | | | 1,338,478 | | | Buy | | 01/13/17 | | | 961,000 | | | | 929,496 | | | | (31,504 | ) | |
JPMorgan Chase
Bank N.A. | | Australian Dollar | | | 1,650,350 | | | Buy | | 01/13/17 | | | 1,223,000 | | | | 1,190,652 | | | | (32,348 | ) | |
JPMorgan Chase
Bank N.A. | | Canadian Dollar | | | 526,568 | | | Buy | | 01/13/17 | | | 390,000 | | | | 392,235 | | | | 2,235 | | |
JPMorgan Chase
Bank N.A. | | Australian Dollar | | | 1,617,360 | | | Buy | | 01/13/17 | | | 1,220,765 | | | | 1,166,851 | | | | (53,914 | ) | |
JPMorgan Chase
Bank N.A. | | Canadian Dollar | | | 2,814,772 | | | Buy | | 01/13/17 | | | 2,092,000 | | | | 2,096,696 | | | | 4,696 | | |
JPMorgan Chase
Bank N.A. | | EU Euro | | | 25,260,553 | | | Buy | | 01/13/17 | | | 27,174,073 | | | | 26,605,195 | | | | (568,878 | ) | |
Morgan Stanley Capital
Services LLC | | Australian Dollar | | | 2,373,208 | | | Buy | | 01/13/17 | | | 1,772,000 | | | | 1,712,160 | | | | (59,840 | ) | |
See Accompanying Notes to Financial Statements
96
SUMMARY PORTFOLIO OF INVESTMENTS
VOYA GLOBAL BOND PORTFOLIO AS OF DECEMBER 31, 2016 (CONTINUED)
Counterparty | | Currency | | Contract
Amount | | Buy/Sell | | Settlement
Date | | In Exchange
For | | Fair
Value | | Unrealized
Appreciation
(Depreciation) | |
Morgan Stanley Capital
Services LLC | | Japanese Yen | | | 98,722,735 | | | Buy | | 01/13/17 | | $ | 868,000 | | | $ | 845,192 | | | $ | (22,808 | ) | |
Morgan Stanley Capital
Services LLC | | Swedish Krona | | | 5,448,903 | | | Buy | | 01/13/17 | | | 592,000 | | | | 598,498 | | | | 6,498 | | |
Morgan Stanley Capital
Services LLC | | Japanese Yen | | | 534,373,000 | | | Buy | | 01/10/17 | | | 4,829,973 | | | | 4,574,091 | | | | (255,882 | ) | |
Morgan Stanley Capital
Services LLC | | Japanese Yen | | | 253,524,000 | | | Buy | | 01/10/17 | | | 2,291,497 | | | | 2,170,098 | | | | (121,399 | ) | |
Morgan Stanley Capital
Services LLC | | British Pound | | | 503,930 | | | Buy | | 01/13/17 | | | 626,000 | | | | 621,228 | | | | (4,772 | ) | |
Morgan Stanley Capital
Services LLC | | Swiss Franc | | | 1,010,673 | | | Buy | | 01/13/17 | | | 1,004,000 | | | | 993,263 | | | | (10,737 | ) | |
Morgan Stanley Capital
Services LLC | | EU Euro | | | 499,804 | | | Buy | | 01/13/17 | | | 531,000 | | | | 526,409 | | | | (4,591 | ) | |
Morgan Stanley Capital
Services LLC | | British Pound | | | 535,349 | | | Buy | | 01/13/17 | | | 663,000 | | | | 659,961 | | | | (3,039 | ) | |
Morgan Stanley Capital
Services LLC | | Swiss Franc | | | 321,580 | | | Buy | | 01/13/17 | | | 322,000 | | | | 316,040 | | | | (5,960 | ) | |
Morgan Stanley Capital
Services LLC | | Swiss Franc | | | 3,999,485 | | | Buy | | 01/13/17 | | | 4,006,879 | | | | 3,930,586 | | | | (76,293 | ) | |
Morgan Stanley Capital
Services LLC | | British Pound | | | 11,314,322 | | | Buy | | 01/13/17 | | | 14,111,679 | | | | 13,947,924 | | | | (163,755 | ) | |
Morgan Stanley Capital
Services LLC | | Norwegian Krone | | | 22,549,741 | | | Buy | | 01/13/17 | | | 2,674,254 | | | | 2,611,586 | | | | (62,668 | ) | |
| | | | | | | | | | | | | | | $ | (5,240,307 | ) | |
The Bank of New York
Mellon | | Malaysian Ringgit | | | 5,447,079 | | | Sell | | 03/10/17 | | | 1,232,064 | | | | 1,210,167 | | | | 21,897 | | |
Barclays Bank PLC | | Japanese Yen | | | 127,409,282 | | | Sell | | 01/13/17 | | | 1,085,000 | | | | 1,090,785 | | | | (5,785 | ) | |
Barclays Bank PLC | | British Pound | | | 1,245,202 | | | Sell | | 01/13/17 | | | 1,531,000 | | | | 1,535,044 | | | | (4,044 | ) | |
Barclays Bank PLC | | Norwegian Krone | | | 5,558,262 | | | Sell | | 01/13/17 | | | 638,000 | | | | 643,727 | | | | (5,727 | ) | |
Barclays Bank PLC | | Norwegian Krone | | | 6,416,437 | | | Sell | | 01/13/17 | | | 739,000 | | | | 743,116 | | | | (4,116 | ) | |
Barclays Bank PLC | | EU Euro | | | 765,227 | | | Sell | | 01/13/17 | | | 822,000 | | | | 805,961 | | | | 16,039 | | |
Barclays Bank PLC | | Norwegian Krone | | | 9,171,328 | | | Sell | | 01/13/17 | | | 1,067,000 | | | | 1,062,172 | | | | 4,828 | | |
Barclays Bank PLC | | British Pound | | | 300,635 | | | Sell | | 01/13/17 | | | 374,000 | | | | 370,613 | | | | 3,387 | | |
Barclays Bank PLC | | Japanese Yen | | | 250,631,208 | | | Sell | | 01/13/17 | | | 2,285,000 | | | | 2,145,721 | | | | 139,279 | | |
Barclays Bank PLC | | Norwegian Krone | | | 22,639,030 | | | Sell | | 01/13/17 | | | 2,650,000 | | | | 2,621,927 | | | | 28,073 | | |
Barclays Bank PLC | | Norwegian Krone | | | 7,725,707 | | | Sell | | 01/13/17 | | | 911,000 | | | | 894,749 | | | | 16,251 | | |
Barclays Bank PLC | | Philippine Peso | | | 5,648,082 | | | Sell | | 03/10/17 | | | 112,110 | | | | 112,791 | | | | (681 | ) | |
Barclays Bank PLC | | Thai Baht | | | 28,109,443 | | | Sell | | 03/10/17 | | | 789,263 | | | | 784,709 | | | | 4,554 | | |
BNP Paribas | | Norwegian Krone | | | 6,032,011 | | | Sell | | 01/13/17 | | | 693,000 | | | | 698,594 | | | | (5,594 | ) | |
BNP Paribas | | Swedish Krona | | | 3,748,401 | | | Sell | | 01/13/17 | | | 399,000 | | | | 411,718 | | | | (12,718 | ) | |
BNP Paribas | | Canadian Dollar | | | 1,706,026 | | | Sell | | 01/13/17 | | | 1,279,000 | | | | 1,270,802 | | | | 8,198 | | |
BNP Paribas | | EU Euro | | | 845,537 | | | Sell | | 01/13/17 | | | 903,000 | | | | 890,546 | | | | 12,454 | | |
BNP Paribas | | EU Euro | | | 331,373 | | | Sell | | 01/13/17 | | | 354,000 | | | | 349,012 | | | | 4,988 | | |
BNP Paribas | | Norwegian Krone | | | 10,090,645 | | | Sell | | 01/13/17 | | | 1,172,000 | | | | 1,168,643 | | | | 3,357 | | |
BNP Paribas | | Swiss Franc | | | 1,010,397 | | | Sell | | 01/13/17 | | | 997,000 | | | | 992,991 | | | | 4,009 | | |
BNP Paribas | | Japanese Yen | | | 253,524,184 | | | Sell | | 01/10/17 | | | 2,305,000 | | | | 2,170,100 | | | | 134,900 | | |
BNP Paribas | | Swiss Franc | | | 442,229 | | | Sell | | 01/13/17 | | | 440,000 | | | | 434,610 | | | | 5,390 | | |
BNP Paribas | | EU Euro | | | 270,105 | | | Sell | | 01/13/17 | | | 288,000 | | | | 284,483 | | | | 3,517 | | |
Citibank N.A. | | Australian Dollar | | | 507,217 | | | Sell | | 01/13/17 | | | 367,000 | | | | 365,934 | | | | 1,066 | | |
Citibank N.A. | | Norwegian Krone | | | 6,118,284 | | | Sell | | 01/13/17 | | | 706,000 | | | | 708,586 | | | | (2,586 | ) | |
Citibank N.A. | | Turkish Lira | | | 5,545,051 | | | Sell | | 01/27/17 | | | 1,662,870 | | | | 1,564,106 | | | | 98,764 | | |
Citibank N.A. | | Brazilian Real | | | 8,211,832 | | | Sell | | 02/10/17 | | | 2,353,905 | | | | 2,494,581 | | | | (140,676 | ) | |
Citibank N.A. | | Colombian Peso | | | 2,961,027,253 | | | Sell | | 02/10/17 | | | 932,167 | | | | 978,922 | | | | (46,755 | ) | |
Citibank N.A. | | New Zealand Dollar | | | 6,419,791 | | | Sell | | 03/15/17 | | | 4,400,106 | | | | 4,450,308 | | | | (50,202 | ) | |
Deutsche Bank AG | | New Zealand Dollar | | | 2,236,825 | | | Sell | | 01/13/17 | | | 1,543,000 | | | | 1,553,348 | | | | (10,348 | ) | |
Deutsche Bank AG | | New Zealand Dollar | | | 1,470,803 | | | Sell | | 01/13/17 | | | 1,046,000 | | | | 1,021,389 | | | | 24,611 | | |
Deutsche Bank AG | | British Pound | | | 1,326,222 | | | Sell | | 01/13/17 | | | 1,649,000 | | | | 1,634,922 | | | | 14,078 | | |
Deutsche Bank AG | | Norwegian Krone | | | 19,584,943 | | | Sell | | 01/13/17 | | | 2,291,000 | | | | 2,268,220 | | | | 22,780 | | |
Deutsche Bank AG | | New Zealand Dollar | | | 7,141,971 | | | Sell | | 01/09/17 | | | 5,014,006 | | | | 4,960,426 | | | | 53,580 | | |
Deutsche Bank AG | | Norwegian Krone | | | 9,619,808 | | | Sell | | 01/13/17 | | | 1,128,000 | | | | 1,114,113 | | | | 13,887 | | |
Goldman Sachs
International | | Swiss Franc | | | 2,005,241 | | | Sell | | 01/13/17 | | | 1,984,000 | | | | 1,970,697 | | | | 13,303 | | |
Goldman Sachs
International | | EU Euro | | | 5,190,693 | | | Sell | | 01/13/17 | | | 5,528,000 | | | | 5,466,998 | | | | 61,002 | | |
Goldman Sachs
International | | New Zealand Dollar | | | 3,724,966 | | | Sell | | 01/13/17 | | | 2,639,789 | | | | 2,586,776 | | | | 53,013 | | |
Goldman Sachs
International | | Swedish Krona | | | 21,247,874 | | | Sell | | 01/13/17 | | | 2,320,194 | | | | 2,333,828 | | | | (13,634 | ) | |
See Accompanying Notes to Financial Statements
97
SUMMARY PORTFOLIO OF INVESTMENTS
VOYA GLOBAL BOND PORTFOLIO AS OF DECEMBER 31, 2016 (CONTINUED)
Counterparty | | Currency | | Contract
Amount | | Buy/Sell | | Settlement
Date | | In Exchange
For | | Fair
Value | | Unrealized
Appreciation
(Depreciation) | |
Goldman Sachs
International | | Romanian New Leu | | | 1,620,684 | | | Sell | | 01/27/17 | | $ | 386,509 | | | $ | 376,167 | | | $ | 10,342 | | |
HSBC Bank USA N.A. | | Russian Ruble | | | 51,166,596 | | | Sell | | 01/27/17 | | | 800,073 | | | | 827,958 | | | | (27,885 | ) | |
HSBC Bank USA N.A. | | Polish Zloty | | | 6,836,149 | | | Sell | | 01/27/17 | | | 1,667,903 | | | | 1,632,845 | | | | 35,058 | | |
HSBC Bank USA N.A. | | Mexican Peso | | | 26,858,949 | | | Sell | | 02/10/17 | | | 1,295,767 | | | | 1,288,384 | | | | 7,383 | | |
JPMorgan Chase
Bank N.A. | | New Zealand Dollar | | | 4,949,037 | | | Sell | | 01/09/17 | | | 3,462,000 | | | | 3,437,333 | | | | 24,667 | | |
JPMorgan Chase
Bank N.A. | | New Zealand Dollar | | | 2,442,491 | | | Sell | | 01/13/17 | | | 1,681,000 | | | | 1,696,171 | | | | (15,171 | ) | |
JPMorgan Chase
Bank N.A. | | Canadian Dollar | | | 1,437,045 | | | Sell | | 01/13/17 | | | 1,059,000 | | | | 1,070,440 | | | | (11,440 | ) | |
JPMorgan Chase
Bank N.A. | | Australian Dollar | | | 1,859,527 | | | Sell | | 01/13/17 | | | 1,349,000 | | | | 1,341,563 | | | | 7,437 | | |
JPMorgan Chase
Bank N.A. | | Japanese Yen | | | 166,811,432 | | | Sell | | 01/13/17 | | | 1,414,000 | | | | 1,428,118 | | | | (14,118 | ) | |
JPMorgan Chase
Bank N.A. | | EU Euro | | | 418,476 | | | Sell | | 01/13/17 | | | 446,000 | | | | 440,751 | | | | 5,249 | | |
JPMorgan Chase
Bank N.A. | | British Pound | | | 393,490 | | | Sell | | 01/13/17 | | | 499,000 | | | | 485,081 | | | | 13,919 | | |
JPMorgan Chase
Bank N.A. | | Australian Dollar | | | 751,963 | | | Sell | | 01/13/17 | | | 563,000 | | | | 542,507 | | | | 20,493 | | |
JPMorgan Chase
Bank N.A. | | British Pound | | | 602,979 | | | Sell | | 01/13/17 | | | 762,000 | | | | 743,332 | | | | 18,668 | | |
JPMorgan Chase
Bank N.A. | | New Zealand Dollar | | | 750,972 | | | Sell | | 01/13/17 | | | 535,000 | | | | 521,507 | | | | 13,493 | | |
JPMorgan Chase
Bank N.A. | | New Zealand Dollar | | | 906,482 | | | Sell | | 01/13/17 | | | 646,000 | | | | 629,500 | | | | 16,500 | | |
JPMorgan Chase
Bank N.A. | | British Pound | | | 373,299 | | | Sell | | 01/13/17 | | | 475,000 | | | | 460,191 | | | | 14,809 | | |
JPMorgan Chase
Bank N.A. | | British Pound | | | 944,961 | | | Sell | | 01/13/17 | | | 1,191,000 | | | | 1,164,917 | | | | 26,083 | | |
JPMorgan Chase
Bank N.A. | | Swiss Franc | | | 2,326,941 | | | Sell | | 01/13/17 | | | 2,310,000 | | | | 2,286,855 | | | | 23,145 | | |
JPMorgan Chase
Bank N.A. | | British Pound | | | 582,795 | | | Sell | | 01/13/17 | | | 729,000 | | | | 718,450 | | | | 10,550 | | |
JPMorgan Chase
Bank N.A. | | Australian Dollar | | | 1,055,064 | | | Sell | | 01/13/17 | | | 789,000 | | | | 761,180 | | | | 27,820 | | |
JPMorgan Chase
Bank N.A. | | Australian Dollar | | | 3,022,413 | | | Sell | | 01/13/17 | | | 2,257,000 | | | | 2,180,532 | | | | 76,468 | | |
JPMorgan Chase
Bank N.A. | | Swiss Franc | | | 1,402,646 | | | Sell | | 01/13/17 | | | 1,405,000 | | | | 1,378,483 | | | | 26,517 | | |
JPMorgan Chase
Bank N.A. | | EU Euro | | | 1,778,080 | | | Sell | | 01/13/17 | | | 1,912,000 | | | | 1,872,729 | | | | 39,271 | | |
JPMorgan Chase
Bank N.A. | | Australian Dollar | | | 3,370,920 | | | Sell | | 01/13/17 | | | 2,544,000 | | | | 2,431,964 | | | | 112,036 | | |
JPMorgan Chase
Bank N.A. | | Japanese Yen | | | 240,449,260 | | | Sell | | 01/10/17 | | | 2,258,196 | | | | 2,058,182 | | | | 200,014 | | |
JPMorgan Chase
Bank N.A. | | Russian Ruble | | | 37,898,113 | | | Sell | | 01/27/17 | | | 575,915 | | | | 613,252 | | | | (37,337 | ) | |
JPMorgan Chase
Bank N.A. | | Indonesian Rupiah | | | 28,526,241,483 | | | Sell | | 03/10/17 | | | 2,114,621 | | | | 2,092,171 | | | | 22,450 | | |
Morgan Stanley Capital
Services LLC | | Norwegian Krone | | | 11,541,226 | | | Sell | | 01/13/17 | | | 1,325,000 | | | | 1,336,641 | | | | (11,641 | ) | |
Morgan Stanley Capital
Services LLC | | Swedish Krona | | | 6,060,381 | | | Sell | | 01/13/17 | | | 658,000 | | | | 665,661 | | | | (7,661 | ) | |
Morgan Stanley Capital
Services LLC | | EU Euro | | | 885,243 | | | Sell | | 01/13/17 | | | 955,000 | | | | 932,365 | | | | 22,635 | | |
Morgan Stanley Capital
Services LLC | | British Pound | | | 425,533 | | | Sell | | 01/13/17 | | | 542,000 | | | | 524,583 | | | | 17,417 | | |
Morgan Stanley Capital
Services LLC | | British Pound | | | 580,152 | | | Sell | | 01/13/17 | | | 726,000 | | | | 715,192 | | | | 10,808 | | |
Morgan Stanley Capital
Services LLC | | Japanese Yen | | | 534,372,833 | | | Sell | | 01/10/17 | | | 4,875,000 | | | | 4,574,089 | | | | 300,911 | | |
Morgan Stanley Capital
Services LLC | | Canadian Dollar | | | 5,923,136 | | | Sell | | 01/13/17 | | | 4,407,329 | | | | 4,412,085 | | | | (4,756 | ) | |
Morgan Stanley Capital
Services LLC | | South African Rand | | | 23,349,781 | | | Sell | | 01/27/17 | | | 1,602,139 | | | | 1,691,819 | | | | (89,680 | ) | |
Morgan Stanley Capital
Services LLC | | Hungarian Forint | | | 286,495,812 | | | Sell | | 01/27/17 | | | 996,339 | | | | 975,965 | | | | 20,374 | | |
Morgan Stanley Capital
Services LLC | | Japanese Yen | | | 256,088,125 | | | Sell | | 09/20/17 | | | 2,312,000 | | | | 2,222,282 | | | | 89,718 | | |
See Accompanying Notes to Financial Statements
98
SUMMARY PORTFOLIO OF INVESTMENTS
VOYA GLOBAL BOND PORTFOLIO AS OF DECEMBER 31, 2016 (CONTINUED)
Counterparty | | Currency | | Contract
Amount | | Buy/Sell | | Settlement
Date | | In Exchange
For | | Fair
Value | | Unrealized
Appreciation
(Depreciation) | |
Morgan Stanley Capital
Services LLC | | Japanese Yen | | | 253,524,000 | | | Sell | | 09/20/17 | | $ | 2,319,895 | | | $ | 2,200,031 | | | $ | 119,864 | | |
Morgan Stanley Capital
Services LLC | | Japanese Yen | | | 534,373,000 | | | Sell | | 09/20/17 | | | 4,889,830 | | | | 4,637,183 | | | | 252,647 | | |
| | | | | | | | | | | | | | | $ | 1,831,396 | | |
At December 31, 2016, the following futures contracts were outstanding for Voya Global Bond Portfolio:
Contract Description | | Number
of Contracts | | Expiration Date | | Notional
Value | | Unrealized
Appreciation/
(Depreciation) | |
Long Contracts | |
Australia 10-Year Bond | | | 11 | | | 03/15/17 | | $ | 1,014,042 | | | $ | 4,323 | | |
Australia 3-Year Bond | | | 36 | | | 03/15/17 | | | 2,895,857 | | | | (6,622 | ) | |
Canada 10-Year Bond | | | 30 | | | 03/22/17 | | | 3,072,953 | | | | (35,213 | ) | |
CBOE Volatility Index | | | 80 | | | 01/18/17 | | | 1,210,000 | | | | 70,032 | | |
Euro-Bobl 5-Year | | | 66 | | | 03/08/17 | | | 9,283,964 | | | | 87,399 | | |
Euro-Buxl® 30-year German Government Bond | | | 31 | | | 03/08/17 | | | 5,662,351 | | | | 111,065 | | |
Euro-Schatz | | | 128 | | | 03/08/17 | | | 15,129,919 | | | | 25,437 | | |
Long Gilt | | | 29 | | | 03/29/17 | | | 4,497,141 | | | | 80,225 | | |
Short Gilt | | | 16 | | | 03/29/17 | | | 2,083,656 | | | | 8,880 | | |
U.S. Treasury Long Bond | | | 15 | | | 03/22/17 | | | 2,259,844 | | | | (17,233 | ) | |
U.S. Treasury Ultra Long Bond | | | 2 | | | 03/22/17 | | | 320,500 | | | | 3,590 | | |
| | | | | | | $ | 47,430,227 | | | $ | 331,883 | | |
Short Contracts | |
Euro-Bund | | | (54 | ) | | 03/08/17 | | | (9,330,828 | ) | | | (162,617 | ) | |
Japan 10-Year Bond (TSE) | | | (4 | ) | | 03/13/17 | | | (5,141,904 | ) | | | (3,012 | ) | |
U.S. Treasury 10-Year Note | | | (45 | ) | | 03/22/17 | | | (5,592,656 | ) | | | 14,269 | | |
U.S. Treasury 2-Year Note | | | (9 | ) | | 03/31/17 | | | (1,950,187 | ) | | | (720 | ) | |
U.S. Treasury 5-Year Note | | | (131 | ) | | 03/31/17 | | | (15,413,992 | ) | | | 19,985 | | |
U.S. Treasury Ultra 10-Year Note | | | (17 | ) | | 03/22/17 | | | (2,279,062 | ) | | | 3,044 | | |
| | | | | | | $ | (39,708,629 | ) | | $ | (129,051 | ) | |
At December 31, 2016, the following centrally cleared credit default swaps were outstanding for Voya Global Bond Portfolio:
Centrally Cleared Credit Default Swaps on Credit Indices — Sell Protection(1)
Reference
Entity/Obligation | | Buy/Sell
Protection | | (Pay)/
Receive
Fixed
Rate (%) | | Clearinghouse | | Termination
Date | | Notional
Amount(2) | | Fair
Value(3) | | Unrealized
Appreciation/
(Depreciation) | |
CDX North American
High Yield Index,
Series 27, Version 1 | | Sell | | | 5.000 | | | Intercontinental Exchange | | 12/20/21 | | USD | 11,400,000 | | | $ | 705,751 | | | $ | 155,131 | | |
| | | | | | | $ | 705,751 | | | $ | 155,131 | | |
(1) If the Portfolio is a seller of protection and a credit event occurs, as defined under the terms of that particular swap agreement, the Portfolio will generally either i) Pay to the buyer an amount equal to the notional amount of the swap and take delivery of the referenced obligation, other deliverable obligations, or underlying securities comprising a referenced index or ii) Pay a net settlement amount in the form of cash or securities equal to the notional amount of the swap less the recovery value of the referenced obligation or underlying securities comprising a referenced index.
(2) The maximum amount of future payments (undiscounted) that a Portfolio as seller of protection could be required to make or receive as a buyer of credit protection under a credit default swap agreement would be an amount equal to the notional amount of the agreement.
(3) The fair values for credit default swap agreements serve as an indicator of the current status of the payment/performance risk and represent the likelihood or risk of default for the credit derivative. Increasing fair values, in absolute terms, when compared to the notional amount of the agreement, represent a deterioration of the referenced obligation's credit soundness and a greater likelihood or risk of default or other credit event occurring.
See Accompanying Notes to Financial Statements
99
SUMMARY PORTFOLIO OF INVESTMENTS
VOYA GLOBAL BOND PORTFOLIO AS OF DECEMBER 31, 2016 (CONTINUED)
At December 31, 2016, the following centrally cleared interest rate swaps were outstanding for Voya Global Bond Portfolio:
| | | Clearinghouse | | Termination
Date | | Notional
Amount | | Fair
Value | | Unrealized
Appreciation/
(Depreciation) | |
Receive a fixed rate equal to 2.960%
and pay a floating rate based on the
6-month CAD-BA-CDOR | | Chicago Mercantile Exchange | | 11/21/44 | | CAD | 1,000,000 | | | $ | 98,045 | | | $ | 97,377 | | |
Receive a floating rate based on the
6-month EUR-EURIBOR-Reuters and
pay a fixed rate equal to 1.143% | | Chicago Mercantile Exchange | | 02/04/46 | | EUR | 500,000 | | | | 11,448 | | | | 10,994 | | |
Receive a floating rate based on the
6-month EUR-EURIBOR-Reuters and
pay a fixed rate equal to 0.123% | | Chicago Mercantile Exchange | | 02/11/19 | | EUR | 200,000 | | | | (155 | ) | | | (157 | ) | |
Receive a floating rate based on the
6-month EUR-EURIBOR-Reuters and
pay a fixed rate equal to -0.095% | | Chicago Mercantile Exchange | | 02/16/19 | | EUR | 100,000 | | | | (139 | ) | | | (145 | ) | |
Receive a floating rate based on the
6-month EUR-EURIBOR-Reuters and
pay a fixed rate equal to 0.056% | | Chicago Mercantile Exchange | | 02/10/21 | | EUR | 100,000 | | | | (308 | ) | | | (325 | ) | |
Receive a fixed rate equal to 0.294% and
pay a floating rate based on the
6-month EUR-EURIBOR-Reuters | | Chicago Mercantile Exchange | | 02/10/23 | | EUR | 2,400,000 | | | | 14,181 | | | | 15,261 | | |
Receive a fixed rate equal to 0.325% and
pay a floating rate based on the
6-month EUR-EURIBOR-Reuters | | Chicago Mercantile Exchange | | 02/16/23 | | EUR | 100,000 | | | | 784 | | | | 840 | | |
Receive a fixed rate equal to 2.899% and
pay a floating rate based on the
6-month GBP-LIBOR-BBA | | Chicago Mercantile Exchange | | 08/22/44 | | GBP | 2,000,000 | | | | 847,526 | | | | 1,035,878 | | |
Receive a fixed rate equal to -0.165% and
pay a floating rate based on the
6-month JPY-LIBOR-BBA | | Chicago Mercantile Exchange | | 07/14/18 | | JPY | 619,500,000 | | | | (15,155 | ) | | | (17,114 | ) | |
Receive a fixed rate equal to -0.104% and
pay a floating rate based on the
6-month JPY-LIBOR-BBA | | Chicago Mercantile Exchange | | 03/07/21 | | JPY | 750,000,000 | | | | (43,541 | ) | | | (47,455 | ) | |
Receive a fixed rate equal to -0.198% and
pay a floating rate based on the
6-month JPY-LIBOR-BBA | | Chicago Mercantile Exchange | | 07/14/21 | | JPY | 512,300,000 | | | | (52,524 | ) | | | (58,446 | ) | |
Receive a floating rate based on the
6-month JPY-LIBOR-BBA and
pay a fixed rate equal to -0.030% | | Chicago Mercantile Exchange | | 03/02/23 | | JPY | 15,400,000 | | | | 1,091 | | | | 1,159 | | |
Receive a floating rate based on the
6-month JPY-LIBOR-BBA and
pay a fixed rate equal to -0.044% | | Chicago Mercantile Exchange | | 03/03/23 | | JPY | 1,733,000,000 | | | | 135,500 | | | | 143,352 | | |
Receive a fixed rate equal to -0.020% and
pay a floating rate based on the
6-month JPY-LIBOR-BBA | | Chicago Mercantile Exchange | | 03/07/23 | | JPY | 750,000,000 | | | | (49,383 | ) | | | (52,559 | ) | |
Receive a fixed rate equal to 0.754% and
pay a floating rate based on the
6-month JPY-LIBOR-BBA | | Chicago Mercantile Exchange | | 05/21/24 | | JPY | 1,855,000,000 | | | | 723,078 | | | | 729,720 | | |
Receive a fixed rate equal to 0.558% and
pay a floating rate based on the
6-month JPY-LIBOR-BBA | | Chicago Mercantile Exchange | | 02/24/25 | | JPY | 1,084,559,370 | | | | 299,448 | | | | 284,499 | | |
Receive a floating rate based on the
6-month JPY-LIBOR-BBA and
pay a fixed rate equal to 0.119% | | Chicago Mercantile Exchange | | 03/02/26 | | JPY | 10,900,000 | | | | 656 | | | | 666 | | |
Receive a floating rate based on the
6-month JPY-LIBOR-BBA and
pay a fixed rate equal to 0.103% | | Chicago Mercantile Exchange | | 03/03/26 | | JPY | 1,231,000,000 | | | | 89,425 | | | | 90,867 | | |
Receive a fixed rate equal to -0.092% and
pay a floating rate based on the
6-month JPY-LIBOR-BBA | | Chicago Mercantile Exchange | | 07/14/26 | | JPY | 652,900,000 | | | | (160,420 | ) | | | (176,512 | ) | |
Receive a fixed rate equal to 0.387% and
pay a floating rate based on the
6-month JPY-LIBOR-BBA | | Chicago Mercantile Exchange | | 03/02/31 | | JPY | 7,700,000 | | | | (332 | ) | | | (314 | ) | |
Receive a fixed rate equal to 0.360% and
pay a floating rate based on the
6-month JPY-LIBOR-BBA | | Chicago Mercantile Exchange | | 03/03/31 | | JPY | 867,000,000 | | | | (65,745 | ) | | | (64,442 | ) | |
Receive a floating rate based on the
6-month JPY-LIBOR-BBA and
pay a fixed rate equal to 0.373% | | Chicago Mercantile Exchange | | 03/07/31 | | JPY | 350,000,000 | | | | 21,494 | | | | 20,825 | | |
Receive a floating rate based on the
6-month JPY-LIBOR-BBA and
pay a fixed rate equal to 0.074% | | Chicago Mercantile Exchange | | 07/14/31 | | JPY | 79,500,000 | | | | 36,282 | | | | 39,492 | | |
See Accompanying Notes to Financial Statements
100
SUMMARY PORTFOLIO OF INVESTMENTS
VOYA GLOBAL BOND PORTFOLIO AS OF DECEMBER 31, 2016 (CONTINUED)
| | | Clearinghouse | | Termination
Date | | Notional
Amount | | Fair
Value | | Unrealized
Appreciation/
(Depreciation) | |
Receive a fixed rate equal to 0.623% and
pay a floating rate based on the
6-month JPY-LIBOR-BBA | | Chicago Mercantile Exchange | | 03/02/36 | | JPY | 6,200,000 | | | $ | (198 | ) | | $ | (195 | ) | |
Receive a fixed rate equal to 0.585% and
pay a floating rate based on the
6-month JPY-LIBOR-BBA | | Chicago Mercantile Exchange | | 03/03/36 | | JPY | 693,000,000 | | | | (64,132 | ) | | | (64,885 | ) | |
Receive a floating rate based on the
6-month JPY-LIBOR-BBA and
pay a fixed rate equal to 0.178% | | Chicago Mercantile Exchange | | 07/14/36 | | JPY | 326,600,000 | | | | 256,568 | | | | 278,738 | | |
Receive a fixed rate equal to 1.289% and
pay a floating rate based on the
6-month JPY-LIBOR-BBA | | Chicago Mercantile Exchange | | 02/04/45 | | JPY | 1,015,000,000 | | | | 1,062,764 | | | | 1,042,596 | | |
Receive a floating rate based on the
6-month JPY-LIBOR-BBA and
pay a fixed rate equal to 1.443% | | Chicago Mercantile Exchange | | 02/24/45 | | JPY | 468,636,765 | | | | (657,079 | ) | | | (645,979 | ) | |
Receive a floating rate based on the
6-month JPY-LIBOR-BBA and
pay a fixed rate equal to 0.233% | | Chicago Mercantile Exchange | | 07/14/46 | | JPY | 172,300,000 | | | | 255,951 | | | | 278,964 | | |
Receive a fixed rate equal to 0.747% and
pay a floating rate based on the
3-month USD-LIBOR-BBA | | Chicago Mercantile Exchange | | 04/04/17 | | USD | 19,000,000 | | | | (12,569 | ) | | | (12,569 | ) | |
Receive a fixed rate equal to 0.925% and
pay a floating rate based on the
3-month USD-LIBOR-BBA | | Chicago Mercantile Exchange | | 08/13/17 | | USD | 16,000,000 | | | | (13,647 | ) | | | (13,647 | ) | |
Receive a floating rate equal to the
3-month USD-LIBOR-BBA and
pay a fixed rate equal to 1.082% | | Chicago Mercantile Exchange | | 08/21/17 | | USD | 15,000,000 | | | | (1,595 | ) | | | (1,595 | ) | |
Receive a floating rate equal to the
3-month USD-LIBOR-BBA and
pay a fixed rate equal to 1.143% | | Chicago Mercantile Exchange | | 08/27/17 | | USD | 40,000,000 | | | | (19,449 | ) | | | (19,449 | ) | |
Receive a fixed rate equal to 0.859% and
pay a floating rate based on the
3-month USD-LIBOR-BBA | | Chicago Mercantile Exchange | | 04/04/18 | | USD | 18,000,000 | | | | (88,125 | ) | | | (88,125 | ) | |
Receive a floating rate based on the
3-month USD-LIBOR-BBA and
pay a fixed rate equal to 0.702% | | Chicago Mercantile Exchange | | 04/04/18 | | USD | 36,500,000 | | | | 158,534 | | | | 158,534 | | |
Receive a floating rate based on the
3-month USD-LIBOR-BBA and
pay a fixed rate equal to 1.249% | | Chicago Mercantile Exchange | | 07/06/18 | | USD | 11,600,000 | | | | 12,631 | | | | 12,631 | | |
Receive a fixed rate equal to 0.774% and
pay a floating rate based on the
3-month USD-LIBOR-BBA | | Chicago Mercantile Exchange | | 07/11/18 | | USD | 7,400,000 | | | | (61,846 | ) | | | (61,846 | ) | |
Receive a floating rate based on the
3-month USD-LIBOR-BBA and
pay a fixed rate equal to 1.170% | | Chicago Mercantile Exchange | | 01/19/19 | | USD | 27,800,000 | | | | 170,137 | | | | 170,137 | | |
Receive a fixed rate equal to 0.972% and
pay a floating rate based on the
3-month USD-LIBOR-BBA | | Chicago Mercantile Exchange | | 04/04/19 | | USD | 25,000,000 | | | | (303,571 | ) | | | (303,571 | ) | |
Receive a floating rate based on the
3-month USD-LIBOR-BBA and
pay a fixed rate equal to 0.826% | | Chicago Mercantile Exchange | | 04/04/19 | | USD | 13,000,000 | | | | 149,053 | | | | 149,053 | | |
Receive a floating rate based on the
3-month USD-LIBOR-BBA and
pay a fixed rate equal to 0.841% | | Chicago Mercantile Exchange | | 07/11/19 | | USD | 14,500,000 | | | | 266,443 | | | | 266,443 | | |
Receive a fixed rate equal to 1.743% and
pay a floating rate based on the
3-month USD-LIBOR-BBA | | Chicago Mercantile Exchange | | 08/21/19 | | USD | 8,100,000 | | | | 29,098 | | | | 29,098 | | |
Receive a floating rate equal to the
3-month USD-LIBOR-BBA and
pay a fixed rate equal to 1.7440% | | Chicago Mercantile Exchange | | 08/21/19 | | USD | 32,000,000 | | | | (116,201 | ) | | | (116,201 | ) | |
Receive a floating rate equal to the
3-month USD-LIBOR-BBA and
pay a fixed rate equal to 1.792% | | Chicago Mercantile Exchange | | 08/27/19 | | USD | 8,000,000 | | | | (38,737 | ) | | | (38,737 | ) | |
Receive a floating rate based on the
3-month USD-LIBOR-BBA and
pay a fixed rate equal to 0.900% | | Chicago Mercantile Exchange | | 09/14/19 | | USD | 5,000,000 | | | | 73,167 | | | | 73,167 | | |
Receive a floating rate based on the
3-month USD-LIBOR-BBA and
pay a fixed rate equal to 1.668% | | Chicago Mercantile Exchange | | 10/30/19 | | USD | 59,452,000 | | | | (40,186 | ) | | | (40,186 | ) | |
See Accompanying Notes to Financial Statements
101
SUMMARY PORTFOLIO OF INVESTMENTS
VOYA GLOBAL BOND PORTFOLIO AS OF DECEMBER 31, 2016 (CONTINUED)
| | | Clearinghouse | | Termination
Date | | Notional
Amount | | Fair
Value | | Unrealized
Appreciation/
(Depreciation) | |
Receive a floating rate based on the
3-month USD-LIBOR-BBA and
pay a fixed rate equal to 0.983% | | Chicago Mercantile Exchange | | 10/31/19 | | USD | 5,000,000 | | | $ | 67,735 | | | $ | 67,735 | | |
Receive a fixed rate equal to 2.000% and
pay a floating rate based on the
3-month USD-LIBOR-BBA | | Chicago Mercantile Exchange | | 11/05/19 | | USD | 121,260,000 | | | | 1,185,029 | | | | 1,185,029 | | |
Receive a floating rate based on the
3-month USD-LIBOR-BBA and
pay a fixed rate equal to 1.883% | | Chicago Mercantile Exchange | | 06/30/20 | | USD | 27,546,000 | | | | (109,400 | ) | | | (109,400 | ) | |
Receive a fixed rate equal to 1.465% and
pay a floating rate based on the
3-month USD-LIBOR-BBA | | Chicago Mercantile Exchange | | 01/19/21 | | USD | 10,600,000 | | | | (163,259 | ) | | | (163,259 | ) | |
Receive a fixed rate equal to 1.255% and
pay a floating rate based on the
3-month USD-LIBOR-BBA | | Chicago Mercantile Exchange | | 02/04/21 | | USD | 38,214,000 | | | | (922,843 | ) | | | (922,843 | ) | |
Receive a floating rate based on the
3-month USD-LIBOR-BBA and
pay a fixed rate equal to 1.079% | | Chicago Mercantile Exchange | | 04/04/21 | | USD | 7,500,000 | | | | 204,029 | | | | 204,029 | | |
Receive a fixed rate equal to 1.209% and
pay a floating rate based on the
3-month USD-LIBOR-BBA | | Chicago Mercantile Exchange | | 04/04/21 | | USD | 8,000,000 | | | | (223,196 | ) | | | (223,196 | ) | |
Receive a floating rate based on the
3-month USD-LIBOR-BBA and
pay a fixed rate equal to 2.223% | | Chicago Mercantile Exchange | | 05/15/21 | | USD | 12,000,000 | | | | (165,155 | ) | | | (165,155 | ) | |
Receive a floating rate equal to the
3-month USD-LIBOR-BBA and
pay a fixed rate equal to 2.179% | | Chicago Mercantile Exchange | | 07/01/21 | | USD | 45,000,000 | | | | (516,788 | ) | | | (516,788 | ) | |
Receive a fixed rate equal to 0.990% and
pay a floating rate based on the
3-month USD-LIBOR-BBA | | Chicago Mercantile Exchange | | 07/11/21 | | USD | 11,000,000 | | | | (447,763 | ) | | | (447,763 | ) | |
Receive a floating rate based on the
3-month USD-LIBOR-BBA and
pay a fixed rate equal to 1.113% | | Chicago Mercantile Exchange | | 10/11/21 | | USD | 3,500,000 | | | | 112,400 | | | | 112,400 | | |
Receive a fixed rate equal to 1.744% and
pay a floating rate based on the
3-month USD-LIBOR-BBA | | Chicago Mercantile Exchange | | 11/18/21 | | USD | 7,300,000 | | | | (75,100 | ) | | | (75,099 | ) | |
Receive a fixed rate equal to 1.813% and
pay a floating rate based on the
3-month USD-LIBOR-BBA | | Chicago Mercantile Exchange | | 11/22/21 | | USD | 11,000,000 | | | | (78,598 | ) | | | (78,598 | ) | |
Receive a floating rate based on the
3-month USD-LIBOR-BBA and
pay a fixed rate equal to 1.861% | | Chicago Mercantile Exchange | | 11/25/21 | | USD | 14,700,000 | | | | 72,697 | | | | 72,697 | | |
Receive a fixed rate equal to 1.790% and
pay a floating rate based on the
3-month USD-LIBOR-BBA | | Chicago Mercantile Exchange | | 11/30/21 | | USD | 7,300,000 | | | | (60,510 | ) | | | (60,510 | ) | |
Receive a fixed rate equal to 1.817% and
pay a floating rate based on the
3-month USD-LIBOR-BBA | | Chicago Mercantile Exchange | | 12/02/21 | | USD | 7,300,000 | | | | (52,027 | ) | | | (52,027 | ) | |
Receive a floating rate based on the
3-month USD-LIBOR-BBA and
pay a fixed rate equal to 1.874% | | Chicago Mercantile Exchange | | 12/05/21 | | USD | 14,700,000 | | | | 65,875 | | | | 65,875 | | |
Receive a floating rate based on the
3-month USD-LIBOR-BBA and
pay a fixed rate equal to 1.932% | | Chicago Mercantile Exchange | | 12/14/21 | | USD | 19,000,000 | | | | 35,568 | | | | 35,568 | | |
Receive a fixed rate equal to 2.059% and
pay a floating rate based on the
3-month USD-LIBOR-BBA | | Chicago Mercantile Exchange | | 12/21/21 | | USD | 36,800,000 | | | | 148,850 | | | | 148,850 | | |
Receive a fixed rate equal to 1.970% and
pay a floating rate based on the
3-month USD-LIBOR-BBA | | Chicago Mercantile Exchange | | 11/17/22 | | USD | 15,576,000 | | | | (200,059 | ) | | | (200,059 | ) | |
Receive a floating rate based on the
3-month USD-LIBOR-BBA and
pay a fixed rate equal to 1.313% | | Chicago Mercantile Exchange | | 04/04/23 | | USD | 6,000,000 | | | | 237,972 | | | | 237,972 | | |
Receive a fixed rate equal to 1.433% and
pay a floating rate based on the
3-month USD-LIBOR-BBA | | Chicago Mercantile Exchange | | 04/04/23 | | USD | 1,500,000 | | | | (59,897 | ) | | | (59,897 | ) | |
Receive a fixed rate equal to 1.145% and
pay a floating rate based on the
3-month USD-LIBOR-BBA | | Chicago Mercantile Exchange | | 07/11/23 | | USD | 4,900,000 | | | | (297,993 | ) | | | (297,993 | ) | |
See Accompanying Notes to Financial Statements
102
SUMMARY PORTFOLIO OF INVESTMENTS
VOYA GLOBAL BOND PORTFOLIO AS OF DECEMBER 31, 2016 (CONTINUED)
| | | Clearinghouse | | Termination
Date | | Notional
Amount | | Fair
Value | | Unrealized
Appreciation/
(Depreciation) | |
Receive a floating rate based on the
3-month USD-LIBOR-BBA and
pay a fixed rate equal to 1.980% | | Chicago Mercantile Exchange | | 12/05/23 | | USD | 3,500,000 | | | $ | 13,966 | | | $ | 13,966 | | |
Receive a floating rate equal to the
3-month USD-LIBOR-BBA and
pay a fixed rate equal to 2.557% | | Chicago Mercantile Exchange | | 08/21/24 | | USD | 300,000 | | | | (7,328 | ) | | | (7,328 | ) | |
Receive a floating rate based on the
3-month USD-LIBOR-BBA and
pay a fixed rate equal to 2.507% | | Chicago Mercantile Exchange | | 10/09/24 | | USD | 8,500,000 | | | | (174,174 | ) | | | (174,174 | ) | |
Receive a fixed rate equal to 2.408% and
pay a floating rate based on the
3-month USD-LIBOR-BBA | | Chicago Mercantile Exchange | | 10/30/24 | | USD | 30,878,000 | | | | 409,239 | | | | 409,239 | | |
Receive a floating rate based on the
3-month USD-LIBOR-BBA and
pay a fixed rate equal to 2.760% | | Chicago Mercantile Exchange | | 11/05/24 | | USD | 64,260,000 | | | | (2,495,015 | ) | | | (2,495,015 | ) | |
Receive a fixed rate equal to 1.692% and
pay a floating rate based on the
3-month USD-LIBOR-BBA | | Chicago Mercantile Exchange | | 02/04/25 | | USD | 10,917,000 | | | | (457,953 | ) | | | (457,953 | ) | |
Receive a fixed rate equal to 2.133% and
pay a floating rate based on the
3-month USD-LIBOR-BBA | | Chicago Mercantile Exchange | | 03/20/25 | | USD | 6,000,000 | | | | (55,752 | ) | | | (55,752 | ) | |
Receive a fixed rate equal to 2.528% and
pay a floating rate based on the
3-month USD-LIBOR-BBA | | Chicago Mercantile Exchange | | 07/15/25 | | USD | 14,505,000 | | | | 291,998 | | | | 291,998 | | |
Receive a fixed rate equal to 2.232% and
pay a floating rate based on the
3-month USD-LIBOR-BBA | | Chicago Mercantile Exchange | | 09/14/25 | | USD | 7,000,000 | | | | (29,584 | ) | | | (29,584 | ) | |
Receive a floating rate based on the
3-month USD-LIBOR-BBA and
pay a fixed rate equal to 1.339% | | Chicago Mercantile Exchange | | 07/11/26 | | USD | 3,000,000 | | | | 259,961 | | | | 259,961 | | |
Receive a floating rate based on the
3-month USD-LIBOR-BBA and
pay a fixed rate equal to 1.454% | | Chicago Mercantile Exchange | | 10/11/26 | | USD | 1,200,000 | | | | 84,767 | | | | 84,767 | | |
Receive a floating rate based on the
3-month USD-LIBOR-BBA and
pay a fixed rate equal to 1.719% | | Chicago Mercantile Exchange | | 11/14/26 | | USD | 2,500,000 | | | | 119,261 | | | | 119,261 | | |
Receive a fixed rate equal to 2.226% and
pay a floating rate based on the
3-month USD-LIBOR-BBA | | Chicago Mercantile Exchange | | 11/22/26 | | USD | 7,800,000 | | | | (86,249 | ) | | | (86,249 | ) | |
Receive a floating rate based on the
3-month USD-LIBOR-BBA and
pay a fixed rate equal to 2.264% | | Chicago Mercantile Exchange | | 11/25/26 | | USD | 7,800,000 | | | | 59,287 | | | | 59,287 | | |
Receive a fixed rate equal to 2.184% and
pay a floating rate based on the
3-month USD-LIBOR-BBA | | Chicago Mercantile Exchange | | 11/30/26 | | USD | 3,800,000 | | | | (56,669 | ) | | | (56,669 | ) | |
Receive a fixed rate equal to 2.228% and
pay a floating rate based on the
3-month USD-LIBOR-BBA | | Chicago Mercantile Exchange | | 12/02/26 | | USD | 3,800,000 | | | | (41,882 | ) | | | (41,882 | ) | |
Receive a floating rate based on the
3-month USD-LIBOR-BBA and
pay a fixed rate equal to 2.292% | | Chicago Mercantile Exchange | | 12/05/26 | | USD | 7,800,000 | | | | 40,884 | | | | 40,884 | | |
Receive a floating rate based on the
3-month USD-LIBOR-BBA and
pay a fixed rate equal to 2.398% | | Chicago Mercantile Exchange | | 12/14/26 | | USD | 11,100,000 | | | | (47,886 | ) | | | (47,886 | ) | |
Receive a fixed rate equal to 2.474% and
pay a floating rate based on the
3-month USD-LIBOR-BBA | | Chicago Mercantile Exchange | | 12/21/26 | | USD | 21,200,000 | | | | 234,991 | | | | 234,991 | | |
Receive a fixed rate equal to 2.307% and
pay a floating rate based on the
3-month USD-LIBOR-BBA | | Chicago Mercantile Exchange | | 11/17/27 | | USD | 11,328,000 | | | | (211,027 | ) | | | (211,027 | ) | |
Receive a fixed rate equal to 1.837% and
pay a floating rate based on the
3-month USD-LIBOR-BBA | | Chicago Mercantile Exchange | | 04/04/31 | | USD | 1,500,000 | | | | (107,634 | ) | | | (107,634 | ) | |
Receive a floating rate based on the
3-month USD-LIBOR-BBA and
pay a fixed rate equal to 2.517% | | Chicago Mercantile Exchange | | 12/05/36 | | USD | 5,500,000 | | | | 59,741 | | | | 59,742 | | |
Receive a fixed rate equal to 2.508% and
pay a floating rate based on the
3-month USD-LIBOR-BBA | | Chicago Mercantile Exchange | | 12/06/36 | | USD | 8,800,000 | | | | (108,637 | ) | | | (108,637 | ) | |
See Accompanying Notes to Financial Statements
103
SUMMARY PORTFOLIO OF INVESTMENTS
VOYA GLOBAL BOND PORTFOLIO AS OF DECEMBER 31, 2016 (CONTINUED)
| | | Clearinghouse | | Termination
Date | | Notional
Amount | | Fair
Value | | Unrealized
Appreciation/
(Depreciation) | |
Receive a floating rate based on the
3-month USD-LIBOR-BBA and
pay a fixed rate equal to 2.543% | | Chicago Mercantile Exchange | | 12/06/36 | | USD | 8,800,000 | | | $ | 58,506 | | | $ | 58,506 | | |
Receive a floating rate based on the
3-month USD-LIBOR-BBA and
pay a fixed rate equal to 2.516% | | Chicago Mercantile Exchange | | 12/06/36 | | USD | 5,500,000 | | | | 61,184 | | | | 61,184 | | |
Receive a floating rate based on the
3-month USD-LIBOR-BBA and
pay a fixed rate equal to 2.649% | | Chicago Mercantile Exchange | | 12/13/36 | | USD | 3,400,000 | | | | (35,883 | ) | | | (35,883 | ) | |
Receive a fixed rate equal to 2.585% and
pay a floating rate based on the
3-month USD-LIBOR-BBA | | Chicago Mercantile Exchange | | 12/13/36 | | USD | 4,400,000 | | | | 1,120 | | | | 1,120 | | |
Receive a floating rate based on the
3-month USD-LIBOR-BBA and
pay a fixed rate equal to 2.691% | | Chicago Mercantile Exchange | | 12/14/36 | | USD | 3,400,000 | | | | (59,030 | ) | | | (59,030 | ) | |
Receive a floating rate based on the
3-month USD-LIBOR-BBA and
pay a fixed rate equal to 2.767% | | Chicago Mercantile Exchange | | 12/20/36 | | USD | 3,400,000 | | | | (101,314 | ) | | | (101,314 | ) | |
Receive a fixed rate equal to 2.640% and
pay a floating rate based on the
3-month USD-LIBOR-BBA | | Chicago Mercantile Exchange | | 01/03/37 | | USD | 2,200,000 | | | | 19,687 | | | | 19,687 | | |
Receive a fixed rate equal to 3.057% and
pay a floating rate based on the
3-month USD-LIBOR-BBA | | Chicago Mercantile Exchange | | 10/09/44 | | USD | 1,400,000 | | | | 129,250 | | | | 129,250 | | |
Receive a fixed rate equal to 2.036% and
pay a floating rate based on the
3-month USD-LIBOR-BBA | | Chicago Mercantile Exchange | | 04/04/46 | | USD | 900,000 | | | | (91,657 | ) | | | (91,657 | ) | |
Receive a floating rate based on the
3-month USD-LIBOR-BBA and
pay a fixed rate equal to 2.188% | | Chicago Mercantile Exchange | | 04/04/46 | | USD | 900,000 | | | | 83,141 | | | | 83,141 | | |
Receive a floating rate based on the
3-month USD-LIBOR-BBA and
pay a fixed rate equal to 2.558% | | Chicago Mercantile Exchange | | 12/05/46 | | USD | 4,100,000 | | | | 52,143 | | | | 52,143 | | |
Receive a floating rate based on the
3-month USD-LIBOR-BBA and
pay a fixed rate equal to 2.557% | | Chicago Mercantile Exchange | | 12/06/46 | | USD | 4,100,000 | | | | 53,159 | | | | 53,159 | | |
Receive a floating rate based on the
3-month USD-LIBOR-BBA and
pay a fixed rate equal to 2.588% | | Chicago Mercantile Exchange | | 12/06/46 | | USD | 6,400,000 | | | | 39,014 | | | | 39,014 | | |
Receive a fixed rate equal to 2.551% and
pay a floating rate based on the
3-month USD-LIBOR-BBA | | Chicago Mercantile Exchange | | 12/06/46 | | USD | 6,400,000 | | | | (91,548 | ) | | | (91,548 | ) | |
Receive a fixed rate equal to 2.635% and
pay a floating rate based on the
3-month USD-LIBOR-BBA | | Chicago Mercantile Exchange | | 12/13/46 | | USD | 3,300,000 | | | | 14,188 | | | | 14,188 | | |
Receive a floating rate based on the
3-month USD-LIBOR-BBA and
pay a fixed rate equal to 2.698% | | Chicago Mercantile Exchange | | 12/13/46 | | USD | 2,500,000 | | | | (45,222 | ) | | | (45,222 | ) | |
Receive a floating rate based on the
3-month USD-LIBOR-BBA and
pay a fixed rate equal to 2.742% | | Chicago Mercantile Exchange | | 12/14/46 | | USD | 2,500,000 | | | | (69,105 | ) | | | (69,105 | ) | |
Receive a floating rate based on the
3-month USD-LIBOR-BBA and
pay a fixed rate equal to 2.794% | | Chicago Mercantile Exchange | | 12/20/46 | | USD | 2,500,000 | | | | (97,544 | ) | | | (97,544 | ) | |
Receive a fixed rate equal to 2.668% and
pay a floating rate based on the
3-month USD-LIBOR-BBA | | Chicago Mercantile Exchange | | 01/03/47 | | USD | 3,300,000 | | | | 37,612 | | | | 37,612 | | |
| | | | | | | | | $ | (682,160 | ) | | $ | (484,588 | ) | |
At December 31, 2016, the following over-the-counter written interest rate swaptions were outstanding for Voya Global Bond Portfolio:
Description | | Counterparty | | Exercise
Rate | | Pay/Receive
Exercise
Rate | | Floating
Rate
Index | | Expiration
Date | | Notional
Amount | | Premiums
Received | | Fair
Value | |
Call on 20-year
Interest Rate
Swap | | Goldman Sachs
International | | | 2.435 | % | |
Pay | | 3-month
USD-LIBOR-BBA | | 11/17/17 | | USD | 44,200,000 | | | $ | 2,351,440 | | | $ | (1,532,139 | ) | |
Call on 30-year
Interest Rate
Swap | | Goldman Sachs
International | | | 2.435 | % | |
Pay | | 3-month
USD-LIBOR-BBA | | 11/16/17 | | USD | 31,850,000 | | | | 2,344,514 | | | | (1,467,163 | ) | |
See Accompanying Notes to Financial Statements
104
SUMMARY PORTFOLIO OF INVESTMENTS
VOYA GLOBAL BOND PORTFOLIO AS OF DECEMBER 31, 2016 (CONTINUED)
Description | | Counterparty | | Exercise
Rate | | Pay/Receive
Exercise
Rate | | Floating
Rate
Index | | Expiration
Date | | Notional
Amount | | Premiums
Received | | Fair
Value | |
Put on 10-year
Interest Rate
Swap | | Bank of
America N.A. | | | 2.250 | % | |
Receive | | 3-month
USD-LIBOR-BBA | | 11/15/17 | | USD | 141,600,000 | | | $ | 4,602,000 | | | $ | (5,774,439 | ) | |
Put on 20-year
Interest Rate
Swap | | Goldman Sachs
International | | | 2.435 | % | |
Receive | | 3-month
USD-LIBOR-BBA | | 11/17/17 | | USD | 44,200,000 | | | | 2,351,440 | | | | (3,013,320 | ) | |
Put on 30-year
Interest Rate
Swap | | Goldman Sachs
International | | | 2.435 | % | |
Receive | | 3-month
USD-LIBOR-BBA | | 11/16/17 | | USD | 31,850,000 | | | | 2,344,514 | | | | (2,910,031 | ) | |
Put on 5-year
Interest Rate
Swap | | Bank of
America N.A. | | | 1.970 | % | |
Receive | | 3-month
USD-LIBOR-BBA | | 11/15/17 | | USD | 247,800,000 | | | | 3,717,000 | | | | (5,344,776 | ) | |
| | | | | | | | | | | | | Total Written Swaptions | | $ | 17,710,908 | | | $ | (20,041,868 | ) | |
Transactions with Affiliates
An investment of at least 5% of the voting securities of an issuer, or a company which is under common control results in that issuer becoming an affiliated person as defined by the 1940 Act.
The following table provides transactions during the year ended December 31, 2016, where the following issuers were considered an affiliate:
Issuer | | Beginning
Fair
Value at
12/31/15 | | Purchases
at Cost | | Sales
at Cost | | Change in
Unrealized
Appreciation/
(Depreciation) | | Ending
Fair
Value at
12/31/16 | | Investment
Income | | Realized
Gains/
(Losses) | | Net Capital
Gain
Distributions | |
Voya Emerging Markets
Corporate Debt
Fund — Class P | | $ | 10,077,423 | | | $ | 531,487 | | | $ | (1,226,586 | ) | | $ | 458,143 | | | $ | 9,840,467 | | | $ | 531,487 | | | $ | (26,586 | ) | | $ | — | | |
Voya Emerging Markets
Hard Currency Debt
Fund — Class P | | | 15,265,422 | | | | 934,968 | | | | (2,526,548 | ) | | | 818,808 | | | | 14,492,650 | | | | 934,968 | | | | (126,548 | ) | | | — | | |
Voya Emerging Markets
Local Currency Debt
Fund — Class P | | | 20,054,916 | | | | — | | | | — | | | | 1,122,806 | | | | 21,177,722 | | | | — | | | | — | | | | — | | |
Voya High Yield Bond
Fund — Class P | | | 8,523,268 | | | | 233,039 | | | | (7,044,233 | ) | | | 989,685 | | | | 2,701,759 | | | | 232,872 | | | | (764,233 | ) | | | — | | |
| | | $ | 53,921,029 | | | $ | 1,699,494 | | | $ | (10,797,367 | ) | | $ | 3,389,442 | | | $ | 48,212,598 | | | $ | 1,699,327 | | | $ | (917,367 | ) | | $ | — | | |
The financial statements for the above mutual fund[s] can be found at www.sec.gov.
A summary of derivative instruments by primary risk exposure is outlined in the following tables.
The fair value of derivative instruments as of December 31, 2016 was as follows:
Derivatives not accounted
for as hedging instruments | | Location on Statement of Assets and Liabilities | | Fair Value | |
Asset Derivatives | |
Foreign exchange contracts | | Investments in securities at value* | | $ | 558,589 | | |
Interest rate contracts | | Investments in securities at value* | | | 19,648,288 | | |
Foreign exchange contracts | | Unrealized appreciation on forward foreign currency contracts | | | 2,510,309 | | |
Interest rate contracts | | Net Assets — Unrealized appreciation** | | | 358,217 | | |
Equity contracts | | Net Assets — Unrealized appreciation** | | | 70,032 | | |
Credit contracts | | Net Assets — Unrealized appreciation*** | | | 155,131 | | |
Interest rate contracts | | Net Assets — Unrealized appreciation*** | | | 9,183,546 | | |
Total Asset Derivatives | | | | $ | 32,484,112 | | |
Liability Derivatives | |
Foreign exchange contracts | | Unrealized depreciation on forward foreign currency contracts | | $ | 5,919,220 | | |
Interest rate contracts | | Net Assets — Unrealized depreciation** | | | 225,417 | | |
Interest rate contracts | | Net Assets — Unrealized depreciation*** | | | 9,668,135 | | |
Interest rate contracts | | Written options, at fair value | | | 20,041,868 | | |
Total Liability Derivatives | | | | $ | 35,854,640 | | |
* Includes purchased options.
See Accompanying Notes to Financial Statements
105
SUMMARY PORTFOLIO OF INVESTMENTS
VOYA GLOBAL BOND PORTFOLIO AS OF DECEMBER 31, 2016 (CONTINUED)
** Includes cumulative appreciation/depreciation of futures contracts as reported in the table following the Portfolio of Investments.
*** Includes cumulative appreciation/depreciation of centrally cleared swaps as reported in the table following the Portfolio of Investments. Only current day's variation margin receivable/payable is shown on the Statement of Assets and Liabiliites.
The effect of derivative instruments on the Portfolio's Statement of Operations for the year ended December 31, 2016 was as follows:
| | | Amount of Realized Gain or (Loss) on Derivatives Recognized in Income | |
Derivatives not
accounted for as
hedging instruments | | Investments* | | Foreign currency
related transactions** | | Futures | | Swaps | | Written
options | | Total | |
Equity contracts | | $ | — | | | $ | — | | | $ | 179,608 | | | $ | — | | | $ | — | | | $ | 179,608 | | |
Credit Contracts | | | (15,312 | ) | | | — | | | | — | | | | (76,682 | ) | | | — | | | | (91,994 | ) | |
Foreign exchange contracts | | | 627,577 | | | | (3,327,565 | ) | | | — | | | | (77,771 | ) | | | 3,337,578 | | | | 559,819 | | |
Interest rate contracts | | | 7,751,382 | | | | — | | | | 1,871,706 | | | | (2,441,912 | ) | | | (3,044,657 | ) | | | 4,136,519 | | |
Total | | $ | 8,363,647 | | | $ | (3,327,565 | ) | | $ | 2,051,314 | | | $ | (2,596,365 | ) | | $ | 292,921 | | | $ | 4,783,952 | | |
| | | Change in Unrealized Appreciation or (Depreciation) on Derivatives Recognized in Income | |
Derivatives not
accounted for as
hedging instruments | | Investments* | | Foreign currency
related transactions** | | Futures | | Swaps | | Written
options | | Total | |
Equity contracts | | $ | — | | | $ | — | | | $ | 70,032 | | | $ | — | | | $ | — | | | $ | 70,032 | | |
Credit contracts | | | — | | | | — | | | | — | | | | 188,255 | | | | — | | | | 188,255 | | |
Foreign exchange contracts | | | (71,430 | ) | | | (3,325,713 | ) | | | — | | | | — | | | | — | | | | (3,397,143 | ) | |
Interest rate contracts | | | 2,841,921 | | | | — | | | | 395,098 | | | | 220,698 | | | | (2,330,960 | ) | | | 1,126,757 | | |
Total | | $ | 2,770,491 | | | $ | (3,325,713 | ) | | $ | 465,130 | | | $ | 408,953 | | | $ | (2,330,960 | ) | | $ | (2,012,099 | ) | |
* Amounts recognized for purchased options are included in net realized gain (loss) on investments and net change in unrealized appreciation or depreciation on investments.
** Amounts recognized for forward foreign currency contracts are included in net realized gain (loss) on foreign currency related transactions and net change in unrealized appreciation or depreciation on foreign currency related transactions.
The following is a summary by counterparty of the fair value of OTC derivative instruments subject to Master Netting Agreements and collateral pledged (received), if any, at December 31, 2016:
| | | Bank of
America
N.A. | | Barclays
Bank
PLC | | BNP
Paribas | | Citibank
N.A. | | Deutsche
Bank AG | | Goldman
Sachs
International | | HSBC
Bank
USA
N.A. | | JPMorgan
Chase
Bank N.A. | | Morgan
Stanley
Capital
Services
LLC | | The
Bank of
New York | | Totals | |
Assets: | |
Purchased options | | $ | 12,054,215 | | | $ | — | | | $ | — | | | $ | — | | | $ | — | | | $ | 8,152,662 | | | $ | — | | | $ | — | | | $ | — | | | $ | — | | | $ | 20,206,877 | | |
Forward foreign currency
contracts | | | — | | | | 254,088 | | | | 186,442 | | | | 115,591 | | | | 134,923 | | | | 170,225 | | | | 42,527 | | | | 743,744 | | | | 840,872 | | | | 21,897 | | | | 2,510,309 | | |
Total Assets | | $ | 12,054,215 | | | $ | 254,088 | | | $ | 186,442 | | | $ | 115,591 | | | $ | 134,923 | | | $ | 8,322,887 | | | $ | 42,527 | | | $ | 743,744 | | | $ | 840,872 | | | $ | 21,897 | | | $ | 22,717,186 | | |
Liabilities: | |
Forward foreign currency
contracts | | $ | — | | | $ | 251,929 | | | $ | 2,627,855 | | | $ | 298,062 | | | $ | 677,302 | | | $ | 364,719 | | | $ | 29,161 | | | $ | 764,710 | | | $ | 905,482 | | | $ | — | | | $ | 5,919,220 | | |
Written options | | | 11,119,215 | | | | — | | | | — | | | | — | | | | — | | | | 8,922,653 | | | | — | | | | — | | | | — | | | | — | | | | 20,041,868 | | |
Total Liabilities | | $ | 11,119,215 | | | $ | 251,929 | | | $ | 2,627,855 | | | $ | 298,062 | | | $ | 677,302 | | | $ | 9,287,372 | | | $ | 29,161 | | | $ | 764,710 | | | $ | 905,482 | | | $ | — | | | $ | 25,961,088 | | |
Net OTC derivative
instruments by
counterparty, at fair
value | | $ | 935,000 | | | $ | 2,159 | | | $ | (2,441,413 | ) | | $ | (182,471 | ) | | $ | (542,379 | ) | | $ | (964,485 | ) | | $ | 13,366 | | | $ | (20,966 | ) | | $ | (64,610 | ) | | $ | 21,897 | | | $ | (3,243,902 | ) | |
Total collateral pledged
by the Portfolio/
(Received from
counterparty) | | $ | (935,000 | ) | | $ | — | | | $ | 2,441,413 | | | $ | — | | | $ | — | | | $ | — | | | $ | — | | | $ | — | | | $ | — | | | $ | — | | | $ | 1,506,413 | | |
Net Exposure(1)(2)
— | | $ | | | | $ | 2,159 | | | $ | — | | | $ | (182,471 | ) | | $ | (542,379 | ) | | $ | (964,485 | ) | | $ | 13,366 | | | $ | (20,966 | ) | | $ | (64,610 | ) | | $ | 21,897 | | | $ | (1,737,489 | ) | |
(1) Positive net exposure represents amounts due from each respective counterparty. Negative exposure represents amounts due from the Portfolio. Please refer to Note 2 for additional details regarding counterparty credit risk and credit related contingent features.
(2) At December 31, 2016, the Portfolio had pledged $2,810,000 to BNP Paribas. In addition, the Portfolio received $2,030,000 from Bank of America N.A. Excess cash collateral is not shown for financial reporting purposes.
See Accompanying Notes to Financial Statements
106
VY® AMERICAN CENTURY SUMMARY PORTFOLIO OF INVESTMENTS
SMALL-MID CAP VALUE PORTFOLIO AS OF DECEMBER 31, 2016
Shares | |
| |
| | Value | | Percentage
of Net
Assets | |
COMMON STOCK: 95.1% | | | |
| | | | | Consumer Discretionary: 7.6% | |
| | 15,936 | | | | | | | Advance Auto Parts, Inc. | | $ | 2,695,096 | | | | 0.7 | | |
| | 37,031 | | | | | | | Delphi Automotive PLC | | | 2,494,038 | | | | 0.7 | | |
| | 33,029 | | | | | | | Target Corp. | | | 2,385,685 | | | | 0.7 | | |
| | 1,005,147 | | | | | | | Other Securities(a) | | | 19,837,805 | | | | 5.5 | | |
| | | | | | | | | | 27,412,624 | | | | 7.6 | | |
| | | | | Consumer Staples: 4.6% | |
| | 86,835 | | | | | | | Conagra Brands, Inc. | | | 3,434,324 | | | | 0.9 | | |
| | 69,698 | | | | | | | Mondelez International,
Inc. | | | 3,089,713 | | | | 0.9 | | |
| | 172,943 | | | | | | | Other Securities(a) | | | 10,065,236 | | | | 2.8 | | |
| | | | | | | | | | 16,589,273 | | | | 4.6 | | |
| | | | | Energy: 10.2% | |
| | 46,964 | | | | | | | Anadarko Petroleum Corp. | | | 3,274,800 | | | | 0.9 | | |
| | 60,078 | | | | | | | Baker Hughes, Inc. | | | 3,903,268 | | | | 1.1 | | |
| | 51,913 | | | | | | | Devon Energy Corp. | | | 2,370,867 | | | | 0.6 | | |
| | 61,335 | | | | | | | EQT Corp. | | | 4,011,309 | | | | 1.1 | | |
| | 126,462 | | | | | | | Imperial Oil Ltd. | | | 4,399,538 | | | | 1.2 | | |
| | 100,791 | | | | | | | Noble Energy, Inc. | | | 3,836,105 | | | | 1.1 | | |
| | 41,623 | | | | | | | Occidental Petroleum
Corp. | | | 2,964,806 | | | | 0.8 | | |
| | 652,214 | | | | | | | Other Securities(a) | | | 12,325,617 | | | | 3.4 | | |
| | | | | | | | | | 37,086,310 | | | | 10.2 | | |
| | | | | Financials: 25.4% | |
| | 48,110 | | | | | | | Allied World Assurance
Co. Holdings Ltd. | | | 2,583,988 | | | | 0.7 | | |
| | 50,408 | | | | | | | Bank of the Ozarks, Inc. | | | 2,650,957 | | | | 0.7 | | |
| | 69,378 | | | | | | | BB&T Corp. | | | 3,262,154 | | | | 0.9 | �� | |
| | 75,437 | | | | | | | Capital Bank Financial
Corp. | | | 2,960,902 | | | | 0.8 | | |
| | 154,697 | | | | | | | Capitol Federal Financial,
Inc. | | | 2,546,313 | | | | 0.7 | | |
| | 26,976 | | | | | | | Chubb Ltd. | | | 3,564,069 | | | | 1.0 | | |
| | 47,608 | | | | | | | Commerce Bancshares,
Inc. | | | 2,752,218 | | | | 0.7 | | |
| | 88,353 | | | | | | | Invesco Ltd. | | | 2,680,630 | | | | 0.7 | | |
| | 17,718 | | | | | | | M&T Bank Corp. | | | 2,771,627 | | | | 0.8 | | |
| | 88,069 | | | | | | | Northern Trust Corp. | | | 7,842,544 | | | | 2.2 | | |
| | 28,372 | | | | | | | PNC Financial Services
Group, Inc. | | | 3,318,389 | | | | 0.9 | | |
| | 22,385 | | | | | | | Reinsurance Group of
America, Inc. | | | 2,816,705 | | | | 0.8 | | |
| | 41,201 | | | | | | | UMB Financial Corp. | | | 3,177,421 | | | | 0.9 | | |
| | 57,952 | | | | | | | Unum Group | | | 2,545,831 | | | | 0.7 | | |
| | 38,779 | | | | L | | | Westamerica Bancorp. | | | 2,440,362 | | | | 0.7 | | |
| | 1,095,015 | | | | | | | Other Securities(a) | | | 44,201,996 | | | | 12.2 | | |
| | | | | | | | | | 92,116,106 | | | | 25.4 | | |
Shares | |
| |
| | Value | | Percentage
of Net
Assets | |
| | | | | Health Care: 7.7% | |
| | 94,142 | | | | @ | | | LifePoint Health, Inc. | | $ | 5,347,265 | | | | 1.5 | | |
| | 43,768 | | | | | | | Zimmer Biomet Holdings,
Inc. | | | 4,516,858 | | | | 1.2 | | |
| | 352,342 | | | | | | | Other Securities | | | 18,054,801 | | | | 5.0 | | |
| | | | | | | | | | 27,918,924 | | | | 7.7 | | |
| | | | | Industrials: 14.5% | |
| | 129,761 | | | | | | | Heartland Express, Inc. | | | 2,641,934 | | | | 0.7 | | |
| | 25,995 | | | | | | | Hubbell, Inc. | | | 3,033,617 | | | | 0.8 | | |
| | 40,991 | | | | | | | Ingersoll-Rand PLC -
Class A | | | 3,075,965 | | | | 0.8 | | |
| | 163,917 | | | | | | | Johnson Controls
International plc | | | 6,751,741 | | | | 1.9 | | |
| | 91,782 | | | | | | | Koninklijke Philips NV | | | 2,805,961 | | | | 0.8 | | |
| | 54,347 | | | | | | | Republic Services, Inc. | | | 3,100,496 | | | | 0.9 | | |
| | 60,847 | | | | | | | Textron, Inc. | | | 2,954,730 | | | | 0.8 | | |
| | 757,487 | | | | | | | Other Securities(a) | | | 28,257,201 | | | | 7.8 | | |
| | | | | | | | | | 52,621,645 | | | | 14.5 | | |
| | | | | Information Technology: 9.4% | |
| | 125,577 | | | | | | | Applied Materials, Inc. | | | 4,052,370 | | | | 1.1 | | |
| | 78,993 | | | | @ | | | Keysight Technologies,
Inc. | | | 2,888,774 | | | | 0.8 | | |
| | 23,484 | | | | | | | Lam Research Corp. | | | 2,482,963 | | | | 0.7 | | |
| | 78,585 | | | | | | | Maxim Integrated
Products | | | 3,031,023 | | | | 0.8 | | |
| | 35,021 | | | | | | | TE Connectivity Ltd. | | | 2,426,255 | | | | 0.7 | | |
| | 100,464 | | | | | | | Teradyne, Inc. | | | 2,551,786 | | | | 0.7 | | |
| | 773,384 | | | | | | | Other Securities | | | 16,710,397 | | | | 4.6 | | |
| | | | | | | | | | 34,143,568 | | | | 9.4 | | |
| | | | | Materials: 4.5% | |
| | 213,590 | | | | | | | Graphic Packaging
Holding Co. | | | 2,665,603 | | | | 0.7 | | |
| | 175,637 | | | | @ | | | Multi Packaging Solutions
International Ltd. | | | 2,504,584 | | | | 0.7 | | |
| | 64,844 | | | | | | | WestRock Co. | | | 3,292,130 | | | | 0.9 | | |
| | 162,802 | | | | | | | Other Securities | | | 7,873,016 | | | | 2.2 | | |
| | | | | | | | | | 16,335,333 | | | | 4.5 | | |
| | | | | Real Estate: 5.3% | |
| | 126,634 | | | | | | | Weyerhaeuser Co. | | | 3,810,417 | | | | 1.1 | | |
| | 825,145 | | | | | | | Other Securities(a) | | | 15,403,199 | | | | 4.2 | | |
| | | | | | | | | | 19,213,616 | | | | 5.3 | | |
| | | | | Telecommunication Services: 0.5% | |
| | 32,645 | | | | | | | Other Securities | | | 1,839,872 | | | | 0.5 | | |
| | | | | Utilities: 5.4% | |
| | 50,313 | | | | | | | Edison International | | | 3,622,033 | | | | 1.0 | | |
| | 56,519 | | | | | | | PG&E Corp. | | | 3,434,660 | | | | 1.0 | | |
| | 79,688 | | | | | | | Xcel Energy, Inc. | | | 3,243,301 | | | | 0.9 | | |
See Accompanying Notes to Financial Statements
107
VY® AMERICAN CENTURY SUMMARY PORTFOLIO OF INVESTMENTS
SMALL-MID CAP VALUE PORTFOLIO AS OF DECEMBER 31, 2016 (CONTINUED)
Shares | |
| |
| | Value | | Percentage
of Net
Assets | |
| | | | | Utilities (continued) | |
| | 147,389 | | | | | | | Other Securities | | $ | 9,102,628 | | | | 2.5 | | |
| | | | | | | | | | 19,402,622 | | | | 5.4 | | |
| | | | | | | Total Common Stock
(Cost $296,406,423) | | | 344,679,893 | | | | 95.1 | | |
EXCHANGE-TRADED FUNDS: 2.1% | | | |
| | 7,418 | | | | | | | iShares Russell 2000
Value Index Fund | | | 882,297 | | | | 0.2 | | |
| | 84,591 | | | | | | | iShares Russell Midcap
Value Index Fund | | | 6,803,654 | | | | 1.9 | | |
| | | | | | | Total Exchange-Traded
Funds
(Cost $7,207,110) | | | 7,685,951 | | | | 2.1 | | |
PREFERRED STOCK: 0.1% | | | |
| | | | | Industrials: 0.1% | |
| | 11,716 | | | | | | | Other Securities | | | 574,084 | | | | 0.1 | | |
| | | | | | | Total Preferred Stock
(Cost $584,581) | | | 574,084 | | | | 0.1 | | |
| | | | | | | Total Long-Term
Investments
(Cost $304,198,114) | | | 352,939,928 | | | | 97.3 | | |
Principal
Amount† | |
| |
| | Value | | Percentage
of Net
Assets | |
SHORT-TERM INVESTMENTS: 5.0% | | | |
| | | | | Securities Lending Collateralcc: 2.0% | |
| | 1,719,057 | | | | | | | Bank of Nova Scotia,
Repurchase Agreement
dated 12/30/16, 0.51%,
due 01/03/17
(Repurchase Amount
$1,719,153, collateralized
by various U.S.
Government/U.S.
Government Agency
Obligations,
1.000%-4.000%,
Market Value plus
accrued interest
$1,753,538, due
12/31/17-10/20/46) | | $ | 1,719,057 | | | | 0.4 | | |
Principal
Amount† | |
| |
| | Value | | Percentage
of Net
Assets | |
| | 1,719,057 | | | | | | | Cantor Fitzgerald,
Repurchase Agreement
dated 12/30/16, 0.50%,
due 01/03/17
(Repurchase Amount
$1,719,151, collateralized
by various U.S.
Government/U.S.
Government Agency
Obligations,
0.000%-10.000%,
Market Value plus
accrued interest
$1,753,438,
due 01/25/17-10/20/66) | | $ | 1,719,057 | | | | 0.5 | | |
| | 1,719,057 | | | | | | | Daiwa Capital Markets,
Repurchase Agreement
dated 12/30/16, 0.52%,
due 01/03/17
(Repurchase Amount
$1,719,155,
collateralized by various
U.S. Government/U.S.
Government Agency
Obligations,
0.000%-6.500%,
Market Value plus
accrued interest
$1,753,438,
due 03/02/17-02/01/49) | | | 1,719,057 | | | | 0.5 | | |
| | 361,828 | | | | | | | Merrill Lynch & Co., Inc.,
Repurchase Agreement
dated 12/30/16,
0.50%, due 01/03/17
(Repurchase Amount
$361,848, collateralized
by various U.S.
Government Securities,
0.685%-2.000%,
Market Value plus
accrued interest
$369,065, due
10/31/18-11/30/22) | | | 361,828 | | | | 0.1 | | |
| | 1,719,057 | | | | | | | Nomura Securities,
Repurchase Agreement
dated 12/30/16,
0.50%, due 01/03/17
(Repurchase Amount
$1,719,151, collateralized
by various U.S.
Government/U.S.
Government Agency
Obligations,
0.000%-9.500%,
Market Value plus
accrued interest
$1,753,438, due
01/15/17-08/20/66) | | | 1,719,057 | | | | 0.5 | | |
| | | | | | | | | | 7,238,056 | | | | 2.0 | | |
See Accompanying Notes to Financial Statements
108
VY® AMERICAN CENTURY SUMMARY PORTFOLIO OF INVESTMENTS
SMALL-MID CAP VALUE PORTFOLIO AS OF DECEMBER 31, 2016 (CONTINUED)
Shares | |
| |
| | Value | | Percentage
of Net
Assets | |
| | | | | Mutual Funds: 3.0% | |
| | 10,884,862 | | | | | | | BlackRock Liquidity Funds,
FedFund, Institutional
Class, 0.420%††
(Cost $10,884,862) | | $ | 10,884,862 | | | | 3.0 | | |
| | | | | Total Short-Term
Investments
(Cost $18,122,918) | | | 18,122,918 | | | | 5.0 | | |
| | | | | | | Total Investments in
Securities
(Cost $322,321,032) | | $ | 371,062,846 | | | | 102.3 | | |
| | | | | | | Liabilities in Excess of
Other Assets | | | (8,487,583 | ) | | | (2.3 | ) | |
| | | | | | | Net Assets | | $ | 362,575,263 | | | | 100.0 | | |
"Other Securities" represents issues not identified as the top 50 holdings in terms of market value and issues or issuers not exceeding 1% of net assets individually or in aggregate respectively as of December 31, 2016.
The following footnotes apply to either the individual securities noted or one or more of the securities aggregated and listed as a single line item.
† Unless otherwise indicated, principal amount is shown in USD.
†† Rate shown is the 7-day yield as of December 31, 2016.
@ Non-income producing security.
cc Represents securities purchased with cash collateral received for securities on loan.
L Loaned security, a portion or all of the security is on loan at December 31, 2016.
(a) This grouping contains securities on loan.
Cost for federal income tax purposes is $327,525,333.
Net unrealized appreciation consists of: | |
Gross Unrealized Appreciation | | $ | 53,278,990 | | |
Gross Unrealized Depreciation | | | (9,741,477 | ) | |
Net Unrealized Appreciation | | $ | 43,537,513 | | |
Fair Value Measurements^
The following is a summary of the fair valuations according to the inputs used as of December 31, 2016 in valuing the assets and liabilities:
| | | Quoted Prices
in Active Markets
for Identical Investments
(Level 1) | | Significant Other
Observable
Inputs#
(Level 2) | | Significant
Unobservable
Inputs
(Level 3) | | Fair Value
at
December 31, 2016 | |
Asset Table | |
Investments, at fair value | |
Common Stock | |
Consumer Discretionary | | $ | 27,412,624 | | | $ | — | | | $ | — | | | $ | 27,412,624 | | |
Consumer Staples | | | 16,589,273 | | | | — | | | | — | | | | 16,589,273 | | |
Energy | | | 37,086,310 | | | | — | | | | — | | | | 37,086,310 | | |
Financials | | | 92,116,106 | | | | — | | | | — | | | | 92,116,106 | | |
Health Care | | | 27,918,924 | | | | — | | | | — | | | | 27,918,924 | | |
Industrials | | | 49,815,684 | | | | 2,805,961 | | | | — | | | | 52,621,645 | | |
Information Technology | | | 34,143,568 | | | | — | | | | — | | | | 34,143,568 | | |
Materials | | | 16,335,333 | | | | — | | | | — | | | | 16,335,333 | | |
Real Estate | | | 19,213,616 | | | | — | | | | — | | | | 19,213,616 | | |
Telecommunication Services | | | 1,839,872 | | | | — | | | | — | | | | 1,839,872 | | |
Utilities | | | 19,402,622 | | | | — | | | | — | | | | 19,402,622 | | |
Total Common Stock | | | 341,873,932 | | | | 2,805,961 | | | | — | | | | 344,679,893 | | |
Exchange-Traded Funds | | | 7,685,951 | | | | — | | | | — | | | | 7,685,951 | | |
Preferred Stock | | | 574,084 | | | | — | | | | — | | | | 574,084 | | |
Short-Term Investments | | | 10,884,862 | | | | 7,238,056 | | | | — | | | | 18,122,918 | | |
Total Investments, at fair value | | $ | 361,018,829 | | | $ | 10,044,017 | | | $ | — | | | $ | 371,062,846 | | |
Other Financial Instruments+ | |
Forward Foreign Currency Contracts | | | — | | | | 11,678 | | | | — | | | | 11,678 | | |
Total Assets | | $ | 361,018,829 | | | $ | 10,055,695 | | | $ | — | | | $ | 371,074,524 | | |
Liabilities Table | |
Other Financial Instruments+ | |
Forward Foreign Currency Contracts | | $ | — | | | $ | (50,142 | ) | | $ | — | | | $ | (50,142 | ) | |
Total Liabilities | | $ | — | | | $ | (50,142 | ) | | $ | — | | | $ | (50,142 | ) | |
^ See Note 2, "Significant Accounting Policies" in the Notes to Financial Statements for additional information.
+ Other Financial Instruments are derivatives not reflected in the Portfolio of Investments and may include open forward foreign currency contracts, futures, centrally cleared swaps, OTC swaps and written options. Forward foreign currency contracts, futures and centrally cleared swaps are valued at the unrealized gain (loss) on the instrument. OTC swaps and written options are valued at the fair value of the instrument.
See Accompanying Notes to Financial Statements
109
VY® AMERICAN CENTURY SUMMARY PORTFOLIO OF INVESTMENTS
SMALL-MID CAP VALUE PORTFOLIO AS OF DECEMBER 31, 2016 (CONTINUED)
# The earlier close of the foreign markets gives rise to the possibility that significant events, including broad market moves, may have occurred in the interim and may materially affect the value of those securities. To account for this, the Portfolio may frequently value many of its foreign equity securities using fair value prices based on third party vendor modeling tools to the extent available. Accordingly, a portion of the Portfolio's investments are categorized as Level 2 investments.
At December 31, 2016, the following forward foreign currency contracts were outstanding for VY® American Century Small-Mid Cap Value Portfolio:
Counterparty | | Currency | | Contract
Amount | | Buy/Sell | | Settlement
Date | | In Exchange
For | | Fair
Value | | Unrealized
Appreciation
(Depreciation) | |
Morgan Stanley | | Canadian Dollar | | | 139,710 | | | Buy | | 03/31/17 | | $ | 103,146 | | | $ | 104,164 | | | $ | 1,018 | | |
| | | | | | | | | | | | | | | $ | 1,018 | | |
Credit Suisse AG | | Japanese Yen | | | 5,307,491 | | | Sell | | 03/31/17 | | | 45,105 | | | | 45,615 | | | | (510 | ) | |
Credit Suisse AG | | Japanese Yen | | | 143,550,429 | | | Sell | | 03/31/17 | | | 1,218,677 | | | | 1,233,733 | | | | (15,056 | ) | |
Morgan Stanley | | Canadian Dollar | | | 5,266,883 | | | Sell | | 03/31/17 | | | 3,937,503 | | | | 3,926,843 | | | | 10,660 | | |
UBS AG | | EU Euro | | | 55,390 | | | Sell | | 03/31/17 | | | 58,261 | | | | 58,570 | | | | (309 | ) | |
UBS AG | | EU Euro | | | 7,620 | | | Sell | | 03/31/17 | | | 7,995 | | | | 8,058 | | | | (63 | ) | |
UBS AG | | EU Euro | | | 57,856 | | | Sell | | 03/31/17 | | | 60,439 | | | | 61,178 | | | | (739 | ) | |
UBS AG | | EU Euro | | | 6,939 | | | Sell | | 03/31/17 | | | 7,274 | | | | 7,338 | | | | (64 | ) | |
UBS AG | | EU Euro | | | 132,893 | | | Sell | | 03/31/17 | | | 138,582 | | | | 140,522 | | | | (1,940 | ) | |
UBS AG | | EU Euro | | | 2,154,641 | | | Sell | | 03/31/17 | | | 2,246,881 | | | | 2,278,342 | | | | (31,461 | ) | |
| | | | | | | | | | | | | | | $ | (39,482 | ) | |
A summary of derivative instruments by primary risk exposure is outlined in the following tables.
The fair value of derivative instruments as of December 31, 2016 was as follows:
Derivatives not accounted
for as hedging instruments | | Location on Statement of Assets and Liabilities | | Fair Value | |
Asset Derivatives | |
Foreign exchange contracts | | Unrealized appreciation on forward foreign currency contracts | | $ | 11,678 | | |
Total Asset Derivatives | | | | $ | 11,678 | | |
Liability Derivatives | |
Foreign exchange contracts | | Unrealized depreciation on forward foreign currency contracts | | $ | 50,142 | | |
Total Liability Derivatives | | | | $ | 50,142 | | |
The effect of derivative instruments on the Portfolio's Statement of Operations for the year ended December 31, 2016 was as follows:
| | | Amount of Realized Gain or (Loss) on Derivatives Recognized in Income | |
Derivatives not accounted
for as hedging instruments | | Foreign currency related transactions* | |
Foreign exchange contracts | | $ | 171,354 | | |
Total | | $ | 171,354 | | |
| | | Change in Unrealized Appreciation or (Depreciation) on Derivatives Recognized in Income | |
Derivatives not accounted
for as hedging instruments | | Foreign currency related transactions* | |
Foreign exchange contracts | | $ | 72,805 | | |
Total | | $ | 72,805 | | |
* Amounts recognized for forward foreign currency contracts are included in net realized gain (loss) on foreign currency related transactions and net change in unrealized appreciation or depreciation on foreign currency related transactions.
See Accompanying Notes to Financial Statements
110
SUMMARY PORTFOLIO OF INVESTMENTS
VY® BARON GROWTH PORTFOLIO AS OF DECEMBER 31, 2016
Shares | |
| |
| | Value | | Percentage
of Net
Assets | |
COMMON STOCK: 99.1% | | | |
| | | | | Consumer Discretionary: 34.5% | |
| | 2,790,684 | | | | @ | | | AO World PLC | | $ | 6,238,817 | | | | 0.9 | | |
| | 364,500 | | | | @ | | | Bright Horizons Family
Solutions, Inc. | | | 25,522,290 | | | | 3.6 | | |
| | 560,000 | | | | | | | Choice Hotels
International, Inc. | | | 31,388,000 | | | | 4.4 | | |
| | 202,600 | | | | | | | Dick's Sporting Goods, Inc. | | | 10,758,060 | | | | 1.5 | | |
| | 728,364 | | | | | | | Manchester United PLC -
Class A | | | 10,379,187 | | | | 1.5 | | |
| | 188,200 | | | | | | | Marriott Vacations
Worldwide Corp. | | | 15,968,770 | | | | 2.3 | | |
| | 280,845 | | | | @ | | | Nord Anglia
Education, Inc. | | | 6,543,689 | | | | 0.9 | | |
| | 65,000 | | | | @ | | | Panera Bread Co. | | | 13,330,850 | | | | 1.9 | | |
| | 472,571 | | | | @ | | | Penn National
Gaming, Inc. | | | 6,516,754 | | | | 0.9 | | |
| | 593,691 | | | | @ | | | Pinnacle
Entertainment, Inc. | | | 8,608,519 | | | | 1.2 | | |
| | 213,000 | | | | | | | Red Rock Resorts, Inc. | | | 4,939,470 | | | | 0.7 | | |
| | 477,500 | | | | @ | | | Under Armour, Inc. -
Class A | | | 13,871,375 | | | | 2.0 | | |
| | 457,001 | | | | @ | | | Under Armour, Inc. -
Class C | | | 11,502,715 | | | | 1.6 | | |
| | 475,000 | | | | | | | Vail Resorts, Inc. | | | 76,622,250 | | | | 10.8 | | |
| | 170,000 | | | | | | | Other Securities | | | 2,439,500 | | | | 0.3 | | |
| | | | | | | | | | 244,630,246 | | | | 34.5 | | |
| | | | | Consumer Staples: 4.2% | |
| | 273,000 | | | | | | | Church & Dwight Co., Inc. | | | 12,063,870 | | | | 1.7 | | |
| | 152,000 | | | | @ | | | Performance Food
Group Co. | | | 3,648,000 | | | | 0.5 | | |
| | 300,000 | | | | @ | | | Smart & Final Stores, Inc. | | | 4,230,000 | | | | 0.6 | | |
| | 142,500 | | | | @ | | | TreeHouse Foods, Inc. | | | 10,287,075 | | | | 1.4 | | |
| | | | | | | | | | 30,228,945 | | | | 4.2 | | |
| | | | | Financials: 16.2% | |
| | 195,000 | | | | @ | | | Arch Capital Group Ltd. | | | 16,826,550 | | | | 2.4 | | |
| | 275,000 | | | | | | | Carlyle Group L.P. | | | 4,193,750 | | | | 0.6 | | |
| | 407,500 | | | | | | | Cohen & Steers, Inc. | | | 13,692,000 | | | | 1.9 | | |
| | 85,000 | | | | | | | Factset Research
Systems, Inc. | | | 13,891,550 | | | | 2.0 | | |
| | 297,229 | | | | | | | Financial Engines, Inc. | | | 10,923,166 | | | | 1.5 | | |
| | 80,000 | | | | | | | Moelis & Co. | | | 2,712,000 | | | | 0.4 | | |
| | 155,000 | | | | | | | Morningstar, Inc. | | | 11,401,800 | | | | 1.6 | | |
| | 182,500 | | | | | | | MSCI, Inc. - Class A | | | 14,377,350 | | | | 2.0 | | |
| | 160,000 | | | | | | | Oaktree Capital Group, LLC | | | 6,000,000 | | | | 0.8 | | |
| | 278,168 | | | | | | | Primerica, Inc. | | | 19,235,317 | | | | 2.7 | | |
| | 64,500 | | | | | | | Other Securities | | | 2,116,565 | | | | 0.3 | | |
| | | | | | | | | | 115,370,048 | | | | 16.2 | | |
Shares | |
| |
| | Value | | Percentage
of Net
Assets | |
| | | | | Health Care: 9.2% | |
| | 105,000 | | | | | | | Bio-Techne Corp. | | $ | 10,797,150 | | | | 1.5 | | |
| | 205,000 | | | | @ | | | Idexx Laboratories, Inc. | | | 24,040,350 | | | | 3.4 | | |
| | 299,978 | | | | @ | | | Inovalon Holdings, Inc. | | | 3,089,773 | | | | 0.4 | | |
| | 28,400 | | | | @ | | | Mettler Toledo
International, Inc. | | | 11,887,104 | | | | 1.7 | | |
| | 47,008 | | | | @ | | | Neogen Corp. | | | 3,102,528 | | | | 0.4 | | |
| | 130,000 | | | | | | | West Pharmaceutical
Services, Inc. | | | 11,027,900 | | | | 1.6 | | |
| | 33,680 | | | | | | | Other Securities | | | 1,155,224 | | | | 0.2 | | |
| | | | | | | | | | 65,100,029 | | | | 9.2 | | |
| | | | | Industrials: 4.3% | |
| | 361,500 | | | | @ | | | Caesarstone Ltd. | | | 10,356,975 | | | | 1.5 | | |
| | 102,500 | | | | @ | | | Middleby Corp. | | | 13,203,025 | | | | 1.9 | | |
| | 65,000 | | | | @ | | | Trex Co., Inc. | | | 4,186,000 | | | | 0.6 | | |
| | 74,000 | | | | | | | Other Securities | | | 2,540,420 | | | | 0.3 | | |
| | | | | | | | | | 30,286,420 | | | | 4.3 | | |
| | | | | Information Technology: 20.9% | |
| | 226,500 | | | | @ | | | Ansys, Inc. | | | 20,948,985 | | | | 2.9 | | |
| | 300,448 | | | | @ | | | Benefitfocus, Inc. | | | 8,923,306 | | | | 1.3 | | |
| | 156,500 | | | | | | | Booz Allen Hamilton
Holding Corp. | | | 5,644,955 | | | | 0.8 | | |
| | 150,500 | | | | @ | | | CoStar Group, Inc. | | | 28,367,745 | | | | 4.0 | | |
| | 347,000 | | | | @ | | | Gartner, Inc. | | | 35,071,290 | | | | 4.9 | | |
| | 164,000 | | | | @ | | | Guidewire Software, Inc. | | | 8,090,120 | | | | 1.1 | | |
| | 338,000 | | | | | | | MAXIMUS, Inc. | | | 18,857,020 | | | | 2.7 | | |
| | 685,000 | | | | | | | SS&C Technologies
Holdings, Inc. | | | 19,591,000 | | | | 2.8 | | |
| | 24,000 | | | | | | | Other Securities | | | 2,677,500 | | | | 0.4 | | |
| | | | | | | | | | 148,171,921 | | | | 20.9 | | |
| | | | | Real Estate: 8.6% | |
| | 15,000 | | | | | | | Alexander's, Inc. | | | 6,403,050 | | | | 0.9 | | |
| | 82,000 | | | | | | | Alexandria Real Estate
Equities, Inc. | | | 9,112,660 | | | | 1.3 | | |
| | 115,000 | | | | | | | American Assets Trust, Inc. | | | 4,954,200 | | | | 0.7 | | |
| | 474,170 | | | | | | | Douglas Emmett, Inc. | | | 17,335,655 | | | | 2.5 | | |
| | 750,000 | | | | | | | Gaming and Leisure
Properties, Inc. | | | 22,965,000 | | | | 3.2 | | |
| | | | | | | | | | 60,770,565 | | | | 8.6 | | |
| | | | | Telecommunication Services: 1.2% | |
| | 921,311 | | | | @ | | | Iridium Communications, Inc. | | | 8,844,586 | | | | 1.2 | | |
| | | | | | | Total Common Stock
(Cost $321,947,917) | | | 703,402,760 | | | | 99.1 | | |
See Accompanying Notes to Financial Statements
111
SUMMARY PORTFOLIO OF INVESTMENTS
VY® BARON GROWTH PORTFOLIO AS OF DECEMBER 31, 2016 (CONTINUED)
Shares | |
| |
| | Value | | Percentage
of Net
Assets | |
SHORT-TERM INVESTMENTS: 0.7% | |
| | | | | Mutual Funds: 0.7% | |
| | 5,192,517 | | | | | | | BlackRock Liquidity
Funds, FedFund,
Institutional Class,
0.420%††
(Cost $5,192,517) | | $ | 5,192,517 | | | | 0.7 | | |
| | | | | Total Short-Term
Investments
(Cost $5,192,517) | | | 5,192,517 | | | | 0.7 | | |
| | | | | Total Investments in
Securities
(Cost $327,140,434) | | $ | 708,595,277 | | | | 99.8 | | |
| | | | | Assets in Excess of
Other Liabilities | | | 1,239,386 | | | | 0.2 | | |
| | | | | Net Assets | | $ | 709,834,663 | | | | 100.0 | | |
"Other Securities" represents issues not identified as the top 50 holdings in terms of market value and issues or issuers not exceeding 1% of net assets individually or in aggregate respectively as of December 31, 2016.
The following footnotes apply to either the individual securities noted or one or more of the securities aggregated and listed as a single line item.
†† Rate shown is the 7-day yield as of December 31, 2016.
@ Non-income producing security.
Cost for federal income tax purposes is $333,136,898.
Net unrealized appreciation consists of: | |
Gross Unrealized Appreciation | | $ | 390,264,615 | | |
Gross Unrealized Depreciation | | | (14,806,236 | ) | |
Net Unrealized Appreciation | | $ | 375,458,379 | | |
Fair Value Measurements^
The following is a summary of the fair valuations according to the inputs used as of December 31, 2016 in valuing the assets and liabilities:
| | | Quoted Prices
in Active Markets
for Identical Investments
(Level 1) | | Significant Other
Observable
Inputs
(Level 2) | | Significant
Unobservable
Inputs
(Level 3) | | Fair Value
at
December 31, 2016 | |
Asset Table | |
Investments, at fair value | |
Common Stock* | | $ | 703,402,760 | | | $ | — | | | $ | — | | | $ | 703,402,760 | | |
Short-Term Investments | | | 5,192,517 | | | | — | | | | — | | | | 5,192,517 | | |
Total Investments, at fair value | | $ | 708,595,277 | | | $ | — | | | $ | — | | | $ | 708,595,277 | | |
^ See Note 2, "Significant Accounting Policies" in the Notes to Financial Statements for additional information.
* For further breakdown of Common Stock by sector, please refer to the Portfolio of Investments.
See Accompanying Notes to Financial Statements
112
VY® COLUMBIA SUMMARY PORTFOLIO OF INVESTMENTS
CONTRARIAN CORE PORTFOLIO AS OF DECEMBER 31, 2016
Shares | |
| |
| | Value | | Percentage
of Net
Assets | |
COMMON STOCK: 98.9% | | | |
| | | | | Consumer Discretionary: 12.5% | |
| | 79,615 | | | | | | | Coach, Inc. | | $ | 2,788,117 | | | | 0.8 | | |
| | 128,207 | | | | | | | Comcast Corp. - Class A | | | 8,852,694 | | | | 2.7 | | |
| | 104,149 | | | | | | | Lowe's Cos, Inc. | | | 7,407,077 | | | | 2.3 | | |
| | 32,055 | | | | | | | McDonald's Corp. | | | 3,901,735 | | | | 1.2 | | |
| | 36,915 | | | | | | | Walt Disney Co. | | | 3,847,281 | | | | 1.2 | | |
| | 257,790 | | | | | | | Other Securities | | | 13,993,623 | | | | 4.3 | | |
| | | | | | | | | | 40,790,527 | | | | 12.5 | | |
| | | | | Consumer Staples: 9.2% | |
| | 68,896 | | | | | | | Coca-Cola Co. | | | 2,856,428 | | | | 0.9 | | |
| | 84,946 | | | | | | | CVS Health Corp. | | | 6,703,089 | | | | 2.1 | | |
| | 118,175 | | | | | | | Kroger Co. | | | 4,078,219 | | | | 1.2 | | |
| | 49,043 | | | | | | | PepsiCo, Inc. | | | 5,131,369 | | | | 1.6 | | |
| | 98,165 | | | | | | | Philip Morris
International, Inc. | | | 8,981,116 | | | | 2.7 | | |
| | 27,526 | | | | | | | Walgreens Boots
Alliance, Inc. | | | 2,278,052 | | | | 0.7 | | |
| | | | | | | | | | 30,028,273 | | | | 9.2 | | |
| | | | | Energy: 7.3% | |
| | 44,221 | | | | | | | Chevron Corp. | | | 5,204,812 | | | | 1.6 | | |
| | 80,477 | | | | | | | ConocoPhillips | | | 4,035,117 | | | | 1.2 | | |
| | 65,795 | | | | | | | Exxon Mobil Corp. | | | 5,938,657 | | | | 1.8 | | |
| | 64,110 | | | | | | | Noble Energy, Inc. | | | 2,440,026 | | | | 0.8 | | |
| | 39,700 | | | | | | | Schlumberger Ltd. | | | 3,332,815 | | | | 1.0 | | |
| | 66,567 | | | | | | | Other Securities | | | 2,810,489 | | | | 0.9 | | |
| | | | | | | | | | 23,761,916 | | | | 7.3 | | |
| | | | | Financials: 17.8% | |
| | 138,371 | | | | | | | Bank of New York
Mellon Corp. | | | 6,556,018 | | | | 2.0 | | |
| | 62,142 | | | | @ | | | Berkshire Hathaway, Inc. -
Class B | | | 10,127,903 | | | | 3.1 | | |
| | 201,236 | | | | | | | Citigroup, Inc. | | | 11,959,455 | | | | 3.7 | | |
| | 132,593 | | | | | | | JPMorgan Chase & Co. | | | 11,441,450 | | | | 3.5 | | |
| | 196,530 | | | | | | | Morgan Stanley | | | 8,303,393 | | | | 2.6 | | |
| | 89,890 | | | | | | | Wells Fargo & Co. | | | 4,953,838 | | | | 1.5 | | |
| | 53,234 | | | | | | | Other Securities | | | 4,470,120 | | | | 1.4 | | |
| | | | | | | | | | 57,812,177 | | | | 17.8 | | |
| | | | | Health Care: 14.1% | |
| | 13,125 | | | | @ | | | Allergan plc | | | 2,756,381 | | | | 0.8 | | |
| | 25,035 | | | | | | | Anthem, Inc. | | | 3,599,282 | | | | 1.1 | | |
| | 15,790 | | | | @ | | | Biogen, Inc. | | | 4,477,728 | | | | 1.4 | | |
| | 31,699 | | | | | | | Cardinal Health, Inc. | | | 2,281,377 | | | | 0.7 | | |
| | 32,109 | | | | @ | | | Celgene Corp. | | | 3,716,617 | | | | 1.1 | | |
| | 29,953 | | | | | | | Cigna Corp. | | | 3,995,431 | | | | 1.2 | | |
| | 55,224 | | | | | | | Johnson & Johnson | | | 6,362,357 | | | | 2.0 | | |
| | 32,123 | | | | | | | Medtronic PLC | | | 2,288,121 | | | | 0.7 | | |
| | 195,545 | | | | | | | Pfizer, Inc. | | | 6,351,302 | | | | 2.0 | | |
Shares | |
| |
| | Value | | Percentage
of Net
Assets | |
| | 32,140 | | | | | | | Zimmer Biomet
Holdings, Inc. | | $ | 3,316,848 | | | | 1.0 | | |
| | 94,096 | | | | | | | Other Securities | | | 6,858,405 | | | | 2.1 | | |
| | | | | | | | | | 46,003,849 | | | | 14.1 | | |
| | | | | Industrials: 9.3% | |
| | 38,871 | | | | | | | FedEx Corp. | | | 7,237,780 | | | | 2.2 | | |
| | 222,315 | | | | | | | General Electric Co. | | | 7,025,154 | | | | 2.2 | | |
| | 59,717 | | | | | | | Honeywell International, Inc. | | | 6,918,214 | | | | 2.1 | | |
| | 80,505 | | | | | | | Nielsen NV | | | 3,377,185 | | | | 1.0 | | |
| | 89,973 | | | | | | | Other Securities | | | 5,723,079 | | | | 1.8 | | |
| | | | | | | | | | 30,281,412 | | | | 9.3 | | |
| | | | | Information Technology: 20.6% | |
| | 5,323 | | | | @ | | | Alphabet, Inc. - Class A | | | 4,218,211 | | | | 1.3 | | |
| | 12,304 | | | | @ | | | Alphabet, Inc. - Class C | | | 9,496,473 | | | | 2.9 | | |
| | 112,231 | | | | | | | Apple, Inc. | | | 12,998,594 | | | | 4.0 | | |
| | 30,631 | | | | | | | Broadcom Ltd. | | | 5,414,642 | | | | 1.7 | | |
| | 37,944 | | | | @ | | | Electronic Arts, Inc. | | | 2,988,470 | | | | 0.9 | | |
| | 65,890 | | | | @ | | | Facebook, Inc. | | | 7,580,645 | | | | 2.3 | | |
| | 35,000 | | | | | | | Fidelity National
Information Services, Inc. | | | 2,647,400 | | | | 0.8 | | |
| | 43,321 | | | | | | | Mastercard, Inc. | | | 4,472,893 | | | | 1.4 | | |
| | 151,910 | | | | | | | Microsoft Corp. | | | 9,439,687 | | | | 2.9 | | |
| | 34,515 | | | | | | | Qualcomm, Inc. | | | 2,250,378 | | | | 0.7 | | |
| | 96,000 | | | | | | | Other Securities | | | 5,603,075 | | | | 1.7 | | |
| | | | | | | | | | 67,110,468 | | | | 20.6 | | |
| | | | | Materials: 1.9% | |
| | 15,893 | | | | | | | Sherwin-Williams Co. | | | 4,271,085 | | | | 1.3 | | |
| | 18,055 | | | | | | | Other Securities | | | 1,899,566 | | | | 0.6 | | |
| | | | | | | | | | 6,170,651 | | | | 1.9 | | |
| | | | | Real Estate: 1.4% | |
| | 42,390 | | | | | | | American Tower Corp. | | | 4,479,775 | | | | 1.4 | | |
| | | | | Telecommunication Services: 3.5% | |
| | 62,825 | | | | | | | AT&T, Inc. | | | 2,671,947 | | | | 0.8 | | |
| | 165,547 | | | | | | | Verizon
Communications, Inc. | | | 8,836,899 | | | | 2.7 | | |
| | | | | | | | | | 11,508,846 | | | | 3.5 | | |
| | | | | Utilities: 1.3% | |
| | 35,971 | | | | | | | Edison International | | | 2,589,552 | | | | 0.8 | | |
| | 17,452 | | | | | | | Other Securities | | | 1,719,197 | | | | 0.5 | | |
| | | | | | | | | | 4,308,749 | | | | 1.3 | | |
| | | | | | | Total Common Stock
(Cost $281,324,211) | | | 322,256,643 | | | | 98.9 | | |
See Accompanying Notes to Financial Statements
113
VY® COLUMBIA SUMMARY PORTFOLIO OF INVESTMENTS
CONTRARIAN CORE PORTFOLIO AS OF DECEMBER 31, 2016 (CONTINUED)
Principal
Amount† | |
| |
| | Value | | Percentage
of Net
Assets | |
CORPORATE BONDS/NOTES: — % | |
| | | | | Materials: —% | |
| | 649,000 | | | | | | | Other Securities | | $ | — | | | | — | | |
| | | | | Total Corporate
Bonds/Notes
(Cost $—) | | | — | | | | — | | |
| | | | | Total Long-Term
Investments
(Cost $281,324,211) | | | 322,256,643 | | | | 98.9 | | |
SHORT-TERM INVESTMENTS: 1.1% | |
| | | | | Mutual Funds: 1.1% | |
| | 3,610,640 | | | | | | | BlackRock Liquidity
Funds, FedFund,
Institutional Class,
0.420%††
(Cost $3,610,640) | | | 3,610,640 | | | | 1.1 | | |
| | | | | Total Short-Term
Investments
(Cost $3,610,640) | | | 3,610,640 | | | | 1.1 | | |
| | | | | Total Investments in
Securities
(Cost $284,934,851) | | $ | 325,867,283 | | | | 100.0 | | |
| | | | | Assets in Excess of
Other Liabilities | | | 57,350 | | | | 0.0 | | |
| | | | | Net Assets | | $ | 325,924,633 | | | | 100.0 | | |
"Other Securities" represents issues not identified as the top 50 holdings in terms of market value and issues or issuers not exceeding 1% of net assets individually or in aggregate respectively as of December 31, 2016.
The following footnotes apply to either the individual securities noted or one or more of the securities aggregated and listed as a single line item.
† Unless otherwise indicated, principal amount is shown in USD.
†† Rate shown is the 7-day yield as of December 31, 2016.
@ Non-income producing security.
Cost for federal income tax purposes is $285,909,324.
Net unrealized appreciation consists of: | |
Gross Unrealized Appreciation | | $ | 43,256,690 | | |
Gross Unrealized Depreciation | | | (3,298,731 | ) | |
Net Unrealized Appreciation | | $ | 39,957,959 | | |
Fair Value Measurements^
The following is a summary of the fair valuations according to the inputs used as of December 31, 2016 in valuing the assets and liabilities:
| | | Quoted Prices
in Active Markets
for Identical Investments
(Level 1) | | Significant Other
Observable
Inputs
(Level 2) | | Significant
Unobservable
Inputs
(Level 3) | | Fair Value
at
December 31, 2016 | |
Asset Table | |
Investments, at fair value | |
Common Stock* | | $ | 322,256,643 | | | $ | — | | | $ | — | | | $ | 322,256,643 | | |
Corporate Bonds/Notes | | | — | | | | — | | | | — | | | | — | | |
Short-Term Investments | | | 3,610,640 | | | | — | | | | — | | | | 3,610,640 | | |
Total Investments, at fair value | | $ | 325,867,283 | | | $ | — | | | $ | — | | | $ | 325,867,283 | | |
^ See Note 2, "Significant Accounting Policies" in the Notes to Financial Statements for additional information.
* For further breakdown of Common Stock by sector, please refer to the Portfolio of Investments.
See Accompanying Notes to Financial Statements
114
VY® COLUMBIA SUMMARY PORTFOLIO OF INVESTMENTS
SMALL CAP VALUE II PORTFOLIO AS OF DECEMBER 31, 2016
Shares | |
| |
| | Value | | Percentage
of Net
Assets | |
COMMON STOCK: 96.8% | | | |
| | | | | Consumer Discretionary: 6.9% | |
| | 25,300 | | | | | | | Childrens Place Retail
Stores, Inc. | | $ | 2,554,035 | | | | 1.1 | | |
| | 79,000 | | | | | | | Tower International, Inc. | | | 2,239,650 | | | | 0.9 | | |
| | 436,800 | | | | | | | Other Securities | | | 11,687,064 | | | | 4.9 | | |
| | | | | | | | | | 16,480,749 | | | | 6.9 | | |
| | | | | Consumer Staples: 3.1% | |
| | 78,000 | | | | | | | AdvancePierre Foods
Holdings, Inc. | | | 2,322,840 | | | | 1.0 | | |
| | 386,800 | | | | | | | Other Securities | | | 4,960,848 | | | | 2.1 | | |
| | | | | | | | | | 7,283,688 | | | | 3.1 | | |
| | | | | Energy: 6.7% | |
| | 90,000 | | | | | | | Patterson-UTI Energy, Inc. | | | 2,422,800 | | | | 1.0 | | |
| | 545,000 | | | | | | | Other Securities | | | 13,463,475 | | | | 5.7 | | |
| | | | | | | | | | 15,886,275 | | | | 6.7 | | |
| | | | | Financials: 31.8% | |
| | 105,000 | | | | | | | American Equity
Investment Life
Holding Co. | | | 2,366,700 | | | | 1.0 | | |
| | 58,500 | | | | | | | Ameris Bancorp. | | | 2,550,600 | | | | 1.1 | | |
| | 43,843 | | | | | | | Amerisafe, Inc. | | | 2,733,611 | | | | 1.2 | | |
| | 37,500 | | | | | | | Argo Group International
Holdings Ltd. | | | 2,471,250 | | | | 1.0 | | |
| | 47,000 | | | | | | | Bank of the Ozarks, Inc. | | | 2,471,730 | | | | 1.0 | | |
| | 85,000 | | | | @ | | | BofI Holding, Inc. | | | 2,426,750 | | | | 1.0 | | |
| | 58,000 | | | | | | | Community Bank
System, Inc. | | | 3,583,820 | | | | 1.5 | | |
| | 80,000 | | | | @ | | | Customers Bancorp, Inc. | | | 2,865,600 | | | | 1.2 | | |
| | 57,000 | | | | | | | Hancock Holding Co. | | | 2,456,700 | | | | 1.0 | | |
| | 133,000 | | | | | | | Hope Bancorp, Inc. | | | 2,911,370 | | | | 1.2 | | |
| | 49,004 | | | | | | | Independent Bank Corp. | | | 3,452,332 | | | | 1.5 | | |
| | 52,000 | | | | | | | MB Financial, Inc. | | | 2,455,960 | | | | 1.0 | | |
| | 290,000 | | | | @ | | | MGIC Investment Corp. | | | 2,955,100 | | | | 1.2 | | |
| | 34,000 | | | | | | | Prosperity
Bancshares, Inc. | | | 2,440,520 | | | | 1.0 | | |
| | 77,500 | | | | | | | Renasant Corp. | | | 3,272,050 | | | | 1.4 | | |
| | 80,000 | | | | | | | Sandy Spring
Bancorp, Inc. | | | 3,199,200 | | | | 1.4 | | |
| | 149,000 | | | | | | | Sterling Bancorp/DE | | | 3,486,600 | | | | 1.5 | | |
| | 33,200 | | | | | | | UMB Financial Corp. | | | 2,560,384 | | | | 1.1 | | |
| | 86,500 | | | | | | | Union Bankshares Corp. | | | 3,091,510 | | | | 1.3 | | |
| | 58,000 | | | | @ | | | Western Alliance Bancorp. | | | 2,825,180 | | | | 1.2 | | |
| | 33,500 | | | | | | | Wintrust Financial Corp. | | | 2,431,095 | | | | 1.0 | | |
| | 50,000 | | | | | | | WSFS Financial Corp. | | | 2,317,500 | | | | 1.0 | | |
| | 729,000 | | | | | | | Other Securities | | | 14,266,240 | | | | 6.0 | | |
| | | | | | | | | | 75,591,802 | | | | 31.8 | | |
Shares | |
| |
| | Value | | Percentage
of Net
Assets | |
| | | | | Health Care: 4.8% | |
| | 370,500 | | | | | | | Other Securities | | $ | 11,497,170 | | | | 4.8 | | |
| | | | | Industrials: 14.0% | |
| | 58,500 | | | | | | | ABM Industries, Inc. | | | 2,389,140 | | | | 1.0 | | |
| | 48,500 | | | | | | | Barnes Group, Inc. | | | 2,299,870 | | | | 0.9 | | |
| | 22,000 | | | | | | | Curtiss-Wright Corp. | | | 2,163,920 | | | | 0.9 | | |
| | 34,500 | | | | | | | Deluxe Corp. | | | 2,470,545 | | | | 1.0 | | |
| | 46,500 | | | | | | | EMCOR Group, Inc. | | | 3,290,340 | | | | 1.4 | | |
| | 42,500 | | | | | | | Granite Construction, Inc. | | | 2,337,500 | | | | 1.0 | | |
| | 67,500 | | | | @ | | | Mastec, Inc. | | | 2,581,875 | | | | 1.1 | | |
| | 64,000 | | | | | | | Skywest, Inc. | | | 2,332,800 | | | | 1.0 | | |
| | 105,000 | | | | @ | | | Swift Transportation Co. | | | 2,557,800 | | | | 1.1 | | |
| | 53,500 | | | | @ | | | XPO Logistics, Inc. | | | 2,309,060 | | | | 1.0 | | |
| | 251,771 | | | | | | | Other Securities | | | 8,488,421 | | | | 3.6 | | |
| | | | | | | | | | 33,221,271 | | | | 14.0 | | |
| | | | | Information Technology: 9.9% | |
| | 45,500 | | | | @ | | | Cirrus Logic, Inc. | | | 2,572,570 | | | | 1.1 | | |
| | 80,000 | | | | @ | | | II-VI, Inc. | | | 2,372,000 | | | | 1.0 | | |
| | 140,000 | | | | @ | | | Kulicke & Soffa
Industries, Inc. | | | 2,233,000 | | | | 1.0 | | |
| | 28,500 | | | | | | | Science Applications
International Corp. | | | 2,416,800 | | | | 1.0 | | |
| | 19,500 | | | | | | | SYNNEX Corp. | | | 2,359,890 | | | | 1.0 | | |
| | 646,000 | | | | | | | Other Securities | | | 11,492,175 | | | | 4.8 | | |
| | | | | | | | | | 23,446,435 | | | | 9.9 | | |
| | | | | Materials: 6.8% | |
| | 220,000 | | | | @ | | | AK Steel Holding Corp. | | | 2,246,200 | | | | 0.9 | | |
| | 30,500 | | | | | | | Neenah Paper, Inc. | | | 2,598,600 | | | | 1.1 | | |
| | 364,844 | | | | | | | Other Securities | | | 11,429,240 | | | | 4.8 | | |
| | �� | | | | | | | | 16,274,040 | | | | 6.8 | | |
| | | | | Real Estate: 8.0% | |
| | 54,000 | | | | | | | American Assets Trust, Inc. | | | 2,326,320 | | | | 1.0 | | |
| | 97,000 | | | | | | | First Industrial Realty
Trust, Inc. | | | 2,720,850 | | | | 1.1 | | |
| | 45,500 | | | | | | | Highwoods Properties, Inc. | | | 2,320,955 | | | | 1.0 | | |
| | 19,000 | | | | | | | PS Business Parks, Inc. | | | 2,213,880 | | | | 0.9 | | |
| | 369,300 | | | | | | | Other Securities | | | 9,540,323 | | | | 4.0 | | |
| | | | | | | | | | 19,122,328 | | | | 8.0 | | |
| | | | | Utilities: 4.8% | |
| | 70,000 | | | | | | | New Jersey Resources Corp. | | | 2,485,000 | | | | 1.0 | | |
| | 76,000 | | | | | | | South Jersey Industries, Inc. | | | 2,560,440 | | | | 1.1 | | |
| | 109,500 | | | | | | | Other Securities | | | 6,398,290 | | | | 2.7 | | |
| | | | | | | | | | 11,443,730 | | | | 4.8 | | |
| | | | | | | Total Common Stock
(Cost $176,324,773) | | | 230,247,488 | | | | 96.8 | | |
See Accompanying Notes to Financial Statements
115
VY® COLUMBIA SUMMARY PORTFOLIO OF INVESTMENTS
SMALL CAP VALUE II PORTFOLIO AS OF DECEMBER 31, 2016 (CONTINUED)
Shares | |
| |
| | Value | | Percentage
of Net
Assets | |
EXCHANGE-TRADED FUNDS: 1.1% | |
| | 20,000 | | | | | | | iShares Russell 2000 ETF | | $ | 2,697,000 | | | | 1.1 | | |
| | | | | Total Exchange-Traded
Funds
(Cost $2,696,400) | | | 2,697,000 | | | | 1.1 | | |
| | | | | Total Long-Term
Investments
(Cost $179,021,173) | | | 232,944,488 | | | | 97.9 | | |
SHORT-TERM INVESTMENTS: 3.9% | |
| | | | | Mutual Funds: 3.9% | |
| | 9,231,151 | | | | | | | BlackRock Liquidity
Funds, FedFund,
Institutional Class,
0.420%††
(Cost $9,231,151) | | | 9,231,151 | | | | 3.9 | | |
| | | | | Total Short-Term
Investments
(Cost $9,231,151) | | | 9,231,151 | | | | 3.9 | | |
| | | | | Total Investments in
Securities
(Cost $188,252,324) | | $ | 242,175,639 | | | | 101.8 | | |
| | | | | Liabilities in Excess of
Other Assets | | | (4,180,630 | ) | | | (1.8 | ) | |
| | | | | Net Assets | | $ | 237,995,009 | | | | 100.0 | | |
"Other Securities" represents issues not identified as the top 50 holdings in terms of market value and issues or issuers not exceeding 1% of net assets individually or in aggregate respectively as of December 31, 2016.
The following footnotes apply to either the individual securities noted or one or more of the securities aggregated and listed as a single line item.
†† Rate shown is the 7-day yield as of December 31, 2016.
@ Non-income producing security.
Cost for federal income tax purposes is $188,459,681.
Net unrealized appreciation consists of: | |
Gross Unrealized Appreciation | | $ | 57,119,416 | | |
Gross Unrealized Depreciation | | | (3,403,458 | ) | |
Net Unrealized Appreciation | | $ | 53,715,958 | | |
Fair Value Measurements^
The following is a summary of the fair valuations according to the inputs used as of December 31, 2016 in valuing the assets and liabilities:
| | | Quoted Prices
in Active Markets
for Identical Investments
(Level 1) | | Significant Other
Observable
Inputs
(Level 2) | | Significant
Unobservable
Inputs
(Level 3) | | Fair Value
at
December 31, 2016 | |
Asset Table | |
Investments, at fair value | |
Common Stock* | | $ | 230,247,488 | | | $ | — | | | $ | — | | | $ | 230,247,488 | | |
Exchange-Traded Funds | | | 2,697,000 | | | | — | | | | — | | | | 2,697,000 | | |
Short-Term Investments | | | 9,231,151 | | | | — | | | | — | | | | 9,231,151 | | |
Total Investments, at fair value | | $ | 242,175,639 | | | $ | — | | | $ | — | | | $ | 242,175,639 | | |
^ See Note 2, "Significant Accounting Policies" in the Notes to Financial Statements for additional information.
* For further breakdown of Common Stock by sector, please refer to the Portfolio of Investments.
See Accompanying Notes to Financial Statements
116
SUMMARY PORTFOLIO OF INVESTMENTS
VY® INVESCO COMSTOCK PORTFOLIO AS OF DECEMBER 31, 2016
Shares | |
| |
| | Value | | Percentage
of Net
Assets | |
COMMON STOCK: 98.4% | | | |
| | | | | Consumer Discretionary: 10.4% | |
| | 265,940 | | | | | | | Carnival Corp. | | $ | 13,844,836 | | | | 2.6 | | |
| | 81,378 | | | | | | | Comcast Corp. - Class A | | | 5,619,151 | | | | 1.1 | | |
| | 272,194 | | | | | | | General Motors Co. | | | 9,483,239 | | | | 1.8 | | |
| | 76,832 | | | | | | | Target Corp. | | | 5,549,575 | | | | 1.1 | | |
| | 205,495 | | | | | | | Twenty-First Century
Fox, Inc. - Class B | | | 5,599,739 | | | | 1.1 | | |
| | 177,465 | | | | | | | Other Securities | | | 13,876,239 | | | | 2.7 | | |
| | | | | | | | | | 53,972,779 | | | | 10.4 | | |
| | | | | Consumer Staples: 3.0% | |
| | 74,643 | | | | | | | Wal-Mart Stores, Inc. | | | 5,159,324 | | | | 1.0 | | |
| | 205,779 | | | | | | | Other Securities | | | 10,680,307 | | | | 2.0 | | |
| | | | | | | | | | 15,839,631 | | | | 3.0 | | |
| | | | | Energy: 17.2% | |
| | 255,687 | | | | | | | BP PLC ADR | | | 9,557,580 | | | | 1.8 | | |
| | 82,864 | | | | | | | Chevron Corp. | | | 9,753,093 | | | | 1.9 | | |
| | 193,657 | | | | | | | Devon Energy Corp. | | | 8,844,315 | | | | 1.7 | | |
| | 121,675 | | | | | | | Halliburton Co. | | | 6,581,401 | | | | 1.3 | | |
| | 115,402 | | | | | | | Hess Corp. | | | 7,188,391 | | | | 1.4 | | |
| | 288,175 | | | | | | | Marathon Oil Corp. | | | 4,988,309 | | | | 1.0 | | |
| | 65,044 | | | | | | | Occidental
Petroleum Corp. | | | 4,633,084 | | | | 0.9 | | |
| | 244,277 | | | | | | | QEP Resources, Inc. | | | 4,497,139 | | | | 0.9 | | |
| | 194,580 | | | | | | | Royal Dutch Shell PLC -
Class A ADR | | | 10,581,260 | | | | 2.0 | | |
| | 405,058 | | | | | | | Suncor Energy, Inc. | | | 13,241,346 | | | | 2.5 | | |
| | 1,008,530 | | | | @,L | | | Weatherford
International PLC | | | 5,032,565 | | | | 1.0 | | |
| | 138,983 | | | | | | | Other Securities | | | 4,429,362 | | | | 0.8 | | |
| | | | | | | | | | 89,327,845 | | | | 17.2 | | |
| | | | | Financials: 36.2% | |
| | 65,710 | | | | | | | Aflac, Inc. | | | 4,573,416 | | | | 0.9 | | |
| | 116,395 | | | | | | | American International
Group, Inc. | | | 7,601,758 | | | | 1.5 | | |
| | 100,193 | | | | | | | Allstate Corp. | | | 7,426,305 | | | | 1.4 | | |
| | 362,435 | | | | | | | Ally Financial, Inc. | | | 6,893,514 | | | | 1.3 | | |
| | 973,247 | | | | | | | Bank of America Corp. | | | 21,508,759 | | | | 4.1 | | |
| | 136,997 | | | | | | | Bank of New York
Mellon Corp. | | | 6,490,918 | | | | 1.2 | | |
| | 505,597 | | | | | | | Citigroup, Inc. | | | 30,047,630 | | | | 5.8 | | |
| | 169,970 | | | | | | | Citizens Financial
Group, Inc. | | | 6,056,031 | | | | 1.2 | | |
| | 365,985 | | | | | | | Fifth Third Bancorp | | | 9,870,615 | | | | 1.9 | | |
| | 27,746 | | | | | | | Goldman Sachs
Group, Inc. | | | 6,643,780 | | | | 1.3 | | |
| | 274,944 | | | | | | | JPMorgan Chase & Co. | | | 23,724,918 | | | | 4.6 | | |
| | 190,106 | | | | | | | Metlife, Inc. | | | 10,244,812 | | | | 2.0 | | |
| | 245,621 | | | | | | | Morgan Stanley | | | 10,377,487 | | | | 2.0 | | |
| | 99,621 | | | | | | | PNC Financial Services
Group, Inc. | | | 11,651,672 | | | | 2.2 | | |
Shares | |
| |
| | Value | | Percentage
of Net
Assets | |
| | 125,520 | | | | | | | State Street Corp. | | $ | 9,755,414 | | | | 1.9 | | |
| | 191,952 | | | | | | | Wells Fargo & Co. | | | 10,578,475 | | | | 2.0 | | |
| | 166,762 | | | | | | | Other Securities | | | 4,649,841 | | | | 0.9 | | |
| | | | | | | | | | 188,095,345 | | | | 36.2 | | |
| | | | | Health Care: 9.6% | |
| | 38,721 | | | | | | | Anthem, Inc. | | | 5,566,918 | | | | 1.1 | | |
| | 17,167 | | | | @ | | | Biogen, Inc. | | | 4,868,218 | | | | 0.9 | | |
| | 123,569 | | | | | | | Merck & Co., Inc. | | | 7,274,507 | | | | 1.4 | | |
| | 301,869 | | | | | | | Pfizer, Inc. | | | 9,804,705 | | | | 1.9 | | |
| | 183,047 | | | | | | | Sanofi ADR | | | 7,402,421 | | | | 1.4 | | |
| | 219,549 | | | | | | | Other Securities | | | 15,272,674 | | | | 2.9 | | |
| | | | | | | | | | 50,189,443 | | | | 9.6 | | |
| | | | | Industrials: 9.2% | |
| | 106,551 | | | | | | | Caterpillar, Inc. | | | 9,881,540 | | | | 1.9 | | |
| | 73,113 | | | | | | | Eaton Corp. PLC | | | 4,905,151 | | | | 0.9 | | |
| | 100,878 | | | | | | | Emerson Electric Co. | | | 5,623,949 | | | | 1.1 | | |
| | 204,587 | | | | | | | General Electric Co. | | | 6,464,949 | | | | 1.2 | | |
| | 173,343 | | | | | | | Johnson Controls
International plc | | | 7,139,998 | | | | 1.4 | | |
| | 153,008 | | | | | | | Textron, Inc. | | | 7,430,068 | | | | 1.4 | | |
| | 207,368 | | | | | | | Other Securities | | | 6,609,148 | | | | 1.3 | | |
| | | | | | | | | | 48,054,803 | | | | 9.2 | | |
| | | | | Information Technology: 9.4% | |
| | 397,186 | | | | | | | Cisco Systems, Inc. | | | 12,002,961 | | | | 2.3 | | |
| | 234,958 | | | | @ | | | eBay, Inc. | | | 6,975,903 | | | | 1.3 | | |
| | 170,502 | | | | | | | Intel Corp. | | | 6,184,107 | | | | 1.2 | | |
| | 118,005 | | | | | | | Microsoft Corp. | | | 7,332,831 | | | | 1.4 | | |
| | 224,692 | | | | | | | NetApp, Inc. | | | 7,924,887 | | | | 1.5 | | |
| | 335,019 | | | | | | | Other Securities | | | 8,671,767 | | | | 1.7 | | |
| | | | | | | | | | 49,092,456 | | | | 9.4 | | |
| | | | | Materials: 1.8% | |
| | 85,591 | | | | | | | International Paper Co. | | | 4,541,459 | | | | 0.9 | | |
| | 155,173 | | | | | | | Other Securities | | | 4,705,285 | | | | 0.9 | | |
| | | | | | | | | | 9,246,744 | | | | 1.8 | | |
| | | | | Telecommunication Services: 1.0% | |
| | 1,776,602 | | | | | | | Other Securities(a) | | | 5,281,480 | | | | 1.0 | | |
| | | | | Utilities: 0.6% | |
| | 99,873 | | | | | | | Other Securities | | | 3,093,067 | | | | 0.6 | | |
| | | | | | | Total Common Stock
(Cost $425,209,667) | | | 512,193,593 | | | | 98.4 | | |
See Accompanying Notes to Financial Statements
117
SUMMARY PORTFOLIO OF INVESTMENTS
VY® INVESCO COMSTOCK PORTFOLIO AS OF DECEMBER 31, 2016 (CONTINUED)
Principal
Amount† | |
| |
| | Value | | Percentage
of Net
Assets | |
SHORT-TERM INVESTMENTS: 2.6% | | | |
| | | | | Securities Lending Collateralcc: 1.2% | |
| | 1,462,984 | | | | | | | Cantor Fitzgerald,
Repurchase Agreement
dated 12/30/16, 0.50%,
due 01/03/17
(Repurchase
Amount $1,463,064,
collateralized by various
U.S. Government/
U.S. Government
Agency Obligations,
0.000%-10.000%,
Market Value plus
accrued interest
$1,492,244, due
01/25/17-10/20/66) | | $ | 1,462,984 | | | | 0.3 | | |
| | 1,462,984 | | | | | | | Citigroup, Inc.,
Repurchase Agreement
dated 12/30/16, 0.53%,
due 01/03/17
(Repurchase
Amount $1,463,069,
collateralized by various
U.S. Government
Agency Obligations,
2.000%-8.500%,
Market Value plus
accrued interest
$1,492,244, due
12/01/17-01/01/47) | | | 1,462,984 | | | | 0.3 | | |
| | 1,462,984 | | | | | | | Daiwa Capital Markets,
Repurchase Agreement
dated 12/30/16, 0.52%,
due 01/03/17
(Repurchase
Amount $1,463,067,
collateralized by various
U.S. Government/
U.S. Government
Agency Obligations,
0.000%-6.500%,
Market Value plus
accrued interest
$1,492,244, due
03/02/17-02/01/49) | | | 1,462,984 | | | | 0.3 | | |
| | 307,916 | | | | | | | Merrill Lynch & Co., Inc.,
Repurchase Agreement
dated 12/30/16, 0.50%,
due 01/03/17
(Repurchase
Amount $307,933,
collateralized by various
U.S. Government
Securities,
0.685%-2.000%,
Market Value plus
accrued interest
$314,074, due
10/31/18-11/30/22) | | | 307,916 | | | | 0.0 | | |
Principal
Amount† | |
| |
| | Value | | Percentage
of Net
Assets | |
| | 1,462,984 | | | | | | | Nomura Securities,
Repurchase Agreement
dated 12/30/16, 0.50%,
due 01/03/17
(Repurchase
Amount $1,463,064,
collateralized by various
U.S. Government/
U.S. Government
Agency Obligations,
0.000%-9.500%,
Market Value plus
accrued interest
$1,492,244, due
01/15/17-08/20/66) | | $ | 1,462,984 | | | | 0.3 | | |
| | | | | | | | 6,159,852 | | | | 1.2 | | |
Shares | |
| |
| | Value | | Percentage
of Net
Assets | |
| | | | | Mutual Funds: 1.4% | |
| | 7,177,230 | | | | | | | BlackRock Liquidity
Funds, FedFund,
Institutional Class,
0.420%††
(Cost $7,177,230) | | $ | 7,177,230 | | | | 1.4 | | |
| | | | | Total Short-Term
Investments
(Cost $13,337,082) | | | 13,337,082 | | | | 2.6 | | |
| | | | | Total Investments in
Securities
(Cost $438,546,749) | | $ | 525,530,675 | | | | 101.0 | | |
| | | | | Liabilities in Excess of
Other Assets | | | (5,329,598 | ) | | | (1.0 | ) | |
| | | | | Net Assets | | $ | 520,201,077 | | | | 100.0 | | |
"Other Securities" represents issues not identified as the top 50 holdings in terms of market value and issues or issuers not exceeding 1% of net assets individually or in aggregate respectively as of December 31, 2016.
The following footnotes apply to either the individual securities noted or one or more of the securities aggregated and listed as a single line item.
† Unless otherwise indicated, principal amount is shown in USD.
†† Rate shown is the 7-day yield as of December 31, 2016.
@ Non-income producing security.
ADR American Depositary Receipt
cc Represents securities purchased with cash collateral received for securities on loan.
L Loaned security, a portion or all of the security is on loan at December 31, 2016.
(a) This grouping contains securities on loan.
Cost for federal income tax purposes is $446,747,864.
Net unrealized appreciation consists of: | |
Gross Unrealized Appreciation | | $ | 107,445,032 | | |
Gross Unrealized Depreciation | | | (28,662,221 | ) | |
Net Unrealized Appreciation | | $ | 78,782,811 | | |
See Accompanying Notes to Financial Statements
118
SUMMARY PORTFOLIO OF INVESTMENTS
VY® INVESCO COMSTOCK PORTFOLIO AS OF DECEMBER 31, 2016 (CONTINUED)
Fair Value Measurements^
The following is a summary of the fair valuations according to the inputs used as of December 31, 2016 in valuing the assets and liabilities:
| | | Quoted Prices
in Active Markets
for Identical Investments
(Level 1) | | Significant Other
Observable
Inputs#
(Level 2) | | Significant
Unobservable
Inputs
(Level 3) | | Fair Value
at
December 31, 2016 | |
Asset Table | |
Investments, at fair value | |
Common Stock | |
Consumer Discretionary | | $ | 53,972,779 | | | $ | — | | | $ | — | | | $ | 53,972,779 | | |
Consumer Staples | | | 15,839,631 | | | | — | | | | — | | | | 15,839,631 | | |
Energy | | | 89,327,845 | | | | — | | | | — | | | | 89,327,845 | | |
Financials | | | 188,095,345 | | | | — | | | | — | | | | 188,095,345 | | |
Health Care | | | 45,846,468 | | | | 4,342,975 | | | | — | | | | 50,189,443 | | |
Industrials | | | 48,054,803 | | | | — | | | | — | | | | 48,054,803 | | |
Information Technology | | | 49,092,456 | | | | — | | | | — | | | | 49,092,456 | | |
Materials | | | 9,246,744 | | | | — | | | | — | | | | 9,246,744 | | |
Telecommunication Services | | | 3,344,493 | | | | 1,936,987 | | | | — | | | | 5,281,480 | | |
Utilities | | | 3,093,067 | | | | — | | | | — | | | | 3,093,067 | | |
Total Common Stock | | | 505,913,631 | | | | 6,279,962 | | | | — | | | | 512,193,593 | | |
Short-Term Investments | | | 7,177,230 | | | | 6,159,852 | | | | — | | | | 13,337,082 | | |
Total Investments, at fair value | | $ | 513,090,861 | | | $ | 12,439,814 | | | $ | — | | | $ | 525,530,675 | | |
Other Financial Instruments+ | |
Forward Foreign Currency Contracts | | | — | | | | 822,857 | | | | — | | | | 822,857 | | |
Total Assets | | $ | 513,090,861 | | | $ | 13,262,671 | | | $ | — | | | $ | 526,353,532 | | |
Liabilities Table | |
Other Financial Instruments+ | |
Forward Foreign Currency Contracts | | $ | — | | | $ | (1,731 | ) | | $ | — | | | $ | (1,731 | ) | |
Total Liabilities | | $ | — | | | $ | (1,731 | ) | | $ | — | | | $ | (1,731 | ) | |
^ See Note 2, "Significant Accounting Policies" in the Notes to Financial Statements for additional information.
+ Other Financial Instruments are derivatives not reflected in the Portfolio of Investments and may include open forward foreign currency contracts, futures, centrally cleared swaps, OTC swaps and written options. Forward foreign currency contracts, futures and centrally cleared swaps are valued at the unrealized gain (loss) on the instrument. OTC swaps and written options are valued at the fair value of the instrument.
# The earlier close of the foreign markets gives rise to the possibility that significant events, including broad market moves, may have occurred in the interim and may materially affect the value of those securities. To account for this, the Portfolio may frequently value many of its foreign equity securities using fair value prices based on third party vendor modeling tools to the extent available. Accordingly, a portion of the Portfolio's investments are categorized as Level 2 investments.
At December 31, 2016, the following forward foreign currency contracts were outstanding for VY® Invesco Comstock Portfolio:
Counterparty | | Currency | | Contract
Amount | | Buy/Sell | | Settlement
Date | | In Exchange
For | | Fair
Value | | Unrealized
Appreciation
(Depreciation) | |
Barclays Bank PLC | | Canadian Dollar | | | 55,142 | | | Buy | | 01/20/17 | | $ | 42,038 | | | $ | 41,079 | | | $ | (959 | ) | |
Barclays Bank PLC | | Swiss Franc | | | 38,144 | | | Buy | | 01/20/17 | | | 37,784 | | | | 37,507 | | | | (277 | ) | |
Barclays Bank PLC | | British Pound | | | 13,924 | | | Buy | | 01/20/17 | | | 17,663 | | | | 17,168 | | | | (495 | ) | |
| | | | | | | | | | | | | | | $ | (1,731 | ) | |
Barclays Bank PLC | | EU Euro | | | 4,115,723 | | | Sell | | 01/20/17 | | | 4,381,014 | | | | 4,336,469 | | | | 44,545 | | |
Barclays Bank PLC | | Canadian Dollar | | | 5,040,113 | | | Sell | | 01/20/17 | | | 3,843,164 | | | | 3,754,663 | | | | 88,501 | | |
Barclays Bank PLC | | Swiss Franc | | | 901,029 | | | Sell | | 01/20/17 | | | 892,174 | | | | 885,976 | | | | 6,198 | | |
Barclays Bank PLC | | British Pound | | | 1,921,741 | | | Sell | | 01/20/17 | | | 2,436,869 | | | | 2,369,543 | | | | 67,326 | | |
CIBC World Markets Corp. | | Swiss Franc | | | 901,029 | | | Sell | | 01/20/17 | | | 892,143 | | | | 885,976 | | | | 6,167 | | |
CIBC World Markets Corp. | | Canadian Dollar | | | 5,040,116 | | | Sell | | 01/20/17 | | | 3,841,874 | | | | 3,754,665 | | | | 87,209 | | |
CIBC World Markets Corp. | | EU Euro | | | 4,115,723 | | | Sell | | 01/20/17 | | | 4,380,961 | | | | 4,336,470 | | | | 44,491 | | |
CIBC World Markets Corp. | | British Pound | | | 1,914,191 | | | Sell | | 01/20/17 | | | 2,427,319 | | | | 2,360,234 | | | | 67,085 | | |
Goldman Sachs International | | Canadian Dollar | | | 5,040,113 | | | Sell | | 01/20/17 | | | 3,842,883 | | | | 3,754,664 | | | | 88,219 | | |
Goldman Sachs International | | Swiss Franc | | | 901,029 | | | Sell | | 01/20/17 | | | 892,108 | | | | 885,977 | | | | 6,131 | | |
Goldman Sachs International | | EU Euro | | | 4,119,995 | | | Sell | | 01/20/17 | | | 4,385,368 | | | | 4,340,971 | | | | 44,397 | | |
Goldman Sachs International | | British Pound | | | 1,914,191 | | | Sell | | 01/20/17 | | | 2,427,596 | | | | 2,360,234 | | | | 67,362 | | |
RBC Capital Markets Corp. | | British Pound | | | 1,914,191 | | | Sell | | 01/20/17 | | | 2,427,701 | | | | 2,360,233 | | | | 67,468 | | |
RBC Capital Markets Corp. | | Swiss Franc | | | 897,523 | | | Sell | | 01/20/17 | | | 888,592 | | | | 882,528 | | | | 6,064 | | |
RBC Capital Markets Corp. | | EU Euro | | | 4,115,723 | | | Sell | | 01/20/17 | | | 4,380,422 | | | | 4,336,470 | | | | 43,952 | | |
RBC Capital Markets Corp. | | Canadian Dollar | | | 5,040,113 | | | Sell | | 01/20/17 | | | 3,842,405 | | | | 3,754,663 | | | | 87,742 | | |
| | | | | | | | | | | | | | | $ | 822,857 | | |
See Accompanying Notes to Financial Statements
119
SUMMARY PORTFOLIO OF INVESTMENTS
VY® INVESCO COMSTOCK PORTFOLIO AS OF DECEMBER 31, 2016 (CONTINUED)
A summary of derivative instruments by primary risk exposure is outlined in the following tables.
The fair value of derivative instruments as of December 31, 2016 was as follows:
Derivatives not accounted
for as hedging instruments | | Location on Statement of Assets and Liabilities | | Fair Value | |
Asset Derivatives | |
Foreign exchange contracts | | Unrealized appreciation on forward foreign currency contracts | | $ | 822,857 | | |
Total Asset Derivatives | | | | $ | 822,857 | | |
Liability Derivatives | |
Foreign exchange contracts | | Unrealized depreciation on forward foreign currency contracts | | $ | 1,731 | | |
Total Liability Derivatives | | | | $ | 1,731 | | |
The effect of derivative instruments on the Portfolio's Statement of Operations for the year ended December 31, 2016 was as follows:
| | | Amount of Realized Gain or (Loss) on Derivatives Recognized in Income | |
Derivatives not accounted
for as hedging instruments | | Foreign currency related transactions* | |
Foreign exchange contracts | | $ | 964,553 | | |
Total | | $ | 964,553 | | |
| | | Change in Unrealized Appreciation or (Depreciation) on Derivatives Recognized in Income | |
Derivatives not accounted
for as hedging instruments | | Foreign currency related transactions* | |
Foreign exchange contracts | | $ | 172,351 | | |
Total | | $ | 172,351 | | |
* Amounts recognized for forward foreign currency contracts are included in net realized gain (loss) on foreign currency related transactions and net change in unrealized appreciation or depreciation on foreign currency related transactions.
The following is a summary by counterparty of the fair value of OTC derivative instruments subject to Master Netting Agreements and collateral pledged (received), if any, at December 31, 2016:
| | | Barclays
Bank PLC | | CIBC World
Markets Corp. | | Deutsche
Bank AG | | Goldman
Sachs
International | | RBC Capital
Markets Corp. | | Totals | |
Assets: | |
Forward foreign currency contracts | | $ | 206,570 | | | $ | 204,952 | | | $ | — | | | $ | 206,109 | | | $ | 205,226 | | | $ | 822,857 | | |
Total Assets | | $ | 206,570 | | | $ | 204,952 | | | $ | — | | | $ | 206,109 | | | $ | 205,226 | | | $ | 822,857 | | |
Forward foreign currency contracts | | $ | 1,731 | | | $ | — | | | $ | — | | | $ | — | | | $ | — | | | $ | 1,731 | | |
Total Liabilities | | $ | 1,731 | | | $ | — | | | $ | — | | | $ | — | | | $ | — | | | $ | 1,731 | | |
Net OTC derivative instruments by counterparty, at fair value | | $ | 204,839 | | | $ | 204,952 | | | $ | — | | | $ | 206,109 | | | $ | 205,226 | | | $ | 821,126 | | |
Total collateral pledged by the Portfolio/(Received from
counterparty) | | $ | — | | | $ | — | | | $ | — | | | $ | — | | | $ | — | | | $ | — | | |
Net Exposure(1) | | $ | 204,839 | | | $ | 204,952 | | | $ | — | | | $ | 206,109 | | | $ | 205,226 | | | $ | 821,126 | | |
(1) Positive net exposure represents amounts due from each respective counterparty. Negative exposure represents amounts due from the Portfolio. Please refer to Note 2 for additional details regarding counterparty credit risk and credit related contingent features.
See Accompanying Notes to Financial Statements
120
VY® INVESCO SUMMARY PORTFOLIO OF INVESTMENTS
EQUITY AND INCOME PORTFOLIO AS OF DECEMBER 31, 2016
Shares | |
| |
| | Value | | Percentage
of Net
Assets | |
COMMON STOCK: 64.5% | | | |
| | | | | Consumer Discretionary: 5.2% | |
| | 390,840 | | | | | | | Carnival Corp. | | $ | 20,347,131 | | | | 1.1 | | |
| | 245,378 | | | | | | | Comcast Corp. - Class A | | | 16,943,351 | | | | 1.0 | | |
| | 396,113 | | | | | | | General Motors Co. | | | 13,800,577 | | | | 0.8 | | |
| | 2,424,041 | | | | | | | Other Securities | | | 41,667,567 | | | | 2.3 | | |
| | | | | | | | | | 92,758,626 | | | | 5.2 | | |
| | | | | Consumer Staples: 2.8% | |
| | 302,614 | | | | | | | Mondelez
International, Inc. | | | 13,414,879 | | | | 0.8 | | |
| | 130,388 | | | | | | | Philip Morris
International, Inc. | | | 11,929,198 | | | | 0.7 | | |
| | 283,675 | | | | | | | Walgreens Boots
Alliance, Inc. | | | 23,476,943 | | | | 1.3 | | |
| | | | | | | | | | 48,821,020 | | | | 2.8 | | |
| | | | | Energy: 9.3% | |
| | 498,039 | | | | | | | Apache Corp. | | | 31,610,535 | | | | 1.8 | | |
| | 402,869 | | | | | | | Baker Hughes, Inc. | | | 26,174,399 | | | | 1.5 | | |
| | 588,345 | | | | | | | Canadian Natural
Resources Ltd. | | | 18,750,443 | | | | 1.0 | | |
| | 572,346 | | | | | | | Devon Energy Corp. | | | 26,139,042 | | | | 1.5 | | |
| | 124,650 | | | | | | | Exxon Mobil Corp. | | | 11,250,909 | | | | 0.6 | | |
| | 170,717 | | | | | | | Occidental
Petroleum Corp. | | | 12,160,172 | | | | 0.7 | | |
| | 929,287 | | | | | | | Royal Dutch Shell
PLC - Class A | | | 25,651,764 | | | | 1.4 | | |
| | 271,318 | | | | | | | Total S.A. | | | 13,916,516 | | | | 0.8 | | |
| | | | | | | | | | 165,653,780 | | | | 9.3 | | |
| | | | | Financials: 22.5% | |
| | 129,849 | | | | | | | Aon PLC | | | 14,482,059 | | | | 0.8 | | |
| | 2,149,409 | | | | | | | Bank of America Corp. | | | 47,501,939 | | | | 2.7 | | |
| | 342,878 | | | | | | | Charles Schwab Corp. | | | 13,533,395 | | | | 0.8 | | |
| | 993,614 | | | | | | | Citigroup, Inc. | | | 59,050,480 | | | | 3.3 | | |
| | 812,372 | | | | | | | Citizens Financial
Group, Inc. | | | 28,944,814 | | | | 1.6 | | |
| | 222,373 | | | | | | | Comerica, Inc. | | | 15,145,825 | | | | 0.9 | | |
| | 777,070 | | | | | | | Fifth Third Bancorp | | | 20,957,578 | | | | 1.2 | | |
| | 557,536 | | | | | | | First Horizon
National Corp. | | | 11,156,295 | | | | 0.6 | | |
| | 67,012 | | | | | | | Goldman Sachs
Group, Inc. | | | 16,046,023 | | | | 0.9 | | |
| | 585,964 | | | | | | | JPMorgan Chase & Co. | | | 50,562,834 | | | | 2.8 | | |
| | 830,934 | | | | | | | Morgan Stanley | | | 35,106,961 | | | | 2.0 | | |
| | 163,864 | | | | | | | Northern Trust Corp. | | | 14,592,089 | | | | 0.8 | | |
| | 193,633 | | | | | | | PNC Financial Services
Group, Inc. | | | 22,647,316 | | | | 1.3 | | |
| | 230,598 | | | | | | | State Street Corp. | | | 17,922,077 | | | | 1.0 | | |
| | 421,630 | | | | | | | Other Securities | | | 31,541,270 | | | | 1.8 | | |
| | | | | | | | | | 399,190,955 | | | | 22.5 | | |
Shares | |
| |
| | Value | | Percentage
of Net
Assets | |
| | | | | Health Care: 7.2% | |
| | 192,483 | | | | | | | Medtronic PLC | | $ | 13,710,564 | | | | 0.8 | | |
| | 379,322 | | | | | | | Merck & Co., Inc. | | | 22,330,686 | | | | 1.2 | | |
| | 177,057 | | | | | | | Novartis AG | | | 12,876,205 | | | | 0.7 | | |
| | 653,310 | | | | | | | Pfizer, Inc. | | | 21,219,509 | | | | 1.2 | | |
| | 145,564 | | | | | | | Sanofi | | | 11,771,099 | | | | 0.7 | | |
| | 598,778 | | | | | | | Other Securities | | | 45,901,411 | | | | 2.6 | | |
| | | | | | | | | | 127,809,474 | | | | 7.2 | | |
| | | | | Industrials: 5.1% | |
| | 167,149 | | | | | | | Caterpillar, Inc. | | | 15,501,398 | | | | 0.9 | | |
| | 408,880 | | | | | | | CSX Corp. | | | 14,691,058 | | | | 0.8 | | |
| | 97,522 | | | | | | | General Dynamics Corp. | | | 16,838,149 | | | | 1.0 | | |
| | 642,018 | | | | | | | General Electric Co. | | | 20,287,769 | | | | 1.1 | | |
| | 161,885 | | | | | | | Ingersoll-Rand PLC -
Class A | | | 12,147,850 | | | | 0.7 | | |
| | 255,351 | | | | | | | Other Securities | | | 10,517,908 | | | | 0.6 | | |
| | | | | | | | | | 89,984,132 | | | | 5.1 | | |
| | | | | Information Technology: 8.5% | |
| | 387,442 | | | | | | | Applied Materials, Inc. | | | 12,502,753 | | | | 0.7 | | |
| | 622,713 | | | | | | | Cisco Systems, Inc. | | | 18,818,387 | | | | 1.1 | | |
| | 105,819 | | | | @ | | | Citrix Systems, Inc. | | | 9,450,695 | | | | 0.5 | | |
| | 477,825 | | | | @ | | | eBay, Inc. | | | 14,186,624 | | | | 0.8 | | |
| | 377,903 | | | | | | | Intel Corp. | | | 13,706,542 | | | | 0.8 | | |
| | 566,703 | | | | | | | Juniper Networks, Inc. | | | 16,015,027 | | | | 0.9 | | |
| | 192,589 | | | | | | | Microsoft Corp. | | | 11,967,480 | | | | 0.7 | | |
| | 507,135 | | | | | | | Oracle Corp. | | | 19,499,341 | | | | 1.1 | | |
| | 281,644 | | | | | | | Qualcomm, Inc. | | | 18,363,189 | | | | 1.0 | | |
| | 361,715 | | | | | | | Other Securities | | | 16,034,006 | | | | 0.9 | | |
| | | | | | | | | | 150,544,044 | | | | 8.5 | | |
| | | | | Materials: 1.9% | |
| | 580,145 | | | | | | | Mosaic Co. | | | 17,015,653 | | | | 0.9 | | |
| | 583,918 | | | | | | | Other Securities(a) | | | 17,514,714 | | | | 1.0 | | |
| | | | | | | | | | 34,530,367 | | | | 1.9 | | |
| | | | | Telecommunication Services: 1.2% | |
| | 183,129 | | | | | | | Verizon
Communications, Inc. | | | 9,775,426 | | | | 0.6 | | |
| | 511,607 | | | | | | | Other Securities | | | 10,827,106 | | | | 0.6 | | |
| | | | | | | | | | 20,602,532 | | | | 1.2 | | |
| | | | | Utilities: 0.8% | |
| | 340,256 | | | | | | | Other Securities | | | 15,011,602 | | | | 0.8 | | |
| | | | | | | Total Common Stock
(Cost $983,221,429) | | | 1,144,906,532 | | | | 64.5 | | |
PREFERRED STOCK: 1.1% | | | |
| | | | | Energy: 0.4% | |
| | 140,612 | | | | | | | Other Securities | | | 6,925,141 | | | | 0.4 | | |
See Accompanying Notes to Financial Statements
121
VY® INVESCO SUMMARY PORTFOLIO OF INVESTMENTS
EQUITY AND INCOME PORTFOLIO AS OF DECEMBER 31, 2016 (CONTINUED)
Shares | |
| |
| | Value | | Percentage
of Net
Assets | |
| | | | | Financials: 0.7% | |
| | 137,999 | | | | | | | Other Securities | | $ | 12,106,970 | | | | 0.7 | | |
| | | | | | | Total Preferred Stock
(Cost $17,144,943) | | | 19,032,111 | | | | 1.1 | | |
Principal
Amount† | |
| | | | Value | | Percentage
of Net
Assets | |
CORPORATE BONDS/NOTES: 17.7% | | | |
| | | | | Basic Materials: 0.2% | |
| | 770,000 | | | | # | | | Montell Finance Co. BV,
8.100%, 03/15/27 | | $ | 1,008,549 | | | | 0.1 | | |
| | 2,315,000 | | | | | | | Other Securities | | | 2,442,201 | | | | 0.1 | | |
| | | | | | | | | | 3,450,750 | | | | 0.2 | | |
| | | | | Communications: 3.3% | |
| | 1,210,000 | | | | # | | | Cox Communications,
Inc., 8.375%, 03/01/39 | | | 1,511,111 | | | | 0.1 | | |
| | 2,700,000 | | | | # | | | Crown Castle Towers,
LLC, 4.883%, 08/15/40 | | | 2,877,633 | | | | 0.2 | | |
| | 435,000 | | | | # | | | Crown Castle Towers,
LLC, 6.113%, 01/15/40 | | | 471,667 | | | | 0.0 | | |
| | 3,989,000 | | | | # | | | Ctrip.com International
Ltd., 1.250%, 09/15/22 | | | 3,859,358 | | | | 0.2 | | |
| | 4,731,000 | | | | # | | | DISH Network Corp.,
3.375%, 08/15/26 | | | 5,408,125 | | | | 0.3 | | |
| | 1,319,000 | | | | # | | | Finisar Corp.,
0.500%, 12/15/36 | | | 1,333,014 | | | | 0.1 | | |
| | 2,954,000 | | | | # | | | Liberty Interactive LLC,
1.750%, 09/30/46 | | | 3,190,320 | | | | 0.2 | | |
| | 9,559,000 | | | | | | | Liberty Media Corp.,
1.375%, 10/15/23 | | | 10,311,771 | | | | 0.6 | | |
| | 1,933,000 | | | | # | | | Liberty Media Corp.,
2.250%, 09/30/46 | | | 2,046,564 | | | | 0.1 | | |
| | 2,941,000 | | | | | | | Verizon
Communications, Inc.,
4.125%-5.150%,
09/15/23-08/21/54 | | | 2,960,021 | | | | 0.2 | | |
| | 22,704,000 | | | | | | | Other Securities(a) | | | 23,756,820 | | | | 1.3 | | |
| | | | | | | | | | 57,726,404 | | | | 3.3 | | |
| | | | | Consumer, Cyclical: 1.2% | |
| | 1,120,333 | | | | # | | | Virgin Australia 2013-1A
Trust,
5.000%, 04/23/25 | | | 1,172,148 | | | | 0.1 | | |
| | 2,126,000 | | | | | | | Walgreens Boots
Alliance, Inc.,
3.100%-4.500%,
11/18/21-11/18/34 | | | 2,148,215 | | | | 0.1 | | |
| | 17,690,278 | | | | | | | Other Securities | | | 17,847,034 | | | | 1.0 | | |
| | | | | | | | | | 21,167,397 | | | | 1.2 | | |
| | | | | Consumer, Non-cyclical: 3.2% | |
| | 981,000 | | | | # | | | Bayer US Finance LLC,
3.000%, 10/08/21 | | | 986,109 | | | | 0.0 | | |
Principal
Amount† | | | | | | Value | | Percentage
of Net
Assets | |
| | 965,000 | | | | # | | | ERAC USA Finance
LLC, 2.350%, 10/15/19 | | $ | 964,328 | | | | 0.0 | | |
| | 1,251,000 | | | | # | | | Medicines Co.,
2.750%, 07/15/23 | | | 1,209,561 | | | | 0.1 | | |
| | 574,000 | | | | # | | | Mylan NV,
3.150%, 06/15/21 | | | 563,400 | | | | 0.0 | | |
| | 785,000 | | | | # | | | Mylan NV,
5.250%, 06/15/46 | | | 725,306 | | | | 0.1 | | |
| | 2,762,000 | | | | # | | | NuVasive, Inc.,
2.250%, 03/15/21 | | | 3,519,824 | | | | 0.2 | | |
| | 1,095,000 | | | | | | | Philip Morris
International, Inc.,
3.600%-4.875%,
11/15/23-11/15/43 | | | 1,168,137 | | | | 0.1 | | |
| | 1,309,000 | | | | # | | | Wright Medical Group
NV, 2.250%, 11/15/21 | | | 1,638,704 | | | | 0.1 | | |
| | 43,442,000 | | | | | | | Other Securities | | | 45,590,831 | | | | 2.6 | | |
| | | | | | | | | | 56,366,200 | | | | 3.2 | | |
| | | | | Energy: 1.5% | |
| | 1,298,000 | | | | # | | | Chesapeake
Energy Corp.,
5.500%, 09/15/26 | | | 1,411,575 | | | | 0.1 | | |
| | 2,490,000 | | | | # | | | Ensco Jersey Finance
Ltd., 3.000%, 01/31/24 | | | 2,546,025 | | | | 0.2 | | |
| | 136,000 | | | | # | | | Petroleos Mexicanos,
6.500%, 03/13/27 | | | 140,454 | | | | 0.0 | | |
| | 21,136,000 | | | | | | | Other Securities | | | 21,749,828 | | | | 1.2 | | |
| | | | | | | | | | 25,847,882 | | | | 1.5 | | |
| | | | | Financial: 5.1% | |
| | 440,000 | | | | # | | | Apollo Management
Holdings L.P.,
4.000%, 05/30/24 | | | 436,174 | | | | 0.0 | | |
| | 1,117,000 | | | | # | | | Apollo Management
Holdings L.P.,
4.400%, 05/27/26 | | | 1,111,259 | | | | 0.1 | | |
| | 927,000 | | | | # | | | Athene Global Funding,
2.875%, 10/23/18 | | | 926,718 | | | | 0.1 | | |
| | 725,000 | | | | # | | | BBVA Bancomer SA/
Texas,
4.375%, 04/10/24 | | | 732,250 | | | | 0.1 | | |
| | 4,217,000 | | | | # | | | Blackhawk Network
Holdings, Inc.,
1.500%, 01/15/22 | | | 4,343,510 | | | | 0.3 | | |
| | 595,000 | | | | | | | Citizens Financial
Group, Inc.,
2.375%, 07/28/21 | | | 583,572 | | | | 0.0 | | |
| | 472,000 | | | | # | | | Credit Suisse AG,
6.500%, 08/08/23 | | | 503,303 | | | | 0.0 | | |
| | 1,540,000 | | | | # | | | Farmers Exchange
Capital III,
5.454%, 10/15/54 | | | 1,499,744 | | | | 0.1 | | |
| | 4,179,000 | | | | # | | | Goldman Sachs Group,
Inc., 1.000%, 09/28/20 | | | 5,364,917 | | | | 0.3 | | |
| | 1,175,000 | | | | | | | Goldman Sachs Group,
Inc., 4.250%-5.250%,
07/27/21-10/21/25 | | | 1,222,532 | | | | 0.1 | | |
See Accompanying Notes to Financial Statements
122
VY® INVESCO SUMMARY PORTFOLIO OF INVESTMENTS
EQUITY AND INCOME PORTFOLIO AS OF DECEMBER 31, 2016 (CONTINUED)
Principal
Amount† | | | | | | Value | | Percentage
of Net
Assets | |
| | | | | Financial (continued) | |
| | 465,000 | | | | # | | | HBOS PLC,
6.750%, 05/21/18 | | $ | 491,388 | | | | 0.0 | | |
| | 670,000 | | | | # | | | Jackson National Life
Global Funding,
2.100%, 10/25/21 | | | 653,618 | | | | 0.0 | | |
| | 2,850,000 | | | | | | | JPMorgan Chase & Co.,
3.200%-5.300%,
06/15/26-12/29/49 | | | 2,877,600 | | | | 0.2 | | |
| | 443,000 | | | | # | | | KKR Group Finance
Co. III LLC,
5.125%, 06/01/44 | | | 418,418 | | | | 0.0 | | |
| | 2,335,000 | | | | # | | | Liberty Mutual Group,
Inc., 4.850%, 08/01/44 | | | 2,314,924 | | | | 0.1 | | |
| | 1,300,000 | | | | # | | | MassMutual Global
Funding II,
2.000%, 04/15/21 | | | 1,266,920 | | | | 0.1 | | |
| | 3,250,000 | | | | # | | | MassMutual Global
Funding II,
2.100%, 08/02/18 | | | 3,278,399 | | | | 0.2 | | |
| | 2,360,000 | | | | # | | | Mizuho Financial Group
Cayman 3 Ltd.,
4.600%, 03/27/24 | | | 2,474,264 | | | | 0.1 | | |
| | 4,015,000 | | | | | | | Morgan Stanley,
2.375%-4.000%,
07/23/19-07/23/25 | | | 4,050,538 | | | | 0.2 | | |
| | 1,515,000 | | | | # | | | Nationwide Financial
Services, Inc.,
5.300%, 11/18/44 | | | 1,580,574 | | | | 0.1 | | |
| | 1,305,000 | | | | # | | | Nordea Bank AB,
2.250%, 05/27/21 | | | 1,284,196 | | | | 0.1 | | |
| | 690,000 | | | | # | | | Reliance Standard Life
Global Funding II,
3.050%, 01/20/21 | | | 695,325 | | | | 0.0 | | |
| | 1,360,000 | | | | # | | | Societe Generale SA,
2.625%, 09/16/20 | | | 1,360,387 | | | | 0.1 | | |
| | 805,000 | | | | # | | | Societe Generale SA,
5.000%, 01/17/24 | | | 817,757 | | | | 0.0 | | |
| | 660,000 | | | | # | | | Spirit Realty L.P.,
4.450%, 09/15/26 | | | 622,274 | | | | 0.0 | | |
| | 985,000 | | | | # | | | Standard Chartered PLC,
3.050%, 01/15/21 | | | 985,146 | | | | 0.1 | | |
| | 585,000 | | | | # | | | UBS Group Funding
Jersey Ltd.,
4.125%, 04/15/26 | | | 598,603 | | | | 0.0 | | |
| | 47,012,000 | | | | | | | Other Securities | | | 48,549,645 | | | | 2.7 | | |
| | | | | | | | | | 91,043,955 | | | | 5.1 | | |
| | | | | Industrial: 0.8% | |
| | 1,105,000 | | | | # | | | Aviation Capital
Group Corp.,
2.875%, 09/17/18 | | | 1,120,193 | | | | 0.0 | | |
| | 1,095,000 | | | | # | | | Aviation Capital
Group Corp.,
4.875%, 10/01/25 | | | 1,162,069 | | | | 0.1 | | |
| | 435,000 | | | | # | | | BAE Systems Holdings,
Inc., 2.850%, 12/15/20 | | | 435,693 | | | | 0.0 | | |
Principal
Amount† | | | | | | Value | | Percentage
of Net
Assets | |
| | 410,000 | | | | # | | | SMBC Aviation Capital
Finance DAC,
2.650%, 07/15/21 | | $ | 394,754 | | | | 0.0 | | |
| | 11,749,000 | | | | | | | Other Securities | | | 11,755,757 | | | | 0.7 | | |
| | | | | | | | | | 14,868,466 | | | | 0.8 | | |
| | | | | Technology: 2.3% | |
| | 6,052,000 | | | | | | | Citrix Systems, Inc.,
0.500%, 04/15/19 | | | 7,035,450 | | | | 0.4 | | |
| | 910,000 | | | | # | | | Diamond 1 Finance
Corp. / Diamond 2
Finance Corp.,
5.450%, 06/15/23 | | | 965,569 | | | | 0.0 | | |
| | 35,000 | | | | # | | | Diamond 1 Finance
Corp. / Diamond 2
Finance Corp.,
8.350%, 07/15/46 | | | 43,163 | | | | 0.0 | | |
| | 29,951,000 | | | | | | | Other Securities(a) | | | 33,327,671 | | | | 1.9 | | |
| | | | | | | | | | 41,371,853 | | | | 2.3 | | |
| | | | | Utilities: 0.1% | |
| | 150,000 | | | | # | | | Electricite de France
SA, 4.600%, 01/27/20 | | | 159,113 | | | | 0.0 | | |
| | 620,000 | | | | # | | | Electricite de France
SA, 4.875%, 01/22/44 | | | 621,456 | | | | 0.1 | | |
| | 350,000 | | | | # | | | Electricite de France
SA, 5.625%, 12/29/49 | | | 332,938 | | | | 0.0 | | |
| | 605,000 | | | | | | | Other Securities | | | 599,382 | | | | 0.0 | | |
| | | | | | | | | | 1,712,889 | | | | 0.1 | | |
| | | | | | | Total Corporate
Bonds/Notes
(Cost $305,758,125) | | | 313,555,796 | | | | 17.7 | | |
MUNICIPAL BONDS: 0.1% | | | |
| | | | | Georgia: 0.1% | |
| | 500,000 | | | | | | | Other Securities | | | 609,856 | | | | 0.1 | | |
| | | | | | | Total Municipal Bonds
(Cost $503,958) | | | 609,856 | | | | 0.1 | | |
U.S. TREASURY OBLIGATIONS: 9.4% | | | |
| | | | | U.S. Treasury Bonds: 0.7% | |
| | 14,368,200 | | | | L | | | 2.000%-2.250%,
due 11/15/26-08/15/46 | | | 12,316,811 | | | | 0.7 | | |
| | | | | U.S. Treasury Notes: 8.7% | |
| | 57,470,000 | | | | L | | | 1.000%, due 11/30/18 | | | 57,280,809 | | | | 3.2 | | |
| | 57,650,000 | | | | | | | 1.375%, due 12/15/19 | | | 57,485,352 | | | | 3.3 | | |
| | 36,360,000 | | | | L | | | 1.750%, due 11/30/21 | | | 36,057,557 | | | | 2.0 | | |
| | 4,029,000 | | | | | | | 2.125%-2.625%,
due 11/15/20-11/30/23 | | | 4,005,209 | | | | 0.2 | | |
| | | | | | | | | | 154,828,927 | | | | 8.7 | | |
| | | | | | | Total U.S. Treasury
Obligations
(Cost $167,422,730) | | | 167,145,738 | | | | 9.4 | | |
See Accompanying Notes to Financial Statements
123
VY® INVESCO SUMMARY PORTFOLIO OF INVESTMENTS
EQUITY AND INCOME PORTFOLIO AS OF DECEMBER 31, 2016 (CONTINUED)
Principal
Amount† | | | | | | Value | | Percentage
of Net
Assets | |
U.S. GOVERNMENT AGENCY OBLIGATIONS: 0.2% | | | |
| | | | | Federal Home Loan Mortgage Corporation##: 0.1% | |
| | 2,400,000 | | | | | | | Other Securities | | $ | 2,527,848 | | | | 0.1 | | |
| | | | | Federal National Mortgage Association##: 0.1% | |
| | 915,000 | | | | | | | Other Securities | | | 1,272,433 | | | | 0.1 | | |
| | | | | | | Total U.S. Government
Agency Obligations
(Cost $3,478,972) | | | 3,800,281 | | | | 0.2 | | |
| | | | | | | Total Long-Term
Investments
(Cost $1,477,530,157) | | | 1,649,050,314 | | | | 93.0 | | |
SHORT-TERM INVESTMENTS: 13.8% | | | |
| | | | | Corporate Bonds/Notes: 3.1% | |
| | 1,455,000 | | | | | | | Actavis Funding SCS,
1.850%, 03/01/17 | | | 1,456,470 | | | | 0.1 | | |
| | 400,000 | | | | | | | Bank of America Corp.,
5.750%, 12/01/17 | | | 414,406 | | | | 0.0 | | |
| | 365,000 | | | | | | | British
Telecommunications
PLC, 1.250%, 02/14/17 | | | 365,028 | | | | 0.0 | | |
| | 3,000,000 | | | | | | | Caterpillar Financial
Services Corp.,
1.750%, 03/24/17 | | | 3,004,980 | | | | 0.2 | | |
| | 775,000 | | | | | | | Cintas Corp. No 2,
6.125%, 12/01/17 | | | 806,677 | | | | 0.0 | | |
| | 3,260,000 | | | | | | | Eaton Corp.,
1.500%, 11/02/17 | | | 3,263,192 | | | | 0.2 | | |
| | 1,845,000 | | | | | | | Ford Motor Credit Co.
LLC, 1.724%, 12/06/17 | | | 1,843,906 | | | | 0.1 | | |
| | 3,900,000 | | | | | | | GlaxoSmithKline Capital
PLC, 1.500%, 05/08/17 | | | 3,905,869 | | | | 0.2 | | |
| | 4,011,000 | | | | # | | | Goldman Sachs Group,
Inc., 1.000%, 03/15/17 | | | 7,169,983 | | | | 0.4 | | |
| | 3,490,000 | | | | | | | Intel Corp.,
1.350%, 12/15/17 | | | 3,495,507 | | | | 0.2 | | |
| | 285,000 | | | | | | | Interpublic Group of
Cos., Inc.,
2.250%, 11/15/17 | | | 286,814 | | | | 0.0 | | |
| | 2,000,000 | | | | | | | Kellogg Co.,
1.750%, 05/17/17 | | | 2,004,828 | | | | 0.1 | | |
| | 1,644,000 | | | | | | | Kraft Heinz Foods Co.,
1.600%, 06/30/17 | | | 1,645,478 | | | | 0.1 | | |
| | 1,040,000 | | | | | | | Kraft Heinz Foods Co.,
2.250%, 06/05/17 | | | 1,043,398 | | | | 0.1 | | |
| | 510,000 | | | | # | | | Macquarie Bank Ltd.,
5.000%, 02/22/17 | | | 512,562 | | | | 0.0 | | |
| | 3,060,000 | | | | | | | MGIC Investment Corp.,
5.000%, 05/01/17 | | | 3,130,762 | | | | 0.2 | | |
| | 3,250,000 | | | | | | | National Rural Utilities
Cooperative
Finance Corp.,
0.950%, 04/24/17 | | | 3,247,579 | | | | 0.2 | | |
| | 3,930,000 | | | | # | | | New York Life Global
Funding,
1.650%, 05/15/17 | | | 3,939,546 | | | | 0.2 | | |
Principal
Amount† | | | | | | Value | | Percentage
of Net
Assets | |
| | 130,000 | | | | | | | Noble Holding
International Ltd.,
2.500%, 03/15/17 | | $ | 130,162 | | | | 0.0 | | |
| | 328,000 | | | | | | | Philip Morris
International, Inc.,
1.250%, 08/11/17 | | | 328,239 | | | | 0.0 | | |
| | 1,835,000 | | | | | | | Philip Morris
International, Inc.,
1.625%, 03/20/17 | | | 1,835,081 | | | | 0.1 | | |
| | 1,995,000 | | | | | | | Prudential Financial,
Inc., 6.000%, 12/01/17 | | | 2,073,036 | | | | 0.1 | | |
| | 1,744,000 | | | | | | | Radian Group, Inc.,
3.000%, 11/15/17 | | | 2,674,860 | | | | 0.2 | | |
| | 3,630,000 | | | | # | | | Roche Holdings, Inc.,
1.350%, 09/29/17 | | | 3,636,538 | | | | 0.2 | | |
| | 3,245,000 | | | | | | | Vodafone Group PLC,
1.625%, 03/20/17 | | | 3,245,808 | | | | 0.2 | | |
| | 135,000 | | | | | | | Wyndham
Worldwide Corp.,
2.950%, 03/01/17 | | | 135,138 | | | | 0.0 | | |
| | | | | | | | | | 55,595,847 | | | | 3.1 | | |
| | | | | Securities Lending Collateralcc: 6.7% | |
| | 28,065,094 | | | | | | | Citigroup, Inc.,
Repurchase
Agreement dated
12/30/16, 0.53%, due
01/03/17 (Repurchase
Amount $28,066,724,
collateralized by
various U.S.
Government Agency
Obligations,
2.000%-8.500%,
Market Value plus
accrued interest
$28,626,396, due
12/01/17-01/01/47) | | | 28,065,094 | | | | 1.6 | | |
| | 5,906,573 | | | | | | | Merrill Lynch & Co., Inc.,
Repurchase
Agreement dated
12/30/16, 0.50%, due
01/03/17 (Repurchase
Amount $5,906,897,
collateralized by
various U.S.
Government Securities,
0.685%-2.000%,
Market Value plus
accrued interest
$6,024,705, due
10/31/18-11/30/22) | | | 5,906,573 | | | | 0.3 | | |
See Accompanying Notes to Financial Statements
124
VY® INVESCO SUMMARY PORTFOLIO OF INVESTMENTS
EQUITY AND INCOME PORTFOLIO AS OF DECEMBER 31, 2016 (CONTINUED)
Principal
Amount† | | | | | | Value | | Percentage
of Net
Assets | |
| | | | | Securities Lending Collateralcc (continued) | |
| | 28,065,094 | | | | | | | Nomura Securities,
Repurchase
Agreement dated
12/30/16, 0.50%, due
01/03/17 (Repurchase
Amount $28,066,632,
collateralized by
various U.S.
Government/U.S.
Government Agency
Obligations,
0.000%-9.500%,
Market Value plus
accrued interest
$28,626,397, due
01/15/17-08/20/66) | | $ | 28,065,094 | | | | 1.6 | | |
| | 28,065,094 | | | | | | | RBC Dominion
Securities Inc.,
Repurchase
Agreement dated
12/30/16, 0.52%, due
01/03/17 (Repurchase
Amount $28,066,693,
collateralized by
various U.S.
Government Agency
Obligations,
0.875%-7.000%,
Market Value plus
accrued interest
$28,626,396, due
02/13/17-01/01/47) | | | 28,065,094 | | | | 1.6 | | |
| | 28,065,094 | | | | | | | State of Wisconsin
Investment Board,
Repurchase
Agreement dated
12/30/16, 0.65%, due
01/03/17 (Repurchase
Amount $28,067,093,
collateralized by
various U.S.
Government Securities,
0.125%-3.875%,
Market Value plus
accrued interest
$28,778,201, due
04/15/18-02/15/46) | | | 28,065,094 | | | | 1.6 | | |
| | | | | | | | | | 118,166,949 | | | | 6.7 | | |
| | | | | U.S. Treasury Notes: 0.0% | |
| | 120,000 | | | | | | | United States
Treasury Note,
0.875%, 04/30/17
(Cost $120,056) | | | 120,143 | | | | 0.0 | | |
Shares | |
| |
| | Value | | Percentage
of Net
Assets | |
| | | | | Mutual Funds: 4.0% | |
| | 71,747,761 | | | | | | | BlackRock Liquidity
Funds, FedFund,
Institutional Class,
0.420%††
(Cost $71,747,761) | | $ | 71,747,761 | | | | 4.0 | | |
| | | | | Total Short-Term
Investments
(Cost $242,031,419) | | | 245,630,700 | | | | 13.8 | | |
| | | | | Total Investments in
Securities
(Cost $1,719,561,576) | | $ | 1,894,681,014 | | | | 106.8 | | |
| | | | | Liabilities in Excess of
Other Assets | | | (121,134,858 | ) | | | (6.8 | ) | |
| | | | | Net Assets | | $ | 1,773,546,156 | | | | 100.0 | | |
"Other Securities" represents issues not identified as the top 50 holdings in terms of market value and issues or issuers not exceeding 1% of net assets individually or in aggregate respectively as of December 31, 2016.
The following footnotes apply to either the individual securities noted or one or more of the securities aggregated and listed as a single line item.
† Unless otherwise indicated, principal amount is shown in USD.
†† Rate shown is the 7-day yield as of December 31, 2016.
# Securities with purchases pursuant to Rule 144A or section 4(a)(2), under the Securities Act of 1933 and may not be resold subject to that rule except to qualified institutional buyers.
## The Federal Housing Finance Agency ("FHFA") placed the Federal Home Loan Mortgage Corporation and Federal National Mortgage Association into conservatorship with FHFA as the conservator. As such, the FHFA oversees the continuing affairs of these companies.
@ Non-income producing security.
cc Represents securities purchased with cash collateral received for securities on loan.
L Loaned security, a portion or all of the security is on loan at December 31, 2016.
(a) This grouping contains securities on loan.
Cost for federal income tax purposes is $1,726,884,535.
Net unrealized appreciation consists of: | |
Gross Unrealized Appreciation | | $ | 212,681,882 | | |
Gross Unrealized Depreciation | | | (44,885,403 | ) | |
Net Unrealized Appreciation | | $ | 167,796,479 | | |
See Accompanying Notes to Financial Statements
125
VY® INVESCO SUMMARY PORTFOLIO OF INVESTMENTS
EQUITY AND INCOME PORTFOLIO AS OF DECEMBER 31, 2016 (CONTINUED)
Fair Value Measurements^
The following is a summary of the fair valuations according to the inputs used as of December 31, 2016 in valuing the assets and liabilities:
| | | Quoted Prices
in Active Markets
for Identical Investments
(Level 1) | | Significant Other
Observable
Inputs#
(Level 2) | | Significant
Unobservable
Inputs
(Level 3) | | Fair Value
at
December 31, 2016 | |
Asset Table | |
Investments, at fair value | |
Common Stock | |
Consumer Discretionary | | $ | 84,065,076 | | | $ | 8,693,550 | | | $ | — | | | $ | 92,758,626 | | |
Consumer Staples | | | 48,821,020 | | | | — | | | | — | | | | 48,821,020 | | |
Energy | | | 126,085,500 | | | | 39,568,280 | | | | — | | | | 165,653,780 | | |
Financials | | | 399,190,955 | | | | — | | | | — | | | | 399,190,955 | | |
Health Care | | | 103,162,170 | | | | 24,647,304 | | | | — | | | | 127,809,474 | | |
Industrials | | | 89,984,132 | | | | — | | | | — | | | | 89,984,132 | | |
Information Technology | | | 150,544,044 | | | | — | | | | — | | | | 150,544,044 | | |
Materials | | | 25,598,802 | | | | 8,931,565 | | | | — | | | | 34,530,367 | | |
Telecommunication Services | | | 17,867,155 | | | | 2,735,377 | | | | — | | | | 20,602,532 | | |
Utilities | | | 15,011,602 | | | | — | | | | — | | | | 15,011,602 | | |
Total Common Stock | | | 1,060,330,456 | | | | 84,576,076 | | | | — | | | | 1,144,906,532 | | |
Preferred Stock | | | 100,960 | | | | 18,931,151 | | | | — | | | | 19,032,111 | | |
Corporate Bonds/Notes | | | — | | | | 313,555,796 | | | | — | | | | 313,555,796 | | |
Municipal Bonds | | | — | | | | 609,856 | | | | — | | | | 609,856 | | |
Short-Term Investments | | | 71,747,761 | | | | 173,882,939 | | | | — | | | | 245,630,700 | | |
U.S. Treasury Obligations | | | — | | | | 167,145,738 | | | | — | | | | 167,145,738 | | |
U.S. Government Agency Obligations | | | — | | | | 3,800,281 | | | | — | | | | 3,800,281 | | |
Total Investments, at fair value | | $ | 1,132,179,177 | | | $ | 762,501,837 | | | $ | — | | | $ | 1,894,681,014 | | |
Other Financial Instruments+ | |
Forward Foreign Currency Contracts | | | — | | | | 1,883,232 | | | | — | | | | 1,883,232 | | |
Total Assets | | $ | 1,132,179,177 | | | $ | 764,385,069 | | | $ | — | | | $ | 1,896,564,246 | | |
^ See Note 2, "Significant Accounting Policies" in the Notes to Financial Statements for additional information.
+ Other Financial Instruments are derivatives not reflected in the Portfolio of Investments and may include open forward foreign currency contracts, futures, centrally cleared swaps, OTC swaps and written options. Forward foreign currency contracts, futures and centrally cleared swaps are valued at the unrealized gain (loss) on the instrument. OTC swaps and written options are valued at the fair value of the instrument.
# The earlier close of the foreign markets gives rise to the possibility that significant events, including broad market moves, may have occurred in the interim and may materially affect the value of those securities. To account for this, the Portfolio may frequently value many of its foreign equity securities using fair value prices based on third party vendor modeling tools to the extent available. Accordingly, a portion of the Portfolio's investments are categorized as Level 2 investments.
At December 31, 2016, the following forward foreign currency contracts were outstanding for VY® Invesco Equity and Income Portfolio:
Counterparty | | Currency | | Contract
Amount | | Buy/Sell | | Settlement
Date | | In Exchange
For | | Fair
Value | | Unrealized
Appreciation
(Depreciation) | |
The Bank of New York Mellon | | British Pound | | | 12,423,966 | | | Sell | | 01/20/17 | | $ | 15,779,431 | | | $ | 15,318,986 | | | $ | 460,445 | | |
The Bank of New York Mellon | | EU Euro | | | 10,449,187 | | | Sell | | 01/20/17 | | | 11,142,699 | | | | 11,009,628 | | | | 133,071 | | |
The Bank of New York Mellon | | Canadian Dollar | | | 9,764,121 | | | Sell | | 01/20/17 | | | 7,445,684 | | | | 7,273,842 | | | | 171,842 | | |
The Bank of New York Mellon | | Swiss Franc | | | 4,662,406 | | | Sell | | 01/20/17 | | | 4,623,293 | | | | 4,584,516 | | | | 38,777 | | |
The Bank of New York Mellon | | Australian Dollar | | | 4,923,058 | | | Sell | | 01/20/17 | | | 3,689,782 | | | | 3,551,078 | | | | 138,704 | | |
State Street Bank and Trust Co. | | Australian Dollar | | | 4,918,438 | | | Sell | | 01/20/17 | | | 3,687,303 | | | | 3,547,745 | | | | 139,558 | | |
State Street Bank and Trust Co. | | Canadian Dollar | | | 9,765,993 | | | Sell | | 01/20/17 | | | 7,445,692 | | | | 7,275,236 | | | | 170,456 | | |
State Street Bank and Trust Co. | | EU Euro | | | 10,463,046 | | | Sell | | 01/20/17 | | | 11,158,001 | | | | 11,024,230 | | | | 133,771 | | |
State Street Bank and Trust Co. | | British Pound | | | 12,425,737 | | | Sell | | 01/20/17 | | | 15,780,376 | | | | 15,321,170 | | | | 459,206 | | |
State Street Bank and Trust Co. | | Swiss Franc | | | 4,659,646 | | | Sell | | 01/20/17 | | | 4,619,205 | | | | 4,581,803 | | | | 37,402 | | |
| | | | | | | | | | | | | | | $ | 1,883,232 | | |
See Accompanying Notes to Financial Statements
126
VY® INVESCO SUMMARY PORTFOLIO OF INVESTMENTS
EQUITY AND INCOME PORTFOLIO AS OF DECEMBER 31, 2016 (CONTINUED)
A summary of derivative instruments by primary risk exposure is outlined in the following tables.
The fair value of derivative instruments as of December 31, 2016 was as follows:
Derivatives not accounted
for as hedging instruments | | Location on Statement of Assets and Liabilities | | Fair Value | |
Asset Derivatives | |
Foreign exchange contracts | | Unrealized appreciation on forward foreign currency contracts | | $ | 1,883,232 | | |
Total Asset Derivatives | | | | $ | 1,883,232 | | |
The effect of derivative instruments on the Portfolio's Statement of Operations for the year ended December 31, 2016 was as follows:
| | | Amount of Realized Gain or (Loss) on Derivatives Recognized in Income | |
Derivatives not accounted
for as hedging instruments | | Foreign currency related transactions* | |
Foreign exchange contracts | | $ | 6,297,911 | | |
Total | | $ | 6,297,911 | | |
| | | Change in Unrealized Appreciation or (Depreciation) on Derivatives Recognized in Income | |
Derivatives not accounted
for as hedging instruments | | Foreign currency related transactions* | |
Foreign exchange contracts | | $ | 913,016 | | |
Total | | $ | 913,016 | | |
* Amounts recognized for forward foreign currency contracts are included in net realized gain (loss) on foreign currency related transactions and net change in unrealized appreciation or depreciation on foreign currency related transactions.
The following is a summary by counterparty of the fair value of OTC derivative instruments subject to Master Netting Agreements and collateral pledged (received), if any, at December 31, 2016:
| | | State Street Bank
and Trust Co. | | The Bank of
New York Mellon | | Totals | |
Assets: | |
Forward foreign currency contracts | | $ | 940,393 | | | $ | 942,839 | | | $ | 1,883,232 | | |
Total Assets | | $ | 940,393 | | | $ | 942,839 | | | $ | 1,883,232 | | |
Net OTC derivative instruments by counterparty, at fair value | | $ | 940,393 | | | $ | 942,839 | | | $ | 1,883,232 | | |
Total collateral pledged by the Portfolio/(Received from counterparty) | | $ | — | | | $ | — | | | $ | — | | |
Net Exposure(1) | | $ | 940,393 | | | $ | 942,839 | | | $ | 1,883,232 | | |
(1) Positive net exposure represents amounts due from each respective counterparty. Negative exposure represents amounts due from the Portfolio. Please refer to Note 2 for additional details regarding counterparty credit risk and credit related contingent features.
See Accompanying Notes to Financial Statements
127
VY® JPMORGAN SUMMARY PORTFOLIO OF INVESTMENTS
MID CAP VALUE PORTFOLIO AS OF DECEMBER 31, 2016
Shares | |
| |
| | Value | | Percentage
of Net
Assets | |
COMMON STOCK: 98.0% | | | |
| | | | | Consumer Discretionary: 17.2% | |
| | 7,580 | | | | @ | | | Autozone, Inc. | | $ | 5,986,608 | | | | 1.0 | | |
| | 113,630 | | | | @ | | | Dish Network Corp. -
Class A | | | 6,582,586 | | | | 1.1 | | |
| | 72,040 | | | | | | | Expedia, Inc. | | | 8,160,691 | | | | 1.4 | | |
| | 294,690 | | | | | | | Hilton Worldwide
Holdings, Inc. | | | 8,015,568 | | | | 1.3 | | |
| | 127,050 | | | | | | | Kohl's Corp. | | | 6,273,729 | | | | 1.0 | | |
| | 53,040 | | | | @ | | | Mohawk Industries, Inc. | | | 10,591,027 | | | | 1.7 | | |
| | 174,376 | | | | | | | Newell Brands, Inc. | | | 7,785,888 | | | | 1.3 | | |
| | 78,850 | | | | L | | | Tiffany & Co. | | | 6,105,356 | | | | 1.0 | | |
| | 974,395 | | | | | | | Other Securities(a) | | | 45,087,503 | | | | 7.4 | | |
| | | | | | | | | | 104,588,956 | | | | 17.2 | | |
| | | | | Consumer Staples: 6.4% | |
| | 80,690 | | | | | | | Dr Pepper Snapple
Group, Inc. | | | 7,316,162 | | | | 1.2 | | |
| | 235,700 | | | | | | | Kroger Co. | | | 8,134,007 | | | | 1.3 | | |
| | 715,166 | | | | | | | Other Securities | | | 23,583,286 | | | | 3.9 | | |
| | | | | | | | | | 39,033,455 | | | | 6.4 | | |
| | | | | Energy: 3.3% | |
| | 189,890 | | | | | | | EQT Corp. | | | 12,418,806 | | | | 2.0 | | |
| | 203,280 | | | | L | | | PBF Energy, Inc. | | | 5,667,446 | | | | 1.0 | | |
| | 177,300 | | | | | | | Other Securities | | | 1,918,386 | | | | 0.3 | | |
| | | | | | | | | | 20,004,638 | | | | 3.3 | | |
| | | | | Financials: 22.6% | |
| | 215,250 | | | | | | | Citizens Financial
Group, Inc. | | | 7,669,357 | | | | 1.3 | | |
| | 337,790 | | | | | | | Fifth Third Bancorp | | | 9,110,196 | | | | 1.5 | | |
| | 71,090 | | | | | | | First Republic Bank | | | 6,550,233 | | | | 1.1 | | |
| | 166,990 | | | | | | | Hartford Financial
Services Group, Inc. | | | 7,957,073 | | | | 1.3 | | |
| | 197,400 | | | | | | | Invesco Ltd. | | | 5,989,116 | | | | 1.0 | | |
| | 253,070 | | | | | | | Loews Corp. | | | 11,851,268 | | | | 1.9 | | |
| | 67,973 | | | | | | | M&T Bank Corp. | | | 10,633,016 | | | | 1.7 | | |
| | 101,450 | | | | | | | Marsh & McLennan
Cos., Inc. | | | 6,857,006 | | | | 1.1 | | |
| | 76,530 | | | | | | | Northern Trust Corp. | | | 6,814,997 | | | | 1.1 | | |
| | 83,860 | | | | | | | Raymond James
Financial, Inc. | | | 5,808,982 | | | | 0.9 | | |
| | 160,600 | | | | | | | SunTrust Banks, Inc. | | | 8,808,910 | | | | 1.4 | | |
| | 93,710 | | | | | | | T. Rowe Price Group, Inc. | | | 7,052,615 | | | | 1.2 | | |
| | 189,110 | | | | | | | XL Group Ltd. | | | 7,046,239 | | | | 1.2 | | |
| | 1,107,311 | | | | | | | Other Securities | | | 35,675,835 | | | | 5.9 | | |
| | | | | | | | | | 137,824,843 | | | | 22.6 | | |
| | | | | Health Care: 4.4% | |
| | 33,960 | | | | | | | Humana, Inc. | | | 6,928,859 | | | | 1.1 | | |
| | 179,470 | | | | | | | Other Securities | | | 19,842,591 | | | | 3.3 | | |
| | | | | | | | | | 26,771,450 | | | | 4.4 | | |
Shares | |
| |
| | Value | | Percentage
of Net
Assets | |
| | | | | Industrials: 8.7% | |
| | 134,810 | | | | | | | Ametek, Inc. | | $ | 6,551,766 | | | | 1.1 | | |
| | 65,820 | | | | | | | Carlisle Cos., Inc. | | | 7,259,288 | | | | 1.2 | | |
| | 55,960 | | | | | | | Hubbell, Inc. | | | 6,530,532 | | | | 1.1 | | |
| | 74,390 | | | | | | | IDEX Corp. | | | 6,699,564 | | | | 1.1 | | |
| | 67,560 | | | | | | | MSC Industrial Direct Co. | | | 6,241,868 | | | | 1.0 | | |
| | 44,401 | | | | | | | Snap-On, Inc. | | | 7,604,559 | | | | 1.2 | | |
| | 323,876 | | | | | | | Other Securities | | | 11,879,063 | | | | 2.0 | | |
| | | | | | | | | | 52,766,640 | | | | 8.7 | | |
| | | | | Information Technology: 9.8% | |
| | 109,120 | | | | | | | Amphenol Corp. | | | 7,332,864 | | | | 1.2 | | |
| | 120,210 | | | | @ | | | Arrow Electronics, Inc. | | | 8,570,973 | | | | 1.4 | | |
| | 111,730 | | | | | | | CDW Corp. | | | 5,820,016 | | | | 0.9 | | |
| | 87,686 | | | | | | | Jack Henry &
Associates, Inc. | | | 7,784,763 | | | | 1.3 | | |
| | 160,720 | | | | @ | | | Keysight Technologies, Inc. | | | 5,877,531 | | | | 1.0 | | |
| | 140,020 | | | | @ | | | Synopsys, Inc. | | | 8,241,577 | | | | 1.3 | | |
| | 384,736 | | | | | | | Other Securities(a) | | | 16,326,747 | | | | 2.7 | | |
| | | | | | | | | | 59,954,471 | | | | 9.8 | | |
| | | | | Materials: 4.1% | |
| | 97,370 | | | | | | | Ball Corp. | | | 7,309,566 | | | | 1.2 | | |
| | 167,970 | | | | | | | WestRock Co. | | | 8,527,837 | | | | 1.4 | | |
| | 124,315 | | | | | | | Other Securities | | | 9,403,930 | | | | 1.5 | | |
| | | | | | | | | | 25,241,333 | | | | 4.1 | | |
| | | | | Real Estate: 10.2% | |
| | 34,130 | | | | | | | AvalonBay
Communities, Inc. | | | 6,046,129 | | | | 1.0 | | |
| | 45,070 | | | | | | | Boston Properties, Inc. | | | 5,668,905 | | | | 0.9 | | |
| | 68,276 | | | | | | | Vornado Realty Trust | | | 7,125,966 | | | | 1.2 | | |
| | 1,369,132 | | | | | | | Other Securities | | | 43,156,347 | | | | 7.1 | | |
| | | | | | | | | | 61,997,347 | | | | 10.2 | | |
| | | | | Utilities: 11.3% | |
| | 252,800 | | | | | | | Centerpoint Energy, Inc. | | | 6,228,992 | | | | 1.0 | | |
| | 183,480 | | | | | | | CMS Energy Corp. | | | 7,636,438 | | | | 1.3 | | |
| | 112,040 | | | | | | | Edison International | | | 8,065,760 | | | | 1.3 | | |
| | 240,444 | | | | @ | | | Energen Corp. | | | 13,866,405 | | | | 2.3 | | |
| | 109,270 | | | | | | | National Fuel Gas Co. | | | 6,189,053 | | | | 1.0 | | |
| | 72,550 | | | | | | | Sempra Energy | | | 7,301,432 | | | | 1.2 | | |
| | 127,580 | | | | | | | WEC Energy Group, Inc. | | | 7,482,567 | | | | 1.2 | | |
| | 205,330 | | | | | | | Xcel Energy, Inc. | | | 8,356,931 | | | | 1.4 | | |
| | 66,420 | | | | | | | Other Securities | | | 3,742,767 | | | | 0.6 | | |
| | | | | | | | | | 68,870,345 | | | | 11.3 | | |
| | | | | | | Total Common Stock
(Cost $460,622,506) | | | 597,053,478 | | | | 98.0 | | |
See Accompanying Notes to Financial Statements
128
VY® JPMORGAN SUMMARY PORTFOLIO OF INVESTMENTS
MID CAP VALUE PORTFOLIO AS OF DECEMBER 31, 2016 (CONTINUED)
Principal
Amount† | |
| |
| |
Value | | Percentage
of Net
Assets | |
SHORT-TERM INVESTMENTS: 4.1% | | | |
| | | | | Securities Lending Collateralcc: 1.9% | |
| | 2,771,401 | | | | | | | Bank of Nova Scotia,
Repurchase Agreement
dated 12/30/16, 0.51%,
due 01/03/17
(Repurchase Amount
$2,771,556,
collateralized by various
U.S. Government/U.S.
Government Agency
Obligations,
1.000%-4.000%,
Market Value plus
accrued interest
$2,826,990, due
12/31/17-10/20/46) | | $ | 2,771,401 | | | | 0.5 | | |
| | 2,771,401 | | | | | | | Cantor Fitzgerald,
Repurchase Agreement
dated 12/30/16, 0.50%,
due 01/03/17
(Repurchase Amount
$2,771,553,
collateralized by various
U.S. Government/U.S.
Government Agency
Obligations,
0.000%-10.000%,
Market Value plus
accrued interest
$2,826,829, due
01/25/17-10/20/66) | | | 2,771,401 | | | | 0.4 | | |
| | 2,771,401 | | | | | | | Daiwa Capital Markets,
Repurchase Agreement
dated 12/30/16, 0.52%,
due 01/03/17
(Repurchase Amount
$2,771,559,
collateralized by various
U.S. Government/U.S.
Government Agency
Obligations,
0.000%-6.500%,
Market Value plus
accrued interest
$2,826,829, due
03/02/17-02/01/49) | | | 2,771,401 | | | | 0.4 | | |
| | 583,285 | | | | | | | Merrill Lynch & Co., Inc.,
Repurchase Agreement
dated 12/30/16, 0.50%,
due 01/03/17
(Repurchase Amount
$583,317, collateralized
by various U.S.
Government Securities,
0.685%-2.000%,
Market Value plus
accrued interest
$594,951, due
10/31/18-11/30/22) | | | 583,285 | | | | 0.1 | | |
Principal
Amount† | |
| |
| |
Value | | Percentage
of Net
Assets | |
| | 2,771,401 | | | | | | | Nomura Securities,
Repurchase Agreement
dated 12/30/16, 0.50%,
due 01/03/17
(Repurchase Amount
$2,771,553,
collateralized by various
U.S. Government/U.S.
Government Agency
Obligations,
0.000%-9.500%,
Market Value plus
accrued interest
$2,826,829,
due 01/15/17-08/20/66) | | $ | 2,771,401 | | | | 0.5 | | |
| | | | | | | | 11,668,889 | | | | 1.9 | | |
Shares | |
| |
| | Value | | Percentage
of Net
Assets | |
| | | | | Mutual Funds: 2.2% | |
| | 13,568,320 | | | | | | | BlackRock Liquidity Funds,
FedFund, Institutional
Class, 0.420%††
(Cost $13,568,320) | | $ | 13,568,320 | | | | 2.2 | | |
| | | | | Total Short-Term
Investments
(Cost $25,237,209) | | | 25,237,209 | | | | 4.1 | | |
| | | | | Total Investments in
Securities
(Cost $485,859,715) | | $ | 622,290,687 | | | | 102.1 | | |
| | | | | Liabilities in Excess of
Other Assets | | | (12,861,133 | ) | | | (2.1 | ) | |
| | | | | Net Assets | | $ | 609,429,554 | | | | 100.0 | | |
"Other Securities" represents issues not identified as the top 50 holdings in terms of market value and issues or issuers not exceeding 1% of net assets individually or in aggregate respectively as of December 31, 2016.
The following footnotes apply to either the individual securities noted or one or more of the securities aggregated and listed as a single line item.
† Unless otherwise indicated, principal amount is shown in USD.
†† Rate shown is the 7-day yield as of December 31, 2016.
@ Non-income producing security.
cc Represents securities purchased with cash collateral received for securities on loan.
L Loaned security, a portion or all of the security is on loan at December 31, 2016.
(a) This grouping contains securities on loan.
Cost for federal income tax purposes is $487,727,050.
Net unrealized appreciation consists of: | |
Gross Unrealized Appreciation | | $ | 152,270,460 | | |
Gross Unrealized Depreciation | | | (17,706,823 | ) | |
Net Unrealized Appreciation | | $ | 134,563,637 | | |
See Accompanying Notes to Financial Statements
129
VY® JPMORGAN SUMMARY PORTFOLIO OF INVESTMENTS
MID CAP VALUE PORTFOLIO AS OF DECEMBER 31, 2016 (CONTINUED)
Fair Value Measurements^
The following is a summary of the fair valuations according to the inputs used as of December 31, 2016 in valuing the assets and liabilities:
| | | Quoted Prices
in Active Markets
for Identical Investments
(Level 1) | | Significant Other
Observable
Inputs
(Level 2) | | Significant
Unobservable
Inputs
(Level 3) | | Fair Value
at
December 31, 2016 | |
Asset Table | |
Investments, at fair value | |
Common Stock* | | $ | 597,053,478 | | | $ | — | | | $ | — | | | $ | 597,053,478 | | |
Short-Term Investments | | | 13,568,320 | | | | 11,668,889 | | | | — | | | | 25,237,209 | | |
Total Investments, at fair value | | $ | 610,621,798 | | | $ | 11,668,889 | | | $ | — | | | $ | 622,290,687 | | |
^ See Note 2, "Significant Accounting Policies" in the Notes to Financial Statements for additional information.
* For further breakdown of Common Stock by sector, please refer to the Portfolio of Investments.
See Accompanying Notes to Financial Statements
130
SUMMARY PORTFOLIO OF INVESTMENTS
VY® OPPENHEIMER GLOBAL PORTFOLIO AS OF DECEMBER 31, 2016
Shares | |
| |
| |
Value | | Percentage
of Net
Assets | |
COMMON STOCK: 96.7% | | | |
| | | | | China: 1.3% | |
| | 674,995 | | | | @,L | | | JD.com, Inc. ADR | | $ | 17,171,873 | | | | 1.3 | | |
| | | | | Denmark: 0.4% | |
| | 123,320 | | | | | | | Other Securities(a) | | | 5,113,398 | | | | 0.4 | | |
| | | | | France: 6.5% | |
| | 176,998 | | | | | | | LVMH Moet Hennessy
Louis Vuitton SE | | | 33,748,611 | | | | 2.5 | | |
| | 103,880 | | | | | | | Kering | | | 23,300,744 | | | | 1.7 | | |
| | 366,460 | | | | | | | Societe Generale | | | 18,025,061 | | | | 1.3 | | |
| | 189,437 | | | | | | | Technip S.A. | | | 13,493,979 | | | | 1.0 | | |
| | | | | | | | | | 88,568,395 | | | | 6.5 | | |
| | | | | Germany: 7.2% | |
| | 146,838 | | | | | | | Allianz SE | | | 24,233,914 | | | | 1.7 | | |
| | 180,764 | | | | | | | Bayer AG | | | 18,832,683 | | | | 1.4 | | |
| | 81,976 | | | | | | | Linde AG | | | 13,447,198 | | | | 1.0 | | |
| | 374,830 | | | | | | | SAP SE | | | 32,424,793 | | | | 2.4 | | |
| | 77,987 | | | | | | | Other Securities | | | 9,548,757 | | | | 0.7 | | |
| | | | | | | | | | 98,487,345 | | | | 7.2 | | |
| | | | | India: 3.4% | |
| | 11,081,846 | | | | | | | DLF Ltd. | | | 18,136,563 | | | | 1.4 | | |
| | 2,374,040 | | | | | | | ICICI Bank Ltd. ADR | | | 17,781,560 | | | | 1.3 | | |
| | 1,494,555 | | | | | | | Other Securities | | | 9,948,123 | | | | 0.7 | | |
| | | | | | | | | | 45,866,246 | | | | 3.4 | | |
| | | | | Italy: 1.2% | |
| | 566,046 | | | | | | | Other Securities(a) | | | 16,155,679 | | | | 1.2 | | |
| | | | | Japan: 14.2% | |
| | 1,213,400 | | | | | | | Dai-ichi Life
Holdings, Inc. | | | 20,174,574 | | | | 1.5 | | |
| | 807,100 | | | | | | | KDDI Corp. | | | 20,381,679 | | | | 1.5 | | |
| | 39,751 | | | | | | | Keyence Corp. | | | 27,199,605 | | | | 2.0 | | |
| | 359,200 | | | | | | | Kyocera Corp. | | | 17,809,328 | | | | 1.3 | | |
| | 268,700 | | | | | | | Murata Manufacturing
Co., Ltd. | | | 35,881,315 | | | | 2.6 | | |
| | 321,700 | | | | | | | Nidec Corp. | | | 27,695,371 | | | | 2.0 | | |
| | 301,600 | | | | | | | Sumitomo Mitsui
Financial Group, Inc. | | | 11,485,825 | | | | 0.8 | | |
| | 305,400 | | | | | | | Suzuki Motor Corp. | | | 10,722,251 | | | | 0.8 | | |
| | 173,100 | | | | | | | Other Securities | | | 22,445,719 | | | | 1.7 | | |
| | | | | | | | | | 193,795,667 | | | | 14.2 | | |
| | | | | Netherlands: 2.7% | |
| | 553,853 | | | | | | | Airbus Group SE | | | 36,581,394 | | | | 2.7 | | |
| | | | | Spain: 2.7% | |
| | 847,575 | | | | | | | Industria de Diseno
Textil SA | | | 28,873,561 | | | | 2.1 | | |
Shares | |
| |
| |
Value | | Percentage
of Net
Assets | |
| | 1,168,262 | | | | | | | Other Securities | | $ | 7,872,858 | | | | 0.6 | | |
| | | | | | | | | | 36,746,419 | | | | 2.7 | | |
| | | | | Sweden: 1.4% | |
| | 1,037,339 | | | | | | | Assa Abloy AB | | | 19,194,539 | | | | 1.4 | | |
| | | | | Switzerland: 4.3% | |
| | 166,236 | | | | | | | Nestle S.A. | | | 11,908,746 | | | | 0.9 | | |
| | 52,719 | | | | | | | Roche Holding AG | | | 12,017,431 | | | | 0.9 | | |
| | 1,851,086 | | | | | | | UBS Group AG | | | 28,942,583 | | | | 2.1 | | |
| | 380,537 | | | | | | | Other Securities | | | 5,438,267 | | | | 0.4 | | |
| | | | | | | | | | 58,307,027 | | | | 4.3 | | |
| | | | | United Kingdom: 5.9% | |
| | 444,927 | | | | | | | International Game
Technology PLC | | | 11,354,537 | | | | 0.8 | | |
| | 1,265,166 | | | | | | | Prudential PLC | | | 25,249,674 | | | | 1.9 | | |
| | 575,775 | | | | | | | Unilever PLC | | | 23,284,402 | | | | 1.7 | | |
| | 11,653,666 | | | | | | | Other Securities(a) | | | 20,325,562 | | | | 1.5 | | |
| | | | | | | | | | 80,214,175 | | | | 5.9 | | |
| | | | | United States: 45.5% | |
| | 128,360 | | | | | | | 3M Co. | | | 22,921,245 | | | | 1.7 | | |
| | 225,053 | | | | @ | | | Adobe Systems, Inc. | | | 23,169,206 | | | | 1.7 | | |
| | 321,710 | | | | | | | Aetna, Inc. | | | 39,895,257 | | | | 2.9 | | |
| | 44,940 | | | | @ | | | Alphabet, Inc. - Class A | | | 35,612,703 | | | | 2.6 | | |
| | 46,607 | | | | @ | | | Alphabet, Inc. - Class C | | | 35,972,215 | | | | 2.6 | | |
| | 167,240 | | | | | | | Anthem, Inc. | | | 24,044,095 | | | | 1.8 | | |
| | 54,130 | | | | @ | | | Biogen, Inc. | | | 15,350,185 | | | | 1.1 | | |
| | 688,420 | | | | | | | Citigroup, Inc. | | | 40,912,801 | | | | 3.0 | | |
| | 502,140 | | | | | | | Colgate-Palmolive Co. | | | 32,860,042 | | | | 2.4 | | |
| | 244,740 | | | | @ | | | Facebook, Inc. | | | 28,157,337 | | | | 2.1 | | |
| | 341,370 | | | | | | | FNF Group | | | 11,592,925 | | | | 0.9 | | |
| | 196,530 | | | | | | | Gilead Sciences, Inc. | | | 14,073,513 | | | | 1.0 | | |
| | 110,630 | | | | | | | Goldman Sachs
Group, Inc. | | | 26,490,354 | | | | 2.0 | | |
| | 274,980 | | | | | | | Intuit, Inc. | | | 31,515,458 | | | | 2.3 | | |
| | 219,560 | | | | @,L | | | Ionis
Pharmaceuticals, Inc. | | | 10,501,555 | | | | 0.8 | | |
| | 704,620 | | | | | | | Maxim Integrated
Products | | | 27,177,193 | | | | 2.0 | | |
| | 317,290 | | | | @ | | | PayPal Holdings, Inc. | | | 12,523,436 | | | | 0.9 | | |
| | 390,540 | | | | | | | S&P Global, Inc. | | | 41,998,672 | | | | 3.1 | | |
| | 234,000 | | | | L | | | Tiffany & Co. | | | 18,118,620 | | | | 1.3 | | |
| | 154,700 | | | | | | | United Parcel Service,
Inc. - Class B | | | 17,734,808 | | | | 1.3 | | |
| | 275,380 | | | | | | | Walt Disney Co. | | | 28,700,104 | | | | 2.1 | | |
| | 168,310 | | | | | | | Zimmer Biomet
Holdings, Inc. | | | 17,369,592 | | | | 1.3 | | |
| | 1,869,860 | | | | | | | Other Securities(a) | | | 62,091,924 | | | | 4.6 | | |
| | | | | | | | | | 618,783,240 | | | | 45.5 | | |
| | | | | | | Total Common Stock
(Cost $794,926,725) | | | 1,314,985,397 | | | | 96.7 | | |
See Accompanying Notes to Financial Statements
131
SUMMARY PORTFOLIO OF INVESTMENTS
VY® OPPENHEIMER GLOBAL PORTFOLIO AS OF DECEMBER 31, 2016 (CONTINUED)
Shares | |
| |
| |
Value | | Percentage
of Net
Assets | |
PREFERRED STOCK: 1.9% | | | |
| | | | | Germany: 1.9% | |
| | 334,794 | | | | | | | Bayerische Motoren
Werke AG | | $ | 25,568,342 | | | | 1.9 | | |
| | | | | India: 0.0% | |
| | 5,080,989 | | | | | | | Other Securities | | | 732,914 | | | | 0.0 | | |
| | | | | | | Total Preferred Stock
(Cost $12,716,306) | | | 26,301,256 | | | | 1.9 | | |
| | | | | | | Total Long-Term
Investments
(Cost $807,643,031) | | | 1,341,286,653 | | | | 98.6 | | |
Principal
Amount† | |
| |
| |
Value | | Percentage
of Net
Assets | |
SHORT-TERM INVESTMENTS: 5.8% | | | |
| | | | | Securities Lending Collateralcc: 4.5% | |
| | 3,087,985 | | | | | | | Bank of Nova Scotia,
Repurchase
Agreement dated
12/30/16, 0.51%, due
01/03/17 (Repurchase
Amount $3,088,158,
collateralized by
various U.S.
Government/U.S.
Government Agency
Obligations,
1.000%-4.000%,
Market Value plus
accrued interest
$3,149,924, due
12/31/17-10/20/46) | | $ | 3,087,985 | | | | 0.2 | | |
| | 14,671,056 | | | | | | | Cantor Fitzgerald,
Repurchase
Agreement dated
12/30/16, 0.50%, due
01/03/17 (Repurchase
Amount $14,671,860,
collateralized by
various U.S.
Government/U.S.
Government Agency
Obligations,
0.000%-10.000%,
Market Value plus
accrued interest
$14,964,477, due
01/25/17-10/20/66) | | | 14,671,056 | | | | 1.0 | | |
Principal
Amount† | |
| |
| |
Value | | Percentage
of Net
Assets | |
| | 14,671,056 | | | | | | | Daiwa Capital Markets,
Repurchase
Agreement dated
12/30/16, 0.52%, due
01/03/17 (Repurchase
Amount $14,671,892,
collateralized by
various U.S.
Government/U.S.
Government Agency
Obligations,
0.000%-6.500%,
Market Value plus
accrued interest
$14,964,477, due
03/02/17-02/01/49) | | $ | 14,671,056 | | | | 1.1 | | |
| | 14,671,056 | | | | | | | Nomura Securities,
Repurchase
Agreement dated
12/30/16, 0.50%, due
01/03/17 (Repurchase
Amount $14,671,860,
collateralized by
various U.S.
Government/U.S.
Government Agency
Obligations,
0.000%-9.500%,
Market Value plus
accrued interest
$14,964,478, due
01/15/17-08/20/66) | | | 14,671,056 | | | | 1.1 | | |
| | 14,671,056 | | | | | | | State of Wisconsin
Investment Board,
Repurchase
Agreement dated
12/30/16, 0.65%, due
01/03/17 (Repurchase
Amount $14,672,101,
collateralized by
various U.S.
Government
Securities,
0.125%-3.875%,
Market Value plus
accrued interest
$15,043,833, due
04/15/18-02/15/46) | | | 14,671,056 | | | | 1.1 | | |
| | | | | | | | | | 61,772,209 | | | | 4.5 | | |
See Accompanying Notes to Financial Statements
132
SUMMARY PORTFOLIO OF INVESTMENTS
VY® OPPENHEIMER GLOBAL PORTFOLIO AS OF DECEMBER 31, 2016 (CONTINUED)
Shares | |
| |
| |
Value | | Percentage
of Net
Assets | |
| | | | | Mutual Funds: 1.3% | |
| | 17,378,495 | | | | | | | BlackRock Liquidity
Funds, FedFund,
Institutional Class,
0.420%††
(Cost $17,378,495) | | $ | 17,378,495 | | | | 1.3 | | |
| | | | | Total Short-Term
Investments
(Cost $79,150,704) | | | 79,150,704 | | | | 5.8 | | |
| | | | | Total Investments
in Securities
(Cost $886,793,735) | | $ | 1,420,437,357 | | | | 104.4 | | |
| | | | | Liabilities in Excess of
Other Assets | | | (60,467,594 | ) | | | (4.4 | ) | |
| | | | | Net Assets | | $ | 1,359,969,763 | | | | 100.0 | | |
"Other Securities" represents issues not identified as the top 50 holdings in terms of market value and issues or issuers not exceeding 1% of net assets individually or in aggregate respectively as of December 31, 2016.
The following footnotes apply to either the individual securities noted or one or more of the securities aggregated and listed as a single line item.
† Unless otherwise indicated, principal amount is shown in USD.
†† Rate shown is the 7-day yield as of December 31, 2016.
@ Non-income producing security.
ADR American Depositary Receipt
cc Represents securities purchased with cash collateral received for securities on loan.
L Loaned security, a portion or all of the security is on loan at December 31, 2016.
(a) This grouping contains securities on loan.
Cost for federal income tax purposes is $894,308,904.
Net unrealized appreciation consists of: | |
Gross Unrealized Appreciation | | $ | 565,017,363 | | |
Gross Unrealized Depreciation | | | (38,888,910 | ) | |
Net Unrealized Appreciation | | $ | 526,128,453 | | |
Sector Diversification | | Percentage of
Net Assets | |
Information Technology | | | 24.3 | % | |
Financials | | | 20.6 | | |
Consumer Discretionary | | | 15.9 | | |
Health Care | | | 14.7 | | |
Industrials | | | 12.4 | | |
Consumer Staples | | | 5.4 | | |
Telecommunication Services | | | 1.5 | | |
Materials | | | 1.4 | | |
Real Estate | | | 1.4 | | |
Energy | | | 1.0 | | |
Short-Term Investments | | | 5.8 | | |
Liabilities in Excess of Other Assets | | | (4.4 | ) | |
Net Assets | | | 100.0 | % | |
Fair Value Measurements^
The following is a summary of the fair valuations according to the inputs used as of December 31, 2016 in valuing the assets and liabilities:
| | | Quoted Prices
in Active Markets
for Identical Investments
(Level 1) | | Significant Other
Observable
Inputs#
(Level 2) | | Significant
Unobservable
Inputs
(Level 3) | | Fair Value
at
December 31, 2016 | |
Asset Table | |
Investments, at fair value | |
Common Stock | |
China | | $ | 17,171,873 | | | $ | — | | | $ | — | | | $ | 17,171,873 | | |
Denmark | | | — | | | | 5,113,398 | | | | — | | | | 5,113,398 | | |
France | | | — | | | | 88,568,395 | | | | — | | | | 88,568,395 | | |
Germany | | | — | | | | 98,487,345 | | | | — | | | | 98,487,345 | | |
India | | | 17,781,560 | | | | 28,084,686 | | | | — | | | | 45,866,246 | | |
Italy | | | 9,850,878 | | | | 6,304,801 | | | | — | | | | 16,155,679 | | |
Japan | | | — | | | | 193,795,667 | | | | — | | | | 193,795,667 | | |
Netherlands | | | — | | | | 36,581,394 | | | | — | | | | 36,581,394 | | |
Spain | | | — | | | | 36,746,419 | | | | — | | | | 36,746,419 | | |
Sweden | | | — | | | | 19,194,539 | | | | — | | | | 19,194,539 | | |
Switzerland | | | — | | | | 58,307,027 | | | | — | | | | 58,307,027 | | |
United Kingdom | | | 16,509,121 | | | | 63,705,054 | | | | — | | | | 80,214,175 | | |
United States | | | 618,783,240 | | | | — | | | | — | | | | 618,783,240 | | |
Total Common Stock | | | 680,096,672 | | | | 634,888,725 | | | | — | | | | 1,314,985,397 | | |
Preferred Stock | | | 732,914 | | | | 25,568,342 | | | | — | | | | 26,301,256 | | |
Short-Term Investments | | | 17,378,495 | | | | 61,772,209 | | | | — | | | | 79,150,704 | | |
Total Investments, at fair value | | $ | 698,208,081 | | | $ | 722,229,276 | | | $ | — | | | $ | 1,420,437,357 | | |
^ See Note 2, "Significant Accounting Policies" in the Notes to Financial Statements for additional information.
# The earlier close of the foreign markets gives rise to the possibility that significant events, including broad market moves, may have occurred in the interim and may materially affect the value of those securities. To account for this, the Portfolio may frequently value many of its foreign equity securities using fair value prices based on third party vendor modeling tools to the extent available. Accordingly, a portion of the Portfolio's investments are categorized as Level 2 investments.
See Accompanying Notes to Financial Statements
133
VY® PIONEER SUMMARY PORTFOLIO OF INVESTMENTS
HIGH YIELD PORTFOLIO AS OF DECEMBER 31, 2016
Principal
Amount† | |
| |
| | Value | | Percentage
of Net
Assets | |
CORPORATE BONDS/NOTES: 85.4% | | | |
| | | | | Basic Materials: 2.3% | |
| | 300,000 | | | | # | | | Ausdrill Finance Pty Ltd.,
6.875%, 11/01/19 | | $ | 300,000 | | | | 0.3 | | |
| | 100,000 | | | | # | | | CVR Partners L.P. / CVR
Nitrogen Finance
Corp., 9.250%,
06/15/23 | | | 103,375 | | | | 0.1 | | |
| | 530,000 | | | | | | | Freeport-McMoRan, Inc.,
3.550%, 03/01/22 | | | 495,550 | | | | 0.5 | | |
| | 75,000 | | | | # | | | HudBay Minerals, Inc.,
7.250%, 01/15/23 | | | 77,813 | | | | 0.1 | | |
| | 100,000 | | | | # | | | HudBay Minerals, Inc.,
7.625%, 01/15/25 | | | 104,188 | | | | 0.1 | | |
| | 200,000 | | | | # | | | INEOS Group
Holdings SA,
5.875%, 02/15/19 | | | 204,600 | | | | 0.2 | | |
| | 35,000 | | | | # | | | Teck Resources Ltd.,
8.000%, 06/01/21 | | | 38,588 | | | | 0.0 | | |
| | 35,000 | | | | # | | | Teck Resources Ltd.,
8.500%, 06/01/24 | | | 40,425 | | | | 0.1 | | |
| | 145,000 | | | | # | | | Tronox Finance LLC,
7.500%, 03/15/22 | | | 135,937 | | | | 0.1 | | |
| | 80,000 | | | | # | | | United States Steel Corp.,
8.375%, 07/01/21 | | | 88,642 | | | | 0.1 | | |
| | 810,000 | | | | | | | Other Securities | | | 756,800 | | | | 0.7 | | |
| | | | | | | | | | 2,345,918 | | | | 2.3 | | |
| | | | | Communications: 14.4% | |
| | 200,000 | | | | # | | | Altice Financing SA,
6.625%, 02/15/23 | | | 206,000 | | | | 0.2 | | |
| | 200,000 | | | | # | | | Altice US Finance I Corp.,
5.375%, 07/15/23 | | | 208,250 | | | | 0.2 | | |
| | 200,000 | | | | # | | | CCO Holdings LLC /
CCO Holdings
Capital Corp.,
5.500%, 05/01/26 | | | 204,500 | | | | 0.2 | | |
| | 310,000 | | | | # | | | CCO Holdings LLC /
CCO Holdings
Capital Corp.,
5.750%, 02/15/26 | | | 321,625 | | | | 0.3 | | |
| | 580,000 | | | | | | | CenturyLink, Inc.,
6.450%, 06/15/21 | | | 613,350 | | | | 0.6 | | |
| | 120,000 | | | | # | | | CommScope, Inc.,
5.000%, 06/15/21 | | | 124,050 | | | | 0.1 | | |
| | 200,000 | | | | # | | | CSC Holdings LLC,
5.500%, 04/15/27 | | | 203,000 | | | | 0.2 | | |
| | 125,000 | | | | # | | | Ctrip.com
International Ltd.,
1.250%, 09/15/22 | | | 120,937 | | | | 0.1 | | |
| | 260,000 | | | | # | | | DISH Network Corp.,
3.375%, 08/15/26 | | | 297,212 | | | | 0.3 | | |
| | 555,000 | | | | | | | Frontier
Communications Corp.,
8.750%, 04/15/22 | | | 552,225 | | | | 0.6 | | |
Principal
Amount† | |
| |
| | Value | | Percentage
of Net
Assets | |
| | 613,000 | | | | | | | Frontier
Communications Corp.,
8.500%-10.500%,
04/15/20-09/15/22 | | $ | 647,353 | | | | 0.6 | | |
| | 250,000 | | | | # | | | Gray Television, Inc.,
5.125%, 10/15/24 | | | 242,500 | | | | 0.2 | | |
| | 280,000 | | | | # | | | Gray Television, Inc.,
5.875%, 07/15/26 | | | 278,600 | | | | 0.3 | | |
| | 415,000 | | | | # | | | Hughes Satellite
Systems Corp.,
5.250%, 08/01/26 | | | 407,737 | | | | 0.4 | | |
| | 690,000 | | | | # | | | Level 3 Financing, Inc.,
5.250%, 03/15/26 | | | 684,825 | | | | 0.7 | | |
| | 447,750 | | | | | | | McGraw-Hill Global
Education
Holdings, LLC,
5.000%, 05/04/22 | | | 448,701 | | | | 0.4 | | |
| | 195,000 | | | | # | | | MDC Partners, Inc.,
6.500%, 05/01/24 | | | 176,475 | | | | 0.2 | | |
| | 550,000 | | | | # | | | Netflix, Inc., 4.375%,
11/15/26 | | | 534,188 | | | | 0.5 | | |
| | 245,000 | | | | # | | | Nexstar Escrow Corp.,
5.625%, 08/01/24 | | | 243,775 | | | | 0.2 | | |
| | 200,000 | | | | # | | | SFR Group SA,
6.000%, 05/15/22 | | | 206,000 | | | | 0.2 | | |
| | 480,000 | | | | | | | Shutterfly, Inc.,
0.250%, 05/15/18 | | | 488,100 | | | | 0.5 | | |
| | 425,000 | | | | # | | | Sinclair Television
Group, Inc.,
5.125%, 02/15/27 | | | 405,875 | | | | 0.4 | | |
| | 170,000 | | | | # | | | Sirius XM Radio, Inc.,
4.625%, 05/15/23 | | | 168,938 | | | | 0.2 | | |
| | 1,760,000 | | | | | | | Sprint Corp.,
7.250%, 09/15/21 | | | 1,874,400 | | | | 1.8 | | |
| | 425,000 | | | | | | | TEGNA, Inc.,
6.375%, 10/15/23 | | | 451,307 | | | | 0.4 | | |
| | 450,000 | | | | | | | T-Mobile USA, Inc.,
6.500%, 01/15/26 | | | 487,688 | | | | 0.5 | | |
| | 550,000 | | | | | | | T-Mobile USA, Inc.,
6.000%-6.633%,
04/28/21-04/15/24 | | | 581,575 | | | | 0.5 | | |
| | 160,000 | | | | # | | | Univision
Communications, Inc.,
5.125%, 02/15/25 | | | 153,600 | | | | 0.1 | | |
| | 440,000 | | | | # | | | Videotron Ltd.,
5.375%, 06/15/24 | | | 453,200 | | | | 0.4 | | |
| | 105,000 | | | | # | | | WebMD Health Corp.,
2.625%, 06/15/23 | | | 98,963 | | | | 0.1 | | |
| | 935,000 | | | | | | | Windstream
Services LLC,
6.375%-7.750%,
10/15/20-08/01/23 | | | 897,763 | | | | 0.9 | | |
| | 150,000 | | | | # | | | Zillow Group, Inc.,
2.000%, 12/01/21 | | | 154,781 | | | | 0.2 | | |
| | 1,933,349 | | | | | | | Other Securities | | | 2,018,241 | | | | 1.9 | | |
| | | | | | | | | | 14,955,734 | | | | 14.4 | | |
See Accompanying Notes to Financial Statements
134
VY® PIONEER SUMMARY PORTFOLIO OF INVESTMENTS
HIGH YIELD PORTFOLIO AS OF DECEMBER 31, 2016 (CONTINUED)
Principal
Amount† | |
| |
| | Value | | Percentage
of Net
Assets | |
| | | | | Consumer, Cyclical: 12.0% | |
| | 130,000 | | | | # | | | AdvancePierre Foods
Holdings, Inc.,
5.500%, 12/15/24 | | $ | 131,544 | | | | 0.1 | | |
| | 190,000 | | | | # | | | AMC Entertainment
Holdings, Inc.,
5.875%, 11/15/26 | | | 194,750 | | | | 0.2 | | |
| | 70,000 | | | | # | | | Beazer
Homes USA, Inc.,
8.750%, 03/15/22 | | | 75,775 | | | | 0.1 | | |
| | 230,000 | | | | # | | | Cooper-Standard
Automotive, Inc.,
5.625%, 11/15/26 | | | 227,987 | | | | 0.2 | | |
| | 610,000 | | | | | | | Global Partners L.P. / GLP
Finance Corp.,
6.250%-7.000%,
07/15/22-06/15/23 | | | 589,326 | | | | 0.6 | | |
| | 165,000 | | | | # | | | Hilton Grand Vacations
Borrower LLC/Hilton
Grand Vacations
Borrower, Inc.,
6.125%, 12/01/24 | | | 172,219 | | | | 0.2 | | |
| | 205,000 | | | | #,& | | | IHO Verwaltungs GmbH,
4.125%, 09/15/21 | | | 207,563 | | | | 0.2 | | |
| | 185,000 | | | | # | | | International Automotive
Components Group SA,
9.125%, 06/01/18 | | | 179,450 | | | | 0.2 | | |
| | 175,000 | | | | # | | | Intrepid Aviation
Group Holdings LLC /
Intrepid Finance Co.,
6.875%, 02/15/19 | | | 157,500 | | | | 0.1 | | |
| | 310,000 | | | | # | | | JB Poindexter & Co., Inc.,
9.000%, 04/01/22 | | | 327,050 | | | | 0.3 | | |
| | 400,000 | | | | | | | KB Home,
7.000%, 12/15/21 | | | 424,000 | | | | 0.4 | | |
| | 655,000 | | | | | | | KB Home,
1.375%-7.500%,
02/01/19-09/15/22 | | | 660,731 | | | | 0.6 | | |
| | 205,000 | | | | # | | | KFC Holding Co/Pizza
Hut Holdings LLC/Taco
Bell of America LLC,
5.000%, 06/01/24 | | | 209,869 | | | | 0.2 | | |
| | 205,000 | | | | # | | | KFC Holding Co/Pizza
Hut Holdings LLC/Taco
Bell of America LLC,
5.250%, 06/01/26 | | | 208,587 | | | | 0.2 | | |
| | 250,000 | | | | # | | | Landry's, Inc.,
6.750%, 10/15/24 | | | 254,375 | | | | 0.2 | | |
| | 250,000 | | | | | | | Lennar Corp.,
4.500%, 06/15/19 | | | 259,375 | | | | 0.2 | | |
| | 465,000 | | | | | | | Lennar Corp.,
4.750%, 11/15/22 | | | 478,950 | | | | 0.5 | | |
| | 200,000 | | | | # | | | Nexteer Automotive
Group Ltd.,
5.875%, 11/15/21 | | | 208,500 | | | | 0.2 | | |
| | 230,000 | | | | # | | | PetSmart, Inc.,
7.125%, 03/15/23 | | | 235,175 | | | | 0.2 | | |
| | 264,000 | | | | # | | | Rexel SA,
5.250%, 06/15/20 | | | 272,085 | | | | 0.3 | | |
Principal
Amount† | |
| |
| | Value | | Percentage
of Net
Assets | |
| | 150,000 | | | | | | | Scientific Games
International, Inc.,
6.250%, 09/01/20 | | $ | 128,250 | | | | 0.1 | | |
| | 990,000 | | | | | | | Scientific Games
International, Inc.,
10.000%, 12/01/22 | | | 990,000 | | | | 1.0 | | |
| | 365,000 | | | | # | | | Taylor Morrison
Communities, Inc. /
Monarch
Communities, Inc.,
5.625%, 03/01/24 | | | 370,475 | | | | 0.4 | | |
| | 360,000 | | | | # | | | TI Group Automotive
Systems LLC,
8.750%, 07/15/23 | | | 378,000 | | | | 0.4 | | |
| | 350,000 | | | | # | | | Viking Cruises Ltd.,
8.500%, 10/15/22 | | | 364,438 | | | | 0.3 | | |
| | 160,000 | | | | # | | | ZF North America
Capital, Inc.,
4.750%, 04/29/25 | | | 163,400 | | | | 0.2 | | |
| | 4,562,075 | | | | | | | Other Securities | | | 4,615,167 | | | | 4.4 | | |
| | | | | | | | | | 12,484,541 | | | | 12.0 | | |
| | | | | Consumer, Non-cyclical: 16.1% | |
| | 545,000 | | | | | | | Alliance One
International, Inc.,
9.875%, 07/15/21 | | | 469,381 | | | | 0.4 | | |
| | 80,000 | | | | # | | | Alliance One
International, Inc.,
8.500%, 04/15/21 | | | 81,400 | | | | 0.1 | | |
| | 215,000 | | | | # | | | C&S Group
Enterprises LLC,
5.375%, 07/15/22 | | | 208,550 | | | | 0.2 | | |
| | 225,000 | | | | # | | | Cenveo Corp.,
6.000%, 08/01/19 | | | 201,937 | | | | 0.2 | | |
| | 145,000 | | | | | | | CHS/Community
Health Systems, Inc.,
6.875%, 02/01/22 | | | 101,500 | | | | 0.1 | | |
| | 870,000 | | | | | | | CHS/Community
Health Systems, Inc.,
8.000%, 11/15/19 | | | 726,450 | | | | 0.7 | | |
| | 375,000 | | | | # | | | Cimpress NV,
7.000%, 04/01/22 | | | 384,375 | | | | 0.4 | | |
| | 500,000 | | | | | | | Constellation Brands, Inc.,
3.750%-4.250%,
05/01/21-05/01/23 | | | 519,390 | | | | 0.5 | | |
| | 305,000 | | | | # | | | Constellis Holdings
LLC / Constellis
Finance Corp.,
9.750%, 05/15/20 | | | 314,150 | | | | 0.3 | | |
| | 310,000 | | | | # | | | Dole Food Co., Inc.,
7.250%, 05/01/19 | | | 316,975 | | | | 0.3 | | |
| | 406,000 | | | | # | | | DPx Holdings BV,
7.500%, 02/01/22 | | | 429,853 | | | | 0.4 | | |
| | 315,000 | | | | # | | | Endo Finance Co.,
5.750%, 01/15/22 | | | 281,925 | | | | 0.3 | | |
| | 140,000 | | | | # | | | Endo Finance LLC &
Endo Finco, Inc.,
5.375%, 01/15/23 | | | 119,700 | | | | 0.1 | | |
See Accompanying Notes to Financial Statements
135
VY® PIONEER SUMMARY PORTFOLIO OF INVESTMENTS
HIGH YIELD PORTFOLIO AS OF DECEMBER 31, 2016 (CONTINUED)
Principal
Amount† | |
| |
| | Value | | Percentage
of Net
Assets | |
| | | | | Consumer, Non-cyclical (continued) | |
| | 200,000 | | | | # | | | Endo Finance LLC / Endo
Ltd. / Endo Finco, Inc.,
6.000%, 07/15/23 | | $ | 176,500 | | | | 0.2 | | |
| | 200,000 | | | | # | | | Endo Ltd / Endo Finance
LLC / Endo Finco, Inc.,
6.500%, 02/01/25 | | | 167,500 | | | | 0.1 | | |
| | 200,000 | | | | # | | | FAGE International
SA/ FAGE USA
Dairy Industry, Inc.,
5.625%, 08/15/26 | | | 201,000 | | | | 0.2 | | |
| | 600,000 | | | | | | | HCA, Inc.,
5.250%, 06/15/26 | | | 621,750 | | | | 0.6 | | |
| | 35,000 | | | | # | | | Horizon Pharma, Inc. /
Horizon Pharma
USA, Inc.,
8.750%, 11/01/24 | | | 35,613 | | | | 0.0 | | |
| | 295,000 | | | | # | | | Insulet Corp.,
1.250%, 09/15/21 | | | 274,719 | | | | 0.3 | | |
| | 495,000 | | | | | | | Kindred Healthcare, Inc.,
6.375%-8.000%,
01/15/20-04/15/22 | | | 468,544 | | | | 0.4 | | |
| | 80,000 | | | | # | | | Lamb Weston
Holdings, Inc.,
4.625%, 11/01/24 | | | 80,400 | | | | 0.1 | | |
| | 80,000 | | | | # | | | Lamb Weston
Holdings, Inc.,
4.875%, 11/01/26 | | | 79,350 | | | | 0.0 | | |
| | 90,000 | | | | # | | | Medicines Co.,
2.750%, 07/15/23 | | | 87,019 | | | | 0.1 | | |
| | 345,000 | | | | # | | | NuVasive, Inc.,
2.250%, 03/15/21 | | | 439,659 | | | | 0.4 | | |
| | 325,000 | | | | # | | | Post Holdings, Inc.,
5.000%, 08/15/26 | | | 312,000 | | | | 0.3 | | |
| | 260,000 | | | | # | | | Post Holdings, Inc.,
6.000%, 12/15/22 | | | 272,675 | | | | 0.3 | | |
| | 100,000 | | | | # | | | Post Holdings, Inc.,
6.750%, 12/01/21 | | | 107,000 | | | | 0.1 | | |
| | 100,000 | | | | # | | | Post Holdings, Inc.,
7.750%, 03/15/24 | | | 111,500 | | | | 0.1 | | |
| | 510,000 | | | | # | | | RegionalCare Hospital
Partners Holdings, Inc.,
8.250%, 05/01/23 | | | 511,275 | | | | 0.5 | | |
| | 500,000 | | | | # | | | Sothebys,
5.250%, 10/01/22 | | | 493,750 | | | | 0.5 | | |
| | 85,000 | | | | # | | | Tenet Healthcare Corp.,
7.500%, 01/01/22 | | | 88,825 | | | | 0.1 | | |
| | 525,000 | | | | | | | United Rentals
North America, Inc.,
5.750%, 11/15/24 | | | 553,875 | | | | 0.5 | | |
| | 1,225,000 | | | | # | | | VRX Escrow Corp.,
5.875%, 05/15/23 | | | 931,000 | | | | 0.9 | | |
| | 470,000 | | | | | | | Wright Medical Group,
Inc., 2.000%, 02/15/20 | | | 492,031 | | | | 0.5 | | |
| | 6,252,564 | | | | | | | Other Securities | | | 6,113,703 | | | | 5.9 | | |
| | | | | | | | | | 16,775,274 | | | | 16.1 | | |
Principal
Amount† | |
| |
| | Value | | Percentage
of Net
Assets | |
| | | | | Energy: 15.2% | |
| | 150,000 | | | | # | | | Alta Mesa Holdings L.P. /
Alta Mesa Finance
Services Corp.,
7.875%, 12/15/24 | | $ | 156,000 | | | | 0.2 | | |
| | 135,000 | | | | # | | | Antero Midstream
Partners L.P. / Antero
Midstream
Finance Corp.,
5.375%, 09/15/24 | | | 138,037 | | | | 0.1 | | |
| | 175,000 | | | | | | | Antero Resources Corp.,
6.000%, 12/01/20 | | | 180,259 | | | | 0.2 | | |
| | 355,000 | | | | # | | | Antero Resources Corp.,
5.000%, 03/01/25 | | | 348,968 | | | | 0.3 | | |
| | 275,000 | | | | # | | | Blue Racer Midstream
LLC / Blue Racer
Finance Corp.,
6.125%, 11/15/22 | | | 276,375 | | | | 0.3 | | |
| | 310,000 | | | | # | | | California
Resources Corp.,
8.000%, 12/15/22 | | | 277,450 | | | | 0.3 | | |
| | 125,000 | | | | # | | | Chesapeake
Energy Corp.,
5.500%, 09/15/26 | | | 135,938 | | | | 0.1 | | |
| | 173,000 | | | | # | | | Chesapeake
Energy Corp.,
8.000%, 12/15/22 | | | 187,575 | | | | 0.2 | | |
| | 137,000 | | | | # | | | Cobalt International
Energy, Inc.,
7.750%, 12/01/23 | | | 76,720 | | | | 0.1 | | |
| | 318,000 | | | | # | | | Cobalt International
Energy, Inc.,
10.750%, 12/01/21 | | | 308,301 | | | | 0.3 | | |
| | 510,000 | | | | | | | Archrock Partners L.P. /
Archrock Partners
Finance Corp.,
6.000%, 04/01/21 | | | 497,250 | | | | 0.5 | | |
| | 50,000 | | | | | | | Archrock Partners L.P. /
Archrock Partners
Finance Corp.,
6.000%, 10/01/22 | | | 48,750 | | | | 0.0 | | |
| | 205,000 | | | | # | | | Extraction Oil & Gas
Holdings LLC /
Extraction
Finance Corp.,
7.875%, 07/15/21 | | | 220,375 | | | | 0.2 | | |
| | 210,000 | | | | # | | | Great Western Petroleum
LLC / Great Western
Finance, Inc.,
9.000%, 09/30/21 | | | 219,450 | | | | 0.2 | | |
| | 110,000 | | | | | | | Gulfport Energy Corp.,
6.625%, 05/01/23 | | | 115,500 | | | | 0.1 | | |
| | 300,000 | | | | # | | | Gulfport Energy Corp.,
6.000%, 10/15/24 | | | 306,750 | | | | 0.3 | | |
| | 200,000 | | | | # | | | Gulfport Energy Corp.,
6.375%, 05/15/25 | | | 203,040 | | | | 0.2 | | |
| | 131,000 | | | | # | | | Halcon Resources Corp.,
12.000%, 02/15/22 | | | 143,445 | | | | 0.1 | | |
See Accompanying Notes to Financial Statements
136
VY® PIONEER SUMMARY PORTFOLIO OF INVESTMENTS
HIGH YIELD PORTFOLIO AS OF DECEMBER 31, 2016 (CONTINUED)
Principal
Amount† | |
| |
| | Value | | Percentage
of Net
Assets | |
| | | | | Energy (continued) | |
| | 90,000 | | | | # | | | Hiland Partners L.P. /
Hiland Partners
Finance Corp.,
5.500%, 05/15/22 | | $ | 94,021 | | | | 0.1 | | |
| | 255,000 | | | | # | | | Hilcorp Energy I L.P. /
Hilcorp Finance Co.,
5.750%, 10/01/25 | | | 259,462 | | | | 0.3 | | |
| | 140,000 | | | | # | | | Holly Energy Partners
L.P. / Holly Energy
Finance Corp.,
6.000%, 08/01/24 | | | 146,650 | | | | 0.1 | | |
| | 490,000 | | | | | | | Oasis Petroleum, Inc.,
6.875%, 03/15/22 | | | 504,700 | | | | 0.5 | | |
| | 425,000 | | | | | | | ONEOK, Inc.,
7.500%, 09/01/23 | | | 489,812 | | | | 0.5 | | |
| | 230,000 | | | | # | | | Parsley Energy LLC /
Parsley Finance Corp.,
5.375%, 01/15/25 | | | 231,932 | | | | 0.2 | | |
| | 210,000 | | | | # | | | Parsley Energy LLC /
Parsley Finance Corp.,
6.250%, 06/01/24 | | | 222,033 | | | | 0.2 | | |
| | 275,000 | | | | # | | | Range Resources Corp.,
5.000%, 03/15/23 | | | 272,938 | | | | 0.3 | | |
| | 535,000 | | | | | | | Rice Energy, Inc.,
6.250%-7.250%,
05/01/22-05/01/23 | | | 556,450 | | | | 0.5 | | |
| | 125,000 | | | | # | | | Sabine Pass
Liquefaction LLC,
5.000%, 03/15/27 | | | 126,563 | | | | 0.1 | | |
| | 245,000 | | | | # | | | Sabine Pass
Liquefaction LLC,
5.875%, 06/30/26 | | | 264,906 | | | | 0.3 | | |
| | 580,000 | | | | | | | Sabine Pass
Liquefaction LLC,
5.625%-5.750%,
02/01/21-05/15/24 | | | 624,137 | | | | 0.6 | | |
| | 535,000 | | | | | | | Targa Resources
Partners L.P. / Targa
Resources Partners
Finance Corp.,
4.250%-6.375%,
08/01/22-11/15/23 | | | 540,788 | | | | 0.5 | | |
| | 135,000 | | | | # | | | TerraForm Power
Operating LLC,
6.375%, 02/01/23 | | | 137,363 | | | | 0.1 | | |
| | 585,000 | | | | | | | Williams Cos, Inc.,
4.550%-5.750%,
06/24/24-06/24/44 | | | 574,425 | | | | 0.6 | | |
| | 7,406,606 | | | | | | | Other Securities | | | 6,892,735 | | | | 6.6 | | |
| | | | | | | | | | 15,779,098 | | | | 15.2 | | |
| | | | | Financial: 9.1% | |
| | 232,413 | | | | #,& | | | AAF Holdings
LLC/AAF Finance Co.,
12.000%, 07/01/19 | | | 241,128 | | | | 0.2 | | |
Principal
Amount† | |
| |
| | Value | | Percentage
of Net
Assets | |
| | 275,000 | | | | # | | | Alliance Data
Systems Corp.,
5.875%, 11/01/21 | | $ | 279,812 | | | | 0.3 | | |
| | 508,000 | | | | | | | Ally Financial, Inc.,
5.750%, 11/20/25 | | | 508,635 | | | | 0.5 | | |
| | 500,000 | | | | | | | Ally Financial, Inc.,
4.625%,
05/19/22-03/30/25 | | | 499,375 | | | | 0.5 | | |
| | 225,000 | | | | | | | Citigroup, Inc.,
5.900%, 12/29/49 | | | 228,094 | | | | 0.2 | | |
| | 550,000 | | | | | | | Citigroup, Inc.,
6.250%, 12/29/49 | | | 566,637 | | | | 0.6 | | |
| | 335,000 | | | | # | | | Communications Sales &
Leasing, Inc. / CSL
Capital LLC,
6.000%, 04/15/23 | | | 346,725 | | | | 0.3 | | |
| | 475,000 | | | | # | | | Credit Agricole SA,
8.125%, 12/29/49 | | | 501,709 | | | | 0.5 | | |
| | 600,000 | | | | | | | Fly Leasing Ltd,
6.375%, 10/15/21 | | | 627,000 | | | | 0.6 | | |
| | 250,000 | | | | # | | | Galileo Re Ltd.
(Cat Bond),
7.918%, 01/09/19 | | | 250,887 | | | | 0.2 | | |
| | 260,000 | | | | # | | | Iron Mountain US
Holdings, Inc.,
5.375%, 06/01/26 | | | 252,850 | | | | 0.2 | | |
| | 300,000 | | | | | | | Iron Mountain, Inc.,
5.750%, 08/15/24 | | | 309,750 | | | | 0.3 | | |
| | 250,000 | | | | # | | | Kilimanjaro Re Ltd.
(Cat Bond),
5.003%, 04/30/18 | | | 255,462 | | | | 0.2 | | |
| | 250,000 | | | | # | | | Kilimanjaro Re Ltd.,
9.753%, 12/06/19 | | | 261,088 | | | | 0.3 | | |
| | 575,000 | | | | | | | Nationstar Mortgage
LLC / Nationstar
Capital Corp.,
6.500%, 07/01/21 | | | 585,063 | | | | 0.6 | | |
| | 225,000 | | | | | | | Nationstar Mortgage
LLC / Nationstar
Capital Corp., 6.500%,
08/01/18-06/01/22 | | | 226,750 | | | | 0.2 | | |
| | 125,000 | | | | # | | | Ocwen Loan
Servicing LLC,
8.375%, 11/15/22 | | | 127,563 | | | | 0.1 | | |
| | 435,000 | | | | # | | | Provident Funding
Associates L.P. / PFG
Finance Corp.,
6.750%, 06/15/21 | | | 439,350 | | | | 0.4 | | |
| | 120,000 | | | | # | | | Quicken Loans, Inc.,
5.750%, 05/01/25 | | | 117,300 | | | | 0.1 | | |
| | 225,000 | | | | # | | | Rialto Holdings LLC /
Rialto Corp.,
7.000%, 12/01/18 | | | 228,938 | | | | 0.2 | | |
| | 210,000 | | | | # | | | TMX Finance LLC /
TitleMax Finance Corp.,
8.500%, 09/15/18 | | | 184,275 | | | | 0.2 | | |
| | 2,410,555 | | | | | | | Other Securities | | | 2,438,262 | | | | 2.4 | | |
| | | | | | | | | | 9,476,653 | | | | 9.1 | | |
See Accompanying Notes to Financial Statements
137
VY® PIONEER SUMMARY PORTFOLIO OF INVESTMENTS
HIGH YIELD PORTFOLIO AS OF DECEMBER 31, 2016 (CONTINUED)
Principal
Amount† | |
| |
| | Value | | Percentage
of Net
Assets | |
| | | | | Industrial: 7.9% | |
| | 135,000 | | | | # | | | Advanced Disposal
Services, Inc.,
5.625%, 11/15/24 | | $ | 134,662 | | | | 0.1 | | |
| | 250,000 | | | | # | | | Amsted Industries, Inc.,
5.000%, 03/15/22 | | | 251,250 | | | | 0.2 | | |
EUR | 100,000 | | | | #,& | | | ARD Finance SA,
6.625%, 09/15/23 | | | 105,668 | | | | 0.1 | | |
| | 100,000 | | | | #,& | | | ARD Finance SA,
7.125%, 09/15/23 | | | 99,125 | | | | 0.1 | | |
| | 70,000 | | | | # | | | Ardagh Packaging
Finance PLC / Ardagh
Holdings USA, Inc.,
4.156%, 05/15/21 | | | 72,187 | | | | 0.0 | | |
| | 80,000 | | | | # | | | Ardagh Packaging
Finance PLC / Ardagh
Holdings USA, Inc.,
4.625%, 05/15/23 | | | 79,300 | | | | 0.1 | | |
| | 90,000 | | | | # | | | Ardagh Packaging
Finance PLC / Ardagh
Holdings USA, Inc.,
7.250%, 05/15/24 | | | 95,175 | | | | 0.1 | | |
| | 325,000 | | | | | | | Ball Corp.,
4.000%, 11/15/23 | | | 319,719 | | | | 0.3 | | |
| | 575,000 | | | | | | | Ball Corp.,
5.250%, 07/01/25 | | | 603,031 | | | | 0.6 | | |
| | 350,000 | | | | # | | | BC Mountain LLC /
BC Mountain
Finance, Inc.,
7.000%, 02/01/21 | | | 315,000 | | | | 0.3 | | |
| | 85,000 | | | | # | | | Belden, Inc.,
5.250%, 07/15/24 | | | 85,850 | | | | 0.1 | | |
| | 140,000 | | | | # | | | Builders FirstSource, Inc.,
5.625%, 09/01/24 | | | 141,225 | | | | 0.1 | | |
| | 305,000 | | | | # | | | Cleaver-Brooks, Inc.,
8.750%, 12/15/19 | | | 319,106 | | | | 0.3 | | |
| | 205,000 | | | | # | | | Coveris Holdings SA,
7.875%, 11/01/19 | | | 204,488 | | | | 0.2 | | |
| | 640,000 | | | | | | | Crown Cork &
Seal Co., Inc.,
7.375%, 12/15/26 | | | 720,000 | | | | 0.7 | | |
| | 425,000 | | | | | | | Dycom Industries, Inc.,
0.750%, 09/15/21 | | | 465,906 | | | | 0.5 | | |
| | 150,000 | | | | # | | | Engility Corp.,
8.875%, 09/01/24 | | | 157,688 | | | | 0.2 | | |
| | 270,000 | | | | # | | | Florida East Coast
Holdings Corp.,
6.750%, 05/01/19 | | | 280,125 | | | | 0.3 | | |
| | 644,000 | | | | | | | General Cable Corp.,
4.500%, 11/15/29 | | | 505,943 | | | | 0.5 | | |
| | 575,000 | | | | # | | | NANA Development
Corp., 9.500%,
03/15/19 | | | 526,125 | | | | 0.5 | | |
| | 200,000 | | | | # | | | syncreon Group BV /
syncreon Global
Finance US, Inc.,
8.625%, 11/01/21 | | | 147,000 | | | | 0.1 | | |
Principal
Amount† | |
| |
| | Value | | Percentage
of Net
Assets | |
| | 75,000 | | | | # | | | Tutor Perini Corp.,
2.875%, 06/15/21 | | $ | 85,828 | | | | 0.1 | | |
| | 2,655,883 | | | | | | | Other Securities | | | 2,474,177 | | | | 2.4 | | |
| | | | | | | | | | 8,188,578 | | | | 7.9 | | |
| | | | | Insurance: 0.1% | |
| | 71,581 | | | | | | | Other Securities | | | 71,954 | | | | 0.1 | | |
| | | | | Technology: 5.8% | |
| | 145,000 | | | | # | | | Diamond 1 Finance
Corp. / Diamond 2
Finance Corp.,
5.875%, 06/15/21 | | | 154,277 | | | | 0.2 | | |
| | 375,000 | | | | # | | | Entegris, Inc.,
6.000%, 04/01/22 | | | 391,406 | | | | 0.4 | | |
| | 420,000 | | | | # | | | First Data Corp.,
5.750%, 01/15/24 | | | 434,965 | | | | 0.4 | | |
| | 155,000 | | | | # | | | First Data Corp.,
7.000%, 12/01/23 | | | 165,462 | | | | 0.2 | | |
| | 300,000 | | | | # | | | Inception Merger Sub,
Inc. / Rackspace
Hosting, Inc.,
8.625%, 11/15/24 | | | 318,285 | | | | 0.3 | | |
| | 510,000 | | | | | | | j2 Global, Inc.,
8.000%, 08/01/20 | | | 530,719 | | | | 0.5 | | |
| | 465,000 | | | | # | | | Micron Technology, Inc.,
5.250%, 08/01/23 | | | 469,069 | | | | 0.5 | | |
| | 110,000 | | | | # | | | Micron Technology, Inc.,
5.625%, 01/15/26 | | | 109,587 | | | | 0.1 | | |
| | 160,000 | | | | # | | | MSCI, Inc.,
4.750%, 08/01/26 | | | 159,000 | | | | 0.1 | | |
| | 250,000 | | | | # | | | MSCI, Inc.,
5.250%, 11/15/24 | | | 263,125 | | | | 0.3 | | |
| | 440,000 | | | | | | | ON Semiconductor Corp.,
1.000%, 12/01/20 | | | 452,925 | | | | 0.4 | | |
| | 200,000 | | | | # | | | Open Text Corp.,
5.875%, 06/01/26 | | | 211,500 | | | | 0.2 | | |
| | 200,000 | | | | # | | | Quintiles IMS, Inc.,
5.000%, 10/15/26 | | | 201,000 | | | | 0.2 | | |
| | 46,000 | | | | # | | | Teradyne, Inc.,
1.250%, 12/15/23 | | | 48,818 | | | | 0.0 | | |
| | 2,224,250 | | | | | | | Other Securities(a) | | | 2,071,860 | | | | 2.0 | | |
| | | | | | | | | | 5,981,998 | | | | 5.8 | | |
| | | | | Utilities: 2.5% | |
| | 505,000 | | | | | | | AES Corp.,
4.875%, 05/15/23 | | | 501,313 | | | | 0.5 | | |
| | 100,000 | | | | | | | AES Corp.,
5.500%, 03/15/24 | | | 102,250 | | | | 0.1 | | |
| | 200,000 | | | | # | | | Calpine Corp.,
5.250%, 06/01/26 | | | 198,000 | | | | 0.2 | | |
| | 245,000 | | | | | | | NRG Energy, Inc.,
6.250%, 05/01/24 | | | 239,487 | | | | 0.2 | | |
| | 515,000 | | | | # | | | NRG Energy, Inc.,
6.625%, 01/15/27 | | | 489,250 | | | | 0.5 | | |
See Accompanying Notes to Financial Statements
138
VY® PIONEER SUMMARY PORTFOLIO OF INVESTMENTS
HIGH YIELD PORTFOLIO AS OF DECEMBER 31, 2016 (CONTINUED)
Principal
Amount† | |
| |
| | Value | | Percentage
of Net
Assets | |
| | | | | Utilities (continued) | |
| | 170,000 | | | | # | | | NRG Energy, Inc.,
7.250%, 05/15/26 | | $ | 170,000 | | | | 0.2 | | |
| | 107,296 | | | | # | | | NSG Holdings, LLC,
7.750%, 12/15/25 | | | 116,282 | | | | 0.1 | | |
| | 755,000 | | | | | | | Talen Energy Supply
LLC, 6.500%, 06/01/25 | | | 587,013 | | | | 0.5 | | |
| | 210,261 | | | | | | | Other Securities | | | 208,337 | | | | 0.2 | | |
| | | | | | | | | | 2,611,932 | | | | 2.5 | | |
| | | | | | | Total Corporate
Bonds/Notes
(Cost $87,316,206) | | | 88,671,680 | | | | 85.4 | | |
MUNICIPAL BONDS: 0.6% | | | |
| | | | | : 0.6% | |
| | 745,000 | | | | | | | Other Securities | | | 650,759 | | | | 0.6 | | |
| | | | | | | | | Total Municipal
Bonds
(Cost $634,642) | | | 650,759 | | | | 0.6 | | |
FOREIGN GOVERNMENT BONDS: —% | | | |
| | 14,440 | | | | | | | Other Securities | | | — | | | | — | | |
| | | | | | | | | Total Foreign
Government Bonds
(Cost $1,223) | | | — | | | | — | | |
U.S. TREASURY OBLIGATIONS: 3.4% | | | |
| | | | | U.S. Treasury Notes: 3.4% | |
| | 3,500,000 | | | | | | | 0.705%, due 07/31/18 | | | 3,503,889 | | | | 3.4 | | |
| | | | | | | | | Total U.S. Treasury
Obligations
(Cost $3,500,614) | | | 3,503,889 | | | | 3.4 | | |
Shares | |
| |
| | Value | | Percentage
of Net
Assets | |
COMMON STOCK: 4.6% | | | |
| | | | | Consumer Discretionary: 0.9% | |
| | 50,408 | | | | | | | Ford Motor Co. | | $ | 611,449 | | | | 0.6 | | |
| | 1,476 | | | | #,@ | | | Perseus Holding Corp. | | | — | | | | — | | |
| | 8,679 | | | | | | | Other Securities | | | 336,952 | | | | 0.3 | | |
| | | | | | | | | | 948,401 | | | | 0.9 | | |
| | | | | Energy: 0.2% | |
| | 428,295 | | | | | | | Other Securities | | | 195,441 | | | | 0.2 | | |
| | | | | Financials: 0.4% | |
| | 4,651 | | | | | | | Other Securities | | | 403,314 | | | | 0.4 | | |
| | | | | Health Care: 1.0% | |
| | 28,200 | | | | | | | Other Securities | | | 1,064,262 | | | | 1.0 | | |
Shares | |
| |
| | Value | | Percentage
of Net
Assets | |
| | | | | Industrials: 0.5% | |
| | 28,534 | | | | | | | Other Securities | | $ | 452,986 | | | | 0.5 | | |
| | | | | Information Technology: 0.5% | |
| | 10,537 | | | | @ | | | NCR Corp. | | | 427,381 | | | | 0.4 | | |
| | 1,750 | | | | | | | Other Securities | | | 121,240 | | | | 0.1 | | |
| | | | | | | | | | 548,621 | | | | 0.5 | | |
| | | | | Materials: 0.3% | |
| | 3,564 | | | | | | | Other Securities | | | 305,720 | | | | 0.3 | | |
| | | | | Real Estate: 0.8% | |
| | 32,109 | | | | | | | Forest City Realty
Trust, Inc. | | | 669,151 | | | | 0.7 | | |
| | 5,760 | | | | | | | Other Securities | | | 146,362 | | | | 0.1 | | |
| | | | | | | | | | 815,513 | | | | 0.8 | | |
| | | | | Telecommunication Services: 0.0% | |
| | 1,994 | | | | | | | Other Securities | | | 14,616 | | | | 0.0 | | |
| | | | | | | | | Total Common Stock
(Cost $3,787,530) | | | 4,748,874 | | | | 4.6 | | |
PREFERRED STOCK: 1.4% | | | |
| | | | | Consumer Discretionary: —% | |
| | 775 | | | | #,@ | | | Perseus Holding Corp. | | | — | | | | — | | |
| | | | | Financials: 0.9% | |
| | 470 | | | | @ | | | Bank of America Corp. | | | 548,396 | | | | 0.5 | | |
| | 3,774 | | | | | | | Other Securities | | | 366,047 | | | | 0.4 | | |
| | | | | | | | | | 914,443 | | | | 0.9 | | |
| | | | | Health Care: 0.5% | |
| | 150 | | | | @ | | | Kindred Healthcare, Inc. | | | 70,762 | | | | 0.1 | | |
| | 1,080 | | | | | | | Other Securities | | | 442,514 | | | | 0.4 | | |
| | | | | | | | | | 513,276 | | | | 0.5 | | |
| | | | | Industrials: 0.0% | |
| | 267 | | | | | | | Other Securities | | | 60,082 | | | | 0.0 | | |
| | | | | | | Total Preferred Stock
(Cost $1,850,002) | | | 1,487,801 | | | | 1.4 | | |
WARRANTS: —% | | | |
| | | | | Energy: —% | |
| | 644 | | | | | | | Other Securities | | | — | | | | — | | |
| | | | | Health Care: —% | |
| | 252 | | | | | | | Other Securities | | | — | | | | — | | |
| | | | | | | Total Warrants
(Cost $—) | | | — | | | | — | | |
| | | | | | | Total Long-Term
Investments
(Cost $97,090,217) | | | 99,063,003 | | | | 95.4 | | |
See Accompanying Notes to Financial Statements
139
VY® PIONEER SUMMARY PORTFOLIO OF INVESTMENTS
HIGH YIELD PORTFOLIO AS OF DECEMBER 31, 2016 (CONTINUED)
Principal
Amount† | |
| |
| | Value | | Percentage
of Net
Assets | |
SHORT-TERM INVESTMENTS: 3.1% | | | |
| | | | | Corporate Bonds/Notes: 0.5% | |
| | 300,000 | | | | | | | Golar LNG Ltd.,
3.750%, 03/07/17 | | $ | 299,625 | | | | 0.3 | | |
| | 250,000 | | | | # | | | Sanders Re Ltd.
(Cat Bond),
4.503%, 05/05/17 | | | 250,862 | | | | 0.2 | | |
| | | | | | | | | | 550,487 | | | | 0.5 | | |
| | | | | U.S. Treasury Bills: 1.9% | |
| | 700,000 | | | | Z | | | United States
Treasury Bill,
0.350%, 01/19/17 | | | 699,874 | | | | 0.7 | | |
| | 1,250,000 | | | | Z | | | United States
Treasury Bill,
0.390%, 02/02/17 | | | 1,249,566 | | | | 1.2 | | |
| | | | | | | | | | 1,949,440 | | | | 1.9 | | |
| | | | | Certificates of Deposit: 0.2% | |
| | 260,000 | | | | | | | Sumitomo,
1.260%, 04/03/17
(Cost $260,000) | | | 260,199 | | | | 0.2 | | |
Shares | |
| |
| | Value | | Percentage
of Net
Assets | |
| | | | | Mutual Funds: 0.5% | |
| | | | 489,318 | | | BlackRock Liquidity
Funds, FedFund,
Institutional Class,
0.420%††
(Cost $489,318) | | $ | 489,318 | | | | 0.5 | | |
| | | | | Total Short-Term
Investments
(Cost $3,252,170) | | | 3,249,444 | | | | 3.1 | | |
| | | | | Total Investments in
Securities
(Cost
$100,342,387) | | $ | 102,312,447 | | | | 98.5 | | |
| | | | | Assets in Excess of
Other Liabilities | | | 1,523,269 | | | | 1.5 | | |
| | | | | Net Assets | | $ | 103,835,716 | | | | 100.0 | | |
"Other Securities" represents issues not identified as the top 50 holdings in terms of market value and issues or issuers not exceeding 1% of net assets individually or in aggregate respectively as of December 31, 2016.
The following footnotes apply to either the individual securities noted or one or more of the securities aggregated and listed as a single line item.
† Unless otherwise indicated, principal amount is shown in USD.
†† Rate shown is the 7-day yield as of December 31, 2016.
# Securities with purchases pursuant to Rule 144A or section 4(a)(2), under the Securities Act of 1933 and may not be resold subject to that rule except to qualified institutional buyers.
@ Non-income producing security.
& Payment-in-kind
Z Indicates Zero Coupon Bond; rate shown reflects current effective yield.
(a) The grouping contains securities in default.
EUR EU Euro
Cost for federal income tax purposes is $100,876,856.
Net unrealized appreciation consists of: | |
Gross Unrealized Appreciation | | $ | 4,903,725 | | |
Gross Unrealized Depreciation | | | (3,468,134 | ) | |
Net Unrealized Appreciation | | $ | 1,435,591 | | |
See Accompanying Notes to Financial Statements
140
VY® PIONEER SUMMARY PORTFOLIO OF INVESTMENTS
HIGH YIELD PORTFOLIO AS OF DECEMBER 31, 2016 (CONTINUED)
Fair Value Measurements^
The following is a summary of the fair valuations according to the inputs used as of December 31, 2016 in valuing the assets and liabilities:
| | | Quoted Prices
in Active Markets
for Identical Investments
(Level 1) | | Significant Other
Observable
Inputs#
(Level 2) | | Significant
Unobservable
Inputs
(Level 3) | | Fair Value
at
December 31, 2016 | |
Asset Table | |
Investments, at fair value | |
Common Stock | |
Consumer Discretionary | | $ | 891,436 | | | $ | 56,965 | | | $ | — | | | $ | 948,401 | | |
Energy | | | 190,348 | | | | — | | | | 5,093 | | | | 195,441 | | |
Financials | | | 403,314 | | | | — | | | | — | | | | 403,314 | | |
Health Care | | | 1,064,262 | | | | — | | | | — | | | | 1,064,262 | | |
Industrials | | | 440,651 | | | | — | | | | 12,335 | | | | 452,986 | | |
Information Technology | | | 548,621 | | | | — | | | | — | | | | 548,621 | | |
Materials | | | 305,720 | | | | — | | | | — | | | | 305,720 | | |
Real Estate | | | 815,513 | | | | — | | | | — | | | | 815,513 | | |
Telecommunication Services | | | 14,616 | | | | — | | | | — | | | | 14,616 | | |
Total Common Stock | | | 4,674,481 | | | | 56,965 | | | | 17,428 | | | | 4,748,874 | | |
Preferred Stock | | | 715,859 | | | | 709,125 | | | | 62,817 | | | | 1,487,801 | | |
Warrants | | | — | | | | — | | | | — | | | | — | | |
Corporate Bonds/Notes | | | — | | | | 88,671,680 | | | | — | | | | 88,671,680 | | |
Municipal Bonds | | | — | | | | 650,759 | | | | — | | | | 650,759 | | |
Short-Term Investments | | | 489,318 | | | | 2,760,126 | | | | — | | | | 3,249,444 | | |
U.S. Treasury Obligations | | | — | | | | 3,503,889 | | | | — | | | | 3,503,889 | | |
Foreign Government Bonds | | | — | | | | — | | | | — | | | | — | | |
Total Investments, at fair value | | $ | 5,879,658 | | | $ | 96,352,544 | | | $ | 80,245 | | | $ | 102,312,447 | | |
Other Financial Instruments+ | |
Centrally Cleared Swaps | | | — | | | | 102,133 | | | | — | | | | 102,133 | | |
Futures | | | 30,262 | | | | — | | | | — | | | | 30,262 | | |
Total Assets | | $ | 5,909,920 | | | $ | 96,454,677 | | | $ | 80,245 | | | $ | 102,444,842 | | |
^ See Note 2, "Significant Accounting Policies" in the Notes to Financial Statements for additional information.
+ Other Financial Instruments are derivatives not reflected in the Portfolio of Investments and may include open forward foreign currency contracts, futures, centrally cleared swaps, OTC swaps and written options. Forward foreign currency contracts, futures and centrally cleared swaps are valued at the unrealized gain (loss) on the instrument. OTC swaps and written options are valued at the fair value of the instrument.
# The earlier close of the foreign markets gives rise to the possibility that significant events, including broad market moves, may have occurred in the interim and may materially affect the value of those securities. To account for this, the Portfolio may frequently value many of its foreign equity securities using fair value prices based on third party vendor modeling tools to the extent available. Accordingly, a portion of the Portfolio's investments are categorized as Level 2 investments.
At December 31, 2016, the following futures contracts were outstanding for VY® Pioneer High Yield Portfolio:
Contract Description | | Number
of Contracts | | Expiration Date | | Notional
Value | | Unrealized
Appreciation/
(Depreciation) | |
Short Contracts | |
S&P 500 E-Mini | | | (19 | ) | | 03/17/17 | | $ | (2,124,390 | ) | | $ | 30,262 | | |
| | | | | | | $ | (2,124,390 | ) | | $ | 30,262 | | |
See Accompanying Notes to Financial Statements
141
VY® PIONEER SUMMARY PORTFOLIO OF INVESTMENTS
HIGH YIELD PORTFOLIO AS OF DECEMBER 31, 2016 (CONTINUED)
At December 31, 2016, the following centrally cleared credit default swaps were outstanding for VY® Pioneer High Yield Portfolio:
Centrally Cleared Credit Default Swaps on Credit Indices — Sell Protection(1)
Reference
Entity/Obligation | | Buy/Sell
Protection | | (Pay)/
Receive
Fixed
Rate (%) | | Clearinghouse | | Termination
Date | | Notional
Amount(2) | | Fair
Value(3) | | Unrealized
Appreciation/
(Depreciation) | |
CDX North American
High Yield Index
Series 23, Version 1 | | Sell | | | 5.000 | | | Chicago Mercantile Exchange | | 12/20/19 | | USD | 1,101,678 | | | $ | 86,829 | | | $ | 16,321 | | |
CDX North American
High Yield Index
Series 25, Version 1 | | Sell | | | 5.000 | | | Chicago Mercantile Exchange | | 12/20/20 | | USD | 2,044,350 | | | | 141,066 | | | | 85,812 | | |
| | | | | $ | 227,895 | | | $ | 102,133 | | |
(1) If the Portfolio is a seller of protection and a credit event occurs, as defined under the terms of that particular swap agreement, the Portfolio will generally either i) Pay to the buyer an amount equal to the notional amount of the swap and take delivery of the referenced obligation, other deliverable obligations, or underlying securities comprising a referenced index or ii) Pay a net settlement amount in the form of cash or securities equal to the notional amount of the swap less the recovery value of the referenced obligation or underlying securities comprising a referenced index.
(2) The maximum amount of future payments (undiscounted) that a Portfolio as seller of protection could be required to make or receive as a buyer of credit protection under a credit default swap agreement would be an amount equal to the notional amount of the agreement.
(3) The fair values for credit default swap agreements serve as an indicator of the current status of the payment/performance risk and represent the likelihood or risk of default for the credit derivative. Increasing fair values, in absolute terms, when compared to the notional amount of the agreement, represent a deterioration of the referenced obligation's credit soundness and a greater likelihood or risk of default or other credit event occurring.
A summary of derivative instruments by primary risk exposure is outlined in the following tables.
The fair value of derivative instruments as of December 31, 2016 was as follows:
Derivatives not accounted
for as hedging instruments | | Location on Statement of Assets and Liabilities | | Fair Value | |
Asset Derivatives | |
Credit contracts | | Net Assets — Unrealized appreciation* | | $ | 102,133 | | |
Equity contracts | | Net Assets — Unrealized appreciation** | | | 30,262 | | |
Total Asset Derivatives | | | | $ | 132,395 | | |
* Includes cumulative appreciation/depreciation of centrally cleared swaps as reported in the table following the Portfolio of Investments. Only current day's variation margin receivable/payable is shown on the Statement of Assets and Liabiliites.
** Includes cumulative appreciation/depreciation of futures contracts as reported in the table following the Portfolio of Investments.
The effect of derivative instruments on the Portfolio's Statement of Operations for the year ended December 31, 2016 was as follows:
| | | Amount of Realized Gain or (Loss) on Derivatives Recognized in Income | |
Derivatives not accounted
for as hedging instruments | | Futures | | Swaps | | Total | |
Credit Contract | | $ | — | | | $ | 141,185 | | | $ | 141,185 | | |
Equity contracts | | | (122,214 | ) | | | — | | | | (122,214 | ) | |
Total | | $ | (122,214 | ) | | $ | 141,185 | | | $ | 18,971 | | |
| | | Change in Unrealized Appreciation or (Depreciation) on Derivatives Recognized in Income | |
Derivatives not accounted
for as hedging instruments | | Futures | | Swaps | | Total | |
Credit contracts | | $ | — | | | $ | 146,722 | | | $ | 146,722 | | |
Equity contracts | | | 52,947 | | | | — | | | | 52,947 | | |
Total | | $ | 52,947 | | | $ | 146,722 | | | $ | 199,669 | | |
* Amounts recognized for purchased options are included in net realized gain (loss) on investments and net change in unrealized appreciation or depreciation on investments.
** Amounts recognized for forward foreign currency contracts are included in net realized gain (loss) on foreign currency related transactions and net change in unrealized appreciation or depreciation on foreign currency related transactions.
See Accompanying Notes to Financial Statements
142
VY® T. ROWE PRICE DIVERSIFIED SUMMARY PORTFOLIO OF INVESTMENTS
MID CAP GROWTH PORTFOLIO AS OF DECEMBER 31, 2016
Shares | |
| |
| |
Value | | Percentage
of Net
Assets | |
COMMON STOCK: 98.8% | | | |
| | | | | Consumer Discretionary: 21.3% | |
| | 9,800 | | | | @ | | | Autozone, Inc. | | $ | 7,739,942 | | | | 0.9 | | |
| | 62,200 | | | | @ | | | Burlington Stores, Inc. | | | 5,271,450 | | | | 0.6 | | |
| | 84,300 | | | | @ | | | Carmax, Inc. | | | 5,428,077 | | | | 0.6 | | |
| | 102,900 | | | | | | | Dollar General Corp. | | | 7,621,803 | | | | 0.9 | | |
| | 60,900 | | | | @ | | | Dollar Tree, Inc. | | | 4,700,262 | | | | 0.6 | | |
| | 320,900 | | | | | | | Hanesbrands, Inc. | | | 6,921,813 | | | | 0.8 | | |
| | 71,500 | | | | | | | L Brands, Inc. | | | 4,707,560 | | | | 0.6 | | |
| | 27,700 | | | | @ | | | O'Reilly Automotive, Inc. | | | 7,711,957 | | | | 0.9 | | |
| | 125,000 | | | | | | | Ross Stores, Inc. | | | 8,200,000 | | | | 1.0 | | |
| | 151,000 | | | | | | | Service Corp.
International | | | 4,288,400 | | | | 0.5 | | |
| | 67,100 | | | | | | | Tractor Supply Co. | | | 5,086,851 | | | | 0.6 | | |
| | 18,100 | | | | @ | | | Ulta Salon Cosmetics &
Fragrance, Inc. | | | 4,614,414 | | | | 0.5 | | |
| | 2,419,832 | | | | | | | Other Securities(a) | | | 108,272,084 | | | | 12.8 | | |
| | | | | | | | | | 180,564,613 | | | | 21.3 | | |
| | | | | Consumer Staples: 5.6% | |
| | 46,400 | | | | | | | Hershey Co. | | | 4,799,152 | | | | 0.6 | | |
| | 45,000 | | | | | | | McCormick & Co., Inc. | | | 4,199,850 | | | | 0.5 | | |
| | 59,800 | | | | | | | Mead Johnson
Nutrition Co. | | | 4,231,448 | | | | 0.5 | | |
| | 765,300 | | | | | | | Other Securities(a) | | | 34,233,737 | | | | 4.0 | | |
| | | | | | | | | | 47,464,187 | | | | 5.6 | | |
| | | | | Energy: 1.8% | |
| | 281,437 | | | | | | | Other Securities | | | 14,982,455 | | | | 1.8 | | |
| | | | | Financials: 7.8% | |
| | 86,833 | | | | | | | CBOE Holdings, Inc. | | | 6,416,090 | | | | 0.7 | | |
| | 129,100 | | | | | | | FNF Group | | | 4,384,236 | | | | 0.5 | | |
| | 1,008,030 | | | | | | | Other Securities(a) | | | 55,684,310 | | | | 6.6 | | |
| | | | | | | | | | 66,484,636 | | | | 7.8 | | |
| | | | | Health Care: 15.2% | |
| | 54,500 | | | | | | | AmerisourceBergen Corp. | | | 4,261,355 | | | | 0.5 | | |
| | 28,600 | | | | | | | Cooper Cos., Inc. | | | 5,002,998 | | | | 0.6 | | |
| | 77,650 | | | | | | | Dentsply Sirona, Inc. | | | 4,482,734 | | | | 0.5 | | |
| | 140,800 | | | | @ | | | Hologic, Inc. | | | 5,648,896 | | | | 0.7 | | |
| | 41,100 | | | | @ | | | Idexx Laboratories, Inc. | | | 4,819,797 | | | | 0.6 | | |
| | 45,900 | | | | @ | | | Incyte Corp., Ltd. | | | 4,602,393 | | | | 0.5 | | |
| | 11,400 | | | | @ | | | Intuitive Surgical, Inc. | | | 7,229,538 | | | | 0.9 | | |
| | 10,100 | | | | @ | | | Mettler Toledo
International, Inc. | | | 4,227,456 | | | | 0.5 | | |
| | 32,470 | | | | @,L | | | Tesaro, Inc. | | | 4,366,566 | | | | 0.5 | | |
| | 132,850 | | | | | | | Zoetis, Inc. | | | 7,111,461 | | | | 0.8 | | |
| | 1,327,629 | | | | | | | Other Securities(a) | | | 76,947,595 | | | | 9.1 | | |
| | | | | | | | | | 128,700,789 | | | | 15.2 | | |
Shares | |
| |
| |
Value | | Percentage
of Net
Assets | |
| | | | | Industrials: 17.0% | |
| | 45,787 | | | | | | | Equifax, Inc. | | $ | 5,413,397 | | | | 0.6 | | |
| | 54,100 | | | | | | | Rockwell Collins, Inc. | | | 5,018,316 | | | | 0.6 | | |
| | 77,500 | | | | @ | | | Verisk Analytics, Inc. | | | 6,290,675 | | | | 0.8 | | |
| | 2,093,866 | | | | | | | Other Securities(a) | | | 127,472,656 | | | | 15.0 | | |
| | | | | | | | | | 144,195,044 | | | | 17.0 | | |
| | | | | Information Technology: 19.6% | |
| | 104,700 | | | | | | | Amphenol Corp. | | | 7,035,840 | | | | 0.8 | | |
| | 182,479 | | | | @ | | | Atlassian Corp. PLC | | | 4,394,094 | | | | 0.5 | | |
| | 76,700 | | | | @ | | | Electronic Arts, Inc. | | | 6,040,892 | | | | 0.7 | | |
| | 67,500 | | | | | | | Fidelity National
Information
Services, Inc. | | | 5,105,700 | | | | 0.6 | | |
| | 82,100 | | | | @ | | | Fiserv, Inc. | | | 8,725,588 | | | | 1.0 | | |
| | 41,700 | | | | @ | | | Gartner, Inc. | | | 4,214,619 | | | | 0.5 | | |
| | 53,400 | | | | | | | Harris Corp. | | | 5,471,898 | | | | 0.7 | | |
| | 45,400 | | | | | | | Intuit, Inc. | | | 5,203,294 | | | | 0.6 | | |
| | 73,800 | | | | @ | | | Red Hat, Inc. | | | 5,143,860 | | | | 0.6 | | |
| | 180,700 | | | | | | | Sabre Corp. | | | 4,508,465 | | | | 0.5 | | |
| | 69,700 | | | | @ | | | ServiceNow, Inc. | | | 5,181,498 | | | | 0.6 | | |
| | 99,600 | | | | @ | | | Vantiv, Inc. | | | 5,938,152 | | | | 0.7 | | |
| | 60,100 | | | | @,L | | | VeriSign, Inc. | | | 4,571,807 | | | | 0.6 | | |
| | 1,791,865 | | | | | | | Other Securities(a) | | | 95,172,388 | | | | 11.2 | | |
| | | | | | | | | | 166,708,095 | | | | 19.6 | | |
| | | | | Materials: 5.5% | |
| | 82,100 | | | | | | | Ball Corp. | | | 6,163,247 | | | | 0.7 | | |
| | 87,100 | | | | | | | RPM International, Inc. | | | 4,688,593 | | | | 0.6 | | |
| | 18,600 | | | | | | | Sherwin-Williams Co. | | | 4,998,564 | | | | 0.6 | | |
| | 55,900 | | | | | | | Vulcan Materials Co. | | | 6,995,885 | | | | 0.8 | | |
| | 463,000 | | | | | | | Other Securities(a) | | | 23,719,026 | | | | 2.8 | | |
| | | | | | | | | | 46,565,315 | | | | 5.5 | | |
| | | | | Real Estate: 3.6% | |
| | 60,400 | | | | | | | Crown Castle
International Corp. | | | 5,240,908 | | | | 0.6 | | |
| | 16,615 | | | | | | | Equinix, Inc. | | | 5,938,367 | | | | 0.7 | | |
| | 591,314 | | | | | | | Other Securities | | | 19,303,883 | | | | 2.3 | | |
| | | | | | | | | | 30,483,158 | | | | 3.6 | | |
| | | | | Telecommunication Services: 0.9% | |
| | 70,850 | | | | @ | | | SBA
Communications Corp. | | | 7,315,971 | | | | 0.9 | | |
| | | | | Utilities: 0.5% | |
| | 117,000 | | | | | | | Other Securities | | | 4,535,554 | | | | 0.5 | | |
| | | | | | | | | Total Common Stock
(Cost $644,301,403) | | | 837,999,817 | | | | 98.8 | | |
See Accompanying Notes to Financial Statements
143
VY® T. ROWE PRICE DIVERSIFIED SUMMARY PORTFOLIO OF INVESTMENTS
MID CAP GROWTH PORTFOLIO AS OF DECEMBER 31, 2016 (CONTINUED)
Shares | |
| |
| |
Value | | Percentage
of Net
Assets | |
PREFERRED STOCK: 1.3% | | | |
| | | | | Consumer Discretionary: 0.1% | |
| | 8,859 | | | | | | | Other Securities | | $ | 825,216 | | | | 0.1 | | |
| | | | | Information Technology: 0.8% | |
| | 533,210 | | | | | | | Other Securities | | | 6,850,495 | | | | 0.8 | | |
| | | | | Real Estate: 0.4% | |
| | 103,987 | | | | | | | Other Securities | | | 3,369,179 | | | | 0.4 | | |
| | | | | | | Total Preferred Stock
(Cost $7,911,058) | | | 11,044,890 | | | | 1.3 | | |
| | | | | | | Total Long-Term
Investments
(Cost $652,212,461) | | | 849,044,707 | | | | 100.1 | | |
Principal
Amount† | |
| |
| |
Value | | Percentage
of Net
Assets | |
SHORT-TERM INVESTMENTS: 5.4% | | | |
| | | | | Securities Lending Collateralcc: 5.3% | |
| | 2,256,421 | | | | | | | Bank of Nova Scotia,
Repurchase
Agreement dated
12/30/16, 0.51%,
due 01/03/17
(Repurchase
Amount $2,256,547,
collateralized
by various
U.S. Government/U.S.
Government
Agency Obligations,
1.000%-4.000%,
Market Value plus
accrued interest
$2,301,680, due
12/31/17-10/20/46) | | $ | 2,256,421 | | | | 0.3 | | |
| | 10,721,519 | | | | | | | Cantor Fitzgerald,
Repurchase
Agreement dated
12/30/16, 0.50%,
due 01/03/17
(Repurchase
Amount $10,722,106,
collateralized
by various
U.S. Government/U.S.
Government Agency
Obligations,
0.000%-10.000%,
Market Value plus
accrued interest
$10,935,949, due
01/25/17-10/20/66) | | | 10,721,519 | | | | 1.3 | | |
Principal
Amount† | |
| |
| |
Value | | Percentage
of Net
Assets | |
| | 10,721,519 | | | | | | | Daiwa Capital Markets,
Repurchase
Agreement dated
12/30/16, 0.52%,
due 01/03/17
(Repurchase
Amount $10,722,130,
collateralized
by various
U.S. Government/U.S.
Government Agency
Obligations,
0.000%-6.500%,
Market Value plus
accrued interest
$10,935,949, due
03/02/17-02/01/49) | | $ | 10,721,519 | | | | 1.2 | | |
| | 10,721,519 | | | | | | | Nomura Securities,
Repurchase
Agreement dated
12/30/16, 0.50%,
due 01/03/17
(Repurchase
Amount $10,722,106,
collateralized
by various
U.S. Government/U.S.
Government Agency
Obligations,
0.000%-9.500%,
Market Value plus
accrued interest
$10,935,950, due
01/15/17-08/20/66) | | | 10,721,519 | | | | 1.2 | | |
| | 10,721,519 | | | | | | | State of Wisconsin
Investment Board,
Repurchase
Agreement dated
12/30/16, 0.65%,
due 01/03/17
(Repurchase
Amount $10,722,283,
collateralized
by various
U.S. Government
Securities,
0.125%-3.875%,
Market Value plus
accrued interest
$10,993,942, due
04/15/18-02/15/46) | | | 10,721,519 | | | | 1.3 | | |
| | | | | | | | | | 45,142,497 | | | | 5.3 | | |
See Accompanying Notes to Financial Statements
144
VY® T. ROWE PRICE DIVERSIFIED SUMMARY PORTFOLIO OF INVESTMENTS
MID CAP GROWTH PORTFOLIO AS OF DECEMBER 31, 2016 (CONTINUED)
Shares | |
| |
| |
Value | | Percentage
of Net
Assets | |
| | | | | Mutual Funds: 0.1% | |
| | 1,064,917 | | | | | | | T. Rowe Price Reserve
Investment Fund,
0.453%††
(Cost $1,064,917) | | $ | 1,064,917 | | | | 0.1 | | |
| | | | | | | Total Short-Term
Investments
(Cost $46,207,414) | | | 46,207,414 | | | | 5.4 | | |
| | | | | Total Investments
in Securities
(Cost $698,419,875) | | $ | 895,252,121 | | | | 105.5 | | |
| | | | | Liabilities in Excess
of Other Assets | | | (46,666,642 | ) | | | (5.5 | ) | |
| | | | | Net Assets | | $ | 848,585,479 | | | | 100.0 | | |
"Other Securities" represents issues not identified as the top 50 holdings in terms of market value and issues or issuers not exceeding 1% of net assets individually or in aggregate respectively as of December 31, 2016.
The following footnotes apply to either the individual securities noted or one or more of the securities aggregated and listed as a single line item.
† Unless otherwise indicated, principal amount is shown in USD.
†† Rate shown is the 7-day yield as of December 31, 2016.
@ Non-income producing security.
cc Represents securities purchased with cash collateral received for securities on loan.
L Loaned security, a portion or all of the security is on loan at December 31, 2016.
(a) This grouping contains securities on loan.
Cost for federal income tax purposes is $702,861,643.
Net unrealized appreciation consists of: | |
Gross Unrealized Appreciation | | $ | 225,333,782 | | |
Gross Unrealized Depreciation | | | (32,943,304 | ) | |
Net Unrealized Appreciation | | $ | 192,390,478 | | |
Fair Value Measurements^
The following is a summary of the fair valuations according to the inputs used as of December 31, 2016 in valuing the assets and liabilities:
| | | Quoted Prices
in Active Markets
for Identical Investments
(Level 1) | | Significant Other
Observable
Inputs#
(Level 2) | | Significant
Unobservable
Inputs
(Level 3) | | Fair Value
at
December 31, 2016 | |
Asset Table | |
Investments, at fair value | |
Common Stock | |
Consumer Discretionary | | $ | 180,564,613 | | | $ | — | | | $ | — | | | $ | 180,564,613 | | |
Consumer Staples | | | 47,464,187 | | | | — | | | | — | | | | 47,464,187 | | |
Energy | | | 14,216,446 | | | | 766,009 | | | | — | | | | 14,982,455 | | |
Financials | | | 66,484,636 | | | | — | | | | — | | | | 66,484,636 | | |
Health Care | | | 128,700,789 | | | | — | | | | — | | | | 128,700,789 | | |
Industrials | | | 144,195,044 | | | | — | | | | — | | | | 144,195,044 | | |
Information Technology | | | 166,096,095 | | | | — | | | | 612,000 | | | | 166,708,095 | | |
Materials | | | 46,565,315 | | | | — | | | | — | | | | 46,565,315 | | |
Real Estate | | | 29,618,111 | | | | — | | | | 865,047 | | | | 30,483,158 | | |
Telecommunication Services | | | 7,315,971 | | | | — | | | | — | | | | 7,315,971 | | |
Utilities | | | 4,535,554 | | | | — | | | | — | | | | 4,535,554 | | |
Total Common Stock | | | 835,756,761 | | | | 766,009 | | | | 1,477,047 | | | | 837,999,817 | | |
Preferred Stock | | | — | | | | — | | | | 11,044,890 | | | | 11,044,890 | | |
Short-Term Investments | | | 1,064,917 | | | | 45,142,497 | | | | — | | | | 46,207,414 | | |
Total Investments, at fair value | | $ | 836,821,678 | | | $ | 45,908,506 | | | $ | 12,521,937 | | | $ | 895,252,121 | | |
The following table presents additional information about valuation techniques and inputs used for investments that are measured at fair value and categorized within Level 3 at December 31, 2016.
| Investments, at fair value | | Fair Value at
December 31,
2016 | | Valuation
Technique(s) | | Unobservable
Inputs | | Range | | Impact to Valuation
from an Increase
in Input | |
Common Stock | |
Dropbox, Inc. - Series A | | $ | 424,848 | | | Market Comparable | | Enterprise Value to
Sales Multiple | | 5.2x-9.1x | | Increase | |
| | | | | | Discount for lack of
marketability | | 10% | | Decrease | |
| | | | | | Sales Growth Rate | | 40% | | Increase | |
| | | | | | Premium for Strategic
Acquisition | | 28% | | Increase | |
See Accompanying Notes to Financial Statements
145
VY® T. ROWE PRICE DIVERSIFIED SUMMARY PORTFOLIO OF INVESTMENTS
MID CAP GROWTH PORTFOLIO AS OF DECEMBER 31, 2016 (CONTINUED)
| Investments, at fair value | | Fair Value at
December 31,
2016 | | Valuation
Technique(s) | | Unobservable
Inputs | | Range | | Impact to Valuation
from an Increase
in Input | |
Dropbox, Inc. | | $ | 187,152 | | | Market Comparable | | Enterprise Value to
Sales Multiple | | 5.2x-9.1x | | Increase | |
| | | | | | Discount for lack of
marketability | | 10% | | Decrease | |
| | | | | | Sales Growth Rate | | 40% | | Increase | |
| | | | | | Premium for Strategic
Acquisition | | 28% | | Increase | |
WeWork Companies, Inc., - Class A | | | 865,047 | | | Recent Comparable
Transaction Price/
Market Comparable | | Discount for non-
controlling interest | | 15% | | Decrease | |
| | | | | | Enterprise Value to
Sales Multiple | | 14.7x | | Increase | |
| | | | | | | | Enterprise Value to
EBITDA | | 7.4x-19.1x | | Increase | |
| | | | | | | | Discount rate for the
Time Value of Money | | 17%-24% | | Decrease | |
| | | | | | | | Discount for lack of
marketability | | 10% | | Decrease | |
| | | | | | | | Sales Growth Rate | | 122% | | Increase | |
Total Common Stock | | $ | 1,477,047 | | | | | | | | | | |
Preferred Stock | |
AirBNB, Inc. - Series D | | $ | 3,401,055 | | | Recent Comparable
Transaction Price | | Discount Factor* | | 0.00% | | n/a | |
AirBNB, Inc. - Series E | | | 390,495 | | | Recent Comparable
Transaction Price | | Discount Factor* | | 0.00% | | n/a | |
Dropbox, Inc. - Series A | | | 232,406 | | | Market Comparable | | Enterprise Value to
Sales Multiple | | 5.2x-9.1x | | Increase | |
| | | | | | Discount for lack of
marketability | | 10% | | Decrease | |
| | | | | | Sales Growth Rate | | 40% | | Increase | |
| | | | | | Premium for Strategic
Acquisition | | 28% | | Increase | |
Dropbox, Inc. - Series A-1 | | | 1,141,642 | | | Market Comparable | | Enterprise Value to
Sales Multiple | | 5.2x-9.1x | | Increase | |
| | | | | | Discount for lack of
marketability | | 10% | | Decrease | |
| | | | | | Sales Growth Rate | | 40% | | Increase | |
| | | | | | Premium for Strategic
Acquisition | | 28% | | Increase | |
Flipkart Online Services - Pvt. Ltd., -
Series G | | | 825,216 | | | Recent Comparable
Transaction Price/
Market Comparable | | Discount Factor* | | 0.00% | | n/a | |
| | | | | | Enterprise Value to
Sales Multiple | | 3.1x-4.0x | | Increase | |
| | | | | | Discount for lack of
marketability | | 10% | | Decrease | |
| | | | | | Sales Growth Rate | | 28% | | Increase | |
Tanium, Inc.- Series G | | | 1,684,897 | | | Recent Comparable
Transaction Price/
Market Comparable | | Discount Factor* | | 0.00% | | n/a | |
| | | | | | Enterprise Value to
Sales Multiple | | 8.3x | | Increase | |
| | | | | | Discount for lack of
marketability | | 10% | | Decrease | |
| | | | | | Sales Growth Rate | | 99% | | Increase | |
See Accompanying Notes to Financial Statements
146
VY® T. ROWE PRICE DIVERSIFIED SUMMARY PORTFOLIO OF INVESTMENTS
MID CAP GROWTH PORTFOLIO AS OF DECEMBER 31, 2016 (CONTINUED)
| Investments, at fair value | | Fair Value at
December 31,
2016 | | Valuation
Technique(s) | | Unobservable
Inputs | | Range | | Impact to Valuation
from an Increase
in Input | |
WeWork Companies, Inc. - Series D-1
| | $ | 1,438,430
| | | Recent Comparable
Transaction Price/
Market Comparable | |
Discount for non-
controlling interest | |
15% | |
Decrease | |
| | | | | | Enterprise Value to
Sales Multiple | | 14.7x | | Increase | |
| | | | | | Enterprise Value to
EBITDA | | 7.4x-19.1x | | Increase | |
| | | | | | Discount rate for the
Time Value of Money | | 17%-24% | | Decrease | |
| | | | | | Discount for lack of
marketability | | 10% | | Decrease | |
| | | | | | Sales Growth Rate | | 122% | | Increase | |
WeWork Companies, Inc. - Series D-2 | | | 1,130,177 | | | Recent Comparable
Transaction Price/
Market Comparable | | Discount for non-
controlling interest | | 15% | | Decrease | |
| | | | | | Enterprise Value to
Sales Multiple | | 14.7x | | Increase | |
| | | | | | Enterprise Value to
EBITDA | | 7.4x-19.1x | | Increase | |
| | | | | | Discount rate for the
Time Value of Money | | 17%-24% | | Decrease | |
| | | | | | Discount for lack of
marketability | | 10% | | Decrease | |
| | | | | | Sales Growth Rate | | 122% | | Increase | |
WeWork Companies, Inc. - Series E | | | 800,572 | | | Recent Comparable
Transaction Price/
Market Comparable | | Discount for non-
controlling interest | | 15% | | Decrease | |
| | | | | | Enterprise Value to
Sales Multiple | | 14.7x | | Increase | |
| | | | | | Enterprise Value to
EBITDA | | 7.4x-19.1x | | Increase | |
| | | | | | Discount rate for the
Time Value of Money | | 17%-24% | | Decrease | |
| | | | | | Discount for lack of
marketability | | 10% | | Decrease | |
| | | | | | Sales Growth Rate | | 122% | | Increase | |
Total Preferred Stock | | $ | 11,044,890 | | | | | | | | | | |
* No quantitative unobservable inputs were significant to the fair valuation determination at December 31, 2016.
The following is a reconciliation of the fair valuations using significant unobservable inputs (Level 3) for the Portfolio's assets and liabilities during the year ended December 31, 2016:
| | Beginning
Balance
12/31/15 | | Purchases | | Sales | | Accrued
Discounts/
(Premiums) | | Total
Realized
Gain/(Loss) | | Net Change
in Unrealized
Appreciation/
(Depreciation)* | | Transfers
Into
Level 3 | | Transfers
Out of
Level 3 | | Ending
Balance
12/31/16 | |
Asset Table | |
Investments,
at fair value
Common Stock | | $ | 1,477,438 | | | $ | — | | | $ | — | | | $ | — | | | $ | — | | | $ | (391 | ) | | $ | — | | | $ | — | | | $ | 1,477,047 | | |
Preferred Stock | | | 11,144,623 | | | | — | | | | — | | | | — | | | | — | | | | (99,733 | ) | | | — | | | | — | | | | 11,044,890 | | |
Total Investments,
at value | | $ | 12,622,061 | | | $ | — | | | $ | — | | | $ | — | | | $ | — | | | $ | (100,124 | ) | | $ | — | | | $ | — | | | $ | 12,521,937 | | |
* As of December 31, 2016 total change in unrealized gain (loss) on Level 3 securities still held at period end and included in the change in net assets was $(100,124).
See Accompanying Notes to Financial Statements
147
VY® T. ROWE PRICE SUMMARY PORTFOLIO OF INVESTMENTS
GROWTH EQUITY PORTFOLIO AS OF DECEMBER 31, 2016
Shares | |
| |
| | Value | | Percentage
of Net
Assets | |
COMMON STOCK: 97.6% | | | |
| | | | | Consumer Discretionary: 25.7% | |
| | 153,900 | | | | @ | | | Amazon.com, Inc. | | $ | 115,404,993 | | | | 7.6 | | |
| | 22,851 | | | | @ | | | Autozone, Inc. | | | 18,047,491 | | | | 1.2 | | |
| | 171,700 | | | | | | | Delphi Automotive PLC | | | 11,563,995 | | | | 0.8 | | |
| | 208,920 | | | | L | | | Ferrari NV | | | 12,146,609 | | | | 0.8 | | |
| | 193,100 | | | | | | | Lowe's Cos, Inc. | | | 13,733,272 | | | | 0.9 | | |
| | 165,100 | | | | | | | Marriott International,
Inc. | | | 13,650,468 | | | | 0.9 | | |
| | 504,260 | | | | @ | | | MGM Resorts
International | | | 14,537,816 | | | | 1.0 | | |
| | 44,859 | | | | @ | | | Priceline.com, Inc. | | | 65,765,985 | | | | 4.3 | | |
| | 172,400 | | | | | | | Ross Stores, Inc. | | | 11,309,440 | | | | 0.7 | | |
| | 230,500 | | | | | | | Starbucks Corp. | | | 12,797,360 | | | | 0.8 | | |
| | 98,875 | | | | @,L | | | Tesla Motors, Inc. | | | 21,128,599 | | | | 1.4 | | |
| | 162,102 | | | | | | | Tractor Supply Co. | | | 12,288,952 | | | | 0.8 | | |
| | 1,025,480 | | | | | | | Other Securities | | | 69,377,669 | | | | 4.5 | | |
| | | | | | | | | | 391,752,649 | | | | 25.7 | | |
| | | | | Consumer Staples: 3.6% | |
| | 295,500 | | | | | | | Mondelez International,
Inc. | | | 13,099,515 | | | | 0.9 | | |
| | 242,700 | | | | | | | Philip Morris
International, Inc. | | | 22,204,623 | | | | 1.5 | | |
| | 212,187 | | | | | | | Walgreens Boots
Alliance, Inc. | | | 17,560,596 | | | | 1.1 | | |
| | 12,400 | | | | | | | Other Securities | | | 1,985,364 | | | | 0.1 | | |
| | | | | | | | | | 54,850,098 | | | | 3.6 | | |
| | | | | Financials: 6.1% | |
| | 283,500 | | | | | | | Charles Schwab Corp. | | | 11,189,745 | | | | 0.7 | | |
| | 306,600 | | | | | | | Intercontinental
Exchange, Inc. | | | 17,298,372 | | | | 1.1 | | |
| | 130,600 | | | | | | | JPMorgan Chase & Co. | | | 11,269,474 | | | | 0.8 | | |
| | 606,600 | | | | | | | Morgan Stanley | | | 25,628,850 | | | | 1.7 | | |
| | 162,900 | | | | | | | State Street Corp. | | | 12,660,588 | | | | 0.8 | | |
| | 283,431 | | | | | | | TD Ameritrade Holding
Corp. | | | 12,357,592 | | | | 0.8 | | |
| | 34,000 | | | | | | | Other Securities | | | 3,132,760 | | | | 0.2 | | |
| | | | | | | | | | 93,537,381 | | | | 6.1 | | |
| | | | | Health Care: 15.4% | |
| | 124,069 | | | | | | | Aetna, Inc. | | | 15,385,797 | | | | 1.0 | | |
| | 174,819 | | | | @ | | | Alexion
Pharmaceuticals, Inc. | | | 21,389,105 | | | | 1.4 | | |
| | 69,048 | | | | @ | | | Biogen, Inc. | | | 19,580,632 | | | | 1.3 | | |
| | 195,200 | | | | | | | Bristol-Myers
Squibb Co. | | | 11,407,488 | | | | 0.7 | | |
| | 271,500 | | | | | | | Danaher Corp. | | | 21,133,560 | | | | 1.4 | | |
| | 71,815 | | | | | | | Humana, Inc. | | | 14,652,414 | | | | 1.0 | | |
| | 37,500 | | | | @ | | | Intuitive Surgical, Inc. | | | 23,781,375 | | | | 1.5 | | |
| | 151,300 | | | | | | | Stryker Corp. | | | 18,127,253 | | | | 1.2 | | |
| | 150,000 | | | | | | | UnitedHealth Group,
Inc. | | | 24,006,000 | | | | 1.6 | | |
Shares | |
| |
| | Value | | Percentage
of Net
Assets | |
| | 222,600 | | | | | | | Zoetis, Inc. | | $ | 11,915,778 | | | | 0.8 | | |
| | 497,024 | | | | | | | Other Securities | | | 54,278,789 | | | | 3.5 | | |
| | | | | | | | | | 235,658,191 | | | | 15.4 | | |
| | | | | Industrials: 6.5% | |
| | 466,130 | | | | | | | American Airlines
Group, Inc. | | | 21,763,609 | | | | 1.4 | | |
| | 137,600 | | | | | | | Boeing Co. | | | 21,421,568 | | | | 1.4 | | |
| | 64,000 | | | | | | | Roper Technologies,
Inc. | | | 11,717,120 | | | | 0.8 | | |
| | 590,416 | | | | | | | Other Securities(a) | | | 44,902,845 | | | | 2.9 | | |
| | | | | | | | | | 99,805,142 | | | | 6.5 | | |
| | | | | Information Technology: 35.6% | |
| | 202,900 | | | | @ | | | Alibaba Group
Holding Ltd. ADR | | | 17,816,649 | | | | 1.2 | | |
| | 70,150 | | | | @ | | | Alphabet, Inc. - Class A | | | 55,590,368 | | | | 3.6 | | |
| | 61,071 | | | | @ | | | Alphabet, Inc. - Class C | | | 47,135,819 | | | | 3.1 | | |
| | 382,800 | | | | | | | Apple, Inc. | | | 44,335,896 | | | | 2.9 | | |
| | 117,200 | | | | L | | | ASML Holding
NV-NY REG | | | 13,149,840 | | | | 0.9 | | |
| | 545,469 | | | | @ | | | Facebook, Inc. | | | 62,756,209 | | | | 4.1 | | |
| | 115,028 | | | | @ | | | Fiserv, Inc. | | | 12,225,176 | | | | 0.8 | | |
| | 328,900 | | | | | | | Mastercard, Inc. | | | 33,958,925 | | | | 2.2 | | |
| | 986,600 | | | | | | | Microsoft Corp. | | | 61,307,324 | | | | 4.0 | | |
| | 207,007 | | | | @ | | | NXP Semiconductor
NV - NXPI - US | | | 20,288,756 | | | | 1.3 | | |
| | 758,500 | | | | @ | | | PayPal Holdings, Inc. | | | 29,937,995 | | | | 2.0 | | |
| | 364,264 | | | | @ | | | Salesforce.com, Inc. | | | 24,937,513 | | | | 1.6 | | |
| | 186,460 | | | | @ | | | ServiceNow, Inc. | | | 13,861,436 | | | | 0.9 | | |
| | 792,200 | | | | | | | Tencent Holdings Ltd. | | | 19,208,564 | | | | 1.3 | | |
| | 589,900 | | | | | | | Visa, Inc. - Class A | | | 46,023,998 | | | | 3.0 | | |
| | 590,721 | | | | | | | Other Securities(a) | | | 41,576,418 | | | | 2.7 | | |
| | | | | | | | | | 544,110,886 | | | | 35.6 | | |
| | | | | Materials: 0.7% | |
| | 64,805 | | | | | | | Other Securities | | | 10,079,908 | | | | 0.7 | | |
| | | | | Real Estate: 2.9% | |
| | 219,900 | | | | | | | American Tower Corp. | | | 23,239,032 | | | | 1.5 | | |
| | 129,912 | | | | | | | Crown Castle
International Corp. | | | 11,272,464 | | | | 0.7 | | |
| | 32,362 | | | | | | | Other Securities | | | 9,921,302 | | | | 0.7 | | |
| | | | | | | | | | 44,432,798 | | | | 2.9 | | |
| | | | | Telecommunication Services: 0.4% | |
| | 113,700 | | | | | | | Other Securities | | | 6,538,887 | | | | 0.4 | | |
| | | | | Utilities: 0.7% | |
| | 90,500 | | | | | | | Other Securities | | | 10,811,130 | | | | 0.7 | | |
| | | | | | | Total Common Stock
(Cost $1,173,420,773) | | | 1,491,577,070 | | | | 97.6 | | |
See Accompanying Notes to Financial Statements
148
VY® T. ROWE PRICE SUMMARY PORTFOLIO OF INVESTMENTS
GROWTH EQUITY PORTFOLIO AS OF DECEMBER 31, 2016 (CONTINUED)
Shares | |
| |
| | Value | | Percentage
of Net
Assets | |
PREFERRED STOCK: 1.5% | | | |
| | | | | Consumer Discretionary: 0.2% | |
| | 36,963 | | | | | | | Other Securities | | $ | 3,443,103 | | | | 0.2 | | |
| | | | | Information Technology: 1.2% | |
| | 389,009 | | | | | | | Other Securities | | | 18,660,586 | | | | 1.2 | | |
| | | | | Real Estate: 0.1% | |
| | 45,554 | | | | | | | Other Securities | | | 1,475,950 | | | | 0.1 | | |
| | | | | | | Total Preferred Stock
(Cost $20,129,811) | | | 23,579,639 | | | | 1.5 | | |
| | | | | | | Total Long-Term
Investments
(Cost $1,193,550,584) | | | 1,515,156,709 | | | | 99.1 | | |
Principal
Amount† | |
| |
| | Value | | Percentage
of Net
Assets | |
SHORT-TERM INVESTMENTS: 3.9% | | | |
| | | | | Securities Lending Collateralcc: 3.2% | |
| | 2,429,810 | | | | | | | Bank of Nova Scotia,
Repurchase
Agreement dated
12/30/16, 0.51%,
due 01/03/17
(Repurchase Amount
$2,429,946,
collateralized by
various U.S.
Government/U.S.
Government Agency
Obligations,
1.000%-4.000%,
Market Value plus
accrued interest
$2,478,547, due
12/31/17-10/20/46) | | $ | 2,429,810 | | | | 0.2 | | |
| | 11,544,871 | | | | | | | Cantor Fitzgerald,
Repurchase
Agreement dated
12/30/16, 0.50%,
due 01/03/17
(Repurchase Amount
$11,545,504,
collateralized by
various U.S.
Government/U.S.
Government Agency
Obligations,
0.000%-10.000%,
Market Value plus
accrued interest
$11,775,768, due
01/25/17-10/20/66) | | | 11,544,871 | | | | 0.8 | | |
Principal
Amount† | |
| |
| | Value | | Percentage
of Net
Assets | |
| | 11,544,871 | | | | | | | Daiwa Capital Markets,
Repurchase
Agreement dated
12/30/16, 0.52%,
due 01/03/17
(Repurchase Amount
$11,545,529,
collateralized by
various U.S.
Government/U.S.
Government Agency
Obligations,
0.000%-6.500%,
Market Value plus
accrued interest
$11,775,769, due
03/02/17-02/01/49) | | $ | 11,544,871 | | | | 0.8 | | |
| | 11,544,871 | | | | | | | Nomura Securities,
Repurchase
Agreement dated
12/30/16, 0.50%,
due 01/03/17
(Repurchase Amount
$11,545,504,
collateralized by
various U.S.
Government/U.S.
Government Agency
Obligations,
0.000%-9.500%,
Market Value plus
accrued interest
$11,775,769, due
01/15/17-08/20/66) | | | 11,544,871 | | | | 0.7 | | |
| | 11,544,871 | | | | | | | State of Wisconsin
Investment Board,
Repurchase
Agreement dated
12/30/16, 0.65%,
due 01/03/17
(Repurchase Amount
$11,545,693,
collateralized by
various U.S.
Government
Securities,
0.125%-3.875%,
Market Value plus
accrued interest
$11,838,215, due
04/15/18-02/15/46) | | | 11,544,871 | | | | 0.7 | | |
| | | | | | | | | | 48,609,294 | | | | 3.2 | | |
See Accompanying Notes to Financial Statements
149
VY® T. ROWE PRICE SUMMARY PORTFOLIO OF INVESTMENTS
GROWTH EQUITY PORTFOLIO AS OF DECEMBER 31, 2016 (CONTINUED)
Shares | |
| |
| | Value | | Percentage
of Net
Assets | |
| | | | | Mutual Funds: 0.7% | |
| | 10,570,215 | | | | | | | T. Rowe Price Reserve
Investment Fund,
0.453%††
(Cost $10,570,215) | | $ | 10,570,215 | | | | 0.7 | | |
| | | | | Total Short-Term
Investments
(Cost $59,179,509) | | | 59,179,509 | | | | 3.9 | | |
| | | | | Total Investments in
Securities
(Cost $1,252,730,093) | | $ | 1,574,336,218 | | | | 103.0 | | |
| | | | | Liabilities in Excess
of Other Assets | | | (46,557,135 | ) | | | (3.0 | ) | |
| | | | | Net Assets | | $ | 1,527,779,083 | | | | 100.0 | | |
"Other Securities" represents issues not identified as the top 50 holdings in terms of market value and issues or issuers not exceeding 1% of net assets individually or in aggregate respectively as of December 31, 2016.
The following footnotes apply to either the individual securities noted or one or more of the securities aggregated and listed as a single line item.
† Unless otherwise indicated, principal amount is shown in USD.
†† Rate shown is the 7-day yield as of December 31, 2016.
@ Non-income producing security.
ADR American Depositary Receipt
cc Represents securities purchased with cash collateral received for securities on loan.
L Loaned security, a portion or all of the security is on loan at December 31, 2016.
(a) This grouping contains securities on loan.
Cost for federal income tax purposes is $1,256,763,447.
Net unrealized appreciation consists of: | |
Gross Unrealized Appreciation | | $ | 344,622,148 | | |
Gross Unrealized Depreciation | | | (27,049,377 | ) | |
Net Unrealized Appreciation | | $ | 317,572,771 | | |
Fair Value Measurements^
The following is a summary of the fair valuations according to the inputs used as of December 31, 2016 in valuing the assets and liabilities:
| | | Quoted Prices
in Active Markets
for Identical Investments
(Level 1) | | Significant Other
Observable
Inputs#
(Level 2) | | Significant
Unobservable
Inputs
(Level 3) | | Fair Value
at
December 31, 2016 | |
Asset Table | |
Investments, at fair value | |
Common Stock | |
Consumer Discretionary | | $ | 391,465,002 | | | $ | — | | | $ | 287,647 | | | $ | 391,752,649 | | |
Consumer Staples | | | 54,850,098 | | | | — | | | | — | | | | 54,850,098 | | |
Financials | | | 93,537,381 | | | | — | | | | — | | | | 93,537,381 | | |
Health Care | | | 235,658,191 | | | | — | | | | — | | | | 235,658,191 | | |
Industrials | | | 99,805,142 | | | | — | | | | — | | | | 99,805,142 | | |
Information Technology | | | 523,526,229 | | | | 19,208,564 | | | | 1,376,093 | | | | 544,110,886 | | |
Materials | | | 10,079,908 | | | | — | | | | — | | | | 10,079,908 | | |
Real Estate | | | 44,268,789 | | | | — | | | | 164,009 | | | | 44,432,798 | | |
Telecommunication Services | | | 6,538,887 | | | | — | | | | — | | | | 6,538,887 | | |
Utilities | | | 10,811,130 | | | | — | | | | — | | | | 10,811,130 | | |
Total Common Stock | | | 1,470,540,757 | | | | 19,208,564 | | | | 1,827,749 | | | | 1,491,577,070 | | |
Preferred Stock | | | — | | | | — | | | | 23,579,639 | | | | 23,579,639 | | |
Short-Term Investments | | | 10,570,215 | | | | 48,609,294 | | | | — | | | | 59,179,509 | | |
Total Investments, at fair value | | $ | 1,481,110,972 | | | $ | 67,817,858 | | | $ | 25,407,388 | | | $ | 1,574,336,218 | | |
^ See Note 2, "Significant Accounting Policies" in the Notes to Financial Statements for additional information.
# The earlier close of the foreign markets gives rise to the possibility that significant events, including broad market moves, may have occurred in the interim and may materially affect the value of those securities. To account for this, the Portfolio may frequently value many of its foreign equity securities using fair value prices based on third party vendor modeling tools to the extent available. Accordingly, a portion of the Portfolio's investments are categorized as Level 2 investments.
See Accompanying Notes to Financial Statements
150
VY® T. ROWE PRICE SUMMARY PORTFOLIO OF INVESTMENTS
GROWTH EQUITY PORTFOLIO AS OF DECEMBER 31, 2016 (CONTINUED)
The following table presents additional information about valuation techniques and inputs used for investments that are measured at fair value and categorized within Level 3 at December 31, 2016.
| Investments, at fair value | | Fair Value at
December 31,
2016 | | Valuation
Technique(s) | | Unobservable
Inputs | | Range | | Impact to Valuation
from an Increase
in Input | |
Common Stock | |
Dropbox, Inc. - Series A | | $ | 1,376,093 | | | Market Comparable | | Enterprise Value to
Sales Multiple | | 5.2x-9.1x | | Increase | |
| | | | | | Discount for lack of
marketability | | 10% | | Decrease | |
| | | | | | Sales Growth Rate | | 40% | | Increase | |
| | | | | | Premium for Strategic
Acquisition | | 28% | | Increase | |
Flipkart Online Services Pvt. Ltd. | | | 287,647 | | | Recent Comparable
Transaction Price/
Market Comparable | | Discount Factor* | | 0.00% | | n/a | |
| | | | | | Enterprise Value to
Sales Multiple | | 3.1x-4.0x | | Increase | |
| | | | | | Discount for lack of
marketability | | 10% | | Decrease | |
| | | | | | Sales Growth Rate | | 28% | | Increase | |
WeWork Companies, Inc., - Class A
| | | 164,009
| | | Recent Comparable
Transaction Price/
Market Comparable | |
Discount for non-
controlling interest | |
15% | |
Decrease | |
| | | | | | Enterprise Value to
Sales Multiple | | 14.7x | | Increase | |
| | | | | | Enterprise Value to
EBITDA | | 7.4x-19.1x | | Increase | |
| | | | | | Discount rate for the
Time Value of Money | | 17%-24% | | Decrease | |
| | | | | | Discount for lack of
marketability | | 10% | | Decrease | |
| | | | | | Sales Growth Rate | | 122% | | Increase | |
Total Common Stock | | $ | 1,827,749 | | | | | | | | | | |
Preferred Stock | |
AirBNB, Inc. - Series D | | | 6,220,305 | | | Recent Comparable
Transaction Price | | Discount Factor* | | 0.00% | | n/a | |
AirBNB, Inc. - Series E | | | 1,686,090 | | | Recent Comparable
Transaction Price | | Discount Factor* | | 0.00% | | n/a | |
Flipkart Online Services
Pvt. Ltd., - Series A | | | 98,180 | | | Recent Comparable
Transaction Price/
Market Comparable | | Discount Factor* | | 0.00% | | n/a | |
| | | | | | Enterprise Value to
Sales Multiple | | 3.1x-4.0x | | Increase | |
| | | | | | Discount for lack of
marketability | | 10% | | Decrease | |
| | | | | | Sales Growth Rate | | 28% | | Increase | |
Flipkart Online Services Pvt. Ltd., -
Series C | | | 173,445 | | | Recent Comparable
Transaction Price/
Market Comparable | | Discount Factor* | | 0.00% | | n/a | |
| | | | | | Enterprise Value to
Sales Multiple | | 3.1x-4.0x | | Increase | |
| | | | | | Discount for lack of
marketability | | 10% | | Decrease | |
| | | | | | Sales Growth Rate | | 28% | | Increase | |
Flipkart Online Services Pvt. Ltd., -
Series E | | | 322,485 | | | Recent Comparable
Transaction Price/
Market Comparable | | Discount Factor* | | 0.00% | | n/a | |
| | | | | | Enterprise Value to
Sales Multiple | | 3.1x-4.0x | | Increase | |
| | | | | | Discount for lack of
marketability | | 10% | | Decrease | |
| | | | | | Sales Growth Rate | | 28% | | Increase | |
See Accompanying Notes to Financial Statements
151
VY® T. ROWE PRICE SUMMARY PORTFOLIO OF INVESTMENTS
GROWTH EQUITY PORTFOLIO AS OF DECEMBER 31, 2016 (CONTINUED)
| Investments, at fair value | | Fair Value at
December 31,
2016 | | Valuation
Technique(s) | | Unobservable
Inputs | | Range | | Impact to Valuation
from an Increase
in Input | |
Flipkart Online Services Pvt. Ltd., -
Series G $1,542,192 | | Recent Comparable | | Transaction Price/
Market Comparable | | Discount Factor* | | 0.00% | | n/a | |
| | | | | | Enterprise Value to
Sales Multiple | | 3.1x-4.0x | | Increase | |
| | | | | | Discount for lack of
marketability | | 10% | | Decrease | |
| | | | | | Sales Growth Rate | | 28% | | Increase | |
Flipkart Online Services Pvt. Ltd., -
Series H
| | | 1,306,801
| | | Recent Comparable
Transaction Price/
Market Comparable | |
Discount Factor* | |
0.00% | |
n/a | |
| | | | | | Enterprise Value to
Sales Multiple | | 3.1x-4.0x | | Increase | |
| | | | | | Discount for lack of
marketability | | 10% | | Decrease | |
| | | | | | Sales Growth Rate | | 28% | | Increase | |
Magic Leap, Inc., - Series C | | | 2,152,641 | | | Recent Comparable
Transaction Price | | Discount Factor* | | 0.00% | | n/a | |
Snapchat, Inc. - Series F | | | 2,421,965 | | | Recent Comparable
Transaction Price | | Discount Factor* | | 0.00% | | n/a | |
Uber Technologies, Inc. - Series G | | | 3,579,148 | | | Recent Comparable
Transaction Price | | Discount Factor* | | 0.00% | | n/a | |
WeWork Companies, Inc. - Series E | | | 1,475,950 | | | Recent Comparable
Transaction Price/
Market Comparable | | Discount for non-
controlling interest | | 15% | | Decrease | |
| | | | | | Enterprise Value to
Sales Multiple | | 14.7x | | Increase | |
| | | | | | Enterprise Value to
EBITDA | | 7.4x-19.1x | | Increase | |
| | | | | | Discount rate for the
Time Value of Money | | 17%-24% | | Decrease | |
| | | | | | Discount for lack of
marketability | | 10% | | Decrease | |
| | | | | | Sales Growth Rate | | 122% | | Increase | |
Xiaoju Kuaizhi, Inc., Series A-17 | | | 2,600,437 | | | Recent Comparable
Transaction Price | | Discount Factor* | | 0.00% | | n/a | |
Total Preferred Stock | | $ | 23,579,639 | | | | | | | | | | |
* No quantitative unobservable inputs were significant to the fair valuation determination at December 31, 2016.
The following is a reconciliation of the fair valuations using significant unobservable inputs (Level 3) for the Portfolio's assets and liabilities during the year ended December 31, 2016:
| | Beginning
Balance
12/31/15 | | Purchases | | Sales | | Accrued
Discounts/
(Premiums) | | Total
Realized
Gain/(Loss) | | Net Change
in Unrealized
Appreciation/
(Depreciation)* | | Transfers
Into
Level 3 | | Transfers
Out of
Level 3 | | Ending
Balance
12/31/16 | |
Asset Table | |
Investments,
at fair value
Common Stock | | $ | 1,953,306 | | | $ | — | | | $ | — | | | $ | — | | | $ | — | | | $ | (125,557 | ) | | $ | — | | | $ | — | | | $ | 1,827,749 | | |
Preferred Stock | | | 19,424,931 | | | | 4,574,606 | | | | — | | | | — | | | | — | | | | (419,898 | ) | | | — | | | | — | | | | 23,579,639 | | |
Total Investments,
at value | | $ | 21,378,237 | | | $ | 4,574,606 | | | $ | — | | | $ | — | | | $ | — | | | $ | (545,455 | ) | | $ | — | | | $ | — | | | $ | 25,407,388 | | |
* As of December 31, 2016, total change in unrealized gain (loss) on Level 3 securities still held at year end and included in the change in net assets was $(545,455).
See Accompanying Notes to Financial Statements
152
VY® TEMPLETON SUMMARY PORTFOLIO OF INVESTMENTS
FOREIGN EQUITY PORTFOLIO AS OF DECEMBER 31, 2016
Shares | |
| |
| | Value | | Percentage
of Net
Assets | |
COMMON STOCK: 97.7% | | | |
| | | | | Canada: 0.5% | |
| | 167,100 | | | | | | | Other Securities | | $ | 3,228,372 | | | | 0.5 | | |
| | | | | China: 6.8% | |
| | 36,110 | | | | @ | | | Baidu, Inc. ADR | | | 5,936,845 | | | | 0.9 | | |
| | 2,585,000 | | | | | | | China Life Insurance
Co., Ltd. | | | 6,682,093 | | | | 1.1 | | |
| | 670,500 | | | | | | | China Mobile Ltd. | | | 7,069,199 | | | | 1.1 | | |
| | 21,246,000 | | | | | | | China Telecom Corp.,
Ltd. | | | 9,745,734 | | | | 1.6 | | |
| | 10,446,300 | | | | | | | Other Securities | | | 13,462,799 | | | | 2.1 | | |
| | | | | | | | | | 42,896,670 | | | | 6.8 | | |
| | | | | France: 10.3% | |
| | 306,996 | | | | | | | AXA S.A. | | | 7,739,027 | | | | 1.2 | | |
| | 195,968 | | | | | | | BNP Paribas | | | 12,471,035 | | | | 2.0 | | |
| | 191,520 | | | | | | | Cie de Saint-Gobain | | | 8,909,040 | | | | 1.4 | | |
| | 57,514 | | | | | | | Cie Generale des
Etablissements
Michelin | | | 6,393,210 | | | | 1.0 | | |
| | 499,790 | | | | | | | Credit Agricole SA | | | 6,186,762 | | | | 1.0 | | |
| | 135,141 | | | | | | | Sanofi | | | 10,928,238 | | | | 1.8 | | |
| | 171,714 | | | | | | | Total S.A. | | | 8,807,601 | | | | 1.4 | | |
| | 141,860 | | | | | | | Other Securities | | | 3,253,002 | | | | 0.5 | | |
| | | | | | | | | | 64,687,915 | | | | 10.3 | | |
| | | | | Germany: 12.3% | |
| | 100,971 | | | | | | | Bayer AG | | | 10,519,544 | | | | 1.7 | | |
| | 87,505 | | | | | | | HeidelbergCement AG | | | 8,144,994 | | | | 1.3 | | |
| | 521,675 | | | | | | | Infineon
Technologies AG | | | 9,023,693 | | | | 1.4 | | |
| | 157,650 | | | | #,@ | | | Innogy SE | | | 5,478,038 | | | | 0.9 | | |
| | 143,370 | | | | | | | Lanxess | | | 9,388,364 | | | | 1.5 | | |
| | 103,258 | | | | | | | Merck KGaA | | | 10,751,354 | | | | 1.7 | | |
| | 65,920 | | | | | | | Siemens AG | | | 8,071,269 | | | | 1.3 | | |
| | 273,394 | | | | | | | Other Securities(a) | | | 16,042,278 | | | | 2.5 | | |
| | | | | | | | | | 77,419,534 | | | | 12.3 | | |
| | | | | Hong Kong: 2.6% | |
| | 228,400 | | | | | | | CK Hutchison Holdings
Ltd. ADR | | | 2,592,340 | | | | 0.4 | | |
| | 485,640 | | | | | | | CK Hutchison Holdings
Ltd. | | | 5,482,127 | | | | 0.9 | | |
| | 1,459,540 | | | | | | | Other Securities | | | 8,421,434 | | | | 1.3 | | |
| | | | | | | | | | 16,495,901 | | | | 2.6 | | |
| | | | | India: 1.5% | |
| | 496,486 | | | | | | | Housing Development
Finance Corp. | | | 9,207,786 | | | | 1.5 | | |
| | | | | Israel: 1.8% | |
| | 301,899 | | | | | | | Teva Pharmaceutical
Industries Ltd. ADR | | | 10,943,839 | | | | 1.8 | | |
Shares | |
| |
| | Value | | Percentage
of Net
Assets | |
| | | | | Italy: 2.0% | |
| | 680,187 | | | | | | | ENI S.p.A. | | $ | 11,026,598 | | | | 1.7 | | |
| | 575,172 | | | | | | | Other Securities(a) | | | 1,651,745 | | | | 0.3 | | |
| | | | | | | | | | 12,678,343 | | | | 2.0 | | |
| | | | | Japan: 11.9% | |
| | 851,600 | | | | | | | Konica Minolta, Inc. | | | 8,439,953 | | | | 1.3 | | |
| | 988,300 | | | | | | | Nissan Motor Co., Ltd. | | | 9,913,779 | | | | 1.6 | | |
| | 190,100 | | | | | | | Omron Corp. | | | 7,264,665 | | | | 1.2 | | |
| | 171,300 | | | | | | | SoftBank Group Corp. | | | 11,335,616 | | | | 1.8 | | |
| | 240,400 | | | | | | | Suntory Beverage &
Food Ltd. | | | 9,957,757 | | | | 1.6 | | |
| | 4,116,400 | | | | | | | Other Securities | | | 27,741,496 | | | | 4.4 | | |
| | | | | | | | | | 74,653,266 | | | | 11.9 | | |
| | | | | Netherlands: 5.6% | |
| | 127,558 | | | | | | | Akzo Nobel NV | | | 7,970,720 | | | | 1.3 | | |
| | 588,596 | | | | | | | Royal Dutch Shell PLC -
Class B | | | 16,911,586 | | | | 2.7 | | |
| | 374,301 | | | | L | | | SBM Offshore NV | | | 5,860,200 | | | | 0.9 | | |
| | 150,904 | | | | | | | Other Securities | | | 4,228,850 | | | | 0.7 | | |
| | | | | | | | | | 34,971,356 | | | | 5.6 | | |
| | | | | Norway: 2.5% | |
| | 573,623 | | | | | | | Telenor ASA | | | 8,562,308 | | | | 1.4 | | |
| | 381,610 | | | | | | | Other Securities | | | 6,902,823 | | | | 1.1 | | |
| | | | | | | | | | 15,465,131 | | | | 2.5 | | |
| | | | | Portugal: 1.1% | |
| | 474,200 | | | | | | | Galp Energia SGPS SA | | | 7,069,510 | | | | 1.1 | | |
| | | | | Singapore: 3.5% | |
| | 701,482 | | | | | | | DBS Group Holdings Ltd. | | | 8,369,270 | | | | 1.3 | | |
| | 3,420,600 | | | | | | | Singapore
Telecommunications
Ltd. | | | 8,580,360 | | | | 1.4 | | |
| | 362,500 | | | | | | | Other Securities | | | 5,092,726 | | | | 0.8 | | |
| | | | | | | | | | 22,042,356 | | | | 3.5 | | |
| | | | | South Korea: 6.3% | |
| | 35,481 | | | | | | | Hyundai Mobis Co. Ltd. | | | 7,746,325 | | | | 1.2 | | |
| | 247,680 | | | | @ | | | KB Financial Group, Inc.
ADR | | | 8,740,627 | | | | 1.4 | | |
| | 24,941 | | | | | | | Samsung Electronics
Co., Ltd. GDR | | | 18,543,852 | | | | 3.0 | | |
| | 171,216 | | | | | | | Other Securities | | | 4,419,096 | | | | 0.7 | | |
| | | | | | | | | | 39,449,900 | | | | 6.3 | | |
| | | | | Spain: 0.9% | |
| | 634,810 | | | | | | | Telefonica S.A. | | | 5,860,814 | | | | 0.9 | | |
| | | | | Sweden: 0.7% | |
| | 282,620 | | | | | | | Other Securities(a) | | | 4,528,418 | | | | 0.7 | | |
See Accompanying Notes to Financial Statements
153
VY® TEMPLETON SUMMARY PORTFOLIO OF INVESTMENTS
FOREIGN EQUITY PORTFOLIO AS OF DECEMBER 31, 2016 (CONTINUED)
Shares | |
| |
| | Value | | Percentage
of Net
Assets | |
| | | | | Switzerland: 6.3% | |
| | 82,527 | | | | | | | Novartis AG | | $ | 6,001,652 | | | | 1.0 | | |
| | 53,696 | | | | | | | Roche Holding AG | | | 12,240,141 | | | | 1.9 | | |
| | 492,410 | | | | | | | UBS Group AG | | | 7,699,058 | | | | 1.2 | | |
| | 1,508,905 | | | | | | | Other Securities | | | 13,614,667 | | | | 2.2 | | |
| | | | | | | | | | 39,555,518 | | | | 6.3 | | |
| | | | | Taiwan: 1.0% | |
| | 1,099,251 | | | | | | | Taiwan Semiconductor
Manufacturing Co., Ltd. | | | 6,157,186 | | | | 1.0 | | |
| | | | | Thailand: 0.9% | |
| | 1,298,000 | | | | | | | Other Securities | | | 5,834,659 | | | | 0.9 | | |
| | | | | United Kingdom: 19.2% | |
| | 1,136,625 | | | | | | | Aviva PLC | | | 6,770,496 | | | | 1.1 | | |
| | 1,403,493 | | | | | | | BAE Systems PLC | | | 10,208,435 | | | | 1.6 | | |
| | 2,978,460 | | | | | | | Barclays PLC | | | 8,173,979 | | | | 1.3 | | |
| | 2,776,524 | | | | | | | BP PLC | | | 17,390,665 | | | | 2.8 | | |
| | 609,930 | | | | | | | Sky PLC | | | 7,435,661 | | | | 1.2 | | |
| | 283,504 | | | | | | | CRH PLC - London | | | 9,831,753 | | | | 1.6 | | |
| | 406,976 | | | | | | | GlaxoSmithKline PLC | | | 7,817,448 | | | | 1.2 | | |
| | 1,537,600 | | | | | | | HSBC Holdings PLC | | | 12,295,031 | | | | 2.0 | | |
| | 989,391 | | | | @ | | | Standard Chartered PLC | | | 8,068,453 | | | | 1.3 | | |
| | 3,336,261 | | | | | | | Vodafone Group PLC | | | 8,210,186 | | | | 1.3 | | |
| | 3,917,174 | | | | | | | Other Securities | | | 24,143,723 | | | | 3.8 | | |
| | | | | | | | | | 120,345,830 | | | | 19.2 | | |
| | | | | | | Total Common Stock
(Cost $545,350,230) | | | 613,492,304 | | | | 97.7 | | |
Principal
Amount† | |
| |
| | Value | | Percentage
of Net
Assets | |
SHORT-TERM INVESTMENTS: 4.3% | | | |
| | | | | U.S. Government Agency Obligations: 2.1% | |
| | 8,700,000 | | | | Z | | | Federal Farm Credit
Notes, 0.233%,
01/03/17 | | $ | 8,700,000 | | | | 1.4 | | |
| | 4,300,000 | | | | Z | | | Federal Home Loan
Mortgage Corp.,
0.300%, 01/03/17 | | | 4,300,000 | | | | 0.7 | | |
| | | | | | | | | | 13,000,000 | | | | 2.1 | | |
Principal
Amount† | |
| |
| | Value | | Percentage
of Net
Assets | |
| | | | | Securities Lending Collateralcc: 2.2% | |
| | 3,251,866 | | | | | | | Citigroup, Inc.,
Repurchase
Agreement dated
12/30/16, 0.53%, due
01/03/17 (Repurchase
Amount $3,252,055,
collateralized by
various U.S.
Government Agency
Obligations,
2.000%-8.500%,
Market Value plus
accrued interest
$3,316,904, due
12/01/17-01/01/47) | | $ | 3,251,866 | | | | 0.5 | | |
| | 3,251,866 | | | | | | | HSBC Securities USA,
Repurchase
Agreement dated
12/30/16, 0.46%, due
01/03/17 (Repurchase
Amount $3,252,030,
collateralized by
various U.S.
Government
Securities,
1.375%-3.750%,
Market Value plus
accrued interest
$3,316,921, due
11/30/18-11/15/43) | | | 3,251,866 | | | | 0.5 | | |
| | 684,381 | | | | | | | Merrill Lynch & Co., Inc.,
Repurchase
Agreement dated
12/30/16, 0.50%, due
01/03/17 (Repurchase
Amount $684,419,
collateralized by
various U.S.
Government Securities,
0.685%-2.000%,
Market Value plus
accrued interest
$698,069, due 1
0/31/18-11/30/22) | | | 684,381 | | | | 0.1 | | |
| | 3,251,866 | | | | | | | Nomura Securities,
Repurchase
Agreement dated
12/30/16, 0.50%, due
01/03/17 (Repurchase
Amount $3,252,044,
collateralized by
various U.S.
Government/U.S.
Government Agency
Obligations,
0.000%-9.500%,
Market Value plus
accrued interest
$3,316,903, due
01/15/17-08/20/66) | | | 3,251,866 | | | | 0.6 | | |
See Accompanying Notes to Financial Statements
154
VY® TEMPLETON SUMMARY PORTFOLIO OF INVESTMENTS
FOREIGN EQUITY PORTFOLIO AS OF DECEMBER 31, 2016 (CONTINUED)
Principal
Amount† | |
| |
| | Value | | Percentage
of Net
Assets | |
| | | | | Securities Lending Collateralcc (continued) | |
| | 3,251,866 | | | | | | | RBC Dominion
Securities Inc.,
Repurchase
Agreement dated
12/30/16, 0.52%, due
01/03/17 (Repurchase
Amount $3,252,051,
collateralized by
various U.S.
Government Agency
Obligations,
0.875%-7.000%,
Market Value plus
accrued interest
$3,316,903, due
02/13/17-01/01/47) | | $ | 3,251,866 | | | | 0.5 | | |
| | | | | | | | 13,691,845 | | | | 2.2 | | |
Shares | |
| |
| | Value | | Percentage
of Net
Assets | |
| | | | | Mutual Funds: 0.0% | |
| | 285,341 | | | | | | | BlackRock Liquidity
Funds, FedFund,
Institutional Class,
0.420%††
(Cost $285,341) | | $ | 285,341 | | | | 0.0 | | |
| | | | | Total Short-Term
Investments
(Cost $26,976,909) | | | 26,977,186 | | | | 4.3 | | |
| | | | | Total Investments in
Securities
(Cost $572,327,139) | | $ | 640,469,490 | | | | 102.0 | | |
| | | | | Liabilities in Excess
of Other Assets | | | (12,590,952 | ) | | | (2.0 | ) | |
| | | | | Net Assets | | $ | 627,878,538 | | | | 100.0 | | |
"Other Securities" represents issues not identified as the top 50 holdings in terms of market value and issues or issuers not exceeding 1% of net assets individually or in aggregate respectively as of December 31, 2016.
The following footnotes apply to either the individual securities noted or one or more of the securities aggregated and listed as a single line item.
† Unless otherwise indicated, principal amount is shown in USD.
†† Rate shown is the 7-day yield as of December 31, 2016.
# Securities with purchases pursuant to Rule 144A or section 4(a)(2), under the Securities Act of 1933 and may not be resold subject to that rule except to qualified institutional buyers.
@ Non-income producing security.
ADR American Depositary Receipt
GDR Global Depositary Receipt
cc Represents securities purchased with cash collateral received for securities on loan.
L Loaned security, a portion or all of the security is on loan at December 31, 2016.
Z Indicates Zero Coupon Bond; rate shown reflects current effective yield.
(a) This grouping contains securities on loan.
Cost for federal income tax purposes is $574,921,879.
Net unrealized appreciation consists of: | |
Gross Unrealized Appreciation | | $ | 123,642,969 | | |
Gross Unrealized Depreciation | | | (58,095,358 | ) | |
Net Unrealized Appreciation | | $ | 65,547,611 | | |
Sector Diversification | | Percentage of
Net Assets | |
Financials | | | 21.5 | % | |
Health Care | | | 14.4 | | |
Energy | | | 13.1 | | |
Information Technology | | | 9.6 | | |
Telecommunication Services | | | 9.5 | | |
Materials | | | 9.0 | | |
Industrials | | | 9.0 | | |
Consumer Discretionary | | | 7.8 | | |
Consumer Staples | | | 2.4 | | |
Utilities | | | 0.9 | | |
Real Estate | | | 0.5 | | |
U.S. Government Agency Obligations | | | 2.1 | | |
Short-Term Investments | | | 2.2 | | |
Liabilities in Excess of Other Assets | | | (2.0 | ) | |
Net Assets | | | 100.0 | % | |
See Accompanying Notes to Financial Statements
155
VY® TEMPLETON SUMMARY PORTFOLIO OF INVESTMENTS
FOREIGN EQUITY PORTFOLIO AS OF DECEMBER 31, 2016 (CONTINUED)
Fair Value Measurements^
The following is a summary of the fair valuations according to the inputs used as of December 31, 2016 in valuing the assets and liabilities:
| | | Quoted Prices
in Active Markets
for Identical Investments
(Level 1) | | Significant Other
Observable
Inputs#
(Level 2) | | Significant
Unobservable
Inputs
(Level 3) | | Fair Value
at
December 31, 2016 | |
Asset Table | |
Investments, at fair value | |
Common Stock | |
Canada | | $ | 3,228,372 | | | $ | — | | | $ | — | | | $ | 3,228,372 | | |
China | | | 5,936,845 | | | | 36,959,825 | | | | — | | | | 42,896,670 | | |
France | | | — | | | | 64,687,915 | | | | — | | | | 64,687,915 | | |
Germany | | | 5,478,038 | | | | 71,941,496 | | | | — | | | | 77,419,534 | | |
Hong Kong | | | 2,592,340 | | | | 13,903,561 | | | | — | | | | 16,495,901 | | |
India | | | — | | | | 9,207,786 | | | | — | | | | 9,207,786 | | |
Israel | | | 10,943,839 | | | | — | | | | — | | | | 10,943,839 | | |
Italy | | | — | | | | 12,678,343 | | | | — | | | | 12,678,343 | | |
Japan | | | — | | | | 74,653,266 | | | | — | | | | 74,653,266 | | |
Netherlands | | | — | | | | 34,971,356 | | | | — | | | | 34,971,356 | | |
Norway | | | — | | | | 15,465,131 | | | | — | | | | 15,465,131 | | |
Portugal | | | — | | | | 7,069,510 | | | | — | | | | 7,069,510 | | |
Singapore | | | — | | | | 22,042,356 | | | | — | | | | 22,042,356 | | |
South Korea | | | 8,740,627 | | | | 30,709,273 | | | | — | | | | 39,449,900 | | |
Spain | | | — | | | | 5,860,814 | | | | — | | | | 5,860,814 | | |
Sweden | | | — | | | | 4,528,418 | | | | — | | | | 4,528,418 | | |
Switzerland | | | — | | | | 39,555,518 | | | | — | | | | 39,555,518 | | |
Taiwan | | | — | | | | 6,157,186 | | | | — | | | | 6,157,186 | | |
Thailand | | | — | | | | 5,834,659 | | | | — | | | | 5,834,659 | | |
United Kingdom | | | 4,371,983 | | | | 115,973,847 | | | | — | | | | 120,345,830 | | |
Total Common Stock | | | 41,292,044 | | | | 572,200,260 | | | | — | | | | 613,492,304 | | |
Short-Term Investments | | | 285,341 | | | | 26,691,845 | | | | — | | | | 26,977,186 | | |
Total Investments, at fair value | | $ | 41,577,385 | | | $ | 598,892,105 | | | $ | — | | | $ | 640,469,490 | | |
^ See Note 2, "Significant Accounting Policies" in the Notes to Financial Statements for additional information.
# The earlier close of the foreign markets gives rise to the possibility that significant events, including broad market moves, may have occurred in the interim and may materially affect the value of those securities. To account for this, the Portfolio may frequently value many of its foreign equity securities using fair value prices based on third party vendor modeling tools to the extent available. Accordingly, a portion of the Portfolio's investments are categorized as Level 2 investments.
See Accompanying Notes to Financial Statements
156
TAX INFORMATION (UNAUDITED)
Dividends and distributions paid during the year ended December 31, 2016 were as follows:
Portfolio Name | | Type | | Per Share Amount | |
Voya Global Bond Portfolio | |
Class ADV | | NII | | $ | 0.0622 | | |
Class I | | NII | | $ | 0.1008 | | |
Class S | | NII | | $ | 0.0826 | | |
All Classes | | ROC | | $ | 0.0817 | | |
VY® American Century Small-Mid Cap Value Portfolio | |
Class ADV | | NII | | $ | 0.1381 | | |
Class I | | NII | | $ | 0.1967 | | |
Class S | | NII | | $ | 0.1640 | | |
Class S2 | | NII | | $ | 0.1551 | | |
All Classes | | STCG | | $ | 0.2945 | | |
All Classes | | LTCG | | $ | 0.7580 | | |
VY® Baron Growth Portfolio | |
All Classes | | LTCG | | $ | 3.1511 | | |
VY® Columbia Contrarian Core Portfolio | |
Class ADV | | NII | | $ | 0.7448 | | |
Class I | | NII | | $ | 0.8360 | | |
Class S | | NII | | $ | 0.7741 | | |
All Classes | | STCG | | $ | 0.0248 | | |
All Classes | | LTCG | | $ | 2.0011 | | |
VY® Columbia Small Cap Value II Portfolio | |
Class ADV | | NII | | $ | 0.0091 | | |
Class I | | NII | | $ | 0.0942 | | |
Class R6 | | NII | | $ | 0.0943 | | |
Class S | | NII | | $ | 0.0454 | | |
Class S2 | | NII | | $ | 0.0288 | | |
All Classes | | LTCG | | $ | 0.7179 | | |
VY® Invesco Comstock Portfolio | |
Class ADV | | NII | | $ | 0.3728 | | |
Class I | | NII | | $ | 0.4553 | | |
Class S | | NII | | $ | 0.4125 | | |
VY® Invesco Equity and Income Portfolio | |
Class ADV | | NII | | $ | 0.6799 | | |
Class I | | NII | | $ | 0.8875 | | |
Class S | | NII | | $ | 0.7756 | | |
Class S2 | | NII | | $ | 0.7191 | | |
All Classes | | LTCG | | $ | 1.8669 | | |
Portfolio Name | | Type | | Per Share Amount | |
VY® JPMorgan Mid Cap Value Portfolio | |
Class ADV | | NII | | $ | 0.0835 | | |
Class I | | NII | | $ | 0.1752 | | |
Class S | | NII | | $ | 0.1265 | | |
Class S2 | | NII | | $ | 0.0997 | | |
All Classes | | STCG | | $ | 0.0321 | | |
All Classes | | LTCG | | $ | 1.8149 | | |
VY® Oppenheimer Global Portfolio | |
Class ADV | | NII | | $ | 0.1192 | | |
Class I | | NII | | $ | 0.2133 | | |
Class S | | NII | | $ | 0.1597 | | |
Class S2 | | NII | | $ | 0.1236 | | |
All Classes | | STCG | | $ | 0.0381 | | |
All Classes | | LTCG | | $ | 1.1572 | | |
VY® Pioneer High Yield Portfolio | |
Class I | | NII | | $ | 0.5799 | | |
Class S | | NII | | $ | 0.5513 | | |
VY® T. Rowe Price Diversified Mid Cap Growth Portfolio | |
Class ADV | | NII | | $ | 0.0028 | | |
Class I | | NII | | $ | 0.0338 | | |
Class R6 | | NII | | $ | 0.0338 | | |
Class S | | NII | | $ | 0.0092 | | |
All Classes | | STCG | | $ | 0.0717 | | |
All Classes | | LTCG | | $ | 1.2342 | | |
VY® T. Rowe Price Growth Equity Portfolio | |
All Classes | | LTCG | | $ | 9.8410 | | |
VY® Templeton Foreign Equity Portfolio | |
Class ADV | | NII | | $ | 0.3143 | | |
Class I | | NII | | $ | 0.3801 | | |
Class S | | NII | | $ | 0.3455 | | |
Class S2 | | NII | | $ | 0.3392 | | |
NII — Net investment income
STCG — Short-term capital gain
LTCG — Long-term capital gain
ROC — Return of capital
Of the ordinary distributions made during the year ended December 31, 2016, the following percentages qualify for the dividends received deduction (DRD) available to corporate shareholders:
VY® American Century Small-Mid Cap Value Portfolio | | | 41.91 | % | |
VY® Columbia Contrarian Core Portfolio | | | 44.38 | % | |
VY® Columbia Small Cap Value II Portfolio | | | 100.00 | % | |
VY® Invesco Comstock Portfolio | | | 85.84 | % | |
VY® Invesco Equity and Income Portfolio | | | 64.02 | % | |
VY® JPMorgan Mid Cap Value Portfolio | | | 100.00 | % | |
VY® Oppenheimer Global Portfolio | | | 41.99 | % | |
VY® Pioneer High Yield Portfolio | | | 4.20 | % | |
VY® T. Rowe Price Diversified Mid Cap Growth Portfolio | | | 86.06 | % | |
The Portfolios designate the following amounts of long-term capital gain distributions as 20% rate long-term capital gain dividends under Internal Revenue Code Section 852(b)(3)(C):
VY® American Century Small-Mid Cap Value Portfolio | | $ | 18,783,541 | | |
VY® Baron Growth Portfolio | | $ | 84,297,100 | | |
VY® Columbia Contrarian Core Portfolio | | $ | 28,863,136 | | |
VY® Columbia Small Cap Value II Portfolio | | $ | 8,733,630 | | |
VY® Invesco Equity and Income Portfolio | | $ | 74,541,031 | | |
VY® JPMorgan Mid Cap Value Portfolio | | $ | 54,525,340 | | |
VY® Oppenheimer Global Portfolio | | $ | 95,053,417 | | |
VY® T. Rowe Price Diversified Mid Cap Growth Portfolio | | $ | 94,064,466 | | |
VY® T. Rowe Price Growth Equity Portfolio | | $ | 184,243,879 | | |
157
TAX INFORMATION (UNAUDITED) (CONTINUED)
Pursuant to Section 853 of the Internal Revenue Code, the Portfolios designate the following amounts as foreign taxes paid for the year ended December 31, 2016. Foreign taxes paid for purposes of Section 853 may be less than actual foreign taxes paid for financial statement purposes.
| | | Creditable
Foreign
Taxes Paid | | Per Share
Amount | | Portion of Ordinary
Income Distribution
Derived from Foreign
Sourced Income* | |
VY® Oppenheimer Global Portfolio | | $ | 1,235,365 | | | $ | 0.0149 | | | | 64.59 | % | |
VY® Templeton Foreign Equity Portfolio | | $ | 1,036,478 | | | $ | 0.0181 | | | | 99.23 | % | |
*None of the Portfolios listed above derived any income from ineligible foreign sources as defined under Section 901(j) of the Internal Revenue Code.
Foreign taxes paid or withheld must be included in taxable income with an offsetting deduction from gross income or as a credit for taxes paid to foreign governments. Shareholders are strongly advised to consult their own tax advisors regarding the appropriate treatment of foreign taxes paid.
Above figures may differ from those cited elsewhere in this report due to differences in the calculation of income and gains under U.S. generally accepted accounting principles (book) purposes and Internal Revenue Service (tax) purposes.
Shareholders are strongly advised to consult their own tax advisers with respect to the tax consequences of their investments in the Portfolios. In January, shareholders, excluding corporate shareholders, receive an IRS 1099-DIV regarding the federal tax status of the dividends and distributions they received in the calendar year.
158
DIRECTOR AND OFFICER INFORMATION (UNAUDITED)
The business and affairs of the Company are managed under the direction of the Board. A Director, who is not an interested person of the Company, as defined in the 1940 Act, is an independent director ("Independent Director"). The Directors and Officers of the Company are listed below. The Statement of Additional Information includes additional information about directors of the Company and is available, without charge, upon request at (800) 262-3862.
Name, Address
and Age | | Position(s)
held with the
Company | | Term of
Office and
Length of
Time
Served(1) | | Principal
Occupation(s) -
during the
Past 5 Years | | Number of
funds in
Fund Complex
Overseen
by Director(2) | | Other Board
Positions
held by
Director | |
Independent Directors: | |
Colleen D. Baldwin
7337 East Doubletree Ranch Rd.
Suite 100
Scottsdale, Arizona 85258
Age: 56 | | Director | | November 2007 - Present | | President, Glantuam Partners, LLC, a business consulting firm (January 2009 - Present). | | | 151 | | | DSM/Dentaquest, Boston, MA (February 2014 - Present). | |
John V. Boyer
7337 East Doubletree Ranch Rd.
Suite 100
Scottsdale, Arizona 85258
Age: 63 | | Chairperson
Director | | January 2014 - Present
November 1997 - Present | | President and Chief Executive Officer, Bechtler Arts Foundation, an arts and education foundation (January 2008 - Present). | | | 151 | | | None. | |
Patricia W. Chadwick
7337 East Doubletree Ranch Rd.
Suite 100
Scottsdale, Arizona 85258
Age: 68 | | Director | | January 2006 - Present | | Consultant and President, Ravengate Partners LLC, a consulting firm that provides advice regarding financial markets and the global economy (January 2000 - Present). | | | 151 | | | Wisconsin Energy Corporation (June 2006 - Present); The Royce Funds (23 funds) (December 2009 - Present); and AMICA Mutual Insurance Company (1992 - Present). | |
Peter S. Drotch
7337 East Doubletree Ranch Rd.
Suite 100
Scottsdale, Arizona 85258
Age: 75 | | Director | | November 2007 - Present | | Retired. | | | 151 | | | None. | |
Martin J. Gavin
7337 East Doubletree Ranch Rd. Suite 100
Scottsdale, AZ 85258-2034
Age: 66 | | Director | | August 2015 - Present | | Retired. Formerly, President and Chief Executive Officer, Connecticut Children's Medical Center (May 2006 - November 2015). | | | 151 | | | None. | |
Russell H. Jones
7337 East Doubletree Ranch Rd.
Suite 100
Scottsdale, Arizona 85258
Age: 72 | | Director | | May 2013 - Present | | Retired. | | | 151 | | | None. | |
Patrick W. Kenny
7337 East Doubletree Ranch Rd.
Suite 100
Scottsdale, Arizona 85258
Age: 74 | | Director | | March 2002 - Present | | Retired. | | | 151 | | | Assured Guaranty Ltd. (April 2004 - Present). | |
Joseph E. Obermeyer
7337 East Doubletree Ranch Rd.
Suite 100
Scottsdale, Arizona 85258
Age: 59 | | Director | | May 2013 - Present | | President, Obermeyer & Associates, Inc., a provider of financial and economic consulting services (November 1999 - Present). | | | 151 | | | None. | |
Sheryl K. Pressler
7337 East Doubletree Ranch Rd.
Suite 100
Scottsdale, Arizona 85258
Age: 66 | | Director | | January 2006 - Present | | Consultant (May 2001 - Present). | | | 151 | | | None. | |
159
DIRECTOR AND OFFICER INFORMATION (UNAUDITED) (CONTINUED)
Name, Address
and Age | | Position(s)
held with the
Company | | Term of
Office and
Length of
Time
Served(1) | | Principal
Occupation(s) -
during the
Past 5 Years | | Number of
funds in
Fund Complex
Overseen
by Director(2) | | Other Board
Positions
held by
Director | |
Christopher P. Sullivan
7337 East Doubletree Ranch Rd.
Suite 100
Scottsdale, Arizona 85258
Age: 63 | | Director | | October 2015 - Present | | Retired. Formerly, President, Bond Division, Fidelity Management and Research (June 2009 - September 2012). | | | 151 | | | None. | |
Roger B. Vincent
7337 East Doubletree Ranch Rd.
Suite 100
Scottsdale, Arizona 85258
Age: 71 | | Director | | January 2005 - Present | | Retired. | | | 151 | | | UGI Corporation (February 2006 - Present) and UGI Utilities, Inc. (February 2006 - Present). | |
Director who is an "interested person": | |
Shaun P. Mathews(3)
7337 East Doubletree Ranch Rd.
Suite 100
Scottsdale, Arizona 85258
Age: 61 | | Director | | November 2007 - Present | | President and Chief Executive Officer, Voya Investments, LLC (December 2006 - Present). | | | 151 | | | Voya Capital Corporation, LLC and Voya Investments Distributor, LLC (December 2005 - Present); Voya Funds Services, LLC, Voya Investments, LLC and Voya Investment Management (March 2006 - Present); and Voya Investment Trust Co. (April 2009 - Present). | |
(1) Directors serve until their successors are duly elected and qualified. The tenure of each Director who is not an "interested person" as defined in the 1940 Act, of each Portfolio ("Independent Director") is subject to the Board's retirement policy which states that each duly elected or appointed Independent Director shall retire from and cease to be a member of the Board of Directors at the close of business on December 31 of the calendar year in which the Independent Director attains the age of 75. A majority vote of the Board's other Independent Directors may extend the retirement date of an Independent Director if the retirement would trigger a requirement to hold a meeting of shareholders of the Company under applicable law, whether for the purposes of appointing a successor to the Independent Director or otherwise comply under applicable law, in which case the extension would apply until such time as the shareholder meeting can be held or is no longer required (as determined by a vote of a majority of the other Independent Directors).
(2) For the purposes of this table, "Fund Complex" means the Voya family of funds including the following investment companies: Voya Asia Pacific High Dividend Equity Income Fund; Voya Balanced Portfolio, Inc.; Voya Emerging Markets High Dividend Equity Fund; Voya Equity Trust; Voya Funds Trust; Voya Global Advantage and Premium Opportunity Fund; Voya Global Equity Dividend and Premium Opportunity Fund; Voya Government Money Market Portfolio; Voya Infrastructure, Industrials and Materials Fund; Voya Intermediate Bond Portfolio; Voya International High Dividend Equity Income Fund; Voya Investors Trust; Voya Mutual Funds; Voya Natural Resources Equity Income Fund; Voya Partners, Inc.; Voya Prime Rate Trust; Voya Senior Income Fund; Voya Separate Portfolios Trust; Voya Series Fund, Inc.; Voya Strategic Allocation Portfolios, Inc.; Voya Variable Funds; Voya Variable Insurance Trust; Voya Variable Portfolios, Inc.; and Voya Variable Products Trust. The number of funds in the Fund Complex is as of January 31, 2017.
(3) Mr. Mathews is deemed to be an "interested person" of the Company as defined in the 1940 Act, because of his current affiliation with the Voya funds, Voya Financial, Inc., or Voya Financial, Inc.'s affiliates.
160
DIRECTOR AND OFFICER INFORMATION (UNAUDITED) (CONTINUED)
Name, Address
and Age | | Position(s)
Held with the Company | | Term of Office and
Length of Time Served(1) | | Principal Occupation(s) - during the
Past 5 Years | |
Shaun P. Mathews
7337 East Doubletree Ranch Rd.
Suite 100
Scottsdale, Arizona 85258
Age: 61 | | President and Chief Executive Officer | | November 2006 - Present | | President and Chief Executive Officer, Voya Investments, LLC (December 2006 - Present). | |
Michael J. Roland
7337 East Doubletree Ranch Rd.
Suite 100
Scottsdale, Arizona 85258
Age: 58 | | Executive Vice President | | January 2005 - Present | | Managing Director and Chief Operating Officer, Voya Investments, LLC and Voya Funds Services, LLC (March 2012 - Present). Formerly, Chief Compliance Officer, Directed Services LLC and Voya Investments, LLC (March 2011 - December 2013); Executive Vice President and Chief Operating Officer, Voya Investments, LLC and Voya Funds Services, LLC (January 2007 - April 2012) and Chief Compliance Officer, Voya Family of Funds (March 2011 - February 2012). | |
Stanley D. Vyner
230 Park Avenue
New York, New York 10169
Age: 66 | | Executive Vice President
Chief Investment Risk Officer | | January 2005 - Present
September 2009 - Present | | Executive Vice President, Voya Investments, LLC (July 2000 - Present) and Chief Investment Risk Officer, Voya Investments, LLC (January 2003 - Present). | |
Kevin M. Gleason
7337 East Doubletree Ranch Rd.
Suite 100
Scottsdale, Arizona 85258
Age: 50 | | Chief Compliance Officer | | February 2012 - Present | | Senior Vice President, Voya Investment Management and Chief Compliance Officer, Voya Family of Funds (February 2012- Present). Formerly, Assistant General Counsel and Assistant Secretary, The Northwestern Mutual Life Insurance Company (June 2004 - January 2012). | |
Todd Modic
7337 East Doubletree Ranch Rd.
Suite 100
Scottsdale, Arizona 85258
Age: 49 | | Senior Vice President, Chief/Principal Financial Officer and Assistant Secretary | | March 2005 - Present | | Senior Vice President, Voya Investments, LLC and Voya Funds Services, LLC (April 2005 - Present). | |
Kimberly A. Anderson
7337 East Doubletree Ranch Rd.
Suite 100
Scottsdale, Arizona 85258
Age: 52 | | Senior Vice President | | January 2005 - Present | | Senior Vice President, Voya Investments, LLC (September 2003 - Present). | |
Robert Terris
7337 East Doubletree Ranch Rd.
Suite 100
Scottsdale, Arizona 85258
Age: 46 | | Senior Vice President | | May 2006 - Present | | Senior Vice President, Head of Division Operations, Voya Investments, LLC (October 2015 - Present) and Voya Funds Services, LLC (March 2006 - Present). | |
Fred Bedoya
7337 East Doubletree Ranch Rd.
Suite 100
Scottsdale, Arizona 85258
Age: 44 | | Vice President and Treasurer | | September 2012 - Present | | Vice President, Voya Investments, LLC (October 2015 - Present) and Voya Funds Services, LLC (July 2012 - Present). Formerly, Assistant Vice President — Director, Voya Funds Services, LLC (March 2003 - March 2012). | |
Maria M. Anderson
7337 East Doubletree Ranch Rd.
Suite 100
Scottsdale, Arizona 85258
Age: 58 | | Vice President | | January 2005 - Present | | Vice President, Voya Investments, LLC (October 2015 - Present) and Voya Funds Services, LLC (September 2004 - Present). | |
Lauren D. Bensinger
7337 East Doubletree Ranch Rd.
Suite 100
Scottsdale, Arizona 85258
Age: 63 | | Vice President | | January 2005 - Present | | Vice President, Voya Funds Services, LLC (February 1996 - Present) and Voya Investments, LLC (October 2004 - Present); Vice President and Money Laundering Reporting Officer, Voya Investments Distributor, LLC (April 2010 - Present). Anti-Money Laundering Compliance Officer, Voya Financial, Inc. (January 2013 - Present); and Money Laundering Reporting Officer, Voya Investment Management Trust Co. (October 2012 - Present). | |
161
DIRECTOR AND OFFICER INFORMATION (UNAUDITED) (CONTINUED)
Name, Address
and Age | | Position(s)
Held with the Company | | Term of Office and
Length of Time Served(1) | | Principal Occupation(s) - during the
Past 5 Years | |
Sara M. Donaldson
7337 East Doubletree Ranch Rd.
Suite 100
Scottsdale, Arizona 85258
Age: 57 | | Vice President | | September 2014 - Present | | Vice President, Voya Investments, LLC (October 2015 - Present). Formerly, Vice President, Voya Funds Services, LLC (April 2014 - October 2015). Formerly, Director, Compliance, AXA Rosenberg Global Services, LLC (September 1997 - March 2014). | |
Micheline S. Favor
7337 East Doubletree Ranch Rd.
Suite 100
Scottsdale, Arizona 85258
Age: 39 | | Vice President | | September 2016 - Present | | Vice President, Head of Fund Compliance, Voya Investments LLC, and Chief Compliance Officer for Voya Investments, LLC and Directed Services, LLC (June 2016 - Present). Formerly, Vice President, Mutual Fund Compliance (March 2014 - June 2016); Assistant Vice President, Mutual Fund Compliance (May 2013 - March 2014); Assistant Vice President, Senior Project Manager (May 2008 - May 2013). | |
Robyn L. Ichilov
7337 East Doubletree Ranch Rd.
Suite 100
Scottsdale, Arizona 85258
Age: 49 | | Vice President | | January 2005 - Present | | Vice President, Voya Funds Services, LLC (November 1995 - Present) and Voya Investments, LLC (August 1997 - Present). Formerly, Treasurer, Voya Family of Funds (November 1999 - February 2012). | |
Jason Kadavy
7337 East Doubletree Ranch Rd.
Suite 100
Scottsdale, Arizona 85258
Age: 40 | | Vice President | | September 2012 - Present | | Vice President, Voya Investments, LLC (October 2015 - Present) and Voya Funds Services, LLC (July 2007 - Present). | |
Kimberly K. Springer
7337 East Doubletree Ranch Rd.
Suite 100
Scottsdale, Arizona 85258
Age: 59 | | Vice President | | March 2006 - Present | | Vice President - Mutual Fund Product Development, Voya Investments, LLC (July 2012 - Present); Vice President, Voya Family of Funds (March 2010 - Present) and Vice President, Voya Funds Services, LLC (March 2006 - Present). Formerly Managing Paralegal, Registration Statements (June 2003 - July 2012). | |
Craig Wheeler
7337 East Doubletree Ranch Rd.
Suite 100
Scottsdale, Arizona 85258
Age: 47 | | Vice President | | May 2013 - Present | | Vice President - Director of Tax, Voya Investments, LLC (October 2015 - Present). Formerly, Vice President - Director of Tax, Voya Funds Services, LLC (March 2013 - October 2015). Formerly, Assistant Vice President - Director of Tax, Voya Funds Services, LLC (March 2008 - February 2013). | |
Huey P. Falgout, Jr.
7337 East Doubletree Ranch Rd.
Suite 100
Scottsdale, Arizona 85258
Age: 53 | | Secretary | | August 2003 - Present | | Senior Vice President and Chief Counsel, Voya Investment Management - Mutual Fund Legal Department (March 2010- Present). | |
Paul A. Caldarelli
7337 East Doubletree Ranch Rd.
Suite 100
Scottsdale, Arizona 85258
Age: 65 | | Assistant Secretary | | June 2010 - Present | | Vice President and Senior Counsel, Voya Investment Management - Mutual Fund Legal Department (March 2010-Present). | |
Theresa K. Kelety
7337 East Doubletree Ranch Rd.
Suite 100
Scottsdale, Arizona 85258
Age: 54 | | Assistant Secretary | | August 2003 - Present | | Vice President and Senior Counsel, Voya Investment Management - Mutual Fund Legal Department (March 2010 - Present). | |
(1) The Officers hold office until the next annual meeting of the Board of Directors and until their successors shall have been elected and qualified.
162
ADVISORY CONTRACT APPROVAL DISCUSSION (UNAUDITED)
BOARD CONSIDERATION AND APPROVAL OF INVESTMENT MANAGEMENT CONTRACTS AND SUB-ADVISORY CONTRACTS
Section 15(c) of the Investment Company Act of 1940, as amended (the "1940 Act"), provides that, after an initial period, the Board of Directors (the "Board") of Voya Partners, Inc. (the "Company"), including a majority of the Board members who have no direct or indirect interest in the investment management and sub-advisory contracts, and who are not "interested persons" of Voya Global Bond Portfolio, VY® American Century Small-Mid Cap Value Portfolio, VY® Baron Growth Portfolio, VY® Columbia Contrarian Core Portfolio, VY® Columbia Small Cap Value II Portfolio, VY® Invesco Comstock Portfolio, VY® Invesco Equity and Income Portfolio, VY® JPMorgan Mid Cap Value Portfolio, VY® Oppenheimer Global Portfolio, VY® Pioneer High Yield Portfolio, VY® T. Rowe Price Diversified Mid Cap Growth Portfolio, VY® T. Rowe Price Growth Equity Portfolio, and VY® Templeton Foreign Equity Portfolio (collectively, the "Portfolios"), as such term is defined under the 1940 Act (the "Independent Directors"), must annually review and approve the Portfolios' existing investment management and sub-advisory contracts. At a meeting held on October 18, 2016, the Board, including a majority of the Independent Directors, considered whether to renew and approve the investment management contracts (the "Management Contracts") between Directed Services LLC (the "Adviser") and the Portfolios, and the sub-advisory contracts (the "Sub-Advisory Contracts") with the sub-adviser to each Portfolio (each a "Sub-Adviser" and collectively, the "Sub-Advisers") effective through November 30, 2016. Consideration by the Board at its October 18, 2016 meeting of whether to renew the Management and Sub-Advisory Contracts effective through November 30, 2016 was deemed prudent because the prior approval of the Contracts was set to expire on November 17, 2016 (the same date of the Board's meeting to discuss the annual renewal/approval). In addition, at a meeting held on November 17, 2016, the Board, including a majority of the Independent Directors, considered whether to renew and approve the Management and Sub-Advisory Contracts effective through November 30, 2017.
In addition to the Board meetings on October 18, 2016 and November 17, 2016, the Independent Directors also held separate meetings outside the presence of Management on October 18, 2016, and November 15, 2016, to consider the renewal of the Management and Sub-Advisory Contracts. As a result, subsequent references herein to factors considered and determinations made by the Independent Directors and/or the Board include, as applicable, factors
considered and determinations made at those meetings by the Independent Directors.
At its October 18, 2016 meeting, the Board, including the Independent Directors, voted to renew the Management and Sub-Advisory Contracts for the Portfolios effective through November 30, 2016. At its November 17, 2016 meeting, the Board, including the Independent Directors voted to renew the Management Contracts and Sub-Advisory Contracts for the Portfolios effective through November 30, 2017. In reaching these decisions, the Board took into account information furnished to it throughout the year at meetings of the Board and the Board's committees, as well as information prepared specifically in connection with the annual renewal or approval process. Determinations by the Independent Directors also took into account various factors that they believed, in light of the legal advice furnished to them by K&L Gates LLP ("K&L Gates"), their independent legal counsel, and their own business judgment, to be relevant. Further, while the Board considered at the same meetings the investment management contracts and sub-advisory contracts that were subject to renewal for the investment companies in the Voya family of funds ("Voya funds"), the Board considered each Voya fund's investment management and sub-advisory relationships separately.
Provided below is an overview of the Board's contract approval process in general, as well as a discussion of certain specific factors that the Board considered at its renewal meetings. While the Board gave its attention to the information furnished at the request of the Independent Directors that was most relevant to its considerations, discussed below are a number of the primary factors relevant to the Board's consideration as to whether to renew the Management and Sub-Advisory Contracts. Each Board member may have accorded different weight to the various factors in reaching his or her conclusions with respect to each Portfolio's investment management and sub-advisory arrangements.
The Board, in considering the Management and Sub-Advisory Contracts, was cognizant that shareholders of each Portfolio have a broad range of investment options available to them and that, based upon their opportunity to review and weigh the disclosure provided by the Portfolio, have chosen the Portfolio as an investment.
Overview of the Contract Renewal and Approval Process
The Board follows a structured process pursuant to which it seeks, considers, reviews and analyzes relevant information when it decides whether to approve new or
163
ADVISORY CONTRACT APPROVAL DISCUSSION (UNAUDITED) (CONTINUED)
existing investment management and sub-advisory arrangements for Voya funds, including the Portfolios' existing Management and Sub-Advisory Contracts (the "Contract Review Process").
The Contract Review Process has evolved as the Board's membership has changed through periodic retirements of some Directors and the appointment and election of new Directors. In addition, the Independent Directors have reviewed and refined the renewal and approval process at least annually in order to make revised requests for information from Management and address certain unique characteristics related to new or existing Voya funds.
The Board has established (among other committees) three Investment Review Committees (each, an "IRC") and a Contracts Committee. Among other matters, the Contracts Committee provides oversight with respect to the contracts renewal and approval process, and each Portfolio is assigned to an IRC, which provides ongoing oversight regarding, among other matters, the investment performance of the Adviser and the Sub-Advisers, as well as the oversight by the Adviser of the performance of the Sub-Advisers. The IRCs will typically apply a heightened level of scrutiny in cases where performance has lagged a Portfolio's relevant benchmark and/or Morningstar, Inc. ("Morningstar") category average, as applicable. The Board and/or IRCs may also apply a heightened level of scrutiny in cases where a Portfolio's performance has lagged its Selected Peer Group (defined below).
The type and format of the information provided to the Board or to legal counsel for the Independent Directors in connection with the Contract Review Process has been codified in a 15(c) methodology guide for the Voya funds ("15(c) Methodology Guide"). This 15(c) Methodology Guide was developed by the Independent Directors and sets out a blueprint pursuant to which the Independent Directors request, and Management provides, certain information that the Independent Directors deem important to facilitate an informed review in connection with initial and annual approvals of investment management and sub-advisory contracts. Among other actions, the Independent Directors retain the services of an independent consultant with experience in the mutual fund industry to assist the Independent Directors in developing and determining a selected peer group of investment companies for each Portfolio ("Selected Peer Group") based on each Portfolio's particular attributes, such as fund type and scale, Morningstar category and sales channels and structure. The Independent Directors review, evaluate and update the 15(c) Methodology Guide at least annually.
Management provides certain of the information requested by the 15(c) Methodology Guide in Fund Analysis and Comparison Tables ("FACT sheets") prior to the Independent Directors' review of investment management and sub-advisory arrangements (including the Portfolios' Management and Sub-Advisory Contracts). The Independent Directors have periodically retained an independent firm to test and verify the accuracy of certain FACT sheet data for a representative sample of the Voya funds. In addition, the Contracts Committee routinely employs the services of an independent consultant to assist in its review and analysis of, among other matters, the 15(c) Methodology Guide, the content and format of the FACT sheets, and Selected Peer Groups to be used by the Portfolios for certain comparison purposes during the renewal process. As part of an ongoing process, the Contracts Committee recommends and considers recommendations from Management for refinements to the 15(c) Methodology Guide and other aspects of the review process, and the Board's IRCs review benchmarks and peer groups used to assess the performance of the Voya funds.
The Board employed its process for reviewing contracts when considering the renewals of the Portfolios' Management and Sub-Advisory Contracts at its October 18, 2016 and November 17, 2016 meetings that would be effective through November 30, 2016 and November 30, 2017, respectively. Set forth below is a discussion of many of the Board's primary considerations and conclusions resulting from this process.
Nature, Extent and Quality of Service
In determining whether to approve the Management and Sub-Advisory Contracts, the Independent Directors received and evaluated such information as they deemed necessary regarding the nature, extent and quality of services provided to the Portfolios by the Adviser and the Sub-Advisers. This included information regarding the Adviser and the Sub-Advisers provided throughout the year at regular meetings of the Board and its committees, as well as information furnished in connection with the contract renewal meetings.
The Adviser oversees, subject to the authority of the Board, the provision of all investment advisory and portfolio management services for the Portfolios. In addition, the Adviser provides administrative services reasonably necessary for the operation of the Portfolio. The Adviser conducts day-to-day oversight of the Portfolios' operations and risks but may delegate certain management responsibilities to one or more Sub-Advisers. Also, the Adviser oversees various other service providers, which may include, among others, distributors, custodians and fund accounting agents,
164
ADVISORY CONTRACT APPROVAL DISCUSSION (UNAUDITED) (CONTINUED)
shareholder service providers, and transfer agents, who provide services to the Portfolios.
The materials requested by the Independent Directors and provided to the Board, K&L Gates and/or independent consultants that assisted the Independent Directors prior to the October 18, 2016 and November 17, 2016 Board meetings included, among other information, the following items for each Portfolio: (1) FACT sheets that provided information regarding the performance and expenses of the Portfolio and other similarly managed funds in its Selected Peer Group, as well as information regarding the Portfolio's investment portfolio, objective and strategies; (2) reports providing risk and attribution analyses of the Portfolio; (3) the 15(c) Methodology Guide, which describes how the FACT sheets were prepared, including the manner in which each Portfolio's Selected Peer Group was selected and how profitability was determined; (4) responses from the Adviser and the Sub-Adviser to the Portfolios to a series of questions posed by K&L Gates on behalf of the Independent Directors; (5) copies of the forms of Management and Sub-Advisory Contracts; (6) copies of the Forms ADV for the Adviser and the Sub-Adviser; (7) financial statements for the Adviser and the Sub-Adviser (or the parent company of certain unaffiliated sub-advisers); (8) a draft of a narrative summary addressing key factors the Board customarily considers in evaluating the Management and Sub-Advisory Contracts for the Voya funds' (including the Portfolio's) investment management and sub-advisory contracts, including a written analysis for the Portfolio of how performance, fees and expenses compare to its Selected Peer Group and/or designated benchmarks; (9) independent analyses of Portfolio performance by the Company's Chief Investment Risk Officer, who leads the Adviser's Investment Risk Management Department ("IRMD"); (10) information regarding net asset flows into and out of the Portfolio; and (11) other information relevant to the Board's evaluations.
For each Portfolio, Class I shares were used for purposes of certain comparisons between the Portfolio and its Selected Peer Group. Class I shares generally were selected so that a Portfolio's share class with the longest performance history was compared to the analogous class of shares for each fund in its Selected Peer Group. The mutual funds included in the Portfolios' Selected Peer Groups were selected based upon criteria designed to represent the Portfolio share class being compared to the Selected Peer Groups.
In arriving at its conclusions with respect to the Management Contracts, the Board was mindful of the "manager-of-managers" platform of the Voya funds that has been developed by the Adviser. The Board
recognized that the Adviser is responsible for monitoring the investment program, performance, developments and ongoing operations of the Sub-Advisers under this manager-of-managers arrangement. The Board also considered the techniques and resources that the Adviser has developed to provide ongoing oversight of the nature, extent and quality of the services each Sub-Adviser provides to the applicable Portfolios and each Sub-Adviser's compliance with applicable laws and regulations. The Board was advised that to assist in the selection and monitoring of the Sub-Advisers, the Adviser has developed an oversight process formulated by its Manager Research & Selection Group ("MR&S"), which analyzes both qualitative (such as in-person meetings and telephonic meetings with the Sub-Advisers and research on sub-advisers) and quantitative information (such as performance data, portfolio data and attribution analysis) about each Sub-Adviser and the Portfolios that it manages. The Board recognized that MR&S also typically provides in-person reports to the IRCs at their meetings prior to any Sub-Adviser presentations. In addition, the Board noted that MR&S prepares periodic due diligence reports regarding the Sub-Advisers based on on-site visits and information and analysis which team members use to attempt to gain and maintain an in-depth understanding of each Sub-Adviser's investment process and to try to identify issues that may be relevant to the Sub-Adviser's services to a Portfolio and/or its performance. The Board also noted that MR&S provides written reports on these due diligence analyses to the pertinent IRC. The Board noted the resources that Management has committed to its services as a manager-of-managers, including resources for reporting to the Board and the IRCs to assist them with their assessment of the investment performance of the Portfolios on an on-going basis throughout the year. This includes the appointment of a Chief Investment Risk Officer and the IRMD staff members, who report directly to the Board and who have developed attribution analyses and other metrics used by the IRCs to analyze the key factors underlying investment performance for the funds in the Voya funds.
The Board also considered the techniques that the Adviser has developed to screen and perform due diligence on new sub-advisers if and when the Adviser recommends to the Board a new sub-adviser to manage a Portfolio in the Voya funds. The Board noted that, for new non-Voya-affiliated sub-advisers, MR&S is responsible for: identifying qualified candidates; analyzing their investment processes, personnel and resources; conducting due diligence on the candidates; and selecting a firm to propose as a new sub-adviser, as well as preparing written materials and reports to the
165
ADVISORY CONTRACT APPROVAL DISCUSSION (UNAUDITED) (CONTINUED)
committees and the Board as part of the process of considering the approval of any new sub-adviser for a Portfolio.
The Board also considered that in the course of monitoring performance of the Sub-Advisers, MR&S has developed, based on guidance from the IRCs, a methodology for comparing performance of each Portfolio to its Morningstar category average and/or median and primary benchmark. The Board also recognized that MR&S provides the IRCs with regular updates on the Portfolios and alerts the IRCs to potential issues as they arise. The Board noted that another service provided by MR&S is the preparation of the Fund Dispersion Report. This report seeks to monitor any dispersion between the Portfolios managed by non-Voya-affiliated sub-advisers and their similarly managed retail counterparts, and it assists the Board in carrying out its general oversight duties. The Board also considered that the Adviser regularly monitors performance, personnel, compliance and other issues that may arise on a day-to-day basis regarding the Sub-Advisers and contemplated that, if issues are identified either through formal or informal processes, they are brought before the IRCs and the Board for consideration and action and the Adviser consistently makes its resources available to the Board and the IRCs to assist with addressing any issues that arise.
The Board considered that the Portfolios also benefit from the services of the IRMD, under the leadership of the Chief Investment Risk Officer, the costs of which are shared by the Portfolios and the Adviser. The Board considered that the IRMD regularly presents written materials and reports to the IRCs that focus on the investment risks of the Portfolios. The Board also considered that the IRMD provides the IRCs with analyses that are developed to assist the IRCs in identifying trends in Portfolio performance and other areas over consecutive periods. The Board noted that the services provided by the IRMD are meant to provide an additional perspective for the benefit of the IRCs, which may vary from the perspective of MR&S.
The Board also considered the techniques used by the Adviser to monitor the performance of the Sub-Adviser and the proactive approach that the Adviser, working in cooperation with the IRCs, has taken to advocate or recommend, when it believed appropriate, changes designed to assist in improving the Voya funds' performance.
In considering the Portfolios' Management Contracts, the Board also considered the extent of benefits provided to the Portfolios' shareholders, beyond investment management services, from being part of the Voya funds.
This includes, in most cases, the right to exchange or transfer investments, without a sales charge, between the same class of shares of such funds or among Voya funds available on a product platform, and the wide range of Voya funds available for exchange or transfer. The Board also took into account the Adviser's ongoing efforts to reduce the expenses of the Voya funds through renegotiated arrangements with certain of the Voya funds' service providers. In addition, the Board considered the efforts of the Adviser and the expenses that it incurred in recent years to help make the Voya funds more balanced and efficient by the launch of new investment products and the combinations of similar funds.
Further, the Board received periodic reports showing that the investment policies and restrictions for each Portfolio were consistently complied with and other periodic reports covering matters such as compliance by Adviser and the Sub-Adviser personnel with codes of ethics. The Board considered reports throughout the year and also in connection with the Board's consideration of the Management and Sub-Advisory Contracts from the Company's Chief Compliance Officer ("CCO") evaluating whether the regulatory compliance systems and procedures of the Adviser and the Sub-Adviser are reasonably designed to ensure compliance with the federal securities laws. The Board also took into account the CCO's annual and periodic reports and recommendations with respect to service provider compliance programs. In this regard, the Board also considered the policies and procedures developed by the CCO in consultation with the Board's Compliance Committee that guide the CCO's compliance oversight function.
The Board requested and considered information regarding the staffing of each Portfolio's portfolio management team. The Board took into account the respective resources and reputations of the Adviser and each Sub-Adviser, and evaluated the compensation arrangements for each Portfolio's portfolio management team. The Board also considered the adequacy of the resources committed to the Portfolios (and other relevant funds in the Voya funds) by the Adviser and each Sub-Adviser, and whether those resources are commensurate with the needs of the Portfolios and are sufficient to provide high-quality services to the Portfolios. The Board also considered the financial stability of the Adviser and each Sub-Adviser.
Based on their deliberations and the materials presented to them, the Board concluded that the investment management and related services provided by the Adviser and each Sub-Adviser are appropriate in light of
166
ADVISORY CONTRACT APPROVAL DISCUSSION (UNAUDITED) (CONTINUED)
the Portfolios' operations, the competitive landscape of the investment company business, and investor needs, and that the nature, extent and quality of the overall services provided by the Adviser and each Sub-Adviser were appropriate.
Portfolio Performance
In assessing investment management and sub-advisory relationships, the Board placed emphasis on the investment returns of each Portfolio. The Board considered the performance reports and analyses from MR&S and IRMD and discussions with portfolio managers at Board and committee meetings during the year. The Board also paid particular attention in assessing performance to the FACT sheets furnished in connection with the renewal and approval process. The FACT sheets prepared for each Portfolio included its investment performance compared to the Portfolio's Morningstar category average, Selected Peer Group and primary benchmark. The FACT sheet performance data was as of March 31, 2016.
In addition, the Board also considered at its October 18, 2016 and November 17, 2016 meetings certain additional data regarding performance and Portfolio asset levels as of August 31, 2016 and September 30, 2016, respectively. The Board's findings specific to each Portfolio's performance are discussed under "Portfolio-by-Portfolio Analysis" below.
Economies of Scale
When evaluating the reasonableness of advisory fee rates, the Board also considered whether economies of scale likely will be realized by the Adviser and a Sub-Adviser as a Portfolio grows larger and the extent to which any such economies are reflected in contractual fee rates. In this regard, the Board noted any breakpoints in advisory fee rate schedules that will result in a lower advisory fee rate when a Portfolio achieves sufficient asset levels to receive a breakpoint discount. In the case of sub-advisory fees, the Board considered that breakpoints would inure to the benefit of the Adviser, except to the extent that there are corresponding advisory fee rate breakpoints or waivers, which the Board monitors over time. The Board also considered that some of the Portfolios that do not have advisory fee breakpoints do have fee waiver or expense reimbursement arrangements. In this connection, the Board considered the extent to which economies of scale could be realized through such fee waivers, expense reimbursements or other expense reductions. In evaluating fee rate breakpoint arrangements and economies of scale, the Independent Directors also considered prior periodic
management reports, industry information on this topic and the Portfolios' investment performance.
Information Regarding Services to Other Clients
The Board requested and considered information regarding the nature of services and fee rates offered by the Adviser and the Sub-Advisers to other clients, including other registered investment companies and relevant institutional accounts. When fee rates offered to other clients differed materially from those charged to a Portfolio, the Board considered any underlying rationale provided by the Adviser or the Sub-Adviser for these differences. For non-Voya-affiliated Sub-Advisers, the Board did not view this information as being a key factor in its deliberations because of the arm's-length nature of negotiations between the Adviser and non-Voya-affiliated Sub-Advisers with respect to sub-advisory fee rates. The Board also noted that the fee rates charged to the Portfolios and other institutional clients of the Adviser or the Sub-Advisers (including other investment companies) may differ materially due to, among other reasons, as applicable: differences in services; different regulatory requirements associated with registered investment companies, such as the Portfolios, as compared to non-registered investment company clients; market differences in fee rates that existed when a Portfolio first was organized; differences in the original sponsors of Portfolios that now are managed by the Adviser; investment capacity constraints that existed when certain contracts were first agreed upon or that might exist at present; and different pricing structures that are necessary to be competitive in different marketing channels.
Fee Rates, Profitability and Fall-out Benefits
The Board reviewed and considered each contractual management fee rate payable by each Portfolio to the Adviser. The Board also considered the contractual sub-advisory fee rate payable by the Adviser to each Sub-Adviser for sub-advisory services for each Portfolio, including the portion of the contractual management fees that are paid to each Sub-Adviser, as compared to the portion retained by the Adviser. In addition, the Board considered fee waivers and expense limitations applicable to the fees payable by the Portfolios, including the Adviser's agreement to extend each such fee waiver and expense limitation agreement and not to terminate such agreement without prior approval of the Board.
The Board requested information regarding and considered: (1) the fee rate structure of each Portfolio as it relates to the services provided under the contracts; and (2) the potential fall-out benefits to the Adviser and the Sub-Adviser and their respective affiliates from their
167
ADVISORY CONTRACT APPROVAL DISCUSSION (UNAUDITED) (CONTINUED)
association with the Portfolios. For each Portfolio, the Board separately determined that the fees payable to the Adviser and the fee rate payable to the Sub-Adviser are reasonable for the services that each performs, which were considered in light of the nature, extent and quality of the services that each has performed and is expected to perform.
For each Portfolio, the Board considered information on revenues, costs and profits realized by the Adviser and the Voya-affiliated Sub-Adviser, which was prepared by Management in accordance with the methodology (including related assumptions) specified in the 15(c) Methodology Guide. In analyzing the profitability of the Adviser in connection with its services to a Portfolio, the Board took into account the sub-advisory fee rate payable by the Adviser to each Sub-Adviser. In addition, the Board considered information that it requested and that was provided by Management with respect to the profitability of service providers affiliated with the Adviser. The Board also considered the profitability of the Adviser and its affiliated companies attributable to managing and operating each Portfolio both with and without the profitability of the distributor of the Portfolios and both before and after giving effect to any expenses incurred by the Adviser or any affiliated company in making revenue sharing or other payments to third parties, including affiliated insurance companies, for distribution services. The Board did not request profitability data from the Sub-Advisers that were not affiliated with the Adviser because the Board did not view this data as relevant to its deliberations, given the arm's-length nature of the relationship between the Adviser and these non-Voya-affiliated Sub-Advisers with respect to the negotiation of sub-advisory fee rates. In this regard, the Board also noted that the Adviser (and not a Portfolio) pays the sub-advisory fees earned by a non-Voya-affiliated Sub-Adviser. In addition, the Board noted that certain of the Voya funds' Sub-Advisers had previously represented that they had not accounted for their profits on an account-by-account basis.
Although the 15(c) Methodology Guide establishes certain standards for profit calculation, the Board recognized that profitability analysis on a client-by-client basis is not an exact science and there is no uniform methodology within the asset management industry for determining profitability for this purpose. In this context, the Board realized that Management's calculations regarding its costs incurred in establishing the infrastructure necessary for the Portfolios' operations may not be fully reflected in the expenses allocated to each Portfolio in determining profitability, and that the information presented may not portray all of the costs borne by the Adviser and Management or capture their
entrepreneurial risk associated with offering and managing a mutual fund complex in the current regulatory and market environment. In addition, the Board recognized that the use of different reasonable methodologies for purposes of calculating profit data can give rise to dramatically different profit and loss results.
In considering the Management and Sub-Advisory Contracts, the Board noted that, at the request of the Board, the Adviser has from time to time agreed to implement remedial actions regarding certain Voya funds. These remedial actions have included, among others: reductions in fee rates or adjustments to expense limitation and waiver arrangements; changes in the Sub-Adviser or portfolio managers; and strategy modifications.
In making its determinations, the Board based its conclusions as to the reasonableness of the management and sub-advisory fees of the Adviser and each Sub-Adviser primarily on the factors described for each Portfolio below.
Portfolio-by-Portfolio Analysis
The following paragraphs outline certain of the specific factors that the Board considered, and the conclusions reached, at its October 18, 2016 and November 17, 2016 meetings in relation to approving each Portfolio's Management and Sub-Advisory Contracts. These specific factors are in addition to those considerations discussed above. In each case, the Portfolio's performance was compared to its Morningstar category median and/or average, as well as its primary benchmark, a broad-based securities market index that appears in the Portfolio's prospectus. With respect to Morningstar quintile rankings, the first quintile represents the highest (best) performance and the fifth quintile represents the lowest performance. Each Portfolio's management fee rates and expense ratio were compared to the fees and expense ratios of the funds in its Selected Peer Group.
Voya Global Bond Portfolio
In considering whether to approve the renewal of the Management and Sub-Advisory Contracts for Voya Global Bond Portfolio, the Board considered that, based on performance data for the periods ended March 31, 2016: (1) the Portfolio underperformed its Morningstar category average for all periods presented, with the exception of the year-to-date and one-year periods, during which it outperformed; (2) the Portfolio underperformed its primary benchmark for all periods presented, with the exception of the year-to-date period, during which it outperformed; and (3) the Portfolio is ranked in the first (highest) quintile of its Morningstar
168
ADVISORY CONTRACT APPROVAL DISCUSSION (UNAUDITED) (CONTINUED)
category for the one-year period, the second quintile for the year-to-date period, and the third quintile for the three-year, five-year and ten-year periods. In analyzing this performance data, the Board took into account: (1) Management's representations regarding the strength of the Portfolio's performance during certain periods; and (2) that Management would continue to monitor, and the Board or its Investment Review Committee would periodically review, the Portfolio's performance.
In considering the fees payable under the Management and Sub-Advisory Contracts for the Portfolio, the Board took into account the factors described above and also considered: (1) the fairness of the compensation under a Management Contract with a breakpoint fee schedule where the asset level necessary to achieve a breakpoint discount had not been reached by the Portfolio; and (2) the pricing structure (including the expense ratio to be borne by shareholders) of the Portfolio, as compared to its Selected Peer Group, including that: (a) the management fee for the Portfolio is below the median and the average management fees of the funds in its Selected Peer Group; and (b) the expense ratio for the Portfolio is below the median and the average expense ratios of the funds in its Selected Peer Group.
After its deliberation, the Board reached the following conclusions: (1) the Portfolio's management fee rate is reasonable in the context of all factors considered by the Board; (2) the Portfolio's expense ratio is reasonable in the context of all factors considered by the Board; (3) taking into account that Management will continue to monitor, and the Board or its Investment Review Committee would periodically review, the Portfolio's performance, the Portfolio's performance is reasonable in the context of all factors considered by the Board; and (4) the sub-advisory fee rate payable by the Adviser to the Sub-Adviser is reasonable in the context of all factors considered by the Board. Based on these conclusions and other factors, the Board voted to renew the Management and Sub-Advisory Contracts for the Portfolio for the relevant periods. During this renewal process, different Board members may have given different weight to different individual factors and related conclusions.
VY® American Century Small-Mid Cap Value Portfolio
In considering whether to approve the renewal of the Management and Sub-Advisory Contracts for VY® American Century Small-Mid Cap Value Portfolio, the Board considered that, based on performance data for the periods ended March 31, 2016: (1) the Portfolio outperformed its Morningstar category average for all periods presented; (2) the Portfolio outperformed its primary benchmark for all periods presented; and (3) the
Portfolio is ranked in the first (highest) quintile of its Morningstar category for the one-year, three-year, five-year and ten-year periods, and the second quintile for year-to-date period.
In considering the fees payable under the Management and Sub-Advisory Contracts for the Portfolio, the Board took into account the factors described above and also considered: (1) the economies of scale benefits to the Portfolio and its shareholders from breakpoint discounts applicable to the Portfolio's management fee rate, which result in lower fees at higher asset levels; and (2) the pricing structure (including the expense ratio to be borne by shareholders) of the Portfolio, as compared to its Selected Peer Group, including that: (a) the management fee for the Portfolio is above the median and the average management fees of the funds in its Selected Peer Group; and (b) the expense ratio for the Portfolio is above the median and below the average expense ratios of the funds in its Selected Peer Group. In analyzing this fee data, the Board took into account: (1) Management's representations regarding the competitiveness of the Portfolio's management fee and expense ratio; and (2) Management's discussions of fee waivers and expense limits, which lower the Portfolio's effective management fee rate.
After its deliberation, the Board reached the following conclusions: (1) the Portfolio's management fee rate is reasonable in the context of all factors considered by the Board; (2) the Portfolio's expense ratio is reasonable in the context of all factors considered by the Board; (3) the Portfolio's performance is reasonable in the context of all factors considered by the Board; and (4) the sub-advisory fee rate payable by the Adviser to the Sub-Adviser is reasonable in the context of all factors considered by the Board. Based on these conclusions and other factors, the Board voted to renew the Management and Sub-Advisory Contracts for the Portfolio for the relevant periods. During this renewal process, different Board members may have given different weight to different individual factors and related conclusions.
VY® Baron Growth Portfolio
In considering whether to approve the renewal of the Management and Sub-Advisory Contracts for VY® Baron Growth Portfolio, the Board considered that, based on performance data for the periods ended March 31, 2016: (1) the Portfolio outperformed its Morningstar category average for all periods presented, with the exception of the one-year and three-year periods, during which it underperformed; (2) the Portfolio outperformed its primary benchmark for all periods presented, with the exception of the three-year period, during which it underperformed; and (3) the Portfolio is ranked in the first
169
ADVISORY CONTRACT APPROVAL DISCUSSION (UNAUDITED) (CONTINUED)
(highest) quintile of its Morningstar category for the year-to-date period, the second quintile for the five-year and ten-year periods, the third quintile for the one-year period, and the fourth quintile for the three-year period. In analyzing this performance data, the Board took into account: (1) Management's representations regarding the strength of the Portfolio's performance during certain periods; (2) Management's analysis with respect to the effect that the Portfolio's smaller capitalization investment portfolio relative to its Morningstar category peer group, and sector weightings, had on the Portfolio's performance during certain periods; (3) Management's confidence in the Sub-Adviser's ability to execute the Portfolio's investment strategy; and (4) that Management would continue to monitor, and the Board or its Investment Review Committee would periodically review, the Portfolio's performance.
In considering the fees payable under the Management and Sub-Advisory Contracts for the Portfolio, the Board took into account the factors described above and also considered: (1) the fairness of the compensation under a Management Contract with a breakpoint fee schedule where the asset level necessary to achieve a breakpoint discount had not been reached by the Portfolio; and (2) the pricing structure (including the expense ratio to be borne by shareholders) of the Portfolio, as compared to its Selected Peer Group, including that: (a) the management fee for the Portfolio is above the median and the average management fees of the funds in its Selected Peer Group; and (b) the expense ratio for the Portfolio is above the median and the average expense ratios of the funds in its Selected Peer Group. In analyzing this fee data, the Board took into account: (1) that, as directed by the Board during the 2015 annual Contract Review Process, lower expense limits were implemented for the Portfolio in January 2016; and (2) Management's representations regarding the competitiveness of the Portfolio's management fee and expense ratio.
After its deliberation, the Board reached the following conclusions: (1) the Portfolio's management fee rate is reasonable in the context of all factors considered by the Board; (2) the Portfolio's expense ratio is reasonable in the context of all factors considered by the Board; (3) taking into account that Management will continue to monitor, and the Board or its Investment Review Committee would periodically review, the Portfolio's performance, the Portfolio's performance is reasonable in the context of all factors considered by the Board; and (4) the sub-advisory fee rate payable by the Adviser to the Sub-Adviser is reasonable in the context of all factors considered by the Board. Based on these conclusions and other factors, the Board voted to renew the
Management and Sub-Advisory Contracts for the Portfolio for the relevant periods. During this renewal process, different Board members may have given different weight to different individual factors and related conclusions.
VY® Columbia Contrarian Core Portfolio
In considering whether to approve the renewal of the Management and Sub-Advisory Contracts for VY® Columbia Contrarian Core Portfolio, the Board considered that, based on performance data for the periods ended March 31, 2016: (1) the Portfolio outperformed its Morningstar category average for all periods presented, with the exception of the ten-year period, during which the Portfolio's performance was equal to its Morningstar category average; (2) the Portfolio underperformed its primary benchmark for all periods presented, with the exception of the one-year and three-year periods, during which it outperformed; and (3) the Portfolio is ranked in the first (highest) quintile of its Morningstar category for the one-year and three-year periods and the third quintile for the year-to-date, five-year and ten-year periods.
In considering the fees payable under the Management and Sub-Advisory Contracts for the Portfolio, the Board took into account the factors described above and also considered: (1) the fairness of the compensation under a Management Contract with a breakpoint fee schedule where the asset level necessary to achieve a breakpoint discount had not been reached by the Portfolio; and (2) the pricing structure (including the expense ratio to be borne by shareholders) of the Portfolio, as compared to its Selected Peer Group, including that: (a) the management fee for the Portfolio is above the median and the average management fees of the funds in its Selected Peer Group; and (b) the expense ratio for the Portfolio is below the median and above the average expense ratios of the funds in its Selected Peer Group. In analyzing this fee data, the Board took into account Management's representations regarding the competitiveness of the Portfolio's management fee and expense ratio.
After its deliberation, the Board reached the following conclusions: (1) the Portfolio's management fee rate is reasonable in the context of all factors considered by the Board; (2) the Portfolio's expense ratio is reasonable in the context of all factors considered by the Board; (3) the Portfolio's performance is reasonable in the context of all factors considered by the Board; and (4) the sub-advisory fee rate payable by the Adviser to the Sub-Adviser is reasonable in the context of all factors considered by the Board. Based on these conclusions and other factors, the Board voted to renew the Management and Sub-Advisory
170
ADVISORY CONTRACT APPROVAL DISCUSSION (UNAUDITED) (CONTINUED)
Contracts for the Portfolio for the relevant periods. During this renewal process, different Board members may have given different weight to different individual factors and related conclusions.
VY® Columbia Small Cap Value II Portfolio
In considering whether to approve the renewal of the Management and Sub-Advisory Contracts for VY® Columbia Small Cap Value II Portfolio, the Board considered that, based on performance data for the periods ended March 31, 2016: (1) the Portfolio outperformed its Morningstar category average for all periods presented, with the exception of the year-to-date period, during which it underperformed; (2) the Portfolio outperformed its primary benchmark for all periods presented, with the exception of the year-to-date period, during which it underperformed; and (3) the Portfolio is ranked in the first (highest) quintile of its Morningstar category for the three-year and five-year periods, the second quintile for the one-year period, and the fourth quintile for the year-to-date period.
In considering the fees payable under the Management and Sub-Advisory Contracts for the Portfolio, the Board took into account the factors described above and also considered: (1) the fairness of the compensation under a Management Contract with a level fee rate that does not include breakpoints; and (2) the pricing structure (including the expense ratio to be borne by shareholders) of the Portfolio, as compared to its Selected Peer Group, including that: (a) the management fee for the Portfolio is above the median and the average management fees of the funds in its Selected Peer Group; and (b) the expense ratio for the Portfolio is below the median and the average expense ratios of the funds in its Selected Peer Group. In analyzing this fee data, the Board took into account Management's representations regarding the competitiveness of the Portfolio's management fee.
After its deliberation, the Board reached the following conclusions: (1) the Portfolio's management fee rate is reasonable in the context of all factors considered by the Board; (2) the Portfolio's expense ratio is reasonable in the context of all factors considered by the Board; (3) the Portfolio's performance is reasonable in the context of all factors considered by the Board; and (4) the sub-advisory fee rate payable by the Adviser to the Sub-Adviser is reasonable in the context of all factors considered by the Board. Based on these conclusions and other factors, the Board voted to renew the Management and Sub-Advisory Contracts for the Portfolio for the relevant periods. During this renewal process, different Board members may have given different weight to different individual factors and related conclusions.
VY® Invesco Comstock Portfolio
In considering whether to approve the renewal of the Management and Sub-Advisory Contracts for VY® Invesco Comstock Portfolio, the Board considered that, based on performance data for the periods ended March 31, 2016: (1) the Portfolio underperformed its Morningstar category average for all periods presented, with the exception of the ten-year period, during which it outperformed; (2) the Portfolio underperformed its primary benchmark for all periods presented; and (3) the Portfolio is ranked in the third quintile of its Morningstar category for the five-year and ten-year periods, the fourth quintile for the three-year period, and the fifth (lowest) quintile for the year-to-date and one-year periods. In analyzing this performance data, the Board took into account: (1) Management's analysis regarding the impact that stock selection, sector allocation and factors such as size bias and valuation bias had on the Portfolio's performance; (2) Management's representations regarding the Portfolio's favorable performance during certain periods and Management's expectation that performance will improve; (3) Management's confidence in the Sub-Adviser's ability to execute the Portfolio's investment strategy; and (4) that Management would continue to closely monitor, and the Board or its Investment Review Committee would periodically review, the Portfolio's performance.
In considering the fees payable under the Management and Sub-Advisory Contracts for the Portfolio, the Board took into account the factors described above and also considered: (1) the fairness of the compensation under a Management Contract with a level fee rate that does not include breakpoints; and (2) the pricing structure (including the expense ratio to be borne by shareholders) of the Portfolio, as compared to its Selected Peer Group, including that: (a) the management fee for the Portfolio is below the median and above the average management fees of the funds in its Selected Peer Group; and (b) the expense ratio for the Portfolio is below the median and the average expense ratios of the funds in its Selected Peer Group.
After its deliberation, the Board reached the following conclusions: (1) the Portfolio's management fee rate is reasonable in the context of all factors considered by the Board; (2) the Portfolio's expense ratio is reasonable in the context of all factors considered by the Board; (3) taking into account that Management would continue to monitor, and the Board or its Investment Review Committee would periodically review, the Portfolio's performance, the Portfolio's performance is reasonable in the context of all factors considered by the Board; and (4) the sub-advisory fee rate payable by the Adviser to
171
ADVISORY CONTRACT APPROVAL DISCUSSION (UNAUDITED) (CONTINUED)
the Sub-Adviser is reasonable in the context of all factors considered by the Board. Based on these conclusions and other factors, the Board voted to renew the Management and Sub-Advisory Contracts for the Portfolio for the relevant periods. During this renewal process, different Board members may have given different weight to different individual factors and related conclusions.
VY® Invesco Equity and Income Portfolio
In considering whether to approve the renewal of the Management and Sub-Advisory Contracts for VY® Invesco Equity and Income Portfolio, the Board considered that, based on performance data for the periods ended March 31, 2016: (1) the Portfolio outperformed its Morningstar category average for all periods presented, with the exception of the year-to-date and one-year periods, during which it underperformed; (2) the Portfolio underperformed its primary benchmark for all periods presented, with the exception of the ten-year period, during which it outperformed; and (3) the Portfolio is ranked in the first (highest) quintile of its Morningstar category for the ten-year period, the second quintile for the three-year and five-year periods, the third quintile for the one-year period, and the fifth (lowest) quintile for the year-to-date period.
In considering the fees payable under the Management and Sub-Advisory Contracts for the Portfolio, the Board took into account the factors described above and also considered: (1) the economies of scale benefits to the Portfolio and its shareholders from breakpoint discounts applicable to the Portfolio's management fee rate, which result in lower fees at higher asset levels; and (2) the pricing structure (including the expense ratio to be borne by shareholders) of the Portfolio, as compared to its Selected Peer Group, including that: (a) the management fee for the Portfolio is below the median and the average management fees of the funds in its Selected Peer Group; and (b) the expense ratio for the Portfolio is below the median and the average expense ratios of the funds in its Selected Peer Group.
After its deliberation, the Board reached the following conclusions: (1) the Portfolio's management fee rate is reasonable in the context of all factors considered by the Board; (2) the Portfolio's expense ratio is reasonable in the context of all factors considered by the Board; (3) the Portfolio's performance is reasonable in the context of all factors considered by the Board; and (4) the sub-advisory fee rate payable by the Adviser to the Sub-Adviser is reasonable in the context of all factors considered by the Board. Based on these conclusions and other factors, the Board voted to renew the Management and Sub-Advisory Contracts for the Portfolio for the relevant periods. During
this renewal process, different Board members may have given different weight to different individual factors and related conclusions.
VY® JPMorgan Mid Cap Value Portfolio
In considering whether to approve the renewal of the Management and Sub-Advisory Contracts for VY® JPMorgan Mid Cap Value Portfolio, the Board considered that, based on performance data for the periods ended March 31, 2016: (1) the Portfolio outperformed its Morningstar category average for all periods presented; (2) the Portfolio outperformed its primary benchmark for all periods presented; and (3) the Portfolio is ranked in the first (highest) quintile of its Morningstar category for all periods presented.
In considering the fees payable under the Management and Sub-Advisory Contracts for the Portfolio, the Board took into account the factors described above and also considered: (1) the economies of scale benefits to the Portfolio and its shareholders from breakpoint discounts applicable to the Portfolio's management fee rate, which result in lower fees at higher asset levels; and (2) the pricing structure (including the expense ratio to be borne by shareholders) of the Portfolio, as compared to its Selected Peer Group, including that: (a) the management fee for the Portfolio is above the median and the average management fees of the funds in its Selected Peer Group; and (b) the expense ratio for the Portfolio is above the median and the average expense ratios of the funds in its Selected Peer Group. In analyzing this fee data, the Board took into account Management's representations regarding the competitiveness of the Portfolio's management fee and expense ratio.
After its deliberation, the Board reached the following conclusions: (1) the Portfolio's management fee rate is reasonable in the context of all factors considered by the Board; (2) the Portfolio's expense ratio is reasonable in the context of all factors considered by the Board; (3) the Portfolio's performance is reasonable in the context of all factors considered by the Board; and (4) the sub-advisory fee rate payable by the Adviser to the Sub-Adviser is reasonable in the context of all factors considered by the Board. Based on these conclusions and other factors, the Board voted to renew the Management and Sub-Advisory Contracts for the Portfolio for the relevant periods. During this renewal process, different Board members may have given different weight to different individual factors and related conclusions.
VY® Oppenheimer Global Portfolio
In considering whether to approve the renewal of the Management and Sub-Advisory Contracts for VY® Oppenheimer Global Portfolio, the Board considered that,
172
ADVISORY CONTRACT APPROVAL DISCUSSION (UNAUDITED) (CONTINUED)
based on performance data for the periods ended March 31, 2016: (1) the Portfolio outperformed its Morningstar category average for all periods presented, with the exception of the year-to-date and one-year periods, during which it underperformed; (2) the Portfolio outperformed its primary benchmark for all periods presented, with the exception of the year-to-date and one-year periods, during which it underperformed; and (3) the Portfolio is ranked in the second quintile of its Morningstar category for the ten-year period, the third quintile for the three-year and five-year periods, and the fifth (lowest) quintile for the year-to-date and one-year periods.
In considering the fees payable under the Management and Sub-Advisory Contracts for the Portfolio, the Board took into account the factors described above and also considered: (1) the fairness of the compensation under a Management Contract with a breakpoint fee schedule where the asset level necessary to achieve a breakpoint discount had not been reached by the Portfolio; and (2) the pricing structure (including the expense ratio to be borne by shareholders) of the Portfolio, as compared to its Selected Peer Group, including that: (a) the management fee for the Portfolio is below the median and the average management fees of the funds in its Selected Peer Group; and (b) the expense ratio for the Portfolio is below the median and the average expense ratios of the funds in its Selected Peer Group.
After its deliberation, the Board reached the following conclusions: (1) the Portfolio's management fee rate is reasonable in the context of all factors considered by the Board; (2) the Portfolio's expense ratio is reasonable in the context of all factors considered by the Board; (3) the Portfolio's performance is reasonable in the context of all factors considered by the Board; and (4) the sub-advisory fee rate payable by the Adviser to the Sub-Adviser is reasonable in the context of all factors considered by the Board. Based on these conclusions and other factors, the Board voted to renew the Management and Sub-Advisory Contracts for the Portfolio for the relevant periods. During this renewal process, different Board members may have given different weight to different individual factors and related conclusions.
VY® Pioneer High Yield Portfolio
In considering whether to approve the renewal of the Management and Sub-Advisory Contracts for VY® Pioneer High Yield Portfolio, the Board considered that, based on performance data for the periods ended March 31, 2016: (1) the Portfolio underperformed its Morningstar category average for all periods presented, with the exception of the three-year and ten-year periods, during which it outperformed; (2) the Portfolio underperformed its primary benchmark for all periods
presented, with the exception of the ten-year period, during which it outperformed; and (3) the Portfolio is ranked in the first (highest) quintile of its Morningstar category for the ten-year period, the third quintile for the three-year period, the fourth quintile for the year-to-date and five-year periods, and the fifth (lowest) quintile for the one-year period. In analyzing this performance data, the Board took into account Management's representations regarding the competitiveness of the Portfolio's performance during certain periods.
In considering the fees payable under the Management and Sub-Advisory Contracts for the Portfolio, the Board took into account the factors described above and also considered: (1) the fairness of the compensation under a Management Contract with a breakpoint fee schedule where the asset level necessary to achieve a breakpoint discount had not been reached by the Portfolio; and (2) the pricing structure (including the expense ratio to be borne by shareholders) of the Portfolio, as compared to its Selected Peer Group, including that: (a) the management fee for the Portfolio is above the median and the average management fees of the funds in its Selected Peer Group; and (b) the expense ratio for the Portfolio is below the median and the average expense ratios of the funds in its Selected Peer Group. In analyzing this fee data, the Board took into account Management's representations regarding the competitiveness of the Portfolio's management fee.
After its deliberation, the Board reached the following conclusions: (1) the Portfolio's management fee rate is reasonable in the context of all factors considered by the Board; (2) the Portfolio's expense ratio is reasonable in the context of all factors considered by the Board; (3) the Portfolio's performance is reasonable in the context of all factors considered by the Board; and (4) the sub-advisory fee rate payable by the Adviser to the Sub-Adviser is reasonable in the context of all factors considered by the Board. Based on these conclusions and other factors, the Board voted to renew the Management and Sub-Advisory Contracts for the Portfolio for the relevant periods. During this renewal process, different Board members may have given different weight to different individual factors and related conclusions.
VY® T. Rowe Price Diversified Mid Cap Growth Portfolio
In considering whether to approve the renewal of the Management and Sub-Advisory Contracts for VY® T. Rowe Price Diversified Mid Cap Growth Portfolio, the Board considered that, based on performance data for the periods ended March 31, 2016: (1) the Portfolio outperformed its Morningstar category average for all periods presented; (2) the Portfolio outperformed its primary benchmark for all periods presented, with the
173
ADVISORY CONTRACT APPROVAL DISCUSSION (UNAUDITED) (CONTINUED)
exception of the year-to-date and one-year periods, during which it underperformed; and (3) the Portfolio is ranked in the first (highest) quintile of its Morningstar category for the three-year, five-year and ten-year periods, and the second quintile for the year-to-date and one-year periods.
In considering the fees payable under the Management and Sub-Advisory Contracts for the Portfolio, the Board took into account the factors described above and also considered: (1) the fairness of the compensation under a Management Contract with a level fee rate that does not include breakpoints; and (2) the pricing structure (including the expense ratio to be borne by shareholders) of the Portfolio, as compared to its Selected Peer Group, including that: (a) the management fee for the Portfolio is below the median and the average management fees of the funds in its Selected Peer Group; and (b) the expense ratio for the Portfolio is below the median and the average expense ratios of the funds in its Selected Peer Group.
After its deliberation, the Board reached the following conclusions: (1) the Portfolio's management fee rate is reasonable in the context of all factors considered by the Board; (2) the Portfolio's expense ratio is reasonable in the context of all factors considered by the Board; (3) the Portfolio's performance is reasonable in the context of all factors considered by the Board; and (4) the sub-advisory fee rate payable by the Adviser to the Sub-Adviser is reasonable in the context of all factors considered by the Board. Based on these conclusions and other factors, the Board voted to renew the Management and Sub-Advisory Contracts for the Portfolio for the relevant periods. During this renewal process, different Board members may have given different weight to different individual factors and related conclusions.
VY® T. Rowe Price Growth Equity Portfolio
In considering whether to approve the renewal of the Management and Sub-Advisory Contracts for VY® T. Rowe Price Growth Equity Portfolio, the Board considered that, based on performance data for the periods ended March 31, 2016: (1) the Portfolio outperformed its Morningstar category average for all periods presented, with the exception of the year-to-date period, during which it underperformed; (2) the Portfolio outperformed its benchmark for all periods presented, with the exception of the year-to-date and one-year periods, during which it underperformed; and (3) the Portfolio is ranked in the first (highest) quintile of its Morningstar category for the three-year, five-year and ten-year periods, the second quintile for the one-year period, and the fifth (lowest) quintile for the year-to-date period.
In considering the fees payable under the Management and Sub-Advisory Contracts for the Portfolio, the Board took into account the factors described above and also considered: (1) the fairness of the compensation under a Management Contract with a level fee rate that does not include breakpoints; and (2) the pricing structure (including the expense ratio to be borne by shareholders) of the Portfolio, as compared to its Selected Peer Group, including that: (a) the management fee for the Portfolio is above the median and the average management fees of the funds in its Selected Peer Group; and (b) the expense ratio for the Portfolio is above the median and the average expense ratios of the funds in its Selected Peer Group. In analyzing this fee data, the Board took into account Management's representations regarding the competitiveness of the Portfolio's management fee and expense ratio.
After its deliberation, the Board reached the following conclusions: (1) the Portfolio's management fee rate is reasonable in the context of all factors considered by the Board; (2) the Portfolio's expense ratio is reasonable in the context of all factors considered by the Board; (3) the Portfolio's performance is reasonable in the context of all factors considered by the Board; and (4) the sub-advisory fee rate payable by the Adviser to the Sub-Adviser is reasonable in the context of all factors considered by the Board. Based on these conclusions and other factors, the Board voted to renew the Management and Sub-Advisory Contracts for the Portfolio for the relevant periods. During this renewal process, different Board members may have given different weight to different individual factors and related conclusions.
VY® Templeton Foreign Equity Portfolio
In considering whether to approve the renewal of the Management and Sub-Advisory Contracts for VY® Templeton Foreign Equity Portfolio, the Board considered that, based on performance data for the periods ended March 31, 2016: (1) the Portfolio underperformed its Morningstar category average for all periods presented, with the exception of the five-year and ten-year periods, during which it outperformed; and (2) the Portfolio outperformed its primary benchmark for all periods presented, with the exception of the year-to-date and one-year periods, during which it underperformed; and (3) the Portfolio is ranked in the first (highest) quintile of its Morningstar category for the ten-year period, the third quintile for the three-year and five-year periods, the fourth quintile for the year-to-date period, and the fifth (lowest) quintile for the one-year period. In analyzing this performance data, the Board took into account: (1) Management's analysis regarding the negative effect that the Portfolio's stock selection,
174
ADVISORY CONTRACT APPROVAL DISCUSSION (UNAUDITED) (CONTINUED)
including its value bias, focus on stocks with larger capitalization and higher volatility had on the Portfolio's performance; (2) Management's representations regarding the reasonableness of the Portfolio's performance during certain periods; (3) Management's representations that it was analyzing options for addressing the Portfolio's underperformance; and (4) that Management would continue to monitor, and the Board or its Investment Review Committee would periodically review, the Portfolio's performance.
In considering the fees payable under the Management and Sub-Advisory Contracts for the Portfolio, the Board took into account the factors described above and also considered: (1) the economies of scale benefits to the Portfolio and its shareholders from breakpoint discounts applicable to the Portfolio's management fee rate, which result in lower fees at higher asset levels; and (2) the pricing structure (including the expense ratio to be borne by shareholders) of the Portfolio, as compared to its Selected Peer Group, including that: (a) the management fee for the Portfolio is above the median and the average management fees of the funds in its Selected Peer Group; and (b) the expense ratio for the Portfolio is above the median the average expense ratios of the funds in its Selected Peer Group. In analyzing this fee data, the
Board took into account management's representations regarding the competitiveness of the Portfolio's management fee and expense ratio, including the Portfolio's recent decrease in the sub-advisory fee rate breakpoints and the implementation of a corresponding management fee waiver effective January 1, 2016.
After its deliberation, the Board reached the following conclusions: (1) the Portfolio's management fee rate is reasonable in the context of all factors considered by the Board; (2) the Portfolio's expense ratio is reasonable in the context of all factors considered by the Board; (3) taking into account that Management will continue to monitor, and the Board or its Investment Review Committee would periodically review, the Portfolio's performance, the Portfolio's performance is reasonable in the context of all factors considered by the Board; and (4) the sub-advisory fee rate payable by the Adviser to the Sub-Adviser is reasonable in the context of all factors considered by the Board. Based on these conclusions and other factors, the Board voted to renew the Management and Sub-Advisory Contracts for the Portfolio for the relevant periods. During this renewal process, different Board members may have given different weight to different individual factors and related conclusions.
175
Investment Adviser
Directed Services LLC
1475 Dunwoody Drive
West Chester, Pennsylvania 19380
Distributor
Voya Investments Distributor, LLC
7337 East Doubletree Ranch Road, Suite 100
Scottsdale, Arizona 85258
Transfer Agent
BNY Mellon Investment Servicing (U.S.) Inc.
301 Bellevue Parkway
Wilmington, Delaware 19809
Independent Registered Public Accounting Firm
KPMG LLP
Two Financial Center
60 South Street
Boston, Massachusetts 02111
Custodian
The Bank of New York Mellon
225 Liberty Street
New York, New York 10286
Legal Counsel
Ropes & Gray LLP
Prudential Tower
800 Boylston Street
Boston, Massachusetts 02199
Before investing, carefully consider the investment objectives, risks, charges and expenses of the variable annuity contract or variable life insurance policy and the underlying variable investment options. This and other information is contained in the prospectus for the variable annuity contract or variable life insurance policy and the underlying variable investment options. Obtain these prospectuses from your agent/registered representative and read them carefully before investing.

Annual Report
December 31, 2016
Classes ADV, I, R6, S, S2 and T
Voya Partners, Inc.
| | ■
Voya Solution Aggressive Portfolio | | | ■
Voya Solution 2030 Portfolio | |
| | ■
Voya Solution Balanced Portfolio | | | ■
Voya Solution 2035 Portfolio | |
| | ■
Voya Solution Conservative Portfolio | | | ■
Voya Solution 2040 Portfolio | |
| | ■
Voya Solution Income Portfolio | | | ■
Voya Solution 2045 Portfolio | |
| | ■
Voya Solution Moderately Aggressive Portfolio | | | ■
Voya Solution 2050 Portfolio | |
| | ■
Voya Solution Moderately Conservative Portfolio | | | ■
Voya Solution 2055 Portfolio | |
| | ■
Voya Solution 2020 Portfolio | | | ■
Voya Solution 2060 Portfolio | |
| | ■
Voya Solution 2025 Portfolio | | |
| | | This report is submitted for general information to shareholders of the Voya mutual funds. It is not authorized for distribution to prospective shareholders unless accompanied or preceded by a prospectus which includes details regarding the funds’ investment objectives, risks, charges, expenses and other information. This information should be read carefully. | | |
PROXY VOTING INFORMATION
A description of the policies and procedures that the Portfolios use to determine how to vote proxies related to portfolio securities is available: (1) without charge, upon request, by calling Shareholder Services toll-free at (800) 992-0180; (2) on the Portfolios’ website at www.voyainvestments.com; and (3) on the U.S. Securities and Exchange Commission’s (“SEC’s”) website at www.sec.gov. Information regarding how the Portfolios voted proxies related to portfolio securities during the most recent 12-month period ended June 30 is available without charge on the Portfolios’ website at www.voyainvestments.com and on the SEC’s website at www.sec.gov.
QUARTERLY PORTFOLIO HOLDINGS
The Portfolios file their complete schedule of portfolio holdings with the SEC for the first and third quarters of each fiscal year on Form N-Q. The Portfolios’ Forms N-Q are available on the SEC’s website at www.sec.gov. The Portfolios’ Forms N-Q may be reviewed and copied at the SEC’s Public Reference Room in Washington, D.C., and information on the operation of the Public Reference Room may be obtained by calling (800) SEC-0330. The Portfolios’ Forms N-Q, as well as a complete portfolio of investments, are available without charge upon request from the Portfolios by calling Shareholder Services toll-free at (800) 992-0180.
New administration, new possibilities
Dear Shareholder,
During the presidential campaign, President Donald Trump promised to cut taxes and regulations; since the election, anticipation of these policies has driven a rally in the stock markets. As the Trump administration transitions into power, it’s appropriate to consider how its policies might impact long-term investors.
The incoming president inherits a much better economy than the outgoing one did: job growth is accelerating, inflation is rising at an acceptable pace and corporate earnings have turned positive again. These trends were established enough in December that the U.S. Federal Reserve Board (“Fed”) could justify increasing interest rates. In a recent update to its World Economic Outlook, the International Monetary Fund (“IMF”) raised its near-term estimates of U.S. growth. Optimism about the pro-growth impacts of Trump policies is evident in surveys of small-business and consumer sentiment. We believe expectations of tax cuts, deregulation and increased fiscal policy stimulus will accelerate economic growth in the near term, leading to expectations of improved corporate revenue and earnings, which, if realized, could help sustain a stock market rally.
Greater fiscal stimulus also could help our trading partners, provided the new administration does not impose protectionist trade policies. Globally, near-term economic progress and easier fiscal policies should reduce the need to rely so heavily upon monetary policy. The IMF notes that the outlook for advanced economies has improved, though tighter financial conditions challenge the prospects for emerging and developing economies.
The potential benefits of Trump policies could be mitigated by longer-term trends in the economy: an aging population, consumers’ reluctance to borrow and subdued productivity growth. Fiscal stimulus would increase demand, but if coupled with aggressive tax cuts could increase the federal budget deficit, raising inflation. Should inflation accelerate above the Fed’s comfort threshold, we could see a faster than expected pace of interest rate increases, dampening growth potential.
Political uncertainty persists in this post-election world; the shift from monetary toward fiscal stimulus, while potentially beneficial, may also increase volatility. Investors should remain vigilant. True to our philosophy, we believe a globally diversified portfolio represents the best way to navigate the changing landscape of 2017. Before taking any action that could impact your long-term potential for investment success, thoroughly discuss with your investment advisor your circumstances and possible responses.
We seek to remain a reliable partner committed to reliable investing, helping you and your investment advisor achieve your goals. We appreciate your continued confidence in us, and we look forward to serving your investment needs in the future.
Sincerely,
Shaun Mathews
President and Chief Executive Officer
Voya Family of Funds
January 19, 2017
The views expressed in the President’s Letter reflect those of the President as of the date of the letter. Any such views are subject to change at any time based upon market or other conditions and the Voya mutual funds disclaim any responsibility to update such views. These views may not be relied on as investment advice and because investment decisions for a Voya mutual fund are based on numerous factors, may not be relied on as an indication of investment intent on behalf of any Voya mutual fund. Reference to specific company securities should not be construed as recommendations or investment advice.
International investing poses special risks including currency fluctuation, economic and political risks not found in investments that are solely domestic.
Market Perspective: Year Ended December 31, 2016
In our semi-annual report we described how markets in global equities, in the form of the MSCI World IndexSM (the “Index”) measured in local currencies, including net reinvested dividends, recovered sharply after intensifying global concerns had driven them down into February. With much turmoil along the way, the Index managed to turn a 0.70% loss in the first half into a 9.00% gain for the whole fiscal year. (The Index returned 7.51% for the year ended December 31, 2016, measured in U.S. dollars.)
The U.S. Federal Open Market Committee (“FOMC”) had started raising interest rates in December with the prospect of more to come in 2016 despite sluggish economic progress. It was worse in the rest of the developed world where negative bond yields were increasingly common.
China was an ongoing concern with declining growth, policy missteps and ballooning debt. Energy and commodities prices were falling, adding to deflationary pressures.
Many indices of risky assets seemed to reach their nadir on February 11. The Index, with no specific catalyst evident, rebounded by nearly 14% to the end of May.
As asset prices recovered, there were still many who doubted that the gains would be sustained. Yet by the end of May, the domestic economy was delivering some more encouraging data. FOMC officials started talking about two to three rate increases in 2016, as the faint growth in U.S. gross domestic product (“GDP”) in late 2015 and early 2016 would soon improve and employment was nearly full.
A surprisingly weak U.S. employment report on June 3 put paid to an interest rate increase that month. But worse was to come. On June 23, the British electorate unexpectedly voted to leave the European Union (“EU”). The strident voices of anti-globalization in other EU countries were sure to demand their own referendum. The potential disintegration of the world’s largest trading bloc had alarming implications for global demand and investment. Yet an initial 6% drop in the Index was mostly reversed by month end.
Indeed, the prices of risk assets resumed their recovery; the Index rose 4.56% in the two months through August. Two strong employment reports took the unemployment rate below 4.9%. Core inflation was holding above 2%. Slim second quarter annualized GDP growth of just 1.1% concealed real final sales growth of 2.4%. By the end of August, Federal Reserve officials were again warning of two interest rate increases before year end. In the event the FOMC did not act in September after a less strong employment report and listless purchasing managers’ indices, but broadly hinted that they would do so in December.
By the end of October, one notable trend was the increase in government bond yields. There were various reasons. In the U.S., an interest rate hike in December was an increasingly likely prospect, not dimmed by GDP growth for the third quarter of 2016 reported at 2.9% and later revised even higher. In the euro zone, it was feared that the European Central Bank was about to “taper” its bond buying. In the U.K., the weakening pound made government bonds less attractive.
But this and other market trends were thrown into disarray when on November 8 a new U.S. President was unexpectedly elected on a platform of massive infrastructure spending, tax reductions, lighter financial regulation, trade protectionism and the repeal of the Affordable Care Act.
Having stumbled for two months, the Index danced 2.63% higher in November and 2.78% in December. But the music had changed. The platform was seen as reflationary and inflationary in the U.S. The yield curve rose and steepened faster than ever. This and the prospect of lighter regulation benefited banks. The promised infrastructure spending boosted sectors like industrials, energy and materials. However, sectors that had been “bond surrogates” like utilities and consumer staples suffered. The technology sector, on which the net effect was unclear, was little changed.
In U.S. fixed income markets, the Bloomberg Barclays U.S. Aggregate Bond Index (“Barclays Aggregate”) gained 2.65% in the fiscal year, while the Bloomberg Barclays U.S. Treasury Bond sub-index added 1.04%. Indices of riskier classes generally outperformed Treasuries. The Bloomberg Barclays U.S. Corporate Investment Grade Bond sub-index advanced 6.11%; the Bloomberg Barclays High Yield Bond — 2% Issuer Constrained Composite Index (not a part of the Barclays Aggregate) soared 17.13%.
U.S. equities, represented by the S&P 500® index including dividends, rose 11.96% over the twelve months. The strongest sectors were energy and telecommunications, returning 27.36% and 23.49% respectively. Weakest were health care and consumer staples, which returned -2.69% and 5.38%, respectively. S&P 500® companies’ earnings per share recorded a 3.13% year-over-year increase in the third quarter of 2016 after five straight year-over-year declines.
In currencies, the dollar was boosted by developments in November and on a trade-weighted basis reached a 14-year high. The dollar gained 3.21% against the euro and 19.38% on the pound in 2016, although in the latter case it was primarily due to Britain’s vote to leave the EU. The dollar actually lost 2.71% against the yen, but this included a gain after November 8 of more than 11%.
In international markets, the MSCI Japan® Index, in a pattern that inversely reflected the yen, a driver of the value of non-yen export earnings, slipped 0.74% for the year, but rose nearly 15% in the last quarter. The MSCI Europe ex UK® Index added 2.31%, the balance of larger effects: industrials gained over 15% and made the largest contribution, while health care lost 10% and made the largest negative contribution. The MSCI UK® Index surged 19.16%, its big multinational members like HSBC, Shell and Glencore benefiting from the weaker pound, the currency in which their substantial overseas earnings would be reported.
All indices are unmanaged and investors cannot invest directly in an index. Past performance does not guarantee future results. The performance quoted represents past performance. Investment return and principal value of an investment will fluctuate, and shares, when redeemed, may be worth more or less than their original cost. The Portfolios’ performance is subject to change since the period’s end and may be lower or higher than the performance data shown. Please call (800) 262-3862 or log on to www.voyainvestments.com to obtain performance data current to the most recent month end.
Market Perspective reflects the views of Voya Investment Management’s Chief Investment Risk Officer only through the end of the period, and is subject to change based on market and other conditions.
| | | Index | | | | Description | | |
| | | Bloomberg Barclays High Yield Bond — 2% Issuer Constrained Composite Index | | | | An index that includes all fixed-income securities having a maximum quality rating of Ba1, a minimum amount outstanding of $150 million, and at least one year to maturity. | | |
| | | Bloomberg Barclays U.S. Aggregate Bond Index | | | | An index of publicly issued investment grade U.S. Government, mortgage-backed, asset-backed and corporate debt securities. | | |
| | | Bloomberg Barclays U.S. Corporate Investment Grade Bond Index | | | | An index consisting of publicly issued, fixed rate, nonconvertible, investment grade debt securities. | | |
| | | Bloomberg Barclays U.S. Treasury Bond Index | | | | A market capitalization-weighted index that measures the performance of public obligations of the U.S. Treasury that have a remaining maturity of one year or more. | | |
| | | MSCI EAFE® Index | | | | An index that measures the performance of securities listed on exchanges in Europe, Australasia and the Far East. It includes the reinvestment of dividends net of withholding taxes, but does not reflect fees, brokerage commissions or other expenses of investing. | | |
| | | MSCI Europe ex UK® Index | | | | A free float-adjusted market capitalization index that is designed to measure developed market equity performance in Europe, excluding the UK. | | |
| | | MSCI Japan® Index | | | | A free float-adjusted market capitalization index that is designed to measure developed market equity performance in Japan. | | |
| | | MSCI UK® Index | | | | A free float-adjusted market capitalization index that is designed to measure developed market equity performance in the UK. | | |
| | | MSCI World IndexSM | | | | An index that measures the performance of over 1,400 securities listed on exchanges in the U.S., Europe, Canada, Australia, New Zealand and the Far East. | | |
| | | Russell 3000® Index | | | | An index that measures the performance of the largest 3000 U.S. companies representing approximately 98% of the investable U.S. equity market. | | |
| | | S&P 500® Index | | | | An index that measures the performance of securities of approximately 500 large-capitalization companies whose securities are traded on major U.S. stock markets. | | |
| | | S&P Target Date Retirement Income Index | | | | Seeks to represent asset allocations which target an immediate retirement horizon. | | |
| | | S&P Target Risk Aggressive Index | | | | Seeks to emphasize exposure to equity securities, maximizing opportunities for long-term capital accumulation. It may include small allocations in fixed-income securities to enhance portfolio efficiency. | | |
| | | S&P Target Risk Conservative Index | | | | Seeks to emphasize exposure to fixed income securities in order to produce a current income stream and avoid excessive volatility of returns. Equity securities are included to protect long-term purchasing power. | | |
| | | S&P Target Risk Growth Index | | | | Seeks to measure the performance of an asset allocation strategy targeted to a growth focused risk profile. | | |
| | | S&P Target Risk Moderate Index | | | | Seeks to measure the performance of an asset allocation strategy targeted to a moderate risk profile. | | |
| | | S&P Target Date 2020 Index,
S&P Target Date 2025 Index,
S&P Target Date 2030 Index,
S&P Target Date 2035 Index,
S&P Target Date 2040 Index,
S&P Target Date 2045 Index,
S&P Target Date 2050 Index and
S&P Target Date 2055+ Index | | | | Each seeks to represent the market consensus for asset allocations which target an approximate 2020, 2025, 2030, 2035, 2040, 2045, 2050, 2055 and beyond 2055 retirement horizon, respectively. | | |
| Voya Solution Portfolios | Portfolio Managers’ Report |
The Voya Solution Portfolios consist of Voya Solution Aggressive Portfolio, Voya Solution Balanced Portfolio, Voya Solution Conservative Portfolio, Voya Solution Income Portfolio, Voya Solution Moderately Aggressive Portfolio, Voya Solution Moderately Conservative Portfolio, Voya Solution 2020 Portfolio, Voya Solution 2025 Portfolio, Voya Solution 2030 Portfolio, Voya Solution 2035 Portfolio, Voya Solution 2040 Portfolio, Voya Solution 2045 Portfolio, Voya Solution 2050 Portfolio, Voya Solution 2055 Portfolio, and Voya Solution 2060 Portfolio (each a “Portfolio” or collectively, the “Portfolios” or the “Solution Portfolios”). Each Portfolio seeks to achieve its investment objective by investing in a combination of underlying funds which are actively managed funds or passively managed funds (index funds)(1). Each Portfolio uses an asset allocation strategy (“Strategic Asset Allocation”) designed for investors expecting to retire around the year or have the risk profile applicable to that Portfolio. The Portfolios are managed by Halvard Kvaale, CIMA, Paul Zemsky, CFA and Chief Investment Officer, and Jody Hrazanek, Portfolio Managers of Voya Investment Management Co. LLC (“Voya IM”) the Sub-Adviser (“Sub-Adviser”).*
Portfolio Specifics: The Portfolios began the year with an overweight position in U.S. core fixed income, funded by underweight positions in U.S. large-cap equity (in the far-dated Portfolios) and high yield bonds (in the near-dated Portfolios).
In January, the Portfolios reduced exposure to U.S. mid cap equities, allocating proceeds to core U.S. fixed income. This tactical trade was made to reduce risk given uncertainty around U.S. Federal Reserve Board (“Fed”) policy and global growth. In February, with continual global weakness and policy induced volatility, equity exposure was further reduced by selling U.S. large cap and developed international equities in favor of core U.S. fixed income.
In mid-March, both short-term positions implemented in February were reversed by selling U.S. core fixed income and purchasing U.S. large-cap and developed international equities. This trade was made to add risk back into the Portfolios, as policy steps from the European Central Bank, Fed and Bank of Japan helped to ventilate the monetary system and economic growth numbers had firmed.
In mid-April, given improved U.S. economic data, the Portfolios covered a portion of the short U.S. mid cap position that was originated in January. At the end of April, to maintain equity weights through the Portfolios’ annual glide down, the underweight large cap/overweight U.S. fixed income position initiated in July of 2015 was closed. In addition, the last of the short U.S. mid cap/long core fixed income position initiated in January was closed. These trades were a continuation of re-risking the Portfolios from their defensive posture, reflecting confidence that a trough in the markets was made in the first quarter.
In early-June, a modest overweight to commodities was enacted, offset by an underweight to core bonds. At the time of the trade, we believed the global oil market would likely move to a balanced state in 2017 as demand continues to rise faster than production. In addition, commodities should benefit from continued global growth and Fed-driven U.S. dollar weakness.
In mid-June, a portion of the Portfolios U.S. large cap position was shifted into U.S. mid cap. This trade reflected the view that U.S. consumer spending will continue to drive U.S. outperformance relative to the global equity markets. Given that U.S. large cap corporations have greater exposure to international markets than do their mid cap counterparts, this trade provided the suite with greater exposure to the U.S. growth story without incurring a meaningful increase in tracking error. In addition, we believed U.S. mid cap provided greater protection from the possibility of a successful British referendum and lower sensitivity to both the shape of the yield curve and energy prices.
At the end of the second quarter, in response to the financial shock and uncertainty surrounding the passing of Brexit, the Portfolios reduced volatility by selling U.S. large cap into cash.
In July, the Portfolios purchased U.S. large cap equities with cash, directly reversing the risk-reduction trade implemented in June as a response to the British withdrawal from the European Union. Support for this trade include a strong June payroll report and improved fundamental and technical indicators.
Also in July, duration was increased in some of the Portfolios by purchasing long-term U.S. Treasury Bonds and core fixed income. The pursuit of yield from investors had increased demand for U.S. Treasuries given its positive yielding bond market and high credit rating. At the time, the odds of a rate hike were relatively low, but U.S. policy is still expected to tighten versus other major central banks which only increases the value of the U.S. dollar and, subsequently, the demand for its bonds.
In August, the Portfolios enacted a modest overweight to emerging markets (“EM”) equities offset by selling high yield and U.S. large cap. We believe that EM equities have been making a meaningful turnaround after prolonged underperformance relative to domestic markets since 2011. Increased acceleration of industrial production combined with the easing of financial market conditions are positive for the asset class.
At the end of October, the Portfolios further increased their tactical overweight to EM funded by a reduction in short duration (and core bonds for Portfolios where short duration exposure was unavailable). In addition, as part of the semi-annual review of the Portfolios’ strategic asset allocation, existing tactical trades were incorporated into longer-term strategic positions, resulting in a slight decrease in fixed income exposure.
In November, the Portfolios closed the mid-cap overweight enacted in June after meaningful gains in mid-cap leading into and after the U.S. elections. At the end of the month, the Portfolios removed their overweight to EM equities as headwinds from a rise in dollar strength and the uncertainty of the Trump administration’s stance on trade continued to pressure the asset class. Proceeds from both trades were allocated to U.S. large cap equities.
During the year, tactical moves relative to our Strategic Asset Allocations had a negative impact across all Portfolios.
The performance of Portfolios against their benchmarks was also impacted by differences between Strategic Asset Allocations and benchmark asset allocations. This varied from Portfolio to Portfolio. For example, in some cases Portfolios had a higher allocation to equities than their
| Portfolio Managers’ Report | Voya Solution Portfolios |
benchmarks, enhancing relative performance. In addition, the Portfolios tended to have a higher weighting in high yield bonds and bank loans with less cash than the benchmarks within the fixed income exposure, which was beneficial. On the other hand, the Portfolios tended to have a lower weighting in U.S. mid-caps within the equities exposure, which detracted.
Individual contributors to benchmark-relative performance include Voya Intermediate Bond Fund, Voya Small Company Portfolio and Voya Global Bond Fund. Individual detractors to relative performance include VY® T. Rowe Price Growth Equity Portfolio, Voya Multi-Manager Mid Cap Value Fund and Voya Multi-Manager Large Cap Core Portfolio.
During the year, the Portfolios utilized futures to enact tactical positions. Futures were utilized to avoid significant manager disruption and provide the Portfolios with greater liquidity. The impact of the derivatives was in line with expectations of the tactical asset allocation positions. Overall, tactical positions detracted from performance for the year.
Current Strategy and Outlook: We believe both monetary and fiscal policy are going to be far more active than any time since the post-2009 era. President-elect Donald Trump has promised a meaningful reduction in corporate and personal income tax rates as part of his agenda to reinvigorate the U.S. economy. Additionally, the Fed is now forecasting three interest rate hikes in 2017. Both of these initiatives come while the U.S. is at or approaching full employment, making each an important issue in its own right for markets to digest this coming year.
In our view, a tightening monetary and loose fiscal policy environment will favor continued U.S. dollar strength, albeit at a more modest pace going forward. U.S. bond yields are still likely to climb, met with fits and starts, and will be highly dependent upon the strength of U.S. economic progress. Rising bond yields have historically created a virtuous circle of attracting foreign flows looking for yield, but the key will be the speed of those moves. Commodity prices have found their legs and are continuing to move higher on a deal from OPEC to cut oil production, while the prospects of better growth around the world should benefit cyclical commodities such as iron ore and copper. The U.S. consumer has fared very well as a result of an increase in disposable income, solid job prospects and favorable financing rates. Consumer confidence and wage growth will be key indicators for us to monitor going forward.
Though we believe equity markets can continue to do well, this thesis rests on a few conditions being met. First, U.S. dollar strength can continue but must be within reasonable bounds. Too strong a dollar can hurt earnings of the larger capitalization companies that earn a sizeable share of revenues overseas. The year-on-year change in the U.S. dollar is just turning positive, and a large move from this point forward could start to negatively impact earnings. We favor the U.S. in this environment, as it has the best growth trajectory and visibility over the next quarter.
We are mindful that fund flows are just starting to warm up to the ideas that equities can outpace fixed income returns. We think equities can finally get some traction among investors as the coming reflation initiatives take hold. As for bonds they may be susceptible the old adage “don’t throw the baby out with the bath water,” but we are still finding opportunities in high yield fixed income and senior loans.
In retrospect, making asset allocation decisions in 2016 was easy. Simply buying after equity market corrections was a good strategy. The market environment in 2017 may not be so cut and dry. We are closely looking for signs of overheating sentiment among investors, and have yet to see any of our indicators firmly pointing to ebullience. While we believe recession risk in the near-term has all but disappeared, we are keenly aware that if the Fed starts hiking faster than the markets expect, it could spell trouble for all risk assets, especially with U.S. equities at lofty 17 times earnings. Tightening labor markets and fast rising wages could be a challenge for equities, but in our view that is more likely a concern for later this coming year.
*
Each Portfolio’s relative performance versus its respective benchmarks can be found on page x.
(1)
The investment objective of each Portfolio is described in the Portfolios’ prospectuses, each dated May 1, 2016.
Portfolio holdings and characteristics are subject to change and may not be representative of current holdings and characteristics. Portfolio holdings are subject to change daily. The outlook for this Portfolio may differ from that presented for other Voya mutual funds. The Portfolio’s performance returns shown reflect applicable fee waivers and/or expense limits in effect during this period. Absent such fee waivers/expense limitations, if any, performance would have been lower. Performance for the different classes of shares will vary based on differences in fees associated with each class.
| Voya Solution Portfolios | Portfolio Managers’ Report |
| | | Target Allocations as of December 31, 2016 | | |
| | | | | | Income | | | 2020 | | | 2025 | | | 2030 | | | 2035 | | | 2040 | | | 2045 | | | 2050 | | | 2055 | | | 2060 | | |
| | | U.S. Large Blend | | | | | 14.0% | | | | | | 15.0% | | | | | | 16.0% | | | | | | 22.0% | | | | | | 21.0% | | | | | | 20.0% | | | | | | 18.0% | | | | | | 19.0% | | | | | | 21.0% | | | | | | 21.0% | | | |
| | | U.S. Large Growth | | | | | 4.0% | | | | | | 7.0% | | | | | | 8.0% | | | | | | 9.0% | | | | | | 12.0% | | | | | | 13.0% | | | | | | 15.0% | | | | | | 15.0% | | | | | | 15.0% | | | | | | 15.0% | | | |
| | | U.S. Large Value | | | | | 6.0% | | | | | | 7.0% | | | | | | 8.0% | | | | | | 9.0% | | | | | | 10.0% | | | | | | 11.0% | | | | | | 13.0% | | | | | | 13.0% | | | | | | 13.0% | | | | | | 13.0% | | | |
| | | U.S. Mid Cap | | | | | 3.0% | | | | | | 5.0% | | | | | | 7.0% | | | | | | 7.0% | | | | | | 7.0% | | | | | | 10.0% | | | | | | 11.0% | | | | | | 11.0% | | | | | | 11.0% | | | | | | 11.0% | | | |
| | | U.S. Small Cap | | | | | — | | | | | | 2.0% | | | | | | 3.0% | | | | | | 3.0% | | | | | | 3.0% | | | | | | 4.0% | | | | | | 4.0% | | | | | | 4.0% | | | | | | 4.0% | | | | | | 4.0% | | | |
| | | International Equity | | | | | 5.0% | | | | | | 11.0% | | | | | | 14.0% | | | | | | 15.0% | | | | | | 19.0% | | | | | | 19.0% | | | | | | 21.0% | | | | | | 21.0% | | | | | | 21.0% | | | | | | 21.0% | | | |
| | | Emerging Markets | | | | | — | | | | | | — | | | | | | 3.0% | | | | | | 4.0% | | | | | | 6.0% | | | | | | 6.0% | | | | | | 6.0% | | | | | | 6.0% | | | | | | 6.0% | | | | | | 6.0% | | | |
| | | U.S. Real Estate | | | | | 1.0% | | | | | | 1.0% | | | | | | 1.0% | | | | | | 1.5% | | | | | | 1.5% | | | | | | 1.5% | | | | | | 1.5% | | | | | | 1.5% | | | | | | 1.5% | | | | | | 1.5% | | | |
| | | Global Real Estate | | | | | 1.0% | | | | | | 1.0% | | | | | | 1.0% | | | | | | 1.5% | | | | | | 1.5% | | | | | | 1.5% | | | | | | 1.5% | | | | | | 1.5% | | | | | | 1.5% | | | | | | 1.5% | | | |
| | | Commodities | | | | | 1.5% | | | | | | 1.5% | | | | | | 1.5% | | | | | | 1.5% | | | | | | 1.5% | | | | | | 1.5% | | | | | | 1.5% | | | | | | 1.5% | | | | | | 1.5% | | | | | | 1.5% | | | |
| | | Core Fixed Income | | | | | 32.5% | | | | | | 22.5% | | | | | | 18.5% | | | | | | 13.5% | | | | | | 8.5% | | | | | | 7.5% | | | | | | 4.8% | | | | | | 3.8% | | | | | | 3.8% | | | | | | 3.8% | | | |
| | | High Yield | | | | | 3.0% | | | | | | 3.0% | | | | | | 3.0% | | | | | | 3.0% | | | | | | 3.0% | | | | | | 3.0% | | | | | | — | | | | | | — | | | | | | — | | | | | | — | | | |
| | | Senior Debt | | | | | 5.0% | | | | | | 5.0% | | | | | | 5.0% | | | | | | 5.0% | | | | | | 5.0% | | | | | | 2.0% | | | | | | 1.7% | | | | | | 1.7% | | | | | | — | | | | | | — | | | |
| | | Global Bond | | | | | 6.0% | | | | | | 6.0% | | | | | | 6.0% | | | | | | — | | | | | | — | | | | | | — | | | | | | — | | | | | | — | | | | | | — | | | | | | — | | | |
| | | TIPS | | | | | 9.0% | | | | | | 7.0% | | | | | | — | | | | | | — | | | | | | — | | | | | | — | | | | | | — | | | | | | — | | | | | | — | | | | | | — | | | |
| | | Short Duration | | | | | 8.0% | | | | | | 5.3% | | | | | | 4.3% | | | | | | 3.3% | | | | | | 0.3% | | | | | | — | | | | | | — | | | | | | — | | | | | | — | | | | | | — | | | |
| | | Long Gov’t Bond | | | | | 1.0% | | | | | | 0.7% | | | | | | 0.7% | | | | | | 1.7% | | | | | | 0.7% | | | | | | — | | | | | | 1.0% | | | | | | 1.0% | | | | | | 0.7% | | | | | | 0.7% | | | |
| | | Total Equity | | | | | 35% | | | | | | 51% | | | | | | 63% | | | | | | 74% | | | | | | 83% | | | | | | 88% | | | | | | 93% | | | | | | 94% | | | | | | 96% | | | | | | 96% | | | |
| | | Total Fixed Income | | | | | 65% | | | | | | 49% | | | | | | 37% | | | | | | 26% | | | | | | 17% | | | | | | 12% | | | | | | 7% | | | | | | 6% | | | | | | 4% | | | | | | 4% | | | |
| | | Target Allocations as of December 31, 2016 | | |
| | | | | | Aggressive | | | Moderately
Aggressive | | | Balanced | | | Moderately
Conservative | | | Conservative | | |
| | | U.S. Large Blend | | | | | 19.0% | | | | | | 17.5% | | | | | | 16.5% | | | | | | 10.5% | | | | | | 11.0% | | | |
| | | U.S. Large Growth | | | | | 17.0% | | | | | | 11.0% | | | | | | 9.5% | | | | | | 3.0% | | | | | | 0.0% | | | |
| | | U.S. Large Value | | | | | 13.0% | | | | | | 12.0% | | | | | | 12.5% | | | | | | 7.0% | | | | | | 5.5% | | | |
| | | U.S. Mid Cap | | | | | 16.0% | | | | | | 14.0% | | | | | | 9.0% | | | | | | 7.5% | | | | | | 4.0% | | | |
| | | U.S. Small Cap | | | | | 4.0% | | | | | | 3.0% | | | | | | 2.0% | | | | | | 2.0% | | | | | | 0.0% | | | |
| | | International Equity | | | | | 20.0% | | | | | | 16.0% | | | | | | 9.0% | | | | | | 7.0% | | | | | | 3.0% | | | |
| | | Emerging Markets | | | | | 5.0% | | | | | | 4.0% | | | | | | 2.0% | | | | | | 2.0% | | | | | | 0.0% | | | |
| | | U.S. Real Estate | | | | | 1.0% | | | | | | 1.0% | | | | | | 1.0% | | | | | | 1.0% | | | | | | 0.0% | | | |
| | | Global Real Estate | | | | | 1.0% | | | | | | 1.0% | | | | | | 1.0% | | | | | | 1.0% | | | | | | 0.0% | | | |
| | | Commodities | | | | | 1.0% | | | | | | 1.5% | | | | | | 1.5% | | | | | | 2.0% | | | | | | 2.0% | | | |
| | | Core Fixed Income | | | | | 3.0% | | | | | | 10.3% | | | | | | 19.0% | | | | | | 25.0% | | | | | | 28.5% | | | |
| | | High Yield | | | | | 0.0% | | | | | | 3.0% | | | | | | 5.0% | | | | | | 7.0% | | | | | | 9.0% | | | |
| | | Senior Debt | | | | | 0.0% | | | | | | 3.0% | | | | | | 5.0% | | | | | | 6.0% | | | | | | 7.0% | | | |
| | | Global Bond | | | | | 0.0% | | | | | | 2.0% | | | | | | 2.0% | | | | | | 5.0% | | | | | | 7.0% | | | |
| | | TIPS | | | | | 0.0% | | | | | | 0.0% | | | | | | 0.0% | | | | | | 4.0% | | | | | | 8.0% | | | |
| | | Short Duration | | | | | 0.0% | | | | | | 0.0% | | | | | | 4.3% | | | | | | 10.0% | | | | | | 15.0% | | | |
| | | Long Gov’t Bond | | | | | 0.0% | | | | | | 0.7% | | | | | | 0.7% | | | | | | 0.0% | | | | | | 0.0% | | | |
| | | Equity | | | | | 97% | | | | | | 81% | | | | | | 64% | | | | | | 43% | | | | | | 25% | | | |
| | | Fixed Income | | | | | 3% | | | | | | 19% | | | | | | 36% | | | | | | 57% | | | | | | 75% | | | |
| | | | | | | | | |
As these are target allocations, the actual allocations of each Portfolio’s assets may deviate from the percentages shown. Although the Portfolios expect to be fully invested at all times, they may maintain liquidity reserves to meet redemption requests.
Portfolio holdings are subject to change daily.
| Portfolio Managers’ Report | Voya Solution Portfolios |
| | | Total Returns for the Period Ended December 31, 2016 | | |
| | | | | | 1 Year | | |
| | | Voya Solution Aggressive Portfolio, Class S | | | 6.75% | | |
| | | S&P Target Risk Aggressive Index | | | 7.93% | | |
| | | Voya Solution Balanced Portfolio, Class S | | | 6.32% | | |
| | | S&P Target Risk Growth Index | | | 6.94% | | |
| | | Voya Solution Conservative Portfolio, Class S | | | 6.04% | | |
| | | S&P Target Risk Conservative Index | | | 5.35% | | |
| | | Voya Solution Income Portfolio, Class S | | | 4.47% | | |
| | | S&P Target Date Retirement Income Index | | | 5.27% | | |
| | | Russell 3000® Index | | | 12.74% | | |
| | | MSCI EAFE® Index | | | 1.00% | | |
| | | Bloomberg Barclays U.S. Aggregate Bond (“BCAB”) Index | | | 2.65% | | |
| | | Voya Solution Moderately Aggressive Portfolio, Class S | | | 6.17% | | |
| | | S&P Target Risk Aggressive Index | | | 7.93% | | |
| | | Voya Solution Moderately Conservative Portfolio, Class S | | | 5.87% | | |
| | | S&P Target Risk Moderate Index | | | 5.89% | | |
| | | Voya Solution 2020 Portfolio, Class S | | | 5.46% | | |
| | | S&P Target Date 2020 Index | | | 7.49% | | |
| | | Voya Solution 2025 Portfolio, Class S | | | 5.88% | | |
| | | S&P Target Date 2025 Index | | | 8.09% | | |
| | | Russell 3000® Index | | | 12.74% | | |
| | | MSCI EAFE® Index | | | 1.00% | | |
| | | BCAB Index | | | 2.65% | | |
| | | Voya Solution 2030 Portfolio, Class S | | | 6.32% | | |
| | | S&P Target Date 2030 Index | | | 8.62% | | |
| | | Voya Solution 2035 Portfolio, Class S | | | 6.23% | | |
| | | S&P Target Date 2035 Index | | | 9.12% | | |
| | | Russell 3000® Index | | | 12.74% | | |
| | | MSCI EAFE® Index | | | 1.00% | | |
| | | BCAB Index | | | 2.65% | | |
| | | Voya Solution 2040 Portfolio, Class S | | | 6.79% | | |
| | | S&P Target Date 2040 Index | | | 9.50% | | |
| | | Voya Solution 2045 Portfolio, Class S | | | 6.40% | | |
| | | S&P Target Date 2045 Index | | | 9.81% | | |
| | | Russell 3000® Index | | | 12.74% | | |
| | | MSCI EAFE® Index | | | 1.00% | | |
| | | BCAB Index | | | 2.65% | | |
| | | Voya Solution 2050 Portfolio, Class S | | | 6.56% | | |
| | | S&P Target Date 2050 Index | | | 10.01% | | |
| | | Voya Solution 2055 Portfolio, Class S | | | 6.44% | | |
| | | S&P Target Date 2055+ Index | | | 10.21% | | |
| | | Voya Solution 2060 Portfolio, Class S | | | 6.56% | | |
| | | S&P Target Date 2055+ Index | | | 10.21% | | |
| | | | | |
| Voya Solution Aggressive Portfolio | Portfolio Managers’ Report |
| | | Average Annual Total Returns for the Periods Ended December 31, 2016 | | |
| | | | | | 1 Year | | | Since Inception
of Classes ADV, I, S, and S2
May 1, 2013 | | |
| | | Class ADV | | | | | 6.41% | | | | | | 7.12% | | | |
| | | Class I | | | | | 6.93% | | | | | | 7.79% | | | |
| | | Class S | | | | | 6.75% | | | | | | 7.52% | | | |
| | | Class S2 | | | | | 6.57% | | | | | | 7.21% | | | |
| | | Class R6(1) | | | | | 6.94% | | | | | | 7.79% | | | |
| | | S&P Target Risk Aggressive Index | | | | | 7.93% | | | | | | 7.24% | | | |
| | | | | |
Based on a $10,000 initial investment, the graph and table above illustrate the total return of Voya Solution Aggressive Portfolio against the index indicated. The index is unmanaged, has no cash in its portfolio, imposes no sales charges and incurs no operating expenses. An investor cannot invest directly in an index. The Portfolio’s performance is shown without the imposition of any expenses or charges which are, or may be, imposed under your variable annuity contract or variable life insurance policy. Total returns would have been lower if such expenses or charges were included.
The performance graph and table do not reflect the deduction of taxes that a shareholder will pay on Portfolio distributions or the redemption of Portfolio shares.
The performance shown may include the effect of fee waivers and/or expense reimbursements by the Investment Adviser and/or other service providers, which have the effect of increasing total return. Had all fees and expenses been considered, the total returns would have been lower.
The performance update illustrates performance for a variable investment option available through a variable annuity contract or a variable life insurance policy. The
performance shown indicates past performance and is not a projection or prediction of future results. Actual investment returns and principal value will fluctuate so that shares and/or units, at redemption, may be worth more or less than their original cost. Please log on to www.voyainvestments.com or call (800) 262-3862 to get performance through the most recent month end.
This report contains statements that may be “forward-looking” statements. Actual results may differ materially from those projected in the “forward-looking” statements.
The views expressed in this report reflect those of the portfolio managers, only through the end of the period as stated on the cover. The portfolio managers’ views are subject to change at any time based on market and other conditions.
Portfolio holdings are subject to change daily.
(1)
Class R6 incepted on May 2, 2016. The Class R6 shares performance shown for the period prior to their inception date is the performance of Class I shares without adjustment for any differences in the expenses between the two classes. If adjusted for such differences, returns would be different.
| Portfolio Managers’ Report | Voya Solution Balanced Portfolio |
| | | Average Annual Total Returns for the Periods Ended December 31, 2016 | | |
| | | | | | 1 Year | | | 5 Year | | | Since Inception
of Classes ADV, I and S
July 2, 2007 | | | Since Inception
of Class S2
April 30, 2010 | | |
| | | Class ADV | | | | | 6.08% | | | | | | 7.89% | | | | | | 2.96% | | | | | | — | | | |
| | | Class I | | | | | 6.69% | | | | | | 8.44% | | | | | | 3.56% | | | | | | — | | | |
| | | Class S | | | | | 6.32% | | | | | | 8.16% | | | | | | 3.28% | | | | | | — | | | |
| | | Class S2 | | | | | 6.10% | | | | | | 8.00% | | | | | | — | | | | | | 6.62% | | | |
| | | Class R6(1) | | | | | 6.58% | | | | | | 8.41% | | | | | | 3.55% | | | | | | — | | | |
| | | S&P Target Risk Growth Index | | | | | 6.94% | | | | | | 8.02% | | | | | | 4.16% | | | | | | 7.26% | | | |
| | | | | |
Based on a $10,000 initial investment, the graph and table above illustrate the total return of Voya Solution Balanced Portfolio against the index indicated. The index is unmanaged and has no cash in its portfolio, imposes no sales charges and incurs no operating expenses. An investor cannot invest directly in an index. The Portfolio’s performance is shown without the imposition of any expenses or charges which are, or may be, imposed under your variable annuity contract or variable life insurance policy. Total returns would have been lower if such expenses or charges were included.
The performance graph and table do not reflect the deduction of taxes that a shareholder will pay on Portfolio distributions or the redemption of Portfolio shares.
The performance shown may include the effect of fee waivers and/or expense reimbursements by the Investment Adviser and/or other service providers, which have the effect of increasing total return. Had all fees and expenses been considered, the total returns would have been lower.
The performance update illustrates performance for a variable investment option available through a variable annuity contract or a variable life insurance policy. The
performance shown indicates past performance and is not a projection or prediction of future results. Actual investment returns and principal value will fluctuate so that shares and/or units, at redemption, may be worth more or less than their original cost. Please log on to www.voyainvestments.com or call (800) 262-3862 to get performance through the most recent month end.
This report contains statements that may be “forward-looking” statements. Actual results may differ materially from those projected in the “forward-looking” statements.
The views expressed in this report reflect those of the portfolio managers, only through the end of the period as stated on the cover. The portfolio managers’ views are subject to change at any time based on market and other conditions.
Portfolio holdings are subject to change daily.
(1)
Class R6 incepted on May 2, 2016. The Class R6 shares performance shown for the period prior to their inception date is the performance of Class I shares without adjustment for any differences in the expenses between the two classes. If adjusted for such differences, returns would be different.
| Voya Solution Conservative Portfolio | Portfolio Managers’ Report |
| | | Average Annual Total Returns for the Periods Ended December 31, 2016 | | |
| | | | | | 1 Year | | | 5 Year | | | Since Inception
of Classes ADV, I, S, and S2
April 30, 2010 | | |
| | | Class ADV | | | | | 5.76% | | | | | | 4.90% | | | | | | 4.43% | | | |
| | | Class I | | | | | 6.24% | | | | | | 5.40% | | | | | | 4.95% | | | |
| | | Class S | | | | | 6.04% | | | | | | 5.16% | | | | | | 4.69% | | | |
| | | Class S2 | | | | | 5.90% | | | | | | 5.01% | | | | | | 4.54% | | | |
| | | Class R6(1) | | | | | 6.24% | | | | | | 5.40% | | | | | | 4.95% | | | |
| | | S&P Target Risk Conservative Index | | | | | 5.35% | | | | | | 4.48% | | | | | | 4.68% | | | |
| | | | | |
Based on a $10,000 initial investment, the graph and table above illustrate the total return of Voya Solution Conservative Portfolio against the index indicated. The index is unmanaged and has no cash in its portfolio, imposes no sales charges and incurs no operating expenses. An investor cannot invest directly in an index. The Portfolio’s performance is shown without the imposition of any expenses or charges which are, or may be, imposed under your variable annuity contract or variable life insurance policy. Total returns would have been lower if such expenses or charges were included.
The performance graph and table do not reflect the deduction of taxes that a shareholder will pay on Portfolio distributions or the redemption of Portfolio shares.
The performance shown may include the effect of fee waivers and/or expense reimbursements by the Investment Adviser and/or other service providers, which have the effect of increasing total return. Had all fees and expenses been considered, the total returns would have been lower.
The performance update illustrates performance for a variable investment option available through a variable annuity contract or a variable life insurance policy. The
performance shown indicates past performance and is not a projection or prediction of future results. Actual investment returns and principal value will fluctuate so that shares and/or units, at redemption, may be worth more or less than their original cost. Please log on to www.voyainvestments.com or call (800) 262-3862 to get performance through the most recent month end.
This report contains statements that may be “forward-looking” statements. Actual results may differ materially from those projected in the “forward-looking” statements.
The views expressed in this report reflect those of the portfolio managers, only through the end of the period as stated on the cover. The portfolio managers’ views are subject to change at any time based on market and other conditions.
Portfolio holdings are subject to change daily.
(1)
Class R6 incepted on May 2, 2016. The Class R6 shares performance shown for the period prior to their inception date is the performance of Class I shares without adjustment for any differences in the expenses between the two classes. If adjusted for such differences, returns would be different.
| Portfolio Managers’ Report | Voya Solution Income Portfolio |
| | | Average Annual Total Returns for the Periods Ended December 31, 2016 | | |
| | | | | | 1 Year | | | 5 Year | | | 10 Year | | | Since Inception
of Class S2
May 28, 2009 | | |
| | | Class ADV | | | | | 4.26% | | | | | | 5.10% | | | | | | 3.64% | | | | | | — | | | |
| | | Class I | | | | | 4.78% | | | | | | 5.63% | | | | | | 4.17% | | | | | | — | | | |
| | | Class S | | | | | 4.47% | | | | | | 5.36% | | | | | | 3.91% | | | | | | — | | | |
| | | Class S2 | | | | | 4.28% | | | | | | 5.20% | | | | | | — | | | | | | 6.39% | | | |
| | | Class T | | | | | 4.11% | | | | | | 4.91% | | | | | | 3.45% | | | | | | — | | | |
| | | S&P Target Date Retirement Income Index | | | | | 5.27% | | | | | | 4.92% | | | | | | 4.15% | | | | | | 6.51% | | | |
| | | Russell 3000® Index | | | | | 12.74% | | | | | | 14.67% | | | | | | 7.07% | | | | | | 15.24% | | | |
| | | MSCI EAFE® Index | | | | | 1.00% | | | | | | 6.53% | | | | | | 0.75% | | | | | | 6.44% | | | |
| | | BCAB Index | | | | | 2.65% | | | | | | 2.23% | | | | | | 4.34% | | | | | | 4.07% | | | |
| | | | | |
Based on a $10,000 initial investment, the graph and table above illustrate the total return of Voya Solution Income Portfolio against the indices indicated. An index is unmanaged and has no cash in its portfolio, imposes no sales charges and incurs no operating expenses. An investor cannot invest directly in an index. The Portfolio’s performance is shown without the imposition of any expenses or charges which are, or may be, imposed under your variable annuity contract or variable life insurance policy. Total returns would have been lower if such expenses or charges were included.
The performance graph and table do not reflect the deduction of taxes that a shareholder will pay on Portfolio distributions or the redemption of Portfolio shares.
The performance shown may include the effect of fee waivers and/or expense reimbursements by the Investment Adviser and/or other service providers, which have the effect of increasing total return. Had all fees and expenses been considered, the total returns would have been lower.
The performance update illustrates performance for a variable investment option available through a variable annuity contract or a variable life insurance policy. The performance shown indicates past performance and is not a projection or prediction of future results. Actual investment returns and principal value will fluctuate so that shares and/or units, at redemption, may be worth more or less than their original cost. Please log on to www.voyainvestments.com or call (800) 262-3862 to get performance through the most recent month end.
This report contains statements that may be “forward-looking” statements. Actual results may differ materially from those projected in the “forward-looking” statements.
The views expressed in this report reflect those of the portfolio managers, only through the end of the period as stated on the cover. The portfolio managers’ views are subject to change at any time based on market and other conditions.
Portfolio holdings are subject to change daily.
| Voya Solution Moderately Aggressive Portfolio | Portfolio Managers’ Report |
| | | Average Annual Total Returns for the Periods Ended December 31, 2016 | | |
| | | | | | 1 Year | | | 5 Year | | | Since Inception
of Classes ADV, I, S, and S2
April 30, 2010 | | |
| | | Class ADV | | | | | 6.00% | | | | | | 8.97% | | | | | | 7.15% | | | |
| | | Class I | | | | | 6.40% | | | | | | 9.51% | | | | | | 7.70% | | | |
| | | Class S | | | | | 6.17% | | | | | | 9.22% | | | | | | 7.42% | | | |
| | | Class S2 | | | | | 5.97% | | | | | | 9.07% | | | | | | 7.27% | | | |
| | | Class R6(1) | | | | | 6.31% | | | | | | 9.49% | | | | | | 7.68% | | | |
| | | S&P Target Risk Aggressive Index | | | | | 7.93% | | | | | | 10.13% | | | | | | 8.79% | | | |
| | | | | |
Based on a $10,000 initial investment, the graph and table above illustrate the total return of Voya Solution Moderately Aggressive Portfolio against the index indicated. The index is unmanaged and has no cash in its portfolio, imposes no sales charges and incurs no operating expenses. An investor cannot invest directly in an index. The Portfolio’s performance is shown without the imposition of any expenses or charges which are, or may be, imposed under your variable annuity contract or variable life insurance policy. Total returns would have been lower if such expenses or charges were included.
The performance graph and table do not reflect the deduction of taxes that a shareholder will pay on Portfolio distributions or the redemption of Portfolio shares.
The performance shown may include the effect of fee waivers and/or expense reimbursements by the Investment Adviser and/or other service providers, which have the effect of increasing total return. Had all fees and expenses been considered, the total returns would have been lower.
The performance update illustrates performance for a variable investment option available through a variable annuity contract or a variable life insurance policy. The
performance shown indicates past performance and is not a projection or prediction of future results. Actual investment returns and principal value will fluctuate so that shares and/or units, at redemption, may be worth more or less than their original cost. Please log on to www.voyainvestments.com or call (800) 262-3862 to get performance through the most recent month end.
This report contains statements that may be “forward-looking” statements. Actual results may differ materially from those projected in the “forward-looking” statements.
The views expressed in this report reflect those of the portfolio managers, only through the end of the period as stated on the cover. The portfolio managers’ views are subject to change at any time based on market and other conditions.
Portfolio holdings are subject to change daily.
(1)
Class R6 incepted on May 2, 2016. The Class R6 shares performance shown for the period prior to their inception date is the performance of Class I shares without adjustment for any differences in the expenses between the two classes. If adjusted for such differences, returns would be different.
| Portfolio Managers’ Report | Voya Solution Moderately Conservative Portfolio |
| | | Average Annual Total Returns for the Periods Ended December 31, 2016 | | |
| | | | | | 1 Year | | | 5 Year | | | Since Inception
of Classes ADV, I and S
July 2, 2007 | | | Since Inception
of Class S2
April 30, 2010 | | |
| | | Class ADV | | | | | 5.64% | | | | | | 6.17% | | | | | | 3.16% | | | | | | — | | | |
| | | Class I | | | | | 6.12% | | | | | | 6.66% | | | | | | 3.80% | | | | | | — | | | |
| | | Class S | | | | | 5.87% | | | | | | 6.44% | | | | | | 3.52% | | | | | | — | | | |
| | | Class S2 | | | | | 5.62% | | | | | | 6.26% | | | | | | — | | | | | | 5.49% | | | |
| | | Class R6(1) | | | | | 6.03% | | | | | | 6.64% | | | | | | 3.79% | | | | | | — | | | |
| | | S&P Target Risk Moderate Index | | | | | 5.89% | | | | | | 5.81% | | | | | | 3.70% | | | | | | 5.53% | | | |
| | | | | |
Based on a $10,000 initial investment, the graph and table above illustrate the total return of Voya Solution Moderately Conservative Portfolio against the index indicated. The index is unmanaged and has no cash in its portfolio, imposes no sales charges and incurs no operating expenses. An investor cannot invest directly in an index. The Portfolio’s performance is shown without the imposition of any expenses or charges which are, or may be, imposed under your variable annuity contract or variable life insurance policy. Total returns would have been lower if such expenses or charges were included.
The performance graph and table do not reflect the deduction of taxes that a shareholder will pay on Portfolio distributions or the redemption of Portfolio shares.
The performance shown may include the effect of fee waivers and/or expense reimbursements by the Investment Adviser and/or other service providers, which have the effect of increasing total return. Had all fees and expenses been considered, the total returns would have been lower.
The performance update illustrates performance for a variable investment option available through a variable annuity contract or a variable life insurance policy. The
performance shown indicates past performance and is not a projection or prediction of future results. Actual investment returns and principal value will fluctuate so that shares and/or units, at redemption, may be worth more or less than their original cost. Please log on to www.voyainvestments.com or call (800) 262-3862 to get performance through the most recent month end.
This report contains statements that may be “forward-looking” statements. Actual results may differ materially from those projected in the “forward-looking” statements.
The views expressed in this report reflect those of the portfolio managers, only through the end of the period as stated on the cover. The portfolio managers’ views are subject to change at any time based on market and other conditions.
Portfolio holdings are subject to change daily.
(1)
Class R6 incepted on May 2, 2016. The Class R6 shares performance shown for the period prior to their inception date is the performance of Class I shares without adjustment for any differences in the expenses between the two classes. If adjusted for such differences, returns would be different.
| Voya Solution 2020 Portfolio | Portfolio Managers’ Report |
| | | Average Annual Total Returns for the Periods Ended December 31, 2016 | | |
| | | | | | 1 Year | | | 5 Year | | | Since Inception
of Classes ADV, I, S, S2 and T
October 3, 2011 | | |
| | | Class ADV | | | | | 5.21% | | | | | | 7.27% | | | | | | 8.60% | | | |
| | | Class I | | | | | 5.73% | | | | | | 7.82% | | | | | | 9.15% | | | |
| | | Class S | | | | | 5.46% | | | | | | 7.53% | | | | | | 8.86% | | | |
| | | Class S2 | | | | | 5.33% | | | | | | 7.41% | | | | | | 8.74% | | | |
| | | Class T | | | | | 4.99% | | | | | | 7.15% | | | | | | 8.46% | | | |
| | | S&P Target Date 2020 Index | | | | | 7.49% | | | | | | 7.93% | | | | | | 9.39% | | | |
| | | | | |
Based on a $10,000 initial investment, the graph and table above illustrate the total return of Voya Solution 2020 Portfolio against the index indicated. The index is unmanaged and has no cash in its portfolio, imposes no sales charges and incurs no operating expenses. An investor cannot invest directly in an index. The Portfolio’s performance is shown without the imposition of any expenses or charges which are, or may be, imposed under your variable annuity contract or variable life insurance policy. Total returns would have been lower if such expenses or charges were included.
The performance graph and table do not reflect the deduction of taxes that a shareholder will pay on Portfolio distributions or the redemption of Portfolio shares.
The performance shown may include the effect of fee waivers and/or expense reimbursements by the Investment Adviser and/or other service providers, which have the effect of increasing total return. Had all fees and expenses been considered, the total returns would have been lower.
The performance update illustrates performance for a variable investment option available through a variable
annuity contract or a variable life insurance policy. The performance shown indicates past performance and is not a projection or prediction of future results. Actual investment returns and principal value will fluctuate so that shares and/or units, at redemption, may be worth more or less than their original cost. Please log on to www.voyainvestments.com or call (800) 262-3862 to get performance through the most recent month end.
This report contains statements that may be “forward-looking” statements. Actual results may differ materially from those projected in the “forward-looking” statements.
The views expressed in this report reflect those of the portfolio managers, only through the end of the period as stated on the cover. The portfolio managers’ views are subject to change at any time based on market and other conditions.
Portfolio holdings are subject to change daily.
| Portfolio Managers’ Report | Voya Solution 2025 Portfolio |
| | | Average Annual Total Returns for the Periods Ended December 31, 2016 | | |
| | | | | | 1 Year | | | 5 Year | | | 10 Year | | | Since Inception
of Class S2
May 28, 2009 | | |
| | | Class ADV | | | | | 5.53% | | | | | | 7.80% | | | | | | 3.26% | | | | | | — | | | |
| | | Class I | | | | | 6.13% | | | | | | 8.34% | | | | | | 3.78% | | | | | | — | | | |
| | | Class S | | | | | 5.88% | | | | | | 8.07% | | | | | | 3.53% | | | | | | — | | | |
| | | Class S2 | | | | | 5.75% | | | | | | 7.91% | | | | | | — | | | | | | 9.07% | | | |
| | | Class T | | | | | 5.43% | | | | | | 7.58% | | | | | | 3.07% | | | | | | — | | | |
| | | S&P Target Date 2025 Index | | | | | 8.09% | | | | | | 8.64% | | | | | | 5.04% | | | | | | 10.10% | | | |
| | | Russell 3000® Index | | | | | 12.74% | | | | | | 14.67% | | | | | | 7.07% | | | | | | 15.24% | | | |
| | | MSCI EAFE® Index | | | | | 1.00% | | | | | | 6.53% | | | | | | 0.75% | | | | | | 6.44% | | | |
| | | BCAB Index | | | | | 2.65% | | | | | | 2.23% | | | | | | 4.34% | | | | | | 4.07% | | | |
| | | | | |
Based on a $10,000 initial investment, the graph and table above illustrate the total return of Voya Solution 2025 Portfolio against the indices indicated. An index is unmanaged and has no cash in its portfolio, imposes no sales charges and incurs no operating expenses. An investor cannot invest directly in an index. The Portfolio’s performance is shown without the imposition of any expenses or charges which are, or may be, imposed under your variable annuity contract or variable life insurance policy. Total returns would have been lower if such expenses or charges were included.
The performance graph and table do not reflect the deduction of taxes that a shareholder will pay on Portfolio distributions or the redemption of Portfolio shares.
The performance shown may include the effect of fee waivers and/or expense reimbursements by the Investment Adviser and/or other service providers, which have the effect of increasing total return. Had all fees and expenses been considered, the total returns would have been lower.
The performance update illustrates performance for a variable investment option available through a variable
annuity contract or a variable life insurance policy. The performance shown indicates past performance and is not a projection or prediction of future results. Actual investment returns and principal value will fluctuate so that shares and/or units, at redemption, may be worth more or less than their original cost. Please log on to www.voyainvestments.com or call (800) 262-3862 to get performance through the most recent month end.
This report contains statements that may be “forward-looking” statements. Actual results may differ materially from those projected in the “forward-looking” statements.
The views expressed in this report reflect those of the portfolio managers, only through the end of the period as stated on the cover. The portfolio managers’ views are subject to change at any time based on market and other conditions.
Portfolio holdings are subject to change daily.
| Voya Solution 2030 Portfolio | Portfolio Managers’ Report |
| | | Average Annual Total Returns for the Periods Ended December 31, 2016 | | |
| | | | | | 1 Year | | | 5 Year | | | Since Inception
of Classes ADV, I, S, S2 and T
October 3, 2011 | | |
| | | Class ADV | | | | | 6.09% | | | | | | 8.75% | | | | | | 10.43% | | | |
| | | Class I | | | | | 6.55% | | | | | | 9.30% | | | | | | 10.99% | | | |
| | | Class S | | | | | 6.32% | | | | | | 8.97% | | | | | | 10.65% | | | |
| | | Class S2 | | | | | 6.17% | | | | | | 8.80% | | | | | | 10.48% | | | |
| | | Class T | | | | | 5.81% | | | | | | 8.58% | | | | | | 10.25% | | | |
| | | S&P Target Date 2030 Index | | | | | 8.62% | | | | | | 9.32% | | | | | | 11.11% | | | |
| | | | | |
Based on a $10,000 initial investment, the graph and table above illustrate the total return of Voya Solution 2030 Portfolio against the index indicated. The index is unmanaged, has no cash in its portfolio, imposes no sales charges and incurs no operating expenses. An investor cannot invest directly in an index. The Portfolio’s performance is shown without the imposition of any expenses or charges which are, or may be, imposed under your variable annuity contract or variable life insurance policy. Total returns would have been lower if such expenses or charges were included.
The performance graph and table do not reflect the deduction of taxes that a shareholder will pay on Portfolio distributions or the redemption of Portfolio shares.
The performance shown may include the effect of fee waivers and/or expense reimbursements by the Investment Adviser and/or other service providers, which have the effect of increasing total return. Had all fees and expenses been considered, the total returns would have been lower.
The performance update illustrates performance for a variable investment option available through a variable contract or a variable life insurance policy. The
performance shown indicates past performance and is not a projection or prediction of future results. Actual investment returns and principal value will fluctuate so that shares and/or units, at redemption, may be worth more or less than their original cost. Please call (800) 262-3862 to get performance through the most recent month end.
It is important to note that the Portfolio has a limited operating history. Performance over a longer period of time may be more meaningful thanshort-term performance.
This report contains statements that may be “forward-looking” statements. Actual results may differ materially from those projected in the “forward-looking” statements.
The views expressed in this report reflect those of the portfolio managers, only through the end of the period as stated on the cover. The portfolio managers’ views are subject to change at any time based on market and other conditions.
Portfolio holdings are subject to change daily.
| Portfolio Managers’ Report | Voya Solution 2035 Portfolio |
| | | Average Annual Total Returns for the Periods Ended December 31, 2016 | | |
| | | | | | 1 Year | | | 5 Year | | | 10 Year | | | Since Inception
of Class S2
May 28, 2009 | | |
| | | Class ADV | | | | | 6.00% | | | | | | 8.87% | | | | | | 3.45% | | | | | | — | | | |
| | | Class I | | | | | 6.49% | | | | | | 9.39% | | | | | | 3.97% | | | | | | — | | | |
| | | Class S | | | | | 6.23% | | | | | | 9.13% | | | | | | 3.71% | | | | | | — | | | |
| | | Class S2 | | | | | 6.09% | | | | | | 8.97% | | | | | | — | | | | | | 9.85% | | | |
| | | Class T | | | | | 5.73% | | | | | | 8.64% | | | | | | 3.24% | | | | | | — | | | |
| | | S&P Target Date 2035 Index | | | | | 9.12% | | | | | | 9.87% | | | | | | 5.12% | | | | | | 11.13% | | | |
| | | Russell 3000® Index | | | | | 12.74% | | | | | | 14.67% | | | | | | 7.07% | | | | | | 15.24% | | | |
| | | MSCI EAFE® Index | | | | | 1.00% | | | | | | 6.53% | | | | | | 0.75% | | | | | | 6.44% | | | |
| | | BCAB Index | | | | | 2.65% | | | | | | 2.23% | | | | | | 4.34% | | | | | | 4.07% | | | |
| | | | | |
Based on a $10,000 initial investment, the graph and table above illustrate the total return of Voya Solution 2035 Portfolio against the indices indicated. An index is unmanaged, has no cash in its portfolio, imposes no sales charges and incurs no operating expenses. An investor cannot invest directly in an index. The Portfolio’s performance is shown without the imposition of any expenses or charges which are, or may be, imposed under your variable annuity contract or variable life insurance policy. Total returns would have been lower if such expenses or charges were included.
The performance graph and table do not reflect the deduction of taxes that a shareholder will pay on Portfolio distributions or the redemption of Portfolio shares.
The performance shown may include the effect of fee waivers and/or expense reimbursements by the Investment Adviser and/or other service providers, which have the effect of increasing total return. Had all fees and expenses been considered, the total returns would have been lower.
The performance update illustrates performance for a variable investment option available through a variable
contract or a variable life insurance policy. The performance shown indicates past performance and is not a projection or prediction of future results. Actual investment returns and principal value will fluctuate so that shares and/or units, at redemption, may be worth more or less than their original cost. Please call (800) 262-3862 to get performance through the most recent month end.
It is important to note that the Portfolio has a limited operating history. Performance over a longer period of time may be more meaningful thanshort-term performance.
This report contains statements that may be “forward-looking” statements. Actual results may differ materially from those projected in the “forward-looking” statements.
The views expressed in this report reflect those of the portfolio managers, only through the end of the period as stated on the cover. The portfolio managers’ views are subject to change at any time based on market and other conditions.
Portfolio holdings are subject to change daily.
| Voya Solution 2040 Portfolio | Portfolio Managers’ Report |
| | | Average Annual Total Returns for the Periods Ended December 31, 2016 | | |
| | | | | | 1 Year | | | 5 Year | | | Since Inception
of Classes ADV, I, S, S2 and T
October 3, 2011 | | |
| | | Class ADV | | | | | 6.48% | | | | | | 9.66% | | | | | | 11.64% | | | |
| | | Class I | | | | | 7.06% | | | | | | 10.25% | | | | | | 12.23% | | | |
| | | Class S | | | | | 6.79% | | | | | | 9.92% | | | | | | 11.89% | | | |
| | | Class S2 | | | | | 6.64% | | | | | | 9.76% | | | | | | 11.74% | | | |
| | | Class T | | | | | 6.27% | | | | | | 9.45% | | | | | | 11.42% | | | |
| | | S&P Target Date 2040 Index | | | | | 9.50% | | | | | | 10.27% | | | | | | 12.23% | | | |
| | | | | |
Based on a $10,000 initial investment, the graph and table above illustrate the total return of Voya Solution 2040 Portfolio against the index indicated. The index is unmanaged and has no cash in its portfolio, imposes no sales charges and incurs no operating expenses. An investor cannot invest directly in an index. The Portfolio’s performance is shown without the imposition of any expenses or charges which are, or may be, imposed under your variable annuity contract or variable life insurance policy. Total returns would have been lower if such expenses or charges were included.
The performance graph and table do not reflect the deduction of taxes that a shareholder will pay on Portfolio distributions or the redemption of Portfolio shares.
The performance shown may include the effect of fee waivers and/or expense reimbursements by the Investment Adviser and/or other service providers, which have the effect of increasing total return. Had all fees and expenses been considered, the total returns would have been lower.
The performance update illustrates performance for a variable investment option available through a variable
annuity contract or a variable life insurance policy. The performance shown indicates past performance and is not a projection or prediction of future results. Actual investment returns and principal value will fluctuate so that shares and/or units, at redemption, may be worth more or less than their original cost. Please log on to www.voyainvestments.com or call (800) 262-3862 to get performance through the most recent month end.
This report contains statements that may be “forward-looking” statements. Actual results may differ materially from those projected in the “forward-looking” statements.
The views expressed in this report reflect those of the portfolio managers, only through the end of the period as stated on the cover. The portfolio managers’ views are subject to change at any time based on market and other conditions.
Portfolio holdings are subject to change daily.
| Portfolio Managers’ Report | Voya Solution 2045 Portfolio |
| | | Average Annual Total Returns for the Periods Ended December 31, 2016 | | |
| | | | | | 1 Year | | | 5 Year | | | 10 Year | | | Since Inception
of Class S2
May 28, 2009 | | |
| | | Class ADV | | | | | 6.16% | | | | | | 9.51% | | | | | | 3.45% | | | | | | — | | | |
| | | Class I | | | | | 6.63% | | | | | | 10.07% | | | | | | 3.96% | | | | | | — | | | |
| | | Class S | | | | | 6.40% | | | | | | 9.77% | | | | | | 3.70% | | | | | | — | | | |
| | | Class S2 | | | | | 6.28% | | | | | | 9.62% | | | | | | — | | | | | | 10.36% | | | |
| | | Class T | | | | | 5.94% | | | | | | 9.29% | | | | | | 3.24% | | | | | | — | | | |
| | | S&P Target Date 2045 Index | | | | | 9.81% | | | | | | 10.59% | | | | | | 5.15% | | | | | | 11.65% | | | |
| | | Russell 3000® Index | | | | | 12.74% | | | | | | 14.67% | | | | | | 7.07% | | | | | | 15.24% | | | |
| | | MSCI EAFE® Index | | | | | 1.00% | | | | | | 6.53% | | | | | | 0.75% | | | | | | 6.44% | | | |
| | | BCAB Index | | | | | 2.65% | | | | | | 2.23% | | | | | | 4.34% | | | | | | 4.07% | | | |
| | | | | |
Based on a $10,000 initial investment, the graph and table above illustrate the total return of Voya Solution 2045 Portfolio against the indices indicated. An index is unmanaged and has no cash in its portfolio, imposes no sales charges and incurs no operating expenses. An investor cannot invest directly in an index. The Portfolio’s performance is shown without the imposition of any expenses or charges which are, or may be, imposed under your variable annuity contract or variable life insurance policy. Total returns would have been lower if such expenses or charges were included.
The performance graph and table do not reflect the deduction of taxes that a shareholder will pay on Portfolio distributions or the redemption of Portfolio shares.
The performance shown may include the effect of fee waivers and/or expense reimbursements by the Investment Adviser and/or other service providers, which have the effect of increasing total return. Had all fees and expenses been considered, the total returns would have been lower.
The performance update illustrates performance for a variable investment option available through a variable
annuity contract or a variable life insurance policy. The performance shown indicates past performance and is not a projection or prediction of future results. Actual investment returns and principal value will fluctuate so that shares and/or units, at redemption, may be worth more or less than their original cost. Please log on to www.voyainvestments.com or call (800) 262-3862 to get performance through the most recent month end.
This report contains statements that may be “forward-looking” statements. Actual results may differ materially from those projected in the “forward-looking” statements.
The views expressed in this report reflect those of the portfolio managers, only through the end of the period as stated on the cover. The portfolio managers’ views are subject to change at any time based on market and other conditions.
Portfolio holdings are subject to change daily.
| Voya Solution 2050 Portfolio | Portfolio Managers’ Report |
| | | Average Annual Total Returns for the Periods Ended December 31, 2016 | | |
| | | | | | 1 Year | | | 5 Year | | | Since Inception
of Classes ADV, I, S, S2 and T
October 3, 2011 | | |
| | | Class ADV | | | | | 6.27% | | | | | | 9.78% | | | | | | 11.76% | | | |
| | | Class I | | | | | 6.75% | | | | | | 10.39% | | | | | | 12.37% | | | |
| | | Class S | | | | | 6.56% | | | | | | 10.04% | | | | | | 12.00% | | | |
| | | Class S2 | | | | | 6.32% | | | | | | 9.86% | | | | | | 11.83% | | | |
| | | Class T | | | | | 6.02% | | | | | | 9.63% | | | | | | 11.59% | | | |
| | | S&P Target Date 2050 Index | | | | | 10.01% | | | | | | 10.88% | | | | | | 12.90% | | | |
| | | | | |
Based on a $10,000 initial investment, the graph and table above illustrate the total return of Voya Solution 2050 Portfolio against the index indicated. The index is unmanaged and has no cash in its portfolio, imposes no sales charges and incurs no operating expenses. An investor cannot invest directly in an index. The Portfolio’s performance is shown without the imposition of any expenses or charges which are, or may be, imposed under your variable annuity contract or variable life insurance policy. Total returns would have been lower if such expenses or charges were included.
The performance graph and table do not reflect the deduction of taxes that a shareholder will pay on Portfolio distributions or the redemption of Portfolio shares.
The performance shown may include the effect of fee waivers and/or expense reimbursements by the Investment Adviser and/or other service providers, which have the effect of increasing total return. Had all fees and expenses been considered, the total returns would have been lower.
The performance update illustrates performance for a variable investment option available through a variable
annuity contract or a variable life insurance policy. The performance shown indicates past performance and is not a projection or prediction of future results. Actual investment returns and principal value will fluctuate so that shares and/or units, at redemption, may be worth more or less than their original cost. Please log on to www.voyainvestments.com or call (800) 262-3862 to get performance through the most recent month end.
This report contains statements that may be “forward-looking” statements. Actual results may differ materially from those projected in the “forward-looking” statements.
The views expressed in this report reflect those of the portfolio managers, only through the end of the period as stated on the cover. The portfolio managers’ views are subject to change at any time based on market and other conditions.
Portfolio holdings are subject to change daily.
| Portfolio Managers’ Report | Voya Solution 2055 Portfolio |
| | | Average Annual Total Returns for the Periods Ended December 31, 2016 | | |
| | | | | | 1 Year | | | 5 Year | | | Since Inception
of Classes ADV, I, S, S2 and T
March 8, 2010 | | |
| | | Class ADV | | | | | 6.13% | | | | | | 9.58% | | | | | | 8.01% | | | |
| | | Class I | | | | | 6.72% | | | | | | 10.14% | | | | | | 8.55% | | | |
| | | Class S | | | | | 6.44% | | | | | | 9.86% | | | | | | 8.28% | | | |
| | | Class S2 | | | | | 6.24% | | | | | | 9.68% | | | | | | 8.12% | | | |
| | | Class T | | | | | 5.96% | | | | | | 9.39% | | | | | | 7.82% | | | |
| | | S&P Target Date 2055+ Index | | | | | 10.21% | | | | | | 11.10% | | | | | | 9.56% | | | |
| | | | | |
Based on a $10,000 initial investment, the graph and table above illustrate the total return of Voya Solution 2055 Portfolio against the index indicated. The index is unmanaged and has no cash in its portfolio, imposes no sales charges and incurs no operating expenses. An investor cannot invest directly in an index. The Portfolio’s performance is shown without the imposition of any expenses or charges which are, or may be, imposed under your variable annuity contract or variable life insurance policy. Total returns would have been lower if such expenses or charges were included.
The performance graph and table do not reflect the deduction of taxes that a shareholder will pay on Portfolio distributions or the redemption of Portfolio shares.
The performance shown may include the effect of fee waivers and/or expense reimbursements by the Investment Adviser and/or other service providers, which have the effect of increasing total return. Had all fees and expenses been considered, the total returns would have been lower.
The performance update illustrates performance for a variable investment option available through a variable
annuity contract or a variable life insurance policy. The performance shown indicates past performance and is not a projection or prediction of future results. Actual investment returns and principal value will fluctuate so that shares and/or units, at redemption, may be worth more or less than their original cost. Please log on to www.voyainvestments.com or call (800) 262-3862 to get performance through the most recent month end.
This report contains statements that may be “forward-looking” statements. Actual results may differ materially from those projected in the “forward-looking” statements.
The views expressed in this report reflect those of the portfolio managers, only through the end of the period as stated on the cover. The portfolio managers’ views are subject to change at any time based on market and other conditions.
Portfolio holdings are subject to change daily.
| Voya Solution 2060 Portfolio | Portfolio Managers’ Report |
| | | Average Annual Total Returns for the Periods Ended December 31, 2016 | | |
| | | | | | 1 Year | | | Since Inception
of Classes ADV, I, S, S2 and T
February 9, 2015 | | |
| | | Class ADV | | | | | 6.34% | | | | | | 2.70% | | | |
| | | Class I | | | | | 6.73% | | | | | | 3.07% | | | |
| | | Class S | | | | | 6.56% | | | | | | 2.65% | | | |
| | | Class S2 | | | | | 6.34% | | | | | | 2.70% | | | |
| | | Class T | | | | | 5.91% | | | | | | 2.32% | | | |
| | | S&P Target Date 2055+ Index | | | | | 10.21% | | | | | | 4.31% | | | |
| | | | | |
Based on a $10,000 initial investment, the graph and table above illustrate the total return of Voya Solution 2060 Portfolio against the index indicated. The index is unmanaged and has no cash in its portfolio, imposes no sales charges and incurs no operating expenses. An investor cannot invest directly in an index. The Portfolio’s performance is shown without the imposition of any expenses or charges which are, or may be, imposed under your variable annuity contract or variable life insurance policy. Total returns would have been lower if such expenses or charges were included.
The performance graph and table do not reflect the deduction of taxes that a shareholder will pay on Portfolio distributions or the redemption of Portfolio shares.
The performance shown may include the effect of fee waivers and/or expense reimbursements by the Investment Adviser and/or other service providers, which have the effect of increasing total return. Had all fees and expenses been considered, the total returns would have been lower.
The performance update illustrates performance for a variable investment option available through a variable annuity contract or a variable life insurance policy. The
performance shown indicates past performance and is not a projection or prediction of future results. Actual investment returns and principal value will fluctuate so that shares and/or units, at redemption, may be worth more or less than their original cost. Please log on to www.voyainvestments.com or call (800) 262-3862 to get performance through the most recent month end.
It is important to note that the Portfolio has a limited operating history. Performance over a longer period of time may be more meaningful than short-term performance.
This report contains statements that may be “forward-looking”statements. Actual results may differ materially from those projected in the “forward-looking” statements.
The views expressed in this report reflect those of the portfolio managers, only through the end of the period as stated on the cover. The portfolio managers’ views are subject to change at any time based on market and other conditions.
Portfolio holdings are subject to change daily.
SHAREHOLDER EXPENSE EXAMPLES (Unaudited)
As a shareholder of a Portfolio, you incur two types of costs: (1) transaction costs, including redemption fees and exchange fees; and (2) ongoing costs including management fees, distribution and/or service (12b-1) fees, and other Portfolio expenses. These Examples are intended to help you understand your ongoing costs (in dollars) of investing in a Portfolio and to compare these costs with the ongoing costs of investing in other mutual funds.
The Examples are based on an investment of $1,000 invested at the beginning of the period and held for the entire period from July 1, 2016 to December 31, 2016. The Portfolios’ expenses are shown without the imposition of any charges which are, or may be, imposed under your variable annuity contract, variable life insurance policy, qualified pension or retirement plan. Expenses would have been higher if such charges were included.
Actual Expenses
The left section of the table shown below, “Actual Portfolio Return,” provides information about actual account values and actual expenses. You may use the information in this section, together with the amount you invested, to estimate the expenses that you paid over the period. Simply divide your account value by $1,000 (for example, an $8,600 account value divided by $1,000 = 8.6), then multiply the result by the number in the first section under the heading entitled “Expenses Paid During the Period” to estimate the expenses you paid on your account during this period.
Hypothetical Example for Comparison Purposes
The right section of the table shown below, “Hypothetical (5% return before expenses),” provides information about hypothetical account values and hypothetical expenses based on a Portfolio’s actual expense ratio and an assumed rate of return of 5% per year before expenses, which is not a Portfolio’s actual return. The hypothetical account values and expenses may not be used to estimate the actual ending account balance or expenses you paid for the period. You may use this information to compare the ongoing costs of investing in a Portfolio and other mutual funds. To do so, compare this 5% hypothetical example with the 5% hypothetical examples that appear in the shareholder reports of the other mutual funds.
Please note that the expenses shown in the table are meant to highlight your ongoing costs only and do not reflect any transactional costs, such as redemption fees or exchange fees. Therefore, the hypothetical section of the table is useful in comparing ongoing costs only, and will not help you determine the relative total costs of owning different mutual funds. In addition, if these transactional costs were included, your costs would have been higher.
| | | | Actual Portfolio Return | | | Hypothetical (5% return before expenses) | |
| | | | Beginning
Account
Value
July 1,
2016 | | | Ending
Account
Value
December 31,
2016 | | | Annualized
Expense
Ratio* | | | Expenses Paid
During the
Period Ended
December 31,
2016** | | | Beginning
Account
Value
July 1,
2016 | | | Ending
Account
Value
December 31,
2016 | | | Annualized
Expense
Ratio* | | | Expenses Paid
During the
Period Ended
December 31,
2016** | |
| Voya Solution Aggressive Portfolio | |
| Class ADV | | | | $ | 1,000.00 | | | | | $ | 1,063.10 | | | | | | 0.68% | | | | | $ | 3.53 | | | | | $ | 1,000.00 | | | | | $ | 1,021.72 | | | | | | 0.68% | | | | | $ | 3.46 | | |
| Class I | | | | | 1,000.00 | | | | | | 1,065.60 | | | | | | 0.18 | | | | | | 0.93 | | | | | | 1,000.00 | | | | | | 1,024.23 | | | | | | 0.18 | | | | | | 0.92 | | |
| Class R6 | | | | | 1,000.00 | | | | | | 1,065.70 | | | | | | 0.18 | | | | | | 0.93 | | | | | | 1,000.00 | | | | | | 1,024.23 | | | | | | 0.18 | | | | | | 0.92 | | |
| Class S | | | | | 1,000.00 | | | | | | 1,064.80 | | | | | | 0.43 | | | | | | 2.23 | | | | | | 1,000.00 | | | | | | 1,022.97 | | | | | | 0.43 | | | | | | 2.19 | | |
| Class S2 | | | | | 1,000.00 | | | | | | 1,063.90 | | | | | | 0.58 | | | | | | 3.01 | | | | | | 1,000.00 | | | | | | 1,022.22 | | | | | | 0.58 | | | | | | 2.95 | | |
| Voya Solution Balanced Portfolio | |
| Class ADV | | | | $ | 1,000.00 | | | | | $ | 1,042.00 | | | | | | 0.64% | | | | | $ | 3.29 | | | | | $ | 1,000.00 | | | | | $ | 1,021.92 | | | | | | 0.64% | | | | | $ | 3.25 | | |
| Class I | | | | | 1,000.00 | | | | | | 1,044.40 | | | | | | 0.14 | | | | | | 0.72 | | | | | | 1,000.00 | | | | | | 1,024.43 | | | | | | 0.14 | | | | | | 0.71 | | |
| Class R6 | | | | | 1,000.00 | | | | | | 1,043.30 | | | | | | 0.14 | | | | | | 0.72 | | | | | | 1,000.00 | | | | | | 1,024.43 | | | | | | 0.14 | | | | | | 0.71 | | |
| Class S | | | | | 1,000.00 | | | | | | 1,042.40 | | | | | | 0.39 | | | | | | 2.00 | | | | | | 1,000.00 | | | | | | 1,023.18 | | | | | | 0.39 | | | | | | 1.98 | | |
| Class S2 | | | | | 1,000.00 | | | | | | 1,041.30 | | | | | | 0.54 | | | | | | 2.77 | | | | | | 1,000.00 | | | | | | 1,022.42 | | | | | | 0.54 | | | | | | 2.75 | | |
| Voya Solution Conservative Portfolio | |
| Class ADV | | | | $ | 1,000.00 | | | | | $ | 1,014.00 | | | | | | 0.62% | | | | | $ | 3.14 | | | | | $ | 1,000.00 | | | | | $ | 1,022.02 | | | | | | 0.62% | | | | | $ | 3.15 | | |
| Class I | | | | | 1,000.00 | | | | | | 1,015.50 | | | | | | 0.12 | | | | | | 0.61 | | | | | | 1,000.00 | | | | | | 1,024.53 | | | | | | 0.12 | | | | | | 0.61 | | |
| Class R6 | | | | | 1,000.00 | | | | | | 1,015.50 | | | | | | 0.12 | | | | | | 0.61 | | | | | | 1,000.00 | | | | | | 1,024.53 | | | | | | 0.12 | | | | | | 0.61 | | |
| Class S | | | | | 1,000.00 | | | | | | 1,015.10 | | | | | | 0.37 | | | | | | 1.87 | | | | | | 1,000.00 | | | | | | 1,023.28 | | | | | | 0.37 | | | | | | 1.88 | | |
| Class S2 | | | | | 1,000.00 | | | | | | 1,014.40 | | | | | | 0.52 | | | | | | 2.63 | | | | | | 1,000.00 | | | | | | 1,022.52 | | | | | | 0.52 | | | | | | 2.64 | | |
SHAREHOLDER EXPENSE EXAMPLES (Unaudited) (continued)
| | | | Actual Portfolio Return | | | Hypothetical (5% return before expenses) | |
| | | | Beginning
Account
Value
July 1,
2016 | | | Ending
Account
Value
December 31,
2016 | | | Annualized
Expense
Ratio* | | | Expenses Paid
During the
Period Ended
December 31,
2016** | | | Beginning
Account
Value
July 1,
2016 | | | Ending
Account
Value
December 31,
2016 | | | Annualized
Expense
Ratio* | | | Expenses Paid
During the
Period Ended
December 31,
2016** | |
| Voya Solution Income Portfolio | |
| Class ADV | | | | $ | 1,000.00 | | | | | $ | 1,010.10 | | | | | | 0.62% | | | | | $ | 3.13 | | | | | $ | 1,000.00 | | | | | $ | 1,022.02 | | | | | | 0.62% | | | | | $ | 3.15 | | |
| Class I | | | | | 1,000.00 | | | | | | 1,013.10 | | | | | | 0.12 | | | | | | 0.61 | | | | | | 1,000.00 | | | | | | 1,024.53 | | | | | | 0.12 | | | | | | 0.61 | | |
| Class S | | | | | 1,000.00 | | | | | | 1,011.70 | | | | | | 0.37 | | | | | | 1.87 | | | | | | 1,000.00 | | | | | | 1,023.28 | | | | | | 0.37 | | | | | | 1.88 | | |
| Class S2 | | | | | 1,000.00 | | | | | | 1,010.90 | | | | | | 0.52 | | | | | | 2.63 | | | | | | 1,000.00 | | | | | | 1,022.52 | | | | | | 0.52 | | | | | | 2.64 | | |
| Class T | | | | | 1,000.00 | | | | | | 1,010.00 | | | | | | 0.82 | | | | | | 4.14 | | | | | | 1,000.00 | | | | | | 1,021.01 | | | | | | 0.82 | | | | | | 4.17 | | |
| Voya Solution Moderately Aggressive Portfolio | |
| Class ADV | | | | $ | 1,000.00 | | | | | $ | 1,051.50 | | | | | | 0.70% | | | | | $ | 3.61 | | | | | $ | 1,000.00 | | | | | $ | 1,021.62 | | | | | | 0.70% | | | | | $ | 3.56 | | |
| Class I | | | | | 1,000.00 | | | | | | 1,053.90 | | | | | | 0.20 | | | | | | 1.03 | | | | | | 1,000.00 | | | | | | 1,024.13 | | | | | | 0.20 | | | | | | 1.02 | | |
| Class R6 | | | | | 1,000.00 | | | | | | 1,053.00 | | | | | | 0.20 | | | | | | 1.03 | | | | | | 1,000.00 | | | | | | 1,024.13 | | | | | | 0.20 | | | | | | 1.02 | | |
| Class S | | | | | 1,000.00 | | | | | | 1,052.40 | | | | | | 0.45 | | | | | | 2.32 | | | | | | 1,000.00 | | | | | | 1,022.87 | | | | | | 0.45 | | | | | | 2.29 | | |
| Class S2 | | | | | 1,000.00 | | | | | | 1,051.30 | | | | | | 0.60 | | | | | | 3.09 | | | | | | 1,000.00 | | | | | | 1,022.12 | | | | | | 0.60 | | | | | | 3.05 | | |
| Voya Solution Moderately Conservative Portfolio | |
| Class ADV | | | | $ | 1,000.00 | | | | | $ | 1,026.20 | | | | | | 0.64% | | | | | $ | 3.26 | | | | | $ | 1,000.00 | | | | | $ | 1,021.92 | | | | | | 0.64% | | | | | $ | 3.25 | | |
| Class I | | | | | 1,000.00 | | | | | | 1,029.10 | | | | | | 0.14 | | | | | | 0.71 | | | | | | 1,000.00 | | | | | | 1,024.43 | | | | | | 0.14 | | | | | | 0.71 | | |
| Class R6 | | | | | 1,000.00 | | | | | | 1,028.20 | | | | | | 0.14 | | | | | | 0.71 | | | | | | 1,000.00 | | | | | | 1,024.43 | | | | | | 0.14 | | | | | | 0.71 | | |
| Class S | | | | | 1,000.00 | | | | | | 1,027.00 | | | | | | 0.39 | | | | | | 1.99 | | | | | | 1,000.00 | | | | | | 1,023.18 | | | | | | 0.39 | | | | | | 1.98 | | |
| Class S2 | | | | | 1,000.00 | | | | | | 1,026.40 | | | | | | 0.54 | | | | | | 2.75 | | | | | | 1,000.00 | | | | | | 1,022.42 | | | | | | 0.54 | | | | | | 2.75 | | |
| Voya Solution 2020 Portfolio | |
| Class ADV | | | | $ | 1,000.00 | | | | | $ | 1,028.30 | | | | | | 0.64% | | | | | $ | 3.26 | | | | | $ | 1,000.00 | | | | | $ | 1,021.92 | | | | | | 0.64% | | | | | $ | 3.25 | | |
| Class I | | | | | 1,000.00 | | | | | | 1,030.20 | | | | | | 0.14 | | | | | | 0.71 | | | | | | 1,000.00 | | | | | | 1,024.43 | | | | | | 0.14 | | | | | | 0.71 | | |
| Class S | | | | | 1,000.00 | | | | | | 1,029.20 | | | | | | 0.39 | | | | | | 1.99 | | | | | | 1,000.00 | | | | | | 1,023.18 | | | | | | 0.39 | | | | | | 1.98 | | |
| Class S2 | | | | | 1,000.00 | | | | | | 1,028.70 | | | | | | 0.54 | | | | | | 2.75 | | | | | | 1,000.00 | | | | | | 1,022.42 | | | | | | 0.54 | | | | | | 2.75 | | |
| Class T | | | | | 1,000.00 | | | | | | 1,027.00 | | | | | | 0.84 | | | | | | 4.28 | | | | | | 1,000.00 | | | | | | 1,020.91 | | | | | | 0.84 | | | | | | 4.27 | | |
| Voya Solution 2025 Portfolio | |
| Class ADV | | | | $ | 1,000.00 | | | | | $ | 1,036.80 | | | | | | 0.64% | | | | | $ | 3.28 | | | | | $ | 1,000.00 | | | | | $ | 1,021.92 | | | | | | 0.64% | | | | | $ | 3.25 | | |
| Class I | | | | | 1,000.00 | | | | | | 1,039.50 | | | | | | 0.14 | | | | | | 0.72 | | | | | | 1,000.00 | | | | | | 1,024.43 | | | | | | 0.14 | | | | | | 0.71 | | |
| Class S | | | | | 1,000.00 | | | | | | 1,038.60 | | | | | | 0.39 | | | | | | 2.00 | | | | | | 1,000.00 | | | | | | 1,023.18 | | | | | | 0.39 | | | | | | 1.98 | | |
| Class S2 | | | | | 1,000.00 | | | | | | 1,037.80 | | | | | | 0.54 | | | | | | 2.77 | | | | | | 1,000.00 | | | | | | 1,022.42 | | | | | | 0.54 | | | | | | 2.75 | | |
| Class T | | | | | 1,000.00 | | | | | | 1,035.50 | | | | | | 0.84 | | | | | | 4.30 | | | | | | 1,000.00 | | | | | | 1,020.91 | | | | | | 0.84 | | | | | | 4.27 | | |
| Voya Solution 2030 Portfolio | |
| Class ADV | | | | $ | 1,000.00 | | | | | $ | 1,045.80 | | | | | | 0.66% | | | | | $ | 3.39 | | | | | $ | 1,000.00 | | | | | $ | 1,021.82 | | | | | | 0.66% | | | | | $ | 3.35 | | |
| Class I | | | | | 1,000.00 | | | | | | 1,047.60 | | | | | | 0.16 | | | | | | 0.82 | | | | | | 1,000.00 | | | | | | 1,024.33 | | | | | | 0.16 | | | | | | 0.81 | | |
| Class S | | | | | 1,000.00 | | | | | | 1,046.90 | | | | | | 0.41 | | | | | | 2.11 | | | | | | 1,000.00 | | | | | | 1,023.08 | | | | | | 0.41 | | | | | | 2.08 | | |
| Class S2 | | | | | 1,000.00 | | | | | | 1,046.00 | | | | | | 0.56 | | | | | | 2.88 | | | | | | 1,000.00 | | | | | | 1,022.32 | | | | | | 0.56 | | | | | | 2.85 | | |
| Class T | | | | | 1,000.00 | | | | | | 1,044.70 | | | | | | 0.86 | | | | | | 4.42 | | | | | | 1,000.00 | | | | | | 1,020.81 | | | | | | 0.86 | | | | | | 4.37 | | |
| Voya Solution 2035 Portfolio | |
| Class ADV | | | | $ | 1,000.00 | | | | | $ | 1,050.70 | | | | | | 0.66% | | | | | $ | 3.40 | | | | | $ | 1,000.00 | | | | | $ | 1,021.82 | | | | | | 0.66% | | | | | $ | 3.35 | | |
| Class I | | | | | 1,000.00 | | | | | | 1,053.00 | | | | | | 0.16 | | | | | | 0.83 | | | | | | 1,000.00 | | | | | | 1,024.33 | | | | | | 0.16 | | | | | | 0.81 | | |
| Class S | | | | | 1,000.00 | | | | | | 1,052.20 | | | | | | 0.41 | | | | | | 2.11 | | | | | | 1,000.00 | | | | | | 1,023.08 | | | | | | 0.41 | | | | | | 2.08 | | |
| Class S2 | | | | | 1,000.00 | | | | | | 1,051.40 | | | | | | 0.56 | | | | | | 2.89 | | | | | | 1,000.00 | | | | | | 1,022.32 | | | | | | 0.56 | | | | | | 2.85 | | |
| Class T | | | | | 1,000.00 | | | | | | 1,049.20 | | | | | | 0.86 | | | | | | 4.43 | | | | | | 1,000.00 | | | | | | 1,020.81 | | | | | | 0.86 | | | | | | 4.37 | | |
SHAREHOLDER EXPENSE EXAMPLES (Unaudited) (continued)
| | | | Actual Portfolio Return | | | Hypothetical (5% return before expenses) | |
| | | | Beginning
Account
Value
July 1,
2016 | | | Ending
Account
Value
December 31,
2016 | | | Annualized
Expense
Ratio* | | | Expenses Paid
During the
Period Ended
December 31,
2016** | | | Beginning
Account
Value
July 1,
2016 | | | Ending
Account
Value
December 31,
2016 | | | Annualized
Expense
Ratio* | | | Expenses Paid
During the
Period Ended
December 31,
2016** | |
| Voya Solution 2040 Portfolio | |
| Class ADV | | | | $ | 1,000.00 | | | | | $ | 1,055.60 | | | | | | 0.66% | | | | | $ | 3.41 | | | | | $ | 1,000.00 | | | | | $ | 1,021.82 | | | | | | 0.66% | | | | | $ | 3.35 | | |
| Class I | | | | | 1,000.00 | | | | | | 1,058.60 | | | | | | 0.16 | | | | | | 0.83 | | | | | | 1,000.00 | | | | | | 1,024.33 | | | | | | 0.16 | | | | | | 0.81 | | |
| Class S | | | | | 1,000.00 | | | | | | 1,057.30 | | | | | | 0.41 | | | | | | 2.12 | | | | | | 1,000.00 | | | | | | 1,023.08 | | | | | | 0.41 | | | | | | 2.08 | | |
| Class S2 | | | | | 1,000.00 | | | | | | 1,056.50 | | | | | | 0.56 | | | | | | 2.89 | | | | | | 1,000.00 | | | | | | 1,022.32 | | | | | | 0.56 | | | | | | 2.85 | | |
| Class T | | | | | 1,000.00 | | | | | | 1,054.30 | | | | | | 0.86 | | | | | | 4.44 | | | | | | 1,000.00 | | | | | | 1,020.81 | | | | | | 0.86 | | | | | | 4.37 | | |
| Voya Solution 2045 Portfolio | |
| Class ADV | | | | $ | 1,000.00 | | | | | $ | 1,056.80 | | | | | | 0.68% | | | | | $ | 3.52 | | | | | $ | 1,000.00 | | | | | $ | 1,021.72 | | | | | | 0.68% | | | | | $ | 3.46 | | |
| Class I | | | | | 1,000.00 | | | | | | 1,059.80 | | | | | | 0.18 | | | | | | 0.93 | | | | | | 1,000.00 | | | | | | 1,024.23 | | | | | | 0.18 | | | | | | 0.92 | | |
| Class S | | | | | 1,000.00 | | | | | | 1,058.40 | | | | | | 0.43 | | | | | | 2.22 | | | | | | 1,000.00 | | | | | | 1,022.97 | | | | | | 0.43 | | | | | | 2.19 | | |
| Class S2 | | | | | 1,000.00 | | | | | | 1,057.10 | | | | | | 0.58 | | | | | | 3.00 | | | | | | 1,000.00 | | | | | | 1,022.22 | | | | | | 0.58 | | | | | | 2.95 | | |
| Class T | | | | | 1,000.00 | | | | | | 1,056.60 | | | | | | 0.88 | | | | | | 4.55 | | | | | | 1,000.00 | | | | | | 1,020.71 | | | | | | 0.88 | | | | | | 4.47 | | |
| Voya Solution 2050 Portfolio | |
| Class ADV | | | | $ | 1,000.00 | | | | | $ | 1,057.40 | | | | | | 0.68% | | | | | $ | 3.52 | | | | | $ | 1,000.00 | | | | | $ | 1,021.72 | | | | | | 0.68% | | | | | $ | 3.46 | | |
| Class I | | | | | 1,000.00 | | | | | | 1,059.30 | | | | | | 0.18 | | | | | | 0.93 | | | | | | 1,000.00 | | | | | | 1,024.23 | | | | | | 0.18 | | | | | | 0.92 | | |
| Class S | | | | | 1,000.00 | | | | | | 1,058.80 | | | | | | 0.43 | | | | | | 2.23 | | | | | | 1,000.00 | | | | | | 1,022.97 | | | | | | 0.43 | | | | | | 2.19 | | |
| Class S2 | | | | | 1,000.00 | | | | | | 1,057.10 | | | | | | 0.58 | | | | | | 3.00 | | | | | | 1,000.00 | | | | | | 1,022.22 | | | | | | 0.58 | | | | | | 2.95 | | |
| Class T | | | | | 1,000.00 | | | | | | 1,055.60 | | | | | | 0.88 | | | | | | 4.55 | | | | | | 1,000.00 | | | | | | 1,020.71 | | | | | | 0.88 | | | | | | 4.47 | | |
| Voya Solution 2055 Portfolio | |
| Class ADV | | | | $ | 1,000.00 | | | | | $ | 1,057.10 | | | | | | 0.69% | | | | | $ | 3.57 | | | | | $ | 1,000.00 | | | | | $ | 1,021.67 | | | | | | 0.69% | | | | | $ | 3.51 | | |
| Class I | | | | | 1,000.00 | | | | | | 1,060.50 | | | | | | 0.19 | | | | | | 0.98 | | | | | | 1,000.00 | | | | | | 1,024.18 | | | | | | 0.19 | | | | | | 0.97 | | |
| Class S | | | | | 1,000.00 | | | | | | 1,059.40 | | | | | | 0.44 | | | | | | 2.28 | | | | | | 1,000.00 | | | | | | 1,022.92 | | | | | | 0.44 | | | | | | 2.24 | | |
| Class S2 | | | | | 1,000.00 | | | | | | 1,058.20 | | | | | | 0.59 | | | | | | 3.05 | | | | | | 1,000.00 | | | | | | 1,022.17 | | | | | | 0.59 | | | | | | 3.00 | | |
| Class T | | | | | 1,000.00 | | | | | | 1,057.20 | | | | | | 0.89 | | | | | | 4.60 | | | | | | 1,000.00 | | | | | | 1,020.66 | | | | | | 0.89 | | | | | | 4.52 | | |
| Voya Solution 2060 Portfolio | |
| Class ADV | | | | $ | 1,000.00 | | | | | $ | 1,058.10 | | | | | | 0.69% | | | | | $ | 3.57 | | | | | $ | 1,000.00 | | | | | $ | 1,021.67 | | | | | | 0.69% | | | | | $ | 3.51 | | |
| Class I | | | | | 1,000.00 | | | | | | 1,060.90 | | | | | | 0.19 | | | | | | 0.98 | | | | | | 1,000.00 | | | | | | 1,024.18 | | | | | | 0.19 | | | | | | 0.97 | | |
| Class S | | | | | 1,000.00 | | | | | | 1,059.20 | | | | | | 0.44 | | | | | | 2.28 | | | | | | 1,000.00 | | | | | | 1,022.92 | | | | | | 0.44 | | | | | | 2.24 | | |
| Class S2 | | | | | 1,000.00 | | | | | | 1,059.10 | | | | | | 0.59 | | | | | | 3.05 | | | | | | 1,000.00 | | | | | | 1,022.17 | | | | | | 0.59 | | | | | | 3.00 | | |
| Class T | | | | | 1,000.00 | | | | | | 1,057.00 | | | | | | 0.89 | | | | | | 4.60 | | | | | | 1,000.00 | | | | | | 1,020.66 | | | | | | 0.89 | | | | | | 4.52 | | |
*
The annualized expense ratios do not include expenses of the underlying funds.
**
Expenses are equal to each Portfolio’s respective annualized expense ratios multiplied by the average account value over the period, multiplied by 184/366 to reflect the most recent fiscal half-year.
Report of Independent Registered Public Accounting Firm
The Shareholders and Board of Directors
Voya Partners, Inc.
We have audited the accompanying statements of assets and liabilities, including the portfolios of investments, of Voya Solution Aggressive Portfolio, Voya Solution Balanced Portfolio, Voya Solution Conservative Portfolio, Voya Solution Income Portfolio, Voya Solution Moderately Aggressive Portfolio, Voya Solution Moderately Conservative Portfolio, Voya Solution 2020 Portfolio, Voya Solution 2025 Portfolio, Voya Solution 2030 Portfolio, Voya Solution 2035 Portfolio, Voya Solution 2040 Portfolio, Voya Solution 2045 Portfolio, Voya Solution 2050 Portfolio, Voya Solution 2055 Portfolio, and Voya Solution 2060 Portfolio, each a series of Voya Partners, Inc., as of December 31, 2016, and the related statements of operations for the year then ended, the statements of changes in net assets for each of the years or periods in the two-year period then ended, and the financial highlights for each of the years or periods in the five-year period then ended. These financial statements and financial highlights are the responsibility of management. Our responsibility is to express an opinion on these financial statements and financial highlights based on our audits.
We conducted our audits in accordance with the standards of the Public Company Accounting Oversight Board (United States). Those standards require that we plan and perform the audit to obtain reasonable assurance about whether the financial statements and financial highlights are free of material misstatement. An audit includes examining, on a test basis, evidence supporting the amounts and disclosures in the financial statements. Our procedures included confirmation of securities owned as of December 31, 2016, by correspondence with the custodian and transfer agent of the underlying funds. An audit also includes assessing the accounting principles used and significant estimates made by management, as well as evaluating the overall financial statement presentation. We believe that our audits provide a reasonable basis for our opinion.
In our opinion, the financial statements and financial highlights referred to above present fairly, in all material respects, the financial position of the aforementioned funds of Voya Partners, Inc. as of December 31, 2016, and the results of their operations for the year then ended, the changes in their net assets for each of the years or periods in the two-year period then ended, and the financial highlights for each of the years or periods in the five-year period then ended, in conformity with accounting principles generally accepted in the United States of America.
Boston, Massachusetts
February 23, 2017
STATEMENTS OF ASSETS AND LIABILITIES as of December 31, 2016
| | | | Voya Solution
Aggressive
Portfolio | | | Voya Solution
Balanced
Portfolio | | | Voya Solution
Conservative
Portfolio | | | Voya Solution
Income
Portfolio | |
| ASSETS: | | | | | |
| Investments in affiliated underlying funds at fair value* | | | | $ | 7,249,914 | | | | | $ | 46,591,928 | | | | | $ | 15,261,546 | | | | | $ | 452,310,440 | | |
| Investments in unaffiliated underlying funds at fair value** | | | | | 545,069 | | | | | | 3,064,435 | | | | | | 1,081,270 | | | | | | 32,762,919 | | |
| Total investments at fair value | | | | $ | 7,794,983 | | | | | $ | 49,656,363 | | | | | $ | 16,342,816 | | | | | $ | 485,073,359 | | |
| Cash | | | | | 14,506 | | | | | | 78,234 | | | | | | 29,113 | | | | | | 718,836 | | |
| Receivables: | | | | | |
| Investments in affiliated underlying funds sold | | | | | — | | | | | | — | | | | | | — | | | | | | 1,526,114 | | |
| Fund shares sold | | | | | 123,144 | | | | | | 535,722 | | | | | | 48,465 | | | | | | 285,261 | | |
| Dividends | | | | | 4,227 | | | | | | 55,726 | | | | | | 23,230 | | | | | | 550,548 | | |
| Prepaid expenses | | | | | 24 | | | | | | 200 | | | | | | 65 | | | | | | 2,425 | | |
| Reimbursement due from manager | | | | | 7,350 | | | | | | 5,976 | | | | | | 5,421 | | | | | | 59,101 | | |
| Other assets | | | | | — | | | | | | 842 | | | | | | 274 | | | | | | 21,765 | | |
| Total assets | | | | | 7,944,234 | | | | | | 50,333,063 | | | | | | 16,449,384 | | | | | | 488,237,409 | | |
| LIABILITIES: | | | | | |
| Payable for investments in affiliated underlying funds purchased | | | | | 125,655 | | | | | | 560,358 | | | | | | 67,770 | | | | | | 431,052 | | |
| Payable for fund shares redeemed | | | | | — | | | | | | 19,440 | | | | | | — | | | | | | 1,811,375 | | |
| Payable for investment management fees | | | | | 1,355 | | | | | | 8,845 | | | | | | 2,935 | | | | | | 89,190 | | |
| Payable for distribution and shareholder service fees | | | | | 2,048 | | | | | | 13,732 | | | | | | 5,173 | | | | | | 130,955 | | |
| Payable for directors fees | | | | | 32 | | | | | | 230 | | | | | | 79 | | | | | | 2,698 | | |
| Payable to directors under the deferred compensation plan (Note 6) | | | | | — | | | | | | 842 | | | | | | 274 | | | | | | 21,765 | | |
| Other accrued expenses and liabilities | | | | | 2,547 | | | | | | 10,860 | | | | | | 3,550 | | | | | | 82,717 | | |
| Total liabilities | | | | | 131,637 | | | | | | 614,307 | | | | | | 79,781 | | | | | | 2,569,752 | | |
| NET ASSETS | | | | $ | 7,812,597 | | | | | $ | 49,718,756 | | | | | $ | 16,369,603 | | | | | $ | 485,667,657 | | |
| NET ASSETS WERE COMPRISED OF: | | | | | |
| Paid-in capital | | | | $ | 8,026,853 | | | | | $ | 50,042,818 | | | | | $ | 16,633,762 | | | | | $ | 495,929,118 | | |
| Undistributed net investment income | | | | | 65,132 | | | | | | 809,692 | | | | | | 341,095 | | | | | | 9,866,359 | | |
| Accumulated net realized loss | | | | | (208,806) | | | | | | (152,561) | | | | | | (413,074) | | | | | | (9,618,540) | | |
| Net unrealized depreciation | | | | | (70,582) | | | | | | (981,193) | | | | | | (192,180) | | | | | | (10,509,280) | | |
| NET ASSETS | | | | $ | 7,812,597 | | | | | $ | 49,718,756 | | | | | $ | 16,369,603 | | | | | $ | 485,667,657 | | |
*
Cost of investments in affiliated underlying funds | | | | $ | 7,345,890 | | | | | $ | 47,516,737 | | | | | $ | 15,455,962 | | | | | $ | 462,189,994 | | |
**
Cost of investments in unaffiliated underlying funds | | | | $ | 519,676 | | | | | $ | 3,120,819 | | | | | $ | 1,079,034 | | | | | $ | 33,392,645 | | |
See Accompanying Notes to Financial Statements
STATEMENTS OF ASSETS AND LIABILITIES as of December 31, 2016 (continued)
| | | | Voya Solution
Aggressive
Portfolio | | | Voya Solution
Balanced
Portfolio | | | Voya Solution
Conservative
Portfolio | | | Voya Solution
Income
Portfolio | |
| Class ADV | | | | | |
| Net assets | | | | $ | 2,519,716 | | | | | $ | 18,215,398 | | | | | $ | 8,524,036 | | | | | $ | 205,103,019 | | |
| Shares authorized | | | | | 100,000,000 | | | | | | 100,000,000 | | | | | | 100,000,000 | | | | | | 100,000,000 | | |
| Par value | | | | $ | 0.001 | | | | | $ | 0.001 | | | | | $ | 0.001 | | | | | $ | 0.001 | | |
| Shares outstanding | | | | | 222,329 | | | | | | 2,011,166 | | | | | | 803,979 | | | | | | 18,457,750 | | |
| Net asset value and redemption price per share | | | | $ | 11.33 | | | | | $ | 9.06 | | | | | $ | 10.60 | | | | | $ | 11.11 | | |
| Class I | | | | | |
| Net assets | | | | $ | 257,982 | | | | | $ | 2,092,101 | | | | | $ | 108,819 | | | | | $ | 82,425,671 | | |
| Shares authorized | | | | | 100,000,000 | | | | | | 100,000,000 | | | | | | 100,000,000 | | | | | | 100,000,000 | | |
| Par value | | | | $ | 0.001 | | | | | $ | 0.001 | | | | | $ | 0.001 | | | | | $ | 0.001 | | |
| Shares outstanding | | | | | 22,319 | | | | | | 222,652 | | | | | | 10,128 | | | | | | 7,241,485 | | |
| Net asset value and redemption price per share | | | | $ | 11.56 | | | | | $ | 9.40 | | | | | $ | 10.74 | | | | | $ | 11.38 | | |
| Class R6 | | | | | |
| Net assets | | | | $ | 658,581 | | | | | $ | 2,412,207 | | | | | $ | 717,969 | | | | | | n/a | | |
| Shares authorized | | | | | 100,000,000 | | | | | | 100,000,000 | | | | | | 100,000,000 | | | | | | n/a | | |
| Par value | | | | $ | 0.001 | | | | | $ | 0.001 | | | | | $ | 0.001 | | | | | | n/a | | |
| Shares outstanding | | | | | 56,976 | | | | | | 256,775 | | | | | | 66,851 | | | | | | n/a | | |
| Net asset value and redemption price per share | | | | $ | 11.56 | | | | | $ | 9.39 | | | | | $ | 10.74 | | | | | | n/a | | |
| Class S | | | | | |
| Net assets | | | | $ | 3,954,039 | | | | | $ | 25,331,451 | | | | | $ | 6,512,968 | | | | | $ | 186,264,384 | | |
| Shares authorized | | | | | 100,000,000 | | | | | | 100,000,000 | | | | | | 100,000,000 | | | | | | 100,000,000 | | |
| Par value | | | | $ | 0.001 | | | | | $ | 0.001 | | | | | $ | 0.001 | | | | | $ | 0.001 | | |
| Shares outstanding | | | | | 345,659 | | | | | | 2,758,679 | | | | | | 610,995 | | | | | | 16,513,601 | | |
| Net asset value and redemption price per share | | | | $ | 11.44 | | | | | $ | 9.18 | | | | | $ | 10.66 | | | | | $ | 11.28 | | |
| Class S2 | | | | | |
| Net assets | | | | $ | 422,279 | | | | | $ | 1,667,599 | | | | | $ | 505,811 | | | | | $ | 11,669,790 | | |
| Shares authorized | | | | | 100,000,000 | | | | | | 100,000,000 | | | | | | 100,000,000 | | | | | | 100,000,000 | | |
| Par value | | | | $ | 0.001 | | | | | $ | 0.001 | | | | | $ | 0.001 | | | | | $ | 0.001 | | |
| Shares outstanding | | | | | 37,312 | | | | | | 181,985 | | | | | | 47,760 | | | | | | 1,061,564 | | |
| Net asset value and redemption price per share | | | | $ | 11.32 | | | | | $ | 9.16 | | | | | $ | 10.59 | | | | | $ | 10.99 | | |
| Class T | | | | | |
| Net assets | | | | | n/a | | | | | | n/a | | | | | | n/a | | | | | $ | 204,793 | | |
| Shares authorized | | | | | n/a | | | | | | n/a | | | | | | n/a | | | | | | 100,000,000 | | |
| Par value | | | | | n/a | | | | | | n/a | | | | | | n/a | | | | | $ | 0.001 | | |
| Shares outstanding | | | | | n/a | | | | | | n/a | | | | | | n/a | | | | | | 17,460 | | |
| Net asset value and redemption price per share | | | | | n/a | | | | | | n/a | | | | | | n/a | | | | | $ | 11.73 | | |
See Accompanying Notes to Financial Statements
STATEMENTS OF ASSETS AND LIABILITIES as of December 31, 2016
| | | | Voya Solution
Moderately
Aggressive
Portfolio | | | Voya Solution
Moderately
Conservative
Portfolio | | | Voya Solution
2020 Portfolio | | | Voya Solution
2025 Portfolio | |
| ASSETS: | | | | | |
| Investments in affiliated underlying funds at fair value* | | | | $ | 609,753,023 | | | | | $ | 33,338,594 | | | | | $ | 20,879,769 | | | | | $ | 827,941,166 | | |
| Investments in unaffiliated underlying funds at fair value** | | | | | 82,395,602 | | | | | | 2,151,517 | | | | | | 1,258,060 | | | | | | 67,271,303 | | |
| Total investments at fair value | | | | $ | 692,148,625 | | | | | $ | 35,490,111 | | | | | $ | 22,137,829 | | | | | $ | 895,212,469 | | |
| Cash | | | | | 1,198,430 | | | | | | 59,175 | | | | | | 28,671 | | | | | | 1,046,554 | | |
| Receivables: | | | | | |
| Investments in affiliated underlying funds sold | | | | | — | | | | | | — | | | | | | — | | | | | | 6,057,299 | | |
| Fund shares sold | | | | | 351,429 | | | | | | 105,440 | | | | | | 770,865 | | | | | | 586,411 | | |
| Dividends | | | | | 663,513 | | | | | | 41,839 | | | | | | 18,816 | | | | | | 767,471 | | |
| Prepaid expenses | | | | | 3,053 | | | | | | 177 | | | | | | 45 | | | | | | 4,103 | | |
| Reimbursement due from manager | | | | | 25 | | | | | | 4,813 | | | | | | 24,477 | | | | | | 80,110 | | |
| Other assets | | | | | 21,712 | | | | | | 730 | | | | | | 110 | | | | | | 29,384 | | |
| Total assets | | | | | 694,386,787 | | | | | | 35,702,285 | | | | | | 22,980,813 | | | | | | 903,783,801 | | |
| LIABILITIES: | | | | | |
| Payable for investments in affiliated underlying funds purchased | | | | | 545,173 | | | | | | 117,819 | | | | | | 649,871 | | | | | | 546,459 | | |
| Payable for fund shares redeemed | | | | | 220,807 | | | | | | 21,001 | | | | | | 135,007 | | | | | | 6,643,710 | | |
| Payable for investment management fees | | | | | 163,009 | | | | | | 6,350 | | | | | | 11,508 | | | | | | 166,236 | | |
| Payable for distribution and shareholder service fees | | | | | 151,670 | | | | | | 10,412 | | | | | | 5,207 | | | | | | 217,107 | | |
| Payable for directors fees | | | | | 3,540 | | | | | | 190 | | | | | | 80 | | | | | | 4,752 | | |
| Payable to directors under the deferred compensation plan (Note 6) | | | | | 21,712 | | | | | | 730 | | | | | | 110 | | | | | | 29,384 | | |
| Other accrued expenses and liabilities | | | | | 84,360 | | | | | | 10,843 | | | | | | 2,350 | | | | | | 146,869 | | |
| Total liabilities | | | | | 1,190,271 | | | | | | 167,345 | | | | | | 804,133 | | | | | | 7,754,517 | | |
| NET ASSETS | | | | $ | 693,196,516 | | | | | $ | 35,534,940 | | | | | $ | 22,176,680 | | | | | $ | 896,029,284 | | |
| NET ASSETS WERE COMPRISED OF: | | | | | |
| Paid-in capital | | | | $ | 705,965,513 | | | | | $ | 36,556,133 | | | | | $ | 21,356,253 | | | | | $ | 901,284,303 | | |
| Undistributed net investment income | | | | | 9,726,651 | | | | | | 692,402 | | | | | | 315,292 | | | | | | 17,184,274 | | |
| Accumulated net realized gain (loss) | | | | | (2,908,643) | | | | | | (1,394,863) | | | | | | 367,247 | | | | | | 5,300,288 | | |
| Net unrealized appreciation (depreciation) | | | | | (19,587,005) | | | | | | (318,732) | | | | | | 137,888 | | | | | | (27,739,581) | | |
| NET ASSETS | | | | $ | 693,196,516 | | | | | $ | 35,534,940 | | | | | $ | 22,176,680 | | | | | $ | 896,029,284 | | |
*
Cost of investments in affiliated underlying funds | | | | $ | 631,787,918 | | | | | $ | 33,673,106 | | | | | $ | 20,755,087 | | | | | $ | 854,104,991 | | |
**
Cost of investments in unaffiliated underlying funds | | | | $ | 79,947,712 | | | | | $ | 2,135,737 | | | | | $ | 1,244,855 | | | | | $ | 68,847,059 | | |
See Accompanying Notes to Financial Statements
STATEMENTS OF ASSETS AND LIABILITIES as of December 31, 2016 (continued)
| | | | Voya Solution
Moderately
Aggressive
Portfolio | | | Voya Solution
Moderately
Conservative
Portfolio | | | Voya Solution
2020 Portfolio | | | Voya Solution
2025 Portfolio | |
| Class ADV | | | | | |
| Net assets | | | | $ | 24,644,749 | | | | | $ | 13,487,330 | | | | | $ | 9,166,520 | | | | | $ | 302,669,886 | | |
| Shares authorized | | | | | 100,000,000 | | | | | | 100,000,000 | | | | | | 100,000,000 | | | | | | 100,000,000 | | |
| Par value | | | | $ | 0.001 | | | | | $ | 0.001 | | | | | $ | 0.001 | | | | | $ | 0.001 | | |
| Shares outstanding | | | | | 2,121,473 | | | | | | 1,459,989 | | | | | | 754,207 | | | | | | 28,394,029 | | |
| Net asset value and redemption price per share | | | | $ | 11.62 | | | | | $ | 9.24 | | | | | $ | 12.15 | | | | | $ | 10.66 | | |
| Class I | | | | | |
| Net assets | | | | $ | 4,334,258 | | | | | $ | 32,815 | | | | | $ | 6,376,847 | | | | | $ | 193,794,563 | | |
| Shares authorized | | | | | 100,000,000 | | | | | | 100,000,000 | | | | | | 100,000,000 | | | | | | 100,000,000 | | |
| Par value | | | | $ | 0.001 | | | | | $ | 0.001 | | | | | $ | 0.001 | | | | | $ | 0.001 | | |
| Shares outstanding | | | | | 366,246 | | | | | | 3,401 | | | | | | 515,334 | | | | | | 17,714,104 | | |
| Net asset value and redemption price per share | | | | $ | 11.83 | | | | | $ | 9.65 | | | | | $ | 12.37 | | | | | $ | 10.94 | | |
| Class R6 | | | | | |
| Net assets | | | | $ | 1,287,150 | | | | | $ | 287,156 | | | | | | n/a | | | | | | n/a | | |
| Shares authorized | | | | | 100,000,000 | | | | | | 100,000,000 | | | | | | n/a | | | | | | n/a | | |
| Par value | | | | $ | 0.001 | | | | | $ | 0.001 | | | | | | n/a | | | | | | n/a | | |
| Shares outstanding | | | | | 108,861 | | | | | | 29,795 | | | | | | n/a | | | | | | n/a | | |
| Net asset value and redemption price per share | | | | $ | 11.82 | | | | | $ | 9.64 | | | | | | n/a | | | | | | n/a | | |
| Class S | | | | | |
| Net assets | | | | $ | 661,798,132 | | | | | $ | 20,882,843 | | | | | $ | 6,477,318 | | | | | $ | 376,402,664 | | |
| Shares authorized | | | | | 200,000,000 | | | | | | 100,000,000 | | | | | | 100,000,000 | | | | | | 100,000,000 | | |
| Par value | | | | $ | 0.001 | | | | | $ | 0.001 | | | | | $ | 0.001 | | | | | $ | 0.001 | | |
| Shares outstanding | | | | | 56,505,521 | | | | | | 2,212,798 | | | | | | 525,139 | | | | | | 34,800,548 | | |
| Net asset value and redemption price per share | | | | $ | 11.71 | | | | ��� | $ | 9.44 | | | | | $ | 12.33 | | | | | $ | 10.82 | | |
| Class S2 | | | | | |
| Net assets | | | | $ | 1,132,227 | | | | | $ | 844,796 | | | | | $ | 147,883 | | | | | $ | 22,356,469 | | |
| Shares authorized | | | | | 100,000,000 | | | | | | 100,000,000 | | | | | | 100,000,000 | | | | | | 100,000,000 | | |
| Par value | | | | $ | 0.001 | | | | | $ | 0.001 | | | | | $ | 0.001 | | | | | $ | 0.001 | | |
| Shares outstanding | | | | | 96,743 | | | | | | 90,426 | | | | | | 12,099 | | | | | | 2,126,076 | | |
| Net asset value and redemption price per share | | | | $ | 11.70 | | | | | $ | 9.34 | | | | | $ | 12.22 | | | | | $ | 10.52 | | |
| Class T | | | | | |
| Net assets | | | | | n/a | | | | | | n/a | | | | | $ | 8,112 | | | | | $ | 805,702 | | |
| Shares authorized | | | | | n/a | | | | | | n/a | | | | | | 100,000,000 | | | | | | 100,000,000 | | |
| Par value | | | | | n/a | | | | | | n/a | | | | | $ | 0.001 | | | | | $ | 0.001 | | |
| Shares outstanding | | | | | n/a | | | | | | n/a | | | | | | 667 | | | | | | 72,610 | | |
| Net asset value and redemption price per share | | | | | n/a | | | | | | n/a | | | | | $ | 12.16 | | | | | $ | 11.10 | | |
See Accompanying Notes to Financial Statements
STATEMENTS OF ASSETS AND LIABILITIES as of December 31, 2016
| | | | Voya Solution
2030 Portfolio | | | Voya Solution
2035 Portfolio | | | Voya Solution
2040 Portfolio | | | Voya Solution
2045 Portfolio | |
| ASSETS: | | | | | |
| Investments in affiliated underlying funds at fair value* | | | | $ | 13,766,499 | | | | | $ | 779,817,426 | | | | | $ | 10,171,425 | | | | | $ | 549,799,630 | | |
| Investments in unaffiliated underlying funds at fair value** | | | | | 1,121,244 | | | | | | 73,360,327 | | | | | | 1,006,102 | | | | | | 67,099,383 | | |
| Total investments at fair value | | | | $ | 14,887,743 | | | | | $ | 853,177,753 | | | | | $ | 11,177,527 | | | | | $ | 616,899,013 | | |
| Cash | | | | | 15,833 | | | | | | 941,754 | | | | | | 15,206 | | | | | | 1,166,717 | | |
| Receivables: | | | | | |
| Investments in affiliated underlying funds sold | | | | | 293,888 | | | | | | 10,190,688 | | | | | | 72,942 | | | | | | 7,884,391 | | |
| Fund shares sold | | | | | 18,607 | | | | | | 719,878 | | | | | | 41,002 | | | | | | 643,508 | | |
| Dividends | | | | | 10,839 | | | | | | 654,617 | | | | | | 6,553 | | | | | | 357,502 | | |
| Prepaid expenses | | | | | 18 | | | | | | 3,681 | | | | | | 14 | | | | | | 2,615 | | |
| Reimbursement due from manager | | | | | 16,096 | | | | | | 62,862 | | | | | | 19,579 | | | | | | 38,238 | | |
| Other assets | | | | | — | | | | | | 25,442 | | | | | | — | | | | | | 16,678 | | |
| Total assets | | | | | 15,243,024 | | | | | | 865,776,675 | | | | | | 11,332,823 | | | | | | 627,008,662 | | |
| LIABILITIES: | | | | | |
| Payable for investments in affiliated underlying funds purchased | | | | | 7,563 | | | | | | 444,268 | | | | | | 4,055 | | | | | | 206,353 | | |
| Payable for fund shares redeemed | | | | | 312,496 | | | | | | 10,910,566 | | | | | | 113,944 | | | | | | 8,527,899 | | |
| Payable for investment management fees | | | | | 10,266 | | | | | | 160,542 | | | | | | 13,535 | | | | | | 118,495 | | |
| Payable for distribution and shareholder service fees | | | | | 3,793 | | | | | | 196,206 | | | | | | 2,817 | | | | | | 134,502 | | |
| Payable for directors fees | | | | | 45 | | | | | | 4,404 | | | | | | 37 | | | | | | 3,136 | | |
| Payable to directors under the deferred compensation plan (Note 6) | | | | | — | | | | | | 25,442 | | | | | | — | | | | | | 16,678 | | |
| Other accrued expenses and liabilities | | | | | 2,417 | | | | | | 126,549 | | | | | | 2,045 | | | | | | 89,234 | | |
| Total liabilities | | | | | 336,580 | | | | | | 11,867,977 | | | | | | 136,433 | | | | | | 9,096,297 | | |
| NET ASSETS | | | | $ | 14,906,444 | | | | | $ | 853,908,698 | | | | | $ | 11,196,390 | | | | | $ | 617,912,365 | | |
| NET ASSETS WERE COMPRISED OF: | | | | | |
| Paid-in capital | | | | $ | 14,287,003 | | | | | $ | 857,386,204 | | | | | $ | 10,680,350 | | | | | $ | 618,418,312 | | |
| Undistributed net investment income | | | | | 199,946 | | | | | | 13,786,106 | | | | | | 130,837 | | | | | | 7,128,010 | | |
| Accumulated net realized gain | | | | | 263,519 | | | | | | 8,430,297 | | | | | | 209,851 | | | | | | 8,281,765 | | |
| Net unrealized appreciation (depreciation) | | | | | 155,976 | | | | | | (25,693,909) | | | | | | 175,352 | | | | | | (15,915,722) | | |
| NET ASSETS | | | | $ | 14,906,444 | | | | | $ | 853,908,698 | | | | | $ | 11,196,390 | | | | | $ | 617,912,365 | | |
*
Cost of investments in affiliated underlying funds | | | | $ | 13,605,915 | | | | | $ | 806,116,709 | | | | | $ | 10,053,137 | | | | | $ | 568,251,257 | | |
**
Cost of investments in unaffiliated underlying funds | | | | $ | 1,125,852 | | | | | $ | 72,754,954 | | | | | $ | 949,038 | | | | | $ | 64,563,477 | | |
See Accompanying Notes to Financial Statements
STATEMENTS OF ASSETS AND LIABILITIES as of December 31, 2016 (continued)
| | | | Voya Solution
2030 Portfolio | | | Voya Solution
2035 Portfolio | | | Voya Solution
2040 Portfolio | | | Voya Solution
2045 Portfolio | |
| Class ADV | | | | | |
| Net assets | | | | $ | 6,623,438 | | | | | $ | 262,148,182 | | | | | $ | 4,897,361 | | | | | $ | 176,396,938 | | |
| Shares authorized | | | | | 100,000,000 | | | | | | 100,000,000 | | | | | | 100,000,000 | | | | | | 100,000,000 | | |
| Par value | | | | $ | 0.001 | | | | | $ | 0.001 | | | | | $ | 0.001 | | | | | $ | 0.001 | | |
| Shares outstanding | | | | | 475,219 | | | | | | 24,483,057 | | | | | | 336,584 | | | | | | 16,600,491 | | |
| Net asset value and redemption price per share | | | | $ | 13.94 | | | | | $ | 10.71 | | | | | $ | 14.55 | | | | | $ | 10.63 | | |
| Class I | | | | | |
| Net assets | | | | $ | 3,247,231 | | | | | $ | 210,862,892 | | | | | $ | 2,887,323 | | | | | $ | 171,475,045 | | |
| Shares authorized | | | | | 100,000,000 | | | | | | 100,000,000 | | | | | | 100,000,000 | | | | | | 100,000,000 | | |
| Par value | | | | $ | 0.001 | | | | | $ | 0.001 | | | | | $ | 0.001 | | | | | $ | 0.001 | | |
| Shares outstanding | | | | | 228,139 | | | | | | 19,198,949 | | | | | | 194,309 | | | | | | 15,707,052 | | |
| Net asset value and redemption price per share | | | | $ | 14.23 | | | | | $ | 10.98 | | | | | $ | 14.86 | | | | | $ | 10.92 | | |
| Class S | | | | | |
| Net assets | | | | $ | 4,769,785 | | | | | $ | 359,464,379 | | | | | $ | 3,217,247 | | | | | $ | 256,935,417 | | |
| Shares authorized | | | | | 100,000,000 | | | | | | 100,000,000 | | | | | | 100,000,000 | | | | | | 100,000,000 | | |
| Par value | | | | $ | 0.001 | | | | | $ | 0.001 | | | | | $ | 0.001 | | | | | $ | 0.001 | | |
| Shares outstanding | | | | | 336,308 | | | | | | 33,084,513 | | | | | | 217,679 | | | | | | 23,852,146 | | |
| Net asset value and redemption price per share | | | | $ | 14.18 | | | | | $ | 10.87 | | | | | $ | 14.78 | | | | | $ | 10.77 | | |
| Class S2 | | | | | |
| Net assets | | | | $ | 255,154 | | | | | $ | 20,808,815 | | | | | $ | 182,552 | | | | | $ | 12,686,975 | | |
| Shares authorized | | | | | 100,000,000 | | | | | | 100,000,000 | | | | | | 100,000,000 | | | | | | 100,000,000 | | |
| Par value | | | | $ | 0.001 | | | | | $ | 0.001 | | | | | $ | 0.001 | | | | | $ | 0.001 | | |
| Shares outstanding | | | | | 18,208 | | | | | | 1,984,380 | | | | | | 12,490 | | | | | | 1,207,346 | | |
| Net asset value and redemption price per share | | | | $ | 14.01 | | | | | $ | 10.49 | | | | | $ | 14.62 | | | | | $ | 10.51 | | |
| Class T | | | | | |
| Net assets | | | | $ | 10,836 | | | | | $ | 624,430 | | | | | $ | 11,907 | | | | | $ | 417,990 | | |
| Shares authorized | | | | | 100,000,000 | | | | | | 100,000,000 | | | | | | 100,000,000 | | | | | | 100,000,000 | | |
| Par value | | | | $ | 0.001 | | | | | $ | 0.001 | | | | | $ | 0.001 | | | | | $ | 0.001 | | |
| Shares outstanding | | | | | 775 | | | | | | 56,042 | | | | | | 819 | | | | | | 38,172 | | |
| Net asset value and redemption price per share | | | | $ | 13.98 | | | | | $ | 11.14 | | | | | $ | 14.53 | | | | | $ | 10.95 | | |
See Accompanying Notes to Financial Statements
STATEMENTS OF ASSETS AND LIABILITIES as of December 31, 2016
| | | | Voya Solution
2050 Portfolio | | | Voya Solution
2055 Portfolio | | | Voya Solution
2060 Portfolio | |
| ASSETS: | | | | |
| Investments in affiliated underlying funds at fair value* | | | | $ | 6,077,456 | | | | | $ | 129,451,265 | | | | | $ | 2,576,215 | | |
| Investments in unaffiliated underlying funds at fair value** | | | | | 695,524 | | | | | | 11,980,491 | | | | | | 295,621 | | |
| Total investments at fair value | | | | $ | 6,772,980 | | | | | $ | 141,431,756 | | | | | $ | 2,871,836 | | |
| Cash | | | | | 9,239 | | | | | | 239,230 | | | | | | 3,217 | | |
| Receivables: | | | | |
| Investments in affiliated underlying funds sold | | | | | 119,885 | | | | | | 1,886,205 | | | | | | 34,018 | | |
| Fund shares sold | | | | | 6,046 | | | | | | 431,250 | | | | | | 9,771 | | |
| Dividends | | | | | 3,909 | | | | | | 55,779 | | | | | | 1,474 | | |
| Prepaid expenses | | | | | 9 | | | | | | 517 | | | | | | 4 | | |
| Reimbursement due from manager | | | | | 15,838 | | | | | | 8,424 | | | | | | 8,804 | | |
| Other assets | | | | | — | | | | | | 1,816 | | | | | | — | | |
| Total assets | | | | | 6,927,906 | | | | | | 144,054,977 | | | | | | 2,929,124 | | |
| LIABILITIES: | | | | |
| Payable for investments in affiliated underlying funds purchased | | | | | 2,341 | | | | | | 38,645 | | | | | | 793 | | |
| Payable for fund shares redeemed | | | | | 125,931 | | | | | | 2,317,455 | | | | | | 43,789 | | |
| Payable for investment management fees | | | | | 12,892 | | | | | | 26,427 | | | | | | 8,117 | | |
| Payable for distribution and shareholder service fees | | | | | 1,781 | | | | | | 29,993 | | | | | | 742 | | |
| Payable for directors fees | | | | | 21 | | | | | | 664 | | | | | | 9 | | |
| Payable to directors under the deferred compensation plan (Note 6) | | | | | — | | | | | | 1,816 | | | | | | — | | |
| Other accrued expenses and liabilities | | | | | 1,168 | | | | | | 13,578 | | | | | | 4,166 | | |
| Total liabilities | | | | | 144,134 | | | | | | 2,428,578 | | | | | | 57,616 | | |
| NET ASSETS | | | | $ | 6,783,772 | | | | | $ | 141,626,399 | | | | | $ | 2,871,508 | | |
| NET ASSETS WERE COMPRISED OF: | | | | |
| Paid-in capital | | | | $ | 6,463,560 | | | | | $ | 144,192,275 | | | | | $ | 2,708,752 | | |
| Undistributed net investment income | | | | | 64,080 | | | | | | 1,560,825 | | | | | | 26,736 | | |
| Accumulated net realized gain (loss) | | | | | 119,433 | | | | | | (848,506) | | | | | | 80,625 | | |
| Net unrealized appreciation (depreciation) | | | | | 136,699 | | | | | | (3,278,195) | | | | | | 55,395 | | |
| NET ASSETS | | | | $ | 6,783,772 | | | | | $ | 141,626,399 | | | | | $ | 2,871,508 | | |
*
Cost of investments in affiliated underlying funds | | | | $ | 5,969,485 | | | | | $ | 133,290,290 | | | | | $ | 2,533,835 | | |
**
Cost of investments in unaffiliated underlying funds | | | | $ | 666,796 | | | | | $ | 11,419,661 | | | | | $ | 282,607 | | |
See Accompanying Notes to Financial Statements
STATEMENTS OF ASSETS AND LIABILITIES as of December 31, 2016 (continued)
| | | | Voya Solution
2050 Portfolio | | | Voya Solution
2055 Portfolio | | | Voya Solution
2060 Portfolio |
| Class ADV | | | | |
| Net assets | | | | $ | 3,184,366 | | | | | $ | 42,792,893 | | | | | $ | 1,394,514 |
| Shares authorized | | | | | 100,000,000 | | | | | | 100,000,000 | | | | | | 100,000,000 |
| Par value | | | | $ | 0.001 | | | | | $ | 0.001 | | | | | $ | 0.001 |
| Shares outstanding | | | | | 218,609 | | | | | | 3,486,408 | | | | | | 133,841 |
| Net asset value and redemption price per share | | | | $ | 14.57 | | | | | $ | 12.27 | | | | | $ | 10.42 |
| Class I | | | | |
| Net assets | | | | $ | 1,451,521 | | | | | $ | 44,518,648 | | | | | $ | 606,268 |
| Shares authorized | | | | | 100,000,000 | | | | | | 100,000,000 | | | | | | 100,000,000 |
| Par value | | | | $ | 0.001 | | | | | $ | 0.001 | | | | | $ | 0.001 |
| Shares outstanding | | | | | 97,322 | | | | | | 3,559,851 | | | | | | 57,781 |
| Net asset value and redemption price per share | | | | $ | 14.91 | | | | | $ | 12.51 | | | | | $ | 10.49 |
| Class S | | | | |
| Net assets | | | | $ | 1,995,750 | | | | | $ | 51,294,122 | | | | | $ | 835,797 |
| Shares authorized | | | | | 100,000,000 | | | | | | 100,000,000 | | | | | | 100,000,000 |
| Par value | | | | $ | 0.001 | | | | | $ | 0.001 | | | | | $ | 0.001 |
| Shares outstanding | | | | | 134,764 | | | | | | 4,144,792 | | | | | | 80,270 |
| Net asset value and redemption price per share | | | | $ | 14.81 | | | | | $ | 12.38 | | | | | $ | 10.41 |
| Class S2 | | | | |
| Net assets | | | | $ | 142,490 | | | | | $ | 2,995,767 | | | | | $ | 31,785 |
| Shares authorized | | | | | 100,000,000 | | | | | | 100,000,000 | | | | | | 100,000,000 |
| Par value | | | | $ | 0.001 | | | | | $ | 0.001 | | | | | $ | 0.001 |
| Shares outstanding | | | | | 9,731 | | | | | | 243,355 | | | | | | 3,050 |
| Net asset value and redemption price per share | | | | $ | 14.64 | | | | | $ | 12.31 | | | | | $ | 10.42 |
| Class T | | | | |
| Net assets | | | | $ | 9,645 | | | | | $ | 24,969 | | | | | $ | 3,144 |
| Shares authorized | | | | | 100,000,000 | | | | | | 100,000,000 | | | | | | 100,000,000 |
| Par value | | | | $ | 0.001 | | | | | $ | 0.001 | | | | | $ | 0.001 |
| Shares outstanding | | | | | 660 | | | | | | 1,998 | | | | | | 304 |
| Net asset value and redemption price per share | | | | $ | 14.60 | | | | | $ | 12.50 | | | | | $ | 10.35 |
See Accompanying Notes to Financial Statements
STATEMENTS OF OPERATIONS for the year ended December 31, 2016
| | | | Voya Solution
Aggressive
Portfolio | | | Voya Solution
Balanced
Portfolio | | | Voya Solution
Conservative
Portfolio | | | Voya Solution
Income
Portfolio | |
| INVESTMENT INCOME: | | | | | |
| Dividends from affiliated underlying funds | | | | $ | 89,707 | | | | | $ | 897,405 | | | | | $ | 355,303 | | | | | $ | 10,635,438 | | |
| Dividends from unaffiliated underlying funds | | | | | 8,339 | | | | | | 30,423 | | | | | | 24,113 | | | | | | 362,736 | | |
| Total investment income | | | | | 98,046 | | | | | | 927,828 | | | | | | 379,416 | | | | | | 10,998,174 | | |
| EXPENSES: | | | | | |
| Investment management fees | | | | | 13,520 | | | | | | 96,336 | | | | | | 33,646 | | | | | | 1,123,565 | | |
| Distribution and shareholder service fees: | | | | | | | | | | | | | | | | | | | | | | | | | |
| Class ADV | | | | | 11,776 | | | | | | 107,367 | | | | | | 43,390 | | | | | | 1,132,888 | | |
| Class S | | | | | 8,618 | | | | | | 57,231 | | | | | | 15,948 | | | | | | 510,615 | | |
| Class S2 | | | | | 1,206 | | | | | | 3,454 | | | | | | 1,916 | | | | | | 59,981 | | |
| Class T | | | | | — | | | | | | — | | | | | | — | | | | | | 3,177 | | |
| Transfer agent fees | | | | | 103 | | | | | | 181 | | | | | | 243 | | | | | | 5,857 | | |
| Shareholder reporting expense | | | | | 1,833 | | | | | | 7,320 | | | | | | 1,962 | | | | | | 36,287 | | |
| Professional fees | | | | | 7,170 | | | | | | 12,810 | | | | | | 9,444 | | | | | | 61,885 | | |
| Custody and accounting expense | | | | | 311 | | | | | | 4,392 | | | | | | 1,307 | | | | | | 51,297 | | |
| Directors fees | | | | | 190 | | | | | | 1,385 | | | | | | 471 | | | | | | 16,191 | | |
| Miscellaneous expense | | | | | 11,681 | | | | | | 9,603 | | | | | | 8,956 | | | | | | 42,196 | | |
| Total expenses | | | | | 56,408 | | | | | | 300,079 | | | | | | 117,283 | | | | | | 3,043,939 | | |
| Net waived and reimbursed fees | | | | | (23,057) | | | | | | (66,645) | | | | | | (36,983) | | | | | | (682,578) | | |
| Net expenses | | | | | 33,351 | | | | | | 233,434 | | | | | | 80,300 | | | | | | 2,361,361 | | |
| Net investment income | | | | | 64,695 | | | | | | 694,394 | | | | | | 299,116 | | | | | | 8,636,813 | | |
| REALIZED AND UNREALIZED GAIN (LOSS): | | | | | |
| Net realized gain (loss) on: | | | | | |
| Sale of affiliated underlying funds | | | | | (238,359) | | | | | | (931,291) | | | | | | (316,676) | | | | | | (9,954,305) | | |
| Sale of unaffiliated underlying funds | | | | | (3,426) | | | | | | (76,300) | | | | | | 10,776 | | | | | | (345,117) | | |
| Capital gain distributions from affiliated underlying funds | | | | | 235,588 | | | | | | 1,553,364 | | | | | | 245,912 | | | | | | 11,092,811 | | |
| Futures | | | | | (2,117) | | | | | | (142,126) | | | | | | (6,352) | | | | | | (994,090) | | |
| Net realized gain (loss) | | | | | (8,314) | | | | | | 403,647 | | | | | | (66,340) | | | | | | (200,701) | | |
| Net change in unrealized appreciation (depreciation) on: | | | | | |
| Affiliated underlying funds | | | | | 345,819 | | | | | | 1,525,542 | | | | | | 563,000 | | | | | | 13,508,401 | | |
| Unaffiliated underlying funds | | | | | 44,149 | | | | | | 109,238 | | | | | | 88,291 | | | | | | 1,513,403 | | |
| Net change in unrealized appreciation (depreciation) | | | | | 389,968 | | | | | | 1,634,780 | | | | | | 651,291 | | | | | | 15,021,804 | | |
| Net realized and unrealized gain | | | | | 381,654 | | | | | | 2,038,427 | | | | | | 584,951 | | | | | | 14,821,103 | | |
| Increase in net assets resulting from operations | | | | $ | 446,349 | | | | | $ | 2,732,821 | | | | | $ | 884,067 | | | | | $ | 23,457,916 | | |
| | | | | | | | | | | |
See Accompanying Notes to Financial Statements
STATEMENTS OF OPERATIONS for the year ended December 31, 2016
| | | | Voya Solution
Moderately
Aggressive
Portfolio | | | Voya Solution
Moderately
Conservative
Portfolio | | | Voya Solution
2020 Portfolio | | | Voya Solution
2025 Portfolio | |
| INVESTMENT INCOME: | | | | | |
| Dividends from affiliated underlying funds | | | | $ | 10,849,015 | | | | | $ | 752,240 | | | | | $ | 326,439 | | | | | $ | 18,070,288 | | |
| Dividends from unaffiliated underlying funds | | | | | 1,211,081 | | | | | | 35,633 | | | | | | 13,926 | | | | | | 644,809 | | |
| Total investment income | | | | | 12,060,096 | | | | | | 787,873 | | | | | | 340,365 | | | | | | 18,715,097 | | |
| EXPENSES: | | | | | |
| Investment management fees | | | | | 1,539,265 | | | | | | 79,704 | | | | | | 33,306 | | | | | | 1,979,007 | | |
| Distribution and shareholder service fees: | | | | | | | | | | | | | | | | | | | | | | | | | |
| Class ADV | | | | | 134,548 | | | | | | 82,301 | | | | | | 34,640 | | | | | | 1,632,186 | | |
| Class S | | | | | 1,689,298 | | | | | | 51,634 | | | | | | 13,301 | | | | | | 976,600 | | |
| Class S2 | | | | | 4,430 | | | | | | 3,349 | | | | | | 747 | | | | | | 110,336 | | |
| Class T | | | | | — | | | | | | — | | | | | | 43 | | | | | | 5,959 | | |
| Transfer agent fees | | | | | 6,856 | | | | | | 166 | | | | | | 322 | | | | | | 1,351 | | |
| Shareholder reporting expense | | | | | 25,620 | | | | | | 7,954 | | | | | | 3,713 | | | | | | 46,865 | | |
| Professional fees | | | | | 81,804 | | | | | | 12,078 | | | | | | 9,349 | | | | | | 103,578 | | |
| Custody and accounting expense | | | | | 58,710 | | | | | | 3,642 | | | | | | 817 | | | | | | 69,930 | | |
| Directors fees | | | | | 21,234 | | | | | | 1,138 | | | | | | 475 | | | | | | 28,509 | | |
| Miscellaneous expense | | | | | 46,193 | | | | | | 8,863 | | | | | | 9,194 | | | | | | 56,392 | | |
| Interest expense | | | | | 195 | | | | | | — | | | | | | — | | | | | | — | | |
| Total expenses | | | | | 3,608,153 | | | | | | 250,829 | | | | | | 105,907 | | | | | | 5,010,713 | | |
| Net waived and reimbursed fees | | | | | (350,055) | | | | | | (60,094) | | | | | | (34,694) | | | | | | (946,420) | | |
| Net expenses | | | | | 3,258,098 | | | | | | 190,735 | | | | | | 71,213 | | | | | | 4,064,293 | | |
| Net investment income | | | | | 8,801,998 | | | | | | 597,138 | | | | | | 269,152 | | | | | | 14,650,804 | | |
| REALIZED AND UNREALIZED GAIN (LOSS): | | | | | |
| Net realized gain (loss) on: | | | | | |
| Sale of affiliated underlying funds | | | | | (18,724,101) | | | | | | (1,386,330) | | | | | | (8,072) | | | | | | (9,859,943) | | |
| Sale of unaffiliated underlying funds | | | | | (2,113,993) | | | | | | (53,396) | | | | | | 6,515 | | | | | | (1,646,873) | | |
| Capital gain distributions from affiliated underlying funds | | | | | 24,241,634 | | | | | | 894,085 | | | | | | 460,798 | | | | | | 29,917,695 | | |
| Futures | | | | | (2,229,195) | | | | | | (132,900) | | | | | | (6,351) | | | | | | (1,699,994) | | |
| Net realized gain (loss) | | | | | 1,174,345 | | | | | | (678,541) | | | | | | 452,890 | | | | | | 16,710,885 | | |
| Net change in unrealized appreciation (depreciation) on: | | | | | |
| Affiliated underlying funds | | | | | 25,358,302 | | | | | | 2,012,039 | | | | | | 245,129 | | | | | | 19,948,494 | | |
| Unaffiliated underlying funds | | | | | 5,657,029 | | | | | | 160,377 | | | | | | 19,797 | | | | | | 1,059,823 | | |
| Net change in unrealized appreciation (depreciation) | | | | | 31,015,331 | | | | | | 2,172,416 | | | | | | 264,926 | | | | | | 21,008,317 | | |
| Net realized and unrealized gain | | | | | 32,189,676 | | | | | | 1,493,875 | | | | | | 717,816 | | | | | | 37,719,202 | | |
| Increase in net assets resulting from operations | | | | $ | 40,991,674 | | | | | $ | 2,091,013 | | | | | $ | 986,968 | | | | | $ | 52,370,006 | | |
| |
See Accompanying Notes to Financial Statements
STATEMENTS OF OPERATIONS for the year ended December 31, 2016
| | | | Voya Solution
2030 Portfolio | | | Voya Solution
2035 Portfolio | | | Voya Solution
2040 Portfolio | | | Voya Solution
2045 Portfolio | |
| INVESTMENT INCOME: | | | | | |
| Dividends from affiliated underlying funds | | | | $ | 207,316 | | | | | $ | 15,035,087 | | | | | $ | 142,000 | | | | | $ | 8,912,128 | | |
| Dividends from unaffiliated underlying funds | | | | | 11,431 | | | | | | 930,521 | | | | | | 12,017 | | | | | | 933,217 | | |
| Total investment income | | | | | 218,747 | | | | | | 15,965,608 | | | | | | 154,017 | | | | | | 9,845,345 | | |
| EXPENSES: | | | | | |
| Investment management fees | | | | | 19,186 | | | | | | 1,862,706 | | | | | | 15,773 | | | | | | 1,345,577 | | |
| Distribution and shareholder service fees: | | | | | | | | | | | | | | | | | | | | | | | | | |
| Class ADV | | | | | 21,360 | | | | | | 1,397,957 | | | | | | 19,009 | | | | | | 918,730 | | |
| Class S | | | | | 7,079 | | | | | | 901,342 | | | | | | 4,674 | | | | | | 640,887 | | |
| Class S2 | | | | | 934 | | | | | | 93,598 | | | | | | 551 | | | | | | 56,642 | | |
| Class T | | | | | 49 | | | | | | 5,253 | | | | | | 56 | | | | | | 2,813 | | |
| Transfer agent fees | | | | | 486 | | | | | | 1,313 | | | | | | 435 | | | | | | 935 | | |
| Shareholder reporting expense | | | | | 2,538 | | | | | | 45,750 | | | | | | 3,081 | | | | | | 37,000 | | |
| Professional fees | | | | | 8,824 | | | | | | 91,374 | | | | | | 8,982 | | | | | | 66,149 | | |
| Custody and accounting expense | | | | | 787 | | | | | | 65,400 | | | | | | 683 | | | | | | 48,342 | | |
| Directors fees | | | | | 270 | | | | | | 26,430 | | | | | | 219 | | | | | | 18,817 | | |
| Miscellaneous expense | | | | | 9,800 | | | | | | 56,916 | | | | | | 9,523 | | | | | | 36,693 | | |
| Interest expense | | | | | — | | | | | | 135 | | | | | | — | | | | | | 20 | | |
| Total expenses | | | | | 71,313 | | | | | | 4,548,174 | | | | | | 62,986 | | | | | | 3,172,605 | | |
| Net waived and reimbursed fees | | | | | (26,875) | | | | | | (729,076) | | | | | | (26,885) | | | | | | (416,938) | | |
| Net expenses | | | | | 44,438 | | | | | | 3,819,098 | | | | | | 36,101 | | | | | | 2,755,667 | | |
| Net investment income | | | | | 174,309 | | | | | | 12,146,510 | | | | | | 117,916 | | | | | | 7,089,678 | | |
| REALIZED AND UNREALIZED GAIN (LOSS): | | | | | |
| Net realized gain (loss) on: | | | | | |
| Sale of affiliated underlying funds | | | | | (13,983) | | | | | | (7,744,179) | | | | | | (4,560) | | | | | | (5,727,264) | | |
| Sale of unaffiliated underlying funds | | | | | 10,251 | | | | | | (699,021) | | | | | | 9,826 | | | | | | (965,688) | | |
| Capital gain distributions from affiliated underlying funds | | | | | 319,093 | | | | | | 29,059,473 | | | | | | 282,751 | | | | | | 22,115,490 | | |
| Futures | | | | | (4,234) | | | | | | (2,747,900) | | | | | | (4,234) | | | | | | (1,925,431) | | |
| Net realized gain | | | | | 311,127 | | | | | | 17,868,373 | | | | | | 283,783 | | | | | | 13,497,107 | | |
| Net change in unrealized appreciation (depreciation) on: | | | | | |
| Affiliated underlying funds | | | | | 229,102 | | | | | | 19,777,978 | | | | | | 191,651 | | | | | | 13,577,801 | | |
| Unaffiliated underlying funds | | | | | (1,581) | | | | | | 2,413,182 | | | | | | 60,345 | | | | | | 4,559,006 | | |
| Net change in unrealized appreciation (depreciation) | | | | | 227,521 | | | | | | 22,191,160 | | | | | | 251,996 | | | | | | 18,136,807 | | |
| Net realized and unrealized gain | | | | | 538,648 | | | | | | 40,059,533 | | | | | | 535,779 | | | | | | 31,633,914 | | |
| Increase in net assets resulting from operations | | | | $ | 712,957 | | | | | $ | 52,206,043 | | | | | $ | 653,695 | | | | | $ | 38,723,592 | | |
| |
See Accompanying Notes to Financial Statements
STATEMENTS OF OPERATIONS for the year ended December 31, 2016
| | | | Voya Solution
2050 Portfolio | | | Voya Solution
2055 Portfolio | | | Voya Solution
2060 Portfolio | |
| INVESTMENT INCOME: | | | | |
| Dividends from affiliated underlying funds | | | | $ | 77,995 | | | | | $ | 1,960,292 | | | | | $ | 32,390 | | |
| Dividends from unaffiliated underlying funds | | | | | 8,254 | | | | | | 176,318 | | | | | | 3,414 | | |
| Total investment income | | | | | 86,249 | | | | | | 2,136,610 | | | | | | 35,804 | | |
| EXPENSES: | | | | |
| Investment management fees | | | | | 9,237 | | | | | | 283,668 | | | | | | 3,850 | | |
| Distribution and shareholder service fees: | | | | | | | | | | | | | | | | | | | |
| Class ADV | | | | | 10,575 | | | | | | 206,517 | | | | | | 3,576 | | |
| Class S | | | | | 2,841 | | | | | | 119,188 | | | | | | 1,111 | | |
| Class S2 | | | | | 358 | | | | | | 13,106 | | | | | | 144 | | |
| Class T | | | | | 49 | | | | | | 121 | | | | | | 22 | | |
| Transfer agent fees | | | | | 263 | | | | | | 1,028 | | | | | | 2,017 | | |
| Shareholder reporting expense | | | | | 3,012 | | | | | | 11,926 | | | | | | 2,059 | | |
| Professional fees | | | | | 8,725 | | | | | | 20,862 | | | | | | 7,837 | | |
| Custody and accounting expense | | | | | 678 | | | | | | 12,219 | | | | | | 113 | | |
| Directors fees | | | | | 127 | | | | | | 3,986 | | | | | | 53 | | |
| Offering expense | | | | | — | | | | | | — | | | | | | 1,477 | | |
| Miscellaneous expense | | | | | 8,896 | | | | | | 13,179 | | | | | | 8,821 | | |
| Total expenses | | | | | 44,761 | | | | | | 685,800 | | | | | | 31,080 | | |
| Net waived and reimbursed fees | | | | | (23,311) | | | | | | (93,134) | | | | | | (22,838) | | |
| Net expenses | | | | | 21,450 | | | | | | 592,666 | | | | | | 8,242 | | |
| Net investment income | | | | | 64,799 | | | | | | 1,543,944 | | | | | | 27,562 | | |
| REALIZED AND UNREALIZED GAIN (LOSS): | | | | |
| Net realized gain (loss) on: | | | | |
| Sale of affiliated underlying funds | | | | | (14,997) | | | | | | (4,020,350) | | | | | | 12,613 | | |
| Sale of unaffiliated underlying funds | | | | | 5,781 | | | | | | (194,841) | | | | | | 2,586 | | |
| Capital gain distributions from affiliated underlying funds | | | | | 154,912 | | | | | | 4,856,041 | | | | | | 67,466 | | |
| Futures | | | | | (2,117) | | | | | | (386,537) | | | | | | — | | |
| Net realized gain | | | | | 143,579 | | | | | | 254,313 | | | | | | 82,665 | | |
| Net change in unrealized appreciation (depreciation) on: | | | | |
| Affiliated underlying funds | | | | | 150,852 | | | | | | 6,059,972 | | | | | | 52,015 | | |
| Unaffiliated underlying funds | | | | | 30,975 | | | | | | 914,787 | | | | | | 13,433 | | |
| Net change in unrealized appreciation (depreciation) | | | | | 181,827 | | | | | | 6,974,759 | | | | | | 65,448 | | |
| Net realized and unrealized gain | | | | | 325,406 | | | | | | 7,229,072 | | | | | | 148,113 | | |
| Increase in net assets resulting from operations | | | | $ | 390,205 | | | | | $ | 8,773,016 | | | | | $ | 175,675 | | |
| |
See Accompanying Notes to Financial Statements
STATEMENTS OF CHANGES IN NET ASSETS
| | | | Voya Solution Aggressive Portfolio | | | Voya Solution Balanced Portfolio | |
| | | | Year Ended
December 31,
2016 | | | Year Ended
December 31,
2015 | | | Year Ended
December 31,
2016 | | | Year Ended
December 31,
2015 | |
| FROM OPERATIONS: | | | | | |
| Net investment income | | | | $ | 64,695 | | | | | $ | 37,990 | | | | | $ | 694,394 | | | | | $ | 574,191 | | |
| Net realized gain (loss) | | | | | (8,314) | | | | | | 194,126 | | | | | | 403,647 | | | | | | 3,361,626 | | |
| Net change in unrealized appreciation (depreciation) | | | | | 389,968 | | | | | | (363,437) | | | | | | 1,634,780 | | | | | | (4,226,720) | | |
| Increase (decrease) in net assets resulting from operations | | | | | 446,349 | | | | | | (131,321) | | | | | | 2,732,821 | | | | | | (290,903) | | |
| FROM DISTRIBUTIONS TO SHAREHOLDERS: | | | | | | | | | | | | | | | | | | | | | | | | | |
| Net investment income: | | | | | | | | | | | | | | | | | | | | | | | | | |
| Class ADV | | | | | (23,934) | | | | | | (47,203) | | | | | | (410,012) | | | | | | (724,136) | | |
| Class I | | | | | (2,335) | | | | | | (2,457) | | | | | | (2,354) | | | | | | (1,464) | | |
| Class R6 | | | | | (957) | | | | | | — | | | | | | (20,744) | | | | | | — | | |
| Class S | | | | | (48,921) | | | | | | (44,857) | | | | | | (525,795) | | | | | | (676,369) | | |
| Class S2 | | | | | (3,605) | | | | | | (2,927) | | | | | | (11,571) | | | | | | (16,597) | | |
| Net realized gains: | | | | | | | | | | | | | | | | | | | | | | | | | |
| Class ADV | | | | | (123,049) | | | | | | (96,240) | | | | | | (1,429,535) | | | | | | (2,180,551) | | |
| Class I | | | | | (7,887) | | | | | | (4,428) | | | | | | (6,154) | | | | | | (3,705) | | |
| Class R6 | | | | | (3,226) | | | | | | — | | | | | | (54,237) | | | | | | — | | |
| Class S | | | | | (182,612) | | | | | | (85,945) | | | | | | (1,528,071) | | | | | | (1,860,233) | | |
| Class S2 | | | | | (14,026) | | | | | | (5,577) | | | | | | (36,902) | | | | | | (49,700) | | |
| Total distributions | | | | | (410,552) | | | | | | (289,634) | | | | | | (4,025,375) | | | | | | (5,512,755) | | |
| FROM CAPITAL SHARE TRANSACTIONS: | | | | | |
| Net proceeds from sale of shares | | | | | 3,630,137 | | | | | | 3,899,642 | | | | | | 14,742,333 | | | | | | 5,899,791 | | |
| Reinvestment of distributions | | | | | 410,552 | | | | | | 289,634 | | | | | | 4,025,375 | | | | | | 5,512,755 | | |
| | | | | | 4,040,689 | | | | | | 4,189,276 | | | | | | 18,767,708 | | | | | | 11,412,546 | | |
| Cost of shares redeemed | | | | | (1,371,169) | | | | | | (2,325,550) | | | | | | (16,023,486) | | | | | | (9,400,747) | | |
| Net increase in net assets resulting from capital share transactions | | | | | 2,669,520 | | | | | | 1,863,726 | | | | | | 2,744,222 | | | | | | 2,011,799 | | |
| Net increase (decrease) in net assets | | | | | 2,705,317 | | | | | | 1,442,771 | | | | | | 1,451,668 | | | | | | (3,791,859) | | |
| NET ASSETS: | | | | | |
| Beginning of year or period | | | | | 5,107,280 | | | | | | 3,664,509 | | | | | | 48,267,088 | | | | | | 52,058,947 | | |
| End of year or period | | | | $ | 7,812,597 | | | | | $ | 5,107,280 | | | | | $ | 49,718,756 | | | | | $ | 48,267,088 | | |
| Undistributed net investment income at end of year or period | | | | $ | 65,132 | | | | | $ | 79,719 | | | | | $ | 809,692 | | | | | $ | 969,949 | | |
| |
See Accompanying Notes to Financial Statements
STATEMENTS OF CHANGES IN NET ASSETS
| | | | Voya Solution Conservative Portfolio | | | Voya Solution Income Portfolio | |
| | | | Year Ended
December 31,
2016 | | | Year Ended
December 31,
2015 | | | Year Ended
December 31,
2016 | | | Year Ended
December 31,
2015 | |
| FROM OPERATIONS: | | | | | |
| Net investment income | | | | $ | 299,116 | | | | | $ | 240,782 | | | | | $ | 8,636,813 | | | | | $ | 4,565,044 | | |
| Net realized gain (loss) | | | | | (66,340) | | | | | | 306,825 | | | | | | (200,701) | | | | | | 4,801,141 | | |
| Net change in unrealized appreciation (depreciation) | | | | | 651,291 | | | | | | (642,838) | | | | | | 15,021,804 | | | | | | (14,960,555) | | |
| Increase (decrease) in net assets resulting from operations | | | | | 884,067 | | | | | | (95,231) | | | | | | 23,457,916 | | | | | | (5,594,370) | | |
| FROM DISTRIBUTIONS TO SHAREHOLDERS: | | | | | | | | | | | | | | | | | | | | | | | | | |
| Net investment income: | | | | | | | | | | | | | | | | | | | | | | | | | |
| Class ADV | | | | | (150,115) | | | | | | (263,669) | | | | | | (2,150,558) | | | | | | (1,908,525) | | |
| Class I | | | | | (628) | | | | | | (369) | | | | | | (1,212,513) | | | | | | (694,006) | | |
| Class R6 | | | | | (8,166) | | | | | | — | | | | | | — | | | | | | — | | |
| Class S | | | | | (136,481) | | | | | | (164,946) | | | | | | (2,220,269) | | | | | | (1,447,689) | | |
| Class S2 | | | | | (9,380) | | | | | | (10,087) | | | | | | (138,417) | | | | | | (107,320) | | |
| Class T | | | | | — | | | | | | — | | | | | | — | | | | | | (1,719) | | |
| Net realized gains: | | | | | | | | | | | | | | | | | | | | | | | | | |
| Class ADV | | | | | (206,616) | | | | | | (339,072) | | | | | | (2,591,594) | | | | | | (2,774,895) | | |
| Class I | | | | | (635) | | | | | | (391) | | | | | | (1,083,900) | | | | | | (816,284) | | |
| Class R6 | | | | | (8,257) | | | | | | — | | | | | | — | | | | | | — | | |
| Class S | | | | | (153,138) | | | | | | (190,593) | | | | | | (2,268,074) | | | | | | (1,876,766) | | |
| Class S2 | | | | | (10,919) | | | | | | (12,061) | | | | | | (155,401) | | | | | | (146,501) | | |
| Class T | | | | | — | | | | | | — | | | | | | (2,132) | | | | | | (3,225) | | |
| Total distributions | | | | | (684,335) | | | | | | (981,188) | | | | | | (11,822,858) | | | | | | (9,776,930) | | |
| FROM CAPITAL SHARE TRANSACTIONS: | | | | | |
| Net proceeds from sale of shares | | | | | 4,259,688 | | | | | | 2,704,514 | | | | | | 32,380,433 | | | | | | 24,468,475 | | |
| Proceeds from shares issued in merger (Note 11) | | | | | — | | | | | | — | | | | | | — | | | | | | 502,116,080 | | |
| Reinvestment of distributions | | | | | 684,168 | | | | | | 980,967 | | | | | | 11,822,858 | | | | | | 9,776,930 | | |
| | | | | | 4,943,856 | | | | | | 3,685,481 | | | | | | 44,203,291 | | | | | | 536,361,485 | | |
| Cost of shares redeemed | | | | | (3,277,607) | | | | | | (5,820,892) | | | | | | (158,926,207) | | | | | | (100,672,020) | | |
| Net increase (decrease) in net assets resulting from capital share transactions | | | | | 1,666,249 | | | | | | (2,135,411) | | | | | | (114,722,916) | | | | | | 435,689,465 | | |
| Net increase (decrease) in net assets | | | | | 1,865,981 | | | | | | (3,211,830) | | | | | | (103,087,858) | | | | | | 420,318,165 | | |
| NET ASSETS: | | | | | |
| Beginning of year or period | | | | | 14,503,622 | | | | | | 17,715,452 | | | | | | 588,755,515 | | | | | | 168,437,350 | | |
| End of year or period | | | | $ | 16,369,603 | | | | | $ | 14,503,622 | | | | | $ | 485,667,657 | | | | | $ | 588,755,515 | | |
| Undistributed net investment income at end of year or period | | | | $ | 341,095 | | | | | $ | 304,540 | | | | | $ | 9,866,359 | | | | | $ | 5,704,462 | | |
| |
See Accompanying Notes to Financial Statements
STATEMENTS OF CHANGES IN NET ASSETS
| | | | Voya Solution Moderately
Aggressive Portfolio | | | Voya Solution Moderately
Conservative Portfolio |
| | | | Year Ended
December 31,
2016 | | | Year Ended
December 31,
2015 | | | Year Ended
December 31,
2016 | | | Year Ended
December 31,
2015 |
| FROM OPERATIONS: | | | | | |
| Net investment income | | | | $ | 8,801,998 | | | | | $ | 5,540,845 | | | | | $ | 597,138 | | | | | $ | 533,264 |
| Net realized gain (loss) | | | | | 1,174,345 | | | | | | 10,904,776 | | | | | | (678,541) | | | | | | 2,219,539 |
| Net change in unrealized appreciation (depreciation) | | | | | 31,015,331 | | | | | | (47,890,854) | | | | | | 2,172,416 | | | | | | (2,910,960) |
| Increase (decrease) in net assets resulting from operations | | | | | 40,991,674 | | | | | | (31,445,233) | | | | | | 2,091,013 | | | | | | (158,157) |
| FROM DISTRIBUTIONS TO SHAREHOLDERS: |
| Net investment income: | | | | | | | | | | | | | | | | | | | | | | | |
| Class ADV | | | | | (212,822) | | | | | | (571,200) | | | | | | (274,375) | | | | | | (574,383) |
| Class I | | | | | (53,499) | | | | | | (2,819) | | | | | | (1,055) | | | | | | (1,147) |
| Class R6 | | | | | (1,403) | | | | | | — | | | | | | (203) | | | | | | — |
| Class S | | | | | (8,226,554) | | | | | | (316,380) | | | | | | (513,040) | | | | | | (563,437) |
| Class S2 | | | | | (8,934) | | | | | | (28,735) | | | | | | (18,457) | | | | | | (25,478) |
| Net realized gains: | | | | | | | | | | | | | | | | | | | | | | | |
| Class ADV | | | | | (395,963) | | | | | | (2,042,964) | | | | | | (828,646) | | | | | | (1,294,485) |
| Class I | | | | | (62,404) | | | | | | (8,662) | | | | | | (2,273) | | | | | | (2,177) |
| Class R6 | | | | | (1,637) | | | | | | — | | | | | | (437) | | | | | | — |
| Class S | | | | | (10,441,172) | | | | | | (1,067,852) | | | | | | (1,219,917) | | | | | | (1,180,760) |
| Class S2 | | | | | (14,815) | | | | | | (96,371) | | | | | | (47,298) | | | | | | (53,881) |
| Total distributions | | | | | (19,419,203) | | | | | | (4,134,983) | | | | | | (2,905,701) | | | | | | (3,695,748) |
| FROM CAPITAL SHARE TRANSACTIONS: |
| Net proceeds from sale of shares | | | | | 11,405,648 | | | | | | 8,915,955 | | | | | | 6,036,432 | | | | | | 8,095,674 |
| Proceeds from shares issued in merger (Note 11) | | | | | — | | | | | | 812,445,061 | | | | | | — | | | | | | — |
| Reinvestment of distributions | | | | | 19,419,203 | | | | | | 4,134,983 | | | | | | 2,905,701 | | | | | | 3,695,748 |
| | | | | | 30,824,851 | | | | | | 825,495,999 | | | | | | 8,942,133 | | | | | | 11,791,422 |
| Cost of shares redeemed | | | | | (115,010,937) | | | | | | (66,302,153) | | | | | | (15,464,819) | | | | | | (9,954,124) |
Net increase (decrease) in net assets resulting from capital
share transactions | | | | | (84,186,086) | | | | | | 759,193,846 | | | | | | (6,522,686) | | | | | | 1,837,298 |
| Net increase (decrease) in net assets | | | | | (62,613,615) | | | | | | 723,613,630 | | | | | | (7,337,374) | | | | | | (2,016,607) |
| NET ASSETS: | | | | | |
| Beginning of year or period | | | | | 755,810,131 | | | | | | 32,196,501 | | | | | | 42,872,314 | | | | | | 44,888,921 |
| End of year or period | | | | $ | 693,196,516 | | | | | $ | 755,810,131 | | | | | $ | 35,534,940 | | | | | $ | 42,872,314 |
| Undistributed net investment income at end of year or period | | | | $ | 9,726,651 | | | | | $ | 8,487,428 | | | | | $ | 692,402 | | | | | $ | 806,668 |
| |
See Accompanying Notes to Financial Statements
STATEMENTS OF CHANGES IN NET ASSETS
| | | | Voya Solution 2020 Portfolio | | | Voya Solution 2025 Portfolio | |
| | | | Year Ended
December 31,
2016 | | | Year Ended
December 31,
2015 | | | Year Ended
December 31,
2016 | | | Year Ended
December 31,
2015 | |
| FROM OPERATIONS: | | | | | |
| Net investment income | | | | $ | 269,152 | | | | | $ | 57,081 | | | | | $ | 14,650,804 | | | | | $ | 12,142,052 | | |
| Net realized gain | | | | | 452,890 | | | | | | 62,041 | | | | | | 16,710,885 | | | | | | 79,656,406 | | |
| Net change in unrealized appreciation (depreciation) | | | | | 264,926 | | | | | | (114,868) | | | | | | 21,008,317 | | | | | | (91,093,462) | | |
| Increase in net assets resulting from operations | | | | | 986,968 | | | | | | 4,254 | | | | | | 52,370,006 | | | | | | 704,996 | | |
| FROM DISTRIBUTIONS TO SHAREHOLDERS: | |
| Net investment income: | | | | | | | | | | | | | | | | | | | | | | | | | |
| Class ADV | | | | | (30,050) | | | | | | (13,688) | | | | | | (5,850,591) | | | | | | (10,970,091) | | |
| Class I | | | | | (17,525) | | | | | | (195) | | | | | | (5,020,661) | | | | | | (7,433,439) | | |
| Class S | | | | | (23,360) | | | | | | (183) | | | | | | (8,047,201) | | | | | | (14,388,544) | | |
| Class S2 | | | | | (683) | | | | | | (176) | | | | | | (504,984) | | | | | | (911,625) | | |
| Class T | | | | | — | | | | | | (169) | | | | | | (12,925) | | | | | | (10,324) | | |
| Net realized gains: | | | | | | | | | | | | | | | | | | | | | | | | | |
| Class ADV | | | | | (39,585) | | | | | | (18,880) | | | | | | (25,793,205) | | | | | | (38,955,867) | | |
| Class I | | | | | (19,182) | | | | | | (238) | | | | | | (16,534,468) | | | | | | (21,794,551) | | |
| Class S | | | | | (26,838) | | | | | | (238) | | | | | | (30,295,541) | | | | | | (45,794,442) | | |
| Class S2 | | | | | (970) | | | | | | (238) | | | | | | (2,072,239) | | | | | | (3,108,350) | | |
| Class T | | | | | (28) | | | | | | (238) | | | | | | (62,642) | | | | | | (87,705) | | |
| Total distributions | | | | | (158,221) | | | | | | (34,243) | | | | | | (94,194,457) | | | | | | (143,454,938) | | |
| FROM CAPITAL SHARE TRANSACTIONS: | | | | | |
| Net proceeds from sale of shares | | | | | 21,178,235 | | | | | | 10,083,488 | | | | | | 77,865,505 | | | | | | 118,002,074 | | |
| Reinvestment of distributions | | | | | 158,203 | | | | | | 32,574 | | | | | | 94,194,456 | | | | | | 143,454,938 | | |
| | | | | | 21,336,438 | | | | | | 10,116,062 | | | | | | 172,059,961 | | | | | | 261,457,012 | | |
| Cost of shares redeemed | | | | | (9,430,029) | | | | | | (1,291,607) | | | | | | (243,406,338) | | | | | | (264,465,132) | | |
Net increase (decrease) in net assets resulting from capital
share transactions | | | | | 11,906,409 | | | | | | 8,824,455 | | | | | | (71,346,377) | | | | | | (3,008,120) | | |
| Net increase (decrease) in net assets | | | | | 12,735,156 | | | | | | 8,794,466 | | | | | | (113,170,828) | | | | | | (145,758,062) | | |
| NET ASSETS: | | | | | |
| Beginning of year or period | | | | | 9,441,524 | | | | | | 647,058 | | | | | | 1,009,200,112 | | | | | | 1,154,958,174 | | |
| End of year or period | | | | $ | 22,176,680 | | | | | $ | 9,441,524 | | | | | $ | 896,029,284 | | | | | $ | 1,009,200,112 | | |
| Undistributed net investment income at end of year or period | | | | $ | 315,292 | | | | | $ | 71,599 | | | | | $ | 17,184,274 | | | | | $ | 19,413,501 | | |
| |
See Accompanying Notes to Financial Statements
STATEMENTS OF CHANGES IN NET ASSETS
| | | | Voya Solution 2030 Portfolio | | | Voya Solution 2035 Portfolio | |
| | | | Year Ended
December 31,
2016 | | | Year Ended
December 31,
2015 | | | Year Ended
December 31,
2016 | | | Year Ended
December 31,
2015 | |
| FROM OPERATIONS: | | | | | |
| Net investment income | | | | $ | 174,309 | | | | | $ | 27,284 | | | | | $ | 12,146,510 | | | | | $ | 10,849,741 | | |
| Net realized gain | | | | | 311,127 | | | | | | 32,015 | | | | | | 17,868,373 | | | | | | 82,911,381 | | |
| Net change in unrealized appreciation (depreciation) | | | | | 227,521 | | | | | | (68,356) | | | | | | 22,191,160 | | | | | | (97,689,028) | | |
| Increase (decrease) in net assets resulting from operations | | | | | 712,957 | | | | | | (9,057) | | | | | | 52,206,043 | | | | | | (3,927,906) | | |
| FROM DISTRIBUTIONS TO SHAREHOLDERS: | | | | |
| Net investment income: | | | | | | | | | | | | | | | | | | | | | | | | | |
| Class ADV | | | | | (16,483) | | | | | | (3,964) | | | | | | (5,125,743) | | | | | | (9,275,972) | | |
| Class I | | | | | (5,762) | | | | | | (1,232) | | | | | | (5,348,117) | | | | | | (8,012,932) | | |
| Class S | | | | | (11,238) | | | | | | (51) | | | | | | (7,573,427) | | | | | | (13,253,942) | | |
| Class S2 | | | | | (1,455) | | | | | | (48) | | | | | | (448,201) | | | | | | (727,376) | | |
| Class T | | | | | — | | | | | | (39) | | | | | | (7,825) | | | | | | (15,578) | | |
| Net realized gains: | | | | | | | | | | | | | | | | | | | | | | | | | |
| Class ADV | | | | | (22,721) | | | | | | (11,578) | | | | | | (24,216,893) | | | | | | (38,056,781) | | |
| Class I | | | | | (7,039) | | | | | | (2,860) | | | | | | (19,033,957) | | | | | | (27,087,345) | | |
| Class S | | | | | (14,220) | | | | | | (169) | | | | | | (30,708,986) | | | | | | (48,462,268) | | |
| Class S2 | | | | | (1,785) | | | | | | (169) | | | | | | (1,959,015) | | | | | | (2,896,790) | | |
| Class T | | | | | (26) | | | | | | (169) | | | | | | (50,073) | | | | | | (100,161) | | |
| Total distributions | | | | | (80,729) | | | | | | (20,279) | | | | | | (94,472,237) | | | | | | (147,889,145) | | |
| FROM CAPITAL SHARE TRANSACTIONS: | | | | | |
| Net proceeds from sale of shares | | | | | 14,162,825 | | | | | | 4,050,320 | | | | | | 84,881,033 | | | | | | 132,031,334 | | |
| Reinvestment of distributions | | | | | 80,678 | | | | | | 19,396 | | | | | | 94,472,237 | | | | | | 147,889,145 | | |
| | | | | | 14,243,503 | | | | | | 4,069,716 | | | | | | 179,353,270 | | | | | | 279,920,479 | | |
| Cost of shares redeemed | | | | | (3,898,412) | | | | | | (284,913) | | | | | | (210,855,745) | | | | | | (241,552,464) | | |
Net increase (decrease) in net assets resulting from capital
share transactions | | | | | 10,345,091 | | | | | | 3,784,803 | | | | | | (31,502,475) | | | | | | 38,368,015 | | |
| Net increase (decrease) in net assets | | | | | 10,977,319 | | | | | | 3,755,467 | | | | | | (73,768,669) | | | | | | (113,449,036) | | |
| NET ASSETS: | | | | | |
| Beginning of year or period | | | | | 3,929,125 | | | | | | 173,658 | | | | | | 927,677,367 | | | | | | 1,041,126,403 | | |
| End of year or period | | | | $ | 14,906,444 | | | | | $ | 3,929,125 | | | | | $ | 853,908,698 | | | | | $ | 927,677,367 | | |
| Undistributed net investment income at end of year or period | | | | $ | 199,946 | | | | | $ | 34,930 | | | | | $ | 13,786,106 | | | | | $ | 18,484,561 | | |
| |
See Accompanying Notes to Financial Statements
STATEMENTS OF CHANGES IN NET ASSETS
| | | | Voya Solution 2040 Portfolio | | | Voya Solution 2045 Portfolio | |
| | | | Year Ended
December 31,
2016 | | | Year Ended
December 31,
2015 | | | Year Ended
December 31,
2016 | | | Year Ended
December 31,
2015 | |
| FROM OPERATIONS: | | | | | |
| Net investment income | | | | $ | 117,916 | | | | | $ | 24,315 | | | | | $ | 7,089,678 | | | | | $ | 5,873,825 | | |
| Net realized gain | | | | | 283,783 | | | | | | 27,859 | | | | | | 13,497,107 | | | | | | 59,565,361 | | |
| Net change in unrealized appreciation (depreciation) | | | | | 251,996 | | | | | | (57,581) | | | | | | 18,136,807 | | | | | | (70,781,842) | | |
| Increase (decrease) in net assets resulting from operations | | | | | 653,695 | | | | | | (5,407) | | | | | | 38,723,592 | | | | | | (5,342,656) | | |
| FROM DISTRIBUTIONS TO SHAREHOLDERS: | | | | | | | | | | | | | | | | | | | | | | | | | |
| Net investment income: | | | | | | | | | | | | | | | | | | | | | | | | | |
| Class ADV | | | | | (16,429) | | | | | | (19,082) | | | | | | (2,509,631) | | | | | | (5,806,658) | | |
| Class I | | | | | (7,933) | | | | | | (119) | | | | | | (3,442,244) | | | | | | (5,832,169) | | |
| Class S | | | | | (11,673) | | | | | | (104) | | | | | | (4,215,034) | | | | | | (8,956,275) | | |
| Class S2 | | | | | (846) | | | | | | (100) | | | | | | (205,558) | | | | | | (423,849) | | |
| Class T | | | | | (9) | | | | | | (88) | | | | | | (4,674) | | | | | | (5,671) | | |
| Net realized gains: | | | | | | | | | | | | | | | | | | | | | | | | | |
| Class ADV | | | | | (36,813) | | | | | | (37,793) | | | | | | (16,558,058) | | | | | | (31,366,475) | | |
| Class I | | | | | (13,678) | | | | | | (209) | | | | | | (15,825,344) | | | | | | (25,860,796) | | |
| Class S | | | | | (20,636) | | | | | | (209) | | | | | | (22,768,310) | | | | | | (43,087,460) | | |
| Class S2 | | | | | (1,485) | | | | | | (209) | | | | | | (1,227,821) | | | | | | (2,223,782) | | |
| Class T | | | | | (65) | | | | | | (209) | | | | | | (34,121) | | | | | | (56,087) | | |
| Total distributions | | | | | (109,567) | | | | | | (58,122) | | | | | | (66,790,795) | | | | | | (123,619,222) | | |
| FROM CAPITAL SHARE TRANSACTIONS: | | | | | |
| Net proceeds from sale of shares | | | | | 10,328,998 | | | | | | 3,416,687 | | | | | | 74,260,683 | | | | | | 104,390,931 | | |
| Reinvestment of distributions | | | | | 109,464 | | | | | | 56,880 | | | | | | 66,790,795 | | | | | | 123,619,222 | | |
| | | | | | 10,438,462 | | | | | | 3,473,567 | | | | | | 141,051,478 | | | | | | 228,010,153 | | |
| Cost of shares redeemed | | | | | (3,126,569) | | | | | | (788,865) | | | | | | (145,774,446) | | | | | | (168,987,078) | | |
Net increase (decrease) in net assets resulting from capital
share transactions | | | | | 7,311,893 | | | | | | 2,684,702 | | | | | | (4,722,968) | | | | | | 59,023,075 | | |
| Net increase (decrease) in net assets | | | | | 7,856,021 | | | | | | 2,621,173 | | | | | | (32,790,171) | | | | | | (69,938,803) | | |
| NET ASSETS: | | | | | |
| Beginning of year or period | | | | | 3,340,369 | | | | | | 719,196 | | | | | | 650,702,536 | | | | | | 720,641,339 | | |
| End of year or period | | | | $ | 11,196,390 | | | | | $ | 3,340,369 | | | | | $ | 617,912,365 | | | | | $ | 650,702,536 | | |
| Undistributed net investment income at end of year or period | | | | $ | 130,837 | | | | | $ | 35,885 | | | | | $ | 7,128,010 | | | | | $ | 10,360,171 | | |
| |
See Accompanying Notes to Financial Statements
STATEMENTS OF CHANGES IN NET ASSETS
| | | | Voya Solution 2050 Portfolio | | | Voya Solution 2055 Portfolio | |
| | | | Year Ended
December 31,
2016 | | | Year Ended
December 31,
2015 | | | Year Ended
December 31,
2016 | | | Year Ended
December 31,
2015 | |
| FROM OPERATIONS: | | | | | |
| Net investment income | | | | $ | 64,799 | | | | | $ | 10,652 | | | | | $ | 1,543,944 | | | | | $ | 1,056,227 | | |
| Net realized gain | | | | | 143,579 | | | | | | 21,337 | | | | | | 254,313 | | | | | | 9,062,866 | | |
| Net change in unrealized appreciation (depreciation) | | | | | 181,827 | | | | | | (36,519) | | | | | | 6,974,759 | | | | | | (11,819,562) | | |
| Increase (decrease) in net assets resulting from operations | | | | | 390,205 | | | | | | (4,530) | | | | | | 8,773,016 | | | | | | (1,700,469) | | |
| FROM DISTRIBUTIONS TO SHAREHOLDERS: | |
| Net investment income: | | | | | | | | | | | | | | | | | | | | | | | | | |
| Class ADV | | | | | (7,610) | | | | | | (9,415) | | | | | | (475,842) | | | | | | (927,010) | | |
| Class I | | | | | (3,867) | | | | | | (118) | | | | | | (700,799) | | | | | | (877,070) | | |
| Class S | | | | | (5,038) | | | | | | (104) | | | | | | (671,361) | | | | | | (1,196,206) | | |
| Class S2 | | | | | (380) | | | | | | (99) | | | | | | (39,938) | | | | | | (68,106) | | |
| Class T | | | | | — | | | | | | (89) | | | | | | (203) | | | | | | — | | |
| Net realized gains: | | | | | | | | | | | | | | | | | | | | | | | | | |
| Class ADV | | | | | (20,068) | | | | | | (19,432) | | | | | | (2,731,652) | | | | | | (3,822,880) | | |
| Class I | | | | | (7,612) | | | | | | (221) | | | | | | (2,812,511) | | | | | | (3,009,474) | | |
| Class S | | | | | (10,258) | | | | | | (221) | | | | | | (3,164,455) | | | | | | (4,426,890) | | |
| Class S2 | | | | | (798) | | | | | | (221) | | | | | | (207,570) | | | | | | (268,925) | | |
| Class T | | | | | (49) | | | | | | (221) | | | | | | (1,005) | | | | | | (628) | | |
| Total distributions | | | | | (55,680) | | | | | | (30,141) | | | | | | (10,805,336) | | | | | | (14,597,189) | | |
| FROM CAPITAL SHARE TRANSACTIONS: | | | | | |
| Net proceeds from sale of shares | | | | | 6,583,275 | | | | | | 1,558,673 | | | | | | 41,346,741 | | | | | | 49,522,854 | | |
| Reinvestment of distributions | | | | | 55,596 | | | | | | 28,852 | | | | | | 10,805,337 | | | | | | 14,597,187 | | |
| | | | | | 6,638,871 | | | | | | 1,587,525 | | | | | | 52,152,078 | | | | | | 64,120,041 | | |
| Cost of shares redeemed | | | | | (1,867,857) | | | | | | (247,971) | | | | | | (36,891,031) | | | | | | (29,052,084) | | |
| Net increase in net assets resulting from capital share transactions | | | | | 4,771,014 | | | | | | 1,339,554 | | | | | | 15,261,047 | | | | | | 35,067,957 | | |
| Net increase in net assets | | | | | 5,105,539 | | | | | | 1,304,883 | | | | | | 13,228,727 | | | | | | 18,770,299 | | |
| NET ASSETS: | | | | | |
| Beginning of year or period | | | | | 1,678,233 | | | | | | 373,350 | | | | | | 128,397,672 | | | | | | 109,627,373 | | |
| End of year or period | | | | $ | 6,783,772 | | | | | $ | 1,678,233 | | | | | $ | 141,626,399 | | | | | $ | 128,397,672 | | |
| Undistributed net investment income at end of year or period | | | | $ | 64,080 | | | | | $ | 15,896 | | | | | $ | 1,560,825 | | | | | $ | 1,887,097 | | |
| |
See Accompanying Notes to Financial Statements
STATEMENTS OF CHANGES IN NET ASSETS
| | | | Voya Solution 2060 Portfolio | |
| | | | Year Ended
December 31,
2016 | | | February 9, 2015(1)
to December 31,
2015 | |
| FROM OPERATIONS: | | | |
| Net investment income | | | | $ | 27,562 | | | | | $ | 4,755 | | |
| Net realized gain | | | | | 82,665 | | | | | | 12,229 | | |
| Net change in unrealized appreciation (depreciation) | | | | | 65,448 | | | | | | (10,053) | | |
| Increase in net assets resulting from operations | | | | | 175,675 | | | | | | 6,931 | | |
| FROM DISTRIBUTIONS TO SHAREHOLDERS: | |
| Net investment income: | | | | | | | | | | | | | |
| Class ADV | | | | | (3,173) | | | | | | — | | |
| Class I | | | | | (2,369) | | | | | | — | | |
| Class S | | | | | (1,737) | | | | | | — | | |
| Class S2 | | | | | (167) | | | | | | — | | |
| Class T | | | | | (9) | | | | | | — | | |
| Net realized gains: | | | | | | | | | | | | | |
| Class ADV | | | | | (5,282) | | | | | | — | | |
| Class I | | | | | (3,922) | | | | | | — | | |
| Class S | | | | | (2,891) | | | | | | — | | |
| Class S2 | | | | | (282) | | | | | | — | | |
| Class T | | | | | (18) | | | | | | — | | |
| Total distributions | | | | | (19,850) | | | | | | — | | |
| FROM CAPITAL SHARE TRANSACTIONS: | | | |
| Net proceeds from sale of shares | | | | | 3,046,992 | | | | | | 749,836 | | |
| Reinvestment of distributions | | | | | 19,850 | | | | | | — | | |
| | | | | | 3,066,842 | | | | | | 749,836 | | |
| Cost of shares redeemed | | | | | (1,027,327) | | | | | | (80,599) | | |
| Net increase in net assets resulting from capital share transactions | | | | | 2,039,515 | | | | | | 669,237 | | |
| Net increase in net assets | | | | | 2,195,340 | | | | | | 676,168 | | |
| NET ASSETS: | | | |
| Beginning of year or period | | | | | 676,168 | | | | | | — | | |
| End of year or period | | | | $ | 2,871,508 | | | | | $ | 676,168 | | |
| Undistributed net investment income at end of year or period | | | | $ | 26,736 | | | | | $ | 6,453 | | |
| |
(1)
Commencement of operations.
See Accompanying Notes to Financial Statements
Selected data for a share of beneficial interest outstanding throughout each year or period.
| | | | | | | | | | Income
(loss) from
investment
operations | | | | | | | | | Less
Distributions | | | | | | | | | | | | | | | | | | | | | | | | | | | Ratios to average
net assets | | | Supplemental
Data | |
| | | | Net asset value, beginning of year
or period | | | Net investment income (loss) | | | Net realized and unrealized
gain (loss) | | | Total from investment operations | | | From net investment income | | | From net realized gains | | | From return of capital | | | Total distributions | | | Payment by affiliate | | | Net asset value, end of year
or period | | | Total Return(1) | | | Expenses before
reductions/additions(2)(3)(4) | | | Expenses net of fee waivers
and/or recoupments if any(2)(3)(4) | | | Expenses net of all
reductions/additions(2)(3)(4) | | | Net investment income (loss)(2)(3) | | | Net assets, end of year or period | | | Portfolio turnover rate | |
Year or
period ended | | | ($) | | | ($) | | | ($) | | | ($) | | | ($) | | | ($) | | | ($) | | | ($) | | | ($) | | | ($) | | | (%) | | | (%) | | | (%) | | | (%) | | | (%) | | | ($000’s) | | | (%) | |
| Voya Solution Aggressive Portfolio | | | | | | | | | | | | | | | | | | | | | | | | | | | | | | | | | | | | | | | | | | | | | | | | | | | | | | | | | | | | | | | | | | | | | | | | | | | | | | | | | | | | | | | | | | | | | | | | | | | | | | | |
| Class ADV | | | | | | | | | | | | | | | | | | | | | | | | | | | | | | | | | | | | | | | | | | | | | | | | | | | | | | | | | | | | | | | | | | | | | | | | | | | | | | | | | | | | | | | | | | | | | | | | | | | | | | | |
| 12-31-16 | | | | | 11.35 | | | | | | 0.08 | | | | | | 0.63 | | | | | | 0.71 | | | | | | 0.12 | | | | | | 0.61 | | | | | | — | | | | | | 0.73 | | | | | | — | | | | | | 11.33 | | | | | | 6.41 | | | | | | 1.04 | | | | | | 0.68 | | | | | | 0.68 | | | | | | 0.77 | | | | | | 2,520 | | | | | | 61 | | |
| 12-31-15 | | | | | 12.13 | | | | | | 0.06• | | | | | | (0.19) | | | | | | (0.13) | | | | | | 0.21 | | | | | | 0.44 | | | | | | — | | | | | | 0.65 | | | | | | — | | | | | | 11.35 | | | | | | (1.32) | | | | | | 0.94 | | | | | | 0.68 | | | | | | 0.68 | | | | | | 0.53 | | | | | | 2,383 | | | | | | 78 | | |
| 12-31-14 | | | | | 11.55 | | | | | | 0.13• | | | | | | 0.57 | | | | | | 0.70 | | | | | | 0.06 | | | | | | 0.06 | | | | | | — | | | | | | 0.12 | | | | | | — | | | | | | 12.13 | | | | | | 6.10 | | | | | | 1.26 | | | | | | 0.65 | | | | | | 0.65 | | | | | | 1.12 | | | | | | 2,180 | | | | | | 70 | | |
05-01-13(5) -
12-31-13 | | | | | 10.00 | | | | | | 0.19• | | | | | | 1.36 | | | | | | 1.55 | | | | | | — | | | | | | — | | | | | | — | | | | | | — | | | | | | — | | | | | | 11.55 | | | | | | 15.50 | | | | | | 12.00 | | | | | | 0.56 | | | | | | 0.56 | | | | | | 2.55 | | | | | | 496 | | | | | | 35 | | |
| Class I | | | | | | | | | | | | | | | | | | | | | | | | | | | | | | | | | | | | | | | | | | | | | | | | | | | | | | | | | | | | | | | | | | | | | | | | | | | | | | | | | | | | | | | | | | | | | | | | | | | | | | | |
| 12-31-16 | | | | | 11.57 | | | | | | 0.17• | | | | | | 0.61 | | | | | | 0.78 | | | | | | 0.18 | | | | | | 0.61 | | | | | | — | | | | | | 0.79 | | | | | | — | | | | | | 11.56 | | | | | | 6.93 | | | | | | 0.54 | | | | | | 0.18 | | | | | | 0.18 | | | | | | 1.53 | | | | | | 258 | | | | | | 61 | | |
| 12-31-15 | | | | | 12.32 | | | | | | 0.19• | | | | | | (0.26) | | | | | | (0.07) | | | | | | 0.24 | | | | | | 0.44 | | | | | | — | | | | | | 0.68 | | | | | | — | | | | | | 11.57 | | | | | | (0.83) | | | | | | 0.44 | | | | | | 0.18 | | | | | | 0.18 | | | | | | 1.56 | | | | | | 138 | | | | | | 78 | | |
| 12-31-14 | | | | | 11.65 | | | | | | 0.24• | | | | | | 0.52 | | | | | | 0.76 | | | | | | 0.03 | | | | | | 0.06 | | | | | | — | | | | | | 0.09 | | | | | | — | | | | | | 12.32 | | | | | | 6.56 | | | | | | 0.76 | | | | | | 0.15 | | | | | | 0.15 | | | | | | 2.01 | | | | | | 12 | | | | | | 70 | | |
05-01-13(5) -
12-31-13 | | | | | 10.00 | | | | | | 0.29• | | | | | | 1.36 | | | | | | 1.65 | | | | | | — | | | | | | — | | | | | | — | | | | | | — | | | | | | — | | | | | | 11.65 | | | | | | 16.50 | | | | | | 11.50 | | | | | | 0.06 | | | | | | 0.06 | | | | | | 3.99 | | | | | | 4 | | | | | | 35 | | |
| Class R6 | | | | | | | | | | | | | | | | | | | | | | | | | | | | | | | | | | | | | | | | | | | | | | | | | | | | | | | | | | | | | | | | | | | | | | | | | | | | | | | | | | | | | | | | | | | | | | | | | | | | | | | |
05-02-16(5) -
12-31-16 | | | | | 11.66 | | | | | | 0.44• | | | | | | 0.25 | | | | | | 0.69 | | | | | | 0.18 | | | | | | 0.61 | | | | | | — | | | | | | 0.79 | | | | | | — | | | | | | 11.56 | | | | | | 6.11 | | | | | | 0.54 | | | | | | 0.18 | | | | | | 0.18 | | | | | | 5.93 | | | | | | 659 | | | | | | 61 | | |
| Class S | | | | | | | | | | | | | | | | | | | | | | | | | | | | | | | | | | | | | | | | | | | | | | | | | | | | | | | | | | | | | | | | | | | | | | | | | | | | | | | | | | | | | | | | | | | | | | | | | | | | | | | |
| 12-31-16 | | | | | 11.46 | | | | | | 0.12• | | | | | | 0.63 | | | | | | 0.75 | | | | | | 0.16 | | | | | | 0.61 | | | | | | — | | | | | | 0.77 | | | | | | — | | | | | | 11.44 | | | | | | 6.75 | | | | | | 0.79 | | | | | | 0.43 | | | | | | 0.43 | | | | | | 1.08 | | | | | | 3,954 | | | | | | 61 | | |
| 12-31-15 | | | | | 12.23 | | | | | | 0.13• | | | | | | (0.23) | | | | | | (0.10) | | | | | | 0.23 | | | | | | 0.44 | | | | | | — | | | | | | 0.67 | | | | | | — | | | | | | 11.46 | | | | | | (1.12) | | | | | | 0.69 | | | | | | 0.43 | | | | | | 0.43 | | | | | | 1.04 | | | | | | 2,417 | | | | | | 78 | | |
| 12-31-14 | | | | | 11.63 | | | | | | 0.11• | | | | | | 0.61 | | | | | | 0.72 | | | | | | 0.06 | | | | | | 0.06 | | | | | | — | | | | | | 0.12 | | | | | | — | | | | | | 12.23 | | | | | | 6.25 | | | | | | 1.01 | | | | | | 0.40 | | | | | | 0.40 | | | | | | 0.92 | | | | | | 1,395 | | | | | | 70 | | |
05-01-13(5) -
12-31-13 | | | | | 10.00 | | | | | | 0.28• | | | | | | 1.35 | | | | | | 1.63 | | | | | | — | | | | | | — | | | | | | — | | | | | | — | | | | | | — | | | | | | 11.63 | | | | | | 16.30 | | | | | | 11.75 | | | | | | 0.31 | | | | | | 0.31 | | | | | | 3.73 | | | | | | 591 | | | | | | 35 | | |
| Class S2 | | | | | | | | | | | | | | | | | | | | | | | | | | | | | | | | | | | | | | | | | | | | | | | | | | | | | | | | | | | | | | | | | | | | | | | | | | | | | | | | | | | | | | | | | | | | | | | | | | | | | | | |
| 12-31-16 | | | | | 11.36 | | | | | | 0.13• | | | | | | 0.60 | | | | | | 0.73 | | | | | | 0.16 | | | | | | 0.61 | | | | | | — | | | | | | 0.77 | | | | | | — | | | | | | 11.32 | | | | | | 6.57 | | | | | | 0.97 | | | | | | 0.58 | | | | | | 0.58 | | | | | | 1.15 | | | | | | 422 | | | | | | 61 | | |
| 12-31-15 | | | | | 12.14 | | | | | | 0.11• | | | | | | (0.22) | | | | | | (0.11) | | | | | | 0.23 | | | | | | 0.44 | | | | | | — | | | | | | 0.67 | | | | | | — | | | | | | 11.36 | | | | | | (1.20) | | | | | | 0.94 | | | | | | 0.58 | | | | | | 0.58 | | | | | | 0.93 | | | | | | 169 | | | | | | 78 | | |
| 12-31-14 | | | | | 11.56 | | | | | | 0.18• | | | | | | 0.51 | | | | | | 0.69 | | | | | | 0.05 | | | | | | 0.06 | | | | | | — | | | | | | 0.11 | | | | | | — | | | | | | 12.14 | | | | | | 6.04 | | | | | | 1.26 | | | | | | 0.55 | | | | | | 0.55 | | | | | | 1.54 | | | | | | 78 | | | | | | 70 | | |
05-01-13(5) -
12-31-13 | | | | | 10.00 | | | | | | 0.23• | | | | | | 1.33 | | | | | | 1.56 | | | | | | — | | | | | | — | | | | | | — | | | | | | — | | | | | | — | | | | | | 11.56 | | | | | | 15.60 | | | | | | 12.00 | | | | | | 0.46 | | | | | | 0.46 | | | | | | 3.12 | | | | | | 38 | | | | | | 35 | | |
| Voya Solution Balanced Portfolio | | | | | | | | | | | | | | | | | | | | | | | | | | | | | | | | | | | | | | | | | | | | | | | | | | | | | | | | | | | | | | | | | | | | | | | | | | | | | | | | | | | | | | | | | | | | | | | | | | | | | | | |
| Class ADV | | | | | | | | | | | | | | | | | | | | | | | | | | | | | | | | | | | | | | | | | | | | | | | | | | | | | | | | | | | | | | | | | | | | | | | | | | | | | | | | | | | | | | | | | | | | | | | | | | | | | | | |
| 12-31-16 | | | | | 9.39 | | | | | | 0.12• | | | | | | 0.44 | | | | | | 0.56 | | | | | | 0.20 | | | | | | 0.69 | | | | | | — | | | | | | 0.89 | | | | | | — | | | | | | 9.06 | | | | | | 6.08 | | | | | | 0.78 | | | | | | 0.64 | | | | | | 0.64 | | | | | | 1.25 | | | | | | 18,215 | | | | | | 78 | | |
| 12-31-15 | | | | | 10.57 | | | | | | 0.10• | | | | | | (0.14) | | | | | | (0.04) | | | | | | 0.28 | | | | | | 0.86 | | | | | | — | | | | | | 1.14 | | | | | | — | | | | | | 9.39 | | | | | | (0.72) | | | | | | 0.78 | | | | | | 0.65 | | | | | | 0.65 | | | | | | 0.97 | | | | | | 25,079 | | | | | | 49 | | |
| 12-31-14 | | | | | 10.88 | | | | | | 0.12 | | | | | | 0.52 | | | | | | 0.64 | | | | | | 0.20 | | | | | | 0.75 | | | | | | — | | | | | | 0.95 | | | | | | — | | | | | | 10.57 | | | | | | 6.14 | | | | | | 0.78 | | | | | | 0.64 | | | | | | 0.64 | | | | | | 1.09 | | | | | | 28,237 | | | | | | 61 | | |
| 12-31-13 | | | | | 9.84 | | | | | | 0.10• | | | | | | 1.38 | | | | | | 1.48 | | | | | | 0.20 | | | | | | 0.24 | | | | | | — | | | | | | 0.44 | | | | | | — | | | | | | 10.88 | | | | | | 15.39 | | | | | | 0.78 | | | | | | 0.63 | | | | | | 0.63 | | | | | | 0.97 | | | | | | 27,369 | | | | | | 78 | | |
| 12-31-12 | | | | | 8.84 | | | | | | 0.14• | | | | | | 1.03 | | | | | | 1.17 | | | | | | 0.14 | | | | | | 0.03 | | | | | | — | | | | | | 0.17 | | | | | | — | | | | | | 9.84 | | | | | | 13.35 | | | | | | 0.71 | | | | | | 0.62 | | | | | | 0.62 | | | | | | 1.44 | | | | | | 24,244 | | | | | | 75 | | |
See Accompanying Notes to Financial Statements
Financial Highlights (continued)
| | | | | | | | | | Income
(loss) from
investment
operations | | | | | | | | | Less
Distributions | | | | | | | | | | | | | | | | | | | | | | | | | | | Ratios to average
net assets | | | Supplemental
Data | |
| | | | Net asset value, beginning of year
or period | | | Net investment income (loss) | | | Net realized and unrealized
gain (loss) | | | Total from investment operations | | | From net investment income | | | From net realized gains | | | From return of capital | | | Total distributions | | | Payment by affiliate | | | Net asset value, end of year
or period | | | Total Return(1) | | | Expenses before
reductions/additions(2)(3)(4) | | | Expenses net of fee waivers
and/or recoupments if any(2)(3)(4) | | | Expenses net of all
reductions/additions(2)(3)(4) | | | Net investment income (loss)(2)(3) | | | Net assets, end of year or period | | | Portfolio turnover rate | |
Year or
period ended | | | ($) | | | ($) | | | ($) | | | ($) | | | ($) | | | ($) | | | ($) | | | ($) | | | ($) | | | ($) | | | (%) | | | (%) | | | (%) | | | (%) | | | (%) | | | ($000’s) | | | (%) | |
| Voya Solution Balanced Portfolio (continued) | | | | | | | | | | | | | | | | | | | | | | | | | | | | | | | | | | | | | | | | | | | | | | | | | | | | | | | | | | | | | | | | | | | | | | | | | | | | | | | | | | | | | | | | | | | | | | | | | | | | | | | |
| Class I | | | | | | | | | | | | | | | | | | | | | | | | | | | | | | | | | | | | | | | | | | | | | | | | | | | | | | | | | | | | | | | | | | | | | | | | | | | | | | | | | | | | | | | | | | | | | | | | | | | | | | | |
| 12-31-16 | | | | | 9.72 | | | | | | 0.28• | | | | | | 0.35 | | | | | | 0.63 | | | | | | 0.26 | | | | | | 0.69 | | | | | | — | | | | | | 0.95 | | | | | | — | | | | | | 9.40 | | | | | | 6.69 | | | | | | 0.28 | | | | | | 0.14 | | | | | | 0.14 | | | | | | 3.03 | | | | | | 2,092 | | | | | | 78 | | |
| 12-31-15 | | | | | 10.90 | | | | | | 0.18• | | | | | | (0.16) | | | | | | 0.02 | | | | | | 0.34 | | | | | | 0.86 | | | | | | — | | | | | | 1.20 | | | | | | — | | | | | | 9.72 | | | | | | (0.19) | | | | | | 0.28 | | | | | | 0.15 | | | | | | 0.15 | | | | | | 1.72 | | | | | | 59 | | | | | | 49 | | |
| 12-31-14 | | | | | 11.19 | | | | | | 0.27• | | | | | | 0.45 | | | | | | 0.72 | | | | | | 0.26 | | | | | | 0.75 | | | | | | — | | | | | | 1.01 | | | | | | — | | | | | | 10.90 | | | | | | 6.66 | | | | | | 0.28 | | | | | | 0.14 | | | | | | 0.14 | | | | | | 2.53 | | | | | | 23 | | | | | | 61 | | |
| 12-31-13 | | | | | 10.10 | | | | | | 0.16 | | | | | | 1.42 | | | | | | 1.58 | | | | | | 0.25 | | | | | | 0.24 | | | | | | — | | | | | | 0.49 | | | | | | — | | | | | | 11.19 | | | | | | 15.93 | | | | | | 0.28 | | | | | | 0.13 | | | | | | 0.13 | | | | | | 1.49 | | | | | | 1 | | | | | | 78 | | |
| 12-31-12 | | | | | 9.05 | | | | | | 0.18 | | | | | | 1.06 | | | | | | 1.24 | | | | | | 0.16 | | | | | | 0.03 | | | | | | — | | | | | | 0.19 | | | | | | — | | | | | | 10.10 | | | | | | 13.86 | | | | | | 0.21 | | | | | | 0.12 | | | | | | 0.12 | | | | | | 1.85 | | | | | | 1 | | | | | | 75 | | |
| Class R6 | | | | | | | | | | | | | | | | | | | | | | | | | | | | | | | | | | | | | | | | | | | | | | | | | | | | | | | | | | | | | | | | | | | | | | | | | | | | | | | | | | | | | | | | | | | | | | | | | | | | | | | |
05-02-16(5) -
12-31-16 | | | | | 9.89 | | | | | | 0.23• | | | | | | 0.22 | | | | | | 0.45 | | | | | | 0.26 | | | | | | 0.69 | | | | | | — | | | | | | 0.95 | | | | | | — | | | | | | 9.39 | | | | | | 4.75 | | | | | | 0.28 | | | | | | 0.14 | | | | | | 0.14 | | | | | | 3.74 | | | | | | 2,412 | | | | | | 78 | | |
| Class S | | | | | | | | | | | | | | | | | | | | | | | | | | | | | | | | | | | | | | | | | | | | | | | | | | | | | | | | | | | | | | | | | | | | | | | | | | | | | | | | | | | | | | | | | | | | | | | | | | | | | | | |
| 12-31-16 | | | | | 9.52 | | | | | | 0.16 | | | | | | 0.43 | | | | | | 0.59 | | | | | | 0.24 | | | | | | 0.69 | | | | | | — | | | | | | 0.93 | | | | | | — | | | | | | 9.18 | | | | | | 6.32 | | | | | | 0.53 | | | | | | 0.39 | | | | | | 0.39 | | | | | | 1.63 | | | | | | 25,331 | | | | | | 78 | | |
| 12-31-15 | | | | | 10.70 | | | | | | 0.13 | | | | | | (0.14) | | | | | | (0.01) | | | | | | 0.31 | | | | | | 0.86 | | | | | | — | | | | | | 1.17 | | | | | | — | | | | | | 9.52 | | | | | | (0.46) | | | | | | 0.53 | | | | | | 0.40 | | | | | | 0.40 | | | | | | 1.28 | | | | | | 22,552 | | | | | | 49 | | |
| 12-31-14 | | | | | 11.01 | | | | | | 0.16 | | | | | | 0.51 | | | | | | 0.67 | | | | | | 0.23 | | | | | | 0.75 | | | | | | — | | | | | | 0.98 | | | | | | — | | | | | | 10.70 | | | | | | 6.34 | | | | | | 0.53 | | | | | | 0.39 | | | | | | 0.39 | | | | | | 1.35 | | | | | | 23,128 | | | | | | 61 | | |
| 12-31-13 | | | | | 9.95 | | | | | | 0.13• | | | | | | 1.39 | | | | | | 1.52 | | | | | | 0.22 | | | | | | 0.24 | | | | | | — | | | | | | 0.46 | | | | | | — | | | | | | 11.01 | | | | | | 15.65 | | | | | | 0.53 | | | | | | 0.38 | | | | | | 0.38 | | | | | | 1.24 | | | | | | 23,012 | | | | | | 78 | | |
| 12-31-12 | | | | | 8.92 | | | | | | 0.16• | | | | | | 1.05 | | | | | | 1.21 | | | | | | 0.15 | | | | | | 0.03 | | | | | | — | | | | | | 0.18 | | | | | | — | | | | | | 9.95 | | | | | | 13.71 | | | | | | 0.46 | | | | | | 0.37 | | | | | | 0.37 | | | | | | 1.70 | | | | | | 18,349 | | | | | | 75 | | |
| Class S2 | | | | | | | | | | | | | | | | | | | | | | | | | | | | | | | | | | | | | | | | | | | | | | | | | | | | | | | | | | | | | | | | | | | | | | | | | | | | | | | | | | | | | | | | | | | | | | | | | | | | | | | |
| 12-31-16 | | | | | 9.50 | | | | | | 0.18• | | | | | | 0.39 | | | | | | 0.57 | | | | | | 0.22 | | | | | | 0.69 | | | | | | — | | | | | | 0.91 | | | | | | — | | | | | | 9.16 | | | | | | 6.10 | | | | | | 0.71 | | | | | | 0.54 | | | | | | 0.54 | | | | | | 1.96 | | | | | | 1,668 | | | | | | 78 | | |
| 12-31-15 | | | | | 10.67 | | | | | | 0.11• | | | | | | (0.13) | | | | | | (0.02) | | | | | | 0.29 | | | | | | 0.86 | | | | | | — | | | | | | 1.15 | | | | | | — | | | | | | 9.50 | | | | | | (0.60) | | | | | | 0.78 | | | | | | 0.55 | | | | | | 0.55 | | | | | | 1.06 | | | | | | 578 | | | | | | 49 | | |
| 12-31-14 | | | | | 10.95 | | | | | | 0.12• | | | | | | 0.54 | | | | | | 0.66 | | | | | | 0.19 | | | | | | 0.75 | | | | | | — | | | | | | 0.94 | | | | | | — | | | | | | 10.67 | | | | | | 6.22 | | | | | | 0.78 | | | | | | 0.54 | | | | | | 0.54 | | | | | | 1.06 | | | | | | 671 | | | | | | 61 | | |
| 12-31-13 | | | | | 9.90 | | | | | | 0.11• | | | | | | 1.39 | | | | | | 1.50 | | | | | | 0.21 | | | | | | 0.24 | | | | | | — | | | | | | 0.45 | | | | | | — | | | | | | 10.95 | | | | | | 15.51 | | | | | | 0.78 | | | | | | 0.53 | | | | | | 0.53 | | | | | | 1.06 | | | | | | 1,103 | | | | | | 78 | | |
| 12-31-12 | | | | | 8.88 | | | | | | 0.17• | | | | | | 1.02 | | | | | | 1.19 | | | | | | 0.14 | | | | | | 0.03 | | | | | | — | | | | | | 0.17 | | | | | | — | | | | | | 9.90 | | | | | | 13.54 | | | | | | 0.71 | | | | | | 0.52 | | | | | | 0.52 | | | | | | 1.75 | | | | | | 1,022 | | | | | | 75 | | |
| Voya Solution Conservative Portfolio | | | | | | | | | | | | | | | | | | | | | | | | | | | | | | | | | | | | | | | | | | | | | | | | | | | | | | | | | | | | | | | | | | | | | | | | | | | | | | | | | | | | | | | | | | | | | | | | | | | | | | | |
| Class ADV | | | | | | | | | | | | | | | | | | | | | | | | | | | | | | | | | | | | | | | | | | | | | | | | | | | | | | | | | | | | | | | | | | | | | | | | | | | | | | | | | | | | | | | | | | | | | | | | | | | | | | | |
| 12-31-16 | | | | | 10.45 | | | | | | 0.20 | | | | | | 0.40 | | | | | | 0.60 | | | | | | 0.19 | | | | | | 0.26 | | | | | | — | | | | | | 0.45 | | | | | | — | | | | | | 10.60 | | | | | | 5.76 | | | | | | 0.85 | | | | | | 0.62 | | | | | | 0.62 | | | | | | 1.79 | | | | | | 8,524 | | | | | | 58 | | |
| 12-31-15 | | | | | 11.15 | | | | | | 0.14• | | | | | | (0.22) | | | | | | (0.08) | | | | | | 0.27 | | | | | | 0.35 | | | | | | — | | | | | | 0.62 | | | | | | — | | | | | | 10.45 | | | | | | (0.76) | | | | | | 0.83 | | | | | | 0.61 | | | | | | 0.61 | | | | | | 1.29 | | | | | | 8,595 | | | | | | 51 | | |
| 12-31-14 | | | | | 11.42 | | | | | | 0.17 | | | | | | 0.30 | | | | | | 0.47 | | | | | | 0.27 | | | | | | 0.47 | | | | | | — | | | | | | 0.74 | | | | | | — | | | | | | 11.15 | | | | | | 4.20 | | | | | | 0.81 | | | | | | 0.58 | | | | | | 0.58 | | | | | | 1.62 | | | | | | 11,527 | | | | | | 54 | | |
| 12-31-13 | | | | | 11.22 | | | | | | 0.17• | | | | | | 0.43 | | | | | | 0.60 | | | | | | 0.29 | | | | | | 0.11 | | | | | | — | | | | | | 0.40 | | | | | | — | | | | | | 11.42 | | | | | | 5.40 | | | | | | 0.85 | | | | | | 0.60 | | | | | | 0.60 | | | | | | 1.50 | | | | | | 10,870 | | | | | | 72 | | |
| 12-31-12 | | | | | 10.44 | | | | | | 0.24• | | | | | | 0.82 | | | | | | 1.06 | | | | | | 0.28 | | | | | | — | | | | | | — | | | | | | 0.28 | | | | | | — | | | | | | 11.22 | | | | | | 10.19 | | | | | | 0.75 | | | | | | 0.62 | | | | | | 0.62 | | | | | | 2.19 | | | | | | 9,541 | | | | | | 69 | | |
| Class I | | | | | | | | | | | | | | | | | | | | | | | | | | | | | | | | | | | | | | | | | | | | | | | | | | | | | | | | | | | | | | | | | | | | | | | | | | | | | | | | | | | | | | | | | | | | | | | | | | | | | | | |
| 12-31-16 | | | | | 10.60 | | | | | | 0.29• | | | | | | 0.37 | | | | | | 0.66 | | | | | | 0.26 | | | | | | 0.26 | | | | | | — | | | | | | 0.52 | | | | | | — | | | | | | 10.74 | | | | | | 6.24 | | | | | | 0.35 | | | | | | 0.12 | | | | | | 0.12 | | | | | | 2.67 | | | | | | 109 | | | | | | 58 | | |
| 12-31-15 | | | | | 11.30 | | | | | | 0.21• | | | | | | (0.23) | | | | | | (0.02) | | | | | | 0.33 | | | | | | 0.35 | | | | | | — | | | | | | 0.68 | | | | | | — | | | | | | 10.60 | | | | | | (0.23) | | | | | | 0.33 | | | | | | 0.11 | | | | | | 0.11 | | | | | | 1.86 | | | | | | 13 | | | | | | 51 | | |
| 12-31-14 | | | | | 11.57 | | | | | | 0.25• | | | | | | 0.27 | | | | | | 0.52 | | | | | | 0.32 | | | | | | 0.47 | | | | | | — | | | | | | 0.79 | | | | | | — | | | | | | 11.30 | | | | | | 4.63 | | | | | | 0.31 | | | | | | 0.08 | | | | | | 0.08 | | | | | | 2.19 | | | | | | 10 | | | | | | 54 | | |
| 12-31-13 | | | | | 11.34 | | | | | | 0.23 | | | | | | 0.44 | | | | | | 0.67 | | | | | | 0.33 | | | | | | 0.11 | | | | | | — | | | | | | 0.44 | | | | | | — | | | | | | 11.57 | | | | | | 6.02 | | | | | | 0.35 | | | | | | 0.10 | | | | | | 0.10 | | | | | | 1.99 | | | | | | 3 | | | | | | 72 | | |
| 12-31-12 | | | | | 10.54 | | | | | | 0.29• | | | | | | 0.82 | | | | | | 1.11 | | | | | | 0.31 | | | | | | — | | | | | | — | | | | | | 0.31 | | | | | | — | | | | | | 11.34 | | | | | | 10.60 | | | | | | 0.25 | | | | | | 0.12 | | | | | | 0.12 | | | | | | 2.61 | | | | | | 3 | | | | | | 69 | | |
| Class R6 | | | | | | | | | | | | | | | | | | | | | | | | | | | | | | | | | | | | | | | | | | | | | | | | | | | | | | | | | | | | | | | | | | | | | | | | | | | | | | | | | | | | | | | | | | | | | | | | | | | | | | | |
05-02-16(5) -
12-31-16 | | | | | 10.98 | | | | | | 0.20• | | | | | | 0.08 | | | | | | 0.28 | | | | | | 0.26 | | | | | | 0.26 | | | | | | — | | | | | | 0.52 | | | | | | — | | | | | | 10.74 | | | | | | 2.57 | | | | | | 0.35 | | | | | | 0.12 | | | | | | 0.12 | | | | | | 2.81 | | | | | | 718 | | | | | | 58 | | |
See Accompanying Notes to Financial Statements
Financial Highlights (continued)
| | | | | | | | | | Income
(loss) from
investment
operations | | | | | | | | | Less
Distributions | | | | | | | | | | | | | | | | | | | | | | | | | | | Ratios to average
net assets | | | Supplemental
Data | |
| | | | Net asset value, beginning of year
or period | | | Net investment income (loss) | | | Net realized and unrealized
gain (loss) | | | Total from investment operations | | | From net investment income | | | From net realized gains | | | From return of capital | | | Total distributions | | | Payment by affiliate | | | Net asset value, end of year
or period | | | Total Return(1) | | | Expenses before
reductions/additions(2)(3)(4) | | | Expenses net of fee waivers
and/or recoupments if any(2)(3)(4) | | | Expenses net of all
reductions/additions(2)(3)(4) | | | Net investment income (loss)(2)(3) | | | Net assets, end of year or period | | | Portfolio turnover rate | |
Year or
period ended | | | ($) | | | ($) | | | ($) | | | ($) | | | ($) | | | ($) | | | ($) | | | ($) | | | ($) | | | ($) | | | (%) | | | (%) | | | (%) | | | (%) | | | (%) | | | ($000’s) | | | (%) | |
| Voya Solution Conservative Portfolio (continued) | | | | | | | | | | | | | | | | | | | | | | | | | | | | | | | | | | | | | | | | | | | | | | | | | | | | | | | | | | | | | | | | | | | | | | | | | | | | | | | | | | | | | | | | | | | | | | | | | | | | | | | |
| Class S | | | | | | | | | | | | | | | | | | | | | | | | | | | | | | | | | | | | | | | | | | | | | | | | | | | | | | | | | | | | | | | | | | | | | | | | | | | | | | | | | | | | | | | | | | | | | | | | | | | | | | | |
| 12-31-16 | | | | | 10.52 | | | | | | 0.22• | | | | | | 0.41 | | | | | | 0.63 | | | | | | 0.23 | | | | | | 0.26 | | | | | | — | | | | | | 0.49 | | | | | | — | | | | | | 10.66 | | | | | | 6.04 | | | | | | 0.60 | | | | | | 0.37 | | | | | | 0.37 | | | | | | 2.02 | | | | | | 6,513 | | | | | | 58 | | |
| 12-31-15 | | | | | 11.22 | | | | | | 0.17 | | | | | | (0.21) | | | | | | (0.04) | | | | | | 0.31 | | | | | | 0.35 | | | | | | — | | | | | | 0.66 | | | | | | — | | | | | | 10.52 | | | | | | (0.48) | | | | | | 0.58 | | | | | | 0.36 | | | | | | 0.36 | | | | | | 1.61 | | | | | | 5,539 | | | | | | 51 | | |
| 12-31-14 | | | | | 11.49 | | | | | | 0.21• | | | | | | 0.29 | | | | | | 0.50 | | | | | | 0.30 | | | | | | 0.47 | | | | | | — | | | | | | 0.77 | | | | | | — | | | | | | 11.22 | | | | | | 4.40 | | | | | | 0.56 | | | | | | 0.33 | | | | | | 0.33 | | | | | | 1.86 | | | | | | 5,867 | | | | | | 54 | | |
| 12-31-13 | | | | | 11.27 | | | | | | 0.20• | | | | | | 0.44 | | | | | | 0.64 | | | | | | 0.31 | | | | | | 0.11 | | | | | | — | | | | | | 0.42 | | | | | | — | | | | | | 11.49 | | | | | | 5.77 | | | | | | 0.60 | | | | | | 0.35 | | | | | | 0.35 | | | | | | 1.74 | | | | | | 6,168 | | | | | | 72 | | |
| 12-31-12 | | | | | 10.49 | | | | | | 0.28• | | | | | | 0.80 | | | | | | 1.08 | | | | | | 0.30 | | | | | | — | | | | | | — | | | | | | 0.30 | | | | | | — | | | | | | 11.27 | | | | | | 10.34 | | | | | | 0.50 | | | | | | 0.37 | | | | | | 0.37 | | | | | | 2.51 | | | | | | 5,285 | | | | | | 69 | | |
| Class S2 | | | | | | | | | | | | | | | | | | | | | | | | | | | | | | | | | | | | | | | | | | | | | | | | | | | | | | | | | | | | | | | | | | | | | | | | | | | | | | | | | | | | | | | | | | | | | | | | | | | | | | | |
| 12-31-16 | | | | | 10.46 | | | | | | 0.21• | | | | | | 0.40 | | | | | | 0.61 | | | | | | 0.22 | | | | | | 0.26 | | | | | | — | | | | | | 0.48 | | | | | | — | | | | | | 10.59 | | | | | | 5.90 | | | | | | 0.78 | | | | | | 0.52 | | | | | | 0.52 | | | | | | 1.94 | | | | | | 506 | | | | | | 58 | | |
| 12-31-15 | | | | | 11.17 | | | | | | 0.16• | | | | | | (0.22) | | | | | | (0.06) | | | | | | 0.30 | | | | | | 0.35 | | | | | | — | | | | | | 0.65 | | | | | | — | | | | | | 10.46 | | | | | | (0.67) | | | | | | 0.83 | | | | | | 0.51 | | | | | | 0.51 | | | | | | 1.43 | | | | | | 357 | | | | | | 51 | | |
| 12-31-14 | | | | | 11.44 | | | | | | 0.18 | | | | | | 0.30 | | | | | | 0.48 | | | | | | 0.28 | | | | | | 0.47 | | | | | | — | | | | | | 0.75 | | | | | | — | | | | | | 11.17 | | | | | | 4.28 | | | | | | 0.81 | | | | | | 0.48 | | | | | | 0.48 | | | | | | 1.70 | | | | | | 312 | | | | | | 54 | | |
| 12-31-13 | | | | | 11.23 | | | | | | 0.18• | | | | | | 0.44 | | | | | | 0.62 | | | | | | 0.30 | | | | | | 0.11 | | | | | | — | | | | | | 0.41 | | | | | | — | | | | | | 11.44 | | | | | | 5.59 | | | | | | 0.85 | | | | | | 0.50 | | | | | | 0.50 | | | | | | 1.60 | | | | | | 298 | | | | | | 72 | | |
| 12-31-12 | | | | | 10.46 | | | | | | 0.29• | | | | | | 0.77 | | | | | | 1.06 | | | | | | 0.29 | | | | | | — | | | | | | — | | | | | | 0.29 | | | | | | — | | | | | | 11.23 | | | | | | 10.23 | | | | | | 0.75 | | | | | | 0.52 | | | | | | 0.52 | | | | | | 2.61 | | | | | | 298 | | | | | | 69 | | |
| Voya Solution Income Portfolio | | | | | | | | | | | | | | | | | | | | | | | | | | | | | | | | | | | | | | | | | | | | | | | | | | | | | | | | | | | | | | | | | | | | | | | | | | | | | | | | | | | | | | | | | | | | | | | | | | | | | | | |
| Class ADV | | | | | | | | | | | | | | | | | | | | | | | | | | | | | | | | | | | | | | | | | | | | | | | | | | | | | | | | | | | | | | | | | | | | | | | | | | | | | | | | | | | | | | | | | �� | | | | | | | | | | | | | | |
| 12-31-16 | | | | | 10.88 | | | | | | 0.16• | | | | | | 0.31 | | | | | | 0.47 | | | | | | 0.11 | | | | | | 0.13 | | | | | | — | | | | | | 0.24 | | | | | | — | | | | | | 11.11 | | | | | | 4.26 | | | | | | 0.75 | | | | | | 0.62 | | | | | | 0.62 | | | | | | 1.41 | | | | | | 205,103 | | | | | | 46 | | |
| 12-31-15 | | | | | 11.61 | | | | | | 0.13• | | | | | | (0.15) | | | | | | (0.02) | | | | | | 0.29 | | | | | | 0.42 | | | | | | — | | | | | | 0.71 | | | | | | — | | | | | | 10.88 | | | | | | (0.30) | | | | | | 0.73 | | | | | | 0.63 | | | | | | 0.63 | | | | | | 1.16 | | | | | | 248,968 | | | | | | 31 | | |
| 12-31-14 | | | | | 11.26 | | | | | | 0.15• | | | | | | 0.47 | | | | | | 0.62 | | | | | | 0.27 | | | | | | — | | | | | | — | | | | | | 0.27 | | | | | | — | | | | | | 11.61 | | | | | | 5.53 | | | | | | 0.75 | | | | | | 0.62 | | | | | | 0.62 | | | | | | 1.33 | | | | | | 84,286 | | | | | | 47 | | |
| 12-31-13 | | | | | 10.89 | | | | | | 0.13• | | | | | | 0.59 | | | | | | 0.72 | | | | | | 0.35 | | | | | | — | | | | | | — | | | | | | 0.35 | | | | | | — | | | | | | 11.26 | | | | | | 6.68 | | | | | | 0.74 | | | | | | 0.63 | | | | | | 0.63 | | | | | | 1.19 | | | | | | 94,068 | | | | | | 70 | | |
| 12-31-12 | | | | | 10.40 | | | | | | 0.20• | | | | | | 0.78 | | | | | | 0.98 | | | | | | 0.49 | | | | | | — | | | | | | — | | | | | | 0.49 | | | | | | — | | | | | | 10.89 | | | | | | 9.57 | | | | | | 0.70 | | | | | | 0.62 | | | | | | 0.62 | | | | | | 1.82 | | | | | | 111,796 | | | | | | 71 | | |
| Class I | | | | | | | | | | | | | | | | | | | | | | | | | | | | | | | | | | | | | | | | | | | | | | | | | | | | | | | | | | | | | | | | | | | | | | | | | | | | | | | | | | | | | | | | | | | | | | | | | | | | | | | |
| 12-31-16 | | | | | 11.12 | | | | | | 0.22• | | | | | | 0.31 | | | | | | 0.53 | | | | | | 0.14 | | | | | | 0.13 | | | | | | — | | | | | | 0.27 | | | | | | — | | | | | | 11.38 | | | | | | 4.78 | | | | | | 0.25 | | | | | | 0.12 | | | | | | 0.12 | | | | | | 1.91 | | | | | | 82,426 | | | | | | 46 | | |
| 12-31-15 | | | | | 11.86 | | | | | | 0.19• | | | | | | (0.15) | | | | | | 0.04 | | | | | | 0.36 | | | | | | 0.42 | | | | | | — | | | | | | 0.78 | | | | | | — | | | | | | 11.12 | | | | | | 0.20 | | | | | | 0.23 | | | | | | 0.13 | | | | | | 0.13 | | | | | | 1.72 | | | | | | 98,321 | | | | | | 31 | | |
| 12-31-14 | | | | | 11.51 | | | | | | 0.22• | | | | | | 0.47 | | | | | | 0.69 | | | | | | 0.34 | | | | | | — | | | | | | — | | | | | | 0.34 | | | | | | — | | | | | | 11.86 | | | | | | 6.02 | | | | | | 0.25 | | | | | | 0.12 | | | | | | 0.12 | | | | | | 1.85 | | | | | | 23,178 | | | | | | 47 | | |
| 12-31-13 | | | | | 11.12 | | | | | | 0.19• | | | | | | 0.61 | | | | | | 0.80 | | | | | | 0.41 | | | | | | — | | | | | | — | | | | | | 0.41 | | | | | | — | | | | | | 11.51 | | | | | | 7.30 | | | | | | 0.24 | | | | | | 0.13 | | | | | | 0.13 | | | | | | 1.70 | | | | | | 24,937 | | | | | | 70 | | |
| 12-31-12 | | | | | 10.61 | | | | | | 0.24 | | | | | | 0.82 | | | | | | 1.06 | | | | | | 0.55 | | | | | | — | | | | | | — | | | | | | 0.55 | | | | | | — | | | | | | 11.12 | | | | | | 10.12 | | | | | | 0.20 | | | | | | 0.12 | | | | | | 0.12 | | | | | | 2.32 | | | | | | 25,403 | | | | | | 71 | | |
| Class S | | | | | | | | | | | | | | | | | | | | | | | | | | | | | | | | | | | | | | | | | | | | | | | | | | | | | | | | | | | | | | | | | | | | | | | | | | | | | | | | | | | | | | | | | | | | | | | | | | | | | | | |
| 12-31-16 | | | | | 11.04 | | | | | | 0.19• | | | | | | 0.31 | | | | | | 0.50 | | | | | | 0.13 | | | | | | 0.13 | | | | | | — | | | | | | 0.26 | | | | | | — | | | | | | 11.28 | | | | | | 4.47 | | | | | | 0.50 | | | | | | 0.37 | | | | | | 0.37 | | | | | | 1.66 | | | | | | 186,264 | | | | | | 46 | | |
| 12-31-15 | | | | | 11.76 | | | | | | 0.16• | | | | | | (0.14) | | | | | | 0.02 | | | | | | 0.32 | | | | | | 0.42 | | | | | | — | | | | | | 0.74 | | | | | | — | | | | | | 11.04 | | | | | | 0.10 | | | | | | 0.48 | | | | | | 0.38 | | | | | | 0.38 | | | | | | 1.43 | | | | | | 225,274 | | | | | | 31 | | |
| 12-31-14 | | | | | 11.41 | | | | | | 0.19• | | | | | | 0.46 | | | | | | 0.65 | | | | | | 0.30 | | | | | | — | | | | | | — | | | | | | 0.30 | | | | | | — | | | | | | 11.76 | | | | | | 5.76 | | | | | | 0.50 | | | | | | 0.37 | | | | | | 0.37 | | | | | | 1.59 | | | | | | 56,602 | | | | | | 47 | | |
| 12-31-13 | | | | | 11.03 | | | | | | 0.16• | | | | | | 0.60 | | | | | | 0.76 | | | | | | 0.38 | | | | | | — | | | | | | — | | | | | | 0.38 | | | | | | — | | | | | | 11.41 | | | | | | 6.97 | | | | | | 0.49 | | | | | | 0.38 | | | | | | 0.38 | | | | | | 1.46 | | | | | | 62,431 | | | | | | 70 | | |
| 12-31-12 | | | | | 10.53 | | | | | | 0.22• | | | | | | 0.80 | | | | | | 1.02 | | | | | | 0.52 | | | | | | — | | | | | | — | | | | | | 0.52 | | | | | | — | | | | | | 11.03 | | | | | | 9.77 | | | | | | 0.45 | | | | | | 0.37 | | | | | | 0.37 | | | | | | 2.02 | | | | | | 68,703 | | | | | | 71 | | |
| Class S2 | | | | | | | | | | | | | | | | | | | | | | | | | | | | | | | | | | | | | | | | | | | | | | | | | | | | | | | | | | | | | | | | | | | | | | | | | | | | | | | | | | | | | | | | | | | | | | | | | | | | | | | |
| 12-31-16 | | | | | 10.77 | | | | | | 0.16• | | | | | | 0.30 | | | | | | 0.46 | | | | | | 0.11 | | | | | | 0.13 | | | | | | — | | | | | | 0.24 | | | | | | — | | | | | | 10.99 | | | | | | 4.28 | | | | | | 0.68 | | | | | | 0.52 | | | | | | 0.52 | | | | | | 1.49 | | | | | | 11,670 | | | | | | 46 | | |
| 12-31-15 | | | | | 11.50 | | | | | | 0.14• | | | | | | (0.14) | | | | | | 0.00* | | | | | | 0.31 | | | | | | 0.42 | | | | | | — | | | | | | 0.73 | | | | | | — | | | | | | 10.77 | | | | | | (0.13) | | | | | | 0.73 | | | | | | 0.53 | | | | | | 0.53 | | | | | | 1.27 | | | | | | 15,377 | | | | | | 31 | | |
| 12-31-14 | | | | | 11.15 | | | | | | 0.16• | | | | | | 0.46 | | | | | | 0.62 | | | | | | 0.27 | | | | | | — | | | | | | — | | | | | | 0.27 | | | | | | — | | | | | | 11.50 | | | | | | 5.61 | | | | | | 0.75 | | | | | | 0.52 | | | | | | 0.52 | | | | | | 1.42 | | | | | | 4,281 | | | | | | 47 | | |
| 12-31-13 | | | | | 10.79 | | | | | | 0.14• | | | | | | 0.59 | | | | | | 0.73 | | | | | | 0.37 | | | | | | — | | | | | | — | | | | | | 0.37 | | | | | | — | | | | | | 11.15 | | | | | | 6.85 | | | | | | 0.74 | | | | | | 0.53 | | | | | | 0.53 | | | | | | 1.28 | | | | | | 5,274 | | | | | | 70 | | |
| 12-31-12 | | | | | 10.32 | | | | | | 0.21• | | | | | | 0.77 | | | | | | 0.98 | | | | | | 0.51 | | | | | | — | | | | | | — | | | | | | 0.51 | | | | | | — | | | | | | 10.79 | | | | | | 9.62 | | | | | | 0.70 | | | | | | 0.52 | | | | | | 0.52 | | | | | | 2.00 | | | | | | 5,889 | | | | | | 71 | | |
See Accompanying Notes to Financial Statements
Financial Highlights (continued)
| | | | | | | | | | Income
(loss) from
investment
operations | | | | | | | | | Less
Distributions | | | | | | | | | | | | | | | | | | | | | | | | | | | Ratios to average
net assets | | | Supplemental
Data | |
| | | | Net asset value, beginning of year
or period | | | Net investment income (loss) | | | Net realized and unrealized
gain (loss) | | | Total from investment operations | | | From net investment income | | | From net realized gains | | | From return of capital | | | Total distributions | | | Payment by affiliate | | | Net asset value, end of year
or period | | | Total Return(1) | | | Expenses before
reductions/additions(2)(3)(4) | | | Expenses net of fee waivers
and/or recoupments if any(2)(3)(4) | | | Expenses net of all
reductions/additions(2)(3)(4) | | | Net investment income (loss)(2)(3) | | | Net assets, end of year or period | | | Portfolio turnover rate | |
Year or
period ended | | | ($) | | | ($) | | | ($) | | | ($) | | | ($) | | | ($) | | | ($) | | | ($) | | | ($) | | | ($) | | | (%) | | | (%) | | | (%) | | | (%) | | | (%) | | | ($000’s) | | | (%) | |
| Voya Solution Income Portfolio (continued) | | | | | | | | | | | | | | | | | | | | | | | | | | | | | | | | | | | | | | | | | | | | | | | | | | | | | | | | | | | | | | | | | | | | | | | | | | | | | | | | | | | | | | | | | | | | | | | | | | | | | | | |
| Class T | | | | | | | | | | | | | | | | | | | | | | | | | | | | | | | | | | | | | | | | | | | | | | | | | | | | | | | | | | | | | | | | | | | | | | | | | | | | | | | | | | | | | | | | | | | | | | | | | | | | | | | |
| 12-31-16 | | | | | 11.39 | | | | | | 0.11• | | | | | | 0.36 | | | | | | 0.47 | | | | | | — | | | | | | 0.13 | | | | | | — | | | | | | 0.13 | | | | | | — | | | | | | 11.73 | | | | | | 4.11 | | | | | | 0.97 | | | | | | 0.82 | | | | | | 0.82 | | | | | | 0.92 | | | | | | 205 | | | | | | 46 | | |
| 12-31-15 | | | | | 12.07 | | | | | | 0.13• | | | | | | (0.17) | | | | | | (0.04) | | | | | | 0.22 | | | | | | 0.42 | | | | | | — | | | | | | 0.64 | | | | | | — | | | | | | 11.39 | | | | | | (0.40) | | | | | | 0.98 | | | | | | 0.83 | | | | | | 0.83 | | | | | | 1.09 | | | | | | 815 | | | | | | 31 | | |
| 12-31-14 | | | | | 11.67 | | | | | | 0.13• | | | | | | 0.48 | | | | | | 0.61 | | | | | | 0.21 | | | | | | — | | | | | | — | | | | | | 0.21 | | | | | | — | | | | | | 12.07 | | | | | | 5.22 | | | | | | 1.00 | | | | | | 0.82 | | | | | | 0.82 | | | | | | 1.05 | | | | | | 91 | | | | | | 47 | | |
| 12-31-13 | | | | | 11.29 | | | | | | 0.12• | | | | | | 0.61 | | | | | | 0.73 | | | | | | 0.35 | | | | | | — | | | | | | — | | | | | | 0.35 | | | | | | — | | | | | | 11.67 | | | | | | 6.55 | | | | | | 0.99 | | | | | | 0.83 | | | | | | 0.83 | | | | | | 1.00 | | | | | | 193 | | | | | | 70 | | |
| 12-31-12 | | | | | 10.70 | | | | | | 0.19• | | | | | | 0.80 | | | | | | 0.99 | | | | | | 0.40 | | | | | | — | | | | | | — | | | | | | 0.40 | | | | | | — | | | | | | 11.29 | | | | | | 9.29 | | | | | | 0.95 | | | | | | 0.82 | | | | | | 0.82 | | | | | | 1.69 | | | | | | 259 | | | | | | 71 | | |
| Voya Solution Moderately Aggressive Portfolio | | | | | | | | | | | | | | | | | | | | | | | | | | | | | | | | | | | | | | | | | | | | | | | | | | | | | | | | | | | | | | | | | | | | | | | | | | | | | | | | | | | | | | | | | | | | | | | | | | | | | | | |
| Class ADV | | | | | | | | | | | | | | | | | | | | | | | | | | | | | | | | | | | | | | | | | | | | | | | | | | | | | | | | | | | | | | | | | | | | | | | | | | | | | | | | | | | | | | | | | | | | | | | | | | | | | | | |
| 12-31-16 | | | | | 11.23 | | | | | | 0.11• | | | | | | 0.56 | | | | | | 0.67 | | | | | | 0.10 | | | | | | 0.18 | | | | | | — | | | | | | 0.28 | | | | | | — | | | | | | 11.62 | | | | | | 6.00 | | | | | | 0.75 | | | | | | 0.70 | | | | | | 0.70 | | | | | | 0.95 | | | | | | 24,645 | | | | | | 52 | | |
| 12-31-15 | | | | | 13.03 | | | | | | 0.11• | | | | | | (0.22) | | | | | | (0.11) | | | | | | 0.37 | | | | | | 1.32 | | | | | | — | | | | | | 1.69 | | | | | | — | | | | | | 11.23 | | | | | | (1.42) | | | | | | 0.74 | | | | | | 0.69 | | | | | | 0.69 | | | | | | 0.94 | | | | | | 31,416 | | | | | | 26 | | |
| 12-31-14 | | | | | 13.38 | | | | | | 0.12• | | | | | | 0.67 | | | | | | 0.79 | | | | | | 0.20 | | | | | | 0.94 | | | | | | — | | | | | | 1.14 | | | | | | — | | | | | | 13.03 | | | | | | 6.09 | | | | | | 0.78 | | | | | | 0.67 | | | | | | 0.67 | | | | | | 0.89 | | | | | | 20,020 | | | | | | 71 | | |
| 12-31-13 | | | | | 11.61 | | | | | | 0.10• | | | | | | 2.23 | | | | | | 2.33 | | | | | | 0.21 | | | | | | 0.35 | | | | | | — | | | | | | 0.56 | | | | | | — | | | | | | 13.38 | | | | | | 20.42 | | | | | | 0.80 | | | | | | 0.63 | | | | | | 0.63 | | | | | | 0.78 | | | | | | 16,945 | | | | | | 79 | | |
| 12-31-12 | | | | | 10.25 | | | | | | 0.11• | | | | | | 1.42 | | | | | | 1.53 | | | | | | 0.12 | | | | | | 0.05 | | | | | | — | | | | | | 0.17 | | | | | | — | | | | | | 11.61 | | | | | | 15.07 | | | | | | 0.73 | | | | | | 0.62 | | | | | | 0.62 | | | | | | 0.98 | | | | | | 13,603 | | | | | | 70 | | |
| Class I | | | | | | | | | | | | | | | | | | | | | | | | | | | | | | | | | | | | | | | | | | | | | | | | | | | | | | | | | | | | | | | | | | | | | | | | | | | | | | | | | | | | | | | | | | | | | | | | | | | | | | | |
| 12-31-16 | | | | | 11.44 | | | | | | 0.17 | | | | | | 0.55 | | | | | | 0.72 | | | | | | 0.15 | | | | | | 0.18 | | | | | | — | | | | | | 0.33 | | | | | | — | | | | | | 11.83 | | | | | | 6.40 | | | | | | 0.25 | | | | | | 0.20 | | | | | | 0.20 | | | | | | 1.55 | | | | | | 4,334 | | | | | | 52 | | |
| 12-31-15 | | | | | 13.23 | | | | | | 0.23• | | | | | | (0.27) | | | | | | (0.04) | | | | | | 0.43 | | | | | | 1.32 | | | | | | — | | | | | | 1.75 | | | | | | — | | | | | | 11.44 | | | | | | (0.85) | | | | | | 0.24 | | | | | | 0.19 | | | | | | 0.19 | | | | | | 2.00 | | | | | | 4,035 | | | | | | 26 | | |
| 12-31-14 | | | | | 13.56 | | | | | | 0.31• | | | | | | 0.56 | | | | | | 0.87 | | | | | | 0.26 | | | | | | 0.94 | | | | | | — | | | | | | 1.20 | | | | | | — | | | | | | 13.23 | | | | | | 6.60 | | | | | | 0.28 | | | | | | 0.17 | | | | | | 0.17 | | | | | | 2.39 | | | | | | 56 | | | | | | 71 | | |
| 12-31-13 | | | | | 11.74 | | | | | | 0.15 | | | | | | 2.28 | | | | | | 2.43 | | | | | | 0.26 | | | | | | 0.35 | | | | | | — | | | | | | 0.61 | | | | | | — | | | | | | 13.56 | | | | | | 21.10 | | | | | | 0.30 | | | | | | 0.13 | | | | | | 0.13 | | | | | | 1.19 | | | | | | 4 | | | | | | 79 | | |
| 12-31-12 | | | | | 10.34 | | | | | | 0.16 | | | | | | 1.44 | | | | | | 1.60 | | | | | | 0.15 | | | | | | 0.05 | | | | | | — | | | | | | 0.20 | | | | | | — | | | | | | 11.74 | | | | | | 15.62 | | | | | | 0.23 | | | | | | 0.12 | | | | | | 0.12 | | | | | | 1.42 | | | | | | 4 | | | | | | 70 | | |
| Class R6 | | | | | | | | | | | | | | | | | | | | | | | | | | | | | | | | | | | | | | | | | | | | | | | | | | | | | | | | | | | | | | | | | | | | | | | | | | | | | | | | | | | | | | | | | | | | | | | | | | | | | | | |
05-02-16(5) -
12-31-16 | | | | | 11.56 | | | | | | 0.39• | | | | | | 0.20 | | | | | | 0.59 | | | | | | 0.15 | | | | | | 0.18 | | | | | | — | | | | | | 0.33 | | | | | | — | | | | | | 11.82 | | | | | | 5.21 | | | | | | 0.25 | | | | | | 0.20 | | | | | | 0.20 | | | | | | 5.04 | | | | | | 1,287 | | | | | | 52 | | |
| Class S | | | | | | | | | | | | | | | | | | | | | | | | | | | | | | | | | | | | | | | | | | | | | | | | | | | | | | | | | | | | | | | | | | | | | | | | | | | | | | | | | | | | | | | | | | | | | | | | | | | | | | | |
| 12-31-16 | | | | | 11.34 | | | | | | 0.14• | | | | | | 0.55 | | | | | | 0.69 | | | | | | 0.14 | | | | | | 0.18 | | | | | | — | | | | | | 0.32 | | | | | | — | | | | | | 11.71 | | | | | | 6.17 | | | | | | 0.50 | | | | | | 0.45 | | | | | | 0.45 | | | | | | 1.25 | | | | | | 661,798 | | | | | | 52 | | |
| 12-31-15 | | | | | 13.13 | | | | | | 0.21• | | | | | | (0.29) | | | | | | (0.08) | | | | | | 0.39 | | | | | | 1.32 | | | | | | — | | | | | | 1.71 | | | | | | — | | | | | | 11.34 | | | | | | (1.15) | | | | | | 0.49 | | | | | | 0.44 | | | | | | 0.44 | | | | | | 1.81 | | | | | | 719,319 | | | | | | 26 | | |
| 12-31-14 | | | | | 13.47 | | | | | | 0.15 | | | | | | 0.68 | | | | | | 0.83 | | | | | | 0.23 | | | | | | 0.94 | | | | | | — | | | | | | 1.17 | | | | | | — | | | | | | 13.13 | | | | | | 6.33 | | | | | | 0.53 | | | | | | 0.42 | | | | | | 0.42 | | | | | | 1.04 | | | | | | 11,315 | | | | | | 71 | | |
| 12-31-13 | | | | | 11.67 | | | | | | 0.12• | | | | | | 2.27 | | | | | | 2.39 | | | | | | 0.24 | | | | | | 0.35 | | | | | | — | | | | | | 0.59 | | | | | | — | | | | | | 13.47 | | | | | | 20.84 | | | | | | 0.55 | | | | | | 0.38 | | | | | | 0.38 | | | | | | 0.96 | | | | | | 11,871 | | | | | | 79 | | |
| 12-31-12 | | | | | 10.30 | | | | | | 0.14• | | | | | | 1.42 | | | | | | 1.56 | | | | | | 0.14 | | | | | | 0.05 | | | | | | — | | | | | | 0.19 | | | | | | — | | | | | | 11.67 | | | | | | 15.28 | | | | | | 0.48 | | | | | | 0.37 | | | | | | 0.37 | | | | | | 1.29 | | | | | | 9,256 | | | | | | 70 | | |
| Class S2 | | | | | | | | | | | | | | | | | | | | | | | | | | | | | | | | | | | | | | | | | | | | | | | | | | | | | | | | | | | | | | | | | | | | | | | | | | | | | | | | | | | | | | | | | | | | | | | | | | | | | | | |
| 12-31-16 | | | | | 11.32 | | | | | | 0.13 | | | | | | 0.54 | | | | | | 0.67 | | | | | | 0.11 | | | | | | 0.18 | | | | | | — | | | | | | 0.29 | | | | | | — | | | | | | 11.70 | | | | | | 5.97 | | | | | | 0.68 | | | | | | 0.60 | | | | | | 0.60 | | | | | | 1.14 | | | | | | 1,132 | | | | | | 52 | | |
| 12-31-15 | | | | | 13.12 | | | | | | 0.12• | | | | | | (0.21) | | | | | | (0.09) | | | | | | 0.39 | | | | | | 1.32 | | | | | | — | | | | | | 1.71 | | | | | | — | | | | | | 11.32 | | | | | | (1.21) | | | | | | 0.74 | | | | | | 0.59 | | | | | | 0.59 | | | | | | 0.98 | | | | | | 1,040 | | | | | | 26 | | |
| 12-31-14 | | | | | 13.50 | | | | | | 0.14• | | | | | | 0.67 | | | | | | 0.81 | | | | | | 0.25 | | | | | | 0.94 | | | | | | — | | | | | | 1.19 | | | | | | — | | | | | | 13.12 | | | | | | 6.17 | | | | | | 0.78 | | | | | | 0.57 | | | | | | 0.57 | | | | | | 1.08 | | | | | | 806 | | | | | | 71 | | |
| 12-31-13 | | | | | 11.72 | | | | | | 0.17• | | | | | | 2.19 | | | | | | 2.36 | | | | | | 0.23 | | | | | | 0.35 | | | | | | — | | | | | | 0.58 | | | | | | — | | | | | | 13.50 | | | | | | 20.56 | | | | | | 0.80 | | | | | | 0.53 | | | | | | 0.53 | | | | | | 1.34 | | | | | | 284 | | | | | | 79 | | |
| 12-31-12 | | | | | 10.30 | | | | | | 0.14• | | | | | | 1.41 | | | | | | 1.55 | | | | | | 0.08 | | | | | | 0.05 | | | | | | — | | | | | | 0.13 | | | | | | — | | | | | | 11.72 | | | | | | 15.18 | | | | | | 0.73 | | | | | | 0.52 | | | | | | 0.52 | | | | | | 1.27 | | | | | | 84 | | | | | | 70 | | |
See Accompanying Notes to Financial Statements
Financial Highlights (continued)
| | | | | | | | | | Income
(loss) from
investment
operations | | | | | | | | | Less
Distributions | | | | | | | | | | | | | | | | | | | | | | | | | | | Ratios to average
net assets | | | Supplemental
Data | |
| | | | Net asset value, beginning of year
or period | | | Net investment income (loss) | | | Net realized and unrealized
gain (loss) | | | Total from investment operations | | | From net investment income | | | From net realized gains | | | From return of capital | | | Total distributions | | | Payment by affiliate | | | Net asset value, end of year
or period | | | Total Return(1) | | | Expenses before
reductions/additions(2)(3)(4) | | | Expenses net of fee waivers
and/or recoupments if any(2)(3)(4) | | | Expenses net of all
reductions/additions(2)(3)(4) | | | Net investment income (loss)(2)(3) | | | Net assets, end of year or period | | | Portfolio turnover rate | |
Year or
period ended | | | ($) | | | ($) | | | ($) | | | ($) | | | ($) | | | ($) | | | ($) | | | ($) | | | ($) | | | ($) | | | (%) | | | (%) | | | (%) | | | (%) | | | (%) | | | ($000’s) | | | (%) | |
| Voya Solution Moderately Conservative Portfolio | | | | | | | | | | | | | | | | | | | | | | | | | | | | | | | | | | | | | | | | | | | | | | | | | | | | | | | | | | | | | | | | | | | | | | | | | | | | | | | | | | | | | | | | | | | | | | | | | | | | | | | |
| Class ADV | | | | | | | | | | | | | | | | | | | | | | | | | | | | | | | | | | | | | | | | | | | | | | | | | | | | | | | | | | | | | | | | | | | | | | | | | | | | | | | | | | | | | | | | | | | | | | | | | | | | | | | |
| 12-31-16 | | | | | 9.51 | | | | | | 0.13• | | | | | | 0.40 | | | | | | 0.53 | | | | | | 0.20 | | | | | | 0.60 | | | | | | — | | | | | | 0.80 | | | | | | — | | | | | | 9.24 | | | | | | 5.64 | | | | | | 0.80 | | | | | | 0.64 | | | | | | 0.64 | | | | | | 1.35 | | | | | | 13,487 | | | | | | 65 | | |
| 12-31-15 | | | | | 10.45 | | | | | | 0.10 | | | | | | (0.14) | | | | | | (0.04) | | | | | | 0.28 | | | | | | 0.62 | | | | | | — | | | | | | 0.90 | | | | | | — | | | | | | 9.51 | | | | | | (0.60) | | | | | | 0.78 | | | | | | 0.66 | | | | | | 0.66 | | | | | | 1.09 | | | | | | 22,005 | | | | | | 58 | | |
| 12-31-14 | | | | | 10.80 | | | | | | 0.15 | | | | | | 0.39 | | | | | | 0.54 | | | | | | 0.23 | | | | | | 0.66 | | | | | | — | | | | | | 0.89 | | | | | | — | | | | | | 10.45 | | | | | | 5.20 | | | | | | 0.78 | | | | | | 0.65 | | | | | | 0.65 | | | | | | 1.30 | | | | | | 21,659 | | | | | | 66 | | |
| 12-31-13 | | | | | 10.42 | | | | | | 0.13• | | | | | | 0.81 | | | | | | 0.94 | | | | | | 0.27 | | | | | | 0.29 | | | | | | — | | | | | | 0.56 | | | | | | — | | | | | | 10.80 | | | | | | 9.27 | | | | | | 0.79 | | | | | | 0.62 | | | | | | 0.62 | | | | | | 1.23 | | | | | | 21,918 | | | | | | 85 | | |
| 12-31-12 | | | | | 9.55 | | | | | | 0.18• | | | | | | 0.94 | | | | | | 1.12 | | | | | | 0.19 | | | | | | 0.06 | | | | | | — | | | | | | 0.25 | | | | | | — | | | | | | 10.42 | | | | | | 11.79 | | | | | | 0.70 | | | | | | 0.62 | | | | | | 0.62 | | | | | | 1.74 | | | | | | 22,425 | | | | | | 85 | | |
| Class I | | | | | | | | | | | | | | | | | | | | | | | | | | | | | | | | | | | | | | | | | | | | | | | | | | | | | | | | | | | | | | | | | | | | | | | | | | | | | | | | | | | | | | | | | | | | | | | | | | | | | | | |
| 12-31-16 | | | | | 9.93 | | | | | | 0.19 | | | | | | 0.41 | | | | | | 0.60 | | | | | | 0.28 | | | | | | 0.60 | | | | | | — | | | | | | 0.88 | | | | | | — | | | | | | 9.65 | | | | | | 6.12 | | | | | | 0.30 | | | | | | 0.14 | | | | | | 0.14 | | | | | | 1.93 | | | | | | 33 | | | | | | 65 | | |
| 12-31-15 | | | | | 10.87 | | | | | | 0.16 | | | | | | (0.15) | | | | | | 0.01 | | | | | | 0.33 | | | | | | 0.62 | | | | | | — | | | | | | 0.95 | | | | | | — | | | | | | 9.93 | | | | | | (0.09) | | | | | | 0.28 | | | | | | 0.16 | | | | | | 0.16 | | | | | | 1.58 | | | | | | 36 | | | | | | 58 | | |
| 12-31-14 | | | | | 11.20 | | | | | | 0.23• | | | | | | 0.39 | | | | | | 0.62 | | | | | | 0.29 | | | | | | 0.66 | | | | | | — | | | | | | 0.95 | | | | | | — | | | | | | 10.87 | | | | | | 5.74 | | | | | | 0.28 | | | | | | 0.15 | | | | | | 0.15 | | | | | | 2.19 | | | | | | 37 | | | | | | 66 | | |
| 12-31-13 | | | | | 10.79 | | | | | | 0.18 | | | | | | 0.84 | | | | | | 1.02 | | | | | | 0.32 | | | | | | 0.29 | | | | | | — | | | | | | 0.61 | | | | | | — | | | | | | 11.20 | | | | | | 9.70 | | | | | | 0.29 | | | | | | 0.12 | | | | | | 0.12 | | | | | | 1.66 | | | | | | 1 | | | | | | 85 | | |
| 12-31-12 | | | | | 9.86 | | | | | | 0.23 | | | | | | 0.97 | | | | | | 1.20 | | | | | | 0.21 | | | | | | 0.06 | | | | | | — | | | | | | 0.27 | | | | | | — | | | | | | 10.79 | | | | | | 12.23 | | | | | | 0.20 | | | | | | 0.12 | | | | | | 0.12 | | | | | | 2.16 | | | | | | 1 | | | | | | 85 | | |
| Class R6 | | | | | | | | | | | | | | | | | | | | | | | | | | | | | | | | | | | | | | | | | | | | | | | | | | | | | | | | | | | | | | | | | | | | | | | | | | | | | | | | | | | | | | | | | | | | | | | | | | | | | | | |
05-02-16(5) -
12-31-16 | | | | | 10.17 | | | | | | 0.36• | | | | | | (0.01) | | | | | | 0.35 | | | | | | 0.28 | | | | | | 0.60 | | | | | | — | | | | | | 0.88 | | | | | | — | | | | | | 9.64 | | | | | | 3.52 | | | | | | 0.30 | | | | | | 0.14 | | | | | | 0.14 | | | | | | 5.68 | | | | | | 287 | | | | | | 65 | | |
| Class S | | | | | | | | | | | | | | | | | | | | | | | | | | | | | | | | | | | | | | | | | | | | | | | | | | | | | | | | | | | | | | | | | | | | | | | | | | | | | | | | | | | | | | | | | | | | | | | | | | | | | | | |
| 12-31-16 | | | | | 9.73 | | | | | | 0.17 | | | | | | 0.39 | | | | | | 0.56 | | | | | | 0.25 | | | | | | 0.60 | | | | | | — | | | | | | 0.85 | | | | | | — | | | | | | 9.44 | | | | | | 5.87 | | | | | | 0.55 | | | | | | 0.39 | | | | | | 0.39 | | | | | | 1.74 | | | | | | 20,883 | | | | | | 65 | | |
| 12-31-15 | | | | | 10.67 | | | | | | 0.14• | | | | | | (0.16) | | | | | | (0.02) | | | | | | 0.30 | | | | | | 0.62 | | | | | | — | | | | | | 0.92 | | | | | | — | | | | | | 9.73 | | | | | | (0.38) | | | | | | 0.53 | | | | | | 0.41 | | | | | | 0.41 | | | | | | 1.33 | | | | | | 20,081 | | | | | | 58 | | |
| 12-31-14 | | | | | 11.00 | | | | | | 0.17• | | | | | | 0.42 | | | | | | 0.59 | | | | | | 0.26 | | | | | | 0.66 | | | | | | — | | | | | | 0.92 | | | | | | — | | | | | | 10.67 | | | | | | 5.58 | | | | | | 0.53 | | | | | | 0.40 | | | | | | 0.40 | | | | | | 1.53 | | | | | | 22,346 | | | | | | 66 | | |
| 12-31-13 | | | | | 10.60 | | | | | | 0.16 | | | | | | 0.82 | | | | | | 0.98 | | | | | | 0.29 | | | | | | 0.29 | | | | | | — | | | | | | 0.58 | | | | | | — | | | | | | 11.00 | | | | | | 9.54 | | | | | | 0.54 | | | | | | 0.37 | | | | | | 0.37 | | | | | | 1.43 | | | | | | 24,016 | | | | | | 85 | | |
| 12-31-12 | | | | | 9.70 | | | | | | 0.21• | | | | | | 0.95 | | | | | | 1.16 | | | | | | 0.20 | | | | | | 0.06 | | | | | | — | | | | | | 0.26 | | | | | | — | | | | | | 10.60 | | | | | | 11.99 | | | | | | 0.45 | | | | | | 0.37 | | | | | | 0.37 | | | | | | 2.02 | | | | | | 22,653 | | | | | | 85 | | |
| Class S2 | | | | | | | | | | | | | | | | | | | | | | | | | | | | | | | | | | | | | | | | | | | | | | | | | | | | | | | | | | | | | | | | | | | | | | | | | | | | | | | | | | | | | | | | | | | | | | | | | | | | | | | |
| 12-31-16 | | | | | 9.64 | | | | | | 0.14 | | | | | | 0.39 | | | | | | 0.53 | | | | | | 0.23 | | | | | | 0.60 | | | | | | — | | | | | | 0.83 | | | | | | — | | | | | | 9.34 | | | | | | 5.62 | | | | | | 0.73 | | | | | | 0.54 | | | | | | 0.54 | | | | | | 1.61 | | | | | | 845 | | | | | | 65 | | |
| 12-31-15 | | | | | 10.59 | | | | | | 0.10 | | | | | | (0.13) | | | | | | (0.03) | | | | | | 0.30 | | | | | | 0.62 | | | | | | — | | | | | | 0.92 | | | | | | — | | | | | | 9.64 | | | | | | (0.50) | | | | | | 0.78 | | | | | | 0.56 | | | | | | 0.56 | | | | | | 1.14 | | | | | | 751 | | | | | | 58 | | |
| 12-31-14 | | | | | 10.93 | | | | | | 0.16• | | | | | | 0.41 | | | | | | 0.57 | | | | | | 0.25 | | | | | | 0.66 | | | | | | — | | | | | | 0.91 | | | | | | — | | | | | | 10.59 | | | | | | 5.40 | | | | | | 0.78 | | | | | | 0.55 | | | | | | 0.55 | | | | | | 1.43 | | | | | | 848 | | | | | | 66 | | |
| 12-31-13 | | | | | 10.55 | | | | | | 0.14• | | | | | | 0.82 | | | | | | 0.96 | | | | | | 0.29 | | | | | | 0.29 | | | | | | — | | | | | | 0.58 | | | | | | — | | | | | | 10.93 | | | | | | 9.36 | | | | | | 0.79 | | | | | | 0.52 | | | | | | 0.52 | | | | | | 1.26 | | | | | | 669 | | | | | | 85 | | |
| 12-31-12 | | | | | 9.67 | | | | | | 0.23• | | | | | | 0.91 | | | | | | 1.14 | | | | | | 0.20 | | | | | | 0.06 | | | | | | — | | | | | | 0.26 | | | | | | — | | | | | | 10.55 | | | | | | 11.85 | | | | | | 0.70 | | | | | | 0.52 | | | | | | 0.52 | | | | | | 2.23 | | | | | | 712 | | | | | | 85 | | |
| Voya Solution 2020 Portfolio | | | | | | | | | | | | | | | | | | | | | | | | | | | | | | | | | | | | | | | | | | | | | | | | | | | | | | | | | | | | | | | | | | | | | | | | | | | | | | | | | | | | | | | | | | | | | | | | | | | | | | | |
| Class ADV | | | | | | | | | | | | | | | | | | | | | | | | | | | | | | | | | | | | | | | | | | | | | | | | | | | | | | | | | | | | | | | | | | | | | | | | | | | | | | | | | | | | | | | | | | | | | | | | | | | | | | | |
| 12-31-16 | | | | | 11.65 | | | | | | 0.18• | | | | | | 0.43 | | | | | | 0.61 | | | | | | 0.05 | | | | | | 0.06 | | | | | | — | | | | | | 0.11 | | | | | | — | | | | | | 12.15 | | | | | | 5.21 | | | | | | 0.86 | | | | | | 0.64 | | | | | | 0.64 | | | | | | 1.53 | | | | | | 9,167 | | | | | | 84 | | |
| 12-31-15 | | | | | 12.87 | | | | | | 0.19• | | | | | | (0.05) | | | | | | 0.14 | | | | | | 0.57 | | | | | | 0.79 | | | | | | — | | | | | | 1.36 | | | | | | — | | | | | | 11.65 | | | | | | 0.88 | | | | | | 1.49 | | | | | | 0.63 | | | | | | 0.63 | | | | | | 1.60 | | | | | | 2,853 | | | | | | 86 | | |
| 12-31-14 | | | | | 12.19 | | | | | | 0.20• | | | | | | 0.53 | | | | | | 0.73 | | | | | | 0.01 | | | | | | 0.04 | | | | | | — | | | | | | 0.05 | | | | | | — | | | | | | 12.87 | | | | | | 5.97 | | | | | | 4.32 | | | | | | 0.63 | | | | | | 0.63 | | | | | | 1.55 | | | | | | 631 | | | | | | 32 | | |
| 12-31-13 | | | | | 11.80 | | | | | | 0.11• | | | | | | 1.36 | | | | | | 1.47 | | | | | | 0.29 | | | | | | 0.80 | | | | | | — | | | | | | 1.09 | | | | | | 0.01 | | | | | | 12.19 | | | | | | 13.01(a) | | | | | | 89.79 | | | | | | 0.63 | | | | | | 0.63 | | | | | | 0.87 | | | | | | 4 | | | | | | 68 | | |
| 12-31-12 | | | | | 10.85 | | | | | | 0.15 | | | | | | 1.12 | | | | | | 1.27 | | | | | | 0.11 | | | | | | 0.21 | | | | | | — | | | | | | 0.32 | | | | | | — | | | | | | 11.80 | | | | | | 11.76 | | | | | | 45.86 | | | | | | 0.62 | | | | | | 0.62 | | | | | | 1.28 | | | | | | 4 | | | | | | 72 | | |
| Class I | | | | | | | | | | | | | | | | | | | | | | | | | | | | | | | | | | | | | | | | | | | | | | | | | | | | | | | | | | | | | | | | | | | | | | | | | | | | | | | | | | | | | | | | | | | | | | | | | | | | | | | |
| 12-31-16 | | | | | 11.81 | | | | | | 0.26• | | | | | | 0.42 | | | | | | 0.68 | | | | | | 0.06 | | | | | | 0.06 | | | | | | — | | | | | | 0.12 | | | | | | — | | | | | | 12.37 | | | | | | 5.73 | | | | | | 0.36 | | | | | | 0.14 | | | | | | 0.14 | | | | | | 2.13 | | | | | | 6,377 | | | | | | 84 | | |
| 12-31-15 | | | | | 13.04 | | | | | | 0.32• | | | | | | (0.11) | | | | | | 0.21 | | | | | | 0.65 | | | | | | 0.79 | | | | | | — | | | | | | 1.44 | | | | | | — | | | | | | 11.81 | | | | | | 1.38 | | | | | | 0.99 | | | | | | 0.13 | | | | | | 0.13 | | | | | | 2.76 | | | | | | 2,157 | | | | | | 86 | | |
| 12-31-14 | | | | | 12.29 | | | | | | 0.19 | | | | | | 0.60 | | | | | | 0.79 | | | | | | — | | | | | | 0.04 | | | | | | — | | | | | | 0.04 | | | | | | — | | | | | | 13.04 | | | | | | 6.41 | | | | | | 3.82 | | | | | | 0.13 | | | | | | 0.13 | | | | | | 1.52 | | | | | | 4 | | | | | | 32 | | |
| 12-31-13 | | | | | 11.85 | | | | | | 0.17 | | | | | | 1.40 | | | | | | 1.57 | | | | | | 0.34 | | | | | | 0.80 | | | | | | — | | | | | | 1.14 | | | | | | 0.01 | | | | | | 12.29 | | | | | | 13.85(a) | | | | | | 89.29 | | | | | | 0.13 | | | | | | 0.13 | | | | | | 1.38 | | | | | | 4 | | | | | | 68 | | |
| 12-31-12 | | | | | 10.86 | | | | | | 0.21 | | | | | | 1.12 | | | | | | 1.33 | | | | | | 0.13 | | | | | | 0.21 | | | | | | — | | | | | | 0.34 | | | | | | — | | | | | | 11.85 | | | | | | 12.22 | | | | | | 45.36 | | | | | | 0.12 | | | | | | 0.12 | | | | | | 1.81 | | | | | | 4 | | | | | | 72 | | |
See Accompanying Notes to Financial Statements
Financial Highlights (continued)
| | | | | | | | | | Income
(loss) from
investment
operations | | | | | | | | | Less
Distributions | | | | | | | | | | | | | | | | | | | | | | | | | | | Ratios to average
net assets | | | Supplemental
Data | |
| | | | Net asset value, beginning of year
or period | | | Net investment income (loss) | | | Net realized and unrealized
gain (loss) | | | Total from investment operations | | | From net investment income | | | From net realized gains | | | From return of capital | | | Total distributions | | | Payment by affiliate | | | Net asset value, end of year
or period | | | Total Return(1) | | | Expenses before
reductions/additions(2)(3)(4) | | | Expenses net of fee waivers
and/or recoupments if any(2)(3)(4) | | | Expenses net of all
reductions/additions(2)(3)(4) | | | Net investment income (loss)(2)(3) | | | Net assets, end of year or period | | | Portfolio turnover rate | |
Year or
period ended | | | ($) | | | ($) | | | ($) | | | ($) | | | ($) | | | ($) | | | ($) | | | ($) | | | ($) | | | ($) | | | (%) | | | (%) | | | (%) | | | (%) | | | (%) | | | ($000’s) | | | (%) | |
| Voya Solution 2020 Portfolio (continued) | | | | | | | | | | | | | | | | | | | | | | | | | | | | | | | | | | | | | | | | | | | | | | | | | | | | | | | | | | | | | | | | | | | | | | | | | | | | | | | | | | | | | | | | | | | | | | | | | | | | | | | |
| Class S | | | | | | | | | | | | | | | | | | | | | | | | | | | | | | | | | | | | | | | | | | | | | | | | | | | | | | | | | | | | | | | | | | | | | | | | | | | | | | | | | | | | | | | | | | | | | | | | | | | | | | | |
| 12-31-16 | | | | | 11.80 | | | | | | 0.20• | | | | | | 0.44 | | | | | | 0.64 | | | | | | 0.05 | | | | | | 0.06 | | | | | | — | | | | | | 0.11 | | | | | | — | | | | | | 12.33 | | | | | | 5.46 | | | | | | 0.61 | | | | | | 0.39 | | | | | | 0.39 | | | | | | 1.65 | | | | | | 6,477 | | | | | | 84 | | |
| 12-31-15 | | | | | 13.01 | | | | | | 0.53• | | | | | | (0.34) | | | | | | 0.19 | | | | | | 0.61 | | | | | | 0.79 | | | | | | — | | | | | | 1.40 | | | | | | — | | | | | | 11.80 | | | | | | 1.23 | | | | | | 1.24 | | | | | | 0.38 | | | | | | 0.38 | | | | | | 4.58 | | | | | | 4,145 | | | | | | 86 | | |
| 12-31-14 | | | | | 12.30 | | | | | | 0.16 | | | | | | 0.59 | | | | | | 0.75 | | | | | | — | | | | | | 0.04 | | | | | | — | | | | | | 0.04 | | | | | | — | | | | | | 13.01 | | | | | | 6.08 | | | | | | 4.07 | | | | | | 0.38 | | | | | | 0.38 | | | | | | 1.27 | | | | | | 4 | | | | | | 32 | | |
| 12-31-13 | | | | | 11.81 | | | | | | 0.14 | | | | | | 1.39 | | | | | | 1.53 | | | | | | 0.25 | | | | | | 0.80 | | | | | | — | | | | | | 1.05 | | | | | | 0.01 | | | | | | 12.30 | | | | | | 13.47(a) | | | | | | 89.54 | | | | | | 0.38 | | | | | | 0.38 | | | | | | 1.14 | | | | | | 4 | | | | | | 68 | | |
| 12-31-12 | | | | | 10.85 | | | | | | 0.18 | | | | | | 1.11 | | | | | | 1.29 | | | | | | 0.12 | | | | | | 0.21 | | | | | | — | | | | | | 0.33 | | | | | | — | | | | | | 11.81 | | | | | | 11.90 | | | | | | 45.61 | | | | | | 0.37 | | | | | | 0.37 | | | | | | 1.56 | | | | | | 4 | | | | | | 72 | | |
| Class S2 | | | | | | | | | | | | | | | | | | | | | | | | | | | | | | | | | | | | | | | | | | | | | | | | | | | | | | | | | | | | | | | | | | | | | | | | | | | | | | | | | | | | | | | | | | | | | | | | | | | | | | | |
| 12-31-16 | | | | | 11.70 | | | | | | 0.14• | | | | | | 0.48 | | | | | | 0.62 | | | | | | 0.04 | | | | | | 0.06 | | | | | | — | | | | | | 0.10 | | | | | | — | | | | | | 12.22 | | | | | | 5.33 | | | | | | 0.79 | | | | | | 0.54 | | | | | | 0.54 | | | | | | 1.18 | | | | | | 148 | | | | | | 84 | | |
| 12-31-15 | | | | | 12.91 | | | | | | 0.36• | | | | | | (0.20) | | | | | | 0.16 | | | | | | 0.58 | | | | | | 0.79 | | | | | | — | | | | | | 1.37 | | | | | | — | | | | | | 11.70 | | | | | | 1.08 | | | | | | 1.49 | | | | | | 0.53 | | | | | | 0.53 | | | | | | 3.08 | | | | | | 283 | | | | | | 86 | | |
| 12-31-14 | | | | | 12.23 | | | | | | 0.14 | | | | | | 0.58 | | | | | | 0.72 | | | | | | — | | | | | | 0.04 | | | | | | — | | | | | | 0.04 | | | | | | — | | | | | | 12.91 | | | | | | 5.87 | | | | | | 4.32 | | | | | | 0.53 | | | | | | 0.53 | | | | | | 1.12 | | | | | | 4 | | | | | | 32 | | |
| 12-31-13 | | | | | 11.81 | | | | | | 0.12 | | | | | | 1.40 | | | | | | 1.52 | | | | | | 0.31 | | | | | | 0.80 | | | | | | — | | | | | | 1.11 | | | | | | 0.01 | | | | | | 12.23 | | | | | | 13.39(a) | | | | | | 89.79 | | | | | | 0.53 | | | | | | 0.53 | | | | | | 0.97 | | | | | | 4 | | | | | | 68 | | |
| 12-31-12 | | | | | 10.85 | | | | | | 0.16 | | | | | | 1.13 | | | | | | 1.29 | | | | | | 0.12 | | | | | | 0.21 | | | | | | — | | | | | | 0.33 | | | | | | — | | | | | | 11.81 | | | | | | 11.88 | | | | | | 45.86 | | | | | | 0.52 | | | | | | 0.52 | | | | | | 1.39 | | | | | | 4 | | | | | | 72 | | |
| Class T | | | | | | | | | | | | | | | | | | | | | | | | | | | | | | | | | | | | | | | | | | | | | | | | | | | | | | | | | | | | | | | | | | | | | | | | | | | | | | | | | | | | | | | | | | | | | | | | | | | | | | | |
| 12-31-16 | | | | | 11.64 | | | | | | 0.15• | | | | | | 0.43 | | | | | | 0.58 | | | | | | — | | | | | | 0.06 | | | | | | — | | | | | | 0.06 | | | | | | — | | | | | | 12.16 | | | | | | 4.99 | | | | | | 1.08 | | | | | | 0.84 | | | | | | 0.84 | | | | | | 1.29 | | | | | | 8 | | | | | | 84 | | |
| 12-31-15 | | | | | 12.87 | | | | | | 0.11• | | | | | | 0.01 | | | | | | 0.12 | | | | | | 0.56 | | | | | | 0.79 | | | | | | — | | | | | | 1.35 | | | | | | — | | | | | | 11.64 | | | | | | 0.72 | | | | | | 1.74 | | | | | | 0.83 | | | | | | 0.83 | | | | | | 0.91 | | | | | | 4 | | | | | | 86 | | |
| 12-31-14 | | | | | 12.21 | | | | | | 0.10 | | | | | | 0.60 | | | | | | 0.70 | | | | | | — | | | | | | 0.04 | | | | | | — | | | | | | 0.04 | | | | | | — | | | | | | 12.87 | | | | | | 5.72 | | | | | | 4.57 | | | | | | 0.83 | | | | | | 0.83 | | | | | | 0.81 | | | | | | 4 | | | | | | 32 | | |
| 12-31-13 | | | | | 11.77 | | | | | | 0.08 | | | | | | 1.42 | | | | | | 1.50 | | | | | | 0.27 | | | | | | 0.80 | | | | | | — | | | | | | 1.07 | | | | | | 0.01 | | | | | | 12.21 | | | | | | 13.28(a) | | | | | | 90.04 | | | | | | 0.83 | | | | | | 0.83 | | | | | | 0.67 | | | | | | 4 | | | | | | 68 | | |
| 12-31-12 | | | | | 10.84 | | | | | | 0.13 | | | | | | 1.12 | | | | | | 1.25 | | | | | | 0.11 | | | | | | 0.21 | | | | | | — | | | | | | 0.32 | | | | | | — | | | | | | 11.77 | | | | | | 11.53 | | | | | | 46.11 | | | | | | 0.82 | | | | | | 0.82 | | | | | | 1.11 | | | | | | 4 | | | | | | 72 | | |
| Voya Solution 2025 Portfolio | | | | | | | | | | | | | | | | | | | | | | | | | | | | | | | | | | | | | | | | | | | | | | | | | | | | | | | | | | | | | | | | | | | | | | | | | | | | | | | | | | | | | | | | | | | | | | | | | | | | | | | |
| Class ADV | | | | | | | | | | | | | | | | | | | | | | | | | | | | | | | | | | | | | | | | | | | | | | | | | | | | | | | | | | | | | | | | | | | | | | | | | | | | | | | | | | | | | | | | | | | | | | | | | | | | | | | |
| 12-31-16 | | | | | 11.17 | | | | | | 0.14• | | | | | | 0.47 | | | | | | 0.61 | | | | | | 0.21 | | | | | | 0.91 | | | | | | — | | | | | | 1.12 | | | | | | — | | | | | | 10.66 | | | | | | 5.53 | | | | | | 0.74 | | | | | | 0.64 | | | | | | 0.64 | | | | | | 1.31 | | | | | | 302,670 | | | | | | 43 | | |
| 12-31-15 | | | | | 12.83 | | | | | | 0.11• | | | | | | (0.09) | | | | | | 0.02 | | | | | | 0.37 | | | | | | 1.31 | | | | | | — | | | | | | 1.68 | | | | | | — | | | | | | 11.17 | | | | | | (0.26) | | | | | | 0.74 | | | | | | 0.65 | | | | | | 0.65 | | | | | | 0.89 | | | | | | 357,443 | | | | | | 42 | | |
| 12-31-14 | | | | | 13.06 | | | | | | 0.12• | | | | | | 0.54 | | | | | | 0.66 | | | | | | 0.23 | | | | | | 0.66 | | | | | | — | | | | | | 0.89 | | | | | | — | | | | | | 12.83 | | | | | | 5.26 | | | | | | 0.74 | | | | | | 0.63 | | | | | | 0.63 | | | | | | 0.94 | | | | | | 435,280 | | | | | | 46 | | |
| 12-31-13 | | | | | 11.48 | | | | | | 0.10• | | | | | | 1.73 | | | | | | 1.83 | | | | | | 0.25 | | | | | | — | | | | | | — | | | | | | 0.25 | | | | | | — | | | | | | 13.06 | | | | | | 16.05 | | | | | | 0.74 | | | | | | 0.62 | | | | | | 0.62 | | | | | | 0.85 | | | | | | 500,390 | | | | | | 72 | | |
| 12-31-12 | | | | | 10.39 | | | | | | 0.14• | | | | | | 1.23 | | | | | | 1.37 | | | | | | 0.28 | | | | | | — | | | | | | — | | | | | | 0.28 | | | | | | — | | | | | | 11.48 | | | | | | 13.24 | | | | | | 0.70 | | | | | | 0.62 | | | | | | 0.62 | | | | | | 1.22 | | | | | | 494,888 | | | | | | 65 | | |
| Class I | | | | | | | | | | | | | | | | | | | | | | | | | | | | | | | | | | | | | | | | | | | | | | | | | | | | | | | | | | | | | | | | | | | | | | | | | | | | | | | | | | | | | | | | | | | | | | | | | | | | | | | |
| 12-31-16 | | | | | 11.44 | | | | | | 0.21 | | | | | | 0.48 | | | | | | 0.69 | | | | | | 0.28 | | | | | | 0.91 | | | | | | — | | | | | | 1.19 | | | | | | — | | | | | | 10.94 | | | | | | 6.13 | | | | | | 0.24 | | | | | | 0.14 | | | | | | 0.14 | | | | | | 1.84 | | | | | | 193,795 | | | | | | 43 | | |
| 12-31-15 | | | | | 13.12 | | | | | | 0.18• | | | | | | (0.10) | | | | | | 0.08 | | | | | | 0.45 | | | | | | 1.31 | | | | | | — | | | | | | 1.76 | | | | | | — | | | | | | 11.44 | | | | | | 0.19 | | | | | | 0.24 | | | | | | 0.15 | | | | | | 0.15 | | | | | | 1.44 | | | | | | 204,693 | | | | | | 42 | | |
| 12-31-14 | | | | | 13.34 | | | | | | 0.20• | | | | | | 0.55 | | | | | | 0.75 | | | | | | 0.31 | | | | | | 0.66 | | | | | | — | | | | | | 0.97 | | | | | | — | | | | | | 13.12 | | | | | | 5.82 | | | | | | 0.24 | | | | | | 0.13 | | | | | | 0.13 | | | | | | 1.47 | | | | | | 197,457 | | | | | | 46 | | |
| 12-31-13 | | | | | 11.73 | | | | | | 0.17• | | | | | | 1.75 | | | | | | 1.92 | | | | | | 0.31 | | | | | | — | | | | | | — | | | | | | 0.31 | | | | | | — | | | | | | 13.34 | | | | | | 16.54 | | | | | | 0.24 | | | | | | 0.12 | | | | | | 0.12 | | | | | | 1.39 | | | | | | 225,551 | | | | | | 72 | | |
| 12-31-12 | | | | | 10.61 | | | | | | 0.20• | | | | | | 1.25 | | | | | | 1.45 | | | | | | 0.33 | | | | | | — | | | | | | — | | | | | | 0.33 | | | | | | — | | | | | | 11.73 | | | | | | 13.83 | | | | | | 0.20 | | | | | | 0.12 | | | | | | 0.12 | | | | | | 1.75 | | | | | | 191,144 | | | | | | 65 | | |
| Class S | | | | | | | | | | | | | | | | | | | | | | | | | | | | | | | | | | | | | | | | | | | | | | | | | | | | | | | | | | | | | | | | | | | | | | | | | | | | | | | | | | | | | | | | | | | | | | | | | | | | | | | |
| 12-31-16 | | | | | 11.32 | | | | | | 0.17• | | | | | | 0.48 | | | | | | 0.65 | | | | | | 0.24 | | | | | | 0.91 | | | | | | — | | | | | | 1.15 | | | | | | — | | | | | | 10.82 | | | | | | 5.88 | | | | | | 0.49 | | | | | | 0.39 | | | | | | 0.39 | | | | | | 1.58 | | | | | | 376,403 | | | | | | 43 | | |
| 12-31-15 | | | | | 13.00 | | | | | | 0.14• | | | | | | (0.10) | | | | | | 0.04 | | | | | | 0.41 | | | | | | 1.31 | | | | | | — | | | | | | 1.72 | | | | | | — | | | | | | 11.32 | | | | | | (0.09) | | | | | | 0.49 | | | | | | 0.40 | | | | | | 0.40 | | | | | | 1.14 | | | | | | 418,555 | | | | | | 42 | | |
| 12-31-14 | | | | | 13.22 | | | | | | 0.16• | | | | | | 0.55 | | | | | | 0.71 | | | | | | 0.27 | | | | | | 0.66 | | | | | | — | | | | | | 0.93 | | | | | | — | | | | | | 13.00 | | | | | | 5.58 | | | | | | 0.49 | | | | | | 0.38 | | | | | | 0.38 | | | | | | 1.21 | | | | | | 486,302 | | | | | | 46 | | |
| 12-31-13 | | | | | 11.62 | | | | | | 0.14• | | | | | | 1.74 | | | | | | 1.88 | | | | | | 0.28 | | | | | | — | | | | | | — | | | | | | 0.28 | | | | | | — | | | | | | 13.22 | | | | | | 16.33 | | | | | | 0.49 | | | | | | 0.37 | | | | | | 0.37 | | | | | | 1.11 | | | | | | 530,013 | | | | | | 72 | | |
| 12-31-12 | | | | | 10.52 | | | | | | 0.17• | | | | | | 1.23 | | | | | | 1.40 | | | | | | 0.30 | | | | | | — | | | | | | — | | | | | | 0.30 | | | | | | — | | | | | | 11.62 | | | | | | 13.44 | | | | | | 0.45 | | | | | | 0.37 | | | | | | 0.37 | | | | | | 1.48 | | | | | | 512,357 | | | | | | 65 | | |
See Accompanying Notes to Financial Statements
Financial Highlights (continued)
| | | | | | | | | | Income
(loss) from
investment
operations | | | | | | | | | Less
Distributions | | | | | | | | | | | | | | | | | | | | | | | | | | | Ratios to average
net assets | | | Supplemental
Data | |
| | | | Net asset value, beginning of year
or period | | | Net investment income (loss) | | | Net realized and unrealized
gain (loss) | | | Total from investment operations | | | From net investment income | | | From net realized gains | | | From return of capital | | | Total distributions | | | Payment by affiliate | | | Net asset value, end of year
or period | | | Total Return(1) | | | Expenses before
reductions/additions(2)(3)(4) | | | Expenses net of fee waivers
and/or recoupments if any(2)(3)(4) | | | Expenses net of all
reductions/additions(2)(3)(4) | | | Net investment income (loss)(2)(3) | | | Net assets, end of year or period | | | Portfolio turnover rate | |
Year or
period ended | | | ($) | | | ($) | | | ($) | | | ($) | | | ($) | | | ($) | | | ($) | | | ($) | | | ($) | | | ($) | | | (%) | | | (%) | | | (%) | | | (%) | | | (%) | | | ($000’s) | | | (%) | |
| Voya Solution 2025 Portfolio (continued) | | | | | | | | | | | | | | | | | | | | | | | | | | | | | | | | | | | | | | | | | | | | | | | | | | | | | | | | | | | | | | | | | | | | | | | | | | | | | | | | | | | | | | | | | | | | | | | | | | | | | | | |
| Class S2 | | | | | | | | | | | | | | | | | | | | | | | | | | | | | | | | | | | | | | | | | | | | | | | | | | | | | | | | | | | | | | | | | | | | | | | | | | | | | | | | | | | | | | | | | | | | | | | | | | | | | | | |
| 12-31-16 | | | | | 11.03 | | | | | | 0.15• | | | | | | 0.47 | | | | | | 0.62 | | | | | | 0.22 | | | | | | 0.91 | | | | | | — | | | | | | 1.13 | | | | | | — | | | | | | 10.52 | | | | | | 5.75 | | | | | | 0.67 | | | | | | 0.54 | | | | | | 0.54 | | | | | | 1.39 | | | | | | 22,356 | | | | | | 43 | | |
| 12-31-15 | | | | | 12.70 | | | | | | 0.12• | | | | | | (0.10) | | | | | | 0.02 | | | | | | 0.38 | | | | | | 1.31 | | | | | | — | | | | | | 1.69 | | | | | | — | | | | | | 11.03 | | | | | | (0.23) | | | | | | 0.74 | | | | | | 0.55 | | | | | | 0.55 | | | | | | 0.98 | | | | | | 27,673 | | | | | | 42 | | |
| 12-31-14 | | | | | 12.93 | | | | | | 0.13• | | | | | | 0.55 | | | | | | 0.68 | | | | | | 0.25 | | | | | | 0.66 | | | | | | — | | | | | | 0.91 | | | | | | — | | | | | | 12.70 | | | | | | 5.40 | | | | | | 0.74 | | | | | | 0.53 | | | | | | 0.53 | | | | | | 1.03 | | | | | | 35,050 | | | | | | 46 | | |
| 12-31-13 | | | | | 11.38 | | | | | | 0.11• | | | | | | 1.70 | | | | | | 1.81 | | | | | | 0.26 | | | | | | — | | | | | | — | | | | | | 0.26 | | | | | | — | | | | | | 12.93 | | | | | | 16.08 | | | | | | 0.74 | | | | | | 0.52 | | | | | | 0.52 | | | | | | 0.93 | | | | | | 41,255 | | | | | | 72 | | |
| 12-31-12 | | | | | 10.32 | | | | | | 0.15• | | | | | | 1.21 | | | | | | 1.36 | | | | | | 0.30 | | | | | | — | | | | | | — | | | | | | 0.30 | | | | | | — | | | | | | 11.38 | | | | | | 13.33 | | | | | | 0.70 | | | | | | 0.52 | | | | | | 0.52 | | | | | | 1.40 | | | | | | 43,134 | | | | | | 65 | | |
| Class T | | | | | | | | | | | | | | | | | | | | | | | | | | | | | | | | | | | | | | | | | | | | | | | | | | | | | | | | | | | | | | | | | | | | | | | | | | | | | | | | | | | | | | | | | | | | | | | | | | | | | | | |
| 12-31-16 | | | | | 11.58 | | | | | | 0.14 | | | | | | 0.48 | | | | | | 0.62 | | | | | | 0.19 | | | | | | 0.91 | | | | | | — | | | | | | 1.10 | | | | | | — | | | | | | 11.10 | | | | | | 5.43 | | | | | | 0.96 | | | | | | 0.84 | | | | | | 0.84 | | | | | | 1.14 | | | | | | 806 | | | | | | 43 | | |
| 12-31-15 | | | | | 13.07 | | | | | | 0.09• | | | | | | (0.12) | | | | | | (0.03) | | | | | | 0.15 | | | | | | 1.31 | | | | | | — | | | | | | 1.46 | | | | | | — | | | | | | 11.58 | | | | | | (0.56) | | | | | | 0.99 | | | | | | 0.85 | | | | | | 0.85 | | | | | | 0.70 | | | | | | 837 | | | | | | 42 | | |
| 12-31-14 | | | | | 13.29 | | | | | | 0.06• | | | | | | 0.60 | | | | | | 0.66 | | | | | | 0.22 | | | | | | 0.66 | | | | | | — | | | | | | 0.88 | | | | | | — | | | | | | 13.07 | | | | | | 5.14 | | | | | | 0.99 | | | | | | 0.83 | | | | | | 0.83 | | | | | | 0.45 | | | | | | 869 | | | | | | 46 | | |
| 12-31-13 | | | | | 11.68 | | | | | | 0.08• | | | | | | 1.75 | | | | | | 1.83 | | | | | | 0.22 | | | | | | — | | | | | | — | | | | | | 0.22 | | | | | | — | | | | | | 13.29 | | | | | | 15.75 | | | | | | 0.99 | | | | | | 0.82 | | | | | | 0.82 | | | | | | 0.66 | | | | | | 2,992 | | | | | | 72 | | |
| 12-31-12 | | | | | 10.49 | | | | | | 0.11• | | | | | | 1.24 | | | | | | 1.35 | | | | | | 0.16 | | | | | | — | | | | | | — | | | | | | 0.16 | | | | | | — | | | | | | 11.68 | | | | | | 12.95 | | | | | | 0.95 | | | | | | 0.82 | | | | | | 0.82 | | | | | | 0.93 | | | | | | 2,737 | | | | | | 65 | | |
| Voya Solution 2030 Portfolio | | | | | | | | | | | | | | | | | | | | | | | | | | | | | | | | | | | | | | | | | | | | | | | | | | | | | | | | | | | | | | | | | | | | | | | | | | | | | | | | | | | | | | | | | | | | | | | | | | | | | | | |
| Class ADV | | | | | | | | | | | | | | | | | | | | | | | | | | | | | | | | | | | | | | | | | | | | | | | | | | | | | | | | | | | | | | | | | | | | | | | | | | | | | | | | | | | | | | | | | | | | | | | | | | | | | | | |
| 12-31-16 | | | | | 13.24 | | | | | | 0.23• | | | | | | 0.57 | | | | | | 0.80 | | | | | | 0.04 | | | | | | 0.06 | | | | | | — | | | | | | 0.10 | | | | | | — | | | | | | 13.94 | | | | | | 6.09 | | | | | | 0.95 | | | | | | 0.66 | | | | | | 0.66 | | | | | | 1.71 | | | | | | 6,623 | | | | | | 67 | | |
| 12-31-15 | | | | | 13.94 | | | | | | 0.36• | | | | | | (0.31) | | | | | | 0.05 | | | | | | 0.19 | | | | | | 0.56 | | | | | | — | | | | | | 0.75 | | | | | | — | | | | | | 13.24 | | | | | | 0.18 | | | | | | 2.57 | | | | | | 0.66 | | | | | | 0.66 | | | | | | 2.65 | | | | | | 1,569 | | | | | | 69 | | |
| 12-31-14 | | | | | 13.23 | | | | | | 0.14• | | | | | | 0.69 | | | | | | 0.83 | | | | | | 0.02 | | | | | | 0.10 | | | | | | — | | | | | | 0.12 | | | | | | — | | | | | | 13.94 | | | | | | 6.30 | | | | | | 8.42 | | | | | | 0.66 | | | | | | 0.66 | | | | | | 0.98 | | | | | | 157 | | | | | | 136 | | |
| 12-31-13 | | | | | 12.12 | | | | | | 0.11 | | | | | | 2.06 | | | | | | 2.17 | | | | | | 0.24 | | | | | | 0.84 | | | | | | — | | | | | | 1.08 | | | | | | 0.02 | | | | | | 13.23 | | | | | | 18.66(b) | | | | | | 85.63 | | | | | | 0.64 | | | | | | 0.64 | | | | | | 0.86 | | | | | | 4 | | | | | | 73 | | |
| 12-31-12 | | | | | 11.06 | | | | | | 0.11 | | | | | | 1.38 | | | | | | 1.49 | | | | | | 0.10 | | | | | | 0.33 | | | | | | — | | | | | | 0.43 | | | | | | — | | | | | | 12.12 | | | | | | 13.48 | | | | | | 42.34 | | | | | | 0.62 | | | | | | 0.62 | | | | | | 0.96 | | | | | | 4 | | | | | | 76 | | |
| Class I | | | | | | | | | | | | | | | | | | | | | | | | | | | | | | | | | | | | | | | | | | | | | | | | | | | | | | | | | | | | | | | | | | | | | | | | | | | | | | | | | | | | | | | | | | | | | | | | | | | | | | | |
| 12-31-16 | | | | | 13.46 | | | | | | 0.35• | | | | | | 0.53 | | | | | | 0.88 | | | | | | 0.05 | | | | | | 0.06 | | | | | | — | | | | | | 0.11 | | | | | | — | | | | | | 14.23 | | | | | | 6.55 | | | | | | 0.45 | | | | | | 0.16 | | | | | | 0.16 | | | | | | 2.54 | | | | | | 3,247 | | | | | | 67 | | |
| 12-31-15 | | | | | 14.14 | | | | | | 0.39• | | | | | | (0.27) | | | | | | 0.12 | | | | | | 0.24 | | | | | | 0.56 | | | | | | — | | | | | | 0.80 | | | | | | — | | | | | | 13.46 | | | | | | 0.66 | | | | | | 2.07 | | | | | | 0.16 | | | | | | 0.16 | | | | | | 2.90 | | | | | | 861 | | | | | | 69 | | |
| 12-31-14 | | | | | 13.32 | | | | | | 0.20 | | | | | | 0.72 | | | | | | 0.92 | | | | | | — | | | | | | 0.10 | | | | | | — | | | | | | 0.10 | | | | | | — | | | | | | 14.14 | | | | | | 6.94 | | | | | | 7.92 | | | | | | 0.16 | | | | | | 0.16 | | | | | | 1.50 | | | | | | 4 | | | | | | 136 | | |
| 12-31-13 | | | | | 12.17 | | | | | | 0.18 | | | | | | 2.08 | | | | | | 2.26 | | | | | | 0.29 | | | | | | 0.84 | | | | | | — | | | | | | 1.13 | | | | | | 0.02 | | | | | | 13.32 | | | | | | 19.38(b) | | | | | | 85.13 | | | | | | 0.14 | | | | | | 0.14 | | | | | | 1.36 | | | | | | 4 | | | | | | 73 | | |
| 12-31-12 | | | | | 11.07 | | | | | | 0.18 | | | | | | 1.37 | | | | | | 1.55 | | | | | | 0.12 | | | | | | 0.33 | | | | | | — | | | | | | 0.45 | | | | | | — | | | | | | 12.17 | | | | | | 13.94 | | | | | | 41.84 | | | | | | 0.12 | | | | | | 0.12 | | | | | | 1.48 | | | | | | 4 | | | | | | 76 | | |
| Class S | | | | | | | | | | | | | | | | | | | | | | | | | | | | | | | | | | | | | | | | | | | | | | | | | | | | | | | | | | | | | | | | | | | | | | | | | | | | | | | | | | | | | | | | | | | | | | | | | | | | | | | |
| 12-31-16 | | | | | 13.44 | | | | | | 0.27• | | | | | | 0.58 | | | | | | 0.85 | | | | | | 0.05 | | | | | | 0.06 | | | | | | — | | | | | | 0.11 | | | | | | — | | | | | | 14.18 | | | | | | 6.32 | | | | | | 0.70 | | | | | | 0.41 | | | | | | 0.41 | | | | | | 2.00 | | | | | | 4,770 | | | | | | 67 | | |
| 12-31-15 | | | | | 14.07 | | | | | | 0.49• | | | | | | (0.39) | | | | | | 0.10 | | | | | | 0.17 | | | | | | 0.56 | | | | | | — | | | | | | 0.73 | | | | | | — | | | | | | 13.44 | | | | | | 0.52 | | | | | | 2.32 | | | | | | 0.41 | | | | | | 0.41 | | | | | | 3.69 | | | | | | 1,454 | | | | | | 69 | | |
| 12-31-14 | | | | | 13.32 | | | | | | 0.17 | | | | | | 0.68 | | | | | | 0.85 | | | | | | — | | | | | | 0.10 | | | | | | — | | | | | | 0.10 | | | | | | — | | | | | | 14.07 | | | | | | 6.41 | | | | | | 8.17 | | | | | | 0.41 | | | | | | 0.41 | | | | | | 1.25 | | | | | | 4 | | | | | | 136 | | |
| 12-31-13 | | | | | 12.13 | | | | | | 0.14 | | | | | | 2.06 | | | | | | 2.20 | | | | | | 0.19 | | | | | | 0.84 | | | | | | — | | | | | | 1.03 | | | | | | 0.02 | | | | | | 13.32 | | | | | | 18.92(b) | | | | | | 85.38 | | | | | | 0.39 | | | | | | 0.39 | | | | | | 1.09 | | | | | | 4 | | | | | | 73 | | |
| 12-31-12 | | | | | 11.06 | | | | | | 0.14 | | | | | | 1.37 | | | | | | 1.51 | | | | | | 0.11 | | | | | | 0.33 | | | | | | — | | | | | | 0.44 | | | | | | — | | | | | | 12.13 | | | | | | 13.62 | | | | | | 42.09 | | | | | | 0.37 | | | | | | 0.37 | | | | | | 1.21 | | | | | | 4 | | | | | | 76 | | |
| Class S2 | | | | | | | | | | | | | | | | | | | | | | | | | | | | | | | | | | | | | | | | | | | | | | | | | | | | | | | | | | | | | | | | | | | | | | | | | | | | | | | | | | | | | | | | | | | | | | | | | | | | | | | |
| 12-31-16 | | | | | 13.30 | | | | | | 0.18• | | | | | | 0.64 | | | | | | 0.82 | | | | | | 0.05 | | | | | | 0.06 | | | | | | — | | | | | | 0.11 | | | | | | — | | | | | | 14.01 | | | | | | 6.17 | | | | | | 0.88 | | | | | | 0.56 | | | | | | 0.56 | | | | | | 1.30 | | | �� | | | 255 | | | | | | 67 | | |
| 12-31-15 | | | | | 13.96 | | | | | | 0.28• | | | | | | (0.22) | | | | | | 0.06 | | | | | | 0.16 | | | | | | 0.56 | | | | | | — | | | | | | 0.72 | | | | | | — | | | | | | 13.30 | | | | | | 0.23 | | | | | | 2.57 | | | | | | 0.56 | | | | | | 0.56 | | | | | | 2.01 | | | | | | 41 | | | | | | 69 | | |
| 12-31-14 | | | | | 13.22 | | | | | | 0.15 | | | | | | 0.69 | | | | | | 0.84 | | | | | | — | | | | | | 0.10 | | | | | | — | | | | | | 0.10 | | | | | | — | | | | | | 13.96 | | | | | | 6.38 | | | | | | 8.42 | | | | | | 0.56 | | | | | | 0.56 | | | | | | 1.10 | | | | | | 4 | | | | | | 136 | | |
| 12-31-13 | | | | | 12.13 | | | | | | 0.12 | | | | | | 2.04 | | | | | | 2.16 | | | | | | 0.25 | | | | | | 0.84 | | | | | | — | | | | | | 1.09 | | | | | | 0.02 | | | | | | 13.22 | | | | | | 18.57(b) | | | | | | 85.63 | | | | | | 0.54 | | | | | | 0.54 | | | | | | 0.96 | | | | | | 4 | | | | | | 73 | | |
| 12-31-12 | | | | | 11.06 | | | | | | 0.13 | | | | | | 1.38 | | | | | | 1.51 | | | | | | 0.11 | | | | | | 0.33 | | | | | | — | | | | | | 0.44 | | | | | | — | | | | | | 12.13 | | | | | | 13.60 | | | | | | 42.34 | | | | | | 0.52 | | | | | | 0.52 | | | | | | 1.06 | | | | | | 4 | | | | | | 76 | | |
See Accompanying Notes to Financial Statements
Financial Highlights (continued)
| | | | | | | | | | Income
(loss) from
investment
operations | | | | | | | | | Less
Distributions | | | | | | | | | | | | | | | | | | | | | | | | | | | Ratios to average
net assets | | | Supplemental
Data | |
| | | | Net asset value, beginning of year
or period | | | Net investment income (loss) | | | Net realized and unrealized
gain (loss) | | | Total from investment operations | | | From net investment income | | | From net realized gains | | | From return of capital | | | Total distributions | | | Payment by affiliate | | | Net asset value, end of year
or period | | | Total Return(1) | | | Expenses before
reductions/additions(2)(3)(4) | | | Expenses net of fee waivers
and/or recoupments if any(2)(3)(4) | | | Expenses net of all
reductions/additions(2)(3)(4) | | | Net investment income (loss)(2)(3) | | | Net assets, end of year or period | | | Portfolio turnover rate | |
Year or
period ended | | | ($) | | | ($) | | | ($) | | | ($) | | | ($) | | | ($) | | | ($) | | | ($) | | | ($) | | | ($) | | | (%) | | | (%) | | | (%) | | | (%) | | | (%) | | | ($000’s) | | | (%) | |
| Voya Solution 2030 Portfolio (continued) | | | | | | | | | | | | | | | | | | | | | | | | | | | | | | | | | | | | | | | | | | | | | | | | | | | | | | | | | | | | | | | | | | | | | | | | | | | | | | | | | | | | | | | | | | | | | | | | | | | | | | | |
| Class T | | | | | | | | | | | | | | | | | | | | | | | | | | | | | | | | | | | | | | | | | | | | | | | | | | | | | | | | | | | | | | | | | | | | | | | | | | | | | | | | | | | | | | | | | | | | | | | | | | | | | | | |
| 12-31-16 | | | | | 13.27 | | | | | | 0.19• | | | | | | 0.58 | | | | | | 0.77 | | | | | | — | | | | | | 0.06 | | | | | | — | | | | | | 0.06 | | | | | | — | | | | | | 13.98 | | | | | | 5.81 | | | | | | 1.17 | | | | | | 0.86 | | | | | | 0.86 | | | | | | 1.43 | | | | | | 11 | | | | | | 67 | | |
| 12-31-15 | | | | | 13.97 | | | | | | 0.13 | | | | | | (0.14) | | | | | | (0.01) | | | | | | 0.13 | | | | | | 0.56 | | | | | | — | | | | | | 0.69 | | | | | | — | | | | | | 13.27 | | | | | | (0.26) | | | | | | 2.82 | | | | | | 0.86 | | | | | | 0.86 | | | | | | 0.92 | | | | | | 4 | | | | | | 69 | | |
| 12-31-14 | | | | | 13.25 | | | | | | 0.11 | | | | | | 0.71 | | | | | | 0.82 | | | | | | — | | | | | | 0.10 | | | | | | — | | | | | | 0.10 | | | | | | — | | | | | | 13.97 | | | | | | 6.22 | | | | | | 8.67 | | | | | | 0.86 | | | | | | 0.86 | | | | | | 0.80 | | | | | | 4 | | | | | | 136 | | |
| 12-31-13 | | | | | 12.09 | | | | | | 0.08 | | | | | | 2.11 | | | | | | 2.19 | | | | | | 0.21 | | | | | | 0.84 | | | | | | — | | | | | | 1.05 | | | | | | 0.02 | | | | | | 13.25 | | | | | | 18.89(b) | | | | | | 85.88 | | | | | | 0.84 | | | | | | 0.84 | | | | | | 0.66 | | | | | | 4 | | | | | | 73 | | |
| 12-31-12 | | | | | 11.05 | | | | | | 0.09 | | | | | | 1.38 | | | | | | 1.47 | | | | | | 0.10 | | | | | | 0.33 | | | | | | — | | | | | | 0.43 | | | | | | — | | | | | | 12.09 | | | | | | 13.25 | | | | | | 42.59 | | | | | | 0.82 | | | | | | 0.82 | | | | | | 0.74 | | | | | | 4 | | | | | | 76 | | |
| Voya Solution 2035 Portfolio | | | | | | | | | | | | | | | | | | | | | | | | | | | | | | | | | | | | | | | | | | | | | | | | | | | | | | | | | | | | | | | | | | | | | | | | | | | | | | | | | | | | | | | | | | | | | | | | | | | | | | | |
| Class ADV | | | | | | | | | | | | | | | | | | | | | | | | | | | | | | | | | | | | | | | | | | | | | | | | | | | | | | | | | | | | | | | | | | | | | | | | | | | | | | | | | | | | | | | | | | | | | | | | | | | | | | | |
| 12-31-16 | | | | | 11.27 | | | | | | 0.12• | | | | | | 0.53 | | | | | | 0.65 | | | | | | 0.21 | | | | | | 1.00 | | | | | | — | | | | | | 1.21 | | | | | | — | | | | | | 10.71 | | | | | | 6.00 | | | | | | 0.74 | | | | | | 0.66 | | | | | | 0.66 | | | | | | 1.11 | | | | | | 262,148 | | | | | | 44 | | |
| 12-31-15 | | | | | 13.22 | | | | | | 0.11• | | | | | | (0.13) | | | | | | (0.02) | | | | | | 0.38 | | | | | | 1.55 | | | | | | — | | | | | | 1.93 | | | | | | — | | | | | | 11.27 | | | | | | (0.77) | | | | | | 0.74 | | | | | | 0.67 | | | | | | 0.67 | | | | | | 0.84 | | | | | | 303,218 | | | | | | 46 | | |
| 12-31-14 | | | | | 13.97 | | | | | | 0.12• | | | | | | 0.61 | | | | | | 0.73 | | | | | | 0.26 | | | | | | 1.22 | | | | | | — | | | | | | 1.48 | | | | | | — | | | | | | 13.22 | | | | | | 5.38 | | | | | | 0.75 | | | | | | 0.66 | | | | | | 0.66 | | | | | | 0.84 | | | | | | 361,683 | | | | | | 59 | | |
| 12-31-13 | | | | | 11.82 | | | | | | 0.11• | | | | | | 2.25 | | | | | | 2.36 | | | | | | 0.21 | | | | | | — | | | | | | — | | | | | | 0.21 | | | | | | — | | | | | | 13.97 | | | | | | 20.09 | | | | | | 0.74 | | | | | | 0.63 | | | | | | 0.63 | | | | | | 0.82 | | | | | | 425,221 | | | | | | 74 | | |
| 12-31-12 | | | | | 10.48 | | | | | | 0.10• | | | | | | 1.45 | | | | | | 1.55 | | | | | | 0.21 | | | | | | — | | | | | | — | | | | | | 0.21 | | | | | | — | | | | | | 11.82 | | | | | | 14.89 | | | | | | 0.70 | | | | | | 0.62 | | | | | | 0.62 | | | | | | 0.86 | | | | | | 411,758 | | | | | | 58 | | |
| Class I | | | | | | | | | | | | | | | | | | | | | | | | | | | | | | | | | | | | | | | | | | | | | | | | | | | | | | | | | | | | | | | | | | | | | | | | | | | | | | | | | | | | | | | | | | | | | | | | | | | | | | | |
| 12-31-16 | | | | | 11.54 | | | | | | 0.19 | | | | | | 0.53 | | | | | | 0.72 | | | | | | 0.28 | | | | | | 1.00 | | | | | | — | | | | | | 1.28 | | | | | | — | | | | | | 10.98 | | | | | | 6.49 | | | | | | 0.24 | | | | | | 0.16 | | | | | | 0.16 | | | | | | 1.67 | | | | | | 210,863 | | | | | | 44 | | |
| 12-31-15 | | | | | 13.51 | | | | | | 0.18• | | | | | | (0.14) | | | | | | 0.04 | | | | | | 0.46 | | | | | | 1.55 | | | | | | — | | | | | | 2.01 | | | | | | — | | | | | | 11.54 | | | | | | (0.30) | | | | | | 0.24 | | | | | | 0.17 | | | | | | 0.17 | | | | | | 1.39 | | | | | | 218,051 | | | | | | 46 | | |
| 12-31-14 | | | | | 14.25 | | | | | | 0.20 | | | | | | 0.61 | | | | | | 0.81 | | | | | | 0.33 | | | | | | 1.22 | | | | | | — | | | | | | 1.55 | | | | | | — | | | | | | 13.51 | | | | | | 5.93 | | | | | | 0.25 | | | | | | 0.16 | | | | | | 0.16 | | | | | | 1.40 | | | | | | 214,675 | | | | | | 59 | | |
| 12-31-13 | | | | | 12.05 | | | | | | 0.18• | | | | | | 2.30 | | | | | | 2.48 | | | | | | 0.28 | | | | | | — | | | | | | — | | | | | | 0.28 | | | | | | — | | | | | | 14.25 | | | | | | 20.72 | | | | | | 0.24 | | | | | | 0.13 | | | | | | 0.13 | | | | | | 1.39 | | | | | | 208,709 | | | | | | 74 | | |
| 12-31-12 | | | | | 10.69 | | | | | | 0.16• | | | | | | 1.47 | | | | | | 1.63 | | | | | | 0.27 | | | | | | — | | | | | | — | | | | | | 0.27 | | | | | | — | | | | | | 12.05 | | | | | | 15.37 | | | | | | 0.20 | | | | | | 0.12 | | | | | | 0.12 | | | | | | 1.39 | | | | | | 168,154 | | | | | | 58 | | |
| Class S | | | | | | | | | | | | | | | | | | | | | | | | | | | | | | | | | | | | | | | | | | | | | | | | | | | | | | | | | | | | | | | | | | | | | | | | | | | | | | | | | | | | | | | | | | | | | | | | | | | | | | | |
| 12-31-16 | | | | | 11.43 | | | | | | 0.16• | | | | | | 0.53 | | | | | | 0.69 | | | | | | 0.25 | | | | | | 1.00 | | | | | | — | | | | | | 1.25 | | | | | | — | | | | | | 10.87 | | | | | | 6.23 | | | | | | 0.49 | | | | | | 0.41 | | | | | | 0.41 | | | | | | 1.41 | | | | | | 359,464 | | | | | | 44 | | |
| 12-31-15 | | | | | 13.39 | | | | | | 0.14• | | | | | | (0.13) | | | | | | 0.01 | | | | | | 0.42 | | | | | | 1.55 | | | | | | — | | | | | | 1.97 | | | | | | — | | | | | | 11.43 | | | | | | (0.48) | | | | | | 0.49 | | | | | | 0.42 | | | | | | 0.42 | | | | | | 1.10 | | | | | | 383,233 | | | | | | 46 | | |
| 12-31-14 | | | | | 14.13 | | | | | | 0.16• | | | | | | 0.61 | | | | | | 0.77 | | | | | | 0.29 | | | | | | 1.22 | | | | | | — | | | | | | 1.51 | | | | | | — | | | | | | 13.39 | | | | | | 5.68 | | | | | | 0.50 | | | | | | 0.41 | | | | | | 0.41 | | | | | | 1.14 | | | | | | 432,573 | | | | | | 59 | | |
| 12-31-13 | | | | | 11.96 | | | | | | 0.14• | | | | | | 2.28 | | | | | | 2.42 | | | | | | 0.25 | | | | | | — | | | | | | — | | | | | | 0.25 | | | | | | — | | | | | | 14.13 | | | | | | 20.35 | | | | | | 0.49 | | | | | | 0.38 | | | | | | 0.38 | | | | | | 1.08 | | | | | | 485,103 | | | | | | 74 | | |
| 12-31-12 | | | | | 10.61 | | | | | | 0.13• | | | | | | 1.46 | | | | | | 1.59 | | | | | | 0.24 | | | | | | — | | | | | | — | | | | | | 0.24 | | | | | | — | | | | | | 11.96 | | | | | | 15.09 | | | | | | 0.45 | | | | | | 0.37 | | | | | | 0.37 | | | | | | 1.15 | | | | | | 456,581 | | | | | | 58 | | |
| Class S2 | | | | | | | | | | | | | | | | | | | | | | | | | | | | | | | | | | | | | | | | | | | | | | | | | | | | | | | | | | | | | | | | | | | | | | | | | | | | | | | | | | | | | | | | | | | | | | | | | | | | | | | |
| 12-31-16 | | | | | 11.07 | | | | | | 0.14 | | | | | | 0.51 | | | | | | 0.65 | | | | | | 0.23 | | | | | | 1.00 | | | | | | — | | | | | | 1.23 | | | | | | — | | | | | | 10.49 | | | | | | 6.09 | | | | | | 0.67 | | | | | | 0.56 | | | | | | 0.56 | | | | | | 1.24 | | | | | | 20,809 | | | | | | 44 | | |
| 12-31-15 | | | | | 13.01 | | | | | | 0.11• | | | | | | (0.11) | | | | | | 0.00* | | | | | | 0.39 | | | | | | 1.55 | | | | | | — | | | | | | 1.94 | | | | | | — | | | | | | 11.07 | | | | | | (0.62) | | | | | | 0.74 | | | | | | 0.57 | | | | | | 0.57 | | | | | | 0.90 | | | | | | 22,289 | | | | | | 46 | | |
| 12-31-14 | | | | | 13.77 | | | | | | 0.13• | | | | | | 0.60 | | | | | | 0.73 | | | | | | 0.27 | | | | | | 1.22 | | | | | | — | | | | | | 1.49 | | | | | | — | | | | | | 13.01 | | | | | | 5.50 | | | | | | 0.75 | | | | | | 0.56 | | | | | | 0.56 | | | | | | 0.95 | | | | | | 31,331 | | | | | | 59 | | |
| 12-31-13 | | | | | 11.66 | | | | | | 0.11• | | | | | | 2.22 | | | | | | 2.33 | | | | | | 0.22 | | | | | | — | | | | | | — | | | | | | 0.22 | | | | | | — | | | | | | 13.77 | | | | | | 20.17 | | | | | | 0.74 | | | | | | 0.53 | | | | | | 0.53 | | | | | | 0.88 | | | | | | 34,588 | | | | | | 74 | | |
| 12-31-12 | | | | | 10.36 | | | | | | 0.12• | | | | | | 1.42 | | | | | | 1.54 | | | | | | 0.24 | | | | | | — | | | | | | — | | | | | | 0.24 | | | | | | — | | | | | | 11.66 | | | | | | 14.97 | | | | | | 0.70 | | | | | | 0.52 | | | | | | 0.52 | | | | | | 1.07 | | | | | | 36,830 | | | | | | 58 | | |
| Class T | | | | | | | | | | | | | | | | | | | | | | | | | | | | | | | | | | | | | | | | | | | | | | | | | | | | | | | | | | | | | | | | | | | | | | | | | | | | | | | | | | | | | | | | | | | | | | | | | | | | | | | |
| 12-31-16 | | | | | 11.65 | | | | | | 0.09• | | | | | | 0.56 | | | | | | 0.65 | | | | | | 0.16 | | | | | | 1.00 | | | | | | — | | | | | | 1.16 | | | | | | — | | | | | | 11.14 | | | | | | 5.73 | | | | | | 0.96 | | | | | | 0.86 | | | | | | 0.86 | | | | | | 0.83 | | | | | | 624 | | | | | | 44 | | |
| 12-31-15 | | | | | 13.50 | | | | | | 0.09• | | | | | | (0.15) | | | | | | (0.06) | | | | | | 0.24 | | | | | | 1.55 | | | | | | — | | | | | | 1.79 | | | | | | — | | | | | | 11.65 | | | | | | (1.00) | | | | | | 0.99 | | | | | | 0.87 | | | | | | 0.87 | | | | | | 0.69 | | | | | | 887 | | | | | | 46 | | |
| 12-31-14 | | | | | 14.22 | | | | | | 0.05• | | | | | | 0.67 | | | | | | 0.72 | | | | | | 0.22 | | | | | | 1.22 | | | | | | — | | | | | | 1.44 | | | | | | — | | | | | | 13.50 | | | | | | 5.26 | | | | | | 1.00 | | | | | | 0.86 | | | | | | 0.86 | | | | | | 0.32 | | | | | | 864 | | | | | | 59 | | |
| 12-31-13 | | | | | 12.02 | | | | | | 0.06• | | | | | | 2.31 | | | | | | 2.37 | | | | | | 0.17 | | | | | | — | | | | | | — | | | | | | 0.17 | | | | | | — | | | | | | 14.22 | | | | | | 19.85 | | | | | | 0.99 | | | | | | 0.83 | | | | | | 0.83 | | | | | | 0.48 | | | | | | 1,898 | | | | | | 74 | | |
| 12-31-12 | | | | | 10.63 | | | | | | 0.07• | | | | | | 1.47 | | | | | | 1.54 | | | | | | 0.15 | | | | | | — | | | | | | — | | | | | | 0.15 | | | | | | — | | | | | | 12.02 | | | | | | 14.59 | | | | | | 0.95 | | | | | | 0.82 | | | | | | 0.82 | | | | | | 0.61 | | | | | | 2,561 | | | | | | 58 | | |
See Accompanying Notes to Financial Statements
Financial Highlights (continued)
| | | | | | | | | | Income
(loss) from
investment
operations | | | | | | | | | Less
Distributions | | | | | | | | | | | | | | | | | | | | | | | | | | | Ratios to average
net assets | | | Supplemental
Data | |
| | | | Net asset value, beginning of year
or period | | | Net investment income (loss) | | | Net realized and unrealized
gain (loss) | | | Total from investment operations | | | From net investment income | | | From net realized gains | | | From return of capital | | | Total distributions | | | Payment by affiliate | | | Net asset value, end of year
or period | | | Total Return(1) | | | Expenses before
reductions/additions(2)(3)(4) | | | Expenses net of fee waivers
and/or recoupments if any(2)(3)(4) | | | Expenses net of all
reductions/additions(2)(3)(4) | | | Net investment income (loss)(2)(3) | | | Net assets, end of year or period | | | Portfolio turnover rate | |
Year or
period ended | | | ($) | | | ($) | | | ($) | | | ($) | | | ($) | | | ($) | | | ($) | | | ($) | | | ($) | | | ($) | | | (%) | | | (%) | | | (%) | | | (%) | | | (%) | | | ($000’s) | | | (%) | |
| Voya Solution 2040 Portfolio | | | | | | | | | | | | | | | | | | | | | | | | | | | | | | | | | | | | | | | | | | | | | | | | | | | | | | | | | | | | | | | | | | | | | | | | | | | | | | | | | | | | | | | | | | | | | | | | | | | | | | | |
| Class ADV | | | | | | | | | | | | | | | | | | | | | | | | | | | | | | | | | | | | | | | | | | | | | | | | | | | | | | | | | | | | | | | | | | | | | | | | | | | | | | | | | | | | | | | | | | | | | | | | | | | | | | | |
| 12-31-16 | | | | | 13.84 | | | | | | 0.19• | | | | | | 0.71 | | | | | | 0.90 | | | | | | 0.06 | | | | | | 0.13 | | | | | | — | | | | | | 0.19 | | | | | | — | | | | | | 14.55 | | | | | | 6.48 | | | | | | 1.03 | | | | | | 0.66 | | | | | | 0.66 | | | | | | 1.34 | | | | | | 4,897 | | | | | | 72 | | |
| 12-31-15 | | | | | 14.89 | | | | | | 0.25• | | | | | | (0.26) | | | | | | (0.01) | | | | | | 0.35 | | | | | | 0.69 | | | | | | — | | | | | | 1.04 | | | | | | — | | | | | | 13.84 | | | | | | (0.33) | | | | | | 2.07 | | | | | | 0.67 | | | | | | 0.67 | | | | | | 1.72 | | | | | | 2,229 | | | | | | 108 | | |
| 12-31-14 | | | | | 14.04 | | | | | | 0.18• | | | | | | 0.73 | | | | | | 0.91 | | | | | | 0.01 | | | | | | 0.05 | | | | | | — | | | | | | 0.06 | | | | | | — | | | | | | 14.89 | | | | | | 6.51 | | | | | | 3.66 | | | | | | 0.67 | | | | | | 0.67 | | | | | | 1.23 | | | | | | 701 | | | | | | 80 | | |
| 12-31-13 | | | | | 12.45 | | | | | | 0.08 | | | | | | 2.58 | | | | | | 2.66 | | | | | | 0.21 | | | | | | 0.89 | | | | | | — | | | | | | 1.10 | | | | | | 0.03 | | | | | | 14.04 | | | | | | 22.31(c) | | | | | | 84.89 | | | | | | 0.64 | | | | | | 0.64 | | | | | | 0.63 | | | | | | 4 | | | | | | 67 | | |
| 12-31-12 | | | | | 11.23 | | | | | | 0.08 | | | | | | 1.57 | | | | | | 1.65 | | | | | | 0.09 | | | | | | 0.34 | | | | | | — | | | | | | 0.43 | | | | | | — | | | | | | 12.45 | | | | | | 14.70 | | | | | | 44.95 | | | | | | 0.62 | | | | | | 0.62 | | | | | | 0.63 | | | | | | 4 | | | | | | 64 | | |
| Class I | | | | | | | | | | | | | | | | | | | | | | | | | | | | | | | | | | | | | | | | | | | | | | | | | | | | | | | | | | | | | | | | | | | | | | | | | | | | | | | | | | | | | | | | | | | | | | | | | | | | | | | |
| 12-31-16 | | | | | 14.07 | | | | | | 0.31• | | | | | | 0.68 | | | | | | 0.99 | | | | | | 0.07 | | | | | | 0.13 | | | | | | — | | | | | | 0.20 | | | | | | — | | | | | | 14.86 | | | | | | 7.06 | | | | | | 0.53 | | | | | | 0.16 | | | | | | 0.16 | | | | | | 2.14 | | | | | | 2,887 | | | | | | 72 | | |
| 12-31-15 | | | | | 15.08 | | | | | | 0.43• | | | | | | (0.36) | | | | | | 0.07 | | | | | | 0.39 | | | | | | 0.69 | | | | | | — | | | | | | 1.08 | | | | | | — | | | | | | 14.07 | | | | | | 0.22 | | | | | | 1.57 | | | | | | 0.17 | | | | | | 0.17 | | | | | | 3.06 | | | | | | 487 | | | | | | 108 | | |
| 12-31-14 | | | | | 14.14 | | | | | | 0.17 | | | | | | 0.82 | | | | | | 0.99 | | | | | | — | | | | | | 0.05 | | | | | | — | | | | | | 0.05 | | | | | | — | | | | | | 15.08 | | | | | | 7.04 | | | | | | 3.16 | | | | | | 0.17 | | | | | | 0.17 | | | | | | 1.14 | | | | | | 5 | | | | | | 80 | | |
| 12-31-13 | | | | | 12.52 | | | | | | 0.15 | | | | | | 2.60 | | | | | | 2.75 | | | | | | 0.27 | | | | | | 0.89 | | | | | | — | | | | | | 1.16 | | | | | | 0.03 | | | | | | 14.14 | | | | | | 22.99(c) | | | | | | 84.39 | | | | | | 0.14 | | | | | | 0.14 | | | | | | 1.11 | | | | | | 4 | | | | | | 67 | | |
| 12-31-12 | | | | | 11.24 | | | | | | 0.14 | | | | | | 1.58 | | | | | | 1.72 | | | | | | 0.10 | | | | | | 0.34 | | | | | | — | | | | | | 0.44 | | | | | | — | | | | | | 12.52 | | | | | | 15.34 | | | | | | 44.45 | | | | | | 0.12 | | | | | | 0.12 | | | | | | 1.16 | | | | | | 4 | | | | | | 64 | | |
| Class S | | | | | | | | | | | | | | | | | | | | | | | | | | | | | | | | | | | | | | | | | | | | | | | | | | | | | | | | | | | | | | | | | | | | | | | | | | | | | | | | | | | | | | | | | | | | | | | | | | | | | | | |
| 12-31-16 | | | | | 14.03 | | | | | | 0.25• | | | | | | 0.70 | | | | | | 0.95 | | | | | | 0.07 | | | | | | 0.13 | | | | | | — | | | | | | 0.20 | | | | | | — | | | | | | 14.78 | | | | | | 6.79 | | | | | | 0.78 | | | | | | 0.41 | | | | | | 0.41 | | | | | | 1.75 | | | | | | 3,217 | | | | | | 72 | | |
| 12-31-15 | | | | | 15.02 | | | | | | 0.49• | | | | | | (0.45) | | | | | | 0.04 | | | | | | 0.34 | | | | | | 0.69 | | | | | | — | | | | | | 1.03 | | | | | | — | | | | | | 14.03 | | | | | | 0.03 | | | | | | 1.82 | | | | | | 0.42 | | | | | | 0.42 | | | | | | 3.50 | | | | | | 610 | | | | | | 108 | | |
| 12-31-14 | | | | | 14.15 | | | | | | 0.13 | | | | | | 0.79 | | | | | | 0.92 | | | | | | — | | | | | | 0.05 | | | | | | — | | | | | | 0.05 | | | | | | — | | | | | | 15.02 | | | | | | 6.54 | | | | | | 3.41 | | | | | | 0.42 | | | | | | 0.42 | | | | | | 0.90 | | | | | | 5 | | | | | | 80 | | |
| 12-31-13 | | | | | 12.48 | | | | | | 0.11 | | | | | | 2.59 | | | | | | 2.70 | | | | | | 0.17 | | | | | | 0.89 | | | | | | — | | | | | | 1.06 | | | | | | 0.03 | | | | | | 14.15 | | | | | | 22.57(c) | | | | | | 84.64 | | | | | | 0.39 | | | | | | 0.39 | | | | | | 0.84 | | | | | | 4 | | | | | | 67 | | |
| 12-31-12 | | | | | 11.23 | | | | | | 0.11 | | | | | | 1.58 | | | | | | 1.69 | | | | | | 0.10 | | | | | | 0.34 | | | | | | — | | | | | | 0.44 | | | | | | — | | | | | | 12.48 | | | | | | 15.02 | | | | | | 44.70 | | | | | | 0.37 | | | | | | 0.37 | | | | | | 0.92 | | | | | | 4 | | | | | | 64 | | |
| Class S2 | | | | | | | | | | | | | | | | | | | | | | | | | | | | | | | | | | | | | | | | | | | | | | | | | | | | | | | | | | | | | | | | | | | | | | | | | | | | | | | | | | | | | | | | | | | | | | | | | | | | | | | |
| 12-31-16 | | | | | 13.90 | | | | | | 0.20• | | | | | | 0.72 | | | | | | 0.92 | | | | | | 0.07 | | | | | | 0.13 | | | | | | — | | | | | | 0.20 | | | | | | — | | | | | | 14.62 | | | | | | 6.64 | | | | | | 0.96 | | | | | | 0.56 | | | | | | 0.56 | | | | | | 1.41 | | | | | | 183 | | | | | | 72 | | |
| 12-31-15 | | | | | 14.93 | | | | | | 0.22• | | | | | | (0.23) | | | | | | (0.01) | | | | | | 0.33 | | | | | | 0.69 | | | | | | — | | | | | | 1.02 | | | | | | — | | | | | | 13.90 | | | | | | (0.33) | | | | | | 2.07 | | | | | | 0.57 | | | | | | 0.57 | | | | | | 1.46 | | | | | | 9 | | | | | | 108 | | |
| 12-31-14 | | | | | 14.05 | | | | | | 0.11 | | | | | | 0.82 | | | | | | 0.93 | | | | | | — | | | | | | 0.05 | | | | | | — | | | | | | 0.05 | | | | | | — | | | | | | 14.93 | | | | | | 6.66 | | | | | | 3.66 | | | | | | 0.57 | | | | | | 0.57 | | | | | | 0.76 | | | | | | 5 | | | | | | 80 | | |
| 12-31-13 | | | | | 12.47 | | | | | | 0.10 | | | | | | 2.56 | | | | | | 2.66 | | | | | | 0.22 | | | | | | 0.89 | | | | | | — | | | | | | 1.11 | | | | | | 0.03 | | | | | | 14.05 | | | | | | 22.30(c) | | | | | | 84.89 | | | | | | 0.54 | | | | | | 0.54 | | | | | | 0.71 | | | | | | 4 | | | | | | 67 | | |
| 12-31-12 | | | | | 11.23 | | | | | | 0.09 | | | | | | 1.58 | | | | | | 1.67 | | | | | | 0.09 | | | | | | 0.34 | | | | | | — | | | | | | 0.43 | | | | | | — | | | | | | 12.47 | | | | | | 14.91 | | | | | | 44.95 | | | | | | 0.52 | | | | | | 0.52 | | | | | | 0.73 | | | | | | 4 | | | | | | 64 | | |
| Class T | | | | | | | | | | | | | | | | | | | | | | | | | | | | | | | | | | | | | | | | | | | | | | | | | | | | | | | | | | | | | | | | | | | | | | | | | | | | | | | | | | | | | | | | | | | | | | | | | | | | | | | |
| 12-31-16 | | | | | 13.81 | | | | | | 0.17• | | | | | | 0.70 | | | | | | 0.87 | | | | | | 0.02 | | | | | | 0.13 | | | | | | — | | | | | | 0.15 | | | | | | — | | | | | | 14.53 | | | | | | 6.27 | | | | | | 1.25 | | | | | | 0.86 | | | | | | 0.86 | | | | | | 1.19 | | | | | | 12 | | | | | | 72 | | |
| 12-31-15 | | | | | 14.85 | | | | | | 0.10• | | | | | | (0.16) | | | | | | (0.06) | | | | | | 0.29 | | | | | | 0.69 | | | | | | — | | | | | | 0.98 | | | | | | — | | | | | | 13.81 | | | | | | (0.66) | | | | | | 2.32 | | | | | | 0.87 | | | | | | 0.87 | | | | | | 0.67 | | | | | | 4 | | | | | | 108 | | |
| 12-31-14 | | | | | 14.01 | | | | | | 0.06 | | | | | | 0.83 | | | | | | 0.89 | | | | | | — | | | | | | 0.05 | | | | | | — | | | | | | 0.05 | | | | | | — | | | | | | 14.85 | | | | | | 6.40 | | | | | | 3.91 | | | | | | 0.87 | | | | | | 0.87 | | | | | | 0.45 | | | | | | 4 | | | | | | 80 | | |
| 12-31-13 | | | | | 12.43 | | | | | | 0.06 | | | | | | 2.56 | | | | | | 2.62 | | | | | | 0.18 | | | | | | 0.89 | | | | | | — | | | | | | 1.07 | | | | | | 0.03 | | | | | | 14.01 | | | | | | 22.06(c) | | | | | | 85.14 | | | | | | 0.84 | | | | | | 0.84 | | | | | | 0.41 | | | | | | 4 | | | | | | 67 | | |
| 12-31-12 | | | | | 11.22 | | | | | | 0.05 | | | | | | 1.58 | | | | | | 1.63 | | | | | | 0.08 | | | | | | 0.34 | | | | | | — | | | | | | 0.42 | | | | | | — | | | | | | 12.43 | | | | | | 14.56 | | | | | | 45.20 | | | | | | 0.82 | | | | | | 0.82 | | | | | | 0.43 | | | | | | 4 | | | | | | 64 | | |
| Voya Solution 2045 Portfolio | | | | | | | | | | | | | | | | | | | | | | | | | | | | | | | | | | | | | | | | | | | | | | | | | | | | | | | | | | | | | | | | | | | | | | | | | | | | | | | | | | | | | | | | | | | | | | | | | | | | | | | |
| Class ADV | | | | | | | | | | | | | | | | | | | | | | | | | | | | | | | | | | | | | | | | | | | | | | | | | | | | | | | | | | | | | | | | | | | | | | | | | | | | | | | | | | | | | | | | | | | | | | | | | | | | | | | |
| 12-31-16 | | | | | 11.15 | | | | | | 0.09• | | | | | | 0.56 | | | | | | 0.65 | | | | | | 0.15 | | | | | | 1.02 | | | | | | — | | | | | | 1.17 | | | | | | — | | | | | | 10.63 | | | | | | 6.16 | | | | | | 0.75 | | | | | | 0.68 | | | | | | 0.68 | | | | | | 0.86 | | | | | | 176,397 | | | | | | 45 | | |
| 12-31-15 | | | | | 13.60 | | | | | | 0.07• | | | | | | (0.11) | | | | | | (0.04) | | | | | | 0.38 | | | | | | 2.03 | | | | | | — | | | | | | 2.41 | | | | | | — | | | | | | 11.15 | | | | | | (1.15) | | | | | | 0.75 | | | | | | 0.69 | | | | | | 0.69 | | | | | | 0.58 | | | | | | 197,360 | | | | | | 41 | | |
| 12-31-14 | | | | | 14.55 | | | | | | 0.08• | | | | | | 0.73 | | | | | | 0.81 | | | | | | 0.22 | | | | | | 1.54 | | | | | | — | | | | | | 1.76 | | | | | | — | | | | | | 13.60 | | | | | | 5.84 | | | | | | 0.74 | | | | | | 0.68 | | | | | | 0.68 | | | | | | 0.55 | | | | | | 237,641 | | | | | | 58 | | |
| 12-31-13 | | | | | 11.98 | | | | | | 0.06• | | | | | | 2.69 | | | | | | 2.75 | | | | | | 0.18 | | | | | | — | | | | | | — | | | | | | 0.18 | | | | | | — | | | | | | 14.55 | | | | | | 23.09 | | | | | | 0.74 | | | | | | 0.63 | | | | | | 0.63 | | | | | | 0.49 | | | | | | 266,469 | | | | | | 72 | | |
| 12-31-12 | | | | | 10.56 | | | | | | 0.07• | | | | | | 1.53 | | | | | | 1.60 | | | | | | 0.18 | | | | | | — | | | | | | — | | | | | | 0.18 | | | | | | — | | | | | | 11.98 | | | | | | 15.23 | | | | | | 0.70 | | | | | | 0.62 | | | | | | 0.62 | | | | | | 0.60 | | | | | | 239,901 | | | | | | 50 | | |
See Accompanying Notes to Financial Statements
Financial Highlights (continued)
| | | | | | | | | | Income
(loss) from
investment
operations | | | | | | | | | Less
Distributions | | | | | | | | | | | | | | | | | | | | | | | | | | | Ratios to average
net assets | | | Supplemental
Data | |
| | | | Net asset value, beginning of year
or period | | | Net investment income (loss) | | | Net realized and unrealized
gain (loss) | | | Total from investment operations | | | From net investment income | | | From net realized gains | | | From return of capital | | | Total distributions | | | Payment by affiliate | | | Net asset value, end of year
or period | | | Total Return(1) | | | Expenses before
reductions/additions(2)(3)(4) | | | Expenses net of fee waivers
and/or recoupments if any(2)(3)(4) | | | Expenses net of all
reductions/additions(2)(3)(4) | | | Net investment income (loss)(2)(3) | | | Net assets, end of year or period | | | Portfolio turnover rate | |
Year or
period ended | | | ($) | | | ($) | | | ($) | | | ($) | | | ($) | | | ($) | | | ($) | | | ($) | | | ($) | | | ($) | | | (%) | | | (%) | | | (%) | | | (%) | | | (%) | | | ($000’s) | | | (%) | |
| Voya Solution 2045 Portfolio (continued) | | | | | | | | | | | | | | | | | | | | | | | | | | | | | | | | | | | | | | | | | | | | | | | | | | | | | | | | | | | | | | | | | | | | | | | | | | | | | | | | | | | | | | | | | | | | | | | | | | | | | | | |
| Class I | | | | | | | | | | | | | | | | | | | | | | | | | | | | | | | | | | | | | | | | | | | | | | | | | | | | | | | | | | | | | | | | | | | | | | | | | | | | | | | | | | | | | | | | | | | | | | | | | | | | | | | |
| 12-31-16 | | | | | 11.44 | | | | | | 0.15 | | | | | | 0.57 | | | | | | 0.72 | | | | | | 0.22 | | | | | | 1.02 | | | | | | — | | | | | | 1.24 | | | | | | — | | | | | | 10.92 | | | | | | 6.63 | | | | | | 0.25 | | | | | | 0.18 | | | | | | 0.18 | | | | | | 1.41 | | | | | | 171,475 | | | | | | 45 | | |
| 12-31-15 | | | | | 13.90 | | | | | | 0.15• | | | | | | (0.12) | | | | | | 0.03 | | | | | | 0.46 | | | | | | 2.03 | | | | | | — | | | | | | 2.49 | | | | | | — | | | | | | 11.44 | | | | | | (0.59) | | | | | | 0.25 | | | | | | 0.19 | | | | | | 0.19 | | | | | | 1.15 | | | | | | 169,325 | | | | | | 41 | | |
| 12-31-14 | | | | | 14.84 | | | | | | 0.15 | | | | | | 0.75 | | | | | | 0.90 | | | | | | 0.30 | | | | | | 1.54 | | | | | | — | | | | | | 1.84 | | | | | | — | | | | | | 13.90 | | | | | | 6.34 | | | | | | 0.24 | | | | | | 0.18 | | | | | | 0.18 | | | | | | 1.04 | | | | | | 161,654 | | | | | | 58 | | |
| 12-31-13 | | | | | 12.21 | | | | | | 0.14• | | | | | | 2.74 | | | | | | 2.88 | | | | | | 0.25 | | | | | | — | | | | | | — | | | | | | 0.25 | | | | | | — | | | | | | 14.84 | | | | | | 23.74 | | | | | | 0.24 | | | | | | 0.13 | | | | | | 0.13 | | | | | | 1.07 | | | | | | 158,048 | | | | | | 72 | | |
| 12-31-12 | | | | | 10.76 | | | | | | 0.11 | | | | | | 1.58 | | | | | | 1.69 | | | | | | 0.24 | | | | | | — | | | | | | — | | | | | | 0.24 | | | | | | — | | | | | | 12.21 | | | | | | 15.81 | | | | | | 0.20 | | | | | | 0.12 | | | | | | 0.12 | | | | | | 1.11 | | | | | | 124,166 | | | | | | 50 | | |
| Class S | | | | | | | | | | | | | | | | | | | | | | | | | | | | | | | | | | | | | | | | | | | | | | | | | | | | | | | | | | | | | | | | | | | | | | | | | | | | | | | | | | | | | | | | | | | | | | | | | | | | | | | |
| 12-31-16 | | | | | 11.29 | | | | | | 0.14 | | | | | | 0.55 | | | | | | 0.69 | | | | | | 0.19 | | | | | | 1.02 | | | | | | — | | | | | | 1.21 | | | | | | — | | | | | | 10.77 | | | | | | 6.40 | | | | | | 0.50 | | | | | | 0.43 | | | | | | 0.43 | | | | | | 1.14 | | | | | | 256,935 | | | | | | 45 | | |
| 12-31-15 | | | | | 13.76 | | | | | | 0.12 | | | | | | (0.14) | | | | | | (0.02) | | | | | | 0.42 | | | | | | 2.03 | | | | | | — | | | | | | 2.45 | | | | | | — | | | | | | 11.29 | | | | | | (0.95) | | | | | | 0.50 | | | | | | 0.44 | | | | | | 0.44 | | | | | | 0.85 | | | | | | 270,222 | | | | | | 41 | | |
| 12-31-14 | | | | | 14.70 | | | | | | 0.12• | | | | | | 0.73 | | | | | | 0.85 | | | | | | 0.25 | | | | | | 1.54 | | | | | | — | | | | | | 1.79 | | | | | | — | | | | | | 13.76 | | | | | | 6.10 | | | | | | 0.49 | | | | | | 0.43 | | | | | | 0.43 | | | | | | 0.83 | | | | | | 301,617 | | | | | | 58 | | |
| 12-31-13 | | | | | 12.10 | | | | | | 0.10• | | | | | | 2.72 | | | | | | 2.82 | | | | | | 0.22 | | | | | | — | | | | | | — | | | | | | 0.22 | | | | | | — | | | | | | 14.70 | | | | | | 23.45 | | | | | | 0.49 | | | | | | 0.38 | | | | | | 0.38 | | | | | | 0.74 | | | | | | 350,686 | | | | | | 72 | | |
| 12-31-12 | | | | | 10.67 | | | | | | 0.11 | | | | | | 1.53 | | | | | | 1.64 | | | | | | 0.21 | | | | | | — | | | | | | — | | | | | | 0.21 | | | | | | — | | | | | | 12.10 | | | | | | 15.47 | | | | | | 0.45 | | | | | | 0.37 | | | | | | 0.37 | | | | | | 0.91 | | | | | | 313,757 | | | | | | 50 | | |
| Class S2 | | | | | | | | | | | | | | | | | | | | | | | | | | | | | | | | | | | | | | | | | | | | | | | | | | | | | | | | | | | | | | | | | | | | | | | | | | | | | | | | | | | | | | | | | | | | | | | | | | | | | | | |
| 12-31-16 | | | | | 11.04 | | | | | | 0.11 | | | | | | 0.55 | | | | | | 0.66 | | | | | | 0.17 | | | | | | 1.02 | | | | | | — | | | | | | 1.19 | | | | | | — | | | | | | 10.51 | | | | | | 6.28 | | | | | | 0.68 | | | | | | 0.58 | | | | | | 0.58 | | | | | | 0.96 | | | | | | 12,687 | | | | | | 45 | | |
| 12-31-15 | | | | | 13.49 | | | | | | 0.08• | | | | | | (0.11) | | | | | | (0.03) | | | | | | 0.39 | | | | | | 2.03 | | | | | | — | | | | | | 2.42 | | | | | | — | | | | | | 11.04 | | | | | | (1.07) | | | | | | 0.75 | | | | | | 0.59 | | | | | | 0.59 | | | | | | 0.65 | | | | | | 13,402 | | | | | | 41 | | |
| 12-31-14 | | | | | 14.45 | | | | | | 0.09• | | | | | | 0.72 | | | | | | 0.81 | | | | | | 0.23 | | | | | | 1.54 | | | | | | — | | | | | | 1.77 | | | | | | — | | | | | | 13.49 | | | | | | 5.87 | | | | | | 0.74 | | | | | | 0.58 | | | | | | 0.58 | | | | | | 0.67 | | | | | | 19,353 | | | | | | 58 | | |
| 12-31-13 | | | | | 11.89 | | | | | | 0.07• | | | | | | 2.68 | | | | | | 2.75 | | | | | | 0.19 | | | | | | — | | | | | | — | �� | | | | | 0.19 | | | | | | — | | | | | | 14.45 | | | | | | 23.26 | | | | | | 0.74 | | | | | | 0.53 | | | | | | 0.53 | | | | | | 0.52 | | | | | | 19,968 | | | | | | 72 | | |
| 12-31-12 | | | | | 10.49 | | | | | | 0.09• | | | | | | 1.51 | | | | | | 1.60 | | | | | | 0.20 | | | | | | — | | | | | | — | | | | | | 0.20 | | | | | | — | | | | | | 11.89 | | | | | | 15.37 | | | | | | 0.70 | | | | | | 0.52 | | | | | | 0.52 | | | | | | 0.76 | | | | | | 22,458 | | | | | | 50 | | |
| Class T | | | | | | | | | | | | | | | | | | | | | | | | | | | | | | | | | | | | | | | | | | | | | | | | | | | | | | | | | | | | | | | | | | | | | | | | | | | | | | | | | | | | | | | | | | | | | | | | | | | | | | | |
| 12-31-16 | | | | | 11.46 | | | | | | 0.07 | | | | | | 0.58 | | | | | | 0.65 | | | | | | 0.14 | | | | | | 1.02 | | | | | | — | | | | | | 1.16 | | | | | | — | | | | | | 10.95 | | | | | | 5.94 | | | | | | 0.97 | | | | | | 0.88 | | | | | | 0.88 | | | | | | 0.70 | | | | | | 418 | | | | | | 45 | | |
| 12-31-15 | | | | | 13.77 | | | | | | 0.06• | | | | | | (0.13) | | | | | | (0.07) | | | | | | 0.21 | | | | | | 2.03 | | | | | | — | | | | | | 2.24 | | | | | | — | | | | | | 11.46 | | | | | | (1.31) | | | | | | 1.00 | | | | | | 0.89 | | | | | | 0.89 | | | | | | 0.44 | | | | | | 393 | | | | | | 41 | | |
| 12-31-14 | | | | | 14.73 | | | | | | (0.00)*• | | | | | | 0.78 | | | | | | 0.78 | | | | | | 0.20 | | | | | | 1.54 | | | | | | — | | | | | | 1.74 | | | | | | — | | | | | | 13.77 | | | | | | 5.53 | | | | | | 0.99 | | | | | | 0.88 | | | | | | 0.88 | | | | | | (0.00)* | | | | | | 376 | | | | | | 58 | | |
| 12-31-13 | | | | | 12.10 | | | | | | 0.04• | | | | | | 2.72 | | | | | | 2.76 | | | | | | 0.13 | | | | | | — | | | | | | — | | | | | | 0.13 | | | | ��� | | — | | | | | | 14.73 | | | | | | 22.93 | | | | | | 0.99 | | | | | | 0.83 | | | | | | 0.83 | | | | | | 0.27 | | | | | | 1,068 | | | | | | 72 | | |
| 12-31-12 | | | | | 10.63 | | | | | | 0.02• | | | | | | 1.57 | | | | | | 1.59 | | | | | | 0.12 | | | | | | — | | | | | | — | | | | | | 0.12 | | | | | | — | | | | | | 12.10 | | | | | | 14.98 | | | | | | 0.95 | | | | | | 0.82 | | | | | | 0.82 | | | | | | 0.21 | | | | | | 936 | | | | | | 50 | | |
| Voya Solution 2050 Portfolio | | | | | | | | | | | | | | | | | | | | | | | | | | | | | | | | | | | | | | | | | | | | | | | | | | | | | | | | | | | | | | | | | | | | | | | | | | | | | | | | | | | | | | | | | | | | | | | | | | | | | | | |
| Class ADV | | | | | | | | | | | | | | | | | | | | | | | | | | | | | | | | | | | | | | | | | | | | | | | | | | | | | | | | | | | | | | | | | | | | | | | | | | | | | | | | | | | | | | | | | | | | | | | | | | | | | | | |
| 12-31-16 | | | | | 13.86 | | | | | | 0.18• | | | | | | 0.68 | | | | | | 0.86 | | | | | | 0.04 | | | | | | 0.11 | | | | | | — | | | | | | 0.15 | | | | | | — | | | | | | 14.57 | | | | | | 6.27 | | | | | | 1.22 | | | | | | 0.68 | | | | | | 0.68 | | | | | | 1.26 | | | | | | 3,184 | | | | | | 70 | | |
| 12-31-15 | | | | | 14.95 | | | | | | 0.18• | | | | | | (0.19) | | | | | | (0.01) | | | | | | 0.35 | | | | | | 0.73 | | | | | | — | | | | | | 1.08 | | | | | | — | | | | | | 13.86 | | | | | | (0.33) | | | | | | 3.24 | | | | | | 0.69 | | | | | | 0.69 | | | | | | 1.22 | | | | | | 960 | | | | | | 67 | | |
| 12-31-14 | | | | | 14.16 | | | | | | 0.17• | | | | | | 0.74 | | | | | | 0.91 | | | | | | 0.01 | | | | | | 0.11 | | | | | | — | | | | | | 0.12 | | | | | | — | | | | | | 14.95 | | | | | | 6.49 | | | | | | 6.49 | | | | | | 0.68 | | | | | | 0.68 | | | | | | 1.15 | | | | | | 355 | | | | | | 51 | | |
| 12-31-13 | | | | | 12.44 | | | | | | 0.06 | | | | | | 2.70 | | | | | | 2.76 | | | | | | 0.19 | | | | | | 0.88 | | | | | | — | | | | | | 1.07 | | | | | | 0.03 | | | | | | 14.16 | | | | | | 23.18(d) | | | | | | 84.37 | | | | | | 0.64 | | | | | | 0.64 | | | | | | 0.48 | | | | | | 4 | | | | | | 65 | | |
| 12-31-12 | | | | | 11.23 | | | | | | 0.07 | | | | | | 1.59 | | | | | | 1.66 | | | | | | 0.09 | | | | | | 0.36 | | | | | | — | | | | | | 0.45 | | | | | | — | | | | | | 12.44 | | | | | | 14.78 | | | | | | 41.76 | | | | | | 0.62 | | | | | | 0.62 | | | | | | 0.56 | | | | | | 4 | | | | | | 59 | | |
| Class I | | | | | | | | | | | | | | | | | | | | | | | | | | | | | | | | | | | | | | | | | | | | | | | | | | | | | | | | | | | | | | | | | | | | | | | | | | | | | | | | | | | | | | | | | | | | | | | | | | | | | | | |
| 12-31-16 | | | | | 14.13 | | | | | | 0.28• | | | | | | 0.67 | | | | | | 0.95 | | | | | | 0.06 | | | | | | 0.11 | | | | | | — | | | | | | 0.17 | | | | | | — | | | | | | 14.91 | | | | | | 6.75 | | | | | | 0.72 | | | | | | 0.18 | | | | | | 0.18 | | | | | | 1.92 | | | | | | 1,452 | | | | | | 70 | | |
| 12-31-15 | | | | | 15.15 | | | | | | 0.53• | | | | | | (0.43) | | | | | | 0.10 | | | | | | 0.39 | | | | | | 0.73 | | | | | | — | | | | | | 1.12 | | | | | | — | | | | | | 14.13 | | | | | | 0.38 | | | | | | 2.74 | | | | | | 0.19 | | | | | | 0.19 | | | | | | 3.80 | | | | | | 387 | | | | | | 67 | | |
| 12-31-14 | | | | | 14.26 | | | | | | 0.14 | | | | | | 0.86 | | | | | | 1.00 | | | | | | — | | | | | | 0.11 | | | | | | — | | | | | | 0.11 | | | | | | — | | | | | | 15.15 | | | | | | 7.04 | | | | | | 5.99 | | | | | | 0.18 | | | | | | 0.18 | | | | | | 0.97 | | | | | | 5 | | | | | | 51 | | |
| 12-31-13 | | | | | 12.51 | | | | | | 0.13 | | | | | | 2.73 | | | | | | 2.86 | | | | | | 0.26 | | | | | | 0.88 | | | | | | — | | | | | | 1.14 | | | | | | 0.03 | | | | | | 14.26 | | | | | | 23.84(d) | | | | | | 84.87 | | | | | | 0.14 | | | | | | 0.14 | | | | | | 0.98 | | | | | | 4 | | | | | | 65 | | |
| 12-31-12 | | | | | 11.24 | | | | | | 0.13 | | | | | | 1.60 | | | | | | 1.73 | | | | | | 0.10 | | | | | | 0.36 | | | | | | — | | | | | | 0.46 | | | | | | — | | | | | | 12.51 | | | | | | 15.42 | | | | | | 41.26 | | | | | | 0.12 | | | | | | 0.12 | | | | | | 1.09 | | | | | | 4 | | | | | | 59 | | |
See Accompanying Notes to Financial Statements
Financial Highlights (continued)
| | | | | | | | | | Income
(loss) from
investment
operations | | | | | | | | | Less
Distributions | | | | | | | | | | | | | | | | | | | | | | | | | | | Ratios to average
net assets | | | Supplemental
Data | |
| | | | Net asset value, beginning of year
or period | | | Net investment income (loss) | | | Net realized and unrealized
gain (loss) | | | Total from investment operations | | | From net investment income | | | From net realized gains | | | From return of capital | | | Total distributions | | | Payment by affiliate | | | Net asset value, end of year
or period | | | Total Return(1) | | | Expenses before
reductions/additions(2)(3)(4) | | | Expenses net of fee waivers
and/or recoupments if any(2)(3)(4) | | | Expenses net of all
reductions/additions(2)(3)(4) | | | Net investment income (loss)(2)(3) | | | Net assets, end of year or period | | | Portfolio turnover rate | |
Year or
period ended | | | ($) | | | ($) | | | ($) | | | ($) | | | ($) | | | ($) | | | ($) | | | ($) | | | ($) | | | ($) | | | (%) | | | (%) | | | (%) | | | (%) | | | (%) | | | ($000’s) | | | (%) | |
| Voya Solution 2050 Portfolio (continued) | | | | | | | | | | | | | | | | | | | | | | | | | | | | | | | | | | | | | | | | | | | | | | | | | | | | | | | | | | | | | | | | | | | | | | | | | | | | | | | | | | | | | | | | | | | | | | | | | | | | | | | |
| Class S | | | | | | | | | | | | | | | | | | | | | | | | | | | | | | | | | | | | | | | | | | | | | | | | | | | | | | | | | | | | | | | | | | | | | | | | | | | | | | | | | | | | | | | | | | | | | | | | | | | | | | | |
| 12-31-16 | | | | | 14.06 | | | | | | 0.24• | | | | | | 0.68 | | | | | | 0.92 | | | | | | 0.06 | | | | | | 0.11 | | | | | | — | | | | | | 0.17 | | | | | | — | | | | | | 14.81 | | | | | | 6.56 | | | | | | 0.97 | | | | | | 0.43 | | | | | | 0.43 | | | | | | 1.71 | | | | | | 1,996 | | | | | | 70 | | |
| 12-31-15 | | | | | 15.09 | | | | | | 0.38• | | | | | | (0.34) | | | | | | 0.04 | | | | | | 0.34 | | | | | | 0.73 | | | | | | — | | | | | | 1.07 | | | | | | — | | | | | | 14.06 | | | | | | 0.00 | | | | | | 2.99 | | | | | | 0.44 | | | | | | 0.44 | | | | | | 2.70 | | | | | | 317 | | | | | | 67 | | |
| 12-31-14 | | | | | 14.25 | | | | | | 0.13 | | | | | | 0.82 | | | | | | 0.95 | | | | | | — | | | | | | 0.11 | | | | | | — | | | | | | 0.11 | | | | | | — | | | | | | 15.09 | | | | | | 6.69 | | | | | | 6.24 | | | | | | 0.43 | | | | | | 0.43 | | | | | | 0.87 | | | | | | 5 | | | | | | 51 | | |
| 12-31-13 | | | | | 12.46 | | | | | | 0.09 | | | | | | 2.71 | | | | | | 2.80 | | | | | | 0.16 | | | | | | 0.88 | | | | | | — | | | | | | 1.04 | | | | | | 0.03 | | | | | | 14.25 | | | | | | 23.37(d) | | | | | | 84.12 | | | | | | 0.39 | | | | | | 0.39 | | | | | | 0.66 | | | | | | 4 | | | | | | 65 | | |
| 12-31-12 | | | | | 11.23 | | | | | | 0.10 | | | | | | 1.59 | | | | | | 1.69 | | | | | | 0.10 | | | | | | 0.36 | | | | | | — | | | | | | 0.46 | | | | | | — | | | | | | 12.46 | | | | | | 15.01 | | | | | | 41.51 | | | | | | 0.37 | | | | | | 0.37 | | | | | | 0.84 | | | | | | 4 | | | | | | 59 | | |
| Class S2 | | | | | | | | | | | | | | | | | | | | | | | | | | | | | | | | | | | | | | | | | | | | | | | | | | | | | | | | | | | | | | | | | | | | | | | | | | | | | | | | | | | | | | | | | | | | | | | | | | | | | | | |
| 12-31-16 | | | | | 13.93 | | | | | | 0.20• | | | | | | 0.67 | | | | | | 0.87 | | | | | | 0.05 | | | | | | 0.11 | | | | | | — | | | | | | 0.16 | | | | | | — | | | | | | 14.64 | | | | | | 6.32 | | | | | | 1.15 | | | | | | 0.58 | | | | | | 0.58 | | | | | | 1.44 | | | | | | 142 | | | | | | 70 | | |
| 12-31-15 | | | | | 14.97 | | | | | | 0.13• | | | | | | (0.11) | | | | | | 0.02 | | | | | | 0.33 | | | | | | 0.73 | | | | | | — | | | | | | 1.06 | | | | | | — | | | | | | 13.93 | | | | | | (0.17) | | | | | | 3.24 | | | | | | 0.59 | | | | | | 0.59 | | | | | | 0.89 | | | | | | 9 | | | | | | 67 | | |
| 12-31-14 | | | | | 14.15 | | | | | | 0.08 | | | | | | 0.85 | | | | | | 0.93 | | | | | | — | | | | | | 0.11 | | | | | | — | | | | | | 0.11 | | | | | | — | | | | | | 14.97 | | | | | | 6.59 | | | | | | 6.49 | | | | | | 0.58 | | | | | | 0.58 | | | | | | 0.58 | | | | | | 5 | | | | | | 51 | | |
| 12-31-13 | | | | | 12.45 | | | | | | 0.08 | | | | | | 2.68 | | | | | | 2.76 | | | | | | 0.21 | | | | | | 0.88 | | | | | | — | | | | | | 1.09 | | | | | | 0.03 | | | | | | 14.15 | | | | | | 23.09(d) | | | | | | 84.37 | | | | | | 0.54 | | | | | | 0.54 | | | | | | 0.58 | | | | | | 4 | | | | | | 65 | | |
| 12-31-12 | | | | | 11.23 | | | | | | 0.08 | | | | | | 1.59 | | | | | | 1.67 | | | | | | 0.09 | | | | | | 0.36 | | | | | | — | | | | | | 0.45 | | | | | | — | | | | | | 12.45 | | | | | | 14.90 | | | | | | 41.76 | | | | | | 0.52 | | | | | | 0.52 | | | | | | 0.66 | | | | | | 4 | | | | | | 59 | | |
| Class T | | | | | | | | | | | | | | | | | | | | | | | | | | | | | | | | | | | | | | | | | | | | | | | | | | | | | | | | | | | | | | | | | | | | | | | | | | | | | | | | | | | | | | | | | | | | | | | | | | | | | | | |
| 12-31-16 | | | | | 13.88 | | | | | | 0.13• | | | | | | 0.70 | | | | | | 0.83 | | | | | | — | | | | | | 0.11 | | | | | | — | | | | | | 0.11 | | | | | | — | | | | | | 14.60 | | | | | | 6.02 | | | | | | 1.44 | | | | | | 0.88 | | | | | | 0.88 | | | | | | 0.96 | | | | | | 10 | | | | | | 70 | | |
| 12-31-15 | | | | | 14.95 | | | | | | 0.08 | | | | | | (0.13) | | | | | | (0.05) | | | | | | 0.29 | | | | | | 0.73 | | | | | | — | | | | | | 1.02 | | | | | | — | | | | | | 13.88 | | | | | | (0.60) | | | | | | 3.49 | | | | | | 0.89 | | | | | | 0.89 | | | | | | 0.51 | | | | | | 4 | | | | | | 67 | | |
| 12-31-14 | | | | | 14.17 | | | | | | 0.04 | | | | | | 0.85 | | | | | | 0.89 | | | | | | — | | | | | | 0.11 | | | | | | — | | | | | | 0.11 | | | | | | — | | | | | | 14.95 | | | | | | 6.30 | | | | | | 6.74 | | | | | | 0.88 | | | | | | 0.88 | | | | | | 0.28 | | | | | | 5 | | | | | | 51 | | |
| 12-31-13 | | | | | 12.42 | | | | | | 0.04 | | | | | | 2.73 | | | | | | 2.77 | | | | | | 0.17 | | | | | | 0.88 | | | | | | — | | | | | | 1.05 | | | | | | 0.03 | | | | | | 14.17 | | | | | | 23.28(d) | | | | | | 84.62 | | | | | | 0.84 | | | | | | 0.84 | | | | | | 0.26 | | | | | | 4 | | | | | | 65 | | |
| 12-31-12 | | | | | 11.22 | | | | | | 0.04 | | | | | | 1.60 | | | | | | 1.64 | | | | | | 0.08 | | | | | | 0.36 | | | | | | — | | | | | | 0.44 | | | | | | — | | | | | | 12.42 | | | | | | 14.65 | | | | | | 42.01 | | | | | | 0.82 | | | | | | 0.82 | | | | | | 0.36 | | | | | | 4 | | | | | | 59 | | |
| Voya Solution 2055 Portfolio | | | | | | | | | | | | | | | | | | | | | | | | | | | | | | | | | | | | | | | | | | | | | | | | | | | | | | | | | | | | | | | | | | | | | | | | | | | | | | | | | | | | | | | | | | | | | | | | | | | | | | | |
| Class ADV | | | | | | | | | | | | | | | | | | | | | | | | | | | | | | | | | | | | | | | | | | | | | | | | | | | | | | | | | | | | | | | | | | | | | | | | | | | | | | | | | | | | | | | | | | | | | | | | | | | | | | | |
| 12-31-16 | | | | | 12.52 | | | | | | 0.11 | | | | | | 0.64 | | | | | | 0.75 | | | | | | 0.15 | | | | | | 0.85 | | | | | | — | | | | | | 1.00 | | | | | | — | | | | | | 12.27 | | | | | | 6.13 | | | | | | 0.76 | | | | | | 0.69 | | | | | | 0.69 | | | | | | 0.88 | | | | | | 42,793 | | | | | | 58 | | |
| 12-31-15 | | | | | 14.27 | | | | | | 0.08• | | | | | | (0.17) | | | | | | (0.09) | | | | | | 0.32 | | | | | | 1.34 | | | | | | — | | | | | | 1.66 | | | | | | — | | | | | | 12.52 | | | | | | (1.15) | | | | | | 0.76 | | | | | | 0.70 | | | | | | 0.70 | | | | | | 0.61 | | | | | | 41,770 | | | | | | 41 | | |
| 12-31-14 | | | | | 14.46 | | | | | | 0.09• | | | | | | 0.76 | | | | | | 0.85 | | | | | | 0.18 | | | | | | 0.86 | | | | | | — | | | | | | 1.04 | | | | | | — | | | | | | 14.27 | | | | | | 6.03 | | | | | | 0.77 | | | | | | 0.68 | | | | | | 0.68 | | | | | | 0.60 | | | | | | 38,558 | | | | | | 72 | | |
| 12-31-13 | | | | | 12.05 | | | | | | 0.08• | | | | | | 2.69 | | | | | | 2.77 | | | | | | 0.14 | | | | | | 0.22 | | | | | | — | | | | | | 0.36 | | | | | | — | | | | | | 14.46 | | | | | | 23.19 | | | | | | 0.76 | | | | | | 0.63 | | | | | | 0.63 | | | | | | 0.61 | | | | | | 34,195 | | | | | | 73 | | |
| 12-31-12 | | | | | 10.66 | | | | | | 0.09• | | | | | | 1.52 | | | | | | 1.61 | | | | | | 0.10 | | | | | | 0.12 | | | | | | — | | | | | | 0.22 | | | | | | — | | | | | | 12.05 | | | | | | 15.27 | | | | | | 0.72 | | | | | | 0.62 | | | | | | 0.62 | | | | | | 0.78 | | | | | | 19,927 | | | | | | 55 | | |
| Class I | | | | | | | | | | | | | | | | | | | | | | | | | | | | | | | | | | | | | | | | | | | | | | | | | | | | | | | | | | | | | | | | | | | | | | | | | | | | | | | | | | | | | | | | | | | | | | | | | | | | | | | |
| 12-31-16 | | | | | 12.74 | | | | | | 0.18• | | | | | | 0.65 | | | | | | 0.83 | | | | | | 0.21 | | | | | | 0.85 | | | | | | — | | | | | | 1.06 | | | | | | — | | | | | | 12.51 | | | | | | 6.72 | | | | | | 0.26 | | | | | | 0.19 | | | | | | 0.19 | | | | | | 1.46 | | | | | | 44,519 | | | | | | 58 | | |
| 12-31-15 | | | | | 14.49 | | | | | | 0.17• | | | | | | (0.19) | | | | | | (0.02) | | | | | | 0.39 | | | | | | 1.34 | | | | | | — | | | | | | 1.73 | | | | | | — | | | | | | 12.74 | | | | | | (0.67) | | | | | | 0.26 | | | | | | 0.20 | | | | | | 0.20 | | | | | | 1.22 | | | | | | 36,692 | | | | | | 41 | | |
| 12-31-14 | | | | | 14.65 | | | | | | 0.17• | | | | | | 0.76 | | | | | | 0.93 | | | | | | 0.23 | | | | | | 0.86 | | | | | | — | | | | | | 1.09 | | | | | | — | | | | | | 14.49 | | | | | | 6.56 | | | | | | 0.27 | | | | | | 0.18 | | | | | | 0.18 | | | | | | 1.15 | | | | | | 24,787 | | | | | | 72 | | |
| 12-31-13 | | | | | 12.17 | | | | | | 0.17• | | | | | | 2.71 | | | | | | 2.88 | | | | | | 0.18 | | | | | | 0.22 | | | | | | — | | | | | | 0.40 | | | | | | — | | | | | | 14.65 | | | | | | 23.89 | | | | | | 0.26 | | | | | | 0.13 | | | | | | 0.13 | | | | | | 1.24 | | | | | | 16,948 | | | | | | 73 | | |
| 12-31-12 | | | | | 10.74 | | | | | | 0.14• | | | | | | 1.54 | | | | | | 1.68 | | | | | | 0.13 | | | | | | 0.12 | | | | | | — | | | | | | 0.25 | | | | | | — | | | | | | 12.17 | | | | | | 15.80 | | | | | | 0.22 | | | | | | 0.12 | | | | | | 0.12 | | | | | | 1.21 | | | | | | 8,034 | | | | | | 55 | | |
| Class S | | | | | | | | | | | | | | | | | | | | | | | | | | | | | | | | | | | | | �� | | | | | | | | | | | | | | | | | | | | | | | | | | | | | | | | | | | | | | | | | | | | | | | | | | | | | | | | | | | | | | | | | | |
| 12-31-16 | | | | | 12.62 | | | | | | 0.13 | | | | | | 0.66 | | | | | | 0.79 | | | | | | 0.18 | | | | | | 0.85 | | | | | | — | | | | | | 1.03 | | | | | | — | | | | | | 12.38 | | | | | | 6.44 | | | | | | 0.51 | | | | | | 0.44 | | | | | | 0.44 | | | | | | 1.16 | | | | | | 51,294 | | | | | | 58 | | |
| 12-31-15 | | | | | 14.37 | | | | | | 0.12• | | | | | | (0.17) | | | | | | (0.05) | | | | | | 0.36 | | | | | | 1.34 | | | | | | — | | | | | | 1.70 | | | | | | — | | | | | | 12.62 | | | | | | (0.87) | | | | | | 0.51 | | | | | | 0.45 | | | | | | 0.45 | | | | | | 0.86 | | | | | | 46,913 | | | | | | 41 | | |
| 12-31-14 | | | | | 14.55 | | | | | | 0.14• | | | | | | 0.74 | | | | | | 0.88 | | | | | | 0.20 | | | | | | 0.86 | | | | | | — | | | | | | 1.06 | | | | | | — | | | | | | 14.37 | | | | | | 6.25 | | | | | | 0.52 | | | | | | 0.43 | | | | | | 0.43 | | | | | | 0.93 | | | | | | 43,206 | | | | | | 72 | | |
| 12-31-13 | | | | | 12.11 | | | | | | 0.12• | | | | | | 2.70 | | | | | | 2.82 | | | | | | 0.16 | | | | | | 0.22 | | | | | | — | | | | | | 0.38 | | | | | | — | | | | | | 14.55 | | | | | | 23.52 | | | | | | 0.51 | | | | | | 0.38 | | | | | | 0.38 | | | | | | 0.90 | | | | | | 37,658 | | | | | | 73 | | |
| 12-31-12 | | | | | 10.70 | | | | | | 0.13• | | | | | | 1.52 | | | | | | 1.65 | | | | | | 0.12 | | | | | | 0.12 | | | | | | — | | | | | | 0.24 | | | | | | — | | | | | | 12.11 | | | | | | 15.53 | | | | | | 0.47 | | | | | | 0.37 | | | | | | 0.37 | | | | | | 1.14 | | | | | | 22,055 | | | | | | 55 | | |
See Accompanying Notes to Financial Statements
Financial Highlights (continued)
| | | | | | | | | | Income
(loss) from
investment
operations | | | | | | | | | Less
Distributions | | | | | | | | | | | | | | | | | | | | | | | | | | | Ratios to average
net assets | | | Supplemental
Data | |
| | | | Net asset value, beginning of year
or period | | | Net investment income (loss) | | | Net realized and unrealized
gain (loss) | | | Total from investment operations | | | From net investment income | | | From net realized gains | | | From return of capital | | | Total distributions | | | Payment by affiliate | | | Net asset value, end of year
or period | | | Total Return(1) | | | Expenses before
reductions/additions(2)(3)(4) | | | Expenses net of fee waivers
and/or recoupments if any(2)(3)(4) | | | Expenses net of all
reductions/additions(2)(3)(4) | | | Net investment income (loss)(2)(3) | | | Net assets, end of year or period | | | Portfolio turnover rate | |
Year or
period ended | | | ($) | | | ($) | | | ($) | | | ($) | | | ($) | | | ($) | | | ($) | | | ($) | | | ($) | | | ($) | | | (%) | | | (%) | | | (%) | | | (%) | | | (%) | | | ($000’s) | | | (%) | |
| Voya Solution 2055 Portfolio (continued) | | | | | | | | | | | | | | | | | | | | | | | | | | | | | | | | | | | | | | | | | | | | | | | | | | | | | | | | | | | | | | | | | | | | | | | | | | | | | | | | | | | | | | | | | | | | | | | | | | | | | | | |
| Class S2 | | | | | | | | | | | | | | | | | | | | | | | | | | | | | | | | | | | | | | | | | | | | | | | | | | | | | | | | | | | | | | | | | | | | | | | | | | | | | | | | | | | | | | | | | | | | | | | | | | | | | | | |
| 12-31-16 | | | | | 12.56 | | | | | | 0.11 | | | | | | 0.65 | | | | | | 0.76 | | | | | | 0.16 | | | | | | 0.85 | | | | | | — | | | | | | 1.01 | | | | | | — | | | | | | 12.31 | | | | | | 6.24 | | | | | | 0.69 | | | | | | 0.59 | | | | | | 0.59 | | | | | | 0.93 | | | | | | 2,996 | | | | | | 58 | | |
| 12-31-15 | | | | | 14.31 | | | | | | 0.10 | | | | | | (0.17) | | | | | | (0.07) | | | | | | 0.34 | | | | | | 1.34 | | | | | | — | | | | | | 1.68 | | | | | | — | | | | | | 12.56 | | | | | | (1.04) | | | | | | 0.76 | | | | | | 0.60 | | | | | | 0.60 | | | | | | 0.71 | | | | | | 3,014 | | | | | | 41 | | |
| 12-31-14 | | | | | 14.50 | | | | | | 0.11• | | | | | | 0.75 | | | | | | 0.86 | | | | | | 0.19 | | | | | | 0.86 | | | | | | — | | | | | | 1.05 | | | | | | — | | | | | | 14.31 | | | | | | 6.12 | | | | | | 0.77 | | | | | | 0.58 | | | | | | 0.58 | | | | | | 0.78 | | | | | | 3,071 | | | | | | 72 | | |
| 12-31-13 | | | | | 12.07 | | | | | | 0.10• | | | | | | 2.69 | | | | | | 2.79 | | | | | | 0.14 | | | | | | 0.22 | | | | | | — | | | | | | 0.36 | | | | | | — | | | | | | 14.50 | | | | | | 23.36 | | | | | | 0.76 | | | | | | 0.53 | | | | | | 0.53 | | | | | | 0.72 | | | | | | 2,250 | | | | | | 73 | | |
| 12-31-12 | | | | | 10.68 | | | | | | 0.10• | | | | | | 1.52 | | | | | | 1.62 | | | | | | 0.11 | | | | | | 0.12 | | | | | | — | | | | | | 0.23 | | | | | | — | | | | | | 12.07 | | | | | | 15.30 | | | | | | 0.72 | | | | | | 0.52 | | | | | | 0.52 | | | | | | 0.90 | | | | | | 1,294 | | | | | | 55 | | |
| Class T | | | | | | | | | | | | | | | | | | | | | | | | | | | | | | | | | | | | | | | | | | | | | | | | | | | | | | | | | | | | | | | | | | | | | | | | | | | | | | | | | | | | | | | | | | | | | | | | | | | | | | | |
| 12-31-16 | | | | | 12.78 | | | | | | 0.12• | | | | | | 0.62 | | | | | | 0.74 | | | | | | 0.17 | | | | | | 0.85 | | | | | | — | | | | | | 1.02 | | | | | | — | | | | | | 12.50 | | | | | | 5.96 | | | | | | 0.98 | | | | | | 0.89 | | | | | | 0.89 | | | | | | 0.96 | | | | | | 25 | | | | | | 58 | | |
| 12-31-15 | | | | | 14.25 | | | | | | 0.08• | | | | | | (0.21) | | | | | | (0.13) | | | | | | — | | | | | | 1.34 | | | | | | — | | | | | | 1.34 | | | | | | — | | | | | | 12.78 | | | | | | (1.36) | | | | | | 1.01 | | | | | | 0.90 | | | | | | 0.90 | | | | | | 0.56 | | | | | | 9 | | | | | | 41 | | |
| 12-31-14 | | | | | 14.44 | | | | | | (0.06)• | | | | | | 0.90 | | | | | | 0.84 | | | | | | 0.17 | | | | | | 0.86 | | | | | | — | | | | | | 1.03 | | ��� | | | | — | | | | | | 14.25 | | | | | | 6.00 | | | | | | 1.02 | | | | | | 0.88 | | | | | | 0.88 | | | | | | (0.40) | | | | | | 5 | | | | | | 72 | | |
| 12-31-13 | | | | | 12.06 | | | | | | 0.14• | | | | | | 2.61 | | | | | | 2.75 | | | | | | 0.15 | | | | | | 0.22 | | | | | | — | | | | | | 0.37 | | | | | | — | | | | | | 14.44 | | | | | | 23.00 | | | | | | 1.01 | | | | | | 0.83 | | | | | | 0.83 | | | | | | 1.02 | | | | | | 68 | | | | | | 73 | | |
| 12-31-12 | | | | | 10.65 | | | | | | 0.06• | | | | | | 1.52 | | | | | | 1.58 | | | | | | 0.05 | | | | | | 0.12 | | | | | | — | | | | | | 0.17 | | | | | | — | | | | | | 12.06 | | | | | | 14.95 | | | | | | 0.97 | | | | | | 0.82 | | | | | | 0.82 | | | | | | 0.54 | | | | | | 12 | | | | | | 55 | | |
| Voya Solution 2060 Portfolio | | | | | | | | | | | | | | | | | | | | | | | | | | | | | | | | | | | | | | | | | | | | | | | | | | | | | | | | | | | | | | | | | | | | | | | | | | | | | | | | | | | | | | | | | | | | | | | | | | | | | | | |
| Class ADV | | | | | | | | | | | | | | | | | | | | | | | | | | | | | | | | | | | | | | | | | | | | | | | | | | | | | | | | | | | | | | | | | | | | | | | | | | | | | | | | | | | | | | | | | | | | | | | | | | | | | | | |
| 12-31-16 | | | | | 9.89 | | | | | | 0.15• | | | | | | 0.48 | | | | | | 0.63 | | | | | | 0.04 | | | | | | 0.06 | | | | | | — | | | | | | 0.10 | | | | | | — | | | | | | 10.42 | | | | | | 6.34 | | | | | | 1.97 | | | | | | 0.69 | | | | | | 0.69 | | | | | | 1.50 | | | | | | 1,395 | | | | | | 82 | | |
02-09-15(5) -
12-31-15 | | | | | 10.00 | | | | | | 0.25• | | | | | | (0.36) | | | | | | (0.11) | | | | | | — | | | | | | — | | | | | | — | | | | | | — | | | | | | — | | | | | | 9.89 | | | | | | (1.10) | | | | | | 19.06 | | | | | | 0.70 | | | | | | 0.70 | | | | | | 2.85 | | | | | | 191 | | | | | | 78 | | |
| Class I | | | | | | | | | | | | | | | | | | | | | | | | | | | | | | | | | | | | | | | | | | | | | | | | | | | | | | | | | | | | | | | | | | | | | | | | | | | | | | | | | | | | | | | | | | | | | | | | | | | | | | | |
| 12-31-16 | | | | | 9.92 | | | | | | 0.16• | | | | | | 0.51 | | | | | | 0.67 | | | | | | 0.04 | | | | | | 0.06 | | | | | | — | | | | | | 0.10 | | | | | | — | | | | | | 10.49 | | | | | | 6.73 | | | | | | 1.47 | | | | | | 0.19 | | | | | | 0.19 | | | | | | 1.56 | | | | | | 606 | | | | | | 82 | | |
02-09-15(5) -
12-31-15 | | | | | 10.00 | | | | | | 0.27• | | | | | | (0.35) | | | | | | (0.08) | | | | | | — | | | | | | — | | | | | | — | | | | | | — | | | | | | — | | | | | | 9.92 | | | | | | (0.80) | | | | | | 18.56 | | | | | | 0.20 | | | | | | 0.20 | | | | | | 3.11 | | | | | | 317 | | | | | | 78 | | |
| Class S | | | | | | | | | | | | | | | | | | | | | | | | | | | | | | | | | | | | | | | | | | | | | | | | | | | | | | | | | | | | | | | | | | | | | | | | | | | | | | | | | | | | | | | | | | | | | | | | | | | | | | | |
| 12-31-16 | | | | | 9.86 | | | | | | 0.17• | | | | | | 0.48 | | | | | | 0.65 | | | | | | 0.04 | | | | | | 0.06 | | | | | | — | | | | | | 0.10 | | | | | | — | | | | | | 10.41 | | | | | | 6.56 | | | | | | 1.72 | | | | | | 0.44 | | | | | | 0.44 | | | | | | 1.68 | | | | | | 836 | | | | | | 82 | | |
02-09-15(5) -
12-31-15 | | | | | 10.00 | | | | | | 0.27• | | | | | | (0.41) | | | | | | (0.14) | | | | | | — | | | | | | — | | | | | | — | | | | | | — | | | | | | — | | | | | | 9.86 | | | | | | (1.40) | | | | | | 18.81 | | | | | | 0.45 | | | | | | 0.45 | | | | | | 3.06 | | | | | | 140 | | | | | | 78 | | |
| Class S2 | | | | | | | | | | | | | | | | | | | | | | | | | | | | | | | | | | | | | | | | | | | | | | | | | | | | | | | | | | | | | | | | | | | | | | | | | | | | | | | | | | | | | | | | | | | | | | | | | | | | | | | |
| 12-31-16 | | | | | 9.89 | | | | | | 0.09• | | | | | | 0.54 | | | | | | 0.63 | | | | | | 0.04 | | | | | | 0.06 | | | | | | — | | | | | | 0.10 | | | | | | — | | | | | | 10.42 | | | | | | 6.34 | | | | | | 1.90 | | | | | | 0.59 | | | | | | 0.59 | | | | | | 0.92 | | | | | | 32 | | | | | | 82 | | |
02-09-15(5) -
12-31-15 | | | | | 10.00 | | | | | | 0.24• | | | | | | (0.35) | | | | | | (0.11) | | | | | | — | | | | | | — | | | | | | — | | | | | | — | | | | | | — | | | | | | 9.89 | | | | | | (1.10) | | | | | | 19.06 | | | | | | 0.60 | | | | | | 0.60 | | | | | | 2.66 | | | | | | 26 | | | | | | 78 | | |
| Class T | | | | | | | | | | | | | | | | | | | | | | | | | | | | | | | | | | | | | | | | | | | | | | | | | | | | | | | | | | | | | | | | | | | | | | | | | | | | | | | | | | | | | | | | | | | | | | | | | | | | | | | |
| 12-31-16 | | | | | 9.86 | | | | | | 0.07 | | | | | | 0.51 | | | | | | 0.58 | | | | | | 0.03 | | | | | | 0.06 | | | | | | — | | | | | | 0.09 | | | | | | — | | | | | | 10.35 | | | | | | 5.91 | | | | | | 2.19 | | | | | | 0.89 | | | | | | 0.89 | | | | | | 0.67 | | | | | | 3 | | | | | | 82 | | |
02-09-15(5)
12-31-15 | | | | | 10.00 | | | | | | 0.05 | | | | | | (0.19) | | | | | | (0.14) | | | | | | — | | | | | | — | | | | | | — | | | | | | — | | | | | | — | | | | | | 9.86 | | | | | | (1.40) | | | | | | 19.31 | | | | | | 0.90 | | | | | | 0.90 | | | | | | 0.58 | | | | | | 3 | | | | | | 78 | | |
(1)
Total return is calculated assuming reinvestment of all dividends, capital gain distributions and return of capital distributions, if any, at net asset value and does not reflect the effect of insurance contract charges. Total return for periods less than one year is not annualized.
(2)
Annualized for periods less than one year.
(3)
Ratios reflect operating expenses of a Portfolio. Expenses before reductions/additions do not reflect amounts reimbursed by an Investment Adviser and/or Distributor or reductions from brokerage service arrangements or other expense offset arrangements and do not represent the amount paid by a Portfolio during periods when reimbursements or reductions occur. Expenses net of fee waivers reflect expenses after reimbursement by an Investment Adviser and/or Distributor but prior to reductions from brokerage service arrangements or other expense offset arrangements. Expenses net of all reductions/additions represent the net expenses paid by a Portfolio. Net investment income (loss) is net of all such additions or reductions.
See Accompanying Notes to Financial Statements
Financial Highlights (continued)
(4)
Ratios do not include expenses of underlying funds and do not include fees and expenses charged under the variable annuity contract or variable life insurance policy.
(5)
Commencement of operations.
(a)
During the year ended December 31, 2013, Voya Investments, LLC voluntarily reimbursed Voya Solution 2020 Portfolio $22 for the foregone investment opportunities attributable to uninvested cash. Excluding this payment by affiliate, total return would have been 12.88%, 13.71%, 13.33%, 13.25% and 13.15% on Classes ADV, I, S, S2 and T, respectively.
(b)
During the year ended December 31, 2013, Voya Investments, LLC voluntarily reimbursed Voya Solution 2030 Portfolio $33 for the foregone investment opportunities attributable to uninvested cash. Excluding this payment by affiliate, total return would have been 18.46%, 19,19%, 18.72%, 18.37% and 18.69% on Classes ADV, I, S, S2 and T, respectively.
(c)
During the year ended December 31, 2013, Voya Investments, LLC voluntarily reimbursed Voya Solution 2040 Portfolio $39 for the foregone investment opportunities attributable to uninvested cash. Excluding this payment by affiliate, total return would have been 22.09%, 22.76%, 22.35%, 22.07% and 21.84% on Classes ADV, I, S, S2 and T, respectively.
(d)
During the year ended December 31, 2013, Voya Investments, LLC voluntarily reimbursed Voya Solution 2050 Portfolio $40 for the foregone investment opportunities attributable to uninvested cash. Excluding this payment by affiliate, total return would have been 22.95%, 23.61%, 23.14%, 22.86% and 23.05% on Classes ADV, I, S, S2 and T, respectively.
•
Calculated using average number of shares outstanding throughout the year or period.
*
Amount is less than $0.005 or 0.005% or more than $(0.005) or (0.005)%.
See Accompanying Notes to Financial Statements
NOTES TO FINANCIAL STATEMENTS as of December 31, 2016
NOTE 1 — ORGANIZATION
Voya Partners, Inc. (the “Company”) is an open-end management investment company registered under the Investment Company Act of 1940, as amended (the “1940 Act”). It was incorporated under the laws of Maryland on May 7, 1997. The Articles of Incorporation permit the Company to offer separate series, each of which has its own investment objective, policies and restrictions. The series of the Company serve as investment options in underlying variable annuity contracts and variable life insurance policies offered by Directed Services LLC. The Company currently consists of thirty-eight active separate investment series. The fifteen series (each, a “Portfolio” and collectively, the “Portfolios”) included in this report are: Voya Solution Aggressive Portfolio (“Solution Aggressive”), Voya Solution Balanced Portfolio (“Solution Balanced”), Voya Solution Conservative Portfolio (“Solution Conservative”), Voya Solution Income Portfolio (“Solution Income”), Voya Solution Moderately Aggressive Portfolio (“Solution Moderately Aggressive”), Voya Solution Moderately Conservative Portfolio (“Solution Moderately Conservative”), Voya Solution 2020 Portfolio (“Solution 2020”), Voya Solution 2025 Portfolio (“Solution 2025”), Voya Solution 2030 Portfolio (“Solution 2030”), Voya Solution 2035 Portfolio (“Solution 2035”), Voya Solution 2040 Portfolio (“Solution 2040”), Voya Solution 2045 Portfolio (“Solution 2045”), Voya Solution 2050 Portfolio (“Solution 2050”), Voya Solution 2055 Portfolio (“Solution 2055”) and Voya Solution 2060 Portfolio (“Solution 2060”). Each Portfolio is a diversified series of the Company.
Solution 2020, Solution 2025, Solution 2030, Solution 2035, Solution 2040, Solution 2045, Solution 2050, Solution 2055 and Solution 2060 are structured and managed around a specific target retirement or financial goal date (“Target Date”). When these Portfolios reach their respective Target Date, they may be combined with Solution Income, without a vote of shareholders, if approved by the Portfolios’ Board of Directors (the “Board”).
The classes of shares included in this report are: Adviser (“Class ADV”), Initial (“Class I”), Class R6, Service (“Class S”), Service 2 (“Class S2”) and Class T; however, each Portfolio may not offer all share classes. Shares of the Portfolios may be offered to separate accounts (“Separate Accounts”) of insurance companies as investment options in connection with variable annuity contracts and variable life insurance policies (“Variable Contracts”) and to certain of the Portfolios' investment advisers and their affiliates. In the future, shares may also be offered to qualified pension and retirement plans (“Qualified Plans”) outside the Separate Account context. With the exception of class specific matters, each class has equal voting rights as to
voting privileges. For class specific proposals, only the applicable class would have voting privileges. The classes differ principally in the applicable distribution and shareholder service fees. Generally, shareholders of each class also bear certain expenses that pertain to that particular class. All shareholders bear the common expenses of a portfolio and earn income and realized gains/losses from a portfolio pro rata based on the daily ending net assets of each class, without distinction between share classes. Expenses that are specific to a portfolio or a class are charged directly to that portfolio or class. Other operating expenses shared by several portfolios are generally allocated among those portfolios based on average net assets. Distributions are determined separately for each class based on income and expenses allocated to each class. Realized gain distributions are allocated to each class pro rata based on the shares outstanding of each class on the date of distribution. Differences in per share dividend rates generally result from differences in separate class expenses, including distribution and shareholder service fees, if applicable.
Directed Services LLC (“DSL” or the “Investment Adviser”), a Delaware limited liability company and an affiliate of Voya Investments, LLC, serves as the Investment Adviser to the Portfolios. Voya Investment Management Co. LLC (“Voya IM” or the “Sub-Adviser”), a Delaware limited liability company, serves as the Sub-Adviser to the Portfolios. Voya Investments Distributor, LLC (“VID” or the “Distributor”), a Delaware limited liability company, serves as the principal underwriter to the Portfolios.
Each Portfolio seeks to achieve its investment objective by investing in other investment companies (“Underlying Funds”) and uses asset allocation strategies to determine how much to invest in the Underlying Funds. The investment objective of the Portfolios is described in the respective Portfolio’s Prospectus.
NOTE 2 — SIGNIFICANT ACCOUNTING POLICIES
The following significant accounting policies are consistently followed by the Portfolios in the preparation of their financial statements. Each Portfolio is considered an investment company under U.S. generally accepted accounting principles (“GAAP”) and follows the accounting and reporting guidance applicable to investment companies.
A. Security Valuation. Each Portfolio is open for business every day the New York Stock Exchange (“NYSE”) opens for regular trading (each such day, a “Business Day”). The net asset value (“NAV”) per share for each class of each Portfolio is determined each Business Day as of the close of the regular trading session (“Market Close”), as determined by the Consolidated Tape Association (“CTA”),
NOTES TO FINANCIAL STATEMENTS as of December 31, 2016 (continued)
NOTE 2 — SIGNIFICANT ACCOUNTING POLICIES (continued)
the central distributor of transaction prices for exchange-traded securities (normally 4:00 p.m. Eastern time unless otherwise designated by the CTA). The data reflected on the consolidated tape provided by the CTA is generated by various market centers, including all securities exchanges, electronic communications networks, and third-market broker-dealers. The NAV per share of each class of each Portfolio is calculated by taking the value of the Portfolio’s assets attributable to that class, subtracting the Portfolio’s liabilities attributable to that class, and dividing by the number of shares of that class that are outstanding. On days when a Portfolio is closed for business, Portfolio shares will not be priced and a Portfolio does not transact purchase and redemption orders. To the extent a Portfolio’s assets are traded in other markets on days when a Portfolio does not price its shares, the value of a Portfolio’s assets will likely change and you will not be able to purchase or redeem shares of a Portfolio.
Assets for which market quotations are readily available are valued at market value. A security listed or traded on an exchange is valued at its last sales price or official closing price as of the close of the regular trading session on the exchange where the security is principally traded or, if such price is not available, at the last sale price as of the Market Close for such security provided by the CTA. Bank loans are valued at the average of the averages of the bid and ask prices provided to an independent loan pricing service by brokers. Futures contracts are valued at the final settlement price set by an exchange on which they are principally traded. Listed options are valued at the mean between the last bid and ask prices from the exchange on which they are principally traded. Investments in open-end registered investment companies that do not trade on an exchange are valued at the end of day NAV per share. Investments in registered investment companies that trade on an exchange are valued at the last sales price or official closing price as of the close of the regular trading session on the exchange where the security is principally traded.
When a market quotation is not readily available or is deemed unreliable, each Portfolio will determine a fair value for the relevant asset in accordance with procedures adopted by the Portfolios’ Board. Such procedures provide, for example, that: (a) Exchange-traded securities are valued at the mean of the closing bid and ask; (b) Debt obligations are valued using an evaluated price provided by an independent pricing service. Evaluated prices provided by the pricing service may be determined without exclusive reliance on quoted prices, and may reflect factors such as institution-size trading in similar groups of securities, developments related to specific securities, benchmark yield, quality, type of issue, coupon rate,
maturity, individual trading characteristics and other market data; (c) Securities traded in the over-the-counter market are valued based on prices provided by independent pricing services or market makers; (d) Options not listed on an exchange are valued by an independent source using an industry accepted model, such as Black-Scholes; (e) Centrally cleared swap agreements are valued using a price provided by the central counterparty clearinghouse; (f) Over-the-counter swap agreements are valued using a price provided by an independent pricing service; (g) Forward foreign currency exchange contracts are valued utilizing current and forward rates obtained from an independent pricing service. Such prices from the third party pricing service are for specific settlement periods and each Portfolio’s forward foreign currency exchange contracts are valued at an interpolated rate between the closest preceding and subsequent period reported by the independent pricing service and (h) Securities for which market prices are not provided by any of the above methods may be valued based upon quotes furnished by brokers.
The prospectuses of the open-end registered investment companies in which each Portfolio may invest explain the circumstances under which they will use fair value pricing and the effects of using fair value pricing.
Foreign securities’ (including foreign exchange contracts) prices are converted into U.S. dollar amounts using the applicable exchange rates as of Market Close. If market quotations are available and believed to be reliable for foreign exchange-traded equity securities, the securities will be valued at the market quotations. Because trading hours for certain foreign securities end before Market Close, closing market quotations may become unreliable. An independent pricing service determines the degree of certainty, based on historical data, that the closing price in the principal market where a foreign security trades is not the current value as of Market Close. Foreign securities’ prices meeting the approved degree of certainty that the price is not reflective of current value will be valued by the independent pricing service using pricing models designed to estimate likely changes in the values of those securities between the times in which the trading in those securities is substantially completed and Market Close. Multiple factors may be considered by the independent pricing service in determining the value of such securities and may include information relating to sector indices, American Depositary Receipts and domestic and foreign index futures.
All other assets for which market quotations are not readily available or became unreliable (or if the above fair valuation methods are unavailable or determined to be unreliable) are valued at fair value as determined in good faith by or under the supervision of the Board following
NOTES TO FINANCIAL STATEMENTS as of December 31, 2016 (continued)
NOTE 2 — SIGNIFICANT ACCOUNTING POLICIES (continued)
procedures approved by the Board. The Board has delegated to the Investment Adviser responsibility for overseeing the implementation of the Portfolios' valuation procedures; a “Pricing Committee” comprised of employees of the Investment Adviser or its affiliates has responsibility for applying the fair valuation methods set forth in the procedures and, if a fair valuation cannot be determined pursuant to the fair valuation methods, determining the fair value of assets held by the Portfolios. Issuer specific events, transaction price, position size, nature and duration of restrictions on disposition of the security, market trends, bid/ask quotes of brokers and other market data may be reviewed in the course of making a good faith determination of a security’s fair value. Valuations change in response to many factors including the historical and prospective earnings of the issuer, the value of the issuer’s assets, general economic conditions, interest rates, investor perceptions and market liquidity. Because of the inherent uncertainties of fair valuation, the values used to determine each Portfolio’s NAV may materially differ from the value received upon actual sale of those investments. Thus, fair valuation may have an unintended dilutive or accretive effect on the value of shareholders’ investments in each Portfolio.
Each investment asset or liability of the Portfolios is assigned a level at measurement date based on the significance and source of the inputs to its valuation. Quoted prices in active markets for identical securities are classified as “Level 1,” inputs other than quoted prices for an asset or liability that are observable are classified as “Level 2” and significant unobservable inputs, including the Sub-Adviser’s or Pricing Committee’s judgment about the assumptions that a market participant would use in pricing an asset or liability are classified as “Level 3.” The inputs used for valuing securities are not necessarily an indication of the risks associated with investing in those securities. Short-term securities of sufficient credit quality are generally considered to be Level 2 securities under applicable accounting rules. The Portfolios classify each of their investments in the Underlying Funds as Level 1, without consideration as to the classification level of the specific investments held by the Underlying Funds. A table summarizing each Portfolio’s investments under these levels of classification is included following the Portfolio of Investments.
U.S. GAAP requires a reconciliation of the beginning to ending balances for reported fair values that presents changes attributable to total realized and unrealized gains or losses, purchases and sales, and transfers in or out of the Level 3 category during the period. The beginning of period timing recognition is used for the transfers between
levels of a Portfolio’s assets and liabilities. A reconciliation of Level 3 investments is presented only when a Portfolio has a significant amount of Level 3 investments.
For the year ended December 31, 2016, there have been no significant changes to the fair valuation methodologies.
B. Security Transactions and Revenue Recognition. Security transactions are accounted for on the trade date. Dividend income received from the Underlying Funds is recognized on the ex-dividend date. Capital gain distributions received from the Underlying Funds are recognized on the ex-dividend date and are recorded on the Statements of Operations as such. Costs used in determining realized gains and losses on the sales of investment securities are on the basis of specific identification.
C. Distributions to Shareholders. The Portfolios record distributions to their shareholders on the ex-dividend date. Each Portfolio declares and pays dividends from net investment income and capital gain distributions, if any, annually. The Portfolios may make distributions on a more frequent basis to comply with the distribution requirements of the Internal Revenue Code. The characteristics of income and gains to be distributed are determined in accordance with income tax regulations, which may differ from U.S. GAAP for investment companies.
D. Federal Income Taxes. It is the policy of each Portfolio to comply with the requirements of subchapter M of the Internal Revenue Code that are applicable to regulated investment companies and to distribute substantially all of its net investment income and any net realized capital gains to its shareholders. Therefore, a federal income tax or excise tax provision is not required. Management has considered the sustainability of the Portfolios’ tax positions taken on federal income tax returns for all open tax years in making this determination. No capital gain distributions shall be made until the capital loss carryforwards have been fully utilized or expire.
The Portfolios may utilize equalization accounting for tax purposes, whereby a portion of redemption payments are treated as distributions of income or gain.
E. Use of Estimates. The preparation of financial statements in conformity with U.S. GAAP requires management to make estimates and assumptions that affect the reported amounts of assets and liabilities and disclosure of contingent assets and liabilities at the date of the financial statements and the reported amounts of increases and decreases in net assets from operations during the reporting period. Actual results could differ from those estimates.
NOTES TO FINANCIAL STATEMENTS as of December 31, 2016 (continued)
NOTE 2 — SIGNIFICANT ACCOUNTING POLICIES (continued)
F. Risk Exposures and the Use of Derivative Instruments. Each Portfolio’s investment strategies permit it to enter into various types of derivatives contracts, including, but not limited to, futures contracts. In doing so, a Portfolio will employ strategies in differing combinations to permit it to increase or decrease the level of risk, or change the level or types of exposure to risk factors. This may allow a Portfolio to pursue its objectives more quickly and efficiently than if it were to make direct purchases or sales of securities capable of affecting a similar response to market or credit factors.
In pursuit of its investment objectives, a Portfolio may seek to increase or decrease its exposure to the following market or credit risk factors:
Equity Risk. Stock prices may be volatile or have reduced liquidity in response to real or perceived impacts of factors including, but not limited to, economic conditions, changes in market interest rates, and political events. Stock markets tend to be cyclical, with periods when stock prices generally rise and periods when stock prices generally decline. Any given stock market segment may remain out of favor with investors for a short or long period of time, and stocks as an asset class may underperform bonds or other asset classes during some periods. Additionally, legislative, regulatory or tax policies or developments in these areas may adversely impact the investment techniques available to a manager, add to costs and impair the ability of a Portfolio to achieve its investment objectives.
Risks of Investing in Derivatives. Each Portfolio’s use of derivatives can result in losses due to unanticipated changes in the market or credit risk factors and the overall market. In instances where a Portfolio is using derivatives to decrease, or hedge, exposures to market or credit risk factors for securities held by a Portfolio, there are also risks that those derivatives may not perform as expected resulting in losses for the combined or hedged positions.
Derivative instruments are subject to a number of risks, including the risk of changes in the market price of the underlying securities, credit risk with respect to the counterparty, risk of loss due to changes in market interest rates and liquidity and volatility risk. The amounts required to purchase certain derivatives may be small relative to the magnitude of exposure assumed by a Portfolio. Therefore, the purchase of certain derivatives may have an economic leveraging effect on a Portfolio and exaggerate any increase or decrease in the net asset value. Derivatives may not perform as expected, so a Portfolio may not realize the intended benefits. When used for hedging purposes, the change in value of a derivative may not
correlate as expected with the currency, security or other risk being hedged. When used as an alternative or substitute for direct cash investments, the return provided by the derivative may not provide the same return as direct cash investment. In addition, given their complexity, derivatives expose a Portfolio to the risk of improper valuation.
Generally, derivatives are sophisticated financial instruments whose performance is derived, at least in part, from the performance of an underlying asset or assets. Derivatives include, among other things, swap agreements, options, forwards and futures. Investments in derivatives are generally negotiated over-the-counter with a single counterparty and as a result are subject to credit risks related to the counterparty’s ability or willingness to perform its obligations; any deterioration in the counterparty’s creditworthiness could adversely affect the value of the derivative. In addition, derivatives and their underlying securities may experience periods of illiquidity which could cause a Portfolio to hold a security it might otherwise sell, or to sell a security it otherwise might hold at inopportune times or at an unanticipated price. A manager might imperfectly judge the direction of the market. For instance, if a derivative is used as a hedge to offset investment risk in another security, the hedge might not correlate to the market’s movements and may have unexpected or undesired results such as a loss or a reduction in gains.
The U.S. government has enacted legislation that provides for new regulation of the derivatives market, including clearing, margin, reporting, and registration requirements. The European Union is (and other countries outside of the European Union are) implementing similar requirements, which will affect a Portfolio when it enters into a derivatives transaction with a counterparty organized in that country or otherwise subject to that country’s derivatives regulations. Because these requirements are new and evolving (and some of the rules are not yet final), their ultimate impact remains unclear. Central clearing is expected to reduce counterparty risk and increase liquidity, however, there is no assurance that it will achieve that result, and in the meantime, central clearing and related requirements expose a Portfolio to new kinds of costs and risks.
G. Futures Contracts. Certain Portfolios may enter into futures contracts involving foreign currency, interest rates, securities and security indices. A futures contract is a commitment to buy or sell a specific amount of a financial instrument at a negotiated price on a stipulated future date. A Portfolio may buy and sell futures contracts. Futures contracts traded on a commodities or futures exchange will be valued at the final settlement price or official closing price on the principal exchange as reported by such
NOTES TO FINANCIAL STATEMENTS as of December 31, 2016 (continued)
NOTE 2 — SIGNIFICANT ACCOUNTING POLICIES (continued)
principal exchange at its trading session ending at, or most recently prior to, the time when each Portfolio’s assets are valued.
Upon entering into a futures contract, a Portfolio is required to deposit either cash or securities (initial margin) in an amount equal to a certain percentage of the contract value. Subsequent payments (variation margin) are made or received by a Portfolio each day. The variation margin payments are equal to the daily changes in the contract value and are recorded as unrealized gains and losses. Open futures contracts are reported on a table following each Portfolio’s Portfolio of Investments. Securities held in collateralized accounts to cover initial margin requirements on open futures contracts, if any, are footnoted in the Portfolio of Investments. Cash collateral held by the broker to cover initial margin requirements on open futures contracts are noted in the Statements of Assets and Liabilities. The net change in unrealized appreciation and depreciation is reported in the Statements of Operations. Realized gains (losses) are reported in the Statements of Operations at the closing or expiration of futures contracts.
Futures contracts are exposed to the market risk factor of the underlying financial instrument. During the year ended December 31, 2016, certain Portfolios had purchased futures contracts on various equity indices to “equitize” cash. Futures contracts are purchased to provide immediate market exposure proportionate to the size of the Portfolio’s respective cash flows and residual cash balances in order to decrease potential tracking error if the cash remained uninvested in the market. Certain Portfolios also purchased futures contracts on U.S. Treasury Notes and sold futures contracts on equity indices as part of their tactical asset allocation strategy. Additional associated risks of entering into futures contracts include the possibility that there may be an illiquid market where the Portfolios are unable to liquidate the contract or enter into an offsetting position and, if used for hedging purposes, the risk that the price of the contract will correlate imperfectly with the prices of the Portfolios’ securities. With futures, there is minimal counterparty credit risk to the Portfolios since futures are exchange traded and the exchange’s clearinghouse, as counterparty to all exchange traded futures, guarantees the futures against default.
During the year ended December 31, 2016, the following Portfolios had average notional values on futures contracts purchased and sold as of December 31, 2016. There were no open futures contracts for any Portfolio at December 31, 2016.
| | | | Purchased | | | Sold | |
| Solution Aggressive | | | | $ | — | | | | | $ | 102,417 | | |
| Solution Balanced | | | | | 677,643 | | | | | | 701,544 | | |
| Solution Conservative | | | | | — | | | | | | 307,249 | | |
| Solution Income | | | | | 4,465,727 | | | | | | 4,133,315 | | |
| Solution Moderately Aggressive | | | | | 7,206,340 | | | | | | 6,290,323 | | |
| Solution Moderately Conservative | | | | | 512,128 | | | | | | 526,924 | | |
| Solution 2020 | | | | | — | | | | | | 307,250 | | |
| Solution 2025 | | | | | 7,690,098 | | | | | | 8,199,433 | | |
| Solution 2030 | | | | | — | | | | | | 204,833 | | |
| Solution 2035 | | | | | 8,794,353 | | | | | | 7,765,779 | | |
| Solution 2040 | | | | | — | | | | | | 204,833 | | |
| Solution 2045 | | | | | 6,219,968 | | | | | | 6,178,451 | | |
| Solution 2050 | | | | | — | | | | | | 102,417 | | |
| Solution 2055 | | | | | 1,903,706 | | | | | | 2,028,116 | | |
H. Offering Costs. Costs incurred with the offering of shares of a Portfolio are deferred and amortized over a twelve-month period on a straight-line basis starting at the commencement of operations.
I. Indemnifications. In the normal course of business, the Company may enter into contracts that provide certain indemnifications. The Company’s maximum exposure under these arrangements is dependent on future claims that may be made against the Portfolios and, therefore, cannot be estimated; however, based on experience, management considers the risk of loss from such claims remote.
NOTE 3 — INVESTMENTS IN UNDERLYING FUNDS
For the year ended December 31, 2016, the cost of purchases and the proceeds from sales of the Underlying Funds were as follows:
| | | | Purchases | | | Sales | |
| Solution Aggressive | | | | $ | 6,159,427 | | | | | $ | 3,854,684 | | |
| Solution Balanced | | | | | 36,281,456 | | | | | | 37,036,799 | | |
| Solution Conservative | | | | | 10,309,016 | | | | | | 9,040,535 | | |
| Solution Income | | | | | 249,215,031 | | | | | | 368,067,709 | | |
| Solution Moderately Aggressive | | | | | 370,165,139 | | | | | | 467,606,917 | | |
| Solution Moderately Conservative | | | | | 24,816,621 | | | | | | 33,805,437 | | |
| Solution 2020 | | | | | 25,276,706 | | | | | | 13,301,963 | | |
| Solution 2025 | | | | | 410,729,492 | | | | | | 563,708,995 | | |
| Solution 2030 | | | | | 16,521,996 | | | | | | 6,103,890 | | |
| Solution 2035 | | | | | 389,292,474 | | | | | | 505,818,088 | | |
| Solution 2040 | | | | | 12,622,258 | | | | | | 5,323,251 | | |
| Solution 2045 | | | | | 284,827,854 | | | | | | 351,651,826 | | |
| Solution 2050 | | | | | 7,750,006 | | | | | | 2,981,093 | | |
| Solution 2055 | | | | | 82,346,180 | | | | | | 76,852,538 | | |
| Solution 2060 | | | | | 3,507,230 | | | | | | 1,459,102 | | |
NOTE 4 — INVESTMENT MANAGEMENT FEES
The Portfolios have entered into an investment management agreement (“Management Agreement”) with the Investment Adviser. The Investment Adviser has overall
NOTES TO FINANCIAL STATEMENTS as of December 31, 2016 (continued)
NOTE 4 — INVESTMENT MANAGEMENT FEES (continued)
responsibility for the management of the Portfolios. The Investment Adviser oversees all investment management and portfolio management services for the Portfolios and assists in managing and supervising all aspects of the general day-to-day business activities and operations of the Portfolios, including custodial, transfer agency, dividend disbursing, accounting, auditing, compliance and related services. This Management Agreement compensates the Investment Adviser with a management fee, computed daily and payable monthly, based on the average daily net assets of each Portfolio, at the following annual rates: 0.20% of each Portfolio’s average daily nets assets invested in affiliated Underlying Funds and 0.40% of each Portfolio’s average daily net assets invested in unaffiliated Underlying Funds and/or other investments.
The Investment Adviser has entered into a sub-advisory agreement with Voya IM. Subject to such policies as the Board or the Investment Adviser may determine, Voya IM manages the Portfolios’ assets in accordance with the Portfolios’ investment objectives, policies, and limitations.
NOTE 5 — DISTRIBUTION AND SERVICE FEES
Classes ADV, S2 and T of the respective Portfolios have a plan of distribution pursuant to Rule 12b-1 under the 1940 Act (the “12b-1 Plans”), whereby the Distributor is reimbursed or compensated by the Portfolios for expenses incurred in the distribution of each Portfolio’s shares (“Distribution Fees”). The Distributor may pay, on behalf of each Portfolio, out of its distribution fee, compensation to certain financial institutions for providing distribution assistance pursuant to a Distribution Services Agreement. Under the 12b-1 Plans, each Portfolio makes payments to the Distributor at an annual rate of 0.25% of each Portfolio’s average daily net assets attributable to its Class ADV shares and effective May 1, 2016, each Portfolio makes payments to the Distributor at an annual rate of 0.15% and 0.45% of each Portfolio’s average daily net assets attributable to its Class S2 and Class T shares, respectively. Prior to May 1, 2016, the distribution fee on Class S2 shares was 0.25% and the Distributor had contractually agreed to waive a portion of the fee equal to 0.10%, so that the actual fee paid by Class S2 shares of the Portfolios was an annual rate of 0.15%. Prior to May 1, 2016, the distribution fee on Class T shares was 0.50% and the Distributor had contractually agreed to waive a portion of the fee equal to 0.05%, so that the actual fee paid by Class T shares of each applicable Portfolio was an annual rate of 0.45%.
The Company has a shareholder servicing plan (“Service Plan”) for the Classes ADV, S, S2 and T shares of each
respective Portfolio. The Service Plan allows the Distributor to enter into shareholder servicing agreements with insurance companies, broker dealers or other financial intermediaries that provide administrative services related to Classes ADV, S, S2 and T shares and their shareholders including Variable Contract owners or Qualified Plan participants with interests in the Portfolios. Under the Service Plan, each Portfolio makes payments to the Distributor which shall not exceed an annual rate of 0.25% of each applicable Portfolio’s average daily net assets attributable to its Classes ADV, S, S2 and T shares.
NOTE 6 — OTHER TRANSACTIONS WITH AFFILIATES AND RELATED PARTIES
At December 31, 2016, the following direct or indirect, wholly-owned subsidiaries of Voya Financial, Inc. owned more than 5% of the following Portfolios:
| Subsidiary | | | Portfolio | | | Percentage | |
| Voya Institutional Trust Company | | | Solution Aggressive | | | | | 7.53% | | |
| | | | Solution Balanced | | | | | 8.03 | | |
| | | | Solution Conservative | | | | | 8.68 | | |
| | | | Solution Income | | | | | 33.95 | | |
| | | | Solution Moderately Conservative | | | | | 5.24 | | |
| | | | Solution 2020 | | | | | 18.25 | | |
| | | | Solution 2025 | | | | | 30.45 | | |
| | | | Solution 2030 | | | | | 21.88 | | |
| | | | Solution 2035 | | | | | 30.10 | | |
| | | | Solution 2040 | | | | | 17.72 | | |
| | | | Solution 2045 | | | | | 28.06 | | |
| | | | Solution 2050 | | | | | 16.50 | | |
| | | | Solution 2055 | | | | | 28.66 | | |
| | | | Solution 2060 | | | | | 12.29 | | |
Voya Insurance and Annuity Company
| | | Solution Moderately Aggressive | | | | | 92.43 | | |
| Voya Retirement Insurance and Annuity Company | | | Solution Aggressive | | | | | 92.38 | | |
| | | | Solution Balanced | | | | | 91.96 | | |
| | | | Solution Conservative | | | | | 91.30 | | |
| | | | Solution Income | | | | | 61.07 | | |
| | | | Solution Moderately Conservative | | | | | 94.75 | | |
| | | | Solution 2020 | | | | | 81.73 | | |
| | | | Solution 2025 | | | | | 66.74 | | |
| | | | Solution 2030 | | | | | 77.62 | | |
| | | | Solution 2035 | | | | | 68.18 | | |
| | | | Solution 2040 | | | | | 82.24 | | |
| | | | Solution 2045 | | | | | 70.64 | | |
| | | | Solution 2050 | | | | | 83.43 | | |
| | | | Solution 2055 | | | | | 71.34 | | |
| | | | Solution 2060 | | | | | 87.60 | | |
Under the 1940 Act, the direct or indirect beneficial owner of more than 25% of the voting securities of a company (including a fund) is presumed to control such company.
NOTES TO FINANCIAL STATEMENTS as of December 31, 2016 (continued)
NOTE 6 — OTHER TRANSACTIONS WITH AFFILIATES AND RELATED PARTIES (continued)
Companies under common control (e.g., companies with a common owner of greater than 25% of their respective voting securities) are affiliates under the 1940 Act.
The Portfolios have adopted a deferred compensation plan (the “DC Plan”), which allows eligible independent directors, as described in the DC Plan, to defer the receipt of all or a portion of the directors’ fees that they are entitled to receive from the Portfolios. For purposes of determining the amount owed to the director under the Plan, the amounts deferred are invested in shares of the funds selected by the director (the “Notional Funds”). The Portfolios purchase shares of the Notional Funds, which are all advised by Voya Investments, LLC, in amounts equal to the directors’ deferred fees, resulting in a Portfolio asset equal to the deferred compensation liability. Such assets are included as a component of “Other assets” on the accompanying Statements of Assets and Liabilities. Deferral of directors’ fees under the DC Plan will not affect net assets of the Portfolio, and will not materially affect the Portfolios’ assets, liabilities or net investment income per share. Amounts will be deferred until distributed in accordance with the DC Plan.
NOTE 7 — EXPENSE LIMITATION AGREEMENT
The Investment Adviser has entered into a written expense limitation agreement (“Expense Limitation Agreement”) with each Portfolio whereby the Investment Adviser has agreed to limit expenses, excluding interest, taxes, investment-related costs, leverage expenses, and extraordinary expenses to the levels listed below:
Portfolio(1) | | | Class
ADV | | | Class
I | | | Class
R6 | | | Class
S | | | Class
S2 | | | Class
T | |
| Solution Aggressive | | | | | 1.39% | | | | | | 0.89% | | | | | | 0.89% | | | | | | 1.14% | | | | | | 1.29% | | | | | | N/A | | |
| Solution Balanced | | | | | 1.30% | | | | | | 0.80% | | | | | | 0.80% | | | | | | 1.05% | | | | | | 1.20% | | | | | | N/A | | |
| Solution Conservative | | | | | 1.16% | | | | | | 0.66% | | | | | | 0.66% | | | | | | 0.91% | | | | | | 1.06% | | | | | | N/A | | |
| Solution Income | | | | | 1.18% | | | | | | 0.68% | | | | | | N/A | | | | | | 0.93% | | | | | | 1.08% | | | | | | 1.38% | | |
| Solution Moderately Aggressive | | | | | 1.38% | | | | | | 0.88% | | | | | | 0.88% | | | | | | 1.13% | | | | | | 1.28% | | | | | | N/A | | |
| Solution Moderately Conservative | | | | | 1.24% | | | | | | 0.74% | | | | | | 0.74% | | | | | | 0.99% | | | | | | 1.14% | | | | | | N/A | | |
| Solution 2020 | | | | | 1.26% | | | | | | 0.76% | | | | | | N/A | | | | | | 1.01% | | | | | | 1.16% | | | | | | 1.46% | | |
| Solution 2025 | | | | | 1.30% | | | | | | 0.80% | | | | | | N/A | | | | | | 1.05% | | | | | | 1.20% | | | | | | 1.50% | | |
| Solution 2030 | | | | | 1.33% | | | | | | 0.83% | | | | | | N/A | | | | | | 1.08% | | | | | | 1.23% | | | | | | 1.53% | | |
| Solution 2035 | | | | | 1.37% | | | | | | 0.87% | | | | | | N/A | | | | | | 1.12% | | | | | | 1.27% | | | | | | 1.57% | | |
| Solution 2040 | | | | | 1.38% | | | | | | 0.88% | | | | | | N/A | | | | | | 1.13% | | | | | | 1.28% | | | | | | 1.58% | | |
| Solution 2045 | | | | | 1.39% | | | | | | 0.89% | | | | | | N/A | | | | | | 1.14% | | | | | | 1.29% | | | | | | 1.59% | | |
| Solution 2050 | | | | | 1.39% | | | | | | 0.89% | | | | | | N/A | | | | | | 1.14% | | | | | | 1.29% | | | | | | 1.59% | | |
Portfolio(1) | | | Class
ADV | | | Class
I | | | Class
R6 | | | Class
S | | | Class
S2 | | | Class
T | |
| Solution 2055 | | | | | 1.39% | | | | | | 0.89% | | | | | | N/A | | | | | | 1.14% | | | | | | 1.29% | | | | | | 1.59% | | |
| Solution 2060 | | | | | 1.39% | | | | | | 0.89% | | | | | | N/A | | | | | | 1.14% | | | | | | 1.29% | | | | | | 1.59% | | |
(1)
The operating expense limits take into account the operating expenses incurred at the Underlying Fund level. The amount of fees and expenses of an Underlying Fund borne by each Portfolio will vary based on each Portfolio’s allocation of assets to, and the net expenses of, a particular Underlying Fund.
The Investment Adviser may at a later date recoup from a Portfolio for fees waived and/or other expenses assumed by the Investment Adviser during the previous 36 months, but only if, after such recoupment, a Portfolio’s expense ratio does not exceed the percentage described above. Waived and reimbursed fees net of any recoupment by the Investment Adviser of such waived and reimbursed fees are reflected on the accompanying Statements of Operations. Amounts payable by the Investment Adviser are reflected on the accompanying Statements of Assets and Liabilities.
As of December 31, 2016 the amounts of waived and/or reimbursed fees that are subject to possible recoupment by the Investment Adviser and the related expiration dates are as follows:
| | | | December 31, | | | | | | | |
| | | | 2017 | | | 2018 | | | 2019 | | | Total | |
| Solution Aggressive | | | | $ | 14,968 | | | | | $ | 12,690 | | | | | $ | 22,989 | | | | | $ | 50,647 | | |
| Solution Balanced | | | | | 71,065 | | | | | | 63,484 | | | | | | 66,469 | | | | | | 201,018 | | |
| Solution Conservative | | | | | 40,932 | | | | | | 37,813 | | | | | | 36,857 | | | | | | 115,602 | | |
| Solution Income | | | | | 230,838 | | | | | | 340,447 | | | | | | 677,513 | | | | | | 1,248,798 | | |
| Solution Moderately Aggressive | | | | | 38,312 | | | | | | 141,031 | | | | | | 349,713 | | | | | | 529,056 | | |
| Solution Moderately Conservative | | | | | 60,329 | | | | | | 51,944 | | | | | | 59,855 | | | | | | 172,128 | | |
| Solution 2020 | | | | | 14,049 | | | | | | 19,318 | | | | | | 34,629 | | | | | | 67,996 | | |
| Solution 2025 | | | | | 1,358,078 | | | | | | 967,252 | | | | | | 935,785 | | | | | | 3,261,115 | | |
| Solution 2030 | | | | | 13,791 | | | | | | 17,601 | | | | | | 26,854 | | | | | | 58,246 | | |
| Solution 2035 | | | | | 936,968 | | | | | | 727,201 | | | | | | 721,028 | | | | | | 2,385,197 | | |
| Solution 2040 | | | | | 13,435 | | | | | | 16,747 | | | | | | 26,861 | | | | | | 57,043 | | |
| Solution 2045 | | | | | 473,742 | | | | | | 378,863 | | | | | | 412,613 | | | | | | 1,265,218 | | |
| Solution 2050 | | | | | 13,226 | | | | | | 16,251 | | | | | | 23,295 | | | | | | 52,772 | | |
| Solution 2055 | | | | | 84,591 | | | | | | 72,976 | | | | | | 92,164 | | | | | | 249,731 | | |
| Solution 2060 | | | | | — | | | | | | 29,374 | | | | | | 22,828 | | | | | | 52,202 | | |
The Expense Limitation Agreement is contractual through May 1, 2018 for all Portfolios (except for Solution Aggressive and Solution 2060, which are through May 1, 2017) and shall renew automatically for one-year terms. Termination or modification of this obligation requires approval by the Board.
NOTES TO FINANCIAL STATEMENTS as of December 31, 2016 (continued)
NOTE 8 — LINE OF CREDIT
Effective May 20, 2016, each Portfolio, in addition to certain other funds managed by the Investment Adviser, has entered into an unsecured committed revolving line of credit agreement (the “Credit Agreement”) with The Bank of New York Mellon (“BNY”) for an aggregate amount of $400,000,000. The proceeds may be used only to finance temporarily: (1) the purchase or sale of investment securities; or (2) the repurchase or redemption of shares of the Portfolios or certain other funds managed by the Investment Adviser. The funds to which the line of credit is available pay a commitment fee equal to 0.15% per annum on the daily unused portion of the committed line amount payable quarterly in arrears. Prior to May 20, 2016, the aggregate amount was $200,000,000 and the commitment fee was equal to 0.10% per annum on the daily unused portion of the committed line amount payable quarterly in arrears.
Borrowings under the Credit Agreement accrue interest at the federal funds rate plus a specified margin. Repayments generally must be made within 60 days after the date of a revolving credit advance.
The following Portfolios utilized the line of credit during the year ended December 31, 2016 as follows:
| Portfolio | | | Days
Utilized | | | Approximate
Average
Daily
Balance For
Days Utilized | | | Approximate
Weighted
Average
Interest Rate
For Days
Utilized | |
| Solution Moderately Aggressive | | | | | 2 | | | | | $ | 565,500 | | | | | | 1.40% | | |
| Solution 2035 | | | | | 1 | | | | | | 539,000 | | | | | | 1.38 | | |
| Solution 2045 | | | | | 1 | | | | | | 535,000 | | | | | | 1.38 | | |
NOTE 9 — CAPITAL SHARES
Transactions in capital shares and dollars were as follows:
| | | | Shares
sold | | | Shares
issued in
merger | | | Reinvestment
of
distributions | | | Shares
redeemed | | | Net increase
(decrease)
in shares
outstanding | | | Shares
sold | | | Proceeds
from shares
issued in
merger | | | Reinvestment
of
distributions | | | Shares
redeemed | | | Net increase
(decrease) | |
Year or
period ended | | | # | | | # | | | # | | | # | | | # | | | ($) | | | ($) | | | ($) | | | ($) | | | ($) | |
| Solution Aggressive | |
| Class ADV | | | | | | | | | | | |
| 12/31/2016 | | | | | 71,088 | | | | | | — | | | | | | 13,350 | | | | | | (72,164) | | | | | | 12,274 | | | | | | 790,135 | | | | | | — | | | | | | 146,983 | | | | | | (806,792) | | | | | | 130,326 | | |
| 12/31/2015 | | | | | 133,363 | | | | | | — | | | | | | 12,054 | | | | | | (115,116) | | | | | | 30,301 | | | | | | 1,640,492 | | | | | | — | | | | | | 143,443 | | | | | | (1,390,895) | | | | | | 393,040 | | |
| Class I | | | | | | | | | | | |
| 12/31/2016 | | | | | 10,057 | | | | | | — | | | | | | 912 | | | | | | (547) | | | | | | 10,422 | | | | | | 113,995 | | | | | | — | | | | | | 10,222 | | | | | | (6,309) | | | | | | 117,908 | | |
| 12/31/2015 | | | | | 10,343 | | | | | | — | | | | | | 569 | | | | | | —* | | | | | | 10,912 | | | | | | 131,149 | | | | | | — | | | | | | 6,885 | | | | | | —* | | | | | | 138,034 | | |
| Class R6 | | | | | | | | | | | |
5/2/2016(1) -
12/31/2016 | | | | | 58,522 | | | | | | — | | | | | | 373 | | | | | | (1,919) | | | | | | 56,976 | | | | | | 678,814 | | | | | | — | | | | | | 4,183 | | | | | | (21,908) | | | | | | 661,089 | | |
| Class S | | | | | | | | | | | |
| 12/31/2016 | | | | | 157,521 | | | | | | — | | | | | | 20,859 | | | | | | (43,665) | | | | | | 134,715 | | | | | | 1,772,910 | | | | | | — | | | | | | 231,533 | | | | | | (492,326) | | | | | | 1,512,117 | | |
| 12/31/2015 | | | | | 160,428 | | | | | | — | | | | | | 10,900 | | | | | | (74,471) | | | | | | 96,857 | | | | | | 2,006,952 | | | | | | — | | | | | | 130,802 | | | | | | (908,941) | | | | | | 1,228,813 | | |
| Class S2 | | | | | | | | | | | |
| 12/31/2016 | | | | | 24,769 | | | | | | — | | | | | | 1,605 | | | | | | (3,928) | | | | | | 22,446 | | | | | | 274,283 | | | | | | — | | | | | | 17,631 | | | | | | (43,834) | | | | | | 248,080 | | |
| 12/31/2015 | | | | | 9,858 | | | | | | — | | | | | | 715 | | | | | | (2,113) | | | | | | 8,460 | | | | | | 121,049 | | | | | | — | | | | | | 8,504 | | | | | | (25,714) | | | | | | 103,839 | | |
| Solution Balanced | |
| Class ADV | | | | | | | | | | | |
| 12/31/2016 | | | | | 191,318 | | | | | | — | | | | | | 206,691 | | | | | | (1,058,045) | | | | | | (660,036) | | | | | | 1,755,767 | | | | | | — | | | | | | 1,839,547 | | | | | | (9,847,737) | | | | | | (6,252,423) | | |
| 12/31/2015 | | | | | 205,961 | | | | | | — | | | | | | 299,144 | | | | | | (505,975) | | | | | | (870) | | | | | | 2,108,871 | | | | | | — | | | | | | 2,904,687 | | | | | | (5,124,403) | | | | | | (110,845) | | |
| Class I | | | | | | | | | | | |
| 12/31/2016 | | | | | 217,306 | | | | | | — | | | | | | 924 | | | | | | (1,608) | | | | | | 216,622 | | | | | | 2,020,929 | | | | | | — | | | | | | 8,507 | | | | | | (15,058) | | | | | | 2,014,378 | | |
| 12/31/2015 | | | | | 4,324 | | | | | | — | | | | | | 515 | | | | | | (926) | | | | | | 3,913 | | | | | | 46,241 | | | | | | — | | | | | | 5,169 | | | | | | (9,949) | | | | | | 41,461 | | |
| Class R6 | | | | | | | | | | | |
5/2/2016(1) -
12/31/2016 | | | | | 258,700 | | | | | | — | | | | | | 8,141 | | | | | | (10,066) | | | | | | 256,775 | | | | | | 2,459,665 | | | | | | — | | | | | | 74,982 | | | | | | (92,951) | | | | | | 2,441,696 | | |
| Class S | | | | | | | | | | | |
| 12/31/2016 | | | | | 784,782 | | | | | | — | | | | | | 227,954 | | | | | | (622,570) | | | | | | 390,166 | | | | | | 7,217,170 | | | | | | — | | | | | | 2,053,866 | | | | | | (5,826,050) | | | | | | 3,444,986 | | |
| 12/31/2015 | | | | | 344,977 | | | | | | — | | | | | | 257,785 | | | | | | (395,322) | | | | | | 207,440 | | | | | | 3,597,100 | | | | | | — | | | | | | 2,536,602 | | | | | | (4,028,864) | | | | | | 2,104,838 | | |
| Class S2 | | | | | | | | | | | |
| 12/31/2016 | | | | | 141,831 | | | | | | — | | | | | | 5,386 | | | | | | (26,090) | | | | | | 121,127 | | | | | | 1,288,802 | | | | | | — | | | | | | 48,473 | | | | | | (241,690) | | | | | | 1,095,585 | | |
| 12/31/2015 | | | | | 13,992 | | | | | | — | | | | | | 6,751 | | | | | | (22,742) | | | | | | (1,999) | | | | | | 147,579 | | | | | | — | | | | | | 66,297 | | | | | | (237,531) | | | | | | (23,655) | | |
NOTES TO FINANCIAL STATEMENTS as of December 31, 2016 (continued)
NOTE 9 — CAPITAL SHARES (continued)
| | | | Shares
sold | | | Shares
issued in
merger | | | Reinvestment
of
distributions | | | Shares
redeemed | | | Net increase
(decrease)
in shares
outstanding | | | Shares
sold | | | Proceeds
from shares
issued in
merger | | | Reinvestment
of
distributions | | | Shares
redeemed | | | Net increase
(decrease) | |
Year or
period ended | | | # | | | # | | | # | | | # | | | # | | | ($) | | | ($) | | | ($) | | | ($) | | | ($) | |
| Solution Conservative | |
| Class ADV | | | | | | | | | | | |
| 12/31/2016 | | | | | 110,109 | | | | | | — | | | | | | 33,749 | | | | | | (162,455) | | | | | | (18,597) | | | | | | 1,177,944 | | | | | | — | | | | | | 356,731 | | | | | | (1,740,892) | | | | | | (206,217) | | |
| 12/31/2015 | | | | | 125,281 | | | | | | — | | | | | | 56,542 | | | | | | (393,073) | | | | | | (211,250) | | | | | | 1,387,230 | | | | | | — | | | | | | 602,741 | | | | | | (4,271,194) | | | | | | (2,281,223) | | |
| Class I | | | | | | | | | | | |
| 12/31/2016 | | | | | 9,326 | | | | | | — | | | | | | 103 | | | | | | (519) | | | | | | 8,910 | | | | | | 100,105 | | | | | | — | | | | | | 1,096 | | | | | ��� | (5,592) | | | | | | 95,609 | | |
| 12/31/2015 | | | | | 471 | | | | | | — | | | | | | 50 | | | | | | (150) | | | | | | 371 | | | | | | 5,234 | | | | | | — | | | | | | 539 | | | | | | (1,600) | | | | | | 4,173 | | |
| Class R6 | | | | | | | | | | | |
5/2/2016(1) -
12/31/2016 | | | | | 65,603 | | | | | | — | | | | | | 1,537 | | | | | | (289) | | | | | | 66,851 | | | | | | 718,269 | | | | | | — | | | | | | 16,423 | | | | | | (3,103) | | | | | | 731,589 | | |
| Class S | | | | | | | | | | | |
| 12/31/2016 | | | | | 191,001 | | | | | | — | | | | | | 27,271 | | | | | | (133,859) | | | | | | 84,413 | | | | | | 2,045,268 | | | | | | — | | | | | | 289,618 | | | | | | (1,435,029) | | | | | | 899,857 | | |
| 12/31/2015 | | | | | 106,243 | | | | | | — | | | | | | 33,166 | | | | | | (135,562) | | | | | | 3,847 | | | | | | 1,174,400 | | | | | | — | | | | | | 355,539 | | | | | | (1,457,964) | | | | | | 71,975 | | |
| Class S2 | | | | | | | | | | | |
| 12/31/2016 | | | | | 20,580 | | | | | | — | | | | | | 1,923 | | | | | | (8,826) | | | | | | 13,677 | | | | | | 218,102 | | | | | | — | | | | | | 20,300 | | | | | | (92,991) | | | | | | 145,411 | | |
| 12/31/2015 | | | | | 12,292 | | | | | | — | | | | | | 2,075 | | | | | | (8,244) | | | | | | 6,123 | | | | | | 137,650 | | | | | | — | | | | | | 22,148 | | | | | | (90,134) | | | | | | 69,664 | | |
| Solution Income | |
| Class ADV | | | | | | | | | | | |
| 12/31/2016 | | | | | 838,417 | | | | | | — | | | | | | 425,305 | | | | | | (5,679,960) | | | | | | (4,416,238) | | | | | | 9,245,175 | | | | | | — | | | | | | 4,742,151 | | | | | | (62,563,950) | | | | | | (48,576,624) | | |
| 12/31/2015 | | | | | 875,501 | | | | | | 17,732,399 | | | | | | 422,310 | | | | | | (3,417,878) | | | | | | 15,612,332 | | | | | | 8,937,303 | | | | | | 196,406,386 | | | | | | 4,683,419 | | | | | | (38,302,807) | | | | | | 171,724,301 | | |
| Class I | | | | | | | | | | | |
| 12/31/2016 | | | | | 1,339,227 | | | | | | — | | | | | | 201,617 | | | | | | (3,137,728) | | | | | | (1,596,884) | | | | | | 15,151,519 | | | | | | — | | | | | | 2,296,413 | | | | | | (35,447,069) | | | | | | (17,999,137) | | |
| 12/31/2015 | | | | | 882,319 | | | | | | 7,086,887 | | | | | | 133,536 | | | | | | (1,219,110) | | | | | | 6,883,632 | | | | | | 9,761,205 | | | | | | 80,072,506 | | | | | | 1,510,290 | | | | | | (13,921,933) | | | | | | 77,422,068 | | |
| Class S | | | | | | | | | | | |
| 12/31/2016 | | | | | 553,161 | | | | | | — | | | | | | 397,199 | | | | | | (4,849,656) | | | | | | (3,899,296) | | | | | | 6,191,680 | | | | | | — | | | | | | 4,488,343 | | | | | | (54,175,988) | | | | | | (43,495,965) | | |
| 12/31/2015 | | | | | 522,004 | | | | | | 18,628,555 | | | | | | 296,033 | | | | | | (3,844,837) | | | | | | 15,601,755 | | | | | | 4,991,798 | | | | | | 209,005,049 | | | | | | 3,324,455 | | | | | | (43,039,025) | | | | | | 174,282,277 | | |
| Class S2 | | | | | | | | | | | |
| 12/31/2016 | | | | | 155,769 | | | | | | — | | | | | | 26,662 | | | | | | (549,167) | | | | | | (366,736) | | | | | | 1,700,861 | | | | | | — | | | | | | 293,819 | | | | | | (6,019,372) | | | | | | (4,024,692) | | |
| 12/31/2015 | | | | | 75,965 | | | | | | 1,451,787 | | | | | | 23,159 | | | | | | (494,983) | | | | | | 1,055,928 | | | | | | 776,050 | | | | | | 15,898,957 | | | | | | 253,821 | | | | | | (5,406,925) | | | | | | 11,521,903 | | |
| Class T | | | | | | | | | | | |
| 12/31/2016 | | | | | 7,841 | | | | | | — | | | | | | 181 | | | | | | (62,146) | | | | | | (54,124) | | | | | | 91,198 | | | | | | — | | | | | | 2,132 | | | | | | (719,828) | | | | | | (626,498) | | |
| 12/31/2015 | | | | | 516 | | | | | | 63,207 | | | | | | 426 | | | | | | (118) | | | | | | 64,031 | | | | | | 2,119 | | | | | | 733,182 | | | | | | 4,945 | | | | | | (1,330) | | | | | | 738,916 | | |
| Solution Moderately Aggressive | |
| Class ADV | | | | | | | | | | | |
| 12/31/2016 | | | | | 313,018 | | | | | | — | | | | | | 53,590 | | | | | | (1,041,492) | | | | | | (674,884) | | | | | | 3,517,103 | | | | | | — | | | | | | 608,784 | | | | | | (11,697,103) | | | | | | (7,571,216) | | |
| 12/31/2015 | | | | | 356,971 | | | | | | 1,149,017 | | | | | | 222,861 | | | | | | (468,829) | | | | | | 1,260,020 | | | | | | 4,325,948 | | | | | | 13,430,897 | | | | | | 2,614,164 | | | | | | (5,579,778) | | | | | | 14,791,231 | | |
| Class I | | | | | | | | | | | |
| 12/31/2016 | | | | | 56,764 | | | | | | — | | | | | | 10,035 | | | | | | (53,317) | | | | | | 13,482 | | | | | | 650,676 | | | | | | — | | | | | | 115,903 | | | | | | (607,100) | | | | | | 159,479 | | |
| 12/31/2015 | | | | | 25,830 | | | | | | 388,400 | | | | | | 963 | | | | | | (66,689) | | | | | | 348,504 | | | | | | 300,505 | | | | | | 4,613,738 | | | | | | 11,481 | | | | | | (761,743) | | | | | | 4,163,981 | | |
| Class R6 | | | | | | | | | | | |
5/2/2016(1) -
12/31/2016 | | | | | 111,329 | | | | | | — | | | | | | 263 | | | | | | (2,731) | | | | | | 108,861 | | | | | | 1,306,234 | | | | | | — | | | | | | 3,040 | | | | | | (31,825) | | | | | | 1,277,449 | | |
| Class S | | | | | | | | | | | |
| 12/31/2016 | | | | | 496,010 | | | | | | — | | | | | | 1,631,794 | | | | | | (9,052,219) | | | | | | (6,924,415) | | | | | | 5,592,080 | | | | | | — | | | | | | 18,667,727 | | | | | | (102,367,614) | | | | | | (78,107,807) | | |
| 12/31/2015 | | | | | 323,918 | | | | | | 67,391,670 | | | | | | 117,010 | | | | | | (5,264,540) | | | | | | 62,568,058 | | | | | | 3,970,666 | | | | | | 794,400,426 | | | | | | 1,384,232 | | | | | | (59,897,867) | | | | | | 739,857,457 | | |
| Class S2 | | | | | | | | | | | |
| 12/31/2016 | | | | | 30,115 | | | | | | — | | | | | | 2,076 | | | | | | (27,362) | | | | | | 4,829 | | | | | | 339,555 | | | | | | — | | | | | | 23,749 | | | | | | (307,295) | | | | | | 56,009 | | |
| 12/31/2015 | | | | | 24,794 | | | | | | — | | | | | | 10,593 | | | | | | (4,868) | | | | | | 30,519 | | | | | | 318,836 | | | | | | — | | | | | | 125,106 | | | | | | (62,765) | | | | | | 381,177 | | |
| Solution Moderately Conservative | |
| Class ADV | | | | | | | | | | | |
| 12/31/2016 | | | | | 314,962 | | | | | | — | | | | | | 120,417 | | | | | | (1,288,116) | | | | | | (852,737) | | | | | | 2,958,639 | | | | | | — | | | | | | 1,103,021 | | | | | | (12,347,311) | | | | | | (8,285,651) | | |
| 12/31/2015 | | | | | 516,666 | | | | | | — | | | | | | 191,286 | | | | | | (467,114) | | | | | | 240,838 | | | | | | 5,235,276 | | | | | | — | | | | | | 1,868,868 | | | | | | (4,766,056) | | | | | | 2,338,088 | | |
| Class I | | | | | | | | | | | |
| 12/31/2016 | | | | | 270 | | | | | | — | | | | | | 348 | | | | | | (798) | | | | | | (180) | | | | | | 2,671 | | | | | | — | | | | | | 3,328 | | | | | | (7,713) | | | | | | (1,714) | | |
| 12/31/2015 | | | | | 152 | | | | | | — | | | | | | 327 | | | | | | (293) | | | | | | 186 | | | | | | 1,610 | | | | | | — | | | | | | 3,324 | | | | | | (2,963) | | | | | | 1,971 | | |
NOTES TO FINANCIAL STATEMENTS as of December 31, 2016 (continued)
NOTE 9 — CAPITAL SHARES (continued)
| | | | Shares
sold | | | Shares
issued in
merger | | | Reinvestment
of
distributions | | | Shares
redeemed | | | Net increase
(decrease)
in shares
outstanding | | | Shares
sold | | | Proceeds
from shares
issued in
merger | | | Reinvestment
of
distributions | | | Shares
redeemed | | | Net increase
(decrease) |
Year or
period ended | | | # | | | # | | | # | | | # | | | # | | | ($) | | | ($) | | | ($) | | | ($) | | | ($) |
| Solution Moderately Conservative (continued) |
| Class R6 | | | | | | | | | | | |
5/2/2016(1) -
12/31/2016 | | | | | 29,923 | | | | | | — | | | | | | 67 | | | | | | (195) | | | | | | 29,795 | | | | | | 287,964 | | | | | | — | | | | | | 640 | | | | | | (1,877) | | | | | | 286,727 |
| Class S | | | | | | | | | | | |
| 12/31/2016 | | | | | 267,868 | | | | | | — | | | | | | 185,343 | | | | | | (303,784) | | | | | | 149,427 | | | | | | 2,577,222 | | | | | | — | | | | | | 1,732,956 | | | | | | (2,950,942) | | | | | | 1,359,236 |
| 12/31/2015 | | | | | 261,617 | | | | | | — | | | | | | 174,769 | | | | | | (467,681) | | | | | | (31,295) | | | | | | 2,714,729 | | | | | | — | | | | | | 1,744,197 | | | | | | (4,948,852) | | | | | | (489,926) |
| Class S2 | | | | | | | | | | | |
| 12/31/2016 | | | | | 21,737 | | | | | | — | | | | | | 7,101 | | | | | | (16,349) | | | | | | 12,489 | | | | | | 209,936 | | | | | | — | | | | | | 65,756 | | | | | | (156,976) | | | | | | 118,716 |
| 12/31/2015 | | | | | 13,745 | | | | | | — | | | | | | 8,024 | | | | | | (23,916) | | | | | | (2,147) | | | | | | 144,059 | | | | | | — | | | | | | 79,359 | | | | | | (236,253) | | | | | | (12,835) |
| Solution 2020 |
| Class ADV | | | | | | | | | | | |
| 12/31/2016 | | | | | 801,007 | | | | | | — | | | | | | 5,784 | | | | | | (297,458) | | | | | | 509,333 | | | | | | 9,402,802 | | | | | | — | | | | | | 69,636 | | | | | | (3,551,098) | | | | | | 5,921,340 |
| 12/31/2015 | | | | | 270,401 | | | | | | — | | | | | | 2,746 | | | | | | (77,349) | | | | | | 195,798 | | | | | | 3,166,134 | | | | | | — | | | | | | 32,568 | | | | | | (972,350) | | | | | | 2,226,352 |
| Class I | | | | | | | | | | | |
| 12/31/2016 | | | | | 572,827 | | | | | | — | | | | | | 2,999 | | | | | | (243,036) | | | | | | 332,790 | | | | | | 6,912,370 | | | | | | — | | | | | | 36,706 | | | | | | (2,901,732) | | | | | | 4,047,344 |
| 12/31/2015 | | | | | 198,327 | | | | | | — | | | | | | —* | | | | | | (16,085) | | | | | | 182,242 | | | | | | 2,346,484 | | | | | | — | | | | | | 2 | | | | | | (189,304) | | | | | | 2,157,182 |
| Class S | | | | | | | | | | | |
| 12/31/2016 | | | | | 368,264 | | | | | | — | | | | | | 4,111 | | | | | | (198,513) | | | | | | 173,862 | | | | | | 4,408,326 | | | | | | — | | | | | | 50,198 | | | | | | (2,389,852) | | | | | | 2,068,672 |
| 12/31/2015 | | | | | 361,539 | | | | | | — | | | | | | —* | | | | | | (10,564) | | | | | | 350,975 | | | | | | 4,284,726 | | | | | | — | | | | | | 2 | | | | | | (126,396) | | | | | | 4,158,332 |
| Class S2 | | | | | | | | | | | |
| 12/31/2016 | | | | | 37,380 | | | | | | — | | | | | | 137 | | | | | | (49,568) | | | | | | (12,051) | | | | | | 451,006 | | | | | | — | | | | | | 1,653 | | | | | | (587,326) | | | | | | (134,667) |
| 12/31/2015 | | | | | 24,151 | | | | | | — | | | | | | —* | | | | | | (303) | | | | | | 23,848 | | | | | | 285,566 | | | | | | — | | | | | | 1 | | | | | | (3,557) | | | | | | 282,010 |
| Class T | | | | | | | | | | | |
| 12/31/2016 | | | | | 317 | | | | | | — | | | | | | 1 | | | | | | (2) | | | | | | 316 | | | | | | 3,731 | | | | | | — | | | | | | 10 | | | | | | (21) | | | | | | 3,720 |
| 12/31/2015 | | | | | 50 | | | | | | — | | | | | | —* | | | | | | —* | | | | | | 50 | | | | | | 578 | | | | | | — | | | | | | 1 | | | | | | —* | | | | | | 579 |
| Solution 2025 |
| Class ADV | | | | | | | | | | | |
| 12/31/2016 | | | | | 1,472,139 | | | | | | — | | | | | | 3,007,965 | | | | | | (8,095,747) | | | | | | (3,615,643) | | | | | | 16,021,320 | | | | | | — | | | | | | 31,643,796 | | | | | | (87,844,343) | | | | | | (40,179,227) |
| 12/31/2015 | | | | | 1,784,495 | | | | | | — | | | | | | 4,330,092 | | | | | | (8,031,558) | | | | | | (1,916,971) | | | | | | 22,123,192 | | | | | | — | | | | | | 49,925,958 | | | | | | (100,164,909) | | | | | | (28,115,759) |
| Class I | | | | | | | | | | | |
| 12/31/2016 | | | | | 3,616,536 | | | | | | — | | | | | | 2,001,405 | | | | | | (5,789,001) | | | | | | (171,060) | | | | | | 40,352,865 | | | | | | — | | | | | | 21,555,129 | | | | | | (63,717,960) | | | | | | (1,809,966) |
| 12/31/2015 | | | | | 4,602,193 | | | | | | — | | | | | | 2,479,049 | | | | | | (4,243,398) | | | | | | 2,837,844 | | | | | | 58,869,833 | | | | | | — | | | | | | 29,227,991 | | | | | | (51,960,653) | | | | | | 36,137,171 |
| Class S | | | | | | | | | | | |
| 12/31/2016 | | | | | 1,675,948 | | | | | | — | | | | | | 3,596,880 | | | | | | (7,440,994) | | | | | | (2,168,166) | | | | | | 18,501,186 | | | | | | — | | | | | | 38,342,742 | | | | | | (82,053,585) | | | | | | (25,209,657) |
| 12/31/2015 | | | | | 2,603,333 | | | | | | — | | | | | | 5,152,653 | | | | | | (8,206,295) | | | | | | (450,309) | | | | | | 33,211,859 | | | | | | — | | | | | | 60,182,986 | | | | | | (101,006,412) | | | | | | (7,611,567) |
| Class S2 | | | | | | | | | | | |
| 12/31/2016 | | | | | 274,563 | | | | | | — | | | | | | 248,527 | | | | | | (904,887) | | | | | | (381,797) | | | | | | 2,959,702 | | | | | | — | | | | | | 2,577,222 | | | | | | (9,685,304) | | | | | | (4,148,380) |
| 12/31/2015 | | | | | 315,246 | | | | | | — | | | | | | 352,939 | | | | | | (920,180) | | | | | | (251,995) | | | | | | 3,768,785 | | | | | | — | | | | | | 4,019,974 | | | | | | (11,275,404) | | | | | | (3,486,645) |
| Class T | | | | | | | | | | | |
| 12/31/2016 | | | | | 2,735 | | | | | | — | | | | | | 6,895 | | | | | | (9,228) | | | | | | 402 | | | | | | 30,432 | | | | | | — | | | | | | 75,567 | | | | | | (105,146) | | | | | | 853 |
| 12/31/2015 | | | | | 2,283 | | | | | | — | | | | | | 8,190 | | | | | | (4,788) | | | | | | 5,685 | | | | | | 28,405 | | | | | | — | | | | | | 98,029 | | | | | | (57,754) | | | | | | 68,680 |
| Solution 2030 |
| Class ADV | | | | | | | | | | | |
| 12/31/2016 | | | | | 442,625 | | | | | | — | | | | | | 2,868 | | | | | | (88,794) | | | | | | 356,699 | | | | | | 5,898,535 | | | | | | — | | | | | | 39,204 | | | | | | (1,206,550) | | | | | | 4,731,189 |
| 12/31/2015 | | | | | 121,446 | | | | | | — | | | | | | 1,136 | | | | | | (15,299) | | | | | | 107,283 | | | | | | 1,623,383 | | | | | | — | | | | | | 15,542 | | | | | | (204,869) | | | | | | 1,434,056 |
| Class I | | | | | | | | | | | |
| 12/31/2016 | | | | | 263,076 | | | | | | — | | | | | | 918 | | | | | | (99,835) | | | | | | 164,159 | | | | | | 3,633,035 | | | | | | — | | | | | | 12,801 | | | | | | (1,361,694) | | | | | | 2,284,142 |
| 12/31/2015 | | | | | 66,974 | | | | | | — | | | | | | 277 | | | | | | (3,574) | | | | | | 63,677 | | | | | | 906,574 | | | | | | — | | | | | | 3,851 | | | | | | (48,330) | | | | | | 862,095 |
| Class S | | | | | | | | | | | |
| 12/31/2016 | | | | | 301,171 | | | | | | — | | | | | | 1,831 | | | | | | (74,932) | | | | | | 228,070 | | | | | | 4,131,153 | | | | | | — | | | | | | 25,458 | | | | | | (1,036,181) | | | | | | 3,120,430 |
| 12/31/2015 | | | | | 110,273 | | | | | | — | | | | | | —* | | | | | | (2,338) | | | | | | 107,935 | | | | | | 1,483,479 | | | | | | — | | | | | | 1 | | | | | | (31,713) | | | | | | 1,451,767 |
| Class S2 | | | | | | | | | | | |
| 12/31/2016 | | | | | 36,147 | | | | | | — | | | | | | 234 | | | | | | (21,246) | | | | | | 15,135 | | | | | | 493,775 | | | | | | — | | | | | | 3,207 | | | | | | (293,936) | | | | | | 203,046 |
| 12/31/2015 | | | | | 2,769 | | | | | | — | | | | | | —* | | | | | | —* | | | | | | 2,769 | | | | | | 36,883 | | | | | | — | | | | | | 1 | | | | | | (1) | | | | | | 36,883 |
NOTES TO FINANCIAL STATEMENTS as of December 31, 2016 (continued)
NOTE 9 — CAPITAL SHARES (continued)
| | | | Shares
sold | | | Shares
issued in
merger | | | Reinvestment
of
distributions | | | Shares
redeemed | | | Net increase
(decrease)
in shares
outstanding | | | Shares
sold | | | Proceeds
from shares
issued in
merger | | | Reinvestment
of
distributions | | | Shares
redeemed | | | Net increase
(decrease) |
Year or
period ended | | | # | | | # | | | # | | | # | | | # | | | ($) | | | ($) | | | ($) | | | ($) | | | ($) |
| Solution 2030 (continued) |
| Class T | | | | | | | | | | | |
| 12/31/2016 | | | | | 475 | | | | | | — | | | | | | —* | | | | | | (4) | | | | | | 471 | | | | | | 6,327 | | | | | | — | | | | | | 8 | | | | | | (51) | | | | | | 6,284 |
| 12/31/2015 | | | | | — | | | | | | — | | | | | | —* | | | | | | — | | | | | | —* | | | | | | 1 | | | | | | — | | | | | | 1 | | | | | | — | | | | | | 2 |
| Solution 2035 |
| Class ADV | | | | | | | | | | | |
| 12/31/2016 | | | | | 1,664,992 | | | | | | — | | | | | | 2,799,870 | | | | | | (6,879,600) | | | | | | (2,414,738) | | | | | | 18,108,474 | | | | | | — | | | | | | 29,342,636 | | | | | | (74,747,008) | | | | | | (27,295,898) |
| 12/31/2015 | | | | | 1,648,550 | | | | | | — | | | | | | 4,028,320 | | | | | | (6,140,085) | | | | | | (463,215) | | | | | | 20,918,739 | | | | | | — | | | | | | 47,332,753 | | | | | | (77,942,642) | | | | | | (9,691,150) |
| Class I | | | | | | | | | | | |
| 12/31/2016 | | | | | 3,627,460 | | | | | | — | | | | | | 2,272,327 | | | | | | (5,588,967) | | | | | | 310,820 | | | | | | 40,334,615 | | | | | | — | | | | | | 24,382,074 | | | | | | (61,733,997) | | | | | | 2,982,692 |
| 12/31/2015 | | | | | 4,738,743 | | | | | | — | | | | | | 2,922,587 | | | | | | (4,667,888) | | | | | | 2,993,442 | | | | | | 62,332,893 | | | | | | — | | | | | | 35,100,277 | | | | | | (58,410,906) | | | | | | 39,022,264 |
| Class S | | | | | | | | | | | |
| 12/31/2016 | | | | | 2,135,744 | | | | | | — | | | | | | 3,601,356 | | | | | | (6,188,718) | | | | | | (451,618) | | | | | | 23,469,030 | | | | | | — | | | | | | 38,282,413 | | | | | | (68,348,830) | | | | | | (6,597,387) |
| 12/31/2015 | | | | | 3,466,195 | | | | | | — | | | | | | 5,186,236 | | | | | | (7,427,892) | | | | | | 1,224,539 | | | | | | 45,578,722 | | | | | | — | | | | | | 61,716,210 | | | | | | (92,846,886) | | | | | | 14,448,046 |
| Class S2 | | | | | | | | | | | |
| 12/31/2016 | | | | | 274,981 | | | | | | — | | | | | | 234,621 | | | | | | (538,586) | | | | | | (28,984) | | | | | | 2,929,101 | | | | | | — | | | | | | 2,407,216 | | | | | | (5,690,669) | | | | | | (354,352) |
| 12/31/2015 | | | | | 248,552 | | | | | | — | | | | | | 314,052 | | | | | | (957,055) | | | | | | (394,451) | | | | | | 3,153,713 | | | | | | — | | | | | | 3,624,166 | | | | | | (12,335,819) | | | | | | (5,557,940) |
| Class T | | | | | | | | | | | |
| 12/31/2016 | | | | | 3,580 | | | | | | — | | | | | | 5,302 | | | | | | (28,951) | | | | | | (20,069) | | | | | | 39,813 | | | | | | — | | | | | | 57,898 | | | | | | (335,241) | | | | | | (237,530) |
| 12/31/2015 | | | | | 3,744 | | | | | | — | | | | | | 9,518 | | | | | | (1,193) | | | | | | 12,069 | | | | | | 47,267 | | | | | | — | | | | | | 115,739 | | | | | | (16,211) | | | | | | 146,795 |
| Solution 2040 |
| Class ADV | | | | | | | | | | | |
| 12/31/2016 | | | | | 312,727 | | | | | | — | | | | | | 3,752 | | | | | | (141,023) | | | | | | 175,456 | | | | | | 4,342,825 | | | | | | — | | | | | | 53,242 | | | | | | (1,982,272) | | | | | | 2,413,795 |
| 12/31/2015 | | | | | 125,000 | | | | | | — | | | | | | 3,947 | | | | | | (14,900) | | | | | | 114,047 | | | | | | 1,767,906 | | | | | | — | | | | | | 56,875 | | | | | | (214,750) | | | | | | 1,610,031 |
| Class I | | | | | | | | | | | |
| 12/31/2016 | | | | | 183,107 | | | | | | — | | | | | | 1,494 | | | | | | (24,919) | | | | | | 159,682 | | | | | | 2,608,905 | | | | | | — | | | | | | 21,611 | | | | | | (363,209) | | | | | | 2,267,307 |
| 12/31/2015 | | | | | 46,988 | | | | | | — | | | | | | —* | | | | | | (12,663) | | | | | | 34,325 | | | | | | 657,777 | | | | | | — | | | | | | 2 | | | | | | (179,143) | | | | | | 478,636 |
| Class S | | | | | | | | | | | |
| 12/31/2016 | | | | | 213,730 | | | | | | — | | | | | | 2,244 | | | | | | (41,758) | | | | | | 174,216 | | | | | | 3,024,568 | | | | | | — | | | | | | 32,309 | | | | | | (592,676) | | | | | | 2,464,201 |
| 12/31/2015 | | | | | 71,111 | | | | | | — | | | | | | —* | | | | | | (27,951) | | | | | | 43,160 | | | | | | 985,441 | | | | | | — | | | | | | 1 | | | | | | (394,972) | | | | | | 590,470 |
| Class S2 | | | | | | | | | | | |
| 12/31/2016 | | | | | 24,827 | | | | | | — | | | | | | 159 | | | | | | (13,178) | | | | | | 11,808 | | | | | | 345,812 | | | | | | — | | | | | | 2,272 | | | | | | (188,319) | | | | | | 159,765 |
| 12/31/2015 | | | | | 379 | | | | | | — | | | | | | —* | | | | | | —* | | | | | | 379 | | | | | | 5,239 | | | | | | — | | | | | | 1 | | | | | | —* | | | | | | 5,240 |
| Class T | | | | | | | | | | | |
| 12/31/2016 | | | | | 498 | | | | | | — | | | | | | 2 | | | | | | (6) | | | | | | 494 | | | | | | 6,888 | | | | | | — | | | | | | 30 | | | | | | (93) | | | | | | 6,825 |
| 12/31/2015 | | | | | 23 | | | | | | — | | | | | | —* | | | | | | —* | | | | | | 23 | | | | | | 324 | | | | | | — | | | | | | 1 | | | | | | —* | | | | | | 325 |
| Solution 2045 |
| Class ADV | | | | | | | | | | | |
| 12/31/2016 | | | | | 1,279,189 | | | | | | — | | | | | | 1,838,736 | | | | | | (4,217,207) | | | | | | (1,099,282) | | | | | | 13,744,459 | | | | | | — | | | | | | 19,067,689 | | | | | | (45,138,333) | | | | | | (12,326,185) |
| 12/31/2015 | | | | | 1,428,372 | | | | | | — | | | | | | 3,182,631 | | | | | | (4,384,453) | | | | | | 226,550 | | | | | | 18,126,746 | | | | | | — | | | | | | 37,173,134 | | | | | | (56,697,016) | | | | | | (1,397,136) |
| Class I | | | | | | | | | | | |
| 12/31/2016 | | | | | 3,458,160 | | | | | | — | | | | | | 1,812,567 | | | | | | (4,371,118) | | | | | | 899,609 | | | | | | 37,965,364 | | | | | | — | | | | | | 19,267,588 | | | | | | (47,840,957) | | | | | | 9,391,995 |
| 12/31/2015 | | | | | 4,101,908 | | | | | | — | | | | | | 2,652,131 | | | | | | (3,574,117) | | | | | | 3,179,922 | | | | | | 54,184,542 | | | | | | — | | | | | | 31,692,964 | | | | | | (45,385,554) | | | | | | 40,491,952 |
| Class S | | | | | | | | | | | |
| 12/31/2016 | | | | | 1,842,368 | | | | | | — | | | | | | 2,569,842 | | | | | | (4,486,162) | | | | | | (73,952) | | | | | | 19,982,189 | | | | | | — | | | | | | 26,983,344 | | | | | | (48,706,800) | | | | | | (1,741,267) |
| 12/31/2015 | | | | | 2,210,545 | | | | | | — | | | | | | 4,403,023 | | | | | | (4,610,924) | | | | | | 2,002,644 | | | | | | 29,434,671 | | | | | | — | | | | | | 52,043,735 | | | | | | (58,237,822) | | | | | | 23,240,584 |
| Class S2 | | | | | | | | | | | |
| 12/31/2016 | | | | | 237,021 | | | | | | — | | | | | | 139,842 | | | | | | (383,030) | | | | | | (6,167) | | | | | | 2,524,988 | | | | | | — | | | | | | 1,433,379 | | | | | | (4,045,609) | | | | | | (87,242) |
| 12/31/2015 | | | | | 204,790 | | | | | | — | | | | | | 229,034 | | | | | | (654,820) | | | | | | (220,996) | | | | | | 2,608,223 | | | | | | — | | | | | | 2,647,631 | | | | | | (8,652,212) | | | | | | (3,396,358) |
| Class T | | | | | | | | | | | |
| 12/31/2016 | | | | | 4,049 | | | | | | — | | | | | | 3,629 | | | | | | (3,827) | | | | | | 3,851 | | | | | | 43,683 | | | | | | — | | | | | | 38,795 | | | | | | (42,747) | | | | | | 39,731 |
| 12/31/2015 | | | | | 2,952 | | | | | | — | | | | | | 5,142 | | | | | | (1,077) | | | | | | 7,017 | | | | | | 36,749 | | | | | | — | | | | | | 61,758 | | | | | | (14,474) | | | | | | 84,033 |
| Solution 2050 |
| Class ADV | | | | | | | | | | | |
| 12/31/2016 | | | | | 195,180 | | | | | | — | | | | | | 1,949 | | | | | | (47,816) | | | | | | 149,313 | | | | | | 2,707,059 | | | | | | — | | | | | | 27,679 | | | | | | (664,751) | | | | | | 2,069,987 |
| 12/31/2015 | | | | | 49,242 | | | | | | — | | | | | | 2,002 | | | | | | (5,700) | | | | | | 45,544 | | | | | | 691,029 | | | | | | — | | | | | | 28,848 | | | | | | (82,795) | | | | | | 637,082 |
NOTES TO FINANCIAL STATEMENTS as of December 31, 2016 (continued)
NOTE 9 — CAPITAL SHARES (continued)
| | | | Shares
sold | | | Shares
issued in
merger | | | Reinvestment
of
distributions | | | Shares
redeemed | | | Net increase
(decrease)
in shares
outstanding | | | Shares
sold | | | Proceeds
from shares
issued in
merger | | | Reinvestment
of
distributions | | | Shares
redeemed | | | Net increase
(decrease) | |
Year or
period ended | | | # | | | # | | | # | | | # | | | # | | | ($) | | | ($) | | | ($) | | | ($) | | | ($) | |
| Solution 2050 (continued) | |
| Class I | | | | | | | | | | | |
| 12/31/2016 | | | | | 112,886 | | | | | | — | | | | | | 791 | | | | | | (43,767) | | | | | | 69,910 | | | | | | 1,609,179 | | | | | | — | | | | | | 11,478 | | | | | | (627,537) | | | | | | 993,120 | | |
| 12/31/2015 | | | | | 35,144 | | | | | | — | | | | | | —* | | | | | | (8,035) | | | | | | 27,109 | | | | | | 499,073 | | | | | | — | | | | | | 1 | | | | | | (114,137) | | | | | | 384,937 | | |
| Class S | | | | | | | | | | | |
| 12/31/2016 | | | | | 148,122 | | | | | | — | | | | | | 1,060 | | | | | | (36,987) | | | | | | 112,195 | | | | | | 2,095,615 | | | | | | — | | | | | | 15,296 | | | | | | (530,087) | | | | | | 1,580,824 | | |
| 12/31/2015 | | | | | 24,707 | | | | | | — | | | | | | —* | | | | | | (2,441) | | | | | | 22,266 | | | | | | 345,483 | | | | | | — | | | | | | 1 | | | | | | (33,330) | | | | | | 312,154 | | |
| Class S2 | | | | | | | | | | | |
| 12/31/2016 | | | | | 12,196 | | | | | | — | | | | | | 79 | | | | | | (3,206) | | | | | | 9,069 | | | | | | 166,511 | | | | | | — | | | | | | 1,128 | | | | | | (45,435) | | | | | | 122,204 | | |
| 12/31/2015 | | | | | 1,644 | | | | | | — | | | | | | —* | | | | | | (1,285) | | | | | | 359 | | | | | | 23,088 | | | | | | — | | | | | | 1 | | | | | | (17,709) | | | | | | 5,380 | | |
| Class T | | | | | | | | | | | |
| 12/31/2016 | | | | | 359 | | | | | | — | | | | | | 1 | | | | | | (3) | | | | | | 357 | | | | | | 4,911 | | | | | | — | | | | | | 15 | | | | | | (47) | | | | | | 4,879 | | |
| 12/31/2015 | | | | | — | | | | | | — | | | | | | —* | | | | | | — | | | | | | —* | | | | | | — | | | | | | — | | | | | | 1 | | | | | | — | | | | | | 1 | | |
| Solution 2055 | |
| Class ADV | | | | | | | | | | | |
| 12/31/2016 | | | | | 780,954 | | | | | | — | | | | | | 267,961 | | | | | | (897,478) | | | | | | 151,437 | | | | | | 9,513,310 | | | | | | — | | | | | | 3,207,494 | | | | | | (11,004,737) | | | | | | 1,716,067 | | |
| 12/31/2015 | | | | | 958,435 | | | | | | — | | | | | | 362,034 | | | | | | (687,431) | | | | | | 633,038 | | | | | | 13,274,081 | | | | | | — | | | | | | 4,749,889 | | | | | | (9,493,615) | | | | | | 8,530,355 | | |
| Class I | | | | | | | | | | | |
| 12/31/2016 | | | | | 1,528,510 | | | | | | — | | | | | | 288,686 | | | | | | (1,136,841) | | | | | | 680,355 | | | | | | 18,921,397 | | | | | | — | | | | | | 3,513,311 | | | | | | (14,137,682) | | | | | | 8,297,026 | | |
| 12/31/2015 | | | | | 1,335,242 | | | | | | — | | | | | | 291,783 | | | | | | (458,681) | | | | | | 1,168,344 | | | | | | 18,637,734 | | | | | | — | | | | | | 3,886,544 | | | | | | (6,282,177) | | | | | | 16,242,101 | | |
| Class S | | | | | | | | | | | |
| 12/31/2016 | | | | | 955,451 | | | | | | — | | | | | | 318,325 | | | | | | (845,974) | | | | | | 427,802 | | | | | | 11,722,491 | | | | | | — | | | | | | 3,835,816 | | | | | | (10,363,508) | | | | | | 5,194,799 | | |
| 12/31/2015 | | | | | 1,149,129 | | | | | | — | | | | | | 425,992 | | | | | | (864,563) | | | | | | 710,558 | | | | | | 16,171,799 | | | | | | — | | | | | | 5,623,096 | | | | | | (11,796,616) | | | | | | 9,998,279 | | |
| Class S2 | | | | | | | | | | | |
| 12/31/2016 | | | | | 96,308 | | | | | | — | | | | | | 20,626 | | | | | | (113,535) | | | | | | 3,399 | | | | | | 1,175,038 | | | | | | — | | | | | | 247,508 | | | | | | (1,384,825) | | | | | | 37,721 | | |
| 12/31/2015 | | | | | 103,582 | | | | | | — | | | | | | 25,630 | | | | | | (103,907) | | | | | | 25,305 | | | | | | 1,435,275 | | | | | | — | | | | | | 337,030 | | | | | | (1,479,639) | | | | | | 292,666 | | |
| Class T | | | | | | | | | | | |
| 12/31/2016 | | | | | 1,200 | | | | | | — | | | | | | 99 | | | | | | (23) | | | | | | 1,276 | | | | | | 14,505 | | | | | | — | | | | | | 1,208 | | | | | | (279) | | | | | | 15,434 | | |
| 12/31/2015 | | | | | 294 | | | | | | — | | | | | | 47 | | | | | | (3) | | | | | | 338 | | | | | | 3,965 | | | | | | — | | | | | | 628 | | | | | | (37) | | | | | | 4,556 | | |
| Solution 2060 | |
| Class ADV | | | | | | | | | | | |
| 12/31/2016 | | | | | 134,992 | | | | | | — | | | | | | 833 | | | | | | (21,262) | | | | | | 114,563 | | | | | | 1,351,166 | | | | | | — | | | | | | 8,455 | | | | | | (215,748) | | | | | | 1,143,873 | | |
2/9/2015(1) -
12/31/2015 | | | | | 19,776 | | | | | | — | | | | | | — | | | | | | (498) | | | | | | 19,278 | | | | | | 193,663 | | | | | | — | | | | | | — | | | | | | (4,897) | | | | | | 188,766 | | |
| Class I | | | | | | | | | | | |
| 12/31/2016 | | | | | 86,877 | | | | | | — | | | | | | 617 | | | | | | (61,632) | | | | | | 25,862 | | | | | | 857,791 | | | | | | — | | | | | | 6,292 | | | | | | (629,232) | | | | | | 234,851 | | |
2/9/2015(1) -
12/31/2015 | | | | | 34,447 | | | | | | — | | | | | | — | | | | | | (2,528) | | | | | | 31,919 | | | | | | 336,593 | | | | | | — | | | | | | — | | | | | | (25,392) | | | | | | 311,201 | | |
| Class S | | | | | | | | | | | |
| 12/31/2016 | | | | | 79,155 | | | | | | — | | | | | | 456 | | | | | | (13,566) | | | | | | 66,045 | | | | | | 788,824 | | | | | | — | | | | | | 4,628 | | | | | | (136,276) | | | | | | 657,176 | | |
2/9/2015(1) -
12/31/2015 | | | | | 19,042 | | | | | | — | | | | | | — | | | | | | (4,817) | | | | | | 14,225 | | | | | | 187,425 | | | | | | — | | | | | | — | | | | | | (47,313) | | | | | | 140,112 | | |
| Class S2 | | | | | | | | | | | |
| 12/31/2016 | | | | | 4,970 | | | | | | — | | | | | | 44 | | | | | | (4,560) | | | | | | 454 | | | | | | 49,211 | | | | | | — | | | | | | 448 | | | | | | (46,071) | | | | | | 3,588 | | |
2/9/2015(1) -
12/31/2015 | | | | | 2,898 | | | | | | — | | | | | | — | | | | | | (302) | | | | | | 2,596 | | | | | | 29,143 | | | | | | — | | | | | | — | | | | | | (2,997) | | | | | | 26,146 | | |
| Class T | | | | | | | | | | | |
| 12/31/2016 | | | | | — | | | | | | — | | | | | | 3 | | | | | | — | | | | | | 3 | | | | | | — | | | | | | — | | | | | | 27 | | | | | | — | | | | | | 27 | | |
2/9/2015(1) -
12/31/2015 | | | | | 301 | | | | | | — | | | | | | — | | | | | | — | | | | | | 301 | | | | | | 3,012 | | | | | | — | | | | | | — | | | | | | — | | | | | | 3,012 | | |
(1)
Commencement of operations
*
Share amount is less than 0.500 per share or $0.50.
NOTES TO FINANCIAL STATEMENTS as of December 31, 2016 (continued)
NOTE 10 — FEDERAL INCOME TAXES
The amount of distributions from net investment income and net realized capital gains are determined in accordance with federal income tax regulations, which may differ from U.S. GAAP for investment companies. These book/tax differences may be either temporary or permanent. Permanent differences are reclassified within the capital accounts based on their federal tax-basis treatment; temporary differences are not reclassified. Key differences include the treatment of short-term capital gains, foreign currency transactions, and wash sale deferrals. Distributions in excess of net investment income and/or net realized capital gains for tax purposes are reported as return of capital.
The following permanent tax differences have been reclassified as of December 31, 2016:
| | | | Undistributed Net
Investment Income | | | Accumulated
Net Realized
Gains/(Losses) | |
| Solution Aggressive | | | | $ | 470 | | | | | $ | (470) | | |
| Solution Balanced | | | | | 115,825 | | | | | | (115,825) | | |
| Solution Conservative | | | | | 42,209 | | | | | | (42,209) | | |
| Solution Income | | | | | 1,246,841 | | | | | | (1,246,841) | | |
| Solution Moderately Aggressive | | | | | 940,437 | | | | | | (940,437) | | |
| Solution Moderately Conservative | | | | | 95,726 | | | | | | (95,726) | | |
| Solution 2020 | | | | | 46,159 | | | | | | (46,159) | | |
| Solution 2025 | | | | | 2,556,331 | | | | | | (2,556,331) | | |
| Solution 2030 | | | | | 25,645 | | | | | | (25,645) | | |
| Solution 2035 | | | | | 1,658,348 | | | | | | (1,658,348) | | |
| Solution 2040 | | | | | 13,926 | | | | | | (13,926) | | |
| Solution 2045 | | | | | 55,302 | | | | | | (55,302) | | |
| Solution 2050 | | | | | 280 | | | | | | (280) | | |
| Solution 2055 | | | | | 17,927 | | | | | | (17,927) | | |
| Solution 2060 | | | | | 176 | | | | | | (176) | | |
Dividends paid by the Portfolios from net investment income and distributions of net realized short-term capital gains are, for federal income tax purposes, taxable as ordinary income to shareholders.
The tax composition of dividends and distributions to shareholders was as follows:
| | | | Year Ended
December 31, 2016 | | | Year Ended
December 31, 2015 | |
| | | | Ordinary
Income | | | Long-term
Capital Gains | | | Ordinary
Income | | | Long-term
Capital Gains | |
| Solution Aggressive | | | | $ | 79,752 | | | | | $ | 330,800 | | | | | $ | 130,396 | | | | | $ | 159,239 | | |
| Solution Balanced | | | | | 970,476 | | | | | | 3,054,899 | | | | | | 1,902,511 | | | | | | 3,610,244 | | |
| Solution Conservative | | | | | 304,770 | | | | | | 379,565 | | | | | | 584,199 | | | | | | 396,989 | | |
| Solution Income | | | | | 5,721,757 | | | | | | 6,101,101 | | | | | | 4,159,259 | | | | | | 5,617,671 | | |
| | | | Year Ended
December 31, 2016 | | | Year Ended
December 31, 2015 | |
| | | | Ordinary
Income | | | Long-term
Capital Gains | | | Ordinary
Income | | | Long-term
Capital Gains | |
| Solution Moderately Aggressive | | | | | 8,503,212 | | | | | | 10,915,991 | | | | | | 1,265,910 | | | | | | 2,869,073 | | |
| Solution Moderately Conservative | | | | | 808,032 | | | | | | 2,097,669 | | | | | | 1,575,858 | | | | | | 2,119,890 | | |
| Solution 2020 | | | | | 81,257 | | | | | | 76,964 | | | | | | 15,749 | | | | | | 18,494 | | |
| Solution 2025 | | | | | 19,436,362 | | | | | | 74,758,095 | | | | | | 43,850,398 | | | | | | 99,604,540 | | |
| Solution 2030 | | | | | 39,434 | | | | | | 41,295 | | | | | | 8,842 | | | | | | 11,437 | | |
| Solution 2035 | | | | | 18,503,313 | | | | | | 75,968,924 | | | | | | 41,925,780 | | | | | | 105,963,365 | | |
| Solution 2040 | | | | | 39,261 | | | | | | 70,306 | | | | | | 24,130 | | | | | | 33,992 | | |
| Solution 2045 | | | | | 10,377,141 | | | | | | 56,413,654 | | | | | | 30,756,256 | | | | | | 92,862,966 | | |
| Solution 2050 | | | | | 19,203 | | | | | | 36,477 | | | | | | 10,787 | | | | | | 19,354 | | |
| Solution 2055 | | | | | 1,888,143 | | | | | | 8,917,193 | | | | | | 4,299,498 | | | | | | 10,297,691 | | |
| Solution 2060 | | | | | 11,188 | | | | | | 8,662 | | | | | | — | | | | | | — | | |
The tax-basis components of distributable earnings as of December 31, 2016 were:
| | | | Undistributed
Ordinary
Income | | | Undistributed
Long-term
Capital Gains | | | Unrealized
Appreciation/
(Depreciation) | | | Short-term
Capital Loss
Carryforwards | | | Expiration | |
| Solution Aggressive | | | | $ | 65,177 | | | | | $ | 150,623 | | | | | $ | (430,011) | | | | | $ | — | | | | | | — | | |
| Solution Balanced | | | | | 810,360 | | | | | | 934,614 | | | | | | (2,068,368) | | | | | | — | | | | | | — | | |
Solution
Conservative | | | | | 341,318 | | | | | | 97,474 | | | | | | (702,728) | | | | | | — | | | | | | — | | |
| Solution Income | | | | | 9,885,381 | | | | | | 1,397,734 | | | | | | (21,525,554) | | | | | | — | | | | | | — | | |
| Solution Moderately Aggressive | | | | | 9,743,248 | | | | | | 7,846,351 | | | | | | (30,340,749) | | | | | | — | | | | | | — | | |
Solution
Moderately
Conservative | | | | | 692,986 | | | | | | — | | | | | | (1,653,970) | | | | | | (59,625) | | | | | | None | | |
| Solution 2020 | | | | | 480,935 | | | | | | 422,653 | | | | | | (83,088) | | | | | | — | | | | | | — | | |
| Solution 2025 | | | | | 17,209,520 | | | | | | 24,780,546 | | | | | | (47,219,839) | | | | | | — | | | | | | — | | |
| Solution 2030 | | | | | 280,113 | | | | | | 305,497 | | | | | | 33,870 | | | | | | — | | | | | | — | | |
| Solution 2035 | | | | | 13,807,818 | | | | | | 22,975,987 | | | | | | (40,239,599) | | | | | | — | | | | | | — | | |
| Solution 2040 | | | | | 199,443 | | | | | | 277,865 | | | | | | 38,766 | | | | | | — | | | | | | — | | |
| Solution 2045 | | | | | 7,142,084 | | | | | | 17,575,061 | | | | | | (25,209,018) | | | | | | — | | | | | | — | | |
| Solution 2050 | | | | | 108,847 | | | | | | 158,946 | | | | | | 52,438 | | | | | | — | | | | | | — | | |
| Solution 2055 | | | | | 1,562,221 | | | | | | 3,304,219 | | | | | | (7,430,920) | | | | | | — | | | | | | — | | |
| Solution 2060 | | | | | 61,974 | | | | | | 69,843 | | | | | | 30,947 | | | | | | — | | | | | | — | | |
The Portfolios’ major tax jurisdictions are U.S. federal and Arizona state.
As of December 31, 2016, no provision for income tax is required in the Portfolios’ financial statements as a result of tax positions taken on federal and state income tax returns for open tax years. The Portfolios’ federal and state income and federal excise tax returns for tax years for which the applicable statutes of limitations have not expired are subject to examination by the Internal Revenue Service and state department of revenue. The earliest tax year that remains that remains subject to examination by these jurisdictions is 2012.
NOTE 11 — REORGANIZATIONS
On August 14, 2015, Solution Income (“Acquiring Portfolio”) acquired all of the assets of, and assumed all of the liabilities of Voya Solution 2015 Portfolio (“Acquired
NOTES TO FINANCIAL STATEMENTS as of December 31, 2016 (continued)
NOTE 11 — REORGANIZATIONS (continued)
Portfolio”), which is not included in this report, an open-end investment company in a tax-free reorganization in exchange for shares of the Acquiring Portfolio, pursuant to a plan of reorganization. The transaction occurred due to the Acquired Portfolio reaching its Target Date in 2015. For financial reporting purposes, assets received and shares issued by the Acquiring Portfolio were recorded at fair value; however, the cost basis of the investments received from the Acquired Portfolio were carried forward to align ongoing reporting of the Acquiring Portfolio’s realized and unrealized gains and losses with amounts distributable to shareholders for tax purposes.
Assuming the acquisition had been completed on January 1, 2015, the beginning of the annual reporting period of the Acquiring Portfolio, the Acquiring Portfolio’s pro forma results of operations for the year ended December 31, 2015, are as follows:
| | Net investment income | | | | $ | 8,797,000 | | |
| | Net realized and unrealized loss on investments | | | | $ | (6,156,878) | | |
| | Net increase in net assets resulting from operations | | | | $ | 2,640,123 | | |
Because the combined investment portfolios have been managed as a single integrated portfolio since the acquisition was completed, it is not practicable to separate the amounts of revenue and earnings of the Acquired Portfolio that have been included in the Acquiring Portfolio’s statement of operations since August 14, 2015. Net assets and unrealized appreciation or depreciation as of the reorganization date were as follows:
| | Total Net
Assets of
Acquired
Portfolio
(000s) | | | Total Net
Assets of
Acquiring
Portfolio
(000s) | | | Acquired
Portfolio’s
Capital Loss
Carryforwards
(000s) | | | Acquired
Portfolio’s
Unrealized
Depreciation
(000s) | | | Portfolios’
Conversion
Ratio | |
| | $502,116 | | | | $ | 156,751 | | | | | $ | — | | | | | $ | (11,548) | | | | | | 0.9579 | | |
The net assets of the Acquiring Portfolio after the acquisition were $658,867,349.
On August 14, 2015, Solution Moderately Aggressive (“Acquiring Portfolio”) acquired all of the assets of, and assumed all of the liabilities of VY® Franklin Templeton Founding Strategy Portfolio (“Acquired Portfolio”), which is not included in this report, an open-end investment company in a tax-free reorganization in exchange for shares of the Acquiring Portfolio, pursuant to a plan of reorganization approved by the shareholders of the Acquired Portfolio on July 28, 2015. The reorganization provided shareholders of the Acquired Portfolio with an immediate benefit through lower net expenses. For financial reporting purposes, assets received and shares issued by the Acquiring Portfolio were recorded at fair value; however, the cost basis of the investments received
from the Acquired Portfolio were carried forward to align ongoing reporting of the Acquiring Portfolio’s realized and unrealized gains and losses with amounts distributable to shareholders for tax purposes.
Assuming the acquisition had been completed on January 1, 2015, the beginning of the annual reporting period of the Acquiring Portfolio, the Acquiring Portfolio’s pro forma results of operations for the year ended December 31, 2015, are as follows:
| | Net investment income | | | | $ | 38,457,769 | | |
| | Net realized and unrealized loss on investments | | | | $ | (65,616,857) | | |
| | Net decrease in net assets resulting from operations | | | | $ | (27,159,089) | | |
Because the combined investment portfolios have been managed as a single integrated portfolio since the acquisition was completed, it is not practicable to separate the amounts of revenue and earnings of the Acquired Portfolio that have been included in the Acquiring Portfolio’s statement of operations since August 14, 2015. Net assets and unrealized appreciation or depreciation as of the reorganization date were as follows:
| | Total Net
Assets of
Acquired
Portfolio
(000s) | | | Total Net
Assets of
Acquiring
Portfolio
(000s) | | | Acquired
Portfolio’s
Capital Loss
Carryforwards
(000s) | | | Acquired
Portfolio’s
Unrealized
Depreciation
(000s) | | | Portfolios’
Conversion
Ratio | |
| | $812,445 | | | | $ | 32,834 | | | | | $ | — | | | | | $ | (3,610) | | | | | | 0.7713 | | |
The net assets of the Acquiring Portfolio after the acquisition were $845,279,259.
NOTE 12 — SUBSEQUENT EVENTS
Expense Limitation Agreement: On January 12, 2017, the Board approved revisions to the expense limits for certain Portfolios. Effective January 1, 2017, the expense limits, through May 1, 2018, for the below Portfolios are as follows:
Portfolio(1) | | | Class ADV | | | Class I | | | Class S | | | Class S2 | | | Class T | |
| Solution 2020 | | | | | 1.22% | | | | | | 0.72% | | | | | | 0.97% | | | | | | 1.12% | | | | | | 1.42% | | |
| Solution 2025 | | | | | 1.28% | | | | | | 0.78% | | | | | | 1.03% | | | | | | 1.18% | | | | | | 1.48% | | |
| Solution 2030 | | | | | 1.29% | | | | | | 0.79% | | | | | | 1.04% | | | | | | 1.19% | | | | | | 1.49% | | |
| Solution 2035 | | | | | 1.33% | | | | | | 0.83% | | | | | | 1.08% | | | | | | 1.23% | | | | | | 1.53% | | |
| Solution 2040 | | | | | 1.33% | | | | | | 0.83% | | | | | | 1.08% | | | | | | 1.23% | | | | | | 1.53% | | |
| Solution 2045 | | | | | 1.36% | | | | | | 0.86% | | | | | | 1.11% | | | | | | 1.26% | | | | | | 1.56% | | |
| Solution 2050 | | | | | 1.36% | | | | | | 0.86% | | | | | | 1.11% | | | | | | 1.26% | | | | | | 1.56% | | |
| Solution 2055 | | | | | 1.36% | | | | | | 0.86% | | | | | | 1.11% | | | | | | 1.26% | | | | | | 1.56% | | |
| Solution 2060 | | | | | 1.37% | | | | | | 0.87% | | | | | | 1.12% | | | | | | 1.27% | | | | | | 1.57% | | |
(1)
The operating expense limits take into account the operating expenses incurred at the Underlying Fund level. The amount of fees and expenses of an Underlying Fund borne by each Portfolio will vary based on each Portfolio’s allocation of assets to, and the net expenses of, a particular Underlying Fund.
NOTES TO FINANCIAL STATEMENTS as of December 31, 2016 (continued)
NOTE 12 — SUBSEQUENT EVENTS (continued)
Investment Adviser: On January 12, 2017, the Board approved a proposal to change the Investment Adviser for all Portfolios from DSL to Voya Investments, LLC with an effective date of May 1, 2017. There are no changes to the services provided or the fees charged to the Portfolios upon the replacement of DSL with Voya Investments, LLC.
The Portfolios have evaluated events occurring after the Statements of Assets and Liabilities date (“subsequent events”), to determine whether any subsequent events necessitated adjustment to or disclosure in the financial statements. Other than above, no such subsequent events were identified.
PORTFOLIO OF INVESTMENTS
| Voya Solution Aggressive Portfolio | as of December 31, 2016 |
| Shares | | | Value | | | Percentage
of Net
Assets | |
| EXCHANGE-TRADED FUNDS: 6.0% | |
| | | 1,629 | | | | iShares Russell 1000 Value
Index Fund | | | | $ | 182,497 | | | | | | 2.3 | | |
| | | 1,291 | | | | SPDR Trust Series 1 | | | | | 288,577 | | | | | | 3.7 | | |
| | | | | | | Total Exchange-Traded Funds
(Cost $443,184) | | | | | 471,074 | | | | | | 6.0 | | |
| MUTUAL FUNDS: 93.8% | |
| | | | | | | Affiliated Investment Companies: 92.9% | |
| | | 16,150 | | | | Voya Emerging Markets Index
Portfolio - Class I | | | | | 154,390 | | | | | | 2.0 | | |
| | | 9,655 | | | | Voya Index Plus LargeCap
Portfolio - Class I | | | | | 233,563 | | | | | | 3.0 | | |
| | | 15,527 | | | | Voya Intermediate Bond Fund
- Class R6 | | | | | 154,647 | | | | | | 2.0 | | |
| | | 74,586 | | | | Voya International Core
Fund - Class I | | | | | 671,275 | | | | | | 8.6 | | |
| | | 17,891 | | | | Voya International Index
Portfolio - Class I | | | | | 157,616 | | | | | | 2.0 | | |
| | | 37,638 | | | | Voya Large Cap Growth
Portfolio - Class I | | | | | 652,651 | | | | | | 8.4 | | |
| | | 34,652 | | | | Voya Large Cap Value
Fund - Class R6 | | | | | 449,784 | | | | | | 5.8 | | |
| | | 34,156 | @ | | Voya MidCap Opportunities
Portfolio - Class I | | | | | 421,480 | | | | | | 5.4 | | |
| | | 24,539 | | | | Voya Multi-Manager Emerging
Markets Equity Fund - Class I | | | | | 230,418 | | | | | | 2.9 | | |
| | | 73,596 | | | | Voya Multi-Manager
International Equity Fund -
Class I | | | | | 741,845 | | | | | | 9.5 | | |
| | | 49,074 | | | | Voya Multi-Manager Large
Cap Core Portfolio - Class I | | | | | 730,705 | | | | | | 9.4 | | |
| | | 56,318 | | | | Voya Multi-Manager Mid Cap
Value Fund - Class I | | | | | 625,132 | | | | | | 8.0 | | |
| | | 6,721 | | | | Voya Russell™ Mid Cap
Growth Index Portfolio - Class
I | | | | | 191,617 | | | | | | 2.5 | | |
| | | 14,253 | | | | Voya Small Company Portfolio
- Class I | | | | $ | 315,274 | | | | | | 4.0 | | |
| Shares | | | Value | | | Percentage
of Net
Assets | |
| MUTUAL FUNDS: (continued) | |
| | | | | | | Affiliated Investment Companies (continued) | |
| | | 22,698 | | | | Voya U.S. Stock Index
Portfolio - Class I | | | | | 313,001 | | | | | | 4.0 | | |
| | | 6,723 | | | | VY® Clarion Global Real
Estate Portfolio - Class I | | | | | 78,791 | | | | | | 1.0 | | |
| | | 2,163 | | | | VY® Clarion Real Estate
Portfolio - Class I | | | | | 79,339 | | | | | | 1.0 | | |
| | | 22,797 | | | | VY® Invesco Comstock
Portfolio - Class I | | | | | 398,261 | | | | | | 5.1 | | |
| | | 8,395 | @ | | VY® T. Rowe Price Growth
Equity Portfolio - Class I | | | | | 650,125 | | | | | | 8.3 | | |
| | | | | | | | | | | | 7,249,914 | | | | | | 92.9 | | |
| | | | | | | Unaffiliated Investment Companies: 0.9% | |
| | | 14,595 | @ | | Credit Suisse Commodity
Return Strategy Fund -
Class I | | | | | 73,995 | | | | | | 0.9 | | |
| | | | | | | Total Mutual Funds
(Cost $7,422,382) | | | | | 7,323,909 | | | | | | 93.8 | | |
| | | | | | | Total Investments in
Securities
(Cost $7,865,566) | | | | $ | 7,794,983 | | | | | | 99.8 | | |
| | | | | | | Assets in Excess of
Other Liabilities | | | | | 17,614 | | | | | | 0.2 | | |
| | | | | | | Net Assets | | | | $ | 7,812,597 | | | | | | 100.0 | | |
| | | | | | | | |
@
Non-income producing security.
Cost for federal income tax purposes is $8,224,995.
Net unrealized depreciation consists of:
| | Gross Unrealized Appreciation | | | | $ | 168,568 | | |
| | Gross Unrealized Depreciation | | | | | (598,580) | | |
| | Net Unrealized Depreciation | | | | $ | (430,012) | | |
| |
Fair Value Measurements^
The following is a summary of the fair valuations according to the inputs used as of December 31, 2016 in valuing the assets and liabilities:
| | | | Quoted Prices
in Active Markets
for Identical
Investments
(Level 1) | | | Significant
Other
Observable
Inputs
(Level 2) | | | Significant
Unobservable
Inputs
(Level 3) | | | Fair Value
at
December 31, 2016 | |
| Asset Table | | | | | |
| Investments, at fair value | | | | | |
| Exchange-Traded Funds | | | | $ | 471,074 | | | | | $ | — | | | | | $ | — | | | | | $ | 471,074 | | |
| Mutual Funds | | | | | 7,323,909 | | | | | | — | | | | | | — | | | | | | 7,323,909 | | |
| Total Investments, at fair value | | | | $ | 7,794,983 | | | | | $ | — | | | | | $ | — | | | | | $ | 7,794,983 | | |
| |
^
See Note 2, “Significant Accounting Policies” in the Notes to Financial Statements for additional information.
See Accompanying Notes to Financial Statements
PORTFOLIO OF INVESTMENTS
| Voya Solution Aggressive Portfolio | as of December 31, 2016 (continued) |
Transactions with Affiliates
An investment of at least 5% of the voting securities of an issuer, or a company which is under common control results in that issuer becoming an affiliated person as defined by the 1940 Act.
The following table provides transactions during the year ended December 31, 2016, where the following issuers were considered an affiliate:
| Issuer | | | Beginning
Fair Value
at 12/31/15 | | | Purchases
at Cost | | | Sales
at Cost | | | Change in
Unrealized
Appreciation/
(Depreciation) | | | Ending
Fair Value
at 12/31/16 | | | Investment
Income | | | Realized
Gains/
(Losses) | | | Net Capital
Gain
Distributions | |
| Voya Emerging Markets Index Portfolio - Class I | | | | $ | — | | | | | $ | 306,002 | | | | | $ | (144,067) | | | | | $ | (7,545) | | | | | $ | 154,390 | | | | | $ | 2,545 | | | | | $ | 1,318 | | | | | $ | — | | |
| Voya Index Plus LargeCap Portfolio - Class I | | | | | — | | | | | | 247,063 | | | | | | (27,150) | | | | | | 13,650 | | | | | | 233,563 | | | | | | 3,041 | | | | | | 652 | | | | | | — | | |
| Voya Intermediate Bond Fund - Class R6 | | | | | — | | | | | | 162,995 | | | | | | (5,268) | | | | | | (3,080) | | | | | | 154,647 | | | | | | 808 | | | | | | (86) | | | | | | — | | |
| Voya International Core Fund - Class I | | | | | 382,279 | | | | | | 388,320 | | | | | | (108,757) | | | | | | 9,433 | | | | | | 671,275 | | | | | | 9,825 | | | | | | (12,259) | | | | | | — | | |
| Voya International Index Portfolio - Class I | | | | | 101,366 | | | | | | 82,011 | | | | | | (27,620) | | | | | | 1,859 | | | | | | 157,616 | | | | | | 3,622 | | | | | | (3,237) | | | | | | — | | |
| Voya Large Cap Growth Portfolio - Class I | | | | | 388,031 | | | | | | 413,882 | | | | | | (109,442) | | | | | | (39,820) | | | | | | 652,651 | | | | | | 2,942 | | | | | | (7,636) | | | | | | 67,806 | | |
| Voya Large Cap Value Fund - Class R6 | | | | | 384,891 | | | | | | 293,577 | | | | | | (296,974) | | | | | | 68,290 | | | | | | 449,784 | | | | | | 8,965 | | | | | | (28,104) | | | | | | — | | |
| Voya MidCap Opportunities Portfolio - Class I | | | | | 219,039 | | | | | | 290,009 | | | | | | (88,245) | | | | | | 677 | | | | | | 421,480 | | | | | | — | | | | | | (13,747) | | | | | | 36,222 | | |
| Voya Multi-Manager Emerging Markets Equity Fund - Class I | | | | | 249,558 | | | | | | 152,482 | | | | | | (221,786) | | | | | | 50,164 | | | | | | 230,418 | | | | | | 2,563 | | | | | | (30,431) | | | | | | — | | |
| Voya Multi-Manager International Equity Fund - Class I | | | | | 484,382 | | | | | | 383,271 | | | | | | (124,336) | | | | | | (1,472) | | | | | | 741,845 | | | | | | 12,879 | | | | | | (13,381) | | | | | | — | | |
| Voya Multi-Manager Large Cap Core Portfolio - Class I | | | | | 513,972 | | | | | | 408,072 | | | | | | (224,228) | | | | | | 32,889 | | | | | | 730,705 | | | | | | 14,281 | | | | | | (17,205) | | | | | | 22,295 | | |
| Voya Multi-Manager Mid Cap Value Fund - Class I | | | | | 405,837 | | | | | | 350,858 | | | | | | (234,397) | | | | | | 102,834 | | | | | | 625,132 | | | | | | 7,357 | | | | | | (51,115) | | | | | | 10,182 | | |
| Voya Russell™ Mid Cap Growth Index Portfolio - Class I | | | | | 191,769 | | | | | | 103,372 | | | | | | (119,661) | | | | | | 16,137 | | | | | | 191,617 | | | | | | 1,472 | | | | | | (11,399) | | | | | | — | | |
| Voya Small Company Portfolio - Class I | | | | | 205,572 | | | | | | 157,713 | | | | | | (94,153) | | | | | | 46,142 | | | | | | 315,274 | | | | | | 1,092 | | | | | | (8,850) | | | | | | 22,091 | | |
| Voya U.S. Bond Index Portfolio - Class I | | | | | — | | | | | | 370,126 | | | | | | (370,126) | | | | | | — | | | | | | — | | | | | | 771 | | | | | | 2,278 | | | | | | — | | |
| Voya U.S. Stock Index Portfolio - Class I | | | | | 518,494 | | | | | | 598,109 | | | | | | (842,732) | | | | | | 39,130 | | | | | | 313,001 | | | | | | 5,814 | | | | | | (32,083) | | | | | | 14,201 | | |
| VY® Clarion Global Real Estate Portfolio - Class I | | | | | — | | | | | | 90,487 | | | | | | (9,104) | | | | | | (2,592) | | | | | | 78,791 | | | | | | 811 | | | | | | (41) | | | | | | — | | |
| VY® Clarion Real Estate Portfolio - Class I | | | | | 104,830 | | | | | | 55,565 | | | | | | (79,802) | | | | | | (1,254) | | | | | | 79,339 | | | | | | 1,037 | | | | | | 4,314 | | | | | | — | | |
| VY® Invesco Comstock Portfolio - Class I | | | | | 251,821 | | | | | | 185,324 | | | | | | (93,276) | | | | | | 54,392 | | | | | | 398,261 | | | | | | 9,882 | | | | | | (4,818) | | | | | | — | | |
| VY® T. Rowe Price Growth Equity Portfolio - Class I | | | | | 387,643 | | | | | | 413,986 | | | | | | (117,488) | | | | | | (34,015) | | | | | | 650,125 | | | | | | — | | | | | | (12,529) | | | | | | 62,791 | | |
| | | | | $ | 4,789,484 | | | | | $ | 5,453,224 | | | | | $ | (3,338,612) | | | | | $ | 345,819 | | | | | $ | 7,249,914 | | | | | $ | 89,707 | | | | | $ | (238,359) | | | | | $ | 235,588 | | |
| |
The financial statements for the above mutual fund[s] can be found at www.sec.gov.
The effect of derivative instruments on the Portfolio’s Statement of Operations for the year ended December 31, 2016 was as follows:
| | | | Amount of Realized Gain or (Loss) on
Derivatives Recognized in Income | |
| Derivatives not accounted for as hedging instruments | | | Futures | |
| Equity contracts | | | | $ | (2,117) | | |
| Total | | | | $ | (2,117) | | |
| |
See Accompanying Notes to Financial Statements
PORTFOLIO OF INVESTMENTS
| Voya Solution Balanced Portfolio | as of December 31, 2016 |
| Shares | | | Value | | | Percentage
of Net
Assets | |
| EXCHANGE-TRADED FUNDS: 4.7% | |
| | | 2,968 | | | | iShares Barclays 20+ Year
Treasury Bond Fund | | | | $ | 353,578 | | | | | | 0.7 | | |
| | | 8,757 | | | | SPDR Trust Series 1 | | | | | 1,957,452 | | | | | | 4.0 | | |
| | | | | | | Total Exchange-Traded Funds
(Cost $2,320,230) | | | | | 2,311,030 | | | | | | 4.7 | | |
| MUTUAL FUNDS: 95.2% | |
| | | | | | | Affiliated Investment Companies: 93.7% | |
| | | 249,761 | | | | Voya Floating Rate Fund -
Class I | | | | | 2,487,620 | | | | | | 5.0 | | |
| | | 101,897 | | | | Voya Global Bond Fund -
Class R6 | | | | | 979,234 | | | | | | 2.0 | | |
| | | 250,203 | | | | Voya High Yield Bond
Fund - Class R6 | | | | | 2,011,630 | | | | | | 4.0 | | |
| | | 272,224 | | | | Voya Intermediate Bond Fund -
Class R6 | | | | | 2,711,353 | | | | | | 5.5 | | |
| | | 196,130 | | | | Voya International Core
Fund - Class I | | | | | 1,765,168 | | | | | | 3.6 | | |
| | | 114,230 | | | | Voya International Index
Portfolio - Class I | | | | | 1,006,367 | | | | | | 2.0 | | |
| | | 141,255 | | | | Voya Large Cap Growth
Portfolio - Class I | | | | | 2,449,365 | | | | | | 4.9 | | |
| | | 194,908 | | | | Voya Large Cap Value
Fund - Class R6 | | | | | 2,529,908 | | | | | | 5.1 | | |
| | | 178,261 | @ | | Voya MidCap Opportunities
Portfolio - Class I | | | | | 2,199,737 | | | | | | 4.4 | | |
| | | 104,303 | | | | Voya Multi-Manager Emerging
Markets Equity Fund - Class I | | | | | 979,401 | | | | | | 2.0 | | |
| | | 173,018 | | | | Voya Multi-Manager
International Equity Fund -
Class I | | | | | 1,744,024 | | | | | | 3.5 | | |
| | | 186,867 | | | | Voya Multi-Manager Large Cap
Core Portfolio - Class I | | | | | 2,782,448 | | | | | | 5.6 | | |
| | | 202,346 | | | | Voya Multi-Manager Mid Cap
Value Fund - Class I | | | | | 2,246,040 | | | | | | 4.5 | | |
| | | 162,718 | | | | Voya Short Term Bond
Fund - Class R6 | | | | | 1,599,515 | | | | | | 3.2 | | |
| | | 45,533 | | | | Voya Small Company
Portfolio - Class I | | | | | 1,007,181 | | | | | | 2.0 | | |
| | | 233,540 | | | | Voya U.S. Bond Index
Portfolio - Class I | | | | | 2,459,175 | | | | | | 5.0 | | |
| Shares | | | Value | | | Percentage
of Net
Assets | |
| MUTUAL FUNDS: (continued) | |
| | | | | | | Affiliated Investment Companies (continued) | |
| | | 108,722 | | | | Voya U.S. Stock Index
Portfolio - Class I | | | | $ | 1,499,278 | | | | | | 3.0 | | |
| | | 42,867 | | | | VY® Clarion Global Real
Estate Portfolio - Class I | | | | | 502,401 | | | | | | 1.0 | | |
| | | 13,798 | | | | VY® Clarion Real Estate
Portfolio - Class I | | | | | 506,095 | | | | | | 1.0 | | |
| | | 219,951 | | | | VY® Goldman Sachs Bond
Portfolio - Class I | | | | | 2,212,708 | | | | | | 4.5 | | |
| | | 102,077 | | | | VY® Invesco Comstock
Portfolio - Class I | | | | | 1,783,289 | | | | | | 3.6 | | |
| | | 193,354 | | | | VY® T. Rowe Price
Capital Appreciation
Portfolio - Class I | | | | | 4,928,596 | | | | | | 9.9 | | |
| | | 144,860 | | | | VY® T. Rowe Price Equity
Income Portfolio - Class I | | | | | 2,006,312 | | | | | | 4.0 | | |
| | | 28,346 | @ | | VY® T. Rowe Price Growth
Equity Portfolio - Class I | | | | | 2,195,083 | | | | | | 4.4 | | |
| | | | | | | | | | | | 46,591,928 | | | | | | 93.7 | | |
| | | | | | | Unaffiliated Investment Companies: 1.5% | |
| | | 148,601 | @ | | Credit Suisse Commodity
Return Strategy Fund -
Class I | | | | | 753,405 | | | | | | 1.5 | | |
| | | | | | | Total Mutual Funds
(Cost $48,317,326) | | | | | 47,345,333 | | | | | | 95.2 | | |
| | | | | | | Total Investments in
Securities
(Cost $50,637,556) | | | | $ | 49,656,363 | | | | | | 99.9 | | |
| | | | | | | Assets in Excess of
Other Liabilities | | | | | 62,393 | | | | | | 0.1 | | |
| | | | | | | Net Assets | | | | $ | 49,718,756 | | | | | | 100.0 | | |
| |
@
Non-income producing security.
Cost for federal income tax purposes is $51,724,731.
Net unrealized depreciation consists of:
| | Gross Unrealized Appreciation | | | | $ | 495,275 | | |
| | Gross Unrealized Depreciation | | | | | (2,563,643) | | |
| | Net Unrealized Depreciation | | | | $ | (2,068,368) | | |
| |
See Accompanying Notes to Financial Statements
PORTFOLIO OF INVESTMENTS
| Voya Solution Balanced Portfolio | as of December 31, 2016 (continued) |
Fair Value Measurements^
The following is a summary of the fair valuations according to the inputs used as of December 31, 2016 in valuing the assets and liabilities:
| | | | Quoted Prices
in Active Markets
for Identical
Investments
(Level 1) | | | Significant
Other
Observable
Inputs
(Level 2) | | | Significant
Unobservable
Inputs
(Level 3) | | | Fair Value
at
December 31, 2016 | |
| Asset Table | | | | | |
| Investments, at fair value | | | | | |
| Exchange-Traded Funds | | | | $ | 2,311,030 | | | | | $ | — | | | | | $ | — | | | | | $ | 2,311,030 | | |
| Mutual Funds | | | | | 47,345,333 | | | | | | — | | | | | | — | | | | | | 47,345,333 | | |
| Total Investments, at fair value | | | | $ | 49,656,363 | | | | | $ | — | | | | | $ | — | | | | | $ | 49,656,363 | | |
| |
^
See Note 2, “Significant Accounting Policies” in the Notes to Financial Statements for additional information.
Transactions with Affiliates
An investment of at least 5% of the voting securities of an issuer, or a company which is under common control results in that issuer becoming an affiliated person as defined by the 1940 Act.
The following table provides transactions during the year ended December 31, 2016, where the following issuers were considered an affiliate:
| Issuer | | | Beginning
Fair Value
at 12/31/15 | | | Purchases
at Cost | | | Sales
at Cost | | | Change in
Unrealized
Appreciation/
(Depreciation) | | | Ending
Fair Value
at 12/31/16 | | | Investment
Income | | | Realized
Gains/
(Losses) | | | Net Capital
Gain
Distributions | |
| Voya Emerging Markets Index Portfolio - Class I | | | | $ | — | | | | | $ | 1,015,094 | | | | | $ | (1,015,094) | | | | | $ | — | | | | | $ | — | | | | | $ | 22 | | | | | $ | (57,246) | | | | | $ | — | | |
| Voya Floating Rate Fund - Class I | | | | | 2,435,269 | | | | | | 915,885 | | | | | | (976,069) | | | | | | 112,535 | | | | | | 2,487,620 | | | | | | 96,575 | | | | | | (39,796) | | | | | | — | | |
| Voya Global Bond Fund - Class R6 | | | | | 2,434,924 | | | | | | 426,488 | | | | | | (2,007,766) | | | | | | 125,588 | | | | | | 979,234 | | | | | | 36,688 | | | | | | (13,307) | | | | | | — | | |
| Voya High Yield Bond Fund - Class I | | | | | 2,386,386 | | | | | | 297,637 | | | | | | (2,943,000) | | | | | | 258,977 | | | | | | — | | | | | | 77,580 | | | | | | (58,775) | | | | | | — | | |
| Voya High Yield Bond Fund - Class R6 | | | | | — | | | | | | 2,770,181 | | | | | | (763,837) | | | | | | 5,286 | | | | | | 2,011,630 | | | | | | 44,065 | | | | | | (45,114) | | | | | | — | | |
| Voya Intermediate Bond Fund - Class R6 | | | | | 978,596 | | | | | | 2,495,427 | | | | | | (736,128) | | | | | | (26,542) | | | | | | 2,711,353 | | | | | | 61,749 | | | | | | 253 | | | | | | — | | |
| Voya International Core Fund - Class I | | | | | 2,158,659 | | | | | | 757,695 | | | | | | (1,318,819) | | | | | | 167,633 | | | | | | 1,765,168 | | | | | | 26,200 | | | | | | (192,482) | | | | | | — | | |
| Voya International Index Portfolio - Class I | | | | | 952,152 | | | | | | 415,905 | | | | | | (400,109) | | | | | | 38,419 | | | | | | 1,006,367 | | | | | | 28,259 | | | | | | (57,551) | | | | | | — | | |
| Voya Large Cap Growth Portfolio - Class I | | | | | 2,916,982 | | | | | | 1,052,571 | | | | | | (1,213,414) | | | | | | (306,774) | | | | | | 2,449,365 | | | | | | 12,244 | | | | | | 89,733 | | | | | | 282,169 | | |
| Voya Large Cap Value Fund - Class R6 | | | | | 3,579,327 | | | | | | 963,181 | | | | | | (2,481,645) | | | | | | 469,045 | | | | | | 2,529,908 | | | | | | 63,021 | | | | | | (201,743) | | | | | | — | | |
| Voya MidCap Opportunities Portfolio - Class I | | | | | 1,937,392 | | | | | | 1,172,036 | | | | | | (951,650) | | | | | | 41,959 | | | | | | 2,199,737 | | | | | | — | | | | | | (107,987) | | | | | | 210,592 | | |
| Voya Multi-Manager Emerging Markets Equity Fund - Class I | | | | | 937,678 | | | | | | 423,511 | | | | | | (513,881) | | | | | | 132,093 | | | | | | 979,401 | | | | | | 11,055 | | | | | | (68,896) | | | | | | — | | |
| Voya Multi-Manager International Equity Fund - Class I | | | | | 1,197,664 | | | | | | 1,129,746 | | | | | | (549,505) | | | | | | (33,881) | | | | | | 1,744,024 | | | | | | 30,708 | | | | | | (12,806) | | | | | | — | | |
| Voya Multi-Manager Large Cap Core Portfolio - Class I | | | | | 2,897,721 | | | | | | 1,546,355 | | | | | | (1,623,214) | | | | | | (38,414) | | | | | | 2,782,448 | | | | | | 57,596 | | | | | | 112,587 | | | | | | 94,610 | | |
| Voya Multi-Manager Mid Cap Value Fund - Class I | | | | | 2,144,856 | | | | | | 855,203 | | | | | | (1,291,542) | | | | | | 537,523 | | | | | | 2,246,040 | | | | | | 26,806 | | | | | | (293,723) | | | | | | 37,098 | | |
| Voya Russell™ Mid Cap Growth Index Portfolio - Class I | | | | | 240,269 | | | | | | 18,324 | | | | | | (251,295) | | | | | | (7,298) | | | | | | — | | | | | | — | | | | | | 9,340 | | | | | | — | | |
| Voya Russell™ Mid Cap Index Portfolio - Class I | | | | | — | | | | | | 1,059,888 | | | | | | (1,059,888) | | | | | | — | | | | | | — | | | | | | — | | | | | | 277 | | | | | | — | | |
| Voya Short Term Bond Fund - Class R6 | | | | | 979,172 | | | | | | 2,134,532 | | | | | | (1,517,399) | | | | | | 3,210 | | | | | | 1,599,515 | | | | | | 30,548 | | | | | | (9,796) | | | | | | — | | |
| Voya Small Company Portfolio - Class I | | | | | 966,158 | | | | | | 417,312 | | | | | | (503,537) | | | | | | 127,248 | | | | | | 1,007,181 | | | | | | 4,268 | | | | | | (4,669) | | | | | | 86,385 | | |
| Voya U.S. Bond Index Portfolio - Class I | | | | | 2,435,319 | | | | | | 3,362,930 | | | | | | (3,332,320) | | | | | | (6,754) | | | | | | 2,459,175 | | | | | | 46,093 | | | | | | 9,547 | | | | | | 3,304 | | |
| Voya U.S. Stock Index Portfolio - Class I | | | | | 1,904,810 | | | | | | 2,267,049 | | | | | | (2,746,499) | | | | | | 73,918 | | | | | | 1,499,278 | | | | | | 26,300 | | | | | | (83,195) | | | | | | 42,310 | | |
| VY T. Rowe Price Equity Income Portfolio Initial | | | | | — | | | | | | 2,567,165 | | | | | | (586,395) | | | | | | 25,542 | | | | | | 2,006,312 | | | | | | 46,275 | | | | | | (13,623) | | | | | | 174,325 | | |
VY® BlackRock Inflation Protected Bond Portfolio - Class I | | | | | 972,409 | | | | | | 54,608 | | | | | | (1,125,548) | | | | | | 98,531 | | | | | | — | | | | | | — | | | | | | (61,717) | | | | | | — | | |
| VY® Clarion Global Real Estate Portfolio - Class I | | | | | — | | | | | | 644,188 | | | | | | (122,418) | | | | | | (19,369) | | | | | | 502,401 | | | | | | 5,645 | | | | | | (90) | | | | | | — | | |
| VY® Clarion Real Estate Portfolio - Class I | | | | | 984,937 | | | | | | 219,739 | | | | | | (554,062) | | | | | | (144,519) | | | | | | 506,095 | | | | | | 7,338 | | | | | | 169,964 | | | | | | — | | |
| VY® Goldman Sachs Bond Portfolio - Class I | | | | | 972,807 | | | | | | 1,876,262 | | | | | | (599,626) | | | | | | (36,735) | | | | | | 2,212,708 | | | | | | 38,444 | | | | | | 14,586 | | | | | | — | | |
| VY® Invesco Comstock Portfolio - Class I | | | | | 1,655,722 | | | | | | 666,543 | | | | | | (754,043) | | | | | | 215,067 | | | | | | 1,783,289 | | | | | | 44,841 | | | | | | 28,996 | | | | | | — | | |
| VY® T. Rowe Price Capital Appreciation Portfolio - Class I | | | | | 4,843,517 | | | | | | 1,803,822 | | | | | | (1,684,867) | | | | | | (33,876) | | | | | | 4,928,596 | | | | | | 75,085 | | | | | | (49,825) | | | | | | 371,039 | | |
| VY® T. Rowe Price Growth Equity Portfolio - Class I | | | | | 2,914,227 | | | | | | 1,059,741 | | | | | | (1,526,015) | | | | | | (252,870) | | | | | | 2,195,083 | | | | | | — | | | | | | 5,767 | | | | | | 251,532 | | |
| | | | | $ | 45,826,953 | | | | | $ | 34,389,018 | | | | | $ | (35,149,585) | | | | | $ | 1,525,542 | | | | | $ | 46,591,928 | | | | | $ | 897,405 | | | | | $ | (931,291) | | | | | $ | 1,553,364 | | |
| |
The financial statements for the above mutual fund[s] can be found at www.sec.gov.
See Accompanying Notes to Financial Statements
PORTFOLIO OF INVESTMENTS
| Voya Solution Balanced Portfolio | as of December 31, 2016 (continued) |
The effect of derivative instruments on the Portfolio’s Statement of Operations for the year ended December 31, 2016 was as follows:
| | | | Amount of Realized Gain or (Loss) on
Derivatives Recognized in Income | |
| Derivatives not accounted for as hedging instruments | | | Futures | |
| Equity contracts | | | | $ | (156,309) | | |
| Interest rate contracts | | | | | 14,183 | | |
| Total | | | | $ | (142,126) | | |
| |
See Accompanying Notes to Financial Statements
PORTFOLIO OF INVESTMENTS
| Voya Solution Conservative Portfolio | as of December 31, 2016 |
| Shares | | | Value | | | Percentage
of Net
Assets | |
| EXCHANGE-TRADED FUNDS: 4.5% | |
| | | 952 | | | | iShares iBoxx $ High Yield
Corporate Bond Fund | | | | $ | 82,396 | | | | | | 0.5 | | |
| | | 2,953 | | | | SPDR Trust Series 1 | | | | | 660,084 | | | | | | 4.0 | | |
| | | | | | | Total Exchange-Traded Funds
(Cost $721,459) | | | | | 742,480 | | | | | | 4.5 | | |
| MUTUAL FUNDS: 95.3% | |
| | | | | | | Affiliated Investment Companies: 93.2% | |
| | | 115,505 | | | | Voya Floating Rate Fund -
Class I | | | | | 1,150,426 | | | | | | 7.0 | | |
| | | 117,777 | | | | Voya Global Bond Fund -
Class R6 | | | | | 1,131,841 | | | | | | 6.9 | | |
| | | 154,932 | | | | Voya High Yield Bond
Fund - Class R6 | | | | | 1,245,650 | | | | | | 7.6 | | |
| | | 72,655 | | | | Voya Intermediate Bond Fund -
Class R6 | | | | | 723,641 | | | | | | 4.4 | | |
| | | 56,590 | | | | Voya International Index
Portfolio - Class I | | | | | 498,558 | | | | | | 3.1 | | |
| | | 12,877 | | | | Voya Large Cap Value
Fund - Class R6 | | | | | 167,146 | | | | | | 1.0 | | |
| | | 26,153 | @ | | Voya MidCap Opportunities
Portfolio - Class I | | | | | 322,725 | | | | | | 2.0 | | |
| | | 29,700 | | | | Voya Multi-Manager Mid Cap
Value Fund - Class I | | | | | 329,673 | | | | | | 2.0 | | |
| | | 231,508 | | | | Voya Short Term Bond
Fund - Class R6 | | | | | 2,275,721 | | | | | | 13.9 | | |
| | | 130,810 | | | | Voya U.S. Bond Index Portfolio -
Class I | | | | | 1,377,434 | | | | | | 8.4 | | |
| | | 35,905 | | | | Voya U.S. Stock Index Portfolio -
Class I | | | | | 495,132 | | | | | | 3.0 | | |
| | | 135,881 | | | | VY® BlackRock Inflation
Protected Bond Portfolio -
Class I | | | | | 1,297,662 | | | | | | 7.9 | | |
| Shares | | | Value | | | Percentage
of Net
Assets | |
| MUTUAL FUNDS: (continued) | |
| | | | | | | Affiliated Investment Companies (continued) | |
| | | 186,712 | | | | VY® Goldman Sachs Bond
Portfolio - Class I | | | | $ | 1,878,318 | | | | | | 11.5 | | |
| | | 63,843 | | | | VY® T. Rowe Price Capital
Appreciation Portfolio - Class I | | | | | 1,627,353 | | | | | | 10.0 | | |
| | | 53,449 | | | | VY® T. Rowe Price Equity
Income Portfolio - Class I | | | | | 740,266 | | | | | | 4.5 | | |
| | | | | | | | | | | | 15,261,546 | | | | | | 93.2 | | |
| | | | | | | Unaffiliated Investment Companies: 2.1% | |
| | | 66,823 | @ | | Credit Suisse Commodity Return
Strategy Fund -
Class I | | | | | 338,790 | | | | | | 2.1 | | |
| | | | | | | Total Mutual Funds
(Cost $15,813,537) | | | | | 15,600,336 | | | | | | 95.3 | | |
| | | | | | | Total Investments in
Securities
(Cost $16,534,996) | | | | $ | 16,342,816 | | | | | | 99.8 | | |
| | | | | | | Assets in Excess of
Other Liabilities | | | | | 26,787 | | | | | | 0.2 | | |
| | | | | | | Net Assets | | | | $ | 16,369,603 | | | | | | 100.0 | | |
| |
@
Non-income producing security.
Cost for federal income tax purposes is $17,045,544.
Net unrealized depreciation consists of:
| | Gross Unrealized Appreciation | | | | $ | 78,084 | | |
| | Gross Unrealized Depreciation | | | | | (780,812) | | |
| | Net Unrealized Depreciation | | | | $ | (702,728) | | |
| |
Fair Value Measurements^
The following is a summary of the fair valuations according to the inputs used as of December 31, 2016 in valuing the assets and liabilities:
| | | | Quoted Prices
in Active Markets
for Identical
Investments
(Level 1) | | | Significant
Other
Observable
Inputs
(Level 2) | | | Significant
Unobservable
Inputs
(Level 3) | | | Fair Value
at
December 31, 2016 | |
| Asset Table | | | | | |
| Investments, at fair value | | | | | |
| Exchange-Traded Funds | | | | $ | 742,480 | | | | | $ | — | | | | | $ | — | | | | | $ | 742,480 | | |
| Mutual Funds | | | | | 15,600,336 | | | | | | — | | | | | | — | | | | | | 15,600,336 | | |
| Total Investments, at fair value | | | | $ | 16,342,816 | | | | | $ | — | | | | | $ | — | | | | | $ | 16,342,816 | | |
| |
^
See Note 2, “Significant Accounting Policies” in the Notes to Financial Statements for additional information.
See Accompanying Notes to Financial Statements
PORTFOLIO OF INVESTMENTS
| Voya Solution Conservative Portfolio | as of December 31, 2016 (continued) |
Transactions with Affiliates
An investment of at least 5% of the voting securities of an issuer, or a company which is under common control results in that issuer becoming an affiliated person as defined by the 1940 Act.
The following table provides transactions during the year ended December 31, 2016, where the following issuers were considered an affiliate:
| Issuer | | | Beginning
Fair Value
at 12/31/15 | | | Purchases
at Cost | | | Sales
at Cost | | | Change in
Unrealized
Appreciation/
(Depreciation) | | | Ending
Fair Value
at 12/31/16 | | | Investment
Income | | | Realized
Gains/
(Losses) | | | Net Capital
Gain
Distributions | |
| Voya Emerging Market Index Portfolio - Class I | | | | $ | — | | | | | $ | 337,032 | | | | | $ | (337,032) | | | | | $ | — | | | | | $ | — | | | | | $ | 8 | | | | | $ | (19,313) | | | | | $ | — | | |
| Voya Floating Rate Fund - Class I | | | | | 1,019,033 | | | | | | 330,894 | | | | | | (244,220) | | | | | | 44,719 | | | | | | 1,150,426 | | | | | | 46,071 | | | | | | (9,684) | | | | | | — | | |
| Voya Global Bond Fund - Class R6 | | | | | 1,743,765 | | | | | | 423,517 | | | | | | (1,112,666) | | | | | | 77,225 | | | | | | 1,131,841 | | | | | | 35,603 | | | | | | (5,265) | | | | | | — | | |
| Voya High Yield Bond Fund - Class I | | | | | 1,036,364 | | | | | | 301,351 | | | | | | (1,440,607) | | | | | | 102,892 | | | | | | — | | | | | | 39,046 | | | | | | (17,185) | | | | | | — | | |
| Voya High Yield Bond Fund - Class R6 | | | | | — | | | | | | 1,531,910 | | | | | | (302,982) | | | | | | 16,722 | | | | | | 1,245,650 | | | | | | 26,037 | | | | | | (17,997) | | | | | | — | | |
| Voya Intermediate Bond Fund - Class R6 | | | | | 952,577 | | | | | | 710,742 | | | | | | (941,841) | | | | | | 2,163 | | | | | | 723,641 | | | | | | 38,096 | | | | | | (7,805) | | | | | | — | | |
| Voya International Index Portfolio - Class I | | | | | 427,569 | | | | | | 195,766 | | | | | | (136,052) | | | | | | 11,275 | | | | | | 498,558 | | | | | | 14,606 | | | | | | (18,941) | | | | | | — | | |
| Voya Large Cap Growth Portfolio - Class I | | | | | 408,061 | | | | | | 121,858 | | | | | | (549,563) | | | | | | 19,644 | | | | | | — | | | | | | — | | | | | | (25,242) | | | | | | — | | |
| Voya Large Cap Value Fund - Class R6 | | | | | 400,645 | | | | | | 161,223 | | | | | | (451,468) | | | | | | 56,746 | | | | | | 167,146 | | | | | | 5,417 | | | | | | (34,939) | | | | | | — | | |
| Voya MidCap Opportunities Portfolio - Class I | | | | | 290,208 | | | | | | 158,372 | | | | | | (140,458) | | | | | | 14,603 | | | | | | 322,725 | | | | | | — | | | | | | (24,752) | | | | | | 34,060 | | |
| Voya Multi-Manager Mid Cap Value Fund - Class I | | | | | 285,686 | | | | | | 138,452 | | | | | | (166,937) | | | | | | 72,472 | | | | | | 329,673 | | | | | | 3,958 | | | | | | (34,152) | | | | | | 5,477 | | |
| Voya Short Term Bond Fund - Class R6 | | | | | 1,173,055 | | | | | | 1,710,219 | | | | | | (604,030) | | | | | | (3,523) | | | | | | 2,275,721 | | | | | | 37,899 | | | | | | (7,090) | | | | | | — | | |
| Voya U.S. Bond Index Portfolio - Class I | | | | | 1,737,266 | | | | | | 512,304 | | | | | | (880,472) | | | | | | 8,336 | | | | | | 1,377,434 | | | | | | 32,192 | | | | | | 3,671 | | | | | | 2,177 | | |
| Voya U.S. Stock Index Portfolio - Class I | | | | | 288,246 | | | | | | 560,916 | | | | | | (384,181) | | | | | | 30,151 | | | | | | 495,132 | | | | | | 7,815 | | | | | | (13,486) | | | | | | — | | |
| VY T. Rowe Price Equity Income Portfolio Initial | | | | | — | | | | | | 1,018,104 | | | | | | (285,791) | | | | | | 7,953 | | | | | | 740,266 | | | | | | 17,321 | | | | | | (5,951) | | | | | | 70,294 | | |
| VY® BlackRock Inflation Protected Bond Portfolio - Class I | | | | | 1,310,541 | | | | | | 361,541 | | | | | | (484,003) | | | | | | 109,583 | | | | | | 1,297,662 | | | | | | — | | | | | | (58,537) | | | | | | — | | |
| VY® Goldman Sachs Bond Portfolio - Class I | | | | | 946,740 | | | | | | 1,178,325 | | | | | | (246,126) | | | | | | (621) | | | | | | 1,878,318 | | | | | | 26,015 | | | | | | 5,430 | | | | | | — | | |
| VY® T. Rowe Price Capital Appreciation Portfolio - Class I | | | | | 1,450,713 | | | | | | 579,621 | | | | | | (395,641) | | | | | | (7,340) | | | | | | 1,627,353 | | | | | | 25,219 | | | | | | (25,438) | | | | | | 133,904 | | |
| | | | | $ | 13,470,469 | | | | | $ | 10,332,147 | | | | | $ | (9,104,070) | | | | | $ | 563,000 | | | | | $ | 15,261,546 | | | | | $ | 355,303 | | | | | $ | (316,676) | | | | | $ | 245,912 | | |
| |
The financial statements for the above mutual fund[s] can be found at www.sec.gov.
The effect of derivative instruments on the Portfolio’s Statement of Operations for the year ended December 31, 2016 was as follows:
| | | | Amount of Realized Gain or (Loss) on
Derivatives Recognized in Income | |
| Derivatives not accounted for as hedging instruments | | | Futures | |
| Equity contracts | | | | $ | (6,352) | | |
| Total | | | | $ | (6,352) | | |
| |
See Accompanying Notes to Financial Statements
PORTFOLIO OF INVESTMENTS
| Voya Solution Income Portfolio | as of December 31, 2016 |
| | Shares | | | Value | | | Percentage
of Net
Assets | |
| | EXCHANGE-TRADED FUNDS: 5.2% | |
| | | | 40,727 | | | | iShares Barclays 20+
Year Treasury Bond Fund | | | | $ | 4,851,808 | | | | | | 1.0 | | |
| | | | 90,131 | | | | SPDR Trust Series 1 | | | | | 20,146,982 | | | | | | 4.2 | | |
| | | | | | | | Total Exchange-Traded Funds
(Cost $24,962,437) | | | | | 24,998,790 | | | | | | 5.2 | | |
| | MUTUAL FUNDS: 94.7% | |
| | | | | | | | Affiliated Investment Companies: 93.1% | |
| | | | 2,451,013 | | | | Voya Floating Rate Fund -
Class I | | | | | 24,412,085 | | | | | | 5.0 | | |
| | | | 2,997,418 | | | | Voya Global Bond Fund -
Class R6 | | | | | 28,805,185 | | | | | | 5.9 | | |
| | | | 1,228,135 | | | | Voya High Yield Bond
Fund - Class R6 | | | | | 9,874,208 | | | | | | 2.0 | | |
| | | | 2,390,250 | | | | Voya Intermediate Bond
Fund - Class R6 | | | | | 23,806,889 | | | | | | 4.9 | | |
| | | | 1,649,972 | | | | Voya International Core
Fund - Class I | | | | | 14,849,746 | | | | | | 3.1 | | |
| | | | 1,121,003 | | | | Voya International Index
Portfolio - Class I | | | | | 9,876,036 | | | | | | 2.0 | | |
| | | | 553,933 | | | | Voya Large Cap Growth
Portfolio - Class I | | | | | 9,605,205 | | | | | | 2.0 | | |
| | | | 765,658 | | | | Voya Large Cap Value
Fund - Class R6 | | | | | 9,938,244 | | | | | | 2.0 | | |
| | | | 582,598 | @ | | Voya MidCap Opportunities
Portfolio - Class I | | | | | 7,189,262 | | | | | | 1.5 | | |
| | | | 1,927,332 | | | | Voya Multi-Manager Large
Cap Core Portfolio - Class I | | | | | 28,697,976 | | | | | | 5.9 | | |
| | | | 661,914 | | | | Voya Multi-Manager Mid Cap
Value Fund - Class I | | | | | 7,347,244 | | | | | | 1.5 | | |
| | | | 3,437,375 | | | | Voya Short Term Bond
Fund - Class R6 | | | | | 33,789,395 | | | | | | 7.0 | | |
| | | | 4,782,208 | | | | Voya U.S. Bond Index
Portfolio - Class I | | | | | 50,356,648 | | | | | | 10.4 | | |
| | | | 355,673 | | | | Voya U.S. Stock Index
Portfolio - Class I | | | | | 4,904,726 | | | | | | 1.0 | | |
| | | | 4,537,822 | | | | VY® BlackRock Inflation
Protected Bond Portfolio -
Class I | | | | | 43,336,196 | | | | | | 8.9 | | |
| | Shares | | | Value | | | Percentage
of Net
Assets | |
| | MUTUAL FUNDS: (continued) | |
| | | | | | | | Affiliated Investment
Companies (continued) | |
| | | | 420,656 | | | | VY® Clarion Global Real
Estate Portfolio - Class I | | | | $ | 4,930,084 | | | | | | 1.0 | | |
| | | | 135,469 | | | | VY® Clarion Real Estate
Portfolio - Class I | | | | | 4,968,998 | | | | | | 1.0 | | |
| | | | 6,609,216 | | | | VY® Goldman Sachs Bond
Portfolio - Class I | | | | | 66,488,713 | | | | | | 13.7 | | |
| | | | 1,564,368 | | | | VY® T. Rowe Price Capital
Appreciation Portfolio -
Class I | | | | | 39,875,740 | | | | | | 8.2 | | |
| | | | 1,422,110 | | | | VY® T. Rowe Price Equity
Income Portfolio - Class I | | | | | 19,696,222 | | | | | | 4.1 | | |
| | | | 123,472 | @ | | VY® T. Rowe Price Growth
Equity Portfolio - Class I | | | | | 9,561,638 | | | | | | 2.0 | | |
| | | | | | | | | | | | | 452,310,440 | | | | | | 93.1 | | |
| | | | | | | | Unaffiliated Investment Companies: 1.6% | |
| | | | 1,531,386 | @ | | Credit Suisse Commodity
Return Strategy Fund -
Class I | | | | | 7,764,129 | | | | | | 1.6 | | |
| | | | | | | | Total Mutual Funds
(Cost $470,620,202) | | | | | 460,074,569 | | | | | | 94.7 | | |
| | | | | | | | Total Investments in
Securities
(Cost $495,582,639) | | | | $ | 485,073,359 | | | | | | 99.9 | | |
| | | | | | | | Assets in Excess of
Other Liabilities | | | | | 594,298 | | | | | | 0.1 | | |
| | | | | | | | Net Assets | | | | $ | 485,667,657 | | | | | | 100.0 | | |
| | | | | | | | | |
@
Non-income producing security.
Cost for federal income tax purposes is $506,598,913.
Net unrealized depreciation consists of:
| | Gross Unrealized Appreciation | | | | $ | 2,601,673 | | |
| | Gross Unrealized Depreciation | | | | | (24,127,227) | | |
| | Net Unrealized Depreciation | | | | $ | (21,525,554) | | |
| | | | |
See Accompanying Notes to Financial Statements
PORTFOLIO OF INVESTMENTS
| Voya Solution Income Portfolio | as of December 31, 2016 (continued) |
Fair Value Measurements^
The following is a summary of the fair valuations according to the inputs used as of December 31, 2016 in valuing the assets and liabilities:
| | | | Quoted Prices
in Active Markets
for Identical
Investments
(Level 1) | | | Significant
Other
Observable
Inputs
(Level 2) | | | Significant
Unobservable
Inputs
(Level 3) | | | Fair Value
at
December 31, 2016 | |
| Asset Table | | | | | |
| Investments, at fair value | | | | | |
| Exchange-Traded Funds | | | | $ | 24,998,790 | | | | | $ | — | | | | | $ | — | | | | | $ | 24,998,790 | | |
| Mutual Funds | | | | | 460,074,569 | | | | | | — | | | | | | — | | | | | | 460,074,569 | | |
| Total Investments, at fair value | | | | $ | 485,073,359 | | | | | $ | — | | | | | $ | — | | | | | $ | 485,073,359 | | |
| |
^
See Note 2, “Significant Accounting Policies” in the Notes to Financial Statements for additional information.
Transactions with Affiliates
An investment of at least 5% of the voting securities of an issuer, or a company which is under common control results in that issuer becoming an affiliated person as defined by the 1940 Act.
The following table provides transactions during the year ended December 31, 2016, where the following issuers were considered an affiliate:
| Issuer | | | Beginning
Fair Value
at 12/31/15 | | | Purchases
at Cost | | | Sales
at Cost | | | Change in
Unrealized
Appreciation/
(Depreciation) | | | Ending
Fair Value
at 12/31/16 | | | Investment
Income | | | Realized
Gains/
(Losses) | | | Net Capital
Gain
Distributions | |
| Voya Emerging Market Index Portfolio - Class I | | | | $ | — | | | | | $ | 10,568,461 | | | | | $ | (10,568,461) | | | | | $ | — | | | | | $ | — | | | | | $ | 264 | | | | | $ | (597,953) | | | | | $ | — | | |
| Voya Floating Rate Fund - Class I | | | | | 29,495,782 | | | | | | 2,154,043 | | | | | | (8,395,565) | | | | | | 1,157,825 | | | | | | 24,412,085 | | | | | | 1,130,669 | | | | | | (318,813) | | | | | | — | | |
| Voya Global Bond Fund - Class R6 | | | | | 35,348,086 | | | | | | 2,593,710 | | | | | | (10,515,971) | | | | | | 1,379,360 | | | | | | 28,805,185 | | | | | | 872,062 | | | | | | (402,322) | | | | | | — | | |
| Voya High Yield Bond Fund - Class I | | | | | 17,218,299 | | | | | | 952,571 | | | | | | (20,083,776) | | | | | | 1,912,906 | | | | | | — | | | | | | 568,328 | | | | | | (304,548) | | | | | | — | | |
| Voya High Yield Bond Fund - Class R6 | | | | | — | | | | | | 17,490,363 | | | | | | (7,610,506) | | | | | | (5,649) | | | | | | 9,874,208 | | | | | | 249,454 | | | | | | (453,505) | | | | | | — | | |
| Voya Intermediate Bond Fund - Class R6 | | | | | 47,519,474 | | | | | | 15,617,645 | | | | | | (39,202,802) | | | | | | (127,428) | | | | | | 23,806,889 | | | | | | 1,599,603 | | | | | | 256,550 | | | | | | — | | |
| Voya International Core Fund - Class I | | | | | 17,427,150 | | | | | | 2,993,116 | | | | | | (6,652,618) | | | | | | 1,082,098 | | | | | | 14,849,746 | | | | | | 230,986 | | | | | | (1,229,606) | | | | | | — | | |
| Voya International Index Portfolio - Class I | | | | | 11,548,095 | | | | | | 2,084,828 | | | | | | (4,116,502) | | | | | | 359,615 | | | | | | 9,876,036 | | | | | | 338,489 | | | | | | (595,444) | | | | | | — | | |
| Voya Large Cap Growth Portfolio - Class I | | | | | 17,696,581 | | | | | | 2,770,593 | | | | | | (9,195,460) | | | | | | (1,666,509) | | | | | | 9,605,205 | | | | | | 62,105 | | | | | | 484,338 | | | | | | 1,431,285 | | |
| Voya Large Cap Value Fund - Class R6 | | | | | 23,153,396 | | | | | | 2,334,506 | | | | | | (18,869,561) | | | | | | 3,319,903 | | | | | | 9,938,244 | | | | | | 305,542 | | | | | | (2,145,584) | | | | | | — | | |
| Voya MidCap Opportunities Portfolio - Class I | | | | | 8,816,089 | | | | | | 1,796,722 | | | | | | (3,924,472) | | | | | | 500,923 | | | | | | 7,189,262 | | | | | | — | | | | | | (798,712) | | | | | | 893,542 | | |
| Voya Multi-Manager Large Cap Core Portfolio - Class I | | | | | 24,608,464 | | | | | | 16,078,515 | | | | | | (11,728,335) | | | | | | (260,668) | | | | | | 28,697,976 | | | | | | 675,534 | | | | | | 979,025 | | | | | | 1,207,583 | | |
| Voya Multi-Manager Mid Cap Value Fund - Class I | | | | | 8,673,475 | | | | | | 1,370,584 | | | | | | (4,638,177) | | | | | | 1,941,362 | | | | | | 7,347,244 | | | | | | 91,905 | | | | | | (1,005,646) | | | | | | 127,192 | | |
Voya Russell™ Mid Cap Index Portfolio -
Class I | | | | | — | | | | | | 10,828,274 | | | | | | (10,828,274) | | | | | | — | | | | | | — | | | | | | — | | | | | | (26,226) | | | | | | — | | |
| Voya Short Term Bond Fund - Class R6 | | | | | 47,547,406 | | | | | | 3,893,288 | | | | | | (17,784,216) | | | | | | 132,917 | | | | | | 33,789,395 | | | | | | 815,940 | | | | | | (225,299) | | | | | | — | | |
| Voya U.S. Bond Index Portfolio - Class I | | | | | 81,388,349 | | | | | | 24,956,541 | | | | | | (56,909,537) | | | | | | 921,295 | | | | | | 50,356,648 | | | | | | 1,283,078 | | | | | | (113,306) | | | | | | 87,613 | | |
| Voya U.S. Stock Index Portfolio - Class I | | | | | 22,824,571 | | | | | | 18,392,631 | | | | | | (38,482,189) | | | | | | 2,169,713 | | | | | | 4,904,726 | | | | | | 77,904 | | | | | | (2,923,255) | | | | | | — | | |
| VY T. Rowe Price Equity Income Portfolio Initial | | | | | — | | | | | | 25,535,726 | | | | | | (5,915,145) | | | | | | 75,641 | | | | | | 19,696,222 | | | | | | 475,224 | | | | | | (158,890) | | | | | | 2,210,460 | | |
VY® BlackRock Inflation Protected Bond Portfolio - Class I | | | | | 53,111,312 | | | | | | 2,490,277 | | | | | | (16,623,779) | | | | | | 4,358,386 | | | | | | 43,336,196 | | | | | | — | | | | | | (2,366,480) | | | | | | — | | |
VY® Clarion Global Real Estate Portfolio - Class I | | | | | — | | | | | | 6,239,114 | | | | | | (1,131,806) | | | | | | (177,224) | | | | | | 4,930,084 | | | | | | 71,015 | | | | | | 7,696 | | | | | | — | | |
| VY® Clarion Real Estate Portfolio - Class I | | | | | 11,944,468 | | | | | | 1,004,046 | | | | | | (6,146,289) | | | | | | (1,833,227) | | | | | | 4,968,998 | | | | | | 93,038 | | | | | | 2,183,455 | | | | | | — | | |
| VY® Goldman Sachs Bond Portfolio - Class I | | | | | 47,229,418 | | | | | | 32,942,631 | | | | | | (13,867,437) | | | | | | 184,101 | | | | | | 66,488,713 | | | | | | 1,060,354 | | | | | | 261,213 | | | | | | — | | |
VY® T. Rowe Price Capital Appreciation Portfolio - Class I | | | | | 47,019,557 | | | | | | 7,398,417 | | | | | | (14,310,149) | | | | | | (232,085) | | | | | | 39,875,740 | | | | | | 633,944 | | | | | | (734,593) | | | | | | 3,881,730 | | |
VY® T. Rowe Price Growth Equity Portfolio - Class I | | | | | 17,678,737 | | | | | | 2,984,604 | | | | | | (9,416,849) | | | | | | (1,684,854) | | | | | | 9,561,638 | | | | | | — | | | | | | 273,599 | | | | | | 1,253,406 | | |
| | | | | $ | 570,248,709 | | | | | $ | 215,471,206 | | | | | $ | (346,917,876) | | | | | $ | 13,508,401 | | | | | $ | 452,310,440 | | | | | $ | 10,635,438 | | | | | $ | (9,954,305) | | | | | $ | 11,092,811 | | |
| |
The financial statements for the above mutual fund[s] can be found at www.sec.gov.
See Accompanying Notes to Financial Statements
PORTFOLIO OF INVESTMENTS
| Voya Solution Income Portfolio | as of December 31, 2016 (continued) |
The effect of derivative instruments on the Portfolio’s Statement of Operations for the year ended December 31, 2016 was as follows:
| | | | Amount of Realized Gain or (Loss) on
Derivatives Recognized in Income | |
| Derivatives not accounted for as hedging instruments | | | Futures | |
| Equity contracts | | | | $ | (1,089,896) | | |
| Interest rate contracts | | | | | 95,806 | | |
| Total | | | | $ | (994,090) | | |
| |
See Accompanying Notes to Financial Statements
| Voya Solution Moderately | PORTFOLIO OF INVESTMENTS |
| Aggressive Portfolio | as of December 31, 2016 |
| | Shares | | | Value | | | Percentage
of Net
Assets | |
| | EXCHANGE-TRADED FUNDS: 10.3% | |
| | | | 42,330 | | | | iShares Barclays 20+
Year Treasury Bond Fund | | | | $ | 5,042,773 | | | | | | 0.7 | | |
| | | | 220,729 | | | | iShares Russell 1000 Value
Index Fund | | | | | 24,728,270 | | | | | | 3.6 | | |
| | | | 187,355 | | | | SPDR Trust Series 1 | | | | | 41,879,463 | | | | | | 6.0 | | |
| | | | | | | | Total Exchange-Traded Funds
(Cost $69,063,780) | | | | | 71,650,506 | | | | | | 10.3 | | |
| | MUTUAL FUNDS: 89.5% | |
| | | | | | | | Affiliated Investment Companies: 88.0% | |
| | | | 1,432,839 | | | | Voya Emerging Markets Index
Portfolio - Class I | | | | | 13,697,941 | | | | | | 2.0 | | |
| | | | 2,086,527 | | | | Voya Floating Rate Fund -
Class I | | | | | 20,781,804 | | | | | | 3.0 | | |
| | | | 1,418,354 | | | | Voya Global Bond Fund -
Class R6 | | | | | 13,630,379 | | | | | | 2.0 | | |
| | | | 1,742,084 | | | | Voya High Yield Bond Fund -
Class R6 | | | | | 14,006,352 | | | | | | 2.0 | | |
| | | | 858,257 | | | | Voya Index Plus LargeCap
Portfolio - Class I | | | | | 20,761,240 | | | | | | 3.0 | | |
| | | | 3,612,860 | | | | Voya Intermediate Bond
Fund - Class R6 | | | | | 35,984,089 | | | | | | 5.2 | | |
| | | | 4,681,274 | | | | Voya International Core
Fund - Class I | | | | | 42,131,464 | | | | | | 6.1 | | |
| | | | 1,590,430 | | | | Voya International Index
Portfolio - Class I | | | | | 14,011,692 | | | | | | 2.0 | | |
| | | | 2,162,331 | | | | Voya Large Cap Growth
Portfolio - Class I | | | | | 37,494,815 | | | | | | 5.4 | | |
| | | | 2,426,185 | | | | Voya Large Cap Value Fund -
Class R6 | | | | | 31,491,888 | | | | | | 4.5 | | |
| | | | 3,858,631 | @ | | Voya MidCap Opportunities
Portfolio - Class I | | | | | 47,615,502 | | | | | | 6.9 | | |
| | | | 1,451,378 | | | | Voya Multi-Manager Emerging
Markets Equity Fund - Class I | | | | | 13,628,443 | | | | | | 2.0 | | |
| | | | 5,505,418 | | | | Voya Multi-Manager
International Equity Fund -
Class I | | | | | 55,494,611 | | | | | | 8.0 | | |
| | | | 2,298,650 | | | | Voya Multi-Manager Large
Cap Core Portfolio - Class I | | | | | 34,226,903 | | | | | | 4.9 | | |
| | | | 4,382,000 | | | | Voya Multi-Manager Mid Cap
Value Fund - Class I | | | | | 48,640,205 | | | | | | 7.0 | | |
| | | | 950,937 | | | | Voya Small Company
Portfolio - Class I | | | | | 21,034,727 | | | | | | 3.0 | | |
| | Shares | | | Value | | | Percentage
of Net
Assets | |
| | MUTUAL FUNDS: (continued) | |
| | | | | | | | Affiliated Investment Companies (continued) | |
| | | | 1,297,395 | | | | Voya U.S. Bond Index
Portfolio - Class I | | | | $ | 13,661,568 | | | | | | 2.0 | | |
| | | | 1,261,371 | | | | Voya U.S. Stock Index
Portfolio - Class I | | | | | 17,394,306 | | | | | | 2.5 | | |
| | | | 596,789 | | | | VY® Clarion Global Real
Estate Portfolio - Class I | | | | | 6,994,370 | | | | | | 1.0 | | |
| | | | 192,103 | | | | VY® Clarion Real Estate
Portfolio - Class I | | | | | 7,046,351 | | | | | | 1.0 | | |
| | | | 1,624,849 | | | | VY® Invesco Comstock
Portfolio - Class I | | | | | 28,386,120 | | | | | | 4.1 | | |
| | | | 1,345,745 | | | | VY® T. Rowe Price
Capital Appreciation
Portfolio - Class I | | | | | 34,303,039 | | | | | | 5.0 | | |
| | | | 482,118 | @ | | VY® T. Rowe Price Growth
Equity Portfolio - Class I | | | | | 37,335,214 | | | | | | 5.4 | | |
| | | | | | | | | | | | | 609,753,023 | | | | | | 88.0 | | |
| | | | | | | | Unaffiliated Investment Companies: 1.5% | |
| | | | 2,119,348 | @ | | Credit Suisse Commodity
Return Strategy Fund -
Class I | | | | | 10,745,096 | | | | | | 1.5 | | |
| | | | | | | | Total Mutual Funds
(Cost $642,671,850) | | | | | 620,498,119 | | | | | | 89.5 | | |
| | | | | | | | Total Investments in
Securities
(Cost $711,735,630) | | | | $ | 692,148,625 | | | | | | 99.8 | | |
| | | | | | | | Assets in Excess of Other
Liabilities | | | | | 1,047,891 | | | | | | 0.2 | | |
| | | | | | | | Net Assets | | | | $ | 693,196,516 | | | | | | 100.0 | | |
| | | | | | | | | |
@
Non-income producing security.
Cost for federal income tax purposes is $722,489,374.
Net unrealized depreciation consists of:
| | Gross Unrealized Appreciation | | | | $ | 11,829,655 | | |
| | Gross Unrealized Depreciation | | | | | (42,170,404) | | |
| | Net Unrealized Depreciation | | | | $ | (30,340,749) | | |
| |
See Accompanying Notes to Financial Statements
| Voya Solution Moderately | PORTFOLIO OF INVESTMENTS |
| Aggressive Portfolio | as of December 31, 2016 (continued) |
Fair Value Measurements^
The following is a summary of the fair valuations according to the inputs used as of December 31, 2016 in valuing the assets and liabilities:
| | | | Quoted Prices
in Active Markets
for Identical
Investments
(Level 1) | | | Significant
Other
Observable
Inputs
(Level 2) | | | Significant
Unobservable
Inputs
(Level 3) | | | Fair Value
at
December 31, 2016 | |
| Asset Table | | | | | |
| Investments, at fair value | | | | | |
| Exchange-Traded Funds | | | | $ | 71,650,506 | | | | | $ | — | | | | | $ | — | | | | | $ | 71,650,506 | | |
| Mutual Funds | | | | | 620,498,119 | | | | | | — | | | | | | — | | | | | | 620,498,119 | | |
| Total Investments, at fair value | | | | $ | 692,148,625 | | | | | $ | — | | | | | $ | — | | | | | $ | 692,148,625 | | |
| |
^
See Note 2, “Significant Accounting Policies” in the Notes to Financial Statements for additional information.
Transactions with Affiliates
An investment of at least 5% of the voting securities of an issuer, or a company which is under common control results in that issuer becoming an affiliated person as defined by the 1940 Act.
The following table provides transactions during the year ended December 31, 2016, where the following issuers were considered an affiliate:
| Issuer | | | Beginning Fair
Value at
12/31/15 | | | Purchases
at Cost | | | Sales
at Cost | | | Change in
Unrealized
Appreciation/
(Depreciation) | | | Ending
Fair Value
at 12/31/16 | | | Investment
Income | | | Realized
Gains/
(Losses) | | | Net Capital
Gain
Distributions | |
| Voya Emerging Markets Index Portfolio - Class I | | | | $ | — | | | | | $ | 28,799,494 | | | | | $ | (14,388,867) | | | | | $ | (712,686) | | | | | $ | 13,697,941 | | | | | $ | 310,202 | | | | | $ | 184,824 | | | | | $ | — | | |
| Voya Floating Rate Fund - Class I | | | | | 22,944,583 | | | | | | 3,096,868 | | | | | | (6,101,416) | | | | | | 841,769 | | | | | | 20,781,804 | | | | | | 888,738 | | | | | | (187,950) | | | | | | — | | |
| Voya Global Bond Fund - Class R6 | | | | | 15,289,385 | | | | | | 1,910,305 | | | | | | (3,852,461) | | | | | | 283,150 | | | | | | 13,630,379 | | | | | | 375,450 | | | | | | 86,615 | | | | | | — | | |
| Voya High Yield Bond Fund - Class I | | | | | 22,435,932 | | | | | | 1,846,419 | | | | | | (25,622,152) | | | | | | 1,339,801 | | | | | | — | | | | | | 733,274 | | | | | | (197,878) | | | | | | — | | |
| Voya High Yield Bond Fund - Class R6 | | | | | — | | | | | | 22,280,358 | | | | | | (8,552,111) | | | | | | 278,105 | | | | | | 14,006,352 | | | | | | 333,958 | | | | | | 54,091 | | | | | | — | | |
| Voya Index Plus LargeCap Portfolio - Class I | | | | | — | | | | | | 22,419,731 | | | | | | (3,091,638) | | | | | | 1,433,147 | | | | | | 20,761,240 | | | | | | 370,559 | | | | | | 83,273 | | | | | | — | | |
| Voya Intermediate Bond Fund - Class R6 | | | | | 22,909,627 | | | | | | 26,623,237 | | | | | | (13,227,264) | | | | | | (321,511) | | | | | | 35,984,089 | | | | | | 836,320 | | | | | | 270,752 | | | | | | — | | |
| Voya International Core Fund - Class I | | | | | 45,188,975 | | | | | | 5,094,763 | | | | | | (8,688,731) | | | | | | 536,457 | | | | | | 42,131,464 | | | | | | 641,477 | | | | | | (1,050,612) | | | | | | — | | |
| Voya International Index Portfolio - Class I | | | | | 14,985,829 | | | | | | 1,948,979 | | | | | | (2,926,701) | | | | | | 3,585 | | | | | | 14,011,692 | | | | | | 441,589 | | | | | | (327,345) | | | | | | — | | |
| Voya Large Cap Growth Portfolio - Class I | | | | | 57,270,078 | | | | | | 6,467,798 | | | | | | (23,115,590) | | | | | | (3,127,471) | | | | | | 37,494,815 | | | | | | 240,039 | | | | | | (1,397,783) | | | | | | 5,532,002 | | |
| Voya Large Cap Value Fund - Class R6 | | | | | 55,840,384 | | | | | | 5,101,370 | | | | | | (35,481,487) | | | | | | 6,031,621 | | | | | | 31,491,888 | | | | | | 921,618 | | | | | | (2,450,410) | | | | | | — | | |
| Voya MidCap Opportunities Portfolio - Class I | | | | | 32,328,613 | | | | | | 27,848,678 | | | | | | (13,286,220) | | | | | | 724,431 | | | | | | 47,615,502 | | | | | | — | | | | | | (2,904,553) | | | | | | 5,367,339 | | |
| Voya Multi-Manager Emerging Markets Equity Fund - Class I | | | | | 29,478,323 | | | | | | 2,832,789 | | | | | | (21,793,172) | | | | | | 3,110,503 | | | | | | 13,628,443 | | | | | | 157,924 | | | | | | (1,425,831) | | | | | | — | | |
| Voya Multi-Manager International Equity Fund - Class I | | | | | 60,231,796 | | | | | | 6,959,489 | | | | | | (11,516,871) | | | | | | (179,803) | | | | | | 55,494,611 | | | | | | 1,002,632 | | | | | | (1,316,154) | | | | | | — | | |
| Voya Multi-Manager Large Cap Core Portfolio - Class I | | | | | 63,604,033 | | | | | | 7,508,687 | | | | | | (39,076,770) | | | | | | 2,190,953 | | | | | | 34,226,903 | | | | | | 956,949 | | | | | | (1,686,429) | | | | | | 1,927,034 | | |
| Voya Multi-Manager Mid Cap Value Fund - Class I | | | | | 50,521,908 | | | | | | 6,204,920 | | | | | | (16,804,154) | | | | | | 8,717,531 | | | | | | 48,640,205 | | | | | | 595,526 | | | | | | (3,223,365) | | | | | | 824,181 | | |
| Voya Russell™ Mid Cap Growth Index Portfolio - Class I | | | | | 18,864,996 | | | | | | 565,999 | | | | | | (20,471,992) | | | | | | 1,040,997 | | | | | | — | | | | | | — | | | | | | (952,368) | | | | | | — | | |
| Voya Russell™ Mid Cap Index Portfolio - Class I | | | | | — | | | | | | 14,504,321 | | | | | | (14,504,321) | | | | | | — | | | | | | — | | | | | | — | | | | | | (19,127) | | | | | | — | | |
| Voya Small Company Portfolio - Class I | | | | | 22,763,495 | | | | | | 3,000,629 | | | | | | (7,687,058) | | | | | | 2,957,661 | | | | | | 21,034,727 | | | | | | 99,808 | | | | | | (341,358) | | | | | | 2,019,885 | | |
| Voya U.S. Bond Index Portfolio - Class I | | | | | 7,675,694 | | | | | | 40,799,046 | | | | | | (34,478,658) | | | | | | (334,514) | | | | | | 13,661,568 | | | | | | 142,586 | | | | | | 228,455 | | | | | | 10,391 | | |
| Voya U.S. Stock Index Portfolio - Class I | | | | | 45,368,324 | | | | | | 8,048,921 | | | | | | (37,318,711) | | | | | | 1,295,772 | | | | | | 17,394,306 | | | | | | 316,822 | | | | | | (179,132) | | | | | | 618,539 | | |
| VY® Clarion Global Real Estate Portfolio - Class I | | | | | — | | | | | | 8,248,837 | | | | | | (996,558) | | | | | | (257,909) | | | | | | 6,994,370 | | | | | | 91,914 | | | | | | 13,058 | | | | | | — | | |
| VY® Clarion Real Estate Portfolio - Class I | | | | | 15,498,731 | | | | | | 1,073,179 | | | | | | (9,274,302) | | | | | | (251,257) | | | | | | 7,046,351 | | | | | | 119,860 | | | | | | 636,389 | | | | | | — | | |
| VY® Invesco Comstock Portfolio - Class I | | | | | 29,714,726 | | | | | | 2,899,791 | | | | | | (8,753,993) | | | | | | 4,525,596 | | | | | | 28,386,120 | | | | | | 734,357 | | | | | | (488,772) | | | | | | — | | |
VY® T. Rowe Price Capital Appreciation Portfolio -
Class I | | | | | — | | | | | | 40,803,051 | | | | | | (4,755,153) | | | | | | (1,744,859) | | | | | | 34,303,039 | | | | | | 537,413 | | | | | | (108,786) | | | | | | 3,030,784 | | |
VY® T. Rowe Price Growth Equity Portfolio - Class I | | | | | 57,228,546 | | | | | | 7,278,978 | | | | | | (24,149,543) | | | | | | (3,022,767) | | | | | | 37,335,214 | | | | | | — | | | | | | (2,023,704) | | | | | | 4,911,479 | | |
| | | | | $ | 690,143,978 | | | | | $ | 304,166,637 | | | | | $ | (409,915,894) | | | | | $ | 25,358,302 | | | | | $ | 609,753,023 | | | | | $ | 10,849,015 | | | | | $ | (18,724,101) | | | | | $ | 24,241,634 | | |
| |
The financial statements for the above mutual fund[s] can be found at www.sec.gov.
See Accompanying Notes to Financial Statements
| Voya Solution Moderately | PORTFOLIO OF INVESTMENTS |
| Aggressive Portfolio | as of December 31, 2016 (continued) |
The effect of derivative instruments on the Portfolio’s Statement of Operations for the year ended December 31, 2016 was as follows:
| | | | Amount of Realized Gain or (Loss) on
Derivatives Recognized in Income | |
| Derivatives not accounted for as hedging instruments | | | Futures | |
| Equity contracts | | | | $ | (2,447,337) | | |
| Interest rate contracts | | | | | 218,142 | | |
| Total | | | | $ | (2,229,195) | | |
| |
See Accompanying Notes to Financial Statements
| Voya Solution Moderately | PORTFOLIO OF INVESTMENTS |
| Conservative Portfolio | as of December 31, 2016 |
| Shares | | | Value | | | Percentage
of Net
Assets | |
| EXCHANGE-TRADED FUNDS: 4.0% | |
| | | 6,361 | | | | SPDR Trust Series 1 | | | | $ | 1,421,874 | | | | | | 4.0 | | |
| | | | | | | Total Exchange-Traded Funds
(Cost $1,382,793) | | | | | 1,421,874 | | | | | | 4.0 | | |
| MUTUAL FUNDS: 95.9% | |
| | | | | | | Affiliated Investment Companies: 93.8% | |
| | | 73,703 | | | | Voya Emerging Markets Index
Portfolio - Class I | | | | | 704,605 | | | | | | 2.0 | | |
| | | 214,607 | | | | Voya Floating Rate Fund -
Class I | | | | | 2,137,490 | | | | | | 6.0 | | |
| | | 182,366 | | | | Voya Global Bond Fund -
Class R6 | | | | | 1,752,536 | | | | | | 4.9 | | |
| | | 268,751 | | | | Voya High Yield Bond Fund -
Class R6 | | | | | 2,160,759 | | | | | | 6.1 | | |
| | | 103,658 | | | | Voya Intermediate Bond
Fund - Class R6 | | | | | 1,032,437 | | | | | | 2.9 | | |
| | | 100,290 | | | | Voya International Core
Fund - Class I | | | | | 902,606 | | | | | | 2.5 | | |
| | | 81,774 | | | | Voya International Index
Portfolio - Class I | | | | | 720,428 | | | | | | 2.0 | | |
| | | 30,324 | | | | Voya Large Cap Growth
Portfolio - Class I | | | | | 525,813 | | | | | | 1.5 | | |
| | | 27,911 | | | | Voya Large Cap Value Fund -
Class R6 | | | | | 362,284 | | | | | | 1.0 | | |
| | | 106,292 | @ | | Voya MidCap Opportunities
Portfolio - Class I | | | | | 1,311,645 | | | | | | 3.7 | | |
| | | 88,469 | | | | Voya Multi-Manager
International Equity Fund -
Class I | | | | | 891,764 | | | | | | 2.5 | | |
| | | 120,701 | | | | Voya Multi-Manager Mid Cap
Value Fund - Class I | | | | | 1,339,779 | | | | | | 3.8 | | |
| | | 322,617 | | | | Voya Short Term Bond
Fund - Class R6 | | | | | 3,171,325 | | | | | | 8.9 | | |
| | | 32,592 | | | | Voya Small Company
Portfolio - Class I | | | | | 720,942 | | | | | | 2.0 | | |
| | | 250,216 | | | | Voya U.S. Bond Index
Portfolio - Class I | | | | | 2,634,775 | | | | | | 7.4 | | |
| | | 64,902 | | | | Voya U.S. Stock Index
Portfolio - Class I | | | | | 895,000 | | | | | | 2.5 | | |
| | | 147,286 | | | | VY® BlackRock Inflation
Protected Bond Portfolio -
Class I | | | | | 1,406,582 | | | | | | 4.0 | | |
| Shares | | | Value | | | Percentage
of Net
Assets | |
| MUTUAL FUNDS (continued) | |
| | | | | | | Affiliated Investment Companies: (continued) | |
| | | 30,684 | | | | VY® Clarion Global Real
Estate Portfolio - Class I | | | | $ | 359,616 | | | | | | 1.0 | | |
| | | 9,876 | | | | VY® Clarion Real Estate
Portfolio - Class I | | | | | 362,244 | | | | | | 1.0 | | |
| | | 370,463 | | | | VY® Goldman Sachs Bond
Portfolio - Class I | | | | | 3,726,858 | | | | | | 10.5 | | |
| | | 41,775 | | | | VY® Invesco Comstock
Portfolio - Class I | | | | | 729,813 | | | | | | 2.1 | | |
| | | 138,406 | | | | VY® T. Rowe Price Capital
Appreciation Portfolio - Class I | | | | | 3,527,976 | | | | | | 9.9 | | |
| | | 103,806 | | | | VY® T. Rowe Price Equity
Income Portfolio - Class I | | | | | 1,437,718 | | | | | | 4.1 | | |
| | | 6,761 | @ | | VY® T. Rowe Price Growth
Equity Portfolio - Class I | | | | | 523,599 | | | | | | 1.5 | | |
| | | | | | | | | | | | 33,338,594 | | | | | | 93.8 | | |
| | | | | | | Unaffiliated Investment Companies: 2.1% | |
| | | 143,914 | @ | | Credit Suisse Commodity
Return Strategy Fund -
Class I | | | | | 729,643 | | | | | | 2.1 | | |
| | | | | | | Total Mutual Funds
(Cost $34,426,050) | | | | | 34,068,237 | | | | | | 95.9 | | |
| | | | | | | Total Investments in
Securities
(Cost $35,808,843) | | | | $ | 35,490,111 | | | | | | 99.9 | | |
| | | | | | | Assets in Excess of
Other Liabilities | | | | | 44,829 | | | | | | 0.1 | | |
| | | | | | | Net Assets | | | | $ | 35,534,940 | | | | | | 100.0 | | |
| | | | | | | | |
@
Non-income producing security.
Cost for federal income tax purposes is $37,144,081.
Net unrealized depreciation consists of:
| | Gross Unrealized Appreciation | | | | $ | 343,755 | | |
| | Gross Unrealized Depreciation | | | | | (1,997,725) | | |
| | Net Unrealized Depreciation | | | | $ | (1,653,970) | | |
| |
See Accompanying Notes to Financial Statements
| Voya Solution Moderately | PORTFOLIO OF INVESTMENTS |
| Conservative Portfolio | as of December 31, 2016 (continued) |
Fair Value Measurements^
The following is a summary of the fair valuations according to the inputs used as of December 31, 2016 in valuing the assets and liabilities:
| | | | Quoted Prices
in Active Markets
for Identical
Investments
(Level 1) | | | Significant
Other
Observable
Inputs
(Level 2) | | | Significant
Unobservable
Inputs
(Level 3) | | | Fair Value
at
December 31, 2016 | |
| Asset Table | | | | | |
| Investments, at fair value | | | | | |
| Exchange-Traded Funds | | | | $ | 1,421,874 | | | | | $ | — | | | | | $ | — | | | | | $ | 1,421,874 | | |
| Mutual Funds | | | | | 34,068,237 | | | | | | — | | | | | | — | | | | | | 34,068,237 | | |
| Total Investments, at fair value | | | | $ | 35,490,111 | | | | | $ | — | | | | | $ | — | | | | | $ | 35,490,111 | | |
| |
^
See Note 2, “Significant Accounting Policies” in the Notes to Financial Statements for additional information.
Transactions with Affiliates
An investment of at least 5% of the voting securities of an issuer, or a company which is under common control results in that issuer becoming an affiliated person as defined by the 1940 Act.
The following table provides transactions during the year ended December 31, 2016, where the following issuers were considered an affiliate:
| Issuer | | | Beginning
Fair Value
at 12/31/15 | | | Purchases
at Cost | | | Sales
at Cost | | | Change in
Unrealized
Appreciation/
(Depreciation) | | | Ending
Fair Value
at 12/31/16 | | | Investment
Income | | | Realized
Gains/
(Losses) | | | Net Capital
Gain
Distributions | |
| Voya Emerging Markets Index Portfolio - Class I | | | | $ | 821,571 | | | | | $ | 927,842 | | | | | $ | (1,197,664) | | | | | $ | 152,856 | | | | | $ | 704,605 | | | | | $ | 15,662 | | | | | $ | (124,373) | | | | | $ | — | | |
| Voya Floating Rate Fund - Class I | | | | | 2,157,382 | | | | | | 898,103 | | | | | | (1,028,034) | | | | | | 110,039 | | | | | | 2,137,490 | | | | | | 89,455 | | | | | | (43,975) | | | | | | — | | |
| Voya Global Bond Fund - Class R6 | | | | | 2,157,636 | | | | | | 409,238 | | | | | | (893,341) | | | | | | 79,003 | | | | | | 1,752,536 | | | | | | 51,336 | | | | | | (11,972) | | | | | | — | | |
| Voya High Yield Bond Fund - Class I | | | | | 2,118,722 | | | | | | 771,538 | | | | | | (3,113,694) | | | | | | 223,434 | | | | | | — | | | | | | 72,568 | | | | | | (90,066) | | | | | | — | | |
| Voya High Yield Bond Fund - Class R6 | | | | | — | | | | | | 2,633,897 | | | | | | (515,859) | | | | | | 42,721 | | | | | | 2,160,759 | | | | | | 44,336 | | | | | | (25,567) | | | | | | — | | |
| Voya Intermediate Bond Fund - Class R6 | | | | | 2,817,805 | | | | | | 830,414 | | | | | | (2,622,738) | | | | | | 6,956 | | | | | | 1,032,437 | | | | | | 81,878 | | | | | | 9,411 | | | | | | — | | |
| Voya International Core Fund - Class I | | | | | 2,124,868 | | | | | | 491,256 | | | | | | (1,917,691) | | | | | | 204,173 | | | | | | 902,606 | | | | | | 13,612 | | | | | | (224,917) | | | | | | — | | |
| Voya International Index Portfolio - Class I | | | | | 843,621 | | | | | | 230,599 | | | | | | (393,895) | | | | | | 40,103 | | | | | | 720,428 | | | | | | 22,457 | | | | | | (56,222) | | | | | | — | | |
| Voya Large Cap Growth Portfolio - Class I | | | | | 1,184,368 | | | | | | 281,591 | | | | | | (884,670) | | | | | | (55,476) | | | | | | 525,813 | | | | | | 4,014 | | | | | | (23,606) | | | | | | 92,519 | | |
| Voya Large Cap Value Fund - Class R6 | | | | | 1,268,228 | | | | | | 215,385 | | | | | | (1,308,232) | | | | | | 186,903 | | | | | | 362,284 | | | | | | 13,638 | | | | | | (143,661) | | | | | | — | | |
| Voya MidCap Opportunities Portfolio - Class I | | | | | 1,501,774 | | | | | | 591,647 | | | | | | (856,017) | | | | | | 74,241 | | | | | | 1,311,645 | | | | | | — | | | | | | (116,811) | | | | | | 145,580 | | |
| Voya Multi-Manager International Equity Fund - Class I | | | | | — | | | | | | 1,231,727 | | | | | | (318,660) | | | | | | (21,303) | | | | | | 891,764 | | | | | | 15,957 | | | | | | (1,482) | | | | | | — | | |
| Voya Multi-Manager Large Cap Core Portfolio - Class I | | | | | 857,536 | | | | | | 177,109 | | | | | | (1,079,153) | | | | | | 44,508 | | | | | | — | | | | | | — | | | | | | (34,904) | | | | | | — | | |
| Voya Multi-Manager Mid Cap Value Fund - Class I | | | | | 1,583,355 | | | | | | 415,883 | | | | | | (1,078,673) | | | | | | 419,214 | | | | | | 1,339,779 | | | | | | 16,247 | | | | | | (258,052) | | | | | | 22,486 | | |
| Voya Russell™ Mid Cap Growth Index Portfolio - Class I | | | | | 106,431 | | | | | | 15,805 | | | | | | (124,587) | | | | | | 2,351 | | | | | | — | | | | | | — | | | | | | (1,269) | | | | | | — | | |
| Voya Russell™ Mid Cap Index Portfolio - Class I | | | | | — | | | | | | 751,649 | | | | | | (751,649) | | | | | | — | | | | | | — | | | | | | — | | | | | | (495) | | | | | | — | | |
| Voya Short Term Bond Fund - Class R6 | | | | | 2,168,757 | | | | | | 2,114,281 | | | | | | (1,111,993) | | | | | | 280 | | | | | | 3,171,325 | | | | | | 47,697 | | | | | | (12,099) | | | | | | — | | |
| Voya Small Company Portfolio - Class I | | | | | 855,723 | | | | | | 247,824 | | | | | | (504,859) | | | | | | 122,254 | | | | | | 720,942 | | | | | | 3,383 | | | | | | (26,480) | | | | | | 68,458 | | |
| Voya U.S. Bond Index Portfolio - Class I | | | | | 5,183,645 | | | | | | 1,887,523 | | | | | | (4,496,193) | | | | | | 59,800 | | | | | | 2,634,775 | | | | | | 73,106 | | | | | | 8,885 | | | | | | 4,490 | | |
| Voya U.S. Stock Index Portfolio - Class I | | | | | 852,861 | | | | | | 1,260,876 | | | | | | (1,290,802) | | | | | | 72,065 | | | | | | 895,000 | | | | | | 16,447 | | | | | | (66,344) | | | | | | 35,212 | | |
| VY T. Rowe Price Equity Income Portfolio Initial | | | | | — | | | | | | 2,310,338 | | | | | | (883,152) | | | | | | 10,532 | | | | | | 1,437,718 | | | | | | 33,775 | | | | | | (10,329) | | | | | | 140,301 | | |
VY® BlackRock Inflation Protected Bond Portfolio - Class I | | | | | 2,153,808 | | | | | | 338,939 | | | | | | (1,275,470) | | | | | | 189,305 | | | | | | 1,406,582 | | | | | | — | | | | | | (107,187) | | | | | | — | | |
| VY® Clarion Global Real Estate Portfolio - Class I | | | | | — | | | | | | 501,844 | | | | | | (128,738) | | | | | | (13,490) | | | | | | 359,616 | | | | | | 4,623 | | | | | | 1,670 | | | | | | — | | |
| VY® Clarion Real Estate Portfolio - Class I | | | | | 872,774 | | | | | | 140,531 | | | | | | (536,764) | | | | | | (114,297) | | | | | | 362,244 | | | | | | 6,013 | | | | | | 141,273 | | | | | | — | | |
| VY® Goldman Sachs Bond Portfolio - Class I | | | | | 2,801,047 | | | | | | 2,033,502 | | | | | | (1,117,340) | | | | | | 9,649 | | | | | | 3,726,858 | | | | | | 51,199 | | | | | | 27,583 | | | | | | — | | |
| VY® Invesco Comstock Portfolio - Class I | | | | | 733,320 | | | | | | 757,678 | | | | | | (914,790) | | | | | | 153,605 | | | | | | 729,813 | | | | | | 19,886 | | | | | | (34,647) | | | | | | — | | |
VY® T. Rowe Price Capital Appreciation Portfolio - Class I | | | | | 4,290,995 | | | | | | 951,833 | | | | | | (1,754,279) | | | | | | 39,427 | | | | | | 3,527,976 | | | | | | 54,951 | | | | | | (88,527) | | | | | | 304,096 | | |
| VY® T. Rowe Price Growth Equity Portfolio - Class I | | | | | 1,290,913 | | | | | | 310,607 | | | | | | (1,051,107) | | | | | | (26,814) | | | | | | 523,599 | | | | | | — | | | | | | (72,167) | | | | | | 80,943 | | |
| | | | | $ | 40,747,140 | | | | | $ | 23,729,459 | | | | | $ | (33,150,044) | | | | | $ | 2,012,039 | | | | | $ | 33,338,594 | | | | | $ | 752,240 | | | | | $ | (1,386,330) | | | | | $ | 894,085 | | |
| | | | | | | | | | | | | | | | | | | | | | | | | | | | | | | | | | | | | | | | | | | | | | | | | | |
The financial statements for the above mutual fund[s] can be found at www.sec.gov.
See Accompanying Notes to Financial Statements
| Voya Solution Moderately | PORTFOLIO OF INVESTMENTS |
| Conservative Portfolio | as of December 31, 2016 (continued) |
The effect of derivative instruments on the Portfolio’s Statement of Operations for the year ended December 31, 2016 was as follows:
| | | | Amount of Realized Gain or (Loss) on
Derivatives Recognized in Income | |
| Derivatives not accounted for as hedging instruments | | | Futures | |
| Equity contracts | | | | $ | (145,788) | | |
| Interest rate contracts | | | | | 12,888 | | |
| Total | | | | $ | (132,900) | | |
| |
See Accompanying Notes to Financial Statements
PORTFOLIO OF INVESTMENTS
| Voya Solution 2020 Portfolio | as of December 31, 2016 |
| Shares | | | Value | | | Percentage
of Net
Assets | |
| EXCHANGE-TRADED FUNDS: 4.3% | |
| | | 1,219 | | | | iShares Barclays 20+ Year
Treasury Bond Fund | | | | $ | 145,219 | | | | | | 0.7 | | |
| | | 3,596 | | | | SPDR Trust Series 1 | | | | | 803,814 | | | | | | 3.6 | | |
| | | | | | | Total Exchange-Traded Funds
(Cost $945,660) | | | | | 949,033 | | | | | | 4.3 | | |
| MUTUAL FUNDS: 95.5% | |
| | | | | | | Affiliated Investment Companies: 94.1% | |
| | | 111,497 | | | | Voya Floating Rate Fund -
Class I | | | | | 1,110,510 | | | | | | 5.0 | | |
| | | 136,628 | | | | Voya Global Bond Fund -
Class R6 | | | | | 1,312,994 | | | | | | 5.9 | | |
| | | 55,814 | | | | Voya High Yield Bond Fund -
Class R6 | | | | | 448,744 | | | | | | 2.0 | | |
| | | 99,518 | | | | Voya Intermediate Bond
Fund - Class R6 | | | | | 991,201 | | | | | | 4.5 | | |
| | | 149,912 | | | | Voya International Core
Fund - Class I | | | | | 1,349,208 | | | | | | 6.1 | | |
| | | 50,945 | | | | Voya International Index
Portfolio - Class I | | | | | 448,823 | | | | | | 2.0 | | |
| | | 44,163 | | | | Voya Large Cap Growth
Portfolio - Class I | | | | | 765,781 | | | | | | 3.5 | | |
| | | 34,744 | | | | Voya Large Cap Value Fund -
Class R6 | | | | | 450,982 | | | | | | 2.0 | | |
| | | 44,235 | @ | | Voya MidCap Opportunities
Portfolio - Class I | | | | | 545,865 | | | | | | 2.5 | | |
| | | 66,193 | | | | Voya Multi-Manager
International Equity Fund -
Class I | | | | | 667,223 | | | | | | 3.0 | | |
| | | 89,545 | | | | Voya Multi-Manager Large
Cap Core Portfolio - Class I | | | | | 1,333,324 | | | | | | 6.0 | | |
| | | 50,127 | | | | Voya Multi-Manager Mid Cap
Value Fund - Class I | | | | | 556,412 | | | | | | 2.5 | | |
| | | 95,060 | | | | Voya Short Term Bond Fund -
Class R6 | | | | | 934,435 | | | | | | 4.2 | | |
| | | 20,296 | | | | Voya Small Company
Portfolio - Class I | | | | | 448,939 | | | | | | 2.0 | | |
| | | 126,447 | | | | Voya U.S. Bond Index
Portfolio - Class I | | | | | 1,331,484 | | | | | | 6.0 | | |
| | | 72,965 | | | | Voya U.S. Stock Index
Portfolio - Class I | | | | | 1,006,181 | | | | | | 4.5 | | |
| Shares | | | Value | | | Percentage
of Net
Assets | |
| MUTUAL FUNDS: (continued) | |
| | | | | | | Affiliated Investment Companies (continued) | |
| | | 160,911 | | | | VY® BlackRock Inflation
Protected Bond Portfolio -
Class I | | | | $ | 1,536,704 | | | | | | 6.9 | | |
| | | 19,142 | | | | VY® Clarion Global Real
Estate Portfolio - Class I | | | | | 224,349 | | | | | | 1.0 | | |
| | | 6,159 | | | | VY® Clarion Real Estate
Portfolio - Class I | | | | | 225,928 | | | | | | 1.0 | | |
| | | 109,226 | | | | VY® Goldman Sachs Bond
Portfolio - Class I | | | | | 1,098,811 | | | | | | 5.0 | | |
| | | 38,970 | | | | VY® Invesco Comstock
Portfolio - Class I | | | | | 680,809 | | | | | | 3.1 | | |
| | | 86,350 | | | | VY® T. Rowe Price Capital
Appreciation Portfolio - Class I | | | | | 2,201,074 | | | | | | 9.9 | | |
| | | 32,294 | | | | VY® T. Rowe Price Equity
Income Portfolio - Class I | | | | | 447,275 | | | | | | 2.0 | | |
| | | 9,849 | @ | | VY® T. Rowe Price Growth
Equity Portfolio - Class I | | | | | 762,713 | | | | | | 3.5 | | |
| | | | | | | | | | | | 20,879,769 | | | | | | 94.1 | | |
| | | | | | | Unaffiliated Investment Companies: 1.4% | |
| | | 60,952 | @ | | Credit Suisse Commodity
Return Strategy Fund -
Class I | | | | | 309,027 | | | | | | 1.4 | | |
| | | | | | | Total Mutual Funds
(Cost $21,054,282) | | | | | 21,188,796 | | | | | | 95.5 | | |
| | | | | | | Total Investments in
Securities
(Cost $21,999,942) | | | | $ | 22,137,829 | | | | | | 99.8 | | |
| | | | | | | Assets in Excess of
Other Liabilities | | | | | 38,851 | | | | | | 0.2 | | |
| | | | | | | Net Assets | | | | $ | 22,176,680 | | | | | | 100.0 | | |
| |
@
Non-income producing security.
Cost for federal income tax purposes is $22,220,918.
Net unrealized depreciation consists of:
| | Gross Unrealized Appreciation | | | | $ | 357,173 | | |
| | Gross Unrealized Depreciation | | | | | (440,262) | | |
| | Net Unrealized Depreciation | | | | $ | (83,089) | | |
| |
See Accompanying Notes to Financial Statements
PORTFOLIO OF INVESTMENTS
| Voya Solution 2020 Portfolio | as of December 31, 2016 (continued) |
Fair Value Measurements^
The following is a summary of the fair valuations according to the inputs used as of December 31, 2016 in valuing the assets and liabilities:
| | | | Quoted Prices
in Active Markets
for Identical
Investments
(Level 1) | | | Significant
Other
Observable
Inputs
(Level 2) | | | Significant
Unobservable
Inputs
(Level 3) | | | Fair Value
at
December 31, 2016 | |
| Asset Table | | | | | |
| Investments, at fair value | | | | | |
| Exchange-Traded Funds | | | | $ | 949,033 | | | | | $ | — | | | | | $ | — | | | | | $ | 949,033 | | |
| Mutual Funds | | | | | 21,188,796 | | | | | | — | | | | | | — | | | | | | 21,188,796 | | |
| Total Investments, at fair value | | | | $ | 22,137,829 | | | | | $ | — | | | | | $ | — | | | | | $ | 22,137,829 | | |
| |
^
See Note 2, “Significant Accounting Policies” in the Notes to Financial Statements for additional information.
Transactions with Affiliates
An investment of at least 5% of the voting securities of an issuer, or a company which is under common control results in that issuer becoming an affiliated person as defined by the 1940 Act.
The following table provides transactions during the year ended December 31, 2016, where the following issuers were considered an affiliate:
| Issuer | | | Beginning
Fair Value
at 12/31/15 | | | Purchases
at Cost | | | Sales
at Cost | | | Change in
Unrealized
Appreciation/
(Depreciation) | | | Ending
Fair Value
at 12/31/16 | | | Investment
Income | | | Realized
Gains/
(Losses) | | | Net Capital
Gain
Distributions | |
| Voya Emerging Markets Index Portfolio - Class I | | | | $ | — | | | | | $ | 427,715 | | | | | $ | (427,715) | | | | | $ | — | | | | | $ | — | | | | | $ | 9 | | | | | $ | (23,285) | | | | | $ | — | | |
| Voya Floating Rate Fund - Class I | | | | | 472,975 | | | | | | 1,000,417 | | | | | | (392,353) | | | | | | 29,471 | | | | | | 1,110,510 | | | | | | 33,377 | | | | | | (3,247) | | | | | | — | | |
| Voya Global Bond Fund - Class R6 | | | | | 568,624 | | | | | | 1,215,307 | | | | | | (454,099) | | | | | | (16,838) | | | | | | 1,312,994 | | | | | | 23,744 | | | | | | 16,352 | | | | | | — | | |
| Voya High Yield Bond Fund - Class I | | | | | 280,110 | | | | | | 359,449 | | | | | | (649,184) | | | | | | 9,625 | | | | | | — | | | | | | 13,885 | | | | | | (3,524) | | | | | | — | | |
| Voya High Yield Bond Fund - Class R6 | | | | | — | | | | | | 673,928 | | | | | | (238,513) | | | | | | 13,329 | | | | | | 448,744 | | | | | | 9,178 | | | | | | 14,323 | | | | | | — | | |
| Voya Intermediate Bond Fund - Class R6 | | | | | 380,850 | | | | | | 1,004,632 | | | | | | (378,813) | | | | | | (15,468) | | | | | | 991,201 | | | | | | 20,938 | | | | | | 6,447 | | | | | | — | | |
| Voya International Core Fund - Class I | | | | | 468,719 | | | | | | 1,324,143 | | | | | | (478,365) | | | | | | 34,711 | | | | | | 1,349,208 | | | | | | 19,245 | | | | | | (21,839) | | | | | | — | | |
| Voya International Index Portfolio - Class I | | | | | 186,512 | | | | | | 416,259 | | | | | | (165,531) | | | | | | 11,583 | | | | | | 448,823 | | | | | | 8,690 | | | | | | (7,567) | | | | | | — | | |
| Voya Large Cap Growth Portfolio - Class I | | | | | 427,010 | | | | | | 822,584 | | | | | | (450,438) | | | | | | (33,375) | | | | | | 765,781 | | | | | | 3,411 | | | | | | (11,940) | | | | | | 78,613 | | |
| Voya Large Cap Value Fund - Class R6 | | | | | 374,543 | | | | | | 533,868 | | | | | | (506,146) | | | | | | 48,717 | | | | | | 450,982 | | | | | | 9,231 | | | | | | 4,450 | | | | | | — | | |
| Voya MidCap Opportunities Portfolio - Class I | | | | | 236,426 | | | | | | 639,437 | | | | | | (329,826) | | | | | | (172) | | | | | | 545,865 | | | | | | (0.01) | | | | | | (14,492) | | | | | | 43,400 | | |
| Voya Multi-Manager International Equity Fund - Class I | | | | | 374,060 | | | | | | 701,171 | | | | | | (420,437) | | | | | | 12,429 | | | | | | 667,223 | | | | | | 11,285 | | | | | | (12,348) | | | | | | — | | |
| Voya Multi-Manager Large Cap Core Portfolio - Class I | | | | | 377,383 | | | | | | 1,380,713 | | | | | | (453,353) | | | | | | 28,581 | | | | | | 1,333,324 | | | | | | 25,108 | | | | | | 6,364 | | | | | | 37,677 | | |
| Voya Multi-Manager Mid Cap Value Fund - Class I | | | | | 232,832 | | | | | | 622,818 | | | | | | (371,659) | | | | | | 72,421 | | | | | | 556,412 | | | | | | 6,381 | | | | | | (23,515) | | | | | | 8,831 | | |
| Voya Short Term Bond Fund - Class R6 | | | | | 571,209 | | | | | | 1,138,685 | | | | | | (773,041) | | | | | | (2,418) | | | | | | 934,435 | | | | | | 16,373 | | | | | | (523) | | | | | | — | | |
| Voya Small Company Portfolio - Class I | | | | | 275,879 | | | | | | 490,948 | | | | | | (375,574) | | | | | | 57,686 | | | | | | 448,939 | | | | | | 1,304 | | | | | | 10,035 | | | | | | 26,395 | | |
| Voya U.S. Bond Index Portfolio - Class I | | | | | 805,766 | | | | | | 2,157,660 | | | | | | (1,604,051) | | | | | | (27,891) | | | | | | 1,331,484 | | | | | | 24,805 | | | | | | 23,210 | | | | | | 1,534 | | |
| Voya U.S. Stock Index Portfolio - Class I | | | | | 214,238 | | | | | | 1,734,826 | | | | | | (954,567) | | | | | | 11,684 | | | | | | 1,006,181 | | | | | | 15,742 | | | | | | 15,755 | | | | | | 11,166 | | |
| VY T. Rowe Price Equity Income Portfolio Initial | | | | | — | | | | | | 574,516 | | | | | | (133,911) | | | | | | 6,670 | | | | | | 447,275 | | | | | | 10,038 | | | | | | (4,632) | | | | | | 34,704 | | |
| VY® BlackRock Inflation Protected Bond Portfolio - Class I | | | | | 663,308 | | | | | | 1,390,922 | | | | | | (532,181) | | | | | | 14,655 | | | | | | 1,536,704 | | | | | | — | | | | | | 12,764 | | | | | | — | | |
| VY® Clarion Global Real Estate Portfolio - Class I | | | | | — | | | | | | 286,910 | | | | | | (54,835) | | | | | | (7,726) | | | | | | 224,349 | | | | | | 2,297 | | | | | | 506 | | | | | | — | | |
| VY® Clarion Real Estate Portfolio - Class I | | | | | 194,481 | | | | | | 276,649 | | | | | | (235,580) | | | | | | (9,622) | | | | | | 225,928 | | | | | | 2,922 | | | | | | 19,801 | | | | | | — | | |
| VY® Goldman Sachs Bond Portfolio - Class I | | | | | 331,814 | | | | | | 1,129,282 | | | | | | (344,187) | | | | | | (18,098) | | | | | | 1,098,811 | | | | | | 19,148 | | | | | | 5,988 | | | | | | — | | |
| VY® Invesco Comstock Portfolio - Class I | | | | | 277,927 | | | | | | 613,894 | | | | | | (299,385) | | | | | | 88,373 | | | | | | 680,809 | | | | | | 16,679 | | | | | | 4,691 | | | | | | — | | |
| VY® T. Rowe Price Capital Appreciation Portfolio - Class I | | | | | 945,420 | | | | | | 2,057,846 | | | | | | (759,737) | | | | | | (42,455) | | | | | | 2,201,074 | | | | | | 32,649 | | | | | | (2,997) | | | | | | 147,802 | | |
| VY® T. Rowe Price Growth Equity Portfolio - Class I | | | | | 427,596 | | | | | | 820,523 | | | | | | (464,663) | | | | | | (20,743) | | | | | | 762,713 | | | | | | — | | | | | | (18,849) | | | | | | 70,676 | | |
| | | | | $ | 9,087,682 | | | | | $ | 23,795,102 | | | | | $ | (12,248,144) | | | | | $ | 245,129 | | | | | $ | 20,879,769 | | | | | $ | 326,439 | | | | | $ | (8,072) | | | | | $ | 460,798 | | |
| | | | | | | | | | | | | | | | | | | | | | | | | | | | | | | | | | | | | | | | | | | | | | | | | | |
The financial statements for the above mutual fund[s] can be found at www.sec.gov.
See Accompanying Notes to Financial Statements
PORTFOLIO OF INVESTMENTS
| Voya Solution 2020 Portfolio | as of December 31, 2016 (continued) |
The effect of derivative instruments on the Portfolio’s Statement of Operations for the year ended December 31, 2016 was as follows:
| | | | Amount of Realized Gain or (Loss) on
Derivatives Recognized in Income | |
| Derivatives not accounted for as hedging instruments | | | Futures | |
| Equity contracts | | | | $ | (6,351) | | |
| Total | | | | $ | (6,351) | | |
| |
See Accompanying Notes to Financial Statements
PORTFOLIO OF INVESTMENTS
| Voya Solution 2025 Portfolio | as of December 31, 2016 |
| Shares | | | Value | | | Percentage
of Net
Assets | |
| EXCHANGE-TRADED FUNDS: 5.9% | |
| | | 131,725 | | | | iShares Barclays 20+ Year
Treasury Bond Fund | | | | $ | 15,692,399 | | | | | | 1.7 | | |
| | | 166,577 | | | | SPDR Trust Series 1 | | | | | 37,234,957 | | | | | | 4.2 | | |
| | | | | | | Total Exchange-Traded Funds
(Cost $53,298,752) | | | | | 52,927,356 | | | | | | 5.9 | | |
| MUTUAL FUNDS: 94.0% | |
| | | | | | | Affiliated Investment Companies: 92.4% | |
| | | 1,856,156 | | | | Voya Emerging Markets Index
Portfolio - Class I | | | | | 17,744,852 | | | | | | 2.0 | | |
| | | 4,506,231 | | | | Voya Floating Rate Fund -
Class I | | | | | 44,882,064 | | | | | | 5.0 | | |
| | | 5,510,998 | | | | Voya Global Bond Fund -
Class R6 | | | | | 52,960,688 | | | | | | 5.9 | | |
| | | 2,257,940 | | | | Voya High Yield Bond Fund -
Class R6 | | | | | 18,153,839 | | | | | | 2.0 | | |
| | | 4,015,786 | | | | Voya Intermediate Bond
Fund - Class R6 | | | | | 39,997,229 | | | | | | 4.5 | | |
| | | 6,067,473 | | | | Voya International Core
Fund - Class I | | | | | 54,607,258 | | | | | | 6.1 | | |
| | | 2,061,137 | | | | Voya International Index
Portfolio - Class I | | | | | 18,158,620 | | | | | | 2.0 | | |
| | | 2,036,925 | | | | Voya Large Cap Growth
Portfolio - Class I | | | | | 35,320,276 | | | | | | 4.0 | | |
| | | 1,407,723 | | | | Voya Large Cap Value Fund -
Class R6 | | | | | 18,272,247 | | | | | | 2.0 | | |
| | | 2,499,392 | @ | | Voya MidCap Opportunities
Portfolio - Class I | | | | | 30,842,492 | | | | | | 3.5 | | |
| | | 939,911 | | | | Voya Multi-Manager Emerging
Markets Equity Fund - Class I | | | | | 8,825,764 | | | | | | 1.0 | | |
| | | 5,349,989 | | | | Voya Multi-Manager
International Equity Fund -
Class I | | | | | 53,927,891 | | | | | | 6.0 | | |
| | | 4,099,243 | | | | Voya Multi-Manager Large
Cap Core Portfolio - Class I | | | | | 61,037,724 | | | | | | 6.8 | | |
| | | 2,839,562 | | | | Voya Multi-Manager Mid Cap
Value Fund - Class I | | | | | 31,519,136 | | | | | | 3.5 | | |
| | | 2,032,034 | | | | Voya Short Term Bond Fund -
Class R6 | | | | | 19,974,891 | | | | | | 2.2 | | |
| | | 1,232,629 | | | | Voya Small Company
Portfolio - Class I | | | | | 27,265,755 | | | | | | 3.1 | | |
| | | 3,302,777 | | | | Voya U.S. Bond Index
Portfolio - Class I | | | | | 34,778,247 | | | | | | 3.9 | | |
| Shares | | | Value | | | Percentage
of Net
Assets | |
| MUTUAL FUNDS: (continued) | |
| | | | | | | Affiliated Investment Companies (continued) | |
| | | 1,961,673 | | | | Voya U.S. Stock Index
Portfolio - Class I | | | | $ | 27,051,477 | | | | | | 3.0 | | |
| | | 773,449 | | | | VY® Clarion Global Real
Estate Portfolio - Class I | | | | | 9,064,818 | | | | | | 1.0 | | |
| | | 249,092 | | | | VY® Clarion Real Estate
Portfolio - Class I | | | | | 9,136,679 | | | | | | 1.0 | | |
| | | 3,524,266 | | | | VY® Goldman Sachs Bond
Portfolio - Class I | | | | | 35,454,120 | | | | | | 4.0 | | |
| | | 2,108,372 | | | | VY® Invesco Comstock
Portfolio - Class I | | | | | 36,833,252 | | | | | | 4.1 | | |
| | | 3,486,320 | | | | VY® T. Rowe Price Capital
Appreciation Portfolio -
Class I | | | | | 88,866,305 | | | | | | 9.9 | | |
| | | 1,307,294 | | | | VY® T. Rowe Price Equity
Income Portfolio - Class I | | | | | 18,106,023 | | | | | | 2.0 | | |
| | | 454,023 | @ | | VY® T. Rowe Price Growth
Equity Portfolio - Class I | | | | | 35,159,519 | | | | | | 3.9 | | |
| | | | | | | | | | | | 827,941,166 | | | | | | 92.4 | | |
| | | | | | | Unaffiliated Investment Companies: 1.6% | |
| | | 2,829,181 | @ | | Credit Suisse Commodity
Return Strategy Fund -
Class I | | | | | 14,343,947 | | | | | | 1.6 | | |
| | | | | | | Total Mutual Funds
(Cost $869,653,298) | | | | | 842,285,113 | | | | | | 94.0 | | |
| | | | | | | Total Investments in
Securities
(Cost $922,952,050) | | | | $ | 895,212,469 | | | | | | 99.9 | | |
| | | | | | | Assets in Excess of
Other Liabilities | | | | | 816,815 | | | | | | 0.1 | | |
| | | | | | | Net Assets | | | | $ | 896,029,284 | | | | | | 100.0 | | |
| |
@
Non-income producing security.
Cost for federal income tax purposes is $942,432,308.
Net unrealized depreciation consists of:
| | Gross Unrealized Appreciation | | | | $ | 9,221,110 | | |
| | Gross Unrealized Depreciation | | | | | (56,440,949) | | |
| | Net Unrealized Depreciation | | | | $ | (47,219,839) | | |
| |
See Accompanying Notes to Financial Statements
PORTFOLIO OF INVESTMENTS
| Voya Solution 2025 Portfolio | as of December 31, 2016 (continued) |
Fair Value Measurements^
The following is a summary of the fair valuations according to the inputs used as of December 31, 2016 in valuing the assets and liabilities:
| | | | Quoted Prices
in Active Markets
for Identical
Investments
(Level 1) | | | Significant
Other
Observable
Inputs
(Level 2) | | | Significant
Unobservable
Inputs
(Level 3) | | | Fair Value
at
December 31, 2016 | |
| Asset Table | | | | | |
| Investments, at fair value | | | | | |
| Exchange-Traded Funds | | | | $ | 52,927,356 | | | | | $ | — | | | | | $ | — | | | | | $ | 52,927,356 | | |
| Mutual Funds | | | | | 842,285,113 | | | | | | — | | | | | | — | | | | | | 842,285,113 | | |
| Total Investments, at fair value | | | | $ | 895,212,469 | | | | | $ | — | | | | | $ | — | | | | | $ | 895,212,469 | | |
| |
^
See Note 2, “Significant Accounting Policies” in the Notes to Financial Statements for additional information.
Transactions with Affiliates
An investment of at least 5% of the voting securities of an issuer, or a company which is under common control results in that issuer becoming an affiliated person as defined by the 1940 Act.
The following table provides transactions during the year ended December 31, 2016, where the following issuers were considered an affiliate:
| Issuer | | | Beginning
Fair Value
at 12/31/15 | | | Purchases
at Cost | | | Sales
at Cost | | | Change in
Unrealized
Appreciation/
(Depreciation) | | | Ending
Fair Value
at 12/31/16 | | | Investment
Income | | | Realized
Gains/
(Losses) | | | Net Capital
Gain
Distributions | |
| Voya Emerging Markets Index Portfolio - Class I | | | | $ | 19,203,592 | | | | | $ | 21,798,098 | | | | | $ | (27,322,471) | | | | | $ | 4,065,633 | | | | | $ | 17,744,852 | | | | | $ | 414,162 | | | | | $ | (3,446,763) | | | | | $ | — | | |
| Voya Floating Rate Fund - Class I | | | | | 50,876,092 | | | | | | 6,265,808 | | | | | | (14,323,677) | | | | | | 2,063,841 | | | | | | 44,882,064 | | | | | | 1,992,604 | | | | | | (599,080) | | | | | | — | | |
| Voya Global Bond Fund - Class R6 | | | | | 60,976,738 | | | | | | 7,541,910 | | | | | | (17,837,802) | | | | | | 2,279,842 | | | | | | 52,960,688 | | | | | | 1,522,364 | | | | | | (782,472) | | | | | | — | | |
| Voya High Yield Bond Fund - Class I | | | | | 29,709,541 | | | | | | 2,248,939 | | | | | | (35,398,334) | | | | | | 3,439,854 | | | | | | — | | | | | | 983,089 | | | | | | (520,869) | | | | | | — | | |
| Voya High Yield Bond Fund - Class R6 | | | | | — | | | | | | 31,307,124 | | | | | | (13,005,280) | | | | | | (148,005) | | | | | | 18,153,839 | | | | | | 450,755 | | | | | | (771,567) | | | | | | — | | |
| Voya Intermediate Bond Fund - Class R6 | | | | | 35,859,081 | | | | | | 15,851,972 | | | | | | (11,629,605) | | | | | | (84,219) | | | | | | 39,997,229 | | | | | | 1,292,024 | | | | | | 228,346 | | | | | | — | | |
| Voya International Core Fund - Class I | | | | | 60,126,612 | | | | | | 9,677,498 | | | | | | (17,759,929) | | | | | | 2,563,077 | | | | | | 54,607,258 | | | | | | 850,277 | | | | | | (3,127,163) | | | | | | — | | |
| Voya International Index Portfolio - Class I | | | | | 19,922,328 | | | | | | 3,356,921 | | | | | | (5,528,238) | | | | | | 407,609 | | | | | | 18,158,620 | | | | | | 592,037 | | | | | | (816,081) | | | | | | — | | |
| Voya Large Cap Growth Portfolio - Class I | | | | | 50,887,766 | | | | | | 7,958,173 | | | | | | (18,130,170) | | | | | | (5,395,493) | | | | | | 35,320,276 | | | | | | 216,829 | | | | | | 1,445,079 | | | | | | 4,997,100 | | |
| Voya Large Cap Value Fund - Class R6 | | | | | 39,949,144 | | | | | | 3,064,799 | | | | | | (29,275,727) | | | | | | 4,534,031 | | | | | | 18,272,247 | | | | | | 540,485 | | | | | | (2,444,945) | | | | | | — | | |
| Voya MidCap Opportunities Portfolio - Class I | | | | | 25,349,060 | | | | | | 15,859,871 | | | | | | (10,228,549) | | | | | | (137,890) | | | | | | 30,842,492 | | | | | | — | | | | | | (1,270,945) | | | | | | 3,635,670 | | |
| Voya Multi-Manager Emerging Markets Equity Fund - Class I | | | | | 9,814,357 | | | | | | 1,740,367 | | | | | | (4,040,148) | | | | | | 1,311,188 | | | | | | 8,825,764 | | | | | | 104,663 | | | | | | (541,423) | | | | | | — | | |
| Voya Multi-Manager International Equity Fund - Class I | | | | | 60,154,085 | | | | | | 9,797,066 | | | | | | (14,852,911) | | | | | | (1,170,349) | | | | | | 53,927,891 | | | | | | 996,713 | | | | | | (213,142) | | | | | | — | | |
| Voya Multi-Manager Large Cap Core Portfolio - Class I | | | | | 49,179,158 | | | | | | 32,926,185 | | | | | | (20,876,293) | | | | | | (191,326) | | | | | | 61,037,724 | | | | | | 1,397,795 | | | | | | 1,710,698 | | | | | | 2,435,029 | | |
| Voya Multi-Manager Mid Cap Value Fund - Class I | | | | | 34,913,031 | | | | | | 4,818,595 | | | | | | (15,226,665) | | | | | | 7,014,175 | | | | | | 31,519,136 | | | | | | 394,690 | | | | | | (3,224,246) | | | | | | 546,233 | | |
| Voya Russell™ Mid Cap Growth Index Portfolio - Class I | | | | | 10,058,019 | | | | | | 611,632 | | | | | | (9,842,040) | | | | | | (827,611) | | | | | | — | | | | | | — | | | | | | 894,578 | | | | | | — | | |
| Voya Russell™ Mid Cap Index Portfolio - Class I | | | | | — | | | | | | 19,844,228 | | | | | | (19,844,228) | | | | | | — | | | | | | — | | | | | | — | | | | | | (44,086) | | | | | | — | | |
| Voya Short Term Bond Fund - Class R6 | | | | | 51,259,075 | | | | | | 6,672,817 | | | | | | (38,417,552) | | | | | | 460,551 | | | | | | 19,974,891 | | | | | | 802,308 | | | | | | (478,471) | | | | | | — | | |
| Voya Small Company Portfolio - Class I | | | | | 30,340,125 | | | | | | 5,166,855 | | | | | | (11,308,192) | | | | | | 3,066,967 | | | | | | 27,265,755 | | | | | | 133,812 | | | | | | 473,026 | | | | | | 2,708,054 | | |
| Voya U.S. Bond Index Portfolio - Class I | | | | | 66,364,156 | | | | | | 37,669,852 | | | | | | (70,110,506) | | | | | | 854,745 | | | | | | 34,778,247 | | | | | | 947,909 | | | | | | (80,012) | | | | | | 62,713 | | |
| Voya U.S. Stock Index Portfolio - Class I | | | | | 20,150,303 | | | | | | 30,954,048 | | | | | | (25,846,729) | | | | | | 1,793,855 | | | | | | 27,051,477 | | | | | | 494,125 | | | | | | (1,475,441) | | | | | | 944,342 | | |
| VY T. Rowe Price Equity Income Portfolio Initial | | | | | — | | | | | | 22,384,562 | | | | | | (4,351,407) | | | | | | 72,868 | | | | | | 18,106,023 | | | | | | 434,841 | | | | | | (98,915) | | | | | | 1,929,449 | | |
| VY® Clarion Global Real Estate Portfolio - Class I | | | | | — | | | | | | 11,154,530 | | | | | | (1,770,955) | | | | | | (318,757) | | | | | | 9,064,818 | | | | | | 124,774 | | | | | | (1,846) | | | | | | — | | |
| VY® Clarion Real Estate Portfolio - Class I | | | | | 20,613,446 | | | | | | 1,723,829 | | | | | | (10,210,210) | | | | | | (2,990,386) | | | | | | 9,136,679 | | | | | | 162,408 | | | | | | 3,546,274 | | | | | | — | | |
| VY® Goldman Sachs Bond Portfolio - Class I | | | | | 30,552,172 | | | | | | 15,059,084 | | | | | | (9,926,411) | | | | | | (230,725) | | | | | | 35,454,120 | | | | | | 850,936 | | | | | | 188,800 | | | | | | — | | |
| VY® Invesco Comstock Portfolio - Class I | | | | | 39,600,865 | | | | | | 5,956,249 | | | | | | (13,587,401) | | | | | | 4,863,539 | | | | | | 36,833,252 | | | | | | 963,410 | | | | | | 731,079 | | | | | | — | | |
VY® T. Rowe Price Capital Appreciation Portfolio - Class I | | | | | 101,393,528 | | | | | | 13,465,499 | | | | | | (24,955,621) | | | | | | (1,037,101) | | | | | | 88,866,305 | | | | | | 1,407,278 | | | | | | (1,044,925) | | | | | | 8,213,211 | | |
VY® T. Rowe Price Growth Equity Portfolio - Class I | | | | | 50,836,880 | | | | | | 8,316,972 | | | | | | (17,682,914) | | | | | | (6,311,419) | | | | | | 35,159,519 | | | | | | — | | | | | | 1,904,570 | | | | | | 4,445,894 | | |
| | | | | $ | 968,089,154 | | | | | $ | 353,193,483 | | | | | $ | (513,289,965) | | | | | $ | 19,948,494 | | | | | $ | 827,941,166 | | | | | $ | 18,070,288 | | | | | $ | (9,859,943) | | | | | $ | 29,917,695 | | |
| |
The financial statements for the above mutual fund[s] can be found at www.sec.gov.
See Accompanying Notes to Financial Statements
PORTFOLIO OF INVESTMENTS
| Voya Solution 2025 Portfolio | as of December 31, 2016 (continued) |
The effect of derivative instruments on the Portfolio’s Statement of Operations for the year ended December 31, 2016 was as follows:
| | | | Amount of Realized Gain or (Loss) on
Derivatives Recognized in Income | |
| Derivatives not accounted for as hedging instruments | | | Futures | |
| Equity contracts | | | | $ | (1,861,271) | | |
| Interest rate contracts | | | | | 161,277 | | |
| Total | | | | $ | (1,699,994) | | |
| |
See Accompanying Notes to Financial Statements
PORTFOLIO OF INVESTMENTS
| Voya Solution 2030 Portfolio | as of December 31, 2016 |
| Shares | | | Value | | | Percentage
of Net
Assets | |
| EXCHANGE-TRADED FUNDS: 6.1% | |
| | | 3,046 | | | | iShares Barclays 20+ Year
Treasury Bond Fund | | | | $ | 362,870 | | | | | | 2.4 | | |
| | | 2,451 | | | | SPDR Trust Series 1 | | | | | 547,872 | | | | | | 3.7 | | |
| | | | | | | Total Exchange-Traded Funds
(Cost $922,113) | | | | | 910,742 | | | | | | 6.1 | | |
| MUTUAL FUNDS: 93.8% | |
| | | | | | | Affiliated Investment Companies: 92.4% | |
| | | 30,902 | | | | Voya Emerging Markets Index
Portfolio - Class I | | | | | 295,424 | | | | | | 2.0 | | |
| | | 74,845 | | | | Voya Floating Rate Fund -
Class I | | | | | 745,459 | | | | | | 5.0 | | |
| | | 37,467 | | | | Voya High Yield Bond Fund -
Class R6 | | | | | 301,238 | | | | | | 2.0 | | |
| | | 18,455 | | | | Voya Index Plus LargeCap
Portfolio - Class I | | | | | 446,418 | | | | | | 3.0 | | |
| | | 55,673 | | | | Voya Intermediate Bond
Fund - Class R6 | | | | | 554,508 | | | | | | 3.7 | | |
| | | 109,033 | | | | Voya International Core
Fund - Class I | | | | | 981,298 | | | | | | 6.6 | | |
| | | 34,200 | | | | Voya International Index
Portfolio - Class I | | | | | 301,304 | | | | | | 2.0 | | |
| | | 38,087 | | | | Voya Large Cap Growth
Portfolio - Class I | | | | | 660,430 | | | | | | 4.4 | | |
| | | 23,319 | | | | Voya Large Cap Value Fund -
Class R6 | | | | | 302,679 | | | | | | 2.0 | | |
| | | 41,550 | @ | | Voya MidCap Opportunities
Portfolio - Class I | | | | | 512,733 | | | | | | 3.5 | | |
| | | 31,298 | | | | Voya Multi-Manager Emerging
Markets Equity Fund - Class I | | | | | 293,891 | | | | | | 2.0 | | |
| | | 96,277 | | | | Voya Multi-Manager
International Equity Fund -
Class I | | | | | 970,469 | | | | | | 6.5 | | |
| | | 80,114 | | | | Voya Multi-Manager Large
Cap Core Portfolio - Class I | | | | | 1,192,901 | | | | | | 8.0 | | |
| | | 47,089 | | | | Voya Multi-Manager Mid Cap
Value Fund - Class I | | | | | 522,688 | | | | | | 3.5 | | |
| | | 18,777 | | | | Voya Short Term Bond Fund -
Class R6 | | | | | 184,582 | | | | | | 1.3 | | |
| | | 20,432 | | | | Voya Small Company
Portfolio - Class I | | | | | 451,949 | | | | | | 3.0 | | |
| | | 27,589 | | | | Voya U.S. Bond Index
Portfolio - Class I | | | | | 290,509 | | | | | | 2.0 | | |
| | Shares | | | Value | | | Percentage
of Net
Assets | |
| | MUTUAL FUNDS: (continued) | |
| | | | | | | | Affiliated Investment Companies (continued) | |
| | | | 58,936 | | | | Voya U.S. Stock Index
Portfolio - Class I | | | | $ | 812,727 | | | | | | 5.5 | | |
| | | | 19,286 | | | | VY® Clarion Global Real
Estate Portfolio - Class I | | | | | 226,033 | | | | | | 1.5 | | |
| | | | 6,207 | | | | VY® Clarion Real Estate
Portfolio - Class I | | | | | 227,661 | | | | | | 1.5 | | |
| | | | 29,334 | | | | VY® Goldman Sachs Bond
Portfolio - Class I | | | | | 295,098 | | | | | | 2.0 | | |
| | | | 43,585 | | | | VY® Invesco Comstock
Portfolio - Class I | | | | | 761,426 | | | | | | 5.1 | | |
| | | | 57,950 | | | | VY® T. Rowe Price Capital
Appreciation Portfolio - Class I | | | | | 1,477,146 | | | | | | 9.9 | | |
| | | | 21,671 | | | | VY® T. Rowe Price Equity
Income Portfolio - Class I | | | | | 300,141 | | | | | | 2.0 | | |
| | | | 8,494 | @ | | VY® T. Rowe Price Growth
Equity Portfolio - Class I | | | | | 657,787 | | | | | | 4.4 | | |
| | | | | | | | | | | | | 13,766,499 | | | | | | 92.4 | | |
| | | | | | | | Unaffiliated Investment Companies: 1.4% | |
| | | | 41,519 | @ | | Credit Suisse Commodity
Return Strategy Fund -
Class I | | | | | 210,502 | | | | | | 1.4 | | |
| | | | | | | | Total Mutual Funds
(Cost $13,809,654) | | | | | 13,977,001 | | | | | | 93.8 | | |
| | | | | | | | Total Investments in
Securities
(Cost $14,731,767) | | | | $ | 14,887,743 | | | | | | 99.9 | | |
| | | | | | | | Assets in Excess of
Other Liabilities | | | | | 18,701 | | | | | | 0.1 | | |
| | | | | | | | Net Assets | | | | $ | 14,906,444 | | | | | | 100.0 | | |
| |
@
Non-income producing security.
Cost for federal income tax purposes is $14,853,873.
Net unrealized appreciation consists of:
| | Gross Unrealized Appreciation | | | | $ | 303,916 | | |
| | Gross Unrealized Depreciation | | | | | (270,046) | | |
| | Net Unrealized Appreciation | | | | $ | 33,870 | | |
| |
See Accompanying Notes to Financial Statements
PORTFOLIO OF INVESTMENTS
| Voya Solution 2030 Portfolio | as of December 31, 2016 (continued) |
Fair Value Measurements^
The following is a summary of the fair valuations according to the inputs used as of December 31, 2016 in valuing the assets and liabilities:
| | | | Quoted Prices
in Active Markets
for Identical
Investments
(Level 1) | | | Significant
Other
Observable
Inputs
(Level 2) | | | Significant
Unobservable
Inputs
(Level 3) | | | Fair Value
at
December 31, 2016 | |
| Asset Table | | | | | |
| Investments, at fair value | | | | | |
| Exchange-Traded Funds | | | | $ | 910,742 | | | | | $ | — | | | | | $ | — | | | | | $ | 910,742 | | |
| Mutual Funds | | | | | 13,977,001 | | | | | | — | | | | | | — | | | | | | 13,977,001 | | |
| Total Investments, at fair value | | | | $ | 14,887,743 | | | | | $ | — | | | | | $ | — | | | | | $ | 14,887,743 | | |
| |
^
See Note 2, “Significant Accounting Policies” in the Notes to Financial Statements for additional information.
Transactions with Affiliates
An investment of at least 5% of the voting securities of an issuer, or a company which is under common control results in that issuer becoming an affiliated person as defined by the 1940 Act.
The following table provides transactions during the year ended December 31, 2016, where the following issuers were considered an affiliate:
| Issuer | | | Beginning
Fair Value
at 12/31/15 | | | Purchases
at Cost | | | Sales
at Cost | | | Change in
Unrealized
Appreciation/
(Depreciation) | | | Ending
Fair Value
at 12/31/16 | | | Investment
Income | | | Realized
Gains/
(Losses) | | | Net Capital
Gain
Distributions | |
| Voya Emerging Markets Index Portfolio - Class I | | | | $ | 79,251 | | | | | $ | 532,417 | | | | | $ | (309,676) | | | | | $ | (6,568) | | | | | $ | 295,424 | | | | | $ | 3,068 | | | | | $ | 7,357 | | | | | $ | — | | |
| Voya Floating Rate Fund - Class I | | | | | 194,345 | | | | | | 668,944 | | | | | | (133,796) | | | | | | 15,966 | | | | | | 745,459 | | | | | | 19,029 | | | | | | (657) | | | | | | — | | |
| Voya High Yield Bond Fund - Class I | | | | | 119,517 | | | | | | 216,103 | | | | | | (339,318) | | | | | | 3,698 | | | | | | — | | | | | | 6,895 | | | | | | (902) | | | | | | — | | |
| Voya High Yield Bond Fund - Class R6 | | | | | — | | | | | | 436,054 | | | | | | (142,343) | | | | | | 7,527 | | | | | | 301,238 | | | | | | 5,867 | | | | | | 8,175 | | | | | | — | | |
| Voya Index Plus LargeCap Portfolio - Class I | | | | | — | | | | | | 497,589 | | | | | | (74,018) | | | | | | 22,847 | | | | | | 446,418 | | | | | | 3,670 | | | | | | 2,782 | | | | | | — | | |
| Voya Intermediate Bond Fund - Class R6 | | | | | 139,082 | | | | | | 580,998 | | | | | | (157,337) | | | | | | (8,235) | | | | | | 554,508 | | | | | | 11,133 | | | | | | 3,168 | | | | | | — | | |
| Voya International Core Fund - Class I | | | | | 254,655 | | | | | | 891,431 | | | | | | (183,262) | | | | | | 18,474 | | | | | | 981,298 | | | | | | 14,267 | | | | | | (8,992) | | | | | | — | | |
| Voya International Index Portfolio - Class I | | | | | 78,076 | | | | | | 272,362 | | | | | | (55,395) | | | | | | 6,261 | | | | | | 301,304 | | | | | | 4,374 | | | | | | (3,001) | | | | | | — | | |
| Voya Large Cap Growth Portfolio - Class I | | | | | 217,594 | | | | | | 661,960 | | | | | | (194,226) | | | | | | (24,898) | | | | | | 660,430 | | | | | | 2,478 | | | | | | (8,933) | | | | | | 57,099 | | |
| Voya Large Cap Value Fund - Class R6 | | | | | 156,172 | | | | | | 325,040 | | | | | | (205,965) | | | | | | 27,432 | | | | | | 302,679 | | | | | | 5,384 | | | | | | 2,549 | | | | | | — | | |
| Voya MidCap Opportunities Portfolio - Class I | | | | | 98,564 | | | | | | 561,286 | | | | | | (138,792) | | | | | | (8,325) | | | | | | 512,733 | | | | | | — | | | | | | (3,115) | | | | | | 35,173 | | |
| Voya Multi-Manager Emerging Markets Equity Fund - Class I | | | | | 76,813 | | | | | | 273,178 | | | | | | (67,028) | | | | | | 10,928 | | | | | | 293,891 | | | | | | 3,245 | | | | | | 2,706 | | | | | | — | | |
| Voya Multi-Manager International Equity Fund - Class I | | | | | 257,674 | | | | | | 893,973 | | | | | | (180,548) | | | | | | (630) | | | | | | 970,469 | | | | | | 16,735 | | | | | | (8,443) | | | | | | — | | |
| Voya Multi-Manager Large Cap Core Portfolio - Class I | | | | | 363,725 | | | | | | 1,217,582 | | | | | | (421,459) | | | | | | 33,053 | | | | | | 1,192,901 | | | | | | 21,391 | | | | | | (31) | | | | | | 28,376 | | |
| Voya Multi-Manager Mid Cap Value Fund - Class I | | | | | 136,388 | | | | | | 548,705 | | | | | | (210,484) | | | | | | 48,079 | | | | | | 522,688 | | | | | | 6,114 | | | | | | (11,453) | | | | | | 8,462 | | |
| Voya Russell™ Mid Cap Growth Index Portfolio - Class I | | | | | 39,221 | | | | | | 1,446 | | | | | | (41,120) | | | | | | 453 | | | | | | — | | | | | | — | | | | | | (4,160) | | | | | | — | | |
| Voya Short Term Bond Fund - Class R6 | | | | | 155,467 | | | | | | 441,499 | | | | | | (412,110) | | | | | | (274) | | | | | | 184,582 | | | | | | 5,370 | | | | | | (527) | | | | | | — | | |
| Voya Small Company Portfolio - Class I | | | | | 117,754 | | | | | | 401,306 | | | | | | (119,851) | | | | | | 52,740 | | | | | | 451,949 | | | | | | 989 | | | | | | 2,381 | | | | | | 20,009 | | |
| Voya U.S. Bond Index Portfolio - Class I | | | | | 182,609 | | | | | | 818,787 | | | | | | (707,233) | | | | | | (3,654) | | | | | | 290,509 | | | | | | 5,459 | | | | | | 5,073 | | | | | | 234 | | |
| Voya U.S. Stock Index Portfolio - Class I | | | | | 117,908 | | | | | | 1,242,335 | | | | | | (552,923) | | | | | | 5,407 | | | | | | 812,727 | | | | | | 14,217 | | | | | | 9,579 | | | | | | 12,031 | | |
| VY T. Rowe Price Equity Income Portfolio Initial | | | | | — | | | | | | 355,171 | | | | | | (59,088) | | | | | | 4,058 | | | | | | 300,141 | | | | | | 6,933 | | | | | | (1,720) | | | | | | 19,604 | | |
| VY® Clarion Global Real Estate Portfolio - Class I | | | | | 59,150 | | | | | | 212,242 | | | | | | (41,626) | | | | | | (3,733) | | | | | | 226,033 | | | | | | 1,987 | | | | | | 1,009 | | | | | | — | | |
| VY® Clarion Real Estate Portfolio - Class I | | | | | 60,228 | | | | | | 213,429 | | | | | | (44,609) | | | | | | (1,387) | | | | | | 227,661 | | | | | | 2,475 | | | | | | 3,681 | | | | | | — | | |
| VY® Goldman Sachs Bond Portfolio - Class I | | | | | — | | | | | | 345,360 | | | | | | (44,905) | | | | | | (5,357) | | | | | | 295,098 | | | | | | 4,324 | | | | | | (286) | | | | | | — | | |
| VY® Invesco Comstock Portfolio - Class I | | | | | 196,770 | | | | | | 663,465 | | | | | | (180,579) | | | | | | 81,770 | | | | | | 761,426 | | | | | | 19,296 | | | | | | 8,145 | | | | | | — | | |
| VY® T. Rowe Price Capital Appreciation Portfolio - Class I | | | | | 394,683 | | | | | | 1,374,303 | | | | | | (260,621) | | | | | | (31,219) | | | | | | 1,477,146 | | | | | | 22,616 | | | | | | (5,598) | | | | | | 83,458 | | |
| VY® T. Rowe Price Growth Equity Portfolio - Class I | | | | | 217,483 | | | | | | 663,077 | | | | | | (207,462) | | | | | | (15,311) | | | | | | 657,787 | | | | | | — | | | | | | (12,770) | | | | | | 54,647 | | |
| | | | | $ | 3,713,129 | | | | | $ | 15,310,042 | | | | | $ | (5,485,774) | | | | | $ | 229,102 | | | | | $ | 13,766,499 | | | | | $ | 207,316 | | | | | $ | (13,983) | | | | | $ | 319,093 | | |
| | | | | | | | | | | | | | | | | | | | | | | | | | | | | | | | | | | | | | | | | | | | | | | | | | |
The financial statements for the above mutual fund[s] can be found at www.sec.gov.
See Accompanying Notes to Financial Statements
PORTFOLIO OF INVESTMENTS
| Voya Solution 2030 Portfolio | as of December 31, 2016 (continued) |
The effect of derivative instruments on the Portfolio’s Statement of Operations for the year ended December 31, 2016 was as follows:
| | | | Amount of Realized Gain or (Loss) on
Derivatives Recognized in Income | |
| Derivatives not accounted for as hedging instruments | | | Futures | |
| Equity contracts | | | | $ | (4,234) | | |
| Total | | | | $ | (4,234) | | |
| |
See Accompanying Notes to Financial Statements
PORTFOLIO OF INVESTMENTS
| Voya Solution 2035 Portfolio | as of December 31, 2016 |
| | Shares | | | Value | | | Percentage
of Net
Assets | |
| | EXCHANGE-TRADED FUNDS: 7.0% | |
| | | | 53,684 | | | | iShares Barclays 20+ Year
Treasury Bond Fund | | | | $ | 6,395,375 | | | | | | 0.8 | | |
| | | | 159,962 | | | | iShares Russell 1000 Value
Index Fund | | | | | 17,920,543 | | | | | | 2.1 | | |
| | | | 158,405 | | | | SPDR Trust Series 1 | | | | | 35,408,270 | | | | | | 4.1 | | |
| | | | | | | | Total Exchange-Traded Funds
(Cost $58,050,143) | | | | | 59,724,188 | | | | | | 7.0 | | |
| | MUTUAL FUNDS: 92.9% | |
| | | | | | | | Affiliated Investment Companies: 91.3% | |
| | | | 1,764,241 | | | | Voya Emerging Markets Index
Portfolio - Class I | | | | | 16,866,148 | | | | | | 2.0 | | |
| | | | 4,283,019 | | | | Voya Floating Rate Fund -
Class I | | | | | 42,658,867 | | | | | | 5.0 | | |
| | | | 2,146,100 | | | | Voya High Yield Bond Fund -
Class R6 | | | | | 17,254,641 | | | | | | 2.0 | | |
| | | | 1,057,054 | | | | Voya Index Plus LargeCap
Portfolio - Class I | | | | | 25,570,146 | | | | | | 3.0 | | |
| | | | 2,502,237 | | | | Voya Intermediate Bond
Fund - Class R6 | | | | | 24,922,276 | | | | | | 2.9 | | |
| | | | 7,208,910 | | | | Voya International Core
Fund - Class I | | | | | 64,880,186 | | | | | | 7.6 | | |
| | | | 1,959,143 | | | | Voya International Index
Portfolio - Class I | | | | | 17,260,051 | | | | | | 2.0 | | |
| | | | 2,904,039 | | | | Voya Large Cap Growth
Portfolio - Class I | | | | | 50,356,044 | | | | | | 5.9 | | |
| | | | 1,955,740 | | | | Voya Large Cap Value Fund -
Class R6 | | | | | 25,385,505 | | | | | | 3.0 | | |
| | | | 2,375,574 | @ | | Voya MidCap Opportunities
Portfolio - Class I | | | | | 29,314,584 | | | | | | 3.4 | | |
| | | | 3,573,466 | | | | Voya Multi-Manager Emerging
Markets Equity Fund - Class I | | | | | 33,554,846 | | | | | | 3.9 | | |
| | | | 8,051,632 | | | | Voya Multi-Manager
International Equity Fund -
Class I | | | | | 81,160,453 | | | | | | 9.5 | | |
| | | | 4,926,961 | | | | Voya Multi-Manager Large Cap
Core Portfolio - Class I | | | | | 73,362,446 | | | | | | 8.6 | | |
| | | | 2,698,796 | | | | Voya Multi-Manager Mid Cap
Value Fund - Class I | | | | | 29,956,636 | | | | | | 3.5 | | |
| | Shares | | | Value | | | Percentage
of Net
Assets | |
| | MUTUAL FUNDS: (continued) | |
| | | | | | | | Affiliated Investment Companies (continued) | |
| | | | 1,171,572 | | | | Voya Small Company
Portfolio - Class I | | | | $ | 25,915,169 | | | | | | 3.1 | | |
| | | | 774,765 | | | | Voya U.S. Bond Index
Portfolio - Class I | | | | | 8,158,275 | | | | | | 1.0 | | |
| | | | 2,485,874 | | | | Voya U.S. Stock Index
Portfolio - Class I | | | | | 34,280,199 | | | | | | 4.0 | | |
| | | | 1,102,862 | | | | VY® Clarion Global Real
Estate Portfolio - Class I | | | | | 12,925,541 | | | | | | 1.5 | | |
| | | | 355,183 | | | | VY® Clarion Real Estate
Portfolio - Class I | | | | | 13,028,119 | | | | | | 1.5 | | |
| | | | 2,504,584 | | | | VY® Invesco Comstock
Portfolio - Class I | | | | | 43,755,087 | | | | | | 5.1 | | |
| | | | 2,319,562 | | | | VY® T. Rowe Price Capital
Appreciation Portfolio -
Class I | | | | | 59,125,635 | | | | | | 6.9 | | |
| | | | 647,296 | @ | | VY® T. Rowe Price Growth
Equity Portfolio - Class I | | | | | 50,126,572 | | | | | | 5.9 | | |
| | | | | | | | | | | | | 779,817,426 | | | | | | 91.3 | | |
| | | | | | | | Unaffiliated Investment Companies: 1.6% | |
| | | | 2,689,574 | @ | | Credit Suisse Commodity
Return Strategy Fund -
Class I | | | | | 13,636,139 | | | | | | 1.6 | | |
| | | | | | | | Total Mutual Funds
(Cost $820,821,520) | | | | | 793,453,565 | | | | | | 92.9 | | |
| | | | | | | | Total Investments in
Securities
(Cost $878,871,663) | | | | $ | 853,177,753 | | | | | | 99.9 | | |
| | | | | | | | Assets in Excess of
Other Liabilities | | | | | 730,945 | | | | | | 0.1 | | |
| | | | | | | | Net Assets | | | | $ | 853,908,698 | | | | | | 100.0 | | |
| |
@
Non-income producing security.
Cost for federal income tax purposes is $893,417,353.
Net unrealized depreciation consists of:
| | Gross Unrealized Appreciation | | | | $ | 11,743,602 | | |
| | Gross Unrealized Depreciation | | | | | (51,983,202) | | |
| | Net Unrealized Depreciation | | | | $ | (40,239,600) | | |
| |
See Accompanying Notes to Financial Statements
PORTFOLIO OF INVESTMENTS
| Voya Solution 2035 Portfolio | as of December 31, 2016 (continued) |
Fair Value Measurements^
The following is a summary of the fair valuations according to the inputs used as of December 31, 2016 in valuing the assets and liabilities:
| | | | Quoted Prices
in Active Markets
for Identical
Investments
(Level 1) | | | Significant
Other
Observable
Inputs
(Level 2) | | | Significant
Unobservable
Inputs
(Level 3) | | | Fair Value
at
December 31, 2016 | |
| Asset Table | | | | | |
| Investments, at fair value | | | | | |
| Exchange-Traded Funds | | | | $ | 59,724,188 | | | | | $ | — | | | | | $ | — | | | | | $ | 59,724,188 | | |
| Mutual Funds | | | | | 793,453,565 | | | | | | — | | | | | | — | | | | | | 793,453,565 | | |
| Total Investments, at fair value | | | | $ | 853,177,753 | | | | | $ | — | | | | | $ | — | | | | | $ | 853,177,753 | | |
| |
^
See Note 2, “Significant Accounting Policies” in the Notes to Financial Statements for additional information.
Transactions with Affiliates
An investment of at least 5% of the voting securities of an issuer, or a company which is under common control results in that issuer becoming an affiliated person as defined by the 1940 Act.
The following table provides transactions during the year ended December 31, 2016, where the following issuers were considered an affiliate:
| Issuer | | | Beginning
Fair Value
at 12/31/15 | | | Purchases
at Cost | | | Sales
at Cost | | | Change in
Unrealized
Appreciation/
(Depreciation) | | | Ending
Fair Value
at 12/31/16 | | | Investment
Income | | | Realized
Gains/
(Losses) | | | Net Capital
Gain
Distributions | |
| Voya Emerging Markets Index Portfolio - Class I | | | | $ | 17,711,782 | | | | | $ | 20,323,760 | | | | | $ | (24,988,535) | | | | | $ | 3,819,141 | | | | | $ | 16,866,148 | | | | | $ | 381,473 | | | | | $ | (3,310,737) | | | | | $ | — | | |
| Voya Floating Rate Fund - Class I | | | | | 46,911,478 | | | | | | 7,720,183 | | | | | | (13,981,994) | | | | | | 2,009,200 | | | | | | 42,658,867 | | | | | | 1,849,112 | | | | | | (657,348) | | | | | | — | | |
| Voya High Yield Bond Fund - Class I | | | | | 27,355,699 | | | | | | 2,901,272 | | | | | | (32,684,421) | | | | | | 2,427,450 | | | | | | — | | | | | | 903,017 | | | | | | (563,570) | | | | | | — | | |
| Voya High Yield Bond Fund - Class R6 | | | | | — | | | | | | 28,495,481 | | | | | | (11,686,487) | | | | | | 445,647 | | | | | | 17,254,641 | | | | | | 422,804 | | | | | | (468,538) | | | | | | — | | |
| Voya Index Plus LargeCap Portfolio - Class I | | | | | — | | | | | | 28,403,031 | | | | | | (4,578,767) | | | | | | 1,745,882 | | | | | | 25,570,146 | | | | | | 456,815 | | | | | | 175,692 | | | | | | — | | |
| Voya Intermediate Bond Fund - Class R6 | | | | | 14,197,848 | | | | | | 25,339,954 | | | | | | (14,585,088) | | | | | | (30,438) | | | | | | 24,922,276 | | | | | | 819,136 | | | | | | (6,970) | | | | | | — | | |
| Voya International Core Fund - Class I | | | | | 69,309,289 | | | | | | 11,182,986 | | | | | | (14,817,421) | | | | | | (794,668) | | | | | | 64,880,186 | | | | | | 1,011,905 | | | | | | 93,774 | | | | | | — | | |
| Voya International Index Portfolio - Class I | | | | | 18,372,498 | | | | | | 3,270,857 | | | | | | (4,708,027) | | | | | | 324,723 | | | | | | 17,260,051 | | | | | | 545,812 | | | | | | (703,549) | | | | | | — | | |
| Voya Large Cap Growth Portfolio - Class I | | | | | 56,316,052 | | | | | | 11,700,434 | | | | | | (10,543,595) | | | | | | (7,116,847) | | | | | | 50,356,044 | | | | | | 300,637 | | | | | | 1,898,949 | | | | | | 6,928,562 | | |
| Voya Large Cap Value Fund - Class R6 | | | | | 46,056,864 | | | | | | 4,732,544 | | | | | | (30,534,147) | | | | | | 5,130,244 | | | | | | 25,385,505 | | | | | | 695,864 | | | | | | (2,271,764) | | | | | | — | | |
| Voya MidCap Opportunities Portfolio - Class I | | | | | 23,375,530 | | | | | | 14,687,390 | | | | | | (7,458,243) | | | | | | (1,290,093) | | | | | | 29,314,584 | | | | | | — | | | | | | (23,177) | | | | | | 3,356,501 | | |
| Voya Multi-Manager Emerging Markets Equity Fund - Class I | | | | | 36,196,403 | | | | | | 6,458,795 | | | | | | (13,688,631) | | | | | | 4,588,279 | | | | | | 33,554,846 | | | | | | 398,589 | | | | | | (1,864,205) | | | | | | — | | |
| Voya Multi-Manager International Equity Fund - Class I | | | | | 87,828,652 | | | | | | 14,370,989 | | | | | | (19,199,777) | | | | | | (1,839,411) | | | | | | 81,160,453 | | | | | | 1,502,538 | | | | | | (294,527) | | | | | | — | | |
| Voya Multi-Manager Large Cap Core Portfolio - Class I | | | | | 91,846,901 | | | | | | 15,938,840 | | | | | | (35,573,972) | | | | | | 1,150,677 | | | | | | 73,362,446 | | | | | | 1,657,601 | | | | | | 986,080 | | | | | | 2,834,119 | | |
| Voya Multi-Manager Mid Cap Value Fund - Class I | | | | | 32,196,406 | | | | | | 4,327,547 | | | | | | (12,799,068) | | | | | | 6,231,751 | | | | | | 29,956,636 | | | | | | 375,771 | | | | | | (2,748,691) | | | | | | 520,049 | | |
| Voya Russell™ Mid Cap Growth Index Portfolio - Class I | | | | | 9,274,969 | | | | | | 460,957 | | | | | | (9,029,906) | | | | | | (706,020) | | | | | | — | | | | | | — | | | | | | 757,416 | | | | | | — | | |
| Voya Russell™ Mid Cap Index Portfolio - Class I | | | | | — | | | | | | 18,505,749 | | | | | | (18,505,749) | | | | | | — | | | | | | — | | | | | | — | | | | | | (32,079) | | | | | | | | |
| Voya Short Term Bond Fund - Class R6 | | | | | 9,453,157 | | | | | | 1,448,115 | | | | | | (11,025,800) | | | | | | 124,528 | | | | | | — | | | | | | 103,094 | | | | | | (81,586) | | | | | | — | | |
| Voya Small Company Portfolio - Class I | | | | | 27,977,979 | | | | | | 4,838,408 | | | | | | (9,842,264) | | | | | | 2,941,046 | | | | | | 25,915,169 | | | | | | 123,569 | | | | | | 375,247 | | | | | | 2,500,748 | | |
| Voya U.S. Bond Index Portfolio - Class I | | | | | 37,657,364 | | | | | | 30,845,703 | | | | | | (60,834,900) | | | | | | 490,108 | | | | | | 8,158,275 | | | | | | 361,347 | | | | | | 250,866 | | | | | | 19,244 | | |
| Voya U.S. Stock Index Portfolio - Class I | | | | | 37,192,460 | | | | | | 29,760,106 | | | | | | (35,750,390) | | | | | | 3,078,023 | | | | | | 34,280,199 | | | | | | 642,253 | | | | | | (2,354,653) | | | | | | 1,387,989 | | |
| VY® Clarion Global Real Estate Portfolio - Class I | | | | | 13,883,008 | | | | | | 2,676,112 | | | | | | (3,612,016) | | | | | | (21,563) | | | | | | 12,925,541 | | | | | | 173,330 | | | | | | 35,459 | | | | | | — | | |
| VY® Clarion Real Estate Portfolio - Class I | | | | | 14,220,314 | | | | | | 2,912,701 | | | | | | (3,384,190) | | | | | | (720,706) | | | | | | 13,028,119 | | | | | | 225,224 | | | | | | 1,164,382 | | | | | | — | | |
| VY® Invesco Comstock Portfolio - Class I | | | | | 45,652,250 | | | | | | 6,676,257 | | | | | | (14,390,015) | | | | | | 5,816,595 | | | | | | 43,755,087 | | | | | | 1,146,998 | | | | | | 683,635 | | | | | | — | | |
VY® T. Rowe Price Capital Appreciation Portfolio - Class I | | | | | 60,770,096 | | | | | | 15,068,957 | | | | | | (16,156,395) | | | | | | (557,023) | | | | | | 59,125,635 | | | | | | 938,198 | | | | | | (982,473) | | | | | | 5,314,372 | | |
VY® T. Rowe Price Growth Equity Portfolio - Class I | | | | | 56,258,417 | | | | | | 12,223,991 | | | | | | (10,887,289) | | | | | | (7,468,547) | | | | | | 50,126,572 | | | | | | — | | | | | | 2,198,187 | | | | | | 6,197,889 | | |
| | | | | $ | 880,015,416 | | | | | $ | 325,271,119 | | | | | $ | (445,247,087) | | | | | $ | 19,777,978 | | | | | $ | 779,817,426 | | | | | $ | 15,035,087 | | | | | $ | (7,744,179) | | | | | $ | 29,059,473 | | |
| |
The financial statements for the above mutual fund[s] can be found at www.sec.gov.
See Accompanying Notes to Financial Statements
PORTFOLIO OF INVESTMENTS
| Voya Solution 2035 Portfolio | as of December 31, 2016 (continued) |
The effect of derivative instruments on the Portfolio’s Statement of Operations for the year ended December 31, 2016 was as follows:
| | | | Amount of Realized Gain or (Loss) on
Derivatives Recognized in Income | |
| Derivatives not accounted for as hedging instruments | | | Futures | |
| Equity contracts | | | | $ | (3,012,949) | | |
| Interest rate contracts | | | | | 265,049 | | |
| Total | | | | $ | (2,747,900) | | |
| |
See Accompanying Notes to Financial Statements
PORTFOLIO OF INVESTMENTS
| Voya Solution 2040 Portfolio | as of December 31, 2016 |
| Shares | | | Value | | | Percentage
of Net
Assets | |
| EXCHANGE-TRADED FUNDS: 7.5% | | | |
| | | 3,793 | | | | iShares Russell 1000 Value
Index Fund | | | | $ | 424,930 | | | | | | 3.8 | | |
| | | 1,878 | | | | SPDR Trust Series 1 | | | | | 419,789 | | | | | | 3.7 | | |
| | | | | | | Total Exchange-Traded Funds
(Cost $791,223) | | | | | 844,719 | | | | | | 7.5 | | |
| MUTUAL FUNDS: 92.3% | | | |
| | | | | | | Affiliated Investment Companies: 90.9% | |
| | | 23,171 | | | | Voya Emerging Markets Index
Portfolio - Class I | | | | | 221,519 | | | | | | 2.0 | | |
| | | 22,436 | | | | Voya Floating Rate Fund -
Class I | | | | | 223,466 | | | | | | 2.0 | | |
| | | 28,086 | | | | Voya High Yield Bond Fund -
Class R6 | | | | | 225,811 | | | | | | 2.0 | | |
| | | 9,228 | | | | Voya Index Plus LargeCap
Portfolio - Class I | | | | | 223,215 | | | | | | 2.0 | | |
| | | 31,145 | | | | Voya Intermediate Bond
Fund - Class R6 | | | | | 310,200 | | | | | | 2.8 | | |
| | | 94,398 | | | | Voya International Core
Fund - Class I | | | | | 849,580 | | | | | | 7.6 | | |
| | | 25,657 | | | | Voya International Index
Portfolio - Class I | | | | | 226,038 | | | | | | 2.0 | | |
| | | 41,245 | | | | Voya Large Cap Growth
Portfolio - Class I | | | | | 715,185 | | | | | | 6.4 | | |
| | | 23,928 | | | | Voya Large Cap Value Fund -
Class R6 | | | | | 310,586 | | | | | | 2.8 | | |
| | | 44,508 | @ | | Voya MidCap Opportunities
Portfolio - Class I | | | | | 549,225 | | | | | | 4.9 | | |
| | | 46,935 | | | | Voya Multi-Manager Emerging
Markets Equity Fund - Class I | | | | | 440,717 | | | | | | 3.9 | | |
| | | 105,533 | | | | Voya Multi-Manager
International Equity Fund -
Class I | | | | | 1,063,770 | | | | | | 9.5 | | |
| | | 69,658 | | | | Voya Multi-Manager Large
Cap Core Portfolio - Class I | | | | | 1,037,212 | | | | | | 9.3 | | |
| | | 50,463 | | | | Voya Multi-Manager Mid Cap
Value Fund - Class I | | | | | 560,142 | | | | | | 5.0 | | |
| | Shares | | | Value | | | Percentage
of Net
Assets | |
| | MUTUAL FUNDS: (continued) | | | |
| | | | | | | | Affiliated Investment Companies (continued) | |
| | | | 20,434 | | | | Voya Small Company
Portfolio - Class I | | | | | 451,996 | | | | | $ | 4.0 | | |
| | | | 32,538 | | | | Voya U.S. Stock Index
Portfolio - Class I | | | | | 448,696 | | | | | | 4.0 | | |
| | | | 14,465 | | | | VY® Clarion Global Real
Estate Portfolio - Class I | | | | | 169,529 | | | | | | 1.5 | | |
| | | | 4,656 | | | | VY® Clarion Real Estate
Portfolio - Class I | | | | | 170,768 | | | | | | 1.5 | | |
| | | | 29,433 | | | | VY® Invesco Comstock
Portfolio - Class I | | | | | 514,188 | | | | | | 4.6 | | |
| | | | 29,321 | | | | VY® T. Rowe Price Capital
Appreciation Portfolio -
Class I | | | | | 747,382 | | | | | | 6.7 | | |
| | | | 9,197 | @ | | VY® T. Rowe Price Growth
Equity Portfolio - Class I | | | | | 712,200 | | | | | | 6.4 | | |
| | | | | | | | | | | | | 10,171,425 | | | | | | 90.9 | | |
| | | | | | | | Unaffiliated Investment Companies: 1.4% | |
| | | | 31,831 | @ | | Credit Suisse Commodity
Return Strategy Fund -
Class I | | | | | 161,383 | | | | | | 1.4 | | |
| | | | | | | | Total Mutual Funds
(Cost $10,210,952) | | | | | 10,332,808 | | | | | | 92.3 | | |
| | | | | | | | Total Investments
in Securities
(Cost $11,002,175) | | | | $ | 11,177,527 | | | | | | 99.8 | | |
| | | | | | | | Assets in Excess of Other
Liabilities | | | | | 18,863 | | | | | | 0.2 | | |
| | | | | | | | Net Assets | | | | $ | 11,196,390 | | | | | | 100.0 | | |
| |
@
Non-income producing security.
Cost for federal income tax purposes is $11,138,761.
Net unrealized appreciation consists of:
| | Gross Unrealized Appreciation | | | | $ | 282,215 | | |
| | Gross Unrealized Depreciation | | | | | (243,449) | | |
| | Net Unrealized Appreciation | | | | $ | 38,766 | | |
| |
Fair Value Measurements^
The following is a summary of the fair valuations according to the inputs used as of December 31, 2016 in valuing the assets and liabilities:
| | | | Quoted Prices
in Active Markets
for Identical
Investments
(Level 1) | | | Significant
Other
Observable
Inputs
(Level 2) | | | Significant
Unobservable
Inputs
(Level 3) | | | Fair Value
at
December 31, 2016 | |
| Asset Table | | | | | |
| Investments, at fair value | | | | | |
| Exchange-Traded Funds | | | | $ | 844,719 | | | | | $ | — | | | | | $ | — | | | | | $ | 844,719 | | |
| Mutual Funds | | | | | 10,332,808 | | | | | | — | | | | | | — | | | | | | 10,332,808 | | |
| Total Investments, at fair value | | | | $ | 11,177,527 | | | | | $ | — | | | | | $ | — | | | | | $ | 11,177,527 | | |
| |
^
See Note 2, “Significant Accounting Policies” in the Notes to Financial Statements for additional information.
See Accompanying Notes to Financial Statements
PORTFOLIO OF INVESTMENTS
| Voya Solution 2040 Portfolio | as of December 31, 2016 (continued) |
Transactions with Affiliates
An investment of at least 5% of the voting securities of an issuer, or a company which is under common control results in that issuer becoming an affiliated person as defined by the 1940 Act.
The following table provides transactions during the year ended December 31, 2016, where the following issuers were considered an affiliate:
| Issuer | | | Beginning
Fair Value
at 12/31/15 | | | Purchases
at Cost | | | Sales
at Cost | | | Change in
Unrealized
Appreciation/
(Depreciation) | | | Ending
Fair Value
at 12/31/16 | | | Investment
Income | | | Realized
Gains/
(Losses) | | | Net Capital
Gain
Distributions | |
| Voya Emerging Markets Index Portfolio - Class I | | | | $ | 67,366 | | | | | $ | 396,709 | | | | | $ | (236,290) | | | | | $ | (6,266) | | | | | $ | 221,519 | | | | | $ | 2,756 | | | | | $ | 6,963 | | | | | $ | — | | |
| Voya Floating Rate Fund - Class I | | | | | 67,440 | | | | | | 202,261 | | | | | | (51,473) | | | | | | 5,238 | | | | | | 223,466 | | | | | | 6,176 | | | | | | (364) | | | | | | — | | |
| Voya High Yield Bond Fund - Class I | | | | | 99,590 | | | | | | 185,319 | | | | | | (287,944) | | | | | | 3,035 | | | | | | — | | | | | | 5,858 | | | | | | (701) | | | | | | — | | |
| Voya High Yield Bond Fund - Class R6 | | | | | — | | | | | | 325,245 | | | | | | (105,555) | | | | | | 6,121 | | | | | | 225,811 | | | | | | 4,594 | | | | | | 6,545 | | | | | | — | | |
| Voya Index Plus LargeCap Portfolio - Class I | | | | | — | | | | | | 332,841 | | | | | | (121,817) | | | | | | 12,191 | | | | | | 223,215 | | | | | | 3,298 | | | | | | 1,476 | | | | | | — | | |
| Voya Intermediate Bond Fund - Class R6 | | | | | 42,431 | | | | | | 543,826 | | | | | | (269,501) | | | | | | (6,556) | | | | | | 310,200 | | | | | | 7,280 | | | | | | 3,480 | | | | | | — | | |
| Voya International Core Fund - Class I | | | | | 250,240 | | | | | | 766,840 | | | | | | (185,909) | | | | | | 18,409 | | | | | | 849,580 | | | | | | 12,174 | | | | | | (9,664) | | | | | | — | | |
| Voya International Index Portfolio - Class I | | | | | 66,462 | | | | | | 204,762 | | | | | | (49,893) | | | | | | 4,707 | | | | | | 226,038 | | | | | | 3,932 | | | | | | (2,602) | | | | | | — | | |
| Voya Large Cap Growth Portfolio - Class I | | | | | 215,529 | | | | | | 692,416 | | | | | | (159,503) | | | | | | (33,257) | | | | | | 715,185 | | | | | | 2,877 | | | | | | (6,461) | | | | | | 66,295 | | |
| Voya Large Cap Value Fund - Class R6 | | | | | 155,841 | | | | | | 444,703 | | | | | | (313,160) | | | | | | 23,202 | | | | | | 310,586 | | | | | | 5,378 | | | | | | 8,694 | | | | | | — | | |
| Voya MidCap Opportunities Portfolio - Class I | | | | | 100,805 | | | | | | 601,859 | | | | | | (142,106) | | | | | | (11,333) | | | | | | 549,225 | | | | | | — | | | | | | (5,648) | | | | | | 43,583 | | |
| Voya Multi-Manager Emerging Markets Equity Fund - Class I | | | | | 133,754 | | | | | | 405,651 | | | | | | (118,260) | | | | | | 19,572 | | | | | | 440,717 | | | | | | 4,795 | | | | | | 3,154 | | | | | | — | | |
| Voya Multi-Manager International Equity Fund - Class I | | | | | 319,625 | | | | | | 975,636 | | | | | | (233,590) | | | | | | 2,099 | | | | | | 1,063,770 | | | | | | 18,077 | | | | | | (11,879) | | | | | | — | | |
| Voya Multi-Manager Large Cap Core Portfolio - Class I | | | | | 340,848 | | | | | | 1,367,151 | | | | | | (684,528) | | | | | | 13,741 | | | | | | 1,037,212 | | | | | | 19,699 | | | | | | 17,421 | | | | | | 27,886 | | |
| Voya Multi-Manager Mid Cap Value Fund - Class I | | | | | 165,603 | | | | | | 549,160 | | | | | | (219,804) | | | | | | 65,183 | | | | | | 560,142 | | | | | | 6,457 | | | | | | (19,739) | | | | | | 8,936 | | |
| Voya Russell™ Mid Cap Growth Index Portfolio - Class I | | | | | 66,798 | | | | | | 34,402 | | | | | | (101,860) | | | | ��� | | 660 | | | | | | — | | | | | | — | | | | | | (2,611) | | | | | | — | | |
| Voya Small Company Portfolio - Class I | | | | | 133,474 | | | | | | 401,374 | | | | | | (137,396) | | | | | | 54,544 | | | | | | 451,996 | | | | | | 1,185 | | | | | | 2,686 | | | | | | 23,982 | | |
| Voya U.S. Bond Index Portfolio - Class I | | | | | 100,839 | | | | | | 426,031 | | | | | | (527,902) | | | | | | 1,032 | | | | | | — | | | | | | 1,820 | | | | | | 2,806 | | | | | | 185 | | |
| Voya U.S. Stock Index Portfolio - Class I | | | | | 167,152 | | | | | | 705,093 | | | | | | (426,399) | | | | | | 2,850 | | | | | | 448,696 | | | | | | 7,516 | | | | | | 1,717 | | | | | | 4,115 | | |
| VY® Clarion Global Real Estate Portfolio - Class I | | | | | 50,406 | | | | | | 159,863 | | | | | | (37,579) | | | | | | (3,161) | | | | | | 169,529 | | | | | | 1,598 | | | | | | 1,163 | | | | | | — | | |
| VY® Clarion Real Estate Portfolio - Class I | | | | | 51,432 | | | | | | 161,498 | | | | | | (41,041) | | | | | | (1,121) | | | | | | 170,768 | | | | | | 1,989 | | | | | | 3,263 | | | | | | — | | |
| VY® Invesco Comstock Portfolio - Class I | | | | | 148,220 | | | | | | 444,950 | | | | | | (139,984) | | | | | | 61,002 | | | | | | 514,188 | | | | | | 13,064 | | | | | | 4,989 | | | | | | — | | |
| VY® T. Rowe Price Capital Appreciation Portfolio - Class I | | | | | 226,134 | | | | | | 700,880 | | | | | | (161,803) | | | | | | (17,829) | | | | | | 747,382 | | | | | | 11,476 | | | | | | 26 | | | | | | 45,257 | | |
| VY® T. Rowe Price Growth Equity Portfolio - Class I | | | | | 216,571 | | | | | | 687,024 | | | | | | (168,983) | | | | | | (22,412) | | | | | | 712,200 | | | | | | — | | | | | | (9,274) | | | | | | 62,512 | | |
| | | | | $ | 3,186,560 | | | | | $ | 11,715,494 | | | | | $ | (4,922,280) | | | | | $ | 191,651 | | | | | $ | 10,171,425 | | | | | $ | 142,000 | | | | | $ | (4,560) | | | | | $ | 282,751 | | |
| |
The financial statements for the above mutual fund[s] can be found at www.sec.gov.
The effect of derivative instruments on the Portfolio’s Statement of Operations for the year ended December 31, 2016 was as follows:
| | | | Amount of Realized Gain or (Loss) on
Derivatives Recognized in Income | |
| Derivatives not accounted for as hedging instruments | | | Futures | |
| Equity contracts | | | | $ | (4,234) | | |
| Total | | | | $ | (4,234) | | |
| |
See Accompanying Notes to Financial Statements
PORTFOLIO OF INVESTMENTS
| Voya Solution 2045 Portfolio | as of December 31, 2016 |
| Shares | | | Value | | | Percentage
of Net
Assets | |
| EXCHANGE-TRADED FUNDS: 9.3% | |
| | | 51,415 | | | | iShares Barclays 20+ Year
Treasury Bond Fund | | | | $ | 6,125,069 | | | | | | 1.0 | | |
| | | 229,803 | | | | iShares Russell 1000 Value
Index Fund | | | | | 25,744,830 | | | | | | 4.2 | | |
| | | 113,783 | | | | SPDR Trust Series 1 | | | | | 25,433,914 | | | | | | 4.1 | | |
| | | | | | | Total Exchange-Traded Funds
(Cost $54,065,944) | | | | | 57,303,813 | | | | | | 9.3 | | |
| MUTUAL FUNDS: 90.5% | |
| | | | | | | Affiliated Investment Companies: 88.9% | |
| | | 1,275,243 | | | | Voya Emerging Markets Index
Portfolio - Class I | | | | | 12,191,320 | | | | | | 2.0 | | |
| | | 1,083,473 | | | | Voya Floating Rate Fund -
Class I | | | | | 10,791,393 | | | | | | 1.8 | | |
| | | 764,043 | | | | Voya Index Plus LargeCap
Portfolio - Class I | | | | | 18,482,193 | | | | | | 3.0 | | |
| | | 1,665,950 | | | | Voya Intermediate Bond
Fund - Class R6 | | | | | 16,592,861 | | | | | | 2.7 | | |
| | | 5,210,343 | | | | Voya International Core
Fund - Class I | | | | | 46,893,089 | | | | | | 7.6 | | |
| | | 2,478,088 | | | | Voya International Index
Portfolio - Class I | | | | | 21,831,955 | | | | | | 3.5 | | |
| | | 2,624,095 | | | | Voya Large Cap Growth
Portfolio - Class I | | | | | 45,501,803 | | | | | | 7.4 | | |
| | | 1,872,184 | | | | Voya Large Cap Value Fund -
Class R6 | | | | | 24,300,952 | | | | | | 3.9 | | |
| | | 2,698,547 | @ | | Voya MidCap Opportunities
Portfolio - Class I | | | | | 33,300,071 | | | | | | 5.4 | | |
| | | 2,582,999 | | | | Voya Multi-Manager Emerging
Markets Equity Fund - Class I | | | | | 24,254,360 | | | | | | 3.9 | | |
| | | 6,126,151 | | | | Voya Multi-Manager
International Equity Fund -
Class I | | | | | 61,751,601 | | | | | | 10.0 | | |
| | | 4,146,791 | | | | Voya Multi-Manager Large Cap
Core Portfolio - Class I | | | | | 61,745,716 | | | | | | 10.0 | | |
| | | 3,065,193 | | | | Voya Multi-Manager Mid Cap
Value Fund - Class I | | | | | 34,023,643 | | | | | | 5.5 | | |
| Shares | | | Value | | | Percentage
of Net
Assets | |
| MUTUAL FUNDS: (continued) | |
| | | | | | | Affiliated Investment Companies (continued) | |
| | | 1,129,031 | | | | Voya Small Company
Portfolio - Class I | | | | $ | 24,974,157 | | | | | | 4.0 | | |
| | | 1,268,267 | | | | Voya U.S. Stock Index
Portfolio - Class I | | | | | 17,489,407 | | | | | | 2.8 | | |
| | | 797,234 | | | | VY® Clarion Global Real
Estate Portfolio - Class I | | | | | 9,343,586 | | | | | | 1.5 | | |
| | | 256,753 | | | | VY® Clarion Real Estate
Portfolio - Class I | | | | | 9,417,718 | | | | | | 1.5 | | |
| | | 1,809,887 | | | | VY® Invesco Comstock
Portfolio - Class I | | | | | 31,618,719 | | | | | | 5.1 | | |
| | | 584,906 | @ | | VY® T. Rowe Price Growth
Equity Portfolio - Class I | | | | | 45,295,086 | | | | | | 7.3 | | |
| | | | | | | | | | | | 549,799,630 | | | | | | 88.9 | | |
| | | | | | | Unaffiliated Investment Companies: 1.6% | |
| | | 1,932,065 | @ | | Credit Suisse Commodity
Return Strategy Fund - Class I | | | | | 9,795,570 | | | | | | 1.6 | | |
| | | | | | | Total Mutual Funds
(Cost $578,748,790) | | | | | 559,595,200 | | | | | | 90.5 | | |
| | | | | | | Total Investments in
Securities
(Cost $632,814,734) | | | | $ | 616,899,013 | | | | | | 99.8 | | |
| | | | | | | Assets in Excess of
Other Liabilities | | | | | 1,013,352 | | | | | | 0.2 | | |
| | | | | | | Net Assets | | | | $ | 617,912,365 | | | | | | 100.0 | | |
| |
@
Non-income producing security.
Cost for federal income tax purposes is $642,108,030.
Net unrealized depreciation consists of:
| | Gross Unrealized Appreciation | | | | $ | 10,603,250 | | |
| | Gross Unrealized Depreciation | | | | | (35,812,267) | | |
| | Net Unrealized Depreciation | | | | $ | (25,209,017) | | |
| |
Fair Value Measurements^
The following is a summary of the fair valuations according to the inputs used as of December 31, 2016 in valuing the assets and liabilities:
| | | | Quoted Prices
in Active Markets
for Identical
Investments
(Level 1) | | | Significant
Other
Observable
Inputs
(Level 2) | | | Significant
Unobservable
Inputs
(Level 3) | | | Fair Value
at
December 31, 2016 | |
| Asset Table | | | | | |
| Investments, at fair value | | | | | |
| Exchange-Traded Funds | | | | $ | 57,303,813 | | | | | $ | — | | | | | $ | — | | | | | $ | 57,303,813 | | |
| Mutual Funds | | | | | 559,595,200 | | | | | | — | | | | | | — | | | | | | 559,595,200 | | |
| Total Investments, at fair value | | | | $ | 616,899,013 | | | | | $ | — | | | | | $ | — | | | | | $ | 616,899,013 | | |
| |
^
See Note 2, “Significant Accounting Policies” in the Notes to Financial Statements for additional information.
See Accompanying Notes to Financial Statements
PORTFOLIO OF INVESTMENTS
| Voya Solution 2045 Portfolio | as of December 31, 2016 (continued) |
Transactions with Affiliates
An investment of atleast 5% of the votiung securities of an issuer, or a company which is under common control results in that issuer becoming an affiliated person as defined by the 1940 Act.
The following table provides transactions during the year ended December 31, 2016, where the following issuers were considered an affiliate:
| Issuer | | | Beginning
Fair Value
at 12/31/15 | | | Purchases
at Cost | | | Sales
at Cost | | | Change in
Unrealized
Appreciation/
(Depreciation) | | | Ending
Fair Value
at 12/31/16 | | | Investment
Income | | | Realized
Gains/
(Losses) | | | Net Capital
Gain
Distributions | |
| Voya Emerging Markets Index Portfolio - Class I | | | | $ | 12,508,562 | | | | | $ | 14,754,355 | | | | | $ | (17,733,741) | | | | | $ | 2,662,144 | | | | | $ | 12,191,320 | | | | | $ | 270,147 | | | | | $ | (2,317,292) | | | | | $ | — | | |
| Voya Floating Rate Fund - Class I | | | | | 11,534,895 | | | | | | 2,154,759 | | | | | | (3,386,991) | | | | | | 488,730 | | | | | | 10,791,393 | | | | | | 460,615 | | | | | | (152,172) | | | | | | — | | |
| Voya Index Plus LargeCap Portfolio - Class I | | | | | — | | | | | | 20,310,065 | | | | | | (3,085,939) | | | | | | 1,258,067 | | | | | | 18,482,193 | | | | | | 323,614 | | | | | | 116,231 | | | | | | — | | |
| Voya Intermediate Bond Fund - Class R6 | | | | | 14,916,903 | | | | | | 18,124,579 | | | | | | (16,563,233) | | | | | | 114,612 | | | | | | 16,592,861 | | | | | | 626,339 | | | | | | 34,563 | | | | | | — | | |
| Voya International Core Fund - Class I | | | | | 48,682,468 | | | | | | 8,588,664 | | | | | | (10,305,624) | | | | | | (72,419) | | | | | | 46,893,089 | | | | | | 731,114 | | | | | | (403,010) | | | | | | — | | |
| Voya International Index Portfolio - Class I | | | | | 22,602,274 | | | | | | 4,413,614 | | | | | | (5,243,059) | | | | | | 59,126 | | | | | | 21,831,955 | | | | | | 676,328 | | | | | | (512,402) | | | | | | — | | |
| Voya Large Cap Growth Portfolio - Class I | | | | | 49,356,685 | | | | | | 11,210,115 | | | | | | (8,780,332) | | | | | | (6,284,665) | | | | | | 45,501,803 | | | | | | 267,049 | | | | | | 1,667,578 | | | | | | 6,154,468 | | |
| Voya Large Cap Value Fund - Class R6 | | | | | 38,510,566 | | | | | | 6,141,025 | | | | | | (25,147,334) | | | | | | 4,796,695 | | | | | | 24,300,952 | | | | | | 637,145 | | | | | | (2,067,146) | | | | | | — | | |
| Voya MidCap Opportunities Portfolio - Class I | | | | | 19,667,524 | | | | | | 22,376,617 | | | | | | (7,363,105) | | | | | | (1,380,965) | | | | | | 33,300,071 | | | | | | — | | | | | | (189,069) | | | | | | 3,751,217 | | |
| Voya Multi-Manager Emerging Markets Equity Fund - Class I | | | | | 25,404,950 | | | | | | 4,812,241 | | | | | | (9,094,256) | | | | | | 3,131,425 | | | | | | 24,254,360 | | | | | | 288,008 | | | | | | (1,184,379) | | | | | | — | | |
| Voya Multi-Manager International Equity Fund - Class I | | | | | 64,886,708 | | | | | | 11,511,779 | | | | | | (13,230,621) | | | | | | (1,416,265) | | | | | | 61,751,601 | | | | | | 1,142,810 | | | | | | (176,912) | | | | | | — | | |
| Voya Multi-Manager Large Cap Core Portfolio - Class I | | | | | 64,917,522 | | | | | | 10,521,720 | | | | | | (14,218,395) | | | | | | 524,869 | | | | | | 61,745,716 | | | | | | 1,361,518 | | | | | | 1,099,835 | | | | | | 2,293,406 | | |
| Voya Multi-Manager Mid Cap Value Fund - Class I | | | | | 35,477,328 | | | | | | 5,034,385 | | | | | | (13,155,841) | | | | | | 6,667,771 | | | | | | 34,023,643 | | | | | | 426,641 | | | | | | (2,772,431) | | | | | | 590,452 | | |
| Voya Russell™ Mid Cap Growth Index Portfolio - Class I | | | | | 16,258,347 | | | | | | 751,535 | | | | | | (15,615,591) | | | | | | (1,394,291) | | | | | | — | | | | | | — | | | | | | 1,485,328 | | | | | | — | | |
| Voya Russell™ Mid Cap Index Portfolio - Class I | | | | | — | | | | | | 13,306,008 | | | | | | (13,306,008) | | | | | | — | | | | | | — | | | | | | — | | | | | | (24,660) | | | | | | — | | |
| Voya Small Company Portfolio - Class I | | | | | 26,155,720 | | | | | | 4,776,472 | | | | | | (8,808,834) | | | | | | 2,850,799 | | | | | | 24,974,157 | | | | | | 116,647 | | | | | | 321,581 | | | | | | 2,360,680 | | |
| Voya U.S. Bond Index Portfolio - Class I | | | | | 13,070,537 | | | | | | 20,358,309 | | | | | | (33,610,119) | | | | | | 181,273 | | | | | | — | | | | | | 90,673 | | | | | | 114,209 | | | | | | 9,081 | | |
| Voya U.S. Stock Index Portfolio - Class I | | | | | 45,631,486 | | | | | | 23,734,475 | | | | | | (55,945,281) | | | | | | 4,068,727 | | | | | | 17,489,407 | | | | | | 381,202 | | | | | | (3,724,679) | | | | | | 1,395,572 | | |
| VY® Clarion Global Real Estate Portfolio - Class I | | | | | 9,793,080 | | | | | | 2,082,330 | | | | | | (2,512,388) | | | | | | (19,436) | | | | | | 9,343,586 | | | | | | 123,519 | | | | | | 13,290 | | | | | | — | | |
| VY® Clarion Real Estate Portfolio - Class I | | | | | 9,998,583 | | | | | | 2,289,215 | | | | | | (2,384,861) | | | | | | (485,219) | | | | | | 9,417,718 | | | | | | 160,043 | | | | | | 786,658 | | | | | | — | | |
| VY® Invesco Comstock Portfolio - Class I | | | | | 32,014,093 | | | | | | 4,954,900 | | | | | | (9,496,506) | | | | | | 4,146,232 | | | | | | 31,618,719 | | | | | | 828,716 | | | | | | 516,141 | | | | | | — | | |
VY® T. Rowe Price Growth Equity Portfolio - Class I | | | | | 49,323,932 | | | | | | 11,185,120 | | | | | | (8,894,557) | | | | | | (6,319,409) | | | | | | 45,295,086 | | | | | | — | | | | | | 1,641,474 | | | | | | 5,560,614 | | |
| | | | | $ | 610,712,163 | | | | | $ | 223,392,282 | | | | | $ | (297,882,616) | | | | | $ | 13,577,801 | | | | | $ | 549,799,630 | | | | | $ | 8,912,128 | | | | | $ | (5,727,264) | | | | | $ | 22,115,490 | | |
| |
The financial statements for the above mutual fund[s] can be found at www.sec.gov.
The effect of derivative instruments on the Portfolio’s Statement of Operations for the year ended December 31, 2016 was as follows:
| | | | Amount of Realized Gain or (Loss) on
Derivatives Recognized in Income | |
| Derivatives not accounted for as hedging instruments | | | Futures | |
| Equity contracts | | | | $ | (2,110,616) | | |
| Interest rate contracts | | | | | 185,185 | | |
| Total | | | | $ | (1,925,431) | | |
| |
See Accompanying Notes to Financial Statements
PORTFOLIO OF INVESTMENTS
| Voya Solution 2050 Portfolio | as of December 31, 2016 |
| Shares | | | Value | | | Percentage
of Net
Assets | |
| EXCHANGE-TRADED FUNDS: 8.7% | |
| | | 533 | | | | iShares Barclays 20+ Year
Treasury Bond Fund | | | | $ | 63,496 | | | | | | 0.9 | | |
| | | 2,383 | | | | iShares Russell 1000 Value
Index Fund | | | | | 266,968 | | | | | | 3.9 | | |
| | | 1,180 | | | | SPDR Trust Series 1 | | | | | 263,765 | | | | | | 3.9 | | |
| | | | | | | Total Exchange-Traded Funds
(Cost $568,068) | | | | | 594,229 | | | | | | 8.7 | | |
| MUTUAL FUNDS: 91.1% | |
| | | | | | | Affiliated Investment Companies: 89.6% | |
| | | 14,013 | | | | Voya Emerging Markets Index
Portfolio - Class I | | | | | 133,962 | | | | | | 2.0 | | |
| | | 11,898 | | | | Voya Floating Rate Fund -
Class I | | | | | 118,500 | | | | | | 1.8 | | |
| | | 8,389 | | | | Voya Index Plus LargeCap
Portfolio - Class I | | | | | 202,920 | | | | | | 3.0 | | |
| | | 18,695 | | | | Voya Intermediate Bond Fund -
Class R6 | | | | | 186,205 | | | | | | 2.8 | | |
| | | 57,181 | | | | Voya International Core Fund -
Class I | | | | | 514,629 | | | | | | 7.6 | | |
| | | 27,201 | | | | Voya International Index
Portfolio - Class I | | | | | 239,638 | | | | | | 3.5 | | |
| | | 28,831 | | | | Voya Large Cap Growth
Portfolio - Class I | | | | | 499,922 | | | | | | 7.4 | | |
| | | 21,753 | | | | Voya Large Cap Value Fund -
Class R6 | | | | | 282,360 | | | | | | 4.2 | | |
| | | 29,645 | @ | | Voya MidCap Opportunities
Portfolio - Class I | | | | | 365,814 | | | | | | 5.4 | | |
| | | 28,386 | | | | Voya Multi-Manager Emerging
Markets Equity Fund - Class I | | | | | 266,542 | | | | | | 3.9 | | |
| | | 67,273 | | | | Voya Multi-Manager
International Equity Fund -
Class I | | | | | 678,115 | | | | | | 10.0 | | |
| | | 46,143 | | | | Voya Multi-Manager Large Cap
Core Portfolio - Class I | | | | | 687,068 | | | | | | 10.1 | | |
| | | 33,634 | | | | Voya Multi-Manager Mid Cap
Value Fund - Class I | | | | | 373,341 | | | | | | 5.5 | | |
| Shares | | | Value | | | Percentage
of Net
Assets | |
| MUTUAL FUNDS: (continued) | |
| | | | | | | Affiliated Investment Companies (continued) | |
| | | 12,387 | | | | Voya Small Company
Portfolio - Class I | | | | $ | 274,008 | | | | | | 4.0 | | |
| | | 14,795 | | | | Voya U.S. Stock Index
Portfolio - Class I | | | | | 204,028 | | | | | | 3.0 | | |
| | | 8,758 | | | | VY® Clarion Global Real
Estate Portfolio - Class I | | | | | 102,638 | | | | | | 1.5 | | |
| | | 2,820 | | | | VY® Clarion Real Estate
Portfolio - Class I | | | | | 103,429 | | | | | | 1.5 | | |
| | | 19,838 | | | | VY® Invesco Comstock
Portfolio - Class I | | | | | 346,564 | | | | | | 5.1 | | |
| | | 6,428 | @ | | VY® T. Rowe Price Growth
Equity Portfolio - Class I | | | | | 497,773 | | | | | | 7.3 | | |
| | | | | | | | | | | | 6,077,456 | | | | | | 89.6 | | |
| | | | | | | Unaffiliated Investment Companies: 1.5% | |
| | | 19,979 | @ | | Credit Suisse Commodity
Return Strategy Fund -
Class I | | | | | 101,295 | | | | | | 1.5 | | |
| | | | | | | Total Mutual Funds
(Cost $6,068,213) | | | | | 6,178,751 | | | | | | 91.1 | | |
| | | | | | | Total Investments in
Securities | | | |
| | | | | | | (Cost $6,636,281) | | | | $ | 6,772,980 | | | | | | 99.8 | | |
| | | | | | | Assets in Excess of Other
Liabilities | | | | | 10,792 | | | | | | 0.2 | | |
| | | | | | | Net Assets | | | | $ | 6,783,772 | | | | | | 100.0 | | |
| |
@
Non-income producing security.
Cost for federal income tax purposes is $6,720,542.
Net unrealized appreciation consists of:
| | Gross Unrealized Appreciation | | | | $ | 193,460 | | |
| | Gross Unrealized Depreciation | | | | | (141,022) | | |
| | Net Unrealized Appreciation | | | | $ | 52,438 | | |
| |
Fair Value Measurements^
The following is a summary of the fair valuations according to the inputs used as of December 31, 2016 in valuing the assets and liabilities:
| | | | Quoted Prices
in Active Markets
for Identical
Investments
(Level 1) | | | Significant
Other Observable
Inputs
(Level 2) | | | Significant
Unobservable
Inputs
(Level 3) | | | Fair Value
at
December 31, 2016 | |
| Asset Table | | | | | |
| Investments, at fair value | | | | | |
| Exchange-Traded Funds | | | | $ | 594,229 | | | | | $ | — | | | | | $ | — | | | | | $ | 594,229 | | |
| Mutual Funds | | | | | 6,178,751 | | | | | | — | | | | | | — | | | | | | 6,178,751 | | |
| Total Investments, at fair value | | | | $ | 6,772,980 | | | | | $ | — | | | | | $ | — | | | | | $ | 6,772,980 | | |
| |
^
See Note 2, “Significant Accounting Policies” in the Notes to Financial Statements for additional information.
See Accompanying Notes to Financial Statements
PORTFOLIO OF INVESTMENTS
| Voya Solution 2050 Portfolio | as of December 31, 2016 (continued) |
Transactions with Affiliates
An investment of at least 5% of the voting securities of an issuer, or a company which is under common control results in that issuer becoming an affiliated person as defined by the 1940 Act.
The following table provides transactions during the year ended December 31, 2016, where the following issuers were considered an affiliate:
| Issuer | | | Beginning
Fair Value
at 12/31/15 | | | Purchases
at Cost | | | Sales
at Cost | | | Change in
Unrealized
Appreciation/
(Depreciation) | | | Ending
Fair Value
at 12/31/16 | | | Investment
Income | | | Realized
Gains/
(Losses) | | | Net Capital
Gain
Distributions | |
| Voya Emerging Markets Index Portfolio - Class I | | | | $ | 32,383 | | | | | $ | 251,639 | | | | | $ | (146,945) | | | | | $ | (3,115) | | | | | $ | 133,962 | | | | | $ | 1,471 | | | | | $ | 2,818 | | | | | $ | — | | |
| Voya Floating Rate Fund - Class I | | | | | 29,581 | | | | | | 109,694 | | | | | | (23,503) | | | | | | 2,728 | | | | | | 118,500 | | | | | | 3,143 | | | | | | (219) | | | | | | — | | |
| Voya Index Plus LargeCap Portfolio - Class I | | | | | — | | | | | | 225,343 | | | | | | (33,632) | | | | | | 11,209 | | | | | | 202,920 | | | | | | 1,759 | | | | | | 1,198 | | | | | | — | | |
| Voya Intermediate Bond Fund - Class R6 | | | | | 38,274 | | | | | | 347,089 | | | | | | (194,732) | | | | | | (4,426) | | | | | | 186,205 | | | | | | 4,569 | | | | | | 2,516 | | | | | | — | | |
| Voya International Core Fund - Class I | | | | | 125,717 | | | | | | 475,934 | | | | | | (98,370) | | | | | | 11,348 | | | | | | 514,629 | | | | | | 7,967 | | | | | | (6,568) | | | | | | — | | |
| Voya International Index Portfolio - Class I | | | | | 58,422 | | | | | | 246,215 | | | | | | (70,311) | | | | | | 5,312 | | | | | | 239,638 | | | | | | 3,670 | | | | | | (3,787) | | | | | | — | | |
| Voya Large Cap Growth Portfolio - Class I | | | | | 127,012 | | | | | | 497,829 | | | | | | (107,080) | | | | | | (17,839) | | | | | | 499,922 | | | | | | 1,931 | | | | | | (7,753) | | | | | | 44,502 | | |
| Voya Large Cap Value Fund - Class R6 | | | | | 105,544 | | | | | | 415,705 | | | | | | (257,802) | | | | | | 18,913 | | | | | | 282,360 | | | | | | 4,755 | | | | | | 10,678 | | | | | | — | | |
| Voya MidCap Opportunities Portfolio - Class I | | | | | 50,639 | | | | | | 410,686 | | | | | | (90,189) | | | | | | (5,322) | | | | | | 365,814 | | | | | | — | | | | | | (4,052) | | | | | | 26,342 | | |
| Voya Multi-Manager Emerging Markets Equity Fund - Class I | | | | | 65,514 | | | | | | 253,235 | | | | | | (62,872) | | | | | | 10,665 | | | | | | 266,542 | | | | | | 3,141 | | | | | | 1,358 | | | | | | — | | |
| Voya Multi-Manager International Equity Fund - Class I | | | | | 167,504 | | | | | | 638,170 | | | | | | (128,529) | | | | | | 970 | | | | | | 678,115 | | | | | | 12,460 | | | | | | (8,418) | | | | | | — | | |
| Voya Multi-Manager Large Cap Core Portfolio - Class I | | | | | 174,565 | | | | | | 718,260 | | | | | | (222,336) | | | | | | 16,579 | | | | | | 687,068 | | | | | | 12,463 | | | | | | 3,496 | | | | | | 16,585 | | |
| Voya Multi-Manager Mid Cap Value Fund - Class I | | | | | 91,602 | | | | | | 375,189 | | | | | | (131,509) | | | | | | 38,059 | | | | | | 373,341 | | | | | | 4,649 | | | | | | (7,971) | | | | | | 6,434 | | |
| Voya Russell™ Mid Cap Growth Index Portfolio - Class I | | | | | 41,943 | | | | | | 26,522 | | | | | | (68,800) | | | | | | 335 | | | | | | — | | | | | | — | | | | | | (631) | | | | | | — | | |
| Voya Small Company Portfolio - Class I | | | | | 67,095 | | | | | | 246,801 | | | | | | (74,450) | | | | | | 34,562 | | | | | | 274,008 | | | | | | 632 | | | | | | 1,096 | | | | | | 12,790 | | |
| Voya U.S. Bond Index Portfolio - Class I | | | | | 35,276 | | | | | | 214,140 | | | | | | (249,732) | | | | | | 316 | | | | | | — | | | | | | 851 | | | | | | 1,660 | | | | | | 102 | | |
| Voya U.S. Stock Index Portfolio - Class I | | | | | 117,677 | | | | | | 524,591 | | | | | | (441,736) | | | | | | 3,496 | | | | | | 204,028 | | | | | | 3,644 | | | | | | 3,234 | | | | | | 5,188 | | |
| VY® Clarion Global Real Estate Portfolio - Class I | | | | | 25,360 | | | | | | 98,919 | | | | | | (19,561) | | | | | | (2,080) | | | | | | 102,638 | | | | | | 932 | | | | | | 479 | | | | | | — | | |
| VY® Clarion Real Estate Portfolio - Class I | | | | | 25,893 | | | | | | 99,886 | | | | | | (21,242) | | | | | | (1,108) | | | | | | 103,429 | | | | | | 1,157 | | | | | | 1,950 | | | | | | — | | |
| VY® Invesco Comstock Portfolio - Class I | | | | | 82,695 | | | | | | 305,454 | | | | | | (83,335) | | | | | | 41,750 | | | | | | 346,564 | | | | | | 8,801 | | | | | | 2,622 | | | | | | — | | |
| VY® T. Rowe Price Growth Equity Portfolio - Class I | | | | | 127,011 | | | | | | 487,082 | | | | | | (104,820) | | | | | | (11,500) | | | | | | 497,773 | | | | | | — | | | | | | (8,703) | | | | | | 42,969 | | |
| | | | | $ | 1,589,707 | | | | | $ | 6,968,383 | | | | | $ | (2,631,486) | | | | | $ | 150,852 | | | | | $ | 6,077,456 | | | | | $ | 77,995 | | | | | $ | (14,997) | | | | | $ | 154,912 | | |
| |
The financial statements for the above mutual fund[s] can be found at www.sec.gov.
The effect of derivative instruments on the Portfolio’s Statement of Operations for the year ended December 31, 2016 was as follows:
| | | | Amount of Realized Gain or (Loss) on
Derivatives Recognized in Income | |
| Derivatives not accounted for as hedging instruments | | | Futures | |
| Equity contracts | | | | $ | (2,117) | | |
| Total | | | | $ | (2,117) | | |
| |
See Accompanying Notes to Financial Statements
PORTFOLIO OF INVESTMENTS
| Voya Solution 2055 Portfolio | as of December 31, 2016 |
| | Shares | | | Value | | | Percentage
of Net
Assets | |
| | EXCHANGE-TRADED FUNDS: 6.9% | |
| | | | 8,742 | | | | iShares Barclays 20+ Year
Treasury Bond Fund | | | | $ | 1,041,434 | | | | | | 0.7 | | |
| | | | 52,099 | | | | iShares Russell 1000 Value
Index Fund | | | | | 5,836,651 | | | | | | 4.1 | | |
| | | | 12,898 | | | | SPDR Trust Series 1 | | | | | 2,883,090 | | | | | | 2.1 | | |
| | | | | | | | Total Exchange-Traded Funds | | | |
| | | | | | | | (Cost $9,066,930) | | | | | 9,761,175 | | | | | | 6.9 | | |
| | MUTUAL FUNDS: 93.0% | |
| | | | | | | | Affiliated Investment Companies: 91.4% | |
| | | | 292,345 | | | | Voya Emerging Markets Index
Portfolio - Class I | | | | | 2,794,820 | | | | | | 2.0 | | |
| | | | 175,110 | | | | Voya Index Plus LargeCap
Portfolio - Class I | | | | | 4,235,905 | | | | | | 3.0 | | |
| | | | 384,259 | | | | Voya Intermediate Bond Fund -
Class R6 | | | | | 3,827,221 | | | | | | 2.7 | | |
| | | | 1,194,094 | | | | Voya International Core Fund -
Class I | | | | | 10,746,843 | | | | | | 7.6 | | |
| | | | 567,940 | | | | Voya International Index
Portfolio - Class I | | | | | 5,003,550 | | | | | | 3.5 | | |
| | | | 601,508 | | | | Voya Large Cap Growth
Portfolio - Class I | | | | | 10,430,145 | | | | | | 7.4 | | |
| | | | 433,957 | | | | Voya Large Cap Value Fund -
Class R6 | | | | | 5,632,760 | | | | | | 4.0 | | |
| | | | 618,586 | @ | | Voya MidCap Opportunities
Portfolio - Class I | | | | | 7,633,349 | | | | | | 5.4 | | |
| | | | 592,157 | | | | Voya Multi-Manager Emerging
Markets Equity Fund - Class I | | | | | 5,560,357 | | | | | | 3.9 | | |
| | | | 1,404,172 | | | | Voya Multi-Manager
International Equity Fund -
Class I | | | | | 14,154,056 | | | | | | 10.0 | | |
| | | | 950,389 | | | | Voya Multi-Manager Large Cap
Core Portfolio - Class I | | | | | 14,151,297 | | | | | | 10.0 | | |
| | | | 702,456 | | | | Voya Multi-Manager Mid Cap
Value Fund - Class I | | | | | 7,797,265 | | | | | | 5.5 | | |
| | Shares | | | Value | | | Percentage
of Net
Assets | |
| | MUTUAL FUNDS: (continued) | |
| | | | | | | | Affiliated Investment Companies (continued) | |
| | | | 258,729 | | | | Voya Small Company
Portfolio - Class I | | | | $ | 5,723,080 | | | | | | 4.0 | | |
| | | | 713,056 | | | | Voya U.S. Stock Index
Portfolio - Class I | | | | | 9,833,036 | | | | | | 7.0 | | |
| | | | 182,737 | | | | VY® Clarion Global Real
Estate Portfolio - Class I | | | | | 2,141,682 | | | | | | 1.5 | | |
| | | | 58,843 | | | | VY® Clarion Real Estate
Portfolio - Class I | | | | | 2,158,379 | | | | | | 1.5 | | |
| | | | 414,665 | | | | VY® Invesco Comstock
Portfolio - Class I | | | | | 7,244,202 | | | | | | 5.1 | | |
| | | | 134,082 | @ | | VY® T. Rowe Price Growth
Equity Portfolio - Class I | | | | | 10,383,318 | | | | | | 7.3 | | |
| | | | | | | | | | | | | 129,451,265 | | | | | | 91.4 | | |
| | | | | | | | Unaffiliated Investment Companies: 1.6% | |
| | | | 437,735 | @ | | Credit Suisse Commodity
Return Strategy Fund -
Class I | | | | | 2,219,316 | | | | | | 1.6 | | |
| | | | | | | | Total Mutual Funds | | | |
| | | | | | | | (Cost $135,643,021) | | | | | 131,670,581 | | | | | | 93.0 | | |
| | | | | | | | Total Investments in Securities | | | |
| | | | | | | | (Cost $144,709,951) | | | | $ | 141,431,756 | | | | | | 99.9 | | |
| | | | | | | | Assets in Excess of Other
Liabilities | | | | | 194,643 | | | | | | 0.1 | | |
| | | | | | | | Net Assets | | | | $ | 141,626,399 | | | | | | 100.0 | | |
| |
@
Non-income producing security.
Cost for federal income tax purposes is $148,862,676.
Net unrealized depreciation consists of:
| | Gross Unrealized Appreciation | | | | $ | 2,639,520 | | |
| | Gross Unrealized Depreciation | | | | | (10,070,440) | | |
| | Net Unrealized Depreciation | | | | $ | (7,430,920) | | |
| |
Fair Value Measurements^
The following is a summary of the fair valuations according to the inputs used as of December 31, 2016 in valuing the assets and liabilities:
| | | | Quoted Prices
in Active Markets
for Identical
Investments
(Level 1) | | | Significant
Other
Observable
Inputs
(Level 2) | | | Significant
Unobservable
Inputs
(Level 3) | | | Fair Value
at
December 31, 2016 | |
| Asset Table | | | | | |
| Investments, at fair value | | | | | |
| Exchange-Traded Funds | | | | $ | 9,761,175 | | | | | $ | — | | | | | $ | — | | | | | $ | 9,761,175 | | |
| Mutual Funds | | | | | 131,670,581 | | | | | | — | | | | | | — | | | | | | 131,670,581 | | |
| Total Investments, at fair value | | | | $ | 141,431,756 | | | | | $ | — | | | | | $ | — | | | | | $ | 141,431,756 | | |
| |
^
See Note 2, “Significant Accounting Policies” in the Notes to Financial Statements for additional information.
See Accompanying Notes to Financial Statements
PORTFOLIO OF INVESTMENTS
| Voya Solution 2055 Portfolio | as of December 31, 2016 (continued) |
Transactions with Affiliates
An investment of at least 5% of the voting securities of an issuer, or a company which is under common control results in that issuer becoming an affiliated person as defined by the 1940 Act.
The following table provides transactions during the year ended December 31, 2016, where the following issuers were considered an affiliate:
| Issuer | | | Beginning
Fair Value
at 12/31/15 | | | Purchases at
Cost | | | Sales at
Cost | | | Change in
Unrealized
Appreciation/
(Depreciation) | | | Ending
Fair Value
at 12/31/16 | | | Investment
Income | | | Realized
Gains/
(Losses) | | | Net Capital
Gain
Distributions | |
| Voya Emerging Markets Index Portfolio - Class I | | | | $ | 2,482,539 | | | | | $ | 3,645,368 | | | | | $ | (3,781,674) | | | | | $ | 448,587 | | | | | $ | 2,794,820 | | | | | $ | 56,284 | | | | | $ | (389,647) | | | | | $ | — | | |
| Voya Index Plus LargeCap Portfolio - Class I | | | | | — | | | | | | 4,598,576 | | | | | | (642,628) | | | | | | 279,957 | | | | | | 4,235,905 | | | | | | 67,490 | | | | | | 24,476 | | | | | | — | | |
| Voya Intermediate Bond Fund - Class R6 | | | | | 2,939,607 | | | | | | 4,483,940 | | | | | | (3,600,348) | | | | | | 4,022 | | | | | | 3,827,221 | | | | | | 130,382 | | | | | | 20,033 | | | | | | — | | |
| Voya International Core Fund - Class I | | | | | 9,621,776 | | | | | | 3,327,883 | | | | | | (2,546,067) | | | | | | 343,251 | | | | | | 10,746,843 | | | | | | 166,450 | | | | | | (417,464) | | | | | | — | | |
| Voya International Index Portfolio - Class I | | | | | 4,470,245 | | | | | | 2,865,903 | | | | | | (2,595,050) | | | | | | 262,452 | | | | | | 5,003,550 | | | | | | 140,899 | | | | | | (404,971) | | | | | | — | | |
| Voya Large Cap Growth Portfolio - Class I | | | | | 9,739,815 | | | | | | 3,887,747 | | | | | | (2,161,834) | | | | | | (1,035,583) | | | | | | 10,430,145 | | | | | | 56,708 | | | | | | 89,712 | | | | | | 1,306,896 | | |
| Voya Large Cap Value Fund - Class R6 | | | | | 7,699,454 | | | | | | 2,534,373 | | | | | | (5,884,047) | | | | | | 1,282,980 | | | | | | 5,632,760 | | | | | | 136,891 | | | | | | (656,816) | | | | | | — | | |
| Voya MidCap Opportunities Portfolio - Class I | | | | | 3,880,959 | | | | | | 5,584,234 | | | | | | (1,906,212) | | | | | | 74,368 | | | | | | 7,633,349 | | | | | | — | | | | | | (391,407) | | | | | | 794,868 | | |
| Voya Multi-Manager Emerging Markets Equity Fund - Class I | | | | | 5,009,401 | | | | | | 1,815,256 | | | | | | (1,920,837) | | | | | | 656,537 | | | | | | 5,560,357 | | | | | | 65,575 | | | | | | (254,910) | | | | | | — | | |
Voya Multi-Manager International Equity Fund -
Class I | | | | | 12,817,117 | | | | | | 4,460,184 | | | | | | (2,943,378) | | | | | | (179,867) | | | | | | 14,154,056 | | | | | | 260,196 | | | | | | (149,163) | | | | | | — | | |
Voya Multi-Manager Large Cap Core Portfolio -
Class I | | | | | 12,973,510 | | | | | | 4,211,183 | | | | | | (3,411,246) | | | | | | 377,850 | | | | | | 14,151,297 | | | | | | 299,780 | | | | | | 9,081 | | | | | | 487,014 | | |
| Voya Multi-Manager Mid Cap Value Fund - Class I | | | | | 7,002,864 | | | | | | 2,143,266 | | | | | | (2,861,051) | | | | | | 1,512,186 | | | | | | 7,797,265 | | | | | | 97,131 | | | | | | (656,192) | | | | | | 134,425 | | |
Voya Russell™ Mid Cap Growth Index
Portfolio - Class I | | | | | 3,208,924 | | | | | | 332,324 | | | | | | (3,427,765) | | | | | | (113,483) | | | | | | — | | | | | | — | | | | | | 139,250 | | | | | | — | | |
Voya Russell™ Mid Cap Index Portfolio -
Class I | | | | | — | | | | | | 2,975,705 | | | | | | (2,975,705) | | | | | | — | | | | | | — | | | | | | — | | | | | | (859) | | | | | | — | | |
| Voya Small Company Portfolio - Class I | | | | | 5,159,922 | | | | | | 1,777,016 | | | | | | (2,184,380) | | | | | | 970,522 | | | | | | 5,723,080 | | | | | | 24,288 | | | | | | (241,105) | | | | | | 491,538 | | |
| Voya U.S. Bond Index Portfolio - Class I | | | | | 2,622,075 | | | | | | 5,639,078 | | | | | | (8,297,085) | | | | | | 35,932 | | | | | | — | | | | | | 21,049 | | | | | | 29,428 | | | | | | 3,791 | | |
| Voya U.S. Stock Index Portfolio - Class I | | | | | 11,567,479 | | | | | | 9,762,203 | | | | | | (12,629,164) | | | | | | 1,132,518 | | | | | | 9,833,036 | | | | | | 188,692 | | | | | | (909,834) | | | | | | 449,548 | | |
VY® Clarion Global Real Estate Portfolio -
Class I | | | | | 1,948,269 | | | | | | 748,666 | | | | | | (548,595) | | | | | | (6,658) | | | | | | 2,141,682 | | | | | | 26,361 | | | | | | 264 | | | | | | — | | |
| VY® Clarion Real Estate Portfolio - Class I | | | | | 1,968,763 | | | | | | 790,233 | | | | | | (538,185) | | | | | | (62,432) | | | | | | 2,158,379 | | | | | | 33,985 | | | | | | 123,437 | | | | | | — | | |
| VY® Invesco Comstock Portfolio - Class I | | | | | 6,319,628 | | | | | | 2,018,493 | | | | | | (2,072,414) | | | | | | 978,495 | | | | | | 7,244,202 | | | | | | 188,131 | | | | | | 60,978 | | | | | | — | | |
VY® T. Rowe Price Growth Equity Portfolio - Class I | | | | | 9,730,542 | | | | | | 3,846,503 | | | | | | (2,292,065) | | | | | | (901,662) | | | | | | 10,383,318 | | | | | | — | | | | | | (44,640) | | | | | | 1,187,961 | | |
| | | | | $ | 121,162,889 | | | | | $ | 71,448,134 | | | | | $ | (69,219,730) | | | | | $ | 6,059,972 | | | | | $ | 129,451,265 | | | | | $ | 1,960,292 | | | | | $ | (4,020,350) | | | | | $ | 4,856,041 | | |
| |
The financial statements for the above mutual fund[s] can be found at www.sec.gov.
The effect of derivative instruments on the Portfolio’s Statement of Operations for the year ended December 31, 2016 was as follows:
| | | | Amount of Realized Gain or (Loss) on
Derivatives Recognized in Income | |
| Derivatives not accounted for as hedging instruments | | | Futures | |
| Equity contracts | | | | $ | (422,213) | | |
| Interest rate contracts | | | | | 35,676 | | |
| Total | | | | $ | (386,537) | | |
| |
See Accompanying Notes to Financial Statements
PORTFOLIO OF INVESTMENTS
| Voya Solution 2060 Portfolio | as of December 31, 2016 |
| Shares | | | Value | | | Percentage
of Net
Assets | |
| EXCHANGE-TRADED FUNDS: 8.8% | |
| | | 174 | | | | iShares Barclays 20+ Year
Treasury Bond Fund | | | | $ | 20,729 | | | | | | 0.7 | | |
| | | 1,037 | | | | iShares Russell 1000 Value Index
Fund | | | | | 116,175 | | | | | | 4.1 | | |
| | | 513 | | | | SPDR Trust Series 1 | | | | | 114,671 | | | | | | 4.0 | | |
| | | | | | | Total Exchange-Traded Funds
(Cost $239,844) | | | | | 251,575 | | | | | | 8.8 | | |
| MUTUAL FUNDS: 91.2% | |
| | | | | | | Affiliated Investment Companies: 89.7% | |
| | | 5,938 | | | | Voya Emerging Markets Index
Portfolio - Class I | | | | | 56,763 | | | | | | 2.0 | | |
| | | 3,557 | | | | Voya Index Plus LargeCap
Portfolio - Class I | | | | | 86,035 | | | | | | 3.0 | | |
| | | 7,846 | | | | Voya Intermediate Bond Fund -
Class R6 | | | | | 78,150 | | | | | | 2.7 | | |
| | | 24,248 | | | | Voya International Core Fund -
Class I | | | | | 218,234 | | | | | | 7.6 | | |
| | | 11,534 | | | | Voya International Index Portfolio -
Class I | | | | | 101,611 | | | | | | 3.5 | | |
| | | 12,220 | | | | Voya Large Cap Growth Portfolio -
Class I | | | | | 211,893 | | | | | | 7.4 | | |
| | | 8,999 | | | | Voya Large Cap Value Fund -
Class R6 | | | | | 116,812 | | | | | | 4.1 | | |
| | | 12,565 | @ | | Voya MidCap Opportunities
Portfolio - Class I | | | | | 155,055 | | | | | | 5.4 | | |
| | | 12,028 | | | | Voya Multi-Manager Emerging
Markets Equity Fund - Class I | | | | | 112,946 | | | | | | 3.9 | | |
| | | 28,519 | | | | Voya Multi-Manager International
Equity Fund - Class I | | | | | 287,474 | | | | | | 10.0 | | |
| | | 19,292 | | | | Voya Multi-Manager Large Cap
Core Portfolio - Class I | | | | | 287,252 | | | | | | 10.0 | | |
| | | 14,264 | | | | Voya Multi-Manager Mid Cap
Value Fund - Class I | | | | | 158,325 | | | | | | 5.5 | | |
| Shares | | | Value | | | Percentage
of Net
Assets | |
| MUTUAL FUNDS: (continued) | |
| | | | | | | Affiliated Investment Companies (continued) | |
| | | 5,253 | | | | Voya Small Company Portfolio -
Class I | | | | $ | 116,202 | | | | | | 4.1 | | |
| | | 10,453 | | | | Voya U.S. Stock Index Portfolio -
Class I | | | | | 144,152 | | | | | | 5.0 | | |
| | | 3,711 | | | | VY® Clarion Global Real Estate
Portfolio - Class I | | | | | 43,495 | | | | | | 1.5 | | |
| | | 1,195 | | | | VY® Clarion Real Estate Portfolio -
Class I | | | | | 43,843 | | | | | | 1.5 | | |
| | | 8,416 | | | | VY® Invesco Comstock Portfolio -
Class I | | | | | 147,028 | | | | | | 5.1 | | |
| | | 2,724 | @ | | VY® T. Rowe Price Growth Equity
Portfolio - Class I | | | | | 210,945 | | | | | | 7.4 | | |
| | | | | | | | | | | | 2,576,215 | | | | | | 89.7 | | |
| | | | | | | Unaffiliated Investment Companies: 1.5% | |
| | | 8,688 | @ | | Credit Suisse Commodity Return
Strategy Fund - Class I | | | | | 44,046 | | | | | | 1.5 | | |
| | | | | | | Total Mutual Funds
(Cost $2,576,598) | | | | | 2,620,261 | | | | | | 91.2 | | |
| | | | | | | Total Investments in Securities | | | |
| | | | | | | (Cost $2,816,442) | | | | $ | 2,871,836 | | | | | | 100.0 | | |
| | | | | | | Liabilities in Excess of
Other Assets | | | | | (328) | | | | | | — | | |
| | | | | | | Net Assets | | | | $ | 2,871,508 | | | | | | 100.0 | | |
| |
@
Non-income producing security.
Cost for federal income tax purposes is $2,840,890.
Net unrealized appreciation consists of:
| | Gross Unrealized Appreciation | | | | $ | 76,297 | | |
| | Gross Unrealized Depreciation | | | | | (45,351) | | |
| | Net Unrealized Appreciation | | | | $ | 30,946 | | |
| |
Fair Value Measurements^
The following is a summary of the fair valuations according to the inputs used as of December 31, 2016 in valuing the assets and liabilities:
| | | | Quoted Prices
in Active Markets
for Identical
Investments
(Level 1) | | | Significant
Other
Observable
Inputs
(Level 2) | | | Significant
Unobservable
Inputs
(Level 3) | | | Fair Value
at
December 31, 2016 | |
| Asset Table | | | | | |
| Investments, at fair value | | | | | |
| Exchange-Traded Funds | | | | $ | 251,575 | | | | | $ | — | | | | | $ | — | | | | | $ | 251,575 | | |
| Mutual Funds | | | | | 2,620,261 | | | | | | — | | | | | | — | | | | | | 2,620,261 | | |
| Total Investments, at fair value | | | | $ | 2,871,836 | | | | | $ | — | | | | | $ | — | | | | | $ | 2,871,836 | | |
| |
^
See Note 2, “Significant Accounting Policies” in the Notes to Financial Statements for additional information.
See Accompanying Notes to Financial Statements
PORTFOLIO OF INVESTMENTS
| Voya Solution 2060 Portfolio | as of December 31, 2016 (continued) |
Transactions with Affiliates
An investment of at least 5% of the voting securities of an issuer, or a company which is under common control results in that issuer becoming an affiliated person as defined by the 1940 Act.
The following table provides transactions during the year ended December 31, 2016, where the following issuers were considered an affiliate:
| Issuer | | | Beginning
Fair Value
at 12/31/15 | | | Purchases
at Cost | | | Sales
at Cost | | | Change in
Unrealized
Appreciation/
(Depreciation) | | | Ending
Fair Value
at 12/31/16 | | | Investment
Income | | | Realized
Gains/
(Losses) | | | Net Capital
Gain
Distributions | |
| Voya Emerging Markets Index Portfolio - Class I | | | | $ | 13,624 | | | | | $ | 110,435 | | | | | $ | (65,510) | | | | | $ | (1,786) | | | | | $ | 56,763 | | | | | $ | 598 | | | | | $ | 1,540 | | | | | $ | — | | |
| Voya Index Plus LargeCap Portfolio - Class I | | | | | — | | | | | | 99,468 | | | | | | (18,119) | | | | | | 4,686 | | | | | | 86,035 | | | | | | 716 | | | | | | 764 | | | | | | — | | |
| Voya Intermediate Bond Fund - Class R6 | | | | | 15,409 | | | | | | 136,311 | | | | | | (71,823) | | | | | | (1,747) | | | | | | 78,150 | | | | | | 1,878 | | | | | | 830 | | | | | | — | | |
| Voya International Core Fund - Class I | | | | | 50,472 | | | | | | 217,818 | | | | | | (54,639) | | | | | | 4,583 | | | | | | 218,234 | | | | | | 3,404 | | | | | | (1,751) | | | | | | — | | |
| Voya International Index Portfolio - Class I | | | | | 23,435 | | | | | | 111,989 | | | | | | (35,508) | | | | | | 1,695 | | | | | | 101,611 | | | | | | 1,493 | | | | | | (608) | | | | | | — | | |
| Voya Large Cap Growth Portfolio - Class I | | | | | 50,215 | | | | | | 223,843 | | | | | | (54,219) | | | | | | (7,946) | | | | | | 211,893 | | | | | | 805 | | | | | | (2,056) | | | | | | 18,562 | | |
| Voya Large Cap Value Fund - Class R6 | | | | | 41,068 | | | | | | 215,221 | | | | | | (146,423) | | | | | | 6,946 | | | | | | 116,812 | | | | | | 1,957 | | | | | | 6,350 | | | | | | — | | |
| Voya MidCap Opportunities Portfolio - Class I | | | | | 20,351 | | | | | | 185,418 | | | | | | (48,814) | | | | | | (1,900) | | | | | | 155,055 | | | | | | — | | | | | | (1,710) | | | | | | 11,131 | | |
Voya Multi-Manager Emerging Markets Equity Fund -
Class I | | | | | 27,048 | | | | | | 115,286 | | | | | | (32,416) | | | | | | 3,028 | | | | | | 112,946 | | | | | | 1,342 | | | | | | 2,009 | | | | | | — | | |
| Voya Multi-Manager International Equity Fund - Class I | | | | | 68,006 | | | | | | 291,491 | | | | | | (72,114) | | | | | | 91 | | | | | | 287,474 | | | | | | 5,323 | | | | | | (2,138) | | | | | | — | | |
| Voya Multi-Manager Large Cap Core Portfolio - Class I | | | | | 68,064 | | | | | | 327,907 | | | | | | (113,781) | | | | | | 5,062 | | | | | | 287,252 | | | | | | 5,140 | | | | | | 4,549 | | | | | | 6,918 | | |
| Voya Multi-Manager Mid Cap Value Fund - Class I | | | | | 37,317 | | | | | | 170,723 | | | | | | (64,809) | | | | | | 15,094 | | | | | | 158,325 | | | | | | 1,987 | | | | | | (1,667) | | | | | | 2,749 | | |
| Voya Russell™ Mid Cap Growth Index Portfolio - Class I | | | | | 16,838 | | | | | | 12,781 | | | | | | (29,814) | | | | | | 195 | | | | | | — | | | | | | — | | | | | | (268) | | | | | | — | | |
| Voya Small Company Portfolio - Class I | | | | | 27,010 | | | | | | 113,117 | | | | | | (37,255) | | | | | | 13,330 | | | | | | 116,202 | | | | | | 259 | | | | | | 2,278 | | | | | | 5,234 | | |
| Voya U.S. Bond Index Portfolio - Class I | | | | | 13,538 | | | | | | 104,134 | | | | | | (117,818) | | | | | | 146 | | | | | | — | | | | | | 342 | | | | | | 628 | | | | | | 40 | | |
| Voya U.S. Stock Index Portfolio - Class I | | | | | 60,709 | | | | | | 289,499 | | | | | | (207,412) | | | | | | 1,356 | | | | | | 144,152 | | | | | | 2,581 | | | | | | 2,164 | | | | | | 4,266 | | |
| VY® Clarion Global Real Estate Portfolio - Class I | | | | | 10,187 | | | | | | 45,030 | | | | | | (11,081) | | | | | | (641) | | | | | | 43,495 | | | | | | 390 | | | | | | 171 | | | | | | — | | |
| VY® Clarion Real Estate Portfolio - Class I | | | | | 10,365 | | | | | | 45,453 | | | | | | (11,486) | | | | | | (489) | | | | | | 43,843 | | | | | | 483 | | | | | | 991 | | | | | | — | | |
| VY® Invesco Comstock Portfolio - Class I | | | | | 34,063 | | | | | | 139,303 | | | | | | (42,197) | | | | | | 15,859 | | | | | | 147,028 | | | | | | 3,692 | | | | | | 3,417 | | | | | | — | | |
| VY® T. Rowe Price Growth Equity Portfolio - Class I | | | | | 50,469 | | | | | | 223,232 | | | | | | (57,209) | | | | | | (5,547) | | | | | | 210,945 | | | | | | — | | | | | | (2,880) | | | | | | 18,566 | | |
| | | | | $ | 638,188 | | | | | $ | 3,178,459 | | | | | $ | (1,292,447) | | | | | $ | 52,015 | | | | | $ | 2,576,215 | | | | | $ | 32,390 | | | | | $ | 12,613 | | | | | $ | 67,466 | | |
| |
The financial statements for the above mutual fund[s] can be found at www.sec.gov.
See Accompanying Notes to Financial Statements
TAX INFORMATION (Unaudited)
Dividends and distributions paid during the year ended December 31, 2016 were as follows:
| Portfolio Name | | | Type | | | Per Share Amount | |
| Voya Solution Aggressive Portfolio | |
| Class ADV | | | NII | | | | $ | 0.1182 | | |
| Class I | | | NII | | | | $ | 0.1799 | | |
| Class R6 | | | NII | | | | $ | 0.1803 | | |
| Class S | | | NII | | | | $ | 0.1628 | | |
| Class S2 | | | NII | | | | $ | 0.1562 | | |
| All Classes | | | LTCG | | | | $ | 0.6077 | | |
| Voya Solution Balanced Portfolio | |
| Class ADV | | | NII | | | | $ | 0.1973 | | |
| Class I | | | NII | | | | $ | 0.2631 | | |
| Class R6 | | | NII | | | | $ | 0.2631 | | |
| Class S | | | NII | | | | $ | 0.2367 | | |
| Class S2 | | | NII | | | | $ | 0.2157 | | |
| All Classes | | | LTCG | | | | $ | 0.6879 | | |
| Voya Solution Conservative Portfolio | |
| Class ADV | | | NII | | | | $ | 0.1897 | | |
| Class I | | | NII | | | | $ | 0.2581 | | |
| Class R6 | | | NII | | | | $ | 0.2582 | | |
| Class S | | | NII | | | | $ | 0.2327 | | |
| Class S2 | | | NII | | | | $ | 0.2243 | | |
| All Classes | | | LTCG | | | | $ | 0.2611 | | |
| Voya Solution Income Portfolio | |
| Class ADV | | | NII | | | | $ | 0.1063 | | |
| Class I | | | NII | | | | $ | 0.1433 | | |
| Class S | | | NII | | | | $ | 0.1254 | | |
| Class S2 | | | NII | | | | $ | 0.1141 | | |
| Class T | | | NII | | | | $ | — | | |
| All Classes | | | LTCG | | | | $ | 0.1281 | | |
| Voya Solution Moderately Aggressive Portfolio | |
| Class ADV | | | NII | | | | $ | 0.0968 | | |
| Class I | | | NII | | | | $ | 0.1544 | | |
| Class R6 | | | NII | | | | $ | 0.1544 | | |
| Class S | | | NII | | | | $ | 0.1419 | | |
| Class S2 | | | NII | | | | $ | 0.1086 | | |
| All Classes | | | LTCG | | | | $ | 0.1801 | | |
| Voya Solution Moderately Conservative Portfolio | |
| Class ADV | | | NII | | | | $ | 0.1991 | | |
| Class I | | | NII | | | | $ | 0.2789 | | |
| Class R6 | | | NII | | | | $ | 0.2790 | | |
| Class S | | | NII | | | | $ | 0.2528 | | |
| Class S2 | | | NII | | | | $ | 0.2346 | | |
| All Classes | | | LTCG | | | | $ | 0.6001 | | |
| Voya Solution 2020 Portfolio | |
| Class ADV | | | NII | | | | $ | 0.0457 | | |
| Class I | | | NII | | | | $ | 0.0550 | | |
| Class S | | | NII | | | | $ | 0.0524 | | |
| Class S2 | | | NII | | | | $ | 0.0424 | | |
| Class T | | | NII | | | | $ | — | | |
| All Classes | | | STCG | | | | $ | 0.0067 | | |
| All Classes | | | LTCG | | | | $ | 0.0535 | | |
| Voya Solution 2025 Portfolio | |
| Class ADV | | | NII | | | | $ | 0.2058 | | |
| Class I | | | NII | | | | $ | 0.2755 | | |
| Class S | | | NII | | | | $ | 0.2410 | | |
| Class S2 | | | NII | | | | $ | 0.2211 | | |
| Portfolio Name | | | Type | | | Per Share Amount | |
| Voya Solution 2025 Portfolio (continued) | |
| Class T | | | NII | | | | $ | 0.1872 | | |
| All Classes | | | LTCG | | | | $ | 0.9073 | | |
| Voya Solution 2030 Portfolio | |
| Class ADV | | | NII | | | | $ | 0.0436 | | |
| Class I | | | NII | | | | $ | 0.0492 | | |
| Class S | | | NII | | | | $ | 0.0475 | | |
| Class S2 | | | NII | | | | $ | 0.0490 | | |
| Class T | | | NII | | | | $ | — | | |
| All Classes | | | STCG | | | | $ | 0.0059 | | |
| All Classes | | | LTCG | | | | $ | 0.0542 | | |
| Voya Solution 2035 Portfolio | |
| Class ADV | | | NII | | | | $ | 0.2113 | | |
| Class I | | | NII | | | | $ | 0.2805 | | |
| Class S | | | NII | | | | $ | 0.2462 | | |
| Class S2 | | | NII | | | | $ | 0.2284 | | |
| Class T | | | NII | | | | $ | 0.1560 | | |
| All Classes | | | LTCG | | | | $ | 0.9983 | | |
| Voya Solution 2040 Portfolio | |
| Class ADV | | | NII | | | | $ | 0.0561 | | |
| Class I | | | NII | | | | $ | 0.0729 | | |
| Class S | | | NII | | | | $ | 0.0711 | | |
| Class S2 | | | NII | | | | $ | 0.0716 | | |
| Class T | | | NII | | | | $ | 0.0172 | | |
| All Classes | | | STCG | | | | $ | 0.0041 | | |
| All Classes | | | LTCG | | | | $ | 0.1216 | | |
| Voya Solution 2045 Portfolio | |
| Class ADV | | | NII | | | | $ | 0.1549 | | |
| Class I | | | NII | | | | $ | 0.2223 | | |
| Class S | | | NII | | | | $ | 0.1892 | | |
| Class S2 | | | NII | | | | $ | 0.1711 | | |
| Class T | | | NII | | | | $ | 0.1400 | | |
| All Classes | | | LTCG | | | | $ | 1.0220 | | |
| Voya Solution 2050 Portfolio | |
| Class ADV | | | NII | | | | $ | 0.0427 | | |
| Class I | | | NII | | | | $ | 0.0572 | | |
| Class S | | | NII | | | | $ | 0.0553 | | |
| Class S2 | | | NII | | | | $ | 0.0536 | | |
| Class T | | | NII | | | | $ | — | | |
| All Classes | | | STCG | | | | $ | 0.0067 | | |
| All Classes | | | LTCG | | | | $ | 0.1059 | | |
| Voya Solution 2055 Portfolio | |
| Class ADV | | | NII | | | | $ | 0.1473 | | |
| Class I | | | NII | | | | $ | 0.2107 | | |
| Class S | | | NII | | | | $ | 0.1794 | | |
| Class S2 | | | NII | | | | $ | 0.1627 | | |
| Class T | | | NII | | | | $ | 0.1708 | | |
| All Classes | | | LTCG | | | | $ | 0.8456 | | |
| Voya Solution 2060 Portfolio | |
| Class ADV | | | NII | | | | $ | 0.0355 | | |
| Class I | | | NII | | | | $ | 0.0357 | | |
| Class S | | | NII | | | | $ | 0.0355 | | |
| Class S2 | | | NII | | | | $ | 0.0350 | | |
| Class T | | | NII | | | | $ | 0.0316 | | |
| All Classes | | | STCG | | | | $ | 0.0178 | | |
| All Classes | | | LTCG | | | | $ | 0.0413 | | |
NII - Net investment income
STCG - Short-term capital gain
LTCG - Long-term capital gain
TAX INFORMATION (Unaudited) (continued)
Of the ordinary distributions made during the year ended December 31, 2016, the following percentages qualify for the dividends received deduction (DRD) available to corporate shareholders:
| | Voya Solution Aggressive Portfolio | | | | | 56.86% | | |
| | Voya Solution Balanced Portfolio | | | | | 32.19% | | |
| | Voya Solution Conservative Portfolio | | | | | 14.09% | | |
| | Voya Solution Income Portfolio | | | | | 20.87% | | |
| | Voya Solution Moderately Aggressive Portfolio | | | | | 34.33% | | |
| | Voya Solution Moderately Conservative Portfolio | | | | | 21.46% | | |
| | Voya Solution 2020 Portfolio | | | | | 22.70% | | |
| | Voya Solution 2025 Portfolio | | | | | 29.30% | | |
| | Voya Solution 2030 Portfolio | | | | | 24.71% | | |
| | Voya Solution 2035 Portfolio | | | | | 37.42% | | |
| | Voya Solution 2040 Portfolio | | | | | 29.70% | | |
| | Voya Solution 2045 Portfolio | | | | | 50.51% | | |
| | Voya Solution 2050 Portfolio | | | | | 31.42% | | |
| | Voya Solution 2055 Portfolio | | | | | 52.76% | | |
| | Voya Solution 2060 Portfolio | | | | | 19.40% | | |
The Portfolios designate the following amounts of long-term capital gain distributions as 20% rate long-term capital gain dividends under Internal Revenue Code Section 852(b)(3)(C):
| | Voya Solution Aggressive Portfolio | | | | $ | 330,800 | | |
| | Voya Solution Balanced Portfolio | | | | $ | 3,054,899 | | |
| | Voya Solution Conservative Portfolio | | | | $ | 379,565 | | |
| | Voya Solution Income Portfolio | | | | $ | 6,101,101 | | |
| | Voya Solution Moderately Aggressive Portfolio | | | | $ | 10,915,991 | | |
| | Voya Solution Moderately Conservative Portfolio | | | | $ | 2,097,669 | | |
| | Voya Solution 2020 Portfolio | | | | $ | 76,964 | | |
| | Voya Solution 2025 Portfolio | | | | $ | 74,758,095 | | |
| | Voya Solution 2030 Portfolio | | | | $ | 41,295 | | |
| | Voya Solution 2035 Portfolio | | | | $ | 75,968,924 | | |
| | Voya Solution 2040 Portfolio | | | | $ | 70,306 | | |
| | Voya Solution 2045 Portfolio | | | | $ | 56,413,654 | | |
| | Voya Solution 2050 Portfolio | | | | $ | 36,477 | | |
| | Voya Solution 2055 Portfolio | | | | $ | 8,917,193 | | |
| | Voya Solution 2060 Portfolio | | | | $ | 8,662 | | |
The Regulated Investment Company Modernization Act of 2010 allows qualified fund-of-funds to elect to pass through the ability to take foreign tax credits (or deductions) to the extent that foreign taxes are passed through from underlying funds. A qualified fund-of-funds is a regulated investment company that has at least 50% of the value of its total assets invested in other regulated investment companies at the end of each quarter of the taxable year. Pursuant to Section 853 of the Internal Revenue Code, the Portfolios designate the following amounts as foreign taxes paid for the year ended December 31, 2016:
TAX INFORMATION (Unaudited) (continued)
| | | | Creditable
Foreign Taxes
Paid | | | Per Share
Amount | | | Portion of Ordinary Income
Distribution Derived from
Foreign Sourced Income* | |
| Voya Solution Aggressive Portfolio | | | | $ | 3,629 | | | | | $ | 0.0054 | | | | | | 33.17% | | |
| Voya Solution Balanced Portfolio | | | | $ | 12,484 | | | | | $ | 0.0023 | | | | | | 9.86% | | |
| Voya Solution Conservative Portfolio | | | | $ | 694 | | | | | $ | 0.0005 | | | | | | 3.43% | | |
| Voya Solution Income Portfolio | | | | $ | 41,801 | | | | | $ | 0.0010 | | | | | | 4.82% | | |
| Voya Solution Moderately Aggressive Portfolio | | | | $ | 260,696 | | | | | $ | 0.0044 | | | | | | 20.49% | | |
| Voya Solution Moderately Conservative Portfolio | | | | $ | 6,033 | | | | | $ | 0.0016 | | | | | | 8.03% | | |
| Voya Solution 2020 Portfolio | | | | $ | 4,164 | | | | | $ | 0.0024 | | | | | | 7.61% | | |
| Voya Solution 2025 Portfolio | | | | $ | 288,320 | | | | | $ | 0.0034 | | | | | | 14.60% | | |
| Voya Solution 2030 Portfolio | | | | $ | 5,483 | | | | | $ | 0.0051 | | | | | | 13.83% | | |
| Voya Solution 2035 Portfolio | | | | $ | 412,177 | | | | | $ | 0.0052 | | | | | | 22.69% | | |
| Voya Solution 2040 Portfolio | | | | $ | 5,375 | | | | | $ | 0.0070 | | | | | | 18.74% | | |
| Voya Solution 2045 Portfolio | | | | $ | 316,672 | | | | | $ | 0.0054 | | | | | | 32.21% | | |
| Voya Solution 2050 Portfolio | | | | $ | 3,494 | | | | | $ | 0.0074 | | | | | | 22.81% | | |
| Voya Solution 2055 Portfolio | | | | $ | 72,624 | | | | | $ | 0.0063 | | | | | | 32.88% | | |
| Voya Solution 2060 Portfolio | | | | $ | 1,473 | | | | | $ | 0.0053 | | | | | | 18.04% | | |
*
None of the Portfolios listed above derived any income from ineligible foreign sources as defined under Section 901(j) of the Internal Revenue Code.
Foreign taxes paid or withheld must be included in taxable income with an offsetting deduction from gross income or as a credit for taxes paid to foreign governments. Shareholders are strongly advised to consult their own tax advisors regarding the appropriate treatment of foreign taxes paid.
Above figures may differ from those cited elsewhere in this report due to differences in the calculation of income and gains under U.S. generally accepted accounting principles (book) purposes and Internal Revenue Service (tax) purposes.
Shareholders are strongly advised to consult their own tax advisers with respect to the tax consequences of their investments in the Portfolios. In January, shareholders, excluding corporate shareholders, receive an IRS 1099-DIV regarding the federal tax status of the dividends and distributions they received in the calendar year.
DIRECTOR AND OFFICER INFORMATION (Unaudited)
The business and affairs of the Company are managed under the direction of the Board. A Director, who is not an interested person of the Company, as defined in the 1940 Act, is an independent director (“Independent Director”). The Directors and Officers of the Company are listed below. The Statement of Additional Information includes additional information about directors of the Company and is available, without charge, upon request at (800) 262-3862.
| Name, Address and Age | | | Position(s)
Held with the
Company | | | Term of Office and
Length of Time
Served(1) | | | Principal
Occupation(s) –
During the Past 5 Years | | | Number of
funds
in Fund
Complex
Overseen by
Director(2) | | | Other Board Positions
Held by Director | |
| Independent Directors: | |
Colleen D. Baldwin
7337 East Doubletree Ranch Rd.
Suite 100
Scottsdale, Arizona 85258
Age: 56 | | | Director | | | November 2007 – Present | | | President, Glantuam Partners, LLC, a business consulting firm (January 2009 – Present). | | | 151 | | | DSM/Dentaquest, Boston, MA (February 2014 – Present). | |
John V. Boyer
7337 East Doubletree Ranch Rd.
Suite 100
Scottsdale, Arizona 85258
Age: 63 | | | Chairperson
Director | | | January 2014 – Present
November 1997 – Present | | | President and Chief Executive Officer, Bechtler Arts Foundation, an arts and education foundation (January 2008 – Present). | | | 151 | | | None. | |
Patricia W. Chadwick
7337 East Doubletree Ranch Rd.
Suite 100
Scottsdale, Arizona 85258
Age: 68 | | | Director | | | January 2006 – Present | | | Consultant and President, Ravengate Partners LLC, a consulting firm that provides advice regarding financial markets and the global economy (January 2000 – Present). | | | 151 | | | Wisconsin Energy Corporation (June 2006 – Present); The Royce Funds (23 funds) (December 2009 – Present); and AMICA Mutual Insurance Company (1992 – Present). | |
Peter S. Drotch
7337 East Doubletree Ranch Rd.
Suite 100
Scottsdale, Arizona 85258
Age: 75 | | | Director | | | November 2007 – Present | | | Retired. | | | 151 | | | None. | |
Martin J. Gavin
7337 East Doubletree Ranch Rd.
Suite 100
Scottsdale, AZ 85258-2034
Age: 66 | | | Director | | | August 2015 – Present | | | Retired. Formerly, President and Chief Executive Officer, Connecticut Children’s Medical Center (May 2006 – November 2015). | | | 151 | | | None. | |
Russell H. Jones
7337 East Doubletree Ranch Rd.
Suite 100
Scottsdale, Arizona 85258
Age: 72 | | | Director | | | May 2013 – Present | | | Retired. | | | 151 | | | None. | |
Patrick W. Kenny
7337 East Doubletree Ranch Rd.
Suite 100
Scottsdale, Arizona 85258
Age: 74 | | | Director | | | March 2002 – Present | | | Retired. | | | 151 | | | Assured Guaranty Ltd. (April 2004 – Present). | |
Joseph E. Obermeyer
7337 East Doubletree Ranch Rd.
Suite 100
Scottsdale, Arizona 85258
Age: 59 | | | Director | | | May 2013 – Present | | | President, Obermeyer & Associates, Inc., a provider of financial and economic consulting services (November 1999 – Present). | | | 151 | | | None. | |
DIRECTOR AND OFFICER INFORMATION (Unaudited) (continued)
| Name, Address and Age | | | Position(s)
Held with the
Company | | | Term of Office and
Length of Time
Served(1) | | | Principal
Occupation(s) –
During the Past 5 Years | | | Number of
funds
in Fund
Complex
Overseen by
Director(2) | | | Other Board Positions
Held by Director | |
Sheryl K. Pressler
7337 East Doubletree Ranch Rd.
Suite 100
Scottsdale, Arizona 85258
Age: 66 | | | Director | | | January 2006 – Present | | | Consultant (May 2001 – Present). | | | 151 | | | None. | |
Christopher P. Sullivan
7337 East Doubletree Ranch Rd.
Suite 100
Scottsdale, Arizona 85258
Age: 63 | | | Director | | | October 2015 – Present | | | Retired. Formerly, President, Bond Division, Fidelity Management and Research (June 2009 – September 2012). | | | 151 | | | None. | |
Roger B. Vincent
7337 East Doubletree Ranch Rd.
Suite 100
Scottsdale, Arizona 85258
Age: 71 | | | Director | | | January 2005 – Present | | | Retired. | | | 151 | | | UGI Corporation (February 2006 – Present) and UGI Utilities, Inc. (February 2006 – Present). | |
| Director who is an “interested person”: | | | | | |
Shaun P. Mathews(3)
7337 East Doubletree Ranch Rd.
Suite 100
Scottsdale, Arizona 85258
Age: 61 | | | Director | | | November 2007 – Present | | | President and Chief Executive Officer, Voya Investments, LLC (December 2006 – Present). | | | 151 | | | Voya Capital Corporation, LLC and Voya Investments Distributor, LLC (December 2005 – Present); Voya Funds Services, LLC, Voya Investments, LLC and Voya Investment Management (March 2006 – Present); and Voya Investment Trust Co. (April 2009 – Present). | |
(1)
Directors serve until their successors are duly elected and qualified. The tenure of each Director who is not an “interested person” as defined in the 1940 Act, of each Portfolio (“Independent Director”) is subject to the Board’s retirement policy which states that each duly elected or appointed Independent Director shall retire from and cease to be a member of the Board of Directors at the close of business on December 31 of the calendar year in which the Independent Director attains the age of 75. A majority vote of the Board’s other Independent Directors may extend the retirement date of an Independent Director if the retirement would trigger a requirement to hold a meeting of shareholders of the Company under applicable law, whether for the purposes of appointing a successor to the Independent Director or otherwise comply under applicable law, in which case the extension would apply until such time as the shareholder meeting can be held or is no longer required (as determined by a vote of a majority of the other Independent Directors).
(2)
For the purposes of this table, “Fund Complex” means the Voya family of funds including the following investment companies: Voya Asia Pacific High Dividend Equity Income Fund; Voya Balanced Portfolio, Inc.; Voya Emerging Markets High Dividend Equity Fund; Voya Equity Trust; Voya Funds Trust; Voya Global Advantage and Premium Opportunity Fund; Voya Global Equity Dividend and Premium Opportunity Fund; Voya Government Money Market Portfolio; Voya Infrastructure, Industrials and Materials Fund; Voya Intermediate Bond Portfolio; Voya International High Dividend Equity Income Fund; Voya Investors Trust; Voya Mutual Funds; Voya Natural Resources Equity Income Fund; Voya Partners, Inc.; Voya Prime Rate Trust; Voya Senior Income Fund; Voya Separate Portfolios Trust; Voya Series Fund, Inc.; Voya Strategic Allocation Portfolios, Inc.; Voya Variable Funds; Voya Variable Insurance Trust; Voya Variable Portfolios, Inc.; and Voya Variable Products Trust. The number of funds in the Fund Complex is as of January 31, 2017.
(3)
Mr. Mathews is deemed to be an “interested person” of the Company as defined in the 1940 Act, because of his current affiliation with the Voya funds, Voya Financial, Inc., or Voya Financial, Inc.’s affiliates.
DIRECTOR AND OFFICER INFORMATION (Unaudited) (continued)
| Name, Address and Age | | | Position(s) Held
With the Company | | | Term of Office and
Length of Time
Served(1) | | | Principal Occupation(s) – During the Past 5 Years | |
Shaun P. Mathews
7337 East Doubletree Ranch Rd.
Suite 100
Scottsdale, Arizona 85258
Age: 61 | | | President and Chief Executive Officer | | | November 2006 – Present | | | President and Chief Executive Officer, Voya Investments, LLC (December 2006 – Present). | |
Michael J. Roland
7337 East Doubletree Ranch Rd.
Suite 100
Scottsdale, Arizona 85258
Age: 58 | | | Executive Vice President | | | January 2005 – Present | | | Managing Director and Chief Operating Officer, Voya Investments, LLC and Voya Funds Services, LLC (March 2012 – Present). Formerly, Chief Compliance Officer, Directed Services LLC and Voya Investments, LLC (March 2011 – December 2013); Executive Vice President and Chief Operating Officer, Voya Investments, LLC and Voya Funds Services, LLC (January 2007 – April 2012) and Chief Compliance Officer, Voya Family of Funds (March 2011 – February 2012). | |
Stanley D. Vyner
230 Park Avenue
New York, New York 10169
Age: 66 | | | Executive Vice President
Chief Investment Risk Officer | | | January 2005 – Present
September 2009 – Present | | | Executive Vice President, Voya Investments, LLC (July 2000 – Present) and Chief Investment Risk Officer, Voya Investments, LLC (January 2003 – Present). | |
Kevin M. Gleason
7337 East Doubletree Ranch Rd.
Suite 100
Scottsdale, Arizona 85258
Age: 50 | | | Chief Compliance Officer | | | February 2012 – Present | | | Senior Vice President, Voya Investment Management and Chief Compliance Officer, Voya Family of Funds (February 2012 – Present). Formerly, Assistant General Counsel and Assistant Secretary, The Northwestern Mutual Life Insurance Company (June 2004 – January 2012). | |
Todd Modic
7337 East Doubletree Ranch Rd.
Suite 100
Scottsdale, Arizona 85258
Age: 49 | | | Senior Vice President, Chief/Principal Financial Officer and Assistant Secretary | | | March 2005 – Present | | | Senior Vice President, Voya Investments, LLC and Voya Funds Services, LLC (April 2005 – Present). | |
Kimberly A. Anderson
7337 East Doubletree Ranch Rd.
Suite 100
Scottsdale, Arizona 85258
Age: 52 | | | Senior Vice President | | | January 2005 – Present | | | Senior Vice President, Voya Investments, LLC (September 2003 – Present). | |
Robert Terris
7337 East Doubletree Ranch Rd.
Suite 100
Scottsdale, Arizona 85258
Age: 46 | | | Senior Vice President | | | May 2006 – Present | | | Senior Vice President, Head of Division Operations, Voya Investments, LLC (October 2015 – Present) and Voya Funds Services, LLC (March 2006 – Present). | |
Fred Bedoya
7337 East Doubletree Ranch Rd.
Suite 100
Scottsdale, Arizona 85258
Age: 44 | | | Vice President and Treasurer | | | September 2012 – Present | | | Vice President, Voya Investments, LLC (October 2015 – Present) and Voya Funds Services, LLC (July 2012 – Present). Formerly, Assistant Vice President – Director, Voya Funds Services, LLC (March 2003 – March 2012). | |
Maria M. Anderson
7337 East Doubletree Ranch Rd.
Suite 100
Scottsdale, Arizona 85258
Age: 58 | | | Vice President | | | January 2005 – Present | | | Vice President, Voya Investments, LLC (October 2015 – Present) and Voya Funds Services, LLC (September 2004 – Present). | |
Lauren D. Bensinger
7337 East Doubletree Ranch Rd.
Suite 100
Scottsdale, Arizona 85258
Age: 63 | | | Vice President | | | January 2005 – Present | | | Vice President, Voya Funds Services, LLC (February 1996 – Present) and Voya Investments, LLC (October 2004 – Present); Vice President and Money Laundering Reporting Officer, Voya Investments Distributor, LLC (April 2010 – Present). Anti-Money Laundering Compliance Officer, Voya Financial, Inc. (January 2013 – Present); and Money Laundering Reporting Officer, Voya Investment Management Trust Co. (October 2012 – Present). | |
DIRECTOR AND OFFICER INFORMATION (Unaudited) (continued)
| Name, Address and Age | | | Position(s) Held
With the Company | | | Term of Office and
Length of Time
Served(1) | | | Principal Occupation(s) – During the Past 5 Years | |
Sara M. Donaldson
7337 East Doubletree Ranch Rd.
Suite 100
Scottsdale, Arizona 85258
Age: 57 | | | Vice President | | | September 2014 – Present | | | Vice President, Voya Investments, LLC (October 2015 – Present). Formerly, Vice President, Voya Funds Services, LLC (April 2014 – October 2015). Formerly, Director, Compliance, AXA Rosenberg Global Services, LLC (September 1997 – March 2014). | |
Micheline S. Favor
7337 East Doubletree Ranch Rd.
Suite 100
Scottsdale, Arizona 85258
Age: 39 | | | Vice President | | | September 2016 – Present | | | Vice President, Head of Fund Compliance, Voya Investments LLC, and Chief Compliance Officer for Voya Investments, LLC and Directed Services, LLC (June 2016 – Present). Formerly, Vice President, Mutual Fund Compliance (March 2014 – June 2016); Assistant Vice President, Mutual Fund Compliance (May 2013 – March 2014); Assistant Vice President, Senior Project Manager (May 2008 – May 2013). | |
Robyn L. Ichilov
7337 East Doubletree Ranch Rd.
Suite 100
Scottsdale, Arizona 85258
Age: 49 | | | Vice President | | | January 2005 – Present | | | Vice President, Voya Funds Services, LLC (November 1995 – Present) and Voya Investments, LLC (August 1997 – Present). Formerly, Treasurer, Voya Family of Funds (November 1999 – February 2012). | |
Jason Kadavy
7337 East Doubletree Ranch Rd.
Suite 100
Scottsdale, Arizona 85258
Age: 40 | | | Vice President | | | September 2012 – Present | | | Vice President, Voya Investments, LLC (October 2015 – Present) and Voya Funds Services, LLC (July 2007 – Present). | |
Kimberly K. Springer
7337 East Doubletree Ranch Rd.
Suite 100
Scottsdale, Arizona 85258
Age: 59 | | | Vice President | | | March 2006 – Present | | | Vice President – Mutual Fund Product Development, Voya Investments, LLC (July 2012 – Present); Vice President, Voya Family of Funds (March 2010 – Present) and Vice President, Voya Funds Services, LLC (March 2006 – Present). Formerly Managing Paralegal, Registration Statements (June 2003 –
July 2012). | |
Craig Wheeler
7337 East Doubletree Ranch Rd.
Suite 100
Scottsdale, Arizona 85258
Age: 47 | | | Vice President | | | May 2013 – Present | | | Vice President – Director of Tax, Voya Investments, LLC (October 2015 – Present). Formerly, Vice President – Director of Tax, Voya Funds Services, LLC (March 2013 – October 2015). Formerly, Assistant Vice President – Director of Tax, Voya Funds Services, LLC (March 2008 – February 2013). | |
Huey P. Falgout, Jr.
7337 East Doubletree Ranch Rd.
Suite 100
Scottsdale, Arizona 85258
Age: 53 | | | Secretary | | | August 2003 – Present | | | Senior Vice President and Chief Counsel, Voya Investment Management – Mutual Fund Legal Department (March 2010 – Present). | |
Paul A. Caldarelli
7337 East Doubletree Ranch Rd.
Suite 100
Scottsdale, Arizona 85258
Age: 65 | | | Assistant Secretary | | | June 2010 – Present | | | Vice President and Senior Counsel, Voya Investment Management – Mutual Fund Legal Department (March 2010 – Present). | |
Theresa K. Kelety
7337 East Doubletree Ranch Rd.
Suite 100
Scottsdale, Arizona 85258
Age: 54 | | | Assistant Secretary | | | August 2003 – Present | | | Vice President and Senior Counsel, Voya Investment Management – Mutual Fund Legal Department (March 2010 – Present). | |
(1)
The Officers hold office until the next annual meeting of the Board of Directors and until their successors shall have been elected and qualified.
ADVISORY CONTRACT APPROVAL DISCUSSION (Unaudited)
BOARD CONSIDERATION AND APPROVAL OF INVESTMENT Management Contracts AND SUB-ADVISORY CONTRACTS
Section 15(c) of the Investment Company Act of 1940, as amended (the “1940 Act”), provides that, after an initial period, the Board of Directors (the “Board”) of Voya Partners, Inc. (the “Company”), including a majority of the Board members who have no direct or indirect interest in the investment management and sub-advisory contracts, and who are not “interested persons” of the Voya Solution Aggressive Portfolio, Voya Solution Balanced Portfolio, Voya Solution Conservative Portfolio, Voya Solution Income Portfolio, Voya Solution Moderately Aggressive Portfolio, Voya Solution Moderately Conservative Portfolio, Voya Solution 2020 Portfolio, Voya Solution 2025 Portfolio, Voya Solution 2030 Portfolio, Voya Solution 2035 Portfolio, Voya Solution 2040 Portfolio, Voya Solution 2045 Portfolio, Voya Solution 2050 Portfolio, Voya Solution 2055 Portfolio, Voya Solution 2060 Portfolio (collectively, the “Portfolios”), as such term is defined under the 1940 Act (the “Independent Directors”), must annually review and approve the Portfolios’ existing investment management and sub-advisory contracts. At a meeting held on October 18, 2016, the Board, including a majority of the Independent Directors, considered whether to renew and approve the investment management contracts (the “Management Contracts”) between Directed Services LLC (the “Adviser”) and the Portfolios, and the sub-advisory contracts (the “Sub-Advisory Contracts”) with the sub-adviser to each Portfolio (the “Sub-Adviser”) effective through November 30, 2016. Consideration by the Board at its October 18, 2016 meeting of whether to renew the Management and Sub-Advisory Contracts effective through November 30, 2016 was deemed prudent because the prior approval of the Contracts was set to expire on November 17, 2016 (the same date of the Board’s meeting to discuss the annual renewal/approval). In addition, at a meeting held on November 17, 2016, the Board, including a majority of the Independent Directors, considered whether to renew and approve the Management and Sub-Advisory Contracts effective through November 30, 2017.
In addition to the Board meetings on October 18, 2016 and November 17, 2016, the Independent Directors also held separate meetings outside the presence of Management on October 18, 2016, and November 15, 2016, to consider the renewal of the Management and Sub-Advisory Contracts. As a result, subsequent references herein to factors considered and determinations made by the Independent Directors and/or the Board include, as applicable, factors considered and determinations made at those meetings by the Independent Directors.
At its October 18, 2016 meeting, the Board, including the Independent Directors, voted to renew the Management and Sub-Advisory Contracts for the Portfolios effective through November 30, 2016. At its November 17, 2016 meeting, the Board, including the Independent Directors, voted to renew the Management and Sub-Advisory Contracts for the Portfolios effective through November 30, 2017. In reaching these decisions, the Board took into account information furnished to it throughout the year at meetings of the Board and the Board’s committees, as well as information prepared specifically in connection with the annual renewal or approval process. Determinations by the Independent Directors also took into account various factors that they believed, in light of the legal advice furnished to them by K&L Gates LLP (“K&L Gates”), their independent legal counsel, and their own business judgment, to be relevant. Further, while the Board considered at the same meetings the investment management contracts and sub-advisory contracts that were subject to renewal for the investment companies in the Voya family of funds (“Voya funds”), the Board considered each Voya fund’s investment management and sub-advisory relationships separately.
Provided below is an overview of the Board’s contract approval process in general, as well as a discussion of certain specific factors that the Board considered at its renewal meetings. While the Board gave its attention to the information furnished at the request of the Independent Directors that was most relevant to its considerations, discussed below are a number of the primary factors relevant to the Board’s consideration as to whether to renew the Management and Sub-Advisory Contracts. Each Board member may have accorded different weight to the various factors in reaching his or her conclusions with respect to each Portfolio’s investment management and sub-advisory arrangements.
The Board, in considering the Management and Sub-Advisory Contracts, was cognizant that shareholders of each Portfolio have a broad range of investment options available to them and that, based upon their opportunity to review and weigh the disclosure provided by the Portfolio, have chosen the Portfolio as an investment.
Overview of the Contract Renewal and Approval Process
The Board follows a structured process pursuant to which it seeks, considers, reviews and analyzes relevant information when it decides whether to approve new or existing investment management and sub-advisory arrangements for Voya funds, including the Portfolios’ existing Management and Sub-Advisory Contracts (the “Contract Review Process”).
ADVISORY CONTRACT APPROVAL DISCUSSION (Unaudited) (continued)
The Contract Review Process has evolved as the Board’s membership has changed through periodic retirements of some Directors and the appointment and election of new Directors. In addition, the Independent Directors have reviewed and refined the renewal and approval process at least annually in order to make revised requests for information from Management and address certain unique characteristics related to new or existing Voya funds.
The Board has established (among other committees) three Investment Review Committees (each, an “IRC”) and a Contracts Committee. Among other matters, the Contracts Committee provides oversight with respect to the contracts renewal and approval process, and each Portfolio is assigned to an IRC, which provides ongoing oversight regarding, among other matters, the investment performance of the Adviser and the Sub-Adviser, as well as the oversight by the Adviser of the performance of the Sub-Adviser. The IRCs will typically apply a heightened level of scrutiny in cases where performance has lagged a Portfolio’s relevant benchmark, and/or Morningstar, Inc. (“Morningstar”) category average, as applicable. The Board and/or IRCs may also apply a heightened level of scrutiny in cases where a Portfolio’s performance has lagged its Selected Peer Group (defined below).
The type and format of the information provided to the Board or to legal counsel for the Independent Directors in connection with the Contract Review Process has been codified in a 15(c) methodology guide for the Voya funds (“15(c) Methodology Guide”). This 15(c) Methodology Guide was developed by the Independent Directors and sets out a blueprint pursuant to which the Independent Directors request, and Management provides, certain information that the Independent Directors deem important to facilitate an informed review in connection with initial and annual approvals of investment management and sub-advisory contracts. Among other actions, the Independent Directors retain the services of an independent consultant with experience in the mutual fund industry to assist the Independent Directors in developing and determining a selected peer group of investment companies for each Portfolio (“Selected Peer Group”) based on each Portfolio’s particular attributes, such as fund type and scale, Morningstar category and sales channels and structure. The Independent Directors review, evaluate and update the 15(c) Methodology Guide at least annually.
Management provides certain of the information requested by the 15(c) Methodology Guide in Fund Analysis and Comparison Tables (“FACT sheets”) prior to the Independent Directors’ review of investment management and sub-advisory arrangements (including the Portfolios’ Management and Sub-Advisory Contracts). The
Independent Directors have periodically retained an independent firm to test and verify the accuracy of certain FACT sheet data for a representative sample of the Voya funds. In addition, the Contracts Committee routinely employs the services of an independent consultant to assist in its review and analysis of, among other matters, the 15(c) Methodology Guide, the content and format of the FACT sheets, and Selected Peer Groups to be used by the Portfolios for certain comparison purposes during the renewal process. As part of an ongoing process, the Contracts Committee recommends and considers recommendations from Management for refinements to the 15(c) Methodology Guide and other aspects of the review process, and the Board’s IRCs review benchmarks and peer groups used to assess the performance of the Voya funds.
The Board employed its process for reviewing contracts when considering the renewals of the Portfolios’ Management and Sub-Advisory Contracts at its October 18, 2016 and November 17, 2016 meetings that would be effective through November 30, 2016 and November 30, 2017, respectively. Set forth below is a discussion of many of the Board’s primary considerations and conclusions resulting from this process.
Nature, Extent and Quality of Service
In determining whether to approve the Management and Sub-Advisory Contracts, the Independent Directors received and evaluated such information as they deemed necessary regarding the nature, extent and quality of services provided to the Portfolios by the Adviser and the Sub-Adviser. This included information regarding the Adviser and the Sub-Adviser provided throughout the year at regular meetings of the Board and its committees, as well as information furnished in connection with the contract renewal meetings.
The Adviser oversees, subject to the authority of the Board, the provision of all investment advisory and portfolio management services for the Portfolios. In addition, the Adviser provides administrative services reasonably necessary for the operation of the Portfolios. The Adviser conducts day-to-day oversight of the Portfolios’ operations and risks but may delegate certain management responsibilities to one or more Sub-Advisers. Also, the Adviser oversees various other service providers, which may include, among others, distributors, custodians and fund accounting agents, shareholder service providers, and transfer agents, who provide services to the Portfolios.
The materials requested by the Independent Directors and provided to the Board, K&L Gates and/or independent consultants that assisted the Independent Directors prior to
ADVISORY CONTRACT APPROVAL DISCUSSION (Unaudited) (continued)
the October 18, 2016 and November 17, 2016 Board meetings included, among other information, the following items for each Portfolio: (1) FACT sheets that provided information regarding the performance and expenses of the Portfolio and other similarly managed funds in its Selected Peer Group, as well as information regarding the Portfolio’s investment portfolio, objective and strategies; (2) reports providing risk and attribution analyses of the Portfolio; (3) the 15(c) Methodology Guide, which describes how the FACT sheets were prepared, including the manner in which each Portfolio’s Selected Peer Group was selected and how profitability was determined; (4) responses from the Adviser and the Sub-Adviser to the Portfolios to a series of questions posed by K&L Gates on behalf of the Independent Directors; (5) copies of the forms of Management and Sub-Advisory Contracts; (6) copies of the Forms ADV for the Adviser and the Sub-Adviser; (7) financial statements for the Adviser and the Sub-Adviser; (8) a draft of a narrative summary addressing key factors the Board customarily considers in evaluating the Management and Sub-Advisory Contracts for the Voya funds’ (including the Portfolio’s) investment management and sub-advisory contracts, including a written analysis for the Portfolio of how performance, fees and expenses compare to its Selected Peer Group and/or designated benchmark(s); (9) independent analyses of Portfolio performance by the Company’s Chief Investment Risk Officer, who leads the Adviser’s Investment Risk Management Department (“IRMD”); (10) information regarding net asset flows into and out of the Portfolio; and (11) other information relevant to the Board’s evaluations.
For each Portfolio, Class I shares were used for purposes of certain comparisons between the Portfolio and its Selected Peer Group. Class I shares generally were selected so that a Portfolio’s share class with the longest performance history was compared to the analogous class of shares for each fund in its Selected Peer Group. The mutual funds included in the Portfolios’ Selected Peer Groups were selected based upon criteria designed to represent the Portfolio share class being compared to the Selected Peer Groups.
In arriving at its conclusions with respect to the Management Contracts, the Board was mindful of the “manager-of-managers” platform of the Voya funds that has been developed by the Adviser. The Board recognized that the Adviser is responsible for monitoring the investment program, performance, developments and ongoing operations of the Sub-Adviser under this manager-of-managers arrangement. The Board also considered the techniques and resources that the Adviser has developed to provide ongoing oversight of the nature, extent and quality of the services the Sub-Adviser provides
to the applicable Portfolios and the Sub-Adviser’s compliance with applicable laws and regulations. The Board was advised that to assist in the selection and monitoring of the Sub-Adviser, the Adviser has developed an oversight process formulated by its Manager Research & Selection Group (“MR&S”), which analyzes both qualitative (such as in-person meetings and telephonic meetings with the Sub-Adviser and research on sub-advisers) and quantitative information (such as performance data, portfolio data and attribution analysis) about the Sub-Adviser and the Portfolios that it manages. The Board recognized that MR&S also typically provides in-person reports to the IRCs at their meetings prior to any Sub-Adviser presentations. In addition, the Board noted that MR&S prepares periodic due diligence reports regarding the Sub-Adviser based on on-site visits and information and analysis which team members use to attempt to gain and maintain an in-depth understanding of the Sub-Adviser’s investment process and to try to identify issues that may be relevant to the Sub-Adviser’s services to a Portfolio and/or its performance. The Board also noted that MR&S provides written reports on these due diligence analyses to the pertinent IRC. The Board noted the resources that Management has committed to its services as a manager-of-managers, including resources for reporting to the Board and the IRCs to assist them with their assessment of the investment performance of the Portfolios on an on-going basis throughout the year. This includes the appointment of a Chief Investment Risk Officer and the IRMD staff members, who report directly to the Board and who have developed attribution analyses and other metrics used by the IRCs to analyze the key factors underlying investment performance for the funds in the Voya funds.
The Board also considered the techniques that the Adviser has developed to screen and perform due diligence on new sub-advisers if and when the Adviser recommends to the Board a new sub-adviser to manage a Portfolio in the Voya funds.
The Board also considered that in the course of monitoring performance of the Sub-Adviser, MR&S has developed, based on guidance from the IRCs, a methodology for comparing performance of each Portfolio to its Morningstar category average and/or median and primary benchmark. The Board also recognized that MR&S provides the IRCs with regular updates on the Portfolios and alerts the IRCs to potential issues as they arise. The Board also considered that the Adviser regularly monitors performance, personnel, compliance and other issues that may arise on a day-to-day basis regarding the Sub-Adviser and contemplated that, if issues are identified either through formal or informal processes, they are brought
ADVISORY CONTRACT APPROVAL DISCUSSION (Unaudited) (continued)
before the IRCs and the Board for consideration and action and the Adviser consistently makes its resources available to the Board and the IRCs to assist with addressing any issues that arise.
The Board considered that the Portfolios also benefit from the services of the IRMD, under the leadership of the Chief Investment Risk Officer, the costs of which are shared by the Portfolios and the Adviser. The Board considered that the IRMD regularly presents written materials and reports to the IRCs that focus on the investment risks of the Portfolios. The Board also considered that the IRMD provides the IRCs with analyses that are developed to assist the IRCs in identifying trends in Portfolio performance and other areas over consecutive periods. The Board noted that the services provided by the IRMD are meant to provide an additional perspective for the benefit of the IRCs, which may vary from the perspective of MR&S.
The Board also considered the techniques used by the Adviser to monitor the performance of the Sub-Adviser and the proactive approach that the Adviser, working in cooperation with the IRCs, has taken to advocate or recommend, when it believed appropriate, changes designed to assist in improving the Voya funds’ performance.
In considering the Portfolios’ Management Contracts, the Board also considered the extent of benefits provided to the Portfolios’ shareholders, beyond investment management services, from being part of the Voya funds. This includes, in most cases, the right to exchange or transfer investments, without a sales charge, between the same class of shares of such funds or among Voya funds available on a product platform, and the wide range of Voya funds available for exchange or transfer. The Board also took into account the Adviser’s ongoing efforts to reduce the expenses of the Voya funds through renegotiated arrangements with certain of the Voya funds’ service providers. In addition, the Board considered the efforts of the Adviser and the expenses that it incurred in recent years to help make the Voya funds more balanced and efficient by the launch of new investment products and the combinations of similar funds.
Further, the Board received periodic reports showing that the investment policies and restrictions for each Portfolio were consistently complied with and other periodic reports covering matters such as compliance by Adviser and Sub-Adviser personnel with codes of ethics. The Board considered reports throughout the year and also in connection with the Board’s consideration of the Management and Sub-Advisory Contracts from the Company’s Chief Compliance Officer (“CCO”) evaluating whether the regulatory compliance systems and
procedures of the Adviser and the Sub-Adviser are reasonably designed to ensure compliance with the federal securities laws. The Board also took into account the CCO’s annual and periodic reports and recommendations with respect to service provider compliance programs. In this regard, the Board also considered the policies and procedures developed by the CCO in consultation with the Board’s Compliance Committee that guide the CCO’s compliance oversight function.
The Board requested and considered information regarding the staffing of each Portfolio’s portfolio management team. The Board took into account the respective resources and reputations of the Adviser and the Sub-Adviser, and evaluated the compensation arrangements for each Portfolio’s portfolio management team. The Board also considered the adequacy of the resources committed to the Portfolios (and other relevant funds in the Voya funds) by the Adviser and the Sub-Adviser, and whether those resources are commensurate with the needs of the Portfolios and are sufficient to provide high-quality services to the Portfolios. The Board also considered the financial stability of the Adviser and the Sub-Adviser.
Based on their deliberations and the materials presented to them, the Board concluded that the investment management and related services provided by the Adviser and the Sub-Adviser are appropriate in light of the Portfolios’ operations, the competitive landscape of the investment company business, and investor needs, and that the nature, extent and quality of the overall services provided by the Adviser and the Sub-Adviser were appropriate.
Portfolio Performance
In assessing investment management and sub-advisory relationships, the Board placed emphasis on the investment returns of each Portfolio. The Board considered the performance reports and analyses from MR&S and IRMD and discussions with portfolio managers at Board and committee meetings during the year. The Board also paid particular attention in assessing performance to the FACT sheets furnished in connection with the renewal and approval process. The FACT sheets prepared for each Portfolio included its investment performance compared to the Portfolio’s Morningstar category average, Selected Peer Group and primary benchmark. The FACT sheet performance data was as of March 31, 2016.
In addition, the Board also considered at its October 18, 2016 and November 17, 2016 meetings certain additional data regarding performance and Portfolio asset levels as of August 31, 2016 and September 30, 2016, respectively.
ADVISORY CONTRACT APPROVAL DISCUSSION (Unaudited) (continued)
The Board’s findings specific to each Portfolio’s performance are discussed under “Portfolio-by-Portfolio Analysis” below.
Economies of Scale
When evaluating the reasonableness of advisory fee rates, the Board also considered whether economies of scale likely will be realized by the Adviser and the Sub-Adviser as a Portfolio grows larger and the extent to which any such economies are reflected in contractual fee rates. In this regard, the Board also considered that, while the Portfolios do not have advisory fee breakpoints, they do have expense reimbursement arrangements. In this connection, the Board considered the extent to which economies of scale could be realized through such expense reimbursements or other expense reductions. In evaluating fee rate breakpoint arrangements and economies of scale, the Independent Directors also considered prior periodic management reports, industry information on this topic and the Portfolios’ investment performance.
Information Regarding Services to Other Clients
The Board requested and considered information regarding the nature of services and fee rates offered by the Adviser and the Sub-Adviser to other clients, including other registered investment companies and relevant institutional accounts. When fee rates offered to other clients differed materially from those charged to a Portfolio, the Board considered any underlying rationale provided by the Adviser or the Sub-Adviser for these differences. The Board also noted that the fee rates charged to the Portfolios and other institutional clients of the Adviser or the Sub-Adviser (including other investment companies) may differ materially due to, among other reasons, as applicable: differences in services; different regulatory requirements associated with registered investment companies, such as the Portfolios, as compared to non-registered investment company clients; market differences in fee rates that existed when a Portfolio first was organized; differences in the original sponsors of Portfolios that now are managed by the Adviser; investment capacity constraints that existed when certain contracts were first agreed upon or that might exist at present; and different pricing structures that are necessary to be competitive in different marketing channels.
Fee Rates, Profitability and Fall-out Benefits
The Board reviewed and considered each contractual management fee rate payable by each Portfolio to the Adviser. The Board also considered the contractual sub-advisory fee rate payable by the Adviser to the Sub-Adviser for sub-advisory services for each Portfolio, including the portion of the contractual management fees
that are paid to each Sub-Adviser, as compared to the portion retained by the Adviser. In addition, the Board considered fee waivers and expense limitations applicable to the fees payable by the Portfolios, including the Adviser’s agreement to extend each such fee waiver and expense limitation agreement and not to terminate such agreement without prior approval of the Board.
The Board requested information regarding and considered: (1) the fee rate structure of each Portfolio as it relates to the services provided under the contracts; and (2) the potential fall-out benefits to the Adviser and the Sub-Adviser and their respective affiliates from their association with the Portfolios. For each Portfolio, the Board separately determined that the fees payable to the Adviser and the fee rate payable to the Sub-Adviser are reasonable for the services that each performs, which were considered in light of the nature, extent and quality of the services that each has performed and is expected to perform.
For each Portfolio, the Board considered information on revenues, costs and profits realized by the Adviser and the Sub-Adviser, which was prepared by Management in accordance with the methodology (including related assumptions) specified in the 15(c) Methodology Guide. In analyzing the profitability of the Adviser in connection with its services to a Portfolio, the Board took into account the sub-advisory fee rate payable by the Adviser to the Sub-Adviser. In addition, the Board considered information that it requested and that was provided by Management with respect to the profitability of service providers affiliated with the Adviser. The Board also considered the profitability of the Adviser and its affiliated companies attributable to managing and operating each Portfolio both with and without the profitability of the distributor of the Portfolios and both before and after giving effect to any expenses incurred by the Adviser or any affiliated company in making revenue sharing or other payments to third parties, including affiliated insurance companies, for distribution services.
Although the 15(c) Methodology Guide establishes certain standards for profit calculation, the Board recognized that profitability analysis on a client-by-client basis is not an exact science and there is no uniform methodology within the asset management industry for determining profitability for this purpose. In this context, the Board realized that Management’s calculations regarding its costs incurred in establishing the infrastructure necessary for the Portfolios’ operations may not be fully reflected in the expenses allocated to each Portfolio in determining profitability, and that the information presented may not portray all of the costs borne by the Adviser and Management or capture their entrepreneurial risk associated with offering and
ADVISORY CONTRACT APPROVAL DISCUSSION (Unaudited) (continued)
managing a mutual fund complex in the current regulatory and market environment. In addition, the Board recognized that the use of different reasonable methodologies for purposes of calculating profit data can give rise to dramatically different profit and loss results.
In considering the Management and Sub-Advisory Contracts, the Board noted that, at the request of the Board, the Adviser has from time to time agreed to implement remedial actions regarding certain Voya funds. These remedial actions have included, among others: reductions in fee rates or adjustments to expense limitation and waiver arrangements; changes in sub-advisers or portfolio managers; and strategy modifications.
In making its determinations, the Board based its conclusions as to the reasonableness of the management and sub-advisory fees of the Adviser and the Sub-Adviser primarily on the factors described for each Portfolio below.
Portfolio-by-Portfolio Analysis
The following paragraphs outline certain of the specific factors that the Board considered, and the conclusions reached, at its October 18, 2016 and November 17, 2016 meetings in relation to approving each Portfolio’s Management and Sub-Advisory Contracts. These specific factors are in addition to those considerations discussed above. In each case, the Portfolio’s performance was compared to its Morningstar category median and/or average, as well as its primary benchmark, a broad-based securities market index that appears in the Portfolio’s prospectus. With respect to Morningstar quintile rankings, the first quintile represents the highest (best) performance and the fifth quintile represents the lowest performance. Each Portfolio’s management fee rates and expense ratio were compared to the fees and expense ratios of the funds in its Selected Peer Group.
Voya Solution Aggressive Portfolio
In considering whether to approve the renewal of the Management and Sub-Advisory Contracts for Voya Solution Aggressive Portfolio, the Board considered that, based on performance data for the periods ended March 31, 2016: (1) the Portfolio underperformed its Morningstar category average for all periods presented; (2) the Portfolio underperformed its primary benchmark for all periods presented; and (3) the Portfolio is ranked in the fourth quintile of its Morningstar category for all periods presented. In analyzing this performance data, the Board took into account: (1) that the Portfolio commenced operations in May 2013, and therefore had a limited operating history for the purpose of analyzing its
performance; and (2) that Management would continue to monitor, and the Board or its Investment Review Committee would periodically review, the Portfolio’s performance.
In considering the fees payable under the Management and Sub-Advisory Contracts for the Portfolio, the Board took into account the factors described above and also considered: (1) the fairness of the compensation under a Management Contract with a level fee rate that does not include breakpoints; and (2) the pricing structure (including the expense ratio to be borne by shareholders) of the Portfolio, as compared to its Selected Peer Group, including that: (a) the management fee for the Portfolio is below the median and above the average management fees of the funds in its Selected Peer Group; and (b) the expense ratio for the Portfolio, inclusive of Acquired Fund Fees and Expenses (“AFFE”), is below the median and the average of the funds in its Selected Peer Group, and the expense ratio for the Portfolio, not inclusive of AFFE, is above the median and below the average of the expense ratios of the funds in its Selected Peer Group. In analyzing this fee data, the Board took into account: (1) that the Portfolio indirectly bears the fees payable by the underlying funds in which the Portfolio invests; and (2) Management’s representations regarding the competitiveness of the Portfolio’s management fee and expense ratio.
After its deliberation, the Board reached the following conclusions: (1) the Portfolio’s management fee rate is reasonable in the context of all factors considered by the Board; (2) the Portfolio’s expense ratio is reasonable in the context of all factors considered by the Board; (3) taking into account that the Portfolio commenced operations in May 2013, and therefore had a limited operating history for the purpose of analyzing the Portfolio’s performance, it is reasonable to permit the Portfolio time to establish a longer performance record for the purpose of evaluating investment performance; and (4) the sub-advisory fee rate payable by the Adviser to the Sub-Adviser is reasonable in the context of all factors considered by the Board. Based on these conclusions and other factors, the Board voted to renew the Management and Sub-Advisory Contracts for the Portfolio for the relevant periods. During this renewal process, different Board members may have given different weight to different individual factors and related conclusions.
Voya Solution Balanced Portfolio
In considering whether to approve the renewal of the Management and Sub-Advisory Contracts for Voya Solution Balanced Portfolio, the Board considered that, based on performance data for the periods ended March 31, 2016: (1) the Portfolio outperformed its
ADVISORY CONTRACT APPROVAL DISCUSSION (Unaudited) (continued)
Morningstar category average for the one-year and three-year periods, but underperformed for the year-to-date and five-year periods; (2) the Portfolio underperformed its primary benchmark for all periods presented; and (3) the Portfolio is ranked in the third quintile of its Morningstar category for the one-year, three-year and five-year periods, and the fourth quintile for the year-to-date period. In analyzing this performance data, the Board took into account Management’s representations regarding the competitiveness of the Portfolio’s performance during certain periods.
In considering the fees payable under the Management and Sub-Advisory Contracts for the Portfolio, the Board took into account the factors described above and also considered: (1) the fairness of the compensation under a Management Contract with a level fee rate that does not include breakpoints; and (2) the pricing structure (including the expense ratio to be borne by shareholders) of the Portfolio, as compared to its Selected Peer Group, including that: (a) the management fee for the Portfolio is below the median and above the average management fees of the funds in its Selected Peer Group; and (b) the expense ratio for the Portfolio, inclusive of Acquired Fund Fees and Expenses (“AFFE”), is below the median and the average expense ratios of the funds in its Selected Peer Group, and the expense ratio for the Portfolio, not inclusive of AFFE, is above the median and below the average expense ratios of the funds in its Selected Peer Group. In analyzing this fee data, the Board took into account: (1) that the Portfolio indirectly bears the fees payable by the underlying funds in which the Portfolio invests; and (2) Management’s representations regarding the competitiveness of the Portfolio’s management fee and expense ratio.
After its deliberation, the Board reached the following conclusions: (1) the Portfolio’s management fee rate is reasonable in the context of all factors considered by the Board; (2) the Portfolio’s expense ratio is reasonable in the context of all factors considered by the Board; (3) the Portfolio’s performance is reasonable in the context of all factors considered by the Board; and (4) the sub-advisory fee rate payable by the Adviser to the Sub-Adviser is reasonable in the context of all factors considered by the Board. Based on these conclusions and other factors, the Board voted to renew the Management and Sub-Advisory Contracts for the Portfolio for the relevant periods. During this renewal process, different Board members may have given different weight to different individual factors and related conclusions.
Voya Solution Conservative Portfolio
In considering whether to approve the renewal of the Management and Sub-Advisory Contracts for Voya
Solution Conservative Portfolio, the Board considered that, based on performance data for the periods ended March 31, 2016: (1) the Portfolio outperformed its Morningstar category average for all periods presented; (2) the Portfolio outperformed its primary benchmark for the one-year period, equaled its performance for the three-year period, and underperformed for the one-year and five-year periods; and (3) the Portfolio is ranked in the first (highest) quintile of its Morningstar category for the one-year period, the second quintile for the year-to-date and three-year periods, and the third quintile for the five-year period.
In considering the fees payable under the Management and Sub-Advisory Contracts for the Portfolio, the Board took into account the factors described above and also considered: (1) the fairness of the compensation under a Management Contract with a level fee rate that does not include breakpoints; and (2) the pricing structure (including the expense ratio to be borne by shareholders) of the Portfolio, as compared to its Selected Peer Group, including that: (a) the management fee for the Portfolio is below the median and the average management fees of the funds in its Selected Peer Group; and (b) the expense ratio for the Portfolio, inclusive of Acquired Fund Fees and Expenses (“AFFE”), is below the median and the average expense ratios of the funds in its Selected Peer Group, and the expense ratio for the Portfolio, not inclusive of AFFE, is below the median and the average expense ratios of the funds in its Selected Peer Group.
After its deliberation, the Board reached the following conclusions: (1) the Portfolio’s management fee rate is reasonable in the context of all factors considered by the Board; (2) the Portfolio’s expense ratio is reasonable in the context of all factors considered by the Board; (3) the Portfolio’s performance is reasonable in the context of all factors considered by the Board; and (4) the sub-advisory fee rate payable by the Adviser to the Sub-Adviser is reasonable in the context of all factors considered by the Board. Based on these conclusions and other factors, the Board voted to renew the Management and Sub-Advisory Contracts for the Portfolio for the relevant periods. During this renewal process, different Board members may have given different weight to different individual factors and related conclusions.
Voya Solution Income Portfolio
In considering whether to approve the renewal of the Management and Sub-Advisory Contracts for Voya Solution Income Portfolio, the Board considered that, based on performance data for the periods ended March 31, 2016: (1) the Portfolio outperformed its Morningstar category average for all periods presented,
ADVISORY CONTRACT APPROVAL DISCUSSION (Unaudited) (continued)
with the exception of the year-to-date period, during which it underperformed; (2) the Portfolio underperformed its primary benchmark for all periods presented, with the exception of the three-year period, during which it outperformed; and (3) the Portfolio is ranked in the first (highest) quintile of its Morningstar category for the one-year, three-year, five-year and ten-year periods, and the fourth quintile for the year-to-date period.
In considering the fees payable under the Management and Sub-Advisory Contracts for the Portfolio, the Board took into account the factors described above and also considered: (1) the fairness of the compensation under a Management Contract with a level fee rate that does not include breakpoints; and (2) the pricing structure (including the expense ratio to be borne by shareholders) of the Portfolio, as compared to its Selected Peer Group, including that: (a) the management fee for the Portfolio is above the median and the average management fees of the funds in its Selected Peer Group; and (b) the expense ratio for the Portfolio, inclusive of Acquired Fund Fees and Expenses (“AFFE”), is above the median and the average of the funds in its Selected Peer Group, and the expense ratio for the Portfolio, not inclusive of AFFE, is above the median and the average of the expense ratios of the funds in its Selected Peer Group. In analyzing this fee data, the Board took into account: (1) that the Portfolio indirectly bears the fees payable by the underlying funds in which the Portfolio invests; and (2) Management’s representations regarding the competitiveness of the Portfolio’s management fee and expense ratio.
After its deliberation, the Board reached the following conclusions: (1) the Portfolio’s management fee rate is reasonable in the context of all factors considered by the Board; (2) the Portfolio’s expense ratio is reasonable in the context of all factors considered by the Board; (3) the Portfolio’s performance is reasonable in the context of all factors considered by the Board; and (4) the sub-advisory fee rate payable by the Adviser to the Sub-Adviser is reasonable in the context of all factors considered by the Board. Based on these conclusions and other factors, the Board voted to renew the Management and Sub-Advisory Contracts for the Portfolio for the relevant periods. During this renewal process, different Board members may have given different weight to different individual factors and related conclusions.
Voya Solution Moderately Aggressive Portfolio
In considering whether to approve the renewal of the Management and Sub-Advisory Contracts for Voya Solution Moderately Aggressive Portfolio, the Board considered that, based on performance data for the periods ended March 31, 2016: (1) the Portfolio
outperformed its Morningstar category average for all periods presented, except the year-to-date period, during which it underperformed; (2) the Portfolio underperformed its primary benchmark for all periods presented; and (3) the Portfolio is ranked in the second quintile of its Morningstar category for the three-year period, the third quintile for the one-year and five-year periods, and the fourth quintile for the year-to-date period.
In considering the fees payable under the Management and Sub-Advisory Contracts for the Portfolio, the Board took into account the factors described above and also considered: (1) the fairness of the compensation under a Management Contract with a level fee rate that does not include breakpoints; and (2) the pricing structure (including the expense ratio to be borne by shareholders) of the Portfolio, as compared to its Selected Peer Group, including that: (a) the management fee for the Portfolio is above the median and the average management fees of the funds in its Selected Peer Group; and (b) the expense ratio for the Portfolio, inclusive of Acquired Fund Fees and Expenses (“AFFE”), is below the median and the average expense ratios of the funds in its Selected Peer Group, and the expense ratio for the Portfolio, not inclusive of AFFE, is above the median and the average expense ratios of the funds in its Selected Peer Group. In analyzing this fee data, the Board took into account: (1) that the Portfolio indirectly bears the fees payable by the underlying funds in which the Portfolio invests; and (2) Management’s representations regarding the competitiveness of the Portfolio’s management fee and expense ratio.
After its deliberation, the Board reached the following conclusions: (1) the Portfolio’s management fee rate is reasonable in the context of all factors considered by the Board; (2) the Portfolio’s expense ratio is reasonable in the context of all factors considered by the Board; (3) the Portfolio’s performance is reasonable in the context of all factors considered by the Board; and (4) the sub-advisory fee rate payable by the Adviser to the Sub-Adviser is reasonable in the context of all factors considered by the Board. Based on these conclusions and other factors, the Board voted to renew the Management and Sub-Advisory Contracts for the Portfolio for the relevant periods. During this renewal process, different Board members may have given different weight to different individual factors and related conclusions.
Voya Solution Moderately Conservative Portfolio
In considering whether to approve the renewal of the Management and Sub-Advisory Contracts for Voya Solution Moderately Conservative Portfolio, the Board considered that, based on performance data for the periods ended March 31, 2016: (1) the Portfolio
ADVISORY CONTRACT APPROVAL DISCUSSION (Unaudited) (continued)
outperformed its Morningstar category average for all periods presented, with the exception of the year-to-date period, during which it underperformed; (2) the Portfolio underperformed its primary benchmark for all periods presented, with the exception of the three-year period, during which it outperformed; and (3) the Portfolio is ranked in the first (highest) quintile of its Morningstar category for the three-year period, the second quintile for the five-year period, the third quintile for the one-year period, and the fourth quintile for the year-to-date period.
In considering the fees payable under the Management and Sub-Advisory Contracts for the Portfolio, the Board took into account the factors described above and also considered: (1) the fairness of the compensation under a Management Contract with a level fee rate that does not include breakpoints; and (2) the pricing structure (including the expense ratio to be borne by shareholders) of the Portfolio, as compared to its Selected Peer Group, including that: (a) the management fee for the Portfolio is above the median and the average management fees of the funds in its Selected Peer Group; and (b) the expense ratio for the Portfolio, inclusive of Acquired Fund Fees and Expenses (“AFFE”), is below the median and the average expense ratios of the funds in its Selected Peer Group, and the expense ratio for the Portfolio, not inclusive of AFFE, is above the median and below the average expense ratios of the funds in its Selected Peer Group. In analyzing this fee data, the Board took into account: (1) that the Portfolio indirectly bears the fees payable by the underlying funds in which the Portfolio invests; and (2) Management’s representations regarding the competitiveness of the Portfolio’s management fee and expense ratio.
After its deliberation, the Board reached the following conclusions: (1) the Portfolio’s management fee rate is reasonable in the context of all factors considered by the Board; (2) the Portfolio’s expense ratio is reasonable in the context of all factors considered by the Board; (3) the Portfolio’s performance is reasonable in the context of all factors considered by the Board; and (4) the sub-advisory fee rate payable by the Adviser to the Sub-Adviser is reasonable in the context of all factors considered by the Board. Based on these conclusions and other factors, the Board voted to renew the Management and Sub-Advisory Contracts for the Portfolio for the relevant periods. During this renewal process, different Board members may have given different weight to different individual factors and related conclusions.
Voya Solution 2020 Portfolio
In considering whether to approve the renewal of the Management and Sub-Advisory Contracts for Voya Solution 2020 Portfolio, the Board considered that, based
on performance data for the periods ended March 31, 2016: (1) the Portfolio outperformed its Morningstar category average for all periods presented, with the exception of the year-to-date period, during which it underperformed; (2) the Portfolio outperformed its primary benchmark for the three-year period, equaled its performance for the one-year period, and underperformed for the year-to-date period; and (3) the Portfolio is ranked in the first (highest) quintile of its Morningstar category for the one-year and three-year periods, and the fourth quintile for the year-to-date period.
In considering the fees payable under the Management and Sub-Advisory Contracts for the Portfolio, the Board took into account the factors described above and also considered: (1) the fairness of the compensation under a Management Contract with a level fee rate that does not include breakpoints; and (2) the pricing structure (including the expense ratio to be borne by shareholders) of the Portfolio, as compared to its Selected Peer Group, including that: (a) the management fee for the Portfolio is above the median and the average management fees of the funds in its Selected Peer Group; and (b) the expense ratio for the Portfolio, inclusive of Acquired Fund Fees and Expenses (“AFFE”), is above the median and the average expense ratios of the funds in its Selected Peer Group, and the expense ratio for the Portfolio, not inclusive of AFFE, is above the median and the average of the expense ratios of the funds in its Selected Peer Group. In analyzing this fee data, the Board took into account: (1) that, at the Board’s direction during the 2016 Contract Review Process, new lower expense limits were implemented on behalf of the Portfolio, to become effective January 1, 2017; (2) that the Portfolio indirectly bears the fees payable by the underlying funds in which the Portfolio invests; and (3) Management’s representations regarding the competitiveness of the Portfolio’s management fee and expense ratio.
After its deliberation, the Board reached the following conclusions: (1) the Portfolio’s management fee rate is reasonable in the context of all factors considered by the Board; (2) the Portfolio’s expense ratio is reasonable in the context of all factors considered by the Board; (3) the Portfolio’s performance is reasonable in the context of all factors considered by the Board; and (4) the sub-advisory fee rate payable by the Adviser to the Sub-Adviser is reasonable in the context of all factors considered by the Board. Based on these conclusions and other factors, the Board voted to renew the Management and Sub-Advisory Contracts for the Portfolio for the relevant periods. During this renewal process, different Board members may have given different weight to different individual factors and related conclusions.
ADVISORY CONTRACT APPROVAL DISCUSSION (Unaudited) (continued)
Voya Solution 2025 Portfolio
In considering whether to approve the renewal of the Management and Sub-Advisory Contracts for Voya Solution 2025 Portfolio, the Board considered that, based on performance data for the periods ended March 31, 2016: (1) the Portfolio outperformed its Morningstar category average for all periods presented, with the exception of the year-to-date and ten-year periods, during which it underperformed; (2) the Portfolio underperformed its primary benchmark for all periods presented; and (3) the Portfolio is ranked in the first (highest) quintile of its Morningstar category for the three-year period, the second quintile for the five-year period, the third quintile for the one-year and ten-year periods, and the fourth quintile for the year-to-date period.
In considering the fees payable under the Management and Sub-Advisory Contracts for the Portfolio, the Board took into account the factors described above and also considered: (1) the fairness of the compensation under a Management Contract with a level fee rate that does not include breakpoints; and (2) the pricing structure (including the expense ratio to be borne by shareholders) of the Portfolio, as compared to its Selected Peer Group, including that: (a) the management fee for the Portfolio is above the median and the average management fees of the funds in its Selected Peer Group; and (b) the expense ratio for the Portfolio, inclusive of Acquired Fund Fees and Expenses (“AFFE”), is above the median and the average expense ratios of the funds in its Selected Peer Group, and the expense ratio for the Portfolio, not inclusive of AFFE, is above the median and the average of the expense ratios of the funds in its Selected Peer Group. In analyzing this fee data, the Board took into account: (1) that, at the Board’s direction during the 2016 Contract Review Process, new lower expense limits were implemented on behalf of the Portfolio, to become effective January 1, 2017; (2) that the Portfolio indirectly bears the fees payable by the underlying funds in which the Portfolio invests; and (3) Management’s representations regarding the competitiveness of the Portfolio’s management fee and expense ratio.
After its deliberation, the Board reached the following conclusions: (1) the Portfolio’s management fee rate is reasonable in the context of all factors considered by the Board; (2) the Portfolio’s expense ratio is reasonable in the context of all factors considered by the Board; (3) the Portfolio’s performance is reasonable in the context of all factors considered by the Board; and (4) the sub-advisory fee rate payable by the Adviser to the Sub-Adviser is reasonable in the context of all factors considered by the Board. Based on these conclusions and other factors, the Board voted to renew the Management and Sub-Advisory Contracts for the Portfolio for the relevant periods. During
this renewal process, different Board members may have given different weight to different individual factors and related conclusions.
Voya Solution 2030 Portfolio
In considering whether to approve the renewal of the Management and Sub-Advisory Contracts for Voya Solution 2030 Portfolio, the Board considered that, based on performance data for the periods ended March 31, 2016: (1) the Portfolio outperformed its Morningstar category average for all periods presented, with the exception of the year-to-date period, during which it underperformed; (2) the Portfolio underperformed its primary benchmark for all periods presented, with the exception of the three-year period, during which it outperformed; and (3) the Portfolio is ranked in the first (highest) quintile of its Morningstar category for the three-year period, the second quintile for the one-year period, and the fourth quintile for the year-to-date period.
In considering the fees payable under the Management and Sub-Advisory Contracts for the Portfolio, the Board took into account the factors described above and also considered: (1) the fairness of the compensation under a Management Contract with a level fee rate that does not include breakpoints; and (2) the pricing structure (including the expense ratio to be borne by shareholders) of the Portfolio, as compared to its Selected Peer Group, including that: (a) the management fee for the Portfolio is above the median and the average management fees of the funds in its Selected Peer Group; and (b) the expense ratio for the Portfolio, inclusive of Acquired Fund Fees and Expenses (“AFFE”), is above the median and the average expense ratios of the funds in its Selected Peer Group, and the expense ratio for the Portfolio, not inclusive of AFFE, is above the median and the average of the expense ratios of the funds in its Selected Peer Group. In analyzing this fee data, the Board took into account: (1) that, at the Board’s direction during the 2016 Contract Review Process, new lower expense limits were implemented on behalf of the Portfolio, to become effective January 1, 2017; (2) that the Portfolio indirectly bears the fees payable by the underlying funds in which the Portfolio invests; and (3) Management’s representations regarding the competitiveness of the Portfolio’s management fee and expense ratio.
After its deliberation, the Board reached the following conclusions: (1) the Portfolio’s management fee rate is reasonable in the context of all factors considered by the Board; (2) the Portfolio’s expense ratio is reasonable in the context of all factors considered by the Board; (3) the Portfolio’s performance is reasonable in the context of all factors considered by the Board; and (4) the sub-advisory fee rate payable by the Adviser to the Sub-Adviser is
ADVISORY CONTRACT APPROVAL DISCUSSION (Unaudited) (continued)
reasonable in the context of all factors considered by the Board. Based on these conclusions and other factors, the Board voted to renew the Management and Sub-Advisory Contracts for the Portfolio for the relevant periods. During this renewal process, different Board members may have given different weight to different individual factors and related conclusions.
Voya Solution 2035 Portfolio
In considering whether to approve the renewal of the Management and Sub-Advisory Contracts for Voya Solution 2035 Portfolio, the Board considered that, based on performance data for the periods ended March 31, 2016: (1) the Portfolio underperformed its Morningstar category average for all periods presented, with the exception of the three-year period, during which it outperformed, and the five-year period during which its performance was equal to the performance of its Morningstar category average; (2) the Portfolio underperformed its primary benchmark for all periods presented; and (3) the Portfolio is ranked in the second quintile of its Morningstar category for the three-year period, the third quintile for the one-year, five-year and ten-year periods, and the fifth (lowest) quintile for the year-to-date period. In analyzing this performance data, the Board took into account Management’s representations regarding the competitiveness of the Portfolio’s performance during certain periods.
In considering the fees payable under the Management and Sub-Advisory Contracts for the Portfolio, the Board took into account the factors described above and also considered: (1) the fairness of the compensation under a Management Contract with a level fee rate that does not include breakpoints; and (2) the pricing structure (including the expense ratio to be borne by shareholders) of the Portfolio, as compared to its Selected Peer Group, including that: (a) the management fee for the Portfolio is above the median and the average management fees of the funds in its Selected Peer Group; and (b) the expense ratio for the Portfolio, inclusive of Acquired Fund Fees and Expenses (“AFFE”), is above the median and the average of the funds in its Selected Peer Group, and the expense ratio for the Portfolio, not inclusive of AFFE, is above the median and the average of the expense ratios of the funds in its Selected Peer Group. In analyzing this fee data, the Board took into account: (1) that, at the Board’s direction during the 2016 Contract Review Process, new lower expense limits were implemented on behalf of the Portfolio, to become effective January 1, 2017; (2) that the Portfolio indirectly bears the fees payable by the underlying funds in which the Portfolio invests; and (3) Management’s representations regarding the competitiveness of the Portfolio’s management fee and expense ratio.
After its deliberation, the Board reached the following conclusions: (1) the Portfolio’s management fee rate is reasonable in the context of all factors considered by the Board; (2) the Portfolio’s expense ratio is reasonable in the context of all factors considered by the Board; (3) the Portfolio’s performance is reasonable in the context of all factors considered by the Board; and (4) the sub-advisory fee rate payable by the Adviser to the Sub-Adviser is reasonable in the context of all factors considered by the Board. Based on these conclusions and other factors, the Board voted to renew the Management and Sub-Advisory Contracts for the Portfolio for the relevant periods. During this renewal process, different Board members may have given different weight to different individual factors and related conclusions.
Voya Solution 2040 Portfolio
In considering whether to approve the renewal of the Management and Sub-Advisory Contracts for Voya Solution 2040 Portfolio, the Board considered that, based on performance data for the periods ended March 31, 2016: (1) the Portfolio outperformed its Morningstar category average for all periods presented, with the exception of the year-to-date period, during which it underperformed; (2) the Portfolio underperformed its primary benchmark for all periods presented, with the exception of the three-year period, during which it outperformed; and (3) the Portfolio is ranked in the first (highest) quintile of its Morningstar category for the three-year period, the second quintile for the one-year period, and the fourth quintile for the year-to-date period.
In considering the fees payable under the Management and Sub-Advisory Contracts for the Portfolio, the Board took into account the factors described above and also considered: (1) the fairness of the compensation under a Management Contract with a level fee rate that does not include breakpoints; and (2) the pricing structure (including the expense ratio to be borne by shareholders) of the Portfolio, as compared to its Selected Peer Group, including that: (a) the management fee for the Portfolio is above the median and the average management fees of the funds in its Selected Peer Group; and (b) the expense ratio for the Portfolio, inclusive of Acquired Fund Fees and Expenses (“AFFE”), is above the median and the average of the funds in its Selected Peer Group, and the expense ratio for the Portfolio, not inclusive of AFFE, is above the median and the average of the expense ratios of the funds in its Selected Peer Group. In analyzing this fee data, the Board took into account: (1) that, at the Board’s direction during the 2016 Contract Review Process, new lower expense limits were implemented on behalf of the Portfolio, to become effective January 1, 2017; (2) that the Portfolio indirectly bears the fees payable by the underlying
ADVISORY CONTRACT APPROVAL DISCUSSION (Unaudited) (continued)
funds in which the Portfolio invests; and (3) Management’s representations regarding the competitiveness of the Portfolio’s management fee and expense ratio.
After its deliberation, the Board reached the following conclusions: (1) the Portfolio’s management fee rate is reasonable in the context of all factors considered by the Board; (2) the Portfolio’s expense ratio is reasonable in the context of all factors considered by the Board; (3) the Portfolio’s performance is reasonable in the context of all factors considered by the Board; and (4) the sub-advisory fee rate payable by the Adviser to the Sub-Adviser is reasonable in the context of all factors considered by the Board. Based on these conclusions and other factors, the Board voted to renew the Management and Sub-Advisory Contracts for the Portfolio for the relevant periods. During this renewal process, different Board members may have given different weight to different individual factors and related conclusions.
Voya Solution 2045 Portfolio
In considering whether to approve the renewal of the Management and Sub-Advisory Contracts for Voya Solution 2045 Portfolio, the Board considered that, based on performance data for the periods ended March 31, 2016: (1) the Portfolio underperformed its Morningstar category average for all periods presented, with the exception of the three-year and five-year periods, during which it outperformed; (2) the Portfolio underperformed its primary benchmark for all periods presented; and (3) the Portfolio is ranked in the first (highest) quintile of its Morningstar category for the three-year period, the second quintile for the five-year period, the third quintile for the ten-year period, the fourth quintile for the one-year period, and the fifth (lowest) quintile for the year-to-date period. In analyzing this performance data, the Board took into account Management’s representations regarding the competitiveness of the Portfolio’s performance during certain periods.
In considering the fees payable under the Management and Sub-Advisory Contracts for the Portfolio, the Board took into account the factors described above and also considered: (1) the fairness of the compensation under a Management Contract with a level fee rate that does not include breakpoints; and (2) the pricing structure (including the expense ratio to be borne by shareholders) of the Portfolio, as compared to its Selected Peer Group, including that: (a) the management fee for the Portfolio is above the median and the average management fees of the funds in its Selected Peer Group; and (b) the expense ratio for the Portfolio, inclusive of Acquired Fund Fees and Expenses (“AFFE”), is above the median and the average of the funds in its Selected Peer Group, and the expense
ratio for the Portfolio, not inclusive of AFFE, is above the median and the average of the expense ratios of the funds in its Selected Peer Group. In analyzing this fee data, the Board took into account: (1) that, at the Board’s direction during the 2016 Contract Review Process, new lower expense limits were implemented on behalf of the Portfolio, to become effective January 1, 2017; (2) that the Portfolio indirectly bears the fees payable by the underlying funds in which the Portfolio invests; and (3) Management’s representations regarding the competitiveness of the Portfolio’s management fee and expense ratio.
After its deliberation, the Board reached the following conclusions: (1) the Portfolio’s management fee rate is reasonable in the context of all factors considered by the Board; (2) the Portfolio’s expense ratio is reasonable in the context of all factors considered by the Board; (3) the Portfolio’s performance is reasonable in the context of all factors considered by the Board; and (4) the sub-advisory fee rate payable by the Adviser to the Sub-Adviser is reasonable in the context of all factors considered by the Board. Based on these conclusions and other factors, the Board voted to renew the Management and Sub-Advisory Contracts for the Portfolio for the relevant periods. During this renewal process, different Board members may have given different weight to different individual factors and related conclusions.
Voya Solution 2050 Portfolio
In considering whether to approve the renewal of the Management and Sub-Advisory Contracts for Voya Solution 2050 Portfolio, the Board considered that, based on performance data for the periods ended March 31, 2016: (1) the Portfolio outperformed its Morningstar category average for all periods presented, with the exception of the year-to-date period, during which it underperformed; (2) the Portfolio underperformed its primary benchmark for all periods presented; and (3) the Portfolio is ranked in the first (highest) quintile of its Morningstar category for the three-year period, the second quintile for the one-year period, and the fourth quintile for the year-to-date period. In analyzing this performance data, the Board took into account Management’s representations regarding the competitiveness of the Portfolio’s performance during certain periods.
In considering the fees payable under the Management and Sub-Advisory Contracts for the Portfolio, the Board took into account the factors described above and also considered: (1) the fairness of the compensation under a Management Contract with a level fee rate that does not include breakpoints; and (2) the pricing structure (including the expense ratio to be borne by shareholders) of the Portfolio, as compared to its Selected Peer Group,
ADVISORY CONTRACT APPROVAL DISCUSSION (Unaudited) (continued)
including that: (a) the management fee for the Portfolio is above the median and the average management fees of the funds in its Selected Peer Group; and (b) the expense ratio for the Portfolio, inclusive of Acquired Fund Fees and Expenses (“AFFE”), is above the median and the average of the funds in its Selected Peer Group, and the expense ratio for the Portfolio, not inclusive of AFFE, is above the median and the average of the expense ratios of the funds in its Selected Peer Group. In analyzing this fee data, the Board took into account: (1) that, at the Board’s direction during the 2016 Contract Review Process, new lower expense limits were implemented on behalf of the Portfolio, to become effective January 1, 2017; (2) that the Portfolio indirectly bears the fees payable by the underlying funds in which the Portfolio invests; and (3) Management’s representations regarding the competitiveness of the Portfolio’s management fee and expense ratio.
After its deliberation, the Board reached the following conclusions: (1) the Portfolio’s management fee rate is reasonable in the context of all factors considered by the Board; (2) the Portfolio’s expense ratio is reasonable in the context of all factors considered by the Board; (3) the Portfolio’s performance is reasonable in the context of all factors considered by the Board; and (4) the sub-advisory fee rate payable by the Adviser to the Sub-Adviser is reasonable in the context of all factors considered by the Board. Based on these conclusions and other factors, the Board voted to renew the Management and Sub-Advisory Contracts for the Portfolio for the relevant periods. During this renewal process, different Board members may have given different weight to different individual factors and related conclusions.
Voya Solution 2055 Portfolio
In considering whether to approve the renewal of the Management and Sub-Advisory Contracts for Voya Solution 2055 Portfolio, the Board considered that, based on performance data for the periods ended March 31, 2016: (1) the Portfolio underperformed its Morningstar category average for all periods presented, with the exception of the three-year period, during which it outperformed; (2) the Portfolio underperformed its primary benchmark for all periods presented; and (3) the Portfolio is ranked in the second quintile of its Morningstar category for the three-year period, the third quintile for the five-year period, the fourth quintile for the one-year period, and the fifth (lowest) quintile for the year-to-date period. In analyzing this performance data, the Board took into account Management’s representations regarding the competitiveness of the Portfolio’s performance for certain periods.
In considering the fees payable under the Management and Sub-Advisory Contracts for the Portfolio, the Board
took into account the factors described above and also considered: (1) the fairness of the compensation under a Management Contract with a level fee rate that does not include breakpoints; and (2) the pricing structure (including the expense ratio to be borne by shareholders) of the Portfolio, as compared to its Selected Peer Group, including that: (a) the management fee for the Portfolio is above the median and the average management fees of the funds in its Selected Peer Group; and (b) the expense ratio for the Portfolio, inclusive of Acquired Fund Fees and Expenses (“AFFE”), is above the median and the average of the funds in its Selected Peer Group, and the expense ratio for the Portfolio, not inclusive of AFFE, is above the median and the average of the expense ratios of the funds in its Selected Peer Group. In analyzing this fee data, the Board took into account: (1) that, at the Board’s direction during the 2016 Contract Review Process, new lower expense limits were implemented on behalf of the Portfolio, to become effective January 1, 2017; (2) that the Portfolio indirectly bears the fees payable by the underlying funds in which the Portfolio invests; and (3) Management’s representations regarding the competitiveness of the Portfolio’s management fee and expense ratio.
After its deliberation, the Board reached the following conclusions: (1) the Portfolio’s management fee rate is reasonable in the context of all factors considered by the Board; (2) the Portfolio’s expense ratio is reasonable in the context of all factors considered by the Board; (3) the Portfolio’s performance is reasonable in the context of all factors considered by the Board; and (4) the sub-advisory fee rate payable by the Adviser to the Sub-Adviser is reasonable in the context of all factors considered by the Board. Based on these conclusions and other factors, the Board voted to renew the Management and Sub-Advisory Contracts for the Portfolio for the relevant periods. During this renewal process, different Board members may have given different weight to different individual factors and related conclusions.
Voya Solution 2060 Portfolio
In considering whether to approve the renewal of the Management and Sub-Advisory Contracts for Voya Solution 2060 Portfolio, the Board considered that, based on performance data for the periods ended March 31, 2016: (1) the Portfolio underperformed its Morningstar category average for all periods presented; (2) the Portfolio underperformed its primary benchmark for all periods presented; and (3) the Portfolio is ranked in the third quintile of its Morningstar category for the one-year period, and the fifth (lowest) quintile for the year-to-date period. In analyzing this performance data, the Board took into account: (1) that the Portfolio commenced operations in February 2015, and therefore had a limited operating
ADVISORY CONTRACT APPROVAL DISCUSSION (Unaudited) (continued)
history for the purpose of analyzing its performance; (2) Management’s expectation that longer-term performance will improve; and (3) that Management would continue to monitor, and the Board or its Investment Review Committee would periodically review, the Portfolio’s performance.
In considering the fees payable under the Management and Sub-Advisory Contracts for the Portfolio, the Board took into account the factors described above and also considered: (1) the fairness of the compensation under a Management Contract with a level fee rate that does not include breakpoints; and (2) the pricing structure (including the expense ratio to be borne by shareholders) of the Portfolio, as compared to its Selected Peer Group, including that the expense ratio for the Portfolio, inclusive of Acquired Fund Fees and Expenses (“AFFE”), is above the median and the average of the funds in its Selected Peer Group, and the expense ratio for the Portfolio, not inclusive of AFFE, is above the median and the average of the expense ratios of the funds in its Selected Peer Group. In analyzing this fee data, the Board took into account: (1) that, at the Board’s direction during the 2016 Contract Review Process, new lower expense limits were implemented on behalf of the Portfolio, to become
effective January 1, 2017; (2) that the Portfolio indirectly bears the fees payable by the underlying funds in which the Portfolio invests; and (3) Management’s representations regarding the competitiveness of the Portfolio’s expense ratio.
After its deliberation, the Board reached the following conclusions: (1) the Portfolio’s management fee rate is reasonable in the context of all factors considered by the Board; (2) the Portfolio’s expense ratio is reasonable in the context of all factors considered by the Board; (3) taking into account that the Portfolio commenced operations in February 2015, and therefore had a limited operating history for the purpose of analyzing the Portfolio’s performance, it is reasonable to permit the Portfolio time to establish a longer performance record for the purpose of evaluating investment performance; and (4) the sub-advisory fee rate payable by the Adviser to the Sub-Adviser is reasonable in the context of all factors considered by the Board. Based on these conclusions and other factors, the Board voted to renew the Management and Sub-Advisory Contracts for the Portfolio for the relevant periods. During this renewal process, different Board members may have given different weight to different individual factors and related conclusions.
Investment Adviser
Directed Services LLC
1475 Dunwoody Drive
West Chester, Pennsylvania 19380
Distributor
Voya Investments Distributor, LLC
7337 East Doubletree Ranch Road, Suite 100
Scottsdale, Arizona 85258
Transfer Agent
BNY Mellon Investment Servicing (U.S.) Inc.
301 Bellevue Parkway
Wilmington, Delaware 19809
Independent Registered Public Accounting Firm
KPMG LLP
Two Financial Center
60 South Street
Boston, Massachusetts 02111
Custodian
The Bank of New York Mellon
225 Liberty Street
New York, New York 10286
Legal Counsel
Ropes & Gray LLP
Prudential Tower
800 Boylston Street
Boston, Massachusetts 02199
Before investing, carefully consider the investment objectives, risks, charges and expenses of the variable annuity contract or variable life insurance policy and the underlying variable investment options. This and other information is contained in the prospectus for the variable annuity contract or variable life insurance policy and the underlying variable investment options. Obtain these prospectuses from your agent/registered representative and read them carefully before investing.
RETIREMENT | INVESTMENTS | INSURANCE
voyainvestments.com
Annual Report
December 31, 2016
Classes ADV, I, S, S2 and Z
Voya Partners, Inc.
■
Voya Index Solution Income Portfolio
■
Voya Index Solution 2020 Portfolio
■
Voya Index Solution 2025 Portfolio
■
Voya Index Solution 2030 Portfolio
■
Voya Index Solution 2035 Portfolio
■
Voya Index Solution 2040 Portfolio
■
Voya Index Solution 2045 Portfolio
■
Voya Index Solution 2050 Portfolio
■
Voya Index Solution 2055 Portfolio
■
Voya Index Solution 2060 Portfolio
| | | This report is submitted for general information to shareholders of the Voya mutual funds. It is not authorized for distribution to prospective shareholders unless accompanied or preceded by a prospectus which includes details regarding the funds’ investment objectives, risks, charges, expenses and other information. This information should be read carefully. | | |
PROXY VOTING INFORMATION
A description of the policies and procedures that the Portfolios use to determine how to vote proxies related to portfolio securities is available: (1) without charge, upon request, by calling Shareholder Services toll-free at (800) 992-0180; (2) on the Portfolios’ website at www.voyainvestments.com; and (3) on the U.S. Securities and Exchange Commission’s (“SEC’s”) website at www.sec.gov. Information regarding how the Portfolios voted proxies related to portfolio securities during the most recent 12-month period ended June 30 is available without charge on the Portfolios’ website at www.voyainvestments.com and on the SEC’s website at www.sec.gov.
QUARTERLY PORTFOLIO HOLDINGS
The Portfolios file their complete schedule of portfolio holdings with the SEC for the first and third quarters of each fiscal year on Form N-Q. The Portfolios’ Forms N-Q are available on the SEC’s website at www.sec.gov. The Portfolios’ Forms N-Q may be reviewed and copied at the SEC’s Public Reference Room in Washington, D.C., and information on the operation of the Public Reference Room may be obtained by calling (800) SEC-0330. The Portfolios’ Forms N-Q, as well as a complete portfolio of investments, are available without charge upon request from the Portfolios by calling Shareholder Services toll-free at (800) 992-0180.
New administration, new possibilities
Dear Shareholder,
During the presidential campaign, President Donald Trump promised to cut taxes and regulations; since the election, anticipation of these policies has driven a rally in the stock markets. As the Trump administration transitions into power, it’s appropriate to consider how its policies might impact long-term investors.
The incoming president inherits a much better economy than the outgoing one did: job growth is accelerating, inflation is rising at an acceptable pace and corporate earnings have turned positive again. These trends were established enough in December that the U.S. Federal Reserve Board (“Fed”) could justify increasing interest rates. In a recent update to its World Economic Outlook, the International Monetary Fund (“IMF”) raised its near-term estimates of U.S. growth. Optimism about the pro-growth impacts of Trump policies is evident in surveys of small-business and consumer sentiment. We believe expectations of tax cuts, deregulation and increased fiscal policy stimulus will accelerate economic growth in the near term, leading to expectations of improved corporate revenue and earnings, which, if realized, could help sustain a stock market rally.
Greater fiscal stimulus also could help our trading partners, provided the new administration does not impose protectionist trade policies. Globally, near-term economic progress and easier fiscal policies should reduce the need to rely so heavily upon monetary policy. The IMF notes that the outlook for advanced economies has improved, though tighter financial conditions challenge the prospects for emerging and developing economies.
The potential benefits of Trump policies could be mitigated by longer-term trends in the economy: an aging population, consumers’ reluctance to borrow and subdued productivity growth. Fiscal stimulus would increase demand, but if coupled with aggressive tax cuts could increase the federal budget deficit, raising inflation. Should inflation accelerate above the Fed’s comfort threshold, we could see a faster than expected pace of interest rate increases, dampening growth potential.
Political uncertainty persists in this post-election world; the shift from monetary toward fiscal stimulus, while potentially beneficial, may also increase volatility. Investors should remain vigilant. True to our philosophy, we believe a globally diversified portfolio represents the best way to navigate the changing landscape of 2017. Before taking any action that could impact your long-term potential for investment success, thoroughly discuss with your investment advisor your circumstances and possible responses.
We seek to remain a reliable partner committed to reliable investing, helping you and your investment advisor achieve your goals. We appreciate your continued confidence in us, and we look forward to serving your investment needs in the future.
Sincerely,
Shaun Mathews
President and Chief Executive Officer
Voya Family of Funds
January 19, 2017
The views expressed in the President’s Letter reflect those of the President as of the date of the letter. Any such views are subject to change at any time based upon market or other conditions and the Voya mutual funds disclaim any responsibility to update such views. These views may not be relied on as investment advice and because investment decisions for a Voya mutual fund are based on numerous factors, may not be relied on as an indication of investment intent on behalf of any Voya mutual fund. Reference to specific company securities should not be construed as recommendations or investment advice.
International investing poses special risks including currency fluctuation, economic and political risks not found in investments that are solely domestic.
Market Perspective: Year Ended December 31, 2016
In our semi-annual report we described how markets in global equities, in the form of the MSCI World IndexSM (the “Index”) measured in local currencies, including net reinvested dividends, recovered sharply after intensifying global concerns had driven them down into February. With much turmoil along the way, the Index managed to turn a 0.70% loss in the first half into a 9.00% gain for the whole fiscal year. (The Index returned 7.51% for the year ended December 31, 2016, measured in U.S. dollars.)
The U.S. Federal Open Market Committee (“FOMC”) had started raising interest rates in December with the prospect of more to come in 2016 despite sluggish economic progress. It was worse in the rest of the developed world where negative bond yields were increasingly common.
China was an ongoing concern with declining growth, policy missteps and ballooning debt. Energy and commodities prices were falling, adding to deflationary pressures.
Many indices of risky assets seemed to reach their nadir on February 11. The Index, with no specific catalyst evident, rebounded by nearly 14% to the end of May.
As asset prices recovered, there were still many who doubted that the gains would be sustained. Yet by the end of May, the domestic economy was delivering some more encouraging data. FOMC officials started talking about two to three rate increases in 2016, as the faint growth in U.S. gross domestic product (“GDP”) in late 2015 and early 2016 would soon improve and employment was nearly full.
A surprisingly weak U.S. employment report on June 3 put paid to an interest rate increase that month. But worse was to come. On June 23, the British electorate unexpectedly voted to leave the European Union (“EU”). The strident voices of anti-globalization in other EU countries were sure to demand their own referendum. The potential disintegration of the world’s largest trading bloc had alarming implications for global demand and investment. Yet an initial 6% drop in the Index was mostly reversed by month end.
Indeed, the prices of risk assets resumed their recovery; the Index rose 4.56% in the two months through August. Two strong employment reports took the unemployment rate below 4.9%. Core inflation was holding above 2%. Slim second quarter annualized GDP growth of just 1.1% concealed real final sales growth of 2.4%. By the end of August, Federal Reserve officials were again warning of two interest rate increases before year end. In the event the FOMC did not act in September after a less strong employment report and listless purchasing managers’ indices, but broadly hinted that they would do so in December.
By the end of October, one notable trend was the increase in government bond yields. There were various reasons. In the U.S., an interest rate hike in December was an increasingly likely prospect, not dimmed by GDP growth for the third quarter of 2016 reported at 2.9% and later revised even higher. In the euro zone, it was feared that the European Central Bank was about to “taper” its bond buying. In the U.K., the weakening pound made government bonds less attractive.
But this and other market trends were thrown into disarray when on November 8 a new U.S. President was unexpectedly elected on a platform of massive infrastructure spending, tax reductions, lighter financial regulation, trade protectionism and the repeal of the Affordable Care Act.
Having stumbled for two months, the Index danced 2.63% higher in November and 2.78% in December. But the music had changed. The platform was seen as reflationary and inflationary in the U.S. The yield curve rose and steepened faster than ever. This and the prospect of lighter regulation benefited banks. The promised infrastructure spending boosted sectors like industrials, energy and materials. However, sectors that had been “bond surrogates” like utilities and consumer staples suffered. The technology sector, on which the net effect was unclear, was little changed.
In U.S. fixed income markets, the Bloomberg Barclays U.S. Aggregate Bond Index (“Barclays Aggregate”) gained 2.65% in the fiscal year, while the Bloomberg Barclays U.S. Treasury Bond sub-index added 1.04%. Indices of riskier classes generally outperformed Treasuries. The Bloomberg Barclays U.S. Corporate Investment Grade Bond sub-index advanced 6.11%; the Bloomberg Barclays High Yield Bond — 2% Issuer Constrained Composite Index (not a part of the Barclays Aggregate) soared 17.13%.
U.S. equities, represented by the S&P 500® index including dividends, rose 11.96% over the twelve months. The strongest sectors were energy and telecommunications, returning 27.36% and 23.49% respectively. Weakest were health care and consumer staples, which returned -2.69% and 5.38%, respectively. S&P 500® companies’ earnings per share recorded a 3.13% year-over-year increase in the third quarter of 2016 after five straight year-over-year declines.
In currencies, the dollar was boosted by developments in November and on a trade-weighted basis reached a 14-year high. The dollar gained 3.21% against the euro and 19.38% on the pound in 2016, although in the latter case it was primarily due to Britain’s vote to leave the EU. The dollar actually lost 2.71% against the yen, but this included a gain after November 8 of more than 11%.
In international markets, the MSCI Japan® Index, in a pattern that inversely reflected the yen, a driver of the value of non-yen export earnings, slipped 0.74% for the year, but rose nearly 15% in the last quarter. The MSCI Europe ex UK® Index added 2.31%, the balance of larger effects: industrials gained over 15% and made the largest contribution, while health care lost 10% and made the largest negative contribution. The MSCI UK® Index surged 19.16%, its big multinational members like HSBC, Shell and Glencore benefiting from the weaker pound, the currency in which their substantial overseas earnings would be reported.
All indices are unmanaged and investors cannot invest directly in an index. Past performance does not guarantee future results. The performance quoted represents past performance. Investment return and principal value of an investment will fluctuate, and shares, when redeemed, may be worth more or less than their original cost. The Portfolios’ performance is subject to change since the period’s end and may be lower or higher than the performance data shown. Please call (800) 262-3862 or log on to www.voyainvestments.com to obtain performance data current to the most recent month end.
Market Perspective reflects the views of Voya Investment Management’s Chief Investment Risk Officer only through the end of the period, and is subject to change based on market and other conditions.
| | | Index | | | | Description | | |
| | | Bloomberg Barclays High Yield Bond — 2% Issuer Constrained Composite Index | | | | An index that includes all fixed-income securities having a maximum quality rating of Ba1, a minimum amount outstanding of $150 million, and at least one year to maturity. | | |
| | | Bloomberg Barclays U.S. Aggregate Bond Index | | | | An index of publicly issued investment grade U.S. Government, mortgage-backed, asset-backed and corporate debt securities. | | |
| | | Bloomberg Barclays U.S. Corporate Investment Grade Bond Index | | | | An index consisting of publicly issued, fixed rate, nonconvertible, investment grade debt securities. | | |
| | | Bloomberg Barclays U.S. Treasury Bond Index | | | | A market capitalization-weighted index that measures the performance of public obligations of the U.S. Treasury that have a remaining maturity of one year or more. | | |
| | | MSCI Europe ex UK® Index | | | | A free float-adjusted market capitalization index that is designed to measure developed market equity performance in Europe, excluding the UK. | | |
| | | MSCI Japan® Index | | | | A free float-adjusted market capitalization index that is designed to measure developed market equity performance in Japan. | | |
| | | MSCI UK® Index | | | | A free float-adjusted market capitalization index that is designed to measure developed market equity performance in the UK. | | |
| | | MSCI World IndexSM | | | | An index that measures the performance of over 1,400 securities listed on exchanges in the U.S., Europe, Canada, Australia, New Zealand and the Far East. | | |
| | | S&P 500® Index | | | | An index that measures the performance of securities of approximately 500 large-capitalization companies whose securities are traded on major U.S. stock markets. | | |
| | | S&P Target Date Retirement Income Index | | | | Seeks to represent asset allocations which target an immediate retirement horizon. | | |
| | | S&P Target Date 2020 Index, S&P Target Date 2025 Index, S&P Target Date 2030 Index, S&P Target Date 2035 Index, S&P Target Date 2040 Index, S&P Target Date 2045 Index, S&P Target Date 2050 Index and S&P Target Date 2055+ Index | | | | Each seeks to represent the market consensus for asset allocations which target an approximate 2020, 2025, 2030, 2035, 2040, 2045, 2050, 2055 and beyond 2055 retirement horizon, respectively. | | |
| Voya Index Solution Portfolios | Portfolio Managers’ Report |
The Voya Index Solution Portfolios consist of Voya Index Solution Income Portfolio, Voya Index Solution 2020 Portfolio, Voya Index Solution 2025 Portfolio, Voya Index Solution 2030 Portfolio, Voya Index Solution 2035 Portfolio, Voya Index Solution 2040 Portfolio, Voya Index Solution 2045 Portfolio, Voya Index Solution 2050 Portfolio, Voya Index Solution 2055 Portfolio, and Voya Index Solution 2060 Portfolio (each a “Portfolio” or collectively, the “Portfolios”). Each Portfolio seeks to achieve its investment objective by investing in a combination of underlying funds which are actively managed funds or passively managed funds (index funds)(1). Each Portfolio uses an asset allocation strategy (“Target Asset Allocation”) designed for investors expecting to retire around the year applicable to that Portfolio. The Portfolios are managed by Halvard Kvaale, CIMA, Paul Zemsky, CFA and Chief Investment Officer, and Jody Hrazanek, Portfolio Managers of Voya Investment Management Co. LLC (“Voya IM”) — the Sub-Adviser.*
Portfolio Specifics: At the beginning of 2016, the Portfolios were defensively positioned, overweight core U.S. fixed income, funded by underweight positions in U.S. mid-cap equities and high yield bonds.
In January, the Portfolios reduced U.S. mid cap equities, allocating proceeds to core U.S. fixed income. This tactical trade was made to reduce risk given uncertainty around U.S. Federal Reserve Board (“Fed”) policy and global growth. In February, with continual global weakness and policy induced volatility, equity exposure was further reduced by selling U.S. large cap and developed international equities in favor of core U.S. fixed income.
In mid-March, both short-term positions implemented in February were reversed by selling U.S. core fixed income and purchasing U.S. large-cap and developed international equities. This trade was made to add risk back into the Portfolios, as policy steps from the European Central Bank, Fed and Bank of Japan helped to ventilate the monetary system and economic growth numbers had firmed.
In mid-April, given improved U.S. economic data, the Portfolios covered a portion of the short U.S. mid cap position that was originated in January. At the end of April, to maintain equity weights through the Portfolios’ annual glide down, the underweight large cap / overweight U.S. fixed income position initiated in July of 2015 was closed. In addition, the last of the short U.S. mid cap / long core fixed income position initiated in January was closed. These trades were a continuation of re-risking the Portfolios from their defensive posture, reflecting confidence that a trough in the markets was made in the first quarter.
In early-June, a modest overweight to commodities was enacted, offset by an underweight to core bonds. At the time of the trade, we believed the global oil market would likely move to a balanced state in 2017 as demand continues to rise faster than production. In addition, commodities should benefit from continued global growth and Fed-driven U.S. dollar weakness.
In mid-June, a portion of the Portfolios’ U.S. large cap position was shifted into U.S. mid cap. This trade reflected the view that U.S. consumer spending will continue to drive U.S. outperformance relative to the global equity markets. Given that U.S. large cap corporations have greater exposure to international markets than do their mid cap counterparts, this trade provided the suite with greater exposure to the U.S. growth story without incurring a meaningful increase in tracking error. In addition, we believed U.S. mid cap provided greater protection from the possibility of a successful British referendum and lower sensitivity to both the shape of the yield curve and energy prices.
At the end of the second quarter, in response to the financial shock and uncertainty surrounding the passing of Brexit, the Portfolios reduced volatility by selling U.S. large cap into cash.
In July, the Portfolios purchased U.S. large cap equities with cash, directly reversing the risk-reduction trade implemented in June as a response to the British withdrawal from the European Union. Support for this trade include a strong June payroll report and improved fundamental and technical indicators.
Also in July, duration was increased in some of the Portfolios by purchasing long-term U.S. Treasury Bonds and core fixed income. The pursuit of yield from investors had increased demand for U.S. Treasuries given its positive yielding bond market and high credit rating. At the time, the odds of a rate hike were relatively low, but U.S. policy is still expected to tighten versus other major central banks which only increases the value of the U.S. dollar and, subsequently, the demand for its bonds.
In August, the Portfolios enacted a modest overweight to emerging markets (“EM”) equities offset by selling high yield and U.S. large cap. We believe that EM equities have been making a meaningful turnaround after prolonged underperformance relative to domestic markets since 2011. Increased acceleration of industrial production combined with the easing of financial market conditions are positive for the asset class.
At the end of October, the Portfolios further increased their tactical overweight to EM funded by a reduction in core fixed income. In addition, as part of the semi-annual review of the Portfolios’ Target Asset Allocations, existing tactical trades were incorporated into longer-term strategic positions, resulting in a slight decrease in fixed income exposure.
In November, the Portfolios closed the mid-cap overweight enacted in June after meaningful gains in mid-cap leading into and after the U.S. elections. At the end of the month, the Portfolios removed their overweight to EM equities as headwinds from a rise in dollar strength and the uncertainty of the Trump administration’s stance on trade continued to pressure the asset class. Proceeds from both trades were allocated to U.S. large cap equities.
During the year, tactical moves relative to our Target Asset Allocations had a negative impact across the Portfolios.
| Portfolio Managers’ Report | Voya Index Solution Portfolios |
The performance of Portfolios against their benchmarks was also impacted by differences between Target Asset Allocations and benchmark asset allocations. This varied from Portfolio to Portfolio. For example, in some cases Portfolios had a higher allocation to equities than their benchmarks, enhancing relative performance. In addition, the Portfolios tended to have a higher weighting in high yield bonds and less cash than the benchmarks within the fixed income exposure, which was beneficial. On the other hand, the Portfolios tended to have a lower weighting in U.S. mid-caps within the equities exposure, which detracted.
All asset classes utilized in the Portfolios produced positive returns for the year. The best performing asset classes were domestic small and midcap equities and high yield bonds. Asset classes with lowest returns for the year were foreign large cap equities and long government bonds.
Current Strategy and Outlook: We believe both monetary and fiscal policy are going to be far more active than any time since the post-2009 era. President-elect Donald Trump has promised a meaningful reduction in corporate and personal income tax rates as part of his agenda to reinvigorate the U.S. economy. Additionally, the Fed is now forecasting three interest rate hikes in 2017. Both of these initiatives come while the U.S. is at or approaching full employment, making each an important issue in its own right for markets to digest this coming year.
In our view, a tightening monetary and loose fiscal policy environment will favor continued U.S. dollar strength, albeit at a more modest pace going forward. U.S. bond yields are still likely to climb, met with fits and starts, and will be highly dependent upon the strength of U.S. economic progress. Rising bond yields have historically created a virtuous circle of attracting foreign flows looking for yield, but the key will be the speed of those moves. Commodity prices have found their legs and are continuing to move higher on a deal from OPEC to cut oil production, while the prospects of better growth around the world should benefit cyclical commodities such as iron ore and copper. The U.S. consumer has fared very well as a result of an increase in disposable income, solid job prospects and favorable financing rates. Consumer confidence and wage growth will be key indicators for us to monitor going forward.
Though we believe equity markets can continue to do well, this thesis rests on a few conditions being met. First, U.S. dollar strength can continue but must be within reasonable bounds. Too strong a dollar can hurt earnings of the larger capitalization companies that earn a sizeable share of revenues overseas. The year-on-year change in the U.S. dollar is just turning positive, and a large move from this point forward could start to negatively impact earnings. We favor the U.S. in this environment, as it has the best growth trajectory and visibility over the next quarter.
We are mindful that fund flows are just starting to warm up to the ideas that equities can outpace fixed income returns. We think equities can finally get some traction among investors as the coming reflation initiatives take hold. As for bonds they may be susceptible to the old adage “don’t throw the baby out with the bath water,” but we are still finding opportunities in high yield fixed income and senior loans.
In retrospect, making asset allocation decisions in 2016 was easy. Simply buying after equity market corrections was a good strategy. The market environment in 2017 may not be so cut and dry. We are closely looking for signs of overheating sentiment among investors, and have yet to see any of our indicators firmly pointing to ebullience. While we believe recession risk in the near-term has all but disappeared, we are keenly aware that if the Fed starts hiking faster than the markets expect, it could spell trouble for all risk assets, especially with U.S. equities at lofty 17 times earnings. Tightening labor markets and fast rising wages could be a challenge for equities, but in our view that is more likely a concern for later this coming year.
*
Each Portfolio’s relative performance versus its respective benchmark can be found on page 6.
(1)
The investment objective of each Portfolio is described in the Portfolios’ prospectuses, each dated May 1, 2016.
Portfolio holdings and characteristics are subject to change and may not be representative of current holdings and characteristics. Portfolio holdings are subject to change daily. The outlook for this Portfolio may differ from that presented for other Voya mutual funds. The Portfolio’s performance returns shown reflect applicable fee waivers and/or expense limits in effect during this period. Absent such fee waivers/expense limitations, if any, performance would have been lower. Performance for the different classes of shares will vary based on differences in fees associated with each class.
| Voya Index Solution Portfolios | Portfolio Managers’ Report |
| | | Total Returns for the Period Ended December 31, 2016 | | |
| | | | | | 1 Year | | |
| | | Voya Index Solution Income Portfolio, Class S | | | 4.95% | | |
| | | S&P Target Date Retirement Income Index | | | 5.27% | | |
| | | Voya Index Solution 2020 Portfolio, Class S | | | 6.26% | | |
| | | S&P Target Date 2020 Index | | | 7.49% | | |
| | | Voya Index Solution 2025 Portfolio, Class S | | | 6.85% | | |
| | | S&P Target Date 2025 Index | | | 8.09% | | |
| | | Voya Index Solution 2030 Portfolio, Class S | | | 7.08% | | |
| | | S&P Target Date 2030 Index | | | 8.62% | | |
| | | Voya Index Solution 2035 Portfolio, Class S | | | 7.77% | | |
| | | S&P Target Date 2035 Index | | | 9.12% | | |
| | | Voya Index Solution 2040 Portfolio, Class S | | | 7.89% | | |
| | | S&P Target Date 2040 Index | | | 9.50% | | |
| | | Voya Index Solution 2045 Portfolio, Class S | | | 8.05% | | |
| | | S&P Target Date 2045 Index | | | 9.81% | | |
| | | Voya Index Solution 2050 Portfolio, Class S | | | 8.20% | | |
| | | S&P Target Date 2050 Index | | | 10.01% | | |
| | | Voya Index Solution 2055 Portfolio, Class S | | | 7.89% | | |
| | | S&P Target Date 2055+ Index | | | 10.21% | | |
| | | Voya Index Solution 2060 Portfolio, Class S | | | 8.06% | | |
| | | S&P Target Date 2055+ Index | | | 10.21% | | |
| | | | | | | | |
| | | Annual Target Asset Allocation as of December 31, 2016 | | |
| | | | | | Income | | | 2020 | | | 2025 | | | 2030 | | | 2035 | | | 2040 | | | 2045 | | | 2050 | | | 2055 | | | 2060 | | |
| | | U.S. Large Blend | | | | | 23.0% | | | | | | 30.0% | | | | | | 32.0% | | | | | | 38.0% | | | | | | 43.0% | | | | | | 46.0% | | | | | | 48.0% | | | | | | 48.0% | | | | | | 48.5% | | | | | | 48.5% | | | |
| | | U.S. Mid Cap | | | | | 3.0% | | | | | | 4.0% | | | | | | 7.0% | | | | | | 7.5% | | | | | | 8.5% | | | | | | 8.5% | | | | | | 9.5% | | | | | | 10.5% | | | | | | 10.5% | | | | | | 10.5% | | | |
| | | U.S. Small Cap | | | | | — | | | | | | 2.0% | | | | | | 3.0% | | | | | | 3.0% | | | | | | 4.0% | | | | | | 4.0% | | | | | | 4.0% | | | | | | 4.0% | | | | | | 4.0% | | | | | | 4.0% | | | |
| | | International Equity | | | | | 6.0% | | | | | | 11.0% | | | | | | 14.0% | | | | | | 16.5% | | | | | | 18.5% | | | | | | 19.5% | | | | | | 20.5% | | | | | | 20.5% | | | | | | 22.0% | | | | | | 22.0% | | | |
| | | Emerging Markets | | | | | — | | | | | | — | | | | | | 3.0% | | | | | | 4.0% | | | | | | 4.0% | | | | | | 5.0% | | | | | | 6.0% | | | | | | 6.0% | | | | | | 6.0% | | | | | | 6.0% | | | |
| | | U.S. Real Estate | | | | | 1.0% | | | | | | 1.0% | | | | | | 1.0% | | | | | | 1.5% | | | | | | 1.5% | | | | | | 1.5% | | | | | | 1.5% | | | | | | 1.5% | | | | | | 1.5% | | | | | | 1.5% | | | |
| | | Global Real Estate | | | | | 1.0% | | | | | | 1.0% | | | | | | 1.0% | | | | | | 1.5% | | | | | | 1.5% | | | | | | 1.5% | | | | | | 1.5% | | | | | | 1.5% | | | | | | 1.5% | | | | | | 1.5% | | | |
| | | Commodities | | | | | 1.5% | | | | | | 1.5% | | | | | | 1.5% | | | | | | 1.5% | | | | | | 1.5% | | | | | | 1.5% | | | | | | 1.5% | | | | | | 1.5% | | | | | | 1.5% | | | | | | 1.5% | | | |
| | | Core Fixed Income | | | | | 54.5% | | | | | | 38.8% | | | | | | 26.8% | | | | | | 18.8% | | | | | | 10.5% | | | | | | 9.5% | | | | | | 4.5% | | | | | | 3.5% | | | | | | 3.5% | | | | | | 3.5% | | | |
| | | High Yield | | | | | 6.0% | | | | | | 6.0% | | | | | | 6.0% | | | | | | 4.0% | | | | | | 4.0% | | | | | | 1.0% | | | | | | — | | | | | | — | | | | | | — | | | | | | — | | | |
| | | Senior Debt | | | | | 4.0% | | | | | | 4.0% | | | | | | 4.0% | | | | | | 3.0% | | | | | | 3.0% | | | | | | 2.0% | | | | | | 2.0% | | | | | | 2.0% | | | | | | — | | | | | | — | | | |
| | | Long Gov’t Bond | | | | | — | | | | | | 0.7% | | | | | | 0.7% | | | | | | 0.7% | | | | | | — | | | | | | — | | | | | | 1.0% | | | | | | 1.0% | | | | | | 1.0% | | | | | | 1.0% | | | |
| | | Total Equity | | | | | 35.5% | | | | | | 50.5% | | | | | | 62.5% | | | | | | 73.5% | | | | | | 82.5% | | | | | | 87.5% | | | | | | 92.5% | | | | | | 93.5% | | | | | | 95.5% | | | | | | 95.5% | | | |
| | | Total Fixed Income | | | | | 64.5% | | | | | | 49.5% | | | | | | 37.5% | | | | | | 26.5% | | | | | | 17.5% | | | | | | 12.5% | | | | | | 7.5% | | | | | | 6.5% | | | | | | 4.5% | | | | | | 4.5% | | | |
As these are target allocations, the actual allocations of each Portfolio’s assets may deviate from the percentages shown. Although the Portfolios expect to be fully invested at all times, they may maintain liquidity reserves to meet redemption requests.
Portfolio holdings are subject to change daily.
| Portfolio Managers’ Report | Voya Index Solution Income Portfolio |
| | | Average Annual Total Returns for the Periods Ended December 31, 2016 | | |
| | | | | | 1 Year | | | 5 Year | | | Since Inception
of Classes ADV, I and S
March 10, 2008 | | | Since Inception
of Class S2
May 28, 2009 | | |
| | | Class ADV | | | | | 4.71% | | | | | | 4.92% | | | | | | 4.17% | | | | | | — | | | |
| | | Class I | | | | | 5.23% | | | | | | 5.42% | | | | | | 4.71% | | | | | | — | | | |
| | | Class S | | | | | 4.95% | | | | | | 5.15% | | | | | | 4.42% | | | | | | — | | | |
| | | Class S2 | | | | | 4.79% | | | | | | 5.01% | | | | | | — | | | | | | 5.96% | | | |
| | | Class Z(1) | | | | | 5.32% | | | | | | 5.48% | | | | | | 4.74% | | | | | | — | | | |
| | | S&P Target Date Retirement Income Index | | | | | 5.27% | | | | | | 4.92% | | | | | | 4.44% | | | | | | 6.51% | | | |
| | | | | |
Based on a $10,000 initial investment, the graph and table above illustrate the total return of Voya Index Solution Income Portfolio against the index indicated. The index is unmanaged and has no cash in its portfolio, imposes no sales charges and incurs no operating expenses. An investor cannot invest directly in an index. The Portfolio’s performance is shown without the imposition of any expenses or charges which are, or may be, imposed under your variable annuity contract or variable life insurance policy. Total returns would have been lower if such expenses or charges were included.
The performance graph and table do not reflect the deduction of taxes that a shareholder will pay on Portfolio distributions or the redemption of Portfolio shares.
The performance shown may include the effect of fee waivers and/or expense reimbursements by the Investment Adviser and/or other service providers, which have the effect of increasing total return. Had all fees and expenses been considered, the total returns would have been lower.
The performance update illustrates performance for a variable investment option available through a variable annuity contract or a variable life insurance policy. The
performance shown indicates past performance and is not a projection or prediction of future results. Actual investment returns and principal value will fluctuate so that shares and/or units, at redemption, may be worth more or less than their original cost. Please log on to www.voyainvestments.com or call (800) 262-3862 to get performance through the most recent month end.
This report contains statements that may be “forward-looking” statements. Actual results may differ materially from those projected in the “forward-looking” statements.
The views expressed in this report reflect those of the portfolio managers, only through the end of the period as stated on the cover. The portfolio managers’ views are subject to change at any time based on market and other conditions.
Portfolio holdings are subject to change daily.
(1)
Class Z incepted on May 1, 2015. The Class Z shares performance shown for the period prior to their inception date is the performance of Class I shares without adjustment for any differences in the expenses between the two classes. If adjusted for such differences, returns would be different.
| Voya Index Solution 2020 Portfolio | Portfolio Managers’ Report |
| | | Average Annual Total Returns for the Periods Ended December 31, 2016 | | |
| | | | | | 1 Year | | | 5 Year | | | Since Inception
of Classes ADV, I, S, and S2
October 3, 2011 | | |
| | | Class ADV | | | | | 5.90% | | | | | | 7.06% | | | | | | 8.23% | | | |
| | | Class I | | | | | 6.45% | | | | | | 7.50% | | | | | | 8.67% | | | |
| | | Class S | | | | | 6.26% | | | | | | 7.24% | | | | | | 8.39% | | | |
| | | Class S2 | | | | | 6.00% | | | | | | 7.12% | | | | | | 8.29% | | | |
| | | Class Z(1) | | | | | 6.52% | | | | | | 7.55% | | | | | | 8.72% | | | |
| | | S&P Target Date 2020 Index | | | | | 7.49% | | | | | | 7.93% | | | | | | 9.39% | | | |
| | | | | |
Based on a $10,000 initial investment, the graph and table above illustrate the total return of Voya Index Solution 2020 Portfolio against the index indicated. The index is unmanaged and has no cash in its portfolio, imposes no sales charges and incurs no operating expenses. An investor cannot invest directly in an index. The Portfolio’s performance is shown without the imposition of any expenses or charges which are, or may be, imposed under your variable annuity contract or variable life insurance policy. Total returns would have been lower if such expenses or charges were included.
The performance graph and table do not reflect the deduction of taxes that a shareholder will pay on Portfolio distributions or the redemption of Portfolio shares.
The performance shown may include the effect of fee waivers and/or expense reimbursements by the Investment Adviser and/or other service providers, which have the effect of increasing total return. Had all fees and expenses been considered, the total returns would have been lower.
The performance update illustrates performance for a variable investment option available through a variable annuity contract or a variable life insurance policy. The
performance shown indicates past performance and is not a projection or prediction of future results. Actual investment returns and principal value will fluctuate so that shares and/or units, at redemption, may be worth more or less than their original cost. Please log on to www.voyainvestments.com or call (800) 262-3862 to get performance through the most recent month end.
This report contains statements that may be “forward-looking” statements. Actual results may differ materially from those projected in the “forward-looking” statements.
The views expressed in this report reflect those of the portfolio managers, only through the end of the period as stated on the cover. The portfolio managers’ views are subject to change at any time based on market and other conditions.
Portfolio holdings are subject to change daily.
(1)
Class Z incepted on May 1, 2015. The Class Z shares performance shown for the period prior to their inception date is the performance of Class I shares without adjustment for any differences in the expenses between the two classes. If adjusted for such differences, returns would be different.
| Portfolio Managers’ Report | Voya Index Solution 2025 Portfolio |
| | | Average Annual Total Returns for the Periods Ended December 31, 2016 | | |
| | | | | | 1 Year | | | 5 Year | | | Since Inception
of Classes ADV, I, and S
March 10, 2008 | | | Since Inception
of Class S2
May 28, 2009 | | |
| | | Class ADV | | | | | 6.61% | | | | | | 7.76% | | | | | | 4.67% | | | | | | — | | | |
| | | Class I | | | | | 7.14% | | | | | | 8.31% | | | | | | 5.19% | | | | | | — | | | |
| | | Class S | | | | | 6.85% | | | | | | 8.04% | | | | | | 4.93% | | | | | | — | | | |
| | | Class S2 | | | | | 6.72% | | | | | | 7.88% | | | | | | — | | | | | | 8.88% | | | |
| | | Class Z(1) | | | | | 7.33% | | | | | | 8.37% | | | | | | 5.22% | | | | | | — | | | |
| | | S&P Target Date 2025 Index | | | | | 8.09% | | | | | | 8.64% | | | | | | 6.05% | | | | | | 10.10% | | | |
| | | | | |
Based on a $10,000 initial investment, the graph and table above illustrate the total return of Voya Index Solution 2025 Portfolio against the index indicated. The index is unmanaged and has no cash in its portfolio, imposes no sales charges and incurs no operating expenses. An investor cannot invest directly in an index. The Portfolio’s performance is shown without the imposition of any expenses or charges which are, or may be, imposed under your variable annuity contract or variable life insurance policy. Total returns would have been lower if such expenses or charges were included.
The performance graph and table do not reflect the deduction of taxes that a shareholder will pay on Portfolio distributions or the redemption of Portfolio shares.
The performance shown may include the effect of fee waivers and/or expense reimbursements by the Investment Adviser and/or other service providers, which have the effect of increasing total return. Had all fees and expenses been considered, the total returns would have been lower.
The performance update illustrates performance for a variable investment option available through a variable annuity contract or a variable life insurance policy. The
performance shown indicates past performance and is not a projection or prediction of future results. Actual investment returns and principal value will fluctuate so that shares and/or units, at redemption, may be worth more or less than their original cost. Please log on to www.voyainvestments.com or call (800) 262-3862 to get performance through the most recent month end.
This report contains statements that may be “forward-looking” statements. Actual results may differ materially from those projected in the “forward-looking” statements.
The views expressed in this report reflect those of the portfolio managers, only through the end of the period as stated on the cover. The portfolio managers’ views are subject to change at any time based on market and other conditions.
Portfolio holdings are subject to change daily.
(1)
Class Z incepted on May 1, 2015. The Class Z shares performance shown for the period prior to their inception date is the performance of Class I shares without adjustment for any differences in the expenses between the two classes. If adjusted for such differences, returns would be different.
| Voya Index Solution 2030 Portfolio | Portfolio Managers’ Report |
| | | Average Annual Total Returns for the Periods Ended December 31, 2016 | | |
| | | | | | 1 Year | | | 5 Year | | | Since Inception of
Classes ADV, I, S, and S2
October 3, 2011 | | |
| | | Class ADV | | | | | 6.84% | | | | | | 8.60% | | | | | | 10.17% | | | |
| | | Class I | | | | | 7.31% | | | | | | 9.12% | | | | | | 10.70% | | | |
| | | Class S | | | | | 7.08% | | | | | | 8.82% | | | | | | 10.38% | | | |
| | | Class S2 | | | | | 6.92% | | | | | | 8.65% | | | | | | 10.22% | | | |
| | | Class Z(1) | | | | | 7.48% | | | | | | 9.14% | | | | | | 10.71% | | | |
| | | S&P Target Date 2030 Index | | | | | 8.62% | | | | | | 9.32% | | | | | | 11.11% | | | |
| | | | | |
Based on a $10,000 initial investment, the graph and table above illustrate the total return of Voya Index Solution 2030 Portfolio against the index indicated. The index is unmanaged and has no cash in its portfolio, imposes no sales charges and incurs no operating expenses. An investor cannot invest directly in an index. The Portfolio’s performance is shown without the imposition of any expenses or charges which are, or may be, imposed under your variable annuity contract or variable life insurance policy. Total returns would have been lower if such expenses or charges were included.
The performance graph and table do not reflect the deduction of taxes that a shareholder will pay on Portfolio distributions or the redemption of Portfolio shares.
The performance shown may include the effect of fee waivers and/or expense reimbursements by the Investment Adviser and/or other service providers, which have the effect of increasing total return. Had all fees and expenses been considered, the total returns would have been lower.
The performance update illustrates performance for a variable investment option available through a variable annuity contract or a variable life insurance policy. The
performance shown indicates past performance and is not a projection or prediction of future results. Actual investment returns and principal value will fluctuate so that shares and/or units, at redemption, may be worth more or less than their original cost. Please log on to www.voyainvestments.com or call (800) 262-3862 to get performance through the most recent month end.
This report contains statements that may be “forward-looking” statements. Actual results may differ materially from those projected in the “forward-looking” statements.
The views expressed in this report reflect those of the portfolio managers, only through the end of the period as stated on the cover. The portfolio managers’ views are subject to change at any time based on market and other conditions.
Portfolio holdings are subject to change daily.
(1)
Class Z incepted on May 1, 2015. The Class Z shares performance shown for the period prior to their inception date is the performance of Class I shares without adjustment for any differences in the expenses between the two classes. If adjusted for such differences, returns would be different.
| Portfolio Managers’ Report | Voya Index Solution 2035 Portfolio |
| | | Average Annual Total Returns for the Periods Ended December 31, 2016 | | |
| | | | | | 1 Year | | | 5 Year | | | Since Inception
of Classes ADV, I, and S
March 10, 2008 | | | Since Inception
of Class S2
May 28, 2009 | | |
| | | Class ADV | | | | | 7.63% | | | | | | 9.28% | | | | | | 5.14% | | | | | | — | | | |
| | | Class I | | | | | 8.12% | | | | | | 9.82% | | | | | | 5.65% | | | | | | — | | | |
| | | Class S | | | | | 7.77% | | | | | | 9.54% | | | | | | 5.39% | | | | | | — | | | |
| | | Class S2 | | | | | 7.65% | | | | | | 9.39% | | | | | | — | | | | | | 10.01% | | | |
| | | Class Z(1) | | | | | 8.21% | | | | | | 9.90% | | | | | | 5.69% | | | | | | — | | | |
| | | S&P Target Date 2035 Index | | | | | 9.12% | | | | | | 9.87% | | | | | | 6.35% | | | | | | 11.13% | | | |
| | | | | |
Based on a $10,000 initial investment, the graph and table above illustrate the total return of Voya Index Solution 2035 Portfolio against the index indicated. The index is unmanaged and has no cash in its portfolio, imposes no sales charges and incurs no operating expenses. An investor cannot invest directly in an index. The Portfolio’s performance is shown without the imposition of any expenses or charges which are, or may be, imposed under your variable annuity contract or variable life insurance policy. Total returns would have been lower if such expenses or charges were included.
The performance graph and table do not reflect the deduction of taxes that a shareholder will pay on Portfolio distributions or the redemption of Portfolio shares.
The performance shown may include the effect of fee waivers and/or expense reimbursements by the Investment Adviser and/or other service providers, which have the effect of increasing total return. Had all fees and expenses been considered, the total returns would have been lower.
The performance update illustrates performance for a variable investment option available through a variable annuity contract or a variable life insurance policy. The
performance shown indicates past performance and is not a projection or prediction of future results. Actual investment returns and principal value will fluctuate so that shares and/or units, at redemption, may be worth more or less than their original cost. Please log on to www.voyainvestments.com or call (800) 262-3862 to get performance through the most recent month end.
This report contains statements that may be “forward-looking” statements. Actual results may differ materially from those projected in the “forward-looking” statements.
The views expressed in this report reflect those of the portfolio managers, only through the end of the period as stated on the cover. The portfolio managers’ views are subject to change at any time based on market and other conditions.
Portfolio holdings are subject to change daily.
(1)
Class Z incepted on May 1, 2015. The Class Z shares performance shown for the period prior to their inception date is the performance of Class I shares without adjustment for any differences in the expenses between the two classes. If adjusted for such differences, returns would be different.
| Voya Index Solution 2040 Portfolio | Portfolio Managers’ Report |
| | | Average Annual Total Returns for the Periods Ended December 31, 2016 | | |
| | | | | | 1 Year | | | 5 Year | | | Since Inception
of Classes ADV, I, S, and S2
October 3, 2011 | | |
| | | Class ADV | | | | | 7.67% | | | | | | 9.64% | | | | | | 11.52% | | | |
| | | Class I | | | | | 8.24% | | | | | | 10.16% | | | | | | 12.05% | | | |
| | | Class S | | | | | 7.89% | | | | | | 9.87% | | | | | | 11.75% | | | |
| | | Class S2 | | | | | 7.82% | | | | | | 9.72% | | | | | | 11.60% | | | |
| | | Class Z(1) | | | | | 8.40% | | | | | | 10.21% | | | | | | 12.10% | | | |
| | | S&P Target Date 2040 Index | | | | | 9.50% | | | | | | 10.27% | | | | | | 12.23% | | | |
| | | | | |
Based on a $10,000 initial investment, the graph and table above illustrate the total return of Voya Index Solution 2040 Portfolio against the index indicated. The index is unmanaged and has no cash in its portfolio, imposes no sales charges and incurs no operating expenses. An investor cannot invest directly in an index. The Portfolio’s performance is shown without the imposition of any expenses or charges which are, or may be, imposed under your variable annuity contract or variable life insurance policy. Total returns would have been lower if such expenses or charges were included.
The performance graph and table do not reflect the deduction of taxes that a shareholder will pay on Portfolio distributions or the redemption of Portfolio shares.
The performance shown may include the effect of fee waivers and/or expense reimbursements by the Investment Adviser and/or other service providers, which have the effect of increasing total return. Had all fees and expenses been considered, the total returns would have been lower.
The performance update illustrates performance for a variable investment option available through a variable annuity contract or a variable life insurance policy. The
performance shown indicates past performance and is not a projection or prediction of future results. Actual investment returns and principal value will fluctuate so that shares and/or units, at redemption, may be worth more or less than their original cost. Please log on to www.voyainvestments.com or call (800) 262-3862 to get performance through the most recent month end.
This report contains statements that may be “forward-looking” statements. Actual results may differ materially from those projected in the “forward-looking” statements.
The views expressed in this report reflect those of the portfolio managers, only through the end of the period as stated on the cover. The portfolio managers’ views are subject to change at any time based on market and other conditions.
Portfolio holdings are subject to change daily.
(1)
Class Z incepted on May 1, 2015. The Class Z shares performance shown for the period prior to their inception date is the performance of Class I shares without adjustment for any differences in the expenses between the two classes. If adjusted for such differences, returns would be different.
| Portfolio Managers’ Report | Voya Index Solution 2045 Portfolio |
| | | Average Annual Total Returns for the Periods Ended December 31, 2016 | | |
| | | | | | 1 Year | | | 5 Year | | | Since Inception
of Classes ADV, I, and S
March 10, 2008 | | | Since Inception
of Class S2
May 28, 2009 | | |
| | | Class ADV | | | | | 7.67% | | | | | | 9.81% | | | | | | 5.12% | | | | | | — | | | |
| | | Class I | | | | | 8.29% | | | | | | 10.35% | | | | | | 5.66% | | | | | | — | | | |
| | | Class S | | | | | 8.05% | | | | | | 10.08% | | | | | | 5.40% | | | | | | — | | | |
| | | Class S2 | | | | | 7.88% | | | | | | 9.92% | | | | | | — | | | | | | 10.60% | | | |
| | | Class Z(1) | | | | | 8.47% | | | | | | 10.41% | | | | | | 5.69% | | | | | | — | | | |
| | | S&P Target Date 2045 Index | | | | | 9.81% | | | | | | 10.59% | | | | | | 6.47% | | | | | | 11.65% | | | |
| | | | | |
Based on a $10,000 initial investment, the graph and table above illustrate the total return of Voya Index Solution 2045 Portfolio against the index indicated. The index is unmanaged and has no cash in its portfolio, imposes no sales charges and incurs no operating expenses. An investor cannot invest directly in an index. The Portfolio’s performance is shown without the imposition of any expenses or charges which are, or may be, imposed under your variable annuity contract or variable life insurance policy. Total returns would have been lower if such expenses or charges were included.
The performance graph and table do not reflect the deduction of taxes that a shareholder will pay on Portfolio distributions or the redemption of Portfolio shares.
The performance shown may include the effect of fee waivers and/or expense reimbursements by the Investment Adviser and/or other service providers, which have the effect of increasing total return. Had all fees and expenses been considered, the total returns would have been lower.
The performance update illustrates performance for a variable investment option available through a variable annuity contract or a variable life insurance policy. The
performance shown indicates past performance and is not a projection or prediction of future results. Actual investment returns and principal value will fluctuate so that shares and/or units, at redemption, may be worth more or less than their original cost. Please log on to www.voyainvestments.com or call (800) 262-3862 to get performance through the most recent month end.
This report contains statements that may be “forward-looking” statements. Actual results may differ materially from those projected in the “forward-looking” statements.
The views expressed in this report reflect those of the portfolio managers, only through the end of the period as stated on the cover. The portfolio managers’ views are subject to change at any time based on market and other conditions.
Portfolio holdings are subject to change daily.
(1)
Class Z incepted on May 1, 2015. The Class Z shares performance shown for the period prior to their inception date is the performance of Class I shares without adjustment for any differences in the expenses between the two classes. If adjusted for such differences, returns would be different.
| Voya Index Solution 2050 Portfolio | Portfolio Managers’ Report |
| | | Average Annual Total Returns for the Periods Ended December 31, 2016 | | |
| | | | | | 1 Year | | | 5 Year | | | Since Inception
of Classes ADV, I, S, and S2
October 3, 2011 | | |
| | | Class ADV | | | | | 7.94% | | | | | | 9.76% | | | | | | 11.64% | | | |
| | | Class I | | | | | 8.52% | | | | | | 10.34% | | | | | | 12.22% | | | |
| | | Class S | | | | | 8.20% | | | | | | 10.04% | | | | | | 11.93% | | | |
| | | Class S2 | | | | | 8.04% | | | | | | 9.86% | | | | | | 11.76% | | | |
| | | Class Z(1) | | | | | 8.62% | | | | | | 10.36% | | | | | | 12.24% | | | |
| | | S&P Target Date 2050 Index | | | | | 10.01% | | | | | | 10.88% | | | | | | 12.90% | | | |
| | | | | |
Based on a $10,000 initial investment, the graph and table above illustrate the total return of Voya Index Solution 2050 Portfolio against the index indicated. The index is unmanaged and has no cash in its portfolio, imposes no sales charges and incurs no operating expenses. An investor cannot invest directly in an index. The Portfolio’s performance is shown without the imposition of any expenses or charges which are, or may be, imposed under your variable annuity contract or variable life insurance policy. Total returns would have been lower if such expenses or charges were included.
The performance graph and table do not reflect the deduction of taxes that a shareholder will pay on Portfolio distributions or the redemption of Portfolio shares.
The performance shown may include the effect of fee waivers and/or expense reimbursements by the Investment Adviser and/or other service providers, which have the effect of increasing total return. Had all fees and expenses been considered, the total returns would have been lower.
The performance update illustrates performance for a variable investment option available through a variable annuity contract or a variable life insurance policy. The
performance shown indicates past performance and is not a projection or prediction of future results. Actual investment returns and principal value will fluctuate so that shares and/or units, at redemption, may be worth more or less than their original cost. Please log on to www.voyainvestments.com or call (800) 262-3862 to get performance through the most recent month end.
This report contains statements that may be “forward-looking” statements. Actual results may differ materially from those projected in the “forward-looking” statements.
The views expressed in this report reflect those of the portfolio managers, only through the end of the period as stated on the cover. The portfolio managers’ views are subject to change at any time based on market and other conditions.
Portfolio holdings are subject to change daily.
(1)
Class Z incepted on May 1, 2015. The Class Z shares performance shown for the period prior to their inception date is the performance of Class I shares without adjustment for any differences in the expenses between the two classes. If adjusted for such differences, returns would be different.
| Portfolio Managers’ Report | Voya Index Solution 2055 Portfolio |
| | | Average Annual Total Returns for the Periods Ended December 31, 2016 | | |
| | | | | | 1 Year | | | 5 Year | | | Since Inception
of Classes ADV, I, S, and S2
March 8, 2010 | | |
| | | Class ADV | | | | | 7.61% | | | | | | 9.83% | | | | | | 8.19% | | | |
| | | Class I | | | | | 8.10% | | | | | | 10.36% | | | | | | 8.72% | | | |
| | | Class S | | | | | 7.89% | | | | | | 10.12% | | | | | | 8.46% | | | |
| | | Class S2 | | | | | 7.71% | | | | | | 9.93% | | | | | | 8.29% | | | |
| | | Class Z(1) | | | | | 8.24% | | | | | | 10.42% | | | | | | 8.76% | | | |
| | | S&P Target Date 2055+ Index | | | | | 10.21% | | | | | | 11.10% | | | | | | 9.56% | | | |
Based on a $10,000 initial investment, the graph and table above illustrate the total return of Voya Index Solution 2055 Portfolio against the index indicated. The index is unmanaged and has no cash in its portfolio, imposes no sales charges and incurs no operating expenses. An investor cannot invest directly in an index. The Portfolio’s performance is shown without the imposition of any expenses or charges which are, or may be, imposed under your variable annuity contract or variable life insurance policy. Total returns would have been lower if such expenses or charges were included.
The performance graph and table do not reflect the deduction of taxes that a shareholder will pay on Portfolio distributions or the redemption of Portfolio shares.
The performance shown may include the effect of fee waivers and/or expense reimbursements by the Investment Adviser and/or other service providers, which have the effect of increasing total return. Had all fees and expenses been considered, the total returns would have been lower.
The performance update illustrates performance for a variable investment option available through a variable annuity contract or a variable life insurance policy. The
performance shown indicates past performance and is not a projection or prediction of future results. Actual investment returns and principal value will fluctuate so that shares and/or units, at redemption, may be worth more or less than their original cost. Please log on to www.voyainvestments.com or call (800) 262-3862 to get performance through the most recent month end.
This report contains statements that may be “forward-looking” statements. Actual results may differ materially from those projected in the “forward-looking” statements.
The views expressed in this report reflect those of the portfolio managers, only through the end of the period as stated on the cover. The portfolio managers’ views are subject to change at any time based on market and other conditions.
Portfolio holdings are subject to change daily.
(1)
Class Z incepted on May 1, 2015. The Class Z shares performance shown for the period prior to their inception date is the performance of Class I shares without adjustment for any differences in the expenses between the two classes. If adjusted for such differences, returns would be different.
| Voya Index Solution 2060 Portfolio | Portfolio Managers’ Report |
| | | Average Annual Total Returns for the Periods Ended December 31, 2016 | | |
| | | | | | 1 Year | | | Since Inception
of Classes ADV, I, and S
February 9, 2015 | | |
| | | Class ADV | | | | | 7.87% | | | | | | 2.82% | | | |
| | | Class I | | | | | 8.24% | | | | | | 3.28% | | | |
| | | Class S | | | | | 8.06% | | | | | | 3.02% | | | |
| | | Class S2 | | | | | 7.92% | | | | | | 2.84% | | | |
| | | Class Z(1) | | | | | 8.58% | | | | | | 3.45% | | | |
| | | S&P Target Date 2055+ Index | | | | | 10.21% | | | | | | 4.31% | | | |
Based on a $10,000 initial investment, the graph and table above illustrate the total return of Voya Index Solution 2060 Portfolio against the index indicated. The index is unmanaged and has no cash in its portfolio, imposes no sales charges and incurs no operating expenses. An investor cannot invest directly in an index. The Portfolio’s performance is shown without the imposition of any expenses or charges which are, or may be, imposed under your variable annuity contract or variable life insurance policy. Total returns would have been lower if such expenses or charges were included.
The performance graph and table do not reflect the deduction of taxes that a shareholder will pay on Portfolio distributions or the redemption of Portfolio shares.
The performance shown may include the effect of fee waivers and/or expense reimbursements by the Investment Adviser and/or other service providers, which have the effect of increasing total return. Had all fees and expenses been considered, the total returns would have been lower.
The performance update illustrates performance for a variable investment option available through a variable annuity contract or a variable life insurance policy. The performance shown indicates past performance and is
not a projection or prediction of future results. Actual investment returns and principal value will fluctuate so that shares and/or units, at redemption, may be worth more or less than their original cost. Please log on to www.voyainvestments.com or call (800) 262-3862 to get performance through the most recent month end.
It is important to note that the Portfolio has a limited operating history. Performance over a longer period of time may be more meaningful than short-term performance.
This report contains statements that may be “forward-looking” statements. Actual results may differ materially from those projected in the “forward-looking” statements.
The views expressed in this report reflect those of the portfolio managers, only through the end of the period as stated on the cover. The portfolio managers’ views are subject to change at any time based on market and other conditions.
Portfolio holdings are subject to change daily.
(1)
Class Z incepted on May 1, 2015. The Class Z shares performance shown for the period prior to their inception date is the performance of Class I shares without adjustment for any differences in the expenses between the two classes. If adjusted for such differences, returns would be different.
SHAREHOLDER EXPENSE EXAMPLES (Unaudited)
As a shareholder of a Portfolio, you incur two types of costs: (1) transaction costs, including redemption fees and exchange fees; and (2) ongoing costs including management fees, distribution and/or service (12b-1) fees, and other Portfolio expenses. These Examples are intended to help you understand your ongoing costs (in dollars) of investing in a Portfolio and to compare these costs with the ongoing costs of investing in other mutual funds.
The Examples are based on an investment of $1,000 invested at the beginning of the period and held for the entire period from July 1, 2016 to December 31, 2016. The Portfolios’ expenses are shown without the imposition of any charges which are, or may be, imposed under your variable annuity contract, variable life insurance policy, qualified pension or retirement plan. Expenses would have been higher if such charges were included.
Actual Expenses
The left section of the table shown below, “Actual Portfolio Return,” provides information about actual account values and actual expenses. You may use the information in this section, together with the amount you invested, to estimate the expenses that you paid over the period. Simply divide your account value by $1,000 (for example, an $8,600 account value divided by $1,000 = 8.6), then multiply the result by the number in the first section under the heading entitled “Expenses Paid During the Period” to estimate the expenses you paid on your account during this period.
Hypothetical Example for Comparison Purposes
The right section of the table shown below, “Hypothetical (5% return before expenses),” provides information about hypothetical account values and hypothetical expenses based on a Portfolio’s actual expense ratio and an assumed rate of return of 5% per year before expenses, which is not a Portfolio’s actual return. The hypothetical account values and expenses may not be used to estimate the actual ending account balance or expenses you paid for the period. You may use this information to compare the ongoing costs of investing in a Portfolio and other mutual funds. To do so, compare this 5% hypothetical example with the 5% hypothetical examples that appear in the shareholder reports of the other mutual funds.
Please note that the expenses shown in the table are meant to highlight your ongoing costs only and do not reflect any transactional costs, such as redemption fees or exchange fees. Therefore, the hypothetical section of the table is useful in comparing ongoing costs only, and will not help you determine the relative total costs of owning different mutual funds. In addition, if these transactional costs were included, your costs would have been higher.
| | | | Actual Portfolio Return | | | Hypothetical (5% return before expenses) | |
| | | | Beginning
Account
Value
July 1,
2016 | | | Ending
Account
Value
December 31,
2016 | | | Annualized
Expense
Ratio* | | | Expenses Paid
During the
Period Ended
December, 31
2016** | | | Beginning
Account
Value
July 1,
2016 | | | Ending
Account
Value
December 31,
2016 | | | Annualized
Expense
Ratio* | | | Expenses Paid
During the
Period Ended
December, 31
2016** | |
| Voya Index Solution Income Portfolio | |
| Class ADV | | | | $ | 1,000.00 | | | | | $ | 1,007.00 | | | | | | 0.62% | | | | | $ | 3.13 | | | | | $ | 1,000.00 | | | | | $ | 1,022.02 | | | | | | 0.62% | | | | | $ | 3.15 | | |
| Class I | | | | | 1,000.00 | | | | | | 1,008.90 | | | | | | 0.12 | | | | | | 0.61 | | | | | | 1,000.00 | | | | | | 1,024.53 | | | | | | 0.12 | | | | | | 0.61 | | |
| Class S | | | | | 1,000.00 | | | | | | 1,006.80 | | | | | | 0.37 | | | | | | 1.87 | | | | | | 1,000.00 | | | | | | 1,023.28 | | | | | | 0.37 | | | | | | 1.88 | | |
| Class S2 | | | | | 1,000.00 | | | | | | 1,006.60 | | | | | | 0.52 | | | | | | 2.62 | | | | | | 1,000.00 | | | | | | 1,022.52 | | | | | | 0.52 | | | | | | 2.64 | | |
| Class Z | | | | | 1,000.00 | | | | | | 1,008.90 | | | | | | 0.00 | | | | | | — | | | | | | 1,000.00 | | | | | | 1,025.14 | | | | | | 0.00 | | | | | | — | | |
| Voya Index Solution 2020 Portfolio | |
| Class ADV | | | | $ | 1,000.00 | | | | | $ | 1,024.70 | | | | | | 0.63% | | | | | $ | 3.21 | | | | | $ | 1,000.00 | | | | | $ | 1,021.97 | | | | | | 0.63% | | | | | $ | 3.20 | | |
| Class I | | | | | 1,000.00 | | | | | | 1,027.10 | | | | | | 0.13 | | | | | | 0.66 | | | | | | 1,000.00 | | | | | | 1,024.48 | | | | | | 0.13 | | | | | | 0.66 | | |
| Class S | | | | | 1,000.00 | | | | | | 1,026.20 | | | | | | 0.38 | | | | | | 1.94 | | | | | | 1,000.00 | | | | | | 1,023.23 | | | | | | 0.38 | | | | | | 1.93 | | |
| Class S2 | | | | | 1,000.00 | | | | | | 1,025.30 | | | | | | 0.53 | | | | | | 2.70 | | | | | | 1,000.00 | | | | | | 1,022.47 | | | | | | 0.53 | | | | | | 2.69 | | |
| Class Z | | | | | 1,000.00 | | | | | | 1,027.90 | | | | | | 0.00 | | | | | | — | | | | | | 1,000.00 | | | | | | 1,025.14 | | | | | | 0.00 | | | | | | — | | |
SHAREHOLDER EXPENSE EXAMPLES (Unaudited) (continued)
| | | | Actual Portfolio Return | | | Hypothetical (5% return before expenses) | |
| | | | Beginning
Account
Value
July 1,
2016 | | | Ending
Account
Value
December 31,
2016 | | | Annualized
Expense
Ratio* | | | Expenses Paid
During the
Period Ended
December, 31
2016** | | | Beginning
Account
Value
July 1,
2016 | | | Ending
Account
Value
December 31,
2016 | | | Annualized
Expense
Ratio* | | | Expenses Paid
During the
Period Ended
December, 31
2016** | |
| Voya Index Solution 2025 Portfolio | |
| Class ADV | | | | $ | 1,000.00 | | | | | $ | 1,034.60 | | | | | | 0.63% | | | | | $ | 3.22 | | | | | $ | 1,000.00 | | | | | $ | 1,021.97 | | | | | | 0.63% | | | | | $ | 3.20 | | |
| Class I | | | | | 1,000.00 | | | | | | 1,037.50 | | | | | | 0.13 | | | | | | 0.67 | | | | | | 1,000.00 | | | | | | 1,024.48 | | | | | | 0.13 | | | | | | 0.66 | | |
| Class S | | | | | 1,000.00 | | | | | | 1,036.30 | | | | | | 0.38 | | | | | | 1.95 | | | | | | 1,000.00 | | | | | | 1,023.23 | | | | | | 0.38 | | | | | | 1.93 | | |
| Class S2 | | | | | 1,000.00 | | | | | | 1,035.60 | | | | | | 0.53 | | | | | | 2.71 | | | | | | 1,000.00 | | | | | | 1,022.47 | | | | | | 0.53 | | | | | | 2.69 | | |
| Class Z | | | | | 1,000.00 | | | | | | 1,038.40 | | | | | | 0.00 | | | | | | — | | | | | | 1,000.00 | | | | | | 1,025.14 | | | | | | 0.00 | | | | | | — | | |
| Voya Index Solution 2030 Portfolio | |
| Class ADV | | | | $ | 1,000.00 | | | | | $ | 1,041.50 | | | | | | 0.63% | | | | | $ | 3.23 | | | | | $ | 1,000.00 | | | | | $ | 1,021.97 | | | | | | 0.63% | | | | | $ | 3.20 | | |
| Class I | | | | | 1,000.00 | | | | | | 1,045.00 | | | | | | 0.13 | | | | | | 0.67 | | | | | | 1,000.00 | | | | | | 1,024.48 | | | | | | 0.13 | | | | | | 0.66 | | |
| Class S | | | | | 1,000.00 | | | | | | 1,043.40 | | | | | | 0.38 | | | | | | 1.95 | | | | | | 1,000.00 | | | | | | 1,023.23 | | | | | | 0.38 | | | | | | 1.93 | | |
| Class S2 | | | | | 1,000.00 | | | | | | 1,042.40 | | | | | | 0.53 | | | | | | 2.72 | | | | | | 1,000.00 | | | | | | 1,022.47 | | | | | | 0.53 | | | | | | 2.69 | | |
| Class Z | | | | | 1,000.00 | | | | | | 1,045.70 | | | | | | 0.00 | | | | | | — | | | | | | 1,000.00 | | | | | | 1,025.14 | | | | | | 0.00 | | | | | | — | | |
| Voya Index Solution 2035 Portfolio | |
| Class ADV | | | | $ | 1,000.00 | | | | | $ | 1,051.90 | | | | | | 0.63% | | | | | $ | 3.25 | | | | | $ | 1,000.00 | | | | | $ | 1,021.97 | | | | | | 0.63% | | | | | $ | 3.20 | | |
| Class I | | | | | 1,000.00 | | | | | | 1,054.30 | | | | | | 0.13 | | | | | | 0.67 | | | | | | 1,000.00 | | | | | | 1,024.48 | | | | | | 0.13 | | | | | | 0.66 | | |
| Class S | | | | | 1,000.00 | | | | | | 1,052.50 | | | | | | 0.38 | | | | | | 1.96 | | | | | | 1,000.00 | | | | | | 1,023.23 | | | | | | 0.38 | | | | | | 1.93 | | |
| Class S2 | | | | | 1,000.00 | | | | | | 1,052.00 | | | | | | 0.53 | | | | | | 2.73 | | | | | | 1,000.00 | | | | | | 1,022.47 | | | | | | 0.53 | | | | | | 2.69 | | |
| Class Z | | | | | 1,000.00 | | | | | | 1,055.20 | | | | | | 0.00 | | | | | | — | | | | | | 1,000.00 | | | | | | 1,025.14 | | | | | | 0.00 | | | | | | — | | |
| Voya Index Solution 2040 Portfolio | |
| Class ADV | | | | $ | 1,000.00 | | | | | $ | 1,053.30 | | | | | | 0.62% | | | | | $ | 3.20 | | | | | $ | 1,000.00 | | | | | $ | 1,022.02 | | | | | | 0.62% | | | | | $ | 3.15 | | |
| Class I | | | | | 1,000.00 | | | | | | 1,056.00 | | | | | | 0.12 | | | | | | 0.62 | | | | | | 1,000.00 | | | | | | 1,024.53 | | | | | | 0.12 | | | | | | 0.61 | | |
| Class S | | | | | 1,000.00 | | | | | | 1,054.30 | | | | | | 0.37 | | | | | | 1.91 | | | | | | 1,000.00 | | | | | | 1,023.28 | | | | | | 0.37 | | | | | | 1.88 | | |
| Class S2 | | | | | 1,000.00 | | | | | | 1,054.20 | | | | | | 0.52 | | | | | | 2.69 | | | | | | 1,000.00 | | | | | | 1,022.52 | | | | | | 0.52 | | | | | | 2.64 | | |
| Class Z | | | | | 1,000.00 | | | | | | 1,056.70 | | | | | | 0.00 | | | | | | — | | | | | | 1,000.00 | | | | | | 1,025.14 | | | | | | 0.00 | | | | | | — | | |
| Voya Index Solution 2045 Portfolio | |
| Class ADV | | | | $ | 1,000.00 | | | | | $ | 1,054.70 | | | | | | 0.64% | | | | | $ | 3.31 | | | | | $ | 1,000.00 | | | | | $ | 1,021.92 | | | | | | 0.64% | | | | | $ | 3.25 | | |
| Class I | | | | | 1,000.00 | | | | | | 1,057.50 | | | | | | 0.14 | | | | | | 0.72 | | | | | | 1,000.00 | | | | | | 1,024.43 | | | | | | 0.14 | | | | | | 0.71 | | |
| Class S | | | | | 1,000.00 | | | | | | 1,056.80 | | | | | | 0.39 | | | | | | 2.02 | | | | | | 1,000.00 | | | | | | 1,023.18 | | | | | | 0.39 | | | | | | 1.98 | | |
| Class S2 | | | | | 1,000.00 | | | | | | 1,056.70 | | | | | | 0.54 | | | | | | 2.79 | | | | | | 1,000.00 | | | | | | 1,022.42 | | | | | | 0.54 | | | | | | 2.75 | | |
| Class Z | | | | | 1,000.00 | | | | | | 1,058.30 | | | | | | 0.00 | | | | | | — | | | | | | 1,000.00 | | | | | | 1,025.14 | | | | | | 0.00 | | | | | | — | | |
| Voya Index Solution 2050 Portfolio | |
| Class ADV | | | | $ | 1,000.00 | | | | | $ | 1,056.10 | | | | | | 0.64% | | | | | $ | 3.31 | | | | | $ | 1,000.00 | | | | | $ | 1,021.92 | | | | | | 0.64% | | | | | $ | 3.25 | | |
| Class I | | | | | 1,000.00 | | | | | | 1,058.80 | | | | | | 0.14 | | | | | | 0.72 | | | | | | 1,000.00 | | | | | | 1,024.43 | | | | | | 0.14 | | | | | | 0.71 | | |
| Class S | | | | | 1,000.00 | | | | | | 1,057.30 | | | | | | 0.39 | | | | | | 2.02 | | | | | | 1,000.00 | | | | | | 1,023.18 | | | | | | 0.39 | | | | | | 1.98 | | |
| Class S2 | | | | | 1,000.00 | | | | | | 1,057.10 | | | | | | 0.54 | | | | | | 2.79 | | | | | | 1,000.00 | | | | | | 1,022.42 | | | | | | 0.54 | | | | | | 2.75 | | |
| Class Z | | | | | 1,000.00 | | | | | | 1,058.90 | | | | | | 0.00 | | | | | | — | | | | | | 1,000.00 | | | | | | 1,025.14 | | | | | | 0.00 | | | | | | — | | |
SHAREHOLDER EXPENSE EXAMPLES (Unaudited) (continued)
| | | | Actual Portfolio Return | | | Hypothetical (5% return before expenses) | |
| | | | Beginning
Account
Value
July 1,
2016 | | | Ending
Account
Value
December 31,
2016 | | | Annualized
Expense
Ratio* | | | Expenses Paid
During the
Period Ended
December, 31
2016** | | | Beginning
Account
Value
July 1,
2016 | | | Ending
Account
Value
December 31,
2016 | | | Annualized
Expense
Ratio* | | | Expenses Paid
During the
Period Ended
December, 31
2016** | |
| Voya Index Solution 2055 Portfolio | |
| Class ADV | | | | $ | 1,000.00 | | | | | $ | 1,056.00 | | | | | | 0.64% | | | | | $ | 3.31 | | | | | $ | 1,000.00 | | | | | $ | 1,021.92 | | | | | | 0.64% | | | | | $ | 3.25 | | |
| Class I | | | | | 1,000.00 | | | | | | 1,058.00 | | | | | | 0.14 | | | | | | 0.72 | | | | | | 1,000.00 | | | | | | 1,024.43 | | | | | | 0.14 | | | | | | 0.71 | | |
| Class S | | | | | 1,000.00 | | | | | | 1,057.30 | | | | | | 0.39 | | | | | | 2.02 | | | | | | 1,000.00 | | | | | | 1,023.18 | | | | | | 0.39 | | | | | | 1.98 | | |
| Class S2 | | | | | 1,000.00 | | | | | | 1,056.20 | | | | | | 0.54 | | | | | | 2.79 | | | | | | 1,000.00 | | | | | | 1,022.42 | | | | | | 0.54 | | | | | | 2.75 | | |
| Class Z | | | | | 1,000.00 | | | | | | 1,058.70 | | | | | | 0.00 | | | | | | — | | | | | | 1,000.00 | | | | | | 1,025.14 | | | | | | 0.00 | | | | | | — | | |
| Voya Index Solution 2060 Portfolio | |
| Class ADV | | | | $ | 1,000.00 | | | | | $ | 1,057.10 | | | | | | 0.64% | | | | | $ | 3.31 | | | | | $ | 1,000.00 | | | | | $ | 1,021.92 | | | | | | 0.64% | | | | | $ | 3.25 | | |
| Class I | | | | | 1,000.00 | | | | | | 1,058.60 | | | | | | 0.14 | | | | | | 0.72 | | | | | | 1,000.00 | | | | | | 1,024.43 | | | | | | 0.14 | | | | | | 0.71 | | |
| Class S | | | | | 1,000.00 | | | | | | 1,057.90 | | | | | | 0.39 | | | | | | 2.02 | | | | | | 1,000.00 | | | | | | 1,023.18 | | | | | | 0.39 | | | | | | 1.98 | | |
| Class S2 | | | | | 1,000.00 | | | | | | 1,056.50 | | | | | | 0.54 | | | | | | 2.79 | | | | | | 1,000.00 | | | | | | 1,022.42 | | | | | | 0.54 | | | | | | 2.75 | | |
| Class Z | | | | | 1,000.00 | | | | | | 1,060.90 | | | | | | 0.00 | | | | | | — | | | | | | 1,000.00 | | | | | | 1,025.14 | | | | | | 0.00 | | | | | | — | | |
*
The annualized expense ratios do not include expenses of underlying funds.
**
Expenses are equal to each Portfolio’s respective annualized expense ratios multiplied by the average account value over the period, multiplied by 184/366 to reflect the most recent fiscal half-year.
REPORT OF INDEPENDENT REGISTERED PUBLIC ACCOUNTING FIRM
The Shareholders and Board of Directors
Voya Partners, Inc.
We have audited the accompanying statements of assets and liabilities, including the portfolios of investments, of Voya Index Solution Income Portfolio, Voya Index Solution 2020 Portfolio, Voya Index Solution 2025 Portfolio, Voya Index Solution 2030 Portfolio, Voya Index Solution 2035 Portfolio, Voya Index Solution 2040 Portfolio, Voya Index Solution 2045 Portfolio, Voya Index Solution 2050 Portfolio, Voya Index Solution 2055 Portfolio, and Voya Index Solution 2060 Portfolio, each a series of Voya Partners, Inc., as of December 31, 2016, and the related statements of operations for the year then ended, the statements of changes in net assets for each of the years or periods in the two-year period then ended, and the financial highlights for each of the years or periods in the five-year period then ended. These financial statements and financial highlights are the responsibility of management. Our responsibility is to express an opinion on these financial statements and financial highlights based on our audits.
We conducted our audits in accordance with the standards of the Public Company Accounting Oversight Board (United States). Those standards require that we plan and perform the audit to obtain reasonable assurance about whether the financial statements and financial highlights are free of material misstatement. An audit includes examining, on a test basis, evidence supporting the amounts and disclosures in the financial statements. Our procedures included confirmation of securities owned as of December 31, 2016, by correspondence with the custodian, transfer agent, and brokers, or by other appropriate auditing procedures when replies from brokers were not received. An audit also includes assessing the accounting principles used and significant estimates made by management, as well as evaluating the overall financial statement presentation. We believe that our audits provide a reasonable basis for our opinion.
In our opinion, the financial statements and financial highlights referred to above present fairly, in all material respects, the financial position of the aforementioned funds of Voya Partners, Inc. as of December 31, 2016, the results of their operations for the year then ended, the changes in their net assets for each of the years or periods in the two-year period then ended, and the financial highlights for each of the years or periods in the five-year period then ended, in conformity with U.S. generally accepted accounting principles.
Boston, Massachusetts
February 23, 2017
Statements of Assets and Liabilities as of December 31, 2016
| | | | Voya Index
Solution Income
Portfolio | | | Voya Index
Solution 2020
Portfolio | | | Voya Index
Solution 2025
Portfolio | | | Voya Index
Solution 2030
Portfolio | |
| ASSETS: | | | | | |
| Investments in affiliated underlying funds at fair value* | | | | $ | 349,291,972 | | | | | $ | 84,288,880 | | | | | $ | 477,494,740 | | | | | $ | 78,832,160 | | |
| Investments in unaffiliated underlying funds at fair value** | | | | | 58,906,400 | | | | | | 18,145,139 | | | | | | 109,600,029 | | | | | | 14,580,796 | | |
| Total investments at fair value | | | | $ | 408,198,372 | | | | | $ | 102,434,019 | | | | | $ | 587,094,769 | | | | | $ | 93,412,956 | | |
| Cash | | | | | 1,159,853 | | | | | | 216,032 | | | | | | 1,262,062 | | | | | | 197,330 | | |
| Receivables: | | | | | |
| Fund shares sold | | | | | 3,346,463 | | | | | | 1,184,931 | | | | | | 1,145,044 | | | | | | 3,484,500 | | |
| Dividends | | | | | 551,658 | | | | | | 107,125 | | | | | | 554,836 | | | | | | 57,808 | | |
| Prepaid expenses | | | | | 1,662 | | | | | | 62 | | | | | | 2,039 | | | | | | 42 | | |
| Reimbursement due from manager | | | | | 55,409 | | | | | | 81,389 | | | | | | 78,873 | | | | | | 65,297 | | |
| Other assets | | | | | 8,305 | | | | | | 260 | | | | | | 8,781 | | | | | | 207 | | |
| Total assets | | | | | 413,321,722 | | | | | | 104,023,818 | | | | | | 590,146,404 | | | | | | 97,218,140 | | |
| LIABILITIES: | | | | | |
| Payable for investments in affiliated underlying funds purchased | | | | | 2,993,645 | | | | | | 1,186,075 | | | | | | 666,057 | | | | | | 3,019,238 | | |
| Payable for investments in unaffiliated underlying funds purchased | | | | | 102,107 | | | | | | 99,943 | | | | | | 569,923 | | | | | | 91,041 | | |
| Payable for fund shares redeemed | | | | | 1,413,622 | | | | | | 57,219 | | | | | | 739,486 | | | | | | 488,087 | | |
| Payable for investment management fees | | | | | 78,943 | | | | | | 18,288 | | | | | | 116,646 | | | | | | 15,917 | | |
| Payable for distribution and shareholder service fees | | | | | 93,499 | | | | | | 8,679 | | | | | | 140,616 | | | | | | 6,185 | | |
| Payable to director under the deferred compensation plan (Note 6) | | | | | 8,305 | | | | | | 260 | | | | | | 8,781 | | | | | | 207 | | |
| Payable for director fees | | | | | 1,920 | | | | | | 207 | | | | | | 2,552 | | | | | | 162 | | |
| Other accrued expenses and liabilities | | | | | 73,253 | | | | | | 5,116 | | | | | | 97,972 | | | | | | 3,994 | | |
| Total liabilities | | | | | 4,765,294 | | | | | | 1,375,787 | | | | | | 2,342,033 | | | | | | 3,624,831 | | |
| NET ASSETS | | | | $ | 408,556,428 | | | | | $ | 102,648,031 | | | | | $ | 587,804,371 | | | | | $ | 93,593,309 | | |
| NET ASSETS WERE COMPRISED OF: | | | | | |
| Paid-in capital | | | | $ | 415,369,216 | | | | | $ | 100,081,103 | | | | | $ | 582,032,367 | | | | | $ | 90,987,148 | | |
| Undistributed net investment income | | | | | 8,417,366 | | | | | | 1,261,617 | | | | | | 11,308,453 | | | | | | 1,036,050 | | |
| Accumulated net realized gain (loss) | | | | | (8,165,763) | | | | | | 1,314,367 | | | | | | 7,396,022 | | | | | | 1,032,971 | | |
| Net unrealized appreciation (depreciation) | | | | | (7,064,391) | | | | | | (9,056) | | | | | | (12,932,471) | | | | | | 537,140 | | |
| NET ASSETS | | | | $ | 408,556,428 | | | | | $ | 102,648,031 | | | | | $ | 587,804,371 | | | | | $ | 93,593,309 | | |
*
Cost of investments in affiliated underlying funds | | | | $ | 353,032,258 | | | | | $ | 84,375,243 | | | | | $ | 486,328,228 | | | | | $ | 78,231,009 | | |
**
Cost of investments in unaffiliated underlying funds | | | | $ | 62,230,505 | | | | | $ | 18,067,832 | | | | | $ | 113,699,012 | | | | | $ | 14,644,807 | | |
See Accompanying Notes to Financial Statements
Statements of Assets and Liabilities as of December 31, 2016 (continued)
| | | | Voya Index
Solution Income
Portfolio | | | Voya Index
Solution 2020
Portfolio | | | Voya Index
Solution 2025
Portfolio | | | Voya Index
Solution 2030
Portfolio |
| Class ADV | | | | | |
| Net assets | | | | $ | 119,455,456 | | | | | $ | 13,618,793 | | | | | $ | 228,234,450 | | | | | $ | 10,731,660 |
| Shares authorized | | | | | 100,000,000 | | | | | | 100,000,000 | | | | | | 100,000,000 | | | | | | 100,000,000 |
| Par value | | | | $ | 0.001 | | | | | $ | 0.001 | | | | | $ | 0.001 | | | | | $ | 0.001 |
| Shares outstanding | | | | | 12,307,242 | | | | | | 1,133,172 | | | | | | 23,069,074 | | | | | | 811,634 |
| Net asset value and redemption price per share | | | | $ | 9.71 | | | | | $ | 12.02 | | | | | $ | 9.89 | | | | | $ | 13.22 |
| Class I | | | | | |
| Net assets | | | | $ | 29,544,573 | | | | | $ | 3,539,413 | | | | | $ | 56,554,991 | | | | | $ | 2,172,643 |
| Shares authorized | | | | | 100,000,000 | | | | | | 100,000,000 | | | | | | 100,000,000 | | | | | | 100,000,000 |
| Par value | | | | $ | 0.001 | | | | | $ | 0.001 | | | | | $ | 0.001 | | | | | $ | 0.001 |
| Shares outstanding | | | | | 2,965,537 | | | | | | 288,435 | | | | | | 5,584,318 | | | | | | 160,945 |
| Net asset value and redemption price per share | | | | $ | 9.96 | | | | | $ | 12.27 | | | | | $ | 10.13 | | | | | $ | 13.50 |
| Class S | | | | | |
| Net assets | | | | $ | 174,890,744 | | | | | $ | 8,811,257 | | | | | $ | 150,125,714 | | | | | $ | 6,606,868 |
| Shares authorized | | | | | 100,000,000 | | | | | | 100,000,000 | | | | | | 100,000,000 | | | | | | 100,000,000 |
| Par value | | | | $ | 0.001 | | | | | $ | 0.001 | | | | | $ | 0.001 | | | | | $ | 0.001 |
| Shares outstanding | | | | | 17,731,322 | | | | | | 719,545 | | | | | | 14,978,248 | | | | | | 491,563 |
| Net asset value and redemption price per share | | | | $ | 9.86 | | | | | $ | 12.25 | | | | | $ | 10.02 | | | | | $ | 13.44 |
| Class S2 | | | | | |
| Net assets | | | | $ | 13,808,852 | | | | | $ | 3,328,311 | | | | | $ | 34,033,928 | | | | | $ | 1,735,279 |
| Shares authorized | | | | | 100,000,000 | | | | | | 100,000,000 | | | | | | 100,000,000 | | | | | | 100,000,000 |
| Par value | | | | $ | 0.001 | | | | | $ | 0.001 | | | | | $ | 0.001 | | | | | $ | 0.001 |
| Shares outstanding | | | | | 1,429,515 | | | | | | 273,037 | | | | | | 3,452,498 | | | | | | 130,564 |
| Net asset value and redemption price per share | | | | $ | 9.66 | | | | | $ | 12.19 | | | | | $ | 9.86 | | | | | $ | 13.29 |
| Class Z | | | | | |
| Net assets | | | | $ | 70,856,803 | | | | | $ | 73,350,257 | | | | | $ | 118,855,288 | | | | | $ | 72,346,859 |
| Shares authorized | | | | | 100,000,000 | | | | | | 100,000,000 | | | | | | 100,000,000 | | | | | | 100,000,000 |
| Par value | | | | $ | 0.001 | | | | | $ | 0.001 | | | | | $ | 0.001 | | | | | $ | 0.001 |
| Shares outstanding | | | | | 7,091,513 | | | | | | 5,961,847 | | | | | | 11,703,744 | | | | | | 5,355,875 |
| Net asset value and redemption price per share | | | | $ | 9.99 | | | | | $ | 12.30 | | | | | $ | 10.16 | | | | | $ | 13.51 |
See Accompanying Notes to Financial Statements
Statements of Assets and Liabilities as of December 31, 2016
| | | | Voya Index
Solution 2035
Portfolio | | | Voya Index
Solution 2040
Portfolio | | | Voya Index
Solution 2045
Portfolio | | | Voya Index
Solution 2050
Portfolio | |
| ASSETS: | | | | | |
| Investments in affiliated underlying funds at fair value* | | | | $ | 441,118,357 | | | | | $ | 54,844,436 | | | | | $ | 299,138,827 | | | | | $ | 27,333,808 | | |
| Investments in unaffiliated underlying funds at fair value** | | | | | 61,544,096 | | | | | | 4,746,938 | | | | | | 30,293,943 | | | | | | 2,701,560 | | |
| Total investments at fair value | | | | $ | 502,662,453 | | | | | $ | 59,591,374 | | | | | $ | 329,432,770 | | | | | $ | 30,035,368 | | |
| Cash | | | | | 1,532,690 | | | | | | 99,283 | | | | | | 816,022 | | | | | | 60,689 | | |
| Receivables: | | | | | |
| Fund shares sold | | | | | 1,366,568 | | | | | | 1,221,342 | | | | | | 542,701 | | | | | | 435,057 | | |
| Dividends | | | | | 209,432 | | | | | | 13,162 | | | | | | 53,134 | | | | | | 4,122 | | |
| Prepaid expenses | | | | | 1,657 | | | | | | 29 | | | | | | 1,068 | | | | | | 16 | | |
| Reimbursement due from manager | | | | | 63,229 | | | | | | 47,004 | | | | | | 38,692 | | | | | | 23,319 | | |
| Other assets | | | | | 7,141 | | | | | | 128 | | | | | | 4,430 | | | | | | 66 | | |
| Total assets | | | | | 505,843,170 | | | | | | 60,972,322 | | | | | | 330,888,817 | | | | | | 30,558,637 | | |
| LIABILITIES: | | | | | |
| Payable for investments in affiliated underlying funds purchased | | | | | 487,170 | | | | | | 1,212,113 | | | | | | 202,713 | | | | | | 408,399 | | |
| Payable for investments in unaffiliated underlying funds purchased | | | | | 677,494 | | | | | | — | | | | | | 266,964 | | | | | | 29,549 | | |
| Payable for fund shares redeemed | | | | | 1,283,231 | | | | | | 16,782 | | | | | | 484,636 | | | | | | 28,017 | | |
| Payable for investment management fees | | | | | 94,903 | | | | | | 9,775 | | | | | | 60,377 | | | | | | 4,916 | | |
| Payable for distribution and shareholder service fees | | | | | 122,806 | | | | | | 3,304 | | | | | | 81,794 | | | | | | 2,397 | | |
| Payable to director under the deferred compensation plan (Note 6) | | | | | 7,141 | | | | | | 128 | | | | | | 4,430 | | | | | | 66 | | |
| Payable for director fees | | | | | 2,155 | | | | | | 100 | | | | | | 1,406 | | | | | | 51 | | |
| Other accrued expenses and liabilities | | | | | 75,086 | | | | | | 8,226 | | | | | | 45,834 | | | | | | 5,256 | | |
| Total liabilities | | | | | 2,749,986 | | | | | | 1,250,428 | | | | | | 1,148,154 | | | | | | 478,651 | | |
| NET ASSETS | | | | $ | 503,093,184 | | | | | $ | 59,721,894 | | | | | $ | 329,740,663 | | | | | $ | 30,079,986 | | |
| NET ASSETS WERE COMPRISED OF: | | | | | |
| Paid-in capital | | | | $ | 494,630,732 | | | | | $ | 57,625,856 | | | | | $ | 324,031,655 | | | | | $ | 28,984,971 | | |
| Undistributed net investment income | | | | | 9,586,073 | | | | | | 663,858 | | | | | | 5,796,026 | | | | | | 333,154 | | |
| Accumulated net realized gain | | | | | 11,105,561 | | | | | | 743,732 | | | | | | 8,403,885 | | | | | | 374,444 | | |
| Net unrealized appreciation (depreciation) | | | | | (12,229,182) | | | | | | 688,448 | | | | | | (8,490,903) | | | | | | 387,417 | | |
| NET ASSETS | | | | $ | 503,093,184 | | | | | $ | 59,721,894 | | | | | $ | 329,740,663 | | | | | $ | 30,079,986 | | |
*
Cost of investments in affiliated underlying funds | | | | $ | 450,485,801 | | | | | $ | 54,109,191 | | | | | $ | 306,289,083 | | | | | $ | 26,906,540 | | |
**
Cost of investments in unaffiliated underlying funds | | | | $ | 64,405,834 | | | | | $ | 4,793,735 | | | | | $ | 31,634,590 | | | | | $ | 2,741,411 | | |
See Accompanying Notes to Financial Statements
Statements of Assets and Liabilities as of December 31, 2016 (continued)
| | | | Voya Index
Solution 2035
Portfolio | | | Voya Index
Solution 2040
Portfolio | | | Voya Index
Solution 2045
Portfolio | | | Voya Index
Solution 2050
Portfolio |
| Class ADV | | | | | |
| Net assets | | | | $ | 203,566,440 | | | | | $ | 5,222,187 | | | | | $ | 139,777,303 | | | | | $ | 3,296,470 |
| Shares authorized | | | | | 100,000,000 | | | | | | 100,000,000 | | | | | | 100,000,000 | | | | | | 100,000,000 |
| Par value | | | | $ | 0.001 | | | | | $ | 0.001 | | | | | $ | 0.001 | | | | | $ | 0.001 |
| Shares outstanding | | | | | 20,407,658 | | | | | | 384,914 | | | | | | 13,673,019 | | | | | | 241,575 |
| Net asset value and redemption price per share | | | | $ | 9.98 | | | | | $ | 13.57 | | | | | $ | 10.22 | | | | | $ | 13.65 |
| Class I | | | | | |
| Net assets | | | | $ | 47,484,387 | | | | | $ | 659,110 | | | | | $ | 35,877,378 | | | | | $ | 949,692 |
| Shares authorized | | | | | 100,000,000 | | | | | | 100,000,000 | | | | | | 100,000,000 | | | | | | 100,000,000 |
| Par value | | | | $ | 0.001 | | | | | $ | 0.001 | | | | | $ | 0.001 | | | | | $ | 0.001 |
| Shares outstanding | | | | | 4,641,408 | | | | | | 47,706 | | | | | | 3,403,601 | | | | | | 68,640 |
| Net asset value and redemption price per share | | | | $ | 10.23 | | | | | $ | 13.82 | | | | | $ | 10.54 | | | | | $ | 13.84 |
| Class S | | | | | |
| Net assets | | | | $ | 118,462,541 | | | | | $ | 5,043,739 | | | | | $ | 76,655,807 | | | | | $ | 3,987,082 |
| Shares authorized | | | | | 100,000,000 | | | | | | 100,000,000 | | | | | | 100,000,000 | | | | | | 100,000,000 |
| Par value | | | | $ | 0.001 | | | | | $ | 0.001 | | | | | $ | 0.001 | | | | | $ | 0.001 |
| Shares outstanding | | | | | 11,713,160 | | | | | | 364,884 | | | | | | 7,372,681 | | | | | | 288,198 |
| Net asset value and redemption price per share | | | | $ | 10.11 | | | | | $ | 13.82 | | | | | $ | 10.40 | | | | | $ | 13.83 |
| Class S2 | | | | | |
| Net assets | | | | $ | 32,557,867 | | | | | $ | 651,101 | | | | | $ | 18,507,100 | | | | | $ | 766,399 |
| Shares authorized | | | | | 100,000,000 | | | | | | 100,000,000 | | | | | | 100,000,000 | | | | | | 100,000,000 |
| Par value | | | | $ | 0.001 | | | | | $ | 0.001 | | | | | $ | 0.001 | | | | | $ | 0.001 |
| Shares outstanding | | | | | 3,268,400 | | | | | | 47,628 | | | | | | 1,808,135 | | | | | | 56,038 |
| Net asset value and redemption price per share | | | | $ | 9.96 | | | | | $ | 13.67 | | | | | $ | 10.24 | | | | | $ | 13.68 |
| Class Z | | | | | |
| Net assets | | | | $ | 101,021,949 | | | | | $ | 48,145,757 | | | | | $ | 58,923,075 | | | | | $ | 21,080,343 |
| Shares authorized | | | | | 100,000,000 | | | | | | 100,000,000 | | | | | | 100,000,000 | | | | | | 100,000,000 |
| Par value | | | | $ | 0.001 | | | | | $ | 0.001 | | | | | $ | 0.001 | | | | | $ | 0.001 |
| Shares outstanding | | | | | 9,837,685 | | | | | | 3,477,099 | | | | | | 5,572,431 | | | | | | 1,522,069 |
| Net asset value and redemption price per share | | | | $ | 10.27 | | | | | $ | 13.85 | | | | | $ | 10.57 | | | | | $ | 13.85 |
See Accompanying Notes to Financial Statements
Statements of Assets and Liabilities as of December 31, 2016
| | | | Voya Index
Solution 2055
Portfolio | | | Voya Index
Solution 2060
Portfolio | |
| ASSETS: | | | |
| Investments in affiliated underlying funds at fair value* | | | | $ | 94,248,703 | | | | | $ | 5,302,504 | | |
| Investments in unaffiliated underlying funds at fair value** | | | | | 7,404,299 | | | | | | 594,297 | | |
| Total investments at fair value | | | | $ | 101,653,002 | | | | | $ | 5,896,801 | | |
| Cash | | | | | 257,746 | | | | | | 11,435 | | |
| Receivables: | | | |
| Fund shares sold | | | | | 393,510 | | | | | | 76,182 | | |
| Dividends | | | | | 16,390 | | | | | | 1,807 | | |
| Prepaid expenses | | | | | 306 | | | | | | 2 | | |
| Reimbursement due from manager | | | | | 13,826 | | | | | | 4,891 | | |
| Other assets | | | | | 1,054 | | | | | | 12 | | |
| Total assets | | | | | 102,335,834 | | | | | | 5,991,130 | | |
| LIABILITIES: | | | |
| Payable for investments in affiliated underlying funds purchased | | | | | 176,976 | | | | | | 66,707 | | |
| Payable for investments in unaffiliated underlying funds purchased | | | | | 68,696 | | | | | | 2,906 | | |
| Payable for fund shares redeemed | | | | | 303,029 | | | | | | 12,631 | | |
| Payable for investment management fees | | | | | 18,328 | | | | | | 897 | | |
| Payable for distribution and shareholder service fees | | | | | 25,694 | | | | | | 874 | | |
| Payable to director under the deferred compensation plan (Note 6) | | | | | 1,054 | | | | | | 12 | | |
| Payable for director fees | | | | | 415 | | | | | | 11 | | |
| Other accrued expenses and liabilities | | | | | 16,284 | | | | | | 1,893 | | |
| Total liabilities | | | | | 610,476 | | | | | | 85,931 | | |
| NET ASSETS | | | | $ | 101,725,358 | | | | | $ | 5,905,199 | | |
| NET ASSETS WERE COMPRISED OF: | | | |
| Paid-in capital | | | | $ | 100,885,306 | | | | | $ | 5,690,016 | | |
| Undistributed net investment income | | | | | 1,697,478 | | | | | | 62,920 | | |
| Accumulated net realized gain | | | | | 848,464 | | | | | | 110,181 | | |
| Net unrealized appreciation (depreciation) | | | | | (1,705,890) | | | | | | 42,082 | | |
| NET ASSETS | | | | $ | 101,725,358 | | | | | $ | 5,905,199 | | |
*
Cost of investments in affiliated underlying funds | | | | $ | 95,626,937 | | | | | $ | 5,256,918 | | |
**
Cost of investments in unaffiliated underlying funds | | | | $ | 7,731,955 | | | | | $ | 597,801 | | |
See Accompanying Notes to Financial Statements
Statements of Assets and Liabilities as of December 31, 2016 (continued)
| | | | Voya Index
Solution 2055
Portfolio | | | Voya Index
Solution 2060
Portfolio |
| Class ADV | | | |
| Net assets | | | | $ | 43,002,419 | | | | | $ | 1,689,711 |
| Shares authorized | | | | | 100,000,000 | | | | | | 100,000,000 |
| Par value | | | | $ | 0.001 | | | | | $ | 0.001 |
| Shares outstanding | | | | | 3,306,175 | | | | | | 161,243 |
| Net asset value and redemption price per share | | | | $ | 13.01 | | | | | $ | 10.48 |
| Class I | | | |
| Net assets | | | | $ | 10,595,415 | | | | | $ | 146,451 |
| Shares authorized | | | | | 100,000,000 | | | | | | 100,000,000 |
| Par value | | | | $ | 0.001 | | | | | $ | 0.001 |
| Shares outstanding | | | | | 797,109 | | | | | | 13,849 |
| Net asset value and redemption price per share | | | | $ | 13.29 | | | | | $ | 10.57 |
| Class S | | | |
| Net assets | | | | $ | 23,832,262 | | | | | $ | 862,626 |
| Shares authorized | | | | | 100,000,000 | | | | | | 100,000,000 |
| Par value | | | | $ | 0.001 | | | | | $ | 0.001 |
| Shares outstanding | | | | | 1,811,256 | | | | | | 82,008 |
| Net asset value and redemption price per share | | | | $ | 13.16 | | | | | $ | 10.52 |
| Class S2 | | | |
| Net assets | | | | $ | 6,752,305 | | | | | $ | 138,693 |
| Shares authorized | | | | | 100,000,000 | | | | | | 100,000,000 |
| Par value | | | | $ | 0.001 | | | | | $ | 0.001 |
| Shares outstanding | | | | | 517,104 | | | | | | 13,211 |
| Net asset value and redemption price per share | | | | $ | 13.06 | | | | | $ | 10.50 |
| Class Z | | | |
| Net assets | | | | $ | 17,542,957 | | | | | $ | 3,067,718 |
| Shares authorized | | | | | 100,000,000 | | | | | | 100,000,000 |
| Par value | | | | $ | 0.001 | | | | | $ | 0.001 |
| Shares outstanding | | | | | 1,315,643 | | | | | | 289,499 |
| Net asset value and redemption price per share | | | | $ | 13.33 | | | | | $ | 10.60 |
See Accompanying Notes to Financial Statements
Statements of Operations for the year ended December 31, 2016
| | | | Voya Index
Solution Income
Portfolio | | | Voya Index
Solution 2020
Portfolio | | | Voya Index
Solution 2025
Portfolio | | | Voya Index
Solution 2030
Portfolio | |
| INVESTMENT INCOME: | | | | | |
| Interest | | | | $ | 107 | | | | | $ | — | | | | | $ | 152 | | | | | $ | — | | |
| Dividends from affiliated underlying funds | | | | | 7,021,907 | | | | | | 975,336 | | | | | | 9,348,526 | | | | | | 811,226 | | |
| Dividends from unaffiliated underlying funds | | | | | 2,556,910 | | | | | | 342,346 | | | | | | 3,682,435 | | | | | | 257,001 | | |
| Total investment income | | | | | 9,578,924 | | | | | | 1,317,682 | | | | | | 13,031,113 | | | | | | 1,068,227 | | |
| EXPENSES: | | | | | |
| Investment management fees | | | | | 874,789 | | | | | | 95,962 | | | | | | 1,183,044 | | | | | | 73,973 | | |
| Distribution and shareholder service fees: | | | | | | | | | | | | | | | | | | | | | | | | | |
| Class ADV | | | | | 631,086 | | | | | | 51,676 | | | | | | 1,135,045 | | | | | | 31,198 | | |
| Class S | | | | | 469,803 | | | | | | 11,530 | | | | | | 375,371 | | | | | | 7,273 | | |
| Class S2 | | | | | 58,677 | | | | | | 6,250 | | | | | | 143,978 | | | | | | 3,377 | | |
Class T(1) | | | | | 29 | | | | | | 19 | | | | | | 15 | | | | | | 20 | | |
| Transfer agent fees | | | | | 847 | | | | | | 183 | | | | | | 770 | | | | | | 256 | | |
| Shareholder reporting expense | | | | | 12,780 | | | | | | 3,872 | | | | | | 10,980 | | | | | | 3,452 | | |
| Professional fees | | | | | 69,632 | | | | | | 11,351 | | | | | | 80,512 | | | | | | 9,950 | | |
| Custody and accounting expense | | | | | 39,838 | | | | | | 8,590 | | | | | | 47,416 | | | | | | 7,998 | | |
| Director fees | | | | | 11,520 | | | | | | 1,242 | | | | | | 15,315 | | | | | | 973 | | |
| Miscellaneous expense | | | | | 24,217 | | | | | | 10,532 | | | | | | 30,309 | | | | | | 10,472 | | |
| Interest expense | | | | | — | | | | | | — | | | | | | 68 | | | | | | — | | |
| Total expenses | | | | | 2,193,218 | | | | | | 201,207 | | | | | | 3,022,823 | | | | | | 148,942 | | |
| Net waived and reimbursed fees | | | | | (601,008) | | | | | | (108,703) | | | | | | (767,024) | | | | | | (91,984) | | |
| Net expenses | | | | | 1,592,210 | | | | | | 92,504 | | | | | | 2,255,799 | | | | | | 56,958 | | |
| Net investment income | | | | | 7,986,714 | | | | | | 1,225,178 | | | | | | 10,775,314 | | | | | | 1,011,269 | | |
| REALIZED AND UNREALIZED GAIN (LOSS): | | | | | |
| Net realized gain (loss) on: | | | | | |
| Sale of affiliated underlying funds | | | | | (7,143,037) | | | | | | 379,651 | | | | | | (808,915) | | | | | | 188,332 | | |
| Sale of unaffiliated underlying funds | | | | | (892,243) | | | | | | 97,940 | | | | | | (907,709) | | | | | | 80,008 | | |
| Capital gain distributions from affiliated underlying funds | | | | | 6,420,522 | | | | | | 893,804 | | | | | | 15,011,721 | | | | | | 804,656 | | |
| Futures | | | | | (658,282) | | | | | | (12,702) | | | | | | (835,416) | | | | | | (8,468) | | |
| Net realized gain (loss) | | | | | (2,273,040) | | | | | | 1,358,693 | | | | | | 12,459,681 | | | | | | 1,064,528 | | |
| Net change in unrealized appreciation (depreciation) on: | | | | | |
| Affiliated underlying funds | | | | | 8,916,109 | | | | | | (784) | | | | | | 7,196,161 | | | | | | 671,333 | | |
| Unaffiliated underlying funds | | | | | 3,210,224 | | | | | | 113,197 | | | | | | 3,371,310 | | | | | | (47,617) | | |
| Net change in unrealized appreciation (depreciation) | | | | | 12,126,333 | | | | | | 112,413 | | | | | | 10,567,471 | | | | | | 623,716 | | |
| Net realized and unrealized gain | | | | | 9,853,293 | | | | | | 1,471,106 | | | | | | 23,027,152 | | | | | | 1,688,244 | | |
| Increase in net assets resulting from operations | | | | $ | 17,840,007 | | | | | $ | 2,696,284 | | | | | $ | 33,802,466 | | | | | $ | 2,699,513 | | |
| |
(1)
Class T liquidated on August 31, 2016.
See Accompanying Notes to Financial Statements
Statements of Operations for the year ended December 31, 2016
| | | | Voya Index
Solution 2035
Portfolio | | | Voya Index
Solution 2040
Portfolio | | | Voya Index
Solution 2045
Portfolio | | | Voya Index
Solution 2050
Portfolio | |
| INVESTMENT INCOME: | | | | | |
| Interest | | | | $ | 129 | | | | | $ | — | | | | | $ | 78 | | | | | $ | — | | |
| Dividends from affiliated underlying funds | | | | | 8,492,332 | | | | | | 577,553 | | | | | | 5,749,113 | | | | | | 295,549 | | |
| Dividends from unaffiliated underlying funds | | | | | 2,560,636 | | | | | | 97,821 | | | | | | 1,039,799 | | | | | | 50,620 | | |
| Total investment income | | | | | 11,053,097 | | | | | | 675,374 | | | | | | 6,788,990 | | | | | | 346,169 | | |
| EXPENSES: | | | | | |
| Investment management fees | | | | | 971,555 | | | | | | 43,430 | | | | | | 616,704 | | | | | | 22,720 | | |
| Distribution and shareholder service fees: | | | | | | | | | | | | | | | | | | | | | | | | | |
| Class ADV | | | | | 992,879 | | | | | | 14,059 | | | | | | 677,233 | | | | | | 8,928 | | |
| Class S | | | | | 296,045 | | | | | | 4,998 | | | | | | 185,676 | | | | | | 4,088 | | |
| Class S2 | | | | | 133,644 | | | | | | 1,251 | | | | | | 73,179 | | | | | | 1,391 | | |
Class T(1) | | | | | 15 | | | | | | 20 | | | | | | 15 | | | | | | 20 | | |
| Transfer agent fees | | | | | 1,033 | | | | | | 1,049 | | | | | | 588 | | | | | | 729 | | |
| Shareholder reporting expense | | | | | 14,360 | | | | | | 3,743 | | | | | | 11,745 | | | | | | 3,433 | | |
| Professional fees | | | | | 66,780 | | | | | | 12,899 | | | | | | 46,893 | | | | | | 10,402 | | |
| Custody and accounting expense | | | | | 39,930 | | | | | | 6,623 | | | | | | 31,020 | | | | | | 6,698 | | |
| Director fees | | | | | 12,929 | | | | | | 601 | | | | | | 8,432 | | | | | | 312 | | |
| Miscellaneous expense | | | | | 26,496 | | | | | | 10,947 | | | | | | 21,136 | | | | | | 10,521 | | |
| Interest expense | | | | | 87 | | | | | | — | | | | | | 55 | | | | | | — | | |
| Total expenses | | | | | 2,555,753 | | | | | | 99,620 | | | | | | 1,672,676 | | | | | | 69,242 | | |
| Net waived and reimbursed fees | | | | | (628,537) | | | | | | (72,818) | | | | | | (375,085) | | | | | | (48,710) | | |
| Net expenses | | | | | 1,927,216 | | | | | | 26,802 | | | | | | 1,297,591 | | | | | | 20,532 | | |
| Net investment income | | | | | 9,125,881 | | | | | | 648,572 | | | | | | 5,491,399 | | | | | | 325,637 | | |
| REALIZED AND UNREALIZED GAIN (LOSS): | | | | | |
| Net realized gain (loss) on: | | | | | |
| Sale of affiliated underlying funds | | | | | (1,720,725) | | | | | | 179,620 | | | | | | (1,259,289) | | | | | | 41,290 | | |
| Sale of unaffiliated underlying funds | | | | | (740,991) | | | | | | 49,224 | | | | | | 38,162 | | | | | | 27,074 | | |
| Capital gain distributions from affiliated underlying funds | | | | | 16,496,796 | | | | | | 539,327 | | | | | | 11,763,873 | | | | | | 320,645 | | |
| Futures | | | | | (1,218,161) | | | | | | (4,234) | | | | | | (779,125) | | | | | | (2,117) | | |
| Net realized gain | | | | | 12,816,919 | | | | | | 763,937 | | | | | | 9,763,621 | | | | | | 386,892 | | |
| Net change in unrealized appreciation (depreciation) on: | | | | | |
| Affiliated underlying funds | | | | | 9,203,108 | | | | | | 783,625 | | | | | | 6,778,683 | | | | | | 457,750 | | |
| Unaffiliated underlying funds | | | | | 2,077,583 | | | | | | (41,071) | | | | | | 132,250 | | | | | | (37,989) | | |
| Net change in unrealized appreciation (depreciation) | | | | | 11,280,691 | | | | | | 742,554 | | | | | | 6,910,933 | | | | | | 419,761 | | |
| Net realized and unrealized gain | | | | | 24,097,610 | | | | | | 1,506,491 | | | | | | 16,674,554 | | | | | | 806,653 | | |
| Increase in net assets resulting from operations | | | | $ | 33,223,491 | | | | | $ | 2,155,063 | | | | | $ | 22,165,953 | | | | | $ | 1,132,290 | | |
| |
(1)
Class T liquidated on August 31, 2016.
See Accompanying Notes to Financial Statements
Statements of Operations for the year ended December 31, 2016
| | | | Voya Index
Solution 2055
Portfolio | | | Voya Index
Solution 2060
Portfolio | |
| INVESTMENT INCOME: | | | |
| Dividends from affiliated underlying funds | | | | $ | 1,756,245 | | | | | $ | 59,272 | | |
| Dividends from unaffiliated underlying funds | | | | | 236,034 | | | | | | 10,571 | | |
| Total investment income | | | | | 1,992,279 | | | | | | 69,843 | | |
| EXPENSES: | | | |
| Investment management fees | | | | | 178,815 | | | | | | 4,445 | | |
| Distribution and shareholder service fees: | | | | | | | | | | | | | |
| Class ADV | | | | | 197,134 | | | | | | 4,502 | | |
| Class S | | | | | 53,167 | | | | | | 1,019 | | |
| Class S2 | | | | | 27,609 | | | | | | 256 | | |
Class T(1) | | | | | 20 | | | | | | — | | |
| Transfer agent fees | | | | | 609 | | | | | | 921 | | |
| Shareholder reporting expense | | | | | 5,490 | | | | | | 3,140 | | |
| Professional fees | | | | | 19,260 | | | | | | 8,296 | | |
| Custody and accounting expense | | | | | 13,908 | | | | | | 397 | | |
| Director fees | | | | | 2,493 | | | | | | 61 | | |
| Offering expense | | | | | — | | | | | | 1,490 | | |
| Miscellaneous expense | | | | | 12,996 | | | | | | 10,175 | | |
| Total expenses | | | | | 511,501 | | | | | | 34,702 | | |
| Net waived and reimbursed fees | | | | | (127,366) | | | | | | (26,906) | | |
| Net expenses | | | | | 384,135 | | | | | | 7,796 | | |
| Net investment income | | | | | 1,608,144 | | | | | | 62,047 | | |
| REALIZED AND UNREALIZED GAIN (LOSS): | | | |
| Net realized gain (loss) on: | | | |
| Sale of affiliated underlying funds | | | | | (2,032,344) | | | | | | 40,412 | | |
| Sale of unaffiliated underlying funds | | | | | 43,945 | | | | | | 4,792 | | |
| Capital gain distributions from affiliated underlying funds | | | | | 3,490,286 | | | | | | 70,844 | | |
| Futures | | | | | (211,828) | | | | | | — | | |
| Net realized gain | | | | | 1,290,059 | | | | | | 116,048 | | |
| Net change in unrealized appreciation (depreciation) on: | | | |
| Affiliated underlying funds | | | | | 3,843,416 | | | | | | 52,402 | | |
| Unaffiliated underlying funds | | | | | (64,899) | | | | | | (3,121) | | |
| Net change in unrealized appreciation (depreciation) | | | | | 3,778,517 | | | | | | 49,281 | | |
| Net realized and unrealized gain | | | | | 5,068,576 | | | | | | 165,329 | | |
| Increase in net assets resulting from operations | | | | $ | 6,676,720 | | | | | $ | 227,376 | | |
| |
(1)
Class T liquidated on August 31, 2016.
See Accompanying Notes to Financial Statements
Statements of Changes in Net Assets
| | | | Voya Index Solution Income Portfolio | | | Voya Index Solution 2020 Portfolio | |
| | | | Year Ended
December 31,
2016 | | | Year Ended
December 31,
2015 | | | Year Ended
December 31,
2016 | | | Year Ended
December 31,
2015 | |
| FROM OPERATIONS: | | | | | |
| Net investment income | | | | $ | 7,986,714 | | | | | $ | 5,810,622 | | | | | $ | 1,225,178 | | | | | $ | 61,706 | | |
| Net realized gain (loss) | | | | | (2,273,040) | | | | | | 3,880,136 | | | | | | 1,358,693 | | | | | | 17,747 | | |
| Net change in unrealized appreciation (depreciation) | | | | | 12,126,333 | | | | | | (16,363,090) | | | | | | 112,413 | | | | | | (122,805) | | |
| Increase (decrease) in net assets resulting from operations | | | | | 17,840,007 | | | | | | (6,672,332) | | | | | | 2,696,284 | | | | | | (43,352) | | |
| FROM DISTRIBUTIONS TO SHAREHOLDERS: | | | | | | | | | | | | | | | | | | | | | | | | | |
| Net investment income: | | | | | | | | | | | | | | | | | | | | | | | | | |
| Class ADV | | | | | (1,896,664) | | | | | | (634,249) | | | | | | (13,350) | | | | | | (166) | | |
| Class I | | | | | (568,456) | | | | | | (130,597) | | | | | | (3,145) | | | | | | (22) | | |
| Class S | | | | | (2,982,354) | | | | | | (2,345,797) | | | | | | (5,249) | | | | | | (17) | | |
| Class S2 | | | | | (206,350) | | | | | | (58,282) | | | | | | (1,371) | | | | | | (1) | | |
Class T(1) | | | | | (83) | | | | | | (53) | | | | | | — | | | | | | — | | |
| Class Z | | | | | (476,510) | | | | | | (79) | | | | | | (38,737) | | | | | | (111) | | |
| Net realized gains: | | | | | | | | | | | | | | | | | | | | | | | | | |
| Class ADV | | | | | (1,734,768) | | | | | | (2,276,217) | | | | | | (6,725) | | | | | | (326) | | |
| Class I | | | | | (433,421) | | | | | | (360,664) | | | | | | (1,208) | | | | | | (99) | | |
| Class S | | | | | (2,575,586) | | | | | | (7,391,138) | | | | | | (2,150) | | | | | | (98) | | |
| Class S2 | | | | | (182,389) | | | | | | (216,486) | | | | | | (626) | | | | | | (98) | | |
Class T(1) | | | | | (87) | | | | | | (215) | | | | | | (2) | | | | | | (98) | | |
| Class Z | | | | | (363,317) | | | | | | (219) | | | | | | (14,716) | | | | | | (493) | | |
| Total distributions | | | | | (11,419,985) | | | | | | (13,413,996) | | | | | | (87,279) | | | | | | (1,529) | | |
| FROM CAPITAL SHARE TRANSACTIONS: | | | | | |
| Net proceeds from sale of shares | | | | | 108,379,409 | | | | | | 26,814,739 | | | | | | 103,660,958 | | | | | | 8,854,316 | | |
| Proceeds from shares issued in merger (Note 10) | | | | | — | | | | | | 251,868,347 | | | | | | — | | | | | | — | | |
| Reinvestment of distributions | | | | | 11,419,815 | | | | | | 13,413,728 | | | | | | 87,277 | | | | | | 948 | | |
| | | | | | 119,799,224 | | | | | | 292,096,814 | | | | | | 103,748,235 | | | | | | 8,855,264 | | |
| Cost of shares redeemed | | | | | (99,550,236) | | | | | | (61,919,717) | | | | | | (12,207,530) | | | | | | (331,327) | | |
| Net increase in net assets resulting from capital share transactions | | | | | 20,248,988 | | | | | | 230,177,097 | | | | | | 91,540,705 | | | | | | 8,523,937 | | |
| Net increase in net assets | | | | | 26,669,010 | | | | | | 210,090,769 | | | | | | 94,149,710 | | | | | | 8,479,056 | | |
| NET ASSETS: | | | | | |
| Beginning of year or period | | | | | 381,887,418 | | | | | | 171,796,649 | | | | | | 8,498,321 | | | | | | 19,265 | | |
| End of year or period | | | | $ | 408,556,428 | | | | | $ | 381,887,418 | | | | | $ | 102,648,031 | | | | | $ | 8,498,321 | | |
| Undistributed net investment income at end of year or period | | | | $ | 8,417,366 | | | | | $ | 6,124,094 | | | | | $ | 1,261,617 | | | | | $ | 61,745 | | |
(1)
Class T liquidated on August 31, 2016.
See Accompanying Notes to Financial Statements
Statements of Changes in Net Assets
| | | | Voya Index Solution 2025 Portfolio | | | Voya Index Solution 2030 Portfolio | |
| | | | Year Ended
December 31,
2016 | | | Year Ended
December 31,
2015 | | | Year Ended
December 31,
2016 | | | Year Ended
December 31,
2015 | |
| FROM OPERATIONS: | | | | | |
| Net investment income | | | | $ | 10,775,314 | | | | | $ | 9,935,346 | | | | | $ | 1,011,269 | | | | | $ | 35,179 | | |
| Net realized gain | | | | | 12,459,681 | | | | | | 36,092,601 | | | | | | 1,064,528 | | | | | | 14,524 | | |
| Net change in unrealized appreciation (depreciation) | | | | | 10,567,471 | | | | | | (54,354,273) | | | | | | 623,716 | | | | | | (88,801) | | |
| Increase (decrease) in net assets resulting from operations | | | | | 33,802,466 | | | | | | (8,326,326) | | | | | | 2,699,513 | | | | | | (39,098) | | |
| FROM DISTRIBUTIONS TO SHAREHOLDERS: | | | | | | | | | | | | | | | | | | | | | | | | | |
| Net investment income: | | | | | | | | | | | | | | | | | | | | | | | | | |
| Class ADV | | | | | (4,509,119) | | | | | | (3,410,776) | | | | | | (5,045) | | | | | | (392) | | |
| Class I | | | | | (1,358,591) | | | | | | (1,024,278) | | | | | | (2,574) | | | | | | — | | |
| Class S | | | | | (3,171,814) | | | | | | (3,258,109) | | | | | | (2,574) | | | | | | — | | |
| Class S2 | | | | | (668,502) | | | | | | (497,192) | | | | | | (1,035) | | | | | | — | | |
Class T(1) | | | | | (60) | | | | | | (46) | | | | | | — | | | | | | — | | |
| Class Z | | | | | (1,297,114) | | | | | | (97) | | | | | | (24,000) | | | | | | — | | |
| Net realized gains: | | | | | | | | | | | | | | | | | | | | | | | | | |
| Class ADV | | | | | (16,111,045) | | | | | | (20,270,652) | | | | | | (4,079) | | | | | | (1,153) | | |
| Class I | | | | | (3,826,257) | | | | | | (4,465,190) | | | | | | (1,438) | | | | | | (63) | | |
| Class S | | | | | (10,295,036) | | | | | | (16,160,818) | | | | | | (1,631) | | | | | | (63) | | |
| Class S2 | | | | | (2,297,858) | | | | | | (2,976,718) | | | | | | (596) | | | | | | (63) | | |
Class T(1) | | | | | (240) | | | | | | (310) | | | | | | (2) | | | | | | (63) | | |
| Class Z | | | | | (3,653,118) | | | | | | (425) | | | | | | (13,313) | | | | | | (287) | | |
| Total distributions | | | | | (47,188,754) | | | | | | (52,064,611) | | | | | | (56,287) | | | | | | (2,084) | | |
| FROM CAPITAL SHARE TRANSACTIONS: | | | | | |
| Net proceeds from sale of shares | | | | | 181,654,567 | | | | | | 82,168,309 | | | | | | 92,623,692 | | | | | | 5,919,215 | | |
| Reinvestment of distributions | | | | | 47,188,454 | | | | | | 52,064,255 | | | | | | 56,285 | | | | | | 1,749 | | |
| | | | | | 228,843,021 | | | | | | 134,232,564 | | | | | | 92,679,977 | | | | | | 5,920,964 | | |
| Cost of shares redeemed | | | | | (108,675,021) | | | | | | (112,129,124) | | | | | | (6,874,563) | | | | | | (756,043) | | |
| Net increase in net assets resulting from capital share transactions | | | | | 120,168,000 | | | | | | 22,103,440 | | | | | | 85,805,414 | | | | | | 5,164,921 | | |
| Net increase (decrease) in net assets | | | | | 106,781,712 | | | | | | (38,287,497) | | | | | | 88,448,640 | | | | | | 5,123,739 | | |
| NET ASSETS: | | | | | |
| Beginning of year or period | | | | | 481,022,659 | | | | | | 519,310,156 | | | | | | 5,144,669 | | | | | | 20,930 | | |
| End of year or period | | | | $ | 587,804,371 | | | | | $ | 481,022,659 | | | | | $ | 93,593,309 | | | | | $ | 5,144,669 | | |
| Undistributed net investment income at end of year or period | | | | $ | 11,308,453 | | | | | $ | 10,998,166 | | | | | $ | 1,036,050 | | | | | $ | 35,142 | | |
(1)
Class T liquidated on August 31, 2016.
See Accompanying Notes to Financial Statements
Statements of Changes in Net Assets
| | | | Voya Index Solution 2035 Portfolio | | | Voya Index Solution 2040 Portfolio | |
| | | | Year Ended
December 31,
2016 | | | Year Ended
December 31,
2015 | | | Year Ended
December 31,
2016 | | | Year Ended
December 31,
2015 | |
| FROM OPERATIONS: | | | | | |
| Net investment income | | | | $ | 9,125,881 | | | | | $ | 7,698,354 | | | | | $ | 648,572 | | | | | $ | 21,238 | | |
| Net realized gain | | | | | 12,816,919 | | | | | | 38,159,937 | | | | | | 763,937 | | | | | | 8,495 | | |
| Net change in unrealized appreciation (depreciation) | | | | | 11,280,691 | | | | | | (53,561,447) | | | | | | 742,554 | | | | | | (57,230) | | |
| Increase (decrease) in net assets resulting from operations | | | | | 33,223,491 | | | | | | (7,703,156) | | | | | | 2,155,063 | | | | | | (27,497) | | |
| FROM DISTRIBUTIONS TO SHAREHOLDERS: | | | | | | | | | | | | | | | | | | | | | | | | | |
| Net investment income: | | | | | | | | | | | | | | | | | | | | | | | | | |
| Class ADV | | | | | (3,603,282) | | | | | | (2,703,379) | | | | | | (1,774) | | | | | | (75) | | |
| Class I | | | | | (999,520) | | | | | | (708,488) | | | | | | (584) | | | | | | (34) | | |
| Class S | | | | | (2,357,186) | | | | | | (2,295,635) | | | | | | (1,703) | | | | | | (17) | | |
| Class S2 | | | | | (590,771) | | | | | | (396,748) | | | | | | (393) | | | | | | (17) | | |
Class T(1) | | | | | (55) | | | | | | (42) | | | | | | — | | | | | | (3) | | |
| Class Z | | | | | (1,013,827) | | | | | | (1,039) | | | | | | (16,856) | | | | | | (145) | | |
| Net realized gains: | | | | | | | | | | | | | | | | | | | | | | | | | |
| Class ADV | | | | | (17,256,361) | | | | | | (21,434,185) | | | | | | (1,881) | | | | | | (374) | | |
| Class I | | | | | (3,691,944) | | | | | | (4,034,485) | | | | | | (345) | | | | | | (211) | | |
| Class S | | | | | (10,100,983) | | | | | | (15,058,363) | | | | | | (1,153) | | | | | | (211) | | |
| Class S2 | | | | | (2,683,902) | | | | | | (3,244,251) | | | | | | (244) | | | | | | (210) | | |
Class T(1) | | | | | (297) | | | | | | (384) | | | | | | (3) | | | | | | (210) | | |
| Class Z | | | | | (3,744,788) | | | | | | (5,917) | | | | | | (9,695) | | | | | | (896) | | |
| Total distributions | | | | | (46,042,916) | | | | | | (49,882,916) | | | | | | (34,631) | | | | | | (2,403) | | |
| FROM CAPITAL SHARE TRANSACTIONS: | | | | | |
| Net proceeds from sale of shares | | | | | 157,130,588 | | | | | | 71,304,946 | | | | | | 58,469,965 | | | | | | 3,198,357 | | |
| Reinvestment of distributions | | | | | 46,042,564 | | | | | | 49,882,490 | | | | | | 34,612 | | | | | | 1,242 | | |
| | | | | | 203,173,152 | | | | | | 121,187,436 | | | | | | 58,504,577 | | | | | | 3,199,599 | | |
| Cost of shares redeemed | | | | | (86,920,360) | | | | | | (97,566,851) | | | | | | (3,826,593) | | | | | | (269,435) | | |
| Net increase in net assets resulting from capital share transactions | | | | | 116,252,792 | | | | | | 23,620,585 | | | | | | 54,677,984 | | | | | | 2,930,164 | | |
| Net increase (decrease) in net assets | | | | | 103,433,367 | | | | | | (33,965,487) | | | | | | 56,798,416 | | | | | | 2,900,264 | | |
| NET ASSETS: | | | | | |
| Beginning of year or period | | | | | 399,659,817 | | | | | | 433,625,304 | | | | | | 2,923,478 | | | | | | 23,214 | | |
| End of year or period | | | | $ | 503,093,184 | | | | | $ | 399,659,817 | | | | | $ | 59,721,894 | | | | | $ | 2,923,478 | | |
| Undistributed net investment income at end of year or period | | | | $ | 9,586,073 | | | | | $ | 8,559,830 | | | | | $ | 663,858 | | | | | $ | 21,302 | | |
(1)
Class T liquidated on August 31, 2016.
See Accompanying Notes to Financial Statements
Statements of Changes in Net Assets
| | | | Voya Index Solution 2045 Portfolio | | | Voya Index Solution 2050 Portfolio | |
| | | | Year Ended
December 31,
2016 | | | Year Ended
December 31,
2015 | | | Year Ended
December 31,
2016 | | | Year Ended
December 31,
2015 | |
| FROM OPERATIONS: | | | | | |
| Net investment income | | | | $ | 5,491,399 | | | | | $ | 4,352,460 | | | | | $ | 325,637 | | | | | $ | 13,140 | | |
| Net realized gain | | | | | 9,763,621 | | | | | | 24,934,769 | | | | | | 386,892 | | | | | | 22,102 | | |
| Net change in unrealized appreciation (depreciation) | | | | | 6,910,933 | | | | | | (34,997,424) | | | | | | 419,761 | | | | | | (35,562) | | |
| Increase (decrease) in net assets resulting from operations | | | | | 22,165,953 | | | | | | (5,710,195) | | | | | | 1,132,290 | | | | | | (320) | | |
| FROM DISTRIBUTIONS TO SHAREHOLDERS: | | | | | | | | | | | | | | | | | | | | | | | | | |
| Net investment income: | | | | | | | | | | | | | | | | | | | | | | | | | |
| Class ADV | | | | | (2,182,058) | | | | | | (1,357,061) | | | | | | (2,178) | | | | | | (14) | | |
| Class I | | | | | (681,779) | ��� | | | | | (377,565) | | | | | | (914) | | | | | | (37) | | |
| Class S | | | | | (1,300,575) | | | | | | (1,127,665) | | | | | | (1,904) | | | | | | (24) | | |
| Class S2 | | | | | (291,671) | | | | | | (156,530) | | | | | | (469) | | | | | | (21) | | |
Class T(1) | | | | | (46) | | | | | | (31) | | | | | | — | | | | | | (6) | | |
| Class Z | | | | | (541,674) | | | | | | (43) | | | | | | (8,751) | | | | | | (158) | | |
| Net realized gains: | | | | | | | | | | | | | | | | | | | | | | | | | |
| Class ADV | | | | | (11,812,553) | | | | | | (14,880,990) | | | | | | (5,066) | | | | | | (232) | | |
| Class I | | | | | (2,793,476) | | | | | | (2,763,241) | | | | | | (1,752) | | | | | | (233) | | |
| Class S | | | | | (6,293,044) | | | | | | (9,852,747) | | | | | | (3,547) | | | | | | (232) | | |
| Class S2 | | | | | (1,480,752) | | | | | | (1,757,731) | | | | | | (851) | | | | | | (232) | | |
Class T(1) | | | | | (299) | | | | | | (417) | | | | | | (11) | | | | | | (231) | | |
| Class Z | | | | | (2,219,425) | | | | | | (314) | | | | | | (14,720) | | | | | | (982) | | |
| Total distributions | | | | | (29,597,352) | | | | | | (32,274,335) | | | | | | (40,163) | | | | | | (2,402) | | |
| FROM CAPITAL SHARE TRANSACTIONS: | | | | | |
| Net proceeds from sale of shares | | | | | 105,962,148 | | | | | | 58,386,012 | | | | | | 28,838,296 | | | | | | 2,217,945 | | |
| Reinvestment of distributions | | | | | 29,597,007 | | | | | | 32,273,888 | | | | | | 40,137 | | | | | | 1,145 | | |
| | | | | | 135,559,155 | | | | | | 90,659,900 | | | | | | 28,878,433 | | | | | | 2,219,090 | | |
| Cost of shares redeemed | | | | | (57,672,449) | | | | | | (62,654,289) | | | | | | (1,699,518) | | | | | | (429,831) | | |
| Net increase in net assets resulting from capital share transactions | | | | | 77,886,706 | | | | | | 28,005,611 | | | | | | 27,178,915 | | | | | | 1,789,259 | | |
| Net increase (decrease) in net assets | | | | | 70,455,307 | | | | | | (9,978,919) | | | | | | 28,271,042 | | | | | | 1,786,537 | | |
| NET ASSETS: | | | | | |
| Beginning of year or period | | | | | 259,285,356 | | | | | | 269,264,275 | | | | | | 1,808,944 | | | | | | 22,407 | | |
| End of year or period | | | | $ | 329,740,663 | | | | | $ | 259,285,356 | | | | | $ | 30,079,986 | | | | | $ | 1,808,944 | | |
| Undistributed net investment income at end of year or period | | | | $ | 5,796,026 | | | | | $ | 4,993,787 | | | | | $ | 333,154 | | | | | $ | 13,201 | | |
(1)
Class T liquidated on August 31, 2016.
See Accompanying Notes to Financial Statements
Statements of Changes in Net Assets
| | | | Voya Index Solution 2055 Portfolio | | | Voya Index Solution 2060 Portfolio | |
| | | | Year Ended
December 31,
2016 | | | Year Ended
December 31,
2015 | | | Year Ended
December 31,
2016 | | | February 9, 2015(2)
to December 31,
2015 | |
| FROM OPERATIONS: | | | | | |
| Net investment income | | | | $ | 1,608,144 | | | | | $ | 1,081,435 | | | | | $ | 62,047 | | | | | $ | 2,240 | | |
| Net realized gain | | | | | 1,290,059 | | | | | | 5,654,215 | | | | | | 116,048 | | | | | | 4,895 | | |
| Net change in unrealized appreciation (depreciation) | | | | | 3,778,517 | | | | | | (8,439,372) | | | | | | 49,281 | | | | | | (7,199) | | |
| Increase (decrease) in net assets resulting from operations | | | | | 6,676,720 | | | | | | (1,703,722) | | | | | | 227,376 | | | | | | (64) | | |
| FROM DISTRIBUTIONS TO SHAREHOLDERS: | | | | | | | | | | | | | | | | | | | | | | | | | |
| Net investment income: | | | | | | | | | | | | | | | | | | | | | | | | | |
| Class ADV | | | | | (523,322) | | | | | | (292,320) | | | | | | (1,502) | | | | | | — | | |
| Class I | | | | | (161,426) | | | | | | (72,668) | | | | | | (139) | | | | | | — | | |
| Class S | | | | | (321,142) | | | | | | (245,405) | | | | | | (634) | | | | | | — | | |
| Class S2 | | | | | (92,558) | | | | | | (39,840) | | | | | | — | | | | | | — | | |
Class T(1) | | | | | (49) | | | | | | (27) | | | | | | — | | | | | | — | | |
| Class Z | | | | | (145,094) | | | | | | (2,379) | | | | | | (1,005) | | | | | | — | | |
| Net realized gains: | | | | | | | | | | | | | | | | | | | | | | | | | |
| Class ADV | | | | | (2,656,568) | | | | | | (2,921,488) | | | | | | (4,145) | | | | | | — | | |
| Class I | | | | | (610,144) | | | | | | (488,658) | | | | | | (401) | | | | | | — | | |
| Class S | | | | | (1,433,092) | | | | | | (1,953,282) | | | | | | (1,762) | | | | | | — | | |
| Class S2 | | | | | (432,018) | | | | | | (416,612) | | | | | | (194) | | | | | | — | | |
Class T(1) | | | | | (286) | | | | | | (378) | | | | | | — | | | | | | — | | |
| Class Z | | | | | (548,406) | | | | | | (15,988) | | | | | | (2,347) | | | | | | — | | |
| Total distributions | | | | | (6,924,105) | | | | | | (6,449,045) | | | | | | (12,129) | | | | | | — | | |
| FROM CAPITAL SHARE TRANSACTIONS: | | | | | |
| Net proceeds from sale of shares | | | | | 42,855,401 | | | | | | 32,927,242 | | | | | | 6,244,067 | | | | | | 607,321 | | |
| Reinvestment of distributions | | | | | 6,923,770 | | | | | | 6,448,642 | | | | | | 12,012 | | | | | | — | | |
| | | | | | 49,779,171 | | | | | | 39,375,884 | | | | | | 6,256,079 | | | | | | 607,321 | | |
| Cost of shares redeemed | | | | | (19,876,346) | | | | | | (21,064,074) | | | | | | (963,735) | | | | | | (209,649) | | |
| Net increase in net assets resulting from capital share transactions | | | | | 29,902,825 | | | | | | 18,311,810 | | | | | | 5,292,344 | | | | | | 397,672 | | |
| Net increase in net assets | | | | | 29,655,440 | | | | | | 10,159,043 | | | | | | 5,507,591 | | | | | | 397,608 | | |
| NET ASSETS: | | | | | |
| Beginning of year or period | | | | | 72,069,918 | | | | | | 61,910,875 | | | | | | 397,608 | | | | | | — | | |
| End of year or period | | | | $ | 101,725,358 | | | | | $ | 72,069,918 | | | | | $ | 5,905,199 | | | | | $ | 397,608 | | |
| Undistributed net investment income at end of year or period | | | | $ | 1,697,478 | | | | | $ | 1,243,025 | | | | | $ | 62,920 | | | | | $ | 2,288 | | |
(1)
Class T liquidated on August 31, 2016.
(2)
Commencement of operations.
See Accompanying Notes to Financial Statements
Selected data for a share of beneficial interest outstanding throughout each year or period.
| | | | | | | | | | Income (loss)
from
investment
operations | | | | | | | | | Less Distributions | | | | | | Ratios to average net assets | | | Supplemental
Data | |
| | | | Net asset value, beginning
of year or period | | | Net investment income (loss) | | | Net realized and unrealized
gain (loss) | | | Total from investment
operations | | | From net investment income | | | From net realized gains | | | From return of capital | | | Total distributions | | | Payment by affiliate | | | Net asset value, end of year
or period | | | Total Return(1) | | | Expenses before
reductions/additions(2)(3)(4) | | | Expenses net of fee waivers
and/or recoupments if any(2)(3)(4) | | | Expenses net of all
reductions/additions(2)(3)(4) | | | Net investment income
(loss)(2)(3) | | | Net assets, end of year
or period | | | Portfolio turnover rate | |
Year or
period ended | | | ($) | | | ($) | | | ($) | | | ($) | | | ($) | | | ($) | | | ($) | | | ($) | | | ($) | | | ($) | | | (%) | | | (%) | | | (%) | | | (%) | | | (%) | | | ($000’s) | | | (%) | |
| Voya Index Solution Income Portfolio | | | | | | | | | | | | | | | | | | | | | | | | | | | | | | | | | | | | | | | | | | | | | | | | | | | | | | | | | | | | | | | | | | | | | | | | | | | | | | | | | | | | | | | | | | | | | | | | | | | | | | | |
| Class ADV | | | | | | | | | | | | | | | | | | | | | | | | | | | | | | | | | | | | | | | | | | | | | | | | | | | | | | | | | | | | | | | | | | | | | | | | | | | | | | | | | | | | | | | | | | | | | | | | | | | | | | | |
| 12-31-16 | | | | | 9.55 | | | | | | 0.18• | | | | | | 0.27 | | | | | | 0.45 | | | | | | 0.15 | | | | | | 0.14 | | | | | | — | | | | | | 0.29 | | | | | | — | | | | | | 9.71 | | | | | | 4.71 | | | | | | 0.77 | | | | | | 0.62 | | | | | | 0.62 | | | | | | 1.82 | | | | | | 119,455 | | | | | | 45 | | |
| 12-31-15 | | | | | 10.53 | | | | | | 0.21• | | | | | | (0.33) | | | | | | (0.12) | | | | | | 0.19 | | | | | | 0.67 | | | | | | — | | | | | | 0.86 | | | | | | — | | | | | | 9.55 | | | | | | (1.37) | | | | | | 0.77 | | | | | | 0.62 | | | | | | 0.62 | | | | | | 2.17 | | | | | | 134,515 | | | | | | 34 | | |
| 12-31-14 | | | | | 10.73 | | | | | | 0.17 | | | | | | 0.43 | | | | | | 0.60 | | | | | | 0.23 | | | | | | 0.57 | | | | | | — | | | | | | 0.80 | | | | | | — | | | | | | 10.53 | | | | | | 5.68 | | | | | | 0.78 | | | | | | 0.62 | | | | | | 0.62 | | | | | | 1.50 | | | | | | 37,651 | | | | | | 23 | | |
| 12-31-13 | | | | | 10.64 | | | | | | 0.19• | | | | | | 0.58 | | | | | | 0.77 | | | | | | 0.30 | | | | | | 0.38 | | | | | | — | | | | | | 0.68 | | | | | | — | | | | | | 10.73 | | | | | | 7.50 | | | | | | 0.76 | | | | | | 0.61 | | | | | | 0.61 | | | | | | 1.74 | | | | | | 37,886 | | | | | | 39 | | |
| 12-31-12 | | | | | 10.42 | | | | | | 0.19• | | | | | | 0.67 | | | | | | 0.86 | | | | | | 0.26 | | | | | | 0.38 | | | | | | — | | | | | | 0.64 | | | | | | — | | | | | | 10.64 | | | | | | 8.36 | | | | | | 0.71 | | | | | | 0.62 | | | | | | 0.62 | | | | | | 1.79 | | | | | | 31,359 | | | | | | 45 | | |
| Class I | | | | | | | | | | | | | | | | | | | | | | | | | | | | | | | | | | | | | | | | | | | | | | | | | | | | | | | | | | | | | | | | | | | | | | | | | | | | | | | | | | | | | | | | | | | | | | | | | | | | | | | |
| 12-31-16 | | | | | 9.77 | | | | | | 0.23• | | | | | | 0.28 | | | | | | 0.51 | | | | | | 0.18 | | | | | | 0.14 | | | | | | — | | | | | | 0.32 | | | | | | — | | | | | | 9.96 | | | | | | 5.23 | | | | | | 0.27 | | | | | | 0.12 | | | | | | 0.12 | | | | | | 2.33 | | | | | | 29,545 | | | | | | 45 | | |
| 12-31-15 | | | | | 10.76 | | | | | | 0.28• | | | | | | (0.36) | | | | | | (0.08) | | | | | | 0.24 | | | | | | 0.67 | | | | | | — | | | | | | 0.91 | | | | | | — | | | | | | 9.77 | | | | | | (0.91) | | | | | | 0.27 | | | | | | 0.12 | | | | | | 0.12 | | | | | | 2.84 | | | | | | 30,873 | | | | | | 34 | | |
| 12-31-14 | | | | | 10.94 | | | | | | 0.22• | | | | | | 0.45 | | | | | | 0.67 | | | | | | 0.28 | | | | | | 0.57 | | | | | | — | | | | | | 0.85 | | | | | | — | | | | | | 10.76 | | | | | | 6.23 | | | | | | 0.28 | | | | | | 0.12 | | | | | | 0.12 | | | | | | 2.00 | | | | | | 5,042 | | | | | | 23 | | |
| 12-31-13 | | | | | 10.82 | | | | | | 0.22• | | | | | | 0.63 | | | | | | 0.85 | | | | | | 0.35 | | | | | | 0.38 | | | | | | — | | | | | | 0.73 | | | | | | — | | | | | | 10.94 | | | | | | 8.10 | | | | | | 0.26 | | | | | | 0.11 | | | | | | 0.11 | | | | | | 2.01 | | | | | | 5,682 | | | | | | 39 | | |
| 12-31-12 | | | | | 10.59 | | | | | | 0.27• | | | | | | 0.64 | | | | | | 0.91 | | | | | | 0.30 | | | | | | 0.38 | | | | | | — | | | | | | 0.68 | | | | | | — | | | | | | 10.82 | | | | | | 8.75 | | | | | | 0.21 | | | | | | 0.12 | | | | | | 0.12 | | | | | | 2.53 | | | | | | 10,690 | | | | | | 45 | | |
| Class S | | | | | | | | | | | | | | | | | | | | | | | | | | | | | | | | | | | | | | | | | | | | | | | | | | | | | | | | | | | | | | | | | | | | | | | | | | | | | | | | | | | | | | | | | | | | | | | | | | | | | | | |
| 12-31-16 | | | | | 9.68 | | | | | | 0.20• | | | | | | 0.28 | | | | | | 0.48 | | | | | | 0.16 | | | | | | 0.14 | | | | | | — | | | | | | 0.30 | | | | | | — | | | | | | 9.86 | | | | | | 4.95 | | | | | | 0.52 | | | | | | 0.37 | | | | | | 0.37 | | | | | | 2.05 | | | | | | 174,891 | | | | | | 45 | | |
| 12-31-15 | | | | | 10.66 | | | | | | 0.23• | | | | | | (0.33) | | | | | | (0.10) | | | | | | 0.21 | | | | | | 0.67 | | | | | | — | | | | | | 0.88 | | | | | | — | | | | | | 9.68 | | | | | | (1.11) | | | | | | 0.52 | | | | | | 0.37 | | | | | | 0.37 | | | | | | 2.24 | | | | | | 199,999 | | | | | | 34 | | |
| 12-31-14 | | | | | 10.85 | | | | | | 0.19• | | | | | | 0.44 | | | | | | 0.63 | | | | | | 0.25 | | | | | | 0.57 | | | | | | — | | | | | | 0.82 | | | | | | — | | | | | | 10.66 | | | | | | 5.90 | | | | | | 0.53 | | | | | | 0.37 | | | | | | 0.37 | | | | | | 1.73 | | | | | | 124,505 | | | | | | 23 | | |
| 12-31-13 | | | | | 10.74 | | | | | | 0.21• | | | | | | 0.60 | | | | | | 0.81 | | | | | | 0.32 | | | | | | 0.38 | | | | | | — | | | | | | 0.70 | | | | | | — | | | | | | 10.85 | | | | | | 7.78 | | | | | | 0.51 | | | | | | 0.36 | | | | | | 0.36 | | | | | | 1.92 | | | | | | 134,689 | | | | | | 39 | | |
| 12-31-12 | | | | | 10.51 | | | | | | 0.21• | | | | | | 0.68 | | | | | | 0.89 | | | | | | 0.28 | | | | | | 0.38 | | | | | | — | | | | | | 0.66 | | | | | | — | | | | | | 10.74 | | | | | | 8.52 | | | | | | 0.46 | | | | | | 0.37 | | | | | | 0.37 | | | | | | 1.97 | | | | | | 141,443 | | | | | | 45 | | |
| Class S2 | | | | | | | | | | | | | | | | | | | | | | | | | | | | | | | | | | | | | | | | | | | | | | | | | | | | | | | | | | | | | | | | | | | | | | | | | | | | | | | | | | | | | | | | | | | | | | | | | | | | | | | |
| 12-31-16 | | | | | 9.50 | | | | | | 0.19• | | | | | | 0.27 | | | | | | 0.46 | | | | | | 0.16 | | | | | | 0.14 | | | | | | — | | | | | | 0.30 | | | | | | — | | | | | | 9.66 | | | | | | 4.79 | | | | | | 0.70 | | | | | | 0.52 | | | | | | 0.52 | | | | | | 1.98 | | | | | | 13,809 | | | | | | 45 | | |
| 12-31-15 | | | | | 10.46 | | | | | | 0.22• | | | | | | (0.33) | | | | | | (0.11) | | | | | | 0.18 | | | | | | 0.67 | | | | | | — | | | | | | 0.85 | | | | | | — | | | | | | 9.50 | | | | | | (1.25) | | | | | | 0.77 | | | | | | 0.52 | | | | | | 0.52 | | | | | | 2.28 | | | | | | 14,859 | | | | | | 34 | | |
| 12-31-14 | | | | | 10.66 | | | | | | 0.17• | | | | | | 0.43 | | | | | | 0.60 | | | | | | 0.23 | | | | | | 0.57 | | | | | | — | | | | | | 0.80 | | | | | | — | | | | | | 10.46 | | | | | | 5.78 | | | | | | 0.78 | | | | | | 0.52 | | | | | | 0.52 | | | | | | 1.56 | | | | | | 4,595 | | | | | | 23 | | |
| 12-31-13 | | | | | 10.58 | | | | | | 0.20• | | | | | | 0.58 | | | | | | 0.78 | | | | | | 0.32 | | | | | | 0.38 | | | | | | — | | | | | | 0.70 | | | | | | — | | | | | | 10.66 | | | | | | 7.64 | | | | | | 0.76 | | | | | | 0.51 | | | | | | 0.51 | | | | | | 1.87 | | | | | | 5,531 | | | | | | 39 | | |
| 12-31-12 | | | | | 10.39 | | | | | | 0.22• | | | | | | 0.64 | | | | | | 0.86 | | | | | | 0.29 | | | | | | 0.38 | | | | | | — | | | | | | 0.67 | | | | | | — | | | | | | 10.58 | | | | | | 8.38 | | | | | | 0.71 | | | | | | 0.52 | | | | | | 0.52 | | | | | | 2.06 | | | | | | 4,328 | | | | | | 45 | | |
| Class Z | | | | | | | | | | | | | | | | | | | | | | | | | | | | | | | | | | | | | | | | | | | | | | | | | | | | | | | | | | | | | | | | | | | | | | | | | | | | | | | | | | | | | | | | | | | | | | | | | | | | | | | |
| 12-31-16 | | | | | 9.79 | | | | | | 0.32• | | | | | | 0.20 | | | | | | 0.52 | | | | | | 0.18 | | | | | | 0.14 | | | | | | — | | | | | | 0.32 | | | | | | — | | | | | | 9.99 | | | | | | 5.32 | | | | | | 0.27 | | | | | | 0.00 | | | | | | 0.00 | | | | | | 3.20 | | | | | | 70,857 | | | | | | 45 | | |
05-01-15(5) -
12-31-15 | | | | | 11.02 | | | | | | 0.58• | | | | | | (0.90) | | | | | | (0.32) | | | | | | 0.24 | | | | | | 0.67 | | | | | | — | | | | | | 0.91 | | | | | | — | | | | | | 9.79 | | | | | | (3.06) | | | | | | 0.28 | | | | | | 0.00 | | | | | | 0.00 | | | | | | 9.14 | | | | | | 1,635 | | | | | | 34 | | |
| Voya Index Solution 2020 Portfolio | | | | | | | | | | | | | | | | | | | | | | | | | | | | | | | | | | | | | | | | | | | | | | | | | | | | | | | | | | | | | | | | | | | | | | | | | | | | | | | | | | | | | | | | | | | | | | | | | | | | | | | |
| Class ADV | | | | | | | | | | | | | | | | | | | | | | | | | | | | | | | | | | | | | | | | | | | | | | | | | | | | | | | | | | | | | | | | | | | | | | | | | | | | | | | | | | | | | | | | | | | | | | | | | | | | | | | |
| 12-31-16 | | | | | 11.37 | | | | | | 0.24• | | | | | | 0.43 | | | | | | 0.67 | | | | | | 0.01 | | | | | | 0.01 | | | | | | — | | | | | | 0.02 | | | | | | — | | | | | | 12.02 | | | | | | 5.90 | | | | | | 0.82 | | | | | | 0.63 | | | | | | 0.63 | | | | | | 2.07 | | | | | | 13,619 | | | | | | 75 | | |
| 12-31-15 | | | | | 11.82 | | | | | | 0.46• | | | | | | (0.46) | | | | | | 0.00* | | | | | | 0.15 | | | | | | 0.30 | | | | | | — | | | | | | 0.45 | | | | | | — | | | | | | 11.37 | | | | | | 0.00 | | | | | | 2.22 | | | | | | 0.63 | | | | | | 0.63 | | | | | | 4.05 | | | | | | 4,703 | | | | | | 108 | | |
| 12-31-14 | | | | | 12.11 | | | | | | 0.15 | | | | | | 0.47 | | | | | | 0.62 | | | | | | 0.23 | | | | | | 0.68 | | | | | | — | | | | | | 0.91 | | | | | | — | | | | | | 11.82 | | | | | | 5.27 | | | | | | 71.22 | | | | | | 0.63 | | | | | | 0.63 | | | | | | 1.31 | | | | | | 4 | | | | | | 23 | | |
| 12-31-13 | | | | | 11.41 | | | | | | 0.19 | | | | | | 1.30 | | | | | | 1.49 | | | | | | 0.26 | | | | | | 0.54 | | | | | | — | | | | | | 0.80 | | | | | | 0.01 | | | | | | 12.11 | | | | | | 13.55(a) | | | | | | 95.97 | | | | | | 0.62 | | | | | | 0.62 | | | | | | 1.61 | | | | | | 4 | | | | | | 36 | | |
| 12-31-12 | | | | | 10.76 | | | | | | 0.17 | | | | | | 1.02 | | | | | | 1.19 | | | | | | 0.02 | | | | | | 0.52 | | | | | | — | | | | | | 0.54 | | | | | | — | | | | | | 11.41 | | | | | | 11.12 | | | | | | 58.46 | | | | | | 0.62 | | | | | | 0.62 | | | | | | 1.54 | | | | | | 3 | | | | | | 61 | | |
See Accompanying Notes to Financial Statements
Financial Highlights (continued)
| | | | | | | | | | Income (loss)
from
investment
operations | | | | | | | | | Less Distributions | | | | | | Ratios to average net assets | | | Supplemental
Data | |
| | | | Net asset value, beginning
of year or period | | | Net investment income (loss) | | | Net realized and unrealized
gain (loss) | | | Total from investment
operations | | | From net investment income | | | From net realized gains | | | From return of capital | | | Total distributions | | | Payment by affiliate | | | Net asset value, end of year
or period | | | Total Return(1) | | | Expenses before
reductions/additions(2)(3)(4) | | | Expenses net of fee waivers
and/or recoupments if any(2)(3)(4) | | | Expenses net of all
reductions/additions(2)(3)(4) | | | Net investment income
(loss)(2)(3) | | | Net assets, end of year
or period | | | Portfolio turnover rate | |
Year or
period ended | | | ($) | | | ($) | | | ($) | | | ($) | | | ($) | | | ($) | | | ($) | | | ($) | | | ($) | | | ($) | | | (%) | | | (%) | | | (%) | | | (%) | | | (%) | | | ($000’s) | | | (%) | |
| Voya Index Solution 2020 Portfolio (continued) | | | | | | | | | | | | | | | | | | | | | | | | | | | | | | | | | | | | | | | | | | | | | | | | | | | | | | | | | | | | | | | | | | | | | | | | | | | | | | | | | | | | | | | | | | | | | | | | | | | | | | | |
| Class I | | | | | | | | | | | | | | | | | | | | | | | | | | | | | | | | | | | | | | | | | | | | | | | | | | | | | | | | | | | | | | | | | | | | | | | | | | | | | | | | | | | | | | | | | | | | | | | | | | | | | | | |
| 12-31-16 | | | | | 11.55 | | | | | | 0.37• | | | | | | 0.38 | | | | | | 0.75 | | | | | | 0.02 | | | | | | 0.01 | | | | | | — | | | | | | 0.03 | | | | | | — | | | | | | 12.27 | | | | | | 6.45 | | | | | | 0.32 | | | | | | 0.13 | | | | | | 0.13 | | | | | | 3.05 | | | | | | 3,539 | | | | | | 75 | | |
| 12-31-15 | | | | | 11.91 | | | | | | 0.34• | | | | | | (0.33) | | | | | | 0.01 | | | | | | 0.07 | | | | | | 0.30 | | | | | | — | | | | | | 0.37 | | | | | | — | | | | | | 11.55 | | | | | | 0.04 | | | | | | 1.72 | | | | | | 0.13 | | | | | | 0.13 | | | | | | 2.98 | | | | | | 311 | | | | | | 108 | | |
| 12-31-14 | | | | | 12.18 | | | | | | 0.21 | | | | | | 0.49 | | | | | | 0.70 | | | | | | 0.29 | | | | | | 0.68 | | | | | | — | | | | | | 0.97 | | | | | | — | | | | | | 11.91 | | | | | | 5.86 | | | | | | 70.72 | | | | | | 0.13 | | | | | | 0.13 | | | | | | 1.82 | | | | | | 4 | | | | | | 23 | | |
| 12-31-13 | | | | | 11.47 | | | | | | 0.25 | | | | | | 1.30 | | | | | | 1.55 | | | | | | 0.31 | | | | | | 0.54 | | | | | | — | | | | | | 0.85 | | | | | | 0.01 | | | | | | 12.18 | | | | | | 14.02(a) | | | | | | 95.47 | | | | | | 0.12 | | | | | | 0.12 | | | | | | 2.11 | | | | | | 4 | | | | | | 36 | | |
| 12-31-12 | | | | | 10.77 | | | | | | 0.23 | | | | | | 1.02 | | | | | | 1.25 | | | | | | 0.03 | | | | | | 0.52 | | | | | | — | | | | | | 0.55 | | | | | | — | | | | | | 11.47 | | | | | | 11.69 | | | | | | 57.96 | | | | | | 0.12 | | | | | | 0.12 | | | | | | 2.04 | | | | | | 3 | | | | | | 61 | | |
| Class S | | | | | | | | | | | | | | | | | | | | | | | | | | | | | | | | | | | | | | | | | | | | | | | | | | | | | | | | | | | | | | | | | | | | | | | | | | | | | | | | | | | | | | | | | | | | | | | | | | | | | | | |
| 12-31-16 | | | | | 11.55 | | | | | | 0.30• | | | | | | 0.43 | | | | | | 0.73 | | | | | | 0.02 | | | | | | 0.01 | | | | | | — | | | | | | 0.03 | | | | | | — | | | | | | 12.25 | | | | | | 6.26 | | | | | | 0.57 | | | | | | 0.38 | | | | | | 0.38 | | | | | | 2.53 | | | | | | 8,811 | | | | | | 75 | | |
| 12-31-15 | | | | | 11.91 | | | | | | 0.58• | | | | | | (0.59) | | | | | | (0.01) | | | | | | 0.05 | | | | | | 0.30 | | | | | | — | | | | | | 0.35 | | | | | | — | | | | | | 11.55 | | | | | | (0.08) | | | | | | 1.97 | | | | | | 0.38 | | | | | | 0.38 | | | | | | 5.10 | | | | | | 1,084 | | | | | | 108 | | |
| 12-31-14 | | | | | 12.19 | | | | | | 0.18 | | | | | | 0.48 | | | | | | 0.66 | | | | | | 0.26 | | | | | | 0.68 | | | | | | — | | | | | | 0.94 | | | | | | — | | | | | | 11.91 | | | | | | 5.54 | | | | | | 70.97 | | | | | | 0.38 | | | | | | 0.38 | | | | | | 1.57 | | | | | | 4 | | | | | | 23 | | |
| 12-31-13 | | | | | 11.43 | | | | | | 0.22 | | | | | | 1.29 | | | | | | 1.51 | | | | | | 0.22 | | | | | | 0.54 | | | | | | — | | | | | | 0.76 | | | | | | 0.01 | | | | | | 12.19 | | | | | | 13.63(a) | | | | | | 95.72 | | | | | | 0.37 | | | | | | 0.37 | | | | | | 1.86 | | | | | | 4 | | | | | | 36 | | |
| 12-31-12 | | | | | 10.76 | | | | | | 0.20 | | | | | | 1.01 | | | | | | 1.21 | | | | | | 0.02 | | | | | | 0.52 | | | | | | — | | | | | | 0.54 | | | | | | — | | | | | | 11.43 | | | | | | 11.36 | | | | | | 58.21 | | | | | | 0.37 | | | | | | 0.37 | | | | | | 1.79 | | | | | | 3 | | | | | | 61 | | |
| Class S2 | | | | | | | | | | | | | | | | | | | | | | | | | | | | | | | | | | | | | | | | | | | | | | | | | | | | | | | | | | | | | | | | | | | | | | | | | | | | | | | | | | | | | | | | | | | | | | | | | | | | | | | |
| 12-31-16 | | | | | 11.52 | | | | | | 0.30• | | | | | | 0.39 | | | | | | 0.69 | | | | | | 0.01 | | | | | | 0.01 | | | | | | — | | | | | | 0.02 | | | | | | — | | | | | | 12.19 | | | | | | 6.00 | | | | | | 0.75 | | | | | | 0.53 | | | | | | 0.53 | | | | | | 2.54 | | | | | | 3,328 | | | | | | 75 | | |
| 12-31-15 | | | | | 11.84 | | | | | | 0.46• | | | | | | (0.48) | | | | | | (0.02) | | | | | | 0.00* | | | | | | 0.30 | | | | | | — | | | | | | 0.30 | | | | | | — | | | | | | 11.52 | | | | | | (0.16) | | | | | | 2.22 | | | | | | 0.53 | | | | | | 0.53 | | | | | | 3.99 | | | | | | 367 | | | | | | 108 | | |
| 12-31-14 | | | | | 12.13 | | | | | | 0.16 | | | | | | 0.48 | | | | | | 0.64 | | | | | | 0.25 | | | | | | 0.68 | | | | | | — | | | | | | 0.93 | | | | | | — | | | | | | 11.84 | | | | | | 5.36 | | | | | | 71.22 | | | | | | 0.53 | | | | | | 0.53 | | | | | | 1.41 | | | | | | 4 | | | | | | 23 | | |
| 12-31-13 | | | | | 11.43 | | | | | | 0.20 | | | | | | 1.31 | | | | | | 1.51 | | | | | | 0.28 | | | | | | 0.54 | | | | | | — | | | | | | 0.82 | | | | | | 0.01 | | | | | | 12.13 | | | | | | 13.64(a) | | | | | | 95.97 | | | | | | 0.52 | | | | | | 0.52 | | | | | | 1.71 | | | | | | 4 | | | | | | 36 | | |
| 12-31-12 | | | | | 10.76 | | | | | | 0.21 | | | | | | 1.00 | | | | | | 1.21 | | | | | | 0.02 | | | | | | 0.52 | | | | | | — | | | | | | 0.54 | | | | | | — | | | | | | 11.43 | | | | | | 11.33 | | | | | | 58.46 | | | | | | 0.52 | | | | | | 0.52 | | | | | | 1.90 | | | | | | 3 | | | | | | 61 | | |
| Class Z | | | | | | | | | | | | | | | | | | | | | | | | | | | | | | | | | | | | | | | | | | | | | | | | | | | | | | | | | | | | | | | | | | | | | | | | | | | | | | | | | | | | | | | | | | | | | | | | | | | | | | | |
| 12-31-16 | | | | | 11.57 | | | | | | 0.41• | | | | | | 0.35 | | | | | | 0.76 | | | | | | 0.02 | | | | | | 0.01 | | | | | | — | | | | | | 0.03 | | | | | | — | | | | | | 12.30 | | | | | | 6.52 | | | | | | 0.32 | | | | | | 0.00 | | | | | | 0.00 | | | | | | 3.44 | | | | | | 73,350 | | | | | | 75 | | |
05-01-15(5) -
12-31-15 | | | | | 12.30 | | | | | | 0.38• | | | | | | (0.74) | | | | | | (0.36) | | | | | | 0.07 | | | | | | 0.30 | | | | | | — | | | | | | 0.37 | | | | | | — | | | | | | 11.57 | | | | | | (2.97) | | | | | | 1.70 | | | | | | 0.00 | | | | | | 0.00 | | | | | | 4.91 | | | | | | 2,030 | | | | | | 108 | | |
| Voya Index Solution 2025 Portfolio | | | | | | | | | | | | | | | | | | | | | | | | | | | | | | | | | | | | | | | | | | | | | | | | | | | | | | | | | | | | | | | | | | | | | | | | | | | | | | | | | | | | | | | | | | | | | | | | | | | | | | | |
| Class ADV | | | | | | | | | | | | | | | | | | | | | | | | | | | | | | | | | | | | | | | | | | | | | | | | | | | | | | | | | | | | | | | | | | | | | | | | | | | | | | | | | | | | | | | | | | | | | | | ��� | | | | | | | | |
| 12-31-16 | | | | | 10.19 | | | | | | 0.19 | | | | | | 0.47 | | | | | | 0.66 | | | | | | 0.21 | | | | | | 0.75 | | | | | | — | | | | | | 0.96 | | | | | | — | | | | | | 9.89 | | | | | | 6.61 | | | | | | 0.77 | | | | | | 0.63 | | | | | | 0.63 | | | | | | 1.86 | | | | | | 228,234 | | | | | | 44 | | |
| 12-31-15 | | | | | 11.49 | | | | | | 0.19 | | | | | | (0.36) | | | | | | (0.17) | | | | | | 0.16 | | | | | | 0.97 | | | | | | — | | | | | | 1.13 | | | | | | — | | | | | | 10.19 | | | | | | (1.80) | | | | | | 0.77 | | | | | | 0.63 | | | | | | 0.63 | | | | | | 1.75 | | | | | | 228,081 | | | | | | 40 | | |
| 12-31-14 | | | | | 11.63 | | | | | | 0.15 | | | | | | 0.46 | | | | | | 0.61 | | | | | | 0.19 | | | | | | 0.56 | | | | | | — | | | | | | 0.75 | | | | | | — | | | | | | 11.49 | | | | | | 5.41 | | | | | | 0.77 | | | | | | 0.62 | | | | | | 0.62 | | | | | | 1.29 | | | | | | 242,980 | | | | | | 33 | | |
| 12-31-13 | | | | | 10.38 | | | | | | 0.18• | | | | | | 1.54 | | | | | | 1.72 | | | | | | 0.16 | | | | | | 0.31 | | | | | | — | | | | | | 0.47 | | | | | | — | | | | | | 11.63 | | | | | | 16.77 | | | | | | 0.75 | | | | | | 0.61 | | | | | | 0.61 | | | | | | 1.66 | | | | | | 245,758 | | | | | | 40 | | |
| 12-31-12 | | | | | 9.56 | | | | | | 0.16• | | | | | | 1.04 | | | | | | 1.20 | | | | | | 0.12 | | | | | | 0.26 | | | | | | — | | | | | | 0.38 | | | | | | — | | | | | | 10.38 | | | | | | 12.74 | | | | | | 0.71 | | | | | | 0.62 | | | | | | 0.62 | | | | | | 1.63 | | | | | | 181,218 | | | | | | 39 | | |
| Class I | | | | | | | | | | | | | | | | | | | | | | | | | | | | | | | | | | | | | | | | | | | | | | | | | | | | | | | | | | | | | | | | | | | | | | | | | | | | | | | | | | | | | | | | | | | | | | | | | | | | | | | |
| 12-31-16 | | | | | 10.42 | | | | | | 0.25• | | | | | | 0.48 | | | | | | 0.73 | | | | | | 0.27 | | | | | | 0.75 | | | | | | — | | | | | | 1.02 | | | | | | — | | | | | | 10.13 | | | | | | 7.14 | | | | | | 0.27 | | | | | | 0.13 | | | | | | 0.13 | | | | | | 2.39 | | | | | | 56,555 | | | | | | 44 | | |
| 12-31-15 | | | | | 11.72 | | | | | | 0.26• | | | | | | (0.37) | | | | | | (0.11) | | | | | | 0.22 | | | | | | 0.97 | | | | | | — | | | | | | 1.19 | | | | | | — | | | | | | 10.42 | | | | | | (1.25) | | | | | | 0.27 | | | | | | 0.13 | | | | | | 0.13 | | | | | | 2.29 | | | | | | 49,275 | | | | | | 40 | | |
| 12-31-14 | | | | | 11.84 | | | | | | 0.22• | | | | | | 0.46 | | | | | | 0.68 | | | | | | 0.24 | | | | | | 0.56 | | | | | | — | | | | | | 0.80 | | | | | | — | | | | | | 11.72 | | | | | | 5.95 | | | | | | 0.27 | | | | | | 0.12 | | | | | | 0.12 | | | | | | 1.89 | | | | | | 46,808 | | | | | | 33 | | |
| 12-31-13 | | | | | 10.54 | | | | | | 0.24• | | | | | | 1.56 | | | | | | 1.80 | | | | | | 0.19 | | | | | | 0.31 | | | | | | — | | | | | | 0.50 | | | | | | — | | | | | | 11.84 | | | | | | 17.38 | | | | | | 0.25 | | | | | | 0.11 | | | | | | 0.11 | | | | | | 2.13 | | | | | | 33,098 | | | | | | 40 | | |
| 12-31-12 | | | | | 9.69 | | | | | | 0.24• | | | | | | 1.02 | | | | | | 1.26 | | | | | | 0.15 | | | | | | 0.26 | | | | | | — | | | | | | 0.41 | | | | | | — | | | | | | 10.54 | | | | | | 13.26 | | | | | | 0.21 | | | | | | 0.12 | | | | | | 0.12 | | | | | | 2.32 | | | | | | 29,471 | | | | | | 39 | | |
| Class S | | | | | | | | | | | | | | | | | | | | | | | | | | | | | | | | | | | | | | | | | | | | | | | | | | | | | | | | | | | | | | | | | | | | | | | | | | | | | | | | | | | | | | | | | | | | | | | | | | | | | | | |
| 12-31-16 | | | | | 10.31 | | | | | | 0.21• | | | | | | 0.48 | | | | | | 0.69 | | | | | | 0.23 | | | | | | 0.75 | | | | | | — | | | | | | 0.98 | | | | | | — | | | | | | 10.02 | | | | | | 6.85 | | | | | | 0.52 | | | | | | 0.38 | | | | | | 0.38 | | | | | | 2.07 | | | | | | 150,126 | | | | | | 44 | | |
| 12-31-15 | | | | | 11.61 | | | | | | 0.23 | | | | | | (0.36) | | | | | | (0.13) | | | | | | 0.20 | | | | | | 0.97 | | | | | | — | | | | | | 1.17 | | | | | | — | | | | | | 10.31 | | | | | | (1.50) | | | | | | 0.52 | | | | | | 0.38 | | | | | | 0.38 | | | | | | 1.99 | | | | | | 166,420 | | | | | | 40 | | |
| 12-31-14 | | | | | 11.74 | | | | | | 0.18 | | | | | | 0.47 | | | | | | 0.65 | | | | | | 0.22 | | | | | | 0.56 | | | | | | — | | | | | | 0.78 | | | | | | — | | | | | | 11.61 | | | | | | 5.67 | | | | | | 0.52 | | | | | | 0.37 | | | | | | 0.37 | | | | | | 1.55 | | | | | | 186,666 | | | | | | 33 | | |
| 12-31-13 | | | | | 10.47 | | | | | | 0.21• | | | | | | 1.54 | | | | | | 1.75 | | | | | | 0.17 | | | | | | 0.31 | | | | | | — | | | | | | 0.48 | | | | | | — | | | | | | 11.74 | | | | | | 17.00 | | | | | | 0.50 | | | | | | 0.36 | | | | | | 0.36 | | | | | | 1.88 | | | | | | 174,380 | | | | | | 40 | | |
| 12-31-12 | | | | | 9.62 | | | | | | 0.19• | | | | | | 1.05 | | | | | | 1.24 | | | | | | 0.13 | | | | | | 0.26 | | | | | | — | | | | | | 0.39 | | | | | | — | | | | | | 10.47 | | | | | | 13.12 | | | | | | 0.46 | | | | | | 0.37 | | | | | | 0.37 | | | | | | 1.84 | | | | | | 138,176 | | | | | | 39 | | |
See Accompanying Notes to Financial Statements
Financial Highlights (continued)
| | | | | | | | | | Income (loss)
from
investment
operations | | | | | | | | | Less Distributions | | | | | | Ratios to average net assets | | | Supplemental
Data | |
| | | | Net asset value, beginning
of year or period | | | Net investment income (loss) | | | Net realized and unrealized
gain (loss) | | | Total from investment
operations | | | From net investment income | | | From net realized gains | | | From return of capital | | | Total distributions | | | Payment by affiliate | | | Net asset value, end of year
or period | | | Total Return(1) | | | Expenses before
reductions/additions(2)(3)(4) | | | Expenses net of fee waivers
and/or recoupments if any(2)(3)(4) | | | Expenses net of all
reductions/additions(2)(3)(4) | | | Net investment income
(loss)(2)(3) | | | Net assets, end of year
or period | | | Portfolio turnover rate | |
Year or
period ended | | | ($) | | | ($) | | | ($) | | | ($) | | | ($) | | | ($) | | | ($) | | | ($) | | | ($) | | | ($) | | | (%) | | | (%) | | | (%) | | | (%) | | | (%) | | | ($000’s) | | | (%) | |
| Voya Index Solution 2025 Portfolio (continued) | | | | | | | | | | | | | | | | | | | | | | | | | | | | | | | | | | | | | | | | | | | | | | | | | | | | | | | | | | | | | | | | | | | | | | | | | | | | | | | | | | | | | | | | | | | | | | | | | | | | | | | |
| Class S2 | | | | | | | | | | | | | | | | | | | | | | | | | | | | | | | | | | | | | | | | | | | | | | | | | | | | | | | | | | | | | | | | | | | | | | | | | | | | | | | | | | | | | | | | | | | | | | | | | | | | | | | |
| 12-31-16 | | | | | 10.16 | | | | | | 0.20• | | | | | | 0.47 | | | | | | 0.67 | | | | | | 0.22 | | | | | | 0.75 | | | | | | — | | | | | | 0.97 | | | | | | — | | | | | | 9.86 | | | | | | 6.72 | | | | | | 0.70 | | | | | | 0.53 | | | | | | 0.53 | | | | | | 2.04 | | | | | | 34,034 | | | | | | 44 | | |
| 12-31-15 | | | | | 11.44 | | | | | | 0.20• | | | | | | (0.35) | | | | | | (0.15) | | | | | | 0.16 | | | | | | 0.97 | | | | | | — | | | | | | 1.13 | | | | | | — | | | | | | 10.16 | | | | | | (1.63) | | | | | | 0.77 | | | | | | 0.53 | | | | | | 0.53 | | | | | | 1.83 | | | | | | 34,934 | | | | | | 40 | | |
| 12-31-14 | | | | | 11.58 | | | | | | 0.16• | | | | | | 0.46 | | | | | | 0.62 | | | | | | 0.20 | | | | | | 0.56 | | | | | | — | | | | | | 0.76 | | | | | | — | | | | | | 11.44 | | | | | | 5.52 | | | | | | 0.77 | | | | | | 0.52 | | | | | | 0.52 | | | | | | 1.36 | | | | | | 42,853 | | | | | | 33 | | |
| 12-31-13 | | | | | 10.34 | | | | | | 0.20• | | | | | | 1.52 | | | | | | 1.72 | | | | | | 0.17 | | | | | | 0.31 | | | | | | — | | | | | | 0.48 | | | | | | — | | | | | | 11.58 | | | | | | 16.87 | | | | | | 0.75 | | | | | | 0.51 | | | | | | 0.51 | | | | | | 1.80 | | | | | | 48,649 | | | | | | 40 | | |
| 12-31-12 | | | | | 9.53 | | | | | | 0.18• | | | | | | 1.03 | | | | | | 1.21 | | | | | | 0.14 | | | | | | 0.26 | | | | | | — | | | | | | 0.40 | | | | | | — | | | | | | 10.34 | | | | | | 12.88 | | | | | | 0.71 | | | | | | 0.52 | | | | | | 0.52 | | | | | | 1.77 | | | | | | 32,743 | | | | | | 39 | | |
| Class Z | | | | | | | | | | | | | | | | | | | | | | | | | | | | | | | | | | | | | | | | | | | | | | | | | | | | | | | | | | | | | | | | | | | | | | | | | | | | | | | | | | | | | | | | | | | | | | | | | | | | | | | |
| 12-31-16 | | | | | 10.43 | | | | | | 0.32• | | | | | | 0.43 | | | | | | 0.75 | | | | | | 0.27 | | | | | | 0.75 | | | | | | — | | | | | | 1.02 | | | | | | — | | | | | | 10.16 | | | | | | 7.33 | | | | | | 0.27 | | | | | | 0.00 | | | | | | 0.00 | | | | | | 3.13 | | | | | | 118,855 | | | | | | 44 | | |
05-01-15(5) -
12-31-15 | | | | | 12.17 | | | | | | 0.41• | | | | | | (0.96) | | | | | | (0.55) | | | | | | 0.22 | | | | | | 0.97 | | | | | | — | | | | | | 1.19 | | | | | | — | | | | | | 10.43 | | | | | | (4.81) | | | | | | 0.28 | | | | | | 0.00 | | | | | | 0.00 | | | | | | 5.95 | | | | | | 2,310 | | | | | | 40 | | |
| Voya Index Solution 2030 Portfolio | | | | | | | | | | | | | | | | | | | | | | | | | | | | | | | | | | | | | | | | | | | | | | | | | | | | | | | | | | | | | | | | | | | | | | | | | | | | | | | | | | | | | | | | | | | | | | | | | | | | | | | |
| Class ADV | | | | | | | | | | | | | | | | | | | | | | | | | | | | | | | | | | | | | | | | | | | | | | | | | | | | | | | | | | | | | | | | | | | | | | | | | | | | | | | | | | | | | | | | | | | | | | | | | | | | | | | |
| 12-31-16 | | | | | 12.39 | | | | | | 0.27• | | | | | | 0.58 | | | | | | 0.85 | | | | | | 0.01 | | | | | | 0.01 | | | | | | — | | | | | | 0.02 | | | | | | — | | | | | | 13.22 | | | | | | 6.84 | | | | | | 0.83 | | | | | | 0.63 | | | | | | 0.63 | | | | | | 2.13 | | | | | | 10,732 | | | | | | 64 | | |
| 12-31-15 | | | | | 12.70 | | | | | | 0.48• | | | | | | (0.53) | | | | | | (0.05) | | | | | | 0.07 | | | | | | 0.19 | | | | | | — | | | | | | 0.26 | | | | | | — | | | | | | 12.39 | | | | | | (0.48) | | | | | | 3.36 | | | | | | 0.63 | | | | | | 0.63 | | | | | | 3.93 | | | | | | 2,598 | | | | | | 136 | | |
| 12-31-14 | | | | | 13.19 | | | | | | 0.14 | | | | | | 0.50 | | | | | | 0.64 | | | | | | 0.22 | | | | | | 0.91 | | | | | | — | | | | | | 1.13 | | | | | | — | | | | | | 12.70 | | | | | | 5.00 | | | | | | 65.69 | | | | | | 0.63 | | | | | | 0.63 | | | | | | 1.10 | | | | | | 4 | | | | | | 32 | | |
| 12-31-13 | | | | | 11.85 | | | | | | 0.19• | | | | | | 1.95 | | | | | | 2.14 | | | | | | 0.27 | | | | | | 0.55 | | | | | | — | | | | | | 0.82 | | | | | | 0.02 | | | | | | 13.19 | | | | | | 18.71(b) | | | | | | 87.48 | | | | | | 0.61 | | | | | | 0.61 | | | | | | 1.48 | | | | | | 4 | | | | | | 41 | | |
| 12-31-12 | | | | | 11.00 | | | | | | 0.20 | | | | | | 1.33 | | | | | | 1.53 | | | | | | 0.01 | | | | | | 0.67 | | | | | | — | | | | | | 0.68 | | | | | | — | | | | | | 11.85 | | | | | | 13.99 | | | | | | 43.07 | | | | | | 0.62 | | | | | | 0.62 | | | | | | 1.74 | | | | | | 4 | | | | | | 51 | | |
| Class I | | | | | | | | | | | | | | | | | | | | | | | | | | | | | | | | | | | | | | | | | | | | | | | | | | | | | | | | | | | | | | | | | | | | | | | | | | | | | | | | | | | | | | | | | | | | | | | | | | | | | | | |
| 12-31-16 | | | | | 12.60 | | | | | | 0.31• | | | | | | 0.61 | | | | | | 0.92 | | | | | | 0.01 | | | | | | 0.01 | | | | | | — | | | | | | 0.02 | | | | | | — | | | | | | 13.50 | | | | | | 7.31 | | | | | | 0.33 | | | | | | 0.13 | | | | | | 0.13 | | | | | | 2.36 | | | | | | 2,173 | | | | | | 64 | | |
| 12-31-15 | | | | | 12.79 | | | | | | 0.99• | | | | | | (0.99) | | | | | | 0.00* | | | | | | — | | | | | | 0.19 | | | | | | — | | | | | | 0.19 | | | | | | — | | | | | | 12.60 | | | | | | (0.03) | | | | | | 2.86 | | | | | | 0.13 | | | | | | 0.13 | | | | | | 8.08 | | | | | | 779 | | | | | | 136 | | |
| 12-31-14 | | | | | 13.28 | | | | | | 0.20 | | | | | | 0.51 | | | | | | 0.71 | | | | | | 0.29 | | | | | | 0.91 | | | | | | — | | | | | | 1.20 | | | | | | — | | | | | | 12.79 | | | | | | 5.52 | | | | | | 65.19 | | | | | | 0.13 | | | | | | 0.13 | | | | | | 1.61 | | | | | | 4 | | | | | | 32 | | |
| 12-31-13 | | | | | 11.91 | | | | | | 0.25• | | | | | | 1.97 | | | | | | 2.22 | | | | | | 0.32 | | | | | | 0.55 | | | | | | — | | | | | | 0.87 | | | | | | 0.02 | | | | | | 13.28 | | | | | | 19.32(b) | | | | | | 86.98 | | | | | | 0.11 | | | | | | 0.11 | | | | | | 1.97 | | | | | | 4 | | | | | | 41 | | |
| 12-31-12 | | | | | 11.01 | | | | | | 0.26• | | | | | | 1.33 | | | | | | 1.59 | | | | | | 0.02 | | | | | | 0.67 | | | | | | — | | | | | | 0.69 | | | | | | — | | | | | | 11.91 | | | | | | 14.55 | | | | | | 42.57 | | | | | | 0.12 | | | | | | 0.12 | | | | | | 2.23 | | | | | | 4 | | | | | | 51 | | |
| Class S | | | | | | | | | | | | | | | | | | | | | | | | | | | | | | | | | | | | | | | | | | | | | | | | | | | | | | | | | | | | | | | | | | | | | | | | | | | | | | | | | | | | | | | | | | | | | | | | | | | | | | | |
| 12-31-16 | | | | | 12.57 | | | | | | 0.37• | | | | | | 0.52 | | | | | | 0.89 | | | | | | 0.01 | | | | | | 0.01 | | | | | | — | | | | | | 0.02 | | | | | | — | | | | | | 13.44 | | | | | | 7.08 | | | | | | 0.58 | | | | | | 0.38 | | | | | | 0.38 | | | | | | 2.83 | | | | | | 6,607 | | | | | | 64 | | |
| 12-31-15 | | | | | 12.79 | | | | | | 0.43• | | | | | | (0.46) | | | | | | (0.03) | | | | | | — | | | | | | 0.19 | | | | | | — | | | | | | 0.19 | | | | | | — | | | | | | 12.57 | | | | | | (0.27) | | | | | | 3.11 | | | | | | 0.38 | | | | | | 0.38 | | | | | | 3.45 | | | | | | 521 | | | | | | 136 | | |
| 12-31-14 | | | | | 13.27 | | | | | | 0.17 | | | | | | 0.52 | | | | | | 0.69 | | | | | | 0.26 | | | | | | 0.91 | | | | | | — | | | | | | 1.17 | | | | | | — | | | | | | 12.79 | | | | | | 5.32 | | | | | | 65.44 | | | | | | 0.38 | | | | | | 0.38 | | | | | | 1.35 | | | | | | 4 | | | | | | 32 | | |
| 12-31-13 | | | | | 11.87 | | | | | | 0.22 | | | | | | 1.94 | | | | | | 2.16 | | | | | | 0.23 | | | | | | 0.55 | | | | | | — | | | | | | 0.78 | | | | | | 0.02 | | | | | | 13.27 | | | | | | 18.78(b) | | | | | | 87.23 | | | | | | 0.36 | | | | | | 0.36 | | | | | | 1.73 | | | | | | 4 | | | | | | 41 | | |
| 12-31-12 | | | | | 11.00 | | | | | | 0.23 | | | | | | 1.32 | | | | | | 1.55 | | | | | | 0.01 | | | | | | 0.67 | | | | | | — | | | | | | 0.68 | | | | | | — | | | | | | 11.87 | | | | | | 14.22 | | | | | | 42.82 | | | | | | 0.37 | | | | | | 0.37 | | | | | | 2.00 | | | | | | 4 | | | | | | 51 | | |
| Class S2 | | | | | | | | | | | | | | | | | | | | | | | | | | | | | | | | | | | | | | | | | | | | | | | | | | | | | | | | | | | | | | | | | | | | | | | | | | | | | | | | | | | | | | | | | | | | | | | | | | | | | | | |
| 12-31-16 | | | | | 12.45 | | | | | | 0.33• | | | | | | 0.53 | | | | | | 0.86 | | | | | | 0.01 | | | | | | 0.01 | | | | | | — | | | | | | 0.02 | | | | | | — | | | | | | 13.29 | | | | | | 6.92 | | | | | | 0.76 | | | | | | 0.53 | | | | | | 0.53 | | | | | | 2.54 | | | | | | 1,735 | | | | | | 64 | | |
| 12-31-15 | | | | | 12.71 | | | | | | 0.48• | | | | | | (0.55) | | | | | | (0.07) | | | | | | — | | | | | | 0.19 | | | | | | — | | | | | | 0.19 | | | | | | — | | | | | | 12.45 | | | | | | (0.58) | | | | | | 3.36 | | | | | | 0.53 | | | | | | 0.53 | | | | | | 3.87 | | | | | | 47 | | | | | | 136 | | |
| 12-31-14 | | | | | 13.21 | | | | | | 0.15 | | | | | | 0.49 | | | | | | 0.64 | | | | | | 0.23 | | | | | | 0.91 | | | | | | — | | | | | | 1.14 | | | | | | — | | | | | | 12.71 | | | | | | 5.00 | | | | | | 65.69 | | | | | | 0.53 | | | | | | 0.53 | | | | | | 1.20 | | | | | | 4 | | | | | | 32 | | |
| 12-31-13 | | | | | 11.87 | | | | | | 0.20 | | | | | | 1.95 | | | | | | 2.15 | | | | | | 0.28 | | | | | | 0.55 | | | | | | — | | | | | | 0.83 | | | | | | 0.02 | | | | | | 13.21 | | | | | | 18.79(b) | | | | | | 87.48 | | | | | | 0.51 | | | | | | 0.51 | | | | | | 1.58 | | | | | | 4 | | | | | | 41 | | |
| 12-31-12 | | | | | 11.00 | | | | | | 0.23 | | | | | | 1.32 | | | | | | 1.55 | | | | | | 0.01 | | | | | | 0.67 | | | | | | — | | | | | | 0.68 | | | | | | — | | | | | | 11.87 | | | | | | 14.20 | | | | | | 43.07 | | | | | | 0.52 | | | | | | 0.52 | | | | | | 1.97 | | | | | | 4 | | | | | | 51 | | |
| Class Z | | | | | | | | | | | | | | | | | | | | | | | | | | | | | | | | | | | | | | | | | | | | | | | | | | | | | | | | | | | | | | | | | | | | | | | | | | | | | | | | | | | | | | | | | | | | | | | | | | | | | | | |
| 12-31-16 | | | | | 12.59 | | | | | | 0.46• | | | | | | 0.48 | | | | | | 0.94 | | | | | | 0.01 | | | | | | 0.01 | | | | | | — | | | | | | 0.02 | | | | | | — | | | | | | 13.51 | | | | | | 7.48 | | | | | | 0.33 | | | | | | 0.00 | | | | | | 0.00 | | | | | | 3.53 | | | | | | 72,347 | | | | | | 64 | | |
05-01-15(5) -
12-31-15 | | | | | 13.34 | | | | | | 0.36• | | | | | | (0.92) | | | | | | (0.56) | | | | | | — | | | | | | 0.19 | | | | | | — | | | | | | 0.19 | | | | | | — | | | | | | 12.59 | | | | | | (4.23) | | | | | | 2.82 | | | | | | 0.00 | | | | | | 0.00 | | | | | | 4.30 | | | | | | 1,196 | | | | | | 136 | | |
See Accompanying Notes to Financial Statements
Financial Highlights (continued)
| | | | | | | | | | Income (loss)
from
investment
operations | | | | | | | | | Less Distributions | | | | | | Ratios to average net assets | | | Supplemental
Data | |
| | | | Net asset value, beginning
of year or period | | | Net investment income (loss) | | | Net realized and unrealized
gain (loss) | | | Total from investment
operations | | | From net investment income | | | From net realized gains | | | From return of capital | | | Total distributions | | | Payment by affiliate | | | Net asset value, end of year
or period | | | Total Return(1) | | | Expenses before
reductions/additions(2)(3)(4) | | | Expenses net of fee waivers
and/or recoupments if any(2)(3)(4) | | | Expenses net of all
reductions/additions(2)(3)(4) | | | Net investment income
(loss)(2)(3) | | | Net assets, end of year
or period | | | Portfolio turnover rate | |
Year or
period ended | | | ($) | | | ($) | | | ($) | | | ($) | | | ($) | | | ($) | | | ($) | | | ($) | | | ($) | | | ($) | | | (%) | | | (%) | | | (%) | | | (%) | | | (%) | | | ($000’s) | | | (%) | |
| Voya Index Solution 2035 Portfolio | | | | | | | | | | | | | | | | | | | | | | | | | | | | | | | | | | | | | | | | | | | | | | | | | | | | | | | | | | | | | | | | | | | | | | | | | | | | | | | | | | | | | | | | | | | | | | | | | | | | | | | |
| Class ADV | | | | | | | | | | | | | | | | | | | | | | | | | | | | | | | | | | | | | | | | | | | | | | | | | | | | | | | | | | | | | | | | | | | | | | | | | | | | | | | | | | | | | | | | | | | | | | | | | | | | | | | |
| 12-31-16 | | | | | 10.34 | | | | | | 0.19 | | | | | | 0.57 | | | | | | 0.76 | | | | | | 0.19 | | | | | | 0.93 | | | | | | — | | | | | | 1.12 | | | | | | — | | | | | | 9.98 | | | | | | 7.63 | | | | | | 0.76 | | | | | | 0.63 | | | | | | 0.63 | | | | | | 1.86 | | | | | | 203,566 | | | | | | 41 | | |
| 12-31-15 | | | | | 11.86 | | | | | | 0.18 | | | | | | (0.35) | | | | | | (0.17) | | | | | | 0.15 | | | | | | 1.20 | | | | | | — | | | | | | 1.35 | | | | | | — | | | | | | 10.34 | | | | | | (1.91) | | | | | | 0.77 | | | | | | 0.64 | | | | | | 0.64 | | | | | | 1.62 | | | | | | 199,097 | | | | | | 38 | | |
| 12-31-14 | | | | | 12.01 | | | | | | 0.13 | | | | | | 0.53 | | | | | | 0.66 | | | | | | 0.17 | | | | | | 0.64 | | | | | | — | | | | | | 0.81 | | | | | | — | | | | | | 11.86 | | | | | | 5.65 | | | | | | 0.76 | | | | | | 0.63 | | | | | | 0.63 | | | | | | 1.12 | | | | | | 213,542 | | | | | | 44 | | |
| 12-31-13 | | | | | 10.25 | | | | | | 0.17• | | | | | | 2.01 | | | | | | 2.18 | | | | | | 0.12 | | | | | | 0.30 | | | | | | — | | | | | | 0.42 | | | | | | — | | | | | | 12.01 | | | | | | 21.67 | | | | | | 0.75 | | | | | | 0.62 | | | | | | 0.62 | | | | | | 1.51 | | | | | | 208,246 | | | | | | 45 | | |
| 12-31-12 | | | | | 9.30 | | | | | | 0.15• | | | | | | 1.21 | | | | | | 1.36 | | | | | | 0.09 | | | | | | 0.32 | | | | | | — | | | | | | 0.41 | | | | | | — | | | | | | 10.25 | | | | | | 14.87 | | | | | | 0.71 | | | | | | 0.62 | | | | | | 0.62 | | | | | | 1.47 | | | | | | 150,358 | | | | | | 34 | | |
| Class I | | | | | | | | | | | | | | | | | | | | | | | | | | | | | | | | | | | | | | | | | | | | | | | | | | | | | | | | | | | | | | | | | | | | | | | | | | | | | | | | | | | | | | | | | | | | | | | | | | | | | | | |
| 12-31-16 | | | | | 10.58 | | | | | | 0.25• | | | | | | 0.58 | | | | | | 0.83 | | | | | | 0.25 | | | | | | 0.93 | | | | | | — | | | | | | 1.18 | | | | | | — | | | | | | 10.23 | | | | | | 8.12 | | | | | | 0.26 | | | | | | 0.13 | | | | | | 0.13 | | | | | | 2.40 | | | | | | 47,484 | | | | | | 41 | | |
| 12-31-15 | | | | | 12.11 | | | | | | 0.25• | | | | | | (0.37) | | | | | | (0.12) | | | | | | 0.21 | | | | | | 1.20 | | | | | | — | | | | | | 1.41 | | | | | | — | | | | | | 10.58 | | | | | | (1.47) | | | | | | 0.27 | | | | | | 0.14 | | | | | | 0.14 | | | | | | 2.18 | | | | | | 37,272 | | | | | | 38 | | |
| 12-31-14 | | | | | 12.24 | | | | | | 0.21• | | | | | | 0.53 | | | | | | 0.74 | | | | | | 0.23 | | | | | | 0.64 | | | | | | — | | | | | | 0.87 | | | | | | — | | | | | | 12.11 | | | | | | 6.16 | | | | | | 0.26 | | | | | | 0.13 | | | | | | 0.13 | | | | | | 1.73 | | | | | | 34,038 | | | | | | 44 | | |
| 12-31-13 | | | | | 10.42 | | | | | | 0.23• | | | | | | 2.05 | | | | | | 2.28 | | | | | | 0.16 | | | | | | 0.30 | | | | | | — | | | | | | 0.46 | | | | | | — | | | | | | 12.24 | | | | | | 22.29 | | | | | | 0.25 | | | | | | 0.12 | | | | | | 0.12 | | | | | | 1.99 | | | | | | 20,257 | | | | | | 45 | | |
| 12-31-12 | | | | | 9.43 | | | | | | 0.21• | | | | | | 1.23 | | | | | | 1.44 | | | | | | 0.13 | | | | | | 0.32 | | | | | | — | | | | | | 0.45 | | | | | | — | | | | | | 10.42 | | | | | | 15.49 | | | | | | 0.21 | | | | | | 0.12 | | | | | | 0.12 | | | | | | 2.05 | | | | | | 18,530 | | | | | | 34 | | |
| Class S | | | | | | | | | | | | | | | | | | | | | | | | | | | | | | | | | | | | | | | | | | | | | | | | | | | | | | | | | | | | | | | | | | | | | | | | | | | | | | | | | | | | | | | | | | | | | | | | | | | | | | | |
| 12-31-16 | | | | | 10.47 | | | | | | 0.21• | | | | | | 0.58 | | | | | | 0.79 | | | | | | 0.22 | | | | | | 0.93 | | | | | | — | | | | | | 1.15 | | | | | | — | | | | | | 10.11 | | | | | | 7.77 | | | | | | 0.51 | | | | | | 0.38 | | | | | | 0.38 | | | | | | 2.06 | | | | | | 118,463 | | | | | | 41 | | |
| 12-31-15 | | | | | 11.99 | | | | | | 0.22 | | | | | | (0.36) | | | | | | (0.14) | | | | | | 0.18 | | | | | | 1.20 | | | | | | — | | | | | | 1.38 | | | | | | — | | | | | | 10.47 | | | | | | (1.63) | | | | | | 0.52 | | | | | | 0.39 | | | | | | 0.39 | | | | | | 1.87 | | | | | | 129,764 | | | | | | 38 | | |
| 12-31-14 | | | | | 12.13 | | | | | | 0.16 | | | | | | 0.54 | | | | | | 0.70 | | | | | | 0.20 | | | | | | 0.64 | | | | | | — | | | | | | 0.84 | | | | | | — | | | | | | 11.99 | | | | | | 5.90 | | | | | | 0.51 | | | | | | 0.38 | | | | | | 0.38 | | | | | | 1.38 | | | | | | 145,942 | | | | | | 44 | | |
| 12-31-13 | | | | | 10.34 | | | | | | 0.20• | | | | | | 2.03 | | | | | | 2.23 | | | | | | 0.14 | | | | | | 0.30 | | | | | | — | | | | | | 0.44 | | | | | | — | | | | | | 12.13 | | | | | | 21.97 | | | | | | 0.50 | | | | | | 0.37 | | | | | | 0.37 | | | | | | 1.76 | | | | | | 133,001 | | | | | | 45 | | |
| 12-31-12 | | | | | 9.37 | | | | | | 0.17• | | | | | | 1.23 | | | | | | 1.40 | | | | | | 0.11 | | | | | | 0.32 | | | | | | — | | | | | | 0.43 | | | | | | — | | | | | | 10.34 | | | | | | 15.15 | | | | | | 0.46 | | | | | | 0.37 | | | | | | 0.37 | | | | | | 1.69 | | | | | | 93,319 | | | | | | 34 | | |
| Class S2 | | | | | | | | | | | | | | | | | | | | | | | | | | | | | | | | | | | | | | | | | | | | | | | | | | | | | | | | | | | | | | | | | | | | | | | | | | | | | | | | | | | | | | | | | | | | | | | | | | | | | | | |
| 12-31-16 | | | | | 10.33 | | | | | | 0.20 | | | | | | 0.56 | | | | | | 0.76 | | | | | | 0.20 | | | | | | 0.93 | | | | | | — | | | | | | 1.13 | | | | | | — | | | | | | 9.96 | | | | | | 7.65 | | | | | | 0.69 | | | | | | 0.53 | | | | | | 0.53 | | | | | | 2.01 | | | | | | 32,558 | | | | | | 41 | | |
| 12-31-15 | | | | | 11.83 | | | | | | 0.19• | | | | | | (0.34) | | | | | | (0.15) | | | | | | 0.15 | | | | | | 1.20 | | | | | | — | | | | | | 1.35 | | | | | | — | | | | | | 10.33 | | | | | | (1.78) | | | | | | 0.77 | | | | | | 0.54 | | | | | | 0.54 | | | | | | 1.71 | | | | | | 31,067 | | | | | | 38 | | |
| 12-31-14 | | | | | 11.98 | | | | | | 0.14• | | | | | | 0.54 | | | | | | 0.68 | | | | | | 0.19 | | | | | | 0.64 | | | | | | — | | | | | | 0.83 | | | | | | — | | | | | | 11.83 | | | | | | 5.77 | | | | | | 0.76 | | | | | | 0.53 | | | | | | 0.53 | | | | | | 1.17 | | | | | | 40,100 | | | | | | 44 | | |
| 12-31-13 | | | | | 10.23 | | | | | | 0.18• | | | | | | 2.01 | | | | | | 2.19 | | | | | | 0.14 | | | | | | 0.30 | | | | | | — | | | | | | 0.44 | | | | | | — | | | | | | 11.98 | | | | | | 21.74 | | | | | | 0.75 | | | | | | 0.52 | | | | | | 0.52 | | | | | | 1.66 | | | | | | 44,066 | | | | | | 45 | | |
| 12-31-12 | | | | | 9.29 | | | | | | 0.16• | | | | | | 1.22 | | | | | | 1.38 | | | | | | 0.12 | | | | | | 0.32 | | | | | | — | | | | | | 0.44 | | | | | | — | | | | | | 10.23 | | | | | | 15.04 | | | | | | 0.71 | | | | | | 0.52 | | | | | | 0.52 | | | | | | 1.63 | | | | | | 28,712 | | | | | | 34 | | |
| Class Z | | | | | | | | | | | | | | | | | | | | | | | | | | | | | | | | | | | | | | | | | | | | | | | | | | | | | | | | | | | | | | | | | | | | | | | | | | | | | | | | | | | | | | | | | | | | | | | | | | | | | | | |
| 12-31-16 | | | | | 10.61 | | | | | | 0.34• | | | | | | 0.50 | | | | | | 0.84 | | | | | | 0.25 | | | | | | 0.93 | | | | | | — | | | | | | 1.18 | | | | | | — | | | | | | 10.27 | | | | | | 8.21 | | | | | | 0.26 | | | | | | 0.00 | | | | | | 0.00 | | | | | | 3.31 | | | | | | 101,022 | | | | | | 41 | | |
05-01-15(5) -
12-31-15 | | | | | 12.66 | | | | | | 0.43• | | | | | | (1.07) | | | | | | (0.64) | | | | | | 0.21 | | | | | | 1.20 | | | | | | — | | | | | | 1.41 | | | | | | — | | | | | | 10.61 | | | | | | (5.49) | | | | | | 0.28 | | | | | | 0.00 | | | | | | 0.00 | | | | | | 6.12 | | | | | | 2,456 | | | | | | 38 | | |
| Voya Index Solution 2040 Portfolio | | | | | | | | | | | | | | | | | | | | | | | | | | | | | | | | | | | | | | | | | | | | | | | | | | | | | | | | | | | | | | | | | | | | | | | | | | | | | | | | | | | | | | | | | | | | | | | | | | | | | | | |
| Class ADV | | | | | | | | | | | | | | | | | | | | | | | | | | | | | | | | | | | | | | | | | | | | | | | | | | | | | | | | | | | | | | | | | | | | | | | | | | | | | | | | | | | | | | | | | | | | | | | | | | | | | | | |
| 12-31-16 | | | | | 12.62 | | | | | | 0.29• | | | | | | 0.68 | | | | | | 0.97 | | | | | | 0.01 | | | | | | 0.01 | | | | | | — | | | | | | 0.02 | | | | | | — | | | | | | 13.57 | | | | | | 7.67 | | | | | | 0.90 | | | | | | 0.62 | | | | | | 0.62 | | | | | | 2.27 | | | | | | 5,222 | | | | | | 52 | | |
| 12-31-15 | | | | | 13.60 | | | | | | 0.52• | | | | | | (0.73) | | | | | | (0.21) | | | | | | 0.13 | | | | | | 0.64 | | | | | | — | | | | | | 0.77 | | | | | | — | | | | | | 12.62 | | | | | | (1.78) | | | | | | 5.76 | | | | | | 0.63 | | | | | | 0.63 | | | | | | 4.17 | | | | | | 1,252 | | | | | | 106 | | |
| 12-31-14 | | | | | 13.98 | | | | | | 0.14• | | | | | | 0.64 | | | | | | 0.78 | | | | | | 0.20 | | | | | | 0.96 | | | | | | — | | | | | | 1.16 | | | | | | — | | | | | | 13.60 | | | | | | 5.73 | | | | | | 61.99 | | | | | | 0.63 | | | | | | 0.63 | | | | | | 0.98 | | | | | | 5 | | | | | | 32 | | |
| 12-31-13 | | | | | 12.06 | | | | | | 0.17 | | | | | | 2.54 | | | | | | 2.71 | | | | | | 0.18 | | | | | | 0.63 | | | | | | — | | | | | | 0.81 | | | | | | 0.02 | | | | | | 13.98 | | | | | | 23.19(c) | | | | | | 83.06 | | | | | | 0.61 | | | | | | 0.61 | | | | | | 1.29 | | | | | | 4 | | | | | | 41 | | |
| 12-31-12 | | | | | 11.18 | | | | | | 0.14 | | | | | | 1.53 | | | | | | 1.67 | | | | | | — | | | | | | 0.79 | | | | | | — | | | | | | 0.79 | | | | | | — | | | | | | 12.06 | | | | | | 15.03 | | | | | | 54.52 | | | | | | 0.62 | | | | | | 0.62 | | | | | | 1.14 | | | | | | 4 | | | | | | 44 | | |
| Class I | | | | | | | | | | | | | | | | | | | | | | | | | | | | | | | | | | | | | | | | | | | | | | | | | | | | | | | | | | | | | | | | | | | | | | | | | | | | | | | | | | | | | | | | | | | | | | | | | | | | | | | |
| 12-31-16 | | | | | 12.79 | | | | | | 0.32• | | | | | | 0.73 | | | | | | 1.05 | | | | | | 0.01 | | | | | | 0.01 | | | | | | — | | | | | | 0.02 | | | | | | — | | | | | | 13.82 | | | | | | 8.24 | | | | | | 0.40 | | | | | | 0.12 | | | | | | 0.12 | | | | | | 2.43 | | | | | | 659 | | | | | | 52 | | |
| 12-31-15 | | | | | 13.71 | | | | | | 1.29• | | | | | | (1.47) | | | | | | (0.18) | | | | | | 0.10 | | | | | | 0.64 | | | | | | — | | | | | | 0.74 | | | | | | — | | | | | | 12.79 | | | | | | (1.50) | | | | | | 5.26 | | | | | | 0.13 | | | | | | 0.13 | | | | | | 10.20 | | | | | | 165 | | | | | | 106 | | |
| 12-31-14 | | | | | 14.09 | | | | | | 0.19 | | | | | | 0.66 | | | | | | 0.85 | | | | | | 0.27 | | | | | | 0.96 | | | | | | — | | | | | | 1.23 | | | | | | — | | | | | | 13.71 | | | | | | 6.21 | | | | | | 61.49 | | | | | | 0.13 | | | | | | 0.13 | | | | | | 1.42 | | | | | | 5 | | | | | | 32 | | |
| 12-31-13 | | | | | 12.13 | | | | | | 0.24• | | | | | | 2.57 | | | | | | 2.81 | | | | | | 0.24 | | | | | | 0.63 | | | | | | — | | | | | | 0.87 | | | | | | 0.02 | | | | | | 14.09 | | | | | | 23.90(c) | | | | | | 82.56 | | | | | | 0.11 | | | | | | 0.11 | | | | | | 1.79 | | | | | | 4 | | | | | | 41 | | |
| 12-31-12 | | | | | 11.19 | | | | | | 0.20 | | | | | | 1.54 | | | | | | 1.74 | | | | | | 0.01 | | | | | | 0.79 | | | | | | — | | | | | | 0.80 | | | | | | — | | | | | | 12.13 | | | | | | 15.63 | | | | | | 54.02 | | | | | | 0.12 | | | | | | 0.12 | | | | | | 1.64 | | | | | | 4 | | | | | | 44 | | |
See Accompanying Notes to Financial Statements
Financial Highlights (continued)
| | | | | | | | | | Income (loss)
from
investment
operations | | | | | | | | | Less Distributions | | | | | | Ratios to average net assets | | | Supplemental
Data | |
| | | | Net asset value, beginning
of year or period | | | Net investment income (loss) | | | Net realized and unrealized
gain (loss) | | | Total from investment
operations | | | From net investment income | | | From net realized gains | | | From return of capital | | | Total distributions | | | Payment by affiliate | | | Net asset value, end of year
or period | | | Total Return(1) | | | Expenses before
reductions/additions(2)(3)(4) | | | Expenses net of fee waivers
and/or recoupments if any(2)(3)(4) | | | Expenses net of all
reductions/additions(2)(3)(4) | | | Net investment income
(loss)(2)(3) | | | Net assets, end of year
or period | | | Portfolio turnover rate | |
Year or
period ended | | | ($) | | | ($) | | | ($) | | | ($) | | | ($) | | | ($) | | | ($) | | | ($) | | | ($) | | | ($) | | | (%) | | | (%) | | | (%) | | | (%) | | | (%) | | | ($000’s) | | | (%) | |
| Voya Index Solution 2040 Portfolio (continued) | | | | | | | | | | | | | | | | | | | | | | | | | | | | | | | | | | | | | | | | | | | | | | | | | | | | | | | | | | | | | | | | | | | | | | | | | | | | | | | | | | | | | | | | | | | | | | | | | | | | | | | |
| Class S | | | | | | | | | | | | | | | | | | | | | | | | | | | | | | | | | | | | | | | | | | | | | | | | | | | | | | | | | | | | | | | | | | | | | | | | | | | | | | | | | | | | | | | | | | | | | | | | | | | | | | | |
| 12-31-16 | | | | | 12.83 | | | | | | 0.38• | | | | | | 0.63 | | | | | | 1.01 | | | | | | 0.01 | | | | | | 0.01 | | | | | | — | | | | | | 0.02 | | | | | | — | | | | | | 13.82 | | | | | | 7.89 | | | | | | 0.65 | | | | | | 0.37 | | | | | | 0.37 | | | | | | 2.85 | | | | | | 5,044 | | | | | | 52 | | |
| 12-31-15 | | | | | 13.72 | | | | | | 0.51• | | | | | | (0.71) | | | | | | (0.20) | | | | | | 0.05 | | | | | | 0.64 | | | | | | — | | | | | | 0.69 | | | | | | — | | | | | | 12.83 | | | | | | (1.65) | | | | | | 5.51 | | | | | | 0.38 | | | | | | 0.38 | | | | | | 3.95 | | | | | | 401 | | | | | | 106 | | |
| 12-31-14 | | | | | 14.09 | | | | | | 0.16 | | | | | | 0.66 | | | | | | 0.82 | | | | | | 0.23 | | | | | | 0.96 | | | | | | — | | | | | | 1.19 | | | | | | — | | | | | | 13.72 | | | | | | 6.03 | | | | | | 61.74 | | | | | | 0.38 | | | | | | 0.38 | | | | | | 1.16 | | | | | | 4 | | | | | | 32 | | |
| 12-31-13 | | | | | 12.08 | | | | | | 0.20• | | | | | | 2.56 | | | | | | 2.76 | | | | | | 0.14 | | | | | | 0.63 | | | | | | — | | | | | | 0.77 | | | | | | 0.02 | | | | | | 14.09 | | | | | | 23.53(c) | | | | | | 82.81 | | | | | | 0.36 | | | | | | 0.36 | | | | | | 1.54 | | | | | | 4 | | | | | | 41 | | |
| 12-31-12 | | | | | 11.18 | | | | | | 0.17 | | | | | | 1.52 | | | | | | 1.69 | | | | | | 0.00* | | | | | | 0.79 | | | | | | — | | | | | | 0.79 | | | | | | — | | | | | | 12.08 | | | | | | 15.23 | | | | | | 54.27 | | | | | | 0.37 | | | | | | 0.37 | | | | | | 1.39 | | | | | | 4 | | | | | | 44 | | |
| Class S2 | | | | | | | | | | | | | | | | | | | | | | | | | | | | | | | | | | | | | | | | | | | | | | | | | | | | | | | | | | | | | | | | | | | | | | | | | | | | | | | | | | | | | | | | | | | | | | | | | | | | | | | |
| 12-31-16 | | | | | 12.70 | | | | | | 0.34• | | | | | | 0.65 | | | | | | 0.99 | | | | | | 0.01 | | | | | | 0.01 | | | | | | — | | | | | | 0.02 | | | | | | — | | | | | | 13.67 | | | | | | 7.82 | | | | | | 0.83 | | | | | | 0.52 | | | | | | 0.52 | | | | | | 2.60 | | | | | | 651 | | | | | | 52 | | |
| 12-31-15 | | | | | 13.62 | | | | | | 0.38• | | | | | | (0.61) | | | | | | (0.23) | | | | | | 0.05 | | | | | | 0.64 | | | | | | — | | | | | | 0.69 | | | | | | — | | | | | | 12.70 | | | | | | (1.88) | | | | | | 5.76 | | | | | | 0.53 | | | | | | 0.53 | | | | | | 2.84 | | | | | | 14 | | | | | | 106 | | |
| 12-31-14 | | | | | 14.00 | | | | | | 0.13 | | | | | | 0.66 | | | | | | 0.79 | | | | | | 0.21 | | | | | | 0.96 | | | | | | — | | | | | | 1.17 | | | | | | — | | | | | | 13.62 | | | | | | 5.80 | | | | | | 61.99 | | | | | | 0.53 | | | | | | 0.53 | | | | | | 1.01 | | | | | | 4 | | | | | | 32 | | |
| 12-31-13 | | | | | 12.07 | | | | | | 0.18 | | | | | | 2.55 | | | | | | 2.73 | | | | | | 0.19 | | | | | | 0.63 | | | | | | — | | | | | | 0.82 | | | | | | 0.02 | | | | | | 14.00 | | | | | | 23.36(c) | | | | | | 83.06 | | | | | | 0.51 | | | | | | 0.51 | | | | | | 1.38 | | | | | | 4 | | | | | | 41 | | |
| 12-31-12 | | | | | 11.18 | | | | | | 0.15 | | | | | | 1.53 | | | | | | 1.68 | | | | | | 0.00* | | | | | | 0.79 | | | | | | — | | | | | | 0.79 | | | | | | — | | | | | | 12.07 | | | | | | 15.13 | | | | | | 54.52 | | | | | | 0.52 | | | | | | 0.52 | | | | | | 1.24 | | | | | | 4 | | | | | | 44 | | |
| Class Z | | | | | | | | | | | | | | | | | | | | | | | | | | | | | | | | | | | | | | | | | | | | | | | | | | | | | | | | | | | | | | | | | | | | | | | | | | | | | | | | | | | | | | | | | | | | | | | | | | | | | | | |
| 12-31-16 | | | | | 12.80 | | | | | | 0.47• | | | | | | 0.61 | | | | | | 1.08 | | | | | | 0.02 | | | | | | 0.01 | | | | | | — | | | | | | 0.03 | | | | | | — | | | | | | 13.85 | | | | | | 8.40 | | | | | | 0.40 | | | | | | 0.00 | | | | | | 0.00 | | | | | | 3.51 | | | | | | 48,146 | | | | | | 52 | | |
05-01-15(5) -
12-31-15 | | | | | 14.34 | | | | | | 0.57• | | | | | | (1.37) | | | | | | (0.80) | | | | | | 0.10 | | | | | | 0.64 | | | | | | — | | | | | | 0.74 | | | | | | — | | | | | | 12.80 | | | | | | (5.75) | | | | | | 5.12 | | | | | | 0.00 | | | | | | 0.00 | | | | | | 6.74 | | | | | | 1,086 | | | | | | 106 | | |
| Voya Index Solution 2045 Portfolio | | | | | | | | | | | | | | | | | | | | | | | | | | | | | | | | | | | | | | | | | | | | | | | | | | | | | | | | | | | | | | | | | | | | | | | | | | | | | | | | | | | | | | | | | | | | | | | | | | | | | | | |
| Class ADV | | | | | | | | | | | | | | | | | | | | | | | | | | | | | | | | | | | | | | | | | | | | | | | | | | | | | | | | | | | | | | | | | | | | | | | | | | | | | | | | | | | | | | | | | | | | | | | | | | | | | | | |
| 12-31-16 | | | | | 10.55 | | | | | | 0.17 | | | | | | 0.61 | | | | | | 0.78 | | | | | | 0.17 | | | | | | 0.94 | | | | | | — | | | | | | 1.11 | | | | | | — | | | | | | 10.22 | | | | | | 7.67 | | | | | | 0.76 | | | | | | 0.64 | | | | | | 0.64 | | | | | | 1.70 | | | | | | 139,777 | | | | | | 41 | | |
| 12-31-15 | | | | | 12.16 | | | | | | 0.16 | | | | | | (0.34) | | | | | | (0.18) | | | | | | 0.12 | | | | | | 1.31 | | | | | | — | | | | | | 1.43 | | | | | | — | | | | | | 10.55 | | | | | | (2.05) | | | | | | 0.76 | | | | | | 0.64 | | | | | | 0.64 | | | | | | 1.44 | | | | | | 133,884 | | | | | | 36 | | |
| 12-31-14 | | | | | 12.25 | | | | | | 0.10• | | | | | | 0.59 | | | | | | 0.69 | | | | | | 0.14 | | | | | | 0.64 | | | | | | — | | | | | | 0.78 | | | | | | — | | | | | | 12.16 | | | | | | 5.80 | | | | | | 0.75 | | | | | | 0.63 | | | | | | 0.63 | | | | | | 0.83 | | | | | | 138,235 | | | | | | 44 | | |
| 12-31-13 | | | | | 10.26 | | | | | | 0.14• | | | | | | 2.26 | | | | | | 2.40 | | | | | | 0.10 | | | | | | 0.31 | | | | | | — | | | | | | 0.41 | | | | | | — | | | | | | 12.25 | | | | | | 23.74 | | | | | | 0.75 | | | | | | 0.61 | | | | | | 0.61 | | | | | | 1.27 | | | | | | 128,133 | | | | | | 48 | | |
| 12-31-12 | | | | | 9.18 | | | | | | 0.12• | | | | | | 1.30 | | | | | | 1.42 | | | | | | 0.08 | | | | | | 0.26 | | | | | | — | | | | | | 0.34 | | | | | | — | | | | | | 10.26 | | | | | | 15.64 | | | | | | 0.71 | | | | | | 0.62 | | | | | | 0.62 | | | | | | 1.22 | | | | | | 86,051 | | | | | | 28 | | |
| Class I | | | | | | | | | | | | | | | | | | | | | | | | | | | | | | | | | | | | | | | | | | | | | | | | | | | | | | | | | | | | | | | | | | | | | | | | | | | | | | | | | | | | | | | | | | | | | | | | | | | | | | | |
| 12-31-16 | | | | | 10.84 | | | | | | 0.24• | | | | | | 0.63 | | | | | | 0.87 | | | | | | 0.23 | | | | | | 0.94 | | | | | | — | | | | | | 1.17 | | | | | | — | | | | | | 10.54 | | | | | | 8.29 | | | | | | 0.26 | | | | | | 0.14 | | | | | | 0.14 | | | | | | 2.24 | | | | | | 35,877 | | | | | | 41 | | |
| 12-31-15 | | | | | 12.46 | | | | | | 0.25• | | | | | | (0.38) | | | | | | (0.13) | | | | | | 0.18 | | | | | | 1.31 | | | | | | — | | | | | | 1.49 | | | | | | — | | | | | | 10.84 | | | | | | (1.61) | | | | | | 0.26 | | | | | | 0.14 | | | | | | 0.14 | | | | | | 2.09 | | | | | | 27,900 | | | | | | 36 | | |
| 12-31-14 | | | | | 12.52 | | | | | | 0.18• | | | | | | 0.59 | | | | | | 0.77 | | | | | | 0.19 | | | | | | 0.64 | | | | | | — | | | | | | 0.83 | | | | | | — | | | | | | 12.46 | | | | | | 6.32 | | | | | | 0.25 | | | | | | 0.13 | | | | | | 0.13 | | | | | | 1.42 | | | | | | 19,837 | | | | | | 44 | | |
| 12-31-13 | | | | | 10.46 | | | | | | 0.20• | | | | | | 2.31 | | | | | | 2.51 | | | | | | 0.14 | | | | | | 0.31 | | | | | | — | | | | | | 0.45 | | | | | | — | | | | | | 12.52 | | | | | | 24.34 | | | | | | 0.25 | | | | | | 0.11 | | | | | | 0.11 | | | | | | 1.74 | | | | | | 11,306 | | | | | | 48 | | |
| 12-31-12 | | | | | 9.34 | | | | | | 0.17• | | | | | | 1.33 | | | | | | 1.50 | | | | | | 0.12 | | | | | | 0.26 | | | | | | — | | | | | | 0.38 | | | | | | — | | | | | | 10.46 | | | | | | 16.19 | | | | | | 0.21 | | | | | | 0.12 | | | | | | 0.12 | | | | | | 1.73 | | | | | | 14,728 | | | | | | 28 | | |
| Class S | | | | | | | | | | | | | | | | | | | | | | | | | | | | | | | | | | | | | | | | | | | | | | | | | | | | | | | | | | | | | | | | | | | | | | | | | | | | | | | | | | | | | | | | | | | | | | | | | | | | | | | |
| 12-31-16 | | | | | 10.70 | | | | | | 0.21 | | | | | | 0.62 | | | | | | 0.83 | | | | | | 0.19 | | | | | | 0.94 | | | | | | — | | | | | | 1.13 | | | | | | — | | | | | | 10.40 | | | | | | 8.05 | | | | | | 0.51 | | | | | | 0.39 | | | | | | 0.39 | | | | | | 1.91 | | | | | | 76,656 | | | | | | 41 | | |
| 12-31-15 | | | | | 12.32 | | | | | | 0.20 | | | | | | (0.36) | | | | | | (0.16) | | | | | | 0.15 | | | | | | 1.31 | | | | | | — | | | | | | 1.46 | | | | | | — | | | | | | 10.70 | | | | | | (1.86) | | | | | | 0.51 | | | | | | 0.39 | | | | | | 0.39 | | | | | | 1.66 | | | | | | 80,586 | | | | | | 36 | | |
| 12-31-14 | | | | | 12.40 | | | | | | 0.13 | | | | | | 0.60 | | | | | | 0.73 | | | | | | 0.17 | | | | | | 0.64 | | | | | | — | | | | | | 0.81 | | | | | | — | | | | | | 12.32 | | | | | | 6.01 | | | | | | 0.50 | | | | | | 0.38 | | | | | | 0.38 | | | | | | 1.07 | | | | | | 90,710 | | | | | | 44 | | |
| 12-31-13 | | | | | 10.37 | | | | | | 0.18• | | | | | | 2.28 | | | | | | 2.46 | | | | | | 0.12 | | | | | | 0.31 | | | | | | — | | | | | | 0.43 | | | | | | — | | | | | | 12.40 | | | | | | 24.07 | | | | | | 0.50 | | | | | | 0.36 | | | | | | 0.36 | | | | | | 1.53 | | | | | | 83,716 | | | | | | 48 | | |
| 12-31-12 | | | | | 9.27 | | | | | | 0.14• | | | | | | 1.32 | | | | | | 1.46 | | | | | | 0.10 | | | | | | 0.26 | | | | | | — | | | | | | 0.36 | | | | | | — | | | | | | 10.37 | | | | | | 15.88 | | | | | | 0.46 | | | | | | 0.37 | | | | | | 0.37 | | | | | | 1.42 | | | | | | 54,383 | | | | | | 28 | | |
| Class S2 | | | | | | | | | | | | | | | | | | | | | | | | | | | | | | | | | | | | | | | | | | | | | | | | | | | | | | | | | | | | | | | | | | | | | | | | | | | | | | | | | | | | | | | | | | | | | | | | | | | | | | | |
| 12-31-16 | | | | | 10.56 | | | | | | 0.20• | | | | | | 0.60 | | | | | | 0.80 | | | | | | 0.18 | | | | | | 0.94 | | | | | | — | | | | | | 1.12 | | | | | | — | | | | | | 10.24 | | | | | | 7.88 | | | | | | 0.69 | | | | | | 0.54 | | | | | | 0.54 | | | | | | 1.93 | | | | | | 18,507 | | | | | | 41 | | |
| 12-31-15 | | | | | 12.16 | | | | | | 0.18• | | | | | | (0.35) | | | | | | (0.17) | | | | | | 0.12 | | | | | | 1.31 | | | | | | — | | | | | | 1.43 | | | | | | — | | | | | | 10.56 | | | | | | (1.99) | | | | | | 0.76 | | | | | | 0.54 | | | | | | 0.54 | | | | | | 1.54 | | | | | | 16,368 | | | | | | 36 | | |
| 12-31-14 | | | | | 12.24 | | | | | | 0.11 | | | | | | 0.60 | | | | | | 0.71 | | | | | | 0.15 | | | | | | 0.64 | | | | | | — | | | | | | 0.79 | | | | | | — | | | | | | 12.16 | | | | | | 5.95 | | | | | | 0.75 | | | | | | 0.53 | | | | | | 0.53 | | | | | | 0.90 | | | | | | 20,479 | | | | | | 44 | | |
| 12-31-13 | | | | | 10.25 | | | | | | 0.16• | | | | | | 2.25 | | | | | | 2.41 | | | | | | 0.11 | | | | | | 0.31 | | | | | | — | | | | | | 0.42 | | | | | | — | | | | | | 12.24 | | | | | | 23.86 | | | | | | 0.75 | | | | | | 0.51 | | | | | | 0.51 | | | | | | 1.41 | | | | | | 20,484 | | | | | | 48 | | |
| 12-31-12 | | | | | 9.19 | | | | | | 0.13• | | | | | | 1.29 | | | | | | 1.42 | | | | | | 0.10 | | | | | | 0.26 | | | | | | — | | | | | | 0.36 | | | | | | — | | | | | | 10.25 | | | | | | 15.65 | | | | | | 0.71 | | | | | | 0.52 | | | | | | 0.52 | | | | | | 1.33 | | | | | | 13,683 | | | | | | 28 | | |
See Accompanying Notes to Financial Statements
Financial Highlights (continued)
| | | | | | | | | | Income (loss)
from
investment
operations | | | | | | | | | Less Distributions | | | | | | Ratios to average net assets | | | Supplemental
Data | |
| | | | Net asset value, beginning
of year or period | | | Net investment income (loss) | | | Net realized and unrealized
gain (loss) | | | Total from investment
operations | | | From net investment income | | | From net realized gains | | | From return of capital | | | Total distributions | | | Payment by affiliate | | | Net asset value, end of year
or period | | | Total Return(1) | | | Expenses before
reductions/additions(2)(3)(4) | | | Expenses net of fee waivers
and/or recoupments if any(2)(3)(4) | | | Expenses net of all
reductions/additions(2)(3)(4) | | | Net investment income
(loss)(2)(3) | | | Net assets, end of year
or period | | | Portfolio turnover rate | |
Year or
period ended | | | ($) | | | ($) | | | ($) | | | ($) | | | ($) | | | ($) | | | ($) | | | ($) | | | ($) | | | ($) | | | (%) | | | (%) | | | (%) | | | (%) | | | (%) | | | ($000’s) | | | (%) | |
| Voya Index Solution 2045 Portfolio (continued) | | | | | | | | | | | | | | | | | | | | | | | | | | | | | | | | | | | | | | | | | | | | | | | | | | | | | | | | | | | | | | | | | | | | | | | | | | | | | | | | | | | | | | | | | | | | | | | | | | | | | | | |
| Class Z | | | | | | | | | | | | | | | | | | | | | | | | | | | | | | | | | | | | | | | | | | | | | | | | | | | | | | | | | | | | | | | | | | | | | | | | | | | | | | | | | | | | | | | | | | | | | | | | | | | | | | | |
| 12-31-16 | | | | | 10.85 | | | | | | 0.34• | | | | | | 0.55 | | | | | | 0.89 | | | | | | 0.23 | | | | | | 0.94 | | | | | | — | | | | | | 1.17 | | | | | | — | | | | | | 10.57 | | | | | | 8.47 | | | | | | 0.26 | | | | | | 0.00 | | | | ��� | | 0.00 | | | | | | 3.21 | | | | | | 58,923 | | | | | | 41 | | |
05-01-15(5) -
12-31-15 | | | | | 13.09 | | | | | | 0.59• | | | | | | (1.34) | | | | | | (0.75) | | | | | | 0.18 | | | | | | 1.31 | | | | | | — | | | | | | 1.49 | | | | | | — | | | | | | 10.85 | | | | | | (6.26) | | | | | | 0.32 | | | | | | 0.00 | | | | | | 0.00 | | | | | | 8.27 | | | | | | 544 | | | | | | 36 | | |
| Voya Index Solution 2050 Portfolio | | | | | | | | | | | | | | | | | | | | | | | | | | | | | | | | | | | | | | | | | | | | | | | | | | | | | | | | | | | | | | | | | | | | | | | | | | | | | | | | | | | | | | | | | | | | | | | | | | | | | | | |
| Class ADV | | | | | | | | | | | | | | | | | | | | | | | | | | | | | | | | | | | | | | | | | | | | | | | | | | | | | | | | | | | | | | | | | | | | | | | | | | | | | | | | | | | | | | | | | | | | | | | | | | | | | | | |
| 12-31-16 | | | | | 12.69 | | | | | | 0.27• | | | | | | 0.73 | | | | | | 1.00 | | | | | | 0.01 | | | | | | 0.03 | | | | | | — | | | | | | 0.04 | | | | | | — | | | | | | 13.65 | | | | | | 7.94 | | | | | | 1.03 | | | | | | 0.64 | | | | | | 0.64 | | | | | | 2.05 | | | | | | 3,296 | | | | | | 49 | | |
| 12-31-15 | | | | | 13.68 | | | | | | 0.44• | | | | | | (0.68) | | | | | | (0.24) | | | | | | 0.04 | | | | | | 0.71 | | | | | | — | | | | | | 0.75 | | | | | | — | | | | | | 12.69 | | | | | | (1.97) | | | | | | 7.70 | | | | | | 0.64 | | | | | | 0.64 | | | | | | 3.52 | | | | | | 666 | | | | | | 195 | | |
| 12-31-14 | | | | | 14.03 | | | | | | 0.10 | | | | | | 0.68 | | | | | | 0.78 | | | | | | 0.19 | | | | | | 0.94 | | | | | | — | | | | | | 1.13 | | | | | | — | | | | | | 13.68 | | | | | | 5.64 | | | | | | 62.26 | | | | | | 0.64 | | | | | | 0.64 | | | | | | 0.77 | | | | | | 4 | | | | | | 32 | | |
| 12-31-13 | | | | | 11.95 | | | | | | 0.16 | | | | | | 2.59 | | | | | | 2.75 | | | | | | 0.17 | | | | | | 0.52 | | | | | | — | | | | | | 0.69 | | | | | | 0.02 | | | | | | 14.03 | | | | | | 23.69(d) | | | | | | 83.28 | | | | | | 0.62 | | | | | | 0.62 | | | | | | 1.20 | | | | | | 4 | | | | | | 39 | | |
| 12-31-12 | | | | | 11.18 | | | | | | 0.14 | | | | | | 1.55 | | | | | | 1.69 | | | | | | — | | | | | | 0.92 | | | | | | — | | | | | | 0.92 | | | | | | — | | | | | | 11.95 | | | | | | 15.24 | | | | | | 42.58 | | | | | | 0.62 | | | | | | 0.62 | | | | | | 1.14 | | | | | | 4 | | | | | | 43 | | |
| Class I | | | | | | | | | | | | | | | | | | | | | | | | | | | | | | | | | | | | | | | | | | | | | | | | | | | | | | | | | | | | | | | | | | | | | | | | | | | | | | | | | | | | | | | | | | | | | | | | | | | | | | | |
| 12-31-16 | | | | | 12.80 | | | | | | 0.33• | | | | | | 0.76 | | | | | | 1.09 | | | | | | 0.02 | | | | | | 0.03 | | | | | | — | | | | | | 0.05 | | | | | | — | | | | | | 13.84 | | | | | | 8.52 | | | | | | 0.53 | | | | | | 0.14 | | | | | | 0.14 | | | | | | 2.52 | | | | | | 950 | | | | | | 49 | | |
| 12-31-15 | | | | | 13.79 | | | | | | 0.44• | | | | | | (0.61) | | | | | | (0.17) | | | | | | 0.11 | | | | | | 0.71 | | | | | | — | | | | | | 0.82 | | | | | | — | | | | | | 12.80 | | | | | | (1.45) | | | | | | 7.20 | | | | | | 0.14 | | | | | | 0.14 | | | | | | 3.47 | | | | | | 295 | | | | | | 195 | | |
| 12-31-14 | | | | | 14.14 | | | | | | 0.18 | | | | | | 0.67 | | | | | | 0.85 | | | | | | 0.26 | | | | | | 0.94 | | | | | | — | | | | | | 1.20 | | | | | | — | | | | | | 13.79 | | | | | | 6.12 | | | | | | 61.76 | | | | | | 0.14 | | | | | | 0.14 | | | | | | 1.29 | | | | | | 5 | | | | | | 32 | | |
| 12-31-13 | | | | | 12.02 | | | | | | 0.22• | | | | | | 2.63 | | | | | | 2.85 | | | | | | 0.23 | | | | | | 0.52 | | | | | | — | | | | | | 0.75 | | | | | | 0.02 | | | | | | 14.14 | | | | | | 24.41(d) | | | | | | 82.78 | | | | | | 0.12 | | | | | | 0.12 | | | | | | 1.70 | | | | | | 4 | | | | | | 39 | | |
| 12-31-12 | | | | | 11.19 | | | | | | 0.20 | | | | | | 1.56 | | | | | | 1.76 | | | | | | 0.01 | | | | | | 0.92 | | | | | | — | | | | | | 0.93 | | | | | | — | | | | | | 12.02 | | | | | | 15.83 | | | | | | 42.08 | | | | | | 0.12 | | | | | | 0.12 | | | | | | 1.65 | | | | | | 4 | | | | | | 43 | | |
| Class S | | | | | | | | | | | | | | | | | | | | | | | | | | | | | | | | | | | | | | | | | | | | | | | | | | | | | | | | | | | | | | | | | | | | | | | | | | | | | | | | | | | | | | | | | | | | | | | | | | | | | | | |
| 12-31-16 | | | | | 12.83 | | | | | | 0.37• | | | | | | 0.68 | | | | | | 1.05 | | | | | | 0.02 | | | | | | 0.03 | | | | | | — | | | | | | 0.05 | | | | | | — | | | | | | 13.83 | | | | | | 8.20 | | | | | | 0.78 | | | | | | 0.39 | | | | | | 0.39 | | | | | | 2.76 | | | | | | 3,987 | | | | | | 49 | | |
| 12-31-15 | | | | | 13.80 | | | | | | 0.55• | | | | | | (0.74) | | | | | | (0.19) | | | | | | 0.07 | | | | | | 0.71 | | | | | | — | | | | | | 0.78 | | | | | | — | | | | | | 12.83 | | | | | | (1.60) | | | | | | 7.45 | | | | | | 0.39 | | | | | | 0.39 | | | | | | 4.31 | | | | | | 254 | | | | | | 195 | | |
| 12-31-14 | | | | | 14.14 | | | | | | 0.14 | | | | | | 0.68 | | | | | | 0.82 | | | | | | 0.22 | | | | | | 0.94 | | | | | | — | | | | | | 1.16 | | | | | | — | | | | | | 13.80 | | | | | | 5.93 | | | | | | 62.01 | | | | | | 0.39 | | | | | | 0.39 | | | | | | 1.04 | | | | | | 5 | | | | | | 32 | | |
| 12-31-13 | | | | | 11.97 | | | | | | 0.19• | | | | | | 2.61 | | | | | | 2.80 | | | | | | 0.13 | | | | | | 0.52 | | | | | | — | | | | | | 0.65 | | | | | | 0.02 | | | | | | 14.14 | | | | | | 24.03(d) | | | | | | 83.03 | | | | | | 0.37 | | | | | | 0.37 | | | | | | 1.44 | | | | | | 4 | | | | | | 39 | | |
| 12-31-12 | | | | | 11.19 | | | | | | 0.16 | | | | | | 1.54 | | | | | | 1.70 | | | | | | 0.00* | | | | | | 0.92 | | | | | | — | | | | | | 0.92 | | | | | | — | | | | | | 11.97 | | | | | | 15.33 | | | | | | 42.33 | | | | | | 0.37 | | | | | | 0.37 | | | | | | 1.35 | | | | | | 4 | | | | | | 43 | | |
| Class S2 | | | | | | | | | | | | | | | | | | | | | | | | | | | | | | | | | | | | | | | | | | | | | | | | | | | | | | | | | | | | | | | | | | | | | | | | | | | | | | | | | | | | | | | | | | | | | | | | | | | | | | | |
| 12-31-16 | | | | | 12.71 | | | | | | 0.35• | | | | | | 0.67 | | | | | | 1.02 | | | | | | 0.02 | | | | | | 0.03 | | | | | | — | | | | | | 0.05 | | | | | | — | | | | | | 13.68 | | | | | | 8.04 | | | | | | 0.96 | | | | | | 0.54 | | | | | | 0.54 | | | | | | 2.66 | | | | | | 766 | | | | | | 49 | | |
| 12-31-15 | | | | | 13.70 | | | | | | 0.32• | | | | | | (0.54) | | | | | | (0.22) | | | | | | 0.06 | | | | | | 0.71 | | | | | | — | | | | | | 0.77 | | | | | | — | | | | | | 12.71 | | | | | | (1.83) | | | | | | 7.70 | | | | | | 0.54 | | | | | | 0.54 | | | | | | 2.43 | | | | | | 14 | | | | | | 195 | | |
| 12-31-14 | | | | | 14.05 | | | | | | 0.12 | | | | | | 0.67 | | | | | | 0.79 | | | | | | 0.20 | | | | | | 0.94 | | | | | | — | | | | | | 1.14 | | | | | | — | | | | | | 13.70 | | | | | | 5.71 | | | | | | 62.26 | | | | | | 0.54 | | | | | | 0.54 | | | | | | 0.88 | | | | | | 4 | | | | | | 32 | | |
| 12-31-13 | | | | | 11.97 | | | | | | 0.17 | | | | | | 2.59 | | | | | | 2.76 | | | | | | 0.18 | | | | | | 0.52 | | | | | | — | | | | | | 0.70 | | | | | | 0.02 | | | | | | 14.05 | | | | | | 23.76(d) | | | | | | 83.28 | | | | | | 0.52 | | | | | | 0.52 | | | | | | 1.30 | | | | | | 4 | | | | | | 39 | | |
| 12-31-12 | | | | | 11.19 | | | | | | 0.15 | | | | | | 1.55 | | | | | | 1.70 | | | | | | 0.00* | | | | | | 0.92 | | | | | | — | | | | | | 0.92 | | | | | | — | | | | | | 11.97 | | | | | | 15.33 | | | | | | 42.58 | | | | | | 0.52 | | | | | | 0.52 | | | | | | 1.28 | | | | | | 4 | | | | | | 43 | | |
| Class Z | | | | | | | | | | | | | | | | | | | | | | | | | | | | | | | | | | | | | | | | | | | | | | | | | | | | | | | | | | | | | | | | | | | | | | | | | | | | | | | | | | | | | | | | | | | | | | | | | | | | | | | |
| 12-31-16 | | | | | 12.80 | | | | | | 0.49• | | | | | | 0.61 | | | | | | 1.10 | | | | | | 0.02 | | | | | | 0.03 | | | | | | — | | | | | | 0.05 | | | | | | — | | | | | | 13.85 | | | | | | 8.62 | | | | | | 0.53 | | | | | | 0.00 | | | | | | 0.00 | | | | | | 3.63 | | | | | | 21,080 | | | | | | 49 | | |
05-01-15(5) -
12-31-15 | | | | | 14.46 | | | | | | 0.61• | | | | | | (1.45) | | | | | | (0.84) | | | | | | 0.11 | | | | | | 0.71 | | | | | | — | | | | | | 0.82 | | | | | | — | | | | | | 12.80 | | | | | | (6.02) | | | | | | 7.05 | | | | | | 0.00 | | | | | | 0.00 | | | | | | 7.16 | | | | | | 576 | | | | | | 195 | | |
| Voya Index Solution 2055 Portfolio | | | | | | | | | | | | | | | | | | | | | | | | | | | | | | | | | | | | | | | | | | | | | | | | | | | | | | | | | | | | | | | | | | | | | | | | | | | | | | | | | | | | | | | | | | | | | | | | | | | | | | | |
| Class ADV | | | | | | | | | | | | | | | | | | | | | | | | | | | | | | | | | | | | | | | | | | | | | | | | | | | | | | | | | | | | | | | | | | | | | | | | | | | | | | | | | | | | | | | | | | | | | | | | | | | | | | | |
| 12-31-16 | | | | | 13.12 | | | | | | 0.22• | | | | | | 0.75 | | | | | | 0.97 | | | | | | 0.18 | | | | | | 0.90 | | | | | | — | | | | | | 1.08 | | | | | | — | | | | | | 13.01 | | | | | | 7.61 | | | | | | 0.78 | | | | | | 0.64 | | | | | | 0.64 | | | | | | 1.68 | | | | | | 43,002 | | | | | | 42 | | |
| 12-31-15 | | | | | 14.69 | | | | | | 0.20• | | | | | | (0.45) | | | | | | (0.25) | | | | | | 0.12 | | | | | | 1.20 | | | | | | — | | | | | | 1.32 | | | | | | — | | | | | | 13.12 | | | | | | (2.15) | | | | | | 0.78 | | | | | | 0.65 | | | | | | 0.65 | | | | | | 1.42 | | | | | | 37,162 | | | | | | 39 | | |
| 12-31-14 | | | | | 14.57 | | | | | | 0.13• | | | | | | 0.74 | | | | | | 0.87 | | | | | | 0.14 | | | | | | 0.61 | | | | | | — | | | | | | 0.75 | | | | | | — | | | | | | 14.69 | | | | | | 6.08 | | | | | | 0.78 | | | | | | 0.63 | | | | | | 0.63 | | | | | | 0.88 | | | | | | 31,811 | | | | | | 44 | | |
| 12-31-13 | | | | | 12.06 | | | | | | 0.17• | | | | | | 2.67 | | | | | | 2.84 | | | | | | 0.10 | | | | | | 0.23 | | | | | | — | | | | | | 0.33 | | | | | | — | | | | | | 14.57 | | | | | | 23.83 | | | | | | 0.80 | | | | | | 0.61 | | | | | | 0.61 | | | | | | 1.31 | | | | | | 24,873 | | | | | | 50 | | |
| 12-31-12 | | | | | 10.57 | | | | | | 0.15• | | | | | | 1.48 | | | | | | 1.63 | | | | | | 0.03 | | | | | | 0.11 | | | | | | — | | | | | | 0.14 | | | | | | — | | | | | | 12.06 | | | | | | 15.52 | | | | | | 0.74 | | | | | | 0.62 | | | | | | 0.62 | | | | | | 1.29 | | | | | | 13,319 | | | | | | 28 | | |
See Accompanying Notes to Financial Statements
Financial Highlights (continued)
| | | | | | | | | | Income (loss)
from
investment
operations | | | | | | | | | Less Distributions | | | | | | Ratios to average net assets | | | Supplemental
Data | |
| | | | Net asset value, beginning
of year or period | | | Net investment income (loss) | | | Net realized and unrealized
gain (loss) | | | Total from investment
operations | | | From net investment income | | | From net realized gains | | | From return of capital | | | Total distributions | | | Payment by affiliate | | | Net asset value, end of year
or period | | | Total Return(1) | | | Expenses before
reductions/additions(2)(3)(4) | | | Expenses net of fee waivers
and/or recoupments if any(2)(3)(4) | | | Expenses net of all
reductions/additions(2)(3)(4) | | | Net investment income
(loss)(2)(3) | | | Net assets, end of year
or period | | | Portfolio turnover rate | |
Year or
period ended | | | ($) | | | ($) | | | ($) | | | ($) | | | ($) | | | ($) | | | ($) | | | ($) | | | ($) | | | ($) | | | (%) | | | (%) | | | (%) | | | (%) | | | (%) | | | ($000’s) | | | (%) | |
| Voya Index Solution 2055 Portfolio (continued) | | | | | | | | | | | | | | | | | | | | | | | | | | | | | | | | | | | | | | | | | | | | | | | | | | | | | | | | | | | | | | | | | | | | | | | | | | | | | | | | | | | | | | | | | | | | | | | | | | | | | | | |
| Class I | | | | | | | | | | | | | | | | | | | | | | | | | | | | | | | | | | | | | | | | | | | | | | | | | | | | | | | | | | | | | | | | | | | | | | | | | | | | | | | | | | | | | | | | | | | | | | | | | | | | | | | |
| 12-31-16 | | | | | 13.38 | | | | | | 0.30• | | | | | | 0.75 | | | | | | 1.05 | | | | | | 0.24 | | | | | | 0.90 | | | | | | — | | | | | | 1.14 | | | | | | — | | | | | | 13.29 | | | | | | 8.10 | | | | | | 0.28 | | | | | | 0.14 | | | | | | 0.14 | | | | | | 2.24 | | | | | | 10,595 | | | | | | 42 | | |
| 12-31-15 | | | | | 14.94 | | | | | | 0.32• | | | | | | (0.50) | | | | | | (0.18) | | | | | | 0.18 | | | | | | 1.20 | | | | | | — | | | | | | 1.38 | | | | | | — | | | | | | 13.38 | | | | | | (1.66) | | | | | | 0.28 | | | | | | 0.15 | | | | | | 0.15 | | | | | | 2.23 | | | | | | 8,113 | | | | | | 39 | | |
| 12-31-14 | | | | | 14.78 | | | | | | 0.22• | | | | | | 0.74 | | | | | | 0.96 | | | | | | 0.19 | | | | | | 0.61 | | | | | | — | | | | | | 0.80 | | | | | | — | | | | | | 14.94 | | | | | | 6.61 | | | | | | 0.28 | | | | | | 0.13 | | | | | | 0.13 | | | | | | 1.44 | | | | | | 3,974 | | | | | | 44 | | |
| 12-31-13 | | | | | 12.21 | | | | | | 0.26• | | | | | | 2.67 | | | | | | 2.93 | | | | | | 0.13 | | | | | | 0.23 | | | | | | — | | | | | | 0.36 | | | | | | — | | | | | | 14.78 | | | | | | 24.32 | | | | | | 0.30 | | | | | | 0.11 | | | | | | 0.11 | | | | | | 1.89 | | | | | | 1,782 | | | | | | 50 | | |
| 12-31-12 | | | | | 10.66 | | | | | | 0.21• | | | | | | 1.50 | | | | | | 1.71 | | | | | | 0.05 | | | | | | 0.11 | | | | | | — | | | | | | 0.16 | | | | | | — | | | | | | 12.21 | | | | | | 16.18 | | | | | | 0.24 | | | | | | 0.12 | | | | | | 0.12 | | | | | | 1.80 | | | | | | 1,750 | | | | | | 28 | | |
| Class S | | | | | | | | | | | | | | | | | | | | | | | | | | | | | | | | | | | | | | | | | | | | | | | | | | | | | | | | | | | | | | | | | | | | | | | | | | | | | | | | | | | | | | | | | | | | | | | | | | | | | | | |
| 12-31-16 | | | | | 13.25 | | | | | | 0.25• | | | | | | 0.76 | | | | | | 1.01 | | | | | | 0.20 | | | | | | 0.90 | | | | | | — | | | | | | 1.10 | | | | | | — | | | | | | 13.16 | | | | | | 7.89 | | | | | | 0.53 | | | | | | 0.39 | | | | | | 0.39 | | | | | | 1.92 | | | | | | 23,832 | | | | | | 42 | | |
| 12-31-15 | | | | | 14.82 | | | | | | 0.21 | | | | | | (0.43) | | | | | | (0.22) | | | | | | 0.15 | | | | | | 1.20 | | | | | | — | | | | | | 1.35 | | | | | | — | | | | | | 13.25 | | | | | | (1.93) | | | | | | 0.53 | | | | | | 0.40 | | | | | | 0.40 | | | | | | 1.55 | | | | | | 20,530 | | | | | | 39 | | |
| 12-31-14 | | | | | 14.68 | | | | | | 0.16• | | | | | | 0.76 | | | | | | 0.92 | | | | | | 0.17 | | | | | | 0.61 | | | | | | — | | | | | | 0.78 | | | | | | — | | | | | | 14.82 | | | | | | 6.35 | | | | | | 0.53 | | | | | | 0.38 | | | | | | 0.38 | | | | | | 1.09 | | | | | | 20,758 | | | | | | 44 | | |
| 12-31-13 | | | | | 12.13 | | | | | | 0.21• | | | | | | 2.68 | | | | | | 2.89 | | | | | | 0.11 | | | | | | 0.23 | | | | | | — | | | | | | 0.34 | | | | | | — | | | | | | 14.68 | | | | | | 24.15 | | | | | | 0.55 | | | | | | 0.36 | | | | | | 0.36 | | | | | | 1.57 | | | | | | 15,267 | | | | | | 50 | | |
| 12-31-12 | | | | | 10.61 | | | | | | 0.17• | | | | | | 1.50 | | | | | | 1.67 | | | | | | 0.04 | | | | | | 0.11 | | | | | | — | | | | | | 0.15 | | | | | | — | | | | | | 12.13 | | | | | | 15.89 | | | | | | 0.49 | | | | | | 0.37 | | | | | | 0.37 | | | | | | 1.48 | | | | | | 8,886 | | | | | | 28 | | |
| Class S2 | | | | | | | | | | | | | | | | | | | | | | | | | | | | | | | | | | | | | | | | | | | | | | | | | | | | | | | | | | | | | | | | | | | | | | | | | | | | | | | | | | | | | | | | | | | | | | | | | | | | | | | |
| 12-31-16 | | | | | 13.17 | | | | | | 0.24• | | | | | | 0.74 | | | | | | 0.98 | | | | | | 0.19 | | | | | | 0.90 | | | | | | — | | | | | | 1.09 | | | | | | — | | | | | | 13.06 | | | | | | 7.71 | | | | | | 0.71 | | | | | | 0.54 | | | | | | 0.54 | | | | | | 1.87 | | | | | | 6,752 | | | | | | 42 | | |
| 12-31-15 | | | | | 14.72 | | | | | | 0.21• | | | | | | (0.45) | | | | | | (0.24) | | | | | | 0.11 | | | | | | 1.20 | | | | | | — | | | | | | 1.31 | | | | | | — | | | | | | 13.17 | | | | | | (2.04) | | | | | | 0.78 | | | | | | 0.55 | | | | | | 0.55 | | | | | | 1.50 | | | | | | 5,816 | | | | | | 39 | | |
| 12-31-14 | | | | | 14.59 | | | | | | 0.13• | | | | | | 0.75 | | | | | | 0.88 | | | | | | 0.14 | | | | | | 0.61 | | | | | | — | | | | | | 0.75 | | | | | | — | | | | | | 14.72 | | | | | | 6.15 | | | | | | 0.78 | | | | | | 0.53 | | | | | | 0.53 | | | | | | 0.89 | | | | | | 5,363 | | | | | | 44 | | |
| 12-31-13 | | | | | 12.07 | | | | | | 0.18• | | | | | | 2.67 | | | | | | 2.85 | | | | | | 0.10 | | | | | | 0.23 | | | | | | — | | | | | | 0.33 | | | | | | — | | | | | | 14.59 | | | | | | 23.92 | | | | | | 0.80 | | | | | | 0.51 | | | | | | 0.51 | | | | | | 1.36 | | | | | | 5,212 | | | | | | 50 | | |
| 12-31-12 | | | | | 10.58 | | | | | | 0.17• | | | | | | 1.48 | | | | | | 1.65 | | | | | | 0.05 | | | | | | 0.11 | | | | | | — | | | | | | 0.16 | | | | | | — | | | | | | 12.07 | | | | | | 15.69 | | | | | | 0.74 | | | | | | 0.52 | | | | | | 0.52 | | | | | | 1.44 | | | | | | 3,663 | | | | | | 28 | | |
| Class Z | | | | | | | | | | | | | | | | | | | | | | | | | | | | | | | | | | | | | | | | | | | | | | | | | | | | | | | | | | | | | | | | | | | | | | | | | | | | | | | | | | | | | | | | | | | | | | | | | | | | | | | |
| 12-31-16 | | | | | 13.40 | | | | | | 0.40• | | | | | | 0.67 | | | | | | 1.07 | | | | | | 0.24 | | | | | | 0.90 | | | | | | — | | | | | | 1.14 | | | | | | — | | | | | | 13.33 | | | | | | 8.24 | | | | | | 0.28 | | | | | | 0.00 | | | | | | 0.00 | | | | | | 3.06 | | | | | | 17,543 | | | | | | 42 | | |
05-01-15(5) -
12-31-15 | | | | | 15.69 | | | | | | 0.28• | | | | | | (1.19) | | | | | | (0.91) | | | | | | 0.18 | | | | | | 1.20 | | | | | | — | | | | | | 1.38 | | | | | | — | | | | | | 13.40 | | | | | | (6.22) | | | | | | 0.30 | | | | | | 0.00 | | | | | | 0.00 | | | | | | 3.14 | | | | | | 446 | | | | | | 39 | | |
| Voya Index Solution 2060 Portfolio | | | | | | | | | | | | | | | | | | | | | | | | | | | | | | | | | | | | | | | | | | | | | | | | | | | | | | | | | | | | | | | | | | | | | | | | | | | | | | | | | | | | | | | | | | | | | | | | | | | | | | | |
| Class ADV | | | | | | | | | | | | | | | | | | | | | | | | | | | | | | | | | | | | | | | | | | | | | | | | | | | | | | | | | | | | | | | | | | | | | | | | | | | | | | | | | | | | | | | | | | | | | | | | | | | | | | | |
| 12-31-16 | | | | | 9.77 | | | | | | 0.21• | | | | | | 0.56 | | | | | | 0.77 | | | | | | 0.02 | | | | | | 0.04 | | | | | | — | | | | | | 0.06 | | | | | | — | | | | | | 10.48 | | | | | | 7.87 | | | | | | 1.91 | | | | | | 0.64 | | | | | | 0.64 | | | | | | 2.06 | | | | | | 1,690 | | | | | | 63 | | |
02-09-15(5) -
12-31-15 | | | | | 10.00 | | | | | | 0.20• | | | | | | (0.43) | | | | | | (0.23) | | | | | | — | | | | | | — | | | | | | — | | | | | | — | | | | | | — | | | | | | 9.77 | | | | | | (2.30) | | | | | | 36.51 | | | | | | 0.65 | | | | | | 0.65 | | | | | | 2.29 | | | | | | 87 | | | | | | 208 | | |
| Class I | | | | | | | | | | | | | | | | | | | | | | | | | | | | | | | | | | | | | | | | | | | | | | | | | | | | | | | | | | | | | | | | | | | | | | | | | | | | | | | | | | | | | | | | | | | | | | | | | | | | | | | |
| 12-31-16 | | | | | 9.82 | | | | | | 0.26• | | | | | | 0.54 | | | | | | 0.80 | | | | | | 0.01 | | | | | | 0.04 | | | | | | — | | | | | | 0.05 | | | | | | — | | | | | | 10.57 | | | | | | 8.24 | | | | | | 1.41 | | | | | | 0.14 | | | | | | 0.14 | | | | | | 2.52 | | | | | | 146 | | | | | | 63 | | |
02-09-15(5) -
12-31-15 | | | | | 10.00 | | | | | | 0.51• | | | | | | (0.69) | | | | | | (0.18) | | | | | | — | | | | | | — | | | | | | — | | | | | | — | | | | | | — | | | | | | 9.82 | | | | | | (1.80) | | | | | | 36.01 | | | | | | 0.15 | | | | | | 0.15 | | | | | | 5.86 | | | | | | 32 | | | | | | 208 | | |
| Class S | | | | | | | | | | | | | | | | | | | | | | | | | | | | | | | | | | | | | | | | | | | | | | | | | | | | | | | | | | | | | | | | | | | | | | | | | | | | | | | | | | | | | | | | | | | | | | | | | | | | | | | |
| 12-31-16 | | | | | 9.79 | | | | | | 0.25• | | | | | | 0.54 | | | | | | 0.79 | | | | | | 0.02 | | | | | | 0.04 | | | | | | — | | | | | | 0.06 | | | | | | — | | | | | | 10.52 | | | | | | 8.06 | | | | | | 1.66 | | | | | | 0.39 | | | | | | 0.39 | | | | | | 2.46 | | | | | | 863 | | | | | | 63 | | |
02-09-15(5) -
12-31-15 | | | | | 10.00 | | | | | | 0.58• | | | | | | (0.79) | | | | | | (0.21) | | | | | | — | | | | | | — | | | | | | — | | | | | | — | | | | | | — | | | | | | 9.79 | | | | | | (2.10) | | | | | | 36.26 | | | | | | 0.40 | | | | | | 0.40 | | | | | | 6.61 | | | | | | 131 | | | | | | 208 | | |
| Class S2 | | | | | | | | | | | | | | | | | | | | | | | | | | | | | | | | | | | | | | | | | | | | | | | | | | | | | | | | | | | | | | | | | | | | | | | | | | | | | | | | | | | | | | | | | | | | | | | | | | | | | | | |
| 12-31-16 | | | | | 9.77 | | | | | | 0.26• | | | | | | 0.51 | | | | | | 0.77 | | | | | | — | | | | | | 0.04 | | | | | | — | | | | | | 0.04 | | | | | | — | | | | | | 10.50 | | | | | | 7.92 | | | | | | 1.84 | | | | | | 0.54 | | | | | | 0.54 | | | | | | 2.61 | | | | | | 139 | | | | | | 63 | | |
02-09-15(5) -
12-31-15 | | | | | 10.00 | | | | | | 0.06• | | | | | | (0.29) | | | | | | (0.23) | | | | | | — | | | | | | — | | | | | | — | | | | | | — | | | | | | — | | | | | | 9.77 | | | | | | (2.30) | | | | | | 36.51 | | | | | | 0.55 | | | | | | 0.55 | | | | | | 0.73 | | | | | | 4 | | | | | | 208 | | |
| Class Z | | | | | | | | | | | | | | | | | | | | | | | | | | | | | | | | | | | | | | | | | | | | | | | | | | | | | | | | | | | | | | | | | | | | | | | | | | | | | | | | | | | | | | | | | | | | | | | | | | | | | | | |
| 12-31-16 | | | | | 9.82 | | | | | | 0.50• | | | | | | 0.34 | | | | | | 0.84 | | | | | | 0.02 | | | | | | 0.04 | | | | | | — | | | | | | 0.06 | | | | | | — | | | | | | 10.60 | | | | | | 8.58 | | | | | | 1.41 | | | | | | 0.00 | | | | | | 0.00 | | | | | | 4.95 | | | | | | 3,068 | | | | | | 63 | | |
05-01-15(5) -
12-31-15 | | | | | 10.46 | | | | | | 0.03• | | | | | | (0.67) | | | | | | (0.64) | | | | | | — | | | | | | — | | | | | | — | | | | | | — | | | | | | — | | | | | | 9.82 | | | | | | (6.12) | | | | | | 35.54 | | | | | | 0.00 | | | | | | 0.00 | | | | | | 0.52 | | | | | | 143 | | | | | | 208 | | |
See Accompanying Notes to Financial Statements
Financial Highlights (continued)
(1)
Total return is calculated assuming reinvestment of all dividends, capital gain distributions and return of capital distributions, if any, at net asset value and does not reflect the effect of insurance contract charges. Total return for periods less than one year is not annualized.
(2)
Annualized for periods less than one year.
(3)
Ratios reflect operating expenses of a Portfolio. Expenses before reductions/additions do not reflect amounts reimbursed by an Investment Adviser and/or Distributor or reductions from brokerage service arrangements or other expense offset arrangements and do not represent the amount paid by a Portfolio during periods when reimbursements or reductions occur. Expenses net of fee waivers reflect expenses after reimbursement by an Investment Adviser and/or Distributor but prior to reductions from brokerage service arrangements or other expense offset arrangements. Expenses net of all reductions/additions represent the net expenses paid by a Portfolio. Net investment income (loss) is net of all such additions or reductions.
(4)
Ratios do not include expenses of underlying funds and do not include fees and expenses charged under the variable annuity contract or variable life insurance policy.
(5)
Commencement of operations.
(a)
During the year ended December 31, 2013, Voya Investments, LLC voluntarily reimbursed Voya Index Solution 2020 Portfolio $22 for the foregone investment opportunities attributable to uninvested cash. Excluding this payment by affiliate, total return would have been 13.41%, 13.88%, 13.50%, and 13.50% on Classes ADV, I, S, and S2, respectively.
(b)
During the year ended December 31, 2013, Voya Investments, LLC voluntarily reimbursed Voya Index Solution 2030 Portfolio $24 for the foregone investment opportunities attributable to uninvested cash. Excluding this payment by affiliate, total return would have been 18.53%, 19.14%, 18.60%, and 18.62% on Classes ADV, I, S, and S2, respectively.
(c)
During the year ended December 31, 2013, Voya Investments, LLC voluntarily reimbursed Voya Index Solution 2040 Portfolio $30 for the foregone investment opportunities attributable to uninvested cash. Excluding this payment by affiliate, total return would have been 23.01%, 23.72%, 23.35%, and 23.18% on Classes ADV, I, S, and S2, respectively.
(d)
During the year ended December 31, 2013, Voya Investments, LLC voluntarily reimbursed Voya Index Solution 2050 Portfolio $31 for the foregone investment opportunities attributable to uninvested cash. Excluding this payment by affiliate, total return would have been 23.51%, 24.22%, 23.85%, and 23.58% on Classes ADV, I, S, and S2, respectively.
•
Calculated using average number of shares outstanding throughout the year or period.
*
Amount is less than $0.005 or 0.005% or more than $(0.005) or (0.005)%.
See Accompanying Notes to Financial Statements
Notes to Financial Statements as of December 31, 2016
NOTE 1 — ORGANIZATION
Voya Partners, Inc. (the “Company”) is an open-end management investment company registered under the Investment Company Act of 1940, as amended (the “1940 Act”). It was incorporated under the laws of Maryland on May 7, 1997. The Articles of Incorporation permit the Company to offer separate series, each of which has its own investment objective, policies and restrictions. The series of the Company serve as investment options in underlying variable annuity contracts and variable life insurance policies offered by Directed Services LLC. The Company currently consists of thirty-eight active separate investment series. The ten series (each, a “Portfolio” and collectively, the “Portfolios”) included in this report are: Voya Index Solution Income Portfolio (“Index Solution Income”), Voya Index Solution 2020 Portfolio (“Index Solution 2020”), Voya Index Solution 2025 Portfolio (“Index Solution 2025”), Voya Index Solution 2030 Portfolio (“Index Solution 2030”), Voya Index Solution 2035 Portfolio (“Index Solution 2035”), Voya Index Solution 2040 Portfolio (“Index Solution 2040”), Voya Index Solution 2045 Portfolio (“Index Solution 2045”), Voya Index Solution 2050 Portfolio (“Index Solution 2050”), Voya Index Solution 2055 Portfolio (“Index Solution 2055”) and Voya Index Solution 2060 Portfolio (“Index Solution 2060”), each a diversified series of the Company.
Index Solution 2020, Index Solution 2025, Index Solution 2030, Index Solution 2035, Index Solution 2040, Index Solution 2045, Index Solution 2050, Index Solution 2055 and Index Solution 2060 are structured and managed around a specific target retirement or financial goal date (“Target Date”). When these Portfolios reach their respective Target Date, they may be combined with Index Solution Income, without a vote of shareholders, if approved by the Board of Directors (the “Board”).
The classes of shares included in this report are: Adviser (“Class ADV”), Initial (“Class I”), Service (“Class S”), Service 2 (“Class S2”) and Class Z. Shares of the Portfolios may be offered to separate accounts (“Separate Accounts”) of insurance companies as investment options in connection with variable annuity contracts and variable life insurance policies (“Variable Contracts”) and to certain of the Portfolios’ investment advisers and their affiliates. In the future, shares may also be offered to qualified pension and retirement plans (“Qualified Plans”) outside the Separate Account context. With the exception of class specific matters, each class has equal voting rights as to voting privileges. For class specific proposals, only the applicable class would have voting privileges. The classes differ principally in the applicable distribution and shareholder service fees. Generally, shareholders of each class also bear certain expenses that pertain to that
particular class. All shareholders bear the common expenses of a portfolio and earn income and realized gains/losses from a portfolio pro rata based on the daily ending net assets of each class, without distinction between share classes. Expenses that are specific to a portfolio or a class are charged directly to that portfolio or class. Other operating expenses shared by several portfolios are generally allocated among those portfolios based on average net assets. Distributions are determined separately for each class based on income and expenses allocated to each class. Realized gain distributions are allocated to each class pro rata based on the shares outstanding of each class on the date of distribution. Differences in per share dividend rates generally result from differences in separate class expenses, including distribution and shareholder service fees, if applicable.
Directed Services LLC (“DSL” or the “Investment Adviser”), a Delaware limited liability company and an affiliate of Voya Investments, LLC, serves as the Investment Adviser to the Portfolios. Voya Investment Management Co. LLC (“Voya IM” or the “Sub-Adviser”), a Delaware limited liability company, serves as the Sub-Adviser to the Portfolios. Voya Investments Distributor, LLC (“VID” or the “Distributor”), a Delaware limited liability company, serves as the principal underwriter to the Portfolios.
Each Portfolio seeks to achieve its investment objective by investing in other investment companies (“Underlying Funds”) and uses asset allocation strategies to determine how much to invest in the Underlying Funds. The investment objective of the Portfolios is described in the respective Portfolio’s Prospectus.
NOTE 2 — SIGNIFICANT ACCOUNTING POLICIES
The following significant accounting policies are consistently followed by the Portfolios in the preparation of their financial statements. Each Portfolio is considered an investment company under U.S. generally accepted accounting principles (“GAAP”) and follows the accounting and reporting guidance applicable to investment companies.
A. Security Valuation. Each Portfolio is open for business every day the New York Stock Exchange (“NYSE”) opens for regular trading (each such day, a “Business Day”). The net asset value (“NAV”) per share for each class of each Portfolio is determined each Business Day as of the close of the regular trading session (“Market Close”), as determined by the Consolidated Tape Association (“CTA”), the central distributor of transaction prices for exchange-traded securities (normally 4:00 p.m. Eastern time unless otherwise designated by the CTA). The data reflected on the consolidated tape provided by the CTA is generated by various market centers, including all securities exchanges,
Notes to Financial Statements as of December 31, 2016 (continued)
NOTE 2 — SIGNIFICANT ACCOUNTING POLICIES (continued)
electronic communications networks, and third-market broker-dealers. The NAV per share of each class of each Portfolio is calculated by taking the value of the Portfolio’s assets attributable to that class, subtracting the Portfolio’s liabilities attributable to that class, and dividing by the number of shares of that class that are outstanding. On days when a Portfolio is closed for business, Portfolio shares will not be priced and a Portfolio does not transact purchase and redemption orders. To the extent a Portfolio’s assets are traded in other markets on days when a Portfolio does not price its shares, the value of a Portfolio’s assets will likely change and you will not be able to purchase or redeem shares of a Portfolio.
Assets for which market quotations are readily available are valued at market value. A security listed or traded on an exchange is valued at its last sales price or official closing price as of the close of the regular trading session on the exchange where the security is principally traded or, if such price is not available, at the last sale price as of the Market Close for such security provided by the CTA. Bank loans are valued at the average of the averages of the bid and ask prices provided to an independent loan pricing service by brokers. Futures contracts are valued at the final settlement price set by an exchange on which they are principally traded. Listed options are valued at the mean between the last bid and ask prices from the exchange on which they are principally traded. Investments in open-end registered investment companies that do not trade on an exchange are valued at the end of day NAV per share. Investments in registered investment companies that trade on an exchange are valued at the last sales price or official closing price as of the close of the regular trading session on the exchange where the security is principally traded.
When a market quotation is not readily available or is deemed unreliable, each Portfolio will determine a fair value for the relevant asset in accordance with procedures adopted by the Portfolios’ Board. Such procedures provide, for example, that: (a) Exchange-traded securities are valued at the mean of the closing bid and ask; (b) Debt obligations are valued using an evaluated price provided by an independent pricing service. Evaluated prices provided by the pricing service may be determined without exclusive reliance on quoted prices, and may reflect factors such as institution-size trading in similar groups of securities, developments related to specific securities, benchmark yield, quality, type of issue, coupon rate, maturity, individual trading characteristics and other market data; (c) Securities traded in the over-the-counter market are valued based on prices provided by independent pricing services or market makers; (d) Options not listed on an exchange are valued by an independent source using
an industry accepted model, such as Black-Scholes; (e) Centrally cleared swap agreements are valued using a price provided by the central counterparty clearinghouse; (f) Over-the-counter swap agreements are valued using a price provided by an independent pricing service; (g) Forward foreign currency exchange contracts are valued utilizing current and forward rates obtained from an independent pricing service. Such prices from the third party pricing service are for specific settlement periods and each Portfolio’s forward foreign currency exchange contracts are valued at an interpolated rate between the closest preceding and subsequent period reported by the independent pricing service and (h) Securities for which market prices are not provided by any of the above methods may be valued based upon quotes furnished by brokers.
The prospectuses of the open-end registered investment companies in which each Portfolio may invest explain the circumstances under which they will use fair value pricing and the effects of using fair value pricing.
Foreign securities’ (including foreign exchange contracts) prices are converted into U.S. dollar amounts using the applicable exchange rates as of Market Close. If market quotations are available and believed to be reliable for foreign exchange-traded equity securities, the securities will be valued at the market quotations. Because trading hours for certain foreign securities end before Market Close, closing market quotations may become unreliable. An independent pricing service determines the degree of certainty, based on historical data, that the closing price in the principal market where a foreign security trades is not the current value as of Market Close. Foreign securities’ prices meeting the approved degree of certainty that the price is not reflective of current value will be valued by the independent pricing service using pricing models designed to estimate likely changes in the values of those securities between the times in which the trading in those securities is substantially completed and Market Close. Multiple factors may be considered by the independent pricing service in determining the value of such securities and may include information relating to sector indices, American Depositary Receipts and domestic and foreign index futures.
All other assets for which market quotations are not readily available or became unreliable (or if the above fair valuation methods are unavailable or determined to be unreliable) are valued at fair value as determined in good faith by or under the supervision of the Board following procedures approved by the Board. The Board has delegated to the Investment Adviser responsibility for overseeing the implementation of the Portfolios’ valuation procedures; a “Pricing Committee” comprised of employees of the Investment Adviser or its affiliates has
Notes to Financial Statements as of December 31, 2016 (continued)
NOTE 2 — SIGNIFICANT ACCOUNTING POLICIES (continued)
responsibility for applying the fair valuation methods set forth in the procedures and, if a fair valuation cannot be determined pursuant to the fair valuation methods, determining the fair value of assets held by the Portfolios. Issuer specific events, transaction price, position size, nature and duration of restrictions on disposition of the security, market trends, bid/ask quotes of brokers and other market data may be reviewed in the course of making a good faith determination of a security’s fair value. Valuations change in response to many factors including the historical and prospective earnings of the issuer, the value of the issuer’s assets, general economic conditions, interest rates, investor perceptions and market liquidity. Because of the inherent uncertainties of fair valuation, the values used to determine each Portfolio’s NAV may materially differ from the value received upon actual sale of those investments. Thus, fair valuation may have an unintended dilutive or accretive effect on the value of shareholders’ investments in each Portfolio.
Each investment asset or liability of the Portfolios is assigned a level at measurement date based on the significance and source of the inputs to its valuation. Quoted prices in active markets for identical securities are classified as “Level 1,” inputs other than quoted prices for an asset or liability that are observable are classified as “Level 2” and significant unobservable inputs, including the Sub-Adviser’s or Pricing Committee’s judgment about the assumptions that a market participant would use in pricing an asset or liability are classified as “Level 3.” The inputs used for valuing securities are not necessarily an indication of the risks associated with investing in those securities. Short-term securities of sufficient credit quality are generally considered to be Level 2 securities under applicable accounting rules. The Portfolios classify each of their investments in the Underlying Funds as Level 1, without consideration as to the classification level of the specific investments held by the Underlying Funds. A table summarizing each Portfolio’s investments under these levels of classification is included following the Portfolio of Investments.
U.S. GAAP requires a reconciliation of the beginning to ending balances for reported fair values that presents changes attributable to total realized and unrealized gains or losses, purchases and sales, and transfers in or out of the Level 3 category during the period. The beginning of period timing recognition is used for the transfers between levels of a Portfolio’s assets and liabilities. A reconciliation of Level 3 investments is presented only when a Portfolio has a significant amount of Level 3 investments.
For the year ended December 31, 2016, there have been no significant changes to the fair valuation methodologies.
B. Security Transactions and Revenue Recognition. Security transactions are accounted for on the trade date. Dividend income received from the Underlying Funds is recognized on the ex-dividend date and is recorded as income distributions in the Statements of Operations. Capital gain distributions received from the Underlying Funds are recognized on the ex-dividend date and are recorded on the Statements of Operations as such. Realized gains and losses are reported on the basis of identified cost of securities sold.
C. Distributions to Shareholders. The Portfolios record distributions to their shareholders on the ex-dividend date. Dividends from net investment income and capital gain distributions, if any, are declared and paid annually. The Portfolios may make distributions on a more frequent basis to comply with the distribution requirements of the Internal Revenue Code. The characteristics of income and gains to be distributed are determined in accordance with income tax regulations, which may differ from U.S. GAAP for investment companies.
D. Federal Income Taxes. It is the policy of each Portfolio to comply with the requirements of subchapter M of the Internal Revenue Code that are applicable to regulated investment companies and to distribute substantially all of its net investment income and any net realized capital gains to its shareholders. Therefore, a federal income tax or excise tax provision is not required. Management has considered the sustainability of the Portfolios’ tax positions taken on federal income tax returns for all open tax years in making this determination. No capital gain distributions shall be made until the capital loss carryforwards have been fully utilized or expire.
The Portfolios may utilize equalization accounting for tax purposes, whereby a portion of redemption payments are treated as distributions of income or gain.
E. Use of Estimates. The preparation of financial statements in conformity with U.S. GAAP requires management to make estimates and assumptions that affect the reported amounts of assets and liabilities and disclosure of contingent assets and liabilities at the date of the financial statements and the reported amounts of increases and decreases in net assets from operations during the reporting period. Actual results could differ from those estimates.
F. Risk Exposures and the Use of Derivative Instruments. Each Portfolio’s investment strategies permit it to enter into various types of derivatives contracts, including, but not limited to, futures contracts. In doing so, a
Notes to Financial Statements as of December 31, 2016 (continued)
NOTE 2 — SIGNIFICANT ACCOUNTING POLICIES (continued)
Portfolio will employ strategies in differing combinations to permit it to increase or decrease the level of risk, or change the level or types of exposure to risk factors. This may allow a Portfolio to pursue its objectives more quickly and efficiently than if it were to make direct purchases or sales of securities capable of affecting a similar response to market or credit factors.
In pursuit of its investment objectives, a Portfolio may seek to increase or decrease its exposure to the following market or credit risk factors:
Equity Risk. Stock prices may be volatile or have reduced liquidity in response to real or perceived impacts of factors including, but not limited to, economic conditions, changes in market interest rates, and political events. Stock markets tend to be cyclical, with periods when stock prices generally rise and periods when stock prices generally decline. Any given stock market segment may remain out of favor with investors for a short or long period of time, and stocks as an asset class may underperform bonds or other asset classes during some periods. Additionally, legislative, regulatory or tax policies or developments in these areas may adversely impact the investment techniques available to a manager, add to costs and impair the ability of a Portfolio to achieve its investment objectives.
Risks of Investing in Derivatives. Each Portfolio’s use of derivatives can result in losses due to unanticipated changes in the market or credit risk factors and the overall market. In instances where a Portfolio is using derivatives to decrease, or hedge, exposures to market or credit risk factors for securities held by a Portfolio, there are also risks that those derivatives may not perform as expected resulting in losses for the combined or hedged positions.
Derivative instruments are subject to a number of risks, including the risk of changes in the market price of the underlying securities, credit risk with respect to the counterparty, risk of loss due to changes in market interest rates and liquidity and volatility risk. The amounts required to purchase certain derivatives may be small relative to the magnitude of exposure assumed by a Portfolio. Therefore, the purchase of certain derivatives may have an economic leveraging effect on a Portfolio and exaggerate any increase or decrease in the net asset value. Derivatives may not perform as expected, so a Portfolio may not realize the intended benefits. When used for hedging purposes, the change in value of a derivative may not correlate as expected with the currency, security or other risk being hedged. When used as an alternative or substitute for direct cash investments, the return provided
by the derivative may not provide the same return as direct cash investment. In addition, given their complexity, derivatives expose a Portfolio to the risk of improper valuation.
Generally, derivatives are sophisticated financial instruments whose performance is derived, at least in part, from the performance of an underlying asset or assets. Derivatives include, among other things, swap agreements, options, forwards and futures. Investments in derivatives are generally negotiated over-the-counter with a single counterparty and as a result are subject to credit risks related to the counterparty’s ability or willingness to perform its obligations; any deterioration in the counterparty’s creditworthiness could adversely affect the value of the derivative. In addition, derivatives and their underlying securities may experience periods of illiquidity which could cause a Portfolio to hold a security it might otherwise sell, or to sell a security it otherwise might hold at inopportune times or at an unanticipated price. A manager might imperfectly judge the direction of the market. For instance, if a derivative is used as a hedge to offset investment risk in another security, the hedge might not correlate to the market’s movements and may have unexpected or undesired results such as a loss or a reduction in gains.
The U.S. government has enacted legislation that provides for new regulation of the derivatives market, including clearing, margin, reporting, and registration requirements. The European Union is (and other countries outside of the European Union are) implementing similar requirements, which will affect a Portfolio when it enters into a derivatives transaction with a counterparty organized in that country or otherwise subject to that country’s derivatives regulations. Because these requirements are new and evolving (and some of the rules are not yet final), their ultimate impact remains unclear. Central clearing is expected to reduce counterparty risk and increase liquidity, however, there is no assurance that it will achieve that result, and in the meantime, central clearing and related requirements expose a Portfolio to new kinds of costs and risks.
G. Futures Contracts. Certain Portfolios may enter into futures contracts involving foreign currency, interest rates, securities and security indices. A futures contract is a commitment to buy or sell a specific amount of a financial instrument at a negotiated price on a stipulated future date. A Portfolio may buy and sell futures contracts. Futures contracts traded on a commodities or futures exchange will be valued at the final settlement price or official closing price on the principal exchange as reported by such principal exchange at its trading session ending at, or most recently prior to, the time when each Portfolio’s assets are valued.
Notes to Financial Statements as of December 31, 2016 (continued)
NOTE 2 — SIGNIFICANT ACCOUNTING POLICIES (continued)
Upon entering into a futures contract, a Portfolio is required to deposit either cash or securities (initial margin) in an amount equal to a certain percentage of the contract value. Subsequent payments (variation margin) are made or received by a Portfolio each day. The variation margin payments are equal to the daily changes in the contract value and are recorded as unrealized gains and losses. Open futures contracts are reported on a table following each Portfolio’s Portfolio of Investments. Securities held in collateralized accounts to cover initial margin requirements on open futures contracts, if any, are footnoted in the Portfolio of Investments. Cash collateral held by the broker to cover initial margin requirements on open futures contracts are noted in the Statements of Assets and Liabilities. The net change in unrealized appreciation and depreciation is reported in the Statements of Operations. Realized gains (losses) are reported in the Statements of Operations at the closing or expiration of futures contracts.
Futures contracts are exposed to the market risk factor of the underlying financial instrument. During the year ended December 31, 2016, certain Portfolios had purchased futures contracts on various equity indices to “equitize” cash. Futures contracts are purchased to provide immediate market exposure proportionate to the size of the Portfolio’s respective cash flows and residual cash balances in order to decrease potential tracking error if the cash remained uninvested in the market. Certain Portfolios also purchased futures contracts on U.S. Treasury Notes and sold futures contracts on equity indices as part of their tactical asset allocation strategy. Additional associated risks of entering into futures contracts include the possibility that there may be an illiquid market where the Portfolios are unable to liquidate the contract or enter into an offsetting position and, if used for hedging purposes, the risk that the price of the contract will correlate imperfectly with the prices of the Portfolios’ securities. With futures, there is minimal counterparty credit risk to the Portfolios since futures are exchange traded and the exchange’s clearinghouse, as counterparty to all exchange traded futures, guarantees the futures against default.
During the year ended December 31, 2016, the following Portfolios had average notional values on futures contracts purchased and sold as disclosed below. There were no open futures contracts for any Portfolio at December 31, 2016.
| | | | Purchased | | | Sold | |
| Index Solution Income | | | | $ | 3,783,741 | | | | | $ | 3,718,658 | | |
| Index Solution 2020 | | | | | — | | | | | | 614,500 | | |
| Index Solution 2025 | | | | | 6,440,637 | | | | | | 5,776,792 | | |
| Index Solution 2030 | | | | | — | | | | | | 409,667 | | |
| | | | Purchased | | | Sold | |
| Index Solution 2035 | | | | $ | 4,809,717 | | | | | $ | 5,327,724 | | |
| Index Solution 2040 | | | | | — | | | | | | 204,833 | | |
| Index Solution 2045 | | | | | 3,909,375 | | | | | | 3,459,518 | | |
| Index Solution 2050 | | | | | — | | | | | | 102,417 | | |
| Index Solution 2055 | | | | | 1,123,920 | | | | | | 1,178,481 | | |
H. Offering Costs. Costs incurred with the offering of shares of a Portfolio are deferred and amortized over a twelve-month period on a straight-line basis starting at the commencement of operations.
I. Indemnifications. In the normal course of business, the Company may enter into contracts that provide certain indemnifications. The Company’s maximum exposure under these arrangements is dependent on future claims that may be made against the Portfolios and, therefore, cannot be estimated; however, based on experience, management considers the risk of loss from such claims remote.
NOTE 3 — INVESTMENTS IN UNDERLYING FUNDS
For the year ended December 31, 2016, the cost of purchases and the proceeds from sales of the Underlying Funds were as follows:
| | | | Purchases | | | Sales | |
| Index Solution Income | | | | $ | 187,823,096 | | | | | $ | 171,580,322 | | |
| Index Solution 2020 | | | | | 124,529,946 | | | | | | 32,067,600 | | |
| Index Solution 2025 | | | | | 307,955,702 | | | | | | 225,267,175 | | |
| Index Solution 2030 | | | | | 108,575,733 | | | | | | 21,997,965 | | |
| Index Solution 2035 | | | | | 253,991,331 | | | | | | 175,898,590 | | |
| Index Solution 2040 | | | | | 66,054,630 | | | | | | 10,894,615 | | |
| Index Solution 2045 | | | | | 168,240,859 | | | | | | 115,270,149 | | |
| Index Solution 2050 | | | | | 32,763,047 | | | | | | 5,342,594 | | |
| Index Solution 2055 | | | | | 59,676,005 | | | | | | 35,309,641 | | |
| Index Solution 2060 | | | | | 6,953,250 | | | | | | 1,618,722 | | |
NOTE 4 — INVESTMENT MANAGEMENT FEES
The Portfolios have entered into an investment management agreement (“Management Agreement”) with the Investment Adviser. The Investment Adviser has overall responsibility for the management of the Portfolios. The Investment Adviser oversees all investment management and portfolio management services for the Portfolios and assists in managing and supervising all aspects of the general day-to-day business activities and operations of the Portfolios, including custodial, transfer agency, dividend disbursing, accounting, auditing, compliance and related services. This Management Agreement compensates the Investment Adviser with a management fee, computed daily and payable monthly, based on the average daily net assets of each Portfolio, at the following annual rates: 0.20% of each Portfolio’s average daily nets assets invested in affiliated Underlying Funds and 0.40%
Notes to Financial Statements as of December 31, 2016 (continued)
NOTE 4 — INVESTMENT MANAGEMENT FEES (continued)
of each Portfolio’s average daily net assets invested in unaffiliated Underlying Funds and/or other investments.
The Investment Adviser has entered into a sub-advisory agreement with Voya IM. Subject to such policies as the Board or the Investment Adviser may determine, Voya IM manages the Portfolios’ assets in accordance with the Portfolios’ investment objectives, policies, and limitations.
NOTE 5 — DISTRIBUTION AND SERVICE FEES
Classes ADV and S2 of the Portfolios have a plan of distribution pursuant to Rule 12b-1 under the 1940 Act (the “12b-1 Plans”), whereby the Distributor is reimbursed or compensated by the Portfolios for expenses incurred in the distribution of each respective Portfolio’s shares (“Distribution Fees”). The Distributor may pay, on behalf of each Portfolio, out of its distribution fee, compensation to certain financial institutions for providing distribution assistance pursuant to a Distribution Services Agreement. Under the 12b-1 Plans each Portfolio makes payments to the Distributor at an annual rate of 0.25% of each Portfolio’s average daily net assets attributable to its Class ADV shares and effective May 1, 2016, each Portfolio makes payments to the Distributor at an annual rate of 0.15% of each Portfolio’s average daily net assets attributable to its Class S2 shares. Prior to May 1, 2016, the distribution fee on Class S2 shares was 0.25% and the Distributor had contractually agreed to waive a portion of the fee equal to 0.10%, so that the actual fee paid by Class S2 shares of the Portfolios was an annual rate of 0.15%.
The Company has a shareholder servicing plan (“Service Plan”) for the Classes ADV, S and S2 shares of each respective Portfolio. The Service Plan allows the Distributor to enter into shareholder servicing agreements with insurance companies, broker dealers or other financial intermediaries that provide administrative services related to Classes ADV, S and S2 shares and their shareholders including Variable Contract owners or Qualified Plan participants with interests in the Portfolios. Under the Service Plan, each Portfolio makes payments to the Distributor which shall not exceed an annual rate of 0.25% of each Portfolio’s average daily net assets attributable to its Classes ADV, S and S2 shares.
NOTE 6 — OTHER TRANSACTIONS WITH AFFILIATES AND RELATED PARTIES
At December 31, 2016, the following direct or indirect, wholly-owned subsidiaries of Voya Financial, Inc. owned more than 5% of the following Portfolios:
| Subsidiary | | | Portfolio | | | Percentage | |
| Voya Institutional Trust Company | | | Index Solution Income | | | | | 44.72% | | |
| | | | Index Solution 2020 | | | | | 9.54 | | |
| | | | Index Solution 2025 | | | | | 18.97 | | |
| | | | Index Solution 2030 | | | | | 7.93 | | |
| | | | Index Solution 2035 | | | | | 15.40 | | |
| | | | Index Solution 2045 | | | | | 12.26 | | |
| | | | Index Solution 2055 | | | | | 9.09 | | |
| Voya Retirement Insurance and Annuity Company | | | Index Solution Income | | | | | 55.24 | | |
| | | | Index Solution 2020 | | | | | 90.46 | | |
| | | | Index Solution 2025 | | | | | 80.90 | | |
| | | | Index Solution 2030 | | | | | 92.07 | | |
| | | | Index Solution 2035 | | | | | 84.55 | | |
| | | | Index Solution 2040 | | | | | 97.11 | | |
| | | | Index Solution 2045 | | | | | 87.74 | | |
| | | | Index Solution 2050 | | | | | 95.98 | | |
| | | | Index Solution 2055 | | | | | 90.91 | | |
| | | | Index Solution 2060 | | | | | 96.87 | | |
| | | | |
Under the 1940 Act, the direct or indirect beneficial owner of more than 25% of the voting securities of a company (including a fund) is presumed to control such company. Companies under common control (e.g., companies with a common owner of greater than 25% of their respective voting securities) are affiliates under the 1940 Act.
The Portfolios have adopted a deferred compensation plan (the “DC Plan”), which allows eligible independent directors, as described in the DC Plan, to defer the receipt of all or a portion of the directors’ fees that they are entitled to receive from the Portfolios. For purposes of determining the amount owed to the director under the DC Plan, the amounts deferred are invested in shares of the funds selected by the director (the “Notional Funds”). The Portfolios purchase shares of the Notional Funds, which are all advised by Voya Investments, LLC, in amounts equal to the directors’ deferred fees, resulting in a Portfolio asset equal to the deferred compensation liability. Such assets are included as a component of “Other assets” on the accompanying Statements of Assets and Liabilities. Deferral of directors’ fees under the DC Plan will not affect net assets of the Portfolio, and will not materially affect the Portfolios’ assets, liabilities or net investment income per share. Amounts will be deferred until distributed in accordance with the DC Plan.
NOTE 7 — EXPENSE LIMITATION AGREEMENTS
The Investment Adviser has entered into a written expense limitation agreement (“Expense Limitation Agreement”) with each Portfolio whereby the Investment Adviser has agreed to limit expenses, excluding interest, taxes,
Notes to Financial Statements as of December 31, 2016 (continued)
NOTE 7 — EXPENSE LIMITATION AGREEMENTS (continued)
investment-related costs, leverage expenses, and extraordinary expenses to the levels listed in the table below.
| Portfolio | | | Class
ADV(1) | | | Class
I(1) | | | Class
S(1) | | | Class
S2(1) | | | Class
Z(2)(3) | |
| Index Solution Income | | | | | 1.01% | | | | | | 0.51% | | | | | | 0.76% | | | | | | 0.91% | | | | | | 0.00% | | |
| Index Solution 2020 | | | | | 1.01% | | | | | | 0.51% | | | | | | 0.76% | | | | | | 0.91% | | | | | | 0.00% | | |
| Index Solution 2025 | | | | | 1.01% | | | | | | 0.51% | | | | | | 0.76% | | | | | | 0.91% | | | | | | 0.00% | | |
| Index Solution 2030 | | | | | 1.01% | | | | | | 0.51% | | | | | | 0.76% | | | | | | 0.91% | | | | | | 0.00% | | |
| Index Solution 2035 | | | | | 1.01% | | | | | | 0.51% | | | | | | 0.76% | | | | | | 0.91% | | | | | | 0.00% | | |
| Index Solution 2040 | | | | | 1.00% | | | | | | 0.50% | | | | | | 0.75% | | | | | | 0.90% | | | | | | 0.00% | | |
| Index Solution 2045 | | | | | 1.01% | | | | | | 0.51% | | | | | | 0.76% | | | | | | 0.91% | | | | | | 0.00% | | |
| Index Solution 2050 | | | | | 1.01% | | | | | | 0.51% | | | | | | 0.76% | | | | | | 0.91% | | | | | | 0.00% | | |
| Index Solution 2055 | | | | | 1.01% | | | | | | 0.51% | | | | | | 0.76% | | | | | | 0.91% | | | | | | 0.00% | | |
| Index Solution 2060 | | | | | 1.01% | | | | | | 0.51% | | | | | | 0.76% | | | | | | 0.91% | | | | | | 0.00% | | |
(1)
The operating expense limits take into account the operating expenses incurred at the Underlying Fund level. The amount of fees and expenses of an Underlying Fund borne by each Portfolio will vary based on each Portfolio’s allocation of assets to, and the net expenses of, a particular Underlying Fund.
(2)
Pursuant to a side letter agreement, through May 1, 2018, the Investment Adviser has agreed to waive all or a portion of the advisory fee so that the direct expense limits are 0.00% for all Portfolios. Any fees waived pursuant to the side letter agreement shall not be eligible for recoupment. Termination or modification of this obligation requires approval by the Board.
(3)
The operating expense limits shown apply only at each Portfolio level and do not include the fees payable by the Underlying Funds in which each Portfolio invests.
The Investment Adviser may at a later date recoup from a Portfolio, except for Class Z, for fees waived and/or other expenses assumed by the Investment Adviser during the previous 36 months, but only if, after such recoupment, a Portfolio’s expense ratio does not exceed the percentage described above. Waived and reimbursed fees net of any recoupment by the Investment Adviser of such waived and reimbursed fees are reflected on the accompanying Statements of Operations. Amounts payable by the Investment Adviser are reflected on the accompanying Statements of Assets and Liabilities.
As of December 31, 2016, the amounts of waived and/or reimbursed fees that are subject to possible recoupment by the Investment Adviser, and the related expiration dates are as follows:
| | | | December 31, | | | | | | | |
| | | | 2017 | | | 2018 | | | 2019 | | | Total | |
| Index Solution Income | | | | $ | 283,370 | | | | | $ | 374,853 | | | | | $ | 596,379 | | | | | $ | 1,254,602 | | |
| Index Solution 2020 | | | | | 13,317 | | | | | | 23,703 | | | | | | 108,524 | | | | | | 145,544 | | |
| Index Solution 2025 | | | | | 759,707 | | | | | | 713,698 | | | | | | 755,947 | | | | | | 2,229,352 | | |
| Index Solution 2030 | | | | | 13,352 | | | | | | 22,957 | | | | | | 91,865 | | | | | | 128,174 | | |
| Index Solution 2035 | | | | | 552,136 | | | | | | 538,481 | | | | | | 618,630 | | | | | | 1,709,247 | | |
| Index Solution 2040 | | | | | 13,502 | | | | | | 22,307 | | | | | | 72,789 | | | | | | 108,598 | | |
| Index Solution 2045 | | | | | 314,407 | | | | | | 321,987 | | | | | | 369,798 | | | | | | 1,006,192 | | |
| Index Solution 2050 | | | | | 13,467 | | | | | | 21,910 | | | | | | 48,669 | | | | | | 84,046 | | |
| Index Solution 2055 | | | | | 80,383 | | | | | | 91,837 | | | | | | 125,455 | | | | | | 297,675 | | |
| Index Solution 2060 | | | | | — | | | | | | 26,627 | | | | | | 26,900 | | | | | | 53,527 | | |
The Expense Limitation Agreement is contractual through May 1, 2018 (except for Index Solution 2060, which is through May 1, 2017) and shall renew automatically for one-year terms. Termination or modification of this obligation requires approval by the Board.
NOTE 8 — LINE OF CREDIT
Effective May 20, 2016, each Portfolio, in addition to certain other funds managed by the Investment Adviser, has entered into an unsecured committed revolving line of credit agreement (the “Credit Agreement”) with The Bank of New York Mellon (“BNY”) for an aggregate amount of $400,000,000. The proceeds may be used only to finance temporarily: (1) the purchase or sale of investment securities; or (2) the repurchase or redemption of shares of the Portfolios or certain other funds managed by the Investment Adviser. The funds to which the line of credit is available pay a commitment fee equal to 0.15% per annum on the daily unused portion of the committed line amount payable quarterly in arrears. Prior to May 20, 2016, the aggregate amount was $200,000,000 and the commitment fee was equal to 0.10% per annum on the daily unused portion of the committed line amount payable quarterly in arrears.
Borrowings under the Credit Agreement accrue interest at the federal funds rate plus a specified margin. Repayments generally must be made within 60 days after the date of a revolving credit advance.
The following Portfolios utilized the line of credit during the year ended December 31, 2016.
| Portfolio | | | Days
Utilized | | | Approximate
Average
Daily
Balance For
Days
Utilized | | | Approximate
Weighted
Average
Interest Rate
For Days
Utilized | |
| Index Solution 2025 | | | | | 2 | | | | | $ | 903,000 | | | | | | 1.38% | | |
| Index Solution 2035 | | | | | 2 | | | | | | 1,149,000 | | | | | | 1.38 | | |
| Index Solution 2045 | | | | | 2 | | | | | | 729,000 | | | | | | 1.38 | | |
Notes to Financial Statements as of December 31, 2016 (continued)
NOTE 9 — CAPITAL SHARES
Transactions in capital shares and dollars were as follows:
| | | | Shares
sold | | | Shares
issued in
merger | | | Reinvestment
of
distributions | | | Shares
redeemed | | | Net increase
(decrease)
in shares
outstanding | | | Shares
sold | | | Proceeds
from shares
issued in
merger | | | Reinvestment
of
distributions | | | Shares
redeemed | | | Net increase
(decrease) | |
| Year or period ended | | | # | | | # | | | # | | | # | | | # | | | ($) | | | ($) | | | ($) | | | ($) | | | ($) | |
| Index Solution Income | |
| Class ADV | | | | | | | | | | | |
| 12/31/2016 | | | | | 1,757,497 | | | | | | — | | | | | | 371,692 | | | | | | (3,908,445) | | | | | | (1,779,256) | | | | | | 17,037,732 | | | | | | — | | | | | | 3,631,432 | | | | | | (37,893,146) | | | | | | (17,223,982) | | |
| 12/31/2015 | | | | | 1,343,831 | | | | | | 10,951,625 | | | | | | 297,898 | | | | | | (2,083,879) | | | | | | 10,509,475 | | | | | | 13,444,759 | | | | | | 106,767,778 | | | | | | 2,910,466 | | | | | | (20,716,015) | | | | | | 102,406,988 | | |
| Class I | | | | | | | | | | | |
| 12/31/2016 | | | | | 411,277 | | | | | | — | | | | | | 100,188 | | | | | | (704,445) | | | | | | (192,980) | | | | | | 4,109,474 | | | | | | — | | | | | | 1,001,877 | | | | | | (7,033,363) | | | | | | (1,922,012) | | |
| 12/31/2015 | | | | | 421,734 | | | | | | 2,669,648 | | | | | | 49,225 | | | | | | (450,785) | | | | | | 2,689,822 | | | | | | 4,260,951 | | | | | | 26,589,402 | | | | | | 491,261 | | | | | | (4,459,722) | | | | | | 26,881,892 | | |
| Class S | | | | | | | | | | | |
| 12/31/2016 | | | | | 692,560 | | | | | | — | | | | | | 560,841 | | | | | | (4,173,828) | | | | | | (2,920,427) | | | | | | 6,821,948 | | | | | | — | | | | | | 5,557,940 | | | | | | (40,942,521) | | | | | | (28,562,633) | | |
| 12/31/2015 | | | | | 610,317 | | | | | | 10,746,585 | | | | | | 983,529 | | | | | | (3,365,521) | | | | | | 8,974,910 | | | | | | 6,142,945 | | | | | | 106,152,600 | | | | | | 9,736,935 | | | | | | (33,612,981) | | | | | | 88,419,499 | | |
| Class S2 | | | | | | | | | | | |
| 12/31/2016 | | | | | 302,117 | | | | | | — | | | | | | 39,994 | | | | | | (476,597) | | | | | | (134,486) | | | | | | 2,910,178 | | | | | | — | | | | | | 388,739 | | | | | | (4,588,398) | | | | | | (1,289,481) | | |
| 12/31/2015 | | | | | 110,560 | | | | | | 1,274,307 | | | | | | 28,268 | | | | | | (288,516) | | | | | | 1,124,619 | | | | | | 1,092,463 | | | | | | 12,355,591 | | | | | | 274,769 | | | | | | (2,906,358) | | | | | | 10,816,465 | | |
| Class T(2) | | | | | | | | | | | |
| 12/31/2016 | | | | | — | | | | | | — | | | | | | — | | | | | | (625) | | | | | | (625) | | | | | | — | | | | | | — | | | | | | — | | | | | | (6,185) | | | | | | (6,185) | | |
| 12/31/2015 | | | | | — | | | | | | 303 | | | | | | — | | | | | | —* | | | | | | 303 | | | | | | — | | | | | | 2,976 | | | | | | — | | | | | | — | | | | | | 2,976 | | |
| Class Z | | | | | | | | | | | |
| 12/31/2016 | | | | | 7,750,816 | | | | | | — | | | | | | 83,732 | | | | | | (910,013) | | | | | | 6,924,535 | | | | | | 77,500,077 | | | | | | — | | | | | | 839,827 | | | | | | (9,086,623) | | | | | | 69,253,281 | | |
5/1/2015(1) -
12/31/2015 | | | | | 190,009 | | | | | | — | | | | | | 30 | | | | | | (23,061) | | | | | | 166,978 | | | | | | 1,873,621 | | | | | | — | | | | | | 297 | | | | | | (224,641) | | | | | | 1,649,277 | | |
| Index Solution 2020 | |
| Class ADV | | | | | | | | | | | |
| 12/31/2016 | | | | | 1,054,518 | | | | | | — | | | | | | 1,682 | | | | | | (336,704) | | | | | | 719,496 | | | | | | 12,205,040 | | | | | | — | | | | | | 20,075 | | | | | | (3,964,761) | | | | | | 8,260,354 | | |
| 12/31/2015 | | | | | 418,271 | | | | | | — | | | | | | 30 | | | | | | (4,950) | | | | | | 413,351 | | | | | | 4,779,768 | | | | | | — | | | | | | 344 | | | | | | (56,611) | | | | | | 4,723,501 | | |
| Class I | | | | | | | | | | | |
| 12/31/2016 | | | | | 280,008 | | | | | | — | | | | | | 358 | | | | | | (18,891) | | | | | | 261,475 | | | | | | 3,363,327 | | | | | | — | | | | | | 4,353 | | | | | | (220,531) | | | | | | 3,147,149 | | |
| 12/31/2015 | | | | | 32,278 | | | | | | — | | | | | | —* | | | | | | (5,644) | | | | | | 26,634 | | | | | | 369,062 | | | | | | — | | | | | | 1 | | | | | | (66,188) | | | | | | 302,875 | | |
| Class S | | | | | | | | | | | |
| 12/31/2016 | | | | | 752,349 | | | | | | — | | | | | | 609 | | | | | | (127,208) | | | | | | 625,750 | | | | | | 9,012,238 | | | | | | — | | | | | | 7,399 | | | | | | (1,525,863) | | | | | | 7,493,774 | | |
| 12/31/2015 | | | | | 102,494 | | | | | | — | | | | | | —* | | | | | | (9,024) | | | | | | 93,470 | | | | | | 1,190,661 | | | | | | — | | | | | | —* | | | | | | (105,325) | | | | | | 1,085,336 | | |
| Class S2 | | | | | | | | | | | |
| 12/31/2016 | | | | | 287,919 | | | | | | — | | | | | | 165 | | | | | | (46,919) | | | | | | 241,165 | | | | | | 3,412,223 | | | | | | — | | | | | | 1,997 | | | | | | (532,075) | | | | | | 2,882,145 | | |
| 12/31/2015 | | | | | 35,668 | | | | | | — | | | | | | —* | | | | | | (4,121) | | | | | | 31,547 | | | | | | 416,642 | | | | | | — | | | | | | —* | | | | | | (47,695) | | | | | | 368,947 | | |
| Class T(2) | | | | | | | | | | | |
| 12/31/2016 | | | | | — | | | | | | — | | | | | | — | | | | | | (324) | | | | | | (324) | | | | | | — | | | | | | — | | | | | | — | | | | | | (3,016) | | | | | | (3,016) | | |
| 12/31/2015 | | | | | — | | | | | | — | | | | | | —* | | | | | | — | | | | | | —* | | | | | | 3 | | | | | | — | | | | | | —* | | | | | | — | | | | | | 3 | | |
| Class Z | | | | | | | | | | | |
| 12/31/2016 | | | | | 6,273,312 | | | | | | — | | | | | | 4,385 | | | | | | (491,288) | | | | | | 5,786,409 | | | | | | 75,668,130 | | | | | | — | | | | | | 53,453 | | | | | | (5,961,284) | | | | | | 69,760,299 | | |
5/1/2015(1) -
12/31/2015 | | | | | 180,141 | | | | | | — | | | | | | 51 | | | | | | (4,754) | | | | | | 175,438 | | | | | | 2,098,180 | | | | | | — | | | | | | 603 | | | | | | (55,508) | | | | | | 2,043,275 | | |
| Index Solution 2025 | |
| Class ADV | | | | | | | | | | | |
| 12/31/2016 | | | | | 3,154,325 | | | | | | — | | | | | | 2,110,559 | | | | | | (4,568,562) | | | | | | 696,322 | | | | | | 31,493,273 | | | | | | — | | | | | | 20,620,164 | | | | | | (45,898,182) | | | | | | 6,215,255 | | |
| 12/31/2015 | | | | | 2,925,766 | | | | | | — | | | | | | 2,238,320 | | | | | | (3,934,257) | | | | | | 1,229,829 | | | | | | 32,697,172 | | | | | | — | | | | | | 23,681,428 | | | | | | (43,355,227) | | | | | | 13,023,373 | | |
| Class I | | | | | | | | | | | |
| 12/31/2016 | | | | | 953,157 | | | | | | — | | | | | | 519,524 | | | | | | (618,362) | | | | | | 854,319 | | | | | | 9,785,563 | | | | | | — | | | | | | 5,184,848 | | | | | | (6,320,110) | | | | | | 8,650,301 | | |
| 12/31/2015 | | | | | 1,223,807 | | | | | | — | | | | | | 508,755 | | | | | | (996,076) | | | | | | 736,486 | | | | | | 13,996,775 | | | | | | — | | | | | | 5,489,468 | | | | | | (10,660,151) | | | | | | 8,826,092 | | |
| Class S | | | | | | | | | | | |
| 12/31/2016 | | | | | 1,759,298 | | | | | | — | | | | | | 1,361,663 | | | | | | (4,282,561) | | | | | | (1,161,600) | | | | | | 17,733,882 | | | | | | — | | | | | | 13,466,850 | | | | | | (43,421,336) | | | | | | (12,220,604) | | |
| 12/31/2015 | | | | | 2,475,618 | | | | | | — | | | | | | 1,816,551 | | | | | | (4,223,848) | | | | | | 68,321 | | | | | | 28,299,354 | | | | | | — | | | | | | 19,418,927 | | | | | | (45,861,924) | | | | | | 1,856,357 | | |
| Class S2 | | | | | | | | | | | |
| 12/31/2016 | | | | | 464,377 | | | | | | — | | | | | | 304,868 | | | | | | (755,404) | | | | | | 13,841 | | | | | | 4,620,137 | | | | | | — | | | | | | 2,966,360 | | | | | | (7,633,634) | | | | | | (47,137) | | |
| 12/31/2015 | | | | | 425,446 | | | | | | — | | | | | | 329,593 | | | | | | (1,061,017) | | | | | | (305,978) | | | | | | 4,660,744 | | | | | | — | | | | | | 3,473,910 | | | | | | (12,060,973) | | | | | | (3,926,319) | | |
| Class T(2) | | | | | | | | | | | |
| 12/31/2016 | | | | | — | | | | | | — | | | | | | — | | | | | | (319) | | | | | | (319) | | | | | | — | | | | | | — | | | | | | — | | | | | | (3,002) | | | | | | (3,002) | | |
| 12/31/2015 | | | | | — | | | | | | — | | | | | | — | | | | | | — | | | | | | — | | | | | | — | | | | | | — | | | | | | — | | | | | | — | | | | | | — | | |
Notes to Financial Statements as of December 31, 2016 (continued)
NOTE 9 — CAPITAL SHARES (continued)
| | | | Shares
sold | | | Shares
issued in
merger | | | Reinvestment
of
distributions | | | Shares
redeemed | | | Net increase
(decrease)
in shares
outstanding | | | Shares
sold | | | Proceeds
from shares
issued in
merger | | | Reinvestment
of
distributions | | | Shares
redeemed | | | Net increase
(decrease) | |
| Year or period ended | | | # | | | # | | | # | | | # | | | # | | | ($) | | | ($) | | | ($) | | | ($) | | | ($) | |
| Index Solution 2025 (continued) | |
| Class Z | | | | | | | | | | | |
| 12/31/2016 | | | | | 11,517,559 | | | | | | — | | | | | | 495,023 | | | | | | (530,329) | | | | | | 11,482,253 | | | | | | 118,021,712 | | | | | | — | | | | | | 4,950,232 | | | | | | (5,398,757) | | | | | | 117,573,187 | | |
5/1/2015(1) -
12/31/2015 | | | | | 239,522 | | | | | | — | | | | | | 48 | | | | | | (18,079) | | | | | | 221,491 | | | | | | 2,514,264 | | | | | | — | | | | | | 522 | | | | | | (190,849) | | | | | | 2,323,937 | | |
| Index Solution 2030 | |
| Class ADV | | | | | | | | | | | |
| 12/31/2016 | | | | | 765,208 | | | | | | — | | | | | | 702 | | | | | | (163,945) | | | | | | 601,965 | | | | | | 9,736,426 | | | | | | — | | | | | | 9,124 | | | | | | (2,072,010) | | | | | | 7,673,540 | | |
| 12/31/2015 | | | | | 227,492 | | | | | | — | | | | | | 115 | | | | | | (18,266) | | | | | | 209,341 | | | | | | 2,843,605 | | | | | | — | | | | | | 1,462 | | | | | | (226,871) | | | | | | 2,618,196 | | |
| Class I | | | | | | | | | | | |
| 12/31/2016 | | | | | 166,654 | | | | | | — | | | | | | 303 | | | | | | (67,898) | | | | | | 99,059 | | | | | | 2,138,175 | | | | | | — | | | | | | 4,012 | | | | | | (902,410) | | | | | | 1,239,777 | | |
| 12/31/2015 | | | | | 62,097 | | | | | | — | | | | | | —* | | | | | | (541) | | | | | | 61,556 | | | | | | 783,259 | | | | | | — | | | | | | —* | | | | | | (6,817) | | | | | | 776,442 | | |
| Class S | | | | | | | | | | | |
| 12/31/2016 | | | | | 563,415 | | | | | | — | | | | | | 319 | | | | | | (113,604) | | | | | | 450,130 | | | | | | 7,371,588 | | | | | | — | | | | | | 4,205 | | | | | | (1,491,566) | | | | | | 5,884,227 | | |
| 12/31/2015 | | | | | 58,036 | | | | | | — | | | | | | —* | | | | | | (16,932) | | | | | | 41,104 | | | | | | 735,399 | | | | | | — | | | | | | —* | | | | | | (214,270) | | | | | | 521,129 | | |
| Class S2 | | | | | | | | | | | |
| 12/31/2016 | | | | | 147,444 | | | | | | — | | | | | | 125 | | | | | | (20,760) | | | | | | 126,809 | | | | | | 1,882,849 | | | | | | — | | | | | | 1,631 | | | | | | (263,990) | | | | | | 1,620,490 | | |
| 12/31/2015 | | | | | 3,853 | | | | | | — | | | | | | —* | | | | | | (426) | | | | | | 3,427 | | | | | | 48,461 | | | | | | — | | | | | | —* | | | | | | (5,317) | | | | | | 43,144 | | |
| Class T(2) | | | | | | | | | | | |
| 12/31/2016 | | | | | — | | | | | | — | | | | | | — | | | | | | (328) | | | | | | (328) | | | | | | — | | | | | | — | | | | | | — | | | | | | (3,015) | | | | | | (3,015) | | |
| 12/31/2015 | | | | | — | | | | | | — | | | | | | —* | | | | | | — | | | | | | —* | | | | | | 3 | | | | | | — | | | | | | —* | | | | | | (1) | | | | | | 2 | | |
| Class Z | | | | | | | | | | | |
| 12/31/2016 | | | | | 5,419,901 | | | | | | — | | | | | | 2,816 | | | | | | (161,825) | | | | | | 5,260,892 | | | | | | 71,494,654 | | | | | | — | | | | | | 37,313 | | | | | | (2,141,572) | | | | | | 69,390,395 | | |
5/1/2015(1)-
12/31/2015 | | | | | 118,696 | | | | | | — | | | | | | 22 | | | | | | (23,735) | | | | | | 94,983 | | | | | | 1,508,488 | | | | | | — | | | | | | 287 | | | | | | (302,767) | | | | | | 1,206,008 | | |
| Index Solution 2035 | |
| Class ADV | | | | | | | | | | | |
| 12/31/2016 | | | | | 2,979,966 | | | | | | — | | | | | | 2,139,450 | | | | | | (3,962,090) | | | | | | 1,157,326 | | | | | | 29,828,035 | | | | | | — | | | | | | 20,859,643 | | | | | | (39,867,145) | | | | | | 10,820,533 | | |
| 12/31/2015 | | | | | 2,166,518 | | | | | | — | | | | | | 2,232,892 | | | | | | (3,152,755) | | | | | | 1,246,655 | | | | | | 25,011,219 | | | | | | — | | | | | | 24,137,564 | | | | | | (35,451,057) | | | | | | 13,697,726 | | |
| Class I | | | | | | | | | | | |
| 12/31/2016 | | | | | 927,921 | | | | | | — | | | | | | 470,087 | | | | | | (278,167) | | | | | | 1,119,841 | | | | | | 9,590,177 | | | | | | — | | | | | | 4,691,464 | | | | | | (2,854,854) | | | | | | 11,426,787 | | |
| 12/31/2015 | | | | | 1,188,894 | | | | | | — | | | | | | 429,617 | | | | | | (908,306) | | | | | | 710,205 | | | | | | 14,069,611 | | | | | | — | | | | | | 4,742,973 | | | | | | (9,984,964) | | | | | | 8,827,620 | | |
| Class S | | | | | | | | | | | |
| 12/31/2016 | | | | | 1,603,662 | | | | | | — | | | | | | 1,262,226 | | | | | | (3,547,916) | | | | | | (682,028) | | | | | | 16,320,237 | | | | | | — | | | | | | 12,458,169 | | | | | | (36,082,453) | | | | | | (7,304,047) | | |
| 12/31/2015 | | | | | 2,164,681 | | | | | | — | | | | | | 1,587,740 | | | | | | (3,526,780) | | | | | | 225,641 | | | | | | 25,342,780 | | | | | | — | | | | | | 17,353,998 | | | | | | (39,171,851) | | | | | | 3,524,927 | | |
| Class S2 | | | | | | | | | | | |
| 12/31/2016 | | | | | 536,606 | | | | | | — | | | | | | 336,554 | | | | | | (612,158) | | | | | | 261,002 | | | | | | 5,358,701 | | | | | | — | | | | | | 3,274,673 | | | | | | (6,145,494) | | | | | | 2,487,880 | | |
| 12/31/2015 | | | | | 386,767 | | | | | | — | | | | | | 337,442 | | | | | | (1,105,555) | | | | | | (381,346) | | | | | | 4,365,413 | | | | | | — | | | | | | 3,640,999 | | | | | | (12,933,530) | | | | | | (4,927,118) | | |
| Class T(2) | | | | | | | | | | | |
| 12/31/2016 | | | | | — | | | | | | — | | | | | | — | | | | | | (320) | | | | | | (320) | | | | | | — | | | | | | — | | | | | | — | | | | | | (3,002) | | | | | | (3,002) | | |
| 12/31/2015 | | | | | — | | | | | | — | | | | | | — | | | | | | — | | | | | | — | | | | | | — | | | | | | — | | | | | | — | | | | | | — | | | | | | — | | |
| Class Z | | | | | | | | | | | |
| 12/31/2016 | | | | | 9,322,101 | | | | | | — | | | | | | 475,386 | | | | | | (191,420) | | | | | | 9,606,067 | | | | | | 96,033,438 | | | | | | — | | | | | | 4,758,615 | | | | | | (1,967,412) | | | | | | 98,824,641 | | |
5/1/2015(1) -
12/31/2015 | | | | | 233,338 | | | | | | — | | | | | | 629 | | | | | | (2,350) | | | | | | 231,617 | | | | | | 2,515,923 | | | | | | — | | | | | | 6,956 | | | | | | (25,449) | | | | | | 2,497,430 | | |
| Index Solution 2040 | |
| Class ADV | | | | | | | | | | | |
| 12/31/2016 | | | | | 370,116 | | | | | | — | | | | | | 276 | | | | | | (84,750) | | | | | | 285,642 | | | | | | 4,769,724 | | | | | | — | | | | | | 3,655 | | | | | | (1,104,069) | | | | | | 3,669,310 | | |
| 12/31/2015 | | | | | 108,014 | | | | | | — | | | | | | 15 | | | | | | (9,148) | | | | | | 98,881 | | | | | | 1,379,869 | | | | | | — | | | | | | 198 | | | | | | (115,566) | | | | | | 1,264,501 | | |
| Class I | | | | | | | | | | | |
| 12/31/2016 | | | | | 41,205 | | | | | | — | | | | | | 68 | | | | | | (6,483) | | | | | | 34,790 | | | | | | 536,998 | | | | | | — | | | | | | 921 | | | | | | (88,273) | | | | | | 449,646 | | |
| 12/31/2015 | | | | | 13,472 | | | | | | — | | | | | | —* | | | | | | (885) | | | | | | 12,587 | | | | | | 171,135 | | | | | | — | | | | | | 1 | | | | | | (11,381) | | | | | | 159,755 | | |
| Class S | | | | | | | | | | | |
| 12/31/2016 | | | | | 411,083 | | | | | | — | | | | | | 212 | | | | | | (77,707) | | | | | | 333,588 | | | | | | 5,492,155 | | | | | | — | | | | | | 2,856 | | | | | | (1,015,554) | | | | | | 4,479,457 | | |
| 12/31/2015 | | | | | 40,416 | | | | | | — | | | | | | —* | | | | | | (9,448) | | | | | | 30,968 | | | | | | 526,030 | | | | | | — | | | | | | 1 | | | | | | (122,735) | | | | | | 403,296 | | |
| Class S2 | | | | | | | | | | | |
| 12/31/2016 | | | | | 53,128 | | | | | | ��� | | | | | | 47 | | | | | | (6,646) | | | | | | 46,529 | | | | | | 693,973 | | | | | | — | | | | | | 629 | | | | | | (88,396) | | | | | | 606,206 | | |
| 12/31/2015 | | | | | 810 | | | | | | — | | | | | | —* | | | | | | (39) | | | | | | 771 | | | | | | 10,416 | | | | | | — | | | | | | 1 | | | | | | (490) | | | | | | 9,927 | | |
| Class T(2) | | | | | | | | | | | |
| 12/31/2016 | | | | | — | | | | | | — | | | | | | — | | | | | | (327) | | | | | | (327) | | | | | | — | | | | | | — | | | | | | — | | | | | | (3,014) | | | | | | (3,014) | | |
| 12/31/2015 | | | | | — | | | | | | — | | | | | | —* | | | | | | — | | | | | | —* | | | | | | — | | | | | | — | | | | | | 1 | | | | | | — | | | | | | 1 | | |
Notes to Financial Statements as of December 31, 2016 (continued)
NOTE 9 — CAPITAL SHARES (continued)
| | | | Shares
sold | | | Shares
issued in
merger | | | Reinvestment
of
distributions | | | Shares
redeemed | | | Net increase
(decrease)
in shares
outstanding | | | Shares
sold | | | Proceeds
from shares
issued in
merger | | | Reinvestment
of
distributions | | | Shares
redeemed | | | Net increase
(decrease) | |
| Year or period ended | | | # | | | # | | | # | | | # | | | # | | | ($) | | | ($) | | | ($) | | | ($) | | | ($) | |
| Index Solution 2040 (continued) | |
| Class Z | | | | | | | | | | | |
| 12/31/2016 | | | | | 3,504,110 | | | | | | — | | | | | | 1,968 | | | | | | (113,852) | | | | | | 3,392,226 | | | | | | 46,977,115 | | | | | | — | | | | | | 26,551 | | | | | | (1,527,287) | | | | | | 45,476,379 | | |
5/1/2015(1) -
12/31/2015 | | | | | 86,298 | | | | | | — | | | | | | 78 | | | | | | (1,502) | | | | | | 84,874 | | | | | | 1,110,907 | | | | | | — | | | | | | 1,040 | | | | | | (19,263) | | | | | | 1,092,684 | | |
| Index Solution 2045 | |
| Class ADV | | | | | | | | | | | |
| 12/31/2016 | | | | | 2,360,032 | | | | | | — | | | | | | 1,402,265 | | | | | | (2,784,447) | | | | | | 977,850 | | | | | | 24,248,207 | | | | | | — | | | | | | 13,994,611 | | | | | | (28,446,613) | | | | | | 9,796,205 | | |
| 12/31/2015 | | | | | 1,840,874 | | | | | | — | | | | | | 1,468,178 | | | | | | (1,977,968) | | | | | | 1,331,084 | | | | | | 21,429,285 | | | | | | — | | | | | | 16,238,051 | | | | | | (22,675,585) | | | | | | 14,991,751 | | |
| Class I | | | | | | | | | | | |
| 12/31/2016 | | | | | 767,211 | | | | | | — | | | | | | 338,389 | | | | | | (275,321) | | | | | | 830,279 | | | | | | 8,111,369 | | | | | | — | | | | | | 3,475,255 | | | | | | (2,909,050) | | | | | | 8,677,574 | | |
| 12/31/2015 | | | | | 1,215,424 | | | | | | — | | | | | | 276,723 | | | | | | (510,383) | | | | | | 981,764 | | | | | | 14,519,501 | | | | | | — | | | | | | 3,140,806 | | | | | | (5,643,479) | | | | | | 12,016,828 | | |
| Class S | | | | | | | | | | | |
| 12/31/2016 | | | | | 1,248,296 | | | | | | — | | | | | | 748,878 | | | | | | (2,154,611) | | | | | | (157,437) | | | | | | 13,009,971 | | | | | | — | | | | | | 7,593,619 | | | | | | (22,382,822) | | | | | | (1,779,232) | | |
| 12/31/2015 | | | | | 1,531,338 | | | | | | — | | | | | | 979,519 | | | | | | (2,341,112) | | | | | | 169,745 | | | | | | 18,249,450 | | | | | | — | | | | | | 10,980,412 | | | | | | (26,872,818) | | | | | | 2,357,044 | | |
| Class S2 | | | | | | | | | | | |
| 12/31/2016 | | | | | 390,585 | | | | | | — | | | | | | 177,420 | | | | | | (310,107) | | | | | | 257,898 | | | | | | 4,045,254 | | | | | | — | | | | | | 1,772,423 | | | | | | (3,199,726) | | | | | | 2,617,951 | | |
| 12/31/2015 | | | | | 315,781 | | | | | | — | | | | | | 172,923 | | | | | | (622,382) | | | | | | (133,678) | | | | | | 3,634,347 | | | | | | — | | | | | | 1,914,261 | | | | | | (7,454,252) | | | | | | (1,905,644) | | |
| Class T(2) | | | | | | | | | | | |
| 12/31/2016 | | | | | — | | | | | | — | | | | | | — | | | | | | (319) | | | | | | (319) | | | | | | — | | | | | | — | | | | | | — | | | | | | (3,001) | | | | | | (3,001) | | |
| 12/31/2015 | | | | | — | | | | | | — | | | | | | — | | | | | | — | | | | | | — | | | | | | — | | | | | | — | | | | | | — | | | | | | — | | | | | | — | | |
| Class Z | | | | | | | | | | | |
| 12/31/2016 | | | | | 5,322,803 | | | | | | — | | | | | | 268,068 | | | | | | (68,555) | | | | | | 5,522,316 | | | | | | 56,547,347 | | | | | | — | | | | | | 2,761,099 | | | | | | (731,237) | | | | | | 58,577,209 | | |
5/1/2015(1) -
12/31/2015 | | | | | 50,832 | | | | | | — | | | | | | 31 | | | | | | (748) | | | | | | 50,115 | | | | | | 553,429 | | | | | | — | | | | | | 358 | | | | | | (8,155) | | | | | | 545,632 | | |
| Index Solution 2050 | |
| Class ADV | | | | | | | | | | | |
| 12/31/2016 | | | | | 225,991 | | | | | | — | | | | | | 544 | | | | | | (37,453) | | | | | | 189,082 | | | | | | 2,938,579 | | | | | | — | | | | | | 7,244 | | | | | | (487,762) | | | | | | 2,458,061 | | |
| 12/31/2015 | | | | | 75,462 | | | | | | — | | | | | | —* | | | | | | (23,295) | | | | | | 52,167 | | | | | | 962,895 | | | | | | — | | | | | | 1 | | | | | | (302,268) | | | | | | 660,628 | | |
| Class I | | | | | | | | | | | |
| 12/31/2016 | | | | | 52,400 | | | | | | — | | | | | | 198 | | | | | | (7,015) | | | | | | 45,583 | | | | | | 679,924 | | | | | | — | | | | | | 2,666 | | | | | | (92,458) | | | | | | 590,132 | | |
| 12/31/2015 | | | | | 26,404 | | | | | | — | | | | | | —* | | | | | | (3,674) | | | | | | 22,730 | | | | | | 335,518 | | | | | | — | | | | | | 1 | | | | | | (47,087) | | | | | | 288,432 | | |
| Class S | | | | | | | | | | | |
| 12/31/2016 | | | | | 317,982 | | | | | | — | | | | | | 404 | | | | | | (50,007) | | | | | | 268,379 | | | | | | 4,259,326 | | | | | | — | | | | | | 5,451 | | | | | | (672,963) | | | | | | 3,591,814 | | |
| 12/31/2015 | | | | | 23,747 | | | | | | — | | | | | | —* | | | | | | (4,255) | | | | | | 19,492 | | | | | | 306,231 | | | | | | — | | | | | | 1 | | | | | | (54,538) | | | | | | 251,694 | | |
| Class S2 | | | | | | | | | | | |
| 12/31/2016 | | | | | 61,739 | | | | | | — | | | | | | 98 | | | | | | (6,868) | | | | | | 54,969 | | | | | | 805,340 | | | | | | — | | | | | | 1,305 | | | | | | (89,834) | | | | | | 716,811 | | |
| 12/31/2015 | | | | | 743 | | | | | | — | | | | | | —* | | | | | | —* | | | | | | 743 | | | | | | 9,307 | | | | | | — | | | | | | 1 | | | | | | — | | | | | | 9,308 | | |
| Class T(2) | | | | | | | | | | | |
| 12/31/2016 | | | | | — | | | | | | — | | | | | | — | | | | | | (326) | | | | | | (326) | | | | | | — | | | | | | — | | | | | | — | | | | | | (3,037) | | | | | | (3,037) | | |
| 12/31/2015 | | | | | — | | | | | | — | | | | | | —* | | | | | | — | | | | | | —* | | | | | | 23 | | | | | | — | | | | | | 1 | | | | | | — | | | | | | 24 | | |
| Class Z | | | | | | | | | | | |
| 12/31/2016 | | | | | 1,501,501 | | | | | | — | | | | | | 1,741 | | | | | | (26,136) | | | | | | 1,477,106 | | | | | | 20,155,127 | | | | | | — | | | | | | 23,471 | | | | | | (353,464) | | | | | | 19,825,134 | | |
5/1/2015(1) -
12/31/2015 | | | | | 46,905 | | | | | | — | | | | | | 85 | | | | | | (2,027) | | | | | | 44,963 | | | | | | 603,971 | | | | | | — | | | | | | 1,140 | | | | | | (25,938) | | | | | | 579,173 | | |
| Index Solution 2055 | |
| Class ADV | | | | | | | | | | | |
| 12/31/2016 | | | | | 944,610 | | | | | | — | | | | | | 250,385 | | | | | | (721,251) | | | | | | 473,744 | | | | | | 12,194,729 | | | | | | — | | | | | | 3,179,890 | | | | | | (9,341,279) | | | | | | 6,033,340 | | |
| 12/31/2015 | | | | | 900,410 | | | | | | — | | | | | | 233,561 | | | | | | (467,458) | | | | | | 666,513 | | | | | | 12,838,610 | | | | | | — | | | | | | 3,213,808 | | | | | | (6,571,970) | | | | | | 9,480,448 | | |
| Class I | | | | | | | | | | | |
| 12/31/2016 | | | | | 307,196 | | | | | | — | | | | | | 59,581 | | | | | | (176,025) | | | | | | 190,752 | | | | | | 4,058,952 | | | | | | — | | | | | | 771,570 | | | | | | (2,356,125) | | | | | | 2,474,397 | | |
| 12/31/2015 | | | | | 433,679 | | | | | | — | | | | | | 40,066 | | | | | | (133,475) | | | | | | 340,270 | | | | | | 6,190,272 | | | | | | — | | | | | | 561,326 | | | | | | (1,802,931) | | | | | | 4,948,667 | | |
| Class S | | | | | | | | | | | |
| 12/31/2016 | | | | | 605,714 | | | | | | — | | | | | | 136,729 | | | | | | (480,292) | | | | | | 262,151 | | | | | | 7,892,568 | | | | | | — | | | | | | 1,754,234 | | | | | | (6,208,601) | | | | | | 3,438,201 | | |
| 12/31/2015 | | | | | 783,303 | | | | | | — | | | | | | 158,293 | | | | | | (793,583) | | | | | | 148,013 | | | | | | 11,259,852 | | | | | | — | | | | | | 2,198,688 | | | | | | (11,059,282) | | | | | | 2,399,258 | | |
| Class S2 | | | | | | | | | | | |
| 12/31/2016 | | | | | 171,377 | | | | | | — | | | | | | 41,176 | | | | | | (137,039) | | | | | | 75,514 | | | | | | 2,223,368 | | | | | | — | | | | | | 524,576 | | | | | | (1,772,787) | | | | | | 975,157 | | |
| 12/31/2015 | | | | | 155,806 | | | | | | — | | | | | | 33,052 | | | | | | (111,625) | | | | | | 77,233 | | | | | | 2,176,589 | | | | | | — | | | | | | 456,452 | | | | | | (1,626,637) | | | | | | 1,006,404 | | |
| Class T(2) | | | | | | | | | | | |
| 12/31/2016 | | | | | — | | | | | | — | | | | | | — | | | | | | (316) | | | | | | (316) | | | | | | — | | | | | | — | | | | | | — | | | | | | (3,010) | | | | | | (3,010) | | |
| 12/31/2015 | | | | | — | | | | | | — | | | | | | —* | | | | | | — | | | | | | —* | | | | | | — | | | | | | — | | | | | | 1 | | | | | | — | | | | | | 1 | | |
Notes to Financial Statements as of December 31, 2016 (continued)
NOTE 9 — CAPITAL SHARES (continued)
| | | | Shares
sold | | | Shares
issued in
merger | | | Reinvestment
of
distributions | | | Shares
redeemed | | | Net increase
(decrease)
in shares
outstanding | | | Shares
sold | | | Proceeds
from shares
issued in
merger | | | Reinvestment
of
distributions | | | Shares
redeemed | | | Net increase
(decrease) | |
| Year or period ended | | | # | | | # | | | # | | | # | | | # | | | ($) | | | ($) | | | ($) | | | ($) | | | ($) | |
| Index Solution 2055 (continued) | |
| Class Z | | | | | | | | | | | |
| 12/31/2016 | | | | | 1,243,694 | | | | | | — | | | | | | 53,428 | | | | | | (14,742) | | | | | | 1,282,380 | | | | | | 16,485,784 | | | | | | — | | | | | | 693,500 | | | | | | (194,544) | | | | | | 16,984,740 | | |
5/1/2015(1) -
12/31/2015 | | | | | 32,196 | | | | | | — | | | | | | 1,310 | | | | | | (243) | | | | | | 33,263 | | | | | | 461,919 | | | | | | — | | | | | | 18,367 | | | | | | (3,254) | | | | | | 477,032 | | |
| Index Solution 2060 | |
| Class ADV | | | | | | | | | | | |
| 12/31/2016 | | | | | 201,121 | | | | | | — | | | | | | 553 | | | | | | (49,297) | | | | | | 152,377 | | | | | | 1,982,420 | | | | | | — | | | | | | 5,647 | | | | | | (490,919) | | | | | | 1,497,148 | | |
2/9/2015(1) -
12/31/2015 | | | | | 21,787 | | | | | | — | | | | | | — | | | | | | (12,921) | | | | | | 8,866 | | | | | | 213,509 | | | | | | — | | | | | | — | | | | | | (129,000) | | | | | | 84,509 | | |
| Class I | | | | | | | | | | | |
| 12/31/2016 | | | | | 12,420 | | | | | | — | | | | | | 52 | | | | | | (1,893) | | | | | | 10,579 | | | | | | 125,354 | | | | | | — | | | | | | 540 | | | | | | (19,888) | | | | | | 106,006 | | |
2/9/2015(1) -
12/31/2015 | | | | | 4,605 | | | | | | — | | | | | | — | | | | | | (1,335) | | | | | | 3,270 | | | | | | 45,138 | | | | | | — | | | | | | — | | | | | | (13,001) | | | | | | 32,137 | | |
| Class S | | | | | | | | | | | |
| 12/31/2016 | | | | | 90,967 | | | | | | — | | | | | | 234 | | | | | | (22,577) | | | | | | 68,624 | | | | | | 920,206 | | | | | | — | | | | | | 2,396 | | | | | | (229,803) | | | | | | 692,799 | | |
2/9/2015(1) -
12/31/2015 | | | | | 14,774 | | | | | | — | | | | | | — | | | | | | (1,390) | | | | | | 13,384 | | | | | | 146,710 | | | | | | — | | | | | | — | | | | | | (13,729) | | | | | | 132,981 | | |
| Class S2 | | | | | | | | | | | |
| 12/31/2016 | | | | | 23,184 | | | | | | — | | | | | | 19 | | | | | | (10,440) | | | | | | 12,763 | | | | | | 234,817 | | | | | | — | | | | | | 194 | | | | | | (103,465) | | | | | | 131,546 | | |
2/9/2015(1) -
12/31/2015 | | | | | 5,812 | | | | | | — | | | | | | — | | | | | | (5,364) | | | | | | 448 | | | | | | 54,743 | | | | | | — | | | | | | — | | | | | | (53,298) | | | | | | 1,445 | | |
| Class Z | | | | | | | | | | | |
| 12/31/2016 | | | | | 286,270 | | | | | | — | | | | | | 314 | | | | | | (11,685) | | | | | | 274,899 | | | | | | 2,981,270 | | | | | | — | | | | | | 3,235 | | | | | | (119,660) | | | | | | 2,864,845 | | |
5/1/2015(1) -
12/31/2015 | | | | | 14,664 | | | | | | — | | | | | | — | | | | | | (64) | | | | | | 14,600 | | | | | | 147,221 | | | | | | — | | | | | | — | | | | | | (621) | | | | | | 146,600 | | |
*
Share amount is less than 0.500 per share or $0.50.
(1)
Commencement of operations.
(2)
Class T liquidated on August 31, 2016.
NOTE 10 — REORGANIZATIONS
On August 14, 2015, Index Solution Income (“Acquiring Portfolio”) acquired all of the assets of, and assumed all of the liabilities of Voya Index Solution 2015 Portfolio (“Acquired Portfolio”), which is not included in this report, an open-end investment company in a tax-free reorganization in exchange for shares of the Acquiring Portfolio, pursuant to a plan of reorganization. The transaction occurred due to the Acquired Portfolio reaching its Target Date in 2015. For financial reporting purposes, assets received and shares issued by the Acquiring Portfolio were recorded at fair value; however, the cost basis of the investments received from the Acquired Portfolio were carried forward to align ongoing reporting of the Acquiring Portfolio’s realized and unrealized gains and losses with amounts distributable to shareholders for tax purposes.
Assuming the acquisition had been completed on January 1, 2015, the beginning of the annual reporting period of the Acquiring Portfolio, the Acquiring Portfolio’s pro forma results of operations for the year ended December 31, 2015, are as follows:
| | Net investment income | | | | $ | 8,301,108 | | |
| | Net realized and unrealized loss on investments | | | | $ | (12,026,946) | | |
| | Net decrease in net assets resulting from operations | | | | $ | (3,725,838) | | |
Because the combined investment portfolios have been managed as a single integrated portfolio since the acquisition was completed, it is not practicable to separate the amounts of revenue and earnings of the Acquired Portfolio that have been included in the Acquiring Portfolio’s statement of operations since August 14, 2015. Net assets and unrealized appreciation or depreciation as of the reorganization date were as follows:
| | Total
Net Assets of
Acquired
Portfolio
(000s) | | | Total
Net Assets of
Acquiring
Portfolio
(000s) | | | Acquired
Portfolio’s
Capital Loss
Carryforwards
(000s) | | | Acquired
Portfolio’s
Unrealized
Depreciation
(000s) | | | Portfolios’
Conversion
Ratio | |
| | $251,868 | | | | $ | 164,154 | | | | | $ | — | | | | | $ | (6,096) | | | | | | 0.9345 | | |
The net assets of the Acquiring Portfolio after the acquisition were $416,022,017.
NOTE 11 — FEDERAL INCOME TAXES
The amount of distributions from net investment income and net realized capital gains are determined in
Notes to Financial Statements as of December 31, 2016 (continued)
NOTE 11 — FEDERAL INCOME TAXES (continued)
accordance with federal income tax regulations, which may differ from U.S. GAAP for investment companies. These book/tax differences may be either temporary or permanent. Permanent differences are reclassified within the capital accounts based on their federal tax-basis treatment; temporary differences are not reclassified. Key differences include the treatment of short-term capital gains, foreign currency transactions, and wash sale deferrals. Distributions in excess of net investment income and/or net realized capital gains for tax purposes are reported as return of capital.
The following permanent tax differences have been reclassified as of December 31, 2016:
| | | | Undistributed Net
Investment Income | | | Accumulated
Net Realized
Gains/(Losses) | |
| Index Solution Income | | | | $ | 436,975 | | | | | $ | (436,975) | | |
| Index Solution 2020 | | | | | 36,546 | | | | | | (36,546) | | |
| Index Solution 2025 | | | | | 540,173 | | | | | | (540,173) | | |
| Index Solution 2030 | | | | | 24,867 | | | | | | (24,867) | | |
| Index Solution 2035 | | | | | 465,003 | | | | | | (465,003) | | |
| Index Solution 2040 | | | | | 15,294 | | | | | | (15,294) | | |
| Index Solution 2045 | | | | | 308,643 | | | | | | (308,643) | | |
| Index Solution 2050 | | | | | 8,532 | | | | | | (8,532) | | |
| Index Solution 2055 | | | | | 89,900 | | | | | | (89,900) | | |
| Index Solution 2060 | | | | | 1,865 | | | | | | (1,865) | | |
Dividends paid by the Portfolios from net investment income and distributions of net realized short-term capital gains are, for federal income tax purposes, taxable as ordinary income to shareholders.
The tax composition of dividends and distributions to shareholders was as follows:
| | | | Year Ended
December 31, 2016 | | | Year Ended
December 31, 2015 | |
| | | | Ordinary
Income | | | Long-term
Capital
Gains | | | Ordinary
Income | | | Long-term
Capital
Gains | |
| Index Solution Income | | | | $ | 6,130,417 | | | | | $ | 5,289,568 | | | | | $ | 3,808,025 | | | | | $ | 9,605,971 | | |
| Index Solution 2020 | | | | | 85,035 | | | | | | 2,244 | | | | | | 381 | | | | | | 1,148 | | |
| Index Solution 2025 | | | | | 11,005,200 | | | | | | 36,183,554 | | | | | | 9,305,750 | | | | | | 42,758,861 | | |
| Index Solution 2030 | | | | | 52,131 | | | | | | 4,156 | | | | | | 480 | | | | | | 1,604 | | |
| Index Solution 2035 | | | | | 8,750,297 | | | | | | 37,292,619 | | | | | | 7,447,396 | | | | | | 42,435,520 | | |
| Index Solution 2040 | | | | | 29,939 | | | | | | 4,692 | | | | | | 390 | | | | | | 2,013 | | |
| Index Solution 2045 | | | | | 5,102,627 | | | | | | 24,494,725 | | | | | | 4,001,461 | | | | | | 28,272,874 | | |
| Index Solution 2050 | | | | | 35,891 | | | | | | 4,272 | | | | | | 364 | | | | | | 2,038 | | |
| Index Solution 2055 | | | | | 1,243,590 | | | | | | 5,680,515 | | | | | | 882,789 | | | | | | 5,566,256 | | |
| Index Solution 2060 | | | | | 9,568 | | | | | | 2,561 | | | | | | — | | | | | | — | | |
The tax-basis components of distributable earnings as of December 31, 2016 were:
| | | | Undistributed
Ordinary
Income | | | Undistributed
Long-term
Capital Gains | | | Unrealized
Appreciation/
(Depreciation) | |
| Index Solution Income | | | | $ | 8,424,022 | | | | | $ | 2,051,846 | | | | | $ | (17,282,000) | | |
| Index Solution 2020 | | | | | 1,896,813 | | | | | | 868,494 | | | | | | (198,206) | | |
| Index Solution 2025 | | | | | 11,315,381 | | | | | | 14,461,980 | | | | | | (19,998,429) | | |
| Index Solution 2030 | | | | | 1,515,853 | | | | | | 801,007 | | | | | | 289,440 | | |
| Index Solution 2035 | | | | | 9,591,682 | | | | | | 16,028,359 | | | | | | (17,151,980) | | |
| Index Solution 2040 | | | | | 989,707 | | | | | | 528,071 | | | | | | 578,346 | | |
| Index Solution 2045 | | | | | 5,799,492 | | | | | | 11,829,530 | | | | | | (11,916,548) | | |
| Index Solution 2050 | | | | | 450,802 | | | | | | 317,998 | | | | | | 326,260 | | |
| Index Solution 2055 | | | | | 1,797,814 | | | | | | 2,996,819 | | | | | | (3,953,780) | | |
| Index Solution 2060 | | | | | 118,800 | | | | | | 68,392 | | | | | | 27,999 | | |
At December 31, 2016, the Portfolios did not have any capital loss carryovers for U.S. federal income tax purposes.
The Portfolios’ major tax jurisdictions are U.S. federal and Arizona state.
As of December 31, 2016, no provision for income tax is required in the Portfolios' financial statements as a result of tax positions taken on federal and state income tax returns for open tax years. The Portfolios' federal and state income and federal excise tax returns for tax years for which the applicable statutes of limitations have not expired are subject to examination by the Internal Revenue Service and state department of revenue. The earliest tax year that remains subject to examination by these jurisdictions is 2012.
NOTE 12 — SUBSEQUENT EVENTS
Investment Adviser: On January 12, 2017, the Board approved a proposal to change the Investment Adviser for all Portfolios, from DSL to Voya Investments, LLC with an effective date of May 1, 2017. There are no changes to the services provided or the fees charged to the Portfolios upon the replacement of DSL with Voya Investments, LLC.
The Portfolios have evaluated events occurring after the Statements of Assets and Liabilities date (“subsequent events”), to determine whether any subsequent events necessitated adjustment to or disclosure in the financial statements. Other than the above, no such subsequent events were identified.
PORTFOLIO OF INVESTMENTS
| Voya Index Solution Income Portfolio | as of December 31, 2016 |
| | Shares | | | Value | | | Percentage
of Net
Assets | |
| | EXCHANGE-TRADED FUNDS: 12.9% | |
| | | | 694,787 | | | | PowerShares Senior
Loan Portfolio | | | | $ | 16,230,224 | | | | | | 4.0 | | |
| | | | 556,745 | | | | SPDR Barclays Capital
High Yield Bond | | | | | 20,293,355 | | | | | | 5.0 | | |
| | | | 108,968 | | | | SPDR Dow Jones
International Real Estate | | | | | 3,931,566 | | | | | | 0.9 | | |
| | | | 36,342 | | | | SPDR Trust Series 1 | | | | | 8,123,527 | | | | | | 2.0 | | |
| | | | 49,362 | | | | Vanguard REIT | | | | | 4,073,846 | | | | | | 1.0 | | |
| | | | | | | | Total Exchange-Traded
Funds
(Cost $55,452,783) | | | | | 52,652,518 | | | | | | 12.9 | | |
| | MUTUAL FUNDS: 87.0% | |
| | | | | | | | Affiliated Investment Companies: 85.5% | |
| | | | 2,827,356 | | | | Voya International Index
Portfolio - Class I | | | | | 24,909,003 | | | | | | 6.1 | | |
| | | | 815,432 | | | | Voya Russell™ Mid Cap
Index Portfolio - Class I | | | | | 12,264,095 | | | | | | 3.0 | | |
| | | | 20,632,629 | | | | Voya U.S. Bond Index
Portfolio - Class I | | | | | 217,261,578 | | | | | | 53.2 | | |
| | | | 6,878,702 | | | | Voya U.S. Stock Index
Portfolio - Class I | | | | | 94,857,296 | | | | | | 23.2 | | |
| | | | | | | | | | | | | 349,291,972 | | | | | | 85.5 | | |
| | Shares | | | Value | | | Percentage
of Net
Assets | |
| | MUTUAL FUNDS: (continued) | |
| | | | | | | | Unaffiliated Investment Companies: 1.5% | |
| | | | 1,233,507 | @ | | Credit Suisse
Commodity Return
Strategy Fund - Class I | | | | $ | 6,253,882 | | | | | | 1.5 | | |
| | | | | | | | Total Mutual Funds
(Cost $359,809,980) | | | | | 355,545,854 | | | | | | 87.0 | | |
| | | | | | | | Total Investments in
Securities
(Cost $415,262,763) | | | | $ | 408,198,372 | | | | | | 99.9 | | |
| | | | | | | | Assets in Excess of
Other Liabilities | | | | | 358,056 | | | | | | 0.1 | | |
| | | | | | | | Net Assets | | | | $ | 408,556,428 | | | | | | 100.0 | | |
| |
@
Non-income producing security.
Cost for federal income tax purposes is $425,480,372.
Net unrealized depreciation consists of:
| | Gross Unrealized Appreciation | | | | $ | 1,022,854 | | |
| | Gross Unrealized Depreciation | | | | | (18,304,854) | | |
| | Net Unrealized Depreciation | | | | $ | (17,282,000) | | |
| |
Fair Value Measurements^
The following is a summary of the fair valuations according to the inputs used as of December 31, 2016 in valuing the assets and liabilities:
| | | | Quoted Prices
in Active Markets
for Identical
Investments
(Level 1) | | | Significant
Other
Observable
Inputs
(Level 2) | | | Significant
Unobservable
Inputs
(Level 3) | | | Fair Value
at
December 31, 2016 | |
| Asset Table | | | | | | | | | | | | | | | | | | | | | | | | | |
| Investments, at fair value | | | | | | | | | | | | | | | | | | | | | | | | | |
| Exchange-Traded Funds | | | | $ | 52,652,518 | | | | | $ | — | | | | | $ | — | | | | | $ | 52,652,518 | | |
| Mutual Funds | | | | | 355,545,854 | | | | | | — | | | | | | — | | | | | | 355,545,854 | | |
| Total Investments, at fair value | | | | $ | 408,198,372 | | | | | $ | — | | | | | $ | — | | | | | $ | 408,198,372 | | |
^
See Note 2, “Significant Accounting Policies” in the Notes to Financial Statements for additional information.
Transactions with Affiliates
An investment of at least 5% of the voting securities of an issuer, or a company which is under common control results in that issuer becoming an affiliated person as defined by the 1940 Act.
See Accompanying Notes to Financial Statements
PORTFOLIO OF INVESTMENTS
| Voya Index Solution Income Portfolio | as of December 31, 2016 (continued) |
The following table provides transactions during the year ended December 31, 2016, where the following issuers were considered an affiliate:
| Issuer | | | Beginning
Fair
Value at
12/31/2015 | | | Purchases
at Cost | | | Sales
at Cost | | | Change in
Unrealized
Appreciation/
(Depreciation) | | | Ending
Fair
Value at
12/31/16 | | | Investment
Income | | | Realized
Gains/
(Losses) | | | Net
Capital
Gain
Distributions | |
| Voya Emerging Markets Index Portfolio - Class I | | | | $ | 3,655,900 | | | | | $ | 8,779,187 | | | | | $ | (13,300,825) | | | | | $ | 865,738 | | | | | $ | — | | | | | $ | 196 | | | | | $ | (1,069,385) | | | | | $ | — | | |
| Voya International Index Portfolio - Class I | | | | | 22,644,680 | | | | | | 8,636,124 | | | | | | (6,210,074) | | | | | | (161,727) | | | | | | 24,909,003 | | | | | | 687,208 | | | | | | (211,322) | | | | | | — | | |
| Voya Russell™ Mid Cap Index Portfolio - Class I | | | | | 11,382,412 | | | | | | 12,815,492 | | | | | | (12,910,742) | | | | | | 976,933 | | | | | | 12,264,095 | | | | | | 150,689 | | | | | | (941,274) | | | | | | 1,352,590 | | |
| Voya U.S. Bond Index Portfolio - Class I | | | | | 214,202,917 | | | | | | 70,032,670 | | | | | | (68,052,343) | | | | | | 1,078,334 | | | | | | 217,261,578 | | | | | | 4,369,893 | | | | | | (1,135,741) | | | | | | 296,476 | | |
| Voya U.S. Stock Index Portfolio - Class I | | | | | 75,397,570 | | | | | | 54,545,791 | | | | | | (41,242,896) | | | | | | 6,156,831 | | | | | | 94,857,296 | | | | | | 1,813,921 | | | | | | (3,785,315) | | | | | | 4,771,456 | | |
| | | | | $ | 327,283,479 | | | | | $ | 154,809,264 | | | | | $ | (141,716,880) | | | | | $ | 8,916,109 | | | | | $ | 349,291,972 | | | | | $ | 7,021,907 | | | | | $ | (7,143,037) | | | | | $ | 6,420,522 | | |
| |
The financial statements for the above mutual fund[s] can be found at www.sec.gov.
The effect of derivative instruments on the Portfolio’s Statement of Operations for the year ended December 31, 2016 was as follows:
| | | | Amount of Realized Gain or (Loss) on
Derivatives Recognized in Income | |
| Derivatives not accounted for as hedging instruments | | | Futures | |
| Equity contracts | | | | $ | (721,294) | | |
| Interest rate contracts | | | | | 63,012 | | |
| Total | | | | $ | (658,282) | | |
| |
See Accompanying Notes to Financial Statements
PORTFOLIO OF INVESTMENTS
| Voya Index Solution 2020 Portfolio | as of December 31, 2016 |
| Shares | | | Value | | | Percentage
of Net
Assets | |
| EXCHANGE-TRADED FUNDS: 16.2% | |
| | | 14,016 | | | | iShares Barclays 20+ Year
Treasury Bond Fund | | | | $ | 1,669,726 | | | | | | 1.6 | | |
| | | 167,420 | | | | PowerShares Senior Loan
Portfolio | | | | | 3,910,931 | | | | | | 3.8 | | |
| | | 134,505 | | | | SPDR Barclays Capital High
Yield Bond | | | | | 4,902,707 | | | | | | 4.8 | | |
| | | 22,018 | | | | SPDR Dow Jones International
Real Estate | | | | | 794,410 | | | | | | 0.8 | | |
| | | 19,680 | | | | SPDR Trust Series 1 | | | | | 4,399,070 | | | | | | 4.3 | | |
| | | 12,033 | | | | Vanguard REIT | | | | | 993,084 | | | | | | 0.9 | | |
| | | | | | | Total Exchange-Traded Funds
(Cost $16,635,010) | | | | | 16,669,928 | | | | | | 16.2 | | |
| MUTUAL FUNDS: 83.6% | |
| | | | | | | Affiliated Investment Companies: 82.1% | |
| | | 1,317,465 | | | | Voya International Index
Portfolio - Class I | | | | | 11,606,868 | | | | | | 11.3 | | |
| | | 271,855 | | | | Voya Russell™ Mid Cap Index
Portfolio - Class I | | | | | 4,088,701 | | | | | | 4.0 | | |
| | | 138,643 | | | | Voya Russell™ Small Cap Index
Portfolio - Class I | | | | | 2,067,165 | | | | | | 2.0 | | |
| | | 3,342,036 | | | | Voya U.S. Bond Index
Portfolio - Class I | | | | | 35,191,642 | | | | | | 34.3 | | |
| Shares | | | Value | | | Percentage
of Net
Assets | |
| MUTUAL FUNDS: (continued) | |
| | | | | | | Affiliated Investment Companies (continued) | |
| | | 2,272,263 | | | | Voya U.S. Stock Index
Portfolio - Class I | | | | $ | 31,334,504 | | | | | | 30.5 | | |
| | | | | | | | | | | | 84,288,880 | | | | | | 82.1 | | |
| | | | | | | Unaffiliated Investment Companies: 1.5% | |
| | | 290,969 | @ | | Credit Suisse Commodity
Return Strategy Fund - Class I | | | | | 1,475,211 | | | | | | 1.5 | | |
| | | | | | | Total Mutual Funds
(Cost $85,808,065) | | | | | 85,764,091 | | | | | | 83.6 | | |
| | | | | | | Total Investments in
Securities
(Cost $102,443,075) | | | | $ | 102,434,019 | | | | | | 99.8 | | |
| | | | | | | Assets in Excess of Other
Liabilities | | | | | 214,012 | | | | | | 0.2 | | |
| | | | | | | Net Assets | | | | $ | 102,648,031 | | | | | | 100.0 | | |
| |
@
Non-income producing security.
Cost for federal income tax purposes is $102,632,225.
Net unrealized depreciation consists of:
| | Gross Unrealized Appreciation | | | | $ | 1,018,687 | | |
| | Gross Unrealized Depreciation | | | | | (1,216,893) | | |
| | Net Unrealized Depreciation | | | | $ | (198,206) | | |
| |
Fair Value Measurements^
The following is a summary of the fair valuations according to the inputs used as of December 31, 2016 in valuing the assets and liabilities:
| | | | Quoted Prices
in Active Markets
for Identical
Investments
(Level 1) | | | Significant
Other
Observable
Inputs
(Level 2) | | | Significant
Unobservable
Inputs
(Level 3) | | | Fair Value
at
December 31, 2016 | |
| Asset Table | | | | | | | | | | | | | | | | | | | | | | | | | |
| Investments, at fair value | | | | | | | | | | | | | | | | | | | | | | | | | |
| Exchange-Traded Funds | | �� | | $ | 16,669,928 | | | | | $ | — | | | | | $ | — | | | | | $ | 16,669,928 | | |
| Mutual Funds | | | | | 85,764,091 | | | | | | — | | | | | | — | | | | | | 85,764,091 | | |
| Total Investments, at fair value | | | | $ | 102,434,019 | | | | | $ | — | | | | | $ | — | | | | | $ | 102,434,019 | | |
^
See Note 2, “Significant Accounting Policies” in the Notes to Financial Statements for additional information.
Transactions with Affiliates
An investment of at least 5% of the voting securities of an issuer, or a company which is under common control results in that issuer becoming an affiliated person as defined by the 1940 Act.
See Accompanying Notes to Financial Statements
PORTFOLIO OF INVESTMENTS
| Voya Index Solution 2020 Portfolio | as of December 31, 2016 (continued) |
The following table provides transactions during the year ended December 31, 2016, where the following issuers were considered an affiliate:
| Issuer | | | Beginning
Fair Value
at 12/31/2015 | | | Purchases
at Cost | | | Sales
at Cost | | | Change in
Unrealized
Appreciation/
(Depreciation) | | | Ending
Fair Value
at 12/31/16 | | | Investment
Income | | | Realized
Gains/
(Losses) | | | Net Capital
Gain
Distributions | |
| Voya Emerging Markets Index Portfolio - Class I | | | | $ | 172,425 | | | | | $ | 1,980,390 | | | | | $ | (2,159,495) | | | | | $ | 6,680 | | | | | $ | — | | | | | $ | 26 | | | | | $ | (50,952) | | | | | $ | 3 | | |
| Voya International Index Portfolio - Class I | | | | | 1,017,291 | | | | | | 12,262,896 | | | | | | (1,831,974) | | | | | | 158,655 | | | | | | 11,606,868 | | | | | | 85,855 | | | | | | 15,313 | | | | | | — | | |
| Voya Russell™ Mid Cap Index Portfolio - Class I | | | | | 342,985 | | | | | | 5,183,402 | | | | | | (1,584,228) | | | | | | 146,542 | | | | | | 4,088,701 | | | | | | 13,682 | | | | | | (31,295) | | | | | | 122,810 | | |
| Voya Russell™ Small Cap Index Portfolio - Class I | | | | | 168,249 | | | | | | 2,061,356 | | | | | | (343,821) | | | | | | 181,381 | | | | | | 2,067,165 | | | | | | 7,109 | | | | | | 7,253 | | | | | | 60,527 | | |
| Voya U.S. Bond Index Portfolio - Class I | | | | | 3,372,768 | | | | | | 47,177,579 | | | | | | (14,567,304) | | | | | | (791,401) | | | | | | 35,191,642 | | | | | | 334,555 | | | | | | 132,781 | | | | | | 13,622 | | |
| Voya U.S. Stock Index Portfolio - Class I | | | | | 2,239,848 | | | | | | 35,667,150 | | | | | | (6,869,853) | | | | | | 297,359 | | | | | | 31,334,504 | | | | | | 534,109 | | | | | | 306,552 | | | | | | 696,841 | | |
| | | | | $ | 7,313,566 | | | | | $ | 104,332,773 | | | | | $ | (27,356,675) | | | | | $ | (784) | | | | | $ | 84,288,880 | | | | | $ | 975,336 | | | | | $ | 379,651 | | | | | $ | 893,804 | | |
| |
The financial statements for the above mutual fund[s] can be found at www.sec.gov.
The effect of derivative instruments on the Portfolio’s Statement of Operations for the year ended December 31, 2016 was as follows:
| | | | Amount of Realized Gain or (Loss) on
Derivatives Recognized in Income | |
| Derivatives not accounted for as hedging instruments | | | Futures | |
| Equity contracts | | | | $ | (12,702) | | |
| Total | | | | $ | (12,702) | | |
| |
See Accompanying Notes to Financial Statements
PORTFOLIO OF INVESTMENTS
| Voya Index Solution 2025 Portfolio | as of December 31, 2016 |
| Shares | | | | | | Value | | | Percentage
of Net
Assets | |
| EXCHANGE-TRADED FUNDS: 17.2% | |
| | | 81,769 | | | | iShares Barclays 20+ Year
Treasury Bond Fund | | | | $ | 9,741,141 | | | | | | 1.7 | | |
| | | 977,818 | | | | PowerShares Senior Loan
Portfolio | | | | | 22,841,828 | | | | | | 3.9 | | |
| | | 783,799 | | | | SPDR Barclays Capital
High Yield Bond | | | | | 28,569,474 | | | | | | 4.9 | | |
| | | 151,319 | | | | SPDR Dow Jones
International Real Estate | | | | | 5,459,590 | | | | | | 0.9 | | |
| | | 127,548 | | | | SPDR Trust Series 1 | | | | | 28,510,804 | | | | | | 4.8 | | |
| | | 69,611 | | | | Vanguard REIT | | | | | 5,744,996 | | | | | | 1.0 | | |
| | | | | | | Total Exchange-Traded Funds
(Cost $104,388,834) | | | | | 100,867,833 | | | | | | 17.2 | | |
| MUTUAL FUNDS: 82.7% | |
| | | | | | | Affiliated Investment Companies: 81.2% | |
| | | 1,825,849 | | | | Voya Emerging Markets Index
Portfolio - Class I | | | | | 17,455,119 | | | | | | 3.0 | | |
| | | 9,450,677 | | | | Voya International Index
Portfolio - Class I | | | | | 83,260,465 | | | | | | 14.1 | | |
| | | 2,723,090 | | | | Voya Russell™ Mid Cap
Index Portfolio - Class I | | | | | 40,955,269 | | | | | | 7.0 | | |
| | | 1,192,019 | | | | Voya Russell™ Small Cap Index
Portfolio - Class I | | | | | 17,773,004 | | | | | | 3.0 | | |
| | | 12,722,655 | | | | Voya U.S. Bond Index
Portfolio - Class I | | | | | 133,969,556 | | | | | | 22.8 | | |
| | | 13,348,900 | | | | Voya U.S. Stock Index
Portfolio - Class I | | | | | 184,081,327 | | | | | | 31.3 | | |
| | | | | | | | | | | | 477,494,740 | | | | | | 81.2 | | |
| | Shares | | | | | | Value | | | Percentage
of Net
Assets | |
| | MUTUAL FUNDS: (continued) | |
| | | | | | | | Unaffiliated Investment Companies: 1.5% | |
| | | | 1,722,327 | @ | | Credit Suisse Commodity
Return Strategy Fund -
Class I | | | | $ | 8,732,196 | | | | | | 1.5 | | |
| | | | | | | | Total Mutual Funds
(Cost $495,638,406) | | | | | 486,226,936 | | | | | | 82.7 | | |
| | | | | | | | Total Investments in
Securities
(Cost $600,027,240) | | | | $ | 587,094,769 | | | | | | 99.9 | | |
| | | | | | | | Assets in Excess of Other
Liabilities | | | | | 709,602 | | | | | | 0.1 | | |
| | | | | | | | Net Assets | | | | $ | 587,804,371 | | | | | | 100.0 | | |
| |
@
Non-income producing security.
Cost for federal income tax purposes is $607,093,198.
Net unrealized depreciation consists of:
| | Gross Unrealized Appreciation | | | | $ | 1,393,615 | | |
| | Gross Unrealized Depreciation | | | | | (21,392,044) | | |
| | Net Unrealized Depreciation | | | | $ | (19,998,429) | | |
| | | | |
Fair Value Measurements^
The following is a summary of the fair valuations according to the inputs used as of December 31, 2016 in valuing the assets and liabilities:
| | | | Quoted Prices
in Active Markets
for Identical
Investments
(Level 1) | | | Significant
Other
Observable
Inputs
(Level 2) | | | Significant
Unobservable
Inputs
(Level 3) | | | Fair Value
at
December 31, 2016 | |
| Asset Table | | | | | |
| Investments, at fair value | | | | | |
| Exchange-Traded Funds | | | | $ | 100,867,833 | | | | | $ | — | | | | | $ | — | | | | | $ | 100,867,833 | | |
| Mutual Funds | | | | | 486,226,936 | | | | | | — | | | | | | — | | | | | | 486,226,936 | | |
| Total Investments, at fair value | | | | $ | 587,094,769 | | | | | $ | — | | | | | $ | — | | | | | $ | 587,094,769 | | |
| |
^
See Note 2, “Significant Accounting Policies” in the Notes to Financial Statements for additional information.
See Accompanying Notes to Financial Statements
PORTFOLIO OF INVESTMENTS
| Voya Index Solution 2025 Portfolio | as of December 31, 2016 (continued) |
Transactions with Affiliates
An investment of at least 5% of the voting securities of an issuer, or a company which is under common control results in that issuer becoming an affiliated person as defined by the 1940 Act.
The following table provides transactions during the year ended December 31, 2016, where the following issuers were considered an affiliate:
| Issuer | | | Beginning
Fair Value
at 12/31/2015 | | | Purchases
at Cost | | | Sales
at Cost | | | Change in
Unrealized
Appreciation/
(Depreciation) | | | Ending
Fair Value
at 12/31/16 | | | Investment
Income | | | Realized
Gains/
(Losses) | | | Net Capital
Gain
Distributions | |
| Voya Emerging Markets Index Portfolio - Class I | | | | $ | 13,924,282 | | | | | $ | 17,049,142 | | | | | $ | (16,803,460) | | | | | $ | 3,285,155 | | | | | $ | 17,455,119 | | | | | $ | 315,793 | | | | | $ | (2,649,257) | | | | | $ | — | | |
| Voya International Index Portfolio - Class I | | | | | 71,708,609 | | | | | | 27,965,356 | | | | | | (13,353,520) | | | | | | (3,059,980) | | | | | | 83,260,465 | | | | | | 2,112,928 | | | | | | 1,954,906 | | | | | | — | | |
| Voya Russell™ Mid Cap Index Portfolio - Class I | | | | | 33,054,103 | | | | | | 26,705,518 | | | | | | (19,380,961) | | | | | | 576,609 | | | | | | 40,955,269 | | | | | | 461,798 | | | | | | (420,151) | | | | | | 4,145,110 | | |
| Voya Russell™ Small Cap Index Portfolio - Class I | | | | | 14,403,666 | | | | | | 6,774,255 | | | | | | (4,553,807) | | | | | | 1,148,890 | | | | | | 17,773,004 | | | | | | 205,669 | | | | | | 129,572 | | | | | | 1,751,170 | | |
| Voya U.S. Bond Index Portfolio - Class I | | | | | 134,538,253 | | | | | | 71,359,367 | | | | | | (70,938,721) | | | | | | (989,343) | | | | | | 133,969,556 | | | | | | 2,740,053 | | | | | | 1,101,637 | | | | | | 184,142 | | |
| Voya U.S. Stock Index Portfolio - Class I | | | | | 138,647,008 | | | | | | 80,537,780 | | | | | | (41,338,291) | | | | | | 6,234,830 | | | | | | 184,081,327 | | | | | | 3,512,285 | | | | | | (925,622) | | | | | | 8,931,299 | | |
| | | | | $ | 406,275,921 | | | | | $ | 230,391,418 | | | | | $ | (166,368,760) | | | | | $ | 7,196,161 | | | | | $ | 477,494,740 | | | | | $ | 9,348,526 | | | | | $ | (808,915) | | | | | $ | 15,011,721 | | |
| |
The financial statements for the above mutual fund[s] can be found at www.sec.gov.
The effect of derivative instruments on the Portfolio’s Statement of Operations for the year ended December 31, 2016 was as follows:
| | | | Amount of Realized Gain or (Loss) on
Derivatives Recognized in Income | |
| Derivatives not accounted for as hedging instruments | | | Futures | |
| Equity contracts | | | | $ | (913,295) | | |
| Interest rate contracts | | | | | 77,879 | | |
| Total | | | | $ | (835,416) | | |
| |
See Accompanying Notes to Financial Statements
PORTFOLIO OF INVESTMENTS
| Voya Index Solution 2030 Portfolio | as of December 31, 2016 |
| Shares | | | | | | Value | | | Percentage
of Net
Assets | |
| EXCHANGE-TRADED FUNDS: 14.2% | |
| | | 12,530 | | | | iShares Barclays 20+ Year
Treasury Bond Fund | | | | $ | 1,492,699 | | | | | | 1.6 | | |
| | | 111,708 | | | | PowerShares Senior Loan
Portfolio | | | | | 2,609,499 | | | | | | 2.8 | | |
| | | 71,541 | | | | SPDR Barclays Capital High
Yield Bond | | | | | 2,607,669 | | | | | | 2.8 | | |
| | | 34,186 | | | | SPDR Dow Jones
International Real Estate | | | | | 1,233,431 | | | | | | 1.3 | | |
| | | 17,904 | | | | SPDR Trust Series 1 | | | | | 4,002,081 | | | | | | 4.3 | | |
| | | 16,128 | | | | Vanguard REIT | | | | | 1,331,044 | | | | | | 1.4 | | |
| | | | | | | Total Exchange-Traded Funds
(Cost $13,374,138) | | | | | 13,276,423 | | | | | | 14.2 | | |
| MUTUAL FUNDS: 85.6% | |
| | | | | | | Affiliated Investment Companies: 84.2% | |
| | | 386,981 | | | | Voya Emerging Markets Index
Portfolio - Class I | | | | | 3,699,534 | | | | | | 4.0 | | |
| | | 1,777,165 | | | | Voya International Index
Portfolio - Class I | | | | | 15,656,821 | | | | | | 16.7 | | |
| | | 463,078 | | | | Voya Russell™ Mid Cap Index
Portfolio - Class I | | | | | 6,964,693 | | | | | | 7.4 | | |
| | | 188,877 | | | | Voya Russell™ Small Cap
Index Portfolio - Class I | | | | | 2,816,149 | | | | | | 3.0 | | |
| | | 1,364,164 | | | | Voya U.S. Bond Index
Portfolio - Class I | | | | | 14,364,650 | | | | | | 15.3 | | |
| | | 2,562,024 | | | | Voya U.S. Stock Index
Portfolio - Class I | | | | | 35,330,313 | | | | | | 37.8 | | |
| | | | | | | | | | | | 78,832,160 | | | | | | 84.2 | | |
| | Shares | | | | | | Value | | | Percentage
of Net
Assets | |
| | MUTUAL FUNDS: (continued) | |
| | | | | | | | Unaffiliated Investment Companies: 1.4% | |
| | | | 257,273 | @ | | Credit Suisse Commodity
Return Strategy Fund -
Class I | | | | $ | 1,304,373 | | | | | | 1.4 | | |
| | | | | | | | Total Mutual Funds
(Cost $79,501,678) | | | | | 80,136,533 | | | | | | 85.6 | | |
| | | | | | | | Total Investments in
Securities
(Cost $92,875,816) | | | | $ | 93,412,956 | | | | | | 99.8 | | |
| | | | | | | | Assets in Excess of
Other Liabilities | | | | | 180,353 | | | | | | 0.2 | | |
| | | | | | | | Net Assets | | | | $ | 93,593,309 | | | | | | 100.0 | | |
| |
@
Non-income producing security.
Cost for federal income tax purposes is $93,123,516.
Net unrealized appreciation consists of:
| | Gross Unrealized Appreciation | | | | $ | 1,173,914 | | |
| | Gross Unrealized Depreciation | | | | | (884,474) | | |
| | Net Unrealized Appreciation | | | | $ | 289,440 | | |
| |
Fair Value Measurements^
The following is a summary of the fair valuations according to the inputs used as of December 31, 2016 in valuing the assets and liabilities:
| | | | Quoted Prices
in Active Markets
for Identical
Investments
(Level 1) | | | Significant
Other
Observable
Inputs
(Level 2) | | | Significant
Unobservable
Inputs
(Level 3) | | | Fair Value
at
December 31, 2016 | |
| Asset Table | | | | | |
| Investments, at fair value | | | | | |
| Exchange-Traded Funds | | | | $ | 13,276,423 | | | | | $ | — | | | | | $ | — | | | | | $ | 13,276,423 | | |
| Mutual Funds | | | | | 80,136,533 | | | | | | — | | | | | | — | | | | | | 80,136,533 | | |
| Total Investments, at fair value | | | | $ | 93,412,956 | | | | | $ | — | | | | | $ | — | | | | | $ | 93,412,956 | | |
| |
^
See Note 2, “Significant Accounting Policies” in the Notes to Financial Statements for additional information.
See Accompanying Notes to Financial Statements
PORTFOLIO OF INVESTMENTS
| Voya Index Solution 2030 Portfolio | as of December 31, 2016 (continued) |
Transactions with Affiliates
An investment of at least 5% of the voting securities of an issuer, or a company which is under common control results in that issuer becoming an affiliated person as defined by the 1940 Act.
The following table provides transactions during the year ended December 31, 2016, where the following issuers were considered an affiliate:
| Issuer | | | Beginning
Fair Value
at 12/31/2015 | | | Purchases
at Cost | | | Sales
at Cost | | | Change in
Unrealized
Appreciation/
(Depreciation) | | | Ending
Fair Value
at 12/31/16 | | | Investment
Income | | | Realized
Gains/
(Losses) | | | Net Capital
Gain
Distributions | |
| Voya Emerging Markets Index Portfolio - Class I | | | | $ | 209,130 | | | | | $ | 4,965,532 | | | | | $ | (1,362,821) | | | | | $ | (112,307) | | | | | $ | 3,699,534 | | | | | $ | 13,088 | | | | | $ | 69,814 | | | | | $ | — | | |
| Voya International Index Portfolio - Class I | | | | | 956,738 | | | | | | 16,132,167 | | | | | | (1,635,189) | | | | | | 203,105 | | | | | | 15,656,821 | | | | | | 76,967 | | | | | | (7,331) | | | | | | — | | |
| Voya Russell™ Mid Cap Index Portfolio - Class I | | | | | 386,443 | | | | | | 7,830,909 | | | | | | (1,511,610) | | | | | | 258,951 | | | | | | 6,964,693 | | | | | | 15,305 | | | | | | (58,345) | | | | | | 137,379 | | |
| Voya Russell™ Small Cap Index Portfolio - Class I | | | | | 154,091 | | | | | | 2,704,613 | | | | | | (284,418) | | | | | | 241,863 | | | | | | 2,816,149 | | | | | | 6,359 | | | | | | 4,402 | | | | | | 54,143 | | |
| Voya U.S. Bond Index Portfolio - Class I | | | | | 999,397 | | | | | | 22,241,518 | | | | | | (8,599,696) | | | | | | (276,569) | | | | | | 14,364,650 | | | | | | 121,702 | | | | | | (13,400) | | | | | | 3,996 | | |
| Voya U.S. Stock Index Portfolio - Class I | | | | | 1,768,409 | | | | | | 38,126,657 | | | | | | (4,921,043) | | | | | | 356,290 | | | | | | 35,330,313 | | | | | | 577,805 | | | | | | 193,193 | | | | | | 609,137 | | |
| | | | | $ | 4,474,208 | | | | | $ | 92,001,396 | | | | | $ | (18,314,777) | | | | | $ | 671,333 | | | | | $ | 78,832,160 | | | | | $ | 811,226 | | | | | $ | 188,332 | | | | | $ | 804,656 | | |
| |
The financial statements for the above mutual fund[s] can be found at www.sec.gov.
The effect of derivative instruments on the Portfolio’s Statement of Operations for the year ended December 31, 2016 was as follows:
| | | | Amount of Realized Gain or (Loss) on
Derivatives Recognized in Income | |
| Derivatives not accounted for as hedging instruments | | | Futures | |
| Equity contracts | | | | $ | (8,468) | | |
| Total | | | | $ | (8,468) | | |
| |
See Accompanying Notes to Financial Statements
PORTFOLIO OF INVESTMENTS
| Voya Index Solution 2035 Portfolio | as of December 31, 2016 |
| Shares | | | | | | Value | | | Percentage
of Net
Assets | |
| EXCHANGE-TRADED FUNDS: 10.7% | |
| | | 634,579 | | | | PowerShares Senior Loan
Portfolio | | | | $ | 14,823,765 | | | | | | 2.9 | | |
| | | 406,937 | | | | SPDR Barclays Capital High
Yield Bond | | | | | 14,832,854 | | | | | | 3.0 | | |
| | | 200,551 | | | | SPDR Dow Jones
International Real Estate | | | | | 7,235,880 | | | | | | 1.4 | | |
| | | 43,735 | | | | SPDR Trust Series 1 | | | | | 9,776,084 | | | | | | 1.9 | | |
| | | 89,107 | | | | Vanguard REIT | | | | | 7,354,001 | | | | | | 1.5 | | |
| | | | | | | Total Exchange-Traded Funds
(Cost $56,419,719) | | | | | 54,022,584 | | | | | | 10.7 | | |
| MUTUAL FUNDS: 89.2% | |
| | | | | | | Affiliated Investment Companies: 87.7% | |
| | | 2,071,691 | | | | Voya Emerging Markets
Index Portfolio - Class I | | | | | 19,805,366 | | | | | | 3.9 | | |
| | | 10,651,522 | | | | Voya International Index
Portfolio - Class I | | | | | 93,839,912 | | | | | | 18.7 | | |
| | | 2,821,426 | | | | Voya Russell™ Mid Cap
Index Portfolio - Class I | | | | | 42,434,246 | | | | | | 8.4 | | |
| | | 1,356,324 | | | | Voya Russell™ Small Cap Index
Portfolio - Class I | | | | | 20,222,793 | | | | | | 4.0 | | |
| | | 4,052,418 | | | | Voya U.S. Bond Index
Portfolio - Class I | | | | | 42,671,960 | | | | | | 8.5 | | |
| | | 16,109,070 | | | | Voya U.S. Stock Index
Portfolio - Class I | | | | | 222,144,080 | | | | | | 44.2 | | |
| | | | | | | | | | | | 441,118,357 | | | | | | 87.7 | | |
| | Shares | | | | | | Value | | | Percentage
of Net
Assets | |
| | MUTUAL FUNDS: (continued) | |
| | | | | | | | Unaffiliated Investment Companies: 1.5% | |
| | | | 1,483,533 | @ | | Credit Suisse Commodity
Return Strategy Fund -
Class I | | | | $ | 7,521,512 | | | | | | 1.5 | | |
| | | | | | | | Total Mutual Funds
(Cost $458,471,916) | | | | | 448,639,869 | | | | | | 89.2 | | |
| | | | | | | | Total Investments in
Securities
(Cost $514,891,635) | | | | $ | 502,662,453 | | | | | | 99.9 | | |
| | | | | | | | Assets in Excess of
Other Liabilities | | | | | 430,731 | | | | | | 0.1 | | |
| | | | | | | | Net Assets | | | | $ | 503,093,184 | | | | | | 100.0 | | |
| |
@
Non-income producing security.
Cost for federal income tax purposes is $519,814,433.
Net unrealized depreciation consists of:
| | Gross Unrealized Appreciation | | | | $ | 772,444 | | |
| | Gross Unrealized Depreciation | | | | | (17,924,424) | | |
| | Net Unrealized Depreciation | | | | $ | (17,151,980) | | |
| |
Fair Value Measurements^
The following is a summary of the fair valuations according to the inputs used as of December 31, 2016 in valuing the assets and liabilities:
| | | | Quoted Prices
in Active Markets
for Identical
Investments
(Level 1) | | | Significant
Other
Observable
Inputs
(Level 2) | | | Significant
Unobservable
Inputs
(Level 3) | | | Fair Value
at
December 31, 2016 | |
| Asset Table | | | | | |
| Investments, at fair value | | | | | |
| Exchange-Traded Funds | | | | $ | 54,022,584 | | | | | $ | — | | | | | $ | — | | | | | $ | 54,022,584 | | |
| Mutual Funds | | | | | 448,639,869 | | | | | | — | | | | | | — | | | | | | 448,639,869 | | |
| Total Investments, at fair value | | | | $ | 502,662,453 | | | | | $ | — | | | | | $ | — | | | | | $ | 502,662,453 | | |
| |
^
See Note 2, “Significant Accounting Policies” in the Notes to Financial Statements for additional information.
Transactions with Affiliates
An investment of at least 5% of the voting securities of an issuer, or a company which is under common control results in that issuer becoming an affiliated person as defined by the 1940 Act.
See Accompanying Notes to Financial Statements
PORTFOLIO OF INVESTMENTS
| Voya Index Solution 2035 Portfolio | as of December 31, 2016 (continued) |
The following table provides transactions during the year ended December 31, 2016, where the following issuers were considered an affiliate:
| Issuer | | | Beginning
Fair Value
at 12/31/2015 | | | Purchases
at Cost | | | Sales
at Cost | | | Change in
Unrealized
Appreciation/
(Depreciation) | | | Ending
Fair Value
at 12/31/16 | | | Investment
Income | | | Realized
Gains/
(Losses) | | | Net Capital
Gain
Distributions | |
| Voya Emerging Markets Index Portfolio - Class I | | | | $ | 15,492,406 | | | | | $ | 16,023,416 | | | | | $ | (15,202,141) | | | | | $ | 3,491,685 | | | | | $ | 19,805,366 | | | | | $ | 354,561 | | | | | $ | (2,643,335) | | | | | $ | — | | |
| Voya International Index Portfolio - Class I | | | | | 73,646,576 | | | | | | 31,823,870 | | | | | | (9,016,837) | | | | | | (2,613,697) | | | | | | 93,839,912 | | | | | | 2,344,749 | | | | | | 1,451,175 | | | | | | — | | |
| Voya Russell™ Mid Cap Index Portfolio - Class I | | | | | 33,932,811 | | | | | | 24,719,772 | | | | | | (15,923,252) | | | | | | (295,085) | | | | | | 42,434,246 | | | | | | 472,278 | | | | | | 402,774 | | | | | | 4,239,180 | | |
| Voya Russell™ Small Cap Index Portfolio - Class I | | | | | 15,995,118 | | | | | | 7,466,817 | | | | | | (4,447,390) | | | | | | 1,208,248 | | | | | | 20,222,793 | | | | | | 230,958 | | | | | | 249,296 | | | | | | 1,966,496 | | |
| Voya U.S. Bond Index Portfolio - Class I | | | | | 43,428,897 | | | | | | 34,002,147 | | | | | | (34,775,516) | | | | | | 16,432 | | | | | | 42,671,960 | | | | | | 892,531 | | | | | | 10,018 | | | | | | 59,640 | | |
| Voya U.S. Stock Index Portfolio - Class I | | | | | 159,099,195 | | | | | | 93,979,364 | | | | | | (38,330,004) | | | | | | 7,395,525 | | | | | | 222,144,080 | | | | | | 4,197,255 | | | | | | (1,190,653) | | | | | | 10,231,480 | | |
| | | | | $ | 341,595,003 | | | | | $ | 208,015,386 | | | | | $ | (117,695,140) | | | | | $ | 9,203,108 | | | | | $ | 441,118,357 | | | | | $ | 8,492,332 | | | | | $ | (1,720,725) | | | | | $ | 16,496,796 | | |
| |
The financial statements for the above mutual fund[s] can be found at www.sec.gov.
The effect of derivative instruments on the Portfolio’s Statement of Operations for the year ended December 31, 2016 was as follows:
| | | | Amount of Realized Gain or (Loss) on
Derivatives Recognized in Income | |
| Derivatives not accounted for as hedging instruments | | | Futures | |
| Equity contracts | | | | $ | (1,333,171) | | |
| Interest rate contracts | | | | | 115,010 | | |
| Total | | | | $ | (1,218,161) | | |
| |
See Accompanying Notes to Financial Statements
PORTFOLIO OF INVESTMENTS
| Voya Index Solution 2040 Portfolio | as of December 31, 2016 |
| Shares | | | | | | Value | | | Percentage
of Net
Assets | |
| EXCHANGE-TRADED FUNDS: 6.5% | |
| | | 49,261 | | | | PowerShares Senior Loan
Portfolio | | | | $ | 1,150,737 | | | | | | 1.9 | | |
| | | 23,064 | | | | SPDR Dow Jones
International Real Estate | | | | | 832,149 | | | | | | 1.4 | | |
| | | 4,569 | | | | SPDR Trust Series 1 | | | | | 1,021,309 | | | | | | 1.7 | | |
| | | 10,740 | | | | Vanguard REIT | | | | | 886,372 | | | | | | 1.5 | | |
| | | | | | | Total Exchange-Traded Funds
(Cost $3,958,984) | | | | | 3,890,567 | | | | | | 6.5 | | |
| MUTUAL FUNDS: 93.3% | |
| | | | | | | Affiliated Investment Companies: 91.8% | |
| | | 308,295 | | | | Voya Emerging Markets Index
Portfolio - Class I | | | | | 2,947,296 | | | | | | 4.9 | | |
| | | 1,332,264 | | | | Voya International Index
Portfolio - Class I | | | | | 11,737,244 | | | | | | 19.7 | | |
| | | 334,972 | | | | Voya Russell™ Mid Cap Index
Portfolio - Class I | | | | | 5,037,983 | | | | | | 8.4 | | |
| | | 160,812 | | | | Voya Russell™ Small Cap
Index Portfolio - Class I | | | | | 2,397,710 | | | | | | 4.0 | | |
| | | 430,244 | | | | Voya U.S. Bond Index
Portfolio - Class I | | | | | 4,530,470 | | | | | | 7.6 | | |
| | | 2,044,506 | | | | Voya U.S. Stock Index
Portfolio - Class I | | | | | 28,193,733 | | | | | | 47.2 | | |
| | | | | | | | | | | | 54,844,436 | | | | | | 91.8 | | |
| | Shares | | | | | | Value | | | Percentage
of Net
Assets | |
| | MUTUAL FUNDS: (continued) | |
| | | | | | | | Unaffiliated Investment Companies: 1.5% | |
| | | | 168,909 | @ | | Credit Suisse Commodity
Return Strategy Fund -
Class I | | | | $ | 856,371 | | | | | | 1.5 | | |
| | | | | | | | Total Mutual Funds
(Cost $54,943,942) | | | | | 55,700,807 | | | | | | 93.3 | | |
| | | | | | | | Total Investments in
Securities
(Cost $58,902,926) | | | | $ | 59,591,374 | | | | | | 99.8 | | |
| | | | | | | | Assets in Excess of Other
Liabilities | | | | | 130,520 | | | | | | 0.2 | | |
| | | | | | | | Net Assets | | | | $ | 59,721,894 | | | | | | 100.0 | | |
| |
@
Non-income producing security.
Cost for federal income tax purposes is $59,013,028.
Net unrealized appreciation consists of:
| | Gross Unrealized Appreciation | | | | $ | 975,897 | | |
| | Gross Unrealized Depreciation | | | | | (397,551) | | |
| | Net Unrealized Appreciation | | | | $ | 578,346 | | |
| |
Fair Value Measurements^
The following is a summary of the fair valuations according to the inputs used as of December 31, 2016 in valuing the assets and liabilities:
| | | | Quoted Prices
in Active Markets
for Identical
Investments
(Level 1) | | | Significant
Other
Observable
Inputs
(Level 2) | | | Significant
Unobservable
Inputs
(Level 3) | | | Fair Value
at
December 31, 2016 | |
| Asset Table | | | | | |
| Investments, at fair value | | | | | |
| Exchange-Traded Funds | | | | $ | 3,890,567 | | | | | $ | — | | | | | $ | — | | | | | $ | 3,890,567 | | |
| Mutual Funds | | | | | 55,700,807 | | | | | | — | | | | | | — | | | | | | 55,700,807 | | |
| Total Investments, at fair value | | | | $ | 59,591,374 | | | | | $ | — | | | | | $ | — | | | | | $ | 59,591,374 | | |
| |
^
See Note 2, “Significant Accounting Policies” in the Notes to Financial Statements for additional information.
Transactions with Affiliates
An investment of at least 5% of the voting securities of an issuer, or a company which is under common control results in that issuer becoming an affiliated person as defined by the 1940 Act.
See Accompanying Notes to Financial Statements
PORTFOLIO OF INVESTMENTS
| Voya Index Solution 2040 Portfolio | as of December 31, 2016 (continued) |
The following table provides transactions during the year ended December 31, 2016, where the following issuers were considered an affiliate:
| Issuer | | | Beginning
Fair Value
at 12/31/2015 | | | Purchases
at Cost | | | Sales
at Cost | | | Change in
Unrealized
Appreciation/
(Depreciation) | | | Ending
Fair Value
at 12/31/16 | | | Investment
Income | | | Realized
Gains/
(Losses) | | | Net Capital
Gain
Distributions | |
| Voya Emerging Markets Index Portfolio - Class I | | | | $ | 147,682 | | | | | $ | 3,754,465 | | | | | $ | (868,823) | | | | | $ | (86,028) | | | | | $ | 2,947,296 | | | | | $ | 9,600 | | | | | $ | 58,753 | | | | | $ | — | | |
| Voya International Index Portfolio - Class I | | | | | 569,378 | | | | | | 12,036,409 | | | | | | (1,029,218) | | | | | | 160,675 | | | | | | 11,737,244 | | | | | | 53,344 | | | | | | (8,594) | | | | | | — | | |
| Voya Russell™ Mid Cap Index Portfolio - Class I | | | | | 247,925 | | | | | | 5,625,340 | | | | | | (1,022,820) | | | | | | 187,538 | | | | | | 5,037,983 | | | | | | 10,183 | | | | | | (27,685) | | | | | | 91,407 | | |
| Voya Russell™ Small Cap Index Portfolio - Class I | | | | | 116,357 | | | | | | 2,312,512 | | | | | | (240,349) | | | | | | 209,190 | | | | | | 2,397,710 | | | | | | 4,978 | | | | | | 6,210 | | | | | | 42,383 | | |
| Voya U.S. Bond Index Portfolio - Class I | | | | | 262,501 | | | | | | 6,902,108 | | | | | | (2,533,714) | | | | | | (100,425) | | | | | | 4,530,470 | | | | | | 37,966 | | | | | | 9,083 | | | | | | 1,164 | | |
| Voya U.S. Stock Index Portfolio - Class I | | | | | 1,246,336 | | | | | | 29,391,372 | | | | | | (2,856,650) | | | | | | 412,675 | | | | | | 28,193,733 | | | | | | 461,482 | | | | | | 141,854 | | | | | | 404,372 | | |
| | | | | $ | 2,590,179 | | | | | $ | 60,022,206 | | | | | $ | (8,551,574) | | | | | $ | 783,625 | | | | | $ | 54,844,436 | | | | | $ | 577,553 | | | | | $ | 179,620 | | | | | $ | 539,327 | | |
| |
The financial statements for the above mutual fund[s] can be found at www.sec.gov.
The effect of derivative instruments on the Portfolio’s Statement of Operations for the year ended December 31, 2016 was as follows:
| | | | Amount of Realized Gain or (Loss) on
Derivatives Recognized in Income | |
| Derivatives not accounted for as hedging instruments | | | Futures | |
| Equity contracts | | | | $ | (4,234) | | |
| Total | | | | $ | (4,234) | | |
| |
See Accompanying Notes to Financial Statements
PORTFOLIO OF INVESTMENTS
| Voya Index Solution 2045 Portfolio | as of December 31, 2016 |
| Shares | | | | | | Value | | | Percentage
of Net
Assets | |
| EXCHANGE-TRADED FUNDS: 7.7% | |
| | | 26,180 | | | | iShares Barclays 20+ Year
Treasury Bond Fund | | | | $ | 3,118,823 | | | | | | 1.0 | | |
| | | 274,453 | | | | PowerShares Senior Loan
Portfolio | | | | | 6,411,222 | | | | | | 1.9 | | |
| | | 127,781 | | | | SPDR Dow Jones
International Real Estate | | | | | 4,610,339 | | | | | | 1.4 | | |
| | | 28,677 | | | | SPDR Trust Series 1 | | | | | 6,410,170 | | | | | | 1.9 | | |
| | | 58,608 | | | | Vanguard REIT | | | | | 4,836,918 | | | | | | 1.5 | | |
| | | | | | | Total Exchange-Traded Funds
(Cost $26,446,754) | | | | | 25,387,472 | | | | | | 7.7 | | |
| MUTUAL FUNDS: 92.2% | |
| | | | | | | Affiliated Investment Companies: 90.7% | |
| | | 2,041,120 | | | | Voya Emerging Markets Index
Portfolio - Class I | | | | | 19,513,108 | | | | | | 5.9 | | |
| | | 7,737,983 | | | | Voya International Index
Portfolio - Class I | | | | | 68,171,632 | | | | | | 20.7 | | |
| | | 2,066,950 | | | | Voya Russell™ Mid Cap Index
Portfolio - Class I | | | | | 31,086,931 | | | | | | 9.4 | | |
| | | 888,992 | | | | Voya Russell™ Small Cap
Index Portfolio - Class I | | | | | 13,254,869 | | | | | | 4.0 | | |
| | | 794,581 | | | | Voya U.S. Bond Index
Portfolio - Class I | | | | | 8,366,934 | | | | | | 2.5 | | |
| | | 11,511,628 | | | | Voya U.S. Stock Index
Portfolio - Class I | | | | | 158,745,353 | | | | | | 48.2 | | |
| | | | | | | | | | | | 299,138,827 | | | | | | 90.7 | | |
| | Shares | | | | | | Value | | | Percentage
of Net
Assets | |
| | MUTUAL FUNDS: (continued) | |
| | | | | | | | Unaffiliated Investment Companies: 1.5% | |
| | | | 967,746 | @ | | Credit Suisse Commodity
Return Strategy Fund -
Class I | | | | $ | 4,906,471 | | | | | | 1.5 | | |
| | | | | | | | Total Mutual Funds
(Cost $311,476,919) | | | | | 304,045,298 | | | | | | 92.2 | | |
| | | | | | | | Total Investments in
Securities
(Cost $337,923,673) | | | | $ | 329,432,770 | | | | | | 99.9 | | |
| | | | | | | | Assets in Excess of Other
Liabilities | | | | | 307,893 | | | | | | 0.1 | | |
| | | | | | | | Net Assets | | | | $ | 329,740,663 | | | | | | 100.0 | | |
| |
@
Non-income producing security.
Cost for federal income tax purposes is $341,349,318.
Net unrealized depreciation consists of:
| | Gross Unrealized Appreciation | | | | $ | 429,665 | | |
| | Gross Unrealized Depreciation | | | | | (12,346,213) | | |
| | Net Unrealized Depreciation | | | | $ | (11,916,548) | | |
| |
Fair Value Measurements^
The following is a summary of the fair valuations according to the inputs used as of December 31, 2016 in valuing the assets and liabilities:
| | | | Quoted Prices
in Active Markets
for Identical
Investments
(Level 1) | | | Significant
Other
Observable
Inputs
(Level 2) | | | Significant
Unobservable
Inputs
(Level 3) | | | Fair Value
at
December 31, 2016 | |
| Asset Table | | | | | |
| Investments, at fair value | | | | | |
| Exchange-Traded Funds | | | | $ | 25,387,472 | | | | | $ | — | | | | | $ | — | | | | | $ | 25,387,472 | | |
| Mutual Funds | | | | | 304,045,298 | | | | | | — | | | | | | — | | | | | | 304,045,298 | | |
| Total Investments, at fair value | | | | $ | 329,432,770 | | | | | $ | — | | | | | $ | — | | | | | $ | 329,432,770 | | |
| |
^
See Note 2, “Significant Accounting Policies” in the Notes to Financial Statements for additional information.
Transactions with Affiliates
An investment of at least 5% of the voting securities of an issuer, or a company which is under common control results in that issuer becoming an affiliated person as defined by the 1940 Act.
See Accompanying Notes to Financial Statements
PORTFOLIO OF INVESTMENTS
| Voya Index Solution 2045 Portfolio | as of December 31, 2016 (continued) |
The following table provides transactions during the year ended December 31, 2016, where the following issuers were considered an affiliate:
| Issuer | | | Beginning
Fair Value
at 12/31/2015 | | | Purchases
at Cost | | | Sales
at Cost | | | Change in
Unrealized
Appreciation/
(Depreciation) | | | Ending
Fair Value
at 12/31/16 | | | Investment
Income | | | Realized
Gains/
(Losses) | | | Net Capital
Gain
Distributions | |
| Voya Emerging Markets Index Portfolio - Class I | | | | $ | 15,045,258 | | | | | $ | 12,691,884 | | | | | $ | (11,147,876) | | | | | $ | 2,923,842 | | | | | $ | 19,513,108 | | | | | $ | 346,268 | | | | | $ | (1,926,798) | | | | | $ | — | | |
| Voya International Index Portfolio - Class I | | | | | 52,951,756 | | | | | | 23,624,759 | | | | | | (6,659,525) | | | | | | (1,745,358) | | | | | | 68,171,632 | | | | | | 1,692,201 | | | | | | 914,343 | | | | | | — | | |
| Voya Russell™ Mid Cap Index Portfolio - Class I | | | | | 27,158,102 | | | | | | 17,610,329 | | | | | | (13,702,310) | | | | | | 20,810 | | | | | | 31,086,931 | | | | | | 343,542 | | | | | | 110,326 | | | | | | 3,083,641 | | |
| Voya Russell™ Small Cap Index Portfolio - Class I | | | | | 10,369,280 | | | | | | 4,915,801 | | | | | | (2,910,267) | | | | | | 880,055 | | | | | | 13,254,869 | | | | | | 150,391 | | | | | | 62,386 | | | | | | 1,280,505 | | |
| Voya U.S. Bond Index Portfolio - Class I | | | | | 10,241,070 | | | | | | 17,111,731 | | | | | | (18,916,369) | | | | | | (69,498) | | | | | | 8,366,934 | | | | | | 214,660 | | | | | | 106,752 | | | | | | 29,434 | | |
| Voya U.S. Stock Index Portfolio - Class I | | | | | 113,792,246 | | | | | | 66,062,019 | | | | | | (25,877,744) | | | | | | 4,768,832 | | | | | | 158,745,353 | | | | | | 3,002,051 | | | | | | (526,299) | | | | | | 7,370,294 | | |
| | | | | $ | 229,557,712 | | | | | $ | 142,016,523 | | | | | $ | (79,214,091) | | | | | $ | 6,778,683 | | | | | $ | 299,138,827 | | | | | $ | 5,749,113 | | | | | $ | (1,259,289) | | | | | $ | 11,763,873 | | |
| |
The financial statements for the above mutual fund[s] can be found at www.sec.gov.
The effect of derivative instruments on the Portfolio’s Statement of Operations for the year ended December 31, 2016 was as follows:
| | | | Amount of Realized Gain or (Loss) on
Derivatives Recognized in Income | |
| Derivatives not accounted for as hedging instruments | | | Futures | |
| Equity contracts | | | | $ | (853,399) | | |
| Interest rate contracts | | | | | 74,274 | | |
| Total | | | | $ | (779,125) | | |
| |
See Accompanying Notes to Financial Statements
PORTFOLIO OF INVESTMENTS
| Voya Index Solution 2050 Portfolio | as of December 31, 2016 |
| | Shares | | | Value | | | Percentage
of Net
Assets | |
| | EXCHANGE-TRADED FUNDS: 7.6% | |
| | | | 2,367 | | | | iShares Barclays 20+ Year
Treasury Bond Fund | | | | $ | 281,981 | | | | | | 1.0 | | |
| | | | 24,567 | | | | PowerShares Senior Loan
Portfolio | | | | | 573,885 | | | | | | 1.9 | | |
| | | | 11,794 | | | | SPDR Dow Jones International
Real Estate | | | | | 425,528 | | | | | | 1.4 | | |
| | | | 2,421 | | | | SPDR Trust Series 1 | | | | | 541,166 | | | | | | 1.8 | | |
| | | | 5,370 | | | | Vanguard REIT | | | | | 443,186 | | | | | | 1.5 | | |
| | | | | | | | Total Exchange-Traded Funds
(Cost $2,316,950) | | | | | 2,265,746 | | | | | | 7.6 | | |
| | MUTUAL FUNDS: 92.3% | |
| | | | | | | | Affiliated Investment Companies: 90.9% | |
| | | | 186,396 | | | | Voya Emerging Markets Index
Portfolio - Class I | | | | | 1,781,949 | | | | | | 5.9 | | |
| | | | 705,431 | | | | Voya International Index
Portfolio - Class I | | | | | 6,214,851 | | | | | | 20.7 | | |
| | | | 208,298 | | | | Voya Russell™ Mid Cap Index
Portfolio - Class I | | | | | 3,132,802 | | | | | | 10.4 | | |
| | | | 80,925 | | | | Voya Russell™ Small Cap Index
Portfolio - Class I | | | | | 1,206,593 | | | | | | 4.0 | | |
| | | | 74,865 | | | | Voya U.S. Bond Index
Portfolio - Class I | | | | | 788,331 | | | | | | 2.6 | | |
| | Shares | | | Value | | | Percentage
of Net
Assets | |
| | MUTUAL FUNDS: (continued) | |
| | | | | | | | Affiliated Investment Companies (continued) | |
| | | | 1,030,405 | | | | Voya U.S. Stock Index
Portfolio - Class I | | | | $ | 14,209,282 | | | | | | 47.3 | | |
| | | | | | | | | | | | | 27,333,808 | | | | | | 90.9 | | |
| | | | | | | | Unaffiliated Investment Companies: 1.4% | |
| | | | 85,959 | @ | | Credit Suisse Commodity
Return Strategy Fund - Class I | | | | | 435,814 | | | | | | 1.4 | | |
| | | | | | | | Total Mutual Funds
(Cost $27,331,001) | | | | | 27,769,622 | | | | | | 92.3 | | |
| | | | | | | | Total Investments in
Securities
(Cost $29,647,951) | | | | $ | 30,035,368 | | | | | | 99.9 | | |
| | | | | | | | Assets in Excess of Other
Liabilities | | | | | 44,618 | | | | | | 0.1 | | |
| | | | | | | | Net Assets | | | | $ | 30,079,986 | | | | | | 100.0 | | |
| |
@
Non-income producing security.
Cost for federal income tax purposes is $29,709,108.
Net unrealized appreciation consists of:
| | Gross Unrealized Appreciation | | | | $ | 497,897 | | |
| | Gross Unrealized Depreciation | | | | | (171,637) | | |
| | Net Unrealized Appreciation | | | | $ | 326,260 | | |
| |
Fair Value Measurements^
The following is a summary of the fair valuations according to the inputs used as of December 31, 2016 in valuing the assets and liabilities:
| | | | Quoted Prices
in Active Markets
for Identical
Investments
(Level 1) | | | Significant
Other
Observable
Inputs
(Level 2) | | | Significant
Unobservable
Inputs
(Level 3) | | | Fair Value
at
December 31, 2016 | |
| Asset Table | | | | | |
| Investments, at fair value | | | | | |
| Exchange-Traded Funds | | | | $ | 2,265,746 | | | | | $ | — | | | | | $ | — | | | | | $ | 2,265,746 | | |
| Mutual Funds | | | | | 27,769,622 | | | | | | — | | | | | | — | | | | | | 27,769,622 | | |
| Total Investments, at fair value | | | | $ | 30,035,368 | | | | | $ | — | | | | | $ | — | | | | | $ | 30,035,368 | | |
^
See Note 2, “Significant Accounting Policies” in the Notes to Financial Statements for additional information.
Transactions with Affiliates
An investment of at least 5% of the voting securities of an issuer, or a company which is under common control results in that issuer becoming an affiliated person as defined by the 1940 Act.
See Accompanying Notes to Financial Statements
PORTFOLIO OF INVESTMENTS
| Voya Index Solution 2050 Portfolio | as of December 31, 2016 (continued) |
The following table provides transactions during the year ended December 31, 2016, where the following issuers were considered an affiliate:
| Issuer | | | Beginning
Fair Value
at 12/31/2015 | | | Purchases
at Cost | | | Sales
at Cost | | | Change in
Unrealized
Appreciation/
(Depreciation) | | | Ending
Fair Value
at 12/31/16 | | | Investment
Income | | | Realized
Gains/
(Losses) | | | Net Capital
Gain
Distributions | |
| Voya Emerging Markets Index Portfolio - Class I | | | | $ | 107,827 | | | | | $ | 2,110,778 | | | | | $ | (401,613) | | | | | $ | (35,043) | | | | | $ | 1,781,949 | | | | | $ | 6,896 | | | | | $ | 29,689 | | | | | $ | — | | |
| Voya International Index Portfolio - Class I | | | | | 372,048 | | | | | | 6,180,843 | | | | | | (426,479) | | | | | | 88,439 | | | | | | 6,214,851 | | | | | | 33,615 | | | | | | (11,774) | | | | | | — | | |
| Voya Russell™ Mid Cap Index Portfolio - Class I | | | | | 190,491 | | | | | | 3,318,829 | | | | | | (483,245) | | | | | | 106,727 | | | | | | 3,132,802 | | | | | | 7,536 | | | | | | (17,083) | | | | | | 67,642 | | |
| Voya Russell™ Small Cap Index Portfolio - Class I | | | | | 72,128 | | | | | | 1,135,741 | | | | | | (104,062) | | | | | | 102,786 | | | | | | 1,206,593 | | | | | | 2,983 | | | | | | 514 | | | | | | 25,395 | | |
| Voya U.S. Bond Index Portfolio - Class I | | | | | 73,022 | | | | | | 2,186,180 | | | | | | (1,463,418) | | | | | | (7,453) | | | | | | 788,331 | | | | | | 8,642 | | | | | | (7,233) | | | | | | 315 | | |
| Voya U.S. Stock Index Portfolio - Class I | | | | | 795,906 | | | | | | 14,507,413 | | | | | | (1,296,331) | | | | | | 202,294 | | | | | | 14,209,282 | | | | | | 235,877 | | | | | | 47,177 | | | | | | 227,293 | | |
| | | | | $ | 1,611,422 | | | | | $ | 29,439,784 | | | | | $ | (4,175,148) | | | | | $ | 457,750 | | | | | $ | 27,333,808 | | | | | $ | 295,549 | | | | | $ | 41,290 | | | | | $ | 320,645 | | |
| |
The financial statements for the above mutual fund[s] can be found at www.sec.gov.
The effect of derivative instruments on the Portfolio’s Statement of Operations for the year ended December 31, 2016 was as follows:
| | | | Amount of Realized Gain or (Loss) on
Derivatives Recognized in Income | |
| Derivatives not accounted for as hedging instruments | | | Futures | |
| Equity contracts | | | | $ | (2,117) | | |
| Total | | | | $ | (2,117) | | |
| |
See Accompanying Notes to Financial Statements
PORTFOLIO OF INVESTMENTS
| Voya Index Solution 2055 Portfolio | as of December 31, 2016 |
| | Shares | | | Value | | | Percentage
of Net
Assets | |
| | EXCHANGE-TRADED FUNDS: 5.8% | |
| | | | 7,994 | | | | iShares Barclays 20+
Year Treasury Bond
Fund | | | | $ | 952,325 | | | | | | 0.9 | | |
| | | | 40,653 | | | | SPDR Dow Jones
International Real Estate | | | | | 1,466,760 | | | | | | 1.4 | | |
| | | | 8,845 | | | | SPDR Trust Series 1 | | | | | 1,977,123 | | | | | | 2.0 | | |
| | | | 18,021 | | | | Vanguard REIT | | | | | 1,487,273 | | | | | | 1.5 | | |
| | | | | | | | Total Exchange-Traded
Funds
(Cost $6,143,202) | | | | | 5,883,481 | | | | | | 5.8 | | |
| | MUTUAL FUNDS: 94.1% | |
| | | | | | | | Affiliated Investment Companies: 92.6% | |
| | | | 628,265 | | | | Voya Emerging Markets
Index Portfolio - Class I | | | | | 6,006,209 | | | | | | 5.9 | | |
| | | | 2,560,159 | | | | Voya International Index
Portfolio - Class I | | | | | 22,554,999 | | | | | | 22.2 | | |
| | | | 704,662 | | | | Voya Russell™ Mid Cap
Index Portfolio - Class I | | | | | 10,598,114 | | | | | | 10.4 | | |
| | | | 274,228 | | | | Voya Russell™ Small
Cap Index Portfolio -
Class I | | | | | 4,088,734 | | | | | | 4.0 | | |
| | | | 239,246 | | | | Voya U.S. Bond Index
Portfolio - Class I | | | | | 2,519,256 | | | | | | 2.5 | | |
| | | | 3,515,692 | | | | Voya U.S. Stock Index
Portfolio - Class I | | | | | 48,481,391 | | | | | | 47.6 | | |
| | | | | | | | | | | | | 94,248,703 | | | | | | 92.6 | | |
| | Shares | | | Value | | | Percentage
of Net
Assets | |
| | MUTUAL FUNDS: (continued) | |
| | | | | | | | Unaffiliated Investment Companies: 1.5% | |
| | | | 299,964 | @ | | Credit Suisse
Commodity Return
Strategy Fund - Class I | | | | $ | 1,520,818 | | | | | | 1.5 | | |
| | | | | | | | Total Mutual Funds
(Cost $97,215,690) | | | | | 95,769,521 | | | | | | 94.1 | | |
| | | | | | | | Total Investments in
Securities
(Cost $103,358,892) | | | | $ | 101,653,002 | | | | | | 99.9 | | |
| | | | | | | | Assets in Excess of
Other Liabilities | | | | | 72,356 | | | | | | 0.1 | | |
| | | | | | | | Net Assets | | | | $ | 101,725,358 | | | | | | 100.0 | | |
| |
@
Non-income producing security.
Cost for federal income tax purposes is $105,606,782.
Net unrealized depreciation consists of:
| | Gross Unrealized Appreciation | | | | $ | 210,601 | | |
| | Gross Unrealized Depreciation | | | | | (4,164,381) | | |
| | Net Unrealized Depreciation | | | | $ | (3,953,780) | | |
| |
Fair Value Measurements^
The following is a summary of the fair valuations according to the inputs used as of December 31, 2016 in valuing the assets and liabilities:
| | | | Quoted Prices
in Active Markets
for Identical
Investments
(Level 1) | | | Significant
Other
Observable
Inputs
(Level 2) | | | Significant
Unobservable
Inputs
(Level 3) | | | Fair Value
at
December 31, 2016 | |
| Asset Table | | | | | | | | | | | | | | | | | | | | | | | | | |
| Investments, at fair value | | | | | | | | | | | | | | | | | | | | | | | | | |
| Exchange-Traded Funds | | | | $ | 5,883,481 | | | | | $ | — | | | | | $ | — | | | | | $ | 5,883,481 | | |
| Mutual Funds | | | | | 95,769,521 | | | | | | — | | | | | | — | | | | | | 95,769,521 | | |
| Total Investments, at fair value | | | | $ | 101,653,002 | | | | | $ | — | | | | | $ | — | | | | | $ | 101,653,002 | | |
^
See Note 2, “Significant Accounting Policies” in the Notes to Financial Statements for additional information.
Transactions with Affiliates
An investment of at least 5% of the voting securities of an issuer, or a company which is under common control results in that issuer becoming an affiliated person as defined by the 1940 Act.
See Accompanying Notes to Financial Statements
PORTFOLIO OF INVESTMENTS
| Voya Index Solution 2055 Portfolio | as of December 31, 2016 (continued) |
The following table provides transactions during the year ended December 31, 2016, where the following issuers were considered an affiliate:
| Issuer | | | Beginning
Fair Value
at 12/31/2015 | | | Purchases
at Cost | | | Sales
at Cost | | | Change in
Unrealized
Appreciation/
(Depreciation) | | | Ending
Fair Value
at 12/31/16 | | | Investment
Income | | | Realized
Gains/
(Losses) | | | Net Capital
Gain
Distributions | |
| Voya Emerging Markets Index Portfolio - Class I | | | | $ | 4,179,532 | | | | | $ | 4,412,877 | | | | | $ | (3,459,093) | | | | | $ | 872,893 | | | | | $ | 6,006,209 | | | | | $ | 100,663 | | | | | $ | (590,287) | | | | | $ | — | | |
| Voya International Index Portfolio - Class I | | | | | 15,796,359 | | | | | | 10,355,648 | | | | | | (3,441,270) | | | | | | (155,738) | | | | | | 22,554,999 | | | | | | 529,424 | | | | | | (77,043) | | | | | | — | | |
| Voya Russell™ Mid Cap Index Portfolio - Class I | | | | | 7,556,062 | | | | | | 6,531,546 | | | | | | (3,922,966) | | | | | | 433,472 | | | | | | 10,598,114 | | | | | | 110,423 | | | | | | (376,288) | | | | | | 991,162 | | |
| Voya Russell™ Small Cap Index Portfolio - Class I | | | | | 2,881,956 | | | | | | 1,870,429 | | | | | | (1,112,045) | | | | | | 448,394 | | | | | | 4,088,734 | | | | | | 44,062 | | | | | | (138,860) | | | | | | 375,167 | | |
| Voya U.S. Bond Index Portfolio - Class I | | | | | 2,920,551 | | | | | | 5,061,823 | | | | | | (5,441,908) | | | | | | (21,210) | | | | | | 2,519,256 | | | | | | 62,151 | | | | | | 34,242 | | | | | | 4,519 | | |
| Voya U.S. Stock Index Portfolio - Class I | | | | | 32,116,444 | | | | | | 23,486,976 | | | | | | (9,387,634) | | | | | | 2,265,605 | | | | | | 48,481,391 | | | | | | 909,522 | | | | | | (884,108) | | | | | | 2,119,437 | | |
| | | | | $ | 65,450,904 | | | | | $ | 51,719,299 | | | | | $ | (26,764,916) | | | | | $ | 3,843,416 | | | | | $ | 94,248,703 | | | | | $ | 1,756,245 | | | | | $ | (2,032,344) | | | | | $ | 3,490,286 | | |
| |
The financial statements for the above mutual fund[s] can be found at www.sec.gov.
The effect of derivative instruments on the Portfolio’s Statement of Operations for the year ended December 31, 2016 was as follows:
| | | | Amount of Realized Gain or (Loss) on
Derivatives Recognized in Income | |
| Derivatives not accounted for as hedging instruments | | | Futures | |
| Equity contracts | | | | $ | (231,531) | | |
| Interest rate contracts | | | | | 19,703 | | |
| Total | | | | $ | (211,828) | | |
| |
See Accompanying Notes to Financial Statements
PORTFOLIO OF INVESTMENTS
| Voya Index Solution 2060 Portfolio | as of December 31, 2016 |
| | Shares | | | Value | | | Percentage
of Net
Assets | |
| | EXCHANGE-TRADED FUNDS: 8.6% | |
| | | | 458 | | | | iShares Barclays 20+
Year Treasury Bond
Fund | | | | $ | 54,562 | | | | | | 0.9 | | |
| | | | 2,342 | | | | SPDR Dow Jones
International Real Estate | | | | | 84,499 | | | | | | 1.5 | | |
| | | | 1,249 | | | | SPDR Trust Series 1 | | | | | 279,189 | | | | | | 4.7 | | |
| | | | 1,088 | | | | Vanguard REIT | | | | | 89,793 | | | | | | 1.5 | | |
| | | | | | | | Total Exchange-Traded
Funds
(Cost $514,303) | | | | | 508,043 | | | | | | 8.6 | | |
| | MUTUAL FUNDS: 91.3% | |
| | | | | | | | Affiliated Investment Companies: 89.8% | |
| | | | 37,016 | | | | Voya Emerging Markets
Index Portfolio - Class I | | | | | 353,873 | | | | | | 6.0 | | |
| | | | 148,215 | | | | Voya International Index
Portfolio - Class I | | | | | 1,305,771 | | | | | | 22.1 | | |
| | | | 41,013 | | | | Voya Russell™ Mid Cap
Index Portfolio - Class I | | | | | 616,838 | | | | | | 10.5 | | |
| | | | 15,854 | | | | Voya Russell™ Small
Cap Index Portfolio -
Class I | | | | | 236,386 | | | | | | 4.0 | | |
| | | | 14,673 | | | | Voya U.S. Bond Index
Portfolio - Class I | | | | | 154,501 | | | | | | 2.6 | | |
| | | | 191,090 | | | | Voya U.S. Stock Index
Portfolio - Class I | | | | | 2,635,135 | | | | | | 44.6 | | |
| | | | | | | | | | | | | 5,302,504 | | | | | | 89.8 | | |
| | Shares | | | Value | | | Percentage
of Net
Assets | |
| | MUTUAL FUNDS: (continued) | |
| | | | | | | | Unaffiliated Investment Companies: 1.5% | |
| | | | 17,013 | @ | | Credit Suisse
Commodity Return
Strategy Fund - Class I | | | | $ | 86,254 | | | | | | 1.5 | | |
| | | | | | | | Total Mutual Funds
(Cost $5,340,416) | | | | | 5,388,758 | | | | | | 91.3 | | |
| | | | | | | | Total Investments in
Securities
(Cost $5,854,719) | | | | $ | 5,896,801 | | | | | | 99.9 | | |
| | | | | | | | Assets in Excess of
Other Liabilities | | | | | 8,398 | | | | | | 0.1 | | |
| | | | | | | | Net Assets | | | | $ | 5,905,199 | | | | | | 100.0 | | |
| |
@
Non-income producing security.
Cost for federal income tax purposes is $5,868,802.
Net unrealized appreciation consists of:
| | Gross Unrealized Appreciation | | | | $ | 59,003 | | |
| | Gross Unrealized Depreciation | | | | | (31,004) | | |
| | Net Unrealized Appreciation | | | | $ | 27,999 | | |
| |
Fair Value Measurements^
The following is a summary of the fair valuations according to the inputs used as of December 31, 2016 in valuing the assets and liabilities:
| | | | Quoted Prices
in Active Markets
for Identical
Investments
(Level 1) | | | Significant
Other
Observable
Inputs
(Level 2) | | | Significant
Unobservable
Inputs
(Level 3) | | | Fair Value
at
December 31, 2016 | |
| Asset Table | | | | | | | | | | | | | | | | | | | | | | | | | |
| Investments, at fair value | | | | | | | | | | | | | | | | | | | | | | | | | |
| Exchange-Traded Funds | | | | $ | 508,043 | | | | | $ | — | | | | | $ | — | | | | | $ | 508,043 | | |
| Mutual Funds | | | | | 5,388,758 | | | | | | — | | | | | | — | | | | | | 5,388,758 | | |
| Total Investments, at fair value | | | | $ | 5,896,801 | | | | | $ | — | | | | | $ | — | | | | | $ | 5,896,801 | | |
Transactions with Affiliates
An investment of at least 5% of the voting securities of an issuer, or a company which is under common control results in that issuer becoming an affiliated person as defined by the 1940 Act.
See Accompanying Notes to Financial Statements
PORTFOLIO OF INVESTMENTS
| Voya Index Solution 2060 Portfolio | as of December 31, 2016 (continued) |
The following table provides transactions during the year ended December 31, 2016, where the following issuers were considered an affiliate:
| Issuer | | | Beginning
Fair Value
at 12/31/2015 | | | Purchases
at Cost | | | Sales
at Cost | | | Change in
Unrealized
Appreciation/
(Depreciation) | | | Ending
Fair Value
at 12/31/16 | | | Investment
Income | | | Realized
Gains/
(Losses) | | | Net Capital
Gain
Distributions | |
| Voya Emerging Markets Index Portfolio - Class I | | | | $ | 23,730 | | | | | $ | 435,992 | | | | | $ | (100,747) | | | | | $ | (5,102) | | | | | $ | 353,873 | | | | | $ | 1,697 | | | | | $ | 9,522 | | | | | $ | — | | |
| Voya International Index Portfolio - Class I | | | | | 87,393 | | | | | | 1,401,870 | | | | | | (200,358) | | | | | | 16,866 | | | | | | 1,305,771 | | | | | | 8,931 | | | | | | (631) | | | | | | — | | |
| Voya Russell™ Mid Cap Index Portfolio - Class I | | | | | 41,640 | | | | | | 689,331 | | | | | | (129,418) | | | | | | 15,285 | | | | | | 616,838 | | | | | | 1,858 | | | | | | (1,704) | | | | | | 16,678 | | |
| Voya Russell™ Small Cap Index Portfolio - Class I | | | | | 15,667 | | | | | | 242,319 | | | | | | (38,410) | | | | | | 16,810 | | | | | | 236,386 | | | | | | 736 | | | | | | 798 | | | | | | 6,263 | | |
| Voya U.S. Bond Index Portfolio - Class I | | | | | 15,831 | | | | | | 373,191 | | | | | | (232,744) | | | | | | (1,777) | | | | | | 154,501 | | | | | | 1,721 | | | | | | 321 | | | | | | 78 | | |
| Voya U.S. Stock Index Portfolio - Class I | | | | | 174,671 | | | | | | 3,067,800 | | | | | | (617,656) | | | | | | 10,320 | | | | | | 2,635,135 | | | | | | 44,329 | | | | | | 32,105 | | | | | | 47,826 | | |
| | | | | $ | 358,932 | | | | | $ | 6,210,503 | | | | | $ | (1,319,333) | | | | | $ | 52,402 | | | | | $ | 5,302,504 | | | | | $ | 59,272 | | | | | $ | 40,412 | | | | | $ | 70,844 | | |
| |
The financial statements for the above mutual fund[s] can be found at www.sec.gov.
See Accompanying Notes to Financial Statements
TAX INFORMATION (Unaudited)
Dividends and distributions paid during the year ended December 31, 2016 were as follows:
| Portfolio Name | | | Type | | | Per Share Amount | |
| Voya Index Solution Income Portfolio | |
| Class ADV | | | NII | | | | $ | 0.1523 | | |
| Class I | | | NII | | | | $ | 0.1827 | | |
| Class S | | | NII | | | | $ | 0.1613 | | |
| Class S2 | | | NII | | | | $ | 0.1576 | | |
| Class Z | | | NII | | | | $ | 0.1827 | | |
| All Classes | | | LTCG | | | | $ | 0.1393 | | |
| Voya Index Solution 2020 Portfolio | |
| Class ADV | | | NII | | | | $ | 0.0135 | | |
| Class I | | | NII | | | | $ | 0.0177 | | |
| Class S | | | NII | | | | $ | 0.0166 | | |
| Class S2 | | | NII | | | | $ | 0.0149 | | |
| Class Z | | | NII | | | | $ | 0.0179 | | |
| All Classes | | | STCG | | | | $ | 0.0062 | | |
| All Classes | | | LTCG | | | | $ | 0.0006 | | |
| Voya Index Solution 2025 Portfolio | |
| Class ADV | | | NII | | | | $ | 0.2103 | | |
| Class I | | | NII | | | | $ | 0.2668 | | |
| Class S | | | NII | | | | $ | 0.2315 | | |
| Class S2 | | | NII | | | | $ | 0.2186 | | |
| Class Z | | | NII | | | | $ | 0.2668 | | |
| All Classes | | | LTCG | | | | $ | 0.7514 | | |
| Voya Index Solution 2030 Portfolio | |
| Class ADV | | | NII | | | | $ | 0.0094 | | |
| Class I | | | NII | | | | $ | 0.0136 | | |
| Class S | | | NII | | | | $ | 0.0120 | | |
| Class S2 | | | NII | | | | $ | 0.0132 | | |
| Class Z | | | NII | | | | $ | 0.0137 | | |
| All Classes | | | STCG | | | | $ | 0.0061 | | |
| All Classes | | | LTCG | | | | $ | 0.0015 | | |
| Voya Index Solution 2035 Portfolio | |
| Class ADV | | | NII | | | | $ | 0.1939 | | |
| Class I | | | NII | | | | $ | 0.2514 | | |
| Class S | | | NII | | | | $ | 0.2167 | | |
| Class S2 | | | NII | | | | $ | 0.2044 | | |
| Class Z | | | NII | | | | $ | 0.2514 | | |
| All Classes | | | STCG | | | | $ | 0.0046 | | |
| All Classes | | | LTCG | | | | $ | 0.9240 | | |
| Portfolio Name | | | Type | | | Per Share Amount | |
| Voya Index Solution 2040 Portfolio | |
| Class ADV | | | NII | | | | $ | 0.0083 | | |
| Class I | | | NII | | | | $ | 0.0149 | | |
| Class S | | | NII | | | | $ | 0.0130 | | |
| Class S2 | | | NII | | | | $ | 0.0142 | | |
| Class Z | | | NII | | | | $ | 0.0153 | | |
| All Classes | | | STCG | | | | $ | 0.0057 | | |
| All Classes | | | LTCG | | | | $ | 0.0031 | | |
| Voya Index Solution 2045 Portfolio | |
| Class ADV | | | NII | | | | $ | 0.1734 | | |
| Class I | | | NII | | | | $ | 0.2291 | | |
| Class S | | | NII | | | | $ | 0.1940 | | |
| Class S2 | | | NII | | | | $ | 0.1849 | | |
| Class Z | | | NII | | | | $ | 0.2291 | | |
| All Classes | | | STCG | | | | $ | 0.0040 | | |
| All Classes | | | LTCG | | | | $ | 0.9347 | | |
| Voya Index Solution 2050 Portfolio | |
| Class ADV | | | NII | | | | $ | 0.0141 | | |
| Class I | | | NII | | | | $ | 0.0171 | | |
| Class S | | | NII | | | | $ | 0.0176 | | |
| Class S2 | | | NII | | | | $ | 0.0181 | | |
| Class Z | | | NII | | | | $ | 0.0195 | | |
| All Classes | | | STCG | | | | $ | 0.0274 | | |
| All Classes | | | LTCG | | | | $ | 0.0054 | | |
| Voya Index Solution 2055 Portfolio | |
| Class ADV | | | NII | | | | $ | 0.1781 | | |
| Class I | | | NII | | | | $ | 0.2392 | | |
| Class S | | | NII | | | | $ | 0.2026 | | |
| Class S2 | | | NII | | | | $ | 0.1937 | | |
| Class Z | | | NII | | | | $ | 0.2392 | | |
| All Classes | | | LTCG | | | | $ | 0.9041 | | |
| Voya Index Solution 2060 Portfolio | |
| Class ADV | | | NII | | | | $ | 0.0154 | | |
| Class I | | | NII | | | | $ | 0.0147 | | |
| Class S | | | NII | | | | $ | 0.0153 | | |
| Class S2 | | | NII | | | | $ | — | | |
| Class Z | | | NII | | | | $ | 0.0182 | | |
| All Classes | | | STCG | | | | $ | 0.0302 | | |
| All Classes | | | LTCG | | | | $ | 0.0123 | | |
NII - Net investment income
STCG - Short-term capital gain
LTCG - Long-term capital gain
TAX INFORMATION (Unaudited) (continued)
Of the ordinary distributions made during the year ended December 31, 2016, the following percentages qualify for the dividends received deduction (DRD) available to corporate shareholders:
| | Voya Index Solution Income Portfolio | | | | | 22.12% | | |
| | Voya Index Solution 2020 Portfolio | | | | | 21.86% | | |
| | Voya Index Solution 2025 Portfolio | | | | | 25.82% | | |
| | Voya Index Solution 2030 Portfolio | | | | | 16.39% | | |
| | Voya Index Solution 2035 Portfolio | | | | | 37.12% | | |
| | Voya Index Solution 2040 Portfolio | | | | | 23.59% | | |
| | Voya Index Solution 2045 Portfolio | | | | | 43.85% | | |
| | Voya Index Solution 2050 Portfolio | | | | | 10.12% | | |
| | Voya Index Solution 2055 Portfolio | | | | | 58.87% | | |
| | Voya Index Solution 2060 Portfolio | | | | | 16.66% | | |
The Portfolios designate the following amounts of long-term capital gain distributions as 20% rate long-term capital gain dividends under Internal Revenue Code Section 852(b)(3)(C):
| | Voya Index Solution Income Portfolio | | | | $ | 5,289,568 | | |
| | Voya Index Solution 2020 Portfolio | | | | $ | 2,244 | | |
| | Voya Index Solution 2025 Portfolio | | | | $ | 36,183,554 | | |
| | Voya Index Solution 2030 Portfolio | | | | $ | 4,156 | | |
| | Voya Index Solution 2035 Portfolio | | | | $ | 37,292,619 | | |
| | Voya Index Solution 2040 Portfolio | | | | $ | 4,692 | | |
| | Voya Index Solution 2045 Portfolio | | | | $ | 24,494,725 | | |
| | Voya Index Solution 2050 Portfolio | | | | $ | 4,272 | | |
| | Voya Index Solution 2055 Portfolio | | | | $ | 5,680,515 | | |
| | Voya Index Solution 2060 Portfolio | | | | $ | 2,561 | | |
The Regulated Investment Company Modernization Act of 2010 allows qualified fund-of-funds to elect to pass through the ability to take foreign tax credits (or deductions) to the extent that foreign taxes are passed through from underlying funds. A qualified fund-of-funds is a regulated investment company that has at least 50% of the value of its total assets invested in other regulated investment companies at the end of each quarter of the taxable year. Pursuant to Section 853 of the Internal Revenue Code, the Portfolios designate the following amounts as foreign taxes paid for the year ended December 31, 2016:
| | | | Creditable
Foreign Taxes
Paid | | | Per Share
Amount | | | Portion of Ordinary Income
Distribution Derived from
Foreign Sourced Income* | |
| Voya Index Solution Income Portfolio | | | | $ | 34,588 | | | | | $ | 0.0008 | | | | | | 6.79% | | |
| Voya Index Solution 2020 Portfolio | | | | $ | 16,016 | | | | | $ | 0.0019 | | | | | | 4.80% | | |
| Voya Index Solution 2025 Portfolio | | | | $ | 161,730 | | | | | $ | 0.0028 | | | | | | 17.94% | | |
| Voya Index Solution 2030 Portfolio | | | | $ | 30,467 | | | | | $ | 0.0045 | | | | | | 7.16% | | |
| Voya Index Solution 2035 Portfolio | | | | $ | 182,774 | | | | | $ | 0.0037 | | | | | | 23.42% | | |
| Voya Index Solution 2040 Portfolio | | | | $ | 23,584 | | | | | $ | 0.0056 | | | | | | 7.92% | | |
| Voya Index Solution 2045 Portfolio | | | | $ | 146,070 | | | | | $ | 0.0046 | | | | | | 28.72% | | |
| Voya Index Solution 2050 Portfolio | | | | $ | 13,148 | | | | | $ | 0.0061 | | | | | | 10.52% | | |
| Voya Index Solution 2055 Portfolio | | | | $ | 47,153 | | | | | $ | 0.0061 | | | | | | 28.93% | | |
| Voya Index Solution 2060 Portfolio | | | | $ | 2,718 | | | | | $ | 0.0049 | | | | | | 9.69% | | |
*None of the Portfolios listed above derived any income from ineligible foreign sources as defined under Section 901(j) of the Internal Revenue Code.
TAX INFORMATION (Unaudited) (continued)
Foreign taxes paid or withheld must be included in taxable income with an offsetting deduction from gross income or as a credit for taxes paid to foreign governments. Shareholders are strongly advised to consult their own tax advisors regarding the appropriate treatment of foreign taxes paid.
Above figures may differ from those cited elsewhere in this report due to differences in the calculation of income and gains under U.S. generally accepted accounting principles (book) purposes and Internal Revenue Service (tax) purposes.
Shareholders are strongly advised to consult their own tax advisers with respect to the tax consequences of their investments in the Portfolios. In January, shareholders, excluding corporate shareholders, receive an IRS 1099-DIV regarding the federal tax status of the dividends and distributions they received in the calendar year.
DIRECTOR AND OFFICER INFORMATION (Unaudited)
The business and affairs of the Company are managed under the direction of the Board. A Director, who is not an interested person of the Company, as defined in the 1940 Act, is an independent director (“Independent Director”). The Directors and Officers of the Company are listed below. The Statement of Additional Information includes additional information about directors of the Company and is available, without charge, upon request at (800) 262-3862.
| | Name, Address and Age | | | Position(s)
Held with the
Company | | | Term of Office and
Length of Time
Served(1) | | | Principal
Occupation(s) –
During the Past 5 Years | | | Number of
funds
in Fund
Complex
Overseen
by Director(2) | | | Other Board Positions
Held by Director | |
| | Independent Directors: | |
| | Colleen D. Baldwin
7337 East Doubletree Ranch Rd.
Suite 100
Scottsdale, Arizona 85258
Age: 56 | | | Director | | | November 2007 – Present | | | President, Glantuam Partners, LLC, a business consulting firm (January 2009 – Present). | | | 151 | | | DSM/Dentaquest, Boston, MA (February 2014 – Present). | |
| | John V. Boyer
7337 East Doubletree Ranch Rd.
Suite 100
Scottsdale, Arizona 85258
Age: 63 | | | Chairperson
Director | | | January 2014 – Present
November 1997 – Present | | | President and Chief Executive Officer, Bechtler Arts Foundation, an arts and education foundation (January 2008 – Present). | | | 151 | | | None. | |
| | Patricia W. Chadwick
7337 East Doubletree Ranch Rd.
Suite 100
Scottsdale, Arizona 85258
Age: 68 | | | Director | | | January 2006 – Present | | | Consultant and President, Ravengate Partners LLC, a consulting firm that provides advice regarding financial markets and the global economy (January 2000 – Present). | | | 151 | | | Wisconsin Energy Corporation (June 2006 – Present); The Royce Funds (23 funds) (December 2009 – Present); and AMICA Mutual Insurance Company (1992 – Present). | |
| | Peter S. Drotch
7337 East Doubletree Ranch Rd.
Suite 100
Scottsdale, Arizona 85258
Age: 75 | | | Director | | | November 2007 – Present | | | Retired. | | | 151 | | | None. | |
| | Martin J. Gavin
7337 East Doubletree Ranch Rd.
Suite 100
Scottsdale, AZ 85258-2034
Age: 66 | | | Director | | | August 2015 – Present | | | Retired. Formerly, President and Chief Executive Officer, Connecticut Children’s Medical Center (May 2006 – November 2015). | | | 151 | | | None. | |
| | Russell H. Jones
7337 East Doubletree Ranch Rd.
Suite 100
Scottsdale, Arizona 85258
Age: 72 | | | Director | | | May 2013 – Present | | | Retired. | | | 151 | | | None. | |
| | Patrick W. Kenny
7337 East Doubletree Ranch Rd.
Suite 100
Scottsdale, Arizona 85258
Age: 74 | | | Director | | | March 2002 – Present | | | Retired. | | | 151 | | | Assured Guaranty Ltd. (April 2004 – Present). | |
| | Joseph E. Obermeyer
7337 East Doubletree Ranch Rd.
Suite 100
Scottsdale, Arizona 85258
Age: 59 | | | Director | | | May 2013 – Present | | | President, Obermeyer & Associates, Inc., a provider of financial and economic consulting services (November 1999 – Present). | | | 151 | | | None. | |
DIRECTOR AND OFFICER INFORMATION (Unaudited) (continued)
| | Name, Address and Age | | | Position(s)
Held with the
Company | | | Term of Office and
Length of Time
Served(1) | | | Principal
Occupation(s) –
During the Past 5 Years | | | Number of
funds
in Fund
Complex
Overseen
by Director(2) | | | Other Board Positions
Held by Director | |
| | Sheryl K. Pressler
7337 East Doubletree Ranch Rd.
Suite 100
Scottsdale, Arizona 85258
Age: 66 | | | Director | | | January 2006 – Present | | | Consultant (May 2001 – Present). | | | 151 | | | None. | |
| | Christopher P. Sullivan
7337 East Doubletree Ranch Rd.
Suite 100
Scottsdale, Arizona 85258
Age: 63 | | | Director | | | October 2015 – Present | | | Retired. Formerly, President, Bond Division, Fidelity Management and Research (June 2009 – September 2012). | | | 151 | | | None. | |
| | Roger B. Vincent
7337 East Doubletree Ranch Rd.
Suite 100
Scottsdale, Arizona 85258
Age: 71 | | | Director | | | January 2005 – Present | | | Retired. | | | 151 | | | UGI Corporation (February 2006 – Present) and UGI Utilities, Inc. (February 2006 – Present). | |
| | Director who is an “interested person”: | | | | | |
| | Shaun P. Mathews(3)
7337 East Doubletree Ranch Rd.
Suite 100
Scottsdale, Arizona 85258
Age: 61 | | | Director | | | November 2007 – Present | | | President and Chief Executive Officer, Voya Investments, LLC (December 2006 – Present). | | | 151 | | | Voya Capital Corporation, LLC and Voya Investments Distributor, LLC (December 2005 – Present); Voya Funds Services, LLC, Voya Investments, LLC and Voya Investment Management (March 2006 – Present); and Voya Investment Trust Co. (April 2009 – Present). | |
(1)
Directors serve until their successors are duly elected and qualified. The tenure of each Director who is not an “interested person” as defined in the 1940 Act, of each Portfolio (“Independent Director”) is subject to the Board’s retirement policy which states that each duly elected or appointed Independent Director shall retire from and cease to be a member of the Board of Directors at the close of business on December 31 of the calendar year in which the Independent Director attains the age of 75. A majority vote of the Board’s other Independent Directors may extend the retirement date of an Independent Director if the retirement would trigger a requirement to hold a meeting of shareholders of the Company under applicable law, whether for the purposes of appointing a successor to the Independent Director or otherwise comply under applicable law, in which case the extension would apply until such time as the shareholder meeting can be held or is no longer required (as determined by a vote of a majority of the other Independent Directors).
(2)
For the purposes of this table, “Fund Complex” means the Voya family of funds including the following investment companies: Voya Asia Pacific High Dividend Equity Income Fund; Voya Balanced Portfolio, Inc.; Voya Emerging Markets High Dividend Equity Fund; Voya Equity Trust; Voya Funds Trust; Voya Global Advantage and Premium Opportunity Fund; Voya Global Equity Dividend and Premium Opportunity Fund; Voya Government Money Market Portfolio; Voya Infrastructure, Industrials and Materials Fund; Voya Intermediate Bond Portfolio; Voya International High Dividend Equity Income Fund; Voya Investors Trust; Voya Mutual Funds; Voya Natural Resources Equity Income Fund; Voya Partners, Inc.; Voya Prime Rate Trust; Voya Senior Income Fund; Voya Separate Portfolios Trust; Voya Series Fund, Inc.; Voya Strategic Allocation Portfolios, Inc.; Voya Variable Funds; Voya Variable Insurance Trust; Voya Variable Portfolios, Inc.; and Voya Variable Products Trust. The number of funds in the Fund Complex is as of January 31, 2017.
(3)
Mr. Mathews is deemed to be an “interested person” of the Company as defined in the 1940 Act, because of his current affiliation with the Voya funds, Voya Financial, Inc., or Voya Financial, Inc.’s affiliates.
DIRECTOR AND OFFICER INFORMATION (Unaudited) (continued)
| | Name, Address and Age | | | Position(s) Held
With the Company | | | Term of Office and
Length of Time Served(1) | | | Principal Occupation(s) –
During the Past 5 Years | |
| | Shaun P. Mathews
7337 East Doubletree Ranch Rd.
Suite 100
Scottsdale, Arizona 85258
Age: 61 | | | President and Chief Executive Officer | | | November 2006 – Present | | | President and Chief Executive Officer, Voya Investments, LLC (December 2006 – Present). | |
| | Michael J. Roland
7337 East Doubletree Ranch Rd.
Suite 100
Scottsdale, Arizona 85258
Age: 58 | | | Executive Vice President | | | January 2005 – Present | | | Managing Director and Chief Operating Officer, Voya Investments, LLC and Voya Funds Services, LLC (March 2012 – Present). Formerly, Chief Compliance Officer, Directed Services LLC and Voya Investments, LLC (March 2011 – December 2013); Executive Vice President and Chief Operating Officer, Voya Investments, LLC and Voya Funds Services, LLC (January 2007 – April 2012) and Chief Compliance Officer, Voya Family of Funds (March 2011 – February 2012). | |
| | Stanley D. Vyner
230 Park Avenue
New York, New York 10169
Age: 66 | | | Executive Vice President
Chief Investment Risk Officer | | | January 2005 – Present
September 2009 – Present | | | Executive Vice President, Voya Investments, LLC (July 2000 – Present) and Chief Investment Risk Officer, Voya Investments, LLC (January 2003 – Present). | |
| | Kevin M. Gleason
7337 East Doubletree Ranch Rd.
Suite 100
Scottsdale, Arizona 85258
Age: 50 | | | Chief Compliance Officer | | | February 2012 – Present | | | Senior Vice President, Voya Investment Management and Chief Compliance Officer, Voya Family of Funds (February 2012 – Present). Formerly, Assistant General Counsel and Assistant Secretary, The Northwestern Mutual Life Insurance Company (June 2004 – January 2012). | |
| | Todd Modic
7337 East Doubletree Ranch Rd.
Suite 100
Scottsdale, Arizona 85258
Age: 49 | | | Senior Vice President, Chief/Principal Financial Officer and Assistant Secretary | | | March 2005 – Present | | | Senior Vice President, Voya Investments, LLC and Voya Funds Services, LLC (April 2005 – Present). | |
| | Kimberly A. Anderson
7337 East Doubletree Ranch Rd.
Suite 100
Scottsdale, Arizona 85258
Age: 52 | | | Senior Vice President | | | January 2005 – Present | | | Senior Vice President, Voya Investments, LLC (September 2003 – Present). | |
| | Robert Terris
7337 East Doubletree Ranch Rd.
Suite 100
Scottsdale, Arizona 85258
Age: 46 | | | Senior Vice President | | | May 2006 – Present | | | Senior Vice President, Head of Division Operations, Voya Investments, LLC (October 2015 – Present) and Voya Funds Services, LLC (March 2006 – Present). | |
| | Fred Bedoya
7337 East Doubletree Ranch Rd.
Suite 100
Scottsdale, Arizona 85258
Age: 44 | | | Vice President and Treasurer | | | September 2012 – Present | | | Vice President, Voya Investments, LLC (October 2015 – Present) and Voya Funds Services, LLC (July 2012 – Present). Formerly, Assistant Vice President – Director, Voya Funds Services, LLC (March 2003 – March 2012). | |
| | Maria M. Anderson
7337 East Doubletree Ranch Rd.
Suite 100
Scottsdale, Arizona 85258
Age: 58 | | | Vice President | | | January 2005 – Present | | | Vice President, Voya Investments, LLC (October 2015 – Present) and Voya Funds Services, LLC (September 2004 – Present). | |
| | Lauren D. Bensinger
7337 East Doubletree Ranch Rd.
Suite 100
Scottsdale, Arizona 85258
Age: 63 | | | Vice President | | | January 2005 – Present | | | Vice President, Voya Funds Services, LLC (February 1996 – Present) and Voya Investments, LLC (October 2004 – Present); Vice President and Money Laundering Reporting Officer, Voya Investments Distributor, LLC (April 2010 – Present). Anti-Money Laundering Compliance Officer, Voya Financial, Inc. (January 2013 – Present); and Money Laundering Reporting Officer, Voya Investment Management Trust Co. (October 2012 – Present). | |
DIRECTOR AND OFFICER INFORMATION (Unaudited) (continued)
| | Name, Address and Age | | | Position(s) Held
With the Company | | | Term of Office and
Length of Time Served(1) | | | Principal Occupation(s) –
During the Past 5 Years | |
| | Sara M. Donaldson
7337 East Doubletree Ranch Rd.
Suite 100
Scottsdale, Arizona 85258
Age: 57 | | | Vice President | | | September 2014 – Present | | | Vice President, Voya Investments, LLC (October 2015 – Present). Formerly, Vice President, Voya Funds Services, LLC (April 2014 – October 2015). Formerly, Director, Compliance, AXA Rosenberg Global Services, LLC (September 1997 – March 2014). | |
| | Micheline S. Favor
7337 East Doubletree Ranch Rd.
Suite 100
Scottsdale, Arizona 85258
Age: 39 | | | Vice President | | | September 2016 – Present | | | Vice President, Head of Fund Compliance, Voya Investments LLC, and Chief Compliance Officer for Voya Investments, LLC and Directed Services, LLC (June 2016 – Present). Formerly, Vice President, Mutual Fund Compliance (March 2014 – June 2016); Assistant Vice President, Mutual Fund Compliance (May 2013 – March 2014); Assistant Vice President, Senior Project Manager (May 2008 – May 2013). | |
| | Robyn L. Ichilov
7337 East Doubletree Ranch Rd.
Suite 100
Scottsdale, Arizona 85258
Age: 49 | | | Vice President | | | January 2005 – Present | | | Vice President, Voya Funds Services, LLC (November 1995 – Present) and Voya Investments, LLC (August 1997 – Present). Formerly, Treasurer, Voya Family of Funds (November 1999 – February 2012). | |
| | Jason Kadavy
7337 East Doubletree Ranch Rd.
Suite 100
Scottsdale, Arizona 85258
Age: 40 | | | Vice President | | | September 2012 – Present | | | Vice President, Voya Investments, LLC (October 2015 – Present) and Voya Funds Services, LLC (July 2007 – Present). | |
| | Kimberly K. Springer
7337 East Doubletree Ranch Rd.
Suite 100
Scottsdale, Arizona 85258
Age: 59 | | | Vice President | | | March 2006 – Present | | | Vice President – Mutual Fund Product Development, Voya Investments, LLC (July 2012 – Present); Vice President, Voya Family of Funds (March 2010 – Present) and Vice President, Voya Funds Services, LLC (March 2006 – Present). Formerly Managing Paralegal, Registration Statements (June 2003 – July 2012). | |
| | Craig Wheeler
7337 East Doubletree Ranch Rd.
Suite 100
Scottsdale, Arizona 85258
Age: 47 | | | Vice President | | | May 2013 – Present | | | Vice President – Director of Tax, Voya Investments, LLC (October 2015 – Present). Formerly, Vice President – Director of Tax, Voya Funds Services, LLC (March 2013 – October 2015). Formerly, Assistant Vice President – Director of Tax, Voya Funds Services, LLC (March 2008 – February 2013). | |
| | Huey P. Falgout, Jr.
7337 East Doubletree Ranch Rd.
Suite 100
Scottsdale, Arizona 85258
Age: 53 | | | Secretary | | | August 2003 – Present | | | Senior Vice President and Chief Counsel, Voya Investment Management – Mutual Fund Legal Department (March 2010 – Present). | |
| | Paul A. Caldarelli
7337 East Doubletree Ranch Rd.
Suite 100
Scottsdale, Arizona 85258
Age: 65 | | | Assistant Secretary | | | June 2010 – Present | | | Vice President and Senior Counsel, Voya Investment Management – Mutual Fund Legal Department (March 2010 –Present). | |
| | Theresa K. Kelety
7337 East Doubletree Ranch Rd.
Suite 100
Scottsdale, Arizona 85258
Age: 54 | | | Assistant Secretary | | | August 2003 – Present | | | Vice President and Senior Counsel, Voya Investment Management – Mutual Fund Legal Department (March 2010 – Present). | |
(1)
The Officers hold office until the next annual meeting of the Board of Directors and until their successors shall have been elected and qualified.
ADVISORY CONTRACT APPROVAL DISCUSSION (Unaudited)
BOARD CONSIDERATION AND APPROVAL OF INVESTMENT Management Contracts AND
SUB-ADVISORY CONTRACTS
Section 15(c) of the Investment Company Act of 1940, as amended (the “1940 Act”), provides that, after an initial period, the Board of Directors (the “Board”) of Voya Partners, Inc. (the “Company”), including a majority of the Board members who have no direct or indirect interest in the investment management and sub-advisory contracts, and who are not “interested persons” of Voya Index Solution Income Portfolio, Voya Index Solution 2020 Portfolio, Voya Index Solution 2025 Portfolio, Voya Index Solution 2030 Portfolio, Voya Index Solution 2035 Portfolio, Voya Index Solution 2040 Portfolio, Voya Index Solution 2045 Portfolio, Voya Index Solution 2050 Portfolio, Voya Index Solution 2055 Portfolio, Voya Index Solution 2060 Portfolio (collectively, the “Portfolios”), as such term is defined under the 1940 Act (the “Independent Directors”), must annually review and approve the Portfolios’ existing investment management and sub-advisory contracts. At a meeting held on October 18, 2016, the Board, including a majority of the Independent Directors, considered whether to renew and approve the investment management contracts (the “Management Contracts”) between Directed Services LLC (the “Adviser”) and the Portfolios, and the sub-advisory contracts (the “Sub-Advisory Contracts”) with the sub-adviser to each Portfolio (the “Sub-Adviser”) effective through November 30, 2016. Consideration by the Board at its October 18, 2016 meeting of whether to renew the Management and Sub-Advisory Contracts effective through November 30, 2016 was deemed prudent because the prior approval of the Contracts was set to expire on November 17, 2016 (the same date of the Board’s meeting to discuss the annual renewal/approval). In addition, at a meeting held on November 17, 2016, the Board, including a majority of the Independent Directors, considered whether to renew and approve the Management and Sub-Advisory Contracts effective through November 30, 2017.
In addition to the Board meetings on October 18, 2016 and November 17, 2016, the Independent Directors also held separate meetings outside the presence of Management on October 18, 2016, and November 15, 2016, to consider the renewal of the Management and Sub-Advisory Contracts. As a result, subsequent references herein to factors considered and determinations made by the Independent Directors and/or the Board include, as applicable, factors considered and determinations made at those meetings by the Independent Directors.
At its October 18, 2016 meeting, the Board, including the Independent Directors, voted to renew the Management and Sub-Advisory Contracts for the Portfolios effective through November 30, 2016. At its November 17, 2016
meeting, the Board, including the Independent Directors, voted to renew the Management Contracts and Sub-Advisory Contracts for the Portfolios effective through November 30, 2017. In reaching these decisions, the Board took into account information furnished to it throughout the year at meetings of the Board and the Board’s committees, as well as information prepared specifically in connection with the annual renewal or approval process. Determinations by the Independent Directors also took into account various factors that they believed, in light of the legal advice furnished to them by K&L Gates LLP (“K&L Gates”), their independent legal counsel, and their own business judgment, to be relevant. Further, while the Board considered at the same meetings the investment management contracts and sub-advisory contracts that were subject to renewal for the investment companies in the Voya family of funds (“Voya funds”), the Board considered each Voya fund’s investment management and sub-advisory relationships separately.
Provided below is an overview of the Board’s contract approval process in general, as well as a discussion of certain specific factors that the Board considered at its renewal meetings. While the Board gave its attention to the information furnished at the request of the Independent Directors that was most relevant to its considerations, discussed below are a number of the primary factors relevant to the Board’s consideration as to whether to renew the Management and Sub-Advisory Contracts. Each Board member may have accorded different weight to the various factors in reaching his or her conclusions with respect to each Portfolio’s investment management and sub-advisory arrangements.
The Board, in considering the Management and Sub-Advisory Contracts, was cognizant that shareholders of each Portfolio have a broad range of investment options available to them and that, based upon their opportunity to review and weigh the disclosure provided by the Portfolio, have chosen the Portfolio as an investment.
Overview of the Contract Renewal and Approval Process
The Board follows a structured process pursuant to which it seeks, considers, reviews and analyzes relevant information when it decides whether to approve new or existing investment management and sub-advisory arrangements for Voya funds, including the Portfolios’ existing Management and Sub-Advisory Contracts (the “Contract Review Process”).
The Contract Review Process has evolved as the Board’s membership has changed through periodic retirements of some Directors and the appointment and election of new Directors. In addition, the Independent Directors have
ADVISORY CONTRACT APPROVAL DISCUSSION (Unaudited) (continued)
reviewed and refined the renewal and approval process at least annually in order to make revised requests for information from Management and address certain unique characteristics related to new or existing Voya funds.
The Board has established (among other committees) three Investment Review Committees (each, an “IRC”) and a Contracts Committee. Among other matters, the Contracts Committee provides oversight with respect to the contracts renewal and approval process, and each Portfolio is assigned to an IRC, which provides ongoing oversight regarding, among other matters, the investment performance of the Adviser and the Sub-Adviser, as well as the oversight by the Adviser of the performance of the Sub-Adviser. The IRCs will typically apply a heightened level of scrutiny in cases where performance has lagged a Portfolio’s relevant benchmark and/or Morningstar, Inc. (“Morningstar”) category average, as applicable. The Board and/or IRCs may also apply a heightened level of scrutiny in cases where a Portfolio’s performance has lagged its Selected Peer Group (defined below).
The type and format of the information provided to the Board or to legal counsel for the Independent Directors in connection with the Contract Review Process has been codified in a 15(c) methodology guide for the Voya funds (“15(c) Methodology Guide”). This 15(c) Methodology Guide was developed by the Independent Directors and sets out a blueprint pursuant to which the Independent Directors request, and Management provides, certain information that the Independent Directors deem important to facilitate an informed review in connection with initial and annual approvals of investment management and sub-advisory contracts. Among other actions, the Independent Directors retain the services of an independent consultant with experience in the mutual fund industry to assist the Independent Directors in developing and determining a selected peer group of investment companies for each Portfolio (“Selected Peer Group”) based on each Portfolio’s particular attributes, such as fund type and scale, Morningstar category and sales channels and structure. The Independent Directors review, evaluate and update the 15(c) Methodology Guide at least annually.
Management provides certain of the information requested by the 15(c) Methodology Guide in Fund Analysis and Comparison Tables (“FACT sheets”) prior to the Independent Directors’ review of investment management and sub-advisory arrangements (including the Portfolios’ Management and Sub-Advisory Contracts). The Independent Directors have periodically retained an independent firm to test and verify the accuracy of certain FACT sheet data for a representative sample of the Voya funds. In addition, the Contracts Committee routinely
employs the services of an independent consultant to assist in its review and analysis of, among other matters, the 15(c) Methodology Guide, the content and format of the FACT sheets, and Selected Peer Groups to be used by the Portfolios for certain comparison purposes during the renewal process. As part of an ongoing process, the Contracts Committee recommends and considers recommendations from Management for refinements to the 15(c) Methodology Guide and other aspects of the review process, and the Board’s IRCs review benchmarks and peer groups used to assess the performance of the Voya funds.
The Board employed its process for reviewing contracts when considering the renewals of the Portfolios’ Management and Sub-Advisory Contracts at its October 18, 2016 and November 17, 2016 meetings that would be effective through November 30, 2016 and November 30, 2017, respectively. Set forth below is a discussion of many of the Board’s primary considerations and conclusions resulting from this process.
Nature, Extent and Quality of Service
In determining whether to approve the Management and Sub-Advisory Contracts, the Independent Directors received and evaluated such information as they deemed necessary regarding the nature, extent and quality of services provided to the Portfolios by the Adviser and the Sub-Adviser. This included information regarding the Adviser and the Sub-Adviser provided throughout the year at regular meetings of the Board and its committees, as well as information furnished in connection with the contract renewal meetings.
The Adviser oversees, subject to the authority of the Board, the provision of all investment advisory and portfolio management services for the Portfolios. In addition, the Adviser provides administrative services reasonably necessary for the operation of the Portfolios. The Adviser conducts day-to-day oversight of the Portfolios’ operations and risks but may delegate certain management responsibilities to one or more Sub-Advisers. Also, the Adviser oversees various other service providers, which may include, among others, distributors, custodians and fund accounting agents, shareholder service providers, and transfer agents, who provide services to the Portfolios.
The materials requested by the Independent Directors and provided to the Board, K&L Gates and/or independent consultants that assisted the Independent Directors prior to the October 18, 2016 and November 17, 2016 Board meetings included, among other information, the following items for each Portfolio: (1) FACT sheets that provided information regarding the performance and expenses of
ADVISORY CONTRACT APPROVAL DISCUSSION (Unaudited) (continued)
the Portfolio and other similarly managed funds in its Selected Peer Group, as well as information regarding the Portfolio’s investment portfolio, objective and strategies; (2) reports providing risk and attribution analyses of the Portfolio; (3) the 15(c) Methodology Guide, which describes how the FACT sheets were prepared, including the manner in which each Portfolio’s Selected Peer Group was selected and how profitability was determined; (4) responses from the Adviser and the Sub-Adviser to the Portfolios to a series of questions posed by K&L Gates on behalf of the Independent Directors; (5) copies of the forms of Management and Sub-Advisory Contracts; (6) copies of the Forms ADV for the Adviser and the Sub-Adviser; (7) financial statements for the Adviser and the Sub-Adviser; (8) a draft of a narrative summary addressing key factors the Board customarily considers in evaluating the Management and Sub-Advisory Contracts for the Voya funds’ (including the Portfolio’s) investment management and sub-advisory contracts, including a written analysis for the Portfolio of how performance, fees and expenses compare to its Selected Peer Group and/or designated benchmark(s); (9) independent analyses of Portfolio performance by the Company’s Chief Investment Risk Officer, who leads the Adviser’s Investment Risk Management Department (“IRMD”); (10) information regarding net asset flows into and out of the Portfolio; and (11) other information relevant to the Board’s evaluations.
For each Portfolio, Class I shares were used for purposes of certain comparisons between the Portfolio and its Selected Peer Group. Class I shares generally were selected so that a Portfolio’s share class with the longest performance history was compared to the analogous class of shares for each fund in its Selected Peer Group. The mutual funds included in the Portfolios’ Selected Peer Groups were selected based upon criteria designed to represent the Portfolio share class being compared to the Selected Peer Groups.
In arriving at its conclusions with respect to the Management Contracts, the Board was mindful of the “manager-of-managers” platform of the Voya funds that has been developed by the Adviser. The Board recognized that the Adviser is responsible for monitoring the investment program, performance, developments and ongoing operations of the Sub-Adviser under this manager-of-managers arrangement. The Board also considered the techniques and resources that the Adviser has developed to provide ongoing oversight of the nature, extent and quality of the services the Sub-Adviser provides to the applicable Portfolios and the Sub-Adviser’s compliance with applicable laws and regulations. The Board was advised that to assist in the selection and monitoring of the Sub-Adviser, the Adviser has developed an oversight process formulated by its Manager
Research & Selection Group (“MR&S”), which analyzes both qualitative (such as in-person meetings and telephonic meetings with the Sub-Adviser and research on sub-advisers) and quantitative information (such as performance data, portfolio data and attribution analysis) about the Sub-Adviser and the Portfolios that it manages. The Board recognized that MR&S also typically provides in-person reports to the IRCs at their meetings prior to any Sub-Adviser presentations. In addition, the Board noted that MR&S prepares periodic due diligence reports regarding the Sub-Adviser based on on-site visits and information and analysis which team members use to attempt to gain and maintain an in-depth understanding of the Sub-Adviser’s investment process and to try to identify issues that may be relevant to the Sub-Adviser’s services to a Portfolio and/or its performance. The Board also noted that MR&S provides written reports on these due diligence analyses to the pertinent IRC. The Board noted the resources that Management has committed to its services as a manager-of-managers, including resources for reporting to the Board and the IRCs to assist them with their assessment of the investment performance of the Portfolios on an on-going basis throughout the year. This includes the appointment of a Chief Investment Risk Officer and the IRMD staff members, who report directly to the Board and who have developed attribution analyses and other metrics used by the IRCs to analyze the key factors underlying investment performance for the funds in the Voya funds.
The Board also considered the techniques that the Adviser has developed to screen and perform due diligence on new sub-advisers if and when the Adviser recommends to the Board a new sub-adviser to manage a Portfolio in the Voya funds.
The Board also considered that in the course of monitoring performance of the Sub-Adviser, MR&S has developed, based on guidance from the IRCs, a methodology for comparing performance of each Portfolio to its Morningstar category average and/or median and primary benchmark. The Board also recognized that MR&S provides the IRCs with regular updates on the Portfolios and alerts the IRCs to potential issues as they arise. The Board also considered that the Adviser regularly monitors performance, personnel, compliance and other issues that may arise on a day-to-day basis regarding the Sub-Adviser and contemplated that, if issues are identified either through formal or informal processes, they are brought before the IRCs and the Board for consideration and action and the Adviser consistently makes its resources available to the Board and the IRCs to assist with addressing any issues that arise.
The Board considered that the Portfolios also benefit from the services of the IRMD, under the leadership of the Chief
ADVISORY CONTRACT APPROVAL DISCUSSION (Unaudited) (continued)
Investment Risk Officer, the costs of which are shared by the Portfolios and the Adviser. The Board considered that the IRMD regularly presents written materials and reports to the IRCs that focus on the investment risks of the Portfolios. The Board also considered that the IRMD provides the IRCs with analyses that are developed to assist the IRCs in identifying trends in Portfolio performance and other areas over consecutive periods. The Board noted that the services provided by the IRMD are meant to provide an additional perspective for the benefit of the IRCs, which may vary from the perspective of MR&S.
The Board also considered the techniques used by the Adviser to monitor the performance of the Sub-Adviser and the proactive approach that the Adviser, working in cooperation with the IRCs, has taken to advocate or recommend, when it believed appropriate, changes designed to assist in improving the Voya funds’ performance.
In considering the Portfolios’ Management Contracts, the Board also considered the extent of benefits provided to the Portfolios’ shareholders, beyond investment management services, from being part of the Voya funds. This includes, in most cases, the right to exchange or transfer investments, without a sales charge, between the same class of shares of such funds or among Voya funds available on a product platform, and the wide range of Voya funds available for exchange or transfer. The Board also took into account the Adviser’s ongoing efforts to reduce the expenses of the Voya funds through renegotiated arrangements with certain of the Voya funds’ service providers. In addition, the Board considered the efforts of the Adviser and the expenses that it incurred in recent years to help make the Voya funds more balanced and efficient by the launch of new investment products and the combinations of similar funds.
Further, the Board received periodic reports showing that the investment policies and restrictions for each Portfolio were consistently complied with and other periodic reports covering matters such as compliance by Adviser and Sub-Adviser personnel with codes of ethics. The Board considered reports throughout the year and also in connection with the Board’s consideration of the Management and Sub-Advisory Contracts from the Company’s Chief Compliance Officer (“CCO”) evaluating whether the regulatory compliance systems and procedures of the Adviser and the Sub-Adviser are reasonably designed to ensure compliance with the federal securities laws. The Board also took into account the CCO’s annual and periodic reports and recommendations with respect to service provider compliance programs. In this regard, the Board also considered the policies and
procedures developed by the CCO in consultation with the Board’s Compliance Committee that guide the CCO’s compliance oversight function.
The Board requested and considered information regarding the staffing of each Portfolio’s portfolio management team. The Board took into account the respective resources and reputations of the Adviser and the Sub-Adviser, and evaluated the compensation arrangements for each Portfolio’s portfolio management team. The Board also considered the adequacy of the resources committed to the Portfolios (and other relevant funds in the Voya funds) by the Adviser and the Sub-Adviser, and whether those resources are commensurate with the needs of the Portfolios and are sufficient to provide high-quality services to the Portfolios. The Board also considered the financial stability of the Adviser and the Sub-Adviser.
Based on their deliberations and the materials presented to them, the Board concluded that the investment management and related services provided by the Adviser and the Sub-Adviser are appropriate in light of the Portfolios’ operations, the competitive landscape of the investment company business, and investor needs, and that the nature, extent and quality of the overall services provided by the Adviser and the Sub-Adviser were appropriate.
Portfolio Performance
In assessing investment management and sub-advisory relationships, the Board placed emphasis on the investment returns of each Portfolio. The Board considered the performance reports and analyses from MR&S and IRMD and discussions with portfolio managers at Board and committee meetings during the year. The Board also paid particular attention in assessing performance to the FACT sheets furnished in connection with the renewal and approval process. The FACT sheets prepared for each Portfolio included its investment performance compared to the Portfolio’s Morningstar category average, Selected Peer Group and primary benchmark. The FACT sheet performance data was as of March 31, 2016.
In addition, the Board also considered at its October 18, 2016 and November 17, 2016 meetings certain additional data regarding performance and Portfolio asset levels as of August 31, 2016 and September 30, 2016, respectively. The Board’s findings specific to each Portfolio’s performance are discussed under “Portfolio-by-Portfolio Analysis” below.
Economies of Scale
When evaluating the reasonableness of advisory fee rates, the Board also considered whether economies of scale
ADVISORY CONTRACT APPROVAL DISCUSSION (Unaudited) (continued)
likely will be realized by the Adviser and the Sub-Adviser as a Portfolio grows larger and the extent to which any such economies are reflected in contractual fee rates. In this regard, the Board also considered that, while the Portfolios do not have advisory fee breakpoints, they do have expense reimbursement arrangements. In this connection, the Board considered the extent to which economies of scale could be realized through such expense reimbursements or other expense reductions. In evaluating fee rate breakpoint arrangements and economies of scale, the Independent Directors also considered prior periodic management reports, industry information on this topic and the Portfolios’ investment performance.
Information Regarding Services to Other Clients
The Board requested and considered information regarding the nature of services and fee rates offered by the Adviser and the Sub-Adviser to other clients, including other registered investment companies and relevant institutional accounts. When fee rates offered to other clients differed materially from those charged to a Portfolio, the Board considered any underlying rationale provided by the Adviser or the Sub-Adviser for these differences. The Board also noted that the fee rates charged to the Portfolios and other institutional clients of the Adviser or the Sub-Adviser (including other investment companies) may differ materially due to, among other reasons, as applicable: differences in services; different regulatory requirements associated with registered investment companies, such as the Portfolios, as compared to non-registered investment company clients; market differences in fee rates that existed when a Portfolio first was organized; differences in the original sponsors of Portfolios that now are managed by the Adviser; investment capacity constraints that existed when certain contracts were first agreed upon or that might exist at present; and different pricing structures that are necessary to be competitive in different marketing channels.
Fee Rates, Profitability and Fall-out Benefits
The Board reviewed and considered each contractual management fee rate payable by each Portfolio to the Adviser. The Board also considered the contractual sub-advisory fee rate payable by the Adviser to the Sub-Adviser for sub-advisory services for each Portfolio, including the portion of the contractual management fees that are paid to the Sub-Adviser, as compared to the portion retained by the Adviser. In addition, the Board considered fee waivers and expense limitations applicable to the fees payable by the Portfolios, including the Adviser’s agreement to extend each such fee waiver and expense limitation agreement and not to terminate such agreement without prior approval of the Board.
The Board requested information regarding and considered: (1) the fee rate structure of each Portfolio as it relates to the services provided under the contracts; and (2) the potential fall-out benefits to the Adviser and the Sub-Adviser and their respective affiliates from their association with the Portfolios. For each Portfolio, the Board separately determined that the fees payable to the Adviser and the fee rate payable to the Sub-Adviser are reasonable for the services that each performs, which were considered in light of the nature, extent and quality of the services that each has performed and is expected to perform.
For each Portfolio, the Board considered information on revenues, costs and profits realized by the Adviser and the Sub-Adviser, which was prepared by Management in accordance with the methodology (including related assumptions) specified in the 15(c) Methodology Guide. In analyzing the profitability of the Adviser in connection with its services to a Portfolio, the Board took into account the sub-advisory fee rate payable by the Adviser to the Sub-Adviser. In addition, the Board considered information that it requested and that was provided by Management with respect to the profitability of service providers affiliated with the Adviser. The Board also considered the profitability of the Adviser and its affiliated companies attributable to managing and operating each Portfolio both with and without the profitability of the distributor of the Portfolios and both before and after giving effect to any expenses incurred by the Adviser or any affiliated company in making revenue sharing or other payments to third parties, including affiliated insurance companies, for distribution services.
Although the 15(c) Methodology Guide establishes certain standards for profit calculation, the Board recognized that profitability analysis on a client-by-client basis is not an exact science and there is no uniform methodology within the asset management industry for determining profitability for this purpose. In this context, the Board realized that Management’s calculations regarding its costs incurred in establishing the infrastructure necessary for the Portfolios’ operations may not be fully reflected in the expenses allocated to each Portfolio in determining profitability, and that the information presented may not portray all of the costs borne by the Adviser and Management or capture their entrepreneurial risk associated with offering and managing a mutual fund complex in the current regulatory and market environment. In addition, the Board recognized that the use of different reasonable methodologies for purposes of calculating profit data can give rise to dramatically different profit and loss results.
In considering the Management and Sub-Advisory Contracts, the Board noted that, at the request of the
ADVISORY CONTRACT APPROVAL DISCUSSION (Unaudited) (continued)
Board, the Adviser has from time to time agreed to implement remedial actions regarding certain Voya funds. These remedial actions have included, among others: reductions in fee rates or adjustments to expense limitation and waiver arrangements; changes in sub-advisers or portfolio managers; and strategy modifications.
In making its determinations, the Board based its conclusions as to the reasonableness of the management and sub-advisory fees of the Adviser and the Sub-Adviser primarily on the factors described for each Portfolio below.
Portfolio-by-Portfolio Analysis
The following paragraphs outline certain of the specific factors that the Board considered, and the conclusions reached, at its October 18, 2016 and November 17, 2016 meetings in relation to approving each Portfolio’s Management and Sub-Advisory Contracts. These specific factors are in addition to those considerations discussed above. In each case, the Portfolio’s performance was compared to its Morningstar category median and/or average, as well as its primary benchmark, a broad-based securities market index that appears in the Portfolio’s prospectus. With respect to Morningstar quintile rankings, the first quintile represents the highest (best) performance and the fifth quintile represents the lowest performance. Each Portfolio’s management fee rates and expense ratio were compared to the fees and expense ratios of the funds in its Selected Peer Group.
Voya Index Solution Income Portfolio
In considering whether to approve the renewal of the Management and Sub-Advisory Contracts for Voya Index Solution Income Portfolio, the Board considered that, based on performance data for the periods ended March 31, 2016: (1) the Portfolio outperformed its Morningstar category average for all periods presented; (2) the Portfolio outperformed its primary benchmark for the three-year and five-year periods, but underperformed for the year-to-date and one-year periods; and (3) the Portfolio is ranked in the first (highest) quintile of its Morningstar category for the three-year and five-year periods, and the second quintile for the year-to-date and one-year periods.
In considering the fees payable under the Management and Sub-Advisory Contracts for the Portfolio, the Board took into account the factors described above and also considered: (1) the fairness of the compensation under a Management Contract with a level fee rate that does not include breakpoints; and (2) the pricing structure (including the expense ratio to be borne by shareholders) of the Portfolio, as compared to its Selected Peer Group, including that: (a) the management fee for the Portfolio is
above the median and the average management fees of the funds in its Selected Peer Group; and (b) the expense ratio for the Portfolio, inclusive of Acquired Fund Fees and Expenses (“AFFE”), is above the median and the average of the funds in its Selected Peer Group, and the expense ratio for the Portfolio, not inclusive of AFFE, is above the median and below the average of the expense ratios of the funds in its Selected Peer Group. In analyzing this fee data, the Board took into account: (1) that the Portfolio indirectly bears the fees payable by the underlying funds in which the Portfolio invests; and (2) Management’s representations regarding the competitiveness of the Portfolio’s management fee and expense ratio.
After its deliberation, the Board reached the following conclusions: (1) the Portfolio’s management fee rate is reasonable in the context of all factors considered by the Board; (2) the Portfolio’s expense ratio is reasonable in the context of all factors considered by the Board; (3) the Portfolio’s performance is reasonable in the context of all factors considered by the Board; and (4) the sub-advisory fee rate payable by the Adviser to the Sub-Adviser is reasonable in the context of all factors considered by the Board. Based on these conclusions and other factors, the Board voted to renew the Management and Sub-Advisory Contracts for the Portfolio for the relevant periods. During this renewal process, different Board members may have given different weight to different individual factors and related conclusions.
Voya Index Solution 2020 Portfolio
In considering whether to approve the renewal of the Management and Sub-Advisory Contracts for Voya Index Solution 2020 Portfolio, the Board considered that, based on performance data for the periods ended March 31, 2016: (1) the Portfolio outperformed its Morningstar category average for all periods presented, with the exception of the year-to-date period, during which it underperformed; (2) the Portfolio underperformed its primary benchmark for all periods presented; and (3) the Portfolio is ranked in the first (highest) quintile of its Morningstar category for the one-year and three-year periods, and the third quintile for the year-to-date period.
In considering the fees payable under the Management and Sub-Advisory Contracts for the Portfolio, the Board took into account the factors described above and also considered: (1) the fairness of the compensation under a Management Contract with a level fee rate that does not include breakpoints; and (2) the pricing structure (including the expense ratio to be borne by shareholders) of the Portfolio, as compared to its Selected Peer Group, including that: (a) the management fee for the Portfolio is above the median and above the average management
ADVISORY CONTRACT APPROVAL DISCUSSION (Unaudited) (continued)
fees of the funds in its Selected Peer Group; and (b) the expense ratio for the Portfolio, inclusive of Acquired Fund Fees and Expenses (“AFFE”), is above the median and the average of the funds in its Selected Peer Group, and the expense ratio for the Portfolio, not inclusive of AFFE, is above the median and below the average of the expense ratios of the funds in its Selected Peer Group. In analyzing this fee data, the Board took into account: (1) that the Portfolio indirectly bears the fees payable by the underlying funds in which the Portfolio invests; and (2) Management’s representations regarding the competitiveness of the Portfolio’s management fee and expense ratio.
After its deliberation, the Board reached the following conclusions: (1) the Portfolio’s management fee rate is reasonable in the context of all factors considered by the Board; (2) the Portfolio’s expense ratio is reasonable in the context of all factors considered by the Board; (3) the Portfolio’s performance is reasonable in the context of all factors considered by the Board; and (4) the sub-advisory fee rate payable by the Adviser to the Sub-Adviser is reasonable in the context of all factors considered by the Board. Based on these conclusions and other factors, the Board voted to renew the Management and Sub-Advisory Contracts for the Portfolio for the relevant periods. During this renewal process, different Board members may have given different weight to different individual factors and related conclusions.
Voya Index Solution 2025 Portfolio
In considering whether to approve the renewal of the Management and Sub-Advisory Contracts for Voya Solution 2025 Portfolio, the Board considered that, based on performance data for the periods ended March 31, 2016: (1) the Portfolio outperformed its Morningstar category average for the three-year and five-year periods, but underperformed for the year-to-date and one-year periods; (2) the Portfolio underperformed its primary benchmark for all periods presented; and (3) the Portfolio is ranked in the second quintile of its Morningstar category for the three-year and five-year periods, and the third quintile for the year-to-date and one-year periods.
In considering the fees payable under the Management and Sub-Advisory Contracts for the Portfolio, the Board took into account the factors described above and also considered: (1) the fairness of the compensation under a Management Contract with a level fee rate that does not include breakpoints; and (2) the pricing structure (including the expense ratio to be borne by shareholders) of the Portfolio, as compared to its Selected Peer Group, including that: (a) the management fee for the Portfolio is above the median and the average management fees of the funds in its Selected Peer Group; and (b) the expense
ratio for the Portfolio, inclusive of Acquired Fund Fees and Expenses (“AFFE”), is above the median and the average of the funds in its Selected Peer Group, and the expense ratio for the Portfolio, not inclusive of AFFE, is above the median and below the average of the expense ratios of the funds in its Selected Peer Group. In analyzing this fee data, the Board took into account: (1) that the Portfolio indirectly bears the fees payable by the underlying funds in which the Portfolio invests; and (2) Management’s representations regarding the competitiveness of the Portfolio’s management fee and expense ratio.
After its deliberation, the Board reached the following conclusions: (1) the Portfolio’s management fee rate is reasonable in the context of all factors considered by the Board; (2) the Portfolio’s expense ratio is reasonable in the context of all factors considered by the Board; (3) the Portfolio’s performance is reasonable in the context of all factors considered by the Board; and (4) the sub-advisory fee rate payable by the Adviser to the Sub-Adviser is reasonable in the context of all factors considered by the Board. Based on these conclusions and other factors, the Board voted to renew the Management and Sub-Advisory Contracts for the Portfolio for the relevant periods. During this renewal process, different Board members may have given different weight to different individual factors and related conclusions.
Voya Index Solution 2030 Portfolio
In considering whether to approve the renewal of the Management and Sub-Advisory Contracts for Voya Index Solution 2030 Portfolio, the Board considered that, based on performance data for the periods ended March 31, 2016: (1) the Portfolio outperformed its Morningstar category average for all periods presented, with the exception of the year-to-date period, during which it underperformed; (2) the Portfolio underperformed its primary benchmark for all periods presented; and (3) the Portfolio is ranked in the first (highest) quintile of its Morningstar category for the one-year and three-year periods, and the third quintile for the year-to-date period.
In considering the fees payable under the Management and Sub-Advisory Contracts for the Portfolio, the Board took into account the factors described above and also considered: (1) the fairness of the compensation under a Management Contract with a level fee rate that does not include breakpoints; and (2) the pricing structure (including the expense ratio to be borne by shareholders) of the Portfolio, as compared to its Selected Peer Group, including that: (a) the management fee for the Portfolio is above the median and the average management fees of the funds in its Selected Peer Group; and (b) the expense ratio for the Portfolio, inclusive of Acquired Fund Fees and
ADVISORY CONTRACT APPROVAL DISCUSSION (Unaudited) (continued)
Expenses (“AFFE”), is above the median and the average of the funds in its Selected Peer Group, and the expense ratio for the Portfolio, not inclusive of AFFE, is above the median and below the average of the expense ratios of the funds in its Selected Peer Group. In analyzing this fee data, the Board took into account: (1) that the Portfolio indirectly bears the fees payable by the underlying funds in which the Portfolio invests; and (2) Management’s representations regarding the competitiveness of the Portfolio’s management fee and expense ratio.
After its deliberation, the Board reached the following conclusions: (1) the Portfolio’s management fee rate is reasonable in the context of all factors considered by the Board; (2) the Portfolio’s expense ratio is reasonable in the context of all factors considered by the Board; (3) the Portfolio’s performance is reasonable in the context of all factors considered by the Board; and (4) the sub-advisory fee rate payable by the Adviser to the Sub-Adviser is reasonable in the context of all factors considered by the Board. Based on these conclusions and other factors, the Board voted to renew the Management and Sub-Advisory Contracts for the Portfolio for the relevant periods. During this renewal process, different Board members may have given different weight to different individual factors and related conclusions.
Voya Index Solution 2035 Portfolio
In considering whether to approve the renewal of the Management and Sub-Advisory Contracts for Voya Index Solution 2035 Portfolio, the Board considered that, based on performance data for the periods ended March 31, 2016: (1) the Portfolio outperformed its Morningstar category average for all periods presented, with the exception of the year-to-date period, during which it underperformed; (2) the Portfolio underperformed its primary benchmark for all periods presented; and (3) the Portfolio is ranked in the second quintile of its Morningstar category for the three-year and five-year periods, and the third quintile for the year-to-date and one-year periods.
In considering the fees payable under the Management and Sub-Advisory Contracts for the Portfolio, the Board took into account the factors described above and also considered: (1) the fairness of the compensation under a Management Contract with a level fee rate that does not include breakpoints; and (2) the pricing structure (including the expense ratio to be borne by shareholders) of the Portfolio, as compared to its Selected Peer Group, including that: (a) the management fee for the Portfolio is above the median and the average management fees of the funds in its Selected Peer Group; and (b) the expense ratio for the Portfolio, inclusive of Acquired Fund Fees and Expenses (“AFFE”), is above the median and the average
of the funds in its Selected Peer Group, and the expense ratio for the Portfolio, not inclusive of AFFE, is above the median and the average of the expense ratios of the funds in its Selected Peer Group. In analyzing this fee data, the Board took into account: (1) that the Portfolio indirectly bears the fees payable by the underlying funds in which the Portfolio invests; and (2) Management’s representations regarding the competitiveness of the Portfolio’s management fee and expense ratio.
After its deliberation, the Board reached the following conclusions: (1) the Portfolio’s management fee rate is reasonable in the context of all factors considered by the Board; (2) the Portfolio’s expense ratio is reasonable in the context of all factors considered by the Board; (3) the Portfolio’s performance is reasonable in the context of all factors considered by the Board; and (4) the sub-advisory fee rate payable by the Adviser to the Sub-Adviser is reasonable in the context of all factors considered by the Board. Based on these conclusions and other factors, the Board voted to renew the Management and Sub-Advisory Contracts for the Portfolio for the relevant periods. During this renewal process, different Board members may have given different weight to different individual factors and related conclusions.
Voya Index Solution 2040 Portfolio
In considering whether to approve the renewal of the Management and Sub-Advisory Contracts for Voya Index Solution 2040 Portfolio, the Board considered that, based on performance data for the periods ended March 31, 2016: (1) the Portfolio outperformed its Morningstar category average for all periods presented; (2) the Portfolio underperformed its primary benchmark for all periods presented; and (3) the Portfolio is ranked in the first (highest) quintile of its Morningstar category for the three-year period, the second quintile for the one-year period, and the third quintile for the year-to-date period.
In considering the fees payable under the Management and Sub-Advisory Contracts for the Portfolio, the Board took into account the factors described above and also considered: (1) the fairness of the compensation under a Management Contract with a level fee rate that does not include breakpoints; and (2) the pricing structure (including the expense ratio to be borne by shareholders) of the Portfolio, as compared to its Selected Peer Group, including that: (a) the management fee for the Portfolio is above the median and the average management fees of the funds in its Selected Peer Group; and (b) the expense ratio for the Portfolio, inclusive of Acquired Fund Fees and Expenses (“AFFE”), is above the median and the average expense ratios of the funds in its Selected Peer Group, and the expense ratio for the Portfolio, not inclusive of AFFE, is
ADVISORY CONTRACT APPROVAL DISCUSSION (Unaudited) (continued)
above the median and below the average of the expense ratios of the funds in its Selected Peer Group. In analyzing this fee data, the Board took into account: (1) that the Portfolio indirectly bears the fees payable by the underlying funds in which the Portfolio invests; and (2) Management’s representations regarding the competitiveness of the Portfolio’s management fee and expense ratio.
After its deliberation, the Board reached the following conclusions: (1) the Portfolio’s management fee rate is reasonable in the context of all factors considered by the Board; (2) the Portfolio’s expense ratio is reasonable in the context of all factors considered by the Board; (3) the Portfolio’s performance is reasonable in the context of all factors considered by the Board; and (4) the sub-advisory fee rate payable by the Adviser to the Sub-Adviser is reasonable in the context of all factors considered by the Board. Based on these conclusions and other factors, the Board voted to renew the Management and Sub-Advisory Contracts for the Portfolio for the relevant periods. During this renewal process, different Board members may have given different weight to different individual factors and related conclusions.
Voya Index Solution 2045 Portfolio
In considering whether to approve the renewal of the Management and Sub-Advisory Contracts for Voya Index Solution 2045 Portfolio, the Board considered that, based on performance data for the periods ended March 31, 2016: (1) the Portfolio outperformed its Morningstar category average for all periods presented; (2) the Portfolio underperformed its primary benchmark for all periods presented; and (3) the Portfolio is ranked in the first (highest) quintile of its Morningstar category for the three-year period, the second quintile for the five-year period, and the third quintile for the year-to-date and one-year periods.
In considering the fees payable under the Management and Sub-Advisory Contracts for the Portfolio, the Board took into account the factors described above and also considered: (1) the fairness of the compensation under a Management Contract with a level fee rate that does not include breakpoints; and (2) the pricing structure (including the expense ratio to be borne by shareholders) of the Portfolio, as compared to its Selected Peer Group, including that: (a) the management fee for the Portfolio is above the median and the average management fees of the funds in its Selected Peer Group; and (b) the expense ratio for the Portfolio, inclusive of Acquired Fund Fees and Expenses (“AFFE”), is above the median and the average expense ratios of the funds in its Selected Peer Group, and the expense ratio for the Portfolio, not inclusive of AFFE, is above the median and the average of the expense ratios of
the funds in its Selected Peer Group. In analyzing this fee data, the Board took into account: (1) that the Portfolio indirectly bears the fees payable by the underlying funds in which the Portfolio invests; and (2) Management’s representations regarding the competitiveness of the Portfolio’s management fee and expense ratio.
After its deliberation, the Board reached the following conclusions: (1) the Portfolio’s management fee rate is reasonable in the context of all factors considered by the Board; (2) the Portfolio’s expense ratio is reasonable in the context of all factors considered by the Board; (3) the Portfolio’s performance is reasonable in the context of all factors considered by the Board; and (4) the sub-advisory fee rate payable by the Adviser to the Sub-Adviser is reasonable in the context of all factors considered by the Board. Based on these conclusions and other factors, the Board voted to renew the Management and Sub-Advisory Contracts for the Portfolio for the relevant periods. During this renewal process, different Board members may have given different weight to different individual factors and related conclusions.
Voya Index Solution 2050 Portfolio
In considering whether to approve the renewal of the Management and Sub-Advisory Contracts for Voya Index Solution 2050 Portfolio, the Board considered that, based on performance data for the periods ended March 31, 2016: (1) the Portfolio outperformed its Morningstar category average for all periods presented; (2) the Portfolio underperformed its primary benchmark for all periods presented; and (3) the Portfolio is ranked in the first (highest) quintile of its Morningstar category for the three-year period, and the second quintile for the year-to-date and one-year periods.
In considering the fees payable under the Management and Sub-Advisory Contracts for the Portfolio, the Board took into account the factors described above and also considered: (1) the fairness of the compensation under a Management Contract with a level fee rate that does not include breakpoints; and (2) the pricing structure (including the expense ratio to be borne by shareholders) of the Portfolio, as compared to its Selected Peer Group, including that: (a) the management fee for the Portfolio is above the median and the average management fees of the funds in its Selected Peer Group; and (b) the expense ratio for the Portfolio, inclusive of Acquired Fund Fees and Expenses (“AFFE”), is above the median and the average expense ratios of the funds in its Selected Peer Group, and the expense ratio for the Portfolio, not inclusive of AFFE, is above the median and below the average of the expense ratios of the funds in its Selected Peer Group. In analyzing this fee data, the Board took into account: (1) that the
ADVISORY CONTRACT APPROVAL DISCUSSION (Unaudited) (continued)
Portfolio indirectly bears the fees payable by the underlying funds in which the Portfolio invests; and (2) Management’s representations regarding the competitiveness of the Portfolio’s management fee and expense ratio.
After its deliberation, the Board reached the following conclusions: (1) the Portfolio’s management fee rate is reasonable in the context of all factors considered by the Board; (2) the Portfolio’s expense ratio is reasonable in the context of all factors considered by the Board; (3) the Portfolio’s performance is reasonable in the context of all factors considered by the Board; and (4) the sub-advisory fee rate payable by the Adviser to the Sub-Adviser is reasonable in the context of all factors considered by the Board. Based on these conclusions and other factors, the Board voted to renew the Management and Sub-Advisory Contracts for the Portfolio for the relevant periods. During this renewal process, different Board members may have given different weight to different individual factors and related conclusions.
Voya Index Solution 2055 Portfolio
In considering whether to approve the renewal of the Management and Sub-Advisory Contracts for Voya Index Solution 2055 Portfolio, the Board considered that, based on performance data for the periods ended March 31, 2016: (1) the Portfolio outperformed its Morningstar category average for all periods presented; (2) the Portfolio underperformed its primary benchmark for all periods presented; and (3) the Portfolio is ranked in the second quintile of its Morningstar category for the three-year and five-year periods, and the third quintile for the year-to-date and one-year periods.
In considering the fees payable under the Management and Sub-Advisory Contracts for the Portfolio, the Board took into account the factors described above and also considered: (1) the fairness of the compensation under the a Management Contract with a level fee rate that does not include breakpoints; and (2) the pricing structure (including the expense ratio to be borne by shareholders) of the Portfolio, as compared to its Selected Peer Group, including that: (a) the management fee for the Portfolio is above the median and the average management fees of the funds in its Selected Peer Group; and (b) the expense ratio for the Portfolio, inclusive of Acquired Fund Fees and Expenses (“AFFE”), is above the median and the average of the funds in its Selected Peer Group, and the expense ratio for the Portfolio, not inclusive of AFFE, is above the median and the average of the expense ratios of the funds in its Selected Peer Group. In analyzing this fee data, the Board took into account: (1) that the Portfolio indirectly bears the fees payable by the underlying funds in which the Portfolio invests; and (2) Management’s representations
regarding the competitiveness of the Portfolio’s management fee and expense ratio.
After its deliberation, the Board reached the following conclusions: (1) the Portfolio’s management fee rate is reasonable in the context of all factors considered by the Board; (2) the Portfolio’s expense ratio is reasonable in the context of all factors considered by the Board; (3) the Portfolio’s performance is reasonable in the context of all factors considered by the Board; and (4) the sub-advisory fee rate payable by the Adviser to the Sub-Adviser is reasonable in the context of all factors considered by the Board. Based on these conclusions and other factors, the Board voted to renew the Management and Sub-Advisory Contracts for the Portfolio for the relevant periods. During this renewal process, different Board members may have given different weight to different individual factors and related conclusions.
Voya Index Solution 2060 Portfolio
In considering whether to approve the renewal of the Management and Sub-Advisory Contracts for Voya Index Solution 2060 Portfolio, the Board considered that, based on performance data for the periods ended March 31, 2016: (1) the Portfolio outperformed its Morningstar category average for all periods presented; (2) the Portfolio underperformed its primary benchmark for all periods presented; and (3) the Portfolio is ranked in the second quintile of its Morningstar category for the one-year period, and the third quintile for the year-to-date period.
In considering the fees payable under the Management and Sub-Advisory Contracts for the Portfolio, the Board took into account the factors described above and also considered: (1) the fairness of the compensation under a Management Contract with a level fee rate that does not include breakpoints; and (2) the pricing structure (including the expense ratio to be borne by shareholders) of the Portfolio, as compared to its Selected Peer Group, including that: (a) the management fee for the Portfolio is above the median and the average management fees of the funds in its Selected Peer Group; and (b) the expense ratio for the Portfolio, inclusive of Acquired Fund Fees and Expenses (“AFFE”), is above the median and the average of the funds in its Selected Peer Group, and the expense ratio for the Portfolio, not inclusive of AFFE, is above the median and the average of the expense ratios of the funds in its Selected Peer Group. In analyzing this fee data, the Board took into account: (1) that the Portfolio indirectly bears the fees payable by the underlying funds in which the Portfolio invests; and (2) Management’s representations regarding the competitiveness of the Portfolio’s management fee and expense ratio.
ADVISORY CONTRACT APPROVAL DISCUSSION (Unaudited) (continued)
After its deliberation, the Board reached the following conclusions: (1) the Portfolio’s management fee rate is reasonable in the context of all factors considered by the Board; (2) the Portfolio’s expense ratio is reasonable in the context of all factors considered by the Board; (3) taking into account that the Portfolio commenced operations in February 2015, and therefore had a limited operating history for the purpose of analyzing the Portfolio’s performance, it is reasonable to permit the Portfolio time to establish a longer performance record for the purpose of
evaluating investment performance; and (4) the sub-advisory fee rate payable by the Adviser to the Sub-Adviser is reasonable in the context of all factors considered by the Board. Based on these conclusions and other factors, the Board voted to renew the Management and Sub-Advisory Contracts for the Portfolio for relevant periods. During this renewal process, different Board members may have given different weight to different individual factors and related conclusions.
Investment Adviser
Directed Services LLC
1475 Dunwoody Drive
West Chester, Pennsylvania 19380
Distributor
Voya Investments Distributor, LLC
7337 East Doubletree Ranch Road, Suite 100
Scottsdale, Arizona 85258
Transfer Agent
BNY Mellon Investment Servicing (U.S.) Inc.
301 Bellevue Parkway
Wilmington, Delaware 19809
Independent Registered Public Accounting Firm
KPMG LLP
Two Financial Center
60 South Street
Boston, Massachusetts 02111
Custodian
The Bank of New York Mellon
225 Liberty Street
New York, New York 10286
Legal Counsel
Ropes & Gray LLP
Prudential Tower
800 Boylston Street
Boston, Massachusetts 02199
Before investing, carefully consider the investment objectives, risks, charges and expenses of the variable annuity contract or variable life insurance policy and the underlying variable investment options. This and other information is contained in the prospectus for the variable annuity contract or variable life insurance policy and the underlying variable investment options. Obtain these prospectuses from your agent/registered representative and read them carefully before investing.
RETIREMENT | INVESTMENTS | INSURANCE
voyainvestments.com
VPAR-VINDSOL (1216-021517)
Item 2. Code of Ethics.
As of the end of the period covered by this report, Registrant had adopted a code of ethics, as defined in Item 2 of Form N-CSR, that applies to the Registrant’s principal executive officer and principal financial officer. There were no amendments to the Code during the period covered by the report. The Registrant did not grant any waivers, including implicit waivers, from any provisions of the Code during the period covered by this report. The code of ethics is filed herewith pursuant to Item 10(a)(1), Ex-99.CODE ETH.
Item 3. Audit Committee Financial Expert.
The Board of Directors has determined that Colleen D. Baldwin, Peter S. Drotch, Martin J. Gavin, Patrick W. Kenny, Joseph E. Obermeyer, and Roger B. Vincent are audit committee financial experts, as defined in Item 3 of Form N-CSR. Ms. Baldwin, Mr. Drotch, Mr. Gavin, Mr. Kenny, Mr. Obermeyer and Mr. Vincent are “independent” for purposes of Item 3 of Form N-CSR.
Item 4. Principal Accountant Fees and Services.
| (a) | Audit Fees: The aggregate fees billed for each of the last two fiscal years for professional services rendered by KPMG LLP (“KPMG”), the principal accountant for the audit of the registrant’s annual financial statements or services that are normally provided by the accountant in connection with statutory and regulatory filings or engagements for those fiscal years were $891,345 for the year ended December 31, 2016 and $872,625 for the year ended December 31, 2015. |
| (b) | Audit-Related Fees: The aggregate fees billed in each of the last two fiscal years for assurance and related services by KPMG that are reasonably related to the performance of the audit of the registrant’s financial statements and are not reported under paragraph (a) of this Item were $103,525 for the year ended December 31, 2016 and $111,100 for the year ended December 31, 2015. |
| (c) | Tax Fees: The aggregate fees billed in each of the last two fiscal years for professional services rendered by KPMG for tax compliance, tax advice, and tax planning were $217,359 for the year ended December 31, 2016 and $231,398 for the year ended December 31, 2015. Such services included review of excise distribution calculations (if applicable), preparation of the Funds’ federal, state, and excise tax returns, tax services related to mergers and routine consulting. |
| (d) | All Other Fees: The aggregate fees billed in each of the last two fiscal years for products and services provided by KPMG, other than the services reported in paragraphs (a) through (c) of this Item were $0 for the year ended December 31, 2016 and $0 for the year ended December 31, 2015. |
| (e)(1) | Audit Committee Pre-Approval Policies and Procedures |
AUDIT AND NON-AUDIT SERVICES
PRE-APPROVAL POLICY
| I. | Statement of Principles |
Under the Sarbanes-Oxley Act of 2002 (the “Act”), the Audit Committee of the Board of Directors or Trustees (the “Committee”) of the Voya funds (each a “Fund,” collectively, the “Funds”) set out on Exhibit A to this Audit and Non-Audit Services Pre-Approval Policy (“Policy”) is responsible for the oversight of the work of the Funds’ independent auditors. As part of its responsibilities, the Committee must pre-approve the audit and non-audit services performed by the auditors in order to assure that the provision of these services does not impair the auditors’ independence from the Funds. The Committee has adopted, and the Board has ratified, this Policy, which sets out the procedures and conditions under which the services of the independent auditors may be pre-approved.
Under Securities and Exchange Commission (“SEC”) rules promulgated in accordance with the Act, the Funds may establish two different approaches to pre-approving audit and non-audit services. The Committee may approve services without consideration of specific case-by-case services (“general pre-approval”) or it may pre-approve specific services (“specific pre-approval”). The Committee believes that the combination of these approaches contemplated in this Policy results in an effective and efficient method for pre-approving audit and non-audit services to be performed by the Funds’ independent auditors. Under this Policy, services that are not of a type that may receive general pre-approval require specific pre-approval by the Committee. Any proposed services that exceed pre-approved cost levels or budgeted amounts will also require the Committee’s specific pre-approval.
For both types of approval, the Committee considers whether the subject services are consistent with the SEC’s rules on auditor independence and that such services are compatible with maintaining the auditors independence. The Committee also considers whether a particular audit firm is in the best position to provide effective and efficient services to the Funds. Reasons that the auditors are in the best position include the auditors’ familiarity with the Funds’ business, personnel, culture, accounting systems, risk profile, and other factors, and whether the services will enhance the Funds’ ability to manage and control risk or improve audit quality. Such factors will be considered as a whole, with no one factor being determinative.
The appendices attached to this Policy describe the audit, audit-related, tax-related, and other services that have the Committee’s general pre-approval. For any service that has been approved through general pre-approval, the general pre-approval will remain in place for a period 12 months from the date of pre-approval, unless the Committee determines that a different period is appropriate. The Committee will annually review and pre-approve the services that may be provided by the independent auditors without specific pre-approval. The Committee will revise the list of services subject to general pre-approval as appropriate. This Policy does not serve as a delegation to Fund management of the Committee’s duty to pre-approve services performed by the Funds’ independent auditors.
The annual audit services engagement terms and fees are subject to the Committee’s specific pre-approval. Audit services are those services that are normally provided by auditors in connection with statutory and regulatory filings or engagements or those that generally only independent auditors can reasonably provide. They include the Funds’ annual financial statement audit and procedures that the independent auditors must perform in order to form an opinion on the Funds’ financial statements (e.g., information systems and procedural reviews and testing). The Committee will monitor the audit services engagement and approve any changes in terms, conditions or fees deemed by the Committee to be necessary or appropriate.
The Committee may grant general pre-approval to other audit services, such as statutory audits and services associated with SEC registration statements, periodic reports and other documents filed with the SEC or issued in connection with securities offerings.
The Committee has pre-approved the audit services listed on Appendix A. The Committee must specifically approve all audit services not listed on Appendix A.
| III. | Audit-related Services |
Audit-related services are assurance and related services that are reasonably related to the performance of the audit or the review of the Funds’ financial statements or are traditionally performed by the independent auditors. The Committee believes that the provision of audit-related services will not impair the independent auditors’ independence, and therefore may grant pre-approval to audit-related services. Audit-related services include accounting consultations related to accounting, financial reporting or disclosure matters not classified as “audit services;” assistance with understanding and implementing new accounting and financial reporting guidance from rulemaking authorities; agreed-upon or expanded audit procedures relating to accounting and/or billing records required to respond to or comply with financial, accounting or regulatory reporting matters; and assistance with internal control reporting requirements under Form N-SAR or Form N-CSR.
The Committee has pre-approved the audit-related services listed on Appendix B. The Committee must specifically approve all audit-related services not listed on Appendix B.
The Committee believes the independent auditors can provide tax services to the Funds, including tax compliance, tax planning, and tax advice, without compromising the auditors’ independence. Therefore, the Committee may grant general pre-approval with respect to tax services historically provided by the Funds’ independent auditors that do not, in the Committee’s view, impair auditor independence and that are consistent with the SEC’s rules on auditor independence.
The Committee will not grant pre-approval if the independent auditors initially recommends a transaction the sole business purpose of which is tax avoidance and the tax treatment of which may not be supported in the Internal Revenue Code and related regulations. The Committee may consult outside counsel to determine that tax planning and reporting positions are consistent with this Policy.
The Committee has pre-approved the tax-related services listed on Appendix C. The Committee must specifically approve all tax-related services not listed on Appendix C.
The Committee believes it may grant approval of non-audit services that are permissible services for independent auditors to a Fund. The Committee has determined to grant general pre-approval to other services that it believes are routine and recurring, do not impair auditor independence, and are consistent with SEC rules on auditor independence.
The Committee has pre-approved the non-audit services listed on Appendix D. The Committee must specifically approve all non-audit services not listed on Appendix D.
A list of the SEC’s prohibited non-audit services is attached to this Policy as Appendix E. The SEC’s rules and relevant guidance should be consulted to determine the precise definitions of these impermissible services and the applicability of exceptions to certain of the SEC’s prohibitions.
| VI. | Pre-approval of Fee levels and Budgeted Amounts |
The Committee will annually establish pre-approval fee levels or budgeted amounts for audit, audit-related, tax and non-audit services to be provided to the Funds by the independent auditors. Any proposed services exceeding these levels or amounts require the Committee’s specific pre-approval. The Committee considers fees for audit and non-audit services when deciding whether to pre-approve services. The Committee may determine, for a pre-approval period of 12 months, the appropriate ratio between the total amount of fees for the Fund’s audit, audit-related, and tax services (including fees for services provided to Fund affiliates that are subject to pre-approval), and the total amount of fees for certain permissible non-audit services for the Fund classified as other services (including any such services provided to Fund affiliates that are subject to pre-approval).
Requests or applications for services to be provided by the independent auditors will be submitted to management. If management determines that the services do not fall within those services generally pre-approved by the Committee and set out in the appendices to these procedures, management will submit the services to the Committee or its delagee. Any such submission will include a detailed description of the services to be rendered. Notwithstanding this paragraph, the Committee will, on a quarterly basis, receive from the independent auditors a list of services provided for the previous calendar quarter on a cumulative basis by the auditors during the Pre-Approval Period.
The Committee may delegate pre-approval authority to one or more of the Committee’s members. Any member or members to whom such pre-approval authority is delegated must report any pre-approval decisions, including any pre-approved services, to the Committee at its next scheduled meeting. The Committee will identify any member to whom pre-approval authority is delegated in writing. The member will retain such authority for a period of 12 months from the date of pre-approval unless the Committee determines that a different period is appropriate. The period of delegated authority may be terminated by the Committee or at the option of the member.
| IX. | Additional Requirements |
The Committee will take any measures the Committee deems necessary or appropriate to oversee the work of the independent auditors and to assure the auditors’ independence from the Funds. This may include reviewing a formal written statement from the independent auditors delineating all relationships between the auditors and the Funds, consistent with Independence Standards Board No. 1, and discussing with the auditors their methods and procedures for ensuring independence.
Part of KPMG’s performance of an audit in accordance with standards of the Public Company Accounting Oversight Board (US) includes their responsibility to maintain and monitor auditor independence with respect to the Voya funds. Using a proprietary system called Sentinel, the audit team is able to identify and manage potential conflicts of interest across the member firms of the KPMG International Network and prevent the provision of prohibited services to the Voya entities that would impair KPMG independence with the respect to the Voya funds. KPMG requests pre-approval from the Voya funds Audit Committee for services provided to the Voya funds and for services to affiliated entities that relate to the financial reporting or nature of operations of the Voya Funds. Additionally, KPMG provides an annual summary of the fees for services that have commenced for Voya funds and Affiliates.
Last Approved: November 19, 2015
Appendix A
Pre-Approved Audit Services for the Pre-Approval Period January 1, 2016 through December 31, 2016
| Service |
| | The Fund(s) | Fee Range |
| Statutory audits or financial audits (including tax services associated with audit services) | √ | As presented to Audit Committee1 |
| Services associated with SEC registration statements, periodic reports and other documents filed with the SEC or other documents issued in connection with securities offerings (e.g., consents), and assistance in responding to SEC comment letters. | √ | Not to exceed $9,750 per filing |
| Consultations by Fund management with respect to accounting or disclosure treatment of transactions or events and/or the actual or potential effect of final or proposed rules, standards or interpretations by the SEC, Financial Accounting Standards Board, or other regulatory or standard setting bodies. | √ | Not to exceed $8,000 during the Pre-Approval Period |
| Seed capital audit and related review and issuance of consent on the N-2 registration statement | √ | Not to exceed $13,750 per audit |
| Audit of summary portfolio of investments | √ | Not to exceed $525 per fund |
| 1 | For new Funds launched during the Pre-Approval Period, the fee ranges pre-approved will be the same as those for existing Funds, pro-rated in accordance with inception dates as provided in the auditors’ Proposal or any Engagement Letter covering the period at issue. Fees in the Engagement Letter will be controlling. |
Appendix B
Pre-Approved Audit-Related Services for the Pre-Approval Period January 1, 2016 through December 31, 2016
| Service |
| | The Fund(s) | Fund Affiliates | Fee Range |
| Services related to Fund mergers (Excludes tax services - See Appendix C for tax services associated with Fund mergers) | √ | √ | Not to exceed $10,000 per merger |
| Consultations by Fund management with respect to accounting or disclosure treatment of transactions or events and/or the actual or potential effect of final or proposed rules, standards or interpretations by the SEC, Financial Accounting Standards Board, or other regulatory or standard setting bodies. [Note: Under SEC rules some consultations may be “audit” services and others may be “audit-related” services.] | √ | | Not to exceed $5,000 per occurrence during the Pre-Approval Period |
| Review of the Funds’ semi-annual and quarterly financial statements | √ | | Not to exceed $2,525 per set of financial statements per fund |
| Reports to regulatory or government agencies related to the annual engagement | √ | | Up to $5,000 per occurrence during the Pre-Approval Period |
| Regulatory compliance assistance | √ | √ | Not to exceed $5,000 per quarter |
| Training courses | | √ | Not to exceed $5,000 per course |
| For Prime Rate Trust, agreed upon procedures for quarterly reports to rating agencies | √ | | Not to exceed $9,450 per quarter |
Appendix C
Pre-Approved Tax Services for the Pre-Approval Period January 1, 2016 through December 31, 2016
| Service |
| | The Fund(s) | Fund
Affiliates | Fee Range |
| Preparation of federal and state income tax returns and federal excise tax returns for the Funds including assistance and review with excise tax distributions | √ | | As presented to Audit Committee2 |
| Review of IRC Sections 851(b) and 817(h) diversification testing on a real-time basis | √ | | As presented to Audit Committee2 |
| Assistance and advice regarding year-end reporting for 1099’s, as requested | √ | | As presented to Audit Committee2 |
| Tax assistance and advice regarding statutory, regulatory or administrative developments | √ | √ | Not to exceed $5,000 for the Funds or for the Funds’ investment adviser during the Pre-Approval Period |
| 2 | For new Funds launched during the Pre-Approval Period, the fee ranges pre-approved will be the same as those for existing Funds, pro-rated in accordance with inception dates as provided in the auditors’ Proposal or any Engagement Letter covering the period at issue. Fees in the Engagement Letter will be controlling. |
Appendix C, continued
| Service |
| | The Fund(s) | Fund
Affiliates | Fee Range |
| Tax training courses | | √ | Not to exceed $5,000 per course during the Pre-Approval Period |
| Tax services associated with Fund mergers | √ | √ | Not to exceed $4,000 per fund per merger during the Pre-Approval Period |
| Other tax-related assistance and consultation, including, without limitation, assistance in evaluating derivative financial instruments and international tax issues, qualification and distribution issues, and similar routine tax consultations. | √ | | Not to exceed $120,000 during the Pre-Approval Period |
Appendix D
Pre-Approved Other Services for the Pre-Approval Period January 1, 2016 through December 31, 2016
| Service |
| | The Fund(s) | Fund Affiliates | Fee Range |
| Agreed-upon procedures for Class B share 12b-1 programs | | √ | Not to exceed $60,000 during the Pre-Approval Period |
Security counts performed pursuant to Rule 17f-2 of the 1940 Act (i.e., counts for Funds holding securities with affiliated sub-custodians) Cost to be borne 50% by the Funds and 50% by Voya Investments, LLC. | √ | √ | Not to exceed $5,300 per Fund during the Pre-Approval Period |
| Agreed upon procedures for 15 (c) FACT Books | √ | | Not to exceed $50,000 during the Pre-Approval Period |
Appendix E
Prohibited Non-Audit Services
Dated: January 1, 2016 to December 31, 2016
| · | Bookkeeping or other services related to the accounting records or financial statements of the Funds |
| · | Financial information systems design and implementation |
| · | Appraisal or valuation services, fairness opinions, or contribution-in-kind reports |
| · | Internal audit outsourcing services |
| · | Broker-dealer, investment adviser, or investment banking services |
| · | Expert services unrelated to the audit |
| · | Any other service that the Public Company Accounting Oversight Board determines, by regulation, is impermissible |
EXHIBIT A
VOYA ASIA PACIFIC HIGH DIVIDEND EQUITY INCOME FUND
VOYA BALANCED PORTFOLIO, INC.
VOYA EMERGING MARKETS HIGH DIVIDEND EQUITY FUND
VOYA EQUITY TRUST
VOYA FUNDS TRUST
VOYA GLOBAL ADVANTAGE AND PREMIUM OPPORTUNITY FUND
VOYA GLOBAL EQUITY DIVIDEND AND PREMIUM OPPORTUNITY FUND
VOYA INFRASTRUCTURE, INDUSTRIALS, AND MATERIALS FUND
VOYA INTERMEDIATE BOND PORTFOLIO
VOYA INTERNATIONAL HIGH DIVIDEND EQUITY INCOME FUND
VOYA INVESTORS TRUST
VOYA MONEY MARKET PORTFOLIO
VOYA MUTUAL FUNDS
VOYA PARTNERS, INC.
VOYA PRIME RATE TRUST
VOYA NATURAL RESOURCES EQUITY INCOME FUND
VOYA SENIOR INCOME FUND
VOYA SEPARATE PORTFOLIOS TRUST
VOYA SERIES FUND, INC.
VOYA STRATEGIC ALLOCATIONS PORTFOLIOS, INC.
VOYA VARIABLE FUNDS
VOYA VARIABLE INSURANCE TRUST
VOYA VARIABLE PORTFOLIOS INC,
VOYA VARIABLE PRODUCTS TRUST
| (e)(2) | Percentage of services referred to in 4(b) – (4)(d) that were approved by the audit committee |
100% of the services were approved by the audit committee.
| (f) | Percentage of hours expended attributable to work performed by other than full time employees of KPMG if greater than 50% |
Not applicable.
| (g) | Non-Audit Fees: The following table presents (i) the aggregate non-audit fees (i.e., fees for audit-related, tax, and other services) billed to each Registrant by the independent registered public accounting firm for each Registrant’s fiscal years ended December 31, 2016 and December 31, 2015; and (ii) the aggregate non-audit fees billed to the investment adviser, or any of its affiliates that provide ongoing services to the registrant, by the independent registered public accounting firm for the same time periods. |
| Registrant/Investment Adviser | | 2016 | | | 2015 | |
| Voya Partners, Inc. | | $ | 320,884 | | | $ | 342,498 | |
| Voya Investments, LLC (1) | | $ | 93,650 | | | $ | 145,625 | |
(1) Each Registrant’s investment adviser and any of its affiliates, which are subsidiaries of Voya Financial, Inc.
| (h) | Principal Accountants Independence: The Registrant’s Audit committee has considered whether the provision of non-audit services that were rendered to the registrant’s investment adviser and any entity controlling, controlled by, or under common control with the investment adviser that provides ongoing services to the registrant that were not pre-approved pursuant to Rule 2-01(c)(7)(ii) of Regulation S-X is compatible with maintaining KPMG’s independence. |
Item 5. Audit Committee of Listed Registrants.
Not applicable.
Item 6. Schedule of Investments.
Complete schedule of investments, as applicable, in included as part of the report to shareholders filed under Item 1 of this Form and filed herein, as applicable.
Report of Independent Registered Public Accounting Firm
The Shareholders and Board of Directors
Voya Partners, Inc.
We have audited the accompanying statements of assets and liabilities, including the summary portfolios of investments, of Voya Global Bond Portfolio, VY® American Century Small-Mid Cap Value Portfolio, VY® Baron Growth Portfolio, VY® Columbia Contrarian Core Portfolio, VY® Columbia Small Cap Value II Portfolio, VY® Invesco Comstock Portfolio, VY® Invesco Equity and Income Portfolio, VY® JPMorgan Mid Cap Value Portfolio, VY® Oppenheimer Global Portfolio, VY® Pioneer High Yield Portfolio, VY® T. Rowe Price Diversified Mid Cap Growth Portfolio, VY® T. Rowe Price Growth Equity Portfolio, and VY® Templeton Foreign Equity Portfolio, and including the portfolios of investments of Voya Solution Aggressive Portfolio, Voya Solution Balanced Portfolio, Voya Solution Conservative Portfolio, Voya Solution Income Portfolio, Voya Solution Moderately Aggressive Portfolio, Voya Solution Moderately Conservative Portfolio, Voya Solution 2020 Portfolio, Voya Solution 2025 Portfolio, Voya Solution 2030 Portfolio, Voya Solution 2035 Portfolio, Voya Solution 2040 Portfolio, Voya Solution 2045 Portfolio, Voya Solution 2050 Portfolio, Voya Solution 2055 Portfolio, Voya Solution 2060 Portfolio, Voya Index Solution Income Portfolio, Voya Index Solution 2020 Portfolio, Voya Index Solution 2025 Portfolio, Voya Index Solution 2030 Portfolio, Voya Index Solution 2035 Portfolio, Voya Index Solution 2040 Portfolio, Voya Index Solution 2045 Portfolio, Voya Index Solution 2050 Portfolio, Voya Index Solution 2055 Portfolio, and Voya Index Solution 2060 Portfolio, each a series of Voya Partners, Inc., as of December 31, 2016, and the related statements of operations for the year then ended, the statements of changes in net assets for each of the years in the two-year period then ended (collectively, the "financial statements"), the financial highlights for each of the years or periods in the five-year period then ended (the financial statements and financial highlights are included in Item 1 of this Form N-CSR), and the portfolios of investments of Voya Global Bond Portfolio, VY® American Century Small-Mid Cap Value Portfolio, VY® Baron Growth Portfolio, VY® Columbia Contrarian Core Portfolio, VY® Columbia Small Cap Value II Portfolio, VY® Invesco Comstock Portfolio, VY® Invesco Equity and Income Portfolio, VY® JPMorgan Mid Cap Value Portfolio, VY® Oppenheimer Global Portfolio, VY® Pioneer High Yield Portfolio, VY® T. Rowe Price Diversified Mid Cap Growth Portfolio, VY® T. Rowe Price Growth Equity Portfolio, and VY® Templeton Foreign Equity Portfolio, as of December 31, 2016 (included in Item 6 of this Form N-CSR). These financial statements, financial highlights, and portfolios of investments are the responsibility of management. Our responsibility is to express an opinion on these financial statements, financial highlights, and portfolios of investments based on our audits.
We conducted our audits in accordance with the standards of the Public Company Accounting Oversight Board (United States). Those standards require that we plan and perform the audit to obtain reasonable assurance about whether the financial statements, financial highlights, and portfolios of investments are free of material misstatement. An audit includes examining, on a test basis, evidence supporting the amounts and disclosures in the financial statements and portfolios of investments. Our procedures included confirmation of securities owned as of December 31, 2016, by correspondence with the custodian, transfer agent, and brokers, or by other appropriate auditing procedures when replies from brokers were not received. An audit also includes assessing the accounting principles used and significant estimates made by management, as well as evaluating the overall financial statement presentation. We believe that our audits provide a reasonable basis for our opinion.
In our opinion, the financial statements, financial highlights, and portfolios of investments referred to above present fairly, in all material respects, the financial position of the aforementioned funds of Voya Partners, Inc. as of December 31, 2016, and the results of their operations for the year then ended, the changes in their net assets for each of the years in the two-year period then ended, and the financial highlights for each of the years or periods in the five-year period then ended, in conformity with U.S. generally accepted accounting principles.

Boston, Massachusetts
February 23, 2017
| Voya Global Bond Portfolio | PORTFOLIO OF INVESTMENTS AS OF December 31, 2016 |
Principal
Amount† | | | | | | | Value | | | Percentage
of Net
Assets | |
| CORPORATE BONDS/NOTES: 22.7% | | | | | | | | |
| | | | | | | Brazil: 0.4% | | | | | | | | |
| | 900,000 | | | | | Petrobras Global Finance BV, 8.750%, 05/23/26 | | | 973,125 | | | | 0.4 | |
| | | | | | | | | | | | | | | |
| | | | | | | Canada: 0.2% | | | | | | | | |
| | 130,000 | | | | | Bank of Montreal, 1.500%, 07/18/19 | | | 128,288 | | | | 0.1 | |
| | 324,000 | | | | | Goldcorp, Inc., 3.700%, 03/15/23 | | | 318,873 | | | | 0.1 | |
| | | | | | | | | | 447,161 | | | | 0.2 | |
| | | | | | | | | | | | | | | |
| | | | | | | China: 0.3% | | | | | | | | |
| | 601,000 | | | | | Alibaba Group Holding Ltd, 3.600%, 11/28/24 | | | 596,075 | | | | 0.3 | |
| | | | | | | | | | | | | | | |
| | | | | | | France: 0.8% | | | | | | | | |
| | 294,000 | | | | | BPCE SA, 2.500%, 12/10/18 | | | 296,602 | | | | 0.2 | |
| | 287,000 | | | # | | BPCE SA, 5.150%, 07/21/24 | | | 291,888 | | | | 0.1 | |
| | 226,000 | | | # | | Electricite de France SA, 2.350%, 10/13/20 | | | 223,787 | | | | 0.1 | |
| | 940,000 | | | # | | SFR Group SA, 6.000%, 05/15/22 | | | 968,200 | | | | 0.4 | |
| | | | | | | | | | 1,780,477 | | | | 0.8 | |
| | | | | | | | | | | | | | | |
| | | | | | | Guernsey: 0.3% | | | | | | | | |
| | 716,000 | | | | | Credit Suisse Group Funding Guernsey Ltd., 2.750%, 03/26/20 | | | 709,863 | | | | 0.3 | |
| | | | | | | | | | | | | | | |
| | | | | | | Ireland: 0.3% | | | | | | | | |
| | 282,000 | | | | | GE Capital International Funding Co. Unlimited Co., 4.418%, 11/15/35 | | | 295,608 | | | | 0.1 | |
| | 370,000 | | | | | Shire Acquisitions Investments Ireland DAC, 3.200%, 09/23/26 | | | 345,986 | | | | 0.2 | |
| | | | | | | | | | 641,594 | | | | 0.3 | |
| | | | | | | | | | | | | | | |
| | | | | | | Italy: 0.1% | | | | | | | | |
| | 286,000 | | | | | Intesa Sanpaolo SpA, 3.875%, 01/15/19 | | | 291,165 | | | | 0.1 | |
| | | | | | | | | | | | | | | |
| | | | | | | Japan: 0.6% | | | | | | | | |
| | 790,000 | | | # | | Bank of Tokyo-Mitsubishi UFJ Ltd./The, 2.300%, 03/05/20 | | | 781,079 | | | | 0.4 | |
| | 200,000 | | | # | | Mizuho Bank Ltd., 3.200%, 03/26/25 | | | 198,781 | | | | 0.1 | |
| | 300,000 | | | | | Sumitomo Mitsui Financial Group, Inc., 3.784%, 03/09/26 | | | 306,617 | | | | 0.1 | |
| | | | | | | | | | 1,286,477 | | | | 0.6 | |
| | | | | | | | | | | | | | | |
| | | | | | | Mexico: 0.0% | | | | | | | | |
| MXN | 1,007,437 | | | ± | | Banco Invex S.A., 03/13/34 | | | – | | | | – | |
| MXN | 144,790 | | | | | JPMorgan Hipotecaria su Casita, 09/25/35 | | | 6,584 | | | | 0.0 | |
| | | | | | | | | | 6,584 | | | | 0.0 | |
| | | | | | | | | | | | | | | |
| | | | | | | Netherlands: 0.8% | | | | | | | | |
| | 269,000 | | | | | Cooperatieve Centrale Raiffeisen-Boerenleenbank BA/Netherlands, 4.500%, 01/11/21 | | | 289,008 | | | | 0.1 | |
| | 340,000 | | | | | Shell International Finance BV, 1.625%, 11/10/18 | | | 340,651 | | | | 0.1 | |
| | 690,000 | | | | | Shell International Finance BV, 3.250%, 05/11/25 | | | 689,271 | | | | 0.3 | |
| | 361,000 | | | | | Shell International Finance BV, 4.000%, 05/10/46 | | | 345,360 | | | | 0.2 | |
| | 300,000 | | | # | | Siemens Financieringsmaatschappij NV, 2.350%, 10/15/26 | | | 277,604 | | | | 0.1 | |
| | | | | | | | | | 1,941,894 | | | | 0.8 | |
| | | | | | | | | | | | | | | |
| | | | | | | Norway: 0.2% | | | | | | | | |
| | 380,000 | | | | | Statoil ASA, 2.450%, 01/17/23 | | | 370,862 | | | | 0.2 | |
| | | | | | | | | | | | | | | |
| | | | | | | South Africa: 0.0% | | | | | | | | |
| ZAR | 1,000,000 | | | | | Transnet SOC Ltd., 10.800%, 11/06/23 | | | 74,075 | | | | 0.0 | |
| | | | | | | | | | | | | | | |
| | | | | | | Sweden: 0.1% | | | | | | | | |
| | 298,000 | | | #,L | | Nordea Bank AB, 5.500%, 09/29/49 | | | 296,927 | | | | 0.1 | |
| | | | | | | | | | | | | | | |
| | | | | | | Switzerland: 0.3% | | | | | | | | |
| | 400,000 | | | # | | Credit Suisse AG, 6.500%, 08/08/23 | | | 426,528 | | | | 0.2 | |
| | 250,000 | | | | | UBS AG/Stamford CT, 7.625%, 08/17/22 | | | 284,063 | | | | 0.1 | |
| | | | | | | | | | 710,591 | | | | 0.3 | |
| | | | | | | | | | | | | | | |
| | | | | | | United Kingdom: 1.1% | | | | | | | | |
| | 283,000 | | | | | Aon PLC, 2.800%, 03/15/21 | | | 282,924 | | | | 0.1 | |
| | 530,000 | | | | | BP Capital Markets PLC, 3.216%, 11/28/23 | | | 535,158 | | | | 0.2 | |
| | 1,002,000 | | | | | Santander UK PLC, 2.375%, 03/16/20 | | | 996,287 | | | | 0.4 | |
| | 400,000 | | | #,L | | Standard Chartered PLC, 4.300%, 02/19/27 | | | 381,159 | | | | 0.2 | |
| | 344,000 | | | # | | UBS Group Funding Jersey Ltd., 4.125%, 04/15/26 | | | 351,999 | | | | 0.2 | |
| | | | | | | | | | 2,547,527 | | | | 1.1 | |
| | | | | | | | | | | | | | | |
| | | | | | | United States: 17.2% | | | | | | | | |
| | 424,000 | | | | | 21st Century Fox America, Inc., 4.500%, 02/15/21 | | | 453,377 | | | | 0.2 | |
| | 338,000 | | | | | 21st Century Fox America, Inc., 5.400%, 10/01/43 | | | 364,625 | | | | 0.2 | |
| | 616,000 | | | | | AbbVie, Inc., 2.500%, 05/14/20 | | | 616,302 | | | | 0.3 | |
| | 190,000 | | | | | AbbVie, Inc., 2.850%, 05/14/23 | | | 184,376 | | | | 0.1 | |
| | 537,000 | | | | | Actavis Funding SCS, 2.350%, 03/12/18 | | | 540,192 | | | | 0.2 | |
| Voya Global Bond Portfolio | PORTFOLIO OF INVESTMENTS AS OF December 31, 2016 (CONTINUED) |
| | 100,000 | | | # | | AMC Entertainment Holdings, Inc., 5.875%, 11/15/26 | | | 102,500 | | | | 0.0 | |
| | 233,000 | | | | | American Tower Corp., 3.500%, 01/31/23 | | | 233,778 | | | | 0.1 | |
| | 432,000 | | | | | Anheuser-Busch InBev Finance, Inc., 2.650%, 02/01/21 | | | 434,391 | | | | 0.2 | |
| | 554,000 | | | | | Anheuser-Busch InBev Finance, Inc., 3.300%, 02/01/23 | | | 563,998 | | | | 0.2 | |
| | 710,000 | | | | | Apple, Inc., 3.200%, 05/13/25 | | | 712,777 | | | | 0.3 | |
| | 295,000 | | | | | AT&T, Inc., 3.000%, 06/30/22 | | | 289,627 | | | | 0.1 | |
| | 962,000 | | | | | AT&T, Inc., 3.600%, 02/17/23 | | | 970,494 | | | | 0.4 | |
| | 299,000 | | | | | AT&T, Inc., 5.150%, 03/15/42 | | | 298,381 | | | | 0.1 | |
| | 368,000 | | | �� | | Bank of America Corp., 3.300%, 01/11/23 | | | 369,364 | | | | 0.2 | |
| | 226,000 | | | | | Bank of America Corp., 3.875%, 08/01/25 | | | 229,916 | | | | 0.1 | |
| | 458,000 | | | | | Bank of America Corp., 4.100%, 07/24/23 | | | 478,612 | | | | 0.2 | |
| | 309,000 | | | | | Bank of America Corp., 4.000%, 04/01/24 | | | 318,818 | | | | 0.1 | |
| | 412,000 | | | | | Bank of New York Mellon Corp., 2.050%, 05/03/21 | | | 404,272 | | | | 0.2 | |
| | 300,000 | | | | | Boardwalk Pipelines L.P., 5.950%, 06/01/26 | | | 326,027 | | | | 0.1 | |
| | 540,000 | | | # | | Calpine Corp., 6.000%, 01/15/22 | | | 566,325 | | | | 0.2 | |
| | 395,000 | | | | | CBRE Services, Inc., 5.250%, 03/15/25 | | | 407,486 | | | | 0.2 | |
| | 216,000 | | | | | CBS Corp., 3.700%, 08/15/24 | | | 217,673 | | | | 0.1 | |
| | 249,000 | | | | | CCO Holdings LLC / CCO Holdings Capital Corp., 5.125%, 02/15/23 | | | 256,470 | | | | 0.1 | |
| | 501,000 | | | | | Celgene Corp., 4.000%, 08/15/23 | | | 522,575 | | | | 0.2 | |
| | 472,000 | | | | | Charter Communications Operating LLC / Charter Communications Operating Capital, 4.464%, 07/23/22 | | | 493,340 | | | | 0.2 | |
| | 290,000 | | | | | Chevron Corp., 2.419%, 11/17/20 | | | 291,998 | | | | 0.1 | |
| | 360,000 | | | | | Chevron Corp., 2.954%, 05/16/26 | | | 354,028 | | | | 0.2 | |
| | 579,000 | | | | | Citigroup, Inc., 4.000%, 08/05/24 | | | 583,741 | | | | 0.3 | |
| | 469,000 | | | | | Citigroup, Inc., 5.500%, 09/13/25 | | | 515,678 | | | | 0.2 | |
| | 758,000 | | | | | Citizens Bank NA/Providence RI, 2.450%, 12/04/19 | | | 760,697 | | | | 0.3 | |
| | 165,000 | | | | | Comcast Corp., 2.350%, 01/15/27 | | | 152,457 | | | | 0.1 | |
| | 562,000 | | | # | | COX Communications, Inc., 2.950%, 06/30/23 | | | 529,067 | | | | 0.2 | |
| | 777,000 | | | | | CVS Health Corp., 2.800%, 07/20/20 | | | 788,883 | | | | 0.3 | |
| | 320,000 | | | # | | Diamond 1 Finance Corp. / Diamond 2 Finance Corp., 4.420%, 06/15/21 | | | 331,166 | | | | 0.1 | |
| | 337,000 | | | # | | Diamond 1 Finance Corp. / Diamond 2 Finance Corp., 5.450%, 06/15/23 | | | 357,579 | | | | 0.2 | |
| | 313,000 | | | # | | Diamond 1 Finance Corp. / Diamond 2 Finance Corp., 6.020%, 06/15/26 | | | 339,234 | | | | 0.2 | |
| | 442,000 | | | | | Discover Bank/Greenwood DE, 7.000%, 04/15/20 | | | 490,839 | | | | 0.2 | |
| | 240,000 | | | | | Duke Energy Carolinas LLC, 2.500%, 03/15/23 | | | 237,809 | | | | 0.1 | |
| | 277,000 | | | | | Eastman Chemical Co., 2.700%, 01/15/20 | | | 278,677 | | | | 0.1 | |
| | 1,026,000 | | | | | Energy Transfer Partners L.P., 4.900%, 02/01/24 | | | 1,061,649 | | | | 0.5 | |
| | 558,000 | | | | | Entergy Corp., 5.125%, 09/15/20 | | | 601,567 | | | | 0.3 | |
| | 238,000 | | | | | Envision Healthcare Corp., 5.625%, 07/15/22 | | | 246,270 | | | | 0.1 | |
| | 165,000 | | | # | | ESH Hospitality, Inc., 5.250%, 05/01/25 | | | 164,587 | | | | 0.1 | |
| | 329,000 | | | | | Exxon Mobil Corp., 2.222%, 03/01/21 | | | 329,113 | | | | 0.1 | |
| | 318,000 | | | | | Fifth Third Bancorp, 8.250%, 03/01/38 | | | 444,612 | | | | 0.2 | |
| | 532,000 | | | | | FirstEnergy Corp., 4.250%, 03/15/23 | | | 550,173 | | | | 0.2 | |
| | 205,000 | | | | | General Electric Co., 6.750%, 03/15/32 | | | 272,954 | | | | 0.1 | |
| | 322,000 | | | | | General Motors Financial Co., Inc., 4.300%, 07/13/25 | | | 319,573 | | | | 0.1 | |
| | 240,000 | | | | | Goldman Sachs Group, Inc., 2.625%, 04/25/21 | | | 238,292 | | | | 0.1 | |
| | 627,000 | | | | | Goldman Sachs Group, Inc., 5.250%, 07/27/21 | | | 687,287 | | | | 0.3 | |
| | 605,000 | | | | | Hartford Financial Services Group, Inc., 6.625%, 03/30/40 | | | 747,822 | | | | 0.3 | |
| | 194,000 | | | | | Hewlett Packard Enterprise Co., 2.850%, 10/05/18 | | | 195,923 | | | | 0.1 | |
| | 294,000 | | | | | Huntington Bancshares, Inc./OH, 2.600%, 08/02/18 | | | 296,924 | | | | 0.1 | |
| | 570,000 | | | | | Huntington National Bank, 2.200%, 11/06/18 | | | 571,750 | | | | 0.3 | |
| | 1,041,000 | | | | | Indiana Michigan Power Co., 7.000%, 03/15/19 | | | 1,147,414 | | | | 0.5 | |
| | 238,000 | | | | | Intel Corp., 2.600%, 05/19/26 | | | 230,128 | | | | 0.1 | |
| | 570,000 | | | # | | JBS USA LLC / JBS USA Finance, Inc., 5.875%, 07/15/24 | | | 591,375 | | | | 0.3 | |
| | 245,000 | | | | | Jefferson Smurfit Escrow, 06/01/49 | | | – | | | | – | |
| | 384,000 | | | | | JM Smucker Co., 3.000%, 03/15/22 | | | 387,776 | | | | 0.2 | |
| | 362,000 | | | | | JPMorgan Chase & Co., 1.625%, 05/15/18 | | | 361,555 | | | | 0.2 | |
| | 357,000 | | | | | JPMorgan Chase & Co., 2.550%, 03/01/21 | | | 355,744 | | | | 0.2 | |
| | 478,000 | | | | | JPMorgan Chase & Co., 6.000%, 12/29/49 | | | 480,987 | | | | 0.2 | |
| | 40 | | | # | | Kern River Funding Corp., 4.893%, 04/30/18 | | | 41 | | | | 0.0 | |
| | 222,000 | | | | | Kinder Morgan Energy Partners L.P., 4.250%, 09/01/24 | | | 227,274 | | | | 0.1 | |
| | 127,000 | | | | | Kohls Corp., 4.750%, 12/15/23 | | | 131,834 | | | | 0.1 | |
| | 317,000 | | | | | Kraft Heinz Foods Co., 3.000%, 06/01/26 | | | 297,773 | | | | 0.1 | |
| | 218,000 | | | | | Lockheed Martin Corp., 3.100%, 01/15/23 | | | 220,451 | | | | 0.1 | |
| Voya Global Bond Portfolio | PORTFOLIO OF INVESTMENTS AS OF December 31, 2016 (CONTINUED) |
| | 375,000 | | | | | Medtronic, Inc., 3.150%, 03/15/22 | | | 383,923 | | | | 0.2 | |
| | 170,000 | | | | | MGM Resorts International, 4.625%, 09/01/26 | | | 164,475 | | | | 0.1 | |
| | 372,000 | | | | | Morgan Stanley, 3.750%, 02/25/23 | | | 382,238 | | | | 0.2 | |
| | 618,000 | | | | | Morgan Stanley, 4.100%, 05/22/23 | | | 634,630 | | | | 0.3 | |
| | 240,000 | | | L | | MPT Operating Partnership L.P./MPT Finance Corp., 6.375%, 02/15/22 | | | 249,000 | | | | 0.1 | |
| | 1,048,000 | | | | | Mylan, Inc., 2.600%, 06/24/18 | | | 1,054,279 | | | | 0.5 | |
| | 625,000 | | | | | Netflix, Inc., 5.750%, 03/01/24 | | | 670,313 | | | | 0.3 | |
| | 438,000 | | | | | Newell Rubbermaid, Inc., 2.875%, 12/01/19 | | | 445,895 | | | | 0.2 | |
| | 381,000 | | | | | NextEra Energy Capital Holdings, Inc., 3.625%, 06/15/23 | | | 387,512 | | | | 0.2 | |
| | 200,000 | | | # | | Novelis Corp., 5.875%, 09/30/26 | | | 202,500 | | | | 0.1 | |
| | 349,000 | | | | | Oracle Corp., 2.950%, 05/15/25 | | | 342,036 | | | | 0.2 | |
| | 110,000 | | | # | | Owens-Brockway Glass Container, Inc., 5.875%, 08/15/23 | | | 114,881 | | | | 0.1 | |
| | 235,000 | | | | | Pfizer, Inc., 2.750%, 06/03/26 | | | 228,086 | | | | 0.1 | |
| | 460,000 | | | | | Philip Morris International, Inc., 4.250%, 11/10/44 | | | 454,399 | | | | 0.2 | |
| | 165,000 | | | # | | Post Holdings, Inc., 5.000%, 08/15/26 | | | 158,400 | | | | 0.1 | |
| | 280,000 | | | | | Regency Energy Partners L.P. / Regency Energy Finance Corp., 4.500%, 11/01/23 | | | 284,231 | | | | 0.1 | |
| | 280,000 | | | | | Regency Energy Partners L.P. / Regency Energy Finance Corp., 5.500%, 04/15/23 | | | 290,500 | | | | 0.1 | |
| | 272,000 | | | | | Reynolds American, Inc., 6.150%, 09/15/43 | | | 328,791 | | | | 0.1 | |
| | 117,000 | | | | | Scripps Networks Interactive, Inc., 2.750%, 11/15/19 | | | 118,682 | | | | 0.1 | |
| | 245,000 | | | | | Stone Webster Escrow, 07/01/49 | | | – | | | | – | |
| | 104,000 | | | | | Sunoco Logistics Partners Operations L.P., 4.250%, 04/01/24 | | | 104,846 | | | | 0.0 | |
| | 445,000 | | | | | Synchrony Financial, 4.250%, 08/15/24 | | | 453,179 | | | | 0.2 | |
| | 70,000 | | | | | Tesoro Logistics L.P. / Tesoro Logistics Finance Corp., 5.250%, 01/15/25 | | | 71,750 | | | | 0.0 | |
| | 272,000 | | | | | Time Warner Cable LLC, 5.875%, 11/15/40 | | | 290,547 | | | | 0.1 | |
| | 485,000 | | | | | Time Warner, Inc., 6.500%, 11/15/36 | | | 587,480 | | | | 0.3 | |
| | 100,000 | | | | | United Rentals North America, Inc., 5.500%, 07/15/25 | | | 102,375 | | | | 0.0 | |
| | 505,000 | | | # | | Valeant Pharmaceuticals International, 7.250%, 07/15/22 | | | 415,363 | | | | 0.2 | |
| | 270,000 | | | | | Verizon Communications, Inc., 5.012%, 08/21/54 | | | 270,063 | | | | 0.1 | |
| | 1,071,000 | | | | | Verizon Communications, Inc., 5.150%, 09/15/23 | | | 1,184,706 | | | | 0.5 | |
| | 600,000 | | | | | Visa, Inc., 3.150%, 12/14/25 | | | 602,483 | | | | 0.3 | |
| | 100,000 | | | | | Walt Disney Co., 3.000%, 07/30/46 | | | 85,087 | | | | 0.0 | |
| | 599,000 | | | | | Wells Fargo & Co., 4.100%, 06/03/26 | | | 606,747 | | | | 0.3 | |
| | | | | | | | | | 39,197,794 | | | | 17.2 | |
| | | | | | | | | | | | | | | |
| | | | | Total Corporate Bonds/Notes
(Cost $51,389,388) | | | 51,872,191 | | | | 22.7 | |
| | | | | | | | | | | | | | | |
| COLLATERALIZED MORTGAGE OBLIGATIONS: 16.7% | | | | | | | | |
| | | | | | | United States: 16.7% | | | | | | | | |
| | 529,898 | | | | | Adjustable Rate Mortgage Trust 2006-2 1A1, 3.227%, 05/25/36 | | | 493,554 | | | | 0.2 | |
| | 365,125 | | | | | Alternative Loan Trust 2005-51 3A2A, 1.857%, 11/20/35 | | | 319,932 | | | | 0.1 | |
| | 110,204 | | | | | Alternative Loan Trust 2006-13T1 A9, 6.000%, 05/25/36 | | | 86,769 | | | | 0.0 | |
| | 217,548 | | | | | Banc of America Alternative Loan Trust 2004-1 4A1, 4.750%, 02/25/19 | | | 214,601 | | | | 0.1 | |
| | 710,636 | | | | | Banc of America Funding 2005-1 Trust 1A1, 5.500%, 02/25/35 | | | 713,563 | | | | 0.3 | |
| | 520,825 | | | | | CHL Mortgage Pass-Through Trust 2007-7 A7, 5.750%, 06/25/37 | | | 469,461 | | | | 0.2 | |
| | 176,668 | | | | | Citigroup Mortgage Loan Trust, Inc. 2005-2 1A3, 3.074%, 05/25/35 | | | 174,738 | | | | 0.1 | |
| | 471,126 | | | | | CitiMortgage Alternative Loan Trust Series 2006-A3 1A7, 6.000%, 07/25/36 | | | 423,126 | | | | 0.2 | |
| | 78,471 | | | | | Countrywide Alternative Loan Trust 2005-53T2 2A6, 1.256%, 11/25/35 | | | 44,893 | | | | 0.0 | |
| | 122,427 | | | | | CHL Mortgage Pass-Through Trust 2005-17 1A8, 5.500%, 09/25/35 | | | 122,072 | | | | 0.1 | |
| | 105,780 | | | | | CHL Mortgage Pass-Through Trust 2005-J4 A7, 5.500%, 11/25/35 | | | 104,232 | | | | 0.1 | |
| | 35,187 | | | # | | Deutsche ALT-A Securities, Inc. Alternate Loan Trust 2007-RS1 A2, 1.256%, 01/27/37 | | | 94,930 | | | | 0.0 | |
| | 100,000 | | | | | Fannie Mae Connecticut Avenue Securities 2014-C01 M2, 5.156%, 01/25/24 | | | 106,715 | | | | 0.1 | |
| | 320,000 | | | | | Fannie Mae Connecticut Avenue Securities 2014-C03 2M2, 3.656%, 07/25/24 | | | 321,614 | | | | 0.1 | |
| | 400,000 | | | | | Fannie Mae Connecticut Avenue Securities 2014-CO3 1M2, 3.756%, 07/25/24 | | | 401,489 | | | | 0.2 | |
| | 1,780,000 | | | | | Fannie Mae Connecticut Avenue Securities 2014-CO4 1M2, 5.656%, 11/25/24 | | | 1,934,926 | | | | 0.9 | |
| | 80,000 | | | | | Fannie Mae Connecticut Avenue Securities 2015-C02 1M2, 4.756%, 05/25/25 | | | 83,526 | | | | 0.0 | |
| Voya Global Bond Portfolio | PORTFOLIO OF INVESTMENTS AS OF December 31, 2016 (CONTINUED) |
| | 500,000 | | | | | Fannie Mae Connecticut Avenue Securities 2015-C03 1M2, 5.756%, 07/25/25 | | | 539,551 | | | | 0.2 | |
| | 122,747 | | | | | Fannie Mae REMIC Trust 2005-74 DK, 20.976%, 07/25/35 | | | 168,540 | | | | 0.1 | |
| | 165,645 | | | | | Fannie Mae REMIC Trust 2005-87 SB, 21.061%, 10/25/35 | | | 285,353 | | | | 0.1 | |
| | 387,165 | | | | | Fannie Mae REMIC Trust 2006-104 ES, 29.670%, 11/25/36 | | | 688,119 | | | | 0.3 | |
| | 1,759,907 | | | ^ | | Fannie Mae REMIC Trust 2007-89 SB, 5.794%, 09/25/37 | | | 322,825 | | | | 0.1 | |
| | 2,870,295 | | | ^ | | Fannie Mae REMIC Trust 2007-94 SG, 5.694%, 10/25/37 | | | 528,201 | | | | 0.2 | |
| | 248,774 | | | | | Fannie Mae REMIC Trust 2010-109 SN, 21.145%, 10/25/40 | | | 557,200 | | | | 0.3 | |
| | 5,234,621 | | | ^ | | Fannie Mae REMIC Trust 2011-55 SK, 5.804%, 06/25/41 | | | 1,003,892 | | | | 0.4 | |
| | 602,582 | | | ^ | | Fannie Mae REMIC Trust 2011-69 AI, 5.000%, 05/25/18 | | | 10,584 | | | | 0.0 | |
| | 4,159,677 | | | ^ | | Fannie Mae REMIC Trust 2011-86 NS, 5.194%, 09/25/41 | | | 663,788 | | | | 0.3 | |
| | 3,193,101 | | | ^ | | Fannie Mae REMIC Trust 2012-10 US, 5.694%, 02/25/42 | | | 482,383 | | | | 0.2 | |
| | 1,963,455 | | | ^ | | Fannie Mae REMIC Trust 2012-110 JI, 4.000%, 06/25/42 | | | 320,021 | | | | 0.1 | |
| | 6,553,427 | | | ^ | | Fannie Mae REMIC Trust 2012-133 PS, 5.444%, 03/25/42 | | | 980,715 | | | | 0.4 | |
| | 2,963,226 | | | ^ | | Fannie Mae REMIC Trust 2012-144 SB, 5.344%, 01/25/43 | | | 693,963 | | | | 0.3 | |
| | 6,767 | | | | | Fannie Mae, 1.156%, 11/25/33 | | | 6,774 | | | | 0.0 | |
| | 7,224 | | | | | Fannie Mae, 1.236%, 10/18/32 | | | 7,260 | | | | 0.0 | |
| | 32,010 | | | | | Fannie Mae, 1.756%, 12/25/32 | | | 32,802 | | | | 0.0 | |
| | 3,339 | | | | | Fannie Mae, 1.756%, 04/25/32 | | | 3,426 | | | | 0.0 | |
| | 10,851 | | | | | Fannie Mae, 1.756%, 04/25/32 | | | 11,133 | | | | 0.0 | |
| | 32,006 | | | | | Fannie Mae, 1.756%, 09/25/32 | | | 32,798 | | | | 0.0 | |
| | 1,039,896 | | | ^ | | Fannie Mae, 3.500%, 08/25/33 | | | 154,649 | | | | 0.1 | |
| | 657,315 | | | ^ | | Fannie Mae, 3.500%, 08/25/43 | | | 145,279 | | | | 0.1 | |
| | 2,032,743 | | | ^ | | Fannie Mae, 3.000%, 06/25/33 | | | 272,276 | | | | 0.1 | |
| | 109,676 | | | | | Fannie Mae, 4.500%, 08/25/25 | | | 115,339 | | | | 0.1 | |
| | 2,579,901 | | | ^ | | Fannie Mae, 5.184%, 01/25/38 | | | 448,142 | | | | 0.2 | |
| | 3,731,908 | | | ^ | | Fannie Mae, 5.224%, 11/25/41 | | | 716,467 | | | | 0.3 | |
| | 22,763 | | | ^ | | Fannie Mae, 5.500%, 06/25/35 | | | 5,126 | | | | 0.0 | |
| | 54,786 | | | ^ | | Fannie Mae, 5.500%, 07/25/33 | | | 12,096 | | | | 0.0 | |
| | 208,781 | | | | | Fannie Mae, 5.000%, 07/25/40 | | | 219,231 | | | | 0.1 | |
| | 113,915 | | | ^ | | Fannie Mae, 5.784%, 06/25/37 | | | 21,514 | | | | 0.0 | |
| | 348,530 | | | ^ | | Fannie Mae, 5.814%, 06/25/36 | | | 62,907 | | | | 0.0 | |
| | 20,479 | | | ^ | | Fannie Mae, 5.994%, 05/25/35 | | | 3,388 | | | | 0.0 | |
| | 23,903 | | | | | Fannie Mae, 6.000%, 01/25/32 | | | 26,917 | | | | 0.0 | |
| | 103,563 | | | ^ | | Fannie Mae, 6.000%, 12/25/32 | | | 23,238 | | | | 0.0 | |
| | 44,730 | | | ^ | | Fannie Mae, 6.000%, 02/25/33 | | | 9,758 | | | | 0.0 | |
| | 52,899 | | | ^ | | Fannie Mae, 6.000%, 03/25/33 | | | 12,300 | | | | 0.0 | |
| | 43,640 | | | ^ | | Fannie Mae, 6.000%, 03/25/33 | | | 11,183 | | | | 0.0 | |
| | 27,013 | | | ^ | | Fannie Mae, 6.344%, 06/25/23 | | | 2,777 | | | | 0.0 | |
| | 111,587 | | | ^ | | Fannie Mae, 6.474%, 09/25/36 | | | 22,713 | | | | 0.0 | |
| | 25,575 | | | | | Fannie Mae, 6.500%, 11/25/29 | | | 29,399 | | | | 0.0 | |
| | 181,173 | | | ^ | | Fannie Mae, 6.500%, 02/25/32 | | | 41,815 | | | | 0.0 | |
| | 17,328 | | | | | Fannie Mae, 6.500%, 04/25/29 | | | 19,622 | | | | 0.0 | |
| | 28,089 | | | | | Fannie Mae, 6.500%, 04/25/32 | | | 31,697 | | | | 0.0 | |
| | 170,702 | | | ^ | | Fannie Mae, 6.794%, 10/25/33 | | | 37,898 | | | | 0.0 | |
| | 20,492 | | | ^ | | Fannie Mae, 6.874%, 03/25/23 | | | 214 | | | | 0.0 | |
| | 24,157 | | | ^ | | Fannie Mae, 6.000%, 09/25/35 | | | 5,367 | | | | 0.0 | |
| | 61,750 | | | ^ | | Fannie Mae, 6.994%, 02/25/32 | | | 13,728 | | | | 0.0 | |
| | 112,685 | | | ^ | | Fannie Mae, 6.994%, 07/25/31 | | | 24,949 | | | | 0.0 | |
| | 39,387 | | | ^ | | Fannie Mae, 7.194%, 07/25/32 | | | 8,211 | | | | 0.0 | |
| | 32,992 | | | ^ | | Fannie Mae, 7.000%, 02/25/28 | | | 7,631 | | | | 0.0 | |
| | 1,215,417 | | | ^ | | Fannie Mae, 7.264%, 12/18/32 | | | 265,270 | | | | 0.1 | |
| | 40,341 | | | ^ | | Fannie Mae, 7.000%, 03/25/33 | | | 11,034 | | | | 0.0 | |
| | 30,954 | | | ^ | | Fannie Mae, 7.000%, 04/25/33 | | | 7,464 | | | | 0.0 | |
| | 217,418 | | | ^ | | Fannie Mae, 7.500%, 01/25/24 | | | 40,176 | | | | 0.0 | |
| | 30,637 | | | | | Fannie Mae, 8.000%, 05/25/43 | | | 34,761 | | | | 0.0 | |
| | 61,202 | | | | | Fannie Mae, 21.427%, 06/25/36 | | | 95,249 | | | | 0.0 | |
| | 20,972 | | | | | Fannie Mae, 21.794%, 03/25/36 | | | 31,223 | | | | 0.0 | |
| | 44,601 | | | | | Fannie Mae, 24.833%, 04/25/35 | | | 75,897 | | | | 0.0 | |
| | 12,897,440 | | | ^ | | Freddie Mac 3502 DL, 5.296%, 01/15/39 | | | 2,278,766 | | | | 1.0 | |
| | 3,673,619 | | | ^ | | Freddie Mac REMIC Trust 3505 SA, 5.296%, 01/15/39 | | | 611,050 | | | | 0.3 | |
| | 4,294,538 | | | ^ | | Freddie Mac REMIC Trust 3702 S, 3.746%, 05/15/36 | | | 393,713 | | | | 0.2 | |
| | 4,214,389 | | | ^ | | Freddie Mac REMIC Trust 3710 SL, 5.296%, 05/15/36 | | | 333,978 | | | | 0.2 | |
| | 592,487 | | | ^ | | Freddie Mac REMIC Trust 3803 SG, 5.896%, 08/15/28 | | | 28,308 | | | | 0.0 | |
| Voya Global Bond Portfolio | PORTFOLIO OF INVESTMENTS AS OF December 31, 2016 (CONTINUED) |
| | 4,067,833 | | | ^ | | Freddie Mac REMIC Trust 3925 SD, 5.346%, 07/15/40 | | | 584,925 | | | | 0.3 | |
| | 2,012,292 | | | ^ | | Freddie Mac REMIC Trust 4136 SW, 5.546%, 11/15/32 | | | 365,246 | | | | 0.2 | |
| | 853,151 | | | ^ | | Freddie Mac REMIC Trust 4161 CI, 4.000%, 02/15/43 | | | 159,219 | | | | 0.1 | |
| | 13,229,759 | | | ^ | | Freddie Mac REMIC Trust 4194 GI, 4.000%, 04/15/43 | | | 2,415,533 | | | | 1.1 | |
| | 1,565,159 | | | ^ | | Freddie Mac Series 4120 IK, 3.000%, 10/15/32 | | | 210,042 | | | | 0.1 | |
| | 530,000 | | | | | Freddie Mac Structured Agency Credit Risk Debt Notes 2014-DN1 M3, 5.256%, 02/25/24 | | | 578,732 | | | | 0.3 | |
| | 400,000 | | | | | Freddie Mac Structured Agency Credit Risk Debt Notes 2014-DN3 M3, 4.756%, 08/25/24 | | | 416,823 | | | | 0.2 | |
| | 1,100,000 | | | | | Freddie Mac Structured Agency Credit Risk Debt Notes 2014-DN4 M3, 5.306%, 10/25/24 | | | 1,178,106 | | | | 0.5 | |
| | 340,000 | | | | | Freddie Mac Structured Agency Credit Risk Debt Notes 2014-HQ3 M3, 5.506%, 10/25/24 | | | 369,394 | | | | 0.2 | |
| | 100,000 | | | | | Freddie Mac Structured Agency Credit Risk Debt Notes 2015-DNA3 M3, 5.456%, 04/25/28 | | | 108,282 | | | | 0.1 | |
| | 170,673 | | | | | Freddie Mac Structured Agency Credit Risk Debt Notes 2015-HQ1 M2, 2.956%, 03/25/25 | | | 172,229 | | | | 0.1 | |
| | 200,000 | | | | | Freddie Mac Structured Agency Credit Risk Debt Notes 2016-DNA4 M3, 4.556%, 03/25/29 | | | 200,669 | | | | 0.1 | |
| | 200,000 | | | | | Freddie Mac Structured Agency Credit Risk Debt Notes 2016-HQA3 M3, 4.606%, 03/25/29 | | | 200,313 | | | | 0.1 | |
| | 35,286 | | | | | Freddie Mac, 1.154%, 02/15/29 | | | 35,386 | | | | 0.0 | |
| | 44,417 | | | | | Freddie Mac, 1.204%, 01/15/33 | | | 44,624 | | | | 0.0 | |
| | 11,300 | | | | | Freddie Mac, 1.204%, 03/15/32 | | | 11,361 | | | | 0.0 | |
| | 8,922 | | | | | Freddie Mac, 1.654%, 02/15/32 | | | 9,180 | | | | 0.0 | |
| | 17,075 | | | | | Freddie Mac, 1.654%, 08/15/31 | | | 17,573 | | | | 0.0 | |
| | 9,945 | | | | | Freddie Mac, 1.704%, 02/15/32 | | | 10,195 | | | | 0.0 | |
| | 9,695 | | | | | Freddie Mac, 1.704%, 02/15/32 | | | 9,939 | | | | 0.0 | |
| | 13,900 | | | | | Freddie Mac, 1.704%, 03/15/32 | | | 14,254 | | | | 0.0 | |
| | 484,005 | | | | | Freddie Mac, 5.000%, 11/15/34 | | | 526,277 | | | | 0.2 | |
| | 561,789 | | | | | Freddie Mac, 5.000%, 02/15/34 | | | 613,676 | | | | 0.3 | |
| | 1,433,294 | | | ^ | | Freddie Mac, 5.246%, 10/15/36 | | | 193,974 | | | | 0.1 | |
| | 103,087 | | | ^ | | Freddie Mac, 5.446%, 07/15/35 | | | 14,282 | | | | 0.0 | |
| | 136,953 | | | | | Freddie Mac, 5.000%, 09/15/23 | | | 145,993 | | | | 0.1 | |
| | 74,017 | | | | | Freddie Mac, 6.500%, 02/15/32 | | | 85,022 | | | | 0.0 | |
| | 49,972 | | | | | Freddie Mac, 6.500%, 06/15/32 | | | 58,296 | | | | 0.0 | |
| | 38,623 | | | | | Freddie Mac, 6.750%, 02/15/24 | | | 42,186 | | | | 0.0 | |
| | 123,094 | | | ^ | | Freddie Mac, 6.946%, 03/15/29 | | | 23,139 | | | | 0.0 | |
| | 113,968 | | | ^ | | Freddie Mac, 6.996%, 03/15/29 | | | 20,559 | | | | 0.0 | |
| | 13,235 | | | ^ | | Freddie Mac, 7.000%, 03/15/28 | | | 3,106 | | | | 0.0 | |
| | 70,732 | | | ^ | | Freddie Mac, 7.000%, 04/15/28 | | | 15,516 | | | | 0.0 | |
| | 66,016 | | | | | Freddie Mac, 7.500%, 09/15/22 | | | 72,100 | | | | 0.0 | |
| | 80,709 | | | | | Freddie Mac, 7.000%, 09/15/26 | | | 89,457 | | | | 0.0 | |
| | 166,309 | | | ^ | | Freddie Mac, 8.246%, 08/15/29 | | | 37,206 | | | | 0.0 | |
| | 86,293 | | | | | Freddie Mac, 8.000%, 05/15/35 | | | 99,227 | | | | 0.0 | |
| | 1,286 | | | | | Freddie Mac, 21.802%, 06/15/34 | | | 1,319 | | | | 0.0 | |
| | 21,449 | | | | | Freddie Mac, 22.169%, 08/15/35 | | | 33,171 | | | | 0.0 | |
| | 576,790 | | | | | Ginnie Mae Series 2007-8 SP, 19.652%, 03/20/37 | | | 893,897 | | | | 0.4 | |
| | 5,003,597 | | | ^ | | Ginnie Mae Series 2010-165 IP, 4.000%, 04/20/38 | | | 317,050 | | | | 0.1 | |
| | 3,368,343 | | | ^ | | Ginnie Mae Series 2010-68 MS, 5.111%, 06/20/40 | | | 527,455 | | | | 0.2 | |
| | 2,257,048 | | | ^ | | Ginnie Mae Series 2012-97 SC, 5.993%, 07/16/41 | | | 419,362 | | | | 0.2 | |
| | 317,284 | | | | | GreenPoint Mortgage Funding Trust 2006-AR3 4A1, 0.966%, 04/25/36 | | | 268,713 | | | | 0.1 | |
| | 102,001 | | | | | GSR Mortgage Loan Trust 2005-AR6 1A4, 3.070%, 09/25/35 | | | 105,816 | | | | 0.1 | |
| | 809,671 | | | | | IndyMac INDX Mortgage Loan Trust 2006-AR2 1A1B, 0.966%, 04/25/46 | | | 670,487 | | | | 0.3 | |
| | 720,699 | | | | | JP Morgan Mortgage Trust 2005-A4 B1, 3.091%, 07/25/35 | | | 619,035 | | | | 0.3 | |
| | 143,489 | | | | | JP Morgan Mortgage Trust 2007-A1 7A1, 3.137%, 07/25/35 | | | 142,111 | | | | 0.1 | |
| | 189,596 | | | | | Lehman XS Trust Series 2005-5N 1A2, 1.116%, 11/25/35 | | | 148,772 | | | | 0.1 | |
| | 155,425 | | | | | MASTR Adjustable Rate Mortgages Trust 2006-2 1A1, 3.188%, 04/25/36 | | | 143,756 | | | | 0.1 | |
| | 2,998,433 | | | | | RALI Series 2006-QO1 Trust, 2.371%, 02/25/46 | | | 334,386 | | | | 0.2 | |
| | 1,044 | | | | | RALI Series Trust 2005-QA4 A32, 3.510%, 04/25/35 | | | 33 | | | | 0.0 | |
| | 853,229 | | | | | TBW Mortgage-Backed Trust 2007-2 A1A, 5.965%, 07/25/37 | | | 578,931 | | | | 0.3 | |
| | 10,373,614 | | | ^ | | WaMu Mortgage Pass-Through Certificates Series 2005-AR11 X, 1.437%, 08/25/45 | | | 414,157 | | | | 0.2 | |
| Voya Global Bond Portfolio | PORTFOLIO OF INVESTMENTS AS OF December 31, 2016 (CONTINUED) |
| | 69,972 | | | | | WaMu Mortgage Pass-Through Certificates Series 2006-AR12 1A1, 2.850%, 10/25/36 | | | 61,520 | | | | 0.0 | |
| | 1,093,899 | | | | | WaMu Mortgage Pass-Through Certificates Series 2006-AR16 Trust 3A1, 2.648%, 12/25/36 | | | 1,007,584 | | | | 0.4 | |
| | 272,248 | | | | | WaMu Mortgage Pass-Through Certificates Series 2006-AR8 1A4, 2.804%, 08/25/46 | | | 238,751 | | | | 0.1 | |
| | 513,329 | | | | | WaMu Mortgage Pass-Through Certificates Series 2007-HY2 1A1, 2.676%, 12/25/36 | �� | | 474,029 | | | | 0.2 | |
| | 145,537 | | | | | WaMu Mortgage Pass-Through Certificates Series 2007-HY4 1A1, 2.361%, 04/25/37 | | | 127,152 | | | | 0.1 | |
| | 188,519 | | | | | Wells Fargo Alternative Loan 2007-PA2 2A1, 1.186%, 06/25/37 | | | 139,503 | | | | 0.1 | |
| | 80,123 | | | | | Wells Fargo Mortgage Backed Securities 2005-AR16 Trust 2A1, 3.040%, 02/25/34 | | | 81,551 | | | | 0.0 | |
| | 333,072 | | | | | Wells Fargo Mortgage Backed Securities 2006-AR17 Trust A1, 3.048%, 10/25/36 | | | 318,144 | | | | 0.1 | |
| | 71,839 | | | | | Wells Fargo Mortgage Backed Securities 2006-AR17 Trust A2, 3.048%, 10/25/36 | | | 68,619 | | | | 0.0 | |
| | 384,562 | | | | | Wells Fargo Mortgage Backed Securities 2006-AR7 Trust 2A1, 3.089%, 05/25/36 | | | 366,972 | | | | 0.2 | |
| | 361,278 | | | | | Wells Fargo Mortgage Backed Securities 2006-AR8 Trust 3A2, 3.087%, 04/25/36 | | | 353,689 | | | | 0.2 | |
| | | | | | | | | | | | | | | |
| | | | | Total Collateralized Mortgage Obligations
(Cost $35,735,286) | | | 38,170,195 | | | | 16.7 | |
| | | | | | | | | | | | | | | |
| STRUCTURED PRODUCTS: 0.0% | | | | | | | | |
| | | | | | | Russia: 0.0% | | | | | | | | |
| RUB | 5,671,358 | | | | | Morgan Stanley & Co. International PLC - EM Whole Loan SA /Russian Federation Total Return Linked Bonds, Series 007, Cl. VR, 4.650%, 08/22/34 | | | 40,792 | | | | 0.0 | |
| | | | | | | | | | | | | | | |
| | | | | Total Structured Products
(Cost $202,246) | | | 40,792 | | | | 0.0 | |
| | | | | | | | | | | | | | | |
| FOREIGN GOVERNMENT BONDS: 14.0% | | | | | | | | |
| | | | | | | Austria: 1.5% | | | | | | | | |
| EUR | 3,000,000 | | | # | | Republic of Austria Government Bond, 1.650%, 10/21/24 | | | 3,541,347 | | | | 1.5 | |
| | | | | | | | | | | | | | | |
| | | | | | | | | | | | | | | |
| | | | | | | Belgium: 7.2% | | | | | | | | |
| EUR | 15,100,000 | | | # | | Kingdom of Belgium Government Bond, 0.800%, 06/22/25 | | | 16,478,421 | | | | 7.2 | |
| | | | | | | | | | | | | | | |
| | | | | | | Brazil: 0.3% | | | | | | | | |
| BRL | 705,000 | | | | | Brazil Notas do Tesouro Nacional Series F, 6.000%, 05/15/45 | | | 666,280 | | | | 0.3 | |
| | | | | | | | | | | | | | | |
| | | | | | | Germany: 0.1% | | | | | | | | |
| EUR | 130,000 | | | | | Bundesrepublik Deutschland, 2.500%, 08/15/46 | | | 192,681 | | | | 0.1 | |
| EUR | 10,000 | | | | | Bundesrepublik Deutschland, 2.000%, 08/15/23 | | | 12,131 | | | | 0.0 | |
| | | | | | | | | | 204,812 | | | | 0.1 | |
| | | | | | | | | | | | | | | |
| | | | | | | Italy: 2.8% | | | | | | | | |
| EUR | 4,900,000 | | | | | Italy Buoni Poliennali Del Tesoro, 4.500%, 03/01/26 | | | 6,364,202 | | | | 2.8 | |
| | | | | | | | | | | | | | | |
| | | | | | | Russia: 0.4% | | | | | | | | |
| RUB | 51,720,000 | | | | | Russian Federal Bond - OFZ, 7.500%, 08/18/21 | | | 825,564 | | | | 0.4 | |
| | | | | | | | | | | | | | | |
| | | | | | | Spain: 1.7% | | | | | | | | |
| EUR | 3,500,000 | | | # | | Spain Government Bond, 1.950%, 04/30/26 | | | 3,886,552 | | | | 1.7 | |
| | | | | | | | | | | | | | | |
| | | | | Total Foreign Government Bonds
(Cost $32,935,157) | | | 31,967,178 | | | | 14.0 | |
| | | | | | | | | | | | | | | |
| U.S. GOVERNMENT AGENCY OBLIGATIONS: 1.4% | | | | | | | | |
| | | | | | | Federal Home Loan Mortgage Corporation: 0.7%## | |
| | 256,971 | | | | | 4.000%, due 09/01/45 | | | 270,147 | | | | 0.1 | |
| | 406,183 | | | | | 4.000%, due 09/01/45 | | | 427,082 | | | | 0.2 | |
| | 228,089 | | | | | 4.000%, due 09/01/45 | | | 239,833 | | | | 0.1 | |
| | 144,074 | | | | | 4.000%, due 09/01/45 | | | 151,488 | | | | 0.1 | |
| | 303,934 | | | | | 4.000%, due 05/01/46 | | | 319,599 | | | | 0.2 | |
| | 3,473 | | | | | 5.000%, due 01/01/20 | | | 3,612 | | | | 0.0 | |
| | 14,429 | | | | | 5.000%, due 02/01/20 | | | 15,045 | | | | 0.0 | |
| | 14,933 | | | | | 5.000%, due 12/01/34 | | | 16,338 | | | | 0.0 | |
| | 4,178 | | | | | 5.500%, due 01/01/18 | | | 4,250 | | | | 0.0 | |
| | 49,550 | | | | | 6.000%, due 02/01/34 | | | 56,715 | | | | 0.0 | |
| | 357 | | | | | 6.500%, due 04/01/18 | | | 360 | | | | 0.0 | |
| | 10,457 | | | | | 6.500%, due 02/01/22 | | | 11,599 | | | | 0.0 | |
| | 11,868 | | | | | 6.500%, due 09/01/22 | | | 13,217 | | | | 0.0 | |
| | 3,953 | | | | | 6.500%, due 08/01/32 | | | 4,491 | | | | 0.0 | |
| | 7,233 | | | | | 6.500%, due 07/01/34 | | | 8,176 | | | | 0.0 | |
| | 6,693 | | | | | 6.500%, due 07/01/34 | | | 7,562 | | | | 0.0 | |
| | | | | | | | | | 1,549,514 | | | | 0.7 | |
| | | | | | | | | | | | | | | |
| | | | | | | Federal National Mortgage Association: 0.7%## | |
| | 83,577 | | | | | 2.500%, due 06/01/30 | | | 83,809 | | | | 0.0 | |
| | 123,054 | | | | | 2.500%, due 06/01/30 | | | 123,395 | | | | 0.1 | |
| | 51,004 | | | | | 2.500%, due 07/01/30 | | | 51,145 | | | | 0.0 | |
| | 234,791 | | | | | 3.058%, due 10/01/36 | | | 248,662 | | | | 0.1 | |
| | 248,848 | | | | | 4.000%, due 05/01/45 | | | 261,896 | | | | 0.1 | |
| | 99,602 | | | | | 5.000%, due 06/01/41 | | | 108,701 | | | | 0.1 | |
| | 9,870 | | | | | 5.500%, due 09/01/19 | | | 10,221 | | | | 0.0 | |
| | 9,206 | | | | | 5.500%, due 09/01/19 | | | 9,509 | | | | 0.0 | |
| | 33,608 | | | | | 5.500%, due 09/01/24 | | | 37,371 | | | | 0.0 | |
| | 4,480 | | | | | 6.000%, due 05/01/21 | | | 4,701 | | | | 0.0 | |
| | 124,710 | | | | | 6.000%, due 11/01/34 | | | 142,287 | | | | 0.1 | |
| | 194,661 | | | | | 6.000%, due 04/01/35 | | | 222,097 | | | | 0.1 | |
| | 89,065 | | | | | 6.500%, due 12/01/29 | | | 101,853 | | | | 0.1 | |
| Voya Global Bond Portfolio | PORTFOLIO OF INVESTMENTS AS OF December 31, 2016 (CONTINUED) |
| | 36,949 | | | | | 6.500%, due 01/01/34 | | | 42,396 | | | | 0.0 | |
| | 1,082 | | | | | 7.000%, due 04/01/33 | | | 1,254 | | | | 0.0 | |
| | 25,867 | | | | | 7.500%, due 09/01/32 | | | 31,443 | | | | 0.0 | |
| | 64,813 | | | | | 7.500%, due 01/01/33 | | | 77,963 | | | | 0.0 | |
| | | | | | | | | | 1,558,703 | | | | 0.7 | |
| | | | | | | | | | | | | | | |
| | | | | | | Government National Mortgage Association: 0.0% | |
| | 54,178 | | | | | 5.000%, due 04/15/34 | | | 59,904 | | | | 0.0 | |
| | 21,636 | | | | | 6.500%, due 02/20/35 | | | 25,406 | | | | 0.0 | |
| | | | | | | | | | 85,310 | | | | 0.0 | |
| | | | | | | | | | | | | | | |
| | | | | Total U.S. Government Agency Obligations
(Cost $3,124,965) | | | 3,193,527 | | | | 1.4 | |
| | | | | | | | | | | | | | | |
| COMMERCIAL MORTGAGE-BACKED SECURITIES: 8.3% | | | | | | | | |
| | | | | | | United States: 8.3% | | | | | | | | |
| | 810,000 | | | | | Banc of America Commercial Mortgage Trust 2007-3 AJ, 5.549%, 06/10/49 | | | 820,858 | | | | 0.4 | |
| | 450,000 | | | | | Banc of America Commercial Mortgage Trust 2007-3 B, 5.602%, 06/10/49 | | | 451,543 | | | | 0.2 | |
| | 390,000 | | | | | Banc of America Commercial Mortgage Trust 2007-3 C, 5.602%, 06/10/49 | | | 387,250 | | | | 0.2 | |
| | 540,000 | | | | | Banc of America Commercial Mortgage Trust 2007-4 AJ, 5.814%, 02/10/51 | | | 544,612 | | | | 0.2 | |
| | 8,020,000 | | | #,^ | | BBCCRE Trust 2015-GTP XA, 0.597%, 08/10/33 | | | 359,850 | | | | 0.2 | |
| | 440,000 | | | # | | Bear Stearns Commercial Mortgage Securities Trust 2004-PWR6 E, 5.406%, 11/11/41 | | | 458,185 | | | | 0.2 | |
| | 71,656 | | | | | Bear Stearns Commercial Mortgage Securities Trust 2005-TOP20 C, 5.124%, 10/12/42 | | | 71,577 | | | | 0.0 | |
| | 140,000 | | | # | | Bear Stearns Commercial Mortgage Securities Trust 2006-TOP22 E, 5.714%, 04/12/38 | | | 131,521 | | | | 0.1 | |
| | 410,000 | | | | | Bear Stearns Commercial Mortgage Securities Trust 2007-PWR17 AJ, 5.887%, 06/11/50 | | | 413,114 | | | | 0.2 | |
| | 448,655 | | | # | | Beckman Coulter, Inc. 2000-A A, 7.498%, 12/15/18 | | | 450,007 | | | | 0.2 | |
| | 1,885,802 | | | ^ | | CD 2016-CD1 Mortgage Trust, 1.446%, 08/10/49 | | | 186,287 | | | | 0.1 | |
| | 280,000 | | | # | | Citigroup Commercial Mortgage Trust 2016-GC36, 2.850%, 02/10/49 | | | 193,479 | | | | 0.1 | |
| | 680,000 | | | # | | COMM 2004-LB2A H, 6.067%, 03/10/39 | | | 721,045 | | | | 0.3 | |
| | 10,479,540 | | | #,^ | | COMM 2012 - LTRT XA, 1.030%, 10/05/30 | | | 464,116 | | | | 0.2 | |
| | 4,005,394 | | | ^ | | COMM 2012-CR1 XA, 2.023%, 05/15/45 | | | 289,136 | | | | 0.1 | |
| | 6,512,726 | | | ^ | | COMM 2013-LC6 XA, 1.683%, 01/10/46 | | | 360,277 | | | | 0.2 | |
| | 4,348,928 | | | ^ | | COMM 2014-CR17 XA, 1.163%, 05/10/47 | | | 234,058 | | | | 0.1 | |
| | 200,000 | | | # | | COMM 2015-CR27 D, 3.472%, 10/10/48 | | | 152,888 | | | | 0.1 | |
| | 240,000 | | | | | COMM 2015-PC1 D, 4.443%, 07/10/50 | | | 175,359 | | | | 0.1 | |
| | 453,068 | | | # | | Commercial Mortgage Trust 2004-GG1 F, 6.361%, 06/10/36 | | | 455,091 | | | | 0.2 | |
| | 104,264 | | | # | | Credit Suisse Commercial Mortgage Trust Series 2006-K1A K, 5.415%, 02/25/21 | | | 104,219 | | | | 0.0 | |
| | 12,974 | | | # | | Credit Suisse First Boston Mortgage Securities Corp. 2003-C4 J, 5.322%, 08/15/36 | | | 12,954 | | | | 0.0 | |
| | 300,000 | | | # | | CSAIL 2016-C7 Commercial Mortgage Trust, 4.394%, 11/15/49 | | | 213,452 | | | | 0.1 | |
| | 2,207,120 | | | #,^ | | DBUBS 2011-LC1A XA, 0.748%, 11/10/46 | | | 48,588 | | | | 0.0 | |
| | 210,000 | | | # | | DBUBS 2011-LC2A D, 5.543%, 07/10/44 | | | 215,077 | | | | 0.1 | |
| | 565,385 | | | # | | EQTY 2014-INNS Mortgage Trust, 4.216%, 05/08/31 | | | 554,567 | | | | 0.2 | |
| | 3,560,000 | | | ^ | | Freddie Mac Multifamily Structured Pass Through Certificates K010 X3, 4.631%, 11/25/44 | | | 565,953 | | | | 0.2 | |
| | 9,125,089 | | | ^ | | Freddie Mac Multifamily Structured Pass Through Certificates K704 X1, 1.964%, 08/25/18 | | | 217,966 | | | | 0.1 | |
| | 4,423,190 | | | ^ | | Freddie Mac Multifamily Structured Pass Through Certificates K711 X3, 1.619%, 08/25/40 | | | 166,070 | | | | 0.1 | |
| | 42,116,459 | | | #,^ | | FREMF Mortgage Trust 2012-K17 X2A, 0.100%, 12/25/44 | | | 165,189 | | | | 0.1 | |
| | 12,349 | | | # | | GE Capital Commercial Mortgage Series 2005-C2 H, 5.463%, 05/10/43 | | | 12,307 | | | | 0.0 | |
| | 100,000 | | | # | | GS Mortgage Securities Trust 2010-C2 F, 4.548%, 12/10/43 | | | 81,374 | | | | 0.0 | |
| | 2,801,170 | | | ^ | | GS Mortgage Securities Trust 2012-GCJ7 XA, 2.386%, 05/10/45 | | | 207,150 | | | | 0.1 | |
| | 75,000 | | | # | | GS Mortgage Securities Trust 2016-GS3, 2.620%, 10/10/49 | | | 53,784 | | | | 0.0 | |
| | 13,641,502 | | | ^ | | JPMBB Commercial Mortgage Securities Trust 2014-C24 XA, 1.072%, 11/15/47 | | | 682,060 | | | | 0.3 | |
| | 250,000 | | | # | | JP Morgan Chase Commercial Mortgage Securities Corp. 2004-CB8 J, 4.733%, 01/12/39 | | | 240,731 | | | | 0.1 | |
| | 434,785 | | | | | JP Morgan Chase Commercial Mortgage Securities Corp. 2006-LDP8 B, 5.520%, 05/15/45 | | | 434,389 | | | | 0.2 | |
| | 2,940,000 | | | #,^ | | JP Morgan Chase Commercial Mortgage Securities Corp. 2012-LC9 XB, 0.353%, 12/15/47 | | | 52,915 | | | | 0.0 | |
| Voya Global Bond Portfolio | PORTFOLIO OF INVESTMENTS AS OF December 31, 2016 (CONTINUED) |
| | 175,811 | | | # | | JP Morgan Chase Commercial Mortgage Securities Trust 2003-LN1 H, 5.571%, 10/15/37 | | | 175,697 | | | | 0.1 | |
| | 270,000 | | | | | JP Morgan Chase Commercial Mortgage Securities Trust 2004-CIBC9 E, 5.373%, 06/12/41 | | | 260,846 | | | | 0.1 | |
| | 460,000 | | | | | JP Morgan Chase Commercial Mortgage Securities Trust 2007-LDP11 AM, 5.753%, 06/15/49 | | | 464,875 | | | | 0.2 | |
| | 7,205,245 | | | ^ | | JP Morgan Chase Commercial Mortgage Securities Trust 2012-CIBX XA, 1.660%, 06/15/45 | | | 414,954 | | | | 0.2 | |
| | 360,000 | | | | | LB-UBS Commercial Mortgage Trust 2005-C3 E, 4.983%, 07/15/40 | | | 362,037 | | | | 0.2 | |
| | 360,000 | | | | | LB-UBS Commercial Mortgage Trust 2005-C3 F, 5.013%, 07/15/40 | | | 344,684 | | | | 0.2 | |
| | 50,000 | | | | | LB-UBS Commercial Mortgage Trust 2006-C4 C, 5.872%, 06/15/38 | | | 50,052 | | | | 0.0 | |
| | 780,000 | | | | | LB-UBS Commercial Mortgage Trust 2006-C4 D, 5.872%, 06/15/38 | | | 780,780 | | | | 0.3 | |
| | 390,000 | | | | | Merrill Lynch Mortgage Investors Trust Series 1998-C1 E, 6.750%, 11/15/26 | | | 397,513 | | | | 0.2 | |
| | 310,000 | | | | | Morgan Stanley Capital I Trust 2006-IQ11, 6.235%, 10/15/42 | | | 303,423 | | | | 0.1 | |
| | 865,000 | | | # | | Morgan Stanley Capital I Trust 2011-C1 C, 5.432%, 09/15/47 | | | 945,019 | | | | 0.4 | |
| | 570,000 | | | # | | Morgan Stanley Capital I Trust 2011-C1 D, 5.432%, 09/15/47 | | | 610,079 | | | | 0.3 | |
| | 460,000 | | | # | | Morgan Stanley Capital I Trust 2011-C1 E, 5.432%, 09/15/47 | | | 491,264 | | | | 0.2 | |
| | 290,000 | | | # | | Morgan Stanley Reremic Trust 2012-XA B, 0.250%, 07/27/49 | | | 267,522 | | | | 0.1 | |
| | 6,404,433 | | | #,^ | | UBS-Barclays Commercial Mortgage Trust 2012-C3 XA, 2.043%, 08/10/49 | | | 496,505 | | | | 0.2 | |
| | 5,896,031 | | | #,^ | | Wells Fargo Commercial Mortgage Trust 2012-LC5 XA, 2.018%, 10/15/45 | | | 419,426 | | | | 0.2 | |
| | 50,000 | | | # | | Wells Fargo Commercial Mortgage Trust 2016-C34, 5.030%, 06/15/49 | | | 40,250 | | | | 0.0 | |
| | 7,230,000 | | | ^ | | Wells Fargo Commercial Mortgage Trust 2016-C37, 1.047%, 12/15/49 | | | 455,842 | | | | 0.2 | |
| | 3,892,934 | | | #,^ | | WFRBS Commercial Mortgage Trust 2012-C8 XA, 1.989%, 08/15/45 | | | 285,475 | | | | 0.1 | |
| | | | | | | | | | | | | | | |
| | | | | Total Commercial Mortgage-Backed Securities
(Cost $18,996,542) | | | 18,915,241 | | | | 8.3 | |
| U.S. TREASURY OBLIGATIONS: 9.1% | | | | | | | | |
| | | | | | | U.S. Treasury Bonds: 2.0% | |
| | 830,000 | | | | | 2.000%, due 11/15/26 | | | 797,403 | | | | 0.3 | |
| | 4,597,000 | | | L | | 2.250%, due 08/15/46 | | | 3,855,555 | | | | 1.7 | |
| | | | | | | | | | 4,652,958 | | | | 2.0 | |
| | | | | | | | | | | | | | | |
| | | | | | | U.S. Treasury Notes: 7.1% | |
| | 95,000 | | | L | | 1.000%, due 11/30/18 | | | 94,687 | | | | 0.1 | |
| | 30,000 | | | | | 1.250%, due 10/31/21 | | | 29,065 | | | | 0.0 | |
| | 106,000 | | | | | 1.375%, due 12/15/19 | | | 105,697 | | | | 0.1 | |
| | 220,000 | | | | | 1.625%, due 10/31/23 | | | 211,432 | | | | 0.1 | |
| | 10,414,000 | | | L | | 1.750%, due 11/30/21 | | | 10,327,377 | | | | 4.5 | |
| | 5,360,000 | | | | | 2.125%, due 11/30/23 | | | 5,318,605 | | | | 2.3 | |
| | | | | | | | | | 16,086,863 | | | | 7.1 | |
| | | | | | | | | | | | | | | |
| | | | | Total U.S. Treasury Obligations
(Cost $20,769,816) | | | 20,739,821 | | | | 9.1 | |
| | | | | | | | | | | | | | | |
| ASSET-BACKED SECURITIES: 4.2% | | | | | | | | |
| | | | | | | Cayman Islands: 3.8% | | | | | | | | |
| | 350,000 | | | # | | ALM VII R-2 Ltd., 2.887%, 10/15/27 | | | 349,966 | | | | 0.1 | |
| | 240,000 | | | # | | Apidos CLO XI, 2.834%, 01/17/28 | | | 240,233 | | | | 0.1 | |
| | 210,000 | | | # | | Apidos CLO XVII, 2.733%, 04/17/26 | | | 210,000 | | | | 0.1 | |
| | 370,000 | | | # | | Apidos CLO XVII, 3.383%, 04/17/26 | | | 370,000 | | | | 0.2 | |
| | 640,000 | | | # | | Ares XXVII CLO Ltd. 2013-2A B, 2.690%, 07/28/25 | | | 640,061 | | | | 0.3 | |
| | 400,000 | | | # | | Blue Hill CLO 2013-1A B1, 2.830%, 01/15/26 | | | 400,317 | | | | 0.2 | |
| | 510,000 | | | # | | BlueMountain CLO 2012-2 Ltd., 2.784%, 11/20/28 | | | 509,993 | | | | 0.2 | |
| | 330,000 | | | # | | BlueMountain CLO 2014-4 Ltd., 2.737%, 11/30/26 | | | 329,996 | | | | 0.1 | |
| | 300,000 | | | # | | BlueMountain CLO 2014-4 Ltd., 3.437%, 11/30/26 | | | 299,994 | | | | 0.1 | |
| | 1,000,000 | | | # | | BlueMountain CLO III Ltd. 2007-3A C, 1.683%, 03/17/21 | | | 995,688 | | | | 0.4 | |
| | 640,000 | | | # | | Bristol Park CLO Ltd., 2.784%, 04/15/29 | | | 639,989 | | | | 0.3 | |
| | 210,000 | | | # | | Carlyle Global Market Strategies CLO 2012-4 Ltd., 2.330%, 01/20/29 | | | 210,591 | | | | 0.1 | |
| | 290,000 | | | # | | Carlyle Global Market Strategies CLO 2012-4 Ltd., 2.780%, 01/20/29 | | | 289,998 | | | | 0.1 | |
| | 620,000 | | | # | | Carlyle US CLO 2016-4 Ltd., 2.732%, 10/20/27 | | | 619,987 | | | | 0.3 | |
| | 520,000 | | | # | | Dryden 33 Senior Loan Fund 2014-33A BR, 2.636%, 10/15/28 | | | 521,187 | | | | 0.2 | |
| | 1,300,000 | | | # | | Madison Park Funding Ltd. 2007-6A C, 1.884%, 07/26/21 | | | 1,274,385 | | | | 0.6 | |
| | 160,000 | | | # | | Madison Park Funding X Ltd. 2012-10A BR, 2.778%, 01/20/29 | | | 159,999 | | | | 0.1 | |
| | 250,000 | | | # | | Magnetite VIII Ltd. 2014-8A BR, 2.630%, 04/15/26 | | | 249,997 | | | | 0.1 | |
| | 420,000 | | | # | | Shackleton 2016-IX CLO Ltd., 2.364%, 10/20/28 | | | 419,987 | | | | 0.2 | |
| | | | | | | | | | 8,732,368 | | | | 3.8 | |
| Voya Global Bond Portfolio | PORTFOLIO OF INVESTMENTS AS OF December 31, 2016 (CONTINUED) |
| | | | | | | United States: 0.4% | |
| | 387,880 | | | | | Citigroup Mortgage Loan Trust 2006-WF1 A2E, 5.204%, 03/25/36 | | | 278,276 | | | | 0.1 | |
| | 640,000 | | | # | | OHA Loan Funding Ltd. 2016-1A B1, 2.686%, 01/20/28 | | | 639,987 | | | | 0.3 | |
| | | | | | | | | | 918,263 | | | | 0.4 | |
| | | | | | | | | | | | | | | |
| | | | | Total Asset-Backed Securities
(Cost $9,629,572) | | | 9,650,631 | | | | 4.2 | |
| | | | | | | | | | | | | |
| Shares | | | | | | | Value | | | Percentage
of Net
Assets | |
| COMMON STOCK: 0.0% | | | | | | | | |
| | | | | | | United States: 0.0% | |
| | 43,083 | | | @,L | | American Media, Inc. | | | – | | | | – | |
| | 4,988 | | | @,L | | Resolute Forest Products, Inc. | | | 26,686 | | | | 0.0 | |
| | | | | | | | | | | | | | | |
| | | | | Total Common Stock
(Cost $1,298,013) | | | 26,686 | | | | 0.0 | |
| | | | | | | | | | | | | | | |
| MUTUAL FUNDS: 21.1% | | | | | | | | |
| | | | | | | United States: 21.1% | |
| | 1,016,577 | | | | | Voya Emerging Markets Corporate Debt Fund - Class P | | | 9,840,467 | | | | 4.3 | |
| | 1,543,413 | | | | | Voya Emerging Markets Hard Currency Debt Fund - Class P | | | 14,492,650 | | | | 6.3 | |
| | 2,978,583 | | | | | Voya Emerging Markets Local Currency Debt Fund - Class P | | | 21,177,722 | | | | 9.3 | |
| | 336,040 | | | | | Voya High Yield Bond Fund - Class P | | | 2,701,759 | | | | 1.2 | |
| | | | | | | | | | | | | | | |
| | | | | Total Mutual Funds
(Cost $57,285,247) | | | 48,212,598 | | | | 21.1 | |
| | | | | | | | | | | | | |
| # of Contracts | | | | | | | Value | | | Percentage
of Net
Assets | |
| PURCHASED OPTIONS: 8.9% | | | | | | | | |
| | | | | | | Options on Currencies: 0.3% | | | | | | | | |
| | 49,600,000 | | | @ | | Call USD vs. Put JPY, Strike @ 120.000, Exp. 03/17/17 Counterparty: Bank of America N.A. | | | 558,589 | | | | 0.3 | |
| | | | | | | | | | | | | | | |
| | | | | | | OTC Interest Rate Swaptions: 8.6% | |
| | 19,100,000 | | | @ | | Call on 20-year Interest Rate Swap, Receive a fixed rate equal to 2.610% and pay a floating rate based on the 3-month USD-LIBOR-BBA, Exp. 11/17/23 Counterparty: Goldman Sachs International | | | 1,760,489 | | | | 0.8 | |
| | 15,950,000 | | | @ | | Call on 30-year Interest Rate Swap, Receive a fixed rate equal to 2.540% and pay a floating rate based on the 3-month USD-LIBOR-BBA, Exp. 11/16/21 Counterparty: Goldman Sachs International | | | 1,767,671 | | | | 0.8 | |
| | 283,200,000 | | | @ | | Put on 10-year Interest Rate Swap, Receive a floating rate based on the 3-month USD-LIBOR-BBA and pay a fixed rate equal to 2.710%, Exp. 11/15/17 Counterparty: Bank of America N.A. | | | 5,933,751 | | | | 2.6 | |
| | 19,100,000 | | | @ | | Put on 20-year Interest Rate Swap, Receive a floating rate based on the 3-month USD-LIBOR-BBA and pay a fixed rate equal to 2.610%, Exp. 11/17/23 Counterparty: Goldman Sachs International | | | 2,229,128 | | | | 1.0 | |
| | 15,950,000 | | | @ | | Put on 30-year Interest Rate Swap, Receive a floating rate based on the 3-month USD-LIBOR-BBA and pay a fixed rate equal to 2.540%, Exp. 11/16/21 Counterparty: Goldman Sachs International | | | 2,395,374 | | | | 1.0 | |
| | 495,600,000 | | | @ | | Put on 5-year Interest Rate Swap, Receive a floating rate based on the 3-month USD-LIBOR-BBA and pay a fixed rate equal to 2.423%, Exp. 11/15/17 Counterparty: Bank of America N.A. | | | 5,561,875 | | | | 2.4 | |
| | | | | | | | | | 19,648,288 | | | | 8.6 | |
| | | | | | | | | | | | | | | |
| | | | | Total Purchased Options
(Cost $17,436,386) | | | 20,206,877 | | | | 8.9 | |
| | | | | | | | | | | | | | | |
| | | | | Total Long-Term Investments
(Cost $248,802,618) | | | 242,995,737 | | | | 106.4 | |
| | | | | | | | | | | | | |
Principal
Amount† | | | | | | | Value | | | Percentage
of Net
Assets | |
| SHORT-TERM INVESTMENTS: 9.4% | | | | | | | | |
| | | | | | | Corporate Bonds/Notes: 0.2% | |
| | 265,000 | | | # | | Barclays Bank PLC, 6.050%, 12/04/17 | | | 273,873 | | | | 0.1 | |
| | 258,000 | | | | | Hewlett Packard Enterprise Co., 2.450%, 10/05/17 | | | 259,469 | | | | 0.1 | |
| | | | | | | | | | 533,342 | | | | 0.2 | |
| | | | | | | | | | | | | | | |
| | | | | | | U.S. Government Agency Obligations: 0.0% | |
| | 1,879 | | | | | Fannie Mae, 6.000%, 06/01/17 | | | 1,890 | | | | 0.0 | |
| | 15 | | | | | Fannie Mae, 7.000%, 11/01/17 | | | 15 | | | | 0.0 | |
| | | | | | | | | | 1,905 | | | | 0.0 | |
| Voya Global Bond Portfolio | PORTFOLIO OF INVESTMENTS AS OF December 31, 2016 (CONTINUED) |
| | | | | | | Securities Lending Collateralcc: 6.9% | |
| | 3,736,204 | | | | | Bank of Nova Scotia, Repurchase Agreement dated 12/30/16, 0.51%, due 01/03/17 (Repurchase Amount $3,736,413, collateralized by various U.S. Government/U.S. Government Agency Obligations, 1.000%-4.000%, Market Value plus accrued interest $3,811,145, due 12/31/17-10/20/46) | | | 3,736,204 | | | | 1.6 | |
| | 3,736,204 | | | | | Cantor Fitzgerald, Repurchase Agreement dated 12/30/16, 0.50%, due 01/03/17 (Repurchase Amount $3,736,409, collateralized by various U.S. Government/U.S. Government Agency Obligations, 0.000%-10.000%, Market Value plus accrued interest $3,810,928, due 01/25/17-10/20/66) | | | 3,736,204 | | | | 1.6 | |
| | 3,736,204 | | | | | Daiwa Capital Markets, Repurchase Agreement dated 12/30/16, 0.52%, due 01/03/17 (Repurchase Amount $3,736,417, collateralized by various U.S. Government/U.S. Government Agency Obligations, 0.000%-6.500%, Market Value plus accrued interest $3,810,928, due 03/02/17-02/01/49) | | | 3,736,204 | | | | 1.7 | |
| | 786,391 | | | | | Merrill Lynch & Co., Inc., Repurchase Agreement dated 12/30/16, 0.50%, due 01/03/17 (Repurchase Amount $786,434, collateralized by various U.S. Government Securities, 0.685%-2.000%, Market Value plus accrued interest $802,119, due 10/31/18-11/30/22) | | | 786,391 | | | | 0.4 | |
| | 3,736,204 | | | | | Nomura Securities, Repurchase Agreement dated 12/30/16, 0.50%, due 01/03/17 (Repurchase Amount $3,736,409, collateralized by various U.S. Government/U.S. Government Agency Obligations, 0.000%-9.500%, Market Value plus accrued interest $3,810,928, due 01/15/17-08/20/66) | | | 3,736,204 | | | | 1.6 | |
| | | | | | | | | | 15,731,207 | | | | 6.9 | |
| | | | | | | | | | | | | | | |
| | | | | | | Collateralized Mortgage Obligations: 0.0% | |
| | 173 | | | | | Fannie Mae, 6.000%, 03/25/17 | | | 175 | | | | 0.0 | |
| | 1,024 | | | | | Freddie Mac, 6.000%, 05/15/17 | | | 1,038 | | | | 0.0 | |
| | | | | | | | | | 1,213 | | | | 0.0 | |
| | | | | | | | | | | | | | | |
| | | | | | | Foreign Government Bonds: 0.4% | |
| EUR | 10,000 | | | Z | | Bundesschatzanweisungen, -0.810%, 12/15/17 | | | 10,609 | | | | 0.0 | |
| EUR | 830,000 | | | Z | | Bundesschatzanweisungen, -0.930%, 06/16/17 | | | 877,425 | | | | 0.4 | |
| | | | | | | | | | 888,034 | | | | 0.4 | |
| Shares | | | | | | | Value | | | Percentage
of Net
Assets | |
| | | | | | | Mutual Funds: 1.9% | | | | | | | | |
| | 4,318,000 | | | | | BlackRock Liquidity Funds, FedFund, Institutional Class, 0.420%†† | | | | | | | | |
| | | | | | | (Cost $4,318,000) | | | 4,318,000 | | | | 1.9 | |
| | | | | | | | | | | | | | | |
| | | | | Total Short-Term Investments
(Cost $21,510,566) | | | 21,473,701 | | | | 9.4 | |
| | | | | | | | | | | | | | | |
| | | | | Total Investments in Securities
(Cost $270,313,184) | | $ | 264,469,438 | | | | 115.8 | |
| | | | | Liabilities in Excess of Other Assets | | | (36,072,350 | ) | | | (15.8 | ) |
| | | | | Net Assets | | $ | 228,397,088 | | | | 100.0 | |
| † | Unless otherwise indicated, principal amount is shown in USD. |
| †† | Rate shown is the 7-day yield as of December 31, 2016. |
| # | Securities with purchases pursuant to Rule 144A or section 4(a)(2), under the Securities Act of 1933 and may not be resold subject to that rule except to qualified institutional buyers. |
| ## | The Federal Housing Finance Agency (“FHFA”) placed the Federal Home Loan Mortgage Corporation and Federal National Mortgage Association into conservatorship with FHFA as the conservator. As such, the FHFA oversees the continuing affairs of these companies. |
| @ | Non-income producing security. |
| cc | Represents securities purchased with cash collateral received for securities on loan. |
| L | Loaned security, a portion or all of the security is on loan at December 31, 2016. |
| ± | Defaulted security |
| ^ | Interest only securities represent the right to receive the monthly interest payments on an underlying pool of mortgage loans. Principal amount shown represents the notional amount on which current interest is calculated. Payments of principal on the pool reduce the value of the interest only security. |
| Z | Indicates Zero Coupon Bond; rate shown reflects current effective yield. |
| BRL | Brazilian Real |
| EUR | EU Euro |
| MXN | Mexican Peso |
| RUB | Russian Ruble |
| ZAR | South African Rand |
| Voya Global Bond Portfolio | PORTFOLIO OF INVESTMENTS AS OF December 31, 2016 (CONTINUED) |
Cost for federal income tax purposes is $270,151,431.
Net unrealized depreciation consists of:
| Gross Unrealized Appreciation | | $ | 7,774,906 | |
| Gross Unrealized Depreciation | | | (13,456,899 | ) |
| | | | | |
| Net Unrealized Depreciation | | $ | (5,681,993 | ) |
VY® American Century Small-Mid Cap Value Portfolio | PORTFOLIO OF INVESTMENTS AS OF December 31, 2016 |
| Shares | | | | | | | Value | | | Percentage
of Net
Assets | |
| COMMON STOCK: 95.1% | |
| | | | | | | Consumer Discretionary: 7.6% |
| | 15,936 | | | | | Advance Auto Parts, Inc. | | | 2,695,096 | | | | 0.7 | |
| | 28,320 | | | | | Camping World Holdings, Inc. | | | 922,949 | | | | 0.3 | |
| | 33,188 | | | | | Carnival Corp. | | | 1,727,767 | | | | 0.5 | |
| | 1,898 | | | @ | | Cavco Industries, Inc. | | | 189,515 | | | | 0.0 | |
| | 18,492 | | | @ | | Century Communities, Inc. | | | 388,332 | | | | 0.1 | |
| | 94,065 | | | | | ClubCorp Holdings, Inc. | | | 1,349,833 | | | | 0.4 | |
| | 42,778 | | | | | CST Brands, Inc. | | | 2,059,761 | | | | 0.6 | |
| | 7,143 | | | | | Culp, Inc. | | | 265,362 | | | | 0.1 | |
| | 37,031 | | | | | Delphi Automotive PLC | | | 2,494,038 | | | | 0.7 | |
| | 4,581 | | | L | | Destination Maternity Corp. | | | 23,684 | | | | 0.0 | |
| | 3,704 | | | | | Entercom Communications Corp. | | | 56,671 | | | | 0.0 | |
| | 299,744 | | | | | Entravision Communications Corp. | | | 2,098,208 | | | | 0.6 | |
| | 77,158 | | | @ | | Gray Television, Inc. | | | 837,164 | | | | 0.2 | |
| | 73,576 | | | | | Honda Motor Co., Ltd. ADR | | | 2,147,683 | | | | 0.6 | |
| | 18,682 | | | @ | | Malibu Boats, Inc. | | | 356,453 | | | | 0.1 | |
| | 33,631 | | | @ | | MarineMax, Inc. | | | 650,760 | | | | 0.2 | |
| | 33,320 | | | | | Mattel, Inc. | | | 917,966 | | | | 0.3 | |
| | 37,916 | | | | | MCBC Holdings, Inc. | | | 552,815 | | | | 0.1 | |
| | 25,738 | | | | | Peak Resorts, Inc. | | | 142,846 | | | | 0.0 | |
| | 15,484 | | | L | | Penske Auto Group, Inc. | | | 802,691 | | | | 0.2 | |
| | 96,120 | | | | | Pulte Group, Inc. | | | 1,766,686 | | | | 0.5 | |
| | 13,714 | | | | | Ralph Lauren Corp. | | | 1,238,648 | | | | 0.3 | |
| | 18,792 | | | @ | | Red Robin Gourmet Burgers, Inc. | | | 1,059,869 | | | | 0.3 | |
| | 33,029 | | | | | Target Corp. | | | 2,385,685 | | | | 0.7 | |
| | 27,103 | | | @ | | Townsquare Media, Inc. | | | 282,142 | | | | 0.1 | |
| | | | | | | | | | 27,412,624 | | | | 7.6 | |
| | | | | | | | | | | | | | | |
| | | | | | | Consumer Staples: 4.6% | | | | | | | | |
| | 86,835 | | | | | Conagra Brands, Inc. | | | 3,434,324 | | | | 0.9 | |
| | 30,921 | | | | | General Mills, Inc. | | | 1,909,990 | | | | 0.5 | |
| | 21,850 | | | @,L | | Inventure Foods, Inc. | | | 215,223 | | | | 0.1 | |
| | 12,497 | | | | | JM Smucker Co. | | | 1,600,366 | | | | 0.4 | |
| | 27,755 | | | | | Kellogg Co. | | | 2,045,821 | | | | 0.6 | |
| | 23,856 | | | @ | | Lamb Weston Holdings, Inc. | | | 902,950 | | | | 0.2 | |
| | 18,624 | | | | | Mead Johnson Nutrition Co. | | | 1,317,834 | | | | 0.4 | |
| | 69,698 | | | | | Mondelez International, Inc. | | | 3,089,712 | | | | 0.9 | |
| | 37,440 | | | | | Sysco Corp. | | | 2,073,053 | | | | 0.6 | |
| | | | | | | | | | 16,589,273 | | | | 4.6 | |
| | | | | | | | | | | | | | | |
| | | | | | | Energy: 10.2% | | | | | | | | |
| | 28,788 | | | | | Aegean Marine Petroleum Network, Inc. | | | 292,198 | | | | 0.1 | |
| | 46,964 | | | | | Anadarko Petroleum Corp. | | | 3,274,800 | | | | 0.9 | |
| | 81,107 | | | L | | Ardmore Shipping Corp. | | | 600,192 | | | | 0.2 | |
| | 60,078 | | | | | Baker Hughes, Inc. | | | 3,903,268 | | | | 1.1 | |
| | 14,474 | | | @ | | Callon Petroleum Co. | | | 222,465 | | | | 0.1 | |
| | 7,022 | | | | | Cimarex Energy Co. | | | 954,290 | | | | 0.3 | |
| | 56,061 | | | @ | | Contango Oil & Gas Co. | | | 523,610 | | | | 0.1 | |
| | 51,913 | | | | | Devon Energy Corp. | | | 2,370,867 | | | | 0.6 | |
| | 10,905 | | | @ | | Dril-Quip, Inc. | | | 654,845 | | | | 0.2 | |
| | 5,968 | | | @,L | | Earthstone Energy, Inc. | | | 82,000 | | | | 0.0 | |
| | 61,335 | | | | | EQT Corp. | | | 4,011,309 | | | | 1.1 | |
| | 22,905 | | | L | | Euronav NV | | | 182,095 | | | | 0.0 | |
| | 30,886 | | | @,L | | Extraction Oil & Gas, Inc. | | | 618,955 | | | | 0.2 | |
| | 15,801 | | | @ | | FMC Technologies, Inc. | | | 561,410 | | | | 0.2 | |
| | 86,322 | | | L | | Frank's International N.V. | | | 1,062,624 | | | | 0.3 | |
| | 36,694 | | | | | Halliburton Co. | | | 1,984,778 | | | | 0.5 | |
| | 126,462 | | | | | Imperial Oil Ltd. | | | 4,399,538 | | | | 1.2 | |
| | 36,833 | | | @,L | | Mammoth Energy Services, Inc. | | | 559,862 | | | | 0.1 | |
| | 17,615 | | | @ | | Matrix Service Co. | | | 399,861 | | | | 0.1 | |
| | 58,936 | | | | | National Oilwell Varco, Inc. | | | 2,206,564 | | | | 0.6 | |
| | 100,791 | | | | | Noble Energy, Inc. | | | 3,836,105 | | | | 1.1 | |
| | 41,623 | | | | | Occidental Petroleum Corp. | | | 2,964,806 | | | | 0.8 | |
| | 105,897 | | | | | Scorpio Tankers, Inc. | | | 479,713 | | | | 0.1 | |
| | 13,270 | | | L | | Spectra Energy Partners L.P. | | | 608,297 | | | | 0.2 | |
| | 22,730 | | | @,L | | WildHorse Resource Development Corp. | | | 331,858 | | | | 0.1 | |
| | | | | | | | | | 37,086,310 | | | | 10.2 | |
| | | | | | | | | | | | | | | |
| | | | | | | Financials: 25.4% | | | | | | | | |
| | 16,881 | | | | | Aflac, Inc. | | | 1,174,918 | | | | 0.3 | |
| | 48,110 | | | | | Allied World Assurance Co. Holdings Ltd. | | | 2,583,988 | | | | 0.7 | |
| | 13,171 | | | | | Allstate Corp. | | | 976,235 | | | | 0.3 | |
| | 19,800 | | | | | Ameriprise Financial, Inc. | | | 2,196,612 | | | | 0.6 | |
| | 62,049 | | | L | | Ares Management L.P. | | | 1,191,341 | | | | 0.3 | |
| | 22,298 | | | @ | | Atlas Financial Holdings, Inc. | | | 402,479 | | | | 0.1 | |
| | 19,499 | | | L | | Bank of Hawaii Corp. | | | 1,729,366 | | | | 0.5 | |
| | 50,408 | | | | | Bank of the Ozarks, Inc. | | | 2,650,957 | | | | 0.7 | |
| | 61,494 | | | | | BankUnited, Inc. | | | 2,317,709 | | | | 0.6 | |
| | 69,378 | | | | | BB&T Corp. | | | 3,262,154 | | | | 0.9 | |
| | 11,270 | | | | | Blackstone Mortgage Trust, Inc. | | | 338,889 | | | | 0.1 | |
| | 55,961 | | | | | Boston Private Financial Holdings, Inc. | | | 926,155 | | | | 0.3 | |
| | 47,199 | | | | | Brown & Brown, Inc. | | | 2,117,347 | | | | 0.6 | |
| | 75,437 | | | | | Capital Bank Financial Corp. | | | 2,960,902 | | | | 0.8 | |
| | 154,697 | | | | | Capitol Federal Financial, Inc. | | | 2,546,313 | | | | 0.7 | |
| | 26,976 | | | | | Chubb Ltd. | | | 3,564,069 | | | | 1.0 | |
| | 28,296 | | | | | Comerica, Inc. | | | 1,927,241 | | | | 0.5 | |
| | 47,608 | | | | | Commerce Bancshares, Inc. | | | 2,752,218 | | | | 0.8 | |
| | 99,226 | | | | | Compass Diversified Holdings | | | 1,776,145 | | | | 0.5 | |
| | 730 | | | | | Endurance Specialty Holdings Ltd. | | | 67,452 | | | | 0.0 | |
| | 26,552 | | | @ | | FCB Financial Holdings, Inc. | | | 1,266,530 | | | | 0.3 | |
| | 11,997 | | | | | First Financial Bankshares, Inc. | | | 542,264 | | | | 0.2 | |
| | 21,850 | | | L | | First Hawaiian, Inc. | | | 760,817 | | | | 0.2 | |
VY® American Century Small-Mid Cap Value Portfolio | PORTFOLIO OF INVESTMENTS AS OF December 31, 2016 (CONTINUED) |
| | 95,600 | | | | | FNB Corp. | | | 1,532,468 | | | | 0.4 | |
| | 25,050 | | | | | Hanover Insurance Group, Inc. | | | 2,279,800 | | | | 0.6 | |
| | 6,002 | | | | | Infinity Property & Casualty Corp. | | | 527,576 | | | | 0.1 | |
| | 88,353 | | | | | Invesco Ltd. | | | 2,680,630 | | | | 0.7 | |
| | 15,285 | | | | | James River Group Holdings Ltd. | | | 635,092 | | | | 0.2 | |
| | 15,872 | | | | | Kinsale Capital Group, Inc. | | | 539,807 | | | | 0.1 | |
| | 41,621 | | | | | LegacyTexas Financial Group, Inc. | | | 1,792,200 | | | | 0.5 | |
| | 17,718 | | | | | M&T Bank Corp. | | | 2,771,627 | | | | 0.8 | |
| | 33,923 | | | | | Metlife, Inc. | | | 1,828,110 | | | | 0.5 | |
| | 18,003 | | | | | MFA Financial, Inc. | | | 137,363 | | | | 0.0 | |
| | 14,275 | | | | | New Residential Investment Corp. | | | 224,403 | | | | 0.1 | |
| | 88,069 | | | | | Northern Trust Corp. | | | 7,842,544 | | | | 2.2 | |
| | 4,952 | | | | | PacWest Bancorp | | | 269,587 | | | | 0.1 | |
| | 28,372 | | | | | PNC Financial Services Group, Inc. | | | 3,318,389 | | | | 0.9 | |
| | 22,856 | | | | | ProAssurance Corp. | | | 1,284,507 | | | | 0.4 | |
| | 10,044 | | | | | Prosperity Bancshares, Inc. | | | 720,958 | | | | 0.2 | |
| | 22,385 | | | | | Reinsurance Group of America, Inc. | | | 2,816,705 | | | | 0.8 | |
| | 14,314 | | | | | RLI Corp. | | | 903,643 | | | | 0.2 | |
| | 9,408 | | | | | Southside Bancshares, Inc. | | | 354,399 | | | | 0.1 | |
| | 26,183 | | | | | State Street Corp. | | | 2,034,943 | | | | 0.6 | |
| | 34,206 | | | | | SunTrust Banks, Inc. | | | 1,876,199 | | | | 0.5 | |
| | 23,563 | | | | | T. Rowe Price Group, Inc. | | | 1,773,351 | | | | 0.5 | |
| | 21,767 | | | @ | | Texas Capital Bancshares, Inc. | | | 1,706,533 | | | | 0.5 | |
| | 11,827 | | | | | Torchmark Corp. | | | 872,360 | | | | 0.2 | |
| | 85,773 | | | | | Two Harbors Investment Corp. | | | 747,941 | | | | 0.2 | |
| | 41,201 | | | | | UMB Financial Corp. | | | 3,177,421 | | | | 0.9 | |
| | 57,952 | | | | | Unum Group | | | 2,545,831 | | | | 0.7 | |
| | 31,425 | | | | | Validus Holdings Ltd. | | | 1,728,689 | | | | 0.5 | |
| | 38,779 | | | L | | Westamerica Bancorp. | | | 2,440,362 | | | | 0.7 | |
| | 14,793 | | | @ | | Western Alliance Bancorp. | | | 720,567 | | | | 0.2 | |
| | | | | | | | | | 92,116,106 | | | | 25.4 | |
| | | | | | | | | | | | | | | |
| | | | | | | Health Care: 7.7% | | | | | | | | |
| | 39,153 | | | | | Abbott Laboratories | | | 1,503,867 | | | | 0.4 | |
| | 44,233 | | | @ | | AMN Healthcare Services, Inc. | | | 1,700,759 | | | | 0.5 | |
| | 37,389 | | | | | Baxter International, Inc. | | | 1,657,828 | | | | 0.5 | |
| | 24,927 | | | | | Cardinal Health, Inc. | | | 1,793,996 | | | | 0.5 | |
| | 18,172 | | | @ | | Express Scripts Holding Co. | | | 1,250,052 | | | | 0.3 | |
| | 10,207 | | | @ | | HCA Holdings, Inc. | | | 755,522 | | | | 0.2 | |
| | 94,142 | | | @ | | LifePoint Health, Inc. | | | 5,347,266 | | | | 1.5 | |
| | 3,092 | | | @ | | Magellan Health, Inc. | | | 232,673 | | | | 0.1 | |
| | 9,707 | | | | | McKesson Corp. | | | 1,363,348 | | | | 0.4 | |
| | 24,362 | | | | | Owens & Minor, Inc. | | | 859,735 | | | | 0.2 | |
| | 54,455 | | | @ | | PharMerica Corp. | | | 1,369,543 | | | | 0.4 | |
| | 29,970 | | | @ | | Providence Service Corp. | | | 1,140,359 | | | | 0.3 | |
| | 22,756 | | | | | Quest Diagnostics, Inc. | | | 2,091,276 | | | | 0.6 | |
| | 24,583 | | | | | STERIS PLC | | | 1,656,648 | | | | 0.4 | |
| | 9,336 | | | | | Utah Medical Products, Inc. | | | 679,194 | | | | 0.2 | |
| | 43,768 | | | | | Zimmer Biomet Holdings, Inc. | | | 4,516,858 | | | | 1.2 | |
| | | | | | | | | | 27,918,924 | | | | 7.7 | |
| | | | | | | | | | | | | | | |
| | | | | | | Industrials: 14.5% | | | | | | | | |
| | 5,630 | | | | | Albany International Corp. | | | 260,669 | | | | 0.1 | |
| | 22,582 | | | | | Apogee Enterprises, Inc. | | | 1,209,492 | | | | 0.3 | |
| | 22,249 | | | | | Brink's Co. | | | 917,771 | | | | 0.2 | |
| | 11,419 | | | @ | | Clean Harbors, Inc. | | | 635,467 | | | | 0.2 | |
| | 19,141 | | | @ | | Continental Building Products, Inc. | | | 442,157 | | | | 0.1 | |
| | 46,829 | | | @ | | CSW Industrials, Inc. | | | 1,725,649 | | | | 0.5 | |
| | 62,799 | | | | | CSX Corp. | | | 2,256,368 | | | | 0.6 | |
| | 15,177 | | | | | Cummins, Inc. | | | 2,074,241 | | | | 0.6 | |
| | 7,105 | | | | | Deluxe Corp. | | | 508,789 | | | | 0.1 | |
| | 17,376 | | | @ | | DXP Enterprises, Inc. | | | 603,642 | | | | 0.2 | |
| | 8,991 | | | @,L | | Dycom Industries, Inc. | | | 721,887 | | | | 0.2 | |
| | 32,074 | | | | | Emerson Electric Co. | | | 1,788,126 | | | | 0.5 | |
| | 15,893 | | | | | EnPro Industries, Inc. | | | 1,070,552 | | | | 0.3 | |
| | 30,112 | | | | | Global Brass & Copper Holdings, Inc. | | | 1,032,842 | | | | 0.3 | |
| | 27,230 | | | @ | | GMS, Inc. | | | 797,294 | | | | 0.2 | |
| | 32,965 | | | | | Graham Corp. | | | 730,175 | | | | 0.2 | |
| | 30,525 | | | | | Harsco Corp. | | | 415,140 | | | | 0.1 | |
| | 129,761 | | | | | Heartland Express, Inc. | | | 2,641,934 | | | | 0.7 | |
| | 12,369 | | | | | Hexcel Corp. | | | 636,261 | | | | 0.2 | |
| | 25,995 | | | | | Hubbell, Inc. | | | 3,033,617 | | | | 0.8 | |
| | 40,991 | | | | | Ingersoll-Rand PLC - Class A | | | 3,075,965 | | | | 0.8 | |
| | 92,284 | | | @ | | Innerworkings, Inc. | | | 908,997 | | | | 0.2 | |
| | 40,327 | | | | | Interface, Inc. | | | 748,066 | | | | 0.2 | |
| | 14,453 | | | | | ITT, Inc. | | | 557,452 | | | | 0.2 | |
| | 163,917 | | | | | Johnson Controls International plc | | | 6,751,741 | | | | 1.9 | |
| | 91,782 | | | | | Koninklijke Philips NV | | | 2,805,961 | | | | 0.8 | |
| | 19,663 | | | | | Korn/Ferry International | | | 578,682 | | | | 0.2 | |
| | 10,870 | | | | | Multi-Color Corp. | | | 843,512 | | | | 0.2 | |
| | 36,604 | | | @ | | NCI Building Systems, Inc. | | | 572,853 | | | | 0.2 | |
| | 19,562 | | | @ | | On Assignment, Inc. | | | 863,858 | | | | 0.2 | |
| | 6,973 | | | | | Oshkosh Corp. | | | 450,526 | | | | 0.1 | |
| | 9,590 | | | | | Parker Hannifin Corp. | | | 1,342,600 | | | | 0.4 | |
| | 21,670 | | | @ | | PGT Innovations, Inc. | | | 248,122 | | | | 0.1 | |
| | 16,730 | | | | | Raven Industries, Inc. | | | 421,596 | | | | 0.1 | |
| | 54,347 | | | | | Republic Services, Inc. | | | 3,100,496 | | | | 0.9 | |
| | 31,730 | | | @ | | Rexnord Corp. | | | 621,591 | | | | 0.2 | |
| | 9,413 | | | | | Rockwell Automation, Inc. | | | 1,265,107 | | | | 0.3 | |
| | 60,847 | | | | | Textron, Inc. | | | 2,954,730 | | | | 0.8 | |
| | 7,152 | | | | | Valmont Industries, Inc. | | | 1,007,717 | | | | 0.3 | |
| | | | | | | | | | 52,621,645 | | | | 14.5 | |
| | | | | | | | | | | | | | | |
| | | | | | | Information Technology: 9.4% | |
| | 125,577 | | | | | Applied Materials, Inc. | | | 4,052,370 | | | | 1.1 | |
| | 36,456 | | | @ | | BroadSoft, Inc. | | | 1,503,810 | | | | 0.4 | |
| | 39,421 | | | @ | | Cray, Inc. | | | 816,015 | | | | 0.2 | |
| | 39,975 | | | | | CSRA, Inc. | | | 1,272,804 | | | | 0.3 | |
| | 117,934 | | | | | Cypress Semiconductor Corp. | | | 1,349,165 | | | | 0.4 | |
| | 95,104 | | | | | EVERTEC, Inc. | | | 1,688,096 | | | | 0.5 | |
| | 160,225 | | | @ | | Exar Corp. | | | 1,727,226 | | | | 0.5 | |
| | 9,703 | | | @ | | IPG Photonics Corp. | | | 957,783 | | | | 0.3 | |
| | 78,993 | | | @ | | Keysight Technologies, Inc. | | | 2,888,774 | | | | 0.8 | |
VY® American Century Small-Mid Cap Value Portfolio | PORTFOLIO OF INVESTMENTS AS OF December 31, 2016 (CONTINUED) |
| | 61,326 | | | @ | | Kulicke & Soffa Industries, Inc. | | | 978,150 | | | | 0.3 | |
| | 23,484 | | | | | Lam Research Corp. | | | 2,482,963 | | | | 0.7 | |
| | 78,585 | | | | | Maxim Integrated Products | | | 3,031,023 | | | | 0.8 | |
| | 18,569 | | | | | Mentor Graphics Corp. | | | 685,010 | | | | 0.2 | |
| | 37,339 | | | | | NetApp, Inc. | | | 1,316,947 | | | | 0.3 | |
| | 32,430 | | | @ | | Netscout Systems, Inc. | | | 1,021,545 | | | | 0.3 | |
| | 18,634 | | | @ | | OSI Systems, Inc. | | | 1,418,420 | | | | 0.4 | |
| | 6,606 | | | @ | | Semtech Corp. | | | 208,419 | | | | 0.0 | |
| | 35,021 | | | | | TE Connectivity Ltd. | | | 2,426,255 | | | | 0.7 | |
| | 100,464 | | | | | Teradyne, Inc. | | | 2,551,786 | | | | 0.7 | |
| | 99,662 | | | @ | | VeriFone Holdings, Inc. | | | 1,767,007 | | | | 0.5 | |
| | | | | | | | | | 34,143,568 | | | | 9.4 | |
| | | | | | | | | | | | | | | |
| | | | | | | Materials: 4.5% | | | | | | | | |
| | 20,394 | | | | | Bemis Co., Inc. | | | 975,241 | | | | 0.3 | |
| | 2,917 | | | | | Chase Corp. | | | 243,715 | | | | 0.1 | |
| | 213,590 | | | | | Graphic Packaging Holding Co. | | | 2,665,603 | | | | 0.7 | |
| | 14,982 | | | | | Innophos Holdings, Inc. | | | 782,959 | | | | 0.2 | |
| | 19,564 | | | | | Innospec, Inc. | | | 1,340,134 | | | | 0.4 | |
| | 48,981 | | | | | KapStone Paper and Packaging Corp. | | | 1,080,031 | | | | 0.3 | |
| | 18,351 | | | | | Minerals Technologies, Inc. | | | 1,417,615 | | | | 0.4 | |
| | 175,637 | | | @ | | Multi Packaging Solutions International Ltd. | | | 2,504,584 | | | | 0.7 | |
| | 7,495 | | | | | Nucor Corp. | | | 446,102 | | | | 0.1 | |
| | 30,118 | | | | | Sonoco Products Co. | | | 1,587,219 | | | | 0.4 | |
| | 64,844 | | | | | WestRock Co. | | | 3,292,130 | | | | 0.9 | |
| | | | | | | | | | 16,335,333 | | | | 4.5 | |
| | | | | | | | | | | | | | | |
| | | | | | | Real Estate: 5.3% | | | | | | | | |
| | 35,098 | | | | | Armada Hoffler Properties, Inc. | | | 511,378 | | | | 0.1 | |
| | 1,340 | | | | | Boston Properties, Inc. | | | 168,545 | | | | 0.0 | |
| | 35,520 | | | | | CareTrust REIT, Inc. | | | 544,166 | | | | 0.1 | |
| | 30,458 | | | | | CBL & Associates Properties, Inc. | | | 350,267 | | | | 0.1 | |
| | 15,699 | | | | | Chatham Lodging Trust | | | 322,614 | | | | 0.1 | |
| | 17,938 | | | | | Community Healthcare Trust, Inc. | | | 413,112 | | | | 0.1 | |
| | 26,647 | | | | | DiamondRock Hospitality Co. | | | 307,240 | | | | 0.1 | |
| | 48,157 | | | | | Empire State Realty Trust, Inc. | | | 972,290 | | | | 0.3 | |
| | 1,625 | | | | | EPR Properties | | | 116,626 | | | | 0.0 | |
| | 14,919 | | | | | Four Corners Property Trust, Inc. | | | 306,138 | | | | 0.1 | |
| | 87,210 | | | | | Host Hotels & Resorts, Inc. | | | 1,643,036 | | | | 0.5 | |
| | 81,333 | | | | | Kite Realty Group Trust | | | 1,909,699 | | | | 0.5 | |
| | 44,589 | | | | | Lexington Realty Trust | | | 481,561 | | | | 0.1 | |
| | 70,629 | | | L | | MedEquities Realty Trust, Inc. | | | 783,982 | | | | 0.2 | |
| | 40,415 | | | | | Medical Properties Trust, Inc. | | | 497,105 | | | | 0.1 | |
| | 53,090 | | | | | MGM Growth Properties LLC | | | 1,343,708 | | | | 0.4 | |
| | 9,195 | | | | | Outfront Media, Inc. | | | 228,680 | | | | 0.1 | |
| | 97,114 | | | | | Piedmont Office Realty Trust, Inc. | | | 2,030,654 | | | | 0.6 | |
| | 14,274 | | | | | RLJ Lodging Trust | | | 349,570 | | | | 0.1 | |
| | 28,118 | | | | | Sabra Healthcare REIT, Inc. | | | 686,642 | | | | 0.2 | |
| | 36,792 | | | | | Summit Hotel Properties, Inc. | | | 589,776 | | | | 0.2 | |
| | 15,271 | | | | | Sunstone Hotel Investors, Inc. | | | 232,883 | | | | 0.1 | |
| | 16,486 | | | | | Urstadt Biddle Properties, Inc. | | | 397,477 | | | | 0.1 | |
| | 3,228 | | | | | Welltower, Inc. | | | 216,050 | | | | 0.1 | |
| | 126,634 | | | | | Weyerhaeuser Co. | | | 3,810,417 | | | | 1.0 | |
| | | | | | | | | | 19,213,616 | | | | 5.3 | |
| | | | | | | | | | | | | | | |
| | | | | | | Telecommunication Services: 0.5% | |
| | 32,645 | | | @ | | Level 3 Communications, Inc. | | | 1,839,872 | | | | 0.5 | |
| | | | | | | | | | | | | | | |
| | | | | | | Utilities: 5.4% | | | | | | | | |
| | 34,029 | | | | | Ameren Corp. | | | 1,785,161 | | | | 0.5 | |
| | 19,660 | | | | | Atmos Energy Corp. | | | 1,457,789 | | | | 0.4 | |
| | 20,199 | | | | | Consolidated Edison, Inc. | | | 1,488,262 | | | | 0.4 | |
| | 50,313 | | | | | Edison International | | | 3,622,033 | | | | 1.0 | |
| | 18,579 | | | | | Eversource Energy | | | 1,026,118 | | | | 0.3 | |
| | 26,031 | | | | | NorthWestern Corp. | | | 1,480,383 | | | | 0.4 | |
| | 56,519 | | | | | PG&E Corp. | | | 3,434,660 | | | | 1.0 | |
| | 28,891 | | | | | Spire, Inc. | | | 1,864,914 | | | | 0.5 | |
| | 79,688 | | | | | Xcel Energy, Inc. | | | 3,243,302 | | | | 0.9 | |
| | | | | | | | | | 19,402,622 | | | | 5.4 | |
| | | | | | | | | | | | | | | |
| | | | | Total Common Stock | | | | | | | | |
| | | | | (Cost $296,406,423) | | | 344,679,893 | | | | 95.1 | |
| | | | | | | | | | | | | | | |
| EXCHANGE-TRADED FUNDS: 2.1% | | | | | | | | |
| | 7,418 | | | | | iShares Russell 2000 Value Index Fund | | | 882,297 | | | | 0.2 | |
| | 84,591 | | | | | iShares Russell Midcap Value Index Fund | | | 6,803,654 | | | | 1.9 | |
| | | | | | | | | | | | | | | |
| | | | | Total Exchange-Traded Funds | | | | | | | | |
| | | | | (Cost $7,207,110) | | | 7,685,951 | | | | 2.1 | |
| | | | | | | | | | | | | | | |
| PREFERRED STOCK: 0.1% | | | | | | | | |
| | | | | | | Industrials: 0.1% | | | | | | | | |
| | 11,716 | | | @ | | Rexnord Corp. | | | 574,084 | | | | 0.1 | |
| | | | | | | | | | | | | | | |
| | | | | Total Preferred Stock | | | | | | | | |
| | | | | (Cost $584,581) | | | 574,084 | | | | 0.1 | |
| | | | | | | | | | | | | | | |
| | | | | Total Long-Term Investments | | | | | | | | |
| | | | | (Cost $304,198,114) | | | 352,939,928 | | | | 97.3 | |
VY® American Century Small-Mid Cap Value Portfolio | PORTFOLIO OF INVESTMENTS AS OF December 31, 2016 (CONTINUED) |
Principal
Amount† | | | | | | | Value | | | Percentage
of Net
Assets | |
| SHORT-TERM INVESTMENTS: 5.0% | |
| | | | | | | Securities Lending Collateralcc: 2.0% |
| | 1,719,057 | | | | | Bank of Nova Scotia, Repurchase Agreement dated 12/30/16, 0.51%, due 01/03/17 (Repurchase Amount $1,719,153, collateralized by various U.S. Government/U.S. Government Agency Obligations, 1.000%-4.000%, Market Value plus accrued interest $1,753,538, due 12/31/17-10/20/46) | | | 1,719,057 | | | | 0.4 | |
| | 1,719,057 | | | | | Cantor Fitzgerald, Repurchase Agreement dated 12/30/16, 0.50%, due 01/03/17 (Repurchase Amount $1,719,151, collateralized by various U.S. Government/U.S. Government Agency Obligations, 0.000%-10.000%, Market Value plus accrued interest $1,753,438, due 01/25/17-10/20/66) | | | 1,719,057 | | | | 0.5 | |
| | 1,719,057 | | | | | Daiwa Capital Markets, Repurchase Agreement dated 12/30/16, 0.52%, due 01/03/17 (Repurchase Amount $1,719,155, collateralized by various U.S. Government/U.S. Government Agency Obligations, 0.000%-6.500%, Market Value plus accrued interest $1,753,438, due 03/02/17-02/01/49) | | | 1,719,057 | | | | 0.5 | |
| | 361,828 | | | | | Merrill Lynch & Co., Inc., Repurchase Agreement dated 12/30/16, 0.50%, due 01/03/17 (Repurchase Amount $361,848, collateralized by various U.S. Government Securities, 0.685%-2.000%, Market Value plus accrued interest $369,065, due 10/31/18-11/30/22) | | | 361,828 | | | | 0.1 | |
| | 1,719,057 | | | | | Nomura Securities, Repurchase Agreement dated 12/30/16, 0.50%, due 01/03/17 (Repurchase Amount $1,719,151, collateralized by various U.S. Government/U.S. Government Agency Obligations, 0.000%-9.500%, Market Value plus accrued interest $1,753,438, due 01/15/17-08/20/66) | | | 1,719,057 | | | | 0.5 | |
| | | | | | | | | | 7,238,056 | | | | 2.0 | |
| Shares | | | | | | | Value | | | Percentage
of Net
Assets | |
| | | | | | | Mutual Funds: 3.0% | | | | | | | | |
| | 10,884,862 | | | | | BlackRock Liquidity Funds, FedFund, Institutional Class, 0.420%†† | | | | | | | | |
| | | | | | | (Cost $10,884,862) | | | 10,884,862 | | | | 3.0 | |
| | | | | | | | | | | | | | | |
| | | | | | | Total Short-Term Investments | | | | | | | | |
| | | | | | | (Cost $18,122,918) | | | 18,122,918 | | | | 5.0 | |
| | | | | | | | | | | | | | | |
| | | | | | | Total Investments in Securities
(Cost $322,321,032) | | $ | 371,062,846 | | | | 102.3 | |
| | | | | | | Liabilities in Excess of Other Assets | | | (8,487,583 | ) | | | (2.3 | ) |
| | | | | | | Net Assets | | $ | 362,575,263 | | | | 100.0 | |
| † | Unless otherwise indicated, principal amount is shown in USD. |
| †† | Rate shown is the 7-day yield as of December 31, 2016. |
| @ | Non-income producing security. |
| ADR | American Depositary Receipt |
| cc | Represents securities purchased with cash collateral received for securities on loan. |
| L | Loaned security, a portion or all of the security is on loan at December 31, 2016. |
Cost for federal income tax purposes is $327,525,333.
Net unrealized appreciation consists of:
| Gross Unrealized Appreciation | | $ | 53,278,990 | |
| Gross Unrealized Depreciation | | | (9,741,477 | ) |
| | | | | |
| Net Unrealized Appreciation | | $ | 43,537,513 | |
| VY® Baron Growth Portfolio | PORTFOLIO OF INVESTMENTS AS OF December 31, 2016 |
| Shares | | | | | | | Value | | | Percentage
of Net
Assets | |
| COMMON STOCK: 99.1% | | | | | | | | |
| | | | | | | Consumer Discretionary: 34.5% | |
| | 2,790,684 | | | @ | | AO World PLC | | | 6,238,817 | | | | 0.9 | |
| | 364,500 | | | @ | | Bright Horizons Family Solutions, Inc. | | | 25,522,290 | | | | 3.6 | |
| | 560,000 | | | | | Choice Hotels International, Inc. | | | 31,388,000 | | | | 4.4 | |
| | 170,000 | | | | | ClubCorp Holdings, Inc. | | | 2,439,500 | | | | 0.3 | |
| | 202,600 | | | | | Dick's Sporting Goods, Inc. | | | 10,758,060 | | | | 1.5 | |
| | 728,364 | | | | | Manchester United PLC - Class A | | | 10,379,187 | | | | 1.5 | |
| | 188,200 | | | | | Marriott Vacations Worldwide Corp. | | | 15,968,770 | | | | 2.3 | |
| | 280,845 | | | @ | | Nord Anglia Education, Inc. | | | 6,543,689 | | | | 0.9 | |
| | 65,000 | | | @ | | Panera Bread Co. | | | 13,330,850 | | | | 1.9 | |
| | 472,571 | | | @ | | Penn National Gaming, Inc. | | | 6,516,754 | | | | 0.9 | |
| | 593,691 | | | @ | | Pinnacle Entertainment, Inc. | | | 8,608,519 | | | | 1.2 | |
| | 213,000 | | | | | Red Rock Resorts, Inc. | | | 4,939,470 | | | | 0.7 | |
| | 477,500 | | | @ | | Under Armour, Inc. - Class A | | | 13,871,375 | | | | 2.0 | |
| | 457,001 | | | @ | | Under Armour, Inc. - Class C | | | 11,502,715 | | | | 1.6 | |
| | 475,000 | | | | | Vail Resorts, Inc. | | | 76,622,250 | | | | 10.8 | |
| | | | | | | | | | 244,630,246 | | | | 34.5 | |
| | | | | | | | | | | | | | | |
| | | | | | | Consumer Staples: 4.2% | |
| | 273,000 | | | | | Church & Dwight Co., Inc. | | | 12,063,870 | | | | 1.7 | |
| | 152,000 | | | @ | | Performance Food Group Co. | | | 3,648,000 | | | | 0.5 | |
| | 300,000 | | | @ | | Smart & Final Stores, Inc. | | | 4,230,000 | | | | 0.6 | |
| | 142,500 | | | @ | | TreeHouse Foods, Inc. | | | 10,287,075 | | | | 1.4 | |
| | | | | | | | | | 30,228,945 | | | | 4.2 | |
| | | | | | | | | | | | | | | |
| | | | | | | Financials: 16.2% | | | | | | | | |
| | 195,000 | | | @ | | Arch Capital Group Ltd. | | | 16,826,550 | | | | 2.4 | |
| | 275,000 | | | | | Carlyle Group L.P. | | | 4,193,750 | | | | 0.6 | |
| | 407,500 | | | | | Cohen & Steers, Inc. | | | 13,692,000 | | | | 1.9 | |
| | 47,000 | | | @ | | Essent Group Ltd. | | | 1,521,390 | | | | 0.2 | |
| | 85,000 | | | | | Factset Research Systems, Inc. | | | 13,891,550 | | | | 2.0 | |
| | 297,229 | | | | | Financial Engines, Inc. | | | 10,923,166 | | | | 1.5 | |
| | 17,500 | | | | | Kinsale Capital Group, Inc. | | | 595,175 | | | | 0.1 | |
| | 80,000 | | | | | Moelis & Co. | | | 2,712,000 | | | | 0.4 | |
| | 155,000 | | | | | Morningstar, Inc. | | | 11,401,800 | | | | 1.6 | |
| | 182,500 | | | | | MSCI, Inc. - Class A | | | 14,377,350 | | | | 2.0 | |
| | 160,000 | | | | | Oaktree Capital Group, LLC | | | 6,000,000 | | | | 0.8 | |
| | 278,168 | | | | | Primerica, Inc. | | | 19,235,317 | | | | 2.7 | |
| | | | | | | | | | 115,370,048 | | | | 16.2 | |
| | | | | | | | | | | | | | | |
| | | | | | | Health Care: 9.2% | | | | | | | | |
| | 105,000 | | | | | Bio-Techne Corp. | | | 10,797,150 | | | | 1.5 | |
| | 33,680 | | | @ | | Glaukos Corp. | | | 1,155,224 | | | | 0.2 | |
| | 205,000 | | | @ | | Idexx Laboratories, Inc. | | | 24,040,350 | | | | 3.4 | |
| | 299,978 | | | @ | | Inovalon Holdings, Inc. | | | 3,089,773 | | | | 0.4 | |
| | 28,400 | | | @ | | Mettler Toledo International, Inc. | | | 11,887,104 | | | | 1.7 | |
| | 47,008 | | | @ | | Neogen Corp. | | | 3,102,528 | | | | 0.4 | |
| | 130,000 | | | | | West Pharmaceutical Services, Inc. | | | 11,027,900 | | | | 1.6 | |
| | | | | | | | | | 65,100,029 | | | | 9.2 | |
| | | | | | | | | | | | | | | |
| | | | | | | Industrials: 4.3% | | | | | | | | |
| | 74,000 | | | | | Air Lease Corp. | | | 2,540,420 | | | | 0.3 | |
| | 361,500 | | | @ | | Caesarstone Ltd. | | | 10,356,975 | | | | 1.5 | |
| | 102,500 | | | @ | | Middleby Corp. | | | 13,203,025 | | | | 1.9 | |
| | 65,000 | | | @ | | Trex Co., Inc. | | | 4,186,000 | | | | 0.6 | |
| | | | | | | | | | 30,286,420 | | | | 4.3 | |
| | | | | | | | | | | | | | | |
| | | | | | | Information Technology: 20.9% | |
| | 226,500 | | | @ | | Ansys, Inc. | | | 20,948,985 | | | | 2.9 | |
| | 300,448 | | | @ | | Benefitfocus, Inc. | | | 8,923,306 | | | | 1.3 | |
| | 156,500 | | | | | Booz Allen Hamilton Holding Corp. | | | 5,644,955 | | | | 0.8 | |
| | 150,500 | | | @ | | CoStar Group, Inc. | | | 28,367,745 | | | | 4.0 | |
| | 347,000 | | | @ | | Gartner, Inc. | | | 35,071,290 | | | | 4.9 | |
| | 164,000 | | | @ | | Guidewire Software, Inc. | | | 8,090,120 | | | | 1.1 | |
| | 15,000 | | | | | Littelfuse, Inc. | | | 2,276,550 | | | | 0.3 | |
| | 338,000 | | | | | MAXIMUS, Inc. | | | 18,857,020 | | | | 2.7 | |
| | 685,000 | | | | | SS&C Technologies Holdings, Inc. | | | 19,591,000 | | | | 2.8 | |
| | 9,000 | | | @ | | Wix.com Ltd. | | | 400,950 | | | | 0.1 | |
| | | | | | | | | | 148,171,921 | | | | 20.9 | |
| | | | | | | | | | | | | | | |
| | | | | | | Real Estate: 8.6% | | | | | | | | |
| | 15,000 | | | | | Alexander's, Inc. | | | 6,403,050 | | | | 0.9 | |
| | 82,000 | | | | | Alexandria Real Estate Equities, Inc. | | | 9,112,660 | | | | 1.3 | |
| | 115,000 | | | | | American Assets Trust, Inc. | | | 4,954,200 | | | | 0.7 | |
| | 474,170 | | | | | Douglas Emmett, Inc. | | | 17,335,655 | | | | 2.5 | |
| | 750,000 | | | | | Gaming and Leisure Properties, Inc. | | | 22,965,000 | | | | 3.2 | |
| | | | | | | | | | 60,770,565 | | | | 8.6 | |
| | | | | | | | | | | | | | | |
| | | | | | | Telecommunication Services: 1.2% | |
| | 921,311 | | | @ | | Iridium Communications, Inc. | | | 8,844,586 | | | | 1.2 | |
| | | | | | | | | | | | | | | |
| | | | | Total Common Stock
(Cost $321,947,917) | | | 703,402,760 | | | | 99.1 | |
| | | | | | | | | | | | | | | |
| SHORT-TERM INVESTMENTS: 0.7% | | | | | | | | |
| | | | | | | Mutual Funds: 0.7% | | | | | | | | |
| | 5,192,517 | | | | | BlackRock Liquidity Funds, FedFund, Institutional Class, 0.420%†† | | | | | | | | |
| | | | | | | (Cost $5,192,517) | | | 5,192,517 | | | | 0.7 | |
| | | | | | | | | | | | | | | |
| | | | | Total Short-Term Investments
(Cost $5,192,517) | | | 5,192,517 | | | | 0.7 | |
| | | | | | | | | | | | | | | |
| | | | | Total Investments in Securities
(Cost $327,140,434) | | $ | 708,595,277 | | | | 99.8 | |
| | | | | Assets in Excess of Other Liabilities | | | 1,239,386 | | | | 0.2 | |
| | | | | Net Assets | | $ | 709,834,663 | | | | 100.0 | |
| †† | Rate shown is the 7-day yield as of December 31, 2016. |
| VY® Baron Growth Portfolio | PORTFOLIO OF INVESTMENTS AS OF December 31, 2016 (CONTINUED) |
| @ | Non-income producing security. |
Cost for federal income tax purposes is $333,136,898.
Net unrealized appreciation consists of:
| Gross Unrealized Appreciation | | $ | 390,264,615 | |
| Gross Unrealized Depreciation | | | (14,806,236 | ) |
| | | | | |
| Net Unrealized Appreciation | | $ | 375,458,379 | |
| VY® Columbia Contrarian Core Portfolio | PORTFOLIO OF INVESTMENTS AS OF December 31, 2016 |
| Shares | | | | | | | Value | | | Percentage
of Net
Assets | |
| COMMON STOCK: 98.9% | | | | | | | | |
| | | | | | | Consumer Discretionary: 12.5% | |
| | 6,735 | | | | | Advance Auto Parts, Inc. | | | 1,139,023 | | | | 0.3 | |
| | 41,791 | | | | | Aramark | | | 1,492,775 | | | | 0.5 | |
| | 2,955 | | | @ | | Chipotle Mexican Grill, Inc. | | | 1,114,981 | | | | 0.3 | |
| | 79,615 | | | | | Coach, Inc. | | | 2,788,117 | | | | 0.9 | |
| | 128,207 | | | | | Comcast Corp. – Class A | | | 8,852,693 | | | | 2.7 | |
| | 14,395 | | | | | Expedia, Inc. | | | 1,630,666 | | | | 0.5 | |
| | 32,805 | | | @ | | Liberty Interactive Corp. QVC Group | | | 655,444 | | | | 0.2 | |
| | 104,149 | | | | | Lowe's Cos, Inc. | | | 7,407,077 | | | | 2.3 | |
| | 21,497 | | | | | Marriott International, Inc. | | | 1,777,372 | | | | 0.5 | |
| | 32,055 | | | | | McDonald's Corp. | | | 3,901,735 | | | | 1.2 | |
| | 63,787 | | | @ | | Michaels Cos, Inc. | | | 1,304,444 | | | | 0.4 | |
| | 36,230 | | | | | Newell Brands, Inc. | | | 1,617,669 | | | | 0.5 | |
| | 21,580 | | | | | PVH Corp. | | | 1,947,379 | | | | 0.6 | |
| | 16,015 | | | | | Royal Caribbean Cruises Ltd. | | | 1,313,871 | | | | 0.4 | |
| | 36,915 | | | | | Walt Disney Co. | | | 3,847,281 | | | | 1.2 | |
| | | | | | | | | | 40,790,527 | | | | 12.5 | |
| | | | | | | | | | | | | | | |
| | | | | | | Consumer Staples: 9.2% | |
| | 68,896 | | | | | Coca-Cola Co. | | | 2,856,428 | | | | 0.9 | |
| | 84,946 | | | | | CVS Health Corp. | | | 6,703,089 | | | | 2.1 | |
| | 118,175 | | | | | Kroger Co. | | | 4,078,219 | | | | 1.2 | |
| | 49,043 | | | | | PepsiCo, Inc. | | | 5,131,369 | | | | 1.6 | |
| | 98,165 | | | | | Philip Morris International, Inc. | | | 8,981,116 | | | | 2.7 | |
| | 27,526 | | | | | Walgreens Boots Alliance, Inc. | | | 2,278,052 | | | | 0.7 | |
| | | | | | | | | | 30,028,273 | | | | 9.2 | |
| | | | | | | | | | | | | | | |
| | | | | | | Energy: 7.3% | | | | | | | | |
| | 46,032 | | | | | Canadian Natural Resources Ltd. | | | 1,467,500 | | | | 0.5 | |
| | 44,221 | | | | | Chevron Corp. | | | 5,204,812 | | | | 1.6 | |
| | 80,477 | | | | | ConocoPhillips | | | 4,035,117 | | | | 1.2 | |
| | 20,535 | | | | | EQT Corp. | | | 1,342,989 | | | | 0.4 | |
| | 65,795 | | | | | Exxon Mobil Corp. | | | 5,938,657 | | | | 1.8 | |
| | 64,110 | | | | | Noble Energy, Inc. | | | 2,440,026 | | | | 0.8 | |
| | 39,700 | | | | | Schlumberger Ltd. | | | 3,332,815 | | | | 1.0 | |
| | | | | | | | | | 23,761,916 | | | | 7.3 | |
| | | | | | | | | | | | | | | |
| | | | | | | Financials: 17.8% | | | | | | | | |
| | 14,868 | | | | | Aon PLC | | | 1,658,228 | | | | 0.5 | |
| | 138,371 | | | | | Bank of New York Mellon Corp. | | | 6,556,018 | | | | 2.0 | |
| | 62,142 | | | @ | | Berkshire Hathaway, Inc. – Class B | | | 10,127,903 | | | | 3.1 | |
| | 2,576 | | | | | Blackrock, Inc. | | | 980,271 | | | | 0.3 | |
| | 201,236 | | | | | Citigroup, Inc. | | | 11,959,456 | | | | 3.7 | |
| | 26,130 | | | | | Invesco Ltd. | | | 792,784 | | | | 0.3 | |
| | 132,593 | | | | | JPMorgan Chase & Co. | | | 11,441,450 | | | | 3.5 | |
| | 196,530 | | | | | Morgan Stanley | | | 8,303,393 | | | | 2.6 | |
| | 9,660 | | | | | S&P Global, Inc. | | | 1,038,836 | | | | 0.3 | |
| | 89,890 | | | | | Wells Fargo & Co. | | | 4,953,838 | | | | 1.5 | |
| | | | | | | | | | 57,812,177 | | | | 17.8 | |
| | | | | | | Health Care: 14.1% | | | | | | | | |
| | 52,140 | | | | | Abbott Laboratories | | | 2,002,698 | | | | 0.6 | |
| | 13,320 | | | @ | | Alexion Pharmaceuticals, Inc. | | | 1,629,702 | | | | 0.5 | |
| | 13,125 | | | @ | | Allergan plc | | | 2,756,381 | | | | 0.8 | |
| | 25,035 | | | | | Anthem, Inc. | | | 3,599,282 | | | | 1.1 | |
| | 15,790 | | | @ | | Biogen, Inc. | | | 4,477,728 | | | | 1.4 | |
| | 31,699 | | | | | Cardinal Health, Inc. | | | 2,281,377 | | | | 0.7 | |
| | 32,109 | | | @ | | Celgene Corp. | | | 3,716,617 | | | | 1.1 | |
| | 29,953 | | | | | Cigna Corp. | | | 3,995,431 | | | | 1.2 | |
| | 11,025 | | | | | Cooper Cos., Inc. | | | 1,928,603 | | | | 0.6 | |
| | 55,224 | | | | | Johnson & Johnson | | | 6,362,357 | | | | 2.0 | |
| | 32,123 | | | | | Medtronic PLC | | | 2,288,121 | | | | 0.7 | |
| | 195,545 | | | | | Pfizer, Inc. | | | 6,351,302 | | | | 2.0 | |
| | 17,611 | | | @ | | Vertex Pharmaceuticals, Inc. | | | 1,297,402 | | | | 0.4 | |
| | 32,140 | | | | | Zimmer Biomet Holdings, Inc. | | | 3,316,848 | | | | 1.0 | |
| | | | | | | | | | 46,003,849 | | | | 14.1 | |
| | | | | | | | | | | | | | | |
| | | | | | | Industrials: 9.3% | | | | | | | | |
| | 13,148 | | | | | Dun & Bradstreet Corp. | | | 1,595,115 | | | | 0.5 | |
| | 25,257 | | | | | Eaton Corp. PLC | | | 1,694,492 | | | | 0.5 | |
| | 38,871 | | | | | FedEx Corp. | | | 7,237,780 | | | | 2.2 | |
| | 222,315 | | | | | General Electric Co. | | | 7,025,154 | | | | 2.2 | |
| | 59,717 | | | | | Honeywell International, Inc. | | | 6,918,215 | | | | 2.1 | |
| | 42,938 | | | | | Johnson Controls International plc | | | 1,768,616 | | | | 0.6 | |
| | 80,505 | | | | | Nielsen NV | | | 3,377,185 | | | | 1.0 | |
| | 8,630 | | | @ | | Stericycle, Inc. | | | 664,855 | | | | 0.2 | |
| | | | | | | | | | 30,281,412 | | | | 9.3 | |
| | | | | | | | | | | | | | | |
| | | | | | | Information Technology: 20.6% | |
| | 53,520 | | | | | Activision Blizzard, Inc. | | | 1,932,607 | | | | 0.6 | |
| | 28,125 | | | @ | | Akamai Technologies, Inc. | | | 1,875,375 | | | | 0.6 | |
| | 5,323 | | | @ | | Alphabet, Inc. - Class A | | | 4,218,211 | | | | 1.3 | |
| | 12,304 | | | @ | | Alphabet, Inc. - Class C | | | 9,496,473 | | | | 2.9 | |
| | 112,231 | | | | | Apple, Inc. | | | 12,998,594 | | | | 4.0 | |
| | 30,631 | | | | | Broadcom Ltd. | | | 5,414,642 | | | | 1.7 | |
| | 37,944 | | | @ | | Electronic Arts, Inc. | | | 2,988,470 | | | | 0.9 | |
| | 65,890 | | | @ | | Facebook, Inc. | | | 7,580,645 | | | | 2.3 | |
| | 35,000 | | | | | Fidelity National Information Services, Inc. | | | 2,647,400 | | | | 0.8 | |
| | 43,321 | | | | | Mastercard, Inc. | | | 4,472,893 | | | | 1.4 | |
| | 151,910 | | | | | Microsoft Corp. | | | 9,439,687 | | | | 2.9 | |
| | 14,355 | | | @ | | Palo Alto Networks, Inc. | | | 1,795,093 | | | | 0.5 | |
| | 34,515 | | | | | Qualcomm, Inc. | | | 2,250,378 | | | | 0.7 | |
| | | | | | | | | | 67,110,468 | | | | 20.6 | |
| | | | | | | | | | | | | | | |
| | | | | | | Materials: 1.9% | | | | | | | | |
| | 18,055 | | | | | Monsanto Co. | | | 1,899,566 | | | | 0.6 | |
| | 15,893 | | | | | Sherwin-Williams Co. | | | 4,271,085 | | | | 1.3 | |
| | | | | | | | | | 6,170,651 | | | | 1.9 | |
| | | | | | | | | | | | | | | |
| | | | | | | Real Estate: 1.4% | | | | | | | | |
| | 42,390 | | | | | American Tower Corp. | | | 4,479,775 | | | | 1.4 | |
| | | | | | | | | | | | | | | |
| | | | | | | Telecommunication Services: 3.5% | |
| | 62,825 | | | | | AT&T, Inc. | | | 2,671,947 | | | | 0.8 | |
| | 165,547 | | | | | Verizon Communications, Inc. | | | 8,836,899 | | | | 2.7 | |
| | | | | | | | | | 11,508,846 | | | | 3.5 | |
| VY® Columbia Contrarian Core Portfolio | PORTFOLIO OF INVESTMENTS AS OF December 31, 2016 (CONTINUED) |
| | | | | | | Utilities: 1.3% | | | | | | | | |
| | 17,452 | | | | | DTE Energy Co. | | | 1,719,197 | | | | 0.5 | |
| | 35,971 | | | | | Edison International | | | 2,589,552 | | | | 0.8 | |
| | | | | | | | | | 4,308,749 | | | | 1.3 | |
| | | | | | | | | | | | | | | |
| | | | | Total Common Stock
(Cost $281,324,211) | | | 322,256,643 | | | | 98.9 | |
| | | | | | | | | | | | |
Principal
Amount† | | | | | | | Value | | | Percentage
of Net
Assets | |
| CORPORATE BONDS/NOTES: –% | | | | | | | | |
| | | | | | | Materials: –% | | | | | | | | |
| | 649,000 | | | | | SINO Forest Corp. Escrow, 08/01/49 | | | – | | | | – | |
| | | | | | | | | | | | | | | |
| | | | | Total Corporate Bonds/Notes
(Cost $–) | | | – | | | | – | |
| | | | | | | | | | | | | | | |
| | | | | Total Long-Term Investments
(Cost $281,324,211) | | | 322,256,643 | | | | 98.9 | |
| | | | | | | | | | | | |
| Shares | | | | | | | Value | | | Percentage
of Net
Assets | |
| SHORT-TERM INVESTMENTS: 1.1% | | | | | | | | |
| | | | | | | Mutual Funds: 1.1% | |
| | 3,610,640 | | | | | BlackRock Liquidity Funds, FedFund, Institutional Class, 0.420%†† | | | | | | | | |
| | | | | | | (Cost $3,610,640) | | | 3,610,640 | | | | 1.1 | |
| | | | | | | | | | | | | | | |
| | | | | Total Short-Term Investments
(Cost $3,610,640) | | | 3,610,640 | | | | 1.1 | |
| | | | | | | | | | | | | | | |
| | | | | Total Investments in Securities
(Cost $284,934,851) | | $ | 325,867,283 | | | | 100.0 | |
| | | | | Assets in Excess of Other Liabilities | | | 57,350 | | | | 0.0 | |
| | | | | Net Assets | | $ | 325,924,633 | | | | 100.0 | |
| † | Unless otherwise indicated, principal amount is shown in USD. |
| †† | Rate shown is the 7-day yield as of December 31, 2016. |
| @ | Non-income producing security. |
Cost for federal income tax purposes is $285,909,324.
Net unrealized appreciation consists of:
| Gross Unrealized Appreciation | | $ | 43,256,690 | |
| Gross Unrealized Depreciation | | | (3,298,731 | ) |
| | | | | |
| Net Unrealized Appreciation | | $ | 39,957,959 | |
| VY® Columbia Small Cap Value II Portfolio | PORTFOLIO OF INVESTMENTS AS OF December 31, 2016 |
| Shares | | | | | | | Value | | | Percentage
of Net
Assets | |
| COMMON STOCK: 96.8% | | | | | | | | |
| | | | | | | Consumer Discretionary: 6.9% | |
| | 50,000 | | | | | AMC Entertainment Holdings, Inc. | | | 1,682,500 | | | | 0.7 | |
| | 25,300 | | | | | Childrens Place Retail Stores, Inc. | | | 2,554,035 | | | | 1.1 | |
| | 15,300 | | | @ | | Cooper-Standard Holdings, Inc. | | | 1,581,714 | | | | 0.7 | |
| | 17,500 | | | @ | | Dave & Buster's Entertainment, Inc. | | | 985,250 | | | | 0.4 | |
| | 17,500 | | | @ | | Genesco, Inc. | | | 1,086,750 | | | | 0.5 | |
| | 65,000 | | | @ | | Kate Spade & Co. | | | 1,213,550 | | | | 0.5 | |
| | 67,500 | | | @ | | Nord Anglia Education, Inc. | | | 1,572,750 | | | | 0.7 | |
| | 119,000 | | | @ | | Sequential Brands Group, Inc. | | | 556,920 | | | | 0.2 | |
| | 32,000 | | | @ | | Tenneco, Inc. | | | 1,999,040 | | | | 0.8 | |
| | 79,000 | | | | | Tower International, Inc. | | | 2,239,650 | | | | 0.9 | |
| | 53,000 | | | @ | | William Lyon Homes | | | 1,008,590 | | | | 0.4 | |
| | | | | | | | | | 16,480,749 | | | | 6.9 | |
| | | | | | | | | | | | | | | |
| | | | | | | Consumer Staples: 3.1% | |
| | 78,000 | | | | | AdvancePierre Foods Holdings, Inc. | | | 2,322,840 | | | | 1.0 | |
| | 227,000 | | | | | Avon Products, Inc. | | | 1,144,080 | | | | 0.5 | |
| | 80,800 | | | @ | | Darling Ingredients, Inc. | | | 1,043,128 | | | | 0.4 | |
| | 42,000 | | | @ | | Performance Food Group Co. | | | 1,008,000 | | | | 0.4 | |
| | 37,000 | | | @ | | United Natural Foods, Inc. | | | 1,765,640 | | | | 0.8 | |
| | | | | | | | | | 7,283,688 | | | | 3.1 | |
| | | | | | | | | | | | | | | |
| | | | | | | Energy: 6.7% | | | | | | | | |
| | 99,000 | | | | | Aegean Marine Petroleum Network, Inc. | | | 1,004,850 | | | | 0.4 | |
| | 11,500 | | | @ | | Arch Coal, Inc. | | | 897,575 | | | | 0.4 | |
| | 112,000 | | | @ | | Oasis Petroleum, Inc. | | | 1,695,680 | | | | 0.7 | |
| | 90,000 | | | | | Patterson-UTI Energy, Inc. | | | 2,422,800 | | | | 1.0 | |
| | 52,000 | | | | | PBF Energy, Inc. | | | 1,449,760 | | | | 0.6 | |
| | 29,500 | | | @ | | PDC Energy, Inc. | | | 2,141,110 | | | | 0.9 | |
| | 47,000 | | | @ | | RSP Permian, Inc. | | | 2,097,140 | | | | 0.9 | |
| | 56,000 | | | | | SM Energy Co. | | | 1,930,880 | | | | 0.8 | |
| | 28,000 | | | | | United States Steel Corp. | | | 924,280 | | | | 0.4 | |
| | 110,000 | | | @ | | Whiting Petroleum Corp. | | | 1,322,200 | | | | 0.6 | |
| | | | | | | | | | 15,886,275 | | | | 6.7 | |
| | | | | | | | | | | | | | | |
| | | | | | | Financials: 31.8% | | | | | | | | |
| | 105,000 | | | | | American Equity Investment Life Holding Co. | | | 2,366,700 | | | | 1.0 | |
| | 58,500 | | | | | Ameris Bancorp. | | | 2,550,600 | | | | 1.1 | |
| | 43,843 | | | | | Amerisafe, Inc. | | | 2,733,611 | | | | 1.2 | |
| | 64,000 | | | | | Amtrust Financial Services, Inc. | | | 1,752,320 | | | | 0.7 | |
| | 37,500 | | | | | Argo Group International Holdings Ltd. | | | 2,471,250 | | | | 1.0 | |
| | 47,000 | | | | | Bank of the Ozarks, Inc. | | | 2,471,730 | | | | 1.0 | |
| | 85,000 | | | @ | | BofI Holding, Inc. | | | 2,426,750 | | | | 1.0 | |
| | 48,000 | | | | | Cathay General Bancorp. | | | 1,825,440 | | | | 0.8 | |
| | 75,000 | | | | | CNO Financial Group, Inc. | | | 1,436,250 | | | | 0.6 | |
| | 58,000 | | | | | Community Bank System, Inc. | | | 3,583,820 | | | | 1.5 | |
| | 80,000 | | | @ | | Customers Bancorp, Inc. | | | 2,865,600 | | | | 1.2 | |
| | 14,000 | | | | | Evercore Partners, Inc. | | | 961,800 | | | | 0.4 | |
| | 57,000 | | | | | Hancock Holding Co. | | | 2,456,700 | | | | 1.0 | |
| | 133,000 | | | | | Hope Bancorp, Inc. | | | 2,911,370 | | | | 1.2 | |
| | 49,004 | | | | | Independent Bank Corp. | | | 3,452,332 | | | | 1.5 | |
| | 52,000 | | | | | MB Financial, Inc. | | | 2,455,960 | | | | 1.0 | |
| | 185,000 | | | @ | | MBIA, Inc. | | | 1,979,500 | | | | 0.8 | |
| | 290,000 | | | @ | | MGIC Investment Corp. | | | 2,955,100 | | | | 1.2 | |
| | 30,000 | | | | | Moelis & Co. | | | 1,017,000 | | | | 0.4 | |
| | 34,000 | | | | | Prosperity Bancshares, Inc. | | | 2,440,520 | | | | 1.0 | |
| | 77,500 | | | | | Renasant Corp. | | | 3,272,050 | | | | 1.4 | |
| | 80,000 | | | | | Sandy Spring Bancorp, Inc. | | | 3,199,200 | | | | 1.4 | |
| | 194,000 | | | @ | | SLM Corp. | | | 2,137,880 | | | | 0.9 | |
| | 149,000 | | | | | Sterling Bancorp/DE | | | 3,486,600 | | | | 1.5 | |
| | 37,000 | | | @ | | Stifel Financial Corp. | | | 1,848,150 | | | | 0.8 | |
| | 33,200 | | | | | UMB Financial Corp. | | | 2,560,384 | | | | 1.1 | |
| | 86,500 | | | | | Union Bankshares Corp. | | | 3,091,510 | | | | 1.3 | |
| | 82,000 | | | | | Virtu Financial, Inc. | | | 1,307,900 | | | | 0.6 | |
| | 58,000 | | | @ | | Western Alliance Bancorp. | | | 2,825,180 | | | | 1.2 | |
| | 33,500 | | | | | Wintrust Financial Corp. | | | 2,431,095 | | | | 1.0 | |
| | 50,000 | | | | | WSFS Financial Corp. | | | 2,317,500 | | | | 1.0 | |
| | | | | | | | | | 75,591,802 | | | | 31.8 | |
| | | | | | | | | | | | | | | |
| | | | | | | Health Care: 4.8% | | | | | | | | |
| | 66,000 | | | @ | | Ariad Pharmaceuticals, Inc. | | | 821,040 | | | | 0.3 | |
| | 12,000 | | | @ | | Bluebird Bio, Inc. | | | 740,400 | | | | 0.3 | |
| | 22,000 | | | @ | | Envision Healthcare Corp. | | | 1,392,380 | | | | 0.6 | |
| | 42,500 | | | @ | | LHC Group, Inc. | | | 1,942,250 | | | | 0.8 | |
| | 78,000 | | | @ | | Merit Medical Systems, Inc. | | | 2,067,000 | | | | 0.9 | |
| | 19,000 | | | @ | | Parexel International Corp. | | | 1,248,680 | | | | 0.5 | |
| | 48,000 | | | @ | | Patheon NV | | | 1,378,080 | | | | 0.6 | |
| | 83,000 | | | @ | | Wright Medical Group NV | | | 1,907,340 | | | | 0.8 | |
| | | | | | | | | | 11,497,170 | | | | 4.8 | |
| | | | | | | | | | | | | | | |
| | | | | | | Industrials: 14.0% | | | | | | | | |
| | 58,500 | | | | | ABM Industries, Inc. | | | 2,389,140 | | | | 1.0 | |
| | 48,500 | | | | | Barnes Group, Inc. | | | 2,299,870 | | | | 1.0 | |
| | 43,500 | | | @ | | Beacon Roofing Supply, Inc. | | | 2,004,045 | | | | 0.8 | |
| | 22,000 | | | | | Curtiss-Wright Corp. | | | 2,163,920 | | | | 0.9 | |
| | 34,500 | | | | | Deluxe Corp. | | | 2,470,545 | | | | 1.0 | |
| | 46,500 | | | | | EMCOR Group, Inc. | | | 3,290,340 | | | | 1.4 | |
| | 39,997 | | | | | Franklin Electric Co., Inc. | | | 1,555,883 | | | | 0.6 | |
| | 42,500 | | | | | Granite Construction, Inc. | | | 2,337,500 | | | | 1.0 | |
| | 51,000 | | | | | Kennametal, Inc. | | | 1,594,260 | | | | 0.7 | |
| | 67,500 | | | @ | | Mastec, Inc. | | | 2,581,875 | | | | 1.1 | |
| | 84,000 | | | @ | | Neff Corp. | | | 1,184,400 | | | | 0.5 | |
| | 33,274 | | | | | Oshkosh Corp. | | | 2,149,833 | | | | 0.9 | |
| | 64,000 | | | | | Skywest, Inc. | | | 2,332,800 | | | | 1.0 | |
| | 105,000 | | | @ | | Swift Transportation Co. | | | 2,557,800 | | | | 1.1 | |
| VY® Columbia Small Cap Value II Portfolio | PORTFOLIO OF INVESTMENTS AS OF December 31, 2016 (CONTINUED) |
| | 53,500 | | | @ | | XPO Logistics, Inc. | | | 2,309,060 | | | | 1.0 | |
| | | | | | | | | | 33,221,271 | | | | 14.0 | |
| | | | | | | | | | | | | | | |
| | | | | | | Information Technology: 9.9% | |
| | 45,500 | | | @ | | Cirrus Logic, Inc. | | | 2,572,570 | | | | 1.1 | |
| | 155,000 | | | | | Cypress Semiconductor Corp. | | | 1,773,200 | | | | 0.7 | |
| | 15,000 | | | | | Ebix, Inc. | | | 855,750 | | | | 0.4 | |
| | 35,500 | | | @ | | Fabrinet | | | 1,430,650 | | | | 0.6 | |
| | 38,000 | | | @ | | Finisar Corp. | | | 1,150,260 | | | | 0.5 | |
| | 125,000 | | | @ | | Formfactor, Inc. | | | 1,400,000 | | | | 0.6 | |
| | 80,000 | | | @ | | II-VI, Inc. | | | 2,372,000 | | | | 1.0 | |
| | 140,000 | | | @ | | Kulicke & Soffa Industries, Inc. | | | 2,233,000 | | | | 0.9 | |
| | 231,000 | | | @ | | Oclaro, Inc. | | | 2,067,450 | | | | 0.9 | |
| | 19,000 | | | @ | | Rogers Corp. | | | 1,459,390 | | | | 0.6 | |
| | 28,500 | | | | | Science Applications International Corp. | | | 2,416,800 | | | | 1.0 | |
| | 19,500 | | | | | SYNNEX Corp. | | | 2,359,890 | | | | 1.0 | |
| | 27,500 | | | @ | | Take-Two Interactive Software, Inc. | | | 1,355,475 | | | | 0.6 | |
| | | | | | | | | | 23,446,435 | | | | 9.9 | |
| | | | | | | | | | | | | | | |
| | | | | | | Materials: 6.8% | | | | | | | | |
| | 220,000 | | | @ | | AK Steel Holding Corp. | | | 2,246,200 | | | | 0.9 | |
| | 28,944 | | | | | Cabot Corp. | | | 1,462,830 | | | | 0.6 | |
| | 42,000 | | | | | Carpenter Technology Corp. | | | 1,519,140 | | | | 0.6 | |
| | 92,000 | | | | | KapStone Paper and Packaging Corp. | | | 2,028,600 | | | | 0.8 | |
| | 33,500 | | | | | Materion Corp. | | | 1,326,600 | | | | 0.6 | |
| | 30,500 | | | | | Neenah Paper, Inc. | | | 2,598,600 | | | | 1.1 | |
| | 67,000 | | | | | Olin Corp. | | | 1,715,870 | | | | 0.7 | |
| | 70,000 | | | | | Orion Engineered Carbons SA | | | 1,319,500 | | | | 0.6 | |
| | 31,400 | | | @ | | US Concrete, Inc. | | | 2,056,700 | | | | 0.9 | |
| | | | | | | | | | 16,274,040 | | | | 6.8 | |
| | | | | | | | | | | | | | | |
| | | | | | | Real Estate: 8.0% | | | | | | | | |
| | 54,000 | | | | | American Assets Trust, Inc. | | | 2,326,320 | | | | 1.0 | |
| | 70,500 | | | | | Brandywine Realty Trust | | | 1,163,955 | | | | 0.5 | |
| | 63,000 | | | | | Chesapeake Lodging Trust | | | 1,629,180 | | | | 0.7 | |
| | 97,000 | | | | | First Industrial Realty Trust, Inc. | | | 2,720,850 | | | | 1.1 | |
| | 45,500 | | | | | Highwoods Properties, Inc. | | | 2,320,955 | | | | 1.0 | |
| | 57,000 | | | | | Hudson Pacific Properties, Inc. | | | 1,982,460 | | | | 0.8 | |
| | 60,000 | | | | | LaSalle Hotel Properties | | | 1,828,200 | | | | 0.8 | |
| | 68,000 | | | | | Mack-Cali Realty Corp. | | | 1,973,360 | | | | 0.8 | |
| | 50,800 | | | | | Physicians Realty Trust | | | 963,168 | | | | 0.4 | |
| | 19,000 | | | | | PS Business Parks, Inc. | | | 2,213,880 | | | | 0.9 | |
| | | | | | | | | | 19,122,328 | | | | 8.0 | |
| | | | | | | | | | | | | | | |
| | | | | | | Utilities: 4.8% | | | | | | | | |
| | 37,000 | | | | | Avista Corp. | | | 1,479,630 | | | | 0.6 | |
| | 23,000 | | | | | Black Hills Corp. | | | 1,410,820 | | | | 0.6 | |
| | 70,000 | | | | | New Jersey Resources Corp. | | | 2,485,000 | | | | 1.0 | |
| | 22,500 | | | | | ONE Gas, Inc. | | | 1,439,100 | | | | 0.6 | |
| | 76,000 | | | | | South Jersey Industries, Inc. | | | 2,560,440 | | | | 1.1 | |
| | 27,000 | | | | | Southwest Gas Corp. | | | 2,068,740 | | | | 0.9 | |
| | | | | | | | | | 11,443,730 | | | | 4.8 | |
| | | | | | | | | | | | | | | |
| | | | | Total Common Stock
(Cost $176,324,773) | | | 230,247,488 | | | | 96.8 | |
| | | | | | | | | | | | | | | |
| EXCHANGE-TRADED FUNDS: 1.1% | | | | | | | | |
| | 20,000 | | | | | iShares Russell 2000 ETF | | | 2,697,000 | | | | 1.1 | |
| | | | | | | | | | | | | | | |
| | | | | Total Exchange-Traded Funds
(Cost $2,696,400) | | | 2,697,000 | | | | 1.1 | |
| | | | | | | | | | | | | | | |
| | | | | Total Long-Term Investments
(Cost $179,021,173) | | | 232,944,488 | | | | 97.9 | |
| | | | | | | | | | | | | | | |
| SHORT-TERM INVESTMENTS: 3.9% | | | | | | | | |
| | | | | | | Mutual Funds: 3.9% | | | | | | | | |
| | 9,231,151 | | | | | BlackRock Liquidity Funds, FedFund, Institutional Class, 0.420%†† | | | | | | | | |
| | | | | | | (Cost $9,231,151) | | | 9,231,151 | | | | 3.9 | |
| | | | | | | | | | | | | | | |
| | | | | Total Short-Term Investments
(Cost $9,231,151) | | | 9,231,151 | | | | 3.9 | |
| | | | | | | | | | | | | | | |
| | | | | Total Investments in Securities
(Cost $188,252,324) | | $ | 242,175,639 | | | | 101.8 | |
| | | | | Liabilities in Excess of Other Assets | | | (4,180,630 | ) | | | (1.8 | ) |
| | | | | Net Assets | | $ | 237,995,009 | | | | 100.0 | |
| †† | Rate shown is the 7-day yield as of December 31, 2016. |
| @ | Non-income producing security. |
Cost for federal income tax purposes is $188,459,681.
Net unrealized appreciation consists of:
| Gross Unrealized Appreciation | | $ | 57,119,416 | |
| Gross Unrealized Depreciation | | | (3,403,458 | ) |
| | | | | |
| Net Unrealized Appreciation | | $ | 53,715,958 | |
| VY® Invesco Comstock Portfolio | PORTFOLIO OF INVESTMENTS AS OF December 31, 2016 |
| Shares | | | | | | | Value | | | Percentage
of Net
Assets | |
| COMMON STOCK: 98.4% | | | | | | | | |
| | | | | | | Consumer Discretionary: 10.4% | |
| | 15,580 | | | | | Advance Auto Parts, Inc. | | | 2,634,890 | | | | 0.5 | |
| | 265,940 | | | | | Carnival Corp. | | | 13,844,836 | | | | 2.7 | |
| | 49,618 | | | | | CBS Corp. - Class B | | | 3,156,697 | | | | 0.6 | |
| | 13,307 | | | @ | | Charter Communications, Inc. | | | 3,831,351 | | | | 0.7 | |
| | 81,378 | | | | | Comcast Corp. – Class A | | | 5,619,151 | | | | 1.1 | |
| | 272,194 | | | | | General Motors Co. | | | 9,483,239 | | | | 1.8 | |
| | 98,960 | | | @ | | Michael Kors Holdings Ltd. | | | 4,253,301 | | | | 0.8 | |
| | 76,832 | | | | | Target Corp. | | | 5,549,575 | | | | 1.1 | |
| | 205,495 | | | | | Twenty-First Century Fox, Inc. - Class B | | | 5,599,739 | | | | 1.1 | |
| | | | | | | | | | 53,972,779 | | | | 10.4 | |
| | | | | | | | | | | | | | | |
| | | | | | | Consumer Staples: 3.0% | |
| | 52,639 | | | | | Coca-Cola Co. | | | 2,182,413 | | | | 0.4 | |
| | 55,490 | | | | | CVS Health Corp. | | | 4,378,716 | | | | 0.8 | |
| | 33,538 | | | | | Mondelez International, Inc. | | | 1,486,739 | | | | 0.3 | |
| | 64,112 | | | | | Unilever NV ADR | | | 2,632,439 | | | | 0.5 | |
| | 74,643 | | | | | Wal-Mart Stores, Inc. | | | 5,159,324 | | | | 1.0 | |
| | | | | | | | | | 15,839,631 | | | | 3.0 | |
| | | | | | | | | | | | | | | |
| | | | | | | Energy: 17.2% | | | | | | | | |
| | 255,687 | | | | | BP PLC ADR | | | 9,557,580 | | | | 1.8 | |
| | 138,983 | | | | | Canadian Natural Resources Ltd. | | | 4,429,362 | | | | 0.8 | |
| | 82,864 | | | | | Chevron Corp. | | | 9,753,093 | | | | 1.9 | |
| | 193,657 | | | | | Devon Energy Corp. | | | 8,844,315 | | | | 1.7 | |
| | 121,675 | | | | | Halliburton Co. | | | 6,581,401 | | | | 1.3 | |
| | 115,402 | | | | | Hess Corp. | | | 7,188,391 | | | | 1.4 | |
| | 288,175 | | | | | Marathon Oil Corp. | | | 4,988,309 | | | | 1.0 | |
| | 65,044 | | | | | Occidental Petroleum Corp. | | | 4,633,084 | | | | 0.9 | |
| | 244,277 | | | | | QEP Resources, Inc. | | | 4,497,139 | | | | 0.9 | |
| | 194,580 | | | | | Royal Dutch Shell PLC - Class A ADR | | | 10,581,260 | | | | 2.0 | |
| | 405,058 | | | | | Suncor Energy, Inc. | | | 13,241,346 | | | | 2.5 | |
| | 1,008,530 | | | @,L | | Weatherford International PLC | | | 5,032,565 | | | | 1.0 | |
| | | | | | | | | | 89,327,845 | | | | 17.2 | |
| | | | | | | | | | | | | | | |
| | | | | | | Financials: 36.2% | | | | | | | | |
| | 65,710 | | | | | Aflac, Inc. | | | 4,573,416 | | | | 0.9 | |
| | 116,395 | | | | | American International Group, Inc. | | | 7,601,758 | | | | 1.5 | |
| | 100,193 | | | | | Allstate Corp. | | | 7,426,305 | | | | 1.4 | |
| | 362,435 | | | | | Ally Financial, Inc. | | | 6,893,514 | | | | 1.3 | |
| | 973,247 | | | | | Bank of America Corp. | | | 21,508,759 | | | | 4.1 | |
| | 136,997 | | | | | Bank of New York Mellon Corp. | | | 6,490,918 | | | | 1.2 | |
| | 505,597 | | | | | Citigroup, Inc. | | | 30,047,630 | | | | 5.8 | |
| | 169,970 | | | | | Citizens Financial Group, Inc. | | | 6,056,031 | | | | 1.2 | |
| | 365,985 | | | | | Fifth Third Bancorp | | | 9,870,615 | | | | 1.9 | |
| | 27,746 | | | | | Goldman Sachs Group, Inc. | | | 6,643,780 | | | | 1.3 | |
| | 274,944 | | | | | JPMorgan Chase & Co. | | | 23,724,918 | | | | 4.6 | |
| | 118,330 | | | | | Keycorp | | | 2,161,889 | | | | 0.4 | |
| | 190,106 | | | | | Metlife, Inc. | | | 10,244,812 | | | | 2.0 | |
| | 245,621 | | | | | Morgan Stanley | | | 10,377,487 | | | | 2.0 | |
| | 99,621 | | | | | PNC Financial Services Group, Inc. | | | 11,651,672 | | | | 2.2 | |
| | 125,520 | | | | | State Street Corp. | | | 9,755,414 | | | | 1.9 | |
| | 48,432 | | | | | US Bancorp | | | 2,487,952 | | | | 0.5 | |
| | 191,952 | | | | | Wells Fargo & Co. | | | 10,578,475 | | | | 2.0 | |
| | | | | | | | | | 188,095,345 | | | | 36.2 | |
| | | | | | | | | | | | | | | |
| | | | | | | Health Care: 9.6% | | | | | | | | |
| | 55,247 | | | | | AbbVie, Inc. | | | 3,459,567 | | | | 0.7 | |
| | 38,721 | | | | | Anthem, Inc. | | | 5,566,918 | | | | 1.1 | |
| | 17,167 | | | @ | | Biogen, Inc. | | | 4,868,218 | | | | 0.9 | |
| | 54,434 | | | | | Gilead Sciences, Inc. | | | 3,898,019 | | | | 0.7 | |
| | 50,149 | | | | | Medtronic PLC | | | 3,572,113 | | | | 0.7 | |
| | 123,569 | | | | | Merck & Co., Inc. | | | 7,274,507 | | | | 1.4 | |
| | 59,719 | | | | | Novartis AG | | | 4,342,975 | | | | 0.8 | |
| | 301,869 | | | | | Pfizer, Inc. | | | 9,804,705 | | | | 1.9 | |
| | 183,047 | | | | | Sanofi ADR | | | 7,402,421 | | | | 1.4 | |
| | | | | | | | | | 50,189,443 | | | | 9.6 | |
| | | | | | | | | | | | | | | |
| | | | | | | Industrials: 9.2% | | | | | | | | |
| | 158,438 | | | | | Arconic, Inc. | | | 2,937,441 | | | | 0.6 | |
| | 106,551 | | | | | Caterpillar, Inc. | | | 9,881,540 | | | | 1.9 | |
| | 73,113 | | | | | Eaton Corp. PLC | | | 4,905,151 | | | | 0.9 | |
| | 100,878 | | | | | Emerson Electric Co. | | | 5,623,949 | | | | 1.1 | |
| | 204,587 | | | | | General Electric Co. | | | 6,464,949 | | | | 1.2 | |
| | 48,930 | | | | | Ingersoll-Rand PLC - Class A | | | 3,671,707 | | | | 0.7 | |
| | 173,343 | | | | | Johnson Controls International plc | | | 7,139,998 | | | | 1.4 | |
| | 153,008 | | | | | Textron, Inc. | | | 7,430,068 | | | | 1.4 | |
| | | | | | | | | | 48,054,803 | | | | 9.2 | |
| | | | | | | | | | | | | | | |
| | | | | | | Information Technology: 9.4% | |
| | 397,186 | | | | | Cisco Systems, Inc. | | | 12,002,961 | | | | 2.3 | |
| | 234,958 | | | @ | | eBay, Inc. | | | 6,975,903 | | | | 1.3 | |
| | 139,749 | | | | | HP, Inc. | | | 2,073,875 | | | | 0.4 | |
| | 170,502 | | | | | Intel Corp. | | | 6,184,107 | | | | 1.2 | |
| | 118,005 | | | | | Microsoft Corp. | | | 7,332,831 | | | | 1.4 | |
| | 224,692 | | | | | NetApp, Inc. | | | 7,924,887 | | | | 1.5 | |
| | 88,024 | | | @ | | PayPal Holdings, Inc. | | | 3,474,307 | | | | 0.7 | |
| | 69,257 | | | | | Symantec Corp. | | | 1,654,550 | | | | 0.3 | |
| | 37,989 | | | @ | | Yahoo!, Inc. | | | 1,469,035 | | | | 0.3 | |
| | | | | | | | | | 49,092,456 | | | | 9.4 | |
| | | | | | | | | | | | | | | |
| | | | | | | Materials: 1.8% | | | | | | | | |
| | 52,812 | | | | | Alcoa Corp. | | | 1,482,961 | | | | 0.3 | |
| | 102,361 | | | | | CF Industries Holdings, Inc. | | | 3,222,324 | | | | 0.6 | |
| | 85,591 | | | | | International Paper Co. | | | 4,541,459 | | | | 0.9 | |
| | | | | | | | | | 9,246,744 | | | | 1.8 | |
| | | | | | | | | | | | | | | |
| | | | | | | Telecommunication Services: 1.0% | |
| | 989,495 | | | L | | Frontier Communications Corp. | | | 3,344,493 | | | | 0.6 | |
| | 787,107 | | | | | Vodafone Group PLC | | | 1,936,987 | | | | 0.4 | |
| | | | | | | | | | 5,281,480 | | | | 1.0 | |
| | | | | | | | | | | | | | | |
| | | | | | | Utilities: 0.6% | | | | | | | | |
| | 99,873 | | | | | FirstEnergy Corp. | | | 3,093,067 | | | | 0.6 | |
| | | | | | | | | | | | | | | |
| | | | | Total Common Stock
(Cost $425,209,667) | | | 512,193,593 | | | | 98.4 | |
| VY® Invesco Comstock Portfolio | PORTFOLIO OF INVESTMENTS AS OF December 31, 2016 (CONTINUED) |
Principal
Amount† | | | | | | | Value | | | Percentage
of Net
Assets | |
| SHORT-TERM INVESTMENTS: 2.6% | | | | | | | | |
| | | | | | | Securities Lending Collateralcc: 1.2% | |
| | 1,462,984 | | | | | Cantor Fitzgerald, Repurchase Agreement dated 12/30/16, 0.50%, due 01/03/17 (Repurchase Amount $1,463,064, collateralized by various U.S. Government/U.S. Government Agency Obligations, 0.000%-10.000%, Market Value plus accrued interest $1,492,244, due 01/25/17-10/20/66) | | | 1,462,984 | | | | 0.3 | |
| | 1,462,984 | | | | | Citigroup, Inc., Repurchase Agreement dated 12/30/16, 0.53%, due 01/03/17 (Repurchase Amount $1,463,069, collateralized by various U.S. Government Agency Obligations, 2.000%-8.500%, Market Value plus accrued interest $1,492,244, due 12/01/17-01/01/47) | | | 1,462,984 | | | | 0.3 | |
| | 1,462,984 | | | | | Daiwa Capital Markets, Repurchase Agreement dated 12/30/16, 0.52%, due 01/03/17 (Repurchase Amount $1,463,067, collateralized by various U.S. Government/U.S. Government Agency Obligations, 0.000%-6.500%, Market Value plus accrued interest $1,492,244, due 03/02/17-02/01/49) | | | 1,462,984 | | | | 0.3 | |
| | 307,916 | | | | | Merrill Lynch & Co., Inc., Repurchase Agreement dated 12/30/16, 0.50%, due 01/03/17 (Repurchase Amount $307,933, collateralized by various U.S. Government Securities, 0.685%-2.000%, Market Value plus accrued interest $314,074, due 10/31/18-11/30/22) | | | 307,916 | | | | 0.0 | |
| | 1,462,984 | | | | | Nomura Securities, Repurchase Agreement dated 12/30/16, 0.50%, due 01/03/17 (Repurchase Amount $1,463,064, collateralized by various U.S. Government/U.S. Government Agency Obligations, 0.000%-9.500%, Market Value plus accrued interest $1,492,244, due 01/15/17-08/20/66) | | | 1,462,984 | | | | 0.3 | |
| | | | | | | | | | 6,159,852 | | | | 1.2 | |
| | | | | | | | | | | | |
| Shares | | | | | | | Value | | | Percentage
of Net
Assets | |
| | | | | | | Mutual Funds: 1.4% | |
| | 7,177,230 | | | | | BlackRock Liquidity Funds, FedFund, Institutional Class, 0.420%†† | | | | | | | | |
| | | | | | | (Cost $7,177,230) | | | 7,177,230 | | | | 1.4 | |
| | | | | | | | | | | | | | | |
| | | | | Total Short-Term Investments
(Cost $13,337,082) | | | 13,337,082 | | | | 2.6 | |
| | | | | | | | | | | | | | | |
| | | | | Total Investments in Securities
(Cost $438,546,749) | | $ | 525,530,675 | | | | 101.0 | |
| | | | | Liabilities in Excess of Other Assets | | | (5,329,598 | ) | | | (1.0 | ) |
| | | | | Net Assets | | $ | 520,201,077 | | | | 100.0 | |
| † | Unless otherwise indicated, principal amount is shown in USD. |
| †† | Rate shown is the 7-day yield as of December 31, 2016. |
| @ | Non-income producing security. |
| ADR | American Depositary Receipt |
| cc | Represents securities purchased with cash collateral received for securities on loan. |
| L | Loaned security, a portion or all of the security is on loan at December 31, 2016. |
Cost for federal income tax purposes is $446,747,864.
Net unrealized appreciation consists of:
| Gross Unrealized Appreciation | | $ | 107,445,032 | |
| Gross Unrealized Depreciation | | | (28,662,221 | ) |
| | | | | |
| Net Unrealized Appreciation | | $ | 78,782,811 | |
| VY® Invesco Equity and Income Portfolio | PORTFOLIO OF INVESTMENTS AS OF December 31, 2016 |
| Shares | | | | | | | Value | | | Percentage
of Net
Assets | |
| COMMON STOCK: 64.6% | | | | | | | | |
| | | | | | | Consumer Discretionary: 5.2% | |
| | 390,840 | | | | | Carnival Corp. | | | 20,347,130 | | | | 1.1 | |
| | 58,706 | | | | | CBS Corp. - Class B | | | 3,734,876 | | | | 0.2 | |
| | 35,969 | | | @ | | Charter Communications, Inc. | | | 10,356,195 | | | | 0.6 | |
| | 245,378 | | | | | Comcast Corp. – Class A | | | 16,943,351 | | | | 0.9 | |
| | 396,113 | | | | | General Motors Co. | | | 13,800,577 | | | | 0.8 | |
| | 2,017,807 | | | | | Kingfisher PLC | | | 8,693,550 | | | | 0.5 | |
| | 208,998 | | | @ | | Michael Kors Holdings Ltd. | | | 8,982,734 | | | | 0.5 | |
| | 102,561 | | | | | Time Warner, Inc. | | | 9,900,213 | | | | 0.6 | |
| | | | | | | | | | 92,758,626 | | | | 5.2 | |
| | | | | | | | | | | | | | | |
| | | | | | | Consumer Staples: 2.8% | |
| | 302,614 | | | | | Mondelez International, Inc. | | | 13,414,879 | | | | 0.8 | |
| | 130,388 | | | | | Philip Morris International, Inc. | | | 11,929,198 | | | | 0.7 | |
| | 283,675 | | | | | Walgreens Boots Alliance, Inc. | | | 23,476,943 | | | | 1.3 | |
| | | | | | | | | | 48,821,020 | | | | 2.8 | |
| | | | | | | | | | | | | | | |
| | | | | | | Energy: 9.3% | | | | | | | | |
| | 498,039 | | | | | Apache Corp. | | | 31,610,535 | | | | 1.8 | |
| | 402,869 | | | | | Baker Hughes, Inc. | | | 26,174,399 | | | | 1.5 | |
| | 588,345 | | | | | Canadian Natural Resources Ltd. | | | 18,750,443 | | | | 1.0 | |
| | 572,346 | | | | | Devon Energy Corp. | | | 26,139,042 | | | | 1.5 | |
| | 124,650 | | | | | Exxon Mobil Corp. | | | 11,250,909 | | | | 0.6 | |
| | 170,717 | | | | | Occidental Petroleum Corp. | | | 12,160,172 | | | | 0.7 | |
| | 929,287 | | | | | Royal Dutch Shell PLC - Class A | | | 25,651,764 | | | | 1.4 | |
| | 271,318 | | | | | Total S.A. | | | 13,916,516 | | | | 0.8 | |
| | | | | | | | | | 165,653,780 | | | | 9.3 | |
| | | | | | | | | | | | | | | |
| | | | | | | Financials: 22.5% | | | | | | | | |
| | 129,849 | | | | | Aon PLC | | | 14,482,059 | | | | 0.8 | |
| | 2,149,409 | | | | | Bank of America Corp. | | | 47,501,939 | | | | 2.7 | |
| | 168,237 | | | | | BB&T Corp. | | | 7,910,504 | | | | 0.4 | |
| | 342,878 | | | | | Charles Schwab Corp. | | | 13,533,395 | | | | 0.8 | |
| | 993,614 | | | | | Citigroup, Inc. | | | 59,050,480 | | | | 3.3 | |
| | 812,372 | | | | | Citizens Financial Group, Inc. | | | 28,944,814 | | | | 1.6 | |
| | 42,437 | | | | | CME Group, Inc. | | | 4,895,108 | | | | 0.3 | |
| | 222,373 | | | | | Comerica, Inc. | | | 15,145,825 | | | | 0.9 | |
| | 777,070 | | | | | Fifth Third Bancorp | | | 20,957,578 | | | | 1.2 | |
| | 557,536 | | | | | First Horizon National Corp. | | | 11,156,295 | | | | 0.6 | |
| | 67,012 | | | | | Goldman Sachs Group, Inc. | | | 16,046,023 | | | | 0.9 | |
| | 585,964 | | | | | JPMorgan Chase & Co. | | | 50,562,834 | | | | 2.8 | |
| | 129,092 | | | | | Marsh & McLennan Cos., Inc. | | | 8,725,328 | | | | 0.5 | |
| | 830,934 | | | | | Morgan Stanley | | | 35,106,961 | | | | 2.0 | |
| | 163,864 | | | | | Northern Trust Corp. | | | 14,592,089 | | | | 0.8 | |
| | 193,633 | | | | | PNC Financial Services Group, Inc. | | | 22,647,316 | | | | 1.3 | |
| | 230,598 | | | | | State Street Corp. | | | 17,922,077 | | | | 1.0 | |
| | 81,864 | | | | | Willis Towers Watson PLC | | | 10,010,330 | | | | 0.6 | |
| | | | | | | | | | 399,190,955 | | | | 22.5 | |
| | | | | | | | | | | | | | | |
| | | | | | | Health Care: 7.2% | | | | | | | | |
| | 72,729 | | | | | Amgen, Inc. | | | 10,633,707 | | | | 0.6 | |
| | 62,613 | | | | | Anthem, Inc. | | | 9,001,871 | | | | 0.5 | |
| | 250,009 | | | | | Baxter International, Inc. | | | 11,085,399 | | | | 0.6 | |
| | 104,788 | | | | | Eli Lilly & Co. | | | 7,707,158 | | | | 0.4 | |
| | 108,639 | | | @ | | Express Scripts Holding Co. | | | 7,473,277 | | | | 0.4 | |
| | 192,483 | | | | | Medtronic PLC | | | 13,710,564 | | | | 0.8 | |
| | 379,322 | | | | | Merck & Co., Inc. | | | 22,330,686 | | | | 1.3 | |
| | 177,057 | | | | | Novartis AG | | | 12,876,205 | | | | 0.7 | |
| | 653,310 | | | | | Pfizer, Inc. | | | 21,219,509 | | | | 1.2 | |
| | 145,564 | | | | | Sanofi | | | 11,771,098 | | | | 0.7 | |
| | | | | | | | | | 127,809,474 | | | | 7.2 | |
| | | | | | | | | | | | | | | |
| | | | | | | Industrials: 5.1% | | | | | | | | |
| | 167,149 | | | | | Caterpillar, Inc. | | | 15,501,398 | | | | 0.9 | |
| | 408,880 | | | | | CSX Corp. | | | 14,691,058 | | | | 0.8 | |
| | 97,522 | | | | | General Dynamics Corp. | | | 16,838,149 | | | | 1.0 | |
| | 642,018 | | | | | General Electric Co. | | | 20,287,769 | | | | 1.1 | |
| | 161,885 | | | | | Ingersoll-Rand PLC - Class A | | | 12,147,850 | | | | 0.7 | |
| | 255,351 | | | | | Johnson Controls International plc | | | 10,517,908 | | | | 0.6 | |
| | | | | | | | | | 89,984,132 | | | | 5.1 | |
| | | | | | | | | | | | | | | |
| | | | | | | Information Technology: 8.5% | |
| | 387,442 | | | | | Applied Materials, Inc. | | | 12,502,753 | | | | 0.7 | |
| | 622,713 | | | | | Cisco Systems, Inc. | | | 18,818,387 | | | | 1.1 | |
| | 105,819 | | | @ | | Citrix Systems, Inc. | | | 9,450,695 | | | | 0.5 | |
| | 106,106 | | | @ | | Cognizant Technology Solutions Corp. | | | 5,945,119 | | | | 0.3 | |
| | 477,825 | | | @ | | eBay, Inc. | | | 14,186,624 | | | | 0.8 | |
| | 377,903 | | | | | Intel Corp. | | | 13,706,542 | | | | 0.8 | |
| | 566,703 | | | | | Juniper Networks, Inc. | | | 16,015,027 | | | | 0.9 | |
| | 192,589 | | | | | Microsoft Corp. | | | 11,967,480 | | | | 0.7 | |
| | 507,135 | | | | | Oracle Corp. | | | 19,499,341 | | | | 1.1 | |
| | 255,609 | | | @ | | PayPal Holdings, Inc. | | | 10,088,887 | | | | 0.6 | |
| | 281,644 | | | | | Qualcomm, Inc. | | | 18,363,189 | | | | 1.0 | |
| | | | | | | | | | 150,544,044 | | | | 8.5 | |
| | | | | | | | | | | | | | | |
| | | | | | | Materials: 2.0% | | | | | | | | |
| | 85,362 | | | L | | Agrium, Inc. | | | 8,583,149 | | | | 0.5 | |
| | 498,556 | | | | | BHP Billiton Ltd. | | | 8,931,565 | | | | 0.5 | |
| | 580,145 | | | | | Mosaic Co. | | | 17,015,653 | | | | 1.0 | |
| | | | | | | | | | 34,530,367 | | | | 2.0 | |
| | | | | | | | | | | | | | | |
| | | | | | | Telecommunication Services: 1.2% | |
| | 180,386 | | | | | Orange SA | | | 2,735,377 | | | | 0.2 | |
| | 183,129 | | | | | Verizon Communications, Inc. | | | 9,775,426 | | | | 0.5 | |
| | 331,221 | | | | | Vodafone Group PLC ADR | | | 8,091,729 | | | | 0.5 | |
| | | | | | | | | | 20,602,532 | | | | 1.2 | |
| | | | | | | | | | | | | | | |
| | | | | | | Utilities: 0.8% | | | | | | | | |
| | 190,126 | | | | | FirstEnergy Corp. | | | 5,888,202 | | | | 0.3 | |
| | 150,130 | | | | | PG&E Corp. | | | 9,123,400 | | | | 0.5 | |
| | | | | | | | | | 15,011,602 | | | | 0.8 | |
| | | | | | | | | | | | | | | |
| | | | | Total Common Stock
(Cost $983,221,429) | | | 1,144,906,532 | | | | 64.6 | |
| VY® Invesco Equity and Income Portfolio | PORTFOLIO OF INVESTMENTS AS OF December 31, 2016 (CONTINUED) |
| PREFERRED STOCK: 1.1% | | | | | | | | |
| | | | | | | Energy: 0.4% | | | | | | | | |
| | 140,612 | | | @,P | | El Paso Energy Capital Trust I | | | 6,925,141 | | | | 0.4 | |
| | | | | | | | | | | | | | | |
| | | | | | | Financials: 0.7% | | | | | | | | |
| | 75,900 | | | @ | | AMG Capital Trust II | | | 4,162,644 | | | | 0.2 | |
| | 58,099 | | | @ | | Keycorp | | | 7,843,365 | | | | 0.5 | |
| | 4,000 | | | @,P | | Wells Fargo & Co. | | | 100,960 | | | | 0.0 | |
| | | | | | | | | | 12,106,969 | | | | 0.7 | |
| | | | | | | | | | | | | | | |
| | | | | Total Preferred Stock
(Cost $17,144,943) | | | 19,032,110 | | | | 1.1 | |
| | | | | | | | | | | | |
Principal
Amount† | | | | | | | Value | | | Percentage
of Net
Assets | |
| CORPORATE BONDS/NOTES: 17.7% | | | | | | | | |
| | | | | | | Basic Materials: 0.2% | |
| | 1,320,000 | | | | | Eastman Chemical Co., 2.700%, 01/15/20 | | | 1,327,990 | | | | 0.1 | |
| | 195,000 | | | | | International Paper Co., 6.000%, 11/15/41 | | | 219,357 | | | | 0.0 | |
| | 315,000 | | | | | Monsanto Co., 2.125%, 07/15/19 | | | 314,554 | | | | 0.0 | |
| | 770,000 | | | # | | Montell Finance Co. BV, 8.100%, 03/15/27 | | | 1,008,549 | | | | 0.1 | |
| | 150,000 | | | | | Rio Tinto Finance USA Ltd., 7.125%, 07/15/28 | | | 193,968 | | | | 0.0 | |
| | 335,000 | | | | | Rio Tinto Finance USA Ltd., 9.000%, 05/01/19 | | | 386,332 | | | | 0.0 | |
| | | | | | | | | | 3,450,750 | | | | 0.2 | |
| | | | | | | | | | | | | | | |
| | | | | | | Communications: 3.3% | |
| | 455,000 | | | | | America Movil S.A.B de CV, 4.375%, 07/16/42 | | | 423,021 | | | | 0.0 | |
| | 466,000 | | | | | AT&T, Inc., 3.400%, 05/15/25 | | | 449,359 | | | | 0.0 | |
| | 837,000 | | | | | AT&T, Inc., 3.000%, 06/30/22 | | | 821,756 | | | | 0.1 | |
| | 505,000 | | | | | AT&T, Inc., 3.800%, 03/15/22 | | | 517,783 | | | | 0.0 | |
| | 747,000 | | | | | AT&T, Inc., 4.500%, 05/15/35 | | | 722,843 | | | | 0.0 | |
| | 1,300,000 | | | | | AT&T, Inc., 4.800%, 06/15/44 | | | 1,230,679 | | | | 0.1 | |
| | 2,960,000 | | | | | AT&T, Inc., 5.150%, 03/15/42 | | | 2,953,873 | | | | 0.2 | |
| | 101,000 | | | | | AT&T, Inc., 5.350%, 09/01/40 | | | 103,903 | | | | 0.0 | |
| | 270,000 | | | | | AT&T, Inc., 6.150%, 09/15/34 | | | 294,169 | | | | 0.0 | |
| | 1,635,000 | | | | | Charter Communications Operating LLC / Charter Communications Operating Capital, 4.464%, 07/23/22 | | | 1,708,920 | | | | 0.1 | |
| | 2,421,000 | | | | | Ciena Corp., 4.000%, 12/15/20 | | | 3,389,400 | | | | 0.2 | |
| | 1,019,000 | | | | | Comcast Corp., 5.700%, 05/15/18 | | | 1,075,734 | | | | 0.1 | |
| | 135,000 | | | | | Comcast Corp., 6.450%, 03/15/37 | | | 174,360 | | | | 0.0 | |
| | 1,210,000 | | | # | | Cox Communications, Inc., 8.375%, 03/01/39 | | | 1,511,111 | | | | 0.1 | |
| | 2,700,000 | | | # | | Crown Castle Towers, LLC, 4.883%, 08/15/40 | | | 2,877,633 | | | | 0.2 | |
| | 435,000 | | | # | | Crown Castle Towers, LLC, 6.113%, 01/15/40 | | | 471,667 | | | | 0.0 | |
| | 3,989,000 | | | # | | Ctrip.com International Ltd., 1.250%, 09/15/22 | | | 3,859,357 | | | | 0.2 | |
| | 4,731,000 | | | # | | DISH Network Corp., 3.375%, 08/15/26 | | | 5,408,124 | | | | 0.3 | |
| | 1,319,000 | | | # | | Finisar Corp., 0.500%, 12/15/36 | | | 1,333,014 | | | | 0.1 | |
| | 1,689,000 | | | L | | FireEye, Inc., 1.000%, 06/01/35 | | | 1,568,659 | | | | 0.1 | |
| | 1,689,000 | | | | | FireEye, Inc., 1.625%, 06/01/35 | | | 1,529,601 | | | | 0.1 | |
| | 5,355,000 | | | L | | JDS Uniphase Corp., 0.625%, 08/15/33 | | | 5,562,506 | | | | 0.3 | |
| | 2,954,000 | | | # | | Liberty Interactive LLC, 1.750%, 09/30/46 | | | 3,190,320 | | | | 0.2 | |
| | 9,559,000 | | | | | Liberty Media Corp., 1.375%, 10/15/23 | | | 10,311,771 | | | | 0.6 | |
| | 1,933,000 | | | # | | Liberty Media Corp., 2.250%, 09/30/46 | | | 2,046,564 | | | | 0.1 | |
| | 125,000 | | | | | NBCUniversal Media, LLC, 5.150%, 04/30/20 | | | 136,664 | | | | 0.0 | |
| | 210,000 | | | | | NBCUniversal Media, LLC, 5.950%, 04/01/41 | | | 258,832 | | | | 0.0 | |
| | 415,000 | | | | | Rogers Communications, Inc., 4.500%, 03/15/43 | | | 404,693 | | | | 0.0 | |
| | 370,000 | | | | | Telefonica Emisones SAU, 7.045%, 06/20/36 | | | 430,067 | | | | 0.0 | |
| | 136,000 | | | | | Verizon Communications, Inc., 4.125%, 08/15/46 | | | 123,336 | | | | 0.0 | |
| | 535,000 | | | | | Verizon Communications, Inc., 4.400%, 11/01/34 | | | 528,851 | | | | 0.0 | |
| | 1,058,000 | | | | | Verizon Communications, Inc., 4.522%, 09/15/48 | | | 1,016,630 | | | | 0.1 | |
| | 467,000 | | | | | Verizon Communications, Inc., 5.012%, 08/21/54 | | | 467,109 | | | | 0.0 | |
| | 745,000 | | | | | Verizon Communications, Inc., 5.150%, 09/15/23 | | | 824,095 | | | | 0.1 | |
| | | | | | | | | | 57,726,404 | | | | 3.3 | |
| | | | | | | | | | | | | | | |
| | | | | | | Consumer, Cyclical: 1.2% | | | | | | | | |
| | 2,650,000 | | | | | Advance Auto Parts, Inc., 4.500%, 12/01/23 | | | 2,741,126 | | | | 0.2 | |
| | 387,000 | | | | | Advance Auto Parts, Inc., 5.750%, 05/01/20 | | | 416,504 | | | | 0.0 | |
| | 668,472 | | | | | American Airlines 2014-1 Class A Pass Through Trust, 3.700%, 10/01/26 | | | 662,623 | | | | 0.0 | |
| | 204,406 | | | | | Continental Airlines 2010-1 Class A Pass Through Trust, 4.750%, 07/15/22 | | | 215,904 | | | | 0.0 | |
| | 331,094 | | | | | Continental Airlines 2012-1 Class A Pass Thru Trusts, 4.150%, 10/11/25 | | | 340,613 | | | | 0.0 | |
| | 620,000 | | | | | CVS Health Corp., 3.375%, 08/12/24 | | | 622,184 | | | | 0.0 | |
| | 593,427 | | | | | CVS Pass-Through Trust, 6.036%, 12/10/28 | | | 665,513 | | | | 0.0 | |
| | 124,923 | | | | | Delta Air Lines 2010-1 Class A Pass Through Trust, 6.200%, 01/02/20 | | | 131,637 | | | | 0.0 | |
| VY® Invesco Equity and Income Portfolio | PORTFOLIO OF INVESTMENTS AS OF December 31, 2016 (CONTINUED) |
| | 595,000 | | | | | Dollar General Corp., 3.250%, 04/15/23 | | | 587,352 | | | | 0.0 | |
| | 368,000 | | | | | Ford Motor Credit Co. LLC, 3.096%, 05/04/23 | | | 355,501 | | | | 0.0 | |
| | 1,056,000 | | | | | Ford Motor Credit Co. LLC, 4.134%, 08/04/25 | | | 1,059,472 | | | | 0.1 | |
| | 563,000 | | | | | General Motors Co., 6.600%, 04/01/36 | | | 644,424 | | | | 0.0 | |
| | 713,000 | | | | | General Motors Financial Co., Inc., 5.250%, 03/01/26 | | | 751,192 | | | | 0.1 | |
| | 896,000 | | | | | Home Depot, Inc., 2.000%, 04/01/21 | | | 888,648 | | | | 0.1 | |
| | 587,000 | | | | | Lifestorage L.P./CA, 3.500%, 07/01/26 | | | 563,695 | | | | 0.0 | |
| | 725,000 | | | | | MDC Holdings, Inc., 6.000%, 01/15/43 | | | 612,625 | | | | 0.0 | |
| | 305,000 | | | | | Newell Rubbermaid, Inc., 5.500%, 04/01/46 | | | 350,287 | | | | 0.0 | |
| | 1,460,000 | | | | | QVC, Inc., 5.450%, 08/15/34 | | | 1,330,809 | | | | 0.1 | |
| | 594,000 | | | | | Ross Stores, Inc., 3.375%, 09/15/24 | | | 598,407 | | | | 0.0 | |
| | 833,956 | | | | | United Airlines 2014-2 Class A Pass Through Trust, 3.750%, 03/03/28 | | | 839,168 | | | | 0.1 | |
| | 1,120,333 | | | # | | Virgin Australia 2013-1A Trust, 5.000%, 04/23/25 | | | 1,172,148 | | | | 0.1 | |
| | 389,000 | | | | | Walgreens Boots Alliance, Inc., 3.100%, 06/01/23 | | | 386,558 | | | | 0.0 | |
| | 1,000,000 | | | | | Walgreens Boots Alliance, Inc., 3.300%, 11/18/21 | | | 1,018,930 | | | | 0.1 | |
| | 737,000 | | | | | Walgreens Boots Alliance, Inc., 4.500%, 11/18/34 | | | 742,727 | | | | 0.1 | |
| | 3,415,000 | | | + | | Wal-Mart Stores, Inc., 5.524%, 06/01/18 | | | 3,469,350 | | | | 0.2 | |
| | | | | | | | | | 21,167,397 | | | | 1.2 | |
| | | | | | | | | | | | | | | |
| | | | | | | Consumer, Non-cyclical: 3.2% | |
| | 1,137,000 | | | | | AbbVie, Inc., 4.500%, 05/14/35 | | | 1,118,871 | | | | 0.1 | |
| | 985,000 | | | | | Actavis Funding SCS, 4.850%, 06/15/44 | | | 978,475 | | | | 0.1 | |
| | 610,000 | | | | | Aetna, Inc., 3.950%, 09/01/20 | | | 641,734 | | | | 0.0 | |
| | 476,000 | | | | | Aetna, Inc., 4.375%, 06/15/46 | | | 478,959 | | | | 0.0 | |
| | 952,000 | | | | | Anheuser-Busch InBev Finance, Inc., 2.650%, 02/01/21 | | | 957,268 | | | | 0.1 | |
| | 871,000 | | | | | Anheuser-Busch InBev Finance, Inc., 3.300%, 02/01/23 | | | 886,719 | | | | 0.1 | |
| | 1,475,000 | | | | | Anheuser-Busch InBev Finance, Inc., 4.700%, 02/01/36 | | | 1,555,849 | | | | 0.1 | |
| | 1,646,000 | | | | | Anheuser-Busch InBev Finance, Inc., 4.900%, 02/01/46 | | | 1,774,353 | | | | 0.1 | |
| | 981,000 | | | # | | Bayer US Finance LLC, 3.000%, 10/08/21 | | | 986,109 | | | | 0.1 | |
| | 442,000 | | | | | Becton Dickinson & Co., 2.675%, 12/15/19 | | | 448,549 | | | | 0.0 | |
| | 435,000 | | | | | Becton Dickinson and Co., 4.875%, 05/15/44 | | | 453,775 | | | | 0.0 | |
| | 3,952,000 | | | | | BioMarin Pharmaceutical, Inc., 1.500%, 10/15/20 | | | 4,651,010 | | | | 0.3 | |
| | 4,526,000 | | | | | Brookdale Senior Living, Inc., 2.750%, 06/15/18 | | | 4,421,336 | | | | 0.3 | |
| | 1,445,000 | | | | | Celgene Corp., 4.625%, 05/15/44 | | | 1,417,555 | | | | 0.1 | |
| | 325,000 | | | | | Celgene Corp., 4.000%, 08/15/23 | | | 338,996 | | | | 0.0 | |
| | 240,000 | | | | | Corn Products International, Inc., 6.625%, 04/15/37 | | | 290,718 | | | | 0.0 | |
| | 493,000 | | | | | Edwards Lifesciences Corp., 2.875%, 10/15/18 | | | 500,526 | | | | 0.0 | |
| | 965,000 | | | # | | ERAC USA Finance LLC, 2.350%, 10/15/19 | | | 964,328 | | | | 0.1 | |
| | 420,000 | | | | | Express Scripts Holding Co., 2.250%, 06/15/19 | | | 420,092 | | | | 0.0 | |
| | 1,400,000 | | | | | General Mills, Inc., 2.200%, 10/21/19 | | | 1,407,087 | | | | 0.1 | |
| | 755,000 | | | | | Gilead Sciences, Inc., 4.400%, 12/01/21 | | | 812,040 | | | | 0.1 | |
| | 80,000 | | | | | GlaxoSmithKline Capital, Inc., 6.375%, 05/15/38 | | | 105,256 | | | | 0.0 | |
| | 4,883,000 | | | | | HealthSouth Corp., 2.000%, 12/01/43 | | | 5,804,666 | | | | 0.3 | |
| | 2,410,000 | | | | | Jazz Investments I Ltd., 1.875%, 08/15/21 | | | 2,321,131 | | | | 0.1 | |
| | 963,000 | | | | | Laboratory Corp. of America Holdings, 3.200%, 02/01/22 | | | 971,162 | | | | 0.1 | |
| | 423,000 | | | | | Laboratory Corp. of America Holdings, 4.700%, 02/01/45 | | | 418,627 | | | | 0.0 | |
| | 1,883,000 | | | | | Live Nation Entertainment, Inc., 2.500%, 05/15/19 | | | 2,015,987 | | | | 0.1 | |
| | 730,000 | | | | | McKesson Corp., 2.284%, 03/15/19 | | | 732,953 | | | | 0.1 | |
| | 92,000 | | | | | Mead Johnson Nutrition Co., 4.125%, 11/15/25 | | | 94,106 | | | | 0.0 | |
| | 1,251,000 | | | # | | Medicines Co., 2.750%, 07/15/23 | | | 1,209,561 | | | | 0.1 | |
| | 1,733,000 | | | | | Medtronic, Inc., 3.150%, 03/15/22 | | | 1,774,237 | | | | 0.1 | |
| | 576,000 | | | | | Medtronic, Inc., 4.375%, 03/15/35 | | | 609,566 | | | | 0.0 | |
| | 502,000 | | | | | Molson Coors Brewing Co., 1.450%, 07/15/19 | | | 494,683 | | | | 0.0 | |
| | 513,000 | | | | | Molson Coors Brewing Co., 4.200%, 07/15/46 | | | 479,268 | | | | 0.0 | |
| | 630,000 | | | | | Moody's Corp., 4.500%, 09/01/22 | | | 675,349 | | | | 0.0 | |
| | 574,000 | | | # | | Mylan NV, 3.150%, 06/15/21 | | | 563,399 | | | | 0.0 | |
| | 785,000 | | | # | | Mylan NV, 5.250%, 06/15/46 | | | 725,306 | | | | 0.0 | |
| | 2,762,000 | | | # | | NuVasive, Inc., 2.250%, 03/15/21 | | | 3,519,824 | | | | 0.2 | |
| | 275,000 | | | | | Perrigo Co. PLC, 2.300%, 11/08/18 | | | 274,704 | | | | 0.0 | |
| | 200,000 | | | | | Perrigo Finance Unlimited Co., 3.500%, 03/15/21 | | | 202,113 | | | | 0.0 | |
| | 275,000 | | | | | Philip Morris International, Inc., 3.600%, 11/15/23 | | | 285,772 | | | | 0.0 | |
| VY® Invesco Equity and Income Portfolio | PORTFOLIO OF INVESTMENTS AS OF December 31, 2016 (CONTINUED) |
| | 820,000 | | | | | Philip Morris International, Inc., 4.875%, 11/15/43 | | | 882,365 | | | | 0.1 | |
| | 474,000 | | | | | Teva Pharmaceutical Finance Netherlands III BV, 2.800%, 07/21/23 | | | 448,837 | | | | 0.0 | |
| | 419,000 | | | | | Teva Pharmaceutical Finance Netherlands III BV, 4.100%, 10/01/46 | | | 359,750 | | | | 0.0 | |
| | 354,000 | | | | | Tyson Foods, Inc., 4.875%, 08/15/34 | | | 361,266 | | | | 0.0 | |
| | 415,000 | | | | | Verisk Analytics, Inc., 5.500%, 06/15/45 | | | 442,141 | | | | 0.0 | |
| | 1,309,000 | | | # | | Wright Medical Group NV, 2.250%, 11/15/21 | | | 1,638,704 | | | | 0.1 | |
| | 3,223,000 | | | | | Wright Medical Group, Inc., 2.000%, 02/15/20 | | | 3,374,078 | | | | 0.2 | |
| | 79,000 | | | | | Zoetis, Inc., 4.700%, 02/01/43 | | | 77,040 | | | | 0.0 | |
| | | | | | | | | | 56,366,200 | | | | 3.2 | |
| | | | | | | | | | | | | | | |
| | | | | | | Energy: 1.5% | | | | | | | | |
| | 397,000 | | | | | Anadarko Petroleum Corp., 4.850%, 03/15/21 | | | 425,736 | | | | 0.0 | |
| | 610,000 | | | | | Anadarko Petroleum Corp., 6.600%, 03/15/46 | | | 753,705 | | | | 0.1 | |
| | 1,298,000 | | | # | | Chesapeake Energy Corp., 5.500%, 09/15/26 | | | 1,411,575 | | | | 0.1 | |
| | 2,284,000 | | | | | Chevron Corp., 1.365%, 03/02/18 | | | 2,281,862 | | | | 0.1 | |
| | 360,000 | | | | | Chevron Corp., 1.718%, 06/24/18 | | | 361,122 | | | | 0.0 | |
| | 1,425,000 | | | | | ConocoPhillips Co., 2.875%, 11/15/21 | | | 1,436,089 | | | | 0.1 | |
| | 1,528,000 | | | | | ConocoPhillips Co., 4.150%, 11/15/34 | | | 1,495,874 | | | | 0.1 | |
| | 460,000 | | | | | Enable Midstream Partners L.P., 2.400%, 05/15/19 | | | 451,771 | | | | 0.0 | |
| | 545,000 | | | | | Enbridge, Inc., 5.500%, 12/01/46 | | | 586,878 | | | | 0.0 | |
| | 570,000 | | | | | Energy Transfer Partners L.P., 4.900%, 03/15/35 | | | 533,467 | | | | 0.0 | |
| | 2,490,000 | | | # | | Ensco Jersey Finance Ltd., 3.000%, 01/31/24 | | | 2,546,025 | | | | 0.2 | |
| | 175,000 | | | | | Enterprise Products Operating L.P., 5.250%, 01/31/20 | | | 189,374 | | | | 0.0 | |
| | 300,000 | | | | | Enterprise Products Operating L.P., 6.500%, 01/31/19 | | | 327,071 | | | | 0.0 | |
| | 615,000 | | | | | Enterprise Products Operating LLC, 2.550%, 10/15/19 | | | 621,392 | | | | 0.0 | |
| | 1,359,000 | | | | | Helix Energy Solutions Group, Inc., 4.250%, 05/01/22 | | | 1,410,812 | | | | 0.1 | |
| | 250,000 | | | | | Husky Energy, Inc., 3.950%, 04/15/22 | | | 259,747 | | | | 0.0 | |
| | 700,000 | | | | | Kinder Morgan, Inc./DE, 5.300%, 12/01/34 | | | 711,406 | | | | 0.1 | |
| | 570,000 | | | | | Noble Energy, Inc., 5.250%, 11/15/43 | | | 581,657 | | | | 0.0 | |
| | 505,000 | | | | | Occidental Petroleum Corp., 3.400%, 04/15/26 | | | 508,681 | | | | 0.0 | |
| | 136,000 | | | # | | Petroleos Mexicanos, 6.500%, 03/13/27 | | | 140,454 | | | | 0.0 | �� |
| | 295,000 | | | | | Plains All American Pipeline L.P. / PAA Finance Corp., 3.650%, 06/01/22 | | | 296,678 | | | | 0.0 | |
| | 1,244,000 | | | | | Shell International Finance BV, 4.000%, 05/10/46 | | | 1,190,105 | | | | 0.1 | |
| | 858,000 | | | | | Spectra Energy Partners L.P., 4.500%, 03/15/45 | | | 817,429 | | | | 0.1 | |
| | 544,000 | | | | | Suncor Energy, Inc., 3.600%, 12/01/24 | | | 557,706 | | | | 0.0 | |
| | 835,000 | | | | | Sunoco Logistics Partners Operations L.P., 5.300%, 04/01/44 | | | 807,617 | | | | 0.1 | |
| | 550,000 | | | | | Sunoco Logistics Partners Operations L.P., 5.500%, 02/15/20 | | | 593,826 | | | | 0.0 | |
| | 215,000 | | | | | Texas Eastern Transmission LP, 7.000%, 07/15/32 | | | 262,898 | | | | 0.0 | |
| | 3,942,000 | | | | | Weatherford International Ltd., 5.875%, 07/01/21 | | | 4,286,925 | | | | 0.3 | |
| | | | | | | | | | 25,847,882 | | | | 1.5 | |
| | | | | | | | | | | | | | | |
| | | | | | | Financial: 5.1% | | | | | | | | |
| | 530,000 | | | | | AerCap Ireland Capital Ltd. / AerCap Global Aviation Trust, 3.950%, 02/01/22 | | | 535,962 | | | | 0.0 | |
| | 395,000 | | | | | American International Group, Inc., 2.300%, 07/16/19 | | | 396,932 | | | | 0.0 | |
| | 1,685,000 | | | | | Air Lease Corp., 2.625%, 09/04/18 | | | 1,697,135 | | | | 0.1 | |
| | 851,000 | | | | | Air Lease Corp., 3.000%, 09/15/23 | | | 813,315 | | | | 0.1 | |
| | 1,870,000 | | | | | Air Lease Corp., 4.250%, 09/15/24 | | | 1,900,178 | | | | 0.1 | |
| | 410,000 | | | | | Allstate Corp./The, 3.280%, 12/15/26 | | | 411,590 | | | | 0.0 | |
| | 543,000 | | | | | American Express Co., 3.625%, 12/05/24 | | | 545,499 | | | | 0.0 | |
| | 1,200,000 | | | | | American Financial Group, Inc./OH, 9.875%, 06/15/19 | | | 1,409,374 | | | | 0.1 | |
| | 1,140,000 | | | | | American International Group, Inc., 4.375%, 01/15/55 | | | 1,046,756 | | | | 0.1 | |
| | 1,117,000 | | | # | | Apollo Management Holdings L.P., 4.400%, 05/27/26 | | | 1,111,259 | | | | 0.1 | |
| | 440,000 | | | # | | Apollo Management Holdings L.P., 4.000%, 05/30/24 | | | 436,174 | | | | 0.0 | |
| | 927,000 | | | # | | Athene Global Funding, 2.875%, 10/23/18 | | | 926,718 | | | | 0.1 | |
| | 948,000 | | | | | Australia & New Zealand Banking Group Ltd./New York NY, 2.300%, 06/01/21 | | | 933,033 | | | | 0.1 | |
| | 720,000 | | | | | Bank of America Corp., 3.248%, 10/21/27 | | | 687,800 | | | | 0.0 | |
| | 850,000 | | | | | Bank of America Corp., 3.500%, 04/19/26 | | | 839,116 | | | | 0.1 | |
| | 500,000 | | | | | Bank of America Corp., 5.650%, 05/01/18 | | | 523,975 | | | | 0.0 | |
| VY® Invesco Equity and Income Portfolio | PORTFOLIO OF INVESTMENTS AS OF December 31, 2016 (CONTINUED) |
| | 725,000 | | | # | | BBVA Bancomer SA/Texas, 4.375%, 04/10/24 | | | 732,250 | | | | 0.0 | |
| | 4,217,000 | | | # | | Blackhawk Network Holdings, Inc., 1.500%, 01/15/22 | | | 4,343,510 | | | | 0.3 | |
| | 55,000 | | | | | Brixmor Operating Partnership LP, 3.875%, 08/15/22 | | | 56,079 | | | | 0.0 | |
| | 765,000 | | | | | Brookfield Asset Management, Inc., 4.000%, 01/15/25 | | | 750,717 | | | | 0.1 | |
| | 520,000 | | | | | Citigroup, Inc., 4.750%, 05/18/46 | | | 521,634 | | | | 0.0 | |
| | 1,930,000 | | | | | Citigroup, Inc., 4.000%, 08/05/24 | | | 1,945,803 | | | | 0.1 | |
| | 260,000 | | | | | Citigroup, Inc., 5.300%, 05/06/44 | | | 280,589 | | | | 0.0 | |
| | 560,000 | | | | | Citigroup, Inc., 6.675%, 09/13/43 | | | 711,051 | | | | 0.0 | |
| | 595,000 | | | | | Citizens Financial Group, Inc., 2.375%, 07/28/21 | | | 583,572 | | | | 0.0 | |
| | 325,000 | | | | | CNA Financial Corp., 5.875%, 08/15/20 | | | 359,067 | | | | 0.0 | |
| | 472,000 | | | # | | Credit Suisse AG, 6.500%, 08/08/23 | | | 503,304 | | | | 0.0 | |
| | 2,755,000 | | | | | EPR Properties, 4.750%, 12/15/26 | | | 2,729,519 | | | | 0.2 | |
| | 1,540,000 | | | # | | Farmers Exchange Capital III, 5.454%, 10/15/54 | | | 1,499,744 | | | | 0.1 | |
| | 4,179,000 | | | # | | Goldman Sachs Group, Inc., 1.000%, 09/28/20 | | | 5,364,917 | | | | 0.3 | |
| | 820,000 | | | | | Goldman Sachs Group, Inc., 4.250%, 10/21/25 | | | 833,399 | | | | 0.1 | |
| | 355,000 | | | | | Goldman Sachs Group, Inc., 5.250%, 07/27/21 | | | 389,134 | | | | 0.0 | |
| | 465,000 | | | # | | HBOS PLC, 6.750%, 05/21/18 | | | 491,388 | | | | 0.0 | |
| | 840,000 | | | | | HCP, Inc., 3.875%, 08/15/24 | | | 839,950 | | | | 0.1 | |
| | 320,000 | | | | | HCP, Inc., 4.200%, 03/01/24 | | | 325,819 | | | | 0.0 | |
| | 670,000 | | | # | | Jackson National Life Global Funding, 2.100%, 10/25/21 | | | 653,618 | | | | 0.0 | |
| | 5,209,000 | | | | | Jefferies Group, Inc., 3.875%, 11/01/29 | | | 5,280,624 | | | | 0.3 | |
| | 550,000 | | | | | JPMorgan Chase & Co., 3.200%, 06/15/26 | | | 538,172 | | | | 0.0 | |
| | 515,000 | | | | | JPMorgan Chase & Co., 4.250%, 10/01/27 | | | 529,432 | | | | 0.0 | |
| | 665,000 | | | | | JPMorgan Chase & Co., 5.000%, 12/29/49 | | | 664,169 | | | | 0.0 | |
| | 1,120,000 | | | | | JPMorgan Chase & Co., 5.300%, 12/29/49 | | | 1,145,827 | | | | 0.1 | |
| | 443,000 | | | # | | KKR Group Finance Co. III LLC, 5.125%, 06/01/44 | | | 418,418 | | | | 0.0 | |
| | 1,830,000 | | | | | Lazard Group LLC, 3.750%, 02/13/25 | | | 1,790,225 | | | | 0.1 | |
| | 2,335,000 | | | # | | Liberty Mutual Group, Inc., 4.850%, 08/01/44 | | | 2,314,924 | | | | 0.1 | |
| | 285,000 | | | | | Markel Corp., 5.000%, 03/30/43 | | | 289,595 | | | | 0.0 | |
| | 3,250,000 | | | # | | MassMutual Global Funding II, 2.100%, 08/02/18 | | | 3,278,399 | | | | 0.2 | |
| | 1,300,000 | | | # | | MassMutual Global Funding II, 2.000%, 04/15/21 | | | 1,266,920 | | | | 0.1 | |
| | 1,076,000 | | | | | MGIC Investment Corp., 2.000%, 04/01/20 | | | 1,600,550 | | | | 0.1 | |
| | 2,360,000 | | | # | | Mizuho Financial Group Cayman 3 Ltd., 4.600%, 03/27/24 | | | 2,474,264 | | | | 0.1 | |
| | 2,975,000 | | | | | Morgan Stanley, 2.375%, 07/23/19 | | | 2,984,002 | | | | 0.2 | |
| | 1,040,000 | | | | | Morgan Stanley, 4.000%, 07/23/25 | | | 1,066,536 | | | | 0.1 | |
| | 2,245,000 | | | | | National Australia Bank Ltd./New York, 1.875%, 07/12/21 | | | 2,172,318 | | | | 0.1 | |
| | 1,365,000 | | | | | National Australia Bank Ltd/New York, 2.000%, 01/14/19 | | | 1,365,016 | | | | 0.1 | |
| | 1,515,000 | | | # | | Nationwide Financial Services, Inc., 5.300%, 11/18/44 | | | 1,580,574 | | | | 0.1 | |
| | 1,305,000 | | | # | | Nordea Bank AB, 2.250%, 05/27/21 | | | 1,284,196 | | | | 0.1 | |
| | 1,467,000 | | | | | Old Republic International Corp., 3.750%, 03/15/18 | | | 1,842,919 | | | | 0.1 | |
| | 400,000 | | | | | Piedmont Operating Partnership L.P., 4.450%, 03/15/24 | | | 398,587 | | | | 0.0 | |
| | 275,000 | | | | | Prudential Financial, Inc., 5.100%, 08/15/43 | | | 298,131 | | | | 0.0 | |
| | 648,000 | | | | | Radian Group, Inc., 2.250%, 03/01/19 | | | 1,068,795 | | | | 0.1 | |
| | 125,000 | | | | | Realty Income Corp., 2.000%, 01/31/18 | | | 125,370 | | | | 0.0 | |
| | 525,000 | | | | | Reinsurance Group of America, Inc., 4.700%, 09/15/23 | | | 556,868 | | | | 0.0 | |
| | 690,000 | | | # | | Reliance Standard Life Global Funding II, 3.050%, 01/20/21 | | | 695,325 | | | | 0.0 | |
| | 1,360,000 | | | # | | Societe Generale SA, 2.625%, 09/16/20 | | | 1,360,388 | | | | 0.1 | |
| | 805,000 | | | # | | Societe Generale SA, 5.000%, 01/17/24 | | | 817,757 | | | | 0.1 | |
| | 660,000 | | | # | | Spirit Realty L.P., 4.450%, 09/15/26 | | | 622,274 | | | | 0.0 | |
| | 985,000 | | | # | | Standard Chartered PLC, 3.050%, 01/15/21 | | | 985,146 | | | | 0.1 | |
| | 1,100,000 | | | | | Sumitomo Mitsui Banking Corp., 2.650%, 07/23/20 | | | 1,098,189 | | | | 0.1 | |
| | 590,000 | | | | | SunTrust Bank/Atlanta GA, 3.300%, 05/15/26 | | | 569,770 | | | | 0.0 | |
| | 2,140,000 | | | | | Svenska Handelsbanken AB, 1.875%, 09/07/21 | | | 2,074,884 | | | | 0.1 | |
| | 445,000 | | | | | Travelers Cos, Inc., 4.600%, 08/01/43 | | | 481,342 | | | | 0.0 | |
| | 585,000 | | | # | | UBS Group Funding Jersey Ltd., 4.125%, 04/15/26 | | | 598,603 | | | | 0.0 | |
| | 410,000 | | | | | US Bancorp, 3.100%, 04/27/26 | | | 399,055 | | | | 0.0 | |
| | 145,000 | | | | | Ventas Realty L.P., 5.700%, 09/30/43 | | | 163,178 | | | | 0.0 | |
| | 1,020,000 | | | | | Visa, Inc., 4.150%, 12/14/35 | | | 1,068,281 | | | | 0.1 | |
| VY® Invesco Equity and Income Portfolio | PORTFOLIO OF INVESTMENTS AS OF December 31, 2016 (CONTINUED) |
| | 140,000 | | | | | Wells Fargo & Co., 1.500%, 01/16/18 | | | 139,838 | | | | 0.0 | |
| | 965,000 | | | | | Wells Fargo & Co., 3.550%, 09/29/25 | | | 963,167 | | | | 0.1 | |
| | 1,815,000 | | | | | Wells Fargo & Co., 3.900%, 05/01/45 | | | 1,722,284 | | | | 0.1 | |
| | 470,000 | | | | | Wells Fargo & Co., 4.100%, 06/03/26 | | | 476,079 | | | | 0.0 | |
| | 2,000,000 | | | | | Wells Fargo & Co., 4.650%, 11/04/44 | | | 1,969,248 | | | | 0.1 | |
| | 350,000 | | | | | WR Berkley Corp., 4.625%, 03/15/22 | | | 374,437 | | | | 0.0 | |
| | | | | | | | | | 91,043,956 | | | | 5.1 | |
| | | | | | | | | | | | | | | |
| | | | | | | Industrial: 0.8% | | | | | | | | |
| | 1,105,000 | | | # | | Aviation Capital Group Corp., 2.875%, 09/17/18 | | | 1,120,194 | | | | 0.1 | |
| | 1,095,000 | | | # | | Aviation Capital Group Corp., 4.875%, 10/01/25 | | | 1,162,069 | | | | 0.1 | |
| | 970,000 | | | | | Avnet, Inc., 4.625%, 04/15/26 | | | 945,575 | | | | 0.1 | |
| | 435,000 | | | # | | BAE Systems Holdings, Inc., 2.850%, 12/15/20 | | | 435,693 | | | | 0.0 | |
| | 1,335,000 | | | | | Burlington Northern Santa Fe LLC, 5.150%, 09/01/43 | | | 1,533,773 | | | | 0.1 | |
| | 330,000 | | | | | CSX Corp., 5.500%, 04/15/41 | | | 379,496 | | | | 0.0 | |
| | 1,015,000 | | | | | Deere & Co., 2.600%, 06/08/22 | | | 1,009,746 | | | | 0.1 | |
| | 295,000 | | | | | FedEx Corp., 4.900%, 01/15/34 | | | 314,920 | | | | 0.0 | |
| | 605,000 | | | | | FedEx Corp., 5.100%, 01/15/44 | | | 657,696 | | | | 0.0 | |
| | 304,000 | | | | | Northrop Grumman Corp., 3.850%, 04/15/45 | | | 288,992 | | | | 0.0 | |
| | 703,000 | | | | | Packaging Corp. of America, 4.500%, 11/01/23 | | | 744,923 | | | | 0.0 | |
| | 820,000 | | | | | Precision Castparts Corp., 1.250%, 01/15/18 | | | 818,440 | | | | 0.1 | |
| | 285,000 | | | | | Precision Castparts Corp., 2.500%, 01/15/23 | | | 280,632 | | | | 0.0 | |
| | 410,000 | | | # | | SMBC Aviation Capital Finance DAC, 2.650%, 07/15/21 | | | 394,754 | | | | 0.0 | |
| | 157,000 | | | | | Union Pacific Corp., 3.646%, 02/15/24 | | | 163,872 | | | | 0.0 | |
| | 730,000 | | | | | Union Pacific Corp., 4.150%, 01/15/45 | | | 735,451 | | | | 0.0 | |
| | 375,000 | | | | | Union Pacific Corp., 4.850%, 06/15/44 | | | 418,822 | | | | 0.0 | |
| | 330,000 | | | | | United Parcel Service, Inc., 3.400%, 11/15/46 | | | 304,341 | | | | 0.0 | |
| | 550,000 | | | | | Valmont Industries, Inc., 5.000%, 10/01/44 | | | 485,512 | | | | 0.0 | |
| | 2,193,000 | | | | | Valmont Industries, Inc., 5.250%, 10/01/54 | | | 1,924,713 | | | | 0.1 | |
| | 752,000 | | | | | Waste Management, Inc., 3.900%, 03/01/35 | | | 748,852 | | | | 0.1 | |
| | | | | | | | | | 14,868,466 | | | | 0.8 | |
| | | | | | | | | | | | | | | |
| | | | | | | Technology: 2.3% | | | | | | | | |
| | 1,146,000 | | | | | Apple, Inc., 2.150%, 02/09/22 | | | 1,126,529 | | | | 0.1 | |
| | 6,052,000 | | | | | Citrix Systems, Inc., 0.500%, 04/15/19 | | | 7,035,450 | | | | 0.4 | |
| | 340,000 | | | | | Computer Sciences Corp., 4.450%, 09/15/22 | | | 352,102 | | | | 0.0 | |
| | 910,000 | | | # | | Diamond 1 Finance Corp. / Diamond 2 Finance Corp., 5.450%, 06/15/23 | | | 965,569 | | | | 0.1 | |
| | 35,000 | | | # | | Diamond 1 Finance Corp. / Diamond 2 Finance Corp., 8.350%, 07/15/46 | | | 43,162 | | | | 0.0 | |
| | 4,090,000 | | | L | | Lam Research Corp., 1.250%, 05/15/18 | | | 7,195,844 | | | | 0.4 | |
| | 2,986,000 | | | | | Microchip Technology, Inc., 1.625%, 02/15/25 | | | 3,881,800 | | | | 0.2 | |
| | 5,822,000 | | | L | | Micron Technology, Inc., 3.000%, 11/15/43 | | | 5,811,084 | | | | 0.3 | |
| | 649,000 | | | | | Microsoft Corp., 3.500%, 02/12/35 | | | 624,928 | | | | 0.0 | |
| | 925,000 | | | | | NetApp, Inc., 3.375%, 06/15/21 | | | 939,592 | | | | 0.0 | |
| | 1,734,000 | | | | | Nuance Communications, Inc., 1.000%, 12/15/35 | | | 1,574,689 | | | | 0.1 | |
| | 3,529,000 | | | | | ON Semiconductor Corp., 1.000%, 12/01/20 | | | 3,632,664 | | | | 0.2 | |
| | 1,810,000 | | | | | Oracle Corp., 1.900%, 09/15/21 | | | 1,768,214 | | | | 0.1 | |
| | 1,005,000 | | | | | Oracle Corp., 4.300%, 07/08/34 | | | 1,039,479 | | | | 0.1 | |
| | 330,000 | | | | | Pitney Bowes, Inc., 4.625%, 03/15/24 | | | 325,187 | | | | 0.0 | |
| | 3,899,000 | | | | | SanDisk Corp., 0.500%, 10/15/20 | | | 3,563,086 | | | | 0.2 | |
| | 540,000 | | | | | Seagate HDD Cayman, 4.750%, 01/01/25 | | | 514,793 | | | | 0.0 | |
| | 1,146,000 | | | | | Seagate HDD Cayman, 5.750%, 12/01/34 | | | 977,681 | | | | 0.1 | |
| | | | | | | | | | 41,371,853 | | | | 2.3 | |
| | | | | | | | | | | | | | | |
| | | | | | | Utilities: 0.1% | | | | | | | | |
| | 150,000 | | | # | | Electricite de France SA, 4.600%, 01/27/20 | | | 159,113 | | | | 0.0 | |
| | 620,000 | | | # | | Electricite de France SA, 4.875%, 01/22/44 | | | 621,456 | | | | 0.1 | |
| | 350,000 | | | # | | Electricite de France SA, 5.625%, 12/29/49 | | | 332,937 | | | | 0.0 | |
| | 605,000 | | | | | Oglethorpe Power Corp., 4.550%, 06/01/44 | | | 599,383 | | | | 0.0 | |
| | | | | | | | | | 1,712,889 | | | | 0.1 | |
| | | | | | | | | | | | | | | |
| | | | | Total Corporate Bonds/Notes
(Cost $305,758,125) | | | 313,555,797 | | | | 17.7 | |
| | | | | | | | | | | | | | | |
| MUNICIPAL BONDS: 0.0% | | | | | | | | |
| | | | | | | Georgia: 0.0% | | | | | | | | |
| | 175,000 | | | | | Municipal Electric Authority of Georgia, 6.637%, 04/01/57 | | | 215,481 | | | | 0.0 | |
| | 325,000 | | | | | Municipal Electric Authority of Georgia, 6.655%, 04/01/57 | | | 394,375 | | | | 0.0 | |
| | | | | | | | | | | | | | | |
| | | | | Total Municipal Bonds
(Cost $503,958) | | | 609,856 | | | | 0.0 | |
| | | | | | | | | | | | | | | |
| U.S. TREASURY OBLIGATIONS: 9.4% | | | | | | | | |
| | | | | | | U.S. Treasury Bonds: 0.7% | |
| | 2,180,400 | | | | | 2.000%, due 11/15/26 | | | 2,094,769 | | | | 0.1 | |
| | 12,187,800 | | | L | | 2.250%, due 08/15/46 | | | 10,222,042 | | | | 0.6 | |
| | | | | | | | | | 12,316,811 | | | | 0.7 | |
| VY® Invesco Equity and Income Portfolio | PORTFOLIO OF INVESTMENTS AS OF December 31, 2016 (CONTINUED) |
| | | | | | | U.S. Treasury Notes: 8.7% |
| | 57,470,000 | | | L | | 1.000%, due 11/30/18 | | | 57,280,809 | | | | 3.2 | |
| | 57,650,000 | | | | | 1.375%, due 12/15/19 | | | 57,485,352 | | | | 3.3 | |
| | 36,360,000 | | | L | | 1.750%, due 11/30/21 | | | 36,057,557 | | | | 2.0 | |
| | 3,849,000 | | | | | 2.125%, due 11/30/23 | | | 3,819,274 | | | | 0.2 | |
| | 180,000 | | | | | 2.625%, due 11/15/20 | | | 185,935 | | | | 0.0 | |
| | | | | | | | | | 154,828,927 | | | | 8.7 | |
| | | | | | | | | | | | | | | |
| | | | | Total U.S. Treasury Obligations
(Cost $167,422,730) | | | 167,145,738 | | | | 9.4 | |
| | | | | | | | | | | | | | | |
| U.S. GOVERNMENT AGENCY OBLIGATIONS: 0.2% |
| | | | | | | Federal Home Loan Mortgage Corporation: 0.1%## | |
| | 2,400,000 | | | | | 4.875%, due 06/13/18 | | | 2,527,848 | | | | 0.1 | |
| | | | | | | | | | | | | | | |
| | | | | | | Federal National Mortgage Association: 0.1%## | |
| | 915,000 | | | | | 6.625%, due 11/15/30 | | | 1,272,433 | | | | 0.1 | |
| | | | | | | | | | | | | | | |
| | | | | Total U.S. Government Agency Obligations
(Cost $3,478,972) | | | 3,800,281 | | | | 0.2 | |
| | | | | | | | | | | | | | | |
| | | | | Total Long-Term Investments
(Cost $1,477,530,157) | | | 1,649,050,314 | | | | 93.0 | |
| | | | | | | | | | | | | | | |
| SHORT-TERM INVESTMENTS: 13.8% | | | | | | | | |
| | | | | | | Corporate Bonds/Notes: 3.1% | |
| | 1,455,000 | | | | | Actavis Funding SCS, 1.850%, 03/01/17 | | | 1,456,470 | | | | 0.1 | |
| | 400,000 | | | | | Bank of America Corp., 5.750%, 12/01/17 | | | 414,406 | | | | 0.0 | |
| | 365,000 | | | | | British Telecommunications PLC, 1.250%, 02/14/17 | | | 365,028 | | | | 0.0 | |
| | 3,000,000 | | | | | Caterpillar Financial Services Corp., 1.750%, 03/24/17 | | | 3,004,980 | | | | 0.2 | |
| | 775,000 | | | | | Cintas Corp. No 2, 6.125%, 12/01/17 | | | 806,677 | | | | 0.0 | |
| | 3,260,000 | | | | | Eaton Corp., 1.500%, 11/02/17 | | | 3,263,192 | | | | 0.2 | |
| | 1,845,000 | | | | | Ford Motor Credit Co. LLC, 1.724%, 12/06/17 | | | 1,843,906 | | | | 0.1 | |
| | 3,900,000 | | | | | GlaxoSmithKline Capital PLC, 1.500%, 05/08/17 | | | 3,905,869 | | | | 0.2 | |
| | 4,011,000 | | | # | | Goldman Sachs Group, Inc., 1.000%, 03/15/17 | | | 7,169,983 | | | | 0.4 | |
| | 3,490,000 | | | | | Intel Corp., 1.350%, 12/15/17 | | | 3,495,507 | | | | 0.2 | |
| | 285,000 | | | | | Interpublic Group of Cos., Inc., 2.250%, 11/15/17 | | | 286,814 | | | | 0.0 | |
| | 2,000,000 | | | | | Kellogg Co., 1.750%, 05/17/17 | | | 2,004,828 | | | | 0.1 | |
| | 1,644,000 | | | | | Kraft Heinz Foods Co., 1.600%, 06/30/17 | | | 1,645,478 | | | | 0.1 | |
| | 1,040,000 | | | | | Kraft Heinz Foods Co., 2.250%, 06/05/17 | | | 1,043,398 | | | | 0.1 | |
| | 510,000 | | | # | | Macquarie Bank Ltd., 5.000%, 02/22/17 | | | 512,562 | | | | 0.0 | |
| | 3,060,000 | | | | | MGIC Investment Corp., 5.000%, 05/01/17 | | | 3,130,762 | | | | 0.2 | |
| | 3,250,000 | | | | | National Rural Utilities Cooperative Finance Corp., 0.950%, 04/24/17 | | | 3,247,579 | | | | 0.2 | |
| | 3,930,000 | | | # | | New York Life Global Funding, 1.650%, 05/15/17 | | | 3,939,546 | | | | 0.2 | |
| | 130,000 | | | | | Noble Holding International Ltd., 2.500%, 03/15/17 | | | 130,162 | | | | 0.0 | |
| | 328,000 | | | | | Philip Morris International, Inc., 1.250%, 08/11/17 | | | 328,239 | | | | 0.0 | |
| | 1,835,000 | | | | | Philip Morris International, Inc., 1.625%, 03/20/17 | | | 1,835,081 | | | | 0.1 | |
| | 1,995,000 | | | | | Prudential Financial, Inc., 6.000%, 12/01/17 | | | 2,073,036 | | | | 0.1 | |
| | 1,744,000 | | | | | Radian Group, Inc., 3.000%, 11/15/17 | | | 2,674,860 | | | | 0.2 | |
| | 3,630,000 | | | # | | Roche Holdings, Inc., 1.350%, 09/29/17 | | | 3,636,538 | | | | 0.2 | |
| | 3,245,000 | | | | | Vodafone Group PLC, 1.625%, 03/20/17 | | | 3,245,808 | | | | 0.2 | |
| | 135,000 | | | | | Wyndham Worldwide Corp., 2.950%, 03/01/17 | | | 135,138 | | | | 0.0 | |
| | | | | | | | | | 55,595,847 | | | | 3.1 | |
| | | | | | | | | | | | | | | |
| | | | | | | Securities Lending Collateralcc: 6.7% | |
| | 28,065,094 | | | | | Citigroup, Inc., Repurchase Agreement dated 12/30/16, 0.53%, due 01/03/17 (Repurchase Amount $28,066,724, collateralized by various U.S. Government Agency Obligations, 2.000%-8.500%, Market Value plus accrued interest $28,626,396, due 12/01/17-01/01/47) | | | 28,065,094 | | | | 1.6 | |
| | 5,906,573 | | | | | Merrill Lynch & Co., Inc., Repurchase Agreement dated 12/30/16, 0.50%, due 01/03/17 (Repurchase Amount $5,906,897, collateralized by various U.S. Government Securities, 0.685%-2.000%, Market Value plus accrued interest $6,024,705, due 10/31/18-11/30/22) | | | 5,906,573 | | | | 0.3 | |
| | 28,065,094 | | | | | Nomura Securities, Repurchase Agreement dated 12/30/16, 0.50%, due 01/03/17 (Repurchase Amount $28,066,632, collateralized by various U.S. Government/U.S. Government Agency Obligations, 0.000%-9.500%, Market Value plus accrued interest $28,626,397, due 01/15/17-08/20/66) | | | 28,065,094 | | | | 1.6 | |
| VY® Invesco Equity and Income Portfolio | PORTFOLIO OF INVESTMENTS AS OF December 31, 2016 (CONTINUED) |
| | 28,065,094 | | | | | RBC Dominion Securities Inc., Repurchase Agreement dated 12/30/16, 0.52%, due 01/03/17 (Repurchase Amount $28,066,693, collateralized by various U.S. Government Agency Obligations, 0.875%-7.000%, Market Value plus accrued interest $28,626,396, due 02/13/17-01/01/47) | | | 28,065,094 | | | | 1.6 | |
| | 28,065,094 | | | | | State of Wisconsin Investment Board, Repurchase Agreement dated 12/30/16, 0.65%, due 01/03/17 (Repurchase Amount $28,067,093, collateralized by various U.S. Government Securities, 0.125%-3.875%, Market Value plus accrued interest $28,778,201, due 04/15/18-02/15/46) | | | 28,065,094 | | | | 1.6 | |
| | | | | | | | | | 118,166,949 | | | | 6.7 | |
| | | | | | | | | | | | | | | |
| | | | | | | U.S. Treasury Notes: 0.0% | |
| | 120,000 | | | | | United States Treasury Note, 0.875%, 04/30/17 | | | | | | | | |
| | | | | | | (Cost $120,056) | | | 120,143 | | | | 0.0 | |
| Shares | | | | | | | Value | | | Percentage
of Net
Assets | |
| | | | | | | Mutual Funds: 4.0% | |
| | 71,747,761 | | | | | BlackRock Liquidity Funds, FedFund, Institutional Class, 0.420%†† | | | | | | | | |
| | | | | | | (Cost $71,747,761) | | | 71,747,761 | | | | 4.0 | |
| | | | | | | | | | | | | | | |
| | | | | Total Short-Term Investments
(Cost $242,031,419) | | | 245,630,700 | | | | 13.8 | |
| | | | | | | | | | | | | | | |
| | | | | Total Investments in Securities
(Cost $1,719,561,576) | | $ | 1,894,681,014 | | | | 106.8 | |
| | | | | Liabilities in Excess of Other Assets | | | (121,134,858 | ) | | | (6.8 | ) |
| | | | | Net Assets | | $ | 1,773,546,156 | | | | 100.0 | |
| † | Unless otherwise indicated, principal amount is shown in USD. |
| †† | Rate shown is the 7-day yield as of December 31, 2016. |
| # | Securities with purchases pursuant to Rule 144A or section 4(a)(2), under the Securities Act of 1933 and may not be resold subject to that rule except to qualified institutional buyers. |
| ## | The Federal Housing Finance Agency (“FHFA”) placed the Federal Home Loan Mortgage Corporation and Federal National Mortgage Association into conservatorship with FHFA as the conservator. As such, the FHFA oversees the continuing affairs of these companies. |
| @ | Non-income producing security. |
| ADR | American Depositary Receipt |
| + | Step-up basis bonds. Interest rates shown reflect current and next coupon rates. |
| P | Preferred Stock may be called prior to convertible date. |
| cc | Represents securities purchased with cash collateral received for securities on loan. |
| L | Loaned security, a portion or all of the security is on loan at December 31, 2016. |
Cost for federal income tax purposes is $1,726,884,535.
Net unrealized appreciation consists of:
| Gross Unrealized Appreciation | | $ | 212,681,882 | |
| Gross Unrealized Depreciation | | | (44,885,403 | ) |
| | | | | |
| Net Unrealized Appreciation | | $ | 167,796,479 | |
| VY® JPMorgan Mid Cap Value Portfolio | PORTFOLIO OF INVESTMENTS AS OF December 31, 2016 |
| Shares | | | | | | | Value | | | Percentage
of Net
Assets | |
| COMMON STOCK: 98.0% | | | | | | | | |
| | | | | | | Consumer Discretionary: 17.2% | |
| | 7,580 | | | @ | | Autozone, Inc. | | | 5,986,608 | | | | 1.0 | |
| | 106,860 | | | | | Bed Bath & Beyond, Inc. | | | 4,342,790 | | | | 0.7 | |
| | 94,740 | | | | | Best Buy Co., Inc. | | | 4,042,556 | | | | 0.7 | |
| | 135,470 | | | | | BorgWarner, Inc. | | | 5,342,937 | | | | 0.9 | |
| | 77,309 | | | | | CBS Corp. - Class B | | | 4,918,399 | | | | 0.8 | |
| | 113,630 | | | @ | | Dish Network Corp. - Class A | | | 6,582,586 | | | | 1.1 | |
| | 72,040 | | | | | Expedia, Inc. | | | 8,160,691 | | | | 1.3 | |
| | 185,230 | | | | | Gap, Inc. | | | 4,156,561 | | | | 0.7 | |
| | 59,140 | | | | | Genuine Parts Co. | | | 5,650,236 | | | | 0.9 | |
| | 294,690 | | | | | Hilton Worldwide Holdings, Inc. | | | 8,015,568 | | | | 1.3 | |
| | 127,050 | | | | | Kohl's Corp. | | | 6,273,729 | | | | 1.0 | |
| | 22,806 | | | | | Marriott International, Inc. | | | 1,885,600 | | | | 0.3 | |
| | 53,040 | | | @ | | Mohawk Industries, Inc. | | | 10,591,027 | | | | 1.7 | |
| | 174,376 | | | | | Newell Brands, Inc. | | | 7,785,888 | | | | 1.3 | |
| | 100,090 | | | L | | Nordstrom, Inc. | | | 4,797,314 | | | | 0.8 | |
| | 58,360 | | | | | PVH Corp. | | | 5,266,406 | | | | 0.9 | |
| | 26,260 | | | | | Ralph Lauren Corp. | | | 2,371,803 | | | | 0.4 | |
| | 108,130 | | | | | TEGNA, Inc. | | | 2,312,901 | | | | 0.4 | |
| | 78,850 | | | L | | Tiffany & Co. | | | 6,105,356 | | | | 1.0 | |
| | | | | | | | | | 104,588,956 | | | | 17.2 | |
| | | | | | | | | | | | | | | |
| | | | | | | Consumer Staples: 6.4% | |
| | 34,490 | | | | | Constellation Brands, Inc. | | | 5,287,662 | | | | 0.9 | |
| | 278,300 | | | | | Coty, Inc - Class A | | | 5,095,673 | | | | 0.8 | |
| | 80,690 | | | | | Dr Pepper Snapple Group, Inc. | | | 7,316,162 | | | | 1.2 | |
| | 67,323 | | | @ | | Edgewell Personal Care Co. | | | 4,913,906 | | | | 0.8 | |
| | 57,073 | | | | | Energizer Holdings, Inc. | | | 2,546,026 | | | | 0.4 | |
| | 235,700 | | | | | Kroger Co. | | | 8,134,007 | | | | 1.3 | |
| | 224,040 | | | @ | | Rite Aid Corp. | | | 1,846,090 | | | | 0.3 | |
| | 53,940 | | | @ | | TreeHouse Foods, Inc. | | | 3,893,929 | | | | 0.7 | |
| | | | | | | | | | 39,033,455 | | | | 6.4 | |
| | | | | | | | | | | | | | | |
| | | | | | | Energy: 3.3% | | | | | | | | |
| | 189,890 | | | | | EQT Corp. | | | 12,418,806 | | | | 2.1 | |
| | 203,280 | | | L | | PBF Energy, Inc. | | | 5,667,446 | | | | 0.9 | |
| | 177,300 | | | @ | | Southwestern Energy Co. | | | 1,918,386 | | | | 0.3 | |
| | | | | | | | | | 20,004,638 | | | | 3.3 | |
| | | | | | | | | | | | | | | |
| | | | | | | Financials: 22.6% | | | | | | | | |
| | 6,433 | | | @ | | Alleghany Corp. | | | 3,912,036 | | | | 0.6 | |
| | 234,990 | | | | | Ally Financial, Inc. | | | 4,469,510 | | | | 0.7 | |
| | 37,350 | | | | | Ameriprise Financial, Inc. | | | 4,143,609 | | | | 0.7 | |
| | 24,247 | | | | | Chubb Ltd. | | | 3,203,514 | | | | 0.5 | |
| | 215,250 | | | | | Citizens Financial Group, Inc. | | | 7,669,357 | | | | 1.3 | |
| | 337,790 | | | | | Fifth Third Bancorp | | | 9,110,196 | | | | 1.5 | |
| | 71,090 | | | | | First Republic Bank | | | 6,550,233 | | | | 1.1 | |
| | 166,990 | | | | | Hartford Financial Services Group, Inc. | | | 7,957,073 | | | | 1.3 | |
| | 358,920 | | | | | Huntington Bancshares, Inc. | | | 4,744,922 | | | | 0.8 | |
| | 197,400 | | | | | Invesco Ltd. | | | 5,989,116 | | | | 1.0 | |
| | 149,721 | | | | | Investors Bancorp, Inc. | | | 2,088,608 | | | | 0.3 | |
| | 253,070 | | | | | Loews Corp. | | | 11,851,268 | | | | 1.9 | |
| | 67,973 | | | | | M&T Bank Corp. | | | 10,633,016 | | | | 1.7 | |
| | 101,450 | | | | | Marsh & McLennan Cos., Inc. | | | 6,857,006 | | | | 1.1 | |
| | 76,530 | | | | | Northern Trust Corp. | | | 6,814,997 | | | | 1.1 | |
| | 84,740 | | | | | Progressive Corp. | | | 3,008,270 | | | | 0.5 | |
| | 83,860 | | | | | Raymond James Financial, Inc. | | | 5,808,982 | | | | 1.0 | |
| | 160,600 | | | | | SunTrust Banks, Inc. | | | 8,808,910 | | | | 1.4 | |
| | 93,710 | | | | | T. Rowe Price Group, Inc. | | | 7,052,615 | | | | 1.2 | |
| | 105,010 | | | | | Unum Group | | | 4,613,089 | | | | 0.8 | |
| | 39,810 | | | | | WR Berkley Corp. | | | 2,647,763 | | | | 0.4 | |
| | 189,110 | | | | | XL Group Ltd. | | | 7,046,239 | | | | 1.2 | |
| | 66,090 | | | | | Zions Bancorp. | | | 2,844,514 | | | | 0.5 | |
| | | | | | | | | | 137,824,843 | | | | 22.6 | |
| | | | | | | | | | | | | | | |
| | | | | | | Health Care: 4.4% | | | | | | | | |
| | 66,700 | | | | | AmerisourceBergen Corp. | | | 5,215,273 | | | | 0.8 | |
| | 39,150 | | | | | Cigna Corp. | | | 5,222,218 | | | | 0.9 | |
| | 34,710 | | | @ | | Henry Schein, Inc. | | | 5,265,854 | | | | 0.9 | |
| | 33,960 | | | | | Humana, Inc. | | | 6,928,859 | | | | 1.1 | |
| | 38,910 | | | | | Universal Health Services, Inc. | | | 4,139,246 | | | | 0.7 | |
| | | | | | | | | | 26,771,450 | | | | 4.4 | |
| | | | | | | | | | | | | | | |
| | | | | | | Industrials: 8.7% | | | | | | | | |
| | 134,810 | | | | | Ametek, Inc. | | | 6,551,766 | | | | 1.1 | |
| | 65,820 | | | | | Carlisle Cos., Inc. | | | 7,259,288 | | | | 1.2 | |
| | 98,960 | | | | | Fortune Brands Home & Security, Inc. | | | 5,290,402 | | | | 0.9 | |
| | 55,960 | | | | | Hubbell, Inc. | | | 6,530,532 | | | | 1.1 | |
| | 74,390 | | | | | IDEX Corp. | | | 6,699,563 | | | | 1.1 | |
| | 67,560 | | | | | MSC Industrial Direct Co. | | | 6,241,868 | | | | 1.0 | |
| | 43,950 | | | | | Regal-Beloit Corp. | | | 3,043,538 | | | | 0.5 | |
| | 180,966 | | | @ | | Rexnord Corp. | | | 3,545,124 | | | | 0.6 | |
| | 44,401 | | | | | Snap-On, Inc. | | | 7,604,559 | | | | 1.2 | |
| | | | | | | | | | 52,766,640 | | | | 8.7 | |
| | | | | | | | | | | | | | | |
| | | | | | | Information Technology: 9.8% | |
| | 109,120 | | | | | Amphenol Corp. | | | 7,332,864 | | | | 1.2 | |
| | 59,900 | | | | | Analog Devices, Inc. | | | 4,349,938 | | | | 0.7 | |
| | 120,210 | | | @ | | Arrow Electronics, Inc. | | | 8,570,973 | | | | 1.4 | |
| | 111,730 | | | | | CDW Corp. | | | 5,820,016 | | | | 1.0 | |
| | 143,806 | | | @ | | CommScope Holding Co., Inc. | | | 5,349,583 | | | | 0.9 | |
| | 87,686 | | | | | Jack Henry & Associates, Inc. | | | 7,784,763 | | | | 1.3 | |
| | 160,720 | | | @ | | Keysight Technologies, Inc. | | | 5,877,531 | | | | 1.0 | |
| | 57,350 | | | | | KLA-Tencor Corp. | | | 4,512,298 | | | | 0.7 | |
| | 123,680 | | | @,L | | Match Group, Inc. | | | 2,114,928 | | | | 0.3 | |
| | 140,020 | | | @ | | Synopsys, Inc. | | | 8,241,577 | | | | 1.3 | |
| | | | | | | | | | 59,954,471 | | | | 9.8 | |
| | | | | | | | | | | | | | | |
| | | | | | | Materials: 4.1% | | | | | | | | |
| | 97,370 | | | | | Ball Corp. | | | 7,309,566 | | | | 1.2 | |
| | 13,980 | | | | | Sherwin-Williams Co. | | | 3,756,985 | | | | 0.6 | |
| | 110,335 | | | | | Silgan Holdings, Inc. | | | 5,646,945 | | | | 0.9 | |
| | 167,970 | | | | | WestRock Co. | | | 8,527,837 | | | | 1.4 | |
| | | | | | | | | | 25,241,333 | | | | 4.1 | |
| VY® JPMorgan Mid Cap Value Portfolio | PORTFOLIO OF INVESTMENTS AS OF December 31, 2016 (CONTINUED) |
| | | | | | | Real Estate: 10.2% | | | | | | | | |
| | 64,040 | | | | | American Campus Communities, Inc. | | | 3,187,271 | | | | 0.5 | |
| | 122,980 | | | | | American Homes 4 Rent | | | 2,580,120 | | | | 0.4 | |
| | 34,130 | | | | | AvalonBay Communities, Inc. | | | 6,046,129 | | | | 1.0 | |
| | 45,070 | | | | | Boston Properties, Inc. | | | 5,668,905 | | | | 0.9 | |
| | 201,370 | | | | | Brixmor Property Group, Inc. | | | 4,917,455 | | | | 0.8 | |
| | 75,790 | | | @ | | CBRE Group, Inc. | | | 2,386,627 | | | | 0.4 | |
| | 14,170 | | | | | Essex Property Trust, Inc. | | | 3,294,525 | | | | 0.5 | |
| | 106,170 | | | | | General Growth Properties, Inc. | | | 2,652,127 | | | | 0.4 | |
| | 39,300 | | | | | HCP, Inc. | | | 1,167,996 | | | | 0.2 | |
| | 220,080 | | | | | Kimco Realty Corp. | | | 5,537,213 | | | | 0.9 | |
| | 159,242 | | | | | Outfront Media, Inc. | | | 3,960,349 | | | | 0.7 | |
| | 150,050 | | | | | Rayonier, Inc. | | | 3,991,330 | | | | 0.7 | |
| | 54,430 | | | | | Regency Centers Corp. | | | 3,752,948 | | | | 0.6 | |
| | 68,276 | | | | | Vornado Realty Trust | | | 7,125,966 | | | | 1.2 | |
| | 131,560 | | | | | Weyerhaeuser Co. | | | 3,958,640 | | | | 0.7 | |
| | 29,950 | | | | | WP Carey, Inc. | | | 1,769,746 | | | | 0.3 | |
| | | | | | | | | | 61,997,347 | | | | 10.2 | |
| | | | | | | | | | | | | | | |
| | | | | | | Utilities: 11.3% | | | | | | | | |
| | 252,800 | | | | | Centerpoint Energy, Inc. | | | 6,228,992 | | | | 1.0 | |
| | 183,480 | | | | | CMS Energy Corp. | | | 7,636,438 | | | | 1.3 | |
| | 112,040 | | | | | Edison International | | | 8,065,760 | | | | 1.3 | |
| | 240,444 | | | @ | | Energen Corp. | | | 13,866,405 | | | | 2.3 | |
| | 109,270 | | | | | National Fuel Gas Co. | | | 6,189,053 | | | | 1.0 | |
| | 72,550 | | | | | Sempra Energy | | | 7,301,432 | | | | 1.2 | |
| | 127,580 | | | | | WEC Energy Group, Inc. | | | 7,482,567 | | | | 1.2 | |
| | 66,420 | | | | | Westar Energy, Inc. | | | 3,742,767 | | | | 0.6 | |
| | 205,330 | | | | | Xcel Energy, Inc. | | | 8,356,931 | | | | 1.4 | |
| | | | | | | | | | 68,870,345 | | | | 11.3 | |
| | | | | | | | | | | | | | | |
| | | | | Total Common Stock
(Cost $460,622,506) | | | 597,053,478 | | | | 98.0 | |
Principal
Amount† | | | | | | | Value | | | Percentage
of Net
Assets | |
| SHORT-TERM INVESTMENTS: 4.1% | | | | | | | | |
| | | | | | | Securities Lending Collateralcc: 1.9% | |
| | 2,771,401 | | | | | Bank of Nova Scotia, Repurchase Agreement dated 12/30/16, 0.51%, due 01/03/17 (Repurchase Amount $2,771,556, collateralized by various U.S. Government/U.S. Government Agency Obligations, 1.000%-4.000%, Market Value plus accrued interest $2,826,990, due 12/31/17-10/20/46) | | | 2,771,401 | | | | 0.5 | |
| | 2,771,401 | | | | | Cantor Fitzgerald, Repurchase Agreement dated 12/30/16, 0.50%, due 01/03/17 (Repurchase Amount $2,771,553, collateralized by various U.S. Government/U.S. Government Agency Obligations, 0.000%-10.000%, Market Value plus accrued interest $2,826,829, due 01/25/17-10/20/66) | | | 2,771,401 | | | | 0.4 | |
| | 2,771,401 | | | | | Daiwa Capital Markets, Repurchase Agreement dated 12/30/16, 0.52%, due 01/03/17 (Repurchase Amount $2,771,559, collateralized by various U.S. Government/U.S. Government Agency Obligations, 0.000%-6.500%, Market Value plus accrued interest $2,826,829, due 03/02/17-02/01/49) | | | 2,771,401 | | | | 0.4 | |
| | 583,285 | | | | | Merrill Lynch & Co., Inc., Repurchase Agreement dated 12/30/16, 0.50%, due 01/03/17 (Repurchase Amount $583,317, collateralized by various U.S. Government Securities, 0.685%-2.000%, Market Value plus accrued interest $594,951, due 10/31/18-11/30/22) | | | 583,285 | | | | 0.1 | |
| | 2,771,401 | | | | | Nomura Securities, Repurchase Agreement dated 12/30/16, 0.50%, due 01/03/17 (Repurchase Amount $2,771,553, collateralized by various U.S. Government/U.S. Government Agency Obligations, 0.000%-9.500%, Market Value plus accrued interest $2,826,829, due 01/15/17-08/20/66) | | | 2,771,401 | | | | 0.5 | |
| | | | | | | | | | 11,668,889 | | | | 1.9 | |
| VY® JPMorgan Mid Cap Value Portfolio | PORTFOLIO OF INVESTMENTS AS OF December 31, 2016 (CONTINUED) |
| Shares | | | | | | | Value | | | Percentage
of Net
Assets | |
| | | | | | | Mutual Funds: 2.2% | |
| | 13,568,320 | | | | | BlackRock Liquidity Funds, FedFund, Institutional Class, 0.420%†† | | | | | | | | |
| | | | | | | (Cost $13,568,320) | | | 13,568,320 | | | | 2.2 | |
| | | | | | | | | | | | | | | |
| | | | | Total Short-Term Investments
(Cost $25,237,209) | | | 25,237,209 | | | | 4.1 | |
| | | | | | | | | | | | | | | |
| | | | | Total Investments in Securities
(Cost $485,859,715) | | $ | 622,290,687 | | | | 102.1 | |
| | | | | Liabilities in Excess of Other Assets | | | (12,861,133 | ) | | | (2.1 | ) |
| | | | | Net Assets | | $ | 609,429,554 | | | | 100.0 | |
| † | Unless otherwise indicated, principal amount is shown in USD. |
| †† | Rate shown is the 7-day yield as of December 31, 2016. |
| @ | Non-income producing security. |
| cc | Represents securities purchased with cash collateral received for securities on loan. |
| L | Loaned security, a portion or all of the security is on loan at December 31, 2016. |
Cost for federal income tax purposes is $487,727,050.
Net unrealized appreciation consists of:
| Gross Unrealized Appreciation | | $ | 152,270,460 | |
| Gross Unrealized Depreciation | | | (17,706,823 | ) |
| | | | | |
| Net Unrealized Appreciation | | $ | 134,563,637 | |
| VY® Oppenheimer Global Portfolio | PORTFOLIO OF INVESTMENTS AS OF December 31, 2016 |
| Shares | | | | | | | Value | | | Percentage
of Net
Assets | |
| COMMON STOCK: 96.7% | | | | | | | | |
| | | | | | | China: 1.3% | | | | | | | | |
| | 674,995 | | | @,L | | JD.com, Inc. ADR | | | 17,171,873 | | | | 1.3 | |
| | | | | | | | | | | | | | | |
| | | | | | | Denmark: 0.4% | | | | | | | | |
| | 123,320 | | | L | | FLSmidth & Co. A/S | | | 5,113,398 | | | | 0.4 | |
| | | | | | | | | | | | | | | |
| | | | | | | France: 6.5% | | | | | | | | |
| | 176,998 | | | | | LVMH Moet Hennessy Louis Vuitton SE | | | 33,748,611 | | | | 2.5 | |
| | 103,880 | | | | | Kering | | | 23,300,744 | | | | 1.7 | |
| | 366,460 | | | | | Societe Generale | | | 18,025,061 | | | | 1.3 | |
| | 189,437 | | | | | Technip S.A. | | | 13,493,979 | | | | 1.0 | |
| | | | | | | | | | 88,568,395 | | | | 6.5 | |
| | | | | | | | | | | | | | | |
| | | | | | | Germany: 7.2% | | | | | | | | |
| | 146,838 | | | | | Allianz SE | | | 24,233,914 | | | | 1.7 | |
| | 180,764 | | | | | Bayer AG | | | 18,832,683 | | | | 1.4 | |
| | 81,976 | | | | | Linde AG | | | 13,447,198 | | | | 1.0 | |
| | 374,830 | | | | | SAP SE | | | 32,424,793 | | | | 2.4 | |
| | 77,987 | | | | | Siemens AG | | | 9,548,757 | | | | 0.7 | |
| | | | | | | | | | 98,487,345 | | | | 7.2 | |
| | | | | | | | | | | | | | | |
| | | | | | | India: 3.4% | | | | | | | | |
| | 11,081,846 | | | | | DLF Ltd. | | | 18,136,563 | | | | 1.4 | |
| | 2,374,040 | | | | | ICICI Bank Ltd. ADR | | | 17,781,560 | | | | 1.3 | |
| | 1,494,555 | | | | | Zee Entertainment Enterprises Ltd. | | | 9,948,123 | | | | 0.7 | |
| | | | | | | | | | 45,866,246 | | | | 3.4 | |
| | | | | | | | | | | | | | | |
| | | | | | | Italy: 1.2% | | | | | | | | |
| | 251,360 | | | L | | Brunello Cucinelli SpA | | | 5,381,863 | | | | 0.4 | |
| | 245,989 | | | | | Prysmian S.p.A. | | | 6,304,801 | | | | 0.5 | |
| | 68,697 | | | L | | Tod's S.p.A. | | | 4,469,015 | | | | 0.3 | |
| | | | | | | | | | 16,155,679 | | | | 1.2 | |
| | | | | | | | | | | | | | | |
| | | | | | | Japan: 14.2% | | | | | | | | |
| | 1,213,400 | | | | | Dai-ichi Life Holdings, Inc. | | | 20,174,574 | | | | 1.5 | |
| | 62,400 | | | | | Fanuc Ltd. | | | 10,439,177 | | | | 0.8 | |
| | 807,100 | | | | | KDDI Corp. | | | 20,381,679 | | | | 1.5 | |
| | 39,751 | | | | | Keyence Corp. | | | 27,199,605 | | | | 2.0 | |
| | 359,200 | | | | | Kyocera Corp. | | | 17,809,328 | | | | 1.3 | |
| | 268,700 | | | | | Murata Manufacturing Co., Ltd. | | | 35,881,315 | | | | 2.6 | |
| | 321,700 | | | | | Nidec Corp. | | | 27,695,371 | | | | 2.0 | |
| | 31,700 | | | | | Nintendo Co., Ltd. | | | 6,589,651 | | | | 0.5 | |
| | 301,600 | | | | | Sumitomo Mitsui Financial Group, Inc. | | | 11,485,825 | | | | 0.8 | |
| | 305,400 | | | | | Suzuki Motor Corp. | | | 10,722,251 | | | | 0.8 | |
| | 79,000 | | | | | TDK Corp. | | | 5,416,891 | | | | 0.4 | |
| | | | | | | | | | 193,795,667 | | | | 14.2 | |
| | | | | | | | | | | | | | | |
| | | | | | | Netherlands: 2.7% | |
| | 553,853 | | | | | Airbus Group SE | | | 36,581,394 | | | | 2.7 | |
| | | | | | | | | | | | | | | |
| | | | | | | Spain: 2.7% | | | | | | | | |
| | 1,168,262 | | | | | Banco Bilbao Vizcaya Argentaria S.A. | | | 7,872,858 | | | | 0.6 | |
| | 847,575 | | | | | Industria de Diseno Textil SA | | | 28,873,561 | | | | 2.1 | |
| | | | | | | | | | 36,746,419 | | | | 2.7 | |
| | | | | | | Sweden: 1.4% | | | | | | | | |
| | 1,037,339 | | | | | Assa Abloy AB | | | 19,194,539 | | | | 1.4 | |
| | | | | | | | | | | | | | | |
| | | | | | | Switzerland: 4.3% | | | | | | | | |
| | 380,537 | | | | | Credit Suisse Group AG | | | 5,438,267 | | | | 0.4 | |
| | 166,236 | | | | | Nestle S.A. | | | 11,908,746 | | | | 0.9 | |
| | 52,719 | | | | | Roche Holding AG | | | 12,017,431 | | | | 0.9 | |
| | 1,851,086 | | | | | UBS Group AG | | | 28,942,583 | | | | 2.1 | |
| | | | | | | | | | 58,307,027 | | | | 4.3 | |
| | | | | | | | | | | | | | | |
| | | | | | | United Kingdom: 5.9% | | | | | | | | |
| | 2,760,672 | | | @,L | | Circassia Pharmaceuticals Plc | | | 3,198,136 | | | | 0.2 | |
| | 7,470,594 | | | @,L | | Earthport PLC | | | 1,956,448 | | | | 0.2 | |
| | 1,277,980 | | | | | International Consolidated Airlines Group SA | | | 6,924,656 | | | | 0.5 | |
| | 444,927 | | | | | International Game Technology PLC | | | 11,354,537 | | | | 0.8 | |
| | 1,265,166 | | | | | Prudential PLC | | | 25,249,674 | | | | 1.9 | |
| | 144,420 | | | | | Shire PLC | | | 8,246,322 | | | | 0.6 | |
| | 575,775 | | | | | Unilever PLC | | | 23,284,402 | | | | 1.7 | |
| | | | | | | | | | 80,214,175 | | | | 5.9 | |
| | | | | | | | | | | | | | | |
| | | | | | | United States: 45.5% | | | | | | | | |
| | 128,360 | | | | | 3M Co. | | | 22,921,245 | | | | 1.7 | |
| | 354,930 | | | @,L | | Acadia Pharmaceuticals, Inc. | | | 10,236,181 | | | | 0.8 | |
| | 225,053 | | | @ | | Adobe Systems, Inc. | | | 23,169,206 | | | | 1.7 | |
| | 321,710 | | | | | Aetna, Inc. | | | 39,895,257 | | | | 2.9 | |
| | 44,940 | | | @ | | Alphabet, Inc. - Class A | | | 35,612,703 | | | | 2.6 | |
| | 46,607 | | | @ | | Alphabet, Inc. - Class C | | | 35,972,215 | | | | 2.6 | |
| | 167,240 | | | | | Anthem, Inc. | | | 24,044,095 | | | | 1.8 | |
| | 54,130 | | | @ | | Biogen, Inc. | | | 15,350,185 | | | | 1.1 | |
| | 80,940 | | | @ | | BioMarin Pharmaceutical, Inc. | | | 6,705,070 | | | | 0.5 | |
| | 78,530 | | | @,L | | Bluebird Bio, Inc. | | | 4,845,301 | | | | 0.4 | |
| | 688,420 | | | | | Citigroup, Inc. | | | 40,912,801 | | | | 3.0 | |
| | 502,140 | | | | | Colgate-Palmolive Co. | | | 32,860,042 | | | | 2.4 | |
| | 183,830 | | | | | Emerson Electric Co. | | | 10,248,522 | | | | 0.8 | |
| | 244,740 | | | @ | | Facebook, Inc. | | | 28,157,337 | | | | 2.1 | |
| | 341,370 | | | | | FNF Group | | | 11,592,925 | | | | 0.9 | |
| | 196,530 | | | | | Gilead Sciences, Inc. | | | 14,073,513 | | | | 1.0 | |
| | 110,630 | | | | | Goldman Sachs Group, Inc. | | | 26,490,354 | | | | 1.9 | |
| | 274,980 | | | | | Intuit, Inc. | | | 31,515,458 | | | | 2.3 | |
| | 219,560 | | | @,L | | Ionis Pharmaceuticals, Inc. | | | 10,501,555 | | | | 0.8 | |
| | 244,730 | | | @ | | MacroGenics, Inc. | | | 5,002,281 | | | | 0.4 | |
| | 704,620 | | | | | Maxim Integrated Products | | | 27,177,193 | | | | 2.0 | |
| | 317,290 | | | @ | | PayPal Holdings, Inc. | | | 12,523,436 | | | | 0.9 | |
| | 390,540 | | | | | S&P Global, Inc. | | | 41,998,672 | | | | 3.1 | |
| | 143,780 | | | @ | | Sage Therapeutics, Inc. | | | 7,341,407 | | | | 0.5 | |
| | 234,000 | | | L | | Tiffany & Co. | | | 18,118,620 | | | | 1.3 | |
| | 569,050 | | | @,L | | Twitter, Inc. | | | 9,275,515 | | | | 0.7 | |
| | 154,700 | | | | | United Parcel Service, Inc. - Class B | | | 17,734,808 | | | | 1.3 | |
| | 43,180 | | | @ | | Vertex Pharmaceuticals, Inc. | | | 3,181,071 | | | | 0.2 | |
| | 275,380 | | | | | Walt Disney Co. | | | 28,700,104 | | | | 2.1 | |
| | 170,890 | | | | | Whole Foods Market, Inc. | | | 5,256,576 | | | | 0.4 | |
| VY® Oppenheimer Global Portfolio | PORTFOLIO OF INVESTMENTS AS OF December 31, 2016 (CONTINUED) |
| | 168,310 | | | | | Zimmer Biomet Holdings, Inc. | | | 17,369,592 | | | | 1.3 | |
| | | | | | | | | | 618,783,240 | | | | 45.5 | |
| | | | | | | | | | | | | | | |
| | | | | Total Common Stock
(Cost $794,926,725) | | | 1,314,985,397 | | | | 96.7 | |
| | | | | | | | | | | | | | | |
| PREFERRED STOCK: 1.9% | | | | | | | | |
| | | | | | | Germany: 1.9% | | | | | | | | |
| | 334,794 | | | | | Bayerische Motoren Werke AG | | | 25,568,342 | | | | 1.9 | |
| | | | | | | | | | | | | | | |
| | | | | | | India: 0.0% | | | | | | | | |
| | 5,080,989 | | | @ | | Zee Entertainment Enterprises Ltd. | | | 732,914 | | | | 0.0 | |
| | | | | | | | | | | | | | | |
| | | | | Total Preferred Stock
(Cost $12,716,306) | | | 26,301,256 | | | | 1.9 | |
| | | | | | | | | | | | | | | |
| | | | | Total Long-Term Investments
(Cost $807,643,031) | | | 1,341,286,653 | | | | 98.6 | |
Principal
Amount† | | | | | | | Value | | | Percentage
of Net
Assets | |
| SHORT-TERM INVESTMENTS: 5.8% | | | | | | | | |
| | | | | | | Securities Lending Collateralcc: 4.5% | |
| | 3,087,985 | | | | | Bank of Nova Scotia, Repurchase Agreement dated 12/30/16, 0.51%, due 01/03/17 (Repurchase Amount $3,088,158, collateralized by various U.S. Government/U.S. Government Agency Obligations, 1.000%-4.000%, Market Value plus accrued interest $3,149,924, due 12/31/17-10/20/46) | | | 3,087,985 | | | | 0.2 | |
| | 14,671,056 | | | | | Cantor Fitzgerald, Repurchase Agreement dated 12/30/16, 0.50%, due 01/03/17 (Repurchase Amount $14,671,860, collateralized by various U.S. Government/U.S. Government Agency Obligations, 0.000%-10.000%, Market Value plus accrued interest $14,964,477, due 01/25/17-10/20/66) | | | 14,671,056 | | | | 1.0 | |
| | 14,671,056 | | | | | Daiwa Capital Markets, Repurchase Agreement dated 12/30/16, 0.52%, due 01/03/17 (Repurchase Amount $14,671,892, collateralized by various U.S. Government/U.S. Government Agency Obligations, 0.000%-6.500%, Market Value plus accrued interest $14,964,477, due 03/02/17-02/01/49) | | | 14,671,056 | | | | 1.1 | |
| | 14,671,056 | | | | | Nomura Securities, Repurchase Agreement dated 12/30/16, 0.50%, due 01/03/17 (Repurchase Amount $14,671,860, collateralized by various U.S. Government/U.S. Government Agency Obligations, 0.000%-9.500%, Market Value plus accrued interest $14,964,478, due 01/15/17-08/20/66) | | | 14,671,056 | | | | 1.1 | |
| | 14,671,056 | | | | | State of Wisconsin Investment Board, Repurchase Agreement dated 12/30/16, 0.65%, due 01/03/17 (Repurchase Amount $14,672,101, collateralized by various U.S. Government Securities, 0.125%-3.875%, Market Value plus accrued interest $15,043,833, due 04/15/18-02/15/46) | | | 14,671,056 | | | | 1.1 | |
| | | | | | | | | | 61,772,209 | | | | 4.5 | |
| Shares | | | | | | | Value | | | Percentage
of Net
Assets | |
| | | | | | | Mutual Funds: 1.3% | |
| | 17,378,495 | | | | | BlackRock Liquidity Funds, FedFund, Institutional Class, 0.420%†† | | | | | | | | |
| | | | | | | (Cost $17,378,495) | | | 17,378,495 | | | | 1.3 | |
| | | | | | | | | | | | | | | |
| | | | | Total Short-Term Investments
(Cost $79,150,704) | | | 79,150,704 | | | | 5.8 | |
| | | | | | | | | | | | | | | |
| | | | | Total Investments in Securities
(Cost $886,793,735) | | $ | 1,420,437,357 | | | | 104.4 | |
| | | | | Liabilities in Excess of Other Assets | | | (60,467,594 | ) | | | (4.4 | ) |
| | | | | Net Assets | | $ | 1,359,969,763 | | | | 100.0 | |
| † | Unless otherwise indicated, principal amount is shown in USD. |
| †† | Rate shown is the 7-day yield as of December 31, 2016. |
| @ | Non-income producing security. |
| ADR | American Depositary Receipt |
| VY® Oppenheimer Global Portfolio | PORTFOLIO OF INVESTMENTS AS OF December 31, 2016 (CONTINUED) |
| cc | Represents securities purchased with cash collateral received for securities on loan. |
| L | Loaned security, a portion or all of the security is on loan at December 31, 2016. |
Cost for federal income tax purposes is $894,308,904.
Net unrealized appreciation consists of:
| Gross Unrealized Appreciation | | $ | 565,017,363 | |
| Gross Unrealized Depreciation | | | (38,888,910 | ) |
| | | | | |
| Net Unrealized Appreciation | | $ | 526,128,453 | |
| VY® Pioneer High Yield Portfolio | PORTFOLIO OF INVESTMENTS AS OF December 31, 2016 |
Principal
Amount† | | | | | | | Value | | | Percentage
of Net
Assets | |
| CORPORATE BONDS/NOTES: 85.4% | | | | | | | | |
| | | | | | | Basic Materials: 2.3% | | | | | | | | |
| | 300,000 | | | # | | Ausdrill Finance Pty Ltd., 6.875%, 11/01/19 | | | 300,000 | | | | 0.3 | |
| | 100,000 | | | # | | CVR Partners L.P. / CVR Nitrogen Finance Corp., 9.250%, 06/15/23 | | | 103,375 | | | | 0.1 | |
| | 530,000 | | | | | Freeport-McMoRan, Inc., 3.550%, 03/01/22 | | | 495,550 | | | | 0.5 | |
| | 60,000 | | | | | Hexion, Inc., 6.625%, 04/15/20 | | | 53,400 | | | | 0.1 | |
| | 195,000 | | | | | Hexion, Inc., 8.875%, 02/01/18 | | | 195,000 | | | | 0.2 | |
| | 75,000 | | | # | | HudBay Minerals, Inc., 7.250%, 01/15/23 | | | 77,813 | | | | 0.1 | |
| | 100,000 | | | # | | HudBay Minerals, Inc., 7.625%, 01/15/25 | | | 104,188 | | | | 0.1 | |
| | 200,000 | | | # | | INEOS Group Holdings SA, 5.875%, 02/15/19 | | | 204,600 | | | | 0.2 | |
| | 380,000 | | | | | Resolute Forest Products, Inc., 5.875%, 05/15/23 | | | 343,900 | | | | 0.3 | |
| | 35,000 | | | # | | Teck Resources Ltd., 8.500%, 06/01/24 | | | 40,425 | | | | 0.0 | |
| | 35,000 | | | # | | Teck Resources Ltd., 8.000%, 06/01/21 | | | 38,588 | | | | 0.0 | |
| | 175,000 | | | | | Tronox Finance LLC, 6.375%, 08/15/20 | | | 164,500 | | | | 0.2 | |
| | 145,000 | | | # | | Tronox Finance LLC, 7.500%, 03/15/22 | | | 135,937 | | | | 0.1 | |
| | 80,000 | | | # | | United States Steel Corp., 8.375%, 07/01/21 | | | 88,642 | | | | 0.1 | |
| | | | | | | | | | 2,345,918 | | | | 2.3 | |
| | | | | | | | | | | | | | | |
| | | | | | | Communications: 14.4% | |
| | 200,000 | | | # | | Altice Financing SA, 6.625%, 02/15/23 | | | 206,000 | | | | 0.2 | |
| | 200,000 | | | # | | Altice US Finance I Corp., 5.375%, 07/15/23 | | | 208,250 | | | | 0.2 | |
| | 200,000 | | | # | | CCO Holdings LLC / CCO Holdings Capital Corp., 5.500%, 05/01/26 | | | 204,500 | | | | 0.2 | |
| | 310,000 | | | # | | CCO Holdings LLC / CCO Holdings Capital Corp., 5.750%, 02/15/26 | | | 321,625 | | | | 0.3 | |
| | 580,000 | | | | | CenturyLink, Inc., 6.450%, 06/15/21 | | | 613,350 | | | | 0.6 | |
| | 120,000 | | | # | | CommScope, Inc., 5.000%, 06/15/21 | | | 124,050 | | | | 0.1 | |
| | 200,000 | | | # | | CSC Holdings LLC, 5.500%, 04/15/27 | | | 203,000 | | | | 0.2 | |
| | 125,000 | | | # | | Ctrip.com International Ltd., 1.250%, 09/15/22 | | | 120,937 | | | | 0.1 | |
| | 300,000 | | | | | DISH DBS Corp., 5.875%, 07/15/22 | | | 316,500 | | | | 0.3 | |
| | 260,000 | | | # | | DISH Network Corp., 3.375%, 08/15/26 | | | 297,212 | | | | 0.3 | |
| | 225,000 | | | | | Finisar Corp., 0.500%, 12/15/33 | | | 266,766 | | | | 0.3 | |
| | 50,000 | | | | | FireEye, Inc., 1.000%, 06/01/35 | | | 46,437 | | | | 0.0 | |
| | 50,000 | | | | | FireEye, Inc., 1.625%, 06/01/35 | | | 45,281 | | | | 0.0 | |
| | 218,000 | | | | | Frontier Communications Corp., 8.500%, 04/15/20 | | | 229,717 | | | | 0.2 | |
| | 555,000 | | | | | Frontier Communications Corp., 8.750%, 04/15/22 | | | 552,225 | | | | 0.5 | |
| | 65,000 | | | | | Frontier Communications Corp., 8.875%, 09/15/20 | | | 69,469 | | | | 0.1 | |
| | 330,000 | | | | | Frontier Communications Corp., 10.500%, 09/15/22 | | | 348,166 | | | | 0.3 | |
| | 250,000 | | | | | GCI, Inc., 6.750%, 06/01/21 | | | 257,500 | | | | 0.3 | |
| | 140,000 | | | | | GCI, Inc., 6.875%, 04/15/25 | | | 142,800 | | | | 0.1 | |
| | 250,000 | | | # | | Gray Television, Inc., 5.125%, 10/15/24 | | | 242,500 | | | | 0.2 | |
| | 280,000 | | | # | | Gray Television, Inc., 5.875%, 07/15/26 | | | 278,600 | | | | 0.3 | |
| | 415,000 | | | # | | Hughes Satellite Systems Corp., 5.250%, 08/01/26 | | | 407,737 | | | | 0.4 | |
| | 91,000 | | | | | IAC/InterActiveCorp, 4.875%, 11/30/18 | | | 92,524 | | | | 0.1 | |
| | 690,000 | | | # | | Level 3 Financing, Inc., 5.250%, 03/15/26 | | | 684,825 | | | | 0.7 | |
| | 447,750 | | | | | McGraw-Hill Global Education Holdings, LLC, 5.000%, 05/04/22 | | | 448,701 | | | | 0.4 | |
| | 195,000 | | | # | | MDC Partners, Inc., 6.500%, 05/01/24 | | | 176,475 | | | | 0.2 | |
| | 550,000 | | | # | | Netflix, Inc., 4.375%, 11/15/26 | | | 534,188 | | | | 0.5 | |
| | 245,000 | | | # | | Nexstar Escrow Corp., 5.625%, 08/01/24 | | | 243,775 | | | | 0.2 | |
| | 200,000 | | | # | | SFR Group SA, 6.000%, 05/15/22 | | | 206,000 | | | | 0.2 | |
| | 350,000 | | | | | Quebecor Media, Inc., 5.750%, 01/15/23 | | | 364,438 | | | | 0.4 | |
| | 480,000 | | | | | Shutterfly, Inc., 0.250%, 05/15/18 | | | 488,100 | | | | 0.5 | |
| | 425,000 | | | # | | Sinclair Television Group, Inc., 5.125%, 02/15/27 | | | 405,875 | | | | 0.4 | |
| | 170,000 | | | # | | Sirius XM Radio, Inc., 4.625%, 05/15/23 | | | 168,938 | | | | 0.2 | |
| | 1,760,000 | | | | | Sprint Corp., 7.250%, 09/15/21 | | | 1,874,400 | | | | 1.8 | |
| | 425,000 | | | | | TEGNA, Inc., 6.375%, 10/15/23 | | | 451,307 | | | | 0.4 | |
| | 130,000 | | | | | T-Mobile USA, Inc., 6.000%, 03/01/23 | | | 137,638 | | | | 0.1 | |
| | 250,000 | | | | | T-Mobile USA, Inc., 6.000%, 04/15/24 | | | 264,063 | | | | 0.3 | |
| | 70,000 | | | | | T-Mobile USA, Inc., 6.500%, 01/15/24 | | | 75,250 | | | | 0.1 | |
| | 450,000 | | | | | T-Mobile USA, Inc., 6.500%, 01/15/26 | | | 487,688 | | | | 0.5 | |
| | 100,000 | | | | | T-Mobile USA, Inc., 6.633%, 04/28/21 | | | 104,625 | | | | 0.1 | |
| VY® Pioneer High Yield Portfolio | PORTFOLIO OF INVESTMENTS AS OF December 31, 2016 (CONTINUED) |
| | 57,674 | | | | | Univision Communications Inc. Term Loan C3, 4.000%, 03/01/20 | | | 57,994 | | | | 0.1 | |
| | 160,000 | | | # | | Univision Communications, Inc., 5.125%, 02/15/25 | | | 153,600 | | | | 0.1 | |
| | 440,000 | | | # | | Videotron Ltd., 5.375%, 06/15/24 | | | 453,200 | | | | 0.4 | |
| | 290,000 | | | | | WebMD Health Corp., 2.500%, 01/31/18 | | | 297,613 | | | | 0.3 | |
| | 105,000 | | | # | | WebMD Health Corp., 2.625%, 06/15/23 | | | 98,963 | | | | 0.1 | |
| | 129,675 | | | | | West Corp. 1st Lien Term Loan B12, 3.270%, 06/17/23 | | | 130,388 | | | | 0.1 | |
| | 375,000 | | | | | Windstream Services LLC, 6.375%, 08/01/23 | | | 336,563 | | | | 0.3 | |
| | 360,000 | | | | | Windstream Services LLC, 7.500%, 06/01/22 | | | 354,600 | | | | 0.3 | |
| | 200,000 | | | | | Windstream Services LLC, 7.750%, 10/15/20 | | | 206,600 | | | | 0.2 | |
| | 150,000 | | | # | | Zillow Group, Inc., 2.000%, 12/01/21 | | | 154,781 | | | | 0.2 | |
| | | | | | | | | | 14,955,734 | | | | 14.4 | |
| | | | | | | | | | | | | | | |
| | | | | | | Consumer, Cyclical: 12.0% | |
| | 130,000 | | | # | | AdvancePierre Foods Holdings, Inc., 5.500%, 12/15/24 | | | 131,544 | | | | 0.1 | |
| | 190,000 | | | # | | AMC Entertainment Holdings, Inc., 5.875%, 11/15/26 | | | 194,750 | | | | 0.2 | |
| | 335,000 | | | | | Asbury Automotive Group, Inc., 6.000%, 12/15/24 | | | 344,212 | | | | 0.3 | |
| | 70,000 | | | # | | Beazer Homes USA, Inc., 8.750%, 03/15/22 | | | 75,775 | | | | 0.1 | |
| | 230,000 | | | # | | Cooper-Standard Automotive, Inc., 5.625%, 11/15/26 | | | 227,987 | | | | 0.2 | |
| | 285,000 | | | | | DR Horton, Inc., 5.750%, 08/15/23 | | | 306,731 | | | | 0.3 | |
| | 171,270 | | | | | Federal Mogul Corp., 4.750%, 04/15/21 | | | 169,879 | | | | 0.2 | |
| | 375,000 | | | | | Ferrellgas L.P. / Ferrellgas Finance Corp., 6.750%, 01/15/22 | | | 373,125 | | | | 0.4 | |
| | 345,000 | | | | | Global Partners L.P. / GLP Finance Corp., 6.250%, 07/15/22 | | | 332,276 | | | | 0.3 | |
| | 265,000 | | | | | Global Partners L.P. / GLP Finance Corp., 7.000%, 06/15/23 | | | 257,050 | | | | 0.2 | |
| | 350,000 | | | | | Goodyear Tire & Rubber Co/The, 5.000%, 05/31/26 | | | 349,279 | | | | 0.3 | |
| | 270,000 | | | | | H&E Equipment Services, Inc., 7.000%, 09/01/22 | | | 285,525 | | | | 0.3 | |
| | 165,000 | | | # | | Hilton Grand Vacations Borrower LLC/Hilton Grand Vacations Borrower, Inc., 6.125%, 12/01/24 | | | 172,219 | | | | 0.2 | |
| | 205,000 | | | #,& | | IHO Verwaltungs GmbH, 4.125%, 09/15/21 | | | 207,563 | | | | 0.2 | |
| | 185,000 | | | # | | International Automotive Components Group SA, 9.125%, 06/01/18 | | | 179,450 | | | | 0.2 | |
| | 175,000 | | | # | | Intrepid Aviation Group Holdings LLC / Intrepid Finance Co., 6.875%, 02/15/19 | | | 157,500 | | | | 0.1 | |
| | 310,000 | | | # | | JB Poindexter & Co., Inc., 9.000%, 04/01/22 | | | 327,050 | | | | 0.3 | |
| | 410,000 | | | | | KB Home, 1.375%, 02/01/19 | | | 401,031 | | | | 0.4 | |
| | 400,000 | | | | | KB Home, 7.000%, 12/15/21 | | | 424,000 | | | | 0.4 | |
| | 245,000 | | | | | KB Home, 7.500%, 09/15/22 | | | 259,700 | | | | 0.2 | |
| | 205,000 | | | # | | KFC Holding Co/Pizza Hut Holdings LLC/Taco Bell of America LLC, 5.250%, 06/01/26 | | | 208,587 | | | | 0.2 | |
| | 205,000 | | | # | | KFC Holding Co/Pizza Hut Holdings LLC/Taco Bell of America LLC, 5.000%, 06/01/24 | | | 209,869 | | | | 0.2 | |
| | 60,929 | | | | | Landry's, Inc. - TL 1L, 4.000%, 10/04/23 | | | 61,675 | | | | 0.1 | |
| | 250,000 | | | # | | Landry's, Inc., 6.750%, 10/15/24 | | | 254,375 | | | | 0.2 | |
| | 250,000 | | | | | Lennar Corp., 4.500%, 06/15/19 | | | 259,375 | | | | 0.2 | |
| | 465,000 | | | | | Lennar Corp., 4.750%, 11/15/22 | | | 478,950 | | | | 0.5 | |
| | 100,000 | | | | | LKQ Corp., 4.750%, 05/15/23 | | | 100,000 | | | | 0.1 | |
| | 310,000 | | | | | MDC Holdings, Inc., 5.500%, 01/15/24 | | | 321,625 | | | | 0.3 | |
| | 145,000 | | | | | Meritage Homes Corp., 7.000%, 04/01/22 | | | 157,688 | | | | 0.2 | |
| | 200,000 | | | # | | Nexteer Automotive Group Ltd., 5.875%, 11/15/21 | | | 208,500 | | | | 0.2 | |
| | 230,000 | | | # | | PetSmart, Inc., 7.125%, 03/15/23 | | | 235,175 | | | | 0.2 | |
| | 280,000 | | | | | PulteGroup, Inc., 5.000%, 01/15/27 | | | 267,050 | | | | 0.3 | |
| | 262,969 | | | | | Redbox - TL 1L, 8.500%, 09/27/21 | | | 256,148 | | | | 0.2 | |
| | 270,000 | | | | | Regal Entertainment Group, 5.750%, 02/01/25 | | | 275,400 | | | | 0.3 | |
| | 150,000 | | | | | Regal Entertainment Group, 5.750%, 03/15/22 | | | 157,500 | | | | 0.1 | |
| | 264,000 | | | # | | Rexel SA, 5.250%, 06/15/20 | | | 272,085 | | | | 0.3 | |
| | 130,000 | | | | | CalAtlantic Group, Inc., 5.375%, 10/01/22 | | | 133,250 | | | | 0.1 | |
| | 270,000 | | | | | Ryland Group, Inc./The, 0.250%, 06/01/19 | | | 252,788 | | | | 0.2 | |
| | 150,000 | | | | | Scientific Games International, Inc., 6.250%, 09/01/20 | | | 128,250 | | | | 0.1 | |
| | 990,000 | | | | | Scientific Games International, Inc., 10.000%, 12/01/22 | | | 990,000 | | | | 1.0 | |
| | 235,000 | | | | | CalAtlantic Group, Inc., 1.250%, 08/01/32 | | | 243,078 | | | | 0.2 | |
| VY® Pioneer High Yield Portfolio | PORTFOLIO OF INVESTMENTS AS OF December 31, 2016 (CONTINUED) |
| | 365,000 | | | # | | Taylor Morrison Communities, Inc. / Monarch Communities, Inc., 5.625%, 03/01/24 | | | 370,475 | | | | 0.4 | |
| | 360,000 | | | # | | TI Group Automotive Systems LLC, 8.750%, 07/15/23 | | | 378,000 | | | | 0.4 | |
| | 190,000 | | | | | Titan International, Inc., 6.875%, 10/01/20 | | | 186,913 | | | | 0.2 | |
| | 371,907 | | | | | Tower Automotive Holdings - TL B 1L, 4.000%, 04/23/20 | | | 373,301 | | | | 0.4 | |
| | 350,000 | | | # | | Viking Cruises Ltd., 8.500%, 10/15/22 | | | 364,438 | | | | 0.3 | |
| | 160,000 | | | # | | ZF North America Capital, Inc., 4.750%, 04/29/25 | | | 163,400 | | | | 0.2 | |
| | | | | | | | | | 12,484,541 | | | | 12.0 | |
| | | | | | | | | | | | | | | |
| | | | | | | Consumer, Non-cyclical: 16.1% | |
| | 34,290 | | | | | AdvancePierre Foods - TL B 1L, 4.000%, 06/02/23 | | | 34,766 | | | | 0.0 | |
| | 125,000 | | | | | Albany Molecular Research, Inc., 2.250%, 11/15/18 | | | 162,812 | | | | 0.2 | |
| | 80,000 | | | # | | Alliance One International, Inc., 8.500%, 04/15/21 | | | 81,400 | | | | 0.1 | |
| | 545,000 | | | | | Alliance One International, Inc., 9.875%, 07/15/21 | | | 469,381 | | | | 0.4 | |
| | 155,000 | | | | | Ascent Capital Group, Inc., 4.000%, 07/15/20 | | | 117,800 | | | | 0.1 | |
| | 65,690 | | | | | BioScrip, Inc. - TL B DD, 6.500%, 07/31/20 | | | 60,599 | | | | 0.1 | |
| | 112,986 | | | | | BioScrip, Inc. - TL B, 6.500%, 07/31/20 | | | 104,230 | | | | 0.1 | |
| | 225,000 | | | | | BioScrip, Inc., 8.875%, 02/15/21 | | | 169,875 | | | | 0.2 | |
| | 115,000 | | | | | BioMarin Pharmaceutical, Inc., 1.500%, 10/15/20 | | | 135,341 | | | | 0.1 | |
| | 215,000 | | | # | | C&S Group Enterprises LLC, 5.375%, 07/15/22 | | | 208,550 | | | | 0.2 | |
| | 265,000 | | | | | Cardtronics, Inc., 1.000%, 12/01/20 | | | 312,700 | | | | 0.3 | |
| | 42,000 | | | | | Carriage Services, Inc., 2.750%, 03/15/21 | | | 56,674 | | | | 0.0 | |
| | 150,000 | | | | | Centene Corp., 4.750%, 01/15/25 | | | 146,812 | | | | 0.1 | |
| | 165,000 | | | | | Centene Corp., 5.625%, 02/15/21 | | | 173,893 | | | | 0.2 | |
| | 110,000 | | | | | Centene Corp., 6.125%, 02/15/24 | | | 116,187 | | | | 0.1 | |
| | 225,000 | | | # | | Cenveo Corp., 6.000%, 08/01/19 | | | 201,937 | | | | 0.2 | |
| | 145,000 | | | | | CHS/Community Health Systems, Inc., 6.875%, 02/01/22 | | | 101,500 | | | | 0.1 | |
| | 870,000 | | | | | CHS/Community Health Systems, Inc., 8.000%, 11/15/19 | | | 726,450 | | | | 0.7 | |
| | 375,000 | | | # | | Cimpress NV, 7.000%, 04/01/22 | | | 384,375 | | | | 0.4 | |
| | 225,000 | | | | | Constellation Brands, Inc., 3.750%, 05/01/21 | | | 232,870 | | | | 0.2 | |
| | 275,000 | | | | | Constellation Brands, Inc., 4.250%, 05/01/23 | | | 286,520 | | | | 0.3 | |
| | 305,000 | | | # | | Constellis Holdings LLC / Constellis Finance Corp., 9.750%, 05/15/20 | | | 314,150 | | | | 0.3 | |
| | 430,000 | | | | | Del Monte Foods, Inc. 2nd Lien Term Loan, 8.450%, 08/18/21 | | | 331,100 | | | | 0.3 | |
| | 310,000 | | | # | | Dole Food Co., Inc., 7.250%, 05/01/19 | | | 316,975 | | | | 0.3 | |
| | 406,000 | | | # | | DPx Holdings BV, 7.500%, 02/01/22 | | | 429,853 | | | | 0.4 | |
| | 246,000 | | | | | Emergent Biosolutions, Inc., 2.875%, 01/15/21 | | | 314,572 | | | | 0.3 | |
| | 315,000 | | | # | | Endo Finance Co., 5.750%, 01/15/22 | | | 281,925 | | | | 0.3 | |
| | 140,000 | | | # | | Endo Finance LLC & Endo Finco, Inc., 5.375%, 01/15/23 | | | 119,700 | | | | 0.1 | |
| | 200,000 | | | # | | Endo Finance LLC / Endo Ltd. / Endo Finco, Inc., 6.000%, 07/15/23 | | | 176,500 | | | | 0.2 | |
| | 200,000 | | | # | | Endo Ltd / Endo Finance LLC / Endo Finco, Inc., 6.500%, 02/01/25 | | | 167,500 | | | | 0.2 | |
| | 180,000 | | | | | Endologix, Inc., 2.250%, 12/15/18 | | | 162,225 | | | | 0.2 | |
| | 205,000 | | | | | Endologix, Inc., 3.250%, 11/01/20 | | | 180,144 | | | | 0.2 | |
| | 200,000 | | | # | | FAGE International SA/ FAGE USA Dairy Industry, Inc., 5.625%, 08/15/26 | | | 201,000 | | | | 0.2 | |
| | 600,000 | | | | | HCA, Inc., 5.250%, 06/15/26 | | | 621,750 | | | | 0.6 | |
| | 35,000 | | | # | | Horizon Pharma, Inc. / Horizon Pharma USA, Inc., 8.750%, 11/01/24 | | | 35,613 | | | | 0.0 | |
| | 365,000 | | | | | Impax Laboratories, Inc., 2.000%, 06/15/22 | | | 289,947 | | | | 0.3 | |
| | 295,000 | | | # | | Insulet Corp., 1.250%, 09/15/21 | | | 274,719 | | | | 0.3 | |
| | 212,000 | | | | | Ironwood Pharmaceuticals, Inc., 2.250%, 06/15/22 | | | 243,668 | | | | 0.2 | |
| | 400,000 | | | | | Jazz Investments I Ltd., 1.875%, 08/15/21 | | | 385,250 | | | | 0.4 | |
| | 255,000 | | | | | Kindred Healthcare, Inc., 6.375%, 04/15/22 | | | 228,544 | | | | 0.2 | |
| | 240,000 | | | | | Kindred Healthcare, Inc., 8.000%, 01/15/20 | | | 240,000 | | | | 0.2 | |
| | 80,000 | | | # | | Lamb Weston Holdings, Inc., 4.625%, 11/01/24 | | | 80,400 | | | | 0.1 | |
| | 80,000 | | | # | | Lamb Weston Holdings, Inc., 4.875%, 11/01/26 | | | 79,350 | | | | 0.1 | |
| | 117,065 | | | | | Lantheus Medical Imaging, Inc. - TL B 1L, 7.000%, 06/30/22 | | | 117,138 | | | | 0.1 | |
| | 115,000 | | | | | Macquarie Infrastructure Corp., 2.000%, 10/01/23 | | | 116,366 | | | | 0.1 | |
| | 205,000 | | | | | Medicines Co., 2.500%, 01/15/22 | | | 246,769 | | | | 0.2 | |
| | 90,000 | | | # | | Medicines Co., 2.750%, 07/15/23 | | | 87,019 | | | | 0.1 | |
| | 142,533 | | | | | Metaldyne LLC - TL B 1L, 3.750%, 10/20/21 | | | 143,780 | | | | 0.1 | |
| | 205,000 | | | | | Molina Healthcare, Inc., 5.375%, 11/15/22 | | | 209,100 | | | | 0.2 | |
| | 345,000 | | | # | | NuVasive, Inc., 2.250%, 03/15/21 | | | 439,659 | | | | 0.4 | |
| VY® Pioneer High Yield Portfolio | PORTFOLIO OF INVESTMENTS AS OF December 31, 2016 (CONTINUED) |
| | 325,000 | | | # | | Post Holdings, Inc., 5.000%, 08/15/26 | | | 312,000 | | | | 0.3 | |
| | 260,000 | | | # | | Post Holdings, Inc., 6.000%, 12/15/22 | | | 272,675 | | | | 0.3 | |
| | 100,000 | | | # | | Post Holdings, Inc., 6.750%, 12/01/21 | | | 107,000 | | | | 0.1 | |
| | 100,000 | | | # | | Post Holdings, Inc., 7.750%, 03/15/24 | | | 111,500 | | | | 0.1 | |
| | 245,000 | | | | | Quidel Corp., 3.250%, 12/15/20 | | | 242,550 | | | | 0.2 | |
| | 510,000 | | | # | | RegionalCare Hospital Partners Holdings, Inc., 8.250%, 05/01/23 | | | 511,275 | | | | 0.5 | |
| | 250,000 | | | | | Revlon Consumer Products Corp., 5.750%, 02/15/21 | | | 252,500 | | | | 0.2 | |
| | 500,000 | | | # | | Sothebys, 5.250%, 10/01/22 | | | 493,750 | | | | 0.5 | |
| | 85,000 | | | # | | Tenet Healthcare Corp., 7.500%, 01/01/22 | | | 88,825 | | | | 0.1 | |
| | 130,000 | | | | | Tenet Healthcare Corp., 8.125%, 04/01/22 | | | 123,305 | | | | 0.1 | |
| | 360,000 | | | | | Tenet Healthcare Corp., 4.375%, 10/01/21 | | | 356,400 | | | | 0.3 | |
| | 480,000 | | | | | Theravance, Inc., 2.125%, 01/15/23 | | | 409,200 | | | | 0.4 | |
| | 525,000 | | | | | United Rentals North America, Inc., 5.750%, 11/15/24 | | | 553,875 | | | | 0.5 | |
| | 400,000 | | | | | Universal Hospital Services, Inc., 7.625%, 08/15/20 | | | 398,000 | | | | 0.4 | |
| | 1,225,000 | | | # | | VRX Escrow Corp., 5.875%, 05/15/23 | | | 931,000 | | | | 0.9 | |
| | 470,000 | | | | | Wright Medical Group, Inc., 2.000%, 02/15/20 | | | 492,031 | | | | 0.5 | |
| | | | | | | | | | 16,775,274 | | | | 16.1 | |
| | | | | | | | | | | | | | | |
| | | | | | | Energy: 15.2% | | | | | | | | |
| | 150,000 | | | # | | Alta Mesa Holdings L.P. / Alta Mesa Finance Services Corp., 7.875%, 12/15/24 | | | 156,000 | | | | 0.2 | |
| | 135,000 | | | # | | Antero Midstream Partners L.P. / Antero Midstream Finance Corp., 5.375%, 09/15/24 | | | 138,037 | | | | 0.1 | |
| | 355,000 | | | # | | Antero Resources Corp., 5.000%, 03/01/25 | | | 348,969 | | | | 0.3 | |
| | 175,000 | | | | | Antero Resources Corp., 6.000%, 12/01/20 | | | 180,259 | | | | 0.2 | |
| | 275,000 | | | # | | Blue Racer Midstream LLC / Blue Racer Finance Corp., 6.125%, 11/15/22 | | | 276,375 | | | | 0.3 | |
| | 310,000 | | | # | | California Resources Corp., 8.000%, 12/15/22 | | | 277,450 | | | | 0.3 | |
| | 350,000 | | | | | Calumet Specialty Products Partners L.P. / Calumet Finance Corp., 6.500%, 04/15/21 | | | 298,375 | | | | 0.3 | |
| | 175,000 | | | | | Calumet Specialty Products Partners L.P. / Calumet Finance Corp., 7.750%, 04/15/23 | | | 146,125 | | | | 0.1 | |
| | 125,000 | | | | | Carrizo Oil & Gas, Inc., 7.500%, 09/15/20 | | | 129,687 | | | | 0.1 | |
| | 125,000 | | | # | | Chesapeake Energy Corp., 5.500%, 09/15/26 | | | 135,937 | | | | 0.1 | |
| | 173,000 | | | # | | Chesapeake Energy Corp., 8.000%, 12/15/22 | | | 187,575 | | | | 0.2 | |
| | 137,000 | | | # | | Cobalt International Energy, Inc., 7.750%, 12/01/23 | | | 76,720 | | | | 0.1 | |
| | 318,000 | | | # | | Cobalt International Energy, Inc., 10.750%, 12/01/21 | | | 308,301 | | | | 0.3 | |
| | 200,000 | | | | | Concho Resources, Inc., 4.375%, 01/15/25 | | | 200,602 | | | | 0.2 | |
| | 200,000 | | | | | Concho Resources, Inc., 5.500%, 04/01/23 | | | 208,260 | | | | 0.2 | |
| | 90,000 | | | | | DCP Midstream Operating L.P., 2.700%, 04/01/19 | | | 89,325 | | | | 0.1 | |
| | 120,000 | | | | | DCP Midstream Operating L.P., 3.875%, 03/15/23 | | | 116,026 | | | | 0.1 | |
| | 325,000 | | | | | DCP Midstream Operating L.P., 5.600%, 04/01/44 | | | 298,187 | | | | 0.3 | |
| | 205,000 | | | | | Denbury Resources, Inc., 4.625%, 07/15/23 | | | 165,537 | | | | 0.2 | |
| | 160,000 | | | | | Denbury Resources, Inc., 5.500%, 05/01/22 | | | 140,400 | | | | 0.1 | |
| | 295,000 | | | | | Energy Transfer Equity L.P., 5.875%, 01/15/24 | | | 306,062 | | | | 0.3 | |
| | 60,000 | | | | | EnLink Midstream Partners L.P., 5.050%, 04/01/45 | | | 54,491 | | | | 0.1 | |
| | 174,000 | | | | | EnLink Midstream Partners L.P., 5.600%, 04/01/44 | | | 167,869 | | | | 0.2 | |
| | 305,226 | | | | | EP Energy Corp. TL B2 2L, 9.750%, 06/30/21 | | | 320,106 | | | | 0.3 | |
| | 5,000 | | | | | EP Energy LLC / EP Energy Finance, Inc., 9.375%, 05/01/20 | | | 4,634 | | | | 0.0 | |
| | 50,000 | | | | | Archrock Partners L.P. / Archrock Partners Finance Corp., 6.000%, 10/01/22 | | | 48,750 | | | | 0.0 | |
| | 510,000 | | | | | Archrock Partners L.P. / Archrock Partners Finance Corp., 6.000%, 04/01/21 | | | 497,250 | | | | 0.5 | |
| | 205,000 | | | # | | Extraction Oil & Gas Holdings LLC / Extraction Finance Corp., 7.875%, 07/15/21 | | | 220,375 | | | | 0.2 | |
| | 145,000 | | | | | Genesis Energy L.P. / Genesis Energy Finance Corp., 5.750%, 02/15/21 | | | 147,175 | | | | 0.1 | |
| | 100,000 | | | | | Genesis Energy L.P. / Genesis Energy Finance Corp., 6.750%, 08/01/22 | | | 104,400 | | | | 0.1 | |
| | 210,000 | | | # | | Great Western Petroleum LLC / Great Western Finance, Inc., 9.000%, 09/30/21 | | | 219,450 | | | | 0.2 | |
| | 2,000 | | | | | Green Field Energy Services, Inc. - Escrow Shares | | | – | | | | – | |
| | 300,000 | | | # | | Gulfport Energy Corp., 6.000%, 10/15/24 | | | 306,750 | | | | 0.3 | |
| | 200,000 | | | # | | Gulfport Energy Corp., 6.375%, 05/15/25 | | | 203,040 | | | | 0.2 | |
| | 110,000 | | | | | Gulfport Energy Corp., 6.625%, 05/01/23 | | | 115,500 | | | | 0.1 | |
| VY® Pioneer High Yield Portfolio | PORTFOLIO OF INVESTMENTS AS OF December 31, 2016 (CONTINUED) |
| | 131,000 | | | # | | Halcon Resources Corp., 12.000%, 02/15/22 | | | 143,445 | | | | 0.1 | |
| | 90,000 | | | # | | Hiland Partners L.P. / Hiland Partners Finance Corp., 5.500%, 05/15/22 | | | 94,021 | | | | 0.1 | |
| | 255,000 | | | # | | Hilcorp Energy I L.P. / Hilcorp Finance Co., 5.750%, 10/01/25 | | | 259,462 | | | | 0.3 | |
| | 200,000 | | | | | Holly Energy Partners L.P. / Holly Energy Finance Corp., 6.500%, 03/01/20 | | | 206,500 | | | | 0.2 | |
| | 140,000 | | | # | | Holly Energy Partners L.P. / Holly Energy Finance Corp., 6.000%, 08/01/24 | | | 146,650 | | | | 0.1 | |
| | 250,380 | | | | | Jonah Energy, 7.500%, 05/12/21 | | | 237,861 | | | | 0.2 | |
| | 345,000 | | | | | MPLX L.P., 4.875%, 06/01/25 | | | 354,870 | | | | 0.3 | |
| | 80,000 | | | | | Murphy Oil Corp., 6.875%, 08/15/24 | | | 85,400 | | | | 0.1 | |
| | 250,000 | | | | | Murphy Oil USA, Inc., 6.000%, 08/15/23 | | | 261,875 | | | | 0.3 | |
| | 303,000 | | | | | Noble Energy, Inc., 5.625%, 05/01/21 | | | 316,157 | | | | 0.3 | |
| | 490,000 | | | | | Oasis Petroleum, Inc., 6.875%, 03/15/22 | | | 504,700 | | | | 0.5 | |
| | 425,000 | | | | | ONEOK, Inc., 7.500%, 09/01/23 | | | 489,813 | | | | 0.5 | |
| | 230,000 | | | # | | Parsley Energy LLC / Parsley Finance Corp., 5.375%, 01/15/25 | | | 231,932 | | | | 0.2 | |
| | 210,000 | | | # | | Parsley Energy LLC / Parsley Finance Corp., 6.250%, 06/01/24 | | | 222,033 | | | | 0.2 | |
| | 215,000 | | | | | PDC Energy, Inc., 7.750%, 10/15/22 | | | 230,050 | | | | 0.2 | |
| | 275,000 | | | # | | Range Resources Corp., 5.000%, 03/15/23 | | | 272,938 | | | | 0.3 | |
| | 410,000 | | | | | Rice Energy, Inc., 6.250%, 05/01/22 | | | 423,325 | | | | 0.4 | |
| | 125,000 | | | | | Rice Energy, Inc., 7.250%, 05/01/23 | | | 133,125 | | | | 0.1 | |
| | 70,000 | | | | | Rowan Cos, Inc., 4.875%, 06/01/22 | | | 66,500 | | | | 0.1 | |
| | 296,000 | | | | | Rowan Cos, Inc., 5.400%, 12/01/42 | | | 224,960 | | | | 0.2 | |
| | 31,000 | | | | | Rowan Cos, Inc., 5.850%, 01/15/44 | | | 24,180 | | | | 0.0 | |
| | 125,000 | | | # | | Sabine Pass Liquefaction LLC, 5.000%, 03/15/27 | | | 126,563 | | | | 0.1 | |
| | 325,000 | | | | | Sabine Pass Liquefaction LLC, 5.625%, 02/01/21 | | | 349,375 | | | | 0.3 | |
| | 255,000 | | | | | Sabine Pass Liquefaction LLC, 5.750%, 05/15/24 | | | 274,763 | | | | 0.3 | |
| | 245,000 | | | # | | Sabine Pass Liquefaction LLC, 5.875%, 06/30/26 | | | 264,906 | | | | 0.3 | |
| | 360,000 | | | | | Sanchez Energy Corp., 7.750%, 06/15/21 | | | 368,100 | | | | 0.4 | |
| | 130,000 | | | | | SEACOR Holdings, Inc., 3.000%, 11/15/28 | | | 115,131 | | | | 0.1 | |
| | 35,000 | | | | | SM Energy Co., 6.125%, 11/15/22 | | | 35,613 | | | | 0.0 | |
| | 45,000 | | | | | SM Energy Co., 6.750%, 09/15/26 | | | 46,575 | | | | 0.0 | |
| | 200,000 | | | | | Swift Energy Co., 12/31/49 | | | – | | | | – | |
| | 175,000 | | | | | Swift Energy Co., 12/31/49 | | | – | | | | – | |
| | 130,000 | | | | | Targa Resources Partners L.P. / Targa Resources Partners Finance Corp., 4.250%, 11/15/23 | | | 124,963 | | | | 0.1 | |
| | 215,000 | | | | | Targa Resources Partners L.P. / Targa Resources Partners Finance Corp., 5.250%, 05/01/23 | | | 218,225 | | | | 0.2 | |
| | 190,000 | | | | | Targa Resources Partners L.P. / Targa Resources Partners Finance Corp., 6.375%, 08/01/22 | | | 197,600 | | | | 0.2 | |
| | 135,000 | | | # | | TerraForm Power Operating LLC, 6.375%, 02/01/23 | | | 137,363 | | | | 0.1 | |
| | 300,000 | | | | | Tesoro Corp., 5.375%, 10/01/22 | | | 312,375 | | | | 0.3 | |
| | 200,000 | | | | | Tesoro Logistics L.P. / Tesoro Logistics Finance Corp., 5.250%, 01/15/25 | | | 205,000 | | | | 0.2 | |
| | 295,000 | | | | | Western Refining Logistics L.P. / WNRL Finance Corp., 7.500%, 02/15/23 | | | 320,075 | | | | 0.3 | |
| | 260,000 | | | | | Whiting Petroleum Corp., 1.250%, 04/01/20 | | | 229,450 | | | | 0.2 | |
| | 180,000 | | | | | Williams Cos, Inc., 4.550%, 06/24/24 | | | 179,550 | | | | 0.2 | |
| | 405,000 | | | | | Williams Cos, Inc., 5.750%, 06/24/44 | | | 394,875 | | | | 0.4 | |
| | 100,000 | | | | | WPX Energy, Inc., 6.000%, 01/15/22 | | | 103,000 | | | | 0.1 | |
| | 150,000 | | | | | WPX Energy, Inc., 7.500%, 08/01/20 | | | 162,000 | | | | 0.2 | |
| | 80,000 | | | | | WPX Energy, Inc., 8.250%, 08/01/23 | | | 89,800 | | | | 0.1 | |
| | | | | | | | | | 15,779,098 | | | | 15.2 | |
| | | | | | | | | | | | | | | |
| | | | | | | Financial: 9.1% | | | | | | | | |
| | 232,413 | | | #,& | | AAF Holdings LLC/AAF Finance Co., 12.000%, 07/01/19 | | | 241,128 | | | | 0.2 | |
| | 275,000 | | | # | | Alliance Data Systems Corp., 5.875%, 11/01/21 | | | 279,812 | | | | 0.3 | |
| | 300,000 | | | | | Ally Financial, Inc., 4.625%, 03/30/25 | | | 296,625 | | | | 0.3 | |
| | 200,000 | | | | | Ally Financial, Inc., 4.625%, 05/19/22 | | | 202,750 | | | | 0.2 | |
| | 508,000 | | | | | Ally Financial, Inc., 5.750%, 11/20/25 | | | 508,635 | | | | 0.5 | |
| | 325,000 | | | | | Capital One Financial Corp., 5.550%, 12/29/49 | | | 329,875 | | | | 0.3 | |
| | 225,000 | | | | | Citigroup, Inc., 5.900%, 12/29/49 | | | 228,094 | | | | 0.2 | |
| | 550,000 | | | | | Citigroup, Inc., 6.250%, 12/29/49 | | | 566,637 | | | | 0.5 | |
| VY® Pioneer High Yield Portfolio | PORTFOLIO OF INVESTMENTS AS OF December 31, 2016 (CONTINUED) |
| | 335,000 | | | # | | Communications Sales & Leasing, Inc. / CSL Capital LLC, 6.000%, 04/15/23 | | | 346,725 | | | | 0.3 | |
| | 315,555 | | | | | Confie Seguros Holding II - TL B 1L, 5.750%, 04/19/22 | | | 317,724 | | | | 0.3 | |
| | 475,000 | | | # | | Credit Agricole SA, 8.125%, 12/29/49 | | | 501,709 | | | | 0.5 | |
| | 200,000 | | | | | DuPont Fabros Technology L.P., 5.875%, 09/15/21 | | | 209,375 | | | | 0.2 | |
| | 195,000 | | | | | Equinix, Inc., 5.375%, 04/01/23 | | | 203,287 | | | | 0.2 | |
| | 600,000 | | | | | Fly Leasing Ltd, 6.375%, 10/15/21 | | | 627,000 | | | | 0.6 | |
| | 250,000 | | | # | | Galileo Re Ltd. (Cat Bond), 7.918%, 01/09/19 | | | 250,887 | | | | 0.2 | |
| | 260,000 | | | # | | Iron Mountain US Holdings, Inc., 5.375%, 06/01/26 | | | 252,850 | | | | 0.2 | |
| | 300,000 | | | | | Iron Mountain, Inc., 5.750%, 08/15/24 | | | 309,750 | | | | 0.3 | |
| | 250,000 | | | | | Kennedy-Wilson, Inc., 5.875%, 04/01/24 | | | 255,625 | | | | 0.3 | |
| | 250,000 | | | # | | Kilimanjaro Re Ltd. (Cat Bond), 5.003%, 04/30/18 | | | 255,463 | | | | 0.3 | |
| | 250,000 | | | # | | Kilimanjaro Re Ltd., 9.753%, 12/06/19 | | | 261,088 | | | | 0.3 | |
| | 350,000 | | | | | Morgan Stanley, 5.550%, 12/29/49 | | | 354,375 | | | | 0.3 | |
| | 300,000 | | | | | MPT Operating Partnership L.P. / MPT Finance Corp., 5.500%, 05/01/24 | | | 304,500 | | | | 0.3 | |
| | 125,000 | | | | | Nationstar Mortgage LLC / Nationstar Capital Corp., 6.500%, 06/01/22 | | | 125,000 | | | | 0.1 | |
| | 575,000 | | | | | Nationstar Mortgage LLC / Nationstar Capital Corp., 6.500%, 07/01/21 | | | 585,063 | | | | 0.6 | |
| | 100,000 | | | | | Nationstar Mortgage LLC / Nationstar Capital Corp., 6.500%, 08/01/18 | | | 101,750 | | | | 0.1 | |
| | 75,000 | | | | | Navient Corp., 6.625%, 07/26/21 | | | 79,500 | | | | 0.1 | |
| | 125,000 | | | # | | Ocwen Loan Servicing LLC, 8.375%, 11/15/22 | | | 127,563 | | | | 0.1 | |
| | 435,000 | | | # | | Provident Funding Associates L.P. / PFG Finance Corp., 6.750%, 06/15/21 | | | 439,350 | | | | 0.4 | |
| | 120,000 | | | # | | Quicken Loans, Inc., 5.750%, 05/01/25 | | | 117,300 | | | | 0.1 | |
| | 225,000 | | | # | | Rialto Holdings LLC / Rialto Corp., 7.000%, 12/01/18 | | | 228,938 | | | | 0.2 | |
| | 400,000 | | | | | Royal Bank of Scotland Group PLC, 8.000%, 12/29/49 | | | 384,000 | | | | 0.4 | |
| | 210,000 | | | # | | TMX Finance LLC / TitleMax Finance Corp., 8.500%, 09/15/18 | | | 184,275 | | | | 0.2 | |
| | | | | | | | | | 9,476,653 | | | | 9.1 | |
| | | | | | | | | | | | | | | |
| | | | | | | Industrial: 7.9% | | | | | | | | |
| | 135,000 | | | # | | Advanced Disposal Services, Inc., 5.625%, 11/15/24 | | | 134,662 | | | | 0.1 | |
| | 105,000 | | | | | AECOM, 5.875%, 10/15/24 | | | 112,624 | | | | 0.1 | |
| | 242,000 | | | | | AEP Industries, Inc., 8.250%, 04/15/19 | | | 248,111 | | | | 0.2 | |
| | 250,000 | | | # | | Amsted Industries, Inc., 5.000%, 03/15/22 | | | 251,250 | | | | 0.2 | |
| EUR | 100,000 | | | #,& | | ARD Finance SA, 6.625%, 09/15/23 | | | 105,668 | | | | 0.1 | |
| | 100,000 | | | #,& | | ARD Finance SA, 7.125%, 09/15/23 | | | 99,125 | | | | 0.1 | |
| | 70,000 | | | # | | Ardagh Packaging Finance PLC / Ardagh Holdings USA, Inc., 4.156%, 05/15/21 | | | 72,187 | | | | 0.1 | |
| | 80,000 | | | # | | Ardagh Packaging Finance PLC / Ardagh Holdings USA, Inc., 4.625%, 05/15/23 | | | 79,300 | | | | 0.1 | |
| | 90,000 | | | # | | Ardagh Packaging Finance PLC / Ardagh Holdings USA, Inc., 7.250%, 05/15/24 | | | 95,175 | | | | 0.1 | |
| | 325,000 | | | | | Ball Corp., 4.000%, 11/15/23 | | | 319,719 | | | | 0.3 | |
| | 575,000 | | | | | Ball Corp., 5.250%, 07/01/25 | | | 603,031 | | | | 0.6 | |
| | 350,000 | | | # | | BC Mountain LLC / BC Mountain Finance, Inc., 7.000%, 02/01/21 | | | 315,000 | | | | 0.3 | |
| | 85,000 | | | # | | Belden, Inc., 5.250%, 07/15/24 | | | 85,850 | | | | 0.1 | |
| | 208,961 | | | | | Builders FirstSource, Inc. Term Loan B, 4.750%, 07/31/22 | | | 211,077 | | | | 0.2 | |
| | 140,000 | | | # | | Builders FirstSource, Inc., 5.625%, 09/01/24 | | | 141,225 | | | | 0.1 | |
| | 305,000 | | | # | | Cleaver-Brooks, Inc., 8.750%, 12/15/19 | | | 319,106 | | | | 0.3 | |
| | 205,000 | | | # | | Coveris Holdings SA, 7.875%, 11/01/19 | | | 204,487 | | | | 0.2 | |
| | 640,000 | | | | | Crown Cork & Seal Co., Inc., 7.375%, 12/15/26 | | | 720,000 | | | | 0.7 | |
| | 425,000 | | | | | Dycom Industries, Inc., 0.750%, 09/15/21 | | | 465,906 | | | | 0.4 | |
| | 150,000 | | | # | | Engility Corp., 8.875%, 09/01/24 | | | 157,687 | | | | 0.2 | |
| | 270,000 | | | # | | Florida East Coast Holdings Corp., 6.750%, 05/01/19 | | | 280,125 | | | | 0.3 | |
| | 644,000 | | | | | General Cable Corp., 4.500%, 11/15/29 | | | 505,942 | | | | 0.5 | |
| | 405,000 | | | | | Griffon Corp., 5.250%, 03/01/22 | | | 411,885 | | | | 0.4 | |
| | 273,000 | | | | | Jack Cooper Holdings Corp., 9.250%, 06/01/20 | | | 119,438 | | | | 0.1 | |
| | 265,000 | | | | | MasTec, Inc., 4.875%, 03/15/23 | | | 260,363 | | | | 0.3 | |
| | 575,000 | | | # | | NANA Development Corp., 9.500%, 03/15/19 | | | 526,125 | | | | 0.5 | |
| | 81,496 | | | | | Reynolds Group Issuer, Inc. / Reynolds Group Issuer LLC / Reynolds Group Issuer Lu, 8.250%, 02/15/21 | | | 84,169 | | | | 0.1 | |
| | 100,000 | | | | | Reynolds Group Issuer, Inc., 5.750%, 10/15/20 | | | 103,250 | | | | 0.1 | |
| | 100,000 | | | | | RTI International Metals, Inc., 1.625%, 10/15/19 | | | 103,938 | | | | 0.1 | |
| VY® Pioneer High Yield Portfolio | PORTFOLIO OF INVESTMENTS AS OF December 31, 2016 (CONTINUED) |
| | 126,000 | | | | | SunPower Corp., 0.875%, 06/01/21 | | | 83,318 | | | | 0.1 | |
| | 200,000 | | | # | | syncreon Group BV / syncreon Global Finance US, Inc., 8.625%, 11/01/21 | | | 147,000 | | | | 0.1 | |
| | 125,000 | | | | | Triumph Group, Inc., 5.250%, 06/01/22 | | | 117,188 | | | | 0.1 | |
| | 75,000 | | | # | | Tutor Perini Corp., 2.875%, 06/15/21 | | | 85,828 | | | | 0.1 | |
| | 311,000 | | | | | Vishay Intertechnology, Inc., 2.250%, 05/15/41 | | | 301,476 | | | | 0.3 | |
| | 313,425 | | | | | Zekelman Industries, Inc., 6.000%, 06/14/21 | | | 317,343 | | | | 0.3 | |
| | | | | | | | | | 8,188,578 | | | | 7.9 | |
| | | | | | | | | | | | | | | |
| | | | | | | Insurance: 0.1% | | | | | | | | |
| | 71,581 | | | | | Alliant Holdings I, Inc. 2015 Term Loan B, 4.753%, 08/12/22 | | | 71,954 | | | | 0.1 | |
| | | | | | | | | | | | | | | |
| | | | | | | Technology: 5.8% | | | | | | | | |
| | 210,000 | | | | | Brocade Communications Systems, Inc., 4.625%, 01/15/23 | | | 208,950 | | | | 0.2 | |
| | 110,000 | | | | | Citrix Systems, Inc., 0.500%, 04/15/19 | | | 127,875 | | | | 0.1 | |
| | 145,000 | | | # | | Diamond 1 Finance Corp. / Diamond 2 Finance Corp., 5.875%, 06/15/21 | | | 154,277 | | | | 0.1 | |
| | 385,000 | | | | | Diebold, Inc., 8.500%, 04/15/24 | | | 412,431 | | | | 0.4 | |
| | 200,000 | | | | | DynCorp International, Inc. Term Loan B2, 7.750%, 07/07/20 | | | 201,021 | | | | 0.2 | |
| | 28,750 | | | & | | DynCorp International, Inc., 11.875%, 11/30/20 | | | 26,881 | | | | 0.0 | |
| | 375,000 | | | # | | Entegris, Inc., 6.000%, 04/01/22 | | | 391,406 | | | | 0.4 | |
| | 420,000 | | | # | | First Data Corp., 5.750%, 01/15/24 | | | 434,965 | | | | 0.4 | |
| | 155,000 | | | # | | First Data Corp., 7.000%, 12/01/23 | | | 165,462 | | | | 0.2 | |
| | 300,000 | | | # | | Inception Merger Sub, Inc. / Rackspace Hosting, Inc., 8.625%, 11/15/24 | | | 318,285 | | | | 0.3 | |
| | 510,000 | | | | | j2 Global, Inc., 8.000%, 08/01/20 | | | 530,719 | | | | 0.5 | |
| | 145,000 | | | | | KEYW Holding Corp./The, 2.500%, 07/15/19 | | | 146,178 | | | | 0.1 | |
| | 465,000 | | | # | | Micron Technology, Inc., 5.250%, 08/01/23 | | | 469,069 | | | | 0.5 | |
| | 110,000 | | | # | | Micron Technology, Inc., 5.625%, 01/15/26 | | | 109,587 | | | | 0.1 | |
| | 200,000 | | | ± | | Midway Games, Inc., 06/01/21 | | | – | | | | – | |
| | 160,000 | | | # | | MSCI, Inc., 4.750%, 08/01/26 | | | 159,000 | | | | 0.2 | |
| | 250,000 | | | # | | MSCI, Inc., 5.250%, 11/15/24 | | | 263,125 | | | | 0.3 | |
| | 265,000 | | | | | NCR Corp., 5.000%, 07/15/22 | | | 271,625 | | | | 0.3 | |
| | 160,000 | | | | | NCR Corp., 6.375%, 12/15/23 | | | 172,400 | | | | 0.2 | |
| | 120,000 | | | | | Nuance Communications, Inc., 1.000%, 12/15/35 | | | 108,975 | | | | 0.1 | |
| | 440,000 | | | | | ON Semiconductor Corp., 1.000%, 12/01/20 | | | 452,925 | | | | 0.4 | |
| | 200,000 | | | # | | Open Text Corp., 5.875%, 06/01/26 | | | 211,500 | | | | 0.2 | |
| | 200,000 | | | # | | Quintiles IMS, Inc., 5.000%, 10/15/26 | | | 201,000 | | | | 0.2 | |
| | 195,500 | | | | | SkillSoft 1st Lien TL, 5.837%, 04/28/21 | | | 179,249 | | | | 0.2 | |
| | 205,000 | | | | | Synchronoss Technologies, Inc., 0.750%, 08/15/19 | | | 216,275 | | | | 0.2 | |
| | 46,000 | | | # | | Teradyne, Inc., 1.250%, 12/15/23 | | | 48,818 | | | | 0.0 | |
| | | | | | | | | | 5,981,998 | | | | 5.8 | |
| | | | | | | | | | | | | | | |
| | | | | | | Utilities: 2.5% | | | | | | | | |
| | 505,000 | | | | | AES Corp., 4.875%, 05/15/23 | | | 501,313 | | | | 0.5 | |
| | 100,000 | | | | | AES Corp., 5.500%, 03/15/24 | | | 102,250 | | | | 0.1 | |
| | 261 | | | | | Red Oak Power LLC, 8.540%, 11/30/19 | | | 262 | | | | 0.0 | |
| | 100,000 | | | | | AmeriGas Partners L.P. / AmeriGas Finance Corp., 5.500%, 05/20/25 | | | 101,375 | | | | 0.1 | |
| | 200,000 | | | # | | Calpine Corp., 5.250%, 06/01/26 | | | 198,000 | | | | 0.2 | |
| | 110,000 | | | | | Calpine Corp., 5.750%, 01/15/25 | | | 106,700 | | | | 0.1 | |
| | 245,000 | | | | | NRG Energy, Inc., 6.250%, 05/01/24 | | | 239,487 | | | | 0.2 | |
| | 515,000 | | | # | | NRG Energy, Inc., 6.625%, 01/15/27 | | | 489,250 | | | | 0.5 | |
| | 170,000 | | | # | | NRG Energy, Inc., 7.250%, 05/15/26 | | | 170,000 | | | | 0.1 | |
| | 107,296 | | | # | | NSG Holdings, LLC, 7.750%, 12/15/25 | | | 116,282 | | | | 0.1 | |
| | 755,000 | | | | | Talen Energy Supply LLC, 6.500%, 06/01/25 | | | 587,013 | | | | 0.6 | |
| | | | | | | | | | 2,611,932 | | | | 2.5 | |
| | | | | | | | | | | | | | | |
| | | | | Total Corporate Bonds/Notes
(Cost $87,316,206) | | | 88,671,680 | | | | 85.4 | |
| | | | | | | | | | | | | | | |
| MUNICIPAL BONDS: 0.6% | | | | | | | | |
| | | | | | | : 0.6% | | | | | | | | |
| | 30,000 | | | | | Buckeye Tobacco Settlement Financing Authority, 5.750%, 06/01/34 | | | 25,913 | | | | 0.0 | |
| | 293,000 | | | | | Buckeye Tobacco Settlement Financing Authority, 5.875%, 06/01/47 | | | 257,087 | | | | 0.3 | |
| | 62,000 | | | | | Buckeye Tobacco Settlement Financing Authority, 6.000%, 06/01/42 | | | 53,949 | | | | 0.1 | |
| | 125,000 | | | | | Golden State Tobacco Securitization Corp., 5.125%, 06/01/47 | | | 110,161 | | | | 0.1 | |
| | 15,000 | | | | | Michigan Tobacco Settlement Finance Authority, 6.000%, 06/01/48 | | | 13,281 | | | | 0.0 | |
| VY® Pioneer High Yield Portfolio | PORTFOLIO OF INVESTMENTS AS OF December 31, 2016 (CONTINUED) |
| | 165,000 | | | | | Tobacco Settlement Financing Corp./NJ, 5.000%, 06/01/41 | | | 143,547 | | | | 0.1 | |
| | 55,000 | | | | | Tobacco Settlement Financing Corp./VA, 5.000%, 06/01/47 | | | 46,821 | | | | 0.0 | |
| | | | | | | | | | | | | | | |
| | | | | Total Municipal Bonds
(Cost $634,642) | | | 650,759 | | | | 0.6 | |
| | | | | | | | | | | | | | | |
| FOREIGN GOVERNMENT BONDS: –% | | | | | | | | |
| | 14,440 | | | & | | Mashantucket Western Pequot Tribe, 07/01/36 | | | – | | | | – | |
| | | | | | | | | | | | | | | |
| | | | | Total Foreign Government Bonds
(Cost $1,223) | | | – | | | | – | |
| | | | | | | | | | | | | | | |
| U.S. TREASURY OBLIGATIONS: 3.4% | | | | | | | | |
| | | | | | | U.S. Treasury Notes: 3.4% | | | | | | | | |
| | 3,500,000 | | | | | 0.705%, due 07/31/18 | | | 3,503,889 | | | | 3.4 | |
| | | | | | | | | | | | | | | |
| | | | | Total U.S. Treasury Obligations
(Cost $3,500,614) | | | 3,503,889 | | | | 3.4 | |
| Shares | | | | | | | Value | | | Percentage
of Net
Assets | |
| COMMON STOCK: 4.6% | |
| | | | | | | Consumer Discretionary: 0.9% | |
| | 3,636 | | | @ | | Cengage Learning Holdings II L.P. | | | 56,965 | | | | 0.0 | |
| | 50,408 | | | | | Ford Motor Co. | | | 611,449 | | | | 0.6 | |
| | 1,476 | | | #,@ | | Perseus Holding Corp. | | | – | | | | – | |
| | 5,043 | | | | | Starbucks Corp. | | | 279,987 | | | | 0.3 | |
| | | | | | | | | | 948,401 | | | | 0.9 | |
| | | | | | | | | | | | | | | |
| | | | | | | Energy: 0.2% | | | | | | | | |
| | 424,441 | | | @ | | Ascent Resources - Utica LLC | | | 5,093 | | | | 0.0 | |
| | 3,743 | | | | | Marathon Petroleum Corp. | | | 188,460 | | | | 0.2 | |
| | 91 | | | @ | | Midstates Petroleum Co., Inc. | | | 1,888 | | | | 0.0 | |
| | 20 | | | @ | | TPT Acquisition, Inc. | | | – | | | | – | |
| | | | | | | | | | 195,441 | | | | 0.2 | |
| | | | | | | | | | | | | | | |
| | | | | | | Financials: 0.4% | | | | | | | | |
| | 2,083 | | | | | Capital One Financial Corp. | | | 181,721 | | | | 0.2 | |
| | 2,568 | | | | | JPMorgan Chase & Co. | | | 221,593 | | | | 0.2 | |
| | | | | | | | | | 403,314 | | | | 0.4 | |
| | | | | | | | | | | | | | | |
| | | | | | | Health Care: 1.0% | | | | | | | | |
| | 2,690 | | | | | Aetna, Inc. | | | 333,587 | | | | 0.3 | |
| | 3,183 | | | @ | | Alere, Inc. | | | 124,041 | | | | 0.1 | |
| | 15,129 | | | @ | | BioScrip, Inc. | | | 15,734 | | | | 0.0 | |
| | 1,411 | | | | | Cigna Corp. | | | 188,213 | | | | 0.2 | |
| | 4,020 | | | @ | | Mylan NV | | | 153,363 | | | | 0.2 | |
| | 1,767 | | | | | Thermo Fisher Scientific, Inc. | | | 249,324 | | | | 0.2 | |
| | | | | | | | | | 1,064,262 | | | | 1.0 | |
| | | | | | | | | | | | | | | |
| | | | | | | Industrials: 0.5% | | | | | | | | |
| | 123 | | | @ | | Ceva Holdings LLC | | | 12,335 | | | | 0.0 | |
| | 18,113 | | | @ | | Commercial Vehicle Group, Inc. | | | 100,165 | | | | 0.1 | |
| | 5,836 | | | @ | | Liberty Tire Recycling | | | – | | | | – | |
| | 1,030 | | | | | Orbital ATK, Inc. | | | 90,362 | | | | 0.1 | |
| | 3,432 | | | @ | | United Continental Holdings, Inc. | | | 250,124 | | | | 0.3 | |
| | | | | | | | | | 452,986 | | | | 0.5 | |
| | | | | | | | | | | | | | | |
| | | | | | | Information Technology: 0.5% | |
| | 10,537 | | | @ | | NCR Corp. | | | 427,381 | | | | 0.4 | |
| | 1,750 | | | | | TE Connectivity Ltd. | | | 121,240 | | | | 0.1 | |
| | | | | | | | | | 548,621 | | | | 0.5 | |
| | | | | | | | | | | | | | | |
| | | | | | | Materials: 0.3% | | | | | | | | |
| | 3,564 | | | | | LyondellBasell Industries NV - Class A | | | 305,720 | | | | 0.3 | |
| | | | | | | | | | | | | | | |
| | | | | | | Real Estate: 0.8% | | | | | | | | |
| | 5,760 | | | @ | | Communications Sales & Leasing, Inc. | | | 146,362 | | | | 0.1 | |
| | 32,109 | | | | | Forest City Realty Trust, Inc. | | | 669,151 | | | | 0.7 | |
| | | | | | | | | | 815,513 | | | | 0.8 | |
| | | | | | | | | | | | | | | |
| | | | | | | Telecommunication Services: 0.0% | |
| | 1,994 | | | | | Windstream Holdings, Inc. | | | 14,616 | | | | 0.0 | |
| | | | | | | | | | | | | | | |
| | | | | Total Common Stock
(Cost $3,787,530) | | | 4,748,874 | | | | 4.6 | |
| | | | | | | | | | | | | | | |
| PREFERRED STOCK: 1.4% | | | | | | | | |
| | | | | | | Consumer Discretionary: –% | |
| | 775 | | | #,@ | | Perseus Holding Corp. | | | – | | | | – | |
| | | | | | | | | | | | | | | |
| | | | | | | Financials: 0.9% | | | | | | | | |
| | 470 | | | @ | | Bank of America Corp. | | | 548,396 | | | | 0.5 | |
| | 3,542 | | | @,P | | GMAC Capital Trust I | | | 89,967 | | | | 0.1 | |
| | 232 | | | @ | | Wells Fargo & Co. | | | 276,080 | | | | 0.3 | |
| | | | | | | | | | 914,443 | | | | 0.9 | |
| | | | | | | | | | | | | | | |
| | | | | | | Health Care: 0.5% | | | | | | | | |
| | 811 | | | @ | | Alere, Inc. | | | 268,226 | | | | 0.2 | |
| | 225 | | | @ | | Allergan PLC | | | 171,553 | | | | 0.2 | |
| | 44 | | | @ | | BioScrip, Inc. | | | 2,735 | | | | 0.0 | |
| | 150 | | | @ | | Kindred Healthcare, Inc. | | | 70,762 | | | | 0.1 | |
| | | | | | | | | | 513,276 | | | | 0.5 | |
| | | | | | | | | | | | | | | |
| | | | | | | Industrials: 0.0% | | | | | | | | |
| | 267 | | | @ | | Ceva Holdings Series A-2 | | | 60,082 | | | | 0.0 | |
| | | | | | | | | | | | | | | |
| | | | | Total Preferred Stock
(Cost $1,850,002) | | | 1,487,801 | | | | 1.4 | |
| | | | | | | | | | | | | | | |
| WARRANTS: –% | | | | | | | | |
| | | | | | | Energy: –% | | | | | | | | |
| | 644 | | | @ | | Midstates Petroleum Co., Inc. | | | – | | | | – | |
| | | | | | | | | | | | | | | |
| | | | | | | Health Care: –% | | | | | | | | |
| | 126 | | | @ | | BioScrip, Inc. - Class A | | | – | | | | – | |
| | 126 | | | @ | | BioScrip, Inc. - Class B | | | – | | | | – | |
| | | | | | | | | | – | | | | – | |
| | | | | | | | | | | | | | | |
| | | | | Total Warrants
(Cost $–) | | | – | | | | – | |
| | | | | | | | | | | | | | | |
| | | | | Total Long-Term Investments
(Cost $97,090,217) | | | 99,063,003 | | | | 95.4 | |
| VY® Pioneer High Yield Portfolio | PORTFOLIO OF INVESTMENTS AS OF December 31, 2016 (CONTINUED) |
Principal
Amount† | | | | | | | Value | | | Percentage
of Net
Assets | |
| SHORT-TERM INVESTMENTS: 3.1% | | | | | | | | |
| | | | | | | Corporate Bonds/Notes: 0.5% | |
| | 300,000 | | | | | Golar LNG Ltd., 3.750%, 03/07/17 | | | 299,625 | | | | 0.3 | |
| | 250,000 | | | # | | Sanders Re Ltd. (Cat Bond), 4.503%, 05/05/17 | | | 250,862 | | | | 0.2 | |
| | | | | | | | | | 550,487 | | | | 0.5 | |
| | | | | | | | | | | | | | | |
| | | | | | | U.S. Treasury Bills: 1.9% | |
| | 700,000 | | | Z | | United States Treasury Bill, 0.350%, 01/19/17 | | | 699,874 | | | | 0.7 | |
| | 1,250,000 | | | Z | | United States Treasury Bill, 0.390%, 02/02/17 | | | 1,249,566 | | | | 1.2 | |
| | | | | | | | | | 1,949,440 | | | | 1.9 | |
| | | | | | | | | | | | | | | |
| | | | | | | Certificates of Deposit: 0.2% | |
| | 260,000 | | | | | Sumitomo, 1.260%, 04/03/17 | | | | | | | | |
| | | | | | | (Cost $260,000) | | | 260,199 | | | | 0.2 | |
| Shares | | | | | | | Value | | | Percentage
of Net
Assets | |
| | | | | | | Mutual Funds: 0.5% | | | | | | | | |
| | 489,318 | | | | | BlackRock Liquidity Funds, FedFund, Institutional Class, 0.420%†† | | | | | | | | |
| | | | | | | (Cost $489,318) | | | 489,318 | | | | 0.5 | |
| | | | | | | | | | | | | | | |
| | | | | Total Short-Term Investments
(Cost $3,252,170) | | | 3,249,444 | | | | 3.1 | |
| | | | | | | | | | | | | | | |
| | | | | Total Investments in Securities
(Cost $100,342,387) | | $ | 102,312,447 | | | | 98.5 | |
| | | | | Assets in Excess of Other Liabilities | | | 1,523,269 | | | | 1.5 | |
| | | | | Net Assets | | $ | 103,835,716 | | | | 100.0 | |
| † | Unless otherwise indicated, principal amount is shown in USD. |
| †† | Rate shown is the 7-day yield as of December 31, 2016. |
| # | Securities with purchases pursuant to Rule 144A or section 4(a)(2), under the Securities Act of 1933 and may not be resold subject to that rule except to qualified institutional buyers. |
| @ | Non-income producing security. |
| & | Payment-in-kind |
| P | Preferred Stock may be called prior to convertible date. |
| ± | Defaulted security |
| Z | Indicates Zero Coupon Bond; rate shown reflects current effective yield. |
Cost for federal income tax purposes is $100,876,856.
Net unrealized appreciation consists of:
| Gross Unrealized Appreciation | | $ | 4,903,725 | |
| Gross Unrealized Depreciation | | | (3,468,134 | ) |
| | | | | |
| Net Unrealized Appreciation | | $ | 1,435,591 | |
| VY® T. Rowe Price Diversified Mid Cap Growth Portfolio | PORTFOLIO OF INVESTMENTS AS OF December 31, 2016 |
| Shares | | | | | | | Value | | | Percentage
of Net
Assets | |
| COMMON STOCK: 98.8% | | | | | | | | |
| | | | | | | Consumer Discretionary: 21.3% | |
| | 9,800 | | | @ | | Autozone, Inc. | | | 7,739,942 | | | | 0.9 | |
| | 68,000 | | | | | Bloomin Brands, Inc. | | | 1,226,040 | | | | 0.1 | |
| | 68,300 | | | | | BorgWarner, Inc. | | | 2,693,752 | | | | 0.3 | |
| | 38,100 | | | L | | Brinker International, Inc. | | | 1,887,093 | | | | 0.2 | |
| | 62,200 | | | @ | | Burlington Stores, Inc. | | | 5,271,450 | | | | 0.6 | |
| | 84,300 | | | @ | | Carmax, Inc. | | | 5,428,077 | | | | 0.6 | |
| | 29,700 | | | | | Carter's, Inc. | | | 2,565,783 | | | | 0.3 | |
| | 4,300 | | | @,L | | Chipotle Mexican Grill, Inc. | | | 1,622,476 | | | | 0.2 | |
| | 40,100 | | | | | Choice Hotels International, Inc. | | | 2,247,605 | | | | 0.3 | |
| | 86,400 | | | | | Coach, Inc. | | | 3,025,728 | | | | 0.4 | |
| | 57,000 | | | @ | | Ctrip.com International Ltd. ADR | | | 2,280,000 | | | | 0.3 | |
| | 44,200 | | | | | Delphi Automotive PLC | | | 2,976,870 | | | | 0.4 | |
| | 55,200 | | | | | Dick's Sporting Goods, Inc. | | | 2,931,120 | | | | 0.3 | |
| | 102,900 | | | | | Dollar General Corp. | | | 7,621,803 | | | | 0.9 | |
| | 60,900 | | | @ | | Dollar Tree, Inc. | | | 4,700,262 | | | | 0.6 | |
| | 48,200 | | | | | Dunkin' Brands Group, Inc. | | | 2,527,608 | | | | 0.3 | |
| | 120,800 | | | | | Extended Stay America, Inc. | | | 1,950,920 | | | | 0.2 | |
| | 31,900 | | | | | Ferrari NV | | | 1,854,666 | | | | 0.2 | |
| | 36,100 | | | @ | | Five Below, Inc. | | | 1,442,556 | | | | 0.2 | |
| | 320,900 | | | | | Hanesbrands, Inc. | | | 6,921,813 | | | | 0.8 | |
| | 24,600 | | | | | Harley-Davidson, Inc. | | | 1,435,164 | | | | 0.2 | |
| | 12,000 | | | | | Harman International Industries, Inc. | | | 1,333,920 | | | | 0.2 | |
| | 109,300 | | | | | Hilton Worldwide Holdings, Inc. | | | 2,972,960 | | | | 0.4 | |
| | 122,900 | | | | | Interpublic Group of Cos., Inc. | | | 2,877,089 | | | | 0.3 | |
| | 64,900 | | | @ | | Kate Spade & Co. | | | 1,211,683 | | | | 0.1 | |
| | 71,500 | | | | | L Brands, Inc. | | | 4,707,560 | | | | 0.6 | |
| | 62,500 | | | @ | | Liberty Interactive Corp. QVC Group | | | 1,248,750 | | | | 0.1 | |
| | 19,600 | | | @ | | Lululemon Athletica, Inc. | | | 1,273,804 | | | | 0.2 | |
| | 50,312 | | | | | Marriott International, Inc. | | | 4,159,796 | | | | 0.5 | |
| | 84,700 | | | | | Mattel, Inc. | | | 2,333,485 | | | | 0.3 | |
| | 131,300 | | | @ | | MGM Resorts International | | | 3,785,379 | | | | 0.4 | |
| | 122,500 | | | @ | | Michaels Cos, Inc. | | | 2,505,125 | | | | 0.3 | |
| | 16,600 | | | @ | | Mohawk Industries, Inc. | | | 3,314,688 | | | | 0.4 | |
| | 80,800 | | | | | Newell Brands, Inc. | | | 3,607,720 | | | | 0.4 | |
| | 42,200 | | | @ | | Norwegian Cruise Line Holdings Ltd. | | | 1,794,766 | | | | 0.2 | |
| | 1,700 | | | @ | | NVR, Inc. | | | 2,837,300 | | | | 0.3 | |
| | 41,100 | | | | | Omnicom Group | | | 3,498,021 | | | | 0.4 | |
| | 27,700 | | | @ | | O'Reilly Automotive, Inc. | | | 7,711,957 | | | | 0.9 | |
| | 8,000 | | | @ | | Panera Bread Co. | | | 1,640,720 | | | | 0.2 | |
| | 25,900 | | | | | Papa John's International, Inc. | | | 2,216,522 | | | | 0.3 | |
| | 18,800 | | | L | | Polaris Industries, Inc. | | | 1,548,932 | | | | 0.2 | |
| | 88,900 | | | | | Pulte Group, Inc. | | | 1,633,982 | | | | 0.2 | |
| | 32,000 | | | | | PVH Corp. | | | 2,887,680 | | | | 0.3 | |
| | 24,600 | | | @,L | | Restoration Hardware Holdings, Inc. | | | 755,220 | | | | 0.1 | |
| | 125,000 | | | | | Ross Stores, Inc. | | | 8,200,000 | | | | 1.0 | |
| | 23,600 | | | | | Royal Caribbean Cruises Ltd. | | | 1,936,144 | | | | 0.2 | |
| | 151,000 | | | | | Service Corp. International | | | 4,288,400 | | | | 0.5 | |
| | 36,000 | | | | | Signet Jewelers Ltd. | | | 3,393,360 | | | | 0.4 | |
| | 36,500 | | | L | | Sotheby's | | | 1,454,890 | | | | 0.2 | |
| | 34,500 | | | @,L | | Tempur Sealy International, Inc. | | | 2,355,660 | | | | 0.3 | |
| | 9,300 | | | @,L | | Tesla Motors, Inc. | | | 1,987,317 | | | | 0.2 | |
| | 39,400 | | | L | | Tiffany & Co. | | | 3,050,742 | | | | 0.4 | |
| | 58,900 | | | @ | | Toll Brothers, Inc. | | | 1,825,900 | | | | 0.2 | |
| | 67,100 | | | | | Tractor Supply Co. | | | 5,086,851 | | | | 0.6 | |
| | 18,400 | | | @ | | TripAdvisor, Inc. | | | 853,208 | | | | 0.1 | |
| | 18,100 | | | @ | | Ulta Salon Cosmetics & Fragrance, Inc. | | | 4,614,414 | | | | 0.5 | |
| | 84,300 | | | @ | | Vipshop Holdings Ltd. ADR | | | 928,143 | | | | 0.1 | |
| | 33,020 | | | @,L | | Wayfair, Inc. | | | 1,157,351 | | | | 0.1 | |
| | 12,700 | | | | | Whirlpool Corp. | | | 2,308,479 | | | | 0.3 | |
| | 47,000 | | | | | Williams-Sonoma, Inc. | | | 2,274,330 | | | | 0.3 | |
| | 56,500 | | | | | Wolverine World Wide, Inc. | | | 1,240,175 | | | | 0.1 | |
| | 16,200 | | | L | | Wynn Resorts Ltd. | | | 1,401,462 | | | | 0.2 | |
| | | | | | | | | | 180,564,613 | | | | 21.3 | |
| | | | | | | | | | | | | | | |
| | | | | | | Consumer Staples: 5.6% | |
| | 84,200 | | | @ | | Blue Buffalo Pet Products, Inc. | | | 2,024,168 | | | | 0.2 | |
| | 79,300 | | | | | Brown-Forman Corp. - Class B | | | 3,562,156 | | | | 0.4 | |
| | 75,200 | | | | | Church & Dwight Co., Inc. | | | 3,323,088 | | | | 0.4 | |
| | 11,800 | | | | | Clorox Co. | | | 1,416,236 | | | | 0.2 | |
| | 67,500 | | | | | Conagra Brands, Inc. | | | 2,669,625 | | | | 0.3 | |
| | 10,100 | | | | | Constellation Brands, Inc. | | | 1,548,431 | | | | 0.2 | |
| | 44,600 | | | | | Dr Pepper Snapple Group, Inc. | | | 4,043,882 | | | | 0.5 | |
| | 109,700 | | | L | | Flowers Foods, Inc. | | | 2,190,709 | | | | 0.3 | |
| | 45,400 | | | @ | | Hain Celestial Group, Inc. | | | 1,771,962 | | | | 0.2 | |
| | 46,400 | | | | | Hershey Co. | | | 4,799,152 | | | | 0.6 | |
| | 18,500 | | | | | JM Smucker Co. | | | 2,369,110 | | | | 0.3 | |
| | 45,000 | | | | | McCormick & Co., Inc. | | | 4,199,850 | | | | 0.5 | |
| | 59,800 | | | | | Mead Johnson Nutrition Co. | | | 4,231,448 | | | | 0.5 | |
| | 17,100 | | | @ | | Monster Beverage Corp. | | | 758,214 | | | | 0.1 | |
| | 35,000 | | | | | Pinnacle Foods, Inc. | | | 1,870,750 | | | | 0.2 | |
| | 14,300 | | | | | Pricesmart, Inc. | | | 1,194,050 | | | | 0.1 | |
| | 61,400 | | | @ | | Sprouts Farmers Market, Inc. | | | 1,161,688 | | | | 0.1 | |
| | 49,300 | | | | | Tyson Foods, Inc. | | | 3,040,824 | | | | 0.4 | |
| | 41,900 | | | | | Whole Foods Market, Inc. | | | 1,288,844 | | | | 0.1 | |
| | | | | | | | | | 47,464,187 | | | | 5.6 | |
| | | | | | | | | | | | | | | |
| | | | | | | Energy: 1.8% | | | | | | | | |
| | 53,500 | | | | | Cabot Oil & Gas Corp. | | | 1,249,760 | | | | 0.2 | |
| | 39,637 | | | @ | | Centennial Resource Development, Inc. | | | 766,009 | | | | 0.1 | |
| | 13,000 | | | | | Cimarex Energy Co. | | | 1,766,700 | | | | 0.2 | |
| | 13,200 | | | @ | | Concho Resources, Inc./Midland TX | | | 1,750,320 | | | | 0.2 | |
| | 16,000 | | | @ | | Diamondback Energy, Inc. | | | 1,616,960 | | | | 0.2 | |
| VY® T. Rowe Price Diversified Mid Cap Growth Portfolio | PORTFOLIO OF INVESTMENTS AS OF December 31, 2016 (CONTINUED) |
| | 25,700 | | | | | EQT Corp. | | | 1,680,780 | | | | 0.2 | |
| | 61,900 | | | | | Oceaneering International, Inc. | | | 1,746,199 | | | | 0.2 | |
| | 9,300 | | | | | Pioneer Natural Resources Co. | | | 1,674,651 | | | | 0.2 | |
| | 29,600 | | | | | Range Resources Corp. | | | 1,017,056 | | | | 0.1 | |
| | 19,600 | | | | | Tesoro Corp. | | | 1,714,020 | | | | 0.2 | |
| | | | | | | | | | 14,982,455 | | | | 1.8 | |
| | | | | | | | | | | | | | | |
| | | | | | | Financials: 7.8% | | | | | | | | |
| | 25,600 | | | | | Aon PLC | | | 2,855,168 | | | | 0.3 | |
| | 58,800 | | | | | BankUnited, Inc. | | | 2,216,172 | | | | 0.3 | |
| | 86,833 | | | | | CBOE Holdings, Inc. | | | 6,416,090 | | | | 0.8 | |
| | 106,100 | | | @ | | E*Trade Financial Corp. | | | 3,676,365 | | | | 0.4 | |
| | 9,800 | | | | | Factset Research Systems, Inc. | | | 1,601,614 | | | | 0.2 | |
| | 64,700 | | | | | Fifth Third Bancorp | | | 1,744,959 | | | | 0.2 | |
| | 28,900 | | | | | Financial Engines, Inc. | | | 1,062,075 | | | | 0.1 | |
| | 44,900 | | | | | First Republic Bank | | | 4,137,086 | | | | 0.5 | |
| | 129,100 | | | | | FNF Group | | | 4,384,236 | | | | 0.5 | |
| | 60,300 | | | | | Intercontinental Exchange, Inc. | | | 3,402,126 | | | | 0.4 | |
| | 36,100 | | | | | Invesco Ltd. | | | 1,095,274 | | | | 0.1 | |
| | 84,700 | | | | | Lazard Ltd. | | | 3,480,323 | | | | 0.4 | |
| | 40,700 | | | | | Moody's Corp. | | | 3,836,789 | | | | 0.5 | |
| | 30,700 | | | | | MSCI, Inc. - Class A | | | 2,418,546 | | | | 0.3 | |
| | 28,800 | | | | | Northern Trust Corp. | | | 2,564,640 | | | | 0.3 | |
| | 64,800 | | | | | Progressive Corp. | | | 2,300,400 | | | | 0.3 | |
| | 6,400 | | | | | S&P Global, Inc. | | | 688,256 | | | | 0.1 | |
| | 11,400 | | | @ | | Signature Bank | | | 1,712,280 | | | | 0.2 | |
| | 37,000 | | | | | State Street Corp. | | | 2,875,640 | | | | 0.3 | |
| | 20,600 | | | @ | | SVB Financial Group | | | 3,536,196 | | | | 0.4 | |
| | 86,800 | | | | | TD Ameritrade Holding Corp. | | | 3,784,480 | | | | 0.5 | |
| | 53,630 | | | | | Webster Financial Corp. | | | 2,911,037 | | | | 0.3 | |
| | 23,300 | | | | | Willis Towers Watson PLC | | | 2,849,124 | | | | 0.3 | |
| | 84,000 | | | L | | WisdomTree Investments, Inc. | | | 935,760 | | | | 0.1 | |
| | | | | | | | | | 66,484,636 | | | | 7.8 | |
| | | | | | | | | | | | | | | |
| | | | | | | Health Care: 15.2% | | | | | | | | |
| | 84,399 | | | @,L | | Acadia Healthcare Co., Inc. | | | 2,793,607 | | | | 0.3 | |
| | 60,800 | | | @,L | | Acadia Pharmaceuticals, Inc. | | | 1,753,472 | | | | 0.2 | |
| | 61,900 | | | | | Agilent Technologies, Inc. | | | 2,820,164 | | | | 0.3 | |
| | 18,700 | | | @,L | | Agios Pharmaceuticals, Inc. | | | 780,351 | | | | 0.1 | |
| | 41,100 | | | @ | | Akorn, Inc. | | | 897,213 | | | | 0.1 | |
| | 13,200 | | | @ | | Alexion Pharmaceuticals, Inc. | | | 1,615,020 | | | | 0.2 | |
| | 22,900 | | | @ | | Align Technology, Inc. | | | 2,201,377 | | | | 0.3 | |
| | 42,300 | | | @ | | Alkermes PLC | | | 2,351,034 | | | | 0.3 | |
| | 16,600 | | | @,L | | Alnylam Pharmaceuticals, Inc. | | | 621,504 | | | | 0.1 | |
| | 54,500 | | | | | AmerisourceBergen Corp. | | | 4,261,355 | | | | 0.5 | |
| | 9,800 | | | @,L | | Athenahealth, Inc. | | | 1,030,666 | | | | 0.1 | |
| | 47,800 | | | @ | | BioMarin Pharmaceutical, Inc. | | | 3,959,752 | | | | 0.5 | |
| | 14,400 | | | @,L | | Bluebird Bio, Inc. | | | 888,480 | | | | 0.1 | |
| | 57,700 | | | | | Bruker Corp. | | | 1,222,086 | | | | 0.2 | |
| | 69,684 | | | @ | | Catalent, Inc. | | | 1,878,681 | | | | 0.2 | |
| | 49,000 | | | @ | | Centene Corp. | | | 2,768,990 | | | | 0.3 | |
| | 43,400 | | | @ | | Cerner Corp. | | | 2,055,858 | | | | 0.2 | |
| | 28,600 | | | | | Cooper Cos., Inc. | | | 5,002,998 | | | | 0.6 | |
| | 18,600 | | | | | CR Bard, Inc. | | | 4,178,676 | | | | 0.5 | |
| | 32,900 | | | @ | | DaVita, Inc. | | | 2,112,180 | | | | 0.3 | |
| | 77,650 | | | | | Dentsply Sirona, Inc. | | | 4,482,734 | | | | 0.5 | |
| | 46,100 | | | @ | | Endo International PLC | | | 759,267 | | | | 0.1 | |
| | 25,217 | | | @ | | Envision Healthcare Corp. | | | 1,595,984 | | | | 0.2 | |
| | 27,000 | | | @ | | Henry Schein, Inc. | | | 4,096,170 | | | | 0.5 | |
| | 140,800 | | | @ | | Hologic, Inc. | | | 5,648,896 | | | | 0.7 | |
| | 41,700 | | | @ | | Horizon Pharma PLC | | | 674,706 | | | | 0.1 | |
| | 9,300 | | | | | Humana, Inc. | | | 1,897,479 | | | | 0.2 | |
| | 41,100 | | | @ | | Idexx Laboratories, Inc. | | | 4,819,797 | | | | 0.6 | |
| | 22,200 | | | @ | | Illumina, Inc. | | | 2,842,488 | | | | 0.3 | |
| | 45,900 | | | @ | | Incyte Corp., Ltd. | | | 4,602,393 | | | | 0.5 | |
| | 5,050 | | | @,L | | Intercept Pharmaceuticals, Inc. | | | 548,682 | | | | 0.1 | |
| | 11,400 | | | @ | | Intuitive Surgical, Inc. | | | 7,229,538 | | | | 0.9 | |
| | 59,700 | | | @,L | | Ironwood Pharmaceuticals, Inc. | | | 912,813 | | | | 0.1 | |
| | 13,000 | | | @ | | Jazz Pharmaceuticals PLC | | | 1,417,390 | | | | 0.2 | |
| | 20,100 | | | @ | | Mallinckrodt PLC - W/I | | | 1,001,382 | | | | 0.1 | |
| | 22,600 | | | @ | | Medidata Solutions, Inc. | | | 1,122,542 | | | | 0.1 | |
| | 29,700 | | | @ | | Mednax, Inc. | | | 1,979,802 | | | | 0.2 | |
| | 10,100 | | | @ | | Mettler Toledo International, Inc. | | | 4,227,456 | | | | 0.5 | |
| | 33,779 | | | @ | | Neurocrine Biosciences, Inc. | | | 1,307,247 | | | | 0.2 | |
| | 15,700 | | | @ | | Pacira Pharmaceuticals, Inc. | | | 507,110 | | | | 0.1 | |
| | 26,200 | | | @ | | Quintiles IMS Holdings, Inc. | | | 1,992,510 | | | | 0.2 | |
| | 25,400 | | | @ | | Seattle Genetics, Inc. | | | 1,340,358 | | | | 0.2 | |
| | 16,800 | | | | | Teleflex, Inc. | | | 2,707,320 | | | | 0.3 | |
| | 32,470 | | | @,L | | Tesaro, Inc. | | | 4,366,566 | | | | 0.5 | |
| | 11,100 | | | @,L | | Ultragenyx Pharmaceutical, Inc. | | | 780,441 | | | | 0.1 | |
| | 12,500 | | | @,L | | United Therapeutics Corp. | | | 1,792,875 | | | | 0.2 | |
| | 25,300 | | | | | Universal Health Services, Inc. | | | 2,691,414 | | | | 0.3 | |
| | 67,700 | | | @ | | Veeva Systems, Inc. | | | 2,755,390 | | | | 0.3 | |
| | 26,500 | | | @ | | Vertex Pharmaceuticals, Inc. | | | 1,952,255 | | | | 0.2 | |
| | 18,500 | | | @ | | WellCare Health Plans, Inc. | | | 2,535,980 | | | | 0.3 | |
| | 21,300 | | | | | West Pharmaceutical Services, Inc. | | | 1,806,879 | | | | 0.2 | |
| | 132,850 | | | | | Zoetis, Inc. | | | 7,111,461 | | | | 0.8 | |
| | | | | | | | | | 128,700,789 | | | | 15.2 | |
| | | | | | | | | | | | | | | |
| | | | | | | Industrials: 17.0% | | | | | | | | |
| | 37,800 | | | | | Alaska Air Group, Inc. | | | 3,353,994 | | | | 0.4 | |
| | 9,500 | | | | | Allegiant Travel Co. | | | 1,580,800 | | | | 0.2 | |
| | 62,800 | | | | | Allegion Public Ltd. | | | 4,019,200 | | | | 0.5 | |
| | 44,362 | | | | | Ametek, Inc. | | | 2,155,993 | | | | 0.2 | |
| | 32,400 | | | @ | | Avis Budget Group, Inc. | | | 1,188,432 | | | | 0.1 | |
| | 21,700 | | | | | CH Robinson Worldwide, Inc. | | | 1,589,742 | | | | 0.2 | |
| | 41,300 | | | @ | | Colfax Corp. | | | 1,483,909 | | | | 0.2 | |
| | 20,000 | | | L | | Copa Holdings S.A. | | | 1,816,600 | | | | 0.2 | |
| | 44,500 | | | @ | | Copart, Inc. | | | 2,465,745 | | | | 0.3 | |
| | 44,100 | | | @ | | DigitalGlobe, Inc. | | | 1,263,465 | | | | 0.1 | |
| | 56,300 | | | | | Donaldson Co., Inc. | | | 2,369,104 | | | | 0.3 | |
| | 45,787 | | | | | Equifax, Inc. | | | 5,413,397 | | | | 0.6 | |
| | 43,000 | | | | | Expeditors International Washington, Inc. | | | 2,277,280 | | | | 0.3 | |
| VY® T. Rowe Price Diversified Mid Cap Growth Portfolio | PORTFOLIO OF INVESTMENTS AS OF December 31, 2016 (CONTINUED) |
| | 30,100 | | | | | Fastenal Co. | | | 1,414,098 | | | | 0.2 | |
| | 38,900 | | | | | Flowserve Corp. | | | 1,869,145 | | | | 0.2 | |
| | 41,600 | | | | | Fortive Corp. | | | 2,231,008 | | | | 0.3 | |
| | 61,500 | | | | | Fortune Brands Home & Security, Inc. | | | 3,287,790 | | | | 0.4 | |
| | 35,100 | | | @ | | Generac Holdings, Inc. | | | 1,429,974 | | | | 0.2 | |
| | 27,800 | | | @ | | Genesee & Wyoming, Inc. | | | 1,929,598 | | | | 0.2 | |
| | 40,900 | | | | | Graco, Inc. | | | 3,398,381 | | | | 0.4 | |
| | 16,100 | | | | | Hubbell, Inc. | | | 1,878,870 | | | | 0.2 | |
| | 27,700 | | | | | IDEX Corp. | | | 2,494,662 | | | | 0.3 | |
| | 116,953 | | | @ | | IHS Markit Ltd. | | | 4,141,306 | | | | 0.5 | |
| | 27,100 | | | | | JB Hunt Transport Services, Inc. | | | 2,630,597 | | | | 0.3 | |
| | 25,300 | | | | | Kansas City Southern | | | 2,146,705 | | | | 0.2 | |
| | 78,200 | | | | | KAR Auction Services, Inc. | | | 3,332,884 | | | | 0.4 | |
| | 21,600 | | | @ | | Kirby Corp. | | | 1,436,400 | | | | 0.2 | |
| | 18,700 | | | | | Landstar System, Inc. | | | 1,595,110 | | | | 0.2 | |
| | 25,500 | | | | | Manpowergroup, Inc. | | | 2,266,185 | | | | 0.3 | |
| | 17,800 | | | @ | | Middleby Corp. | | | 2,292,818 | | | | 0.3 | |
| | 89,400 | | | | | Nielsen NV | | | 3,750,330 | | | | 0.4 | |
| | 14,400 | | | | | Nordson Corp. | | | 1,613,520 | | | | 0.2 | |
| | 29,000 | | | @ | | Old Dominion Freight Line | | | 2,487,910 | | | | 0.3 | |
| | 26,000 | | | | | Paccar, Inc. | | | 1,661,400 | | | | 0.2 | |
| | 49,600 | | | | | Ritchie Bros Auctioneers, Inc. | | | 1,686,400 | | | | 0.2 | |
| | 37,100 | | | | | Robert Half International, Inc. | | | 1,809,738 | | | | 0.2 | |
| | 54,100 | | | | | Rockwell Collins, Inc. | | | 5,018,316 | | | | 0.6 | |
| | 104,510 | | | | | Rollins, Inc. | | | 3,530,348 | | | | 0.4 | |
| | 21,200 | | | | | Roper Technologies, Inc. | | | 3,881,296 | | | | 0.5 | |
| | 81,900 | | | @ | | Sensata Technologies Holdings N.V. | | | 3,190,005 | | | | 0.4 | |
| | 19,000 | | | | | Snap-On, Inc. | | | 3,254,130 | | | | 0.4 | |
| | 65,000 | | | | | Southwest Airlines Co. | | | 3,239,600 | | | | 0.4 | |
| | 27,200 | | | @ | | Spirit Airlines, Inc. | | | 1,573,792 | | | | 0.2 | |
| | 25,600 | | | @ | | Stericycle, Inc. | | | 1,972,224 | | | | 0.2 | |
| | 56,800 | | | | | Textron, Inc. | | | 2,758,208 | | | | 0.3 | |
| | 45,000 | | | | | Toro Co. | | | 2,517,750 | | | | 0.3 | |
| | 16,600 | | | | | TransDigm Group, Inc. | | | 4,132,736 | | | | 0.5 | |
| | 79,200 | | | @ | | TransUnion | | | 2,449,656 | | | | 0.3 | |
| | 51,241 | | | @ | | United Continental Holdings, Inc. | | | 3,734,444 | | | | 0.4 | |
| | 12,100 | | | | | Valmont Industries, Inc. | | | 1,704,890 | | | | 0.2 | |
| | 77,500 | | | @ | | Verisk Analytics, Inc. | | | 6,290,675 | | | | 0.7 | |
| | 16,800 | | | @ | | Wabco Holdings, Inc. | | | 1,783,320 | | | | 0.2 | |
| | 31,100 | | | L | | Wabtec Corp. | | | 2,581,922 | | | | 0.3 | |
| | 47,000 | | | | | Waste Connections, Inc. | | | 3,693,730 | | | | 0.4 | |
| | 6,400 | | | | | WW Grainger, Inc. | | | 1,486,400 | | | | 0.2 | |
| | 33,100 | | | | | Xylem, Inc. | | | 1,639,112 | | | | 0.2 | |
| | | | | | | | | | 144,195,044 | | | | 17.0 | |
| | | | | | | | | | | | | | | |
| | | | | | | Information Technology: 19.6% | |
| | 19,200 | | | | | Activision Blizzard, Inc. | | | 693,312 | | | | 0.1 | |
| | 29,900 | | | @ | | Akamai Technologies, Inc. | | | 1,993,732 | | | | 0.2 | |
| | 17,300 | | | | | Alliance Data Systems Corp. | | | 3,953,050 | | | | 0.5 | |
| | 104,700 | | | | | Amphenol Corp. | | | 7,035,840 | | | | 0.8 | |
| | 13,700 | | | @ | | Ansys, Inc. | | | 1,267,113 | | | | 0.2 | |
| | 182,479 | | | @ | | Atlassian Corp. PLC | | | 4,394,094 | | | | 0.5 | |
| | 25,900 | | | @ | | Autodesk, Inc. | | | 1,916,859 | | | | 0.2 | |
| | 90,500 | | | @,L | | Black Knight Financial Services, Inc. | | | 3,420,900 | | | | 0.4 | |
| | 73,700 | | | | | Booz Allen Hamilton Holding Corp. | | | 2,658,359 | | | | 0.3 | |
| | 29,200 | | | | | Cognex Corp. | | | 1,857,704 | | | | 0.2 | |
| | 87,500 | | | @ | | CoreLogic, Inc. | | | 3,222,625 | | | | 0.4 | |
| | 15,900 | | | @ | | CoStar Group, Inc. | | | 2,996,991 | | | | 0.4 | |
| | 80,000 | | | | | CSRA, Inc. | | | 2,547,200 | | | | 0.3 | |
| | 19,495 | | | @ | | Dropbox, Inc. | | | 187,152 | | | | 0.0 | |
| | 44,255 | | | @ | | Dropbox, Inc. - Series A | | | 424,848 | | | | 0.0 | |
| | 76,700 | | | @ | | Electronic Arts, Inc. | | | 6,040,892 | | | | 0.7 | |
| | 18,600 | | | @ | | Ellie Mae, Inc. | | | 1,556,448 | | | | 0.2 | |
| | 20,600 | | | @ | | EPAM Systems, Inc. | | | 1,324,786 | | | | 0.2 | |
| | 15,100 | | | @ | | F5 Networks, Inc. | | | 2,185,272 | | | | 0.3 | |
| | 67,500 | | | | | Fidelity National Information Services, Inc. | | | 5,105,700 | | | | 0.6 | |
| | 82,100 | | | @ | | Fiserv, Inc. | | | 8,725,588 | | | | 1.0 | |
| | 13,600 | | | @ | | FleetCor Technologies, Inc. | | | 1,924,672 | | | | 0.2 | |
| | 48,000 | | | @ | | Fortinet, Inc. | | | 1,445,760 | | | | 0.2 | |
| | 41,700 | | | @ | | Gartner, Inc. | | | 4,214,619 | | | | 0.5 | |
| | 65,500 | | | @ | | Genpact Ltd. | | | 1,594,270 | | | | 0.2 | |
| | 49,900 | | | | | Global Payments, Inc. | | | 3,463,559 | | | | 0.4 | |
| | 58,700 | | | @ | | Guidewire Software, Inc. | | | 2,895,671 | | | | 0.3 | |
| | 53,400 | | | | | Harris Corp. | | | 5,471,898 | | | | 0.6 | |
| | 46,100 | | | @ | | Integrated Device Technology, Inc. | | | 1,086,116 | | | | 0.1 | |
| | 45,400 | | | | | Intuit, Inc. | | | 5,203,294 | | | | 0.6 | |
| | 23,500 | | | @ | | IPG Photonics Corp. | | | 2,319,685 | | | | 0.3 | |
| | 34,950 | | | @ | | Keysight Technologies, Inc. | | | 1,278,122 | | | | 0.2 | |
| | 29,800 | | | | | KLA-Tencor Corp. | | | 2,344,664 | | | | 0.3 | |
| | 72,700 | | | @,L | | Match Group, Inc. | | | 1,243,170 | | | | 0.2 | |
| | 11,400 | | | | | Mercadolibre, Inc. | | | 1,779,996 | | | | 0.2 | |
| | 57,900 | | | | | Microchip Technology, Inc. | | | 3,714,285 | | | | 0.4 | |
| | 57,100 | | | @ | | Microsemi Corp. | | | 3,081,687 | | | | 0.4 | |
| | 44,100 | | | @ | | Mobileye NV | | | 1,681,092 | | | | 0.2 | |
| | 22,100 | | | | | Motorola Solutions, Inc. | | | 1,831,869 | | | | 0.2 | |
| | 23,700 | | | @ | | Palo Alto Networks, Inc. | | | 2,963,685 | | | | 0.4 | |
| | 37,500 | | | | | Paychex, Inc. | | | 2,283,000 | | | | 0.3 | |
| | 16,600 | | | @ | | Proofpoint, Inc. | | | 1,172,790 | | | | 0.1 | |
| | 73,800 | | | @ | | Red Hat, Inc. | | | 5,143,860 | | | | 0.6 | |
| | 180,700 | | | | | Sabre Corp. | | | 4,508,465 | | | | 0.5 | |
| | 69,700 | | | @ | | ServiceNow, Inc. | | | 5,181,498 | | | | 0.6 | |
| | 48,500 | | | | | Skyworks Solutions, Inc. | | | 3,621,010 | | | | 0.4 | |
| | 48,900 | | | @ | | Splunk, Inc. | | | 2,501,235 | | | | 0.3 | |
| | 68,800 | | | | | SS&C Technologies Holdings, Inc. | | | 1,967,680 | | | | 0.2 | |
| | 56,419 | | | @ | | Tableau Software, Inc. | | | 2,378,061 | | | | 0.3 | |
| | 63,400 | | | @ | | Trimble, Inc. | | | 1,911,510 | | | | 0.2 | |
| | 5,700 | | | @ | | Tyler Technologies, Inc. | | | 813,789 | | | | 0.1 | |
| | 8,500 | | | @ | | Ultimate Software Group, Inc. | | | 1,549,975 | | | | 0.2 | |
| | 99,600 | | | @ | | Vantiv, Inc. | | | 5,938,152 | | | | 0.7 | |
| | 60,100 | | | @,L | | VeriSign, Inc. | | | 4,571,807 | | | | 0.5 | |
| | 24,199 | | | @ | | WEX, Inc. | | | 2,700,608 | | | | 0.3 | |
| | 37,647 | | | @ | | Workday, Inc. | | | 2,488,090 | | | | 0.3 | |
| | 50,300 | | | | | Xilinx, Inc. | | | 3,036,611 | | | | 0.4 | |
| | 32,400 | | | @ | | Zendesk, Inc. | | | 686,880 | | | | 0.1 | |
| | 33,100 | | | @,L | | Zillow Group, Inc. - Class A | | | 1,206,495 | | | | 0.1 | |
| | | | | | | | | | 166,708,095 | | | | 19.6 | |
| | | | | | | | | | | | | | | |
| | | | | | �� | Materials: 5.5% | | | | | | | | |
| | 19,500 | | | | | Air Products & Chemicals, Inc. | | | 2,804,490 | | | | 0.3 | |
| VY® T. Rowe Price Diversified Mid Cap Growth Portfolio | PORTFOLIO OF INVESTMENTS AS OF December 31, 2016 (CONTINUED) |
| | 31,300 | | | | | Ashland Global Holdings, Inc. | | | 3,420,777 | | | | 0.4 | |
| | 82,100 | | | | | Ball Corp. | | | 6,163,247 | | | | 0.7 | |
| | 21,500 | | | | | Carpenter Technology Corp. | | | 777,655 | | | | 0.1 | |
| | 34,600 | | | | | Celanese Corp. | | | 2,724,404 | | | | 0.3 | |
| | 60,200 | | | | | CF Industries Holdings, Inc. | | | 1,895,096 | | | | 0.2 | |
| | 15,800 | | | | | Compass Minerals International, Inc. | | | 1,237,930 | | | | 0.2 | |
| | 15,600 | | | | | Eagle Materials, Inc. | | | 1,537,068 | | | | 0.2 | |
| | 4,000 | | | | | NewMarket Corp. | | | 1,695,360 | | | | 0.2 | |
| | 33,400 | | | | | PolyOne Corp. | | | 1,070,136 | | | | 0.1 | |
| | 87,100 | | | | | RPM International, Inc. | | | 4,688,593 | | | | 0.6 | |
| | 77,200 | | | | | Sealed Air Corp. | | | 3,500,248 | | | | 0.4 | |
| | 18,600 | | | | | Sherwin-Williams Co. | | | 4,998,564 | | | | 0.6 | |
| | 76,600 | | | L | | Silver Wheaton Corp. | | | 1,479,912 | | | | 0.2 | |
| | 73,300 | | | L | | Valvoline, Inc. | | | 1,575,950 | | | | 0.2 | |
| | 55,900 | | | | | Vulcan Materials Co. | | | 6,995,885 | | | | 0.8 | |
| | | | | | | | | | 46,565,315 | | | | 5.5 | |
| | | | | | | | | | | | | | | |
| | | | | | | Real Estate: 3.6% | | | | | | | | |
| | 36,200 | | | | | American Campus Communities, Inc. | | | 1,801,674 | | | | 0.2 | |
| | 60,400 | | | | | Crown Castle International Corp. | | | 5,240,908 | | | | 0.6 | |
| | 55,900 | | | | | CubeSmart | | | 1,496,443 | | | | 0.2 | |
| | 16,615 | | | | | Equinix, Inc. | | | 5,938,367 | | | | 0.7 | |
| | 14,300 | | | | | Federal Realty Investment Trust | | | 2,032,173 | | | | 0.2 | |
| | 67,800 | | | | | Iron Mountain, Inc. | | | 2,202,144 | | | | 0.3 | |
| | 30,000 | | | | | Jones Lang LaSalle, Inc. | | | 3,031,200 | | | | 0.4 | |
| | 83,100 | | | | | MGM Growth Properties LLC | | | 2,103,261 | | | | 0.2 | |
| | 20,500 | | | | | SL Green Realty Corp. | | | 2,204,775 | | | | 0.3 | |
| | 21,300 | | | | | Taubman Centers, Inc. | | | 1,574,709 | | | | 0.2 | |
| | 235,515 | | | | | VEREIT, Inc. | | | 1,992,457 | | | | 0.2 | |
| | 26,699 | | | @ | | WeWork Companies, Inc., - Class A | | | 865,047 | | | | 0.1 | |
| | | | | | | | | | 30,483,158 | | | | 3.6 | |
| | | | | | | | | | | | | | | |
| | | | | | | Telecommunication Services: 0.9% | |
| | 70,850 | | | @ | | SBA Communications Corp. | | | 7,315,971 | | | | 0.9 | |
| | | | | | | | | | | | | | | |
| | | | | | | Utilities: 0.5% | | | | | | | | |
| | 37,400 | | | | | Atmos Energy Corp. | | | 2,773,210 | | | | 0.3 | |
| | 79,600 | | | | | NiSource, Inc. | | | 1,762,344 | | | | 0.2 | |
| | | | | | | | | | 4,535,554 | | | | 0.5 | |
| | | | | | | | | | | | | | | |
| | | | | Total Common Stock
(Cost $644,301,403) | | | 837,999,817 | | | | 98.8 | |
| | | | | | | | | | | | | | | |
| PREFERRED STOCK: 1.3% | | | | | | | | |
| | | | | | | Consumer Discretionary: 0.1% | |
| | 8,859 | | | @ | | Flipkart Online Services Pvt. Ltd., - Series G | | | 825,216 | | | | 0.1 | |
| | | | | | | | | | | | | | | |
| | | | | | | Information Technology: 0.8% | |
| | 32,391 | | | @ | | AirBNB, Inc. - Series D | | | 3,401,055 | | | | 0.4 | |
| | 3,719 | | | @ | | AirBNB, Inc. - Series E | | | 390,495 | | | | 0.1 | |
| | 24,209 | | | @ | | Dropbox, Inc. - Series A | | | 232,406 | | | | 0.0 | |
| | 118,921 | | | @ | | Dropbox, Inc. - Series A-1 | | | 1,141,642 | | | | 0.1 | |
| | 353,970 | | | @ | | Tanium, Inc.- Series G | | | 1,684,897 | | | | 0.2 | |
| | | | | | | | | | 6,850,495 | | | | 0.8 | |
| | | | | | | Real Estate: 0.4% | |
| | 44,396 | | | @ | | WeWork Companies, Inc. - Series D-1 | | | 1,438,430 | | | | 0.2 | |
| | 34,882 | | | @ | | WeWork Companies, Inc. - Series D-2 | | | 1,130,177 | | | | 0.1 | |
| | 24,709 | | | @ | | WeWork Companies, Inc. - Series E | | | 800,572 | | | | 0.1 | |
| | | | | | | | | | 3,369,179 | | | | 0.4 | |
| | | | | | | | | | | | | | | |
| | | | | Total Preferred Stock
(Cost $7,911,058) | | | 11,044,890 | | | | 1.3 | |
| | | | | | | | | | | | | | | |
| | | | | Total Long-Term Investments
(Cost $652,212,461) | | | 849,044,707 | | | | 100.1 | |
| | | | | | | | | | | | | |
Principal
Amount† | | | | | | | Value | | | Percentage
of Net
Assets | |
| SHORT-TERM INVESTMENTS: 5.4% | | | | | | | | |
| | | | | | | Securities Lending Collateralcc: 5.3% | |
| | 2,256,421 | | | | | Bank of Nova Scotia, Repurchase Agreement dated 12/30/16, 0.51%, due 01/03/17 (Repurchase Amount $2,256,547, collateralized by various U.S. Government/U.S. Government Agency Obligations, 1.000%-4.000%, Market Value plus accrued interest $2,301,680, due 12/31/17-10/20/46) | | | 2,256,421 | | | | 0.3 | |
| | 10,721,519 | | | | | Cantor Fitzgerald, Repurchase Agreement dated 12/30/16, 0.50%, due 01/03/17 (Repurchase Amount $10,722,106, collateralized by various U.S. Government/U.S. Government Agency Obligations, 0.000%-10.000%, Market Value plus accrued interest $10,935,949, due 01/25/17-10/20/66) | | | 10,721,519 | | | | 1.3 | |
| | 10,721,519 | | | | | Daiwa Capital Markets, Repurchase Agreement dated 12/30/16, 0.52%, due 01/03/17 (Repurchase Amount $10,722,130, collateralized by various U.S. Government/U.S. Government Agency Obligations, 0.000%-6.500%, Market Value plus accrued interest $10,935,949, due 03/02/17-02/01/49) | | | 10,721,519 | | | | 1.2 | |
| VY® T. Rowe Price Diversified Mid Cap Growth Portfolio | PORTFOLIO OF INVESTMENTS AS OF December 31, 2016 (CONTINUED) |
| | 10,721,519 | | | | | Nomura Securities, Repurchase Agreement dated 12/30/16, 0.50%, due 01/03/17 (Repurchase Amount $10,722,106, collateralized by various U.S. Government/U.S. Government Agency Obligations, 0.000%-9.500%, Market Value plus accrued interest $10,935,950, due 01/15/17-08/20/66) | | | 10,721,519 | | | | 1.2 | |
| | 10,721,519 | | | | | State of Wisconsin Investment Board, Repurchase Agreement dated 12/30/16, 0.65%, due 01/03/17 (Repurchase Amount $10,722,283, collateralized by various U.S. Government Securities, 0.125%-3.875%, Market Value plus accrued interest $10,993,942, due 04/15/18-02/15/46) | | | 10,721,519 | | | | 1.3 | |
| | | | | | | | | | 45,142,497 | | | | 5.3 | |
| | | | | | | | | | | | | | | |
| Shares | | | | | | | Value | | | Percentage
of Net
Assets | |
| | | | | | | Mutual Funds: 0.1% | |
| | 1,064,917 | | | | | T. Rowe Price Reserve Investment Fund, 0.453%†† | | | | | | | | |
| | | | | | | (Cost $1,064,917) | | | 1,064,917 | | | | 0.1 | |
| | | | | | | | | | | | | | | |
| | | | | Total Short-Term Investments
(Cost $46,207,414) | | | 46,207,414 | | | | 5.4 | |
| | | | | | | | | | | | | | | |
| | | | | Total Investments in Securities
(Cost $698,419,875) | | $ | 895,252,121 | | | | 105.5 | |
| | | | | Liabilities in Excess of Other Assets | | | (46,666,642 | ) | | | (5.5 | ) |
| | | | | Net Assets | | $ | 848,585,479 | | | | 100.0 | |
| † | Unless otherwise indicated, principal amount is shown in USD. |
| †† | Rate shown is the 7-day yield as of December 31, 2016. |
| @ | Non-income producing security. |
| ADR | American Depositary Receipt |
| cc | Represents securities purchased with cash collateral received for securities on loan. |
| L | Loaned security, a portion or all of the security is on loan at December 31, 2016. |
Cost for federal income tax purposes is $702,861,643.
Net unrealized appreciation consists of:
| Gross Unrealized Appreciation | | $ | 225,333,782 | |
| Gross Unrealized Depreciation | | | (32,943,304 | ) |
| | | | | |
| Net Unrealized Appreciation | | $ | 192,390,478 | |
| VY® T. Rowe Price Growth Equity Portfolio | PORTFOLIO OF INVESTMENTS AS OF December 31, 2016 |
| Shares | | | | | | | Value | | | Percentage
of Net
Assets | |
| COMMON STOCK: 97.6% | | | | | | | | |
| | | | | | | Consumer Discretionary: 25.7% | |
| | 153,900 | | | @ | | Amazon.com, Inc. | | | 115,404,993 | | | | 7.6 | |
| | 22,851 | | | @ | | Autozone, Inc. | | | 18,047,491 | | | | 1.2 | |
| | 176,500 | | | @ | | Ctrip.com International Ltd. ADR | | | 7,060,000 | | | | 0.5 | |
| | 171,700 | | | | | Delphi Automotive PLC | | | 11,563,995 | | | | 0.8 | |
| | 75,100 | | | | | Dollar General Corp. | | | 5,562,657 | | | | 0.4 | |
| | 208,920 | | | L | | Ferrari NV | | | 12,146,609 | | | | 0.8 | |
| | 3,088 | | | @ | | Flipkart Online Services Pvt. Ltd. | | | 287,647 | | | | 0.0 | |
| | 265,100 | | | | | Hilton Worldwide Holdings, Inc. | | | 7,210,720 | | | | 0.5 | |
| | 83,100 | | | | | Home Depot, Inc. | | | 11,142,048 | | | | 0.7 | |
| | 167,400 | | | | | Las Vegas Sands Corp. | | | 8,940,834 | | | | 0.6 | |
| | 193,100 | | | | | Lowe's Cos, Inc. | | | 13,733,272 | | | | 0.9 | |
| | 165,100 | | | | | Marriott International, Inc. | | | 13,650,468 | | | | 0.9 | |
| | 504,260 | | | @ | | MGM Resorts International | | | 14,537,816 | | | | 0.9 | |
| | 51,303 | | | @ | | Netflix, Inc. | | | 6,351,311 | | | | 0.4 | |
| | 36,400 | | | @ | | O'Reilly Automotive, Inc. | | | 10,134,124 | | | | 0.7 | |
| | 44,859 | | | @ | | Priceline.com, Inc. | | | 65,765,985 | | | | 4.3 | |
| | 172,400 | | | | | Ross Stores, Inc. | | | 11,309,440 | | | | 0.7 | |
| | 67,289 | | | | | Signet Jewelers Ltd. | | | 6,342,661 | | | | 0.4 | |
| | 230,500 | | | | | Starbucks Corp. | | | 12,797,360 | | | | 0.8 | |
| | 98,875 | | | @,L | | Tesla Motors, Inc. | | | 21,128,599 | | | | 1.4 | |
| | 162,102 | | | | | Tractor Supply Co. | | | 12,288,953 | | | | 0.8 | |
| | 100,200 | | | | | Yum! Brands, Inc. | | | 6,345,666 | | | | 0.4 | |
| | | | | | | | | | 391,752,649 | | | | 25.7 | |
| | | | | | | | | | | | | | | |
| | | | | | | Consumer Staples: 3.6% | |
| | 12,400 | | | | | Costco Wholesale Corp. | | | 1,985,364 | | | | 0.1 | |
| | 295,500 | | | | | Mondelez International, Inc. | | | 13,099,515 | | | | 0.9 | |
| | 242,700 | | | | | Philip Morris International, Inc. | | | 22,204,623 | | | | 1.5 | |
| | 212,187 | | | | | Walgreens Boots Alliance, Inc. | | | 17,560,596 | | | | 1.1 | |
| | | | | | | | | | 54,850,098 | | | | 3.6 | |
| | | | | | | | | | | | | | | |
| | | | | | | Financials: 6.1% | | | | | | | | |
| | 283,500 | | | | | Charles Schwab Corp. | | | 11,189,745 | | | | 0.7 | |
| | 34,000 | | | | | First Republic Bank | | | 3,132,760 | | | | 0.2 | |
| | 306,600 | | | | | Intercontinental Exchange, Inc. | | | 17,298,372 | | | | 1.1 | |
| | 130,600 | | | | | JPMorgan Chase & Co. | | | 11,269,474 | | | | 0.8 | |
| | 606,600 | | | | | Morgan Stanley | | | 25,628,850 | | | | 1.7 | |
| | 162,900 | | | | | State Street Corp. | | | 12,660,588 | | | | 0.8 | |
| | 283,431 | | | | | TD Ameritrade Holding Corp. | | | 12,357,592 | | | | 0.8 | |
| | | | | | | | | | 93,537,381 | | | | 6.1 | |
| | | | | | | | | | | | | | | |
| | | | | | | Health Care: 15.4% | | | | | | | | |
| | 124,069 | | | | | Aetna, Inc. | | | 15,385,797 | | | | 1.0 | |
| | 174,819 | | | @ | | Alexion Pharmaceuticals, Inc. | | | 21,389,105 | | | | 1.4 | |
| | 32,731 | | | @ | | Allergan plc | | | 6,873,837 | | | | 0.4 | |
| | 46,400 | | | | | Anthem, Inc. | | | 6,670,928 | | | | 0.4 | |
| | 69,048 | | | @ | | Biogen, Inc. | | | 19,580,632 | | | | 1.3 | |
| | 195,200 | | | | | Bristol-Myers Squibb Co. | | | 11,407,488 | | | | 0.7 | |
| | 79,916 | | | @ | | Celgene Corp. | | | 9,250,277 | | | | 0.6 | |
| | 57,446 | | | @ | | Centene Corp. | | | 3,246,274 | | | | 0.2 | |
| | 66,200 | | | | | Cigna Corp. | | | 8,830,418 | | | | 0.6 | |
| | 271,500 | | | | | Danaher Corp. | | | 21,133,560 | | | | 1.4 | |
| | 71,815 | | | | | Humana, Inc. | | | 14,652,414 | | | | 1.0 | |
| | 66,531 | | | @ | | Illumina, Inc. | | | 8,518,629 | | | | 0.6 | |
| | 37,500 | | | @ | | Intuitive Surgical, Inc. | | | 23,781,375 | | | | 1.5 | |
| | 151,300 | | | | | Stryker Corp. | | | 18,127,253 | | | | 1.2 | |
| | 150,000 | | | | | UnitedHealth Group, Inc. | | | 24,006,000 | | | | 1.6 | |
| | 147,800 | | | @ | | Vertex Pharmaceuticals, Inc. | | | 10,888,426 | | | | 0.7 | |
| | 222,600 | | | | | Zoetis, Inc. | | | 11,915,778 | | | | 0.8 | |
| | | | | | | | | | 235,658,191 | | | | 15.4 | |
| | | | | | | | | | | | | | | |
| | | | | | | Industrials: 6.5% | | | | | | | | |
| | 466,130 | | | | | American Airlines Group, Inc. | | | 21,763,610 | | | | 1.4 | |
| | 137,600 | | | | | Boeing Co. | | | 21,421,568 | | | | 1.4 | |
| | 70,100 | | | | | Delta Air Lines, Inc. | | | 3,448,219 | | | | 0.2 | |
| | 18,639 | | | | | Equifax, Inc. | | | 2,203,689 | | | | 0.2 | |
| | 45,600 | | | | | FedEx Corp. | | | 8,490,720 | | | | 0.6 | |
| | 150,950 | | | | | Fortive Corp. | | | 8,095,448 | | | | 0.5 | |
| | 95,200 | | | | | Honeywell International, Inc. | | | 11,028,920 | | | | 0.7 | |
| | 144,525 | | | @ | | IHS Markit Ltd. | | | 5,117,630 | | | | 0.3 | |
| | 27,600 | | | | | Illinois Tool Works, Inc. | | | 3,379,896 | | | | 0.2 | |
| | 64,000 | | | | | Roper Technologies, Inc. | | | 11,717,120 | | | | 0.8 | |
| | 37,802 | | | L | | Wabtec Corp. | | | 3,138,322 | | | | 0.2 | |
| | | | | | | | | | 99,805,142 | | | | 6.5 | |
| | | | | | | | | | | | | | | |
| | | | | | | Information Technology: 35.6% | |
| | 202,900 | | | @ | | Alibaba Group Holding Ltd. ADR | | | 17,816,649 | | | | 1.2 | |
| | 70,150 | | | @ | | Alphabet, Inc. - Class A | | | 55,590,368 | | | | 3.6 | |
| | 61,071 | | | @ | | Alphabet, Inc. - Class C | | | 47,135,819 | | | | 3.1 | |
| | 382,800 | | | | | Apple, Inc. | | | 44,335,896 | | | | 2.9 | |
| | 117,200 | | | L | | ASML Holding NV-NY REG | | | 13,149,840 | | | | 0.9 | |
| | 143,343 | | | @ | | Dropbox, Inc. - Series A | | | 1,376,093 | | | | 0.1 | |
| | 545,469 | | | @ | | Facebook, Inc. | | | 62,756,208 | | | | 4.1 | |
| | 50,700 | | | | | Fidelity National Information Services, Inc. | | | 3,834,948 | | | | 0.3 | |
| | 115,028 | | | @ | | Fiserv, Inc. | | | 12,225,176 | | | | 0.8 | |
| | 328,900 | | | | | Mastercard, Inc. | | | 33,958,925 | | | | 2.2 | |
| | 39,000 | | | | | Mercadolibre, Inc. | | | 6,089,460 | | | | 0.4 | |
| | 986,600 | | | | | Microsoft Corp. | | | 61,307,324 | | | | 4.0 | |
| | 92,400 | | | | | Nvidia Corp. | | | 9,862,776 | | | | 0.7 | |
| | 207,007 | | | @ | | NXP Semiconductor NV - NXPI - US | | | 20,288,756 | | | | 1.3 | |
| | 28,300 | | | @ | | Palo Alto Networks, Inc. | | | 3,538,915 | | | | 0.2 | |
| | 758,500 | | | @ | | PayPal Holdings, Inc. | | | 29,937,995 | | | | 2.0 | |
| | 364,264 | | | @ | | Salesforce.com, Inc. | | | 24,937,513 | | | | 1.6 | |
| | 186,460 | | | @ | | ServiceNow, Inc. | | | 13,861,436 | | | | 0.9 | |
| | 792,200 | | | | | Tencent Holdings Ltd. | | | 19,208,564 | | | | 1.2 | |
| | 121,478 | | | @,L | | VeriSign, Inc. | | | 9,240,832 | | | | 0.6 | |
| | 589,900 | | | | | Visa, Inc. - Class A | | | 46,023,998 | | | | 3.0 | |
| | 115,500 | | | @,L | | Workday, Inc. | | | 7,633,395 | | | | 0.5 | |
| | | | | | | | | | 544,110,886 | | | | 35.6 | |
| VY® T. Rowe Price Growth Equity Portfolio | PORTFOLIO OF INVESTMENTS AS OF December 31, 2016 (CONTINUED) |
| | | | | | | Materials: 0.7% | | | | | | | | |
| | 38,100 | | | | | Ashland Global Holdings, Inc. | | | 4,163,949 | | | | 0.3 | |
| | 26,705 | | | | | Martin Marietta Materials, Inc. | | | 5,915,959 | | | | 0.4 | |
| | | | | | | | | | 10,079,908 | | | | 0.7 | |
| | | | | | | | | | | | | | | |
| | | | | | | Real Estate: 2.9% | | | | | | | | |
| | 219,900 | | | | | American Tower Corp. | | | 23,239,032 | | | | 1.5 | |
| | 129,912 | | | | | Crown Castle International Corp. | | | 11,272,464 | | | | 0.7 | |
| | 27,300 | | | | | Equinix, Inc. | | | 9,757,293 | | | | 0.7 | |
| | 5,062 | | | @ | | WeWork Companies, Inc., - Class A | | | 164,009 | | | | 0.0 | |
| | | | | | | | | | 44,432,798 | | | | 2.9 | |
| | | | | | | | | | | | | | | |
| | | | | | | Telecommunication Services: 0.4% | |
| | 113,700 | | | @ | | T-Mobile US, Inc. | | | 6,538,887 | | | | 0.4 | |
| | | | | | | | | | | | | | | |
| | | | | | | Utilities: 0.7% | | | | | | | | |
| | 90,500 | | | | | NextEra Energy, Inc. | | | 10,811,130 | | | | 0.7 | |
| | | | | | | | | | | | | | | |
| | | | | Total Common Stock
(Cost $1,173,420,773) | | | 1,491,577,070 | | | | 97.6 | |
| | | | | | | | | | | | | | | |
| PREFERRED STOCK: 1.5% | | | | | | | | |
| | | | | | | Consumer Discretionary: 0.2% | |
| | 1,054 | | | @ | | Flipkart Online Services Pvt. Ltd., - Series A | | | 98,180 | | | | 0.0 | |
| | 1,862 | | | @ | | Flipkart Online Services Pvt. Ltd., - Series C | | | 173,445 | | | | 0.0 | |
| | 3,462 | | | @ | | Flipkart Online Services Pvt. Ltd., - Series E | | | 322,485 | | | | 0.0 | |
| | 14,029 | | | @ | | Flipkart Online Services Pvt. Ltd., - Series H | | | 1,306,801 | | | | 0.1 | |
| | 16,556 | | | @ | | Flipkart Online Services Pvt. Ltd., - Series G | | | 1,542,192 | | | | 0.1 | |
| | | | | | | | | | 3,443,103 | | | | 0.2 | |
| | | | | | | | | | | | | | | |
| | | | | | | Information Technology: 1.2% | |
| | 59,241 | | | @ | | AirBNB, Inc. - Series D | | | 6,220,305 | | | | 0.4 | |
| | 16,058 | | | @ | | AirBNB, Inc. - Series E | | | 1,686,090 | | | | 0.1 | |
| | 93,459 | | | @ | | Magic Leap, Inc., - Series C | | | 2,152,641 | | | | 0.1 | |
| | 78,840 | | | @ | | Snapchat, Inc. - Series F | | | 2,421,965 | | | | 0.2 | |
| | 73,385 | | | @ | | Uber Technologies, Inc. - Series G | | | 3,579,148 | | | | 0.2 | |
| | 68,026 | | | @ | | Xiaoju Kuaizhi, Inc., Series A-17 | | | 2,600,437 | | | | 0.2 | |
| | | | | | | | | | 18,660,586 | | | | 1.2 | |
| | | | | | | | | | | | | | | |
| | | | | | | Real Estate: 0.1% | | | | | | | | |
| | 45,554 | | | @ | | WeWork Companies, Inc. - Series E | | | 1,475,950 | | | | 0.1 | |
| | | | | | | | | | | | | | | |
| | | | | Total Preferred Stock
(Cost $20,129,811) | | | 23,579,639 | | | | 1.5 | |
| | | | | | | | | | | | | | | |
| | | | | Total Long-Term Investments
(Cost $1,193,550,584) | | | 1,515,156,709 | | | | 99.1 | |
Principal
Amount† | | | | | | | Value | | | Percentage
of Net
Assets | |
| SHORT-TERM INVESTMENTS: 3.9% | | | | | | | | |
| | | | | | | Securities Lending Collateralcc: 3.2% | |
| | 2,429,810 | | | | | Bank of Nova Scotia, Repurchase Agreement dated 12/30/16, 0.51%, due 01/03/17 (Repurchase Amount $2,429,946, collateralized by various U.S. Government/U.S. Government Agency Obligations, 1.000%-4.000%, Market Value plus accrued interest $2,478,547, due 12/31/17-10/20/46) | | | 2,429,810 | | | | 0.2 | |
| | 11,544,871 | | | | | Cantor Fitzgerald, Repurchase Agreement dated 12/30/16, 0.50%, due 01/03/17 (Repurchase Amount $11,545,504, collateralized by various U.S. Government/U.S. Government Agency Obligations, 0.000%-10.000%, Market Value plus accrued interest $11,775,768, due 01/25/17-10/20/66) | | | 11,544,871 | | | | 0.8 | |
| | 11,544,871 | | | | | Daiwa Capital Markets, Repurchase Agreement dated 12/30/16, 0.52%, due 01/03/17 (Repurchase Amount $11,545,529, collateralized by various U.S. Government/U.S. Government Agency Obligations, 0.000%-6.500%, Market Value plus accrued interest $11,775,769, due 03/02/17-02/01/49) | | | 11,544,871 | | | | 0.8 | |
| | 11,544,871 | | | | | Nomura Securities, Repurchase Agreement dated 12/30/16, 0.50%, due 01/03/17 (Repurchase Amount $11,545,504, collateralized by various U.S. Government/U.S. Government Agency Obligations, 0.000%-9.500%, Market Value plus accrued interest $11,775,769, due 01/15/17-08/20/66) | | | 11,544,871 | | | | 0.7 | |
| VY® T. Rowe Price Growth Equity Portfolio | PORTFOLIO OF INVESTMENTS AS OF December 31, 2016 (CONTINUED) |
| | 11,544,871 | | | | | State of Wisconsin Investment Board, Repurchase Agreement dated 12/30/16, 0.65%, due 01/03/17 (Repurchase Amount $11,545,693, collateralized by various U.S. Government Securities, 0.125%-3.875%, Market Value plus accrued interest $11,838,215, due 04/15/18-02/15/46) | | | 11,544,871 | | | | 0.7 | |
| | | | | | | | | | 48,609,294 | | | | 3.2 | |
| Shares | | | | | | | Value | | | Percentage
of Net
Assets | |
| | | | | | | Mutual Funds: 0.7% | |
| | 10,570,215 | | | | | T. Rowe Price Reserve Investment Fund, 0.453%†† | | | | | | | | |
| | | | | | | (Cost $10,570,215) | | | 10,570,215 | | | | 0.7 | |
| | | | | | | | | | | | | | | |
| | | | | Total Short-Term Investments
(Cost $59,179,509) | | | 59,179,509 | | | | 3.9 | |
| | | | | | | | | | | | | | | |
| | | | | Total Investments in Securities
(Cost $1,252,730,093) | | $ | 1,574,336,218 | | | | 103.0 | |
| | | | | Liabilities in Excess of Other Assets | | | (46,557,135 | ) | | | (3.0 | ) |
| | | | | Net Assets | | $ | 1,527,779,083 | | | | 100.0 | |
| † | Unless otherwise indicated, principal amount is shown in USD. |
| †† | Rate shown is the 7-day yield as of December 31, 2016. |
| @ | Non-income producing security. |
| ADR | American Depositary Receipt |
| cc | Represents securities purchased with cash collateral received for securities on loan. |
| L | Loaned security, a portion or all of the security is on loan at December 31, 2016. |
Cost for federal income tax purposes is $1,256,763,447.
Net unrealized appreciation consists of:
| Gross Unrealized Appreciation | | $ | 344,622,148 | |
| Gross Unrealized Depreciation | | | (27,049,377 | ) |
| | | | | |
| Net Unrealized Appreciation | | $ | 317,572,771 | |
| VY® Templeton Foreign Equity Portfolio | PORTFOLIO OF INVESTMENTS AS OF December 31, 2016 |
| Shares | | | | | | | Value | | | Percentage
of Net
Assets | |
| COMMON STOCK: 97.7% | | | | | | | | |
| | | | | | | Canada: 0.5% | | | | | | | | |
| | 167,100 | | | | | Silver Wheaton Corp. | | | 3,228,372 | | | | 0.5 | |
| | | | | | | | | | | | | | | |
| | | | | | | China: 6.8% | | | | | | | | |
| | 36,110 | | | @ | | Baidu, Inc. ADR | | | 5,936,845 | | | | 0.9 | |
| | 2,585,000 | | | | | China Life Insurance Co., Ltd. | | | 6,682,093 | | | | 1.1 | |
| | 670,500 | | | | | China Mobile Ltd. | | | 7,069,199 | | | | 1.1 | |
| | 21,246,000 | | | | | China Telecom Corp., Ltd. | | | 9,745,734 | | | | 1.6 | |
| | 4,266,600 | | | | | CRRC Corp. Ltd. | | | 3,810,624 | | | | 0.6 | |
| | 4,230,000 | | | | | Kunlun Energy Co. Ltd. | | | 3,151,529 | | | | 0.5 | |
| | 1,368,800 | | | | | Sinopharm Group Co. | | | 5,609,814 | | | | 0.9 | |
| | 580,900 | | | | | Weichai Power Co. Ltd. | | | 890,832 | | | | 0.1 | |
| | | | | | | | | | 42,896,670 | | | | 6.8 | |
| | | | | | | | | | | | | | | |
| | | | | | | France: 10.3% | | | | | | | | |
| | 306,996 | | | | | AXA S.A. | | | 7,739,027 | | | | 1.2 | |
| | 195,968 | | | | | BNP Paribas | | | 12,471,035 | | | | 2.0 | |
| | 191,520 | | | | | Cie de Saint-Gobain | | | 8,909,040 | | | | 1.4 | |
| | 57,514 | | | | | Cie Generale des Etablissements Michelin | | | 6,393,210 | | | | 1.0 | |
| | 499,790 | | | | | Credit Agricole SA | | | 6,186,762 | | | | 1.0 | |
| | 135,141 | | | | | Sanofi | | | 10,928,238 | | | | 1.8 | |
| | 171,714 | | | | | Total S.A. | | | 8,807,601 | | | | 1.4 | |
| | 141,860 | | | | | Zodiac Aerospace | | | 3,253,002 | | | | 0.5 | |
| | | | | | | | | | 64,687,915 | | | | 10.3 | |
| | | | | | | | | | | | | | | |
| | | | | | | Germany: 12.3% | | | | | | | | |
| | 100,971 | | | | | Bayer AG | | | 10,519,544 | | | | 1.7 | |
| | 60,360 | | | @ | | Deutsche Boerse AG | | | 4,911,847 | | | | 0.8 | |
| | 107,848 | | | | | Deutsche Post AG | | | 3,536,891 | | | | 0.6 | |
| | 87,505 | | | | | HeidelbergCement AG | | | 8,144,994 | | | | 1.3 | |
| | 521,675 | | | | | Infineon Technologies AG | | | 9,023,693 | | | | 1.4 | |
| | 157,650 | | | #,@ | | Innogy SE | | | 5,478,038 | | | | 0.9 | |
| | 143,370 | | | | | Lanxess | | | 9,388,364 | | | | 1.5 | |
| | 103,258 | | | | | Merck KGaA | | | 10,751,354 | | | | 1.7 | |
| | 42,620 | | | @,L | | Morphosys AG | | | 2,181,247 | | | | 0.3 | |
| | 62,566 | | | | | SAP SE | | | 5,412,293 | | | | 0.8 | |
| | 65,920 | | | | | Siemens AG | | | 8,071,269 | | | | 1.3 | |
| | | | | | | | | | 77,419,534 | | | | 12.3 | |
| | | | | | | | | | | | | | | |
| | | | | | | Hong Kong: 2.6% | | | | | | | | |
| | 973,900 | | | | | AIA Group Ltd. | | | 5,455,633 | | | | 0.8 | |
| | 485,640 | | | | | Cheung Kong Property Holdings Ltd. | | | 2,965,801 | | | | 0.5 | |
| | 228,400 | | | | | CK Hutchison Holdings Ltd. ADR | | | 2,592,340 | | | | 0.4 | |
| | 485,640 | | | | | CK Hutchison Holdings Ltd. | | | 5,482,127 | | | | 0.9 | |
| | | | | | | | | | 16,495,901 | | | | 2.6 | |
| | | | | | | | | | | | | | | |
| | | | | | | India: 1.5% | | | | | | | | |
| | 496,486 | | | | | Housing Development Finance Corp. | | | 9,207,786 | | | | 1.5 | |
| | | | | | | | | | | | | | | |
| | | | | | | Israel: 1.8% | | | | | | | | |
| | 301,899 | | | | | Teva Pharmaceutical Industries Ltd. ADR | | | 10,943,839 | | | | 1.8 | |
| | | | | | | Italy: 2.0% | | | | | | | | |
| | 680,187 | | | | | ENI S.p.A. | | | 11,026,598 | | | | 1.7 | |
| | 575,172 | | | L | | UniCredit SpA | | | 1,651,745 | | | | 0.3 | |
| | | | | | | | | | 12,678,343 | | | | 2.0 | |
| | | | | | | | | | | | | | | |
| | | | | | | Japan: 11.9% | | | | | | | | |
| | 1,056,000 | | | @ | | IHI Corp. | | | 2,734,934 | | | | 0.4 | |
| | 402,500 | | | | | Inpex Corp. | | | 4,023,314 | | | | 0.6 | |
| | 851,600 | | | | | Konica Minolta, Inc. | | | 8,439,953 | | | | 1.4 | |
| | 988,300 | | | | | Nissan Motor Co., Ltd. | | | 9,913,779 | | | | 1.6 | |
| | 190,100 | | | | | Omron Corp. | | | 7,264,664 | | | | 1.2 | |
| | 574,600 | | | | | Panasonic Corp. | | | 5,827,685 | | | | 0.9 | |
| | 171,300 | | | | | SoftBank Group Corp. | | | 11,335,616 | | | | 1.8 | |
| | 431,000 | | | | | Sumitomo Metal Mining Co., Ltd. | | | 5,498,566 | | | | 0.9 | |
| | 202,900 | | | | | Sumitomo Rubber Industries, Inc. | | | 3,210,355 | | | | 0.5 | |
| | 240,400 | | | | | Suntory Beverage & Food Ltd. | | | 9,957,757 | | | | 1.6 | |
| | 1,397,000 | | | @ | | Toshiba Corp. | | | 3,374,514 | | | | 0.5 | |
| | 52,400 | | | | | Toyota Motor Corp. | | | 3,072,129 | | | | 0.5 | |
| | | | | | | | | | 74,653,266 | | | | 11.9 | |
| | | | | | | | | | | | | | | |
| | | | | | | Netherlands: 5.6% | | | | | | | | |
| | 127,558 | | | | | Akzo Nobel NV | | | 7,970,720 | | | | 1.3 | |
| | 150,904 | | | @ | | Qiagen NV | | | 4,228,850 | | | | 0.7 | |
| | 588,596 | | | | | Royal Dutch Shell PLC - Class B | | | 16,911,586 | | | | 2.7 | |
| | 374,301 | | | L | | SBM Offshore NV | | | 5,860,200 | | | | 0.9 | |
| | | | | | | | | | 34,971,356 | | | | 5.6 | |
| | | | | | | | | | | | | | | |
| | | | | | | Norway: 2.5% | | | | | | | | |
| | 303,610 | | | @ | | Subsea 7 SA | | | 3,834,376 | | | | 0.6 | |
| | 573,623 | | | | | Telenor ASA | | | 8,562,308 | | | | 1.4 | |
| | 78,000 | | | | | Yara International ASA | | | 3,068,447 | | | | 0.5 | |
| | | | | | | | | | 15,465,131 | | | | 2.5 | |
| | | | | | | | | | | | | | | |
| | | | | | | Portugal: 1.1% | | | | | | | | |
| | 474,200 | | | | | Galp Energia SGPS SA | | | 7,069,510 | | | | 1.1 | |
| | | | | | | | | | | | | | | |
| | | | | | | Singapore: 3.5% | | | | | | | | |
| | 701,482 | | | | | DBS Group Holdings Ltd. | | | 8,369,270 | | | | 1.3 | |
| | 3,420,600 | | | | | Singapore Telecommunications Ltd. | | | 8,580,360 | | | | 1.4 | |
| | 362,500 | | | | | United Overseas Bank Ltd. | | | 5,092,726 | | | | 0.8 | |
| | | | | | | | | | 22,042,356 | | | | 3.5 | |
| | | | | | | | | | | | | | | |
| | | | | | | South Korea: 6.3% | | | | | | | | |
| | 171,216 | | | | | Hana Financial Group, Inc. | | | 4,419,096 | | | | 0.7 | |
| | 35,481 | | | | | Hyundai Mobis Co. Ltd. | | | 7,746,325 | | | | 1.2 | |
| | 247,680 | | | @ | | KB Financial Group, Inc. ADR | | | 8,740,627 | | | | 1.4 | |
| | 24,941 | | | | | Samsung Electronics Co., Ltd. GDR | | | 18,543,852 | | | | 3.0 | |
| | | | | | | | | | 39,449,900 | | | | 6.3 | |
| | | | | | | | | | | | | | | |
| | | | | | | Spain: 0.9% | | | | | | | | |
| | 634,810 | | | | | Telefonica S.A. | | | 5,860,814 | | | | 0.9 | |
| | | | | | | | | | | | | | | |
| | | | | | | Sweden: 0.7% | | | | | | | | |
| | 282,620 | | | L | | Getinge AB | | | 4,528,418 | | | | 0.7 | |
| | | | | | | | | | | | | | | |
| | | | | | | Switzerland: 6.3% | | | | | | | | |
| | 199,690 | | | | | ABB Ltd. | | | 4,201,822 | | | | 0.7 | |
| VY® Templeton Foreign Equity Portfolio | PORTFOLIO OF INVESTMENTS AS OF December 31, 2016 (CONTINUED) |
| | 1,254,530 | | | @ | | Glencore PLC | | | 4,238,938 | | | | 0.7 | |
| | 82,527 | | | | | Novartis AG | | | 6,001,652 | | | | 1.0 | |
| | 53,696 | | | | | Roche Holding AG | | | 12,240,141 | | | | 1.9 | |
| | 54,685 | | | | | Swiss Re Ltd. | | | 5,173,908 | | | | 0.8 | |
| | 492,410 | | | | | UBS Group AG | | | 7,699,057 | | | | 1.2 | |
| | | | | | | | | | 39,555,518 | | | | 6.3 | |
| | | | | | | | | | | | | | | |
| | | | | | | Taiwan: 1.0% | | | | | | | | |
| | 1,099,251 | | | | | Taiwan Semiconductor Manufacturing Co., Ltd. | | | 6,157,186 | | | | 1.0 | |
| | | | | | | | | | | | | | | |
| | | | | | | Thailand: 0.9% | | | | | | | | |
| | 1,298,000 | | | | | Bangkok Bank PCL - Foreign Reg | | | 5,834,659 | | | | 0.9 | |
| | | | | | | | | | | | | | | |
| | | | | | | United Kingdom: 19.2% | |
| | 1,136,625 | | | | | Aviva PLC | | | 6,770,496 | | | | 1.1 | |
| | 1,403,493 | | | | | BAE Systems PLC | | | 10,208,435 | | | | 1.6 | |
| | 2,978,460 | | | | | Barclays PLC | | | 8,173,979 | | | | 1.3 | |
| | 2,776,524 | | | | | BP PLC | | | 17,390,665 | | | | 2.8 | |
| | 609,930 | | | | | Sky PLC | | | 7,435,661 | | | | 1.2 | |
| | 283,504 | | | | | CRH PLC - London | | | 9,831,753 | | | | 1.6 | |
| | 406,976 | | | | | GlaxoSmithKline PLC | | | 7,817,448 | | | | 1.2 | |
| | 1,537,600 | | | | | HSBC Holdings PLC | | | 12,295,032 | | | | 2.0 | |
| | 113,200 | | | | | Johnson Matthey PLC | | | 4,429,231 | | | | 0.7 | |
| | 1,352,034 | | | | | Kingfisher PLC | | | 5,825,123 | | | | 0.9 | |
| | 97,220 | | | @ | | LivaNova PLC | | | 4,371,983 | | | | 0.7 | |
| | 430,980 | | | | | Petrofac Ltd. | | | 4,612,206 | | | | 0.7 | |
| | 989,391 | | | @ | | Standard Chartered PLC | | | 8,068,453 | | | | 1.3 | |
| | 1,923,740 | | | @ | | Tesco PLC | | | 4,905,179 | | | | 0.8 | |
| | 3,336,261 | | | | | Vodafone Group PLC | | | 8,210,186 | | | | 1.3 | |
| | | | | | | | | | 120,345,830 | | | | 19.2 | |
| | | | | | | | | | | | | | | |
| | | | | Total Common Stock
(Cost $545,350,230) | | | 613,492,304 | | | | 97.7 | |
| Principal Amount† | | | | | | | Value | | | Percentage
of Net
Assets | |
| SHORT-TERM INVESTMENTS: 4.3% | | | | | | | | |
| | | | | | | U.S. Government Agency Obligations: 2.1% | |
| | 8,700,000 | | | Z | | Federal Farm Credit Notes, 0.233%, 01/03/17 | | | 8,700,000 | | | | 1.4 | |
| | 4,300,000 | | | Z | | Federal Home Loan Mortgage Corp., 0.300%, 01/03/17 | | | 4,300,000 | | | | 0.7 | |
| | | | | | | | | | 13,000,000 | | | | 2.1 | |
| | | | | | | | | | | | | | | |
| | | | | | | Securities Lending Collateralcc: 2.2% | |
| | 3,251,866 | | | | | Citigroup, Inc., Repurchase Agreement dated 12/30/16, 0.53%, due 01/03/17 (Repurchase Amount $3,252,055, collateralized by various U.S. Government Agency Obligations, 2.000%-8.500%, Market Value plus accrued interest $3,316,904, due 12/01/17-01/01/47) | | | 3,251,866 | | | | 0.5 | |
| | 3,251,866 | | | | | HSBC Securities USA, Repurchase Agreement dated 12/30/16, 0.46%, due 01/03/17 (Repurchase Amount $3,252,030, collateralized by various U.S. Government Securities, 1.375%-3.750%, Market Value plus accrued interest $3,316,921, due 11/30/18-11/15/43) | | | 3,251,866 | | | | 0.5 | |
| | 684,381 | | | | | Merrill Lynch & Co., Inc., Repurchase Agreement dated 12/30/16, 0.50%, due 01/03/17 (Repurchase Amount $684,419, collateralized by various U.S. Government Securities, 0.685%-2.000%, Market Value plus accrued interest $698,069, due 10/31/18-11/30/22) | | | 684,381 | | | | 0.1 | |
| | 3,251,866 | | | | | Nomura Securities, Repurchase Agreement dated 12/30/16, 0.50%, due 01/03/17 (Repurchase Amount $3,252,044, collateralized by various U.S. Government/U.S. Government Agency Obligations, 0.000%-9.500%, Market Value plus accrued interest $3,316,903, due 01/15/17-08/20/66) | | | 3,251,866 | | | | 0.6 | |
| | 3,251,866 | | | | | RBC Dominion Securities Inc., Repurchase Agreement dated 12/30/16, 0.52%, due 01/03/17 (Repurchase Amount $3,252,051, collateralized by various U.S. Government Agency Obligations, 0.875%-7.000%, Market Value plus accrued interest $3,316,903, due 02/13/17-01/01/47) | | | 3,251,866 | | | | 0.5 | |
| | | | | | | | | | 13,691,845 | | | | 2.2 | |
| Shares | | | | | | | Value | | | Percentage
of Net
Assets | |
| | | | | | | Mutual Funds: 0.0% | | | | | | | | |
| | 285,341 | | | | | BlackRock Liquidity Funds, FedFund, Institutional Class, 0.420%†† | | | | | | | | |
| | | | | | | (Cost $285,341) | | | 285,341 | | | | 0.0 | |
| | | | | | | | | | | | | | | |
| | | | | Total Short-Term Investments
(Cost $26,976,909) | | | 26,977,186 | | | | 4.3 | |
| VY® Templeton Foreign Equity Portfolio | PORTFOLIO OF INVESTMENTS AS OF December 31, 2016 (CONTINUED) |
| | | | | | | Total Investments in Securities
(Cost $572,327,139) | | $ | 640,469,490 | | | | 102.0 | |
| | | | | | | Liabilities in Excess of Other Assets | | | (12,590,952 | ) | | | (2.0 | ) |
| | | | | | | Net Assets | | $ | 627,878,538 | | | | 100.0 | |
| † | Unless otherwise indicated, principal amount is shown in USD. |
| †† | Rate shown is the 7-day yield as of December 31, 2016. |
| # | Securities with purchases pursuant to Rule 144A or section 4(a)(2), under the Securities Act of 1933 and may not be resold subject to that rule except to qualified institutional buyers. |
| @ | Non-income producing security. |
| ADR | American Depositary Receipt |
| GDR | Global Depositary Receipt |
| cc | Represents securities purchased with cash collateral received for securities on loan. |
| L | Loaned security, a portion or all of the security is on loan at December 31, 2016. |
| Z | Indicates Zero Coupon Bond; rate shown reflects current effective yield. |
Cost for federal income tax purposes is $574,921,879.
Net unrealized appreciation consists of:
| Gross Unrealized Appreciation | | $ | 123,642,969 | |
| Gross Unrealized Depreciation | | | (58,095,358 | ) |
| | | | | |
| Net Unrealized Appreciation | | $ | 65,547,611 | |
Item 7. Disclosure of Proxy Voting Policies and Procedures for Closed-End Management Investment Companies.
Not applicable.
Item 8. Portfolio Managers of Closed-End Management Investment Companies.
Not applicable.
Item 9. Purchases of Equity Securities by Closed-End Management Investment Company and Affiliated Purchasers.
Not applicable.
Item 10. Submission of Matters to a Vote of Security Holders.
Not applicable.
Item 11. Controls and Procedures.
| (a) | Based on our evaluation conducted within 90 days of the filing date, hereof, the design and operation of the registrant’s disclosure controls and procedures are effective to ensure that material information relating to the registrant is made known to the certifying officers by others within the appropriate entities, particularly during the period in which Forms N-CSR are being prepared, and the registrant’s disclosure controls and procedures allow timely preparation and review of the information for the registrant’s Form N-CSR and the officer certifications of such Form N-CSR. |
| (b) | There were no significant changes in the registrant’s internal controls that occurred during the second fiscal quarter of the period covered by this report that has materially affected, or is reasonably likely to materially affect, the registrant’s internal control over financial reporting. |
Item 12. Exhibits.
| (a)(1) | The Code of Ethics pursuant to Item 2 of Form N-CSR is filed and attached hereto as EX-99.CODE ETH. |
| (a)(2) | A separate certification for each principal executive officer and principal financial officer of the registrant as required by Rule 30a-2(a) under the Act (17 CFR 270.30a-2(a)) is attached hereto as EX-99.CERT. |
| (b) | The officer certifications required by Section 906 of the Sarbanes-Oxley Act of 2002 are attached hereto as EX-99.906CERT. |
SIGNATURES
Pursuant to the requirements of the Securities Exchange Act of 1934 and the Investment Company Act of 1940, the registrant has duly caused this report to be signed on its behalf by the undersigned, thereunto duly authorized.
(Registrant): Voya Partners, Inc.
| By | /s/ Shaun P. Mathews | |
| | Shaun P. Mathews | |
| | President and Chief Executive Officer | |
Date: March 10, 2017
Pursuant to the requirements of the Securities Exchange Act of 1934 and the Investment Company Act of 1940, this report has been signed below by the following persons on behalf of the registrant and in the capacities and on the dates indicated.
| By | /s/ Shaun P. Mathews | |
| | Shaun P. Mathews | |
| | President and Chief Executive Officer | |
Date: March 10, 2017
| By | /s/ Todd Modic | |
| | Todd Modic | |
| | Senior Vice President and Chief Financial Officer | |
Date: March 10, 2017
![[MISSING IMAGE: ing_cov.jpg]](https://capedge.com/proxy/N-CSR/0001571049-17-002261/ing_cov.jpg)
![[MISSING IMAGE: voya_covinvmgt.jpg]](https://capedge.com/proxy/N-CSR/0001571049-17-002261/voya_covinvmgt.jpg)
![[MISSING IMAGE: ph_shaun-mathews.jpg]](https://capedge.com/proxy/N-CSR/0001571049-17-002261/ph_shaun-mathews.jpg)
![[MISSING IMAGE: sg_shaun-mathews.jpg]](https://capedge.com/proxy/N-CSR/0001571049-17-002261/sg_shaun-mathews.jpg)
![[MISSING IMAGE: t1700079_chart-aggressive.jpg]](https://capedge.com/proxy/N-CSR/0001571049-17-002261/t1700079_chart-aggressive.jpg)
![[MISSING IMAGE: t1700079_chart-balanced.jpg]](https://capedge.com/proxy/N-CSR/0001571049-17-002261/t1700079_chart-balanced.jpg)
![[MISSING IMAGE: t1700079_chart-conservative.jpg]](https://capedge.com/proxy/N-CSR/0001571049-17-002261/t1700079_chart-conservative.jpg)
![[MISSING IMAGE: t1700079_chart-income.jpg]](https://capedge.com/proxy/N-CSR/0001571049-17-002261/t1700079_chart-income.jpg)
![[MISSING IMAGE: t1700079_chart-modagresiv.jpg]](https://capedge.com/proxy/N-CSR/0001571049-17-002261/t1700079_chart-modagresiv.jpg)
![[MISSING IMAGE: t1700079_chart-modcnsrvtv.jpg]](https://capedge.com/proxy/N-CSR/0001571049-17-002261/t1700079_chart-modcnsrvtv.jpg)
![[MISSING IMAGE: t1700079_chart-2020.jpg]](https://capedge.com/proxy/N-CSR/0001571049-17-002261/t1700079_chart-2020.jpg)
![[MISSING IMAGE: t1700079_chart-2025.jpg]](https://capedge.com/proxy/N-CSR/0001571049-17-002261/t1700079_chart-2025.jpg)
![[MISSING IMAGE: t1700079_chart-2030.jpg]](https://capedge.com/proxy/N-CSR/0001571049-17-002261/t1700079_chart-2030.jpg)
![[MISSING IMAGE: t1700079_chart-2035.jpg]](https://capedge.com/proxy/N-CSR/0001571049-17-002261/t1700079_chart-2035.jpg)
![[MISSING IMAGE: t1700079_chart-2040.jpg]](https://capedge.com/proxy/N-CSR/0001571049-17-002261/t1700079_chart-2040.jpg)
![[MISSING IMAGE: t1700079_chart-2045.jpg]](https://capedge.com/proxy/N-CSR/0001571049-17-002261/t1700079_chart-2045.jpg)
![[MISSING IMAGE: t1700079_chart-2050.jpg]](https://capedge.com/proxy/N-CSR/0001571049-17-002261/t1700079_chart-2050.jpg)
![[MISSING IMAGE: t1700079_chart-2055.jpg]](https://capedge.com/proxy/N-CSR/0001571049-17-002261/t1700079_chart-2055.jpg)
![[MISSING IMAGE: t1700079_chart-2060.jpg]](https://capedge.com/proxy/N-CSR/0001571049-17-002261/t1700079_chart-2060.jpg)
![[MISSING IMAGE: t1700080_chrt-isi.jpg]](https://capedge.com/proxy/N-CSR/0001571049-17-002261/t1700080_chrt-isi.jpg)
![[MISSING IMAGE: t1700080_chart-index2020.jpg]](https://capedge.com/proxy/N-CSR/0001571049-17-002261/t1700080_chart-index2020.jpg)
![[MISSING IMAGE: t1700080_chart-index2025.jpg]](https://capedge.com/proxy/N-CSR/0001571049-17-002261/t1700080_chart-index2025.jpg)
![[MISSING IMAGE: t1700080_chart-index2030.jpg]](https://capedge.com/proxy/N-CSR/0001571049-17-002261/t1700080_chart-index2030.jpg)
![[MISSING IMAGE: t1700080_chart-index2035.jpg]](https://capedge.com/proxy/N-CSR/0001571049-17-002261/t1700080_chart-index2035.jpg)
![[MISSING IMAGE: t1700080_chart-index2040.jpg]](https://capedge.com/proxy/N-CSR/0001571049-17-002261/t1700080_chart-index2040.jpg)
![[MISSING IMAGE: t1700080_chart-index2045.jpg]](https://capedge.com/proxy/N-CSR/0001571049-17-002261/t1700080_chart-index2045.jpg)
![[MISSING IMAGE: t1700080_chart-index2050.jpg]](https://capedge.com/proxy/N-CSR/0001571049-17-002261/t1700080_chart-index2050.jpg)
![[MISSING IMAGE: t1700080_chart-index2055.jpg]](https://capedge.com/proxy/N-CSR/0001571049-17-002261/t1700080_chart-index2055.jpg)
![[MISSING IMAGE: t1700080_chart-index2060.jpg]](https://capedge.com/proxy/N-CSR/0001571049-17-002261/t1700080_chart-index2060.jpg)