UNITED STATES
SECURITIES AND EXCHANGE COMMISSION
Washington, D.C. 20549
FORM N-CSR
CERTIFIED SHAREHOLDER REPORT OF
REGISTERED MANAGEMENT INVESTMENT COMPANIES
Investment Company Act file number: 811-08319
Voya Partners, Inc.
(Exact name of registrant as specified in charter)
| 7337 East Doubletree Ranch Road, Suite 100, Scottsdale, AZ | 85258 |
| (Address of principal executive offices) | (Zip code) |
The Corporation Trust Company, 1209 Orange Street, Wilmington, DE 19801
(Name and address of agent for service)
Registrant’s telephone number, including area code: 1-800-262-3862
| Date of fiscal year end: | December 31 |
| | |
| Date of reporting period: | December 31, 2015 |
Item 1. Reports to Stockholders.
The following is a copy of the report transmitted to stockholders pursuant to Rule 30e-1 under the Act (17 CFR 270.30e-1):
Annual Report
December 31, 2015
Classes ADV, I, S and S2
Voya Partners, Inc.
■
Voya Global Bond Portfolio
■
VY® American Century Small-Mid Cap Value Portfolio
■
VY® Baron Growth Portfolio
■
VY® Columbia Contrarian Core Portfolio
■
VY® Columbia Small Cap Value II Portfolio
■
VY® Invesco Comstock Portfolio
■
VY® Invesco Equity and Income Portfolio
■
VY® JPMorgan Mid Cap Value Portfolio
■
VY® Oppenheimer Global Portfolio
■
VY® Pioneer High Yield Portfolio
■
VY® T. Rowe Price Diversified Mid Cap Growth Portfolio
■
VY® T. Rowe Price Growth Equity Portfolio
■
VY® Templeton Foreign Equity Portfolio
| | | This report is submitted for general information to shareholders of the Voya mutual funds. It is not authorized for distribution to prospective shareholders unless accompanied or preceded by a prospectus which includes details regarding the funds’ investment objectives, risks, charges, expenses and other information. This information should be read carefully. | | |
PROXY VOTING INFORMATION
A description of the policies and procedures that the Portfolios use to determine how to vote proxies related to portfolio securities is available: (1) without charge, upon request, by calling Shareholder Services toll-free at (800) 992-0180; (2) on the Portfolios’ website at www.voyainvestments.com; and (3) on the U.S. Securities and Exchange Commission’s (“SEC’s”) website at www.sec.gov. Information regarding how the Portfolios voted proxies related to portfolio securities during the most recent 12-month period ended June 30 is available without charge on the Portfolios’ website at www.voyainvestments.com and on the SEC’s website at www.sec.gov.
QUARTERLY PORTFOLIO HOLDINGS
The Portfolios file their complete schedule of portfolio holdings with the SEC for the first and third quarters of each fiscal year on Form N-Q. This report contains a summary portfolio of investments for certain Portfolios. The Portfolios’ Forms N-Q are available on the SEC’s website at www.sec.gov. The Portfolios’ Forms N-Q may be reviewed and copied at the SEC’s Public Reference Room in Washington, DC, and information on the operation of the Public Reference Room may be obtained by calling (800) SEC-0330. The Portfolios’ Forms N-Q, as well as a complete portfolio of investments, are available without charge upon request from the Portfolios by calling Shareholder Services toll-free at (800) 992-0180.
Fed action — global reaction
Dear Shareholder,
One of the most anticipated events of 2015 came to pass with only a few weeks left on the calendar. Following the mid-December gathering of its policy-making Federal Open Market Committee, the Federal Reserve Board (“Fed”) announced the first increase of the federal funds target rate in nearly a decade, hiking its key policy interest rate 0.25% to a range of 0.25% – 0.50%. In its announcement, the central bank cited considerable improvement in labor-market conditions and a reasonable confidence that inflation will approach its 2% objective over the medium term. The widely expected interest rate hike already had been priced into most asset classes and thus had minimal immediate impact on the direction of financial markets.
Worth noting is that the Fed’s decision to begin raising short-term interest rates comes at a time when other major central banks — notably, in Europe, China and Japan — continue to provide massive amounts of support to their economies and are biased more toward further accommodation. The disruptions that potentially may emerge from this divergence in central bank policies will demand close attention in the year ahead. Witness January stock market performance.
Though the Fed believes the U.S. economy is strong enough to bear a fed funds interest rate increase, many of the same risks and opportunities persist in the markets. The global economic backdrop and geopolitical stresses continue to induce uncertainty, which could lead to periods of intense volatility, in our view. How can investors keep their perspective in such times? Don’t let today’s uncertainties distract you from focusing on your long-term goals, and don’t risk compromising your goals for the sake of avoiding volatility now. Keep your portfolio well-diversified and thoroughly discuss any prospective changes with your investment advisor before you take action.
At Voya Investment Management, we seek to be a reliable partner committed to reliable investing, helping you and your investment advisor achieve your goals. We appreciate your continued confidence in us, and we look forward to serving your investment needs in the future.
Sincerely,
Shaun Mathews
President and Chief Executive Officer
January 12, 2016
The views expressed in the President’s Letter reflect those of the President as of the date of the letter. Any such views are subject to change at any time based upon market or other conditions and the Voya mutual funds disclaim any responsibility to update such views. These views may not be relied on as investment advice and because investment decisions for a Voya mutual fund are based on numerous factors, may not be relied on as an indication of investment intent on behalf of any Voya mutual fund. Reference to specific company securities should not be construed as recommendations or investment advice.
International investing poses special risks including currency fluctuation, economic and political risks not found in investments that are solely domestic.
Market Perspective: Year Ended December 31, 2015
In our semi-annual report, we described how equity market interest had recently moved from the U.S. to Europe with the advent of the European Central Bank’s (“ECB”) quantitative easing program. But from there, attention moved east and in August an unexpected announcement from China re-awakened other concerns, sending global equities, in the form of the MSCI World IndexSM (the “Index”) measured in local currencies, including net reinvested dividends, on a roller-coaster ride. Having been up 4.14% for the half-year, the Index finally ended 2015 with a gain of 2.08%. (The Index returned -0.87% for the one year ended December 31, 2015, measured in U.S. dollars.)
U.S. economic data was mixed in what was still a rather pedestrian recovery. A disappointing October employment report was followed by a very strong one in November showing that 271,000 jobs had been created the previous month. Sluggish annual wage growth improved to 2.5%, which doesn’t sound like much, but it was the best since 2009. The unemployment rate fell to 5.0%. The December report was a little weaker. Gross domestic product (“GDP”), initially held back by another harsh winter, rebounded to 3.9% in the second quarter of 2015, before an inventory downturn pegged it back to 2.0% in the third. Industrial production was uneven, while retail sales were still showing no acceleration despite lower gasoline prices.
Superimposed on this was the prospect of rising U.S. interest rates. The Federal Open Market Committee (“FOMC”) had not increased the federal funds interest rate for nine years and many feared that it would feel pressed to act before the economy was really ready. But when on September 17 the FOMC left rates unchanged, citing weakness overseas, investors seemed unnerved at this new narrative rather than relieved. Perhaps sensing a credibility problem, the FOMC tried to re-set expectations, signaling in October the December increase of 0.25% that eventually took place, to a range of 0.25% – 0.50%.
Internationally, as noted, the ECB at last implemented a program of quantitative easing in March. Before long the economic data started to look a little less weak: the unemployment rate ticked down to 10.7% and GDP rose 1.6% year-over-year in the third quarter of 2015. Core inflation edged above 1.0% before slipping back. In December, ECB President Draghi’s much anticipated intensification of the program disappointed markets. Sentiment also suffered in mid-year when the integrity of the euro zone itself was threatened, as Greece wrangled over the terms of its bailout. Creditors stood firm and facing ejection, Greece finally accepted even stricter terms.
Annual GDP growth in China decelerated to 7.0% in the first and second quarters of 2015, the slowest in six years, then to 6.9% in the third. But to many commentators 7.0% was suspiciously close to government targets and perhaps overstated. They watched nervously as the Shanghai Stock Exchange Composite Index (“Shanghai Composite”) soared 64% in 2015 by June 12, fueled by retail savings and margin debt. The Shanghai Composite was already in retreat when on August 11, global commodities and equity markets were shaken as China announced a 2% devaluation of the yuan, suggesting that the Chinese economy, the largest single contributor to global growth in recent years, was indeed weaker than had previously been admitted. By August 26 the Shanghai Composite was down 43% from its peak. But gradually the feeling grew that concerns had been overdone. The
Bank of China lowered interest rates, eased bank reserve requirements and by the end of December, with the yuan gradually depreciating, the Shanghai Composite had regained over a quarter of its losses.
In U.S. fixed income markets, the Barclays U.S. Aggregate Bond Index (“Barclays Aggregate”) gained 0.55% in 2015, while the Barclays U.S. Treasury Bond sub-index added 0.84%. Indices of riskier classes fared worse: the Barclays U.S. Corporate Investment Grade Bond sub-index lost 0.68%, while the Barclays High Yield Bond — 2% Issuer Constrained Composite Index (not a part of the Barclays Aggregate) sagged 4.43%. Reflecting another kind of risk, the Barclays Global Inflation Linked U.S. TIPS Index dipped 1.44% as inflationary expectations receded.
U.S. equities, represented by the S&P 500® Index including dividends, crept up 1.38% over the year, within which August represented the worst month since September 2011, while October was the strongest since October 2011. The consumer discretionary sector did best, rising 10.11%. The most challenged sector was understandably energy, slumping 21.12%. S&P 500® earnings per share, dragged down by the energy sector, recorded their first year-over-year decline since 2012 in the second quarter of 2015, despite continuing high levels of share buybacks, and declined again in the third. Shares of companies with smaller market capitalizations lagged: the Russell Midcap® Index fell 2.44% and the Russell 2000® Index fell 4.41%.
In currencies, “divergence” became the word on the experts’ lips to describe the prospect of the U.S. starting to raise interest rates just as the ECB ratcheted up its quantitative easing program. Unsurprisingly the dollar rose 11.47% against the euro over the year. It rose less, 5.75%, against the pound, as the UK is much closer to raising rates than the euro zone. The dollar’s gains against the yen had been made before the period started and it barely moved, rising just 0.40%.
International markets fell sharply after the events in August, with a partial recovery which was faltering by year-end. The MSCI Japan® Index held on to a gain of 9.93% for the year, amid renewed optimism about the yen-denominated profitability and better governance of Japanese corporations. The MSCI Europe ex UK® Index was cushioned by the introduction of quantitative easing, plus the declining euro that went with it and advanced 8.30%. The MSCI UK® Index, burdened by its large, losing holdings in the energy, materials and banking sectors, dropped 2.21%.
All indices are unmanaged and investors cannot invest directly in an index. Past performance does not guarantee future results. The performance quoted represents past performance. Investment return and principal value of an investment will fluctuate, and shares, when redeemed, may be worth more or less than their original cost. The Portfolios’ performance is subject to change since the period’s end and may be lower or higher than the performance data shown. Please call (800) 262-3862 or log on to www.voyainvestments.com to obtain performance data current to the most recent month end.
Market Perspective reflects the views of Voya Investment Management’s Chief Investment Risk Officer only through the end of the period, and is subject to change based on market and other conditions.
| | | Index | | | | Description | | |
| | | Bank of America/Merrill Lynch All Convertibles (Speculative Grade) Index | | | | An unmanaged index that includes about 270 convertible securities and represents the non-investment-grade convertible market. | | |
| | | Bank of America/Merrill Lynch High Yield Master II Index | | | | A broad-based index consisting of all U.S. dollar-denominated high-yield bonds with a minimum outstanding amount of $100 million and with a maturity of greater than one year period. The quality rating is less than BBB by Standard & Poor’s. | | |
| | | Barclays Global Aggregate Index | | | | Provides a broad-based measure of the global investment-grade fixed-rate debt markets. | | |
| | | Barclays Global Inflation Linked U.S. TIPS Index | | | | The index measures the performance of the US Treasury Inflation Protected Securities (TIPS) market. | | |
| | | Barclays High Yield Bond — 2% Issuer Constrained Composite Index | | | | An unmanaged index that includes all fixed-income securities having a maximum quality rating of Ba1, a minimum amount outstanding of $150 million, and at least one year to maturity. | | |
| | | Barclays U.S. Aggregate Bond Index | | | | An unmanaged index of publicly issued investment grade U.S. Government, mortgage-backed, asset-backed and corporate debt securities. | | |
| | | Barclays U.S. Corporate Investment Grade Bond Index | | | | An unmanaged index consisting of publicly issued, fixed rate, nonconvertible, investment grade debt securities. | | |
| | | Barclays U.S. Government/Credit Bond Index | | | | An index made up of the Barclays Government and Credit indices, including securities issued by the U.S. government and its agencies and publicly issued U.S. corporate and foreign debentures and secured notes that meet specified maturity, liquidity and quality requirements. | | |
| | | Barclays U.S. Treasury Bond Index | | | | A market capitalization-weighted index that measures the performance of public obligations of the U.S. Treasury that have a remaining maturity of one year or more. | | |
| | | MSCI All Country World IndexSM | | | | A broad-based unmanaged index comprised of equity securities in countries around the world, including the United States, other developed countries and emerging markets. | | |
| | | MSCI All Country World ex-U.S. IndexSM | | | | A free float-adjusted market capitalization index that is designed to measure equity market performance in the global developed and emerging markets, excluding the U.S. It includes the reinvestment of dividends and distributions net of withholding taxes, but does not reflect fees, brokerage commissions or other expenses of investing. | | |
| | | MSCI EAFE® Index | | | | An unmanaged index that measures the performance of securities listed on exchanges in Europe, Australasia and the Far East. | | |
| | | MSCI Europe ex UK® Index | | | | A free float-adjusted market capitalization index that is designed to measure developed market equity performance in Europe, excluding the UK. | | |
| | | MSCI Japan® Index | | | | A free float-adjusted market capitalization index that is designed to measure developed market equity performance in Japan. | | |
| | | MSCI UK® Index | | | | A free float-adjusted market capitalization index that is designed to measure developed market equity performance in the UK. | | |
| | | MSCI World IndexSM | | | | An unmanaged index that measures the performance of over 1,400 securities listed on exchanges in the U.S., Europe, Canada, Australia, New Zealand and the Far East. | | |
| | | Russell 1000® Index | | | | An unmanaged, comprehensive large-cap index measuring the performance of the largest 1,000 U.S. incorporated companies. | | |
| | | Russell 1000® Growth Index | | | | Measures the performance of the 1,000 largest companies in the Russell 3000® Index with higher price-to-book ratios and higher forecasted growth. | | |
| | | Russell 1000® Value Index | | | | An unmanaged index that measures the performance of those Russell 1000® securities with lower price-to-book ratios and lower forecasted growth values. | | |
| | | Russell 2000® Index | | | | An unmanaged index that measures the performance of securities of small U.S. companies. | | |
| | | Russell 2000® Growth Index | | | | An unmanaged index that measures the performance of securities of smaller U.S. companies with greater than average growth orientation. | | |
Benchmark Descriptions (continued)
| | | Index | | | | Description | | |
| | | Russell 2000® Value Index | | | | An unmanaged index that measures the performance of those Russell 2000® companies with lower price-to-book ratios and lower than forecasted growth values. | | |
| | | Russell 2500™ Growth Index | | | | Measures the performance of the small- to mid-cap growth segment of the U.S. equity universe. It includes those Russell 2500™ Index companies with higher price-to-book ratios and higher forecasted growth values. | | |
| | | Russell 2500™ Value Index | | | | Measures the performance of those Russell 2500 companies with lower price-to-book ratios and lower forecasted growth values. | | |
| | | Russell Midcap® Index | | | | An unmanaged index that measures the performance of the 800 smallest companies in the Russell 1000® Index, which represents approximately 26% of the total market capitalization of the Russell 1000® Index. | | |
| | | Russell Midcap® Growth Index | | | | An unmanaged index that measures the performance of those companies included in the Russell Midcap® Index with relatively higher price-to-book ratios and higher forecasted growth values. | | |
| | | Russell Midcap® Value Index | | | | Measures the performance of those Russell Midcap companies with lower price-to-book ratios and lower forecasted growth values. | | |
| | | S&P 500® Index | | | | An unmanaged index that measures the performance of securities of approximately 500 large-capitalization companies whose securities are traded on major U.S. stock markets. | | |
| | | S&P MidCap 400 Index | | | | A broad-based unmanaged capitalization weighted index of midcapitalization companies. | | |
| | | S&P Small Cap 600/Citigroup Value Index | | | | Measures the performance of those S&P 600 Index companies with lower price-to-book ratios. | | |
| | | Shanghai Stock Exchange Composite Index | | | | A capitalization-weighted index. The index tracks the daily price performance of all A-shares and B-shares listed on the Shanghai Stock Exchange. The index was developed on December 19, 1990 with a base value of 100. | | |
| Portfolio Managers’ Report | Voya Global Bond Portfolio |
| | Geographic Diversification
as of December 31, 2015
(as a percentage of net assets) | |
| | | | | | |
| | United States(1) | | | 83.3% | |
| | Spain | | | 4.5% | |
| | Cayman Islands | | | 2.7% | |
| | Austria | | | 1.5% | |
| | France | | | 1.0% | |
| | Netherlands | | | 1.0% | |
| | United Kingdom | | | 0.8% | |
| | Germany | | | 0.7% | |
| | Japan | | | 0.4% | |
| | Sweden | | | 0.4% | |
| | Countries between 0.0% – 0.3%^ | | | 2.1% | |
| | Assets in Excess of Other Liabilities* | | | 1.6% | |
| | Net Assets | | | 100.0% | |
| | *
Includes short-term investments. | |
| | ^
Includes 12 countries, which each represents 0.0% – 0.3% of net assets. | |
| | (1)
Includes 22.6% total investment in Voya Emerging Markets Corporate Debt Fund, Voya Emerging Markets Hard Currency Debt Fund, Voya Emerging Markets Local Currency Debt Fund, and Voya High Yield Bond Fund. | |
| | Portfolio holdings are subject to change daily. | |
Voya Global Bond Portfolio (the “Portfolio”) seeks to maximize total return through a combination of current income and capital appreciation. The Portfolio is managed by Christine Hurtsellers, CFA, Mustafa Chowdhury and Brian Timberlake, Ph.D., CFA, Portfolio Managers of Voya Investment Management Co. LLC (“Voya IM”) — the Sub-Adviser.*
Performance: For the year ended December 31, 2015, the Portfolio’s Class S shares provided a total return of -4.50% compared to the Barclays Global Aggregate Index, which returned -3.15% for the same period.
Portfolio Specifics: The main event of the fourth quarter — at least the most anticipated — was the first increase of interest rates in nearly a decade. The U.S. Federal Reserve Board (“Fed”) announced a 0.25% hike in the federal funds rate following the gathering of its policy-making Federal Open Market Committee (“FOMC”) in December; the increase brought the rate target to 0.25–0.50%. In its announcement, the FOMC cited considerable improvement in labor market conditions and a reasonable confidence that inflation will approach its 2% objective over the medium term.
The interest rate hike had already been priced into most asset classes, so it did not change the direction of the markets for the quarter. U.S. stocks posted high, single-digit gains despite reduced expectations of fourth quarter 2015 earnings; possibly due to early indications of a positive holiday shopping season. Though somewhat below U.S. equities, international stocks also posted gains. Oil prices continued to drop, sustaining losses for the quarter and for the full year. Bond prices generally declined, particularly among high-yield issues; the main exceptions were mortgage-backed securities. Bond yields, which
| | Top Ten Holdings
as of December 31, 2015*
(as a percentage of net assets) | |
| | | | | | |
| | Voya Emerging Markets Local Currency Debt Fund – Class P | | | 8.4% | |
| | Voya Emerging Markets Hard Currency Debt Fund – Class P | | | 6.4% | |
| | Voya Emerging Markets Corporate Debt Fund – Class P | | | 4.2% | |
| | Voya High Yield Bond Fund – Class P | | | 3.6% | |
| | Spain Government Bond, 1.600%, 04/30/25 | | | 3.3% | |
| | United States Treasury Note, 0.875%, 11/30/17 | | | 2.6% | |
| | Fannie Mae, 4.500%, 05/01/44 | | | 1.6% | |
| | Fannie Mae, 3.000%, 07/01/43 | | | 1.6% | |
| | Austria Government Bond, 1.650%, 10/21/24 | | | 1.5% | |
| | Spain Government Bond, 2.750%, 10/31/24 | | | 1.2% | |
| | *
Excludes short-term investments. | |
| | Portfolio holdings are subject to change daily. | |
move in the opposite direction of bond prices, generally increased. The yield on the widely watched ten-year U.S. Treasury note began the year just below 2.2% and finished close to 2.3%.
The Fed’s decision to begin raising short-term interest rates comes at a time when other major central banks — notably, in Europe, China and Japan — continue to provide massive amounts of support to their economies and are biased more toward further accommodation. The disruptions that potentially may emerge from this divergence in central bank policies will demand close attention from investors this year.
The Portfolio’s allocation to spread assets was the largest positive contributor to performance for the period. We remained generally overweight to corporate credit, both high yield and investment grade within the U.S. and emerging markets (“EM”). Since declining oil prices resulted in spread widening within high yield early in the year, the Portfolio moved more defensive in its allocation to the sector. Volatility within commodities resulted in a shift away from credits more sensitive to these price moves to a focus in higher quality, more consumer-related names that could take advantage of a resurgent consumer both in the U.S. and Europe. Additionally, the Portfolio favored mortgages as the U.S. housing market continued to gain steam throughout the year.
The overall foreign exchange allocation in the Portfolio added to performance for the period. EM currencies struggled for the year as growth across EM economies slowed. Positions such as the Mexican peso detracted from performance in response to the collapse of global commodities and slowing economic growth; however, developed market currency positioning more than offset negative performance from EM currencies. Overweight positioning during the first half of the year to the Swiss franc versus an underweight to the Euro resulted in solid returns. During the second and third quarters, the Portfolio maintained an overweight to the Euro and was underweight the dollar as we held a stronger view than the market on a
| Voya Global Bond Portfolio | Portfolio Managers’ Report |
European economic recovery. The Portfolio was also long the Japanese Yen (“JPY”) relative to USD at the end of the third quarter and fourth quarter resulting in negative performance for the Portfolio. We held a view that Abe and Kuroda lacked the joint will to stimulate growth further; however JPY performance was overwhelmed by risk on sentiment early in the fourth quarter. In the fourth quarter, our expectations of increased quantitative easing and rate cuts from the European Central Bank (“ECB”) led us to be short EUR. This position ultimately resulted in losses as the magnitude of ECB easing was less than half of market expectations. These losses were partly offset with gains in a short GBP position that expressed our view of a slowing economy with lower inflation expectations.
For the year, interest rate positioning detracted in all four quarters, including quarters 1, 2, and 4 in the U.S. as well as quarters 2, 3, and 4 in Europe. The Portfolio’s allocation to interest rate risk was the main detractor from performance as sovereign debt yields shifted dramatically as a result of negative macro headlines. The Portfolio’s allocation to developed market sovereigns underperformed the allocation to EM sovereigns for the period. The Portfolio’s short duration posture when rates rose in the U.S. and long duration positioning when rates fell in Germany provided nice returns early on in the year. During second and third quarters of the year, the Portfolio increased its duration as anticipation of an interest rate hike by the Fed declined, but decreased duration in the fourth quarter when a rate hike became more imminent. The Portfolio also capitalized on lower Italian 10-year interest rates relative to German 10-year interest rates. Carry in the portfolio arising from US and Euro interest rate derivatives further enhanced returns.
To manage interest rate risk during the period, the portfolio used government bond futures and interest rate swaps. To manage currency risk we employed currency forwards, occasionally using currency options to limit risk in adverse scenarios. Occasionally, we used index credit default swaps to manage exposure to spread sectors. The use of derivatives contributed to performance.
Current Strategy and Outlook: Our view is that U.S. growth is poised to stay closely tethered to a frustratingly low potential rate. We believe momentum in the household formation rate is likely to continue and is a sign of the continued resilience of the U.S. consumer. However, a continued cautious stance towards leverage, particularly within the millennial generation, is subduing the upside to growth. While U.S. dollar strength will continue to weigh on near term growth prospects, we believe this headwind will wane throughout 2016.
The Fed’s decision to begin raising short-term interest rates comes at a time when other major central banks — notably, in Europe, China and Japan — continue to provide massive amounts of support to their economies and are biased more toward further accommodation. The disruptions that potentially may emerge from this divergence in central bank policies will demand close attention from investors this year. We believe G-3 central banks will be progressively less effective in either calibrating monetary policy to economic conditions or achieving desired growth or inflation outcomes. Central Banks are addressing only the demand side of the economy while there is significant supply side weakness arising from historically low productivity growth and low labor force participation. Central bank policy deployment is now more likely to cause market confusion and volatility, in contrast to generally positive influence to markets over prior years.
The speed of the Fed’s normalization actions will be driven by supply-side and/or productivity improvements or lack thereof. We believe a continuation of the relatively muted growth in supply side factors would be received negatively by the market and would pressure the Fed to accelerate the near term pace of tightening while also lowering the terminal funds rate. Additionally, the lack of top-line revenue growth, paired with continued pressure for a larger share of income for labor, will pressure corporate margins from their historically high levels. We believe that higher levels of nominal growth will ultimately prove necessary for more leveraged entities.
*
Effective January 1, 2015, Mustafa Chowdhury was added as a portfolio manager of the Portfolio.
Portfolio holdings and characteristics are subject to change and may not be representative of current holdings and characteristics. Portfolio holdings are subject to change daily. The outlook for this Portfolio may differ from that presented for other Voya mutual funds. The Portfolio’s performance returns shown reflect applicable fee waivers and/or expense limits in effect during this period. Absent such fee waivers/expense limitations, if any, performance would have been lower. Performance for the different classes of shares will vary based on differences in fees associated with each class.
| Portfolio Managers’ Report | Voya Global Bond Portfolio |
| | | Average Annual Total Returns for the Periods Ended December 31, 2015 | | |
| | | | | | 1 Year | | | 5 Year | | | 10 Year | | |
| | | Class ADV | | | | | -4.85% | | | | | | 0.13% | | | | | | 3.27% | | | |
| | | Class I | | | | | -4.32% | | | | | | 0.64% | | | | | | 3.78% | | | |
| | | Class S | | | | | -4.50% | | | | | | 0.40% | | | | | | 3.54% | | | |
| | | Barclays Global Aggregate Index | | | | | -3.15% | | | | | | 0.90% | | | | | | 3.74% | | | |
| | | | | |
Based on a $10,000 initial investment, the graph and table above illustrate the total return of Voya Global Bond Portfolio against the index indicated. The index is unmanaged and has no cash in its portfolio, imposes no sales charges and incurs no operating expenses. An investor cannot invest directly in an index. The Portfolio’s performance is shown without the imposition of any expenses or charges which are, or may be, imposed under your variable annuity contract or variable life insurance policy. Total returns would have been lower if such expenses or charges were included.
The performance graph and table do not reflect the deduction of taxes that a shareholder will pay on Portfolio distributions or the redemption of Portfolio shares.
The performance shown may include the effect of fee waivers and/or expense reimbursements by the Investment Adviser and/or other service providers, which have the effect of increasing total return. Had all fees and expenses been considered, the total returns would have been lower.
The performance update illustrates performance for a variable investment option available through a variable
annuity contract or a variable life insurance policy. The performance shown indicates past performance and is not a projection or prediction of future results. Actual investment returns and principal value will fluctuate so that shares and/or units, at redemption, may be worth more or less than their original cost. Please log on to www.voyainvestments.com or call (800) 262-3862 to get performance through the most recent month end.
This report contains statements that may be “forward-looking” statements. Actual results may differ materially from those projected in the “forward-looking” statements.
The views expressed in this report reflect those of the portfolio managers, only through the end of the period as stated on the cover. The portfolio managers’ views are subject to change at any time based on market and other conditions.
Portfolio holdings are subject to change daily.
Prior to January 21, 2011, the Portfolio was advised by a different sub-adviser.
| VY® American Century Small-Mid Cap Value Portfolio | Portfolio Managers’ Report |
| | Sector Diversification
as of December 31, 2015
(as a percentage of net assets) | |
| | | | | | |
| | Financials | | | 29.2% | |
| | Industrials | | | 13.2% | |
| | Information Technology | | | 10.2% | |
| | Energy | | | 9.6% | |
| | Consumer Discretionary | | | 8.3% | |
| | Utilities | | | 7.5% | |
| | Health Care | | | 7.2% | |
| | Consumer Staples | | | 6.2% | |
| | Materials | | | 5.1% | |
| | Telecommunication Services | | | 0.8% | |
| | Exchange-Traded Funds | | | 0.7% | |
| | Assets in Excess of Other Liabilities* | | | 2.0% | |
| | Net Assets | | | 100.0% | |
| | *
Includes short-term investments. | |
| | Portfolio holdings are subject to change daily. | |
VY
® American Century Small-Mid Cap Value Portfolio (the “Portfolio”) seeks long-term capital growth. Income is a secondary objective. The Portfolio is managed by a team of portfolio managers comprised of Miles Lewis, CFA, and Jeff John, CFA, Vice President (responsible for the management of the Small Cap Value portion of the Portfolio) and Kevin Toney, CFA, Vice President, Phillip N. Davidson, CFA, Chief Investment Officer — Value Equity and Senior Vice President, Michael Liss, CFA, CPA, and Brian Woglom, CFA, Vice President (responsible for the Mid Cap Value portion of the Portfolio) (each a “Sleeve”), Portfolio Managers of American Century Investment Management, Inc. — the Sub-Adviser.
Performance: For the year ended December 31, 2015, the Portfolio’s Class S shares provided a total return -1.74% compared to the Russell 2500™ Value Index and the S&P SmallCap 600®/Citigroup Value Index, which returned -5.49% and -6.67%, respectively, for the same period.
Portfolio Specifics: Overall Portfolio — The portfolio outperformed the Russell 2500 Value benchmark due to security selection. Although the Russell 2500 Value is the overall portfolio benchmark, the Small Cap Value and Mid Cap Value sleeves are managed against the Russell 2000 Value and Russell Mid Cap Value benchmarks, respectively.
Small Cap Value Sleeve — Investments in the energy, consumer discretionary, and financials sectors added significantly to performance, while positions in the information technology, utilities, and consumer staples sectors detracted from returns. The Small Cap Value Sleeve outperformed the Russell 2000 Value Index due to security selection. Sector weightings were detractive on balance.
Two banking positions, Bank of the Ozarks and BankUnited, led contributors for the Sleeve. Bank of the Ozarks sold off early in the period but bounced back in the second quarter on solid loan growth and announced three acquisitions later in the year. BankUnited exhibited solid loan growth throughout the year. In the media space, Entravision, the largest Spanish-language broadcaster in the U.S., continued to benefit from news that television broadcasters may be able to auction off the excess broadcast spectrum they gained by switching from analog to digital. Additionally, the company should benefit from the 2016 U.S. presidential election cycle, as Latinos are a significant demographic for candidates.
Cumulus Media detracted from relative returns as core advertising trends weakened across the industry. The company’s integration of its acquisition of the Westwood One network was slower and more expensive than hoped, as it worked to unlock the considerable value in Westwood
| | Top Ten Holdings
as of December 31, 2015*
(as a percentage of net assets) | |
| | | | | | |
| | Sysco Corp. | | | 2.3% | |
| | Northern Trust Corp. | | | 2.1% | |
| | Republic Services, Inc. | | | 1.7% | |
| | Zimmer Biomet Holdings, Inc. | | | 1.4% | |
| | Imperial Oil Ltd. | | | 1.3% | |
| | LifePoint Hospitals, Inc. | | | 1.3% | |
| | Applied Materials, Inc. | | | 1.2% | |
| | Weyerhaeuser Co. | | | 1.2% | |
| | Tyco International Plc | | | 1.2% | |
| | Cameron International Corp. | | | 1.2% | |
| | *
Excludes short-term investments. | |
| | Portfolio holdings are subject to change daily. | |
One’s content. In the materials sector, Horsehead Holdings Corporation added new, low-cost capacity but experienced cost overruns at a new plant. The team felt the company’s balance sheet was deteriorating and exited the portfolio’s position.
Mid Cap Value Sleeve — Positions in the consumer staples, utilities, and energy sectors contributed the most to performance, while positions in the information technology and financials sectors detracted from returns. The Mid Cap Value Sleeve outperformed the Russell Mid Cap Value Index due to security selection. Sector allocations detracted slightly from relative performance.
Waste management company Republic Services contributed as the company continued to execute well and has minimal exposure to emerging markets and foreign currency issues. The team trimmed its position on outperformance. A lack of exposure to Freeport-McMoRan was helpful when the company sold shares in a secondary offering in the third quarter and the stock sold off.
A non-index position in Devon Energy detracted after the company announced a $2 billion acquisition of Felix Energy. Shares of natural gas producer EQT Corp. underperformed as warm weather caused weak natural gas consumption and drove commodity prices to decade lows.
Current Strategy and Outlook: We continue to be bottom-up investment managers, building our portfolios one stock at a time, a process that seeks exposure to market segments based on the attractiveness of individual companies in terms of their valuation and fundamentals. As of December 31, 2015, the Mid Cap Value Sleeve is notably overweight the consumer staples sector and also has a significant overweight in energy stocks. The Portfolio has smaller overweights in the industrials and health care sector. The Small Cap Value Sleeve, as of December 31, 2015, maintained substantial overweights in the materials and industrials sectors and a smaller overweight to consumer discretionary companies. The Portfolio’s greatest underweights are in the financials and utilities sectors.
Portfolio holdings and characteristics are subject to change and may not be representative of current holdings and characteristics. Portfolio holdings are subject to change daily. The outlook for this Portfolio may differ from that presented for other Voya mutual funds. The Portfolio’s performance returns shown reflect applicable fee waivers and/or expense limits in effect during this period. Absent such fee waivers/expense limitations, if any, performance would have been lower. Performance for the different classes of shares will vary based on differences in fees associated with each class.
| Portfolio Managers’ Report | VY® American Century Small-Mid Cap Value Portfolio |
| | | Average Annual Total Returns for the Periods Ended December 31, 2015 | | |
| | | | | | 1 Year | | | 5 Year | | | 10 Year | | | Since Inception
of Class S2
February 27, 2009 | | |
| | | Class ADV | | | | | -1.97% | | | | | | 10.06% | | | | | | 8.08% | | | | | | — | | | |
| | | Class I | | | | | -1.54% | | | | | | 10.61% | | | | | | 8.61% | | | | | | — | | | |
| | | Class S | | | | | -1.74% | | | | | | 10.34% | | | | | | 8.35% | | | | | | — | | | |
| | | Class S2 | | | | | -1.91% | | | | | | 10.18% | | | | | | — | | | | | | 19.17% | | | |
| | | Russell 2500TM Value Index | | | | | -5.49% | | | | | | 9.23% | | | | | | 6.51% | | | | | | 18.66% | | | |
| | | S&P SmallCap 600®/Citigroup Value Index | | | | | -6.67% | | | | | | 10.37% | | | | | | 7.17% | | | | | | 19.34% | | | |
| | | | | |
Based on a $10,000 initial investment, the graph and table above illustrate the total return of VY® American Century Small-Mid Cap Value Portfolio against the indices indicated. An index is unmanaged and has no cash in its portfolio, imposes no sales charges and incurs no operating expenses. An investor cannot invest directly in an index. The Portfolio’s performance is shown without the imposition of any expenses or charges which are, or may be, imposed under your variable annuity contract or variable life insurance policy. Total returns would have been lower if such expenses or charges were included.
The performance graph and table do not reflect the deduction of taxes that a shareholder will pay on Portfolio distributions or the redemption of Portfolio shares.
The performance shown may include the effect of fee waivers and/or expense reimbursements by the Investment Adviser and/or other service providers, which have the effect of increasing total return. Had all fees and expenses been considered, the total returns would have been lower.
The performance update illustrates performance for a variable investment option available through a variable annuity contract or a variable life insurance policy. The performance shown indicates past performance and is not a projection or prediction of future results. Actual investment returns and principal value will fluctuate so that shares and/or units, at redemption, may be worth more or less than their original cost. Please call (800) 262-3862 to get performance through the most recent month end.
This report contains statements that may be “forward-looking” statements. Actual results may differ materially from those projected in the “forward-looking” statements.
The views expressed in this report reflect those of the portfolio managers, only through the end of the period as stated on the cover. The portfolio managers’ views are subject to change at any time based on market and other conditions.
Portfolio holdings are subject to change daily.
| VY® Baron Growth Portfolio | Portfolio Managers’ Report |
| | Sector Diversification
as of December 31, 2015
(as a percentage of net assets) | |
| | | | | | |
| | Consumer Discretionary | | | 30.9% | |
| | Information Technology | | | 18.1% | |
| | Financials | | | 17.3% | |
| | Industrials | | | 10.5% | |
| | Health Care | | | 9.7% | |
| | Consumer Staples | | | 7.5% | |
| | Utilities | | | 2.2% | |
| | Materials | | | 2.1% | |
| | Telecommunication Services | | | 0.9% | |
| | Assets in Excess of Other Liabilities* | | | 0.8% | |
| | Net Assets | | | 100.0% | |
| | *
Includes short-term investments. | |
| | Portfolio holdings are subject to change daily. | |
VY
® Baron Growth Portfolio (the “Portfolio”) seeks capital appreciation. The Portfolio is managed by Ronald Baron, Founder, Chief Executive Officer, Chief Investment Officer, Chairman, and Portfolio Manager of BAMCO, Inc. — the Sub-Adviser.
Performance: For the year ended December 31, 2015, the Portfolio’s Class S shares provided a total return of -5.03% compared to the Russell 2000® Growth Index and the Russell 2500™ Growth Index, which returned -1.38% and -0.19%, respectively, for the same period.
Portfolio Specifics: Many sectors and capitalization ranges experienced significant volatility in 2015, in reaction to geopolitical events, global monetary policies, sagging oil and commodity prices, and a strengthening U.S. dollar. For the first seven and a half months of 2015, the markets generally increased. In late August, and again in late September, however, stocks plunged sharply, largely as a reaction to the collapse of China’s A-shares stock market and concerns around a slowing Chinese economy. In October, the markets again reversed course, boosted by signals from central banks that they would extend the global trend of easy monetary policy. Toward the end of the year, the Federal Reserve Board (“Fed”) raised interest rates for the first time since 2006. After an initial rally, the markets sold off over concerns about the implications of Fed tightening in the face of lingering concerns around employment trends, soft commodity prices, slowing overseas growth, and weakness in corporate earnings.
Information technology (“IT”) and consumer discretionary were the top contributors to performance in 2015. IT had a solid year, with gains in 12 of 13 sector holdings, led by application software. Consumer discretionary investments had a mixed year, although contributors outweighed detractors. The sector included ski resort company Vail Resorts, Inc. and corporate-sponsored childcare company Bright Horizons Family Solutions, Inc., the top and second largest contributors to performance.
Industrials, consumer staples, and health care were the top sector detractors. Industrials holdings were pressured by foreign exchange headwinds. The sector included the portfolio’s third biggest detractor, shortline railroad Genesee & Wyoming, Inc. Consumer staples was hurt by poor performance of the second biggest detractor, United Natural Foods, Inc. Health care was pressured by weakness in the stock of top detractor Community Health Systems, Inc.
Outperformance of consumer discretionary and IT investments and lower exposure to the poor performing materials sector contributed the most to relative results. Within consumer discretionary, outperformance of Vail Resorts, Inc., Bright Horizons Family Solutions, Inc., and Under Armour,
| | Top Ten Holdings
as of December 31, 2015
(as a percentage of net assets) | |
| | | | | | |
| | Vail Resorts, Inc. | | | 7.2% | |
| | Under Armour, Inc. | | | 4.6% | |
| | Gartner, Inc. | | | 4.1% | |
| | Middleby Corp. | | | 4.1% | |
| | CoStar Group, Inc. | | | 3.8% | |
| | Choice Hotels International, Inc. | | | 3.4% | |
| | Bright Horizons Family Solutions, Inc. | | | 3.4% | |
| | SS&C Technologies Holdings, Inc. | | | 3.1% | |
| | Mettler Toledo International, Inc. | | | 2.7% | |
| | MAXIMUS, Inc. | | | 2.7% | |
| | Portfolio holdings are subject to change daily. | |
Inc. added value and overshadowed the negative effect of larger exposure to this lagging sector. Strength in IT was partly attributable to outperformance of application software investments and larger exposure to this strong performing sub-industry. Larger exposure to the outperforming IT consulting & other services sub-industry also aided relative results. These positive effects were somewhat offset by lack of exposure to semiconductor stocks, which rose 8.3% within the Russell 2000
® Growth index.
Health care, industrials, consumer staples, and financials investments were the primary detractors from relative performance. Within health care, underperformance of Community Health Systems, Inc. and lower exposure to outperforming biotechnology and health care equipment stocks detracted the most from relative results. Weakness in industrials was mainly due to the underperformance of Genesee & Wyoming, Inc., CaesarStone Sdot-Yam Ltd., Colfax Corp., and Generac Holdings, Inc. Consumer staples holdings trailed their counterparts in the Russell 2000® Growth index after falling 18.1%, with United Natural Foods, Inc. and The Boston Beer Company, Inc. leading the decline. Within financials, underperformance of asset management & custody bank holdings, led by Cohen & Steers, Inc., The Carlyle Group, and Artisan Partners Asset Management, Inc., and larger exposure to this lagging sub-industry hurt relative results.
Current Strategy and Outlook: As long-term, fundamental, bottom-up investors, we are continuing to position the Portfolio to benefit from what we believe to be growth opportunities over the long term. We think the U.S. economy will continue on its path to recovery, which is good news for the types of companies in which we invest. At the same time, we think the process of deleveraging from historical highs could take years, during which interest rates will remain relatively low, in our view. We also believe that low oil prices, which have dampened economic growth in the past year due to the negative impact on the energy sector and its suppliers, will be offset by faster growth in the rest of the economy in part spurred by the lower cost of energy.
Portfolio holdings and characteristics are subject to change and may not be representative of current holdings and characteristics. Portfolio holdings are subject to change daily. The outlook for this Portfolio may differ from that presented for other Voya mutual funds. The Portfolio’s performance returns shown reflect applicable fee waivers and/or expense limits in effect during this period. Absent such fee waivers/expense limitations, if any, performance would have been lower. Performance for the different classes of shares will vary based on differences in fees associated with each class.
| Portfolio Managers’ Report | VY® Baron Growth Portfolio |
| | | Average Annual Total Returns for the Periods Ended December 31, 2015 | | |
| | | | | | 1 Year | | | 5 Year | | | 10 Year | | | Since Inception
of Class S2
February 27, 2009 | | |
| | | Class ADV | | | | | -5.27% | | | | | | 10.68% | | | | | | 7.26% | | | | | | — | | | |
| | | Class I | | | | | -4.75% | | | | | | 11.24% | | | | | | 7.80% | | | | | | — | | | |
| | | Class S | | | | | -5.03% | | | | | | 10.97% | | | | | | 7.54% | | | | | | — | | | |
| | | Class S2 | | | | | -5.17% | | | | | | 10.81% | | | | | | — | | | | | | 19.23% | | | |
| | | Russell 2000® Growth Index | | | | | -1.38% | | | | | | 10.67% | | | | | | 7.95% | | | | | | 20.02% | | | |
| | | Russell 2500TM Growth Index | | | | | -0.19% | | | | | | 11.43% | | | | | | 8.49% | | | | | | 20.87% | | | |
| | | | | |
Based on a $10,000 initial investment, the graph and table above illustrate the total return of VY® Baron Growth Portfolio against the indices indicated. An index is unmanaged and has no cash in its portfolio, imposes no sales charges and incurs no operating expenses. An investor cannot invest directly in an index. The Portfolio’s performance is shown without the imposition of any expenses or charges which are, or may be, imposed under your variable annuity contract or variable life insurance policy. Total returns would have been lower if such expenses or charges were included.
The performance graph and table do not reflect the deduction of taxes that a shareholder will pay on Portfolio distributions or the redemption of Portfolio shares.
The performance shown may include the effect of fee waivers and/or expense reimbursements by the Investment Adviser and/or other service providers, which have the effect of increasing total return. Had all fees and expenses been considered, the total returns would have been lower.
The performance update illustrates performance for a variable investment option available through a variable annuity contract or a variable life insurance policy. The performance shown indicates past performance and is not a projection or prediction of future results. Actual investment returns and principal value will fluctuate so that shares and/or units, at redemption, may be worth more or less than their original cost. Please call (800) 262-3862 to get performance through the most recent month end.
This report contains statements that may be “forward-looking” statements. Actual results may differ materially from those projected in the “forward-looking” statements.
The views expressed in this report reflect those of the portfolio manager, only through the end of the period as stated on the cover. The portfolio manager’s views are subject to change at any time based on market and other conditions.
Portfolio holdings are subject to change daily.
| VY® Columbia Contrarian Core Portfolio | Portfolio Managers’ Report |
| | Sector Diversification
as of December 31, 2015
(as a percentage of net assets) | |
| | | | | | |
| | Information Technology | | | 21.2% | |
| | Financials | | | 18.5% | |
| | Health Care | | | 18.4% | |
| | Consumer Discretionary | | | 12.0% | |
| | Industrials | | | 9.6% | |
| | Consumer Staples | | | 7.9% | |
| | Energy | | | 5.5% | |
| | Telecommunication Services | | | 2.7% | |
| | Materials | | | 1.5% | |
| | Utilities | | | 1.4% | |
| | Assets in Excess of Other Liabilities | | | 1.3% | |
| | Net Assets | | | 100.0% | |
| | Portfolio holdings are subject to change daily. | |
VY
® Columbia Contrarian Core Portfolio (the “Portfolio”) seeks total return, consisting of long-term capital appreciation and current income. The Portfolio is managed by Guy W. Pope, CFA, Portfolio Manager and Head of Contrarian Core Strategy with Columbia Management Investment Advisers, LLC (“CMIA”) — the Sub-Adviser.
Performance: For the year ended December 31, 2015, the Portfolio’s Class S shares provided a total return of 2.98% compared to the Russell 1000® Index, which returned 0.92% for the same period.
Portfolio Specifics: During the reporting period, stock selection was the primary driver of performance, with strong stock selection in the information technology sector, while the detractors were driven primarily from stock selection in the financials and consumer discretionary sectors. An underweight to the poor performing energy sector also contributed positively.
In the tech sector, the top contributor in the Portfolio for the period was Activision Blizzard. The video game maker finished a strong year with its “Call of Duty” franchise dominating holiday sales within the industry and its massive active user base leaving room for additional cross sell and monetization opportunities as its highly profitable franchises, including “World of Warcraft,” “Call of Duty” and “Destiny,” will be leveraged on other platforms and media (online, mobile, social networking, film and video). During the period, the company also announced it was acquiring King Digital Entertainment, maker of the popular “Candy Crush Saga” game, which will further enable Activision Blizzard to extend its presence across the fast-growing mobile gaming category.
Alphabet Inc. was also a top contributor as the company delivered strong results driven primarily by Google mobile search and YouTube. YouTube’s revenue continues to grow rapidly as a result of hours watched and demand for TrueView ads by advertisers. TrueView ads allow viewers to skip ads after five seconds or select which ads they want to view. Sponsors pay
| | Top Ten Holdings
as of December 31, 2015
(as a percentage of net assets) | |
| | | | | | |
| | Apple, Inc. | | | 3.4% | |
| | Citigroup, Inc. | | | 2.9% | |
| | JPMorgan Chase & Co. | | | 2.8% | |
| | Microsoft Corp. | | | 2.7% | |
| | Verizon Communications, Inc. | | | 2.7% | |
| | Berkshire Hathaway, Inc. – Class B | | | 2.6% | |
| | CVS Health Corp. | | | 2.6% | |
| | Medtronic PLC | | | 2.6% | |
| | Alphabet, Inc. - Class C | | | 2.4% | |
| | Johnson & Johnson | | | 2.4% | |
| | Portfolio holdings are subject to change daily. | |
only for ads that are viewed in their entirety. Google is well-positioned to continue to capture an increasing percentage of advertisers’ wallet share with unified ad campaigns that optimize spending across channels and products, and new measurement tools that ensure better understanding of their online to offline conversions.
Range Resources Inc., an independent oil and natural gas company that was added to the Portfolio in March of this year, was the top detractor in the Portfolio for the period. The stock dropped approximately 54%, driven by earnings and revenue misses. We sold the stock before the end of the period.
Current Strategy and Outlook: In 2016, we expect continued slow earnings growth and a more volatile stock market. Earnings growth ended 2015 essentially flat, which was a let-down given estimates at the start of the year targeting high single digits. At this time, we feel the market will take its cue from the global macroeconomic outlook. The perception that there will be a recovery of global growth would be welcomed and the opposite would have a negative impact on markets. From a long term standpoint, we believe equities remain an attractive asset class even though the short-term market backdrop is less certain.
Portfolio holdings and characteristics are subject to change and may not be representative of current holdings and characteristics. Portfolio holdings are subject to change daily. The outlook for this Portfolio may differ from that presented for other Voya mutual funds. The Portfolio’s performance returns shown reflect applicable fee waivers and/or expense limits in effect during this period. Absent such fee waivers/expense limitations, if any, performance would have been lower. Performance for the different classes of shares will vary based on differences in fees associated with each class.
| Portfolio Managers’ Report | VY® Columbia Contrarian Core Portfolio |
| | | Average Annual Total Returns for the Periods Ended December 31, 2015 | | |
| | | | | | 1 Year | | | 5 Year | | | 10 Year | | |
| | | Class ADV | | | | | 2.75% | | | | | | 10.59% | | | | | | 5.68% | | | |
| | | Class I | | | | | 3.25% | | | | | | 11.15% | | | | | | 6.21% | | | |
| | | Class S | | | | | 2.98% | | | | | | 10.88% | | | | | | 5.94% | | | |
| | | Russell 1000® Index | | | | | 0.92% | | | | | | 12.44% | | | | | | 7.40% | | | |
| | | | | |
Based on a $10,000 initial investment, the graph and table above illustrate the total return of VY® Columbia Contrarian Core Portfolio against the index indicated. The index is unmanaged and has no cash in its portfolio, imposes no sales charges and incurs no operating expenses. An investor cannot invest directly in an index. The Portfolio’s performance is shown without the imposition of any expenses or charges which are, or may be, imposed under your variable annuity contract or variable life insurance policy. Total returns would have been lower if such expenses or charges were included.
The performance graph and table do not reflect the deduction of taxes that a shareholder will pay on Portfolio distributions or the redemption of Portfolio shares.
The performance shown may include the effect of fee waivers and/or expense reimbursements by the Investment Adviser and/or other service providers, which have the effect of increasing total return. Had all fees and expenses been considered, the total returns would have been lower.
The performance update illustrates performance for a variable investment option available through a variable annuity contract or a variable life insurance policy. The
performance shown indicates past performance and is not a projection or prediction of future results. Actual investment returns and principal value will fluctuate so that shares and/or units, at redemption, may be worth more or less than their original cost. Please call (800) 262-3862 to get performance through the most recent month end.
This report contains statements that may be “forward-looking” statements. Actual results may differ materially from those projected in the “forward-looking” statements.
The views expressed in this report reflect those of the portfolio manager, only through the end of the period as stated on the cover. The portfolio manager’s views are subject to change at any time based on market and other conditions.
Portfolio holdings are subject to change daily.
Prior to October 31, 2005, the Portfolio was advised by a different sub-adviser. Prior to April 30, 2013, the Portfolio was advised by a different sub-adviser.
| VY® Columbia Small Cap Value II Portfolio | Portfolio Managers’ Report |
| | Sector Diversification
as of December 31, 2015
(as a percentage of net assets) | |
| | | | | | |
| | Financials | | | 38.2% | |
| | Industrials | | | 13.4% | |
| | Consumer Discretionary | | | 11.6% | |
| | Information Technology | | | 10.8% | |
| | Health Care | | | 6.3% | |
| | Energy | | | 4.9% | |
| | Materials | | | 4.6% | |
| | Utilities | | | 4.5% | |
| | Consumer Staples | | | 3.4% | |
| | Assets in Excess of Other Liabilities* | | | 2.3% | |
| | Net Assets | | | 100.0% | |
| | *
Includes short-term investments. | |
| | Portfolio holdings are subject to change daily. | |
VY
® Columbia Small Cap Value II Portfolio (the “Portfolio”) seeks long-term growth of capital. The Portfolio is managed by Christian K. Stadlinger, Ph. D., CFA, and Jarl Ginsberg, CFA, CAIA, Portfolio Managers, of Columbia Management Investment Advisors, LLC — the Sub-Adviser.
Performance: For the year ended December 31, 2015, the Portfolio’s Class I shares provided a total return of -2.74% compared to the Russell 2000® Value Index, which returned -7.47% for the same period.
Portfolio Specifics: During the reporting period, stock selection accounted for the overwhelming majority of outperformance, with strongest stock selection in the financials sector, followed by energy, consumer discretionary and industrials. This was slightly offset by poorer stock selection in the consumer staples sector. An overweight to health care stocks helped, and an overweight to the poor performing consumer discretionary sector detracted.
The Portfolio’s holdings in life insurer Symetra Financial benefitted from news of an acquisition agreement with a Japanese insurance company, sending the company’s stock price higher.
In consumer discretionary, signs of improving consumer spending aided the sector. Stock selection was favorable in apparel (Skechers U.S.A, Inc.) and household durables (Helen of Troy Limited). These two holdings contributed strongly to the Portfolio’s relative outperformance. Skechers continued to advance strongly on robust athletic and apparel trends in the U.S., product innovation combined with a sound marketing strategy and broad expansion internationally. Helen of Troy also continued its incremental rise through solid product positioning of its hair care appliances, accessories and related consumer products.
In the health care sector, PharMerica Corporation advanced on general merger and acquisition activity in the service area
| | Top Ten Holdings
as of December 31, 2015*
(as a percentage of net assets) | |
| | | | | | |
| | Sterling Bancorp/DE | | | 1.5% | |
| | Amerisafe, Inc. | | | 1.5% | |
| | Argo Group International Holdings Ltd. | | | 1.4% | |
| | Independent Bank Corp. | | | 1.4% | |
| | CubeSmart | | | 1.4% | |
| | PharMerica Corp. | | | 1.4% | |
| | Renasant Corp. | | | 1.4% | |
| | Community Bank System, Inc. | | | 1.3% | |
| | Avista Corp. | | | 1.3% | |
| | Fairchild Semiconductor International, Inc. | | | 1.3% | |
| | *
Excludes short-term investments. | |
| | Portfolio holdings are subject to change daily. | |
highlighting the company’s franchise value as well as pharmacy sales to long term care facilities.
Swift Transportation Company, the largest truckload carrier in North America, was the top detractor in the Portfolio for the period. The company earnings came in below estimates and guidance, and in the face of the current headwinds - no fleet growth, lowered pricing expectations, and the absence of any material utilization improvement - we sold the stock.
Current Strategy and Outlook: In 2016, we expect continued slow earnings growth and a more volatile stock market. Earnings growth ended 2015 essentially flat, which was a let-down given estimates at the start of the year targeting high single digits. At this time we feel the market will take its cue from the global macroeconomic outlook. We continue to believe that our focus on small-cap value companies with strong underlying earnings prospects and attractively priced shares has the potential to reward investors. We remain focused on our research of those companies where we believe the valuation gap is likely to shrink in the near term and look for a company’s upward inflection point. We seek out stocks that are both inexpensive and show improving operating performance/metrics.
Portfolio holdings and characteristics are subject to change and may not be representative of current holdings and characteristics. Portfolio holdings are subject to change daily. The outlook for this Portfolio may differ from that presented for other Voya mutual funds. The Portfolio’s performance returns shown reflect applicable fee waivers and/or expense limits in effect during this period. Absent such fee waivers/expense limitations, if any, performance would have been lower. Performance for the different classes of shares will vary based on differences in fees associated with each class.
| Portfolio Managers’ Report | VY® Columbia Small Cap Value II Portfolio |
| | | Average Annual Total Returns for the Periods Ended December 31, 2015 | | |
| | | | | | 1 Year | | | 5 Year | | | Since Inception
of Class ADV
December 29, 2006 | | | Since Inception
of Class I
April 28, 2006 | | | Since Inception
of Class S
May 1, 2006 | | | Since Inception
of Class S2
February 27, 2009 | | |
| | | Class ADV | | | | | -3.21% | | | | | | 9.25% | | | | | | 5.60% | | | | | | — | | | | | | — | | | | | | — | | | |
| | | Class I | | | | | -2.74% | | | | | | 9.80% | | | | | | — | | | | | | 5.88% | | | | | | — | | | | | | — | | | |
| | | Class S | | | | | -2.95% | | | | | | 9.51% | | | | | | — | | | | | | — | | | | | | 5.67% | | | | | | — | | | |
| | | Class S2 | | | | | -3.19% | | | | | | 9.33% | | | | | | — | | | | | | — | | | | | | — | | | | | | 18.40% | | | |
| | | Russell 2000® Value Index | | | | | -7.47% | | | | | | 7.67% | | | | | | 3.75% | | | | | | 4.37% | | | | | | 4.41% | | | | | | 17.12% | | | |
| | | | | |
Based on a $10,000 initial investment, the graph and table above illustrate the total return of VY® Columbia Small Cap Value II Portfolio against the index indicated. The index is unmanaged and has no cash in its portfolio, imposes no sales charges and incurs no operating expenses. An investor cannot invest directly in an index. The Portfolio’s performance is shown without the imposition of any expenses or charges which are, or may be, imposed under your variable annuity contract or variable life insurance policy. Total returns would have been lower if such expenses or charges were included.
The performance graph and table do not reflect the deduction of taxes that a shareholder will pay on Portfolio distributions or the redemption of Portfolio shares.
The performance shown may include the effect of fee waivers and/or expense reimbursements by the Investment Adviser and/or other service providers, which have the effect of increasing total return. Had all fees and expenses been considered, the total returns would have been lower.
The performance update illustrates performance for a variable investment option available through a variable annuity contract or a variable life insurance policy. The performance shown indicates past performance and is not a projection or prediction of future results. Actual investment returns and principal value will fluctuate so that shares and/or units, at redemption, may be worth more or less than their original cost. Please call (800) 262-3862 to get performance through the most recent month end.
This report contains statements that may be “forward-looking” statements. Actual results may differ materially from those projected in the “forward-looking” statements.
The views expressed in this report reflect those of the portfolio managers, only through the end of the period as stated on the cover. The portfolio managers’ views are subject to change at any time based on market and other conditions.
Portfolio holdings are subject to change daily.
| VY® Invesco Comstock Portfolio | Portfolio Managers’ Report |
| | Sector Diversification
as of December 31, 2015
(as a percentage of net assets) | |
| | | | | | |
| | Financials | | | 28.3% | |
| | Consumer Discretionary | | | 14.7% | |
| | Energy | | | 13.0% | |
| | Information Technology | | | 12.8% | |
| | Health Care | | | 11.0% | |
| | Industrials | | | 6.9% | |
| | Consumer Staples | | | 4.7% | |
| | Materials | | | 1.7% | |
| | Utilities | | | 1.1% | |
| | Telecommunication Services | | | 0.7% | |
| | Assets in Excess of Other Liabilities* | | | 5.1% | |
| | Net Assets | | | 100.0% | |
| | *
Includes short-term investments. | |
| | Portfolio holdings are subject to change daily. | |
VY
® Invesco Comstock Portfolio (the “Portfolio”) seeks capital growth and income. The Portfolio is managed by Kevin Holt, Lead Portfolio Manager, Devin E. Armstrong, James N. Warwick, and Charles DyReyes, Product Managers, of Invesco Advisers, Inc. — the Sub-Adviser.*
Performance: For the year ended December 31, 2015, the Portfolio’s Class S shares, provided a total return of -5.97% compared to the Russell 1000® Value Index and the S&P 500® Index, which returned -3.83% and 1.38%, respectively, for the same period.
Portfolio Specifics: On the positive side of sector performance, we used currency forward contracts during the reporting period for the purpose of hedging currency exposure of non-US based companies held in the Portfolio. Derivatives were used solely for the purpose of hedging and not for speculative purposes or leverage. The use of currency forward contracts had a large positive impact on the Portfolio’s performance relative to the Russell 1000® Value Index for the reporting period.
Stock selection within consumer staples also contributed to relative performance. ConAgra Foods shares benefited after the packaged foods maker reported earnings that exceeded analysts’ estimates towards the end of the reporting period, causing the stock to post double digit returns. Also, not owning Proctor & Gamble, which is a large benchmark holding that posted negative performance for the period helped relative performance.
A material underweight in utilities also helped relative performance, as utilities stocks posted negative returns for the period. We continue to believe utilities remain overvalued, as a sector.
On the negative side, weak stock selection and an underweight to healthcare stocks was a large detractor to relative performance. Specifically, being underweight within the healthcare equipment and services industry hurt performance. Also, not owning select names within pharmaceuticals, like Eli Lilly and Company, hurt performance as that stock posted a return of over 20% for the period.
Stock selection and an underweight in financials also acted as a large detractor to performance. Within diversified financials, Morgan Stanley and State Street underperformed the sector and benchmark, posting double digit negative returns. Although Morgan Stanley
| | Top Ten Holdings
as of December 31, 2015*
(as a percentage of net assets) | |
| | | | | | |
| | Citigroup, Inc. | | | 4.8% | |
| | JPMorgan Chase & Co. | | | 3.8% | |
| | Bank of America Corp. | | | 3.0% | |
| | Carnival Corp. | | | 2.9% | |
| | Cisco Systems, Inc. | | | 2.4% | |
| | General Electric Co. | | | 2.3% | |
| | Suncor Energy, Inc. | | | 2.1% | |
| | Wells Fargo & Co. | | | 2.1% | |
| | Merck & Co., Inc. | | | 2.0% | |
| | General Motors Co. | | | 1.9% | |
| | *
Excludes short-term investments. | |
| | Portfolio holdings are subject to change daily. | |
reported profits and revenues that beat estimates, financial stocks in general declined in the latter part of the period due to concerns about a prolonged low interest rate environment. Not owning real estate also hurt performance.
Stock selection and an overweight within the energy sector also hurt performance, mainly due to the declining prices of oil. Notably, Royal Dutch Shell and Murphy Oil Corp. were two of the largest relative detractors within the sector. Despite having a strong balance sheet and maintaining an attractive dividend, Royal Dutch Shell, a non-benchmark and top holding within the portfolio, underperformed the sector and benchmark for the period.
Current Strategy and Outlook: Although the Portfolio is underweight financials and overweight in energy compared to the Russell 1000® Value Index, we have a favorable view of large diversified financials companies and have been taking advantage of what we perceive to be weakness in the energy sector to add to the Portfolio’s energy position. The Portfolio’s exposure in each sector has a higher volatility than the Russell 1000® Value Index. Therefore, we believe the Portfolio should be more sensitive to broad moves within these sectors for the foreseeable future.
*
Effective November 9, 2015, Matthew Seinsheimer was removed as a portfolio manager of the Portfolio and Charles DyReyes was added as a portfolio manager of the Portfolio.
Portfolio holdings and characteristics are subject to change and may not be representative of current holdings and characteristics. Portfolio holdings are subject to change daily. The outlook for this Portfolio may differ from that presented for other Voya mutual funds. The Portfolio’s performance returns shown reflect applicable fee waivers and/or expense limits in effect during this period. Absent such fee waivers/expense limitations, if any, performance would have been lower. Performance for the different classes of shares will vary based on differences in fees associated with each class.
| Portfolio Managers’ Report | VY® Invesco Comstock Portfolio |
| | | Average Annual Total Returns for the Periods Ended December 31, 2015 | | |
| | | | | | 1 Year | | | 5 Year | | | 10 Year | | |
| | | Class ADV | | | | | -6.19% | | | | | | 9.72% | | | | | | 5.27% | | | |
| | | Class I | | | | | -5.76% | | | | | | 10.26% | | | | | | 5.79% | | | |
| | | Class S | | | | | -5.97% | | | | | | 9.99% | | | | | | 5.53% | | | |
| | | Russell 1000® Value Index | | | | | -3.83% | | | | | | 11.27% | | | | | | 6.16% | | | |
| | | S&P 500® Index | | | | | 1.38% | | | | | | 12.57% | | | | | | 7.31% | | | |
| | | | | |
Based on a $10,000 initial investment, the graph and table above illustrate the total return of VY® Invesco Comstock Portfolio against the indices indicated. An index is unmanaged and has no cash in its portfolio, imposes no sales charges and incurs no operating expenses. An investor cannot invest directly in an index. The Portfolio’s performance is shown without the imposition of any expenses or charges which are, or may be, imposed under your variable annuity contract or variable life insurance policy. Total returns would have been lower if such expenses or charges were included.
The performance graph and table do not reflect the deduction of taxes that a shareholder will pay on Portfolio distributions or the redemption of Portfolio shares.
The performance shown may include the effect of fee waivers and/or expense reimbursements by the Investment Adviser and/or other service providers, which have the effect of increasing total return. Had all fees and expenses been considered, the total returns would have been lower.
The performance update illustrates performance for a variable investment option available through a variable annuity contract or a variable life insurance policy. The performance shown indicates past performance and is not a projection or prediction of future results. Actual investment returns and principal value will fluctuate so that shares and/or units, at redemption, may be worth more or less than their original cost. Please call (800) 262-3862 to get performance through the most recent month end.
This report contains statements that may be “forward-looking” statements. Actual results may differ materially from those projected in the “forward-looking” statements.
The views expressed in this report reflect those of the portfolio managers, only through the end of the period as stated on the cover. The portfolio managers’ views are subject to change at any time based on market and other conditions.
Portfolio holdings are subject to change daily.
| VY® Invesco Equity and Income Portfolio | Portfolio Managers’ Report |
| | Sector Diversification
as of December 31, 2015
(as a percentage of net assets) | |
| | | | | | |
| | Financials | | | 26.5% | |
| | Health Care | | | 9.1% | |
| | Energy | | | 8.5% | |
| | Information Technology | | | 8.3% | |
| | U.S. Treasury Notes | | | 8.2% | |
| | Industrials | | | 6.4% | |
| | Consumer Discretionary | | | 5.8% | |
| | Consumer Staples | | | 5.0% | |
| | Consumer, Non-cyclical | | | 4.7% | |
| | Technology | | | 3.3% | |
| | Communications | | | 2.4% | |
| | Telecommunication Services | | | 1.8% | |
| | U.S. Treasury Bonds | | | 1.6% | |
| | Consumer, Cyclical | | | 1.3% | |
| | Utilities | | | 1.1% | |
| | Materials | | | 0.4% | |
| | Basic Materials | | | 0.3% | |
| | Federal Home Loan Mortgage Corporation | | | 0.1% | |
| | Foreign Government Bonds | | | 0.1% | |
| | Federal National Mortgage Association | | | 0.1% | |
| | Municipal | | | 0.1% | |
| | Assets in Excess of Other Liabilities* | | | 4.9% | |
| | Net Assets | | | 100.0% | |
| | *
Includes short-term investments. | | |
| | Portfolio holdings are subject to change daily. | |
VY
® Invesco Equity and Income Portfolio (the “Portfolio”) seeks total return, consisting of long-term capital appreciation and current income. The Portfolio is managed by Brian Jurkash, Thomas B. Bastian, CFA, James O. Roeder, Sergio Marcheli, Mary Jayne Maly and Chuck Burge of Invesco Advisers, Inc. — the Sub-Adviser.*
Performance: For the year ended December 31, 2015, the Portfolio’s Class S shares provided a total return of -2.31% compared to the Russell 1000® Value Index, Barclays U.S. Government/Credit Index and the 60% Russell 1000® Value Index/40% Barclays U.S. Government/Credit Index, which returned -3.83%, 0.15% and -2.03%, respectively, for the same period.
Portfolio Specifics: On the positive side, strong stock selection within the information technology sector was a large contributor to the Portfolio’s relative returns for the reporting period. Notably, Amdocs within software and services was a large driver of performance, posting returns in double-digits for the reporting period. UK-based Amdocs’ stock price rallied when the company reported record revenues in July of 2015, after expanding their product suite and renewing major service contracts. Also, we used currency forward contracts during the reporting period for the purpose of hedging currency exposure of non-U.S. based companies held in the Portfolio. The use of currency forward contracts had a large positive impact on the Portfolio’s relative performance. This was mainly due to the strength of the U.S. dollar. Energy was one of the worst performing sectors during the period, with continued weakness in oil prices driving down stock prices. As such, the Portfolio’s meaningful underweight in the sector was a positive contributor to relative return. Stock selection in consumer discretionary also added to relative returns. Within the sector, Carnival Corp. was a notable contributor, posting returns over 20% for the period. The cruise line operator reported higher-than-expected earnings and raised its outlook for 2016.
On the negative side, stock selection and an underweight within the industrials sector detracted from the Portfolio’s relative performance. Tyco International within commercial and professional services performed poorly for the reporting period, posting negative double-digit returns. In the 4
th quarter, Tyco met analysts’ earnings expectations; however, revenue numbers fell short due to the impact from foreign currency. Stock selection in consumer staples also dampened relative performance. Notably,
| | Top Ten Holdings
as of December 31, 2015*
(as a percentage of net assets) | |
| | | | | | |
| | JPMorgan Chase & Co. | | | 3.2% | |
| | United States Treasury Note, 1.250%, 12/15/18 | | | 3.1% | |
| | Citigroup, Inc. | | | 3.1% | |
| | United States Treasury Note, 0.875%, 11/30/17 | | | 3.1% | |
| | General Electric Co. | | | 2.5% | |
| | Bank of America Corp. | | | 1.9% | |
| | United States Treasury Note, 1.625%, 11/30/20 | | | 1.9% | |
| | Morgan Stanley | | | 1.6% | |
| | Carnival Corp. | | | 1.4% | |
| | PNC Financial Services Group, Inc. | | | 1.3% | |
| | *
Excludes short-term investments. | |
| | Portfolio holdings are subject to change daily. | |
Archer-Daniels-Midland stock sold off during the 4
th quarter as investors weighed 3
rd quarter profits that missed analyst expectations and guidance that the company may continue to have a challenging operating environment due to the strong U.S. dollar and depressed ethanol margins. Stock selection and the allocation to healthcare stocks hurt performance, as well. Specifically, an underweight to healthcare services and not owning names like Cigna Corp. were large detractors, as those stocks performed well for the period.
The Portfolio’s allocation to high grade bonds posted flat returns, whereas convertible bonds posted negative returns. However, the Portfolio’s allocation to bonds contributed to relative performance versus the Russell 1000® Value index, as bonds outperformed large value equities, which posted negative returns. Cash is utilized for investment opportunities and the fixed income allocation potentially provides income and capital preservation during equity market downturns.
Current Strategy and Outlook: Equity markets experienced continued volatility during the reporting period based on political unrest in Eastern Europe, a sluggish Chinese economy and the effects to the global economy from falling oil prices. We believe that market volatility creates opportunities to invest in companies with attractive valuations and strong fundamentals. We believe that ultimately those valuations and fundamentals will be reflected in those companies’ stock prices.
*
Brian Jurkash was added as a portfolio manager in April 2015. Effective January 25, 2016, Matthew Titus was added as a portfolio manager of the Portfolio. Effective March 1, 2016, Mary Jayne Maly will be removed as a portfolio manager of the Portfolio.
Portfolio holdings and characteristics are subject to change and may not be representative of current holdings and characteristics. Portfolio holdings are subject to change daily. The outlook for this Portfolio may differ from that presented for other Voya mutual funds. The Portfolio’s performance returns shown reflect applicable fee waivers and/or expense limits in effect during this period. Absent such fee waivers/expense limitations, if any, performance would have been lower. Performance for the different classes of shares will vary based on differences in fees associated with each class.
| Portfolio Managers’ Report | VY® Invesco Equity and Income Portfolio |
| | | Average Annual Total Returns for the Periods Ended December 31, 2015 | | |
| | | | | | 1 Year | | | 5 Year | | | 10 Year | | | Since Inception
of Class S2
February 27, 2009 | | |
| | | Class ADV | | | | | -2.55% | | | | | | 7.73% | | | | | | 5.72% | | | | | | — | | | |
| | | Class I | | | | | -2.06% | | | | | | 8.27% | | | | | | 6.25% | | | | | | — | | | |
| | | Class S | | | | | -2.31% | | | | | | 8.00% | | | | | | 5.98% | | | | | | — | | | |
| | | Class S2 | | | | | -2.44% | | | | | �� | 7.84% | | | | | | — | | | | | | 12.87% | | | |
| | | Russell 1000® Value Index | | | | | -3.83% | | | | | | 11.27% | | | | | | 6.16% | | | | | | 17.87% | | | |
| | | Barclays U.S. Government/Credit Index | | | | | 0.15% | | | | | | 3.39% | | | | | | 4.47% | | | | | | 4.47% | | | |
| | | 60% Russell 1000® Value Index/40% Barclays U.S.
Government/Credit Index | | | | | -2.03% | | | | | | 8.28% | | | | | | 5.82% | | | | | | 12.63% | | | |
| | | | | |
Based on a $10,000 initial investment, the graph and table above illustrate the total return of VY® Invesco Equity and Income Portfolio against the indices indicated. An index is unmanaged and has no cash in its portfolio, imposes no sales charges and incurs no operating expenses. An investor cannot invest directly in an index. The Portfolio’s performance is shown without the imposition of any expenses or charges which are, or may be, imposed under your variable annuity contract or variable life insurance policy. Total returns would have been lower if such expenses or charges were included.
The performance graph and table do not reflect the deduction of taxes that a shareholder will pay on Portfolio distributions or the redemption of Portfolio shares.
The performance shown may include the effect of fee waivers and/or expense reimbursements by the Investment Adviser and/or other service providers, which have the effect of increasing total return. Had all fees and expenses been considered, the total returns would have been lower.
The performance update illustrates performance for a variable investment option available through a variable annuity contract or a variable life insurance policy. The performance shown indicates past performance and is not a projection or prediction of future results. Actual investment returns and principal value will fluctuate so that shares and/or units, at redemption, may be worth more or less than their original cost. Please call (800) 262-3862 to get performance through the most recent month end.
This report contains statements that may be “forward-looking” statements. Actual results may differ materially from those projected in the “forward-looking” statements.
The views expressed in this report reflect those of the portfolio managers, only through the end of the period as stated on the cover. The portfolio managers’ views are subject to change at any time based on market and other conditions.
Portfolio holdings are subject to change daily.
| VY® JPMorgan Mid Cap Value Portfolio | Portfolio Managers’ Report |
| | Sector Diversification
as of December 31, 2015
(as a percentage of net assets) | |
| | | | | | |
| | Financials | | | 33.0% | |
| | Consumer Discretionary | | | 17.8% | |
| | Utilities | | | 10.8% | |
| | Industrials | | | 9.3% | |
| | Information Technology | | | 9.3% | |
| | Consumer Staples | | | 6.3% | |
| | Health Care | | | 5.4% | |
| | Materials | | | 5.4% | |
| | Energy | | | 3.5% | |
| | Liabilities in Excess of Other Assets* | | | (0.8)% | |
| | Net Assets | | | 100.0% | |
| | *
Includes short-term investments. | |
| | Portfolio holdings are subject to change daily. | |
VY
® JPMorgan Mid Cap Value Portfolio (the “Portfolio”) seeks growth from capital appreciation. The Portfolio is managed by Jonathan K.L. Simon, Lawrence Playford, CFA, and Gloria Fu, CFA, Managing Directors and Portfolio Managers of J.P. Morgan Investment Management Inc. — the Sub-Adviser.
Performance: For the year ended December 31, 2015, the Portfolio’s Class S shares provided a total return of -3.04% compared to the Russell Midcap® Value Index (the “Index” or “Russell Midcap® Value”), which returned -4.78% for the same period.
Portfolio Specifics: The Portfolio outperformed the Index during the year. The strategy’s historical performance remained strong with positive alpha in all standard time periods.
Within the consumer staples sector, we saw solid performance from Kroger, which had another excellent year as it continued to consecutively post strong top-line growth. The company has positioned itself well for the shift in consumer eating trends by offering a wide range of price points. Kroger has been investing in its omni-channel platform, growing its organic food selection, and successfully winning market share from its main competitors. We are impressed with management’s innovative thinking and strong commitment to returning capital to shareholders through steady dividend raises and aggressive share buybacks. We view Kroger as a top supermarket operator that should continue to gain market share in 2016.
Although stock selection and sector overweight in consumer discretionary detracted from results this year, the position in Expedia performed well. The global expansion of mobile connectivity has driven rapid growth in online travel expenditures, allowing online travel agencies (“OTA”) such as Expedia to take market share from traditional travel agencies. The OTA market continued to consolidate in 2015 largely due to Expedia’s activity in the merger-and-acquisition space. Expedia has strengthened its position as the online market leader through the acquisitions of Travelocity, Orbitz and HomeAway. Organic growth was strong this year in the hotel and airline segments, and management proved that they remain focused on returning cash to shareholders with a $10 million increase to the company’s stock repurchase plan.
Stock selection within the materials sector was strong this year largely due to our position in Airgas (“ARG”) and our lack of ownership in Freeport-McMoran (“FCX”). The French industrial gas company, Air Liquide, announced it would acquire ARG, one of the largest suppliers of industrial, medical and specialty gases, to expand its footprint in the U.S. The agreed upon price was 50% above the one-month average stock price prior to the announcement. We chose not to purchase FCX due to deteriorating business fundamentals in their mining business as they are experiencing decreased demand and weak pricing. FCX’s heavy exposure to commodity price volatility conflicts with our investment philosophy of owning high quality companies with stable end products.
An underweight to the energy sector was the largest contributor to relative performance this year. Despite strong sector allocation, a few of our energy names, such as Southwestern Energy and Energen were among the worst-performing names in the Portfolio. Southwestern Energy, a major natural gas
| | Top Ten Holdings
as of December 31, 2015
(as a percentage of net assets) | |
| | | | | | |
| | Jack Henry & Associates, Inc. | | | 1.9% | |
| | Mohawk Industries, Inc. | | | 1.8% | |
| | M&T Bank Corp. | | | 1.8% | |
| | Loews Corp. | | | 1.6% | |
| | Fifth Third Bancorp | | | 1.6% | |
| | Arrow Electronics, Inc. | | | 1.6% | |
| | Synopsys, Inc. | | | 1.5% | |
| | Energen Corp. | | | 1.5% | |
| | SunTrust Bank | | | 1.5% | |
| | Kroger Co. | | | 1.5% | |
| | Portfolio holdings are subject to change daily. | |
exploration and production company, had a challenging year navigating the weak natural gas price environment, hurt by the resilient production levels from the shale gas producers. Additionally, the warmer-than-usual fall and winter has created an oversupplied gas market, further exacerbating the price weakness. Despite these headwinds, Southwestern Energy is trading at a sharp discount to net asset value as their assets in the Marcellus, Appalachia and Fayetteville regions are among the highest quality. At these price levels, we believe the risk/reward of company’s stock falls in our favor. Energen, an oil and natural gas exploration and production company, had a difficult year as commodity prices continued to fall. Despite the weak macro environment, the company is seeing growth in its Midland Basin assets where Energen should continue to benefit from drilling efficiencies and higher-margin volume growth in 2016. We are impressed by management’s commitment to a strong balance sheet. At these low commodity price levels, we believe Energen still has enough liquidity to fund its operations through 2017. We feel confident management will be able to fully utilize available resources to weather these tough times.
Current Strategy and Outlook: The financial sector remains the largest absolute sector weight within the Portfolio. As value investors, we are able to find high-quality financial companies that are trading at what we believe to be attractive valuations. The increase in the fed funds rate that was initiated at the December Federal Reserve Board meeting was welcome news as, in our opinion, the Portfolio is well positioned to benefit as the interest rate environment normalizes. We expect that bank holdings will see meaningful net interest margin expansion over time as short-term interest rates increase.
The consumer discretionary sector continues to be where we find some of our highest-conviction ideas and is the largest overweight position relative to the benchmark. In the consumer discretionary space, the Portfolio’s traditional retail holdings are developing effective omni-channel retailing systems that blend the best of online and brick and mortar retailing.
Portfolio holdings and characteristics are subject to change and may not be representative of current holdings and characteristics. Portfolio holdings are subject to change daily. The outlook for this Portfolio may differ from that presented for other Voya mutual funds. The Portfolio’s performance returns shown reflect applicable fee waivers and/or expense limits in effect during this period. Absent such fee waivers/expense limitations, if any, performance would have been lower. Performance for the different classes of shares will vary based on differences in fees associated with each class.
| Portfolio Managers’ Report | VY® JPMorgan Mid Cap Value Portfolio |
| | | Average Annual Total Returns for the Periods Ended December 31, 2015 | | |
| | | | | | 1 Year | | | 5 Year | | | 10 Year | | | Since Inception
of Class S2
February 27, 2009 | | |
| | | Class ADV | | | | | -3.27% | | | | | | 12.10% | | | | | | 7.99% | | | | | | — | | | |
| | | Class I | | | | | -2.77% | | | | | | 12.67% | | | | | | 8.53% | | | | | | — | | | |
| | | Class S | | | | | -3.04% | | | | | | 12.38% | | | | | | 8.26% | | | | | | — | | | |
| | | Class S2 | | | | | -3.20% | | | | | | 12.21% | | | | | | — | | | | | | 19.39% | | | |
| | | Russell Midcap® Value | | | | | -4.78% | | | | | | 11.25% | | | | | | 7.61% | | | | | | 20.79% | | | |
| | | | | |
Based on a $10,000 initial investment, the graph and table above illustrate the total return of VY® JPMorgan Mid Cap Value Portfolio against the index indicated. The index is unmanaged and has no cash in its portfolio, imposes no sales charges and incurs no operating expenses. An investor cannot invest directly in an index. The Portfolio’s performance is shown without the imposition of any expenses or charges which are, or may be, imposed under your variable annuity contract or variable life insurance policy. Total returns would have been lower if such expenses or charges were included.
The performance graph and table do not reflect the deduction of taxes that a shareholder will pay on Portfolio distributions or the redemption of Portfolio shares.
The performance shown may include the effect of fee waivers and/or expense reimbursements by the Investment Adviser and/or other service providers, which have the effect of increasing total return. Had all fees and expenses been considered, the total returns would have been lower.
The performance update illustrates performance for a variable investment option available through a variable annuity contract or a variable life insurance policy. The performance shown indicates past performance and is not a projection or prediction of future results. Actual investment returns and principal value will fluctuate so that shares and/or units, at redemption, may be worth more or less than their original cost. Please call (800) 262-3862 to get performance through the most recent month end.
This report contains statements that may be “forward-looking” statements. Actual results may differ materially from those projected in the “forward-looking” statements.
The views expressed in this report reflect those of the portfolio managers, only through the end of the period as stated on the cover. The portfolio managers’ views are subject to change at any time based on market and other conditions.
Portfolio holdings are subject to change daily.
| VY® Oppenheimer Global Portfolio | Portfolio Managers’ Report |
| | Geographic Diversification
as of December 31, 2015
(as a percentage of net assets) | |
| | | | | | |
| | United States | | | 45.1% | |
| | Japan | | | 12.4% | |
| | Germany | | | 9.2% | |
| | United Kingdom | | | 5.6% | |
| | Switzerland | | | 5.1% | |
| | France | | | 4.6% | |
| | India | | | 3.3% | |
| | Spain | | | 3.2% | |
| | Sweden | | | 3.1% | |
| | Netherlands | | | 2.3% | |
| | Countries between 0.3% – 1.7%^ | | | 4.8% | |
| | Assets in Excess of Other Liabilities* | | | 1.3% | |
| | Net Assets | | | 100.0% | |
| | *
Includes short-term investments. | |
| | ^
Includes 5 countries, which each represents 0.3% – 1.7% of net assets. | |
| | Portfolio holdings are subject to change daily. | |
VY
® Oppenheimer Global Portfolio (the “Portfolio”) seeks capital appreciation. The Portfolio is managed by Rajeev Bhaman, CFA, Portfolio Manager of OppenheimerFunds, Inc. — the Sub-Adviser.
Performance: For the year ended December 31, 2015, the Portfolio’s Class S shares provided a total return of 3.84% compared to the MSCI All Country World IndexSM, which returned -2.36% for the same period.
Portfolio Specifics: The Portfolio outperformed the MSCI All Country World IndexSM in seven out of ten sectors, led by stock selection in information technology and industrials, and underweight positions in energy and materials, which were the two worst performing sectors of the Index. The Portfolio underperformed the MSCI All Country World IndexSM in the consumer staples sector due to an underweight position and stock selection, and in the health care sector as a result of stock selection.
On a country basis, stock selection in the United States was the strongest contributor to performance. Stock selection and an overweight position in Japan and an underweight position in Canada also contributed positively to relative performance. Detractors from performance included stock selection in India, an overweight position in Brazil and stock selection in Denmark.
Top contributors to performance this period included information technology stocks Alphabet, Inc. (United States), Altera Corp. (United States), Murata Manufacturing Co., Ltd. (Japan) and Adobe Systems, Inc. (United States). Airbus Group SE (Industrials) (France) also contributed positively to performance. Alphabet is the new holding company vehicle for what was previously known as Google, now a mere division. The company reorganized the structure of the company in a way which will make it easier for investors to see the value in its core businesses and more easily assess the progress of their developing ones. We initiated a position in Alphabet several years ago due to its dominance in a variety of fast growing areas in e-commerce and mobility. In our view, given its strengths, and the durability of these strengths, it was unusually cheap, valued at essentially a market multiple. The valuation is a bit higher now but the business remains one of significant structural opportunity. Altera is a key player in the programmable logic device (“PLD”) niche of the semiconductor industry. In contrast to application-specific integrated circuits, PLDs can be reconfigured to address the unique needs of respective users. Recognizing the value of Altera’s intellectual property, Intel, the largest chip maker, announced plans to acquire Altera. The acquisition was completed late in the year. Murata Manufacturing Co. Ltd. is a Japan-based smartphone ceramic capacitor manufacturer. The company has exceeded earnings expectations due to robust, global sales of high-end smartphones. As a component manufacturer with both Apple and Samsung as customers, it does not matter which company wins the next product refresh. Adobe Systems, Inc. performed well and reported a sharp increase in quarterly sales and profits for its fiscal fourth quarter. After declining in 2014 on fears of Europe and oil prices potentially reducing new orders, Airbus performed positively in 2015. None of these issues are especially important to the bigger economic case for Airbus. A snapback was to be expected.
The most significant detractors from performance this period included SunEdison, Inc. (Information Technology) (United States), ICICI Bank Ltd. (Financials) (India), Tiffany & Co. (Consumer Discretionary) (United States), bluebird bio, Inc. (Health Care) (United States) and LM Ericsson Telefon AB (“Ericsson”) (Information Technology) (Sweden). SunEdison, Inc. is a position we initiated during the reporting period, in a period of sharp decline in its share price. The company is a developer of technologies in the field of solar power. During the reporting period, concerns developed about the durability of their finances. Accelerating the share decline may have the involvement of hedge funds that
| | Top Ten Holdings
as of December 31, 2015
(as a percentage of net assets) | |
| | | | | | |
| | McGraw-Hill Cos., Inc. | | | 2.6% | |
| | Aetna, Inc. | | | 2.4% | |
| | Airbus Group SE | | | 2.3% | |
| | Alphabet, Inc. - Class C | | | 2.3% | |
| | Murata Manufacturing Co., Ltd. | | | 2.3% | |
| | Alphabet, Inc. - Class A | | | 2.2% | |
| | Adobe Systems, Inc. | | | 2.2% | |
| | Colgate-Palmolive Co. | | | 2.2% | |
| | Citigroup, Inc. | | | 2.1% | |
| | Maxim Integrated Products | | | 2.0% | |
| | Portfolio holdings are subject to change daily. | |
appear to have exhibited stop loss behaviors, needing a quick out as the share price declined. ICICI Bank Ltd. is the largest private sector bank in India. After the company’s share price nearly doubled since the third quarter of 2013, it underwent a correction this reporting period. This was not a major concern of ours, as India is among the most under-banked nations in the world. Shares of Tiffany & Co. fell early in the year as it experienced a soft holiday sales season due to some promotional missteps. Also, in contrast to its European luxury counterparts, it was negatively impacted by the sharp rise in the U.S. dollar. Despite much talk of China’s current slowdown, we believe our thesis on increasing consumption of luxury goods, particularly in the emerging markets, over the longer term remains intact. China has demonstrated an appetite for jewelry. Tiffany & Co. continues to improve its product offering, which has positive implications for margins, and continues to have a strong global brand, in our view. bluebird bio, inc. is a clinical-stage biotechnology company that experienced declines during the reporting period. Ericsson, a mobile network operator, underperformed for a few reasons: slower U.S. recovery, 4G peaking in China and no resolution of a patent dispute with Apple. We viewed these as transient factors and remained comfortable with our position in Ericsson at period-end.
Current Strategy and Outlook: At period end, the Portfolio had its largest overweight positions in information technology, health care, consumer discretionary and industrials. The Portfolio had its most significant underweight positions in energy, consumer staples, materials and utilities. On a country basis, the Portfolio had its largest overweight positions in Germany, Japan and France, with its most significant underweight positions in the United States, Canada and Australia. Despite being underweight the United States relative to the MSCI All Country World IndexSM, the Portfolio had its largest allocation to that country on an absolute basis at period-end.
Headlines have very little to do with the way we invest, other than perhaps creating opportunities to buy or add to companies where we believe that near-term concerns have caused share prices to dislocate from long-term fundamentals. The Portfolio is a long-term, growth-oriented investment portfolio. We use a bottom-up, fundamental approach and seek to invest only in high quality companies with above average, sustainable growth characteristics. We seek to add value via our individual stock selection, and make no effort to mimic the weights assigned to the benchmark by sector, region or country. Valuation is a critical part of our investment criteria. Assuming we properly understand a given set of business economics, we believe our returns are principally a function of paying an appropriate price.
Portfolio holdings and characteristics are subject to change and may not be representative of current holdings and characteristics. Portfolio holdings are subject to change daily. The outlook for this Portfolio may differ from that presented for other Voya mutual funds. The Portfolio’s performance returns shown reflect applicable fee waivers and/or expense limits in effect during this period. Absent such fee waivers/expense limitations, if any, performance would have been lower. Performance for the different classes of shares will vary based on differences in fees associated with each class.
| Portfolio Managers’ Report | VY® Oppenheimer Global Portfolio |
| | | Average Annual Total Returns for the Periods Ended December 31, 2015 | | |
| | | | | | 1 Year | | | 5 Year | | | 10 Year | | | Since Inception
of Class S2
February 27, 2009 | | |
| | | Class ADV | | | | | 3.56% | | | | | | 8.12% | | | | | | 5.76% | | | | | | — | | | |
| | | Class I | | | | | 4.13% | | | | | | 8.65% | | | | | | 6.29% | | | | | | — | | | |
| | | Class S | | | | | 3.84% | | | | | | 8.37% | | | | | | 6.03% | | | | | | — | | | |
| | | Class S2 | | | | | 3.74% | | | | | | 8.22% | | | | | | — | | | | | | 16.59% | | | |
| | | MSCI All Country World IndexSM | | | | | -2.36% | | | | | | 6.09% | | | | | | 4.76% | | | | | | 14.15% | | | |
| | | | | |
Based on a $10,000 initial investment, the graph and table above illustrate the total return of VY® Oppenheimer Global Portfolio against the index indicated. The index is unmanaged and has no cash in its portfolio, imposes no sales charges and incurs no operating expenses. An investor cannot invest directly in an index. The Portfolio’s performance is shown without the imposition of any expenses or charges which are, or may be, imposed under your variable annuity contract or variable life insurance policy. Total returns would have been lower if such expenses or charges were included.
The performance graph and table do not reflect the deduction of taxes that a shareholder will pay on Portfolio distributions or the redemption of Portfolio shares.
The performance shown may include the effect of fee waivers and/or expense reimbursements by the Investment Adviser and/or other service providers, which have the effect of increasing total return. Had all fees and expenses been considered, the total returns would have been lower.
The performance update illustrates performance for a variable investment option available through a variable
annuity contract or a variable life insurance policy. The performance shown indicates past performance and is not a projection or prediction of future results. Actual investment returns and principal value will fluctuate so that shares and/or units, at redemption, may be worth more or less than their original cost. Please call (800) 262-3862 to get performance through the most recent month end.
This report contains statements that may be “forward-looking”statements. Actual results may differ materially from those projected in the “forward-looking” statements.
The views expressed in this report reflect those of the portfolio manager, only through the end of the period as stated on the cover. The portfolio manager’s views are subject to change at any time based on market and other conditions.
Portfolio holdings are subject to change daily.
Prior to November 8, 2004, the Portfolio was advised by a different sub-adviser.
| VY® Pioneer High Yield Portfolio | Portfolio Managers’ Report |
| | Investment Type Allocation
as of December 31, 2015
(as a percentage of net assets) | |
| | | | | | |
| | Corporate Bonds/Notes | | | 83.2% | |
| | Common Stock | | | 6.5% | |
| | Preferred Stock | | | 2.4% | |
| | Collateralized Mortgage Obligations | | | 1.0% | |
| | Foreign Government Bonds** | | | 0.0% | |
| | Rights** | | | 0.0% | |
| | Assets in Excess of Other Liabilities* | | | 6.9% | |
| | Net Assets | | | 100.0% | |
| | *
Includes short-term investments. | |
| | **
Amount is less than 0.05%. | |
| | Portfolio holdings are subject to change daily. | |
VY
® Pioneer High Yield Portfolio (the “Portfolio”) seeks to maximize total return through income and capital appreciation. The Portfolio is managed by Andrew Feltus, Director of High Yield and Senior Vice President, and Tracy Wright, Senior Vice President, Portfolio Managers, of Pioneer Investment Management, Inc. — the Sub-Adviser.
Performance: For the year ended December 31, 2015, the Portfolio’s Class I shares provided a total return of -4.55% compared to the Bank of America/Merrill Lynch High Yield Master II Index and the Bank of America/Merrill Lynch All Convertibles (Speculative Grade) Index, which returned -4.64% and -10.29%, respectively, for the same period.
Portfolio Specifics: The Portfolio benefited during 2015 from our out of benchmark exposure of approximately 15% to convertible securities with a focus on technology and healthcare issuers. Healthcare was a strong contributor as issuers benefited from industry consolidation and ongoing favorable demographic trends. Technology also was a contributor. The modest energy allocation was a detractor.
Within high yield corporates, a significant contributor to relative returns was the underweight combined with security selection in the basic industry sector. The metals/mining sector was hurt by the sharp drop in prices experienced by most commodities throughout the year as a result of overcapacity and concerns about the pace of global growth. Issue selection in the homebuilding, healthcare, media and services sectors also helped. Additionally, the overweight to the banking sector and the underweight to energy contributed to relative returns. Both the underweight and security selection in the leisure and telecommunications sectors hurt returns.
The Portfolio’s underweight allocation to the lower-rated CCC quality tier was a strong relative contributor to performance as the more speculative credits significantly lagged during the period. Also, the 5.3% average allocation to floating rate bank loans helped relative returns during 2015 as securities positioned higher in the capital structure generally outperformed.
The Portfolio’s approximate 6% allocation to equity was a modest detractor during the year. The equity allocation was hurt by its energy and materials exposure. The healthcare and consumer discretionary sectors contributed to returns.
| | Top Ten Holdings
as of December 31, 2015*
(as a percentage of net assets) | |
| | | | | | |
| | Sprint Corp., 7.250%, 09/15/21 | | | 1.3% | |
| | Timberstar Trust, 7.530%, 10/15/36 | | | 1.0% | |
| | Scientific Games International, Inc., 10.000%, 12/01/22 | | | 1.0% | |
| | CHS/Community Health Systems, Inc., 8.000%, 11/15/19 | | | 0.9% | |
| | VRX Escrow Corp., 5.875%, 05/15/23 | | | 0.8% | |
| | Forest City Enterprises, Inc. | | | 0.8% | |
| | Ford Motor Co. | | | 0.7% | |
| | Sealy Corp. | | | 0.8% | |
| | Crown Cork & Seal Co., Inc., 7.375%, 12/15/26 | | | 0.7% | |
| | Citigroup, Inc. | | | 0.7% | |
| | *
Excludes short-term investments. | |
| | Portfolio holdings are subject to change daily. | |
Securities contributing to performance included the convertible bond positions in healthcare focused Salix Pharmaceuticals, Emergent Biosolutions, Alere and Amarin. The convertible holding in Jarden Corporation also helped. The corporate bond positions in Rentech Nitrogen Partners, Lennar Corporation and Post Holdings were also contributors.
Securities detracting from performance included the corporate bond positions in Denbury Resources, Linn Energy and Scientific Games International. The convertible and corporate bond holdings in Chesapeake Energy also detracted.
Current Strategy and Outlook: We continue to hold overweights to asset rich industries such as healthcare and those with strong free cash flows generating capabilities such as technology, which offer significant asset value and strong downside protection. The average high yield index option-adjusted spread stands at 695 basis points (“bps”) (a basis point is one-hundredth of one percent) which is now well above its 550 bps long-term average. We believe current spread levels more than compensate for any default risk, which we believe will remain below the 4% long-term average through at least 2016. Our positive fundamental outlook is supported by the fact that issuers are generally maintaining strong margins and balance sheets. In addition, in our view, financial conditions remain positive with issuers continuing to have ample access to capital. Given our growth outlook, we will maintain our exposure to certain names in convertibles and equity.
Portfolio holdings and characteristics are subject to change and may not be representative of current holdings and characteristics. Portfolio holdings are subject to change daily. The outlook for this Portfolio may differ from that presented for other Voya mutual funds. The Portfolio’s performance returns shown reflect applicable fee waivers and/or expense limits in effect during this period. Absent such fee waivers/expense limitations, if any, performance would have been lower. Performance for the different classes of shares will vary based on differences in fees associated with each class.
| Portfolio Managers’ Report | VY® Pioneer High Yield Portfolio |
| | | Average Annual Total Returns for the Periods Ended December 31, 2015 | | |
| | | | | | 1 Year | | | 5 Year | | | Since Inception
of Class I
January 3, 2006 | | | Since Inception
of Class S
January 20, 2006 | | |
| | | Class I | | | | | -4.55% | | | | | | 4.40% | | | | | | 7.19% | | | | | | — | | | |
| | | Class S | | | | | -4.79% | | | | | | 4.15% | | | | | | — | | | | | | 6.95% | | | |
| | | Bank of America/Merrill Lynch High Yield Master II Index | | | | | -4.64% | | | | | | 4.84% | | | | | | 6.80% | | | | | | 6.75% | | | |
| | | Bank of American/Merrill Lynch All Convertibles (Speculative Grade) Index | | | | | -10.29% | | | | | | 5.01% | | | | | | 6.33% | | | | | | 6.15% | | | |
| | | | | |
Based on a $10,000 initial investment, the graph and table above illustrate the total return of VY® Pioneer High Yield Portfolio against the indices indicated. An index is unmanaged and has no cash in its portfolio, imposes no sales charges and incurs no operating expenses. An investor cannot invest directly in an index. The Portfolio’s performance is shown without the imposition of any expenses or charges which are, or may be, imposed under your variable annuity contract or variable life insurance policy. Total returns would have been lower if such expenses or charges were included.
The performance graph and table do not reflect the deduction of taxes that a shareholder will pay on Portfolio distributions or the redemption of Portfolio shares.
The performance shown may include the effect of fee waivers and/or expense reimbursements by the Investment Adviser and/or other service providers, which have the effect of increasing total return. Had all fees and expenses been considered, the total returns would have been lower.
The performance update illustrates performance for a variable investment option available through a variable annuity contract or a variable life insurance policy. The performance shown indicates past performance and is not a projection or prediction of future results. Actual investment returns and principal value will fluctuate so that shares and/or units, at redemption, may be worth more or less than their original cost. Please call (800) 262-3862 to get performance through the most recent month end.
This report contains statements that may be “forward-looking” statements. Actual results may differ materially from those projected in the “forward-looking” statements.
The views expressed in this report reflect those of the portfolio managers, only through the end of the period as stated on the cover. The portfolio managers’ views are subject to change at any time based on market and other conditions.
Portfolio holdings are subject to change daily.
| VY® T. Rowe Price Diversified Mid Cap Growth Portfolio | Portfolio Managers’ Report |
| | Sector Diversification
as of December 31, 2015
(as a percentage of net assets) | |
| | | | | | |
| | Information Technology | | | 20.8% | |
| | Consumer Discretionary | | | 20.7% | |
| | Industrials | | | 18.1% | |
| | Health Care | | | 15.2% | |
| | Financials | | | 9.6% | |
| | Consumer Staples | | | 6.0% | |
| | Materials | | | 6.0% | |
| | Energy | | | 1.7% | |
| | Telecommunication Services | | | 1.3% | |
| | Utilities | | | 0.5% | |
| | Assets in Excess of Other Liabilities* | | | 0.1% | |
| | Net Assets | | | 100.0% | |
| | *
Excludes short-term investments. | |
| | Portfolio holdings are subject to change daily. | |
VY
® T. Rowe Price Diversified Mid Cap Growth Portfolio (the “Portfolio”) seeks long-term capital appreciation. The Portfolio is managed by Donald J. Peters, Vice President, and Donald J. Easley, CFA, Vice President, Portfolio Managers of T. Rowe Price Associates, Inc. — the Sub-Adviser.
Performance: For the year ended December 31, 2015, the Portfolio’s Class S shares provided a total return of 1.72% compared to the S&P MidCap 400 Index and the Russell Midcap® Growth Index, which returned -2.18% and -0.20%, respectively, for the same period.
Portfolio Specifics: Health care contributed most to relative outperformance, due to stock positioning and a strategic overweight. Synageva Biopharmaceutical and Thoratec both helped here. A developer of enzyme replacement therapies for extremely rare diseases, Synageva Biopharmaceutical benefited from Alexion Pharmaceuticals’ announcement that it would acquire the company with an eye toward expanding its drug pipeline.
In information technology, our stock holdings also outperformed their benchmark peers, most notably Verisign and Vantiv. Verisign, which manages the .com and .net domain name registry and provides various online security services, benefited from strong results driven in large part by increased demand in China. A credit and debit card processing provider, Vantiv beat sales and earnings estimates this past quarter, and we also believe that the company stands to benefit from helping card issuers comply with the new requirements for chip-and-PIN card systems in the U.S.
Financials was another area of relative strength, owing to stock selection. E*TRADE Financial provided a boost here, as this online brokerage received regulatory approval to put its excess capital reserves to work. The firm chose to pay down debt, and we believe it will continue to benefit from more flexible use of its funds.
Consumer staples hurt relative results, as our stock holdings ended slightly down in a quarter when consumer staples led
| | Top Ten Holdings
as of December 31, 2015*
(as a percentage of net assets) | |
| | | | | | |
| | Hanesbrands, Inc. | | | 1.0% | |
| | Crown Castle International Corp. | | | 1.0% | |
| | SBA Communications Corp. | | | 1.0% | |
| | Ross Stores, Inc. | | | 1.0% | |
| | Dollar General Corp. | | | 0.9% | |
| | Autozone, Inc. | | | 0.9% | |
| | Carmax, Inc. | | | 0.8% | |
| | Southwest Airlines Co. | | | 0.8% | |
| | Intuitive Surgical, Inc. | | | 0.8% | |
| | Verisk Analytics, Inc. | | | 0.8% | |
| | *
Includes short-term investments. | |
| | Portfolio holdings are subject to change daily. | |
the benchmark. Among our detrimental positions were Fresh Market and Monster Beverage. Fresh Market struggled amid strong competition from more established players within the organic grocery space. By contrast, Monster Beverage shares benefited from the company’s lucrative deal with Coca-Cola, and so our limited allocation to the company proved disadvantageous.
Current Strategy and Outlook: We anticipate that the U.S. economy should benefit from stable growth, driven by labor market strength, low inflation, and reduced fiscal headwinds. On balance, it is our opinion that the environment for growth stocks has the potential to remain favorable in 2016, though market volatility is likely to increase. We believe that interest rates may rise but will stay low, and the drop in energy costs could boost spending power for most consumers. Our strategy remains focused on growth companies with the ability to grow revenues and earnings regardless of the macroeconomic conditions, and we believe that the market will continue to reward our bottom-up, fundamentals-based approach.
Portfolio holdings and characteristics are subject to change and may not be representative of current holdings and characteristics. Portfolio holdings are subject to change daily. The outlook for this Portfolio may differ from that presented for other Voya mutual funds. The Portfolio’s performance returns shown reflect applicable fee waivers and/or expense limits in effect during this period. Absent such fee waivers/expense limitations, if any, performance would have been lower. Performance for the different classes of shares will vary based on differences in fees associated with each class.
| Portfolio Managers’ Report | VY® T. Rowe Price Diversified Mid Cap Growth Portfolio |
| | | Average Annual Total Returns for the Periods Ended December 31, 2015 | | |
| | | | | | 1 Year | | | 5 Year | | | 10 Year | | | Since Inception
of Class S2
February 27, 2009 | | |
| | | Class ADV | | | | | 1.51% | | | | | | 10.98% | | | | | | 8.07% | | | | | | — | | | |
| | | Class I | | | | | 2.02% | | | | | | 11.52% | | | | | | 8.60% | | | | | | — | | | |
| | | Class S | | | | | 1.72% | | | | | | 11.25% | | | | | | 8.34% | | | | | | — | | | |
| | | Class S2 | | | | | 1.60% | | | | | | 11.08% | | | | | | — | | | | | | 20.35% | | | |
| | | S&P MidCap 400 Index | | | | | -2.18% | | | | | | 10.68% | | | | | | 8.18% | | | | | | 19.86% | | | |
| | | Russell Midcap® Growth Index | | | | | -0.20% | | | | | | 11.54% | | | | | | 8.16% | | | | | | 20.71% | | | |
| | | | | |
Based on a $10,000 initial investment, the graph and table above illustrate the total return of VY® T. Rowe Price Diversified Mid Cap Growth Portfolio against the indices indicated. An index is unmanaged and has no cash in its portfolio, imposes no sales charges and incurs no operating expenses. An investor cannot invest directly in an index. The Portfolio’s performance is shown without the imposition of any expenses or charges which are, or may be, imposed under your variable annuity contract or variable life insurance policy. Total returns would have been lower if such expenses or charges were included.
The performance graph and table do not reflect the deduction of taxes that a shareholder will pay on Portfolio distributions or the redemption of Portfolio shares.
The performance shown may include the effect of fee waivers and/or expense reimbursements by the Investment Adviser and/or other service providers, which have the effect of increasing total return. Had all fees and expenses been considered, the total returns would have been lower.
The performance update illustrates performance for a variable investment option available through a variable
annuity contract or a variable life insurance policy. The performance shown indicates past performance and is not a projection or prediction of future results. Actual investment returns and principal value will fluctuate so that shares and/or units, at redemption, may be worth more or less than their original cost. Please call (800) 262-3862 to get performance through the most recent month end.
This report contains statements that may be “forward-looking” statements. Actual results may differ materially from those projected in the “forward-looking”statements.
The views expressed in this report reflect those of the portfolio managers, only through the end of the period as stated on the cover. The portfolio managers’ views are subject to change at any time based on market and other conditions.
Portfolio holdings are subject to change daily.
Prior to November 8, 2004, the Portfolio was advised by a different sub-adviser.
| VY® T. Rowe Price Growth Equity Portfolio | Portfolio Managers’ Report |
| | Sector Diversification
as of December 31, 2015
(as a percentage of net assets) | |
| | | | | | |
| | Information Technology | | | 30.5% | |
| | Consumer Discretionary | | | 27.1% | |
| | Health Care | | | 21.3% | |
| | Industrials | | | 10.4% | |
| | Financials | | | 5.5% | |
| | Consumer Staples | | | 2.2% | |
| | Materials | | | 1.0% | |
| | Telecommunication Services | | | 0.1% | |
| | Assets in Excess of Other Liabilities* | | | 1.9% | |
| | Net Assets | | | 100.0% | |
| | *
Includes short-term investments. | |
| | Portfolio holdings are subject to change daily. | |
VY
® T. Rowe Price Growth Equity Portfolio (the “Portfolio”) seeks long-term growth through investments in stocks. The Portfolio is managed by Joseph Fath, Vice President and Portfolio Manager of T. Rowe Price Associates, Inc. — the Sub-Adviser.
Performance: For the year ended December 31, 2015, the Portfolio’s Class I shares, provided a total return of 10.81% compared to the S&P 500® Index and the Russell 1000® Growth Index, which returned 1.38% and 5.67%, respectively, for the same period.
Portfolio Specifics: Stock selection was the primary reason for outperformance by the Portfolio, and sector weighting was notably positive. Consumer discretionary was the leading relative outperformer, primarily driven by stock selection, but significant overweighting of the strongest performer in the benchmark also helped. Information technology outperformed largely on stock selection. The lack of energy stocks in the Portfolio also benefited results, as that was by far the worst performer in the benchmark. Industrials and business services was the largest relative detractor, mainly due to stock selection.
Consumer discretionary was the leading outperformer. Amazon.com continued to improve operating leverage in its core retail business throughout the year and reported impressive results with sharp acceleration in revenue and margins in its Amazon Web Services (“AWS”) cloud-computing unit. Despite the stock’s runup, we believe there is room for improvement as retail margins ramp up from below normalized levels and the company benefits from the expanding higher margin and faster growth AWS unit.
Information technology also outperformed. Multiple factors drove shares of Alphabet higher, including strong earnings driven by the move to increase advertising coverage on mobile searches. The market was also encouraged by a new focus on expense discipline. Alphabet, the new holding company of Google, also instituted its first-ever share buyback program, indicating management’s move toward more shareholder-friendly behavior.
Industrials and business services was the largest detractor. American Airlines performed well early in 2015, but the stock began experiencing difficulty toward the end of the second quarter due to concerns that industry-wide capacity discipline may not remain in effect, which would hurt pricing power and reduce revenue. Canadian Pacific Railway shares lagged as investors became concerned that
| | Top Ten Holdings
as of December 31, 2015
(as a percentage of net assets) | |
| | | | | | |
| | Amazon.com, Inc. | | | 7.2% | |
| | Alphabet, Inc. - Class A | | | 3.6% | |
| | Priceline.com, Inc. | | | 3.5% | |
| | Microsoft Corp. | | | 3.3% | |
| | Alphabet, Inc. - Class C | | | 3.3% | |
| | Allergan plc | | | 3.1% | |
| | Facebook, Inc. | | | 2.9% | |
| | Danaher Corp. | | | 2.8% | |
| | Visa, Inc. - Class A | | | 2.7% | |
| | Mastercard, Inc. | | | 2.7% | |
| | Portfolio holdings are subject to change daily. | |
a slowdown in crude shipments would start to pressure earnings of railway companies. Shares of Canadian Pacific fell further in the fourth quarter after the company announced plans to merge with competitor Norfolk Southern. Norfolk Southern has thus far rejected Canadian Pacific Railway’s offers.
Current Strategy and Outlook: Major U.S. stock indexes were narrowly mixed in 2015. In the first part of the year, equities benefited from steady economic and employment growth, generally favorable corporate earnings outside of the energy sector, higher merger activity, and central bank stimulus measures. Large-cap U.S. indexes reached their highest levels of the year in May, while smaller-cap benchmarks peaked about one month later. During the summer, global equities fell sharply in response to a plunge in Chinese stocks, which stemmed from its decelerating economy. Large-cap U.S. indexes experienced their first “correction,” typically defined as a drop of at least 10% from the highs, in the last four years. Growth stocks outpaced value shares according to Russell indexes, while large-cap shares generally outperformed small-caps.
We are optimistic about the longer-term prospects for large-cap growth stocks and expect the United States to generate moderate economic growth in 2016. We expect that the Federal Reserve Board is likely to raise short-term interest rates at a slower pace than the market currently expects, which should not hinder rising stock prices. However, the recent weakness in China’s industrial economy, falling energy and commodity prices, and geopolitical flare-ups could perpetuate the market’s recent volatility.
Portfolio holdings and characteristics are subject to change and may not be representative of current holdings and characteristics. Portfolio holdings are subject to change daily. The outlook for this Portfolio may differ from that presented for other Voya mutual funds. The Portfolio’s performance returns shown reflect applicable fee waivers and/or expense limits in effect during this period. Absent such fee waivers/expense limitations, if any, performance would have been lower. Performance for the different classes of shares will vary based on differences in fees associated with each class.
| Portfolio Managers’ Report | VY® T. Rowe Price Growth Equity Portfolio |
| | | Average Annual Total Returns for the Periods Ended December 31, 2015 | | |
| | | | | | 1 Year | | | 5 Year | | | 10 Year | | | Since Inception
of Class S2
February 27, 2009 | | |
| | | Class ADV | | | | | 10.25% | | | | | | 13.99% | | | | | | 8.48% | | | | | | — | | | |
| | | Class I | | | | | 10.81% | | | | | | 14.56% | | | | | | 9.02% | | | | | | — | | | |
| | | Class S | | | | | 10.54% | | | | | | 14.27% | | | | | | 8.75% | | | | | | — | | | |
| | | Class S2 | | | | | 10.38% | | | | | | 14.10% | | | | | | — | | | | | | 20.00% | | | |
| | | S&P 500® Index | | | | | 1.38% | | | | | | 12.57% | | | | | | 7.31% | | | | | | 18.63% | | | |
| | | Russell 1000® Growth Index | | | | | 5.67% | | | | | | 13.53% | | | | | | 8.53% | | | | | | 19.78% | | | |
| | | | | |
Based on a $10,000 initial investment, the graph and table above illustrate the total return of VY® T. Rowe Price Growth Equity Portfolio against the indices indicated. An index is unmanaged and has no cash in its portfolio, imposes no sales charges and incurs no operating expenses. An investor cannot invest directly in an index. The Portfolio’s performance is shown without the imposition of any expenses or charges which are, or may be, imposed under your variable annuity contract or variable life insurance policy. Total returns would have been lower if such expenses or charges were included.
The performance graph and table do not reflect the deduction of taxes that a shareholder will pay on Portfolio distributions or the redemption of Portfolio shares.
The performance shown may include the effect of fee waivers and/or expense reimbursements by the Investment Adviser and/or other service providers, which have the effect of increasing total return. Had all fees and expenses been considered, the total returns would have been lower.
The performance update illustrates performance for a variable investment option available through a variable annuity contract or a variable life insurance policy. The performance shown indicates past performance and is not a projection or prediction of future results. Actual investment returns and principal value will fluctuate so that shares and/or units, at redemption, may be worth more or less than their original cost. Please call (800) 262-3862 to get performance through the most recent month end.
This report contains statements that may be “forward-looking” statements. Actual results may differ materially from those projected in the “forward-looking” statements.
The views expressed in this report reflect those of the portfolio manager, only through the end of the period as stated on the cover. The portfolio manager’s views are subject to change at any time based on market and other conditions.
Portfolio holdings are subject to change daily.
| VY® Templeton Foreign Equity Portfolio | Portfolio Managers’ Report |
| | Geographic Diversification
as of December 31, 2015
(as a percentage of net assets) | |
| | | | | | |
| | United Kingdom | | | 20.5% | |
| | Germany | | | 12.0% | |
| | France | | | 11.5% | |
| | Switzerland | | | 7.9% | |
| | Japan | | | 6.9% | |
| | China | | | 6.1% | |
| | South Korea | | | 5.6% | |
| | Netherlands | | | 5.4% | |
| | Italy | | | 3.0% | |
| | Hong Kong | | | 2.8% | |
| | Countries between 0.2% – 2.8%^ | | | 14.6% | |
| | Assets in Excess of Other Liabilities* | | | 3.7% | |
| | Net Assets | | | 100.0% | |
| | *
Includes short-term investments. | |
| | ^
Includes 11 countries, which each represents 0.2% – 2.8% of net assets. | |
| | Portfolio holdings are subject to change daily. | |
VY
® Templeton Foreign Equity Portfolio (the “Portfolio”) seeks long-term capital growth. The Portfolio is managed by Cindy L. Sweeting, CFA, Antonio T. Docal, CFA, and Peter A. Nori, CFA, Portfolio Managers of Templeton Investment Counsel, LLC — the Sub-Adviser.
Performance: For the year ended December 31, 2015, the Portfolio’s Class I shares provided a total return of -3.34% compared to the MSCI All Country World ex-U.S. IndexSM (“MSCI ACWI ex-U.S.”) and the MSCI EAFE® Index, which returned -5.66% and -0.81%, respectively, for the same period.
Portfolio Specifics: In an environment where international stocks ended the year lower, the Portfolio limited losses and performed better than the MSCI ACWI ex-U.S., supported by stock selection. From a regional standpoint, stock selection and an overweighting in Europe contributed to relative performance, while the Portfolio’s underweighting and stock selection in Japan, the world’s best performing developed market in 2015, led to underperformance for the Portfolio’s Asia allocation.
Turning to sectors, even-weighted materials holdings delivered strong relative returns, supported by an underweighting and stock selection in metals and mining and stock selection in the construction materials industry. For example, Irish building materials firm CRH PLC and German cement-maker HeidelbergCement AG, were among the top contributors as they benefited from industry consolidation and restructuring as well as improving end-market demand.
Stock selection in financials also contributed. SwissRe AG, the world’s second largest reinsurer, was a top performer, rallying to the highest levels in more than a decade due to benign natural weather events and successful operational and financial management. The financials sector more broadly represented compelling value, in our analysis, particularly in Europe. We believe falling provisions, easing regulatory pressures and eventual turns in the business and interest rate cycles should support book value and earnings recoveries in the restructured sector.
Stock selection in consumer discretionary, information technology and energy also contributed, as did an overweighting in health care. An overweighting in energy detracted, but stock selection offset the negative effect. Although the timing for a recovery in the broader energy sector remains uncertain, at year-end oil traded near the cash cost of production, a very depressed level realized only a few times in the past 25 years. In our opinion, these types of prices should continue to accelerate the supply adjustment, ultimately restoring balance at a level that encourages continued investment in the production
| | Top Ten Holdings
as of December 31, 2015
(as a percentage of net assets) | |
| | | | | | |
| | Samsung Electronics Co., Ltd. GDR | | | 2.5% | |
| | Teva Pharmaceutical Industries Ltd. ADR | | | 2.3% | |
| | Roche Holding AG | | | 2.2% | |
| | BNP Paribas | | | 2.1% | |
| | Swiss Re Ltd. | | | 1.9% | |
| | Credit Suisse Group AG | | | 1.9% | |
| | Nissan Motor Co., Ltd. | | | 1.9% | |
| | GlaxoSmithKline PLC | | | 1.8% | |
| | CRH PLC - London | | | 1.8% | |
| | AXA S.A. | | | 1.8% | |
| | Portfolio holdings are subject to change daily. | |
necessary to meet global demand over the long term.
Detractors included an underweighted position in the defensive consumer staples sector. Despite the sector’s stable earnings and balance sheet profile, we found few opportunities among what we considered richly valued companies in a competitive industry selling commoditized products at single-digit profit margins. The few bargains we identified in consumer staples were mostly in special situations or restructuring. U.K. retailer Tesco PLC (“Tesco”), a significant detractor in 2015, is one such example. With sentiment at an all-time low, valuations we considered depressed, and progress evident under new management’s reorganization plan, Tesco appeared to us to be positioned for a long-term recovery. Stock selection in telecommunication services also lagged, pressured by Spanish mobile company Telefonica SA, which faced headwinds in its Latin American operations.
During the period, the U.S. dollar appreciated against most foreign currencies, which also hurt the Portfolio’s performance because investments in securities with non-U.S. currency exposure lost value as the dollar rose.
Current Strategy and Outlook: A critical insight we have gleaned through six decades of investing in global equity markets is that returns seem to accrue to value intermittently. We believe our style of investing has historically compounded positive performance over a long-term investment horizon. But, it has rarely been a steady appreciation. At Templeton, we buy on pessimism, and the market can remain at odds with our portfolios for a considerable stretch. But, empirical evidence has shown that when the value cycle turns, it does so swiftly and abruptly. We believe being properly positioned for these turns is essential to capturing the long-term benefits of the value investment discipline. We have been witnessing historical extremes in the discount afforded to value relative to growth, quality and safety. Although this environment has been, and may remain, painful for some time, we believe the eventual normalization of these extremes represents the most compelling opportunity in equity markets today, and we have sought to position the Portfolio accordingly.
Portfolio holdings and characteristics are subject to change and may not be representative of current holdings and characteristics. Portfolio holdings are subject to change daily. The outlook for this Portfolio may differ from that presented for other Voya mutual funds. The Portfolio’s performance returns shown reflect applicable fee waivers and/or expense limits in effect during this period. Absent such fee waivers/expense limitations, if any, performance would have been lower. Performance for the different classes of shares will vary based on differences in fees associated with each class.
| Portfolio Managers’ Report | VY® Templeton Foreign Equity Portfolio |
| | | Average Annual Total Returns for the Periods Ended December 31, 2015 | | |
| | | | | | 1 Year | | | 5 Year | | | Since Inception
of Class ADV
December 20, 2006 | | | Since Inception
of Class I
January 3, 2006 | | | Since Inception
of Class S
January 12, 2006 | | | Since Inception
of Class S2
February 27, 2009 | | |
| | | Class ADV | | | | | -3.83% | | | | | | 2.09% | | | | | | 0.96% | | | | | | — | | | | | | — | | | | | | — | | | |
| | | Class I | | | | | -3.34% | | | | | | 2.59% | | | | | | — | | | | | | 3.19% | | | | | | — | | | | | | — | | | |
| | | Class S | | | | | -3.57% | | | | | | 2.33% | | | | | | — | | | | | | — | | | | | | 2.91% | | | | | | — | | | |
| | | Class S2 | | | | | -3.72% | | | | | | 2.19% | | | | | | — | | | | | | — | | | | | | — | | | | | | 10.57% | | | |
| | | MSCI ACWI ex-U.S. | | | | | -5.66% | | | | | | 1.06% | | | | | | 0.65% | | | | | | 2.71% | | | | | | 2.41% | | | | | | 10.72% | | | |
| | | MSCI EAFE® Index | | | | | -0.81% | | | | | | 3.60% | | | | | | 0.77% | | | | | | 2.82% | | | | | | 2.54% | | | | | | 11.42% | | | |
| | | | | |
Based on a $10,000 initial investment, the graph and table above illustrate the total return of VY® Templeton Foreign Equity Portfolio against the indices indicated. An index is unmanaged and has no cash in its portfolio, imposes no sales charges and incurs no operating expenses. An investor cannot invest directly in an index. The Portfolio’s performance is shown without the imposition of any expenses or charges which are, or may be, imposed under your variable annuity contract or variable life insurance policy. Total returns would have been lower if such expenses or charges were included.
The performance graph and table do not reflect the deduction of taxes that a shareholder will pay on Portfolio distributions or the redemption of Portfolio shares.
The performance shown may include the effect of fee waivers and/or expense reimbursements by the Investment Adviser and/or other service providers, which have the effect of increasing total return. Had all fees and expenses been considered, the total returns would have been lower.
The performance update illustrates performance for a variable investment option available through a variable annuity contract or a variable life insurance policy. The performance shown indicates past performance and is not a projection or prediction of future results. Actual investment returns and principal value will fluctuate so that shares and/or units, at redemption, may be worth more or less than their original cost. Please log on to www.voyainvestments.com or call (800) 262-3862 to get performance through the most recent month end.
This report contains statements that may be “forward-looking” statements. Actual results may differ materially from those projected in the “forward-looking” statements.
The views expressed in this report reflect those of the portfolio managers, only through the end of the period as stated on the cover. The portfolio managers’ views are subject to change at any time based on market and other conditions.
Portfolio holdings are subject to change daily.
SHAREHOLDER EXPENSE EXAMPLES (Unaudited)
As a shareholder of a Portfolio, you incur two types of costs: (1) transaction costs, including redemption fees and exchange fees; and (2) ongoing costs, including management fees, distribution and/or service (12b-1) fees, and other Portfolio expenses. These Examples are intended to help you understand your ongoing costs (in dollars) of investing in each class of a Portfolio and to compare these costs with the ongoing costs of investing in other mutual funds.
The Examples are based on an investment of $1,000 invested at the beginning of the period and held for the entire period from July 1, 2015 to December 31, 2015. The Portfolios’ expenses are shown without the imposition of any charges which are, or may be, imposed under your variable annuity contract, variable life insurance policy, qualified pension, or retirement plan. Expenses would have been higher if such charges were included.
Actual Expenses
The left section of the table shown below, “Actual Portfolio Return,” provides information about actual account values and actual expenses. You may use the information in this section, together with the amount you invested, to estimate the expenses that you paid over the period. Simply divide your account value by $1,000 (for example, an $8,600 account value divided by $1,000 = 8.6), then multiply the result by the number in the first section under the heading entitled “Expenses Paid During the Period” to estimate the expenses you paid on your account during this period.
Hypothetical Example for Comparison Purposes
The right section of the table shown below, “Hypothetical (5% return before expenses),” provides information about hypothetical account values and hypothetical expenses based on a Portfolio’s actual expense ratio and an assumed rate of return of 5% per year before expenses, which is not a Portfolio’s actual return. The hypothetical account values and expenses may not be used to estimate the actual ending account balance or expenses you paid for the period. You may use this information to compare the ongoing costs of investing in a Portfolio and other mutual funds. To do so, compare this 5% hypothetical example with the 5% hypothetical examples that appear in the shareholder reports of the other mutual funds.
Please note that the expenses shown in the table are meant to highlight your ongoing costs only and do not reflect any transactional costs, such as redemption fees or exchange fees. Therefore, the hypothetical section of the table is useful in comparing ongoing costs only, and will not help you determine the relative total costs of owning different mutual funds. In addition, if these transactional costs were included, your costs would have been higher.
| | | | Actual Portfolio Return | | | Hypothetical (5% return before expenses) | | | | | | | | | |
| | | | Beginning
Account
Value
July 1, 2015 | | | Ending
Account
Value
December 31,
2015 | | | Annualized
Expense
Ratio | | | Expenses Paid
During the
Period Ended
December 31,
2015* | | | Beginning
Account
Value
July 1, 2015 | | | Ending
Account
Value
December 31,
2015 | | | Annualized
Expense
Ratio | | | Expenses Paid
During the
Period Ended
December 31,
2015* | | | | | | | | | |
| Voya Global Bond Portfolio | | | | | | | | | | | | | | | | | | | | | | | | | |
| Class ADV | | | | $ | 1,000.00 | | | | | $ | 977.10 | | | | | | 1.10% | | | | | $ | 5.48 | | | | | $ | 1,000.00 | | | | | $ | 1,019.66 | | | | | | 1.10% | | | | | $ | 5.60 | | | | | | | | | | |
| Class I | | | | | 1,000.00 | | | | | | 980.30 | | | | | | 0.60 | | | | | | 2.99 | | | | | | 1,000.00 | | | | | | 1,022.18 | | | | | | 0.60 | | | | | | 3.06 | | | | | | | | | | |
| Class S | | | | | 1,000.00 | | | | | | 979.40 | | | | | | 0.85 | | | | | | 4.24 | | | | | | 1,000.00 | | | | | | 1,020.92 | | | | | | 0.85 | | | | | | 4.33 | | | | | | | | | | |
| VY® American Century Small-Mid Cap Value Portfolio | | | | | | | | | | | | | | | | | | | | | | | | | |
| Class ADV | | | | $ | 1,000.00 | | | | | $ | 964.30 | | | | | | 1.36% | | | | | $ | 6.73 | | | | | $ | 1,000.00 | | | | | $ | 1,018.35 | | | | | | 1.36% | | | | | $ | 6.92 | | | | | | | | | | |
| Class I | | | | | 1,000.00 | | | | | | 966.40 | | | | | | 0.86 | | | | | | 4.26 | | | | | | 1,000.00 | | | | | | 1,020.87 | | | | | | 0.86 | | | | | | 4.38 | | | | | | | | | | |
| Class S | | | | | 1,000.00 | | | | | | 965.70 | | | | | | 1.11 | | | | | | 5.50 | | | | | | 1,000.00 | | | | | | 1,019.61 | | | | | | 1.11 | | | | | | 5.65 | | | | | | | | | | |
| Class S2 | | | | | 1,000.00 | | | | | | 964.80 | | | | | | 1.26 | | | | | | 6.24 | | | | | | 1,000.00 | | | | | | 1,018.85 | | | | | | 1.26 | | | | | | 6.41 | | | | | | | | | | |
| VY® Baron Growth Portfolio | | | | | | | | | | | | | | | | | | | | | | | | | |
| Class ADV | | | | $ | 1,000.00 | | | | | $ | 920.30 | | | | | | 1.49% | | | | | $ | 7.21 | | | | | $ | 1,000.00 | | | | | $ | 1,017.69 | | | | | | 1.49% | | | | | $ | 7.58 | | | | | | | | | | |
| Class I | | | | | 1,000.00 | | | | | | 923.10 | | | | | | 0.99 | | | | | | 4.80 | | | | | | 1,000.00 | | | | | | 1,020.21 | | | | | | 0.99 | | | | | | 5.04 | | | | | | | | | | |
| Class S | | | | | 1,000.00 | | | | | | 921.50 | | | | | | 1.24 | | | | | | 6.01 | | | | | | 1,000.00 | | | | | | 1,018.95 | | | | | | 1.24 | | | | | | 6.31 | | | | | | | | | | |
| Class S2 | | | | | 1,000.00 | | | | | | 921.00 | | | | | | 1.39 | | | | | | 6.73 | | | | | | 1,000.00 | | | | | | 1,018.20 | | | | | | 1.39 | | | | | | 7.07 | | | | | | | | | | |
| VY® Columbia Contrarian Core Portfolio | | | | | | | | | | | | | | | | | | | | | | | | | |
| Class ADV | | | | $ | 1,000.00 | | | | | $ | 997.90 | | | | | | 1.18% | | | | | $ | 5.94 | | | | | $ | 1,000.00 | | | | | $ | 1,019.26 | | | | | | 1.18% | | | | | $ | 6.01 | | | | | | | | | | |
| Class I | | | | | 1,000.00 | | | | | | 1,000.60 | | | | | | 0.68 | | | | | | 3.43 | | | | | | 1,000.00 | | | | | | 1,021.78 | | | | | | 0.68 | | | | | | 3.47 | | | | | | | | | | |
| Class S | | | | | 1,000.00 | | | | | | 999.10 | | | | | | 0.93 | | | | | | 4.69 | | | | | | 1,000.00 | | | | | | 1,020.52 | | | | | | 0.93 | | | | | | 4.74 | | | | | | | | | | |
SHAREHOLDER EXPENSE EXAMPLES (Unaudited) (continued)
| | | | Actual Portfolio Return | | | Hypothetical (5% return before expenses) | | | | | | | | | |
| | | | Beginning
Account
Value
July 1, 2015 | | | Ending
Account
Value
December 31,
2015 | | | Annualized
Expense
Ratio | | | Expenses Paid
During the
Period Ended
December 31,
2015* | | | Beginning
Account
Value
July 1, 2015 | | | Ending
Account
Value
December 31,
2015 | | | Annualized
Expense
Ratio | | | Expenses Paid
During the
Period Ended
December 31,
2015* | | | | | | | | | |
| VY® Columbia Small Cap Value II Portfolio | | | | | | | | | | | | | | | | | | | | | | | | | |
| Class ADV | | | | $ | 1,000.00 | | | | | $ | 929.00 | | | | | | 1.36% | | | | | $ | 6.61 | | | | | $ | 1,000.00 | | | | | $ | 1,018.35 | | | | | | 1.36% | | | | | $ | 6.92 | | | | | | | | | | |
| Class I | | | | | 1,000.00 | | | | | | 931.30 | | | | | | 0.86 | | | | | | 4.19 | | | | | | 1,000.00 | | | | | | 1,020.87 | | | | | | 0.86 | | | | | | 4.38 | | | | | | | | | | |
| Class S | | | | | 1,000.00 | | | | | | 930.10 | | | | | | 1.11 | | | | | | 5.40 | | | | | | 1,000.00 | | | | | | 1,019.61 | | | | | | 1.11 | | | | | | 5.65 | | | | | | | | | | |
| Class S2 | | | | | 1,000.00 | | | | | | 929.10 | | | | | | 1.26 | | | | | | 6.13 | | | | | | 1,000.00 | | | | | | 1,018.85 | | | | | | 1.26 | | | | | | 6.41 | | | | | | | | | | |
| VY® Invesco Comstock Portfolio | | | | | | | | | | | | | | | | | | | | | | | | | |
| Class ADV | | | | $ | 1,000.00 | | | | | $ | 933.00 | | | | | | 1.22% | | | | | $ | 5.94 | | | | | $ | 1,000.00 | | | | | $ | 1,019.06 | | | | | | 1.22% | | | | | $ | 6.21 | | | | | | | | | | |
| Class I | | | | | 1,000.00 | | | | | | 935.10 | | | | | | 0.72 | | | | | | 3.51 | | | | | | 1,000.00 | | | | | | 1,021.58 | | | | | | 0.72 | | | | | | 3.67 | | | | | | | | | | |
| Class S | | | | | 1,000.00 | | | | | | 934.10 | | | | | | 0.97 | | | | | | 4.73 | | | | | | 1,000.00 | | | | | | 1,020.32 | | | | | | 0.97 | | | | | | 4.94 | | | | | | | | | | |
| VY® Invesco Equity and Income Portfolio | | | | | | | | | | | | | | | | | | | | | | | | | |
| Class ADV | | | | $ | 1,000.00 | | | | | $ | 964.30 | | | | | | 1.14% | | | | | $ | 5.64 | | | | | $ | 1,000.00 | | | | | $ | 1,019.46 | | | | | | 1.14% | | | | | $ | 5.80 | | | | | | | | | | |
| Class I | | | | | 1,000.00 | | | | | | 966.40 | | | | | | 0.64 | | | | | | 3.17 | | | | | | 1,000.00 | | | | | | 1,021.98 | | | | | | 0.64 | | | | | | 3.26 | | | | | | | | | | |
| Class S | | | | | 1,000.00 | | | | | | 965.20 | | | | | | 0.89 | | | | | | 4.41 | | | | | | 1,000.00 | | | | | | 1,020.72 | | | | | | 0.89 | | | | | | 4.53 | | | | | | | | | | |
| Class S2 | | | | | 1,000.00 | | | | | | 964.70 | | | | | | 1.02 | | | | | | 5.05 | | | | | | 1,000.00 | | | | | | 1,020.06 | | | | | | 1.02 | | | | | | 5.19 | | | | | | | | | | |
| VY® JPMorgan Mid Cap Value Portfolio | | | | | | | | | | | | | | | | | | | | | | | | | |
| Class ADV | | | | $ | 1,000.00 | | | | | $ | 954.10 | | | | | | 1.36% | | | | | $ | 6.70 | | | | | $ | 1,000.00 | | | | | $ | 1,018.35 | | | | | | 1.36% | | | | | $ | 6.92 | | | | | | | | | | |
| Class I | | | | | 1,000.00 | | | | | | 956.80 | | | | | | 0.86 | | | | | | 4.24 | | | | | | 1,000.00 | | | | | | 1,020.87 | | | | | | 0.86 | | | | | | 4.38 | | | | | | | | | | |
| Class S | | | | | 1,000.00 | | | | | | 955.30 | | | | | | 1.11 | | | | | | 5.47 | | | | | | 1,000.00 | | | | | | 1,019.61 | | | | | | 1.11 | | | | | | 5.65 | | | | | | | | | | |
| Class S2 | | | | | 1,000.00 | | | | | | 954.30 | | | | | | 1.26 | | | | | | 6.21 | | | | | | 1,000.00 | | | | | | 1,018.85 | | | | | | 1.26 | | | | | | 6.41 | | | | | | | | | | |
| VY® Oppenheimer Global Portfolio | | | | | | | | | | | | | | | | | | | | | | | | | |
| Class ADV | | | | $ | 1,000.00 | | | | | $ | 939.10 | | | | | | 1.25% | | | | | $ | 6.11 | | | | | $ | 1,000.00 | | | | | $ | 1,018.90 | | | | | | 1.25% | | | | | $ | 6.36 | | | | | | | | | | |
| Class I | | | | | 1,000.00 | | | | | | 941.40 | | | | | | 0.75 | | | | | | 3.67 | | | | | | 1,000.00 | | | | | | 1,021.42 | | | | | | 0.75 | | | | | | 3.82 | | | | | | | | | | |
| Class S | | | | | 1,000.00 | | | | | | 940.10 | | | | | | 1.00 | | | | | | 4.89 | | | | | | 1,000.00 | | | | | | 1,020.16 | | | | | | 1.00 | | | | | | 5.09 | | | | | | | | | | |
| Class S2 | | | | | 1,000.00 | | | | | | 939.60 | | | | | | 1.15 | | | | | | 5.62 | | | | | | 1,000.00 | | | | | | 1,019.41 | | | | | | 1.15 | | | | | | 5.85 | | | | | | | | | | |
| VY® Pioneer High Yield Portfolio | | | | | | | | | | | | | | | | | | | | | | | | | |
| Class I | | | | $ | 1,000.00 | | | | | $ | 915.00 | | | | | | 0.71% | | | | | $ | 3.43 | | | | | | 1,000.00 | | | | | $ | 1,021.63 | | | | | | 0.71% | | | | | $ | 3.62 | | | | | | | | | | |
| Class S | | | | | 1,000.00 | | | | | | 913.80 | | | | | | 0.96 | | | | | | 4.63 | | | | | | 1,000.00 | | | | | | 1,020.37 | | | | | | 0.96 | | | | | | 4.89 | | | | | | | | | | |
| VY® T. Rowe Price Diversified Mid Cap Growth Portfolio | | | | | | | | | | | | | | | | | | | | | | | | | |
| Class ADV | | | | $ | 1,000.00 | | | | | $ | 956.50 | | | | | | 1.27% | | | | | $ | 6.26 | | | | | $ | 1,000.00 | | | | | $ | 1,018.80 | | | | | | 1.27% | | | | | $ | 6.46 | | | | | | | | | | |
| Class I | | | | | 1,000.00 | | | | | | 958.50 | | | | | | 0.77 | | | | | | 3.80 | | | | | | 1,000.00 | | | | | | 1,021.32 | | | | | | 0.77 | | | | | | 3.92 | | | | | | | | | | |
| Class S | | | | | 1,000.00 | | | | | | 957.50 | | | | | | 1.02 | | | | | | 5.03 | | | | | | 1,000.00 | | | | | | 1,020.06 | | | | | | 1.02 | | | | | | 5.19 | | | | | | | | | | |
| Class S2 | | | | | 1,000.00 | | | | | | 956.60 | | | | | | 1.17 | | | | | | 5.77 | | | | | | 1,000.00 | | | | | | 1,019.31 | | | | | | 1.17 | | | | | | 5.96 | | | | | | | | | | |
| VY® T. Rowe Price Growth Equity Portfolio | | | | | | | | | | | | | | | | | | | | | | | | | |
| Class ADV | | | | $ | 1,000.00 | | | | | $ | 1,032.70 | | | | | | 1.23% | | | | | $ | 6.30 | | | | | $ | 1,000.00 | | | | | $ | 1,019.00 | | | | | | 1.23% | | | | | $ | 6.26 | | | | | | | | | | |
| Class I | | | | | 1,000.00 | | | | | | 1,035.20 | | | | | | 0.73 | | | | | | 3.74 | | | | | | 1,000.00 | | | | | | 1,021.53 | | | | | | 0.73 | | | | | | 3.72 | | | | | | | | | | |
| Class S | | | | | 1,000.00 | | | | | | 1,034.10 | | | | | | 0.98 | | | | | | 5.02 | | | | | | 1,000.00 | | | | | | 1,020.27 | | | | | | 0.98 | | | | | | 4.99 | | | | | | | | | | |
| Class S2 | | | | | 1,000.00 | | | | | | 1,033.30 | | | | | | 1.13 | | | | | | 5.79 | | | | | | 1,000.00 | | | | | | 1,019.51 | | | | | | 1.13 | | | | | | 5.75 | | | | | | | | | | |
| VY® Templeton Foreign Equity Portfolio | | | | | | | | | | | | | | | | | | | | | | | | | |
| Class ADV | | | | $ | 1,000.00 | | | | | $ | 904.70 | | | | | | 1.43% | | | | | $ | 6.87 | | | | | $ | 1,000.00 | | | | | $ | 1,018.00 | | | | | | 1.43% | | | | | $ | 7.27 | | | | | | | | | | |
| Class I | | | | | 1,000.00 | | | | | | 906.40 | | | | | | 0.93 | | | | | | 4.47 | | | | | | 1,000.00 | | | | | | 1,020.52 | | | | | | 0.93 | | | | | | 4.74 | | | | | | | | | | |
| Class S | | | | | 1,000.00 | | | | | | 905.30 | | | | | | 1.18 | | | | | | 5.67 | | | | | | 1,000.00 | | | | | | 1,019.26 | | | | | | 1.18 | | | | | | 6.01 | | | | | | | | | | |
| Class S2 | | | | | 1,000.00 | | | | | | 905.00 | | | | | | 1.33 | | | | | | 6.39 | | | | | | 1,000.00 | | | | | | 1,018.50 | | | | | | 1.33 | | | | | | 6.77 | | | | | | | | | | |
*
Expenses are equal to each Portfolio’s respective annualized expense ratios multiplied by the average account value over the period, multiplied by 184/365 to reflect the most recent fiscal half-year.
REPORT OF INDEPENDENT REGISTERED PUBLIC ACCOUNTING FIRM
The Shareholders and Board of Directors
Voya Partners, Inc.
We have audited the accompanying statements of assets and liabilities, including the summary portfolios of investments, of Voya Global Bond Portfolio, VY® American Century Small-Mid Cap Value Portfolio, VY® Baron Growth Portfolio, VY® Columbia Contrarian Core Portfolio, VY® Columbia Small Cap Value II Portfolio, VY® Invesco Comstock Portfolio, VY® Invesco Equity and Income Portfolio, VY® JPMorgan Mid Cap Value Portfolio, VY® Oppenheimer Global Portfolio, VY® Pioneer High Yield Portfolio, VY® T. Rowe Price Diversified Mid Cap Growth Portfolio, VY® T. Rowe Price Growth Equity Portfolio, and VY® Templeton Foreign Equity Portfolio, each a series of Voya Partners, Inc., as of December 31, 2015, and the related statements of operations for the year then ended, the statements of changes in net assets for each of the years in the two-year period then ended, and the financial highlights for each of the years in the five-year period then ended. These financial statements and financial highlights are the responsibility of management. Our responsibility is to express an opinion on these financial statements and financial highlights based on our audits.
We conducted our audits in accordance with the standards of the Public Company Accounting Oversight Board (United States). Those standards require that we plan and perform the audit to obtain reasonable assurance about whether the financial statements and financial highlights are free of material misstatement. An audit includes examining, on a test basis, evidence supporting the amounts and disclosures in the financial statements. Our procedures included confirmation of securities owned as of December 31, 2015, by correspondence with custodian, transfer agent, and brokers, or by other appropriate auditing procedures when replies from brokers were not received. An audit also includes assessing the accounting principles used and significant estimates made by management, as well as evaluating the overall financial statement presentation. We believe that our audits provides a reasonable basis for our opinion.
In our opinion, the financial statements and financial highlights referred to above present fairly, in all material respects, the financial position of the aforementioned funds of Voya Partners, Inc. as of December 31, 2015, the results of their operations for the year then ended, the changes in their net assets for each of the years in the two-year period then ended, and the financial highlights for each of the years in the five-year period then ended, in conformity with U.S. generally accepted accounting principles.
Boston, Massachusetts
February 25, 2016
STATEMENTS OF ASSETS AND LIABILITIES as of December 31, 2015
| | | | Voya Global
Bond Portfolio | | | VY® American
Century Small-Mid
Cap Value
Portfolio | | | VY® Baron
Growth Portfolio | | | VY® Columbia
Contrarian Core
Portfolio | |
| ASSETS: | | | | | |
| Investments in securities at fair value+* | | | | $ | 180,552,569 | | | | | $ | 271,805,798 | | | | | $ | 842,852,503 | | | | | $ | 333,463,536 | | |
| Investments in affiliates at fair value** | | | | | 53,921,029 | | | | | | — | | | | | | — | | | | | | — | | |
| Short-term investments at fair value*** | | | | | 12,022,540 | | | | | | 14,415,860 | | | | | | 9,848,887 | | | | | | — | | |
| Total investments at fair value | | | | $ | 246,496,138 | | | | | $ | 286,221,658 | | | | | $ | 852,701,390 | | | | | $ | 333,463,536 | | |
| Cash | | | | | — | | | | | | — | | | | | | — | | | | | | 7,996,171 | | |
| Cash collateral for futures | | | | | 2,110,207 | | | | | | — | | | | | | — | | | | | | — | | |
| Cash pledged for centrally cleared swaps (Note 2) | | | | | 1,388,000 | | | | | | — | | | | | | — | | | | | | — | | |
| Cash pledged as collateral for OTC derivatives (Note 2) | | | | | 1,430,000 | | | | | | — | | | | | | — | | | | | | — | | |
| Receivables: | | | | | |
| Investment securities sold | | | | | 1,544,435 | | | | | | 547,021 | | | | | | 1,901,520 | | | | | | 141,703 | | |
| Investment securities sold on a delayed-delivery or when-issued basis | | | | | 291,145 | | | | | | — | | | | | | — | | | | | | — | | |
| Fund shares sold | | | | | 271,195 | | | | | | 27,289 | | | | | | 1,798,188 | | | | | | 3,459 | | |
| Dividends | | | | | 979 | | | | | | 599,292 | | | | | | 780,371 | | | | | | 364,693 | | |
| Interest | | | | | 1,343,831 | | | | | | — | | | | | | — | | | | | | 31 | | |
| Foreign currency settlement (Note 13) | | | | | 57,422 | | | | | | 56 | | | | | | 12,863 | | | | | | 57,981 | | |
| Foreign tax reclaims | | | | | — | | | | | | — | | | | | | — | | | | | | 3,831 | | |
| Unrealized appreciation on forward foreign currency contracts | | | | | 4,443,411 | | | | | | 16,457 | | | | | | — | | | | | | — | | |
| Prepaid expenses | | | | | 535 | | | | | | 601 | | | | | | 1,914 | | | | | | 714 | | |
| Reimbursement due from manager | | | | | 10,599 | | | | | | 44,198 | | | | | | — | | | | | | 66,126 | | |
| Other assets | | | | | 9,573 | | | | | | 4,779 | | | | | | 18,077 | | | | | | 8,423 | | |
| Total assets | | | | | 259,397,470 | | | | | | 287,461,351 | | | | | | 857,214,323 | | | | | | 342,106,668 | | |
| LIABILITIES: | | | | | |
| Payable for investment securities purchased | | | | | — | | | | | | 731,425 | | | | | | — | | | | | | 1,540,374 | | |
Payable for investment securities purchased on a delayed-delivery or
when-issued basis | | | | | 6,315,690 | | | | | | — | | | | | | — | | | | | | — | | |
| Payable for fund shares redeemed | | | | | 576,937 | | | | | | 1,275,901 | | | | | | 6,768,993 | | | | | | 2,457,232 | | |
| Payable for foreign cash collateral for futures***** | | | | | 143,086 | | | | | | — | | | | | | — | | | | | | — | | |
| Payable upon receipt of securities loaned | | | | | 7,383,540 | | | | | | 7,642,699 | | | | | | — | | | | | | — | | |
| Unrealized depreciation on forward foreign currency contracts | | | | | 4,526,609 | | | | | | 27,726 | | | | | | — | | | | | | — | | |
| Variation margin payable on centrally cleared swaps | | | | | 72,306 | | | | | | — | | | | | | — | | | | | | — | | |
| Cash received as collateral for OTC derivatives (Note 2) | | | | | 470,000 | | | | | | — | | | | | | — | | | | | | — | | |
| Payable for investment management fees | | | | | 122,449 | | | | | | 260,850 | | | | | | 698,669 | | | | | | 261,409 | | |
| Payable for distribution and shareholder service fees | | | | | 20,485 | | | | | | 52,322 | | | | | | 161,361 | | | | | | 75,108 | | |
| Payable to custodian due to bank overdraft | | | | | 53,328 | | | | | | — | | | | | | — | | | | | | — | | |
| Payable to custodian due to foreign currency overdraft**** | | | | | 1,353,517 | | | | | | — | | | | | | — | | | | | | — | | |
| Payable to trustees under the deferred compensation plan (Note 6) | | | | | 9,573 | | | | | | 4,779 | | | | | | 18,077 | | | | | | 8,423 | | |
| Payable for trustee fees | | | | | 1,328 | | | | | | 1,520 | | | | | | 4,937 | | | | | | 1,751 | | |
| Other accrued expenses and liabilities | | | | | 66,701 | | | | | | 65,107 | | | | | | 114,756 | | | | | | 44,872 | | |
| Total liabilities | | | | | 21,115,549 | | | | | | 10,062,329 | | | | | | 7,766,793 | | | | | | 4,389,169 | | |
| NET ASSETS | | | | $ | 238,281,921 | | | | | $ | 277,399,022 | | | | | $ | 849,447,530 | | | | | $ | 337,717,499 | | |
| NET ASSETS WERE COMPRISED OF: | | | | | |
| Paid-in capital | | | | $ | 260,477,303 | | | | | $ | 251,925,774 | | | | | $ | 336,876,357 | | | | | $ | 262,186,088 | | |
| Undistributed (distributions in excess of) net investment income/ Accumulated net investment loss | | | | | (515,854) | | | | | | 4,090,003 | | | | | | (17,659) | | | | | | 11,151,533 | | |
| Accumulated net realized gain (loss) | | | | | (6,239,479) | | | | | | 23,495,106 | | | | | | 84,847,270 | | | | | | 28,433,459 | | |
| Net unrealized appreciation (depreciation) | | | | | (15,440,049) | | | | | | (2,111,861) | | | | | | 427,741,562 | | | | | | 35,946,419 | | |
| NET ASSETS | | | | $ | 238,281,921 | | | | | $ | 277,399,022 | | | | | $ | 849,447,530 | | | | | $ | 337,717,499 | | |
+
Including securities loaned at value | | | | $ | 7,233,208 | | | | | $ | 7,458,299 | | | | | $ | — | | | | | $ | — | | |
*
Cost of investments in securities | | | | $ | 182,465,088 | | | | | $ | 273,906,056 | | | | | $ | 415,110,941 | | | | | $ | 297,516,833 | | |
**
Cost of investments in affiliates | | | | $ | 66,383,120 | | | | | $ | — | | | | | $ | — | | | | | $ | — | | |
***
Cost of short-term investments | | | | $ | 12,022,540 | | | | | $ | 14,415,860 | | | | | $ | 9,848,887 | | | | | $ | — | | |
****
Cost of foreign currency overdraft | | | | $ | 1,373,523 | | | | | $ | — | | | | | $ | — | | | | | $ | — | | |
*****
Cost of payable for foreign cash collateral for futures | | | | $ | 143,086 | | | | | $ | — | | | | | $ | — | | | | | $ | — | | |
See Accompanying Notes to Financial Statements
STATEMENTS OF ASSETS AND LIABILITIES as of December 31, 2015 (continued)
| | | | Voya Global
Bond Portfolio | | | VY® American
Century Small-Mid
Cap Value
Portfolio | | | VY® Baron
Growth Portfolio | | | VY® Columbia
Contrarian Core
Portfolio | |
| Class ADV | | | | | |
| Net assets | | | | $ | 26,374,087 | | | | | $ | 79,900,789 | | | | | $ | 90,913,545 | | | | | $ | 22,737,764 | | |
| Shares authorized | | | | | 100,000,000 | | | | | | 100,000,000 | | | | | | 100,000,000 | | | | | | 100,000,000 | | |
| Par value | | | | $ | 0.001 | | | | | $ | 0.001 | | | | | $ | 0.001 | | | | | $ | 0.001 | | |
| Shares outstanding | | | | | 2,687,310 | | | | | | 7,400,575 | | | | | | 3,419,867 | | | | | | 1,046,350 | | |
| Net asset value and redemption price per share | | | | $ | 9.81 | | | | | $ | 10.80 | | | | | $ | 26.58 | | | | | $ | 21.73 | | |
| Class I | | | | | |
| Net assets | | | | $ | 168,738,824 | | | | | $ | 115,279,483 | | | | | $ | 193,600,718 | | | | | $ | 10,627,647 | | |
| Shares authorized | | | | | 100,000,000 | | | | | | 100,000,000 | | | | | | 100,000,000 | | | | | | 100,000,000 | | |
| Par value | | | | $ | 0.001 | | | | | $ | 0.001 | | | | | $ | 0.001 | | | | | $ | 0.001 | | |
| Shares outstanding | | | | | 16,923,189 | | | | | | 10,156,250 | | | | | | 6,806,048 | | | | | | 470,439 | | |
| Net asset value and redemption price per share | | | | $ | 9.97 | | | | | $ | 11.35 | | | | | $ | 28.45 | | | | | $ | 22.59 | | |
| Class S | | | | | |
| Net assets | | | | $ | 43,169,010 | | | | | $ | 78,645,514 | | | | | $ | 559,237,436 | | | | | $ | 304,352,088 | | |
| Shares authorized | | | | | 100,000,000 | | | | | | 100,000,000 | | | | | | 100,000,000 | | | | | | 100,000,000 | | |
| Par value | | | | $ | 0.001 | | | | | $ | 0.001 | | | | | $ | 0.001 | | | | | $ | 0.001 | | |
| Shares outstanding | | | | | 4,331,150 | | | | | | 7,011,335 | | | | | | 20,282,059 | | | | | | 13,703,391 | | |
| Net asset value and redemption price per share | | | | $ | 9.97 | | | | | $ | 11.22 | | | | | $ | 27.57 | | | | | $ | 22.21 | | |
| Class S2 | | | | | |
| Net assets | | | | | n/a | | | | | $ | 3,573,236 | | | | | $ | 5,695,831 | | | | | | n/a | | |
| Shares authorized | | | | | n/a | | | | | | 100,000,000 | | | | | | 100,000,000 | | | | | | n/a | | |
| Par value | | | | | n/a | | | | | $ | 0.001 | | | | | $ | 0.001 | | | | | | n/a | | |
| Shares outstanding | | | | | n/a | | | | | | 331,545 | | | | | | 213,711 | | | | | | n/a | | |
| Net asset value and redemption price per share | | | | | n/a | | | | | $ | 10.78 | | | | | $ | 26.65 | | | | | | n/a | | |
See Accompanying Notes to Financial Statements
STATEMENTS OF ASSETS AND LIABILITIES as of December 31, 2015
| | | | VY® Columbia
Small Cap Value II
Portfolio | | | VY® Invesco
Comstock
Portfolio | | | VY® Invesco
Equity and Income
Portfolio | | | VY® JPMorgan
Mid Cap Value
Portfolio | |
| ASSETS: | | | | | |
| Investments in securities at fair value+* | | | | $ | 206,174,661 | | | | | $ | 507,905,196 | | | | | $ | 1,724,699,607 | | | | | $ | 625,949,709 | | |
| Short-term investments at fair value** | | | | | 5,109,137 | | | | | | 28,499,873 | | | | | | 155,328,095 | | | | | | 13,187,586 | | |
| Total investments at fair value | | | | $ | 211,283,798 | | | | | $ | 536,405,069 | | | | | $ | 1,880,027,702 | | | | | $ | 639,137,295 | | |
| Cash | | | | | 178 | | | | | | 9,008 | | | | | | 5,030 | | | | | | 38,166 | | |
| Foreign currencies at value*** | | | | | — | | | | | | 507 | | | | | | 495,242 | | | | | | — | | |
| Receivables: | | | | | |
| Investment securities sold | | | | | 36,743 | | | | | | 692,011 | | | | | | 523,527 | | | | | | — | | |
| Fund shares sold | | | | | 821,722 | | | | | | 766,652 | | | | | | 1,484,614 | | | | | | 259,310 | | |
| Dividends | | | | | 194,693 | | | | | | 713,996 | | | | | | 2,392,497 | | | | | | 949,047 | | |
| Interest | | | | | — | | | | | | — | | | | | | 3,093,860 | | | | | | — | | |
| Foreign currency settlement (Note 13) | | | | | — | | | | | | — | | | | | | 8,604 | | | | | | — | | |
| Foreign tax reclaims | | | | | — | | | | | | 156,518 | | | | | | 294,271 | | | | | | — | | |
| Unrealized appreciation on forward foreign currency contracts | | | | | — | | | | | | 648,775 | | | | | | 970,216 | | | | | | — | | |
| Prepaid expenses | | | | | 465 | | | | | | 1,175 | | | | | | 3,985 | | | | | | 1,371 | | |
| Reimbursement due from manager | | | | | — | | | | | | — | | | | | | 9,530 | | | | | | — | | |
| Other assets | | | | | 5,369 | | | | | | 14,234 | | | | | | 53,838 | | | | | | 9,868 | | |
| Total assets | | | | | 212,342,968 | | | | | | 539,407,945 | | | | | | 1,889,362,916 | | | | | | 640,395,057 | | |
| LIABILITIES: | | | | | |
| Payable for investment securities purchased | | | | | 219,288 | | | | | | 268,521 | | | | | | 389,201 | | | | | | 48,969 | | |
| Payable for fund shares redeemed | | | | | 924,431 | | | | | | 630,974 | | | | | | 1,563,425 | | | | | | 7,110,160 | | |
| Payable upon receipt of securities loaned | | | | | — | | | | | | 2,490,134 | | | | | | 72,856,452 | | | | | | 11,324,364 | | |
| Payable for investment management fees | | | | | 155,053 | | | | | | 322,713 | | | | | | 964,206 | | | | | | 445,673 | | |
| Payable for distribution and shareholder service fees | | | | | 42,774 | | | | | | 79,919 | | | | | | 320,234 | | | | | | 104,439 | | |
| Payable to trustees under the deferred compensation plan (Note 6) | | | | | 5,369 | | | | | | 14,234 | | | | | | 53,838 | | | | | | 9,868 | | |
| Payable for trustee fees | | | | | 1,160 | | | | | | 2,828 | | | | | | 10,016 | | | | | | 3,459 | | |
| Other accrued expenses and liabilities | | | | | 24,904 | | | | | | 53,021 | | | | | | 118,162 | | | | | | 82,604 | | |
| Total liabilities | | | | | 1,372,979 | | | | | | 3,862,344 | | | | | | 76,275,534 | | | | | | 19,129,536 | | |
| NET ASSETS | | | | $ | 210,969,989 | | | | | $ | 535,545,601 | | | | | $ | 1,813,087,382 | | | | | $ | 621,265,521 | | |
| NET ASSETS WERE COMPRISED OF: | | | | | |
| Paid-in capital | | | | $ | 183,446,555 | | | | | $ | 608,292,316 | | | | | $ | 1,729,937,992 | | | | | $ | 453,963,130 | | |
| Undistributed net investment income | | | | | 598,885 | | | | | | 988,549 | | | | | | 3,193,599 | | | | | | 3,516 | | |
| Accumulated net realized gain (loss) | | | | | 8,485,558 | | | | | | (115,973,715) | | | | | | 70,903,667 | | | | | | 54,346,594 | | |
| Net unrealized appreciation | | | | | 18,438,991 | | | | | | 42,238,451 | | | | | | 9,052,124 | | | | | | 112,952,281 | | |
| NET ASSETS | | | | $ | 210,969,989 | | | | | $ | 535,545,601 | | | | | $ | 1,813,087,382 | | | | | $ | 621,265,521 | | |
+
Including securities loaned at value | | | | $ | — | | | | | $ | 2,428,639 | | | | | $ | 71,184,581 | | | | | $ | 11,010,866 | | |
*
Cost of investments in securities | | | | $ | 187,735,670 | | | | | $ | 466,305,430 | | | | | $ | 1,716,593,503 | | | | | $ | 512,997,428 | | |
**
Cost of short-term investments | | | | $ | 5,109,137 | | | | | $ | 28,499,873 | | | | | $ | 155,328,095 | | | | | $ | 13,187,586 | | |
***
Cost of foreign currencies | | | | $ | — | | | | | $ | 513 | | | | | $ | 495,388 | | | | | $ | — | | |
See Accompanying Notes to Financial Statements
STATEMENTS OF ASSETS AND LIABILITIES as of December 31, 2015 (continued)
| | | | VY® Columbia
Small Cap Value II
Portfolio | | | VY® Invesco
Comstock
Portfolio | | | VY® Invesco
Equity and Income
Portfolio | | | VY® JPMorgan
Mid Cap Value
Portfolio | |
| Class ADV | | | | | |
| Net assets | | | | $ | 27,978,236 | | | | | $ | 34,395,214 | | | | | $ | 49,572,223 | | | | | $ | 90,817,613 | | |
| Shares authorized | | | | | 100,000,000 | | | | | | 100,000,000 | | | | | | 100,000,000 | | | | | | 100,000,000 | | |
| Par value | | | | $ | 0.001 | | | | | $ | 0.001 | | | | | $ | 0.001 | | | | | $ | 0.001 | | |
| Shares outstanding | | | | | 1,786,008 | | | | | | 2,282,848 | | | | | | 1,215,107 | | | | | | 4,867,628 | | |
| Net asset value and redemption price per share | | | | $ | 15.67 | | | | | $ | 15.07 | | | | | $ | 40.80 | | | | | $ | 18.66 | | |
| Class I | | | | | |
| Net assets | | | | $ | 42,844,750 | | | | | $ | 198,366,670 | | | | | $ | 600,309,293 | | | | | $ | 227,934,544 | | |
| Shares authorized | | | | | 100,000,000 | | | | | | 100,000,000 | | | | | | 100,000,000 | | | | | | 100,000,000 | | |
| Par value | | | | $ | 0.001 | | | | | $ | 0.001 | | | | | $ | 0.001 | | | | | $ | 0.001 | | |
| Shares outstanding | | | | | 2,658,611 | | | | | | 13,066,107 | | | | | | 14,474,552 | | | | | | 11,974,047 | | |
| Net asset value and redemption price per share | | | | $ | 16.12 | | | | | $ | 15.18 | | | | | $ | 41.47 | | | | | $ | 19.04 | | |
| Class S | | | | | |
| Net assets | | | | $ | 135,312,648 | | | | | $ | 302,783,717 | | | | | $ | 720,086,455 | | | | | $ | 298,607,186 | | |
| Shares authorized | | | | | 100,000,000 | | | | | | 100,000,000 | | | | | | 100,000,000 | | | | | | 100,000,000 | | |
| Par value | | | | $ | 0.001 | | | | | $ | 0.001 | | | | | $ | 0.001 | | | | | $ | 0.001 | | |
| Shares outstanding | | | | | 8,437,958 | | | | | | 19,957,210 | | | | | | 17,501,535 | | | | | | 15,808,931 | | |
| Net asset value and redemption price per share | | | | $ | 16.04 | | | | | $ | 15.17 | | | | | $ | 41.14 | | | | | $ | 18.89 | | |
| Class S2 | | | | | |
| Net assets | | | | $ | 4,834,355 | | | | | | n/a | | | | | $ | 443,119,411 | | | | | $ | 3,906,178 | | |
| Shares authorized | | | | | 100,000,000 | | | | | | n/a | | | | | | 100,000,000 | | | | | | 100,000,000 | | |
| Par value | | | | $ | 0.001 | | | | | | n/a | | | | | $ | 0.001 | | | | | $ | 0.001 | | |
| Shares outstanding | | | | | 309,418 | | | | | | n/a | | | | | | 10,913,573 | | | | | | 209,969 | | |
| Net asset value and redemption price per share | | | | $ | 15.62 | | | | | | n/a | | | | | $ | 40.60 | | | | | $ | 18.60 | | |
See Accompanying Notes to Financial Statements
STATEMENTS OF ASSETS AND LIABILITIES as of December 31, 2015
| | | | VY® Oppenheimer
Global Portfolio | | | VY® Pioneer High
Yield Portfolio | | | VY® T. Rowe Price
Diversified Mid
Cap Growth
Portfolio | | | VY® T. Rowe Price
Growth Equity
Portfolio | |
| ASSETS: | | | | | |
| Investments in securities at fair value+* | | | | $ | 1,580,135,580 | | | | | $ | 88,799,800 | | | | | $ | 827,245,150 | | | | | $ | 1,725,864,392 | | |
| Short-term investments at fair value** | | | | | 72,472,740 | | | | | | 5,223,470 | | | | | | 44,957,460 | | | | | | 111,455,188 | | |
| Total investments at fair value | | | | $ | 1,652,608,320 | | | | | $ | 94,023,270 | | | | | $ | 872,202,610 | | | | | $ | 1,837,319,580 | | |
| Cash | | | | | — | | | | | | 4,548 | | | | | | 830,996 | | | | | | 1,615,375 | | |
| Cash collateral for futures | | | | | — | | | | | | 243,880 | | | | | | — | | | | | | — | | |
| Cash pledged for centrally cleared swaps (Note 2) | | | | | — | | | | | | 200,000 | | | | | | — | | | | | | — | | |
| Receivables: | | | | | |
| Investment securities sold | | | | | — | | | | | | 2,384,854 | | | | | | 960,036 | | | | | | — | | |
| Fund shares sold | | | | | 23,303 | | | | | | 102,307 | | | | | | 27,637 | | | | | | 232,392 | | |
| Dividends | | | | | 405,509 | | | | | | 10,625 | | | | | | 398,199 | | | | | | 759,600 | | |
| Interest | | | | | — | | | | | | 1,201,765 | | | | | | — | | | | | | — | | |
| Foreign currency settlement (Note 13) | | | | | 302,563 | | | | | | — | | | | | | — | | | | | | 402,047 | | |
| Foreign tax reclaims | | | | | 583,430 | | | | | | — | | | | | | — | | | | | | 60,287 | | |
| Variation margin receivable on centrally cleared swaps | | | | | — | | | | | | 813 | | | | | | — | | | | | | — | | |
| Prepaid expenses | | | | | 3,419 | | | | | | 224 | | | | | | 1,771 | | | | | | 3,547 | | |
| Reimbursement due from manager | | | | | — | | | | | | 4,727 | | | | | | — | | | | | | — | | |
| Other assets | | | | | 45,071 | | | | | | 3,633 | | | | | | 20,435 | | | | | | 31,868 | | |
| Total assets | | | | | 1,653,971,615 | | | | | | 98,180,646 | | | | | | 874,441,684 | | | | | | 1,840,424,696 | | |
| LIABILITIES: | | | | | |
| Payable for investment securities purchased | | | | | — | | | | | | 2,340,000 | | | | | | 62,458 | | | | | | 1,730,212 | | |
| Payable for fund shares redeemed | | | | | 2,619,711 | | | | | | 429,868 | | | | | | 707,209 | | | | | | 5,349,167 | | |
| Payable upon receipt of securities loaned | | | | | 49,184,412 | | | | | | — | | | | | | 44,494,247 | | | | | | 72,625,813 | | |
| Payable for investment management fees | | | | | 956,973 | | | | | | 58,228 | | | | | | 526,412 | | | | | | 1,035,500 | | |
| Payable for distribution and shareholder service fees | | | | | 97,799 | | | | | | 811 | | | | | | 20,182 | | | | | | 178,924 | | |
| Payable to trustees under the deferred compensation plan (Note 6) | | | | | 45,071 | | | | | | 3,633 | | | | | | 20,435 | | | | | | 31,868 | | |
| Payable for trustee fees | | | | | 8,484 | | | | | | 571 | | | | | | 4,378 | | | | | | 8,341 | | |
| Other accrued expenses and liabilities | | | | | 457,572 | | | | | | 12,124 | | | | | | 89,189 | | | | | | 190,225 | | |
| Total liabilities | | | | | 53,370,022 | | | | | | 2,845,235 | | | | | | 45,924,510 | | | | | | 81,150,050 | | |
| NET ASSETS | | | | $ | 1,600,601,593 | | | | | $ | 95,335,411 | | | | | $ | 828,517,174 | | | | | $ | 1,759,274,646 | | |
| NET ASSETS WERE COMPRISED OF: | | | | | |
| Paid-in capital | | | | $ | 932,930,976 | | | | | $ | 116,127,966 | | | | | $ | 519,247,704 | | | | | $ | 1,096,210,216 | | |
Undistributed (distributions in excess of) net investment
income | | | | | 16,309,516 | | | | | | 3,208,204 | | | | | | 2,304,604 | | | | | | (32,269) | | |
| Accumulated net realized gain (loss) | | | | | 86,320,984 | | | | | | (14,763,380) | | | | | | 98,222,397 | | | | | | 181,735,971 | | |
| Net unrealized appreciation (depreciation) | | | | | 565,040,117 | | | | | | (9,237,379) | | | | | | 208,742,469 | | | | | | 481,360,728 | | |
| NET ASSETS | | | | $ | 1,600,601,593 | | | | | $ | 95,335,411 | | | | | $ | 828,517,174 | | | | | $ | 1,759,274,646 | | |
+
Including securities loaned at value | | | | $ | 47,337,016 | | | | | $ | — | | | | | $ | 43,488,320 | | | | | $ | 71,050,174 | | |
*
Cost of investments in securities | | | | $ | 1,015,054,082 | | | | | $ | 97,969,905 | | | | | $ | 618,502,682 | | | | | $ | 1,244,497,546 | | |
**
Cost of short-term investments | | | | $ | 72,472,740 | | | | | $ | 5,223,470 | | | | | $ | 44,957,460 | | | | | $ | 111,455,188 | | |
See Accompanying Notes to Financial Statements
STATEMENTS OF ASSETS AND LIABILITIES as of December 31, 2015 (continued)
| | | | VY® Oppenheimer
Global Portfolio | | | VY® Pioneer High
Yield Portfolio | | | VY® T. Rowe Price
Diversified Mid
Cap Growth
Portfolio | | | VY® T. Rowe Price
Growth Equity
Portfolio | |
| Class ADV | | | | | |
| Net assets | | | | $ | 110,372,308 | | | | | | n/a | | | | | $ | 27,217,451 | | | | | $ | 202,306,993 | | |
| Shares authorized | | | | | 100,000,000 | | | | | | n/a | | | | | | 100,000,000 | | | | | | 100,000,000 | | |
| Par value | | | | $ | 0.001 | | | | | | n/a | | | | | $ | 0.001 | | | | | $ | 0.001 | | |
| Shares outstanding | | | | | 6,378,629 | | | | | | n/a | | | | | | 2,769,608 | | | | | | 2,476,469 | | |
| Net asset value and redemption price per share | | | | $ | 17.30 | | | | | | n/a | | | | | $ | 9.83 | | | | | $ | 81.69 | | |
| Class I | | | | | |
| Net assets | | | | $ | 1,254,237,876 | | | | | $ | 91,559,738 | | | | | $ | 766,591,030 | | | | | $ | 1,124,420,639 | | |
| Shares authorized | | | | | 250,000,000 | | | | | | 100,000,000 | | | | | | 250,000,000 | | | | | | 100,000,000 | | |
| Par value | | | | $ | 0.001 | | | | | $ | 0.001 | | | | | $ | 0.001 | | | | | $ | 0.001 | | |
| Shares outstanding | | | | | 69,792,241 | | | | | | 8,502,632 | | | | | | 72,319,521 | | | | | | 13,053,026 | | |
| Net asset value and redemption price per share | | | | $ | 17.97 | | | | | $ | 10.77 | | | | | $ | 10.60 | | | | | $ | 86.14 | | |
| Class S | | | | | |
| Net assets | | | | $ | 231,620,672 | | | | | $ | 3,775,673 | | | | | $ | 30,613,515 | | | | | $ | 427,185,998 | | |
| Shares authorized | | | | | 100,000,000 | | | | | | 100,000,000 | | | | | | 100,000,000 | | | | | | 100,000,000 | | |
| Par value | | | | $ | 0.001 | | | | | $ | 0.001 | | | | | $ | 0.001 | | | | | $ | 0.001 | | |
| Shares outstanding | | | | | 13,326,142 | | | | | | 351,036 | | | | | | 2,972,159 | | | | | | 5,091,758 | | |
| Net asset value and redemption price per share | | | | $ | 17.38 | | | | | $ | 10.76 | | | | | $ | 10.30 | | | | | $ | 83.90 | | |
| Class S2 | | | | | |
| Net assets | | | | $ | 4,370,737 | | | | | | n/a | | | | | $ | 4,095,178 | | | | | $ | 5,361,016 | | |
| Shares authorized | | | | | 100,000,000 | | | | | | n/a | | | | | | 100,000,000 | | | | | | 100,000,000 | | |
| Par value | | | | $ | 0.001 | | | | | | n/a | | | | | $ | 0.001 | | | | | $ | 0.001 | | |
| Shares outstanding | | | | | 257,602 | | | | | | n/a | | | | | | 415,804 | | | | | | 65,103 | | |
| Net asset value and redemption price per share | | | | $ | 16.97 | | | | | | n/a | | | | | $ | 9.85 | | | | | $ | 82.35 | | |
See Accompanying Notes to Financial Statements
STATEMENTS OF ASSETS AND LIABILITIES as of December 31, 2015
| | | | VY® Templeton
Foreign Equity
Portfolio | |
| ASSETS: | | |
| Investments in securities at fair value+* | | | | $ | 695,852,126 | | |
| Short-term investments at fair value** | | | | | 34,523,830 | | |
| Total investments at fair value | | | | $ | 730,375,956 | | |
| Cash | | | | | 676,973 | | |
| Foreign currencies at value*** | | | | | 516 | | |
| Receivables: | | |
| Fund shares sold | | | | | 4,656,252 | | |
| Dividends | | | | | 1,181,700 | | |
| Foreign currency settlement (Note 13) | | | | | 1,974,841 | | |
| Foreign tax reclaims | | | | | 1,042,301 | | |
| Prepaid expenses | | | | | 1,617 | | |
| Reimbursement due from manager | | | | | 12,321 | | |
| Other assets | | | | | 42,055 | | |
| Total assets | | | | | 739,964,532 | | |
| LIABILITIES: | | |
| Payable for fund shares redeemed | | | | | 844,965 | | |
| Payable upon receipt of securities loaned | | | | | 15,523,830 | | |
| Payable for investment management fees | | | | | 547,202 | | |
| Payable for distribution and shareholder service fees | | | | | 122,380 | | |
| Payable to trustees under the deferred compensation plan (Note 6) | | | | | 42,055 | | |
| Payable for trustee fees | | | | | 4,109 | | |
| Other accrued expenses and liabilities | | | | | 193,451 | | |
| Total liabilities | | | | | 17,277,992 | | |
| NET ASSETS | | | | $ | 722,686,540 | | |
| NET ASSETS WERE COMPRISED OF: | | |
| Paid-in capital | | | | $ | 792,011,916 | | |
| Undistributed net investment income | | | | | 21,744,257 | | |
| Accumulated net realized loss | | | | | (160,962,495) | | |
| Net unrealized appreciation | | | | | 69,892,862 | | |
| NET ASSETS | | | | $ | 722,686,540 | | |
+
Including securities loaned at value | | | | $ | 14,742,324 | | |
*
Cost of investments in securities | | | | $ | 625,817,843 | | |
**
Cost of short-term investments | | | | $ | 34,523,773 | | |
***
Cost of foreign currencies | | | | $ | 516 | | |
See Accompanying Notes to Financial Statements
STATEMENTS OF ASSETS AND LIABILITIES as of December 31, 2015 (continued)
| | | | VY® Templeton
Foreign Equity
Portfolio |
| Class ADV | | |
| Net assets | | | | $ | 35,751,134 |
| Shares authorized | | | | | 100,000,000 |
| Par value | | | | $ | 0.001 |
| Shares outstanding | | | | | 3,226,953 |
| Net asset value and redemption price per share | | | | $ | 11.08 |
| Class I | | |
| Net assets | | | | $ | 186,601,766 |
| Shares authorized | | | | | 100,000,000 |
| Par value | | | | $ | 0.001 |
| Shares outstanding | | | | | 16,658,322 |
| Net asset value and redemption price per share | | | | $ | 11.20 |
| Class S | | |
| Net assets | | | | $ | 497,824,134 |
| Shares authorized | | | | | 100,000,000 |
| Par value | | | | $ | 0.001 |
| Shares outstanding | | | | | 44,762,281 |
| Net asset value and redemption price per share | | | | $ | 11.12 |
| Class S2 | | |
| Net assets | | | | $ | 2,509,506 |
| Shares authorized | | | | | 100,000,000 |
| Par value | | | | $ | 0.001 |
| Shares outstanding | | | | | 226,920 |
| Net asset value and redemption price per share | | | | $ | 11.06 |
See Accompanying Notes to Financial Statements
STATEMENTS OF OPERATIONS for the year ended December 31, 2015
| | | | Voya Global Bond
Portfolio | | | VY® American
Century Small-Mid
Cap Value
Portfolio | | | VY® Baron
Growth Portfolio | | | VY® Columbia
Contrarian Core
Portfolio | |
| INVESTMENT INCOME: | | | | | |
| Dividends, net of foreign taxes withheld* | | | | $ | 5,171 | | | | | $ | 6,188,458 | | | | | $ | 9,366,369 | | | | | $ | 5,884,781 | | |
| Interest | | | | | 7,222,908 | | | | | | — | | | | | | — | | | | | | 597 | | |
| Dividends from affiliated underlying funds | | | | | 2,534,880 | | | | | | — | | | | | | — | | | | | | — | | |
| Securities lending income, net | | | | | 18,255 | | | | | | 110,196 | | | | | | — | | | | | | — | | |
| Total investment income | | | | | 9,781,214 | | | | | | 6,298,654 | | | | | | 9,366,369 | | | | | | 5,885,378 | | |
| EXPENSES: | | | | | |
| Investment management fees(1) | | | | | 1,500,091 | | | | | | 3,213,282 | | | | | | 9,026,546 | | | | | | 3,034,378 | | |
| Distribution and shareholder service fees: | | | | | |
| Class ADV | | | | | 148,425 | | | | | | 421,879 | | | | | | 521,850 | | | | | | 100,220 | | |
| Class S | | | | | 116,825 | | | | | | 219,597 | | | | | | 1,616,391 | | | | | | 797,378 | | |
| Class S2 | | | | | — | | | | | | 16,157 | | | | | | 32,716 | | | | | | — | | |
| Transfer agent fees | | | | | 383 | | | | | | 924 | | | | | | 1,425 | | | | | | 618 | | |
| Administrative service fees(1) | | | | | 93,366 | | | | | | 104,883 | | | | | | 348,180 | | | | | | 118,004 | | |
| Shareholder reporting expense | | | | | 18,250 | | | | | | 40,005 | | | | | | 94,082 | | | | | | 28,092 | | |
| Professional fees | | | | | 23,176 | | | | | | 25,552 | | | | | | 61,260 | | | | | | 26,151 | | |
| Custody and accounting expense | | | | | 74,432 | | | | | | 124,025 | | | | | | 122,256 | | | | | | 44,285 | | |
| Trustee fees | | | | | 7,967 | | | | | | 9,123 | | | | | | 29,625 | | | | | | 10,508 | | |
| Miscellaneous expense | | | | | 18,039 | | | | | | 19,059 | | | | | | 51,100 | | | | | | 18,537 | | |
| Interest expense | | | | | 2,360 | | | | | | 585 | | | | | | 5,566 | | | | | | — | | |
| Total expenses | | | | | 2,003,314 | | | | | | 4,195,071 | | | | | | 11,910,997 | | | | | | 4,178,171 | | |
| Net waived and reimbursed fees | | | | | (142,336) | | | | | | (934,721) | | | | | | (6,543) | | | | | | (895,419) | | |
| Brokerage commission recapture | | | | | — | | | | | | — | | | | | | (3,207) | | | | | | (33,328) | | |
| Net expenses | | | | | 1,860,978 | | | | | | 3,260,350 | | | | | | 11,901,247 | | | | | | 3,249,424 | | |
| Net investment income (loss) | | | | | 7,920,236 | | | | | | 3,038,304 | | | | | | (2,534,878) | | | | | | 2,635,954 | | |
| REALIZED AND UNREALIZED GAIN (LOSS): | | | | | |
| Net realized gain (loss) on: | | | | | |
| Investments | | | | | (6,708,968) | | | | | | 26,117,556 | | | | | | 86,241,289 | | | | | | 30,285,684 | | |
| Sale of affiliated underlying funds | | | | | (4,172,706) | | | | | | — | | | | | | — | | | | | | — | | |
| Foreign currency related transactions | | | | | (9,349,939) | | | | | | 1,092,835 | | | | | | 11,773 | | | | | | 52,838 | | |
| Futures | | | | | 1,315,608 | | | | | | — | | | | | | — | | | | | | — | | |
| Swaps | | | | | (2,971,336) | | | | | | — | | | | | | — | | | | | | — | | |
| Written options | | | | | 3,869,332 | | | | | | — | | | | | | — | | | | | | — | | |
| Net realized gain (loss) | | | | | (18,018,009) | | | | | | 27,210,391 | | | | | | 86,253,062 | | | | | | 30,338,522 | | |
| Net change in unrealized appreciation (depreciation) on: | | | | | |
| Investments | | | | | (2,243,362) | | | | | | (35,554,669) | | | | | | (129,335,954) | | | | | | (22,253,588) | | |
| Affiliated underlying funds | | | | | (982,279) | | | | | | — | | | | | | — | | | | | | — | | |
| Foreign currency related transactions | | | | | 3,128,192 | | | | | | (47,534) | | | | | | 74 | | | | | | 13,036 | | |
| Futures | | | | | (793,316) | | | | | | — | | | | | | — | | | | | | — | | |
| Swaps | | | | | (800,529) | | | | | | — | | | | | | — | | | | | | — | | |
| Written options | | | | | (19,338) | | | | | | — | | | | | | — | | | | | | — | | |
| Net change in unrealized appreciation (depreciation) | | | | | (1,710,632) | | | | | | (35,602,203) | | | | | | (129,335,880) | | | | | | (22,240,552) | | |
| Net realized and unrealized gain (loss) | | | | | (19,728,641) | | | | | | (8,391,812) | | | | | | (43,082,818) | | | | | | 8,097,970 | | |
| Increase (decrease) in net assets resulting from operations | | | | $ | (11,808,405) | | | | | $ | (5,353,508) | | | | | $ | (45,617,696) | | | | | $ | 10,733,924 | | |
*
Foreign taxes withheld | | | | $ | — | | | | | $ | 19,743 | | | | | $ | 14,314 | | | | | $ | 20,297 | | |
(1)
Effective May 1, 2015, the investment management fee and administration fee were combined under a single amended and restated investment management agreement. Please see Note 4 for further information.
See Accompanying Notes to Financial Statements
STATEMENTS OF OPERATIONS for the year ended December 31, 2015
| | | | VY® Columbia
Small Cap Value II
Portfolio | | | VY® Invesco
Comstock
Portfolio | | | VY® Invesco
Equity and Income
Portfolio | | | VY® JPMorgan
Mid Cap Value
Portfolio | |
| INVESTMENT INCOME: | | | | | |
| Dividends, net of foreign taxes withheld* | | | | $ | 3,125,908 | | | | | $ | 12,997,632 | | | | | $ | 30,799,061 | | | | | $ | 11,506,542 | | |
| Interest | | | | | — | | | | | | — | | | | | | 12,181,561 | | | | | | — | | |
| Securities lending income, net | | | | | — | | | | | | 98,853 | | | | | | 570,317 | | | | | | 2,697 | | |
| Total investment income | | | | | 3,125,908 | | | | | | 13,096,485 | | | | | | 43,550,939 | | | | | | 11,509,239 | | |
| EXPENSES: | | | | | |
| Investment management fees(1) | | | | | 1,892,093 | | | | | | 3,775,354 | | | | | | 11,874,112 | | | | | | 5,449,867 | | |
| Distribution and shareholder service fees: | | | | | |
| Class ADV | | | | | 146,665 | | | | | | 189,124 | | | | | | 257,885 | | | | | | 470,933 | | |
| Class S | | | | | 376,447 | | | | | | 868,033 | | | | | | 2,019,841 | | | | | | 835,030 | | |
| Class S2 | | | | | 24,419 | | | | | | — | | | | | | 2,437,527 | | | | | | 24,272 | | |
| Transfer agent fees | | | | | 658 | | | | | | 1,353 | | | | | | 2,709 | | | | | | 704 | | |
| Administrative service fees(1) | | | | | 79,482 | | | | | | 183,116 | | | | | | 695,221 | | | | | | 238,384 | | |
| Shareholder reporting expense | | | | | 29,573 | | | | | | 45,625 | | | | | | 126,875 | | | | | | 68,985 | | |
| Registration fees | | | | | — | | | | | | — | | | | | | 1,095 | | | | | | — | | |
| Professional fees | | | | | 20,605 | | | | | | 34,310 | | | | | | 141,310 | | | | | | 50,370 | | |
| Custody and accounting expense | | | | | 26,276 | | | | | | 97,090 | | | | | | 259,475 | | | | | | 79,205 | | |
| Trustee fees | | | | | 6,959 | | | | | | 16,965 | | | | | | 60,095 | | | | | | 20,753 | | |
| Miscellaneous expense | | | | | 16,267 | | | | | | 31,888 | | | | | | 113,127 | | | | | | 48,037 | | |
| Interest expense | | | | | 16 | | | | | | — | | | | | | — | | | | | | 18 | | |
| Total expenses | | | | | 2,619,460 | | | | | | 5,242,858 | | | | | | 17,989,272 | | | | | | 7,286,558 | | |
| Net waived and reimbursed fees | | | | | (71,992) | | | | | | (93,750) | | | | | | (992,407) | | | | | | (4,854) | | |
| Brokerage commission recapture | | | | | (24,697) | | | | | | (6,899) | | | | | | (33,378) | | | | | | (5,173) | | |
| Net expenses | | | | | 2,522,771 | | | | | | 5,142,209 | | | | | | 16,963,487 | | | | | | 7,276,531 | | |
| Net investment income | | | | | 603,137 | | | | | | 7,954,276 | | | | | | 26,587,452 | | | | | | 4,232,708 | | |
| REALIZED AND UNREALIZED GAIN (LOSS): | | | | | |
| Net realized gain (loss) on: | | | | | |
| Investments | | | | | 21,134,398 | | | | | | 41,800,027 | | | | | | 73,190,916 | | | | | | 55,658,161 | | |
| Foreign currency related transactions | | | | | — | | | | | | 4,786,231 | | | | | | 9,748,471 | | | | | | — | | |
| Net realized gain | | | | | 21,134,398 | | | | | | 46,586,258 | | | | | | 82,939,387 | | | | | | 55,658,161 | | |
| Net change in unrealized appreciation (depreciation) on: | | | | | |
| Investments | | | | | (28,061,517) | | | | | | (89,582,034) | | | | | | (149,964,701) | | | | | | (79,176,650) | | |
| Foreign currency related transactions | | | | | — | | | | | | (325,562) | | | | | | (1,496,328) | | | | | | — | | |
| Net change in unrealized appreciation (depreciation) | | | | | (28,061,517) | | | | | | (89,907,596) | | | | | | (151,461,029) | | | | | | (79,176,650) | | |
| Net realized and unrealized loss | | | | | (6,927,119) | | | | | | (43,321,338) | | | | | | (68,521,642) | | | | | | (23,518,489) | | |
| Decrease in net assets resulting from operations | | | | $ | (6,323,982) | | | | | $ | (35,367,062) | | | | | $ | (41,934,190) | | | | | $ | (19,285,781) | | |
*
Foreign taxes withheld | | | | $ | 9,324 | | | | | $ | 288,449 | | | | | $ | 825,140 | | | | | $ | — | | |
(1)
Effective May 1, 2015, the investment management fee and administration fee were combined under a single amended and restated investment management agreement. Please see Note 4 for further information.
See Accompanying Notes to Financial Statements
STATEMENTS OF OPERATIONS for the year ended December 31, 2015
| | | | VY® Oppenheimer
Global Portfolio | | | VY® Pioneer High
Yield Portfolio | | | VY® T. Rowe Price
Diversified Mid
Cap Growth
Portfolio | | | VY® T. Rowe Price
Growth Equity
Portfolio | |
| INVESTMENT INCOME: | | | | | |
| Dividends, net of foreign taxes withheld* | | | | $ | 28,683,794 | | | | | $ | 384,840 | | | | | $ | 7,719,942 | | | | | $ | 11,262,395 | | |
| Interest | | | | | 8,144 | | | | | | 6,109,108 | | | | | | — | | | | | | — | | |
| Securities lending income, net | | | | | 1,526,917 | | | | | | — | | | | | | 510,529 | | | | | | 304,047 | | |
| Total investment income | | | | | 30,218,855 | | | | | | 6,493,948 | | | | | | 8,230,471 | | | | | | 11,566,442 | | |
| EXPENSES: | | | | | |
| Investment management fees(1) | | | | | 11,319,279 | | | | | | 758,340 | | | | | | 6,188,794 | | | | | | 11,153,176 | | |
| Distribution and shareholder service fees: | | | | | |
| Class ADV | | | | | 542,859 | | | | | | — | | | | | | 151,844 | | | | | | 938,328 | | |
| Class S | | | | | 595,314 | | | | | | 10,957 | | | | | | 74,149 | | | | | | 1,007,543 | | |
| Class S2 | | | | | 22,765 | | | | | | — | | | | | | 21,028 | | | | | | 24,905 | | |
| Transfer agent fees | | | | | 2,188 | | | | | | 648 | | | | | | 1,397 | | | | | | 2,883 | | |
| Administrative service fees(1) | | | | | 557,558 | | | | | | 40,184 | | | | | | 291,035 | | | | | | 523,201 | | |
| Shareholder reporting expense | | | | | 161,172 | | | | | | 17,155 | | | | | | 76,479 | | | | | | 133,479 | | |
| Professional fees | | | | | 116,510 | | | | | | 13,608 | | | | | | 55,391 | | | | | | 108,808 | | |
| Custody and accounting expense | | | | | 422,437 | | | | | | 25,550 | | | | | | 104,305 | | | | | | 241,336 | | |
| Trustee fees | | | | | 50,901 | | | | | | 3,422 | | | | | | 26,270 | | | | | | 50,042 | | |
| Miscellaneous expense | | | | | 79,742 | | | | | | 8,595 | | | | | | 37,782 | | | | | | 65,515 | | |
| Interest expense | | | | | — | | | | | | — | | | | | | 263 | | | | | | 2,514 | | |
| Total expenses | | | | | 13,870,725 | | | | | | 878,459 | | | | | | 7,028,737 | | | | | | 14,251,730 | | |
| Net waived and reimbursed fees | | | | | (4,553) | | | | | | (55,577) | | | | | | (4,206) | | | | | | (101,142) | | |
| Brokerage commission recapture | | | | | — | | | | | | (239) | | | | | | (17) | | | | | | (10,128) | | |
| Net expenses | | | | | 13,866,172 | | | | | | 822,643 | | | | | | 7,024,514 | | | | | | 14,140,460 | | |
| Net investment income (loss) | | | | | 16,352,683 | | | | | | 5,671,305 | | | | | | 1,205,957 | | | | | | (2,574,018) | | |
| REALIZED AND UNREALIZED GAIN (LOSS): | | | | | |
| Net realized gain (loss) on: | | | | | |
| Investments | | | | | 100,324,141 | | | | | | (1,410,316) | | | | | | 99,490,810 | | | | | | 183,660,306 | | |
| Foreign currency related transactions | | | | | 251,954 | | | | | | — | | | | | | — | | | | | | 418,060 | | |
| Futures | | | | | — | | | | | | 91,023 | | | | | | — | | | | | | — | | |
| Swaps | | | | | — | | | | | | 38,467 | | | | | | — | | | | | | — | | |
| Net realized gain (loss) | | | | | 100,576,095 | | | | | | (1,280,826) | | | | | | 99,490,810 | | | | | | 184,078,366 | | |
| Net change in unrealized appreciation (depreciation) on: | | | | | |
| Investments | | | | | (50,509,264) | | | | | | (8,716,053) | | | | | | (83,377,794) | | | | | | (19,215,215) | | |
| Foreign currency related transactions | | | | | 53,725 | | | | | | — | | | | | | — | | | | | | 439 | | |
| Futures | | | | | — | | | | | | (22,685) | | | | | | — | | | | | | — | | |
| Swaps | | | | | — | | | | | | (44,589) | | | | | | — | | | | | | — | | |
| Net change in unrealized appreciation (depreciation) | | | | | (50,455,539) | | | | | | (8,783,327) | | | | | | (83,377,794) | | | | | | (19,214,776) | | |
| Net realized and unrealized gain (loss) | | | | | 50,120,556 | | | | | | (10,064,153) | | | | | | 16,113,016 | | | | | | 164,863,590 | | |
| Increase (decrease) in net assets resulting from operations | | | | $ | 66,473,239 | | | | | $ | (4,392,848) | | | | | $ | 17,318,973 | | | | | $ | 162,289,572 | | |
*
Foreign taxes withheld | | | | $ | 1,688,287 | | | | | $ | — | | | | | $ | 22,433 | | | | | $ | 17,120 | | |
(1)
Effective May 1, 2015, the investment management fee and administration fee were combined under a single amended and restated investment management agreement. Please see Note 4 for further information.
See Accompanying Notes to Financial Statements
STATEMENTS OF OPERATIONS for the year ended December 31, 2015
| | | | VY® Templeton
Foreign Equity
Portfolio | |
| INVESTMENT INCOME: | | |
| Dividends, net of foreign taxes withheld* | | | | $ | 25,484,746 | | |
| Interest | | | | | 2,617 | | |
| Securities lending income, net | | | | | 855,368 | | |
| Total investment income | | | | | 26,342,731 | | |
| EXPENSES: | | |
| Investment management fees(1) | | | | | 6,952,089 | | |
| Distribution and shareholder service fees: | | |
| Class ADV | | | | | 198,374 | | |
| Class S | | | | | 1,413,957 | | |
| Class S2 | | | | | 11,542 | | |
| Transfer agent fees | | | | | 1,253 | | |
| Administrative service fees(1) | | | | | 283,572 | | |
| Shareholder reporting expense | | | | | 73,050 | | |
| Professional fees | | | | | 55,002 | | |
| Custody and accounting expense | | | | | 302,435 | | |
| Trustee fees | | | | | 24,655 | | |
| Miscellaneous expense | | | | | 84,943 | | |
| Interest expense | | | | | 132 | | |
| Total expenses | | | | | 9,401,004 | | |
| Net waived and reimbursed fees | | | | | (156,716) | | |
| Brokerage commission recapture | | | | | (14,927) | | |
| Net expenses | | | | | 9,229,361 | | |
| Net investment income | | | | | 17,113,370 | | |
| REALIZED AND UNREALIZED GAIN (LOSS): | | |
| Net realized gain (loss) on: | | |
| Investments | | | | | 26,575,986 | | |
| Foreign currency related transactions | | | | | 1,875,763 | | |
| Net realized gain | | | | | 28,451,749 | | |
| Net change in unrealized appreciation (depreciation) on: | | |
| Investments | | | | | (68,785,113) | | |
| Foreign currency related transactions | | | | | 11,945 | | |
| Net change in unrealized appreciation (depreciation) | | | | | (68,773,168) | | |
| Net realized and unrealized loss | | | | | (40,321,419) | | |
| Decrease in net assets resulting from operations | | | | $ | (23,208,049) | | |
*
Foreign taxes withheld | | | | $ | 2,310,763 | | |
(1)
Effective May 1, 2015, the investment management fee and administration fee were combined under a single amended and restated investment management agreement. Please see Note 4 for further information.
See Accompanying Notes to Financial Statements
STATEMENTS OF CHANGES IN NET ASSETS
| | | | Voya Global Bond Portfolio | | | VY® American Century Small-Mid
Cap Value Portfolio | |
| | | | Year Ended
December 31,
2015 | | | Year Ended
December 31,
2014 | | | Year Ended
December 31,
2015 | | | Year Ended
December 31,
2014 | |
| FROM OPERATIONS: | | | | | |
| Net investment income | | | | $ | 7,920,236 | | | | | $ | 12,389,576 | | | | | $ | 3,038,304 | | | | | $ | 3,911,807 | | |
| Net realized gain (loss) | | | | | (18,018,009) | | | | | | (7,213,226) | | | | | | 27,210,391 | | | | | | 57,937,406 | | |
| Net change in unrealized appreciation (depreciation) | | | | | (1,710,632) | | | | | | (3,176,868) | | | | | | (35,602,203) | | | | | | (19,173,176) | | |
| Increase (decrease) in net assets resulting from operations | | | | | (11,808,405) | | | | | | 1,999,482 | | | | | | (5,353,508) | | | | | | 42,676,037 | | |
| FROM DISTRIBUTIONS TO SHAREHOLDERS: | | | | | |
| Net investment income: | | | | | | | | | | | | | | | | | | | | | | | | | |
| Class ADV | | | | | — | | | | | | (114,685) | | | | | | (1,133,028) | | | | | | (943,984) | | |
| Class I | | | | | — | | | | | | (1,849,829) | | | | | | (2,364,293) | | | | | | (2,025,981) | | |
| Class S | | | | | — | | | | | | (296,298) | | | | | | (1,308,701) | | | | | | (1,186,565) | | |
| Class S2 | | | | | — | | | | | | — | | | | | | (43,628) | | | | | | (23,116) | | |
| Net realized gains: | | | | | | | | | | | | | | | | | | | | | | | | | |
| Class ADV | | | | | — | | | | | | — | | | | | | (16,172,736) | | | | | | (12,843,745) | | |
| Class I | | | | | — | | | | | | — | | | | | | (23,979,645) | | | | | | (19,472,109) | | |
| Class S | | | | | — | | | | | | — | | | | | | (15,919,521) | | | | | | (13,873,858) | | |
| Class S2 | | | | | — | | | | | | — | | | | | | (639,323) | | | | | | (418,876) | | |
| Total distributions | | | | | — | | | | | | (2,260,812) | | | | | | (61,560,875) | | | | | | (50,788,234) | | |
| FROM CAPITAL SHARE TRANSACTIONS: | | | | | |
| Net proceeds from sale of shares | | | | | 7,497,148 | | | | | | 14,678,953 | | | | | | 24,872,268 | | | | | | 43,456,299 | | |
| Reinvestment of distributions | | | | | — | | | | | | 2,260,812 | | | | | | 61,560,875 | | | | | | 50,788,234 | | |
| | | | | | 7,497,148 | | | | | | 16,939,765 | | | | | | 86,433,143 | | | | | | 94,244,533 | | |
| Cost of shares redeemed | | | | | (49,345,165) | | | | | | (50,787,435) | | | | | | (64,589,400) | | | | | | (152,989,535) | | |
Net increase (decrease) in net assets resulting from capital
share transactions | | | | | (41,848,017) | | | | | | (33,847,670) | | | | | | 21,843,743 | | | | | | (58,745,002) | | |
| Net decrease in net assets | | | | | (53,656,422) | | | | | | (34,109,000) | | | | | | (45,070,640) | | | | | | (66,857,199) | | |
| NET ASSETS: | | | | | |
| Beginning of year or period | | | | | 291,938,343 | | | | | | 326,047,343 | | | | | | 322,469,662 | | | | | | 389,326,861 | | |
| End of year or period | | | | $ | 238,281,921 | | | | | $ | 291,938,343 | | | | | $ | 277,399,022 | | | | | $ | 322,469,662 | | |
Undistributed net investment income/Accumulated net
investments loss at end of year or period | | | | $ | (515,854) | | | | | $ | 2,772,329 | | | | | $ | 4,090,003 | | | | | $ | 4,778,941 | | |
| |
See Accompanying Notes to Financial Statements
STATEMENTS OF CHANGES IN NET ASSETS
| | | | VY® Baron Growth Portfolio | | | VY® Columbia Contrarian Core
Portfolio | |
| | | | Year Ended
December 31,
2015 | | | Year Ended
December 31,
2014 | | | Year Ended
December 31,
2015 | | | Year Ended
December 31,
2014 | |
| FROM OPERATIONS: | | | | | |
| Net investment income (loss) | | | | $ | (2,534,878) | | | | | $ | 3,028,876 | | | | | $ | 2,635,954 | | | | | $ | 2,929,509 | | |
| Net realized gain | | | | | 86,253,062 | | | | | | 73,161,869 | | | | | | 30,338,522 | | | | | | 38,496,638 | | |
| Net change in unrealized appreciation (depreciation) | | | | | (129,335,880) | | | | | | (34,136,106) | | | | | | (22,240,552) | | | | | | 2,079,591 | | |
| Increase (decrease) in net assets resulting from operations | | | | | (45,617,696) | | | | | | 42,054,639 | | | | | | 10,733,924 | | | | | | 43,505,738 | | |
| FROM DISTRIBUTIONS TO SHAREHOLDERS: | | | | | | | | | | | | | | | | | | | | | | | | | |
| Net investment income: | | | | | | | | | | | | | | | | | | | | | | | | | |
| Class ADV | | | | | (51,188) | | | | | | — | | | | | | (146,230) | | | | | | (112,210) | | |
| Class I | | | | | (1,281,940) | | | | | | (762,616) | | | | | | (120,209) | | | | | | (105,520) | | |
| Class S | | | | | (1,817,615) | | | | | | (535,394) | | | | | | (2,665,751) | | | | | | (2,590,384) | | |
| Class S2 | | | | | (10,839) | | | | | | (9,273) | | | | | | — | | | | | | — | | |
| Net realized gains: | | | | | | | | | | | | | | | | | | | | | | | | | |
| Class ADV | | | | | (7,956,319) | | | | | | (1,793,066) | | | | | | (2,307,141) | | | | | | (2,100,491) | | |
| Class I | | | | | (16,920,166) | | | | | | (3,916,469) | | | | | | (1,206,112) | | | | | | (1,350,174) | | |
| Class S | | | | | (47,874,375) | | | | | | (11,070,262) | | | | | | (35,019,245) | | | | | | (40,149,084) | | |
| Class S2 | | | | | (484,995) | | | | | | (100,704) | | | | | | — | | | | | | — | | |
| Total distributions | | | | | (76,397,437) | | | | | | (18,187,784) | | | | | | (41,464,688) | | | | | | (46,407,863) | | |
| FROM CAPITAL SHARE TRANSACTIONS: | | | | | |
| Net proceeds from sale of shares | | | | | 34,281,041 | | | | | | 66,706,432 | | | | | | 18,857,402 | | | | | | 32,189,740 | | |
| Reinvestment of distributions | | | | | 76,397,437 | | | | | | 18,187,784 | | | | | | 41,464,688 | | | | | | 46,407,863 | | |
| | | | | | 110,678,478 | | | | | | 84,894,216 | | | | | | 60,322,090 | | | | | | 78,597,603 | | |
| Cost of shares redeemed | | | | | (203,226,667) | | | | | | (230,556,638) | | | | | | (53,225,750) | | | | | | (68,347,084) | | |
| Net increase (decrease) in net assets resulting from capital share transactions | | | | | (92,548,189) | | | | | | (145,662,422) | | | | | | 7,096,340 | | | | | | 10,250,519 | | |
| Net increase (decrease) in net assets | | | | | (214,563,322) | | | | | | (121,795,567) | | | | | | (23,634,424) | | | | | | 7,348,394 | | |
| NET ASSETS: | | | | | |
| Beginning of year or period | | | | | 1,064,010,852 | | | | | | 1,185,806,419 | | | | | | 361,351,923 | | | | | | 354,003,529 | | |
| End of year or period | | | | $ | 849,447,530 | | | | | $ | 1,064,010,852 | | | | | $ | 337,717,499 | | | | | $ | 361,351,923 | | |
| Undistributed (distributions in excess of) net investment income at end of year or period | | | | $ | (17,659) | | | | | $ | 2,927,220 | | | | | $ | 11,151,533 | | | | | $ | 2,924,735 | | |
| |
See Accompanying Notes to Financial Statements
STATEMENTS OF CHANGES IN NET ASSETS
| | | | VY® Columbia Small Cap Value II
Portfolio | | | VY® Invesco Comstock Portfolio | |
| | | | Year Ended
December 31,
2015 | | | Year Ended
December 31,
2014 | | | Year Ended
December 31,
2015 | | | Year Ended
December 31,
2014 | |
| FROM OPERATIONS: | | | | | |
| Net investment income | | | | $ | 603,137 | | | | | $ | 857,989 | | | | | $ | 7,954,276 | | | | | $ | 8,379,700 | | |
| Net realized gain | | | | | 21,134,398 | | | | | | 20,004,933 | | | | | | 46,586,258 | | | | | | 62,146,491 | | |
| Net change in unrealized appreciation (depreciation) | | | | | (28,061,517) | | | | | | (13,107,266) | | | | | | (89,907,596) | | | | | | (17,797,366) | | |
| Increase (decrease) in net assets resulting from operations | | | | | (6,323,982) | | | | | | 7,755,656 | | | | | | (35,367,062) | | | | | | 52,728,825 | | |
| FROM DISTRIBUTIONS TO SHAREHOLDERS: | | | | | |
| Net investment income: | | | | | | | | | | | | | | | | | | | | | | | | | |
| Class ADV | | | | | (75,657) | | | | | | (92,128) | | | | | | (775,483) | | | | | | (684,628) | | |
| Class I | | | | | (281,364) | | | | | | (231,900) | | | | | | (5,351,730) | | | | | | (3,056,581) | | |
| Class S | | | | | (483,770) | | | | | | (301,525) | | | | | | (7,603,995) | | | | | | (7,164,868) | | |
| Class S2 | | | | | (21,449) | | | | | | (16,920) | | | | | | — | | | | | | — | | |
| Total distributions | | | | | (862,240) | | | | | | (642,473) | | | | | | (13,731,208) | | | | | | (10,906,077) | | |
| FROM CAPITAL SHARE TRANSACTIONS: | | | | | |
| Net proceeds from sale of shares | | | | | 26,522,023 | | | | | | 101,567,544 | | | | | | 116,065,545 | | | | | | 176,901,259 | | |
| Reinvestment of distributions | | | | | 862,240 | | | | | | 642,473 | | | | | | 13,731,208 | | | | | | 10,906,077 | | |
| | | | | | 27,384,263 | | | | | | 102,210,017 | | | | | | 129,796,753 | | | | | | 187,807,336 | | |
| Cost of shares redeemed | | | | | (54,259,618) | | | | | | (62,885,471) | | | | | | (114,041,864) | | | | | | (123,556,176) | | |
Net increase (decrease) in net assets resulting from
capital share transactions | | | | | (26,875,355) | | | | | | 39,324,546 | | | | | | 15,754,889 | | | | | | 64,251,160 | | |
| Net increase (decrease) in net assets | | | | | (34,061,577) | | | | | | 46,437,729 | | | | | | (33,343,381) | | | | | | 106,073,908 | | |
| NET ASSETS: | | | | | |
| Beginning of year or period | | | | | 245,031,566 | | | | | | 198,593,837 | | | | | | 568,888,982 | | | | | | 462,815,074 | | |
| End of year or period | | | | $ | 210,969,989 | | | | | $ | 245,031,566 | | | | | $ | 535,545,601 | | | | | $ | 568,888,982 | | |
| Undistributed net investment income at end of year or period | | | | $ | 598,885 | | | | | $ | 857,988 | | | | | $ | 988,549 | | | | | $ | 2,019,041 | | |
| |
See Accompanying Notes to Financial Statements
STATEMENTS OF CHANGES IN NET ASSETS
| | | | VY® Invesco Equity and Income
Portfolio | | | VY® JPMorgan Mid Cap Value
Portfolio | |
| | | | Year Ended
December 31,
2015 | | | Year Ended
December 31,
2014 | | | Year Ended
December 31,
2015 | | | Year Ended
December 31,
2014 | |
| FROM OPERATIONS: | | | | | |
| Net investment income | | | | $ | 26,587,452 | | | | | $ | 23,970,346 | | | | | $ | 4,232,708 | | | | | $ | 5,870,848 | | |
| Net realized gain | | | | | 82,939,387 | | | | | | 165,375,547 | | | | | | 55,658,161 | | | | | | 96,022,768 | | |
| Net change in unrealized appreciation (depreciation) | | | | | (151,461,029) | | | | | | (61,888,899) | | | | | | (79,176,650) | | | | | | (2,497,019) | | |
| Increase (decrease) in net assets resulting from operations | | | | | (41,934,190) | | | | | | 127,456,994 | | | | | | (19,285,781) | | | | | | 99,396,597 | | |
| FROM DISTRIBUTIONS TO SHAREHOLDERS: | | | | | |
| Net investment income: | | | | | |
| Class ADV | | | | | (921,211) | | | | | | (609,164) | | | | | | (377,888) | | | | | | (557,039) | | |
| Class I | | | | | (14,265,378) | | | | | | (10,642,922) | | | | | | (2,143,085) | | | | | | (2,825,478) | | |
| Class S | | | | | (15,265,238) | | | | | | (12,476,571) | | | | | | (1,937,538) | | | | | | (2,815,938) | | |
| Class S2 | | | | | (8,811,979) | | | | | | (6,589,109) | | | | | | (19,270) | | | | | | (39,286) | | |
| Net realized gains: | | | | | | | | | | | | | | | | | | | | | | | | | |
| Class ADV | | | | | (4,055,040) | | | | | | (1,298,506) | | | | | | (13,223,638) | | | | | | (5,003,963) | | |
| Class I | | | | | (50,510,479) | | | | | | (17,942,741) | | | | | | (35,398,660) | | | | | | (15,175,805) | | |
| Class S | | | | | (62,177,273) | | | | | | (25,536,665) | | | | | | (45,650,719) | | | | | | (20,943,381) | | |
| Class S2 | | | | | (38,137,778) | | | | | | (14,282,158) | | | | | | (649,788) | | | | | | (303,318) | | |
| Total distributions | | | | | (194,144,376) | | | | | | (89,377,836) | | | | | | (99,400,586) | | | | | | (47,664,208) | | |
| FROM CAPITAL SHARE TRANSACTIONS: | | | | | |
| Net proceeds from sale of shares | | | | | 29,358,738 | | | | | | 85,106,952 | | | | | | 49,706,246 | | | | | | 56,082,178 | | |
| Proceeds from shares issued in merger (Note 14) | | | | | — | | | | | | 1,400,213,515 | | | | | | — | | | | | | — | | |
| Reinvestment of distributions | | | | | 194,144,376 | | | | | | 89,377,836 | | | | | | 99,400,586 | | | | | | 47,664,208 | | |
| | | | | | 223,503,114 | | | | | | 1,574,698,303 | | | | | | 149,106,832 | | | | | | 103,746,386 | | |
| Cost of shares redeemed | | | | | (333,647,596) | | | | | | (323,833,395) | | | | | | (131,017,273) | | | | | | (154,469,981) | | |
| Net increase (decrease) in net assets resulting from capital share transactions | | | | | (110,144,482) | | | | | | 1,250,864,908 | | | | | | 18,089,559 | | | | | | (50,723,595) | | |
| Net increase (decrease) in net assets | | | | | (346,223,048) | | | | | | 1,288,944,066 | | | | | | (100,596,808) | | | | | | 1,008,794 | | |
| NET ASSETS: | | | | | |
| Beginning of year or period | | | | | 2,159,310,430 | | | | | | 870,366,364 | | | | | | 721,862,329 | | | | | | 720,853,535 | | |
| End of year or period | | | | $ | 1,813,087,382 | | | | | $ | 2,159,310,430 | | | | | $ | 621,265,521 | | | | | $ | 721,862,329 | | |
| Undistributed net investment income at end of year or period | | | | $ | 3,193,599 | | | | | $ | 6,410,004 | | | | | $ | 3,516 | | | | | $ | 236,493 | | |
| | | | | | |
See Accompanying Notes to Financial Statements
STATEMENTS OF CHANGES IN NET ASSETS
| | | | VY® Oppenheimer Global Portfolio | | | VY® Pioneer High Yield Portfolio | |
| | | | Year Ended
December 31,
2015 | | | Year Ended
December 31,
2014 | | | Year Ended
December 31,
2015 | | | Year Ended
December 31,
2014 | |
| FROM OPERATIONS: | | | | | |
| Net investment income | | | | $ | 16,352,683 | | | | | $ | 22,196,860 | | | | | $ | 5,671,305 | | | | | $ | 6,111,043 | | |
| Net realized gain (loss) | | | | | 100,576,095 | | | | | | 128,057,325 | | | | | | (1,280,826) | | | | | | 4,633,438 | | |
| Net change in unrealized appreciation (depreciation) | | | | | (50,455,539) | | | | | | (109,887,134) | | | | | | (8,783,327) | | | | | | (10,322,519) | | |
| Increase (decrease) in net assets resulting from operations | | | | | 66,473,239 | | | | | | 40,367,051 | | | | | | (4,392,848) | | | | | | 421,962 | | |
| FROM DISTRIBUTIONS TO SHAREHOLDERS: | | | | | |
| Net investment income: | | | | | |
| Class ADV | | | | | (1,084,846) | | | | | | (828,803) | | | | | | — | | | | | | — | | |
| Class I | | | | | (19,318,309) | | | | | | (16,555,290) | | | | | | (5,539,616) | | | | | | (5,902,329) | | |
| Class S | | | | | (3,033,566) | | | | | | (2,294,916) | | | | | | (210,519) | | | | | | (192,274) | | |
| Class S2 | | | | | (54,499) | | | | | | (44,585) | | | | | | — | | | | | | — | | |
| Net realized gains: | | | | | |
| Class ADV | | | | | (8,315,481) | | | | | | (1,471,549) | | | | | | — | | | | | | — | | |
| Class I | | | | | (100,091,139) | | | | | | (19,161,555) | | | | | | — | | | | | | — | | |
| Class S | | | | | (18,803,314) | | | | | | (3,303,767) | | | | | | — | | | | | | — | | |
| Class S2 | | | | | (376,490) | | | | | | (64,256) | | | | | | — | | | | | | — | | |
| Total distributions | | | | | (151,077,644) | | | | | | (43,724,721) | | | | | | (5,750,135) | | | | | | (6,094,603) | | |
| FROM CAPITAL SHARE TRANSACTIONS: | | | | | |
| Net proceeds from sale of shares | | | | | 94,529,991 | | | | | | 58,362,659 | | | | | | 12,634,324 | | | | | | 27,951,610 | | |
| Reinvestment of distributions | | | | | 151,077,644 | | | | | | 43,724,721 | | | | | | 5,750,135 | | | | | | 6,094,603 | | |
| | | | | | 245,607,635 | | | | | | 102,087,380 | | | | | | 18,384,459 | | | | | | 34,046,213 | | |
| Cost of shares redeemed | | | | | (202,359,715) | | | | | | (298,181,303) | | | | | | (34,934,776) | | | | | | (28,792,935) | | |
| Net increase (decrease) in net assets resulting from capital share transactions | | | | | 43,247,920 | | | | | | (196,093,923) | | | | | | (16,550,317) | | | | | | 5,253,278 | | |
| Net decrease in net assets | | | | | (41,356,485) | | | | | | (199,451,593) | | | | | | (26,693,300) | | | | | | (419,363) | | |
| NET ASSETS: | | | | | |
| Beginning of year or period | | | | | 1,641,958,078 | | | | | | 1,841,409,671 | | | | | | 122,028,711 | | | | | | 122,448,074 | | |
| End of year or period | | | | $ | 1,600,601,593 | | | | | $ | 1,641,958,078 | | | | | $ | 95,335,411 | | | | | $ | 122,028,711 | | |
| Undistributed net investment income at end of year or period | | | | $ | 16,309,516 | | | | | $ | 23,404,553 | | | | | $ | 3,208,204 | | | | | $ | 3,169,121 | | |
| |
See Accompanying Notes to Financial Statements
STATEMENTS OF CHANGES IN NET ASSETS
| | | | VY® T. Rowe Price Diversified Mid
Cap Growth Portfolio | | | VY® T. Rowe Price Growth Equity
Portfolio | |
| | | | Year Ended
December 31,
2015 | | | Year Ended
December 31,
2014 | | | Year Ended
December 31,
2015 | | | Year Ended
December 31,
2014 | |
| FROM OPERATIONS: | | | | | |
| Net investment income (loss) | | | | $ | 1,205,957 | | | | | $ | 1,672,712 | | | | | $ | (2,574,018) | | | | | $ | (1,742,915) | | |
| Net realized gain | | | | | 99,490,810 | | | | | | 130,307,409 | | | | | | 184,078,366 | | | | | | 242,928,704 | | |
| Net change in unrealized appreciation (depreciation) | | | | | (83,377,794) | | | | | | (37,524,909) | | | | | | (19,214,776) | | | | | | (112,699,410) | | |
| Increase in net assets resulting from operations | | | | | 17,318,973 | | | | | | 94,455,212 | | | | | | 162,289,572 | | | | | | 128,486,379 | | |
| FROM DISTRIBUTIONS TO SHAREHOLDERS: | | | | | |
| Net investment income: | | | | | |
| Class ADV | | | | | — | | | | | | (7,890) | | | | | | — | | | | | | — | | |
| Class I | | | | | — | | | | | | (2,088,115) | | | | | | — | | | | | | — | | |
| Class S | | | | | — | | | | | | (11,072) | | | | | | — | | | | | | — | | |
| Class S2 | | | | | — | | | | | | (1,180) | | | | | | — | | | | | | — | | |
| Net realized gains: | | | | | | | | | | | | | | | | | | | | | | | | | |
| Class ADV | | | | | (4,928,655) | | | | | | (1,976,917) | | | | | | (28,240,157) | | | | | | (11,953,361) | | |
| Class I | | | | | (119,999,747) | | | | | | (52,939,583) | | | | | | (150,611,865) | | | | | | (72,666,041) | | |
| Class S | | | | | (4,330,538) | | | | | | (2,001,564) | | | | | | (60,500,345) | | | | | | (24,431,255) | | |
| Class S2 | | | | | (689,460) | | | | | | (235,821) | | | | | | (740,378) | | | | | | (256,132) | | |
| Total distributions | | | | | (129,948,400) | | | | | | (59,262,142) | | | | | | (240,092,745) | | | | | | (109,306,789) | | |
| FROM CAPITAL SHARE TRANSACTIONS: | | | | | |
| Net proceeds from sale of shares | | | | | 38,636,631 | | | | | | 17,929,392 | | | | | | 285,115,923 | | | | | | 152,663,324 | | |
| Reinvestment of distributions | | | | | 129,948,400 | | | | | | 59,262,142 | | | | | | 240,092,745 | | | | | | 109,306,789 | | |
| | | | | | 168,585,031 | | | | | | 77,191,534 | | | | | | 525,208,668 | | | | | | 261,970,113 | | |
| Cost of shares redeemed | | | | | (87,954,330) | | | | | | (113,441,115) | | | | | | (262,660,670) | | | | | | (311,468,327) | | |
| Net increase (decrease) in net assets resulting from capital share transactions | | | | | 80,630,701 | | | | | | (36,249,581) | | | | | | 262,547,998 | | | | | | (49,498,214) | | |
| Net increase (decrease) in net assets | | | | | (31,998,726) | | | | | | (1,056,511) | | | | | | 184,744,825 | | | | | | (30,318,624) | | |
| NET ASSETS: | | | | | |
| Beginning of year or period | | | | | 860,515,900 | | | | | | 861,572,411 | | | | | | 1,574,529,821 | | | | | | 1,604,848,445 | | |
| End of year or period | | | | $ | 828,517,174 | | | | | $ | 860,515,900 | | | | | $ | 1,759,274,646 | | | | | $ | 1,574,529,821 | | |
Undistributed (distributions in excess of) net investment income
at end of year or period | | | | $ | 2,304,604 | | | | | $ | (18,084) | | | | | $ | (32,269) | | | | | $ | (26,371) | | |
| |
See Accompanying Notes to Financial Statements
STATEMENTS OF CHANGES IN NET ASSETS
| | | | VY® Templeton Foreign Equity
Portfolio | |
| | | | Year Ended
December 31,
2015 | | | Year Ended
December 31,
2014 | |
| FROM OPERATIONS: | | | |
| Net investment income | | | | $ | 17,113,370 | | | | | $ | 29,635,498 | | |
| Net realized gain | | | | | 28,451,749 | | | | | | 35,572,487 | | |
| Net change in unrealized appreciation (depreciation) | | | | | (68,773,168) | | | | | | (128,123,640) | | |
| Decrease in net assets resulting from operations | | | | | (23,208,049) | | | | | | (62,915,655) | | |
| FROM DISTRIBUTIONS TO SHAREHOLDERS: | | | | | | | | | | | | | |
| Net investment income: | | | | | | | | | | | | | |
| Class ADV | | | | | (1,326,137) | | | | | | (910,170) | | |
| Class I | | | | | (8,274,865) | | | | | | (5,906,833) | | |
| Class S | | | | | (19,973,007) | | | | | | (14,604,147) | | |
| Class S2 | | | | | (83,426) | | | | | | (45,628) | | |
| Total distributions | | | | | (29,657,435) | | | | | | (21,466,778) | | |
| FROM CAPITAL SHARE TRANSACTIONS: | | | |
| Net proceeds from sale of shares | | | | | 27,587,391 | | | | | | 50,603,767 | | |
| Reinvestment of distributions | | | | | 29,657,435 | | | | | | 21,466,778 | | |
| | | | | | 57,244,826 | | | | | | 72,070,545 | | |
| Cost of shares redeemed | | | | | (124,914,543) | | | | | | (180,342,792) | | |
| Net decrease in net assets resulting from capital share transactions | | | | | (67,669,717) | | | | | | (108,272,247) | | |
| Net decrease in net assets | | | | | (120,535,201) | | | | | | (192,654,680) | | |
| NET ASSETS: | | | |
| Beginning of year or period | | | | | 843,221,741 | | | | | | 1,035,876,421 | | |
| End of year or period | | | | $ | 722,686,540 | | | | | $ | 843,221,741 | | |
| Undistributed net investment income at end of year or period | | | | $ | 21,744,257 | | | | | $ | 30,257,712 | | |
| |
See Accompanying Notes to Financial Statements
Selected data for a share of beneficial interest outstanding throughout each year or period.
| | | | | | | | | | Income
(loss) from
investment
operations | | | | | | | | | Less
Distributions | | | | | | Ratios to average
net assets | | | Supplemental
Data | |
| | | | Net asset value, beginning
of year or period | | | Net investment income (loss) | | | Net realized and unrealized
gain (loss) | | | Total from investment operations | | | From net investment income | | | From net realized gains | | | From return of capital | | | Total distributions | | | Payment by affiliate | | | Net asset value, end of year
or period | | | Total Return(1) | | | Expenses before
reductions/additions(2)(3)(4) | | | Expenses net of fee waivers
and/or recoupments if any(2)(3)(4) | | | Expense net of all
reductions/additions(2)(3)(4) | | | Net investment
income (loss)(2)(3) | | | Net assets, end of year
or period | | | Portfolio turnover rate | |
Year or
period ended | | | ($) | | | ($) | | | ($) | | | ($) | | | ($) | | | ($) | | | ($) | | | ($) | | | ($) | | | ($) | | | (%) | | | (%) | | | (%) | | | (%) | | | (%) | | | ($000’s) | | | (%) | |
| Voya Global Bond Portfolio | | | | | | | | | | | | | | | | | | | | | | | | | | | | | | | | | | | | | | | | | | | | | | | | | | | | | | | | | | | | | | | | | | | | | | | | | | | | | | | | | | | | | | | | | | | | | | | | | | | | | | | |
| Class ADV | | | | | | | | | | | | | | | | | | | | | | | | | | | | | | | | | | | | | | | | | | | | | | | | | | | | | | | | | | | | | | | | | | | | | | | | | | | | | | | | | | | | | | | | | | | | | | | | | | | | | | | |
| 12-31-15 | | | | | 10.31 | | | | | | 0.26• | | | | | | (0.76) | | | | | | (0.50) | | | | | | — | | | | | | — | | | | | | — | | | | | | — | | | | | | — | | | | | | 9.81 | | | | | | (4.85) | | | | | | 1.15 | | | | | | 1.10 | | | | | | 1.10 | | | | | | 2.58 | | | | | | 26,374 | | | | | | 335 | | |
| 12-31-14 | | | | | 10.35 | | | | | | 0.37• | | | | | | (0.37) | | | | | | 0.00* | | | | | | 0.04 | | | | | | — | | | | | | — | | | | | | 0.04 | | | | | | — | | | | | | 10.31 | | | | | | (0.06) | | | | | | 1.16 | | | | | | 1.10 | | | | | | 1.10 | | | | | | 3.49 | | | | | | 32,874 | | | | | | 296 | | |
| 12-31-13 | | | | | 11.35 | | | | | | 0.33• | | | | | | (0.85) | | | | | | (0.52) | | | | | | 0.19 | | | | | | 0.29 | | | | | | — | | | | | | 0.48 | | | | | | — | | | | | | 10.35 | | | | | | (4.50) | | | | | | 1.19 | | | | | | 1.08 | | | | | | 1.08 | | | | | | 3.09 | | | | | | 34,155 | | | | | | 394 | | |
| 12-31-12 | | | | | 11.22 | | | | | | 0.41• | | | | | | 0.39 | | | | | | 0.80 | | | | | | 0.67 | | | | | | — | | | | | | — | | | | | | 0.67 | | | | | | — | | | | | | 11.35 | | | | | | 7.36 | | | | | | 1.18 | | | | | | 1.02 | | | | | | 1.02 | | | | | | 3.61 | | | | | | 34,927 | | | | | | 487 | | |
| 12-31-11 | | | | | 11.67 | | | | | | 0.44• | | | | | | (0.04) | | | | | | 0.40 | | | | | | 0.85 | | | | | | — | | | | | | — | | | | | | 0.85 | | | | | | — | | | | | | 11.22 | | | | | | 3.26 | | | | | | 1.16 | | | | | | 1.02 | | | | | | 1.02 | | | | | | 3.73 | | | | | | 30,299 | | | | | | 590 | | |
| Class I | | | | | | | | | | | | | | | | | | | | | | | | | | | | | | | | | | | | | | | | | | | | | | | | | | | | | | | | | | | | | | | | | | | | | | | | | | | | | | | | | | | | | | | | | | | | | | | | | | | | | | | |
| 12-31-15 | | | | | 10.42 | | | | | | 0.32• | | | | | | (0.77) | | | | | | (0.45) | | | | | | — | | | | | | — | | | | | | — | | | | | | — | | | | | | — | | | | | | 9.97 | | | | | | (4.32) | | | | | | 0.65 | | | | | | 0.60 | | | | | | 0.60 | | | | | | 3.08 | | | | | | 168,739 | | | | | | 335 | | |
| 12-31-14 | | | | | 10.46 | | | | | | 0.43• | | | | | | (0.38) | | | | | | 0.05 | | | | | | 0.09 | | | | | | — | | | | | | — | | | | | | 0.09 | | | | | | — | | | | | | 10.42 | | | | | | 0.42 | | | | | | 0.66 | | | | | | 0.60 | | | | | | 0.60 | | | | | | 3.99 | | | | | | 208,023 | | | | | | 296 | | |
| 12-31-13 | | | | | 11.46 | | | | | | 0.40• | | | | | | (0.87) | | | | | | (0.47) | | | | | | 0.24 | | | | | | 0.29 | | | | | | — | | | | | | 0.53 | | | | | | — | | | | | | 10.46 | | | | | | (4.00) | | | | | | 0.69 | | | | | | 0.58 | | | | | | 0.58 | | | | | | 3.65 | | | | | | 237,646 | | | | | | 394 | | |
| 12-31-12 | | | | | 11.32 | | | | | | 0.47• | | | | | | 0.40 | | | | | | 0.87 | | | | | | 0.73 | | | | | | — | | | | | | — | | | | | | 0.73 | | | | | | — | | | | | | 11.46 | | | | | | 7.91 | | | | | | 0.68 | | | | | | 0.52 | | | | | | 0.52 | | | | | | 4.09 | | | | | | 309,348 | | | | | | 487 | | |
| 12-31-11 | | | | | 11.77 | | | | | | 0.50• | | | | | | (0.05) | | | | | | 0.45 | | | | | | 0.90 | | | | | | — | | | | | | — | | | | | | 0.90 | | | | | | — | | | | | | 11.32 | | | | | | 3.70 | | | | | | 0.66 | | | | | | 0.52 | | | | | | 0.52 | | | | | | 4.22 | | | | | | 330,477 | | | | | | 590 | | |
| Class S | | | | | | | | | | | | | | | | | | | | | | | | | | | | | | | | | | | | | | | | | | | | | | | | | | | | | | | | | | | | | | | | | | | | | | | | | | | | | | | | | | | | | | | | | | | | | | | | | | | | | | | |
| 12-31-15 | | | | | 10.44 | | | | | | 0.29• | | | | | | (0.76) | | | | | | (0.47) | | | | | | — | | | | | | — | | | | | | — | | | | | | — | | | | | | — | | | | | | 9.97 | | | | | | (4.50) | | | | | | 0.90 | | | | | | 0.85 | | | | | | 0.85 | | | | | | 2.83 | | | | | | 43,169 | | | | | | 335 | | |
| 12-31-14 | | | | | 10.48 | | | | | | 0.40• | | | | | | (0.38) | | | | | | 0.02 | | | | | | 0.06 | | | | | | — | | | | | | — | | | | | | 0.06 | | | | | | — | | | | | | 10.44 | | | | | | 0.15 | | | | | | 0.91 | | | | | | 0.85 | | | | | | 0.85 | | | | | | 3.74 | | | | | | 51,041 | | | | | | 296 | | |
| 12-31-13 | | | | | 11.48 | | | | | | 0.37• | | | | | | (0.87) | | | | | | (0.50) | | | | | | 0.21 | | | | | | 0.29 | | | | | | — | | | | | | 0.50 | | | | | | — | | | | | | 10.48 | | | | | | (4.28) | | | | | | 0.94 | | | | | | 0.83 | | | | | | 0.83 | | | | | | 3.39 | | | | | | 54,246 | | | | | | 394 | | |
| 12-31-12 | | | | | 11.33 | | | | | | 0.47• | | | | | | 0.37 | | | | | | 0.84 | | | | | | 0.69 | | | | | | — | | | | | | — | | | | | | 0.69 | | | | | | — | | | | | | 11.48 | | | | | | 7.65 | | | | | | 0.93 | | | | | | 0.77 | | | | | | 0.77 | | | | | | 4.05 | | | | | | 66,533 | | | | | | 487 | | |
| 12-31-11 | | | | | 11.76 | | | | | | 0.47• | | | | | | (0.04) | | | | | | 0.43 | | | | | | 0.86 | | | | | | — | | | | | | — | | | | | | 0.86 | | | | | | — | | | | | | 11.33 | | | | | | 3.51 | | | | | | 0.91 | | | | | | 0.77 | | | | | | 0.77 | | | | | | 3.97 | | | | | | 67,103 | | | | | | 590 | | |
VY® American Century Small-Mid Cap Value Portfolio | | | | | | | | | | | | | | | | | | | | | | | | | | | | | | | | | | | | | | | | | | | | | | | | | | | | | | | | | | | | | | | | | | | | | | | | | | | | | | | | | | | | | | | | | | | | | | | | | | | | | | | |
| Class ADV | | | | | | | | | | | | | | | | | | | | | | | | | | | | | | | | | | | | | | | | | | | | | | | | | | | | | | | | | | | | | | | | | | | | | | | | | | | | | | | | | | | | | | | | | | | | | | | | | | | | | | | |
| 12-31-15 | | | | | 13.82 | | | | | | 0.08 | | | | | | (0.27) | | | | | | (0.19) | | | | | | 0.19 | | | | | | 2.64 | | | | | | — | | | | | | 2.83 | | | | | | — | | | | | | 10.80 | | | | | | (1.97) | | | | | | 1.66 | | | | | | 1.36 | | | | | | 1.36 | | | | | | 0.72 | | | | | | 79,901 | | | | | | 71 | | |
| 12-31-14 | | | | | 14.79 | | | | | | 0.12• | | | | | | 1.49 | | | | | | 1.61 | | | | | | 0.18 | | | | | | 2.40 | | | | | | — | | | | | | 2.58 | | | | | | — | | | | | | 13.82 | | | | | | 12.15 | | | | | | 1.65 | | | | | | 1.36 | | | | | | 1.36 | | | | | | 0.82 | | | | | | 86,335 | | | | | | 79 | | |
| 12-31-13 | | | | | 11.76 | | | | | | 0.12• | | | | | | 3.49 | | | | | | 3.61 | | | | | | 0.14 | | | | | | 0.44 | | | | | | — | | | | | | 0.58 | | | | | | — | | | | | | 14.79 | | | | | | 31.12 | | | | | | 1.66 | | | | | | 1.42 | | | | | | 1.42 | | | | | | 0.88 | | | | | | 95,563 | | | | | | 84 | | |
| 12-31-12 | | | | | 11.08 | | | | | | 0.18• | | | | | | 1.53 | | | | | | 1.71 | | | | | | 0.12 | | | | | | 0.91 | | | | | | — | | | | | | 1.03 | | | | | | — | | | | | | 11.76 | | | | | | 16.07 | | | | | | 1.70 | | | | | | 1.43 | | | | | | 1.43 | | | | | | 1.55 | | | | | | 56,202 | | | | | | 95 | | |
| 12-31-11 | | | | | 11.63 | | | | | | 0.12• | | | | | | (0.54) | | | | | | (0.42) | | | | | | 0.13 | | | | | | 0.00* | | | | | | — | | | | | | 0.13 | | | | | | — | | | | | | 11.08 | | | | | | (3.47) | | | | | | 1.75 | | | | | | 1.44 | | | | | | 1.44 | | | | | | 1.07 | | | | | | 37,525 | | | | | | 109 | | |
| Class I | | | | | | | | | | | | | | | | | | | | | | | | | | | | | | | | | | | | | | | | | | | | | | | | | | | | | | | | | | | | | | | | | | | | | | | | | | | | | | | | | | | | | | | | | | | | | | | | | | | | | | | |
| 12-31-15 | | | | | 14.40 | | | | | | 0.16• | | | | | | (0.31) | | | | | | (0.15) | | | | | | 0.26 | | | | | | 2.64 | | | | | | — | | | | | | 2.90 | | | | | | — | | | | | | 11.35 | | | | | | (1.54) | | | | | | 1.16 | | | | | | 0.86 | | | | | | 0.86 | | | | | | 1.21 | | | | | | 115,279 | | | | | | 71 | | |
| 12-31-14 | | | | | 15.30 | | | | | | 0.20• | | | | | | 1.55 | | | | | | 1.75 | | | | | | 0.25 | | | | | | 2.40 | | | | | | — | | | | | | 2.65 | | | | | | — | | | | | | 14.40 | | | | | | 12.76 | | | | | | 1.15 | | | | | | 0.86 | | | | | | 0.86 | | | | | | 1.31 | | | | | | 138,605 | | | | | | 79 | | |
| 12-31-13 | | | | | 12.12 | | | | | | 0.19• | | | | | | 3.61 | | | | | | 3.80 | | | | | | 0.18 | | | | | | 0.44 | | | | | | — | | | | | | 0.62 | | | | | | — | | | | | | 15.30 | | | | | | 31.78 | | | | | | 1.16 | | | | | | 0.92 | | | | | | 0.92 | | | | | | 1.38 | | | | | | 171,086 | | | | | | 84 | | |
| 12-31-12 | | | | | 11.38 | | | | | | 0.24• | | | | | | 1.58 | | | | | | 1.82 | | | | | | 0.17 | | | | | | 0.91 | | | | | | — | | | | | | 1.08 | | | | | | — | | | | | | 12.12 | | | | | | 16.59 | | | | | | 1.20 | | | | | | 0.93 | | | | | | 0.93 | | | | | | 2.05 | | | | | | 116,175 | | | | | | 95 | | |
| 12-31-11 | | | | | 11.91 | | | | | | 0.18 | | | | | | (0.56) | | | | | | (0.38) | | | | | | 0.15 | | | | | | 0.00* | | | | | | — | | | | | | 0.15 | | | | | | — | | | | | | 11.38 | | | | | | (2.97) | | | | | | 1.25 | | | | | | 0.94 | | | | | | 0.94 | | | | | | 1.54 | | | | | | 87,411 | | | | | | 109 | | |
| Class S | | | | | | | | | | | | | | | | | | | | | | | | | | | | | | | | | | | | | | | | | | | | | | | | | | | | | | | | | | | | | | | | | | | | | | | | | | | | | | | | | | | | | | | | | | | | | | | | | | | | | | | |
| 12-31-15 | | | | | 14.25 | | | | | | 0.13• | | | | | | (0.30) | | | | | | (0.17) | | | | | | 0.22 | | | | | | 2.64 | | | | | | — | | | | | | 2.86 | | | | | | — | | | | | | 11.22 | | | | | | (1.74) | | | | | | 1.41 | | | | | | 1.11 | | | | | | 1.11 | | | | | | 0.96 | | | | | | 78,646 | | | | | | 71 | | |
| 12-31-14 | | | | | 15.16 | | | | | | 0.16• | | | | | | 1.54 | | | | | | 1.70 | | | | | | 0.21 | | | | | | 2.40 | | | | | | — | | | | | | 2.61 | | | | | | — | | | | | | 14.25 | | | | | | 12.47 | | | | | | 1.40 | | | | | | 1.11 | | | | | | 1.11 | | | | | | 1.06 | | | | | | 94,268 | | | | | | 79 | | |
| 12-31-13 | | | | | 12.03 | | | | | | 0.15• | | | | | | 3.57 | | | | | | 3.72 | | | | | | 0.15 | | | | | | 0.44 | | | | | | — | | | | | | 0.59 | | | | | | — | | | | | | 15.16 | | | | | | 31.36 | | | | | | 1.41 | | | | | | 1.17 | | | | | | 1.17 | | | | | | 1.12 | | | | | | 116,117 | | | | | | 84 | | |
| 12-31-12 | | | | | 11.30 | | | | | | 0.19 | | | | | | 1.59 | | | | | | 1.78 | | | | | | 0.14 | | | | | | 0.91 | | | | | | — | | | | | | 1.05 | | | | | | — | | | | | | 12.03 | | | | | | 16.35 | | | | | | 1.45 | | | | | | 1.18 | | | | | | 1.18 | | | | | | 1.76 | | | | | | 84,475 | | | | | | 95 | | |
| 12-31-11 | | | | | 11.82 | | | | | | 0.15 | | | | | | (0.54) | | | | | | (0.39) | | | | | | 0.13 | | | | | | 0.00* | | | | | | — | | | | | | 0.13 | | | | | | — | | | | | | 11.30 | | | | | | (3.16) | | | | | | 1.50 | | | | | | 1.19 | | | | | | 1.19 | | | | | | 1.28 | | | | | | 72,824 | | | | | | 109 | | |
See Accompanying Notes to Financial Statements
Financial Highlights (continued)
| | | | | | | | | | Income
(loss) from
investment
operations | | | | | | | | | Less
Distributions | | | | | | Ratios to average
net assets | | | Supplemental
Data | |
| | | | Net asset value, beginning
of year or period | | | Net investment income (loss) | | | Net realized and unrealized
gain (loss) | | | Total from investment operations | | | From net investment income | | | From net realized gains | | | From return of capital | | | Total distributions | | | Payment by affiliate | | | Net asset value, end of year
or period | | | Total Return(1) | | | Expenses before
reductions/additions(2)(3)(4) | | | Expenses net of fee waivers
and/or recoupments if any(2)(3)(4) | | | Expense net of all
reductions/additions(2)(3)(4) | | | Net investment
income (loss)(2)(3) | | | Net assets, end of year
or period | | | Portfolio turnover rate | |
Year or
period ended | | | ($) | | | ($) | | | ($) | | | ($) | | | ($) | | | ($) | | �� | ($) | | | ($) | | | ($) | | | ($) | | | (%) | | | (%) | | | (%) | | | (%) | | | (%) | | | ($000’s) | | | (%) | |
VY® American Century Small-Mid Cap Value Portfolio (continued) | | | | | | | | | | | | | | | | | | | | | | | | | | | | | | | | | | | | | | | | | | | | | | | | | | | | | | | | | | | | | | | | | | | | | | | | | | | | | | | | | | | | | | | | | | | | | | | | | | | | | | | |
| Class S2 | | | | | | | | | | | | | | | | | | | | | | | | | | | | | | | | | | | | | | | | | | | | | | | | | | | | | | | | | | | | | | | | | | | | | | | | | | | | | | | | | | | | | | | | | | | | | | | | | | | | | | | |
| 12-31-15 | | | | | 13.79 | | | | | | 0.11• | | | | | | (0.30) | | | | | | (0.19) | | | | | | 0.18 | | | | | | 2.64 | | | | | | — | | | | | | 2.82 | | | | | | — | | | | | | 10.78 | | | | | | (1.91) | | | | | | 1.66 | | | | | | 1.26 | | | | | | 1.26 | | | | | | 0.85 | | | | | | 3,573 | | | | | | 71 | | |
| 12-31-14 | | | | | 14.70 | | | | | | 0.13• | | | | | | 1.49 | | | | | | 1.62 | | | | | | 0.13 | | | | | | 2.40 | | | | | | — | | | | | | 2.53 | | | | | | — | | | | | | 13.79 | | | | | | 12.33 | | | | | | 1.65 | | | | | | 1.26 | | | | | | 1.26 | | | | | | 0.89 | | | | | | 3,262 | | | | | | 79 | | |
| 12-31-13 | | | | | 11.70 | | | | | | 0.13• | | | | | | 3.46 | | | | | | 3.59 | | | | | | 0.15 | | | | | | 0.44 | | | | | | — | | | | | | 0.59 | | | | | | — | | | | | | 14.70 | | | | | | 31.15 | | | | | | 1.66 | | | | | | 1.32 | | | | | | 1.32 | | | | | | 0.98 | | | | | | 6,560 | | | | | | 84 | | |
| 12-31-12 | | | | | 11.03 | | | | | | 0.19• | | | | | | 1.53 | | | | | | 1.72 | | | | | | 0.14 | | | | | | 0.91 | | | | | | — | | | | | | 1.05 | | | | | | — | | | | | | 11.70 | | | | | | 16.24 | | | | | | 1.70 | | | | | | 1.33 | | | | | | 1.33 | | | | | | 1.68 | | | | | | 3,205 | | | | | | 95 | | |
| 12-31-11 | | | | | 11.59 | | | | | | 0.14• | | | | | | (0.55) | | | | | | (0.41) | | | | | | 0.15 | | | | | | 0.00* | | | | | | — | | | | | | 0.15 | | | | | | — | | | | | | 11.03 | | | | | | (3.33) | | | | | | 1.75 | | | | | | 1.34 | | | | | | 1.34 | | | | | | 1.26 | | | | | | 1,891 | | | | | | 109 | | |
VY® Baron Growth Portfolio | | | | | | | | | | | | | | | | | | | | | | | | | | | | | | | | | | | | | | | | | | | | | | | | | | | | | | | | | | | | | | | | | | | | | | | | | | | | | | | | | | | | | | | | | | | | | | | | | | | | | | | |
| Class ADV | | | | | | | | | | | | | | | | | | | | | | | | | | | | | | | | | | | | | | | | | | | | | | | | | | | | | | | | | | | | | | | | | | | | | | | | | | | | | | | | | | | | | | | | | | | | | | | | | | | | | | | |
| 12-31-15 | | | | | 30.35 | | | | | | (0.16) | | | | | | (1.23) | | | | | | (1.39) | | | | | | 0.02 | | | | | | 2.36 | | | | | | — | | | | | | 2.38 | | | | | | — | | | | | | 26.58 | | | | | | (5.27) | | | | | | 1.49 | | | | | | 1.49 | | | | | | 1.49 | | | | | | (0.54) | | | | | | 90,914 | | | | | | 5 | | |
| 12-31-14 | | | | | 29.66 | | | | | | (0.01) | | | | | | 1.17 | | | | | | 1.16 | | | | | | — | | | | | | 0.47 | | | | | | — | | | | | | 0.47 | | | | | | — | | | | | | 30.35 | | | | | | 4.06 | | | | | | 1.48 | | | | | | 1.48 | | | | | | 1.48 | | | | | | (0.04) | | | | | | 111,145 | | | | | | 10 | | |
| 12-31-13 | | | | | 22.53 | | | | | | (0.04)• | | | | | | 8.55 | | | | | | 8.51 | | | | | | 0.32 | | | | | | 1.06 | | | | | | — | | | | | | 1.38 | | | | | | — | | | | | | 29.66 | | | | | | 38.50 | | | | | | 1.49 | | | | | | 1.49 | | | | | | 1.49 | | | | | | (0.15) | | | | | | 110,486 | | | | | | 8 | | |
| 12-31-12 | | | | | 18.87 | | | | | | 0.30• | | | | | | 3.36 | | | | | | 3.66 | | | | | | — | | | | | | — | | | | | | — | | | | | | — | | | | | | — | | | | | | 22.53 | | | | | | 19.40 | | | | | | 1.52 | | | | | | 1.52 | | | | | | 1.52 | | | | | | 1.45 | | | | | | 61,428 | | | | | | 15 | | |
| 12-31-11 | | | | | 18.52 | | | | | | (0.19) | | | | | | 0.54 | | | | | | 0.35 | | | | | | — | | | | | | — | | | | | | — | | | | | | — | | | | | | — | | | | | | 18.87 | | | | | | 1.89 | | | | | | 1.58 | | | | | | 1.58 | | | | | | 1.58 | | | | | | (0.98) | | | | | | 54,052 | | | | | | 14 | | |
| Class I | | | | | | | | | | | | | | | | | | | | | | | | | | | | | | | | | | | | | | | | | | | | | | | | | | | | | | | | | | | | | | | | | | | | | | | | | | | | | | | | | | | | | | | | | | | | | | | | | | | | | | | |
| 12-31-15 | | | | | 32.31 | | | | | | (0.01) | | | | | | (1.31) | | | | | | (1.32) | | | | | | 0.18 | | | | | | 2.36 | | | | | | — | | | | | | 2.54 | | | | | | — | | | | | | 28.45 | | | | | | (4.75) | | | | | | 0.99 | | | | | | 0.99 | | | | | | 0.99 | | | | | | (0.04) | | | | | | 193,601 | | | | | | 5 | | |
| 12-31-14 | | | | | 31.49 | | | | | | 0.14 | | | | | | 1.24 | | | | | | 1.38 | | | | | | 0.09 | | | | | | 0.47 | | | | | | — | | | | | | 0.56 | | | | | | — | | | | | | 32.31 | | | | | | 4.55 | | | | | | 0.98 | | | | | | 0.98 | | | | | | 0.98 | | | | | | 0.45 | | | | | | 251,230 | | | | | | 10 | | |
| 12-31-13 | | | | | 23.80 | | | | | | 0.10• | | | | | | 9.06 | | | | | | 9.16 | | | | | | 0.41 | | | | | | 1.06 | | | | | | — | | | | | | 1.47 | | | | | | — | | | | | | 31.49 | | | | | | 39.23 | | | | | | 0.99 | | | | | | 0.99 | | | | | | 0.99 | | | | | | 0.36 | | | | | | 270,788 | | | | | | 8 | | |
| 12-31-12 | | | | | 19.84 | | | | | | 0.43• | | | | | | 3.53 | | | | | | 3.96 | | | | | | — | | | | | | — | | | | | | — | | | | | | — | | | | | | — | | | | | | 23.80 | | | | | | 19.96 | | | | | | 1.02 | | | | | | 1.02 | | | | | | 1.02 | | | | | | 1.95 | | | | | | 169,708 | | | | | | 15 | | |
| 12-31-11 | | | | | 19.37 | | | | | | (0.10)• | | | | | | 0.57 | | | | | | 0.47 | | | | | | — | | | | | | — | | | | | | — | | | | | | — | | | | | | — | | | | | | 19.84 | | | | | | 2.43 | | | | | | 1.08 | | | | | | 1.08 | | | | | | 1.08 | | | | | | (0.51) | | | | | | 153,934 | | | | | | 14 | | |
| Class S | | | | | | | | | | | | | | | | | | | | | | | | | | | | | | | | | | | | | | | | | | | | | | | | | | | | | | | | | | | | | | | | | | | | | | | | | | | | | | | | | | | | | | | | | | | | | | | | | | | | | | | |
| 12-31-15 | | | | | 31.39 | | | | | | (0.08) | | | | | | (1.29) | | | | | | (1.37) | | | | | | 0.09 | | | | | | 2.36 | | | | | | — | | | | | | 2.45 | | | | | | — | | | | | | 27.57 | | | | | | (5.03) | | | | | | 1.24 | | | | | | 1.24 | | | | | | 1.24 | | | | | | (0.29) | | | | | | 559,237 | | | | | | 5 | | |
| 12-31-14 | | | | | 30.60 | | | | | | 0.09 | | | | | | 1.19 | | | | | | 1.28 | | | | | | 0.02 | | | | | | 0.47 | | | | | | — | | | | | | 0.49 | | | | | | — | | | | | | 31.39 | | | | | | 4.34 | | | | | | 1.23 | | | | | | 1.23 | | | | | | 1.23 | | | | | | 0.26 | | | | | | 694,762 | | | | | | 10 | | |
| 12-31-13 | | | | | 23.18 | | | | | | 0.01 | | | | | | 8.83 | | | | | | 8.84 | | | | | | 0.36 | | | | | | 1.06 | | | | | | — | | | | | | 1.42 | | | | | | — | | | | | | 30.60 | | | | | | 38.85 | | | | | | 1.24 | | | | | | 1.24 | | | | | | 1.24 | | | | | | 0.09 | | | | | | 798,221 | | | | | | 8 | | |
| 12-31-12 | | | | | 19.37 | | | | | | 0.35• | | | | | | 3.46 | | | | | | 3.81 | | | | | | — | | | | | | — | | | | | | — | | | | | | — | | | | | | — | | | | | | 23.18 | | | | | | 19.67 | | | | | | 1.27 | | | | | | 1.27 | | | | | | 1.27 | | | | | | 1.65 | | | | | | 551,582 | | | | | | 15 | | |
| 12-31-11 | | | | | 18.95 | | | | | | (0.14)• | | | | | | 0.56 | | | | | | 0.42 | | | | | | — | | | | | | — | | | | | | — | | | | | | — | | | | | | — | | | | | | 19.37 | | | | | | 2.22 | | | | | | 1.33 | | | | | | 1.31 | | | | | | 1.31 | | | | | | (0.72) | | | | | | 526,672 | | | | | | 14 | | |
| Class S2 | | | | | | | | | | | | | | | | | | | | | | | | | | | | | | | | | | | | | | | | | | | | | | | | | | | | | | | | | | | | | | | | | | | | | | | | | | | | | | | | | | | | | | | | | | | | | | | | | | | | | | | |
| 12-31-15 | | | | | 30.43 | | | | | | (0.13) | | | | | | (1.24) | | | | | | (1.37) | | | | | | 0.05 | | | | | | 2.36 | | | | | | — | | | | | | 2.41 | | | | | | — | | | | | | 26.65 | | | | | | (5.17) | | | | | | 1.49 | | | | | | 1.39 | | | | | | 1.39 | | | | | | (0.44) | | | | | | 5,696 | | | | | | 5 | | |
| 12-31-14 | | | | | 29.75 | | | | | | 0.02 | | | | | | 1.17 | | | | | | 1.19 | | | | | | 0.04 | | | | | | 0.47 | | | | | | — | | | | | | 0.51 | | | | | | — | | | | | | 30.43 | | | | | | 4.17 | | | | | | 1.48 | | | | | | 1.38 | | | | | | 1.38 | | | | | | 0.05 | | | | | | 6,874 | | | | | | 10 | | |
| 12-31-13 | | | | | 22.62 | | | | | | (0.03)• | | | | | | 8.61 | | | | | | 8.58 | | | | | | 0.39 | | | | | | 1.06 | | | | | | — | | | | | | 1.45 | | | | | | — | | | | | | 29.75 | | | | | | 38.68 | | | | | | 1.49 | | | | | | 1.39 | | | | | | 1.39 | | | | | | (0.11) | | | | | | 6,312 | | | | | | 8 | | |
| 12-31-12 | | | | | 18.93 | | | | | | 0.36• | | | | | | 3.33 | | | | | | 3.69 | | | | | | — | | | | | | — | | | | | | — | | | | | | — | | | | | | — | | | | | | 22.62 | | | | | | 19.49 | | | | | | 1.52 | | | | | | 1.42 | | | | | | 1.42 | | | | | | 1.70 | | | | | | 1,427 | | | | | | 15 | | |
| 12-31-11 | | | | | 18.55 | | | | | | (0.13)• | | | | | | 0.51 | | | | | | 0.38 | | | | | | — | | | | | | — | | | | | | — | | | | | | — | | | | | | — | | | | | | 18.93 | | | | | | 2.05 | | | | | | 1.58 | | | | | | 1.48 | | | | | | 1.48 | | | | | | (0.68) | | | | | | 339 | | | | | | 14 | | |
VY® Columbia Contrarian Core Portfolio | | | | | | | | | | | | | | | | | | | | | | | | | | | | | | | | | | | | | | | | | | | | | | | | | | | | | | | | | | | | | | | | | | | | | | | | | | | | | | | | | | | | | | | | | | | | | | | | | | | | | | | |
| Class ADV | | | | | | | | | | | | | | | | | | | | | | | | | | | | | | | | | | | | | | | | | | | | | | | | | | | | | | | | | | | | | | | | | | | | | | | | | | | | | | | | | | | | | | | | | | | | | | | | | | | | | | | |
| 12-31-15 | | | | | 24.00 | | | | | | 0.12• | | | | | | 0.58 | | | | | | 0.70 | | | | | | 0.18 | | | | | | 2.79 | | | | | | — | | | | | | 2.97 | | | | | | — | | | | | | 21.73 | | | | | | 2.75 | | | | | | 1.44 | | | | | | 1.18 | | | | | | 1.17 | | | | | | 0.51 | | | | | | 22,738 | | | | | | 65 | | |
| 12-31-14 | | | | | 24.56 | | | | | | 0.14• | | | | | | 2.70 | | | | | | 2.84 | | | | | | 0.17 | | | | | | 3.23 | | | | | | — | | | | | | 3.40 | | | | | | — | | | | | | 24.00 | | | | | | 12.50 | | | | | | 1.44 | | | | | | 1.18 | | | | | | 1.17 | | | | | | 0.56 | | | | | | 17,942 | | | | | | 72 | | |
| 12-31-13 | | | | | 18.49 | | | | | | 0.11 | | | | | | 6.23 | | | | | | 6.34 | | | | | | 0.27 | | | | | | — | | | | | | — | | | | | | 0.27 | | | | | | — | | | | | | 24.56 | | | | | | 34.42 | | | | | | 1.46 | | | | | | 1.24 | | | | | | 1.23 | | | | | | 0.55 | | | | | | 15,554 | | | | | | 128 | | |
| 12-31-12 | | | | | 16.53 | | | | | | 0.15 | | | | | | 1.83 | | | | | | 1.98 | | | | | | 0.02 | | | | | | — | | | | | | — | | | | | | 0.02 | | | | | | — | | | | | | 18.49 | | | | | | 11.99 | | | | | | 1.44 | | | | | | 1.25 | | | | | | 1.25 | | | | | | 0.86 | | | | | | 10,347 | | | | | | 20 | | |
| 12-31-11 | | | | | 17.57 | | | | | | 0.05• | | | | | | (0.93) | | | | | | (0.88) | | | | | | 0.16 | | | | | | — | | | | | | — | | | | | | 0.16 | | | | | | — | | | | | | 16.53 | | | | | | (4.92) | | | | | | 1.40 | | | | | | 1.38 | | | | | | 1.38 | | | | | | 0.31 | | | | | | 9,266 | | | | | | 12 | | |
See Accompanying Notes to Financial Statements
Financial Highlights (continued)
| | | | | | | | | | Income
(loss) from
investment
operations | | | | | | | | | Less
Distributions | | | | | | Ratios to average
net assets | | | Supplemental
Data | |
| | | | Net asset value, beginning
of year or period | | | Net investment income (loss) | | | Net realized and unrealized
gain (loss) | | | Total from investment operations | | | From net investment income | | | From net realized gains | | | From return of capital | | | Total distributions | | | Payment by affiliate | | | Net asset value, end of year
or period | | | Total Return(1) | | | Expenses before
reductions/additions(2)(3)(4) | | | Expenses net of fee waivers
and/or recoupments if any(2)(3)(4) | | | Expense net of all
reductions/additions(2)(3)(4) | | | Net investment
income (loss)(2)(3) | | | Net assets, end of year
or period | | | Portfolio turnover rate | |
Year or
period ended | | | ($) | | | ($) | | | ($) | | | ($) | | | ($) | | | ($) | | | ($) | | | ($) | | | ($) | | | ($) | | | (%) | | | (%) | | | (%) | | | (%) | | | (%) | | | ($000’s) | | | (%) | |
VY® Columbia Contrarian Core Portfolio (continued) | | | | | | | | | | | | | | | | | | | | | | | | | | | | | | | | | | | | | | | | | | | | | | | | | | | | | | | | | | | | | | | | | | | | | | | | | | | | | | | | | | | | | | | | | | | | | | | | | | | | | | | |
| Class I | | | | | | | | | | | | | | | | | | | | | | | | | | | | | | | | | | | | | | | | | | | | | | | | | | | | | | | | | | | | | | | | | | | | | | | | | | | | | | | | | | | | | | | | | | | | | | | | | | | | | | | |
| 12-31-15 | | | | | 24.82 | | | | | | 0.24• | | | | | | 0.60 | | | | | | 0.84 | | | | | | 0.28 | | | | | | 2.79 | | | | | | — | | | | | | 3.07 | | | | | | — | | | | | | 22.59 | | | | | | 3.25 | | | | | | 0.94 | | | | | | 0.68 | | | | | | 0.67 | | | | | | 1.01 | | | | | | 10,628 | | | | | | 65 | | |
| 12-31-14 | | | | | 25.24 | | | | | | 0.27 | | | | | | 2.79 | | | | | | 3.06 | | | | | | 0.25 | | | | | | 3.23 | | | | | | — | | | | | | 3.48 | | | | | | — | | | | | | 24.82 | | | | | | 13.09 | | | | | | 0.94 | | | | | | 0.68 | | | | | | 0.67 | | | | | | 1.07 | | | | | | 11,751 | | | | | | 72 | | |
| 12-31-13 | | | | | 18.96 | | | | | | 0.18• | | | | | | 6.45 | | | | | | 6.63 | | | | | | 0.35 | | | | | | — | | | | | | — | | | | | | 0.35 | | | | | | — | | | | | | 25.24 | | | | | | 35.18 | | | | | | 0.96 | | | | | | 0.74 | | | | | | 0.72 | | | | | | 0.87 | | | | | | 10,991 | | | | | | 128 | | |
| 12-31-12 | | | | | 16.94 | | | | | | 0.25• | | | | | | 1.87 | | | | | | 2.12 | | | | | | 0.10 | | | | | | — | | | | | | — | | | | | | 0.10 | | | | | | — | | | | | | 18.96 | | | | | | 12.56 | | | | | | 0.94 | | | | | | 0.75 | | | | | | 0.75 | | | | | | 1.37 | | | | | | 92,694 | | | | | | 20 | | |
| 12-31-11 | | | | | 17.99 | | | | | | 0.14 | | | | | | (0.97) | | | | | | (0.83) | | | | | | 0.22 | | | | | | — | | | | | | — | | | | | | 0.22 | | | | | | — | | | | | | 16.94 | | | | | | (4.52) | | | | | | 0.90 | | | | | | 0.88 | | | | | | 0.88 | | | | | | 0.80 | | | | | | 109,831 | | | | | | 12 | | |
| Class S | | | | | | | | | | | | | | | | | | | | | | | | | | | | | | | | | | | | | | | | | | | | | | | | | | | | | | | | | | | | | | | | | | | | | | | | | | | | | | | | | | | | | | | | | | | | | | | | | | | | | | | |
| 12-31-15 | | | | | 24.45 | | | | | | 0.18• | | | | | | 0.58 | | | | | | 0.76 | | | | | | 0.21 | | | | | | 2.79 | | | | | | — | | | | | | 3.00 | | | | | | — | | | | | | 22.21 | | | | | | 2.98 | | | | | | 1.19 | | | | | | 0.93 | | | | | | 0.92 | | | | | | 0.76 | | | | | | 304,352 | | | | | | 65 | | |
| 12-31-14 | | | | | 24.93 | | | | | | 0.21 | | | | | | 2.75 | | | | | | 2.96 | | | | | | 0.21 | | | | | | 3.23 | | | | | | — | | | | | | 3.44 | | | | | | — | | | | | | 24.45 | | | | | | 12.81 | | | | | | 1.19 | | | | | | 0.93 | | | | | | 0.92 | | | | | | 0.82 | | | | | | 331,659 | | | | | | 72 | | |
| 12-31-13 | | | | | 18.75 | | | | | | 0.18• | | | | | | 6.30 | | | | | | 6.48 | | | | | | 0.30 | | | | | | — | | | | | | — | | | | | | 0.30 | | | | | | — | | | | | | 24.93 | | | | | | 34.74 | | | | | | 1.21 | | | | | | 0.99 | | | | | | 0.98 | | | | | | 0.80 | | | | | | 327,459 | | | | | | 128 | | |
| 12-31-12 | | | | | 16.75 | | | | | | 0.20• | | | | | | 1.85 | | | | | | 2.05 | | | | | | 0.05 | | | | | | — | | | | | | — | | | | | | 0.05 | | | | | | — | | | | | | 18.75 | | | | | | 12.27 | | | | | | 1.19 | | | | | | 1.00 | | | | | | 1.00 | | | | | | 1.09 | | | | | | 272,420 | | | | | | 20 | | |
| 12-31-11 | | | | | 17.76 | | | | | | 0.09• | | | | | | (0.93) | | | | | | (0.84) | | | | | | 0.17 | | | | | | — | | | | | | — | | | | | | 0.17 | | | | | | — | | | | | | 16.75 | | | | | | (4.63) | | | | | | 1.15 | | | | | | 1.13 | | | | | | 1.13 | | | | | | 0.56 | | | | | | 270,261 | | | | | | 12 | | |
VY® Columbia Small Cap Value II Portfolio | | | | | | | | | | | | | | | | | | | | | | | | | | | | | | | | | | | | | | | | | | | | | | | | | | | | | | | | | | | | | | | | | | | | | | | | | | | | | | | | | | | | | | | | | | | | | | | | | | | | | | | |
| Class ADV | | | | | | | | | | | | | | | | | | | | | | | | | | | | | | | | | | | | | | | | | | | | | | | | | | | | | | | | | | | | | | | | | | | | | | | | | | | | | | | | | | | | | | | | | | | | | | | | | | | | | | | |
| 12-31-15 | | | | | 16.23 | | | | | | 0.00* | | | | | | (0.52) | | | | | | (0.52) | | | | | | 0.04 | | | | | | — | | | | | | — | | | | | | 0.04 | | | | | | — | | | | | | 15.67 | | | | | | (3.21) | | | | | | 1.39 | | | | | | 1.36 | | | | | | 1.35 | | | | | | 0.00* | | | | | | 27,978 | | | | | | 53 | | |
| 12-31-14 | | | | | 15.63 | | | | | | 0.03• | | | | | | 0.61 | | | | | | 0.64 | | | | | | 0.04 | | | | | | — | | | | | | — | | | | | | 0.04 | | | | | | — | | | | | | 16.23 | | | | | | 4.12 | | | | | | 1.39 | | | | | | 1.36 | | | | | | 1.35 | | | | | | 0.18 | | | | | | 30,927 | | | | | | 52 | | |
| 12-31-13 | | | | | 11.28 | | | | | | 0.01• | | | | | | 4.44 | | | | | | 4.45 | | | | | | 0.10 | | | | | | — | | | | | | — | | | | | | 0.10 | | | | | | — | | | | | | 15.63 | | | | | | 39.58 | | | | | | 1.38 | | | | | | 1.36 | | | | | | 1.36 | | | | | | 0.10 | | | | | | 12,246 | | | | | | 39 | | |
| 12-31-12 | | | | | 9.92 | | | | | | 0.06 | | | | | | 1.33 | | | | | | 1.39 | | | | | | 0.03 | | | | | | — | | | | | | — | | | | | | 0.03 | | | | | | — | | | | | | 11.28 | | | | | | 14.01 | | | | | | 1.39 | | | | | | 1.39 | | | | | | 1.37 | | | | | | 0.69 | | | | | | 6,763 | | | | | | 44 | | |
| 12-31-11 | | | | | 10.29 | | | | | | (0.01) | | | | | | (0.30) | | | | | | (0.31) | | | | | | 0.06 | | | | | | — | | | | | | — | | | | | | 0.06 | | | | | | — | | | | | | 9.92 | | | | | | (2.96) | | | | | | 1.40 | | | | | | 1.40 | | | | | | 1.38 | | | | | | 0.06 | | | | | | 4,677 | | | | | | 36 | | |
| Class I | | | | | | | | | | | | | | | | | | | | | | | | | | | | | | | | | | | | | | | | | | | | | | | | | | | | | | | | | | | | | | | | | | | | | | | | | | | | | | | | | | | | | | | | | | | | | | | | | | | | | | | |
| 12-31-15 | | | | | 16.67 | | | | | | 0.09 | | | | | | (0.54) | | | | | | (0.45) | | | | | | 0.10 | | | | | | — | | | | | | — | | | | | | 0.10 | | | | | | — | | | | | | 16.12 | | | | | | (2.74) | | | | | | 0.89 | | | | | | 0.86 | | | | | | 0.85 | | | | | | 0.50 | | | | | | 42,845 | | | | | | 53 | | |
| 12-31-14 | | | | | 15.99 | | | | | | 0.11• | | | | | | 0.63 | | | | | | 0.74 | | | | | | 0.06 | | | | | | — | | | | | | — | | | | | | 0.06 | | | | | | — | | | | | | 16.67 | | | | | | 4.68 | | | | | | 0.89 | | | | | | 0.86 | | | | | | 0.85 | | | | | | 0.67 | | | | | | 49,412 | | | | | | 52 | | |
| 12-31-13 | | | | | 11.51 | | | | | | 0.08• | | | | | | 4.54 | | | | | | 4.62 | | | | | | 0.14 | | | | | | — | | | | | | — | | | | | | 0.14 | | | | | | — | | | | | | 15.99 | | | | | | 40.27 | | | | | | 0.88 | | | | | | 0.86 | | | | | | 0.86 | | | | | | 0.60 | | | | | | 23,620 | | | | | | 39 | | |
| 12-31-12 | | | | | 10.10 | | | | | | 0.12• | | | | | | 1.35 | | | | | | 1.47 | | | | | | 0.06 | | | | | | — | | | | | | — | | | | | | 0.06 | | | | | | — | | | | | | 11.51 | | | | | | 14.56 | | | | | | 0.89 | | | | | | 0.89 | | | | | | 0.87 | | | | | | 1.14 | | | | | | 16,180 | | | | | | 44 | | |
| 12-31-11 | | | | | 10.44 | | | | | | 0.03• | | | | | | (0.30) | | | | | | (0.27) | | | | | | 0.07 | | | | | | — | | | | | | — | | | | | | 0.07 | | | | | | — | | | | | | 10.10 | | | | | | (2.48) | | | | | | 0.90 | | | | | | 0.90 | | | | | | 0.88 | | | | | | 0.31 | | | | | | 17,304 | | | | | | 36 | | |
| Class S | | | | | | | | | | | | | | | | | | | | | | | | | | | | | | | | | | | | | | | | | | | | | | | | | | | | | | | | | | | | | | | | | | | | | | | | | | | | | | | | | | | | | | | | | | | | | | | | | | | | | | | |
| 12-31-15 | | | | | 16.58 | | | | | | 0.05 | | | | | | (0.54) | | | | | | (0.49) | | | | | | 0.05 | | | | | | — | | | | | | — | | | | | | 0.05 | | | | | | — | | | | | | 16.04 | | | | | | (2.95) | | | | | | 1.14 | | | | | | 1.11 | | | | | | 1.10 | | | | | | 0.24 | | | | | | 135,313 | | | | | | 53 | | |
| 12-31-14 | | | | | 15.92 | | | | | | 0.06 | | | | | | 0.63 | | | | | | 0.69 | | | | | | 0.03 | | | | | | — | | | | | | — | | | | | | 0.03 | | | | | | — | | | | | | 16.58 | | | | | | 4.33 | | | | | | 1.14 | | | | | | 1.11 | | | | | | 1.10 | | | | | | 0.36 | | | | | | 160,726 | | | | | | 52 | | |
| 12-31-13 | | | | | 11.46 | | | | | | 0.05• | | | | | | 4.52 | | | | | | 4.57 | | | | | | 0.11 | | | | | | — | | | | | | — | | | | | | 0.11 | | | | | | — | | | | | | 15.92 | | | | | | 39.97 | | | | | | 1.13 | | | | | | 1.11 | | | | | | 1.11 | | | | | | 0.34 | | | | | | 161,750 | | | | | | 39 | | |
| 12-31-12 | | | | | 10.06 | | | | | | 0.10• | | | | | | 1.33 | | | | | | 1.43 | | | | | | 0.03 | | | | | | — | | | | | | — | | | | | | 0.03 | | | | | | — | | | | | | 11.46 | | | | | | 14.20 | | | | | | 1.14 | | | | | | 1.14 | | | | | | 1.12 | | | | | | 0.88 | | | | | | 135,653 | | | | | | 44 | | |
| 12-31-11 | | | | | 10.39 | | | | | | 0.03 | | | | | | (0.32) | | | | | | (0.29) | | | | | | 0.04 | | | | | | — | | | | | | — | | | | | | 0.04 | | | | | | — | | | | | | 10.06 | | | | | | (2.69) | | | | | | 1.15 | | | | | | 1.15 | | | | | | 1.13 | | | | | | 0.21 | | | | | | 138,626 | | | | | | 36 | | |
| Class S2 | | | | | | | | | | | | | | | | | | | | | | | | | | | | | | | | | | | | | | | | | | | | | | | | | | | | | | | | | | | | | | | | | | | | | | | | | | | | | | | | | | | | | | | | | | | | | | | | | | | | | | | |
| 12-31-15 | | | | | 16.20 | | | | | | 0.02• | | | | | | (0.53) | | | | | | (0.51) | | | | | | 0.07 | | | | | | — | | | | | | — | | | | | | 0.07 | | | | | | — | | | | | | 15.62 | | | | | | (3.19) | | | | | | 1.39 | | | | | | 1.26 | | | | | | 1.25 | | | | | | 0.12 | | | | | | 4,834 | | | | | | 53 | | |
| 12-31-14 | | | | | 15.59 | | | | | | 0.05• | | | | | | 0.61 | | | | | | 0.66 | | | | | | 0.05 | | | | | | — | | | | | | — | | | | | | 0.05 | | | | | | — | | | | | | 16.20 | | | | | | 4.28 | | | | | | 1.39 | | | | | | 1.26 | | | | | | 1.25 | | | | | | 0.30 | | | | | | 3,967 | | | | | | 52 | | |
| 12-31-13 | | | | | 11.24 | | | | | | 0.02 | | | | | | 4.43 | | | | | | 4.45 | | | | | | 0.10 | | | | | | — | | | | | | — | | | | | | 0.10 | | | | | | — | | | | | | 15.59 | | | | | | 39.68 | | | | | | 1.38 | | | | | | 1.26 | | | | | | 1.26 | | | | | | 0.19 | | | | | | 978 | | | | | | 39 | | |
| 12-31-12 | | | | | 9.90 | | | | | | 0.07 | | | | | | 1.32 | | | | | | 1.39 | | | | | | 0.05 | | | | | | — | | | | | | — | | | | | | 0.05 | | | | | | — | | | | | | 11.24 | | | | | | 14.07 | | | | | | 1.39 | | | | | | 1.29 | | | | | | 1.27 | | | | | | 0.76 | | | | | | 604 | | | | | | 44 | | |
| 12-31-11 | | | | | 10.27 | | | | | | 0.04 | | | | | | (0.35) | | | | | | (0.31) | | | | | | 0.06 | | | | | | — | | | | | | — | | | | | | 0.06 | | | | | | — | | | | | | 9.90 | | | | | | (2.88) | | | | | | 1.40 | | | | | | 1.30 | | | | | | 1.28 | | | | | | 0.49 | | | | | | 436 | | | | | | 36 | | |
See Accompanying Notes to Financial Statements
Financial Highlights (continued)
| | | | | | | | | | Income
(loss) from
investment
operations | | | | | | | | | Less
Distributions | | | | | | Ratios to average
net assets | | | Supplemental
Data | |
| | | | Net asset value, beginning
of year or period | | | Net investment income (loss) | | | Net realized and unrealized
gain (loss) | | | Total from investment operations | | | From net investment income | | | From net realized gains | | | From return of capital | | | Total distributions | | | Payment by affiliate | | | Net asset value, end of year
or period | | | Total Return(1) | | | Expenses before
reductions/additions(2)(3)(4) | | | Expenses net of fee waivers
and/or recoupments if any(2)(3)(4) | | | Expense net of all
reductions/additions(2)(3)(4) | | | Net investment
income (loss)(2)(3) | | | Net assets, end of year
or period | | | Portfolio turnover rate | |
Year or
period ended | | | ($) | | | ($) | | | ($) | | | ($) | | | ($) | | | ($) | | | ($) | | | ($) | | | ($) | | | ($) | | | (%) | | | (%) | | | (%) | | | (%) | | | (%) | | | ($000’s) | | | (%) | |
VY® Invesco Comstock Portfolio | | | | | | | | | | | | | | | | | | | | | | | | | | | | | | | | | | | | | | | | | | | | | | | | | | | | | | | | | | | | | | | | | | | | | | | | | | | | | | | | | | | | | | | | | | | | | | | | | | | | | | | |
| Class ADV | | | | | | | | | | | | | | | | | | | | | | | | | | | | | | | | | | | | | | | | | | | | | | | | | | | | | | | | | | | | | | | | | | | | | | | | | | | | | | | | | | | | | | | | | | | | | | | | | | | | | | | |
| 12-31-15 | | | | | 16.42 | | | | | | 0.17• | | | | | | (1.18) | | | | | | (1.01) | | | | | | 0.34 | | | | | | — | | | | | | — | | | | | | 0.34 | | | | | | — | | | | | | 15.07 | | | | | | (6.19) | | | | | | 1.24 | | | | | | 1.22 | | | | | | 1.22 | | | | | | 1.08 | | | | | | 34,395 | | | | | | 24 | | |
| 12-31-14 | | | | | 15.34 | | | | | | 0.19 | | | | | | 1.17 | | | | | | 1.36 | | | | | | 0.28 | | | | | | — | | | | | | — | | | | | | 0.28 | | | | | | — | | | | | | 16.42 | | | | | | 8.82 | | | | | | 1.24 | | | | | | 1.22 | | | | | | 1.22 | | | | | | 1.20 | | | | | | 41,258 | | | | | | 26 | | |
| 12-31-13 | | | | | 11.44 | | | | | | 0.11 | | | | | | 3.87 | | | | | | 3.98 | | | | | | 0.08 | | | | | | — | | | | | | — | | | | | | 0.08 | | | | | | — | | | | | | 15.34 | | | | | | 34.79 | | | | | | 1.24 | | | | | | 1.24 | | | | | | 1.24 | | | | | | 0.87 | | | | | | 36,783 | | | | | | 15 | | |
| 12-31-12 | | | | | 9.77 | | | | | | 0.13 | | | | | | 1.66 | | | | | | 1.79 | | | | | | 0.12 | | | | | | — | | | | | | — | | | | | | 0.12 | | | | | | — | | | | | | 11.44 | | | | | | 18.30 | | | | | | 1.28 | | | | | | 1.27 | | | | | | 1.26 | | | | | | 1.25 | | | | | | 22,633 | | | | | | 18 | | |
| 12-31-11 | | | | | 10.13 | | | | | | 0.11 | | | | | | (0.35) | | | | | | (0.24) | | | | | | 0.12 | | | | | | — | | | | | | — | | | | | | 0.12 | | | | | | — | | | | | | 9.77 | | | | | | (2.32) | | | | | | 1.35 | | | | | | 1.31 | | | | | | 1.31 | | | | | | 1.09 | | | | | | 17,338 | | | | | | 23 | | |
| Class I | | | | | | | | | | | | | | | | | | | | | | | | | | | | | | | | | | | | | | | | | | | | | | | | | | | | | | | | | | | | | | | | | | | | | | | | | | | | | | | | | | | | | | | | | | | | | | | | | | | | | | | |
| 12-31-15 | | | | | 16.55 | | | | | | 0.26• | | | | | | (1.20) | | | | | | (0.94) | | | | | | 0.43 | | | | | | — | | | | | | — | | | | | | 0.43 | | | | | | — | | | | | | 15.18 | | | | | | (5.76) | | | | | | 0.74 | | | | | | 0.72 | | | | | | 0.72 | | | | | | 1.62 | | | | | | 198,367 | | | | | | 24 | | |
| 12-31-14 | | | | | 15.45 | | | | | | 0.28 | | | | | | 1.17 | | | | | | 1.45 | | | | | | 0.35 | | | | | | — | | | | | | — | | | | | | 0.35 | | | | | | — | | | | | | 16.55 | | | | | | 9.39 | | | | | | 0.74 | | | | | | 0.72 | | | | | | 0.72 | | | | | | 1.70 | | | | | | 143,633 | | | | | | 26 | �� | |
| 12-31-13 | | | | | 11.51 | | | | | | 0.19 | | | | | | 3.89 | | | | | | 4.08 | | | | | | 0.14 | | | | | | — | | | | | | — | | | | | | 0.14 | | | | | | — | | | | | | 15.45 | | | | | | 35.47 | | | | | | 0.74 | | | | | | 0.74 | | | | | | 0.74 | | | | | | 1.38 | | | | | | 58,373 | | | | | | 15 | | |
| 12-31-12 | | | | | 9.83 | | | | | | 0.19• | | | | | | 1.66 | | | | | | 1.85 | | | | | | 0.17 | | | | | | — | | | | | | — | | | | | | 0.17 | | | | | | — | | | | | | 11.51 | | | | | | 18.83 | | | | | | 0.78 | | | | | | 0.77 | | | | | | 0.76 | | | | | | 1.74 | | | | | | 48,793 | | | | | | 18 | | |
| 12-31-11 | | | | | 10.19 | | | | | | 0.16 | | | | | | (0.35) | | | | | | (0.19) | | | | | | 0.17 | | | | | | — | | | | | | — | | | | | | 0.17 | | | | | | — | | | | | | 9.83 | | | | | | (1.81) | | | | | | 0.85 | | | | | | 0.81 | | | | | | 0.81 | | | | | | 1.59 | | | | | | 45,814 | | | | | | 23 | | |
| Class S | | | | | | | | | | | | | | | | | | | | | | | | | | | | | | | | | | | | | | | | | | | | | | | | | | | | | | | | | | | | | | | | | | | | | | | | | | | | | | | | | | | | | | | | | | | | | | | | | | | | | | | |
| 12-31-15 | | | | | 16.53 | | | | | | 0.22• | | | | | | (1.20) | | | | | | (0.98) | | | | | | 0.38 | | | | | | — | | | | | | — | | | | | | 0.38 | | | | | | — | | | | | | 15.17 | | | | | | (5.97) | | | | | | 0.99 | | | | | | 0.97 | | | | | | 0.97 | | | | | | 1.33 | | | | | | 302,784 | | | | | | 24 | | |
| 12-31-14 | | | | | 15.43 | | | | | | 0.24 | | | | | | 1.17 | | | | | | 1.41 | | | | | | 0.31 | | | | | | — | | | | | | — | | | | | | 0.31 | | | | | | — | | | | | | 16.53 | | | | | | 9.13 | | | | | | 0.99 | | | | | | 0.97 | | | | | | 0.97 | | | | | | 1.44 | | | | | | 383,997 | | | | | | 26 | | |
| 12-31-13 | | | | | 11.51 | | | | | | 0.15 | | | | | | 3.88 | | | | | | 4.03 | | | | | | 0.11 | | | | | | — | | | | | | — | | | | | | 0.11 | | | | | | — | | | | | | 15.43 | | | | | | 35.00 | | | | | | 0.99 | | | | | | 0.99 | | | | | | 0.99 | | | | | | 1.13 | | | | | | 367,659 | | | | | | 15 | | |
| 12-31-12 | | | | | 9.82 | | | | | | 0.16• | | | | | | 1.67 | | | | | | 1.83 | | | | | | 0.14 | | | | | | — | | | | | | — | | | | | | 0.14 | | | | | | — | | | | | | 11.51 | | | | | | 18.66 | | | | | | 1.03 | | | | | | 1.02 | | | | | | 1.01 | | | | | | 1.49 | | | | | | 259,717 | | | | | | 18 | | |
| 12-31-11 | | | | | 10.18 | | | | | | 0.15 | | | | | | (0.37) | | | | | | (0.22) | | | | | | 0.14 | | | | | | — | | | | | | — | | | | | | 0.14 | | | | | | — | | | | | | 9.82 | | | | | | (2.09) | | | | | | 1.10 | | | | | | 1.06 | | | | | | 1.06 | | | | | | 1.34 | | | | | | 238,369 | | | | | | 23 | | |
VY® Invesco Equity and Income Portfolio | | | | | | | | | | | | | | | | | | | | | | | | | | | | | | | | | | | | | | | | | | | | | | | | | | | | | | | | | | | | | | | | | | | | | | | | | | | | | | | | | | | | | | | | | | | | | | | | | | | | | | | |
| Class ADV | | | | | | | | | | | | | | | | | | | | | | | | | | | | | | | | | | | | | | | | | | | | | | | | | | | | | | | | | | | | | | | | | | | | | | | | | | | | | | | | | | | | | | | | | | | | | | | | | | | | | | | |
| 12-31-15 | | | | | 46.25 | | | | | | 0.46 | | | | | | (1.47) | | | | | | (1.01) | | | | | | 0.79 | | | | | | 3.65 | | | | | | — | | | | | | 4.44 | | | | | | — | | | | | | 40.80 | | | | | | (2.55) | | | | | | 1.16 | | | | | | 1.14 | | | | | | 1.14 | | | | | | 1.04 | | | | | | 49,572 | | | | | | 140 | | |
| 12-31-14 | | | | | 44.34 | | | | | | 0.61• | | | | | | 3.09 | | | | | | 3.70 | | | | | | 0.55 | | | | | | 1.24 | | | | | | — | | | | | | 1.79 | | | | | | — | | | | | | 46.25 | | | | | | 8.43 | | | | | | 1.16 | | | | | | 1.14 | | | | | | 1.14 | | | | | | 1.34 | | | | | | 52,407 | | | | | | 157 | | |
| 12-31-13 | | | | | 36.01 | | | | | | 0.49• | | | | | | 8.27 | | | | | | 8.76 | | | | | | 0.43 | | | | | | — | | | | | | — | | | | | | 0.43 | | | | | | — | | | | | | 44.34 | | | | | | 24.33 | | | | | | 1.18 | | | | | | 1.15 | | | | | | 1.15 | | | | | | 1.19 | | | | | | 32,942 | | | | | | 37 | | |
| 12-31-12 | | | | | 32.57 | | | | | | 0.53• | | | | | | 3.45 | | | | | | 3.98 | | | | | | 0.54 | | | | | | — | | | | | | — | | | | | | 0.54 | | | | | | — | | | | | | 36.01 | | | | | | 12.23 | | | | | | 1.18 | | | | | | 1.15 | | | | | | 1.15 | | | | | | 1.52 | | | | | | 19,776 | | | | | | 27 | | |
| 12-31-11 | | | | | 33.75 | | | | | | 0.49• | | | | | | (1.04) | | | | | | (0.55) | | | | | | 0.63 | | | | | | — | | | | | | — | | | | | | 0.63 | | | | | | — | | | | | | 32.57 | | | | | | (1.58) | | | | | | 1.15 | | | | | | 1.15 | | | | | | 1.15 | | | | | | 1.46 | | | | | | 22,313 | | | | | | 20 | | |
| Class I | | | | | | | | | | | | | | | | | | | | | | | | | | | | | | | | | | | | | | | | | | | | | | | | | | | | | | | | | | | | | | | | | | | | | | | | | | | | | | | | | | | | | | | | | | | | | | | | | | | | | | | |
| 12-31-15 | | | | | 46.93 | | | | | | 0.70• | | | | | | (1.50) | | | | | | (0.80) | | | | | | 1.01 | | | | | | 3.65 | | | | | | — | | | | | | 4.66 | | | | | | — | | | | | | 41.47 | | | | | | (2.06) | | | | | | 0.66 | | | | | | 0.64 | | | | | | 0.64 | | | | | | 1.53 | | | | | | 600,309 | | | | | | 140 | | |
| 12-31-14 | | | | | 44.92 | | | | | | 0.87• | | | | | | 3.11 | | | | | | 3.98 | | | | | | 0.73 | | | | | | 1.24 | | | | | | — | | | | | | 1.97 | | | | | | — | | | | | | 46.93 | | | | | | 8.96 | | | | | | 0.66 | | | | | | 0.64 | | | | | | 0.64 | | | | | | 1.87 | | | | | | 694,569 | | | | | | 157 | | |
| 12-31-13 | | | | | 36.43 | | | | | | 0.71• | | | | | | 8.38 | | | | | | 9.09 | | | | | | 0.60 | | | | | | — | | | | | | — | | | | | | 0.60 | | | | | | — | | | | | | 44.92 | | | | | | 24.96 | | | | | | 0.68 | | | | | | 0.65 | | | | | | 0.65 | | | | | | 1.70 | | | | | | 561,393 | | | | | | 37 | | |
| 12-31-12 | | | | | 33.05 | | | | | | 0.71• | | | | | | 3.51 | | | | | | 4.22 | | | | | | 0.84 | | | | | | — | | | | | | — | | | | | | 0.84 | | | | | | — | | | | | | 36.43 | | | | | | 12.79 | | | | | | 0.68 | | | | | | 0.65 | | | | | | 0.65 | | | | | | 2.01 | | | | | | 499,847 | | | | | | 27 | | |
| 12-31-11 | | | | | 34.22 | | | | | | 0.66• | | | | | | (1.05) | | | | | | (0.39) | | | | | | 0.78 | | | | | | — | | | | | | — | | | | | | 0.78 | | | | | | — | | | | | | 33.05 | | | | | | (1.08) | | | | | | 0.65 | | | | | | 0.65 | | | | | | 0.65 | | | | | | 1.93 | | | | | | 530,983 | | | | | | 20 | | |
| Class S | | | | | | | | | | | | | | | | | | | | | | | | | | | | | | | | | | | | | | | | | | | | | | | | | | | | | | | | | | | | | | | | | | | | | | | | | | | | | | | | | | | | | | | | | | | | | | | | | | | | | | | |
| 12-31-15 | | | | | 46.59 | | | | | | 0.58• | | | | | | (1.49) | | | | | | (0.91) | | | | | | 0.89 | | | | | | 3.65 | | | | | | — | | | | | | 4.54 | | | | | | — | | | | | | 41.14 | | | | | | (2.31) | | | | | | 0.91 | | | | | | 0.89 | | | | | | 0.89 | | | | | | 1.28 | | | | | | 720,086 | | | | | | 140 | | |
| 12-31-14 | | | | | 44.65 | | | | | | 0.64• | | | | | | 3.20 | | | | | | 3.84 | | | | | | 0.66 | | | | | | 1.24 | | | | | | — | | | | | | 1.90 | | | | | | — | | | | | | 46.59 | | | | | | 8.69 | | | | | | 0.91 | | | | | | 0.89 | | | | | | 0.89 | | | | | | 1.39 | | | | | | 889,726 | | | | | | 157 | | |
| 12-31-13 | | | | | 36.23 | | | | | | 0.60• | | | | | | 8.32 | | | | | | 8.92 | | | | | | 0.50 | | | | | | — | | | | | | — | | | | | | 0.50 | | | | | | — | | | | | | 44.65 | | | | | | 24.64 | | | | | | 0.93 | | | | | | 0.90 | | | | | | 0.90 | | | | | | 1.45 | | | | | | 271,953 | | | | | | 37 | | |
| 12-31-12 | | | | | 32.81 | | | | | | 0.62• | | | | | | 3.48 | | | | | | 4.10 | | | | | | 0.68 | | | | | | — | | | | | | — | | | | | | 0.68 | | | | | | — | | | | | | 36.23 | | | | | | 12.52 | | | | | | 0.93 | | | | | | 0.90 | | | | | | 0.90 | | | | | | 1.76 | | | | | | 198,595 | | | | | | 27 | | |
| 12-31-11 | | | | | 33.97 | | | | | | 0.57• | | | | | | (1.04) | | | | | | (0.47) | | | | | | 0.69 | | | | | | — | | | | | | — | | | | | | 0.69 | | | | | | — | | | | | | 32.81 | | | | | | (1.33) | | | | | | 0.90 | | | | | | 0.90 | | | | | | 0.90 | | | | | | 1.67 | | | | | | 205,145 | | | | | | 20 | | |
See Accompanying Notes to Financial Statements
Financial Highlights (continued)
| | | | | | | | | | Income
(loss) from
investment
operations | | | | | | | | | Less
Distributions | | | | | | Ratios to average
net assets | | | Supplemental
Data | |
| | | | Net asset value, beginning
of year or period | | | Net investment income (loss) | | | Net realized and unrealized
gain (loss) | | | Total from investment operations | | | From net investment income | | | From net realized gains | | | From return of capital | | | Total distributions | | | Payment by affiliate | | | Net asset value, end of year
or period | | | Total Return(1) | | | Expenses before
reductions/additions(2)(3)(4) | | | Expenses net of fee waivers
and/or recoupments if any(2)(3)(4) | | | Expense net of all
reductions/additions(2)(3)(4) | | | Net investment
income (loss)(2)(3) | | | Net assets, end of year
or period | | | Portfolio turnover rate | |
Year or
period ended | | | ($) | | | ($) | | | ($) | | | ($) | | | ($) | | | ($) | | | ($) | | | ($) | | | ($) | | | ($) | | | (%) | | | (%) | | | (%) | | | (%) | | | (%) | | | ($000’s) | | | (%) | |
VY® Invesco Equity and Income Portfolio (continued) | | | | | | | | | | | | | | | | | | | | | | | | | | | | | | | | | | | | | | | | | | | | | | | | | | | | | | | | | | | | | | | | | | | | | | | | | | | | | | | | | | | | | | | | | | | | | | | | | | | | | | | |
| Class S2 | | | | | | | | | | | | | | | | | | | | | | | | | | | | | | | | | | | | | | | | | | | | | | | | | | | | | | | | | | | | | | | | | | | | | | | | | | | | | | | | | | | | | | | | | | | | | | | | | | | | | | | |
| 12-31-15 | | | | | 46.03 | | | | | | 0.51• | | | | | | (1.46) | | | | | | (0.95) | | | | | | 0.83 | | | | | | 3.65 | | | | | | — | | | | | | 4.48 | | | | | | — | | | | | | 40.60 | | | | | | (2.44) | | | | | | 1.16 | | | | | | 1.02 | | | | | | 1.02 | | | | | | 1.15 | | | | | | 443,119 | | | | | | 140 | | |
| 12-31-14 | | | | | 44.13 | | | | | | 0.43• | | | | | | 3.29 | | | | | | 3.72 | | | | | | 0.58 | | | | | | 1.24 | | | | | | — | | | | | | 1.82 | | | | | | — | | | | | | 46.03 | | | | | | 8.54 | | | | | | 1.16 | | | | | | 1.02 | | | | | | 1.02 | | | | | | 0.95 | | | | | | 522,608 | | | | | | 157 | | |
| 12-31-13 | | | | | 35.87 | | | | | | 0.54• | | | | | | 8.24 | | | | | | 8.78 | | | | | | 0.52 | | | | | | — | | | | | | — | | | | | | 0.52 | | | | | | — | | | | | | 44.13 | | | | | | 24.47 | | | | | | 1.18 | | | | | | 1.05 | | | | | | 1.05 | | | | | | 1.31 | | | | | | 4,078 | | | | | | 37 | | |
| 12-31-12 | | | | | 32.52 | | | | | | 0.56• | | | | | | 3.45 | | | | | | 4.01 | | | | | | 0.66 | | | | | | — | | | | | | — | | | | | | 0.66 | | | | | | — | | | | | | 35.87 | | | | | | 12.34 | | | | | | 1.18 | | | | | | 1.05 | | | | | | 1.05 | | | | | | 1.60 | | | | | | 1,540 | | | | | | 27 | | |
| 12-31-11 | | | | | 33.70 | | | | | | 0.52• | | | | | | (1.03) | | | | | | (0.51) | | | | | | 0.67 | | | | | | — | | | | | | — | | | | | | 0.67 | | | | | | — | | | | | | 32.52 | | | | | | (1.48) | | | | | | 1.15 | | | | | | 1.05 | | | | | | 1.05 | | | | | | 1.55 | | | | | | 967 | | | | | | 20 | | |
VY® JPMorgan Mid Cap Value Portfolio | | | | | | | | | | | | | | | | | | | | | | | | | | | | | | | | | | | | | | | | | | | | | | | | | | | | | | | | | | | | | | | | | | | | | | | | | | | | | | | | | | | | | | | | | | | | | | | | | | | | | | | |
| Class ADV | | | | | | | | | | | | | | | | | | | | | | | | | | | | | | | | | | | | | | | | | | | | | | | | | | | | | | | | | | | | | | | | | | | | | | | | | | | | | | | | | | | | | | | | | | | | | | | | | | | | | | | |
| 12-31-15 | | | | | 22.47 | | | | | | 0.06 | | | | | | (0.63) | | | | | | (0.57) | | | | | | 0.08 | | | | | | 3.16 | | | | | | — | | | | | | 3.24 | | | | | | — | | | | | | 18.66 | | | | | | (3.27) | | | | | | 1.36 | | | | | | 1.36 | | | | | | 1.36 | | | | | | 0.31 | | | | | | 90,818 | | | | | | 14 | | |
| 12-31-14 | | | | | 20.96 | | | | | | 0.11 | | | | | | 2.84 | | | | | | 2.95 | | | | | | 0.14 | | | | | | 1.30 | | | | | | — | | | | | | 1.44 | | | | | | — | | | | | | 22.47 | | | | | | 14.66 | | | | | | 1.36 | | | | | | 1.36 | | | | | | 1.36 | | | | | | 0.54 | | | | | | 91,446 | | | | | | 22 | | |
| 12-31-13 | | | | | 16.57 | | | | | | 0.06 | | | | | | 5.07 | | | | | | 5.13 | | | | | | 0.08 | | | | | | 0.66 | | | | | | — | | | | | | 0.74 | | | | | | — | | | | | | 20.96 | | | | | | 31.26 | | | | | | 1.36 | | | | | | 1.36 | | | | | | 1.36 | | | | | | 0.39 | | | | | | 78,395 | | | | | | 25 | | |
| 12-31-12 | | | | | 13.91 | | | | | | 0.09 | | | | | | 2.65 | | | | | | 2.74 | | | | | | 0.08 | | | | | | — | | | | | | — | | | | | | 0.08 | | | | | | — | | | | | | 16.57 | | | | | | 19.69 | | | | | | 1.43 | | | | | | 1.43 | | | | | | 1.43 | | | | | | 0.64 | | | | | | 42,637 | | | | | | 28 | | |
| 12-31-11 | | | | | 13.78 | | | | | | 0.07 | | | | | | 0.15 | | | | | | 0.22 | | | | | | 0.09 | | | | | | — | | | | | | — | | | | | | 0.09 | | | | | | — | | | | | | 13.91 | | | | | | 1.60 | | | | | | 1.50 | | | | | | 1.50 | | | | | | 1.50 | | | | | | 0.54 | | | | | | 30,671 | | | | | | 36 | | |
| Class I | | | | | | | | | | | | | | | | | | | | | | | | | | | | | | | | | | | | | | | | | | | | | | | | | | | | | | | | | | | | | | | | | | | | | | | | | | | | | | | | | | | | | | | | | | | | | | | | | | | | | | | |
| 12-31-15 | | | | | 22.85 | | | | | | 0.17 | | | | | | (0.64) | | | | | | (0.47) | | | | | | 0.18 | | | | | | 3.16 | | | | | | — | | | | | | 3.34 | | | | | | — | | | | | | 19.04 | | | | | | (2.77) | | | | | | 0.86 | | | | | | 0.86 | | | | | | 0.86 | | | | | | 0.80 | | | | | | 227,935 | | | | | | 14 | | |
| 12-31-14 | | | | | 21.27 | | | | | | 0.23 | | | | | | 2.89 | | | | | | 3.12 | | | | | | 0.24 | | | | | | 1.30 | | | | | | — | | | | | | 1.54 | | | | | | — | | | | | | 22.85 | | | | | | 15.27 | | | | | | 0.86 | | | | | | 0.86 | | | | | | 0.86 | | | | | | 1.02 | | | | | | 272,496 | | | | | | 22 | | |
| 12-31-13 | | | | | 16.79 | | | | | | 0.16 | | | | | | 5.14 | | | | | | 5.30 | | | | | | 0.16 | | | | | | 0.66 | | | | | | — | | | | | | 0.82 | | | | | | — | | | | | | 21.27 | | | | | | 31.89 | | | | | | 0.86 | | | | | | 0.86 | | | | | | 0.86 | | | | | | 0.88 | | | | | | 256,705 | | | | | | 25 | | |
| 12-31-12 | | | | | 14.08 | | | | | | 0.17 | | | | | | 2.69 | | | | | | 2.86 | | | | | | 0.15 | | | | | | — | | | | | | — | | | | | | 0.15 | | | | | | — | | | | | | 16.79 | | | | | | 20.33 | | | | | | 0.93 | | | | | | 0.93 | | | | | | 0.93 | | | | | | 1.15 | | | | | | 171,485 | | | | | | 28 | | |
| 12-31-11 | | | | | 13.95 | | | | | | 0.15 | | | | | | 0.13 | | | | | | 0.28 | | | | | | 0.15 | | | | | | — | | | | | | — | | | | | | 0.15 | | | | | | — | | | | | | 14.08 | | | | | | 2.07 | | | | | | 1.00 | | | | | | 1.00 | | | | | | 1.00 | | | | | | 1.03 | | | | | | 125,233 | | | | | | 36 | | |
| Class S | | | | | | | | | | | | | | | | | | | | | | | | | | | | | | | | | | | | | | | | | | | | | | | | | | | | | | | | | | | | | | | | | | | | | | | | | | | | | | | | | | | | | | | | | | | | | | | | | | | | | | | |
| 12-31-15 | | | | | 22.70 | | | | | | 0.12 | | | | | | (0.65) | | | | | | (0.53) | | | | | | 0.12 | | | | | | 3.16 | | | | | | — | | | | | | 3.28 | | | | | | — | | | | | | 18.89 | | | | | | (3.04) | | | | | | 1.11 | | | | | | 1.11 | | | | | | 1.11 | | | | | | 0.55 | | | | | | 298,607 | | | | | | 14 | | |
| 12-31-14 | | | | | 21.14 | | | | | | 0.18 | | | | | | 2.86 | | | | | | 3.04 | | | | | | 0.18 | | | | | | 1.30 | | | | | | — | | | | | | 1.48 | | | | | | — | | | | | | 22.70 | | | | | | 14.99 | | | | | | 1.11 | | | | | | 1.11 | | | | | | 1.11 | | | | | | 0.75 | | | | | | 352,277 | | | | | | 22 | | |
| 12-31-13 | | | | | 16.70 | | | | | | 0.11 | | | | | | 5.11 | | | | | | 5.22 | | | | | | 0.12 | | | | | | 0.66 | | | | | | — | | | | | | 0.78 | | | | | | — | | | | | | 21.14 | | | | | | 31.54 | | | | | | 1.11 | | | | | | 1.11 | | | | | | 1.11 | | | | | | 0.63 | | | | | | 380,688 | | | | | | 25 | | |
| 12-31-12 | | | | | 14.01 | | | | | | 0.13 | | | | | | 2.67 | | | | | | 2.80 | | | | | | 0.11 | | | | | | — | | | | | | — | | | | | | 0.11 | | | | | | — | | | | | | 16.70 | | | | | | 20.02 | | | | | | 1.18 | | | | | | 1.18 | | | | | | 1.18 | | | | | | 0.89 | | | | ��� | | 248,115 | | | | | | 28 | | |
| 12-31-11 | | | | | 13.88 | | | | | | 0.11 | | | | | | 0.14 | | | | | | 0.25 | | | | | | 0.12 | | | | | | — | | | | | | — | | | | | | 0.12 | | | | | | — | | | | | | 14.01 | | | | | | 1.82 | | | | | | 1.25 | | | | | | 1.25 | | | | | | 1.25 | | | | | | 0.78 | | | | | | 178,083 | | | | | | 36 | | |
| Class S2 | | | | | | | | | | | | | | | | | | | | | | | | | | | | | | | | | | | | | | | | | | | | | | | | | | | | | | | | | | | | | | | | | | | | | | | | | | | | | | | | | | | | | | | | | | | | | | | | | | | | | | | |
| 12-31-15 | | | | | 22.40 | | | | | | 0.08• | | | | | | (0.63) | | | | | | (0.55) | | | | | | 0.09 | | | | | | 3.16 | | | | | | — | | | | | | 3.25 | | | | | | — | | | | | | 18.60 | | | | | | (3.20) | | | | | | 1.36 | | | | | | 1.26 | | | | | | 1.26 | | | | | | 0.40 | | | | | | 3,906 | | | | | | 14 | | |
| 12-31-14 | | | | | 20.89 | | | | | | 0.13 | | | | | | 2.84 | | | | | | 2.97 | | | | | | 0.16 | | | | | | 1.30 | | | | | | — | | | | | | 1.46 | | | | | | — | | | | | | 22.40 | | | | | | 14.81 | | | | | | 1.36 | | | | | | 1.26 | | | | | | 1.26 | | | | | | 0.63 | | | | | | 5,643 | | | | | | 22 | | |
| 12-31-13 | | | | | 16.52 | | | | | | 0.10• | | | | | | 5.03 | | | | | | 5.13 | | | | | | 0.10 | | | | | | 0.66 | | | | | | — | | | | | | 0.76 | | | | | | — | | | | | | 20.89 | | | | | | 31.37 | | | | | | 1.36 | | | | | | 1.26 | | | | | | 1.26 | | | | | | 0.50 | | | | | | 5,066 | | | | | | 25 | | |
| 12-31-12 | | | | | 13.88 | | | | | | 0.14• | | | | | | 2.62 | | | | | | 2.76 | | | | | | 0.12 | | | | | | — | | | | | | — | | | | | | 0.12 | | | | | | — | | | | | | 16.52 | | | | | | 19.86 | | | | | | 1.43 | | | | | | 1.33 | | | | | | 1.33 | | | | | | 0.86 | | | | | | 2,664 | | | | | | 28 | | |
| 12-31-11 | | | | | 13.79 | | | | | | 0.13• | | | | | | 0.10 | | | | | | 0.23 | | | | | | 0.14 | | | | | | — | | | | | | — | | | | | | 0.14 | | | | | | — | | | | | | 13.88 | | | | | | 1.67 | | | | | | 1.50 | | | | | | 1.40 | | | | | | 1.40 | | | | | | 0.97 | | | | | | 178 | | | | | | 36 | | |
VY® Oppenheimer Global Portfolio | | | | | | | | | | | | | | | | | | | | | | | | | | | | | | | | | | | | | | | | | | | | | | | | | | | | | | | | | | | | | | | | | | | | | | | | | | | | | | | | | | | | | | | | | | | | | | | | | | | | | | | |
| Class ADV | | | | | | | | | | | | | | | | | | | | | | | | | | | | | | | | | | | | | | | | | | | | | | | | | | | | | | | | | | | | | | | | | | | | | | | | | | | | | | | | | | | | | | | | | | | | | | | | | | | | | | | |
| 12-31-15 | | | | | 18.21 | | | | | | 0.08 | | | | | | 0.69 | | | | | | 0.77 | | | | | | 0.19 | | | | | | 1.49 | | | | | | — | | | | | | 1.68 | | | | | | — | | | | | | 17.30 | | | | | | 3.56 | | | | | | 1.25 | | | | | | 1.25 | | | | | | 1.25 | | | | | | 0.51 | | | | | | 110,372 | | | | | | 12 | | |
| 12-31-14 | | | | | 18.28 | | | | | | 0.15 | | | | | | 0.19 | | | | | | 0.34 | | | | | | 0.15 | | | | | | 0.26 | | | | | | — | | | | | | 0.41 | | | | | | — | | | | | | 18.21 | | | | | | 1.86 | | | | | | 1.25 | | | | | | 1.25 | | | | | | 1.25 | | | | | | 0.81 | | | | | | 101,077 | | | | | | 12 | | |
| 12-31-13 | | | | | 14.60 | | | | | | 0.12• | | | | | | 3.73 | | | | | | 3.85 | | | | | | 0.17 | | | | | | — | | | | | | — | | | | | | 0.17 | | | | | | — | | | | | | 18.28 | | | | | | 26.46 | | | | | | 1.26 | | | | | | 1.26 | | | | | | 1.26 | | | | | | 0.70 | | | | | | 102,691 | | | | | | 11 | | |
| 12-31-12 | | | | | 12.15 | | | | | | 0.14 | | | | | | 2.42 | | | | | | 2.56 | | | | | | 0.11 | | | | | | — | | | | | | — | | | | | | 0.11 | | | | | | — | | | | | | 14.60 | | | | | | 21.18 | | | | | | 1.22 | | | | | | 1.22 | | | | | | 1.22 | | | | | | 1.00 | | | | | | 76,791 | | | | | | 13 | | |
| 12-31-11 | | | | | 13.46 | | | | | | 0.13 | | | | | | (1.29) | | | | | | (1.16) | | | | | | 0.15 | | | | | | — | | | | | | — | | | | | | 0.15 | | | | | | — | | | | | | 12.15 | | | | | | (8.60) | | | | | | 1.16 | | | | | | 1.16 | | | | | | 1.16 | | | | | | 0.96 | | | | | | 65,051 | | | | | | 12 | | |
See Accompanying Notes to Financial Statements
Financial Highlights (continued)
| | | | | | | | | | Income
(loss) from
investment
operations | | | | | | | | | Less
Distributions | | | | | | Ratios to average
net assets | | | Supplemental
Data | |
| | | | Net asset value, beginning
of year or period | | | Net investment income (loss) | | | Net realized and unrealized
gain (loss) | | | Total from investment operations | | | From net investment income | | | From net realized gains | | | From return of capital | | | Total distributions | | | Payment by affiliate | | | Net asset value, end of year
or period | | | Total Return(1) | | | Expenses before
reductions/additions(2)(3)(4) | | | Expenses net of fee waivers
and/or recoupments if any(2)(3)(4) | | | Expense net of all
reductions/additions(2)(3)(4) | | | Net investment
income (loss)(2)(3) | | | Net assets, end of year
or period | | | Portfolio turnover rate | |
Year or
period ended | | | ($) | | | ($) | | | ($) | | | ($) | | | ($) | | | ($) | | | ($) | | | ($) | | | ($) | | | ($) | | | (%) | | | (%) | | | (%) | | | (%) | | | (%) | | | ($000’s) | | | (%) | |
VY® Oppenheimer Global Portfolio (continued) | | | | | | | | | | | | | | | | | | | | | | | | | | | | | | | | | | | | | | | | | | | | | | | | | | | | | | | | | | | | | | | | | | | | | | | | | | | | | | | | | | | | | | | | | | | | | | | | | | | | | | | |
| Class I | | | | | | | | | | | | | | | | | | | | | | | | | | | | | | | | | | | | | | | | | | | | | | | | | | | | | | | | | | | | | | | | | | | | | | | | | | | | | | | | | | | | | | | | | | | | | | | | | | | | | | | |
| 12-31-15 | | | | | 18.84 | | | | | | 0.20• | | | | | | 0.71 | | | | | | 0.91 | | | | | | 0.29 | | | | | | 1.49 | | | | | | — | | | | | | 1.78 | | | | | | — | | | | | | 17.97 | | | | | | 4.13 | | | | | | 0.75 | | | | | | 0.75 | | | | | | 0.75 | | | | | | 1.04 | | | | | | 1,254,238 | | | | | | 12 | | |
| 12-31-14 | | | | | 18.89 | | | | | | 0.25• | | | | | | 0.19 | | | | | | 0.44 | | | | | | 0.23 | | | | | | 0.26 | | | | | | — | | | | | | 0.49 | | | | | | — | | | | | | 18.84 | | | | | | 2.32 | | | | | | 0.75 | | | | | | 0.75 | | | | | | 0.75 | | | | | | 1.32 | | | | | | 1,320,671 | | | | | | 12 | | |
| 12-31-13 | | | | | 15.06 | | | | | | 0.21• | | | | | | 3.85 | | | | | | 4.06 | | | | | | 0.23 | | | | | | — | | | | | | — | | | | | | 0.23 | | | | | | — | | | | | | 18.89 | | | | | | 27.12 | | | | | | 0.76 | | | | | | 0.76 | | | | | | 0.76 | | | | | | 1.22 | | | | | | 1,481,760 | | | | | | 11 | | |
| 12-31-12 | | | | | 12.54 | | | | | | 0.21• | | | | | | 2.49 | | | | | | 2.70 | | | | | | 0.18 | | | | | | — | | | | | | — | | | | | | 0.18 | | | | | | — | | | | | | 15.06 | | | | | | 21.70 | | | | | | 0.72 | | | | | | 0.72 | | | | | | 0.72 | | | | | | 1.52 | | | | | | 1,324,037 | | | | | | 13 | | |
| 12-31-11 | | | | | 13.88 | | | | | | 0.20• | | | | | | (1.34) | | | | | | (1.14) | | | | | | 0.20 | | | | | | — | | | | | | — | | | | | | 0.20 | | | | | | — | | | | | | 12.54 | | | | | | (8.13) | | | | | | 0.66 | | | | | | 0.66 | | | | | | 0.66 | | | | | | 1.46 | | | | | | 1,234,551 | | | | | | 12 | | |
| Class S | | | | | | | | | | | | | | | | | | | | | | | | | | | | | | | | | | | | | | | | | | | | | | | | | | | | | | | | | | | | | | | | | | | | | | | | | | | | | | | | | | | | | | | | | | | | | | | | | | | | | | | |
| 12-31-15 | | | | | 18.28 | | | | | | 0.15• | | | | | | 0.68 | | | | | | 0.83 | | | | | | 0.24 | | | | | | 1.49 | | | | | | — | | | | | | 1.73 | | | | | | — | | | | | | 17.38 | | | | | | 3.84 | | | | | | 1.00 | | | | | | 1.00 | | | | | | 1.00 | | | | | | 0.77 | | | | | | 231,621 | | | | | | 12 | | |
| 12-31-14 | | | | | 18.34 | | | | | | 0.20• | | | | | | 0.18 | | | | | | 0.38 | | | | | | 0.18 | | | | | | 0.26 | | | | | | — | | | | | | 0.44 | | | | | | — | | | | | | 18.28 | | | | | | 2.09 | | | | | | 1.00 | | | | | | 1.00 | | | | | | 1.00 | | | | | | 1.08 | | | | | | 215,383 | | | | | | 12 | | |
| 12-31-13 | | | | | 14.63 | | | | | | 0.15 | | | | | | 3.76 | | | | | | 3.91 | | | | | | 0.20 | | | | | | — | | | | | | — | | | | | | 0.20 | | | | | | — | | | | | | 18.34 | | | | | | 26.85 | | | | | | 1.01 | | | | | | 1.01 | | | | | | 1.01 | | | | | | 0.96 | | | | | | 252,672 | | | | | | 11 | | |
| 12-31-12 | | | | | 12.19 | | | | | | 0.17• | | | | | | 2.41 | | | | | | 2.58 | | | | | | 0.14 | | | | | | — | | | | | | — | | | | | | 0.14 | | | | | | — | | | | | | 14.63 | | | | | | 21.33 | | | | | | 0.97 | | | | | | 0.97 | | | | | | 0.97 | | | | | | 1.26 | | | | | | 192,122 | | | | | | 13 | | |
| 12-31-11 | | | | | 13.50 | | | | | | 0.16 | | | | | | (1.30) | | | | | | (1.14) | | | | | | 0.17 | | | | | | — | | | | | | — | | | | | | 0.17 | | | | | | — | | | | | | 12.19 | | | | | | (8.38) | | | | | | 0.91 | | | | | | 0.91 | | | | | | 0.91 | | | | | | 1.20 | | | | | | 171,755 | | | | | | 12 | | |
| Class S2 | | | | | | | | | | | | | | | | | | | | | | | | | | | | | | | | | | | | | | | | | | | | | | | | | | | | | | | | | | | | | | | | | | | | | | | | | | | | | | | | | | | | | | | | | | | | | | | | | | | | | | | |
| 12-31-15 | | | | | 17.88 | | | | | | 0.11• | | | | | | 0.69 | | | | | | 0.80 | | | | | | 0.22 | | | | | | 1.49 | | | | | | — | | | | | | 1.71 | | | | | | — | | | | | | 16.97 | | | | | | 3.74 | | | | | | 1.25 | | | | | | 1.15 | | | | | | 1.15 | | | | | | 0.61 | | | | | | 4,371 | | | | | | 12 | | |
| 12-31-14 | | | | | 17.98 | | | | | | 0.16• | | | | | | 0.18 | | | | | | 0.34 | | | | | | 0.18 | | | | | | 0.26 | | | | | | — | | | | | | 0.44 | | | | | | — | | | | | | 17.88 | | | | | | 1.91 | | | | | | 1.25 | | | | | | 1.15 | | | | | | 1.15 | | | | | | 0.91 | | | | | | 4,827 | | | | | | 12 | | |
| 12-31-13 | | | | | 14.37 | | | | | | 0.11• | | | | | | 3.70 | | | | | | 3.81 | | | | | | 0.20 | | | | | | — | | | | | | — | | | | | | 0.20 | | | | | | — | | | | | | 17.98 | | | | | | 26.66 | | | | | | 1.26 | | | | | | 1.16 | | | | | | 1.16 | | | | | | 0.67 | | | | | | 4,287 | | | | | | 11 | | |
| 12-31-12 | | | | | 12.01 | | | | | | 0.13• | | | | | | 2.39 | | | | | | 2.52 | | | | | | 0.16 | | | | | | — | | | | | | — | | | | | | 0.16 | | | | | | — | | | | | | 14.37 | | | | | | 21.17 | | | | | | 1.22 | | | | | | 1.12 | | | | | | 1.12 | | | | | | 1.01 | | | | | | 2,082 | | | | | | 13 | | |
| 12-31-11 | | | | | 13.36 | | | | | | 0.06• | | | | | | (1.21) | | | | | | (1.15) | | | | | | 0.20 | | | | | | — | | | | | | — | | | | | | 0.20 | | | | | | — | | | | | | 12.01 | | | | | | (8.52) | | | | | | 1.16 | | | | | | 1.06 | | | | | | 1.06 | | | | | | 0.52 | | | | | | 755 | | | | | | 12 | | |
VY® Pioneer High Yield Portfolio | | | | | | | | | | | | | | | | | | | | | | | | | | | | | | | | | | | | | | | | | | | | | | | | | | | | | | | | | | | | | | | | | | | | | | | | | | | | | | | | | | | | | | | | | | | | | | | | | | | | | | | |
| Class I | | | | | | | | | | | | | | | | | | | | | | | | | | | | | | | | | | | | | | | | | | | | | | | | | | | | | | | | | | | | | | | | | | | | | | | | | | | | | | | | | | | | | | | | | | | | | | | | | | | | | | | |
| 12-31-15 | | | | | 11.87 | | | | | | 0.59• | | | | | | (1.10) | | | | | | (0.51) | | | | | | 0.59 | | | | | | — | | | | | | — | | | | | | 0.59 | | | | | | — | | | | | | 10.77 | | | | | | (4.55) | | | | | | 0.76 | | | | | | 0.71 | | | | | | 0.71 | | | | | | 4.98 | | | | | | 91,560 | | | | | | 28 | | |
| 12-31-14 | | | | | 12.41 | | | | | | 0.58 | | | | | | (0.53) | | | | | | 0.05 | | | | | | 0.59 | | | | | | — | | | | | | — | | | | | | 0.59 | | | | | | — | | | | | | 11.87 | | | | | | 0.27 | | | | | | 0.76 | | | | | | 0.71 | | | | | | 0.71 | | | | | | 4.73 | | | | | | 117,617 | | | | | | 35 | | |
| 12-31-13 | | | | | 11.60 | | | | | | 0.60• | | | | | | 0.80 | | | | | | 1.40 | | | | | | 0.59 | | | | | | — | | | | | | — | | | | | | 0.59 | | | | | | — | | | | | | 12.41 | | | | | | 12.33 | | | | | | 0.73 | | | | | | 0.71 | | | | | | 0.71 | | | | | | 4.93 | | | | | | 119,042 | | | | | | 51 | | |
| 12-31-12 | | | | | 10.55 | | | | | | 0.63• | | | | | | 1.04 | | | | | | 1.67 | | | | | | 0.62 | | | | | | — | | | | | | — | | | | | | 0.62 | | | | | | — | | | | | | 11.60 | | | | | | 16.21 | | | | | | 0.75 | | | | | | 0.71 | | | | | | 0.71 | | | | | | 5.58 | | | | | | 104,882 | | | | | | 34 | | |
| 12-31-11 | | | | | 11.24 | | | | | | 0.63 | | | | | | (0.70) | | | | | | (0.07) | | | | | | 0.62 | | | | | | — | | | | | | — | | | | | | 0.62 | | | | | | — | | | | | | 10.55 | | | | | | (0.72) | | | | | | 0.77 | | | | | | 0.71 | | | | | | 0.71 | | | | | | 5.64 | | | | | | 87,529 | | | | | | 41 | | |
| Class S | | | | | | | | | | | | | | | | | | | | | | | | | | | | | | | | | | | | | | | | | | | | | | | | | | | | | | | | | | | | | | | | | | | | | | | | | | | | | | | | | | | | | | | | | | | | | | | | | | | | | | | |
| 12-31-15 | | | | | 11.86 | | | | | | 0.56• | | | | | | (1.10) | | | | | | (0.54) | | | | | | 0.56 | | | | | | — | | | | | | — | | | | | | 0.56 | | | | | | — | | | | | | 10.76 | | | | | | (4.79) | | | | | | 1.01 | | | | | | 0.96 | | | | | | 0.96 | | | | | | 4.73 | | | | | | 3,776 | | | | | | 28 | | |
| 12-31-14 | | | | | 12.39 | | | | | | 0.56• | | | | | | (0.53) | | | | | | 0.03 | | | | | | 0.56 | | | | | | — | | | | | | — | | | | | | 0.56 | | | | | | — | | | | | | 11.86 | | | | | | 0.10 | | | | | | 1.01 | | | | | | 0.96 | | | | | | 0.96 | | | | | | 4.50 | | | | | | 4,412 | | | | | | 35 | | |
| 12-31-13 | | | | | 11.58 | | | | | | 0.57• | | | | | | 0.80 | | | | | | 1.37 | | | | | | 0.56 | | | | | | — | | | | | | — | | | | | | 0.56 | | | | | | — | | | | | | 12.39 | | | | | | 12.07 | | | | | | 0.98 | | | | | | 0.96 | | | | | | 0.96 | | | | | | 4.67 | | | | | | 3,406 | | | | | | 51 | | |
| 12-31-12 | | | | | 10.54 | | | | | | 0.57 | | | | | | 1.07 | | | | | | 1.64 | | | | | | 0.60 | | | | | | — | | | | | | — | | | | | | 0.60 | | | | | | — | | | | | | 11.58 | | | | | | 15.84 | | | | | | 1.00 | | | | | | 0.96 | | | | | | 0.96 | | | | | | 5.39 | | | | | | 4,089 | | | | | | 34 | | |
| 12-31-11 | | | | | 11.23 | | | | | | 0.60• | | | | | | (0.69) | | | | | | (0.09) | | | | | | 0.60 | | | | | | — | | | | | | — | | | | | | 0.60 | | | | | | — | | | | | | 10.54 | | | | | | (0.97) | | | | | | 1.02 | | | | | | 0.96 | | | | | | 0.96 | | | | | | 5.34 | | | | | | 1,712 | | | | | | 41 | | |
VY® T. Rowe Price Diversified Mid Cap Growth Portfolio | | | | | | | | | | | | | | | | | | |
| Class ADV | | | | | | | | | | | | | | | | | | | | | | | | | | | | | | | | | | | | | | | | | | | | | | | | | | | | | | | ��� | | | | | | | | | | | | | | | | | | | | | | | | | | | | | | | | | | | | | | | | | | | | | | | | |
| 12-31-15 | | | | | 11.43 | | | | | | (0.04) | | | | | | 0.31 | | | | | | 0.27 | | | | | | — | | | | | | 1.87 | | | | | | — | | | | | | 1.87 | | | | | | — | | | | | | 9.83 | | | | | | 1.51 | | | | | | 1.27 | | | | | | 1.27 | | | | | | 1.27 | | | | | | (0.34) | | | | | | 27,217 | | | | | | 26 | | |
| 12-31-14 | | | | | 11.08 | | | | | | (0.03) | | | | | | 1.21 | | | | | | 1.18 | | | | | | 0.00* | | | | | | 0.83 | | | | | | — | | | | | | 0.83 | | | | | | — | | | | | | 11.43 | | | | | | 11.29 | | | | | | 1.28 | | | | | | 1.27 | | | | | | 1.27 | | | | | | (0.28) | | | | | | 29,356 | | | | | | 27 | | |
| 12-31-13 | | | | | 8.35 | | | | | | (0.03) | | | | | | 2.90 | | | | | | 2.87 | | | | | | 0.02 | | | | | | 0.12 | | | | | | — | | | | | | 0.14 | | | | | | — | | | | | | 11.08 | | | | | | 34.46 | | | | | | 1.27 | | | | | | 1.25 | | | | | | 1.25 | | | | | | (0.32) | | | | | | 27,222 | | | | | | 20 | | |
| 12-31-12 | | | | | 7.89 | | | | | | 0.01 | | | | | | 1.19 | | | | | | 1.20 | | | | | | 0.00* | | | | | | 0.74 | | | | | | — | | | | | | 0.74 | | | | | | — | | | | | | 8.35 | | | | | | 15.70 | | | | | | 1.24 | | | | | | 1.22 | | | | | | 1.22 | | | | | | 0.14 | | | | | | 21,538 | | | | | | 17 | | |
| 12-31-11 | | | | | 8.25 | | | | | | (0.03) | | | | | | (0.32) | | | | | | (0.35) | | | | | | 0.01 | | | | | | — | | | | | | — | | | | | | 0.01 | | | | | | — | | | | | | 7.89 | | | | | | (4.23) | | | | | | 1.16 | | | | | | 1.16 | | | | | | 1.16 | | | | | | (0.28) | | | | | | 18,993 | | | | | | 38 | | |
See Accompanying Notes to Financial Statements
Financial Highlights (continued)
| | | | | | | | | | Income
(loss) from
investment
operations | | | | | | | | | Less
Distributions | | | | | | Ratios to average
net assets | | | Supplemental
Data | |
| | | | Net asset value, beginning
of year or period | | | Net investment income (loss) | | | Net realized and unrealized
gain (loss) | | | Total from investment operations | | | From net investment income | | | From net realized gains | | | From return of capital | | | Total distributions | | | Payment by affiliate | | | Net asset value, end of year
or period | | | Total Return(1) | | | Expenses before
reductions/additions(2)(3)(4) | | | Expenses net of fee waivers
and/or recoupments if any(2)(3)(4) | | | Expense net of all
reductions/additions(2)(3)(4) | | | Net investment
income (loss)(2)(3) | | | Net assets, end of year
or period | | | Portfolio turnover rate | |
Year or
period ended | | | ($) | | | ($) | | | ($) | | | ($) | | | ($) | | | ($) | | | ($) | | | ($) | | | ($) | | | ($) | | | (%) | | | (%) | | | (%) | | | (%) | | | (%) | | | ($000’s) | | | (%) | |
VY® T. Rowe Price Diversified Mid Cap Growth Portfolio (continued) | | | | | | | | | | | | | | | | | | | | | | | | | | | | | | | | | | | | | | | | | | | | | | | | | | | | | | | | | | | | | | | | | | | | | | | | | | | | | | | | | | | | | | | | | | | | | | | | | | | | | | | |
| Class I | | | | | | | | | | | | | | | | | | | | | | | | | | | | | | | | | | | | | | | | | | | | | | | | | | | | | | | | | | | | | | | | | | | | | | | | | | | | | | | | | | | | | | | | | | | | | | | | | | | | | | | |
| 12-31-15 | | | | | 12.13 | | | | | | 0.02 | | | | | | 0.32 | | | | | | 0.34 | | | | | | — | | | | | | 1.87 | | | | | | — | | | | | | 1.87 | | | | | | — | | | | | | 10.60 | | | | | | 2.02 | | | | | | 0.77 | | | | | | 0.77 | | | | | | 0.77 | | | | | | 0.17 | | | | | | 766,591 | | | | | | 26 | | |
| 12-31-14 | | | | | 11.68 | | | | | | 0.03 | | | | | | 1.28 | | | | | | 1.31 | | | | | | 0.03 | | | | | | 0.83 | | | | | | — | | | | | | 0.86 | | | | | | — | | | | | | 12.13 | | | | | | 11.82 | | | | | | 0.78 | | | | | | 0.77 | | | | | | 0.77 | | | | | | 0.22 | | | | | | 796,856 | | | | | | 27 | | |
| 12-31-13 | | | | | 8.76 | | | | | | 0.02 | | | | | | 3.05 | | | | | | 3.07 | | | | | | 0.03 | | | | | | 0.12 | | | | | | — | | | | | | 0.15 | | | | | | — | | | | | | 11.68 | | | | | | 35.18 | | | | | | 0.77 | | | | | | 0.75 | | | | | | 0.75 | | | | | | 0.17 | | | | | | 804,053 | | | | | | 20 | | |
| 12-31-12 | | | | | 8.25 | | | | | | 0.06 | | | | | | 1.23 | | | | | | 1.29 | | | | | | 0.04 | | | | | | 0.74 | | | | | | — | | | | | | 0.78 | | | | | | — | | | | | | 8.76 | | | | | | 16.13 | | | | | | 0.74 | | | | | | 0.72 | | | | | | 0.72 | | | | | | 0.61 | | | | | | 668,143 | | | | | | 17 | | |
| 12-31-11 | | | | | 8.60 | | | | | | 0.02 | | | | | | (0.34) | | | | | | (0.32) | | | | | | 0.03 | | | | | | — | | | | | | — | | | | | | 0.03 | | | | | | — | | | | | | 8.25 | | | | | | (3.71) | | | | | | 0.66 | | | | | | 0.66 | | | | | | 0.66 | | | | | | 0.25 | | | | | | 663,904 | | | | | | 38 | | |
| Class S | | | | | | | | | | | | | | | | | | | | | | | | | | | | | | | | | | | | | | | | | | | | | | | | | | | | | | | | | | | | | | | | | | | | | | | | | | | | | | | | | | | | | | | | | | | | | | | | | | | | | | | |
| 12-31-15 | | | | | 11.87 | | | | | | (0.01) | | | | | | 0.31 | | | | | | 0.30 | | | | | | — | | | | | | 1.87 | | | | | | — | | | | | | 1.87 | | | | | | — | | | | | | 10.30 | | | | | | 1.72 | | | | | | 1.02 | | | | | | 1.02 | | | | | | 1.02 | | | | | | (0.08) | | | | | | 30,614 | | | | | | 26 | | |
| 12-31-14 | | | | | 11.44 | | | | | | (0.00)* | | | | | | 1.26 | | | | | | 1.26 | | | | | | 0.00* | | | | | | 0.83 | | | | | | — | | | | | | 0.83 | | | | | | — | | | | | | 11.87 | | | | | | 11.65 | | | | | | 1.03 | | | | | | 1.02 | | | | | | 1.02 | | | | | | (0.02) | | | | | | 30,412 | | | | | | 27 | | |
| 12-31-13 | | | | | 8.60 | | | | | | (0.00)* | | | | | | 2.98 | | | | | | 2.98 | | | | | | 0.02 | | | | | | 0.12 | | | | | | — | | | | | | 0.14 | | | | | | — | | | | | | 11.44 | | | | | | 34.74 | | | | | | 1.02 | | | | | | 1.00 | | | | | | 1.00 | | | | | | (0.06) | | | | | | 29,284 | | | | | | 20 | | |
| 12-31-12 | | | | | 8.11 | | | | | | 0.03 | | | | | | 1.22 | | | | | | 1.25 | | | | | | 0.02 | | | | | | 0.74 | | | | | | — | | | | | | 0.76 | | | | | | — | | | | | | 8.60 | | | | | | 15.87 | | | | | | 0.99 | | | | | | 0.97 | | | | | | 0.97 | | | | | | 0.35 | | | | | | 18,731 | | | | | | 17 | | |
| 12-31-11 | | | | | 8.45 | | | | | | 0.00* | | | | | | (0.33) | | | | | | (0.33) | | | | | | 0.01 | | | | | | — | | | | | | — | | | | | | 0.01 | | | | | | — | | | | | | 8.11 | | | | | | (3.89) | | | | | | 0.91 | | | | | | 0.91 | | | | | | 0.91 | | | | | | 0.01 | | | | | | 21,669 | | | | | | 38 | | |
| Class S2 | | | | | | | | | | | | | | | | | | | | | | | | | | | | | | | | | | | | | | | | | | | | | | | | | | | | | | | | | | | | | | | | | | | | | | | | | | | | | | | | | | | | | | | | | | | | | | | | | | | | | | | |
| 12-31-15 | | | | | 11.44 | | | | | | (0.02) | | | | | | 0.30 | | | | | | 0.28 | | | | | | — | | | | | | 1.87 | | | | | | — | | | | | | 1.87 | | | | | | — | | | | | | 9.85 | | | | | | 1.60 | | | | | | 1.27 | | | | | | 1.17 | | | | | | 1.17 | | | | | | (0.23) | | | | | | 4,095 | | | | | | 26 | | |
| 12-31-14 | | | | | 11.08 | | | | | | (0.01) | | | | | | 1.20 | | | | | | 1.19 | | | | | | 0.00* | | | | | | 0.83 | | | | | | — | | | | | | 0.83 | | | | | | — | | | | | | 11.44 | | | | | | 11.39 | | | | | | 1.28 | | | | | | 1.17 | | | | | | 1.17 | | | | | | (0.13) | | | | | | 3,893 | | | | | | 27 | | |
| 12-31-13 | | | | | 8.34 | | | | | | (0.02) | | | | | | 2.90 | | | | | | 2.88 | | | | | | 0.02 | | | | | | 0.12 | | | | | | — | | | | | | 0.14 | | | | | | — | | | | | | 11.08 | | | | | | 34.62 | | | | | | 1.27 | | | | | | 1.15 | | | | | | 1.15 | | | | | | (0.23) | | | | | | 1,013 | | | | | | 20 | | |
| 12-31-12 | | | | | 7.89 | | | | | | 0.02 | | | | | | 1.19 | | | | | | 1.21 | | | | | | 0.02 | | | | | | 0.74 | | | | | | — | | | | | | 0.76 | | | | | | — | | | | | | 8.34 | | | | | | 15.73 | | | | | | 1.24 | | | | | | 1.12 | | | | | | 1.12 | | | | | | 0.29 | | | | | | 1,025 | | | | | | 17 | | |
| 12-31-11 | | | | | 8.25 | | | | | | (0.00)* | | | | | | (0.34) | | | | | | (0.34) | | | | | | 0.02 | | | | | | — | | | | | | — | | | | | | 0.02 | | | | | | — | | | | | | 7.89 | | | | | | (4.07) | | | | | | 1.16 | | | | | | 1.06 | | | | | | 1.06 | | | | | | (0.07) | | | | | | 739 | | | | | | 38 | | |
VY® T. Rowe Price Growth Equity Portfolio | | | | | | | | | | | | | | | | | | | | | | | | | | | | | | | | | | | | | | | | | | | | | | | | | | | | | | | | | | | | | | | | | | | | | | | | | | | | | | | | | | | | | | | | | | | | | | | | | | | | | | | |
| Class ADV | | | | | | | | | | | | | | | | | | | | | | | | | | | | | | | | | | | | | | | | | | | | | | | | | | | | | | | | | | | | | | | | | | | | | | | | | | | | | | | | | | | | | | | | | | | | | | | | | | | | | | | |
| 12-31-15 | | | | | 86.54 | | | | | | (0.46)• | | | | | | 9.58 | | | | | | 9.12 | | | | | | — | | | | | | 13.97 | | | | | | — | | | | | | 13.97 | | | | | | — | | | | | | 81.69 | | | | | | 10.25 | | | | | | 1.24 | | | | | | 1.23 | | | | | | 1.23 | | | | | | (0.54) | | | | | | 202,307 | | | | | | 42 | | |
| 12-31-14 | | | | | 86.20 | | | | | | (0.42) | | | | | | 7.08 | | | | | | 6.66 | | | | | | — | | | | | | 6.32 | | | | | | — | | | | | | 6.32 | | | | | | — | | | | | | 86.54 | | | | | | 8.16 | | | | | | 1.24 | | | | | | 1.23 | | | | | | 1.23 | | | | | | (0.50) | | | | | | 171,971 | | | | | | 35 | | |
| 12-31-13 | | | | | 62.23 | | | | | | (0.38)• | | | | | | 24.36 | | | | | | 23.98 | | | | | | 0.01 | | | | | | — | | | | | | — | | | | | | 0.01 | | | | | | — | | | | | | 86.20 | | | | | | 38.54 | | | | | | 1.24 | | | | | | 1.23 | | | | | | 1.23 | | | | | | (0.53) | | | | | | 164,865 | | | | | | 41 | | |
| 12-31-12 | | | | | 52.59 | | | | | | (0.16)• | | | | | | 9.80 | | | | | | 9.64 | | | | | | — | | | | | | — | | | | | | — | | | | | | — | | | | | | — | | | | | | 62.23 | | | | | | 18.33 | | | | | | 1.24 | | | | | | 1.23 | | | | | | 1.23 | | | | | | (0.26) | | | | | | 112,773 | | | | | | 38 | | |
| 12-31-11 | | | | | 53.43 | | | | | | (0.27)• | | | | | | (0.57) | | | | | | (0.84) | | | | | | — | | | | | | — | | | | | | — | | | | | | — | | | | | | — | | | | | | 52.59 | | | | | | (1.57) | | | | | | 1.25 | | | | | | 1.24 | | | | | | 1.24 | | | | | | (0.50) | | | | | | 92,701 | | | | | | 28 | | |
| Class I | | | | | | | | | | | | | | | | | | | | | | | | | | | | | | | | | | | | | | | | | | | | | | | | | | | | | | | | | | | | | | | | | | | | | | | | | | | | | | | | | | | | | | | | | | | | | | | | | | | | | | | |
| 12-31-15 | | | | | 90.15 | | | | | | (0.03) | | | | | | 9.99 | | | | | | 9.96 | | | | | | — | | | | | | 13.97 | | | | | | — | | | | | | 13.97 | | | | | | — | | | | | | 86.14 | | | | | | 10.81 | | | | | | 0.74 | | | | | | 0.73 | | | | | | 0.73 | | | | | | (0.04) | | | | | | 1,124,421 | | | | | | 42 | | |
| 12-31-14 | | | | | 89.11 | | | | | | 0.00* | | | | | | 7.36 | | | | | | 7.36 | | | | | | — | | | | | | 6.32 | | | | | | — | | | | | | 6.32 | | | | | | — | | | | | | 90.15 | | | | | | 8.69 | | | | | | 0.74 | | | | | | 0.73 | | | | | | 0.73 | | | | | | 0.00* | | | | | | 1,036,976 | | | | | | 35 | | |
| 12-31-13 | | | | | 64.01 | | | | | | (0.02) | | | | | | 25.13 | | | | | | 25.11 | | | | | | 0.01 | | | | | | — | | | | | | — | | | | | | 0.01 | | | | | | — | | | | | | 89.11 | | | | | | 39.24 | | | | | | 0.74 | | | | | | 0.73 | | | | | | 0.73 | | | | | | (0.03) | | | | | | 1,069,544 | | | | | | 41 | | |
| 12-31-12 | | | | | 53.91 | | | | | | 0.14• | | | | | | 10.06 | | | | | | 10.20 | | | | | | 0.10 | | | | | | — | | | | | | — | | | | | | 0.10 | | | | | | — | | | | | | 64.01 | | | | | | 18.92 | | | | | | 0.74 | | | | | | 0.73 | | | | | | 0.73 | | | | | | 0.22 | | | | | | 801,969 | | | | | | 38 | | |
| 12-31-11 | | | | | 54.49 | | | | | | 0.00* | | | | | | (0.58) | | | | | | (0.58) | | | | | | — | | | | | | — | | | | | | — | | | | | | — | | | | | | — | | | | | | 53.91 | | | | | | (1.06) | | | | | | 0.75 | | | | | | 0.74 | | | | | | 0.74 | | | | | | 0.00* | | | | | | 722,532 | | | | | | 28 | | |
| Class S | | | | | | | | | | | | | | | | | | | | | | | | | | | | | | | | | | | | | | | | | | | | | | | | | | | | | | | | | | | | | | | | | | | | | | | | | | | | | | | | | | | | | | | | | | | | | | | | | | | | | | | |
| 12-31-15 | | | | | 88.33 | | | | | | (0.25)• | | | | | | 9.79 | | | | | | 9.54 | | | | | | — | | | | | | 13.97 | | | | | | — | | | | | | 13.97 | | | | | | — | | | | | | 83.90 | | | | | | 10.54 | | | | | | 0.99 | | | | | | 0.98 | | | | | | 0.98 | | | | | | (0.29) | | | | | | 427,186 | | | | | | 42 | | |
| 12-31-14 | | | | | 87.65 | | | | | | (0.22) | | | | | | 7.22 | | | | | | 7.00 | | | | | | — | | | | | | 6.32 | | | | | | — | | | | | | 6.32 | | | | | | — | | | | | | 88.33 | | | | | | 8.42 | | | | | | 0.99 | | | | | | 0.98 | | | | | | 0.98 | | | | | | (0.25) | | | | | | 360,966 | | | | | | 35 | | |
| 12-31-13 | | | | | 63.12 | | | | | | (0.20)• | | | | | | 24.74 | | | | | | 24.54 | | | | | | 0.01 | | | | | | — | | | | | | — | | | | | | 0.01 | | | | | | — | | | | | | 87.65 | | | | | | 38.89 | | | | | | 0.99 | | | | | | 0.98 | | | | | | 0.98 | | | | | | (0.28) | | | | | | 367,958 | | | | | | 41 | | |
| 12-31-12 | | | | | 53.21 | | | | | | (0.00)* | | | | | | 9.91 | | | | | | 9.91 | | | | | | — | | | | | | — | | | | | | — | | | | | | — | | | | | | — | | | | | | 63.12 | | | | | | 18.62 | | | | | | 0.99 | | | | | | 0.98 | | | | | | 0.98 | | | | | | (0.00)* | | | | | | 238,987 | | | | | | 38 | | |
| 12-31-11 | | | | | 53.92 | | | | | | (0.13) | | | | | | (0.58) | | | | | | (0.71) | | | | | | — | | | | | | — | | | | | | — | | | | | | — | | | | | | — | | | | | | 53.21 | | | | | | (1.32) | | | | | | 1.00 | | | | | | 0.99 | | | | | | 0.99 | | | | | | (0.24) | | | | | | 173,070 | | | | | | 28 | | |
See Accompanying Notes to Financial Statements
Financial Highlights (continued)
| | | | | | | | | | Income
(loss) from
investment
operations | | | | | | | | | Less
Distributions | | | | | | Ratios to average
net assets | | | Supplemental
Data | |
| | | | Net asset value, beginning
of year or period | | | Net investment income (loss) | | | Net realized and unrealized
gain (loss) | | | Total from investment operations | | | From net investment income | | | From net realized gains | | | From return of capital | | | Total distributions | | | Payment by affiliate | | | Net asset value, end of year
or period | | | Total Return(1) | | | Expenses before
reductions/additions(2)(3)(4) | | | Expenses net of fee waivers
and/or recoupments if any(2)(3)(4) | | | Expense net of all
reductions/additions(2)(3)(4) | | | Net investment
income (loss)(2)(3) | | | Net assets, end of year
or period | | | Portfolio turnover rate | |
Year or
period ended | | | ($) | | | ($) | | | ($) | | | ($) | | | ($) | | | ($) | | | ($) | | | ($) | | | ($) | | | ($) | | | (%) | | | (%) | | | (%) | | | (%) | | | (%) | | | ($000’s) | | | (%) | |
VY® T. Rowe Price Growth Equity Portfolio (continued) | | | | | | | | | | | | | | | | | | | | | | | | | | | | | | | | | | | | | | | | | | | | | | | | | | | | | | | | | | | | | | | | | | | | | | | | | | | | | | | | | | | | | | | | | | | | | | | | | | | | | | | |
| Class S2 | | | | | | | | | | | | | | | | | | | | | | | | | | | | | | | | | | | | | | | | | | | | | | | | | | | | | | | | | | | | | | | | | | | | | | | | | | | | | | | | | | | | | | | | | | | | | | | | | | | | | | | |
| 12-31-15 | | | | | 87.05 | | | | | | (0.38)• | | | | | | 9.65 | | | | | | 9.27 | | | | | | — | | | | | | 13.97 | | | | | | — | | | | | | 13.97 | | | | | | — | | | | | | 82.35 | | | | | | 10.38 | | | | | | 1.24 | | | | | | 1.13 | | | | | | 1.13 | | | | | | (0.44) | | | | | | 5,361 | | | | | | 42 | | |
| 12-31-14 | | | | | 86.59 | | | | | | (0.33)• | | | | | | 7.11 | | | | | | 6.78 | | | | | | — | | | | | | 6.32 | | | | | | — | | | | | | 6.32 | | | | | | — | | | | | | 87.05 | | | | | | 8.26 | | | | | | 1.24 | | | | | | 1.13 | | | | | | 1.13 | | | | | | (0.38) | | | | | | 4,616 | | | | | | 35 | | |
| 12-31-13 | | | | | 62.45 | | | | | | (0.31)• | | | | | | 24.46 | | | | | | 24.15 | | | | | | 0.01 | | | | | | — | | | | | | — | | | | | | 0.01 | | | | | | — | | | | | | 86.59 | | | | | | 38.68 | | | | | | 1.24 | | | | | | 1.13 | | | | | | 1.13 | | | | | | (0.43) | | | | | | 2,482 | | | | | | 41 | | |
| 12-31-12 | | | | | 52.72 | | | | | | (0.09) | | | | | | 9.82 | | | | | | 9.73 | | | | | | — | | | | | | — | | | | | | — | | | | | | — | | | | | | — | | | | | | 62.45 | | | | | | 18.46 | | | | | | 1.24 | | | | | | 1.13 | | | | | | 1.13 | | | | | | (0.16) | | | | | | 1,534 | | | | | | 38 | | |
| 12-31-11 | | | | | 53.51 | | | | | | (0.17)• | | | | | | (0.62) | | | | | | (0.79) | | | | | | — | | | | | | — | | | | | | — | | | | | | — | | | | | | — | | | | | | 52.72 | | | | | | (1.48) | | | | | | 1.25 | | | | | | 1.14 | | | | | | 1.14 | | | | | | (0.32) | | | | | | 622 | | | | | | 28 | | |
VY® Templeton Foreign Equity Portfolio | | | | | | | | | | | | | | | | | | | | | | | | | | | | | | | | | | | | | | | | | | | | | | | | | | | | | | | | | | | | | | | | | | | | | | | | | | | | | | | | | | | | | | | | | | | | | | | | | | | | | | | |
| Class ADV | | | | | | | | | | | | | | | | | | | | | | | | | | | | | | | | | | | | | | | | | | | | | | | | | | | | | | | | | | | | | | | | | | | | | | | | | | | | | | | | | | | | | | | | | | | | | | | | | | | | | | | |
| 12-31-15 | | | | | 11.91 | | | | | | 0.21• | | | | | | (0.63) | | | | | | (0.42) | | | | | | 0.41 | | | | | | — | | | | | | — | | | | | | 0.41 | | | | | | — | | | | | | 11.08 | | | | | | (3.83)(a) | | | | | | 1.45 | | | | | | 1.43 | | | | | | 1.43 | | | | | | 1.76 | | | | | | 35,751 | | | | | | 10 | | |
| 12-31-14 | | | | | 13.07 | | | | | | 0.36• | | | | | | (1.26) | | | | | | (0.90) | | | | | | 0.26 | | | | | | — | | | | | | — | | | | | | 0.26 | | | | | | — | | | | | | 11.91 | | | | | | (7.01) | | | | | | 1.44 | | | | | | 1.42 | | | | | | 1.42 | | | | | | 2.81 | | | | | | 40,973 | | | | | | 10 | | |
| 12-31-13 | | | | | 11.05 | | | | | | 0.20• | | | | | | 1.96 | | | | | | 2.16 | | | | | | 0.14 | | | | | | — | | | | | | — | | | | | | 0.14 | | | | | | — | | | | | | 13.07 | | | | | | 19.68 | | | | | | 1.44 | | | | | | 1.42 | | | | | | 1.42 | | | | | | 1.64 | | | | | | 46,583 | | | | | | 12 | | |
| 12-31-12 | | | | | 9.45 | | | | | | 0.17• | | | | | | 1.55 | | | | | | 1.72 | | | | | | 0.12 | | | | | | — | | | | | | — | | | | | | 0.12 | | | | | | — | | | | | | 11.05 | | | | | | 18.32 | | | | | | 1.46 | | | | | | 1.44 | | | | | | 1.44 | | | | | | 1.71 | | | | | | 36,360 | | | | | | 9 | | |
| 12-31-11 | | | | | 10.99 | | | | | | 0.20• | | | | | | (1.57) | | | | | | (1.37) | | | | | | 0.17 | | | | | | — | | | | | | — | | | | | | 0.17 | | | | | | — | | | | | | 9.45 | | | | | | (12.42) | | | | | | 1.48 | | | | | | 1.48 | | | | | | 1.48 | | | | | | 1.94 | | | | | | 23,120 | | | | | | 14 | | |
| Class I | | | | | | | | | | | | | | | | | | | | | | | | | | | | | | | | | | | | | | | | | | | | | | | | | | | | | | | | | | | | | | | | | | | | | | | | | | | | | | | | | | | | | | | | | | | | | | | | | | | | | | | |
| 12-31-15 | | | | | 12.04 | | | | | | 0.28• | | | | | | (0.64) | | | | | | (0.36) | | | | | | 0.48 | | | | | | — | | | | | | — | | | | | | 0.48 | | | | | | — | | | | | | 11.20 | | | | | | (3.34)(a) | | | | | | 0.95 | | | | | | 0.93 | | | | | | 0.93 | | | | | | 2.29 | | | | | | 186,602 | | | | | | 10 | | |
| 12-31-14 | | | | | 13.21 | | | | | | 0.43• | | | | | | (1.28) | | | | | | (0.85) | | | | | | 0.32 | | | | | | — | | | | | | — | | | | | | 0.32 | | | | | | — | | | | | | 12.04 | | | | | | (6.59) | | | | | | 0.94 | | | | | | 0.92 | | | | | | 0.92 | | | | | | 3.27 | | | | | | 215,838 | | | | | | 10 | | |
| 12-31-13 | | | | | 11.15 | | | | | | 0.29• | | | | | | 1.95 | | | | | | 2.24 | | | | | | 0.18 | | | | | | — | | | | | | — | | | | | | 0.18 | | | | | | — | | | | | | 13.21 | | | | | | 20.28 | | | | | | 0.94 | | | | | | 0.92 | | | | | | 0.92 | | | | | | 2.47 | | | | | | 277,773 | | | | | | 12 | | |
| 12-31-12 | | | | | 9.52 | | | | | | 0.22• | | | | | | 1.56 | | | | | | 1.78 | | | | | | 0.15 | | | | | | — | | | | | | — | | | | | | 0.15 | | | | | | — | | | | | | 11.15 | | | | | | 18.89 | | | | | | 0.96 | | | | | | 0.94 | | | | | | 0.94 | | | | | | 2.15 | | | | | | 375,814 | | | | | | 9 | | |
| 12-31-11 | | | | | 11.05 | | | | | | 0.26• | | | | | | (1.59) | | | | | | (1.33) | | | | | | 0.20 | | | | | | — | | | | | | — | | | | | | 0.20 | | | | | | — | | | | | | 9.52 | | | | | | (12.00) | | | | | | 0.98 | | | | | | 0.98 | | | | | | 0.98 | | | | | | 2.42 | | | | | | 289,934 | | | | | | 14 | | |
| Class S | | | | | | | | | | | | | | | | | | | | | | | | | | | | | | | | | | | | | | | | | | | | | | | | | | | | | | | | | | | | | | | | | | | | | | | | | | | | | | | | | | | | | | | | | | | | | | | | | | | | | | | |
| 12-31-15 | | | | | 11.95 | | | | | | 0.25• | | | | | | (0.64) | | | | | | (0.39) | | | | | | 0.44 | | | | | | — | | | | | | — | | | | | | 0.44 | | | | | | — | | | | | | 11.12 | | | | | | (3.57)(a) | | | | | | 1.20 | | | | | | 1.18 | | | | | | 1.18 | | | | | | 2.03 | | | | | | 497,824 | | | | | | 10 | | |
| 12-31-14 | | | | | 13.12 | | | | | | 0.40• | | | | | | (1.28) | | | | | | (0.88) | | | | | | 0.29 | | | | | | — | | | | | | — | | | | | | 0.29 | | | | | | — | | | | | | 11.95 | | | | | | (6.87) | | | | | | 1.19 | | | | | | 1.17 | | | | | | 1.17 | | | | | | 3.10 | | | | | | 584,346 | | | | | | 10 | | |
| 12-31-13 | | | | | 11.08 | | | | | | 0.23• | | | | | | 1.97 | | | | | | 2.20 | | | | | | 0.16 | | | | | | — | | | | | | — | | | | | | 0.16 | | | | | | — | | | | | | 13.12 | | | | | | 20.05 | | | | | | 1.19 | | | | | | 1.17 | | | | | | 1.17 | | | | | | 1.91 | | | | | | 709,362 | | | | | | 12 | | |
| 12-31-12 | | | | | 9.48 | | | | | | 0.14• | | | | | | 1.60 | | | | | | 1.74 | | | | | | 0.14 | | | | | | — | | | | | | — | | | | | | 0.14 | | | | | | — | | | | | | 11.08 | | | | | | 18.64 | | | | | | 1.21 | | | | | | 1.19 | | | | | | 1.19 | | | | | | 1.38 | | | | | | 648,985 | | | | | | 9 | | |
| 12-31-11 | | | | | 11.00 | | | | | | 0.25• | | | | | | (1.59) | | | | | | (1.34) | | | | | | 0.18 | | | | | | — | | | | | | — | | | | | | 0.18 | | | | | | — | | | | | | 9.48 | | | | | | (12.21) | | | | | | 1.23 | | | | | | 1.23 | | | | | | 1.23 | | | | | | 2.29 | | | | | | 204,315 | | | | | | 14 | | |
| Class S2 | | | | | | | | | | | | | | | | | | | | | | | | | | | | | | | | | | | | | | | | | | | | | | | | | | | | | | | | | | | | | | | | | | | | | | | | | | | | | | | | | | | | | | | | | | | | | | | | | | | | | | | |
| 12-31-15 | | | | | 11.90 | | | | | | 0.23• | | | | | | (0.63) | | | | | | (0.40) | | | | | | 0.44 | | | | | | — | | | | | | — | | | | | | 0.44 | | | | | | — | | | | | | 11.06 | | | | | | (3.72)(a) | | | | | | 1.45 | | | | | | 1.33 | | | | | | 1.33 | | | | | | 1.88 | | | | | | 2,510 | | | | | | 10 | | |
| 12-31-14 | | | | | 13.07 | | | | | | 0.34 | | | | | | (1.23) | | | | | | (0.89) | | | | | | 0.28 | | | | | | — | | | | | | — | | | | | | 0.28 | | | | | | — | | | | | | 11.90 | | | | | | (6.99) | | | | | | 1.44 | | | | | | 1.32 | | | | | | 1.32 | | | | | | 2.80 | | | | | | 2,065 | | | | | | 10 | | |
| 12-31-13 | | | | | 11.04 | | | | | | 0.21• | | | | | | 1.97 | | | | | | 2.18 | | | | | | 0.15 | | | | | | — | | | | | | — | | | | | | 0.15 | | | | | | — | | | | | | 13.07 | | | | | | 19.88 | | | | | | 1.44 | | | | | | 1.32 | | | | | | 1.32 | | | | | | 1.80 | | | | | | 2,158 | | | | | | 12 | | |
| 12-31-12 | | | | | 9.45 | | | | | | 0.17 | | | | | | 1.55 | | | | | | 1.72 | | | | | | 0.13 | | | | | | — | | | | | | — | | | | | | 0.13 | | | | | | — | | | | | | 11.04 | | | | | | 18.40 | | | | | | 1.46 | | | | | | 1.34 | | | | | | 1.34 | | | | | | 1.89 | | | | | | 1,310 | | | | | | 9 | | |
| 12-31-11 | | | | | 11.01 | | | | | | 0.17• | | | | | | (1.53) | | | | | | (1.36) | | | | | | 0.20 | | | | | | — | | | | | | — | | | | | | 0.20 | | | | | | — | | | | | | 9.45 | | | | | | (12.34) | | | | | | 1.48 | | | | | | 1.38 | | | | | | 1.38 | | | | | | 1.67 | | | | | | 1,013 | | | | | | 14 | | |
(1)
Total return is calculated assuming reinvestment of all dividends, capital gain distributions and return of capital distributions, if any, at net asset value and does not reflect the effect of insurance contract charges. Total return for periods less than one year is not annualized.
(2)
Annualized for periods less than one year.
(3)
Ratios reflect operating expenses of a Portfolio. Expenses before reductions/additions do not reflect amounts reimbursed by an Investment Adviser and/or Distributor or reductions from brokerage service arrangements or other expense offset arrangements and do not represent the amount paid by a Portfolio during periods when reimbursements or reductions occur. Expenses net of fee waivers reflect expenses after reimbursement by an Investment Adviser and/or Distributor but prior to reductions from brokerage service arrangements or other expense offset arrangements. Expenses net of all reductions/additions represent the net expenses paid by a Portfolio. Net investment income (loss) is net of all such additions or reductions.
See Accompanying Notes to Financial Statements
Financial Highlights (continued)
(4)
Ratios do not include fees and expenses charged under the variable annuity contract or variable life insurance policy.
(a)
Excluding amounts related to a foreign currency settlement recorded in the fiscal year ended December 31, 2015, Templeton Foreign Equity’s total return would have been (4.09)%, (3.60)%, (3.83)% and (3.99)% for Classes ADV, I, S and S2, respectively.
•
Calculated using average number of shares outstanding throughout the period.
*
Amount is less than $0.005 or 0.005% or more than $(0.005) or (0.005)%.
See Accompanying Notes to Financial Statements
NOTES TO FINANCIAL STATEMENTS as of December 31, 2015
NOTE 1 — ORGANIZATION
Voya Partners, Inc. (the “Company”) is an open-end management investment company registered under the Investment Company Act of 1940, as amended (the “1940 Act”). It was incorporated under the laws of Maryland on May 7, 1997. The Articles of Incorporation permit the Company to offer separate series, each of which has its own investment objective, policies and restrictions. The series of the Company serve as an investment option in underlying variable insurance products offered by Directed Services LLC. The Company currently consists of forty-one active separate investment series. The thirteen series (each, a “Portfolio” and collectively, the “Portfolios”) included in this report are: Voya Global Bond Portfolio (“Global Bond”), VY® American Century Small-Mid Cap Value Portfolio (“American Century Small-Mid Cap Value”), VY® Baron Growth Portfolio (“Baron Growth”), VY® Columbia Contrarian Core Portfolio (“Columbia Contrarian Core”), VY® Columbia Small Cap Value II Portfolio (“Columbia Small Cap Value II”), VY® Invesco Comstock Portfolio (“Invesco Comstock”), VY® Invesco Equity and Income Portfolio (“Invesco Equity and Income”), VY® JPMorgan Mid Cap Value Portfolio (“JPMorgan Mid Cap Value”), VY® Oppenheimer Global Portfolio (“Oppenheimer Global”), VY® Pioneer High Yield Portfolio (“Pioneer High Yield”), VY® T. Rowe Price Diversified Mid Cap Growth Portfolio (“T. Rowe Price Diversified Mid Cap Growth”), VY® T. Rowe Price Growth Equity Portfolio (“T. Rowe Price Growth Equity”), and VY® Templeton Foreign Equity Portfolio (“Templeton Foreign Equity”), each a diversified series of the Company. The investment objective of the Portfolios is described in the respective Portfolio’s Prospectus.
The classes of shares included in this report are: Adviser (“Class ADV”), Initial (“Class I”), Service (“Class S”) and Service 2 (“Class S2”); however, each Portfolio may not offer all share classes. Shares of the Portfolios may be offered to separate accounts (“Separate Accounts”) of insurance companies as investment options in connection with variable annuity contracts and variable life insurance policies (“Variable Contracts”) and to certain of the Portfolios’ investment advisers and their affiliates. In the future, shares may also be offered to qualified pension and retirement plans (“Qualified Plans”) outside the Separate Account context. Each class has equal rights as to voting privileges. The classes differ principally in the applicable distribution and shareholder service fees. Generally, shareholders of each class also bear certain expenses that pertain to that particular class. All shareholders bear the common expenses of a portfolio and earn income and realized gains/losses from a portfolio pro rata based on the daily ending net assets of each class, without distinction between share classes. Distributions are determined
separately for each class based on income and expenses allocated to each class. Expenses that are specific to a portfolio or a class are charged directly to that portfolio or class. Other operating expenses shared by several portfolios are generally allocated among those portfolios based on average net assets. Realized gain distributions are allocated to each class pro rata based on the shares outstanding of each class on the date of distribution. Differences in per share dividend rates generally result from differences in separate class expenses, including distribution and shareholder service fees, if applicable.
Directed Services LLC (“DSL” or the “Investment Adviser”), a Delaware limited liability company and an affiliate of Voya Investments, LLC, serves as the Investment Adviser to the Portfolios. DSL oversees all investment management and portfolio management services for the Portfolios and assists in managing and supervising all aspects of the general day-to-day business activities and operations of the Portfolios, including custodial, transfer agency, dividend disbursing, accounting, auditing, compliance and related services. Voya Investment Management Co. LLC (“Voya IM”), a Delaware limited liability company, serves as the sub-adviser to Global Bond. Voya Investments Distributor, LLC (“VID” or the “Distributor”), a Delaware limited liability company, serves as the principal underwriter to the Portfolios.
NOTE 2 — SIGNIFICANT ACCOUNTING POLICIES
The following significant accounting policies are consistently followed by the Portfolios in the preparation of their financial statements. Each Portfolio is considered an investment company under U.S. generally accepted accounting principles (“GAAP”) and follows the accounting and reporting guidance applicable to investment companies.
A. Security Valuation. Each Portfolio is open for business every day the New York Stock Exchange (“NYSE”) opens for regular trading (each such day, a “Business Day”). The net asset value (“NAV”) per share for each class of each Portfolio is determined each Business Day as of the close of the regular trading session (“Market Close”), as determined by the Consolidated Tape Association (“CTA”), the central distributor of transaction prices for exchange-traded securities (normally 4:00 p.m. Eastern time unless otherwise designated by the CTA). The NAV per share of each class of each Portfolio is calculated by taking the value of the Portfolio’s assets attributable to that class, subtracting the Portfolio’s liabilities attributable to that class, and dividing by the number of shares of that class that are outstanding. On days when a Portfolio is closed for business, Portfolio shares will not be priced and a Portfolio does not transact purchase and redemption orders. To the
NOTES TO FINANCIAL STATEMENTS as of December 31, 2015 (continued)
NOTE 2 — SIGNIFICANT ACCOUNTING POLICIES (continued)
extent a Portfolio’s assets are traded in other markets on days when a Portfolio does not price its shares, the value of a Portfolio’s assets will likely change and you will not be able to purchase or redeem shares of a Portfolio.
Assets for which market quotations are readily available are valued at market value. A security listed or traded on an exchange is valued at its last sales price or official closing price as of the close of the regular trading session on the exchange where the security is principally traded or, if such price is not available, at the last sale price as of the Market Close for such security provided by the CTA. Bank loans are valued at the average of the averages between the bid and ask prices provided to an independent loan pricing service by brokers. Futures contracts are valued at the final settlement price set by an exchange on which they are principally traded. Listed options are valued at the mean between the last bid and ask prices from the exchange on which they are principally traded. Investments in open-end registered investment companies that do not trade on an exchange are valued at the end of day NAV per share. Investments in registered investment companies that trade on an exchange are valued at the last sales price or official closing price as of the close of the regular trading session on the exchange where the security is principally traded.
When a market quotation is not readily available or is deemed unreliable, each Portfolio will determine a fair value for the relevant asset in accordance with procedures adopted by the Board of Directors (“Board”). Such procedures provide, for example, that: (a) Exchange-traded securities are valued at the mean of the closing bid and ask; (b) Debt obligations are valued using an evaluated price provided by an independent pricing service. Evaluated prices provided by the pricing service may be determined without exclusive reliance on quoted prices, and may reflect factors such as institution-size trading in similar groups of securities, developments related to specific securities, benchmark yield, quality, type of issue, coupon rate, maturity, individual trading characteristics and other market data; (c) Securities traded in the over-the-counter market are valued based on prices provided by independent pricing services or market makers; (d) Options not listed on an exchange are valued by an independent source using an industry accepted model, such as Black-Scholes; (e) Centrally cleared swap agreements are valued using a price provided by the central counterparty clearinghouse; (f) Over-the-counter swap agreements are valued using a price provided by an independent pricing service; (g) Forward foreign currency contracts are valued utilizing current and forward rates obtained from an independent pricing service. Such prices
from the third party pricing service are for specific settlement periods and each Portfolio’s forward foreign currency contracts are valued at an interpolated rate between the closest preceding and subsequent period reported by the independent pricing service and (h) Securities for which market prices are not provided by any of the above methods may be valued based upon quotes furnished by brokers.
The prospectuses of the open-end registered investment companies in which each Portfolio may invest explain the circumstances under which they will use fair value pricing and the effects of using fair value pricing.
Foreign securities’ (including foreign exchange contracts) prices are converted into U.S. dollar amounts using the applicable exchange rates as of Market Close. If market quotations are available and believed to be reliable for foreign exchange-traded equity securities, the securities will be valued at the market quotations. Because trading hours for certain foreign securities end before Market Close, closing market quotations may become unreliable. An independent pricing service determines the degree of certainty, based on historical data, that the closing price in the principal market where a foreign security trades is not the current value as of Market Close. Foreign securities’ prices meeting the approved degree of certainty that the price is not reflective of current value will be valued by the independent pricing service using pricing models designed to estimate likely changes in the values of those securities between the times in which the trading in those securities is substantially completed and Market Close. Multiple factors may be considered by the independent pricing service in determining the value of such securities and may include information relating to sector indices, American Depositary Receipts and domestic and foreign index futures.
All other assets for which market quotations are not readily available or became unreliable (or if the above fair valuation methods are unavailable or determined to be unreliable) are valued at fair value as determined in good faith by or under the supervision of the Board following procedures approved by the Board. The Board has delegated to the Investment Adviser responsibility for overseeing the implementation of the Portfolios’ valuation procedures; a “Pricing Committee” comprised of employees of the Investment Adviser or its affiliates has responsibility for applying the fair valuation methods set forth in the procedures and, if a fair valuation cannot be determined pursuant to the fair valuation methods, determining the fair value of assets held by the Portfolios. Issuer specific events, transaction price, position size, nature and duration of restrictions on disposition of the security, market trends, bid/ask quotes of brokers and other market data may be reviewed in the course of
NOTES TO FINANCIAL STATEMENTS as of December 31, 2015 (continued)
NOTE 2 — SIGNIFICANT ACCOUNTING POLICIES (continued)
making a good faith determination of a security’s fair value. Valuations change in response to many factors including the historical and prospective earnings of the issuer, the value of the issuer’s assets, general economic conditions, interest rates, investor perceptions and market liquidity. Because of the inherent uncertainties of fair valuation, the values used to determine each Portfolio’s NAV may materially differ from the value received upon actual sale of those investments. Thus, fair valuation may have an unintended dilutive or accretive effect on the value of shareholders’ investments in each Portfolio.
Each investment asset or liability of the Portfolios is assigned a level at measurement date based on the significance and source of the inputs to its valuation. Quoted prices in active markets for identical securities are classified as “Level 1,” inputs other than quoted prices for an asset or liability that are observable are classified as “Level 2” and unobservable inputs, including the sub-advisers’ or Pricing Committee’s judgment about the assumptions that a market participant would use in pricing an asset or liability are classified as “Level 3.” The inputs used for valuing securities are not necessarily an indication of the risks associated with investing in those securities. Short-term securities of sufficient credit quality are generally considered to be Level 2 securities under applicable accounting rules. A table summarizing the Portfolios’ investments under these levels of classification is included following the Summary Portfolio of Investments.
U.S. GAAP requires a reconciliation of the beginning to ending balances for reported fair values that presents changes attributable to total realized and unrealized gains or losses, purchases and sales, and transfers in or out of the Level 3 category during the period. The beginning of period timing recognition is used for the transfers between Levels of a Portfolio’s assets and liabilities. A reconciliation of Level 3 investments is presented only when a Portfolio has a significant amount of Level 3 investments.
For the year ended December 31, 2015, there have been no significant changes to the fair valuation methodologies.
B. Security Transactions and Revenue Recognition. Security transactions are accounted for on the trade date. Realized gains and losses are reported on the basis of identified cost of securities sold. Interest income is recorded on an accrual basis. Dividend income is recorded on the ex-dividend date, or for certain foreign securities, when the information becomes available to the Portfolios. Premium amortization and discount accretion are determined by the effective yield method.
C. Foreign Currency Translation. The books and records of the Portfolios are maintained in U.S. dollars. Any foreign currency amounts are translated into U.S. dollars on the following basis:
(1)
Market value of investment securities, other assets and liabilities — at the exchange rates prevailing at Market Close.
(2)
Purchases and sales of investment securities, income and expenses — at the rates of exchange prevailing on the respective dates of such transactions.
Although the net assets and the market values are presented at the foreign exchange rates at Market Close, the Portfolios do not isolate the portion of the results of operations resulting from changes in foreign exchange rates on investments from the fluctuations arising from changes in market prices of securities held. Such fluctuations are included with the net realized and unrealized gains or losses from investments. For securities, which are subject to foreign withholding tax upon disposition, liabilities are recorded on the Statements of Assets and Liabilities for the estimated tax withholding based on the securities’ current market value. Upon disposition, realized gains or losses on such securities are recorded net of foreign withholding tax.
Reported net realized foreign exchange gains or losses arise from sales of foreign currencies, currency gains or losses realized between the trade and settlement dates on securities transactions, the difference between the amounts of dividends, interest, and foreign withholding tax reclaims recorded on the Portfolios’ books, and the U.S. dollar equivalent of the amounts actually received or paid. Net unrealized foreign exchange gains and losses arise from changes in the value of assets and liabilities other than investments in securities, resulting from changes in the exchange rate. Foreign security and currency transactions may involve certain considerations and risks not typically associated with investing in U.S. companies and U.S. government securities. These risks include, but are not limited to, revaluation of currencies and future adverse political and economic developments, which could cause securities and their markets to be less liquid and prices more volatile than those of comparable U.S. companies and U.S. government securities. The foregoing risks are even greater with respect to securities of issuers in emerging markets.
D. Distributions to Shareholders. The Portfolios record distributions to their shareholders on the ex-dividend date. All Portfolios (except Pioneer High Yield) declare and pay dividends annually. Pioneer High Yield declares dividends on a daily basis and pays dividends monthly. The Portfolios distribute capital gains distributions, if any, annually. The
NOTES TO FINANCIAL STATEMENTS as of December 31, 2015 (continued)
NOTE 2 — SIGNIFICANT ACCOUNTING POLICIES (continued)
Portfolios may make distributions on a more frequent basis to comply with the distribution requirements of subchapter M of the Internal Revenue Code. The characteristics of income and gains to be distributed are determined in accordance with income tax regulations, which may differ from U.S. GAAP for investment companies.
E. Federal Income Taxes. It is the policy of each Portfolio to comply with the requirements of subchapter M of the Internal Revenue Code that are applicable to regulated investment companies and to distribute substantially all of its net investment income and any net realized capital gains to its shareholders. Therefore, a federal income tax or excise tax provision is not required. Management has considered the sustainability of the Portfolios’ tax positions taken on federal income tax returns for all open tax years in making this determination. No capital gain distributions shall be made until the capital loss carryforwards have been fully utilized or expire.
The Portfolios may utilize equalization accounting for tax purposes, whereby a portion of redemption payments are treated as distributions of income or gain.
F. Use of Estimates. Management of the Portfolios has made certain estimates and assumptions relating to the reporting of assets, liabilities, income, and expenses to prepare these financial statements in conformity with U.S. GAAP for investment companies. Actual results could differ from these estimates.
G. Risk Exposures and the Use of Derivative Instruments. The Portfolios’ investment strategies permit the Portfolios to enter into various types of derivatives contracts, including, but not limited to, futures contracts, forward foreign currency exchange contracts, credit default swaps, interest rate swaps, total return swaps, and purchased and written options. In doing so, a Portfolio will employ strategies in differing combinations to permit it to increase or decrease the level of risk, or change the level or types of exposure to market risk factors. This may allow a Portfolio to pursue its objectives more quickly, and efficiently than if it were to make direct purchases or sales of securities capable of affecting a similar response to market factors.
Market Risk Factors. In pursuit of its investment objectives, a Portfolio may seek to use derivatives to increase or decrease its exposure to the following market risk factors:
Credit Risk. The price of a bond and other debt instrument is likely to fall if the issuer’s actual or perceived financial health deteriorates, whether because of broad economic or issuer-specific reasons, or if the issuer is late (or defaults) in paying interest or principal.
Equity Risk. Stock prices may be volatile or have reduced liquidity in response to real or perceived impacts of factors including, but not limited to, economic conditions, changes in market interest rates, and political events. Stock markets tend to be cyclical, with periods when stock prices generally rise and periods when stock prices generally decline. Any given stock market segment may remain out of favor with investors for a short or long period of time, and stocks as an asset class may underperform bonds or other asset classes during some periods. Additionally, legislative, regulatory or tax policies or developments in these areas may adversely impact the investment techniques available to a manager, add to costs and impair the ability of a Portfolio to achieve its investment objectives.
Foreign Exchange Rate Risk. To the extent that a Portfolio invests directly in foreign (non-U.S.) currencies or in securities denominated in, or that trade in, foreign (non-U.S.) currencies, it is subject to the risk that those foreign (non-U.S.) currencies will decline in value relative to the U.S. dollar or, in the case of hedging positions, that the U.S. dollar will decline in value relative to the currency being hedged by a Portfolio through foreign currency exchange transactions.
Currency rates may fluctuate significantly over short periods of time. Currency rates may be affected by changes in market interest rates, intervention (or the failure to intervene) by U.S. or foreign governments, central banks or supranational entities such as the International Monetary Fund, by the imposition of currency controls, or other political or economic developments in the United States or abroad.
Interest Rate Risk. With bonds and other fixed rate debt instruments, a rise in market interest rates generally causes values to fall; conversely, values generally rise as market interest rates fall. The higher the credit quality of the instrument, and the longer its maturity or duration, the more sensitive it is likely to be to interest rate risk. In the case of inverse securities, the interest rate paid by the securities is a floating rate, which generally will decrease when the market rate of interest to which the inverse security is indexed increases and will increase when the market rate of interest to which the inverse security is indexed decreases. As of the date of this report, market
NOTES TO FINANCIAL STATEMENTS as of December 31, 2015 (continued)
NOTE 2 — SIGNIFICANT ACCOUNTING POLICIES (continued)
interest rates in the United States are at or near historic lows, which may increase a Portfolio’s exposure to risks associated with rising market interest rates. Rising market interest rates could have unpredictable effects on the markets and may expose fixed-income and related markets to heightened volatility. For a Portfolio that invests in fixed-income securities, an increase in market interest rates may lead to increased redemptions and increased portfolio turnover, which could reduce liquidity for certain investments, adversely affect values, and increase costs. If dealer capacity in fixed-income markets is insufficient for market conditions, it may further inhibit liquidity and increase volatility in the fixed-income markets.
Risks of Investing in Derivatives. A Portfolio’s use of derivatives can result in losses due to unanticipated changes in the market risk factors and the overall market. In instances where a Portfolio is using derivatives to decrease, or hedge, exposures to market risk factors for securities held by a Portfolio, there are also risks that those derivatives may not perform as expected resulting in losses for the combined or hedged positions.
Derivative instruments are subject to a number of risks, including the risk of changes in the market price of the underlying securities, credit risk with respect to the counterparty, risk of loss due to changes in market interest rates and liquidity and volatility risk. The amounts required to purchase certain derivatives may be small relative to the magnitude of exposure assumed by a Portfolio. Therefore, the purchase of certain derivatives may have an economic leveraging effect on a Portfolio and exaggerate any increase or decrease in the net asset value. Derivatives may not perform as expected, so a Portfolio may not realize the intended benefits. When used for hedging purposes, the change in value of a derivative may not correlate as expected with the currency, security or other risk being hedged. When used as an alternative or substitute for direct cash investments, the return provided by the derivative may not provide the same return as direct cash investment. In addition, given their complexity, derivatives expose a Portfolio to the risk of improper valuation.
Generally, derivatives are sophisticated financial instruments whose performance is derived, at least in part, from the performance of an underlying asset or assets. Derivatives include, among other things, swap agreements, options, forwards and futures. Investments in derivatives are generally negotiated over-the-counter with a single counterparty and as a result are subject to credit risks related to the counterparty’s ability or willingness to perform its obligations; any deterioration in the
counterparty’s creditworthiness could adversely affect the value of the derivative. In addition, derivatives and their underlying securities may experience periods of illiquidity which could cause a Portfolio to hold a security it might otherwise sell, or to sell a security it otherwise might hold at inopportune times or at an unanticipated price. A manager might imperfectly judge the direction of the market. For instance, if a derivative is used as a hedge to offset investment risk in another security, the hedge might not correlate to the market’s movements and may have unexpected or undesired results such as a loss or a reduction in gains.
The U.S. government has enacted legislation that provides for new regulation of the derivatives market, including clearing, margin, reporting, and registration requirements. The European Union (and other countries outside of the European Union) is implementing similar requirements, which will affect a Portfolio when it enters into a derivatives transaction with a counterparty organized in that country or otherwise subject to that country’s derivatives regulations. Because these requirements are new and evolving (and some of the rules are not yet final), their ultimate impact remains unclear. Central clearing is expected to reduce counterparty risk and increase liquidity, however, there is no assurance that it will achieve that result, and in the meantime, central clearing and related requirements expose a Portfolio to new kinds of costs and risks.
Counterparty Credit Risk and Credit Related Contingent Features. Certain derivative positions are subject to counterparty credit risk, which is the risk that the counterparty will not fulfill its obligation to a Portfolio. Each Portfolio’s derivative counterparties are financial institutions who are subject to market conditions that may weaken their financial position. A Portfolio intends to enter into financial transactions with counterparties that it believes to be creditworthy at the time of the transaction. To reduce this risk, a Portfolio has entered into master netting arrangements, established within each Portfolio’s International Swap and Derivatives Association, Inc. (“ISDA”) Master Agreements (“Master Agreements”). These agreements are with select counterparties and they govern transactions, including certain over-the-counter (“OTC”) derivative and forward foreign currency contracts, entered into by a Portfolio and the counterparty. The Master Agreements maintain provisions for general obligations, representations, agreements, collateral, and events of default or termination. The occurrence of a specified event of termination may give a counterparty the right to terminate all of its contracts and affect settlement of all outstanding transactions under the applicable Master Agreement.
A Portfolio may also enter into collateral agreements with certain counterparties to further mitigate counterparty
NOTES TO FINANCIAL STATEMENTS as of December 31, 2015 (continued)
NOTE 2 — SIGNIFICANT ACCOUNTING POLICIES (continued)
credit risk on OTC derivative and forward foreign currency contracts. Subject to established minimum levels, collateral is generally determined based on the net aggregate unrealized gain or loss on contracts with a certain counterparty. Collateral pledged to or from a Portfolio is held in a segregated account by a third-party agent and can be in the form of cash or debt securities issued by the U.S. government or related agencies.
As of December 31, 2015, the maximum amount of loss that Global Bond, Invesco Comstock, and Invesco Equity and Income would incur if the counterparties to its derivative transactions failed to perform would be $4,443,411, $648,775, and $970,216, respectively, which represents the gross payments to be received by the Portfolios on open forward foreign currency contracts were they to be unwound as of December 31, 2015. To reduce the amount of potential loss to Global Bond, certain counterparties have posted $470,000 in cash collateral for open OTC transactions at December 31, 2015.
Each Portfolio has credit related contingent features that if triggered would allow its derivative counterparties to close out and demand payment or additional collateral to cover their exposure from a Portfolio. Credit related contingent features are established between each Portfolio and their derivatives counterparties to reduce the risk that a Portfolio will not fulfill its payment obligations to its counterparties. These triggering features include, but are not limited to, a percentage decrease in a Portfolio’s net assets and or a percentage decrease in a Portfolio’s NAV, which could cause a Portfolio to accelerate payment of any net liability owed to the counterparty. The contingent features are established within each Portfolio’s Master Agreements. There were no credit events during the year ended December 31, 2015, that triggered any credit related contingent features for each respective Portfolio.
As of December 31, 2015, Global Bond had a liability position of $4,526,609 on open forward foreign currency contracts with credit related contingent features.
If a contingent feature would have been triggered as of December 31, 2015, the Portfolios could have been required to pay this amount in cash to its counterparties. As of December 31, 2015, Global Bond had posted $1,430,000 in cash collateral for open OTC derivative transactions with its respective counterparties.
H. Forward Foreign Currency Contracts. Certain Portfolios may enter into forward foreign currency contracts primarily to hedge against foreign currency exchange rate risks on their non-U.S. dollar denominated investment securities. When entering into a forward currency contract,
a Portfolio agrees to receive or deliver a fixed quantity of foreign currency for an agreed-upon price on an agreed future date. These contracts are valued daily and a Portfolio’s net equity therein, representing unrealized gain or loss on the contracts as measured by the difference between the forward foreign exchange rates at the dates of entry into the contracts and the forward rates at the reporting date, is included in the Statement of Assets and Liabilities. Realized and unrealized gains and losses are included in the Statement of Operations. These instruments involve market and/or credit risk in excess of the amount recognized in the Statement of Assets and Liabilities. Risks arise from the possible inability of counterparties to meet the terms of their contracts and from movement in currency and securities values and interest rates. Open forward foreign currency contracts are presented following the Summary Portfolio of Investments.
During the year ended December 31 2015, the following Portfolios had average contract amounts on forward foreign currency contracts to buy and sell as disclosed below:
| | | | Buy | | | Sell | |
| Global Bond** | | | | $ | 307,612,271 | | | | | $ | 199,578,844 | | |
| American Century Small-Mid Cap Value* | | | | | 89,493 | | | | | | 7,891,076 | | |
| Invesco Comstock* | | | | | 1,660,371 | | | | | | 51,013,713 | | |
| Invesco Equity and Income* | | | | | — | | | | | | 130,774,252 | | |
*
For the year ended December 31, 2015, the Portfolios used forward foreign currency contracts primarily to protect their non-U.S. dollar-denominated holdings from adverse currency movements. Please refer to the tables following each respective Summary Portfolio of Investments for open forward foreign currency contracts at December 31, 2015.
**
For the year ended December 31, 2015, the Portfolio used forward foreign currency contracts primarily to protect their non-U.S. dollar-denominated holdings from adverse currency movements and to gain exposure to currencies for the purposes of risk management or enhanced return. Please refer to the tables following each respective Summary Portfolio of Investments for open forward foreign currency contracts at December 31, 2015.
I. Futures Contracts. Certain Portfolios may enter into futures contracts involving foreign currency, interest rates, securities and security indices. A futures contract is a commitment to buy or sell a specific amount of a financial instrument at a negotiated price on a stipulated future date. A Portfolio may buy and sell futures contracts. Futures contracts traded on a commodities or futures exchange will be valued at the final settlement price or official closing price on the principal exchange as reported by such principal exchange at its trading session ending at, or most recently prior to, the time when each Portfolio’s assets are valued.
Upon entering into a futures contract, a Portfolio is required to deposit either cash or securities (initial margin) in an amount equal to a certain percentage of the contract
NOTES TO FINANCIAL STATEMENTS as of December 31, 2015 (continued)
NOTE 2 — SIGNIFICANT ACCOUNTING POLICIES (continued)
value. Subsequent payments (variation margin) are made or received by a Portfolio each day. The variation margin payments are equal to the daily changes in the contract value and are recorded as unrealized gains and losses. Open futures contracts are reported on a table following each Portfolio’s Summary Portfolio of Investments. Securities held in collateralized accounts to cover initial margin requirements on open futures contracts are footnoted in the Summary Portfolio of Investments. Cash collateral held by the broker to cover initial margin requirements on open futures contracts are noted in the Statements of Assets and Liabilities. The net change in unrealized appreciation and depreciation is reported in the Statements of Operations. Realized gains (losses) are reported in the Statements of Operations at the closing or expiration of futures contracts.
Futures contracts are exposed to the market risk factor of the underlying financial instrument. During the year ended December 31, 2015, Global Bond had purchased and sold futures contracts on various notes and bonds as part of their respective duration strategy. During the year ended December 31, 2015, Pioneer High Yield had sold futures contracts on equity indices to decrease exposure to equity risk. Additional associated risks of entering into futures contracts include the possibility that there may be an illiquid market where each Portfolio is unable to liquidate the contract or enter into an offsetting position and, if used for hedging purposes, the risk that the price of the contract will correlate imperfectly with the prices of each Portfolios’ securities. With futures, there is minimal counterparty credit risk to the Portfolios since futures are exchange traded and the exchange’s clearinghouse, as counterparty to all exchange traded futures, guarantees the futures against default.
During the year ended December 31, 2015, the following Portfolios had average notional values on futures contracts purchased and sold as disclosed below. Please refer to the tables following each respective Summary Portfolio of Investments for open futures contracts at December 31, 2015.
| | | | Purchased | | | Sold | |
| Global Bond | | | | $ | 254,901,717 | | | | | $ | 160,149,451 | | |
| Pioneer High Yield | | | | | — | | | | | | 4,054,282 | | |
J. Securities Lending. Each Portfolio may temporarily loan up to 331∕3% of its total assets to brokers, dealers or other financial institutions in exchange for a negotiated lender’s fee. Securities lending involves two primary risks: “investment risk” and “borrower default risk.” When lending securities, the Portfolios will receive cash or U.S. government securities as collateral. Investment risk is the
risk that the Portfolios will lose money from the investment of the cash collateral received from the borrower. Borrower default risk is the risk that the Portfolios will lose money due to the failure of a borrower to return a borrowed security. Loans are subject to termination at the option of the borrower or the Portfolios. Securities lending may result in leverage. The use of leverage may exaggerate any increase or decrease in the net asset value, causing the Portfolios to be more volatile. The use of leverage may increase expenses and increase the impact of the Portfolios’ other risks.
K. Restricted Securities. The Portfolios may invest in restricted securities which include those sold under Rule 144A of the Securities Act of 1933 (“1933 Act”) or securities offered pursuant to Section 4(a)(2) of the 1933 Act, and/or are subject to legal or contractual restrictions on resale and may not be publicly sold without registration under the 1933 Act. Restricted securities are fair valued using market quotations when readily available. In the absence of market quotations, the securities are valued based upon their fair value determined in good faith under procedures approved by the Board.
Securities that are not registered for sale to the public under the Securities Act are referred to as “restricted securities.” These securities may be sold in private placement transactions between issuers and their purchasers and may be neither listed on an exchange nor traded in other established markets. Many times these securities are subject to legal or contractual restrictions on resale. As a result of the absence of a public trading market, the prices of these securities may be more volatile, less liquid and more difficult to value than publicly traded securities. The price realized from the sale of these securities could be less than the amount originally paid or less than their fair value if they are resold in privately negotiated transactions. In addition, these securities may not be subject to disclosure and other investment protection requirements that are afforded to publicly traded securities. Certain investments may include investment in smaller, less seasoned issuers, which may involve greater risk.
L. Delayed-Delivery and When-Issued Transactions. Certain Portfolios may purchase or sell securities on a when-issued or forward commitment basis. The price of the underlying securities and date when the securities will be delivered and paid for are fixed at the time the transaction is negotiated. The fair value of such is identified in the Portfolios’ Summary Portfolio of Investments. Losses may arise due to changes in the fair value of the securities or from the inability of counterparties to meet the terms of the contract. In connection with such purchases, the Portfolios are
NOTES TO FINANCIAL STATEMENTS as of December 31, 2015 (continued)
NOTE 2 — SIGNIFICANT ACCOUNTING POLICIES (continued)
required to hold liquid assets as collateral with the Portfolios’ custodian sufficient to cover the purchase price.
To mitigate counterparty risk, certain Portfolios have entered into Master Securities Forward Transaction Agreements (“MSFTA”) with their respective counterparties that provide for collateral and the right to offset amounts due to or from those counterparties under specified conditions. Subject to minimum transfer amounts, collateral requirements are determined and transfers made based on the net aggregate unrealized gain or loss on all the when-issued or delayed-delivery transactions with a particular counterparty. Cash collateral, if any, is presented on the Statement of Assets and Liabilities as an asset (Cash pledged as collateral for delayed-delivery or when-issued securities) and a liability (Cash received as collateral for delayed-delivery or when-issued securities). At December 31, 2015, there was no cash collateral pledged to or posted by any Portfolio.
M. Mortgage Dollar Roll Transactions. Certain Portfolios may engage in dollar roll transactions with respect to mortgage-backed securities issued by Government National Mortgage Association, Federal National Mortgage Association and Federal Home Loan Mortgage Corp. In a dollar roll transaction, a Portfolio sells a mortgage-backed security to a financial institution, such as a bank or broker/dealer, and simultaneously agrees to repurchase a substantially similar (i.e., same type, coupon, and maturity) security from the institution on a delayed delivery basis at an agreed upon price. The mortgage-backed securities that are repurchased will bear the same interest rate as those sold, but generally will be collateralized by different pools of mortgages with different prepayment histories. The Portfolios account for dollar roll transactions as purchases and sales. For fee based dollar roll transactions, the fee is recorded as income.
N. Options Contracts. Certain Portfolios may purchase put and call options and may write (sell) put options and covered call options on futures, swaps (“swaptions”), securities, commodities or foreign currencies. The Portfolios may engage in option transactions as a hedge against adverse movements in the value of portfolio holdings or to increase market exposure. Option contracts are valued daily and unrealized gains or losses are recorded based upon the last sales price on the principal exchange on which the options are traded. An amount equal to the proceeds of the premium received by the Portfolios upon the writing of a put or call option is included in the Statements of Assets and Liabilities as an asset and equivalent liability which is subsequently marked-to-market until it is exercised or closed, or it expires. The Portfolios
will realize a gain or loss upon the expiration or closing of the option contract. When an option is exercised, the proceeds on sales of the underlying security for a written call option, the purchase cost of the security for a written put option, or the cost of the security for a purchased put or call option is adjusted by the amount of premium received or paid. Realized and unrealized gains or losses on option contracts are reflected in the accompanying financial statements. The risk in writing a covered call option is that the Portfolios give up the opportunity for profit if the market price of the security increases and the option is exercised. The risk in writing a put option is that the Portfolios may incur a loss if the market price of the security decreases and the option is exercised. The risk in buying an option is that the Portfolios pay a premium whether or not the option is exercised. Risks may also arise from an illiquid secondary market or from the inability of counterparties to meet the terms of the contract.
During the year ended December 31, 2015, Global Bond had purchased and written exchange-traded futures contracts to gain exposure to interest rates and to generate income. There were no open purchased or written exchange-traded options at December 31, 2015.
During the year ended December 31, 2015, Global Bond had purchased and written foreign currency options to gain exposure to currencies and to generate income. There were no open purchased or written foreign currency options at December 31, 2015.
During the year ended December 31, 2015, Global Bond had purchased and written interest rate swaptions to gain exposure to interest rates and to generate income. There were no open or written interest rate swaptions at December 31, 2015.
Please refer to Note 8 for the volume of both purchased and written option activity during the year ended December 31, 2015.
O. Swap Agreements. Certain Portfolios may enter into swap agreements. A swap is an agreement between two parties pursuant to which each party agrees to make one or more payments to the other at specified future intervals based on the return of an asset (such as a stock, bond or currency) or non-asset reference (such as an interest rate or index). Swap agreements are privately negotiated in the OTC market and may be executed in a multilateral or other trade facility platform, such as a registered commodities exchange (“centrally cleared swaps”).
The swap agreement will specify the “notional” amount of the asset or non-asset reference to which the contract relates. Subsequent changes in fair value, if any, are calculated based upon changes in the performance of the asset or non-asset reference multiplied by the notional
NOTES TO FINANCIAL STATEMENTS as of December 31, 2015 (continued)
NOTE 2 — SIGNIFICANT ACCOUNTING POLICIES (continued)
value of the contract. A Portfolio may enter into credit default, interest rate, total return and currency swaps to manage its exposure to credit, currency and interest rate risk. All outstanding swap agreements are reported following each Portfolio’s Summary Portfolio of Investments.
Swaps are marked to market daily using quotations primarily from third party pricing services, registered commodities exchange(s), counterparties or brokers. The fair value of an OTC swap contract is recorded on each Portfolio’s Statements of Assets and Liabilities. Daily changes in the value of centrally cleared swaps, if any, are recorded as variation margin receivable or payable on the Statement of Assets and Liabilities. During the term of the swap, changes in the value of the swap, if any, are recorded as unrealized gains or losses on the Statements of Operations. Upfront payments paid or received on OTC swaps by a Portfolio when entering into the agreements are reported on the Statements of Assets and Liabilities and as a component of the changes in unrealized gains or losses on the Statements of Operations. These upfront payments represent the amounts paid or received when initially entering into the swap agreement to compensate for differences between the stated terms of the swap agreement and the prevailing market conditions. The upfront payments are included as a component in the realized gains or losses on each Portfolio’s Statement of Operations upon termination or maturity of the swap. A Portfolio also records net periodic payments paid or received on the swap contract as a realized gain or loss on the Statements of Operations.
In a centrally cleared swap, immediately following execution of the swap agreement, the swap agreement is novated to a central counterparty (the “CCP”) and the Portfolio’s counterparty on the swap agreement becomes the CCP. The Portfolios are required to interface with the CCP through a broker. Upon entering into a centrally cleared swap, the Portfolios are required to deposit initial margin with the broker in the form of cash or securities in an amount that varies depending on the size and risk profile of the particular swap. Securities deposited as initial margin are footnoted as pledged on the Summary Portfolio of Investments and cash deposited is recorded on the Statements of Assets and Liabilities as cash pledged for centrally cleared swaps. The daily change in valuation of centrally cleared swaps is recorded as a receivable or payable for variation margin in the Statements of Assets and Liabilities. Payments received from (paid to) the counterparty, including at termination, are recorded as realized gain (loss) on the Statements of Operations.
Entering into swap agreements involves the risk that the maximum potential loss of an investment exceeds the current value of the investment as reported on each Portfolio’s Statements of Assets and Liabilities. Other risks involve the possibility that the counterparty to the agreements may default on its obligation to perform, that there will be no liquid market for these investments and that unfavorable changes in the market will have a negative impact on the value of the index or securities underlying the respective swap agreement.
Credit Default Swap Contracts. A credit default swap is a bilateral agreement between counterparties in which the buyer of the protection agrees to make a stream of periodic payments to the seller of protection in exchange for the right to receive a specified return in the event of a default or other credit event for a referenced entity, obligation or index. As a seller of protection on credit default swaps, a Portfolio will generally receive from the buyer a fixed payment stream based on the notional amount of the swap contract. This fixed payment stream will continue until the swap contract expires or a defined credit event occurs.
A Portfolio is subject to credit risk in the normal course of pursuing its investment objectives. As a seller of protection in a credit default swap, a Portfolio may execute these contracts to manage its exposure to the market or certain sectors of the market. Certain Portfolios may also enter into credit default swaps to speculate on changes in an issuer’s credit quality, to take advantage of perceived spread advantages, or to offset an existing short equivalent (i.e. buying protection on an equivalent reference entity).
Certain Portfolios may sell credit default swaps which expose these Portfolios to the risk of loss from credit risk- related events specified in the contract. Although contract specific, credit events are generally defined as bankruptcy, failure to pay, restructuring, obligation acceleration, obligation default or repudiation/moratorium. If a Portfolio is a seller of protection, and a credit event occurs, as defined under the terms of that particular swap agreement, a Portfolio will generally either (i) pay to the buyer an amount equal to the notional amount of the swap and take delivery of the referenced obligation, other deliverable obligations, or underlying securities comprising a referenced index or (ii) pay a net settlement amount in the form of cash or securities equal to the notional amount of the swap less the recovery value of the referenced obligation or underlying securities comprising a referenced index. If a Portfolio is a buyer of protection and a credit event occurs, as defined under the terms of that particular swap agreement, a Portfolio will either (i) receive from the seller of protection an amount equal to the notional amount
NOTES TO FINANCIAL STATEMENTS as of December 31, 2015 (continued)
NOTE 2 — SIGNIFICANT ACCOUNTING POLICIES (continued)
of the swap and deliver the referenced obligation, other deliverable obligations or underlying securities comprising the referenced index or (ii) receive a net settlement amount in the form of cash or securities equal to the notional amount of the swap less the recovery value of the referenced obligation or underlying securities comprising the referenced index. Recovery values are assumed by market makers considering either industry standard recovery rates or entity specific factors and considerations until a credit event occurs. If a credit event has occurred, the recovery value is determined by a facilitated auction whereby a minimum number of allowable broker bids, together with a specified valuation method, are used to calculate the settlement value.
Implied credit spreads, represented in absolute terms, utilized in determining the fair value of credit default swap agreements on corporate issues or sovereign issues are disclosed in each Portfolio’s Summary Portfolio of Investments and serve as an indicator of the current status of the payment/performance risk and represent the likelihood or risk of default for the credit derivative. The implied credit spread of a particular referenced entity reflects the cost of buying/selling protection and may include upfront payments required to be made to enter into the agreement. For credit default swaps on asset-backed securities or credit indices, the quoted market prices and resulting fair values serve as the indicator of the current status of the payment/performance risk. Wider credit spreads and increasing fair values, in absolute terms when compared to the notional amount of the swap, represent a deterioration of the referenced entity’s credit soundness and a greater likelihood or risk of default or other credit event occurring as defined under the terms of the agreement.
The maximum amount of future payments (undiscounted) that a Portfolio as seller of protection could be required to make under a credit default swap agreement would be an amount equal to the notional amount of the agreement. These potential amounts would be partially offset by any recovery values of the respective referenced obligations, upfront payments received upon entering into the agreements, or net amounts received from the settlement of buy protection credit default swap agreements entered into by a Portfolio for the same referenced entity or entities.
For the year ended December 31, 2015, Global Bond had purchased credit protection on credit default swap indices (“CDX”). A CDX is a basket of credit instruments or exposures designed to be representative of some part of the credit market as a whole. Global Bond used CDX swaps to hedge the credit risk associated with various
sectors with the credit markets. For the year ended December 31, 2015, Global Bond had an average notional amount of $28,826,000 on credit default swaps to buy protection. There were no open credit default swaps to buy protection at December 31, 2015.
For the year ended December 31, 2015, Global Bond and Pioneer High Yield had sold credit protection on various credit default swap indices to gain additional exposure to the market or certain sectors of the markets. For the year ended December 31, 2015, Global Bond and Pioneer High Yield had an average notional amount of $12,000,000 and $1,620,767, respectively, on credit default swaps to sell protection. Please refer to the tables following the Summary Portfolio of Investments for both Global Bond and Pioneer High Yield for open credit default swaps to sell protection at December 31, 2015.
At December 31, 2015, Pioneer High Yield had pledged $200,000 in cash collateral as initial margin for open centrally cleared credit default swaps outstanding at December 31, 2015.
Interest Rate Swap Contracts. An interest rate swap involves the agreement between counterparties to exchange periodic payments based on interest rates. One payment will be based on a floating rate of a specified interest rate while the other will be a fixed rate. Risks involve the future fluctuations of interest rates in which a Portfolio may make payments that are greater than what a Portfolio received from the counterparty. Other risks include credit, liquidity and market risk.
For the year ended December 31, 2015, Global Bond had entered into interest rate swaps in which it pays a floating interest rate and receives a fixed interest rate (“Long interest rate swap”) in order to increase exposure to interest rate risk. Average notional amounts on long interest rate swaps was $1,029,739,181.
For the year ended December 31, 2015, Global Bond had entered into interest rate swaps in which it pays a fixed interest rate and receives a floating interest rate (“Short interest rate swap”) in order to decrease exposure to interest rate risk. Average notional amounts on short interest rate swaps was $866,191,504.
Global Bond entered into interest rate swaps to adjust interest rate and yield curve exposures and to substitute for physical fixed-income securities. Please refer to the table following the Summary Portfolio of Investments for Global Bond for open centrally cleared interest rate swaps at December 31, 2015.
At December 31, 2015, Global Bond had posted $1,388,000 in cash collateral as initial margin for the open centrally cleared interest rate swaps outstanding at December 31, 2015.
NOTES TO FINANCIAL STATEMENTS as of December 31, 2015 (continued)
NOTE 2 — SIGNIFICANT ACCOUNTING POLICIES (continued)
P. Structured Products. Global Bond invests in structured products which are specially-designed derivative investments whose principal payments or interest payments are linked to the performance of underlying foreign currencies, interest rate spreads, stock market indices, prices of individual securities, commodities or other financial instruments or the occurrence of other specific events. The terms and conditions of these products may be ‘structured’ by the purchaser (a Portfolio) and the borrower issuing the note. The market value of these products will increase or decrease based on the performance of the underlying asset or reference. A Portfolio records the net change in the market value of the structured product on the accompanying Statements of Operations as a change in unrealized appreciation or depreciation on investments. A Portfolio records a realized gain or loss on the Statements of Operations upon the sale or maturity of the structured product. Please refer to the Summary Portfolio of Investments for structured products held by Global Bond at December 31, 2015.
Q. Indemnifications. In the normal course of business, the Company may enter into contracts that provide certain indemnifications. The Company’s maximum exposure under these arrangements is dependent on future claims that may be made against the Portfolios and, therefore, cannot be estimated; however, based on experience, management considers the risk of loss from such claims remote.
NOTE 3 — INVESTMENT TRANSACTIONS
For the year ended December 31, 2015, the cost of purchases and the proceeds from the sales of securities, excluding U.S. government and short-term securities, were as follows:
| | | | Purchases | | | Sales | |
| Global Bond | | | | $ | 193,420,619 | | | | | $ | 237,769,025 | | |
| American Century Small-Mid Cap Value | | | | | 212,184,684 | | | | | | 247,184,364 | | |
| Baron Growth | | | | | 53,381,186 | | | | | | 223,463,285 | | |
| Columbia Contrarian Core | | | | | 223,016,364 | | | | | | 258,743,415 | | |
| Columbia Small Cap Value II | | | | | 118,590,365 | | | | | | 142,326,179 | | |
| Invesco Comstock | | | | | 133,063,939 | | | | | | 129,215,626 | | |
| Invesco Equity and Income | | | | | 368,159,965 | | | | | | 541,743,790 | | |
| JPMorgan Mid Cap Value | | | | | 93,127,421 | | | | | | 148,727,322 | | |
| Oppenheimer Global | | | | | 198,464,199 | | | | | | 308,277,842 | | |
| Pioneer High Yield | | | | | 29,984,539 | | | | | | 46,076,052 | | |
| T. Rowe Price Diversified Mid Cap Growth | | | | | 221,347,275 | | | | | | 269,732,791 | | |
| T. Rowe Price Growth Equity | | | | | 691,198,764 | | | | | | 703,316,662 | | |
| Templeton Foreign Equity | | | | | 76,062,238 | | | | | | 147,735,722 | | |
U.S. government securities not included above were as follows:
| | | | Purchases | | | Sales | |
| Global Bond | | | | $ | 706,315,740 | | | | | $ | 718,872,631 | | |
| Invesco Equity and Income | | | | | 2,273,914,450 | | | | | | 2,319,207,158 | | |
| Pioneer High Yield | | | | | — | | | | | | 1,995,041 | | |
NOTE 4 — INVESTMENT MANAGEMENT FEES
Prior to May 1, 2015, the Portfolios had entered into an investment management agreement (“Management Agreement”) with the Investment Adviser. For its services, each Portfolio paid the Investment Adviser a monthly fee in arrears equal to the following as a percentage of each Portfolio’s average daily net assets during the month. Amounts paid to the Investment Adviser through April 30, 2015 are reflected as investment management fees on the accompanying Statement of Operations.
| Portfolio | | | Fee | |
| Global Bond | | | 0.500% on the first $4 billion;
0.475% on the next $1 billion; 0.450% on the next $1 billion; 0.430% on assets over $6 billion | |
American Century Small-Mid
Cap Value | | |
1.00% on the first $250 million;
0.95% on the next $250 million;
0.90% on assets over $500 million | |
| Baron Growth | | | 0.850% on the first $1 billion;
0.825% on the next $1 billion; 0.800% on assets over $2 billion | |
| Columbia Contrarian Core(1) | | | 0.80% on the first $500 million; 0.75% on the next $500 million; 0.70% on assets over $1 billion | |
| Columbia Small Cap Value II | | | 0.75% | |
| Invesco Comstock | | | 0.60% | |
| Invesco Equity and Income(2) | | | 0.55% on the first $750 million; 0.53% on the next $250 million; 0.51% on assets over $1 billion | |
| JPMorgan Mid Cap Value | | | 0.75% on the first $500 million; 0.65% on the next $500 million; 0.60% on assets over $1 billion | |
| Oppenheimer Global | | | 0.60% on the first $3 billion;
0.58% on the next $1 billion;
0.57% on the next $4 billion;
0.56% on assets over $8 billion | |
| Pioneer High Yield | | | 0.60% on the first $2 billion;
0.50% on the next $1 billion;
0.40% on the next $1 billion;
0.30% on assets over $4 billion | |
T. Rowe Price Diversified
Mid Cap Growth | | | 0.64% | |
| T. Rowe Price Growth Equity | | | 0.60% | |
| Templeton Foreign Equity | | | 0.80% on the first $500 million; 0.75% on assets over $500 million | |
(1)
Effective January 1, 2015, advisory fee breakpoints were incorporated.
(2)
The Investment Adviser had contractually agreed to waive 0.01% of the fee for Invesco Equity and Income.
NOTES TO FINANCIAL STATEMENTS as of December 31, 2015 (continued)
NOTE 4 — INVESTMENT MANAGEMENT FEES (continued)
Also, prior to May 1, 2015, the Portfolios had entered into an administrative agreement (“Administrative Agreement”) with Voya Funds Services, LLC (the “Administrator”), a Delaware limited liability company. The Administrator provided certain administrative and shareholder services necessary for each Portfolio’s operations and is responsible for the supervision of other service providers. For its services, the Administrator was entitled to receive from each Portfolio a fee at an annual rate of 0.10% of each Portfolio’s average daily net assets. Amounts paid to the Administrator through April 30, 2015 are reflected as administrative service fees on the accompanying Statements of Operations.
Effective May 1, 2015, the terms of the Portfolios’ Management Agreement and Administrative Agreement were combined under a single Amended and Restated Investment Management Agreement with a single management fee. The single management fee rate under the Portfolios’ Amended and Restated Investment Management Agreement does not exceed the former combined investment management and administrative services fee rates for the Portfolios and there is no change to the investment management or administrative services provided.
The Amended and Restated Investment Management Agreement compensates the Investment Adviser with a monthly fee in arrears equal to the following as a percentage of each Portfolio’s average daily net assets during the month. Single management fee amounts paid to the Investment Adviser from May 1, 2015 through December 31, 2015 are reflected as investment management fees on the accompanying Statements of Operations.
| Portfolio | | | Fee | |
| Global Bond | | | 0.600% on the first $4 billion;
0.575% on the next $1 billion; 0.550% on the next $1 billion; 0.530% on assets over $6 billion | |
American Century Small-Mid
Cap Value | | |
1.10% on the first $250 million;
1.05% on the next $250 million;
1.00% on assets over $500 million | |
| Baron Growth | | | 0.950% on the first $1 billion;
0.925% on the next $1 billion; 0.900% on assets over $2 billion | |
| Columbia Contrarian Core | | | 0.90% on the first $500 million; 0.85% on the next $500 million; 0.80% on assets over $1 billion | |
| Columbia Small Cap Value II | | | 0.85% | |
| Invesco Comstock | | | 0.70% | |
| Portfolio | | | Fee | |
| Invesco Equity and Income(1) | | | 0.65% on the first $750 million; 0.63% on the next $250 million; 0.61% on assets over $1 billion | |
| JPMorgan Mid Cap Value | | | 0.85% on the first $500 million; 0.75% on the next $500 million; 0.70% on assets over $1 billion | |
| Oppenheimer Global | | | 0.70% on the first $3 billion;
0.68% on the next $1 billion;
0.67% on the next $4 billion;
0.66% on assets over $8 billion | |
| Pioneer High Yield | | | 0.70% on the first $2 billion;
0.60% on the next $1 billion;
0.50% on the next $1 billion;
0.40% on assets over $4 billion | |
T. Rowe Price Diversified Mid
Cap Growth | | | 0.74% | |
| T. Rowe Price Growth Equity | | | 0.70% | |
| Templeton Foreign Equity | | | 0.90% on the first $500 million; 0.85% on assets over $500 million | |
(1)
Effective May 1, 2015, the Investment Adviser has contractually agreed to waive 0.01% of the fee for Invesco Equity and Income.
The Investment Adviser has contractually agreed to waive a portion of the advisory fee for Global Bond, American Century Small-Mid Cap Value, Columbia Contrarian Core, Columbia Small Cap Value II, Invesco Comstock and T. Rowe Price Growth Equity in connection with sub-advisory fee reductions for these Portfolios. The waiver is calculated as follows:
Waiver = 50% x (former sub-advisory fee rate minus new sub-advisory fee rate)
In addition, the Investment Adviser has agreed to further waive a portion of the advisory fee for T. Rowe Price Growth Equity. The waiver for T. Rowe Price Growth Equity is based on the total savings in excess of $500,000 as a result of the aggregated sub-advisory fee schedule of T. Rowe Price Growth Equity and VY® T. Rowe Price Equity Income Portfolio, which is not included in this report. The aggregated amount of savings is allocated to the two Portfolios pro rata based on each Portfolio’s contribution to the amount saved.
For the year ended December 31, 2015, the Investment Adviser waived $6,755, $500,588, $104,598, $67,108, $93,750, and $96,161 for Global Bond, American Century Small-Mid Cap Value, Columbia Contrarian Core, Columbia Small Cap Value II, Invesco Comstock, and T. Rowe Price Growth Equity, respectively. Termination or modification of these obligations requires approval by the Board.
Templeton Foreign Equity may invest its assets in Templeton Smaller Companies Fund. Templeton Foreign Equity’s purchase of shares of Templeton Smaller
NOTES TO FINANCIAL STATEMENTS as of December 31, 2015 (continued)
NOTE 4 — INVESTMENT MANAGEMENT FEES (continued)
Companies Fund will result in Templeton Foreign Equity paying a proportionate share of the expenses of Templeton Smaller Companies Fund. The Investment Adviser will waive its management fee in an amount equal to the advisory fee received by the adviser of the Templeton Smaller Companies Fund resulting from the Templeton Foreign Equity’s investment into the Templeton Smaller Companies Fund. There were no such waivers for the year ended December 31, 2015.
The Company and DSL have entered into sub-advisory agreements with each sub-adviser. These sub-advisers provide investment advice for the various Portfolios and are paid by DSL based on the average daily net assets of the respective Portfolios. Subject to such policies as the Board or DSL may determine, the sub-advisers manage each respective Portfolio’s assets in accordance with the Portfolio’s investment objectives, policies, and limitations. The sub-advisers of the Portfolios are as follows (* denotes a related party adviser):
| Portfolio | | | Sub-Adviser | |
| Global Bond | | | Voya Investment Management Co. LLC* | |
American Century Small-Mid
Cap Value | | |
American Century Investment
Management, Inc. | |
| Baron Growth | | | BAMCO, Inc. | |
Columbia Contrarian Core &
Columbia Small Cap Value II | | |
Columbia Management Investment
Advisers, LLC | |
Invesco Comstock & Invesco
Equity and Income | | | Invesco Advisers, Inc. | |
| JPMorgan Mid Cap Value | | | J.P. Morgan Investment Management Inc. | |
| Oppenheimer Global | | | OppenheimerFunds, Inc. | |
| Pioneer High Yield | | | Pioneer Investment Management, Inc. | |
T. Rowe Price Diversified Mid
Cap Growth & T. Rowe Price
Growth Equity | | | T. Rowe Price Associates, Inc. | |
| Templeton Foreign Equity | | | Templeton Investment Counsel, LLC | |
NOTE 5 — DISTRIBUTION AND SERVICE FEES
Class ADV and Class S2 shares of each respective Portfolio have a plan of distribution pursuant to Rule 12b-1 under the 1940 Act (the “Plan”), whereby the Distributor is reimbursed or compensated by the Portfolios for expenses incurred in the distribution of each Portfolio’s shares. The Distributor may pay, on behalf of each Portfolio, out of its distribution fee, compensation to certain financial institutions for providing distribution assistance. Under the Plan, a Portfolio makes payments at an annual rate of 0.25% of the Portfolio’s average daily net assets
attributable to its Class ADV and Class S2 shares, as applicable. The Distributor has contractually agreed to waive a portion of its fee equal to 0.10% of the average daily net assets attributable to the distribution fee paid by Class S2 shares of the Portfolios, so that the actual fee paid by a Portfolio is an annual rate of 0.15%. The Distributor has agreed to waive an additional 0.02% of the distribution fee for Invesco Equity and Income Class S2 shares. Termination or modification of these obligations requires approval by the Board.
Class ADV, Class S and Class S2 shares are further subject to a shareholder servicing fee payable to Shareholder Organizations pursuant to the Shareholder Servicing Plan adopted for Class ADV, Class S and Class S2 shares which shall not exceed an annual rate of 0.25% of the average daily net assets of each class, respectively. The Distributor has contractually agreed to waive a portion of the servicing fee for Baron Growth so that total net operating expenses do not exceed 1.31% for Class S shares. Termination or modification of this obligation requires approval by the Board.
NOTE 6 — OTHER TRANSACTIONS WITH AFFILIATES AND RELATED PARTIES
At December 31, 2015, the following direct or indirect, wholly-owned subsidiaries of Voya Financial, Inc. or affiliated investment companies owned more than 5% of the following Portfolios:
Subsidiary/Affiliated
Investment Company | | | Portfolio | | | Percentage | |
ReliaStar Life Insurance
Company | | | Oppenheimer Global | | | | | 5.34% | | |
| | | | Pioneer High Yield | | | | | 25.07 | | |
| | | | T. Rowe Price Diversified Mid Cap
Growth | | | | | 13.09 | | |
Security Life of Denver
Insurance Company | | | Global Bond | | | | | 6.01 | | |
| | | | Pioneer High Yield | | | | | 19.47 | | |
| | | | T. Rowe Price Diversified Mid Cap
Growth | | | | | 5.67 | | |
Voya Institutional Trust
Company | | | Global Bond | | | | | 19.69 | | |
| | | | American Century Small-Mid Cap
Value | | | | | 42.71 | | |
| | | | Baron Growth | | | | | 14.99 | | |
| | | | Columbia Contrarian Core | | | | | 6.54 | | |
| | | | Columbia Small Cap Value II | | | | | 8.94 | | |
| | | | Invesco Comstock | | | | | 7.34 | | |
| | | | JPMorgan Mid Cap Value | | | | | 20.98 | | |
| | | | Oppenheimer Global | | | | | 9.70 | | |
| | | | T. Rowe Price Growth Equity | | | | | 16.50 | | |
Voya Insurance and Annuity
Company | | | Baron Growth | | | | | 39.69 | | |
| | | | Columbia Contrarian Core | | | | | 81.64 | | |
| | | | Columbia Small Cap Value II | | | | | 50.63 | | |
| | | | Invesco Comstock | | | | | 39.44 | | |
| | | | Invesco Equity and Income | | | | | 61.15 | | |
| | | | JPMorgan Mid Cap Value | | | | | 24.86 | | |
| | | | Oppenheimer Global | | | | | 10.60 | | |
NOTES TO FINANCIAL STATEMENTS as of December 31, 2015 (continued)
NOTE 6 — OTHER TRANSACTIONS WITH AFFILIATES AND RELATED PARTIES (continued)
Subsidiary/Affiliated
Investment Company | | | Portfolio | | | Percentage | |
| | | | T. Rowe Price Growth Equity | | | | | 17.98 | | |
| | | | Templeton Foreign Equity | | | | | 64.92 | | |
Voya Retirement Insurance
and Annuity Company | | | Global Bond | | | | | 67.81 | | |
| | | | American Century Small-Mid Cap
Value | | | | | 54.93 | | |
| | | | Baron Growth | | | | | 40.47 | | |
| | | | Columbia Contrarian Core | | | | | 8.80 | | |
| | | | Columbia Small Cap Value II | | | | | 32.16 | | |
| | | | Invesco Comstock | | | | | 19.19 | | |
| | | | Invesco Equity and Income | | | | | 33.06 | | |
| | | | JPMorgan Mid Cap Value | | | | | 48.04 | | |
| | | | Oppenheimer Global | | | | | 72.41 | | |
| | | | Pioneer High Yield | | | | | 53.10 | | |
| | | | T. Rowe Price Diversified Mid Cap
Growth | | | | | 75.12 | | |
| | | | T. Rowe Price Growth Equity | | | | | 50.25 | | |
| | | | Templeton Foreign Equity | | | | | 24.67 | | |
| Voya Solution 2025 Portfolio | | | Invesco Comstock | | | | | 7.42 | | |
| Voya Solution 2035 Portfolio | | | Invesco Comstock | | | | | 8.54 | | |
| Voya Solution 2045 Portfolio | | | Invesco Comstock | | | | | 5.99 | | |
Voya Solution Moderately
Aggressive Portfolio | | | Invesco Comstock | | | | | 5.54 | | |
Under the 1940 Act, the direct or indirect beneficial owner of more than 25% of the voting securities of a company (including a fund) is presumed to control such company. Companies under common control (e.g., companies with a common owner of greater than 25% of their respective voting securities) are affiliates under the 1940 Act.
The Investment Adviser may direct the Portfolios’ sub-advisers to use their best efforts (subject to obtaining best execution of each transaction) to allocate a Portfolio’s equity security transactions through certain designated broker-dealers. The designated broker-dealer, in turn, will reimburse a portion of the brokerage commissions to pay certain expenses of that Portfolio. Any amounts credited to the Portfolios are reflected as brokerage commission recapture on the accompanying Statements of Operations.
The Portfolios have adopted a deferred compensation plan (the “Plan”), which allows eligible non-affiliated directors, as described in the Plan, to defer the receipt of all or a portion of the directors’ fees that they are entitled to receive from the Portfolios. For purposes of determining the amount owed to the director under the Plan, the amounts deferred are invested in shares of the funds selected by the director (the “Notional Funds”). The Portfolios purchase shares of the Notional Funds, which are all advised by Voya Investments, LLC, in amounts equal to the directors’ deferred fees, resulting in a Portfolio asset equal to the deferred compensation liability. Such assets are included as a component of “Other assets” on the accompanying Statement of Assets and Liabilities. Deferral of directors’ fees under the Plan will not affect net
assets of the Portfolio, and will not materially affect the Portfolios’ assets, liabilities or net investment income per share. Amounts will be deferred until distributed in accordance with the Plan.
The Portfolio(s) may engage in purchase and sale transactions with funds that have a common investment adviser (or affiliated investment advisers) and/or have a common sub-adviser. These interfund transactions are made pursuant to Rule 17a-7 of the Investment Company Act of 1940. For the year ended December 31, 2015, Pioneer High Yield engaged in such purchase and sales transactions totaling $1,208,434 and $850,485, respectively.
NOTE 7 — EXPENSE LIMITATION AGREEMENTS
The Investment Adviser has entered into a written expense limitation agreement (“Expense Limitation Agreement”) with the following Portfolios, whereby the Investment Adviser has agreed to limit expenses, excluding interest, taxes, investment-related costs, leverage expenses, extraordinary expenses, and acquired fund fees and expenses to the following annual expenses to average daily net assets:
| Portfolio | | | Class ADV | | | Class I | | | Class S | | | Class S2 | |
| Global Bond | | | | | 1.10% | | | | | | 0.60% | | | | | | 0.85% | | | | | | N/A | | |
| American Century Small-Mid Cap Value | | | | | 1.52% | | | | | | 1.02% | | | | | | 1.27% | | | | | | 1.42% | | |
| Baron Growth | | | | | 1.59% | | | | | | 1.09% | | | | | | 1.34% | | | | | | 1.49% | | |
| Columbia Contrarian Core(1) | | | | | N/A | | | | | | N/A | | | | | | N/A | | | | | | N/A | | |
| Columbia Small Cap Value II | | | | | 1.65% | | | | | | 1.15% | | | | | | 1.40% | | | | | | 1.55% | | |
| Invesco Comstock(2) | | | | | N/A | | | | | | N/A | | | | | | N/A | | | | | | N/A | | |
| Invesco Equity and Income | | | | | 1.15% | | | | | | 0.65% | | | | | | 0.90% | | | | | | 1.05% | | |
| JPMorgan Mid Cap Value | | | | | 1.50% | | | | | | 1.00% | | | | | | 1.25% | | | | | | 1.40% | | |
| Oppenheimer Global | | | | | 1.30% | | | | | | 0.80% | | | | | | 1.05% | | | | | | 1.20% | | |
| Pioneer High Yield | | | | | N/A | | | | | | 0.71% | | | | | | 0.96% | | | | | | N/A | | |
T. Rowe Price Diversified Mid Cap
Growth | | | | | 1.30% | | | | | | 0.80% | | | | | | 1.05% | | | | | | 1.20% | | |
| T. Rowe Price Growth Equity | | | | | 1.25% | | | | | | 0.75% | | | | | | 1.00% | | | | | | 1.15% | | |
| Templeton Foreign Equity(3) | | | | | 1.48% | | | | | | 0.98% | | | | | | 1.23% | | | | | | 1.38% | | |
(1)
Pursuant to a side letter agreement, through May 1, 2016, the Investment Adviser has agreed to waive all or a portion of the advisory fee and/or reimburse expenses so that the expense limits are 1.21%, 0.71% and 0.96% for Class ADV, Class I, and Class S, respectively. Termination or modification of this obligation requires approval by the Board. Any fees waived pursuant to the side letter agreement shall not be eligible for recoupment.
(2)
Pursuant to a side letter agreement, through May 1, 2016, the Investment Adviser has agreed to waive all or a portion of the advisory fee and/or reimburse expenses so that the expense limits are 1.31%, 0.81% and 1.06% for Class ADV, Class I, and Class S, respectively. Termination or modification of this obligation requires approval by the Board. Any fees waived pursuant to the side letter agreement shall not be eligible for recoupment.
(3)
Pursuant to a side letter agreement, through May 1, 2016, the Investment Adviser has agreed to waive all or a portion of the advisory fee and/or reimburse expenses so that the expense limits are 1.42%, 0.92%, 1.17% and 1.32% for Class ADV, Class I, Class S, and Class S2, respectively. Termination or modification of this obligation requires approval by the Board. Any fees waived pursuant to the side letter agreement shall not be eligible for recoupment.
NOTES TO FINANCIAL STATEMENTS as of December 31, 2015 (continued)
NOTE 7 — EXPENSE LIMITATION AGREEMENTS (continued)
The Investment Adviser may, at a later date, recoup from a Portfolio for fees waived and other expenses, except as otherwise noted above, assumed by the Investment Adviser during the previous 36 months, but only if, after such recoupment, a Portfolio’s expense ratio does not exceed the percentage described above. Waived and reimbursed fees net of any recoupment by the Investment Adviser of such waived and reimbursed fees are reflected on the accompanying Statements of Operations. Amounts payable by the Investment Adviser are reflected on the accompanying Statements of Assets and Liabilities.
At December 31, 2015, the amounts of waived and/or reimbursed fees that are subject to possible recoupment by the Investment Adviser, and the related expiration dates are as follows:
| | | | December 31, | | |
| Portfolio | | | 2016 | | | 2017 | | | 2018 | | | Total | |
| Global Bond | | | | $ | 243,845 | | | | | $ | 173,482 | | | | | $ | 135,581 | | | | | $ | 552,908 | | |
| American Century Small-Mid Cap Value | | | | | 471,719 | | | | | | 463,222 | | | | | | 430,902 | | | | | | 1,365,843 | | |
| Invesco Equity and Income | | | | | 261,856 | | | | | | 201,217 | | | | | | 207,075 | | | | | | 670,148 | | |
| Pioneer High Yield | | | | | 16,528 | | | | | | 60,824 | | | | | | 55,577 | | | | | | 132,929 | | |
T. Rowe Price
Diversified Mid Cap
Growth | | | | | 178,875 | | | | | | 67,420 | | | | | | — | | | | | | 246,295 | | |
The Expense Limitation Agreement is contractual through May 1, 2016 and shall renew automatically for one-year terms. Termination or modification of this obligation requires approval by the Board.
NOTE 8 — PURCHASED AND WRITTEN OPTIONS
Transactions in purchased options on exchange-traded futures contracts for Global Bond during the year ended December 31, 2015 were as follows:
| | | | Number of
Contracts | | | Cost | |
| Balance at 12/31/2014 | | | | | — | | | | | $ | — | | |
| Options Purchased | | | | | 524 | | | | | | 76,635 | | |
| Options Expired | | | | | (524) | | | | | | (76,635) | | |
| Balance at 12/31/2015 | | | | | — | | | | | $ | — | | |
| |
Transactions in purchased foreign currency options for Global Bond during the year ended December 31, 2015 were as follows:
| | | | USD
Notional | | | Cost | |
| Balance at 12/31/2014 | | | | | 16,644,000 | | | | | $ | 76,562 | | |
| Options Purchased | | | | | 123,882,944 | | | | | | 1,135,238 | | |
| Options Terminated in Closing Sell Transactions | | | | | (28,027,648) | | | | | | (324,000) | | |
| | | | USD
Notional | | | Cost | |
| Options Expired | | | | | (112,499,296) | | | | | | (887,800) | | |
| Balance at 12/31/2015 | | | | | — | | | | | $ | — | | |
| |
Transactions in purchased interest rate swaptions for Global Bond during the year ended December 31, 2015 were as follows:
| | | | USD
Notional | | | Cost | |
| Balance at 12/31/2014 | | | | | 81,473,000 | | | | | $ | 332,364 | | |
| Options Purchased | | | | | 1,667,066,000 | | | | | | 22,902,265 | | |
| Options Terminated in Closing Sell Transactions | | | | | (1,272,760,000) | | | | | | (21,548,062) | | |
| Options Expired | | | | | (475,779,000) | | | | | | (1,686,567) | | |
| Balance at 12/31/2015 | | | | | — | | | | | $ | — | | |
| |
Transactions in written options on exchange-traded futures contracts for Global Bond during the year ended December 31, 2015 were as follows:
| | | | Number of
Contracts | | | Premiums
Received | |
| Balance at 12/31/2014 | | | | | — | | | | | $ | — | | |
| Options Written | | | | | 524 | | | | | | 110,040 | | |
| Options Terminated in Closing Purchase Transactions | | | | | (524) | | | | | | (110,040) | | |
| Balance at 12/31/2015 | | | | | — | | | | | $ | — | | |
| |
Transactions in written foreign currency options for Global Bond during the year ended December 31, 2015 were as follows:
| | | | USD
Notional | | | Premiums
Received | |
| Balance at 12/31/2014 | | | | | — | | | | | $ | — | | |
| Options Written | | | | | 127,917,648 | | | | | | 495,944 | | |
| Options Terminated in Closing Purchase Transactions | | | | | (64,670,648) | | | | | | (284,622) | | |
| Options Exercised | | | | | (63,247,000) | | | | | | (211,322) | | |
| Balance at 12/31/2015 | | | | | — | | | | | $ | — | | |
| |
Transactions in written interest rate swaptions for Global Bond Portfolio during the year ended December 31, 2015 were as follows:
| | | | EUR
Notional | | | USD
Notional | | | Premiums
Received | |
Balance at
12/31/2014 | | | | | — | | | | | | 165,890,000 | | | | | $ | 483,169 | | |
| Options Written | | | | | 1,648,904,000 | | | | | | 2,377,398,000 | | | | | | 16,820,310 | | |
Options Terminated in
Closing Purchase
Transactions | | | | | (824,452,000) | | | | | | (2,140,420,000) | | | | | | (15,122,853) | | |
| Options Expired | | | | | (824,452,000) | | | | | | (402,868,000) | | | | | | (2,180,626) | | |
Balance at
12/31/2015 | | | | | — | | | | | | — | | | | | $ | — | | |
| |
NOTE 9 — LINE OF CREDIT
The Portfolios, in addition to certain other funds managed by the Investment Adviser, have entered into an unsecured
NOTES TO FINANCIAL STATEMENTS as of December 31, 2015 (continued)
NOTE 9 — LINE OF CREDIT (continued)
committed revolving line of credit agreement (the “Credit Agreement”) with The Bank of New York Mellon (“BNY”) for an aggregate amount of $200,000,000. The proceeds may be used only to: (1) temporarily finance the purchase and sale of securities; or (2) finance the redemption of shares of an investor in the funds. The funds to which the line of credit is available pay a commitment fee equal to 0.10% per annum on the daily unused portion of the committed line amount payable quarterly in arrears. Prior to May 22, 2015, the funds to which the Credit Agreement is available paid a commitment fee equal to 0.07% per annum on the daily unused portion of the committed line amount payable quarterly in arrears.
Borrowings under the Credit Agreement accrue interest at the federal funds rate plus a specified margin. Repayments generally must be made within 60 days after the date of a revolving credit advance.
The following Portfolios utilized the line of credit during the year ended December 31, 2015:
| Portfolio | | | Days
Utilized | | | Approximate
Average Daily
Balance
For Days
Utilized | | | Approximate
Weighted
Average
Interest Rate
For Days
Utilized | |
| Global Bond | | | | | 59 | | | | | $ | 1,234,136 | | | | | | 1.12% | | |
| American Century Small-Mid Cap Value | | | | | 7 | | | | | | 2,678,000 | | | | | | 1.14 | | |
| Baron Growth | | | | | 63 | | | | | | 2,853,794 | | | | | | 1.13 | | |
Columbia Small Cap
Value II | | | | | 1 | | | | | | 512,000 | | | | | | 1.13 | | |
| JPMorgan Mid Cap Value | | | | | 1 | | | | | | 562,000 | | | | | | 1.14 | | |
| T. Rowe Price Diversified Mid Cap Growth | | | | | 4 | | | | | | 2,108,250 | | | | | | 1.14 | | |
| T. Rowe Price Growth Equity | | | | | 11 | | | | | | 7,382,182 | | | | | | 1.13 | | |
| Templeton Foreign Equity | | | | | 3 | | | | | | 1,425,000 | | | | | | 1.13 | | |
NOTE 10 — CAPITAL SHARES
Transactions in capital shares and dollars were as follows:
| | | | Shares
sold | | | Shares
issued
in
merger | | | Reinvestment
of
distributions | | | Shares
redeemed | | | Net increase
(decrease)
in shares
outstanding | | | Shares
sold | | | Proceeds
from
shares
issued in
merger | | | Reinvestment
of
distributions | | | Shares
redeemed | | | Net increase
(decrease) | |
| Year or period ended | | | # | | | # | | | # | | | # | | | # | | | ($) | | | ($) | | | ($) | | | ($) | | | ($) | |
| Global Bond | |
| Class ADV | |
| 12/31/2015 | | | | | 113,182 | | | | | | — | | | | | | — | | | | | | (614,527) | | | | | | (501,345) | | | | | | 1,149,434 | | | | | | — | | | | | | — | | | | | | (6,210,909) | | | | | | (5,061,475) | | |
| 12/31/2014 | | | | | 278,699 | | | | | | — | | | | | | 10,629 | | | | | | (400,536) | | | | | | (111,208) | | | | | | 2,975,845 | | | | | | — | | | | | | 114,685 | | | | | | (4,254,237) | | | | | | (1,163,707) | | |
| Class I | |
| 12/31/2015 | | | | | 331,772 | | | | | | — | | | | | | — | | | | | | (3,368,908) | | | | | | (3,037,136) | | | | | | 3,408,954 | | | | | | — | | | | | | — | | | | | | (34,472,167) | | | | | | (31,063,213) | | |
| 12/31/2014 | | | | | 483,622 | | | | | | — | | | | | | 169,865 | | | | | | (3,410,514) | | | | | | (2,757,027) | | | | | | 5,229,242 | | | | | | — | | | | | | 1,849,829 | | | | | | (36,697,829) | | | | | | (29,618,758) | | |
| Class S | |
| 12/31/2015 | | | | | 286,919 | | | | | | — | | | | | | — | | | | | | (842,940) | | | | | | (556,021) | | | | | | 2,938,760 | | | | | | — | | | | | | — | | | | | | (8,662,089) | | | | | | (5,723,329) | | |
| 12/31/2014 | | | | | 597,864 | | | | | | — | | | | | | 27,133 | | | | | | (913,455) | | | | | | (288,458) | | | | | | 6,473,866 | | | | | | — | | | | | | 296,298 | | | | | | (9,835,369) | | | | | | (3,065,205) | | |
| Class S2 | |
| 12/31/2015 | | | | | — | | | | | | — | | | | | | — | | | | | | — | | | | | | — | | | | | | — | | | | | | — | | | | | | — | | | | | | — | | | | | | — | | |
| 12/31/2014 | | | | | — | | | | | | — | | | | | | — | | | | | | — | | | | | | — | | | | | | — | | | | | | — | | | | | | — | | | | | | — | | | | | | — | | |
| American Century Small-Mid Cap Value | |
| Class ADV | |
| 12/31/2015 | | | | | 473,429 | | | | | | — | | | | | | 1,557,675 | | | | | | (875,507) | | | | | | 1,155,597 | | | | | | 5,970,451 | | | | | | — | | | | | | 17,305,764 | | | | | | (10,683,402) | | | | | | 12,592,813 | | |
| 12/31/2014 | | | | | 766,656 | | | | | | — | | | | | | 1,070,476 | | | | | | (2,055,345) | | | | | | (218,213) | | | | | | 11,169,061 | | | | | | — | | | | | | 13,787,729 | | | | | | (31,265,428) | | | | | | (6,308,638) | | |
| Class I | |
| 12/31/2015 | | | | | 926,534 | | | | | | — | | | | | | 2,261,282 | | | | | | (2,656,690) | | | | | | 531,126 | | | | | | 12,118,570 | | | | | | — | | | | | | 26,343,938 | | | | | | (33,327,530) | | | | | | 5,134,978 | | |
| 12/31/2014 | | | | | 1,429,466 | | | | | | — | | | | | | 1,605,534 | | | | | | (4,595,045) | | | | | | (1,560,045) | | | | | | 20,964,408 | | | | | | — | | | | | | 21,498,091 | | | | | | (72,207,900) | | | | | | (29,745,401) | | |
| Class S | |
| 12/31/2015 | | | | | 410,728 | | | | | | — | | | | | | 1,494,208 | | | | | | (1,507,539) | | | | | | 397,397 | | | | | | 5,276,838 | | | | | | — | | | | | | 17,228,222 | | | | | | (19,488,659) | | | | | | 3,016,401 | | |
| 12/31/2014 | | | | | 668,630 | | | | | | — | | | | | | 1,134,923 | | | | | | (2,849,694) | | | | | | (1,046,141) | | | | | | 9,811,378 | | | | | | — | | | | | | 15,060,423 | | | | | | (44,122,885) | | | | | | (19,251,084) | | |
| Class S2 | |
| 12/31/2015 | | | | | 118,990 | | | | | | — | | | | | | 61,638 | | | | | | (85,591) | | | | | | 95,037 | | | | | | 1,506,409 | | | | | | — | | | | | | 682,951 | | | | | | (1,089,809) | | | | | | 1,099,551 | | |
| 12/31/2014 | | | | | 107,978 | | | | | | — | | | | | | 34,423 | | | | | | (352,249) | | | | | | (209,848) | | | | | | 1,511,452 | | | | | | — | | | | | | 441,991 | | | | | | (5,393,322) | | | | | | (3,439,879) | | |
| Baron Growth | |
| Class ADV | |
| 12/31/2015 | | | | | 157,011 | | | | | | — | | | | | | 274,983 | | | | | | (674,427) | | | | | | (242,433) | | | | | | 4,531,491 | | | | | | — | | | | | | 8,007,507 | | | | | | (19,713,089) | | | | | | (7,174,091) | | |
| 12/31/2014 | | | | | 462,441 | | | | | | — | | | | | | 63,969 | | | | | | (589,391) | | | | | | (62,981) | | | | | | 13,523,075 | | | | | | — | | | | | | 1,793,066 | | | | | | (17,117,076) | | | | | | (1,800,935) | | |
| Class I | |
NOTES TO FINANCIAL STATEMENTS as of December 31, 2015 (continued)
NOTE 10 — CAPITAL SHARES (continued)
| | | | Shares
sold | | | Shares
issued
in
merger | | | Reinvestment
of
distributions | | | Shares
redeemed | | | Net increase
(decrease)
in shares
outstanding | | | Shares
sold | | | Proceeds
from
shares
issued in
merger | | | Reinvestment
of
distributions | | | Shares
redeemed | | | Net increase
(decrease) | |
| Year or period ended | | | # | | | # | | | # | | | # | | | # | | | ($) | | | ($) | | | ($) | | | ($) | | | ($) | |
| Baron Growth (continued) | |
| 12/31/2015 | | | | | 434,975 | | | | | | — | | | | | | 585,465 | | | | | | (1,988,870) | | | | | | (968,430) | | | | | | 13,911,453 | | | | | | — | | | | | | 18,202,106 | | | | | | (60,748,084) | | | | | | (28,634,525) | | |
| 12/31/2014 | | | | | 955,771 | | | | | | — | | | | | | 157,122 | | | | | | (1,938,401) | | | | | | (825,508) | | | | | | 29,550,969 | | | | | | — | | | | | | 4,679,085 | | | | | | (59,916,474) | | | | | | (25,686,420) | | |
| Class S | |
| 12/31/2015 | | | | | 479,189 | | | | | | — | | | | | | 1,647,066 | | | | | | (3,978,855) | | | | | | (1,852,600) | | | | | | 14,697,709 | | | | | | — | | | | | | 49,691,990 | | | | | | (120,734,669) | | | | | | (56,344,970) | | |
| 12/31/2014 | | | | | 711,655 | | | | | | — | | | | | | 400,748 | | | | | | (5,059,180) | | | | | | (3,946,777) | | | | | | 21,575,656 | | | | | | — | | | | | | 11,605,656 | | | | | | (151,763,902) | | | | | | (118,582,590) | | |
| Class S2 | |
| 12/31/2015 | | | | | 38,030 | | | | | | — | | | | | | 16,992 | | | | | | (67,220) | | | | | | (12,198) | | | | | | 1,140,388 | | | | | | — | | | | | | 495,834 | | | | | | (2,030,825) | | | | | | (394,603) | | |
| 12/31/2014 | | | | | 70,040 | | | | | | — | | | | | | 3,915 | | | | | | (60,211) | | | | | | 13,744 | | | | | | 2,056,732 | | | | | | — | | | | | | 109,977 | | | | | | (1,759,186) | | | | | | 407,523 | | |
| Columbia Contrarian Core | |
| Class ADV | |
| 12/31/2015 | | | | | 298,412 | | | | | | — | | | | | | 111,618 | | | | | | (111,160) | | | | | | 298,870 | | | | | | 6,867,135 | | | | | | — | | | | | | 2,453,372 | | | | | | (2,573,744) | | | | | | 6,746,763 | | |
| 12/31/2014 | | | | | 107,457 | | | | | | — | | | | | | 98,211 | | | | | | (91,440) | | | | | | 114,228 | | | | | | 2,581,671 | | | | | | — | | | | | | 2,212,701 | | | | | | (2,206,659) | | | | | | 2,587,713 | | |
| Class I | |
| 12/31/2015 | | | | | 41,593 | | | | | | — | | | | | | 58,172 | | | | | | (102,770) | | | | | | (3,005) | | | | | | 990,276 | | | | | | — | | | | | | 1,326,321 | | | | | | (2,486,511) | | | | | | (169,914) | | |
| 12/31/2014 | | | | | 44,454 | | | | | | — | | | | | | 62,611 | | | | | | (68,994) | | | | | | 38,071 | | | | | | 1,097,537 | | | | | | — | | | | | | 1,455,694 | | | | | | (1,712,802) | | | | | | 840,429 | | |
| Class S | |
| 12/31/2015 | | | | | 465,869 | | | | | | — | | | | | | 1,679,367 | | | | | | (2,008,544) | | | | | | 136,692 | | | | | | 10,999,991 | | | | | | — | | | | | | 37,684,995 | | | | | | (48,165,495) | | | | | | 519,491 | | |
| 12/31/2014 | | | | | 1,149,239 | | | | | | — | | | | | | 1,864,724 | | | | | | (2,581,735) | | | | | | 432,228 | | | | | | 28,510,532 | | | | | | — | | | | | | 42,739,468 | | | | | | (64,427,623) | | | | | | 6,822,377 | | |
| Columbia Small Cap Value II | |
| Class ADV | |
| 12/31/2015 | | | | | 408,608 | | | | | | — | | | | | | 4,520 | | | | | | (532,746) | | | | | | (119,618) | | | | | | 6,702,716 | | | | | | — | | | | | | 75,657 | | | | | | (8,642,955) | | | | | | (1,864,582) | | |
| 12/31/2014 | | | | | 1,725,460 | | | | | | — | | | | | | 5,978 | | | | | | (609,424) | | | | | | 1,122,014 | | | | | | 27,635,458 | | | | | | — | | | | | | 92,128 | | | | | | (9,469,641) | | | | | | 18,257,945 | | |
| Class I | |
| 12/31/2015 | | | | | 609,948 | | | | | | — | | | | | | 16,368 | | | | | | (932,364) | | | | | | (306,048) | | | | | | 10,295,607 | | | | | | — | | | | | | 281,364 | | | | | | (15,562,223) | | | | | | (4,985,252) | | |
| 12/31/2014 | | | | | 2,645,302 | | | | | | — | | | | | | 14,677 | | | | | | (1,172,464) | | | | | | 1,487,515 | | | | | | 43,529,209 | | | | | | — | | | | | | 231,900 | | | | | | (18,594,005) | | | | | | 25,167,104 | | |
| Class S | |
| 12/31/2015 | | | | | 424,400 | | | | | | — | | | | | | 28,258 | | | | | | (1,706,752) | | | | | | (1,254,094) | | | | | | 7,082,409 | | | | | | — | | | | | | 483,770 | | | | | | (28,634,794) | | | | | | (21,068,615) | | |
| 12/31/2014 | | | | | 1,576,282 | | | | | | — | | | | | | 19,169 | | | | | | (2,066,691) | | | | | | (471,240) | | | | | | 25,666,547 | | | | | | — | | | | | | 301,525 | | | | | | (33,043,385) | | | | | | (7,075,313) | | |
| Class S2 | |
| 12/31/2015 | | | | | 149,977 | | | | | | — | | | | | | 1,285 | | | | | | (86,774) | | | | | | 64,488 | | | | | | 2,441,291 | | | | | | — | | | | | | 21,449 | | | | | | (1,419,646) | | | | | | 1,043,094 | | |
| 12/31/2014 | | | | | 296,541 | | | | | | — | | | | | | 1,100 | | | | | | (115,403) | | | | | | 182,238 | | | | | | 4,736,330 | | | | | | — | | | | | | 16,920 | | | | | | (1,778,440) | | | | | | 2,974,810 | | |
| Invesco Comstock | |
| Class ADV | |
| 12/31/2015 | | | | | 113,278 | | | | | | — | | | | | | 49,774 | | | | | | (392,836) | | | | | | (229,784) | | | | | | 1,807,702 | | | | | | — | | | | | | 775,483 | | | | | | (6,343,359) | | | | | | (3,760,174) | | |
| 12/31/2014 | | | | | 348,747 | | | | | | — | | | | | | 41,145 | | | | | | (275,806) | | | | | | 114,086 | | | | | | 5,511,435 | | | | | | — | | | | | | 684,628 | | | | | | (4,390,054) | | | | | | 1,806,009 | | |
| Class I | |
| 12/31/2015 | | | | | 6,421,704 | | | | | | — | | | | | | 342,384 | | | | | | (2,378,098) | | | | | | 4,385,990 | | | | | | 106,336,129 | | | | | | — | | | | | | 5,351,730 | | | | | | (38,383,357) | | | | | | 73,304,502 | | |
| 12/31/2014 | | | | | 7,273,340 | | | | | | — | | | | | | 182,269 | | | | | | (2,554,336) | | | | | | 4,901,273 | | | | | | 110,787,326 | | | | | | — | | | | | | 3,056,581 | | | | | | (41,490,346) | | | | | | 72,353,561 | | |
| Class S | |
| 12/31/2015 | | | | | 492,751 | | | | | | — | | | | | | 485,164 | | | | | | (4,247,552) | | | | | | (3,269,637) | | | | | | 7,921,714 | | | | | | — | | | | | | 7,603,995 | | | | | | (69,315,148) | | | | | | (53,789,439) | | |
| 12/31/2014 | | | | | 3,774,314 | | | | | | — | | | | | | 427,764 | | | | | | (4,797,035) | | | | | | (594,957) | | | | | | 60,602,498 | | | | | | — | | | | | | 7,164,868 | | | | | | (77,675,776) | | | | | | (9,908,410) | | |
| Invesco Equity and Income | |
| Class ADV | |
| 12/31/2015 | | | | | 151,527 | | | | | | — | | | | | | 115,812 | | | | | | (185,467) | | | | | | 81,872 | | | | | | 6,762,682 | | | | | | — | | | | | | 4,976,251 | | | | | | (8,306,926) | | | | | | 3,432,007 | | |
| 12/31/2014 | | | | | 228,616 | | | | | | 264,770 | | | | | | 41,853 | | | | | | (144,914) | | | | | | 390,325 | | | | | | 10,439,967 | | | | | | 12,496,350 | | | | | | 1,907,670 | | | | | | (6,612,280) | | | | | | 18,231,707 | | |
| Class I | |
| 12/31/2015 | | | | | 164,439 | | | | | | — | | | | | | 1,482,183 | | | | | | (1,971,650) | | | | | | (325,028) | | | | | | 7,496,933 | | | | | | — | | | | | | 64,775,858 | | | | | | (89,096,748) | | | | | | (16,823,957) | | |
| 12/31/2014 | | | | | 1,119,580 | | | | | | 2,472,176 | | | | | | 616,237 | | | | | | (1,906,294) | | | | | | 2,301,699 | | | | | | 52,470,421 | | | | | | 118,523,109 | | | | | | 28,585,663 | | | | | | (88,666,905) | | | | | | 110,912,288 | | |
| Class S | |
| 12/31/2015 | | | | | 161,203 | | | | | | — | | | | | | 1,786,423 | | | | | | (3,542,858) | | | | | | (1,595,232) | | | | | | 7,164,577 | | | | | | — | | | | | | 77,442,510 | | | | | | (159,782,804) | | | | | | (75,175,717) | | |
| 12/31/2014 | | | | | 142,995 | | | | | | 15,240,652 | | | | | | 826,865 | | | | | | (3,204,414) | | | | | | 13,006,098 | | | | | | 6,516,042 | | | | | | 725,313,586 | | | | | | 38,013,236 | | | | | | (148,168,497) | | | | | | 621,674,367 | | |
| Class S2 | |
| 12/31/2015 | | | | | 176,308 | | | | | | — | | | | | | 1,097,658 | | | | | | (1,714,178) | | | | | | (440,212) | | | | | | 7,934,546 | | | | | | — | | | | | | 46,949,757 | | | | | | (76,461,118) | | | | | | (21,576,815) | | |
| 12/31/2014 | | | | | 344,107 | | | | | | 12,218,895 | | | | | | 460,034 | | | | | | (1,761,679) | | | | | | 11,261,357 | | | | | | 15,680,522 | | | | | | 543,880,470 | | | | | | 20,871,267 | | | | | | (80,385,713) | | | | | | 500,046,546 | | |
| JPMorgan Mid Cap Value | |
| Class ADV | |
| 12/31/2015 | | | | | 579,033 | | | | | | — | | | | | | 689,418 | | | | | | (469,879) | | | | | | 798,572 | | | | | | 12,439,583 | | | | | | — | | | | | | 13,601,526 | | | | | | (9,908,503) | | | | | | 16,132,606 | | |
| 12/31/2014 | | | | | 494,222 | | | | | | — | | | | | | 267,177 | | | | | | (433,406) | | | | | | 327,993 | | | | | | 10,646,648 | | | | | | — | | | | | | 5,561,002 | | | | | | (9,329,934) | | | | | | 6,877,716 | | |
| Class I | |
| 12/31/2015 | | | | | 916,659 | | | | | | — | | | | | | 1,862,198 | | | | | | (2,727,988) | | | | | | 50,869 | | | | | | 20,004,354 | | | | | | — | | | | | | 37,541,744 | | | | | | (57,873,448) | | | | | | (327,350) | | |
| 12/31/2014 | | | | | 1,251,469 | | | | | | — | | | | | | 844,345 | | | | | | (2,241,033) | | | | | | (145,219) | | | | | | 27,269,524 | | | | | | — | | | | | | 18,001,283 | | | | | | (48,744,453) | | | | | | (3,473,646) | | |
NOTES TO FINANCIAL STATEMENTS as of December 31, 2015 (continued)
NOTE 10 — CAPITAL SHARES (continued)
| | | | Shares
sold | | | Shares
issued
in
merger | | | Reinvestment
of
distributions | | | Shares
redeemed | | | Net increase
(decrease)
in shares
outstanding | | | Shares
sold | | | Proceeds
from
shares
issued in
merger | | | Reinvestment
of
distributions | | | Shares
redeemed | | | Net increase
(decrease) | |
| Year or period ended | | | # | | | # | | | # | | | # | | | # | | | ($) | | | ($) | | | ($) | | | ($) | | | ($) | |
| JPMorgan Mid Cap Value (continued) | |
| Class S | |
| 12/31/2015 | | | | | 754,919 | | | | | | — | | | | | | 2,381,009 | | | | | | (2,843,433) | | | | | | 292,495 | | | | | | 16,390,139 | | | | | | — | | | | | | 47,588,257 | | | | | | (60,718,665) | | | | | | 3,259,731 | | |
| 12/31/2014 | | | | | 787,608 | | | | | | — | | | | | | 1,127,500 | | | | | | (4,404,972) | | | | | | (2,489,864) | | | | | | 17,177,427 | | | | | | — | | | | | | 23,759,319 | | | | | | (95,277,431) | | | | | | (54,340,685) | | |
| Class S2 | |
| 12/31/2015 | | | | | 41,003 | | | | | | — | | | | | | 34,000 | | | | | | (116,903) | | | | | | (41,900) | | | | | | 872,170 | | | | | | — | | | | | | 669,059 | | | | | | (2,516,657) | | | | | | (975,428) | | |
| 12/31/2014 | | | | | 46,218 | | | | | | — | | | | | | 16,485 | | | | | | (53,315) | | | | | | 9,388 | | | | | | 988,579 | | | | | | — | | | | | | 342,604 | | | | | | (1,118,163) | | | | | | 213,020 | | |
| Oppenheimer Global | |
| Class ADV | |
| 12/31/2015 | | | | | 960,893 | | | | | | — | | | | | | 502,423 | | | | | | (636,796) | | | | | | 826,520 | | | | | | 17,968,362 | | | | | | — | | | | | | 9,400,327 | | | | | | (12,029,300) | | | | | | 15,339,389 | | |
| 12/31/2014 | | | | | 491,367 | | | | | | — | | | | | | 126,602 | | | | | | (682,041) | | | | | | (64,072) | | | | | | 9,014,492 | | | | | | — | | | | | | 2,300,353 | | | | | | (12,504,408) | | | | | | (1,189,563) | | |
| Class I | |
| 12/31/2015 | | | | | 1,382,462 | | | | | | — | | | | | | 6,158,301 | | | | | | (7,840,979) | | | | | | (300,216) | | | | | | 27,346,457 | | | | | | — | | | | | | 119,409,448 | | | | | | (149,839,229) | | | | | | (3,083,324) | | |
| 12/31/2014 | | | | | 1,639,871 | | | | | | — | | | | | | 1,903,883 | | | | | | (11,877,203) | | | | | | (8,333,449) | | | | | | 31,388,757 | | | | | | — | | | | | | 35,716,844 | | | | | | (225,636,846) | | | | | | (158,531,245) | | |
| Class S | |
| 12/31/2015 | | | | | 2,501,221 | | | | | | — | | | | | | 1,162,773 | | | | | | (2,122,531) | | | | | | 1,541,463 | | | | | | 48,174,303 | | | | | | — | | | | | | 21,836,880 | | | | | | (38,875,357) | | | | | | 31,135,826 | | |
| 12/31/2014 | | | | | 914,518 | | | | | | — | | | | | | 307,282 | | | | | | (3,211,814) | | | | | | (1,990,014) | | | | | | 16,783,355 | | | | | | — | | | | | | 5,598,683 | | | | | | (59,323,905) | | | | | | (36,941,867) | | |
| Class S2 | |
| 12/31/2015 | | | | | 55,320 | | | | | | — | | | | | | 23,500 | | | | | | (91,169) | | | | | | (12,349) | | | | | | 1,040,869 | | | | | | — | | | | | | 430,989 | | | | | | (1,615,829) | | | | | | (143,971) | | |
| 12/31/2014 | | | | | 65,214 | | | | | | — | | | | | | 6,101 | | | | | | (39,752) | | | | | | 31,563 | | | | | | 1,176,055 | | | | | | — | | | | | | 108,841 | | | | | | (716,144) | | | | | | 568,752 | | |
| Pioneer High Yield | |
| Class ADV | |
| 12/31/2015 | | | | | — | | | | | | — | | | | | | — | | | | | | — | | | | | | — | | | | | | — | | | | | | — | | | | | | — | | | | | | — | | | | | | — | | |
| 12/31/2014 | | | | | — | | | | | | — | | | | | | — | | | | | | — | | | | | | — | | | | | | — | | | | | | — | | | | | | — | | | | | | — | | | | | | — | | |
| Class I | |
| 12/31/2015 | | | | | 997,272 | | | | | | — | | | | | | 472,917 | | | | | | (2,873,020) | | | | | | (1,402,831) | | | | | | 11,695,730 | | | | | | — | | | | | | 5,539,616 | | | | | | (33,567,286) | | | | | | (16,331,940) | | |
| 12/31/2014 | | | | | 2,053,367 | | | | | | — | | | | | | 473,025 | | | | | | (2,214,692) | | | | | | 311,700 | | | | | | 25,684,022 | | | | | | — | | | | | | 5,902,329 | | | | | | (27,558,304) | | | | | | 4,028,047 | | |
| Class S | |
| 12/31/2015 | | | | | 79,466 | | | | | | — | | | | | | 18,014 | | | | | | (118,390) | | | | | | (20,910) | | | | | | 938,594 | | | | | | — | | | | | | 210,519 | | | | | | (1,367,490) | | | | | | (218,377) | | |
| 12/31/2014 | | | | | 180,973 | | | | | | — | | | | | | 15,441 | | | | | | (99,255) | | | | | | 97,159 | | | | | | 2,267,588 | | | | | | — | | | | | | 192,274 | | | | | | (1,234,631) | | | | | | 1,225,231 | | |
| T. Rowe Price Diversified Mid Cap Growth | |
| Class ADV | |
| 12/31/2015 | | | | | 536,469 | | | | | | — | | | | | | 474,365 | | | | | | (809,175) | | | | | | 201,659 | | | | | | 6,094,705 | | | | | | — | | | | | | 4,928,655 | | | | | | (8,492,047) | | | | | | 2,531,313 | | |
| 12/31/2014 | | | | | 266,097 | | | | | | — | | | | | | 188,491 | | | | | | (344,239) | | | | | | 110,349 | | | | | | 2,975,186 | | | | | | — | | | | | | 1,984,807 | | | | | | (3,807,785) | | | | | | 1,152,208 | | |
| Class I | |
| 12/31/2015 | | | | | 2,032,041 | | | | | | — | | | | | | 10,723,838 | | | | | | (6,103,326) | | | | | | 6,652,553 | | | | | | 24,643,747 | | | | | | — | | | | | | 119,999,748 | | | | | | (71,696,552) | | | | | | 72,946,943 | | |
| 12/31/2014 | | | | | 760,996 | | | | | | — | | | | | | 4,906,939 | | | | | | (8,858,323) | | | | | | (3,190,388) | | | | | | 8,960,731 | | | | | ��� | — | | | | | | 55,027,698 | | | | | | (104,053,966) | | | | | | (40,065,537) | | |
| Class S | |
| 12/31/2015 | | | | | 606,565 | | | | | | — | | | | | | 398,027 | | | | | | (594,730) | | | | | | 409,862 | | | | | | 6,742,873 | | | | | | — | | | | | | 4,330,538 | | | | | | (6,775,241) | | | | | | 4,298,170 | | |
| 12/31/2014 | | | | | 261,061 | | | | | | — | | | | | | 184,114 | | | | | | (442,140) | | | | | | 3,035 | | | | | | 2,976,235 | | | | | | — | | | | | | 2,012,636 | | | | | | (5,074,897) | | | | | | (86,026) | | |
| Class S2 | |
| 12/31/2015 | | | | | 97,971 | | | | | | — | | | | | | 66,230 | | | | | | (88,614) | | | | | | 75,587 | | | | | | 1,155,306 | | | | | | — | | | | | | 689,459 | | | | | | (990,490) | | | | | | 854,275 | | |
| 12/31/2014 | | | | | 271,934 | | | | | | — | | | | | | 22,484 | | | | | | (45,694) | | | | | | 248,724 | | | | | | 3,017,240 | | | | | | — | | | | | | 237,001 | | | | | | (504,467) | | | | | | 2,749,774 | | |
| T. Rowe Price Growth Equity | |
| Class ADV | |
| 12/31/2015 | | | | | 312,835 | | | | | | — | | | | | | 339,629 | | | | | | (163,295) | | | | | | 489,169 | | | | | | 26,554,454 | | | | | | — | | | | | | 28,240,157 | | | | | | (13,937,412) | | | | | | 40,857,199 | | |
| 12/31/2014 | | | | | 172,357 | | | | | | — | | | | | | 146,165 | | | | | | (243,795) | | | | | | 74,727 | | | | | | 14,738,836 | | | | | | — | | | | | | 11,953,361 | | | | | | (20,747,055) | | | | | | 5,945,142 | | |
| Class I | |
| 12/31/2015 | | | | | 1,690,630 | | | | | | — | | | | | | 1,721,278 | | | | | | (1,861,900) | | | | | | 1,550,008 | | | | | | 150,420,520 | | | | | | — | | | | | | 150,611,865 | | | | | | (169,614,232) | | | | | | 131,418,153 | | |
| 12/31/2014 | | | | | 823,913 | | | | | | — | | | | | | 854,693 | | | | | | (2,178,207) | | | | | | (499,601) | | | | | | 72,818,004 | | | | | | — | | | | | | 72,666,041 | | | | | | (193,208,089) | | | | | | (47,724,044) | | |
| Class S | |
| 12/31/2015 | | | | | 1,201,876 | | | | | | — | | | | | | 709,182 | | | | | | (905,956) | | | | | | 1,005,102 | | | | | | 107,064,018 | | | | | | — | | | | | | 60,500,345 | | | | | | (78,301,743) | | | | | | 89,262,620 | | |
| 12/31/2014 | | | | | 716,701 | | | | | | — | | | | | | 292,976 | | | | | | (1,121,253) | | | | | | (111,576) | | | | | | 62,320,632 | | | | | | — | | | | | | 24,431,255 | | | | | | (96,554,289) | | | | | | (9,802,402) | | |
| Class S2 | |
| 12/31/2015 | | | | | 12,276 | | | | | | — | | | | | | 8,837 | | | | | | (9,041) | | | | | | 12,072 | | | | | | 1,076,931 | | | | | | — | | | | | | 740,378 | | | | | | (807,283) | | | | | | 1,010,026 | | |
| 12/31/2014 | | | | | 32,364 | | | | | | — | | | | | | 3,115 | | | | | | (11,108) | | | | | | 24,371 | | | | | | 2,785,852 | | | | | | — | | | | | | 256,132 | | | | | | (958,894) | | | | | | 2,083,090 | | |
| Templeton Foreign Equity | |
| Class ADV | |
| 12/31/2015 | | | | | 306,681 | | | | | | — | | | | | | 108,700 | | | | | | (629,849) | | | | | | (214,468) | | | | | | 3,779,598 | | | | | | — | | | | | | 1,326,137 | | | | | | (7,589,183) | | | | | | (2,483,448) | | |
| 12/31/2014 | | | | | 334,088 | | | | | | — | | | | | | 70,556 | | | | | | (526,520) | | | | | | (121,876) | | | | | | 4,275,954 | | | | | | — | | | | | | 910,170 | | | | | | (6,763,141) | | | | | | (1,577,017) | | |
| Class I | |
| 12/31/2015 | | | | | 629,508 | | | | | | — | | | | | | 672,207 | | | | | | (2,569,753) | | | | | | (1,268,038) | | | | | | 7,847,901 | | | | | | — | | | | | | 8,274,865 | | | | | | (30,862,697) | | | | | | (14,739,931) | | |
| 12/31/2014 | | | | | 788,445 | | | | | | — | | | | | | 453,673 | | | | | | (4,341,392) | | | | | | (3,099,274) | | | | | | 10,318,661 | | | | | | — | | | | | | 5,906,833 | | | | | | (55,741,328) | | | | | | (39,515,834) | | |
NOTES TO FINANCIAL STATEMENTS as of December 31, 2015 (continued)
NOTE 10 — CAPITAL SHARES (continued)
| | | | Shares
sold | | | Shares
issued
in
merger | | | Reinvestment
of
distributions | | | Shares
redeemed | | | Net increase
(decrease)
in shares
outstanding | | | Shares
sold | | | Proceeds
from
shares
issued in
merger | | | Reinvestment
of
distributions | | | Shares
redeemed | | | Net increase
(decrease) | |
| Year or period ended | | | # | | | # | | | # | | | # | | | # | | | ($) | | | ($) | | | ($) | | | ($) | | | ($) | |
| Templeton Foreign Equity (continued) | |
| Class S | |
| 12/31/2015 | | | | | 1,281,336 | | | | | | — | | | | | | 1,633,116 | | | | | | (7,042,292) | | | | | | (4,127,840) | | | | | | 15,119,746 | | | | | | — | | | | | | 19,973,008 | | | | | | (86,161,662) | | | | | | (51,068,908) | | |
| 12/31/2014 | | | | | 2,840,981 | | | | | | — | | | | | | 1,128,605 | | | | | | (9,157,277) | | | | | | (5,187,691) | | | | | | 35,347,679 | | | | | | — | | | | | | 14,604,147 | | | | | | (117,247,042) | | | | | | (67,295,216) | | |
| Class S2 | |
| 12/31/2015 | | | | | 71,716 | | | | | | — | | | | | | 6,855 | | | | | | (25,193) | | | | | | 53,378 | | | | | | 840,146 | | | | | | — | | | | | | 83,425 | | | | | | (301,001) | | | | | | 622,570 | | |
| 12/31/2014 | | | | | 51,536 | | | | | | — | | | | | | 3,540 | | | | | | (46,725) | | | | | | 8,351 | | | | | | 661,473 | | | | | | — | | | | | | 45,628 | | | | | | (591,281) | | | | | | 115,820 | | |
NOTE 11 — SECURITIES LENDING
Under a Master Securities Lending Agreement (the “Agreement”) with BNY, the Portfolios can lend their securities to approved brokers, dealers and other financial institutions. Loans are collateralized by cash and U.S. government securities. The collateral is equal to at least 105% of the market value of non-U.S. securities loaned and 102% of the market value of U.S. securities loaned. The market value of the loaned securities is determined at the Market Close of the Portfolios at their last sale price or official closing price on the principal exchange or system on which they are traded and any additional collateral is delivered to the Portfolios on the next business day. The cash collateral received is invested in approved investments as defined in the Agreement with BNY. The Portfolios bear the risk of loss with respect to the investment of collateral with the following exception: BNY provides the Portfolios indemnification from loss with respect to the investment of collateral provided that the cash collateral is invested solely in overnight repurchase agreements.
The cash collateral is invested in overnight repurchase agreements that are collateralized at 102% with securities issued or fully guaranteed by the U.S. Treasury; U.S. government or any agency, instrumentality or authority of the United States government. The securities purchased with cash collateral received are reflected in the Summary Portfolio of Investments under Securities Lending Collateral.
Generally, in the event of counterparty default, the Portfolios have the right to use the collateral to offset losses incurred. The Agreement contains certain guarantees by BNY in the event of counterparty default and/or a borrower’s failure to return a loaned security; however, there would be a potential loss to the Portfolios in the event the Portfolios are delayed or prevented from exercising their right to dispose of the collateral. Engaging in securities lending could have a leveraging effect, which may intensify the credit, market and other risks associated with investing in a Portfolio.
The following is a summary of the Portfolios’ securities lending agreements by counterparty which are subject to offset under the Agreement as of December 31, 2015:
Global Bond
| Counterparty | | | Securities
Loaned at
Value | | | Cash
Collateral
Received(1) | | | Net
Amount | |
| Citigroup Global Markets Inc. | | | | $ | 4,872,619 | | | | | $ | (4,872,619) | | | | | $ | — | | |
| Goldman, Sachs & Co. | | | | | 116,079 | | | | | | (116,079) | | | | | | — | | |
| Merrill Lynch, Pierce, Fenner & Smith Inc. | | | | | 2,244,510 | | | | | | (2,244,510) | | | | | | — | | |
| Total | | | | $ | 7,233,208 | | | | | $ | (7,233,208) | | | | | $ | — | | |
| |
(1)
Collateral with a fair value of $7,383,540 has been received in connection with the above securities lending transactions. Excess collateral received from the individual counterparty is not shown for financial reporting purposes.
American Century Small-Mid Cap Value
| Counterparty | | | Securities
Loaned at
Value | | | Cash
Collateral
Received(1) | | | Net
Amount | |
| BNP Paribas Prime Brokerage, Inc. | | | | $ | 107,530 | | | | | $ | (107,530) | | | | | $ | — | | |
| Citigroup Global Markets Inc. | | | | | 185,201 | | | | | | (185,201) | | | | | | — | | |
| Goldman, Sachs & Co. | | | | | 815,741 | | | | | | (815,741) | | | | | | — | | |
| HSBC Bank PLC | | | | | 95,266 | | | | | | (95,266) | | | | | | — | | |
| Janney Montgomery Scott LLC | | | | | 40,143 | | | | | | (40,143) | | | | | | — | | |
| JP Morgan Clearing Corp | | | | | 1,659,619 | | | | | | (1,659,619) | | | | | | — | | |
| Maple Securities USA Inc. | | | | | 215,685 | | | | | | (215,685) | | | | | | — | | |
| Morgan Stanley & Co. LLC | | | | | 285,693 | | | | | | (285,693) | | | | | | — | | |
Nomura Securities International,
Inc. | | | | | 634,332 | | | | | | (634,332) | | | | | | — | | |
| RBC Dominion Securities Inc | | | | | 1,439,483 | | | | | | (1,439,483) | | | | | | — | | |
| Scotia Capital (USA) INC | | | | | 894,228 | | | | | | (894,228) | | | | | | — | | |
| SG Americas Securities, LLC | | | | | 970,620 | | | | | | (970,620) | | | | | | — | | |
| Wells Fargo Securities LLC | | | | | 114,760 | | | | | | (114,760) | | | | | | — | | |
| Total | | | | $ | 7,458,299 | | | | | $ | (7,458,299) | | | | | $ | — | | |
| |
(1)
Collateral with a fair value of $7,642,699 has been received in connection with the above securities lending transactions. Excess collateral received from the individual counterparty is not shown for financial reporting purposes.
NOTES TO FINANCIAL STATEMENTS as of December 31, 2015 (continued)
NOTE 11 — SECURITIES LENDING (continued)
Invesco Comstock
| Counterparty | | | Securities
Loaned at
Value | | | Cash
Collateral
Received(1) | | | Net
Amount | |
| Deutsche Bank Securities Inc. | | | | $ | 1,966,550 | | | | | $ | (1,966,550) | | | | | $ | — | | |
| Goldman, Sachs & Co. | | | | | 409,298 | | | | | | (409,298) | | | | | | — | | |
| SG Americas Securities, LLC | | | | | 50,485 | | | | | | (50,485) | | | | | | — | | |
| Wells Fargo Securities LLC | | | | | 2,307 | | | | | | (2,307) | | | | | | — | | |
| Total | | | | $ | 2,428,639 | | | | | $ | (2,428,639) | | | | | $ | — | | |
| |
(1)
Collateral with a fair value of $2,490,134 has been received in connection with the above securities lending transactions. Excess collateral received from the individual counterparty is not shown for financial reporting purposes.
Invesco Equity and Income
| Counterparty | | | Securities
Loaned at
Value | | | Cash
Collateral
Received(1) | | | Net
Amount | |
| Barclays Capital Inc. | | | | $ | 488,735 | | | | | $ | (488,735) | | | | | $ | — | | |
| BNP Paribas Prime Brokerage, Inc. | | | | | 1,927,687 | | | | | | (1,927,687) | | | | | | — | | |
| Citadel Clearing LLC | | | | | 1,674,076 | | | | | | (1,674,076) | | | | | | — | | |
| Citigroup Global Markets Inc. | | | | | 54,251,976 | | | | | | (54,251,976) | | | | | | — | | |
| Citigroup Global Markets Limited | | | | | 210,530 | | | | | | (210,530) | | | | | | — | | |
| Credit Suisse Securities (USA) LLC | | | | | 126,525 | | | | | | (126,525) | | | | | | — | | |
| Deutsche Bank Securities Inc. | | | | | 514,805 | | | | | | (514,805) | | | | | | — | | |
| Goldman, Sachs & Co. | | | | | 2,938,321 | | | | | | (2,938,321) | | | | | | — | | |
| J.P. Morgan Securities LLC | | | | | 928,530 | | | | | | (928,530) | | | | | | — | | |
| Jefferies LLC | | | | | 971,367 | | | | | | (971,367) | | | | | | — | | |
| JP Morgan Clearing Corp | | | | | 54,318 | | | | | | (54,318) | | | | | | — | | |
| JP Morgan Securities, Plc. | | | | | 2,262,840 | | | | | | (2,262,840) | | | | | | — | | |
| Morgan Stanley & Co. LLC | | | | | 92,853 | | | | | | (92,853) | | | | | | — | | |
| RBC Capital Markets, LLC | | | | | 3,607,118 | | | | | | (3,607,118) | | | | | | — | | |
| Scotia Capital (USA) INC | | | | | 993,664 | | | | | | (993,664) | | | | | | — | | |
| Wells Fargo Securities LLC | | | | | 141,235 | | | | | | (141,235) | | | | | | — | | |
| Total | | | | $ | 71,184,581 | | | | | $ | (71,184,581) | | | | | $ | — | | |
| |
(1)
Collateral with a fair value of $72,856,452 has been received in connection with the above securities lending transactions. Excess collateral received from the individual counterparty is not shown for financial reporting purposes.
JPMorgan Mid Cap Value
| Counterparty | | | Securities
Loaned at
Value | | | Cash
Collateral
Received(1) | | | Net
Amount | |
| Credit Suisse Securities (USA) LLC | | | | $ | 2,682,479 | | | | | $ | (2,682,479) | | | | | $ | — | | |
| Goldman, Sachs & Co. | | | | | 329,868 | | | | | | (329,868) | | | | | | — | | |
| Morgan Stanley & Co. LLC | | | | | 464,032 | | | | | | (464,032) | | | | | | — | | |
| Scotia Capital (USA) INC | | | | | 1,868,290 | | | | | | (1,868,290) | | | | | | — | | |
| SG Americas Securities, LLC | | | | | 5,629,621 | | | | | | (5,629,621) | | | | | | — | | |
| UBS Securities LLC. | | | | | 36,575 | | | | | | (36,575) | | | | | | — | | |
| Total | | | | $ | 11,010,866 | | | | | $ | (11,010,866) | | | | | $ | — | | |
| |
(1)
Collateral with a fair value of $11,324,364 has been received in connection with the above securities lending transactions. Excess collateral received from the individual counterparty is not shown for financial reporting purposes.
Oppenheimer Global
| Counterparty | | | Securities
Loaned at
Value | | | Cash
Collateral
Received(1) | | | Net
Amount | |
| Barclays Capital Inc. | | | | $ | 1,571,540 | | | | | $ | (1,571,540) | | | | | $ | — | | |
| Citigroup Global Markets Inc. | | | | | 27,378 | | | | | | (27,378) | | | | | | — | | |
Credit Suisse Securities (Europe)
Limited | | | | | 2,272,049 | | | | | | (2,272,049) | | | | | | — | | |
| Credit Suisse Securities (USA) LLC | | | | | 2,138,942 | | | | | | (2,138,942) | | | | | | — | | |
| Deutsche Bank Securities Inc. | | | | | 1,080,710 | | | | | | (1,080,710) | | | | | | — | | |
| Deutsche Bank, AG | | | | | 1,228,676 | | | | | | (1,228,676) | | | | | | — | | |
| Goldman, Sachs & Co. | | | | | 12,002,553 | | | | | | (12,002,553) | | | | | | — | | |
| HSBC Bank PLC | | | | | 3,508,278 | | | | | | (3,508,278) | | | | | | — | | |
| JP Morgan Clearing Corp | | | | | 1,365,711 | | | | | | (1,365,711) | | | | | | — | | |
| JP Morgan Securities, Plc. | | | | | 497,528 | | | | | | (497,528) | | | | | | — | | |
| Merrill Lynch International | | | | | 1,747,877 | | | | | | (1,747,877) | | | | | | — | | |
| Morgan Stanley & Co. International PLC | | | | | 7,266 | | | | | | (7,266) | | | | | | — | | |
| Morgan Stanley & Co. LLC | | | | | 11,909,106 | | | | | | (11,909,106) | | | | | | — | | |
| Nomura International PLC | | | | | 34,624 | | | | | | (34,624) | | | | | | — | | |
| RBC Dominion Securities Inc | | | | | 1,798,785 | | | | | | (1,798,785) | | | | | | — | | |
| Scotia Capital (USA) INC | | | | | 5,396,121 | | | | | | (5,396,121) | | | | | | — | | |
| SG Americas Securities, LLC | | | | | 215,965 | | | | | | (215,965) | | | | | | — | | |
| Societe Generale | | | | | 456,324 | | | | | | (456,324) | | | | | | — | | |
| UBS AG | | | | | 35,355 | | | | | | (35,355) | | | | | | — | | |
| Wells Fargo Securities LLC | | | | | 42,228 | | | | | | (42,228) | | | | | | — | | |
| Total | | | | $ | 47,337,016 | | | | | $ | (47,337,016) | | | | | $ | — | | |
| |
(1)
Collateral with a fair value of $49,184,412 has been received in connection with the above securities lending transactions. Excess collateral received from the individual counterparty is not shown for financial reporting purposes.
T. Rowe Price Diversified Mid Cap Growth
| Counterparty | | | Securities
Loaned at
Value | | | Cash
Collateral
Received(1) | | | Net
Amount | |
| Barclays Capital Inc. | | | | $ | 1,281,825 | | | | | $ | (1,281,825) | | | | | $ | — | | |
| BNP Paribas Prime Brokerage, Inc. | | | | | 9,585 | | | | | | (9,585) | | | | | | — | | |
| Citigroup Global Markets Inc. | | | | | 1,260,451 | | | | | | (1,260,451) | | | | | | — | | |
| Credit Suisse Securities (USA) LLC | | | | | 2,292,587 | | | | | | (2,292,587) | | | | | | — | | |
| Deutsche Bank Securities Inc. | | | | | 248,246 | | | | | | (248,246) | | | | | | — | | |
| Goldman, Sachs & Co. | | | | | 2,416,143 | | | | | | (2,416,143) | | | | | | — | | |
| HSBC Bank PLC | | | | | 740,904 | | | | | | (740,904) | | | | | | — | | |
| Jefferies LLC | | | | | 240,434 | | | | | | (240,434) | | | | | | — | | |
| JP Morgan Clearing Corp | | | | | 3,630,813 | | | | | | (3,630,813) | | | | | | — | | |
| Merrill Lynch, Pierce, Fenner & Smith Inc. | | | | | 4,216,365 | | | | | | (4,216,365) | | | | | | — | | |
| Morgan Stanley & Co. LLC | | | | | 8,283,657 | | | | | | (8,283,657) | | | | | | — | | |
| National Financial Services LLC | | | | | 2,026,530 | | | | | | (2,026,530) | | | | | | — | | |
NOTES TO FINANCIAL STATEMENTS as of December 31, 2015 (continued)
NOTE 11 — SECURITIES LENDING (continued)
| Counterparty | | | Securities
Loaned at
Value | | | Cash
Collateral
Received(1) | | | Net
Amount | |
Nomura Securities International,
Inc. | | �� | | | 5,993 | | | | | | (5,993) | | | | | | — | | |
| RBC Dominion Securities Inc | | | | | 8,666,072 | | | | | | (8,666,072) | | | | | | — | | |
| Scotia Capital (USA) INC | | | | | 6,965,777 | | | | | | (6,965,777) | | | | | | — | | |
| SG Americas Securities, LLC | | | | | 1,104,800 | | | | | | (1,104,800) | | | | | | — | | |
| UBS Securities LLC. | | | | | 98,135 | | | | | | (98,135) | | | | | | — | | |
| Total | | | | $ | 43,488,320 | | | | | $ | (43,488,320) | | | | | $ | — | | |
| |
(1)
Collateral with a fair value of $44,494,247 has been received in connection with the above securities lending transactions. Excess collateral received from the individual counterparty is not shown for financial reporting purposes.
T. Rowe Price Growth Equity
| Counterparty | | | Securities
Loaned at
Value | | | Cash
Collateral
Received(1) | | | Net
Amount | |
| Barclays Capital Inc. | | | | $ | 481,355 | | | | | $ | (481,355) | | | | | $ | — | | |
| BNP Paribas Prime Brokerage, Inc. | | | | | 20,187 | | | | | | (20,187) | | | | | | — | | |
| Citigroup Global Markets Inc. | | | | | 2,215,145 | | | | | | (2,215,145) | | | | | | — | | |
| Credit Suisse Securities (USA) LLC | | | | | 1,826,709 | | | | | | (1,826,709) | | | | | | — | | |
| Deutsche Bank Securities Inc. | | | | | 3,368,999 | | | | | | (3,368,999) | | | | | | — | | |
| Goldman, Sachs & Co. | | | | | 1,770,657 | | | | | | (1,770,657) | | | | | | — | | |
| Janney Montgomery Scott LLC | | | | | 339,602 | | | | | | (339,602) | | | | | | — | | |
| Jefferies LLC | | | | | 255,752 | | | | | | (255,752) | | | | | | — | | |
| JP Morgan Clearing Corp | | | | | 21,059,651 | | | | | | (21,059,651) | | | | | | — | | |
| Merrill Lynch, Pierce, Fenner & Smith Inc. | | | | | 14,433,318 | | | | | | (14,433,318) | | | | | | — | | |
| Morgan Stanley & Co. LLC | | | | | 1,013,549 | | | | | | (1,013,549) | | | | | | — | | |
| Natixis Securities America LLC | | | | | 88,140 | | | | | | (88,140) | | | | | | — | | |
Nomura Securities International,
Inc. | | | | | 132,369 | | | | | | (132,369) | | | | | | — | | |
| RBC Capital Markets, LLC | | | | | 62,933 | | | | | | (62,933) | | | | | | — | | |
| RBC Dominion Securities Inc | | | | | 5,691,500 | | | | | | (5,691,500) | | | | | | — | | |
| Scotia Capital (USA) INC | | | | | 12,481,699 | | | | | | (12,481,699) | | | | | | — | | |
| SG Americas Securities, LLC | | | | | 4,688,401 | | | | | | (4,688,401) | | | | | | — | | |
| Wells Fargo Securities LLC | | | | | 1,120,209 | | | | | | (1,120,209) | | | | | | — | | |
| Total | | | | $ | 71,050,174 | | | | | $ | (71,050,174) | | | | | $ | — | | |
| |
(1)
Collateral with a fair value of $72,625,813 has been received in connection with the above securities lending transactions. Excess collateral received from the individual counterparty is not shown for financial reporting purposes.
Templeton Foreign Equity
| Counterparty | | | Securities
Loaned at
Value | | | Cash
Collateral
Received(1) | | | Net
Amount | |
| Credit Suisse Securities (USA) LLC | | | | $ | 1,274,830 | | | | | $ | (1,274,830) | | | | | $ | — | | |
| HSBC Bank PLC | | | | | 9,390,318 | | | | | | (9,390,318) | | | | | | — | | |
| Jefferies LLC | | | | | 241,017 | | | | | | (241,017) | | | | | | — | | |
| Merrill Lynch International | | | | | 2,526,535 | | | | | | (2,526,535) | | | | | | — | | |
| Counterparty | | | Securities
Loaned at
Value | | | Cash
Collateral
Received(1) | | | Net
Amount | |
| Morgan Stanley & Co. LLC | | | | | 1,309,613 | | | | | | (1,309,613) | | | | | | — | | |
| Societe Generale | | | | | 11 | | | | | | (11) | | | | | | — | | |
| Total | | | | $ | 14,742,324 | | | | | $ | (14,742,324) | | | | | $ | — | | |
| |
(1)
Collateral with a fair value of $15,523,830 has been received in connection with the above securities lending transactions. Excess collateral received from the individual counterparty is not shown for financial reporting purposes.
NOTE 12 — UNFUNDED LOAN COMMITMENTS
Certain Portfolios may enter in credit agreements, all or a portion of which may be unfunded. The Portfolios are obligated to fund these loan commitments at the borrower’s discretion. Funded portions of the credit agreements are presented in the Summary Portfolio of Investments. At December 31, 2015, Pioneer High Yield had the following unfunded loan commitments:
| Loan | | | Unfunded
Commitments | | | Unrealized
Appreciation
at 12/31/15* | |
Charter Communications Operating LLC
Term Loan | | | | $ | 585,000 | | | | | $ | — | | |
| | | | | $ | 585,000 | | | | | | — | | |
| |
*
Unfunded loan commitments are marked to market daily and any unrealized appreciation or depreciation is included in the Portfolio’s Statement of Assets and Liabilities and Statement of Operations.
NOTE 13 — FOREIGN CURRENCY SETTLEMENT
In March 2015, BNY, the Portfolios’ custodian, announced it had agreed to settle various lawsuits (the “Settlement”) involving its standing instruction foreign exchange services. Certain Portfolios were named members of the Settlement class. On September 24, 2015 the United States District Court, Southern District of New York approved (the “Approval”) the plan of allocation related to the Settlement. After the announcement of the Approval, Global Bond, American Century Small-Mid Cap Value, Baron Growth, Columbia Contrarian Core, Invesco Equity and Income, Oppenheimer Global, T. Rowe Price Growth Equity and Templeton Foreign Equity recorded receivables in the amounts of $57,422, $56, $12,863, $57,981, $8,604, $302,563, $402,047 and $1,974,841, respectively, representing each Portfolio’s respective estimated share of the net recovery associated with the Settlement. The Settlement amount for each Portfolio is included in Net Realized Gain/(Loss) on Foreign Currency Related Transactions in the respective accompanying Statements of Operations.
NOTE 14 — REORGANIZATIONS
On March 14, 2014, Invesco Equity and Income (“Acquiring Portfolio”) acquired all of the assets of, and assumed all
NOTES TO FINANCIAL STATEMENTS as of December 31, 2015 (continued)
NOTE 14 — REORGANIZATIONS (continued)
the liabilities of ING American Funds Asset Allocation Portfolio (“Acquired 1 Portfolio”), an open-end investment company in a tax-free reorganization in exchange for shares of the Acquiring Portfolio, pursuant to a plan of reorganization approved by the shareholders of the Acquired 1 Portfolio on February 27, 2014. The transaction was intended to enhance the efficiency and reduce the complexity of the funds complex. Furthermore, shareholders of the Acquiring Portfolio were expected to benefit from a reduction in net expenses. For financial reporting purposes, assets received and shares issued by the Acquiring Portfolio were recorded at fair value; however, the cost basis of the investments received from the Acquired 1 Portfolio were carried forward to align ongoing reporting of the Acquiring Portfolio’s realized and unrealized gains and losses with amounts distributable to shareholders for tax purposes.
Assuming the acquisition had been completed on January 1, 2014, the beginning of the annual reporting period of the Acquiring Portfolio, the Acquiring Portfolio’s pro forma results of operations for the year ended December 31, 2014, are as follows:
| | Net investment income | | | | $ | 20,103,564 | | |
| | Net realized and unrealized gain on investments | | | | $ | 103,474,665 | | |
| | Net increase in net assets resulting from operations | | | | $ | 123,578,229 | | |
Because the combined investment portfolios have been managed as a single integrated portfolio since the acquisition was completed, it is not practicable to separate the amounts of revenue and earnings of the Acquired 1 Portfolio that have been included in the Acquiring Portfolio’s statement of operations since March 14, 2014. Net assets and unrealized appreciation or depreciation as of the reorganization date were as follows:
| | Total Net
Assets of
Acquired 1
Portfolio
(000s) | | | Total Net
Assets of
Acquiring
Portfolio
(000s) | | | Acquired 1
Portfolio’s
Capital Loss
Carryforwards
(000s) | | | Acquired 1
Portfolio’s
Unrealized
Depreciation
(000s) | | | Portfolios’
Conversion
Ratio | |
| | $512,696 | | | | $ | 861,963 | | | | | $ | 0 | | | | | $ | (8,646) | | | | | | 0.1784 | | |
The net assets of the Acquiring Portfolio after the acquisition of Acquired 1 Portfolio were $1,374,658,988.
On July 18, 2014, Invesco Equity and Income (“Acquiring Portfolio”) acquired all of the assets of, and assumed all the liabilities of VY® MFS Total Return Portfolio (“Acquired 2 Portfolio”), an open-end investment company in a tax-free reorganization in exchange for shares of the Acquiring Portfolio, pursuant to a plan of reorganization approved by the shareholders of the Acquired 2 Portfolio on June 19, 2014. The transaction was intended to enhance the efficiency and reduce the complexity of the Voya family of
funds. Furthermore, the Acquired 2 Portfolio was expected to benefit from a reduction in gross and net expenses as shareholders of the Acquiring Portfolio. For financial reporting purposes, assets received and shares issued by the Acquiring Portfolio were recorded at fair value; however, the cost basis of the investments received from the Acquired 2 Portfolio were carried forward to align ongoing reporting of the Acquiring Portfolio’s realized and unrealized gains and losses with amounts distributable to shareholders for tax purposes.
Assuming the acquisition had been completed on January 1, 2014, the beginning of the annual reporting period of the Acquiring Portfolio, the Acquiring Portfolio’s pro forma results of operations for the year ended December 31, 2014, are as follows:
| | Net investment income | | | | $ | 30,914,116 | | |
| | Net realized and unrealized gain on investments | | | | $ | 145,707,748 | | |
| | Net increase in net assets resulting from operations | | | | $ | 176,621,863 | | |
Because the combined investment portfolios have been managed as a single integrated portfolio since the acquisition was completed, it is not practicable to separate the amounts of revenue and earnings of the Acquired 2 Portfolio that have been included in the Acquiring Portfolio’s statement of operations since July 18, 2014. Net assets and unrealized appreciation or depreciation as of the reorganization date were as follows:
| | Total Net
Assets of
Acquired 2
Portfolio
(000s) | | | Total Net
Assets of
Acquiring
Portfolio
(000s) | | | Acquired 2
Portfolio’s
Capital Loss
Carryforwards
(000s) | | | Acquired 2
Portfolio’s
Unrealized
Appreciation
(000s) | | | Portfolios’
Conversion
Ratio | |
| | $887,517 | | | | $ | 1,388,200 | | | | | $ | 0 | | | | | $ | 35,107 | | | | | | 0.3501 | | |
The net assets of the Acquiring Portfolio after the acquisition of Acquired 2 Portfolio were $2,275,716,892.
NOTE 15 — FEDERAL INCOME TAXES
The amount of distributions from net investment income and net realized capital gains are determined in accordance with federal income tax regulations, which may differ from U.S. GAAP for investment companies. These book/tax differences may be either temporary or permanent. Permanent differences are reclassified within the capital accounts based on their federal tax-basis treatment; temporary differences are not reclassified. Key differences include the treatment of short-term capital gains, foreign currency transactions, paydowns, income from passive foreign investment companies (PFICs), and wash sale deferrals. Distributions in excess of net investment income and/or net realized capital gains for tax purposes are reported as return of capital.
The following permanent tax differences have been reclassified as of December 31, 2015:
NOTES TO FINANCIAL STATEMENTS as of December 31, 2015 (continued)
NOTE 15 — FEDERAL INCOME TAXES (continued)
| | | | Paid-in
Capital | | | Undistributed
Net
Investment
Income | | | Accumulated
Net Realized
Gains/(Losses) | |
| Global Bond(1) | | | | $ | (1,519,695) | | | | | $ | (11,208,419) | | | | | $ | 12,728,114 | | |
| American Century Small-Mid Cap Value | | | | | (657) | | | | | | 1,122,408 | | | | | | (1,121,751) | | |
| Baron Growth | | | | | (2,510,453) | | | | | | 2,751,581 | | | | | | (241,128) | | |
| Columbia Contrarian Core | | | | | (6,954,785) | | | | | | 8,523,034 | | | | | | (1,568,249) | | |
| Invesco Comstock | | | | | — | | | | | | 4,746,440 | | | | | | (4,746,440) | | |
| Invesco Equity and Income | | | | | — | | | | | | 9,459,949 | | | | | | (9,459,949) | | |
| JPMorgan Mid Cap Value | | | | | — | | | | | | 12,096 | | | | | | (12,096) | | |
| | | | Paid-in
Capital | | | Undistributed
Net
Investment
Income | | | Accumulated
Net Realized
Gains/(Losses) | |
| Oppenheimer Global | | | | | 371,781 | | | | | | 43,500 | | | | | | (415,281) | | |
| Pioneer High Yield | | | | | — | | | | | | 117,913 | | | | | | (117,913) | | |
| T. Rowe Price Diversified Mid Cap Growth | | | | | — | | | | | | 1,116,731 | | | | | | (1,116,731) | | |
| T. Rowe Price Growth Equity | | | | | (2,149,594) | | | | | | 2,568,120 | | | | | | (418,526) | | |
| Templeton Foreign Equity | | | | | — | | | | | | 4,030,610 | | | | | | (4,030,610) | | |
(1)
Relates to the tax treatment of foreign currency transactions, swaps and paydowns.
Dividends paid by the Portfolios from net investment income and distributions of net realized short-term capital gains are, for federal income tax purposes, taxable as ordinary income to shareholders.
The tax composition of dividends and distributions to shareholders was as follows:
| | | | | Year Ended
December 31, 2015 | | | Year Ended
December 31, 2014 | |
| | | | | Ordinary
Income | | | Long-term
Capital
Gains | | | Ordinary
Income | | | Long-term
Capital
Gains | |
| | Global Bond | | | | $ | — | | | | | $ | — | | | | | $ | 2,260,812 | | | | | $ | — | | |
| | American Century Small-Mid Cap Value | | | | | 21,982,574 | | | | | | 39,578,301 | | | | | | 27,101,807 | | | | | | 23,686,427 | | |
| | Baron Growth | | | | | 3,161,582 | | | | | | 73,235,855 | | | | | | 11,232,376 | | | | | | 6,955,408 | | |
| | Columbia Contrarian Core | | | | | 15,220,880 | | | | | | 26,243,808 | | | | | �� | 2,808,114 | | | | | | 43,599,749 | | |
| | Columbia Small Cap Value II | | | | | 862,240 | | | | | | — | | | | | | 642,473 | | | | | | — | | |
| | Invesco Comstock | | | | | 13,731,208 | | | | | | — | | | | | | 10,906,077 | | | | | | — | | |
| | Invesco Equity and Income | | | | | 43,306,600 | | | | | | 150,837,776 | | | | | | 30,317,766 | | | | | | 59,060,070 | | |
| | JPMorgan Mid Cap Value | | | | | 7,256,199 | | | | | | 92,144,387 | | | | | | 10,419,182 | | | | | | 37,245,026 | | |
| | Oppenheimer Global | | | | | 23,491,220 | | | | | | 127,586,424 | | | | | | 19,723,594 | | | | | | 24,001,127 | | |
| | Pioneer High Yield | | | | | 5,750,135 | | | | | | — | | | | | | 6,094,603 | | | | | | — | | |
| | T. Rowe Price Diversified Mid Cap Growth | | | | | 8,011,231 | | | | | | 121,937,169 | | | | | | 3,746,359 | | | | | | 55,515,783 | | |
| | T. Rowe Price Growth Equity | | | | | 11,502,817 | | | | | | 228,589,928 | | | | | | — | | | | | | 109,306,789 | | |
| | Templeton Foreign Equity | | | | | 29,657,435 | | | | | | — | | | | | | 21,466,778 | | | | | | — | | |
The tax-basis components of distributable earnings and the capital loss carryforwards which may be used to offset future realized capital gains for federal income tax purposes as of December 31, 2015 are detailed below. The Regulated Investment Company Modernization Act of 2010 (the “Act”) provides an unlimited carryforward period for newly generated capital losses. Under the Act, there may be a greater likelihood that all or a portion of the Portfolios’ pre-enactment capital loss carryforwards may expire without being utilized due to the fact that post-enactment capital losses are required to be utilized before pre-enactment capital loss carryforwards.
| | | | Undistributed
Ordinary
Income | | | Undistributed
Long-term
Capital
Gains | | | Unrealized
Appreciation/
(Depreciation) | | | Capital Loss Carryforwards | |
| | Amount | | | Character | | | Expiration | |
| Global Bond | | | | $ | — | | | | | $ | — | | | | | $ | (14,735,433) | | | | | $ | (2,414,031) | | | | | | Short-term | | | | | | None | | |
| | | | | | | | | | | | | | | | | | | | | | | | (4,936,897) | | | | | | Long-term | | | | | | None | | |
| | | | | | | | | | | | | | | | | | | | | | | $ | (7,350,928) | | | | | | | | | | | | | | |
| American Century Small-Mid Cap Value | | | | | 11,475,651 | | | | | | 18,803,122 | | | | | | (4,800,902) | | | | | | — | | | | | | — | | | | | | — | | |
| Baron Growth | | | | | — | | | | | | 86,556,418 | | | | | | 426,032,414 | | | | | | — | | | | | | — | | | | | | — | | |
| Columbia Contrarian Core | | | | | 11,516,959 | | | | | | 28,861,928 | | | | | | 35,160,586 | | | | | | — | | | | | | — | | | | | | — | | |
| Columbia Small Cap Value II | | | | | 603,894 | | | | | | 8,732,957 | | | | | | 18,191,592 | | | | | | — | | | | | | — | | | | | | — | | |
| Invesco Comstock | | | | | 1,652,606 | | | | | | — | | | | | | 30,775,918 | | | | | | (105,159,957) | | | | | | Short-term | | | | | | 2017 | | |
| Invesco Equity and Income | | | | | 4,448,707 | | | | | | 74,538,528 | | | | | | 4,216,535 | | | | | | — | | | | | | — | | | | | | — | | |
| JPMorgan Mid Cap Value | | | | | 975,845 | | | | | | 54,523,921 | | | | | | 111,812,184 | | | | | | — | | | | | | — | | | | | | — | | |
NOTES TO FINANCIAL STATEMENTS as of December 31, 2015 (continued)
NOTE 15 — FEDERAL INCOME TAXES (continued)
| | | | Undistributed
Ordinary
Income | | | Undistributed
Long-term
Capital
Gains | | | Unrealized
Appreciation/
(Depreciation) | | | Capital Loss Carryforwards | |
| | Amount | | | Character | | | Expiration | |
| Oppenheimer Global | | | | | 19,483,236 | | | | | | 95,046,011 | | | | | | 553,188,486 | | | | | | — | | | | | | — | | | | | | — | | |
| Pioneer High Yield | | | | | 3,167,316 | | | | | | — | | | | | | (9,727,017) | | | | | | (12,856,704) | | | | | | Short-term | | | | | | 2017 | | |
| | | | | | | | | | | | | | | | | | | | | | | | (791,900) | | | | | | Short-term | | | | | | None | | |
| | | | | | | | | | | | | | | | | | | | | | | | (580,549) | | | | | | Long-term | | | | | | None | | |
| | | | | | | | | | | | | | | | | | | | | | | $ | (14,229,153) | | | | | | | | | | | | | | |
| T. Rowe Price Diversified Mid Cap Growth | | | | | 7,784,422 | | | | | | 94,062,524 | | | | | | 207,443,639 | | | | | | — | | | | | | — | | | | | | — | | |
| T. Rowe Price Growth Equity | | | | | — | | | | | | 184,242,222 | | | | | | 478,854,477 | | | | | | — | | | | | | — | | | | | | — | | |
| Templeton Foreign Equity | | | | | 21,140,622 | | | | | | — | | | | | | 65,786,230 | | | | | | (22,498,473) | | | | | | Short-term | | | | | | 2016 | | |
| | | | | | | | | | | | | | | | | | | | | | | | (133,709,136) | | | | | | Short-term | | | | | | 2017 | | |
| | | | | | | | | | | | | | | | | | | | | | | $ | (156,207,609)* | | | | | | | | | |
| |
*
Utilization of these capital losses is subject to annual limitations under Section 382 of the Internal Revenue Code. Amounts and years of expiration may be adjusted to reflect future gain/loss activity to comply with the limitation rules.
The Portfolios’ major tax jurisdictions are U.S. federal and Arizona state.
As of December 31, 2015, no provision for income tax is required in the Portfolios’ financial statements as a result of tax positions taken on federal and state income tax returns for open tax years. The Portfolios’ federal and state income and federal excise tax returns for tax years for which the applicable statutes of limitations have not expired are subject to examination by the Internal Revenue Service and state department of revenue. The earliest tax year that remains subject to examination by these jurisdictions is 2011.
NOTE 16 — SUBSEQUENT EVENTS
Subsequent to December 31, 2015, the following Portfolio paid dividends from net investment income of:
| | | | Per Share
Amount | | | Payable Date | | | Record Date | |
| Pioneer High Yield | | | | | | | | | | | | | | | | |
| Class I | | | | $ | 0.0482 | | | | February 1, 2016 | | | | | Daily | | |
| Class S | | | | $ | 0.0459 | | | | February 1, 2016 | | | | | Daily | | |
50/50 savings waiver: On November 19, 2015, the Board approved a sub-advisory fee reduction for Templeton Foreign Equity effective January 1, 2016. Pursuant to a separate waiver agreement, DSL has agreed to lower the advisory fee for the Portfolio so that the advisory fee payable to DSL will be waived in an amount equal to 50% of the savings to DSL resulting from the implementation of the sub-advisory fee reduction from the period from January 1, 2016 through May 1, 2017.
Expense Limitation Agreement: On January 14, 2016, the Board approved a modification to the expense limits with respect to Baron Growth. Effective January 1, 2016, the new expense limits, through May 1, 2017, are 1.55%, 1.05%, 1.30% and 1.45% for Class ADV, Class I, Class S and Class S2, respectively.
The Portfolios have evaluated events occurring after the Statements of Assets and Liabilities date (“subsequent events”) to determine whether any subsequent events necessitated adjustment to or disclosure in the financial statements. Other than the above, no such subsequent events were identified.
SUMMARY PORTFOLIO OF INVESTMENTS
| Voya Global Bond Portfolio | as of December 31, 2015 |
| | Principal
Amount† | | | Value | | | Percentage
of Net
Assets | |
| | CORPORATE BONDS/NOTES: 24.4% | |
| | | | | | | | Australia: 0.3% | |
| | | | 703,000 | | | | Other Securities | | | | $ | 639,322 | | | | | | 0.3 | | |
| | | | | | | | Canada: 0.1% | |
| | | | 324,000 | | | | Other Securities | | | | | 296,402 | | | | | | 0.1 | | |
| | | | | | | | Cayman Islands: 0.2% | |
| | | | 601,000 | | | | Other Securities | | | | | 576,264 | | | | | | 0.2 | | |
| | | | | | | | France: 1.0% | |
| | | | 287,000 | # | | BPCE SA, 5.150%,
07/21/24 | | | | | 289,941 | | | | | | 0.1 | | |
| | | | 456,000 | # | | Electricite de France SA,
2.350%, 10/13/20 | | | | | 449,495 | | | | | | 0.2 | | |
| | | | 940,000 | # | | Numericable Group SA,
6.000%, 05/15/22 | | | | | 914,150 | | | | | | 0.4 | | |
| | | | 433,000 | # | | Societe Generale SA,
5.625%, 11/24/45 | | | | | 415,996 | | | | | | 0.2 | | |
| | | | 294,000 | | | | Other Securities | | | | | 296,739 | | | | | | 0.1 | | |
| | | | | | | | | | | | | 2,366,321 | | | | | | 1.0 | | |
| | | | | | | | Germany: 0.3% | |
| | | | 730,000 | | | | Deutsche Bank
AG/London,
1.875%, 02/13/18 | | | | | 724,145 | | | | | | 0.3 | | |
| | | | | | | | Guernsey: 0.3% | |
| | | | 716,000 | # | | Credit Suisse Group
Funding Guernsey Ltd.,
2.750%, 03/26/20 | | | | | 709,983 | | | | | | 0.3 | | |
| | | | | | | | Ireland: 0.3% | |
| | | | 706,000 | # | | GE Capital International
Funding Co., 4.418%,
11/15/35 | | | | | 722,145 | | | | | | 0.3 | | |
| | | | | | | | Italy: 0.1% | |
| | | | 286,000 | | | | Other Securities | | | | | 294,766 | | | | | | 0.1 | | |
| | | | | | | | Japan: 0.4% | |
| | | | 790,000 | # | | Bank of Tokyo-Mitsubishi
UFJ Ltd./The, 2.300%,
03/05/20 | | | | | 779,818 | | | | | | 0.3 | | |
| | | | 200,000 | # | | Mizuho Bank Ltd.,
3.200%, 03/26/25 | | | | | 195,975 | | | | | | 0.1 | | |
| | | | | | | | | | | | | 975,793 | | | | | | 0.4 | | |
| | | | | | | | Luxembourg: 0.3% | |
| | | | 690,000 | | | | Other Securities | | | | | 691,193 | | | | | | 0.3 | | |
| | | | | | | | Mexico: 0.0% | |
| | | | MXN1,203,839 | | | | Other Securities(a) | | | | | 11,996 | | | | | | 0.0 | | |
| | | | | | | | Netherlands: 1.0% | |
| | | | 200,000 | # | | Carlson Wagonlit BV,
6.875%, 06/15/19 | | | | | 205,500 | | | | | | 0.1 | | |
| | | | 1,030,000 | | | | Shell International
Finance BV,
1.625%-3.250%,
11/10/18-05/11/25 | | | | | 1,013,487 | | | | | | 0.4 | | |
| | | | 800,000 | # | | Siemens
Financieringsmaatschappij
NV, 2.900%, 05/27/22 | | | | | 801,362 | | | | | | 0.4 | | |
| | | | 269,000 | | | | Other Securities | | | | | 293,026 | | | | | | 0.1 | | |
| | | | | | | | | | | | | 2,313,375 | | | | | | 1.0 | | |
| | Principal
Amount† | | | Value | | | Percentage
of Net
Assets | |
| | CORPORATE BONDS/NOTES: (continued) | |
| | | | | | | | Norway: 0.2% | |
| | | | 380,000 | | | | Other Securities | | | | $ | 360,946 | | | | | | 0.2 | | |
| | | | | | | | Sweden: 0.4% | |
| | | | 298,000 | # | | Nordea Bank AB,
5.500%, 09/29/49 | | | | | 297,627 | | | | | | 0.1 | | |
| | | | 670,000 | # | | Swedbank AB,
2.200%, 03/04/20 | | | | | 662,817 | | | | | | 0.3 | | |
| | | | | | | | | | | | | 960,444 | | | | | | 0.4 | | |
| | | | | | | | Switzerland: 0.3% | |
| | | | 400,000 | # | | Credit Suisse AG,
6.500%, 08/08/23 | | | | | 431,920 | | | | | | 0.2 | | |
| | | | 250,000 | | | | UBS AG/Stamford CT,
7.625%, 08/17/22 | | | | | 285,376 | | | | | | 0.1 | | |
| | | | | | | | | | | | | 717,296 | | | | | | 0.3 | | |
| | | | | | | | United Kingdom: 0.8% | |
| | | | 1,002,000 | | | | Abbey National Treasury
Services PLC/
United Kingdom,
2.375%, 03/16/20 | | | | | 1,001,679 | | | | | | 0.4 | | |
| | | | 265,000 | # | | Barclays Bank PLC,
6.050%, 12/04/17 | | | | | 282,949 | | | | | | 0.1 | | |
| | | | 563,000 | | | | Other Securities | | | | | 560,704 | | | | | | 0.3 | | |
| | | | | | | | | | | | | 1,845,332 | | | | | | 0.8 | | |
| | | | | | | | United States: 18.4% | |
| | | | 762,000 | | | | 21st Century Fox America,
Inc., 4.500%-5.400%,
02/15/21-10/01/43 | | | | | 810,052 | | | | | | 0.4 | | |
| | | | 570,000 | # | | Alliance Data Systems
Corp., 5.375%, 08/01/22 | | | | | 544,350 | | | | | | 0.2 | | |
| | | | 1,050,000 | | | | Apple Inc., 1.000%,
05/03/18 | | | | | 1,042,112 | | | | | | 0.4 | | |
| | | | 710,000 | | | | Apple, Inc., 3.200%,
05/13/25 | | | | | 719,891 | | | | | | 0.3 | | |
| | | | 1,135,000 | | | | Bank of America Corp.,
3.300%-4.100%,
01/11/23-04/01/24 | | | | | 1,154,658 | | | | | | 0.5 | | |
| | | | 1,309,000 | | | | Barrick North America
Finance LLC, 5.750%,
05/01/43 | | | | | 949,444 | | | | | | 0.4 | | |
| | | | 65,000 | # | | Building Materials
Corp. of America,
6.000%, 10/15/25 | | | | | 66,625 | | | | | | 0.0 | | |
| | | | 540,000 | # | | Calpine Corp.,
6.000%, 01/15/22 | | | | | 560,083 | | | | | | 0.2 | | |
| | | | 472,000 | # | | CCO Safari II LLC,
4.464%, 07/23/22 | | | | | 470,887 | | | | | | 0.2 | | |
| | | | 851,000 | | | | Citigroup, Inc.,
4.000%-5.500%,
08/05/24-09/13/25 | | | | | 889,671 | | | | | | 0.4 | | |
| | | | 758,000 | | | | Citizens Bank NA/
Providence RI,
2.450%, 12/04/19 | | | | | 746,657 | | | | | | 0.3 | | |
| | | | 562,000 | # | | COX Communications,
Inc., 2.950%, 06/30/23 | | | | | 495,925 | | | | | | 0.2 | | |
See Accompanying Notes to Financial Statements
SUMMARY PORTFOLIO OF INVESTMENTS
| Voya Global Bond Portfolio | as of December 31, 2015 (continued) |
| | Principal
Amount† | | | Value | | | Percentage
of Net
Assets | |
| | CORPORATE BONDS/NOTES: (continued) | |
| | | | | | | | United States (continued) | |
| | | | 777,000 | | | | CVS Health Corp.,
2.800%, 07/20/20 | | | | $ | 781,628 | | | | | | 0.3 | | |
| | | | 1,026,000 | | | | Energy Transfer Partners
L.P., 4.900%, 02/01/24 | | | | | 916,282 | | | | | | 0.4 | | |
| | | | 539,000 | | | | Fifth Third Bancorp,
8.250%, 03/01/38 | | | | | 754,506 | | | | | | 0.3 | | |
| | | | 255,000 | # | | Glencore Funding LLC,
2.500%, 01/15/19 | | | | | 213,074 | | | | | | 0.1 | | |
| | | | 605,000 | | | | Hartford Financial
Services Group, Inc.,
6.625%, 03/30/40 | | | | | 749,207 | | | | | | 0.3 | | |
| | | | 721,000 | | | | HCP, Inc.,
4.250%, 11/15/23 | | | | | 723,235 | | | | | | 0.3 | | |
| | | | 436,000 | # | | Kraft Heinz Foods Co.,
3.950%, 07/15/25 | | | | | 441,071 | | | | | | 0.2 | | |
| | | | 258,000 | # | | Hewlett Packard
Enterprise Co.,
2.450%, 10/05/17 | | | | | 257,903 | | | | | | 0.1 | | |
| | | | 194,000 | # | | Hewlett Packard
Enterprise Co.,
2.850%, 10/05/18 | | | | | 194,057 | | | | | | 0.1 | | |
| | | | 1,041,000 | | | | Indiana Michigan
Power Co.,
7.000%, 03/15/19 | | | | | 1,180,852 | | | | | | 0.5 | | |
| | | | 570,000 | # | | JBS USA LLC / JBS USA
Finance, Inc.,
5.875%, 07/15/24 | | | | | 518,700 | | | | | | 0.2 | | |
| | | | 840,000 | | | | JPMorgan Chase & Co.,
1.625%-6.000%,
05/15/18-12/29/49 | | | | | 837,989 | | | | | | 0.4 | | |
| | | | 50 | # | | Kern River Funding Corp.,
4.893%, 04/30/18 | | | | | 52 | | | | | | 0.0 | | |
| | | | 768,000 | | | | Medtronic, Inc.,
3.150%-3.500%,
03/15/22-03/15/25 | | | | | 777,596 | | | | | | 0.3 | | |
| | | | 700,000 | | | | Microsoft Corp.,
2.000%, 11/03/20 | | | | | 700,748 | | | | | | 0.3 | | |
| | | | 1,577,000 | | | | Morgan Stanley,
3.750%-4.100%,
02/25/23-04/29/24 | | | | | 1,607,092 | | | | | | 0.7 | | |
| | | | 1,048,000 | | | | Mylan, Inc., 2.600%,
06/24/18 | | | | | 1,040,672 | | | | | | 0.4 | | |
| | | | 110,000 | #,L | | Owens-Brockway Glass
Container, Inc.,
5.875%, 08/15/23 | | | | | 111,856 | | | | | | 0.1 | | |
| | | | 470,000 | # | | Sable International
Finance Ltd.,
8.750%, 02/01/20 | | | | | 494,675 | | | | | | 0.2 | | |
| | | | 585,000 | # | | Sanmina Corp.,
4.375%, 06/01/19 | | | | | 589,387 | | | | | | 0.3 | | |
| | | | 272,000 | | | | Time Warner Cable, Inc.,
5.875%, 11/15/40 | | | | | 258,529 | | | | | | 0.1 | | |
| | | | 485,000 | | | | Time Warner, Inc.,
6.500%, 11/15/36 | | | | | 550,744 | | | | | | 0.2 | | |
| | Principal
Amount† | | | Value | | | Percentage
of Net
Assets | |
| | CORPORATE BONDS/NOTES: (continued) | |
| | | | | | | | United States (continued) | |
| | | | 505,000 | # | | Valeant Pharmaceuticals
International, 7.250%,
07/15/22 | | | | $ | 496,163 | | | | | | 0.2 | | |
| | | | 1,071,000 | | | | Verizon Communications,
Inc., 5.150%, 09/15/23 | | | | | 1,179,388 | | | | | | 0.5 | | |
| | | | 542,000 | | | | Verizon Communications,
Inc., 5.012%-6.550%,
09/15/43-08/21/54 | | | | | 572,197 | | | | | | 0.2 | | |
| | | | 599,000 | | | | Wells Fargo & Co.,
4.100%, 06/03/26 | | | | | 605,452 | | | | | | 0.3 | | |
| | | | 19,031,000 | | | | Other Securities | | | | | 18,835,091 | | | | | | 7.9 | | |
| | | | | | | | | | | | | 43,838,501 | | | | | | 18.4 | | |
| | | | | | | | Total Corporate
Bonds/Notes
(Cost $59,095,483) | | | | | 58,044,224 | | | | | | 24.4 | | |
| | COLLATERALIZED MORTGAGE OBLIGATIONS: 15.3% | |
| | | | | | | | United States: 15.3% | |
| | | | 372,735 | | | | Banc of America
Alternative Loan Trust
2004-1 4A1, 4.750%,
02/25/19 | | | | | 375,179 | | | | | | 0.2 | | |
| | | | 810,000 | | | | Banc of America
Commercial Mortgage
Trust 2007-3 AJ, 5.558%,
06/10/49 | | | | | 821,840 | | | | | | 0.3 | | |
| | | | 700,000 | | | | Banc of America
Commercial Mortgage
Trust 2007-3 B, 5.558%,
06/10/49 | | | | | 692,564 | | | | | | 0.3 | | |
| | | | 540,000 | | | | Banc of America
Commercial Mortgage
Trust 2007-4 AJ, 5.809%,
02/10/51 | | | | | 548,288 | | | | | | 0.2 | | |
| | | | 868,241 | | | | Banc of America Funding
Corp., 5.500%, 02/25/35 | | | | | 877,970 | | | | | | 0.4 | | |
| | | | 1,130,000 | # | | Banc of America Merrill
Lynch Commercial
Mortgage, Inc. 2004-4 G,
5.402%, 07/10/42 | | | | | 1,131,340 | | | | | | 0.5 | | |
| | | | 8,020,000 | #,^ | | BBCCRE Trust 2015-GTP
XA, 0.597%, 08/10/33 | | | | | 404,674 | | | | | | 0.2 | | |
| | | | 574,250 | | | | Bear Stearns ALT-A Trust
2005-10 22A1, 2.608%,
01/25/36 | | | | | 497,575 | | | | | | 0.2 | | |
| | | | 440,000 | # | | Bear Stearns Commercial
Mortgage Securities Trust
2004-PWR6, 5.406%,
11/11/41 | | | | | 472,894 | | | | | | 0.2 | | |
| | | | 500,000 | | | | Bear Stearns Commercial
Mortgage Securities Trust
2005-TOP20, 5.177%,
10/12/42 | | | | | 499,444 | | | | | | 0.2 | | |
See Accompanying Notes to Financial Statements
SUMMARY PORTFOLIO OF INVESTMENTS
| Voya Global Bond Portfolio | as of December 31, 2015 (continued) |
| | Principal
Amount† | | | Value | | | Percentage
of Net
Assets | |
| | COLLATERALIZED MORTGAGE OBLIGATIONS: (continued) | |
| | | | | | | | United States (continued) | |
| | | | 140,000 | # | | Bear Stearns Commercial
Mortgage Securities Trust
2006-TOP22 E, 5.620%,
04/12/38 | | | | $ | 140,131 | | | | | | 0.1 | | |
| | | | 497,440 | # | | Beckman Coulter, Inc.
2000-A A, 7.498%,
12/15/18 | | | | | 524,998 | | | | | | 0.2 | | |
| | | | 240,000 | # | | Citigroup Commercial
Mortgage Trust 2012-GC8
D, 4.877%, 09/10/45 | | | | | 230,804 | | | | | | 0.1 | | |
| | | | 234,440 | | | | Citigroup Mortgage Loan
Trust, Inc. 2005-2 1A3,
2.800%, 05/25/35 | | | | | 233,809 | | | | | | 0.1 | | |
| | | | 680,000 | # | | COMM 2004-LNB2 H
Mortgage Trust H,
6.067%, 03/10/39 | | | | | 735,082 | | | | | | 0.3 | | |
| | | | 10,774,658 | #,^ | | COMM 2012 - LTRT XA
Mortgage Trust, 1.060%,
10/05/30 | | | | | 554,782 | | | | | | 0.2 | | |
| | | | 3,951,125 | ^ | | COMM 2012-CCRE1 XA
Mortgage Trust, 2.080%,
05/15/45 | | | | | 341,884 | | | | | | 0.2 | | |
| | | | 2,953,092 | ^ | | COMM 2013-LC6 XA
Mortgage Trust, 1.742%,
01/10/46 | | | | | 202,419 | | | | | | 0.1 | | |
| | | | 4,401,334 | ^ | | COMM 2014-CCRE17 XA
Mortgage Trust, 1.191%,
05/10/47 | | | | | 277,262 | | | | | | 0.1 | | |
| | | | 225,478 | ^ | | Commercial Mortgage
Pass Through Certificates,
1.394%, 04/10/47 | | | | | 15,973 | | | | | | 0.0 | | |
| | | | 480,000 | # | | Commercial Mortgage
Trust 2004-GG1 F,
6.047%, 06/10/36 | | | | | 486,720 | | | | | | 0.2 | | |
| | | | 23,937 | # | | Credit Suisse First Boston
Mortgage Securities Corp.
2003-C4 J, 5.322%,
08/15/36 | | | | | 23,907 | | | | | | 0.0 | | |
| | | | 372,029 | # | | Credit Suisse Mortgage
Capital Certificates
2009-3R 30A1, 2.380%,
07/27/37 | | | | | 373,279 | | | | | | 0.2 | | |
| | | | 3,057,972 | #,^ | | DBUBS 2011-LC1 XA
Mortgage Trust, 1.127%,
11/10/46 | | | | | 64,549 | | | | | | 0.0 | | |
| | | | 55,972 | # | | Deutsche Alternative-A
Securities, Inc. Alternate
Loan Trust, 0.922%,
01/27/37 | | | | | 108,191 | | | | | | 0.0 | | |
| | | | 320,000 | | | | Fannie Mae Connecticut
Avenue Securities
2014-C03 2M2, 3.322%,
07/25/24 | | | | | 292,351 | | | | | | 0.1 | | |
| | Principal
Amount† | | | Value | | | Percentage
of Net
Assets | |
| | COLLATERALIZED MORTGAGE OBLIGATIONS: (continued) | |
| | | | | | | | United States (continued) | |
| | | | 1,780,000 | | | | Fannie Mae Connecticut
Avenue Securities
2014-CO4 M2, 5.322%,
11/25/24 | | | | $ | 1,815,618 | | | | | | 0.8 | | |
| | | | 9,289,095 | ^ | | Freddie Mac Series K704
X1, 1.966%, 08/25/18 | | | | | 403,600 | | | | | | 0.2 | | |
| | | | 1,100,000 | | | | Freddie Mac Structured
Agency Credit Risk Debt
Notes 2014-DN4 M3,
4.972%, 10/25/24 | | | | | 1,092,614 | | | | | | 0.4 | | |
| | | | 340,000 | | | | Freddie Mac Structured
Agency Credit Risk Debt
Notes 2014-HQ3 M3,
5.172%, 10/25/24 | | | | | 341,716 | | | | | | 0.1 | | |
| | | | 180,000 | | | | Freddie Mac Structured
Agency Credit Risk Debt
Notes 2015-DN1 M3,
4.572%, 01/25/25 | | | | | 177,675 | | | | | | 0.1 | | |
| | | | 200,000 | | | | Freddie Mac Structured
Agency Credit Risk Debt
Notes 2015-HQ1 M2,
2.622%, 03/25/25 | | | | | 199,583 | | | | | | 0.1 | | |
| | | | 220,000 | | | | Freddie Mac Structured
Agency Credit Risk Debt
Notes 2015-HQ1 M3,
4.222%, 03/25/25 | | | | | 212,401 | | | | | | 0.1 | | |
| | | | 44,040,460 | #,^ | | FREMF Mortgage Trust,
0.100%, 12/25/44 | | | | | 208,708 | | | | | | 0.1 | | |
| | | | 24,529 | # | | GE Capital Commercial
Mortgage Series 2005-C2,
5.464%, 05/10/43 | | | | | 24,508 | | | | | | 0.0 | | |
| | | | 906,028 | | | | IndyMac INDX Mortgage
Loan Trust 2006-AR2
1A1B, 0.632%, 04/25/46 | | | | | 703,412 | | | | | | 0.3 | | |
| | | | 500,000 | | | | JP Morgan Chase
Commercial Mortgage
Securities Corp.
2006-LDP8 B, 5.520%,
05/15/45 | | | | | 501,405 | | | | | | 0.2 | | |
| | | | 2,940,000 | #,^ | | JP Morgan Chase
Commercial Mortgage
Securities Corp. 2012-LC9
XB, 0.356%, 12/15/47 | | | | | 62,454 | | | | | | 0.0 | | |
| | | | 372,842 | # | | JP Morgan Chase
Commercial Mortgage
Securities Trust 2003-LN1
H, 5.482%, 10/15/37 | | | | | 372,511 | | | | | | 0.2 | | |
| | | | 270,000 | | | | JP Morgan Chase
Commercial Mortgage
Securities Trust
2004-CIBC9 E, 5.366%,
06/12/41 | | | | | 262,584 | | | | | | 0.1 | | |
See Accompanying Notes to Financial Statements
SUMMARY PORTFOLIO OF INVESTMENTS
| Voya Global Bond Portfolio | as of December 31, 2015 (continued) |
| | Principal
Amount† | | | Value | | | Percentage
of Net
Assets | |
| | COLLATERALIZED MORTGAGE OBLIGATIONS: (continued) | |
| | | | | | | | United States (continued) | |
| | | | 60,000 | | | | JP Morgan Chase
Commercial Mortgage
Securities Trust
2006-LDP8, 5.549%,
05/15/45 | | | | $ | 60,002 | | | | | | 0.0 | | |
| | | | 8,495,255 | ^ | | JP Morgan Chase
Commercial Mortgage
Securities Trust
2012-CIBX XA, 1.746%,
06/15/45 | | | | | 534,773 | | | | | | 0.2 | | |
| | | | 720,699 | | | | JP Morgan Mortgage
Trust 2005-A4 B1,
2.535%, 07/25/35 | | | | | 642,431 | | | | | | 0.3 | | |
| | | | 180,450 | | | | JPMorgan Mortgage
Trust, 2.685%, 07/25/35 | | | | | 179,233 | | | | | | 0.1 | | |
| | | | 360,000 | | | | LB-UBS Commercial
Mortgage Trust 2005-C3
E, 4.983%, 07/15/40 | | | | | 383,365 | | | | | | 0.2 | | |
| | | | 780,000 | | | | LB-UBS Commercial
Mortgage Trust 2006-C4
D, 5.840%, 06/15/38 | | | | | 788,832 | | | | | | 0.3 | | |
| | | | 260,000 | | | | LB-UBS Commercial
Mortgage Trust 2006-C4
E, 5.840%, 06/15/38 | | | | | 259,021 | | | | | | 0.1 | | |
| | | | 360,000 | # | | LB-UBS Commercial
Mortgage Trust 2006-C6
JR14, 5.990%, 09/15/39 | | | | | 364,214 | | | | | | 0.1 | | |
| | | | 150,000 | # | | LB-UBS Commercial
Mortgage Trust 2006-C6
JR15, 5.990%, 09/15/39 | | | | | 151,295 | | | | | | 0.1 | | |
| | | | 150,000 | # | | LB-UBS Commercial
Mortgage Trust 2006-C6
JR16, 5.990%, 09/15/39 | | | | | 149,893 | | | | | | 0.1 | | |
| | | | 360,000 | | | | Merrill Lynch Mortgage
Investors Trust Series
1998-C1-CTL E, 6.750%,
11/15/26 | | | | | 390,528 | | | | | | 0.2 | | |
| | | | 210,000 | | | | Merrill Lynch Mortgage
Trust 2006-C2 AJ,
5.802%, 08/12/43 | | | | | 209,947 | | | | | | 0.1 | | |
| | | | 130,000 | | | | Merrill Lynch Mortgage
Trust, 5.666%, 05/12/39 | | | | | 129,715 | | | | | | 0.0 | | |
| | | | 570,000 | # | | Morgan Stanley Capital I
Trust 2011-C1 D, 5.438%,
09/15/47 | | | | | 601,725 | | | | | | 0.3 | | |
| | | | 460,000 | # | | Morgan Stanley Capital I
Trust 2011-C1 E, 5.438%,
09/15/47 | | | | | 474,475 | | | | | | 0.2 | | |
| | | | 865,000 | # | | Morgan Stanley Capital I
Trust 2011-C1, 5.438%,
09/15/47 | | | | | 942,112 | | | | | | 0.4 | | |
| | | | 290,000 | # | | Morgan Stanley
Re-REMIC Trust, 0.250%,
07/27/49 | | | | | 263,407 | | | | | | 0.1 | | |
| | Principal
Amount† | | | Value | | | Percentage
of Net
Assets | |
| | COLLATERALIZED MORTGAGE OBLIGATIONS: (continued) | |
| | | | | | | | United States (continued) | |
| | | | 216,789 | # | | N-Star Real Estate CDO
Ltd. 2013-1A A, 2.272%,
08/25/29 | | | | $ | 216,724 | | | | | | 0.1 | | |
| | | | 269,940 | | | | Opteum Mortgage
Acceptance Corp. Trust
2006-1 1APT, 0.632%,
04/25/36 | | | | | 234,617 | | | | | | 0.1 | | |
| | | | 590,000 | | | | Opteum Mortgage
Acceptance Corp. Trust
2006-1, 0.722%, 04/25/36 | | | | | 487,997 | | | | | | 0.2 | | |
| | | | 560,183 | # | | TIAA CMBS I Trust
2001-C1A L, 5.770%,
06/19/33 | | | | | 573,734 | | | | | | 0.2 | | |
| | | | 6,596,150 | #,^ | | UBS-Barclays
Commercial Mortgage
Trust 2012-C3 XA,
2.089%, 08/10/49 | | | | | 609,844 | | | | | | 0.2 | | |
| | | | 82,924 | | | | WaMu Mortgage
Pass-Through Certificates
Series 2006-AR12 1A1,
2.431%, 10/25/36 | | | | | 74,743 | | | | | | 0.0 | | |
| | | | 1,340,522 | | | | WaMu Mortgage
Pass-Through Certificates
Series 2006-AR16 Trust
3A1, 3.824%, 12/25/36 | | | | | 1,222,973 | | | | | | 0.5 | | |
| | | | 317,242 | | | | WaMu Mortgage
Pass-Through Certificates
Series 2006-AR8 1A4,
2.397%, 08/25/46 | | | | | 273,905 | | | | | | 0.1 | | |
| | | | 606,111 | | | | WaMu Mortgage
Pass-Through Certificates
Series 2007-HY2 1A1,
2.300%, 12/25/36 | | | | | 529,516 | | | | | | 0.2 | | |
| | | | 168,836 | | | | WaMu Mortgage
Pass-Through Certificates
Series 2007-HY4 1A1,
1.972%, 04/25/37 | | | | | 144,019 | | | | | | 0.1 | | |
| | | | 192,181 | | | | Washington Mutual
Mortgage Pass-Through
Certificates WMALT
Series 2006-AR10 Trust,
0.522%, 12/25/36 | | | | | 128,158 | | | | | | 0.1 | | |
| | | | 235,961 | | | | Wells Fargo Alternative
Loan 2007-PA2 2A1,
0.852%, 06/25/37 | | | | | 171,912 | | | | | | 0.1 | | |
| | | | 6,019,310 | #,^ | | Wells Fargo Commercial
Mortgage Trust 2012-LC5
XA, 2.061%, 10/15/45 | | | | | 528,387 | | | | | | 0.2 | | |
| | | | 593,448 | | | | Wells Fargo Mortgage
Backed Securities Trust
2005-AR14 A1, 2.740%,
08/25/35 | | | | | 587,915 | | | | | | 0.3 | | |
See Accompanying Notes to Financial Statements
SUMMARY PORTFOLIO OF INVESTMENTS
| Voya Global Bond Portfolio | as of December 31, 2015 (continued) |
| | Principal
Amount† | | | Value | | | Percentage
of Net
Assets | |
| | COLLATERALIZED MORTGAGE OBLIGATIONS: (continued) | |
| | | | | | | | United States (continued) | |
| | | | 441,598 | | | | Wells Fargo Mortgage
Backed Securities
2006-AR17 Trust A1,
2.733%, 10/25/36 | | | | $ | 421,597 | | | | | | 0.2 | | |
| | | | 95,247 | | | | Wells Fargo Mortgage
Backed Securities
2006-AR17 Trust A2,
2.733%, 10/25/36 | | | | | 90,933 | | | | | | 0.0 | | |
| | | | 510,545 | | | | Wells Fargo Mortgage
Backed Securities
2006-AR7 Trust 2A1,
2.738%, 05/25/36 | | | | | 487,425 | | | | | | 0.2 | | |
| | | | 467,771 | | | | Wells Fargo Mortgage
Backed Securities
2006-AR8 Trust 3A2,
2.808%, 04/25/36 | | | | | 455,201 | | | | | | 0.2 | | |
| | | | 101,727 | | | | Wells Fargo
Mortgage-Backed
Securities Trust,
2.753%, 02/25/34 | | | | | 103,013 | | | | | | 0.0 | | |
| | | | 2,962,718 | #,^ | | WFRBS Commercial
Mortgage Trust 2012-C8
XA, 2.164%, 08/15/45 | | | | | 246,975 | | | | | | 0.1 | | |
| | | | 5,747,202 | | | | Other Securities | | | | | 5,099,447 | | | | | | 2.1 | | |
| | | | | | | | Total Collateralized
Mortgage Obligations
(Cost $36,418,133) | | | | | 36,520,701 | | | | | | 15.3 | | |
| | STRUCTURED PRODUCTS: 0.0% | |
| | | | | | | | Russia: 0.0% | |
| | | | RUB6,309,181 | | | | Morgan Stanley & Co.
International PLC - EM
Whole Loan SA /Russian
Federation Total Return
Linked Bonds, Series 007,
Cl. VR, 4.390%, 08/22/34 | | | | | 38,156 | | | | | | 0.0 | | |
| | | | | | | | Total Structured Products
(Cost $224,649) | | | | | 38,156 | | | | | | 0.0 | | |
| | U.S. TREASURY OBLIGATIONS: 6.9% | |
| | | | | | | | U.S. Treasury Bonds: 1.7% | |
| | | | 2,269,000 | L | | 2.250%, due 11/15/25 | | | | | 2,264,145 | | | | | | 0.9 | | |
| | | | 1,951,000 | | | | 2.875%, due 08/15/45 | | | | | 1,891,631 | | | | | | 0.8 | | |
| | | | | | | | | | | | | 4,155,776 | | | | | | 1.7 | | |
| | | | | | | | U.S. Treasury Notes: 5.2% | |
| | | | 6,083,700 | L | | 0.875%, due 11/30/17 | | | | | 6,067,158 | | | | | | 2.6 | | |
| | | | 1,890,000 | | | | 1.250%, due 12/15/18 | | | | | 1,886,379 | | | | | | 0.8 | | |
| | | | 1,931,000 | | | | 1.750%, due 12/31/20 | | | | | 1,929,824 | | | | | | 0.8 | | |
| | | | 2,438,000 | | | | 2.000%, due 11/30/22 | | | | | 2,424,981 | | | | | | 1.0 | | |
| | | | | | | | | | | | | 12,308,342 | | | | | | 5.2 | | |
| | | | | | | | Total U.S. Treasury
Obligations
(Cost $16,476,858) | | | | | 16,464,118 | | | | | | 6.9 | | |
| |
| | Principal
Amount† | | | Value | | | Percentage
of Net
Assets | |
| | FOREIGN GOVERNMENT BONDS: 6.6% | |
| | | | | | | | Austria: 1.5% | |
| | | | EUR3,000,000 | # | | Austria Government Bond,
1.650%, 10/21/24 | | | | $ | 3,520,257 | | | | | | 1.5 | | |
| | | | | | | | Brazil: 0.2% | |
| | | | BRL705,000 | | | | Other Securities | | | | | 421,191 | | | | | | 0.2 | | |
| | | | | | | | Germany: 0.4% | |
| | | | EUR140,000 | | | | Bundesschatzanweisungen,
-0.330%, 09/15/17 | | | | | 153,017 | | | | | | 0.0 | | |
| | | | EUR830,000 | | | | Bundesschatzanweisungen,
-0.350%, 06/16/17 | | | | | 906,645 | | | | | | 0.4 | | |
| | | | EUR10,000 | | | | Other Securities | | | | | 12,255 | | | | | | 0.0 | | |
| | | | | | | | | | | | | 1,071,917 | | | | | | 0.4 | | |
| | | | | | | | South Africa: 0.0% | |
| | | | ZAR1,000,000 | | | | Other Securities | | | | | 62,541 | | | | | | 0.0 | | |
| | | | | | | | Spain: 4.5% | |
| | | | EUR7,300,000 | # | | Spain Government Bond,
1.600%, 04/30/25 | | | | | 7,891,619 | | | | | | 3.3 | | |
| | | | EUR2,340,000 | # | | Spain Government Bond,
2.750%, 10/31/24 | | | | | 2,776,457 | | | | | | 1.2 | | |
| | | | | | | | | | | | | 10,668,076 | | | | | | 4.5 | | |
| | | | | | | | Total Foreign Government
Bonds
(Cost $16,459,970) | | | | | 15,743,982 | | | | | | 6.6 | | |
| | U.S. GOVERNMENT AGENCY OBLIGATIONS: 19.5% | |
| | | | | | | | Federal Home Loan Mortgage Corporation: 8.5%## | |
| | | | 1,391,000 | W | | 0.010%, due 12/15/42 | | | | | 1,388,811 | | | | | | 0.6 | | |
| | | | 1,469,601 | | | | 3.000%, due 04/01/45 | | | | | 1,469,230 | | | | | | 0.6 | | |
| | | | 1,436,597 | | | | 3.000%, due 04/01/45 | | | | | 1,436,680 | | | | | | 0.6 | | |
| | | | 1,984,000 | W | | 3.500%, due 07/15/41 | | | | | 2,042,454 | | | | | | 0.9 | | |
| | | | 974,746 | ^ | | 4.000%, due 02/15/43 | | | | | 182,898 | | | | | | 0.1 | | |
| | | | 15,332,354 | ^ | | 4.000%, due 04/15/43 | | | | | 2,766,502 | | | | | | 1.2 | | |
| | | | 1,013,671 | | | | 4.000%, due 09/01/45 | | | | | 1,072,155 | | | | | | 0.5 | | |
| | | | 1,245,288 | | | | 4.000%, due 10/01/45 | | | | | 1,317,136 | | | | | | 0.6 | | |
| | | | 5,710,031 | ^ | | 4.120%, due 05/15/36 | | | | | 567,133 | | | | | | 0.2 | | |
| | | | 2,321,284 | ^ | | 5.620%, due 10/15/36 | | | | | 336,835 | | | | | | 0.1 | | |
| | | | 5,988,929 | ^ | | 5.670%, due 05/15/36 | | | | | 533,507 | | | | | | 0.2 | | |
| | | | 4,882,986 | ^ | | 5.670%, due 01/15/39 | | | | | 662,073 | | | | | | 0.3 | | |
| | | | 5,126,356 | ^ | | 5.720%, due 07/15/40 | | | | | 734,137 | | | | | | 0.3 | | |
| | | | 128,670 | ^ | | 5.820%, due 07/15/35 | | | | | 21,868 | | | | | | 0.0 | | |
| | | | 2,474,601 | ^ | | 5.920%, due 11/15/32 | | | | | 445,522 | | | | | | 0.2 | | |
| | | | 1,130,015 | ^ | | 6.270%, due 08/15/28 | | | | | 85,505 | | | | | | 0.0 | | |
| | | | 16,151 | ^ | | 7.000%, due 03/15/28 | | | | | 3,917 | | | | | | 0.0 | | |
| | | | 89,442 | ^ | | 7.000%, due 04/15/28 | | | | | 21,846 | | | | | | 0.0 | | |
| | | | 149,607 | ^ | | 7.320%, due 03/15/29 | | | | | 32,978 | | | | | | 0.0 | | |
| | | | 140,691 | ^ | | 7.370%, due 03/15/29 | | | | | 26,281 | | | | | | 0.0 | | |
| | | | 203,998 | ^ | | 8.620%, due 08/15/29 | | | | | 51,470 | | | | | | 0.0 | | |
| | | | 4,590,198 | | | | 0.781%-23.538%, due
05/15/17-09/01/45 | | | | | 4,931,955 | | | | | | 2.1 | | |
| | | | | | | | | | | | | 20,130,893 | | | | | | 8.5 | | |
See Accompanying Notes to Financial Statements
SUMMARY PORTFOLIO OF INVESTMENTS
| Voya Global Bond Portfolio | as of December 31, 2015 (continued) |
| | Principal
Amount† | | | Value | | | Percentage
of Net
Assets | |
| | U.S. GOVERNMENT AGENCY OBLIGATIONS: (continued) | |
| | | | | | | | Federal National Mortgage
Association: 9.4%## | |
| | | | 2,296,836 | ^ | | 3.000%, due 06/25/33 | | | | $ | 341,142 | | | | | | 0.2 | | |
| | | | 1,501,000 | W | | 3.000%, due 09/25/42 | | | | | 1,501,131 | | | | | | 0.6 | | |
| | | | 3,660,333 | | | | 3.000%, due 07/01/43 | | | | | 3,691,539 | | | | | | 1.6 | | |
| | | | 1,054,078 | | | | 3.000%, due 07/01/43 | | | | | 1,056,605 | | | | | | 0.5 | | |
| | | | 1,214,246 | ^ | | 3.500%, due 08/25/33 | | | | | 161,769 | | | | | | 0.1 | | |
| | | | 747,151 | ^ | | 3.500%, due 08/25/43 | | | | | 146,819 | | | | | | 0.1 | | |
| | | | 2,036,117 | ^ | | 3.628%, due 02/25/37 | | | | | 29,393 | | | | | | 0.0 | | |
| | | | 2,274,687 | ^ | | 4.000%, due 06/25/42 | | | | | 389,065 | | | | | | 0.2 | | |
| | | | 3,483,043 | | | | 4.500%, due 05/01/44 | | | | | 3,763,414 | | | | | | 1.6 | | |
| | | | 1,771,499 | ^ | | 5.000%, due 05/25/18 | | | | | 64,603 | | | | | | 0.0 | | |
| | | | 69,935 | ^ | | 5.500%, due 07/25/33 | | | | | 14,813 | | | | | | 0.0 | | |
| | | | 28,838 | ^ | | 5.500%, due 06/01/35 | | | | | 6,133 | | | | | | 0.0 | | |
| | | | 3,070,054 | ^ | | 5.518%, due 01/25/38 | | | | | 546,945 | | | | | | 0.2 | | |
| | | | 5,322,507 | ^ | | 5.528%, due 09/25/41 | | | | | 834,013 | | | | | | 0.4 | | |
| | | | 4,679,380 | ^ | | 5.558%, due 11/25/41 | | | | | 752,111 | | | | | | 0.3 | | |
| | | | 3,322,672 | ^ | | 5.678%, due 01/25/43 | | | | | 778,870 | | | | | | 0.3 | | |
| | | | 129,370 | ^ | | 6.000%, due 12/01/32 | | | | | 28,904 | | | | | | 0.0 | | |
| | | | 55,222 | ^ | | 6.000%, due 02/01/33 | | | | | 10,814 | | | | | | 0.0 | | |
| | | | 64,743 | ^ | | 6.000%, due 03/01/33 | | | | | 14,652 | | | | | | 0.0 | | |
| | | | 53,917 | ^ | | 6.000%, due 03/01/33 | | | | | 12,427 | | | | | | 0.0 | | |
| | | | 30,744 | ^ | | 6.000%, due 09/01/35 | | | | | 6,142 | | | | | | 0.0 | | |
| | | | 4,292,968 | ^ | | 6.028%, due 02/25/42 | | | | | 655,617 | | | | | | 0.3 | | |
| | | | 139,634 | ^ | | 6.118%, due 06/25/37 | | | | | 22,918 | | | | | | 0.0 | | |
| | | | 1,896,717 | ^ | | 6.128%, due 09/25/37 | | | | | 337,146 | | | | | | 0.1 | | |
| | | | 4,891,308 | ^ | | 6.138%, due 06/25/41 | | | | | 923,545 | | | | | | 0.4 | | |
| | | | 437,122 | ^ | | 6.148%, due 06/25/36 | | | | | 78,145 | | | | | | 0.0 | | |
| | | | 25,034 | ^ | | 6.328%, due 05/25/35 | | | | | 4,627 | | | | | | 0.0 | | |
| | | | 222,841 | ^ | | 6.500%, due 02/01/32 | | | | | 51,916 | | | | | | 0.0 | | |
| | | | 35,618 | ^ | | 6.678%, due 06/25/23 | | | | | 4,129 | | | | | | 0.0 | | |
| | | | 129,219 | ^ | | 6.808%, due 09/25/36 | | | | | 23,585 | | | | | | 0.0 | | |
| | | | 39,415 | ^ | | 7.000%, due 02/01/28 | | | | | 9,073 | | | | | | 0.0 | | |
| | | | 49,406 | ^ | | 7.000%, due 03/25/33 | | | | | 14,013 | | | | | | 0.0 | | |
| | | | 40,106 | ^ | | 7.000%, due 04/25/33 | | | | | 10,538 | | | | | | 0.0 | | |
| | | | 210,181 | ^ | | 7.128%, due 10/25/33 | | | | | 39,458 | | | | | | 0.0 | | |
| | | | 85,885 | ^ | | 7.208%, due 03/25/23 | | | | | 2,810 | | | | | | 0.0 | | |
| | | | 137,173 | ^ | | 7.328%, due 07/25/31 | | | | | 31,463 | | | | | | 0.0 | | |
| | | | 75,951 | ^ | | 7.328%, due 02/25/32 | | | | | 15,068 | | | | | | 0.0 | | |
| | | | 54,587 | ^ | | 7.500%, due 01/01/24 | | | | | 11,000 | | | | | | 0.0 | | |
| | | | 47,634 | ^ | | 7.528%, due 07/25/32 | | | | | 10,653 | | | | | | 0.0 | | |
| | | | 1,559,579 | ^ | | 7.640%, due 12/18/32 | | | | | 337,729 | | | | | | 0.1 | | |
| | | | 493,825 | | | | 31.342%, due 11/25/36 | | | | | 879,560 | | | | | | 0.4 | | |
| | | | 3,867,240 | W | | 0.822%-26.305%, due
03/25/17-05/25/43 | | | | | 4,725,843 | | | | | | 2.0 | | |
| | | | | | | | | | | | | 22,340,140 | | | | | | 9.4 | | |
| | | | | | | | Government National Mortgage Association: 1.6% | |
| | | | 8,387,827 | ^ | | 4.000%, due 04/20/38 | | | | | 625,699 | | | | | | 0.3 | | |
| | | | 4,487,951 | ^ | | 5.448%, due 06/20/40 | | | | | 691,166 | | | | | | 0.3 | | |
| | | | 2,685,503 | ^ | | 6.356%, due 07/16/41 | | | | | 518,859 | | | | | | 0.2 | | |
| | Principal
Amount† | | | Value | | | Percentage
of Net
Assets | |
| | U.S. GOVERNMENT AGENCY OBLIGATIONS: (continued) | |
| | | | | | | | Government National Mortgage
Association (continued) | |
| | | | 687,827 | | | | 20.745%, due 03/20/37 | | | | $ | 1,073,844 | | | | | | 0.4 | | |
| | | | 839,060 | W | | 3.500%-8.000%, due
02/16/30-06/20/45 | | | | | 910,845 | | | | | | 0.4 | | |
| | | | | | | | | | | | | 3,820,413 | | | | | | 1.6 | | |
| | | | | | | | Total U.S. Government
Agency Obligations
(Cost $45,019,750) | | | | | 46,291,446 | | | | | | 19.5 | | |
| | ASSET-BACKED SECURITIES: 3.1% | |
| | | | | | | | Cayman Islands: 2.5% | |
| | | | 740,000 | # | | ARES XII CLO Ltd.,
2.393%, 11/25/20 | | | | | 726,579 | | | | | | 0.3 | | |
| | | | 463,461 | # | | Black Diamond CLO
2005-1A C, 1.340%,
06/20/17 | | | | | 462,136 | | | | | | 0.2 | | |
| | | | 1,000,000 | # | | Bluemountain CLO III Ltd.
2007-3A C, 1.216%,
03/17/21 | | | | | 964,181 | | | | | | 0.4 | | |
| | | | 1,000,000 | # | | ColumbusNova CLO IV
Ltd. 2007-2A C, 2.571%,
10/15/21 | | | | | 986,331 | | | | | | 0.4 | | |
| | | | 1,300,000 | # | | Madison Park Funding
Ltd. 2007-6A C, 1.320%,
07/26/21 | | | | | 1,233,580 | | | | | | 0.5 | | |
| | | | 1,550,000 | # | | Muir Grove CLO Ltd.
2007-1A B, 2.320%,
03/25/20 | | | | | 1,501,834 | | | | | | 0.7 | | |
| | | | | | | | | | | | | 5,874,641 | | | | | | 2.5 | | |
| | | | | | | | United States: 0.6% | |
| | | | 1,849,572 | | | | Other Securities | | | | | 1,532,888 | | | | | | 0.6 | | |
| | | | | | | | Total Asset-Backed
Securities
(Cost $7,465,751) | | | | | 7,407,529 | | | | | | 3.1 | | |
| |
| | Shares | | | Value | | | Percentage
of Net
Assets | |
| | COMMON STOCK: 0.0% | |
| | | | | | | | United States: 0.0% | |
| | | | 48,173 | | | | Other Securities(b) | | | | | 42,413 | | | | | | 0.0 | | |
| | | | | | | | Total Common Stock
(Cost $1,304,494) | | | | | 42,413 | | | | | | 0.0 | | |
| | MUTUAL FUNDS: 22.6% | |
| | | | | | | | United States: 22.6% | |
| | | | 1,082,430 | | | | Voya Emerging Markets
Corporate Debt Fund -
Class P | | | | | 10,077,423 | | | | | | 4.2 | | |
| | | | 1,688,653 | | | | Voya Emerging Markets
Hard Currency Debt
Fund - Class P | | | | | 15,265,422 | | | | | | 6.4 | | |
See Accompanying Notes to Financial Statements
SUMMARY PORTFOLIO OF INVESTMENTS
| Voya Global Bond Portfolio | as of December 31, 2015 (continued) |
| | Shares | | | Value | | | Percentage
of Net
Assets | |
| | MUTUAL FUNDS: (continued) | |
| | | | | | | | United States (continued) | |
| | | | 2,919,202 | | | | Voya Emerging Markets
Local Currency Debt
Fund - Class P | | | | $ | 20,054,916 | | | | | | 8.4 | | |
| | | | 1,136,436 | | | | Voya High Yield Bond
Fund - Class P | | | | | 8,523,268 | | | | | | 3.6 | | |
| | | | | | | | Total Mutual Funds
(Cost $66,383,120) | | | | | 53,921,029 | | | | | | 22.6 | | |
| | | | | | | | Total Long-Term
Investments
(Cost $248,848,208) | | | | | 234,473,598 | | | | | | 98.4 | | |
| |
| | Principal
Amount† | | | Value | | | Percentage
of Net
Assets | |
| | SHORT-TERM INVESTMENTS: 5.0% | |
| | | | | | | | Securities Lending Collateralcc: 3.1% | |
| | | | 369,116 | | | | Bank of Nova Scotia,
Repurchase Agreement
dated 12/31/15, 0.30%,
due 01/04/16
(Repurchase Amount
$369,128, collateralized
by various U.S.
Government Securities,
0.000%-8.500%, Market
Value plus accrued
interest $376,511, due
02/29/16-02/15/45) | | | | | 369,116 | | | | | | 0.2 | | |
| | | | 1,753,606 | | | | Citigroup, Inc.,
Repurchase Agreement
dated 12/31/15, 0.34%,
due 01/04/16
(Repurchase Amount
$1,753,671, collateralized
by various U.S.
Government Agency
Obligations,
0.000%-11.500%, Market
Value plus accrued
interest $1,788,678, due
01/15/16-04/01/51) | | | | | 1,753,606 | | | | | | 0.7 | | |
| | | | 1,753,606 | | | | Merrill Lynch & Co., Inc.,
Repurchase Agreement
dated 12/31/15, 0.31%,
due 01/04/16
(Repurchase Amount
$1,753,666, collateralized
by various U.S.
Government Agency
Obligations,
3.000%-4.500%, Market
Value plus accrued
interest $1,788,678, due
11/15/42-02/20/45) | | | | | 1,753,606 | | | | | | 0.7 | | |
| | Principal
Amount† | | | Value | | | Percentage
of Net
Assets | |
| | SHORT-TERM INVESTMENTS: (continued) | |
| | | | | | | | Securities Lending
Collateralcc (continued) | |
| | | | 1,753,606 | | | | Millenium Fixed Income
Ltd., Repurchase
Agreement dated
12/31/15, 0.37%,
due 01/04/16
(Repurchase Amount
$1,753,677, collateralized
by various U.S.
Government Securities,
1.500%-3.625%, Market
Value plus accrued
interest $1,788,678, due
03/31/21-02/15/44) | | | | $ | 1,753,606 | | | | | | 0.8 | | |
| | | | 1,753,606 | | | | Nomura Securities,
Repurchase Agreement
dated 12/31/15, 0.33%,
due 01/04/16
(Repurchase Amount
$1,753,669, collateralized
by various U.S.
Government/U.S.
Government Agency
Obligations,
0.000%-10.500%, Market
Value plus accrued
interest $1,788,678, due
01/15/16-10/20/65) | | | | $ | 1,753,606 | | | | | | 0.7 | | |
| | | | | | | | | | | | | 7,383,540 | | | | | | 3.1 | | |
| | Shares | | | Value | | | Percentage
of Net
Assets | |
| | | | | | | | Mutual Funds: 1.9% | |
| | | | 4,639,000 | | | | BlackRock Liquidity
Funds, TempFund,
Institutional Class,
0.270%††
(Cost $4,639,000) | | | | | 4,639,000 | | | | | | 1.9 | | |
| | | | | | | | Total Short-Term
Investments
(Cost $12,022,540) | | | | $ | 12,022,540 | | | | | | 5.0 | | |
| | | | | | | | Total Investments in Securities | | | |
| | | | | | | | (Cost $260,870,748) | | | | $ | 246,496,138 | | | | | | 103.4 | | |
| | | | | | | | Liabilities in Excess of
Other Assets | | | | | (8,214,217) | | | | | | (3.4) | | |
| | | | | | | | Net Assets | | | | $ | 238,281,921 | | | | | | 100.0 | | |
| |
“Other Securities” represents issues not identified as the top 50 holdings in terms of market value and issues or issuers not exceeding 1% of net assets individually or in aggregate respectively as of December 31, 2015.
See Accompanying Notes to Financial Statements
SUMMARY PORTFOLIO OF INVESTMENTS
| Voya Global Bond Portfolio | as of December 31, 2015 (continued) |
The following footnotes apply to either the individual securities noted or one or more of the securities aggregated and listed as a single line item.
†
Unless otherwise indicated, principal amount is shown in USD.
††
Rate shown is the 7-day yield as of December 31, 2015.
#
Securities with purchases pursuant to Rule 144A or section 4(a)(2), under the Securities Act of 1933 and may not be resold subject to that rule except to qualified institutional buyers.
##
The Federal Housing Finance Agency (“FHFA”) placed the Federal Home Loan Mortgage Corporation and Federal National Mortgage Association into conservatorship with FHFA as the conservator. As such, the FHFA oversees the continuing affairs of these companies.
cc
Represents securities purchased with cash collateral received for securities on loan.
W
Settlement is on a when-issued or delayed-delivery basis.
L
Loaned security, a portion or all of the security is on loan at December 31, 2015.
^
Interest only securities represent the right to receive the monthly interest payments on an underlying pool of mortgage loans. Principal amount shown represents the notional amount on which current interest is calculated. Payments of principal on the pool reduce the value of the interest only security.
(a)
The grouping contains securities in default.
(b)
This grouping contains securities on loan.
BRL
Brazilian Real
EUR
EU Euro
MXN
Mexican Peso
RUB
Russian Ruble
ZAR
South African Rand
Cost for federal income tax purposes is $260,618,207.
Net unrealized depreciation consists of:
| | Gross Unrealized Appreciation | | | | $ | 3,288,346 | | |
| | Gross Unrealized Depreciation | | | | | (17,410,415) | | |
| | Net Unrealized Depreciation | | | | $ | (14,122,069) | | |
| |
| Sector Diversification | | | Percentage
of Net Assets | |
| Affiliated Investment Companies | | | | | 22.6% | | |
| U.S. Government Agency Obligations | | | | | 19.5 | | |
| Collateralized Mortgage Obligations | | | | | 15.3 | | |
| Financial | | | | | 8.7 | | |
| U.S. Treasury Obligations | | | | | 6.9 | | |
| Foreign Government Bonds | | | | | 6.6 | | |
| Communications | | | | | 3.9 | | |
| Consumer, Non-cyclical | | | | | 3.8 | | |
| Other Asset-Backed Securities | | | | | 2.9 | | |
| Energy | | | | | 1.7 | | |
| Technology | | | | | 1.6 | | |
| Utilities | | | | | 1.6 | | |
| Industrial | | | | | 1.3 | | |
| Basic Materials | | | | | 1.0 | | |
| Consumer, Cyclical | | | | | 0.8 | | |
| Asset-Backed Securities | | | | | 0.2 | | |
| Structured Products | | | | | 0.0 | | |
| Consumer Discretionary | | | | | 0.0 | | |
| Materials | | | | | 0.0 | | |
| Short-Term Investments | | | | | 5.0 | | |
| Liabilities in Excess of Other Assets | | | | | (3.4) | | |
| Net Assets | | | | | 100.0% | | |
| |
Fair Value Measurements^
The following is a summary of the fair valuations according to the inputs used as of December 31, 2015 in valuing the assets and liabilities:
| | | | Quoted Prices
in Active Markets
for Identical
Investments
(Level 1) | | | Significant
Other
Observable Inputs
(Level 2) | | | Significant
Unobservable
Inputs
(Level 3) | | | Fair Value
at
December 31, 2015 | |
| Asset Table | | | | | |
| Investments, at fair value | | | | | |
| Common Stock | | | | | |
| United States | | | | $ | 42,413 | | | | | $ | — | | | | | $ | — | | | | | $ | 42,413 | | |
| Total Common Stock | | | | | 42,413 | | | | | | — | | | | | | — | | | | | | 42,413 | | |
| Mutual Funds | | | | | 53,921,029 | | | | | | — | | | | | | — | | | | | | 53,921,029 | | |
| Corporate Bonds/Notes | | | | | — | | | | | | 58,032,228 | | | | | | 11,996 | | | | | | 58,044,224 | | |
| Collateralized Mortgage Obligations | | | | | — | | | | | | 36,520,701 | | | | | | — | | | | | | 36,520,701 | | |
| Structured Products | | | | | — | | | | | | — | | | | | | 38,156 | | | | | | 38,156 | | |
| Short-Term Investments | | | | | 4,639,000 | | | | | | 7,383,540 | | | | | | — | | | | | | 12,022,540 | | |
| Foreign Government Bonds | | | | | — | | | | | | 15,743,982 | | | | | | — | | | | | | 15,743,982 | | |
| Asset-Backed Securities | | | | | — | | | | | | 7,407,529 | | | | | | — | | | | | | 7,407,529 | | |
| U.S. Treasury Obligations | | | | | — | | | | | | 16,464,118 | | | | | | — | | | | | | 16,464,118 | | |
| U.S. Government Agency Obligations | | | | | — | | | | | | 46,291,446 | | | | | | — | | | | | | 46,291,446 | | |
| Total Investments, at fair value | | | | $ | 58,602,442 | | | | | $ | 187,843,544 | | | | | $ | 50,152 | | | | | $ | 246,496,138 | | |
| Other Financial Instruments+ | | | | | |
| Centrally Cleared Swaps | | | | | — | | | | | | 12,938,051 | | | | | | — | | | | | | 12,938,051 | | |
| Forward Foreign Currency Contracts | | | | | — | | | | | | 4,443,411 | | | | | | — | | | | | | 4,443,411 | | |
| Futures | | | | | 121,595 | | | | | | — | | | | | | — | | | | | | 121,595 | | |
| Total Assets | | | | $ | 58,724,037 | | | | | $ | 205,225,006 | | | | | $ | 50,152 | | | | | $ | 263,999,195 | | |
| |
See Accompanying Notes to Financial Statements
SUMMARY PORTFOLIO OF INVESTMENTS
| Voya Global Bond Portfolio | as of December 31, 2015 (continued) |
| | | | Quoted Prices
in Active Markets
for Identical
Investments
(Level 1) | | | Significant
Other
Observable Inputs
(Level 2) | | | Significant
Unobservable
Inputs
(Level 3) | | | Fair Value
at
December 31, 2015 | |
| Liabilities Table | | | | | |
| Other Financial Instruments+ | | | | | |
| Centrally Cleared Swaps | | | | $ | — | | | | | $ | (13,676,462) | | | | | $ | — | | | | | $ | (13,676,462) | | |
| Forward Foreign Currency Contracts | | | | | — | | | | | | (4,526,609) | | | | | | — | | | | | | (4,526,609) | | |
| Futures | | | | | (383,893) | | | | | | — | | | | | | — | | | | | | (383,893) | | |
| Total Liabilities | | | | $ | (383,893) | | | | | $ | (18,203,071) | | | | | $ | — | | | | | $ | (18,586,964) | | |
| |
^
See Note 2, “Significant Accounting Policies” in the Notes to Financial Statements for additional information.
+
Other Financial Instruments are derivatives not reflected in the portfolio of investments and may include open forward foreign currency contracts, futures, centrally cleared swaps, OTC swaps and written options. Forward foreign currency contracts, futures and centrally cleared swaps are valued at the unrealized gain (loss) on the instrument. OTC swaps and written options are valued at the fair value of the instrument.
At December 31, 2015, the following forward foreign currency contracts were outstanding for Voya Global Bond Portfolio:
| Counterparty | | | Currency | | | Contract
Amount | | | Buy/Sell | | | Settlement
Date | | | In Exchange For | | | Fair Value | | | Unrealized
Appreciation
(Depreciation) | |
| Barclays Bank PLC | | | Canadian Dollar | | | | | 1,621,047 | | | | Buy | | | 01/15/16 | | | | $ | 1,163,000 | | | | | $ | 1,171,559 | | | | | $ | 8,559 | | |
| Barclays Bank PLC | | | Norwegian Krone | | | | | 17,868,364 | | | | Buy | | | 01/15/16 | | | | | 2,065,000 | | | | | | 2,018,416 | | | | | | (46,584) | | |
| Barclays Bank PLC | | | New Zealand Dollar | | | | | 713,038 | | | | Buy | | | 01/15/16 | | | | | 472,000 | | | | | | 487,307 | | | | | | 15,307 | | |
| Barclays Bank PLC | | | South Korean Won | | | | | 3,481,708,496 | | | | Buy | | | 01/29/16 | | | | | 3,052,256 | | | | | | 2,961,562 | | | | | | (90,694) | | |
| Citigroup, Inc. | | | EU Euro | | | | | 393,174 | | | | Buy | | | 01/15/16 | | | | | 433,000 | | | | | | 427,403 | | | | | | (5,597) | | |
| Citigroup, Inc. | | | New Zealand Dollar | | | | | 884,032 | | | | Buy | | | 01/15/16 | | | | | 592,000 | | | | | | 604,169 | | | | | | 12,169 | | |
| Citigroup, Inc. | | | Canadian Dollar | | | | | 971,148 | | | | Buy | | | 01/15/16 | | | | | 713,000 | | | | | | 701,866 | | | | | | (11,134) | | |
| Citigroup, Inc. | | | EU Euro | | | | | 10,992,942 | | | | Buy | | | 01/15/16 | | | | | 11,994,000 | | | | | | 11,949,977 | | | | | | (44,023) | | |
| Citigroup, Inc. | | | EU Euro | | | | | 6,563,428 | | | | Buy | | | 01/15/16 | | | | | 7,196,000 | | | | | | 7,134,834 | | | | | | (61,166) | | |
| Citigroup, Inc. | | | EU Euro | | | | | 172,099 | | | | Buy | | | 01/15/16 | | | | | 183,000 | | | | | | 187,082 | | | | | | 4,082 | | |
| Citigroup, Inc. | | | EU Euro | | | | | 10,488,053 | | | | Buy | | | 01/15/16 | | | | | 11,106,591 | | | | | | 11,401,134 | | | | | | 294,543 | | |
| Citigroup, Inc. | | | Australian Dollar | | | | | 2,847,843 | | | | Buy | | | 01/29/16 | | | | | 2,023,606 | | | | | | 2,072,589 | | | | | | 48,983 | | |
| Citigroup, Inc. | | | Canadian Dollar | | | | | 64,214 | | | | Buy | | | 01/29/16 | | | | | 49,000 | | | | | | 46,410 | | | | | | (2,590) | | |
| Citigroup, Inc. | | | Swiss Franc | | | | | 1,513,601 | | | | Buy | | | 01/29/16 | | | | | 1,538,223 | | | | | | 1,512,819 | | | | | | (25,404) | | |
| Citigroup, Inc. | | | Hong Kong Sar Dollar | | | | | 762,813 | | | | Buy | | | 01/29/16 | | | | | 98,456 | | | | | | 98,449 | | | | | | (7) | | |
| Deutsche Bank AG | | | New Zealand Dollar | | | | | 1,013,386 | | | | Buy | | | 01/15/16 | | | | | 692,000 | | | | | | 692,573 | | | | | | 573 | | |
| Deutsche Bank AG | | | EU Euro | | | | | 1,060,118 | | | | Buy | | | 01/15/16 | | | | | 1,160,000 | | | | | | 1,152,411 | | | | | | (7,589) | | |
| Deutsche Bank AG | | | Australian Dollar | | | | | 1,809,027 | | | | Buy | | | 01/15/16 | | | | | 1,306,000 | | | | | | 1,317,500 | | | | | | 11,500 | | |
| Deutsche Bank AG | | | Swiss Franc | | | | | 548,121 | | | | Buy | | | 01/15/16 | | | | | 553,000 | | | | | | 547,507 | | | | | | (5,493) | | |
| Deutsche Bank AG | | | Australian Dollar | | | | | 2,449,705 | | | | Buy | | | 01/15/16 | | | | | 1,766,000 | | | | | | 1,784,101 | | | | | | 18,101 | | |
| Deutsche Bank AG | | | EU Euro | | | | | 1,994,285 | | | | Buy | | | 01/15/16 | | | | | 2,179,000 | | | | | | 2,167,906 | | | | | | (11,094) | | |
| Deutsche Bank AG | | | British Pound | | | | | 471,997 | | | | Buy | | | 01/15/16 | | | | | 710,000 | | | | | | 695,845 | | | | | | (14,155) | | |
| Deutsche Bank AG | | | New Zealand Dollar | | | | | 2,224,209 | | | | Buy | | | 01/15/16 | | | | | 1,473,000 | | | | | | 1,520,078 | | | | | | 47,078 | | |
| Deutsche Bank AG | | | Australian Dollar | | | | | 1,762,494 | | | | Buy | | | 01/15/16 | | | | | 1,278,000 | | | | | | 1,283,610 | | | | | | 5,610 | | |
| Deutsche Bank AG | | | EU Euro | | | | | 22,276,084 | | | | Buy | | | 01/15/16 | | | | | 24,107,000 | | | | | | 24,215,419 | | | | | | 108,419 | | |
| Deutsche Bank AG | | | Australian Dollar | | | | | 1,247,732 | | | | Buy | | | 01/15/16 | | | | | 910,000 | | | | | | 908,714 | | | | | | (1,286) | | |
| Deutsche Bank AG | | | EU Euro | | | | | 20,284,521 | | | | Buy | | | 01/15/16 | | | | | 21,592,000 | | | | | | 22,050,472 | | | | | | 458,472 | | |
| Deutsche Bank AG | | | Norwegian Krone | | | | | 5,959,765 | | | | Buy | | | 01/15/16 | | | | | 691,000 | | | | | | 673,217 | | | | | | (17,783) | | |
| Deutsche Bank AG | | | Norwegian Krone | | | | | 26,186,210 | | | | Buy | | | 01/29/16 | | | | | 3,052,993 | | | | | | 2,957,571 | | | | | | (95,422) | | |
| Deutsche Bank AG | | | New Zealand Dollar | | | | | 784,652 | | | | Buy | | | 01/29/16 | | | | | 515,467 | | | | | | 535,727 | | | | | | 20,260 | | |
| Deutsche Bank AG | | | Swedish Krona | | | | | 6,119,410 | | | | Buy | | | 01/29/16 | | | | | 709,887 | | | | | | 725,482 | | | | | | 15,595 | | |
| Deutsche Bank AG | | | Mexican Peso | | | | | 61,047,954 | | | | Buy | | | 03/11/16 | | | | | 3,516,510 | | | | | | 3,524,907 | | | | | | 8,397 | | |
| Deutsche Bank AG | | | Japanese Yen | | | | | 36,781,490 | | | | Buy | | | 01/29/16 | | | | | 305,000 | | | | | | 306,180 | | | | | | 1,180 | | |
| Deutsche Bank AG | | | Singapore Dollar | | | | | 648,988 | | | | Buy | | | 01/29/16 | | | | | 461,682 | | | | | | 457,299 | | | | | | (4,383) | | |
| Goldman Sachs & Co. | | | Canadian Dollar | | | | | 1,077,096 | | | | Buy | | | 01/15/16 | | | | | 781,000 | | | | | | 778,436 | | | | | | (2,564) | | |
See Accompanying Notes to Financial Statements
SUMMARY PORTFOLIO OF INVESTMENTS
| Voya Global Bond Portfolio | as of December 31, 2015 (continued) |
| Counterparty | | | Currency | | | Contract
Amount | | | Buy/Sell | | | Settlement
Date | | | In Exchange For | | | Fair Value | | | Unrealized
Appreciation
(Depreciation) | |
| Goldman Sachs & Co. | | | Japanese Yen | | | | | 259,050,939 | | | | Buy | | | 01/15/16 | | | | | 2,117,000 | | | | | | 2,155,766 | | | | | | 38,766 | | |
| JPMorgan Chase & Co. | | | British Pound | | | | | 958,388 | | | | Buy | | | 01/29/16 | | | | | 1,478,000 | | | | | | 1,412,968 | | | | | | (65,032) | | |
| JPMorgan Chase & Co. | | | Australian Dollar | | | | | 2,093,802 | | | | Buy | | | 01/29/16 | | | | | 1,488,000 | | | | | | 1,523,817 | | | | | | 35,817 | | |
| JPMorgan Chase & Co. | | | Canadian Dollar | | | | | 12,573,881 | | | | Buy | | | 01/29/16 | | | | | 9,594,256 | | | | | | 9,087,636 | | | | | | (506,620) | | |
| JPMorgan Chase & Co. | | | Japanese Yen | | | | | 6,123,230,888 | | | | Buy | | | 01/29/16 | | | | | 50,790,162 | | | | | | 50,971,550 | | | | | | 181,388 | | |
| JPMorgan Chase & Co. | | | British Pound | | | | | 1,149,519 | | | | Buy | | | 01/15/16 | | | | | 1,704,000 | | | | | | 1,694,685 | | | | | | (9,315) | | |
| JPMorgan Chase & Co. | | | Canadian Dollar | | | | | 2,774,631 | | | | Buy | | | 01/15/16 | | | | | 1,988,000 | | | | | | 2,005,274 | | | | | | 17,274 | | |
| JPMorgan Chase & Co. | | | EU Euro | | | | | 968,720 | | | | Buy | | | 01/15/16 | | | | | 1,049,000 | | | | | | 1,053,056 | | | | | | 4,056 | | |
| JPMorgan Chase & Co. | | | Japanese Yen | | | | | 160,427,113 | | | | Buy | | | 01/15/16 | | | | | 1,309,000 | | | | | | 1,335,040 | | | | | | 26,040 | | |
| JPMorgan Chase & Co. | | | EU Euro | | | | | 6,427,654 | | | | Buy | | | 01/15/16 | | | | | 7,040,000 | | | | | | 6,987,240 | | | | | | (52,760) | | |
| JPMorgan Chase & Co. | | | EU Euro | | | | | 1,065,305 | | | | Buy | | | 01/15/16 | | | | | 1,163,000 | | | | | | 1,158,050 | | | | | | (4,950) | | |
| JPMorgan Chase & Co. | | | EU Euro | | | | | 6,583,000 | | | | Buy | | | 01/20/16 | | | | | 7,146,000 | | | | | | 7,157,018 | | | | | | 11,018 | | |
| JPMorgan Chase & Co. | | | EU Euro | | | | | 10,970,746 | | | | Buy | | | 01/20/16 | | | | | 11,909,000 | | | | | | 11,927,361 | | | | | | 18,361 | | |
| JPMorgan Chase & Co. | | | EU Euro | | | | | 6,298,345 | | | | Buy | | | 01/20/16 | | | | | 6,837,000 | | | | | | 6,847,541 | | | | | | 10,541 | | |
| JPMorgan Chase & Co. | | | Japanese Yen | | | | | 66,830,134 | | | | Buy | | | 01/15/16 | | | | | 554,000 | | | | | | 556,146 | | | | | | 2,146 | | |
| JPMorgan Chase & Co. | | | New Zealand Dollar | | | | | 1,956,144 | | | | Buy | | | 01/15/16 | | | | | 1,318,000 | | | | | | 1,336,875 | | | | | | 18,875 | | |
| JPMorgan Chase & Co. | | | Australian Dollar | | | | | 1,049,834 | | | | Buy | | | 01/15/16 | | | | | 764,000 | | | | | | 764,586 | | | | | | 586 | | |
| JPMorgan Chase & Co. | | | EU Euro | | | | | 11,079,847 | | | | Buy | | | 01/15/16 | | | | | 12,053,000 | | | | | | 12,044,448 | | | | | | (8,552) | | |
| JPMorgan Chase & Co. | | | Canadian Dollar | | | | | 2,191,698 | | | | Buy | | | 01/15/16 | | | | | 1,640,000 | | | | | | 1,583,978 | | | | | | (56,022) | | |
| JPMorgan Chase & Co. | | | Canadian Dollar | | | | | 6,064,798 | | | | Buy | | | 01/15/16 | | | | | 4,540,900 | | | | | | 4,383,134 | | | | | | (157,766) | | |
| JPMorgan Chase & Co. | | | Danish Krone | | | | | 6,741,468 | | | | Buy | | | 01/15/16 | | | | | 957,442 | | | | | | 982,015 | | | | | | 24,573 | | |
| JPMorgan Chase & Co. | | | British Pound | | | | | 1,723,442 | | | | Buy | | | 01/15/16 | | | | | 2,596,018 | | | | | | 2,540,796 | | | | | | (55,222) | | |
| JPMorgan Chase & Co. | | | Japanese Yen | | | | | 6,373,751,946 | | | | Buy | | | 01/15/16 | | | | | 51,865,467 | | | | | | 53,040,980 | | | | | | 1,175,513 | | |
| Morgan Stanley | | | New Zealand Dollar | | | | | 1,666,903 | | | | Buy | | | 01/15/16 | | | | | 1,105,000 | | | | | | 1,139,202 | | | | | | 34,202 | | |
| Morgan Stanley | | | Danish Krone | | | | | 6,741,468 | | | | Buy | | | 01/29/16 | | | | | 997,769 | | | | | | 982,429 | | | | | | (15,340) | | |
| Morgan Stanley | | | EU Euro | | | | | 43,150,267 | | | | Buy | | | 01/29/16 | | | | | 47,593,247 | | | | | | 46,923,549 | | | | | | (669,698) | | |
| Morgan Stanley | | | British Pound | | | | | 1,511,541 | | | | Buy | | | 01/29/16 | | | | | 2,329,025 | | | | | | 2,228,491 | | | | | | (100,534) | | |
| Morgan Stanley | | | New Zealand Dollar | | | | | 893,447 | | | | Buy | | | 01/29/16 | | | | | 598,000 | | | | | | 610,007 | | | | | | 12,007 | | |
| Morgan Stanley | | | New Zealand Dollar | | | | | 1,341,749 | | | | Buy | | | 01/15/16 | | | | | 922,000 | | | | | | 916,983 | | | | | | (5,017) | | |
| Morgan Stanley | | | Norwegian Krone | | | | | 27,723,734 | | | | Buy | | | 01/15/16 | | | | | 3,181,000 | | | | | | 3,131,682 | | | | | | (49,318) | | |
| Morgan Stanley | | | British Pound | | | | | 861,361 | | | | Buy | | | 01/15/16 | | | | | 1,285,000 | | | | | | 1,269,867 | | | | | | (15,133) | | |
| Morgan Stanley | | | British Pound | | | | | 7,987,786 | | | | Buy | | | 01/15/16 | | | | | 11,908,000 | | | | | | 11,776,046 | | | | | | (131,954) | | |
| Morgan Stanley | | | British Pound | | | | | 4,792,806 | | | | Buy | | | 01/15/16 | | | | | 7,145,000 | | | | | | 7,065,825 | | | | | | (79,175) | | |
| Morgan Stanley | | | British Pound | | | | | 351,736 | | | | Buy | | | 01/15/16 | | | | | 524,000 | | | | | | 518,549 | | | | | | (5,451) | | |
| Morgan Stanley | | | British Pound | | | | | 380,914 | | | | Buy | | | 01/15/16 | | | | | 577,000 | | | | | | 561,564 | | | | | | (15,436) | | |
| Morgan Stanley | | | Australian Dollar | | | | | 9,963,442 | | | | Buy | | | 01/20/16 | | | | | 7,147,000 | | | | | | 7,254,455 | | | | | | 107,455 | | |
| Morgan Stanley | | | British Pound | | | | | 422,393 | | | | Buy | | | 01/15/16 | | | | | 641,000 | | | | | | 622,716 | | | | | | (18,284) | | |
| Morgan Stanley | | | Australian Dollar | | | | | 2,767,630 | | | | Buy | | | 01/15/16 | | | | | 2,027,000 | | | | | | 2,015,643 | | | | | | (11,357) | | |
| Morgan Stanley | | | EU Euro | | | | | 627,492 | | | | Buy | | | 01/15/16 | | | | | 683,000 | | | | | | 682,121 | | | | | | (879) | | |
| Morgan Stanley | | | Norwegian Krone | | | | | 5,902,210 | | | | Buy | | | 01/15/16 | | | | | 683,000 | | | | | | 666,716 | | | | | | (16,284) | | |
| Morgan Stanley | | | Swiss Franc | | | | | 2,016,018 | | | | Buy | | | 01/15/16 | | | | | 1,967,670 | | | | | | 2,013,757 | | | | | | 46,087 | | |
| Morgan Stanley | | | Norwegian Krone | | | | | 3,607,249 | | | | Buy | | | 01/15/16 | | | | | 414,986 | | | | | | 407,476 | | | | | | (7,510) | | |
| Morgan Stanley | | | Czech Koruna | | | | | 11,239,058 | | | | Buy | | | 03/11/16 | | | | | 459,679 | | | | | | 452,888 | | | | | | (6,791) | | |
| Morgan Stanley | | | Israeli New Shekel | | | | | 2,615,982 | | | | Buy | | | 03/11/16 | | | | | 679,552 | | | | | | 673,242 | | | | | | (6,310) | | |
| | | | | | | | | | | | | | | | | | | | | | | | | | | | | | | | $ | 325,855 | | |
| Barclays Bank PLC | | | EU Euro | | | | | 1,638,935 | | | | Sell | | | 01/15/16 | | | | $ | 1,809,000 | | | | | $ | 1,781,619 | | | | | $ | 27,381 | | |
| Barclays Bank PLC | | | Norwegian Krone | | | | | 3,866,138 | | | | Sell | | | 01/15/16 | | | | | 453,000 | | | | | | 436,720 | | | | | | 16,280 | | |
| Barclays Bank PLC | | | EU Euro | | | | | 22,643,741 | | | | Sell | | | 01/15/16 | | | | | 24,166,000 | | | | | | 24,615,084 | | | | | | (449,084) | | |
| Barclays Bank PLC | | | Romanian New Leu | | | | | 1,620,684 | | | | Sell | | | 03/11/16 | | | | | 394,725 | | | | | | 389,796 | | | | | | 4,929 | | |
| Barclays Bank PLC | | | Brazilian Real | | | | | 8,211,832 | | | | Sell | | | 03/11/16 | | | | | 2,058,619 | | | | | | 2,030,651 | | | | | | 27,968 | | |
See Accompanying Notes to Financial Statements
SUMMARY PORTFOLIO OF INVESTMENTS
| Voya Global Bond Portfolio | as of December 31, 2015 (continued) |
| Counterparty | | | Currency | | | Contract
Amount | | | Buy/Sell | | | Settlement
Date | | | In Exchange For | | | Fair Value | | | Unrealized
Appreciation
(Depreciation) | |
| Barclays Bank PLC | | | Turkish Lira | | | | | 4,504,188 | | | | Sell | | | 03/11/16 | | | | | 1,485,231 | | | | | | 1,515,211 | | | | | | (29,980) | | |
| Barclays Bank PLC | | | Malaysian Ringgit | | | | | 6,307,909 | | | | Sell | | | 01/29/16 | | | | | 1,463,552 | | | | | | 1,462,794 | | | | | | 758 | | |
| Barclays Bank PLC | | | Norwegian Krone | | | | | 4,892,749 | | | | Sell | | | 01/29/16 | | | | | 575,000 | | | | | | 552,606 | | | | | | 22,394 | | |
| Citigroup, Inc. | | | Australian Dollar | | | | | 2,816,553 | | | | Sell | | | 01/15/16 | | | | | 2,023,000 | | | | | | 2,051,273 | | | | | | (28,273) | | |
| Citigroup, Inc. | | | Canadian Dollar | | | | | 1,024,706 | | | | Sell | | | 01/15/16 | | | | | 746,000 | | | | | | 740,573 | | | | | | 5,427 | | |
| Citigroup, Inc. | | | Japanese Yen | | | | | 273,841,379 | | | | Sell | | | 01/15/16 | | | | | 2,232,000 | | | | | | 2,278,849 | | | | | | (46,849) | | |
| Citigroup, Inc. | | | New Zealand Dollar | | | | | 1,106,120 | | | | Sell | | | 01/29/16 | | | | | 740,530 | | | | | | 755,212 | | | | | | (14,682) | | |
| Citigroup, Inc. | | | Norwegian Krone | | | | | 10,611,487 | | | | Sell | | | 01/29/16 | | | | | 1,247,000 | | | | | | 1,198,502 | | | | | | 48,498 | | |
| Citigroup, Inc. | | | Colombian Peso | | | | | 2,961,027,253 | | | | Sell | | | 03/11/16 | | | | | 883,427 | | | | | | 925,792 | | | | | | (42,365) | | |
| Citigroup, Inc. | | | Thai Baht | | | | | 27,099,373 | | | | Sell | | | 01/29/16 | | | | | 755,887 | | | | | | 752,560 | | | | | | 3,327 | | |
| Citigroup, Inc. | | | Swedish Krona | | | | | 6,119,410 | | | | Sell | | | 01/29/16 | | | | | 718,601 | | | | | | 725,482 | | | | | | (6,881) | | |
| Deutsche Bank AG | | | Norwegian Krone | | | | | 8,153,726 | | | | Sell | | | 01/15/16 | | | | | 929,000 | | | | | | 921,048 | | | | | | 7,952 | | |
| Deutsche Bank AG | | | Australian Dollar | | | | | 1,003,491 | | | | Sell | | | 01/15/16 | | | | | 714,000 | | | | | | 730,835 | | | | | | (16,835) | | |
| Deutsche Bank AG | | | Norwegian Krone | | | | | 9,340,778 | | | | Sell | | | 01/15/16 | | | | | 1,073,000 | | | | | | 1,055,137 | | | | | | 17,863 | | |
| Deutsche Bank AG | | | Australian Dollar | | | | | 1,040,530 | | | | Sell | | | 01/15/16 | | | | | 753,000 | | | | | | 757,809 | | | | | | (4,809) | | |
| Deutsche Bank AG | | | Japanese Yen | | | | | 1,478,629,515 | | | | Sell | | | 01/15/16 | | | | | 12,046,000 | | | | | | 12,304,834 | | | | | | (258,834) | | |
| Deutsche Bank AG | | | Swiss Franc | | | | | 519,376 | | | | Sell | | | 01/15/16 | | | | | 525,000 | | | | | | 518,793 | | | | | | 6,207 | | |
| Deutsche Bank AG | | | Danish Krone | | | | | 6,741,468 | | | | Sell | | | 01/29/16 | | | | | 986,003 | | | | | | 982,429 | | | | | | 3,574 | | |
| Deutsche Bank AG | | | Swiss Franc | | | | | 81,418 | | | | Sell | | | 01/29/16 | | | | | 82,084 | | | | | | 81,376 | | | | | | 708 | | |
| Deutsche Bank AG | | | British Pound | | | | | 1,874,125 | | | | Sell | | | 01/29/16 | | | | | 2,849,358 | | | | | | 2,763,055 | | | | | | 86,303 | | |
| Deutsche Bank AG | | | EU Euro | | | | | 42,893,694 | | | | Sell | | | 01/29/16 | | | | | 46,766,565 | | | | | | 46,644,540 | | | | | | 122,025 | | |
| Deutsche Bank AG | | | Australian Dollar | | | | | 4,941,645 | | | | Sell | | | 01/29/16 | | | | | 3,515,941 | | | | | | 3,596,405 | | | | | | (80,464) | | |
| Goldman Sachs & Co. | | | Canadian Dollar | | | | | 11,687,644 | | | | Sell | | | 01/29/16 | | | | | 8,871,962 | | | | | | 8,447,118 | | | | | | 424,844 | | |
| HSBC Bank PLC | | | Thai Baht | | | | | 26,958,750 | | | | Sell | | | 01/15/16 | | | | | 750,000 | | | | | | 748,941 | | | | | | 1,059 | | |
| HSBC Bank PLC | | | Philippine Peso | | | | | 28,280,482 | | | | Sell | | | 01/29/16 | | | | | 600,346 | | | | | | 601,063 | | | | | | (717) | | |
| JPMorgan Chase & Co. | | | New Zealand Dollar | | | | | 571,978 | | | | Sell | | | 01/29/16 | | | | | 381,000 | | | | | | 390,522 | | | | | | (9,522) | | |
| JPMorgan Chase & Co. | | | Swiss Franc | | | | | 976,509 | | | | Sell | | | 01/29/16 | | | | | 989,000 | | | | | | 976,005 | | | | | | 12,995 | | |
| JPMorgan Chase & Co. | | | British Pound | | | | | 595,804 | | | | Sell | | | 01/29/16 | | | | | 918,000 | | | | | | 878,404 | | | | | | 39,596 | | |
| JPMorgan Chase & Co. | | | EU Euro | | | | | 256,573 | | | | Sell | | | 01/29/16 | | | | | 283,000 | | | | | | 279,010 | | | | | | 3,990 | | |
| JPMorgan Chase & Co. | | | Indonesian Rupiah | | | | | 28,526,241,483 | | | | Sell | | | 01/29/16 | | | | | 2,027,451 | | | | | | 2,045,645 | | | | | | (18,194) | | |
| JPMorgan Chase & Co. | | | South Korean Won | | | | | 2,575,240,200 | | | | Sell | | | 01/15/16 | | | | | 2,171,000 | | | | | | 2,193,739 | | | | | | (22,739) | | |
| JPMorgan Chase & Co. | | | Australian Dollar | | | | | 1,367,764 | | | | Sell | | | 01/15/16 | | | | | 995,000 | | | | | | 996,131 | | | | | | (1,131) | | |
| JPMorgan Chase & Co. | | | EU Euro | | | | | 1,425,371 | | | | Sell | | | 01/15/16 | | | | | 1,555,000 | | | | | | 1,549,462 | | | | | | 5,538 | | |
| JPMorgan Chase & Co. | | | Swiss Franc | | | | | 587,004 | | | | Sell | | | 01/15/16 | | | | | 595,000 | | | | | | 586,345 | | | | | | 8,655 | | |
| JPMorgan Chase & Co. | | | EU Euro | | | | | 10,971,195 | | | | Sell | | | 01/15/16 | | | | | 11,908,000 | | | | | | 11,926,337 | | | | | | (18,337) | | |
| JPMorgan Chase & Co. | | | EU Euro | | | | | 6,582,901 | | | | Sell | | | 01/15/16 | | | | | 7,145,000 | | | | | | 7,156,003 | | | | | | (11,003) | | |
| JPMorgan Chase & Co. | | | EU Euro | | | | | 6,299,132 | | | | Sell | | | 01/15/16 | | | | | 6,837,000 | | | | | | 6,847,528 | | | | | | (10,528) | | |
| JPMorgan Chase & Co. | | | New Zealand Dollar | | | | | 981,623 | | | | Sell | | | 01/15/16 | | | | | 661,000 | | | | | | 670,865 | | | | | | (9,865) | | |
| JPMorgan Chase & Co. | | | Canadian Dollar | | | | | 1,615,516 | | | | Sell | | | 01/15/16 | | | | | 1,160,000 | | | | | | 1,167,561 | | | | | | (7,561) | | |
| JPMorgan Chase & Co. | | | Australian Dollar | | | | | 2,139,207 | | | | Sell | | | 01/15/16 | | | | | 1,536,000 | | | | | | 1,557,967 | | | | | | (21,967) | | |
| JPMorgan Chase & Co. | | | New Zealand Dollar | | | | | 1,495,361 | | | | Sell | | | 01/15/16 | | | | | 1,012,000 | | | | | | 1,021,966 | | | | | | (9,966) | | |
| JPMorgan Chase & Co. | | | Swiss Franc | | | | | 1,868,764 | | | | Sell | | | 01/15/16 | | | | | 1,877,000 | | | | | | 1,866,668 | | | | | | 10,332 | | |
| JPMorgan Chase & Co. | | | New Zealand Dollar | | | | | 2,104,613 | | | | Sell | | | 01/15/16 | | | | | 1,420,000 | | | | | | 1,438,343 | | | | | | (18,343) | | |
| JPMorgan Chase & Co. | | | Australian Dollar | | | | | 1,712,559 | | | | Sell | | | 01/15/16 | | | | | 1,233,000 | | | | | | 1,247,243 | | | | | | (14,243) | | |
| JPMorgan Chase & Co. | | | Japanese Yen | | | | | 626,781,720 | | | | Sell | | | 01/15/16 | | | | | 5,177,000 | | | | | | 5,215,941 | | | | | | (38,941) | | |
| JPMorgan Chase & Co. | | | Japanese Yen | | | | | 62,525,555 | | | | Sell | | | 01/15/16 | | | | | 509,000 | | | | | | 520,324 | | | | | | (11,324) | | |
| JPMorgan Chase & Co. | | | Swiss Franc | | | | | 1,028,918 | | | | Sell | | | 01/15/16 | | | | | 1,039,000 | | | | | | 1,027,764 | | | | | | 11,236 | | |
| JPMorgan Chase & Co. | | | Canadian Dollar | | | | | 858,394 | | | | Sell | | | 01/15/16 | | | | | 632,000 | | | | | | 620,376 | | | | | | 11,624 | | |
| JPMorgan Chase & Co. | | | EU Euro | | | | | 1,269,720 | | | | Sell | | | 01/15/16 | | | | | 1,377,000 | | | | | | 1,380,260 | | | | | | (3,260) | | |
| JPMorgan Chase & Co. | | | Canadian Dollar | | | | | 740,506 | | | | Sell | | | 01/15/16 | | | | | 548,000 | | | | | | 535,177 | | | | | | 12,823 | | |
See Accompanying Notes to Financial Statements
SUMMARY PORTFOLIO OF INVESTMENTS
| Voya Global Bond Portfolio | as of December 31, 2015 (continued) |
| Counterparty | | | Currency | | | Contract
Amount | | | Buy/Sell | | | Settlement
Date | | | In Exchange For | | | Fair Value | | | Unrealized
Appreciation
(Depreciation) | |
| JPMorgan Chase & Co. | | | Swiss Franc | | | | | 1,348,635 | | | | Sell | | | 01/15/16 | | | | | 1,351,000 | | | | | | 1,347,122 | | | | | | 3,878 | | |
| JPMorgan Chase & Co. | | | Japanese Yen | | | | | 51,662,583 | | | | Sell | | | 01/15/16 | | | | | 420,000 | | | | | | 429,925 | | | | | | (9,925) | | |
| JPMorgan Chase & Co. | | | British Pound | | | | | 190,607 | | | | Sell | | | 01/15/16 | | | | | 285,000 | | | | | | 281,004 | | | | | | 3,996 | | |
| JPMorgan Chase & Co. | | | Swiss Franc | | | | | 939,083 | | | | Sell | | | 01/15/16 | | | | | 924,000 | | | | | | 938,029 | | | | | | (14,029) | | |
| JPMorgan Chase & Co. | | | Russian Ruble | | | | | 37,898,113 | | | | Sell | | | 03/11/16 | | | | | 524,331 | | | | | | 509,677 | | | | | | 14,654 | | |
| Morgan Stanley | | | New Zealand Dollar | | | | | 3,911,217 | | | | Sell | | | 01/15/16 | | | | | 2,567,311 | | | | | | 2,673,019 | | | | | | (105,708) | | |
| Morgan Stanley | | | Japanese Yen | | | | | 6,160,012,378 | | | | Sell | | | 01/29/16 | | | | | 50,694,625 | | | | | | 51,277,729 | | | | | | (583,104) | | |
| Morgan Stanley | | | Canadian Dollar | | | | | 950,451 | | | | Sell | | | 01/29/16 | | | | | 728,000 | | | | | | 686,928 | | | | | | 41,072 | | |
| Morgan Stanley | | | Norwegian Krone | | | | | 10,681,974 | | | | Sell | | | 01/29/16 | | | | | 1,256,019 | | | | | | 1,206,463 | | | | | | 49,556 | | |
| Morgan Stanley | | | Swiss Franc | | | | | 455,673 | | | | Sell | | | 01/29/16 | | | | | 463,000 | | | | | | 455,438 | | | | | | 7,562 | | |
| Morgan Stanley | | | Norwegian Krone | | | | | 20,736,949 | | | | Sell | | | 01/15/16 | | | | | 2,381,000 | | | | | | 2,342,453 | | | | | | 38,547 | | |
| Morgan Stanley | | | British Pound | | | | | 711,959 | | | | Sell | | | 01/15/16 | | | | | 1,055,000 | | | | | | 1,049,610 | | | | | | 5,390 | | |
| Morgan Stanley | | | EU Euro | | | | | 2,482,522 | | | | Sell | | | 01/15/16 | | | | | 2,722,000 | | | | | | 2,698,648 | | | | | | 23,352 | | |
| Morgan Stanley | | | British Pound | | | | | 4,783,901 | | | | Sell | | | 01/15/16 | | | | | 7,185,000 | | | | | | 7,052,698 | | | | | | 132,302 | | |
| Morgan Stanley | | | British Pound | | | | | 372,643 | | | | Sell | | | 01/15/16 | | | | | 559,000 | | | | | | 549,371 | | | | | | 9,629 | | |
| Morgan Stanley | | | Japanese Yen | | | | | 70,689,114 | | | | Sell | | | 01/15/16 | | | | | 579,000 | | | | | | 588,259 | | | | | | (9,259) | | |
| Morgan Stanley | | | EU Euro | | | | | 6,296,314 | | | | Sell | | | 01/20/16 | | | | | 6,837,000 | | | | | | 6,845,333 | | | | | | (8,333) | | |
| Morgan Stanley | | | British Pound | | | | | 7,988,473 | | | | Sell | | | 01/20/16 | | | | | 11,909,000 | | | | | | 11,777,232 | | | | | | 131,768 | | |
| Morgan Stanley | | | British Pound | | | | | 4,793,486 | | | | Sell | | | 01/20/16 | | | | | 7,146,000 | | | | | | 7,066,933 | | | | | | 79,067 | | |
| Morgan Stanley | | | Japanese Yen | | | | | 102,909,492 | | | | Sell | | | 01/15/16 | | | | | 847,000 | | | | | | 856,390 | | | | | | (9,390) | | |
| Morgan Stanley | | | EU Euro | | | | | 2,236,234 | | | | Sell | | | 01/15/16 | | | | | 2,449,000 | | | | | | 2,430,919 | | | | | | 18,081 | | |
| Morgan Stanley | | | British Pound | | | | | 315,984 | | | | Sell | | | 01/15/16 | | | | | 479,000 | | | | | | 465,842 | | | | | | 13,158 | | |
| Morgan Stanley | | | Canadian Dollar | | | | | 1,008,010 | | | | Sell | | | 01/15/16 | | | | | 742,000 | | | | | | 728,506 | | | | | | 13,494 | | |
| Morgan Stanley | | | EU Euro | | | | | 1,098,604 | | | | Sell | | | 01/15/16 | | | | | 1,198,000 | | | | | | 1,194,248 | | | | | | 3,752 | | |
| Morgan Stanley | | | Japanese Yen | | | | | 50,997,952 | | | | Sell | | | 01/15/16 | | | | | 414,000 | | | | | | 424,394 | | | | | | (10,394) | | |
| Morgan Stanley | | | Australian Dollar | | | | | 378,654 | | | | Sell | | | 01/15/16 | | | | | 273,311 | | | | | | 275,771 | | | | | | (2,460) | | |
| Morgan Stanley | | | Swedish Krona | | | | | 9,076,274 | | | | Sell | | | 01/15/16 | | | | | 1,043,146 | | | | | | 1,075,568 | | | | | | (32,422) | | |
| Morgan Stanley | | | Hungarian Forint | | | | | 340,159,718 | | | | Sell | | | 03/11/16 | | | | | 1,181,108 | | | | | | 1,170,839 | | | | | | 10,269 | | |
| Morgan Stanley | | | Polish Zloty | | | | | 6,414,415 | | | | Sell | | | 03/11/16 | | | | | 1,616,832 | | | | | | 1,633,038 | | | | | | (16,206) | | |
| Morgan Stanley | | | South African Rand | | | | | 23,511,781 | | | | Sell | | | 03/11/16 | | | | | 1,549,433 | | | | | | 1,501,249 | | | | | | 48,184 | | |
| Morgan Stanley | | | Peruvian Nuevo Sol | | | | | 2,756,217 | | | | Sell | | | 03/11/16 | | | | | 806,147 | | | | | | 798,266 | | | | | | 7,881 | | |
| Morgan Stanley | | | Chilean Peso | | | | | 184,927,455 | | | | Sell | | | 03/11/16 | | | | | 257,954 | | | | | | 258,958 | | | | | | (1,004) | | |
| | | | | | | | | | | | | | | | | | | | | | | | | | | | | | | | $ | (409,053) | | |
| |
At December 31, 2015, the following futures contracts were outstanding for Voya Global Bond Portfolio:
| Contract Description | | | Number
of Contracts | | | Expiration
Date | | | Notional
Value | | | Unrealized
Appreciation/
(Depreciation) | |
| Long Contracts | | | | | |
| 30-year German Government Bond | | | | | 40 | | | | | | 03/08/16 | | | | | $ | 6,581,393 | | | | | $ | (53,339) | | |
| Australia 10-Year Bond | | | | | 11 | | | | | | 03/15/16 | | | | | | 1,017,129 | | | | | | 5,035 | | |
| Australia 3-Year Bond | | | | | 36 | | | | | | 03/15/16 | | | | | | 2,924,134 | | | | | | 5,455 | | |
| Canada 10-Year Bond | | | | | 35 | | | | | | 03/21/16 | | | | | | 3,566,272 | | | | | | 68,493 | | |
| Euro-Bobl 5-Year | | | | | 159 | | | | | | 03/08/16 | | | �� | | | 22,579,013 | | | | | | (34,774) | | |
| Euro-Schatz | | | | | 50 | | | | | | 03/08/16 | | | | | | 6,059,206 | | | | | | 2,105 | | |
| Long Gilt | | | | | 45 | | | | | | 03/29/16 | | | | | | 7,746,451 | | | | | | (47,125) | | |
| Short Gilt | | | | | 12 | | | | | | 03/29/16 | | | | | | 1,830,260 | | | | | | (1,277) | | |
| U.S. Treasury 2-Year Note | | | | | 10 | | | | | | 03/31/16 | | | | | | 2,172,344 | | | | | | (2,525) | | |
| U.S. Treasury 5-Year Note | | | | | 431 | | | | | | 03/31/16 | | | | | | 50,996,054 | | | | | | (169,019) | | |
See Accompanying Notes to Financial Statements
SUMMARY PORTFOLIO OF INVESTMENTS
| Voya Global Bond Portfolio | as of December 31, 2015 (continued) |
| Contract Description | | | Number
of Contracts | | | Expiration
Date | | | Notional
Value | | | Unrealized
Appreciation/
(Depreciation) | |
| U.S. Treasury Long Bond | | | | | 40 | | | | | | 03/21/16 | | | | | | 6,150,000 | | | | | | 8,077 | | |
| | | | | | | | | | | | | | | | | $ | 111,622,256 | | | | | $ | (218,894) | | |
| Short Contracts | | | | | |
| Euro-Bund | | | | | (80) | | | | | | 03/08/16 | | | | | | (13,729,637) | | | | | | (62,486) | | |
| Japan 10-Year Bond (TSE) | | | | | (3) | | | | | | 03/14/16 | | | | | | (3,719,955) | | | | | | (7,222) | | |
| U.S. Treasury 10-Year Note | | | | | (46) | | | | | | 03/21/16 | | | | | | (5,791,688) | | | | | | 32,430 | | |
| U.S. Treasury Ultra Long Bond | | | | | (13) | | | | | | 03/21/16 | | | | | | (2,062,938) | | | | | | (6,126) | | |
| | | | | | | | | | | | | | | | | $ | (25,304,218) | | | | | $ | (43,404) | | |
| |
At December 31, 2015, the following centrally cleared credit default swaps were outstanding for Voya Global Bond Portfolio:
Centrally Cleared Credit Default Swaps on Credit Indices — Sell Protection(1)
Reference Entity/
Obligation | | | Buy/Sell
Protection | | | (Pay)/
Receive
Fixed
Rate (%) | | | Clearinghouse | | | Termination
Date | | | Notional Amount(2) | | | Fair
Value(3) | | | Unrealized
Appreciation/
(Depreciation) | |
| CDX North American Investment Grade Index Series 25, Version 1 | | | Sell | | | | | 1.000 | | | | Intercontinental Exchange | | | | | 12/20/20 | | | | | | USD12,000,000 | | | | | $ | 65,556 | | | | | $ | (33,124) | | |
| | | | | | | | | | | | | | | | | | | | | | | | | | | | | $ | 65,556 | | | | | $ | (33,124) | | |
| |
(1)
If the Portfolio is a seller of protection and a credit event occurs, as defined under the terms of that particular swap agreement, the Portfolio will generally either i) Pay to the buyer an amount equal to the notional amount of the swap and take delivery of the referenced obligation, other deliverable obligations, or underlying securities comprising a referenced index or ii) Pay a net settlement amount in the form of cash or securities equal to the notional amount of the swap less the recovery value of the referenced obligation or underlying securities comprising a referenced index.
(2)
The maximum amount of future payments (undiscounted) that a Portfolio as seller of protection could be required to make or receive as a buyer of credit protection under a credit default swap agreement would be an amount equal to the notional amount of the agreement.
(3)
The fair values for credit default swap agreements serve as an indicator of the current status of the payment/performance risk and represent the likelihood or risk of default for the credit derivative. Increasing fair values, in absolute terms, when compared to the notional amount of the agreement, represent a deterioration of the referenced obligation’s credit soundness and a greater likelihood or risk of default or other credit event occurring.
At December 31, 2015, the following centrally cleared interest rate swaps were outstanding for Voya Global Bond Portfolio:
| | | | Clearinghouse | | | Termination
Date | | | Notional Amount | | | Fair
Value | | | Unrealized
Appreciation/
(Depreciation) | |
| Receive a fixed rate equal to 2.960% and pay a floating rate based on the 6-month CAD-BA-CDOR | | | Chicago Mercantile Exchange | | | 11/21/44 | | | CAD | | | | | 1,000,000 | | | | | $ | 73,013 | | | | | $ | 81,267 | | |
| Receive a fixed rate equal to 1.848% and pay a floating rate based on the 6-month EUR-EURIBOR-Reuters | | | Chicago Mercantile Exchange | | | 07/06/45 | | | EUR | | | | | 1,050,000 | | | | | | (66,485) | | | | | | (64,947) | | |
| Receive a fixed rate equal to 1.622% and pay a floating rate based on the 6-month EUR-EURIBOR-Reuters | | | Chicago Mercantile Exchange | | | 07/09/45 | | | EUR | | | | | 1,200,000 | | | | | | 3,585 | | | | | | 874 | | |
| Receive a fixed rate equal to 1.488% and pay a floating rate based on the 6-month EUR-EURIBOR-Reuters | | | Chicago Mercantile Exchange | | | 08/05/45 | | | EUR | | | | | 2,000,000 | | | | | | (66,185) | | | | | | (69,259) | | |
| Receive a floating rate based on the 6-month EUR-EURIBOR-Reuters and pay a fixed rate equal to 1.534% | | | Chicago Mercantile Exchange | | | 08/06/45 | | | EUR | | | | | 1,300,000 | | | | | | 26,860 | | | | | | 28,833 | | |
| Receive a fixed rate equal to 1.448% and pay a floating rate based on the 6-month EUR-EURIBOR-Reuters | | | Chicago Mercantile Exchange | | | 08/25/45 | | | EUR | | | | | 4,100,000 | | | | | | (179,937) | | | | | | (190,240) | | |
See Accompanying Notes to Financial Statements
SUMMARY PORTFOLIO OF INVESTMENTS
| Voya Global Bond Portfolio | as of December 31, 2015 (continued) |
| | | | Clearinghouse | | | Termination
Date | | | Notional Amount | | | Fair
Value | | | Unrealized
Appreciation/
(Depreciation) | |
| Receive a fixed rate equal to 1.409% and pay a floating rate based on the 6-month EUR-EURIBOR-Reuters | | | Chicago Mercantile Exchange | | | 08/26/45 | | | EUR | | | | | 1,900,000 | | | | | | (102,999) | | | | | | (109,101) | | |
| Receive a floating rate based on the 6-month EUR-EURIBOR-Reuters and pay a fixed rate equal to 1.557% | | | Chicago Mercantile Exchange | | | 08/27/45 | | | EUR | | | | | 6,400,000 | | | | | | 94,019 | | | | | | 99,663 | | |
| Receive a floating rate based on the 6-month EUR-EURIBOR-Reuters and pay a fixed rate equal to 1.615% | | | Chicago Mercantile Exchange | | | 09/11/45 | | | EUR | | | | | 9,100,000 | | | | | | (8,219) | | | | | | (7,244) | | |
| Receive a fixed rate equal to 1.682% and pay a floating rate based on the 6-month EUR-EURIBOR-Reuters | | | Chicago Mercantile Exchange | | | 09/18/45 | | | EUR | | | | | 11,100,000 | | | | | | 207,927 | | | | | | 213,638 | | |
| Receive a floating rate based on the 6-month EUR-EURIBOR-Reuters and pay a fixed rate equal to 1.675% | | | Chicago Mercantile Exchange | | | 09/21/45 | | | EUR | | | | | 1,600,000 | | | | | | (27,180) | | | | | | (27,865) | | |
| Receive a fixed rate equal to 1.573% and pay a floating rate based on the 6-month EUR-EURIBOR-Reuters | | | Chicago Mercantile Exchange | | | 09/22/45 | | | EUR | | | | | 3,200,000 | | | | | | (33,230) | | | | | | (35,078) | | |
| Receive a floating rate based on the 6-month EUR-EURIBOR-Reuters and pay a fixed rate equal to 1.612% | | | Chicago Mercantile Exchange | | | 09/23/45 | | | EUR | | | | | 3,200,000 | | | | | | 188 | | | | | | 1,000 | | |
| Receive a floating rate based on the 6-month EUR-EURIBOR-Reuters and pay a fixed rate equal to 1.564% | | | Chicago Mercantile Exchange | | | 09/24/45 | | | EUR | | | | | 7,800,000 | | | | | | 99,875 | | | | | | 104,064 | | |
| Receive a fixed rate equal to 1.552% and pay a floating rate based on the 6-month EUR-EURIBOR-Reuters | | | Chicago Mercantile Exchange | | | 09/25/45 | | | EUR | | | | | 6,300,000 | | | | | | (101,838) | | | | | | (105,771) | | |
| Receive a floating rate based on the 6-month EUR-EURIBOR-Reuters and pay a fixed rate equal to 1.530% | | | Chicago Mercantile Exchange | | | 09/25/45 | | | EUR | | | | | 5,700,000 | | | | | | 125,031 | | | | | | 129,675 | | |
| Receive a fixed rate equal to 1.516% and pay a floating rate based on the 6-month EUR-EURIBOR-Reuters | | | Chicago Mercantile Exchange | | | 09/28/45 | | | EUR | | | | | 1,100,000 | | | | | | (28,236) | | | | | | (29,274) | | |
| Receive a fixed rate equal to 1.509% and pay a floating rate based on the 6-month EUR-EURIBOR-Reuters | | | Chicago Mercantile Exchange | | | 09/28/45 | | | EUR | | | | | 3,800,000 | | | | | | (104,784) | | | | | | (108,599) | | |
| Receive a floating rate based on the 6-month EUR-EURIBOR-Reuters and pay a fixed rate equal to 1.593% | | | Chicago Mercantile Exchange | | | 11/06/45 | | | EUR | | | | | 6,500,000 | | | | | | 31,946 | | | | | | 38,629 | | |
| Receive a floating rate based on the 6-month EUR-EURIBOR-Reuters and pay a fixed rate equal to 1.662% | | | Chicago Mercantile Exchange | | | 11/11/45 | | | EUR | | | | | 6,100,000 | | | | | | (82,462) | | | | | | (74,881) | | |
| Receive a fixed rate equal to 1.548% and pay a floating rate based on the 6-month EUR-EURIBOR-Reuters | | | Chicago Mercantile Exchange | | | 11/20/45 | | | EUR | | | | | 11,168,000 | | | | | | (191,361) | | | | | | (199,913) | | |
| Receive a fixed rate equal to 1.539% and pay a floating rate based on the 6-month EUR-EURIBOR-Reuters | | | Chicago Mercantile Exchange | | | 11/20/45 | | | EUR | | | | | 8,100,000 | | | | | | (157,342) | | | | | | (163,309) | | |
| Receive a fixed rate equal to 1.496% and pay a floating rate based on the 6-month EUR-EURIBOR-Reuters | | | Chicago Mercantile Exchange | | | 11/23/45 | | | EUR | | | | | 4,900,000 | | | | | | (152,564) | | | | | | (155,530) | | |
| Receive a floating rate based on the 6-month EUR-EURIBOR-Reuters and pay a fixed rate equal to 1.481% | | | Chicago Mercantile Exchange | | | 11/27/45 | | | EUR | | | | | 4,900,000 | | | | | | 171,528 | | | | | | 174,233 | | |
| Receive a fixed rate equal to 1.478% and pay a floating rate based on the 6-month EUR-EURIBOR-Reuters | | | Chicago Mercantile Exchange | | | 12/01/45 | | | EUR | | | | | 11,021,000 | | | | | | (395,788) | | | | | | (401,663) | | |
See Accompanying Notes to Financial Statements
SUMMARY PORTFOLIO OF INVESTMENTS
| Voya Global Bond Portfolio | as of December 31, 2015 (continued) |
| | | | Clearinghouse | | | Termination
Date | | | Notional Amount | | | Fair
Value | | | Unrealized
Appreciation/
(Depreciation) | |
| Receive a fixed rate equal to 0.524% and pay a floating rate based on the 6-month EUR-EURIBOR-Reuters | | | Chicago Mercantile Exchange | | | 07/06/20 | | | EUR | | | | | 5,800,000 | | | | | | 75,566 | | | | | | 74,845 | | |
| Receive a floating rate based on the 6-month EUR-EURIBOR-Reuters and pay a fixed rate equal to 0.451% | | | Chicago Mercantile Exchange | | | 07/09/20 | | | EUR | | | | | 5,800,000 | | | | | | (54,305) | | | | | | (53,227) | | |
| Receive a floating rate based on the 6-month EUR-EURIBOR-Reuters and pay a fixed rate equal to 0.393% | | | Chicago Mercantile Exchange | | | 08/05/20 | | | EUR | | | | | 9,800,000 | | | | | | (59,084) | | | | | | (57,905) | | |
| Receive a fixed rate equal to 0.393% and pay a floating rate based on the 6-month EUR-EURIBOR-Reuters | | | Chicago Mercantile Exchange | | | 08/06/20 | | | EUR | | | | | 6,500,000 | | | | | | 39,068 | | | | | | 38,285 | | |
| Receive a floating rate based on the 6-month EUR-EURIBOR-Reuters and pay a fixed rate equal to 0.365% | | | Chicago Mercantile Exchange | | | 08/25/20 | | | EUR | | | | | 19,100,000 | | | | | | (81,046) | | | | | | (77,549) | | |
| Receive a floating rate based on the 6-month EUR-EURIBOR-Reuters and pay a fixed rate equal to 0.372% | | | Chicago Mercantile Exchange | | | 08/26/20 | | | EUR | | | | | 9,500,000 | | | | | | (43,552) | | | | | | (42,029) | | |
| Receive a fixed rate equal to 0.434% and pay a floating rate based on the 6-month EUR-EURIBOR-Reuters | | | Chicago Mercantile Exchange | | | 08/27/20 | | | EUR | | | | | 31,800,000 | | | | | | 245,210 | | | | | | 246,170 | | |
| Receive a fixed rate equal to 0.393% and pay a floating rate based on the 6-month EUR-EURIBOR-Reuters | | | Chicago Mercantile Exchange | | | 09/11/20 | | | EUR | | | | | 22,900,000 | | | | | | 121,980 | | | | | | 121,416 | | |
| Receive a floating rate based on the 6-month EUR-EURIBOR-Reuters and pay a fixed rate equal to 0.429% | | | Chicago Mercantile Exchange | | | 09/18/20 | | | EUR | | | | | 31,700,000 | | | | | | (223,208) | | | | | | (224,630) | | |
| Receive a fixed rate equal to 0.434% and pay a floating rate based on the 6-month EUR-EURIBOR-Reuters | | | Chicago Mercantile Exchange | | | 09/21/20 | | | EUR | | | | | 2,500,000 | | | | | | 18,109 | | | | | | 18,260 | | |
| Receive a floating rate based on the 6-month EUR-EURIBOR-Reuters and pay a fixed rate equal to 0.381% | | | Chicago Mercantile Exchange | | | 09/22/20 | | | EUR | | | | | 12,700,000 | | | | | | (57,034) | | | | | | (56,479) | | |
| Receive a fixed rate equal to 0.394% and pay a floating rate based on the 6-month EUR-EURIBOR-Reuters | | | Chicago Mercantile Exchange | | | 09/23/20 | | | EUR | | | | | 14,480,000 | | | | | | 74,501 | | | | | | 74,178 | | |
| Receive a floating rate based on the 6-month EUR-EURIBOR-Reuters and pay a fixed rate equal to 0.369% | | | Chicago Mercantile Exchange | | | 09/25/20 | | | EUR | | | | | 8,600,000 | | | | | | (33,058) | | | | | | (32,657) | | |
| Receive a fixed rate equal to 0.355% and pay a floating rate based on the 6-month EUR-EURIBOR-Reuters | | | Chicago Mercantile Exchange | | | 09/25/20 | | | EUR | | | | | 17,700,000 | | | | | | 55,344 | | | | | | 54,087 | | |
| Receive a floating rate based on the 6-month EUR-EURIBOR-Reuters and pay a fixed rate equal to 0.360% | | | Chicago Mercantile Exchange | | | 09/28/20 | | | EUR | | | | | 4,800,000 | | | | | | (15,968) | | | | | | (15,655) | | |
| Receive a fixed rate equal to 1.043% and pay a floating rate based on the 6-month EUR-EURIBOR-Reuters | | | Chicago Mercantile Exchange | | | 09/11/25 | | | EUR | | | | | 11,400,000 | | | | | | 91,044 | | | | | | 91,904 | | |
| Receive a floating rate based on the 6-month EUR-EURIBOR-Reuters and pay a fixed rate equal to 1.100% | | | Chicago Mercantile Exchange | | | 09/18/25 | | | EUR | | | | | 7,300,000 | | | | | | (100,076) | | | | | | (102,128) | | |
| Receive a fixed rate equal to 1.101% and pay a floating rate based on the 6-month EUR-EURIBOR-Reuters | | | Chicago Mercantile Exchange | | | 09/21/25 | | | EUR | | | | | 2,400,000 | | | | | | 32,876 | | | | | | 33,551 | | |
| Receive a floating rate based on the 6-month EUR-EURIBOR-Reuters and pay a fixed rate equal to 1.012% | | | Chicago Mercantile Exchange | | | 09/22/25 | | | EUR | | | | | 7,000,000 | | | | | | (31,216) | | | | | | (30,745) | | |
See Accompanying Notes to Financial Statements
SUMMARY PORTFOLIO OF INVESTMENTS
| Voya Global Bond Portfolio | as of December 31, 2015 (continued) |
| | | | Clearinghouse | | | Termination
Date | | | Notional Amount | | | Fair
Value | | | Unrealized
Appreciation/
(Depreciation) | |
| Receive a fixed rate equal to 0.976% and pay a floating rate based on the 6-month EUR-EURIBOR-Reuters | | | Chicago Mercantile Exchange | | | 09/24/25 | | | EUR | | | | | 16,800,000 | | | | | | 11,056 | | | | | | 8,767 | | |
| Receive a floating rate based on the 6-month EUR-EURIBOR-Reuters and pay a fixed rate equal to 0.990% | | | Chicago Mercantile Exchange | | | 09/25/25 | | | EUR | | | | | 4,100,000 | | | | | | (8,508) | | | | | | (8,144) | | |
| Receive a floating rate based on the 6-month EUR-EURIBOR-Reuters and pay a fixed rate equal to 0.965% | | | Chicago Mercantile Exchange | | | 09/28/25 | | | EUR | | | | | 5,400,000 | | | | | | 3,469 | | | | | | 4,444 | | |
| Receive a floating rate based on the 6-month EUR-EURIBOR-Reuters and pay a fixed rate equal to 0.976% | | | Chicago Mercantile Exchange | | | 10/15/25 | | | EUR | | | | | 16,400,000 | | | | | | 1,186 | | | | | | 3,802 | | |
| Receive a fixed rate equal to 0.900% and pay a floating rate based on the 6-month EUR-EURIBOR-Reuters | | | Chicago Mercantile Exchange | | | 10/26/25 | | | EUR | | | | | 18,300,000 | | | | | | (153,764) | | | | | | (162,592) | | |
| Receive a fixed rate equal to 0.902% and pay a floating rate based on the 6-month EUR-EURIBOR-Reuters | | | Chicago Mercantile Exchange | | | 10/27/25 | | | EUR | | | | | 31,200,000 | | | | | | (253,089) | | | | | | (268,047) | | |
| Receive a fixed rate equal to 0.943% and pay a floating rate based on the 6-month EUR-EURIBOR-Reuters | | | Chicago Mercantile Exchange | | | 11/06/25 | | | EUR | | | | | 10,100,000 | | | | | | (42,491) | | | | | | (47,321) | | |
| Receive a fixed rate equal to 0.996% and pay a floating rate based on the 6-month EUR-EURIBOR-Reuters | | | Chicago Mercantile Exchange | | | 11/11/25 | | | EUR | | | | | 13,500,000 | | | | | | 16,790 | | | | | | 9,529 | | |
| Receive a fixed rate equal to 0.955% and pay a floating rate based on the 6-month EUR-EURIBOR-Reuters | | | Chicago Mercantile Exchange | | | 11/12/25 | | | EUR | | | | | 7,700,000 | | | | | | (23,726) | | | | | | (27,402) | | |
| Receive a floating rate based on the 6-month EUR-EURIBOR-Reuters and pay a fixed rate equal to 0.878% | | | Chicago Mercantile Exchange | | | 11/20/25 | | | EUR | | | | | 28,445,000 | | | | | | 324,714 | | | | | | 334,554 | | |
| Receive a floating rate based on the 6-month EUR-EURIBOR-Reuters and pay a fixed rate equal to 0.885% | | | Chicago Mercantile Exchange | | | 11/20/25 | | | EUR | | | | | 18,500,000 | | | | | | 190,717 | | | | | | 197,373 | | |
| Receive a floating rate based on the 6-month EUR-EURIBOR-Reuters and pay a fixed rate equal to 0.857% | | | Chicago Mercantile Exchange | | | 11/23/25 | | | EUR | | | | | 12,500,000 | | | | | | 172,532 | | | | | | 176,566 | | |
| Receive a fixed rate equal to 0.832% and pay a floating rate based on the 6-month EUR-EURIBOR-Reuters | | | Chicago Mercantile Exchange | | | 11/27/25 | | | EUR | | | | | 12,600,000 | | | | | | (207,916) | | | | | | (210,930) | | |
| Receive a floating rate based on the 6-month EUR-EURIBOR-Reuters and pay a fixed rate equal to 0.832% | | | Chicago Mercantile Exchange | | | 12/01/25 | | | EUR | | | | | 28,268,000 | | | | | | 467,688 | | | | | | 475,429 | | |
| Receive a fixed rate equal to 1.555% and pay a floating rate based on the 6-month EUR-EURIBOR-Reuters | | | Chicago Mercantile Exchange | | | 10/15/45 | | | EUR | | | | | 9,600,000 | | | | | | (146,522) | | | | | | (151,513) | | |
| Receive a floating rate based on the 6-month EUR-EURIBOR-Reuters and pay a fixed rate equal to 1.524% | | | Chicago Mercantile Exchange | | | 10/19/45 | | | EUR | | | | | 3,100,000 | | | | | | 72,914 | | | | | | 76,044 | | |
| Receive a floating rate based on the 6-month EUR-EURIBOR-Reuters and pay a fixed rate equal to 1.498% | | | Chicago Mercantile Exchange | | | 10/26/45 | | | EUR | | | | | 9,200,000 | | | | | | 281,486 | | | | | | 291,910 | | |
| Receive a floating rate based on the 6-month EUR-EURIBOR-Reuters and pay a fixed rate equal to 1.527% | | | Chicago Mercantile Exchange | | | 10/27/45 | | | EUR | | | | | 11,800,000 | | | | | | 268,662 | | | | | | 280,856 | | |
| Receive a fixed rate equal to 2.899% and pay a floating rate based on the 6-month GBP-LIBOR-BBA | | | Chicago Mercantile Exchange | | | 08/22/44 | | | GBP | | | | | 2,000,000 | | | | | | 481,307 | | | | | | 511,275 | | |
See Accompanying Notes to Financial Statements
SUMMARY PORTFOLIO OF INVESTMENTS
| Voya Global Bond Portfolio | as of December 31, 2015 (continued) |
| | | | Clearinghouse | | | Termination
Date | | | Notional Amount | | | Fair
Value | | | Unrealized
Appreciation/
(Depreciation) | |
| Receive a fixed rate equal to 0.754% and pay a floating rate based on the 6-month JPY-LIBOR-BBA | | | Chicago Mercantile Exchange | | | 05/21/24 | | | JPY | | | | | 1,855,000,000 | | | | �� | | 548,451 | | | | | | 590,686 | | |
| Receive a fixed rate equal to 1.289% and pay a floating rate based on the 6-month JPY-LIBOR-BBA | | | Chicago Mercantile Exchange | | | 02/04/45 | | | JPY | | | | | 1,015,000,000 | | | | | | 185,795 | | | | | | 176,056 | | |
| Receive a floating rate based on the 6-month JPY-LIBOR-BBA and pay a fixed rate equal to 1.443% | | | Chicago Mercantile Exchange | | | 02/24/45 | | | JPY | | | | | 468,636,765 | | | | | | (241,161) | | | | | | (239,532) | | |
| Receive a fixed rate equal to 0.558% and pay a floating rate based on the 6-month JPY-LIBOR-BBA | | | Chicago Mercantile Exchange | | | 02/24/45 | | | JPY | | | | | 1,084,559,370 | | | | | | 152,346 | | | | | | 150,684 | | |
| Receive a fixed rate equal to 2.928% and pay a floating rate based on the 3-month USD-LIBOR-BBA | | | Chicago Mercantile Exchange | | | 07/15/35 | | | USD | | | | | 5,400,000 | | | | | | 318,704 | | | | | | 318,704 | | |
| Receive a fixed rate equal to 2.832% and pay a floating rate based on the 3-month USD-LIBOR-BBA | | | Chicago Mercantile Exchange | | | 07/09/45 | | | USD | | | | | 2,000,000 | | | | | | 74,151 | | | | | | 74,151 | | |
| Receive a floating rate based on the 3-month USD-LIBOR-BBA and pay a fixed rate equal to 2.901% | | | Chicago Mercantile Exchange | | | 07/13/45 | | | USD | | | | | 4,100,000 | | | | | | (212,677) | | | | | | (212,677) | | |
| Receive a fixed rate equal to 2.896% and pay a floating rate based on the 3-month USD-LIBOR-BBA | | | Chicago Mercantile Exchange | | | 07/21/45 | | | USD | | | | | 1,588,000 | | | | | | 80,724 | | | | | | 80,724 | | |
| Receive a fixed rate equal to 2.860% and pay a floating rate based on the 3-month USD-LIBOR-BBA | | | Chicago Mercantile Exchange | | | 07/24/45 | | | USD | | | | | 2,382,000 | | | | | | 102,891 | | | | | | 102,891 | | |
| Receive a floating rate based on the 3-month USD-LIBOR-BBA and pay a fixed rate equal to 2.782% | | | Chicago Mercantile Exchange | | | 07/29/45 | | | USD | | | | | 4,000,000 | | | | | | (106,213) | | | | | | (106,213) | | |
| Receive a floating rate based on the 3-month USD-LIBOR-BBA and pay a fixed rate equal to 2.799% | | | Chicago Mercantile Exchange | | | 07/30/45 | | | USD | | | | | 2,400,000 | | | | | | (72,223) | | | | | | (72,223) | | |
| Receive a fixed rate equal to 2.808% and pay a floating rate based on the 3-month USD-LIBOR-BBA | | | Chicago Mercantile Exchange | | | 07/31/45 | | | USD | | | | | 9,600,000 | | | | | | 310,154 | | | | | | 310,154 | | |
| Receive a floating rate based on the 3-month USD-LIBOR-BBA and pay a fixed rate equal to 2.687% | | | Chicago Mercantile Exchange | | | 09/25/45 | | | USD | | | | | 1,700,000 | | | | | | (9,203) | | | | | | (9,203) | | |
| Receive a fixed rate equal to 2.613% and pay a floating rate based on the 3-month USD-LIBOR-BBA | | | Chicago Mercantile Exchange | | | 09/28/45 | | | USD | | | | | 2,600,000 | | | | | | (27,379) | | | | | | (27,379) | | |
| Receive a fixed rate equal to 0.704% and pay a floating rate based on the 3-month USD-LIBOR-BBA | | | Chicago Mercantile Exchange | | | 08/27/16 | | | USD | | | | | 21,000,000 | | | | | | (557) | | | | | | (557) | | |
| Receive a fixed rate equal to 0.771% and pay a floating rate based on the 3-month USD-LIBOR-BBA | | | Chicago Mercantile Exchange | | | 10/09/16 | | | USD | | | | | 87,000,000 | | | | | | 3,791 | | | | | | 3,791 | | |
| Receive a fixed rate equal to 0.924% and pay a floating rate based on the 3-month USD-LIBOR-BBA | | | Chicago Mercantile Exchange | | | 08/13/17 | | | USD | | | | | 16,000,000 | | | | | | (29,259) | | | | | | (29,259) | | |
| Receive a floating rate equal to the 3-month USD-LIBOR-BBA and pay a fixed rate equal to 1.082% | | | Chicago Mercantile Exchange | | | 08/21/17 | | | USD | | | | | 15,000,000 | | | | | | (9,585) | | | | | | (9,585) | | |
| Receive a floating rate equal to the 3-month USD-LIBOR-BBA and pay a fixed rate equal to 1.143% | | | Chicago Mercantile Exchange | | | 08/27/17 | | | USD | | | | | 40,000,000 | | | | | | (61,704) | | | | | | (61,704) | | |
See Accompanying Notes to Financial Statements
SUMMARY PORTFOLIO OF INVESTMENTS
| Voya Global Bond Portfolio | as of December 31, 2015 (continued) |
| | | | Clearinghouse | | | Termination
Date | | | Notional Amount | | | Fair
Value | | | Unrealized
Appreciation/
(Depreciation) | |
| Receive a fixed rate equal to 1.178% and pay a floating rate based on the 3-month USD-LIBOR-BBA | | | Chicago Mercantile Exchange | | | 05/15/18 | | | USD | | | | | 56,100,000 | | | | | | (102,271) | | | | | | (102,271) | | |
| Receive a floating rate based on the 3-month USD-LIBOR-BBA and pay a fixed rate equal to 1.166% | | | Chicago Mercantile Exchange | | | 05/20/18 | | | USD | | | | | 28,000,000 | | | | | | 61,287 | | | | | | 61,287 | | |
| Receive a fixed rate equal to 1.208% and pay a floating rate based on the 3-month USD-LIBOR-BBA | | | Chicago Mercantile Exchange | | | 05/21/18 | | | USD | | | | | 16,500,000 | | | | | | (19,704) | | | | | | (19,704) | | |
| Receive a fixed rate equal to 1.224% and pay a floating rate based on the 3-month USD-LIBOR-BBA | | | Chicago Mercantile Exchange | | | 05/27/18 | | | USD | | | | | 23,100,000 | | | | | | (22,424) | | | | | | (22,424) | | |
| Receive a floating rate based on the 3-month USD-LIBOR-BBA and pay a fixed rate equal to 1.231% | | | Chicago Mercantile Exchange | | | 05/27/18 | | | USD | | | | | 32,900,000 | | | | | | 26,060 | | | | | | 26,060 | | |
| Receive a fixed rate equal to 1.206% and pay a floating rate based on the 3-month USD-LIBOR-BBA | | | Chicago Mercantile Exchange | | | 06/01/18 | | | USD | | | | | 16,500,000 | | | | | | (24,320) | | | | | | (24,320) | | |
| Receive a floating rate based on the 3-month USD-LIBOR-BBA and pay a fixed rate equal to 1.257% | | | Chicago Mercantile Exchange | | | 06/04/18 | | | USD | | | | | 16,400,000 | | | | | | 5,208 | | | | | | 5,208 | | |
| Receive a fixed rate equal to 1.323% and pay a floating rate based on the 3-month USD-LIBOR-BBA | | | Chicago Mercantile Exchange | | | 06/10/18 | | | USD | | | | | 13,300,000 | | | | | | 14,643 | | | | | | 14,643 | | |
| Receive a floating rate based on the 3-month USD-LIBOR-BBA and pay a fixed rate equal to 1.347% | | | Chicago Mercantile Exchange | | | 06/11/18 | | | USD | | | | | 16,600,000 | | | | | | (27,856) | | | | | | (27,856) | | |
| Receive a floating rate based on the 3-month USD-LIBOR-BBA and pay a fixed rate equal to 1.374% | | | Chicago Mercantile Exchange | | | 06/12/18 | | | USD | | | | | 6,632,000 | | | | | | (15,268) | | | | | | (15,268) | | |
| Receive a floating rate based on the 3-month USD-LIBOR-BBA and pay a fixed rate equal to 1.267% | | | Chicago Mercantile Exchange | | | 06/19/18 | | | USD | | | | | 33,725,000 | | | | | | 17,236 | | | | | | 17,236 | | |
| Receive a floating rate based on the 3-month USD-LIBOR-BBA and pay a fixed rate equal to 1.283% | | | Chicago Mercantile Exchange | | | 06/26/18 | | | USD | | | | | 11,600,000 | | | | | | 3,244 | | | | | | 3,244 | | |
| Receive a floating rate based on the 3-month USD-LIBOR-BBA and pay a fixed rate equal to 1.301% | | | Chicago Mercantile Exchange | | | 07/03/18 | | | USD | | | | | 11,600,000 | | | | | | (605) | | | | | | (605) | | |
| Receive a floating rate based on the 3-month USD-LIBOR-BBA and pay a fixed rate equal to 1.249% | | | Chicago Mercantile Exchange | | | 07/06/18 | | | USD | | | | | 11,600,000 | | | | | | 14,609 | | | | | | 14,609 | | |
| Receive a floating rate based on the 3-month USD-LIBOR-BBA and pay a fixed rate equal to 1.230% | | | Chicago Mercantile Exchange | | | 07/14/18 | | | USD | | | | | 16,800,000 | | | | | | 31,711 | | | | | | 31,711 | | |
| Receive a floating rate based on the 3-month USD-LIBOR-BBA and pay a fixed rate equal to 1.277% | | | Chicago Mercantile Exchange | | | 07/15/18 | | | USD | | | | | 56,300,000 | | | | | | 39,464 | | | | | | 39,464 | | |
| Receive a fixed rate equal to 1.285% and pay a floating rate based on the 3-month USD-LIBOR-BBA | | | Chicago Mercantile Exchange | | | 07/27/18 | | | USD | | | | | 108,800,000 | | | | | | (67,956) | | | | | | (67,956) | | |
| Receive a fixed rate equal to 1.525% and pay a floating rate based on the 3-month USD-LIBOR-BBA | | | Chicago Mercantile Exchange | | | 05/11/19 | | | USD | | | | | 37,900,000 | | | | | | 61,417 | | | | | | 61,417 | | |
| Receive a floating rate based on the 3-month USD-LIBOR-BBA and pay a fixed rate equal to 1.465% | | | Chicago Mercantile Exchange | | | 05/18/19 | | | USD | | | | | 21,400,000 | | | | | | 9,260 | | | | | | 9,260 | | |
See Accompanying Notes to Financial Statements
SUMMARY PORTFOLIO OF INVESTMENTS
| Voya Global Bond Portfolio | as of December 31, 2015 (continued) |
| | | | Clearinghouse | | | Termination
Date | | | Notional Amount | | | Fair
Value | | | Unrealized
Appreciation/
(Depreciation) | |
| Receive a fixed rate equal to 1.460% and pay a floating rate based on the 3-month USD-LIBOR-BBA | | | Chicago Mercantile Exchange | | | 06/01/19 | | | USD | | | | | 14,800,000 | | | | | | (12,646) | | | | | | (12,646) | | |
| Receive a floating rate based on the 3-month USD-LIBOR-BBA and pay a fixed rate equal to 1.659% | | | Chicago Mercantile Exchange | | | 06/09/19 | | | USD | | | | | 16,400,000 | | | | | | (93,419) | | | | | | (93,419) | | |
| Receive a fixed rate equal to 1.640% and pay a floating rate based on the 3-month USD-LIBOR-BBA | | | Chicago Mercantile Exchange | | | 06/09/19 | | | USD | | | | | 16,400,000 | | | | | | 82,904 | | | | | | 82,904 | | |
| Receive a floating rate based on the 3-month USD-LIBOR-BBA and pay a fixed rate equal to 1.686% | | | Chicago Mercantile Exchange | | | 06/15/19 | | | USD | | | | | 16,600,000 | | | | | | (107,836) | | | | | | (107,836) | | |
| Receive a floating rate based on the 3-month USD-LIBOR-BBA and pay a fixed rate equal to 1.682% | | | Chicago Mercantile Exchange | | | 06/15/19 | | | USD | | | | | 16,600,000 | | | | | | (105,301) | | | | | | (105,301) | | |
| Receive a fixed rate equal to 1.609% and pay a floating rate based on the 3-month USD-LIBOR-BBA | | | Chicago Mercantile Exchange | | | 06/17/19 | | | USD | | | | | 16,600,000 | | | | | | 64,009 | | | | | | 64,009 | | |
| Receive a floating rate based on the 3-month USD-LIBOR-BBA and pay a fixed rate equal to 1.418% | | | Chicago Mercantile Exchange | | | 07/09/19 | | | USD | | | | | 10,200,000 | | | | | | 31,753 | | | | | | 31,753 | | |
| Receive a fixed rate equal to 1.462% and pay a floating rate based on the 3-month USD-LIBOR-BBA | | | Chicago Mercantile Exchange | | | 07/13/19 | | | USD | | | | | 21,200,000 | | | | | | (36,084) | | | | | | (36,084) | | |
| Receive a floating rate based on the 3-month USD-LIBOR-BBA and pay a fixed rate equal to 1.557% | | | Chicago Mercantile Exchange | | | 07/21/19 | | | USD | | | | | 8,503,000 | | | | | | (12,918) | | | | | | (12,918) | | |
| Receive a floating rate based on the 3-month USD-LIBOR-BBA and pay a fixed rate equal to 1.581% | | | Chicago Mercantile Exchange | | | 07/24/19 | | | USD | | | | | 12,754,500 | | | | | | (29,812) | | | | | | (29,812) | | |
| Receive a fixed rate equal to 1.493% and pay a floating rate based on the 3-month USD-LIBOR-BBA | | | Chicago Mercantile Exchange | | | 07/29/19 | | | USD | | | | | 21,100,000 | | | | | | (16,688) | | | | | | (16,688) | | |
| Receive a fixed rate equal to 1.502% and pay a floating rate based on the 3-month USD-LIBOR-BBA | | | Chicago Mercantile Exchange | | | 07/30/19 | | | USD | | | | | 12,700,000 | | | | | | (6,115) | | | | | | (6,115) | | |
| Receive a floating rate based on the 3-month USD-LIBOR-BBA and pay a fixed rate equal to 1.534% | | | Chicago Mercantile Exchange | | | 07/31/19 | | | USD | | | | | 49,100,000 | | | | | | (31,173) | | | | | | (31,173) | | |
| Receive a floating rate equal to the 3-month USD-LIBOR-BBA and pay a fixed rate equal to 1.7440% | | | Chicago Mercantile Exchange | | | 08/21/19 | | | USD | | | | | 32,000,000 | | | | | | (250,465) | | | | | | (250,465) | | |
| Receive a fixed rate equal to 1.743% and pay a floating rate based on the 3-month USD-LIBOR-BBA | | | Chicago Mercantile Exchange | | | 08/21/19 | | | USD | | | | | 8,100,000 | | | | | | 62,966 | | | | | | 62,966 | | |
| Receive a floating rate equal to the 3-month USD-LIBOR-BBA and pay a fixed rate equal to 1.792% | | | Chicago Mercantile Exchange | | | 08/27/19 | | | USD | | | | | 8,000,000 | | | | | | (75,788) | | | | | | (75,788) | | |
| Receive a fixed rate equal to 1.301% and pay a floating rate based on the 3-month USD-LIBOR-BBA | | | Chicago Mercantile Exchange | | | 09/25/19 | | | USD | | | | | 8,600,000 | | | | | | (77,680) | | | | | | (77,680) | | |
| Receive a floating rate based on the 3-month USD-LIBOR-BBA and pay a fixed rate equal to 1.261% | | | Chicago Mercantile Exchange | | | 09/28/19 | | | USD | | | | | 12,200,000 | | | | | | 129,534 | | | | | | 129,534 | | |
| Receive a floating rate based on the 3-month USD-LIBOR-BBA and pay a fixed rate equal to 1.668% | | | Chicago Mercantile Exchange | | | 10/30/19 | | | USD | | | | | 59,452,000 | | | | | | (243,890) | | | | | | (243,890) | | |
See Accompanying Notes to Financial Statements
SUMMARY PORTFOLIO OF INVESTMENTS
| Voya Global Bond Portfolio | as of December 31, 2015 (continued) |
| | | | Clearinghouse | | | Termination
Date | | | Notional Amount | | | Fair
Value | | | Unrealized
Appreciation/
(Depreciation) | |
| Receive a fixed rate equal to 2.000% and pay a floating rate based on the 3-month USD-LIBOR-BBA | | | Chicago Mercantile Exchange | | | 11/05/19 | | | USD | | | | | 121,260,000 | | | | | | 1,991,342 | | | | | | 1,991,342 | | |
| Receive a floating rate based on the 3-month USD-LIBOR-BBA and pay a fixed rate equal to 1.882% | | | Chicago Mercantile Exchange | | | 06/30/20 | | | USD | | | | | 27,546,000 | | | | | | (259,275) | | | | | | (259,275) | | |
| Receive a fixed rate equal to 1.780% and pay a floating rate based on the 3-month USD-LIBOR-BBA | | | Chicago Mercantile Exchange | | | 07/06/20 | | | USD | | | | | 9,100,000 | | | | | | 43,696 | | | | | | 43,696 | | |
| Receive a floating rate based on the 3-month USD-LIBOR-BBA and pay a fixed rate equal to 1.690% | | | Chicago Mercantile Exchange | | | 12/22/20 | | | USD | | | | | 24,219,000 | | | | | | 53,977 | | | | | | 53,977 | | |
| Receive a floating rate based on the 3-month USD-LIBOR-BBA and pay a fixed rate equal to 2.223% | | | Chicago Mercantile Exchange | | | 05/15/21 | | | USD | | | | | 12,000,000 | | | | | | (272,603) | | | | | | (272,603) | | |
| Receive a floating rate equal to the 3-month USD-LIBOR-BBA and pay a fixed rate equal to 2.179% | | | Chicago Mercantile Exchange | | | 07/01/21 | | | USD | | | | | 45,000,000 | | | | | | (891,426) | | | | | | (891,426) | | |
| Receive a floating rate equal to the 3-month USD-LIBOR-BBA and pay a fixed rate equal to 2.557% | | | Chicago Mercantile Exchange | | | 08/21/24 | | | USD | | | | | 300,000 | | | | | | (10,650) | | | | | | (10,650) | | |
| Receive a floating rate based on the 3-month USD-LIBOR-BBA and pay a fixed rate equal to 2.507% | | | Chicago Mercantile Exchange | | | 10/09/24 | | | USD | | | | | 8,500,000 | | | | | | (262,599) | | | | | | (262,599) | | |
| Receive a fixed rate equal to 2.408% and pay a floating rate based on the 3-month USD-LIBOR-BBA | | | Chicago Mercantile Exchange | | | 10/30/24 | | | USD | | | | | 30,878,000 | | | | | | 704,634 | | | | | | 704,634 | | |
| Receive a floating rate based on the 3-month USD-LIBOR-BBA and pay a fixed rate equal to 2.760% | | | Chicago Mercantile Exchange | | | 11/05/24 | | | USD | | | | | 64,260,000 | | | | | | (3,314,473) | | | | | | (3,314,473) | | |
| Receive a fixed rate equal to 2.133% and pay a floating rate based on the 3-month USD-LIBOR-BBA | | | Chicago Mercantile Exchange | | | 03/20/25 | | | USD | | | | | 6,000,000 | | | | | | (14,797) | | | | | | (14,797) | | |
| Receive a floating rate based on the 3-month USD-LIBOR-BBA and pay a fixed rate equal to 2.189% | | | Chicago Mercantile Exchange | | | 05/05/25 | | | USD | | | | | 40,000,000 | | | | | | (65,363) | | | | | | (65,363) | | |
| Receive a fixed rate equal to 2.168% and pay a floating rate based on the 3-month USD-LIBOR-BBA | | | Chicago Mercantile Exchange | | | 05/05/25 | | | USD | | | | | 40,000,000 | | | | | | (7,362) | | | | | | (7,362) | | |
| Receive a floating rate based on the 3-month USD-LIBOR-BBA and pay a fixed rate equal to 2.464% | | | Chicago Mercantile Exchange | | | 06/15/25 | | | USD | | | | | 16,052,667 | | | | | | (401,709) | | | | | | (401,709) | | |
| Receive a fixed rate equal to 2.488% and pay a floating rate based on the 3-month USD-LIBOR-BBA | | | Chicago Mercantile Exchange | | | 06/16/25 | | | USD | | | | | 19,900,000 | | | | | | 539,777 | | | | | | 539,777 | | |
| Receive a fixed rate equal to 2.455% and pay a floating rate based on the 3-month USD-LIBOR-BBA | | | Chicago Mercantile Exchange | | | 06/17/25 | | | USD | | | | | 19,900,000 | | | | | | 482,634 | | | | | | 482,634 | | |
| Receive a floating rate based on the 3-month USD-LIBOR-BBA and pay a fixed rate equal to 2.467% | | | Chicago Mercantile Exchange | | | 06/19/25 | | | USD | | | | | 3,655,000 | | | | | | (91,986) | | | | | | (91,986) | | |
| Receive a fixed rate equal to 2.382% and pay a floating rate based on the 3-month USD-LIBOR-BBA | | | Chicago Mercantile Exchange | | | 06/23/25 | | | USD | | | | | 4,950,000 | | | | | | (87,327) | | | | | | (87,327) | | |
| Receive a fixed rate equal to 2.528% and pay a floating rate based on the 3-month USD-LIBOR-BBA | | | Chicago Mercantile Exchange | | | 07/15/25 | | | USD | | | | | 14,505,000 | | | | | | 439,665 | | | | | | 439,665 | | |
See Accompanying Notes to Financial Statements
SUMMARY PORTFOLIO OF INVESTMENTS
| Voya Global Bond Portfolio | as of December 31, 2015 (continued) |
| | | | Clearinghouse | | | Termination
Date | | | Notional Amount | | | Fair
Value | | | Unrealized
Appreciation/
(Depreciation) | |
| Receive a floating rate based on the 3-month USD-LIBOR-BBA and pay a fixed rate equal to 2.543% | | | Chicago Mercantile Exchange | | | 07/15/25 | | | USD | | | | | 4,600,000 | | | | | | (145,394) | | | | | | (145,394) | | |
| Receive a fixed rate equal to 2.232% and pay a floating rate based on the 3-month USD-LIBOR-BBA | | | Chicago Mercantile Exchange | | | 09/14/25 | | | USD | | | | | 7,000,000 | | | | | | 22,789 | | | | | | 22,789 | | |
| Receive a fixed rate equal to 2.760% and pay a floating rate based on the 3-month USD-LIBOR-BBA | | | Chicago Mercantile Exchange | | | 12/11/25 | | | USD | | | | | 13,758,000 | | | | | | 12,398 | | | | | | 12,398 | | |
| Receive a fixed rate equal to 2.729% and pay a floating rate based on the 3-month USD-LIBOR-BBA | | | Chicago Mercantile Exchange | | | 12/16/25 | | | USD | | | | | 13,763,000 | | | | | | (7,047) | | | | | | (7,047) | | |
| Receive a fixed rate equal to 2.719% and pay a floating rate based on the 3-month USD-LIBOR-BBA | | | Chicago Mercantile Exchange | | | 12/22/25 | | | USD | | | | | 27,898,000 | | | | | | (28,406) | | | | | | (28,406) | | |
| Receive a floating rate based on the 3-month USD-LIBOR-BBA and pay a fixed rate equal to 3.294% | | | Chicago Mercantile Exchange | | | 06/10/35 | | | USD | | | | | 10,000,000 | | | | | | (201,505) | | | | | | (201,505) | | |
| Receive a fixed rate equal to 3.285% and pay a floating rate based on the 3-month USD-LIBOR-BBA | | | Chicago Mercantile Exchange | | | 06/15/35 | | | USD | | | | | 19,900,000 | | | | | | 387,555 | | | | | | 387,555 | | |
| Receive a fixed rate equal to 2.805% and pay a floating rate based on the 3-month USD-LIBOR-BBA | | | Chicago Mercantile Exchange | | | 06/16/35 | | | USD | | | | | 15,422,500 | | | | | | 609,108 | | | | | | 609,108 | | |
| Receive a floating rate based on the 3-month USD-LIBOR-BBA and pay a fixed rate equal to 2.834% | | | Chicago Mercantile Exchange | | | 06/16/35 | | | USD | | | | | 19,900,000 | | | | | | (878,343) | | | | | | (878,343) | | |
| Receive a floating rate based on the 3-month USD-LIBOR-BBA and pay a fixed rate equal to 2.810% | | | Chicago Mercantile Exchange | | | 06/17/35 | | | USD | | | | | 19,900,000 | | | | | | (804,086) | | | | | | (804,086) | | |
| Receive a fixed rate equal to 2.815% and pay a floating rate based on the 3-month USD-LIBOR-BBA | | | Chicago Mercantile Exchange | | | 06/19/35 | | | USD | | | | | 4,187,000 | | | | | | 172,017 | | | | | | 172,017 | | |
| Receive a floating rate based on the 3-month USD-LIBOR-BBA and pay a fixed rate equal to 2.753% | | | Chicago Mercantile Exchange | | | 06/23/35 | | | USD | | | | | 4,950,000 | | | | | | 153,661 | | | | | | 153,661 | | |
| Receive a fixed rate equal to 3.057% and pay a floating rate based on the 3-month USD-LIBOR-BBA | | | Chicago Mercantile Exchange | | | 10/09/44 | | | USD | | | | | 1,400,000 | | | | | | 119,154 | | | | | | 119,154 | | |
| Receive a floating rate based on the 3-month USD-LIBOR-BBA and pay a fixed rate equal to 2.715% | | | Chicago Mercantile Exchange | | | 05/11/45 | | | USD | | | | | 6,900,000 | | | | | | (83,187) | | | | | | (83,187) | | |
| Receive a fixed rate equal to 2.810% and pay a floating rate based on the 3-month USD-LIBOR-BBA | | | Chicago Mercantile Exchange | | | 05/18/45 | | | USD | | | | | 4,000,000 | | | | | | 130,825 | | | | | | 130,825 | | |
| Receive a floating rate based on the 3-month USD-LIBOR-BBA and pay a fixed rate equal to 2.659% | | | Chicago Mercantile Exchange | | | 06/01/45 | | | USD | | | | | 5,900,000 | | | | | | (940) | | | | | | (940) | | |
| Receive a fixed rate equal to 2.905% and pay a floating rate based on the 3-month USD-LIBOR-BBA | | | Chicago Mercantile Exchange | | | 06/09/45 | | | USD | | | | | 3,300,000 | | | | | | 175,121 | | | | | | 175,121 | | |
| Receive a floating rate based on the 3-month USD-LIBOR-BBA and pay a fixed rate equal to 2.926% | | | Chicago Mercantile Exchange | | | 06/09/45 | | | USD | | | | | 3,300,000 | | | | | | (189,692) | | | | | | (189,692) | | |
| Receive a fixed rate equal to 2.980% and pay a floating rate based on the 3-month USD-LIBOR-BBA | | | Chicago Mercantile Exchange | | | 06/15/45 | | | USD | | | | | 3,300,000 | | | | | | 228,004 | | | | | | 228,004 | | |
See Accompanying Notes to Financial Statements
SUMMARY PORTFOLIO OF INVESTMENTS
| Voya Global Bond Portfolio | as of December 31, 2015 (continued) |
| | | | Clearinghouse | | | Termination
Date | | | Notional Amount | | | Fair
Value | | | Unrealized
Appreciation/
(Depreciation) | |
| Receive a fixed rate equal to 2.959% and pay a floating rate based on the 3-month USD-LIBOR-BBA | | | Chicago Mercantile Exchange | | | 06/15/45 | | | USD | | | | | 3,300,000 | | | | | | 213,427 | | | | | | 213,427 | | |
| Receive a floating rate based on the 3-month USD-LIBOR-BBA and pay a fixed rate equal to 2.891% | | | Chicago Mercantile Exchange | | | 06/17/45 | | | USD | | | | | 3,300,000 | | | | | | (164,990) | | | | | | (164,990) | | |
| | | | | | | | | | | | | | | | | | | | $ | (774,226) | | | | | $ | (705,287) | | |
| |
Transactions with Affiliates
An investment of at least 5% of the voting securities of an issuer, or a company which is under common control results in that issuer becoming an affiliated person as defined by the 1940 Act.
The following table provides transactions during the year ended December 31, 2015, where the following issuers were considered an affiliate:
| Issuer | | | Beginning
Fair Value
at 12/31/14 | | | Purchases
at Cost | | | Sales
at Cost | | | Change in
Unrealized
Appreciation/
(Depreciation) | | | Ending
Fair Value
at 12/31/15 | | | Investment
Income | | | Realized
Gains/
(Losses) | | | Net Capital
Gain Distributions | |
Voya Emerging Markets
Corporate Debt Fund -
Class P | | | | $ | 13,690,107 | | | | | $ | 544,732 | | | | | $ | (3,823,918) | | | | | $ | (333,498) | | | | | $ | 10,077,423 | | | | | $ | 544,732 | | | | | $ | (73,918) | | | | | $ | — | | |
| Voya Emerging Markets Hard Currency Debt Fund - Class P | | | | | 32,119,888 | | | | | | 1,048,169 | | | | | | (18,442,929) | | | | | | 540,294 | | | | | | 15,265,422 | | | | | | 1,048,170 | | | | | | (1,188,929) | | | | | | — | | |
| Voya Emerging Markets Local Currency Debt Fund - Class P | | | | | 31,847,994 | | | | | | — | | | | | | (10,969,387) | | | | | | (823,691) | | | | | | 20,054,916 | | | | | | — | | | | | | (2,369,388) | | | | | | — | | |
| Voya High Yield Bond Fund - Class P | | | | | 16,162,281 | | | | | | 941,842 | | | | | | (8,215,471) | | | | | | (365,384) | | | | | | 8,523,268 | | | | | | 941,978 | | | | | | (540,471) | | | | | | — | | |
| | | | | $ | 93,820,270 | | | | | $ | 2,534,743 | | | | | $ | (41,451,705) | | | | | $ | (982,279) | | | | | $ | 53,921,029 | | | | | $ | 2,534,880 | | | | | $ | (4,172,706) | | | | | $ | — | | |
| |
The financial statements for the above mutual fund[s] can be found at www.sec.gov.
A summary of derivative instruments by primary risk exposure is outlined in the following tables.
The fair value of derivative instruments as of December 31, 2015 was as follows:
| Derivatives not accounted for as hedging instruments | | | Location on Statement
of Assets and Liabilities | | | Fair Value | |
| Asset Derivatives | | | | | | | | | | |
| Foreign exchange contracts | | | Unrealized appreciation on forward foreign currency contracts | | | | $ | 4,443,411 | | |
| Interest rate contracts | | | Net Assets — Unrealized appreciation* | | | | | 121,595 | | |
| Interest rate contracts | | | Net Assets — Unrealized appreciation** | | | | | 12,938,051 | | |
| Total Asset Derivatives | | | | | | | $ | 17,503,057 | | |
| Liability Derivatives | | | | | |
| Foreign exchange contracts | | | Unrealized depreciation on forward foreign currency contracts | | | | $ | 4,526,609 | | |
| Interest rate contracts | | | Net Assets — Unrealized depreciation* | | | | | 383,893 | | |
| Credit contracts | | | Net Assets — Unrealized appreciation** | | | | | 33,124 | | |
| Interest rate contracts | | | Net Assets — Unrealized depreciation** | | | | | 13,643,338 | | |
| Total Liability Derivatives | | | | | | | $ | 18,586,964 | | |
| |
See Accompanying Notes to Financial Statements
SUMMARY PORTFOLIO OF INVESTMENTS
| Voya Global Bond Portfolio | as of December 31, 2015 (continued) |
*
Includes cumulative appreciation/depreciation of futures contracts as reported in the table following the Summary Portfolio of Investments.
**
Includes cumulative appreciation/depreciation of centrally cleared swaps as reported in the table following the Summary Portfolio of Investments. Only current day’s variation margin receivable/payable is shown on the Statement of Assets and Liabilities.
The effect of derivative instruments on the Portfolio’s Statement of Operations for the year ended December 31, 2015 was as follows:
Amount of Realized Gain or (Loss) on Derivatives Recognized in Income
Derivatives not accounted for as
hedging instruments | | | Investments* | | | Foreign currency
related transactions** | | | Futures | | | Swaps | | | Written
options | | | Total | |
| Credit Contract | | | | $ | — | | | | | $ | — | | | | | $ | — | | | | | $ | (460,495) | | | | | $ | — | | | | | $ | (460,495) | | |
| Foreign exchange contracts | | | | | (674,086) | | | | | | (9,722,352) | | | | | | — | | | | | | — | | | | | | 336,861 | | | | | | (10,059,577) | | |
| Interest rate contracts | | | | | (2,787,417) | | | | | | — | | | | | | 1,315,608 | | | | | | (2,510,841) | | | | | | 3,532,471 | | | | | | (450,179) | | |
| Total | | | | $ | (3,461,503) | | | | | $ | (9,722,352) | | | | | $ | 1,315,608 | | | | | $ | (2,971,336) | | | | | $ | 3,869,332 | | | | | $ | (10,970,251) | | |
| |
Change in Unrealized Appreciation or (Depreciation) on Derivatives Recognized in Income
Derivatives not accounted for as
hedging instruments | | | Investments* | | | Foreign currency
related transactions** | | | Futures | | | Swaps | | | Written
options | | | Total | |
| Credit contracts | | | | $ | — | | | | | $ | — | | | | | $ | — | | | | | $ | (33,124) | | | | | $ | — | | | | | $ | (33,124) | | |
| Foreign exchange contracts | | | | | 407,392 | | | | | | 3,088,891 | | | | | | — | | | | | | — | | | | | | (19,338) | | | | | | 3,476,945 | | |
| Interest rate contracts | | | | | — | | | | | | — | | | | | | (793,316) | | | | | | (767,405) | | | | | | — | | | | | | (1,560,721) | | |
| Total | | | | $ | 407,392 | | | | | $ | 3,088,891 | | | | | $ | (793,316) | | | | | $ | (800,529) | | | | | $ | (19,338) | | | | | $ | 1,883,100 | | |
| |
*
Amounts recognized for purchased options are included in net realized gain (loss) on investments and net change in unrealized appreciation or depreciation on investments.
**
Amounts recognized for forward foreign currency contracts are included in net realized gain (loss) on foreign currency related transactions and net change in unrealized appreciation or depreciation on foreign currency related transactions.
The following is a summary by counterparty of the fair value of OTC derivative instruments subject to Master Netting Agreements and collateral pledged (received), if any, at December 31, 2015:
| | | | Barclays
Bank PLC | | | Citigroup,
Inc. | | | Deutsche
Bank AG | | | Goldman
Sachs & Co. | | | HSBC
Bank PLC | | | JPMorgan
Chase & Co. | | | Morgan
Stanley | | | Totals | |
| Assets: | | | | | | | | | |
| Forward foreign currency contracts | | | | $ | 123,576 | | | | | $ | 417,029 | | | | | $ | 939,817 | | | | | $ | 463,610 | | | | | $ | 1,059 | | | | | $ | 1,665,505 | | | | | $ | 832,815 | | | | | $ | 4,443,411 | | |
| Total Assets | | | | $ | 123,576 | | | | | $ | 417,029 | | | | | $ | 939,817 | | | | | $ | 463,610 | | | | | $ | 1,059 | | | | | $ | 1,665,505 | | | | | $ | 832,815 | | | | | $ | 4,443,411 | | |
| Liabilities: | | | | | | | | | |
| Forward foreign currency contracts | | | | $ | 616,342 | | | | | $ | 288,971 | | | | | $ | 518,147 | | | | | $ | 2,564 | | | | | $ | 717 | | | | | $ | 1,167,117 | | | | | $ | 1,932,751 | | | | | $ | 4,526,609 | | |
| Total Liabilities | | | | $ | 616,342 | | | | | $ | 288,971 | | | | | $ | 518,147 | | | | | $ | 2,564 | | | | | $ | 717 | | | | | $ | 1,167,117 | | | | | $ | 1,932,751 | | | | | $ | 4,526,609 | | |
Net OTC derivative instruments
by counterparty, at fair value | | | | $ | (492,766) | | | | | $ | 128,058 | | | | | $ | 421,670 | | | | | $ | 461,046 | | | | | $ | 342 | | | | | $ | 498,388 | | | | | $ | (1,099,936) | | | | | | (83,198) | | |
Total collateral pledged by the
Portfolio/(Received from
counterparty) | | | | $ | 620,000 | | | | | $ | — | | | | | $ | — | | | | | $ | — | | | | | $ | — | | | | | $ | (470,000) | | | | | $ | 810,000 | | | | | $ | 960,000 | | |
Net Exposure(1) | | | | $ | 127,234 | | | | | $ | 128,058 | | | | | $ | 421,670 | | | | | $ | 461,046 | | | | | $ | 342 | | | | | $ | 28,388 | | | | | $ | (289,936) | | | | | $ | 876,802 | | |
| |
(1)
Positive net exposure represents amounts due from each respective counterparty. Negative exposure represents amounts due from the Portfolio. Please refer to Note 2 for additional details regarding counterparty credit risk and credit related contingent features.
See Accompanying Notes to Financial Statements
| VY® American Century | SUMMARY PORTFOLIO OF INVESTMENTS |
| Small-Mid Cap Value Portfolio | as of December 31, 2015 |
| Shares | | | Value | | | Percentage
of Net
Assets | |
| COMMON STOCK: 97.3% | |
| | | | | | | Consumer Discretionary: 8.3% | |
| | | 13,609 | | | | Advance Auto Parts, Inc. | | | | $ | 2,048,291 | | | | | | 0.7 | | |
| | | 48,522 | | | | CST Brands, Inc. | | | | | 1,899,151 | | | | | | 0.7 | | |
| | | 813,811 | | | | Other Securities(a) | | | | | 19,199,693 | | | | | | 6.9 | | |
| | | | | | | | | | | | 23,147,135 | | | | | | 8.3 | | |
| | | | | | | Consumer Staples: 6.2% | |
| | | 64,891 | | | | ConAgra Foods, Inc. | | | | | 2,735,805 | | | | | | 1.0 | | |
| | | 16,292 | | | | JM Smucker Co. | | | | | 2,009,455 | | | | | | 0.7 | | |
| | | 27,670 | | | | Kellogg Co. | | | | | 1,999,711 | | | | | | 0.7 | | |
| | | 153,219 | | | | Sysco Corp. | | | | | 6,281,979 | | | | | | 2.3 | | |
| | | 134,572 | | | | Other Securities(a) | | | | | 4,097,513 | | | | | | 1.5 | | |
| | | | | | | | | | | | 17,124,463 | | | | | | 6.2 | | |
| | | | | | | Energy: 9.6% | |
| | | 51,038 | @ | | Cameron International Corp. | | | | | 3,225,602 | | | | | | 1.2 | | |
| | | 54,057 | | | | EQT Corp. | | | | | 2,817,991 | | | | | | 1.0 | | |
| | | 32,965 | L | | Helmerich & Payne, Inc. | | | | | 1,765,276 | | | | | | 0.6 | | |
| | | 113,080 | | | | Imperial Oil Ltd. | | | | | 3,684,069 | | | | | | 1.3 | | |
| | | 85,072 | | | | Noble Energy, Inc. | | | | | 2,801,421 | | | | | | 1.0 | | |
| | | 38,501 | | | | Occidental Petroleum Corp. | | | | | 2,603,053 | | | | | | 1.0 | | |
| | | 379,703 | | | | Other Securities | | | | | 9,810,495 | | | | | | 3.5 | | |
| | | | | | | | | | | | 26,707,907 | | | | | | 9.6 | | |
| | | | | | | Financials: 29.2% | |
| | | 25,044 | | | | ACE Ltd. | | | | | 2,926,391 | | | | | | 1.1 | | |
| | | 49,880 | | | | Commerce Bancshares, Inc. | | | | | 2,121,895 | | | | | | 0.8 | | |
| | | 78,361 | | | | Corrections Corp. of America | | | | | 2,075,783 | | | | | | 0.7 | | |
| | | 29,872L | | | | Cullen/Frost Bankers, Inc. | | | | | 1,792,320 | | | | | | 0.6 | | |
| | | 18,723 | | | | M&T Bank Corp. | | | | | 2,268,853 | | | | | | 0.8 | | |
| | | 82,407 | | | | Northern Trust Corp. | | | | | 5,940,721 | | | | | | 2.1 | | |
| | | 112,754 | | | | Piedmont Office Realty Trust,
Inc. | | | | | 2,128,795 | | | | | | 0.8 | | |
| | | 19,463 | | | | PNC Financial Services
Group, Inc. | | | | | 1,855,019 | | | | | | 0.7 | | |
| | | 23,153 | | | | Reinsurance Group of
America, Inc. | | | | | 1,980,739 | | | | | | 0.7 | | |
| | | 55,007 | | | | Unum Group | | | | | 1,831,183 | | | | | | 0.7 | | |
| | | 47,740 | L | | Westamerica Bancorp. | | | | | 2,231,845 | | | | | | 0.8 | | |
| | | 109,995 | | | | Weyerhaeuser Co. | | | | | 3,297,650 | | | | | | 1.2 | | |
| | | 1,902,719 | | | | Other Securities(a) | | | | | 50,637,625 | | | | | | 18.2 | | |
| | | | | | | | | | | | 81,088,819 | | | | | | 29.2 | | |
| | | | | | | Health Care: 7.2% | |
| | | 78,058 | | | | Baxter International, Inc. | | | | | 2,977,913 | | | | | | 1.1 | | |
| | | 115,499 | @ | | Boston Scientific Corp. | | | | | 2,129,802 | | | | | | 0.7 | | |
| | | 48,058 | @ | | LifePoint Hospitals, Inc. | | | | | 3,527,457 | | | | | | 1.3 | | |
| | | 37,995 | | | | Quest Diagnostics, Inc. | | | | | 2,702,964 | | | | | | 1.0 | | |
| Shares | | | Value | | | Percentage
of Net
Assets | |
| COMMON STOCK: (continued) | |
| | | | | | | Health Care (continued) | |
| | | 37,347 | | | | Zimmer Biomet Holdings, Inc. | | | | $ | 3,831,429 | | | | | | 1.4 | | |
| | | 113,551 | | | | Other Securities | | | | | 4,740,305 | | | | | | 1.7 | | |
| | | | | | | | | | | | 19,909,870 | | | | | | 7.2 | | |
| | | | | | | Industrials: 13.2% | |
| | | 63,339 | @ | | Clean Harbors, Inc. | | | | | 2,638,069 | | | | | | 1.0 | | |
| | | 52,187 | | | | Emerson Electric Co. | | | | | 2,496,104 | | | | | | 0.9 | | |
| | | 129,705 | | | | Heartland Express, Inc. | | | | | 2,207,579 | | | | | | 0.8 | | |
| | | 81,269 | | | | Koninklijke Philips NV | | | | | 2,074,343 | | | | | | 0.7 | | |
| | | 108,073 | | | | Republic Services, Inc. | | | | | 4,754,131 | | | | | | 1.7 | | |
| | | 101,849 | | | | Tyco International Plc | | | | | 3,247,965 | | | | | | 1.2 | | |
| | | 706,818 | | | | Other Securities | | | | | 19,118,502 | | | | | | 6.9 | | |
| | | | | | | | | | | | 36,536,693 | | | | | | 13.2 | | |
| | | | | | | Information Technology: 10.2% | |
| | | 178,792 | | | | Applied Materials, Inc. | | | | | 3,338,047 | | | | | | 1.2 | | |
| | | 71,981 | @ | | Keysight Technologies, Inc. | | | | | 2,039,222 | | | | | | 0.8 | | |
| | | 52,949 | | | Maxim Integrated Products | | | | | 2,012,062 | | | | | | 0.7 | | |
| | | 43,075 | | | | Microchip Technology, Inc. | | | | | 2,004,711 | | | | | | 0.7 | | |
| | | 30,661 | | | | SanDisk Corp. | | | | | 2,329,929 | | | | | | 0.9 | | |
| | | 30,681 | | | | TE Connectivity Ltd. | | | | | 1,982,299 | | | | | | 0.7 | | |
| | | 93,123 | | | | Teradyne, Inc. | | | | | 1,924,852 | | | | | | 0.7 | | |
| | | 685,452 | | | | Other Securities(a) | | | | | 12,518,749 | | | | | | 4.5 | | |
| | | | | | | | | | | | 28,149,871 | | | | | | 10.2 | | |
| | | | | | | Materials: 5.1% | |
| | | 46,862 | | | | Nucor Corp. | | | | | 1,888,538 | | | | | | 0.7 | | |
| | | 429,087 | | | | Other Securities | | | | | 12,382,357 | | | | | | 4.4 | | |
| | | | | | | | | | | | 14,270,895 | | | | | | 5.1 | | |
| | | | | | | Telecommunication Services: 0.8% | |
| | | 87,427 | | | | CenturyLink, Inc. | | | | | 2,199,663 | | | | | | 0.8 | | |
| | | | | | | Utilities: 7.5% | |
| | | 50,351 | | | | Edison International | | | | | 2,981,283 | | | | | | 1.1 | | |
| | | 33,548 | | | | Laclede Group, Inc. | | | | | 1,993,087 | | | | | | 0.7 | | |
| | | 58,108 | | | | PG&E Corp. | | | | | 3,090,765 | | | | | | 1.1 | | |
| | | 67,718 | | | | Westar Energy, Inc. | | | | | 2,871,920 | | | | | | 1.1 | | |
| | | 71,657 | | | Xcel Energy, Inc. | | | | | 2,573,203 | | | | | | 0.9 | | |
| | | 166,184 | | | | Other Securities | | | | | 7,146,046 | | | | | | 2.6 | | |
| | | | | | | | | | | | 20,656,304 | | | | | | 7.5 | | |
| | | | | | | Total Common Stock
(Cost $271,826,090) | | | | | 269,791,620 | | | | | | 97.3 | | |
| EXCHANGE-TRADED FUNDS: 0.7% | |
| | | 29,327 | | | | iShares Russell Midcap
Value Index Fund | | | | | 2,014,178 | | | | | | 0.7 | | |
See Accompanying Notes to Financial Statements
| VY® American Century | SUMMARY PORTFOLIO OF INVESTMENTS |
| Small-Mid Cap Value Portfolio | as of December 31, 2015 (continued) |
| Shares | | | Value | | | Percentage
of Net
Assets | |
| EXCHANGE-TRADED FUNDS: (continued) | |
| | | | Total Exchange-Traded
Funds
(Cost $2,079,966) | | | | $ | 2,014,178 | | | | | | 0.7 | | |
| | | | Total Long-Term
Investments
(Cost $273,906,056) | | | | | 271,805,798 | | | | | | 98.0 | | |
| |
Principal
Amount† | | | Value | | | Percentage
of Net
Assets | |
| SHORT-TERM INVESTMENTS: 5.2% | |
| | | | | | | Securities Lending Collateralcc: 2.8% | |
| | | 382,071 | | | | Bank of Nova Scotia,
Repurchase Agreement
dated 12/31/15, 0.30%, due
01/04/16 (Repurchase
Amount $382,084,
collateralized by various U.S.
Government Securities,
0.000%-8.500%, Market
Value plus accrued
interest $389,725, due
02/29/16-02/15/45) | | | | | 382,071 | | | | | | 0.1 | | |
| | | 1,815,157 | | | | Citigroup, Inc.,
Repurchase Agreement
dated 12/31/15, 0.34%, due
01/04/16 (Repurchase
Amount $1,815,225,
collateralized by various U.S.
Government Agency
Obligations,
0.000%-11.500%, Market
Value plus accrued
interest $1,851,460, due
01/15/16-04/01/51) | | | | | 1,815,157 | | | | | | 0.7 | | |
| | | 1,815,157 | | | | Merrill Lynch & Co., Inc.,
Repurchase Agreement
dated 12/31/15, 0.31%, due
01/04/16 (Repurchase
Amount $1,815,219,
collateralized by various U.S.
Government Agency
Obligations, 3.000%-4.500%,
Market Value plus accrued
interest $1,851,460, due
11/15/42-02/20/45) | | | | | 1,815,157 | | | | | | 0.7 | | |
Principal
Amount† | | | Value | | | Percentage
of Net
Assets | |
| SHORT-TERM INVESTMENTS: (continued) | |
| | | | | | | Securities Lending Collateralcc (continued) | |
| | | 1,815,157 | | | | Millenium Fixed Income Ltd.,
Repurchase Agreement
dated 12/31/15, 0.37%, due
01/04/16 (Repurchase
Amount $1,815,231,
collateralized by various U.S.
Government Securities,
1.500%-3.625%, Market
Value plus accrued interest
$1,851,461, due
03/31/21-02/15/44) | | | | $ | 1,815,157 | | | | | | 0.6 | | |
| | | 1,815,157 | | | | Nomura Securities,
Repurchase Agreement
dated 12/31/15, 0.33%, due
01/04/16 (Repurchase
Amount $1,815,223,
collateralized by various U.S.
Government/U.S.
Government Agency
Obligations,
0.000%-10.500%, Market
Value plus accrued interest
$1,851,460, due
01/15/16-10/20/65) | | | | | 1,815,157 | | | | | | 0.7 | | |
| | | | | | | | | | | | 7,642,699 | | | | | | 2.8 | | |
| Shares | | | Value | | | Percentage
of Net
Assets | |
| | | | | | | Mutual Funds: 2.4% | |
| | | 6,773,161 | | | | BlackRock Liquidity Funds,
TempFund, Institutional
Class, 0.270%††
(Cost $6,773,161) | | | | | 6,773,161 | | | | | | 2.4 | | |
| | | | | | | Total Short-Term
Investments
(Cost $14,415,860) | | | | | 14,415,860 | | | | | | 5.2 | | |
| | | | | | | Total Investments in
Securities
(Cost $288,321,916) | | | | $ | 286,221,658 | | | | | | 103.2 | | |
| | | | | | | Liabilities in Excess of
Other Assets | | | | | (8,822,636) | | | | | | (3.2) | | |
| | | | | | | Net Assets | | | | $ | 277,399,022 | | | | | | 100.0 | | |
| |
“Other Securities” represents issues not identified as the top 50 holdings in terms of market value and issues or issuers not exceeding 1% of net assets individually or in aggregate respectively as of December 31, 2015.
The following footnotes apply to either the individual securities noted or one or more of the securities aggregated and listed as a single line item.
†
Unless otherwise indicated, principal amount is shown in USD.
See Accompanying Notes to Financial Statements
| VY® American Century | SUMMARY PORTFOLIO OF INVESTMENTS |
| Small-Mid Cap Value Portfolio | as of December 31, 2015 (continued) |
††
Rate shown is the 7-day yield as of December 31, 2015.
@
Non-income producing security.
cc
Represents securities purchased with cash collateral received for securities on loan.
L
Loaned security, a portion or all of the security is on loan at December 31, 2015.
(a)
This grouping contains securities on loan.
Cost for federal income tax purposes is $291,022,226.
Net unrealized depreciation consists of:
| | Gross Unrealized Appreciation | | | | $ | 19,007,337 | | |
| | Gross Unrealized Depreciation | | | | | (23,807,905) | | |
| | Net Unrealized Depreciation | | | | $ | (4,800,568) | | |
Fair Value Measurements^
The following is a summary of the fair valuations according to the inputs used as of December 31, 2015 in valuing the assets and liabilities:
| | | | Quoted Prices
in Active Markets
for Identical
Investments
(Level 1) | | | Significant
Other
Observable
Inputs#
(Level 2) | | | Significant
Unobservable
Inputs
(Level 3) | | | Fair Value
at
December 31, 2015 | |
| Asset Table | | | | | |
| Investments, at fair value | | | | | |
| Common Stock | | | | | |
| Consumer Discretionary | | | | $ | 23,147,135 | | | | | $ | — | | | | | $ | — | | | | | $ | 23,147,135 | | |
| Consumer Staples | | | | | 17,124,463 | | | | | | — | | | | | | — | | | | | | 17,124,463 | | |
| Energy | | | | | 26,707,907 | | | | | | — | | | | | | — | | | | | | 26,707,907 | | |
| Financials | | | | | 81,088,819 | | | | | | — | | | | | | — | | | | | | 81,088,819 | | |
| Health Care | | | | | 19,909,870 | | | | | | — | | | | | | — | | | | | | 19,909,870 | | |
| Industrials | | | | | 34,462,350 | | | | | | 2,074,343 | | | | | | — | | | | | | 36,536,693 | | |
| Information Technology | | | | | 28,149,871 | | | | | | — | | | | | | — | | | | | | 28,149,871 | | |
| Materials | | | | | 14,270,895 | | | | | | — | | | | | | — | | | | | | 14,270,895 | | |
| Telecommunication Services | | | | | 2,199,663 | | | | | | — | | | | | | — | | | | | | 2,199,663 | | |
| Utilities | | | | | 20,656,304 | | | | | | — | | | | | | — | | | | | | 20,656,304 | | |
| Total Common Stock | | | | | 267,717,277 | | | | | | 2,074,343 | | | | | | — | | | | | | 269,791,620 | | |
| Exchange-Traded Funds | | | | | 2,014,178 | | | | | | — | | | | | | — | | | | | | 2,014,178 | | |
| Short-Term Investments | | | | | 6,773,161 | | | | | | 7,642,699 | | | | | | — | | | | | | 14,415,860 | | |
| Total Investments, at fair value | | | | $ | 276,504,616 | | | | | $ | 9,717,042 | | | | | $ | — | | | | | $ | 286,221,658 | | |
| Other Financial Instruments+ | | | | | |
| Forward Foreign Currency Contracts | | | | | — | | | | | | 16,457 | | | | | | — | | | | | | 16,457 | | |
| Total Assets | | | | $ | 276,504,616 | | | | | $ | 9,733,499 | | | | | $ | — | | | | | $ | 286,238,115 | | |
| Liabilities Table | | | | | |
| Other Financial Instruments+ | | | | | |
| Forward Foreign Currency Contracts | | | | $ | — | | | | | $ | (27,726) | | | | | $ | — | | | | | $ | (27,726) | | |
| Total Liabilities | | | | $ | — | | | | | $ | (27,726) | | | | | $ | — | | | | | $ | (27,726) | | |
| |
^
See Note 2, “Significant Accounting Policies” in the Notes to Financial Statements for additional information.
+
Other Financial Instruments are derivatives not reflected in the portfolio of investments and may include open forward foreign currency contracts, futures, centrally cleared swaps, OTC swaps and written options. Forward foreign currency contracts, futures and centrally cleared swaps are valued at the unrealized gain (loss) on the instrument. OTC swaps and written options are valued at the fair value of the instrument.
#
The earlier close of the foreign markets gives rise to the possibility that significant events, including broad market moves, may have occurred in the interim and may materially affect the value of those securities. To account for this, the Portfolio may frequently value many of its foreign equity securities using fair value prices based on third party vendor modeling tools to the extent available. Accordingly, a portion of the Portfolio’s investments are categorized as Level 2 investments.
See Accompanying Notes to Financial Statements
| VY® American Century | SUMMARY PORTFOLIO OF INVESTMENTS |
| Small-Mid Cap Value Portfolio | as of December 31, 2015 (continued) |
At December 31, 2015, the following forward foreign currency contracts were outstanding for VY® American Century Small-Mid Cap Value Portfolio:
| Counterparty | | | Currency | | | Contract Amount | | | Buy/Sell | | | Settlement Date | | | In Exchange For | | | Fair Value | | | Unrealized
Appreciation
(Depreciation) | |
| Credit Suisse Group AG | | | Japanese Yen | | | | | 88,604,526 | | | | | | Sell | | | | | | 01/29/16 | | | | | $ | 733,311 | | | | | $ | 737,569 | | | | | $ | (4,258) | | |
| JPMorgan Chase & Co. | | | Canadian Dollar | | | | | 198,003 | | | | | | Sell | | | | | | 01/29/16 | | | | | | 142,735 | | | | | | 143,104 | | | | | | (369) | | |
| JPMorgan Chase & Co. | | | Canadian Dollar | | | | | 4,172,482 | | | | | | Sell | | | | | | 01/29/16 | | | | | | 2,992,528 | | | | | | 3,015,616 | | | | | | (23,088) | | |
| UBS AG | | | EU Euro | | | | | 16,899 | | | | | | Sell | | | | | | 01/29/16 | | | | | | 18,366 | | | | | | 18,377 | | | | | | (11) | | |
| UBS AG | | | EU Euro | | | | | 18,080 | | | | | | Sell | | | | | | 01/29/16 | | | | | | 19,741 | | | | | | 19,662 | | | | | | 79 | | |
| UBS AG | | | EU Euro | | | | | 9,082 | | | | | | Sell | | | | | | 01/29/16 | | | | | | 9,942 | | | | | | 9,876 | | | | | | 66 | | |
| UBS AG | | | EU Euro | | | | | 18,774 | | | | | | Sell | | | | | | 01/29/16 | | | | | | 20,585 | | | | | | 20,416 | | | | | | 169 | | |
| UBS AG | | | EU Euro | | | | | 188,436 | | | | | | Sell | | | | | | 01/29/16 | | | | | | 206,590 | | | | | | 204,914 | | | | | | 1,676 | | |
| UBS AG | | | EU Euro | | | | | 1,626,457 | | | | | | Sell | | | | | | 01/29/16 | | | | | | 1,783,150 | | | | | | 1,768,683 | | | | | | 14,467 | | |
| | | | | | | | | | | | | | | | | | | | | | | | | | | | | | | | | | | | | | $ | (11,269) | | |
| |
A summary of derivative instruments by primary risk exposure is outlined in the following tables.
The fair value of derivative instruments as of December 31, 2015 was as follows:
| Derivatives not accounted for as hedging instruments | | | Location on Statement
of Assets and Liabilities | | | Fair Value | |
| Asset Derivatives | | | | | | | | | | |
| Foreign exchange contracts | | | Unrealized appreciation on forward foreign currency contracts | | | | $ | 16,457 | | |
| Total Asset Derivatives | | | | | | | $ | 16,457 | | |
| | | | | | | | | | | |
| Liability Derivatives | | | | | | | | | | |
| Foreign exchange contracts | | | Unrealized depreciation on forward foreign currency contracts | | | | $ | 27,726 | | |
| Total Liability Derivatives | | | | | | | $ | 27,726 | | |
| |
The effect of derivative instruments on the Portfolio’s Statement of Operations for the year ended December 31, 2015 was as follows:
| | | | Amount of Realized Gain or (Loss) on
Derivatives Recognized in Income | |
| Derivatives not accounted for as hedging instruments | | | Foreign currency
related transactions* | |
| Foreign exchange contracts | | | | $ | 1,084,816 | | |
| Total | | | | $ | 1,084,816 | | |
| |
| | | | Change in Unrealized Appreciation or (Depreciation)
on Derivatives Recognized in Income | |
| Derivatives not accounted for as hedging instruments | | | Foreign currency
related transactions* | |
| Foreign exchange contracts | | | | $ | (48,258) | | |
| Total | | | | $ | (48,258) | | |
| |
*
Amounts recognized for forward foreign currency contracts are included in net realized gain (loss) on foreign currency related transactions and net change in unrealized appreciation or depreciation on foreign currency related transactions.
See Accompanying Notes to Financial Statements
SUMMARY PORTFOLIO OF INVESTMENTS
| VY® Baron Growth Portfolio | as of December 31, 2015 |
| Shares | | | Value | | | Percentage
of Net
Assets | |
| COMMON STOCK: 99.2% | |
| | | | | | | Consumer Discretionary: 30.9% | |
| | | 2,790,684 | @ | | AO World PLC | | | | $ | 6,422,033 | | | | | | 0.7 | | |
| | | 429,000 | @ | | Bright Horizons Family
Solutions, Inc. | | | | | 28,657,200 | | | | | | 3.4 | | |
| | | 570,000 | | | | Choice Hotels International,
Inc. | | | | | 28,733,700 | | | | | | 3.4 | | |
| | | 400,000 | | | | Dick’s Sporting Goods, Inc. | | | | | 14,140,000 | | | | | | 1.7 | | |
| | | 761,383 | | | | Manchester United PLC -
Class A | | | | | 13,560,231 | | | | | | 1.6 | | |
| | | 167,500 | | | Marriott Vacations Worldwide
Corp. | | | | | 9,539,125 | | | | | | 1.1 | | |
| | | 157,000 | | | | Morningstar, Inc. | | | | | 12,624,370 | | | | | | 1.5 | | |
| | | 66,700 | @ | | Panera Bread Co. | | | | | 12,991,826 | | | | | | 1.5 | | |
| | | 400,380 | @ | | Penn National Gaming, Inc. | | | | | 6,414,088 | | | | | | 0.7 | | |
| | | 593,691 | @ | | Pinnacle Entertainment, Inc. | | | | | 18,475,664 | | | | | | 2.2 | | |
| | | 485,000 | @ | | Under Armour, Inc. | | | | | 39,095,850 | | | | | | 4.6 | | |
| | | 475,000 | | | | Vail Resorts, Inc. | | | | | 60,795,250 | | | | | | 7.2 | | |
| | | 601,985 | | | | Other Securities | | | | | 10,708,689 | | | | | | 1.3 | | |
| | | | | | | | | | | | 262,158,026 | | | | | | 30.9 | | |
| | | | | | | Consumer Staples: 7.5% | |
| | | 63,294 | @ | | Boston Beer Co., Inc. | | | | | 12,779,691 | | | | | | 1.5 | | |
| | | 192,000 | | | | Church & Dwight Co., Inc. | | | | | 16,296,960 | | | | | | 1.9 | | |
| | | 470,000 | @ | | Smart & Final Stores, Inc. | | | | | 8,558,700 | | | | | | 1.0 | | |
| | | 203,000 | @ | | TreeHouse Foods, Inc. | | | | | 15,927,380 | | | | | | 1.9 | | |
| | | 175,096 | @ | | United Natural Foods, Inc. | | | | | 6,891,779 | | | | | | 0.8 | | |
| | | 148,903 | | | | Other Securities | | | | | 3,445,615 | | | | | | 0.4 | | |
| | | | | | | | | | | | 63,900,125 | | | | | | 7.5 | | |
| | | | | | | Financials: 17.3% | |
| | | 17,500 | | | | Alexander’s, Inc. | | | | | 6,721,925 | | | | | | 0.8 | | |
| | | 82,000 | | | | Alexandria Real Estate
Equities, Inc. | | | | | 7,409,520 | | | | | | 0.9 | | |
| | | 195,000 | @ | | Arch Capital Group Ltd. | | | | | 13,601,250 | | | | | | 1.6 | | |
| | | 272,255 | | | | Artisan Partners Asset
Management, Inc. | | | | | 9,817,515 | | | | | | 1.2 | | |
| | | 335,000 | | | | Carlyle Group L.P. | | | | | 5,232,700 | | | | | | 0.6 | | |
| | | 420,000 | | | | Cohen & Steers, Inc. | | | | | 12,801,600 | | | | | | 1.5 | | |
| | | 474,170 | | | | Douglas Emmett, Inc. | | | | | 14,784,621 | | | | | | 1.7 | | |
| | | 297,229 | | | | Financial Engines, Inc. | | | | | 10,007,700 | | | | | | 1.2 | | |
| | | 504,411 | | | Gaming and Leisure
Properties, Inc. | | | | | 14,022,626 | | | | | | 1.6 | | |
| | | 161,498 | | | | Moelis & Co. | | | | | 4,712,512 | | | | | | 0.5 | | |
| | | 208,000 | | | | MSCI, Inc. - Class A | | | | | 15,003,040 | | | | | | 1.8 | | |
| | | 160,000 | | | | Oaktree Capital Group, LLC | | | | | 7,635,200 | | | | | | 0.9 | | |
| | | 390,000 | | | | Primerica, Inc. | | | | | 18,419,700 | | | | | | 2.2 | | |
| | | 222,500 | | | | Other Securities | | | | | 7,114,950 | | | | | | 0.8 | | |
| | | | | | | | | | | | 147,284,859 | | | | | | 17.3 | | |
| Shares | | | Value | | | Percentage
of Net
Assets | |
| COMMON STOCK: (continued) | |
| | | | | | | Health Care: 9.7% | |
| | | 105,000 | | | | Bio-Techne Corp. | | | | $ | 9,450,000 | | | | | | 1.1 | | |
| | | 244,400 | | | | Idexx Laboratories, Inc. | | | | | 17,821,648 | | | | | | 2.1 | | |
| | | 465,000 | @ | | Inovalon Holdings, Inc. | | | | | 7,905,000 | | | | | | 0.9 | | |
| | | 68,000 | @ | | Mettler Toledo International,
Inc. | | | | | 23,060,840 | | | | | | 2.7 | | |
| | | 130,000 | | | | West Pharmaceutical
Services, Inc. | | | | | 7,828,600 | | | | | | 0.9 | | |
| | | 518,127 | | | | Other Securities | | | | | 16,649,290 | | | | | | 2.0 | | |
| | | | | | | | | | | | 82,715,378 | | | | | | 9.7 | | |
| | | | | | | Industrials: 10.5% | |
| | | 230,000 | | | | Air Lease Corp. | | | | | 7,700,400 | | | | | | 0.9 | | |
| | | 157,000 | @ | | CoStar Group, Inc. | | | | | 32,450,330 | | | | | | 3.8 | | |
| | | 112,796 | @ | | Genesee & Wyoming, Inc. | | | | | 6,056,017 | | | | | | 0.7 | | |
| | | 318,000 | @ | | Middleby Corp. | | | | | 34,302,660 | | | | | | 4.1 | | |
| | | 282,500 | | | | Other Securities | | | | | 8,723,425 | | | | | | 1.0 | | |
| | | | | | | | | | | | 89,232,832 | | | | | | 10.5 | | |
| | | | | | | Information Technology: 18.1% | |
| | | 239,000 | @ | | Ansys, Inc. | | | | | 22,107,500 | | | | | | 2.6 | | |
| | | 300,448 | @ | | Benefitfocus, Inc. | | | | | 10,933,303 | | | | | | 1.3 | | |
| | | 417,500 | | | | Booz Allen Hamilton Holding
Corp. | | | | | 12,879,875 | | | | | | 1.5 | | |
| | | 85,000 | | | | Factset Research Systems,
Inc. | | | | | 13,818,450 | | | | | | 1.6 | | |
| | | 387,000 | @ | | Gartner, Inc. | | | | | 35,100,900 | | | | | | 4.1 | | |
| | | 165,000 | @ | | Guidewire Software, Inc. | | | | | 9,926,400 | | | | | | 1.2 | | |
| | | 400,000 | | | | MAXIMUS, Inc. | | | | | 22,500,000 | | | | | | 2.7 | | |
| | | 385,000 | | | | SS&C Technologies
Holdings, Inc. | | | | | 26,283,950 | | | | | | 3.1 | | |
| | | | | | | | | | | | 153,550,378 | | | | | | 18.1 | | |
| | | | | | | Materials: 2.1% | |
| | | 402,000 | @ | | Caesar Stone Sdot Yam Ltd. | | | | | 17,422,680 | | | | | | 2.1 | | |
| | | | | | | Telecommunication Services: 0.9% | |
| | | 921,311 | @ | | Iridium Communications, Inc. | | | | | 7,748,225 | | | | | | 0.9 | | |
| | | | | | | Utilities: 2.2% | |
| | | 480,000 | | | | ITC Holdings Corp. | | | | | 18,840,000 | | | | | | 2.2 | | |
| | | | | | | Total Common Stock
(Cost $415,110,941) | | | | | 842,852,503 | | | | | | 99.2 | | |
| SHORT-TERM INVESTMENTS: 1.2% | |
| | | | | | | Mutual Funds: 1.2% | |
| | | 9,848,887 | | | | BlackRock Liquidity Funds,
TempFund, Institutional
Class, 0.270%††
(Cost $9,848,887) | | | | | 9,848,887 | | | | | | 1.2 | | |
See Accompanying Notes to Financial Statements
SUMMARY PORTFOLIO OF INVESTMENTS
| VY® Baron Growth Portfolio | as of December 31, 2015 (continued) |
| Shares | | | Value | | | Percentage
of Net
Assets | |
| SHORT-TERM INVESTMENTS: (continued) | |
| | | | Total Short-Term
Investments
(Cost $9,848,887) | | | | $ | 9,848,887 | | | | | | 1.2 | | |
| | | | Total Investments in
Securities
(Cost $424,959,828) | | | | $ | 852,701,390 | | | | | | 100.4 | | |
| | | | Liabilities in Excess of
Other Assets | | | | | (3,253,860) | | | | | | (0.4) | | |
| | | | Net Assets | | | | $ | 849,447,530 | | | | | | 100.0 | | |
| |
“Other Securities” represents issues not identified as the top 50 holdings in terms of market value and issues or issuers not exceeding 1% of net assets individually or in aggregate respectively as of December 31, 2015.
The following footnotes apply to either the individual securities noted or one or more of the securities aggregated and listed as a single line item.
††
Rate shown is the 7-day yield as of December 31, 2015.
@
Non-income producing security.
Cost for federal income tax purposes is $426,668,976.
Net unrealized appreciation consists of:
| | Gross Unrealized Appreciation | | | | $ | 440,444,758 | | |
| | Gross Unrealized Depreciation | | | | | (14,412,344) | | |
| | Net Unrealized Appreciation | | | | $ | 426,032,414 | | |
| |
Fair Value Measurements^
The following is a summary of the fair valuations according to the inputs used as of December 31, 2015 in valuing the assets and liabilities:
| | | | Quoted Prices
in Active Markets
for Identical
Investments
(Level 1) | | | Significant
Other
Observable
Inputs
(Level 2) | | | Significant
Unobservable
Inputs
(Level 3) | | | Fair Value
at
December 31, 2015 | |
| Asset Table | | | | | |
| Investments, at fair value | | | | | |
| Common Stock* | | | | $ | 842,852,503 | | | | | $ | — | | | | | $ | — | | | | | $ | 842,852,503 | | |
| Short-Term Investments | | | | | 9,848,887 | | | | | | — | | | | | | — | | | | | | 9,848,887 | | |
| Total Investments, at fair value | | | | $ | 852,701,390 | | | | | $ | — | | | | | $ | — | | | | | $ | 852,701,390 | | |
| |
^
See Note 2, “Significant Accounting Policies” in the Notes to Financial Statements for additional information.
*
For further breakdown of Common Stock by sector, please refer to the Summary Portfolio of Investments.
See Accompanying Notes to Financial Statements
| VY® Columbia Contrarian | SUMMARY PORTFOLIO OF INVESTMENTS |
| Core Portfolio | as of December 31, 2015 |
| Shares | | | Value | | | Percentage
of Net
Assets | |
| COMMON STOCK: 98.7% | |
| | | | | | | Consumer Discretionary: 12.0% | |
| | | 84,310 | | | | CBS Corp. - Class B | | | | $ | 3,973,530 | | | | | | 1.2 | | |
| | | 104,195 | | | | Coach, Inc. | | | | | 3,410,302 | | | | | | 1.0 | | |
| | | 133,917 | | | | Comcast Corp. - Class A | | | | | 7,556,936 | | | | | | 2.2 | | |
| | | 58,768 | | | | Delphi Automotive PLC | | | | | 5,038,181 | | | | | | 1.5 | | |
| | | 84,724 | | | | Lowe’s Cos, Inc. | | | | | 6,442,413 | | | | | | 1.9 | | |
| | | 40,985 | | | | McDonald’s Corp. | | | | | 4,841,968 | | | | | | 1.4 | | |
| | | 223,274 | | | | Other Securities | | | | | 9,339,824 | | | | | | 2.8 | | |
| | | | | | | | | | | | 40,603,154 | | | | | | 12.0 | | |
| | | | | | | Consumer Staples: 7.9% | |
| | | 89,141 | | | | CVS Health Corp. | | | | | 8,715,315 | | | | | | 2.6 | | |
| | | 33,510 | | | | Diageo PLC ADR | | | | | 3,654,936 | | | | | | 1.1 | | |
| | | 63,638 | | | | PepsiCo, Inc. | | | | | 6,358,709 | | | | | | 1.9 | | |
| | | 47,140 | | | | Philip Morris International,
Inc. | | | | | 4,144,077 | | | | | | 1.2 | | |
| | | 76,287 | | | | Other Securities | | | | | 3,919,531 | | | | | | 1.1 | | |
| | | | | | | | | | | | 26,792,568 | | | | | | 7.9 | | |
| | | | | | | Energy: 5.5% | |
| | | 51,371 | | | | Chevron Corp. | | | | | 4,621,335 | | | | | | 1.4 | | |
| | | 75,795 | | | | Exxon Mobil Corp. | | | | | 5,908,220 | | | | | | 1.7 | | |
| | | 216,404 | | | | Other Securities | | | | | 8,198,369 | | | | | | 2.4 | | |
| | | | | | | | | | | | 18,727,924 | | | | | | 5.5 | | |
| | | | | | | Financials: 18.5% | |
| | | 75,275 | | | | American Express Co. | | | | | 5,235,376 | | | | | | 1.5 | | |
| | | 35,278 | | | | Aon PLC | | | | | 3,252,984 | | | | | | 1.0 | | |
| | | 317,823 | | | | Bank of America Corp. | | | | | 5,348,961 | | | | | | 1.6 | | |
| | | 108,116 | | | | Bank of New York Mellon
Corp. | | | | | 4,456,542 | | | | | | 1.3 | | |
| | | 68,097 | @ | | Berkshire Hathaway, Inc. -
Class B | | | | | 8,991,528 | | | | | | 2.6 | | |
| | | 15,674 | | | | Blackrock, Inc. | | | | | 5,337,311 | | | | | | 1.6 | | |
| | | 187,096 | | | | Citigroup, Inc. | | | | | 9,682,218 | | | | | | 2.9 | | |
| | | 141,408 | | | | JPMorgan Chase & Co. | | | | | 9,337,170 | | | | | | 2.8 | | |
| | | 124,315 | | | | Wells Fargo & Co. | | | | | 6,757,764 | | | | | | 2.0 | | |
| | | 52,684 | | | | Other Securities | | | | | 4,192,192 | | | | | | 1.2 | | |
| | | | | | | | | | | | 62,592,046 | | | | | | 18.5 | | |
| | | | | | | Health Care: 18.4% | |
| | | 112,570 | | | | Abbott Laboratories | | | | | 5,055,519 | | | | | | 1.5 | | |
| | | 11,270 | | | | Allergan plc | | | | | 3,521,875 | | | | | | 1.0 | | |
| | | 91,945 | | | | Baxalta, Inc. | | | | | 3,588,613 | | | | | | 1.1 | | |
| | | 14,770 | @ | | Biogen, Inc. | | | | | 4,524,790 | | | | | | 1.3 | | |
| | | 73,109 | | | | Cardinal Health, Inc. | | | | | 6,526,441 | | | | | | 1.9 | | |
| | | 30,564 | @ | | Celgene Corp. | | | | | 3,660,345 | | | | | | 1.1 | | |
| | | 28,603 | | | | Cigna Corp. | | | | | 4,185,477 | | | | | | 1.2 | | |
| | | 78,114 | | | | Johnson & Johnson | | | | | 8,023,870 | | | | | | 2.4 | | |
| | | 113,158 | @ | | Medtronic PLC | | | | | 8,704,113 | | | | | | 2.6 | | |
| | | 154,805 | | | | Pfizer, Inc. | | | | | 4,997,105 | | | | | | 1.5 | | |
| Shares | | | Value | | | Percentage
of Net
Assets | |
| COMMON STOCK: (continued) | |
| | | | | | | Health Care (continued) | |
| | | 21,521 | @ | | Vertex Pharmaceuticals, Inc. | | | | $ | 2,707,987 | | | | | | 0.8 | | |
| | | 25,295 | | | | Zimmer Biomet Holdings, Inc. | | | | | 2,595,014 | | | | | | 0.8 | | |
| | | 45,915 | | | | Other Securities | | | | | 4,034,426 | | | | | | 1.2 | | |
| | | | | | | | | | | | 62,125,575 | | | | | | 18.4 | | |
| | | | | | | Industrials: 9.6% | |
| | | 20,076 | | | | FedEx Corp. | | | | | 2,991,123 | | | | | | 0.9 | | |
| | | 226,800 | | | | General Electric Co. | | | | | 7,064,820 | | | | | | 2.1 | | |
| | | 60,877 | | | | Honeywell International, Inc. | | | | | 6,305,031 | | | | | | 1.9 | | |
| | | 136,925 | | | | Nielsen NV | | | | | 6,380,705 | | | | | | 1.9 | | |
| | | 26,840 | | | | United Technologies Corp. | | | | | 2,578,519 | | | | | | 0.7 | | |
| | | 135,821 | | | | Other Securities | | | | | 7,011,589 | | | | | | 2.1 | | |
| | | | | | | | | | | | 32,331,787 | | | | | | 9.6 | | |
| | | | | | | Information Technology: 21.2% | |
| | | 186,685 | | | | Activision Blizzard, Inc. | | | | | 7,226,577 | | | | | | 2.1 | | |
| | | 6,223 | @ | | Alphabet, Inc. - Class A | | | | | 4,841,556 | | | | | | 1.4 | | |
| | | 10,759 | | | | Alphabet, Inc. - Class C | | | | | 8,164,790 | | | | | | 2.4 | | |
| | | 107,416 | | | | Apple, Inc. | | | | | 11,306,608 | | | | | | 3.4 | | |
| | | 84,437 | | | | Broadcom Corp. | | | | | 4,882,147 | | | | | | 1.5 | | |
| | | 171,344 | | | | EMC Corp. | | | | | 4,400,114 | | | | | | 1.3 | | |
| | | 47,385 | @ | | Facebook, Inc. | | | | | 4,959,314 | | | | | | 1.5 | | |
| | | 178,398 | | | | Hewlett Packard Enterprise
Co. | | | | | 2,711,650 | | | | | | 0.8 | | |
| | | 49,475 | | | | Mastercard, Inc. | | | | | 4,816,886 | | | | | | 1.4 | | |
| | | 165,325 | | | | Microsoft Corp. | | | | | 9,172,231 | | | | | | 2.7 | | |
| | | 147,166 | | | | Other Securities | | | | | 9,033,490 | | | | | | 2.7 | | |
| | | | | | | | | | | | 71,515,363 | | | | | | 21.2 | | |
| | | | | | | Materials: 1.5% | |
| | | 49,910 | | | | Monsanto Co. | | | | | 4,917,133 | | | | | | 1.5 | | |
| | | | | | | Telecommunication Services: 2.7% | |
| | | 198,227 | | | | Verizon Communications,
Inc. | | | | | 9,162,052 | | | | | | 2.7 | | |
| | | | | | | Utilities: 1.4% | |
| | | 46,386 | | | | Edison International | | | | | 2,746,515 | | | | | | 0.8 | | |
| | | 24,310 | | | | Other Securities | | | | | 1,949,419 | | | | | | 0.6 | | |
| | | | | | | | | | | | 4,695,934 | | | | | | 1.4 | | |
| | | | | | | Total Common Stock
(Cost $297,516,833) | | | | | 333,463,536 | | | | | | 98.7 | | |
| |
Principal
Amount† | | | Value | | | Percentage
of Net
Assets | |
| CORPORATE BONDS/NOTES: —% | |
| | | | | | | Materials: —% | |
| | | 649,000 | | | | Other Securities | | | | | — | | | | | | — | | |
| | | | | | | Total Corporate
Bonds/Notes
(Cost $—) | | | | | — | | | | | | — | | |
| |
See Accompanying Notes to Financial Statements
| VY® Columbia Contrarian | SUMMARY PORTFOLIO OF INVESTMENTS |
| Core Portfolio | as of December 31, 2015 (continued) |
Principal
Amount† | | | Value | | | Percentage
of Net
Assets | |
| CORPORATE BONDS/NOTES: (continued) | |
| | | | Total Investments in
Securities
(Cost $297,516,833) | | | | $ | 333,463,536 | | | | | | 98.7 | | |
| | | | Assets in Excess of
Other Liabilities | | | | | 4,253,963 | | | | | | 1.3 | | |
| | | | Net Assets | | | | $ | 337,717,499 | | | | | | 100.0 | | |
| |
“Other Securities” represents issues not identified as the top 50 holdings in terms of market value and issues or issuers not exceeding 1% of net assets individually or in aggregate respectively as of December 31, 2015.
The following footnotes apply to either the individual securities noted or one or more of the securities aggregated and listed as a single line item.
†
Unless otherwise indicated, principal amount is shown in USD.
@
Non-income producing security.
ADR American Depositary Receipt
Cost for federal income tax purposes is $298,302,666.
Net unrealized appreciation consists of:
| | Gross Unrealized Appreciation | | | | $ | 44,287,089 | | |
| | Gross Unrealized Depreciation | | | | | (9,126,219) | | |
| | Net Unrealized Appreciation | | | | $ | 35,160,870 | | |
| |
Fair Value Measurements^
The following is a summary of the fair valuations according to the inputs used as of December 31, 2015 in valuing the assets and liabilities:
| | | | Quoted Prices
in Active Markets
for Identical
Investments
(Level 1) | | | Significant
Other
Observable
Inputs
(Level 2) | | | Significant
Unobservable
Inputs
(Level 3) | | | Fair Value
at
December 31, 2015 | |
| Asset Table | | | | | | | | | | | | | | | | | | | | | | | | | |
| Investments, at fair value | | | | | | | | | | | | | | | | | | | | | | | | | |
| Common Stock* | | | | $ | 333,463,536 | | | | | $ | — | | | | | $ | — | | | | | $ | 333,463,536 | | |
| Corporate Bonds/Notes | | | | | — | | | | | | — | | | | | | — | | | | | | — | | |
| Total Investments, at fair value | | | | $ | 333,463,536 | | | | | $ | — | | | | | $ | — | | | | | $ | 333,463,536 | | |
| |
^
See Note 2, “Significant Accounting Policies” in the Notes to Financial Statements for additional information.
*
For further breakdown of Common Stock by sector, please refer to the Summary Portfolio of Investments.
See Accompanying Notes to Financial Statements
| VY® Columbia Small Cap | SUMMARY PORTFOLIO OF INVESTMENTS |
| Value II Portfolio | as of December 31, 2015 |
| | Shares | | | Value | | | Percentage
of Net
Assets | |
| | COMMON STOCK: 97.7% | |
| | | | | | | | Consumer Discretionary: 11.6% | |
| | | | 122,000 | | | | American Eagle Outfitters | | | | $ | 1,891,000 | | | | | | 0.9 | | |
| | | | 52,993 | | | | CalAtlantic Group, Inc. | | | | | 2,009,495 | | | | | | 0.9 | | |
| | | | 24,000 | @ | | Helen of Troy Ltd. | | | | | 2,262,000 | | | | | | 1.1 | | |
| | | | 94,000 | @ | | Nord Anglia Education, Inc. | | | | | 1,906,320 | | | | | | 0.9 | | |
| | | | 63,000 | | | | Sinclair Broadcast Group, Inc. | | | | | 2,050,020 | | | | | | 1.0 | | |
| | | | 63,857 | | | | Tower International, Inc. | | | | | 1,824,394 | | | | | | 0.9 | | |
| | | | 776,000 | | | | Other Securities | | | | | 12,561,860 | | | | | | 5.9 | | |
| | | | | | | | | | | | | 24,505,089 | | | | | | 11.6 | | |
| | | | | | | | Consumer Staples: 3.4% | |
| | | | 31,000 | @ | | TreeHouse Foods, Inc. | | | | | 2,432,260 | | | | | | 1.1 | | |
| | | | 346,000 | | | | Other Securities | | | | | 4,835,860 | | | | | | 2.3 | | |
| | | | | | | | | | | | | 7,268,120 | | | | | | 3.4 | | |
| | | | | | | | Energy: 4.9% | |
| | | | 123,000 | | | | Patterson-UTI Energy, Inc. | | | | | 1,854,840 | | | | | | 0.9 | | |
| | | | 588,000 | | | | Other Securities | | | | | 8,367,960 | | | | | | 4.0 | | |
| | | | | | | | | | | | | 10,222,800 | | | | | | 4.9 | | |
| | | | | | | | Financials: 38.2% | |
| | | | 66,000 | | | | American Assets Trust, Inc. | | | | | 2,531,100 | | | | | | 1.2 | | |
| | | | 80,000 | | | | American Equity Investment
Life Holding Co. | | | | | 1,922,400 | | | | | | 0.9 | | |
| | | | 65,000 | | | | Ameris Bancorp. | | | | | 2,209,350 | | | | | | 1.0 | | |
| | | | 60,000 | | | | Amerisafe, Inc. | | | | | 3,054,000 | | | | | | 1.5 | | |
| | | | 32,000 | | | | Amtrust Financial Services,
Inc. | | | | | 1,970,560 | | | | | | 0.9 | | |
| | | | 50,831 | | | | Argo Group International
Holdings Ltd. | | | | | 3,041,727 | | | | | | 1.4 | | |
| | | | 126,000 | | | | CNO Financial Group, Inc. | | | | | 2,405,340 | | | | | | 1.1 | | |
| | | | 71,000 | | | | Community Bank System, Inc. | | | | | 2,835,740 | | | | | | 1.3 | | |
| | | | 97,000 | | | | CubeSmart | | | | | 2,970,140 | | | | | | 1.4 | | |
| | | | 68,000 | @ | | Customers Bancorp, Inc. | | | | | 1,850,960 | | | | | | 0.9 | | |
| | | | 123,000 | | | | EverBank Financial Corp. | | | | | 1,965,540 | | | | | | 0.9 | | |
| | | | 67,000 | | | | First American Financial Corp. | | | | | 2,405,300 | | | | | | 1.1 | | |
| | | | 110,000 | | | | First Industrial Realty Trust,
Inc. | | | | | 2,434,300 | | | | | | 1.2 | | |
| | | | 125,000 | | | | FirstMerit Corp. | | | | | 2,331,250 | | | | | | 1.1 | | |
| | | | 53,000 | | | | Highwoods Properties, Inc. | | | | | 2,310,800 | | | | | | 1.1 | | |
| | | | 65,000 | | | | Independent Bank Corp. | | | | | 3,023,800 | | | | | | 1.4 | | |
| | | | 66,000 | | | | PrivateBancorp, Inc. | | | | | 2,707,320 | | | | | | 1.3 | | |
| | | | 83,000 | | | | Renasant Corp. | | | | | 2,856,030 | | | | | | 1.4 | | |
| | | | 83,000 | | | | Sandy Spring Bancorp, Inc. | | | | | 2,237,680 | | | | | | 1.1 | | |
| | | | 195,000 | | | | Sterling Bancorp/DE | | | | | 3,162,900 | | | | | | 1.5 | | |
| | | | 107,000 | | | | Union Bankshares Corp. | | | | | 2,700,680 | | | | | | 1.3 | | |
| | | | 89,000 | | | | Virtu Financial, Inc. | | | | | 2,014,960 | | | | | | 1.0 | | |
| | | | 76,000 | @ | | Western Alliance Bancorp. | | | | | 2,725,360 | | | | | | 1.3 | | |
| | | | 212,800 | | | | Wilshire Bancorp., Inc. | | | | | 2,457,840 | | | | | | 1.2 | | |
| | | | 39,000 | | | | Wintrust Financial Corp. | | | | | 1,892,280 | | | | | | 0.9 | | |
| | Shares | | | Value | | | Percentage
of Net
Assets | |
| | COMMON STOCK: (continued) | |
| | | | | | | | Financials (continued) | |
| | | | 805,300 | | | | Other Securities | | | | $ | 18,584,633 | | | | | | 8.8 | | |
| | | | | | | | | | | | | 80,601,990 | | | | | | 38.2 | | |
| | | | | | | | Health Care: 6.3% | |
| | | | 70,000 | @ | | Globus Medical Inc | | | | | 1,947,400 | | | | | | 0.9 | | |
| | | | 47,500 | @ | | LHC Group, Inc. | | | | | 2,151,275 | | | | | | 1.0 | | |
| | | | 83,500 | @ | | PharMerica Corp. | | | | | 2,922,500 | | | | | | 1.4 | | |
| | | | 48,000 | @ | | VCA, Inc. | | | | | 2,640,000 | | | | | | 1.3 | | |
| | | | 75,000 | | | | Other Securities | | | | | 3,526,170 | | | | | | 1.7 | | |
| | | | | | | | | | | | | 13,187,345 | | | | | | 6.3 | | |
| | | | | | | | Industrials: 13.4% | |
| | | | 63,000 | @ | | Beacon Roofing Supply, Inc. | | | | | 2,594,340 | | | | | | 1.2 | | |
| | | | 37,000 | | | | Deluxe Corp. | | | | | 2,017,980 | | | | | | 1.0 | | |
| | | | 50,600 | | | | EMCOR Group, Inc. | | | | | 2,430,824 | | | | | | 1.1 | | |
| | | | 922,932 | | | | Other Securities | | | | | 21,221,861 | | | | | | 10.1 | | |
| | | | | | | | | | | | | 28,265,005 | | | | | | 13.4 | | |
| | | | | | | | Information Technology: 10.8% | |
| | | | 175,000 | | | | Cypress Semiconductor Corp. | | | | | 1,716,750 | | | | | | 0.8 | | |
| | | | 133,000 | @ | | Fairchild Semiconductor
International, Inc. | | | | | 2,754,430 | | | | | | 1.3 | | |
| | | | 121,000 | @ | | II-VI, Inc. | | | | | 2,245,760 | | | | | | 1.1 | | |
| | | | 158,000 | @ | | Kulicke & Soffa Industries,
Inc. | | | | | 1,843,860 | | | | | | 0.9 | | |
| | | | 60,500 | @ | | Take-Two Interactive
Software, Inc. | | | | | 2,107,820 | | | | | | 1.0 | | |
| | | | 457,200 | | | | Other Securities | | | | | 12,127,627 | | | | | | 5.7 | | |
| | | | | | | | | | | | | 22,796,247 | | | | | | 10.8 | | |
| | | | | | | | Materials: 4.6% | |
| | | | 39,704 | | | | Neenah Paper, Inc. | | | | | 2,478,721 | | | | | | 1.2 | | |
| | | | 320,400 | | | | Other Securities | | | | ��� | 7,306,344 | | | | | | 3.4 | | |
| | | | | | | | | | | | | 9,785,065 | | | | | | 4.6 | | |
| | | | | | | | Utilities: 4.5% | |
| | | | 80,000 | | | | Avista Corp. | | | | | 2,829,600 | | | | | | 1.3 | | |
| | | | 72,000 | | | | New Jersey Resources Corp. | | | | | 2,373,120 | | | | | | 1.1 | | |
| | | | 79,000 | | | | South Jersey Industries, Inc. | | | | | 1,858,080 | | | | | | 0.9 | | |
| | | | 45,000 | | | | Southwest Gas Corp. | | | | | 2,482,200 | | | | | | 1.2 | | |
| | | | | | | | | | | | | 9,543,000 | | | | | | 4.5 | | |
| | | | | | | | Total Common Stock
(Cost $187,735,670) | | | | | 206,174,661 | | | | | | 97.7 | | |
| | SHORT-TERM INVESTMENTS: 2.4% | |
| | | | | | | | Mutual Funds: 2.4% | |
| | | | 5,109,137 | | | | BlackRock Liquidity
Funds, TempFund,
Institutional Class,
0.270%††
(Cost $5,109,137) | | | | | 5,109,137 | | | | | | 2.4 | | |
See Accompanying Notes to Financial Statements
| VY® Columbia Small Cap | SUMMARY PORTFOLIO OF INVESTMENTS |
| Value II Portfolio | as of December 31, 2015 (continued) |
| Shares | | | Value | | | Percentage
of Net
Assets | |
| SHORT-TERM INVESTMENTS (continued) | |
| | | | Total Short-Term
Investments
(Cost $5,109,137) | | | | $ | 5,109,137 | | | | | | 2.4 | | |
| | | | Total Investments in
Securities
(Cost $192,844,807) | | | | $ | 211,283,798 | | | | | | 100.1 | | |
| | | | Liabilities in Excess of
Other Assets | | | | | (313,809) | | | | | | (0.1) | | |
| | | | Net Assets | | | | $ | 210,969,989 | | | | | | 100.0 | | |
| |
“Other Securities” represents issues not identified as the top 50 holdings in terms of market value and issues or issuers not
exceeding 1% of net assets individually or in aggregate respectively as of December 31, 2015.
The following footnotes apply to either the individual securities noted or one or more of the securities aggregated and listed as a single line item.
††
Rate shown is the 7-day yield as of December 31, 2015.
@
Non-income producing security.
Cost for federal income tax purposes is $193,092,206.
Net unrealized appreciation consists of:
| | Gross Unrealized Appreciation | | | | $ | 31,479,713 | | |
| | Gross Unrealized Depreciation | | | | | (13,288,121) | | |
| | Net Unrealized Appreciation | | | | $ | 18,191,592 | | |
| |
Fair Value Measurements^
The following is a summary of the fair valuations according to the inputs used as of December 31, 2015 in valuing the assets and liabilities:
| | | | Quoted Prices
in Active Markets
for Identical
Investments
(Level 1) | | | Significant
Other
Observable
Inputs
(Level 2) | | | Significant
Unobservable
Inputs
(Level 3) | | | Fair Value
at
December 31, 2015 | |
| Asset Table | | | | | |
| Investments, at fair value | | | | | |
| Common Stock* | | | | $ | 206,174,661 | | | | | $ | — | | | | | $ | — | | | | | $ | 206,174,661 | | |
| Short-Term Investments | | | | | 5,109,137 | | | | | | — | | | | | | — | | | | | | 5,109,137 | | |
| Total Investments, at fair value | | | | $ | 211,283,798 | | | | | $ | — | | | | | $ | — | | | | | $ | 211,283,798 | | |
| |
^
See Note 2, “Significant Accounting Policies” in the Notes to Financial Statements for additional information.
*
For further breakdown of Common Stock by sector, please refer to the Summary Portfolio of Investments.
See Accompanying Notes to Financial Statements
SUMMARY PORTFOLIO OF INVESTMENTS
| VY® Invesco Comstock Portfolio | as of December 31, 2015 |
| Shares | | | Value | | | Percentage
of Net
Assets | |
| COMMON STOCK: 94.9% | |
| | | | | | | Consumer Discretionary: 14.7% | |
| | | 285,248 | | | | Carnival Corp. | | | | $ | 15,540,311 | | | | | | 2.9 | | |
| | | 146,887 | | | | Comcast Corp. - Class A | | | | | 8,288,833 | | | | | | 1.6 | | |
| | | 291,956 | | | | General Motors Co. | | | | | 9,929,424 | | | | | | 1.9 | | |
| | | 222,481 | | | | Johnson Controls, Inc. | | | | | 8,785,775 | | | | | | 1.6 | | |
| | | 137,870 | | | | Kohl’s Corp. | | | | | 6,566,748 | | | | | | 1.2 | | |
| | | 82,409 | | | | Target Corp. | | | | | 5,983,718 | | | | | | 1.1 | | |
| | | 29,185 | | | | Time Warner Cable, Inc. | | | | | 5,416,444 | | | | | | 1.0 | | |
| | | 33,861 | | | | Time Warner, Inc. | | | | | 2,189,791 | | | | | | 0.4 | | |
| | | 220,414 | | | | Twenty-First Century Fox,
Inc. Class B | | | | | 6,001,873 | | | | | | 1.1 | | |
| | | 140,503 | | | | Viacom, Inc. Class B | | | | | 5,783,103 | | | | | | 1.1 | | |
| | | 118,242 | | | | Other Securities | | | | | 4,183,709 | | | | | | 0.8 | | |
| | | | | | | | | | | | 78,669,729 | | | | | | 14.7 | | |
| | | | | | | Consumer Staples: 4.7% | |
| | | 205,054 | | | | Coca-Cola Co. | | | | | 8,809,120 | | | | | | 1.7 | | |
| | | 80,061 | | | | Wal-Mart Stores, Inc. | | | | | 4,907,739 | | | | | | 0.9 | | |
| | | 232,901 | | | | Other Securities | | | | | 11,401,077 | | | | | | 2.1 | | |
| | | | | | | | | | | | 25,117,936 | | | | | | 4.7 | | |
| | | | | | | Energy: 13.0% | |
| | | 266,621 | | | | BP PLC ADR | | | | | 8,334,572 | | | | | | 1.6 | | |
| | | 88,879 | | | | Chevron Corp. | | | | | 7,995,555 | | | | | | 1.5 | | |
| | | 69,765 | | | | Occidental Petroleum Corp. | | | | | 4,716,812 | | | | | | 0.9 | | |
| | | 202,359 | @ | | Royal Dutch Shell PLC -
Class A ADR | | | | | 9,266,019 | | | | | | 1.7 | | |
| | | 434,465 | | | | Suncor Energy, Inc. | | | | | 11,209,197 | | | | | | 2.1 | | |
| | | 974,333 | @ | | Weatherford International
PLC | | | | | 8,174,654 | | | | | | 1.5 | | |
| | | 862,577 | | | | Other Securities(a) | | | | | 19,710,710 | | | | | | 3.7 | | |
| | | | | | | | | | | | 69,407,519 | | | | | | 13.0 | | |
| | | | | | | Financials: 28.3% | |
| | | 107,455 | | | | Aflac, Inc. | | | | | 6,436,554 | | | | | | 1.2 | | |
| | | 107,466 | | | | Allstate Corp. | | | | | 6,672,564 | | | | | | 1.2 | | |
| | | 287,340 | @ | | Ally Financial, Inc. | | | | | 5,356,018 | | | | | | 1.0 | | |
| | | 951,010 | | | | Bank of America Corp. | | | | | 16,005,498 | | | | | | 3.0 | | |
| | | 146,943 | | | | Bank of New York Mellon
Corp. | | | | | 6,056,990 | | | | | | 1.1 | | |
| | | 496,522 | | | | Citigroup, Inc. | | | | | 25,695,014 | | | | | | 4.8 | | |
| | | 392,554 | | | | Fifth Third Bancorp | | | | | 7,890,335 | | | | | | 1.5 | | |
| | | 29,760 | | | | Goldman Sachs Group, Inc. | | | | | 5,363,645 | | | | | | 1.0 | | |
| | | 306,416 | | | | JPMorgan Chase & Co. | | | | | 20,232,648 | | | | | | 3.8 | | |
| | | 159,461 | | | | Metlife, Inc. | | | | | 7,687,615 | | | | | | 1.4 | | |
| | | 263,453 | | | | Morgan Stanley | | | | | 8,380,440 | | | | | | 1.6 | | |
| | | 99,621 | | | | PNC Financial Services
Group, Inc. | | | | | 9,494,878 | | | | | | 1.8 | | |
| | | 130,098 | | | | State Street Corp. | | | | | 8,633,303 | | | | | | 1.6 | | |
| | | 205,886 | | | | Wells Fargo & Co. | | | | | 11,191,963 | | | | | | 2.1 | | |
| | | 214,348 | | | | Other Securities | | | | | 6,469,861 | | | | | | 1.2 | | |
| | | | | | | | | | | | 151,567,326 | | | | | | 28.3 | | |
| | | | | | | Health Care: 11.0% | |
| | | 36,503 | | | | Anthem, Inc. | | | | | 5,089,978 | | | | | | 0.9 | | |
| | | 54,001 | @ | | Express Scripts Holding Co. | | | | | 4,720,227 | | | | | | 0.9 | | |
| Shares | | | Value | | | Percentage
of Net
Assets | |
| COMMON STOCK: (continued) | |
| | | | | | | Health Care (continued) | |
| | | 199,703 | | | | Merck & Co., Inc. | | | | $ | 10,548,313 | | | | | | 2.0 | | |
| | | 83,902 | | | | Novartis AG | | | | | 7,217,189 | | | | | | 1.3 | | |
| | | 285,385 | | | | Pfizer, Inc. | | | | | 9,212,228 | | | | | | 1.7 | | |
| | | 139,867 | | | | Roche Holding AG ADR | | | | | 4,821,216 | | | | | | 0.9 | | |
| | | 159,237 | | | | Sanofi-Aventis SA ADR | | | | | 6,791,458 | | | | | | 1.3 | | |
| | | 181,197 | | | | Other Securities | | | | | 10,727,319 | | | | | | 2.0 | | |
| | | | | | | | | | | | 59,127,928 | | | | | | 11.0 | | |
| | | | | | | Industrials: 6.9% | |
| | | 108,592 | | | | Caterpillar, Inc. | | | | | 7,379,912 | | | | | | 1.4 | | |
| | | 159,152 | | | | Emerson Electric Co. | | | | | 7,612,240 | | | | | | 1.4 | | |
| | | 398,910 | | | | General Electric Co. | | | | | 12,426,046 | | | | | | 2.3 | | |
| | | 148,773 | | | | Textron, Inc. | | | | | 6,249,954 | | | | | | 1.2 | | |
| | | 56,244 | | | | Other Securities | | | | | 3,109,731 | | | | | | 0.6 | | |
| | | | | | | | | | | | 36,777,883 | | | | | | 6.9 | | |
| | | | | | | Information Technology: 12.8% | |
| | | 466,738 | | | | Cisco Systems, Inc. | | | | | 12,674,270 | | | | | | 2.4 | | |
| | | 255,299 | | | | eBay, Inc. | | | | | 7,015,617 | | | | | | 1.3 | | |
| | | 153,868 | | | | Intel Corp. | | | | | 5,300,753 | | | | | | 1.0 | | |
| | | 162,036 | | | | Microsoft Corp. | | | | | 8,989,757 | | | | | | 1.7 | | |
| | | 284,639 | | | | NetApp, Inc. | | | | | 7,551,473 | | | | | | 1.4 | | |
| | | 142,325 | @ | | PayPal Holdings, Inc. | | | | | 5,152,165 | | | | | | 1.0 | | |
| | | 364,562 | | | | Symantec Corp. | | | | | 7,655,802 | | | | | | 1.4 | | |
| | | 614,070 | | | | Other Securities | | | | | 13,914,280 | | | | | | 2.6 | | |
| | | | | | | | | | | | 68,254,117 | | | | | | 12.8 | | |
| | | | | | | Materials: 1.7% | |
| | | 127,108 | | | | International Paper Co. | | | | | 4,791,972 | | | | | | 0.9 | | |
| | | 441,529 | | | | Other Securities | | | | | 4,357,891 | | | | | | 0.8 | | |
| | | | | | | | | | | | 9,149,863 | | | | | | 1.7 | | |
| | | | | | | Telecommunication Services: 0.7% | |
| | | 846,306 | | | | Other Securities | | | | | 3,952,249 | | | | | | 0.7 | | |
| | | | | | | Utilities: 1.1% | |
| | | 141,135 | | | | Other Securities | | | | | 5,880,646 | | | | | | 1.1 | | |
| | | | | | | Total Common Stock
(Cost $466,305,430) | | | | | 507,905,196 | | | | | | 94.9 | | |
| |
Principal
Amount† | | | Value | | | Percentage
of Net
Assets | |
| SHORT-TERM INVESTMENTS: 5.3% | |
| | | | | | | Securities Lending Collateralcc: 0.5% | |
| | | 490,134 | | | | HSBC Securities USA,
Repurchase Agreement
dated 12/31/15, 0.29%, due
01/04/16 (Repurchase
Amount $490,150,
collateralized by various
U.S. Government Securities,
3.000%, Market Value plus
accrued interest $499,938,
due 11/15/44) | | | | | 490,134 | | | | | | 0.1 | | |
See Accompanying Notes to Financial Statements
SUMMARY PORTFOLIO OF INVESTMENTS
| VY® Invesco Comstock Portfolio | as of December 31, 2015 (continued) |
| | Principal
Amount† | | | Value | | | Percentage
of Net
Assets | |
| | SHORT-TERM INVESTMENTS (continued) | |
| | | | | | | | Securities Lending Collateralcc (continued) | |
| | | | 1,000,000 | | | | Millenium Fixed Income Ltd.,
Repurchase Agreement
dated 12/31/15, 0.37%, due
01/04/16 (Repurchase
Amount $1,000,041,
collateralized by various
U.S. Government Securities,
1.500%-3.625%, Market
Value plus accrued interest
$1,020,000, due
03/31/21-02/15/44) | | | | $ | 1,000,000 | | | | | | 0.2 | | |
| | | | 1,000,000 | | | | Nomura Securities,
Repurchase Agreement
dated 12/31/15, 0.33%, due
01/04/16 (Repurchase
Amount $1,000,036,
collateralized by various
U.S. Government/U.S.
Government Agency
Obligations,
0.000%-10.500%, Market
Value plus accrued interest
$1,020,000, due
01/15/16-10/20/65) | | | | | 1,000,000 | | | | | | 0.2 | | |
| | | | | | | | | | | | | 2,490,134 | | | | | | 0.5 | | |
| Shares | | | Value | | | Percentage
of Net
Assets | |
| | | | | | | Mutual Funds: 4.8% | |
| | | 26,009,739 | | | | BlackRock Liquidity Funds,
TempFund, Institutional Class,
0.270%††
(Cost $26,009,739) | | | | | 26,009,739 | | | | | | 4.8 | | |
| | | | | | | Total Short-Term
Investments
(Cost $28,499,873) | | | | $ | 28,499,873 | | | | | | 5.3 | | |
| |
| Shares | | | Value | | | Percentage
of Net
Assets | |
| | | | Mutual Funds (continued) | |
| | | | Total Investments in
Securities
(Cost $494,805,303) | | | | $ | 536,405,069 | | | | | | 100.2 | | |
| | | | Liabilities in Excess of
Other Assets | | | | | (859,468) | | | | | | (0.2) | | |
| | | | Net Assets | | | | $ | 535,545,601 | | | | | | 100.0 | | |
| |
“Other Securities” represents issues not identified as the top 50 holdings in terms of market value and issues or issuers not exceeding 1% of net assets individually or in aggregate respectively as of December 31, 2015.
The following footnotes apply to either the individual securities noted or one or more of the securities aggregated and listed as a single line item.
†
Unless otherwise indicated, principal amount is shown in USD.
††
Rate shown is the 7-day yield as of December 31, 2015.
@
Non-income producing security.
ADR American Depositary Receipt
cc
Represents securities purchased with cash collateral received for securities on loan.
(a)
This grouping contains securities on loan.
Cost for federal income tax purposes is $505,619,061.
Net unrealized appreciation consists of:
| | Gross Unrealized Appreciation | | | | $ | 79,898,562 | | |
| | Gross Unrealized Depreciation | | | | | (49,112,554) | | |
| | Net Unrealized Appreciation | | | | $ | 30,786,008 | | |
| |
Fair Value Measurements^
The following is a summary of the fair valuations according to the inputs used as of December 31, 2015 in valuing the assets and liabilities:
| | | | Quoted Prices
in Active Markets
for Identical
Investments
(Level 1) | | | Significant
Other
Observable
Inputs#
(Level 2) | | | Significant
Unobservable
Inputs
(Level 3) | | | Fair Value
at
December 31, 2015 | |
| Asset Table | | | | | | | | | | | | | | | | | | | | | | | | | |
| Investments, at fair value | | | | | | | | | | | | | | | | | | | | | | | | | |
| Common Stock | | | | | |
| Consumer Discretionary | | | | $ | 78,669,729 | | | | | $ | — | | | | | $ | — | | | | | $ | 78,669,729 | | |
| Consumer Staples | | | | | 25,117,936 | | | | | | — | | | | | | — | | | | | | 25,117,936 | | |
See Accompanying Notes to Financial Statements
SUMMARY PORTFOLIO OF INVESTMENTS
| VY® Invesco Comstock Portfolio | as of December 31, 2015 (continued) |
| | | | Quoted Prices
in Active Markets
for Identical
Investments
(Level 1) | | | Significant
Other
Observable
Inputs#
(Level 2) | | | Significant
Unobservable
Inputs
(Level 3) | | | Fair Value
at
December 31, 2015 | |
| Energy | | | | | 69,407,519 | | | | | | — | | | | | | — | | | | | | 69,407,519 | | |
| Financials | | | | | 151,567,326 | | | | | | — | | | | | | — | | | | | | 151,567,326 | | |
| Health Care | | | | | 51,910,739 | | | | | | 7,217,189 | | | | | | — | | | | | | 59,127,928 | | |
| Industrials | | | | | 36,777,883 | | | | | | — | | | | | | — | | | | | | 36,777,883 | | |
| Information Technology | | | | | 68,254,117 | | | | | | — | | | | | | — | | | | | | 68,254,117 | | |
| Materials | | | | | 9,149,863 | | | | | | — | | | | | | — | | | | | | 9,149,863 | | |
| Telecommunication Services | | | | | 3,952,249 | | | | | | — | | | | | | — | | | | | | 3,952,249 | | |
| Utilities | | | | | 5,880,646 | | | | | | — | | | | | | — | | | | | | 5,880,646 | | |
| Total Common Stock | | | | | 500,688,007 | | | | | | 7,217,189 | | | | | | — | | | | | | 507,905,196 | | |
| Short-Term Investments | | | | | 26,009,739 | | | | | | 2,490,134 | | | | | | — | | | | | | 28,499,873 | | |
| Total Investments, at fair value | | | | $ | 526,697,746 | | | | | $ | 9,707,323 | | | | | $ | — | | | | | $ | 536,405,069 | | |
| Other Financial Instruments+ | | | | | |
| Forward Foreign Currency Contracts | | | | | — | | | | | | 648,775 | | | | | | — | | | | | | 648,775 | | |
| Total Assets | | | | $ | 526,697,746 | | | | | $ | 10,356,098 | | | | | $ | — | | | | | $ | 537,053,844 | | |
| |
^
See Note 2, “Significant Accounting Policies” in the Notes to Financial Statements for additional information.
+
Other Financial Instruments are derivatives not reflected in the portfolio of investments and may include open forward foreign currency contracts, futures, centrally cleared swaps, OTC swaps and written options. Forward foreign currency contracts, futures and centrally cleared swaps are valued at the unrealized gain (loss) on the instrument. OTC swaps and written options are valued at the fair value of the instrument.
#
The earlier close of the foreign markets gives rise to the possibility that significant events, including broad market moves, may have occurred in the interim and may materially affect the value of those securities. To account for this, the Portfolio may frequently value many of its foreign equity securities using fair value prices based on third party vendor modeling tools to the extent available. Accordingly, a portion of the Portfolio’s investments are categorized as Level 2 investments.
At December 31, 2015, the following forward foreign currency contracts were outstanding for VY® Invesco Comstock Portfolio:
| Counterparty | | | Currency | | | Contract Amount | | | Buy/Sell | | | Settlement Date | | | In Exchange For | | | Fair Value | | | Unrealized
Appreciation
(Depreciation) | |
| Barclays Bank PLC | | | EU Euro | | | | | 2,793,472 | | | | | | Sell | | | | | | 01/22/16 | | | | | $ | 3,075,588 | | | | | $ | 3,037,209 | | | | | $ | 38,379 | | |
| CIBC World Markets | | | Swiss Franc | | | | | 2,404,386 | | | | | | Sell | | | | | | 01/22/16 | | | | | | 2,444,227 | | | | | | 2,402,417 | | | | | | 41,810 | | |
| CIBC World Markets | | | British Pound | | | | | 1,432,620 | | | | | | Sell | | | | | | 01/22/16 | | | | | | 2,167,841 | | | | | | 2,112,093 | | | | | | 55,748 | | |
| CIBC World Markets | | | EU Euro | | | | | 2,793,471 | | | | | | Sell | | | | | | 01/22/16 | | | | | | 3,074,494 | | | | | | 3,037,207 | | | | | | 37,287 | | |
| CIBC World Markets | | | Canadian Dollar | | | | | 3,265,570 | | | | | | Sell | | | | | | 01/22/16 | | | | | | 2,377,035 | | | | | | 2,360,120 | | | | | | 16,915 | | |
| Deutsche Bank AG | | | Swiss Franc | | | | | 2,404,242 | | | | | | Sell | | | | | | 01/22/16 | | | | | | 2,443,410 | | | | | | 2,402,273 | | | | | | 41,137 | | |
| Deutsche Bank AG | | | EU Euro | | | | | 2,793,471 | | | | | | Sell | | | | | | 01/22/16 | | | | | | 3,075,248 | | | | | | 3,037,207 | | | | | | 38,041 | | |
| Deutsche Bank AG | | | Canadian Dollar | | | | | 3,242,250 | | | | | | Sell | | | | | | 01/22/16 | | | | | | 2,359,905 | | | | | | 2,343,265 | | | | | | 16,640 | | |
| Deutsche Bank AG | | | British Pound | | | | | 1,433,087 | | | | | | Sell | | | | | | 01/22/16 | | | | | | 2,169,370 | | | | | | 2,112,782 | | | | | | 56,588 | | |
| Goldman Sachs & Co. | | | Swiss Franc | | | | | 2,404,386 | | | | | | Sell | | | | | | 01/22/16 | | | | | | 2,445,594 | | | | | | 2,402,417 | | | | | | 43,177 | | |
| Goldman Sachs & Co. | | | EU Euro | | | | | 2,793,825 | | | | | | Sell | | | | | | 01/22/16 | | | | | | 3,075,493 | | | | | | 3,037,592 | | | | | | 37,901 | | |
| Goldman Sachs & Co. | | | Canadian Dollar | | | | | 3,242,249 | | | | | | Sell | | | | | | 01/22/16 | | | | | | 2,360,059 | | | | | | 2,343,265 | | | | | | 16,794 | | |
| Goldman Sachs & Co. | | | British Pound | | | | | 1,432,620 | | | | | | Sell | | | | | | 01/22/16 | | | | | | 2,168,227 | | | | | | 2,112,093 | | | | | | 56,134 | | |
| The Royal Bank of Canada | | | Swiss Franc | | | | | 2,404,386 | | | | | | Sell | | | | | | 01/22/16 | | | | | | 2,445,358 | | | | | | 2,402,417 | | | | | | 42,941 | | |
| The Royal Bank of Canada | | | Canadian Dollar | | | | | 3,242,249 | | | | | | Sell | | | | | | 01/22/16 | | | | | | 2,360,583 | | | | | | 2,343,265 | | | | | | 17,318 | | |
| The Royal Bank of Canada | | | British Pound | | | | | 1,432,620 | | | | | | Sell | | | | | | 01/22/16 | | | | | | 2,167,690 | | | | | | 2,112,093 | | | | | | 55,597 | | |
| The Royal Bank of Canada | | | EU Euro | | | | | 2,793,471 | | | | | | Sell | | | | | | 01/22/16 | | | | | | 3,073,575 | | | | | | 3,037,207 | | | | | | 36,368 | | |
| | | | | | | | | | | | | | | | | | | | | | | | | | | | | | | | | | | | | | $ | 648,775 | | |
| |
See Accompanying Notes to Financial Statements
SUMMARY PORTFOLIO OF INVESTMENTS
| VY® Invesco Comstock Portfolio | as of December 31, 2015 (continued) |
A summary of derivative instruments by primary risk exposure is outlined in the following tables.
The fair value of derivative instruments as of December 31, 2015 was as follows:
| Derivatives not accounted for as hedging instruments | | | Location on Statement
of Assets and Liabilities | | | Fair Value | |
| Asset Derivatives | | | | | | | | | | |
| Foreign exchange contracts | | | Unrealized appreciation on forward foreign currency contracts | | | | $ | 648,775 | | |
| Total Asset Derivatives | | | | | | | $ | 648,775 | | |
| |
The effect of derivative instruments on the Portfolio’s Statement of Operations for the year ended December 31, 2015 was as follows:
| | | | Amount of Realized Gain or (Loss) on
Derivatives Recognized in Income | |
| Derivatives not accounted for as hedging instruments | | | Foreign currency
related transactions* | |
| Foreign exchange contracts | | | | $ | 4,931,298 | | |
| Total | | | | $ | 4,931,298 | | |
| |
| | | | Change in Unrealized Appreciation or (Depreciation)
on Derivatives Recognized in Income | |
| Derivatives not accounted for as hedging instruments | | | Foreign currency
related transactions* | |
| Foreign exchange contracts | | | | $ | (322,821) | | |
| Total | | | | $ | (322,821) | | |
| |
*
Amounts recognized for forward foreign currency contracts are included in net realized gain (loss) on foreign currency related transactions and net change in unrealized appreciation or depreciation on foreign currency related transactions.
The following is a summary by counterparty of the fair value of OTC derivative instruments subject to Master Netting Agreements and collateral pledged (received), if any, at December 31, 2015:
| | | | Barclays
Bank PLC | | | CIBC World
Markets | | | Deutsche
Bank AG | | | Goldman
Sachs & Co. | | | The Royal Bank
of Canada | | | Totals | |
| Assets: | | | | | | | |
| Forward foreign currency contracts | | | | $ | 38,379 | | | | | $ | 151,760 | | | | | $ | 152,406 | | | | | $ | 154,006 | | | | | $ | 152,224 | | | | | $ | 648,775 | | |
| Total Assets | | | | $ | 38,379 | | | | | $ | 151,760 | | | | | $ | 152,406 | | | | | $ | 154,006 | | | | | $ | 152,224 | | | | | $ | 648,775 | | |
Net OTC derivative instruments by counterparty,
at fair value | | | | $ | 38,379 | | | | | $ | 151,760 | | | | | $ | 152,406 | | | | | $ | 154,006 | | | | | $ | 152,224 | | | | | | 648,775 | | |
Total collateral pledged by the Portfolio/(Received from
counterparty) | | | | $ | — | | | | | $ | — | | | | | $ | — | | | | | $ | — | | | | | $ | — | | | | | $ | — | | |
Net Exposure(1) | | | | $ | 38,379 | | | | | $ | 151,760 | | | | | $ | 152,406 | | | | | $ | 154,006 | | | | | $ | 152,224 | | | | | $ | 648,775 | | |
| |
(1)
Positive net exposure represents amounts due from each respective counterparty. Negative exposure represents amounts due from the Portfolio. Please refer to Note 2 for additional details regarding counterparty credit risk and credit related contingent features.
See Accompanying Notes to Financial Statements
| VY® Invesco Equity and Income | SUMMARY PORTFOLIO OF INVESTMENTS |
| Portfolio | as of December 31, 2015 |
| Shares | | | Value | | | Percentage
of Net
Assets | |
| COMMON STOCK: 64.2% | |
| | | | | | | Consumer Discretionary: 5.8% | |
| | | 450,810 | | | | Carnival Corp. | | | | $ | 24,560,129 | | | | | | 1.4 | | |
| | | 288,175 | | | | Comcast Corp. - Class A | | | | | 16,261,715 | | | | | | 0.9 | | |
| | | 298,043 | | | | Target Corp. | | | | | 21,640,902 | | | | | | 1.2 | | |
| | | 62,917 | | | | Time Warner Cable, Inc. | | | | | 11,676,766 | | | | | | 0.6 | | |
| | | 132,955 | | | | Time Warner, Inc. | | | | | 8,598,200 | | | | | | 0.5 | | |
| | | 603,718 | | | | Other Securities | | | | | 22,263,692 | | | | | | 1.2 | | |
| | | | | | | | | | | | 105,001,404 | | | | | | 5.8 | | |
| | | | | | | Consumer Staples: 5.0% | |
| | | 334,583 | | | | Archer-Daniels-Midland Co. | | | | | 12,272,504 | | | | | | 0.7 | | |
| | | 364,734 | | | | Mondelez International, Inc. | | | | | 16,354,673 | | | | | | 0.9 | | |
| | | 198,395 | | | | Philip Morris International,
Inc. | | | | | 17,440,904 | | | | | | 1.0 | | |
| | | 200,739 | | | | Procter & Gamble Co. | | | | | 15,940,684 | | | | | | 0.9 | | |
| | | 304,985 | | | | Wal-Mart Stores, Inc. | | | | | 18,695,581 | | | | | | 1.0 | | |
| | | 235,399 | | | | Other Securities | | | | | 9,651,359 | | | | | | 0.5 | | |
| | | | | | | | | | | | 90,355,705 | | | | | | 5.0 | | |
| | | | | | | Energy: 6.9% | |
| | | 431,857 | | | | Apache Corp. | | | | | 19,204,681 | | | | | | 1.1 | | |
| | | 179,093 | | | | Occidental Petroleum Corp. | | | | | 12,108,478 | | | | | | 0.7 | | |
| | | 951,911 | | | | Royal Dutch Shell PLC -
Class A | | | | | 21,560,113 | | | | | | 1.2 | | |
| | | 300,639 | L | | Total S.A. | | | | | 13,478,137 | | | | | | 0.7 | | |
| | | 2,549,368 | | | | Other Securities(a) | | | | | 59,031,930 | | | | | | 3.2 | | |
| | | | | | | | | | | | 125,383,339 | | | | | | 6.9 | | |
| | | | | | | Financials: 20.4% | |
| | | 136,449 | | | | Aon PLC | | | | | 12,581,962 | | | | | | 0.7 | | |
| | | 2,084,928 | | | | Bank of America Corp. | | | | | 35,089,338 | | | | | | 1.9 | | |
| | | 282,115 | | | | BB&T Corp. | | | | | 10,666,768 | | | | | | 0.6 | | |
| | | 407,467 | | | | Charles Schwab Corp. | | | | | 13,417,888 | | | | | | 0.7 | | |
| | | 1,071,888 | | | | Citigroup, Inc. | | | | | 55,470,204 | | | | | | 3.1 | | |
| | | 869,395 | | | | Citizens Financial Group, Inc. | | | | | 22,769,455 | | | | | | 1.3 | | |
| | | 661,617 | | | | Fifth Third Bancorp | | | | | 13,298,502 | | | | | | 0.7 | | |
| | | 72,494 | | | | Goldman Sachs Group, Inc. | | | | | 13,065,594 | | | | | | 0.7 | | |
| | | 868,509 | | | | JPMorgan Chase & Co. | | | | | 57,347,649 | | | | | | 3.2 | | |
| | | 240,571 | | | | Marsh & McLennan Cos.,
Inc. | | | | | 13,339,662 | | | | | | 0.7 | | |
| | | 897,048 | | | | Morgan Stanley | | | | | 28,535,097 | | | | | | 1.6 | | |
| | | 188,028 | | | | Northern Trust Corp. | | | | | 13,554,939 | | | | | | 0.8 | | |
| | | 247,590 | | | | PNC Financial Services
Group, Inc. | | | | | 23,597,803 | | | | | | 1.3 | | |
| | | 254,805 | | | | State Street Corp. | | | | | 16,908,860 | | | | | | 0.9 | | |
| | | 246,112 | | | | Willis Group Holdings PLC | | | | | 11,953,660 | | | | | | 0.7 | | |
| | | 905,266 | | | | Other Securities | | | | | 27,329,516 | | | | | | 1.5 | | |
| | | | | | | | | | | | 368,926,897 | | | | | | 20.4 | | |
| | | | | | | Health Care: 9.1% | |
| | | 74,555 | | | | Amgen, Inc. | | | | | 12,102,513 | | | | | | 0.7 | | |
| Shares | | | Value | | | Percentage
of Net
Assets | |
| COMMON STOCK: (continued) | |
| | | | | | | Health Care (continued) | |
| | | 166,656 | | | | Eli Lilly & Co. | | | | $ | 14,042,435 | | | | | | 0.8 | | �� |
| | | 218,444 | | | | Medtronic PLC | | | | | 16,802,713 | | | | | | 0.9 | | |
| | | 405,137 | | | | Merck & Co., Inc. | | | | | 21,399,336 | | | | | | 1.2 | | |
| | | 193,652 | | | | Novartis AG | | | | | 16,657,805 | | | | | | 0.9 | | |
| | | 387,437 | | | | Pfizer, Inc. | | | | | 12,506,466 | | | | | | 0.7 | | |
| | | 137,545 | | | | Sanofi | | | | | 11,721,890 | | | | | | 0.6 | | |
| | | 252,967 | | | | Teva Pharmaceutical
Industries Ltd. ADR | | | | | 16,604,754 | | | | | | 0.9 | | |
| | | 635,739 | | | | Other Securities | | | | | 42,835,612 | | | | | | 2.4 | | |
| | | | | | | | | | | | 164,673,524 | | | | | | 9.1 | | |
| | | | | | | Industrials: 5.5% | |
| | | 110,678 | | | | General Dynamics Corp. | | | | | 15,202,730 | | | | | | 0.8 | | |
| | | 1,448,783 | | | | General Electric Co. | | | | | 45,129,590 | | | | | | 2.5 | | |
| | | 1,071,430 | | | | Other Securities | | | | | 40,240,949 | | | | | | 2.2 | | |
| | | | | | | | | | | | 100,573,269 | | | | | | 5.5 | | |
| | | | | | | Information Technology: 8.3% | |
| | | 692,396 | | | | Applied Materials, Inc. | | | | | 12,927,033 | | | | | | 0.7 | | |
| | | 706,708 | | | | Cisco Systems, Inc. | | | | | 19,190,656 | | | | | | 1.1 | | |
| | | 147,168 | @ | | Citrix Systems, Inc. | | | | | 11,133,259 | | | | | | 0.6 | | |
| | | 457,224 | | | | eBay, Inc. | | | | | 12,564,515 | | | | | | 0.7 | | |
| | | 471,121 | | | | Intel Corp. | | | | | 16,230,118 | | | | | | 0.9 | | |
| | | 511,458 | | | | Juniper Networks, Inc. | | | | | 14,116,241 | | | | | | 0.8 | | |
| | | 305,449 | | | | Microsoft Corp. | | | | | 16,946,311 | | | | | | 0.9 | | |
| | | 365,614 | @ | | PayPal Holdings, Inc. | | | | | 13,235,227 | | | | | | 0.7 | | |
| | | 296,188 | | | | Qualcomm, Inc. | | | | | 14,804,957 | | | | | | 0.8 | | |
| | | 565,767 | | | | Other Securities | | | | | 19,131,034 | | | | | | 1.1 | | |
| | | | | | | | | | | | 150,279,351 | | | | | | 8.3 | | |
| | | | | | | Materials: 0.4% | |
| | | 267,082 | | | | Other Securities | | | | | 7,368,792 | | | | | | 0.4 | | |
| | | | | | | Telecommunication Services: 1.8% | |
| | | 207,829 | | | | Verizon Communications,
Inc. | | | | | 9,605,856 | | | | | | 0.5 | | |
| | | 367,015 | | | | Vodafone Group PLC ADR | | | | | 11,839,904 | | | | | | 0.7 | | |
| | | 3,215,339 | | | | Other Securities(a) | | | | | 11,333,938 | | | | | | 0.6 | | |
| | | | | | | | | | | | 32,779,698 | | | | | | 1.8 | | |
| | | | | | | Utilities: 1.0% | |
| | | 475,971 | | | | Other Securities | | | | | 18,758,872 | | | | | | 1.0 | | |
| | | | | | | Total Common Stock
(Cost $1,154,435,740) | | | | | 1,164,100,851 | | | | | | 64.2 | | |
| PREFERRED STOCK: 0.9% | |
| | | | | | | Energy: 0.3% | |
| | | 140,612 | | | | Other Securities | | | | | 5,791,457 | | | | | | 0.3 | | |
| | | | | | | Financials: 0.6% | |
| | | 133,522 | | | | Other Securities | | | | | 11,558,517 | | | | | | 0.6 | | |
| | | | | | | Total Preferred Stock
(Cost $16,606,815) | | | | | 17,349,974 | | | | | | 0.9 | | |
| |
See Accompanying Notes to Financial Statements
| VY® Invesco Equity and Income | SUMMARY PORTFOLIO OF INVESTMENTS |
| Portfolio | as of December 31, 2015 (continued) |
Principal
Amount† | | | Value | | | Percentage
of Net
Assets | |
| CORPORATE BONDS/NOTES: 19.8% | |
| | | | | | | Basic Materials: 0.3% | |
| | | 770,000 | # | | Montell Finance Co. BV,
8.100%, 03/15/27 | | | | $ | 961,925 | | | | | | 0.1 | | |
| | | 726,000 | # | | Solvay Finance America
LLC, 4.450%, 12/03/25 | | | | | 718,160 | | | | | | 0.0 | | |
| | | 4,240,000 | | | | Other Securities | | | | | 4,079,877 | | | | | | 0.2 | | |
| | | | | | | | | | | | 5,759,962 | | | | | | 0.3 | | |
| | | | | | | Communications: 2.4% | |
| | | 1,635,000 | # | | CCO Safari II LLC, 4.464%,
07/23/22 | | | | | 1,631,143 | | | | | | 0.1 | | |
| | | 340,000 | # | | Cox Communications, Inc.,
4.700%, 12/15/42 | | | | | 258,930 | | | | | | 0.0 | | |
| | | 1,210,000 | # | | Cox Communications, Inc.,
8.375%, 03/01/39 | | | | | 1,336,275 | | | | | | 0.1 | | |
| | | 2,700,000 | # | | Crown Castle Towers, LLC,
4.883%, 08/15/20 | | | | | 2,894,108 | | | | | | 0.2 | | |
| | | 435,000 | # | | Crown Castle Towers, LLC,
6.113%, 01/15/40 | | | | | 475,736 | | | | | | 0.0 | | |
| | | 1,576,000 | # | | FireEye, Inc., 1.000%,
06/01/35 | | | | | 1,348,465 | | | | | | 0.1 | | |
| | | 1,576,000 | # | | FireEye, Inc., 1.625%,
06/01/35 | | | | | 1,271,635 | | | | | | 0.0 | | |
| | | 3,085,000 | | | | Verizon Communications,
Inc., 4.400%-6.400%,
09/15/23-08/21/54 | | | | | 3,014,760 | | | | | | 0.2 | | |
| | | 30,475,000 | | | | Other Securities | | | | | 31,831,266 | | | | | | 1.7 | | |
| | | | | | | | | | | | 44,062,318 | | | | | | 2.4 | | |
| | | | | | | Consumer, Cyclical: 1.3% | |
| | | 1,284,000 | # | | GNC Holdings, Inc.,
1.500%, 08/15/20 | | | | | 1,034,422 | | | | | | 0.0 | | |
| | | 2,835,000 | | | | Target Corp.,
2.900%-5.875%,
07/15/16-01/15/22 | | | | | 2,903,690 | | | | | | 0.2 | | |
| | | 1,362,327 | # | | Virgin Australia 2013-1A
Trust, 5.000%, 04/23/25 | | | | | 1,408,305 | | | | | | 0.1 | | |
| | | 20,239,649 | | | | Other Securities | | | | | 18,790,084 | | | | | | 1.0 | | |
| | | | | | | | | | | | 24,136,501 | | | | | | 1.3 | | |
| | | | | | | Consumer, Non-cyclical: 4.7% | |
| | | 1,130,000 | | | | Amgen, Inc., 2.300%,
06/15/16 | | | | | 1,136,612 | | | | | | 0.1 | | |
| | | 981,000 | # | | Bayer US Finance LLC,
3.000%, 10/08/21 | | | | | 990,627 | | | | | | 0.1 | | |
| | | 965,000 | # | | ERAC USA Finance LLC,
2.350%, 10/15/19 | | | | | 952,272 | | | | | | 0.0 | | |
| | | 785,000 | # | | Grupo Bimbo SAB de CV,
3.875%, 06/27/24 | | | | | 765,651 | | | | | | 0.0 | | |
| | | 1,644,000 | # | | HJ Heinz Co., 1.600%,
06/30/17 | | | | | 1,639,954 | | | | | | 0.1 | | |
| | | 1,820,000 | | | | Mondelez International,
Inc., 4.125%, 02/09/16 | | | | | 1,824,741 | | | | | | 0.1 | | |
| | | 3,058,000 | | | | Philip Morris International,
Inc., 1.250%-4.875%,
05/16/16-11/15/43 | | | | | 3,128,977 | | | | | | 0.2 | | |
Principal
Amount† | | | Value | | | Percentage
of Net
Assets | |
| CORPORATE BONDS/NOTES: (continued) | |
| | | | | | | Consumer, Non-cyclical (continued) | |
| | | 3,018,000 | # | | Wright Medical Group, Inc.,
2.000%, 02/15/20 | | | | $ | 3,136,834 | | | | | | 0.2 | | |
| | | 68,052,000 | | | | Other Securities(a) | | | | | 70,861,021 | | | | | | 3.9 | | |
| | | | | | | | | | | | 84,436,689 | | | | | | 4.7 | | |
| | | | | | | Energy: 1.3% | |
| | | 27,359,000 | | | | Other Securities(a) | | | | | 23,207,909 | | | | | | 1.3 | | |
| | | | | | | Financial: 5.5% | |
| | | 1,690,000 | # | | ABN AMRO Bank NV,
1.375%, 01/22/16 | | | | | 1,691,394 | | | | | | 0.1 | | |
| | | 440,000 | # | | Apollo Management
Holdings L.P., 4.000%,
05/30/24 | | | | | 435,314 | | | | | | 0.0 | | |
| | | 927,000 | # | | Athene Global Funding,
2.875%, 10/23/18 | | | | | 912,419 | | | | | | 0.1 | | |
| | | 1,295,000 | | | | BB&T Corp., 3.200%,
03/15/16 | | | | | 1,298,561 | | | | | | 0.1 | | |
| | | 725,000 | # | | BBVA Bancomer SA/Texas,
4.375%, 04/10/24 | | | | | 717,750 | | | | | | 0.0 | | |
| | | 472,000 | # | | Credit Suisse AG, 6.500%,
08/08/23 | | | | | 509,666 | | | | | | 0.0 | | |
| | | 1,540,000 | # | | Farmers Exchange
Capital III, 5.454%,
10/15/54 | | | | | 1,501,907 | | | | | | 0.1 | | |
| | | 4,196,000 | | | | Fifth Third Bancorp.,
3.625%, 01/25/16 | | | | | 4,203,469 | | | | | | 0.2 | | |
| | | 820,000 | | | | Goldman Sachs Group,
Inc./The, 4.250%, 10/21/25 | | | | | 815,858 | | | | | | 0.1 | | |
| | | 355,000 | | | | Goldman Sachs Group, Inc.,
5.250%, 07/27/21 | | | | | 393,162 | | | | | | 0.0 | | |
| | | 4,011,000 | # | | Goldman Sachs Group, Inc.,
1.000%, 03/15/17 | | | | | 5,726,666 | | | | | | 0.3 | | |
| | | 4,179,000 | # | | Goldman Sachs Group, Inc.,
1.000%, 09/28/20 | | | | | 4,731,798 | | | | | | 0.3 | | |
| | | 465,000 | # | | HBOS PLC, 6.750%,
05/21/18 | | | | | 508,369 | | | | | | 0.0 | | |
| | | 4,125,000 | | | | JPMorgan Chase & Co.,
4.250%-6.100%,
10/01/27-12/29/49 | | | | | 4,103,216 | | | | | | 0.2 | | |
| | | 443,000 | # | | KKR Group Finance Co. III
LLC, 5.125%, 06/01/44 | | | | | 434,827 | | | | | | 0.0 | | |
| | | 2,000,000 | # | | Liberty Mutual Group, Inc.,
4.850%, 08/01/44 | | | | | 1,859,470 | | | | | | 0.1 | | |
| | | 510,000 | # | | Macquarie Bank Ltd.,
5.000%, 02/22/17 | | | | | 527,608 | | | | | | 0.0 | | |
| | | 2,360,000 | # | | Mizuho Financial Group
Cayman 3 Ltd., 4.600%,
03/27/24 | | | | | 2,434,836 | | | | | | 0.1 | | |
| | | 4,575,000 | | | | Morgan Stanley,
2.375%-6.375%,
07/23/19-07/24/42 | | | | | 4,736,621 | | | | | | 0.3 | | |
See Accompanying Notes to Financial Statements
| VY® Invesco Equity and Income | SUMMARY PORTFOLIO OF INVESTMENTS |
| Portfolio | as of December 31, 2015 (continued) |
Principal
Amount† | | | Value | | | Percentage
of Net
Assets | |
| CORPORATE BONDS/NOTES: (continued) | |
| | | | | | | Financial (continued) | |
| | | 1,515,000 | # | | Nationwide Financial
Services, Inc., 5.300%,
11/18/44 | | | | $ | 1,522,372 | | | | | | 0.1 | | |
| | | 1,360,000 | # | | Societe Generale SA,
2.625%, 09/16/20 | | | | | 1,360,768 | | | | | | 0.1 | | |
| | | 805,000 | # | | Societe Generale SA,
5.000%, 01/17/24 | | | | | 822,292 | | | | | | 0.0 | | |
| | | 1,025,000 | # | | Societe Generale SA,
5.625%, 11/24/45 | | | | | 984,747 | | | | | | 0.1 | | |
| | | 55,755,000 | | | | Other Securities(a) | | | | | 57,375,994 | | | | | | 3.2 | | |
| | | | | | | | | | | | 99,609,084 | | | | | | 5.5 | | |
| | | | | | | Industrial: 0.9% | |
| | | 1,105,000 | # | | Aviation Capital Group Corp.,
2.875%, 09/17/18 | | | | | 1,100,041 | | | | | | 0.1 | | |
| | | 1,095,000 | # | | Aviation Capital Group Corp.,
4.875%, 10/01/25 | | | | | 1,089,656 | | | | | | 0.0 | | |
| | | 435,000 | # | | BAE Systems Holdings, Inc.,
2.850%, 12/15/20 | | | | | 434,571 | | | | | | 0.0 | | |
| | | 510,000 | # | | Penske Truck Leasing Co.
Lp/PTL Finance Corp.,
2.500%, 03/15/16 | | | | | 510,910 | | | | | | 0.0 | | |
| | | 13,440,000 | | | | Other Securities | | | | | 13,216,074 | | | | | | 0.8 | | |
| | | | | | | | | | | | 16,351,252 | | | | | | 0.9 | | |
| | | | | | | Technology: 3.3% | |
| | | 7,292,000 | L | | Citrix Systems, Inc.,
0.500%, 04/15/19 | | | | | 7,966,510 | | | | | | 0.4 | | |
| | | 2,055,000 | # | | Hewlett Packard Enterprise
Co., 2.850%, 10/05/18 | | | | | 2,055,600 | | | | | | 0.1 | | |
| | | 1,025,000 | # | | HP Enterprise Co., 6.200%,
10/15/35 | | | | | 989,950 | | | | | | 0.1 | | |
| | | 2,788,000 | # | | Microchip Technology, Inc.,
1.625%, 02/15/25 | | | | | 2,784,515 | | | | | | 0.2 | | |
| | | 1,613,000 | # | | Nuance Communications,
Inc., 1.000%, 12/15/35 | | | | | 1,559,569 | | | | | | 0.1 | | |
| | | 5,271,000 | #,L | | ON Semiconductor Corp.,
1.000%, 12/01/20 | | | | | 4,934,974 | | | | | | 0.3 | | |
| | | 1,146,000 | # | | Seagate HDD Cayman,
5.750%, 12/01/34 | | | | | 803,900 | | | | | | 0.0 | | |
| | | 33,091,000 | | | | Other Securities(a) | | | | | 38,888,735 | | | | | | 2.1 | | |
| | | | | | | | | | | | 59,983,753 | | | | | | 3.3 | | |
| | | | | | | Utilities: 0.1% | |
| | | 1,989,000 | | | | Other Securities | | | | | 1,967,333 | | | | | | 0.1 | | |
| | | | | | | Total Corporate
Bonds/Notes
(Cost $361,965,373) | | | | | 359,514,801 | | | | | | 19.8 | | |
| MUNICIPAL BONDS: 0.1% | |
| | | | | | | Georgia: 0.1% | |
| | | 500,000 | | | | Other Securities | | | | | 590,971 | | | | | | 0.1 | | |
| | | | | | | Total Municipal Bonds
(Cost $503,979) | | | | | 590,971 | | | | | | 0.1 | | |
| |
Principal
Amount† | | | Value | | | Percentage
of Net
Assets | |
| U.S. TREASURY OBLIGATIONS: 9.8% | |
| | | | | | | U.S. Treasury Bonds: 1.6% | |
| | | 16,308,200 | | | | 2.250%, due 11/15/25 | | | | $ | 16,273,300 | | | | | | 0.9 | | |
| | | 13,689,300 | | | | 2.875%, due 08/15/45 | | | | | 13,272,735 | | | | | | 0.7 | | |
| | | | | | | | | | | | 29,546,035 | | | | | | 1.6 | | |
| | | | | | | U.S. Treasury Notes: 8.2% | |
| | | 55,323,000 | L | | 0.875%, due 11/30/17 | | | | | 55,172,577 | | | | | | 3.1 | | |
| | | 56,840,000 | | | | 1.250%, due 12/15/18 | | | | | 56,731,095 | | | | | | 3.1 | | |
| | | 34,683,000 | | | | 1.625%, due 11/30/20 | | | | | 34,489,850 | | | | | | 1.9 | | |
| | | 1,931,000 | | | | 0.875%-2.625%, due
04/30/17-11/30/22 | | | | | 1,929,382 | | | | | | 0.1 | | |
| | | | | | | | | | | | 148,322,904 | | | | | | 8.2 | | |
| | | | | | | Total U.S. Treasury
Obligations
(Cost $178,184,204) | | | | | 177,868,939 | | | | | | 9.8 | | |
| FOREIGN GOVERNMENT BONDS: 0.1% | |
| | | 1,410,000 | # | | Electricite de France SA,
4.600%-5.625%,
01/27/20-12/29/49 | | | | | 1,368,114 | | | | | | 0.1 | | |
| | | | | | | Total Foreign
Government Bonds
(Cost $1,383,604) | | | | | 1,368,114 | | | | | | 0.1 | | |
| U.S. GOVERNMENT AGENCY OBLIGATIONS: 0.2% | |
| | | | | | | Federal Home Loan Mortgage
Corporation: 0.1%## | |
| | | 2,400,000 | | | | Other Securities | | | | | 2,607,523 | | | | | | 0.1 | | |
| | | | | | | Federal National Mortgage
Association: 0.1%## | |
| | | 915,000 | | | | Other Securities | | | | | 1,298,434 | | | | | | 0.1 | | |
| | | | | | | Total U.S. Government
Agency Obligations
(Cost $3,513,788) | | | | | 3,905,957 | | | | | | 0.2 | | |
| | | | | | | Total Long-Term
Investments
(Cost $1,716,593,503) | | | | | 1,724,699,607 | | | | | | 95.1 | | |
| SHORT-TERM INVESTMENTS: 8.6% | |
| | | | | | | Securities Lending Collateralcc: 4.0% | |
| | | 1,931,950 | | | | BNP Paribas Bank,
Repurchase Agreement
dated 12/31/15, 0.31%,
due 01/04/16 (Repurchase
Amount $1,932,016,
collateralized by various
U.S. Government/U.S.
Government Agency
Obligations,
0.000%-4.500%, Market
Value plus accrued interest
$1,970,589, due
06/09/16-05/20/45) | | | | | 1,931,950 | | | | | | 0.1 | | |
See Accompanying Notes to Financial Statements
| VY® Invesco Equity and Income | SUMMARY PORTFOLIO OF INVESTMENTS |
| Portfolio | as of December 31, 2015 (continued) |
Principal
Amount† | | | Value | | | Percentage
of Net
Assets | |
| SHORT-TERM INVESTMENTS: (continued) | |
| | | | | | | Securities Lending Collateralcc (continued) | |
| | | 17,303,564 | | | | Citigroup, Inc., Repurchase
Agreement dated
12/31/15, 0.34%, due
01/04/16 (Repurchase
Amount $17,304,209,
collateralized by various
U.S. Government Agency
Obligations,
0.000%-11.500%, Market
Value plus accrued interest
$17,649,636, due
01/15/16-04/01/51) | | | | $ | 17,303,564 | | | | | | 0.9 | | |
| | | 11,893,669 | | | | HSBC Securities USA,
Repurchase Agreement
dated 12/31/15, 0.29%,
due 01/04/16 (Repurchase
Amount $11,894,047,
collateralized by various
U.S. Government Securities,
3.000%, Market Value plus
accrued interest
$12,131,576,
due 11/15/44) | | | | | 11,893,669 | | | | | | 0.7 | | |
| | | 17,303,564 | | | | Mizuho Securities USA Inc.,
Repurchase Agreement
dated 12/31/15, 0.30%,
due 01/04/16 (Repurchase
Amount $17,304,133,
collateralized by various
U.S. Government Agency
Obligations,
0.000%-9.000%, Market
Value plus accrued interest
$17,649,635, due
06/13/16-03/01/44) | | | | | 17,303,564 | | | | | | 1.0 | | |
| | | 17,303,564 | | | | Nomura Securities,
Repurchase Agreement
dated 12/31/15, 0.33%,
due 01/04/16 (Repurchase
Amount $17,304,190,
collateralized by various
U.S. Government/U.S.
Government Agency
Obligations,
0.000%-10.500%, Market
Value plus accrued interest
$17,649,635, due
01/15/16-10/20/65) | | | | | 17,303,564 | | | | | | 0.9 | | |
| | Principal
Amount† | | | Value | | | Percentage
of Net
Assets | |
| | SHORT-TERM INVESTMENTS: (continued) | |
| | | | | | | | Securities Lending Collateralcc (continued) | |
| | | | 7,120,141 | | | | State of Wisconsin
Investment Board,
Repurchase Agreement
dated 12/31/15, 0.41%,
due 01/04/16 (Repurchase
Amount $7,120,461,
collateralized by various
U.S. Government Securities,
0.125%-2.500%, Market
Value plus accrued interest
$7,267,774, due
01/15/17-02/15/42) | | | | $ | 7,120,141 | | | | | | 0.4 | | |
| | | | | | | | | | | | | 72,856,452 | | | | | | 4.0 | | |
| Shares | | | Value | | | Percentage
of Net
Assets | |
| | | | | | | Mutual Funds: 4.6% | |
| | | 82,471,643 | | | | BlackRock Liquidity Funds,
TempFund, Institutional
Class, 0.270%††
(Cost $82,471,643) | | | | | 82,471,643 | | | | | | 4.6 | | |
| | | | | | | Total Short-Term
Investments
(Cost $155,328,095) | | | | | 155,328,095 | | | | | | 8.6 | | |
| | | | | | | Total Investments in
Securities
(Cost $1,871,921,598) | | | | $ | 1,880,027,702 | | | | | | 103.7 | | |
| | | | | | | Liabilities in Excess of
Other Assets | | | | | (66,940,320) | | | | | | (3.7) | | |
| | | | | | | Net Assets | | | | $ | 1,813,087,382 | | | | | | 100.0 | | |
| |
“Other Securities” represents issues not identified as the top 50 holdings in terms of market value and issues or issuers not exceeding 1% of net assets individually or in aggregate respectively as of December 31, 2015.
The following footnotes apply to either the individual securities noted or one or more of the securities aggregated and listed as a single line item.
†
Unless otherwise indicated, principal amount is shown in USD.
††
Rate shown is the 7-day yield as of December 31, 2015.
#
Securities with purchases pursuant to Rule 144A or section 4(a)(2), under the Securities Act of 1933 and may not be resold subject to that rule except to qualified institutional buyers.
##
The Federal Housing Finance Agency (“FHFA”) placed the Federal Home Loan Mortgage Corporation and Federal National Mortgage Association into conservatorship with FHFA as the conservator. As such, the FHFA oversees the continuing affairs of these companies.
See Accompanying Notes to Financial Statements
| VY® Invesco Equity and Income | SUMMARY PORTFOLIO OF INVESTMENTS |
| Portfolio | as of December 31, 2015 (continued) |
@
Non-income producing security.
ADR
American Depositary Receipt
cc
Represents securities purchased with cash collateral received for securities on loan.
L
Loaned security, a portion or all of the security is on loan at December 31, 2015.
(a)
This grouping contains securities on loan.
Cost for federal income tax purposes is $1,875,786,971.
Net unrealized appreciation consists of:
| | Gross Unrealized Appreciation | | | | $ | 121,537,596 | | |
| | Gross Unrealized Depreciation | | | | | (117,296,865) | | |
| | Net Unrealized Appreciation | | | | $ | 4,240,731 | | |
| |
Fair Value Measurements^
The following is a summary of the fair valuations according to the inputs used as of December 31, 2015 in valuing the assets and liabilities:
| | | | Quoted Prices
in Active Markets
for Identical
Investments
(Level 1) | | | Significant
Other
Observable
Inputs#
(Level 2) | | | Significant
Unobservable
Inputs
(Level 3) | | | Fair Value
at
December 31, 2015 | |
| Asset Table | | | | | |
| Investments, at fair value | | | | | |
| Common Stock | | | | | |
| Consumer Discretionary | | | | $ | 105,001,404 | | | | | $ | — | | | | | $ | — | | | | | $ | 105,001,404 | | |
| Consumer Staples | | | | | 90,355,705 | | | | | | — | | | | | | — | | | | | | 90,355,705 | | |
| Energy | | | | | 90,345,089 | | | | | | 35,038,250 | | | | | | — | | | | | | 125,383,339 | | |
| Financials | | | | | 368,926,897 | | | | | | — | | | | | | — | | | | | | 368,926,897 | | |
| Health Care | | | | | 136,293,829 | | | | | | 28,379,695 | | | | | | — | | | | | | 164,673,524 | | |
| Industrials | | | | | 100,573,269 | | | | | | — | | | | | | — | | | | | | 100,573,269 | | |
| Information Technology | | | | | 150,279,351 | | | | | | — | | | | | | — | | | | | | 150,279,351 | | |
| Materials | | | | | 7,368,792 | | | | | | — | | | | | | — | | | | | | 7,368,792 | | |
| Telecommunication Services | | | | | 21,445,760 | | | | | | 11,333,938 | | | | | | — | | | | | | 32,779,698 | | |
| Utilities | | | | | 18,758,872 | | | | | | — | | | | | | — | | | | | | 18,758,872 | | |
| Total Common Stock | | | | | 1,089,348,968 | | | | | | 74,751,883 | | | | | | — | | | | | | 1,164,100,851 | | |
| Preferred Stock | | | | | 228,127 | | | | | | 17,121,847 | | | | | | — | | | | | | 17,349,974 | | |
| Corporate Bonds/Notes | | | | | — | | | | | | 359,514,801 | | | | | | — | | | | | | 359,514,801 | | |
| Municipal Bonds | | | | | — | | | | | | 590,971 | | | | | | — | | | | | | 590,971 | | |
| Short-Term Investments | | | | | 82,471,643 | | | | | | 72,856,452 | | | | | | — | | | | | | 155,328,095 | | |
| U.S. Treasury Obligations | | | | | — | | | | | | 177,868,939 | | | | | | — | | | | | | 177,868,939 | | |
| Foreign Government Bonds | | | | | — | | | | | | 1,368,114 | | | | | | — | | | | | | 1,368,114 | | |
| U.S. Government Agency Obligations | | | | | — | | | | | | 3,905,957 | | | | | | — | | | | | | 3,905,957 | | |
| Total Investments, at fair value | | | | $ | 1,172,048,738 | | | | | $ | 707,978,964 | | | | | $ | — | | | | | $ | 1,880,027,702 | | |
| Other Financial Instruments+ | | | | | |
| Forward Foreign Currency Contracts | | | | | — | | | | | | 970,216 | | | | | | — | | | | | | 970,216 | | |
| Total Assets | | | | $ | 1,172,048,738 | | | | | $ | 708,949,180 | | | | | $ | — | | | | | $ | 1,880,997,918 | | |
| |
^
See Note 2, “Significant Accounting Policies” in the Notes to Financial Statements for additional information.
+
Other Financial Instruments are derivatives not reflected in the portfolio of investments and may include open forward foreign currency contracts, futures, centrally cleared swaps, OTC swaps and written options. Forward foreign currency contracts, futures and centrally cleared swaps are valued at the unrealized gain (loss) on the instrument. OTC swaps and written options are valued at the fair value of the instrument.
#
The earlier close of the foreign markets gives rise to the possibility that significant events, including broad market moves, may have occurred in the interim and may materially affect the value of those securities. To account for this, the Portfolio may frequently value many of its foreign equity securities using fair value prices based on third party vendor modeling tools to the extent available. Accordingly, a portion of the Portfolio’s investments are categorized as Level 2 investments.
See Accompanying Notes to Financial Statements
| VY® Invesco Equity and Income | SUMMARY PORTFOLIO OF INVESTMENTS |
| Portfolio | as of December 31, 2015 (continued) |
At December 31, 2015, the following forward foreign currency contracts were outstanding for VY® Invesco Equity and Income Portfolio:
| Counterparty | | | Currency | | | Contract Amount | | | Buy/Sell | | | Settlement
Date | | | In Exchange For | | | Fair
Value | | | Unrealized
Appreciation
(Depreciation) | |
| The Bank of New York | | | Israeli New Shekel | | | | | 24,306,747 | | | | | | Sell | | | | | | 01/15/16 | | | | | $ | 6,257,207 | | | | | $ | 6,248,005 | | | | | $ | 9,202 | | |
| The Bank of New York | | | Canadian Dollar | | | | | 9,923,672 | | | | | | Sell | | | | | | 01/15/16 | | | | | | 7,301,891 | | | | | | 7,172,008 | | | | | | 129,883 | | |
| The Bank of New York | | | EU Euro | | | | | 12,942,854 | | | | | | Sell | | | | | | 01/15/16 | | | | | | 14,115,865 | | | | | | 14,069,647 | | | | | | 46,218 | | |
| The Bank of New York | | | British Pound | | | | | 8,486,901 | | | | | | Sell | | | | | | 01/15/16 | | | | | | 12,736,802 | | | | | | 12,511,870 | | | | | | 224,932 | | |
| The Bank of New York | | | Swiss Franc | | | | | 6,194,412 | | | | | | Sell | | | | | | 01/15/16 | | | | | | 6,254,897 | | | | | | 6,187,464 | | | | | | 67,433 | | |
| State Street | | | Israeli New Shekel | | | | | 24,306,747 | | | | | | Sell | | | | | | 01/15/16 | | | | | | 6,263,980 | | | | | | 6,248,005 | | | | | | 15,975 | | |
| State Street | | | Canadian Dollar | | | | | 9,923,672 | | | | | | Sell | | | | | | 01/15/16 | | | | | | 7,300,414 | | | | | | 7,172,009 | | | | | | 128,405 | | |
| State Street | | | Swiss Franc | | | | | 6,194,412 | | | | | | Sell | | | | | | 01/15/16 | | | | | | 6,256,160 | | | | | | 6,187,463 | | | | | | 68,697 | | |
| State Street | | | British Pound | | | | | 8,486,902 | | | | | | Sell | | | | | | 01/15/16 | | | | | | 12,741,046 | | | | | | 12,511,870 | | | | | | 229,176 | | |
| State Street | | | EU Euro | | | | | 12,942,853 | | | | | | Sell | | | | | | 01/15/16 | | | | | | 14,119,941 | | | | | | 14,069,646 | | | | | | 50,295 | | |
| | | | | | | | | | | | | | | | | | | | | | | | | | | | | | | | | | | | | | $ | 970,216 | | |
| |
A summary of derivative instruments by primary risk exposure is outlined in the following tables.
The fair value of derivative instruments as of December 31, 2015 was as follows:
| Derivatives not accounted for as hedging instruments | | | Location on Statement
of Assets and Liabilities | | | Fair Value | |
| Asset Derivatives | | | | | | | | | | |
| Foreign exchange contracts | | | Unrealized appreciation on forward foreign
currency contracts | | | | $ | 970,216 | | |
| Total Asset Derivatives | | | | | | | $ | 970,216 | | |
| |
The effect of derivative instruments on the Portfolio’s Statement of Operations for the year ended December 31, 2015 was as follows:
| | | | Amount of Realized Gain or (Loss) on
Derivatives Recognized in Income | |
| Derivatives not accounted for as hedging instruments | | | Foreign currency
related transactions* | |
| Foreign exchange contracts | | | | $ | 7,881,015 | | |
| Total | | | | $ | 7,881,015 | | |
| |
| | | | Change in Unrealized Appreciation or (Depreciation)
on Derivatives Recognized in Income | |
| Derivatives not accounted for as hedging instruments | | | Foreign currency
related transactions* | |
| Foreign exchange contracts | | | | $ | (1,509,634) | | |
| Total | | | | $ | (1,509,634) | | |
| |
*
Amounts recognized for forward foreign currency contracts are included in net realized gain (loss) on foreign currency related transactions and net change in unrealized appreciation or depreciation on foreign currency related transactions.
See Accompanying Notes to Financial Statements
| VY® Invesco Equity and Income | SUMMARY PORTFOLIO OF INVESTMENTS |
| Portfolio | as of December 31, 2015 (continued) |
The following is a summary by counterparty of the fair value of OTC derivative instruments subject to Master Netting Agreements and collateral pledged (received), if any, at December 31, 2015:
| | | | State Street
Bank | | | The Bank of
New York | | | Totals | |
| Assets: | | | | |
| Forward foreign currency contracts | | | | $ | 492,548 | | | | | $ | 477,668 | | | | | $ | 970,216 | | |
| Total Assets | | | | $ | 492,548 | | | | | $ | 477,668 | | | | | $ | 970,216 | | |
| Net OTC derivative instruments by counterparty, at fair value | | | | $ | 492,548 | | | | | $ | 477,668 | | | | | | 970,216 | | |
| Total collateral pledged by the Portfolio/(Received from counterparty) | | | | $ | — | | | | | $ | — | | | | | $ | — | | |
| Net Exposure(1) | | | | $ | 492,548 | | | | | $ | 477,668 | | | | | $ | 970,216 | | |
| |
(1)
Positive net exposure represents amounts due from each respective counterparty. Negative exposure represents amounts due from the Portfolio. Please refer to Note 2 for additional details regarding counterparty credit risk and credit related contingent features.
See Accompanying Notes to Financial Statements
| VY® JPMorgan Mid Cap | SUMMARY PORTFOLIO OF INVESTMENTS |
| Value Portfolio | as of December 31, 2015 |
| Shares | | | Value | | | Percentage
of Net
Assets | |
| COMMON STOCK: 100.8% | |
| | | | | | | Consumer Discretionary: 17.8% | |
| | | 10,080 | @ | | Autozone, Inc. | | | | $ | 7,478,453 | | | | | | 1.2 | | |
| | | 216,930 | | | | Best Buy Co., Inc. | | | | | 6,605,518 | | | | | | 1.1 | | |
| | | 108,110 | @ | | Dish Network Corp. -
Class A | | | | | 6,181,730 | | | | | | 1.0 | | |
| | | 71,870 | | | | Expedia, Inc. | | | | | 8,933,441 | | | | | | 1.4 | | |
| | | 75,420 | | | | Genuine Parts Co. | | | | | 6,477,824 | | | | | | 1.1 | | |
| | | 152,095 | @ | | Jarden Corp. | | | | | 8,687,666 | | | | | | 1.4 | | |
| | | 189,270 | | | | Kohl’s Corp. | | | | | 9,014,930 | | | | | | 1.5 | | |
| | | 58,860 | @ | | Mohawk Industries, Inc. | | | | | 11,147,495 | | | | | | 1.8 | | |
| | | 84,840 | | | | Tiffany & Co. | | | | | 6,472,444 | | | | | | 1.0 | | |
| | | 1,040,534 | | | | Other Securities(a) | | | | | 39,300,979 | | | | | | 6.3 | | |
| | | | | | | | | | | | 110,300,480 | | | | | | 17.8 | | |
| | | | | | | Consumer Staples: 6.3% | |
| | | 80,880 | | | | Dr Pepper Snapple Group,
Inc. | | | | | 7,538,016 | | | | | | 1.2 | | |
| | | 218,340 | | | | Kroger Co. | | | | | 9,133,162 | | | | | | 1.5 | | |
| | | 882,836 | | | | Other Securities | | | | | 22,615,097 | | | | | | 3.6 | | |
| | | | | | | | | | | | 39,286,275 | | | | | | 6.3 | | |
| | | | | | | Energy: 3.5% | |
| | | 377,390 | | | | Columbia Pipeline Group,
Inc. | | | | | 7,547,800 | | | | | | 1.2 | | |
| | | 158,130 | | | | EQT Corp. | | | | | 8,243,317 | | | | | | 1.3 | | |
| | | 405,200 | | | | Other Securities(a) | | | | | 6,018,777 | | | | | | 1.0 | | |
| | | | | | | | | | | | 21,809,894 | | | | | | 3.5 | | |
| | | | | | | Financials: 33.0% | |
| | | 72,590 | | | | Ameriprise Financial, Inc. | | | | | 7,725,028 | | | | | | 1.2 | | |
| | | 43,220 | | | | AvalonBay Communities,
Inc. | | | | | 7,958,099 | | | | | | 1.3 | | |
| | | 51,840 | | | | Chubb Corp. | | | | | 6,876,058 | | | | | | 1.1 | | |
| | | 494,320 | | | | Fifth Third Bancorp | | | | | 9,935,832 | | | | | | 1.6 | | |
| | | 218,740 | | | | General Growth Properties,
Inc. | | | | | 5,951,915 | | | | | | 1.0 | | |
| | | 175,240 | | | | Hartford Financial Services
Group, Inc. | | | | | 7,615,930 | | | | | | 1.2 | | |
| | | 287,150 | | | | Kimco Realty Corp. | | | | | 7,597,989 | | | | | | 1.2 | | |
| | | 266,930 | | | | Loews Corp. | | | | | 10,250,112 | | | | | | 1.6 | | |
| | | 91,233 | | | | M&T Bank Corp. | | | | | 11,055,615 | | | | | | 1.8 | | |
| | | 158,880 | | | | Marsh & McLennan Cos.,
Inc. | | | | | 8,809,896 | | | | | | 1.4 | | |
| | | 220,540 | | | | SunTrust Bank | | | | | 9,447,934 | | | | | | 1.5 | | |
| | | 101,300 | | | | T. Rowe Price Group, Inc. | | | | | 7,241,937 | | | | | | 1.2 | | |
| | | 177,890 | | | | Unum Group | | | | | 5,921,958 | | | | | | 1.0 | | |
| Shares | | | Value | | | Percentage
of Net
Assets | |
| COMMON STOCK: (continued) | |
| | | | | | | Financials (continued) | |
| | | 72,776 | | | | Vornado Realty Trust | | | | $ | 7,274,689 | | | | | | 1.2 | | |
| | | 190,830 | | | | XL Group Plc | | | | | 7,476,719 | | | | | | 1.2 | | |
| | | 2,531,425 | | | | Other Securities | | | | | 83,998,398 | | | | | | 13.5 | | |
| | | | | | | | | | | | 205,138,109 | | | | | | 33.0 | | |
| | | | | | | Health Care: 5.4% | |
| | | 77,710 | | | | AmerisourceBergen Corp. | | | | | 8,059,304 | | | | | | 1.3 | | |
| | | 57,570 | | | | Cigna Corp. | | | | | 8,424,218 | | | | | | 1.4 | | |
| | | 46,780 | | | | Humana, Inc. | | | | | 8,350,698 | | | | | | 1.3 | | |
| | | 63,900 | | | | Other Securities | | | | | 8,839,755 | | | | | | 1.4 | | |
| | | | | | | | | | | | 33,673,975 | | | | | | 5.4 | | |
| | | | | | | Industrials: 9.3% | |
| | | 110,880 | | | | Ametek, Inc. | | | | | 5,942,059 | | | | | | 1.0 | | |
| | | 80,430 | | | | Carlisle Cos., Inc. | | | | | 7,133,337 | | | | | | 1.1 | | |
| | | 109,850 | | | | Fortune Brands Home &
Security, Inc. | | | | | 6,096,675 | | | | | | 1.0 | | |
| | | 73,130 | | | | Hubbell, Inc. | | | | | 7,389,055 | | | | | | 1.2 | | |
| | | 93,440 | | | | IDEX Corp. | | | | | 7,158,438 | | | | | | 1.1 | | |
| | | 35,321 | | | | Snap-On, Inc. | | | | | 6,055,079 | | | | | | 1.0 | | |
| | | 379,335 | | | | Other Securities | | | | | 17,858,358 | | | | | | 2.9 | | |
| | | | | | | | | | | | 57,633,001 | | | | | | 9.3 | | |
| | | | | | | Information Technology: 9.3% | |
| | | 113,700 | | | | Amphenol Corp. | | | | | 5,938,551 | | | | | | 1.0 | | |
| | | 179,610 | @ | | Arrow Electronics, Inc. | | | | | 9,731,270 | | | | | | 1.6 | | |
| | | 152,596 | | | | Jack Henry & Associates,
Inc. | | | | | 11,911,644 | | | | | | 1.9 | | |
| | | 208,050 | @ | | Synopsys, Inc. | | | | | 9,489,161 | | | | | | 1.5 | | |
| | | 143,966 | | | | Xilinx, Inc. | | | | | 6,762,083 | | | | | | 1.1 | | |
| | | 319,076 | | | | Other Securities(a) | | | | | 13,647,843 | | | | | | 2.2 | | |
| | | | | | | | | | | | 57,480,552 | | | | | | 9.3 | | |
| | | | | | | Materials: 5.4% | |
| | | 148,045 | | | | Silgan Holdings, Inc. | | | | | 7,952,977 | | | | | | 1.3 | | |
| | | 129,620 | | | | WestRock Co. | | | | | 5,913,264 | | | | | | 1.0 | | |
| | | 203,208 | | | | Other Securities | | | | | 19,513,038 | | | | | | 3.1 | | |
| | | | | | | | | | | | 33,379,279 | | | | | | 5.4 | | |
| | | | | | | Utilities: 10.8% | |
| | | 447,510 | | | | Centerpoint Energy, Inc. | | | | | 8,216,283 | | | | | | 1.3 | | |
| | | 200,000 | | | | CMS Energy Corp. | | | | | 7,216,000 | | | | | | 1.2 | | |
| | | 230,914 | | | | Energen Corp. | | | | | 9,465,165 | | | | | | 1.5 | | |
| | | 425,650 | | | | Questar Corp. | | | | | 8,291,662 | | | | | | 1.3 | | |
| | | 115,600 | | | | WEC Energy Group, Inc. | | | | | 5,931,436 | | | | | | 0.9 | | |
| | | 184,520 | | | | Westar Energy, Inc. | | | | | 7,825,493 | | | | | | 1.3 | | |
See Accompanying Notes to Financial Statements
| VY® JPMorgan Mid Cap | SUMMARY PORTFOLIO OF INVESTMENTS |
| Value Portfolio | as of December 31, 2015 (continued) |
| | Shares | | | Value | | | Percentage
of Net
Assets | |
| | COMMON STOCK: (continued) | |
| | | | | | | | Utilities (continued) | |
| | | | 203,990 | | | | Xcel Energy, Inc. | | | | $ | 7,325,281 | | | | | | 1.2 | | |
| | | | 217,570 | | | | Other Securities | | | | | 12,976,824 | | | | | | 2.1 | | |
| | | | | | | | | | | | | 67,248,144 | | | | | | 10.8 | | |
| | | | | | | | Total Common Stock
(Cost $512,997,428) | | | | | 625,949,709 | | | | | | 100.8 | | |
| |
Principal
Amount† | | | Value | | | Percentage
of Net
Assets | |
| SHORT-TERM INVESTMENTS: 2.1% | |
| | | | | | | Securities Lending Collateralcc: 1.8% | |
| | | 2,149,083 | | | | BNP Paribas Bank,
Repurchase Agreement
dated 12/31/15, 0.31%,
due 01/04/16 (Repurchase
Amount $2,149,156,
collateralized by various
U.S. Government/U.S.
Government Agency
Obligations, 0.000%-4.500%,
Market Value plus accrued
interest $2,192,065, due
06/09/16-05/20/45) | | | | | 2,149,083 | | | | | | 0.4 | | |
| | | 2,689,559 | | | | Citigroup, Inc.,
Repurchase Agreement
dated 12/31/15, 0.34%,
due 01/04/16 (Repurchase
Amount $2,689,659,
collateralized by various
U.S. Government Agency
Obligations,
0.000%-11.500%, Market
Value plus accrued interest
$2,743,350, due
01/15/16-04/01/51) | | | | | 2,689,559 | | | | | | 0.4 | | |
| | | 2,689,559 | | | | Millenium Fixed Income Ltd.,
Repurchase Agreement
dated 12/31/15, 0.37%,
due 01/04/16 (Repurchase
Amount $2,689,668,
collateralized by various
U.S. Government Securities,
1.500%-3.625%, Market
Value plus accrued interest
$2,743,351, due
03/31/21-02/15/44) | | | | | 2,689,559 | | | | | | 0.4 | | |
Principal
Amount† | | | Value | | | Percentage
of Net
Assets | |
| SHORT-TERM INVESTMENTS: (continued) | |
| | | | | | | Securities Lending Collateralcc (continued) | |
| | | 2,689,559 | | | | Nomura Securities,
Repurchase Agreement
dated 12/31/15, 0.33%,
due 01/04/16 (Repurchase
Amount $2,689,656,
collateralized by various
U.S. Government/U.S.
Government Agency
Obligations,
0.000%-10.500%, Market
Value plus accrued interest
$2,743,350, due
01/15/16-10/20/65) | | | | $ | 2,689,559 | | | | | | 0.4 | | |
| | | 1,106,604 | | | | State of Wisconsin
Investment Board,
Repurchase Agreement
dated 12/31/15, 0.41%,
due 01/04/16 (Repurchase
Amount $1,106,654,
collateralized by various
U.S. Government Securities,
0.125%-2.500%, Market
Value plus accrued interest
$1,129,549, due
01/15/17-02/15/42) | | | | | 1,106,604 | | | | | | 0.2 | | |
| | | | | | | | | | | | 11,324,364 | | | | | | 1.8 | | |
| Shares | | | Value | | | Percentage
of Net
Assets | |
| | | | | | | Mutual Funds: 0.3% | |
| | | 1,863,222 | | | | BlackRock Liquidity Funds,
TempFund, Institutional
Class, 0.270%††
(Cost $1,863,222) | | | | | 1,863,222 | | | | | | 0.3 | | |
| | | | | | | Total Short-Term
Investments
(Cost $13,187,586) | | | | | 13,187,586 | | | | | | 2.1 | | |
| | | | | | | Total Investments in
Securities
(Cost $526,185,014) | | | | $ | 639,137,295 | | | | | | 102.9 | | |
| | | | | | | Liabilities in Excess of
Other Assets | | | | | (17,871,774) | | | | | | (2.9) | | |
| | | | | | | Net Assets | | | | $ | 621,265,521 | | | | | | 100.0 | | |
| |
See Accompanying Notes to Financial Statements
| VY® JPMorgan Mid Cap | SUMMARY PORTFOLIO OF INVESTMENTS |
| Value Portfolio | as of December 31, 2015 (continued) |
“Other Securities” represents issues not identified as the top 50 holdings in terms of market value and issues or issuers not exceeding 1% of net assets individually or in aggregate respectively as of December 31, 2015.
The following footnotes apply to either the individual securities noted or one or more of the securities aggregated and listed as a single line item.
†
Unless otherwise indicated, principal amount is shown in USD.
††
Rate shown is the 7-day yield as of December 31, 2015.
@
Non-income producing security.
cc
Represents securities purchased with cash collateral received for securities on loan.
(a)
This grouping contains securities on loan.
Cost for federal income tax purposes is $527,325,111.
Net unrealized appreciation consists of:
| | Gross Unrealized Appreciation | | | | $ | 151,428,286 | | |
| | Gross Unrealized Depreciation | | | | | (39,616,102) | | |
| | Net Unrealized Appreciation | | | | $ | 111,812,184 | | |
| |
Fair Value Measurements^
The following is a summary of the fair valuations according to the inputs used as of December 31, 2015 in valuing the assets and liabilities:
| | | | Quoted Prices
in Active Markets
for Identical
Investments
(Level 1) | | | Significant
Other
Observable
Inputs
(Level 2) | | | Significant
Unobservable
Inputs
(Level 3) | | | Fair Value
at
December 31, 2015 | |
| Asset Table | | | | | |
| Investments, at fair value | | | | | |
| Common Stock* | | | | $ | 625,949,709 | | | | | $ | — | | | | | $ | — | | | | | $ | 625,949,709 | | |
| Short-Term Investments | | | | | 1,863,222 | | | | | | 11,324,364 | | | | | | — | | | | | | 13,187,586 | | |
| Total Investments, at fair value | | | | $ | 627,812,931 | | | | | $ | 11,324,364 | | | | | $ | — | | | | | $ | 639,137,295 | | |
| |
^
See Note 2, “Significant Accounting Policies” in the Notes to Financial Statements for additional information.
*
For further breakdown of Common Stock by sector, please refer to the Summary Portfolio of Investments.
See Accompanying Notes to Financial Statements
| VY® Oppenheimer Global | SUMMARY PORTFOLIO OF INVESTMENTS |
| Portfolio | as of December 31, 2015 |
| Shares | | | Value | | | Percentage
of Net
Assets | |
| COMMON STOCK:96.8% | |
| | | | | | | Brazil: 0.8% | |
| | | 428,350 | | | | Other Securities | | | | $ | 12,653,459 | | | | | | 0.8 | | |
| | | | | | | China: 1.7% | |
| | | 634,217 | @ | | JD.com, Inc. ADR | | | | | 20,463,012 | | | | | | 1.3 | | |
| | | 100,310 | | | | Other Securities(a) | | | | | 7,303,571 | | | | | | 0.4 | | |
| | | | | | | | | | | | 27,766,583 | | | | | | 1.7 | | |
| | | | | | | Denmark: 0.3% | |
| | | 127,522 | | | | Other Securities(a) | | | | | 4,430,752 | | | | | | 0.3 | | |
| | | | | | | France: 4.6% | |
| | | 183,818 | | | | LVMH Moet Hennessy
Louis Vuitton SE | | | | | 28,872,492 | | | | | | 1.8 | | |
| | | 112,560 | | | | Kering | | | | | 19,245,047 | | | | | | 1.2 | | |
| | | 320,940 | | | | Societe Generale | | | | | 14,789,683 | | | | | | 0.9 | | |
| | | 227,644 | | | | Other Securities(a) | | | | | 11,320,858 | | | | | | 0.7 | | |
| | | | | | | | | | | | 74,228,080 | | | | | | 4.6 | | |
| | | | | | | Germany: 7.4% | |
| | | 163,361 | | | | Allianz SE | | | | | 28,797,111 | | | | | | 1.8 | | |
| | | 185,954 | | | | Bayer AG | | | | | 23,223,990 | | | | | | 1.4 | | |
| | | 577,566 | | | | Deutsche Bank AG | | | | | 14,026,078 | | | | | | 0.9 | | |
| | | 396,008 | | | | SAP SE | | | | | 31,424,663 | | | | | | 2.0 | | |
| | | 167,453 | | | | Other Securities | | | | | 20,362,370 | | | | | | 1.3 | | |
| | | | | | | | | | | | 117,834,212 | | | | | | 7.4 | | |
| | | | | | | India: 3.2% | |
| | | 10,626,808 | | | | DLF Ltd. | | | | | 18,535,741 | | | | | | 1.2 | | |
| | | 2,515,850 | | | | ICICI Bank Ltd. ADR | | | | | 19,699,105 | | | | | | 1.2 | | |
| | | 2,081,880 | | | | Zee Telefilms Ltd. | | | | | 13,723,719 | | | | | | 0.8 | | |
| | | | | | | | | | | | 51,958,565 | | | | | | 3.2 | | |
| | | | | | | Italy: 1.5% | |
| | | 4,890,717 | | | | Other Securities(a) | | | | | 23,934,034 | | | | | | 1.5 | | |
| | | | | | | Japan: 12.4% | |
| | | 1,340,100 | | | | Dai-ichi Life Insurance Co.,
Ltd. | | | | | 22,296,167 | | | | | | 1.4 | | |
| | | 962,100 | | | | KDDI Corp. | | | | | 24,985,925 | | | | | | 1.5 | | |
| | | 47,751 | | | | Keyence Corp. | | | | | 26,244,196 | | | | | | 1.6 | | |
| | | 379,600 | | | | Kyocera Corp. | | | | | 17,628,827 | | | | | | 1.1 | | |
| | | 252,300 | | | | Murata Manufacturing Co.,
Ltd. | | | | | 36,301,250 | | | | | | 2.3 | | |
| | | 330,900 | | | | Nidec Corp. | | | | | 23,995,541 | | | | | | 1.5 | | |
| | | 452,700 | | | | Sumitomo Mitsui Financial
Group, Inc. | | | | | 17,085,373 | | | | | | 1.1 | | |
| | | 1,681,900 | | | | Other Securities | | | | | 30,229,818 | | | | | | 1.9 | | |
| | | | | | | | | | | | 198,767,097 | | | | | | 12.4 | | |
| | | | | | | Mexico: 0.5% | |
| | | 94,472 | | | | Other Securities | | | | | 8,724,489 | | | | | | 0.5 | | |
| | | | | | | Netherlands: 2.3% | |
| | | 543,083 | | | | Airbus Group SE | | | | | 36,597,137 | | | | | | 2.3 | | |
| | | | | | | Spain: 3.2% | |
| | | 883,343 | | | | Industria de Diseno Textil
SA | | | | | 30,346,642 | | | | | | 1.9 | | |
| | | 2,447,162 | | | | Other Securities | | | | | 20,424,912 | | | | | | 1.3 | | |
| | | | | | | | | | | | 50,771,554 | | | | | | 3.2 | | |
| | Shares | | | Value | | | Percentage
of Net
Assets | |
| | COMMON STOCK: (continued) | |
| | | | | | | | Sweden: 3.1% | |
| | | | 1,296,882 | | | | Assa Abloy AB | | | | $ | 27,147,251 | | | | | | 1.7 | | |
| | | | 2,379,402 | | | | Telefonaktiebolaget LM
Ericsson | | | | | 22,940,542 | | | | | | 1.4 | | |
| | | | | | | | | | | | | 50,087,793 | | | | | | 3.1 | | |
| | | | | | | | Switzerland: 5.1% | |
| | | | 877,446 | @ | | Credit Suisse Group AG | | | | | 18,901,910 | | | | | | 1.2 | | |
| | | | 219,245 | | | | Nestle S.A. | | | | | 16,275,708 | | | | | | 1.0 | | |
| | | | 54,233 | | | | Roche Holding AG | | | | | 15,028,421 | | | | | | 1.0 | | |
| | | | 1,582,016 | | | | UBS Group AG | | | | | 30,690,275 | | | | | | 1.9 | | |
| | | | | | | | | | | | | 80,896,314 | | | | | | 5.1 | | |
| | | | | | | | United Kingdom: 5.6% | |
| | | | 2,784,375 | @ | | Circassia
Pharmaceuticals Plc | | | | | 13,106,466 | | | | | | 0.8 | | |
| | | | 1,241,676 | | | | Prudential PLC | | | | | 27,974,492 | | | | | | 1.7 | | |
| | | | 667,635 | | | | Unilever PLC | | | | | 28,636,476 | | | | | | 1.8 | | |
| | | | 6,853,571 | | | | Other Securities(a) | | | | | 20,233,715 | | | | | | 1.3 | | |
| | | | | | | | | | | | | 89,951,149 | | | | | | 5.6 | | |
| | | | | | | | United States: 45.1% | |
| | | | 147,760 | | | | 3M Co. | | | | | 22,258,566 | | | | | | 1.4 | | |
| | | | 375,173 | @ | | Adobe Systems, Inc. | | | | | 35,243,752 | | | | | | 2.2 | | |
| | | | 358,940 | | | | Aetna, Inc. | | | | | 38,808,593 | | | | | | 2.4 | | |
| | | | 46,230 | @ | | Alphabet, Inc. - Class A | | | | | 35,967,402 | | | | | | 2.2 | | |
| | | | 47,957 | | | | Alphabet, Inc. - Class C | | | | | 36,393,608 | | | | | | 2.3 | | |
| | | | 193,280 | | | | Anthem, Inc. | | | | | 26,950,963 | | | | | | 1.7 | | |
| | | | 55,680 | @ | | Biogen, Inc. | | | | | 17,057,568 | | | | | | 1.1 | | |
| | | | 662,210 | | | | Citigroup, Inc. | | | | | 34,269,368 | | | | | | 2.1 | | |
| | | | 518,870 | | | | Colgate-Palmolive Co. | | | | | 34,567,119 | | | | | | 2.2 | | |
| | | | 624,570 | @ | | eBay, Inc. | | | | | 17,163,184 | | | | | | 1.1 | | |
| | | | 277,620 | @ | | Facebook, Inc. | | | | | 29,055,709 | | | | | | 1.8 | | |
| | | | 212,960 | | | | Gilead Sciences, Inc. | | | | | 21,549,422 | | | | | | 1.3 | | |
| | | | 131,290 | | | | Goldman Sachs Group,
Inc. | | | | | 23,662,397 | | | | | | 1.5 | | |
| | | | 304,760 | | | | Intuit, Inc. | | | | | 29,409,340 | | | | | | 1.8 | | |
| | | | 836,080 | | | | Maxim Integrated
Products | | | | | 31,771,040 | | | | | | 2.0 | | |
| | | | 429,360 | | | | McGraw-Hill Cos., Inc. | | | | | 42,326,309 | | | | | | 2.6 | | |
| | | | 624,570 | @ | | PayPal Holdings, Inc. | | | | | 22,609,434 | | | | | | 1.4 | | |
| | | | 240,720 | | | | Tiffany & Co. | | | | | 18,364,529 | | | | | | 1.2 | | |
| | | | 211,090 | | | | United Parcel Service,
Inc. - Class B | | | | | 20,313,191 | | | | | | 1.3 | | |
| | | | 286,590 | | | | Walt Disney Co. | | | | | 30,114,877 | | | | | | 1.9 | | |
| | | | 166,470 | | | | Zimmer Biomet Holdings,
Inc. | | | | | 17,078,157 | | | | | | 1.1 | | |
| | | | 5,370,541 | | | | Other Securities(a) | | | | | 136,341,929 | | | | | | 8.5 | | |
| | | | | | | | | | | | | 721,276,457 | | | | | | 45.1 | | |
| | | | | | | | Total Common Stock
(Cost $1,001,566,910) | | | | | 1,549,877,675 | | | | | | 96.8 | | |
| |
See Accompanying Notes of Financial Statements
| VY® Oppenheimer Global | SUMMARY PORTFOLIO OF INVESTMENTS |
| Portfolio | as of December 31, 2015 (continued) |
| Shares | | | Value | | | Percentage
of Net
Assets | |
| PREFERRED STOCK:1.9% | |
| | | | | | | Germany: 1.8% | |
| | | 349,294 | | | | Bayerische Motoren
Werke AG | | | | $ | 29,223,948 | | | | | | 1.8 | | |
| | | | | | | India: 0.1% | |
| | | 50,809,899 | | | | Other Securities | | | | | 691,226 | | | | | | 0.1 | | |
| | | | | | | Total Preferred Stock
(Cost $13,137,519) | | | | | 29,915,174 | | | | | | 1.9 | | |
| RIGHTS:0.0% | |
| | | | | | | Spain: 0.0% | |
| | | 687,083 | | | | Other Securities | | | | | 342,731 | | | | | | 0.0 | | |
| | | | | | | Total Rights
(Cost $349,653) | | | | | 342,731 | | | | | | 0.0 | | |
| | | | | | | Total Long-Term
Investments
(Cost $1,015,054,082) | | | | | 1,580,135,580 | | | | | | 98.7 | | |
| |
Principal
Amount† | | | Value | | | Percentage
of Net
Assets | |
| SHORT-TERM INVESTMENTS:4.5% | |
| | | | | | | Securities Lending Collateralcc: 3.1% | |
| | | 11,681,399 | | | | BNP Paribas Bank,
Repurchase Agreement
dated 12/31/15, 0.30%, due
01/04/16 (Repurchase
Amount $11,681,783,
collateralized by various U.S.
Government/U.S.
Government Agency
Obligations, 0.000%-5.500%,
Market Value plus accrued
interest $11,915,027, due
06/06/16-05/04/37) | | | | | 11,681,399 | | | | | | 0.8 | | |
| | | 11,681,399 | | | | Citigroup, Inc., Repurchase
Agreement dated 12/31/15,
0.34%, due 01/04/16
(Repurchase Amount
$11,681,834, collateralized
by various U.S. Government
Agency Obligations,
0.000%-11.500%, Market
Value plus accrued
interest $11,915,027,
due 01/15/16-04/01/51) | | | | | 11,681,399 | | | | | | 0.7 | | |
| | | 9,333,582 | | | | HSBC Securities USA,
Repurchase Agreement
dated 12/31/15, 0.29%,
due 01/04/16 (Repurchase
Amount $9,333,879,
collateralized by various
U.S. Government Securities,
3.000%, Market Value plus
accrued interest
$9,520,280, due
11/15/44) | | | | | 9,333,582 | | | | | | 0.6 | | |
Principal
Amount† | | | Value | | | Percentage
of Net
Assets | |
| SHORT-TERM INVESTMENTS: (continued) | |
| | | | | | | Securities Lending Collateralcc (continued) | |
| | | 11,681,399 | | | | Nomura Securities,
Repurchase Agreement
dated 12/31/15, 0.33%, due
01/04/16 (Repurchase
Amount $11,681,821,
collateralized by various
U.S. Government/U.S.
Government Agency
Obligations,
0.000%-10.500%, Market
Value plus accrued interest
$11,915,027, due
01/15/16-10/20/65) | | | | $ | 11,681,399 | | | | | | 0.7 | | |
| | | 4,806,633 | | | | State of Wisconsin
Investment Board,
Repurchase Agreement
dated 12/31/15, 0.41%,
due 01/04/16 (Repurchase
Amount $4,806,849,
collateralized by various U.S.
Government Securities,
0.125%-2.500%, Market
Value plus accrued interest
$4,906,296, due
01/15/17-02/15/42) | | | | | 4,806,633 | | | | | | 0.3 | | |
| | | | | | | | | | | | 49,184,412 | | | | | | 3.1 | | |
| Shares | | | Value | | | Percentage
of Net
Assets | |
| | | | | | | Mutual Funds: 1.4% | |
| | | 23,288,328 | | | | BlackRock Liquidity Funds,
TempFund, Institutional
Class, 0.270%††
(Cost $23,288,328) | | | | | 23,288,328 | | | | | | 1.4 | | |
| | | | | | | Total Short-Term
Investments
(Cost $72,472,740) | | | | | 72,472,740 | | | | | | 4.5 | | |
| | | | | | | Total Investments
in Securities
(Cost $1,087,526,822) | | | | $ | 1,652,608,320 | | | | | | 103.2 | | |
| | | | | | | Liabilities in Excess of
Other Assets | | | | | (52,006,727) | | | | | | (3.2) | | |
| | | | | | | Net Assets | | | | $ | 1,600,601,593 | | | | | | 100.0 | | |
| |
“Other Securities” represents issues not identified as the top 50 holdings in terms of market value and issues or issuers not exceeding 1% of net assets individually or in aggregate respectively as of December 31, 2015.
The following footnotes apply to either the individual securities noted or one or more of the securities aggregated and listed as a single line item.
†
Unless otherwise indicated, principal amount is shown in USD.
See Accompanying Notes of Financial Statements
| VY® Oppenheimer Global | SUMMARY PORTFOLIO OF INVESTMENTS |
| Portfolio | as of December 31, 2015 (continued) |
††
Rate shown is the 7-day yield as of December 31, 2015.
@
Non-income producing security.
ADR
American Depositary Receipt
cc
Represents securities purchased with cash collateral received for securities on loan.
(a)
This grouping contains securities on loan.
Cost for federal income tax purposes is $1,099,378,453.
Net unrealized appreciation consists of:
| | Gross Unrealized Appreciation | | | | $ | 629,223,136 | | |
| | Gross Unrealized Depreciation | | | | | (75,993,269) | | |
| | Net Unrealized Appreciation | | | | $ | 553,229,867 | | |
| |
| Sector Diversification | | | Percentage
of Net Assets | |
| Information Technology | | | | | 24.8% | | |
| Financials | | | | | 19.4 | | |
| Health Care | | | | | 17.0 | | |
| Consumer Discretionary | | | | | 16.9 | | |
| Industrials | | | | | 11.3 | | |
| Consumer Staples | | | | | 5.5 | | |
| Telecommunication Services | | | | | 1.5 | | |
| Energy | | | | | 1.2 | | |
| Materials | | | | | 1.1 | | |
| Short-Term Investments | | | | | 4.5 | | |
| Liabilities in Excess of Other Assets | | | | | (3.2) | | |
| Net Assets | | | | | 100.0% | | |
| |
Fair Value Measurements^
The following is a summary of the fair valuations according to the inputs used as of December 31, 2015 in valuing the assets and liabilities:(1)
| | | | Quoted Prices
in Active Markets
for Identical
Investments
(Level 1) | | | Significant
Other
Observable
Inputs#
(Level 2) | | | Significant
Unobservable
Inputs
(Level 3) | | | Fair Value
at
December 31, 2015 | |
| Asset Table | | | | | |
| Investments, at fair value | | | | | |
| Common Stock | | | | | |
| Brazil | | | | $ | 12,653,459 | | | | | $ | — | | | | | $ | — | | | | | $ | 12,653,459 | | |
| China | | | | | 27,766,583 | | | | | | — | | | | | | — | | | | | | 27,766,583 | | |
| Denmark | | | | | — | | | | | | 4,430,752 | | | | | | — | | | | | | 4,430,752 | | |
| France | | | | | — | | | | | | 74,228,080 | | | | | | — | | | | | | 74,228,080 | | |
| Germany | | | | | — | | | | | | 117,834,212 | | | | | | — | | | | | | 117,834,212 | | |
| India | | | | | 19,699,105 | | | | | | 32,259,460 | | | | | | — | | | | | | 51,958,565 | | |
| Italy | | | | | — | | | | | | 23,934,034 | | | | | | — | | | | | | 23,934,034 | | |
| Japan | | | | | — | | | | | | 198,767,097 | | | | | | — | | | | | | 198,767,097 | | |
| Mexico | | | | | 8,724,489 | | | | | | — | | | | | | — | | | | | | 8,724,489 | | |
| Netherlands | | | | | — | | | | | | 36,597,137 | | | | | | — | | | | | | 36,597,137 | | |
| Spain | | | | | — | | | | | | 50,771,554 | | | | | | — | | | | | | 50,771,554 | | |
| Sweden | | | | | — | | | | | | 50,087,793 | | | | | | — | | | | | | 50,087,793 | | |
| Switzerland | | | | | — | | | | | | 80,896,314 | | | | | | — | | | | | | 80,896,314 | | |
| United Kingdom | | | | | 23,147,119 | | | | | | 66,804,030 | | | | | | — | | | | | | 89,951,149 | | |
| United States | | | | | 721,276,457 | | | | | | — | | | | | | — | | | | | | 721,276,457 | | |
| Total Common Stock | | | | | 813,267,212 | | | | | | 736,610,463 | | | | | | — | | | | | | 1,549,877,675 | | |
| Preferred Stock | | | | | 691,226 | | | | | | 29,223,948 | | | | | | — | | | | | | 29,915,174 | | |
| Rights | | | | | 342,731 | | | | | | — | | | | | | — | | | | | | 342,731 | | |
| Short-Term Investments | | | | | 23,288,328 | | | | | | 49,184,412 | | | | | | — | | | | | | 72,472,740 | | |
| Total Investments, at fair value | | | | $ | 837,589,497 | | | | | $ | 815,018,823 | | | | | $ | — | | | | | $ | 1,652,608,320 | | |
| |
(1)
For the year ended December 31, 2015, as a result of the fair value pricing procedures for international equities utilized by the Portfolio, certain securities have transferred in and out of Level 1 and Level 2 measurements during the year. The Portfolio’s policy is to recognize transfers between levels at the beginning of the reporting period. At December 31, 2015, securities valued at $29,503,422 and $7,449,409 were transferred from Level 1 to Level 2 and Level 2 to Level 1, respectively, within the fair value hierarchy.
^
See Note 2, “Significant Accounting Policies” in the Notes to Financial Statements for additional information.
#
The earlier close of the foreign markets gives rise to the possibility that significant events, including broad market moves, may have occurred in the interim and may materially affect the value of those securities. To account for this, the Portfolio may frequently value many of its foreign equity securities using fair value prices based on third party vendor modeling tools to the extent available. Accordingly, a portion of the Portfolio’s investments are categorized as Level 2 investments.
See Accompanying Notes of Financial Statements
SUMMARY PORTFOLIO OF INVESTMENTS
| VY® Pioneer High Yield Portfolio | as of December 31, 2015 |
| | Principal
Amount† | | | Value | | | Percentage
of Net
Assets | |
| | CORPORATE BONDS/NOTES: 83.2% | |
| | | | | | | | Basic Material: 2.6% | |
| | | | 50,000 | # | | Blue Cube Spinco, Inc.,
9.750%, 10/15/23 | | | | $ | 54,187 | | | | | | 0.0 | | |
| | | | 50,000 | # | | Blue Cube Spinco, Inc.,
10.000%, 10/15/25 | | | | | 55,250 | | | | | | 0.1 | | |
| | | | 225,000 | # | | Cliffs Natural Resources,
Inc., 8.250%, 03/31/20 | | | | | 172,687 | | | | | | 0.2 | | |
| | | | 375,000 | # | | Evolution Escrow Issuer
LLC, 7.500%, 03/15/22 | | | | | 218,438 | | | | | | 0.2 | | |
| | | | 300,000 | # | | IAMGOLD Corp., 6.750%,
10/01/20 | | | | | 190,500 | | | | | | 0.2 | | |
| | | | 200,000 | # | | INEOS Group Holdings SA,
5.875%, 02/15/19 | | | | | 194,750 | | | | | | 0.2 | | |
| | | | 80,000 | # | | Prince Mineral Holding
Corp., 11.500%, 12/15/19 | | | | | 58,000 | | | | | | 0.1 | | |
| | | | 120,000 | # | | Unifrax I LLC/Unifrax
Holding Co., 7.500%,
02/15/19 | | | | | 107,400 | | | | | | 0.1 | | |
| | | | 240,000 | # | | WR Grace & Co-Conn,
5.125%, 10/01/21 | | | | | 243,000 | | | | | | 0.2 | | |
| | | | 1,899,000 | | | | Other Securities | | | | | 1,199,286 | | | | | | 1.3 | | |
| | | | | | | | | | | | | 2,493,498 | | | | | | 2.6 | | |
| | | | | | | | Communications: 12.0% | |
| | | | 200,000 | # | | Altice Financing SA,
6.625%, 02/15/23 | | | | | 198,000 | | | | | | 0.2 | | |
| | | | 200,000 | # | | Altice US Finance I Corp.,
5.375%, 07/15/23 | | | | | 201,000 | | | | | | 0.2 | | |
| | | | 550,000 | | | | CCO Holdings LLC/CCO
Holdings Capital Corp.,
6.500%, 04/30/21 | | | | | 573,031 | | | | | | 0.6 | | |
| | | | 210,000 | # | | CCOH Safari LLC, 5.750%,
02/15/26 | | | | | 211,050 | | | | | | 0.2 | | |
| | | | 580,000 | | | | CenturyLink, Inc.,
6.450%, 06/15/21 | | | | | 568,400 | | | | | | 0.6 | | |
| | | | 155,000 | # | | CommScope Tech Finance
LLC, 6.000%, 06/15/25 | | | | | 149,575 | | | | | | 0.2 | | |
| | | | 120,000 | # | | CommScope, Inc., 5.000%,
06/15/21 | | | | | 115,500 | | | | | | 0.1 | | |
| | | | 115,000 | # | | CommScope, Inc., 5.500%,
06/15/24 | | | | | 109,681 | | | | | | 0.1 | | |
| | | | 330,000 | # | | DigitalGlobe, Inc., 5.250%,
02/01/21 | | | | | 278,850 | | | | | | 0.3 | | |
| | | | 400,000 | | | | Equinix, Inc., 5.375%,
01/01/22 | | | | | 412,000 | | | | | | 0.4 | | |
| | | | 195,000 | | | | Equinix, Inc., 5.375%,
04/01/23 | | | | | 199,875 | | | | | | 0.2 | | |
| | | | 50,000 | # | | FireEye, Inc., 1.000%,
06/01/35 | | | | | 42,781 | | | | | | 0.1 | | |
| | | | 50,000 | # | | FireEye, Inc., 1.625%,
06/01/35 | | | | | 40,344 | | | | | | 0.0 | | |
| | | | 218,000 | | | | Frontier Communications
Corp., 8.500%, 04/15/20 | | | | | 219,090 | | | | | | 0.2 | | |
| | | | 555,000 | | | | Frontier Communications
Corp., 8.750%, 04/15/22 | | | | | 516,150 | | | | | | 0.6 | | |
| | | | 65,000 | # | | Frontier Communications
Corp., 8.875%, 09/15/20 | | | | | 65,975 | | | | | | 0.1 | | |
| | Principal
Amount† | | | Value | | | Percentage
of Net
Assets | |
| | CORPORATE BONDS/NOTES: (continued) | |
| | | | | | | | Communications (continued) | |
| | | | 65,000 | # | | Frontier Communications
Corp., 10.500%, 09/15/22 | | | | $ | 64,756 | | | | | | 0.0 | | |
| | | | 465,500 | | | | McGraw-Hill School
Education, 6.250%,
12/17/19 | | | | | 458,518 | | | | | | 0.5 | | |
| | | | 270,000 | # | | MDC Partners, Inc.,
6.750%, 04/01/20 | | | | | 279,112 | | | | | | 0.3 | | |
| | | | 85,000 | # | | MPL 2 Acquisition Canco,
Inc., 9.875%, 08/15/18 | | | | | 88,613 | | | | | | 0.1 | | |
| | | | 200,000 | # | | Numericable Group SA,
6.000%, 05/15/22 | | | | | 194,500 | | | | | | 0.2 | | |
| | | | 480,000 | | | | Shutterfly, Inc., 0.250%,
05/15/18 | | | | | 465,000 | | | | | | 0.5 | | |
| | | | 170,000 | # | | Sirius XM Radio, Inc.,
4.625%, 05/15/23 | | | | | 167,237 | | | | | | 0.2 | | |
| | | | 1,670,000 | | | | Sprint Corp., 7.250%,
09/15/21 | | | | | 1,248,325 | | | | | | 1.3 | | |
| | | | 245,000 | # | | Taylor Morrison
Communities, Inc./
Monarch Communities,
Inc., 5.625%, 03/01/24 | | | | | 236,425 | | | | | | 0.2 | | |
| | | | 425,000 | | | | TEGNA, Inc., 6.375%,
10/15/23 | | | | | 449,437 | | | | | | 0.5 | | |
| | | | 160,000 | # | | Univision Communications,
Inc., 5.125%, 02/15/25 | | | | | 152,400 | | | | | | 0.2 | | |
| | | | 315,000 | | | | WebMD Health Corp.,
1.500%, 12/01/20 | | | | | 353,391 | | | | | | 0.4 | | |
| | | | 600,000 | | | | WebMD Health Corp.,
2.500%, 01/31/18 | | | | | 620,250 | | | | | | 0.6 | | |
| | | | 935,000 | | | | Windstream Corp.,
6.375%-7.750%,
10/15/20-08/01/23 | | | | | 718,306 | | | | | | 0.7 | | |
| | | | 2,226,968 | | | | Other Securities | | | | | 2,053,886 | | | | | | 2.2 | | |
| | | | | | | | | | | | | 11,451,458 | | | | | | 12.0 | | |
| | | | | | | | Consumer, Cyclical: 11.4% | |
| | | | 300,000 | # | | Brookfield Residential
Properties, Inc., 6.500%,
12/15/20 | | | | | 290,625 | | | | | | 0.3 | | |
| | | | 315,000 | # | | DriveTime Automotive
Group, Inc./DT Acceptance
Corp., 8.000%, 06/01/21 | | | | | 281,925 | | | | | | 0.3 | | |
| | | | 610,000 | | | | Global Partners L.P./
GLP Finance Corp.,
6.250%-7.000%,
07/15/22-06/15/23 | | | | | 496,350 | | | | | | 0.5 | | |
| | | | 380,000 | | | | Jarden Corp., 1.125%,
03/15/34 | | | | | 468,113 | | | | | | 0.5 | | |
| | | | 406,000 | # | | JLL/Delta Dutch Newco BV,
7.500%, 02/01/22 | | | | | 397,372 | | | | | | 0.4 | | |
| | | | 650,000 | | | | KB Home, 1.375%,
02/01/19 | | | | | 584,594 | | | | | | 0.6 | | |
| | | | 645,000 | | | | KB Home, 7.000%-7.500%,
12/15/21-09/15/22 | | | | | 641,500 | | | | | | 0.7 | | |
| | | | 250,000 | | | | Lennar Corp., 4.500%,
06/15/19 | | | | | 255,469 | | | | | | 0.2 | | |
See Accompanying Notes to Financial Statements
SUMMARY PORTFOLIO OF INVESTMENTS
| VY® Pioneer High Yield Portfolio | as of December 31, 2015 (continued) |
| | Principal
Amount† | | | Value | | | Percentage
of Net
Assets | |
| | CORPORATE BONDS/NOTES: (continued) | |
| | | | | | | | Consumer, Cyclical (continued) | |
| | | | 465,000 | | | | Lennar Corp., 4.750%,
11/15/22 | | | | $ | 463,372 | | | | | | 0.5 | | |
| | | | 300,000 | # | | NCL Corp. Ltd., 5.250%,
11/15/19 | | | | | 306,000 | | | | | | 0.3 | | |
| | | | 200,000 | # | | Nexteer Automotive Group
Ltd., 5.875%, 11/15/21 | | | | | 205,000 | | | | | | 0.2 | | |
| | | | 665,000 | | | | Outerwall, Inc., 5.875%,
06/15/21 | | | | | 548,625 | | | | | | 0.6 | | |
| | | | 185,000 | # | | Sabre GLBL, Inc., 5.250%,
11/15/23 | | | | | 183,844 | | | | | | 0.2 | | |
| | | | 150,000 | | | | Scientific Games
International, Inc., 6.250%,
09/01/20 | | | | | 71,250 | | | | | | 0.1 | | |
| | | | 1,315,000 | | | | Scientific Games
International, Inc.,
10.000%, 12/01/22 | | | | | 940,225 | | | | | | 1.0 | | |
| | | | 75,000 | # | | Shea Homes L.P./Shea
Homes Funding Corp.,
5.875%, 04/01/23 | | | | | 77,250 | | | | | | 0.1 | | |
| | | | 245,000 | # | | Viking Cruises Ltd.,
8.500%, 10/15/22 | | | | | 233,363 | | | | | | 0.2 | | |
| | | | 160,000 | # | | ZF North America Capital,
Inc., 4.750%, 04/29/25 | | | | | 153,000 | | | | | | 0.2 | | |
| | | | 4,352,062 | | | | Other Securities | | | | | 4,270,124 | | | | | | 4.5 | | |
| | | | | | | | | | | | | 10,868,001 | | | | | | 11.4 | | |
| | | | | | | | Consumer, Non-cyclical: 18.3% | |
| | | | 570,000 | | | | Alliance One International,
Inc., 9.875%, 07/15/21 | | | | | 421,087 | | | | | | 0.4 | | |
| | | | 215,000 | # | | C&S Group Enterprises
LLC, 5.375%, 07/15/22 | | | | | 194,575 | | | | | | 0.2 | | |
| | | | 490,000 | | | | Cardtronics, Inc., 1.000%,
12/01/20 | | | | | 457,231 | | | | | | 0.5 | | |
| | | | 225,000 | # | | Cenveo Corp., 6.000%,
08/01/19 | | | | | 159,750 | | | | | | 0.2 | | |
| | | | 70,000 | | | | CHS/Community Health
Systems, Inc., 6.875%,
02/01/22 | | | | | 66,762 | | | | | | 0.1 | | |
| | | | 870,000 | | | | CHS/Community Health
Systems, Inc., 8.000%,
11/15/19 | | | | | 880,875 | | | | | | 0.9 | | |
| | | | 375,000 | # | | Cimpress NV, 7.000%,
04/01/22 | | | | | 361,406 | | | | | | 0.4 | | |
| | | | 500,000 | | | | Constellation Brands, Inc.,
3.750%-4.250%,
05/01/21-05/01/23 | | | | | 501,812 | | | | | | 0.5 | | |
| | | | 305,000 | # | | Constellis Holdings LLC/
Constellis Finance Corp.,
9.750%, 05/15/20 | | | | | 251,625 | | | | | | 0.3 | | |
| | | | 310,000 | # | | Dole Food Co., Inc.,
7.250%, 05/01/19 | | | | | 307,675 | | | | | | 0.3 | | |
| | | | 411,000 | | | | Emergent Biosolutions,
Inc., 2.875%, 01/15/21 | | | | | 567,437 | | | | | | 0.6 | | |
| | | | 315,000 | # | | Endo Finance LLC,
5.750%, 01/15/22 | | | | | 307,125 | | | | | | 0.3 | | |
| | Principal
Amount† | | | Value | | | Percentage
of Net
Assets | |
| | CORPORATE BONDS/NOTES: (continued) | |
| | | | | | | | Consumer, Non-cyclical (continued) | |
| | | | 140,000 | # | | Endo Finance LLC,
5.875%, 01/15/23 | | | | $ | 137,900 | | | | | | 0.2 | | |
| | | | 250,000 | # | | FAGE Dairy Industry SA/
FAGE USA Dairy Industry,
Inc., 9.875%, 02/01/20 | | | | | 260,469 | | | | | | 0.3 | | |
| | | | 250,000 | #,& | | Igloo Holdings Corp.,
8.250%, 12/15/17 | | | | | 250,237 | | | | | | 0.3 | | |
| | | | 120,000 | # | | Immunomedics, Inc.,
4.750%, 02/15/20 | | | | | 95,775 | | | | | | 0.1 | | |
| | | | 390,000 | # | | Impax Laboratories, Inc.,
2.000%, 06/15/22 | | | | | 384,150 | | | | | | 0.4 | | |
| | | | 490,000 | | | | Insulet Corp., 2.000%,
06/15/19 | | | | | 508,681 | | | | | | 0.5 | | |
| | | | 290,000 | # | | Ironwood Pharmaceuticals,
Inc., 2.250%, 06/15/22 | | | | | 271,512 | | | | | | 0.3 | | |
| | | | 495,000 | | | | Kindred Healthcare, Inc.,
6.375%-8.000%,
01/15/20-04/15/22 | | | | | 438,206 | | | | | | 0.4 | | |
| | | | 205,000 | # | | Medicines Co, 2.500%,
01/15/22 | | | | | 260,863 | | | | | | 0.3 | | |
| | | | 205,000 | # | | Molina Healthcare, Inc.,
5.375%, 11/15/22 | | | | | 205,513 | | | | | | 0.2 | | |
| | | | 550,000 | | | | Post Holdings, Inc.,
7.375%, 02/15/22 | | | | | 575,438 | | | | | | 0.6 | | |
| | | | 260,000 | # | | Post Holdings, Inc.,
6.000%, 12/15/22 | | | | | 255,775 | | | | | | 0.3 | | |
| | | | 100,000 | # | | Post Holdings, Inc.,
6.750%, 12/01/21 | | | | | 102,250 | | | | | | 0.1 | | |
| | | | 100,000 | # | | Post Holdings, Inc.,
7.750%, 03/15/24 | | | | | 105,000 | | | | | | 0.1 | | |
| | | | 255,000 | # | | Quintiles Transnational
Corp., 4.875%, 05/15/23 | | | | | 257,550 | | | | | | 0.3 | | |
| | | | 935,000 | | | | Reynolds Group Issuer,
Inc., 5.750%-9.875%,
05/15/18-02/15/21 | | | | | 928,300 | | | | | | 1.0 | | |
| | | | 165,000 | # | | Safway Group Holding LLC
/ Safway Finance Corp.,
7.000%, 05/15/18 | | | | | 165,413 | | | | | | 0.2 | | |
| | | | 465,000 | # | | Sothebys, 5.250%,
10/01/22 | | | | | 425,475 | | | | | | 0.4 | | |
| | | | 255,000 | # | | Southern States
Cooperative, Inc.,
10.000%, 08/15/21 | | | | | 221,850 | | | | | | 0.2 | | |
| | | | 440,000 | | | | Truven Health Analytics,
Inc., 10.625%, 06/01/20 | | | | | 444,400 | | | | | | 0.5 | | |
| | | | 905,000 | # | | VRX Escrow Corp.,
5.875%, 05/15/23 | | | | | 812,238 | | | | | | 0.8 | | |
| | | | 480,000 | | | | WellCare Health Plans,
Inc., 5.750%, 11/15/20 | | | | | 496,200 | | | | | | 0.5 | | |
| | | | 220,000 | # | | Wright Medical Group, Inc.,
2.000%, 02/15/20 | | | | | 228,663 | | | | | | 0.2 | | |
| | | | 5,541,556 | | | | Other Securities | | | | | 5,148,601 | | | | | | 5.4 | | |
| | | | | | | | | | | | | 17,457,819 | | | | | | 18.3 | | |
See Accompanying Notes to Financial Statements
SUMMARY PORTFOLIO OF INVESTMENTS
| VY® Pioneer High Yield Portfolio | as of December 31, 2015 (continued) |
Principal
Amount† | | | Value | | | Percentage
of Net
Assets | |
| CORPORATE BONDS/NOTES: (continued) | |
| | | | | | | Diversified: 0.2% | |
| | | 230,000 | # | | Argos Merger Sub, Inc.,
7.125%, 03/15/23 | | | | $ | 228,620 | | | | | | 0.2 | | |
| | | | | | | Energy: 9.9% | |
| | | 350,000 | | | | Calumet Specialty
Products Partners L.P./
Calumet Finance Corp.,
6.500%, 04/15/21 | | | | | 306,250 | | | | | | 0.3 | | |
| | | 175,000 | # | | Calumet Specialty
Products Partners L.P./
Calumet Finance Corp.,
7.750%, 04/15/23 | | | | | 149,625 | | | | | | 0.2 | | |
| | | 173,000 | # | | Chesapeake Energy Corp.,
8.000%, 12/15/22 | | | | | 85,635 | | | | | | 0.1 | | |
| | | 210,000 | # | | ContourGlobal Power
Holdings SA, 7.125%,
06/01/19 | | | | | 200,025 | | | | | | 0.2 | | |
| | | 510,000 | | | | Archrock Partners L.P./
Archrock Partners Finance
Corp., 6.000%, 04/01/21 | | | | | 422,025 | | | | | | 0.4 | | |
| | | 131,000 | # | | Halcon Resources Corp.,
12.000%, 02/15/22 | | | | | 86,460 | | | | | | 0.1 | | |
| | | 90,000 | # | | Hiland Partners L.P./Hiland
Partners Finance Corp.,
5.500%, 05/15/22 | | | | | 86,569 | | | | | | 0.1 | | |
| | | 170,000 | # | | Hiland Partners L.P./Hiland
Partners Finance Corp.,
7.250%, 10/01/20 | | | | | 171,912 | | | | | | 0.2 | | |
| | | 285,000 | # | | Hilcorp Energy I L.P./
Hilcorp Finance Co.,
5.750%, 10/01/25 | | | | | 249,375 | | | | | | 0.3 | | |
| | | 207,000 | # | | Linn Energy LLC/Linn
Energy Finance Corp.,
12.000%, 12/15/20 | | | | | 105,570 | | | | | | 0.1 | | |
| | | 585,000 | | | | Noble Energy, Inc.,
5.625%, 05/01/21 | | | | | 572,888 | | | | | | 0.6 | | |
| | | 240,000 | | | | Noble Energy, Inc.,
5.875%, 06/01/22 | | | | | 228,610 | | | | | | 0.2 | | |
| | | 110,000 | # | | TerraForm Power
Operating LLC, 5.875%,
02/01/23 | | | | | 91,575 | | | | | | 0.1 | | |
| | | 260,000 | # | | Whiting Petroleum Corp.,
1.250%, 04/01/20 | | | | | 178,100 | | | | | | 0.2 | | |
| | | 10,793,380 | | | | Other Securities | | | | | 6,450,300 | | | | | | 6.8 | | |
| | | | | | | | | | | | 9,384,919 | | | | | | 9.9 | | |
| | | | | | | Financial: 10.9% | |
| | | 218,276 | #,& | | AAF Holdings LLC/AAF
Finance Co., 12.000%,
07/01/19 | | | | | 207,362 | | | | | | 0.2 | | |
| | | 805,000 | | | | Ally Financial, Inc.,
4.625%-5.750%,
05/19/22-11/20/25 | | | | | 808,075 | | | | | | 0.8 | | |
| | | 300,000 | # | | Ausdrill Finance Pty Ltd.,
6.875%, 11/01/19 | | | | | 216,000 | | | | | | 0.2 | | |
| | Principal
Amount† | | | Value | | | Percentage
of Net
Assets | |
| | CORPORATE BONDS/NOTES: (continued) | |
| | | | | | | | Financial (continued) | |
| | | | 700,000 | | | | Bank of America Corp.,
6.250%-6.500%,
09/29/49-10/29/49 | | | | $ | 721,844 | | | | | | 0.8 | | |
| | | | 400,000 | | | | DuPont Fabros Technology
L.P., 5.875%, 09/15/21 | | | | | 418,000 | | | | | | 0.4 | | |
| | | | 140,000 | # | | Fidelity & Guaranty Life
Holdings, Inc., 6.375%,
04/01/21 | | | | | 143,500 | | | | | | 0.2 | | |
| | | | 250,000 | # | | Galileo Re Ltd., 7.598%,
01/09/19 | | | | | 252,687 | | | | | | 0.3 | | |
| | | | 480,000 | | | | Geo Group, Inc./The,
5.875%, 10/15/24 | | | | | 468,000 | | | | | | 0.5 | | |
| | | | 250,000 | # | | Kilimanjaro Re Ltd.,
4.703%, 04/30/18 | | | | | 247,637 | | | | | | 0.2 | | |
| | | | 250,000 | # | | Kilimanjaro Re Ltd.,
9.250%, 12/06/19 | | | | | 251,913 | | | | | | 0.3 | | |
| | | | 575,000 | | | | Nationstar Mortgage LLC/
Nationstar Capital Corp.,
6.500%, 07/01/21 | | | | | 511,031 | | | | | | 0.5 | | |
| | | | 320,000 | | | | Nationstar Mortgage LLC/
Nationstar Capital Corp.,
6.500%, 08/01/18-06/01/22 | | | | | 288,625 | | | | | | 0.3 | | |
| | | | 435,000 | # | | Provident Funding
Associates L.P./PFG
Finance Corp., 6.750%,
06/15/21 | | | | | 423,037 | | | | | | 0.4 | | |
| | | | 250,000 | # | | Queen Street VII Re Ltd.,
8.803%, 04/08/16 | | | | | 251,931 | | | | | | 0.3 | | |
| | | | 250,000 | # | | Residential Reinsurance
2012 Ltd., 5.953%,
12/06/18 | | | | | 254,212 | | | | | | 0.2 | | |
| | | | 250,000 | # | | Residential Reinsurance
2012 Ltd., 12.953%,
12/06/18 | | | | | 261,763 | | | | | | 0.3 | | |
| | | | 400,000 | | | | Royal Bank of Scotland
Group PLC, 8.000%,
12/29/49 | | | | | 424,000 | | | | | | 0.4 | | |
| | | | 250,000 | # | | Sanders Re Ltd., 4.203%,
05/05/17 | | | | | 250,213 | | | | | | 0.3 | | |
| | | | 210,000 | # | | TMX Finance LLC/
TitleMax Finance Corp.,
8.500%, 09/15/18 | | | | | 157,500 | | | | | | 0.2 | | |
| | | | 525,000 | | | | United Rentals North
America, Inc., 5.750%,
11/15/24 | | | | | 522,375 | | | | | | 0.6 | | |
| | | | 3,334,039 | | | | Other Securities | | | | | 3,305,574 | | | | | | 3.5 | | |
| | | | | | | | | | | | | 10,385,279 | | | | | | 10.9 | | |
| | | | | | | | Industrial: 10.1% | |
| | | | 150,000 | # | | Aguila 3 SA, 7.875%,
01/31/18 | | | | | 150,937 | | | | | | 0.2 | | |
| | | | 208,587 | #,& | | American Energy - Utica
LLC, 3.500%, 03/01/21 | | | | | 7,301 | | | | | | 0.0 | | |
| | | | 345,000 | # | | Amsted Industries, Inc.,
5.000%, 03/15/22 | | | | | 346,725 | | | | | | 0.4 | | |
See Accompanying Notes to Financial Statements
SUMMARY PORTFOLIO OF INVESTMENTS
| VY® Pioneer High Yield Portfolio | as of December 31, 2015 (continued) |
| | Principal
Amount† | | | Value | | | Percentage
of Net
Assets | |
| | CORPORATE BONDS/NOTES: (continued) | |
| | | | | | | | Industrial (continued) | |
| | | | 397,535 | #,& | | Ardagh Finance Holdings
SA, 8.625%, 06/15/19 | | | | $ | 393,806 | | | | | | 0.4 | | |
| | | | 35,294 | # | | Ardagh Packaging Finance
PLC, 7.000%, 11/15/20 | | | | | 34,853 | | | | | | 0.0 | | |
| | | | 250,000 | # | | Aviation Capital Group
Corp., 6.750%, 04/06/21 | | | | | 280,312 | | | | | | 0.3 | | |
| | | | 325,000 | | | | Ball Corp., 4.000%,
11/15/23 | | | | | 311,593 | | | | | | 0.3 | | |
| | | | 575,000 | | | | Ball Corp., 5.250%,
07/01/25 | | | | | 590,094 | | | | | | 0.6 | | |
| | | | 350,000 | # | | BC Mountain LLC/BC
Mountain Finance, Inc.,
7.000%, 02/01/21 | | | | | 271,250 | | | | | | 0.3 | | |
| | | | 85,000 | # | | Belden, Inc., 5.250%,
07/15/24 | | | | | 78,625 | | | | | | 0.1 | | |
| | | | 195,000 | # | | Belden, Inc., 5.500%,
09/01/22 | | | | | 188,662 | | | | | | 0.2 | | |
| | | | 50,000 | # | | Beverage Packaging
Holdings Luxembourg II
SA/ Beverage Packaging
Holdings II Is, 6.000%,
06/15/17 | | | | | 48,563 | | | | | | 0.1 | | |
| | | | 305,000 | # | | Cleaver-Brooks, Inc.,
8.750%, 12/15/19 | | | | | 295,850 | | | | | | 0.3 | | |
| | | | 300,000 | # | | Coveris Holding Corp.,
10.000%, 06/01/18 | | | | | 286,500 | | | | | | 0.3 | | |
| | | | 640,000 | | | | Crown Cork & Seal Co.,
Inc., 7.375%, 12/15/26 | | | | | 691,200 | | | | | | 0.7 | | |
| | | | 250,000 | # | | Dycom Industries, Inc.,
0.750%, 09/15/21 | | | | | 246,875 | | | | | | 0.3 | | |
| | | | 270,000 | # | | Florida East Coast
Holdings Corp., 6.750%,
05/01/19 | | | | | 247,725 | | | | | | 0.3 | | |
| | | | 744,000 | | | | General Cable Corp.,
4.500%, 11/15/29 | | | | | 458,955 | | | | | | 0.5 | | |
| | | | 505,000 | | | | Griffon Corp., 5.250%,
03/01/22 | | | | | 483,538 | | | | | | 0.5 | | |
| | | | 175,000 | # | | Intrepid Aviation Group
Holdings LLC / Intrepid
Finance Co., 6.875%,
02/15/19 | | | | | 144,375 | | | | | | 0.2 | | |
| | | | 310,000 | # | | JB Poindexter & Co., Inc.,
9.000%, 04/01/22 | | | | | 325,500 | | | | | | 0.3 | | |
| | | | 335,000 | # | | JMC Steel Group, 8.250%,
03/15/18 | | | | | 223,613 | | | | | | 0.2 | | |
| | | | 114,328 | #,& | | Liberty Tire Recycling LLC,
11.000%, 03/31/21 | | | | | 70,598 | | | | | | 0.1 | | |
| | | | 575,000 | # | | NANA Development Corp.,
9.500%, 03/15/19 | | | | | 508,875 | | | | | | 0.5 | | |
| | | | 400,000 | # | | Rentech Nitrogen Partners
L.P./Rentech Nitrogen
Finance Corp., 6.500%,
04/15/21 | | | | | 390,000 | | | | | | 0.4 | | |
| | | | 400,000 | # | | Rexel SA, 5.250%,
06/15/20 | | | | | 414,000 | | | | | | 0.4 | | |
| | Principal
Amount† | | | Value | | | Percentage
of Net
Assets | |
| | CORPORATE BONDS/NOTES: (continued) | |
| | | | | | | | Industrial (continued) | |
| | | | 200,000 | # | | Syncreon Group BV/
Syncreon Global Finance
US, Inc., 8.625%, 11/01/21 | | | | $ | 158,000 | | | | | | 0.2 | | |
| | | | 100,000 | # | | Videotron Ltd., 5.375%,
06/15/24 | | | | | 100,750 | | | | | | 0.1 | | |
| | | | 545,000 | | | | Vishay Intertechnology,
Inc., 2.250%, 05/15/41 | | | | | 419,309 | | | | | | 0.4 | | |
| | | | 1,521,582 | | | | Other Securities | | | | | 1,472,016 | | | | | | 1.5 | | |
| | | | | | | | | | | | | 9,640,400 | | | | | | 10.1 | | |
| | | | | | | | Technology: 5.5% | |
| | | | 150,000 | # | | Audatex North America,
Inc., 6.000%, 06/15/21 | | | | | 151,687 | | | | | | 0.1 | | |
| | | | 215,000 | # | | Brocade Communications
Systems, Inc., 1.375%,
01/01/20 | | | | | 206,937 | | | | | | 0.2 | | |
| | | | 375,000 | # | | Entegris, Inc., 6.000%,
04/01/22 | | | | | 381,094 | | | | | | 0.4 | | |
| | | | 420,000 | # | | First Data Corp., 5.750%,
01/15/24 | | | | | 414,750 | | | | | | 0.4 | | |
| | | | 155,000 | # | | First Data Corp., 7.000%,
12/01/23 | | | | | 155,388 | | | | | | 0.2 | | |
| | | | 510,000 | | | | j2 Global, Inc., 8.000%,
08/01/20 | | | | | 535,500 | | | | | | 0.6 | | |
| | | | 395,000 | | | | Mentor Graphics Corp.,
4.000%, 04/01/31 | | | | | 413,516 | | | | | | 0.4 | | |
| | | | 315,000 | # | | Micron Technology, Inc.,
5.250%, 08/01/23 | | | | | 284,288 | | | | | | 0.3 | | |
| | | | 250,000 | # | | MSCI, Inc., 5.250%,
11/15/24 | | | | | 254,375 | | | | | | 0.3 | | |
| | | | 69,000 | # | | Nuance Communications,
Inc., 1.000%, 12/15/35 | | | | | 66,714 | | | | | | 0.1 | | |
| | | | 375,000 | # | | ON Semiconductor Corp.,
1.000%, 12/01/20 | | | | | 351,094 | | | | | | 0.4 | | |
| | | | 2,151,357 | | | | Other Securities | | | | | 1,994,717 | | | | | | 2.1 | | |
| | | | | | | | | | | | | 5,210,060 | | | | | | 5.5 | | |
| | | | | | | | Utilities: 2.3% | |
| | | | 505,000 | | | | AES Corp., 4.875%,
05/15/23 | | | | | 444,400 | | | | | | 0.5 | | |
| | | | 100,000 | | | | AES Corp., 5.500%,
03/15/24 | | | | | 89,750 | | | | | | 0.1 | | |
| | | | 675,000 | | | | NRG Energy, Inc., 6.250%,
05/01/24 | | | | | 570,510 | | | | | | 0.6 | | |
| | | | 425,000 | | | | NRG Energy, Inc.,
6.250%-7.625%,
01/15/18-07/15/22 | | | | | 418,938 | | | | | | 0.4 | | |
| | | | 540,000 | # | | Talen Energy Supply LLC,
5.125%, 07/15/19 | | | | | 407,700 | | | | | | 0.4 | | |
| | | | 345,000 | # | | Talen Energy Supply LLC,
6.500%, 06/01/25 | | | | | 229,425 | | | | | | 0.3 | | |
| | | | 350 | | | | Other Securities | | | | | 366 | | | | | | 0.0 | | |
| | | | | | | | | | | | | 2,161,089 | | | | | | 2.3 | | |
| | | | | | | | Total Corporate
Bonds/Notes
(Cost $88,828,204) | | | | | 79,281,143 | | | | | | 83.2 | | |
| |
See Accompanying Notes to Financial Statements
SUMMARY PORTFOLIO OF INVESTMENTS
| VY® Pioneer High Yield Portfolio | as of December 31, 2015 (continued) |
| | Principal
Amount† | | | Value | | | Percentage
of Net
Assets | |
| | COLLATERALIZED MORTGAGE OBLIGATIONS: 1.0% | |
| | | | 1,000,000 | # | | Timberstar Trust, 7.530%,
10/15/36 | | | | $ | 1,008,890 | | | | | | 1.0 | | |
| | | | | | | | Total Collateralized
Mortgage Obligations
(Cost $1,007,921) | | | | | 1,008,890 | | | | | | 1.0 | | |
| | FOREIGN GOVERNMENT BONDS: 0.0% | |
| | | | 13,615 | | | | Other Securities | | | | | 75 | | | | | | 0.0 | | |
| | | | | | | | Total Foreign
Government Bonds
(Cost $518) | | | | | 75 | | | | | | 0.0 | | |
| |
| | Shares | | | Value | | | Percentage
of Net
Assets | |
| | COMMON STOCK: 6.5% | |
| | | | | | | | Consumer Discretionary: 1.1% | |
| | | | 50,408 | | | | Ford Motor Co. | | | | | 710,249 | | | | | | 0.7 | | |
| | | | 8,679 | | | | Other Securities | | | | | 386,359 | | | | | | 0.4 | | |
| | | | | | | | | | | | | 1,096,608 | | | | | | 1.1 | | |
| | | | | | | | Energy: 0.3% | |
| | | | 47,707 | | | | Other Securities | | | | | 315,123 | | | | | | 0.3 | | |
| | | | | | | | Financials: 1.1% | |
| | | | 35,040 | @ | | Forest City Enterprises, Inc. | | | | | 768,427 | | | | | | 0.8 | | |
| | | | 1,476 | #,@ | | Perseus Holding Corp. | | | | | — | | | | | | — | | |
| | | | 8,642 | | | | Other Securities | | | | | 305,653 | | | | | | 0.3 | | |
| | | | | | | | | | | | | 1,074,080 | | | | | | 1.1 | | |
| | | | | | | | Health Care: 1.8% | |
| | | | 4,129 | | | | Thermo Fisher Scientific,
Inc. | | | | | 585,699 | | | | | | 0.6 | | |
| | | | 25,783 | | | | Other Securities | | | | | 1,102,034 | | | | | | 1.2 | | |
| | | | | | | | | | | | | 1,687,733 | | | | | | 1.8 | | |
| | | | | | | | Industrials: 0.8% | |
| | | | 49,762 | | | | Other Securities | | | | | 753,476 | | | | | | 0.8 | | |
| | | | | | | | Information Technology: 0.8% | |
| | | | 23,277 | | | | Other Securities | | | | | 736,469 | | | | | | 0.8 | | |
| | | | | | | | Materials: 0.6% | |
| | | | 14,803 | | | | Other Securities | | | | | 535,988 | | | | | | 0.6 | | |
| | | | | | | | Telecommunication Services: 0.0% | |
| | | | 4,800 | | | | Other Securities | | | | | 30,912 | | | | | | 0.0 | | |
| | | | | | | | Total Common Stock
(Cost $5,200,320) | | | | | 6,230,389 | | | | | | 6.5 | | |
| | PREFERRED STOCK: 2.4% | |
| | | | | | | | Consumer Discretionary: 0.8% | |
| | | | 7,900 | @ | | Sealy Corp. | | | | | 697,624 | | | | | | 0.8 | | |
| | | | | | | | Energy: 0.0% | |
| | | | 2,701 | | | | Other Securities | | | | | 28,214 | | | | | | 0.0 | | |
| | | | | | | | Financials: 1.0% | |
| | | | 22,770 | P | | Citigroup, Inc. | | | | | 637,788 | | | | | | 0.7 | | |
| | | | 775 | #,@ | | Perseus Holding Corp. | | | | | — | | | | | | — | | |
| | | | 13,310 | | | | Other Securities | | | | | 337,907 | | | | | | 0.3 | | |
| | | | | | | | | | | | | 975,695 | | | | | | 1.0 | | |
| | | | | | | | Health Care: 0.5% | |
| | | | 150 | @ | | Kindred Healthcare, Inc. | | | | | 101,779 | | | | | | 0.1 | | |
| | Shares | | | Value | | | Percentage
of Net
Assets | |
| | PREFERRED STOCK: (continued) | |
| | | | | | | | Health Care (continued) | |
| | | | 936 | | | | Other Securities | | | | $ | 355,828 | | | | | | 0.4 | | |
| | | | | | | | | | | | | 457,607 | | | | | | 0.5 | | |
| | | | | | | | Industrials: 0.1% | |
| | | | 267 | | | | Other Securities | | | | | 120,163 | | | | | | 0.1 | | |
| | | | | | | | Total Preferred Stock
(Cost $2,932,942) | | | | | 2,279,303 | | | | | | 2.4 | | |
| | RIGHTS: —% | |
| | | | | | | | Health Care: —% | |
| | | | 44 | | | | Other Securities | | | | | — | | | | | | — | | |
| | | | | | | | Total Rights
(Cost $ —) | | | | | — | | | | | | — | | |
| | | | | | | | Total Long-Term
Investments
(Cost $97,969,905) | | | | | 88,799,800 | | | | | | 93.1 | | |
| | SHORT-TERM INVESTMENTS: 5.5% | |
| | | | | | | | Mutual Funds: 5.5% | |
| | | | 5,223,470 | | | | BlackRock Liquidity Funds,
TempFund, Institutional
Class, 0.270%††
(Cost $5,223,470) | | | | | 5,223,470 | | | | | | 5.5 | | |
| | | | | | | | Total Short-Term
Investments
(Cost $5,223,470) | | | | | 5,223,470 | | | | | | 5.5 | | |
| | | | | | | | Total Investments
in Securities
(Cost $103,193,375) | | | | $ | 94,023,270 | | | | | | 98.6 | | |
| | | | | | | | Assets in Excess of
Other Liabilities | | | | | 1,312,141 | | | | | | 1.4 | | |
| | | | | | | | Net Assets | | | | $ | 95,335,411 | | | | | | 100.0 | | |
| |
“Other Securities” represents issues not identified as the top 50 holdings in terms of market value and issues or issuers not exceeding 1% of net assets individually or in aggregate respectively as of December 31, 2015.
The following footnotes apply to either the individual securities noted or one or more of the securities aggregated and listed as a single line item.
†
Unless otherwise indicated, principal amount is shown in USD.
††
Rate shown is the 7-day yield as of December 31, 2015.
#
Securities with purchases pursuant to Rule 144A or section 4(a)(2), under the Securities Act of 1933 and may not be resold subject to that rule except to qualified institutional buyers.
@
Non-income producing security.
&
Payment-in-kind
P
Preferred Stock may be called prior to convertible date.
Cost for federal income tax purposes is $103,750,287.
Net unrealized depreciation consists of:
| | Gross Unrealized Appreciation | | | | $ | 3,163,483 | | |
| | Gross Unrealized Depreciation | | | | | (12,890,500) | | |
| | Net Unrealized Depreciation | | | | $ | (9,727,017) | | |
| |
See Accompanying Notes to Financial Statements
SUMMARY PORTFOLIO OF INVESTMENTS
| VY® Pioneer High Yield Portfolio | as of December 31, 2015 (continued) |
Fair Value Measurements^
The following is a summary of the fair valuations according to the inputs used as of December 31, 2015 in valuing the assets and liabilities:
| | | | Quoted Prices
in Active Markets
for Identical
Investments
(Level 1) | | | Significant
Other
Observable
Inputs
(Level 2) | | | Significant
Unobservable
Inputs
(Level 3) | | | Fair Value
at
December 31, 2015 | |
| Asset Table | | | | | |
| Investments, at fair value | | | | | |
| Common Stock | | | | | |
| Consumer Discretionary | | | | $ | 1,096,608 | | | | | $ | — | | | | | $ | — | | | | | $ | 1,096,608 | | |
| Energy | | | | | 315,123 | | | | | | — | | | | | | — | | | | | | 315,123 | | |
| Financials | | | | | 1,074,080 | | | | | | — | | | | | | — | | | | | | 1,074,080 | | |
| Health Care | | | | | 1,687,733 | | | | | | — | | | | | | — | | | | | | 1,687,733 | | |
| Industrials | | | | | 697,969 | | | | | | — | | | | | | 55,507 | | | | | | 753,476 | | |
| Information Technology | | | | | 736,469 | | | | | | — | | | | | | — | | | | | | 736,469 | | |
| Materials | | | | | 535,988 | | | | | | — | | | | | | — | | | | | | 535,988 | | |
| Telecommunication Services | | | | | 30,912 | | | | | | — | | | | | | — | | | | | | 30,912 | | |
| Total Common Stock | | | | | 6,174,882 | | | | | | — | | | | | | 55,507 | | | | | | 6,230,389 | | |
| Preferred Stock | | | | | 1,001,843 | | | | | | 1,157,297 | | | | | | 120,163 | | | | | | 2,279,303 | | |
| Rights | | | | | — | | | | | | — | | | | | | — | | | | | | — | | |
| Corporate Bonds/Notes | | | | | — | | | | | | 79,281,143 | | | | | | — | | | | | | 79,281,143 | | |
| Collateralized Mortgage Obligations | | | | | — | | | | | | 1,008,890 | | | | | | — | | | | | | 1,008,890 | | |
| Short-Term Investments | | | | | 5,223,470 | | | | | | — | | | | | | — | | | | | | 5,223,470 | | |
| Foreign Government Bonds | | | | | — | | | | | | 75 | | | | | | — | | | | | | 75 | | |
| Total Investments, at fair value | | | | $ | 12,400,195 | | | | | $ | 81,447,405 | | | | | $ | 175,670 | | | | | $ | 94,023,270 | | |
| Liabilities Table | | | | | |
| Other Financial Instruments+ | | | | | |
| Centrally Cleared Swaps | | | | $ | — | | | | | $ | (44,589) | | | | | $ | — | | | | | $ | (44,589) | | |
| Futures | | | | | (22,685) | | | | | | — | | | | | | — | | | | | | (22,685) | | |
| Total Liabilities | | | | $ | (22,685) | | | | | $ | (44,589) | | | | | $ | — | | | | | $ | (67,274) | | |
| |
^
See Note 2, “Significant Accounting Policies” in the Notes to Financial Statements for additional information.
+
Other Financial Instruments are derivatives not reflected in the portfolio of investments and may include open forward foreign currency contracts, futures, centrally cleared swaps, OTC swaps and written options. Forward foreign currency contracts, futures and centrally cleared swaps are valued at the unrealized gain (loss) on the instrument. OTC swaps and written options are valued at the fair value of the instrument.
At December 31, 2015, the following futures contracts were outstanding for VY® Pioneer High Yield Portfolio:
| Contract Description | | | Number
of Contracts | | | Expiration
Date | | | Notional
Value | | | Unrealized
Appreciation/
(Depreciation) | |
| Short Contracts | | | | | |
| S&P 500 E-Mini | | | | | (28) | | | | | | 03/18/16 | | | | | $ | (2,849,560) | | | | | $ | (22,685) | | |
| | | | | | | | | | | | | | | | | $ | (2,849,560) | | | | | $ | (22,685) | | |
| |
See Accompanying Notes to Financial Statements
SUMMARY PORTFOLIO OF INVESTMENTS
| VY® Pioneer High Yield Portfolio | as of December 31, 2015 (continued) |
At December 31, 2015, the following centrally cleared credit default swaps were outstanding for VY® Pioneer High Yield Portfolio:
Centrally Cleared Credit Default Swaps on Credit Indices — Sell Protection(1)
Reference Entity/
Obligation | | | Buy/Sell
Protection | | | (Pay)/
Receive
Fixed
Rate (%) | | | Clearinghouse | | | Termination
Date | | | Notional Amount(2) | | | Fair
Value(3) | | | Unrealized
Appreciation/
(Depreciation) | |
CDX North American
High Yield Index
Series 23,
Version 1 | | | Sell | | | | | 5.000 | | | | Chicago Mercantile Exchange | | | | | 12/20/19 | | | | | | USD1,101,678 | | | | | $ | 58,528 | | | | | $ | (11,980) | | |
CDX North American
High Yield Index
Series 25,
Version 1 | | | Sell | | | | | 5.000 | | | | Chicago Mercantile Exchange | | | | | 12/20/20 | | | | | | USD2,065,000 | | | | | | 23,204 | | | | | | (32,609) | | |
| | | | | | | | | | | | | | | | | | | | | | | | | | | | | $ | 81,732 | | | | | $ | (44,589) | | |
| |
(1)
If the Portfolio is a seller of protection and a credit event occurs, as defined under the terms of that particular swap agreement, the Portfolio will generally either i) Pay to the buyer an amount equal to the notional amount of the swap and take delivery of the referenced obligation, other deliverable obligations, or underlying securities comprising a referenced index or ii) Pay a net settlement amount in the form of cash or securities equal to the notional amount of the swap less the recovery value of the referenced obligation or underlying securities comprising a referenced index.
(2)
The maximum amount of future payments (undiscounted) that a Portfolio as seller of protection could be required to make or receive as a buyer of credit protection under a credit default swap agreement would be an amount equal to the notional amount of the agreement.
(3)
The fair values for credit default swap agreements serve as an indicator of the current status of the payment/performance risk and represent the likelihood or risk of default for the credit derivative. Increasing fair values, in absolute terms, when compared to the notional amount of the agreement, represent a deterioration of the referenced obligation’s credit soundness and a greater likelihood or risk of default or other credit event occurring.
A summary of derivative instruments by primary risk exposure is outlined in the following tables.
The fair value of derivative instruments as of December 31, 2015 was as follows:
| Derivatives not accounted for as hedging instruments | | | Location on Statement
of Assets and Liabilities | | | Fair Value | |
| Liability Derivatives | | | | | | | | | | |
| Credit contracts | | | Net Assets — Unrealized depreciation* | | | | $ | 44,589 | | |
| Equity contracts | | | Net Assets — Unrealized depreciation** | | | | | 22,685 | | |
| Total Liability Derivatives | | | | | | | $ | 67,274 | | |
| |
*
Includes cumulative appreciation/depreciation of centrally cleared swaps as reported in the table following the Summary Portfolio of Investments. Only current day’s variation margin receivable/payable is shown on the Statement of Assets and Liabilities.
**
Includes cumulative appreciation/depreciation of futures contracts as reported in the table following the Summary Portfolio of Investments.
The effect of derivative instruments on the Portfolio’s Statement of Operations for the year ended December 31, 2015 was as follows:
Amount of Realized Gain or (Loss) on Derivatives Recognized in Income
| Derivatives not accounted for as hedging instruments | | | Futures | | | Swaps | | | Total | |
| Credit Contract | | | | $ | — | | | | | $ | 38,467 | | | | | $ | 38,467 | | |
| Equity contracts | | | | | 91,023 | | | | | | — | | | | | | 91,023 | | |
| Total | | | | $ | 91,023 | | | | | $ | 38,467 | | | | | $ | 129,490 | | |
| |
See Accompanying Notes to Financial Statements
SUMMARY PORTFOLIO OF INVESTMENTS
| VY® Pioneer High Yield Portfolio | as of December 31, 2015 (continued) |
Change in Unrealized Appreciation or (Depreciation) on Derivatives Recognized in Income
| Derivatives not accounted for as hedging instruments | | | Futures | | | Swaps | | | Total | |
| Credit contracts | | | | $ | — | | | | | $ | (44,589) | | | | | $ | (44,589) | | |
| Equity contracts | | | | | (22,685) | | | | | | — | | | | | | (22,685) | | |
| Total | | | | $ | (22,685) | | | | | $ | (44,589) | | | | | $ | (67,274) | | |
| |
*
Amounts recognized for purchased options are included in net realized gain (loss) on investments and net change in unrealized appreciation or depreciation on investments.
**
Amounts recognized for forward foreign currency contracts are included in net realized gain (loss) on foreign currency related transactions and net change in unrealized appreciation or depreciation on foreign currency related transactions.
See Accompanying Notes to Financial Statements
| VY® T. Rowe Price Diversified | SUMMARY PORTFOLIO OF INVESTMENTS |
| Mid Cap Growth Portfolio | as of December 31, 2015 |
| | Shares | | | Value | | | Percentage
of Net
Assets | |
| | COMMON STOCK: 98.5% | |
| | | | | | | | Consumer Discretionary: 20.7% | |
| | | | 10,000 | @ | | Autozone, Inc. | | | | $ | 7,419,100 | | | | | | 0.9 | | |
| | | | 124,300 | @ | | Carmax, Inc. | | | | | 6,708,471 | | | | | | 0.8 | | |
| | | | 108,400 | | | | Dollar General Corp. | | | | | 7,790,708 | | | | | | 0.9 | | |
| | | | 284,900 | | | | Hanesbrands, Inc. | | | | | 8,384,607 | | | | | | 1.0 | | |
| | | | 55,300 | | | | L Brands, Inc. | | | | | 5,298,846 | | | | | | 0.6 | | |
| | | | 46,300 | | | | McGraw-Hill Cos., Inc. | | | | | 4,564,254 | | | | | | 0.6 | | |
| | | | 24,000 | @ | | O’Reilly Automotive, Inc. | | | | | 6,082,080 | | | | | | 0.7 | | |
| | | | 145,200 | | | | Ross Stores, Inc. | | | | | 7,813,212 | | | | | | 1.0 | | |
| | | | 62,700 | | | | Tractor Supply Co. | | | | | 5,360,850 | | | | | | 0.7 | | |
| | | | 2,761,532 | | | | Other Securities(a) | | | | | 111,776,639 | | | | | | 13.5 | | |
| | | | | | | | | | | | | 171,198,767 | | | | | | 20.7 | | |
| | | | | | | | Consumer Staples: 6.0% | |
| | | | 38,400 | | | | Constellation Brands, Inc. | | | | | 5,469,696 | | | | | | 0.7 | | |
| | | | 49,500 | | | | Hershey Co. | | | | | 4,418,865 | | | | | | 0.5 | | |
| | | | 61,600 | | | | Mead Johnson Nutrition Co. | | | | | 4,863,320 | | | | | | 0.6 | | |
| | | | 1,025,250 | | | | Other Securities(a) | | | | | 34,919,703 | | | | | | 4.2 | | |
| | | | | | | | | | | | | 49,671,584 | | | | | | 6.0 | | |
| | | | | | | | Energy: 1.7% | |
| | | | 315,000 | | | | Other Securities(a) | | | | | 13,795,207 | | | | | | 1.7 | | |
| | | | | | | | Financials: 9.2% | |
| | | | 56,200 | | | | Aon PLC | | | | | 5,182,202 | | | | | | 0.6 | | |
| | | | 64,933 | | | | CBOE Holdings, Inc. | | | | | 4,214,152 | | | | | | 0.5 | | |
| | | | 94,400 | | | | Crown Castle International
Corp. | | | | | 8,160,880 | | | | | | 1.0 | | |
| | | | 129,100 | | | | FNF Group | | | | | 4,475,897 | | | | | | 0.5 | | |
| | | | 21,600 | | | | Intercontinental Exchange,
Inc. | | | | | 5,535,216 | | | | | | 0.7 | | |
| | | | 1,091,314 | | | | Other Securities(a) | | | | | 48,949,766 | | | | | | 5.9 | | |
| | | | | | | | | | | | | 76,518,113 | | | | | | 9.2 | | |
| | | | | | | | Health Care: 15.2% | |
| | | | 74,300 | @ | | Alkermes PLC | | | | | 5,897,934 | | | | | | 0.7 | | |
| | | | 55,800 | | | | AmerisourceBergen Corp. | | | | | 5,787,018 | | | | | | 0.7 | | |
| | | | 50,000 | @ | | BioMarin Pharmaceutical,
Inc. | | | | | 5,238,000 | | | | | | 0.6 | | |
| | | | 55,600 | @ | | Incyte Corp., Ltd. | | | | | 6,029,820 | | | | | | 0.7 | | |
| | | | 12,000 | @ | | Intuitive Surgical, Inc. | | | | | 6,553,920 | | | | | | 0.8 | | |
| | | | 118,950 | | | | Zoetis, Inc. | | | | | 5,700,084 | | | | | | 0.7 | | |
| | | | 1,552,034 | | | | Other Securities(a) | | | | | 90,839,255 | | | | | | 11.0 | | |
| | | | | | | | | | | | | 126,046,031 | | | | | | 15.2 | | |
| | | | | | | | Industrials: 18.1% | |
| | | | 62,800 | | | | Allegion Public Ltd. | | | | | 4,139,776 | | | | | | 0.5 | | |
| | | | 41,000 | | | | Equifax, Inc. | | | | | 4,566,170 | | | | | | 0.5 | | |
| | | | 37,800 | @ | | IHS, Inc. | | | | | 4,476,654 | | | | | | 0.5 | | |
| | Shares | | | Value | | | Percentage
of Net
Assets | |
| | COMMON STOCK: (continued) | |
| | | | | | | | Industrials (continued) | |
| | | | 24,300 | | | | Roper Technologies, Inc. | | | | $ | 4,611,897 | | | | | | 0.5 | | |
| | | | 119,400 | @ | | Sensata Technologies
Holdings N.V. | | | | | 5,499,564 | | | | | | 0.7 | | |
| | | | 154,700 | | | | Southwest Airlines Co. | | | | | 6,661,382 | | | | | | 0.8 | | |
| | | | 19,100 | @ | | TransDigm Group, Inc. | | | | | 4,363,395 | | | | | | 0.5 | | |
| | | | 95,041 | @ | | United Continental
Holdings, Inc. | | | | | 5,445,849 | | | | | | 0.7 | | |
| | | | 84,200 | @ | | Verisk Analytics, Inc. | | | | | 6,473,296 | | | | | | 0.8 | | |
| | | | 2,005,172 | | | | Other Securities(a) | | | | | 104,136,808 | | | | | | 12.6 | | |
| | | | | | | | | | | | | 150,374,791 | | | | | | 18.1 | | |
| | | | | | | | Information Technology: 19.8% | |
| | | | 15,500 | @ | | Alliance Data
Systems Corp. | | | | | 4,286,835 | | | | | | 0.5 | | |
| | | | 106,300 | | | | Amphenol Corp. | | | | | 5,552,049 | | | | | | 0.7 | | |
| | | | 92,500 | | | | ARM Holdings PLC ADR | | | | | 4,184,700 | | | | | | 0.5 | | |
| | | | 85,900 | | | | Fidelity National Information
Services, Inc. | | | | | 5,205,540 | | | | | | 0.6 | | |
| | | | 65,200 | @ | | Fiserv, Inc. | | | | | 5,963,192 | | | | | | 0.7 | | |
| | | | 50,600 | @ | | Gartner, Inc. | | | | | 4,589,420 | | | | | | 0.6 | | |
| | | | 53,100 | | | | Intuit, Inc. | | | | | 5,124,150 | | | | | | 0.6 | | |
| | | | 26,100 | @ | | LinkedIn Corp. | | | | | 5,874,588 | | | | | | 0.7 | | |
| | | | 26,000 | @ | | Palo Alto Networks, Inc. | | | | | 4,579,640 | | | | | | 0.6 | | |
| | | | 75,300 | @ | | Red Hat, Inc. | | | | | 6,235,593 | | | | | | 0.7 | | |
| | | | 66,600 | @ | | ServiceNow, Inc. | | | | | 5,764,896 | | | | | | 0.7 | | |
| | | | 105,600 | @ | | Vantiv, Inc. | | | | | 5,007,552 | | | | | | 0.6 | | |
| | | | 54,600 | @,L | | VeriSign, Inc. | | | | | 4,769,856 | | | | | | 0.6 | | |
| | | | 2,183,825 | | | | Other Securities(a) | | | | | 97,343,336 | | | | | | 11.7 | | |
| | | | | | | | | | | | | 164,481,347 | | | | | | 19.8 | | |
| | | | | | | | Materials: 6.0% | |
| | | | 77,500 | | | | Ball Corp. | | | | | 5,636,575 | | | | | | 0.7 | | |
| | | | 67,500 | | | | Celanese Corp. | | | | | 4,544,775 | | | | | | 0.6 | | |
| | | | 21,700 | | | | Sherwin-Williams Co. | | | | | 5,633,320 | | | | | | 0.7 | | |
| | | | 53,900 | | | | Valspar Corp. | | | | | 4,471,005 | | | | | | 0.5 | | |
| | | | 681,100 | | | | Other Securities(a) | | | | | 29,130,821 | | | | | | 3.5 | | |
| | | | | | | | | | | | | 49,416,496 | | | | | | 6.0 | | |
| | | | | | | | Telecommunication Services: 1.3% | |
| | | | 74,650 | @ | | SBA Communications Corp. | | | | | 7,843,475 | | | | | | 1.0 | | |
| | | | 72,700 | | | | Other Securities | | | | | 2,844,024 | | | | | | 0.3 | | |
| | | | | | | | | | | | | 10,687,499 | | | | | | 1.3 | | |
| | | | | | | | Utilities: 0.5% | |
| | | | 117,000 | | | | Other Securities | | | | | 3,910,692 | | | | | | 0.5 | | |
| | | | | | | | Total Common Stock | | | |
| | | | | | | | (Cost $610,591,624) | | | | | 816,100,527 | | | | | | 98.5 | | |
| |
See Accompanying Notes to Financial Statements
| VY® T. Rowe Price Diversified | SUMMARY PORTFOLIO OF INVESTMENTS |
| Mid Cap Growth Portfolio | as of December 31, 2015 (continued) |
| | Shares | | | Value | | | Percentage
of Net
Assets | |
| | PREFERRED STOCK: 1.4% | |
| | | | | | | | Financials: 0.4% | |
| | | | 103,987 | | | | Other Securities | | | | $ | 3,420,088 | | | | | | 0.4 | | |
| | | | | | | | Information Technology: 1.0% | |
| | | | 542,069 | | | | Other Securities | | | | | 7,724,535 | | | | | | 1.0 | | |
| | | | | | | | Total Preferred Stock | | | |
| | | | | | | | (Cost $7,911,058) | | | | | 11,144,623 | | | | | | 1.4 | | |
| | | | | | | | Total Long-Term Investments | | | |
| | | | | | | | (Cost $618,502,682) | | | | | 827,245,150 | | | | | | 99.9 | | |
| |
| | Principal
Amount† | | | Value | | | Percentage
of Net
Assets | |
| | SHORT-TERM INVESTMENTS: 5.4% | |
| | | | | | | | Securities Lending Collateralcc: 5.4% | |
| | | | 8,443,479 | | | | BNP Paribas Bank,
Repurchase Agreement
dated 12/31/15, 0.31%, due
01/04/16 (Repurchase
Amount $8,443,766,
collateralized by various
U.S. Government/
U.S. Government
Agency Obligations,
0.000%-4.500%, Market
Value plus accrued interest
$8,612,349, due
06/09/16-05/20/45) | | | | | 8,443,479 | | | | | | 1.0 | | |
| | | | 10,567,478 | | | | Citigroup, Inc., Repurchase
Agreement dated 12/31/15,
0.34%, due 01/04/16
(Repurchase Amount
$10,567,872, collateralized
by various U.S. Government
Agency Obligations,
0.000%-11.500%, Market
Value plus accrued interest
$10,778,828, due
01/15/16-04/01/51) | | | | | 10,567,478 | | | | | | 1.3 | | |
| | | | 10,567,478 | | | | Mizuho Securities USA Inc.,
Repurchase Agreement
dated 12/31/15, 0.30%, due
01/04/16 (Repurchase
Amount $10,567,825,
collateralized by various
U.S. Government
Agency Obligations,
0.000%-9.000%, Market
Value plus accrued interest
$10,778,828, due
06/13/16-03/01/44) | | | | | 10,567,478 | | | | | | 1.3 | | |
| | Principal
Amount† | | | Value | | | Percentage
of Net
Assets | |
| | SHORT-TERM INVESTMENTS: (continued) | |
| | | | | | | | Securities Lending Collateralcc (continued) | |
| | | | 10,567,478 | | | | Nomura Securities,
Repurchase Agreement
dated 12/31/15, 0.33%, due
01/04/16 (Repurchase
Amount $10,567,860,
collateralized by various
U.S. Government/U.S.
Government Agency
Obligations,
0.000%-10.500%, Market
Value plus accrued interest
$10,778,828, due
01/15/16-10/20/65) | | | | $ | 10,567,478 | | | | | | 1.3 | | |
| | | | 4,348,334 | | | | State of Wisconsin
Investment Board,
Repurchase Agreement
dated 12/31/15, 0.41%, due
01/04/16 (Repurchase
Amount $4,348,529,
collateralized by various
U.S. Government Securities,
0.125%-2.500%, Market
Value plus accrued interest
$4,438,495, due
01/15/17-02/15/42) | | | | | 4,348,334 | | | | | | 0.5 | | |
| | | | | | | | | | | | | 44,494,247 | | | | | | 5.4 | | |
| | Shares | | | Value | | | Percentage
of Net
Assets | |
| | | | | | | | Mutual Funds: 0.0% | |
| | | | 463,213 | | | | T. Rowe Price Reserve
Investment Fund, 0.225%††
(Cost $463,213) | | | | | 463,213 | | | | | | 0.0 | | |
| | | | | | | | Total Short-Term
Investments
(Cost $44,957,460) | | | | | 44,957,460 | | | | | | 5.4 | | |
| | | | | | | | Total Investments in
Securities
(Cost $663,460,142) | | | | $ | 872,202,610 | | | | | | 105.3 | | |
| | | | | | | | Liabilities in Excess of
Other Assets | | | | | (43,685,436) | | | | | | (5.3) | | |
| | | | | | | | Net Assets | | | | $ | 828,517,174 | | | | | | 100.0 | | |
| |
“Other Securities” represents issues not identified as the top 50 holdings in terms of market value and issues or issuers not exceeding 1% of net assets individually or in aggregate respectively as of December 31, 2015.
See Accompanying Notes to Financial Statements
| VY® T. Rowe Price Diversified | SUMMARY PORTFOLIO OF INVESTMENTS |
| Mid Cap Growth Portfolio | as of December 31, 2015 (continued) |
The following footnotes apply to either the individual securities noted or one or more of the securities aggregated and listed as a single line item.
†
Unless otherwise indicated, principal amount is shown in USD.
††
Rate shown is the 7-day yield as of December 31, 2015.
@
Non-income producing security.
ADR
American Depositary Receipt
cc
Represents securities purchased with cash collateral received for securities on loan.
L
Loaned security, a portion or all of the security is on loan at December 31, 2015.
(a)
This grouping contains securities on loan.
Cost for federal income tax purposes is $664,758,972.
Net unrealized appreciation consists of:
| | Gross Unrealized Appreciation | | | | $ | 247,309,886 | | |
| | Gross Unrealized Depreciation | | | | | (39,866,248) | | |
| | Net Unrealized Appreciation | | | | $ | 207,443,638 | | |
| |
Fair Value Measurements^
The following is a summary of the fair valuations according to the inputs used as of December 31, 2015 in valuing the assets and liabilities:
| | | | Quoted Prices
in Active Markets
for Identical
Investments
(Level 1) | | | Significant
Other
Observable
Inputs#
(Level 2) | | | Significant
Unobservable
Inputs
(Level 3) | | | Fair Value
at
December 31, 2015 | |
| Asset Table | | | | | | | | | | | | | | | | | | | | | | | | | |
| Investments, at fair value | | | | | | | | | | | | | | | | | | | | | | | | | |
| Common Stock | | | | | |
| Consumer Discretionary | | | | $ | 171,198,767 | | | | | $ | — | | | | | $ | — | | | | | $ | 171,198,767 | | |
| Consumer Staples | | | | | 49,671,584 | | | | | | — | | | | | | — | | | | | | 49,671,584 | | |
| Energy | | | | | 13,795,207 | | | | | | — | | | | | | — | | | | | | 13,795,207 | | |
| Financials | | | | | 75,639,995 | | | | | | — | | | | | | 878,118 | | | | | | 76,518,113 | | |
| Health Care | | | | | 126,046,031 | | | | | | — | | | | | | — | | | | | | 126,046,031 | | |
| Industrials | | | | | 150,374,791 | | | | | | — | | | | | | — | | | | | | 150,374,791 | | |
| Information Technology | | | | | 160,900,464 | | | | | | 2,981,563 | | | | | | 599,320 | | | | | | 164,481,347 | | |
| Materials | | | | | 49,416,496 | | | | | | — | | | | | | — | | | | | | 49,416,496 | | |
| Telecommunication Services | | | | | 10,687,499 | | | | | | — | | | | | | — | | | | | | 10,687,499 | | |
| Utilities | | | | | 3,910,692 | | | | | | — | | | | | | — | | | | | | 3,910,692 | | |
| Total Common Stock | | | | | 811,641,526 | | | | | | 2,981,563 | | | | | | 1,477,438 | | | | | | 816,100,527 | | |
| Preferred Stock | | | | | — | | | | | | — | | | | | | 11,144,623 | | | | | | 11,144,623 | | |
| Short-Term Investments | | | | | 463,213 | | | | | | 44,494,247 | | | | | | — | | | | | | 44,957,460 | | |
| Total Investments, at fair value | | | | $ | 812,104,739 | | | | | $ | 47,475,810 | | | | | $ | 12,622,061 | | | | | $ | 872,202,610 | | |
| |
^
See Note 2, “Significant Accounting Policies” in the Notes to Financial Statements for additional information.
#
The earlier close of the foreign markets gives rise to the possibility that significant events, including broad market moves, may have occurred in the interim and may materially affect the value of those securities. To account for this, the Portfolio may frequently value many of its foreign equity securities using fair value prices based on third party vendor modeling tools to the extent available. Accordingly, a portion of the Portfolio’s investments are categorized as Level 2 investments.
The following table presents additional information about valuation techniques and inputs used for investments that are measured at fair value and categorized within Level 3 at December 31, 2015.
| Investments, at fair value | | | Fair Value at
December 31, 2015 | | | Valuation
Technique(s) | | | Unobservable
Inputs | | | Range | | | Impact to
Valuation from an
Increase in Input | |
| Common Stock | | | | $ | 1,477,438 | | | | Recent Comparable
Transaction Price | | | Discount Factor* | | | | | 0.00% | | | | Decrease | |
| Preferred Stock | | | | $ | 11,144,623 | | | | Recent Comparable
Transaction Price | | | Discount Factor* | | | | | 0.00% | | | | Decrease | |
*
No quantitative unobservable inputs were significant to the fair valuation determination at December 31, 2015.
See Accompanying Notes to Financial Statements
| VY® T. Rowe Price Diversified | SUMMARY PORTFOLIO OF INVESTMENTS |
| Mid Cap Growth Portfolio | as of December 31, 2015 (continued) |
The following is a reconciliation of the fair valuations using significant unobservable inputs (Level 3) for the Portfolios’s assets and liabilities during the year ended December 31, 2015:
| | | | Beginning
Balance
12/31/2014* | | | Purchases | | | Sales | ��� | | Accrued
Discounts/
(Premiums) | | | Total
Realized
Gain/(Loss) | | | Net Change
in Unrealized
Appreciation/
(Depreciation)** | | | Transfers
Into
Level 3 | | | Transfers
Out of
Level 3 | | | Ending
Balance
12/31/2015 | |
| Asset Table | | | | | | | | | | | | | | | | | | | | | | | | | | | | | | | | | | | | | | | | | | | | | | | | | | | | | | | |
| Investments, at fair value | | | | | | | | | | | | | | | | | | | | | | | | | | | | | | | | | | | | | | | | | | | | | | | | | | | | | | | |
| Common Stock | | | | $ | 2,427,407 | | | | | $ | 303,091 | | | | | $ | — | | | | | $ | — | | | | | $ | — | | | | | $ | (192,100) | | | | | $ | — | | | | | $ | (1,060,960) | | | | | $ | 1,477,438 | | |
| Preferred Stock | | | | | 7,355,179 | | | | | | 2,916,101 | | | | | | — | | | | | | — | | | | | | — | | | | | | 1,794,805 | | | | | | — | | | | | | (921,462) | | | | | | 11,144,623 | | |
| Total Investments, at value | | | | $ | 9,782,586 | | | | | $ | 3,219,192 | | | | | $ | — | | | | | $ | — | | | | | $ | — | | | | | $ | 1,602,705 | | | | | $ | — | | | | | $ | (1,982,422) | | | | | $ | 12,622,061 | | |
| |
*
A security valued at $2,738,023 was reclassified from Preferred Stock to Common Stock as of December 31, 2015.
**
As of December 31, 2015 total change in unrealized gain (loss) on Level 3 securities still held at period end and included in the change in net assets was $1,602,705.
See Accompanying Notes to Financial Statements
| VY® T. Rowe Price | SUMMARY PORTFOLIO OF INVESTMENTS |
| Growth Equity Portfolio | as of December 31, 2015 |
| | Shares | | | Value | | | Percentage
of Net
Assets | |
| | COMMON STOCK: 97.0% | |
| | | | | | | | Consumer Discretionary: 26.9% | |
| | | | 186,300 | @ | | Amazon.com, Inc. | | | | $ | 125,918,307 | | | | | | 7.2 | | |
| | | | 26,600 | @ | | Autozone, Inc. | | | | | 19,734,806 | | | | | | 1.1 | | |
| | | | 577,400 | | | | Hanesbrands, Inc. | | | | | 16,992,882 | | | | | | 1.0 | | |
| | | | 302,400 | | | | Lowe’s Cos, Inc. | | | | | 22,994,496 | | | | | | 1.3 | | |
| | | | 872,760 | @ | | MGM Resorts International | | | | | 19,829,107 | | | | | | 1.1 | | |
| | | | 314,800 | | | | Nike, Inc. | | | | | 19,675,000 | | | | | | 1.1 | | |
| | | | 47,959 | @ | | Priceline.com, Inc. | | | | | 61,145,327 | | | | | | 3.5 | | |
| | | | 236,700 | | | | Starbucks Corp. | | | | | 14,209,101 | | | | | | 0.8 | | |
| | | | 84,280 | @,L | | Tesla Motors, Inc. | | | | | 20,228,043 | | | | | | 1.1 | | |
| | | | 182,300 | | | | Tractor Supply Co. | | | | | 15,586,650 | | | | | | 0.9 | | |
| | | | 256,400 | | | | Walt Disney Co. | | | | | 26,942,512 | | | | | | 1.5 | | |
| | | | 1,794,908 | | | | Other Securities(a) | | | | | 110,341,843 | | | | | | 6.3 | | |
| | | | | | | | | | | | | 473,598,074 | | | | | | 26.9 | | |
| | | | | | | | Consumer Staples: 2.2% | |
| | | | 129,400 | | | | CVS Health Corp. | | | | | 12,651,438 | | | | | | 0.8 | | |
| | | | 231,000 | | | | Walgreens Boots Alliance,
Inc. | | | | | 19,670,805 | | | | | | 1.1 | | |
| | | | 33,900 | | | | Other Securities | | | | | 5,474,850 | | | | | | 0.3 | | |
| | | | | | | | | | | | | 37,797,093 | | | | | | 2.2 | | |
| | | | | | | | Financials: 5.4% | |
| | | | 236,900 | | | | American Tower Corp. | | | | | 22,967,455 | | | | | | 1.3 | | |
| | | | 147,012 | | | | Crown Castle International
Corp. | | | | | 12,709,187 | | | | | | 0.7 | | |
| | | | 67,800 | | | | Intercontinental Exchange,
Inc. | | | | | 17,374,428 | | | | | | 1.0 | | |
| | | | 563,400 | | | | Morgan Stanley | | | | | 17,921,754 | | | | | | 1.0 | | |
| | | | 418,062 | | | | Other Securities | | | | | 23,397,795 | | | | | | 1.4 | | |
| | | | | | | | | | | | | 94,370,619 | | | | | | 5.4 | | |
| | | | | | | | Health Care: 21.3% | |
| | | | 197,200 | @ | | Alexion Pharmaceuticals,
Inc. | | | | | 37,615,900 | | | | | | 2.1 | | |
| | | | 173,231 | @ | | Allergan plc | | | | | 54,134,688 | | | | | | 3.1 | | |
| | | | 160,000 | | | | Anthem, Inc. | | | | | 22,310,400 | | | | | | 1.3 | | |
| | | | 45,400 | @ | | Biogen, Inc. | | | | | 13,908,290 | | | | | | 0.8 | | |
| | | | 291,400 | | | | Bristol-Myers Squibb Co. | | | | | 20,045,406 | | | | | | 1.1 | | |
| | | | 226,016 | @ | | Celgene Corp. | | | | | 27,067,676 | | | | | | 1.5 | | |
| | | | 93,000 | | | | Cigna Corp. | | | | | 13,608,690 | | | | | | 0.8 | | |
| | | | 231,700 | | | | Gilead Sciences, Inc. | | | | | 23,445,723 | | | | | | 1.3 | | |
| | | | 82,100 | | | | Humana, Inc. | | | | | 14,655,671 | | | | | | 0.8 | | |
| | | | 122,000 | @ | | Incyte Corp., Ltd. | | | | | 13,230,900 | | | | | | 0.8 | | |
| | | | 46,600 | @ | | Intuitive Surgical, Inc. | | | | | 25,451,056 | | | | | | 1.5 | | |
| | | | 109,600 | | | | McKesson Corp. | | | | | 21,616,408 | | | | | | 1.2 | | |
| | | | 31,800 | @ | | Regeneron
Pharmaceuticals, Inc. | | | | | 17,263,266 | | | | | | 1.0 | | |
| | Shares | | | Value | | | Percentage
of Net
Assets | |
| | COMMON STOCK: (continued) | |
| | | | | | | | Health Care (continued) | |
| | | | 180,400 | | | | UnitedHealth Group, Inc. | | | | $ | 21,222,256 | | | | | | 1.2 | | |
| | | | 188,900 | @ | | Valeant Pharmaceuticals
International, Inc. - USD | | | | | 19,201,685 | | | | | | 1.1 | | |
| | | | 124,300 | @ | | Vertex Pharmaceuticals,
Inc. | | | | | 15,640,669 | | | | | | 0.9 | | |
| | | | 111,700 | | | | Other Securities | | | | | 14,386,990 | | | | | | 0.8 | | |
| | | | | | | | | | | | | 374,805,674 | | | | | | 21.3 | | |
| | | | | | | | Industrials: 10.4% | |
| | | | 711,200 | | | | American Airlines Group,
Inc. | | | | | 30,119,320 | | | | | | 1.7 | | |
| | | | 198,800 | | | | Boeing Co. | | | | | 28,744,492 | | | | | | 1.6 | | |
| | | | 112,100 | L | | Canadian Pacific Railway
Ltd | | | | | 14,303,960 | | | | | | 0.8 | | |
| | | | 533,500 | | | | Danaher Corp. | | | | | 49,551,480 | | | | | | 2.8 | | |
| | | | 101,300 | | | | Roper Technologies, Inc. | | | | | 19,225,727 | | | | | | 1.1 | | |
| | | | 175,300 | | | | Wabtec Corp. | | | | | 12,467,336 | | | | | | 0.7 | | |
| | | | 430,072 | | | | Other Securities | | | | | 28,915,748 | | | | | | 1.7 | | |
| | | | | | | | | | | | | 183,328,063 | | | | | | 10.4 | | |
| | | | | | | | Information Technology: 29.7% | |
| | | | 186,092 | @ | | Alibaba Group Holding
Ltd. ADR | | | | | 15,123,697 | | | | | | 0.8 | | |
| | | | 81,250 | @ | | Alphabet, Inc. - Class A | | | | | 63,213,313 | | | | | | 3.6 | | |
| | | | 75,671 | | | | Alphabet, Inc. - Class C | | | | | 57,425,208 | | | | | | 3.3 | | |
| | | | 344,800 | | | | Apple, Inc. | | | | | 36,293,648 | | | | | | 2.0 | | |
| | | | 481,500 | @ | | Facebook, Inc. | | | | | 50,393,790 | | | | | | 2.9 | | |
| | | | 78,900 | @ | | LinkedIn Corp. | | | | | 17,758,812 | | | | | | 1.0 | | |
| | | | 490,500 | | | | Mastercard, Inc. | | | | | 47,755,080 | | | | | | 2.7 | | |
| | | | 1,053,500 | | | | Microsoft Corp. | | | | | 58,448,180 | | | | | | 3.3 | | |
| | | | 239,964 | @ | | Salesforce.com, Inc. | | | | | 18,813,178 | | | | | | 1.1 | | |
| | | | 1,137,000 | | | | Tencent Holdings Ltd. | | | | | 22,262,444 | | | | | | 1.3 | | |
| | | | 180,200 | @,L | | VeriSign, Inc. | | | | | 15,742,272 | | | | | | 0.9 | | |
| | | | 620,700 | | | | Visa, Inc. - Class A | | | | | 48,135,285 | | | | | | 2.7 | | |
| | | | 1,313,844 | | | | Other Securities(a) | | | | | 71,482,979 | | | | | | 4.1 | | |
| | | | | | | | | | | | | 522,847,886 | | | | | | 29.7 | | |
| | | | | | | | Materials: 1.0% | |
| | | | 156,400 | | | | Other Securities | | | | | 17,962,948 | | | | | | 1.0 | | |
| | | | | | | | Telecommunication Services: 0.1% | |
| | | | 44,200 | | | | Other Securities | | | | | 1,729,104 | | | | | | 0.1 | | |
| | | | | | | | Total Common Stock | | | | | | | | | | | | | |
| | | | | | | | (Cost $1,228,942,341) | | | | | 1,706,439,461 | | | | | | 97.0 | | |
| | PREFERRED STOCK: 1.1% | |
| | | | | | | | Consumer Discretionary: 0.2% | |
| | | | 20,407 | | | | Other Securities | | | | | 2,902,692 | | | | | | 0.2 | | |
See Accompanying Notes to Financial Statements
| VY® T. Rowe Price | SUMMARY PORTFOLIO OF INVESTMENTS |
| Growth Equity Portfolio | as of December 31, 2015 (continued) |
| | Shares | | | Value | | | Percentage
of Net
Assets | |
| | PREFERRED STOCK: (continued) | |
| | | | | | | | Financials: 0.1% | |
| | | | 45,554 | | | | Other Securities | | | | $ | 1,498,251 | | | | | | 0.1 | | |
| | | | | | | | Information Technology: 0.8% | |
| | | | 233,266 | | | | Other Securities | | | | | 15,023,988 | | | | | | 0.8 | | |
| | | | | | | | Total Preferred Stock | | | |
| | | | | | | | (Cost $15,555,205) | | | | | 19,424,931 | | | | | | 1.1 | | |
| | | | | | | | Total Long-Term Investments | | | |
| | | | | | | | (Cost $1,244,497,546) | | | | | 1,725,864,392 | | | | | | 98.1 | | |
| |
| | Principal
Amount† | | | Value | | | Percentage
of Net
Assets | |
| | SHORT-TERM INVESTMENTS:6.3% | |
| | | | | | | | Securities Lending Collateralcc: 4.1% | |
| | | | 17,248,744 | | | | BNP Paribas Bank,
Repurchase Agreement
dated 12/31/15, 0.30%, due
01/04/16 (Repurchase
Amount $17,249,311,
collateralized by various
U.S. Government/U.S.
Government Agency
Obligations,
0.000%-5.500%, Market
Value plus accrued interest
$17,593,719, due
06/06/16-05/04/37) | | | | | 17,248,744 | | | | | | 0.9 | | |
| | | | 17,248,744 | | | | Citigroup, Inc.,
Repurchase Agreement
dated 12/31/15, 0.34%, due
01/04/16 (Repurchase
Amount $17,249,387,
collateralized by various
U.S. Government Agency
Obligations,
0.000%-11.500%,
Market Value plus accrued
interest $17,593,719, due
01/15/16-04/01/51) | | | | | 17,248,744 | | | | | | 1.0 | | |
| | | | 13,782,070 | | | | HSBC Securities USA,
Repurchase Agreement
dated 12/31/15, 0.29%, due
01/04/16 (Repurchase
Amount $13,782,508,
collateralized by various
U.S. Government Securities,
3.000%, Market Value
plus accrued interest
$14,057,751, due 11/15/44) | | | | | 13,782,070 | | | | | | 0.8 | | |
| | Principal
Amount† | | | Value | | | Percentage
of Net
Assets | |
| | SHORT-TERM INVESTMENTS: (continued) | |
| | | | | | | | Securities Lending Collateralcc (continued) | |
| | | | 17,248,744 | | | | Nomura Securities,
Repurchase Agreement
dated 12/31/15, 0.33%, due
01/04/16 (Repurchase
Amount $17,249,368,
collateralized by various
U.S. Government/U.S.
Government Agency
Obligations,
0.000%-10.500%, Market
Value plus accrued interest
$17,593,719, due
01/15/16-10/20/65) | | | | $ | 17,248,744 | | | | | | 1.0 | | |
| | | | 7,097,511 | | | | State of Wisconsin
Investment Board,
Repurchase Agreement
dated 12/31/15, 0.41%, due
01/04/16 (Repurchase
Amount $7,097,830,
collateralized by various
U.S. Government Securities,
0.125%-2.500%, Market
Value plus accrued interest
$7,244,674, due
01/15/17-02/15/42) | | | | | 7,097,511 | | | | | | 0.4 | | |
| | | | | | | | | | | | | 72,625,813 | | | | | | 4.1 | | |
| | Shares | | | Value | | | Percentage
of Net
Assets | |
| | | | | | | | Affiliated Investment Companies: 2.2% | |
| | | | 38,829,375 | | | | T. Rowe Price Reserve
Investment Fund,
0.225%†† | | | | | | | | | | | | | |
| | | | | | | | (Cost $38,829,375) | | | | | 38,829,375 | | | | | | 2.2 | | |
| | | | | | | | Total Short-Term
Investments | | | | | | | | | | | | | |
| | | | | | | | (Cost $111,455,188) | | | | | 111,455,188 | | | | | | 6.3 | | |
| | | | | | | | Total Investments in
Securities
(Cost $1,355,952,734) | | | | $ | 1,837,319,580 | | | | | | 104.4 | | |
| | | | | | | | Liabilities in Excess of
Other Assets | | | | | (78,044,934) | | | | | | (4.4) | | |
| | | | | | | | Net Assets | | | | $ | 1,759,274,646 | | | | | | 100.0 | | |
| |
“Other Securities” represents issues not identified as the top 50 holdings in terms of market value and issues or issuers not exceeding 1% of net assets individually or in aggregate respectively as of December 31, 2015.
See Accompanying Notes to Financial Statements
| VY® T. Rowe Price | SUMMARY PORTFOLIO OF INVESTMENTS |
| Growth Equity Portfolio | as of December 31, 2015 (continued) |
The following footnotes apply to either the individual securities noted or one or more of the securities aggregated and listed as a single line item.
†
Unless otherwise indicated, principal amount is shown in USD.
††
Rate shown is the 7-day yield as of December 31, 2015.
@
Non-income producing security.
ADR
American Depositary Receipt
cc
Represents securities purchased with cash collateral received for securities on loan.
L
Loaned security, a portion or all of the security is on loan at December 31, 2015.
(a)
This grouping contains securities on loan.
Cost for federal income tax purposes is $1,358,458,985.
Net unrealized appreciation consists of:
| | Gross Unrealized Appreciation | | | | $ | 511,736,502 | | |
| | Gross Unrealized Depreciation | | | | | (32,875,907) | | |
| | Net Unrealized Appreciation | | | | $ | 478,860,595 | | |
| |
Fair Value Measurements^
The following is a summary of the fair valuations according to the inputs used as of December 31, 2015 in valuing the assets and liabilities:
| | | | Quoted Prices
in Active Markets
for Identical
Investments
(Level 1) | | | Significant
Other
Observable
Inputs#
(Level 2) | | | Significant
Unobservable
Inputs
(Level 3) | | | Fair Value
at
December 31, 2015 | | |
| Asset Table | | | | | | | | | | | | | | | | | | | | | | | | | | |
| Investments, at fair value | | | | | | | | | | | | | | | | | | | | | | | | | | | | |
| Common Stock | | | | | | |
| Consumer Discretionary | | | | $ | 473,158,837 | | | | | $ | — | | | | | $ | 439,237 | | | | | $ | 473,598,074 | | | |
| Consumer Staples | | | | | 37,797,093 | | | | | | — | | | | | | — | | | | | | 37,797,093 | | | |
| Financials | | | | | 94,204,132 | | | | | | — | | | | | | 166,487 | | | | | | 94,370,619 | | | |
| Health Care | | | | | 374,805,674 | | | | | | — | | | | | | — | | | | | | 374,805,674 | | | |
| Industrials | | | | | 183,328,063 | | | | | | — | | | | | | — | | | | | | 183,328,063 | | | |
| Information Technology | | | | | 499,237,860 | | | | | | 22,262,444 | | | | | | 1,347,582 | | | | | | 522,847,886 | | | |
| Materials | | | | | 17,962,948 | | | | | | — | | | | | | — | | | | | | 17,962,948 | | | |
| Telecommunication Services | | | | | 1,729,104 | | | | | | — | | | | | | — | | | | | | 1,729,104 | | | |
| Total Common Stock | | | | | 1,682,223,711 | | | | | | 22,262,444 | | | | | | 1,953,306 | | | | | | 1,706,439,461 | | | |
| Preferred Stock | | | | | — | | | | | | — | | | | | | 19,424,931 | | | | | | 19,424,931 | | | |
| Short-Term Investments | | | | | 38,829,375 | | | | | | 72,625,813 | | | | | | — | | | | | | 111,455,188 | | | |
| Total Investments, at fair value | | | | $ | 1,721,053,086 | | | | | $ | 94,888,257 | | | | | $ | 21,378,237 | | | | | $ | 1,837,319,580 | | | |
| |
^
See Note 2, “Significant Accounting Policies” in the Notes to Financial Statements for additional information.
#
The earlier close of the foreign markets gives rise to the possibility that significant events, including broad market moves, may have occurred in the interim and may materially affect the value of those securities. To account for this, the Portfolio may frequently value many of its foreign equity securities using fair value prices based on third party vendor modeling tools to the extent available. Accordingly, a portion of the Portfolio’s investments are categorized as Level 2 investments.
The following table presents additional information about valuation techniques and inputs used for investments that are measured at fair value and categorized within Level 3 at December 31, 2015.
| Investments, at fair value | | | Fair Value at
December 31, 2015 | | | Valuation
Technique(s) | | | Unobservable Inputs | | | Range | | | Impact to
Valuation from
an Increase in Input | |
| Common Stock | | | | $ | 1,953,306 | | | | Recent Comparable
Transaction Price | | | Discount Factor* | | | | | 0.00% | | | | Decrease | |
| Preferred Stock | | | | $ | 19,424,931 | | | | Recent Comparable
Transaction Price | | | Discount Factor* | | | | | 0.00% | | | | Decrease | |
*
No quantitative unobserable inputs were significant to the fair valuation determination at December 31, 2015.
See Accompanying Notes to Financial Statements
| VY® T. Rowe Price | SUMMARY PORTFOLIO OF INVESTMENTS |
| Growth Equity Portfolio | as of December 31, 2015 (continued) |
The following is a reconciliation of the fair valuations using significant unobservable inputs (Level 3) for the Portfolios’s assets and liabilities during the year ended December 31, 2015:
| | | | Beginning
Balance
12/31/2014 | | | Purchases | | | Sales | | | Accrued
Discounts/
(Premiums) | | | Total
Realized
Gain/
(Loss) | | | Net Change
in Unrealized
Appreciation/
(Depreciation)* | | | Transfers
Into
Level 3 | | | Transfers
Out of
Level 3 | | | Ending
Balance
12/31/2015 | |
| Asset Table | | | | | | | | | | | | | | | | | | | | | | | | | | | | | | | | | | | | | | | | | | | | | | | | | | | | | | | |
| Investments, at fair value | | | | | | | | | | | | | | | | | | | | | | | | | | | | | | | | | | | | | | | | | | | | | | | | | | | | | | | |
| Common Stock | | | | $ | 2,759,993 | | | | | $ | 518,518 | | | | | $ | — | | | | | $ | — | | | | | $ | — | | | | | $ | (1,325,205) | | | | | $ | — | | | | | $ | — | | | | | $ | 1,953,306 | | |
| Preferred Stock | | | | | 4,394,627 | | | | | | 11,160,580 | | | | | | — | | | | | | — | | | | | | | | | | | | 3,869,724 | | | | | | — | | | | | | — | | | | | | 19,424,931 | | |
| Total Investments, at value | | | | $ | 7,154,620 | | | | | $ | 11,679,098 | | | | | $ | — | | | | | $ | — | | | | | $ | — | | | | | $ | 2,544,519 | | | | | $ | — | | | | | $ | — | | | | | $ | 21,378,237 | | |
| |
*
As of December 31, 2015 total change in unrealized gain (loss) on Level 3 securities still held at period end and included in the change in net assets was $2,544,519.
See Accompanying Notes to Financial Statements
| VY® Templeton Foreign Equity | SUMMARY PORTFOLIO OF INVESTMENTS |
| Portfolio | as of December 31, 2015 |
| | Shares | | | Value | | | Percentage
of Net
Assets | |
| | COMMON STOCK: 96.3% | |
| | | | | | | | Brazil: 0.2% | |
| | | | 345,617 | | | | Other Securities(a) | | | | $ | 1,486,153 | | | | | | 0.2 | | |
| | | | | | | | China: 6.1% | |
| | | | 2,585,000 | | | | China Life Insurance Co.,
Ltd. | | | | | 8,298,363 | | | | | | 1.1 | | |
| | | | 774,500 | | | | China Mobile Ltd. | | | | | 8,717,854 | | | | | | 1.2 | | |
| | | | 21,246,000 | | | | China Telecom Corp., Ltd. | | | | | 9,910,559 | | | | | | 1.4 | | |
| | | | 12,217,400 | | | | Other Securities(a) | | | | | 17,051,936 | | | | | | 2.4 | | |
| | | | | | | | | | | | | 43,978,712 | | | | | | 6.1 | | |
| | | | | | | | France: 11.5% | |
| | | | 473,266 | | | | AXA S.A. | | | | | 12,931,388 | | | | | | 1.8 | | |
| | | | 273,888 | | | | BNP Paribas | | | | | 15,495,933 | | | | | | 2.1 | | |
| | | | 191,520 | | | | Cie de Saint-Gobain | | | | | 8,299,616 | | | | | | 1.2 | | |
| | | | 120,314 | | | | Cie Generale des
Etablissements Michelin | | | | | 11,451,858 | | | | | | 1.6 | | |
| | | | 638,860 | | | | Credit Agricole SA | | | | | 7,528,458 | | | | | | 1.0 | | |
| | | | 135,141 | | | | Sanofi | | | | | 11,517,016 | | | | | | 1.6 | | |
| | | | 242,964 | | | | Total S.A. | | | | | 10,892,473 | | | | | | 1.5 | | |
| | | | 103,640 | | | | Other Securities(a) | | | | | 5,154,073 | | | | | | 0.7 | | |
| | | | | | | | | | | | | 83,270,815 | | | | | | 11.5 | | |
| | | | | | | | Germany: 12.0% | |
| | | | 100,971 | | | | Bayer AG | | | | | 12,610,374 | | | | | | 1.7 | | |
| | | | 85,980 | | | | Deutsche Boerse AG | | | | | 7,557,784 | | | | | | 1.0 | | |
| | | | 156,915 | | | | HeidelbergCement AG | | | | | 12,788,256 | | | | | | 1.8 | | |
| | | | 569,995 | | | | Infineon Technologies AG | | | | | 8,309,838 | | | | | | 1.2 | | |
| | | | 103,258 | | | | Merck KGaA | | | | | 9,997,581 | | | | | | 1.4 | | |
| | | | 74,750 | | | | Siemens AG | | | | | 7,231,793 | | | | | | 1.0 | | |
| | | | 548,941 | | | | Other Securities | | | | | 27,826,557 | | | | | | 3.9 | | |
| | | | | | | | | | | | | 86,322,183 | | | | | | 12.0 | | |
| | | | | | | | Hong Kong: 2.8% | |
| | | | 228,400 | @ | | CK Hutchison Holdings Ltd.
ADR | | | | | 3,069,696 | | | | | | 0.4 | | |
| | | | 485,640 | | | | CK Hutchison Holdings Ltd. | | | | | 6,527,938 | | | | | | 0.9 | | |
| | | | 8,330,540 | | | | Other Securities(a) | | | | | 10,881,287 | | | | | | 1.5 | | |
| | | | | | | | | | | | | 20,478,921 | | | | | | 2.8 | | |
| | | | | | | | India: 1.3% | |
| | | | 496,486 | | | | Housing Development
Finance Corp. | | | | | 9,443,085 | | | | | | 1.3 | | |
| | | | | | | | Israel: 2.3% | |
| | | | 253,929 | | | | Teva Pharmaceutical
Industries Ltd. ADR | | | | | 16,667,900 | | | | | | 2.3 | | |
| | | | | | | | Italy: 3.0% | |
| | | | 680,187 | | | | ENI S.p.A. | | | | | 10,106,408 | | | | | | 1.4 | | |
| | | | 1,493,810 | | | | UniCredit SpA | | | | | 8,258,858 | | | | | | 1.1 | | |
| | | | 1,072,600 | | | | Other Securities | | | | | 3,562,124 | | | | | | 0.5 | | |
| | | | | | | | | | | | | 21,927,390 | | | | | | 3.0 | | |
| | Shares | | | Value | | | Percentage
of Net
Assets | |
| | COMMON STOCK: (continued) | |
| | | | | | | | Japan: 6.9% | |
| | | | 1,282,100 | | | | Nissan Motor Co., Ltd. | | | | $ | 13,424,539 | | | | | | 1.9 | | |
| | | | 171,300 | | | | SoftBank Group Corp. | | | | | 8,645,580 | | | | | | 1.2 | | |
| | | | 240,400 | | | | Suntory Beverage & Food
Ltd. | | | | | 10,523,785 | | | | | | 1.4 | | |
| | | | 149,600 | | | | Toyota Motor Corp. | | | | | 9,212,222 | | | | | | 1.3 | | |
| | | | 1,900,800 | | | | Other Securities | | | | | 7,916,797 | | | | | | 1.1 | | |
| | | | | | | | | | | | | 49,722,923 | | | | | | 6.9 | | |
| | | | | | | | Netherlands: 5.4% | |
| | | | 159,998 | | | | Akzo Nobel NV | | | | | 10,690,910 | | | | | | 1.5 | | |
| | | | 455,036 | | | | Royal Dutch Shell PLC -
Class B | | | | | 10,370,755 | | | | | | 1.4 | | |
| | | | 1,168,550 | | | | Other Securities(a) | | | | | 17,950,082 | | | | | | 2.5 | | |
| | | | | | | | | | | | | 39,011,747 | | | | | | 5.4 | | |
| | | | | | | | Norway: 2.1% | |
| | | | 573,623 | | | | Telenor ASA | | | | | 9,561,476 | | | | | | 1.3 | | |
| | | | 651,604 | | | | Other Securities | | | | | 5,752,770 | | | | | | 0.8 | | |
| | | | | | | | | | | | | 15,314,246 | | | | | | 2.1 | | |
| | | | | | | | Portugal: 0.9% | |
| | | | 564,750 | | | | Other Securities | | | | | 6,589,919 | | | | | | 0.9 | | |
| | | | | | | | Russia: 0.4% | |
| | | | 226,203 | | | | Other Securities | | | | | 2,871,647 | | | | | | 0.4 | | |
| | | | | | | | Singapore: 2.8% | |
| | | | 886,582 | | | | DBS Group Holdings Ltd. | | | | | 10,390,302 | | | | | | 1.4 | | |
| | | | 3,902,000 | | | | Singapore
Telecommunications Ltd. | | | | | 10,060,390 | | | | | | 1.4 | | |
| | | | | | | | | | | | | 20,450,692 | | | | | | 2.8 | | |
| | | | | | | | South Korea: 5.6% | |
| | | | 35,481 | | | | Hyundai Mobis | | | | | 7,423,674 | | | | | | 1.0 | | |
| | | | 247,680 | @ | | KB Financial Group, Inc.
ADR | | | | | 6,902,842 | | | | | | 1.0 | | |
| | | | 34,081 | | | | Samsung Electronics Co.,
Ltd. GDR | | | | | 18,069,237 | | | | | | 2.5 | | |
| | | | 247,749 | | | | Other Securities | | | | | 7,993,420 | | | | | | 1.1 | | |
| | | | | | | | | | | | | 40,389,173 | | | | | | 5.6 | | |
| | | | | | | | Spain: 1.8% | |
| | | | 1,007,321 | | | | Telefonica S.A. | | | | | 11,175,205 | | | | | | 1.5 | | |
| | | | 178,256 | | | | Other Securities(a) | | | | | 1,962,479 | | | | | | 0.3 | | |
| | | | | | | | | | | | | 13,137,684 | | | | | | 1.8 | | |
| | | | | | | | Sweden: 1.5% | |
| | | | 282,620 | | | | Getinge AB | | | | | 7,403,304 | | | | | | 1.0 | | |
| | | | 364,710 | | | | Other Securities | | | | | 3,516,281 | | | | | | 0.5 | | |
| | | | | | | | | | | | | 10,919,585 | | | | | | 1.5 | | |
| | | | | | | | Switzerland: 7.9% | |
| | | | 638,169 | @ | | Credit Suisse Group AG | | | | | 13,747,413 | | | | | | 1.9 | | |
| | | | 82,527 | | | | Novartis AG | | | | | 7,098,913 | | | | | | 1.0 | | |
| | | | 57,076 | | | | Roche Holding AG | | | | | 15,816,240 | | | | | | 2.2 | | |
See Accompanying Notes to Financial Statements
| VY® Templeton Foreign Equity | SUMMARY PORTFOLIO OF INVESTMENTS |
| Portfolio | as of December 31, 2015 (continued) |
| | Shares | | | Value | | | Percentage
of Net
Assets | |
| | COMMON STOCK: (continued) | |
| | | | | | | | Switzerland (continued) | |
| | | | 142,055 | | | | Swiss Re Ltd. | | | | $ | 13,873,987 | | | | | | 1.9 | | |
| | | | 2,104,860 | | | | Other Securities | | | | | 6,088,601 | | | | | | 0.9 | | |
| | | | | | | | | | | | | 56,625,154 | | | | | | 7.9 | | |
| | | | | | | | Taiwan: 0.6% | |
| | | | 948,251 | | | | Other Securities | | | | | 4,090,984 | | | | | | 0.6 | | |
| | | | | | | | Thailand: 0.7% | |
| | | | 1,168,800 | | | | Other Securities | | | | | 4,990,907 | | | | | | 0.7 | | |
| | | | | | | | United Kingdom: 20.5% | |
| | | | 1,446,095 | | | | Aviva PLC | | | | | 10,976,614 | | | | | | 1.5 | | |
| | | | 1,403,493 | | | | BAE Systems PLC | | | | | 10,333,301 | | | | | | 1.4 | | |
| | | | 2,345,820 | | | | Barclays PLC | | | | | 7,550,699 | | | | | | 1.1 | | |
| | | | 2,113,824 | | | | BP PLC | | | | | 10,984,942 | | | | | | 1.5 | | |
| | | | 609,930 | | | | Sky PLC | | | | | 9,998,490 | | | | | | 1.4 | | |
| | | | 451,664 | | | | CRH PLC - London | | | | | 13,076,524 | | | | | | 1.8 | | |
| | | | 648,766 | | | | GlaxoSmithKline PLC | | | | | 13,102,453 | | | | | | 1.8 | | |
| | | | 1,466,000 | | | | HSBC Holdings PLC | | | | | 11,591,086 | | | | | | 1.6 | | |
| | | | 2,163,454 | | | | Kingfisher PLC | | | | | 10,478,717 | | | | | | 1.5 | | |
| | | | 7,476,467 | | | | Lloyds Banking Group Plc | | | | | 8,044,689 | | | | | | 1.1 | | |
| | | | 1,471,390 | | | | Marks & Spencer Group
PLC | | | | | 9,796,861 | | | | | | 1.4 | | |
| | | | 2,762,541 | | | | Vodafone Group PLC | | | | | 8,958,329 | | | | | | 1.2 | | |
| | | | 4,493,854 | | | | Other Securities | | | | | 23,269,601 | | | | | | 3.2 | | |
| | | | | | | | | | | | | 148,162,306 | | | | | | 20.5 | | |
| | | | | | | | Total Common Stock
(Cost $625,817,843) | | | | | 695,852,126 | | | | | | 96.3 | | |
| |
| | Principal
Amount† | | | Value | | | Percentage
of Net
Assets | |
| | SHORT-TERM INVESTMENTS: 4.8% | |
| | | | | | | | U.S. Government Agency Obligations: 2.7% | |
| | | | 11,000,000 | | | | Farmer Mac Discount
Notes, 0.120%, 01/04/16 | | | | | 11,000,000 | | | | | | 1.6 | | |
| | | | 8,000,000 | | | | Freddie Mac Discount
Notes, 0.090%, 01/04/16 | | | | | 8,000,000 | | | | | | 1.1 | | |
| | | | | | | | | | | | | 19,000,000 | | | | | | 2.7 | | |
| | | | | | | | Securities Lending Collateralcc: 2.1% | |
| | | | 3,686,971 | | | | Citigroup, Inc., Repurchase
Agreement dated 12/31/15,
0.34%, due 01/04/16
(Repurchase Amount
$3,687,108, collateralized
by various U.S. Government
Agency Obligations,
0.000%-11.500%, Market
Value plus accrued interest
$3,760,710, due
01/15/16-04/01/51) | | | | | 3,686,971 | | | | | | 0.5 | | |
| | Principal
Amount† | | | Value | | | Percentage
of Net
Assets | |
| | SHORT-TERM INVESTMENTS: (continued) | |
| | | | | | | | Securities Lending Collateralcc (continued) | |
| | | | 2,945,850 | | | | HSBC Securities USA,
Repurchase Agreement
dated 12/31/15, 0.29%, due
01/04/16 (Repurchase
Amount $2,945,944,
collateralized by various
U.S. Government Securities,
3.000%, Market Value plus
accrued interest
$3,004,775, due 11/15/44) | | | | $ | 2,945,850 | | | | | | 0.4 | | |
| | | | 3,686,971 | | | | Mizuho Securities USA Inc.,
Repurchase Agreement
dated 12/31/15, 0.30%, due
01/04/16 (Repurchase
Amount $3,687,092,
collateralized by various
U.S. Government
Agency Obligations,
0.000%-9.000%, Market
Value plus accrued interest
$3,760,710, due
06/13/16-03/01/44) | | | | | 3,686,971 | | | | | | 0.5 | | |
| | | | 3,686,971 | | | | Nomura Securities,
Repurchase Agreement
dated 12/31/15, 0.33%, due
01/04/16 (Repurchase
Amount $3,687,104,
collateralized by various
U.S. Government/U.S.
Government Agency
Obligations,
0.000%-10.500%, Market
Value plus accrued interest
$3,760,710, due
01/15/16-10/20/65) | | | | | 3,686,971 | | | | | | 0.5 | | |
| | | | 1,517,067 | | | | State of Wisconsin
Investment Board,
Repurchase Agreement
dated 12/31/15, 0.41%, due
01/04/16 (Repurchase
Amount $1,517,135,
collateralized by various
U.S. Government Securities,
0.125%-2.500%, Market
Value plus accrued interest
$1,548,523, due
01/15/17-02/15/42) | | | | | 1,517,067 | | | | | | 0.2 | | |
| | | | | | | | | | | | | 15,523,830 | | | | | | 2.1 | | |
| | | | | | | | Total Short-Term
Investments
(Cost $34,523,773) | | | | | 34,523,830 | | | | | | 4.8 | | |
| | | | | | | | Total Investments in
Securities
(Cost $660,341,616) | | | | $ | 730,375,956 | | | | | | 101.1 | | |
| | | | | | | | Liabilities in Excess of
Other Assets | | | | | (7,689,416) | | | | | | (1.1) | | |
| | | | | | | | Net Assets | | | | $ | 722,686,540 | | | | | | 100.0 | | |
| |
See Accompanying Notes to Financial Statements
| VY® Templeton Foreign Equity | SUMMARY PORTFOLIO OF INVESTMENTS |
| Portfolio | as of December 31, 2015 (continued) |
“Other Securities” represents issues not identified as the top 50 holdings in terms of market value and issues or issuers not exceeding 1% of net assets individually or in aggregate respectively as of December 31, 2015.
The following footnotes apply to either the individual securities noted or one or more of the securities aggregated and listed as a single line item.
†
Unless otherwise indicated, principal amount is shown in USD.
@
Non-income producing security.
ADR
American Depositary Receipt
GDR
Global Depositary Receipt
cc
Represents securities purchased with cash collateral received for securities on loan.
(a)
This grouping contains securities on loan.
Cost for federal income tax purposes is $664,448,248.
Net unrealized appreciation consists of:
| | Gross Unrealized Appreciation | | | | $ | 158,702,381 | | |
| | Gross Unrealized Depreciation | | | | | (92,774,673) | | |
| | Net Unrealized Appreciation | | | | $ | 65,927,708 | | |
| |
| Sector Diversification | | | Percentage
of Net Assets | |
| Financials | | | | | 25.9% | | |
| Health Care | | | | | 14.8 | | |
| Energy | | | | | 10.5 | | |
| Consumer Discretionary | | | | | 10.1 | | |
| Telecommunication Services | | | | | 9.2 | | |
| Industrials | | | | | 8.7 | | |
| Materials | | | | | 7.9 | | |
| Information Technology | | | | | 6.1 | | |
| Consumer Staples | | | | | 3.1 | | |
| U.S. Government Agency Obligations | | | | | 1.6 | | |
| Short-Term Investments | | | | | 3.2 | | |
| Liabilities in Excess of Other Assets | | | | | (1.1) | | |
| Net Assets | | | | | 100.0% | | |
| |
Fair Value Measurements^
The following is a summary of the fair valuations according to the inputs used as of December 31, 2015 in valuing the assets and liabilities:
| | | | Quoted Prices
in Active Markets
for Identical
Investments
(Level 1) | | | Significant
Other
Observable
Inputs#
(Level 2) | | | Significant
Unobservable
Inputs
(Level 3) | | | Fair Value
at
December 31, 2015 | |
| Asset Table | | | | | | | | | | | | | | | | | | | | | | | | | |
| Investments, at fair value | | | | | | | | | | | | | | | | | | | | | | | | | |
| Common Stock | | | | | |
| Brazil | | | | $ | 1,486,153 | | | | | $ | — | | | | | $ | — | | | | | $ | 1,486,153 | | |
| China | | | | | — | | | | | | 43,978,712 | | | | | | — | | | | | | 43,978,712 | | |
| France | | | | | — | | | | | | 83,270,815 | | | | | | — | | | | | | 83,270,815 | | |
| Germany | | | | | — | | | | | | 86,322,183 | | | | | | — | | | | | | 86,322,183 | | |
| Hong Kong | | | | | — | | | | | | 20,478,921 | | | | | | — | | | | | | 20,478,921 | | |
| India | | | | | — | | | | | | 9,443,085 | | | | | | — | | | | | | 9,443,085 | | |
| Israel | | | | | 16,667,900 | | | | | | — | | | | | | — | | | | | | 16,667,900 | | |
| Italy | | | | | — | | | | | | 21,927,390 | | | | | | — | | | | | | 21,927,390 | | |
| Japan | | | | | — | | | | | | 49,722,923 | | | | | | — | | | | | | 49,722,923 | | |
| Netherlands | | | | | — | | | | | | 39,011,747 | | | | | | — | | | | | | 39,011,747 | | |
| Norway | | | | | — | | | | | | 15,314,246 | | | | | | — | | | | | | 15,314,246 | | |
| Portugal | | | | | — | | | | | | 6,589,919 | | | | | | — | | | | | | 6,589,919 | | |
| Russia | | | | | 2,871,647 | | | | | | — | | | | | | — | | | | | | 2,871,647 | | |
| Singapore | | | | | — | | | | | | 20,450,692 | | | | | | — | | | | | | 20,450,692 | | |
| South Korea | | | | | 8,979,040 | | | | | | 31,410,133 | | | | | | — | | | | | | 40,389,173 | | |
| Spain | | | | | — | | | | | | 13,137,684 | | | | | | — | | | | | | 13,137,684 | | |
| Sweden | | | | | — | | | | | | 10,919,585 | | | | | | — | | | | | | 10,919,585 | | |
| Switzerland | | | | | — | | | | | | 56,625,154 | | | | | | — | | | | | | 56,625,154 | | |
| Taiwan | | | | | — | | | | | | 4,090,984 | | | | | | — | | | | | | 4,090,984 | | |
| Thailand | | | | | — | | | | | | 4,990,907 | | | | | | — | | | | | | 4,990,907 | | |
| United Kingdom | | | | | — | | | | | | 148,162,306 | | | | | | — | | | | | | 148,162,306 | | |
| Total Common Stock | | | | | 30,004,740 | | | | | | 665,847,386 | | | | | | — | | | | | | 695,852,126 | | |
| Short-Term Investments | | | | | — | | | | | | 34,523,830 | | | | | | — | | | | | | 34,523,830 | | |
| Total Investments, at fair value | | | | $ | 30,004,740 | | | | | $ | 700,371,216 | | | | | $ | — | | | | | $ | 730,375,956 | | |
| |
^
See Note 2, “Significant Accounting Policies” in the Notes to Financial Statements for additional information.
#
The earlier close of the foreign markets gives rise to the possibility that significant events, including broad market moves, may have occurred in the interim and may materially affect the value of those securities. To account for this, the Portfolio may frequently value many of its foreign equity securities using fair value prices based on third party vendor modeling tools to the extent available. Accordingly, a portion of the Portfolio’s investments are categorized as Level 2 investments.
See Accompanying Notes to Financial Statements
TAX INFORMATION (Unaudited)
Dividends and distributions paid during the year ended December 31, 2015 were as follows:
| Portfolio Name | | | Type | | | Per Share Amount | | | |
| VY® American Century Small-Mid Cap Value Portfolio | | | | | | | |
| Class ADV | | | NII | | | | $ | 0.1851 | | | | |
| Class I | | | NII | | | | $ | 0.2605 | | | | |
| Class S | | | NII | | | | $ | 0.2172 | | | | |
| Class S2 | | | NII | | | | $ | 0.1803 | | | | |
| All Classes | | | STCG | | | | $ | 0.7982 | | | | |
| All Classes | | | LTCG | | | | $ | 1.8439 | | | | |
| VY® Baron Growth Portfolio | | | | | | | | | | | |
| Class ADV | | | NII | | | | $ | 0.0152 | | | | |
| Class I | | | NII | | | | $ | 0.1790 | | | | |
| Class S | | | NII | | | | $ | 0.0897 | | | | |
| Class S2 | | | NII | | | | $ | 0.0528 | | | | |
| All Classes | | | LTCG | | | | $ | 2.3626 | | | | |
| VY® Columbia Contrarian Core Portfolio | | | | | | | | | | | |
| Class ADV | | | NII | | | | $ | 0.1766 | | | | |
| Class I | | | NII | | | | $ | 0.2777 | | | | |
| Class S | | | NII | | | | $ | 0.2121 | | | | |
| All Classes | | | STCG | | | | $ | 0.8886 | | | | |
| All Classes | | | LTCG | | | | $ | 1.8977 | | | | |
| VY® Columbia Small Cap Value II Portfolio | | | | | | | | | | | |
| Class ADV | | | NII | | | | $ | 0.0419 | | | | |
| Class I | | | NII | | | | $ | 0.1002 | | | | |
| Class S | | | NII | | | | $ | 0.0549 | | | | |
| Class S2 | | | NII | | | | $ | 0.0680 | | | | |
| VY® Invesco Comstock Portfolio | | | | | | | | | | | |
| Class ADV | | | NII | | | | $ | 0.3434 | | | | |
| Class I | | | NII | | | | $ | 0.4278 | | | | |
| Class S | | | NII | | | | $ | 0.3833 | | | | |
| VY® Invesco Equity and Income Portfolio | | | | | | | | | | | |
| Class ADV | | | NII | | | | $ | 0.7895 | | | | |
| Class I | | | NII | | | | $ | 1.0069 | | | | |
| Class S | | | NII | | | | $ | 0.8894 | | | | |
| Portfolio Name | | | Type | | | Per Share Amount | | | |
| Class S2 | | | NII | | | | $ | 0.8254 | | | | |
| All Classes | | | STCG | | | | $ | 0.0954 | | | | |
| All Classes | | | LTCG | | | | $ | 3.5594 | | | | |
| VY® JPMorgan Mid Cap Value Portfolio | | | | | | | | | | | |
| Class ADV | | | NII | | | | $ | 0.0791 | | | | |
| Class I | | | NII | | | | $ | 0.1763 | | | | |
| Class S | | | NII | | | | $ | 0.1234 | | | | |
| Class S2 | | | NII | | | | $ | 0.0880 | | | | |
| All Classes | | | STCG | | | | $ | 0.0925 | | | | |
| All Classes | | | LTCG | | | | $ | 3.0677 | | | | |
| VY Oppenheimer Global Portfolio | | | | | | | | | | | |
| Class ADV | | | NII | | | | $ | 0.1944 | | | | |
| Class I | | | NII | | | | $ | 0.2876 | | | | |
| Class S | | | NII | | | | $ | 0.2404 | | | | |
| Class S2 | | | NII | | | | $ | 0.2157 | | | | |
| All Classes | | | LTCG | | | | $ | 1.4901 | | | | |
| VY® Pioneer High Yield Portfolio | | | | | | | | | | | |
| Class I | | | NII | | | | $ | 0.5944 | | | | |
| Class S | | | NII | | | | $ | 0.5644 | | | | |
| VY® T. Rowe Price Diversified Mid Cap Growth Portfolio | | | | | | | |
| All Classes | | | STCG | | | | $ | 0.1155 | | | | |
| All Classes | | | LTCG | | | | $ | 1.7580 | | | | |
| VY® T. Rowe Price Growth Equity Portfolio | | | | | | | | | | | |
| All Classes | | | STCG | | | | $ | 0.6693 | | | | |
| All Classes | | | LTCG | | | | $ | 13.3008 | | | | |
| VY® Templeton Foreign Equity Portfolio | | | | | | | | | | | |
| Class ADV | | | NII | | | | $ | 0.4111 | | | | |
| Class I | | | NII | | | | $ | 0.4810 | | | | |
| Class S | | | NII | | | | $ | 0.4443 | | | | |
| Class S2 | | | NII | | | | $ | 0.4366 | | | | |
NII – Net investment income
STCG – Short-term capital gain
LTCG – Long-term capital gain
Of the ordinary distributions made during the year ended December 31, 2015, the following percentages qualify for the dividends received deduction (DRD) available to corporate shareholders:
| | VY® American Century Small-Mid Cap Value Portfolio | | | | | 26.93% | | |
| | VY® Baron Growth Portfolio | | | | | 100.00% | | |
| | VY® Columbia Contrarian Core Portfolio | | | | | 34.89% | | |
| | VY® Columbia Small Cap Value II Portfolio | | | | | 100.00% | | |
| | VY® Invesco Comstock Portfolio | | | | | 76.38% | | |
| | VY® Invesco Equity and Income Portfolio | | | | | 60.45% | | |
| | VY® JPMorgan Mid Cap Value Portfolio | | | | | 100.00% | | |
| | VY® Oppenheimer Global Portfolio | | | | | 35.32% | | |
| | VY® Pioneer High Yield Portfolio | | | | | 5.46% | | |
| | VY® T. Rowe Price Diversified Mid Cap Growth Portfolio | | | | | 78.33% | | |
| | VY® T. Rowe Price Growth Equity Portfolio | | | | | 84.71% | | |
TAX INFORMATION (Unaudited) (continued)
The Portfolios designate the following amounts of long-term capital gain distributions as 20% rate long-term capital gain dividends under Internal Revenue Code Section 852(b)(3)(C):
| | VY® American Century Small-Mid Cap Value Portfolio | | | | $ | 39,578,301 | | |
| | VY® Baron Growth Portfolio | | | | $ | 73,235,855 | | |
| | VY® Columbia Contrarian Core Portfolio | | | | $ | 26,243,808 | | |
| | VY® Invesco Equity and Income Portfolio | | | | $ | 150,837,776 | | |
| | VY® JPMorgan Mid Cap Value Portfolio | | | | $ | 92,144,387 | | |
| | VY® Oppenheimer Global Portfolio | | | | $ | 127,586,424 | | |
| | VY® T. Rowe Price Diversified Mid Cap Growth Portfolio | | | | $ | 121,937,169 | | |
| | VY® T. Rowe Price Growth Equity Portfolio | | | | $ | 228,589,928 | | |
Pursuant to Section 853 of the Internal Revenue Code, the Portfolios designate the following amounts as foreign taxes paid for the year ended December 31, 2015. Foreign taxes paid for purposes of Section 853 may be less than actual foreign taxes paid for financial statement purposes.
| | | | Creditable
Foreign Taxes
Paid | | | Per Share
Amount | | | Portion of Ordinary Income
Distribution Derived from
Foreign Sourced Income* | |
VY® Oppenheimer Global Portfolio | | | | $ | 725,382 | | | | | $ | 0.0081 | | | | | | 61.19% | | |
VY® Templeton Foreign Equity Portfolio | | | | $ | 751,398 | | | | | $ | 0.0116 | | | | | | 85.06% | | |
*
None of the Portfolios listed above derived any income from ineligible foreign sources as defined under Section 901(j) of the Internal Revenue Code.
Foreign taxes paid or withheld must be included in taxable income with an offsetting deduction from gross income or as a credit for taxes paid to foreign governments. Shareholders are strongly advised to consult their own tax advisors regarding the appropriate treatment of foreign taxes paid.
Above figures may differ from those cited elsewhere in this report due to differences in the calculation of income and gains under U.S. generally accepted accounting principles (book) purposes and Internal Revenue Service (tax) purposes.
Shareholders are strongly advised to consult their own tax advisers with respect to the tax consequences of their investments in the Portfolios. In January, shareholders, excluding corporate shareholders, receive an IRS 1099-DIV regarding the federal tax status of the dividends and distributions they received in the calendar year.
DIRECTOR AND OFFICER INFORMATION (Unaudited)
The business and affairs of the Company are managed under the direction of the Board. A Director, who is not an interested person of the Company, as defined in the 1940 Act, is an independent director (“Independent Director”). The Directors and Officers of the Company are listed below. The Statement of Additional Information includes additional information about directors of the Company and is available, without charge, upon request at (800) 262-3862.
| | Name, Address and Age | | | Position(s)
Held with the
Company | | | Term of Office and
Length of Time
Served(1) | | | Principal
Occupation(s) –
During the Past 5 Years | | | Number of
Funds
in Fund
Complex
Overseen
by Director(2) | | | Other Board Positions
Held by Director | |
| | Independent Directors*: | |
| | Colleen D. Baldwin
7337 East Doubletree Ranch Rd.
Suite 100
Scottsdale, Arizona 85258
Age: 55 | | | Director | | | November 2007 – Present | | | President, Glantuam Partners, LLC, a business consulting firm (January 2009 – Present). | | | 151 | | | DSM/Dentaquest, Boston, MA (February 2014 – Present). | |
| | John V. Boyer
7337 East Doubletree Ranch Rd.
Suite 100
Scottsdale, Arizona 85258
Age: 62 | | | Chairperson
Director | | | January 2014 – Present
November 1997 – Present | | | President and Chief Executive Officer, Bechtler Arts Foundation, an arts and education foundation (January 2008 – Present). | | | 151 | | | None. | |
| | Patricia W. Chadwick
7337 East Doubletree Ranch Rd.
Suite 100
Scottsdale, Arizona 85258
Age: 67 | | | Director | | | January 2006 – Present | | | Consultant and President, Ravengate Partners LLC, a consulting firm that provides advice regarding financial markets and the global economy (January 2000 – Present). | | | 151 | | | Wisconsin Energy Corporation (June 2006 – Present); The Royce Funds (35 funds) (December 2009 – Present); and AMICA Mutual Insurance Company (1992 – Present). | |
| | Peter S. Drotch
7337 East Doubletree Ranch Rd.
Suite 100
Scottsdale, Arizona 85258
Age: 74 | | | Director | | | November 2007 – Present | | | Retired. | | | 151 | | | First Marblehead Corporation (September 2003 – Present). | |
| | Martin J. Gavin
7337 East Doubletree Ranch Rd.
Suite 100
Scottsdale, AZ 85258-2034
Age: 65 | | | Director | | | August 2015 – Present | | | Retired. Formerly, President and Chief Executive Officer, Connecticut Children’s Medical Center (May 2006 – November 2015). | | | 151 | | | None. | |
| | Russell H. Jones
7337 East Doubletree Ranch Rd.
Suite 100
Scottsdale, Arizona 85258
Age: 71 | | | Director | | | May 2013 – Present | | | Retired. | | | 151 | | | None. | |
| | Patrick W. Kenny
7337 East Doubletree Ranch Rd.
Suite 100
Scottsdale, Arizona 85258
Age: 73 | | | Director | | | March 2002 – Present | | | Retired. | | | 151 | | | Assured Guaranty Ltd. (April 2004 – Present). | |
| | Joseph E. Obermeyer
7337 East Doubletree Ranch Rd.
Suite 100
Scottsdale, Arizona 85258
Age: 58 | | | Director | | | May 2013 – Present | | | President, Obermeyer & Associates, Inc., a provider of financial and economic consulting services (November 1999 – Present). | | | 151 | | | None. | |
DIRECTOR AND OFFICER INFORMATION (Unaudited) (continued)
| | Name, Address and Age | | | Position(s)
Held with the
Company | | | Term of Office and
Length of Time
Served(1) | | | Principal
Occupation(s) –
During the Past 5 Years | | | Number of
Funds
in Fund
Complex
Overseen
by Director(2) | | | Other Board Positions
Held by Director | |
| | Sheryl K. Pressler
7337 East Doubletree Ranch Rd.
Suite 100
Scottsdale, Arizona 85258
Age: 65 | | | Director | | | January 2006 – Present | | | Consultant (May 2001 – Present). | | | 151 | | | None. | |
| | Christopher P. Sullivan
7337 East Doubletree Ranch Rd.
Suite 100
Scottsdale, Arizona 85258
Age: 62 | | | Director | | | October 2015 – Present | | | Retired. Formerly, President, Bond Division, Fidelity Management and Research (June 2009 – September 2012). | | | 151 | | | None. | |
| | Roger B. Vincent
7337 East Doubletree Ranch Rd.
Suite 100
Scottsdale, Arizona 85258
Age: 70 | | | Director | | | January 2005 – Present | | | Retired. Formerly, President, Springwell Corporation, a corporate finance firm (March 1989 – August 2011). | | | 151 | | | UGI Corporation (February 2006 – Present) and UGI Utilities, Inc. (February 2006 – Present). | |
| | Director who is an “interested person”: | |
| | Shaun P. Mathews(3)
7337 East Doubletree Ranch Rd.
Suite 100
Scottsdale, Arizona 85258
Age: 60 | | | Director | | | November 2007 – Present | | | President and Chief Executive Officer, Voya Investments, LLC (December 2006 – Present). | | | 151 | | | Voya Capital Corporation, LLC and Voya Investments Distributor, LLC (December 2005 – Present); Voya Funds Services, LLC, Voya Investments, LLC and Voya Investment Management, LLC (March 2006 – Present); and Voya Investment Trust Co. (April 2009 – Present). | |
(1)
Directors serve until their successors are duly elected and qualified. The tenure of each Director who is not an “interested person” as defined in the 1940 Act, of each Portfolio (“Independent Director”) is subject to the Board’s retirement policy which states that each duly elected or appointed Independent Director shall retire from and cease to be a member of the Board of Directors at the close of business on December 31 of the calendar year in which the Independent Director attains the age of 75. A majority vote of the Board’s other Independent Directors may extend the retirement date of an Independent Director if the retirement would trigger a requirement to hold a meeting of shareholders of the Company under applicable law, whether for the purposes of appointing a successor to the Independent Director or otherwise comply under applicable law, in which case the extension would apply until such time as the shareholder meeting can be held or is no longer required (as determined by a vote of a majority of the other Independent Directors).
(2)
For the purposes of this table, “Fund Complex” means the Voya family of funds including the following investment companies: Voya Asia Pacific High Dividend Equity Income Fund; Voya Balanced Portfolio, Inc.; Voya Emerging Markets High Dividend Equity Fund; Voya Equity Trust; Voya Funds Trust; Voya Global Advantage and Premium Opportunity Fund; Voya Global Equity Dividend and Premium Opportunity Fund; Voya Infrastructure, Industrials and Materials Fund; Voya Intermediate Bond Portfolio; Voya International High Dividend Equity Income Fund; Voya Investors Trust; Voya Money Market Portfolio; Voya Mutual Funds; Voya Natural Resources Equity Income Fund; Voya Partners, Inc.; Voya Prime Rate Trust; Voya Senior Income Fund; Voya Separate Portfolios Trust; Voya Series Fund, Inc.; Voya Strategic Allocation Portfolios, Inc.; Voya Variable Funds; Voya Variable Insurance Trust; Voya Variable Portfolios, Inc.; and Voya Variable Products Trust. The number of funds in the Fund Complex is as of January 31, 2016.
(3)
Mr. Mathews is deemed to be an “interested person” of the Company as defined in the 1940 Act, because of his current affiliation with the Voya funds, Voya Financial, Inc., or Voya Financial, Inc.’s affiliates.
*
Effective December 31, 2015, Dr. Albert E. DePrince, Jr. retired as a Director of the Board.
DIRECTOR AND OFFICER INFORMATION (Unaudited) (continued)
| | Name, Address and Age | | | Position(s) Held
With the Company | | | Term of Office and
Length of Time Served(1) | | | Principal Occupation(s) –
During the Past 5 Years | |
| | Shaun P. Mathews
7337 East Doubletree Ranch Rd.
Suite 100
Scottsdale, Arizona 85258
Age: 60 | | | President and Chief Executive Officer | | | November 2006 – Present | | | President and Chief Executive Officer, Voya Investments, LLC (December 2006 – Present). | |
| | Michael J. Roland
7337 East Doubletree Ranch Rd.
Suite 100
Scottsdale, Arizona 85258
Age: 57 | | | Managing Director and Chief Operating Officer | | | April 2012 – Present | | | Managing Director and Chief Operating Officer, Voya Investments, LLC and Voya Funds Services, LLC (April 2012 – Present). Formerly, Chief Compliance Officer, Directed Services LLC and Voya Investments, LLC (March 2011 – December 2013); Executive Vice President and Chief Operating Officer, Voya Investments, LLC and Voya Funds Services, LLC (January 2007 – April 2012) and Chief Compliance Officer, Voya Family of Funds (March 2011 – February 2012). | |
| | Stanley D. Vyner
230 Park Avenue
New York, New York 10169
Age: 65 | | | Executive Vice President
Chief Investment Risk Officer | | | January 2005 – Present
September 2009 – Present | | | Executive Vice President, Voya Investments, LLC (July 2000 – Present) and Chief Investment Risk Officer, Voya Investments, LLC (January 2003 – Present). | |
| | Kevin M. Gleason
7337 East Doubletree Ranch Rd.
Suite 100
Scottsdale, Arizona 85258
Age: 49 | | | Chief Compliance Officer | | | February 2012 – Present | | | Senior Vice President, Voya Investments, LLC and Chief Compliance Officer, Voya Family of Funds (February 2012 – Present). Formerly, Assistant General Counsel and Assistant Secretary, The Northwestern Mutual Life Insurance Company (June 2004 – January 2012). | |
| | Todd Modic
7337 East Doubletree Ranch Rd.
Suite 100
Scottsdale, Arizona 85258
Age: 48 | | | Senior Vice President, Chief/Principal Financial Officer and Assistant Secretary | | | March 2005 – Present | | | Senior Vice President, Voya Investments, LLC and Voya Funds Services, LLC (April 2005 – Present). | |
| | Kimberly A. Anderson
7337 East Doubletree Ranch Rd.
Suite 100
Scottsdale, Arizona 85258
Age: 51 | | | Senior Vice President | | | January 2005 – Present | | | Senior Vice President, Voya Investments, LLC (September 2003 – Present). | |
| | Julius A. Drelick, III
7337 East Doubletree Ranch Rd.
Suite 100
Scottsdale, Arizona 85258
Age: 49 | | | Senior Vice President | | | July 2012 – Present | | | Senior Vice President and Chief Compliance Officer of Directed Services LLC and Voya Investments, LLC (January 2014 – Present); and Senior Vice President – Fund Compliance, Voya Funds Services, LLC (June 2012 – Present). Formerly, Vice President – Platform Product Management & Project Management, Voya Investments, LLC (April 2007 – June 2012). | |
| | Robert Terris
7337 East Doubletree Ranch Rd.
Suite 100
Scottsdale, Arizona 85258
Age: 45 | | | Senior Vice President | | | May 2006 – Present | | | Senior Vice President, Head of Division Operations, Voya Investments, LLC (October 2015 – Present) and Voya Funds Services, LLC (March 2006 – Present). | |
| | Fred Bedoya
7337 East Doubletree Ranch Rd.
Suite 100
Scottsdale, Arizona 85258
Age: 43 | | | Vice President and Treasurer | | | September 2012 – Present | | | Vice President, Voya Investments, LLC (October 2015 – Present) and Voya Funds Services, LLC (July 2012 – Present). Formerly, Assistant Vice President – Director, Voya Funds Services, LLC (March 2003 – March 2012). | |
| | Maria M. Anderson
7337 East Doubletree Ranch Rd.
Suite 100
Scottsdale, Arizona 85258
Age: 57 | | | Vice President | | | January 2005 – Present | | | Vice President, Voya Investments, LLC (October 2015 – Present) and Voya Funds Services, LLC (September 2004 – Present). | |
DIRECTOR AND OFFICER INFORMATION (Unaudited) (continued)
| | Name, Address and Age | | | Position(s) Held
With the Company | | | Term of Office and
Length of Time Served(1) | | | Principal Occupation(s) –
During the Past 5 Years | |
| | Lauren D. Bensinger
7337 East Doubletree Ranch Rd.
Suite 100
Scottsdale, Arizona 85258
Age: 62 | | | Vice President | | | January 2005 – Present | | | Vice President, Voya Funds Services, LLC (February 1996 – Present) and Voya Investments, LLC (October 2004 – Present); Vice President and Money Laundering Reporting Officer, Voya Investments Distributor, LLC (April 2010 – Present); Anti-Money Laundering Compliance Officer, Voya Financial, Inc. (January 2013 – Present); and Money Laundering Reporting Officer, Voya Investment Management Trust Co. (October 2012 – Present). | |
| | Sara M. Donaldson
7337 East Doubletree Ranch Rd.
Suite 100
Scottsdale, Arizona 85258
Age: 56 | | | Vice President | | | September 2014 – Present | | | Vice President, Voya Investments, LLC (October 2015 – Present). Formerly Vice President, Voya Funds Services, LLC (April 2014 – October 2015). Formerly, Director, Compliance, AXA Rosenberg Global Services, LLC (September 1997 – March 2014). | |
| | Robyn L. Ichilov
7337 East Doubletree Ranch Rd.
Suite 100
Scottsdale, Arizona 85258
Age: 48 | | | Vice President | | | January 2005 – Present | | | Vice President, Voya Funds Services, LLC (November 1995 – Present) and Voya Investments, LLC (August 1997 – Present). Formerly, Treasurer, Voya Family of Funds (November 1999 – February 2012). | |
| | Jason Kadavy
7337 East Doubletree Ranch Rd.
Suite 100
Scottsdale, Arizona 85258
Age: 39 | | | Vice President | | | September 2012 – Present | | | Vice President, Voya Investments, LLC (October 2015 – Present) and Voya Funds Services, LLC (July 2007 – Present). | |
| | Kimberly K. Springer
7337 East Doubletree Ranch Rd.
Suite 100
Scottsdale, Arizona 85258
Age: 58 | | | Vice President | | | March 2006 – Present | | | Vice President – Mutual Fund Product Development, Voya Investments, LLC (July 2012 – Present); Vice President, Voya Investment Management – Voya Family of Funds (March 2010 – Present) and Vice President, Voya Funds Services, LLC (March 2006 – Present). Formerly Managing Paralegal, Registration Statements (June 2003 – July 2012). | |
| | Craig Wheeler
7337 East Doubletree Ranch Rd.
Suite 100
Scottsdale, Arizona 85258
Age: 46 | | | Vice President | | | May 2013 – Present | | | Vice President – Director of Tax, Voya Investments, LLC (October 2015 – Present) and Voya Funds Services, LLC (March 2013 – Present). Formerly, Assistant Vice President – Director of Tax, Voya Funds Services, LLC (March 2008 – February 2013). | |
| | Huey P. Falgout, Jr.
7337 East Doubletree Ranch Rd.
Suite 100
Scottsdale, Arizona 85258
Age: 52 | | | Secretary | | | August 2003 – Present | | | Senior Vice President and Chief Counsel, Voya Investment Management – Mutual Fund Legal Department (March 2010 – Present). | |
| | Paul A. Caldarelli
7337 East Doubletree Ranch Rd.
Suite 100
Scottsdale, Arizona 85258
Age: 64 | | | Assistant Secretary | | | June 2010 – Present | | | Vice President and Senior Counsel, Voya Investment Management – Mutual Fund Legal Department (March 2010 – Present). | |
| | Theresa K. Kelety
7337 East Doubletree Ranch Rd.
Suite 100
Scottsdale, Arizona 85258
Age: 53 | | | Assistant Secretary | | | August 2003 – Present | | | Vice President and Senior Counsel, Voya Investment Management – Mutual Fund Legal Department (March 2010 – Present). | |
(1)
The Officers hold office until the next annual meeting of the Board of Directors and until their successors shall have been elected and qualified.
Investment Adviser
Directed Services LLC
1475 Dunwoody Drive
West Chester, Pennsylvania 19380
Distributor
Voya Investments Distributor, LLC
7337 East Doubletree Ranch Road, Suite 100
Scottsdale, Arizona 85258
Transfer Agent
BNY Mellon Investment Servicing (U.S.) Inc.
301 Bellevue Parkway
Wilmington, Delaware 19809
Independent Registered Public Accounting Firm
KPMG LLP
Two Financial Center
60 South Street
Boston, Massachusetts 02111
Custodian
The Bank of New York Mellon
225 Liberty Street
New York, New York 10286
Legal Counsel
Ropes & Gray LLP
Prudential Tower
800 Boylston Street
Boston, Massachusetts 02199
Before investing, carefully consider the investment objectives, risks, charges and expenses of the variable annuity contract or variable life insurance policy and the underlying variable investment options. This and other information is contained in the prospectus for the variable annuity contract or variable life insurance policy and the underlying variable investment options. Obtain these prospectuses from your agent/registered representative and read them carefully before investing.
RETIREMENT | INVESTMENTS | INSURANCE
voyainvestments.com
Annual Report
December 31, 2015
Classes ADV, I, S, S2 and T
Voya Partners, Inc.
| | ■
Voya Solution Aggressive Portfolio | | | ■
Voya Solution 2030 Portfolio | |
| | ■
Voya Solution Balanced Portfolio | | | ■
Voya Solution 2035 Portfolio | |
| | ■
Voya Solution Conservative Portfolio | | | ■
Voya Solution 2040 Portfolio | |
| | ■
Voya Solution Income Portfolio | | | ■
Voya Solution 2045 Portfolio | |
| | ■
Voya Solution Moderately Aggressive Portfolio | | | ■
Voya Solution 2050 Portfolio | |
| | ■
Voya Solution Moderately Conservative Portfolio | | | ■
Voya Solution 2055 Portfolio | |
| | ■
Voya Solution 2020 Portfolio | | | ■
Voya Solution 2060 Portfolio | |
| | ■
Voya Solution 2025 Portfolio | | | | |
| | | This report is submitted for general information to shareholders of the Voya mutual funds. It is not authorized for distribution to prospective shareholders unless accompanied or preceded by a prospectus which includes details regarding the funds’ investment objectives, risks, charges, expenses and other information. This information should be read carefully. | | |
PROXY VOTING INFORMATION
A description of the policies and procedures that the Portfolios use to determine how to vote proxies related to portfolio securities is available: (1) without charge, upon request, by calling Shareholder Services toll-free at (800) 992-0180; (2) on the Portfolios’ website at www.voyainvestments.com; and (3) on the U.S. Securities and Exchange Commission’s (“SEC’s”) website at www.sec.gov. Information regarding how the Portfolios voted proxies related to portfolio securities during the most recent 12-month period ended June 30 is available without charge on the Portfolios’ website at www.voyainvestments.com and on the SEC’s website at www.sec.gov.
QUARTERLY PORTFOLIO HOLDINGS
The Portfolios file their complete schedule of portfolio holdings with the SEC for the first and third quarters of each fiscal year on Form N-Q. The Portfolios’ Forms N-Q are available on the SEC’s website at www.sec.gov. The Portfolios’ Forms N-Q may be reviewed and copied at the SEC’s Public Reference Room in Washington, DC, and information on the operation of the Public Reference Room may be obtained by calling (800) SEC-0330. The Portfolios’ Forms N-Q, as well as a complete portfolio of investments, are available without charge upon request from the Portfolios by calling Shareholder Services toll-free at (800) 992-0180.
Fed action — global reaction
Dear Shareholder,
One of the most anticipated events of 2015 came to pass with only a few weeks left on the calendar. Following the mid-December gathering of its policy-making Federal Open Market Committee, the Federal Reserve Board (“Fed”) announced the first increase of the federal funds target rate in nearly a decade, hiking its key policy interest rate 0.25% to a range of 0.25% – 0.50%. In its announcement, the central bank cited considerable improvement in labor-market conditions and a reasonable confidence that inflation will approach its 2% objective over the medium term. The widely expected interest rate hike already had been priced into most asset classes and thus had minimal immediate impact on the direction of financial markets.
Worth noting is that the Fed’s decision to begin raising short-term interest rates comes at a time when other major central banks — notably, in Europe, China and Japan — continue to provide massive amounts of support to their economies and are biased more toward further accommodation. The disruptions that potentially may emerge from this divergence in central bank policies will demand close attention in the year ahead. Witness January stock market performance.
Though the Fed believes the U.S. economy is strong enough to bear a fed funds interest rate increase, many of the same risks and opportunities persist in the markets. The global economic backdrop and geopolitical stresses continue to induce uncertainty, which could lead to periods of intense volatility, in our view. How can investors keep their perspective in such times? Don’t let today’s uncertainties distract you from focusing on your long-term goals, and don’t risk compromising your goals for the sake of avoiding volatility now. Keep your portfolio well-diversified and thoroughly discuss any prospective changes with your investment advisor before you take action.
At Voya Investment Management, we seek to be a reliable partner committed to reliable investing, helping you and your investment advisor achieve your goals. We appreciate your continued confidence in us, and we look forward to serving your investment needs in the future.
Sincerely,
Shaun Mathews
President and Chief Executive Officer
January 12, 2016
The views expressed in the President’s Letter reflect those of the President as of the date of the letter. Any such views are subject to change at any time based upon market or other conditions and the Voya mutual funds disclaim any responsibility to update such views. These views may not be relied on as investment advice and because investment decisions for a Voya mutual fund are based on numerous factors, may not be relied on as an indication of investment intent on behalf of any Voya mutual fund. Reference to specific company securities should not be construed as recommendations or investment advice.
International investing poses special risks including currency fluctuation, economic and political risks not found in investments that are solely domestic.
Market Perspective: Year Ended December 31, 2015
In our semi-annual report, we described how equity market interest had recently moved from the U.S. to Europe with the advent of the European Central Bank’s (“ECB”) quantitative easing program. But from there, attention moved east and in August an unexpected announcement from China re-awakened other concerns, sending global equities, in the form of the MSCI World IndexSM (the “Index”) measured in local currencies, including net reinvested dividends, on a roller-coaster ride. Having been up 4.14% for the half-year, the Index finally ended 2015 with a gain of 2.08%. (The Index returned -0.87% for the one year ended December 31, 2015, measured in U.S. dollars.)
U.S. economic data was mixed in what was still a rather pedestrian recovery. A disappointing October employment report was followed by a very strong one in November showing that 271,000 jobs had been created the previous month. Sluggish annual wage growth improved to 2.5%, which doesn’t sound like much, but it was the best since 2009. The unemployment rate fell to 5.0%. The December report was a little weaker. Gross domestic product (“GDP”), initially held back by another harsh winter, rebounded to 3.9% in the second quarter of 2015, before an inventory downturn pegged it back to 2.0% in the third. Industrial production was uneven, while retail sales were still showing no acceleration despite lower gasoline prices.
Superimposed on this was the prospect of rising U.S. interest rates. The Federal Open Market Committee (“FOMC”) had not increased the federal funds interest rate for nine years and many feared that it would feel pressed to act before the economy was really ready. But when on September 17 the FOMC left rates unchanged, citing weakness overseas, investors seemed unnerved at this new narrative rather than relieved. Perhaps sensing a credibility problem, the FOMC tried to re-set expectations, signaling in October the December increase of 0.25% that eventually took place, to a range of 0.25% – 0.50%.
Internationally, as noted, the ECB at last implemented a program of quantitative easing in March. Before long the economic data started to look a little less weak: the unemployment rate ticked down to 10.7% and GDP rose 1.6% year-over-year in the third quarter of 2015. Core inflation edged above 1.0% before slipping back. In December, ECB President Draghi’s much anticipated intensification of the program disappointed markets. Sentiment also suffered in mid-year when the integrity of the euro zone itself was threatened, as Greece wrangled over the terms of its bailout. Creditors stood firm and facing ejection, Greece finally accepted even stricter terms.
Annual GDP growth in China decelerated to 7.0% in the first and second quarters of 2015, the slowest in six years, then to 6.9% in the third. But to many commentators 7.0% was suspiciously close to government targets and perhaps overstated. They watched nervously as the Shanghai Stock Exchange Composite Index (“Shanghai Composite”) soared 64% in 2015 by June 12, fueled by retail savings and margin debt. The Shanghai Composite was already in retreat when on August 11, global commodities and equity markets were shaken as China announced a 2% devaluation of the yuan, suggesting that the Chinese economy, the largest single contributor to global growth in recent years, was indeed weaker than had previously been admitted. By August 26 the Shanghai Composite was down 43% from its peak. But gradually the feeling grew that concerns had been overdone. The
Bank of China lowered interest rates, eased bank reserve requirements and by the end of December, with the yuan gradually depreciating, the Shanghai Composite had regained over a quarter of its losses.
In U.S. fixed income markets, the Barclays U.S. Aggregate Bond Index (“Barclays Aggregate”) gained 0.55% in 2015, while the Barclays U.S. Treasury Bond sub-index added 0.84%. Indices of riskier classes fared worse: the Barclays U.S. Corporate Investment Grade Bond sub-index lost 0.68%, while the Barclays High Yield Bond — 2% Issuer Constrained Composite Index (not a part of the Barclays Aggregate) sagged 4.43%. Reflecting another kind of risk, the Barclays Global Inflation Linked U.S. TIPS Index dipped 1.44% as inflationary expectations receded.
U.S. equities, represented by the S&P 500® Index including dividends, crept up 1.38% over the year, within which August represented the worst month since September 2011, while October was the strongest since October 2011. The consumer discretionary sector did best, rising 10.11%. The most challenged sector was understandably energy, slumping 21.12%. S&P 500® earnings per share, dragged down by the energy sector, recorded their first year-over-year decline since 2012 in the second quarter of 2015, despite continuing high levels of share buybacks, and declined again in the third. Shares of companies with smaller market capitalizations lagged: the Russell Midcap® Index fell 2.44% and the Russell 2000® Index fell 4.41%.
In currencies, “divergence” became the word on the experts’ lips to describe the prospect of the U.S. starting to raise interest rates just as the ECB ratcheted up its quantitative easing program. Unsurprisingly the dollar rose 11.47% against the euro over the year. It rose less, 5.75%, against the pound, as the UK is much closer to raising rates than the euro zone. The dollar’s gains against the yen had been made before the period started and it barely moved, rising just 0.40%.
International markets fell sharply after the events in August, with a partial recovery which was faltering by year-end. The MSCI Japan® Index held on to a gain of 9.93% for the year, amid renewed optimism about the yen-denominated profitability and better governance of Japanese corporations. The MSCI Europe ex UK® Index was cushioned by the introduction of quantitative easing, plus the declining euro that went with it and advanced 8.30%. The MSCI UK® Index, burdened by its large, losing holdings in the energy, materials and banking sectors, dropped 2.21%.
All indices are unmanaged and investors cannot invest directly in an index. Past performance does not guarantee future results. The performance quoted represents past performance. Investment return and principal value of an investment will fluctuate, and shares, when redeemed, may be worth more or less than their original cost. The Portfolios’ performance is subject to change since the period’s end and may be lower or higher than the performance data shown. Please call (800) 262-3862 or log on to www.voyainvestments.com to obtain performance data current to the most recent month end.
Market Perspective reflects the views of Voya Investment Management’s Chief Investment Risk Officer only through the end of the period, and is subject to change based on market and other conditions.
| | | Index | | | | Description | | |
| | | Barclays Global Inflation Linked U.S. TIPS Index | | | | The index measures the performance of the US Treasury Inflation Protected Securities (TIPS) market. | | |
| | | Barclays High Yield Bond — 2% Issuer Constrained Composite Index | | | | An unmanaged index that includes all fixed-income securities having a maximum quality rating of Ba1, a minimum amount outstanding of $150 million, and at least one year to maturity. | | |
| | | Barclays U.S. Aggregate Bond Index | | | | An unmanaged index of publicly issued investment grade U.S. Government, mortgage-backed, asset-backed and corporate debt securities. | | |
| | | Barclays U.S. Corporate Investment Grade Bond Index | | | | An unmanaged index consisting of publicly issued, fixed rate, nonconvertible, investment grade debt securities. | | |
| | | Barclays U.S. Treasury Bond Index | | | | A market capitalization-weighted index that measures the performance of public obligations of the U.S. Treasury that have a remaining maturity of one year or more. | | |
| | | MSCI EAFE® Index | | | | An unmanaged index that measures the performance of securities listed on exchanges in Europe, Australasia and the Far East. It includes the reinvestment of dividends net of withholding taxes, but does not reflect fees, brokerage commissions or other expenses of investing. | | |
| | | MSCI Europe ex UK® Index | | | | A free float-adjusted market capitalization index that is designed to measure developed market equity performance in Europe, excluding the UK. | | |
| | | MSCI Japan® Index | | | | A free float-adjusted market capitalization index that is designed to measure developed market equity performance in Japan. | | |
| | | MSCI UK® Index | | | | A free float-adjusted market capitalization index that is designed to measure developed market equity performance in the UK. | | |
| | | MSCI World IndexSM | | | | An unmanaged index that measures the performance of over 1,400 securities listed on exchanges in the U.S., Europe, Canada, Australia, New Zealand and the Far East. | | |
| | | Russell 2000® Index | | | | An unmanaged index that measures the performance of securities of small U.S. companies. | | |
| | | Russell 3000® Index | | | | An unmanaged index that measures the performance of the largest 3000 U.S. companies representing approximately 98% of the investable U.S. equity market. | | |
| | | Russell Midcap® Index | | | | An unmanaged index that measures the performance of the 800 smallest companies in the Russell 1000® Index, which represents approximately 26% of the total market capitalization of the Russell 1000® Index. | | |
| | | S&P 500® Index | | | | An unmanaged index that measures the performance of securities of approximately 500 large-capitalization companies whose securities are traded on major U.S. stock markets. | | |
| | | S&P Target Date Retirement Income Index | | | | Seeks to represent asset allocations which target an immediate retirement horizon. | | |
| | | S&P Target Risk Aggressive Index | | | | Seeks to emphasize exposure to equity securities, maximizing opportunities for long-term capital accumulation. It may include small allocations in fixed-income securities to enhance portfolio efficiency. | | |
| | | S&P Target Risk Conservative Index | | | | Seeks to emphasize exposure to fixed income securities in order to produce a current income stream and avoid excessive volatility of returns. Equity securities are included to protect long-term purchasing power. | | |
| | | S&P Target Risk Growth Index | | | | Seeks to measure the performance of an asset allocation strategy targeted to a growth focused risk profile. | | |
| | | S&P Target Risk Moderate Index | | | | Seeks to measure the performance of an asset allocation strategy targeted to a moderate risk profile. | | |
| | | S&P Target Date 2020 Index,
S&P Target Date 2025 Index,
S&P Target Date 2030 Index,
S&P Target Date 2035 Index,
S&P Target Date 2040 Index,
S&P Target Date 2045 Index,
S&P Target Date 2050 Index and
S&P Target Date 2055+ Index | | | | Each seeks to represent the market consensus for asset allocations which target an approximate 2020, 2025, 2030, 2035, 2040, 2045, 2050, 2055 and beyond 2055 retirement horizon, respectively. | | |
| | | Shanghai Stock Exchange Composite Index | | | | A capitalization-weighted index. The index tracks the daily price performance of all A-shares and B-shares listed on the Shanghai Stock Exchange. The index was developed on December 19, 1990 with a base value of 100. | | |
| Voya Solution Portfolios | Portfolio Managers’ Report |
The Voya Solution Portfolios consist of Voya Solution Aggressive Portfolio, Voya Solution Balanced Portfolio, Voya Solution Conservative Portfolio, Voya Solution Income Portfolio, Voya Solution Moderately Aggressive Portfolio, Voya Solution Moderately Conservative Portfolio, VoyaVoya Solution 2020 Portfolio,Voya Voya Solution 2025 Portfolio,VOYA Voya Solution 2030 Portfolio, Voya Solution 2035 Portfolio, Voya Solution 2040 Portfolio, Voya Solution 2045 Portfolio, Voya Solution 2050 Portfolio, Voya Solution 2055 Portfolio, and Voya Solution 2060 Portfolio (each a “Portfolio” or collectively, the “Portfolios” or the “Solution Portfolios”). Each Portfolio seeks to achieve its investment objective by investing in a combination of underlying funds which are actively managed funds or passively managed funds (index funds)(1). The Portfolios are managed by Halvard Kvaale, CIMA, Paul Zemsky, CFA and Chief Investment Officer, and Jody Hrazanek, Portfolio Managers of Voya Investment Management Co. LLC (“Voya IM”) the Sub-Adviser (“Sub-Adviser”).*
Portfolio Specifics: The Portfolios began the year with a tactical overweight to developed international and Japanese equities, high yield and senior loans, funded by underweights to emerging markets equity, U.S. large cap and core U.S. fixed income. At the beginning of the year, we reduced exposure to high yield bonds, allocating the proceeds to long duration U.S. Treasuries. This was done in an effort to lengthen our duration exposure, based on lower expectations for inflation in the U.S. and continued signs of decelerated global growth.
At the end of the first quarter, we further reduced our exposure to high yield bonds and allocated the proceeds to cash. At the time, this trade was made over concerns that the effects of declining crude oil prices on energy companies, which have a large representation in the high yield bond market, would create short term headwinds for the asset class. In addition, we closed our Japanese equities position that was initiated at the end of 2014. Our reasoning for the position at the time was that Japanese equities were attractively valued relative to U.S. equities, showed positive corporate earnings revisions by analyst, and that reform efforts by Prime Minister Shinzo Abe would be a tailwind for risk assets. This thesis was largely fulfilled and we closed the position for a profit at the end of the quarter.
In April, we purchased high yield bonds with cash, directly reversing our end of the first quarter trade as the thesis for the original trade, where we believed further declines in crude oil prices could negatively affect high yield, failed to transpire. In mid-April, we shifted assets from domestic mid cap equities into currency-hedged Eurozone equities, forecasting Eurozone equities would outperform U.S. equities because of expected economic activity improvements, continued expansion of bank lending and sustained positive effects from enhanced competitiveness of the Euro.
As part of our annual process, the Portfolios glided down at the end of April, resulting in lower strategic equity allocations across our near and intermediate-dated Portfolios. To achieve this glide down, we sold domestic mid cap equities and purchased core U.S. fixed income. In addition, we added commodities as a strategic asset allocation across all Portfolios, funded by additional reductions in domestic mid cap equities. Both supply and prices of major commodity categories had come down over the past two years, making the asset class more attractive than in previous years. This allocation will also seek to hedge inflationary pressures which may strengthen given nascent wage rises in the U.S. and expansionary monetary policy outside the U.S.
At the end of the quarter, we closed out the Eurozone equities trade enacted at the beginning of the quarter. Since early April, the run-up in sovereign bond yields caused a significant correction in Eurozone equity prices, and the unfolding situation in Greece introduced more risk than we were willing to tolerate.
At the end of July, we reduced exposure to domestic large cap equities, allocating the proceeds to core fixed income. This trade was made to reduce our overweight to equities ahead of the Federal Reserve Board (“Fed”) policy decision in September, believing that the execution of Fed policy and/or its communication on the subject could potentially trigger a market correction. We further de-risked the Portfolios in August ahead of the Fed’s policy decision, reducing domestic large cap equities and shifting the proceeds to global real estate, lengthening the duration of the Portfolios. Subdued U.S. earnings growth, earnings revisions and economic surprises supported the thesis for this risk-off trade.
At the start of October, we reduced risk across the Portfolios by selling mid cap equities and buying core U.S. bonds, neutralizing our equity overweight. This trade was placed due to a worsening global economic outlook at the time and uncertainty around the Fed’s intentions on raising interest rates. We unwound this trade at the end of October after weak payroll numbers helped to push off expectations for a Fed interest rate hike and increased risk appetite in the markets.
At the end of October, we made changes to our strategic asset allocations across all Portfolios to reflect our longer term views. This change led to a reduction to U.S. core fixed income, domestic equities, U.S. real estate and short duration, and an increase to international equity and senior loans for most of the Portfolios. In addition, we added global real estate and long-term government bonds as new strategic asset classes.
In November, we reduced risk in the Portfolios given uncertainty over the Fed, commodities and global growth. The Portfolios ended the year in a defensive posture, with underweights to domestic large cap equity (far-dated Portfolios) and high yield (near-dated Portfolios), with a corresponding overweight position in core U.S. fixed income.
During the year, tactical moves relative to our strategic benchmarks had a positive impact across all Portfolios.
Nine out of the fifteen Solution Portfolios outperformed their respective S&P Target Date or Target Risk indices for the year**.
Among the largest asset class contributors to absolute return were domestic large blend and large growth, U.S. real estate investment trusts, core U.S. fixed income and short duration bonds. Individual contributors to benchmark-relative performance include VY® T.Rowe Price Growth Portfolio, VY® T.Rowe Price Capital Appreciation Portfolio and Voya Small Company Portfolio.
Among the largest asset class detractors from absolute return were broad-basket commodities, emerging markets equity and domestic mid cap value. Individual detractors to relative performance include VY® Invesco Comstock Portfolio, Voya Multi-Manager Large Cap Core Portfolio and Voya Global Bond Portfolio.
| Portfolio Managers’ Report | Voya Solution Portfolios |
The Portfolios utilized S&P 400 Mini Futures and 10 Year Treasury Futures to enact a tactical position held in October. Futures were utilized to avoid affecting underlying managers with shorter term tactical moves and to provide the Portfolios with greater liquidity. This tactical position detracted from performance during the reporting period.
Current Strategy and Outlook: While we have entered into a new year, the market conditions and investor fears first seen in late 2015 persist. High yield credit and commodity markets sank to multi-year lows, while Chinese equities resumed a rout reminiscent of last summer. With a fresh round of meetings around the corner, central banks are once again in the hot seat, battling deflationary pressures and struggling to remain credible.
Chinese volatility has once again crept back into the forefront of global investor worries. While 2015 GDP growth of 6.9% is largely consistent with the People’s Bank of China’s estimates, softer-than-expected December industrial production, fixed asset investment and retail sales numbers point toward slower 2016 growth, which some are even predicting to be sub-6%. While China’s transition to a consumer-driven growth model continues to be difficult, a hard landing for the economy is still not our base case scenario.
Recent dovish commentary from both the European Central Bank (“ECB”) and Bank of Japan (“BoJ”) has raised expectations of possible further monetary stimulus from these authorities. While the ECB left its rates unchanged following its most recent meeting, President Mario Draghi mentioned that failing to reach its inflation target would reflect poorly on the ECB’s credibility and that there is a need to “review and possibly revisit our monetary policy stance at our next meeting in early March”. Similarly, BoJ Governor Kuroda was quoted saying the Japanese central bank will make “policy adjustment without hesitation” to reach its 2% inflation target.
Financial conditions in the U.S. have tightened considerably in the new year. The S&P 500® is down about 8%, and we have seen two consecutive quarters of negative S&P earnings growth. Our current activity model is implying GDP growth of 1% for the fourth quarter, down from 2% in the third quarter. High yield bond spreads have widened out as much as 130 basis points (1.30%) (a basis point is one-hundredth of one percent) since year-end, long-term bond yields are down close to 20 basis points, and crude oil has touched 12-year lows. We believe market volatility is likely to continue since the Fed appears to be focused on both economic and market developments, both at home and abroad; it will be interesting to see if the Federal Open Market Committee’s January statement includes any discussion of market conditions.
For the U.S. we continue to see consumer-driven growth in 2016, as we rounded out 2015 with strong housing data, above consensus payroll gains and record auto sales. On the other hand, the manufacturing sector remains under pressure, with December delivering a second consecutive month of contraction; January flash Markit Manufacturing PMI surprised to the upside, however. Overall, a stronger dollar and weaker oil prices should continue to help consumers while weighing on manufacturers.
*
Effective August 7, 2015, Frank Van Etten was removed as a portfolio manager of the Portfolios. Effective December 18, 2015, Jody Hrazanek was added as a portfolio manager of the Portfolios.
**
Each Portfolio’s relative performance versus its respective benchmarks can be found on page 6.
(1)
The investment objective of each Portfolio is described in the Portfolios’ prospectuses, each dated May 1, 2015.
Portfolio holdings and characteristics are subject to change and may not be representative of current holdings and characteristics. Portfolio holdings are subject to change daily. The outlook for this Portfolio may differ from that presented for other Voya mutual funds. The Portfolio’s performance returns shown reflect applicable fee waivers and/or expense limits in effect during this period. Absent such fee waivers/expense limitations, if any, performance would have been lower. Performance for the different classes of shares will vary based on differences in fees associated with each class.
| Voya Solution Portfolios | Portfolio Managers’ Report |
| | | Average Annual Total Returns for the Period Ended December 31, 2015 | | |
| | | | | | 1 Year | | |
| | | Voya Solution Aggressive Portfolio, Class S | | | -1.12% | | |
| | | S&P Target Risk Aggressive Index | | | -0.54% | | |
| | | Voya Solution Balanced Portfolio, Class S | | | -0.46% | | |
| | | S&P Target Risk Growth Index | | | -0.69% | | |
| | | Voya Solution Conservative Portfolio, Class S | | | -0.48% | | |
| | | S&P Target Risk Conservative Index | | | -0.82% | | |
| | | Voya Solution Income Portfolio, Class S | | | 0.10% | | |
| | | S&P Target Date Retirement Income Index | | | 0.07% | | |
| | | Russell 3000® Index | | | 0.48% | | |
| | | MSCI EAFE® Index | | | -0.81% | | |
| | | Barclays U.S. Aggregate Bond (“BCAB”) Index | | | 0.55% | | |
| | | Voya Solution Moderately Aggressive Portfolio, Class S | | | -1.15% | | |
| | | S&P Target Risk Aggressive Index | | | -0.54% | | |
| | | Voya Solution Moderately Conservative Portfolio, Class S | | | -0.38% | | |
| | | S&P Target Risk Moderate Index | | | -0.81% | | |
| | | Voya Solution 2020 Portfolio, Class S | | | 1.23% | | |
| | | S&P Target Date 2020 Index | | | 0.06% | | |
| | | Voya Solution 2025 Portfolio, Class S | | | -0.09% | | |
| | | S&P Target Date 2025 Index | | | 0.00% | | |
| | | Russell 3000® Index | | | 0.48% | | |
| | | MSCI EAFE® Index | | | -0.81% | | |
| | | BCAB Index | | | 0.55% | | |
| | | Voya Solution 2030 Portfolio, Class S | | | 0.52% | | |
| | | S&P Target Date 2030 Index | | | -0.05% | | |
| | | Voya Solution 2035 Portfolio, Class S | | | -0.48% | | |
| | | S&P Target Date 2035 Index | | | -0.10% | | |
| | | Russell 3000® Index | | | 0.48% | | |
| | | MSCI EAFE® Index | | | -0.81% | | |
| | | BCAB Index | | | 0.55% | | |
| | | Voya Solution 2040 Portfolio, Class S | | | 0.03% | | |
| | | S&P Target Date 2040 Index | | | -0.15% | | |
| | | Voya Solution 2045 Portfolio, Class S | | | -0.95% | | |
| | | S&P Target Date 2045 Index | | | -0.21% | | |
| | | Russell 3000® Index | | | 0.48% | | |
| | | MSCI EAFE® Index | | | -0.81% | | |
| | | BCAB Index | | | 0.55% | | |
| | | Voya Solution 2050 Portfolio, Class S | | | 0.00% | | |
| | | S&P Target Date 2050 Index | | | -0.22% | | |
| | | Voya Solution 2055 Portfolio, Class S | | | -0.87% | | |
| | | S&P Target Date 2055+ Index | | | -0.29% | | |
| | | Voya Solution 2060 Portfolio, Class S* | | | -1.40% | | |
| | | S&P Target Date 2055+ Index* | | | -1.74% | | |
| | | | | | | | |
*
Voya Solution 2060 Portfolio and S&P Target Date 2055+ Index cumulative total returns are for the date of inception on February 9, 2015 to December 31, 2015.
| Portfolio Managers’ Report | Voya Solution Portfolios |
| | | Target Allocations as of December 31, 2015 | | |
| | | Asset Class | | | 2060 | | | 2055 | | | 2050 | | | 2045 | | | 2040 | | | 2035 | | | 2030 | | | 2025 | | | 2020 | | | Income | | |
| | | US Large Blend | | | | | 23.0% | | | | | | 23.0% | | | | | | 21.0% | | | | | | 21.0% | | | | | | 23.0% | | | | | | 22.0% | | | | | | 22.0% | | | | | | 16.0% | | | | | | 15.0% | | | | | | 14.0% | | | |
| | | US Large Growth | | | | | 15.0% | | | | | | 15.0% | | | | | | 15.0% | | | | | | 15.0% | | | | | | 13.0% | | | | | | 12.0% | | | | | | 11.0% | | | | | | 10.0% | | | | | | 9.0% | | | | | | 6.0% | | | |
| | | US Large Value | | | | | 13.0% | | | | | | 13.0% | | | | | | 13.0% | | | | | | 13.0% | | | | | | 11.0% | | | | | | 10.0% | | | | | | 9.0% | | | | | | 8.0% | | | | | | 7.0% | | | | | | 4.0% | | | |
| | | US Mid Cap Growth | | | | | 5.5% | | | | | | 5.5% | | | | | | 5.5% | | | | | | 5.5% | | | | | | 5.0% | | | | | | 3.5% | | | | | | 3.5% | | | | | | 3.5% | | | | | | 2.5% | | | | | | 1.5% | | | |
| | | US Mid Cap Value | | | | | 5.5% | | | | | | 5.5% | | | | | | 5.5% | | | | | | 5.5% | | | | | | 5.0% | | | | | | 3.5% | | | | | | 3.5% | | | | | | 3.5% | | | | | | 2.5% | | | | | | 1.5% | | | |
| | | US Small Cap | | | | | 4.0% | | | | | | 4.0% | | | | | | 4.0% | | | | | | 4.0% | | | | | | 4.0% | | | | | | 3.0% | | | | | | 3.0% | | | | | | 3.0% | | | | | | 3.0% | | | | | | — | | | |
| | | International | | | | | 21.0% | | | | | | 21.0% | | | | | | 21.0% | | | | | | 21.0% | | | | | | 19.0% | | | | | | 19.0% | | | | | | 15.0% | | | | | | 14.0% | | | | | | 11.0% | | | | | | 5.0% | | | |
| | | Emerging Markets | | | | | 6.0% | | | | | | 6.0% | | | | | | 6.0% | | | | | | 6.0% | | | | | | 6.0% | | | | | | 6.0% | | | | | | 4.0% | | | | | | 3.0% | | | | | | — | | | | | | — | | | |
| | | US Real Estate | | | | | 1.5% | | | | | | 1.5% | | | | | | 1.5% | | | | | | 1.5% | | | | | | 1.5% | | | | | | 1.5% | | | | | | 1.5% | | | | | | 2.0% | | | | | | 2.0% | | | | | | 2.0% | | | |
| | | Global Real Estate | | | | | 1.5% | | | | | | 1.5% | | | | | | 1.5% | | | | | | 1.5% | | | | | | 1.5% | | | | | | 1.5% | | | | | | 1.5% | | | | | | — | | | | | | — | | | | | | — | | | |
| | | Commodities | | | | | 1.0% | | | | | | 1.0% | | | | | | 1.0% | | | | | | 1.0% | | | | | | 1.0% | | | | | | 1.0% | | | | | | 1.0% | | | | | | 1.0% | | | | | | 1.0% | | | | | | 1.0% | | | |
| | | Core Fixed Income | | | | | 2.2% | | | | | | 2.2% | | | | | | 2.2% | | | | | | 2.2% | | | | | | 4.0% | | | | | | 7.0% | | | | | | 11.0% | | | | | | 16.0% | | | | | | 19.0% | | | | | | 32.0% | | | |
| | | High Yield | | | | | — | | | | | | — | | | | | | — | | | | | | — | | | | | | 4.0% | | | | | | 4.0% | | | | | | 4.0% | | | | | | 4.0% | | | | | | 4.0% | | | | | | 4.0% | | | |
| | | Senior Debt | | | | | — | | | | | | — | | | | | | 1.8% | | | | | | 1.8% | | | | | | 2.0% | | | | | | 5.0% | | | | | | 5.0% | | | | | | 5.0% | | | | | | 5.0% | | | | | | 5.0% | | | |
| | | International Bonds | | | | | — | | | | | | — | | | | | | — | | | | | | — | | | | | | — | | | | | | — | | | | | | — | | | | | | 6.0% | | | | | | 6.0% | | | | | | 6.0% | | | |
| | | TIPS | | | | | — | | | | | | — | | | | | | — | | | | | | — | | | | | | — | | | | | | — | | | | | | — | | | | | | — | | | | | | 7.0% | | | | | | 9.0% | | | |
| | | Short Duration | | | | | — | | | | | | — | | | | | | — | | | | | | — | | | | | | — | | | | | | 1.0% | | | | | | 4.0% | | | | | | 5.0% | | | | | | 6.0% | | | | | | 8.0% | | | |
| | | Long Gov’t Bonds | | | | | 0.8% | | | | | | 0.8% | | | | | | 1.0% | | | | | | 1.0% | | | | | | — | | | | | | — | | | | | | 1.0% | | | | | | — | | | | | | — | | | | | | 1.0% | | | |
| | | Total Equity | | | | | 97% | | | | | | 97% | | | | | | 95% | | | | | | 95% | | | | | | 90% | | | | | | 83% | | | | | | 75% | | | | | | 64% | | | | | | 53% | | | | | | 35% | | | |
| | | Total Fixed Income | | | | | 3% | | | | | | 3% | | | | | | 5% | | | | | | 5% | | | | | | 10% | | | | | | 17% | | | | | | 25% | | | | | | 36% | | | | | | 47% | | | | | | 65% | | | |
| | | Target Allocations as of December 31, 2015 | | |
| | | Asset Class | | | Aggressive | | | Moderately
Aggressive | | | Balanced | | | Moderately
Conservative | | | Conservative | | |
| | | US Large Blend | | | | | 23.0% | | | | | | 18.5% | | | | | | 19.0% | | | | | | 13.0% | | | | | | 11.0% | | | |
| | | US Large Growth | | | | | 15.0% | | | | | | 15.0% | | | | | | 12.0% | | | | | | 5.8% | | | | | | 3.0% | | | |
| | | US Large Value | | | | | 15.0% | | | | | | 14.0% | | | | | | 11.0% | | | | | | 4.8% | | | | | | 3.0% | | | |
| | | US Mid Cap Growth | | | | | 8.0% | | | | | | 6.8% | | | | | | 4.5% | | | | | | 3.7% | | | | | | 2.0% | | | |
| | | US Mid Cap Value | | | | | 8.0% | | | | | | 6.7% | | | | | | 4.5% | | | | | | 3.7% | | | | | | 2.0% | | | |
| | | US Small Cap | | | | | 4.0% | | | | | | 3.0% | | | | | | 2.0% | | | | | | 2.0% | | | | | | — | | | |
| | | International | | | | | 19.0% | | | | | | 16.0% | | | | | | 9.0% | | | | | | 7.0% | | | | | | 3.0% | | | |
| | | Emerging Markets | | | | | 5.0% | | | | | | 4.0% | | | | | | 2.0% | | | | | | 2.0% | | | | | | — | | | |
| | | US Real Estate | | | | | 2.0% | | | | | | 2.0% | | | | | | 2.0% | | | | | | 2.0% | | | | | | — | | | |
| | | Commodities | | | | | 1.0% | | | | | | 1.0% | | | | | | 1.0% | | | | | | 1.0% | | | | | | 1.0% | | | |
| | | Core Fixed Income | | | | | — | | | | | | 3.0% | | | | | | 12.0% | | | | | | 28.0% | | | | | | 28.0% | | | |
| | | High Yield | | | | | — | | | | | | 4.0% | | | | | | 6.0% | | | | | | 6.0% | | | | | | 10.0% | | | |
| | | Senior Debt | | | | | — | | | | | | 3.0% | | | | | | 5.0% | | | | | | 5.0% | | | | | | 7.0% | | | |
| | | International Bonds | | | | | — | | | | | | 2.0% | | | | | | 5.0% | | | | | | 5.0% | | | | | | 12.0% | | | |
| | | TIPS | | | | | — | | | | | | — | | | | | | 2.0% | | | | | | 5.0% | | | | | | 9.0% | | | |
| | | Short Duration | | | | | — | | | | | | — | | | | | | 2.0% | | | | | | 5.0% | | | | | | 8.0% | | | |
| | | Long Gov’t Bonds | | | | | — | | | | | | 1.0% | | | | | | 1.0% | | | | | | 1.0% | | | | | | 1.0% | | | |
| | | Total Equity | | | | | 100% | | | | | | 87% | | | | | | 67% | | | | | | 45% | | | | | | 25% | | | |
| | | Total Fixed Income | | | | | — | | | | | | 13% | | | | | | 33% | | | | | | 55% | | | | | | 75% | | | |
| | | | | | | | | | | | | | | | | | | | | | | | | | | | | | | | | | | |
As these are target allocations, the actual allocations of each Portfolio’s assets may deviate from the percentages shown. Although the Portfolios expect to be fully invested at all times, they may maintain liquidity reserves to meet redemption requests.
Portfolio holdings are subject to change daily.
| Voya Solution Aggressive Portfolio | Portfolio Managers’ Report |
| | | Average Annual Total Returns for the Periods Ended December 31, 2015 | | |
| | | | | | 1 Year | | | Since Inception
of Classes ADV, I, S, and S2
May 1, 2013 | | |
| | | Class ADV | | | | | -1.32% | | | | | | 7.39% | | | |
| | | Class I | | | | | -0.83% | | | | | | 8.12% | | | |
| | | Class S | | | | | -1.12% | | | | | | 7.81% | | | |
| | | Class S2 | | | | | -1.20% | | | | | | 7.45% | | | |
| | | S&P Target Risk Aggressive Index | | | | | -0.54% | | | | | | 6.98% | | | |
| | | | | |
Based on a $10,000 initial investment, the graph and table above illustrate the total return of Voya Solution Aggressive Portfolio against the index indicated. The index is unmanaged, has no cash in its portfolio, imposes no sales charges and incurs no operating expenses. An investor cannot invest directly in an index. The Portfolio’s performance is shown without the imposition of any expenses or charges which are, or may be, imposed under your variable annuity contract or variable life insurance policy. Total returns would have been lower if such expenses or charges were included.
The performance graph and table do not reflect the deduction of taxes that a shareholder will pay on Portfolio distributions or the redemption of Portfolio shares.
The performance shown may include the effect of fee waivers and/or expense reimbursements by the Investment Adviser and/or other service providers, which have the effect of increasing total return. Had all fees and expenses been considered, the total returns would have been lower.
The performance update illustrates performance for a variable investment option available through a variable annuity contract or a variable life insurance policy. The
performance shown indicates past performance and is not a projection or prediction of future results. Actual investment returns and principal value will fluctuate so that shares and/or units, at redemption, may be worth more or less than their original cost. Please log on to www.voyainvestments.com or call (800) 262-3862 to get performance through the most recent month end.
It is important to note that the Portfolio has a limited operating history. Performance over a longer period of time may be more meaningful than short-term performance.
This report contains statements that may be “forward-looking” statements. Actual results may differ materially from those projected in the “forward-looking” statements.
The views expressed in this report reflect those of the portfolio managers, only through the end of the period as stated on the cover. The portfolio managers’ views are subject to change at any time based on market and other conditions.
Portfolio holdings are subject to change daily.
| Portfolio Managers’ Report | Voya Solution Balanced Portfolio |
| | | Average Annual Total Returns for the Periods Ended December 31, 2015 | | |
| | | | | | 1 Year | | | 5 Year | | | Since Inception
of Classes ADV, I and S
July 2, 2007 | | | Since Inception
of Class S2
April 30, 2010 | | |
| | | Class ADV | | | | | -0.72% | | | | | | 6.05% | | | | | | 2.60% | | | | | | — | | | |
| | | Class I | | | | | -0.19% | | | | | | 6.57% | | | | | | 3.20% | | | | | | — | | | |
| | | Class S | | | | | -0.46% | | | | | | 6.31% | | | | | | 2.92% | | | | | | — | | | |
| | | Class S2 | | | | | -0.60% | | | | | | 6.14% | | | | | | — | | | | | | 6.72% | | | |
| | | S&P Target Risk Growth Index | | | | | -0.69% | | | | | | 6.91% | | | | | | 3.84% | | | | | | 7.32% | | | |
| | | | | |
Based on a $10,000 initial investment, the graph and table above illustrate the total return of Voya Solution Balanced Portfolio against the index indicated. The index is unmanaged and has no cash in its portfolio, imposes no sales charges and incurs no operating expenses. An investor cannot invest directly in an index. The Portfolio’s performance is shown without the imposition of any expenses or charges which are, or may be, imposed under your variable annuity contract or variable life insurance policy. Total returns would have been lower if such expenses or charges were included.
The performance graph and table do not reflect the deduction of taxes that a shareholder will pay on Portfolio distributions or the redemption of Portfolio shares.
The performance shown may include the effect of fee waivers and/or expense reimbursements by the Investment Adviser and/or other service providers, which have the effect of increasing total return. Had all fees and expenses been considered, the total returns would have been lower.
The performance update illustrates performance for a variable investment option available through a variable
annuity contract or a variable life insurance policy. The performance shown indicates past performance and is not a projection or prediction of future results. Actual investment returns and principal value will fluctuate so that shares and/or units, at redemption, may be worth more or less than their original cost. Please log on to www.voyainvestments.com or call (800) 262-3862 to get performance through the most recent month end.
This report contains statements that may be “forward-looking” statements. Actual results may differ materially from those projected in the “forward-looking” statements.
The views expressed in this report reflect those of the portfolio managers, only through the end of the period as stated on the cover. The portfolio managers’ views are subject to change at any time based on market and other conditions.
Portfolio holdings are subject to change daily.
| Voya Solution Conservative Portfolio | Portfolio Managers’ Report |
| | | Average Annual Total Returns for the Periods Ended December 31, 2015 | | |
| | | | | | 1 Year | | | 5 Year | | | Since Inception
of Classes ADV, I, S, and S2
April 30, 2010 | | |
| | | Class ADV | | | | | -0.76% | | | | | | 3.75% | | | | | | 4.19% | | | |
| | | Class I | | | | | -0.23% | | | | | | 4.27% | | | | | | 4.73% | | | |
| | | Class S | | | | | -0.48% | | | | | | 3.99% | | | | | | 4.46% | | | |
| | | Class S2 | | | | | -0.67% | | | | | | 3.85% | | | | | | 4.30% | | | |
| | | S&P Target Risk Conservative Index | | | | | -0.82% | | | | | | 4.33% | | | | | | 4.57% | | | |
| | | | | |
Based on a $10,000 initial investment, the graph and table above illustrate the total return of Voya Solution Conservative Portfolio against the index indicated. The index is unmanaged and has no cash in its portfolio, imposes no sales charges and incurs no operating expenses. An investor cannot invest directly in an index. The Portfolio’s performance is shown without the imposition of any expenses or charges which are, or may be, imposed under your variable annuity contract or variable life insurance policy. Total returns would have been lower if such expenses or charges were included.
The performance graph and table do not reflect the deduction of taxes that a shareholder will pay on Portfolio distributions or the redemption of Portfolio shares.
The performance shown may include the effect of fee waivers and/or expense reimbursements by the Investment Adviser and/or other service providers, which have the effect of increasing total return. Had all fees and expenses been considered, the total returns would have been lower.
The performance update illustrates performance for a variable investment option available through a variable
annuity contract or a variable life insurance policy. The performance shown indicates past performance and is not a projection or prediction of future results. Actual investment returns and principal value will fluctuate so that shares and/or units, at redemption, may be worth more or less than their original cost. Please log on to www.voyainvestments.com or call (800) 262-3862 to get performance through the most recent month end.
This report contains statements that may be “forward-looking” statements. Actual results may differ materially from those projected in the “forward-looking” statements.
The views expressed in this report reflect those of the portfolio managers, only through the end of the period as stated on the cover. The portfolio managers’ views are subject to change at any time based on market and other conditions.
Portfolio holdings are subject to change daily.
| Portfolio Managers’ Report | Voya Solution Income Portfolio |
| | | Average Annual Total Returns for the Periods Ended December 31, 2015 | | |
| | | | | | 1 Year | | | 5 Year | | | 10 Year | | | Since Inception
of Class S2
May 28, 2009 | | |
| | | Class ADV | | | | | -0.30% | | | | | | 4.25% | | | | | | 3.93% | | | | | | — | | | |
| | | Class I | | | | | 0.20% | | | | | | 4.76% | | | | | | 4.45% | | | | | | — | | | |
| | | Class S | | | | | 0.10% | | | | | | 4.52% | | | | | | 4.20% | | | | | | — | | | |
| | | Class S2 | | | | | -0.13% | | | | | | 4.37% | | | | | | — | | | | | | 6.71% | | | |
| | | Class T | | | | | -0.40% | | | | | | 4.07% | | | | | | 3.73% | | | | | | — | | | |
| | | S&P Target Date Retirement Income Index | | | | | 0.07% | | | | | | 4.72% | | | | | | 4.51% | | | | | | 6.70% | | | |
| | | Russell 3000® Index | | | | | 0.48% | | | | | | 12.18% | | | | | | 7.35% | | | | | | 15.62% | | | |
| | | MSCI EAFE® Index | | | | | -0.81% | | | | | | 3.60% | | | | | | 3.03% | | | | | | 7.29% | | | |
| | | BCAB Index | | | | | 0.55% | | | | | | 3.25% | | | | | | 4.51% | | | | | | 4.29% | | | |
| | | | | |
Based on a $10,000 initial investment, the graph and table above illustrate the total return of Voya Solution Income Portfolio against the indices indicated. An index is unmanaged and has no cash in its portfolio, imposes no sales charges and incurs no operating expenses. An investor cannot invest directly in an index. The Portfolio’s performance is shown without the imposition of any expenses or charges which are, or may be, imposed under your variable annuity contract or variable life insurance policy. Total returns would have been lower if such expenses or charges were included.
The performance graph and table do not reflect the deduction of taxes that a shareholder will pay on Portfolio distributions or the redemption of Portfolio shares.
The performance shown may include the effect of fee waivers and/or expense reimbursements by the Investment Adviser and/or other service providers, which have the effect of increasing total return. Had all fees and expenses been considered, the total returns would have been lower.
The performance update illustrates performance for a variable investment option available through a variable annuity contract or a variable life insurance policy. The performance shown indicates past performance and is not a projection or prediction of future results. Actual investment returns and principal value will fluctuate so that shares and/or units, at redemption, may be worth more or less than their original cost. Please log on to www.voyainvestments.com or call (800) 262-3862 to get performance through the most recent month end.
This report contains statements that may be “forward-looking”statements. Actual results may differ materially from those projected in the “forward-looking” statements.
The views expressed in this report reflect those of the portfolio managers, only through the end of the period as stated on the cover. The portfolio managers’ views are subject to change at any time based on market and other conditions.
Portfolio holdings are subject to change daily.
| Voya Solution Moderately Aggressive Portfolio | Portfolio Managers’ Report |
| | | Average Annual Total Returns for the Periods Ended December 31, 2015 | | |
| | | | | | 1 Year | | | 5 Year | | | Since Inception
of Classes ADV, I, S, and S2
April 30, 2010 | | |
| | | Class ADV | | | | | -1.42% | | | | | | 6.54% | | | | | | 7.35% | | | |
| | | Class I | | | | | -0.85% | | | | | | 7.09% | | | | | | 7.93% | | | |
| | | Class S | | | | | -1.15% | | | | | | 6.81% | | | | | | 7.64% | | | |
| | | Class S2 | | | | | -1.21% | | | | | | 6.67% | | | | | | 7.50% | | | |
| | | S&P Target Risk Aggressive Index | | | | | -0.54% | | | | | | 8.17% | | | | | | 8.95% | | | |
| | | | | |
Based on a $10,000 initial investment, the graph and table above illustrate the total return of Voya Solution Moderately Aggressive Portfolio against the index indicated. The index is unmanaged and has no cash in its portfolio, imposes no sales charges and incurs no operating expenses. An investor cannot invest directly in an index. The Portfolio’s performance is shown without the imposition of any expenses or charges which are, or may be, imposed under your variable annuity contract or variable life insurance policy. Total returns would have been lower if such expenses or charges were included.
The performance graph and table do not reflect the deduction of taxes that a shareholder will pay on Portfolio distributions or the redemption of Portfolio shares.
The performance shown may include the effect of fee waivers and/or expense reimbursements by the Investment Adviser and/or other service providers, which have the effect of increasing total return. Had all fees and expenses been considered, the total returns would have been lower.
The performance update illustrates performance for a variable investment option available through a variable
annuity contract or a variable life insurance policy. The performance shown indicates past performance and is not a projection or prediction of future results. Actual investment returns and principal value will fluctuate so that shares and/or units, at redemption, may be worth more or less than their original cost. Please log on to www.voyainvestments.com or call (800) 262-3862 to get performance through the most recent month end.
This report contains statements that may be “forward-looking” statements. Actual results may differ materially from those projected in the “forward-looking” statements.
The views expressed in this report reflect those of the portfolio managers, only through the end of the period as stated on the cover. The portfolio managers’ views are subject to change at any time based on market and other conditions.
Portfolio holdings are subject to change daily.
| Portfolio Managers’ Report | Voya Solution Moderately Conservative Portfolio |
| | | Average Annual Total Returns for the Periods Ended December 31, 2015 | | |
| | | | | | 1 Year | | | 5 Year | | | Since Inception
of Classes ADV, I and S
July 2, 2007 | | | Since Inception
of Class S2
April 30, 2010 | | |
| | | Class ADV | | | | | -0.60% | | | | | | 4.82% | | | | | | 2.87% | | | | | | — | | | |
| | | Class I | | | | | -0.09% | | | | | | 5.34% | | | | | | 3.53% | | | | | | — | | | |
| | | Class S | | | | | -0.38% | | | | | | 5.08% | | | | | | 3.25% | | | | | | — | | | |
| | | Class S2 | | | | | -0.50% | | | | | | 4.93% | | | | | | — | | | | | | 5.47% | | | |
| | | S&P Target Risk Moderate Index | | | | | -0.81% | | | | | | 5.13% | | | | | | 3.45% | | | | | | 5.47% | | | |
| | | | | |
Based on a $10,000 initial investment, the graph and table above illustrate the total return of Voya Solution Moderately Conservative Portfolio against the index indicated. The index is unmanaged and has no cash in its portfolio, imposes no sales charges and incurs no operating expenses. An investor cannot invest directly in an index. The Portfolio’s performance is shown without the imposition of any expenses or charges which are, or may be, imposed under your variable annuity contract or variable life insurance policy. Total returns would have been lower if such expenses or charges were included.
The performance graph and table do not reflect the deduction of taxes that a shareholder will pay on Portfolio distributions or the redemption of Portfolio shares.
The performance shown may include the effect of fee waivers and/or expense reimbursements by the Investment Adviser and/or other service providers, which have the effect of increasing total return. Had all fees and expenses been considered, the total returns would have been lower.
The performance update illustrates performance for a variable investment option available through a variable
annuity contract or a variable life insurance policy. The performance shown indicates past performance and is not a projection or prediction of future results. Actual investment returns and principal value will fluctuate so that shares and/or units, at redemption, may be worth more or less than their original cost. Please log on to www.voyainvestments.com or call (800) 262-3862 to get performance through the most recent month end.
This report contains statements that may be “forward-looking” statements. Actual results may differ materially from those projected in the “forward-looking” statements.
The views expressed in this report reflect those of the portfolio managers, only through the end of the period as stated on the cover. The portfolio managers’ views are subject to change at any time based on market and other conditions.
Portfolio holdings are subject to change daily.
| Voya Solution 2020 Portfolio | Portfolio Managers’ Report |
| | | Average Annual Total Returns for the Periods Ended December 31, 2015 | | |
| | | | | | 1 Year | | | Since Inception
of Classes ADV, I, S, S2 and T
October 3, 2011 | | |
| | | Class ADV | | | | | 0.88% | | | | | | 9.42% | | | |
| | | Class I | | | | | 1.38% | | | | | | 9.98% | | | |
| | | Class S | | | | | 1.23% | | | | | | 9.67% | | | |
| | | Class S2 | | | | | 1.08% | | | | | | 9.56% | | | |
| | | Class T | | | | | 0.72% | | | | | | 9.30% | | | |
| | | S&P Target Date 2020 Index | | | | | 0.06% | | | | | | 9.85% | | | |
| | | | | |
Based on a $10,000 initial investment, the graph and table above illustrate the total return of Voya Solution 2020 Portfolio against the index indicated. The index is unmanaged and has no cash in its portfolio, imposes no sales charges and incurs no operating expenses. An investor cannot invest directly in an index. The Portfolio’s performance is shown without the imposition of any expenses or charges which are, or may be, imposed under your variable annuity contract or variable life insurance policy. Total returns would have been lower if such expenses or charges were included.
The performance graph and table do not reflect the deduction of taxes that a shareholder will pay on Portfolio distributions or the redemption of Portfolio shares.
The performance shown may include the effect of fee waivers and/or expense reimbursements by the Investment Adviser and/or other service providers, which have the effect of increasing total return. Had all fees and expenses been considered, the total returns would have been lower.
The performance update illustrates performance for a variable investment option available through a variable
annuity contract or a variable life insurance policy. The performance shown indicates past performance and is not a projection or prediction of future results. Actual investment returns and principal value will fluctuate so that shares and/or units, at redemption, may be worth more or less than their original cost. Please log on to www.voyainvestments.com or call (800) 262-3862 to get performance through the most recent month end.
This report contains statements that may be “forward-looking” statements. Actual results may differ materially from those projected in the “forward-looking” statements.
The views expressed in this report reflect those of the portfolio managers, only through the end of the period as stated on the cover. The portfolio managers’ views are subject to change at any time based on market and other conditions.
Portfolio holdings are subject to change daily.
| Portfolio Managers’ Report | Voya Solution 2025 Portfolio |
| | | Average Annual Total Returns for the Periods Ended December 31, 2015 | | |
| | | | | | 1 Year | | | 5 Year | | | 10 Year | | | Since Inception
of Class S2
May 28, 2009 | | |
| | | Class ADV | | | | | -0.26% | | | | | | 5.92% | | | | | | 3.91% | | | | | | — | | | |
| | | Class I | | | | | 0.19% | | | | | | 6.43% | | | | | | 4.43% | | | | | | — | | | |
| | | Class S | | | | | -0.09% | | | | | | 6.17% | | | | | | 4.17% | | | | | | — | | | |
| | | Class S2 | | | | | -0.23% | | | | | | 6.01% | | | | | | — | | | | | | 9.58% | | | |
| | | Class T | | | | | -0.56% | | | | | | 5.71% | | | | | | 3.70% | | | | | | — | | | |
| | | S&P Target Date 2025 Index | | | | | 0.00% | | | | | | 6.96% | | | | | | 5.65% | | | | | | 10.41% | | | |
| | | Russell 3000® Index | | | | | 0.48% | | | | | | 12.18% | | | | | | 7.35% | | | | | | 15.62% | | | |
| | | MSCI EAFE® Index | | | | | -0.81% | | | | | | 3.60% | | | | | | 3.03% | | | | | | 7.29% | | | |
| | | BCAB Index | | | | | 0.55% | | | | | | 3.25% | | | | | | 4.51% | | | | | | 4.29% | | | |
| | | | | |
Based on a $10,000 initial investment, the graph and table above illustrate the total return of Voya Solution 2025 Portfolio against the indices indicated. An index is unmanaged and has no cash in its portfolio, imposes no sales charges and incurs no operating expenses. An investor cannot invest directly in an index. The Portfolio’s performance is shown without the imposition of any expenses or charges which are, or may be, imposed under your variable annuity contract or variable life insurance policy. Total returns would have been lower if such expenses or charges were included.
The performance graph and table do not reflect the deduction of taxes that a shareholder will pay on Portfolio distributions or the redemption of Portfolio shares.
The performance shown may include the effect of fee waivers and/or expense reimbursements by the Investment Adviser and/or other service providers, which have the effect of increasing total return. Had all fees and expenses been considered, the total returns would have been lower.
The performance update illustrates performance for a variable investment option available through a variable
annuity contract or a variable life insurance policy. The performance shown indicates past performance and is not a projection or prediction of future results. Actual investment returns and principal value will fluctuate so that shares and/or units, at redemption, may be worth more or less than their original cost. Please log on to www.voyainvestments.com or call (800) 262-3862 to get performance through the most recent month end.
This report contains statements that may be “forward-looking”statements. Actual results may differ materially from those projected in the “forward-looking” statements.
The views expressed in this report reflect those of the portfolio managers, only through the end of the period as stated on the cover. The portfolio managers’ views are subject to change at any time based on market and other conditions.
Portfolio holdings are subject to change daily.
| Voya Solution 2030 Portfolio | Portfolio Managers’ Report |
| | | Average Annual Total Returns for the Periods Ended December 31, 2015 | | |
| | | | | | 1 Year | | | Since Inception
of Classes ADV, I, S, S2 and T
October 3, 2011 | | |
| | | Class ADV | | | | | 0.18% | | | | | | 11.48% | | | |
| | | Class I | | | | | 0.66% | | | | | | 12.06% | | | |
| | | Class S | | | | | 0.52% | | | | | | 11.69% | | | |
| | | Class S2 | | | | | 0.23% | | | | | | 11.52% | | | |
| | | Class T | | | | | -0.26% | | | | | | 11.32% | | | |
| | | S&P Target Date 2030 Index | | | | | -0.05% | | | | | | 11.70% | | | |
| | | | | |
Based on a $10,000 initial investment, the graph and table above illustrate the total return of Voya Solution 2030 Portfolio against the index indicated. The index is unmanaged, has no cash in its portfolio, imposes no sales charges and incurs no operating expenses. An investor cannot invest directly in an index. The Portfolio’s performance is shown without the imposition of any expenses or charges which are, or may be, imposed under your variable annuity contract or variable life insurance policy. Total returns would have been lower if such expenses or charges were included.
The performance graph and table do not reflect the deduction of taxes that a shareholder will pay on Portfolio distributions or the redemption of Portfolio shares.
The performance shown may include the effect of fee waivers and/or expense reimbursements by the Investment Adviser and/or other service providers, which have the effect of increasing total return. Had all fees and expenses been considered, the total returns would have been lower.
The performance update illustrates performance for a variable investment option available through a variable contract or a variable life insurance policy. The
performance shown indicates past performance and is not a projection or prediction of future results. Actual investment returns and principal value will fluctuate so that shares and/or units, at redemption, may be worth more or less than their original cost. Please call (800) 262-3862 to get performance through the most recent month end.
It is important to note that the Portfolio has a limited operating history. Performance over a longer period of time may be more meaningful thanshort-term performance.
This report contains statements that may be “forward-looking” statements. Actual results may differ materially from those projected in the “forward-looking” statements.
The views expressed in this report reflect those of the portfolio managers, only through the end of the period as stated on the cover. The portfolio managers’ views are subject to change at any time based on market and other conditions.
Portfolio holdings are subject to change daily.
| Portfolio Managers’ Report | Voya Solution 2035 Portfolio |
| | | Average Annual Total Returns for the Periods Ended December 31, 2015 | | |
| | | | | | 1 Year | | | 5 Year | | | 10 Year | | | Since Inception
of Class S2
May 28, 2009 | | |
| | | Class ADV | | | | | -0.77% | | | | | | 6.53% | | | | | | 4.20% | | | | | | — | | | |
| | | Class I | | | | | -0.30% | | | | | | 7.05% | | | | | | 4.70% | | | | | | — | | | |
| | | Class S | | | | | -0.48% | | | | | | 6.80% | | | | | | 4.46% | | | | | | — | | | |
| | | Class S2 | | | | | -0.62% | | | | | | 6.64% | | | | | | — | | | | | | 10.43% | | | |
| | | Class T | | | | | -1.00% | | | | | | 6.32% | | | | | | 3.99% | | | | | | — | | | |
| | | S&P Target Date 2035 Index | | | | | -0.10% | | | | | | 7.65% | | | | | | 5.79% | | | | | | 11.43% | | | |
| | | Russell 3000® Index | | | | | 0.48% | | | | | | 12.18% | | | | | | 7.35% | | | | | | 15.62% | | | |
| | | MSCI EAFE® Index | | | | | -0.81% | | | | | | 3.60% | | | | | | 3.03% | | | | | | 7.29% | | | |
| | | BCAB Index | | | | | 0.55% | | | | | | 3.25% | | | | | | 4.51% | | | | | | 4.29% | | | |
| | | | | |
Based on a $10,000 initial investment, the graph and table above illustrate the total return of Voya Solution 2035 Portfolio against the indices indicated. An index is unmanaged, has no cash in its portfolio, imposes no sales charges and incurs no operating expenses. An investor cannot invest directly in an index. The Portfolio’s performance is shown without the imposition of any expenses or charges which are, or may be, imposed under your variable annuity contract or variable life insurance policy. Total returns would have been lower if such expenses or charges were included.
The performance graph and table do not reflect the deduction of taxes that a shareholder will pay on Portfolio distributions or the redemption of Portfolio shares.
The performance shown may include the effect of fee waivers and/or expense reimbursements by the Investment Adviser and/or other service providers, which have the effect of increasing total return. Had all fees and expenses been considered, the total returns would have been lower.
The performance update illustrates performance for a variable investment option available through a variable
contract or a variable life insurance policy. The performance shown indicates past performance and is not a projection or prediction of future results. Actual investment returns and principal value will fluctuate so that shares and/or units, at redemption, may be worth more or less than their original cost. Please call (800) 262-3862 to get performance through the most recent month end.
It is important to note that the Portfolio has a limited operating history. Performance over a longer period of time may be more meaningful thanshort-term performance.
This report contains statements that may be “forward-looking”statements. Actual results may differ materially from those projected in the “forward-looking” statements.
The views expressed in this report reflect those of the portfolio managers, only through the end of the period as stated on the cover. The portfolio managers’ views are subject to change at any time based on market and other conditions.
Portfolio holdings are subject to change daily.
| Voya Solution 2040 Portfolio | Portfolio Managers’ Report |
| | | Average Annual Total Returns for the Periods Ended December 31, 2015 | | |
| | | | | | 1 Year | | | Since Inception
of Classes ADV, I, S, S2 and T
October 3, 2011 | | |
| | | Class ADV | | | | | -0.33% | | | | | | 12.89% | | | |
| | | Class I | | | | | 0.22% | | | | | | 13.49% | | | |
| | | Class S | | | | | 0.03% | | | | | | 13.13% | | | |
| | | Class S2 | | | | | -0.33% | | | | | | 12.97% | | | |
| | | Class T | | | | | -0.66% | | | | | | 12.67% | | | |
| | | S&P Target Date 2040 Index | | | | | -0.15% | | | | | | 12.88% | | | |
| | | | | |
Based on a $10,000 initial investment, the graph and table above illustrate the total return of Voya Solution 2040 Portfolio against the index indicated. The index is unmanaged and has no cash in its portfolio, imposes no sales charges and incurs no operating expenses. An investor cannot invest directly in an index. The Portfolio’s performance is shown without the imposition of any expenses or charges which are, or may be, imposed under your variable annuity contract or variable life insurance policy. Total returns would have been lower if such expenses or charges were included.
The performance graph and table do not reflect the deduction of taxes that a shareholder will pay on Portfolio distributions or the redemption of Portfolio shares.
The performance shown may include the effect of fee waivers and/or expense reimbursements by the Investment Adviser and/or other service providers, which have the effect of increasing total return. Had all fees and expenses been considered, the total returns would have been lower.
The performance update illustrates performance for a variable investment option available through a variable
annuity contract or a variable life insurance policy. The performance shown indicates past performance and is not a projection or prediction of future results. Actual investment returns and principal value will fluctuate so that shares and/or units, at redemption, may be worth more or less than their original cost. Please log on to www.voyainvestments.com or call (800) 262-3862 to get performance through the most recent month end.
This report contains statements that may be “forward-looking” statements. Actual results may differ materially from those projected in the “forward-looking” statements.
The views expressed in this report reflect those of the portfolio managers, only through the end of the period as stated on the cover. The portfolio managers’ views are subject to change at any time based on market and other conditions.
Portfolio holdings are subject to change daily.
| Portfolio Managers’ Report | Voya Solution 2045 Portfolio |
| | | Average Annual Total Returns for the Periods Ended December 31, 2015 | | |
| | | | | | 1 Year | | | 5 Year | | | 10 Year | | | Since Inception
of Class S2
May 28, 2009 | | |
| | | Class ADV | | | | | -1.15% | | | | | | 7.01% | | | | | | 4.26% | | | | | | — | | | |
| | | Class I | | | | | -0.59% | | | | | | 7.55% | | | | | | 4.78% | | | | | | — | | | |
| | | Class S | | | | | -0.95% | | | | | | 7.28% | | | | | | 4.51% | | | | | | — | | | |
| | | Class S2 | | | | | -1.07% | | | | | | 7.10% | | | | | | — | | | | | | 10.99% | | | |
| | | Class T | | | | | -1.31% | | | | | | 6.80% | | | | | | 4.05% | | | | | | — | | | |
| | | S&P Target Date 2045 Index | | | | | -0.21% | | | | | | 8.03% | | | | | | 5.83% | | | | | | 11.93% | | | |
| | | Russell 3000® Index | | | | | 0.48% | | | | | | 12.18% | | | | | | 7.35% | | | | | | 15.62% | | | |
| | | MSCI EAFE® Index | | | | | -0.81% | | | | | | 3.60% | | | | | | 3.03% | | | | | | 7.29% | | | |
| | | BCAB Index | | | | | 0.55% | | | | | | 3.25% | | | | | | 4.51% | | | | | | 4.29% | | | |
| | | | | |
Based on a $10,000 initial investment, the graph and table above illustrate the total return of Voya Solution 2045 Portfolio against the indices indicated. An index is unmanaged and has no cash in its portfolio, imposes no sales charges and incurs no operating expenses. An investor cannot invest directly in an index. The Portfolio’s performance is shown without the imposition of any expenses or charges which are, or may be, imposed under your variable annuity contract or variable life insurance policy. Total returns would have been lower if such expenses or charges were included.
The performance graph and table do not reflect the deduction of taxes that a shareholder will pay on Portfolio distributions or the redemption of Portfolio shares.
The performance shown may include the effect of fee waivers and/or expense reimbursements by the Investment Adviser and/or other service providers, which have the effect of increasing total return. Had all fees and expenses been considered, the total returns would have been lower.
The performance update illustrates performance for a variable investment option available through a variable
annuity contract or a variable life insurance policy. The performance shown indicates past performance and is not a projection or prediction of future results. Actual investment returns and principal value will fluctuate so that shares and/or units, at redemption, may be worth more or less than their original cost. Please log on to www.voyainvestments.com or call (800) 262-3862 to get performance through the most recent month end.
This report contains statements that may be “forward-looking”statements. Actual results may differ materially from those projected in the “forward-looking” statements.
The views expressed in this report reflect those of the portfolio managers, only through the end of the period as stated on the cover. The portfolio managers’ views are subject to change at any time based on market and other conditions.
Portfolio holdings are subject to change daily.
| Voya Solution 2050 Portfolio | Portfolio Managers’ Report |
| | | Average Annual Total Returns for the Periods Ended December 31, 2015 | | |
| | | | | | 1 Year | | | Since Inception
of Classes ADV, I, S, S2 and T
October 3, 2011 | | |
| | | Class ADV | | | | | -0.33% | | | | | | 13.09% | | | |
| | | Class I | | | | | 0.38% | | | | | | 13.73% | | | |
| | | Class S | | | | | 0.00% | | | | | | 13.33% | | | |
| | | Class S2 | | | | | -0.17% | | | | | | 13.17% | | | |
| | | Class T | | | | | -0.60% | | | | | | 12.94% | | | |
| | | S&P Target Date 2050 Index | | | | | -0.22% | | | | | | 13.60% | | | |
| | | S&P Target Date 2045 Index | | | | | -0.21% | | | | | | 13.26% | | | |
| | | | | |
Based on a $10,000 initial investment, the graph and table above illustrate the total return of Voya Solution 2050 Portfolio against the indices indicated. An index is unmanaged and has no cash in its portfolio, imposes no sales charges and incurs no operating expenses. An investor cannot invest directly in an index. The Portfolio’s performance is shown without the imposition of any expenses or charges which are, or may be, imposed under your variable annuity contract or variable life insurance policy. Total returns would have been lower if such expenses or charges were included.
The performance graph and table do not reflect the deduction of taxes that a shareholder will pay on Portfolio distributions or the redemption of Portfolio shares.
The performance shown may include the effect of fee waivers and/or expense reimbursements by the Investment Adviser and/or other service providers, which have the effect of increasing total return. Had all fees and expenses been considered, the total returns would have been lower.
The performance update illustrates performance for a variable investment option available through a variable annuity contract or a variable life insurance policy. The
performance shown indicates past performance and is not a projection or prediction of future results. Actual investment returns and principal value will fluctuate so that shares and/or units, at redemption, may be worth more or less than their original cost. Please log on to www.voyainvestments.com or call (800) 262-3862 to get performance through the most recent month end.
This report contains statements that may be “forward-looking”statements. Actual results may differ materially from those projected in the “forward-looking” statements.
The views expressed in this report reflect those of the portfolio managers, only through the end of the period as stated on the cover. The portfolio managers’ views are subject to change at any time based on market and other conditions.
Portfolio holdings are subject to change daily.
Effective May 1, 2015, the Portfolio changed its primary benchmark from the S&P Target Date 2045 Index to the S&P Target Date 2050 Index because the S&P Target Date 2050 Index is considered by the Adviser to be a more appropriate benchmark reflecting the types of securities in which the Portfolio invests.
| Portfolio Managers’ Report | Voya Solution 2055 Portfolio |
| | | Average Annual Total Returns for the Periods Ended December 31, 2015 | | |
| | | | | | 1 Year | | | 5 Year | | | Since Inception
of Classes ADV, I, S, S2 and T
March 8, 2010 | | |
| | | Class ADV | | | | | -1.15% | | | | | | 7.07% | | | | | | 8.34% | | | |
| | | Class I | | | | | -0.67% | | | | | | 7.62% | | | | | | 8.87% | | | |
| | | Class S | | | | | -0.87% | | | | | | 7.35% | | | | | | 8.60% | | | |
| | | Class S2 | | | | | -1.04% | | | | | | 7.19% | | | | | | 8.44% | | | |
| | | Class T | | | | | -1.36% | | | | | | 6.90% | | | | | | 8.14% | | | |
| | | S&P Target Date 2055+ Index | | | | | -0.29% | | | | | | 8.38% | | | | | | 9.45% | | | |
| | | S&P Target Date 2045 Index | | | | | -0.21% | | | | | | 8.03% | | | | | | 9.14% | | | |
| | | | | |
Based on a $10,000 initial investment, the graph and table above illustrate the total return of Voya Solution 2055 Portfolio against the indices indicated. An index is unmanaged and has no cash in its portfolio, imposes no sales charges and incurs no operating expenses. An investor cannot invest directly in an index. The Portfolio’s performance is shown without the imposition of any expenses or charges which are, or may be, imposed under your variable annuity contract or variable life insurance policy. Total returns would have been lower if such expenses or charges were included.
The performance graph and table do not reflect the deduction of taxes that a shareholder will pay on Portfolio distributions or the redemption of Portfolio shares.
The performance shown may include the effect of fee waivers and/or expense reimbursements by the Investment Adviser and/or other service providers, which have the effect of increasing total return. Had all fees and expenses been considered, the total returns would have been lower.
The performance update illustrates performance for a variable investment option available through a variable annuity contract or a variable life insurance policy. The performance shown
indicates past performance and is not a projection or prediction of future results. Actual investment returns and principal value will fluctuate so that shares and/or units, at redemption, may be worth more or less than their original cost. Please log on to www.voyainvestments.com or call (800) 262-3862 to get performance through the most recent month end.
This report contains statements that may be “forward-looking”statements. Actual results may differ materially from those projected in the “forward-looking” statements.
The views expressed in this report reflect those of the portfolio managers, only through the end of the period as stated on the cover. The portfolio managers’ views are subject to change at any time based on market and other conditions.
Portfolio holdings are subject to change daily.
Effective May 1, 2015, the Portfolio changed its primary benchmark from the S&P Target Date 2045 Index to the S&P Target Date 2055+ Index because the S&P Target Date 2055+ Index is considered by the Adviser to be a more appropriate benchmark reflecting the types of securities in which the Portfolio invests.
| Voya Solution 2060 Portfolio | Portfolio Managers’ Report |
| | | Cumulative Total Returns for the Periods Ended December 31, 2015 | | |
| | | | | | Since Inception
of Classes ADV, I, S, S2 and T
February 9, 2015 | | |
| | | Class ADV | | | | | -1.10% | | | |
| | | Class I | | | | | -0.80% | | | |
| | | Class S | | | | | -1.40% | | | |
| | | Class S2 | | | | | -1.10% | | | |
| | | Class T | | | | | -1.40% | | | |
| | | S&P Target Date 2055+ Index | | | | | -1.74% | | | |
| | | | | |
Based on a $10,000 initial investment, the graph and table above illustrate the total return of Voya Solution 2060 Portfolio against the index indicated. The index is unmanaged and has no cash in its portfolio, imposes no sales charges and incurs no operating expenses. An investor cannot invest directly in an index. The Portfolio’s performance is shown without the imposition of any expenses or charges which are, or may be, imposed under your variable annuity contract or variable life insurance policy. Total returns would have been lower if such expenses or charges were included.
The performance graph and table do not reflect the deduction of taxes that a shareholder will pay on Portfolio distributions or the redemption of Portfolio shares.
The performance shown may include the effect of fee waivers and/or expense reimbursements by the Investment Adviser and/or other service providers, which have the effect of increasing total return. Had all fees and expenses been considered, the total returns would have been lower.
The performance update illustrates performance for a variable investment option available through a variable annuity contract or a variable life insurance policy. The
performance shown indicates past performance and is not a projection or prediction of future results. Actual investment returns and principal value will fluctuate so that shares and/or units, at redemption, may be worth more or less than their original cost. Please log on to www.voyainvestments.com or call (800) 262-3862 to get performance through the most recent month end.
It is important to note that the Portfolio has a limited operating history. Performance over a longer period of time may be more meaningful than short-term performance.
This report contains statements that may be “forward-looking”statements. Actual results may differ materially from those projected in the “forward-looking” statements.
The views expressed in this report reflect those of the portfolio managers, only through the end of the period as stated on the cover. The portfolio managers’ views are subject to change at any time based on market and other conditions.
Portfolio holdings are subject to change daily.
SHAREHOLDER EXPENSE EXAMPLES (Unaudited)
As a shareholder of a Portfolio, you incur two types of costs: (1) transaction costs, including redemption fees and exchange fees; and (2) ongoing costs including management fees, distribution and/or service (12b-1) fees, and other Portfolio expenses. These Examples are intended to help you understand your ongoing costs (in dollars) of investing in a Portfolio and to compare these costs with the ongoing costs of investing in other mutual funds.
The Examples are based on an investment of $1,000 invested at the beginning of the period and held for the entire period from July 1, 2015 to December 31, 2015. The Portfolios’ expenses are shown without the imposition of any charges which are, or may be, imposed under your variable annuity contract, variable life insurance policy, qualified pension or retirement plan. Expenses would have been higher if such charges were included.
Actual Expenses
The left section of the table shown below, “Actual Portfolio Return,” provides information about actual account values and actual expenses. You may use the information in this section, together with the amount you invested, to estimate the expenses that you paid over the period. Simply divide your account value by $1,000 (for example, an $8,600 account value divided by $1,000 = 8.6), then multiply the result by the number in the first section under the heading entitled “Expenses Paid During the Period” to estimate the expenses you paid on your account during this period.
Hypothetical Example for Comparison Purposes
The right section of the table shown below, “Hypothetical (5% return before expenses),” provides information about hypothetical account values and hypothetical expenses based on a Portfolio’s actual expense ratio and an assumed rate of return of 5% per year before expenses, which is not a Portfolio’s actual return. The hypothetical account values and expenses may not be used to estimate the actual ending account balance or expenses you paid for the period. You may use this information to compare the ongoing costs of investing in a Portfolio and other mutual funds. To do so, compare this 5% hypothetical example with the 5% hypothetical examples that appear in the shareholder reports of the other mutual funds.
Please note that the expenses shown in the table are meant to highlight your ongoing costs only and do not reflect any transactional costs, such as redemption fees or exchange fees. Therefore, the hypothetical section of the table is useful in comparing ongoing costs only, and will not help you determine the relative total costs of owning different mutual funds. In addition, if these transactional costs were included, your costs would have been higher.
| | | | Actual Portfolio Return | | | Hypothetical (5% return before expenses) | |
| | | | Beginning
Account
Value
July 1,
2015 | | | Ending
Account
Value
December 31,
2015 | | | Annualized
Expense
Ratio* | | | Expenses Paid
During the
Period Ended
December 31,
2015** | | | Beginning
Account
Value
July 1,
2015 | | | Ending
Account
Value
December 31,
2015 | | | Annualized
Expense
Ratio* | | | Expenses Paid
During the
Period Ended
December 31,
2015** | |
| Voya Solution Aggressive Portfolio | |
| Class ADV | | | | $ | 1,000.00 | | | | | $ | 958.30 | | | | | | 0.68% | | | | | $ | 3.36 | | | | | $ | 1,000.00 | | | | | $ | 1,021.78 | | | | | | 0.68% | | | | | $ | 3.47 | | |
| Class I | | | | | 1,000.00 | | | | | | 961.30 | | | | | | 0.18 | | | | | | 0.89 | | | | | | 1,000.00 | | | | | | 1,024.30 | | | | | | 0.18 | | | | | | 0.92 | | |
| Class S | | | | | 1,000.00 | | | | | | 959.80 | | | | | | 0.43 | | | | | | 2.12 | | | | | | 1,000.00 | | | | | | 1,023.04 | | | | | | 0.43 | | | | | | 2.19 | | |
| Class S2 | | | | | 1,000.00 | | | | | | 958.80 | | | | | | 0.58 | | | | | | 2.86 | | | | | | 1,000.00 | | | | | | 1,022.28 | | | | | | 0.58 | | | | | | 2.96 | | |
| Voya Solution Balanced Portfolio | |
| Class ADV | | | | $ | 1,000.00 | | | | | $ | 973.50 | | | | | | 0.65% | | | | | $ | 3.23 | | | | | $ | 1,000.00 | | | | | $ | 1,021.93 | | | | | | 0.65% | | | | | $ | 3.31 | | |
| Class I | | | | | 1,000.00 | | | | | | 975.70 | | | | | | 0.15 | | | | | | 0.75 | | | | | | 1,000.00 | | | | | | 1,024.45 | | | | | | 0.15 | | | | | | 0.77 | | |
| Class S | | | | | 1,000.00 | | | | | | 974.40 | | | | | | 0.40 | | | | | | 1.99 | | | | | | 1,000.00 | | | | | | 1,023.19 | | | | | | 0.40 | | | | | | 2.04 | | |
| Class S2 | | | | | 1,000.00 | | | | | | 973.90 | | | | | | 0.55 | | | | | | 2.74 | | | | | | 1,000.00 | | | | | | 1,022.43 | | | | | | 0.55 | | | | | | 2.80 | | |
| Voya Solution Conservative Portfolio | |
| Class ADV | | | | $ | 1,000.00 | | | | | $ | 984.40 | | | | | | 0.61% | | | | | $ | 3.05 | | | | | $ | 1,000.00 | | | | | $ | 1,022.13 | | | | | | 0.61% | | | | | $ | 3.11 | | |
| Class I | | | | | 1,000.00 | | | | | | 987.20 | | | | | | 0.11 | | | | | | 0.55 | | | | | | 1,000.00 | | | | | | 1,024.65 | | | | | | 0.11 | | | | | | 0.56 | | |
| Class S | | | | | 1,000.00 | | | | | | 985.50 | | | | | | 0.36 | | | | | | 1.80 | | | | | | 1,000.00 | | | | | | 1,023.39 | | | | | | 0.36 | | | | | | 1.84 | | |
| Class S2 | | | | | 1,000.00 | | | | | | 984.50 | | | | | | 0.51 | | | | | | 2.55 | | | | | | 1,000.00 | | | | | | 1,022.63 | | | | | | 0.51 | | | | | | 2.60 | | |
| Voya Solution Income Portfolio | |
| Class ADV | | | | $ | 1,000.00 | | | | | $ | 989.30 | | | | | | 0.63% | | | | | $ | 3.16 | | | | | $ | 1,000.00 | | | | | $ | 1,022.03 | | | | | | 0.63% | | | | | $ | 3.21 | | |
| Class I | | | | | 1,000.00 | | | | | | 991.10 | | | | | | 0.13 | | | | | | 0.65 | | | | | | 1,000.00 | | | | | | 1,024.55 | | | | | | 0.13 | | | | | | 0.66 | | |
| Class S | | | | | 1,000.00 | | | | | | 990.80 | | | | | | 0.38 | | | | | | 1.91 | | | | | | 1,000.00 | | | | | | 1,023.29 | | | | | | 0.38 | | | | | | 1.94 | | |
| Class S2 | | | | | 1,000.00 | | | | | | 990.10 | | | | | | 0.53 | | | | | | 2.66 | | | | | | 1,000.00 | | | | | | 1,022.53 | | | | | | 0.53 | | | | | | 2.70 | | |
| Class T | | | | | 1,000.00 | | | | | | 988.60 | | | | | | 0.83 | | | | | | 4.16 | | | | | | 1,000.00 | | | | | | 1,021.02 | | | | | | 0.83 | | | | | | 4.23 | | |
SHAREHOLDER EXPENSE EXAMPLES (Unaudited) (continued)
| | | | Actual Portfolio Return | | | Hypothetical (5% return before expenses) | |
| | | | Beginning
Account
Value
July 1,
2015 | | | Ending
Account
Value
December 31,
2015 | | | Annualized
Expense
Ratio* | | | Expenses Paid
During the
Period Ended
December 31,
2015** | | | Beginning
Account
Value
July 1,
2015 | | | Ending
Account
Value
December 31,
2015 | | | Annualized
Expense
Ratio* | | | Expenses Paid
During the
Period Ended
December 31,
2015** | |
| Voya Solution Moderately Aggressive Portfolio | |
| Class ADV | | | | $ | 1,000.00 | | | | | $ | 961.50 | | | | | | 0.69% | | | | | $ | 3.41 | | | | | $ | 1,000.00 | | | | | $ | 1,021.73 | | | | | | 0.69% | | | | | $ | 3.52 | | |
| Class I | | | | | 1,000.00 | | | | | | 964.50 | | | | | | 0.19 | | | | | | 0.94 | | | | | | 1,000.00 | | | | | | 1,024.25 | | | | | | 0.19 | | | | | | 0.97 | | |
| Class S | | | | | 1,000.00 | | | | | | 963.50 | | | | | | 0.44 | | | | | | 2.18 | | | | | | 1,000.00 | | | | | | 1,022.99 | | | | | | 0.44 | | | | | | 2.24 | | |
| Class S2 | | | | | 1,000.00 | | | | | | 962.90 | | | | | | 0.59 | | | | | | 2.92 | | | | | | 1,000.00 | | | | | | 1,022.23 | | | | | | 0.59 | | | | | | 3.01 | | |
| Voya Solution Moderately Conservative Portfolio | |
| Class ADV | | | | $ | 1,000.00 | | | | | $ | 980.00 | | | | | | 0.66% | | | | | $ | 3.29 | | | | | $ | 1,000.00 | | | | | $ | 1,021.88 | | | | | | 0.66% | | | | | $ | 3.36 | | |
| Class I | | | | | 1,000.00 | | | | | | 982.80 | | | | | | 0.16 | | | | | | 0.80 | | | | | | 1,000.00 | | | | | | 1,024.40 | | | | | | 0.16 | | | | | | 0.82 | | |
| Class S | | | | | 1,000.00 | | | | | | 981.50 | | | | | | 0.41 | | | | | | 2.05 | | | | | | 1,000.00 | | | | | | 1,023.14 | | | | | | 0.41 | | | | | | 2.09 | | |
| Class S2 | | | | | 1,000.00 | | | | | | 981.10 | | | | | | 0.56 | | | | | | 2.80 | | | | | | 1,000.00 | | | | | | 1,022.38 | | | | | | 0.56 | | | | | | 2.85 | | |
| Voya Solution 2020 Portfolio | |
| Class ADV | | | | $ | 1,000.00 | | | | | $ | 991.10 | | | | | | 0.63% | | | | | $ | 3.16 | | | | | $ | 1,000.00 | | | | | $ | 1,022.03 | | | | | | 0.63% | | | | | $ | 3.21 | | |
| Class I | | | | | 1,000.00 | | | | | | 993.20 | | | | | | 0.13 | | | | | | 0.65 | | | | | | 1,000.00 | | | | | | 1,024.55 | | | | | | 0.13 | | | | | | 0.66 | | |
| Class S | | | | | 1,000.00 | | | | | | 992.50 | | | | | | 0.38 | | | | | | 1.91 | | | | | | 1,000.00 | | | | | | 1,023.29 | | | | | | 0.38 | | | | | | 1.94 | | |
| Class S2 | | | | | 1,000.00 | | | | | | 992.30 | | | | | | 0.53 | | | | | | 2.66 | | | | | | 1,000.00 | | | | | | 1,022.53 | | | | | | 0.53 | | | | | | 2.70 | | |
| Class T | | | | | 1,000.00 | | | | | | 990.30 | | | | | | 0.83 | | | | | | 4.16 | | | | | | 1,000.00 | | | | | | 1,021.02 | | | | | | 0.83 | | | | | | 4.23 | | |
| Voya Solution 2025 Portfolio | |
| Class ADV | | | | $ | 1,000.00 | | | | | $ | 976.10 | | | | | | 0.65% | | | | | $ | 3.24 | | | | | $ | 1,000.00 | | | | | $ | 1,021.93 | | | | | | 0.65% | | | | | $ | 3.31 | | |
| Class I | | | | | 1,000.00 | | | | | | 978.00 | | | | | | 0.15 | | | | | | 0.75 | | | | | | 1,000.00 | | | | | | 1,024.45 | | | | | | 0.15 | | | | | | 0.77 | | |
| Class S | | | | | 1,000.00 | | | | | | 976.60 | | | | | | 0.40 | | | | | | 1.99 | | | | | | 1,000.00 | | | | | | 1,023.19 | | | | | | 0.40 | | | | | | 2.04 | | |
| Class S2 | | | | | 1,000.00 | | | | | | 975.40 | | | | | | 0.55 | | | | | | 2.74 | | | | | | 1,000.00 | | | | | | 1,022.43 | | | | | | 0.55 | | | | | | 2.80 | | |
| Class T | | | | | 1,000.00 | | | | | | 974.30 | | | | | | 0.85 | | | | | | 4.23 | | | | | | 1,000.00 | | | | | | 1,020.92 | | | | | | 0.85 | | | | | | 4.33 | | |
| Voya Solution 2030 Portfolio | |
| Class ADV | | | | $ | 1,000.00 | | | | | $ | 975.90 | | | | | | 0.66% | | | | | $ | 3.29 | | | | | $ | 1,000.00 | | | | | $ | 1,021.88 | | | | | | 0.66% | | | | | $ | 3.36 | | |
| Class I | | | | | 1,000.00 | | | | | | 975.60 | | | | | | 0.16 | | | | | | 0.80 | | | | | | 1,000.00 | | | | | | 1,024.40 | | | | | | 0.16 | | | | | | 0.82 | | |
| Class S | | | | | 1,000.00 | | | | | | 978.80 | | | | | | 0.41 | | | | | | 2.04 | | | | | | 1,000.00 | | | | | | 1,023.14 | | | | | | 0.41 | | | | | | 2.09 | | |
| Class S2 | | | | | 1,000.00 | | | | | | 976.40 | | | | | | 0.56 | | | | | | 2.79 | | | | | | 1,000.00 | | | | | | 1,022.38 | | | | | | 0.56 | | | | | | 2.85 | | |
| Class T | | | | | 1,000.00 | | | | | | 973.70 | | | | | | 0.86 | | | | | | 4.28 | | | | | | 1,000.00 | | | | | | 1,020.87 | | | | | | 0.86 | | | | | | 4.38 | | |
| Voya Solution 2035 Portfolio | |
| Class ADV | | | | $ | 1,000.00 | | | | | $ | 964.60 | | | | | | 0.67% | | | | | $ | 3.32 | | | | | $ | 1,000.00 | | | | | $ | 1,021.83 | | | | | | 0.67% | | | | | $ | 3.41 | | |
| Class I | | | | | 1,000.00 | | | | | | 966.90 | | | | | | 0.17 | | | | | | 0.84 | | | | | | 1,000.00 | | | | | | 1,024.35 | | | | | | 0.17 | | | | | | 0.87 | | |
| Class S | | | | | 1,000.00 | | | | | | 966.30 | | | | | | 0.42 | | | | | | 2.08 | | | | | | 1,000.00 | | | | | | 1,023.09 | | | | | | 0.42 | | | | | | 2.14 | | |
| Class S2 | | | | | 1,000.00 | | | | | | 965.60 | | | | | | 0.57 | | | | | | 2.82 | | | | | | 1,000.00 | | | | | | 1,022.33 | | | | | | 0.57 | | | | | | 2.91 | | |
| Class T | | | | | 1,000.00 | | | | | | 963.60 | | | | | | 0.87 | | | | | | 4.31 | | | | | | 1,000.00 | | | | | | 1,020.82 | | | | | | 0.87 | | | | | | 4.43 | | |
| Voya Solution 2040 Portfolio | |
| Class ADV | | | | $ | 1,000.00 | | | | | $ | 967.40 | | | | | | 0.67% | | | | | $ | 3.32 | | | | | $ | 1,000.00 | | | | | $ | 1,021.83 | | | | | | 0.67% | | | | | $ | 3.41 | | |
| Class I | | | | | 1,000.00 | | | | | | 970.00 | | | | | | 0.17 | | | | | | 0.84 | | | | | | 1,000.00 | | | | | | 1,024.35 | | | | | | 0.17 | | | | | | 0.87 | | |
| Class S | | | | | 1,000.00 | | | | | | 970.00 | | | | | | 0.42 | | | | | | 2.09 | | | | | | 1,000.00 | | | | | | 1,023.09 | | | | | | 0.42 | | | | | | 2.14 | | |
| Class S2 | | | | | 1,000.00 | | | | | | 966.90 | | | | | | 0.57 | | | | | | 2.83 | | | | | | 1,000.00 | | | | | | 1,022.33 | | | | | | 0.57 | | | | | | 2.91 | | |
| Class T | | | | | 1,000.00 | | | | | | 965.50 | | | | | | 0.87 | | | | | | 4.31 | | | | | | 1,000.00 | | | | | | 1,020.82 | | | | | | 0.87 | | | | | | 4.43 | | |
| Voya Solution 2045 Portfolio | |
| Class ADV | | | | $ | 1,000.00 | | | | | $ | 960.90 | | | | | | 0.69% | | | | | $ | 3.41 | | | | | $ | 1,000.00 | | | | | $ | 1,021.73 | | | | | | 0.69% | | | | | $ | 3.52 | | |
| Class I | | | | | 1,000.00 | | | | | | 963.60 | | | | | | 0.19 | | | | | | 0.94 | | | | | | 1,000.00 | | | | | | 1,024.25 | | | | | | 0.19 | | | | | | 0.97 | | |
| Class S | | | | | 1,000.00 | | | | | | 961.80 | | | | | | 0.44 | | | | | | 2.18 | | | | | | 1,000.00 | | | | | | 1,022.99 | | | | | | 0.44 | | | | | | 2.24 | | |
| Class S2 | | | | | 1,000.00 | | | | | | 960.80 | | | | | | 0.59 | | | | | | 2.92 | | | | | | 1,000.00 | | | | | | 1,022.23 | | | | | | 0.59 | | | | | | 3.01 | | |
| Class T | | | | | 1,000.00 | | | | | | 959.70 | | | | | | 0.89 | | | | | | 4.40 | | | | | | 1,000.00 | | | | | | 1,020.72 | | | | | | 0.89 | | | | | | 4.53 | | |
SHAREHOLDER EXPENSE EXAMPLES (Unaudited) (continued)
| | | | Actual Portfolio Return | | | Hypothetical (5% return before expenses) | |
| | | | Beginning
Account
Value
July 1,
2015 | | | Ending
Account
Value
December 31,
2015 | | | Annualized
Expense
Ratio* | | | Expenses Paid
During the
Period Ended
December 31,
2015** | | | Beginning
Account
Value
July 1,
2015 | | | Ending
Account
Value
December 31,
2015 | | | Annualized
Expense
Ratio* | | | Expenses Paid
During the
Period Ended
December 31,
2015** | |
| Voya Solution 2050 Portfolio | |
| Class ADV | | | | $ | 1,000.00 | | | | | $ | 968.80 | | | | | | 0.69% | | | | | $ | 3.42 | | | | | $ | 1,000.00 | | | | | $ | 1,021.73 | | | | | | 0.69% | | | | | $ | 3.52 | | |
| Class I | | | | | 1,000.00 | | | | | | 973.00 | | | | | | 0.19 | | | | | | 0.94 | | | | | | 1,000.00 | | | | | | 1,024.25 | | | | | | 0.19 | | | | | | 0.97 | | |
| Class S | | | | | 1,000.00 | | | | | | 970.40 | | | | | | 0.44 | | | | | | 2.19 | | | | | | 1,000.00 | | | | | | 1,022.99 | | | | | | 0.44 | | | | | | 2.24 | | |
| Class S2 | | | | | 1,000.00 | | | | | | 969.80 | | | | | | 0.59 | | | | | | 2.93 | | | | | | 1,000.00 | | | | | | 1,022.23 | | | | | | 0.59 | | | | | | 3.01 | | |
| Class T | | | | | 1,000.00 | | | | | | 966.20 | | | | | | 0.89 | | | | | | 4.41 | | | | | | 1,000.00 | | | | | | 1,020.72 | | | | | | 0.89 | | | | | | 4.53 | | |
| Voya Solution 2055 Portfolio | |
| Class ADV | | | | $ | 1,000.00 | | | | | $ | 960.90 | | | | | | 0.70% | | | | | $ | 3.46 | | | | | $ | 1,000.00 | | | | | $ | 1,021.68 | | | | | | 0.70% | | | | | $ | 3.57 | | |
| Class I | | | | | 1,000.00 | | | | | | 963.40 | | | | | | 0.20 | | | | | | 0.99 | | | | | | 1,000.00 | | | | | | 1,024.20 | | | | | | 0.20 | | | | | | 1.02 | | |
| Class S | | | | | 1,000.00 | | | | | | 962.50 | | | | | | 0.45 | | | | | | 2.23 | | | | | | 1,000.00 | | | | | | 1,022.94 | | | | | | 0.45 | | | | | | 2.29 | | |
| Class S2 | | | | | 1,000.00 | | | | | | 961.40 | | | | | | 0.60 | | | | | | 2.97 | | | | | | 1,000.00 | | | | | | 1,022.18 | | | | | | 0.60 | | | | | | 3.06 | | |
| Class T | | | | | 1,000.00 | | | | | | 960.10 | | | | | | 0.90 | | | | | | 4.45 | | | | | | 1,000.00 | | | | | | 1,020.67 | | | | | | 0.90 | | | | | | 4.58 | | |
| Voya Solution 2060 Portfolio | |
| Class ADV | | | | $ | 1,000.00 | | | | | $ | 966.80 | | | | | | 0.70% | | | | | $ | 3.47 | | | | | $ | 1,000.00 | | | | | $ | 1,021.68 | | | | | | 0.70% | | | | | $ | 3.57 | | |
| Class I | | | | | 1,000.00 | | | | | | 967.80 | ��� | | | | | 0.20 | | | | | | 0.99 | | | | | | 1,000.00 | | | | | | 1,024.20 | | | | | | 0.20 | | | | | | 1.02 | | |
| Class S | | | | | 1,000.00 | | | | | | 962.90 | | | | | | 0.45 | | | | | | 2.23 | | | | | | 1,000.00 | | | | | | 1,022.94 | | | | | | 0.45 | | | | | | 2.29 | | |
| Class S2 | | | | | 1,000.00 | | | | | | 965.80 | | | | | | 0.60 | | | | | | 2.97 | | | | | | 1,000.00 | | | | | | 1,022.18 | | | | | | 0.60 | | | | | | 3.06 | | |
| Class T | | | | | 1,000.00 | | | | | | 963.80 | | | | | | 0.90 | | | | | | 4.45 | | | | | | 1,000.00 | | | | | | 1,020.67 | | | | | | 0.90 | | | | | | 4.58 | | |
*
The annualized expense ratios do not include expenses of the underlying funds.
**
Expenses are equal to each Portfolio’s respective annualized expense ratios multiplied by the average account value over the period, multiplied by 184/365 to reflect the most recent fiscal half-year.
REPORT OF INDEPENDENT REGISTERED PUBLIC ACCOUNTING FIRM
The Shareholders and Board of Directors
Voya Partners, Inc.
We have audited the accompanying statements of assets and liabilities, including the portfolios of investments, of Voya Solution Aggressive Portfolio, Voya Solution Balanced Portfolio, Voya Solution Conservative Portfolio, Voya Solution Income Portfolio, Voya Solution Moderately Aggressive Portfolio, Voya Solution Moderately Conservative Portfolio, Voya Solution 2020 Portfolio, Voya Solution 2025 Portfolio, Voya Solution 2030 Portfolio, Voya Solution 2035 Portfolio, Voya Solution 2040 Portfolio, Voya Solution 2045 Portfolio, Voya Solution 2050 Portfolio, Voya Solution 2055 Portfolio, and Voya Solution 2060 Portfolio (commenced operations February 9, 2015), each a series of Voya Partners, Inc., as of December 31, 2015, and the related statements of operations for the year or period then ended, the statements of changes in net assets for each of the years or periods in the two-year period then ended, and the financial highlights for each of the years or periods in the five-year period then ended. These financial statements and financial highlights are the responsibility of management. Our responsibility is to express an opinion on these financial statements and financial highlights based on our audits.
We conducted our audits in accordance with the standards of the Public Company Accounting Oversight Board (United States). Those standards require that we plan and perform the audit to obtain reasonable assurance about whether the financial statements and financial highlights are free of material misstatement. An audit includes examining, on a test basis, evidence supporting the amounts and disclosures in the financial statements. Our procedures included confirmation of securities owned as of December 31, 2015, by correspondence with the custodian and transfer agent of the underlying funds. An audit also includes assessing the accounting principles used and significant estimates made by management, as well as evaluating the overall financial statement presentation. We believe that our audits provide a reasonable basis for our opinion.
In our opinion, the financial statements and financial highlights referred to above present fairly, in all material respects, the financial position of the aforementioned funds of Voya Partners, Inc. as of December 31, 2015, the results of their operations for the year or period then ended, the changes in their net assets for each of the years or periods in the two-year period then ended, and the financial highlights for each of the years or periods in the five-year period then ended, in conformity with U.S. generally accepted accounting principles.
Boston, Massachusetts
February 25, 2016
STATEMENTS OF ASSETS AND LIABILITIES as of December 31, 2015
| | | | Voya Solution
Aggressive
Portfolio | | | Voya Solution
Balanced
Portfolio | | | Voya Solution
Conservative
Portfolio | | | Voya Solution
Income
Portfolio | |
| ASSETS: | | | | | |
| Investments in affiliated underlying funds at fair value* | | | | $ | 4,789,484 | | | | | $ | 45,826,953 | | | | | $ | 13,470,469 | | | | | $ | 570,248,709 | | |
| Investments in unaffiliated underlying funds at fair value** | | | | | 316,986 | | | | | | 2,404,201 | | | | | | 1,012,564 | | | | | | 17,862,134 | | |
| Total investments at fair value | | | | $ | 5,106,470 | | | | | $ | 48,231,154 | | | | | $ | 14,483,033 | | | | | $ | 588,110,843 | | |
| Cash | | | | | 3,522 | | | | | | 56,853 | | | | | | 26,358 | | | | | | 865,143 | | |
| Receivables: | | | | | |
| Investments in affiliated underlying funds sold | | | | | — | | | | | | — | | | | | | — | | | | | | 1,101,148 | | |
| Fund shares sold | | | | | 15,073 | | | | | | 76,242 | | | | | | 36,148 | | | | | | 151,505 | | |
| Dividends | | | | | 881 | | | | | | 8,732 | | | | | | 2,861 | | | | | | 38,058 | | |
| Prepaid expenses | | | | | 11 | | | | | | 97 | | | | | | 32 | | | | | | 1,229 | | |
| Reimbursement due from manager | | | | | 576 | | | | | | 4,970 | | | | | | 3,157 | | | | | | 50,520 | | |
| Other assets | | | | | — | | | | | | 557 | | | | | | 178 | | | | | | 17,928 | | |
| Total assets | | | | | 5,126,533 | | | | | | 48,378,605 | | | | | | 14,551,767 | | | | | | 590,336,374 | | |
| LIABILITIES: | | | | | |
| Payable for investments in affiliated underlying funds purchased | | | | | 14,352 | | | | | | 76,242 | | | | | | 36,147 | | | | | | — | | |
| Payable for fund shares redeemed | | | | | 720 | | | | | | — | | | | | | — | | | | | | 1,252,654 | | |
| Payable for investment management fees | | | | | 914 | | | | | | 8,666 | | | | | | 2,642 | | | | | | 104,610 | | |
| Payable for distribution and shareholder service fees | | | | | 1,565 | | | | | | 15,718 | | | | | | 4,960 | | | | | | 161,936 | | |
| Payable to trustees under the deferred compensation plan (Note 6) | | | | | — | | | | | | 557 | | | | | | 178 | | | | | | 17,928 | | |
| Payable for trustee fees | | | | | 24 | | | | | | 257 | | | | | | 86 | | | | | | 1,688 | | |
| Other accrued expenses and liabilities | | | | | 1,678 | | | | | | 10,077 | | | | | | 4,132 | | | | | | 42,043 | | |
| Total liabilities | | | | | 19,253 | | | | | | 111,517 | | | | | | 48,145 | | | | | | 1,580,859 | | |
| NET ASSETS | | | | $ | 5,107,280 | | | | | $ | 48,267,088 | | | | | $ | 14,503,622 | | | | | $ | 588,755,515 | | |
| NET ASSETS WERE COMPRISED OF: | | | | | |
| Paid-in capital | | | | $ | 5,357,333 | | | | | $ | 47,298,596 | | | | | $ | 14,967,513 | | | | | $ | 610,652,034 | | |
| Undistributed net investment income | | | | | 79,719 | | | | | | 969,949 | | | | | | 304,540 | | | | | | 5,704,462 | | |
| Accumulated net realized gain (loss) | | | | | 130,778 | | | | | | 2,614,516 | | | | | | 75,040 | | | | | | (2,069,897) | | |
| Net unrealized depreciation | | | | | (460,550) | | | | | | (2,615,973) | | | | | | (843,471) | | | | | | (25,531,084) | | |
| NET ASSETS | | | | $ | 5,107,280 | | | | | $ | 48,267,088 | | | | | $ | 14,503,622 | | | | | $ | 588,755,515 | | |
*
Cost of investments in affiliated underlying funds | | | | $ | 5,231,278 | | | | | $ | 48,277,305 | | | | | $ | 14,227,884 | | | | | $ | 593,636,663 | | |
**
Cost of investments in unaffiliated underlying funds | | | | $ | 335,742 | | | | | $ | 2,569,822 | | | | | $ | 1,098,620 | | | | | $ | 20,005,264 | | |
See Accompanying Notes to Financial Statements
STATEMENTS OF ASSETS AND LIABILITIES as of December 31, 2015 (continued)
| | | | Voya Solution
Aggressive
Portfolio | | | Voya Solution
Balanced
Portfolio | | | Voya Solution
Conservative
Portfolio | | | Voya Solution
Income
Portfolio | |
| Class ADV | | | | | |
| Net assets | | | | $ | 2,383,334 | | | | | $ | 25,078,740 | | | | | $ | 8,595,396 | | | | | $ | 248,968,302 | | |
| Shares authorized | | | | | 100,000,000 | | | | | | 100,000,000 | | | | | | 100,000,000 | | | | | | 100,000,000 | | |
| Par value | | | | $ | 0.001 | | | | | $ | 0.001 | | | | | $ | 0.001 | | | | | $ | 0.001 | | |
| Shares outstanding | | | | | 210,055 | | | | | | 2,671,202 | | | | | | 822,576 | | | | | | 22,873,987 | | |
| Net asset value and redemption price per share | | | | $ | 11.35 | | | | | $ | 9.39 | | | | | $ | 10.45 | | | | | $ | 10.88 | | |
| Class I | | | | | |
| Net assets | | | | $ | 137,596 | | | | | $ | 58,624 | | | | | $ | 12,906 | | | | | $ | 98,320,814 | | |
| Shares authorized | | | | | 100,000,000 | | | | | | 100,000,000 | | | | | | 100,000,000 | | | | | | 100,000,000 | | |
| Par value | | | | $ | 0.001 | | | | | $ | 0.001 | | | | | $ | 0.001 | | | | | $ | 0.001 | | |
| Shares outstanding | | | | | 11,897 | | | | | | 6,031 | | | | | | 1,218 | | | | | | 8,838,369 | | |
| Net asset value and redemption price per share | | | | $ | 11.57 | | | | | $ | 9.72 | | | | | $ | 10.60 | | | | | $ | 11.12 | | |
| Class S | | | | | |
| Net assets | | | | $ | 2,417,474 | | | | | $ | 22,551,570 | | | | | $ | 5,538,733 | | | | | $ | 225,273,582 | | |
| Shares authorized | | | | | 100,000,000 | | | | | | 100,000,000 | | | | | | 100,000,000 | | | | | | 100,000,000 | | |
| Par value | | | | $ | 0.001 | | | | | $ | 0.001 | | | | | $ | 0.001 | | | | | $ | 0.001 | | |
| Shares outstanding | | | | | 210,943 | | | | | | 2,368,513 | | | | | | 526,583 | | | | | | 20,412,897 | | |
| Net asset value and redemption price per share | | | | $ | 11.46 | | | | | $ | 9.52 | | | | | $ | 10.52 | | | | | $ | 11.04 | | |
| Class S2 | | | | | |
| Net assets | | | | $ | 168,876 | | | | | $ | 578,154 | | | | | $ | 356,587 | | | | | $ | 15,377,448 | | |
| Shares authorized | | | | | 100,000,000 | | | | | | 100,000,000 | | | | | | 100,000,000 | | | | | | 100,000,000 | | |
| Par value | | | | $ | 0.001 | | | | | $ | 0.001 | | | | | $ | 0.001 | | | | | $ | 0.001 | | |
| Shares outstanding | | | | | 14,867 | | | | | | 60,859 | | | | | | 34,084 | | | | | | 1,428,300 | | |
| Net asset value and redemption price per share | | | | $ | 11.36 | | | | | $ | 9.50 | | | | | $ | 10.46 | | | | | $ | 10.77 | | |
| Class T | | | | | |
| Net assets | | | | | n/a | | | | | | n/a | | | | | | n/a | | | | | $ | 815,369 | | |
| Shares authorized | | | | | n/a | | | | | | n/a | | | | | | n/a | | | | | | 100,000,000 | | |
| Par value | | | | | n/a | | | | | | n/a | | | | | | n/a | | | | | $ | 0.001 | | |
| Shares outstanding | | | | | n/a | | | | | | n/a | | | | | ��� | n/a | | | | | | 71,584 | | |
| Net asset value and redemption price per share | | | | | n/a | | | | | | n/a | | | | | | n/a | | | | | $ | 11.39 | | |
See Accompanying Notes to Financial Statements
STATEMENTS OF ASSETS AND LIABILITIES as of December 31, 2015
| | | | Voya Solution
Moderately
Aggressive
Portfolio | | | Voya Solution
Moderately
Conservative
Portfolio | | | Voya Solution
2020 Portfolio | | | Voya Solution
2025 Portfolio | |
| ASSETS: | | | | | |
| Investments in affiliated underlying funds at fair value* | | | | $ | 690,143,978 | | | | | $ | 40,747,140 | | | | | $ | 9,087,682 | | | | | $ | 968,089,154 | | |
| Investments in unaffiliated underlying funds at fair value** | | | | | 65,027,554 | | | | | | 2,105,014 | | | | | | 351,238 | | | | | | 40,683,622 | | |
| Total investments at fair value | | | | $ | 755,171,532 | | | | | $ | 42,852,154 | | | | | $ | 9,438,920 | | | | | $ | 1,008,772,776 | | |
| Cash | | | | | 840,625 | | | | | | 40,535 | | | | | | 1,517 | | | | | | 723,664 | | |
| Receivables: | | | | | |
| Investments in affiliated underlying funds sold | | | | | — | | | | | | 4,473 | | | | | | 84,917 | | | | | | 4,220,149 | | |
| Fund shares sold | | | | | 1,047,973 | | | | | | 10,594 | | | | | | 9,834 | | | | | | 417,050 | | |
| Dividends | | | | | 184,504 | | | | | | 7,700 | | | | | | 1,597 | | | | | | 186,567 | | |
| Prepaid expenses | | | | | 1,536 | | | | | | 87 | | | | | | 10 | | | | | | 2,061 | | |
| Reimbursement due from manager | | | | | 36,216 | | | | | | 4,069 | | | | | | 4,692 | | | | | | 77,053 | | |
| Other assets | | | | | 16,970 | | | | | | 496 | | | | | | — | | | | | | 23,000 | | |
| Total assets | | | | | 757,299,356 | | | | | | 42,920,108 | | | | | | 9,541,487 | | | | | | 1,014,422,320 | | |
| LIABILITIES: | | | | | |
| Payable for investments in affiliated underlying funds purchased | | | | | 1,047,829 | | | | | | — | | | | | | — | | | | | | — | | |
| Payable for fund shares redeemed | | | | | 144 | | | | | | 15,068 | | | | | | 94,751 | | | | | | 4,637,200 | | |
| Payable for investment management fees | | | | | 140,720 | | | | | | 7,709 | | | | | | 1,558 | | | | | | 180,742 | | |
| Payable for distribution and shareholder service fees | | | | | 167,909 | | | | | | 13,913 | | | | | | 2,067 | | | | | | 253,153 | | |
| Payable to trustees under the deferred compensation plan (Note 6) | | | | | 16,970 | | | | | | 496 | | | | | | — | | | | | | 23,000 | | |
| Payable for trustee fees | | | | | 1,589 | | | | | | 221 | | | | | | 11 | | | | | | 5,511 | | |
| Other accrued expenses and liabilities | | | | | 114,064 | | | | | | 10,387 | | | | | | 1,576 | | | | | | 122,602 | | |
| Total liabilities | | | | | 1,489,225 | | | | | | 47,794 | | | | | | 99,963 | | | | | | 5,222,208 | | |
| NET ASSETS | | | | $ | 755,810,131 | | | | | $ | 42,872,314 | | | | | $ | 9,441,524 | | | | | $ | 1,009,200,112 | | |
| NET ASSETS WERE COMPRISED OF: | | | | | |
| Paid-in capital | | | | $ | 790,151,599 | | | | | $ | 43,078,819 | | | | | $ | 9,449,844 | | | | | $ | 972,630,680 | | |
| Undistributed net investment income | | | | | 8,487,428 | | | | | | 806,668 | | | | | | 71,599 | | | | | | 19,413,501 | | |
| Accumulated net realized gain | | | | | 7,773,440 | | | | | | 1,477,975 | | | | | | 47,119 | | | | | | 65,903,829 | | |
| Net unrealized depreciation | | | | | (50,602,336) | | | | | | (2,491,148) | | | | | | (127,038) | | | | | | (48,747,898) | | |
| NET ASSETS | | | | $ | 755,810,131 | | | | | $ | 42,872,314 | | | | | $ | 9,441,524 | | | | | $ | 1,009,200,112 | | |
*
Cost of investments in affiliated underlying funds | | | | $ | 737,537,175 | | | | | $ | 43,093,693 | | | | | $ | 9,208,129 | | | | | $ | 1,014,201,473 | | |
**
Cost of investments in unaffiliated underlying funds | | | | $ | 68,236,693 | | | | | $ | 2,249,609 | | | | | $ | 357,829 | | | | | $ | 43,319,201 | | |
See Accompanying Notes to Financial Statements
STATEMENTS OF ASSETS AND LIABILITIES as of December 31, 2015 (continued)
| | | | Voya Solution
Moderately
Aggressive
Portfolio | | | Voya Solution
Moderately
Conservative
Portfolio | | | Voya Solution
2020 Portfolio | | | Voya Solution
2025 Portfolio | |
| Class ADV | | | | | |
| Net assets | | | | $ | 31,415,526 | | | | | $ | 22,004,953 | | | | | $ | 2,853,158 | | | | | $ | 357,443,145 | | |
| Shares authorized | | | | | 100,000,000 | | | | | | 100,000,000 | | | | | | 100,000,000 | | | | | | 100,000,000 | | |
| Par value | | | | $ | 0.001 | | | | | $ | 0.001 | | | | | $ | 0.001 | | | | | $ | 0.001 | | |
| Shares outstanding | | | | | 2,796,356 | | | | | | 2,312,726 | | | | | | 244,874 | | | | | | 32,009,672 | | |
| Net asset value and redemption price per share | | | | $ | 11.23 | | | | | $ | 9.51 | | | | | $ | 11.65 | | | | | $ | 11.17 | | |
| Class I | | | | | |
| Net assets | | | | $ | 4,035,397 | | | | | $ | 35,549 | | | | | $ | 2,156,746 | | | | | $ | 204,692,710 | | |
| Shares authorized | | | | | 100,000,000 | | | | | | 100,000,000 | | | | | | 100,000,000 | | | | | | 100,000,000 | | |
| Par value | | | | $ | 0.001 | | | | | $ | 0.001 | | | | | $ | 0.001 | | | | | $ | 0.001 | | |
| Shares outstanding | | | | | 352,764 | | | | | | 3,580 | | | | | | 182,544 | | | | | | 17,885,164 | | |
| Net asset value and redemption price per share | | | | $ | 11.44 | | | | | $ | 9.93 | | | | | $ | 11.81 | | | | | $ | 11.44 | | |
| Class S | | | | | |
| Net assets | | | | $ | 719,319,098 | | | | | $ | 20,080,625 | | | | | $ | 4,144,945 | | | | | $ | 418,555,045 | | |
| Shares authorized | | | | | 200,000,000 | | | | | | 100,000,000 | | | | | | 100,000,000 | | | | | | 100,000,000 | | |
| Par value | | | | $ | 0.001 | | | | | $ | 0.001 | | | | | $ | 0.001 | | | | | $ | 0.001 | | |
| Shares outstanding | | | | | 63,429,937 | | | | | | 2,063,372 | | | | | | 351,277 | | | | | | 36,968,714 | | |
| Net asset value and redemption price per share | | | | $ | 11.34 | | | | | $ | 9.73 | | | | | $ | 11.80 | | | | | $ | 11.32 | | |
| Class S2 | | | | | |
| Net assets | | | | $ | 1,040,110 | | | | | $ | 751,187 | | | | | $ | 282,583 | | | | | $ | 27,672,682 | | |
| Shares authorized | | | | | 100,000,000 | | | | | | 100,000,000 | | | | | | 100,000,000 | | | | | | 100,000,000 | | |
| Par value | | | | $ | 0.001 | | | | | $ | 0.001 | | | | | $ | 0.001 | | | | | $ | 0.001 | | |
| Shares outstanding | | | | | 91,914 | | | | | | 77,937 | | | | | | 24,150 | | | | | | 2,507,872 | | |
| Net asset value and redemption price per share | | | | $ | 11.32 | | | | | $ | 9.64 | | | | | $ | 11.70 | | | | | $ | 11.03 | | |
| Class T | | | | | |
| Net assets | | | | | n/a | | | | | | n/a | | | | | $ | 4,092 | | | | | $ | 836,530 | | |
| Shares authorized | | | | | n/a | | | | | | n/a | | | | | | 100,000,000 | | | | | | 100,000,000 | | |
| Par value | | | | | n/a | | | | | | n/a | | | | | $ | 0.001 | | | | | $ | 0.001 | | |
| Shares outstanding | | | | | n/a | | | | | | n/a | | | | | | 352 | | | | | | 72,208 | | |
| Net asset value and redemption price per share | | | | | n/a | | | | | | n/a | | | | | $ | 11.64 | | | | | $ | 11.58 | | |
See Accompanying Notes to Financial Statements
STATEMENTS OF ASSETS AND LIABILITIES as of December 31, 2015
| | | | Voya Solution
2030 Portfolio | | | Voya Solution
2035 Portfolio | | | Voya Solution
2040 Portfolio | | | Voya Solution
2045 Portfolio | |
| ASSETS: | | | | | |
| Investments in affiliated underlying funds at fair value* | | | | $ | 3,713,129 | | | | | $ | 880,015,416 | | | | | $ | 3,186,560 | | | | | $ | 610,712,163 | | |
| Investments in unaffiliated underlying funds at fair value** | | | | | 213,626 | | | | | | 46,880,518 | | | | | | 151,947 | | | | | | 39,451,476 | | |
| Total investments at fair value | | | | $ | 3,926,755 | | | | | $ | 926,895,934 | | | | | $ | 3,338,507 | | | | | $ | 650,163,639 | | |
| Cash | | | | | 1,531 | | | | | | 990,640 | | | | | | 1,338 | | | | | | 772,614 | | |
| Receivables: | | | | | |
| Investments in affiliated underlying funds sold | | | | | — | | | | | | 2,452,726 | | | | | | — | | | | | | 1,527,218 | | |
| Fund shares sold | | | | | 54,735 | | | | | | 467,788 | | | | | | 16,237 | | | | | | 533,900 | | |
| Dividends | | | | | 744 | | | | | | 227,421 | | | | | | 364 | | | | | | 79,517 | | |
| Prepaid expenses | | | | | 3 | | | | | | 1,881 | | | | | | 3 | | | | | | 1,314 | | |
| Reimbursement due from manager | | | | | 2,907 | | | | | | 57,175 | | | | | | 2,274 | | | | | | 30,103 | | |
| Other assets | | | | | — | | | | | | 19,588 | | | | | | — | | | | | | 12,575 | | |
| Total assets | | | | | 3,986,675 | | | | | | 931,113,153 | | | | | | 3,358,723 | | | | | | 653,120,880 | | |
| LIABILITIES: | | | | | |
| Payable for investments in affiliated underlying funds purchased | | | | | 54,734 | | | | | | — | | | | | | 16,237 | | | | | | — | | |
| Payable for fund shares redeemed | | | | | — | | | | | | 2,920,514 | | | | | | — | | | | | | 2,061,118 | | |
| Payable for investment management fees | | | | | 590 | | | | | | 167,621 | | | | | | 541 | | | | | | 118,292 | | |
| Payable for distribution and shareholder service fees | | | | | 807 | | | | | | 221,171 | | | | | | 997 | | | | | | 147,303 | | |
| Payable to trustees under the deferred compensation plan (Note 6) | | | | | — | | | | | | 19,588 | | | | | | — | | | | | | 12,575 | | |
| Payable for trustee fees | | | | | 5 | | | | | | 5,053 | | | | | | 6 | | | | | | 3,508 | | |
| Other accrued expenses and liabilities | | | | | 1,414 | | | | | | 101,839 | | | | | | 573 | | | | | | 75,548 | | |
| Total liabilities | | | | | 57,550 | | | | | | 3,435,786 | | | | | | 18,354 | | | | | | 2,418,344 | | |
| NET ASSETS | | | | $ | 3,929,125 | | | | | $ | 927,677,367 | | | | | $ | 3,340,369 | | | | | $ | 650,702,536 | | |
| NET ASSETS WERE COMPRISED OF: | | | | | |
| Paid-in capital | | | | $ | 3,941,912 | | | | | $ | 888,888,679 | | | | | $ | 3,368,457 | | | | | $ | 623,141,280 | | |
| Undistributed net investment income | | | | | 34,930 | | | | | | 18,484,561 | | | | | | 35,885 | | | | | | 10,360,171 | | |
| Accumulated net realized gain | | | | | 23,828 | | | | | | 68,189,196 | | | | | | 12,671 | | | | | | 51,253,614 | | |
| Net unrealized depreciation | | | | | (71,545) | | | | | | (47,885,069) | | | | | | (76,644) | | | | | | (34,052,529) | | |
| NET ASSETS | | | | $ | 3,929,125 | | | | | $ | 927,677,367 | | | | | $ | 3,340,369 | | | | | $ | 650,702,536 | | |
*
Cost of investments in affiliated underlying funds | | | | $ | 3,781,647 | | | | | $ | 926,092,675 | | | | | $ | 3,259,922 | | | | | $ | 642,741,591 | | |
**
Cost of investments in unaffiliated underlying funds | | | | $ | 216,653 | | | | | $ | 48,688,328 | | | | | $ | 155,229 | | | | | $ | 41,474,577 | | |
See Accompanying Notes to Financial Statements
STATEMENTS OF ASSETS AND LIABILITIES as of December 31, 2015 (continued)
| | | | Voya Solution
2030 Portfolio | | | Voya Solution
2035 Portfolio | | | Voya Solution
2040 Portfolio | | | Voya Solution
2045 Portfolio | |
| Class ADV | | | | | |
| Net assets | | | | $ | 1,568,838 | | | | | $ | 303,217,615 | | | | | $ | 2,229,302 | | | | | $ | 197,360,162 | | |
| Shares authorized | | | | | 100,000,000 | | | | | | 100,000,000 | | | | | | 100,000,000 | | | | | | 100,000,000 | | |
| Par value | | | | $ | 0.001 | | | | | $ | 0.001 | | | | | $ | 0.001 | | | | | $ | 0.001 | | |
| Shares outstanding | | | | | 118,520 | | | | | | 26,897,795 | | | | | | 161,128 | | | | | | 17,699,773 | | |
| Net asset value and redemption price per share | | | | $ | 13.24 | | | | | $ | 11.27 | | | | | $ | 13.84 | | | | | $ | 11.15 | | |
| Class I | | | | | |
| Net assets | | | | $ | 860,982 | | | | | $ | 218,050,709 | | | | | $ | 487,314 | | | | | $ | 169,324,854 | | |
| Shares authorized | | | | | 100,000,000 | | | | | | 100,000,000 | | | | | | 100,000,000 | | | | | | 100,000,000 | | |
| Par value | | | | $ | 0.001 | | | | | $ | 0.001 | | | | | $ | 0.001 | | | | | $ | 0.001 | | |
| Shares outstanding | | | | | 63,980 | | | | | | 18,888,129 | | | | | | 34,627 | | | | | | 14,807,443 | | |
| Net asset value and redemption price per share | | | | $ | 13.46 | | | | | $ | 11.54 | | | | | $ | 14.07 | | | | | $ | 11.44 | | |
| Class S | | | | | |
| Net assets | | | | $ | 1,454,417 | | | | | $ | 383,233,389 | | | | | $ | 609,784 | | | | | $ | 270,222,109 | | |
| Shares authorized | | | | | 100,000,000 | | | | | | 100,000,000 | | | | | | 100,000,000 | | | | | | 100,000,000 | | |
| Par value | | | | $ | 0.001 | | | | | $ | 0.001 | | | | | $ | 0.001 | | | | | $ | 0.001 | | |
| Shares outstanding | | | | | 108,239 | | | | | | 33,536,131 | | | | | | 43,463 | | | | | | 23,926,098 | | |
| Net asset value and redemption price per share | | | | $ | 13.44 | | | | | $ | 11.43 | | | | | $ | 14.03 | | | | | $ | 11.29 | | |
| Class S2 | | | | | |
| Net assets | | | | $ | 40,862 | | | | | $ | 22,288,590 | | | | | $ | 9,474 | | | | | $ | 13,402,134 | | |
| Shares authorized | | | | | 100,000,000 | | | | | | 100,000,000 | | | | | | 100,000,000 | | | | | | 100,000,000 | | |
| Par value | | | | $ | 0.001 | | | | | $ | 0.001 | | | | | $ | 0.001 | | | | | $ | 0.001 | | |
| Shares outstanding | | | | | 3,073 | | | | | | 2,013,364 | | | | | | 682 | | | | | | 1,213,514 | | |
| Net asset value and redemption price per share | | | | $ | 13.30 | | | | | $ | 11.07 | | | | | $ | 13.90 | | | | | $ | 11.04 | | |
| Class T | | | | | |
| Net assets | | | | $ | 4,026 | | | | | $ | 887,064 | | | | | $ | 4,495 | | | | | $ | 393,277 | | |
| Shares authorized | | | | | 100,000,000 | | | | | | 100,000,000 | | | | | | 100,000,000 | | | | | | 100,000,000 | | |
| Par value | | | | $ | 0.001 | | | | | $ | 0.001 | | | | | $ | 0.001 | | | | | $ | 0.001 | | |
| Shares outstanding | | | | | 303 | | | | | | 76,110 | | | | | | 326 | | | | | | 34,321 | | |
| Net asset value and redemption price per share | | | | $ | 13.27 | | | | | $ | 11.65 | | | | | $ | 13.81 | | | | | $ | 11.46 | | |
See Accompanying Notes to Financial Statements
STATEMENTS OF ASSETS AND LIABILITIES as of December 31, 2015
| | | | Voya Solution
2050 Portfolio | | | Voya Solution
2055 Portfolio | | | Voya Solution
2060 Portfolio | |
| ASSETS: | | | | |
| Investments in affiliated underlying funds at fair value* | | | | $ | 1,589,707 | | | | | $ | 121,162,889 | | | | | $ | 638,188 | | |
| Investments in unaffiliated underlying funds at fair value** | | | | | 86,837 | | | | | | 7,159,616 | | | | | | 37,407 | | |
| Total investments at fair value | | | | $ | 1,676,544 | | | | | $ | 128,322,505 | | | | | $ | 675,595 | | |
| Cash | | | | | 1,038 | | | | | | 109,480 | | | | | | 432 | | |
| Receivables: | | | | |
| Fund shares sold | | | | | 12,202 | | | | | | 310,155 | | | | | | 2,678 | | |
| Dividends | | | | | 177 | | | | | | 15,024 | | | | | | 76 | | |
| Prepaid expenses | | | | | 2 | | | | | | 244 | | | | | | — | | |
| Prepaid offering expense | | | | | — | | | | | | — | | | | | | 1,477 | | |
| Reimbursement due from manager | | | | | 1,622 | | | | | | 13,377 | | | | | | 2,794 | | |
| Other assets | | | | | — | | | | | | 1,023 | | | | | | — | | |
| Total assets | | | | | 1,691,585 | | | | | | 128,771,808 | | | | | | 683,052 | | |
| LIABILITIES: | | | | |
| Payable for investments in affiliated underlying funds purchased | | | | | 12,202 | | | | | | 162,333 | | | | | | 2,679 | | |
| Payable for fund shares redeemed | | | | | — | | | | | | 147,822 | | | | | | — | | |
| Payable for investment management fees | | | | | 267 | | | | | | 22,944 | | | | | | 113 | | |
| Payable for distribution and shareholder service fees | | | | | 426 | | | | | | 28,730 | | | | | | 110 | | |
| Payable to trustees under the deferred compensation plan (Note 6) | | | | | — | | | | | | 1,023 | | | | | | — | | |
| Payable for trustee fees | | | | | 4 | | | | | | 609 | | | | | | 1 | | |
| Other accrued expenses and liabilities | | | | | 453 | | | | | | 10,675 | | | | | | 3,981 | | |
| Total liabilities | | | | | 13,352 | | | | | | 374,136 | | | | | | 6,884 | | |
| NET ASSETS | | | | $ | 1,678,233 | | | | | $ | 128,397,672 | | | | | $ | 676,168 | | |
| NET ASSETS WERE COMPRISED OF: | | | | |
| Paid-in capital | | | | $ | 1,692,546 | | | | | $ | 128,931,228 | | | | | $ | 669,237 | | |
| Undistributed net investment income | | | | | 15,896 | | | | | | 1,887,097 | | | | | | 6,453 | | |
| Accumulated net realized gain | | | | | 14,919 | | | | | | 7,832,301 | | | | | | 10,531 | | |
| Net unrealized depreciation | | | | | (45,128) | | | | | | (10,252,954) | | | | | | (10,053) | | |
| NET ASSETS | | | | $ | 1,678,233 | | | | | $ | 128,397,672 | | | | | $ | 676,168 | | |
*
Cost of investments in affiliated underlying funds | | | | $ | 1,632,587 | | | | | $ | 131,061,886 | | | | | $ | 647,822 | | |
**
Cost of investments in unaffiliated underlying funds | | | | $ | 89,085 | | | | | $ | 7,513,573 | | | | | $ | 37,826 | | |
See Accompanying Notes to Financial Statements
STATEMENTS OF ASSETS AND LIABILITIES as of December 31, 2015 (continued)
| | | | Voya Solution
2050 Portfolio | | | Voya Solution
2055 Portfolio | | | Voya Solution
2060 Portfolio |
| Class ADV | | | | |
| Net assets | | | | $ | 960,186 | | | | | $ | 41,769,732 | | | | | $ | 190,734 |
| Shares authorized | | | | | 100,000,000 | | | | | | 100,000,000 | | | | | | 100,000,000 |
| Par value | | | | $ | 0.001 | | | | | $ | 0.001 | | | | | $ | 0.001 |
| Shares outstanding | | | | | 69,296 | | | | | | 3,334,972 | | | | | | 19,278 |
| Net asset value and redemption price per share | | | | $ | 13.86 | | | | | $ | 12.52 | | | | | $ | 9.89 |
| Class I | | | | |
| Net assets | | | | $ | 387,279 | | | | | $ | 36,691,824 | | | | | $ | 316,500 |
| Shares authorized | | | | | 100,000,000 | | | | | | 100,000,000 | | | | | | 100,000,000 |
| Par value | | | | $ | 0.001 | | | | | $ | 0.001 | | | | | $ | 0.001 |
| Shares outstanding | | | | | 27,412 | | | | | | 2,879,496 | | | | | | 31,919 |
| Net asset value and redemption price per share | | | | $ | 14.13 | | | | | $ | 12.74 | | | | | $ | 9.92 |
| Class S | | | | |
| Net assets | | | | $ | 317,333 | | | | | $ | 46,912,774 | | | | | $ | 140,306 |
| Shares authorized | | | | | 100,000,000 | | | | | | 100,000,000 | | | | | | 100,000,000 |
| Par value | | | | $ | 0.001 | | | | | $ | 0.001 | | | | | $ | 0.001 |
| Shares outstanding | | | | | 22,570 | | | | | | 3,716,990 | | | | | | 14,225 |
| Net asset value and redemption price per share | | | | $ | 14.06 | | | | | $ | 12.62 | | | | | $ | 9.86 |
| Class S2 | | | | |
| Net assets | | | | $ | 9,223 | | | | | $ | 3,014,118 | | | | | $ | 25,661 |
| Shares authorized | | | | | 100,000,000 | | | | | | 100,000,000 | | | | | | 100,000,000 |
| Par value | | | | $ | 0.001 | | | | | $ | 0.001 | | | | | $ | 0.001 |
| Shares outstanding | | | | | 662 | | | | | | 239,956 | | | | | | 2,596 |
| Net asset value and redemption price per share | | | | $ | 13.93 | | | | | $ | 12.56 | | | | | $ | 9.89 |
| Class T | | | | |
| Net assets | | | | $ | 4,212 | | | | | $ | 9,224 | | | | | $ | 2,967 |
| Shares authorized | | | | | 100,000,000 | | | | | | 100,000,000 | | | | | | 100,000,000 |
| Par value | | | | $ | 0.001 | | | | | $ | 0.001 | | | | | $ | 0.001 |
| Shares outstanding | | | | | 303 | | | | | | 722 | | | | | | 301 |
| Net asset value and redemption price per share | | | | $ | 13.88 | | | | | $ | 12.78 | | | | | $ | 9.86 |
See Accompanying Notes to Financial Statements
STATEMENTS OF OPERATIONS for the year ended December 31, 2015
| | | | Voya Solution
Aggressive
Portfolio | | | Voya Solution
Balanced
Portfolio | | | Voya Solution
Conservative
Portfolio | | | Voya Solution
Income
Portfolio | |
| INVESTMENT INCOME: | | | | | |
| Dividends from affiliated underlying funds | | | | $ | 58,793 | | | | | $ | 792,411 | | | | | $ | 300,417 | | | | | $ | 5,799,863 | | |
| Dividends from unaffiliated underlying funds | | | | | 6,157 | | | | | | 58,181 | | | | | | 29,626 | | | | | | 305,520 | | |
| Total investment income | | | | | 64,950 | | | | | | 850,592 | | | | | | 330,043 | | | | | | 6,105,383 | | |
| EXPENSES: | | | | | |
| Investment management fees(1) | | | | | 9,046 | | | | | | 91,270 | | | | | | 30,486 | | | | | | 648,006 | | |
| Distribution and shareholder service fees: | | | | | |
| Class ADV | | | | | 12,555 | | | | | | 136,708 | | | | | | 54,065 | | | | | | 747,467 | | |
| Class S | | | | | 5,245 | | | | | | 58,706 | | | | | | 14,877 | | | | | | 316,091 | | |
| Class S2 | | | | | 685 | | | | | | 3,182 | | | | | | 1,768 | | | | | | 44,198 | | |
| Class T | | | | | — | | | | | | — | | | | | | — | | | | | | 2,764 | | |
| Transfer agent fees | | | | | 58 | | | | | | 147 | | | | | | 266 | | | | | | 3,603 | | |
| Administrative service fees(1) | | | | | 1,343 | | | | | | 17,378 | | | | | | 5,898 | | | | | | 54,943 | | |
| Shareholder reporting expense | | | | | 1,171 | | | | | | 7,644 | | | | | | 2,190 | | | | | | 15,631 | | |
| Professional fees | | | | | 7,448 | | | | | | 13,083 | | | | | | 9,129 | | | | | | 25,665 | | |
| Custody and accounting expense | | | | | 311 | | | | | | 3,764 | | | | | | 1,186 | | | | | | 12,045 | | |
| Trustee fees | | | | | 144 | | | | | | 1,545 | | | | | | 513 | | | | | | 10,127 | | |
| Miscellaneous expense | | | | | 1,781 | | | | | | 7,095 | | | | | | 7,050 | | | | | | 9,270 | | |
| Total expenses | | | | | 39,787 | | | | | | 340,522 | | | | | | 127,428 | | | | | | 1,889,810 | | |
| Net waived and reimbursed fees | | | | | (12,827) | | | | | | (64,121) | | | | | | (38,167) | | | | | | (349,471) | | |
| Net expenses | | | | | 26,960 | | | | | | 276,401 | | | | | | 89,261 | | | | | | 1,540,339 | | |
| Net investment income | | | | | 37,990 | | | | | | 574,191 | | | | | | 240,782 | | | | | | 4,565,044 | | |
| REALIZED AND UNREALIZED GAIN (LOSS): | | | | | |
| Net realized gain (loss) on: | | | | | |
| Sale of affiliated underlying funds | | | | | (139,162) | | | | | | 752,337 | | | | | | (107,222) | | | | | | (1,185,276) | | |
| Sale of unaffiliated underlying funds | | | | | 1,958 | | | | | | (118,332) | | | | | | (50,956) | | | | | | (834,544) | | |
| Capital gain distributions from affiliated underlying funds | | | | | 331,320 | | | | | | 2,741,077 | | | | | | 440,853 | | | | | | 7,366,045 | | |
| Capital gain distributions from unaffiliated underlying funds | | | | | 10 | | | | | | 19 | | | | | | — | | | | | | — | | |
| Foreign currency related transactions | | | | | — | | | | | | 110 | | | | | | 37 | | | | | | 273 | | |
| Futures | | | | | — | | | | | | (13,585) | | | | | | 24,113 | | | | | | (545,357) | | |
| Net realized gain | | | | | 194,126 | | | | | | 3,361,626 | | | | | | 306,825 | | | | | | 4,801,141 | | |
| Net change in unrealized appreciation (depreciation) on: | | | | | |
| Affiliated underlying funds | | | | | (338,460) | | | | | | (4,039,527) | | | | | | (561,067) | | | | | | (14,041,467) | | |
| Unaffiliated underlying funds | | | | | (24,977) | | | | | | (214,349) | | | | | | (90,823) | | | | | | (1,003,575) | | |
| Foreign currency related transactions | | | | | — | | | | | | (268) | | | | | | (89) | | | | | | (832) | | |
| Futures | | | | | — | | | | | | 27,424 | | | | | | 9,141 | | | | | | 85,319 | | |
| Net change in unrealized appreciation (depreciation) | | | | | (363,437) | | | | | | (4,226,720) | | | | | | (642,838) | | | | | | (14,960,555) | | |
| Net realized and unrealized loss | | | | | (169,311) | | | | | | (865,094) | | | | | | (336,013) | | | | | | (10,159,414) | | |
| Decrease in net assets resulting from operations | | | | $ | (131,321) | | | | | $ | (290,903) | | | | | $ | (95,231) | | | | | $ | (5,594,370) | | |
| |
(1)
Effective May 1, 2015, the investment management fee and administration fee were combined under a single amended and restated investment management agreement. Please see Note 4 for further information.
See Accompanying Notes to Financial Statements
STATEMENTS OF OPERATIONS for the year ended December 31, 2015
| | | | Voya Solution
Moderately
Aggressive
Portfolio | | | Voya Solution
Moderately
Conservative
Portfolio | | | Voya Solution
2020 Portfolio | | | Voya Solution
2025 Portfolio | |
| INVESTMENT INCOME: | | | | | |
| Dividends from affiliated underlying funds | | | | $ | 6,189,485 | | | | | $ | 721,497 | | | | | $ | 64,507 | | | | | $ | 16,027,942 | | |
| Dividends from unaffiliated underlying funds | | | | | 811,326 | | | | | | 49,970 | | | | | | 2,792 | | | | | | 1,057,716 | | |
| Total investment income | | | | | 7,000,811 | | | | | | 771,467 | | | | | | 67,299 | | | | | | 17,085,658 | | |
| EXPENSES: | | | | | |
| Investment management fees(1) | | | | | 683,228 | | | | | | 78,228 | | | | | | 4,436 | | | | | | 1,934,636 | | |
| Distribution and shareholder service fees: | | | | | |
| Class ADV | | | | | 126,321 | | | | | | 110,147 | | | | | | 5,927 | | | | | | 1,982,384 | | |
| Class S | | | | | 724,702 | | | | | | 53,087 | | | | | | 1,179 | | | | | | 1,154,526 | | |
| Class S2 | | | | | 4,690 | | | | | | 4,366 | | | | | | 251 | | | | | | 155,513 | | |
| Class T | | | | | — | | | | | | — | | | | | | 29 | | | | | | 6,538 | | |
| Transfer agent fees | | | | | 2,829 | | | | | | 166 | | | | | | 304 | | | | | | 1,418 | | |
| Administrative service fees(1) | | | | | 10,963 | | | | | | 14,912 | | | | | | 216 | | | | | | 376,779 | | |
| Shareholder reporting expense | | | | | 6,611 | | | | | | 5,996 | | | | | | 2,008 | | | | | | 42,545 | | |
| Professional fees | | | | | 18,637 | | | | | | 12,765 | | | | | | 8,044 | | | | | | 110,049 | | |
| Custody and accounting expense | | | | | 10,048 | | | | | | 2,868 | | | | | | 109 | | | | | | 88,280 | | |
| Trustee fees | | | | | 9,533 | | | | | | 1,325 | | | | | | 68 | | | | | | 33,068 | | |
| Miscellaneous expense | | | | | 4,226 | | | | | | 7,160 | | | | | | 7,017 | | | | | | 56,660 | | |
| Interest expense | | | | | 147 | | | | | | — | | | | | | — | | | | | | — | | |
| Total expenses | | | | | 1,601,935 | | | | | | 291,020 | | | | | | 29,588 | | | | | | 5,942,396 | | |
| Net waived and reimbursed fees | | | | | (141,969) | | | | | | (52,817) | | | | | | (19,370) | | | | | | (998,790) | | |
| Net expenses | | | | | 1,459,966 | | | | | | 238,203 | | | | | | 10,218 | | | | | | 4,943,606 | | |
| Net investment income | | | | | 5,540,845 | | | | | | 533,264 | | | | | | 57,081 | | | | | | 12,142,052 | | |
| REALIZED AND UNREALIZED GAIN (LOSS): | | | | | |
| Net realized gain (loss) on: | | | | | |
| Sale of affiliated underlying funds | | | | | (4,038,774) | | | | | | 570,886 | | | | | | (26,507) | | | | | | 29,617,019 | | |
| Sale of unaffiliated underlying funds | | | | | (509,554) | | | | | | (88,419) | | | | | | (3,183) | | | | | | (3,134,945) | | |
| Capital gain distributions from affiliated underlying funds | | | | | 16,816,342 | | | | | | 1,748,753 | | | | | | 91,731 | | | | | | 51,714,775 | | |
| Capital gain distributions from unaffiliated underlying funds | | | | | — | | | | | | — | | | | | | — | | | | | | 389 | | |
| Foreign currency related transactions | | | | | 73 | | | | | | 92 | | | | | | — | | | | | | (1,486) | | |
| Futures | | | | | (1,363,311) | | | | | | (11,773) | | | | | | — | | | | | | 1,460,654 | | |
| Net realized gain | | | | | 10,904,776 | | | | | | 2,219,539 | | | | | | 62,041 | | | | | | 79,656,406 | | |
| Net change in unrealized appreciation (depreciation) on: | | | | | |
| Affiliated underlying funds | | | | | (44,755,001) | | | | | | (2,749,411) | | | | | | (109,878) | | | | | | (88,269,593) | | |
| Unaffiliated underlying funds | | | | | (3,153,958) | | | | | | (185,688) | | | | | | (4,990) | | | | | | (3,437,065) | | |
| Foreign currency related transactions | | | | | (178) | | | | | | (238) | | | | | | — | | | | | | (2,320) | | |
| Futures | | | | | 18,283 | | | | | | 24,377 | | | | | | — | | | | | | 615,516 | | |
| Net change in unrealized appreciation (depreciation) | | | | | (47,890,854) | | | | | | (2,910,960) | | | | | | (114,868) | | | | | | (91,093,462) | | |
| Net realized and unrealized loss | | | | | (36,986,078) | | | | | | (691,421) | | | | | | (52,827) | | | | | | (11,437,056) | | |
| Increase (decrease) in net assets resulting from operations | | | | $ | (31,445,233) | | | | | $ | (158,157) | | | | | $ | 4,254 | | | | | $ | 704,996 | | |
| |
(1)
Effective May 1, 2015, the investment management fee and administration fee were combined under a single amended and restated investment management agreement. Please see Note 4 for further information.
See Accompanying Notes to Financial Statements
STATEMENTS OF OPERATIONS for the year ended December 31, 2015
| | | | Voya Solution
2030 Portfolio | | | Voya Solution
2035 Portfolio | | | Voya Solution
2040 Portfolio | | | Voya Solution
2045 Portfolio | |
| INVESTMENT INCOME: | | | | | |
| Dividends from affiliated underlying funds | | | | $ | 29,903 | | | | | $ | 14,091,049 | | | | | $ | 29,646 | | | | | $ | 8,225,252 | | |
| Dividends from unaffiliated underlying funds | | | | | 1,582 | | | | | | 1,335,460 | | | | | | 1,764 | | | | | | 889,892 | | |
| Total investment income | | | | | 31,485 | | | | | | 15,426,509 | | | | | | 31,410 | | | | | | 9,115,144 | | |
| EXPENSES: | | | | | |
| Investment management fees(1) | | | | | 1,843 | | | | | | 1,819,102 | | | | | | 2,232 | | | | | | 1,263,564 | | |
| Distribution and shareholder service fees: | | | | | |
| Class ADV | | | | | 2,118 | | | | | | 1,676,994 | | | | | | 4,709 | | | | | | 1,092,209 | | |
| Class S | | | | | 561 | | | | | | 1,053,582 | | | | | | 304 | | | | | | 737,459 | | |
| Class S2 | | | | | 28 | | | | | | 127,785 | | | | | | 23 | | | | | | 76,855 | | |
| Class T | | | | | 32 | | | | | | 6,688 | | | | | | 33 | | | | | | 2,942 | | |
| Transfer agent fees | | | | | 339 | | | | | | 1,289 | | | | | | 330 | | | | | | 970 | | |
| Administrative service fees(1) | | | | | 78 | | | | | | 342,975 | | | | | | 254 | | | | | | 237,939 | | |
| Shareholder reporting expense | | | | | 2,008 | | | | | | 39,465 | | | | | | 843 | | | | | | 34,675 | | |
| Professional fees | | | | | 6,844 | | | | | | 100,886 | | | | | | 7,589 | | | | | | 71,655 | | |
| Custody and accounting expense | | | | | 292 | | | | | | 79,725 | | | | | | 183 | | | | | | 57,305 | | |
| Trustee fees | | | | | 28 | | | | | | 30,313 | | | | | | 36 | | | | | | 21,046 | | |
| Miscellaneous expense | | | | | 7,640 | | | | | | 51,010 | | | | | | 7,313 | | | | | | 39,042 | | |
| Interest expense | | | | | — | | | | | | 158 | | | | | | — | | | | | | 88 | | |
| Total expenses | | | | | 21,811 | | | | | | 5,329,972 | | | | | | 23,849 | | | | | | 3,635,749 | | |
| Net waived and reimbursed fees | | | | | (17,610) | | | | | | (753,204) | | | | | | (16,754) | | | | | | (394,430) | | |
| Net expenses | | | | | 4,201 | | | | | | 4,576,768 | | | | | | 7,095 | | | | | | 3,241,319 | | |
| Net investment income | | | | | 27,284 | | | | | | 10,849,741 | | | | | | 24,315 | | | | | | 5,873,825 | | |
| REALIZED AND UNREALIZED GAIN (LOSS): | | | | | |
| Net realized gain (loss) on: | | | | | |
| Sale of affiliated underlying funds | | | | | (14,328) | | | | | | 28,577,633 | | | | | | (47,275) | | | | | | 20,586,426 | | |
| Sale of unaffiliated underlying funds | | | | | (1,098) | | | | | | 256,599 | | | | | | (2,089) | | | | | | 241,394 | | |
| Capital gain distributions from affiliated underlying funds | | | | | 47,441 | | | | | | 53,334,755 | | | | | | 77,223 | | | | | | 39,021,144 | | |
| Capital gain distributions from unaffiliated underlying funds | | | | | — | | | | | | 1,044 | | | | | | — | | | | | | 552 | | |
| Foreign currency related transactions | | | | | — | | | | | | (1,164) | | | | | | — | | | | | | (812) | | |
| Futures | | | | | — | | | | | | 742,514 | | | | | | — | | | | | | (283,343) | | |
| Net realized gain | | | | | 32,015 | | | | | | 82,911,381 | | | | | | 27,859 | | | | | | 59,565,361 | | |
| Net change in unrealized appreciation (depreciation) on: | | | | | |
| Affiliated underlying funds | | | | | (65,145) | | | | | | (91,485,025) | | | | | | (54,304) | | | | | | (66,228,176) | | |
| Unaffiliated underlying funds | | | | | (3,211) | | | | | | (6,753,451) | | | | | | (3,277) | | | | | | (4,936,155) | | |
| Foreign currency related transactions | | | | | — | | | | | | (2,079) | | | | | | — | | | | | | (1,447) | | |
| Futures | | | | | — | | | | | | 551,527 | | | | | | — | | | | | | 383,936 | | |
| Net change in unrealized appreciation (depreciation) | | | | | (68,356) | | | | | | (97,689,028) | | | | | | (57,581) | | | | | | (70,781,842) | | |
| Net realized and unrealized loss | | | | | (36,341) | | | | | | (14,777,647) | | | | | | (29,722) | | | | | | (11,216,481) | | |
| Decrease in net assets resulting from operations | | | | $ | (9,057) | | | | | $ | (3,927,906) | | | | | $ | (5,407) | | | | | $ | (5,342,656) | | |
| |
(1)
Effective May 1, 2015, the investment management fee and administration fee were combined under a single amended and restated investment management agreement. Please see Note 4 for further information.
See Accompanying Notes to Financial Statements
STATEMENTS OF OPERATIONS for the year ended December 31, 2015
| | | | Voya Solution
2050 Portfolio | | | Voya Solution
2055 Portfolio | | | Voya Solution
2060 Portfolio | |
| | | | | | | | | | | | | | | | February 9, 2015(2)
to December 31,
2015 | |
| INVESTMENT INCOME: | | | | |
| Dividends from affiliated underlying funds | | | | $ | 13,598 | | | | | $ | 1,488,551 | | | | | $ | 5,158 | | |
| Dividends from unaffiliated underlying funds | | | | | 904 | | | | | | 145,638 | | | | | | 255 | | |
| Total investment income | | | | | 14,502 | | | | | | 1,634,189 | | | | | | 5,413 | | |
| EXPENSES: | | | | |
| Investment management fees(1) | | | | | 1,191 | | | | | | 222,115 | | | | | | 333 | | |
| Distribution and shareholder service fees: | | | | |
| Class ADV | | | | | 2,410 | | | | | | 204,791 | | | | | | 212 | | |
| Class S | | | | | 175 | | | | | | 117,134 | | | | | | 84 | | |
| Class S2 | | | | | 36 | | | | | | 14,735 | | | | | | 28 | | |
| Class T | | | | | 34 | | | | | | 51 | | | | | | 19 | | |
| Transfer agent fees | | | | | 313 | | | | | | 876 | | | | | | 782 | | |
| Administrative service fees(1) | | | | | 134 | | | | | | 37,694 | | | | | | 3 | | |
| Shareholder reporting expense | | | | | 854 | | | | | | 12,760 | | | | | | 800 | | |
| Professional fees | | | | | 7,504 | | | | | | 19,119 | | | | | | 7,456 | | |
| Custody and accounting expense | | | | | 146 | | | | | | 13,285 | | | | | | 1,003 | | |
| Trustee fees | | | | | 19 | | | | | | 3,656 | | | | | | 5 | | |
| Offering expense | | | | | — | | | | | | — | | | | | | 11,671 | | |
| Miscellaneous expense | | | | | 7,295 | | | | | | 7,673 | | | | | | 7,642 | | |
| Total expenses | | | | | 20,111 | | | | | | 653,889 | | | | | | 30,038 | | |
| Net waived and reimbursed fees | | | | | (16,261) | | | | | | (75,927) | | | | | | (29,380) | | |
| Net expenses | | | | | 3,850 | | | | | | 577,962 | | | | | | 658 | | |
| Net investment income | | | | | 10,652 | | | | | | 1,056,227 | | | | | | 4,755 | | |
| REALIZED AND UNREALIZED GAIN (LOSS): | | | | |
| Net realized gain (loss) on: | | | | |
| Sale of affiliated underlying funds | | | | | (16,834) | | | | | | 1,896,748 | | | | | | 1,859 | | |
| Sale of unaffiliated underlying funds | | | | | (349) | | | | | | 4,489 | | | | | | 6 | | |
| Capital gain distributions from affiliated underlying funds | | | | | 38,520 | | | | | | 7,238,556 | | | | | | 10,364 | | |
| Capital gain distributions from unaffiliated underlying funds | | | | | — | | | | | | 79 | | | | | | — | | |
| Foreign currency related transactions | | | | | — | | | | | | (128) | | | | | | — | | |
| Futures | | | | | — | | | | | | (76,878) | | | | | | — | | |
| Net realized gain | | | | | 21,337 | | | | | | 9,062,866 | | | | | | 12,229 | | |
| Net change in unrealized appreciation (depreciation) on: | | | | |
| Affiliated underlying funds | | | | | (34,117) | | | | | | (11,100,125) | | | | | | (9,634) | | |
| Unaffiliated underlying funds | | | | | (2,402) | | | | | | (774,078) | | | | | | (419) | | |
| Foreign currency related transactions | | | | | — | | | | | | (207) | | | | | | — | | |
| Futures | | | | | — | | | | | | 54,848 | | | | | | — | | |
| Net change in unrealized appreciation (depreciation) | | | | | (36,519) | | | | | | (11,819,562) | | | | | | (10,053) | | |
| Net realized and unrealized gain (loss) | | | | | (15,182) | | | | | | (2,756,696) | | | | | | 2,176 | | |
| Increase (decrease) in net assets resulting from operations | | | | $ | (4,530) | | | | | $ | (1,700,469) | | | | | $ | 6,931 | | |
| |
(1)
Effective May 1, 2015, the investment management fee and administration fee were combined under a single amended and restated investment management agreement. Please see Note 4 for further information.
(2)
Commencement of operations.
See Accompanying Notes to Financial Statements
STATEMENTS OF CHANGES IN NET ASSETS
| | | | Voya Solution Aggressive Portfolio | | | Voya Solution Balanced Portfolio | |
| | | | Year Ended
December 31,
2015 | | | Year Ended
December 31,
2014 | | | Year Ended
December 31,
2015 | | | Year Ended
December 31,
2014 | |
| FROM OPERATIONS: | | | | | |
| Net investment income | | | | $ | 37,990 | | | | | $ | 25,345 | | | | | $ | 574,191 | | | | | $ | 624,261 | | |
| Net realized gain | | | | | 194,126 | | | | | | 242,971 | | | | | | 3,361,626 | | | | | | 4,803,411 | | |
| Net change in unrealized appreciation (depreciation) | | | | | (363,437) | | | | | | (121,360) | | | | | | (4,226,720) | | | | | | (2,271,831) | | |
| Increase (decrease) in net assets resulting from operations | | | | | (131,321) | | | | | | 146,956 | | | | | | (290,903) | | | | | | 3,155,841 | | |
| FROM DISTRIBUTIONS TO SHAREHOLDERS: | | | | | |
| Net investment income: | | | | | |
| Class ADV | | | | | (47,203) | | | | | | (7,127) | | | | | | (724,136) | | | | | | (492,698) | | |
| Class I | | | | | (2,457) | | | | | | (8) | | | | | | (1,464) | | | | | | (26) | | |
| Class S | | | | | (44,857) | | | | | | (6,284) | | | | | | (676,369) | | | | | | (459,274) | | |
| Class S2 | | | | | (2,927) | | | | | | (167) | | | | | | (16,597) | | | | | | (11,001) | | |
| Net realized gains: | | | | | |
| Class ADV | | | | | (96,240) | | | | | | (8,033) | | | | | | (2,180,551) | | | | | | (1,838,481) | | |
| Class I | | | | | (4,428) | | | | | | (19) | | | | | | (3,705) | | | | | | (75) | | |
| Class S | | | | | (85,945) | | | | | | (6,844) | | | | | | (1,860,233) | | | | | | (1,500,747) | | |
| Class S2 | | | | | (5,577) | | | | | | (213) | | | | | | (49,700) | | | | | | (44,553) | | |
| Total distributions | | | | | (289,634) | | | | | | (28,695) | | | | | | (5,512,755) | | | | | | (4,346,855) | | |
| FROM CAPITAL SHARE TRANSACTIONS: | | | | | |
| Net proceeds from sale of shares | | | | | 3,899,642 | | | | | | 2,928,113 | | | | | | 5,899,791 | | | | | | 6,599,193 | | |
| Reinvestment of distributions | | | | | 289,634 | | | | | | 28,695 | | | | | | 5,512,755 | | | | | | 4,346,855 | | |
| | | | | | 4,189,276 | | | | | | 2,956,808 | | | | | | 11,412,546 | | | | | | 10,946,048 | | |
| Cost of shares redeemed | | | | | (2,325,550) | | | | | | (538,538) | | | | | | (9,400,747) | | | | | | (9,181,670) | | |
| Net increase in net assets resulting from capital share transactions | | | | | 1,863,726 | | | | | | 2,418,270 | | | | | | 2,011,799 | | | | | | 1,764,378 | | |
| Net increase (decrease) in net assets | | | | | 1,442,771 | | | | | | 2,536,531 | | | | | | (3,791,859) | | | | | | 573,364 | | |
| NET ASSETS: | | | | | |
| Beginning of year or period | | | | | 3,664,509 | | | | | | 1,127,978 | | | | | | 52,058,947 | | | | | | 51,485,583 | | |
| End of year or period | | | | $ | 5,107,280 | | | | | $ | 3,664,509 | | | | | $ | 48,267,088 | | | | | $ | 52,058,947 | | |
| Undistributed net investment income at end of year or period | | | | $ | 79,719 | | | | | $ | 97,431 | | | | | $ | 969,949 | | | | | $ | 1,408,693 | | |
| |
See Accompanying Notes to Financial Statements
STATEMENTS OF CHANGES IN NET ASSETS
| | | | Voya Solution Conservative Portfolio | | | Voya Solution Income Portfolio | |
| | | | Year Ended
December 31,
2015 | | | Year Ended
December 31,
2014 | | | Year Ended
December 31,
2015 | | | Year Ended
December 31,
2014 | |
| FROM OPERATIONS: | | | | | |
| Net investment income | | | | $ | 240,782 | | | | | $ | 296,721 | | | | | $ | 4,565,044 | | | | | $ | 2,650,486 | | |
| Net realized gain | | | | | 306,825 | | | | | | 647,752 | | | | | | 4,801,141 | | | | | | 9,170,858 | | |
| Net change in unrealized appreciation (depreciation) | | | | | (642,838) | | | | | | (221,695) | | | | | | (14,960,555) | | | | | | (1,965,788) | | |
| Increase (decrease) in net assets resulting from operations | | | | | (95,231) | | | | | | 722,778 | | | | | | (5,594,370) | | | | | | 9,855,556 | | |
| FROM DISTRIBUTIONS TO SHAREHOLDERS: | | | | | |
| Net investment income: | | | | | |
| Class ADV | | | | | (263,669) | | | | | | (258,110) | | | | | | (1,908,525) | | | | | | (2,029,424) | | |
| Class I | | | | | (369) | | | | | | (98) | | | | | | (694,006) | | | | | | (696,238) | | |
| Class S | | | | | (164,946) | | | | | | (148,024) | | | | | | (1,447,689) | | | | | | (1,510,514) | | |
| Class S2 | | | | | (10,087) | | | | | | (7,699) | | | | | | (107,320) | | | | | | (99,007) | | |
| Class T | | | | | — | | | | | | — | | | | | | (1,719) | | | | | | (2,437) | | |
| Net realized gains: | | | | | |
| Class ADV | | | | | (339,072) | | | | | | (454,228) | | | | | | (2,774,895) | | | | | | — | | |
| Class I | | | | | (391) | | | | | | (143) | | | | | | (816,284) | | | | | | — | | |
| Class S | | | | | (190,593) | | | | | | (238,082) | | | | | | (1,876,766) | | | | | | — | | |
| Class S2 | | | | | (12,061) | | | | | | (13,060) | | | | | | (146,501) | | | | | | — | | |
| Class T | | | | | — | | | | | | — | | | | | | (3,225) | | | | | | — | | |
| Total distributions | | | | | (981,188) | | | | | | (1,119,444) | | | | | | (9,776,930) | | | | | | (4,337,620) | | |
| FROM CAPITAL SHARE TRANSACTIONS: | | | | | |
| Net proceeds from sale of shares | | | | | 2,704,514 | | | | | | 2,917,160 | | | | | | 24,468,475 | | | | | | 22,799,864 | | |
| Proceeds from shares issued in merger (Note 12) | | | | | — | | | | | | — | | | | | | 502,116,080 | | | | | | — | | |
| Reinvestment of distributions | | | | | 980,967 | | | | | | 1,119,445 | | | | | | 9,776,930 | | | | | | 4,337,620 | | |
| | | | | | 3,685,481 | | | | | | 4,036,605 | | | | | | 536,361,485 | | | | | | 27,137,484 | | |
| Cost of shares redeemed | | | | | (5,820,892) | | | | | | (3,264,309) | | | | | | (100,672,020) | | | | | | (51,121,212) | | |
| Net increase (decrease) in net assets resulting from capital share transactions | | | | | (2,135,411) | | | | | | 772,296 | | | | | | 435,689,465 | | | | | | (23,983,728) | | |
| Net increase (decrease) in net assets | | | | | (3,211,830) | | | | | | 375,630 | | | | | | 420,318,165 | | | | | | (18,465,792) | | |
| NET ASSETS: | | | | | |
| Beginning of year or period | | | | | 17,715,452 | | | | | | 17,339,822 | | | | | | 168,437,350 | | | | | | 186,903,142 | | |
| End of year or period | | | | $ | 14,503,622 | | | | | $ | 17,715,452 | | | | | $ | 588,755,515 | | | | | $ | 168,437,350 | | |
| Undistributed net investment income at end of year or period | | | | $ | 304,540 | | | | | $ | 431,248 | | | | | $ | 5,704,462 | | | | | $ | 4,118,565 | | |
| |
See Accompanying Notes to Financial Statements
STATEMENTS OF CHANGES IN NET ASSETS
| | | | Voya Solution Moderately
Aggressive Portfolio | | | Voya Solution Moderately
Conservative Portfolio | |
| | | | Year Ended
December 31,
2015 | | | Year Ended
December 31,
2014 | | | Year Ended
December 31,
2015 | | | Year Ended
December 31,
2014 | |
| FROM OPERATIONS: | | | | | |
| Net investment income | | | | $ | 5,540,845 | | | | | $ | 302,350 | | | | | $ | 533,264 | | | | | $ | 648,845 | | |
| Net realized gain | | | | | 10,904,776 | | | | | | 3,774,720 | | | | | | 2,219,539 | | | | | | 2,924,891 | | |
| Net change in unrealized appreciation (depreciation) | | | | | (47,890,854) | | | | | | (2,144,827) | | | | | | (2,910,960) | | | | | | (1,195,117) | | |
| Increase (decrease) in net assets resulting from operations | | | | | (31,445,233) | | | | | | 1,932,243 | | | | | | (158,157) | | | | | | 2,378,619 | | |
| FROM DISTRIBUTIONS TO SHAREHOLDERS: | | | | | |
| Net investment income: | | | | | |
| Class ADV | | | | | (571,200) | | | | | | (281,227) | | | | | | (574,383) | | | | | | (448,243) | | |
| Class I | | | | | (2,819) | | | | | | (78) | | | | | | (1,147) | | | | | | (29) | | |
| Class S | | | | | (316,380) | | | | | | (199,025) | | | | | | (563,437) | | | | | | (528,003) | | |
| Class S2 | | | | | (28,735) | | | | | | (13,714) | | | | | | (25,478) | | | | | | (15,919) | | |
| Net realized gains: | | | | | |
| Class ADV | | | | | (2,042,964) | | | | | | (1,312,300) | | | | | | (1,294,485) | | | | | | (1,274,824) | | |
| Class I | | | | | (8,662) | | | | | | (282) | | | | | | (2,177) | | | | | | (66) | | |
| Class S | | | | | (1,067,852) | | | | | | (818,999) | | | | | | (1,180,760) | | | | | | (1,329,118) | | |
| Class S2 | | | | | (96,371) | | | | | | (51,669) | | | | | | (53,881) | | | | | | (42,168) | | |
| Total distributions | | | | | (4,134,983) | | | | | | (2,677,294) | | | | | | (3,695,748) | | | | | | (3,638,370) | | |
| FROM CAPITAL SHARE TRANSACTIONS: | | | | | |
| Net proceeds from sale of shares | | | | | 8,915,955 | | | | | | 7,817,156 | | | | | | 8,095,674 | | | | | | 8,005,489 | | |
| Proceeds from shares issued in merger (Note 12) | | | | | 812,445,061 | | | | | | — | | | | | | — | | | | | | — | | |
| Reinvestment of distributions | | | | | 4,134,983 | | | | | | 2,677,295 | | | | | | 3,695,748 | | | | | | 3,638,370 | | |
| | | | | | 825,495,999 | | | | | | 10,494,451 | | | | | | 11,791,422 | | | | | | 11,643,859 | | |
| Cost of shares redeemed | | | | | (66,302,153) | | | | | | (6,656,733) | | | | | | (9,954,124) | | | | | | (12,099,886) | | |
| Net increase (decrease) in net assets resulting from capital share transactions | | | | | 759,193,846 | | | | | | 3,837,718 | | | | | | 1,837,298 | | | | | | (456,027) | | |
| Net increase (decrease) in net assets | | | | | 723,613,630 | | | | | | 3,092,667 | | | | | | (2,016,607) | | | | | | (1,715,778) | | |
| NET ASSETS: | | | | | |
| Beginning of year or period | | | | | 32,196,501 | | | | | | 29,103,834 | | | | | | 44,888,921 | | | | | | 46,604,699 | | |
| End of year or period | | | | $ | 755,810,131 | | | | | $ | 32,196,501 | | | | | $ | 42,872,314 | | | | | $ | 44,888,921 | | |
| Undistributed net investment income at end of year or period | | | | $ | 8,487,428 | | | | | $ | 916,562 | | | | | $ | 806,668 | | | | | $ | 1,155,062 | | |
| |
See Accompanying Notes to Financial Statements
STATEMENTS OF CHANGES IN NET ASSETS
| | | | Voya Solution 2020 Portfolio | | | Voya Solution 2025 Portfolio | |
| | | | Year Ended
December 31,
2015 | | | Year Ended
December 31,
2014 | | | Year Ended
December 31,
2015 | | | Year Ended
December 31,
2014 | |
| FROM OPERATIONS: | | | | | |
| Net investment income | | | | $ | 57,081 | | | | | $ | 5,818 | | | | | $ | 12,142,052 | | | | | $ | 14,147,140 | | |
| Net realized gain | | | | | 62,041 | | | | | | 28,077 | | | | | | 79,656,406 | | | | | | 133,853,533 | | |
| Net change in unrealized appreciation (depreciation) | | | | | (114,868) | | | | | | (13,548) | | | | | | (91,093,462) | | | | | | (82,456,837) | | |
| Increase in net assets resulting from operations | | | | | 4,254 | | | | | | 20,347 | | | | | | 704,996 | | | | | | 65,543,836 | | |
| FROM DISTRIBUTIONS TO SHAREHOLDERS: | | | | | |
| Net investment income: | | | | | |
| Class ADV | | | | | (13,688) | | | | | | (390) | | | | | | (10,970,091) | | | | | | (7,770,543) | | |
| Class I | | | | | (195) | | | | | | — | | | | | | (7,433,439) | | | | | | (5,167,433) | | |
| Class S | | | | | (183) | | | | | | — | | | | | | (14,388,544) | | | | | | (9,839,537) | | |
| Class S2 | | | | | (176) | | | | | | — | | | | | | (911,625) | | | | | | (626,978) | | |
| Class T | | | | | (169) | | | | | | — | | | | | | (10,324) | | | | | | (51,109) | | |
| Net realized gains: | | | | | |
| Class ADV | | | | | (18,880) | | | | | | (1,614) | | | | | | (38,955,867) | | | | | | (22,007,158) | | |
| Class I | | | | | (238) | | | | | | (11) | | | | | | (21,794,551) | | | | | | (11,058,574) | | |
| Class S | | | | | (238) | | | | | | (12) | | | | | | (45,794,442) | | | | | | (23,887,292) | | |
| Class S2 | | | | | (238) | | | | | | (11) | | | | | | (3,108,350) | | | | | | (1,695,494) | | |
| Class T | | | | | (238) | | | | | | (11) | | | | | | (87,705) | | | | | | (153,305) | | |
| Total distributions | | | | | (34,243) | | | | | | (2,049) | | | | | | (143,454,938) | | | | | | (82,257,423) | | |
| FROM CAPITAL SHARE TRANSACTIONS: | | | | | |
| Net proceeds from sale of shares | | | | | 10,083,488 | | | | | | 612,209 | | | | | | 118,002,074 | | | | | | 137,902,204 | | |
| Reinvestment of distributions | | | | | 32,574 | | | | | | 2,049 | | | | | | 143,454,938 | | | | | | 82,257,423 | | |
| | | | | | 10,116,062 | | | | | | 614,258 | | | | | | 261,457,012 | | | | | | 220,159,627 | | |
| Cost of shares redeemed | | | | | (1,291,607) | | | | | | (3,935) | | | | | | (264,465,132) | | | | | | (348,688,179) | | |
Net increase (decrease) in net assets resulting from capital share
transactions | | | | | 8,824,455 | | | | | | 610,323 | | | | | | (3,008,120) | | | | | | (128,528,552) | | |
| Net increase (decrease) in net assets | | | | | 8,794,466 | | | | | | 628,621 | | | | | | (145,758,062) | | | | | | (145,242,139) | | |
| NET ASSETS: | | | | | |
| Beginning of year or period | | | | | 647,058 | | | | | | 18,437 | | | | | | 1,154,958,174 | | | | | | 1,300,200,313 | | |
| End of year or period | | | | $ | 9,441,524 | | | | | $ | 647,058 | | | | | $ | 1,009,200,112 | | | | | $ | 1,154,958,174 | | |
| Undistributed net investment income at end of year or period | | | | $ | 71,599 | | | | | $ | 14,270 | | | | | $ | 19,413,501 | | | | | $ | 33,444,752 | | |
| |
See Accompanying Notes to Financial Statements
STATEMENTS OF CHANGES IN NET ASSETS
| | | | Voya Solution 2030 Portfolio | | | Voya Solution 2035 Portfolio | |
| | | | Year Ended
December 31,
2015 | | | Year Ended
December 31,
2014 | | | Year Ended
December 31,
2015 | | | Year Ended
December 31,
2014 | |
| FROM OPERATIONS: | | | | | |
| Net investment income | | | | $ | 27,284 | | | | | $ | 1,771 | | | | | $ | 10,849,741 | | | | | $ | 11,799,947 | | |
| Net realized gain | | | | | 32,015 | | | | | | 18,000 | | | | | | 82,911,381 | | | | | | 139,950,207 | | |
| Net change in unrealized appreciation (depreciation) | | | | | (68,356) | | | | | | (5,697) | | | | | | (97,689,028) | | | | | | (92,469,894) | | |
| Increase (decrease) in net assets resulting from operations | | | | | (9,057) | | | | | | 14,074 | | | | | | (3,927,906) | | | | | | 59,280,260 | | |
| FROM DISTRIBUTIONS TO SHAREHOLDERS: | | | | | |
| Net investment income: | | | | | |
| Class ADV | | | | | (3,964) | | | | | | (374) | | | | | | (9,275,972) | | | | | | (6,802,252) | | |
| Class I | | | | | (1,232) | | | | | | — | | | | | | (8,012,932) | | | | | | (5,095,144) | | |
| Class S | | | | | (51) | | | | | | — | | | | | | (13,253,942) | | | | | | (8,668,342) | | |
| Class S2 | | | | | (48) | | | | | | — | | | | | | (727,376) | | | | | | (579,632) | | |
| Class T | | | | | (39) | | | | | | — | | | | | | (15,578) | | | | | | (35,193) | | |
| Net realized gains: | | | | | |
| Class ADV | | | | | (11,578) | | | | | | (1,930) | | | | | | (38,056,781) | | | | | | (32,474,750) | | |
| Class I | | | | | (2,860) | | | | | | (30) | | | | | | (27,087,345) | | | | | | (18,565,782) | | |
| Class S | | | | | (169) | | | | | | (31) | | | | | | (48,462,268) | | | | | | (35,967,415) | | |
| Class S2 | | | | | (169) | | | | | | (31) | | | | | | (2,896,790) | | | | | | (2,623,213) | | |
| Class T | | | | | (169) | | | | | | (31) | | | | | | (100,161) | | | | | | (193,251) | | |
| Total distributions | | | | | (20,279) | | | | | | (2,427) | | | | | | (147,889,145) | | | | | | (111,004,974) | | |
| FROM CAPITAL SHARE TRANSACTIONS: | | | | | |
| Net proceeds from sale of shares | | | | | 4,050,320 | | | | | | 267,213 | | | | | | 132,031,334 | | | | | | 133,124,882 | | |
| Reinvestment of distributions | | | | | 19,396 | | | | | | 2,425 | | | | | | 147,889,145 | | | | | | 111,004,974 | | |
| | | | | | 4,069,716 | | | | | | 269,638 | | | | | | 279,920,479 | | | | | | 244,129,856 | | |
| Cost of shares redeemed | | | | | (284,913) | | | | | | (127,607) | | | | | | (241,552,464) | | | | | | (306,797,936) | | |
Net increase (decrease) in net assets resulting from capital share
transactions | | | | | 3,784,803 | | | | | | 142,031 | | | | | | 38,368,015 | | | | | | (62,668,080) | | |
| Net increase (decrease) in net assets | | | | | 3,755,467 | | | | | | 153,678 | | | | | | (113,449,036) | | | | | | (114,392,794) | | |
| NET ASSETS: | | | | | |
| Beginning of year or period | | | | | 173,658 | | | | | | 19,980 | | | | | | 1,041,126,403 | | | | | | 1,155,519,197 | | |
| End of year or period | | | | $ | 3,929,125 | | | | | $ | 173,658 | | | | | $ | 927,677,367 | | | | | $ | 1,041,126,403 | | |
| Undistributed net investment income at end of year or period | | | | $ | 34,930 | | | | | $ | 5,333 | | | | | $ | 18,484,561 | | | | | $ | 31,270,051 | | |
| |
See Accompanying Notes to Financial Statements
STATEMENTS OF CHANGES IN NET ASSETS
| | | | Voya Solution 2040 Portfolio | | | Voya Solution 2045 Portfolio | |
| | | | Year Ended
December 31,
2015 | | | Year Ended
December 31,
2014 | | | Year Ended
December 31,
2015 | | | Year Ended
December 31,
2014 | |
| FROM OPERATIONS: | | | | | |
| Net investment income | | | | $ | 24,315 | | | | | $ | 5,456 | | | | | $ | 5,873,825 | | | | | $ | 5,939,457 | | |
| Net realized gain | | | | | 27,859 | | | | | | 49,057 | | | | | | 59,565,361 | | | | | | 120,946,019 | | |
| Net change in unrealized appreciation (depreciation) | | | | | (57,581) | | | | | | (22,406) | | | | | | (70,781,842) | | | | | | (82,592,079) | | |
| Increase (decrease) in net assets resulting from operations | | | | | (5,407) | | | | | | 32,107 | | | | | | (5,342,656) | | | | | | 44,293,397 | | |
| FROM DISTRIBUTIONS TO SHAREHOLDERS: | | | | | |
| Net investment income: | | | | | |
| Class ADV | | | | | (19,082) | | | | | | (346) | | | | | | (5,806,658) | | | | | | (3,656,571) | | |
| Class I | | | | | (119) | | | | | | — | | | | | | (5,832,169) | | | | | | (3,392,204) | | |
| Class S | | | | | (104) | | | | | | — | | | | | | (8,956,275) | | | | | | (5,059,363) | | |
| Class S2 | | | | | (100) | | | | | | — | | | | | | (423,849) | | | | | | (283,975) | | |
| Class T | | | | | (88) | | | | | | — | | | | | | (5,671) | | | | | | (15,222) | | |
| Net realized gains: | | | | | |
| Class ADV | | | | | (37,793) | | | | | | (2,368) | | | | | | (31,366,475) | | | | | | (25,471,735) | | |
| Class I | | | | | (209) | | | | | | (16) | | | | | | (25,860,796) | | | | | | (17,512,336) | | |
| Class S | | | | | (209) | | | | | | (16) | | | | | | (43,087,460) | | | | | | (30,526,941) | | |
| Class S2 | | | | | (209) | | | | | | (16) | | | | | | (2,223,782) | | | | | | (1,899,842) | | |
| Class T | | | | | (209) | | | | | | (17) | | | | | | (56,087) | | | | | | (117,244) | | |
| Total distributions | | | | | (58,122) | | | | | | (2,779) | | | | | | (123,619,222) | | | | | | (87,935,433) | | |
| FROM CAPITAL SHARE TRANSACTIONS: | | | | | |
| Net proceeds from sale of shares | | | | | 3,416,687 | | | | | | 802,761 | | | | | | 104,390,931 | | | | | | 114,754,136 | | |
| Reinvestment of distributions | | | | | 56,880 | | | | | | 2,779 | | | | | | 123,619,222 | | | | | | 87,935,433 | | |
| | | | | | 3,473,567 | | | | | | 805,540 | | | | | | 228,010,153 | | | | | | 202,689,569 | | |
| Cost of shares redeemed | | | | | (788,865) | | | | | | (136,869) | | | | | | (168,987,078) | | | | | | (234,645,609) | | |
| Net increase (decrease) in net assets resulting from capital share transactions | | | | | 2,684,702 | | | | | | 668,671 | | | | | | 59,023,075 | | | | | | (31,956,040) | | |
| Net increase (decrease) in net assets | | | | | 2,621,173 | | | | | | 697,999 | | | | | | (69,938,803) | | | | | | (75,598,076) | | |
| NET ASSETS: | | | | | |
| Beginning of year or period | | | | | 719,196 | | | | | | 21,197 | | | | | | 720,641,339 | | | | | | 796,239,415 | | |
| End of year or period | | | | $ | 3,340,369 | | | | | $ | 719,196 | | | | | $ | 650,702,536 | | | | | $ | 720,641,339 | | |
| Undistributed net investment income at end of year or period | | | | $ | 35,885 | | | | | $ | 19,490 | | | | | $ | 10,360,171 | | | | | $ | 21,014,258 | | |
| |
See Accompanying Notes to Financial Statements
STATEMENTS OF CHANGES IN NET ASSETS
| | | | Voya Solution 2050 Portfolio | | | Voya Solution 2055 Portfolio | |
| | | | Year Ended
December 31,
2015 | | | Year Ended
December 31,
2014 | | | Year Ended
December 31,
2015 | | | Year Ended
December 31,
2014 | |
| FROM OPERATIONS: | | | | | |
| Net investment income | | | | $ | 10,652 | | | | | $ | 2,536 | | | | | $ | 1,056,227 | | | | | $ | 869,325 | | |
| Net realized gain | | | | | 21,337 | | | | | | 26,439 | | | | | | 9,062,866 | | | | | | 13,537,927 | | |
| Net change in unrealized appreciation (depreciation) | | | | | (36,519) | | | | | | (12,063) | | | | | | (11,819,562) | | | | | | (8,152,837) | | |
| Increase (decrease) in net assets resulting from operations | | | | | (4,530) | | | | | | 16,912 | | | | | | (1,700,469) | | | | | | 6,254,415 | | |
| FROM DISTRIBUTIONS TO SHAREHOLDERS: | | | | | |
| Net investment income: | | | | | |
| Class ADV | | | | | (9,415) | | | | | | (322) | | | | | | (927,010) | | | | | | (443,228) | | |
| Class I | | | | | (118) | | | | | | — | | | | | | (877,070) | | | | | | (327,350) | | |
| Class S | | | | | (104) | | | | | | — | | | | | | (1,196,206) | | | | | | (517,436) | | |
| Class S2 | | | | | (99) | | | | | | — | | | | | | (68,106) | | | | | | (32,356) | | |
| Class T | | | | | (89) | | | | | | — | | | | | | — | | | | | | (569) | | |
| Net realized gains: | | | | | |
| Class ADV | | | | | (19,432) | | | | | | (2,393) | | | | | | (3,822,880) | | | | | | (2,181,949) | | |
| Class I | | | | | (221) | | | | | | (33) | | | | | | (3,009,474) | | | | | | (1,227,740) | | |
| Class S | | | | | (221) | | | | | | (34) | | | | | | (4,426,890) | | | | | | (2,218,869) | | |
| Class S2 | | | | | (221) | | | | | | (33) | | | | | | (268,925) | | | | | | (147,095) | | |
| Class T | | | | | (221) | | | | | | (33) | | | | | | (628) | | | | | | (2,909) | | |
| Total distributions | | | | | (30,141) | | | | | | (2,848) | | | | | | (14,597,189) | | | | | | (7,099,501) | | |
| FROM CAPITAL SHARE TRANSACTIONS: | | | | | |
| Net proceeds from sale of shares | | | | | 1,558,673 | | | | | | 343,577 | | | | | | 49,522,854 | | | | | | 45,678,343 | | |
| Reinvestment of distributions | | | | | 28,852 | | | | | | 2,848 | | | | | | 14,597,187 | | | | | | 7,099,501 | | |
| | | | | | 1,587,525 | | | | | | 346,425 | | | | | | 64,120,041 | | | | | | 52,777,844 | | |
| Cost of shares redeemed | | | | | (247,971) | | | | | | (8,517) | | | | | | (29,052,084) | | | | | | (33,424,354) | | |
| Net increase in net assets resulting from capital share transactions | | | | | 1,339,554 | | | | | | 337,908 | | | | | | 35,067,957 | | | | | | 19,353,490 | | |
| Net increase in net assets | | | | | 1,304,883 | | | | | | 351,972 | | | | | | 18,770,299 | | | | | | 18,508,404 | | |
| NET ASSETS: | | | | | |
| Beginning of year or period | | | | | 373,350 | | | | | | 21,378 | | | | | | 109,627,373 | | | | | | 91,118,969 | | |
| End of year or period | | | | $ | 1,678,233 | | | | | $ | 373,350 | | | | | $ | 128,397,672 | | | | | $ | 109,627,373 | | |
| Undistributed net investment income at end of year or period | | | | $ | 15,896 | | | | | $ | 9,823 | | | | | $ | 1,887,097 | | | | | $ | 3,067,766 | | |
| |
See Accompanying Notes to Financial Statements
STATEMENTS OF CHANGES IN NET ASSETS
| | | | Voya Solution
2060 Portfolio | |
| | | | February 9, 2015(1)
to December 31,
2015 | |
| FROM OPERATIONS: | | |
| Net investment income | | | | $ | 4,755 | | |
| Net realized gain | | | | | 12,229 | | |
| Net change in unrealized appreciation (depreciation) | | | | | (10,053) | | |
| Increase in net assets resulting from operations | | | | | 6,931 | | |
| FROM DISTRIBUTIONS TO SHAREHOLDERS: | | | | | | | |
| Total distributions | | | | | — | | |
| FROM CAPITAL SHARE TRANSACTIONS: | | |
| Net proceeds from sale of shares | | | | | 749,836 | | |
| | | | | | 749,836 | | |
| Cost of shares redeemed | | | | | (80,599) | | |
| Net increase in net assets resulting from capital share transactions | | | | | 669,237 | | |
| Net increase in net assets | | | | | 676,168 | | |
| NET ASSETS: | | |
| Beginning of year or period | | | | | — | | |
| End of year or period | | | | $ | 676,168 | | |
| Undistributed net investment income at end of year or period | | | | $ | 6,453 | | |
| |
(1)
Commencement of operations.
See Accompanying Notes to Financial Statements
Selected data for a share of beneficial interest outstanding throughout each year or period.
| | | | | | | | | | Income
(loss) from
investment
operations | | | | | | | | | Less
Distributions | | | | | | | | | | | | | | | | | | | | | | | | | | | Ratios to average
net assets | | | Supplemental
Data | |
| | | | Net asset value, beginning of year
or period | | | Net investment income (loss) | | | Net realized and unrealized
gain (loss) | | | Total from investment operations | | | From net investment income | | | From net realized gains | | | From return of capital | | | Total distributions | | | Payment by affiliate | | | Net asset value, end of year
or period | | | Total Return(1) | | | Expenses before
reductions/additions(2)(3)(4) | | | Expenses net of fee waivers
and/or recoupments if any(2)(3)(4) | | | Expense net of all
reductions/additions(2)(3)(4) | | | Net investment income (loss)(2)(3) | | | Net assets, end of year or period | | | Portfolio turnover rate | |
Year or
period ended | | | ($) | | | ($) | | | ($) | | | ($) | | | ($) | | | ($) | | | ($) | | | ($) | | | ($) | | | ($) | | | (%) | | | (%) | | | (%) | | | (%) | | | (%) | | | ($000’s) | | | (%) | |
| Voya Solution Aggressive Portfolio | | | | | | | | | | | | | | | | | | | | | | | | | | | | | | | | | | | | | | | | | | | | | | | | | | | | | | | | | | | | | | | | | | | | | | | | | | | | | | | | | | | | | | | | | | | | | | | | | | | | | | | |
| Class ADV | | | | | | | | | | | | | | | | | | | | | | | | | | | | | | | | | | | | | | | | | | | | | | | | | | | | | | | | | | | | | | | | | | | | | | | | | | | | | | | | | | | | | | | | | | | | | | | | | | | | | | | |
| 12-31-15 | | | | | 12.13 | | | | | | 0.06• | | | | | | (0.19) | | | | | | (0.13) | | | | | | 0.21 | | | | | | 0.44 | | | | | | — | | | | | | 0.65 | | | | | | — | | | | | | 11.35 | | | | | | (1.32) | | | | | | 0.94 | | | | | | 0.68 | | | | | | 0.68 | | | | | | 0.53 | | | | | | 2,383 | | | | | | 78 | | |
| 12-31-14 | | | | | 11.55 | | | | | | 0.13• | | | | | | 0.57 | | | | | | 0.70 | | | | | | 0.06 | | | | | | 0.06 | | | | | | — | | | | | | 0.12 | | | | | | — | | | | | | 12.13 | | | | | | 6.10 | | | | | | 1.26 | | | | | | 0.65 | | | | | | 0.65 | | | | | | 1.12 | | | | | | 2,180 | | | | | | 70 | | |
| 05-01-13(5) - 12-31-13 | | | | | 10.00 | | | | | | 0.19• | | | | | | 1.36 | | | | | | 1.55 | | | | | | — | | | | | | — | | | | | | — | | | | | | — | | | | | | — | | | | | | 11.55 | | | | | | 15.50 | | | | | | 12.00 | | | | | | 0.56 | | | | | | 0.56 | | | | | | 2.55 | | | | | | 496 | | | | | | 35 | | |
| Class I | | | | | | | | | | | | | | | | | | | | | | | | | | | | | | | | | | | | | | | | | | | | | | | | | | | | | | | | | | | | | | | | | | | | | | | | | | | | | | | | | | | | | | | | | | | | | | | | | | | | | | | |
| 12-31-15 | | | | | 12.32 | | | | | | 0.19• | | | | | | (0.26) | | | | | | (0.07) | | | | | | 0.24 | | | | | | 0.44 | | | | | | — | | | | | | 0.68 | | | | | | — | | | | | | 11.57 | | | | | | (0.83) | | | | | | 0.44 | | | | | | 0.18 | | | | | | 0.18 | | | | | | 1.56 | | | | | | 138 | | | | | | 78 | | |
| 12-31-14 | | | | | 11.65 | | | | | | 0.24• | | | | | | 0.52 | | | | | | 0.76 | | | | | | 0.03 | | | | | | 0.06 | | | | | | — | | | | | | 0.09 | | | | | | — | | | | | | 12.32 | | | | | | 6.56 | | | | | | 0.76 | | | | | | 0.15 | | | | | | 0.15 | | | | | | 2.01 | | | | | | 12 | | | | | | 70 | | |
| 05-01-13(5) - 12-31-13 | | | | | 10.00 | | | | | | 0.29• | | | | | | 1.36 | | | | | | 1.65 | | | | | | — | | | | | | — | | | | | | — | | | | | | — | | | | | | — | | | | | | 11.65 | | | | | | 16.50 | | | | | | 11.50 | | | | | | 0.06 | | | | | | 0.06 | | | | | | 3.99 | | | | | | 4 | | | | | | 35 | | |
| Class S | | | | | | | | | | | | | | | | | | | | | | | | | | | | | | | | | | | | | | | | | | | | | | | | | | | | | | | | | | | | | | | | | | | | | | | | | | | | | | | | | | | | | | | | | | | | | | | | | | | | | | | |
| 12-31-15 | | | | | 12.23 | | | | | | 0.13• | | | | | | (0.23) | | | | | | (0.10) | | | | | | 0.23 | | | | | | 0.44 | | | | | | — | | | | | | 0.67 | | | | | | — | | | | | | 11.46 | | | | | | (1.12) | | | | | | 0.69 | | | | | | 0.43 | | | | | | 0.43 | | | | | | 1.04 | | | | | | 2,417 | | | | | | 78 | | |
| 12-31-14 | | | | | 11.63 | | | | | | 0.11• | | | | | | 0.61 | | | | | | 0.72 | | | | | | 0.06 | | | | | | 0.06 | | | | | | — | | | | | | 0.12 | | | | | | — | | | | | | 12.23 | | | | | | 6.25 | | | | | | 1.01 | | | | | | 0.40 | | | | | | 0.40 | | | | | | 0.92 | | | | | | 1,395 | | | | | | 70 | | |
| 05-01-13(5) - 12-31-13 | | | | | 10.00 | | | | | | 0.28• | | | | | | 1.35 | | | | | | 1.63 | | | | | | — | | | | | | — | | | | | | — | | | | | | — | | | | | | — | | | | | | 11.63 | | | | | | 16.30 | | | | | | 11.75 | | | | | | 0.31 | | | | | | 0.31 | | | | | | 3.73 | | | | | | 591 | | | | | | 35 | | |
| Class S2 | | | | | | | | | | | | | | | | | | | | | | | | | | | | | | | | | | | | | | | | | | | | | | | | | | | | | | | | | | | | | | | | | | | | | | | | | | | | | | | | | | | | | | | | | | | | | | | | | | | | | | | |
| 12-31-15 | | | | | 12.14 | | | | | | 0.11• | | | | | | (0.22) | | | | | | (0.11) | | | | | | 0.23 | | | | | | 0.44 | | | | | | — | | | | | | 0.67 | | | | | | — | | | | | | 11.36 | | | | | | (1.20) | | | | | | 0.94 | | | | | | 0.58 | | | | | | 0.58 | | | | | | 0.93 | | | | | | 169 | | | | | | 78 | | |
| 12-31-14 | | | | | 11.56 | | | | | | 0.18• | | | | | | 0.51 | | | | | | 0.69 | | | | | | 0.05 | | | | | | 0.06 | | | | | | — | | | | | | 0.11 | | | | | | — | | | | | | 12.14 | | | | | | 6.04 | | | | | | 1.26 | | | | | | 0.55 | | | | | | 0.55 | | | | | | 1.54 | | | | | | 78 | | | | | | 70 | | |
| 05-01-13(5) - 12-31-13 | | | | | 10.00 | | | | | | 0.23• | | | | | | 1.33 | | | | | | 1.56 | | | | | | — | | | | | | — | | | | | | — | | | | | | — | | | | | | — | | | | | | 11.56 | | | | | | 15.60 | | | | | | 12.00 | | | | | | 0.46 | | | | | | 0.46 | | | | | | 3.12 | | | | | | 38 | | | | | | 35 | | |
| Voya Solution Balanced Portfolio | | | | | | | | | | | | | | | | | | | | | | | | | | | | | | | | | | | | | | | | | | | | | | | | | | | | | | | | | | | | | | | | | | | | | | | | | | | | | | | | | | | | | | | | | | | | | | | | | | | | | | | |
| Class ADV | | | | | | | | | | | | | | | | | | | | | | | | | | | | | | | | | | | | | | | | | | | | | | | | | | | | | | | | | | | | | | | | | | | | | | | | | | | | | | | | | | | | | | | | | | | | | | | | | | | | | | | |
| 12-31-15 | | | | | 10.57 | | | | | | 0.10• | | | | | | (0.14) | | | | | | (0.04) | | | | | | 0.28 | | | | | | 0.86 | | | | | | — | | | | | | 1.14 | | | | | | — | | | | | | 9.39 | | | | | | (0.72) | | | | | | 0.78 | | | | | | 0.65 | | | | | | 0.65 | | | | | | 0.97 | | | | | | 25,079 | | | | | | 49 | | |
| 12-31-14 | | | | | 10.88 | | | | | | 0.12 | | | | | | 0.52 | | | | | | 0.64 | | | | | | 0.20 | | | | | | 0.75 | | | | | | — | | | | | | 0.95 | | | | | | — | | | | | | 10.57 | | | | | | 6.14 | | | | | | 0.78 | | | | | | 0.64 | | | | | | 0.64 | | | | | | 1.09 | | | | | | 28,237 | | | | | | 61 | | |
| 12-31-13 | | | | | 9.84 | | | | | | 0.10• | | | | | | 1.38 | | | | | | 1.48 | | | | | | 0.20 | | | | | | 0.24 | | | | | | — | | | | | | 0.44 | | | | | | — | | | | | | 10.88 | | | | | | 15.39 | | | | | | 0.78 | | | | | | 0.63 | | | | | | 0.63 | | | | | | 0.97 | | | | | | 27,369 | | | | | | 78 | | |
| 12-31-12 | | | | | 8.84 | | | | | | 0.14• | | | | | | 1.03 | | | | | | 1.17 | | | | | | 0.14 | | | | | | 0.03 | | | | | | — | | | | | | 0.17 | | | | | | — | | | | | | 9.84 | | | | | | 13.35 | | | | | | 0.71 | | | | | | 0.62 | | | | | | 0.62 | | | | | | 1.44 | | | | | | 24,244 | | | | | | 75 | | |
| 12-31-11 | | | | | 9.16 | | | | | | 0.24• | | | | | | (0.49) | | | | | | (0.25) | | | | | | 0.03 | | | | | | 0.04 | | | | | | — | | | | | | 0.07 | | | | | | — | | | | | | 8.84 | | | | | | (2.68) | | | | | | 0.62 | | | | | | 0.62 | | | | | | 0.62 | | | | | | 2.63 | | | | | | 16,050 | | | | | | 70 | | |
| Class I | | | | | | | | | | | | | | | | | | | | | | | | | | | | | | | | | | | | | | | | | | | | | | | | | | | | | | | | | | | | | | | | | | | | | | | | | | | | | | | | | | | | | | | | | | | | | | | | | | | | | | | |
| 12-31-15 | | | | | 10.90 | | | | | | 0.18• | | | | | | (0.16) | | | | | | 0.02 | | | | | | 0.34 | | | | | | 0.86 | | | | | | — | | | | | | 1.20 | | | | | | — | | | | | | 9.72 | | | | | | (0.19) | | | | | | 0.28 | | | | | | 0.15 | | | | | | 0.15 | | | | | | 1.72 | | | | | | 59 | | | | | | 49 | | |
| 12-31-14 | | | | | 11.19 | | | | | | 0.27• | | | | | | 0.45 | | | | | | 0.72 | | | | | | 0.26 | | | | | | 0.75 | | | | | | — | | | | | | 1.01 | | | | | | — | | | | | | 10.90 | | | | | | 6.66 | | | | | | 0.28 | | | | | | 0.14 | | | | | | 0.14 | | | | | | 2.53 | | | | | | 23 | | | | | | 61 | | |
| 12-31-13 | | | | | 10.10 | | | | | | 0.16 | | | | | | 1.42 | | | | | | 1.58 | | | | | | 0.25 | | | | | | 0.24 | | | | | | — | | | | | | 0.49 | | | | | | — | | | | | | 11.19 | | | | | | 15.93 | | | | | | 0.28 | | | | | | 0.13 | | | | | | 0.13 | | | | | | 1.49 | | | | | | 1 | | | | | | 78 | | |
| 12-31-12 | | | | | 9.05 | | | | | | 0.18 | | | | | | 1.06 | | | | | | 1.24 | | | | | | 0.16 | | | | | | 0.03 | | | | | | — | | | | | | 0.19 | | | | | | — | | | | | | 10.10 | | | | | | 13.86 | | | | | | 0.21 | | | | | | 0.12 | | | | | | 0.12 | | | | | | 1.85 | | | | | | 1 | | | | | | 75 | | |
| 12-31-11 | | | | | 9.33 | | | | | | 0.26 | | | | | | (0.47) | | | | | | (0.21) | | | | | | 0.03 | | | | | | 0.04 | | | | | | — | | | | | | 0.07 | | | | | | — | | | | | | 9.05 | | | | | | (2.17) | | | | | | 0.12 | | | | | | 0.12 | | | | | | 0.12 | | | | | | 2.78 | | | | | | 1 | | | | | | 70 | | |
See Accompanying Notes to Financial Statements
Financial Highlights (continued)
| | | | | | | | | | Income
(loss) from
investment
operations | | | | | | | | | Less
Distributions | | | | | | | | | | | | | | | | | | | | | | | | | | | Ratios to average
net assets | | | Supplemental
Data | |
| | | | Net asset value, beginning of year
or period | | | Net investment income (loss) | | | Net realized and unrealized
gain (loss) | | | Total from investment operations | | | From net investment income | | | From net realized gains | | | From return of capital | | | Total distributions | | | Payment by affiliate | | | Net asset value, end of year
or period | | | Total Return(1) | | | Expenses before
reductions/additions(2)(3)(4) | | | Expenses net of fee waivers
and/or recoupments if any(2)(3)(4) | | | Expense net of all
reductions/additions(2)(3)(4) | | | Net investment income (loss)(2)(3) | | | Net assets, end of year or period | | | Portfolio turnover rate | |
Year or
period ended | | | ($) | | | ($) | | | ($) | | | ($) | | | ($) | | | ($) | | | ($) | | | ($) | | | ($) | | | ($) | | | (%) | | | (%) | | | (%) | | | (%) | | | (%) | | | ($000’s) | | | (%) | |
| Voya Solution Balanced Portfolio (continued) | | | | | | | | | | | | | | | | | | | | | | | | | | | | | | | | | | | | | | | | | | | | | | | | | | | | | | | | | | | | | | | | | | | | | | | | | | | | | | | | | | | | | | | | | | | | | | | | | | | | | | | |
| Class S | | | | | | | | | | | | | | | | | | | | | | | | | | | | | | | | | | | | | | | | | | | | | | | | | | | | | | | | | | | | | | | | | | | | | | | | | | | | | | | | | | | | | | | | | | | | | | | | | | | | | | | |
| 12-31-15 | | | | | 10.70 | | | | | | 0.13 | | | | | | (0.14) | | | | | | (0.01) | | | | | | 0.31 | | | | | | 0.86 | | | | | | — | | | | | | 1.17 | | | | | | — | | | | | | 9.52 | | | | | | (0.46) | | | | | | 0.53 | | | | | | 0.40 | | | | | | 0.40 | | | | | | 1.28 | | | | | | 22,552 | | | | | | 49 | | |
| 12-31-14 | | | | | 11.01 | | | | | | 0.16 | | | | | | 0.51 | | | | | | 0.67 | | | | | | 0.23 | | | | | | 0.75 | | | | | | — | | | | | | 0.98 | | | | | | — | | | | | | 10.70 | | | | | | 6.34 | | | | | | 0.53 | | | | | | 0.39 | | | | | | 0.39 | | | | | | 1.35 | | | | | | 23,128 | | | | | | 61 | | |
| 12-31-13 | | | | | 9.95 | | | | | | 0.13• | | | | | | 1.39 | | | | | | 1.52 | | | | | | 0.22 | | | | | | 0.24 | | | | | | — | | | | | | 0.46 | | | | | | — | | | | | | 11.01 | | | | | | 15.65 | | | | | | 0.53 | | | | | | 0.38 | | | | | | 0.38 | | | | | | 1.24 | | | | | | 23,012 | | | | | | 78 | | |
| 12-31-12 | | | | | 8.92 | | | | | | 0.16• | | | | | | 1.05 | | | | | | 1.21 | | | | | | 0.15 | | | | | | 0.03 | | | | | | — | | | | | | 0.18 | | | | | | — | | | | | | 9.95 | | | | | | 13.71 | | | | | | 0.46 | | | | | | 0.37 | | | | | | 0.37 | | | | | | 1.70 | | | | | | 18,349 | | | | | | 75 | | |
| 12-31-11 | | | | | 9.22 | | | | | | 0.24• | | | | | | (0.47) | | | | | | (0.23) | | | | | | 0.03 | | | | | | 0.04 | | | | | | — | | | | | | 0.07 | | | | | | — | | | | | | 8.92 | | | | | | (2.46) | | | | | | 0.37 | | | | | | 0.37 | | | | | | 0.37 | | | | | | 2.66 | | | | | | 12,042 | | | | | | 70 | | |
| Class S2 | | | | | | | | | | | | | | | | | | | | | | | | | | | | | | | | | | | | | | | | | | | | | | | | | | | | | | | | | | | | | | | | | | | | | | | | | | | | | | | | | | | | | | | | | | | | | | | | | | | | | | | |
| 12-31-15 | | | | | 10.67 | | | | | | 0.11• | | | | | | (0.13) | | | | | | (0.02) | | | | | | 0.29 | | | | | | 0.86 | | | | | | — | | | | | | 1.15 | | | | | | — | | | | | | 9.50 | | | | | | (0.60) | | | | | | 0.78 | | | | | | 0.55 | | | | | | 0.55 | | | | | | 1.06 | | | | | | 578 | | | | | | 49 | | |
| 12-31-14 | | | | | 10.95 | | | | | | 0.12• | | | | | | 0.54 | | | | | | 0.66 | | | | | | 0.19 | | | | | | 0.75 | | | | | | — | | | | | | 0.94 | | | | | | — | | | | | | 10.67 | | | | | | 6.22 | | | | | | 0.78 | | | | | | 0.54 | | | | | | 0.54 | | | | | | 1.06 | | | | | | 671 | | | | | | 61 | | |
| 12-31-13 | | | | | 9.90 | | | | | | 0.11• | | | | | | 1.39 | | | | | | 1.50 | | | | | | 0.21 | | | | | | 0.24 | | | | | | — | | | | | | 0.45 | | | | | | — | | | | | | 10.95 | | | | | | 15.51 | | | | | | 0.78 | | | | | | 0.53 | | | | | | 0.53 | | | | | | 1.06 | | | | | | 1,103 | | | | | | 78 | | |
| 12-31-12 | | | | | 8.88 | | | | | | 0.17• | | | | | | 1.02 | | | | | | 1.19 | | | | | | 0.14 | | | | | | 0.03 | | | | | | — | | | | | | 0.17 | | | | | | — | | | | | | 9.90 | | | | | | 13.54 | | | | | | 0.71 | | | | | | 0.52 | | | | | | 0.52 | | | | | | 1.75 | | | | | | 1,022 | | | | | | 75 | | |
| 12-31-11 | | | | | 9.20 | | | | | | 0.19• | | | | | | (0.44) | | | | | | (0.25) | | | | | | 0.03 | | | | | | 0.04 | | | | | | — | | | | | | 0.07 | | | | | | — | | | | | | 8.88 | | | | | | (2.71) | | | | | | 0.62 | | | | | | 0.52 | | | | | | 0.52 | | | | | | 2.04 | | | | | | 415 | | | | | | 70 | | |
| Voya Solution Conservative Portfolio | | | | | | | | | | | | | | | | | | | | | | | | | | | | | | | | | | | | | | | | | | | | | | | | | | | | | | | | | | | | | | | | | | | | | | | | | | | | | | | | | | | | | | | | | | | | | | | | | | | | | | | |
| Class ADV | | | | | | | | | | | | | | | | | | | | | | | | | | | | | | | | | | | | | | | | | | | | | | | | | | | | | | | | | | | | | | | | | | | | | | | | | | | | | | | | | | | | | | | | | | | | | | | | | | | | | | | |
| 12-31-15 | | | | | 11.15 | | | | | | 0.14• | | | | | | (0.22) | | | | | ��� | (0.08) | | | | | | 0.27 | | | | | | 0.35 | | | | | | — | | | | | | 0.62 | | | | | | — | | | | | | 10.45 | | | | | | (0.76) | | | | | | 0.83 | | | | | | 0.61 | | | | | | 0.61 | | | | | | 1.29 | | | | | | 8,595 | | | | | | 51 | | |
| 12-31-14 | | | | | 11.42 | | | | | | 0.17 | | | | | | 0.30 | | | | | | 0.47 | | | | | | 0.27 | | | | | | 0.47 | | | | | | — | | | | | | 0.74 | | | | | | — | | | | | | 11.15 | | | | | | 4.20 | | | | | | 0.81 | | | | | | 0.58 | | | | | | 0.58 | | | | | | 1.62 | | | | | | 11,527 | | | | | | 54 | | |
| 12-31-13 | | | | | 11.22 | | | | | | 0.17• | | | | | | 0.43 | | | | | | 0.60 | | | | | | 0.29 | | | | | | 0.11 | | | | | | — | | | | | | 0.40 | | | | | | — | | | | | | 11.42 | | | | | | 5.40 | | | | | | 0.85 | | | | | | 0.60 | | | | | | 0.60 | | | | | | 1.50 | | | | | | 10,870 | | | | | | 72 | | |
| 12-31-12 | | | | | 10.44 | | | | | | 0.24• | | | | | | 0.82 | | | | | | 1.06 | | | | | | 0.28 | | | | | | — | | | | | | — | | | | | | 0.28 | | | | | | — | | | | | | 11.22 | | | | | | 10.19 | | | | | | 0.75 | | | | | | 0.62 | | | | | | 0.62 | | | | | | 2.19 | | | | | | 9,541 | | | | | | 69 | | |
| 12-31-11 | | | | | 10.50 | | | | | | 0.39• | | | | | | (0.38) | | | | | | 0.01 | | | | | | 0.04 | | | | | | 0.03 | | | | | | — | | | | | | 0.07 | | | | | | — | | | | | | 10.44 | | | | | | 0.09 | | | | | | 0.62 | | | | | | 0.62 | | | | | | 0.62 | | | | | | 3.67 | | | | | | 6,411 | | | | | | 84 | | |
| Class I | | | | | | | | | | | | | | | | | | | | | | | | | | | | | | | | | | | | | | | | | | | | | | | | | | | | | | | | | | | | | | | | | | | | | | | | | | | | | | | | | | | | | | | | | | | | | | | | | | | | | | | |
| 12-31-15 | | | | | 11.30 | | | | | | 0.21• | | | | | | (0.23) | | | | | | (0.02) | | | | | | 0.33 | | | | | | 0.35 | | | | | | — | | | | | | 0.68 | | | | | | — | | | | | | 10.60 | | | | | | (0.23) | | | | | | 0.33 | | | | | | 0.11 | | | | | | 0.11 | | | | | | 1.86 | | | | | | 13 | | | | | | 51 | | |
| 12-31-14 | | | | | 11.57 | | | | | | 0.25• | | | | | | 0.27 | | | | | | 0.52 | | | | | | 0.32 | | | | | | 0.47 | | | | | | — | | | | | | 0.79 | | | | | | — | | | | | | 11.30 | | | | | | 4.63 | | | | | | 0.31 | | | | | | 0.08 | | | | | | 0.08 | | | | | | 2.19 | | | | | | 10 | | | | | | 54 | | |
| 12-31-13 | | | | | 11.34 | | | | | | 0.23 | | | | | | 0.44 | | | | | | 0.67 | | | | | | 0.33 | | | | | | 0.11 | | | | | | — | | | | | | 0.44 | | | | | | — | | | | | | 11.57 | | | | | | 6.02 | | | | | | 0.35 | | | | | | 0.10 | | | | | | 0.10 | | | | | | 1.99 | | | | | | 3 | | | | | | 72 | | |
| 12-31-12 | | | | | 10.54 | | | | | | 0.29• | | | | | | 0.82 | | | | | | 1.11 | | | | | | 0.31 | | | | | | — | | | | | | — | | | | | | 0.31 | | | | | | — | | | | | | 11.34 | | | | | | 10.60 | | | | | | 0.25 | | | | | | 0.12 | | | | | | 0.12 | | | | | | 2.61 | | | | | | 3 | | | | | | 69 | | |
| 12-31-11 | | | | | 10.54 | | | | | | 0.40 | | | | | | (0.33) | | | | | | 0.07 | | | | | | 0.04 | | | | | | 0.03 | | | | | | — | | | | | | 0.07 | | | | | | — | | | | | | 10.54 | | | | | | 0.69 | | | | | | 0.12 | | | | | | 0.12 | | | | | | 0.12 | | | | | | 3.72 | | | | | | 3 | | | | | | 84 | | |
| Class S | | | | | | | | | | | | | | | | | | | | | | | | | | | | | | | | | | | | | | | | | | | | | | | | | | | | | | | | | | | | | | | | | | | | | | | | | | | | | | | | | | | | | | | | | | | | | | | | | | | | | | | |
| 12-31-15 | | | | | 11.22 | | | | | | 0.17 | | | | | | (0.21) | | | | | | (0.04) | | | | | | 0.31 | | | | | | 0.35 | | | | | | — | | | | | | 0.66 | | | | | | — | | | | | | 10.52 | | | | | | (0.48) | | | | | | 0.58 | | | | | | 0.36 | | | | | | 0.36 | | | | | | 1.61 | | | | | | 5,539 | | | | | | 51 | | |
| 12-31-14 | | | | | 11.49 | | | | | | 0.21• | | | | | | 0.29 | | | | | | 0.50 | | | | | | 0.30 | | | | | | 0.47 | | | | | | — | | | | | | 0.77 | | | | | | — | | | | | | 11.22 | | | | | | 4.40 | | | | | | 0.56 | | | | | | 0.33 | | | | | | 0.33 | | | | | | 1.86 | | | | | | 5,867 | | | | | | 54 | | |
| 12-31-13 | | | | | 11.27 | | | | | | 0.20• | | | | | | 0.44 | | | | | | 0.64 | | | | | | 0.31 | | | | | | 0.11 | | | | | | — | | | | | | 0.42 | | | | | | — | | | | | | 11.49 | | | | | | 5.77 | | | | | | 0.60 | | | | | | 0.35 | | | | | | 0.35 | | | | | | 1.74 | | | | | | 6,168 | | | | | | 72 | | |
| 12-31-12 | | | | | 10.49 | | | | | | 0.28• | | | | | | 0.80 | | | | | | 1.08 | | | | | | 0.30 | | | | | | — | | | | | | — | | | | | | 0.30 | | | | | | — | | | | | | 11.27 | | | | | | 10.34 | | | | | | 0.50 | | | | | | 0.37 | | | | | | 0.37 | | | | | | 2.51 | | | | | | 5,285 | | | | | | 69 | | |
| 12-31-11 | | | | | 10.53 | | | | | | 0.40• | | | | | | (0.37) | | | | | | 0.03 | | | | | | 0.04 | | | | | | 0.03 | | | | | | — | | | | | | 0.07 | | | | | | — | | | | | | 10.49 | | | | | | 0.28 | | | | | | 0.37 | | | | | | 0.37 | | | | | | 0.37 | | | | | | 3.76 | | | | | | 2,941 | | | | | | 84 | | |
| Class S2 | | | | | | | | | | | | | | | | | | | | | | | | | | | | | | | | | | | | | | | | | | | | | | | | | | | | | | | | | | | | | | | | | | | | | | | | | | | | | | | | | | | | | | | | | | | | | | | | | | | | | | | |
| 12-31-15 | | | | | 11.17 | | | | | | 0.16• | | | | | | (0.22) | | | | | | (0.06) | | | | | | 0.30 | | | | | | 0.35 | | | | | | — | | | | | | 0.65 | | | | | | — | | | | | | 10.46 | | | | | | (0.67) | | | | | | 0.83 | | | | | | 0.51 | | | | | | 0.51 | | | | | | 1.43 | | | | | | 357 | | | | | | 51 | | |
| 12-31-14 | | | | | 11.44 | | | | | | 0.18 | | | | | | 0.30 | | | | | | 0.48 | | | | | | 0.28 | | | | | | 0.47 | | | | | | — | | | | | | 0.75 | | | | | | — | | | | | | 11.17 | | | | | | 4.28 | | | | | | 0.81 | | | | | | 0.48 | | | | | | 0.48 | | | | | | 1.70 | | | | | | 312 | | | | | | 54 | | |
| 12-31-13 | | | | | 11.23 | | | | | | 0.18• | | | | | | 0.44 | | | | | | 0.62 | | | | | | 0.30 | | | | | | 0.11 | | | | | | — | | | | | | 0.41 | | | | | | — | | | | | | 11.44 | | | | | | 5.59 | | | | | | 0.85 | | | | | | 0.50 | | | | | | 0.50 | | | | | | 1.60 | | | | | | 298 | | | | | | 72 | | |
| 12-31-12 | | | | | 10.46 | | | | | | 0.29• | | | | | | 0.77 | | | | | | 1.06 | | | | | | 0.29 | | | | | | — | | | | | | — | | | | | | 0.29 | | | | | | — | | | | | | 11.23 | | | | | | 10.23 | | | | | | 0.75 | | | | | | 0.52 | | | | | | 0.52 | | | | | | 2.61 | | | | | | 298 | | | | | | 69 | | |
| 12-31-11 | | | | | 10.51 | | | | | | 0.46• | | | | | | (0.44) | | | | | | 0.02 | | | | | | 0.04 | | | | | | 0.03 | | | | | | — | | | | | | 0.07 | | | | | | — | | | | | | 10.46 | | | | | | 0.17 | | | | | | 0.62 | | | | | | 0.52 | | | | | | 0.52 | | | | | | 4.36 | | | | | | 122 | | | | | | 84 | | |
See Accompanying Notes to Financial Statements
Financial Highlights (continued)
| | | | | | | | | | Income
(loss) from
investment
operations | | | | | | | | | Less
Distributions | | | | | | | | | | | | | | | | | | | | | | | | | | | Ratios to average
net assets | | | Supplemental
Data | |
| | | | Net asset value, beginning of year
or period | | | Net investment income (loss) | | | Net realized and unrealized
gain (loss) | | | Total from investment operations | | | From net investment income | | | From net realized gains | | | From return of capital | | | Total distributions | | | Payment by affiliate | | | Net asset value, end of year
or period | | | Total Return(1) | | | Expenses before
reductions/additions(2)(3)(4) | | | Expenses net of fee waivers
and/or recoupments if any(2)(3)(4) | | | Expense net of all
reductions/additions(2)(3)(4) | | | Net investment income (loss)(2)(3) | | | Net assets, end of year or period | | | Portfolio turnover rate | |
Year or
period ended | | | ($) | | | ($) | | | ($) | | | ($) | | | ($) | | | ($) | | | ($) | | | ($) | | | ($) | | | ($) | | | (%) | | | (%) | | | (%) | | | (%) | | | (%) | | | ($000’s) | | | (%) | |
| Voya Solution Income Portfolio | | | | | | | | | | | | | | | | | | | | | | | | | | | | | | | | | | | | | | | | | | | | | | | | | | | | | | | | | | | | | | | | | | | | | | | | | | | | | | | | | | | | | | | | | | | | | | | | | | | | | | | |
| Class ADV | | | | | | | | | | | | | | | | | | | | | | | | | | | | | | | | | | | | | | | | | | | | | | | | | | | | | | | | | | | | | | | | | | | | | | | | | | | | | | | | | | | | | | | | | | | | | | | | | | | | | | | |
| 12-31-15 | | | | | 11.61 | | | | | | 0.13• | | | | | | (0.15) | | | | | | (0.02) | | | | | | 0.29 | | | | | | 0.42 | | | | | | — | | | | | | 0.71 | | | | | | — | | | | | | 10.88 | | | | | | (0.30) | | | | | | 0.73 | | | | | | 0.63 | | | | | | 0.63 | | | | | | 1.16 | | | | | | 248,968 | | | | | | 31 | | |
| 12-31-14 | | | | | 11.26 | | | | | | 0.15• | | | | | | 0.47 | | | | | | 0.62 | | | | | | 0.27 | | | | | | — | | | | | | — | | | | | | 0.27 | | | | | | — | | | | | | 11.61 | | | | | | 5.53 | | | | | | 0.75 | | | | | | 0.62 | | | | | | 0.62 | | | | | | 1.33 | | | | | | 84,286 | | | | | | 47 | | |
| 12-31-13 | | | | | 10.89 | | | | | | 0.13• | | | | | | 0.59 | | | | | | 0.72 | | | | | | 0.35 | | | | | | — | | | | | | — | | | | | | 0.35 | | | | | | — | | | | | | 11.26 | | | | | | 6.68 | | | | | | 0.74 | | | | | | 0.63 | | | | | | 0.63 | | | | | | 1.19 | | | | | | 94,068 | | | | | | 70 | | |
| 12-31-12 | | | | | 10.40 | | | | | | 0.20• | | | | | | 0.78 | | | | | | 0.98 | | | | | | 0.49 | | | | | | — | | | | | | — | | | | | | 0.49 | | | | | | — | | | | | | 10.89 | | | | | | 9.57 | | | | | | 0.70 | | | | | | 0.62 | | | | | | 0.62 | | | | | | 1.82 | | | | | | 111,796 | | | | | | 71 | | |
| 12-31-11 | | | | | 10.83 | | | | | | 0.34• | | | | | | (0.34) | | | | | | 0.00* | | | | | | 0.43 | | | | | | — | | | | | | — | | | | | | 0.43 | | | | | | — | | | | | | 10.40 | | | | | | 0.14 | | | | | | 0.62 | | | | | | 0.62 | | | | | | 0.62 | | | | | | 3.23 | | | | | | 109,184 | | | | | | 75 | | |
| Class I | | | | | | | | | | | | | | | | | | | | | | | | | | | | | | | | | | | | | | | | | | | | | | | | | | | | | | | | | | | | | | | | | | | | | | | | | | | | | | | | | | | | | | | | | | | | | | | | | | | | | | | |
| 12-31-15 | | | | | 11.86 | | | | | | 0.19• | | | | | | (0.15) | | | | | | 0.04 | | | | | | 0.36 | | | | | | 0.42 | | | | | | — | | | | | | 0.78 | | | | | | — | | | | | | 11.12 | | | | | | 0.20 | | | | | | 0.23 | | | | | | 0.13 | | | | | | 0.13 | | | | | | 1.72 | | | | | | 98,321 | | | | | | 31 | | |
| 12-31-14 | | | | | 11.51 | | | | | | 0.22• | | | | | | 0.47 | | | | | | 0.69 | | | | | | 0.34 | | | | | | — | | | | | | — | | | | | | 0.34 | | | | | | — | | | | | | 11.86 | | | | | | 6.02 | | | | | | 0.25 | | | | | | 0.12 | | | | | | 0.12 | | | | | | 1.85 | | | | | | 23,178 | | | | | | 47 | | |
| 12-31-13 | | | | | 11.12 | | | | | | 0.19• | | | | | | 0.61 | | | | | | 0.80 | | | | | | 0.41 | | | | | | — | | | | | | — | | | | | | 0.41 | | | | | | — | | | | | | 11.51 | | | | | | 7.30 | | | | | | 0.24 | | | | | | 0.13 | | | | | | 0.13 | | | | | | 1.70 | | | | | | 24,937 | | | | | | 70 | | |
| 12-31-12 | | | | | 10.61 | | | | | | 0.24 | | | | | | 0.82 | | | | | | 1.06 | | | | | | 0.55 | | | | | | — | | | | | | — | | | | | | 0.55 | | | | | | — | | | | | | 11.12 | | | | | | 10.12 | | | | | | 0.20 | | | | | | 0.12 | | | | | | 0.12 | | | | | | 2.32 | | | | | | 25,403 | | | | | | 71 | | |
| 12-31-11 | | | | | 11.05 | | | | | | 0.40• | | | | | | (0.35) | | | | | | 0.05 | | | | | | 0.49 | | | | | | — | | | | | | — | | | | | | 0.49 | | | | | | — | | | | | | 10.61 | | | | | | 0.54 | | | | | | 0.12 | | | | | | 0.12 | | | | | | 0.12 | | | | | | 3.63 | | | | | | 22,837 | | | | | | 75 | | |
| Class S | | | | | | | | | | | | | | | | | | | | | | | | | | | | | | | | | | | | | | | | | | | | | | | | | | | | | | | | | | | | | | | | | | | | | | | | | | | | | | | | | | | | | | | | | | | | | | | | | | | | | | | |
| 12-31-15 | | | | | 11.76 | | | | | | 0.16• | | | | | | (0.14) | | | | | | 0.02 | | | | | | 0.32 | | | | | | 0.42 | | | | | | — | | | | | | 0.74 | | | | | | — | | | | | | 11.04 | | | | | | 0.10 | | | | | | 0.48 | | | | | | 0.38 | | | | | | 0.38 | | | | | | 1.43 | | | | | | 225,274 | | | | | | 31 | | |
| 12-31-14 | | | | | 11.41 | | | | | | 0.19• | | | | | | 0.46 | | | | | | 0.65 | | | | | | 0.30 | | | | | | — | | | | | | — | | | | | | 0.30 | | | | | | — | | | | | | 11.76 | | | | | | 5.76 | | | | | | 0.50 | | | | | | 0.37 | | | | | | 0.37 | | | | | | 1.59 | | | | | | 56,602 | | | | | | 47 | | |
| 12-31-13 | | | | | 11.03 | | | | | | 0.16• | | | | | | 0.60 | | | | | | 0.76 | | | | | | 0.38 | | | | | | — | | | | | | — | | | | | | 0.38 | | | | | | — | | | | | | 11.41 | | | | | | 6.97 | | | | | | 0.49 | | | | | | 0.38 | | | | | | 0.38 | | | | | | 1.46 | | | | | | 62,431 | | | | | | 70 | | |
| 12-31-12 | | | | | 10.53 | | | | | | 0.22• | | | | | | 0.80 | | | | | | 1.02 | | | | | | 0.52 | | | | | | — | | | | | | — | | | | | | 0.52 | | | | | | — | | | | | | 11.03 | | | | | | 9.77 | | | | | | 0.45 | | | | | | 0.37 | | | | | | 0.37 | | | | | | 2.02 | | | | | | 68,703 | | | | | | 71 | | |
| 12-31-11 | | | | | 10.96 | | | | | | 0.37• | | | | | | (0.34) | | | | | | 0.03 | | | | | | 0.46 | | | | | | — | | | | | | — | | | | | | 0.46 | | | | | | — | | | | | | 10.53 | | | | | | 0.35 | | | | | | 0.37 | | | | | | 0.37 | | | | | | 0.37 | | | | | | 3.39 | | | | | | 80,716 | | | | | | 75 | | |
| Class S2 | | | | | | | | | | | | | | | | | | | | | | | | | | | | | | | | | | | | | | | | | | | | | | | | | | | | | | | | | | | | | | | | | | | | | | | | | | | | | | | | | | | | | | | | | | | | | | | | | | | | | | | |
| 12-31-15 | | | | | 11.50 | | | | | | 0.14• | | | | | | (0.14) | | | | | | 0.00* | | | | | | 0.31 | | | | | | 0.42 | | | | | | — | | | | | | 0.73 | | | | | | — | | | | | | 10.77 | | | | | | (0.13) | | | | | | 0.73 | | | | | | 0.53 | | | | | | 0.53 | | | | | | 1.27 | | | | | | 15,377 | | | | | | 31 | | |
| 12-31-14 | | | | | 11.15 | | | | | | 0.16• | | | | | | 0.46 | | | | | | 0.62 | | | | | | 0.27 | | | | | | — | | | | | | — | | | | | | 0.27 | | | | | | — | | | | | | 11.50 | | | | | | 5.61 | | | | | | 0.75 | | | | | | 0.52 | | | | | | 0.52 | | | | | | 1.42 | | | | | | 4,281 | | | | | | 47 | | |
| 12-31-13 | | | | | 10.79 | | | | | | 0.14• | | | | | | 0.59 | | | | | | 0.73 | | | | | | 0.37 | | | | | | — | | | | | | — | | | | | | 0.37 | | | | | | — | | | | | | 11.15 | | | | | | 6.85 | | | | | | 0.74 | | | | | | 0.53 | | | | | | 0.53 | | | | | | 1.28 | | | | | | 5,274 | | | | | | 70 | | |
| 12-31-12 | | | | | 10.32 | | | | | | 0.21• | | | | | | 0.77 | | | | | | 0.98 | | | | | | 0.51 | | | | | | — | | | | | | — | | | | | | 0.51 | | | | | | — | | | | | | 10.79 | | | | | | 9.62 | | | | | | 0.70 | | | | | | 0.52 | | | | | | 0.52 | | | | | | 2.00 | | | | | | 5,889 | | | | | | 71 | | |
| 12-31-11 | | | | | 10.75 | | | | | | 0.33• | | | | | | (0.32) | | | | | | 0.01 | | | | | | 0.44 | | | | | | — | | | | | | — | | | | | | 0.44 | | | | | | — | | | | | | 10.32 | | | | | | 0.25 | | | | | | 0.62 | | | | | | 0.52 | | | | | | 0.52 | | | | | | 3.13 | | | | | | 4,697 | | | | | | 75 | | |
| Class T | | | | | | | | | | | | | | | | | | | | | | | | | | | | | | | | | | | | | | | | | | | | | | | | | | | | | | | | | | | | | | | | | | | | | | | | | | | | | | | | | | | | | | | | | | | | | | | | | | | | | | | |
| 12-31-15 | | | | | 12.07 | | | | | | 0.13• | | | | | | (0.17) | | | | | | (0.04) | | | | | | 0.22 | | | | | | 0.42 | | | | | | — | | | | | | 0.64 | | | | | | — | | | | | | 11.39 | | | | | | (0.40) | | | | | | 0.98 | | | | | | 0.83 | | | | | | 0.83 | | | | | | 1.09 | | | | | | 815 | | | | | | 31 | | |
| 12-31-14 | | | | | 11.67 | | | | | | 0.13• | | | | | | 0.48 | | | | | | 0.61 | | | | | | 0.21 | | | | | | — | | | | | | — | | | | | | 0.21 | | | | | | — | | | | | | 12.07 | | | | | | 5.22 | | | | | | 1.00 | | | | | | 0.82 | | | | | | 0.82 | | | | | | 1.05 | | | | | | 91 | | | | | | 47 | | |
| 12-31-13 | | | | | 11.29 | | | | | | 0.12• | | | | | | 0.61 | | | | | | 0.73 | | | | | | 0.35 | | | | | | — | | | | | | — | | | | | | 0.35 | | | | | | — | | | | | | 11.67 | | | | | | 6.55 | | | | | | 0.99 | | | | | | 0.83 | | | | | | 0.83 | | | | | | 1.00 | | | | | | 193 | | | | | | 70 | | |
| 12-31-12 | | | | | 10.70 | | | | | | 0.19• | | | | | | 0.80 | | | | | | 0.99 | | | | | | 0.40 | | | | | | — | | | | | | — | | | | | | 0.40 | | | | | | — | | | | | | 11.29 | | | | | | 9.29 | | | | | | 0.95 | | | | | | 0.82 | | | | | | 0.82 | | | | | | 1.69 | | | | | | 259 | | | | | | 71 | | |
| 12-31-11 | | | | | 11.03 | | | | | | 0.33• | | | | | | (0.34) | | | | | | (0.01) | | | | | | 0.32 | | | | | | — | | | | | | — | | | | | | 0.32 | | | | | | — | | | | | | 10.70 | | | | | | 0.03 | | | | | | 0.87 | | | | | | 0.82 | | | | | | 0.82 | | | | | | 2.98 | | | | | | 210 | | | | | | 75 | | |
| Voya Solution Moderately Aggressive Portfolio | | | | | | | | | | | | | | | | | | | | | | | | | | | | | | | | | | | | | | | | | | | | | | | | | | | | | | | | | | | | | | | | | | | | | | | | | | | | | | | | | | | | | | | | | | | | | | | | | | | | | | | |
| Class ADV | | | | | | | | | | | | | | | | | | | | | | | | | | | | | | | | | | | | | | | | | | | | | | | | | | | | | | | | | | | | | | | | | | | | | | | | | | | | | | | | | | | | | | | | | | | | | | | | | | | | | | | |
| 12-31-15 | | | | | 13.03 | | | | | | 0.11• | | | | | | (0.22) | | | | | | (0.11) | | | | | | 0.37 | | | | | | 1.32 | | | | | | — | | | | | | 1.69 | | | | | | — | | | | | | 11.23 | | | | | | (1.42) | | | | | | 0.74 | | | | | | 0.69 | | | | | | 0.69 | | | | | | 0.94 | | | | | | 31,416 | | | | | | 26 | | |
| 12-31-14 | | | | | 13.38 | | | | | | 0.12• | | | | | | 0.67 | | | | | | 0.79 | | | | | | 0.20 | | | | | | 0.94 | | | | | | — | | | | | | 1.14 | | | | | | — | | | | | | 13.03 | | | | | | 6.09 | | | | | | 0.78 | | | | | | 0.67 | | | | | | 0.67 | | | | | | 0.89 | | | | | | 20,020 | | | | | | 71 | | |
| 12-31-13 | | | | | 11.61 | | | | | | 0.10• | | | | | | 2.23 | | | | | | 2.33 | | | | | | 0.21 | | | | | | 0.35 | | | | | | — | | | | | | 0.56 | | | | | | — | | | | | | 13.38 | | | | | | 20.42 | | | | | | 0.80 | | | | | | 0.63 | | | | | | 0.63 | | | | | | 0.78 | | | | | | 16,945 | | | | | | 79 | | |
| 12-31-12 | | | | | 10.25 | | | | | | 0.11• | | | | | | 1.42 | | | | | | 1.53 | | | | | | 0.12 | | | | | | 0.05 | | | | | | — | | | | | | 0.17 | | | | | | — | | | | | | 11.61 | | | | | | 15.07 | | | | | | 0.73 | | | | | | 0.62 | | | | | | 0.62 | | | | | | 0.98 | | | | | | 13,603 | | | | | | 70 | | |
| 12-31-11 | | | | | 10.89 | | | | | | 0.21• | | | | | | (0.79) | | | | | | (0.58) | | | | | | 0.02 | | | | | | 0.04 | | | | | | — | | | | | | 0.06 | | | | | | — | | | | | | 10.25 | | | | | | (5.29) | | | | | | 0.62 | | | | | | 0.62 | | | | | | 0.62 | | | | | | 1.96 | | | | | | 9,527 | | | | | | 83 | | |
See Accompanying Notes to Financial Statements
Financial Highlights (continued)
| | | | | | | | | | Income
(loss) from
investment
operations | | | | | | | | | Less
Distributions | | | | | | | | | | | | | | | | | | | | | | | | | | | Ratios to average
net assets | | | Supplemental
Data | |
| | | | Net asset value, beginning of year
or period | | | Net investment income (loss) | | | Net realized and unrealized
gain (loss) | | | Total from investment operations | | | From net investment income | | | From net realized gains | | | From return of capital | | | Total distributions | | | Payment by affiliate | | | Net asset value, end of year
or period | | | Total Return(1) | | | Expenses before
reductions/additions(2)(3)(4) | | | Expenses net of fee waivers
and/or recoupments if any(2)(3)(4) | | | Expense net of all
reductions/additions(2)(3)(4) | | | Net investment income (loss)(2)(3) | | | Net assets, end of year or period | | | Portfolio turnover rate | |
Year or
period ended | | | ($) | | | ($) | | | ($) | | | ($) | | | ($) | | | ($) | | | ($) | | | ($) | | | ($) | | | ($) | | | (%) | | | (%) | | | (%) | | | (%) | | | (%) | | | ($000’s) | | | (%) | |
| Voya Solution Moderately Aggressive Portfolio (continued) | | | | | | | | | | | | | | | | | | | | | | | | | | | | | | | | | | | | | | | | | | | | | | | | | | | | | | | | | | | | | | | | | | | | | | | | | | | | | | | | | | | | | | | | | | | | | | | | | | | | | | | |
| Class I | | | | | | | | | | | | | | | | | | | | | | | | | | | | | | | | | | | | | | | | | | | | | | | | | | | | | | | | | | | | | | | | | | | | | | | | | | | | | | | | | | | | | | | | | | | | | | | | | | | | | | | |
| 12-31-15 | | | | | 13.23 | | | | | | 0.23• | | | | | | (0.27) | | | | | | (0.04) | | | | | | 0.43 | | | | | | 1.32 | | | | | | — | | | | | | 1.75 | | | | | | — | | | | | | 11.44 | | | | | | (0.85) | | | | | | 0.24 | | | | | | 0.19 | | | | | | 0.19 | | | | | | 2.00 | | | | | | 4,035 | | | | | | 26 | | |
| 12-31-14 | | | | | 13.56 | | | | | | 0.31• | | | | | | 0.56 | | | | | | 0.87 | | | | | | 0.26 | | | | | | 0.94 | | | | | | — | | | | | | 1.20 | | | | | | — | | | | | | 13.23 | | | | | | 6.60 | | | | | | 0.28 | | | | | | 0.17 | | | | | | 0.17 | | | | | | 2.39 | | | | | | 56 | | | | | | 71 | | |
| 12-31-13 | | | | | 11.74 | | | | | | 0.15 | | | | | | 2.28 | | | | | | 2.43 | | | | | | 0.26 | | | | | | 0.35 | | | | | | — | | | | | | 0.61 | | | | | | — | | | | | | 13.56 | | | | | | 21.10 | | | | | | 0.30 | | | | | | 0.13 | | | | | | 0.13 | | | | | | 1.19 | | | | | | 4 | | | | | | 79 | | |
| 12-31-12 | | | | | 10.34 | | | | | | 0.16 | | | | | | 1.44 | | | | | | 1.60 | | | | | | 0.15 | | | | | | 0.05 | | | | | | — | | | | | | 0.20 | | | | | | — | | | | | | 11.74 | | | | | | 15.62 | | | | | | 0.23 | | | | | | 0.12 | | | | | | 0.12 | | | | | | 1.42 | | | | | | 4 | | | | | | 70 | | |
| 12-31-11 | | | | | 10.94 | | | | | | 0.23 | | | | | | (0.77) | | | | | | (0.54) | | | | | | 0.02 | | | | | | 0.04 | | | | | | — | | | | | | 0.06 | | | | | | — | | | | | | 10.34 | | | | | | (4.84) | | | | | | 0.12 | | | | | | 0.12 | | | | | | 0.12 | | | | | | 2.16 | | | | | | 3 | | | | | | 83 | | |
| Class S | | | | | | | | | | | | | | | | | | | | | | | | | | | | | | | | | | | | | | | | | | | | | | | | | | | | | | | | | | | | | | | | | | | | | | | | | | | | | | | | | | | | | | | | | | | ��� | | | | | | | | | | | | |
| 12-31-15 | | | | | 13.13 | | | | | | 0.21• | | | | | | (0.29) | | | | | | (0.08) | | | | | | 0.39 | | | | | | 1.32 | | | | | | — | | | | | | 1.71 | | | | | | — | | | | | | 11.34 | | | | | | (1.15) | | | | | | 0.49 | | | | | | 0.44 | | | | | | 0.44 | | | | | | 1.81 | | | | | | 719,319 | | | | | | 26 | | |
| 12-31-14 | | | | | 13.47 | | | | | | 0.15 | | | | | | 0.68 | | | | | | 0.83 | | | | | | 0.23 | | | | | | 0.94 | | | | | | — | | | | | | 1.17 | | | | | | — | | | | | | 13.13 | | | | | | 6.33 | | | | | | 0.53 | | | | | | 0.42 | | | | | | 0.42 | | | | | | 1.04 | | | | | | 11,315 | | | | | | 71 | | |
| 12-31-13 | | | | | 11.67 | | | | | | 0.12• | | | | | | 2.27 | | | | | | 2.39 | | | | | | 0.24 | | | | | | 0.35 | | | | | | — | | | | | | 0.59 | | | | | | — | | | | | | 13.47 | | | | | | 20.84 | | | | | | 0.55 | | | | | | 0.38 | | | | | | 0.38 | | | | | | 0.96 | | | | | | 11,871 | | | | | | 79 | | |
| 12-31-12 | | | | | 10.30 | | | | | | 0.14• | | | | | | 1.42 | | | | | | 1.56 | | | | | | 0.14 | | | | | | 0.05 | | | | | | — | | | | | | 0.19 | | | | | | — | | | | | | 11.67 | | | | | | 15.28 | | | | | | 0.48 | | | | | | 0.37 | | | | | | 0.37 | | | | | | 1.29 | | | | | | 9,256 | | | | | | 70 | | |
| 12-31-11 | | | | | 10.92 | | | | | | 0.23• | | | | | | (0.79) | | | | | | (0.56) | | | | | | 0.02 | | | | | | 0.04 | | | | | | — | | | | | | 0.06 | | | | | | — | | | | | | 10.30 | | | | | | (5.05) | | | | | | 0.37 | | | | | | 0.37 | | | | | | 0.37 | | | | | | 2.20 | | | | | | 5,379 | | | | | | 83 | | |
| Class S2 | | | | | | | | | | | | | | | | | | | | | | | | | | | | | | | | | | | | | | | | | | | | | | | | | | | | | | | | | | | | | | | | | | | | | | | | | | | | | | | | | | | | | | | | | | | | | | | | | ��� | | | | | | |
| 12-31-15 | | | | | 13.12 | | | | | | 0.12• | | | | | | (0.21) | | | | | | (0.09) | | | | | | 0.39 | | | | | | 1.32 | | | | | | — | | | | | | 1.71 | | | | | | — | | | | | | 11.32 | | | | | | (1.21) | | | | | | 0.74 | | | | | | 0.59 | | | | | | 0.59 | | | | | | 0.98 | | | | | | 1,040 | | | | | | 26 | | |
| 12-31-14 | | | | | 13.50 | | | | | | 0.14• | | | | | | 0.67 | | | | | | 0.81 | | | | | | 0.25 | | | | | | 0.94 | | | | | | — | | | | | | 1.19 | | | | | | — | | | | | | 13.12 | | | | | | 6.17 | | | | | | 0.78 | | | | | | 0.57 | | | | | | 0.57 | | | | | | 1.08 | | | | | | 806 | | | | | | 71 | | |
| 12-31-13 | | | | | 11.72 | | | | | | 0.17• | | | | | | 2.19 | | | | | | 2.36 | | | | | | 0.23 | | | | | | 0.35 | | | | | | — | | | | | | 0.58 | | | | | | — | | | | | | 13.50 | | | | | | 20.56 | | | | | | 0.80 | | | | | | 0.53 | | | | | | 0.53 | | | | | | 1.34 | | | | | | 284 | | | | | | 79 | | |
| 12-31-12 | | | | | 10.30 | | | | | | 0.14• | | | | | | 1.41 | | | | | | 1.55 | | | | | | 0.08 | | | | | | 0.05 | | | | | | — | | | | | | 0.13 | | | | | | — | | | | | | 11.72 | | | | | | 15.18 | | | | | | 0.73 | | | | | | 0.52 | | | | | | 0.52 | | | | | | 1.27 | | | | | | 84 | | | | | | 70 | | |
| 12-31-11 | | | | | 10.91 | | | | | | 0.08• | | | | | | (0.65) | | | | | | (0.57) | | | | | | — | | | | | | 0.04 | | | | | | — | | | | | | 0.04 | | | | | | — | | | | | | 10.30 | | | | | | (5.18) | | | | | | 0.62 | | | | | | 0.52 | | | | | | 0.52 | | | | | | 0.70 | | | | | | 37 | | | | | | 83 | | |
| Voya Solution Moderately Conservative Portfolio | | | | | | | | | | | | | | | | | | | | | | | | | | | | | | | | | | | | | | | | | | | | | | | | | | | | | | | | | | | | | | | | | | | | | | | | | | | | | | | | | | | | | | | | | | | | | | | | | | | | | | | |
| Class ADV | | | | | | | | | | | | | | | | | | | | | | | | | | | | | | | | | | | | | | | | | | | | | | | | | | | | | | | | | | | | | | | | | | | | | | | | | | | | | | | | | | | | | | | | | | | | | | | | | | | | | | | |
| 12-31-15 | | | | | 10.45 | | | | | | 0.10 | | | | | | (0.14) | | | | | | (0.04) | | | | | | 0.28 | | | | | | 0.62 | | | | | | — | | | | | | 0.90 | | | | | | — | | | | | | 9.51 | | | | | | (0.60) | | | | | | 0.78 | | | | | | 0.66 | | | | | | 0.66 | | | | | | 1.09 | | | | | | 22,005 | | | | | | 58 | | |
| 12-31-14 | | | | | 10.80 | | | | | | 0.15 | | | | | | 0.39 | | | | | | 0.54 | | | | | | 0.23 | | | | | | 0.66 | | | | | | — | | | | | | 0.89 | | | | | | — | | | | | | 10.45 | | | | | | 5.20 | | | | | | 0.78 | | | | | | 0.65 | | | | | | 0.65 | | | | | | 1.30 | | | | | | 21,659 | | | | | | 66 | | |
| 12-31-13 | | | | | 10.42 | | | | | | 0.13• | | | | | | 0.81 | | | | | | 0.94 | | | | | | 0.27 | | | | | | 0.29 | | | | | | — | | | | | | 0.56 | | | | | | — | | | | | | 10.80 | | | | | | 9.27 | | | | | | 0.79 | | | | | | 0.62 | | | | | | 0.62 | | | | | | 1.23 | | | | | | 21,918 | | | | | | 85 | | |
| 12-31-12 | | | | | 9.55 | | | | | | 0.18• | | | | | | 0.94 | | | | | | 1.12 | | | | | | 0.19 | | | | | | 0.06 | | | | | | — | | | | | | 0.25 | | | | | | — | | | | | | 10.42 | | | | | | 11.79 | | | | | | 0.70 | | | | | | 0.62 | | | | | | 0.62 | | | | | | 1.74 | | | | | | 22,425 | | | | | | 85 | | |
| 12-31-11 | | | | | 9.79 | | | | | | 0.34• | | | | | | (0.44) | | | | | | (0.10) | | | | | | 0.06 | | | | | | 0.08 | | | | | | — | | | | | | 0.14 | | | | | | — | | | | | | 9.55 | | | | | | (0.94) | | | | | | 0.62 | | | | | | 0.62 | | | | | | 0.62 | | | | | | 3.54 | | | | | | 13,782 | | | | | | 77 | | |
| Class I | | | | | | | | | | | | | | | | | | | | | | | | | | | | | | | | | | | | | | | | | | | | | | | | | | | | | | | | | | | | | | | | | | | | | | | | | | | | | | | | | | | | | | | | | | | | | | | | | | | | | | | |
| 12-31-15 | | | | | 10.87 | | | | | | 0.16 | | | | | | (0.15) | | | | | | 0.01 | | | | | | 0.33 | | | | | | 0.62 | | | | | | — | | | | | | 0.95 | | | | | | — | | | | | | 9.93 | | | | | | (0.09) | | | | | | 0.28 | | | | | | 0.16 | | | | | | 0.16 | | | | | | 1.58 | | | | | | 36 | | | | | | 58 | | |
| 12-31-14 | | | | | 11.20 | | | | | | 0.23• | | | | | | 0.39 | | | | | | 0.62 | | | | | | 0.29 | | | | | | 0.66 | | | | | | — | | | | | | 0.95 | | | | | | — | | | | | | 10.87 | | | | | | 5.74 | | | | | | 0.28 | | | | | | 0.15 | | | | | | 0.15 | | | | | | 2.19 | | | | | | 37 | | | | | | 66 | | |
| 12-31-13 | | | | | 10.79 | | | | | | 0.18 | | | | | | 0.84 | | | | | | 1.02 | | | | | | 0.32 | | | | | | 0.29 | | | | | | — | | | | | | 0.61 | | | | | | — | | | | | | 11.20 | | | | | | 9.70 | | | | | | 0.29 | | | | | | 0.12 | | | | | | 0.12 | | | | | | 1.66 | | | | | | 1 | | | | | | 85 | | |
| 12-31-12 | | | | | 9.86 | | | | | | 0.23 | | | | | | 0.97 | | | | | | 1.20 | | | | | | 0.21 | | | | | | 0.06 | | | | | | — | | | | | | 0.27 | | | | | | — | | | | | | 10.79 | | | | | | 12.23 | | | | | | 0.20 | | | | | | 0.12 | | | | | | 0.12 | | | | | | 2.16 | | | | | | 1 | | | | | | 85 | | |
| 12-31-11 | | | | | 10.04 | | | | | | 0.34 | | | | | | (0.38) | | | | | | (0.04) | | | | | | 0.06 | | | | | | 0.08 | | | | | | — | | | | | | 0.14 | | | | | | — | | | | | | 9.86 | | | | | | (0.30) | | | | | | 0.12 | | | | | | 0.12 | | | | | | 0.12 | | | | | | 3.39 | | | | | | 1 | | | | | | 77 | | |
| Class S | | | | | | | | | | | | | | | | | | | | | | | | | | | | | | | | | | | | | | | | | | | | | | | | | | | | | | | | | | | | | | | | | | | | | | | | | | | | | | | | | | | | | | | | | | | | | | | | | | | | | | | |
| 12-31-15 | | | | | 10.67 | | | | | | 0.14• | | | | | | (0.16) | | | | | | (0.02) | | | | | | 0.30 | | | | | | 0.62 | | | | | | — | | | | | | 0.92 | | | | | | — | | | | | | 9.73 | | | | | | (0.38) | | | | | | 0.53 | | | | | | 0.41 | | | | | | 0.41 | | | | | | 1.33 | | | | | | 20,081 | | | | | | 58 | | |
| 12-31-14 | | | | | 11.00 | | | | | | 0.17• | | | | | | 0.42 | | | | | | 0.59 | | | | | | 0.26 | | | | | | 0.66 | | | | | | — | | | | | | 0.92 | | | | | | — | | | | | | 10.67 | | | | | | 5.58 | | | | | | 0.53 | | | | | | 0.40 | | | | | | 0.40 | | | | | | 1.53 | | | | | | 22,346 | | | | | | 66 | | |
| 12-31-13 | | | | | 10.60 | | | | | | 0.16 | | | | | | 0.82 | | | | | | 0.98 | | | | | | 0.29 | | | | | | 0.29 | | | | | | — | | | | | | 0.58 | | | | | | — | | | | | | 11.00 | | | | | | 9.54 | | | | | | 0.54 | | | | | | 0.37 | | | | | | 0.37 | | | | | | 1.43 | | | | | | 24,016 | | | | | | 85 | | |
| 12-31-12 | | | | | 9.70 | | | | | | 0.21• | | | | | | 0.95 | | | | | | 1.16 | | | | | | 0.20 | | | | | | 0.06 | | | | | | — | | | | | | 0.26 | | | | | | — | | | | | | 10.60 | | | | | | 11.99 | | | | | | 0.45 | | | | | | 0.37 | | | | | | 0.37 | | | | | | 2.02 | | | | | | 22,653 | | | | | | 85 | | |
| 12-31-11 | | | | | 9.91 | | | | | | 0.32• | | | | | | (0.40) | | | | | | (0.08) | | | | | | 0.05 | | | | | | 0.08 | | | | | | — | | | | | | 0.13 | | | | | | — | | | | | | 9.70 | | | | | | (0.69) | | | | | | 0.37 | | | | | | 0.37 | | | | | | 0.37 | | | | | | 3.26 | | | | | | 15,227 | | | | | | 77 | | |
See Accompanying Notes to Financial Statements
Financial Highlights (continued)
| | | | | | | | | | Income
(loss) from
investment
operations | | | | | | | | | Less
Distributions | | | | | | | | | | | | | | | | | | | | | | | | | | | Ratios to average
net assets | | | Supplemental
Data | |
| | | | Net asset value, beginning of year
or period | | | Net investment income (loss) | | | Net realized and unrealized
gain (loss) | | | Total from investment operations | | | From net investment income | | | From net realized gains | | | From return of capital | | | Total distributions | | | Payment by affiliate | | | Net asset value, end of year
or period | | | Total Return(1) | | | Expenses before
reductions/additions(2)(3)(4) | | | Expenses net of fee waivers
and/or recoupments if any(2)(3)(4) | | | Expense net of all
reductions/additions(2)(3)(4) | | | Net investment income (loss)(2)(3) | | | Net assets, end of year or period | | | Portfolio turnover rate | |
Year or
period ended | | | ($) | | | ($) | | | ($) | | | ($) | | | ($) | | | ($) | | | ($) | | | ($) | | | ($) | | | ($) | | | (%) | | | (%) | | | (%) | | | (%) | | | (%) | | | ($000’s) | | | (%) | |
| Voya Solution Moderately Conservative Portfolio (continued) | | | | | | | | | | | | | | | | | | | | | | | | | | | | | | | | | | | | | | | | | | | | | | | | | | | | | | | | | | | | | | | | | | | | | | | | | | | | | | | | | | | | | | | | | | | | | | | | | | | | | | | |
| Class S2 | | | | | | | | | | | | | | | | | | | | | | | | | | | | | | | | | | | | | | | | | | | | | | | | | | | | | | | | | | | | | | | | | | | | | | | | | | | | | | | | | | | | | | | | | | | | | | | | | | | | | | | |
| 12-31-15 | | | | | 10.59 | | | | | | 0.10 | | | | | | (0.13) | | | | | | (0.03) | | | | | | 0.30 | | | | | | 0.62 | | | | | | — | | | | | | 0.92 | | | | | | — | | | | | | 9.64 | | | | | | (0.50) | | | | | | 0.78 | | | | | | 0.56 | | | | | | 0.56 | | | | | | 1.14 | | | | | | 751 | | | | | | 58 | | |
| 12-31-14 | | | | | 10.93 | | | | | | 0.16• | | | | | | 0.41 | | | | | | 0.57 | | | | | | 0.25 | | | | | | 0.66 | | | | | | — | | | | | | 0.91 | | | | | | — | | | | | | 10.59 | | | | | | 5.40 | | | | | | 0.78 | | | | | | 0.55 | | | | | | 0.55 | | | | | | 1.43 | | | | | | 848 | | | | | | 66 | | |
| 12-31-13 | | | | | 10.55 | | | | | | 0.14• | | | | | | 0.82 | | | | | | 0.96 | | | | | | 0.29 | | | | | | 0.29 | | | | | | — | | | | | | 0.58 | | | | | | — | | | | | | 10.93 | | | | | | 9.36 | | | | | | 0.79 | | | | | | 0.52 | | | | | | 0.52 | | | | | | 1.26 | | | | | | 669 | | | | | | 85 | | |
| 12-31-12 | | | | | 9.67 | | | | | | 0.23• | | | | | | 0.91 | | | | | | 1.14 | | | | | | 0.20 | | | | | | 0.06 | | | | | | — | | | | | | 0.26 | | | | | | — | | | | | | 10.55 | | | | | | 11.85 | | | | | | 0.70 | | | | | | 0.52 | | | | | | 0.52 | | | | | | 2.23 | | | | | | 712 | | | | | | 85 | | |
| 12-31-11 | | | | | 9.90 | | | | | | 0.32• | | | | | | (0.41) | | | | | | (0.09) | | | | | | 0.06 | | | | | | 0.08 | | | | | | — | | | | | | 0.14 | | | | | | — | | | | | | 9.67 | | | | | | (0.84) | | | | | | 0.62 | | | | | | 0.52 | | | | | | 0.52 | | | | | | 3.21 | | | | | | 178 | | | | | | 77 | | |
| Voya Solution 2020 Portfolio | | | | | | | | | | | | | | | | | | | | | | | | | | | | | | | | | | | | | | | | | | | | | | | | | | | | | | | | | | | | | | | | | | | | | | | | | | | | | | | | | | | | | | | | | | | | | | | | | | | | | | | |
| Class ADV | | | | | | | | | | | | | | | | | | | | | | | | | | | | | | | | | | | | | | | | | | | | | | | | | | | | | | | | | | | | | | | | | | | | | | | | | | | | | | | | | | | | | | | | | | | | | | | | | | | | | | | |
| 12-31-15 | | | | | 12.87 | | | | | | 0.19• | | | | | | (0.05) | | | | | | 0.14 | | | | | | 0.57 | | | | | | 0.79 | | | | | | — | | | | | | 1.36 | | | | | | — | | | | | | 11.65 | | | | | | 0.88 | | | | | | 1.49 | | | | | | 0.63 | | | | | | 0.63 | | | | | | 1.60 | | | | | | 2,853 | | | | | | 86 | | |
| 12-31-14 | | | | | 12.19 | | | | | | 0.20• | | | | | | 0.53 | | | | | | 0.73 | | | | | | 0.01 | | | | | | 0.04 | | | | | | — | | | | | | 0.05 | | | | | | — | | | | | | 12.87 | | | | | | 5.97 | | | | | | 4.32 | | | | | | 0.63 | | | | | | 0.63 | | | | | | 1.55 | | | | | | 631 | | | | | | 32 | | |
| 12-31-13 | | | | | 11.80 | | | | | | 0.11• | | | | | | 1.36 | | | | | | 1.47 | | | | | | 0.29 | | | | | | 0.80 | | | | | | — | | | | | | 1.09 | | | | | | 0.01 | | | | | | 12.19 | | | | | | 13.01(a) | | | | | | 89.79 | | | | | | 0.63 | | | | | | 0.63 | | | | | | 0.87 | | | | | | 4 | | | | | | 68 | | |
| 12-31-12 | | | | | 10.85 | | | | | | 0.15 | | | | | | 1.12 | | | | | | 1.27 | | | | | | 0.11 | | | | | | 0.21 | | | | | | — | | | | | | 0.32 | | | | | | — | | | | | | 11.80 | | | | | | 11.76 | | | | | | 45.86 | | | | | | 0.62 | | | | | | 0.62 | | | | | | 1.28 | | | | | | 4 | | | | | | 72 | | |
| 10-03-11(5) - 12-31-11 | | | | | 10.00 | | | | | | 0.08 | | | | | | 0.77 | | | | | | 0.85 | | | | | | — | | | | | | — | | | | | | — | | | | | | — | | | | | | — | | | | | | 10.85 | | | | | | 8.50 | | | | | | 0.62 | | | | | | 0.62 | | | | | | 0.62 | | | | | | 3.31 | | | | | | 3 | | | | | | 15 | | |
| Class I | | | | | | | | | | | | | | | | | | | | | | | | | | | | | | | | | | | | | | | | | | | | | | | | | | | | | | | | | | | | | | | | | | | | | | | | | | | | | | | | | | | | | | | | | | | | | | | | | | | | | | | |
| 12-31-15 | | | | | 13.04 | | | | | | 0.32• | | | | | | (0.11) | | | | | | 0.21 | | | | | | 0.65 | | | | | | 0.79 | | | | | | — | | | | | | 1.44 | | | | | | — | | | | | | 11.81 | | | | | | 1.38 | | | | | | 0.99 | | | | | | 0.13 | | | | | | 0.13 | | | | | | 2.76 | | | | | | 2,157 | | | | | | 86 | | |
| 12-31-14 | | | | | 12.29 | | | | | | 0.19 | | | | | | 0.60 | | | | | | 0.79 | | | | | | — | | | | | | 0.04 | | | | | | — | | | | | | 0.04 | | | | | | — | | | | | | 13.04 | | | | | | 6.41 | | | | | | 3.82 | | | | | | 0.13 | | | | | | 0.13 | | | | | | 1.52 | | | | | | 4 | | | | | | 32 | | |
| 12-31-13 | | | | | 11.85 | | | | | | 0.17 | | | | | | 1.40 | | | | | | 1.57 | | | | | | 0.34 | | | | | | 0.80 | | | | | | — | | | | | | 1.14 | | | | | | 0.01 | | | | | | 12.29 | | | | | | 13.85(a) | | | | | | 89.29 | | | | | | 0.13 | | | | | | 0.13 | | | | | | 1.38 | | | | | | 4 | | | | | | 68 | | |
| 12-31-12 | | | | | 10.86 | | | | | | 0.21 | | | | | | 1.12 | | | | | | 1.33 | | | | | | 0.13 | | | | | | 0.21 | | | | | | — | | | | | | 0.34 | | | | | | — | | | | | | 11.85 | | | | | | 12.22 | | | | | | 45.36 | | | | | | 0.12 | | | | | | 0.12 | | | | | | 1.81 | | | | | | 4 | | | | | | 72 | | |
| 10-03-11(5) - 12-31-11 | | | | | 10.00 | | | | | | 0.09 | | | | | | 0.77 | | | | | | 0.86 | | | | | | — | | | | | | — | | | | | | — | | | | | | — | | | | | | — | | | | | | 10.86 | | | | | | 8.60 | | | | | | 0.12 | | | | | | 0.12 | | | | | | 0.12 | | | | | | 3.81 | | | | | | 3 | | | | | | 15 | | |
| Class S | | | | | | | | | | | | | | | | | | | | | | | | | | | | | | | | | | | | | | | | | | | | | | | | | | | | | | | | | | | | | | | | | | | | | | | | | | | | | | | | | | | | | | | | | | | | | | | | | | | | | | | |
| 12-31-15 | | | | | 13.01 | | | | | | 0.53• | | | | | | (0.34) | | | | | | 0.19 | | | | | | 0.61 | | | | | | 0.79 | | | | | | — | | | | | | 1.40 | | | | | | — | | | | | | 11.80 | | | | | | 1.23 | | | | | | 1.24 | | | | | | 0.38 | | | | | | 0.38 | | | | | | 4.58 | | | | | | 4,145 | | | | | | 86 | | |
| 12-31-14 | | | | | 12.30 | | | | | | 0.16 | | | | | | 0.59 | | | | | | 0.75 | | | | | | — | | | | | | 0.04 | | | | | | — | | | | | | 0.04 | | | | | | — | | | | | | 13.01 | | | | | | 6.08 | | | | | | 4.07 | | | | | | 0.38 | | | | | | 0.38 | | | | | | 1.27 | | | | | | 4 | | | | | | 32 | | |
| 12-31-13 | | | | | 11.81 | | | | | | 0.14 | | | | | | 1.39 | | | | | | 1.53 | | | | | | 0.25 | | | | | | 0.80 | | | | | | — | | | | | | 1.05 | | | | | | 0.01 | | | | | | 12.30 | | | | | | 13.47(a) | | | | | | 89.54 | | | | | | 0.38 | | | | | | 0.38 | | | | | | 1.14 | | | | | | 4 | | | | | | 68 | | |
| 12-31-12 | | | | | 10.85 | | | | | | 0.18 | | | | | | 1.11 | | | | | | 1.29 | | | | | | 0.12 | | | | | | 0.21 | | | | | | — | | | | | | 0.33 | | | | | | — | | | | | | 11.81 | | | | | | 11.90 | | | | | | 45.61 | | | | | | 0.37 | | | | | | 0.37 | | | | | | 1.56 | | | | | | 4 | | | | | | 72 | | |
| 10-03-11(5) - 12-31-11 | | | | | 10.00 | | | | | | 0.09 | | | | | | 0.76 | | | | | | 0.85 | | | | | | — | | | | | | — | | | | | | — | | | | | | — | | | | | | — | | | | | | 10.85 | | | | | | 8.50 | | | | | | 0.37 | | | | | | 0.37 | | | | | | 0.37 | | | | | | 3.55 | | | | | | 3 | | | | | | 15 | | |
| Class S2 | | | | | | | | | | | | | | | | | | | | | | | | | | | | | | | | | | | | | | | | | | | | | | | | | | | | | | | | | | | | | | | | | | | | | | | | | | | | | | | | | | | | | | | | | | | | | | | | | | | | | | | |
| 12-31-15 | | | | | 12.91 | | | | | | 0.36• | | | | | | (0.20) | | | | | | 0.16 | | | | | | 0.58 | | | | | | 0.79 | | | | | | — | | | | | | 1.37 | | | | | | — | | | | | | 11.70 | | | | | | 1.08 | | | | | | 1.49 | | | | | | 0.53 | | | | | | 0.53 | | | | | | 3.08 | | | | | | 283 | | | | | | 86 | | |
| 12-31-14 | | | | | 12.23 | | | | | | 0.14 | | | | | | 0.58 | | | | | | 0.72 | | | | | | — | | | | | | 0.04 | | | | | | — | | | | | | 0.04 | | | | | | — | | | | | | 12.91 | | | | | | 5.87 | | | | | | 4.32 | | | | | | 0.53 | | | | | | 0.53 | | | | | | 1.12 | | | | | | 4 | | | | | | 32 | | |
| 12-31-13 | | | | | 11.81 | | | | | | 0.12 | | | | | | 1.40 | | | | | | 1.52 | | | | | | 0.31 | | | | | | 0.80 | | | | | | — | | | | | | 1.11 | | | | | | 0.01 | | | | | | 12.23 | | | | | | 13.39(a) | | | | | | 89.79 | | | | | | 0.53 | | | | | | 0.53 | | | | | | 0.97 | | | | | | 4 | | | | | | 68 | | |
| 12-31-12 | | | | | 10.85 | | | | | | 0.16 | | | | | | 1.13 | | | | | | 1.29 | | | | | | 0.12 | | | | | | 0.21 | | | | | | — | | | | | | 0.33 | | | | | | — | | | | | | 11.81 | | | | | | 11.88 | | | | | | 45.86 | | | | | | 0.52 | | | | | | 0.52 | | | | | | 1.39 | | | | | | 4 | | | | | | 72 | | |
| 10-03-11(5) - 12-31-11 | | | | | 10.00 | | | | | | 0.08 | | | | | | 0.77 | | | | | | 0.85 | | | | | | — | | | | | | — | | | | | | — | | | | | | — | | | | | | — | | | | | | 10.85 | | | | | | 8.50 | | | | | | 0.62 | | | | | | 0.52 | | | | | | 0.52 | | | | | | 3.42 | | | | | | 3 | | | | | | 15 | | |
See Accompanying Notes to Financial Statements
Financial Highlights (continued)
| | | | | | | | | | Income
(loss) from
investment
operations | | | | | | | | | Less
Distributions | | | | | | | | | | | | | | | | | | | | | | | | | | | Ratios to average
net assets | | | Supplemental
Data | |
| | | | Net asset value, beginning of year
or period | | | Net investment income (loss) | | | Net realized and unrealized
gain (loss) | | | Total from investment operations | | | From net investment income | | | From net realized gains | | | From return of capital | | | Total distributions | | | Payment by affiliate | | | Net asset value, end of year
or period | | | Total Return(1) | | | Expenses before
reductions/additions(2)(3)(4) | | | Expenses net of fee waivers
and/or recoupments if any(2)(3)(4) | | | Expense net of all
reductions/additions(2)(3)(4) | | | Net investment income (loss)(2)(3) | | | Net assets, end of year or period | | | Portfolio turnover rate | |
Year or
period ended | | | ($) | | | ($) | | | ($) | | | ($) | | | ($) | | | ($) | | | ($) | | | ($) | | | ($) | | | ($) | | | (%) | | | (%) | | | (%) | | | (%) | | | (%) | | | ($000’s) | | | (%) | |
| Voya Solution 2020 Portfolio (continued) | | | | | | | | | | | | | | | | | | | | | | | | | | | | | | | | | | | | | | | | | | | | | | | | | | | | | | | | | | | | | | | | | | | | | | | | | | | | | | | | | | | | | | | | | | | | | | | | | | | | | | | |
| Class T | | | | | | | | | | | | | | | | | | | | | | | | | | | | | | | | | | | | | | | | | | | | | | | | | | | | | | | | | | | | | | | | | | | | | | | | | | | | | | | | | | | | | | | | | | | | | | | | | | | | | | | |
| 12-31-15 | | | | | 12.87 | | | | | | 0.11• | | | | | | 0.01 | | | | | | 0.12 | | | | | | 0.56 | | | | | | 0.79 | | | | | | — | | | | | | 1.35 | | | | | | — | | | | | | 11.64 | | | | | | 0.72 | | | | | | 1.74 | | | | | | 0.83 | | | | | | 0.83 | | | | | | 0.91 | | | | | | 4 | | | | | | 86 | | |
| 12-31-14 | | | | | 12.21 | | | | | | 0.10 | | | | | | 0.60 | | | | | | 0.70 | | | | | | — | | | | | | 0.04 | | | | | | — | | | | | | 0.04 | | | | | | — | | | | | | 12.87 | | | | | | 5.72 | | | | | | 4.57 | | | | | | 0.83 | | | | | | 0.83 | | | | | | 0.81 | | | | | | 4 | | | | | | 32 | | |
| 12-31-13 | | | | | 11.77 | | | | | | 0.08 | | | | | | 1.42 | | | | | | 1.50 | | | | | | 0.27 | | | | | | 0.80 | | | | | | — | | | | | | 1.07 | | | | | | 0.01 | | | | | | 12.21 | | | | | | 13.28(a) | | | | | | 90.04 | | | | | | 0.83 | | | | | | 0.83 | | | | | | 0.67 | | | | | | 4 | | | | | | 68 | | |
| 12-31-12 | | | | | 10.84 | | | | | | 0.13 | | | | | | 1.12 | | | | | | 1.25 | | | | | | 0.11 | | | | | | 0.21 | | | | | | — | | | | | | 0.32 | | | | | | — | | | | | | 11.77 | | | | | | 11.53 | | | | | | 46.11 | | | | | | 0.82 | | | | | | 0.82 | | | | | | 1.11 | | | | | | 4 | | | | | | 72 | | |
| 10-03-11(5) - 12-31-11 | | | | | 10.00 | | | | | | 0.08 | | | | | | 0.76 | | | | | | 0.84 | | | | | | — | | | | | | — | | | | | | — | | | | | | — | | | | | | — | | | ��� | | | 10.84 | | | | | | 8.40 | | | | | | 0.87 | | | | | | 0.82 | | | | | | 0.82 | | | | | | 3.11 | | | | | | 3 | | | | | | 15 | | |
| Voya Solution 2025 Portfolio | | | | | | | | | | | | | | | | | | | | | | | | | | | | | | | | | | | | | | | | | | | | | | | | | | | | | | | | | | | | | | | | | | | | | | | | | | | | | | | | | | | | | | | | | | | | | | | | | | | | | | | |
| Class ADV | | | | | | | | | | | | | | | | | | | | | | | | | | | | | | | | | | | | | | | | | | | | | | | | | | | | | | | | | | | | | | | | | | | | | | | | | | | | | | | | | | | | | | | | | | | | | | | | | | | | | | | |
| 12-31-15 | | | | | 12.83 | | | | | | 0.11• | | | | | | (0.09) | | | | | | 0.02 | | | | | | 0.37 | | | | | | 1.31 | | | | | | — | | | | | | 1.68 | | | | | | — | | | | | | 11.17 | | | | | | (0.26) | | | | | | 0.74 | | | | | | 0.65 | | | | | | 0.65 | | | | | | 0.89 | | | | | | 357,443 | | | | | | 42 | | |
| 12-31-14 | | | | | 13.06 | | | | | | 0.12• | | | | | | 0.54 | | | | | | 0.66 | | | | | | 0.23 | | | | | | 0.66 | | | | | | — | | | | | | 0.89 | | | | | | — | | | | | | 12.83 | | | | | | 5.26 | | | | | | 0.74 | | | | | | 0.63 | | | | | | 0.63 | | | | | | 0.94 | | | | | | 435,280 | | | | | | 46 | | |
| 12-31-13 | | | | | 11.48 | | | | | | 0.10• | | | | | | 1.73 | | | | | | 1.83 | | | | | | 0.25 | | | | | | — | | | | | | — | | | | | | 0.25 | | | | | | — | | | | | | 13.06 | | | | | | 16.05 | | | | | | 0.74 | | | | | | 0.62 | | | | | | 0.62 | | | | | | 0.85 | | | | | | 500,390 | | | | | | 72 | | |
| 12-31-12 | | | | | 10.39 | | | | | | 0.14• | | | | | | 1.23 | | | | | | 1.37 | | | | | | 0.28 | | | | | | — | | | | | | — | | | | | | 0.28 | | | | | | — | | | | | | 11.48 | | | | | | 13.24 | | | | | | 0.70 | | | | | | 0.62 | | | | | | 0.62 | | | | | | 1.22 | | | | | | 494,888 | | | | | | 65 | | |
| 12-31-11 | | | | | 10.98 | | | | | | 0.22 | | | | | | (0.60) | | | | | | (0.38) | | | | | | 0.21 | | | | | | — | | | | | | — | | | | | | 0.21 | | | | | | — | | | | | | 10.39 | | | | | | (3.37) | | | | | | 0.62 | | | | | | 0.62 | | | | | | 0.62 | | | | | | 2.01 | | | | | | 494,505 | | | | | | 71 | | |
| Class I | | | | | | | | | | | | | | | | | | | | | | | | | | | | | | | | | | | | | | | | | | | | | | | | | | | | | | | | | | | | | | | | | | | | | | | | | | | | | | | | | | | | | | | | | | | | | | | | | | | | | | | |
| 12-31-15 | | | | | 13.12 | | | | | | 0.18• | | | | | | (0.10) | | | | | | 0.08 | | | | | | 0.45 | | | | | | 1.31 | | | | | | — | | | | | | 1.76 | | | | | | — | | | | | | 11.44 | | | | | | 0.19 | | | | | | 0.24 | | | | | | 0.15 | | | | | | 0.15 | | | | | | 1.44 | | | | | | 204,693 | | | | | | 42 | | |
| 12-31-14 | | | | | 13.34 | | | | | | 0.20• | | | | | | 0.55 | | | | | | 0.75 | | | | | | 0.31 | | | | | | 0.66 | | | | | | — | | | | | | 0.97 | | | | | | — | | | | | | 13.12 | | | | | | 5.82 | | | | | | 0.24 | | | | | | 0.13 | | | | | | 0.13 | | | | | | 1.47 | | | | | | 197,457 | | | | | | 46 | | |
| 12-31-13 | | | | | 11.73 | | | | | | 0.17• | | | | | | 1.75 | | | | | | 1.92 | | | | | | 0.31 | | | | | | — | | | | | | — | | | | | | 0.31 | | | | | | — | | | | | | 13.34 | | | | | | 16.54 | | | | | | 0.24 | | | | | | 0.12 | | | | | | 0.12 | | | | | | 1.39 | | | | | | 225,551 | | | | | | 72 | | |
| 12-31-12 | | | | | 10.61 | | | | | | 0.20• | | | | | | 1.25 | | | | | | 1.45 | | | | | | 0.33 | | | | | | — | | | | | | — | | | | | | 0.33 | | | | | | — | | | | | | 11.73 | | | | | | 13.83 | | | | | | 0.20 | | | | | | 0.12 | | | | | | 0.12 | | | | | | 1.75 | | | | | | 191,144 | | | | | | 65 | | |
| 12-31-11 | | | | | 11.21 | | | | | | 0.28• | | | | | | (0.62) | | | | | | (0.34) | | | | | | 0.26 | | | | | | — | | | | | | — | | | | | | 0.26 | | | | | | — | | | | | | 10.61 | | | | | | (2.92) | | | | | | 0.12 | | | | | | 0.12 | | | | | | 0.12 | | | | | | 2.55 | | | | | | 152,184 | | | | | | 71 | | |
| Class S | | | | | | | | | | | | | | | | | | | | | | | | | | | | | | | | | | | | | | | | | | | | | | | | | | | | | | | | | | | | | | | | | | | | | | | | | | | | | | | | | | | | | | | | | | | | | | | | | | | | | | | |
| 12-31-15 | | | | | 13.00 | | | | | | 0.14• | | | | | | (0.10) | | | | | | 0.04 | | | | | | 0.41 | | | | | | 1.31 | | | | | | — | | | | | | 1.72 | | | | | | — | | | | | | 11.32 | | | | | | (0.09) | | | | | | 0.49 | | | | | | 0.40 | | | | | | 0.40 | | | | | | 1.14 | | | | | | 418,555 | | | | | | 42 | | |
| 12-31-14 | | | | | 13.22 | | | | | | 0.16• | | | | | | 0.55 | | | | | | 0.71 | | | | | | 0.27 | | | | | | 0.66 | | | | | | — | | | | | | 0.93 | | | | | | — | | | | | | 13.00 | | | | | | 5.58 | | | | | | 0.49 | | | | | | 0.38 | | | | | | 0.38 | | | | | | 1.21 | | | | | | 486,302 | | | | | | 46 | | |
| 12-31-13 | | | | | 11.62 | | | | | | 0.14• | | | | | | 1.74 | | | | | | 1.88 | | | | | | 0.28 | | | | | | — | | | | | | — | | | | | | 0.28 | | | | | | — | | | | | | 13.22 | | | | | | 16.33 | | | | | | 0.49 | | | | | | 0.37 | | | | | | 0.37 | | | | | | 1.11 | | | | | | 530,013 | | | | | | 72 | | |
| 12-31-12 | | | | | 10.52 | | | | | | 0.17• | | | | | | 1.23 | | | | | | 1.40 | | | | | | 0.30 | | | | | | — | | | | | | — | | | | | | 0.30 | | | | | | — | | | | | | 11.62 | | | | | | 13.44 | | | | | | 0.45 | | | | | | 0.37 | | | | | | 0.37 | | | | | | 1.48 | | | | | | 512,357 | | | | | | 65 | | |
| 12-31-11 | | | | | 11.11 | | | | | | 0.25• | | | | | | (0.61) | | | | | | (0.36) | | | | | | 0.23 | | | | | | — | | | | | | — | | | | | | 0.23 | | | | | | — | | | | | | 10.52 | | | | | | (3.10) | | | | | | 0.37 | | | | | | 0.37 | | | | | | 0.37 | | | | | | 2.24 | | | | | | 503,345 | | | | | | 71 | | |
| Class S2 | | | | | | | | | | | | | | | | | | | | | | | | | | | | | | | | | | | | | | | | | | | | | | | | | | | | | | | | | | | | | | | | | | | | | | | | | | | | | | | | | | | | | | | | | | | | | | | | | | | | | | | |
| 12-31-15 | | | | | 12.70 | | | | | | 0.12• | | | | | | (0.10) | | | | | | 0.02 | | | | | | 0.38 | | | | | | 1.31 | | | | | | — | | | | | | 1.69 | | | | | | — | | | | | | 11.03 | | | | | | (0.23) | | | | | | 0.74 | | | | | | 0.55 | | | | | | 0.55 | | | | | | 0.98 | | | | | | 27,673 | | | | | | 42 | | |
| 12-31-14 | | | | | 12.93 | | | | | | 0.13• | | | | | | 0.55 | | | | | | 0.68 | | | | | | 0.25 | | | | | | 0.66 | | | | | | — | | | | | | 0.91 | | | | | | — | | | | | | 12.70 | | | | | | 5.40 | | | | | | 0.74 | | | | | | 0.53 | | | | | | 0.53 | | | | | | 1.03 | | | | | | 35,050 | | | | | | 46 | | |
| 12-31-13 | | | | | 11.38 | | | | | | 0.11• | | | | | | 1.70 | | | | | | 1.81 | | | | | | 0.26 | | | | | | — | | | | | | — | | | | | | 0.26 | | | | | | — | | | | | | 12.93 | | | | | | 16.08 | | | | | | 0.74 | | | | | | 0.52 | | | | | | 0.52 | | | | | | 0.93 | | | | | | 41,255 | | | | | | 72 | | |
| 12-31-12 | | | | | 10.32 | | | | | | 0.15• | | | | | | 1.21 | | | | | | 1.36 | | | | | | 0.30 | | | | | | — | | | | | | — | | | | | | 0.30 | | | | | | — | | | | | | 11.38 | | | | | | 13.33 | | | | | | 0.70 | | | | | | 0.52 | | | | | | 0.52 | | | | | | 1.40 | | | | | | 43,134 | | | | | | 65 | | |
| 12-31-11 | | | | | 10.92 | | | | | | 0.24• | | | | | | (0.61) | | | | | | (0.37) | | | | | | 0.23 | | | | | | — | | | | | | — | | | | | | 0.23 | | | | | | — | | | | | | 10.32 | | | | | | (3.23) | | | | | | 0.62 | | | | | | 0.52 | | | | | | 0.52 | | | | | | 2.25 | | | | | | 32,053 | | | | | | 71 | | |
| Class T | | | | | | | | | | | | | | | | | | | | | | | | | | | | | | | | | | | | | | | | | | | | | | | | | | | | | | | | | | | | | | | | | | | | | | | | | | | | | | | | | | | | | | | | | | | | | | | | | | | | | | | |
| 12-31-15 | | | | | 13.07 | | | | | | 0.09• | | | | | | (0.12) | | | | | | (0.03) | | | | | | 0.15 | | | | | | 1.31 | | | | | | — | | | | | | 1.46 | | | | | | — | | | | | | 11.58 | | | | | | (0.56) | | | | | | 0.99 | | | | | | 0.85 | | | | | | 0.85 | | | | | | 0.70 | | | | | | 837 | | | | | | 42 | | |
| 12-31-14 | | | | | 13.29 | | | | | | 0.06• | | | | | | 0.60 | | | | | | 0.66 | | | | | | 0.22 | | | | | | 0.66 | | | | | | — | | | | | | 0.88 | | | | | | — | | | | | | 13.07 | | | | | | 5.14 | | | | | | 0.99 | | | | | | 0.83 | | | | | | 0.83 | | | | | | 0.45 | | | | | | 869 | | | | | | 46 | | |
| 12-31-13 | | | | | 11.68 | | | | | | 0.08• | | | | | | 1.75 | | | | | | 1.83 | | | | | | 0.22 | | | | | | — | | | | | | — | | | | | | 0.22 | | | | | | — | | | | | | 13.29 | | | | | | 15.75 | | | | | | 0.99 | | | | | | 0.82 | | | | | | 0.82 | | | | | | 0.66 | | | | | | 2,992 | | | | | | 72 | | |
| 12-31-12 | | | | | 10.49 | | | | | | 0.11• | | | | | | 1.24 | | | | | | 1.35 | | | | | | 0.16 | | | | | | — | | | | | | — | | | | | | 0.16 | | | | | | — | | | | | | 11.68 | | | | | | 12.95 | | | | | | 0.95 | | | | | | 0.82 | | | | | | 0.82 | | | | | | 0.93 | | | | | | 2,737 | | | | | | 65 | | |
| 12-31-11 | | | | | 11.06 | | | | | | 0.19• | | | | | | (0.58) | | | | | | (0.39) | | | | | | 0.18 | | | | | | — | | | | | | — | | | | | | 0.18 | | | | | | — | | | | | | 10.49 | | | | | | (3.44) | | | | | | 0.87 | | | | | | 0.82 | | | | | | 0.82 | | | | | | 1.71 | | | | | | 3,256 | | | | | | 71 | | |
See Accompanying Notes to Financial Statements
Financial Highlights (continued)
| | | | | | | | | | Income
(loss) from
investment
operations | | | | | | | | | Less
Distributions | | | | | | | | | | | | | | | | | | | | | | | | | | | Ratios to average
net assets | | | Supplemental
Data | |
| | | | Net asset value, beginning of year
or period | | | Net investment income (loss) | | | Net realized and unrealized
gain (loss) | | | Total from investment operations | | | From net investment income | | | From net realized gains | | | From return of capital | | | Total distributions | | | Payment by affiliate | | | Net asset value, end of year
or period | | | Total Return(1) | | | Expenses before
reductions/additions(2)(3)(4) | | | Expenses net of fee waivers
and/or recoupments if any(2)(3)(4) | | | Expense net of all
reductions/additions(2)(3)(4) | | | Net investment income (loss)(2)(3) | | | Net assets, end of year or period | | | Portfolio turnover rate | |
Year or
period ended | | | ($) | | | ($) | | | ($) | | | ($) | | | ($) | | | ($) | | | ($) | | | ($) | | | ($) | | | ($) | | | (%) | | | (%) | | | (%) | | | (%) | | | (%) | | | ($000’s) | | | (%) | |
| Voya Solution 2030 Portfolio | | | | | | | | | | | | | | | | | | | | | | | | | | | | | | | | | | | | | | | | | | | | | | | | | | | | | | | | | | | | | | | | | | | | | | | | | | | | | | | | | | | | | | | | | | | | | | | | | | | | | | | |
| Class ADV | | | | | | | | | | | | | | | | | | | | | | | | | | | | | | | | | | | | | | | | | | | | | | | | | | | | | | | | | | | | | | | | | | | | | | | | | | | | | | | | | | | | | | | | | | | | | | | | | | | | | | | |
| 12-31-15 | | | | | 13.94 | | | | | | 0.36• | | | | | | (0.31) | | | | | | 0.05 | | | | | | 0.19 | | | | | | 0.56 | | | | | | — | | | | | | 0.75 | | | | | | — | | | | | | 13.24 | | | | | | 0.18 | | | | | | 2.57 | | | | | | 0.66 | | | | | | 0.66 | | | | | | 2.65 | | | | | | 1,569 | | | | | | 69 | | |
| 12-31-14 | | | | | 13.23 | | | | | | 0.14• | | | | | | 0.69 | | | | | | 0.83 | | | | | | 0.02 | | | | | | 0.10 | | | | | | — | | | | | | 0.12 | | | | | | — | | | | | | 13.94 | | | | | | 6.30 | | | | | | 8.42 | | | | | | 0.66 | | | | | | 0.66 | | | | | | 0.98 | | | | | | 157 | | | | | | 136 | | |
| 12-31-13 | | | | | 12.12 | | | | | | 0.11 | | | | | | 2.06 | | | | | | 2.17 | | | | | | 0.24 | | | | | | 0.84 | | | | | | — | | | | | | 1.08 | | | | | | 0.02 | | | | | | 13.23 | | | | | | 18.66(b) | | | | | | 85.63 | | | | | | 0.64 | | | | | | 0.64 | | | | | | 0.86 | | | | | | 4 | | | | | | 73 | | |
| 12-31-12 | | | | | 11.06 | | | | | | 0.11 | | | | | | 1.38 | | | | | | 1.49 | | | | | | 0.10 | | | | | | 0.33 | | | | | | — | | | | | | 0.43 | | | | | | — | | | | | | 12.12 | | | | | | 13.48 | | | | | | 42.34 | | | | | | 0.62 | | | | | | 0.62 | | | | | | 0.96 | | | | | | 4 | | | | | | 76 | | |
| 10-03-11(5) - 12-31-11 | | | | | 10.00 | | | | | | 0.07 | | | | | | 0.99 | | | | | | 1.06 | | | | | | — | | | | | | — | | | | | | — | | | | | | — | | | | | | — | | | | | | 11.06 | | | | | | 10.60 | | | | | | 0.62 | | | | | | 0.62 | | | | | | 0.62 | | | | | | 2.82 | | | | | | 3 | | | | | | 11 | | |
| Class I | | | | | | | | | | | | | | | | | | | | | | | | | | | | | | | | | | | | | | | | | | | | | | | | | | | | | | | | | | | | | | | | | | | | | | | | | | | | | | | | | | | | | | | | | | | | | | | | | | | | | | | |
| 12-31-15 | | | | | 14.14 | | | | | | 0.39• | | | | | | (0.27) | | | | | | 0.12 | | | | | | 0.24 | | | | | | 0.56 | | | | | | — | | | | | | 0.80 | | | | | | — | | | | | | 13.46 | | | | | | 0.66 | | | | | | 2.07 | | | | | | 0.16 | | | | | | 0.16 | | | | | | 2.90 | | | | | | 861 | | | | | | 69 | | |
| 12-31-14 | | | | | 13.32 | | | | | | 0.20 | | | | | | 0.72 | | | | | | 0.92 | | | | | | — | | | | | | 0.10 | | | | | | — | | | | | | 0.10 | | | | | | — | | | | | | 14.14 | | | | | | 6.94 | | | | | | 7.92 | | | | | | 0.16 | | | | | | 0.16 | | | | | | 1.50 | | | | | | 4 | | | | | | 136 | | |
| 12-31-13 | | | | | 12.17 | | | | | | 0.18 | | | | | | 2.08 | | | | | | 2.26 | | | | | | 0.29 | | | | | | 0.84 | | | | | | — | | | | | | 1.13 | | | | | | 0.02 | | | | | | 13.32 | | | | | | 19.38(b) | | | | | | 85.13 | | | | | | 0.14 | | | | | | 0.14 | | | | | | 1.36 | | | | | | 4 | | | | | | 73 | | |
| 12-31-12 | | | | | 11.07 | | | | | | 0.18 | | | | | | 1.37 | | | | | | 1.55 | | | | | | 0.12 | | | | | | 0.33 | | | | | | — | | | | | | 0.45 | | | | | | — | | | | | | 12.17 | | | | | | 13.94 | | | | | | 41.84 | | | | | | 0.12 | | | | | | 0.12 | | | | | | 1.48 | | | | | | 4 | | | | | | 76 | | |
| 10-03-11(5) - 12-31-11 | | | | | 10.00 | | | | | | 0.08 | | | | | | 0.99 | | | | | | 1.07 | | | | | | — | | | | | | — | | | | | | — | | | | | | — | | | | | | — | | | | | | 11.07 | | | | | | 10.70 | | | | | | 0.12 | | | | | | 0.12 | | | | | | 0.12 | | | | | | 3.32 | | | | | | 3 | | | | | | 11 | | |
| Class S | | | | | | | | | | | | | | | | | | | | | | | | | | | | | | | | | | | | | | | | | | | | | | | | | | | | | | | | | | | | | | | | | | | | | | | | | | | | | | | | | | | | | | | | | | | | | | | | | | | | | | | |
| 12-31-15 | | | | | 14.07 | | | | | | 0.49• | | | | | | (0.39) | | | | | | 0.10 | | | | | | 0.17 | | | | | | 0.56 | | | | | | — | | | | | | 0.73 | | | | | | — | | | | | | 13.44 | | | | | | 0.52 | | | | | | 2.32 | | | | | | 0.41 | | | | | | 0.41 | | | | | | 3.69 | | | | | | 1,454 | | | | | | 69 | | |
| 12-31-14 | | | | | 13.32 | | | | | | 0.17 | | | | | | 0.68 | | | | | | 0.85 | | | | | | — | | | | | | 0.10 | | | | | | — | | | | | | 0.10 | | | | | | — | | | | | | 14.07 | | | | | | 6.41 | | | | | | 8.17 | | | | | | 0.41 | | | | | | 0.41 | | | | | | 1.25 | | | | | | 4 | | | | | | 136 | | |
| 12-31-13 | | | | | 12.13 | | | | | | 0.14 | | | | | | 2.06 | | | | | | 2.20 | | | | | | 0.19 | | | | | | 0.84 | | | | | | — | | | | | | 1.03 | | | | | | 0.02 | | | | | | 13.32 | | | | | | 18.92(b) | | | | | | 85.38 | | | | | | 0.39 | | | | | | 0.39 | | | | | | 1.09 | | | | | | 4 | | | | | | 73 | | |
| 12-31-12 | | | | | 11.06 | | | | | | 0.14 | | | | | | 1.37 | | | | | | 1.51 | | | | | | 0.11 | | | | | | 0.33 | | | | | | — | | | | | | 0.44 | | | | | | — | | | | | | 12.13 | | | | | | 13.62 | | | | | | 42.09 | | | | | | 0.37 | | | | | | 0.37 | | | | | | 1.21 | | | | | | 4 | | | | | | 76 | | |
| 10-03-11(5) - 12-31-11 | | | | | 10.00 | | | | | | 0.08 | | | | | | 0.98 | | | | | | 1.06 | | | | | | — | | | | | | — | | | | | | — | | | | | | — | | | | | | — | | | | | | 11.06 | | | | | | 10.60 | | | | | | 0.37 | | | | | | 0.37 | | | | | | 0.37 | | | | | | 3.10 | | | | | | 3 | | | | | | 11 | | |
| Class S2 | | | | | | | | | | | | | | | | | | | | | | | | | | | | | | | | | | | | | | | | | | | | | | | | | | | | | | | | | | | | | | | | | | | | | | | | | | | | | | | | | | | | | | | | | | | | | | | | | | | | | | | |
| 12-31-15 | | | | | 13.96 | | | | | | 0.28• | | | | | | (0.22) | | | | | | 0.06 | | | | | | 0.16 | | | | | | 0.56 | | | | | | — | | | | | | 0.72 | | | | | | — | | | | | | 13.30 | | | | | | 0.23 | | | | | | 2.57 | | | | | | 0.56 | | | | | | 0.56 | | | | | | 2.01 | | | | | | 41 | | | | | | 69 | | |
| 12-31-14 | | | | | 13.22 | | | | | | 0.15 | | | | | | 0.69 | | | | | | 0.84 | | | | | | — | | | | | | 0.10 | | | | | | — | | | | | | 0.10 | | | | | | — | | | | | | 13.96 | | | | | | 6.38 | | | | | | 8.42 | | | | | | 0.56 | | | | | | 0.56 | | | | | | 1.10 | | | | | | 4 | | | | | | 136 | | |
| 12-31-13 | | | | | 12.13 | | | | | | 0.12 | | | | | | 2.04 | | | | | | 2.16 | | | | | | 0.25 | | | | | | 0.84 | | | | | | — | | | | | | 1.09 | | | | | | 0.02 | | | | | | 13.22 | | | | | | 18.57(b) | | | | | | 85.63 | | | | | | 0.54 | | | | | | 0.54 | | | | | | 0.96 | | | | | | 4 | | | | | | 73 | | |
| 12-31-12 | | | | | 11.06 | | | | | | 0.13 | | | | | | 1.38 | | | | | | 1.51 | | | | | | 0.11 | | | | | | 0.33 | | | | | | — | | | | | | 0.44 | | | | | | — | | | | | | 12.13 | | | | | | 13.60 | | | | | | 42.34 | | | | | | 0.52 | | | | | | 0.52 | | | | | | 1.06 | | | | | | 4 | | | | | | 76 | | |
| 10-03-11(5) - 12-31-11 | | | | | 10.00 | | | | | | 0.07 | | | | | | 0.99 | | | | | | 1.06 | | | | | | — | | | | | | — | | | | | | — | | | | | | — | | | | | | — | | | | | | 11.06 | | | | | | 10.60 | | | | | | 0.62 | | | | | | 0.52 | | | | | | 0.52 | | | | | | 2.93 | | | | | | 3 | | | | | | 11 | | |
| Class T | | | | | | | | | | | | | | | | | | | | | | | | | | | | | | | | | | | | | | | | | | | | | | | | | | | | | | | | | | | | | | | | | | | | | | | | | | | | | | | | | | | | | | | | | | | | | | | | | | | | | | | |
| 12-31-15 | | | | | 13.97 | | | | | | 0.13 | | | | | | (0.14) | | | | | | (0.01) | | | | | | 0.13 | | | | | | 0.56 | | | | | | — | | | | | | 0.69 | | | | | | — | | | | | | 13.27 | | | | | | (0.26) | | | | | | 2.82 | | | | | | 0.86 | | | | | | 0.86 | | | | | | 0.92 | | | | | | 4 | | | | | | 69 | | |
| 12-31-14 | | | | | 13.25 | | | | | | 0.11 | | | | | | 0.71 | | ��� | | | | 0.82 | | | | | | — | | | | | | 0.10 | | | | | | — | | | | | | 0.10 | | | | | | — | | | | | | 13.97 | | | | | | 6.22 | | | | | | 8.67 | | | | | | 0.86 | | | | | | 0.86 | | | | | | 0.80 | | | | | | 4 | | | | | | 136 | | |
| 12-31-13 | | | | | 12.09 | | | | | | 0.08 | | | | | | 2.11 | | | | | | 2.19 | | | | | | 0.21 | | | | | | 0.84 | | | | | | — | | | | | | 1.05 | | | | | | 0.02 | | | | | | 13.25 | | | | | | 18.89(b) | | | | | | 85.88 | | | | | | 0.84 | | | | | | 0.84 | | | | | | 0.66 | | | | | | 4 | | | | | | 73 | | |
| 12-31-12 | | | | | 11.05 | | | | | | 0.09 | | | | | | 1.38 | | | | | | 1.47 | | | | | | 0.10 | | | | | | 0.33 | | | | | | — | | | | | | 0.43 | | | | | | — | | | | | | 12.09 | | | | | | 13.25 | | | | | | 42.59 | | | | | | 0.82 | | | | | | 0.82 | | | | | | 0.74 | | | | | | 4 | | | | | | 76 | | |
| 10-03-11(5) - 12-31-11 | | | | | 10.00 | | | | | | 0.07 | | | | | | 0.98 | | | | | | 1.05 | | | | | | — | | | | | | — | | | | | | — | | | | | | — | | | | | | — | | | | | | 11.05 | | | | | | 10.50 | | | | | | 0.87 | | | | | | 0.82 | | | | | | 0.82 | | | | | | 2.61 | | | | | | 3 | | | | | | 11 | | |
See Accompanying Notes to Financial Statements
Financial Highlights (continued)
| | | | | | | | | | Income
(loss) from
investment
operations | | | | | | | | | Less
Distributions | | | | | | | | | | | | | | | | | | | | | | | | | | | Ratios to average
net assets | | | Supplemental
Data | |
| | | | Net asset value, beginning of year
or period | | | Net investment income (loss) | | | Net realized and unrealized
gain (loss) | | | Total from investment operations | | | From net investment income | | | From net realized gains | | | From return of capital | | | Total distributions | | | Payment by affiliate | | | Net asset value, end of year
or period | | | Total Return(1) | | | Expenses before
reductions/additions(2)(3)(4) | | | Expenses net of fee waivers
and/or recoupments if any(2)(3)(4) | | | Expense net of all
reductions/additions(2)(3)(4) | | | Net investment income (loss)(2)(3) | | | Net assets, end of year or period | | | Portfolio turnover rate | |
Year or
period ended | | | ($) | | | ($) | | | ($) | | | ($) | | | ($) | | | ($) | | | ($) | | | ($) | | | ($) | | | ($) | | | (%) | | | (%) | | | (%) | | | (%) | | | (%) | | | ($000’s) | | | (%) | |
| Voya Solution 2035 Portfolio | | | | | | | | | | | | | | | | | | | | | | | | | | | | | | | | | | | | | | | | | | | | | | | | | | | | | | | | | | | | | | | | | | | | | | | | | | | | | | | | | | | | | | | | | | | | | | | | | | | | | | | |
| Class ADV | | | | | | | | | | | | | | | | | | | | | | | | | | | | | | | | | | | | | | | | | | | | | | | | | | | | | | | | | | | | | | | | | | | | | | | | | | | | | | | | | | | | | | | | | | | | | | | | | | | | | | | |
| 12-31-15 | | | | | 13.22 | | | | | | 0.11• | | | | | | (0.13) | | | | | | (0.02) | | | | | | 0.38 | | | | | | 1.55 | | | | | | — | | | | | | 1.93 | | | | | | — | | | | | | 11.27 | | | | | | (0.77) | | | | | | 0.74 | | | | | | 0.67 | | | | | | 0.67 | | | | | | 0.84 | | | | | | 303,218 | | | | | | 46 | | |
| 12-31-14 | | | | | 13.97 | | | | | | 0.12• | | | | | | 0.61 | | | | | | 0.73 | | | | | | 0.26 | | | | | | 1.22 | | | | | | — | | | | | | 1.48 | | | | | | — | | | | | | 13.22 | | | | | | 5.38 | | | | | | 0.75 | | | | | | 0.66 | | | | | | 0.66 | | | | | | 0.84 | | | | | | 361,683 | | | | | | 59 | | |
| 12-31-13 | | | | | 11.82 | | | | | | 0.11• | | | | | | 2.25 | | | | | | 2.36 | | | | | | 0.21 | | | | | | — | | | | | | — | | | | | | 0.21 | | | | | | — | | | | | | 13.97 | | | | | | 20.09 | | | | | | 0.74 | | | | | | 0.63 | | | | | | 0.63 | | | | | | 0.82 | | | | | | 425,221 | | | | | | 74 | | |
| 12-31-12 | | | | | 10.48 | | | | | | 0.10• | | | | | | 1.45 | | | | | | 1.55 | | | | | | 0.21 | | | | | | — | | | | | | — | | | | | | 0.21 | | | | | | — | | | | | | 11.82 | | | | | | 14.89 | | | | | | 0.70 | | | | | | 0.62 | | | | | | 0.62 | | | | | | 0.86 | | | | | | 411,758 | | | | | | 58 | | |
| 12-31-11 | | | | | 11.19 | | | | | | 0.17 | | | | | | (0.73) | | | | | | (0.56) | | | | | | 0.15 | | | | | | — | | | | | | — | | | | | | 0.15 | | | | | | — | | | | | | 10.48 | | | | | | (4.90) | | | | | | 0.62 | | | | | | 0.62 | | | | | | 0.62 | | | | | | 1.54 | | | | | | 418,753 | | | | | | 71 | | |
| Class I | | | | | | | | | | | | | | | | | | | | | | | | | | | | | | | | | | | | | | | | | | | | | | | | | | | | | | | | | | | | | | | | | | | | | | | | | | | | | | | | | | | | | | | | | | | | | | | | | | | | | | | |
| 12-31-15 | | | | | 13.51 | | | | | | 0.18• | | | | | | (0.14) | | | | | | 0.04 | | | | | | 0.46 | | | | | | 1.55 | | | | | | — | | | | | | 2.01 | | | | | | — | | | | | | 11.54 | | | | | | (0.30) | | | | | | 0.24 | | | | | | 0.17 | | | | | | 0.17 | | | | | | 1.39 | | | | | | 218,051 | | | | | | 46 | | |
| 12-31-14 | | | | | 14.25 | | | | | | 0.20 | | | | | | 0.61 | | | | | | 0.81 | | | | | | 0.33 | | | | | | 1.22 | | | | | | — | | | | | | 1.55 | | | | | | — | | | | | | 13.51 | | | | | | 5.93 | | | | | | 0.25 | | | | | | 0.16 | | | | | | 0.16 | | | | | | 1.40 | | | | | | 214,675 | | | | | | 59 | | |
| 12-31-13 | | | | | 12.05 | | | | | | 0.18• | | | | | | 2.30 | | | | | | 2.48 | | | | | | 0.28 | | | | | | — | | | | | | — | | | | | | 0.28 | | | | | | — | | | | | | 14.25 | | | | | | 20.72 | | | | | | 0.24 | | | | | | 0.13 | | | | | | 0.13 | | | | | | 1.39 | | | | | | 208,709 | | | | | | 74 | | |
| 12-31-12 | | | | | 10.69 | | | | | | 0.16• | | | | | | 1.47 | | | | | | 1.63 | | | | | | 0.27 | | | | | | — | | | | | | — | | | | | | 0.27 | | | | | | — | | | | | | 12.05 | | | | | | 15.37 | | | | | | 0.20 | | | | | | 0.12 | | | | | | 0.12 | | | | | | 1.39 | | | | | | 168,154 | | | | | | 58 | | |
| 12-31-11 | | | | | 11.41 | | | | | | 0.24• | | | | | | (0.76) | | | | | | (0.52) | | | | | | 0.20 | | | | | | — | | | | | | — | | | | | | 0.20 | | | | | | — | | | | | | 10.69 | | | | | | (4.42) | | | | | | 0.12 | | | | | | 0.12 | | | | | | 0.12 | | | | | | 2.10 | | | | | | 140,503 | | | | | | 71 | | |
| Class S | | | | | | | | | | | | | | | | | | | | | | | | | | | | | | | | | | | | | | | | | | | | | | | | | | | | | | | | | | | | | | | | | | | | | | | | | | | | | | | | | | | | | | | | | | | | | | | | | | | | | | | |
| 12-31-15 | | | | | 13.39 | | | | | | 0.14• | | | | | | (0.13) | | | | | | 0.01 | | | | | | 0.42 | | | | | | 1.55 | | | | | | — | | | | | | 1.97 | | | | | | — | | | | | | 11.43 | | | | | | (0.48) | | | | | | 0.49 | | | | | | 0.42 | | | | | | 0.42 | | | | | | 1.10 | | | | | | 383,233 | | | | | | 46 | | |
| 12-31-14 | | | | | 14.13 | | | | | | 0.16• | | | | | | 0.61 | | | | | | 0.77 | | | | | | 0.29 | | | | | | 1.22 | | | | | | — | | | | | | 1.51 | | | | | | — | | | | | | 13.39 | | | | | | 5.68 | | | | | | 0.50 | | | | | | 0.41 | | | | | | 0.41 | | | | | | 1.14 | | | | | | 432,573 | | | | | | 59 | | |
| 12-31-13 | | | | | 11.96 | | | | | | 0.14• | | | | | | 2.28 | | | | | | 2.42 | | | | | | 0.25 | | | | | | — | | | | | | — | | | | | | 0.25 | | | | | | — | | | | | | 14.13 | | | | | | 20.35 | | | | | | 0.49 | | | | | | 0.38 | | | | | | 0.38 | | | | | | 1.08 | | | | | | 485,103 | | | | | | 74 | | |
| 12-31-12 | | | | | 10.61 | | | | | | 0.13• | | | | | | 1.46 | | | | | | 1.59 | | | | | | 0.24 | | | | | | — | | | | | | — | | | | | | 0.24 | | | | | | — | | | | | | 11.96 | | | | | | 15.09 | | | | | | 0.45 | | | | | | 0.37 | | | | | | 0.37 | | | | | | 1.15 | | | | | | 456,581 | | | | | | 58 | | |
| 12-31-11 | | | | | 11.32 | | | | | | 0.21 | | | | | | (0.74) | | | | | | (0.53) | | | | | | 0.18 | | | | | | — | | | | | | — | | | | | | 0.18 | | | | | | — | | | | | | 10.61 | | | | | | (4.61) | | | | | | 0.37 | | | | | | 0.37 | | | | | | 0.37 | | | | | | 1.77 | | | | | | 416,250 | | | | | | 71 | | |
| Class S2 | | | | | | | | | | | | | | | | | | | | | | | | | | | | | | | | | | | | | | | | | | | | | | | | | | | | | | | | | | | | | | | | | | | | | | | | | | | | | | | | | | | | | | | | | | | | | | | | | | | | | | | |
| 12-31-15 | | | | | 13.01 | | | | | | 0.11• | | | | | | (0.11) | | | | | | 0.00* | | | | | | 0.39 | | | | | | 1.55 | | | | | | — | | | | | | 1.94 | | | | | | — | | | | | | 11.07 | | | | | | (0.62) | | | | | | 0.74 | | | | | | 0.57 | | | | | | 0.57 | | | | | | 0.90 | | | | | | 22,289 | | | | | | 46 | | |
| 12-31-14 | | | | | 13.77 | | | | | | 0.13• | | | | | | 0.60 | | | | | | 0.73 | | | | | | 0.27 | | | | | | 1.22 | | | | | | — | | | | | | 1.49 | | | | | | — | | | | | | 13.01 | | | | | | 5.50 | | | | | | 0.75 | | | | | | 0.56 | | | | | | 0.56 | | | | | | 0.95 | | | | | | 31,331 | | | | | | 59 | | |
| 12-31-13 | | | | | 11.66 | | | | | | 0.11• | | | | | | 2.22 | | | | | | 2.33 | | | | | | 0.22 | | | | | | — | | | | | | — | | | | | | 0.22 | | | | | | — | | | | | | 13.77 | | | | | | 20.17 | | | | | | 0.74 | | | | | | 0.53 | | | | | | 0.53 | | | | | | 0.88 | | | | | | 34,588 | | | | | | 74 | | |
| 12-31-12 | | | | | 10.36 | | | | | | 0.12• | | | | | | 1.42 | | | | | | 1.54 | | | | | | 0.24 | | | | | | — | | | | | | — | | | | | | 0.24 | | | | | | — | | | | | | 11.66 | | | | | | 14.97 | | | | | | 0.70 | | | | | | 0.52 | | | | | | 0.52 | | | | | | 1.07 | | | | | | 36,830 | | | | | | 58 | | |
| 12-31-11 | | | | | 11.08 | | | | | | 0.19• | | | | | | (0.73) | | | | | | (0.54) | | | | | | 0.18 | | | | | | — | | | | | | — | | | | | | 0.18 | | | | | | — | | | | | | 10.36 | | | | | | (4.79) | | | | | | 0.62 | | | | | | 0.52 | | | | | | 0.52 | | | | | | 1.78 | | | | | | 26,630 | | | | | | 71 | | |
| Class T | | | | | | | | | | | | | | | | | | | | | | | | | | | | | | | | | | | | | | | | | | | | | | | | | | | | | | | | | | | | | | | | | | | | | | | | | | | | | | | | | | | | | | | | | | | | | | | | | | | | | | | |
| 12-31-15 | | | | | 13.50 | | | | | | 0.09• | | | | | | (0.15) | | | | | | (0.06) | | | | | | 0.24 | | | | | | 1.55 | | | | | | — | | | | | | 1.79 | | | | | | — | | | | | | 11.65 | | | | | | (1.00) | | | | | | 0.99 | | | | | | 0.87 | | | | | | 0.87 | | | | | | 0.69 | | | | | | 887 | | | | | | 46 | | |
| 12-31-14 | | | | | 14.22 | | | | | | 0.05• | | | | | | 0.67 | | | | | | 0.72 | | | | | | 0.22 | | | | | | 1.22 | | | | | | — | | | | | | 1.44 | | | | | | — | | | | | | 13.50 | | | | | | 5.26 | | | | | | 1.00 | | | | | | 0.86 | | | | | | 0.86 | | | | | | 0.32 | | | | | | 864 | | | | | | 59 | | |
| 12-31-13 | | | | | 12.02 | | | | | | 0.06• | | | | | | 2.31 | | | | | | 2.37 | | | | | | 0.17 | | | | | | — | | | | | | — | | | | | | 0.17 | | | | | | — | | | | | | 14.22 | | | | | | 19.85 | | | | | | 0.99 | | | | | | 0.83 | | | | | | 0.83 | | | | | | 0.48 | | | | | | 1,898 | | | | | | 74 | | |
| 12-31-12 | | | | | 10.63 | | | | | | 0.07• | | | | | | 1.47 | | | | | | 1.54 | | | | | | 0.15 | | | | | | — | | | | | | — | | | | | | 0.15 | | | | | | — | | | | | | 12.02 | | | | | | 14.59 | | | | | | 0.95 | | | | | | 0.82 | | | | | | 0.82 | | | | | | 0.61 | | | | | | 2,561 | | | | | | 58 | | |
| 12-31-11 | | | | | 11.33 | | | | | | 0.15• | | | | | | (0.73) | | | | | | (0.58) | | | | | | 0.12 | | | | | | — | | | | | | — | | | | | | 0.12 | | | | | | — | | | | | | 10.63 | | | | | | (5.06) | | | | | | 0.87 | | | | | | 0.82 | | | | | | 0.82 | | | | | | 1.30 | | | | | | 2,927 | | | | | | 71 | | |
| Voya Solution 2040 Portfolio | | | | | | | | | | | | | | | | | | | | | | | | | | | | | | | | | | | | | | | | | | | | | | | | | | | | | | | | | | | | | | | | | | | | | | | | | | | | | | | | | | | | | | | | | | | | | | | | | | | | | | | |
| Class ADV | | | | | | | | | | | | | | | | | | | | | | | | | | | | | | | | | | | | | | | | | | | | | | | | | | | | | | | | | | | | | | | | | | | | | | | | | | | | | | | | | | | | | | | | | | | | | | | | | | | | | | | |
| 12-31-15 | | | | | 14.89 | | | | | | 0.25• | | | | | | (0.26) | | | | | | (0.01) | | | | | | 0.35 | | | | | | 0.69 | | | | | | — | | | | | | 1.04 | | | | | | — | | | | | | 13.84 | | | | | | (0.33) | | | | | | 2.07 | | | | | | 0.67 | | | | | | 0.67 | | | | | | 1.72 | | | | | | 2,229 | | | | | | 108 | | |
| 12-31-14 | | | | | 14.04 | | | | | | 0.18• | | | | | | 0.73 | | | | | | 0.91 | | | | | | 0.01 | | | | | | 0.05 | | | | | | — | | | | | | 0.06 | | | | | | — | | | | | | 14.89 | | | | | | 6.51 | | | | | | 3.66 | | | | | | 0.67 | | | | | | 0.67 | | | | | | 1.23 | | | | | | 701 | | | | | | 80 | | |
| 12-31-13 | | | | | 12.45 | | | | | | 0.08 | | | | | | 2.58 | | | | | | 2.66 | | | | | | 0.21 | | | | | | 0.89 | | | | | | — | | | | | | 1.10 | | | | | | 0.03 | | | | | | 14.04 | | | | | | 22.31(c) | | | | | | 84.89 | | | | | | 0.64 | | | | | | 0.64 | | | | | | 0.63 | | | | | | 4 | | | | | | 67 | | |
| 12-31-12 | | | | | 11.23 | | | | | | 0.08 | | | | | | 1.57 | | | | | | 1.65 | | | | | | 0.09 | | | | | | 0.34 | | | | | | — | | | | | | 0.43 | | | | | | — | | | | | | 12.45 | | | | | | 14.70 | | | | | | 44.95 | | | | | | 0.62 | | | | | | 0.62 | | | | | | 0.63 | | | | | | 4 | | | | | | 64 | | |
| 10-03-11(5) - 12-31-11 | | | | | 10.00 | | | | | | 0.06 | | | | | | 1.17 | | | | | | 1.23 | | | | | | — | | | | | | — | | | | | | — | | | | | | — | | | | | | — | | | | | | 11.23 | | | | | | 12.30 | | | | | | 0.62 | | | | | | 0.62 | | | | | | 0.62 | | | | | | 2.25 | | | | | | 3 | | | | | | 10 | | |
See Accompanying Notes to Financial Statements
Financial Highlights (continued)
| | | | | | | | | | Income
(loss) from
investment
operations | | | | | | | | | Less
Distributions | | | | | | | | | | | | | | | | | | | | | | | | | | | Ratios to average
net assets | | | Supplemental
Data | |
| | | | Net asset value, beginning of year
or period | | | Net investment income (loss) | | | Net realized and unrealized
gain (loss) | | | Total from investment operations | | | From net investment income | | | From net realized gains | | | From return of capital | | | Total distributions | | | Payment by affiliate | | | Net asset value, end of year
or period | | | Total Return(1) | | | Expenses before
reductions/additions(2)(3)(4) | | | Expenses net of fee waivers
and/or recoupments if any(2)(3)(4) | | | Expense net of all
reductions/additions(2)(3)(4) | | | Net investment income (loss)(2)(3) | | | Net assets, end of year or period | | | Portfolio turnover rate | |
Year or
period ended | | | ($) | | | ($) | | | ($) | | | ($) | | | ($) | | | ($) | | | ($) | | | ($) | | | ($) | | | ($) | | | (%) | | | (%) | | | (%) | | | (%) | | | (%) | | | ($000’s) | | | (%) | |
| Voya Solution 2040 Portfolio (continued) | | | | | | | | | | | | | | | | | | | | | | | | | | | | | | | | | | | | | | | | | | | | | | | | | | | | | | | | | | | | | | | | | | | | | | | | | | | | | | | | | | | | | | | | | | | | | | | | | | | | | | | |
| Class I | | | | | | | | | | | | | | | | | | | | | | | | | | | | | | | | | | | | | | | | | | | | | | | | | | | | | | | | | | | | | | | | | | | | | | | | | | | | | | | | | | | | | | | | | | | | | | | | | | | | | | | |
| 12-31-15 | | | | | 15.08 | | | | | | 0.43• | | | | | | (0.36) | | | | | | 0.07 | | | | | | 0.39 | | | | | | 0.69 | | | | | | — | | | | | | 1.08 | | | | | | — | | | | | | 14.07 | | | | | | 0.22 | | | | | | 1.57 | | | | | | 0.17 | | | | | | 0.17 | | | | | | 3.06 | | | | | | 487 | | | | | | 108 | | |
| 12-31-14 | | | | | 14.14 | | | | | | 0.17 | | | | | | 0.82 | | | | | | 0.99 | | | | | | — | | | | | | 0.05 | | | | | | — | | | | | | 0.05 | | | | | | — | | | | | | 15.08 | | | | | | 7.04 | | | | | | 3.16 | | | | | | 0.17 | | | | | | 0.17 | | | | | | 1.14 | | | | | | 5 | | | | | | 80 | | |
| 12-31-13 | | | | | 12.52 | | | | | | 0.15 | | | | | | 2.60 | | | | | | 2.75 | | | | | | 0.27 | | | | | | 0.89 | | | | | | — | | | | | | 1.16 | | | | | | 0.03 | | | | | | 14.14 | | | | | | 22.99(c) | | | | | | 84.39 | | | | | | 0.14 | | | | | | 0.14 | | | | | | 1.11 | | | | | | 4 | | | | | | 67 | | |
| 12-31-12 | | | | | 11.24 | | | | | | 0.14 | | | | | | 1.58 | | | | | | 1.72 | | | | | | 0.10 | | | | | | 0.34 | | | | | | — | | | | | | 0.44 | | | | | | — | | | | | | 12.52 | | | | | | 15.34 | | | | | | 44.45 | | | | | | 0.12 | | | | | | 0.12 | | | | | | 1.16 | | | | | | 4 | | | | | | 64 | | |
| 10-03-11(5) - 12-31-11 | | | | | 10.00 | | | | | | 0.07 | | | | | | 1.17 | | | | | | 1.24 | | | | | | — | | | | | | — | | | | | | — | | | | | | — | | | | | | — | | | | | | 11.24 | | | | | | 12.40 | | | | | | 0.12 | | | | | | 0.12 | | | | | | 0.12 | | | | | | 2.75 | | | | | | 3 | | | | | | 10 | | |
| Class S | | | | | | | | | | | | | | | | | | | | | | | | | | | | | | | | | | | | | | | | | | | | | | | | | | | | | | | | | | | | | | | | | | | | | | | | | | | | | | | | | | | | | | | | | | | | | | | | | | | | | | | |
| 12-31-15 | | | | | 15.02 | | | | | | 0.49• | | | | | | (0.45) | | | | | | 0.04 | | | | | | 0.34 | | | | | | 0.69 | | | | | | — | | | | | | 1.03 | | | | | | — | | | | | | 14.03 | | | | | | 0.03 | | | | | | 1.82 | | | | | | 0.42 | | | | | | 0.42 | | | | | | 3.50 | | | | | | 610 | | | | | | 108 | | |
| 12-31-14 | | | | | 14.15 | | | | | | 0.13 | | | | | | 0.79 | | | | | | 0.92 | | | | | | — | | | | | | 0.05 | | | | | | — | | | | | | 0.05 | | | | | | — | | | | | | 15.02 | | | | | | 6.54 | | | | | | 3.41 | | | | | | 0.42 | | | | | | 0.42 | | | | | | 0.90 | | | | | | 5 | | | | | | 80 | | |
| 12-31-13 | | | | | 12.48 | | | | | | 0.11 | | | | | | 2.59 | | | | | | 2.70 | | | | | | 0.17 | | | | | | 0.89 | | | | | | — | | | | | | 1.06 | | | | | | 0.03 | | | | | | 14.15 | | | | | | 22.57(c) | | | | | | 84.64 | | | | | | 0.39 | | | | | | 0.39 | | | | | | 0.84 | | | | | | 4 | | | | | | 67 | | |
| 12-31-12 | | | | | 11.23 | | | | | | 0.11 | | | | | | 1.58 | | | | | | 1.69 | | | | | | 0.10 | | | | | | 0.34 | | | | | | — | | | | | | 0.44 | | | | | | — | | | | | | 12.48 | | | | | | 15.02 | | | | | | 44.70 | | | | | | 0.37 | | | | | | 0.37 | | | | | | 0.92 | | | | | | 4 | | | | | | 64 | | |
| 10-03-11(5) - 12-31-11 | | | | | 10.00 | | | | | | 0.07 | | | | | | 1.16 | | | | | | 1.23 | | | | | | — | | | | | | — | | | | | | — | | | | | | — | | | | | | — | | | | | | 11.23 | | | | | | 12.30 | | | | | | 0.37 | | | | | | 0.37 | | | | | | 0.37 | | | | | | 2.57 | | | | | | 3 | | | | | | 10 | | |
| Class S2 | | | | | | | | | | | | | | | | | | | | | | | | | | | | | | | | | | | | | | | | | | | | | | | | | | | | | | | | | | | | | | | | | | | | | | | | | | | | | | | | | | | | | | | | | | | | | | | | | | | | | | | |
| 12-31-15 | | | | | 14.93 | | | | | | 0.22• | | | | | | (0.23) | | | | | | (0.01) | | | | | | 0.33 | | | | | | 0.69 | | | | | | — | | | | | | 1.02 | | | | | | — | | | | | | 13.90 | | | | | | (0.33) | | | | | | 2.07 | | | | | | 0.57 | | | | | | 0.57 | | | | | | 1.46 | | | | | | 9 | | | | | | 108 | | |
| 12-31-14 | | | | | 14.05 | | | | | | 0.11 | | | | | | 0.82 | | | | | | 0.93 | | | | | | — | | | | | | 0.05 | | | | | | — | | | | | | 0.05 | | | | | | — | | | | | | 14.93 | | | | | | 6.66 | | | | | | 3.66 | | | | | | 0.57 | | | | | | 0.57 | | | | | | 0.76 | | | | | | 5 | | | | | | 80 | | |
| 12-31-13 | | | | | 12.47 | | | | | | 0.10 | | | | | | 2.56 | | | | | | 2.66 | | | | | | 0.22 | | | | | | 0.89 | | | | | | — | | | | | | 1.11 | | | | | | 0.03 | | | | | | 14.05 | | | | | | 22.30(c) | | | | | | 84.89 | | | | | | 0.54 | | | | | | 0.54 | | | | | | 0.71 | | | | | | 4 | | | | | | 67 | | |
| 12-31-12 | | | | | 11.23 | | | | | | 0.09 | | | | | | 1.58 | | | | | | 1.67 | | | | | | 0.09 | | | | | | 0.34 | | | | | | — | | | | | | 0.43 | | | | | | — | | | | | | 12.47 | | | | | | 14.91 | | | | | | 44.95 | | | | | | 0.52 | | | | | | 0.52 | | | | | | 0.73 | | | | | | 4 | | | | | | 64 | | |
| 10-03-11(5) - 12-31-11 | | | | | 10.00 | | | | | | 0.06 | | | | | | 1.17 | | | | | | 1.23 | | | | | | — | | | | | | — | | | | | | — | | | | | | — | | | | | | — | | | | | | 11.23 | | | | | | 12.30 | | | | | | 0.62 | | | | | | 0.52 | | | | | | 0.52 | | | | | | 2.36 | | | | | | 3 | | | | | | 10 | | |
| Class T | | | | | | | | | | | | | | | | | | | | | | | | | | | | | | | | | | | | | | | | | | | | | | | | | | | | | | | | | | | | | | | | | | | | | | | | | | | | | | | | | | | | | | | | | | | | | | | | | | | | | | | |
| 12-31-15 | | | | | 14.85 | | | | | | 0.10• | | | | | | (0.16) | | | | | | (0.06) | | | | | | 0.29 | | | | | | 0.69 | | | | | | — | | | | | | 0.98 | | | | | | — | | | | | | 13.81 | | | | | | (0.66) | | | | | | 2.32 | | | | | | 0.87 | | | | | | 0.87 | | | | | | 0.67 | | | | | | 4 | | | | | | 108 | | |
| 12-31-14 | | | | | 14.01 | | | | | | 0.06 | | | | | | 0.83 | | | | | | 0.89 | | | | | | — | | | | | | 0.05 | | | | | | — | | | | | | 0.05 | | | | | | — | | | | | | 14.85 | | | | | | 6.40 | | | | | | 3.91 | | | | | | 0.87 | | | | | | 0.87 | | | | | | 0.45 | | | | | | 4 | | | | | | 80 | | |
| 12-31-13 | | | | | 12.43 | | | | | | 0.06 | | | | | | 2.56 | | | | | | 2.62 | | | | | | 0.18 | | | | | | 0.89 | | | | | | — | | | | | | 1.07 | | | | | | 0.03 | | | | | | 14.01 | | | | | | 22.06(c) | | | | | | 85.14 | | | | | | 0.84 | | | | | | 0.84 | | | | | | 0.41 | | | | | | 4 | | | | | | 67 | | |
| 12-31-12 | | | | | 11.22 | | | | | | 0.05 | | | | | | 1.58 | | | | | | 1.63 | | | | | | 0.08 | | | | | | 0.34 | | | | | | — | | | | | | 0.42 | | | | | | — | | | | | | 12.43 | | | | | | 14.56 | | | | | | 45.20 | | | | | | 0.82 | | | | | | 0.82 | | | | | | 0.43 | | | | | | 4 | | | | | | 64 | | |
| 10-03-11(5) - 12-31-11 | | | | | 10.00 | | | | | | 0.05 | | | | | | 1.17 | | | | | | 1.22 | | | | | | — | | | | | | — | | | | | | — | | | | | | — | | | | | | — | | | | | | 11.22 | | | | | | 12.20 | | | | | | 0.87 | | | | | | 0.82 | | | | | | 0.82 | | | | | | 2.06 | | | | | | 3 | | | | | | 10 | | |
| Voya Solution 2045 Portfolio | | | | | | | | | | | | | | | | | | | | | | | | | | | | | | | | | | | | | | | | | | | | | | | | | | | | | | | | | | | | | | | | | | | | | | | | | | | | | | | | | | | | | | | | | | | | | | | | | | | | | | | |
| Class ADV | | | | | | | | | | | | | | | | | | | | | | | | | | | | | | | | | | | | | | | | | | | | | | | | | | | | | | | | | | | | | | | | | | | | | | | | | | | | | | | | | | | | | | | | | | | | | | | | | | | | | | | |
| 12-31-15 | | | | | 13.60 | | | | | | 0.07• | | | | | | (0.11) | | | | | | (0.04) | | | | | | 0.38 | | | | | | 2.03 | | | | | | — | | | | | | 2.41 | | | | | | — | | | | | | 11.15 | | | | | | (1.15) | | | | | | 0.75 | | | | | | 0.69 | | | | | | 0.69 | | | | | | 0.58 | | | | | | 197,360 | | | | | | 41 | | |
| 12-31-14 | | | | | 14.55 | | | | | | 0.08• | | | | | | 0.73 | | | | | | 0.81 | | | | | | 0.22 | | | | | | 1.54 | | | | | | — | | | | | | 1.76 | | | | | | — | | | | | | 13.60 | | | | | | 5.84 | | | | | | 0.74 | | | | | | 0.68 | | | | | | 0.68 | | | | | | 0.55 | | | | | | 237,641 | | | | | | 58 | | |
| 12-31-13 | | | | | 11.98 | | | | | | 0.06• | | | | | | 2.69 | | | | | | 2.75 | | | | | | 0.18 | | | | | | — | | | | | | — | | | | | | 0.18 | | | | | | — | | | | | | 14.55 | | | | | | 23.09 | | | | | | 0.74 | | | | | | 0.63 | | | | | | 0.63 | | | | | | 0.49 | | | | | | 266,469 | | | | | | 72 | | |
| 12-31-12 | | | | | 10.56 | | | | | | 0.07• | | | | | | 1.53 | | | | | | 1.60 | | | | | | 0.18 | | | | | | — | | | | | | — | | | | | | 0.18 | | | | | | — | | | | | | 11.98 | | | | | | 15.23 | | | | | | 0.70 | | | | | | 0.62 | | | | | | 0.62 | | | | | | 0.60 | | | | | | 239,901 | | | | | | 50 | | |
| 12-31-11 | | | | | 11.29 | | | | | | 0.14• | | | | | | (0.76) | | | | | | (0.62) | | | | | | 0.11 | | | | | | — | | | | | | — | | | | | | 0.11 | | | | | | — | | | | | | 10.56 | | | | | | (5.42) | | | | | | 0.62 | | | | | | 0.62 | | | | | | 0.62 | | | | | | 1.28 | | | | | | 244,111 | | | | | | 77 | | |
See Accompanying Notes to Financial Statements
Financial Highlights (continued)
| | | | | | | | | | Income
(loss) from
investment
operations | | | | | | | | | Less
Distributions | | | | | | | | | | | | | | | | | | | | | | | | | | | Ratios to average
net assets | | | Supplemental
Data | |
| | | | Net asset value, beginning of year
or period | | | Net investment income (loss) | | | Net realized and unrealized
gain (loss) | | | Total from investment operations | | | From net investment income | | | From net realized gains | | | From return of capital | | | Total distributions | | | Payment by affiliate | | | Net asset value, end of year
or period | | | Total Return(1) | | | Expenses before
reductions/additions(2)(3)(4) | | | Expenses net of fee waivers
and/or recoupments if any(2)(3)(4) | | | Expense net of all
reductions/additions(2)(3)(4) | | | Net investment income (loss)(2)(3) | | | Net assets, end of year or period | | | Portfolio turnover rate | |
Year or
period ended | | | ($) | | | ($) | | | ($) | | | ($) | | | ($) | | | ($) | | | ($) | | | ($) | | | ($) | | | ($) | | | (%) | | | (%) | | | (%) | | | (%) | | | (%) | | | ($000’s) | | | (%) | |
| Voya Solution 2045 Portfolio (continued) | | | | | | | | | | | | | | | | | | | | | | | | | | | | | | | | | | | | | | | | | | | | | | | | | | | | | | | | | | | | | | | | | | | | | | | | | | | | | | | | | | | | | | | | | | | | | | | | | | | | | | | |
| Class I | | | | | | | | | | | | | | | | | | | | | | | | | | | | | | | | | | | | | | | | | | | | | | | | | | | | | | | | | | | | | | | | | | | | | | | | | | | | | | | | | | | | | | | | | | | | | | | | | | | | | | | |
| 12-31-15 | | | | | 13.90 | | | | | | 0.15• | | | | | | (0.12) | | | | | | 0.03 | | | | | | 0.46 | | | | | | 2.03 | | | | | | — | | | | | | 2.49 | | | | | | — | | | | | | 11.44 | | | | | | (0.59) | | | | | | 0.25 | | | | | | 0.19 | | | | | | 0.19 | | | | | | 1.15 | | | | | | 169,325 | | | | | | 41 | | |
| 12-31-14 | | | | | 14.84 | | | | | | 0.15 | | | | | | 0.75 | | | | | | 0.90 | | | | | | 0.30 | | | | | | 1.54 | | | | | | — | | | | | | 1.84 | | | | | | — | | | | | | 13.90 | | | | | | 6.34 | | | | | | 0.24 | | | | | | 0.18 | | | | | | 0.18 | | | | | | 1.04 | | | | | | 161,654 | | | | | | 58 | | |
| 12-31-13 | | | | | 12.21 | | | | | | 0.14• | | | | | | 2.74 | | | | | | 2.88 | | | | | | 0.25 | | | | | | — | | | | | | — | | | | | | 0.25 | | | | | | — | | | | | | 14.84 | | | | | | 23.74 | | | | | | 0.24 | | | | | | 0.13 | | | | | | 0.13 | | | | | | 1.07 | | | | | | 158,048 | | | | | | 72 | | |
| 12-31-12 | | | | | 10.76 | | | | | | 0.11 | | | | | | 1.58 | | | | | | 1.69 | | | | | | 0.24 | | | | | | — | | | | | | — | | | | | | 0.24 | | | | | | — | | | | | | 12.21 | | | | | | 15.81 | | | | | | 0.20 | | | | | | 0.12 | | | | | | 0.12 | | | | | | 1.11 | | | | | | 124,166 | | | | | | 50 | | |
| 12-31-11 | | | | | 11.51 | | | | | | 0.21• | | | | | | (0.80) | | | | | | (0.59) | | | | | | 0.16 | | | | | | — | | | | | | — | | | | | | 0.16 | | | | | | — | | | | | | 10.76 | | | | | | (5.02) | | | | | | 0.12 | | | | | | 0.12 | | | | | | 0.12 | | | | | | 1.86 | | | | | | 109,358 | | | | | | 77 | | |
| Class S | | | | | | | | | | | | | | | | | | | | | | | | | | | | | | | | | | | | | | | | | | | | | | | | | | | | | | | | | | | | | | | | | | | | | | | | | | | | | | | | | | | | | | | | | | | | | | | | | | | | | | | |
| 12-31-15 | | | | | 13.76 | | | | | | 0.12 | | | | | | (0.14) | | | | | | (0.02) | | | | | | 0.42 | | | | | | 2.03 | | | | | | — | | | | | | 2.45 | | | | | | — | | | | | | 11.29 | | | | | | (0.95) | | | | | | 0.50 | | | | | | 0.44 | | | | | | 0.44 | | | | | | 0.85 | | | | | | 270,222 | | | | | | 41 | | |
| 12-31-14 | | | | | 14.70 | | | | | | 0.12• | | | | | | 0.73 | | | | | | 0.85 | | | | | | 0.25 | | | | | | 1.54 | | | | | | — | | | | | | 1.79 | | | | | | — | | | | | | 13.76 | | | | | | 6.10 | | | | | | 0.49 | | | | | | 0.43 | | | | | | 0.43 | | | | | | 0.83 | | | | | | 301,617 | | | | | | 58 | | |
| 12-31-13 | | | | | 12.10 | | | | | | 0.10• | | | | | | 2.72 | | | | | | 2.82 | | | | | | 0.22 | | | | | | — | | | | | | — | | | | | | 0.22 | | | | | | — | | | | | | 14.70 | | | | | | 23.45 | | | | | | 0.49 | | | | | | 0.38 | | | | | | 0.38 | | | | | | 0.74 | | | | | | 350,686 | | | | | | 72 | | |
| 12-31-12 | | | | | 10.67 | | | | | | 0.11 | | | | | | 1.53 | | | | | | 1.64 | | | | | | 0.21 | | | | | | — | | | | | | — | | | | | | 0.21 | | | | | | — | | | | | | 12.10 | | | | | | 15.47 | | | | | | 0.45 | | | | | | 0.37 | | | | | | 0.37 | | | | | | 0.91 | | | | | | 313,757 | | | | | | 50 | | |
| 12-31-11 | | | | | 11.40 | | | | | | 0.18 | | | | | | (0.78) | | | | | | (0.60) | | | | | | 0.13 | | | | | | — | | | | | | — | | | | | | 0.13 | | | | | | — | | | | | | 10.67 | | | | | | (5.14) | | | | | | 0.37 | | | | | | 0.37 | | | | | | 0.37 | | | | | | 1.51 | | | | | | 277,998 | | | | | | 77 | | |
| Class S2 | | | | | | | | | | | | | | | | | | | | | | | | | | | | | | | | | | | | | | | | | | | | | | | | | | | | | | | | | | | | | | | | | | | | | | | | | | | | | | | | | | | | | | | | | | | | | | | | | | | | | | | |
| 12-31-15 | | | | | 13.49 | | | | | | 0.08• | | | | | | (0.11) | | | | | | (0.03) | | | | | | 0.39 | | | | | | 2.03 | | | | | | — | | | | | | 2.42 | | | | | | — | | | | | | 11.04 | | | | | | (1.07) | | | | | | 0.75 | | | | | | 0.59 | | | | | | 0.59 | | | | | | 0.65 | | | | | | 13,402 | | | | | | 41 | | |
| 12-31-14 | | | | | 14.45 | | | | | | 0.09• | | | | | | 0.72 | | | | | | 0.81 | | | | | | 0.23 | | | | | | 1.54 | | | | | | — | | | | | | 1.77 | | | | | | — | | | | | | 13.49 | | | | | | 5.87 | | | | | | 0.74 | | | | | | 0.58 | | | | | | 0.58 | | | | | | 0.67 | | | | | | 19,353 | | | | | | 58 | | |
| 12-31-13 | | | | | 11.89 | | | | | | 0.07• | | | | | | 2.68 | | | | | | 2.75 | | | | | | 0.19 | | | | | | — | | | | | | — | | | | | | 0.19 | | | | | | — | | | | | | 14.45 | | | | | | 23.26 | | | | | | 0.74 | | | | | | 0.53 | | | | | | 0.53 | | | | | | 0.52 | | | | | | 19,968 | | | | | | 72 | | |
| 12-31-12 | | | | | 10.49 | | | | | | 0.09• | | | | | | 1.51 | | | | | | 1.60 | | | | | | 0.20 | | | | | | — | | | | | | — | | | | | | 0.20 | | | | | | — | | | | | | 11.89 | | | | | | 15.37 | | | | | | 0.70 | | | | | | 0.52 | | | | | | 0.52 | | | | | | 0.76 | | | | | | 22,458 | | | | | | 50 | | |
| 12-31-11 | | | | | 11.24 | | | | | | 0.16• | | | | | | (0.77) | | | | | | (0.61) | | | | | | 0.14 | | | | | | — | | | | | | — | | | | | | 0.14 | | | | | | — | | | | | | 10.49 | | | | | | (5.38) | | | | | | 0.62 | | | | | | 0.52 | | | | | | 0.52 | | | | | | 1.49 | | | | | | 19,318 | | | | | | 77 | | |
| Class T | | | | | | | | | | | | | | | | | | | | | | | | | | | | | | | | | | | | | | | | | | | | | | | | | | | | | | | | | | | | | | | | | | | | | | | | | | | | | | | | | | | | | | | | | | | | | | | | | | | | | | | |
| 12-31-15 | | | | | 13.77 | | | | | | 0.06• | | | | | | (0.13) | | | | | | (0.07) | | | | | | 0.21 | | | | | | 2.03 | | | | | | — | | | | | | 2.24 | | | | | | — | | | | | | 11.46 | | | | | | (1.31) | | | | | | 1.00 | | | | | | 0.89 | | | | | | 0.89 | | | | | | 0.44 | | | | | | 393 | | | | | | 41 | | |
| 12-31-14 | | | | | 14.73 | | | | | | (0.00)*• | | | | | | 0.78 | | | | | | 0.78 | | | | | | 0.20 | | | | | | 1.54 | | | | | | — | | | | | | 1.74 | | | | | | — | | | | | | 13.77 | | | | | | 5.53 | | | | | | 0.99 | | | | | | 0.88 | | | | | | 0.88 | | | | | | (0.00)* | | | | | | 376 | | | | | | 58 | | |
| 12-31-13 | | | | | 12.10 | | | | | | 0.04• | | | | | | 2.72 | | | | | | 2.76 | | | | | | 0.13 | | | | | | — | | | | | | — | | | | | | 0.13 | | | | | | — | | | | | | 14.73 | | | | | | 22.93 | | | | | | 0.99 | | | | | | 0.83 | | | | | | 0.83 | | | | | | 0.27 | | | | | | 1,068 | | | | | | 72 | | |
| 12-31-12 | | | | | 10.63 | | | | | | 0.02• | | | | | | 1.57 | | | | | | 1.59 | | | | | | 0.12 | | | | | | — | | | | | | — | | | | | | 0.12 | | | | | | — | | | | | | 12.10 | | | | | | 14.98 | | | | | | 0.95 | | | | | | 0.82 | | | | | | 0.82 | | | | | | 0.21 | | | | | | 936 | | | | | | 50 | | |
| 12-31-11 | | | | | 11.35 | | | | | | 0.11• | | | | | | (0.75) | | | | | | (0.64) | | | | | | 0.08 | | | | | | — | | | | | | — | | | | | | 0.08 | | | | | | — | | | | | | 10.63 | | | | | | (5.63) | | | | | | 0.87 | | | | | | 0.82 | | | | | | 0.82 | | | | | | 0.98 | | | | | | 1,367 | | | | | | 77 | | |
| Voya Solution 2050 Portfolio | | | | | | | | | | | | | | | | | | | | | | | | | | | | | | | | | | | | | | | | | | | | | | | | | | | | | | | | | | | | | | | | | | | | | | | | | | | | | | | | | | | | | | | | | | | | | | | | | | | | | | | |
| Class ADV | | | | | | | | | | | | | | | | | | | | | | | | | | | | | | | | | | | | | | | | | | | | | | | | | | | | | | | | | | | | | | | | | | | | | | | | | | | | | | | | | | | | | | | | | | | | | | | | | | | | | | | |
| 12-31-15 | | | | | 14.95 | | | | | | 0.18• | | | | | | (0.19) | | | | | | (0.01) | | | | | | 0.35 | | | | | | 0.73 | | | | | | — | | | | | | 1.08 | | | | | | — | | | | | | 13.86 | | | | | | (0.33) | | | | | | 3.24 | | | | | | 0.69 | | | | | | 0.69 | | | | | | 1.22 | | | | | | 960 | | | | | | 67 | | |
| 12-31-14 | | | | | 14.16 | | | | | | 0.17• | | | | | | 0.74 | | | | | | 0.91 | | | | | | 0.01 | | | | | | 0.11 | | | | | | — | | | | | | 0.12 | | | | | | — | | | | | | 14.95 | | | | | | 6.49 | | | | | | 6.49 | | | | | | 0.68 | | | | | | 0.68 | | | | | | 1.15 | | | | | | 355 | | | | | | 51 | | |
| 12-31-13 | | | | | 12.44 | | | | | | 0.06 | | | | | | 2.70 | | | | | | 2.76 | | | | | | 0.19 | | | | | | 0.88 | | | | | | — | | | | | | 1.07 | | | | | | 0.03 | | | | | | 14.16 | | | | | | 23.18(d) | | | | | | 84.37 | | | | | | 0.64 | | | | | | 0.64 | | | | | | 0.48 | | | | | | 4 | | | | | | 65 | | |
| 12-31-12 | | | | | 11.23 | | | | | | 0.07 | | | | | | 1.59 | | | | | | 1.66 | | | | | | 0.09 | | | | | | 0.36 | | | | | | — | | | | | | 0.45 | | | | | | — | | | | | | 12.44 | | | | | | 14.78 | | | | | | 41.76 | | | | | | 0.62 | | | | | | 0.62 | | | | | | 0.56 | | | | | | 4 | | | | | | 59 | | |
| 10-03-11(5) - 12-31-11 | | | | | 10.00 | | | | | | 0.06 | | | | | | 1.17 | | | | | | 1.23 | | | | | | — | | | | | | — | | | | | | — | | | | | | — | | | | | | — | | | | | | 11.23 | | | | | | 12.30 | | | | | | 0.62 | | | | | | 0.62 | | | | | | 0.62 | | | | | | 2.22 | | | | | | 3 | | | | | | 12 | | |
| Class I | | | | | | | | | | | | | | | | | | | | | | | | | | | | | | | | | | | | | | | | | | | | | | | | | | | | | | | | | | | | | | | | | | | | | | | | | | | | | | | | | | | | | | | | | | | | | | | | | | | | | | | |
| 12-31-15 | | | | | 15.15 | | | | | | 0.53• | | | | | | (0.43) | | | | | | 0.10 | | | | | | 0.39 | | | | | | 0.73 | | | | | | — | | | | | | 1.12 | | | | | | — | | | | | | 14.13 | | | | | | 0.38 | | | | | | 2.74 | | | | | | 0.19 | | | | | | 0.19 | | | | | | 3.80 | | | | | | 387 | | | | | | 67 | | |
| 12-31-14 | | | | | 14.26 | | | | | | 0.14 | | | | | | 0.86 | | | | | | 1.00 | | | | | | — | | | | | | 0.11 | | | | | | — | | | | | | 0.11 | | | | | | — | | | | | | 15.15 | | | | | | 7.04 | | | | | | 5.99 | | | | | | 0.18 | | | | | | 0.18 | | | | | | 0.97 | | | | | | 5 | | | | | | 51 | | |
| 12-31-13 | | | | | 12.51 | | | | | | 0.13 | | | | | | 2.73 | | | | | | 2.86 | | | | | | 0.26 | | | | | | 0.88 | | | | | | — | | | | | | 1.14 | | | | | | 0.03 | | | | | | 14.26 | | | | | | 23.84(d) | | | | | | 84.87 | | | | | | 0.14 | | | | | | 0.14 | | | | | | 0.98 | | | | | | 4 | | | | | | 65 | | |
| 12-31-12 | | | | | 11.24 | | | | | | 0.13 | | | | | | 1.60 | | | | | | 1.73 | | | | | | 0.10 | | | | | | 0.36 | | | | | | — | | | | | | 0.46 | | | | | | — | | | | | | 12.51 | | | | | | 15.42 | | | | | | 41.26 | | | | | | 0.12 | | | | | | 0.12 | | | | | | 1.09 | | | | | | 4 | | | | | | 59 | | |
| 10-03-11(5) - 12-31-11 | | | | | 10.00 | | | | | | 0.07 | | | | | | 1.17 | | | | | | 1.24 | | | | | | — | | | | | | — | | | | | | — | | | | | | — | | | | | | — | | | | | | 11.24 | | | | | | 12.40 | | | | | | 0.12 | | | | | | 0.12 | | | | | | 0.12 | | | | | | 2.73 | | | | | | 3 | | | | | | 12 | | |
See Accompanying Notes to Financial Statements
Financial Highlights (continued)
| | | | | | | | | | Income
(loss) from
investment
operations | | | | | | | | | Less
Distributions | | | | | | | | | | | | | | | | | | | | | | | | | | | Ratios to average
net assets | | | Supplemental
Data | |
| | | | Net asset value, beginning of year
or period | | | Net investment income (loss) | | | Net realized and unrealized
gain (loss) | | | Total from investment operations | | | From net investment income | | | From net realized gains | | | From return of capital | | | Total distributions | | | Payment by affiliate | | | Net asset value, end of year
or period | | | Total Return(1) | | | Expenses before
reductions/additions(2)(3)(4) | | | Expenses net of fee waivers
and/or recoupments if any(2)(3)(4) | | | Expense net of all
reductions/additions(2)(3)(4) | | | Net investment income (loss)(2)(3) | | | Net assets, end of year or period | | | Portfolio turnover rate | |
Year or
period ended | | | ($) | | | ($) | | | ($) | | | ($) | | | ($) | | | ($) | | | ($) | | | ($) | | | ($) | | | ($) | | | (%) | | | (%) | | | (%) | | | (%) | | | (%) | | | ($000’s) | | | (%) | |
| Voya Solution 2050 Portfolio (continued) | | | | | | | | | | | | | | | | | | | | | | | | | | | | | | | | | | | | | | | | | | | | | | | | | | | | | | | | | | | | | | | | | | | | | | | | | | | | | | | | | | | | | | | | | | | | | | | | | | | | | | | |
| Class S | | | | | | | | | | | | | | | | | | | | | | | | | | | | | | | | | | | | | | | | | | | | | | | | | | | | | | | | | | | | | | | | | | | | | | | | | | | | | | | | | | | | | | | | | | | | | | | | | | | | | | | |
| 12-31-15 | | | | | 15.09 | | | | | | 0.38• | | | | | | (0.34) | | | | | | 0.04 | | | | | | 0.34 | | | | | | 0.73 | | | | | | — | | | | | | 1.07 | | | | | | — | | | | | | 14.06 | | | | | | 0.00 | | | | | | 2.99 | | | | | | 0.44 | | | | | | 0.44 | | | | | | 2.70 | | | | | | 317 | | | | | | 67 | | |
| 12-31-14 | | | | | 14.25 | | | | | | 0.13 | | | | | | 0.82 | | | | | | 0.95 | | | | | | — | | | | | | 0.11 | | | | | | — | | | | | | 0.11 | | | | | | — | | | | | | 15.09 | | | | | | 6.69 | | | | | | 6.24 | | | | | | 0.43 | | | | | | 0.43 | | | | | | 0.87 | | | | | | 5 | | | | | | 51 | | |
| 12-31-13 | | | | | 12.46 | | | | | | 0.09 | | | | | | 2.71 | | | | | | 2.80 | | | | | | 0.16 | | | | | | 0.88 | | | | | | — | | | | | | 1.04 | | | | | | 0.03 | | | | | | 14.25 | | | | | | 23.37(d) | | | | | | 84.12 | | | | | | 0.39 | | | | | | 0.39 | | | | | | 0.66 | | | | | | 4 | | | | | | 65 | | |
| 12-31-12 | | | | | 11.23 | | | | | | 0.10 | | | | | | 1.59 | | | | | | 1.69 | | | | | | 0.10 | | | | | | 0.36 | | | | | | — | | | | | | 0.46 | | | | | | — | | | | | | 12.46 | | | | | | 15.01 | | | | | | 41.51 | | | | | | 0.37 | | | | | | 0.37 | | | | | | 0.84 | | | | | | 4 | | | | | | 59 | | |
| 10-03-11(5) - 12-31-11 | | | | | 10.00 | | | | | | 0.06 | | | | | | 1.17 | | | | | | 1.23 | | | | | | — | | | | | | — | | | | | | — | | | | | | — | | | | | | — | | | | | | 11.23 | | | | | | 12.30 | | | | | | 0.37 | | | | | | 0.37 | | | | | | 0.37 | | | | | | 2.32 | | | | | | 3 | | | | | | 12 | | |
| Class S2 | | | | | | | | | | | | | | | | | | | | | | | | | | | | | | | | | | | | | | | | | | | | | | | | | | | | | | | | | | | | | | | | | | | | | | | | | | | | | | | | | | | | | | | | | | | | | | | | | | | | | | | |
| 12-31-15 | | | | | 14.97 | | | | | | 0.13• | | | | | | (0.11) | | | | | | 0.02 | | | | | | 0.33 | | | | | | 0.73 | | | | | | — | | | | | | 1.06 | | | | | | — | | | | | | 13.93 | | | | | | (0.17) | | | | | | 3.24 | | | | | | 0.59 | | | | | | 0.59 | | | | | | 0.89 | | | | | | 9 | | | | | | 67 | | |
| 12-31-14 | | | | | 14.15 | | | | | | 0.08 | | | | | | 0.85 | | | | | | 0.93 | | | | | | — | | | | | | 0.11 | | | | | | — | | | | | | 0.11 | | | | | | — | | | | | | 14.97 | | | | | | 6.59 | | | | | | 6.49 | | | | | | 0.58 | | | | | | 0.58 | | | | | | 0.58 | | | | | | 5 | | | | | | 51 | | |
| 12-31-13 | | | | | 12.45 | | | | | | 0.08 | | | | | | 2.68 | | | | | | 2.76 | | | | | | 0.21 | | | | | | 0.88 | | | | | | — | | | | | | 1.09 | | | | | | 0.03 | | | | | | 14.15 | | | | | | 23.09(d) | | | | | | 84.37 | | | | | | 0.54 | | | | | | 0.54 | | | | | | 0.58 | | | | | | 4 | | | | | | 65 | | |
| 12-31-12 | | | | | 11.23 | | | | | | 0.08 | | | | | | 1.59 | | | | | | 1.67 | | | | | | 0.09 | | | | | | 0.36 | | | | | | — | | | | | | 0.45 | | | | | | — | | | | | | 12.45 | | | | | | 14.90 | | | | | | 41.76 | | | | | | 0.52 | | | | | | 0.52 | | | | | | 0.66 | | | | | | 4 | | | | | | 59 | | |
| 10-03-11(5) - 12-31-11 | | | | | 10.00 | | | | | | 0.06 | | | | | | 1.17 | | | | | | 1.23 | | | | | | — | | | | | | — | | | | | | — | | | | | | — | | | | | | — | | | | | | 11.23 | | | | | | 12.30 | | | | | | 0.62 | | | | | | 0.52 | | | | | | 0.52 | | | | | | 2.34 | | | | | | 3 | | | | | | 12 | | |
| Class T | | | | | | | | | | | | | | | | | | | | | | | | | | | | | | | | | | | | | | | | | | | | | | | | | | | | | | | | | | | | | | | | | | | | | | | | | | | | | | | | | | | | | | | | | | | | | | | | | | | | | | | |
| 12-31-15 | | | | | 14.95 | | | | | | 0.08 | | | | | | (0.13) | | | | | | (0.05) | | | | | | 0.29 | | | | | | 0.73 | | | | | | — | | | | | | 1.02 | | | | | | — | | | | | | 13.88 | | | | | | (0.60) | | | | | | 3.49 | | | | | | 0.89 | | | | | | 0.89 | | | | | | 0.51 | | | | | | 4 | | | | | | 67 | | |
| 12-31-14 | | | | | 14.17 | | | | | | 0.04 | | | | | | 0.85 | | | | | | 0.89 | | | | | | — | | | | | | 0.11 | | | | | | — | | | | | | 0.11 | | | | | | — | | | | | | 14.95 | | | | | | 6.30 | | | | | | 6.74 | | | | | | 0.88 | | | | | | 0.88 | | | | | | 0.28 | | | | | | 5 | | | | | | 51 | | |
| 12-31-13 | | | | | 12.42 | | | | | | 0.04 | | | | | | 2.73 | | | | | | 2.77 | | | | | | 0.17 | | | | | | 0.88 | | | | | | — | | | | | | 1.05 | | | | | | 0.03 | | | | | | 14.17 | | | | | | 23.28(d) | | | | | | 84.62 | | | | | | 0.84 | | | | | | 0.84 | | | | | | 0.26 | | | | | | 4 | | | | | | 65 | | |
| 12-31-12 | | | | | 11.22 | | | | | | 0.04 | | | | | | 1.60 | | | | | | 1.64 | | | | | | 0.08 | | | | | | 0.36 | | | | | | — | | | | | | 0.44 | | | | | | — | | | | | | 12.42 | | | | | | 14.65 | | | | | | 42.01 | | | | | | 0.82 | | | | | | 0.82 | | | | | | 0.36 | | | | | | 4 | | | | | | 59 | | |
| 10-03-11(5) - 12-31-11 | | | | | 10.00 | | | | | | 0.05 | | | | | | 1.17 | | | | | | 1.22 | | | | | | — | | | | | | — | | | | | | — | | | | | | — | | | | | | — | | | | | | 11.22 | | | | | | 12.20 | | | | | | 0.87 | | | | | | 0.82 | | | | | | 0.82 | | | | | | 2.03 | | | | | | 3 | | | | | | 12 | | |
| Voya Solution 2055 Portfolio | | | | | | | | | | | | | | | | | | | | | | | | | | | | | | | | | | | | | | | | | | | | | | | | | | | | | | | | | | | | | | | | | | | | | | | | | | | | | | | | | | | | | | | | | | | | | | | | | | | | | | | |
| Class ADV | | | | | | | | | | | | | | | | | | | | | | | | | | | | | | | | | | | | | | | | | | | | | | | | | | | | | | | | | | | | | | | | | | | | | | | | | | | | | | | | | | | | | | | | | | | | | | | | | | | | | | | |
| 12-31-15 | | | | | 14.27 | | | | | | 0.08• | | | | | | (0.17) | | | | | | (0.09) | | | | | | 0.32 | | | | | | 1.34 | | | | | | — | | | | | | 1.66 | | | | | | — | | | | | | 12.52 | | | | | | (1.15) | | | | | | 0.76 | | | | | | 0.70 | | | | | | 0.70 | | | | | | 0.61 | | | | | | 41,770 | | | | | | 41 | | |
| 12-31-14 | | | | | 14.46 | | | | | | 0.09• | | | | | | 0.76 | | | | | | 0.85 | | | | | | 0.18 | | | | | | 0.86 | | | | | | — | | | | | | 1.04 | | | | | | — | | | | | | 14.27 | | | | | | 6.03 | | | | | | 0.77 | | | | | | 0.68 | | | | | | 0.68 | | | | | | 0.60 | | | | | | 38,558 | | | | | | 72 | | |
| 12-31-13 | | | | | 12.05 | | | | | | 0.08• | | | | | | 2.69 | | | | | | 2.77 | | | | | | 0.14 | | | | | | 0.22 | | | | | | — | | | | | | 0.36 | | | | | | — | | | | | | 14.46 | | | | | | 23.19 | | | | | | 0.76 | | | | | | 0.63 | | | | | | 0.63 | | | | | | 0.61 | | | | | | 34,195 | | | | | | 73 | | |
| 12-31-12 | | | | | 10.66 | | | | | | 0.09• | | | | | | 1.52 | | | | | | 1.61 | | | | | | 0.10 | | | | | | 0.12 | | | | | | — | | | | | | 0.22 | | | | | | — | | | | | | 12.05 | | | | | | 15.27 | | | | | | 0.72 | | | | | | 0.62 | | | | | | 0.62 | | | | | | 0.78 | | | | | | 19,927 | | | | | | 55 | | |
| 12-31-11 | | | | | 11.34 | | | | | | 0.17• | | | | | | (0.79) | | | | | | (0.62) | | | | | | 0.03 | | | | | | 0.03 | | | | | | — | | | | | | 0.06 | | | | | | — | | | | | | 10.66 | | | | | | (5.45) | | | | | | 0.62 | | | | | | 0.62 | | | | | | 0.62 | | | | | | 1.58 | | | | | | 11,461 | | | | | | 81 | | |
| Class I | | | | | | | | | | | | | | | | | | | | | | | | | | | | | | | | | | | | | | | | | | | | | | | | | | | | | | | | | | | | | | | | | | | | | | | | | | | | | | | | | | | | | | | | | | | | | | | | | | | | | | | |
| 12-31-15 | | | | | 14.49 | | | | | | 0.17• | | | | | | (0.19) | | | | | | (0.02) | | | | | | 0.39 | | | | | | 1.34 | | | | | | — | | | | | | 1.73 | | | | | | — | | | | | | 12.74 | | | | | | (0.67) | | | | | | 0.26 | | | | | | 0.20 | | | | | | 0.20 | | | | | | 1.22 | | | | | | 36,692 | | | | | | 41 | | |
| 12-31-14 | | | | | 14.65 | | | | | | 0.17• | | | | | | 0.76 | | | | | | 0.93 | | | | | | 0.23 | | | | | | 0.86 | | | | | | — | | | | | | 1.09 | | | | | | — | | | | | | 14.49 | | | | | | 6.56 | | | | | | 0.27 | | | | | | 0.18 | | | | | | 0.18 | | | | | | 1.15 | | | | | | 24,787 | | | | | | 72 | | |
| 12-31-13 | | | | | 12.17 | | | | | | 0.17• | | | | | | 2.71 | | | | | | 2.88 | | | | | | 0.18 | | | | | | 0.22 | | | | | | — | | | | | | 0.40 | | | | | | — | | | | | | 14.65 | | | | | | 23.89 | | | | | | 0.26 | | | | | | 0.13 | | | | | | 0.13 | | | | | | 1.24 | | | | | | 16,948 | | | | | | 73 | | |
| 12-31-12 | | | | | 10.74 | | | | | | 0.14• | | | | | | 1.54 | | | | | | 1.68 | | | | | | 0.13 | | | | | | 0.12 | | | | | | — | | | | | | 0.25 | | | | | | — | | | | | | 12.17 | | | | | | 15.80 | | | | | | 0.22 | | | | | | 0.12 | | | | | | 0.12 | | | | | | 1.21 | | | | | | 8,034 | | | | | | 55 | | |
| 12-31-11 | | | | | 11.37 | | | | | | 0.24• | | | | | | (0.80) | | | | | | (0.56) | | | | | | 0.04 | | | | | | 0.03 | | | | | | — | | | | | | 0.07 | | | | | | — | | | | | | 10.74 | | | | | | (4.91) | | | | | | 0.12 | | | | | | 0.12 | | | | | | 0.12 | | | | | | 2.16 | | | | | | 4,746 | | | | | | 81 | | |
| Class S | | | | | | | | | | | | | | | | | | | | | | | | | | | | | | | | | | | | | | | | | | | | | | | | | | | | | | | | | | | | | | | | | | | | | | | | | | | | | | | | | | | | | | | | | | | | | | | | | | | | | | | |
| 12-31-15 | | | | | 14.37 | | | | | | 0.12• | | | | | | (0.17) | | | | | | (0.05) | | | | | | 0.36 | | | | | | 1.34 | | | | | | — | | | | | | 1.70 | | | | | | — | | | | | | 12.62 | | | | | | (0.87) | | | | | | 0.51 | | | | | | 0.45 | | | | | | 0.45 | | | | | | 0.86 | | | | | | 46,913 | | | | | | 41 | | |
| 12-31-14 | | | | | 14.55 | | | | | | 0.14• | | | | | | 0.74 | | | | | | 0.88 | | | | | | 0.20 | | | | | | 0.86 | | | | | | — | | | | | | 1.06 | | | | | | — | | | | | | 14.37 | | | | | | 6.25 | | | | | | 0.52 | | | | | | 0.43 | | | | | | 0.43 | | | | | | 0.93 | | | | | | 43,206 | | | | | | 72 | | |
| 12-31-13 | | | | | 12.11 | | | | | | 0.12• | | | | | | 2.70 | | | | | | 2.82 | | | | | | 0.16 | | | | | | 0.22 | | | | | | — | | | | | | 0.38 | | | | | | — | | | | | | 14.55 | | | | | | 23.52 | | | | | | 0.51 | | | | | | 0.38 | | | | | | 0.38 | | | | | | 0.90 | | | | | | 37,658 | | | | | | 73 | | |
| 12-31-12 | | | | | 10.70 | | | | | | 0.13• | | | | | | 1.52 | | | | | | 1.65 | | | | | | 0.12 | | | | | | 0.12 | | | | | | — | | | | | | 0.24 | | | | | | — | | | | | | 12.11 | | | | | | 15.53 | | | | | | 0.47 | | | | | | 0.37 | | | | | | 0.37 | | | | | | 1.14 | | | | | | 22,055 | | | | | | 55 | | |
| 12-31-11 | | | | | 11.35 | | | | | | 0.20• | | | | | | (0.78) | | | | | | (0.58) | | | | | | 0.04 | | | | | | 0.03 | | | | | | — | | | | | | 0.07 | | | | | | — | | | | | | 10.70 | | | | | | (5.13) | | | | | | 0.37 | | | | | | 0.37 | | | | | | 0.37 | | | | | | 1.77 | | | | | | 10,061 | | | | | | 81 | | |
See Accompanying Notes to Financial Statements
Financial Highlights (continued)
| | | | | | | | | | Income
(loss) from
investment
operations | | | | | | | | | Less
Distributions | | | | | | | | | | | | | | | | | | | | | | | | | | | Ratios to average
net assets | | | Supplemental
Data | |
| | | | Net asset value, beginning of year
or period | | | Net investment income (loss) | | | Net realized and unrealized
gain (loss) | | | Total from investment operations | | | From net investment income | | | From net realized gains | | | From return of capital | | | Total distributions | | | Payment by affiliate | | | Net asset value, end of year
or period | | | Total Return(1) | | | Expenses before
reductions/additions(2)(3)(4) | | | Expenses net of fee waivers
and/or recoupments if any(2)(3)(4) | | | Expense net of all
reductions/additions(2)(3)(4) | | | Net investment income (loss)(2)(3) | | | Net assets, end of year or period | | | Portfolio turnover rate | |
Year or
period ended | | | ($) | | | ($) | | | ($) | | | ($) | | | ($) | | | ($) | | | ($) | | | ($) | | | ($) | | | ($) | | | (%) | | | (%) | | | (%) | | | (%) | | | (%) | | | ($000’s) | | | (%) | |
| Voya Solution 2055 Portfolio (continued) | | | | | | | | | | | | | | | | | | | | | | | | | | | | | | | | | | | | | | | | | | | | | | | | | | | | | | | | | | | | | | | | | | | | | | | | | | | | | | | | | | | | | | | | | | | | | | | | | | | | | | | |
| Class S2 | | | | | | | | | | | | | | | | | | | | | | | | | | | | | | | | | | | | | | | | | | | | | | | | | | | | | | | | | | | | | | | | | | | | | | | | | | | | | | | | | | | | | | | | | | | | | | | | | | | | | | | |
| 12-31-15 | | | | | 14.31 | | | | | | 0.10 | | | | | | (0.17) | | | | | | (0.07) | | | | | | 0.34 | | | | | | 1.34 | | | | | | — | | | | | | 1.68 | | | | | | — | | | | | | 12.56 | | | | | | (1.04) | | | | | | 0.76 | | | | | | 0.60 | | | | | | 0.60 | | | | | | 0.71 | | | | | | 3,014 | | | | | | 41 | | |
| 12-31-14 | | | | | 14.50 | | | | | | 0.11• | | | | | | 0.75 | | | | | | 0.86 | | | | | | 0.19 | | | | | | 0.86 | | | | | | — | | | | | | 1.05 | | | | | | — | | | | | | 14.31 | | | | | | 6.12 | | | | | | 0.77 | | | | | | 0.58 | | | | | | 0.58 | | | | | | 0.78 | | | | | | 3,071 | | | | | | 72 | | |
| 12-31-13 | | | | | 12.07 | | | | | | 0.10• | | | | | | 2.69 | | | | | | 2.79 | | | | | | 0.14 | | | | | | 0.22 | | | | | | — | | | | | | 0.36 | | | | | | — | | | | | | 14.50 | | | | | | 23.36 | | | | | | 0.76 | | | | | | 0.53 | | | | | | 0.53 | | | | | | 0.72 | | | | | | 2,250 | | | | | | 73 | | |
| 12-31-12 | | | | | 10.68 | | | | | | 0.10• | | | | | | 1.52 | | | | | | 1.62 | | | | | | 0.11 | | | | | | 0.12 | | | | | | — | | | | | | 0.23 | | | | | | — | | | | | | 12.07 | | | | | | 15.30 | | | | | | 0.72 | | | | | | 0.52 | | | | | | 0.52 | | | | | | 0.90 | | | | | | 1,294 | | | | | | 55 | | |
| 12-31-11 | | | | | 11.34 | | | | | | 0.19• | | | | | | (0.79) | | | | | | (0.60) | | | | | | 0.03 | | | | | | 0.03 | | | | | | — | | | | | | 0.06 | | | | | | — | | | | | | 10.68 | | | | | | (5.26) | | | | | | 0.62 | | | | | | 0.52 | | | | | | 0.52 | | | | | | 1.73 | | | | | | 745 | | | | | | 81 | | |
| Class T | | | | | | | | | | | | | | | | | | | | | | | | | | | | | | | | | | | | | | | | | | | | | | | | | | | | | | | | | | | | | | | | | | | | | | | | | | | | | | | | | | | | | | | | | | | | | | | | | | | | | | | |
| 12-31-15 | | | | | 14.25 | | | | | | 0.08• | | | | | | (0.21) | | | | | | (0.13) | | | | | | — | | | | | | 1.34 | | | | | | — | | | | | | 1.34 | | | | | | — | | | | | | 12.78 | | | | | | (1.36) | | | | | | 1.01 | | | | | | 0.90 | | | | | | 0.90 | | | | | | 0.56 | | | | | | 9 | | | | | | 41 | | |
| 12-31-14 | | | | | 14.44 | | | | | | (0.06)• | | | | | | 0.90 | | | | | | 0.84 | | | | | | 0.17 | | | | | | 0.86 | | | | | | — | | | | | | 1.03 | | | | | | — | | | | | | 14.25 | | | | | | 6.00 | | | | | | 1.02 | | | | | | 0.88 | | | | | | 0.88 | | | | | | (0.40) | | | | | | 5 | | | | | | 72 | | |
| 12-31-13 | | | | | 12.06 | | | | | | 0.14• | | | | | | 2.61 | | | | | | 2.75 | | | | | | 0.15 | | | | | | 0.22 | | | | | | — | | | | | | 0.37 | | | | | | — | | | | | | 14.44 | | | | | | 23.00 | | | | | | 1.01 | | | | | | 0.83 | | | | | | 0.83 | | | | | | 1.02 | | | | | | 68 | | | | | | 73 | | |
| 12-31-12 | | | | | 10.65 | | | | | | 0.06• | | | | | | 1.52 | | | | | | 1.58 | | | | | | 0.05 | | | | | | 0.12 | | | | | | — | | | | | | 0.17 | | | | | | — | | | | | | 12.06 | | | | | | 14.95 | | | | | | 0.97 | | | | | | 0.82 | | | | | | 0.82 | | | | | | 0.54 | | | | | | 12 | | | | | | 55 | | |
| 12-31-11 | | | | | 11.31 | | | | | | 0.11 | | | | | | (0.74) | | | | | | (0.63) | | | | | | 0.00* | | | | | | 0.03 | | | | | | — | | | | | | 0.03 | | | | | | — | | | | | | 10.65 | | | | | | (5.56) | | | | | | 0.87 | | | | | | 0.82 | | | | | | 0.82 | | | | | | 0.94 | | | | | | 7 | | | | | | 81 | | |
| Voya Solution 2060 Portfolio | | | | | | | | | | | | | | | | | | | | | | | | | | | | | | | | | | | | | | | | | | | | | | | | | | | | | | | | | | | | | | | | | | | | | | | | | | | | | | | | | | | | | | | | | | | | | | | | | | | | | | | |
| Class ADV | | | | | | | | | | | | | | | | | | | | | | | | | | | | | | | | | | | | | | | | | | | | | | | | | | | | | | | | | | | | | | | | | | | | | | | | | | | | | | | | | | | | | | | | | | | | | | | | | | | | | | | |
| 02-09-15(5) - 12-31-15 | | | | | 10.00 | | | | | | 0.25• | | | | | | (0.36) | | | | | | (0.11) | | | | | | — | | | | | | — | | | | | | — | | | | | | — | | | | | | — | | | | | | 9.89 | | | | | | (1.10) | | | | | | 19.06 | | | | | | 0.70 | | | | | | 0.70 | | | | | | 2.85 | | | | | | 191 | | | | | | 78 | | |
| Class I | | | | | | | | | | | | | | | | | | | | | | | | | | | | | | | | | | | | | | | | | | | | | | | | | | | | | | | | | | | | | | | | | | | | | | | | | | | | | | | | | | | | | | | | | | | | | | | | | | | | | | | |
| 02-09-15(5) - 12-31-15 | | | | | 10.00 | | | | | | 0.27• | | | | | | (0.35) | | | | | | (0.08) | | | | | | — | | | | | | — | | | | | | — | | | | | | — | | | | | | — | | | | | | 9.92 | | | | | | (0.80) | | | | | | 18.56 | | | | | | 0.20 | | | | | | 0.20 | | | | | | 3.11 | | | | | | 317 | | | | | | 78 | | |
| Class S | | | | | | | | | | | | | | | | | | | | | | | | | | | | | | | | | | | | | | | | | | | | | | | | | | | | | | | | | | | | | | | | | | | | | | | | | | | | | | | | | | | | | | | | | | | | | | | | | | | | | | | |
| 02-09-15(5) - 12-31-15 | | | | | 10.00 | | | | | | 0.27• | | | | | | (0.41) | | | | | | (0.14) | | | | | | — | | | | | | — | | | | | | — | | | | | | — | | | | | | — | | | | | | 9.86 | | | | | | (1.40) | | | | | | 18.81 | | | | | | 0.45 | | | | | | 0.45 | | | | | | 3.06 | | | | | | 140 | | | | | | 78 | | |
| Class S2 | | | | | | | | | | | | | | | | | | | | | | | | | | | | | | | | | | | | | | | | | | | | | | | | | | | | | | | | | | | | | | | | | | | | | | | | | | | | | | | | | | | | | | | | | | | | | | | | | | | | | | | |
| 02-09-15(5) - 12-31-15 | | | | | 10.00 | | | | | | 0.24• | | | | | | (0.35) | | | | | | (0.11) | | | | | | — | | | | | | — | | | | | | — | | | | | | — | | | | | | — | | | | | | 9.89 | | | | | | (1.10) | | | | | | 19.06 | | | | | | 0.60 | | | | | | 0.60 | | | | | | 2.66 | | | | | | 26 | | | | | | 78 | | |
| Class T | | | | | | | | | | | | | | | | | | | | | | | | | | | | | | | | | | | | | | | | | | | | | | | | | | | | | | | | | | | | | | | | | | | | | | | | | | | | | | | | | | | | | | | | | | | | | | | | | | | | | | | |
| 02-09-15(5) - 12-31-15 | | | | | 10.00 | | | | | | 0.05 | | | | | | (0.19) | | | | | | (0.14) | | | | | | — | | | | | | — | | | | | | — | | | | | | — | | | | | | — | | | | | | 9.86 | | | | | | (1.40) | | | | | | 19.31 | | | | | | 0.90 | | | | | | 0.90 | | | | | | 0.58 | | | | | | 3 | | | | | | 78 | | |
(1)
Total return is calculated assuming reinvestment of all dividends, capital gain distributions and return of capital distributions, if any, at net asset value and does not reflect the effect of insurance contract charges. Total return for periods less than one year is not annualized.
(2)
Annualized for periods less than one year.
(3)
Ratios reflect operating expenses of a Portfolio. Expenses before reductions/additions do not reflect amounts reimbursed by an Investment Adviser and/or Distributor or reductions from brokerage service arrangements or other expense offset arrangements and do not represent the amount paid by a Portfolio during periods when reimbursements or reductions occur. Expenses net of fee waivers reflect expenses after reimbursement by an Investment Adviser and/or Distributor but prior to reductions from brokerage service arrangements or other expense offset arrangements. Expenses net of all reductions/additions represent the net expenses paid by a Portfolio. Net investment income (loss) is net of all such additions or reductions.
(4)
Ratios do not include expenses of underlying funds and do not include fees and expenses charged under the variable annuity contract or variable life insurance policy.
(5)
Commencement of operations.
(a)
During the year ended December 31, 2013, Voya Investments, LLC voluntarily reimbursed Voya Solution 2020 Portfolio $22 for the foregone investment opportunities attributable to uninvested cash. Excluding this payment by affiliate, total return would have been 12.88%, 13.71%, 13.33%, 13.25% and 13.15% on Classes ADV, I, S, S2 and T, respectively.
See Accompanying Notes to Financial Statements
Financial Highlights (continued)
(b)
During the year ended December 31, 2013, Voya Investments, LLC voluntarily reimbursed Voya Solution 2030 Portfolio $33 for the foregone investment opportunities attributable to uninvested cash. Excluding this payment by affiliate, total return would have been 18.46%, 19,19%, 18.72%, 18.37% and 18.69% on Classes ADV, I, S, S2 and T, respectively.
(c)
During the year ended December 31, 2013, Voya Investments, LLC voluntarily reimbursed Voya Solution 2040 Portfolio $39 for the foregone investment opportunities attributable to uninvested cash. Excluding this payment by affiliate, total return would have been 22.09%, 22.76%, 22.35%, 22.07% and 21.84% on Classes ADV, I, S, S2 and T, respectively.
(d)
During the year ended December 31, 2013, Voya Investments, LLC voluntarily reimbursed Voya Solution 2050 Portfolio $40 for the foregone investment opportunities attributable to uninvested cash. Excluding this payment by affiliate, total return would have been 22.95%, 23.61%, 23.14%, 22.86% and 23.05% on Classes ADV, I, S, S2 and T, respectively.
•
Calculated using average number of shares outstanding throughout the period.
*
Amount is less than $0.005 or 0.005% or more than $(0.005) or (0.005)%.
See Accompanying Notes to Financial Statements
NOTES TO FINANCIAL STATEMENTS as of December 31, 2015
NOTE 1 — ORGANIZATION
Voya Partners, Inc. (the “Company”) is an open-end management investment company registered under the Investment Company Act of 1940, as amended (the “1940 Act”). It was incorporated under the laws of Maryland on May 7, 1997. The Articles of Incorporation permit the Company to offer separate series, each of which has its own investment objective, policies and restrictions. The series of the Company serve as investment options in underlying variable annuity contracts and variable life insurance policies offered by Directed Services LLC. The Company currently consists of forty-one active separate investment series. The fifteen series (each, a “Portfolio” and collectively, the “Portfolios”) included in this report are: Voya Solution Aggressive Portfolio (“Solution Aggressive”), Voya Solution Balanced Portfolio (“Solution Balanced”), Voya Solution Conservative Portfolio (“Solution Conservative”), Voya Solution Income Portfolio (“Solution Income”), Voya Solution Moderately Aggressive Portfolio (“Solution Moderately Aggressive”), Voya Solution Moderately Conservative Portfolio (“Solution Moderately Conservative”), Voya Solution 2020 Portfolio (“Solution 2020”), Voya Solution 2025 Portfolio (“Solution 2025”), Voya Solution 2030 Portfolio (“Solution 2030”), Voya Solution 2035 Portfolio (“Solution 2035”), Voya Solution 2040 Portfolio (“Solution 2040”), Voya Solution 2045 Portfolio (“Solution 2045”), Voya Solution 2050 Portfolio (“Solution 2050”), Voya Solution 2055 Portfolio (“Solution 2055”) and Voya Solution 2060 Portfolio (“Solution 2060”). Each Portfolio is a diversified series of the Company.
Solution 2020, Solution 2025, Solution 2030, Solution 2035, Solution 2040, Solution 2045, Solution 2050, Solution 2055 and Solution 2060 are structured and managed around a specific target retirement or financial goal date (“Target Date”). When these Portfolios reach their respective Target Date, they may be combined with Solution Income, without a vote of shareholders, if approved by the Portfolios’ Board of Directors (the “Board”).
The classes of shares included in this report are: Adviser (“Class ADV”), Initial (“Class I”), Service (“Class S”), Service 2 (“Class S2”) and Class T; however each Portfolio may not offer all share classes. Shares of the Portfolios may be offered to separate accounts (“Separate Accounts”) of insurance companies as investment options in connection with variable annuity contracts and variable life insurance policies (“Variable Contracts”) and to certain of the Portfolios’ investment advisers and their affiliates. In the future, shares may also be offered to qualified pension and retirement plans (“Qualified Plans”) outside the Separate Account context. Each class has equal rights as
to voting privileges. The classes differ principally in the applicable distribution and shareholder service fees. Generally, shareholders of each class also bear certain expenses that pertain to that particular class. All shareholders bear the common expenses of a portfolio and earn income and realized gains/losses from a portfolio pro rata based on the daily ending net assets of each class, without distinction between share classes. Expenses that are specific to a portfolio or a class are charged directly to that portfolio or class. Other operating expenses shared by several portfolios are generally allocated among those portfolios based on average net assets. Distributions are determined separately for each class based on income and expenses allocated to each class. Realized gain distributions are allocated to each class pro rata based on the shares outstanding of each class on the date of distribution. Differences in per share dividend rates generally result from differences in separate class expenses, including distribution and shareholder service fees, if applicable.
Directed Services LLC (“DSL” or the “Investment Adviser”), a Delaware limited liability company and an affiliate of Voya Investments, LLC, serves as the Investment Adviser to the Portfolios. DSL oversees all investment management and portfolio management services for the Portfolios and assists in managing and supervising all aspects of the general day-to-day business activities and operations of the Portfolios, including custodial, transfer agency, dividend disbursing, accounting, auditing, compliance and related services. Voya Investment Management Co. LLC (“Voya IM” or the “Sub-Adviser”), a Delaware limited liability company, serves as the Sub-Adviser to the Portfolios. Voya Investments Distributor, LLC (“VID” or the “Distributor”), a Delaware limited liability company, serves as the principal underwriter to the Portfolios.
Each Portfolio seeks to achieve its investment objective by investing in other investment companies (“Underlying Funds”) and uses asset allocation strategies to determine how much to invest in the Underlying Funds. The investment objective of the Portfolios is described in the respective Portfolio’s Prospectus.
NOTE 2 — SIGNIFICANT ACCOUNTING POLICIES
The following significant accounting policies are consistently followed by the Portfolios in the preparation of their financial statements. Each Portfolio is considered an investment company under U.S. generally accepted accounting principles (“GAAP”) and follows the accounting and reporting guidance applicable to investment companies.
NOTES TO FINANCIAL STATEMENTS as of December 31, 2015 (continued)
NOTE 2 — SIGNIFICANT ACCOUNTING POLICIES (continued)
A. Security Valuation. Each Portfolio is open for business every day the New York Stock Exchange (“NYSE”) opens for regular trading (each such day, a “Business Day”). The net asset value (“NAV”) per share for each class of each Portfolio is determined each Business Day as of the close of the regular trading session (“Market Close”), as determined by the Consolidated Tape Association (“CTA”), the central distributor of transaction prices for exchange-traded securities (normally 4:00 p.m. Eastern time unless otherwise designated by the CTA).The NAV per share of each class of each Portfolio is calculated by taking the value of the Portfolio’s assets attributable to that class, subtracting the Portfolio’s liabilities attributable to that class, and dividing by the number of shares of that class that are outstanding. On days when a Portfolio is closed for business, Portfolio shares will not be priced and a Portfolio does not transact purchase and redemption orders. To the extent a Portfolio’s assets are traded in other markets on days when a Portfolio does not price its shares, the value of a Portfolio’s assets will likely change and you will not be able to purchase or redeem shares of a Portfolio.
Assets for which market quotations are readily available are valued at market value. A security listed or traded on an exchange is valued at its last sales price or official closing price as of the close of the regular trading session on the exchange where the security is principally traded or, if such price is not available, at the last sale price as of the Market Close for such security provided by the CTA. Bank loans are valued at the average of the averages between the bid and ask prices provided to an independent loan pricing service by brokers. Futures contracts are valued at the final settlement price set by an exchange on which they are principally traded. Listed options are valued at the mean between the last bid and ask prices from the exchange on which they are principally traded. Investments in open-end registered investment companies that do not trade on an exchange are valued at the end of day NAV per share. Investments in registered investment companies that trade on an exchange are valued at the last sales price or official closing price as of the close of the regular trading session on the exchange where the security is principally traded.
When a market quotation is not readily available or is deemed unreliable, each Portfolio will determine a fair value for the relevant asset in accordance with procedures adopted by the Board. Such procedures provide, for example, that: (a) Exchange-traded securities are valued at the mean of the closing bid and ask; (b) Debt obligations are valued using an evaluated price provided by an
independent pricing service. Evaluated prices provided by the pricing service may be determined without exclusive reliance on quoted prices, and may reflect factors such as institution-size trading in similar groups of securities, developments related to specific securities, benchmark yield, quality, type of issue, coupon rate, maturity, individual trading characteristics and other market data; (c) Securities traded in the over-the-counter market are valued based on prices provided by independent pricing services or market makers; (d) Options not listed on an exchange are valued by an independent source using an industry accepted model, such as Black-Scholes; (e) Centrally cleared swap agreements are valued using a price provided by the central counterparty clearinghouse; (f) Over-the-counter swap agreements are valued using a price provided by an independent pricing service; (g) Forward foreign currency contracts are valued utilizing current and forward rates obtained from an independent pricing service. Such prices from the third party pricing service are for specific settlement periods and each Portfolio’s forward foreign currency contracts are valued at an interpolated rate between the closest preceding and subsequent period reported by the independent pricing service and (h) Securities for which market prices are not provided by any of the above methods may be valued based upon quotes furnished by brokers.
The prospectuses of the open-end registered investment companies in which each Portfolio may invest explain the circumstances under which they will use fair value pricing and the effects of using fair value pricing.
Foreign securities’ (including foreign exchange contracts) prices are converted into U.S. dollar amounts using the applicable exchange rates as of Market Close. If market quotations are available and believed to be reliable for foreign exchange-traded equity securities, the securities will be valued at the market quotations. Because trading hours for certain foreign securities end before Market Close, closing market quotations may become unreliable. An independent pricing service determines the degree of certainty, based on historical data, that the closing price in the principal market where a foreign security trades is not the current value as of Market Close. Foreign securities’ prices meeting the approved degree of certainty that the price is not reflective of current value will be valued by the independent pricing service using pricing models designed to estimate likely changes in the values of those securities between the times in which the trading in those securities is substantially completed and Market Close. Multiple factors may be considered by the independent pricing service in determining the value of such securities and may include information relating to sector indices, American Depositary Receipts and domestic and foreign index futures.
NOTES TO FINANCIAL STATEMENTS as of December 31, 2015 (continued)
NOTE 2 — SIGNIFICANT ACCOUNTING POLICIES (continued)
All other assets for which market quotations are not readily available or became unreliable (or if the above fair valuation methods are unavailable or determined to be unreliable) are valued at fair value as determined in good faith by or under the supervision of the Board following procedures approved by the Board. The Board has delegated to the Investment Adviser responsibility for overseeing the implementation of the Portfolios’ valuation procedures; a “Pricing Committee” comprised of employees of the Investment Adviser or its affiliates has responsibility for applying the fair valuation methods set forth in the procedures and, if a fair valuation cannot be determined pursuant to the fair valuation methods, determining the fair value of assets held by the Portfolios. Issuer specific events, transaction price, position size, nature and duration of restrictions on disposition of the security, market trends, bid/ask quotes of brokers and other market data may be reviewed in the course of making a good faith determination of a security’s fair value. Valuations change in response to many factors including the historical and prospective earnings of the issuer, the value of the issuer’s assets, general economic conditions, interest rates, investor perceptions and market liquidity. Because of the inherent uncertainties of fair valuation, the values used to determine each Portfolio’s NAV may materially differ from the value received upon actual sale of those investments. Thus, fair valuation may have an unintended dilutive or accretive effect on the value of shareholders’ investments in each Portfolio.
Each investment asset or liability of the Portfolios is assigned a level at measurement date based on the significance and source of the inputs to its valuation. Quoted prices in active markets for identical securities are classified as “Level 1,” inputs other than quoted prices for an asset or liability that are observable are classified as “Level 2” and unobservable inputs, including the Sub-Adviser’s or Pricing Committee’s judgment about the assumptions that a market participant would use in pricing an asset or liability are classified as “Level 3.” The inputs used for valuing securities are not necessarily an indication of the risks associated with investing in those securities. Short-term securities of sufficient credit quality are generally considered to be Level 2 securities under applicable accounting rules. The Portfolios classify each of their investments in the Underlying Funds as Level 1, without consideration as to the classification level of the specific investments held by the Underlying Funds. A table summarizing each Portfolio’s investments under these levels of classification is included following the Portfolio of Investments.
U.S. GAAP requires a reconciliation of the beginning to ending balances for reported fair values that presents changes attributable to total realized and unrealized gains or losses, purchases and sales, and transfers in or out of the Level 3 category during the period. The beginning of period timing recognition is used for the transfers between Levels of a Portfolio’s assets and liabilities. A reconciliation of Level 3 investments is presented only when a Portfolio has a significant amount of Level 3 investments.
For the year ended December 31, 2015, there have been no significant changes to the fair valuation methodologies.
B. Security Transactions and Revenue Recognition. Security transactions are accounted for on the trade date. Dividend income received from the Underlying Funds is recognized on the ex-dividend date and is recorded as income distributions in the Statements of Operations. Capital gain distributions received from the Underlying Funds are recognized on the ex-dividend date and are recorded on the Statements of Operations as such. Costs used in determining realized gains and losses on the sales of investment securities are on the basis of specific identification.
C. Distributions to Shareholders. The Portfolios record distributions to their shareholders on the ex-dividend date. Each Portfolio declares and pays dividends from net investment income and capital gain distributions, if any, annually. The Portfolios may make distributions on a more frequent basis to comply with the distribution requirements of the Internal Revenue Code. The characteristics of income and gains to be distributed are determined in accordance with income tax regulations, which may differ from U.S. GAAP for investment companies.
D. Federal Income Taxes. It is the policy of each Portfolio to comply with the requirements of subchapter M of the Internal Revenue Code that are applicable to regulated investment companies and to distribute substantially all of its net investment income and any net realized capital gains to its shareholders. Therefore, a federal income tax or excise tax provision is not required. Management has considered the sustainability of the Portfolios’ tax positions taken on federal income tax returns for all open tax years in making this determination. No capital gain distributions shall be made until the capital loss carryforwards have been fully utilized or expire.
The Portfolios may utilize equalization accounting for tax purposes, whereby a portion of redemption payments are treated as distributions of income or gain.
E. Use of Estimates. The preparation of financial statements in conformity with U.S. GAAP requires management to make estimates and assumptions that affect the reported amounts of assets and liabilities and
NOTES TO FINANCIAL STATEMENTS as of December 31, 2015 (continued)
NOTE 2 — SIGNIFICANT ACCOUNTING POLICIES (continued)
disclosure of contingent assets and liabilities at the date of the financial statements and the reported amounts of increases and decreases in net assets from operations during the reporting period. Actual results could differ from those estimates.
F. Risk Exposures and the Use of Derivative Instruments. Each Portfolio’s investment strategies permit it to enter into various types of derivatives contracts, including, but not limited to, futures contracts. In doing so, a Portfolio will employ strategies in differing combinations to permit it to increase or decrease the level of risk, or change the level or types of exposure to market risk factors. This may allow a Portfolio to pursue its objectives more quickly and efficiently than if it were to make direct purchases or sales of securities capable of affecting a similar response to market factors.
Market Risk Factors. In pursuit of its investment objectives, a Portfolio may seek to use derivatives to increase or decrease its exposure to the following market risk factors:
Equity Risk. Stock prices may be volatile or have reduced liquidity in response to real or perceived impacts of factors including, but not limited to, economic conditions, changes in market interest rates, and political events. Stock markets tend to be cyclical, with periods when stock prices generally rise and periods when stock prices generally decline. Any given stock market segment may remain out of favor with investors for a short or long period of time, and stocks as an asset class may underperform bonds or other asset classes during some periods. Additionally, legislative, regulatory or tax policies or developments in these areas may adversely impact the investment techniques available to a manager, add to costs and impair the ability of a Portfolio to achieve its investment objectives.
Risks of Investing in Derivatives. Each Portfolio’s use of derivatives can result in losses due to unanticipated changes in the market risk factors and the overall market. In instances where a Portfolio is using derivatives to decrease, or hedge, exposures to market risk factors for securities held by a Portfolio, there are also risks that those derivatives may not perform as expected resulting in losses for the combined or hedged positions.
Derivative instruments are subject to a number of risks, including the risk of changes in the market price of the underlying securities, credit risk with respect to the counterparty, risk of loss due to changes in market interest rates and liquidity and volatility risk. The amounts required
to purchase certain derivatives may be small relative to the magnitude of exposure assumed by a Portfolio. Therefore, the purchase of certain derivatives may have an economic leveraging effect on a Portfolio and exaggerate any increase or decrease in the net asset value. Derivatives may not perform as expected, so a Portfolio may not realize the intended benefits. When used for hedging purposes, the change in value of a derivative may not correlate as expected with the currency, security or other risk being hedged. When used as an alternative or substitute for direct cash investments, the return provided by the derivative may not provide the same return as direct cash investment. In addition, given their complexity, derivatives expose a Portfolio to the risk of improper valuation.
Generally, derivatives are sophisticated financial instruments whose performance is derived, at least in part, from the performance of an underlying asset or assets. Derivatives include, among other things, swap agreements, options, forwards and futures. Investments in derivatives are generally negotiated over-the-counter with a single counterparty and as a result are subject to credit risks related to the counterparty’s ability or willingness to perform its obligations; any deterioration in the counterparty’s creditworthiness could adversely affect the value of the derivative. In addition, derivatives and their underlying securities may experience periods of illiquidity which could cause a Portfolio to hold a security it might otherwise sell, or to sell a security it otherwise might hold at inopportune times or at an unanticipated price. A manager might imperfectly judge the direction of the market. For instance, if a derivative is used as a hedge to offset investment risk in another security, the hedge might not correlate to the market’s movements and may have unexpected or undesired results such as a loss or a reduction in gains.
The U.S. government has enacted legislation that provides for new regulation of the derivatives market, including clearing, margin, reporting, and registration requirements. The European Union (and other countries outside of the European Union) is implementing similar requirements, which will affect a Portfolio when it enters into a derivatives transaction with a counterparty organized in that country or otherwise subject to that country’s derivatives regulations. Because these requirements are new and evolving (and some of the rules are not yet final), their ultimate impact remains unclear. Central clearing is expected to reduce counterparty risk and increase liquidity, however, there is no assurance that it will achieve that result, and in the meantime, central clearing and related requirements expose a Portfolio to new kinds of costs and risks.
NOTES TO FINANCIAL STATEMENTS as of December 31, 2015 (continued)
NOTE 2 — SIGNIFICANT ACCOUNTING POLICIES (continued)
G. Futures Contracts. Certain Portfolios may enter into futures contracts involving foreign currency, interest rates, securities and security indices. A futures contract is a commitment to buy or sell a specific amount of a financial instrument at a negotiated price on a stipulated future date. A Portfolio may buy and sell futures contracts. Futures contracts traded on a commodities or futures exchange will be valued at the final settlement price or official closing price on the principal exchange as reported by such principal exchange at its trading session ending at, or most recently prior to, the time when each Portfolio’s assets are valued.
Upon entering into a futures contract, a Portfolio is required to deposit either cash or securities (initial margin) in an amount equal to a certain percentage of the contract value. Subsequent payments (variation margin) are made or received by a Portfolio each day. The variation margin payments are equal to the daily changes in the contract value and are recorded as unrealized gains and losses. Open futures contracts are reported on a table following each Portfolio’s Portfolio of Investments. Securities held in collateralized accounts to cover initial margin requirements on open futures contracts, if any, are footnoted in the Portfolio of Investments. Cash collateral held by the broker to cover initial margin requirements on open futures contracts are noted in the Statements of Assets and Liabilities. The net change in unrealized appreciation and depreciation is reported in the Statements of Operations. Realized gains (losses) are reported in the Statements of Operations at the closing or expiration of futures contracts.
Futures contracts are exposed to the market risk factor of the underlying financial instrument. During the year ended December 31, 2015, certain Portfolios had purchased futures contracts on various equity indices to “equitize” cash. Futures contracts are purchased to provide immediate market exposure proportionate to the size of the Portfolio’s respective cash flows and residual cash balances in order to decrease potential tracking error if the cash remained uninvested in the market. Certain Portfolios also purchased futures contracts on U.S. Treasury Notes and sold futures contracts on equity indices as part of their tactical asset allocation strategy. Additional associated risks of entering into futures contracts include the possibility that there may be an illiquid market where the Portfolios are unable to liquidate the contract or enter into an offsetting position and, if used for hedging purposes, the risk that the price of the contract will correlate imperfectly with the prices of the Portfolios’ securities. With futures, there is minimal counterparty credit risk to the Portfolios since futures are exchange traded and the
exchange’s clearinghouse, as counterparty to all exchange traded futures, guarantees the futures against default.
During the year ended December 31, 2015, the following Portfolios had average notional values on futures contracts purchased and sold as disclosed below. There were no open futures contracts held by any Portfolio at December 31, 2015.
| | | | Purchased | | | Sold | |
| Solution Balanced | | | | $ | 910,828 | | | | | $ | 1,357,711 | | |
| Solution Conservative | | | | | 246,538 | | | | | | — | | |
| Solution Income | | | | | 3,201,752 | | | | | | 12,219,400 | | |
| Solution Moderately Aggressive | | | | | 6,036,728 | | | | | | 22,402,234 | | |
| Solution Moderately Conservative | | | | | 653,424 | | | | | | 1,221,940 | | |
| Solution 2025 | | | | | 7,898,862 | | | | | | — | | |
| Solution 2035 | | | | | 8,674,019 | | | | | | 9,096,665 | | |
| Solution 2045 | | | | | 8,161,041 | | | | | | 19,007,956 | | |
| Solution 2055 | | | | | 1,636,107 | | | | | | 3,530,049 | | |
H. Offering Costs. Costs incurred with the offering of shares of a Portfolio are deferred and amortized over a twelve month period on a straight-line basis starting at the commencement of operations.
I. Indemnifications. In the normal course of business, the Company may enter into contracts that provide certain indemnifications. The Company’s maximum exposure under these arrangements is dependent on future claims that may be made against the Portfolios and, therefore, cannot be estimated; however, based on experience, management considers the risk of loss from such claims remote.
NOTE 3 — INVESTMENTS IN UNDERLYING FUNDS
For the year ended December 31, 2015, the cost of purchases and the proceeds from sales of the Underlying Funds were as follows:
| | | | Purchases | | | Sales | |
| Solution Aggressive | | | | $ | 5,344,051 | | | | | $ | 3,729,786 | | |
| Solution Balanced | | | | | 24,840,942 | | | | | | 26,765,312 | | |
| Solution Conservative | | | | | 8,665,760 | | | | | | 11,169,415 | | |
| Solution Income | | | | | 105,921,646 | | | | | | 174,695,663 | | |
| Solution Moderately Aggressive | | | | | 82,145,539 | | | | | | 135,577,515 | | |
| Solution Moderately Conservative | | | | | 25,359,810 | | | | | | 25,798,008 | | |
| Solution 2020 | | | | | 10,918,309 | | | | | | 2,071,637 | | |
| Solution 2025 | | | | | 456,646,539 | | | | | | 565,060,274 | | |
| Solution 2030 | | | | | 4,483,123 | | | | | | 692,612 | | |
| Solution 2035 | | | | | 463,316,216 | | | | | | 540,064,901 | | |
| Solution 2040 | | | | | 3,993,158 | | | | | | 1,342,150 | | |
| Solution 2045 | | | | | 281,401,186 | | | | | | 325,734,420 | | |
| Solution 2050 | | | | | 1,762,642 | | | | | | 442,921 | | |
| Solution 2055 | | | | | 73,616,514 | | | | | | 50,025,475 | | |
| Solution 2060 | | | | | 829,603 | | | | | | 156,185 | | |
NOTES TO FINANCIAL STATEMENTS as of December 31, 2015 (continued)
NOTE 4 — INVESTMENT MANAGEMENT FEES
Prior to May 1, 2015, the Portfolios had entered into an investment management agreement (“Management Agreement”) with the Investment Adviser. The Management Agreement compensated the Investment Adviser with an annual management fee of 0.10% of each Portfolio’s average daily nets assets invested in affiliated Underlying Funds and 0.30% of each Portfolio’s average daily net assets invested in unaffiliated Underlying Funds and/or other investments. Amounts paid to the Investment Adviser through April 30, 2015 are reflected as investment management fees on the accompanying Statements of Operations.
Also, prior to May 1, 2015, the Portfolios had entered into an administrative agreement (“Administrative Agreement”) with Voya Funds Services, LLC (the “Administrator”), a Delaware limited liability company. The Administrator provided certain administrative and shareholder services necessary for each Portfolio’s operations and was responsible for the supervision of other service providers. For its services, the Administrator was entitled to receive from each Portfolio a fee at an annual rate of 0.10% of each Portfolio’s average daily net assets. Amounts paid to the Administrator through April 30, 2015 are reflected as administrative service fees on the accompanying Statements of Operations.
Effective May 1, 2015, the terms of the Portfolios’ Management Agreement and Administrative Agreement were combined under a single Amended and Restated Investment Management Agreement with a single management fee. The single management fee rate under the Portfolios’ Amended and Restated Investment Management Agreement does not exceed the former combined investment management and administrative services fee rates for the Portfolios and there is no change to the investment management or administrative services provided.
The Amended and Restated Investment Management Agreement compensates the Investment Adviser with a management fee of 0.20% of each Portfolio’s average daily nets assets invested in affiliated Underlying Funds and 0.40% of each Portfolio’s average daily net assets invested in unaffiliated Underlying Funds and/or other investments. Single management fee amounts paid to the Investment Adviser from May 1, 2015 through December 31, 2015 are reflected as investment management fees on the accompanying Statement of Operations.
The Investment Adviser has entered into a sub-advisory agreement with Voya IM. Subject to such policies as the Board or the Investment Adviser may determine, Voya IM manages the Portfolios’ assets in accordance with the Portfolios’ investment objectives, policies, and limitations.
NOTE 5 — DISTRIBUTION AND SERVICE FEES
Classes ADV, S2 and T of the respective Portfolios have a plan of distribution pursuant to Rule 12b-1 under the 1940 Act (the “12b-1 Plans”), whereby the Distributor is reimbursed or compensated by the Portfolios for expenses incurred in the distribution of each Portfolio’s shares (“Distribution Fees”). The Distributor may pay, on behalf of each Portfolio, out of its distribution fee, compensation to certain financial institutions for providing distribution assistance pursuant to a Distribution Services Agreement. Under the 12b-1 Plans, each Portfolio makes payments to the Distributor at an annual rate of 0.25%, 0.25% and 0.50% of each Portfolio’s average daily net assets attributable to its Class ADV, Class S2 and Class T shares, respectively. The Distributor has contractually agreed to waive a portion of its fee equal to 0.10% of each Portfolio’s average daily net assets attributable to the distribution fee paid by Class S2 shares, so that the actual fee paid is an annual rate of 0.15%. Termination or modification of this obligation requires approval by the Board. The Distributor has contractually agreed to waive a portion of this fee equal to 0.05% of each applicable Portfolio’s average daily net assets attributable to the distribution fee paid by Class T shares, so that the actual fee paid is an annual rate of 0.45%. Termination or modification of this obligation requires approval by the Board.
The Company has a shareholder servicing plan (“Service Plan”) for the Classes ADV, S, S2 and T shares of each respective Portfolio. The Service Plan allows the Distributor to enter into shareholder servicing agreements with insurance companies, broker dealers or other financial intermediaries that provide administrative services related to Classes ADV, S, S2 and T shares and their shareholders including Variable Contract owners or Qualified Plan participants with interests in the Portfolios. Under the Service Plan, each Portfolio makes payments to the Distributor which shall not exceed an annual rate of 0.25% of each applicable Portfolio’s average daily net assets attributable to its Classes ADV, S, S2 and T shares.
NOTE 6 — OTHER TRANSACTIONS WITH AFFILIATES AND RELATED PARTIES
At December 31, 2015, the following direct or indirect, wholly-owned subsidiaries of Voya Financial, Inc. owned more than 5% of the following Portfolios:
| Subsidiary | | | Portfolio | | | Percentage | |
| Voya Institutional Trust Company | | | Solution Aggressive | | | | | 6.38% | | |
| | | | Solution Conservative | | | | | 6.90 | | |
| | | | Solution Income | | | | | 30.47 | | |
| | | | Solution 2020 | | | | | 8.51 | | |
| | | | Solution 2025 | | | | | 27.30 | | |
| | | | Solution 2030 | | | | | 16.07 | | |
NOTES TO FINANCIAL STATEMENTS as of December 31, 2015 (continued)
NOTE 6 — OTHER TRANSACTIONS WITH AFFILIATES AND RELATED PARTIES (continued)
| Subsidiary | | | Portfolio | | | Percentage | |
| | | | Solution 2035 | | | | | 26.92 | | |
| | | | Solution 2040 | | | | | 33.43 | | |
| | | | Solution 2045 | | | | | 24.85 | | |
| | | | Solution 2050 | | | | | 40.02 | | |
| | | | Solution 2055 | | | | | 21.89 | | |
| | | | Solution 2060 | | | | | 23.47 | | |
Voya Insurance and Annuity
Company | | | Solution Moderately
Aggressive | | | | | 92.44 | | |
| Voya Retirement Insurance and Annuity Company | | | Solution Aggressive | | | | | 93.55 | | |
| | | | Solution Balanced | | | | | 96.53 | | |
| | | | Solution Conservative | | | | | 93.08 | | |
| | | | Solution Income | | | | | 65.26 | | |
| | | | Solution Moderately Conservative | | | | | 96.02 | | |
| | | | Solution 2020 | | | | | 91.46 | | |
| | | | Solution 2025 | | | | | 70.16 | | |
| | | | Solution 2030 | | | | | 81.96 | | |
| | | | Solution 2035 | | | | | 71.52 | | |
| | | | Solution 2040 | | | | | 66.31 | | |
| | | | Solution 2045 | | | | | 74.04 | | |
| | | | Solution 2050 | | | | | 59.47 | | |
| | | | Solution 2055 | | | | | 78.11 | | |
| | | | Solution 2060 | | | | | 76.08 | | |
Under the 1940 Act, the direct or indirect beneficial owner of more than 25% of the voting securities of a company (including a fund) is presumed to control such company. Companies under common control (e.g., companies with a common owner of greater than 25% of their respective voting securities) are affiliates under the 1940 Act.
The Portfolios have adopted a deferred compensation plan (the “Plan”), which allows eligible non-affiliated directors, as described in the Plan, to defer the receipt of all or a portion of the directors’ fees that they are entitled to receive from the Portfolios. For purposes of determining the amount owed to the director under the Plan, the amounts deferred are invested in shares of the funds selected by the director (the “Notional Funds”). The Portfolios purchase shares of the Notional Funds, which are all advised by Voya Investments, LLC, in amounts equal to the directors’ deferred fees, resulting in a Portfolio asset equal to the deferred compensation liability. Such assets are included as a component of “Other assets” on the accompanying Statement of Assets and Liabilities. Deferral of directors’ fees under the Plan will not affect net assets of the Portfolio, and will not materially affect the Portfolios’ assets, liabilities or net investment income per share. Amounts will be deferred until distributed in accordance with the Plan.
NOTE 7 — OTHER ACCRUED EXPENSES AND LIABILITIES
At December 31, 2015, the following Portfolios had the below payables included in Other Accrued Expenses and Liabilities on the Statements of Assets and Liabilities that exceeded 5% of total liabilities:
| Portfolio | | | Accrued Expense | | | Amount | |
| Solution Moderately Conservative | | | Custody | | | | $ | 3,074 | | |
| | | | Miscellaneous | | | | | 2,789 | | |
| Solution 2060 | | | Custody | | | | | 383 | | |
| | | | Offering Fee | | | | | 2,774 | | |
NOTE 8 — EXPENSE LIMITATION AGREEMENT
The Investment Adviser has entered into a written expense limitation agreement (“Expense Limitation Agreement”) with each Portfolio whereby the Investment Adviser has agreed to limit expenses, excluding interest, taxes, investment-related costs, leverage expenses, and extraordinary expenses to the levels listed below:
Portfolio(1) | | | Class ADV | | | Class I | | | Class S | | | Class S2 | | | Class T | |
| Solution Aggressive | | | | | 1.39% | | | | | | 0.89% | | | | | | 1.14% | | | | | | 1.29% | | | | | | N/A | | |
| Solution Balanced | | | | | 1.30% | | | | | | 0.80% | | | | | | 1.05% | | | | | | 1.20% | | | | | | N/A | | |
| Solution Conservative | | | | | 1.16% | | | | | | 0.66% | | | | | | 0.91% | | | | | | 1.06% | | | | | | N/A | | |
| Solution Income | | | | | 1.18% | | | | | | 0.68% | | | | | | 0.93% | | | | | | 1.08% | | | | | | 1.38% | | |
Solution Moderately
Aggressive | | | | | 1.38% | | | | | | 0.88% | | | | | | 1.13% | | | | | | 1.28% | | | | | | N/A | | |
Solution Moderately
Conservative | | | | | 1.24% | | | | | | 0.74% | | | | | | 0.99% | | | | | | 1.14% | | | | | | N/A | | |
| Solution 2020 | | | | | 1.26% | | | | | | 0.76% | | | | | | 1.01% | | | | | | 1.16% | | | | | | 1.46% | | |
| Solution 2025 | | | | | 1.30% | | | | | | 0.80% | | | | | | 1.05% | | | | | | 1.20% | | | | | | 1.50% | | |
| Solution 2030 | | | | | 1.33% | | | | | | 0.83% | | | | | | 1.08% | | | | | | 1.23% | | | | | | 1.53% | | |
| Solution 2035 | | | | | 1.37% | | | | | | 0.87% | | | | | | 1.12% | | | | | | 1.27% | | | | | | 1.57% | | |
| Solution 2040 | | | | | 1.38% | | | | | | 0.88% | | | | | | 1.13% | | | | | | 1.28% | | | | | | 1.58% | | |
| Solution 2045 | | | | | 1.39% | | | | | | 0.89% | | | | | | 1.14% | | | | | | 1.29% | | | | | | 1.59% | | |
| Solution 2050 | | | | | 1.39% | | | | | | 0.89% | | | | | | 1.14% | | | | | | 1.29% | | | | | | 1.59% | | |
| Solution 2055 | | | | | 1.39% | | | | | | 0.89% | | | | | | 1.14% | | | | | | 1.29% | | | | | | 1.59% | | |
| Solution 2060 | | | | | 1.39% | | | | | | 0.89% | | | | | | 1.14% | | | | | | 1.29% | | | | | | 1.59% | | |
(1)
The operating expense limits take into account the operating expenses incurred at the Underlying Fund level. The amount of fees and expenses of an Underlying Fund borne by each Portfolio will vary based on each Portfolio’s allocation of assets to, and the net expenses of, a particular Underlying Fund.
The Investment Adviser may at a later date recoup from a Portfolio for fees waived and other expenses assumed by the Investment Adviser during the previous 36 months, but only if, after such recoupment, a Portfolio’s expense ratio
NOTES TO FINANCIAL STATEMENTS as of December 31, 2015 (continued)
NOTE 8 — EXPENSE LIMITATION AGREEMENT (continued)
does not exceed the percentage described above. Waived and reimbursed fees net of any recoupment by the Investment Adviser of such waived and reimbursed fees are reflected on the accompanying Statements of Operations. Amounts payable by the Investment Adviser are reflected on the accompanying Statements of Assets and Liabilities.
As of December 31, 2015 the amounts of waived and/or reimbursed fees that are subject to possible recoupment by the Investment Adviser and the related expiration dates are as follows:
| | | | December 31, | | |
| | | | 2016 | | | 2017 | | | 2018 | | | Total | |
| Solution Aggressive | | | | $ | 24,058 | | | | | $ | 14,968 | | | | | $ | 12,690 | | | | | $ | 51,716 | | |
| Solution Balanced | | | | | 73,602 | | | | | | 71,065 | | | | | | 63,484 | | | | | | 208,151 | | |
| Solution Conservative | | | | | 40,923 | | | | | | 40,932 | | | | | | 37,813 | | | | | | 119,668 | | |
| Solution Income | | | | | 235,643 | | | | | | 230,838 | | | | | | 340,447 | | | | | | 806,928 | | |
| Solution Moderately Aggressive | | | | | 46,092 | | | | | | 38,312 | | | | | | 141,031 | | | | | | 225,435 | | |
| Solution Moderately Conservative | | | | | 76,331 | | | | | | 60,329 | | | | | | 51,944 | | | | | | 188,604 | | |
| Solution 2020 | | | | | 16,311 | | | | | | 14,049 | | | | | | 19,318 | | | | | | 49,678 | | |
| Solution 2025 | | | | | 1,470,250 | | | | | | 1,358,078 | | | | | | 967,252 | | | | | | 3,795,580 | | |
| Solution 2030 | | | | | 16,405 | | | | | | 13,791 | | | | | | 17,601 | | | | | | 47,797 | | |
| Solution 2035 | | | | | 1,223,115 | | | | | | 936,968 | | | | | | 727,201 | | | | | | 2,887,284 | | |
| Solution 2040 | | | | | 16,982 | | | | | | 13,435 | | | | | | 16,747 | | | | | | 47,164 | | |
| Solution 2045 | | | | | 823,846 | | | | | | 473,742 | | | | | | 378,863 | | | | | | 1,676,451 | | |
| Solution 2050 | | | | | 16,935 | | | | | | 13,226 | | | | | | 16,251 | | | | | | 46,412 | | |
| Solution 2055 | | | | | 91,227 | | | | | | 84,591 | | | | | | 72,976 | | | | | | 248,794 | | |
| Solution 2060 | | | | | — | | | | | | — | | | | | | 29,374 | | | | | | 29,374 | | |
The Expense Limitation Agreement is contractual through May 1, 2018 for all Portfolios (except for Solution Aggressive, which is through May 1, 2016, and Solution
2060, which is through May 1, 2017) and shall renew automatically for one-year terms. Termination or modification of this obligation requires approval by the Board.
NOTE 9 — LINE OF CREDIT
The Portfolios, in addition to certain other funds managed by the Investment Adviser, have entered into an unsecured committed revolving line of credit agreement (the “Credit Agreement”) with The Bank of New York Mellon for an aggregate amount of $200,000,000. The proceeds may be used only to: (1) temporarily finance the purchase and sale of securities; or (2) finance the redemption of shares of an investor in the funds. The funds to which the line of credit is available pay a commitment fee equal to 0.10% per annum on the daily unused portion of the committed line amount payable quarterly in arrears. Prior to May 22, 2015, the funds to which the Credit Agreement is available paid a commitment fee equal to 0.07% per annum on the daily unused portion of the committed line amount payable quarterly in arrears.
Borrowings under the Credit Agreement accrue interest at the federal funds rate plus a specified margin. Repayments generally must be made within 60 days after the date of a revolving credit advance.
The following Portfolios utilized the line of credit during the year ended December 31, 2015 as follows:
| Portfolio | | | Days
Utilized | | | Approximate
Average
Daily
Balance For
Days
Utilized | | | Approximate
Weighted
Average
Interest Rate
For Days
Utilized | |
| Solution Moderately Aggressive | | | | | 7 | | | | | $ | 677,571 | | | | | | 1.13% | | |
| Solution 2035 | | | | | 13 | | | | | | 391,462 | | | | | | 1.13 | | |
| Solution 2045 | | | | | 1 | | | | | | 1,071,000 | | | | | | 1.13 | | |
NOTE 10 — CAPITAL SHARES
Transactions in capital shares and dollars were as follows:
| | | | Shares sold | | | Shares
issued in
merger | | | Reinvestment
of
distributions | | | Shares
redeemed | | | Net increase
(decrease)
in shares
outstanding | | | Shares sold | | | Proceeds
from shares
issued in
merger | | | Reinvestment
of
distributions | | | Shares
redeemed | | | Net increase
(decrease) | |
Year or
period ended | | | # | | | # | | | # | | | # | | | # | | | ($) | | | ($) | | | ($) | | | ($) | | | ($) | |
| Solution Aggressive | |
| Class ADV | | | | | | | | | | | |
| 12/31/2015 | | | | | 133,363 | | | | | | — | | | | | | 12,054 | | | | | | (115,116) | | | | | | 30,301 | | | | | | 1,640,492 | | | | | | — | | | | | | 143,443 | | | | | | (1,390,895) | | | | | | 393,040 | | |
| 12/31/2014 | | | | | 154,840 | | | | | | — | | | | | | 1,280 | | | | | | (19,262) | | | | | | 136,858 | | | | | | 1,843,267 | | | | | | — | | | | | | 15,160 | | | | | | (228,253) | | | | | | 1,630,174 | | |
| Class I | | | | | | | | | | | |
| 12/31/2015 | | | | | 10,343 | | | | | | — | | | | | | 569 | | | | | | —* | | | | | | 10,912 | | | | | | 131,149 | | | | | | — | | | | | | 6,885 | | | | | | —* | | | | | | 138,034 | | |
| 12/31/2014 | | | | | 682 | | | | | | — | | | | | | 2 | | | | | | —* | | | | | | 684 | | | | | | 8,352 | | | | | | — | | | | | | 28 | | | | | | 30 | | | | | | 8,410 | | |
NOTES TO FINANCIAL STATEMENTS as of December 31, 2015 (continued)
NOTE 10 — CAPITAL SHARES (continued)
| | | | Shares sold | | | Shares
issued in
merger | | | Reinvestment
of
distributions | | | Shares
redeemed | | | Net increase
(decrease)
in shares
outstanding | | | Shares sold | | | Proceeds
from shares
issued in
merger | | | Reinvestment
of
distributions | | | Shares
redeemed | | | Net increase
(decrease) | |
Year or
period ended | | | # | | | # | | | # | | | # | | | # | | | ($) | | | ($) | | | ($) | | | ($) | | | ($) | |
| Solution Aggressive (continued) | |
| Class S | | | | | | | | | | | |
| 12/31/2015 | | | | | 160,428 | | | | | | — | | | | | | 10,900 | | | | | | (74,471) | | | | | | 96,857 | | | | | | 2,006,952 | | | | | | — | | | | | | 130,802 | | | | | | (908,941) | | | | | | 1,228,813 | | |
| 12/31/2014 | | | | | 85,782 | | | | | | — | | | | | | 1,100 | | | | | | (23,639) | | | | | | 63,243 | | | | | | 1,009,337 | | | | | | — | | | | | | 13,128 | | | | | | (281,068) | | | | | | 741,397 | | |
| Class S2 | | | | | | | | | | | |
| 12/31/2015 | | | | | 9,858 | | | | | | — | | | | | | 715 | | | | | | (2,113) | | | | | | 8,460 | | | | | | 121,049 | | | | | | — | | | | | | 8,504 | | | | | | (25,714) | | | | | | 103,839 | | |
| 12/31/2014 | | | | | 5,646 | | | | | | — | | | | | | 32 | | | | | | (2,531) | | | | | | 3,147 | | | | | | 67,157 | | | | | | — | | | | | | 379 | | | | | | (29,247) | | | | | | 38,289 | | |
| Solution Balanced | |
| Class ADV | | | | | | | | | | | |
| 12/31/2015 | | | | | 205,961 | | | | | | — | | | | | | 299,144 | | | | | | (505,975) | | | | | | (870) | | | | | | 2,108,871 | | | | | | — | | | | | | 2,904,687 | | | | | | (5,124,403) | | | | | | (110,845) | | |
| 12/31/2014 | | | | | 309,124 | | | | | | — | | | | | | 225,452 | | | | | | (378,551) | | | | | | 156,025 | | | | | | 3,375,467 | | | | | | — | | | | | | 2,331,179 | | | | | | (4,140,741) | | | | | | 1,565,905 | | |
| Class I | | | | | | | | | | | |
| 12/31/2015 | | | | | 4,324 | | | | | | — | | | | | | 515 | | | | | | (926) | | | | | | 3,913 | | | | | | 46,241 | | | | | | — | | | | | | 5,169 | | | | | | (9,949) | | | | | | 41,461 | | |
| 12/31/2014 | | | | | 2,118 | | | | | | — | | | | | | 10 | | | | | | (110) | | | | | | 2,018 | | | | | | 23,017 | | | | | | — | | | | | | 101 | | | | | | (1,184) | | | | | | 21,934 | | |
| Class S | | | | | | | | | | | |
| 12/31/2015 | | | | | 344,977 | | | | | | — | | | | | | 257,785 | | | | | | (395,322) | | | | | | 207,440 | | | | | | 3,597,100 | | | | | | — | | | | | | 2,536,602 | | | | | | (4,028,864) | | | | | | 2,104,838 | | |
| 12/31/2014 | | | | | 280,166 | | | | | | — | | | | | | 187,383 | | | | | | (397,351) | | | | | | 70,198 | | | | | | 3,067,644 | | | | | | — | | | | | | 1,960,021 | | | | | | (4,431,354) | | | | | | 596,311 | | |
| Class S2 | | | | | | | | | | | |
| 12/31/2015 | | | | | 13,992 | | | | | | — | | | | | | 6,751 | | | | | | (22,742) | | | | | | (1,999) | | | | | | 147,579 | | | | | | — | | | | | | 66,297 | | | | | | (237,531) | | | | | | (23,655) | | |
| 12/31/2014 | | | | | 12,219 | | | | | | — | | | | | | 5,321 | | | | | | (55,416) | | | | | | (37,876) | | | | | | 133,065 | | | | | | — | | | | | | 55,554 | | | | | | (608,391) | | | | | | (419,772) | | |
| Solution Conservative | |
| Class ADV | | | | | | | | | | | |
| 12/31/2015 | | | | | 125,281 | | | | | | — | | | | | | 56,542 | | | | | | (393,073) | | | | | | (211,250) | | | | | | 1,387,230 | | | | | | — | | | | | | 602,741 | | | | | | (4,271,194) | | | | | | (2,281,223) | | |
| 12/31/2014 | | | | | 151,604 | | | | | | — | | | | | | 64,290 | | | | | | (133,750) | | | | | | 82,144 | | | | | | 1,736,213 | | | | | | — | | | | | | 712,338 | | | | | | (1,537,899) | | | | | | 910,652 | | |
| Class I | | | | | | | | | | | |
| 12/31/2015 | | | | | 471 | | | | | | — | | | | | | 50 | | | | | | (150) | | | | | | 371 | | | | | | 5,234 | | | | | | — | | | | | | 539 | | | | | | (1,600) | | | | | | 4,173 | | |
| 12/31/2014 | | | | | 525 | | | | | | — | | | | | | 21 | | | | | | —* | | | | | | 546 | | | | | | 5,943 | | | | | | — | | | | | | 241 | | | | | | —* | | | | | | 6,184 | | |
| Class S | | | | | | | | | | | |
| 12/31/2015 | | | | | 106,243 | | | | | | — | | | | | | 33,166 | | | | | | (135,562) | | | | | | 3,847 | | | | | | 1,174,400 | | | | | | — | | | | | | 355,539 | | | | | | (1,457,964) | | | | | | 71,975 | | |
| 12/31/2014 | | | | | 95,898 | | | | | | — | | | | | | 34,659 | | | | | | (144,688) | | | | | | (14,131) | | | | | | 1,111,927 | | | | | | — | | | | | | 386,107 | | | | | | (1,664,558) | | | | | | (166,524) | | |
| Class S2 | | | | | | | | | | | |
| 12/31/2015 | | | | | 12,292 | | | | | | — | | | | | | 2,075 | | | | | | (8,244) | | | | | | 6,123 | | | | | | 137,650 | | | | | | — | | | | | | 22,148 | | | | | | (90,134) | | | | | | 69,664 | | |
| 12/31/2014 | | | | | 5,524 | | | | | | — | | | | | | 1,870 | | | | | | (5,445) | | | | | | 1,949 | | | | | | 63,077 | | | | | | — | | | | | | 20,759 | | | | | | (61,852) | | | | | | 21,984 | | |
| Solution Income | |
| Class ADV | | | | | | | | | | | |
| 12/31/2015 | | | | | 875,501 | | | | | | 17,732,399 | | | | | | 422,310 | | | | | | (3,417,878) | | | | | | 15,612,332 | | | | | | 8,937,303 | | | | | | 196,406,386 | | | | | | 4,683,419 | | | | | | (38,302,807) | | | | | | 171,724,301 | | |
| 12/31/2014 | | | | | 663,951 | | | | | | — | | | | | | 177,552 | | | | | | (1,933,340) | | | | | | (1,091,837) | | | | | | 7,610,632 | | | | | | — | | | | | | 2,029,424 | | | | | | (22,271,265) | | | | | | (12,631,209) | | |
| Class I | | | | | | | | | | | |
| 12/31/2015 | | | | | 882,319 | | | | | | 7,086,887 | | | | | | 133,536 | | | | | | (1,219,110) | | | | | | 6,883,632 | | | | | | 9,761,205 | | | | | | 80,072,506 | | | | | | 1,510,290 | | | | | | (13,921,933) | | | | | | 77,422,068 | | |
| 12/31/2014 | | | | | 675,323 | | | | | | — | | | | | | 59,763 | | | | | | (947,414) | | | | | | (212,328) | | | | | | 7,947,689 | | | | | | — | | | | | | 696,238 | | | | | | (11,149,334) | | | | | | (2,505,407) | | |
| Class S | | | | | | | | | | | |
| 12/31/2015 | | | | | 522,004 | | | | | | 18,628,555 | | | | | | 296,033 | | | | | | (3,844,837) | | | | | | 15,601,755 | | | | | | 4,991,798 | | | | | | 209,005,049 | | | | | | 3,324,455 | | | | | | (43,039,025) | | | | | | 174,282,277 | | |
| 12/31/2014 | | | | | 523,734 | | | | | | — | | | | | | 130,555 | | | | | | (1,312,451) | | | | | | (658,162) | | | | | | 6,110,756 | | | | | | — | | | | | | 1,510,514 | | | | | | (15,226,445) | | | | | | (7,605,175) | | |
| Class S2 | | | | | | | | | | | |
| 12/31/2015 | | | | | 75,965 | | | | | | 1,451,787 | | | | | | 23,159 | | | | | | (494,983) | | | | | | 1,055,928 | | | | | | 776,050 | | | | | | 15,898,957 | | | | | | 253,821 | | | | | | (5,406,925) | | | | | | 11,521,903 | | |
| 12/31/2014 | | | | | 97,794 | | | | | | — | | | | | | 8,746 | | | | | | (207,263) | | | | | | (100,723) | | | | | | 1,117,962 | | | | | | — | | | | | | 99,007 | | | | | | (2,351,953) | | | | | | (1,134,984) | | |
| Class T | | | | | | | | | | | |
| 12/31/2015 | | | | | 516 | | | | | | 63,207 | | | | | | 426 | | | | | | (118) | | | | | | 64,031 | | | | | | 2,119 | | | | | | 733,182 | | | | | | 4,945 | | | | | | (1,330) | | | | | | 738,916 | | |
| 12/31/2014 | | | | | 1,071 | | | | | | — | | | | | | 205 | | | | | | (10,275) | | | | | | (8,999) | | | | | | 12,825 | | | | | | — | | | | | | 2,437 | | | | | | (122,215) | | | | | | (106,953) | | |
| Solution Moderately Aggressive | |
| Class ADV | | | | | | | | | | | |
| 12/31/2015 | | | | | 356,971 | | | | | | 1,149,017 | | | | | | 222,861 | | | | | | (468,829) | | | | | | 1,260,020 | | | | | | 4,325,948 | | | | | | 13,430,897 | | | | | | 2,614,164 | | | | | | (5,579,778) | | | | | | 14,791,231 | | |
| 12/31/2014 | | | | | 356,299 | | | | | | — | | | | | | 125,179 | | | | | | (211,294) | | | | | | 270,184 | | | | | | 4,775,780 | | | | | | — | | | | | | 1,593,527 | | | | | | (2,805,589) | | | | | | 3,563,718 | | |
NOTES TO FINANCIAL STATEMENTS as of December 31, 2015 (continued)
NOTE 10 — CAPITAL SHARES (continued)
| | | | Shares sold | | | Shares
issued in
merger | | | Reinvestment
of
distributions | | | Shares
redeemed | | | Net increase
(decrease)
in shares
outstanding | | | Shares sold | | | Proceeds
from shares
issued in
merger | | | Reinvestment
of
distributions | | | Shares
redeemed | | | Net increase
(decrease) | |
Year or
period ended | | | # | | | # | | | # | | | # | | | # | | | ($) | | | ($) | | | ($) | | | ($) | | | ($) | |
| Solution Moderately Aggressive (continued) | |
| Class I | | | | | | | | | | | |
| 12/31/2015 | | | | | 25,830 | | | | | | 388,400 | | | | | | 963 | | | | | | (66,689) | | | | | | 348,504 | | | | | | 300,505 | | | | | | 4,613,738 | | | | | | 11,481 | | | | | | (761,743) | | | | | | 4,163,981 | | |
| 12/31/2014 | | | | | 4,418 | | | | | | — | | | | | | 28 | | | | | | (487) | | | | | | 3,959 | | | | | | 58,536 | | | | | | — | | | | | | 360 | | | | | | (6,395) | | | | | | 52,501 | | |
| Class S | | | | | | | | | | | |
| 12/31/2015 | | | | | 323,918 | | | | | | 67,391,670 | | | | | | 117,010 | | | | | | (5,264,540) | | | | | | 62,568,058 | | | | | | 3,970,666 | | | | | | 794,400,426 | | | | | | 1,384,232 | | | | | | (59,897,867) | | | | | | 739,857,457 | | |
| 12/31/2014 | | | | | 179,296 | | | | | | — | | | | | | 79,409 | | | | | | (278,237) | | | | | | (19,532) | | | | | | 2,401,872 | | | | | | — | | | | | | 1,018,024 | | | | | | (3,738,911) | | | | | | (319,015) | | |
| Class S2 | | | | | | | | | | | |
| 12/31/2015 | | | | | 24,794 | | | | | | — | | | | | | 10,593 | | | | | | (4,868) | | | | | | 30,519 | | | | | | 318,836 | | | | | | — | | | | | | 125,106 | | | | | | (62,765) | | | | | | 381,177 | | |
| 12/31/2014 | | | | | 43,302 | | | | | | — | | | | | | 5,100 | | | | | | (8,018) | | | | | | 40,384 | | | | | | 580,968 | | | | | | — | | | | | | 65,384 | | | | | | (105,838) | | | | | | 540,514 | | |
| Solution Moderately Conservative | |
| Class ADV | | | | | | | | | | | |
| 12/31/2015 | | | | | 516,666 | | | | | | — | | | | | | 191,286 | | | | | | (467,114) | | | | | | 240,838 | | | | | | 5,235,276 | | | | | | — | | | | | | 1,868,868 | | | | | | (4,766,056) | | | | | | 2,338,088 | | |
| 12/31/2014 | | | | | 404,547 | | | | | | — | | | | | | 167,450 | | | | | | (530,499) | | | | | | 41,498 | | | | | | 4,358,637 | | | | | | — | | | | | | 1,723,067 | | | | | | (5,705,865) | | | | | | 375,839 | | |
| Class I | | | | | | | | | | | |
| 12/31/2015 | | | | | 152 | | | | | | — | | | | | | 327 | | | | | | (293) | | | | | | 186 | | | | | | 1,610 | | | | | | — | | | | | | 3,324 | | | | | | (2,963) | | | | | | 1,971 | | |
| 12/31/2014 | | | | | 3,966 | | | | | | — | | | | | | 9 | | | | | | (681) | | | | | | 3,294 | | | | | | 43,084 | | | | | | — | | | | | | 95 | | | | | | (7,291) | | | | | | 35,888 | | |
| Class S | | | | | | | | | | | |
| 12/31/2015 | | | | | 261,617 | | | | | | — | | | | | | 174,769 | | | | | | (467,681) | | | | | | (31,295) | | | | | | 2,714,729 | | | | | | — | | | | | | 1,744,197 | | | | | | (4,948,852) | | | | | | (489,926) | | |
| 12/31/2014 | | | | | 306,420 | | | | | | — | | | | | | 177,037 | | | | | | (572,181) | | | | | | (88,724) | | | | | | 3,347,877 | | | | | | — | | | | | | 1,857,121 | | | | | | (6,270,232) | | | | | | (1,065,234) | | |
| Class S2 | | | | | | | | | | | |
| 12/31/2015 | | | | | 13,745 | | | | | | — | | | | | | 8,024 | | | | | | (23,916) | | | | | | (2,147) | | | | | | 144,059 | | | | | | — | | | | | | 79,359 | | | | | | (236,253) | | | | | | (12,835) | | |
| 12/31/2014 | | | | | 24,148 | | | | | | — | | | | | | 5,580 | | | | | | (10,878) | | | | | | 18,850 | | | | | | 255,891 | | | | | | — | | | | | | 58,087 | | | | | | (116,498) | | | | | | 197,480 | | |
| Solution 2020 | |
| Class ADV | | | | | | | | | | | |
| 12/31/2015 | | | | | 270,401 | | | | | | — | | | | | | 2,746 | | | | | | (77,349) | | | | | | 195,798 | | | | | | 3,166,134 | | | | | | — | | | | | | 32,568 | | | | | | (972,350) | | | | | | 2,226,352 | | |
| 12/31/2014 | | | | | 48,923 | | | | | | — | | | | | | 159 | | | | | | (307) | | | | | | 48,775 | | | | | | 612,209 | | | | | | — | | | | | | 2,004 | | | | | | (3,935) | | | | | | 610,278 | | |
| Class I | | | | | | | | | | | |
| 12/31/2015 | | | | | 198,327 | | | | | | — | | | | | | —* | | | | | | (16,085) | | | | | | 182,242 | | | | | | 2,346,484 | | | | | | — | | | | | | 2 | | | | | | (189,304) | | | | | | 2,157,182 | | |
| 12/31/2014 | | | | | — | | | | | | — | | | | | | 1 | | | | | | — | | | | | | 1 | | | | | | — | | | | | | — | | | | | | 11 | | | | | | — | | | | | | 11 | | |
| Class S | | | | | | | | | | | |
| 12/31/2015 | | | | | 361,539 | | | | | | — | | | | | | —* | | | | | | (10,564) | | | | | | 350,975 | | | | | | 4,284,726 | | | | | | — | | | | | | 2 | | | | | | (126,396) | | | | | | 4,158,332 | | |
| 12/31/2014 | | | | | — | | | | | | — | | | | | | 1 | | | | | | — | | | | | | 1 | | | | | | — | | | | | | — | | | | | | 11 | | | | | | — | | | | | | 11 | | |
| Class S2 | | | | | | | | | | | |
| 12/31/2015 | | | | | 24,151 | | | | | | — | | | | | | —* | | | | | | (303) | | | | | | 23,848 | | | | | | 285,566 | | | | | | — | | | | | | 1 | | | | | | (3,557) | | | | | | 282,010 | | |
| 12/31/2014 | | | | | — | | | | | | — | | | | | | 1 | | | | | | — | | | | | | 1 | | | | | | — | | | | | | — | | | | | | 11 | | | | | | — | | | | | | 11 | | |
| Class T | | | | | | | | | | | |
| 12/31/2015 | | | | | 50 | | | | | | — | | | | | | —* | | | | | | —* | | | | | | 50 | | | | | | 578 | | | | | | — | | | | | | 1 | | | | | | —* | | | | | | 579 | | |
| 12/31/2014 | | | | | — | | | | | | — | | | | | | 1 | | | | | | — | | | | | | 1 | | | | | | — | | | | | | — | | | | | | 12 | | | | | | — | | | | | | 12 | | |
| Solution 2025 | |
| Class ADV | | | | | | | | | | | |
| 12/31/2015 | | | | | 1,784,495 | | | | | | — | | | | | | 4,330,092 | | | | | | (8,031,558) | | | | | | (1,916,971) | | | | | | 22,123,192 | | | | | | — | | | | | | 49,925,958 | | | | | | (100,164,909) | | | | | | (28,115,759) | | |
| 12/31/2014 | | | | | 2,231,249 | | | | | | — | | | | | | 2,365,187 | | | | | | (8,995,769) | | | | | | (4,399,333) | | | | | | 29,044,488 | | | | | | — | | | | | | 29,777,701 | | | | | | (118,304,500) | | | | | | (59,482,311) | | |
| Class I | | | | | | | | | | | |
| 12/31/2015 | | | | | 4,602,193 | | | | | | — | | | | | | 2,479,049 | | | | | | (4,243,398) | | | | | | 2,837,844 | | | | | | 58,869,833 | | | | | | — | | | | | | 29,227,991 | | | | | | (51,960,653) | | | | | | 36,137,171 | | |
| 12/31/2014 | | | | | 5,476,228 | | | | | | — | | | | | | 1,262,725 | | | | | | (8,596,798) | | | | | | (1,857,845) | | | | | | 73,210,248 | | | | | | — | | | | | | 16,226,007 | | | | | | (114,659,726) | | | | | | (25,223,471) | | |
| Class S | | | | | | | | | | | |
| 12/31/2015 | | | | | 2,603,333 | | | | | | — | | | | | | 5,152,653 | | | | | | (8,206,295) | | | | | | (450,309) | | | | | | 33,211,859 | | | | | | — | | | | | | 60,182,986 | | | | | | (101,006,412) | | | | | | (7,611,567) | | |
| 12/31/2014 | | | | | 2,279,513 | | | | | | — | | | | | | 2,647,318 | | | | | | (7,601,495) | | | | | | (2,674,664) | | | | | | 30,203,403 | | | | | | — | | | | | | 33,726,829 | | | | | | (99,848,972) | | | | | | (35,918,740) | | |
| Class S2 | | | | | | | | | | | |
| 12/31/2015 | | | | | 315,246 | | | | | | — | | | | | | 352,939 | | | | | | (920,180) | | | | | | (251,995) | | | | | | 3,768,785 | | | | | | — | | | | | | 4,019,974 | | | | | | (11,275,404) | | | | | | (3,486,645) | | |
| 12/31/2014 | | | | | 390,863 | | | | | | — | | | | | | 186,394 | | | | | | (1,007,792) | | | | | | (430,535) | | | | | | 4,991,097 | | | | | | — | | | | | | 2,322,472 | | | | | | (13,209,698) | | | | | | (5,896,129) | | |
NOTES TO FINANCIAL STATEMENTS as of December 31, 2015 (continued)
NOTE 10 — CAPITAL SHARES (continued)
| | | | Shares sold | | | Shares
issued in
merger | | | Reinvestment
of
distributions | | | Shares
redeemed | | | Net increase
(decrease)
in shares
outstanding | | | Shares sold | | | Proceeds
from shares
issued in
merger | | | Reinvestment
of
distributions | | | Shares
redeemed | | | Net increase
(decrease) |
Year or
period ended | | | # | | | # | | | # | | | # | | | # | | | ($) | | | ($) | | | ($) | | | ($) | | | ($) |
| Solution 2025 (continued) |
| Class T | | | | | | | | | | | |
| 12/31/2015 | | | | | 2,283 | | | | | | — | | | | | | 8,190 | | | | | | (4,788) | | | | | | 5,685 | | | | | | 28,405 | | | | | | — | | | | | | 98,029 | | | | | | (57,754) | | | | | | 68,680 |
| 12/31/2014 | | | | | 33,371 | | | | | | — | | | | | | 15,933 | | | | | | (207,881) | | | | | | (158,577) | | | | | | 452,968 | | | | | | — | | | | | | 204,414 | | | | | | (2,665,283) | | | | | | (2,007,901) |
| Solution 2030 |
| Class ADV | | | | | | | | | | | |
| 12/31/2015 | | | | | 121,446 | | | | | | — | | | | | | 1,136 | | | | | | (15,299) | | | | | | 107,283 | | | | | | 1,623,383 | | | | | | — | | | | | | 15,542 | | | | | | (204,869) | | | | | | 1,434,056 |
| 12/31/2014 | | | | | 19,829 | | | | | | — | | | | | | 169 | | | | | | (9,062) | | | | | | 10,936 | | | | | | 267,213 | | | | | | — | | | | | | 2,303 | | | | | | (127,607) | | | | | | 141,909 |
| Class I | | | | | | | | | | | |
| 12/31/2015 | | | | | 66,974 | | | | | | — | | | | | | 277 | | | | | | (3,574) | | | | | | 63,677 | | | | | | 906,574 | | | | | | — | | | | | | 3,851 | | | | | | (48,330) | | | | | | 862,095 |
| 12/31/2014 | | | | | — | | | | | | — | | | | | | 2 | | | | | | — | | | | | | 2 | | | | | | — | | | | | | — | | | | | | 30 | | | | | | — | | | | | | 30 |
| Class S | | | | | | | | | | | |
| 12/31/2015 | | | | | 110,273 | | | | | | — | | | | | | —* | | | | | | (2,338) | | | | | | 107,935 | | | | | | 1,483,479 | | | | | | — | | | | | | 1 | | | | | | (31,713) | | | | | | 1,451,767 |
| 12/31/2014 | | | | | — | | | | | | — | | | | | | 2 | | | | | | — | | | | | | 2 | | | | | | — | | | | | | — | | | | | | 31 | | | | | | — | | | | | | 31 |
| Class S2 | | | | | | | | | | | |
| 12/31/2015 | | | | | 2,769 | | | | | | — | | | | | | —* | | | | | | —* | | | | | | 2,769 | | | | | | 36,883 | | | | | | — | | | | | | 1 | | | | | | (1) | | | | | | 36,883 |
| 12/31/2014 | | | | | — | | | | | | — | | | | | | 2 | | | | | | — | | | | | | 2 | | | | | | — | | | | | | — | | | | | | 31 | | | | | | — | | | | | | 31 |
| Class T | | | | | | | | | | | |
| 12/31/2015 | | | | | — | | | | | | — | | | | | | —* | | | | | | — | | | | | | —* | | | | | | 1 | | | | | | — | | | | | | 1 | | | | | | — | | | | | | 2 |
| 12/31/2014 | | | | | — | | | | | | — | | | | | | 2 | | | | | | — | | | | | | 2 | | | | | | — | | | | | | — | | | | | | 30 | | | | | | — | | | | | | 30 |
| Solution 2035 |
| Class ADV | | | | | | | | | | | |
| 12/31/2015 | | | | | 1,648,550 | | | | | | — | | | | | | 4,028,320 | | | | | | (6,140,085) | | | | | | (463,215) | | | | | | 20,918,739 | | | | | | — | | | | | | 47,332,753 | | | | | | (77,942,642) | | | | | | (9,691,150) |
| 12/31/2014 | | | | | 1,744,453 | | | | | | — | | | | | | 3,030,633 | | | | | | (7,862,097) | | | | | | (3,087,011) | | | | | | 24,110,514 | | | | | | — | | | | | | 39,277,002 | | | | | | (108,687,237) | | | | | | (45,299,721) |
| Class I | | | | | | | | | | | |
| 12/31/2015 | | | | | 4,738,743 | | | | | | — | | | | | | 2,922,587 | | | | | | (4,667,888) | | | | | | 2,993,442 | | | | | | 62,332,893 | | | | | | — | | | | | | 35,100,277 | | | | | | (58,410,906) | | | | | | 39,022,264 |
| 12/31/2014 | | | | | 5,425,725 | | | | | | — | | | | | | 1,789,783 | | | | | | (5,971,308) | | | | | | 1,244,200 | | | | | | 75,880,127 | | | | | | — | | | | | | 23,660,926 | | | | | | (83,373,140) | | | | | | 16,167,913 |
| Class S | | | | | | | | | | | |
| 12/31/2015 | | | | | 3,466,195 | | | | | | — | | | | | | 5,186,236 | | | | | | (7,427,892) | | | | | | 1,224,539 | | | | | | 45,578,722 | | | | | | — | | | | | | 61,716,210 | | | | | | (92,846,886) | | | | | | 14,448,046 |
| 12/31/2014 | | | | | 1,961,410 | | | | | | — | | | | | | 3,404,711 | | | | | | (7,389,232) | | | | | | (2,023,111) | | | | | | 27,216,748 | | | | | | — | | | | | | 44,635,757 | | | | | | (102,662,482) | | | | | | (30,809,977) |
| Class S2 | | | | | | | | | | | |
| 12/31/2015 | | | | | 248,552 | | | | | | — | | | | | | 314,052 | | | | | | (957,055) | | | | | | (394,451) | | | | | | 3,153,713 | | | | | | — | | | | | | 3,624,166 | | | | | | (12,335,819) | | | | | | (5,557,940) |
| 12/31/2014 | | | | | 401,603 | | | | | | — | | | | | | 251,203 | | | | | | (756,733) | | | | | | (103,927) | | | | | | 5,348,909 | | | | | | — | | | | | | 3,202,845 | | | | | | (10,410,085) | | | | | | (1,858,331) |
| Class T | | | | | | | | | | | |
| 12/31/2015 | | | | | 3,744 | | | | | | — | | | | | | 9,518 | | | | | | (1,193) | | | | | | 12,069 | | | | | | 47,267 | | | | | | — | | | | | | 115,739 | | | | | | (16,211) | | | | | | 146,795 |
| 12/31/2014 | | | | | 39,474 | | | | | | — | | | | | | 17,254 | | | | | | (126,143) | | | | | | (69,415) | | | | | | 568,584 | | | | | | — | | | | | | 228,444 | | | | | | (1,664,992) | | | | | | (867,964) |
| Solution 2040 |
| Class ADV | | | | | | | | | | | |
| 12/31/2015 | | | | | 125,000 | | | | | | — | | | | | | 3,947 | | | | | | (14,900) | | | | | | 114,047 | | | | | | 1,767,906 | | | | | | — | | | | | | 56,875 | | | | | | (214,750) | | | | | | 1,610,031 |
| 12/31/2014 | | | | | 55,828 | | | | | | — | | | | | | 186 | | | | | | (9,235) | | | | | | 46,779 | | | | | | 802,761 | | | | | | — | | | | | | 2,713 | | | | | | (136,869) | | | | | | 668,605 |
| Class I | | | | | | | | | | | |
| 12/31/2015 | | | | | 46,988 | | | | | | — | | | | | | —* | | | | | | (12,663) | | | | | | 34,325 | | | | | | 657,777 | | | | | | — | | | | | | 2 | | | | | | (179,143) | | | | | | 478,636 |
| 12/31/2014 | | | | | — | | | | | | — | | | | | | 1 | | | | | | — | | | | | | 1 | | | | | | — | | | | | | — | | | | | | 17 | | | | | | — | | | | | | 17 |
| Class S | | | | | | | | | | | |
| 12/31/2015 | | | | | 71,111 | | | | | | — | | | | | | —* | | | | | | (27,951) | | | | | | 43,160 | | | | | | 985,441 | | | | | | — | | | | | | 1 | | | | | | (394,972) | | | | | | 590,470 |
| 12/31/2014 | | | | | — | | | | | | — | | | | | | 1 | | | | | | — | | | | | | 1 | | | | | | — | | | | | | — | | | | | | 16 | | | | | | — | | | | | | 16 |
| Class S2 | | | | | | | | | | | |
| 12/31/2015 | | | | | 379 | | | | | | — | | | | | | —* | | | | | | —* | | | | | | 379 | | | | | | 5,239 | | | | | | — | | | | | | 1 | | | | | | —* | | | | | | 5,240 |
| 12/31/2014 | | | | | — | | | | | | — | | | | | | 1 | | | | | | — | | | | | | 1 | | | | | | — | | | | | | — | | | | | | 16 | | | | | | — | | | | | | 16 |
| Class T | | | | | | | | | | | |
| 12/31/2015 | | | | | 23 | | | | | | — | | | | | | —* | | | | | | —* | | | | | | 23 | | | | | | 324 | | | | | | — | | | | | | 1 | | | | | | —* | | | | | | 325 |
| 12/31/2014 | | | | | — | | | | | | — | | | | | | 1 | | | | | | — | | | | | | 1 | | | | | | — | | | | | | — | | | | | | 17 | | | | | | — | | | | | | 17 |
NOTES TO FINANCIAL STATEMENTS as of December 31, 2015 (continued)
NOTE 10 — CAPITAL SHARES (continued)
| | | | Shares sold | | | Shares
issued in
merger | | | Reinvestment
of
distributions | | | Shares
redeemed | | | Net increase
(decrease)
in shares
outstanding | | | Shares sold | | | Proceeds
from shares
issued in
merger | | | Reinvestment
of
distributions | | | Shares
redeemed | | | Net increase
(decrease) |
Year or
period ended | | | # | | | # | | | # | | | # | | | # | | | ($) | | | ($) | | | ($) | | | ($) | | | ($) |
| Solution 2045 |
| Class ADV | | | | | | | | | | | |
| 12/31/2015 | | | | | 1,428,372 | | | | | | — | | | | | | 3,182,631 | | | | | | (4,384,453) | | | | | | 226,550 | | | | | | 18,126,746 | | | | | | — | | | | | | 37,173,134 | | | | | | (56,697,016) | | | | | | (1,397,136) |
| 12/31/2014 | | | | | 1,421,478 | | | | | | — | | | | | | 2,191,746 | | | | | | (4,449,138) | | | | | | (835,914) | | | | | | 20,282,717 | | | | | | — | | | | | | 29,128,306 | | | | | | (63,324,912) | | | | | | (13,913,889) |
| Class I | | | | | | | | | | | |
| 12/31/2015 | | | | | 4,101,908 | | | | | | — | | | | | | 2,652,131 | | | | | | (3,574,117) | | | | | | 3,179,922 | | | | | | 54,184,542 | | | | | | — | | | | | | 31,692,964 | | | | | | (45,385,554) | | | | | | 40,491,952 |
| 12/31/2014 | | | | | 4,631,246 | | | | | | — | | | | | | 1,541,633 | | | | | | (5,193,702) | | | | | | 979,177 | | | | | | 67,357,973 | | | | | | — | | | | | | 20,904,540 | | | | | | (75,567,806) | | | | | | 12,694,707 |
| Class S | | | | | | | | | | | |
| 12/31/2015 | | | | | 2,210,545 | | | | | | — | | | | | | 4,403,023 | | | | | | (4,610,924) | | | | | | 2,002,644 | | | | | | 29,434,671 | | | | | | — | | | | | | 52,043,735 | | | | | | (58,237,822) | | | | | | 23,240,584 |
| 12/31/2014 | | | | | 1,541,939 | | | | | | — | | | | | | 2,649,762 | | | | | | (6,124,054) | | | | | | (1,932,353) | | | | | | 22,188,855 | | | | | | — | | | | | | 35,586,304 | | | | | | (88,338,311) | | | | | | (30,563,152) |
| Class S2 | | | | | | | | | | | |
| 12/31/2015 | | | | | 204,790 | | | | | | — | | | | | | 229,034 | | | | | | (654,820) | | | | | | (220,996) | | | | | | 2,608,223 | | | | | | — | | | | | | 2,647,631 | | | | | | (8,652,212) | | | | | | (3,396,358) |
| 12/31/2014 | | | | | 330,210 | | | | | | — | | | | | | 165,692 | | | | | | (443,661) | | | | | | 52,241 | | | | | | 4,621,951 | | | | | | — | | | | | | 2,183,817 | | | | | | (6,389,684) | | | | | | 416,084 |
| Class T | | | | | | | | | | | |
| 12/31/2015 | | | | | 2,952 | | | | | | — | | | | | | 5,142 | | | | | | (1,077) | | | | | | 7,017 | | | | | | 36,749 | | | | | | — | | | | | | 61,758 | | | | | | (14,474) | | | | | | 84,033 |
| 12/31/2014 | | | | | 20,235 | | | | | | — | | | | | | 9,827 | | | | | | (75,284) | | | | | | (45,222) | | | | | | 302,640 | | | | | | — | | | | | | 132,466 | | | | | | (1,024,896) | | | | | | (589,790) |
| Solution 2050 |
| Class ADV | | | | | | | | | | | |
| 12/31/2015 | | | | | 49,242 | | | | | | — | | | | | | 2,002 | | | | | | (5,700) | | | | | | 45,544 | | | | | | 691,029 | | | | | | — | | | | | | 28,848 | | | | | | (82,795) | | | | | | 637,082 |
| 12/31/2014 | | | | | 23,835 | | | | | | — | | | | | | 186 | | | | | | (569) | | | | | | 23,452 | | | | | | 343,577 | | | | | | — | | | | | | 2,715 | | | | | | (8,517) | | | | | | 337,775 |
| Class I | | | | | | | | | | | |
| 12/31/2015 | | | | | 35,144 | | | | | | — | | | | | | —* | | | | | | (8,035) | | | | | | 27,109 | | | | | | 499,073 | | | | | | — | | | | | | 1 | | | | | | (114,137) | | | | | | 384,937 |
| 12/31/2014 | | | | | — | | | | | | — | | | | | | 2 | | | | | | — | | | | | | 2 | | | | | | — | | | | | | — | | | | | | 33 | | | | | | — | | | | | | 33 |
| Class S | | | | | | | | | | | |
| 12/31/2015 | | | | | 24,707 | | | | | | — | | | | | | —* | | | | | | (2,441) | | | | | | 22,266 | | | | | | 345,483 | | | | | | — | | | | | | 1 | | | | | | (33,330) | | | | | | 312,154 |
| 12/31/2014 | | | | | — | | | | | | — | | | | | | 2 | | | | | | — | | | | | | 2 | | | | | | — | | | | | | — | | | | | | 34 | | | | | | — | | | | | | 34 |
| Class S2 | | | | | | | | | | | |
| 12/31/2015 | | | | | 1,644 | | | | | | — | | | | | | —* | | | | | | (1,285) | | | | | | 359 | | | | | | 23,088 | | | | | | — | | | | | | 1 | | | | | | (17,709) | | | | | | 5,380 |
| 12/31/2014 | | | | | — | | | | | | — | | | | | | 2 | | | | | | — | | | | | | 2 | | | | | | — | | | | | | — | | | | | | 33 | | | | | | — | | | | | | 33 |
| Class T | | | | | | | | | | | |
| 12/31/2015 | | | | | — | | | | | | — | | | | | | —* | | | | | | — | | | | | | —* | | | | | | — | | | | | | — | | | | | | 1 | | | | | | — | | | | | | 1 |
| 12/31/2014 | | | | | — | | | | | | — | | | | | | 2 | | | | | | — | | | | | | 2 | | | | | | — | | | | | | — | | | | | | 33 | | | | | | — | | | | | | 33 |
| Solution 2055 |
| Class ADV | | | | | | | | | | | |
| 12/31/2015 | | | | | 958,435 | | | | | | — | | | | | | 362,034 | | | | | | (687,431) | | | | | | 633,038 | | | | | | 13,274,081 | | | | | | — | | | | | | 4,749,889 | | | | | | (9,493,615) | | | | | | 8,530,355 |
| 12/31/2014 | | | | | 789,420 | | | | | | — | | | | | | 188,455 | | | | | | (640,060) | | | | | | 337,815 | | | | | | 11,381,547 | | | | | | — | | | | | | 2,625,177 | | | | | | (9,240,921) | | | | | | 4,765,803 |
| Class I | | | | | | | | | | | |
| 12/31/2015 | | | | | 1,335,242 | | | | | | — | | | | | | 291,783 | | | | | | (458,681) | | | | | | 1,168,344 | | | | | | 18,637,734 | | | | | | — | | | | | | 3,886,544 | | | | | | (6,282,177) | | | | | | 16,242,101 |
| 12/31/2014 | | | | | 1,276,229 | | | | | | — | | | | | | 110,212 | | | | | | (832,392) | | | | | | 554,049 | | | | | | 18,577,926 | | | | | | — | | | | | | 1,555,089 | | | | | | (12,432,533) | | | | | | 7,700,482 |
| Class S | | | | | | | | | | | |
| 12/31/2015 | | | | | 1,149,129 | | | | | | — | | | | | | 425,992 | | | | | | (864,563) | | | | | | 710,558 | | | | | | 16,171,799 | | | | | | — | | | | | | 5,623,096 | | | | | | (11,796,616) | | | | | | 9,998,279 |
| 12/31/2014 | | | | | 960,371 | | | | | | — | | | | | | 195,311 | | | | | | (737,606) | | | | | | 418,076 | | | | | | 13,967,923 | | | | | | — | | | | | | 2,736,305 | | | | | | (10,611,072) | | | | | | 6,093,156 |
| Class S2 | | | | | | | | | | | |
| 12/31/2015 | | | | | 103,582 | | | | | | — | | | | | | 25,630 | | | | | | (103,907) | | | | | | 25,305 | | | | | | 1,435,275 | | | | | | — | | | | | | 337,030 | | | | | | (1,479,639) | | | | | | 292,666 |
| 12/31/2014 | | | | | 110,096 | | | | | | — | | | | | | 12,855 | | | | | | (63,468) | | | | | | 59,483 | | | | | | 1,580,844 | | | | | | — | | | | | | 179,451 | | | | | | (907,693) | | | | | | 852,602 |
| Class T | | | | | | | | | | | |
| 12/31/2015 | | | | | 294 | | | | | | — | | | | | | 47 | | | | | | (3) | | | | | | 338 | | | | | | 3,965 | | | | | | — | | | | | | 628 | | | | | | (37) | | | | | | 4,556 |
| 12/31/2014 | | | | | 11,983 | | | | | | — | | | | | | 250 | | | | | | (16,576) | | | | | | (4,343) | | | | | | 170,103 | | | | | | — | | | | | | 3,479 | | | | | | (232,135) | | | | | | (58,553) |
| Solution 2060 |
| Class ADV | | | | | | | | | | | |
2/9/2015(1) -
12/31/2015 | | | | | 19,776 | | | | | | — | | | | | | — | | | | | | (498) | | | | | | 19,278 | | | | | | 193,663 | | | | | | — | | | | | | — | | | | | | (4,897) | | | | | | 188,766 |
NOTES TO FINANCIAL STATEMENTS as of December 31, 2015 (continued)
NOTE 10 — CAPITAL SHARES (continued)
| | | | Shares sold | | | Shares
issued in
merger | | | Reinvestment
of
distributions | | | Shares
redeemed | | | Net increase
(decrease)
in shares
outstanding | | | Shares sold | | | Proceeds
from shares
issued in
merger | | | Reinvestment
of
distributions | | | Shares
redeemed | | | Net increase
(decrease) | |
Year or
period ended | | | # | | | # | | | # | | | # | | | # | | | ($) | | | ($) | | | ($) | | | ($) | | | ($) | |
| Solution 2060 (continued) | |
| Class I | | | | | | | | | | | |
2/9/2015(1) -
12/31/2015 | | | | | 34,447 | | | | | | — | | | | | | — | | | | | | (2,528) | | | | | | 31,919 | | | | | | 336,593 | | | | | | — | | | | | | — | | | | | | (25,392) | | | | | | 311,201 | | |
| Class S | | | | | | | | | | | |
2/9/2015(1) -
12/31/2015 | | | | | 19,042 | | | | | | — | | | | | | — | | | | | | (4,817) | | | | | | 14,225 | | | | | | 187,425 | | | | | | — | | | | | | — | | | | | | (47,313) | | | | | | 140,112 | | |
| Class S2 | | | | | | | | | | | |
2/9/2015(1) -
12/31/2015 | | | | | 2,898 | | | | | | — | | | | | | — | | | | | | (302) | | | | | | 2,596 | | | | | | 29,143 | | | | | | — | | | | | | — | | | | | | (2,997) | | | | | | 26,146 | | |
| Class T | | | | | | | | | | | |
2/9/2015(1) -
12/31/2015 | | | | | 301 | | | | | | — | | | | | | — | | | | | | — | | | | | | 301 | | | | | | 3,012 | | | | | | — | | | | | | — | | | | | | — | | | | | | 3,012 | | |
(1)
Commencement of operations
*
Share amount is less than 0.500 per share or $0.50.
NOTE 11 — FEDERAL INCOME TAXES
The amount of distributions from net investment income and net realized capital gains are determined in accordance with federal income tax regulations, which may differ from U.S. GAAP for investment companies. These book/tax differences may be either temporary or permanent. Permanent differences are reclassified within the capital accounts based on their federal tax-basis treatment; temporary differences are not reclassified. Key differences include the treatment of short-term capital gains, foreign currency transactions, and wash sale deferrals. Distributions in excess of net investment income and/or net realized capital gains for tax purposes are reported as return of capital.
The following permanent tax differences have been reclassified as of December 31, 2015:
| | | | Undistributed Net
Investment Income | | | Accumulated
Net Realized
Gains/(Losses) | |
| Solution Aggressive | | | | $ | 41,742 | | | | | $ | (41,742) | | |
| Solution Balanced | | | | | 405,631 | | | | | | (405,631) | | |
| Solution Conservative | | | | | 71,581 | | | | | | (71,581) | | |
| Solution Income | | | | | 1,192,359 | | | | | | (1,192,359) | | |
| Solution Moderately Aggressive | | | | | 2,960,240 | | | | | | (2,960,240) | | |
| Solution Moderately Conservative | | | | | 282,787 | | | | | | (282,787) | | |
| Solution 2020 | | | | | 14,659 | | | | | | (14,659) | | |
| Solution 2025 | | | | | 7,540,720 | | | | | | (7,540,720) | | |
| Solution 2030 | | | | | 7,647 | | | | | | (7,647) | | |
| Solution 2035 | | | | | 7,650,569 | | | | | | (7,650,569) | | |
| Solution 2040 | | | | | 11,573 | | | | | | (11,573) | | |
| Solution 2045 | | | | | 4,496,710 | | | | | | (4,496,710) | | |
| | | | Undistributed Net
Investment Income | | | Accumulated
Net Realized
Gains/(Losses) | |
| Solution 2050 | | | | | 5,246 | | | | | | (5,246) | | |
| Solution 2055 | | | | | 831,496 | | | | | | (831,496) | | |
| Solution 2060 | | | | | 1,698 | | | | | | (1,698) | | |
Dividends paid by the Portfolios from net investment income and distributions of net realized short-term capital gains are, for federal income tax purposes, taxable as ordinary income to shareholders.
The tax composition of dividends and distributions to shareholders was as follows:
| | | | Year Ended
December 31, 2015 | | | Year Ended
December 31, 2014 | |
| | | | Ordinary
Income | | | Long-term
Capital Gains | | | Ordinary
Income | | | Long-term
Capital Gains | |
| Solution Aggressive | | | | $ | 130,396 | | | | | $ | 159,239 | | | | | $ | 17,859 | | | | | $ | 10,836 | | |
| Solution Balanced | | | | | 1,902,511 | | | | | | 3,610,244 | | | | | | 1,836,209 | | | | | | 2,510,646 | | |
| Solution Conservative | | | | | 584,199 | | | | | | 396,989 | | | | | | 651,677 | | | | | | 467,767 | | |
| Solution Income | | | | | 4,159,259 | | | | | | 5,617,671 | | | | | | 4,337,620 | | | | | | — | | |
| Solution Moderately Aggressive | | | | | 1,265,910 | | | | | | 2,869,073 | | | | | | 982,421 | | | | | | 1,694,873 | | |
| Solution Moderately Conservative | | | | | 1,575,858 | | | | | | 2,119,890 | | | | | | 1,919,034 | | | | | | 1,719,336 | | |
| Solution 2020 | | | | | 15,749 | | | | | | 18,494 | | | | | | 599 | | | | | | 1,450 | | |
| Solution 2025 | | | | | 43,850,398 | | | | | | 99,604,540 | | | | | | 23,455,600 | | | | | | 58,801,823 | | |
| Solution 2030 | | | | | 8,842 | | | | | | 11,437 | | | | | | 721 | | | | | | 1,706 | | |
| Solution 2035 | | | | | 41,925,780 | | | | | | 105,963,365 | | | | | | 23,445,726 | | | | | | 87,559,248 | | |
| Solution 2040 | | | | | 24,130 | | | | | | 33,992 | | | | | | 701 | | | | | | 2,078 | | |
| Solution 2045 | | | | | 30,756,256 | | | | | | 92,862,966 | | | | | | 17,516,559 | | | | | | 70,418,874 | | |
| Solution 2050 | | | | | 10,787 | | | | | | 19,354 | | | | | | 660 | | | | | | 2,188 | | |
| Solution 2055 | | | | | 4,299,498 | | | | | | 10,297,691 | | | | | | 2,587,997 | | | | | | 4,511,504 | | |
NOTES TO FINANCIAL STATEMENTS as of December 31, 2015 (continued)
NOTE 11 — FEDERAL INCOME TAXES (continued)
The tax-basis components of distributable earnings as of December 31, 2015 were:
| | | | Undistributed
Ordinary
Income | | | Undistributed
Long-term
Capital Gains | | | Unrealized
Appreciation/
(Depreciation) | |
| Solution Aggressive | | | | $ | 79,742 | | | | | $ | 330,781 | | | | | $ | (660,553) | | |
| Solution Balanced | | | | | 970,458 | | | | | | 3,054,677 | | | | | | (3,056,134) | | |
| Solution Conservative | | | | | 304,708 | | | | | | 379,504 | | | | | | (1,147,935) | | |
| Solution Income | | | | | 5,721,638 | | | | | | 6,099,401 | | | | | | (33,700,382) | | |
| Solution Moderately Aggressive | | | | | 8,500,272 | | | | | | 10,914,767 | | | | | | (53,741,103) | | |
| Solution Moderately Conservative | | | | | 807,123 | | | | | | 2,097,669 | | | | | | (3,110,842) | | |
| Solution 2020 | | | | | 80,249 | | | | | | 76,926 | | | | | | (165,480) | | |
| Solution 2025 | | | | | 19,435,465 | | | | | | 74,756,664 | | | | | | (57,600,733) | | |
| Solution 2030 | | | | | 39,401 | | | | | | 40,314 | | | | | | (92,498) | | |
| Solution 2035 | | | | | 18,503,214 | | | | | | 75,963,827 | | | | | | (55,659,700) | | |
| Solution 2040 | | | | | 38,260 | | | | | | 69,330 | | | | | | (135,672) | | |
| Solution 2045 | | | | | 10,372,064 | | | | | | 56,411,941 | | | | | | (39,210,856) | | |
| Solution 2050 | | | | | 17,221 | | | | | | 35,491 | | | | | | (67,022) | | |
| Solution 2055 | | | | | 1,888,024 | | | | | | 8,916,686 | | | | | | (11,337,339) | | |
| Solution 2060 | | | | | 10,183 | | | | | | 8,661 | | | | | | (11,912) | | |
At December 31, 2015, the Portfolios did not have any capital loss carryovers for U.S. federal income tax purposes.
The Portfolios’ major tax jurisdictions are U.S. federal and Arizona state.
As of December 31, 2015, no provision for income tax is required in the Portfolios’ financial statements as a result of tax positions taken on federal and state income tax returns for open tax years. The Portfolios’ federal and state income and federal excise tax returns for tax years for which the applicable statutes of limitations have not expired are subject to examination by the Internal Revenue Service and state department of revenue. The earliest tax year that remains subject to examination by these jurisdictions is 2011.
NOTE 12 — REORGANIZATIONS
On August 14, 2015, Solution Income (“Acquiring Portfolio”) acquired all of the assets of, and assumed all of the liabilities of Voya Solution 2015 Portfolio (“Acquired Portfolio”), which is not included in this report, an open-end investment company in a tax-free reorganization in exchange for shares of the Acquiring Portfolio, pursuant to a plan of reorganization. The transaction occurred due to the Acquired Portfolio reaching its Target Date in 2015. For financial reporting purposes, assets received and shares issued by the Acquiring Portfolio were recorded at fair
value; however, the cost basis of the investments received from the Acquired Portfolio were carried forward to align ongoing reporting of the Acquiring Portfolio’s realized and unrealized gains and losses with amounts distributable to shareholders for tax purposes.
Assuming the acquisition had been completed on January 1, 2015, the beginning of the annual reporting period of the Acquiring Portfolio, the Acquiring Portfolio’s pro forma results of operations for the year ended December 31, 2015, are as follows:
| | Net investment income | | | | $ | 8,797,000 | | |
| | Net realized and unrealized loss on investments | | | | $ | (6,156,878) | | |
| | Net increase in net assets resulting from operations | | | | $ | 2,640,123 | | |
Because the combined investment portfolios have been managed as a single integrated portfolio since the acquisition was completed, it is not practicable to separate the amounts of revenue and earnings of the Acquired Portfolio that have been included in the Acquiring Portfolio’s statement of operations since August 14, 2015. Net assets and unrealized appreciation or depreciation as of the reorganization date were as follows:
| | Total
Net Assets of
Acquired
Portfolio
(000s) | | | Total
Net Assets of
Acquiring
Portfolio
(000s) | | | Acquired
Portfolio’s
Capital Loss
Carryforwards
(000s) | | | Acquired
Portfolio’s
Unrealized
Depreciation
(000s) | | | Portfolios’
Conversion
Ratio | |
| | $502,116 | | | | $ | 156,751 | | | | | $ | — | | | | | $ | (11,548) | | | | | | 0.9579 | | |
The net assets of the Acquiring Portfolio after the acquisition were $658,867,349.
On August 14, 2015, Solution Moderately Aggressive (“Acquiring Portfolio”) acquired all of the assets of, and assumed all of the liabilities of VY® Franklin Templeton Founding Strategy Portfolio (“Acquired Portfolio”), which is not included in this report, an open-end investment company in a tax-free reorganization in exchange for shares of the Acquiring Portfolio, pursuant to a plan of reorganization approved by the shareholders of the Acquired Portfolio on July 28, 2015. The reorganization provided shareholders of the Acquired Portfolio with an immediate benefit through lower net expenses. For financial reporting purposes, assets received and shares issued by the Acquiring Portfolio were recorded at fair value; however, the cost basis of the investments received from the Acquired Portfolio were carried forward to align ongoing reporting of the Acquiring Portfolio’s realized and unrealized gains and losses with amounts distributable to shareholders for tax purposes.
Assuming the acquisition had been completed on January 1, 2015, the beginning of the annual reporting period of the Acquiring Portfolio, the Acquiring Portfolio’s pro forma results of operations for the year ended December 31, 2015, are as follows:
NOTES TO FINANCIAL STATEMENTS as of December 31, 2015 (continued)
NOTE 12 — REORGANIZATIONS (continued)
| | Net investment income | | | | $ | 38,457,769 | | |
| | Net realized and unrealized loss on investments | | | | $ | (65,616,857) | | |
| | Net decrease in net assets resulting from operations | | | | $ | (27,159,089) | | |
Because the combined investment portfolios have been managed as a single integrated portfolio since the acquisition was completed, it is not practicable to separate the amounts of revenue and earnings of the Acquired Portfolio that have been included in the Acquiring Portfolio’s statement of operations since August 14, 2015. Net assets and unrealized appreciation or depreciation as of the reorganization date were as follows:
| | Total
Net Assets of
Acquired
Portfolio
(000s) | | | Total
Net Assets of
Acquiring
Portfolio
(000s) | | | Acquired
Portfolio’s
Capital Loss
Carryforwards
(000s) | | | Acquired
Portfolio’s
Unrealized
Depreciation
(000s) | | | Portfolios’
Conversion
Ratio | |
| | $812,445 | | | | $ | 32,834 | | | | | $ | — | | | | | $ | (3,610) | | | | | | 0.7713 | | |
The net assets of the Acquiring Portfolio after the acquisition were $845,279,259.
NOTE 13 — SUBSEQUENT EVENTS
The Portfolios have evaluated events occurring after the Statements of Assets and Liabilities date (“subsequent events”), to determine whether any subsequent events necessitated adjustment to or disclosure in the financial statements. No such subsequent events were identified.
PORTFOLIO OF INVESTMENTS
| Voya Solution Aggressive Portfolio | as of December 31, 2015 |
| Shares | | | Value | | | Percentage
of Net
Assets | |
| EXCHANGE-TRADED FUNDS: 5.3% | |
| | | 1,256 | | | | iShares Russell 1000 Value
Index Fund | | | | $ | 122,912 | | | | | | 2.4 | | |
| | | 727 | | | | SPDR Trust Series 1 | | | | | 148,228 | | | | | | 2.9 | | |
| | | | | | | Total Exchange-Traded
Funds
(Cost $277,499) | | | | | 271,140 | | | | | | 5.3 | | |
| MUTUAL FUNDS: 94.7% | |
| | | | | | | Affiliated Investment Companies: 93.8% | |
| | | 41,963 | | | | Voya International Core
Fund - Class I | | | | | 382,279 | | | | | | 7.5 | | |
| | | 11,238 | | | | Voya International Index
Portfolio - Class I | | | | | 101,366 | | | | | | 2.0 | | |
| | | 20,199 | | | | Voya Large Cap Growth
Portfolio - Class I | | | | | 388,031 | | | | | | 7.6 | | |
| | | 32,981 | | | | Voya Large Cap Value Fund -
Class R6 | | | | | 384,891 | | | | | | 7.5 | | |
| | | 16,993 | | | | Voya MidCap Opportunities
Portfolio - Class I | | | | | 219,039 | | | | | | 4.3 | | |
| | | 28,456 | | | | Voya Multi-Manager
Emerging Markets Equity
Fund - Class I | | | | | 249,558 | | | | | | 4.9 | | |
| | | 46,755 | | | | Voya Multi-Manager
International Equity Fund -
Class I | | | | | 484,382 | | | | | | 9.5 | | |
| | | 35,446 | | | | Voya Multi-Manager Large
Cap Core Portfolio - Class I | | | | | 513,972 | | | | | | 10.1 | | |
| | | 40,788 | | | | Voya Multi-Manager Mid Cap
Value Fund - Class I | | | | | 405,837 | | | | | | 7.9 | | |
| | | 7,132 | | | | Voya Russell™ Mid Cap
Growth Index Portfolio -
Class I | | | | | 191,769 | | | | | | 3.8 | | |
| | | 10,419 | | | | Voya Small Company
Portfolio - Class I | | | | | 205,572 | | | | | | 4.0 | | |
| Shares | | | Value | | | Percentage
of Net
Assets | |
| MUTUAL FUNDS: (continued) | |
| | | | | | | Affiliated Investment Companies (continued) | |
| | | 38,868 | | | | Voya U.S. Stock Index
Portfolio - Class I | | | | $ | 518,494 | | | | | | 10.1 | | |
| | | 2,936 | | | | VY® Clarion Real Estate
Portfolio - Class I | | | | | 104,830 | | | | | | 2.1 | | |
| | | 16,589 | | | | VY® Invesco Comstock
Portfolio - Class I | | | | | 251,821 | | | | | | 4.9 | | |
| | | 4,500 | @ | | VY® T. Rowe Price Growth
Equity Portfolio - Class I | | | | | 387,643 | | | | | | 7.6 | | |
| | | | | | | | | | | | 4,789,484 | | | | | | 93.8 | | |
| | | | | | | Unaffiliated Investment Companies: 0.9% | |
| | | 10,165 | @ | | Credit Suisse Commodity
Return Strategy Fund -
Class I | | | | | 45,846 | | | | | | 0.9 | | |
| | | | | | | Total Mutual Funds
(Cost $5,289,521) | | | | | 4,835,330 | | | | | | 94.7 | | |
| | | | | | | Total Investments in
Securities
(Cost $5,567,020) | | | | $ | 5,106,470 | | | | | | 100.0 | | |
| | | | | | | Assets in Excess of
Other Liabilities | | | | | 810 | | | | | | — | | |
| | | | | | | Net Assets | | | | $ | 5,107,280 | | | | | | 100.0 | | |
| |
@
Non-income producing security.
Cost for federal income tax purposes is $5,767,023.
Net unrealized depreciation consists of:
| | Gross Unrealized Appreciation | | | | $ | 3,240 | | |
| | Gross Unrealized Depreciation | | | | | (663,793) | | |
| | Net Unrealized Depreciation | | | | $ | (660,553) | | |
| |
Fair Value Measurements^
The following is a summary of the fair valuations according to the inputs used as of December 31, 2015 in valuing the assets and liabilities:
| | | | Quoted Prices
in Active Markets
for Identical
Investments
(Level 1) | | | Significant
Other
Observable
Inputs
(Level 2) | | | Significant
Unobservable
Inputs
(Level 3) | | | Fair Value
at
December 31,
2015 | |
| Asset Table | | | | | |
| Investments, at fair value | | | | | |
| Exchange-Traded Funds | | | | $ | 271,140 | | | | | $ | — | | | | | $ | — | | | | | $ | 271,140 | | |
| Mutual Funds | | | | | 4,835,330 | | | | | | — | | | | | | — | | | | | | 4,835,330 | | |
| Total Investments, at fair value | | | | $ | 5,106,470 | | | | | $ | — | | | | | $ | — | | | | | $ | 5,106,470 | | |
| |
^
See Note 2, “Significant Accounting Policies” in the Notes to Financial Statements for additional information.
See Accompanying Notes to Financial Statements
PORTFOLIO OF INVESTMENTS
| Voya Solution Aggressive Portfolio | as of December 31, 2015 (continued) |
Transactions with Affiliates
An investment of at least 5% of the voting securities of an issuer, or a company which is under common control results in that issuer becoming an affiliated person as defined by the 1940 Act.
The following table provides transactions during the year ended December 31, 2015, where the following issuers were considered an affiliate:
| Issuer | | | Beginning
Fair Value
at 12/31/14 | | | Purchases
at Cost | | | Sales
at Cost | | | Change in
Unrealized
Appreciation/
(Depreciation) | | | Ending
Fair Value
at 12/31/15 | | | Investment
Income | | | Realized
Gains/
(Losses) | | | Net Capital
Gain
Distributions | |
| Voya Emerging Markets Index Portfolio - Class I | | | | $ | 70,566 | | | | | $ | 82,197 | | | | | $ | (158,928) | | | | | $ | 6,165 | | | | | $ | — | | | | | $ | 1,726 | | | | | $ | (22,957) | | | | | $ | — | | |
| Voya International Core Fund - Class I | | | | | 271,737 | | | | | | 296,557 | | | | | | (203,017) | | | | | | 17,002 | | | | | | 382,279 | | | | | | 4,180 | | | | | | (28,557) | | | | | | 5,696 | | |
| Voya International Index Portfolio - Class I | | | | | 71,613 | | | | | | 111,010 | | | | | | (77,742) | | | | | | (3,515) | | | | | | 101,366 | | | | | | 2,623 | | | | | | (1,648) | | | | | | — | | |
| Voya Large Cap Growth Portfolio - Class I | | | | | 277,320 | | | | | | 327,066 | | | | | | (185,224) | | | | | | (31,131) | | | | | | 388,031 | | | | | | 2,487 | | | | | | 5,169 | | | | | | 43,031 | | |
| Voya Large Cap Value Fund - Class R6 | | | | | 288,310 | | | | | | 423,437 | | | | | | (300,962) | | | | | | (25,894) | | | | | | 384,891 | | | | | | 6,849 | | | | | | (22,499) | | | | | | 20,074 | | |
| Voya MidCap Opportunities Portfolio - Class I | | | | | 149,439 | | | | | | 203,326 | | | | | | (108,914) | | | | | | (24,812) | | | | | | 219,039 | | | | | | — | | | | | | (10,786) | | | | | | 33,188 | | |
| Voya Multi-Manager Emerging Markets Equity Fund - Class I | | | | | 209,270 | | | | | | 259,475 | | | | | | (191,896) | | | | | | (27,291) | | | | | | 249,558 | | | | | | 3,694 | | | | | | (17,267) | | | | | | — | | |
| Voya Multi-Manager International Equity Fund - Class I | | | | | 340,375 | | | | | | 380,351 | | | | | | (235,556) | | | | | | (788) | | | | | | 484,382 | | | | | | 6,180 | | | | | | (18,176) | | | | | | 4,548 | | |
| Voya Multi-Manager Large Cap Core Portfolio - Class I | | | | | 299,936 | | | | | | 489,570 | | | | | | (225,364) | | | | | | (50,170) | | | | | | 513,972 | | | | | | 5,411 | | | | | | 1,949 | | | | | | 35,992 | | |
| Voya Multi-Manager Mid Cap Value Fund - Class I | | | | | 333,961 | | | | | | 454,138 | | | | | | (332,368) | | | | | | (49,894) | | | | | | 405,837 | | | | | | 4,992 | | | | | | (41,579) | | | | | | 64,431 | | |
| Voya RussellTM Mid Cap Growth Index Portfolio - Class I | | | | | 185,888 | | | | | | 224,425 | | | | | | (196,756) | | | | | | (21,788) | | | | | | 191,769 | | | | | | 1,451 | | | | | | 16,787 | | | | | | — | | |
| Voya Small Company Portfolio - Class I | | | | | 150,688 | | | | | | 178,308 | | | | | | (105,008) | | | | | | (18,416) | | | | | | 205,572 | | | | | | 875 | | | | | | (11,804) | | | | | | 25,266 | | |
| Voya U.S. Bond Index Portfolio - Class I | | | | | — | | | | | | 150,355 | | | | | | (150,355) | | | | | | — | | | | | | — | | | | | | — | | | | | | 241 | | | | | | — | | |
| Voya U.S. Stock Index Portfolio - Class I | | | | | 268,895 | | | | | | 662,122 | | | | | | (371,413) | | | | | | (41,110) | | | | | | 518,494 | | | | | | 9,468 | | | | | | (8,555) | | | | | | 41,580 | | |
| VY® Clarion Real Estate Portfolio - Class I | | | | | 77,170 | | | | | | 88,398 | | | | | | (54,148) | | | | | | (6,590) | | | | | | 104,830 | | | | | | 1,918 | | | | | | 8,305 | | | | | | — | | |
| VY® Invesco Comstock Portfolio - Class I | | | | | 110,975 | | | | | | 273,608 | | | | | | (104,282) | | | | | | (28,480) | | | | | | 251,821 | | | | | | 6,939 | | | | | | 2,540 | | | | | | — | | |
| VY® T. Rowe Price Growth Equity Portfolio - Class I | | | | | 276,458 | | | | | | 340,427 | | | | | | (197,494) | | | | | | (31,748) | | | | | | 387,643 | | | | | | — | | | | | | 9,675 | | | | | | 57,514 | | |
| | | | | $ | 3,382,601 | | | | | $ | 4,944,770 | | | | | $ | (3,199,427) | | | | | $ | (338,460) | | | | | $ | 4,789,484 | | | | | $ | 58,793 | | | | | $ | (139,162) | | | | | $ | 331,320 | | |
| |
The financial statements for the above mutual fund[s] can be found at www.sec.gov.
See Accompanying Notes to Financial Statements
PORTFOLIO OF INVESTMENTS
| Voya Solution Balanced Portfolio | as of December 31, 2015 |
| Shares | | | Value | | | Percentage
of Net
Assets | |
| EXCHANGE-TRADED FUNDS: 4.0% | |
| | | 4,075 | | | | iShares Barclays 20+ Year
Treasury Bond Fund | | | | $ | 491,527 | | | | | | 1.0 | | |
| | | 7,133 | | | | SPDR Trust Series 1 | | | | | 1,454,347 | | | | | | 3.0 | | |
| | | | | | | Total Exchange-Traded
Funds
(Cost $1,976,414) | | | | | 1,945,874 | | | | | | 4.0 | | |
| MUTUAL FUNDS: 95.9% | |
| | | | | | | Affiliated Investment Companies: 94.9% | |
| | | 252,359 | | | | Voya Floating Rate Fund -
Class I | | | | | 2,435,269 | | | | | | 5.1 | | |
| | | 254,699 | | | | Voya Global Bond Fund -
Class R6 | | | | | 2,434,924 | | | | | | 5.1 | | |
| | | 318,185 | | | | Voya High Yield Bond Fund -
Class I | | | | | 2,386,386 | | | | | | 5.0 | | |
| | | 98,948 | | | | Voya Intermediate Bond
Fund - Class R6 | | | | | 978,596 | | | | | | 2.0 | | |
| | | 236,955 | | | | Voya International Core
Fund - Class I | | | | | 2,158,659 | | | | | | 4.5 | | |
| | | 105,560 | | | | Voya International Index
Portfolio - Class I | | | | | 952,152 | | | | | | 2.0 | | |
| | | 151,847 | | | | Voya Large Cap Growth
Portfolio - Class I | | | | | 2,916,982 | | | | | | 6.0 | | |
| | | 306,712 | | | | Voya Large Cap Value Fund -
Class R6 | | | | | 3,579,327 | | | | | | 7.4 | | |
| | | 150,302 | | | | Voya MidCap Opportunities
Portfolio - Class I | | | | | 1,937,392 | | | | | | 4.0 | | |
| | | 106,919 | | | | Voya Multi-Manager
Emerging Markets Equity
Fund - Class I | | | | | 937,678 | | | | | | 1.9 | | |
| | | 115,605 | | | | Voya Multi-Manager
International Equity Fund -
Class I | | | | | 1,197,664 | | | | | | 2.5 | | |
| | | 199,843 | | | | Voya Multi-Manager Large
Cap Core Portfolio - Class I | | | | | 2,897,721 | | | | | | 6.0 | | |
| | | 215,563 | | | | Voya Multi-Manager Mid Cap
Value Fund - Class I | | | | | 2,144,856 | | | | | | 4.4 | | |
| | | 8,935 | | | | Voya Russell™ Mid Cap
Growth Index Portfolio -
Class I | | | | | 240,269 | | | | | | 0.5 | | |
| | | 99,307 | | | | Voya Short Term Bond
Fund - Class R6 | | | | | 979,172 | | | | | | 2.0 | | |
| | | 48,969 | | | | Voya Small Company
Portfolio - Class I | | | | | 966,158 | | | | | | 2.0 | | |
| Shares | | | Value | | | Percentage
of Net
Assets | |
| MUTUAL FUNDS: (continued) | |
| | | | | | | Affiliated Investment Companies (continued) | |
| | | 231,494 | | | | Voya U.S. Bond Index
Portfolio - Class I | | | | $ | 2,435,319 | | | | | | 5.1 | | |
| | | 142,789 | | | | Voya U.S. Stock Index
Portfolio - Class I | | | | | 1,904,810 | | | | | | 4.0 | | |
| | | 105,812 | | | | VY® BlackRock Inflation
Protected Bond Portfolio -
Class I | | | | | 972,409 | | | | | | 2.0 | | |
| | | 27,582 | | | | VY® Clarion Real Estate
Portfolio - Class I | | | | | 984,937 | | | | | | 2.0 | | |
| | | 97,087 | @ | | VY® Goldman Sachs Bond
Portfolio - Class I | | | | | 972,807 | | | | | | 2.0 | | |
| | | 109,073 | | | | VY® Invesco Comstock
Portfolio - Class I | | | | | 1,655,722 | | | | | | 3.4 | | |
| | | 185,433 | | | | VY® T. Rowe Price Capital
Appreciation Portfolio -
Class I | | | | | 4,843,517 | | | | | | 10.0 | | |
| | | 33,831 | @ | | VY® T. Rowe Price Growth
Equity Portfolio - Class I | | | | | 2,914,227 | | | | | | 6.0 | | |
| | | | | | | | | | | | 45,826,953 | | | | | | 94.9 | | |
| | | | | | | Unaffiliated Investment Companies: 1.0% | |
| | | 101,625 | @ | | Credit Suisse Commodity
Return Strategy Fund -
Class I | | | | | 458,327 | | | | | | 1.0 | | |
| | | | | | | Total Mutual Funds
(Cost $48,870,713) | | | | | 46,285,280 | | | | | | 95.9 | | |
| | | | | | | Total Investments in
Securities
(Cost $50,847,127) | | | | $ | 48,231,154 | | | | | | 99.9 | | |
| | | | | | | Assets in Excess of Other
Liabilities | | | | | 35,934 | | | | | | 0.1 | | |
| | | | | | | Net Assets | | | | $ | 48,267,088 | | | | | | 100.0 | | |
| |
@
Non-income producing security.
Cost for federal income tax purposes is $51,287,288
Net unrealized depreciation consists of:
| | Gross Unrealized Appreciation | | | | $ | 408,239 | | |
| | Gross Unrealized Depreciation | | | | | (3,464,373) | | |
| | Net Unrealized Depreciation | | | | $ | (3,056,134) | | |
| |
See Accompanying Notes to Financial Statements
PORTFOLIO OF INVESTMENTS
| Voya Solution Balanced Portfolio | as of December 31, 2015 (continued) |
Fair Value Measurements^
The following is a summary of the fair valuations according to the inputs used as of December 31, 2015 in valuing the assets and liabilities:
| | | | Quoted Prices
in Active Markets
for Identical
Investments
(Level 1) | | | Significant
Other
Observable
Inputs
(Level 2) | | | Significant
Unobservable
Inputs
(Level 3) | | | Fair Value
at
December 31,
2015 | |
| Asset Table | | | | | |
| Investments, at fair value | | | | | |
| Exchange-Traded Funds | | | | $ | 1,945,874 | | | | | $ | — | | | | | $ | — | | | | | $ | 1,945,874 | | |
| Mutual Funds | | | | | 46,285,280 | | | | | | — | | | | | | — | | | | | | 46,285,280 | | |
| Total Investments, at fair value | | | | $ | 48,231,154 | | | | | $ | — | | | | | $ | — | | | | | $ | 48,231,154 | | |
| |
^
See Note 2, “Significant Accounting Policies” in the Notes to Financial Statements for additional information.
Transactions with Affiliates
An investment of at least 5% of the voting securities of an issuer, or a company which is under common control results in that issuer becoming an affiliated person as defined by the 1940 Act.
The following table provides transactions during the year ended December 31, 2015, where the following issuers were considered an affiliate:
| Issuer | | | Beginning
Fair Value
at 12/31/14 | | | Purchases
at Cost | | | Sales
at Cost | | | Change in
Unrealized
Appreciation/
(Depreciation) | | | Ending
Fair Value
at 12/31/15 | | | Investment
Income | | | Realized
Gains/
(Losses) | | | Net Capital
Gain
Distributions | |
| Voya Emerging Markets Index Portfolio - Class I | | | | $ | 990,459 | | | | | $ | 269,532 | | | | | $ | (1,358,117) | | | | | $ | 98,126 | | | | | $ | — | | | | | $ | 20,328 | | | | | $ | (241,515) | | | | | $ | — | | |
| Voya Floating Rate Fund - Class I | | | | | 2,613,239 | | | | | | 533,398 | | | | | | (630,419) | | | | | | (80,949) | | | | | | 2,435,269 | | | | | | 105,485 | | | | | | (6,664) | | | | | | — | | |
| Voya Global Bond Fund - Class R6 | | | | | 2,592,404 | | | | | | 634,075 | | | | | | (711,045) | | | | | | (80,510) | | | | | | 2,434,924 | | | | | | 4,197 | | | | | | (34,594) | | | | | | — | | |
| Voya High Yield Bond Fund - Class I | | | | | 3,104,619 | | | | | | 664,422 | | | | | | (1,273,434) | | | | | | (109,221) | | | | | | 2,386,386 | | | | | | 148,932 | | | | | | (58,596) | | | | | | — | | |
| Voya Intermediate Bond Fund - Class R6 | | | | | 1,848,477 | | | | | | 810,753 | | | | | | (1,636,349) | | | | | | (44,285) | | | | | | 978,596 | | | | | | 38,250 | | | | | | 32,991 | | | | | | — | | |
| Voya International Core Fund - Class I | | | | | 1,529,318 | | | | | | 1,085,813 | | | | | | (374,458) | | | | | | (82,014) | | | | | | 2,158,659 | | | | | | 24,045 | | | | | | 4,056 | | | | | | 32,771 | | |
| Voya International Index Portfolio - Class I | | | | | 1,510,736 | | | | | | 255,226 | | | | | | (791,053) | | | | | | (22,757) | | | | | | 952,152 | | | | | | 30,661 | | | | | | 38,114 | | | | | | — | | |
| Voya Large Cap Growth Portfolio - Class I | | | | | 2,603,140 | | | | | | 1,241,755 | | | | | | (601,046) | | | | | | (326,867) | | | | | | 2,916,982 | | | | | | 17,566 | | | | | | 186,557 | | | | | | 303,976 | | |
| Voya Large Cap Value Fund - Class R6 | | | | | 3,137,403 | | | | | | 1,616,569 | | | | | | (761,235) | | | | | | (413,410) | | | | | | 3,579,327 | | | | | | 65,030 | | | | | | (30,115) | | | | | | 198,940 | | |
| Voya MidCap Opportunities Portfolio - Class I | | | | | 1,709,949 | | | | | | 927,494 | | | | | | (341,033) | | | | | | (359,018) | | | | | | 1,937,392 | | | | | | — | | | | | | 54,939 | | | | | | 305,208 | | |
Voya Multi-Manager Emerging Markets Equity Fund -
Class I | | | | | 978,763 | | | | | | 344,693 | | | | | | (241,245) | | | | | | (144,533) | | | | | | 937,678 | | | | | | 14,147 | | | | | | (18,163) | | | | | | — | | |
Voya Multi-Manager International Equity Fund -
Class I | | | | | 1,511,523 | | | | | | 262,126 | | | | | | (539,388) | | | | | | (36,597) | | | | | | 1,197,664 | | | | | | 15,572 | | | | | | 48,448 | | | | | | 11,458 | | |
| Voya Multi-Manager Large Cap Core Portfolio - Class I | | | | | 3,169,348 | | | | | | 750,203 | | | | | | (712,406) | | | | | | (309,424) | | | | | | 2,897,721 | | | | | | 30,386 | | | | | | 82,477 | | | | | | 188,047 | | |
| Voya Multi-Manager Mid Cap Value Fund - Class I | | | | | 3,133,669 | | | | | | 695,739 | | | | | | (1,274,408) | | | | | | (410,144) | | | | | | 2,144,856 | | | | | | 26,882 | | | | | | (12,375) | | | | | | 346,953 | | |
| Voya Russell™ Mid Cap Growth Index Portfolio - Class I | | | | | 1,439,526 | | | | | | 69,052 | | | | | | (1,109,268) | | | | | | (159,041) | | | | | | 240,269 | | | | | | 2,226 | | | | | | 220,237 | | | | | | — | | |
| Voya Short Term Bond Fund - Class R6 | | | | | 1,050,880 | | | | | | 199,636 | | | | | | (263,841) | | | | | | (7,503) | | | | | | 979,172 | | | | | | 19,553 | | | | | | (1,688) | | | | | | — | | |
| Voya Small Company Portfolio - Class I | | | | | 1,061,344 | | | | | | 266,606 | | | | | | (189,181) | | | | | | (172,611) | | | | | | 966,158 | | | | | | 5,151 | | | | | | 14,065 | | | | | | 148,787 | | |
| Voya U.S. Bond Index Portfolio - Class I | | | | | 2,375,676 | | | | | | 2,545,018 | | | | | | (2,414,505) | | | | | | (70,870) | | | | | | 2,435,319 | | | | | | 38,930 | | | | | | 21,932 | | | | | | 4,518 | | |
| Voya U.S. Stock Index Portfolio - Class I | | | | | 1,567,935 | | | | | | 2,460,636 | | | | | | (2,029,749) | | | | | | (94,012) | | | | | | 1,904,810 | | | | | | 33,120 | | | | | | 9,492 | | | | | | 88,303 | | |
VY® BlackRock Inflation Protected Bond Portfolio - Class I | | | | | 1,040,399 | | | | | | 214,274 | | | | | | (285,678) | | | | | | 3,414 | | | | | | 972,409 | | | | | | 14,023 | | | | | | (41,507) | | | | | | — | | |
| VY® Clarion Real Estate Portfolio - Class I | | | | | 1,089,539 | | | | | | 240,126 | | | | | | (268,477) | | | | | | (76,251) | | | | | | 984,937 | | | | | | 16,728 | | | | | | 94,459 | | | | | | — | | |
| VY® Goldman Sachs Bond Portfolio - Class I | | | | | — | | | | | | 1,471,297 | | | | | | (499,663) | | | | | | 1,173 | | | | | | 972,807 | | | | | | — | | | | | | 2,132 | | | | | | — | | |
| VY® Invesco Comstock Portfolio - Class I | | | | | 1,562,088 | | | | | | 620,614 | | | | | | (350,687) | | | | | | (176,293) | | | | | | 1,655,722 | | | | | | 45,956 | | | | | | 28,623 | | | | | | — | | |
VY® T. Rowe Price Capital Appreciation Portfolio - Class I | | | | | 5,249,773 | | | | | | 1,214,285 | | | | | | (1,038,483) | | | | | | (582,058) | | | | | | 4,843,517 | | | | | | 75,243 | | | | | | 103,671 | | | | | | 681,245 | | |
| VY® T. Rowe Price Growth Equity Portfolio - Class I | | | | | 2,594,070 | | | | | | 1,359,654 | | | | | | (655,625) | | | | | | (383,872) | | | | | | 2,914,227 | | | | | | — | | | | | | 255,361 | | | | | | 430,871 | | |
| | | | | $ | 49,464,277 | | | | | $ | 20,752,996 | | | | | $ | (20,350,793) | | | | | $ | (4,039,527) | | | | | $ | 45,826,953 | | | | | $ | 792,411 | | | | | $ | 752,337 | | | | | $ | 2,741,077 | | |
| |
The financial statements for the above mutual fund[s] can be found at www.sec.gov.
See Accompanying Notes to Financial Statements
PORTFOLIO OF INVESTMENTS
| Voya Solution Balanced Portfolio | as of December 31, 2015 (continued) |
The effect of derivative instruments by primary risk exposure on the Portfolio’s Statement of Operations for the year ended December 31, 2015 was as follows:
| | | | Amount of Realized Gain or (Loss) on
Derivatives Recognized in Income | |
| Derivatives not accounted for as hedging instruments | | | Futures | |
| Equity contracts | | | | $ | (2,972) | | |
| Interest rate contracts | | | | | (10,613) | | |
| Total | | | | $ | (13,585) | | |
| |
| | | | Change in Unrealized Appreciation or (Depreciation)
on Derivatives Recognized in Income | |
| Derivatives not accounted for as hedging instruments | | | Futures | |
| Equity contracts | | | | $ | 27,424 | | |
| Total | | | | $ | 27,424 | | |
| |
See Accompanying Notes to Financial Statements
PORTFOLIO OF INVESTMENTS
| Voya Solution Conservative Portfolio | as of December 31, 2015 |
| Shares | | | Value | | | Percentage
of Net
Assets | |
| EXCHANGE-TRADED FUNDS: 6.0% | | | |
| | | 1,324 | | | | iShares Barclays 20+ Year
Treasury Bond Fund | | | | $ | 159,701 | | | | | | 1.1 | | |
| | | 2,908 | | | | iShares iBoxx High Yield
Corporate Bond Fund | | | | | 234,327 | | | | | | 1.6 | | |
| | | 2,317 | | | | SPDR Trust Series 1 | | | | | 472,413 | | | | | | 3.3 | | |
| | | | | | | Total Exchange-Traded
Funds
(Cost $908,343) | | | | | 866,441 | | | | | | 6.0 | | |
| MUTUAL FUNDS: 93.9% | | | |
| | | | | | | Affiliated Investment Companies: 92.9% | |
| | | 105,599 | | | | Voya Floating Rate Fund -
Class I | | | | | 1,019,033 | | | | | | 7.0 | | |
| | | 182,402 | | | | Voya Global Bond Fund -
Class R6 | | | | | 1,743,765 | | | | | | 12.0 | | |
| | | 138,182 | | | | Voya High Yield Bond Fund -
Class I | | | | | 1,036,364 | | | | | | 7.1 | | |
| | | 96,317 | | | | Voya Intermediate Bond
Fund - Class R6 | | | | | 952,577 | | | | | | 6.6 | | |
| | | 47,402 | | | | Voya International Index
Portfolio - Class I | | | | | 427,569 | | | | �� | | 3.0 | | |
| | | 21,242 | | | | Voya Large Cap Growth
Portfolio - Class I | | | | | 408,061 | | | | | | 2.8 | | |
| | | 34,331 | | | | Voya Large Cap Value Fund -
Class R6 | | | | | 400,645 | | | | | | 2.8 | | |
| | | 22,514 | | | | Voya MidCap Opportunities
Portfolio - Class I | | | | | 290,208 | | | | | | 2.0 | | |
| | | 28,712 | | | | Voya Multi-Manager Mid Cap
Value Fund - Class I | | | | | 285,686 | | | | | | 2.0 | | |
| | | 118,971 | | | | Voya Short Term Bond
Fund - Class R6 | | | | | 1,173,055 | | | | | | 8.1 | | |
| | | 165,139 | | | | Voya U.S. Bond Index
Portfolio - Class I | | | | | 1,737,266 | | | | | | 12.0 | | |
| | | 21,608 | | | | Voya U.S. Stock Index
Portfolio - Class I | | | | | 288,246 | | | | | | 2.0 | | |
| Shares | | | Value | | | Percentage
of Net
Assets | |
| MUTUAL FUNDS: (continued) | | | |
| | | | | | | Affiliated Investment Companies (continued) | |
| | | 142,605 | | | | VY® BlackRock Inflation
Protected Bond
Portfolio - Class I | | | | $ | 1,310,541 | | | | | | 9.0 | | |
| | | 94,485 | @ | | VY® Goldman Sachs Bond
Portfolio - Class I | | | | | 946,740 | | | | | | 6.5 | | |
| | | 55,540 | | | | VY® T. Rowe Price Capital
Appreciation Portfolio -
Class I | | | | | 1,450,713 | | | | | | 10.0 | | |
| | | | | | | | | | | | 13,470,469 | | | | | | 92.9 | | |
| | | | | | | Unaffiliated Investment Companies: 1.0% | |
| | | 32,400 | @ | | Credit Suisse Commodity
Return Strategy Fund -
Class I | | | | | 146,123 | | | | | | 1.0 | | |
| | | | | | | Total Mutual Funds
(Cost $14,424,627) | | | | | 13,616,592 | | | | | | 93.9 | | |
| | | | | | | Total Investments in
Securities
(Cost $15,326,504) | | | | $ | 14,483,033 | | | | | | 99.9 | | |
| | | | | | | Assets in Excess of
Other Liabilities | | | | | 20,589 | | | | | | 0.1 | | |
| | | | | | | Net Assets | | | | $ | 14,503,622 | | | | | | 100.0 | | |
| |
@
Non-income producing security.
Cost for federal income tax purposes is $15,630,968.
Net unrealized depreciation consists of:
| | Gross Unrealized Appreciation | | | | $ | 8,442 | | |
| | Gross Unrealized Depreciation | | | | | (1,156,377) | | |
| | Net Unrealized Depreciation | | | | $ | (1,147,935) | | |
| |
Fair Value Measurements^
The following is a summary of the fair valuations according to the inputs used as of December 31, 2015 in valuing the assets and liabilities:
| | | | Quoted Prices
in Active Markets
for Identical
Investments
(Level 1) | | | Significant
Other
Observable
Inputs
(Level 2) | | | Significant
Unobservable
Inputs
(Level 3) | | | Fair Value
at
December 31,
2015 | |
| Asset Table | | | | | | | | | | | | | | | | | | | | | | | | | |
| Investments, at fair value | | | | | | | | | | | | | | | | | | | | | | | | | |
| Exchange-Traded Funds | | | | $ | 866,441 | | | | | $ | — | | | | | $ | — | | | | | $ | 866,441 | | |
| Mutual Funds | | | | | 13,616,592 | | | | | | — | | | | | | — | | | | | | 13,616,592 | | |
| Total Investments, at fair value | | | | $ | 14,483,033 | | | | | $ | — | | | | | $ | — | | | | | $ | 14,483,033 | | |
| |
^
See Note 2, “Significant Accounting Policies” in the Notes to Financial Statements for additional information.
See Accompanying Notes to Financial Statements
PORTFOLIO OF INVESTMENTS
| Voya Solution Conservative Portfolio | as of December 31, 2015 (continued) |
Transactions with Affiliates
An investment of at least 5% of the voting securities of an issuer, or a company which is under common control results in that issuer becoming an affiliated person as defined by the 1940 Act.
The following table provides transactions during the year ended December 31, 2015, where the following issuers were considered an affiliate:
| Issuer | | | Beginning
Fair Value
at 12/31/14 | | | Purchases
at Cost | | | Sales
at Cost | | | Change in
Unrealized
Appreciation/
(Depreciation) | | | Ending
Fair Value
at 12/31/15 | | | Investment
Income | | | Realized
Gains/
(Losses) | | | Net Capital
Gain
Distributions | |
| Voya Floating Rate Fund - Class I | | | | $ | 1,239,823 | | | | | $ | 243,281 | | | | | $ | (429,262) | | | | | $ | (34,809) | | | | | $ | 1,019,033 | | | | | $ | 49,168 | | | | | $ | (4,295) | | | | | $ | — | | |
| Voya Global Bond Fund - Class R6 | | | | | 2,108,839 | | | | | | 474,411 | | | | | | (786,674) | | | | | | (52,811) | | | | | | 1,743,765 | | | | | | 3,414 | | | | | | (38,505) | | | | | | — | | |
| Voya High Yield Bond Fund - Class I | | | | | 1,757,391 | | | | | | 415,541 | | | | | | (1,116,226) | | | | | | (20,342) | | | | | | 1,036,364 | | | | | | 77,459 | | | | | | (50,223) | | | | | | — | | |
| Voya Intermediate Bond Fund - Class R6 | | | | | 1,163,478 | | | | | | 592,267 | | | | | | (777,255) | | | | | | (25,913) | | | | | | 952,577 | | | | | | 32,249 | | | | | | 5,349 | | | | | | — | | |
| Voya International Index Portfolio - Class I | | | | | 511,860 | | | | | | 168,376 | | | | | | (246,814) | | | | | | (5,853) | | | | | | 427,569 | | | | | | 15,790 | | | | | | (6,084) | | | | | | — | | |
| Voya Large Cap Growth Portfolio - Class I | | | | | 265,344 | | | | | | 454,145 | | | | | | (263,837) | | | | | | (47,591) | | | ��� | | | 408,061 | | | | | | 2,891 | | | | | | 18,385 | | | | | | 50,033 | | |
| Voya Large Cap Value Fund - Class R6 | | | | | 532,164 | | | | | | 219,128 | | | | | | (308,780) | | | | | | (41,867) | | | | | | 400,645 | | | | | | 8,870 | | | | | | (12,392) | | | | | | 28,758 | | |
| Voya MidCap Opportunities Portfolio - Class I | | | | | 623,820 | | | | | | 138,227 | | | | | | (395,224) | | | | | | (76,615) | | | | | | 290,208 | | | | | | — | | | | | | 42,385 | | | | | | 53,106 | | |
| Voya Multi-Manager Mid Cap Value Fund - Class I | | | | | 619,328 | | | | | | 148,809 | | | | | | (447,229) | | | | | | (35,222) | | | | | | 285,686 | | | | | | 3,569 | | | | | | (13,296) | | | | | | 46,064 | | |
| Voya Short Term Bond Fund - Class R6 | | | | | 1,424,594 | | | | | | 252,222 | | | | | | (495,592) | | | | | | (8,169) | | | | | | 1,173,055 | | | | | | 25,993 | | | | | | (3,373) | | | | | | — | | |
| Voya U.S. Bond Index Portfolio - Class I | | | | | 3,131,187 | | | | | | 1,184,772 | | | | | | (2,537,313) | | | | | | (41,380) | | | | | | 1,737,266 | | | | | | 38,684 | | | | | | 5,140 | | | | | | 4,241 | | |
| Voya U.S. Stock Index Portfolio - Class I | | | | | — | | | | | | 430,442 | | | | | | (116,098) | | | | | | (26,098) | | | | | | 288,246 | | | | | | 5,527 | | | | | | (10,328) | | | | | | 30,006 | | |
VY® BlackRock Inflation Protected Bond Portfolio - Class I | | | | | 1,586,972 | | | | | | 290,154 | | | | | | (612,424) | | | | | | 45,839 | | | | | | 1,310,541 | | | | | | 13,854 | | | | | | (94,658) | | | | | | — | | |
| VY® Goldman Sachs Bond Portfolio - Class I | | | | | — | | | | | | 1,589,770 | | | | | | (644,113) | | | | | | 1,083 | | | | | | 946,740 | | | | | | — | | | | | | 2,875 | | | | | | — | | |
VY® T. Rowe Price Capital Appreciation Portfolio - Class I | | | | | 1,778,512 | | | | | | 488,027 | | | | | | (667,132) | | | | | | (148,694) | | | | | | 1,450,713 | | | | | | 22,949 | | | | | | (7,218) | | | | | | 228,645 | | |
| VY® T. Rowe Price Growth Equity Portfolio - Class I | | | | | 263,628 | | | | | | 18,879 | | | | | | (239,882) | | | | | | (42,625) | | | | | | — | | | | | | — | | | | | | 59,016 | | | | | | — | | |
| | | | | $ | 17,006,940 | | | | | $ | 7,108,451 | | | | | $ | (10,083,855) | | | | | $ | (561,067) | | | | | $ | 13,470,469 | | | | | $ | 300,417 | | | | | $ | (107,222) | | | | | $ | 440,853 | | |
| |
The financial statements for the above mutual fund[s] can be found at www.sec.gov.
The effect of derivative instruments by primary risk exposure on the Portfolio’s Statement of Operations for the year ended December 31, 2015 was as follows:
| | | | Amount of Realized Gain or (Loss) on
Derivatives Recognized in Income | |
| Derivatives not accounted for as hedging instruments | | | Futures | |
| Equity contracts | | | | $ | 24,113 | | |
| Total | | | | $ | 24,113 | | |
| |
| | | | Change in Unrealized Appreciation or (Depreciation)
on Derivatives Recognized in Income | |
| Derivatives not accounted for as hedging instruments | | | Futures | |
| Equity contracts | | | | $ | 9,141 | | |
| Total | | | | $ | 9,141 | | |
| |
See Accompanying Notes to Financial Statements
PORTFOLIO OF INVESTMENTS
| Voya Solution Income Portfolio | as of December 31, 2015 |
| Shares | | | Value | | | Percentage
of Net
Assets | |
| EXCHANGE-TRADED FUNDS: 2.1% | | | | | | | | | | | | | |
| | | 51,043 | | | | iShares Barclays 20+
Year Treasury Bond Fund | | | | $ | 6,156,807 | | | | | | 1.1 | | |
| | | 29,786 | | | | SPDR Trust Series 1 | | | | | 6,073,067 | | | | | | 1.0 | | |
| | | | | | | Total Exchange-Traded
Funds
(Cost $12,652,342) | | | | | 12,229,874 | | | | | | 2.1 | | |
| MUTUAL FUNDS: 97.8% | | | | | | | | | | | | | |
| | | | | | | Affiliated Investment Companies: 96.8% | |
| | | 3,056,558 | | | | Voya Floating Rate Fund -
Class I | | | | | 29,495,782 | | | | | | 5.0 | | |
| | | 3,697,499 | | | | Voya Global Bond Fund -
Class R6 | | | | | 35,348,086 | | | | | | 6.0 | | |
| | | 2,295,773 | | | | Voya High Yield Bond Fund -
Class I | | | | | 17,218,299 | | | | | | 2.9 | | |
| | | 4,804,800 | | | | Voya Intermediate Bond
Fund - Class R6 | | | | | 47,519,474 | | | | | | 8.1 | | |
| | | 1,912,969 | | | | Voya International Core
Fund - Class I | | | | | 17,427,150 | | | | | | 2.9 | | |
| | | 1,280,277 | | | | Voya International Index
Portfolio - Class I | | | | | 11,548,095 | | | | | | 2.0 | | |
| | | 921,217 | | | | Voya Large Cap Growth
Portfolio - Class I | | | | | 17,696,581 | | | | | | 3.0 | | |
| | | 1,984,010 | | | | Voya Large Cap Value
Fund - Class R6 | | | | | 23,153,396 | | | | | | 3.9 | | |
| | | 683,948 | | | | Voya MidCap Opportunities
Portfolio - Class I | | | | | 8,816,089 | | | | | | 1.5 | | |
| | | 1,697,135 | | | | Voya Multi-Manager Large
Cap Core Portfolio - Class I | | | | | 24,608,464 | | | | | | 4.2 | | |
| | | 871,706 | | | | Voya Multi-Manager Mid Cap
Value Fund - Class I | | | | | 8,673,475 | | | | | | 1.5 | | |
| | | 4,822,252 | | | | Voya Short Term Bond
Fund - Class R6 | | | | | 47,547,406 | | | | | | 8.1 | | |
| | | 7,736,535 | | | | Voya U.S. Bond Index
Portfolio - Class I | | | | | 81,388,349 | | | | | | 13.8 | | |
| | | 1,710,987 | | | | Voya U.S. Stock Index
Portfolio - Class I | | | | | 22,824,571 | | | | | | 3.9 | | |
| Shares | | | Value | | | Percentage
of Net
Assets | |
| MUTUAL FUNDS: (continued) | | | |
| | | | | | | Affiliated Investment Companies (continued) | |
| | | 5,779,251 | | | | VY® BlackRock Inflation
Protected Bond
Portfolio - Class I | | | | $ | 53,111,312 | | | | | | 9.0 | | |
| | | 334,485 | | | | VY® Clarion Real Estate
Portfolio - Class I | | | | | 11,944,468 | | | | | | 2.0 | | |
| | | 4,713,515 | @ | | VY® Goldman Sachs Bond
Portfolio - Class I | | | | | 47,229,418 | | | | | | 8.0 | | |
| | | 1,800,136 | | | | VY® T. Rowe Price Capital
Appreciation Portfolio -
Class I | | | | | 47,019,557 | | | | | | 8.0 | | |
| | | 205,233 | @ | | VY® T. Rowe Price Growth
Equity Portfolio - Class I | | | | | 17,678,737 | | | | | | 3.0 | | |
| | | | | | | | | | | | 570,248,709 | | | | | | 96.8 | | |
| | | | | | | Unaffiliated Investment Companies: 1.0% | |
| | | 1,248,838 | @ | | Credit Suisse Commodity
Return Strategy Fund -
Class I | | | | | 5,632,260 | | | | | | 1.0 | | |
| | | | | | | Total Mutual Funds
(Cost $601,246,175) | | | | | 575,880,969 | | | | | | 97.8 | | |
| | | | | | | Total Investments in
Securities
(Cost $613,641,927) | | | | $ | 588,110,843 | | | | | | 99.9 | | |
| | | | | | | Assets in Excess of
Other Liabilities | | | | | 644,672 | | | | | | 0.1 | | |
| | | | | | | Net Assets | | | | $ | 588,755,515 | | | | | | 100.0 | | |
| |
@
Non-income producing security.
Cost for federal income tax purposes is $621,811,225.
Net unrealized depreciation consists of:
| | Gross Unrealized Appreciation | | | | $ | 4,962,820 | | |
| | Gross Unrealized Depreciation | | | | | (38,663,202) | | |
| | Net Unrealized Depreciation | | | | $ | (33,700,382) | | |
| |
Fair Value Measurements^
The following is a summary of the fair valuations according to the inputs used as of December 31, 2015 in valuing the assets and liabilities:
| | | | Quoted Prices
in Active Markets
for Identical
Investments
(Level 1) | | | Significant
Other
Observable
Inputs
(Level 2) | | | Significant
Unobservable
Inputs
(Level 3) | | | Fair Value
at
December 31,
2015 | |
| Asset Table | | | | | | | | | | | | | | | | | | | | | | | | | |
| Investments, at fair value | | | | | | | | | | | | | | | | | | | | | | | | | |
| Exchange-Traded Funds | | | | $ | 12,229,874 | | | | | $ | — | | | | | $ | — | | | | | $ | 12,229,874 | | |
| Mutual Funds | | | | | 575,880,969 | | | | | | — | | | | | | — | | | | | | 575,880,969 | | |
| Total Investments, at fair value | | | | $ | 588,110,843 | | | | | $ | — | | | | | $ | — | | | | | $ | 588,110,843 | | |
| |
^
See Note 2, “Significant Accounting Policies” in the Notes to Financial Statements for additional information.
See Accompanying Notes to Financial Statements
PORTFOLIO OF INVESTMENTS
| Voya Solution Income Portfolio | as of December 31, 2015 (continued) |
Transactions with Affiliates
An investment of at least 5% of the voting securities of an issuer, or a company which is under common control results in that issuer becoming an affiliated person as defined by the 1940 Act.
The following table provides transactions during the year ended December 31, 2015, where the following issuers were considered an affiliate:
| Issuer | | | Beginning
Fair Value
at 12/31/14 | | | Purchases
at Cost | | | Sales
at Cost | | | Acquired
at Cost
(Note 12) | | | Acquired
Unrealized
Appreciation/
(Depreciation)
(Note 12) | | | Change in
Unrealized
Appreciation/
(Depreciation) | | | Ending
Fair Value
at 12/31/15 | | | Investment
Income | | | Realized
Gains/
(Losses) | | | Net Capital
Gain
Distributions | |
| Voya Floating Rate Fund - Class I | | | | $ | 8,405,003 | | | | | $ | 2,454,987 | | | | | $ | (5,349,900) | | | | | $ | 25,406,717 | | | | | $ | (320,453) | | | | | $ | (1,100,572) | | | | | $ | 29,495,782 | | | | | $ | 706,273 | | | | | $ | (35,300) | | | | | $ | — | | |
Voya Global Bond Fund - Class
R6 | | | | | 10,005,050 | | | | | | 851,054 | | | | | | (7,901,606) | | | | | | 34,296,200 | | | | | | (4,098,852) | | | | | | 2,196,240 | | | | | | 35,348,086 | | | | | | 16,196 | | | | | | (481,376) | | | | | | — | | |
| Voya High Yield Bond Fund - Class I | | | | | 6,638,416 | | | | | | 2,416,963 | | | | | | (5,872,770) | | | | | | 15,624,909 | | | | | | (853,211) | | | | | | (736,008) | | | | | | 17,218,299 | | | | | | 579,151 | | | | | | (345,986) | | | | | | — | | |
Voya Intermediate Bond Fund -
Class R6 | | | | | 16,988,417 | | | | | | 3,595,725 | | | | | | (12,744,322) | | | | | | 40,085,387 | | | | | | 195,867 | | | | | | (601,600) | | | | | | 47,519,474 | | | | | | 764,190 | | | | | | 12,705 | | | | | | — | | |
Voya International Core Fund -
Class I | | | | | — | | | | | | 6,974,024 | | | | | | (3,269,720) | | | | | | 15,868,298 | | | | | | (750,114) | | | | | | (1,395,338) | | | | | | 17,427,150 | | | | | | 194,960 | | | | | | (220,430) | | | | | | 265,701 | | |
| Voya International Index Portfolio - Class I | | | | | 4,857,208 | | | | | | 1,812,284 | | | | | | (4,556,544) | | | | | | 10,453,202 | | | | | | (490,432) | | | | | | (527,623) | | | | | | 11,548,095 | | | | | | 93,776 | | | | | | (43,195) | | | | | | — | | |
| Voya Large Cap Growth Portfolio - Class I | | | | | 4,983,918 | | | | | | 2,470,155 | | | | | | (3,734,947) | | | | | | 13,766,787 | | | | | | 1,169,938 | | | | | | (959,270) | | | | | | 17,696,581 | | | | | | 26,647 | | | | | | 811,801 | | | | | | 461,148 | | |
| Voya Large Cap Value Fund - Class R6 | | | | | 5,846,561 | | | | | | 5,592,695 | | | | | | (6,596,185) | | | | | | 20,864,324 | | | | | | (870,438) | | | | | | (1,683,561) | | | | | | 23,153,396 | | | | | | 290,410 | | | | | | (443,457) | | | | | | 753,783 | | |
| Voya MidCap Opportunities Portfolio - Class I | | | | | 5,077,224 | | | | | | 2,334,900 | | | | | | (4,374,239) | | | | | | 7,096,284 | | | | | | 436,222 | | | | | | (1,754,302) | | | | | | 8,816,089 | | | | | | — | | | | | | 160,475 | | | | | | 1,451,466 | | |
| Voya Multi-Manager International Equity Fund - Class I | | | | | 3,239,895 | | | | | | 174,268 | | | | | | (3,725,871) | | | | | | — | | | | | | — | | | | | | 311,708 | | | | | | — | | | | | | — | | | | | | (90) | | | | | | — | | |
Voya Multi-Manager Large Cap
Core Portfolio - Class I | | | | | 7,221,013 | | | | | | 5,175,376 | | | | | | (7,072,606) | | | | | | 19,406,724 | | | | | | 1,403,734 | | | | | | (1,525,777) | | | | | | 24,608,464 | | | | | | 228,299 | | | | | | 592,199 | | | | | | 395,388 | | |
| Voya Multi-Manager Mid Cap Value Fund - Class I | | | | | 5,039,270 | | | | | | 2,484,178 | | | | | | (4,607,312) | | | | | | 7,565,089 | | | | | | (8,039) | | | | | | (1,799,711) | | | | | | 8,673,475 | | | | | | 109,179 | | | | | | (124,115) | | | | | | 1,409,099 | | |
| Voya Short Term Bond Fund - Class R6 | | | | | 13,520,585 | | | | | | 3,130,568 | | | | | | (9,018,868) | | | | | | 40,515,287 | | | | | | (339,143) | | | | | | (261,023) | | | | | | 47,547,406 | | | | | | 507,301 | | | | | | (70,547) | | | | | | — | | |
Voya U.S. Bond Index Portfolio -
Class I | | | | | 31,839,986 | | | | | | 18,432,557 | | | | | | (32,209,882) | | | | | | 65,185,209 | | | | | | (818,963) | | | | | | (1,040,558) | | | | | | 81,388,349 | | | | | | 1,101,200 | | | | | | (77,980) | | | | | | 44,317 | | |
Voya U.S. Stock Index
Portfolio - Class I | | | | | — | | | | | | 4,024,592 | | | | | | (5,802,801) | | | | | | 26,751,833 | | | | | | (1,844,312) | | | | | | (304,741) | | | | | | 22,824,571 | | | | | | 369,888 | | | | | | (756,308) | | | | | | 272,250 | | |
VY® BlackRock Inflation Protected Bond Portfolio - Class I | | | | | 15,057,129 | | | | | | 3,417,201 | | | | | | (10,805,996) | | | | | | 49,628,958 | | | | | | (4,703,204) | | | | | | 517,224 | | | | | | 53,111,312 | | | | | | 130,276 | | | | | | (1,776,046) | | | | | | — | | |
VY® Clarion Real Estate Portfolio - Class I | | | | | 3,505,431 | | | | | | 628,750 | | | | | | (2,134,842) | | | | | | 8,512,634 | | | | | | 1,746,298 | | | | | | (313,803) | | | | | | 11,944,468 | | | | | | 50,853 | | | | | | 623,355 | | | | | | — | | |
VY® Goldman Sachs Bond Portfolio - Class I | | | | | — | | | | | | 18,508,317 | | | | | | (11,549,882) | | | | | | 40,195,406 | | | | | | 39,054 | | | | | | 36,523 | | | | | | 47,229,418 | | | | | | — | | | | | | 59,392 | | | | | | — | | |
VY® T. Rowe Price Capital Appreciation Portfolio - Class I | | | | | 13,508,310 | | | | | | 4,527,861 | | | | | | (9,469,885) | | | | | | 41,569,429 | | | | | | (1,326,189) | | | | | | (1,789,969) | | | | | | 47,019,557 | | | | | | 631,264 | | | | | | (132,669) | | | | | | 1,656,964 | | |
VY® T. Rowe Price Growth Equity Portfolio - Class I | | | | | 4,171,518 | | | | | | 3,374,061 | | | | | | (3,519,311) | | | | | | 13,782,915 | | | | | | 1,178,860 | | | | | | (1,309,306) | | | | | | 17,678,737 | | | | | | — | | | | | | 1,062,296 | | | | | | 655,929 | | |
| | | | | $ | 159,904,934 | | | | | $ | 92,380,516 | | | | | $ | (154,317,489) | | | | | $ | 496,575,592 | | | | | $ | (10,253,377) | | | | | $ | (14,041,467) | | | | | $ | 570,248,709 | | | | | $ | 5,799,863 | | | | | $ | (1,185,276) | | | | | $ | 7,366,045 | | |
| |
The financial statements for the above mutual fund[s] can be found at www.sec.gov.
The effect of derivative instruments by primary risk exposure on the Portfolio’s Statement of Operations for the year ended December 31, 2015 was as follows:
| | | | Amount of Realized Gain or (Loss) on
Derivatives Recognized in Income | |
| Derivatives not accounted for as hedging instruments | | | Futures | |
| Equity contracts | | | | $ | (452,739) | | |
| Interest rate contracts | | | | | (92,618) | | |
| Total | | | | $ | (545,357) | | |
| |
| | | | Change in Unrealized Appreciation or (Depreciation)
on Derivatives Recognized in Income | |
| Derivatives not accounted for as hedging instruments | | | Futures | |
| Equity contracts | | | | $ | 85,319 | | |
| Total | | | | $ | 85,319 | | |
| |
See Accompanying Notes to Financial Statements
| Voya Solution Moderately | PORTFOLIO OF INVESTMENTS |
| Aggressive Portfolio | | as of December 31, 2015 |
| Shares | | | Value | | | Percentage
of Net
Assets | |
| EXCHANGE-TRADED FUNDS: 7.6% | | | |
| | | 64,758 | | | | iShares Barclays 20+ Year
Treasury Bond Fund | | | | $ | 7,811,110 | | | | | | 1.0 | | |
| | | 195,760 | | | | iShares Russell 1000
Value Index Fund | | | | | 19,157,074 | | | | | | 2.5 | | |
| | | 151,162 | | | | SPDR Trust Series 1 | | | | | 30,820,420 | | | | | | 4.1 | | |
| | | | | | | Total Exchange-Traded
Funds
(Cost $59,834,946) | | | | | 57,788,604 | | | | | | 7.6 | | |
| MUTUAL FUNDS: 92.3% | | | |
| | | | | | | Affiliated Investment Companies: 91.3% | |
| | | 2,377,677 | | | | Voya Floating Rate Fund -
Class I | | | | | 22,944,583 | | | | | | 3.0 | | |
| | | 1,599,308 | | | | Voya Global Bond Fund -
Class R6 | | | | | 15,289,385 | | | | | | 2.0 | | |
| | | 2,991,458 | | | | Voya High Yield Bond
Fund - Class I | | | | | 22,435,932 | | | | | | 3.0 | | |
| | | 2,316,444 | | | | Voya Intermediate Bond
Fund - Class R6 | | | | | 22,909,627 | | | | | | 3.0 | | |
| | | 4,960,370 | | | | Voya International Core
Fund - Class I | | | | | 45,188,975 | | | | | | 6.0 | | |
| | | 1,661,400 | | | | Voya International Index
Portfolio - Class I | | | | | 14,985,829 | | | | | | 2.0 | | |
| | | 2,981,264 | | | | Voya Large Cap Growth
Portfolio - Class I | | | | | 57,270,078 | | | | | | 7.6 | | |
| | | 4,784,951 | | | | Voya Large Cap Value
Fund - Class R6 | | | | | 55,840,384 | | | | | | 7.4 | | |
| | | 2,508,038 | | | | Voya MidCap Opportunities
Portfolio - Class I | | | | | 32,328,613 | | | | | | 4.3 | | |
| | | 3,361,268 | | | | Voya Multi-Manager
Emerging Markets Equity
Fund - Class I | | | | | 29,478,323 | | | | | | 3.9 | | |
| | | 5,813,880 | | | | Voya Multi-Manager
International Equity Fund -
Class I | | | | | 60,231,796 | | | | | | 8.0 | | |
| | | 4,386,485 | | | | Voya Multi-Manager
Large Cap Core
Portfolio - Class I | | | | | 63,604,033 | | | | | | 8.4 | | |
| | | 5,077,579 | | | | Voya Multi-Manager
Mid Cap Value
Fund - Class I | | | | | 50,521,908 | | | | | | 6.7 | | |
| Shares | | | Value | | | Percentage
of Net
Assets | |
| MUTUAL FUNDS: (continued) | | | |
| | | | | | | Affiliated Investment Companies (continued) | |
| | | 701,562 | | | | Voya Russell™ Mid Cap
Growth Index Portfolio -
Class I | | | | $ | 18,864,996 | | | | | | 2.5 | | |
| | | 1,153,750 | | | | Voya Small Company
Portfolio - Class I | | | | | 22,763,495 | | | | | | 3.0 | | |
| | | 729,629 | | | | Voya U.S. Bond Index
Portfolio - Class I | | | | | 7,675,694 | | | | | | 1.0 | | |
| | | 3,400,924 | | | | Voya U.S. Stock Index
Portfolio - Class I | | | | | 45,368,324 | | | | | | 6.0 | | |
| | | 434,017 | | | | VY® Clarion Real Estate
Portfolio - Class I | | | | | 15,498,731 | | | | | | 2.0 | | |
| | | 1,957,492 | | | | VY® Invesco Comstock
Portfolio - Class I | | | | | 29,714,726 | | | | | | 3.9 | | |
| | | 664,367 | @ | | VY® T. Rowe Price Growth
Equity Portfolio - Class I | | | | | 57,228,546 | | | | | | 7.6 | | |
| | | | | | | | | | | | 690,143,978 | | | | | | 91.3 | | |
| | | | | | | Unaffiliated Investment Companies: 1.0% | |
| | | 1,605,089 | @ | | Credit Suisse Commodity
Return Strategy Fund -
Class I | | | | | 7,238,950 | | | | | | 1.0 | | |
| | | | | | | Total Mutual Funds
(Cost $745,938,922) | | | | | 697,382,928 | | | | | | 92.3 | | |
| | | | | | | Total Investments in
Securities
(Cost $805,773,868) | | | | $ | 755,171,532 | | | | | | 99.9 | | |
| | | | | | | Assets in Excess of
Other Liabilities | | | | | 638,599 | | | | | | 0.1 | | |
| | | | | | | Net Assets | | | | $ | 755,810,131 | | | | | | 100.0 | | |
| |
@
Non-income producing security.
Cost for federal income tax purposes is $808,912,635.
Net unrealized depreciation consists of:
| | Gross Unrealized Appreciation | | | | $ | 612,095 | | |
| | Gross Unrealized Depreciation | | | | | (54,353,198) | | |
| | Net Unrealized Depreciation | | | | $ | (53,741,103) | | |
| |
See Accompanying Notes to Financial Statements
| Voya Solution Moderately | PORTFOLIO OF INVESTMENTS |
| Aggressive Portfolio | | as of December 31, 2015 (continued) |
Fair Value Measurements^
The following is a summary of the fair valuations according to the inputs used as of December 31, 2015 in valuing the assets and liabilities:
| | | | Quoted Prices
in Active Markets
for Identical
Investments
(Level 1) | | | Significant
Other
Observable
Inputs
(Level 2) | | | Significant
Unobservable
Inputs
(Level 3) | | | Fair Value
at
December 31,
2015 | |
| Asset Table | | | | | |
| Investments, at fair value | | | | | |
| Exchange-Traded Funds | | | | $ | 57,788,604 | | | | | $ | — | | | | | $ | — | | | | | $ | 57,788,604 | | |
| Mutual Funds | | | | | 697,382,928 | | | | | | — | | | | | | — | | | | | | 697,382,928 | | |
| Total Investments, at fair value | | | | $ | 755,171,532 | | | | | $ | — | | | | | $ | — | | | | | $ | 755,171,532 | | |
| |
^
See Note 2, “Significant Accounting Policies” in the Notes to Financial Statements for additional information.
Transactions with Affiliates
An investment of at least 5% of the voting securities of an issuer, or a company which is under common control results in that issuer becoming an affiliated person as defined by the 1940 Act.
The following table provides transactions during the year ended December 31, 2015, where the following issuers were considered an affiliate:
| Issuer | | | Beginning
Fair Value
at 12/31/14 | | | Purchases
at Cost | | | Sales
at Cost | | | Acquired
at Cost
(Note 12) | | | Acquired
Unrealized
Appreciation/
(Depreciation)
(Note 12) | | | Change in
Unrealized
Appreciation/
(Depreciation) | | | Ending
Fair Value
at 12/31/15 | | | Investment
Income | | | Realized
Gains/
(Losses) | | | Net Capital
Gain
Distributions | |
| Voya Emerging Markets Index Portfolio - Class I | | | | $ | 613,979 | | | | | $ | 200,197 | | | | | $ | (17,286,811) | | | | | $ | 16,412,270 | | | | | $ | (252,756) | | | | | $ | 313,121 | | | | | $ | — | | | | | $ | 13,114 | | | | | $ | (1,144,162) | | | | | $ | — | | |
Voya Floating Rate Fund -
Class I | | | | | 973,576 | | | | | | 2,521,112 | | | | | | (4,352,311) | | | | | | 24,650,000 | | | | | | (36,716) | | | | | | (811,078) | | | | | | 22,944,583 | | | | | | 405,944 | | | | | | (77,050) | | | | | | — | | |
Voya Global Bond Fund -
Class R6 | | | | | 643,873 | | | | | | 1,546,354 | | | | | | (3,191,676) | | | | | | 16,482,634 | | | | | | 33,195 | | | | | | (224,995) | | | | | | 15,289,385 | | | | | | 1,042 | | | | | | (38,739) | | | | | | — | | |
| Voya High Yield Bond Fund - Class I | | | | | 1,608,616 | | | | | | 2,494,094 | | | | | | (5,001,523) | | | | | | 24,597,292 | | | | | | (45,667) | | | | | | (1,216,880) | | | | | | 22,435,932 | | | | | | 537,027 | | | | | | (192,228) | | | | | | — | | |
| Voya Intermediate Bond Fund - Class R6 | | | | | — | | | | | | 3,503,226 | | | | | | (4,970,813) | | | | | | 24,623,829 | | | | | | (12,677) | | | | | | (233,938) | | | | | | 22,909,627 | | | | | | 246,738 | | | | | | (24,560) | | | | | | — | | |
| Voya International Core Fund - Class I | | | | | 1,740,018 | | | | | | 2,954,780 | | | | | | (4,405,293) | | | | | | 49,246,426 | | | | | | (677,175) | | | | | | (3,669,781) | | | | | | 45,188,975 | | | | | | 503,084 | | | | | | (360,187) | | | | | | 685,627 | | |
Voya International Index Portfolio -
Class I | | | | | 937,283 | | | | | | 702,472 | | | | | | (1,924,352) | | | | | | 16,412,388 | | | | | | (134,253) | | | | | | (1,007,709) | | | | | | 14,985,829 | | | | | | 19,796 | | | | | | (99,413) | | | | | | — | | |
Voya Large Cap Growth Portfolio -
Class I | | | | | 1,938,889 | | | | | | 2,714,384 | | | | | | (6,842,924) | | | | | | 59,792,355 | | | | | | (59,591) | | | | | | (273,035) | | | | | | 57,270,078 | | | | | | 14,143 | | | | | | (11,054) | | | | ��� | | 244,747 | | |
| Voya Large Cap Value Fund - Class R6 | | | | | 1,601,294 | | | | | | 6,397,103 | | | | | | (7,618,429) | | | | | | 59,761,473 | | | | | | (144,568) | | | | | | (4,156,489) | | | | | | 55,840,384 | | | | | | 579,762 | | | | | | (482,847) | | | | | | 1,368,614 | | |
| Voya MidCap Opportunities Portfolio - Class I | | | | | 1,224,966 | | | | | | 5,501,649 | | | | | | (3,011,088) | | | | | | 34,862,544 | | | | | | 34,731 | | | | | | (6,284,189) | | | | | | 32,328,613 | | | | | | — | | | | | | (295,701) | | | | | | 5,003,369 | | |
Voya Multi-Manager Emerging
Markets Equity Fund - Class I | | | | | 1,213,144 | | | | | | 2,060,026 | | | | | | (3,334,378) | | | | | | 32,463,747 | | | | | | (832,836) | | | | | | (2,091,380) | | | | | | 29,478,323 | | | | | | 444,487 | | | | | | (355,498) | | | | | | — | | |
Voya Multi-Manager International
Equity Fund - Class I | | | | | 2,344,334 | | | | | | 3,946,228 | | | | | | (5,952,730) | | | | | | 65,668,514 | | | | | | (967,089) | | | | | | (4,807,461) | | | | | | 60,231,796 | | | | | | 782,709 | | | | | | (307,128) | | | | | | 575,924 | | |
| Voya Multi-Manager Large Cap Core Portfolio - Class I | | | | | 2,787,685 | | | | | | 2,642,596 | | | | | | (9,396,248) | | | | | | 69,721,907 | | | | | | (227,878) | | | | | | (1,924,029) | | | | | | 63,604,033 | | | | | | 566,771 | | | | | | (217,139) | | | | | | 171,620 | | |
| Voya Multi-Manager Mid Cap Value Fund - Class I | | | | | 2,674,553 | | | | | | 9,647,763 | | | | | | (5,404,965) | | | | | | 55,440,499 | | | | | | 68,212 | | | | | | (11,904,154) | | | | | | 50,521,908 | | | | | | 632,865 | | | | | | (362,459) | | | | | | 8,167,993 | | |
Voya Russell™ Mid Cap Growth
Index Portfolio - Class I | | | | | 1,462,299 | | | | | | 316,978 | | | | | | (2,240,002) | | | | | | 20,527,953 | | | | | | 1,218 | | | | | | (1,203,450) | | | | | | 18,864,996 | | | | | | 7,326 | | | | | | 145,896 | | | | | | — | | |
Voya Small Company Portfolio -
Class I | | | | | 988,576 | | | | | | 558,420 | | | | | | (2,051,920) | | | | | | 24,623,463 | | | | | | (4,137) | | | | | | (1,350,907) | | | | | | 22,763,495 | | | | | | 4,985 | | | | | | (93,322) | | | | | | 143,988 | | |
Voya U.S. Bond Index Portfolio -
Class I | | | | | — | | | | | | 7,869,064 | | | | | | (157,239) | | | | | | — | | | | | | — | | | | | | (36,131) | | | | | | 7,675,694 | | | | | | 43,142 | | | | | | 597 | | | | | | — | | |
Voya U.S. Stock Index Portfolio -
Class I | | | | | 1,113,525 | | | | | | 18,222,038 | | | | | | (5,808,460) | | | | | | 32,814,748 | | | | | | (33,658) | | | | | | (939,869) | | | | | | 45,368,324 | | | | | | 717,228 | | | | | | (240,086) | | | | | | 115,314 | | |
VY® Clarion Real Estate Portfolio - Class I | | | | | 676,956 | | | | | | 246,814 | | | | | | (2,364,174) | | | | | | 16,459,719 | | | | | | 193,520 | | | | | | 285,896 | | | | | | 15,498,731 | | | | | | 10,777 | | | | | | 74,686 | | | | | | — | | |
VY® Invesco Comstock Portfolio -
Class I | | | | | 969,552 | | | | | | 2,011,157 | | | | | | (3,429,070) | | | | | | 32,814,402 | | | | | | (342,727) | | | | | | (2,308,588) | | | | | | 29,714,726 | | | | | | 658,545 | | | | | | (142,825) | | | | | | — | | |
VY® T. Rowe Price Capital Appreciation Portfolio -
Class I | | | | | 2,444,693 | | | | | | 181,871 | | | | | | (2,488,627) | | | | | | — | | | | | | — | | | | | | (137,937) | | | | | | — | | | | | | — | | | | | | 209,379 | | | | | | — | | |
VY® T. Rowe Price Growth Equity
Portfolio - Class I | | | | | 1,931,738 | | | | | | 1,911,945 | | | | | | (7,401,815) | | | | | | 61,533,930 | | | | | | 24,766 | | | | | | (772,018) | | | | | | 57,228,546 | | | | | | — | | | | | | (24,934) | | | | | | 339,146 | | |
| | | | | $ | 29,889,549 | | | | | $ | 78,150,271 | | | | | $ | (108,634,848) | | | | | $ | 738,910,093 | | | | | $ | (3,416,086) | | | | | $ | (44,755,001) | | | | | $ | 690,143,978 | | | | | $ | 6,189,485 | | | | | $ | (4,038,774) | | | | | $ | 16,816,342 | | |
| |
The financial statements for the above mutual fund[s] can be found at www.sec.gov.
See Accompanying Notes to Financial Statements
| Voya Solution Moderately | PORTFOLIO OF INVESTMENTS |
| Aggressive Portfolio | | as of December 31, 2015 (continued) |
The effect of derivative instruments by primary risk exposure on the Portfolio’s Statement of Operations for the year ended December 31, 2015 was as follows:
| | | | Amount of Realized Gain or (Loss) on
Derivatives Recognized in Income | |
| Derivatives not accounted for as hedging instruments | | | Futures | |
| Equity contracts | | | | $ | (1,194,476) | | |
| Interest rate contracts | | | | | (168,835) | | |
| Total | | | | $ | (1,363,311) | | |
| |
| | | | Change in Unrealized Appreciation or (Depreciation)
on Derivatives Recognized in Income | |
| Derivatives not accounted for as hedging instruments | | | Futures | |
| Equity contracts | | | | $ | 18,283 | | |
| Total | | | | $ | 18,283 | | |
| |
See Accompanying Notes to Financial Statements
| Voya Solution Moderately | PORTFOLIO OF INVESTMENTS |
| Conservative Portfolio | as of December 31, 2015 |
| Shares | | | Value | | | Percentage
of Net
Assets | |
| EXCHANGE-TRADED FUNDS: 4.0% | |
| | | 3,562 | | | | iShares Barclays 20+ Year
Treasury Bond Fund | | | | $ | 429,649 | | | | | | 1.0 | | |
| | | 6,235 | | | | SPDR Trust Series 1 | | | | | 1,271,254 | | | | | | 3.0 | | |
| | | | | | | Total Exchange-Traded
Funds
(Cost $1,728,508) | | | | | 1,700,903 | | | | | | 4.0 | | |
| MUTUAL FUNDS: 96.0% | |
| | | | | | | Affiliated Investment Companies: 95.1% | |
| | | 92,833 | | | | Voya Emerging Markets
Index Portfolio - Class I | | | | | 821,571 | | | | | | 1.9 | | |
| | | 223,563 | | | | Voya Floating Rate Fund -
Class I | | | | | 2,157,382 | | | | | | 5.0 | | |
| | | 225,694 | | | | Voya Global Bond Fund -
Class R6 | | | | | 2,157,636 | | | | | | 5.0 | | |
| | | 282,496 | | | | Voya High Yield Bond Fund -
Class I | | | | | 2,118,722 | | | | | | 4.9 | | |
| | | 284,915 | | | | Voya Intermediate Bond
Fund - Class R6 | | | | | 2,817,805 | | | | | | 6.6 | | |
| | | 233,246 | | | | Voya International Core
Fund - Class I | | | | | 2,124,868 | | | | | | 5.0 | | |
| | | 93,528 | | | | Voya International Index
Portfolio - Class I | | | | | 843,621 | | | | | | 2.0 | | |
| | | 61,654 | | | | Voya Large Cap Growth
Portfolio - Class I | | | | | 1,184,368 | | | | | | 2.8 | | |
| | | 108,674 | | | | Voya Large Cap Value
Fund - Class R6 | | | | | 1,268,228 | | | | | | 3.0 | | |
| | | 116,507 | | | | Voya MidCap Opportunities
Portfolio - Class I | | | | | 1,501,774 | | | | | | 3.5 | | |
| | | 59,140 | | | | Voya Multi-Manager Large
Cap Core Portfolio - Class I | | | | | 857,536 | | | | | | 2.0 | | |
| | | 159,131 | | | | Voya Multi-Manager Mid Cap
Value Fund - Class I | | | | | 1,583,355 | | | | | | 3.7 | | |
| | | 3,958 | | | | Voya Russell™ Mid Cap
Growth Index Portfolio -
Class I | | | | | 106,431 | | | | | | 0.3 | | |
| | | 219,955 | | | | Voya Short Term Bond
Fund - Class R6 | | | | | 2,168,757 | | | | | | 5.1 | | |
| | | 43,372 | | | | Voya Small Company
Portfolio - Class I | | | | | 855,723 | | | | | | 2.0 | | |
| | | 492,742 | | | | Voya U.S. Bond Index
Portfolio - Class I | | | | | 5,183,645 | | | | | | 12.1 | | |
| Shares | | | Value | | | Percentage
of Net
Assets | |
| MUTUAL FUNDS: (continued) | |
| | | | | | | Affiliated Investment Companies (continued) | |
| | | 63,933 | | | | Voya U.S. Stock Index
Portfolio - Class I | | | | $ | 852,861 | | | | | | 2.0 | | |
| | | 234,364 | | | | VY® BlackRock Inflation
Protected Bond Portfolio -
Class I | | | | | 2,153,808 | | | | | | 5.0 | | |
| | | 24,441 | | | | VY® Clarion Real Estate
Portfolio - Class I | | | | | 872,774 | | | | | | 2.0 | | |
| | | 279,546 | @ | | VY® Goldman Sachs Bond
Portfolio - Class I | | | | | 2,801,047 | | | | | | 6.5 | | |
| | | 48,308 | | | | VY® Invesco Comstock
Portfolio - Class I | | | | | 733,320 | | | | | | 1.7 | | |
| | | 164,280 | | | | VY® T. Rowe Price Capital
Appreciation Portfolio -
Class I | | | | | 4,290,995 | | | | | | 10.0 | | |
| | | 14,986 | @ | | VY® T. Rowe Price Growth
Equity Portfolio - Class I | | | | | 1,290,913 | | | | | | 3.0 | | |
| | | | | | | | | | | | 40,747,140 | | | | | | 95.1 | | |
| | | | | | | Unaffiliated Investment Companies: 0.9% | |
| | | 89,603 | @ | | Credit Suisse Commodity
Return Strategy Fund -
Class I | | | | | 404,111 | | | | | | 0.9 | | |
| | | | | | | Total Mutual Funds
(Cost $43,625,406) | | | | | 41,151,251 | | | | | | 96.0 | | |
| | | | | | | Total Investments in
Securities
(Cost $45,343,302) | | | | $ | 42,852,154 | | | | | | 100.0 | | |
| | | | | | | Assets in Excess of Other
Liabilities | | | | | 20,160 | | | | | | — | | |
| | | | | | | Net Assets | | | | $ | 42,872,314 | | | | | | 100.0 | | |
| |
@
Non-income producing security.
Cost for federal income tax purposes is $45,962,996.
Net unrealized depreciation consists of:
| | Gross Unrealized Appreciation | | | | $ | 179,098 | | |
| | Gross Unrealized Depreciation | | | | | (3,289,940) | | |
| | Net Unrealized Depreciation | | | | $ | (3,110,842) | | |
| |
See Accompanying Notes to Financial Statements
| Voya Solution Moderately | PORTFOLIO OF INVESTMENTS |
| Conservative Portfolio | as of December 31, 2015 (continued) |
Fair Value Measurements^
The following is a summary of the fair valuations according to the inputs used as of December 31, 2015 in valuing the assets and liabilities:
| | | | Quoted Prices
in Active Markets
for Identical
Investments
(Level 1) | | | Significant
Other
Observable
Inputs
(Level 2) | | | Significant
Unobservable
Inputs
(Level 3) | | | Fair Value
at
December 31,
2015 | |
| Asset Table | | | | | |
| Investments, at fair value | | | | | |
| Exchange-Traded Funds | | | | $ | 1,700,903 | | | | | $ | — | | | | | $ | — | | | | | $ | 1,700,903 | | |
| Mutual Funds | | | | | 41,151,251 | | | | | | — | | | | | | — | | | | | | 41,151,251 | | |
| Total Investments, at fair value | | | | $ | 42,852,154 | | | | | $ | — | | | | | $ | — | | | | | $ | 42,852,154 | | |
| |
^
See Note 2, “Significant Accounting Policies” in the Notes to Financial Statements for additional information.
Transactions with Affiliates
An investment of at least 5% of the voting securities of an issuer, or a company which is under common control results in that issuer becoming an affiliated person as defined by the 1940 Act.
The following table provides transactions during the year ended December 31, 2015, where the following issuers were considered an affiliate:
| Issuer | | | Beginning
Fair Value
at 12/31/14 | | | Purchases
at Cost | | | Sales
at Cost | | | Change in
Unrealized
Appreciation/
(Depreciation) | | | Ending
Fair Value
at 12/31/15 | | | Investment
Income | | | Realized
Gains/
(Losses) | | | Net Capital
Gain
Distributions | |
| Voya Emerging Markets Index Portfolio - Class I | | | | $ | 850,238 | | | | | $ | 391,397 | | | | | $ | (312,754) | | | | | $ | (107,310) | | | | | $ | 821,571 | | | | | $ | 17,125 | | | | | $ | (36,506) | | | | | $ | — | | |
| Voya Floating Rate Fund - Class I | | | | | 2,245,771 | | | | | | 543,283 | | | | | | (558,604) | | | | | | (73,068) | | | | | | 2,157,382 | | | | | | 90,616 | | | | | | (3,238) | | | | | | — | | |
| Voya Global Bond Fund - Class R6 | | | | | 2,228,129 | | | | | | 632,176 | | | | | | (630,640) | | | | | | (72,029) | | | | | | 2,157,636 | | | | | | 3,606 | | | | | | (26,223) | | | | | | — | | |
| Voya High Yield Bond Fund - Class I | | | | | 2,665,179 | | | | | | 704,666 | | | | | | (1,150,500) | | | | | | (100,623) | | | | | | 2,118,722 | | | | | | 127,898 | | | | | | (43,369) | | | | | | — | | |
| Voya Intermediate Bond Fund - Class R6 | | | | | 3,859,131 | | | | | | 773,066 | | | | | | (1,750,224) | | | | | | (64,168) | | | | | | 2,817,805 | | | | | | 86,788 | | | | | | 15,234 | | | | | | — | | |
| Voya International Core Fund - Class I | | | | | 875,804 | | | | | | 1,819,627 | | | | | | (460,005) | | | | | | (110,558) | | | | | | 2,124,868 | | | | | | 23,818 | | | | | | (13,509) | | | | | | 32,461 | | |
| Voya International Index Portfolio - Class I | | | | | 1,297,538 | | | | | | 327,202 | | | | | | (781,135) | | | | | | 16 | | | | | | 843,621 | | | | | | 25,894 | | | | | | 16,918 | | | | | | — | | |
| Voya Large Cap Growth Portfolio - Class I | | | | | 1,117,967 | | | | | | 508,566 | | | | | | (333,058) | | | | | | (109,107) | | | | | | 1,184,368 | | | | | | 6,732 | | | | | | 65,413 | | | | | | 116,498 | | |
| Voya Large Cap Value Fund - Class R6 | | | | | 1,796,615 | | | | | | 483,033 | | | | | | (853,860) | | | | | | (157,560) | | | | | | 1,268,228 | | | | | | 25,493 | | | | | | (5,349) | | | | | | 96,023 | | |
| Voya MidCap Opportunities Portfolio - Class I | | | | | 1,242,951 | | | | | | 874,382 | | | | | | (329,247) | | | | | | (286,312) | | | | | | 1,501,774 | | | | | | (60) | | | | | | 56,558 | | | | | | 233,991 | | |
| Voya Multi-Manager International Equity Fund - Class I | | | | | 865,463 | | | | | | 57,624 | | | | | | (938,641) | | | | | | 15,554 | | | | | | — | | | | | | — | | | | | | 69,005 | | | | | | — | | |
| Voya Multi-Manager Large Cap Core Portfolio - Class I | | | | | 666,906 | | | | | | 742,318 | | | | | | (438,518) | | | | | | (113,170) | | | | | | 857,536 | | | | | | 8,969 | | | | | | 51,647 | | | | | | 51,024 | | |
| Voya Multi-Manager Mid Cap Value Fund - Class I | | | | | 2,355,197 | | | | | | 690,103 | | | | | | (1,188,141) | | | | | | (273,804) | | | | | | 1,583,355 | | | | | | 19,971 | | | | | | (29,475) | | | | | | 257,747 | | |
| Voya RussellTM Mid Cap Growth Index Portfolio - Class I | | | | | 1,124,125 | | | | | | 106,570 | | | | | | (995,211) | | | | | | (129,053) | | | | | | 106,431 | | | | | | 916 | | | | | | 182,746 | | | | | | — | | |
| Voya Short Term Bond Fund - Class R6 | | | | | 2,258,329 | | | | | | 495,222 | | | | | | (568,304) | | | | | | (16,490) | | | | | | 2,168,757 | | | | | | 41,770 | | | | | | (3,342) | | | | | | — | | |
| Voya Small Company Portfolio - Class I | | | ��� | | 911,814 | | | | | | 312,197 | | | | | | (208,076) | | | | | | (160,212) | | | | | | 855,723 | | | | | | 4,340 | | | | | | 29,244 | | | | | | 125,350 | | |
| Voya U.S. Bond Index Portfolio - Class I | | | | | 7,034,655 | | | | | | 3,346,091 | | | | | | (4,999,207) | | | | | | (197,894) | | | | | | 5,183,645 | | | | | | 101,762 | | | | | | 95,716 | | | | | | 10,452 | | |
| Voya U.S. Stock Index Portfolio - Class I | | | | | 446,564 | | | | | | 1,166,638 | | | | | | (678,245) | | | | | | (82,096) | | | | | | 852,861 | | | | | | 15,968 | | | | | | (1,327) | | | | | | 74,807 | | |
VY® BlackRock Inflation Protected Bond Portfolio - Class I | | | | | 2,235,897 | | | | | | 518,933 | | | | | | (620,369) | | | | | | 19,347 | | | | | | 2,153,808 | | | | | | 19,668 | | | | | | (90,715) | | | | | | — | | |
| VY® Clarion Real Estate Portfolio - Class I | | | | | 936,305 | | | | | | 249,314 | | | | | | (245,792) | | | | | | (67,053) | | | | | | 872,774 | | | | | | 13,998 | | | | | | 85,595 | | | | | | — | | |
| VY® Goldman Sachs Bond Portfolio - Class I | | | | | — | | | | | | 4,146,579 | | | | | | (1,348,805) | | | | | | 3,273 | | | | | | 2,801,047 | | | | | | — | | | | | | 4,554 | | | | | | — | | |
| VY® Invesco Comstock Portfolio - Class I | | | | | — | | | | | | 964,345 | | | | | | (159,479) | | | | | | (71,546) | | | | | | 733,320 | | | | | | 20,145 | | | | | | (7,646) | | | | | | — | | |
VY® T. Rowe Price Capital Appreciation Portfolio - Class I | | | | | 4,510,492 | | | | | | 1,389,816 | | | | | | (1,189,581) | | | | | | (419,732) | | | | | | 4,290,995 | | | | | | 66,080 | | | | | | 29,254 | | | | | | 570,229 | | |
| VY® T. Rowe Price Growth Equity Portfolio - Class I | | | | | 1,114,007 | | | | | | 699,813 | | | | | | (347,091) | | | | | | (175,816) | | | | | | 1,290,913 | | | | | | — | | | | | | 129,701 | | | | | | 180,171 | | |
| | | | | $ | 42,639,077 | | | | | $ | 21,942,961 | | | | | $ | (21,085,487) | | | | | $ | (2,749,411) | | | | | $ | 40,747,140 | | | | | $ | 721,497 | | | | | $ | 570,886 | | | | | $ | 1,748,753 | | |
| |
The financial statements for the above mutual fund[s] can be found at www.sec.gov.
See Accompanying Notes to Financial Statements
| Voya Solution Moderately | PORTFOLIO OF INVESTMENTS |
| Conservative Portfolio | as of December 31, 2015 (continued) |
The effect of derivative instruments by primary risk exposure on the Portfolio’s Statement of Operations for the year ended December 31, 2015 was as follows:
| | | | Amount of Realized Gain or (Loss) on
Derivatives Recognized in Income | |
| Derivatives not accounted for as hedging instruments | | | Futures | |
| Equity contracts | | | | $ | (2,125) | | |
| Interest rate contracts | | | | | (9,648) | | |
| Total | | | | $ | (11,773) | | |
| |
| | | | Change in Unrealized Appreciation or (Depreciation)
on Derivatives Recognized in Income | |
| Derivatives not accounted for as hedging instruments | | | Futures | |
| Equity contracts | | | | $ | 24,337 | | |
| Total | | | | $ | 24,337 | | |
| |
See Accompanying Notes to Financial Statements
PORTFOLIO OF INVESTMENTS
| Voya Solution 2020 Portfolio | as of December 31, 2015 |
| Shares | | | Value | | | Percentage
of Net
Assets | |
| EXCHANGE-TRADED FUNDS: 2.8% | |
| | | 1,301 | | | | SPDR Trust Series 1 | | | | $ | 265,261 | | | | | | 2.8 | | |
| | | | | | | Total Exchange-Traded Funds
(Cost $264,439) | | | | | 265,261 | | | | | | 2.8 | | |
| MUTUAL FUNDS: 97.2% | |
| | | | | | | Affiliated Investment Companies: 96.3% | |
| | | 49,013 | | | | Voya Floating Rate Fund -
Class I | | | | | 472,975 | | | | | | 5.0 | | |
| | | 59,479 | | | | Voya Global Bond Fund -
Class R6 | | | | | 568,624 | | | | | | 6.0 | | |
| | | 37,348 | | | | Voya High Yield Bond Fund -
Class I | | | | | 280,110 | | | | | | 3.0 | | |
| | | 38,509 | | | | Voya Intermediate Bond
Fund - Class R6 | | | | | 380,850 | | | | | | 4.0 | | |
| | | 51,451 | | | | Voya International Core
Fund - Class I | | | | | 468,719 | | | | | | 5.0 | | |
| | | 20,678 | | | | Voya International Index
Portfolio - Class I | | | | | 186,512 | | | | | | 2.0 | | |
| | | 22,229 | | | | Voya Large Cap Growth
Portfolio - Class I | | | | | 427,010 | | | | | | 4.5 | | |
| | | 32,094 | | | | Voya Large Cap Value Fund -
Class R6 | | | | | 374,543 | | | | | | 4.0 | | |
| | | 18,342 | | | | Voya MidCap Opportunities
Portfolio - Class I | | | | | 236,426 | | | | | | 2.5 | | |
| | | 36,106 | | | | Voya Multi-Manager
International Equity Fund -
Class I | | | | | 374,060 | | | | | | 4.0 | | |
| | | 26,026 | | | | Voya Multi-Manager Large
Cap Core Portfolio - Class I | | | | | 377,383 | | | | | | 4.0 | | |
| | | 23,400 | | | | Voya Multi-Manager Mid Cap
Value Fund - Class I | | | | | 232,832 | | | | | | 2.5 | | |
| | | 57,932 | | | | Voya Short Term Bond Fund -
Class R6 | | | | | 571,209 | | | | | | 6.1 | | |
| | | 13,983 | | | | Voya Small Company
Portfolio - Class I | | | | | 275,879 | | | | | | 2.9 | | |
| | | 76,594 | | | | Voya U.S. Bond Index
Portfolio - Class I | | | | | 805,766 | | | | | | 8.5 | | |
| | | 16,060 | | | | Voya U.S. Stock Index
Portfolio - Class I | | | | | 214,238 | | | | | | 2.3 | | |
| Shares | | | Value | | | Percentage
of Net
Assets | |
| MUTUAL FUNDS: (continued) | |
| | | | | | | Affiliated Investment Companies (continued) | |
| | | 72,177 | | | | VY® BlackRock Inflation
Protected Bond Portfolio -
Class I | | | | $ | 663,308 | | | | | | 7.0 | | |
| | | 5,446 | | | | VY® Clarion Real Estate
Portfolio - Class I | | | | | 194,481 | | | | | | 2.1 | | |
| | | 33,115 | @ | | VY® Goldman Sachs Bond
Portfolio - Class I | | | | | 331,814 | | | | | | 3.5 | | |
| | | 18,309 | | | | VY® Invesco Comstock
Portfolio - Class I | | | | | 277,927 | | | | | | 2.9 | | |
| | | 36,195 | | | | VY® T. Rowe Price Capital
Appreciation Portfolio - Class I | | | | | 945,420 | | | | | | 10.0 | | |
| | | 4,964 | @ | | VY® T. Rowe Price Growth
Equity Portfolio - Class I | | | | | 427,596 | | | | | | 4.5 | | |
| | | | | | | | | | | | 9,087,682 | | | | | | 96.3 | | |
| | | | | | | Unaffiliated Investment Companies: 0.9% | |
| | | 19,064 | @ | | Credit Suisse Commodity
Return Strategy Fund -
Class I | | | | | 85,977 | | | | | | 0.9 | | |
| | | | | | | Total Mutual Funds
(Cost $9,301,519) | | | | | 9,173,659 | | | | | | 97.2 | | |
| | | | | | | Total Investments in
Securities
(Cost $9,565,958) | | | | $ | 9,438,920 | | | | | | 100.0 | | |
| | | | | | | Assets in Excess of Other
Liabilities | | | | | 2,604 | | | | | | — | | |
| | | | | | | Net Assets | | | | $ | 9,441,524 | | | | | | 100.0 | | |
| |
@
Non-income producing security.
Cost for federal income tax purposes is $9,604,400.
Net unrealized depreciation consists of:
| | Gross Unrealized Appreciation | | | | $ | 30,919 | | |
| | Gross Unrealized Depreciation | | | | | (196,399) | | |
| | Net Unrealized Depreciation | | | | $ | (165,480) | | |
| |
See Accompanying Notes to Financial Statements
PORTFOLIO OF INVESTMENTS
| Voya Solution 2020 Portfolio | as of December 31, 2015 (continued) |
Fair Value Measurements^
The following is a summary of the fair valuations according to the inputs used as of December 31, 2015 in valuing the assets and liabilities:
| | | | Quoted Prices
in Active Markets
for Identical
Investments
(Level 1) | | | Significant
Other
Observable
Inputs
(Level 2) | | | Significant
Unobservable
Inputs
(Level 3) | | | Fair Value
at
December 31,
2015 | |
| Asset Table | | | | | |
| Investments, at fair value | | | | | |
| Exchange-Traded Funds | | | | $ | 265,261 | | | | | $ | — | | | | | $ | — | | | | | $ | 265,261 | | |
| Mutual Funds | | | | | 9,173,659 | | | | | | — | | | | | | — | | | | | | 9,173,659 | | |
| Total Investments, at fair value | | | | $ | 9,438,920 | | | | | $ | — | | | | | $ | — | | | | | $ | 9,438,920 | | |
| |
^
See Note 2, “Significant Accounting Policies” in the Notes to Financial Statements for additional information.
Transactions with Affiliates
An investment of at least 5% of the voting securities of an issuer, or a company which is under common control results in that issuer becoming an affiliated person as defined by the 1940 Act.
The following table provides transactions during the year ended December 31, 2015, where the following issuers were considered an affiliate:
| Issuer | | | Beginning
Fair Value
at 12/31/14 | | | Purchases
at Cost | | | Sales
at Cost | | | Change in
Unrealized
Appreciation/
(Depreciation) | | | Ending
Fair Value
at 12/31/15 | | | Investment
Income | | | Realized
Gains/
(Losses) | | | Net Capital
Gain
Distributions | |
| Voya Floating Rate Fund - Class I | | | | $ | 32,382 | | | | | $ | 511,287 | | | | | $ | (62,154) | | | | | $ | (8,540) | | | | | $ | 472,975 | | | | | $ | 4,776 | | | | | $ | (1,133) | | | | | $ | — | | |
| Voya Global Bond Fund - Class R6 | | | | | 38,552 | | | | | | 617,332 | | | | | | (83,712) | | | | | | (3,548) | | | | | | 568,624 | | | | | | 63 | | | | | | (3,569) | | | | | | — | | |
| Voya High Yield Bond Fund - Class I | | | | | 25,793 | | | | | | 361,210 | | | | | | (98,639) | | | | | | (8,254) | | | | | | 280,110 | | | | | | 3,986 | | | | | | (2,058) | | | | | | — | | |
| Voya Intermediate Bond Fund - Class R6 | | | | | 29,447 | | | | | | 416,847 | | | | | | (62,795) | | | | | | (2,649) | | | | | | 380,850 | | | | | | 2,660 | | | | | | (267) | | | | | | — | | |
| Voya International Core Fund - Class I | | | | | 22,113 | | | | | | 522,608 | | | | | | (65,813) | | | | | | (10,189) | | | | | | 468,719 | | | | | | 5,060 | | | | | | (3,600) | | | | | | 6,896 | | |
| Voya International Index Portfolio - Class I | | | | | 18,725 | | | | | | 202,328 | | | | | | (34,037) | | | | | | (504) | | | | | | 186,512 | | | | | | 388 | | | | | | (877) | | | | | | — | | |
| Voya Large Cap Growth Portfolio - Class I | | | | | 35,565 | | | | | | 452,270 | | | | | | (69,319) | | | | | | 8,494 | | | | | | 427,010 | | | | | | 192 | | | | | | 758 | | | | | | 3,327 | | |
| Voya Large Cap Value Fund - Class R6 | | | | | 22,757 | | | | | | 414,357 | | | | | | (53,648) | | | | | | (8,923) | | | | | | 374,543 | | | | | | 2,696 | | | | | | (1,842) | | | | | | 9,319 | | |
| Voya MidCap Opportunities Portfolio - Class I | | | | | 19,563 | | | | | | 281,828 | | | | | | (58,243) | | | | | | (6,722) | | | | | | 236,426 | | | | | | — | | | | | | (6,805) | | | | | | 13,918 | | |
| Voya Multi-Manager International Equity Fund - Class I | | | | | 28,103 | | | | | | 410,742 | | | | | | (57,469) | | | | | | (7,316) | | | | | | 374,060 | | | | | | 4,712 | | | | | | (2,350) | | | | | | 3,467 | | |
| Voya Multi-Manager Large Cap Core Portfolio - Class I | | | | | 32,728 | | | | | | 618,318 | | | | | | (273,205) | | | | | | (458) | | | | | | 377,383 | | | | | | 3,406 | | | | | | 555 | | | | | | 2,090 | | |
| Voya Multi-Manager Mid Cap Value Fund - Class I | | | | | 32,371 | | | | | | 308,441 | | | | | | (69,857) | | | | | | (38,123) | | | | | | 232,832 | | | | | | 2,827 | | | | | | (4,603) | | | | | | 36,484 | | |
| Voya Russell™ Mid Cap Growth Index Portfolio - Class I | | | | | 12,976 | | | | | | 737 | | | | | | (12,491) | | | | | | (1,222) | | | | | | — | | | | | | — | | | | | | 1,931 | | | | | | — | | |
| Voya Short Term Bond Fund - Class R6 | | | | | 39,064 | | | | | | 612,794 | | | | | | (78,301) | | | | | | (2,348) | | | | | | 571,209 | | | | | | 2,528 | | | | | | (478) | | | | | | — | | |
| Voya Small Company Portfolio - Class I | | | | | 19,731 | | | | | | 302,073 | | | | | | (40,842) | | | | | | (5,083) | | | | | | 275,879 | | | | | | 98 | | | | | | (628) | | | | | | 2,817 | | |
| Voya U.S. Bond Index Portfolio - Class I | | | | | 49,059 | | | | | | 950,197 | | | | | | (185,541) | | | | | | (7,949) | | | | | | 805,766 | | | | | | 6,439 | | | | | | (559) | | | | | | 107 | | |
| Voya U.S. Stock Index Portfolio - Class I | | | | | — | | | | | | 408,219 | | | | | | (190,224) | | | | | | (3,757) | | | | | | 214,238 | | | | | | 3,448 | | | | | | 4,785 | | | | | | 1,271 | | |
VY® BlackRock Inflation Protected Bond Portfolio - Class I | | | | | 45,126 | | | | | | 716,395 | | | | | | (91,636) | | | | | | (6,577) | | | | | | 663,308 | | | | | | 2,569 | | | | | | (2,459) | | | | | | — | | |
| VY® Clarion Real Estate Portfolio - Class I | | | | | 13,494 | | | | | | 199,923 | | | | | | (27,228) | | | | | | 8,292 | | | | | | 194,481 | | | | | | 247 | | | | | | 1,250 | | | | | | — | | |
| VY® Goldman Sachs Bond Portfolio - Class I | | | | | — | | | | | | 380,809 | | | | | | (47,568) | | | | | | (1,427) | | | | | | 331,814 | | | | | | — | | | | | | 131 | | | | | | — | | |
| VY® Invesco Comstock Portfolio - Class I | | | | | 19,362 | | | | | | 307,923 | | | | | | (40,594) | | | | | | (8,764) | | | | | | 277,927 | | | | | | 6,176 | | | | | | 584 | | | | | | — | | |
VY® T. Rowe Price Capital Appreciation Portfolio - Class I | | | | | 65,055 | | | | | | 1,018,209 | | | | | | (134,849) | | | | | | (2,995) | | | | | | 945,420 | | | | | | 12,236 | | | | | | (7,073) | | | | | | 9,986 | | |
| VY® T. Rowe Price Growth Equity Portfolio - Class I | | | | | 19,292 | | | | | | 463,055 | | | | | | (63,435) | | | | | | 8,684 | | | | | | 427,596 | | | | | | — | | | | | | 1,800 | | | | | | 2,049 | | |
| | | | | $ | 621,258 | | | | | $ | 10,477,902 | | | | | $ | (1,901,600) | | | | | $ | (109,878) | | | | | $ | 9,087,682 | | | | | $ | 64,507 | | | | | $ | (26,507) | | | | | $ | 91,731 | | |
| |
The financial statements for the above mutual fund[s] can be found at www.sec.gov.
See Accompanying Notes to Financial Statements
PORTFOLIO OF INVESTMENTS
| Voya Solution 2025 Portfolio | as of December 31, 2015 |
| Shares | | | Value | | | Percentage
of Net
Assets | |
| EXCHANGE-TRADED FUNDS: 3.1% | |
| | | 152,429 | | | | SPDR Trust Series 1 | | | | $ | 31,078,749 | | | | | | 3.1 | | |
| | | | | | | Total Exchange-Traded
Funds
(Cost $30,878,361) | | | | | 31,078,749 | | | | | | 3.1 | | |
| MUTUAL FUNDS: 96.9% | |
| | | | | | | Affiliated Investment Companies: 95.9% | |
| | | 2,169,897 | | | | Voya Emerging Markets Index
Portfolio - Class I | | | | | 19,203,592 | | | | | | 1.9 | | |
| | | 5,272,134 | | | | Voya Floating Rate Fund -
Class I | | | | | 50,876,092 | | | | | | 5.0 | | |
| | | 6,378,320 | | | | Voya Global Bond Fund -
Class R6 | | | | | 60,976,738 | | | | | | 6.0 | | |
| | | 3,961,272 | | | | Voya High Yield Bond Fund -
Class I | | | | | 29,709,541 | | | | | | 2.9 | | |
| | | 3,625,792 | | | | Voya Intermediate Bond
Fund - Class R6 | | | | | 35,859,081 | | | | | | 3.6 | | |
| | | 6,600,067 | | | | Voya International Core
Fund - Class I | | | | | 60,126,612 | | | | | | 6.0 | | |
| | | 2,208,684 | | | | Voya International Index
Portfolio - Class I | | | | | 19,922,328 | | | | | | 2.0 | | |
| | | 2,649,025 | | | | Voya Large Cap Growth
Portfolio - Class I | | | | | 50,887,766 | | | | | | 5.0 | | |
| | | 3,423,234 | | | | Voya Large Cap Value Fund -
Class R6 | | | | | 39,949,144 | | | | | | 4.0 | | |
| | | 1,966,568 | | | | Voya MidCap Opportunities
Portfolio - Class I | | | | | 25,349,060 | | | | | | 2.5 | | |
| | | 1,119,083 | | | | Voya Multi-Manager Emerging
Markets Equity Fund - Class I | | | | | 9,814,357 | | | | | | 1.0 | | |
| | | 5,806,379 | | | | Voya Multi-Manager
International Equity Fund -
Class I | | | | | 60,154,085 | | | | | | 6.0 | | |
| | | 3,391,666 | | | | Voya Multi-Manager Large
Cap Core Portfolio - Class I | | | | | 49,179,158 | | | | | | 4.9 | | |
| | | 3,508,847 | | | | Voya Multi-Manager Mid Cap
Value Fund - Class I | | | | | 34,913,031 | | | | | | 3.5 | | |
| | | 374,043 | | | | Voya Russell™ Mid Cap
Growth Index Portfolio -
Class I | | | | | 10,058,019 | | | | | | 1.0 | | |
| | | 5,198,689 | | | | Voya Short Term Bond Fund -
Class R6 | | | | | 51,259,075 | | | | | | 5.1 | | |
| Shares | | | Value | | | Percentage
of Net
Assets | |
| MUTUAL FUNDS: (continued) | |
| | | | | | | Affiliated Investment Companies (continued) | |
| | | 1,537,766 | | | | Voya Small Company
Portfolio - Class I | | | | $ | 30,340,125 | | | | | | 3.0 | | |
| | | 6,308,380 | | | | Voya U.S. Bond Index
Portfolio - Class I | | | | | 66,364,156 | | | | | | 6.6 | | |
| | | 1,510,517 | | | | Voya U.S. Stock Index
Portfolio - Class I | | | | | 20,150,303 | | | | | | 2.0 | | |
| | | 577,246 | | | | VY® Clarion Real Estate
Portfolio - Class I | | | | | 20,613,446 | | | | | | 2.0 | | |
| | | 3,049,119 | @ | | VY® Goldman Sachs Bond
Portfolio - Class I | | | | | 30,552,172 | | | | | | 3.0 | | |
| | | 2,608,753 | | | | VY® Invesco Comstock
Portfolio - Class I | | | | | 39,600,865 | | | | | | 3.9 | | |
| | | 3,881,835 | | | | VY® T. Rowe Price Capital
Appreciation Portfolio -
Class I | | | | | 101,393,528 | | | | | | 10.0 | | |
| | | 590,166 | @ | | VY® T. Rowe Price Growth
Equity Portfolio - Class I | | | | | 50,836,880 | | | | | | 5.0 | | |
| | | | | | | | | | | | 968,089,154 | | | | | | 95.9 | | |
| | | | | | | Unaffiliated Investment Companies: 1.0% | |
| | | 2,129,684 | @ | | Credit Suisse Commodity
Return Strategy Fund -
Class I | | | | | 9,604,873 | | | | | | 1.0 | | |
| | | | | | | Total Mutual Funds
(Cost $1,026,642,313) | | | | | 977,694,027 | | | | | | 96.9 | | |
| | | | | | | Total Investments in
Securities
(Cost $1,057,520,674) | | | | $ | 1,008,772,776 | | | | | | 100.0 | | |
| | | | | | | Assets in Excess of
Other Liabilities | | | | | 427,336 | | | | | | — | | |
| | | | | | | Net Assets | | | | $ | 1,009,200,112 | | | | | | 100.0 | | |
| |
@
Non-income producing security.
Cost for federal income tax purposes is $1,066,373,509.
Net unrealized depreciation consists of:
| | Gross Unrealized Appreciation | | | | $ | 10,816,629 | | |
| | Gross Unrealized Depreciation | | | | | (68,417,362) | | |
| | Net Unrealized Depreciation | | | | $ | (57,600,733) | | |
| |
See Accompanying Notes to Financial Statements
PORTFOLIO OF INVESTMENTS
| Voya Solution 2025 Portfolio | as of December 31, 2015 (continued) |
Fair Value Measurements^
The following is a summary of the fair valuations according to the inputs used as of December 31, 2015 in valuing the assets and liabilities:
| | | | Quoted Prices
in Active Markets
for Identical
Investments
(Level 1) | | | Significant
Other
Observable
Inputs
(Level 2) | | | Significant
Unobservable
Inputs
(Level 3) | | | Fair Value
at
December 31,
2015 | |
| Asset Table | | | | | |
| Investments, at fair value | | | | | |
| Exchange-Traded Funds | | | | $ | 31,078,749 | | | | | $ | — | | | | | $ | — | | | | | $ | 31,078,749 | | |
| Mutual Funds | | | | | 977,694,027 | | | | | | — | | | | | | — | | | | | | 977,694,027 | | |
| Total Investments, at fair value | | | | $ | 1,008,772,776 | | | | | $ | — | | | | | $ | — | | | | | $ | 1,008,772,776 | | |
| |
^
See Note 2, “Significant Accounting Policies” in the Notes to Financial Statements for additional information.
Transactions with Affiliates
An investment of at least 5% of the voting securities of an issuer, or a company which is under common control results in that issuer becoming an affiliated person as defined by the 1940 Act.
The following table provides transactions during the year ended December 31, 2015, where the following issuers were considered an affiliate:
| Issuer | | | Beginning
Fair Value
at 12/31/14 | | | Purchases
at Cost | | | Sales
at Cost | | | Change in
Unrealized
Appreciation/
(Depreciation) | | | Ending
Fair Value
at 12/31/15 | | | Investment
Income | | | Realized
Gains/
(Losses) | | | Net Capital
Gain
Distributions | |
| Voya Emerging Markets Index Portfolio - Class I | | | | $ | 21,915,882 | | | | | $ | 6,653,839 | | | | | $ | (6,522,146) | | | | | $ | (2,843,983) | | | | | $ | 19,203,592 | | | | | $ | 434,779 | | | | | $ | (826,845) | | | | | $ | — | | |
| Voya Floating Rate Fund - Class I | | | | | 57,969,673 | | | | | | 8,364,629 | | | | | | (13,772,462) | | | | | | (1,685,748) | | | | | | 50,876,092 | | | | | | 2,258,821 | | | | | | (167,366) | | | | | | — | | |
| Voya Global Bond Fund - Class R6 | | | | | 68,991,426 | | | | | | 12,867,471 | | | | | | (18,980,841) | | | | | | (1,901,318) | | | | | | 60,976,738 | | | | | | 111,682 | | | | | | (1,077,418) | | | | | | — | | |
| Voya High Yield Bond Fund - Class I | | | | | 45,422,442 | | | | | | 6,776,887 | | | | | | (21,240,121) | | | | | | (1,249,667) | | | | | | 29,709,541 | | | | | | 1,962,775 | | | | | | (830,510) | | | | | | — | | |
| Voya Intermediate Bond Fund - Class R6 | | | | | 35,164,284 | | | | | | 23,118,958 | | | | | | (21,250,160) | | | | | | (1,174,001) | | | | | | 35,859,081 | | | | | | 1,092,693 | | | | | | 429,244 | | | | | | — | | |
| Voya International Core Fund - Class I | | | | | 50,831,723 | | | | | | 22,433,666 | | | | | | (11,156,256) | | | | | | (1,982,521) | | | | | | 60,126,612 | | | | | | 670,900 | | | | | | 391,232 | | | | | | 914,335 | | |
| Voya International Index Portfolio - Class I | | | | | 44,610,862 | | | | | | 4,586,290 | | | | | | (29,108,313) | | | | | | (166,511) | | | | | | 19,922,328 | | | | | | 652,094 | | | | | | 1,583,948 | | | | | | — | | |
| Voya Large Cap Growth Portfolio - Class I | | | | | 68,471,758 | | | | | | 12,405,150 | | | | | | (21,329,756) | | | | | | (8,659,386) | | | | | | 50,887,766 | | | | | | 311,727 | | | | | | 7,057,466 | | | | | | 5,394,618 | | |
| Voya Large Cap Value Fund - Class R6 | | | | | 51,385,914 | | | | | | 10,872,023 | | | | | | (17,490,482) | | | | | | (4,818,311) | | | | | | 39,949,144 | | | | | | 794,640 | | | | | | (438,627) | | | | | | 2,806,084 | | |
Voya MidCap Opportunities Portfolio -
Class I | | | | | 35,016,338 | | | | | | 5,849,692 | | | | | | (10,116,261) | | | | | | (5,400,709) | | | | | | 25,349,060 | | | | | | — | | | | | | 1,930,904 | | | | | | 3,966,892 | | |
| Voya Multi-Manager Emerging Markets Equity Fund - Class I | | | | | 10,823,904 | | | | | | 3,666,313 | | | | | | (3,137,215) | | | | | | (1,538,645) | | | | | | 9,814,357 | | | | | | 148,329 | | | | | | (208,448) | | | | | | — | | |
| Voya Multi-Manager International Equity Fund - Class I | | | | | 61,372,711 | | | | | | 13,379,768 | | | | | | (12,306,947) | | | | | | (2,291,447) | | | | | | 60,154,085 | | | | | | 783,463 | | | | | | 1,279,879 | | | | | | 576,478 | | |
| Voya Multi-Manager Large Cap Core Portfolio - Class I | | | | | 70,317,236 | | | | | | 13,123,429 | | | | | | (27,003,381) | | | | | | (7,258,126) | | | | | | 49,179,158 | | | | | | 520,966 | | | | | | 3,560,908 | | | | | | 3,338,322 | | |
| Voya Multi-Manager Mid Cap Value Fund - Class I | | | | | 69,491,025 | | | | | | 10,108,353 | | | | | | (38,750,203) | | | | | | (5,936,144) | | | | | | 34,913,031 | | | | | | 438,333 | | | | | | (419,115) | | | | | | 5,657,293 | | |
Voya RussellTM Mid Cap Growth Index Portfolio - Class I | | | | | 34,830,387 | | | | | | 1,176,332 | | | | | | (22,653,698) | | | | | | (3,295,002) | | | | | | 10,058,019 | | | | | | 96,593 | | | | | | 4,459,806 | | | | | | — | | |
| Voya Short Term Bond Fund - Class R6 | | | | | 57,777,383 | | | | | | 8,356,898 | | | | | | (14,483,310) | | | | | | (391,896) | | | | | | 51,259,075 | | | | | | 1,040,486 | | | | | | (95,877) | | | | | | — | | |
| Voya Small Company Portfolio - Class I | | | | | 35,328,434 | | | | | | 7,138,496 | | | | | | (5,566,119) | | | | | | (6,560,686) | | | | | | 30,340,125 | | | | | | 165,260 | | | | | | 1,528,886 | | | | | | 4,773,495 | | |
| Voya U.S. Bond Index Portfolio - Class I | | | | | 58,583,753 | | | | | | 65,262,667 | | | | | | (54,895,285) | | | | | | (2,586,979) | | | | | | 66,364,156 | | | | | | 1,116,946 | | | | | | 1,131,557 | | | | | | 133,064 | | |
| Voya U.S. Stock Index Portfolio - Class I | | | | | — | | | | | | 25,769,083 | | | | | | (3,549,621) | | | | | | (2,069,159) | | | | | | 20,150,303 | | | | | | 381,211 | | | | | | (306,468) | | | | | | 1,897,979 | | |
| VY® Clarion Real Estate Portfolio - Class I | | | | | 24,205,245 | | | | | | 4,123,190 | | | | | | (6,171,988) | | | | | | (1,543,001) | | | | | | 20,613,446 | | | | | | 359,870 | | | | | | 1,958,847 | | | | | | — | | |
VY® Goldman Sachs Bond Portfolio -
Class I | | | | | — | | | | | | 37,561,515 | | | | | | (7,000,872) | | | | | | (8,471) | | | | | | 30,552,172 | | | | | | — | | | | | | 30,052 | | | | | | — | | |
| VY® Invesco Comstock Portfolio - Class I | | | | | 34,635,481 | | | | | | 17,888,561 | | | | | | (8,599,392) | | | | | | (4,323,785) | | | | | | 39,600,865 | | | | | | 1,104,858 | | | | | | 738,254 | | | | | | — | | |
VY® T. Rowe Price Capital Appreciation Portfolio - Class I | | | | | 116,458,700 | | | | | | 20,397,978 | | | | | | (21,955,951) | | | | | | (13,507,199) | | | | | | 101,393,528 | | | | | | 1,581,516 | | | | | | 3,422,090 | | | | | | 14,562,656 | | |
VY® T. Rowe Price Growth Equity Portfolio -
Class I | | | | | 40,262,234 | | | | | | 29,459,665 | | | | | | (11,808,121) | | | | | | (7,076,898) | | | | | | 50,836,880 | | | | | | — | | | | | | 4,484,620 | | | | | | 7,693,559 | | |
| | | | | $ | 1,093,866,795 | | | | | $ | 371,340,853 | | | | | $ | (408,848,901) | | | | | $ | (88,269,593) | | | | | $ | 968,089,154 | | | | | $ | 16,027,942 | | | | | $ | 29,617,019 | | | | | $ | 51,714,775 | | |
| |
The financial statements for the above mutual fund[s] can be found at www.sec.gov.
See Accompanying Notes to Financial Statements
PORTFOLIO OF INVESTMENTS
| Voya Solution 2025 Portfolio | as of December 31, 2015 (continued) |
The effect of derivative instruments by primary risk exposure on the Portfolio’s Statement of Operations for the year ended December 31, 2015 was as follows:
| | | | Amount of Realized Gain or (Loss) on
Derivatives Recognized in Income | |
| Derivatives not accounted for as hedging instruments | | | Futures | |
| Equity contracts | | | | $ | 1,460,654 | | |
| Total | | | | $ | 1,460,654 | | |
| |
| | | | Change in Unrealized Appreciation or
(Depreciation) on Derivatives Recognized in Income | |
| Derivatives not accounted for as hedging instruments | | | Futures | |
| Equity contracts | | | | $ | 615,516 | | |
| Total | | | | $ | 615,516 | | |
| |
See Accompanying Notes to Financial Statements
PORTFOLIO OF INVESTMENTS
| Voya Solution 2030 Portfolio | as of December 31, 2015 |
| Shares | | | Value | | | Percentage
of Net
Assets | |
| EXCHANGE-TRADED FUNDS: 4.6% | |
| | | 302 | | | | iShares Barclays 20+ Year
Treasury Bond Fund | | | | $ | 36,427 | | | | | | 0.9 | | |
| | | 717 | | | | SPDR Trust Series 1 | | | | | 146,189 | | | | | | 3.7 | | |
| | | | | | | Total Exchange-Traded
Funds
(Cost $182,466) | | | | | 182,616 | | | | | | 4.6 | | |
| MUTUAL FUNDS: 95.3% | |
| | | | | | | Affiliated Investment Companies: 94.5% | |
| | | 8,955 | | | | Voya Emerging Markets
Index Portfolio - Class I | | | | | 79,251 | | | | | | 2.0 | | |
| | | 20,139 | | | | Voya Floating Rate Fund -
Class I | | | | | 194,345 | | | | | | 4.9 | | |
| | | 15,936 | | | | Voya High Yield Bond Fund -
Class I | | | | | 119,517 | | | | | | 3.0 | | |
| | | 14,063 | | | | Voya Intermediate Bond
Fund - Class R6 | | | | | 139,082 | | | | | | 3.5 | | |
| | | 27,953 | | | | Voya International Core
Fund - Class I | | | | | 254,655 | | | | | | 6.5 | | |
| | | 8,656 | | | | Voya International Index
Portfolio - Class I | | | | | 78,076 | | | | | | 2.0 | | |
| | | 11,327 | | | | Voya Large Cap Growth
Portfolio - Class I | | | | | 217,594 | | | | | | 5.5 | | |
| | | 13,382 | | | | Voya Large Cap Value
Fund - Class R6 | | | | | 156,172 | | | | | | 4.0 | | |
| | | 7,647 | | | | Voya MidCap Opportunities
Portfolio - Class I | | | | | 98,564 | | | | | | 2.5 | | |
| | | 8,759 | | | | Voya Multi-Manager
Emerging Markets Equity
Fund - Class I | | | | | 76,813 | | | | | | 2.0 | | |
| | | 24,872 | | | | Voya Multi-Manager
International Equity Fund -
Class I | | | | | 257,674 | | | | | | 6.6 | | |
| | | 25,084 | | | | Voya Multi-Manager Large
Cap Core Portfolio - Class I | | | | | 363,725 | | | | | | 9.3 | | |
| | | 13,707 | | | | Voya Multi-Manager Mid Cap
Value Fund - Class I | | | | | 136,388 | | | | | | 3.5 | | |
| | | 1,459 | | | | Voya RussellTM Mid Cap
Growth Index Portfolio -
Class I | | | | | 39,221 | | | | | | 1.0 | | |
| | | 15,767 | | | | Voya Short Term Bond Fund -
Class R6 | | | | | 155,467 | | | | | | 4.0 | | |
| Shares | | | Value | | | Percentage
of Net
Assets | |
| MUTUAL FUNDS: (continued) | |
| | | | | | | Affiliated Investment Companies (continued) | |
| | | 5,968 | | | | Voya Small Company
Portfolio - Class I | | | | $ | 117,754 | | | | | | 3.0 | | |
| | | 17,358 | | | | Voya U.S. Bond Index
Portfolio - Class I | | | | | 182,609 | | | | | | 4.7 | | |
| | | 8,839 | | | | Voya U.S. Stock Index
Portfolio - Class I | | | | | 117,908 | | | | | | 3.0 | | |
| | | 5,025 | | | | VY® Clarion Global Real
Estate Portfolio - Class I | | | | | 59,150 | | | | | | 1.5 | | |
| | | 1,687 | | | | VY® Clarion Real Estate
Portfolio - Class I | | | | | 60,228 | | | | | | 1.5 | | |
| | | 12,962 | | | | VY® Invesco Comstock
Portfolio - Class I | | | | | 196,770 | | | | | | 5.0 | | |
| | | 15,110 | | | | VY® T. Rowe Price Capital
Appreciation Portfolio -
Class I | | | | | 394,683 | | | | | | 10.0 | | |
| | | 2,525 | @ | | VY® T. Rowe Price Growth
Equity Portfolio - Class I | | | | | 217,483 | | | | | | 5.5 | | |
| | | | | | | | | | | | 3,713,129 | | | | | | 94.5 | | |
| | | | | | | Unaffiliated Investment Companies: 0.8% | |
| | | 6,876 | @ | | Credit Suisse Commodity
Return Strategy Fund -
Class I | | | | | 31,010 | | | | | | 0.8 | | |
| | | | | | | Total Mutual Funds
(Cost $3,815,834) | | | | | 3,744,139 | | | | | | 95.3 | | |
| | | | | | | Total Investments in
Securities
(Cost $3,998,300) | | | | $ | 3,926,755 | | | | | | 99.9 | | |
| | | | | | | Assets in Excess of Other
Liabilities | | | | | 2,370 | | | | | | 0.1 | | |
| | | | | | | Net Assets | | | | $ | 3,929,125 | | | | | | 100.0 | | |
| |
@
Non-income producing security.
Cost for federal income tax purposes is $4,019,253.
Net unrealized depreciation consists of:
| | Gross Unrealized Appreciation | | | | $ | 10,509 | | |
| | Gross Unrealized Depreciation | | | | | (103,007) | | |
| | Net Unrealized Depreciation | | | | $ | (92,498) | | |
| |
See Accompanying Notes to Financial Statements
PORTFOLIO OF INVESTMENTS
| Voya Solution 2030 Portfolio | as of December 31, 2015 (continued) |
Fair Value Measurements^
The following is a summary of the fair valuations according to the inputs used as of December 31, 2015 in valuing the assets and liabilities:
| | | | Quoted Prices
in Active Markets
for Identical
Investments
(Level 1) | | | Significant
Other
Observable
Inputs
(Level 2) | | | Significant
Unobservable
Inputs
(Level 3) | | | Fair Value
at
December 31,
2015 | |
| Asset Table | | | | | |
| Investments, at fair value | | | | | |
| Exchange-Traded Funds | | | | $ | 182,616 | | | | | $ | — | | | | | $ | — | | | | | $ | 182,616 | | |
| Mutual Funds | | | | | 3,744,139 | | | | | | — | | | | | | — | | | | | | 3,744,139 | | |
| Total Investments, at fair value | | | | $ | 3,926,755 | | | | | $ | — | | | | | $ | — | | | | | $ | 3,926,755 | | |
| |
^
See Note 2, “Significant Accounting Policies” in the Notes to Financial Statements for additional information.
Transactions with Affiliates
An investment of at least 5% of the voting securities of an issuer, or a company which is under common control results in that issuer becoming an affiliated person as defined by the 1940 Act.
The following table provides transactions during the year ended December 31, 2015, where the following issuers were considered an affiliate:
| Issuer | | | Beginning
Fair Value
at 12/31/14 | | | Purchases
at Cost | | | Sales
at Cost | | | Change in
Unrealized
Appreciation/
(Depreciation) | | | Ending
Fair Value
at 12/31/15 | | | Investment
Income | | | Realized
Gains/
(Losses) | | | Net Capital
Gain
Distributions | |
| Voya Emerging Markets Index Portfolio - Class I | | | | $ | 3,240 | | | | | $ | 83,960 | | | | | $ | (4,754) | | | | | $ | (3,195) | | | | | $ | 79,251 | | | | | $ | 125 | | | | | $ | (661) | | | | | $ | — | | |
| Voya Floating Rate Fund - Class I | | | | | 8,700 | | | | | | 203,521 | | | | | | (14,518) | | | | | | (3,358) | | | | | | 194,345 | | | | | | 1,946 | | | | | | (456) | | | | | | — | | |
| Voya High Yield Bond Fund - Class I | | | | | 6,995 | | | | | | 145,436 | | | | | | (29,534) | | | | | | (3,380) | | | | | | 119,517 | | | | | | 1,649 | | | | | | (752) | | | | | | — | | |
| Voya Intermediate Bond Fund - Class R6 | | | | | 5,276 | | | | | | 143,213 | | | | | | (8,195) | | | | | | (1,212) | | | | | | 139,082 | | | | | | 910 | | | | | | (82) | | | | | | — | | |
| Voya International Core Fund - Class I | | | | | 8,480 | | | | | | 265,919 | | | | | | (13,117) | | | | | | (6,627) | | | | | | 254,655 | | | | | | 2,481 | | | | | | (1,265) | | | | | | 3,380 | | |
| Voya International Index Portfolio - Class I | | | | | 6,669 | | | | | | 83,089 | | | | | | (11,023) | | | | | | (659) | | | | | | 78,076 | | | | | | 189 | | | | | | (120) | | | | | | — | | |
| Voya Large Cap Growth Portfolio - Class I | | | | | 11,410 | | | | | | 223,714 | | | | | | (21,037) | | | | | | 3,507 | | | | | | 217,594 | | | | | | 116 | | | | | | (445) | | | | | | 2,016 | | |
| Voya Large Cap Value Fund - Class R6 | | | | | 7,803 | | | | | | 170,737 | | | | | | (18,337) | | | | | | (4,031) | | | | | | 156,172 | | | | | | 1,043 | | | | | | (1,102) | | | | | | 3,503 | | |
| Voya MidCap Opportunities Portfolio - Class I | | | | | 5,254 | | | | | | 121,468 | | | | | | (27,867) | | | | | | (291) | | | | | | 98,564 | | | | | | — | | | | | | (4,082) | | | | | | 4,283 | | |
| Voya Multi-Manager Emerging Markets Equity Fund - Class I | | | | | 3,197 | | | | | | 81,410 | | | | | | (4,891) | | | | | | (2,903) | | | | | | 76,813 | | | | | | 1,011 | | | | | | (676) | | | | | | — | | |
| Voya Multi-Manager International Equity Fund - Class I | | | | | 10,004 | | | | | | 267,242 | | | | | | (13,447) | | | | | | (6,125) | | | | | | 257,674 | | | | | | 2,932 | | | | | | (1,045) | | | | | | 2,158 | | |
| Voya Multi-Manager Large Cap Core Portfolio - Class I | | | | | 12,300 | | | | | | 562,725 | | | | | | (207,940) | | | | | | (3,360) | | | | | | 363,725 | | | | | | 3,029 | | | | | | 1,855 | | | | | | 2,281 | | |
| Voya Multi-Manager Mid Cap Value Fund - Class I | | | | | 10,367 | | | | | | 179,372 | | | | | | (31,926) | | | | | | (21,425) | | | | | | 136,388 | | | | | | 1,493 | | | | | | (2,028) | | | | | | 19,264 | | |
| Voya Russell™ Mid Cap Growth Index Portfolio - Class I | | | | | 5,217 | | | | | | 53,485 | | | | | | (18,523) | | | | | | (958) | | | | | | 39,221 | | | | | | 28 | | | | | | 335 | | | | | | — | | |
| Voya Short Term Bond Fund - Class R6 | | | | | 7,024 | | | | | | 165,068 | | | | | | (15,897) | | | | | | (728) | | | | | | 155,467 | | | | | | 686 | | | | | | (111) | | | | | | — | | |
| Voya Small Company Portfolio - Class I | | | | | 5,277 | | | | | | 120,512 | | | | | | (5,793) | | | | | | (2,242) | | | | | | 117,754 | | | | | | 48 | | | | | | (327) | | | | | | 1,375 | | |
| Voya U.S. Bond Index Portfolio - Class I | | | | | — | | | | | | 267,808 | | | | | | (83,420) | | | | | | (1,779) | | | | | | 182,609 | | | | | | 1,240 | | | | | | (126) | | | | | | 24 | | |
| Voya U.S. Stock Index Portfolio - Class I | | | | | 1,770 | | | | | | 128,918 | | | | | | (11,599) | | | | | | (1,181) | | | | | | 117,908 | | | | | | 1,803 | | | | | | (1,124) | | | | | | 1,280 | | |
| VY® Clarion Global Real Estate Portfolio - Class I | | | | | — | | | | | | 60,789 | | | | | | (2,017) | | | | | | 378 | | | | | | 59,150 | | | | | | 2 | | | | | | (45) | | | | | | — | | |
| VY® Clarion Real Estate Portfolio - Class I | | | | | 3,665 | | | | | | 70,911 | | | | | | (15,883) | | | | | | 1,535 | | | | | | 60,228 | | | | | | 122 | | | | | | 661 | | | | | | — | | |
| VY® Invesco Comstock Portfolio - Class I | | | | | 5,184 | | | | | | 209,596 | | | | | | (11,798) | | | | | | (6,212) | | | | | | 196,770 | | | | | | 4,200 | | | | | | (281) | | | | | | — | | |
| VY® T. Rowe Price Capital Appreciation Portfolio - Class I | | | | | 17,502 | | | | | | 404,045 | | | | | | (23,036) | | | | | | (3,828) | | | | | | 394,683 | | | | | | 4,850 | | | | | | (1,943) | | | | | | 4,950 | | |
| VY® T. Rowe Price Growth Equity Portfolio - Class I | | | | | 9,888 | | | | | | 221,560 | | | | | | (16,894) | | | | | | 2,929 | | | | | | 217,483 | | | | | | — | | | | | | (508) | | | | | | 2,927 | | |
| | | | | $ | 155,222 | | | | | $ | 4,234,498 | | | | | $ | (611,446) | | | | | $ | (65,145) | | | | | $ | 3,713,129 | | | | | $ | 29,903 | | | | | $ | (14,328) | | | | | $ | 47,441 | | |
| |
The financial statements for the above mutual fund[s] can be found at www.sec.gov.
See Accompanying Notes to Financial Statements
PORTFOLIO OF INVESTMENTS
| Voya Solution 2035 Portfolio | as of December 31, 2015 |
| Shares | | | Value | | | Percentage
of Net
Assets | |
| EXCHANGE-TRADED FUNDS: 4.1% | |
| | | 186,669 | | | | SPDR Trust Series 1 | | | | $ | 38,059,943 | | | | | | 4.1 | | |
| | | | | | | Total Exchange-Traded
Funds
(Cost $37,309,785) | | | | | 38,059,943 | | | | | | 4.1 | | |
| MUTUAL FUNDS: 95.8% | |
| | | | | | | Affiliated Investment Companies: 94.9% | |
| | | 2,001,331 | | | | Voya Emerging Markets
Index Portfolio - Class I | | | | | 17,711,782 | | | | | | 1.9 | | |
| | | 4,861,293 | | | | Voya Floating Rate Fund -
Class I | | | | | 46,911,478 | | | | | | 5.1 | | |
| | | 3,647,427 | | | | Voya High Yield Bond
Fund - Class I | | | | | 27,355,699 | | | | | | 2.9 | | |
| | | 1,435,576 | | | | Voya Intermediate Bond
Fund - Class R6 | | | | | 14,197,848 | | | | | | 1.5 | | |
| | | 7,608,045 | | | | Voya International Core
Fund - Class I | | | | | 69,309,289 | | | | | | 7.5 | | |
| | | 2,036,862 | | | | Voya International Index
Portfolio - Class I | | | | | 18,372,498 | | | | | | 2.0 | | |
| | | 2,931,601 | | | | Voya Large Cap Growth
Portfolio - Class I | | | | | 56,316,052 | | | | | | 6.1 | | |
| | | 3,946,604 | | | | Voya Large Cap Value
Fund - Class R6 | | | | | 46,056,864 | | | | | | 5.0 | | |
| | | 1,813,462 | | | | Voya MidCap Opportunities
Portfolio - Class I | | | | | 23,375,530 | | | | | | 2.5 | | |
| | | 4,127,298 | | | | Voya Multi-Manager
Emerging Markets Equity
Fund - Class I | | | | | 36,196,403 | | | | | | 3.9 | | |
| | | 8,477,669 | | | | Voya Multi-Manager
International Equity Fund -
Class I | | | | | 87,828,652 | | | | | | 9.5 | | |
| | | 6,334,269 | | | | Voya Multi-Manager
Large Cap Core Portfolio -
Class I | | | | | 91,846,901 | | | | | | 9.9 | | |
| | | 3,235,820 | | | | Voya Multi-Manager Mid
Cap Value Fund - Class I | | | | | 32,196,406 | | | | | | 3.5 | | |
| | | 344,923 | | | | Voya RussellTM Mid Cap
Growth Index Portfolio -
Class I | | | | | 9,274,969 | | | | | | 1.0 | | |
| | | 958,738 | | | | Voya Short Term Bond
Fund - Class R6 | | | | | 9,453,157 | | | | | | 1.0 | | |
| | | 1,418,043 | | | | Voya Small Company
Portfolio - Class I | | | | | 27,977,979 | | | | | | 3.0 | | |
| Shares | | | Value | | | Percentage
of Net
Assets | |
| MUTUAL FUNDS: (continued) | |
| | | | | | | Affiliated Investment Companies (continued) | |
| | | 3,579,597 | | | | Voya U.S. Bond Index
Portfolio - Class I | | | | $ | 37,657,364 | | | | | | 4.1 | | |
| | | 2,788,040 | | | | Voya U.S. Stock Index
Portfolio - Class I | | | | | 37,192,460 | | | | | | 4.0 | | |
| | | 1,179,525 | | | | VY® Clarion Global Real
Estate Portfolio - Class I | | | | | 13,883,008 | | | | | | 1.5 | | |
| | | 398,217 | | | | VY® Clarion Real Estate
Portfolio - Class I | | | | | 14,220,314 | | | | | | 1.5 | | |
| | | 3,007,395 | | | | VY® Invesco Comstock
Portfolio - Class I | | | | | 45,652,250 | | | | | | 4.9 | | |
| | | 2,326,573 | | | | VY® T. Rowe Price Capital
Appreciation Portfolio -
Class I | | | | | 60,770,096 | | | | | | 6.5 | | |
| | | 653,104 | @ | | VY® T. Rowe Price Growth
Equity Portfolio - Class I | | | | | 56,258,417 | | | | | | 6.1 | | |
| | | | | | | | | | | | 880,015,416 | | | | | | 94.9 | | |
| | | | | | | Unaffiliated Investment Companies: 0.9% | |
| | | 1,955,782 | @ | | Credit Suisse Commodity
Return Strategy Fund -
Class I | | | | | 8,820,575 | | | | | | 0.9 | | |
| | | | | | | Total Mutual Funds
(Cost $937,471,218) | | | | | 888,835,991 | | | | | | 95.8 | | |
| | | | | | | Total Investments in
Securities
(Cost $974,781,003) | | | | $ | 926,895,934 | | | | | | 99.9 | | |
| | | | | | | Assets in Excess of Other
Liabilities | | | | | 781,433 | | | | | | 0.1 | | |
| | | | | | | Net Assets | | | | $ | 927,677,367 | | | | | | 100.0 | | |
| |
@
Non-income producing security.
Cost for federal income tax purposes is $982,555,634.
Net unrealized depreciation consists of:
| | Gross Unrealized Appreciation | | | | $ | 14,812,604 | | |
| | Gross Unrealized Depreciation | | | | | (70,472,304) | | |
| | Net Unrealized Depreciation | | | | $ | (55,659,700) | | |
| |
See Accompanying Notes to Financial Statements
PORTFOLIO OF INVESTMENTS
| Voya Solution 2035 Portfolio | as of December 31, 2015 (continued) |
Fair Value Measurements^
The following is a summary of the fair valuations according to the inputs used as of December 31, 2015 in valuing the assets and liabilities:
| | | | Quoted Prices
in Active Markets
for Identical
Investments
(Level 1) | | | Significant
Other
Observable
Inputs
(Level 2) | | | Significant
Unobservable
Inputs
(Level 3) | | | Fair Value
at
December 31,
2015 | |
| Asset Table | | | | | |
| Investments, at fair value | | | | | |
| Exchange-Traded Funds | | | | $ | 38,059,943 | | | | | $ | — | | | | | $ | — | | | | | $ | 38,059,943 | | |
| Mutual Funds | | | | | 888,835,991 | | | | | | — | | | | | | — | | | | | | 888,835,991 | | |
| Total Investments, at fair value | | | | $ | 926,895,934 | | | | | $ | — | | | | | $ | — | | | | | $ | 926,895,934 | | |
| |
^
See Note 2, “Significant Accounting Policies” in the Notes to Financial Statements for additional information.
Transactions with Affiliates
An investment of at least 5% of the voting securities of an issuer, or a company which is under common control results in that issuer becoming an affiliated person as defined by the 1940 Act.
The following table provides transactions during the year ended December 31, 2015, where the following issuers were considered an affiliate:
| Issuer | | | Beginning
Fair Value
at 12/31/14 | | | Purchases
at Cost | | | Sales
at Cost | | | Change in
Unrealized
Appreciation/
(Depreciation) | | | Ending
Fair Value
at 12/31/15 | | | Investment
Income | | | Realized
Gains/
(Losses) | | | Net Capital
Gain
Distributions | |
| Voya Emerging Markets Index Portfolio - Class I | | | | $ | 19,856,322 | | | | | $ | 6,109,242 | | | | | $ | (5,495,712) | | | | | $ | (2,758,070) | | | | | $ | 17,711,782 | | | | | $ | 401,529 | | | | | $ | (682,887) | | | | | $ | — | | |
| Voya Floating Rate Fund - Class I | | | | | 52,487,129 | | | | | | 9,902,623 | | | | | | (13,904,287) | | | | | | (1,573,987) | | | | | | 46,911,478 | | | | | | 2,075,974 | | | | | | (143,206) | | | | | | — | | |
| Voya High Yield Bond Fund - Class I | | | | | 41,626,763 | | | | | | 14,959,498 | | | | | | (28,793,945) | | | | | | (436,617) | | | | | | 27,355,699 | | | | | | 1,340,460 | | | | | | (1,332,367) | | | | | | — | | |
| Voya Intermediate Bond Fund - Class R6 | | | | | — | | | | | | 27,809,923 | | | | | | (13,219,285) | | | | | | (392,790) | | | | | | 14,197,848 | | | | | | 406,960 | | | | | | (254,619) | | | | | | — | | |
| Voya International Core Fund - Class I | | | | | 69,053,265 | | | | | | 13,736,150 | | | | | | (11,230,028) | | | | | | (2,250,098) | | | | | | 69,309,289 | | | | | | 772,100 | | | | | | 1,255,837 | | | | | | 1,052,256 | | |
| Voya International Index Portfolio - Class I | | | | | 40,407,486 | | | | | | 3,910,986 | | | | | | (26,106,963) | | | | | | 160,989 | | | | | | 18,372,498 | | | | | | 602,687 | | | | | | 1,059,172 | | | | | | — | | |
| Voya Large Cap Growth Portfolio - Class I | | | | | 73,176,466 | | | | | | 10,783,867 | | | | | | (19,118,707) | | | | | | (8,525,574) | | | | | | 56,316,052 | | | | | | 348,668 | | | | | | 6,453,041 | | | | | | 6,033,907 | | |
| Voya Large Cap Value Fund - Class R6 | | | | | 51,388,012 | | | | | | 11,807,890 | | | | | | (11,501,908) | | | | | | (5,637,130) | | | | | | 46,056,864 | | | | | | 882,628 | | | | | | (329,325) | | | | | | 2,980,935 | | |
| Voya MidCap Opportunities Portfolio - Class I | | | | | 31,701,643 | | | | | | 5,369,109 | | | | | | (9,132,392) | | | | | | (4,562,830) | | | | | | 23,375,530 | | | | | | — | | | | | | 1,376,635 | | | | | | 3,586,532 | | |
Voya Multi-Manager Emerging Markets Equity
Fund - Class I | | | | | 39,232,448 | | | | | | 12,589,174 | | | | | | (10,074,221) | | | | | | (5,550,998) | | | | | | 36,196,403 | | | | | | 546,144 | | | | | | (908,386) | | | | | | — | | |
Voya Multi-Manager International Equity
Fund - Class I | | | | | 83,384,571 | | | | | | 23,691,750 | | | | | | (15,568,986) | | | | | | (3,678,683) | | | | | | 87,828,652 | | | | | | 1,142,039 | | | | | | 1,496,823 | | | | | | 840,321 | | |
Voya Multi-Manager Large Cap Core
Portfolio - Class I | | | | | 63,656,782 | | | | | | 60,575,566 | | | | | | (22,085,064) | | | | | | (10,300,383) | | | | | | 91,846,901 | | | | | | 972,066 | | | | | | 2,452,206 | | | | | | 6,308,166 | | |
| Voya Multi-Manager Mid Cap Value Fund - Class I | | | | | 62,919,285 | | | | | | 9,202,505 | | | | | | (34,106,136) | | | | | | (5,819,248) | | | | | | 32,196,406 | | | | | | 403,564 | | | | | | (121,619) | | | | | | 5,208,545 | | |
| Voya Russell™ Mid Cap Growth Index Portfolio - Class I | | | | | 31,535,355 | | | | | | 1,282,083 | | | | | | (20,525,309) | | | | | | (3,017,160) | | | | | | 9,274,969 | | | | | | 89,206 | | | | | | 4,044,503 | | | | | | — | | |
| Voya Short Term Bond Fund - Class R6 | | | | | 10,212,894 | | | | | | 2,642,889 | | | | | | (3,333,270) | | | | | | (69,356) | | | | | | 9,453,157 | | | | | | 190,874 | | | | | | (22,531) | | | | | | — | | |
| Voya Small Company Portfolio - Class I | | | | | 31,981,805 | | | | | | 6,866,949 | | | | | | (4,940,244) | | | | | | (5,930,531) | | | | | | 27,977,979 | | | | | | 152,624 | | | | | | 1,223,692 | | | | | | 4,408,487 | | |
| Voya U.S. Bond Index Portfolio - Class I | | | | | — | | | | | | 43,918,515 | | | | | | (5,568,564) | | | | | | (692,587) | | | | | | 37,657,364 | | | | | | 450,041 | | | | | | (84,842) | | | | | | 50,270 | | |
| Voya U.S. Stock Index Portfolio - Class I | | | | | 30,242,542 | | | | | | 36,453,850 | | | | | | (25,983,911) | | | | | | (3,520,021) | | | | | | 37,192,460 | | | | | | 733,748 | | | | | | (1,551,326) | | | | | | 4,436,020 | | |
VY® Clarion Global Real Estate Portfolio - Class I | | | | | — | | | | | | 15,277,449 | | | | | | (1,224,105) | | | | | | (170,336) | | | | | | 13,883,008 | | | | | | 1,621 | | | | | | (42,788) | | | | | | — | | |
| VY® Clarion Real Estate Portfolio - Class I | | | | | 21,905,320 | | | | | | 4,328,477 | | | | | | (8,520,669) | | | | | | (3,492,814) | | | | | | 14,220,314 | | | | | | 334,251 | | | | | | 3,786,573 | | | | | | — | | |
| VY® Invesco Comstock Portfolio - Class I | | | | | 31,360,379 | | | | | | 27,756,934 | | | | | | (8,309,933) | | | | | | (5,155,130) | | | | | | 45,652,250 | | | | | | 1,275,059 | | | | | | 707,289 | | | | | | — | | |
VY® T. Rowe Price Capital Appreciation Portfolio - Class I | | | | | 105,437,209 | | | | | | 15,812,881 | | | | | | (50,307,107) | | | | | | (10,172,887) | | | | | | 60,770,096 | | | | | | 968,806 | | | | | | 4,219,379 | | | | | | 9,828,329 | | |
VY® T. Rowe Price Growth Equity Portfolio - Class I | | | | | 62,498,459 | | | | | | 13,955,828 | | | | | | (12,257,086) | | | | | | (7,938,784) | | | | | | 56,258,417 | | | | | | — | | | | | | 5,976,379 | | | | | | 8,600,987 | | |
| | | | | $ | 954,064,135 | | | | | $ | 378,744,138 | | | | | $ | (361,307,832) | | | | | $ | (91,485,025) | | | | | $ | 880,015,416 | | | | | $ | 14,091,049 | | | | | $ | 28,577,633 | | | | | $ | 53,334,755 | | |
| |
The financial statements for the above mutual fund[s] can be found at www.sec.gov.
See Accompanying Notes to Financial Statements
PORTFOLIO OF INVESTMENTS
| Voya Solution 2035 Portfolio | as of December 31, 2015 (continued) |
The effect of derivative instruments by primary risk exposure on the Portfolio’s Statement of Operations for the year ended December 31, 2015 was as follows:
| | | | Amount of Realized Gain or (Loss) on
Derivatives Recognized in Income | |
| Derivatives not accounted for as hedging instruments | | | Futures | |
| Equity contracts | | | | $ | 811,013 | | |
| Interest rate contracts | | | | | (68,499) | | |
| Total | | | | $ | 742,514 | | |
| |
| | | | Change in Unrealized Appreciation or
(Depreciation) on Derivatives Recognized in Income | |
| Derivatives not accounted for as hedging instruments | | | Futures | |
| Equity contracts | | | | $ | 551,527 | | |
| Total | | | | $ | 551,527 | | |
| |
See Accompanying Notes to Financial Statements
PORTFOLIO OF INVESTMENTS
| Voya Solution 2040 Portfolio | | as of December 31, 2015 |
| Shares | | | Value | | | Percentage
of Net
Assets | |
| EXCHANGE-TRADED FUNDS: 3.6% | | | |
| | | 623 | | | | iShares Russell 1000 Value
Index Fund | | | | $ | 60,967 | | | | | | 1.8 | | |
| | | 297 | | | | SPDR Trust Series 1 | | | | | 60,555 | | | | | | 1.8 | | |
| | | | | | | Total Exchange-Traded
Funds
(Cost $121,378) | | | | | 121,522 | | | | | | 3.6 | | |
| MUTUAL FUNDS: 96.3% | | | |
| | | | | | | Affiliated Investment Companies: 95.4% | |
| | | 7,612 | | | | Voya Emerging Markets
Index Portfolio - Class I | | | | | 67,366 | | | | | | 2.0 | | |
| | | 6,989 | | | | Voya Floating Rate Fund -
Class I | | | | | 67,440 | | | | | | 2.0 | | |
| | | 13,279 | | | | Voya High Yield Bond Fund -
Class I | | | | | 99,590 | | | | | | 3.0 | | |
| | | 4,290 | | | | Voya Intermediate Bond
Fund - Class R6 | | | | | 42,431 | | | | | | 1.3 | | |
| | | 27,469 | | | | Voya International Core
Fund - Class I | | | | | 250,240 | | | | | | 7.5 | | |
| | | 7,368 | | | | Voya International Index
Portfolio - Class I | | | | | 66,462 | | | | | | 2.0 | | |
| | | 11,220 | | | | Voya Large Cap Growth
Portfolio - Class I | | | | | 215,529 | | | | | | 6.4 | | |
| | | 13,354 | | | | Voya Large Cap Value Fund -
Class R6 | | | | | 155,841 | | | | | | 4.7 | | |
| | | 7,820 | | | | Voya MidCap Opportunities
Portfolio - Class I | | | | | 100,805 | | | | | | 3.0 | | |
| | | 15,251 | | | | Voya Multi-Manager
Emerging Markets Equity
Fund - Class I | | | | | 133,754 | | | | | | 4.0 | | |
| | | 30,852 | | | | Voya Multi-Manager
International Equity Fund -
Class I | | | | | 319,625 | | | | | | 9.6 | | |
| | | 23,507 | | | | Voya Multi-Manager Large
Cap Core Portfolio - Class I | | | | | 340,848 | | | | | | 10.2 | | |
| | | 16,644 | | | | Voya Multi-Manager Mid Cap
Value Fund - Class I | | | | | 165,603 | | | | | | 5.0 | | |
| | | 2,484 | | | | Voya Russell™ Mid Cap
Growth Index Portfolio -
Class I | | | | | 66,798 | | | | | | 2.0 | | |
| Shares | | | Value | | | Percentage
of Net
Assets | |
| MUTUAL FUNDS: (continued) | | | |
| | | | | | | Affiliated Investment Companies (continued) | |
| | | 6,765 | | | | Voya Small Company
Portfolio - Class I | | | | $ | 133,474 | | | | | | 4.0 | | |
| | | 9,585 | | | | Voya U.S. Bond Index
Portfolio - Class I | | | | | 100,839 | | | | | | 3.0 | �� | |
| | | 12,530 | | | | Voya U.S. Stock Index
Portfolio - Class I | | | | | 167,152 | | | | | | 5.0 | | |
| | | 4,283 | | | | VY® Clarion Global Real
Estate Portfolio - Class I | | | | | 50,406 | | | | | | 1.5 | | |
| | | 1,440 | | | | VY® Clarion Real Estate
Portfolio - Class I | | | | | 51,432 | | | | | | 1.5 | | |
| | | 9,764 | | | | VY® Invesco Comstock
Portfolio - Class I | | | | | 148,220 | | | | | | 4.4 | | |
| | | 8,657 | | | | VY® T. Rowe Price Capital
Appreciation Portfolio -
Class I | | | | | 226,134 | | | | | | 6.8 | | |
| | | 2,514 | @ | | VY® T. Rowe Price Growth
Equity Portfolio - Class I | | | | | 216,571 | | | | | | 6.5 | | |
| | | | | | | | | | | | 3,186,560 | | | | | | 95.4 | | |
| | | | | | | Unaffiliated Investment Companies: 0.9% | |
| | | 6,746 | @ | | Credit Suisse Commodity
Return Strategy Fund -
Class I | | | | | 30,425 | | | | | | 0.9 | | |
| | | | | | | Total Mutual Funds
(Cost $3,293,773) | | | | | 3,216,985 | | | | | | 96.3 | | |
| | | | | | | Total Investments in
Securities
(Cost $3,415,151) | | | | $ | 3,338,507 | | | | | | 99.9 | | |
| | | | | | | Assets in Excess of Other
Liabilities | | | | | 1,862 | | | | | | 0.1 | | |
| | | | | | | Net Assets | | | | $ | 3,340,369 | | | | | | 100.0 | | |
| |
@
Non-income producing security.
Cost for federal income tax purposes is $3,474,179.
Net unrealized depreciation consists of:
| | Gross Unrealized Appreciation | | | | $ | 10,657 | | |
| | Gross Unrealized Depreciation | | | | | (146,329) | | |
| | Net Unrealized Depreciation | | | | $ | (135,672) | | |
| |
See Accompanying Notes to Financial Statements
PORTFOLIO OF INVESTMENTS
| Voya Solution 2040 Portfolio | | as of December 31, 2015 (continued) |
Fair Value Measurements^
The following is a summary of the fair valuations according to the inputs used as of December 31, 2015 in valuing the assets and liabilities:
| | | | Quoted Prices
in Active Markets
for Identical
Investments
(Level 1) | | | Significant
Other
Observable
Inputs
(Level 2) | | | Significant
Unobservable
Inputs
(Level 3) | | | Fair Value
at
December 31,
2015 | |
| Asset Table | | | | | |
| Investments, at fair value | | | | | |
| Exchange-Traded Funds | | | | $ | 121,522 | | | | | $ | — | | | | | $ | — | | | | | $ | 121,522 | | |
| Mutual Funds | | | | | 3,216,985 | | | | | | — | | | | | | — | | | | | | 3,216,985 | | |
| Total Investments, at fair value | | | | $ | 3,338,507 | | | | | $ | — | | | | | $ | — | | | | | $ | 3,338,507 | | |
| |
^
See Note 2, “Significant Accounting Policies” in the Notes to Financial Statements for additional information.
Transactions with Affiliates
An investment of at least 5% of the voting securities of an issuer, or a company which is under common control results in that issuer becoming an affiliated person as defined by the 1940 Act.
The following table provides transactions during the year ended December 31, 2015, where the following issuers were considered an affiliate:
| Issuer | | | Beginning
Fair Value
at 12/31/14 | | | Purchases
at Cost | | | Sales
at Cost | | | Change in
Unrealized
Appreciation/
(Depreciation) | | | Ending
Fair Value
at 12/31/15 | | | Investment
Income | | | Realized
Gains/
(Losses) | | | Net Capital
Gain
Distributions | |
| Voya Emerging Markets Index Portfolio - Class I | | | | $ | 13,747 | | | | | $ | 73,857 | | | | | $ | (18,732) | | | | | $ | (1,506) | | | | | $ | 67,366 | | | | | $ | 317 | | | | | $ | (2,858) | | | | | $ | — | | |
| Voya Floating Rate Fund - Class I | | | | | 14,499 | | | | | | 70,173 | | | | | | (16,237) | | | | | | (995) | | | | | | 67,440 | | | | | | 1,003 | | | | | | (413) | | | | | | — | | |
| Voya High Yield Bond Fund - Class I | | | | | 28,763 | | | | | | 127,748 | | | | | | (55,400) | | | | | | (1,521) | | | | | | 99,590 | | | | | | 1,724 | | | | | | (2,260) | | | | | | — | | |
| Voya Intermediate Bond Fund - Class R6 | | | | | — | | | | | | 80,337 | | | | | | (37,511) | | | | | | (395) | | | | | | 42,431 | | | | | | 463 | | | | | | (317) | | | | | | — | | |
| Voya International Core Fund - Class I | | | | | 47,731 | | | | | | 265,117 | | | | | | (62,714) | | | | | | 106 | | | | | | 250,240 | | | | | | 2,639 | | | | | | (6,625) | | | | | | 3,597 | | |
| Voya International Index Portfolio - Class I | | | | | 27,943 | | | | | | 70,974 | | | | | | (33,696) | | | | | | 1,241 | | | | | | 66,462 | | | | | | 477 | | | | | | (726) | | | | | | — | | |
| Voya Large Cap Growth Portfolio - Class I | | | | | 54,166 | | | | | | 222,805 | | | | | | (63,484) | | | | | | 2,042 | | | | | | 215,529 | | | | | | 309 | | | | | | (714) | | | | | | 5,352 | | |
| Voya Large Cap Value Fund - Class R6 | | | | | 54,564 | | | | | | 228,626 | | | | | | (122,495) | | | | | | (4,854) | | | | | | 155,841 | | | | | | 1,367 | | | | | | (3,013) | | | | | | 5,452 | | |
| Voya MidCap Opportunities Portfolio - Class I | | | | | 21,896 | | | | | | 105,382 | | | | | | (24,981) | | | | | | (1,492) | | | | | | 100,805 | | | | | | — | | | | | | (3,251) | | | | | | 5,118 | | |
| Voya Multi-Manager Emerging Markets Equity Fund - Class I | | | | | 27,169 | | | | | | 146,668 | | | | | | (37,623) | | | | | | (2,460) | | | | | | 133,754 | | | | | | 1,912 | | | | | | (5,866) | | | | | | — | | |
| Voya Multi-Manager International Equity Fund - Class I | | | | | 57,663 | | | | | | 341,382 | | | | | | (76,906) | | | | | | (2,514) | | | | | | 319,625 | | | | | | 3,936 | | | | | | (5,718) | | | | | | 2,897 | | |
| Voya Multi-Manager Large Cap Core Portfolio - Class I | | | | | 49,453 | | | | | | 467,331 | | | | | | (172,122) | | | | | | (3,814) | | | | | | 340,848 | | | | | | 3,111 | | | | | | (2,210) | | | | | | 5,264 | | |
| Voya Multi-Manager Mid Cap Value Fund - Class I | | | | | 50,721 | | | | | | 208,124 | | | | | | (69,377) | | | | | | (23,865) | | | | | | 165,603 | | | | | | 1,965 | | | | | | (6,364) | | | | | | 25,356 | | |
| Voya Russell™ Mid Cap Growth Index Portfolio - Class I | | | | | 29,047 | | | | | | 80,859 | | | | | | (39,936) | | | | | | (3,172) | | | | | | 66,798 | | | | | | 142 | | | | | | 2,821 | | | | | | — | | |
| Voya Small Company Portfolio - Class I | | | | | 29,445 | | | | | | 138,485 | | | | | | (30,675) | | | | | | (3,781) | | | | | | 133,474 | | | | | | 161 | | | | | | (1,766) | | | | | | 4,648 | | |
| Voya U.S. Bond Index Portfolio - Class I | | | | | — | | | | | | 189,109 | | | | | | (87,238) | | | | | | (1,032) | | | | | | 100,839 | | | | | | 683 | | | | | | 156 | | | | | | — | | |
| Voya U.S. Stock Index Portfolio - Class I | | | | | 29,429 | | | | | | 204,334 | | | | | | (64,634) | | | | | | (1,977) | | | | | | 167,152 | | | | | | 2,749 | | | | | | (3,796) | | | | | | 4,335 | | |
| VY® Clarion Global Real Estate Portfolio - Class I | | | | | — | | | | | | 58,798 | | | | | | (8,787) | | | | | | 395 | | | | | | 50,406 | | | | | | 1 | | | | | | (88) | | | | | | — | | |
| VY® Clarion Real Estate Portfolio - Class I | | | | | 15,106 | | | | | | 62,627 | | | | | | (26,186) | | | | | | (115) | | | | | | 51,432 | | | | | | 273 | | | | | | 2,199 | | | | | | — | | |
| VY® Invesco Comstock Portfolio - Class I | | | | | 21,670 | | | | | | 167,753 | | | | | | (35,665) | | | | | | (5,538) | | | | | | 148,220 | | | | | | 3,423 | | | | | | (783) | | | | | | — | | |
| VY® T. Rowe Price Capital Appreciation Portfolio - Class I | | | | | 52,791 | | | | | | 248,907 | | | | | | (74,570) | | | | | | (994) | | | | | | 226,134 | | | | | | 2,991 | | | | | | (5,227) | | | | | | 7,498 | | |
| VY® T. Rowe Price Growth Equity Portfolio - Class I | | | | | 50,382 | | | | | | 225,553 | | | | | | (61,301) | | | | | | 1,937 | | | | | | 216,571 | | | | | | — | | | | | | (456) | | | | | | 7,706 | | |
| | | | | $ | 676,185 | | | | | $ | 3,784,949 | | | | | $ | (1,220,270) | | | | | $ | (54,304) | | | | | $ | 3,186,560 | | | | | $ | 29,646 | | | | | $ | (47,275) | | | | | $ | 77,223 | | |
| |
The financial statements for the above mutual fund[s] can be found at www.sec.gov.
See Accompanying Notes to Financial Statements
PORTFOLIO OF INVESTMENTS
| Voya Solution 2045 Portfolio | as of December 31, 2015 |
| Shares | | | Value | | | Percentage
of Net
Assets | |
| EXCHANGE-TRADED FUNDS: 5.1% | |
| | | 55,783 | | | | iShares Barclays 20+ Year
Treasury Bond Fund | | | | $ | 6,728,546 | | | | | | 1.0 | | |
| | | 134,950 | | | | iShares Russell 1000 Value
Index Fund | | | | | 13,206,207 | | | | | | 2.0 | | |
| | | 65,126 | | | | SPDR Trust Series 1 | | | | | 13,278,540 | | | | | | 2.1 | | |
| | | | | | | Total Exchange-Traded Funds
(Cost $33,459,666) | | | | | 33,213,293 | | | | | | 5.1 | | |
| MUTUAL FUNDS: 94.8% | |
| | | | | | | Affiliated Investment Companies: 93.8% | |
| | | 1,413,397 | | | | Voya Emerging Markets Index
Portfolio - Class I | | | | | 12,508,562 | | | | | | 1.9 | | |
| | | 1,195,326 | | | | Voya Floating Rate Fund -
Class I | | | | | 11,534,895 | | | | | | 1.8 | | |
| | | 1,508,281 | | | | Voya Intermediate Bond
Fund - Class R6 | | | | | 14,916,903 | | | | | | 2.3 | | |
| | | 5,343,849 | | | | Voya International Core
Fund - Class I | | | | | 48,682,468 | | | | | | 7.5 | | |
| | | 2,505,795 | | | | Voya International Index
Portfolio - Class I | | | | | 22,602,274 | | | | | | 3.5 | | |
| | | 2,569,322 | | | | Voya Large Cap Growth
Portfolio - Class I | | | | | 49,356,685 | | | | | | 7.6 | | |
| | | 3,299,963 | | | | Voya Large Cap Value Fund -
Class R6 | | | | | 38,510,566 | | | | | | 5.9 | | |
| | | 1,525,797 | | | | Voya MidCap Opportunities
Portfolio - Class I | | | | | 19,667,524 | | | | | | 3.0 | | |
| | | 2,896,802 | | | | Voya Multi-Manager Emerging
Markets Equity Fund - Class I | | | | | 25,404,950 | | | | | | 3.9 | | |
| | | 6,263,196 | | | | Voya Multi-Manager
International Equity Fund -
Class I | | | | | 64,886,708 | | | | | | 10.0 | | |
| | | 4,477,070 | | | | Voya Multi-Manager Large Cap
Core Portfolio - Class I | | | | | 64,917,522 | | | | | | 10.0 | | |
| | | 3,565,561 | | | | Voya Multi-Manager Mid Cap
Value Fund - Class I | | | | | 35,477,328 | | | | | | 5.4 | | |
| | | 604,624 | | | | Voya Russell™ Mid Cap
Growth Index Portfolio -
Class I | | | | | 16,258,347 | | | | | | 2.5 | | |
| Shares | | | Value | | | Percentage
of Net
Assets | |
| MUTUAL FUNDS: (continued) | |
| | | | | | | Affiliated Investment Companies (continued) | |
| | | 1,325,683 | | | | Voya Small Company
Portfolio - Class I | | | | $ | 26,155,720 | | | | | | 4.0 | | |
| | | 1,242,447 | | | | Voya U.S. Bond Index
Portfolio - Class I | | | | | 13,070,537 | | | | | | 2.0 | | |
| | | 3,420,651 | | | | Voya U.S. Stock Index
Portfolio - Class I | | | | | 45,631,486 | | | | | | 7.0 | | |
| | | 832,037 | | | | VY® Clarion Global Real
Estate Portfolio - Class I | | | | | 9,793,080 | | | | | | 1.5 | | |
| | | 279,994 | | | | VY® Clarion Real Estate
Portfolio - Class I | | | | | 9,998,583 | | | | | | 1.5 | | |
| | | 2,108,965 | | | | VY® Invesco Comstock
Portfolio - Class I | | | | | 32,014,093 | | | | | | 4.9 | | |
| | | 572,602 | @ | | VY® T. Rowe Price Growth
Equity Portfolio - Class I | | | | | 49,323,932 | | | | | | 7.6 | | |
| | | | | | | | | | | | 610,712,163 | | | | | | 93.8 | | |
| | | | | | | Unaffiliated Investment Companies: 1.0% | |
| | | 1,383,189 | @ | | Credit Suisse Commodity
Return Strategy Fund -
Class I | | | | | 6,238,183 | | | | | | 1.0 | | |
| | | | | | | Total Mutual Funds
(Cost $650,756,502) | | | | | 616,950,346 | | | | | | 94.8 | | |
| | | | | | | Total Investments in
Securities
(Cost $684,216,168) | | | | $ | 650,163,639 | | | | | | 99.9 | | |
| | | | | | | Assets in Excess of Other
Liabilities | | | | | 538,897 | | | | | | 0.1 | | |
| | | | | | | Net Assets | | | | $ | 650,702,536 | | | | | | 100.0 | | |
| |
@
Non-income producing security.
Cost for federal income tax purposes is $689,374,495.
Net unrealized depreciation consists of:
| | Gross Unrealized Appreciation | | | | $ | 11,618,284 | | |
| | Gross Unrealized Depreciation | | | | | (50,829,140) | | |
| | Net Unrealized Depreciation | | | | $ | (39,210,856) | | |
| |
See Accompanying Notes to Financial Statements
PORTFOLIO OF INVESTMENTS
| Voya Solution 2045 Portfolio | as of December 31, 2015 (continued) |
Fair Value Measurements^
The following is a summary of the fair valuations according to the inputs used as of December 31, 2015 in valuing the assets and liabilities:
| | | | Quoted Prices
in Active Markets
for Identical
Investments
(Level 1) | | | Significant
Other
Observable
Inputs
(Level 2) | | | Significant
Unobservable
Inputs
(Level 3) | | | Fair Value
at
December 31,
2015 | |
| Asset Table | | | | | |
| Investments, at fair value | | | | | |
| Exchange-Traded Funds | | | | $ | 33,213,293 | | | | | $ | — | | | | | $ | — | | | | | $ | 33,213,293 | | |
| Mutual Funds | | | | | 616,950,346 | | | | | | — | | | | | | — | | | | | | 616,950,346 | | |
| Total Investments, at fair value | | | | $ | 650,163,639 | | | | | $ | — | | | | | $ | — | | | | | $ | 650,163,639 | | |
| |
^
See Note 2, “Significant Accounting Policies” in the Notes to Financial Statements for additional information.
Transactions with Affiliates
An investment of at least 5% of the voting securities of an issuer, or a company which is under common control results in that issuer becoming an affiliated person as defined by the 1940 Act.
The following table provides transactions during the year ended December 31, 2015, where the following issuers were considered an affiliate:
| Issuer | | | Beginning
Fair Value
at 12/31/14 | | | Purchases
at Cost | | | Sales
at Cost | | | Change in
Unrealized
Appreciation/
(Depreciation) | | | Ending
Fair Value
at 12/31/15 | | | Investment
Income | | | Realized
Gains/
(Losses) | | | Net Capital
Gain
Distributions | |
Voya Emerging Markets Index Portfolio -
Class I | | | | $ | 13,754,033 | | | | | $ | 4,353,945 | | | | | $ | (3,640,653) | | | | | $ | (1,958,763) | | | | | $ | 12,508,562 | | | | | $ | 277,922 | | | | | $ | (435,172) | | | | | $ | — | | |
| Voya Floating Rate Fund - Class I | | | | | 12,730,621 | | | | | | 2,661,284 | | | | | | (3,519,547) | | | | | | (337,463) | | | | | | 11,534,895 | | | | | | 504,987 | | | | | | (81,583) | | | | | | — | | |
| Voya Intermediate Bond Fund - Class R6 | | | | | 7,354,485 | | | | | | 19,048,507 | | | | | | (11,040,938) | | | | | | (445,151) | | | | | | 14,916,903 | | | | | | 287,567 | | | | | | 30,130 | | | | | | — | | |
| Voya International Core Fund - Class I | | | | | 53,160,069 | | | | | | 6,230,018 | | | | | | (9,397,520) | | | | | | (1,310,099) | | | | | | 48,682,468 | | | | | | 540,683 | | | | | | 1,036,004 | | | | | | 736,869 | | |
| Voya International Index Portfolio - Class I | | | | | 27,995,759 | | | | | | 3,953,528 | | | | | | (8,667,459) | | | | | | (679,554) | | | | | | 22,602,274 | | | | | | 735,516 | | | | | | 180,309 | | | | | | — | | |
| Voya Large Cap Growth Portfolio - Class I | | | | | 54,320,049 | | | | | | 10,221,450 | | | | | | (9,927,768) | | | | | | (5,257,046) | | | | | | 49,356,685 | | | | | | 302,928 | | | | | | 3,093,519 | | | | | | 5,242,343 | | |
| Voya Large Cap Value Fund - Class R6 | | | | | 53,853,890 | | | | | | 10,761,915 | | | | | | (20,846,685) | | | | | | (5,258,554) | | | | | | 38,510,566 | | | | | | 781,350 | | | | | | 49,613 | | | | | | 2,885,598 | | |
| Voya MidCap Opportunities Portfolio - Class I | | | | | 21,963,056 | | | | | | 4,625,319 | | | | | | (3,650,359) | | | | | | (3,270,492) | | | | | | 19,667,524 | | | | | | — | | | | | | 450,793 | | | | | | 2,976,420 | | |
Voya Multi-Manager Emerging Markets Equity
Fund - Class I | | | | | 27,176,171 | | | | | | 9,074,386 | | | | | | (6,932,810) | | | | | | (3,912,797) | | | | | | 25,404,950 | | | | | | 382,133 | | | | | | (595,394) | | | | | | — | | |
| Voya Multi-Manager International Equity Fund - Class I | | | | | 66,523,666 | | | | | | 11,493,726 | | | | | | (10,842,466) | | | | | | (2,288,218) | | | | | | 64,886,708 | | | | | | 841,175 | | | | | | 1,184,218 | | | | | | 618,943 | | |
Voya Multi-Manager Large Cap Core Portfolio -
Class I | | | | | 51,452,573 | | | | | | 34,463,334 | | | | | | (13,923,821) | | | | | | (7,074,564) | | | | | | 64,917,522 | | | | | | 682,867 | | | | | | 1,630,502 | | | | | | 4,381,225 | | |
| Voya Multi-Manager Mid Cap Value Fund - Class I | | | | | 50,851,121 | | | | | | 9,597,139 | | | | | | (18,143,708) | | | | | | (6,827,224) | | | | | | 35,477,328 | | | | | | 443,338 | | | | | | (297,594) | | | | | | 5,721,877 | | |
| Voya Russell™ Mid Cap Growth Index Portfolio - Class I | | | | | 29,130,073 | | | | | | 1,724,399 | | | | | | (12,576,643) | | | | | | (2,019,482) | | | | | | 16,258,347 | | | | | | 155,533 | | | | | | 2,446,529 | | | | | | — | | |
| Voya Small Company Portfolio - Class I | | | | | 29,542,471 | | | | | | 6,577,627 | | | | | | (4,683,577) | | | | | | (5,280,801) | | | | | | 26,155,720 | | | | | | 140,853 | | | | | | 923,342 | | | | | | 4,068,500 | | |
| Voya U.S. Bond Index Portfolio - Class I | | | | | — | | | | | | 16,244,964 | | | | | | (2,993,154) | | | | | | (181,273) | | | | | | 13,070,537 | | | | | | 144,164 | | | | | | (1,694) | | | | | | — | | |
| Voya U.S. Stock Index Portfolio - Class I | | | | | 39,043,632 | | | | | | 32,619,063 | | | | | | (21,711,212) | | | | | | (4,319,997) | | | | | | 45,631,486 | | | | | | 881,629 | | | | | | (1,251,584) | | | | | | 4,937,221 | | |
VY® Clarion Global Real Estate Portfolio - Class I | | | | | — | | | | | | 10,793,770 | | | | | | (883,876) | | | | | | (116,814) | | | | | | 9,793,080 | | | | | | 1,127 | | | | | | (30,467) | | | | | | — | | |
| VY® Clarion Real Estate Portfolio - Class I | | | | | 15,180,551 | | | | | | 3,202,641 | | | | | | (6,538,929) | | | | | | (1,845,680) | | | | | | 9,998,583 | | | | | | 231,389 | | | | | | 2,053,908 | | | | | | — | | |
| VY® Invesco Comstock Portfolio - Class I | | | | | 21,724,700 | | | | | | 19,193,251 | | | | | | (5,324,415) | | | | | | (3,579,443) | | | | | | 32,014,093 | | | | | | 890,091 | | | | | | 465,336 | | | | | | — | | |
VY® T. Rowe Price Capital Appreciation Portfolio - Class I | | | | | 42,007,144 | | | | | | 1,318,642 | | | | | | (39,542,002) | | | | | | (3,783,784) | | | | | | — | | | | | | — | | | | | | 4,980,201 | | | | | | — | | |
VY® T. Rowe Price Growth Equity Portfolio - Class I | | | | | 54,125,848 | | | | | | 12,205,535 | | | | | | (10,526,474) | | | | | | (6,480,977) | | | | | | 49,323,932 | | | | | | — | | | | | | 4,755,510 | | | | | | 7,452,148 | | |
| | | | | $ | 671,889,912 | | | | | $ | 230,364,443 | | | | | $ | (225,314,016) | | | | | $ | (66,228,176) | | | | | $ | 610,712,163 | | | | | $ | 8,225,252 | | | | | $ | 20,586,426 | | | | | $ | 39,021,144 | | |
| |
The financial statements for the above mutual fund[s] can be found at www.sec.gov.
See Accompanying Notes to Financial Statements
PORTFOLIO OF INVESTMENTS
| Voya Solution 2045 Portfolio | as of December 31, 2015 (continued) |
The effect of derivative instruments by primary risk exposure on the Portfolio’s Statement of Operations for the year ended December 31, 2015 was as follows:
| | | | Amount of Realized Gain or (Loss) on
Derivatives Recognized in Income | |
| Derivatives not accounted for as hedging instruments | | | Futures | |
| Equity contracts | | | | $ | (140,556) | | |
| Interest rate contracts | | | | | (142,787) | | |
| Total | | | | $ | (283,343) | | |
| |
| | | | Change in Unrealized Appreciation or (Depreciation)
on Derivatives Recognized in Income | |
| Derivatives not accounted for as hedging instruments | | | Futures | |
| Equity contracts | | | | $ | 383,936 | | |
| Total | | | | $ | 383,936 | | |
| |
See Accompanying Notes to Financial Statements
PORTFOLIO OF INVESTMENTS
| Voya Solution 2050 Portfolio | as of December 31, 2015 |
| Shares | | | Value | | | Percentage
of Net
Assets | |
| EXCHANGE-TRADED FUNDS: 4.3% | |
| | | 105 | | | | iShares Barclays 20+ Year
Treasury Bond Fund | | | | $ | 12,665 | | | | | | 0.7 | | |
| | | 304 | | | | iShares Russell 1000 Value
Index Fund | | | | | 29,750 | | | | | | 1.8 | | |
| | | 145 | | | | SPDR Trust Series 1 | | | | | 29,564 | | | | | | 1.8 | | |
| | | | | | | Total Exchange-Traded Funds
(Cost $72,366) | | | | | 71,979 | | | | | | 4.3 | | |
| MUTUAL FUNDS: 95.6% | |
| | | | | | | Affiliated Investment Companies: 94.7% | |
| | | 3,659 | | | | Voya Emerging Markets Index
Portfolio - Class I | | | | | 32,383 | | | | | | 1.9 | | |
| | | 3,065 | | | | Voya Floating Rate Fund -
Class I | | | | | 29,581 | | | | | | 1.8 | | |
| | | 3,870 | | | | Voya Intermediate Bond
Fund - Class R6 | | | | | 38,274 | | | | | | 2.3 | | |
| | | 13,800 | | | | Voya International Core
Fund - Class I | | | | | 125,717 | | | | | | 7.5 | | |
| | | 6,477 | | | | Voya International Index
Portfolio - Class I | | | | | 58,422 | | | | | | 3.5 | | |
| | | 6,612 | | | | Voya Large Cap Growth
Portfolio - Class I | | | | | 127,012 | | | | | | 7.6 | | |
| | | 9,044 | | | | Voya Large Cap Value Fund -
Class R6 | | | | | 105,544 | | | | | | 6.3 | | |
| | | 3,929 | | | | Voya MidCap Opportunities
Portfolio - Class I | | | | | 50,639 | | | | | | 3.0 | | |
| | | 7,470 | | | | Voya Multi-Manager
Emerging Markets Equity
Fund - Class I | | | | | 65,514 | | | | | | 3.9 | | |
| | | 16,168 | | | | Voya Multi-Manager
International Equity Fund -
Class I | | | | | 167,504 | | | | | | 10.0 | | |
| | | 12,039 | | | | Voya Multi-Manager Large
Cap Core Portfolio - Class I | | | | | 174,565 | | | | | | 10.4 | | |
| | | 9,206 | | | | Voya Multi-Manager Mid Cap
Value Fund - Class I | | | | | 91,602 | | | | | | 5.4 | | |
| | | 1,560 | | | | Voya Russell™ Mid Cap
Growth Index Portfolio -
Class I | | | | | 41,943 | | | | | | 2.5 | | |
| Shares | | | Value | | | Percentage
of Net
Assets | |
| MUTUAL FUNDS: (continued) | |
| | | | | | | Affiliated Investment Companies (continued) | |
| | | 3,401 | | | | Voya Small Company
Portfolio - Class I | | | | $ | 67,095 | | | | | | 4.0 | | |
| | | 3,353 | | | | Voya U.S. Bond Index
Portfolio - Class I | | | | | 35,276 | | | | | | 2.1 | | |
| | | 8,821 | | | | Voya U.S. Stock Index
Portfolio - Class I | | | | | 117,677 | | | | | | 7.0 | | |
| | | 2,155 | | | | VY® Clarion Global Real
Estate Portfolio - Class I | | | | | 25,360 | | | | | | 1.5 | | |
| | | 725 | | | | VY® Clarion Real Estate
Portfolio - Class I | | | | | 25,893 | | | | | | 1.5 | | |
| | | 5,448 | | | | VY® Invesco Comstock
Portfolio - Class I | | | | | 82,695 | | | | | | 4.9 | | |
| | | 1,474 | @ | | VY® T. Rowe Price Growth
Equity Portfolio - Class I | | | | | 127,011 | | | | | | 7.6 | | |
| | | | | | | | | | | | 1,589,707 | | | | | | 94.7 | | |
| | | | | | | Unaffiliated Investment Companies: 0.9% | |
| | | 3,294 | @ | | Credit Suisse Commodity
Return Strategy Fund -
Class I | | | | | 14,858 | | | | | | 0.9 | | |
| | | | | | | Total Mutual Funds
(Cost $1,649,306) | | | | | 1,604,565 | | | | | | 95.6 | | |
| | | | | | | Total Investments in
Securities
(Cost $1,721,672) | | | | $ | 1,676,544 | | | | | | 99.9 | | |
| | | | | | | Assets in Excess of Other
Liabilities | | | | | 1,689 | | | | | | 0.1 | | |
| | | | | | | Net Assets | | | | $ | 1,678,233 | | | | | | 100.0 | | |
| |
@
Non-income producing security.
Cost for federal income tax purposes is $1,743,566.
Net unrealized depreciation consists of:
| | Gross Unrealized Appreciation | | | | $ | 4,969 | | |
| | Gross Unrealized Depreciation | | | | | (71,991) | | |
| | Net Unrealized Depreciation | | | | $ | (67,022) | | |
| |
See Accompanying Notes to Financial Statements
PORTFOLIO OF INVESTMENTS
| Voya Solution 2050 Portfolio | as of December 31, 2015 (continued) |
Fair Value Measurements^
The following is a summary of the fair valuations according to the inputs used as of December 31, 2015 in valuing the assets and liabilities:
| | | | Quoted Prices
in Active Markets
for Identical
Investments
(Level 1) | | | Significant
Other
Observable
Inputs
(Level 2) | | | Significant
Unobservable
Inputs
(Level 3) | | | Fair Value
at
December 31,
2015 | |
| Asset Table | | | | | |
| Investments, at fair value | | | | | |
| Exchange-Traded Funds | | | | $ | 71,979 | | | | | $ | — | | | | | $ | — | | | | | $ | 71,979 | | |
| Mutual Funds | | | | | 1,604,565 | | | | | | — | | | | | | — | | | | | | 1,604,565 | | |
| Total Investments, at fair value | | | | $ | 1,676,544 | | | | | $ | — | | | | | $ | — | | | | | $ | 1,676,544 | | |
| |
^
See Note 2, “Significant Accounting Policies” in the Notes to Financial Statements for additional information.
Transactions with Affiliates
An investment of at least 5% of the voting securities of an issuer, or a company which is under common control results in that issuer becoming an affiliated person as defined by the 1940 Act.
The following table provides transactions during the year ended December 31, 2015, where the following issuers were considered an affiliate:
| Issuer | | | Beginning
Fair Value
at 12/31/14 | | | Purchases
at Cost | | | Sales
at Cost | | | Change in
Unrealized
Appreciation/
(Depreciation) | | | Ending
Fair Value
at 12/31/15 | | | Investment
Income | | | Realized
Gains/
(Losses) | | | Net Capital
Gain
Distributions | |
| Voya Emerging Markets Index Portfolio - Class I | | | | $ | 7,130 | | | | | $ | 31,790 | | | | | $ | (5,153) | | | | | $ | (1,384) | | | | | $ | 32,383 | | | | | $ | 166 | | | | | $ | (953) | | | | | $ | — | | |
| Voya Floating Rate Fund - Class I | | | | | 6,581 | | | | | | 27,595 | | | | | | (4,063) | | | | | | (532) | | | | | | 29,581 | | | | | | 465 | | | | | | (132) | | | | | | — | | |
| Voya Intermediate Bond Fund - Class R6 | | | | | 3,800 | | | | | | 45,372 | | | | | | (10,540) | | | | | | (358) | | | | | | 38,274 | | | | | | 324 | | | | | | (85) | | | | | | — | | |
| Voya International Core Fund - Class I | | | | | 27,511 | | | | | | 116,164 | | | | | | (17,714) | | | | | | (244) | | | | | | 125,717 | | | | | | 1,251 | | | | | | (2,701) | | | | | | 1,705 | | |
| Voya International Index Portfolio - Class I | | | | | 14,495 | | | | | | 53,841 | | | | | | (9,810) | | | | | | (104) | | | | | | 58,422 | | | | | | 440 | | | | | | (665) | | | | | | — | | |
| Voya Large Cap Growth Portfolio - Class I | | | | | 28,097 | | | | | | 115,850 | | | | | | (17,456) | | | | | | 521 | | | | | | 127,012 | | | | | | 180 | | | | | | 173 | | | | | | 3,122 | | |
| Voya Large Cap Value Fund - Class R6 | | | | | 28,335 | | | | | | 120,654 | | | | | | (41,025) | | | | | | (2,420) | | | | | | 105,544 | | | | | | 942 | | | | | | (2,704) | | | | | | 3,295 | | |
| Voya MidCap Opportunities Portfolio - Class I | | | | | 11,358 | | | | | | 48,414 | | | | | | (6,887) | | | | | | (2,246) | | | | | | 50,639 | | | | | | — | | | | | | (993) | | | | | | 3,317 | | |
| Voya Multi-Manager Emerging Markets Equity Fund - Class I | | | | | 14,092 | | | | | | 66,681 | | | | | | (13,264) | | | | | | (1,995) | | | | | | 65,514 | | | | | | 881 | | | | | | (2,408) | | | | | | — | | |
| Voya Multi-Manager International Equity Fund - Class I | | | | | 34,443 | | | | | | 156,121 | | | | | | (21,243) | | | | | | (1,817) | | | | | | 167,504 | | | | | | 1,945 | | | | | | (2,268) | | | | | | 1,431 | | |
| Voya Multi-Manager Large Cap Core Portfolio - Class I | | | | | 26,573 | | | | | | 202,673 | | | | | | (53,908) | | | | | | (773) | | | | | | 174,565 | | | | | | 1,578 | | | | | | (2,097) | | | | | | 2,614 | | |
| Voya Multi-Manager Mid Cap Value Fund - Class I | | | | | 26,309 | | | | | | 108,880 | | | | | | (30,848) | | | | | | (12,739) | | | | | | 91,602 | | | | | | 1,024 | | | | | | (3,390) | | | | | | 13,219 | | |
| Voya Russell™ Mid Cap Growth Index Portfolio - Class I | | | | | 15,067 | | | | | | 52,531 | | | | | | (23,873) | | | | | | (1,782) | | | | | | 41,943 | | | | | | 93 | | | | | | 1,463 | | | | | | — | | |
| Voya Small Company Portfolio - Class I | | | | | 15,273 | | | | | | 62,869 | | | | | | (8,203) | | | | | | (2,844) | | | | | | 67,095 | | | | | | 84 | | | | | | (268) | | | | | | 2,431 | | |
| Voya U.S. Bond Index Portfolio - Class I | | | | | — | | | | | | 75,017 | | | | | | (39,425) | | | | | | (316) | | | | | | 35,276 | | | | | | 272 | | | | | | — | | | | | | — | | |
| Voya U.S. Stock Index Portfolio - Class I | | | | | 20,907 | | | | | | 122,047 | | | | | | (23,012) | | | | | | (2,265) | | | | | | 117,677 | | | | | | 1,918 | | | | | | (1,504) | | | | | | 2,932 | | |
| VY® Clarion Global Real Estate Portfolio - Class I | | | | | — | | | | | | 27,961 | | | | | | (2,964) | | | | | | 363 | | | | | | 25,360 | | | | | | 1 | | | | | | (96) | | | | | | — | | |
| VY® Clarion Real Estate Portfolio - Class I | | | | | 7,836 | | | | | | 26,876 | | | | | | (9,285) | | | | | | 466 | | | | | | 25,893 | | | | | | 138 | | | | | | 652 | | | | | | — | | |
| VY® Invesco Comstock Portfolio - Class I | | | | | 11,240 | | | | | | 85,198 | | | | | | (9,855) | | | | | | (3,888) | | | | | | 82,695 | | | | | | 1,896 | | | | | | 139 | | | | | | — | | |
| VY® T. Rowe Price Capital Appreciation Portfolio - Class I | | | | | 21,719 | | | | | | 3,333 | | | | | | (25,345) | | | | | | 293 | | | | | | — | | | | | | — | | | | | | 340 | | | | | | — | | |
| VY® T. Rowe Price Growth Equity Portfolio - Class I | | | | | 28,002 | | | | | | 117,430 | | | | | | (18,368) | | | | | | (53) | | | | | | 127,011 | | | | | | — | | | | | | 663 | | | | | | 4,454 | | |
| | | | | $ | 348,768 | | | | | $ | 1,667,297 | | | | | $ | (392,241) | | | | | $ | (34,117) | | | | | $ | 1,589,707 | | | | | $ | 13,598 | | | | | $ | (16,834) | | | | | $ | 38,520 | | |
| |
The financial statements for the above mutual fund[s] can be found at www.sec.gov.
See Accompanying Notes to Financial Statements
PORTFOLIO OF INVESTMENTS
| Voya Solution 2055 Portfolio | as of December 31, 2015 |
| | Shares | | | Value | | | Percentage
of Net
Assets | |
| | EXCHANGE-TRADED FUNDS: 4.6% | |
| | | | 7,908 | | | | iShares Barclays 20+ Year
Treasury Bond Fund | | | | $ | 953,863 | | | | | | 0.7 | | |
| | | | 25,502 | | | | iShares Russell 1000 Value
Index Fund | | | | | 2,495,626 | | | | | | 1.9 | | |
| | | | 12,306 | | | | SPDR Trust Series 1 | | | | | 2,509,070 | | | | | | 2.0 | | |
| | | | | | | | Total Exchange-Traded
Funds
(Cost $5,987,128) | | | | | 5,958,559 | | | | | | 4.6 | | |
| | MUTUAL FUNDS: 95.3% | |
| | | | | | | | Affiliated Investment Companies: 94.4% | |
| | | | 280,513 | | | | Voya Emerging Markets Index
Portfolio - Class I | | | | | 2,482,539 | | | | | | 1.9 | | |
| | | | 297,230 | | | | Voya Intermediate Bond Fund -
Class R6 | | | | | 2,939,607 | | | | | | 2.3 | | |
| | | | 1,056,177 | | | | Voya International Core Fund -
Class I | | | | | 9,621,776 | | | | | | 7.5 | | |
| | | | 495,593 | | | | Voya International Index
Portfolio - Class I | | | | | 4,470,245 | | | | | | 3.5 | | |
| | | | 507,018 | | | | Voya Large Cap Growth
Portfolio - Class I | | | | | 9,739,815 | | | | | | 7.6 | | |
| | | | 659,765 | | | | Voya Large Cap Value Fund -
Class R6 | | | | | 7,699,454 | | | | | | 6.0 | | |
| | | | 301,083 | | | | Voya MidCap Opportunities
Portfolio - Class I | | | | | 3,880,959 | | | | | | 3.0 | | |
| | | | 571,197 | | | | Voya Multi-Manager Emerging
Markets Equity Fund - Class I | | | | | 5,009,401 | | | | | | 3.9 | | |
| | | | 1,237,173 | | | | Voya Multi-Manager
International Equity Fund -
Class I | | | | | 12,817,117 | | | | | | 10.0 | | |
| | | | 894,725 | | | | Voya Multi-Manager Large Cap
Core Portfolio - Class I | | | | | 12,973,510 | | | | | | 10.1 | | |
| | | | 703,805 | | | | Voya Multi-Manager Mid Cap
Value Fund - Class I | | | | | 7,002,864 | | | | | | 5.5 | | |
| | | | 119,335 | | | | Voya Russel™ Mid Cap
Growth Index Portfolio -
Class I | | | | | 3,208,924 | | | | | | 2.5 | | |
| | Shares | | | Value | | | Percentage
of Net
Assets | |
| | MUTUAL FUNDS: (continued) | |
| | | | | | | | Affiliated Investment Companies (continued) | |
| | | | 261,527 | | | | Voya Small Company
Portfolio - Class I | | | | $ | 5,159,922 | | | | | | 4.0 | | |
| | | | 249,247 | | | | Voya U.S. Bond Index
Portfolio - Class I | | | | | 2,622,075 | | | | | | 2.1 | | |
| | | | 867,127 | | | | Voya U.S. Stock Index
Portfolio - Class I | | | | | 11,567,479 | | | | | | 9.0 | | |
| | | | 165,528 | | | | VY® Clarion Global Real
Estate Portfolio - Class I | | | | | 1,948,269 | | | | | | 1.5 | | |
| | | | 55,132 | | | | VY® Clarion Real Estate
Portfolio - Class I | | | | | 1,968,763 | | | | | | 1.5 | | |
| | | | 416,313 | | | | VY® Invesco Comstock
Portfolio - Class I | | | | | 6,319,628 | | | | | | 4.9 | | |
| | | | 112,962 | @ | | VY® T. Rowe Price Growth
Equity Portfolio - Class I | | | | | 9,730,542 | | | | | | 7.6 | | |
| | | | | | | | | | | | | 121,162,889 | | | | | | 94.4 | | |
| | | | | | | | Unaffiliated Investment Companies: 0.9% | |
| | | | 266,310 | @ | | Credit Suisse Commodity
Return Strategy Fund -
Class I | | | | | 1,201,057 | | | | | | 0.9 | | |
| | | | | | | | Total Mutual Funds
(Cost $132,588,331) | | | | | 122,363,946 | | | | | | 95.3 | | |
| | | | | | | | Total Investments in
Securities
(Cost $138,575,459) | | | | $ | 128,322,505 | | | | | | 99.9 | | |
| | | | | | | | Assets in Excess of Other
Liabilities | | | | | 75,167 | | | | | | 0.1 | | |
| | | | | | | | Net Assets | | | | $ | 128,397,672 | | | | | | 100.0 | | |
| |
@
Non-income producing security.
Cost for federal income tax purposes is $139,659,844.
Net unrealized depreciation consists of:
| | Gross Unrealized Appreciation | | | | $ | 492,114 | | |
| | Gross Unrealized Depreciation | | | | | (11,829,453) | | |
| | Net Unrealized Depreciation | | | | $ | (11,337,339) | | |
| |
Fair Value Measurements^
The following is a summary of the fair valuations according to the inputs used as of December 31, 2015 in valuing the assets and liabilities:
| | | | Quoted Prices
in Active Markets
for Identical
Investments
(Level 1) | | | Significant
Other
Observable
Inputs
(Level 2) | | | Significant
Unobservable
Inputs
(Level 3) | | | Fair Value
at
December 31,
2015 | |
| Asset Table | | | | | |
| Investments, at fair value | | | | | |
| Exchange-Traded Funds | | | | $ | 5,958,559 | | | | | $ | — | | | | | $ | — | | | | | $ | 5,958,559 | | |
| Mutual Funds | | | | | 122,363,946 | | | | | | — | | | | | | — | | | | | | 122,363,946 | | |
| Total Investments, at fair value | | | | $ | 128,322,505 | | | | | $ | — | | | | | $ | — | | | | | $ | 128,322,505 | | |
| |
^
See Note 2, “Significant Accounting Policies” in the Notes to Financial Statements for additional information.
See Accompanying Notes to Financial Statements
PORTFOLIO OF INVESTMENTS
| Voya Solution 2055 Portfolio | as of December 31, 2015 (continued) |
Transactions with Affiliates
An investment of at least 5% of the voting securities of an issuer, or a company which is under common control results in that issuer becoming an affiliated person as defined by the 1940 Act.
The following table provides transactions during the year ended December 31, 2015, where the following issuers were considered an affiliate:
| Issuer | | | Beginning
Fair Value
at 12/31/14 | | | Purchases
at Cost | | | Sales
at Cost | | | Change in
Unrealized
Appreciation/
(Depreciation) | | | Ending
Fair Value
at 12/31/15 | | | Investment
Income | | | Realized
Gains/
(Losses) | | | Net Capital
Gain
Distributions | |
| Voya Emerging Markets Index Portfolio - Class I | | | | $ | 2,096,154 | | | | | $ | 1,274,093 | | | | | $ | (493,501) | | | | | $ | (394,207) | | | | | $ | 2,482,539 | | | | | $ | 46,235 | | | | | $ | (54,875) | | | | | $ | — | | |
| Voya Intermediate Bond Fund - Class R6 | | | | | 838,169 | | | | | | 3,671,965 | | | | | | (1,497,542) | | | | | | (72,985) | | | | | | 2,939,607 | | | | | | 52,469 | | | | | | (3,434) | | | | | | — | | |
| Voya International Core Fund - Class I | | | | | 8,088,480 | | | | | | 3,118,160 | | | | | | (1,469,427) | | | | | | (115,437) | | | | | | 9,621,776 | | | | | | 105,832 | | | | | | (59,328) | | | | | | 144,233 | | |
| Voya International Index Portfolio - Class I | | | | | 4,260,940 | | | | | | 1,647,205 | | | | | | (1,264,999) | | | | | | (172,901) | | | | | | 4,470,245 | | | | | | 122,312 | | | | | | 31,428 | | | | | | — | | |
| Voya Large Cap Growth Portfolio - Class I | | | | | 8,263,096 | | | | | | 3,759,515 | | | | | | (1,476,486) | | | | | | (806,310) | | | | | | 9,739,815 | | | | | | 53,419 | | | | | | 379,393 | | | | | | 924,453 | | |
| Voya Large Cap Value Fund - Class R6 | | | | | 8,308,600 | | | | | | 3,699,292 | | | | | | (3,357,404) | | | | | | (951,034) | | | | | | 7,699,454 | | | | | | 141,236 | | | | | | (715) | | | | | | 493,826 | | |
| Voya MidCap Opportunities Portfolio - Class I | | | | | 3,340,820 | | | | | | 1,632,172 | | | | | | (511,279) | | | | | | (580,754) | | | | | | 3,880,959 | | | | | | — | | | | | | 23,717 | | | | | | 557,613 | | |
| Voya Multi-Manager Emerging Markets Equity Fund - Class I | | | | | 4,142,164 | | | | | | 2,670,804 | | | | | | (1,075,196) | | | | | | (728,371) | | | | | | 5,009,401 | | | | | | 74,610 | | | | | | (111,496) | | | | | | — | | |
| Voya Multi-Manager International Equity Fund - Class I | | | | | 10,125,558 | | | | | | 4,631,482 | | | | | | (1,507,471) | | | | | | (432,452) | | | | | | 12,817,117 | | | | | | 164,549 | | | | | | 63,327 | | | | | | 121,077 | | |
| Voya Multi-Manager Large Cap Core Portfolio - Class I | | | | | 7,824,953 | | | | | | 8,723,161 | | | | | | (2,286,367) | | | | | | (1,288,237) | | | | | | 12,973,510 | | | | | | 134,000 | | | | | | 260,222 | | | | | | 791,843 | | |
| Voya Multi-Manager Mid Cap Value Fund - Class I | | | | | 7,738,805 | | | | | | 3,379,914 | | | | | | (2,853,225) | | | | | | (1,262,630) | | | | | | 7,002,864 | | | | | | 86,658 | | | | | | (168,259) | | | | | | 1,118,444 | | |
| Voya Russell™ Mid Cap Growth Index Portfolio - Class I | | | | | 4,431,650 | | | | | | 1,104,136 | | | | | | (1,978,181) | | | | | | (348,681) | | | | | | 3,208,924 | | | | | | 25,873 | | | | | | 386,653 | | | | | | — | | |
| Voya Small Company Portfolio - Class I | | | | | 4,493,510 | | | | | | 2,175,801 | | | | | | (724,067) | | | | | | (785,322) | | | | | | 5,159,922 | | | | | | 23,433 | | | | | | 22,827 | | | | | | 676,845 | | |
| Voya U.S. Bond Index Portfolio - Class I | | | | | — | | | | | | 3,146,018 | | | | | | (488,011) | | | | | | (35,932) | | | | | | 2,622,075 | | | | | | 27,930 | | | | | | 574 | | | | | | — | | |
| Voya U.S. Stock Index Portfolio - Class I | | | | | 8,327,836 | | | | | | 7,703,200 | | | | | | (3,496,462) | | | | | | (967,095) | | | | | | 11,567,479 | | | | | | 217,424 | | | | | | (248,581) | | | | | | 1,083,391 | | |
VY® Clarion Global Real Estate Portfolio - Class I | | | | | — | | | | | | 2,016,696 | | | | | | (39,239) | | | | | | (29,188) | | | | | | 1,948,269 | | | | | | — | | | | | | (770) | | | | | | — | | |
| VY® Clarion Real Estate Portfolio - Class I | | | | | 2,305,337 | | | | | | 1,030,721 | | | | | | (1,104,884) | | | | | | (262,411) | | | | | | 1,968,763 | | | | | | 40,878 | | | | | | 302,501 | | | | | | — | | |
| VY® Invesco Comstock Portfolio - Class I | | | | | 3,306,078 | | | | | | 4,365,736 | | | | | | (706,888) | | | | | | (645,298) | | | | | | 6,319,628 | | | | | | 171,693 | | | | | | 59,728 | | | | | | — | | |
VY® T. Rowe Price Capital Appreciation Portfolio -
Class I | | | | | 6,387,718 | | | | | | 806,114 | | | | | | (6,974,866) | | | | | | (218,966) | | | | | | — | | | | | | — | | | | | | 402,534 | | | | | | — | | |
VY® T. Rowe Price Growth Equity Portfolio -
Class I | | | | | 8,234,736 | | | | | | 4,116,074 | | | | | | (1,618,354) | | | | | | (1,001,914) | | | | | | 9,730,542 | | | | | | — | | | | | | 611,302 | | | | | | 1,326,831 | | |
| | | | | $ | 102,514,604 | | | | | $ | 64,672,259 | | | | | $ | (34,923,849) | | | | | $ | (11,100,125) | | | | | $ | 121,162,889 | | | | | $ | 1,488,551 | | | | | $ | 1,896,748 | | | | | $ | 7,238,556 | | |
| |
The financial statements for the above mutual fund[s] can be found at www.sec.gov.
The effect of derivative instruments by primary risk exposure on the Portfolio’s Statement of Operations for the year ended December 31, 2015 was as follows:
| | | | Amount of Realized Gain or (Loss) on
Derivatives Recognized in Income | |
| Derivatives not accounted for as hedging instruments | | | Futures | |
| Equity contracts | | | | $ | (49,864) | | |
| Interest rate contracts | | | | | (27,014) | | |
| Total | | | | $ | (76,878) | | |
| |
| | | | Change in Unrealized Appreciation or (Depreciation)
on Derivatives Recognized in Income | |
| Derivatives not accounted for as hedging instruments | | | Futures | |
| Equity contracts | | | | $ | 54,848 | | |
| Total | | | | $ | 54,848 | | |
| |
See Accompanying Notes to Financial Statements
PORTFOLIO OF INVESTMENTS
| Voya Solution 2060 Portfolio | as of December 31, 2015 |
| Shares | | | Value | | | Percentage
of Net
Assets | |
| EXCHANGE-TRADED FUNDS: 4.6% | |
| | | 41 | | | | iShares Barclays 20+ Year
Treasury Bond Fund | | | | $ | 4,945 | | | | | | 0.7 | | |
| | | 131 | | | | iShares Russell 1000 Value Index
Fund | | | | | 12,820 | | | | | | 1.9 | | |
| | | 65 | | | | SPDR Trust Series 1 | | | | | 13,253 | | | | | | 2.0 | | |
| | | | | | | Total Exchange-Traded Funds
(Cost $30,862) | | | | | 31,018 | | | | | | 4.6 | | |
| MUTUAL FUNDS: 95.3% | |
| | | | | | | Affiliated Investment Companies: 94.4% | |
| | | 1,539 | | | | Voya Emerging Markets Index
Portfolio - Class I | | | | | 13,624 | | | | | | 2.0 | | |
| | | 1,558 | | | | Voya Intermediate Bond Fund -
Class R6 | | | | | 15,409 | | | | | | 2.3 | | |
| | | 5,540 | | | | Voya International Core Fund -
Class I | | | | | 50,472 | | | | | | 7.5 | | |
| | | 2,598 | | | | Voya International Index Portfolio -
Class I | | | | | 23,435 | | | | | | 3.5 | | |
| | | 2,614 | | | | Voya Large Cap Growth Portfolio -
Class I | | | | | 50,215 | | | | | | 7.4 | | |
| | | 3,519 | | | | Voya Large Cap Value Fund -
Class R6 | | | | | 41,068 | | | | | | 6.1 | | |
| | | 1,579 | | | | Voya MidCap Opportunities
Portfolio - Class I | | | | | 20,351 | | | | | | 3.0 | | |
| | | 3,084 | | | | Voya Multi-Manager Emerging
Markets Equity Fund - Class I | | | | | 27,048 | | | | | | 4.0 | | |
| | | 6,564 | | | | Voya Multi-Manager International
Equity Fund - Class I | | | | | 68,006 | | | | | | 10.0 | | |
| | | 4,694 | | | | Voya Multi-Manager Large Cap
Core Portfolio - Class I | | | | | 68,064 | | | | | | 10.1 | | |
| | | 3,750 | | | | Voya Multi-Manager Mid Cap Value
Fund - Class I | | | | | 37,317 | | | | | | 5.5 | | |
| | | 626 | | | | Voya Russell™ Mid Cap Growth
Index Portfolio - Class I | | | | | 16,838 | | | | | | 2.5 | | |
| Shares | | | Value | | | Percentage
of Net
Assets | |
| MUTUAL FUNDS: (continued) | |
| | | | | | | Affiliated Investment Companies (continued) | |
| | | 1,369 | | | | Voya Small Company Portfolio -
Class I | | | | $ | 27,010 | | | | | | 4.0 | | |
| | | 1,287 | | | | Voya U.S. Bond Index Portfolio -
Class I | | | | | 13,538 | | | | | | 2.0 | | |
| | | 4,551 | | | | Voya U.S. Stock Index Portfolio -
Class I | | | | | 60,709 | | | | | | 9.0 | | |
| | | 865 | | | | VY® Clarion Global Real Estate
Portfolio - Class I | | | | | 10,187 | | | | | | 1.5 | | |
| | | 290 | | | | VY® Clarion Real Estate Portfolio -
Class I | | | | | 10,365 | | | | | | 1.5 | | |
| | | 2,244 | | | | VY® Invesco Comstock Portfolio -
Class I | | | | | 34,063 | | | | | | 5.0 | | |
| | | 586 | @ | | VY® T. Rowe Price Growth Equity
Portfolio - Class I | | | | | 50,469 | | | | | | 7.5 | | |
| | | | | | | | | | | | 638,188 | | | | | | 94.4 | | |
| | | | | | | Unaffiliated Investment Companies: 0.9% | |
| | | 1,417 | @ | | Credit Suisse Commodity Return
Strategy Fund - Class I | | | | | 6,389 | | | | | | 0.9 | | |
| | | | | | | Total Mutual Funds
(Cost $654,786) | | | | | 644,577 | | | | | | 95.3 | | |
| | | | | | | Total Investments in Securities
(Cost $685,648) | | | | $ | 675,595 | | | | | | 99.9 | | |
| | | | | | | Assets in Excess of Other
Liabilities | | | | | 573 | | | | | | 0.1 | | |
| | | | | | | Net Assets | | | | $ | 676,168 | | | | | | 100.0 | | |
| |
@
Non-income producing security.
Cost for federal income tax purposes is $687,507.
Net unrealized depreciation consists of:
| | Gross Unrealized Appreciation | | | | $ | 4,258 | | |
| | Gross Unrealized Depreciation | | | | | (16,170) | | |
| | Net Unrealized Depreciation | | | | $ | (11,912) | | |
| |
Fair Value Measurements^
The following is a summary of the fair valuations according to the inputs used as of December 31, 2015 in valuing the assets and liabilities:
| | | | Quoted Prices
in Active Markets
for Identical
Investments
(Level 1) | | | Significant
Other
Observable
Inputs
(Level 2) | | | Significant
Unobservable
Inputs
(Level 3) | | | Fair Value
at
December 31,
2015 | |
| Asset Table | | | | | |
| Investments, at fair value | | | | | |
| Exchange-Traded Funds | | | | $ | 31,018 | | | | | $ | — | | | | | $ | — | | | | | $ | 31,018 | | |
| Mutual Funds | | | | | 644,577 | | | | | | — | | | | | | — | | | | | | 644,577 | | |
| Total Investments, at fair value | | | | $ | 675,595 | | | | | $ | — | | | | | $ | — | | | | | $ | 675,595 | | |
| |
^
See Note 2, “Significant Accounting Policies” in the Notes to Financial Statements for additional information.
See Accompanying Notes to Financial Statements
PORTFOLIO OF INVESTMENTS
| Voya Solution 2060 Portfolio | as of December 31, 2015 (continued) |
Transactions with Affiliates
An investment of at least 5% of the voting securities of an issuer, or a company which is under common control results in that issuer becoming an affiliated person as defined by the 1940 Act.
The following table provides transactions during the year ended December 31, 2015, where the following issuers were considered an affiliate:
| Issuer | | | Beginning
Fair Value
at 12/31/14 | | | Purchases
at Cost | | | Sales
at Cost | | | Change in
Unrealized
Appreciation/
(Depreciation) | | | Ending
Fair Value
at 12/31/15 | | | Investment
Income | | | Realized
Gains/
(Losses) | | | Net Capital
Gain
Distributions | |
| Voya Emerging Markets Index Portfolio - Class I | | | | $ | — | | | | | $ | 15,742 | | | | | $ | (1,683) | | | | | $ | (435) | | | | | $ | 13,624 | | | | | $ | 6 | | | | | $ | (32) | | | | | $ | — | | |
| Voya Intermediate Bond Fund - Class R6 | | | | | — | | | | | | 20,575 | | | | | | (5,039) | | | | | | (127) | | | | | | 15,409 | | | | | | 104 | | | | | | (14) | | | | | | — | | |
| Voya International Core Fund - Class I | | | | | — | | | | | | 57,877 | | | | | | (6,156) | | | | | | (1,249) | | | | | | 50,472 | | | | | | 571 | | | | | | (32) | | | | | | 778 | | |
| Voya International Index Portfolio - Class I | | | | | — | | | | | | 26,475 | | | | | | (2,973) | | | | | | (67) | | | | | | 23,435 | | | | | | 16 | | | | | | (37) | | | | | | — | | |
| Voya Large Cap Growth Portfolio - Class I | | | | | — | | | | | | 54,488 | | | | | | (5,927) | | | | | | 1,654 | | | | | | 50,215 | | | | | | 6 | | | | | | 267 | | | | | | 111 | | |
| Voya Large Cap Value Fund - Class R6 | | | | | — | | | | | | 59,239 | | | | | | (17,036) | | | | | | (1,135) | | | | | | 41,068 | | | | | | 282 | | | | | | 411 | | | | | | 1,024 | | |
| Voya MidCap Opportunities Portfolio - Class I | | | | | — | | | | | | 23,161 | | | | | | (1,988) | | | | | | (822) | | | | | | 20,351 | | | | | | — | | | | | | (273) | | | | | | 1,280 | | |
| Voya Multi-Manager Emerging Markets Equity Fund - Class I | | | | | — | | | | | | 31,126 | | | | | | (3,310) | | | | | | (768) | | | | | | 27,048 | | | | | | 414 | | | | | | (26) | | | | | | — | | |
| Voya Multi-Manager International Equity Fund - Class I | | | | | — | | | | | | 77,648 | | | | | | (8,224) | | | | | | (1,418) | | | | | | 68,006 | | | | | | 897 | | | | | | (91) | | | | | | 660 | | |
| Voya Multi-Manager Large Cap Core Portfolio - Class I | | | | | — | | | | | | 94,482 | | | | | | (26,560) | | | | | | 142 | | | | | | 68,064 | | | | | | 593 | | | | | | 1,070 | | | | | | 93 | | |
| Voya Multi-Manager Mid Cap Value Fund - Class I | | | | | — | | | | | | 51,776 | | | | | | (7,946) | | | | | | (6,513) | | | | | | 37,317 | | | | | | 468 | | | | | | (422) | | | | | | 6,041 | | |
| Voya Russell™ Mid Cap Growth Index Portfolio - Class I | | | | | — | | | | | | 25,774 | | | | | | (8,741) | | | | | | (195) | | | | | | 16,838 | | | | | | 3 | | | | | | 93 | | | | | | — | | |
| Voya Small Company Portfolio - Class I | | | | | — | | | | | | 29,512 | | | | | | (2,446) | | | | | | (56) | | | | | | 27,010 | | | | | | 3 | | | | | | (97) | | | | | | 86 | | |
| Voya U.S. Bond Index Portfolio - Class I | | | | | — | | | | | | 32,309 | | | | | | (18,625) | | | | | | (146) | | | | | | 13,538 | | | | | | 105 | | | | | | 12 | | | | | | — | | |
| Voya U.S. Stock Index Portfolio - Class I | | | | | — | | | | | | 71,280 | | | | | | (10,947) | | | | | | 376 | | | | | | 60,709 | | | | | | 945 | | | | | | 517 | | | | | | 133 | | |
| VY® Clarion Global Real Estate Portfolio - Class I | | | | | — | | | | | | 11,070 | | | | | | (792) | | | | | | (91) | | | | | | 10,187 | | | | | | — | | | | | | (16) | | | | | | — | | |
| VY® Clarion Real Estate Portfolio - Class I | | | | | — | | | | | | 13,297 | | | | | | (3,326) | | | | | | 394 | | | | | | 10,365 | | | | | | 5 | | | | | | 260 | | | | | | — | | |
| VY® Invesco Comstock Portfolio - Class I | | | | | — | | | | | | 39,020 | | | | | | (4,313) | | | | | | (644) | | | | | | 34,063 | | | | | | 740 | | | | | | 14 | | | | | | — | | |
| VY® T. Rowe Price Capital Appreciation Portfolio - Class I | | | | | — | | | | | | 874 | | | | | | (874) | | | | | | — | | | | | | — | | | | | | — | | | | | | 16 | | | | | | — | | |
| VY® T. Rowe Price Growth Equity Portfolio - Class I | | | | | — | | | | | | 54,823 | | | | | | (5,820) | | | | | | 1,466 | | | | | | 50,469 | | | | | | — | | | | | | 239 | | | | | | 158 | | |
| | | | | $ | — | | | | | $ | 790,548 | | | | | $ | (142,726) | | | | | $ | (9,634) | | | | | $ | 638,188 | | | | | $ | 5,158 | | | | | $ | 1,859 | | | | | $ | 10,364 | | |
| |
The financial statements for the above mutual fund[s] can be found at www.sec.gov.
See Accompanying Notes to Financial Statements
TAX INFORMATION (Unaudited)
Dividends and distributions paid during the year ended December 31, 2015 were as follows:
| Portfolio Name | | | Type | | | Per Share Amount | |
| Voya Solution Aggressive Portfolio | |
| Class ADV | | | NII | | | | $ | 0.2137 | | |
| Class I | | | NII | | | | $ | 0.2418 | | |
| Class S | | | NII | | | | $ | 0.2274 | | |
| Class S2 | | | NII | | | | $ | 0.2287 | | |
| All Classes | | | STCG | | | | $ | 0.0747 | | |
| All Classes | | | LTCG | | | | $ | 0.3610 | | |
| Voya Solution Balanced Portfolio | |
| Class ADV | | | NII | | | | $ | 0.2846 | | |
| Class I | | | NII | | | | $ | 0.3388 | | �� |
| Class S | | | NII | | | | $ | 0.3116 | | |
| Class S2 | | | NII | | | | $ | 0.2862 | | |
| All Classes | | | STCG | | | | $ | 0.1013 | | |
| All Classes | | | LTCG | | | | $ | 0.7557 | | |
| Voya Solution Conservative Portfolio | |
| Class ADV | | | NII | | | | $ | 0.2745 | | |
| Class I | | | NII | | | | $ | 0.3331 | | |
| Class S | | | NII | | | | $ | 0.3055 | | |
| Class S2 | | | NII | | | | $ | 0.2952 | | |
| All Classes | | | STCG | | | | $ | 0.0945 | | |
| All Classes | | | LTCG | | | | $ | 0.2585 | | |
| Voya Solution Income Portfolio | |
| Class ADV | | | NII | | | | $ | 0.2888 | | |
| Class I | | | NII | | | | $ | 0.3570 | | |
| Class S | | | NII | | | | $ | 0.3239 | | |
| Class S2 | | | NII | | | | $ | 0.3076 | | |
| Class T | | | NII | | | | $ | 0.2239 | | |
| All Classes | | | LTCG | | | | $ | 0.4199 | | |
| Voya Solution Moderately Aggressive Portfolio | |
| Class ADV | | | NII | | | | $ | 0.3687 | | |
| Class I | | | NII | | | | $ | 0.4292 | | |
| Class S | | | NII | | | | $ | 0.3907 | | |
| Class S2 | | | NII | | | | $ | 0.3932 | | |
| All Classes | | | STCG | | | | $ | 0.1422 | | |
| All Classes | | | LTCG | | | | $ | 1.1765 | | |
| Voya Solution Moderately Conservative Portfolio | |
| Class ADV | | | NII | | | | $ | 0.2771 | | |
| Class I | | | NII | | | | $ | 0.3292 | | |
| Class S | | | NII | | | | $ | 0.2980 | | |
| Class S2 | | | NII | | | | $ | 0.2953 | | |
| All Classes | | | STCG | | | | $ | 0.1015 | | |
| All Classes | | | LTCG | | | | $ | 0.5230 | | |
| Voya Solution 2020 Portfolio | |
| Class ADV | | | NII | | | | $ | 0.5707 | | |
| Class I | | | NII | | | | $ | 0.6454 | | |
| Class S | | | NII | | | | $ | 0.6054 | | |
| Class S2 | | | NII | | | | $ | 0.5849 | | |
| Class T | | | NII | | | | $ | 0.5608 | | |
| All Classes | | | STCG | | | | $ | 0.0531 | | |
| All Classes | | | LTCG | | | | $ | 0.7341 | | |
| Voya Solution 2025 Portfolio | |
| Class ADV | | | NII | | | | $ | 0.3689 | | |
| Class I | | | NII | | | | $ | 0.4468 | | |
| Portfolio Name | | | Type | | | Per Share Amount | |
| Class S | | | NII | | | | $ | 0.4116 | | |
| Class S2 | | | NII | | | | $ | 0.3842 | | |
| Class T | | | NII | | | | $ | 0.1542 | | |
| All Classes | | | STCG | | | | $ | 0.1210 | | |
| All Classes | | | LTCG | | | | $ | 1.1890 | | |
| Voya Solution 2030 Portfolio | |
| Class ADV | | | NII | | | | $ | 0.1910 | | |
| Class I | | | NII | | | | $ | 0.2403 | | |
| Class S | | | NII | | | | $ | 0.1673 | | |
| Class S2 | | | NII | | | | $ | 0.1565 | | |
| Class T | | | NII | | | | $ | 0.1294 | | |
| All Classes | | | STCG | | | | $ | 0.1310 | | |
| All Classes | | | LTCG | | | | $ | 0.4269 | | |
| Voya Solution 2035 Portfolio | |
| Class ADV | | | NII | | | | $ | 0.3777 | | |
| Class I | | | NII | | | | $ | 0.4584 | | |
| Class S | | | NII | | | | $ | 0.4238 | | |
| Class S2 | | | NII | | | | $ | 0.3891 | | |
| Class T | | | NII | | | | $ | 0.2410 | | |
| All Classes | | | STCG | | | | $ | 0.1414 | | |
| All Classes | | | LTCG | | | | $ | 1.4082 | | |
| Voya Solution 2040 Portfolio | |
| Class ADV | | | NII | | | | $ | 0.3495 | | |
| Class I | | | NII | | | | $ | 0.3916 | | |
| Class S | | | NII | | | | $ | 0.3423 | | |
| Class S2 | | | NII | | | | $ | 0.3308 | | |
| Class T | | | NII | | | | $ | 0.2919 | | |
| All Classes | | | STCG | | | | $ | 0.0831 | | |
| All Classes | | | LTCG | | | | $ | 0.6091 | | |
| Voya Solution 2045 Portfolio | |
| Class ADV | | | NII | | | | $ | 0.3753 | | |
| Class I | | | NII | | | | $ | 0.4572 | | |
| Class S | | | NII | | | | $ | 0.4214 | | |
| Class S2 | | | NII | | | | $ | 0.3864 | | |
| Class T | | | NII | | | | $ | 0.2050 | | |
| All Classes | | | STCG | | | | $ | 0.1923 | | |
| All Classes | | | LTCG | | | | $ | 1.8350 | | |
| Voya Solution 2050 Portfolio | |
| Class ADV | | | NII | | | | $ | 0.3529 | | |
| Class I | | | NII | | | | $ | 0.3884 | | |
| Class S | | | NII | | | | $ | 0.3417 | | |
| Class S2 | | | NII | | | | $ | 0.3269 | | |
| Class T | | | NII | | | | $ | 0.2933 | | |
| All Classes | | | STCG | | | | $ | 0.0345 | | |
| All Classes | | | LTCG | | | | $ | 0.6939 | | |
| Voya Solution 2055 Portfolio | |
| Class ADV | | | NII | | | | $ | 0.3245 | | |
| Class I | | | NII | | | | $ | 0.3900 | | |
| Class S | | | NII | | | | $ | 0.3616 | | |
| Class S2 | | | NII | | | | $ | 0.3389 | | |
| Class T | | | NII | | | | $ | — | | |
| All Classes | | | STCG | | | | $ | 0.1429 | | |
| All Classes | | | LTCG | | | | $ | 1.1953 | | |
NII - Net investment income
STCG - Short-term capital gain
LTCG - Long-term capital gain
TAX INFORMATION (Unaudited) (continued)
Of the ordinary distributions made during the year ended December 31, 2015, the following percentages qualify for the dividends received deduction (DRD) available to corporate shareholders:
| | Voya Solution Aggressive Portfolio | | | | | 11.30% | | |
| | Voya Solution Balanced Portfolio | | | | | 11.44% | | |
| | Voya Solution Conservative Portfolio | | | | | 4.75% | | |
| | Voya Solution Income Portfolio | | | | | 9.23% | | |
| | Voya Solution Moderately Aggressive Portfolio | | | | | 10.47% | | |
| | Voya Solution Moderately Conservative Portfolio | | | | | 6.96% | | |
| | Voya Solution 2020 Portfolio | | | | | 10.51% | | |
| | Voya Solution 2025 Portfolio | | | | | 10.51% | | |
| | Voya Solution 2030 Portfolio | | | | | 9.39% | | |
| | Voya Solution 2035 Portfolio | | | | | 11.97% | | |
| | Voya Solution 2040 Portfolio | | | | | 11.39% | | |
| | Voya Solution 2045 Portfolio | | | | | 12.27% | | |
| | Voya Solution 2050 Portfolio | | | | | 13.38% | | ��� |
| | Voya Solution 2055 Portfolio | | | | | 13.17% | | |
The Portfolios designate the following amounts of long-term capital gain distributions as 20% rate long-term capital gain dividends under Internal Revenue Code Section 852(b)(3)(C):
| | Voya Solution Aggressive Portfolio | | | | $ | 159,239 | | |
| | Voya Solution Balanced Portfolio | | | | $ | 3,610,244 | | |
| | Voya Solution Conservative Portfolio | | | | $ | 396,989 | | |
| | Voya Solution Income Portfolio | | | | $ | 5,617,671 | | |
| | Voya Solution Moderately Aggressive Portfolio | | | | $ | 2,869,073 | | |
| | Voya Solution Moderately Conservative Portfolio | | | | $ | 2,119,890 | | |
| | Voya Solution 2020 Portfolio | | | | $ | 18,494 | | |
| | Voya Solution 2025 Portfolio | | | | $ | 99,604,540 | | |
| | Voya Solution 2030 Portfolio | | | | $ | 11,437 | | |
| | Voya Solution 2035 Portfolio | | | | $ | 105,963,365 | | |
| | Voya Solution 2040 Portfolio | | | | $ | 33,992 | | |
| | Voya Solution 2045 Portfolio | | | | $ | 92,862,966 | | |
| | Voya Solution 2050 Portfolio | | | | $ | 19,354 | | |
| | Voya Solution 2055 Portfolio | | | | $ | 10,297,691 | | |
The Regulated Investment Company Modernization Act of 2010 allows qualified fund-of-funds to elect to pass through the ability to take foreign tax credits (or deductions) to the extent that foreign taxes are passed through from underlying funds.
TAX INFORMATION (Unaudited) (continued)
A qualified fund-of-funds is a regulated investment company that has at least 50% of the value of its total assets invested in other regulated investment companies at the end of each quarter of the taxable year. Pursuant to Section 853 of the Internal Revenue Code, the Portfolios designate the following amounts as foreign taxes paid for the year ended December 31, 2015:
| | | | Creditable
Foreign Taxes
Paid | | | Per Share
Amount | | | Portion of Ordinary Income
Distribution Derived from
Foreign Sourced Income* | |
| Voya Solution Aggressive Portfolio | | | | $ | 2,040 | | | | | $ | 0.0046 | | | | | | 14.45% | | |
| Voya Solution Balanced Portfolio | | | | $ | 8,640 | | | | | $ | 0.0017 | | | | | | 4.81% | | |
| Voya Solution Conservative Portfolio | | | | $ | 458 | | | | | $ | 0.0003 | | | | | | 0.11% | | |
| Voya Solution Income Portfolio | | | | $ | 39,261 | | | | | $ | 0.0007 | | | | | | 3.20% | | |
| Voya Solution Moderately Aggressive Portfolio | | | | $ | 252,756 | | | | | $ | 0.0038 | | | | | | 18.97% | | |
| Voya Solution Moderately Conservative Portfolio | | | | $ | 6,476 | | | | | $ | 0.0015 | | | | | | 2.87% | | |
| Voya Solution 2020 Portfolio | | | | $ | 1,413 | | | | | $ | 0.0017 | | | | | | 12.16% | | |
| Voya Solution 2025 Portfolio | | | | $ | 280,504 | | | | | $ | 0.0031 | | | | | | 7.57% | | |
| Voya Solution 2030 Portfolio | | | | $ | 1,149 | | | | | $ | 0.0040 | | | | | | 18.53% | | |
| Voya Solution 2035 Portfolio | | | | $ | 401,000 | | | | | $ | 0.0049 | | | | | | 11.94% | | |
| Voya Solution 2040 Portfolio | | | | $ | 1,404 | | | | | $ | 0.0059 | | | | | | 20.73% | | |
| Voya Solution 2045 Portfolio | | | | $ | 296,037 | | | | | $ | 0.0051 | | | | | | 14.52% | | |
| Voya Solution 2050 Portfolio | | | | $ | 699 | | | | | $ | 0.0059 | | | | | | 21.51% | | |
| Voya Solution 2055 Portfolio | | | | $ | 58,002 | | | | | $ | 0.0057 | | | | | | 15.65% | | |
| Voya Solution 2060 Portfolio | | | | $ | 316 | | | | | $ | 0.0046 | | | | | | 19.31% | | |
*
None of the Portfolios listed above derived any income from ineligible foreign sources as defined under Section 901(j) of the Internal Revenue Code.
Foreign taxes paid or withheld should be included in taxable income with an offsetting deduction from gross income or as a credit for taxes paid to foreign governments. Shareholders are strongly advised to consult their own tax advisors regarding the appropriate treatment of foreign taxes paid.
Above figures may differ from those cited elsewhere in this report due to differences in the calculation of income and gains under U.S. generally accepted accounting principles (book) purposes and Internal Revenue Service (tax) purposes.
Shareholders are strongly advised to consult their own tax advisers with respect to the tax consequences of their investments in the Portfolios. In January, shareholders, excluding corporate shareholders, receive an IRS 1099-DIV regarding the federal tax status of the dividends and distributions they received in the calendar year.
DIRECTOR AND OFFICER INFORMATION (Unaudited)
The business and affairs of the Company are managed under the direction of the Board. A Director, who is not an interested person of the Company, as defined in the 1940 Act, is an independent director (“Independent Director”). The Directors and Officers of the Company are listed below. The Statement of Additional Information includes additional information about directors of the Company and is available, without charge, upon request at (800) 262-3862.
| | Name, Address and Age | | | Position(s)
Held with the
Company | | | Term of Office and
Length of Time
Served(1) | | | Principal
Occupation(s) –
During the Past 5 Years | | | Number of
funds
in Fund
Complex
Overseen
by Director(2) | | | Other Board Positions
Held by Director | |
| | Independent Directors*: | |
| | Colleen D. Baldwin
7337 East Doubletree Ranch Rd.
Suite 100
Scottsdale, Arizona 85258
Age: 55 | | | Director | | | November 2007 – Present | | | President, Glantuam Partners, LLC, a business consulting firm (January 2009 – Present). | | | 151 | | | DSM/Dentaquest, Boston, MA (February 2014 – Present). | |
| | John V. Boyer
7337 East Doubletree Ranch Rd.
Suite 100
Scottsdale, Arizona 85258
Age: 62 | | | Chairperson
Director | | | January 2014 – Present November 1997 – Present | | | President and Chief Executive Officer, Bechtler Arts Foundation, an arts and education foundation (January 2008 – Present). | | | 151 | | | None. | |
| | Patricia W. Chadwick
7337 East Doubletree Ranch Rd.
Suite 100
Scottsdale, Arizona 85258
Age: 67 | | | Director | | | January 2006 – Present | | | Consultant and President, Ravengate Partners LLC, a consulting firm that provides advice regarding financial markets and the global economy (January 2000 – Present). | | | 151 | | | Wisconsin Energy Corporation (June 2006 – Present); The Royce Funds (35 funds) (December 2009 – Present); and AMICA Mutual Insurance Company (1992 – Present). | |
| | Peter S. Drotch
7337 East Doubletree Ranch Rd.
Suite 100
Scottsdale, Arizona 85258
Age: 74 | | | Director | | | November 2007 – Present | | | Retired. | | | 151 | | | First Marblehead Corporation (September 2003 – Present). | |
| | Martin J. Gavin
7337 East Doubletree Ranch Rd.
Suite 100
Scottsdale, AZ 85258-2034
Age: 65 | | | Director | | | August 2015 – Present | | | Retired. Formerly, President and Chief Executive Officer, Connecticut Children’s Medical Center (May 2006 – November 2015). | | | 151 | | | None. | |
| | Russell H. Jones
7337 East Doubletree Ranch Rd.
Suite 100
Scottsdale, Arizona 85258
Age: 71 | | | Director | | | May 2013 – Present | | | Retired. | | | 151 | | | None. | |
| | Patrick W. Kenny
7337 East Doubletree Ranch Rd.
Suite 100
Scottsdale, Arizona 85258
Age: 73 | | | Director | | | March 2002 – Present | | | Retired. | | | 151 | | | Assured Guaranty Ltd. (April 2004 – Present). | |
| | Joseph E. Obermeyer
7337 East Doubletree Ranch Rd.
Suite 100
Scottsdale, Arizona 85258
Age: 58 | | | Director | | | May 2013 – Present | | | President, Obermeyer & Associates, Inc., a provider of financial and economic consulting services (November 1999 – Present). | | | 151 | | | None. | |
DIRECTOR AND OFFICER INFORMATION (Unaudited) (continued)
| | Name, Address and Age | | | Position(s)
Held with the
Company | | | Term of Office and
Length of Time
Served(1) | | | Principal
Occupation(s) –
During the Past 5 Years | | | Number of
funds
in Fund
Complex
Overseen
by Director(2) | | | Other Board Positions
Held by Director | |
| | Sheryl K. Pressler
7337 East Doubletree Ranch Rd.
Suite 100
Scottsdale, Arizona 85258
Age: 65 | | | Director | | | January 2006 – Present | | | Consultant (May 2001 – Present). | | | 151 | | | None. | |
| | Christopher P. Sullivan
7337 East Doubletree Ranch Rd.
Suite 100
Scottsdale, Arizona 85258
Age: 62 | | | Director | | | October 2015 – Present | | | Retired. Formerly, President, Bond Division, Fidelity Management and Research (June 2009 – September 2012). | | | 151 | | | None. | |
| | Roger B. Vincent
7337 East Doubletree Ranch Rd.
Suite 100
Scottsdale, Arizona 85258
Age: 70 | | | Director | | | January 2005 – Present | | | Retired. Formerly, President, Springwell Corporation, a corporate finance firm (March 1989 – August 2011). | | | 151 | | | UGI Corporation (February 2006 – Present) and UGI Utilities, Inc. (February 2006 – Present). | |
| | Director who is an “interested person”: | |
| | Shaun P. Mathews(3)
7337 East Doubletree Ranch Rd.
Suite 100
Scottsdale, Arizona 85258
Age: 60 | | | Director | | | November 2007 – Present | | | President and Chief Executive Officer, Voya Investments, LLC (December 2006 – Present). | | | 151 | | | Voya Capital Corporation, LLC and Voya Investments Distributor, LLC (December 2005 – Present); Voya Funds Services, LLC, Voya Investments, LLC and Voya Investment Management, LLC (March 2006 – Present); and Voya Investment Trust Co. (April 2009 – Present). | |
(1)
Directors serve until their successors are duly elected and qualified. The tenure of each Director who is not an “interested person” as defined in the 1940 Act, of each Portfolio (“Independent Director”) is subject to the Board’s retirement policy which states that each duly elected or appointed Independent Director shall retire from and cease to be a member of the Board of Directors at the close of business on December 31 of the calendar year in which the Independent Director attains the age of 75. A majority vote of the Board’s other Independent Directors may extend the retirement date of an Independent Director if the retirement would trigger a requirement to hold a meeting of shareholders of the Company under applicable law, whether for the purposes of appointing a successor to the Independent Director or otherwise comply under applicable law, in which case the extension would apply until such time as the shareholder meeting can be held or is no longer required (as determined by a vote of a majority of the other Independent Directors).
(2)
For the purposes of this table, “Fund Complex” means the Voya family of funds including the following investment companies: Voya Asia Pacific High Dividend Equity Income Fund; Voya Balanced Portfolio, Inc.; Voya Emerging Markets High Dividend Equity Fund; Voya Equity Trust; Voya Funds Trust; Voya Global Advantage and Premium Opportunity Fund; Voya Global Equity Dividend and Premium Opportunity Fund; Voya Infrastructure, Industrials and Materials Fund; Voya Intermediate Bond Portfolio; Voya International High Dividend Equity Income Fund; Voya Investors Trust; Voya Money Market Portfolio; Voya Mutual Funds; Voya Natural Resources Equity Income Fund; Voya Partners, Inc.; Voya Prime Rate Trust; Voya Senior Income Fund; Voya Separate Portfolios Trust; Voya Series Fund, Inc.; Voya Strategic Allocation Portfolios, Inc.; Voya Variable Funds; Voya Variable Insurance Trust; Voya Variable Portfolios, Inc.; and Voya Variable Products Trust. The number of funds in the Fund Complex is as of January 31, 2016.
(3)
Mr. Mathews is deemed to be an “interested person” of the Company as defined in the 1940 Act, because of his current affiliation with the Voya funds, Voya Financial, Inc., or Voya Financial, Inc.’s affiliates.
*
Effective December 31, 2015, Dr. Albert E. DePrince, Jr. retired as a Director of the Board.
DIRECTOR AND OFFICER INFORMATION (Unaudited) (continued)
| | Name, Address and Age | | | Position(s) Held
With the Company | | | Term of Office and
Length of Time Served(1) | | | Principal Occupation(s) –
During the Past 5 Years | |
| | Shaun P. Mathews
7337 East Doubletree Ranch Rd.
Suite 100
Scottsdale, Arizona 85258
Age: 60 | | | President and Chief Executive Officer | | | November 2006 – Present | | | President and Chief Executive Officer, Voya Investments, LLC (December 2006 – Present). | |
| | Michael J. Roland
7337 East Doubletree Ranch Rd.
Suite 100
Scottsdale, Arizona 85258
Age: 57 | | | Managing Director and Chief Operating Officer | | | April 2012 – Present | | | Managing Director and Chief Operating Officer, Voya Investments, LLC and Voya Funds Services, LLC (April 2012 – Present). Formerly, Chief Compliance Officer, Directed Services LLC and Voya Investments, LLC (March 2011 – December 2013); Executive Vice President and Chief Operating Officer, Voya Investments, LLC and Voya Funds Services, LLC (January 2007 – April 2012) and Chief Compliance Officer, Voya Family of Funds (March 2011 – February 2012). | |
| | Stanley D. Vyner
230 Park Avenue
New York, New York 10169
Age: 65 | | | Executive Vice President
Chief Investment Risk Officer | | | January 2005 – Present
September 2009 – Present | | | Executive Vice President, Voya Investments, LLC (July 2000 – Present) and Chief Investment Risk Officer, Voya Investments, LLC (January 2003 – Present). | |
| | Kevin M. Gleason
7337 East Doubletree Ranch Rd.
Suite 100
Scottsdale, Arizona 85258
Age: 49 | | | Chief Compliance Officer | | | February 2012 – Present | | | Senior Vice President, Voya Investments, LLC and Chief Compliance Officer, Voya Family of Funds (February 2012 – resent). Formerly, Assistant General Counsel and Assistant Secretary, The Northwestern Mutual Life Insurance Company (June 2004 – January 2012). | |
| | Todd Modic
7337 East Doubletree Ranch Rd.
Suite 100
Scottsdale, Arizona 85258
Age: 48 | | | Senior Vice President, Chief/Principal Financial Officer and Assistant Secretary | | | March 2005 – Present | | | Senior Vice President, Voya Investments, LLC and Voya Funds Services, LLC (April 2005 – Present). | |
| | Kimberly A. Anderson
7337 East Doubletree Ranch Rd.
Suite 100
Scottsdale, Arizona 85258
Age: 51 | | | Senior Vice President | | | January 2005 – Present | | | Senior Vice President, Voya Investments, LLC (September 2003 – Present). | |
| | Julius A. Drelick, III
7337 East Doubletree Ranch Rd.
Suite 100
Scottsdale, Arizona 85258
Age: 49 | | | Senior Vice President | | | July 2012 – Present | | | Senior Vice President and Chief Compliance Officer of Directed Services LLC and Voya Investments, LLC (January 2014 – Present); and Senior Vice President – Fund Compliance, Voya Funds Services, LLC (June 2012 – Present). Formerly, Vice President – Platform Product Management & Project Management, Voya Investments, LLC (April 2007 – June 2012). | |
| | Robert Terris
7337 East Doubletree Ranch Rd.
Suite 100
Scottsdale, Arizona 85258
Age: 45 | | | Senior Vice President | | | May 2006 – Present | | | Senior Vice President, Head of Division Operations, Voya Investments, LLC (October 2015 – Present) and Voya Funds Services, LLC (March 2006 – Present). | |
| | Fred Bedoya
7337 East Doubletree Ranch Rd.
Suite 100
Scottsdale, Arizona 85258
Age: 43 | | | Vice President and Treasurer | | | September 2012 - Present | | | Vice President, Voya Investments, LLC (October 2015 – Present) and Voya Funds Services, LLC (July 2012 – Present). Formerly, Assistant Vice President – Director, Voya Funds Services, LLC (March 2003 – March 2012). | |
| | Maria M. Anderson
7337 East Doubletree Ranch Rd.
Suite 100
Scottsdale, Arizona 85258
Age: 57 | | | Vice President | | | January 2005 – Present | | | Vice President, Voya Investments, LLC (October 2015 – Present) and Voya Funds Services, LLC (September 2004 – Present). | |
DIRECTOR AND OFFICER INFORMATION (Unaudited) (continued)
| | Name, Address and Age | | | Position(s) Held
With the Company | | | Term of Office and
Length of Time Served(1) | | | Principal Occupation(s) –
During the Past 5 Years | |
| | Lauren D. Bensinger
7337 East Doubletree Ranch Rd.
Suite 100
Scottsdale, Arizona 85258
Age: 62 | | | Vice President | | | January 2005 – Present | | | Vice President, Voya Funds Services, LLC (February 1996 – Present) and Voya Investments, LLC (October 2004 – Present); Vice President and Money Laundering Reporting Officer, Voya Investments Distributor, LLC (April 2010 – Present); Anti-Money Laundering Compliance Officer, Voya Financial, Inc. (January 2013 – Present); and Money Laundering Reporting Officer, Voya Investment Management Trust Co. (October 2012 – Present). | |
| | Sara M. Donaldson
7337 East Doubletree Ranch Rd.
Suite 100
Scottsdale, Arizona 85258
Age: 56 | | | Vice President | | | September 2014 – Present | | | Vice President, Voya Investments, LLC (October 2015 – Present). Formerly Vice President, Voya Funds Services, LLC (April 2014 – October 2015). Formerly, Director, Compliance, AXA Rosenberg Global Services, LLC (September 1997 – March 2014). | |
| | Robyn L. Ichilov
7337 East Doubletree Ranch Rd.
Suite 100
Scottsdale, Arizona 85258
Age: 48 | | | Vice President | | | January 2005 – Present | | | Vice President, Voya Funds Services, LLC (November 1995 – Present) and Voya Investments, LLC (August 1997 –- Present). Formerly, Treasurer, Voya Family of Funds (November 1999 – February 2012). | |
| | Jason Kadavy
7337 East Doubletree Ranch Rd.
Suite 100
Scottsdale, Arizona 85258
Age: 39 | | | Vice President | | | September 2012 – Present | | | Vice President, Voya Investments, LLC (October 2015 – Present) and Voya Funds Services, LLC (July 2007 – Present). | |
| | Kimberly K. Springer
7337 East Doubletree Ranch Rd.
Suite 100
Scottsdale, Arizona 85258
Age: 58 | | | Vice President | | | March 2006 – Present | | | Vice President – Mutual Fund Product Development, Voya Investments, LLC (July 2012 – Present); Vice President, Voya Investment Management – Voya Family of Funds (March 2010 – Present) and Vice President, Voya Funds Services, LLC (March 2006 – Present). Formerly Managing Paralegal, Registration Statements (June 2003 – July 2012). | |
| | Craig Wheeler
7337 East Doubletree Ranch Rd.
Suite 100
Scottsdale, Arizona 85258
Age: 46 | | | Vice President | | | May 2013 – Present | | | Vice President – Director of Tax, Voya Investments, LLC (October 2015 – Present) and Voya Funds Services, LLC (March 2013 – Present). Formerly, Assistant Vice President – Director of Tax, Voya Funds Services, LLC (March 2008 – February 2013). | |
| | Huey P. Falgout, Jr.
7337 East Doubletree Ranch Rd.
Suite 100
Scottsdale, Arizona 85258
Age: 52 | | | Secretary | | | August 2003 – Present | | | Senior Vice President and Chief Counsel, Voya Investment Management – Mutual Fund Legal Department (March 2010 – Present). | |
| | Paul A. Caldarelli
7337 East Doubletree Ranch Rd.
Suite 100
Scottsdale, Arizona 85258
Age: 64 | | | Assistant Secretary | | | June 2010 – Present | | | Vice President and Senior Counsel, Voya Investment Management – Mutual Fund Legal Department (March 2010 – Present). | |
| | Theresa K. Kelety
7337 East Doubletree Ranch Rd.
Suite 100
Scottsdale, Arizona 85258
Age: 53 | | | Assistant Secretary | | | August 2003 – Present | | | Vice President and Senior Counsel, Voya Investment Management – Mutual Fund Legal Department (March 2010 – Present). | |
(1)
The Officers hold office until the next annual meeting of the Board of Directors and until their successors shall have been elected and qualified.
Investment Adviser
Directed Services LLC
1475 Dunwoody Drive
West Chester, Pennsylvania 19380
Distributor
Voya Investments Distributor, LLC
7337 East Doubletree Ranch Road, Suite 100
Scottsdale, Arizona 85258
Transfer Agent
BNY Mellon Investment Servicing (U.S.) Inc.
301 Bellevue Parkway
Wilmington, Delaware 19809
Independent Registered Public Accounting Firm
KPMG LLP
Two Financial Center
60 South Street
Boston, Massachusetts 02111
Custodian
The Bank of New York Mellon
225 Liberty Street
New York, New York 10286
Legal Counsel
Ropes & Gray LLP
Prudential Tower
800 Boylston Street
Boston, Massachusetts 02199
Before investing, carefully consider the investment objectives, risks, charges and expenses of the variable annuity contract or variable life insurance policy and the underlying variable investment options. This and other information is contained in the prospectus for the variable annuity contract or variable life insurance policy and the underlying variable investment options. Obtain these prospectuses from your agent/registered representative and read them carefully before investing.
RETIREMENT | INVESTMENTS | INSURANCE
voyainvestments.com
Annual Report
December 31, 2015
Classes ADV, I, S, S2, T and Z
Voya Partners, Inc.
■
Voya Index Solution Income Portfolio
■
Voya Index Solution 2020 Portfolio
■
Voya Index Solution 2025 Portfolio
■
Voya Index Solution 2030 Portfolio
■
Voya Index Solution 2035 Portfolio
■
Voya Index Solution 2040 Portfolio
■
Voya Index Solution 2045 Portfolio
■
Voya Index Solution 2050 Portfolio
■
Voya Index Solution 2055 Portfolio
■
Voya Index Solution 2060 Portfolio
| | | This report is submitted for general information to shareholders of the Voya mutual funds. It is not authorized for distribution to prospective shareholders unless accompanied or preceded by a prospectus which includes details regarding the funds’ investment objectives, risks, charges, expenses and other information. This information should be read carefully. | | |
| | | | | | | 1 | | |
| | | | | | | 2 | | |
| | | | | | | 4 | | |
| | | | | | | 17 | | |
| | | | | | | 19 | | |
| | Statements of Assets and Liabilities | | | | | 20 | | |
| | Statements of Operations | | | | | 26 | | |
| | Statements of Changes in Net Assets | | | | | 29 | | |
| | | | | | | 34 | | |
| | | | | | | 43 | | |
| | Portfolios of Investments | | | | | 55 | | |
| | | | | | | 75 | | |
| | | | | | | 78 | | |
PROXY VOTING INFORMATION
A description of the policies and procedures that the Portfolios use to determine how to vote proxies related to portfolio securities is available: (1) without charge, upon request, by calling Shareholder Services toll-free at (800) 992-0180; (2) on the Portfolios’ website at www.voyainvestments.com; and (3) on the U.S. Securities and Exchange Commission’s (“SEC’s”) website at www.sec.gov. Information regarding how the Portfolios voted proxies related to portfolio securities during the most recent 12-month period ended June 30 is available without charge on the Portfolios’ website at www.voyainvestments.com and on the SEC’s website at www.sec.gov.
QUARTERLY PORTFOLIO HOLDINGS
The Portfolios file their complete schedule of portfolio holdings with the SEC for the first and third quarters of each fiscal year on Form N-Q. The Portfolios’ Forms N-Q are available on the SEC’s website at www.sec.gov. The Portfolios’ Forms N-Q may be reviewed and copied at the SEC’s Public Reference Room in Washington, DC, and information on the operation of the Public Reference Room may be obtained by calling (800) SEC-0330. The Portfolios’ Forms N-Q, as well as a complete portfolio of investments, are available without charge upon request from the Portfolios by calling Shareholder Services toll-free at (800) 992-0180.
Fed action — global reaction
Dear Shareholder,
One of the most anticipated events of 2015 came to pass with only a few weeks left on the calendar. Following the mid-December gathering of its policy-making Federal Open Market Committee, the Federal Reserve Board (“Fed”) announced the first increase of the federal funds target rate in nearly a decade, hiking its key policy interest rate 0.25% to a range of 0.25% – 0.50%. In its announcement, the central bank cited considerable improvement in labor-market conditions and a reasonable confidence that inflation will approach its 2% objective over the medium term. The widely expected interest rate hike already had been priced into most asset classes and thus had minimal immediate impact on the direction of financial markets.
Worth noting is that the Fed’s decision to begin raising short-term interest rates comes at a time when other major central banks — notably, in Europe, China and Japan — continue to provide massive amounts of support to their economies and are biased more toward further accommodation. The disruptions that potentially may emerge from this divergence in central bank policies will demand close attention in the year ahead. Witness January stock market performance.
Though the Fed believes the U.S. economy is strong enough to bear a fed funds interest rate increase, many of the same risks and opportunities persist in the markets. The global economic backdrop and geopolitical stresses continue to induce uncertainty, which could lead to periods of intense volatility, in our view. How can investors keep their perspective in such times? Don’t let today’s uncertainties distract you from focusing on your long-term goals, and don’t risk compromising your goals for the sake of avoiding volatility now. Keep your portfolio well-diversified and thoroughly discuss any prospective changes with your investment advisor before you take action.
At Voya Investment Management, we seek to be a reliable partner committed to reliable investing, helping you and your investment advisor achieve your goals. We appreciate your continued confidence in us, and we look forward to serving your investment needs in the future.
Sincerely,
Shaun Mathews
President and Chief Executive Officer
January 12, 2016
The views expressed in the President’s Letter reflect those of the President as of the date of the letter. Any such views are subject to change at any time based upon market or other conditions and the Voya mutual funds disclaim any responsibility to update such views. These views may not be relied on as investment advice and because investment decisions for a Voya mutual fund are based on numerous factors, may not be relied on as an indication of investment intent on behalf of any Voya mutual fund. Reference to specific company securities should not be construed as recommendations or investment advice.
International investing poses special risks including currency fluctuation, economic and political risks not found in investments that are solely domestic.
Market Perspective: Year Ended December 31, 2015
In our semi-annual report, we described how equity market interest had recently moved from the U.S. to Europe with the advent of the European Central Bank’s (“ECB”) quantitative easing program. But from there, attention moved east and in August an unexpected announcement from China re-awakened other concerns, sending global equities, in the form of the MSCI World IndexSM (the “Index”) measured in local currencies, including net reinvested dividends, on a roller-coaster ride. Having been up 4.14% for the half-year, the Index finally ended 2015 with a gain of 2.08%. (The Index returned -0.87% for the one year ended December 31, 2015, measured in U.S. dollars.)
U.S. economic data was mixed in what was still a rather pedestrian recovery. A disappointing October employment report was followed by a very strong one in November showing that 271,000 jobs had been created the previous month. Sluggish annual wage growth improved to 2.5%, which doesn’t sound like much, but it was the best since 2009. The unemployment rate fell to 5.0%. The December report was a little weaker. Gross domestic product (“GDP”), initially held back by another harsh winter, rebounded to 3.9% in the second quarter of 2015, before an inventory downturn pegged it back to 2.0% in the third. Industrial production was uneven, while retail sales were still showing no acceleration despite lower gasoline prices.
Superimposed on this was the prospect of rising U.S. interest rates. The Federal Open Market Committee (“FOMC”) had not increased the federal funds interest rate for nine years and many feared that it would feel pressed to act before the economy was really ready. But when on September 17 the FOMC left rates unchanged, citing weakness overseas, investors seemed unnerved at this new narrative rather than relieved. Perhaps sensing a credibility problem, the FOMC tried to re-set expectations, signaling in October the December increase of 0.25% that eventually took place, to a range of 0.25% – 0.50%.
Internationally, as noted, the ECB at last implemented a program of quantitative easing in March. Before long the economic data started to look a little less weak: the unemployment rate ticked down to 10.7% and GDP rose 1.6% year-over-year in the third quarter of 2015. Core inflation edged above 1.0% before slipping back. In December, ECB President Draghi’s much anticipated intensification of the program disappointed markets. Sentiment also suffered in mid-year when the integrity of the euro zone itself was threatened, as Greece wrangled over the terms of its bailout. Creditors stood firm and facing ejection, Greece finally accepted even stricter terms.
Annual GDP growth in China decelerated to 7.0% in the first and second quarters of 2015, the slowest in six years, then to 6.9% in the third. But to many commentators 7.0% was suspiciously close to government targets and perhaps overstated. They watched nervously as the Shanghai Stock Exchange Composite Index (“Shanghai Composite”) soared 64% in 2015 by June 12, fueled by retail savings and margin debt. The Shanghai Composite was already in retreat when on August 11, global commodities and equity markets were shaken as China announced a 2% devaluation of the yuan, suggesting that the Chinese economy, the largest single contributor to global growth in recent years, was indeed weaker than had previously been admitted. By August 26 the Shanghai Composite was down 43% from its peak. But gradually the feeling grew that concerns had been overdone. The Bank of China lowered interest rates, eased bank reserve
requirements and by the end of December, with the yuan gradually depreciating, the Shanghai Composite had regained over a quarter of its losses.
In U.S. fixed income markets, the Barclays U.S. Aggregate Bond Index (“Barclays Aggregate”) gained 0.55% in 2015, while the Barclays U.S. Treasury Bond sub-index added 0.84%. Indices of riskier classes fared worse: the Barclays U.S. Corporate Investment Grade Bond sub-index lost 0.68%, while the Barclays High Yield Bond — 2% Issuer Constrained Composite Index (not a part of the Barclays Aggregate) sagged 4.43%. Reflecting another kind of risk, the Barclays Global Inflation Linked U.S. TIPS Index dipped 1.44% as inflationary expectations receded.
U.S. equities, represented by the S&P 500® Index including dividends, crept up 1.38% over the year, within which August represented the worst month since September 2011, while October was the strongest since October 2011. The consumer discretionary sector did best, rising 10.11%. The most challenged sector was understandably energy, slumping 21.12%. S&P 500® earnings per share, dragged down by the energy sector, recorded their first year-over-year decline since 2012 in the second quarter of 2015, despite continuing high levels of share buybacks, and declined again in the third. Shares of companies with smaller market capitalizations lagged: the Russell Midcap® Index fell 2.44% and the Russell 2000® Index fell 4.41%.
In currencies, “divergence” became the word on the experts’ lips to describe the prospect of the U.S. starting to raise interest rates just as the ECB ratcheted up its quantitative easing program. Unsurprisingly the dollar rose 11.47% against the euro over the year. It rose less, 5.75%, against the pound, as the UK is much closer to raising rates than the euro zone. The dollar’s gains against the yen had been made before the period started and it barely moved, rising just 0.40%.
International markets fell sharply after the events in August, with a partial recovery which was faltering by year-end. The MSCI Japan® Index held on to a gain of 9.93% for the year, amid renewed optimism about the yen-denominated profitability and better governance of Japanese corporations. The MSCI Europe ex UK® Index was cushioned by the introduction of quantitative easing, plus the declining euro that went with it and advanced 8.30%. The MSCI UK® Index, burdened by its large, losing holdings in the energy, materials and banking sectors, dropped 2.21%.
All indices are unmanaged and investors cannot invest directly in an index. Past performance does not guarantee future results. The performance quoted represents past performance. Investment return and principal value of an investment will fluctuate, and shares, when redeemed, may be worth more or less than their original cost. The Portfolios’ performance is subject to change since the period’s end and may be lower or higher than the performance data shown. Please call (800) 262-3862 or log on to www.voyainvestments.com to obtain performance data current to the most recent month end.
Market Perspective reflects the views of Voya Investment Management’s Chief Investment Risk Officer only through the end of the period, and is subject to change based on market and other conditions.
| | | Index | | | | Description | | |
| | | Barclays Global Inflation Linked U.S. TIPS Index | | | | The index measures the performance of the US Treasury Inflation Protected Securities (TIPS) market. | | |
| | | Barclays High Yield Bond — 2% Issuer Constrained Composite Index | | | | An unmanaged index that includes all fixed-income securities having a maximum quality rating of Ba1, a minimum amount outstanding of $150 million, and at least one year to maturity. | | |
| | | Barclays U.S. Aggregate Bond Index | | | | An unmanaged index of publicly issued investment grade U.S. Government, mortgage-backed, asset-backed and corporate debt securities. | | |
| | | Barclays U.S. Corporate Investment Grade Bond Index | | | | An unmanaged index consisting of publicly issued, fixed rate, nonconvertible, investment grade debt securities. | | |
| | | Barclays U.S. Treasury Bond Index | | | | A market capitalization-weighted index that measures the performance of public obligations of the U.S. Treasury that have a remaining maturity of one year or more. | | |
| | | MSCI Europe ex UK® Index | | | | A free float-adjusted market capitalization index that is designed to measure developed market equity performance in Europe, excluding the UK. | | |
| | | MSCI Japan® Index | | | | A free float-adjusted market capitalization index that is designed to measure developed market equity performance in Japan. | | |
| | | MSCI UK® Index | | | | A free float-adjusted market capitalization index that is designed to measure developed market equity performance in the UK. | | |
| | | MSCI World IndexSM | | | | An unmanaged index that measures the performance of over 1,400 securities listed on exchanges in the U.S., Europe, Canada, Australia, New Zealand and the Far East. | | |
| | | Russell 2000® Index | | | | An unmanaged index that measures the performance of securities of small U.S. companies. | | |
| | | Russell Midcap® Index | | | | An unmanaged index that measures the performance of the 800 smallest companies in the Russell 1000® Index, which represents approximately 26% of the total market capitalization of the Russell 1000® Index. | | |
| | | S&P 500® Index | | | | An unmanaged index that measures the performance of securities of approximately 500 large-capitalization companies whose securities are traded on major U.S. stock markets. | | |
| | | S&P Target Date Retirement Income Index | | | | Seeks to represent asset allocations which target an immediate retirement horizon. | | |
| | | S&P Target Date 2020 Index,
S&P Target Date 2025 Index,
S&P Target Date 2030 Index,
S&P Target Date 2035 Index,
S&P Target Date 2040 Index,
S&P Target Date 2045 Index,
S&P Target Date 2050 Index and
S&P Target Date 2055+ Index | | | | Each seeks to represent the market consensus for asset allocations which target an approximate 2020, 2025, 2030, 2035, 2040, 2045, 2050, 2055 and beyond 2055 retirement horizon, respectively. | | |
| | | Shanghai Stock Exchange Composite Index | | | | A capitalization-weighted index. The index tracks the daily price performance of all A-shares and B-shares listed on the Shanghai Stock Exchange. The index was developed on December 19, 1990 with a base value of 100. | | |
| Voya Index Solution Portfolios | Portfolio Managers’ Report |
The Voya Index Solution Portfolios consist of Voya Index Solution Income Portfolio, Voya Index Solution 2020 Portfolio, Voya Index Solution 2025 Portfolio, Voya Index Solution 2030 Portfolio, Voya Index Solution 2035 Portfolio, Voya Index Solution 2040 Portfolio, Voya Index Solution 2045 Portfolio, Voya Index Solution 2050 Portfolio, Voya Index Solution 2055 Portfolio, and Voya Index Solution 2060 Portfolio (each a “Portfolio” or collectively, the “Portfolios” or the “Index Solution Portfolios”). Each Portfolio seeks to achieve its investment objective by investing in a combination of underlying funds which are actively managed funds or passively managed funds (index funds)(1). The Portfolios are managed by Halvard Kvaale, CIMA, Paul Zemsky, CFA and Chief Investment Officer, and Jody Hrazanek Portfolio Managers of Voya Investment Management Co. LLC (“Voya IM”) — the Sub-Adviser (“Sub-Adviser”).*
Portfolio Specifics: We began the year with a tactical overweight to developed international and Japanese equities and senior loans, funded by underweights to U.S. large cap, emerging markets equity and core U.S. fixed income.
We reduced our exposure to high yield bonds at the beginning of the period, allocating the proceeds to long duration U.S. Treasuries. This was done in an effort to lengthen our duration exposure, based on lower expectations for inflation in the U.S. and continued signs of decelerated global growth. At the end of the first quarter, we further reduced our exposure to high yield bonds and allocated the proceeds to cash. This trade was made over concerns that the effects of declining crude oil prices on energy companies, which have a large representation in the high yield bond market, would create short term headwinds for the asset class. In addition, we closed our Japanese equities position that was initiated at the end of 2014 for a profit.
At the start of April, we purchased high yield bonds with cash, directly reversing our end of the first quarter trade as the thesis for the original trade, where we believed further declines in crude oil prices could negatively affect high yield, failed to transpire. In mid-April, we shifted assets from domestic mid cap equities into currency-hedged Eurozone equities, believing Eurozone equities would outperform U.S. equities because of expected economic activity improvements, continued expansion of bank lending and sustained positive effects from enhanced competitiveness of the Euro.
As part of our annual process, the Portfolios glided down at the end of April, resulting in lower strategic equity allocations across our near and intermediate-dated Portfolios. To achieve this glide down, we sold domestic mid cap equities and purchased core U.S. fixed income. In addition, we added commodities as a strategic asset allocation across all Portfolios, funded by additional reductions in domestic mid cap equities. Both supply and prices of major commodity categories have come down over the past two years, making the asset class more attractive than in previous years. This allocation will also seek to hedge inflationary pressures which may strengthen given nascent wage rises in the U.S. and expansionary monetary policy outside the U.S. At the end of the second quarter, we closed out the Eurozone equities trade enacted in April. Since early April, the run-up in sovereign bond yields caused a significant correction in Eurozone equity prices, and the unfolding situation in Greece introduced more risk than we were willing to tolerate.
At the end of July, we slightly increased our underweight to domestic mid cap equities, allocating the proceeds to core fixed income. This trade was made to reduce our overweight to equities ahead of the Federal Reserve Board (“Fed”) policy decision in September. We further de-risked the Portfolios in August ahead of the Fed’s policy decision, reducing our position in international equities and allocating the proceeds to real estate, lengthening the duration of the Portfolios. In September, we increased our underweight to emerging market equities and purchased domestic large cap equities. While emerging market equities are cheap as a group, uncertainty about Fed actions and global growth concerns present headwinds for their economies.
At the onset of the last quarter of the year, we reduced risk across the Portfolios by selling mid cap equities and buying core U.S. bonds, neutralizing our equity overweight. This trade was placed due to a worsening global economic outlook at that time and uncertainty around Fed intentions on raising interest rates. We unwound this trade at the end of October after a weak payroll report helped to push off expectations for a Fed rate hike, thereby increasing risk appetite in the markets.
At the end of October, we made changes to our strategic asset allocations across all Portfolios to reflect our longer term views. This change led to a reduction in core U.S. fixed income, domestic mid and small cap equity, emerging markets equity, and high yield; and an increase to domestic large cap equities. In addition, we added senior loans, long government bonds, U.S. and Global REITs as new asset classes within the strategic asset allocation.
In November and December, we reduced risk in the Portfolios given uncertainty over the Fed, commodities and global growth by selling high yield and buying core U.S. fixed income. The Portfolios ended the quarter in a defensive posture, with underweights to domestic mid cap equity (far-dated Portfolios) and high yield (near-dated Portfolios), with a corresponding overweight position in core U.S. fixed income.
During the year, tactical moves relative to our strategic benchmarks had a positive impact across all of the Portfolios.
All of the Portfolios underperformed their respective S&P Target Date indices this year.
Among the largest asset class contributors to absolute return were domestic large blend equities and core U.S. fixed income. Among the largest asset class detractors from absolute return were emerging markets equity and broad-basket commodities.
The Portfolios utilized S&P 400 Mini Futures and 10 Year Treasury Futures to enact a tactical position held in October. Futures were utilized to avoid affecting underlying managers with shorter term tactical moves and to provide the Portfolios with greater liquidity. This tactical position detracted from performance during the reporting period.
Current Strategy and Outlook: While we have entered into a new year, the market conditions and investor fears first seen in late 2015 persist. High yield credit and commodity markets sank to multi-year lows, while Chinese equities resumed a rout reminiscent of last summer. With a fresh round of meetings around the corner, central banks are once again in the hot seat, battling deflationary pressures and struggling to remain credible.
Chinese volatility has once again crept back into the forefront of global investor worries. While 2015 GDP growth of 6.9% is largely consistent with the People’s Bank of China’s estimates, softer-than-expected December industrial production, fixed asset investment and retail sales numbers point toward slower 2016 growth, which some are even predicting to be sub-6%. While China’s transition to a consumer-driven growth model continues to be difficult, a hard landing for the economy is still not our base case scenario.
| Portfolio Managers’ Report | Voya Index Solution Portfolios |
Recent dovish commentary from both the European Central Bank (“ECB”) and Bank of Japan (“BoJ”) has raised expectations of possible further monetary stimulus from these authorities. While the ECB left its rates unchanged following its most recent meeting, President Mario Draghi mentioned that failing to reach its inflation target would reflect poorly on the ECB’s credibility and that there is a need to “review and possibly revisit our monetary policy stance at our next meeting in early March”. Similarly, BoJ Governor Kuroda was quoted saying the Japanese central bank will make “policy adjustment without hesitation” to reach its 2% inflation target.
Financial conditions in the U.S. have tightened considerably in the new year. The S&P 500® is down about 8%, and we have seen two consecutive quarters of negative S&P earnings growth. Our current activity model is implying GDP growth of 1% for the fourth quarter, down from 2% in the third quarter. High yield bond spreads have widened out as much as 130 basis points (1.30%) (a basis point is one-hundredth of one percent) since year-end, long-term bond yields are down close to 20 basis points, and crude oil has touched 12-year lows. We believe market volatility is likely to continue since the Fed appears to be focused on both economic and market developments, both at home and abroad; it will be interesting to see if the Federal Open Market Committee’s January statement includes any discussion of market conditions.
For the U.S. we continue to see consumer-driven growth in 2016, as we rounded out 2015 with strong housing data, above consensus payroll gains and record auto sales. On the other hand, the manufacturing sector remains under pressure, with December delivering a second consecutive month of contraction; January flash Markit Manufacturing PMI surprised to the upside, however. Overall, a stronger dollar and weaker oil prices should continue to help consumers while weighing on manufacturers.
*
Effective August 7, 2015, Frank Van Etten was removed as a portfolio manager of the Portfolios. Effective December 18, 2015, Jody Hrazanek was added as a portfolio manager of the Portfolios.
**
Each Portfolio’s relative performance versus its respective benchmark can be found on page 5.
(1)
The investment objective of each Portfolio is described in the Portfolios’ prospectuses, each dated May 1, 2015.
Portfolio holdings and characteristics are subject to change and may not be representative of current holdings and characteristics. Portfolio holdings are subject to change daily. The outlook for this Portfolio may differ from that presented for other Voya mutual funds. The Portfolio’s performance returns shown reflect applicable fee waivers and/or expense limits in effect during this period. Absent such fee waivers/expense limitations, if any, performance would have been lower. Performance for the different classes of shares will vary based on differences in fees associated with each class.
| | | Average Annual Total Returns for the Period Ended December 31, 2015 | | |
| | | | | | 1 Year | | |
| | | Voya Index Solution Income Portfolio, Class S | | | -1.11% | | |
| | | S&P Target Date Retirement Income Index | | | 0.07% | | |
| | | Voya Index Solution 2020 Portfolio, Class S | | | -0.08% | | |
| | | S&P Target Date 2020 Index | | | 0.06% | | |
| | | Voya Index Solution 2025 Portfolio, Class S | | | -1.50% | | |
| | | S&P Target Date 2025 Index | | | 0.00% | | |
| | | Voya Index Solution 2030 Portfolio, Class S | | | -0.27% | | |
| | | S&P Target Date 2030 Index | | | -0.05% | | |
| | | Voya Index Solution 2035 Portfolio, Class S | | | -1.63% | | |
| | | S&P Target Date 2035 Index | | | -0.10% | | |
| | | Voya Index Solution 2040 Portfolio, Class S | | | -1.65% | | |
| | | S&P Target Date 2040 Index | | | -0.15% | | |
| | | Voya Index Solution 2045 Portfolio, Class S | | | -1.86% | | |
| | | S&P Target Date 2045 Index | | | -0.21% | | |
| | | Voya Index Solution 2050 Portfolio, Class S | | | -1.60% | | |
| | | S&P Target Date 2050 Index | | | -0.22% | | |
| | | Voya Index Solution 2055 Portfolio, Class S | | | -1.93% | | |
| | | S&P Target Date 2055+ Index | | | -0.29% | | |
| | | Voya Index Solution 2060 Portfolio, Class S* | | | -2.10% | | |
| | | S&P Target Date 2055+ Index | | | -1.74% | | |
| | | | | |
*
Voya Index Solution 2060 Portfolio cumulative total returns are for the date of inception on February 9, 2015, to December 31, 2015.
| Voya Index Solution Portfolios | Portfolio Managers’ Report |
| | | Target Asset Allocation as of December 31, 2015 | | |
| | | Asset Class | | | 2060 | | | 2055 | | | 2050 | | | 2045 | | | 2040 | | | 2035 | | | 2030 | | | 2025 | | | 2020 | | | Income | | |
| | | U.S. Large Blend | | | | | 48.5% | | | | | | 48.5% | | | | | | 48.0% | | | | | | 48.0% | | | | | | 47.0% | | | | | | 44.0% | | | | | | 38.0% | | | | | | 33.0% | | | | | | 30.0% | | | | | | 22.0% | | | |
| | | U.S. Mid Cap Blend | | | | | 12.5% | | | | | | 12.5% | | | | | | 12.5% | | | | | | 12.5% | | | | | | 10.5% | | | | | | 8.5% | | | | | | 7.5% | | | | | | 7.0% | | | | | | 4.0% | | | | | | 3.0% | | | |
| | | U.S. Small Cap | | | | | 4.0% | | | | | | 4.0% | | | | | | 4.0% | | | | | | 4.0% | | | | | | 4.0% | | | | | | 4.0% | | | | | | 3.0% | | | | | | 3.0% | | | | | | 2.0% | | | | | | — | | | |
| | | International Equity | | | | | 22.0% | | | | | | 22.0% | | | | | | 20.5% | | | | | | 20.5% | | | | | | 19.5% | | | | | | 18.5% | | | | | | 18.5% | | | | | | 15.0% | | | | | | 12.0% | | | | | | 6.0% | | | |
| | | Emerging Markets | | | | | 6.0% | | | | | | 6.0% | | | | | | 6.0% | | | | | | 6.0% | | | | | | 5.0% | | | | | | 4.0% | | | | | | 4.0% | | | | | | 3.0% | | | | | | 2.0% | | | | | | 1.0% | | | |
| | | U.S. Real Estate | | | | | 1.5% | | | | | | 1.5% | | | | | | 1.5% | | | | | | 1.5% | | | | | | 1.5% | | | | | | 1.5% | | | | | | 1.5% | | | | | | 1.0% | | | | | | 1.0% | | | | | | 1.0% | | | |
| | | Global Real Estate | | | | | 1.5% | | | | | | 1.5% | | | | | | 1.5% | | | | | | 1.5% | | | | | | 1.5% | | | | | | 1.5% | | | | | | 1.5% | | | | | | 1.0% | | | | | | 1.0% | | | | | | 1.0% | | | |
| | | Commodities | | | | | 1.0% | | | | | | 1.0% | | | | | | 1.0% | | | | | | 1.0% | | | | | | 1.0% | | | | | | 1.0% | | | | | | 1.0% | | | | | | 1.0% | | | | | | 1.0% | | | | | | 1.0% | | | |
| | | Core Fixed Income | | | | | 2.0% | | | | | | 2.0% | | | | | | 2.0% | | | | | | 2.0% | | | | | | 6.0% | | | | | | 9.0% | | | | | | 17.0% | | | | | | 25.0% | | | | | | 36.0% | | | | | | 53.0% | | | |
| | | High Yield | | | | | — | | | | | | — | | | | | | — | | | | | | — | | | | | | 2.0% | | | | | | 6.0% | | | | | | 6.0% | | | | | | 9.0% | | | | | | 9.0% | | | | | | 9.0% | | | |
| | | Senior Debt | | | | | — | | | | | | — | | | | | | 2.0% | | | | | | 2.0% | | | | | | 2.0% | | | | | | 2.0% | | | | | | 2.0% | | | | | | 2.0% | | | | | | 2.0% | | | | | | 2.0% | | | |
| | | Long Gov’t Bonds | | | | | 1.0% | | | | | | 1.0% | | | | | | 1.0% | | | | | | 1.0% | | | | | | — | | | | | | — | | | | | | — | | | | | | — | | | | | | — | | | | | | 1.0% | | | |
| | | Total Equity | | | | | 97% | | | | | | 97% | | | | | | 95% | | | | | | 95% | | | | | | 90% | | | | | | 83% | | | | | | 75% | | | | | | 64% | | | | | | 53% | | | | | | 35% | | | |
| | | Total Fixed Income | | | | | 3% | | | | | | 3% | | | | | | 5% | | | | | | 5% | | | | | | 10% | | | | | | 17% | | | | | | 25% | | | | | | 36% | | | | | | 47% | | | | | | 65% | | | |
As these are target allocations, the actual allocations of each Portfolio’s assets may deviate from the percentages shown. Although the Portfolios expect to be fully invested at all times, they may maintain liquidity reserves to meet redemption requests.
Portfolio holdings are subject to change daily.
| Portfolio Managers’ Report | Voya Index Solution Income Portfolio |
| | | Average Annual Total Returns for the Periods Ended December 31, 2015 | | |
| | | | | | 1 Year | | | 5 Year | | | Since Inception
of Classes ADV,
I, S and T
March 10, 2008 | | | Since Inception
of Class S2
May 28, 2009 | | | Since Inception
of Class Z
May 1, 2015 | | |
| | | Class ADV | | | | | -1.37% | | | | | | 4.44% | | | | | | 4.10% | | | | | | — | | | | | | — | | | |
| | | Class I | | | | | -0.91% | | | | | | 4.97% | | | | | | 4.64% | | | | | | — | | | | | | — | | | |
| | | Class S | | | | | -1.11% | | | | | | 4.70% | | | | | | 4.36% | | | | | | — | | | | | | — | | | |
| | | Class S2 | | | | | -1.25% | | | | | | 4.55% | | | | | | — | | | | | | 6.14% | | | | | | — | | | |
| | | Class T | | | | | -1.47% | | | | | | 4.25% | | | | | | 3.90% | | | | | | — | | | | | | — | | | |
| | | Class Z | | | | | — | | | | | | — | | | | | | — | | | | | | — | | | | | | -3.06% | | | |
| | | S&P Target Date Retirement Income Index | | | | | 0.07% | | | | | | 4.72% | | | | | | 4.33% | | | | | | 6.70% | | | | | | -2.12% | | | |
| | | | | |
Based on a $10,000 initial investment, the graph and table above illustrate the total return of Voya Index Solution Income Portfolio against the index indicated. The index is unmanaged and has no cash in its portfolio, imposes no sales charges and incurs no operating expenses. An investor cannot invest directly in an index. The Portfolio’s performance is shown without the imposition of any expenses or charges which are, or may be, imposed under your variable annuity contract or variable life insurance policy. Total returns would have been lower if such expenses or charges were included.
The performance graph and table do not reflect the deduction of taxes that a shareholder will pay on Portfolio distributions or the redemption of Portfolio shares.
The performance shown may include the effect of fee waivers and/or expense reimbursements by the Investment Adviser and/or other service providers, which have the effect of increasing total return. Had all fees and expenses been considered, the total returns would have been lower.
The performance update illustrates performance for a variable investment option available through a variable annuity contract or a variable life insurance policy. The performance shown indicates past performance and is not a projection or prediction of future results. Actual investment returns and principal value will fluctuate so that shares and/or units, at redemption, may be worth more or less than their original cost. Please log on to www.voyainvestments.com or call (800) 262-3862 to get performance through the most recent month end.
This report contains statements that may be “forward-looking” statements. Actual results may differ materially from those projected in the “forward-looking” statements.
The views expressed in this report reflect those of the portfolio managers, only through the end of the period as stated on the cover. The portfolio managers’ views are subject to change at any time based on market and other conditions.
Portfolio holdings are subject to change daily.
| Voya Index Solution 2020 Portfolio | Portfolio Managers’ Report |
| | | Average Annual Total Returns for the Periods Ended December 31, 2015 | | |
| | | | | | 1 Year | | | Since Inception
of Classes ADV, I, S, T and S2
October 3, 2011 | | | Since Inception
of Class Z
May 1, 2015 | | |
| | | Class ADV | | | | | 0.00% | | | | | | 8.78% | | | | | | — | | | |
| | | Class I | | | | | 0.04% | | | | | | 9.20% | | | | | | — | | | |
| | | Class S | | | | | -0.08% | | | | | | 8.90% | | | | | | — | | | |
| | | Class S2 | | | | | -0.16% | | | | | | 8.83% | | | | | | — | | | |
| | | Class T | | | | | -0.54% | | | | | | 8.46% | | | | | | — | | | |
| | | Class Z | | | | | — | | | | | | — | | | | | | -2.97% | | | |
| | | S&P Target Date 2020 Index | | | | | 0.06% | | | | | | 9.85% | | | | | | -3.44% | | | |
| | | | | |
Based on a $10,000 initial investment, the graph and table above illustrate the total return of Voya Index Solution 2020 Portfolio against the index indicated. The index is unmanaged and has no cash in its portfolio, imposes no sales charges and incurs no operating expenses. An investor cannot invest directly in an index. The Portfolio’s performance is shown without the imposition of any expenses or charges which are, or may be, imposed under your variable annuity contract or variable life insurance policy. Total returns would have been lower if such expenses or charges were included.
The performance graph and table do not reflect the deduction of taxes that a shareholder will pay on Portfolio distributions or the redemption of Portfolio shares.
The performance shown may include the effect of fee waivers and/or expense reimbursements by the Investment Adviser and/or other service providers, which have the effect of increasing total return. Had all fees and expenses been considered, the total returns would have been lower.
The performance update illustrates performance for a variable investment option available through a variable annuity contract or a variable life insurance policy. The performance shown indicates past performance and is not a projection or prediction of future results. Actual investment returns and principal value will fluctuate so that shares and/or units, at redemption, may be worth more or less than their original cost. Please log on to www.voyainvestments.com or call (800) 262-3862 to get performance through the most recent month end.
This report contains statements that may be “forward-looking” statements. Actual results may differ materially from those projected in the “forward-looking” statements.
The views expressed in this report reflect those of the portfolio managers, only through the end of the period as stated on the cover. The portfolio managers’ views are subject to change at any time based on market and other conditions.
Portfolio holdings are subject to change daily.
| Portfolio Managers’ Report | Voya Index Solution 2025 Portfolio |
| | | Average Annual Total Returns for the Periods Ended December 31, 2015 | | |
| | | | | | 1 Year | | | 5 Year | | | Since Inception
of Classes ADV, I, S and T
March 10, 2008 | | | Since Inception
of Class S2
May 28, 2009 | | | Since Inception
of Class Z
May 1, 2015 | | |
| | | Class ADV | | | | | -1.80% | | | | | | 6.01% | | | | | | 4.42% | | | | | | — | | | | | | — | | | |
| | | Class I | | | | | -1.25% | | | | | | 6.56% | | | | | | 4.94% | | | | | | — | | | | | | — | | | |
| | | Class S | | | | | -1.50% | | | | | | 6.28% | | | | | | 4.69% | | | | | | — | | | | | | — | | | |
| | | Class S2 | | | | | -1.63% | | | | | | 6.12% | | | | | | — | | | | | | 9.21% | | | | | | — | | | |
| | | Class T | | | | | -1.87% | | | | | | 5.85% | | | | | | 4.21% | | | | | | — | | | | | | — | | | |
| | | Class Z | | | | | — | | | | | | — | | | | | | — | | | | | | — | | | | | | -4.81% | | | |
| | | S&P Target Date 2025 Index | | | | | 0.00% | | | | | | 6.96% | | | | | | 5.79% | | | | | | 10.41% | | | | | | -3.84% | | | |
| | | | | |
Based on a $10,000 initial investment, the graph and table above illustrate the total return of Voya Index Solution 2025 Portfolio against the index indicated. The index is unmanaged and has no cash in its portfolio, imposes no sales charges and incurs no operating expenses. An investor cannot invest directly in an index. The Portfolio’s performance is shown without the imposition of any expenses or charges which are, or may be, imposed under your variable annuity contract or variable life insurance policy. Total returns would have been lower if such expenses or charges were included.
The performance graph and table do not reflect the deduction of taxes that a shareholder will pay on Portfolio distributions or the redemption of Portfolio shares.
The performance shown may include the effect of fee waivers and/or expense reimbursements by the Investment Adviser and/or other service providers, which have the effect of increasing total return. Had all fees and expenses been considered, the total returns would have been lower.
The performance update illustrates performance for a variable investment option available through a variable annuity contract or a variable life insurance policy. The performance shown indicates past performance and is not a projection or prediction of future results. Actual investment returns and principal value will fluctuate so that shares and/or units, at redemption, may be worth more or less than their original cost. Please log on to www.voyainvestments.com or call (800) 262-3862 to get performance through the most recent month end.
This report contains statements that may be “forward-looking” statements. Actual results may differ materially from those projected in the “forward-looking” statements.
The views expressed in this report reflect those of the portfolio managers, only through the end of the period as stated on the cover. The portfolio managers’ views are subject to change at any time based on market and other conditions.
Portfolio holdings are subject to change daily.
| Voya Index Solution 2030 Portfolio | Portfolio Managers’ Report |
| | | Average Annual Total Returns for the Periods Ended December 31, 2015 | | |
| | | | | | 1 Year | | | Since Inception
of Classes ADV, I, S, T and S2
October 3, 2011 | | | Since Inception
of Class Z
May 1, 2015 | | |
| | | Class ADV | | | | | -0.48% | | | | | | 10.98% | | | | | | — | | | |
| | | Class I | | | | | -0.03% | | | | | | 11.51% | | | | | | — | | | |
| | | Class S | | | | | -0.27% | | | | | | 11.18% | | | | | | — | | | |
| | | Class S2 | | | | | -0.58% | | | | | | 11.01% | | | | | | — | | | |
| | | Class T | | | | | -0.99% | | | | | | 10.67% | | | | | | — | | | |
| | | Class Z | | | | | — | | | | | | — | �� | | | | | -4.23% | | | |
| | | S&P Target Date 2030 Index | | | | | -0.05% | | | | | | 11.70% | | | | | | -4.18% | | | |
| | | | | |
Based on a $10,000 initial investment, the graph and table above illustrate the total return of Voya Index Solution 2030 Portfolio against the index indicated. The index is unmanaged and has no cash in its portfolio, imposes no sales charges and incurs no operating expenses. An investor cannot invest directly in an index. The Portfolio’s performance is shown without the imposition of any expenses or charges which are, or may be, imposed under your variable annuity contract or variable life insurance policy. Total returns would have been lower if such expenses or charges were included.
The performance graph and table do not reflect the deduction of taxes that a shareholder will pay on Portfolio distributions or the redemption of Portfolio shares.
The performance shown may include the effect of fee waivers and/or expense reimbursements by the Investment Adviser and/or other service providers, which have the effect of increasing total return. Had all fees and expenses been considered, the total returns would have been lower.
The performance update illustrates performance for a variable investment option available through a variable annuity contract or a variable life insurance policy. The performance shown indicates past performance and is not a projection or prediction of future results. Actual investment returns and principal value will fluctuate so that shares and/or units, at redemption, may be worth more or less than their original cost. Please log on to www.voyainvestments.com or call (800) 262-3862 to get performance through the most recent month end.
This report contains statements that may be “forward-looking” statements. Actual results may differ materially from those projected in the “forward-looking” statements.
The views expressed in this report reflect those of the portfolio managers, only through the end of the period as stated on the cover. The portfolio managers’ views are subject to change at any time based on market and other conditions.
Portfolio holdings are subject to change daily.
| Portfolio Managers’ Report | Voya Index Solution 2035 Portfolio |
| | | Average Annual Total Returns for the Periods Ended December 31, 2015 | | |
| | | | | | 1 Year | | | 5 Year | | | Since Inception
of Classes ADV, I, S and T
March 10, 2008 | | | Since Inception
of Class S2
May 28, 2009 | | | Since Inception
of Class Z
May 1, 2015 | | |
| | | Class ADV | | | | | -1.91% | | | | | | 6.93% | | | | | | 4.82% | | | | | | — | | | | | | — | | | |
| | | Class I | | | | | -1.47% | | | | | | 7.45% | | | | | | 5.33% | | | | | | — | | | | | | — | | | |
| | | Class S | | | | | -1.63% | | | | | | 7.20% | | | | | | 5.09% | | | | | | — | | | | | | — | | | |
| | | Class S2 | | | | | -1.78% | | | | | | 7.04% | | | | | | — | | | | | | 10.37% | | | | | | — | | | |
| | | Class T | | | | | -2.08% | | | | | | 6.72% | | | | | | 4.60% | | | | | | — | | | | | | — | | | |
| | | Class Z | | | | | — | | | | | | — | | | | | | — | | | | | | — | | | | | | -5.49% | | | |
| | | S&P Target Date 2035 Index | | | | | -0.10% | | | | | | 7.65% | | | | | | 6.00% | | | | | | 11.43% | | | | | | -4.49% | | | |
| | | | | |
Based on a $10,000 initial investment, the graph and table above illustrate the total return of Voya Index Solution 2035 Portfolio against the index indicated. The index is unmanaged and has no cash in its portfolio, imposes no sales charges and incurs no operating expenses. An investor cannot invest directly in an index. The Portfolio’s performance is shown without the imposition of any expenses or charges which are, or may be, imposed under your variable annuity contract or variable life insurance policy. Total returns would have been lower if such expenses or charges were included.
The performance graph and table do not reflect the deduction of taxes that a shareholder will pay on Portfolio distributions or the redemption of Portfolio shares.
The performance shown may include the effect of fee waivers and/or expense reimbursements by the Investment Adviser and/or other service providers, which have the effect of increasing total return. Had all fees and expenses been considered, the total returns would have been lower.
The performance update illustrates performance for a variable investment option available through a variable annuity contract or a variable life insurance policy. The performance shown indicates past performance and is not a projection or prediction of future results. Actual investment returns and principal value will fluctuate so that shares and/or units, at redemption, may be worth more or less than their original cost. Please log on to www.voyainvestments.com or call (800) 262-3862 to get performance through the most recent month end.
This report contains statements that may be “forward-looking” statements. Actual results may differ materially from those projected in the “forward-looking” statements.
The views expressed in this report reflect those of the portfolio managers, only through the end of the period as stated on the cover. The portfolio managers’ views are subject to change at any time based on market and other conditions.
Portfolio holdings are subject to change daily.
| Voya Index Solution 2040 Portfolio | Portfolio Managers’ Report |
| | | Average Annual Total Returns for the Periods Ended December 31, 2015 | | |
| | | | | | 1 Year | | | Since Inception
of Classes ADV, I, S, T and S2
October 3, 2011 | | | Since Inception
of Class Z
May 1, 2015 | | |
| | | Class ADV | | | | | -1.78% | | | | | | 12.45% | | | | | | — | | | |
| | | Class I | | | | | -1.50% | | | | | | 12.97% | | | | | | — | | | |
| | | Class S | | | | | -1.65% | | | | | | 12.68% | | | | | | — | | | |
| | | Class S2 | | | | | -1.88% | | | | | | 12.51% | | | | | | — | | | |
| | | Class T | | | | | -2.19% | | | | | | 12.20% | | | | | | — | | | |
| | | Class Z | | | | | — | | | | | | — | | | | | | -5.75% | | | |
| | | S&P Target Date 2040 Index | | | | | -0.15% | | | | | | 12.88% | | | | | | -4.75% | | | |
| | | | | |
Based on a $10,000 initial investment, the graph and table above illustrate the total return of Voya Index Solution 2040 Portfolio against the index indicated. The index is unmanaged and has no cash in its portfolio, imposes no sales charges and incurs no operating expenses. An investor cannot invest directly in an index. The Portfolio’s performance is shown without the imposition of any expenses or charges which are, or may be, imposed under your variable annuity contract or variable life insurance policy. Total returns would have been lower if such expenses or charges were included.
The performance graph and table do not reflect the deduction of taxes that a shareholder will pay on Portfolio distributions or the redemption of Portfolio shares.
The performance shown may include the effect of fee waivers and/or expense reimbursements by the Investment Adviser and/or other service providers, which have the effect of increasing total return. Had all fees and expenses been considered, the total returns would have been lower.
The performance update illustrates performance for a variable investment option available through a variable annuity contract or a variable life insurance policy. The performance shown indicates past performance and is not a projection or prediction of future results. Actual investment returns and principal value will fluctuate so that shares and/or units, at redemption, may be worth more or less than their original cost. Please log on to www.voyainvestments.com or call (800) 262-3862 to get performance through the most recent month end.
This report contains statements that may be “forward-looking” statements. Actual results may differ materially from those projected in the “forward-looking” statements.
The views expressed in this report reflect those of the portfolio managers, only through the end of the period as stated on the cover. The portfolio managers’ views are subject to change at any time based on market and other conditions.
Portfolio holdings are subject to change daily.
| Portfolio Managers’ Report | Voya Index Solution 2045 Portfolio |
| | | Average Annual Total Returns for the Periods Ended December 31, 2015 | | |
| | | | | | 1 Year | | | 5 Year | | | Since Inception
of Classes ADV, I, S and T
March 10, 2008 | | | Since Inception
of Class S2
May 28, 2009 | | | Since Inception
of Class Z
May 1, 2015 | | |
| | | Class ADV | | | | | -2.05% | | | | | | 7.21% | | | | | | 4.80% | | | | | | — | | | | | | — | | | |
| | | Class I | | | | | -1.61% | | | | | | 7.75% | | | | | | 5.32% | | | | | | — | | �� | | | | — | | | |
| | | Class S | | | | | -1.86% | | | | | | 7.48% | | | | | | 5.06% | | | | | | — | | | | | | — | | | |
| | | Class S2 | | | | | -1.99% | | | | | | 7.32% | | | | | | — | | | | | | 11.02% | | | | | | — | | | |
| | | Class T | | | | | -2.38% | | | | | | 7.00% | | | | | | 4.58% | | | | | | — | | | | | | — | | | |
| | | Class Z | | | | | — | | | | | | — | | | | | | — | | | | | | — | | | | | | -6.26% | | | |
| | | S&P Target Date 2045 Index | | | | | -0.21% | | | | | | 8.03% | | | | | | 6.05% | | | | | | 11.93% | | | | | | -4.97% | | | |
| | | | | |
Based on a $10,000 initial investment, the graph and table above illustrate the total return of Voya Index Solution 2045 Portfolio against the index indicated. The index is unmanaged and has no cash in its portfolio, imposes no sales charges and incurs no operating expenses. An investor cannot invest directly in an index. The Portfolio’s performance is shown without the imposition of any expenses or charges which are, or may be, imposed under your variable annuity contract or variable life insurance policy. Total returns would have been lower if such expenses or charges were included.
The performance graph and table do not reflect the deduction of taxes that a shareholder will pay on Portfolio distributions or the redemption of Portfolio shares.
The performance shown may include the effect of fee waivers and/or expense reimbursements by the Investment Adviser and/or other service providers, which have the effect of increasing total return. Had all fees and expenses been considered, the total returns would have been lower.
The performance update illustrates performance for a variable investment option available through a variable annuity contract or a variable life insurance policy. The performance shown indicates past performance and is not a projection or prediction of future results. Actual investment returns and principal value will fluctuate so that shares and/or units, at redemption, may be worth more or less than their original cost. Please log on to www.voyainvestments.com or call (800) 262-3862 to get performance through the most recent month end.
This report contains statements that may be “forward-looking” statements. Actual results may differ materially from those projected in the “forward-looking” statements.
The views expressed in this report reflect those of the portfolio managers, only through the end of the period as stated on the cover. The portfolio managers’ views are subject to change at any time based on market and other conditions.
Portfolio holdings are subject to change daily.
| Voya Index Solution 2050 Portfolio | Portfolio Managers’ Report |
| | | Average Annual Total Returns for the Periods Ended December 31, 2015 | | |
| | | | | | 1 Year | | | Since Inception
of Classes ADV, I, S, T and S2
October 3, 2011 | | | Since Inception
of Class Z
May 1, 2015 | | |
| | | Class ADV | | | | | -1.97% | | | | | | 12.53% | | | | | | — | | | |
| | | Class I | | | | | -1.45% | | | | | | 13.11% | | | | | | — | | | |
| | | Class S | | | | | -1.60% | | | | | | 12.83% | | | | | | — | | | |
| | | Class S2 | | | | | -1.83% | | | | | | 12.65% | | | | | | — | | | |
| | | Class T | | | | | -2.09% | | | | | | 12.34% | | | | | | — | | | |
| | | Class Z | | | | | — | | | | | | — | | | | | | -6.02% | | | |
| | | S&P Target Date 2050 Index | | | | | -0.22% | | | | | | 13.60% | | | | | | -5.12% | | | |
| | | S&P Target Date 2045 Index | | | | | -0.21% | | | | | | 13.26% | | | | | | -4.97% | | | |
Based on a $10,000 initial investment, the graph and table above illustrate the total return of Voya Index Solution 2050 Portfolio against the indices indicated. An index is unmanaged and has no cash in its portfolio, imposes no sales charges and incurs no operating expenses. An investor cannot invest directly in an index. The Portfolio’s performance is shown without the imposition of any expenses or charges which are, or may be, imposed under your variable annuity contract or variable life insurance policy. Total returns would have been lower if such expenses or charges were included.
The performance graph and table do not reflect the deduction of taxes that a shareholder will pay on Portfolio distributions or the redemption of Portfolio shares.
The performance shown may include the effect of fee waivers and/or expense reimbursements by the Investment Adviser and/or other service providers, which have the effect of increasing total return. Had all fees and expenses been considered, the total returns would have been lower.
The performance update illustrates performance for a variable investment option available through a variable annuity contract or a variable life insurance policy. The
performance shown indicates past performance and is not a projection or prediction of future results. Actual investment returns and principal value will fluctuate so that shares and/or units, at redemption, may be worth more or less than their original cost. Please log on to www.voyainvestments.com or call (800) 262-3862 to get performance through the most recent month end.
This report contains statements that may be “forward-looking” statements. Actual results may differ materially from those projected in the “forward-looking” statements.
The views expressed in this report reflect those of the portfolio managers, only through the end of the period as stated on the cover. The portfolio managers’ views are subject to change at any time based on market and other conditions.
Portfolio holdings are subject to change daily.
Effective May 1, 2015, the Portfolio changed its primary benchmark from the S&P Target Date 2045 Index to the S&P Target Date 2050 Index because the S&P Target Date 2050 Index is considered by the Adviser to be a more appropriate benchmark reflecting the types of securities in which the Portfolio invests.
| Portfolio Managers’ Report | Voya Index Solution 2055 Portfolio |
| | | Average Annual Total Returns for the Periods Ended December 31, 2015 | | |
| | | | | | 1 Year | | | 5 Year | | | Since Inception
of Classes ADV, I, S, T and S2
March 8, 2010 | | | Since Inception
of Class Z
May 1, 2015 | | |
| | | Class ADV | | | | | -2.15% | | | | | | 7.26% | | | | | | 8.29% | | | | | | — | | | |
| | | Class I | | | | | -1.66% | | | | | | 7.78% | | | | | | 8.83% | | | | | | — | | | |
| | | Class S | | | | | -1.93% | | | | | | 7.54% | | | | | | 8.56% | | | | | | — | | | |
| | | Class S2 | | | | | -2.04% | | | | | | 7.36% | | | | | | 8.39% | | | | | | — | | | |
| | | Class T | | | | | -2.31% | | | | | | 7.04% | | | | | | 8.07% | | | | | | — | | | |
| | | Class Z | | | | | — | | | | | | — | | | | | | — | | | | | | -6.22% | | | |
| | | S&P Target Date 2055+ Index | | | | | -0.29% | | | | | | 8.38% | | | | | | 9.45% | | | | | | -5.27% | | | |
| | | S&P Target Date 2045 Index | | | | | -0.21% | | | | | | 8.03% | | | | | | 9.14% | | | | | | -4.97% | | | |
Based on a $10,000 initial investment, the graph and table above illustrate the total return of Voya Index Solution 2055 Portfolio against the indices indicated. An index is unmanaged and has no cash in its portfolio, imposes no sales charges and incurs no operating expenses. An investor cannot invest directly in an index. The Portfolio’s performance is shown without the imposition of any expenses or charges which are, or may be, imposed under your variable annuity contract or variable life insurance policy. Total returns would have been lower if such expenses or charges were included.
The performance graph and table do not reflect the deduction of taxes that a shareholder will pay on Portfolio distributions or the redemption of Portfolio shares.
The performance shown may include the effect of fee waivers and/or expense reimbursements by the Investment Adviser and/or other service providers, which have the effect of increasing total return. Had all fees and expenses been considered, the total returns would have been lower.
The performance update illustrates performance for a variable investment option available through a variable annuity contract or a variable life insurance policy. The performance shown indicates past performance and is
not a projection or prediction of future results. Actual investment returns and principal value will fluctuate so that shares and/or units, at redemption, may be worth more or less than their original cost. Please log on to www.voyainvestments.com or call (800) 262-3862 to get performance through the most recent month end.
This report contains statements that may be “forward-looking” statements. Actual results may differ materially from those projected in the “forward-looking” statements.
The views expressed in this report reflect those of the portfolio managers, only through the end of the period as stated on the cover. The portfolio managers’ views are subject to change at any time based on market and other conditions.
Portfolio holdings are subject to change daily.
Effective May 1, 2015, the Portfolio changed its primary benchmark from the S&P Target Date 2045 Index to the S&P Target Date 2055+ Index because the S&P Target Date 2055+ Index is considered by the Adviser to be a more appropriate benchmark reflecting the types of securities in which the Portfolio invests.
| Voya Index Solution 2060 Portfolio | Portfolio Managers’ Report |
| | | Cumulative Total Returns for the Period Ended December 31, 2015 | | |
| | | | | | Since Inception
of Classes ADV, I, S and T
February 9, 2015 | | | Since Inception
of Class Z
May 1, 2015 | | |
| | | Class ADV | | | | | -2.30% | | | | | | — | | | |
| | | Class I | | | | | -1.80% | | | | | | — | | | |
| | | Class S | | | | | -2.10% | | | | | | — | | | |
| | | Class S2 | | | | | -2.30% | | | | | | — | | | |
| | | Class Z | | | | | — | | | | | | -6.12% | | | |
| | | S&P Target Date 2055+ Index | | | | | -1.74% | | | | | | -5.27% | | | |
Based on a $10,000 initial investment, the graph and table above illustrate the total return of Voya Index Solution 2060 Portfolio against the index indicated. The index is unmanaged and has no cash in its portfolio, imposes no sales charges and incurs no operating expenses. An investor cannot invest directly in an index. The Portfolio’s performance is shown without the imposition of any expenses or charges which are, or may be, imposed under your variable annuity contract or variable life insurance policy. Total returns would have been lower if such expenses or charges were included.
The performance graph and table do not reflect the deduction of taxes that a shareholder will pay on Portfolio distributions or the redemption of Portfolio shares.
The performance shown may include the effect of fee waivers and/or expense reimbursements by the Investment Adviser and/or other service providers, which have the effect of increasing total return. Had all fees and expenses been considered, the total returns would have been lower.
The performance update illustrates performance for a variable investment option available through a variable
annuity contract or a variable life insurance policy. The performance shown indicates past performance and is not a projection or prediction of future results. Actual investment returns and principal value will fluctuate so that shares and/or units, at redemption, may be worth more or less than their original cost. Please log on to www.voyainvestments.com or call (800) 262-3862 to get performance through the most recent month end.
It is important to note that the Portfolio has a limited operating history. Performance over a longer period of time may be more meaningful than short-term performance.
This report contains statements that may be “forward-looking” statements. Actual results may differ materially from those projected in the “forward-looking” statements.
The views expressed in this report reflect those of the portfolio managers, only through the end of the period as stated on the cover. The portfolio managers’ views are subject to change at any time based on market and other conditions.
Portfolio holdings are subject to change daily.
SHAREHOLDER EXPENSE EXAMPLES (Unaudited)
As a shareholder of a Portfolio, you incur two types of costs: (1) transaction costs, including redemption fees and exchange fees; and (2) ongoing costs including management fees, distribution and/or service (12b-1) fees, and other Portfolio expenses. These Examples are intended to help you understand your ongoing costs (in dollars) of investing in a Portfolio and to compare these costs with the ongoing costs of investing in other mutual funds.
The Examples are based on an investment of $1,000 invested at the beginning of the period and held for the entire period from July 1, 2015 to December 31, 2015. The Portfolios’ expenses are shown without the imposition of any charges which are, or may be, imposed under your variable annuity contract, variable life insurance policy, qualified pension or retirement plan. Expenses would have been higher if such charges were included.
Actual Expenses
The left section of the table shown below, “Actual Portfolio Return,” provides information about actual account values and actual expenses. You may use the information in this section, together with the amount you invested, to estimate the expenses that you paid over the period. Simply divide your account value by $1,000 (for example, an $8,600 account value divided by $1,000 = 8.6), then multiply the result by the number in the first section under the heading entitled “Expenses Paid During the Period” to estimate the expenses you paid on your account during this period.
Hypothetical Example for Comparison Purposes
The right section of the table shown below, “Hypothetical (5% return before expenses),” provides information about hypothetical account values and hypothetical expenses based on a Portfolio’s actual expense ratio and an assumed rate of return of 5% per year before expenses, which is not a Portfolio’s actual return. The hypothetical account values and expenses may not be used to estimate the actual ending account balance or expenses you paid for the period. You may use this information to compare the ongoing costs of investing in a Portfolio and other mutual funds. To do so, compare this 5% hypothetical example with the 5% hypothetical examples that appear in the shareholder reports of the other mutual funds.
Please note that the expenses shown in the table are meant to highlight your ongoing costs only and do not reflect any transactional costs, such as redemption fees or exchange fees. Therefore, the hypothetical section of the table is useful in comparing ongoing costs only, and will not help you determine the relative total costs of owning different mutual funds. In addition, if these transactional costs were included, your costs would have been higher.
| | | | Actual Portfolio Return | | | Hypothetical (5% return before expenses) | |
| | | | Beginning
Account
Value
July 1,
2015 | | | Ending
Account
Value
December 31,
2015 | | | Annualized
Expense
Ratio* | | | Expenses Paid
During the
Period Ended
December 31,
2015** | | | Beginning
Account
Value
July 1,
2015 | | | Ending
Account
Value
December 31,
2015 | | | Annualized
Expense
Ratio* | | | Expenses Paid
During the
Period Ended
December 31,
2015** | |
| Voya Index Solution Income Portfolio | |
| Class ADV | | | | $ | 1,000.00 | | | | | $ | 982.60 | | | | | | 0.62% | | | | | $ | 3.10 | | | | | $ | 1,000.00 | | | | | $ | 1,022.08 | | | | | | 0.62% | | | | | $ | 3.16 | | |
| Class I | | | | | 1,000.00 | | | | | | 984.40 | | | | | | 0.12 | | | | | | 0.60 | | | | | | 1,000.00 | | | | | | 1,024.60 | | | | | | 0.12 | | | | | | 0.61 | | |
| Class S | | | | | 1,000.00 | | | | | | 983.30 | | | | | | 0.37 | | | | | | 1.85 | | | | | | 1,000.00 | | | | | | 1,023.34 | | | | | | 0.37 | | | | | | 1.89 | | |
| Class S2 | | | | | 1,000.00 | | | | | | 982.80 | | | | | | 0.52 | | | | | | 2.60 | | | | | | 1,000.00 | | | | | | 1,022.58 | | | | | | 0.52 | | | | | | 2.65 | | |
| Class T | | | | | 1,000.00 | | | | | | 981.60 | | | | | | 0.82 | | | | | | 4.10 | | | | | | 1,000.00 | | | | | | 1,021.07 | | | | | | 0.82 | | | | | | 4.18 | | |
| Class Z | | | | | 1,000.00 | | | | | | 986.50 | | | | | | 0.00 | | | | | | 0.00 | | | | | | 1,000.00 | | | | | | 1,025.21 | | | | | | 0.00 | | | | | | 0.00 | | |
| Voya Index Solution 2020 Portfolio | |
| Class ADV | | | | $ | 1,000.00 | | | | | $ | 989.10 | | | | | | 0.63% | | | | | $ | 3.16 | | | | | $ | 1,000.00 | | | | | $ | 1,022.03 | | | | | | 0.63% | | | | | $ | 3.21 | | |
| Class I | | | | | 1,000.00 | | | | | | 986.30 | | | | | | 0.13 | | | | | | 0.65 | | | | | | 1,000.00 | | | | | | 1,024.55 | | | | | | 0.13 | | | | | | 0.66 | | |
| Class S | | | | | 1,000.00 | | | | | | 987.60 | | | | | | 0.38 | | | | | | 1.90 | | | | | | 1,000.00 | | | | | | 1,023.29 | | | | | | 0.38 | | | | | | 1.94 | | |
| Class S2 | | | | | 1,000.00 | | | | | | 986.70 | | | | | | 0.53 | | | | | | 2.65 | | | | | | 1,000.00 | | | | | | 1,022.53 | | | | | | 0.53 | | | | | | 2.70 | | |
| Class T | | | | | 1,000.00 | | | | | | 984.60 | | | | | | 0.83 | | | | | | 4.15 | | | | | | 1,000.00 | | | | | | 1,021.02 | | | | | | 0.83 | | | | | | 4.23 | | |
| Class Z | | | | | 1,000.00 | | | | | | 988.00 | | | | | | 0.00 | | | | | | 0.00 | | | | | | 1,000.00 | | | | | | 1,025.21 | | | | | | 0.00 | | | | | | 0.00 | | |
| Voya Index Solution 2025 Portfolio | |
| Class ADV | | | | $ | 1,000.00 | | | | | $ | 966.90 | | | | | | 0.63% | | | | | $ | 3.12 | | | | | $ | 1,000.00 | | | | | $ | 1,022.03 | | | | | | 0.63% | | | | | $ | 3.21 | | |
| Class I | | | | | 1,000.00 | | | | | | 970.10 | | | | | | 0.13 | | | | | | 0.65 | | | | | | 1,000.00 | | | | | | 1,024.55 | | | | | | 0.13 | | | | | | 0.66 | | |
| Class S | | | | | 1,000.00 | | | | | | 968.30 | | | | | | 0.38 | | | | | | 1.89 | | | | | | 1,000.00 | | | | | | 1,023.29 | | | | | | 0.38 | | | | | | 1.94 | | |
| Class S2 | | | | | 1,000.00 | | | | | | 967.60 | | | | | | 0.53 | | | | | | 2.63 | | | | | | 1,000.00 | | | | | | 1,022.53 | | | | | | 0.53 | | | | | | 2.70 | | |
| Class T | | | | | 1,000.00 | | | | | | 967.00 | | | | | | 0.83 | | | | | | 4.12 | | | | | | 1,000.00 | | | | | | 1,021.02 | | | | | | 0.83 | | | | | | 4.23 | | |
| Class Z | | | | | 1,000.00 | | | | | | 971.10 | | | | | | 0.00 | | | | | | 0.00 | | | | | | 1,000.00 | | | | | | 1,025.21 | | | | | | 0.00 | | | | | | 0.00 | | |
SHAREHOLDER EXPENSE EXAMPLES (Unaudited) (continued)
| | | | Actual Portfolio Return | | | Hypothetical (5% return before expenses) | |
| | | | Beginning
Account
Value
July 1,
2015 | | | Ending
Account
Value
December 31,
2015 | | | Annualized
Expense
Ratio* | | | Expenses Paid
During the
Period Ended
December 31,
2015** | | | Beginning
Account
Value
July 1,
2015 | | | Ending
Account
Value
December 31,
2015 | | | Annualized
Expense
Ratio* | | | Expenses Paid
During the
Period Ended
December 31,
2015** | |
| Voya Index Solution 2030 Portfolio | |
| Class ADV | | | | $ | 1,000.00 | | | | | $ | 977.50 | | | | | | 0.63% | | | | | $ | 3.14 | | | | | $ | 1,000.00 | | | | | $ | 1,022.03 | | | | | | 0.63% | | | | | $ | 3.21 | | |
| Class I | | | | | 1,000.00 | | | | | | 979.00 | | | | | | 0.13 | | | | | | 0.65 | | | | | | 1,000.00 | | | | | | 1,024.55 | | | | | | 0.13 | | | | | | 0.66 | | |
| Class S | | | | | 1,000.00 | | | | | | 978.20 | | | | | | 0.38 | | | | | | 1.89 | | | | | | 1,000.00 | | | | | | 1,023.29 | | | | | | 0.38 | | | | | | 1.94 | | |
| Class S2 | | | | | 1,000.00 | | | | | | 975.00 | | | | | | 0.53 | | | | | | 2.64 | | | | | | 1,000.00 | | | | | | 1,022.53 | | | | | | 0.53 | | | | | | 2.70 | | |
| Class T | | | | | 1,000.00 | | | | | | 972.50 | | | | | | 0.83 | | | | | | 4.13 | | | | | | 1,000.00 | | | | | | 1,021.02 | | | | | | 0.83 | | | | | | 4.23 | | |
| Class Z | | | | | 1,000.00 | | | | | | 978.30 | | | | | | 0.00 | | | | | | 0.00 | | | | | | 1,000.00 | | | | | | 1,025.21 | | | | | | 0.00 | | | | | | 0.00 | | |
| Voya Index Solution 2035 Portfolio | |
| Class ADV | | | | $ | 1,000.00 | | | | | $ | 961.40 | | | | | | 0.64% | | | | | $ | 3.16 | | | | | $ | 1,000.00 | | | | | $ | 1,021.98 | | | | | | 0.64% | | | | | $ | 3.26 | | |
| Class I | | | | | 1,000.00 | | | | | | 963.10 | | | | | | 0.14 | | | | | | 0.69 | | | | | | 1,000.00 | | | | | | 1,024.50 | | | | | | 0.14 | | | | | | 0.71 | | |
| Class S | | | | | 1,000.00 | | | | | | 962.90 | | | | | | 0.39 | | | | | | 1.93 | | | | | | 1,000.00 | | | | | | 1,023.24 | | | | | | 0.39 | | | | | | 1.99 | | |
| Class S2 | | | | | 1,000.00 | | | | | | 961.90 | | | | | | 0.54 | | | | | | 2.67 | | | | | | 1,000.00 | | | | | | 1,022.48 | | | | | | 0.54 | | | | | | 2.75 | | |
| Class T | | | | | 1,000.00 | | | | | | 959.80 | | | | | | 0.84 | | | | | | 4.15 | | | | | | 1,000.00 | | | | | | 1,020.97 | | | | | | 0.84 | | | | | | 4.28 | | |
| Class Z | | | | | 1,000.00 | | | | | | 965.70 | | | | | | 0.00 | | | | | | 0.00 | | | | | | 1,000.00 | | | | | | 1,025.21 | | | | | | 0.00 | | | | | | 0.00 | | |
| Voya Index Solution 2040 Portfolio | |
| Class ADV | | | | $ | 1,000.00 | | | | | $ | 962.30 | | | | | | 0.63% | | | | | $ | 3.12 | | | | | $ | 1,000.00 | | | | | $ | 1,022.03 | | | | | | 0.63% | | | | | $ | 3.21 | | |
| Class I | | | | | 1,000.00 | | | | | | 962.60 | | | | | | 0.13 | | | | | | 0.64 | | | | | | 1,000.00 | | | | | | 1,024.55 | | | | | | 0.13 | | | | | | 0.66 | | |
| Class S | | | | | 1,000.00 | | | | | | 962.40 | | | | | | 0.38 | | | | | | 1.88 | | | | | | 1,000.00 | | | | | | 1,023.29 | | | | | | 0.38 | | | | | | 1.94 | | |
| Class S2 | | | | | 1,000.00 | | | | | | 960.80 | | | | | | 0.53 | | | | | | 2.62 | | | | | | 1,000.00 | | | | | | 1,022.53 | | | | | | 0.53 | | | | | | 2.70 | | |
| Class T | | | | | 1,000.00 | | | | | | 959.00 | | | | | | 0.83 | | | | | | 4.10 | | | | | | 1,000.00 | | | | | | 1,021.02 | | | | | | 0.83 | | | | | | 4.23 | | |
| Class Z | | | | | 1,000.00 | | | | | | 963.30 | | | | | | 0.00 | | | | | | 0.00 | | | | | | 1,000.00 | | | | | | 1,025.21 | | | | | | 0.00 | | | | | | 0.00 | | |
| Voya Index Solution 2045 Portfolio | |
| Class ADV | | | | $ | 1,000.00 | | | | | $ | 957.40 | | | | | | 0.64% | | | | | $ | 3.16 | | | | | $ | 1,000.00 | | | | | $ | 1,021.98 | | | | | | 0.64% | | | | | $ | 3.26 | | |
| Class I | | | | | 1,000.00 | | | | | | 959.20 | | | | | | 0.14 | | | | | | 0.69 | | | | | | 1,000.00 | | | | | | 1,024.50 | | | | | | 0.14 | | | | | | 0.71 | | |
| Class S | | | | | 1,000.00 | | | | | | 958.00 | | | | | | 0.39 | | | | | | 1.92 | | | | | | 1,000.00 | | | | | | 1,023.24 | | | | | | 0.39 | | | | | | 1.99 | | |
| Class S2 | | | | | 1,000.00 | | | | | | 958.00 | | | | | | 0.54 | | | | | | 2.67 | | | | | | 1,000.00 | | | | | | 1,022.48 | | | | | | 0.54 | | | | | | 2.75 | | |
| Class T | | | | | 1,000.00 | | | | | | 955.80 | | | | | | 0.84 | | | | | | 4.14 | | | | | | 1,000.00 | | | | | | 1,020.97 | | | | | | 0.84 | | | | | | 4.28 | | |
| Class Z | | | | | 1,000.00 | | | | | | 960.10 | | | | | | 0.00 | | | | | | 0.00 | | | | | | 1,000.00 | | | | | | 1,025.21 | | | | | | 0.00 | | | | | | 0.00 | | |
| Voya Index Solution 2050 Portfolio | |
| Class ADV | | | | $ | 1,000.00 | | | | | $ | 959.30 | | | | | | 0.64% | | | | | $ | 3.16 | | | | | $ | 1,000.00 | | | | | $ | 1,021.98 | | | | | | 0.64% | | | | | $ | 3.26 | | |
| Class I | | | | | 1,000.00 | | | | | | 962.50 | | | | | | 0.14 | | | | | | 0.69 | | | | | | 1,000.00 | | | | | | 1,024.50 | | | | | | 0.14 | | | | | | 0.71 | | |
| Class S | | | | | 1,000.00 | | | | | | 961.70 | | | | | | 0.39 | | | | | | 1.93 | | | | | | 1,000.00 | | | | | | 1,023.24 | | | | | | 0.39 | | | | | | 1.99 | | |
| Class S2 | | | | | 1,000.00 | | | | | | 960.00 | | | | | | 0.54 | | | | | | 2.67 | | | | | | 1,000.00 | | | | | | 1,022.48 | | | | | | 0.54 | | | | | | 2.75 | | |
| Class T | | | | | 1,000.00 | | | | | | 958.70 | | | | | | 0.84 | | | | | | 4.15 | | | | | | 1,000.00 | | | | | | 1,020.97 | | | | | | 0.84 | | | | | | 4.28 | | |
| Class Z | | | | | 1,000.00 | | | | | | 962.50 | | | | | | 0.00 | | | | | | 0.00 | | | | | | 1,000.00 | | | | | | 1,025.21 | | | | | | 0.00 | | | | | | 0.00 | | |
| Voya Index Solution 2055 Portfolio | |
| Class ADV | | | | $ | 1,000.00 | | | | | $ | 957.00 | | | | | | 0.65% | | | | | $ | 3.21 | | | | | $ | 1,000.00 | | | | | $ | 1,021.93 | | | | | | 0.65% | | | | | $ | 3.31 | | |
| Class I | | | | | 1,000.00 | | | | | | 959.70 | | | | | | 0.15 | | | | | | 0.74 | | | | | | 1,000.00 | | | | | | 1,024.45 | | | | | | 0.15 | | | | | | 0.77 | | |
| Class S | | | | | 1,000.00 | | | | | | 958.10 | | | | | | 0.40 | | | | | | 1.97 | | | | | | 1,000.00 | | | | | | 1,023.19 | | | | | | 0.40 | | | | | | 2.04 | | |
| Class S2 | | | | | 1,000.00 | | | | | | 957.50 | | | | | | 0.55 | | | | | | 2.71 | | | | | | 1,000.00 | | | | | | 1,022.43 | | | | | | 0.55 | | | | | | 2.80 | | |
| Class T | | | | | 1,000.00 | | | | | | 956.00 | | | | | | 0.85 | | | | | | 4.19 | | | | | | 1,000.00 | | | | | | 1,020.92 | | | | | | 0.85 | | | | | | 4.33 | | |
| Class Z | | | | | 1,000.00 | | | | | | 960.40 | | | | | | 0.00 | | | | | | 0.00 | | | | | | 1,000.00 | | | | | | 1,025.21 | | | | | | 0.00 | | | | | | 0.00 | | |
| Voya Index Solution 2060 Portfolio | |
| Class ADV | | | | $ | 1,000.00 | | | | | $ | 959.70 | | | | | | 0.65% | | | | | $ | 3.21 | | | | | $ | 1,000.00 | | | | | $ | 1,021.93 | | | | | | 0.65% | | | | | $ | 3.31 | | |
| Class I | | | | | 1,000.00 | | | | | | 962.70 | | | | | | 0.15 | | | | | | 0.74 | | | | | | 1,000.00 | | | | | | 1,024.45 | | | | | | 0.15 | | | | | | 0.77 | | |
| Class S | | | | | 1,000.00 | | | | | | 959.80 | | | | | | 0.40 | | | | | | 1.98 | | | | | | 1,000.00 | | | | | | 1,023.19 | | | | | | 0.40 | | | | | | 2.04 | | |
| Class S2 | | | | | 1,000.00 | | | | | | 958.80 | | | | | | 0.55 | | | | | | 2.72 | | | | | | 1,000.00 | | | | | | 1,022.43 | | | | | | 0.55 | | | | | | 2.80 | | |
| Class Z | | | | | 1,000.00 | | | | | | 961.80 | | | | | | 0.00 | | | | | | 0.00 | | | | | | 1,000.00 | | | | | | 1,025.21 | | | | | | 0.00 | | | | | | 0.00 | | |
*
The annualized expense ratios do not include expenses of underlying funds.
**
Expenses are equal to each Portfolio’s respective annualized expense ratios multiplied by the average account value over the period, multiplied by 184/365 to reflect the most recent fiscal half-year.
REPORT OF INDEPENDENT REGISTERED PUBLIC ACCOUNTING FIRM
The Shareholders and Board of Directors
Voya Partners, Inc.
We have audited the accompanying statements of assets and liabilities, including the portfolios of investments, of Voya Index Solution Income Portfolio, Voya Index Solution 2020 Portfolio, Voya Index Solution 2025 Portfolio, Voya Index Solution 2030 Portfolio, Voya Index Solution 2035 Portfolio, Voya Index Solution 2040 Portfolio, Voya Index Solution 2045 Portfolio, Voya Index Solution 2050 Portfolio, Voya Index Solution 2055 Portfolio, and Voya Index Solution 2060 Portfolio, each a series of Voya Partners, Inc., as of December 31, 2015, and the related statements of operations for the year or period then ended, the statements of changes in net assets for each of the years or periods in the two-year period then ended, and the financial highlights for each of the years or periods in the five-year period then ended. These financial statements and financial highlights are the responsibility of management. Our responsibility is to express an opinion on these financial statements and financial highlights based on our audits.
We conducted our audits in accordance with the standards of the Public Company Accounting Oversight Board (United States). Those standards require that we plan and perform the audit to obtain reasonable assurance about whether the financial statements and financial highlights are free of material misstatement. An audit includes examining, on a test basis, evidence supporting the amounts and disclosures in the financial statements. Our procedures included confirmation of securities owned as of December 31, 2015, by correspondence with custodian and transfer agent. An audit also includes assessing the accounting principles used and significant estimates made by management, as well as evaluating the overall financial statement presentation. We believe that our audits provide a reasonable basis for our opinion.
In our opinion, the financial statements and financial highlights referred to above present fairly, in all material respects, the financial position of the aforementioned funds of Voya Partners, Inc. as of December 31, 2015, the results of its operations for the year or period then ended, the changes in its net assets for each of the years or periods in the two-year period then ended, and the financial highlights for each of the years or periods in the five-year period then ended, in conformity with U.S. generally accepted accounting principles.
Boston, Massachusetts
February 24, 2016
STATEMENTS OF ASSETS AND LIABILITIES as of December 31, 2015
| | | | Voya Index
Solution Income
Portfolio | | | Voya Index
Solution 2020
Portfolio | | | Voya Index
Solution 2025
Portfolio | | | Voya Index
Solution 2030
Portfolio | |
| ASSETS: | | | | | |
| Investments in affiliated underlying funds at fair value* | | | | $ | 327,283,479 | | | | | $ | 7,313,566 | | | | | $ | 406,275,921 | | | | | $ | 4,474,208 | | |
| Investments in unaffiliated underlying funds at fair value** | | | | | 54,160,544 | | | | | | 1,174,299 | | | | | | 74,267,753 | | | | | | 664,268 | | |
| Total investments at fair value | | | | $ | 381,444,023 | | | | | $ | 8,487,865 | | | | | $ | 480,543,674 | | | | | $ | 5,138,476 | | |
| Cash | | | | | 468,402 | | | | | | 7,129 | | | | | | 480,374 | | | | | | 4,102 | | |
| Receivables: | | | | | |
| Investments in affiliated underlying funds sold | | | | | 5,071,176 | | | | | | — | | | | | | 13,358,639 | | | | | | — | | |
| Fund shares sold | | | | | 415,998 | | | | | | 244,461 | | | | | | 176,975 | | | | | | 168,442 | | |
| Dividends | | | | | 158,422 | | | | | | 4,100 | | | | | | 262,618 | | | | | | 2,081 | | |
| Prepaid expenses | | | | | 762 | | | | | | 7 | | | | | | 815 | | | | | | 3 | | |
| Reimbursement due from manager | | | | | 46,751 | | | | | | 5,096 | | | | | | 58,705 | | | | | | 4,437 | | |
| Other assets | | | | | 3,177 | | | | | | — | | | | | | 5,629 | | | | | | — | | |
| Total assets | | | | | 387,608,711 | | | | | | 8,748,658 | | | | | | 494,887,429 | | | | | | 5,317,541 | | |
| LIABILITIES: | | | | | ��� |
| Payable for investments in affiliated underlying funds purchased | | | | | — | | | | | | 220,293 | | | | | | — | | | | | | 113,224 | | |
| Payable for fund shares redeemed | | | | | 5,487,174 | | | | | | 24,169 | | | | | | 13,535,613 | | | | | | 55,217 | | |
| Payable for investment management fees | | | | | 76,036 | | | | | | 1,454 | | | | | | 97,502 | | | | | | 832 | | |
| Payable for distribution and shareholder service fees | | | | | 106,865 | | | | | | 2,163 | | | | | | 148,437 | | | | | | 1,107 | | |
| Payable to trustees under the deferred compensation plan (Note 6) | | | | | 3,177 | | | | | | — | | | | | | 5,629 | | | | | | — | | |
| Payable for trustee fees | | | | | 1,288 | | | | | | 8 | | | | | | 2,618 | | | | | | 5 | | |
| Other accrued expenses and liabilities | | | | | 46,753 | | | | | | 2,250 | | | | | | 74,971 | | | | | | 2,487 | | |
| Total liabilities | | | | | 5,721,293 | | | | | | 250,337 | | | | | | 13,864,770 | | | | | | 172,872 | | |
| NET ASSETS | | | | $ | 381,887,418 | | | | | $ | 8,498,321 | | | | | $ | 481,022,659 | | | | | $ | 5,144,669 | | |
| NET ASSETS WERE COMPRISED OF: | | | | | |
| Paid-in capital | | | | $ | 395,120,228 | | | | | $ | 8,540,398 | | | | | $ | 461,864,367 | | | | | $ | 5,181,734 | | |
| Undistributed net investment income | | | | | 6,124,094 | | | | | | 61,745 | | | | | | 10,998,166 | | | | | | 35,142 | | |
| Accumulated net realized gain (loss) | | | | | (166,180) | | | | | | 17,647 | | | | | | 31,660,068 | | | | | | 14,369 | | |
| Net unrealized depreciation | | | | | (19,190,724) | | | | | | (121,469) | | | | | | (23,499,942) | | | | | | (86,576) | | |
| NET ASSETS | | | | $ | 381,887,418 | | | | | $ | 8,498,321 | | | | | $ | 481,022,659 | | | | | $ | 5,144,669 | | |
*
Cost of investments in affiliated underlying funds | | | | $ | 339,939,874 | | | | | $ | 7,399,146 | | | | | $ | 422,305,569 | | | | | $ | 4,544,391 | | |
**
Cost of investments in unaffiliated underlying funds | | | | $ | 60,694,873 | | | | | $ | 1,210,188 | | | | | $ | 81,738,047 | | | | | $ | 680,661 | | |
See Accompanying Notes to Financial Statements
STATEMENTS OF ASSETS AND LIABILITIES as of December 31, 2015 (continued)
| | | | Voya Index
Solution Income
Portfolio | | | Voya Index
Solution 2020
Portfolio | | | Voya Index
Solution 2025
Portfolio | | | Voya Index
Solution 2030
Portfolio |
| Class ADV | | | | | |
| Net assets | | | | $ | 134,514,810 | | | | | $ | 4,702,561 | | | | | $ | 228,081,162 | | | | | $ | 2,598,076 |
| Shares authorized | | | | | 100,000,000 | | | | | | 100,000,000 | | | | | | 100,000,000 | | | | | | 100,000,000 |
| Par value | | | | $ | 0.001 | | | | | $ | 0.001 | | | | | $ | 0.001 | | | | | $ | 0.001 |
| Shares outstanding | | | | | 14,086,498 | | | | | | 413,676 | | | | | | 22,372,753 | | | | | | 209,669 |
| Net asset value and redemption price per share | | | | $ | 9.55 | | | | | $ | 11.37 | | | | | $ | 10.19 | | | | | $ | 12.39 |
| Class I | | | | | |
| Net assets | | | | $ | 30,873,426 | | | | | $ | 311,376 | | | | | $ | 49,274,946 | | | | | $ | 779,493 |
| Shares authorized | | | | | 100,000,000 | | | | | | 100,000,000 | | | | | | 100,000,000 | | | | | | 100,000,000 |
| Par value | | | | $ | 0.001 | | | | | $ | 0.001 | | | | | $ | 0.001 | | | | | $ | 0.001 |
| Shares outstanding | | | | | 3,158,517 | | | | | | 26,959 | | | | | | 4,729,998 | | | | | | 61,885 |
| Net asset value and redemption price per share | | | | $ | 9.77 | | | | | $ | 11.55 | | | | | $ | 10.42 | | | | | $ | 12.60 |
| Class S | | | | | |
| Net assets | | | | $ | 199,998,936 | | | | | $ | 1,083,804 | | | | | $ | 166,419,764 | | | | | $ | 520,745 |
| Shares authorized | | | | | 100,000,000 | | | | | | 100,000,000 | | | | | | 100,000,000 | | | | | | 100,000,000 |
| Par value | | | | $ | 0.001 | | | | | $ | 0.001 | | | | | $ | 0.001 | | | | | $ | 0.001 |
| Shares outstanding | | | | | 20,651,749 | | | | | | 93,795 | | | | | | 16,139,849 | | | | | | 41,433 |
| Net asset value and redemption price per share | | | | $ | 9.68 | | | | | $ | 11.55 | | | | | $ | 10.31 | | | | | $ | 12.57 |
| Class S2 | | | | | |
| Net assets | | | | $ | 14,859,186 | | | | | $ | 367,182 | | | | | $ | 34,933,511 | | | | | $ | 46,758 |
| Shares authorized | | | | | 100,000,000 | | | | | | 100,000,000 | | | | | | 100,000,000 | | | | | | 100,000,000 |
| Par value | | | | $ | 0.001 | | | | | $ | 0.001 | | | | | $ | 0.001 | | | | | $ | 0.001 |
| Shares outstanding | | | | | 1,564,001 | | | | | | 31,872 | | | | | | 3,438,658 | | | | | | 3,756 |
| Net asset value and redemption price per share | | | | $ | 9.50 | | | | | $ | 11.52 | | | | | $ | 10.16 | | | | | $ | 12.45 |
| Class T | | | | | |
| Net assets | | | | $ | 6,013 | | | | | $ | 3,705 | | | | | $ | 3,268 | | | | | $ | 4,054 |
| Shares authorized | | | | | 100,000,000 | | | | | | 100,000,000 | | | | | | 100,000,000 | | | | | | 100,000,000 |
| Par value | | | | $ | 0.001 | | | | | $ | 0.001 | | | | | $ | 0.001 | | | | | $ | 0.001 |
| Shares outstanding | | | | | 625 | | | | | | 324 | | | | | | 319 | | | | | | 328 |
| Net asset value and redemption price per share | | | | $ | 9.63 | | | | | $ | 11.43 | | | | | $ | 10.24 | | | | | $ | 12.35 |
| Class Z | | | | | |
| Net assets | | | | $ | 1,635,047 | | | | | $ | 2,029,693 | | | | | $ | 2,310,008 | | | | | $ | 1,195,543 |
| Shares authorized | | | | | 100,000,000 | | | | | | 100,000,000 | | | | | | 100,000,000 | | | | | | 100,000,000 |
| Par value | | | | $ | 0.001 | | | | | $ | 0.001 | | | | | $ | 0.001 | | | | | $ | 0.001 |
| Shares outstanding | | | | | 166,978 | | | | | | 175,438 | | | | | | 221,491 | | | | | | 94,983 |
| Net asset value and redemption price per share | | | | $ | 9.79 | | | | | $ | 11.57 | | | | | $ | 10.43 | | | | | $ | 12.59 |
See Accompanying Notes to Financial Statements
STATEMENTS OF ASSETS AND LIABILITIES as of December 31, 2015
| | | | Voya Index
Solution 2035
Portfolio | | | Voya Index
Solution 2040
Portfolio | | | Voya Index
Solution 2045
Portfolio | | | Voya Index
Solution 2050
Portfolio | |
| ASSETS: | | | | | |
| Investments in affiliated underlying funds at fair value* | | | | $ | 341,595,003 | | | | | $ | 2,590,179 | | | | | $ | 229,557,712 | | | | | $ | 1,611,422 | | |
| Investments in unaffiliated underlying funds at fair value** | | | | | 57,658,939 | | | | | | 330,454 | | | | | | 29,450,670 | | | | | | 194,723 | | |
| Total investments at fair value | | | | $ | 399,253,942 | | | | | $ | 2,920,633 | | | | | $ | 259,008,382 | | | | | $ | 1,806,145 | | |
| Cash | | | | | 432,495 | | | | | | 1,745 | | | | | | 336,354 | | | | | | 1,968 | | |
| Receivables: | | | | | |
| Investments in affiliated underlying funds sold | | | | | 14,373,169 | | | | | | 140,022 | | | | | | 6,705,257 | | | | | | 42,825 | | |
| Fund shares sold | | | | | 273,590 | | | | | | 10,661 | | | | | | 68,498 | | | | | | 13,673 | | |
| Dividends | | | | | 184,129 | | | | | | 686 | | | | | | 64,055 | | | | | | 307 | | |
| Prepaid expenses | | | | | 834 | | | | | | 1 | | | | | | 532 | | | | | | 1 | | |
| Reimbursement due from manager | | | | | 52,006 | | | | | | 3,833 | | | | | | 36,426 | | | | | | 3,484 | | |
| Other assets | | | | | 4,479 | | | | | | — | | | | | | 2,708 | | | | | | — | | |
| Total assets | | | | | 414,574,644 | | | | | | 3,077,581 | | | | | | 266,222,212 | | | | | | 1,868,403 | | |
| LIABILITIES: | | | | | |
| Payable for investments in unaffiliated underlying funds purchased | | | | | — | | | | | | 34,529 | | | | | | — | | | | | | — | | |
| Payable for fund shares redeemed | | | | | 14,646,759 | | | | | | 116,032 | | | | | | 6,773,754 | | | | | | 56,498 | | |
| Payable for investment management fees | | | | | 80,409 | | | | | | 431 | | | | | | 50,348 | | | | | | 287 | | |
| Payable for distribution and shareholder service fees | | | | | 126,816 | | | | | | 651 | | | | | | 81,571 | | | | | | 330 | | |
| Payable to trustees under the deferred compensation plan (Note 6) | | | | | 4,479 | | | | | | — | | | | | | 2,708 | | | | | | — | | |
| Payable for trustee fees | | | | | 2,179 | | | | | | 3 | | | | | | 1,376 | | | | | | 2 | | |
| Other accrued expenses and liabilities | | | | | 54,185 | | | | | | 2,457 | | | | | | 27,099 | | | | | | 2,342 | | |
| Total liabilities | | | | | 14,914,827 | | | | | | 154,103 | | | | | | 6,936,856 | | | | | | 59,459 | | |
| NET ASSETS | | | | $ | 399,659,817 | | | | | $ | 2,923,478 | | | | | $ | 259,285,356 | | | | | $ | 1,808,944 | | |
| NET ASSETS WERE COMPRISED OF: | | | | | |
| Paid-in capital | | | | $ | 378,377,940 | | | | | $ | 2,947,872 | | | | | $ | 246,144,949 | | | | | $ | 1,806,056 | | |
| Undistributed net investment income | | | | | 8,559,830 | | | | | | 21,302 | | | | | | 4,993,787 | | | | | | 13,201 | | |
| Accumulated net realized gain | | | | | 36,231,920 | | | | | | 8,410 | | | | | | 23,548,456 | | | | | | 22,031 | | |
| Net unrealized depreciation | | | | | (23,509,873) | | | | | | (54,106) | | | | | | (15,401,836) | | | | | | (32,344) | | |
| NET ASSETS | | | | $ | 399,659,817 | | | | | $ | 2,923,478 | | | | | $ | 259,285,356 | | | | | $ | 1,808,944 | | |
*
Cost of investments in affiliated underlying funds | | | | $ | 360,165,555 | | | | | $ | 2,638,559 | | | | | $ | 243,486,651 | | | | | $ | 1,641,904 | | |
**
Cost of investments in unaffiliated underlying funds | | | | $ | 62,598,260 | | | | | $ | 336,180 | | | | | $ | 30,923,567 | | | | | $ | 196,585 | | |
See Accompanying Notes to Financial Statements
STATEMENTS OF ASSETS AND LIABILITIES as of December 31, 2015 (continued)
| | | | Voya Index
Solution 2035
Portfolio | | | Voya Index
Solution 2040
Portfolio | | | Voya Index
Solution 2045
Portfolio | | | Voya Index
Solution 2050
Portfolio | |
| Class ADV | | | | | |
| Net assets | | | | $ | 199,096,902 | | | | | $ | 1,252,338 | | | | | $ | 133,884,063 | | | | | $ | 666,126 | | |
| Shares authorized | | | | | 100,000,000 | | | | | | 100,000,000 | | | | | | 100,000,000 | | | | | | 100,000,000 | | |
| Par value | | | | $ | 0.001 | | | | | $ | 0.001 | | | | | $ | 0.001 | | | | | $ | 0.001 | | |
| Shares outstanding | | | | | 19,250,331 | | | | | | 99,272 | | | | | | 12,695,169 | | | | | | 52,494 | | |
| Net asset value and redemption price per share | | | | $ | 10.34 | | | | | $ | 12.62 | | | | | $ | 10.55 | | | | | $ | 12.69 | | |
| Class I | | | | | |
| Net assets | | | | $ | 37,272,145 | | | | | $ | 165,209 | | | | | $ | 27,900,165 | | | | | $ | 295,249 | | |
| Shares authorized | | | | | 100,000,000 | | | | | | 100,000,000 | | | | | | 100,000,000 | | | | | | 100,000,000 | | |
| Par value | | | | $ | 0.001 | | | | | $ | 0.001 | | | | | $ | 0.001 | | | | | $ | 0.001 | | |
| Shares outstanding | | | | | 3,521,567 | | | | | | 12,915 | | | | | | 2,573,321 | | | | | | 23,058 | | |
| Net asset value and redemption price per share | | | | $ | 10.58 | | | | | $ | 12.79 | | | | | $ | 10.84 | | | | | $ | 12.80 | | |
| Class S | | | | | |
| Net assets | | | | $ | 129,763,865 | | | | | $ | 401,418 | | | | | $ | 80,586,128 | | | | | $ | 254,267 | | |
| Shares authorized | | | | | 100,000,000 | | | | | | 100,000,000 | | | | | | 100,000,000 | | | | | | 100,000,000 | | |
| Par value | | | | $ | 0.001 | | | | | $ | 0.001 | | | | | $ | 0.001 | | | | | $ | 0.001 | | |
| Shares outstanding | | | | | 12,395,188 | | | | | | 31,295 | | | | | | 7,530,118 | | | | | | 19,818 | | |
| Net asset value and redemption price per share | | | | $ | 10.47 | | | | | $ | 12.83 | | | | | $ | 10.70 | | | | | $ | 12.83 | | |
| Class S2 | | | | | |
| Net assets | | | | $ | 31,067,168 | | | | | $ | 13,955 | | | | | $ | 16,367,643 | | | | | $ | 13,591 | | |
| Shares authorized | | | | | 100,000,000 | | | | | | 100,000,000 | | | | | | 100,000,000 | | | | | | 100,000,000 | | |
| Par value | | | | $ | 0.001 | | | | | $ | 0.001 | | | | | $ | 0.001 | | | | | $ | 0.001 | | |
| Shares outstanding | | | | | 3,007,397 | | | | | | 1,099 | | | | | | 1,550,238 | | | | | | 1,070 | | |
| Net asset value and redemption price per share | | | | $ | 10.33 | | | | | $ | 12.70 | | | | | $ | 10.56 | | | | | $ | 12.71 | | |
| Class T | | | | | |
| Net assets | | | | $ | 3,320 | | | | | $ | 4,134 | | | | | $ | 3,377 | | | | | $ | 4,123 | | |
| Shares authorized | | | | | 100,000,000 | | | | | | 100,000,000 | | | | | | 100,000,000 | | | | | | 100,000,000 | | |
| Par value | | | | $ | 0.001 | | | | | $ | 0.001 | | | | | $ | 0.001 | | | | | $ | 0.001 | | |
| Shares outstanding | | | | | 320 | | | | | | 327 | | | | | | 319 | | | | | | 326 | | |
| Net asset value and redemption price per share | | | | $ | 10.37 | | | | | $ | 12.64 | | | | | $ | 10.59 | | | | | $ | 12.65 | | |
| Class Z | | | | | |
| Net assets | | | | $ | 2,456,417 | | | | | $ | 1,086,424 | | | | | $ | 543,980 | | | | | $ | 575,588 | | |
| Shares authorized | | | | | 100,000,000 | | | | | | 100,000,000 | | | | | | 100,000,000 | | | | | | 100,000,000 | | |
| Par value | | | | $ | 0.001 | | | | | $ | 0.001 | | | | | $ | 0.001 | | | | | $ | 0.001 | | |
| Shares outstanding | | | | | 231,617 | | | | | | 84,874 | | | | | | 50,115 | | | | | | 44,963 | | |
| Net asset value and redemption price per share | | | | $ | 10.61 | | | | | $ | 12.80 | | | | | $ | 10.85 | | | | | $ | 12.80 | | |
See Accompanying Notes to Financial Statements
STATEMENTS OF ASSETS AND LIABILITIES as of December 31, 2015
| | | | Voya Index
Solution 2055
Portfolio | | | Voya Index
Solution 2060
Portfolio | |
| ASSETS: | | | |
| Investments in affiliated underlying funds at fair value* | | | | $ | 65,450,904 | | | | | $ | 358,932 | | |
| Investments in unaffiliated underlying funds at fair value** | | | | | 6,555,330 | | | | | | 38,012 | | |
| Total investments at fair value | | | | $ | 72,006,234 | | | | | $ | 396,944 | | |
| Cash | | | | | 86,258 | | | | | | 297 | | |
| Receivables: | | | |
| Investments in affiliated underlying funds sold | | | | | 2,652,497 | | | | | | 39,072 | | |
| Fund shares sold | | | | | 20,220 | | | | | | 257 | | |
| Dividends | | | | | 17,441 | | | | | | 53 | | |
| Prepaid expenses | | | | | 155 | | | | | | — | | |
| Prepaid offering expense | | | | | — | | | | | | 1,490 | | |
| Reimbursement due from manager | | | | | 8,829 | | | | | | — | | |
| Other assets | | | | | 558 | | | | | | — | | |
| Total assets | | | | | 74,792,192 | | | | | | 438,113 | | |
| LIABILITIES: | | | |
| Payable for investments in unaffiliated underlying funds purchased | | | | | — | | | | | | 15,001 | | |
| Payable for fund shares redeemed | | | | | 2,672,717 | | | | | | 24,244 | | |
| Payable for investment management fees | | | | | 13,721 | | | | | | 43 | | |
| Payable to investment adviser (Note 7) | | | | | — | | | | | | 569 | | |
| Payable for distribution and shareholder service fees | | | | | 22,575 | | | | | | 57 | | |
| Payable to trustees under the deferred compensation plan (Note 6) | | | | | 558 | | | | | | — | | |
| Payable for trustee fees | | | | | 351 | | | | | | 1 | | |
| Other accrued expenses and liabilities | | | | | 12,352 | | | | | | 590 | | |
| Total liabilities | | | | | 2,722,274 | | | | | | 40,505 | | |
| NET ASSETS | | | | $ | 72,069,918 | | | | | $ | 397,608 | | |
| NET ASSETS WERE COMPRISED OF: | | | |
| Paid-in capital | | | | $ | 70,982,481 | | | | | $ | 397,672 | | |
| Undistributed net investment income | | | | | 1,243,025 | | | | | | 2,288 | | |
| Accumulated net realized gain | | | | | 5,328,819 | | | | | | 4,847 | | |
| Net unrealized depreciation | | | | | (5,484,407) | | | | | | (7,199) | | |
| NET ASSETS | | | | $ | 72,069,918 | | | | | $ | 397,608 | | |
*
Cost of investments in affiliated underlying funds | | | | $ | 70,672,554 | | | | | $ | 365,747 | | |
**
Cost of investments in unaffiliated underlying funds | | | | $ | 6,818,087 | | | | | $ | 38,396 | | |
See Accompanying Notes to Financial Statements
STATEMENTS OF ASSETS AND LIABILITIES as of December 31, 2015 (continued)
| | | | Voya Index
Solution 2055
Portfolio | | | Voya Index
Solution 2060
Portfolio | |
| Class ADV | | | |
| Net assets | | | | $ | 37,161,804 | | | | | $ | 86,657 | | |
| Shares authorized | | | | | 100,000,000 | | | | | | 100,000,000 | | |
| Par value | | | | $ | 0.001 | | | | | $ | 0.001 | | |
| Shares outstanding | | | | | 2,832,431 | | | | | | 8,866 | | |
| Net asset value and redemption price per share | | | | $ | 13.12 | | | | | $ | 9.77 | | |
| Class I | | | |
| Net assets | | | | $ | 8,112,755 | | | | | $ | 32,102 | | |
| Shares authorized | | | | | 100,000,000 | | | | | | 100,000,000 | | |
| Par value | | | | $ | 0.001 | | | | | $ | 0.001 | | |
| Shares outstanding | | | | | 606,356 | | | | | | 3,270 | | |
| Net asset value and redemption price per share | | | | $ | 13.38 | | | | | $ | 9.82 | | |
| Class S | | | |
| Net assets | | | | $ | 20,529,722 | | | | | $ | 131,030 | | |
| Shares authorized | | | | | 100,000,000 | | | | | | 100,000,000 | | |
| Par value | | | | $ | 0.001 | | | | | $ | 0.001 | | |
| Shares outstanding | | | | | 1,549,105 | | | | | | 13,384 | | |
| Net asset value and redemption price per share | | | | $ | 13.25 | | | | | $ | 9.79 | | |
| Class S2 | | | |
| Net assets | | | | $ | 5,815,865 | | | | | $ | 4,378 | | |
| Shares authorized | | | | | 100,000,000 | | | | | | 100,000,000 | | |
| Par value | | | | $ | 0.001 | | | | | $ | 0.001 | | |
| Shares outstanding | | | | | 441,590 | | | | | | 448 | | |
| Net asset value and redemption price per share | | | | $ | 13.17 | | | | | $ | 9.77 | | |
| Class T | | | |
| Net assets | | | | $ | 4,145 | | | | | | n/a | | |
| Shares authorized | | | | | 100,000,000 | | | | | | n/a | | |
| Par value | | | | $ | 0.001 | | | | | | n/a | | |
| Shares outstanding | | | | | 316 | | | | | | n/a | | |
| Net asset value and redemption price per share | | | | $ | 13.11 | | | | | | n/a | | |
| Class Z | | | |
| Net assets | | | | $ | 445,627 | | | | | $ | 143,441 | | |
| Shares authorized | | | | | 100,000,000 | | | | | | 100,000,000 | | |
| Par value | | | | $ | 0.001 | | | | | $ | 0.001 | | |
| Shares outstanding | | | | | 33,263 | | | | | | 14,600 | | |
| Net asset value and redemption price per share | | | | $ | 13.40 | | | | | $ | 9.82 | | |
See Accompanying Notes to Financial Statements
STATEMENTS OF OPERATIONS for the year ended December 31, 2015
| | | | Voya Index
Solution Income
Portfolio | | | Voya Index
Solution 2020
Portfolio | | | Voya Index
Solution 2025
Portfolio | | | Voya Index
Solution 2030
Portfolio | |
| INVESTMENT INCOME: | | | | | |
| Interest | | | | $ | 139 | | | | | $ | — | | | | | $ | — | | | | | $ | — | | |
| Dividends from affiliated underlying funds | | | | | 5,138,310 | | | | | | 55,499 | | | | | | 8,989,735 | | | | | | 32,368 | | |
| Dividends from unaffiliated underlying funds | | | | | 1,787,782 | | | | | | 12,612 | | | | | | 3,477,016 | | | | | | 6,179 | | |
| Total investment income | | | | | 6,926,231 | | | | | | 68,111 | | | | | | 12,466,751 | | | | | | 38,547 | | |
| EXPENSES: | | | | | |
| Investment management fees(1) | | | | | 541,570 | | | | | | 3,332 | | | | | | 1,044,660 | | | | | | 1,851 | | |
| Distribution and shareholder service fees: | | | | | | | | | | | | | | | | | | | | | | | | | |
| Class ADV | | | | | 378,079 | | | | | | 4,198 | | | | | | 1,211,284 | | | | | | 2,172 | | |
| Class S | | | | | 395,456 | | | | | | 397 | | | | | | 482,701 | | | | | | 312 | | |
| Class S2 | | | | | 41,018 | | | | | | 332 | | | | | | 184,128 | | | | | | 48 | | |
| Class T | | | | | 32 | | | | | | 29 | | | | | | 27 | | | | | | 33 | | |
| Transfer agent fees | | | | | 536 | | | | | | 466 | | | | | | 740 | | | | | | 497 | | |
| Administrative service fees(1) | | | | | 56,267 | | | | | | 6 | | | | | | 174,168 | | | | | | 7 | | |
| Shareholder reporting expense | | | | | 6,888 | | | | | | 1,154 | | | | | | 11,630 | | | | | | 1,074 | | |
| Professional fees | | | | | 38,069 | | | | | | 7,852 | | | | | | 85,685 | | | | | | 7,850 | | |
| Custody and accounting expense | | | | | 16,873 | | | | | | 4,377 | | | | | | 45,930 | | | | | | 4,462 | | |
| Trustee fees | | | | | 7,723 | | | | | | 48 | | | | | | 15,706 | | | | | | 27 | | |
| Miscellaneous expense | | | | | 16,156 | | | | | | 7,986 | | | | | | 25,271 | | | | | | 8,005 | | |
| Total expenses | | | | | 1,498,667 | | | | | | 30,177 | | | | | | 3,281,930 | | | | | | 26,338 | | |
| Net waived and reimbursed fees | | | | | (383,058) | | | | | | (23,772) | | | | | | (750,525) | | | | | | (22,970) | | |
| Net expenses | | | | | 1,115,609 | | | | | | 6,405 | | | | | | 2,531,405 | | | | | | 3,368 | | |
| Net investment income | | | | | 5,810,622 | | | | | | 61,706 | | | | | | 9,935,346 | | | | | | 35,179 | | |
| REALIZED AND UNREALIZED GAIN (LOSS): | | | | | |
| Net realized gain (loss) on: | | | | | |
| Sale of affiliated underlying funds | | | | | 2,616,742 | | | | | | 23,249 | | | | | | 20,321,193 | | | | | | 14,925 | | |
| Sale of unaffiliated underlying funds | | | | | (1,836,275) | | | | | | (6,494) | | | | | | (3,529,700) | | | | | | (2,214) | | |
| Capital gain distributions from affiliated underlying funds | | | | | 3,364,336 | | | | | | 992 | | | | | | 18,618,174 | | | | | | 1,813 | | |
| Foreign currency related transactions | | | | | (194) | | | | | | — | | | | | | (379) | | | | | | — | | |
| Futures | | | | | (264,473) | | | | | | — | | | | | | 683,313 | | | | | | — | | |
| Net realized gain | | | | | 3,880,136 | | | | | | 17,747 | | | | | | 36,092,601 | | | | | | 14,524 | | |
| Net change in unrealized appreciation (depreciation) on: | | | | | |
| Affiliated underlying funds | | | | | (12,937,281) | | | | | | (87,025) | | | | | | (49,026,314) | | | | | | (72,501) | | |
| Unaffiliated underlying funds | | | | | (3,516,810) | | | | | | (35,780) | | | | | | (5,591,864) | | | | | | (16,300) | | |
| Foreign currency related transactions | | | | | (412) | | | | | | — | | | | | | (1,194) | | | | | | — | | |
| Futures | | | | | 91,413 | | | | | | — | | | | | | 265,099 | | | | | | — | | |
| Net change in unrealized appreciation (depreciation) | | | | | (16,363,090) | | | | | | (122,805) | | | | | | (54,354,273) | | | | | | (88,801) | | |
| Net realized and unrealized loss | | | | | (12,482,954) | | | | | | (105,058) | | | | | | (18,261,672) | | | | | | (74,277) | | |
| Decrease in net assets resulting from operations | | | | $ | (6,672,332) | | | | | $ | (43,352) | | | | | $ | (8,326,326) | | | | | $ | (39,098) | | |
| |
(1)
Effective May 1, 2015, the investment management fee and administration fee were combined under a single amended and restated investment management agreement. Please see Note 4 for further information.
See Accompanying Notes to Financial Statements
STATEMENTS OF OPERATIONS for the year ended December 31, 2015
| | | | Voya Index
Solution 2035
Portfolio | | | Voya Index
Solution 2040
Portfolio | | | Voya Index
Solution 2045
Portfolio | | | Voya Index
Solution 2050
Portfolio | |
| INVESTMENT INCOME: | | | | | |
| Interest | | | | $ | — | | | | | $ | — | | | | | $ | 176 | | | | | $ | — | | |
| Dividends from affiliated underlying funds | | | | | 7,630,646 | | | | | | 21,085 | | | | | | 5,148,941 | | | | | | 13,204 | | |
| Dividends from unaffiliated underlying funds | | | | | 2,268,707 | | | | | | 1,975 | | | | | | 593,746 | | | | | | 1,092 | | |
| Total investment income | | | | | 9,899,353 | | | | | | 23,060 | | | | | | 5,742,863 | | | | | | 14,296 | | |
| EXPENSES: | | | | | |
| Investment management fees(1) | | | | | 849,917 | | | | | | 936 | | | | | | 509,676 | | | | | | 673 | | |
| Distribution and shareholder service fees: | | | | | | | | | | | | | | | | | | | | | | | | | |
| Class ADV | | | | | 1,068,637 | | | | | | 1,163 | | | | | | 700,878 | | | | | | 623 | | |
| Class S | | | | | 377,106 | | | | | | 189 | | | | | | 234,650 | | | | | | 121 | | |
| Class S2 | | | | | 169,675 | | | | | | 28 | | | | | | 87,059 | | | | | | 31 | | |
| Class T | | | | | 27 | | | | | | 33 | | | | | | 29 | | | | | | 33 | | |
| Transfer agent fees | | | | | 559 | | | | | | 487 | | | | | | 612 | | | | | | 466 | | |
| Administrative service fees(1) | | | | | 145,420 | | | | | | 8 | | | | | | 90,876 | | | | | | 7 | | |
| Shareholder reporting expense | | | | | 11,226 | | | | | | 1,084 | | | | | | 6,700 | | | | | | 1,081 | | |
| Professional fees | | | | | 72,895 | | | | | | 7,625 | | | | | | 49,262 | | | | | | 7,545 | | |
| Custody and accounting expense | | | | | 39,666 | | | | | | 4,665 | | | | | | 24,617 | | | | | | 4,571 | | |
| Trustee fees | | | | | 13,072 | | | | | | 15 | | | | | | 8,258 | | | | | | 10 | | |
| Miscellaneous expense | | | | | 25,217 | | | | | | 7,905 | | | | | | 17,187 | | | | | | 7,914 | | |
| Total expenses | | | | | 2,773,417 | | | | | | 24,138 | | | | | | 1,729,804 | | | | | | 23,075 | | |
| Net waived and reimbursed fees | | | | | (572,418) | | | | | | (22,316) | | | | | | (339,401) | | | | | | (21,919) | | |
| Net expenses | | | | | 2,200,999 | | | | | | 1,822 | | | | | | 1,390,403 | | | | | | 1,156 | | |
| Net investment income | | | | | 7,698,354 | | | | | | 21,238 | | | | | | 4,352,460 | | | | | | 13,140 | | |
| REALIZED AND UNREALIZED GAIN (LOSS): | | | | | |
| Net realized gain (loss) on: | | | | | |
| Sale of affiliated underlying funds | | | | | 19,873,124 | | | | | | 6,969 | | | | | | 11,166,567 | | | | | | 19,935 | | |
| Sale of unaffiliated underlying funds | | | | | (2,381,316) | | | | | | (475) | | | | | | (519,500) | | | | | | 299 | | |
| Capital gain distributions from affiliated underlying funds | | | | | 20,355,742 | | | | | | 2,001 | | | | | | 14,421,719 | | | | | | 1,868 | | |
| Foreign currency related transactions | | | | | (318) | | | | | | — | | | | | | (201) | | | | | | — | | |
| Futures | | | | | 312,705 | | | | | | — | | | | | | (133,816) | | | | | | — | | |
| Net realized gain | | | | | 38,159,937 | | | | | | 8,495 | | | | | | 24,934,769 | | | | | | 22,102 | | |
| Net change in unrealized appreciation (depreciation) on: | | | | | |
| Affiliated underlying funds | | | | | (49,852,119) | | | | | | (51,585) | | | | | | (33,456,744) | | | | | | (33,745) | | |
| Unaffiliated underlying funds | | | | | (3,930,765) | | | | | | (5,645) | | | | | | (1,677,800) | | | | | | (1,817) | | |
| Foreign currency related transactions | | | | | (1,002) | | | | | | — | | | | | | — | | | | | | — | | |
| Futures | | | | | 222,439 | | | | | | — | | | | | | 137,120 | | | | | | — | | |
| Net change in unrealized appreciation (depreciation) | | | | | (53,561,447) | | | | | | (57,230) | | | | | | (34,997,424) | | | | | | (35,562) | | |
| Net realized and unrealized loss | | | | | (15,401,510) | | | | | | (48,735) | | | | | | (10,062,655) | | | | | | (13,460) | | |
| Decrease in net assets resulting from operations | | | | $ | (7,703,156) | | | | | $ | (27,497) | | | | | $ | (5,710,195) | | | | | $ | (320) | | |
| |
(1)
Effective May 1, 2015, the investment management fee and administration fee were combined under a single amended and restated investment management agreement. Please see Note 4 for further information.
See Accompanying Notes to Financial Statements
STATEMENTS OF OPERATIONS for the year ended December 31, 2015
| | | | Voya Index
Solution 2055
Portfolio | | | Voya Index
Solution 2060
Portfolio | |
| | | | | | | | | | February 9, 2015(2)
to December 31,
2015 | |
| INVESTMENT INCOME: | | | |
| Interest | | | | $ | 42 | | | | | $ | — | | |
| Dividends from affiliated underlying funds | | | | | 1,356,242 | | | | | | 2,382 | | |
| Dividends from unaffiliated underlying funds | | | | | 90,073 | | | | | | 170 | | |
| Total investment income | | | | | 1,446,357 | | | | | | 2,552 | | |
| EXPENSES: | | | |
| Investment management fees(1) | | | | | 128,253 | | | | | | 155 | | |
| Distribution and shareholder service fees: | | | | | | | | | | | | | |
| Class ADV | | | | | 179,305 | | | | | | 141 | | |
| Class S | | | | | 57,940 | | | | | | 40 | | |
| Class S2 | | | | | 27,080 | | | | | | 53 | | |
| Class T | | | | | 34 | | | | | | — | | |
| Transfer agent fees | | | | | 454 | | | | | | 354 | | |
| Administrative service fees(1) | | | | | 21,530 | | | | | | 4 | | |
| Shareholder reporting expense | | | | | 4,047 | | | | | | 837 | | |
| Professional fees | | | | | 19,050 | | | | | | 7,432 | | |
| Custody and accounting expense | | | | | 12,971 | | | | | | 989 | | |
| Trustee fees | | | | | 2,111 | | | | | | 3 | | |
| Offering expense | | | | | — | | | | | | 11,784 | | |
| Miscellaneous expense | | | | | 9,376 | | | | | | 5,157 | | |
| Total expenses | | | | | 462,151 | | | | | | 26,949 | | |
| Net waived and reimbursed fees | | | | | (97,229) | | | | | | (26,637) | | |
| Net expenses | | | | | 364,922 | | | | | | 312 | | |
| Net investment income | | | | | 1,081,435 | | | | | | 2,240 | | |
| REALIZED AND UNREALIZED GAIN (LOSS): | | | |
| Net realized gain (loss) on: | | | |
| Sale of affiliated underlying funds | | | | | 2,027,466 | | | | | | 3,286 | | |
| Sale of unaffiliated underlying funds | | | | | (120,797) | | | | | | (9) | | |
| Capital gain distributions from affiliated underlying funds | | | | | 3,795,609 | | | | | | 1,618 | | |
| Foreign currency related transactions | | | | | (38) | | | | | | — | | |
| Futures | | | | | (48,025) | | | | | | — | | |
| Net realized gain | | | | | 5,654,215 | | | | | | 4,895 | | |
| Net change in unrealized appreciation (depreciation) on: | | | |
| Affiliated underlying funds | | | | | (8,127,114) | | | | | | (6,816) | | |
| Unaffiliated underlying funds | | | | | (342,592) | | | | | | (383) | | |
| Foreign currency related transactions | | | | | (137) | | | | | | — | | |
| Futures | | | | | 30,471 | | | | | | — | | |
| Net change in unrealized appreciation (depreciation) | | | | | (8,439,372) | | | | | | (7,199) | | |
| Net realized and unrealized loss | | | | | (2,785,157) | | | | | | (2,304) | | |
| Decrease in net assets resulting from operations | | | | $ | (1,703,722) | | | | | $ | (64) | | |
| | | | | | | | | |
(1)
Effective May 1, 2015, the investment management fee and administration fee were combined under a single amended and restated investment management agreement. Please see Note 4 for further information.
(2)
Commencement of operations.
See Accompanying Notes to Financial Statements
STATEMENTS OF CHANGES IN NET ASSETS
| | | | Voya Index Solution Income Portfolio | | | Voya Index Solution 2020 Portfolio | |
| | | | Year Ended
December 31,
2015 | | | Year Ended
December 31,
2014 | | | Year Ended
December 31,
2015 | | | Year Ended
December 31,
2014 | |
| FROM OPERATIONS: | | | | | |
| Net investment income | | | | $ | 5,810,622 | | | | | $ | 3,026,253 | | | | | $ | 61,706 | | | | | $ | 280 | | |
| Net realized gain | | | | | 3,880,136 | | | | | | 10,412,571 | | | | | | 17,747 | | | | | | 1,236 | | |
| Net change in unrealized appreciation (depreciation) | | | | | (16,363,090) | | | | | | (3,149,455) | | | | | | (122,805) | | | | | | (524) | | |
| Increase (decrease) in net assets resulting from operations | | | | | (6,672,332) | | | | | | 10,289,369 | | | | | | (43,352) | | | | | | 992 | | |
| FROM DISTRIBUTIONS TO SHAREHOLDERS: | | | | | | | | | | | | | | | | | | | | | | | | | |
| Net investment income: | | | | | | | | | | | | | | | | | | | | | | | | | |
| Class ADV | | | | | (634,249) | | | | | | (772,494) | | | | | | (166) | | | | | | (70) | | |
| Class I | | | | | (130,597) | | | | | | (114,554) | | | | | | (22) | | | | | | (86) | | |
| Class S | | | | | (2,345,797) | | | | | | (2,893,994) | | | | | | (17) | | | | | | (78) | | |
| Class S2 | | | | | (58,282) | | | | | | (105,484) | | | | | | (1) | | | | | | (74) | | |
| Class T | | | | | (53) | | | | | | (60) | | | | | | — | | | | | | (63) | | |
| Class Z | | | | | (79) | | | | | | — | | | | | | (111) | | | | | | — | | |
| Net realized gains: | | | | | | | | | | | | | | | | | | | | | | | | | |
| Class ADV | | | | | (2,276,217) | | | | | | (1,929,367) | | | | | | (326) | | | | | | (204) | | |
| Class I | | | | | (360,664) | | | | | | (234,690) | | | | | | (99) | | | | | | (205) | | |
| Class S | | | | | (7,391,138) | | | | | | (6,640,745) | | | | | | (98) | | | | | | (205) | | |
| Class S2 | | | | | (216,486) | | | | | | (256,790) | | | | | | (98) | | | | | | (205) | | |
| Class T | | | | | (215) | | | | | | (170) | | | | | | (98) | | | | | | (205) | | |
| Class Z | | | | | (219) | | | | | | — | | | | | | (493) | | | | | | — | | |
| Total distributions | | | | | (13,413,996) | | | | | | (12,948,348) | | | | | | (1,529) | | | | | | (1,395) | | |
| FROM CAPITAL SHARE TRANSACTIONS: | | | | | |
| Net proceeds from sale of shares | | | | | 26,814,739 | | | | | | 18,242,750 | | | | | | 8,854,316 | | | | | | — | | |
| Proceeds from shares issued in merger (Note 10) | | | | | 251,868,347 | | | | | | — | | | | | | — | | | | | | — | | |
| Reinvestment of distributions | | | | | 13,413,728 | | | | | | 12,948,348 | | | | | | 948 | | | | | | 1,395 | | |
| | | | | | 292,096,814 | | | | | | 31,191,098 | | | | | | 8,855,264 | | | | | | 1,395 | | |
| Cost of shares redeemed | | | | | (61,919,717) | | | | | | (40,526,463) | | | | | | (331,327) | | | | | | — | | |
| Net increase (decrease) in net assets resulting from capital share transactions | | | | | 230,177,097 | | | | | | (9,335,365) | | | | | | 8,523,937 | | | | | | 1,395 | | |
| Net increase (decrease) in net assets | | | | | 210,090,769 | | | | | | (11,994,344) | | | | | | 8,479,056 | | | | | | 992 | | |
| NET ASSETS: | | | | | |
| Beginning of year or period | | | | | 171,796,649 | | | | | | 183,790,993 | | | | | | 19,265 | | | | | | 18,273 | | |
| End of year or period | | | | $ | 381,887,418 | | | | | $ | 171,796,649 | | | | | $ | 8,498,321 | | | | | $ | 19,265 | | |
| Undistributed net investment income at end of year or period | | | | $ | 6,124,094 | | | | | $ | 3,167,134 | | | | | $ | 61,745 | | | | | $ | 316 | | |
| | | | | | | | | | | |
See Accompanying Notes to Financial Statements
STATEMENTS OF CHANGES IN NET ASSETS
| | | | Voya Index Solution 2025 Portfolio | | | Voya Index Solution 2030 Portfolio | |
| | | | Year Ended
December 31,
2015 | | | Year Ended
December 31,
2014 | | | Year Ended
December 31,
2015 | | | Year Ended
December 31,
2014 | |
| FROM OPERATIONS: | | | | | |
| Net investment income | | | | $ | 9,935,346 | | | | | $ | 7,361,975 | | | | | $ | 35,179 | | | | | $ | 259 | | |
| Net realized gain | | | | | 36,092,601 | | | | | | 43,795,712 | | | | | | 14,524 | | | | | | 1,715 | | |
| Net change in unrealized appreciation (depreciation) | | | | | (54,354,273) | | | | | | (23,332,312) | | | | | | (88,801) | | | | | | (952) | | |
| Increase (decrease) in net assets resulting from operations | | | | | (8,326,326) | | | | | | 27,825,375 | | | | | | (39,098) | | | | | | 1,022 | | |
| FROM DISTRIBUTIONS TO SHAREHOLDERS: | | | | | | | | | | | | | | | | | | | | | | | | | |
| Net investment income: | | | | | | | | | | | | | | | | | | | | | | | | | |
| Class ADV | | | | | (3,410,776) | | | | | | (4,030,265) | | | | | | (392) | | | | | | (66) | | |
| Class I | | | | | (1,024,278) | ��� | | | | | (849,202) | | | | | | — | | | | | | (89) | | |
| Class S | | | | | (3,258,109) | | | | | | (3,199,937) | | | | | | — | | | | | | (77) | | |
| Class S2 | | | | | (497,192) | | | | | | (813,600) | | | | | | — | | | | | | (70) | | |
| Class T | | | | | (46) | | | | | | (49) | | | | | | — | | | | | | (63) | | |
| Class Z | | | | | (97) | | | | | | — | | | | | | — | | | | | | — | | |
| Net realized gains: | | | | | | | | | | | | | | | | | | | | | | | | | |
| Class ADV | | | | | (20,270,652) | | | | | | (11,835,104) | | | | | | (1,153) | | | | | | (275) | | |
| Class I | | | | | (4,465,190) | | | | | | (1,963,736) | | | | | | (63) | | | | | | (275) | | |
| Class S | | | | | (16,160,818) | | | | | | (8,308,066) | | | | | | (63) | | | | | | (275) | | |
| Class S2 | | | | | (2,976,718) | | | | | | (2,273,330) | | | | | | (63) | | | | | | (275) | | |
| Class T | | | | | (310) | | | | | | (169) | | | | | | (63) | | | | | | (275) | | |
| Class Z | | | | | (425) | | | | | | — | | | | | | (287) | | | | | | — | | |
| Total distributions | | | | | (52,064,611) | | | | | | (33,273,458) | | | | | | (2,084) | | | | | | (1,740) | | |
| FROM CAPITAL SHARE TRANSACTIONS: | | | | | |
| Net proceeds from sale of shares | | | | | 82,168,309 | | | | | | 99,795,707 | | | | | | 5,919,215 | | | | | | — | | |
| Reinvestment of distributions | | | | | 52,064,255 | | | | | | 33,273,458 | | | | | | 1,749 | | | | | | 1,740 | | |
| | | | | | 134,232,564 | | | | | | 133,069,165 | | | | | | 5,920,964 | | | | | | 1,740 | | |
| Cost of shares redeemed | | | | | (112,129,124) | | | | | | (110,199,751) | | | | | | (756,043) | | | | | | — | | |
| Net increase in net assets resulting from capital share transactions | | | | | 22,103,440 | | | | | | 22,869,414 | | | | | | 5,164,921 | | | | | | 1,740 | | |
| Net increase (decrease) in net assets | | | | | (38,287,497) | | | | | | 17,421,331 | | | | | | 5,123,739 | | | | | | 1,022 | | |
| NET ASSETS: | | | | | |
| Beginning of year or period | | | | | 519,310,156 | | | | | | 501,888,825 | | | | | | 20,930 | | | | | | 19,908 | | |
| End of year or period | | | | $ | 481,022,659 | | | | | $ | 519,310,156 | | | | | $ | 5,144,669 | | | | | $ | 20,930 | | |
| Undistributed net investment income at end of year or period | | | | $ | 10,998,166 | | | | | $ | 8,183,908 | | | | | $ | 35,142 | | | | | $ | 302 | | |
| |
See Accompanying Notes to Financial Statements
STATEMENTS OF CHANGES IN NET ASSETS
| | | | Voya Index Solution 2035 Portfolio | | | Voya Index Solution 2040 Portfolio | |
| | | | Year Ended
December 31,
2015 | | | Year Ended
December 31,
2014 | | | Year Ended
December 31,
2015 | | | Year Ended
December 31,
2014 | |
| FROM OPERATIONS: | | | | | |
| Net investment income | | | | $ | 7,698,354 | | | | | $ | 5,301,346 | | | | | $ | 21,238 | | | | | $ | 235 | | |
| Net realized gain | | | | | 38,159,937 | | | | | | 45,024,404 | | | | | | 8,495 | | | | | | 2,174 | | |
| Net change in unrealized appreciation (depreciation) | | | | | (53,561,447) | | | | | | (26,274,767) | | | | | | (57,230) | | | | | | (1,164) | | |
| Increase (decrease) in net assets resulting from operations | | | | | (7,703,156) | | | | | | 24,050,983 | | | | | | (27,497) | | | | | | 1,245 | | |
| FROM DISTRIBUTIONS TO SHAREHOLDERS: | | | | | | | | | | | | | | | | | | | | | | | | | |
| Net investment income: | | | | | | | | | | | | | | | | | | | | | | | | | |
| Class ADV | | | | | (2,703,379) | | | | | | (2,989,256) | | | | | | (75) | | | | | | (59) | | |
| Class I | | | | | (708,488) | | | | | | (523,257) | | | | | | (34) | | | | | | (80) | | |
| Class S | | | | | (2,295,635) | | | | | | (2,197,001) | | | | | | (17) | | | | | | (70) | | |
| Class S2 | | | | | (396,748) | | | | | | (689,228) | | | | | | (17) | | | | | | (62) | | |
| Class T | | | | | (42) | | | | | | (44) | | | | | | (3) | | | | | | (54) | | |
| Class Z | | | | | (1,039) | | | | | | — | | | | | | (145) | | | | | | — | | |
| Net realized gains: | | | | | | | | | | | | | | | | | | | | | | | | | |
| Class ADV | | | | | (21,434,185) | | | | | | (10,988,649) | | | | | | (374) | | | | | | (290) | | |
| Class I | | | | | (4,034,485) | | | | | | (1,477,868) | | | | | | (211) | | | | | | (291) | | |
| Class S | | | | | (15,058,363) | | | | | | (7,016,371) | | | | | | (211) | | | | | | (291) | | |
| Class S2 | | | | | (3,244,251) | | | | | | (2,367,719) | | | | | | (210) | | | | | | (290) | | |
| Class T | | | | | (384) | | | | | | (192) | | | | | | (210) | | | | | | (290) | | |
| Class Z | | | | | (5,917) | | | | | | — | | | | | | (896) | | | | | | — | | |
| Total distributions | | | | | (49,882,916) | | | | | | (28,249,585) | | | | | | (2,403) | | | | | | (1,777) | | |
| FROM CAPITAL SHARE TRANSACTIONS: | | | | | |
| Net proceeds from sale of shares | | | | | 71,304,946 | | | | | | 92,260,369 | | | | | | 3,198,357 | | | | | | 858 | | |
| Reinvestment of distributions | | | | | 49,882,490 | | | | | | 28,249,585 | | | | | | 1,242 | | | | | | 1,777 | | |
| | | | | | 121,187,436 | | | | | | 120,509,954 | | | | | | 3,199,599 | | | | | | 2,635 | | |
| Cost of shares redeemed | | | | | (97,566,851) | | | | | | (88,259,903) | | | | | | (269,435) | | | | | | (3) | | |
| Net increase in net assets resulting from capital share transactions | | | | | 23,620,585 | | | | | | 32,250,051 | | | | | | 2,930,164 | | | | | | 2,632 | | |
| Net increase (decrease) in net assets | | | | | (33,965,487) | | | | | | 28,051,449 | | | | | | 2,900,264 | | | | | | 2,100 | | |
| NET ASSETS: | | | | | |
| Beginning of year or period | | | | | 433,625,304 | | | | | | 405,573,855 | | | | | | 23,214 | | | | | | 21,114 | | |
| End of year or period | | | | $ | 399,659,817 | | | | | $ | 433,625,304 | | | | | $ | 2,923,478 | | | | | $ | 23,214 | | |
| Undistributed net investment income at end of year or period | | | | $ | 8,559,830 | | | | | $ | 6,102,320 | | | | | $ | 21,302 | | | | | $ | 291 | | |
| |
See Accompanying Notes to Financial Statements
STATEMENTS OF CHANGES IN NET ASSETS
| | | | Voya Index Solution 2045 Portfolio | | | Voya Index Solution 2050 Portfolio | |
| | | | Year Ended
December 31,
2015 | | | Year Ended
December 31,
2014 | | | Year Ended
December 31,
2015 | | | Year Ended
December 31,
2014 | |
| FROM OPERATIONS: | | | | | |
| Net investment income | | | | $ | 4,352,460 | | | | | $ | 2,485,193 | | | | | $ | 13,140 | | | | | $ | 203 | | |
| Net realized gain | | | | | 24,934,769 | | | | | | 29,766,306 | | | | | | 22,102 | | | | | | 2,196 | | |
| Net change in unrealized appreciation (depreciation) | | | | | (34,997,424) | | | | | | (17,212,877) | | | | | | (35,562) | | | | | | (1,180) | | |
| Increase (decrease) in net assets resulting from operations | | | | | (5,710,195) | | | | | | 15,038,622 | | | | | | (320) | | | | | | 1,219 | | |
| FROM DISTRIBUTIONS TO SHAREHOLDERS: | | | | | | | | | | | | | | | | | | | | | | | | | |
| Net investment income: | | | | | | | | | | | | | | | | | | | | | | | | | |
| Class ADV | | | | | (1,357,061) | | | | | | (1,590,364) | | | | | | (14) | | | | | | (56) | | |
| Class I | | | | | (377,565) | | | | | | (256,041) | | | | | | (37) | | | | | | (77) | | |
| Class S | | | | | (1,127,665) | | | | | | (1,143,217) | | | | | | (24) | | | | | | (67) | | |
| Class S2 | | | | | (156,530) | | | | | | (257,702) | | | | | | (21) | | | | | | (59) | | |
| Class T | | | | | (31) | | | | | | (33) | | | | | | (6) | | | | | | (51) | | |
| Class Z | | | | | (43) | | | | | | — | | | | | | (158) | | | | | | — | | |
| Net realized gains: | | | | | | | | | | | | | | | | | | | | | | | | | |
| Class ADV | | | | | (14,880,990) | | | | | | (7,081,744) | | | | | | (232) | | | | | | (282) | | |
| Class I | | | | | (2,763,241) | | | | | | (854,800) | | | | | | (233) | | | | | | (282) | | |
| Class S | | | | | (9,852,747) | | | | | | (4,391,211) | | | | | | (232) | | | | | | (283) | | |
| Class S2 | | | | | (1,757,731) | | | | | | (1,092,301) | | | | | | (232) | | | | | | (282) | | |
| Class T | | | | | (417) | | | | | | (193) | | | | | | (231) | | | | | | (282) | | |
| Class Z | | | | | (314) | | | | | | — | | | | | | (982) | | | | | | — | | |
| Total distributions | | | | | (32,274,335) | | | | | | (16,667,606) | | | | | | (2,402) | | | | | | (1,721) | | |
| FROM CAPITAL SHARE TRANSACTIONS: | | | | | |
| Net proceeds from sale of shares | | | | | 58,386,012 | | | | | | 61,543,097 | | | | | | 2,217,945 | | | | | | — | | |
| Reinvestment of distributions | | | | | 32,273,888 | | | | | | 16,667,606 | | | | | | 1,145 | | | | | | 1,721 | | |
| | | | | | 90,659,900 | | | | | | 78,210,703 | | | | | | 2,219,090 | | | | | | 1,721 | | |
| Cost of shares redeemed | | | | | (62,654,289) | | | | | | (50,959,586) | | | | | | (429,831) | | | | | | — | | |
| Net increase in net assets resulting from capital share transactions | | | | | 28,005,611 | | | | | | 27,251,117 | | | | | | 1,789,259 | | | | | | 1,721 | | |
| Net increase (decrease) in net assets | | | | | (9,978,919) | | | | | | 25,622,133 | | | | | | 1,786,537 | | | | | | 1,219 | | |
| NET ASSETS: | | | | | |
| Beginning of year or period | | | | | 269,264,275 | | | | | | 243,642,142 | | | | | | 22,407 | | | | | | 21,188 | | |
| End of year or period | | | | $ | 259,285,356 | | | | | $ | 269,264,275 | | | | | $ | 1,808,944 | | | | | $ | 22,407 | | |
| Undistributed net investment income at end of year or period | | | | $ | 4,993,787 | | | | | $ | 3,016,491 | | | | | $ | 13,201 | | | | | $ | 260 | | |
| |
See Accompanying Notes to Financial Statements
STATEMENTS OF CHANGES IN NET ASSETS
| | | | Voya Index Solution 2055 Portfolio | | | Voya Index
Solution 2060
Portfolio | |
| | | | Year Ended
December 31,
2015 | | | Year Ended
December 31,
2014 | | | February 9, 2015(1)
to December 31,
2015 | |
| FROM OPERATIONS: | | | | |
| Net investment income | | | | $ | 1,081,435 | | | | | $ | 540,524 | | | | | $ | 2,240 | | |
| Net realized gain | | | | | 5,654,215 | | | | | | 5,931,849 | | | | | | 4,895 | | |
| Net change in unrealized appreciation (depreciation) | | | | | (8,439,372) | | | | | | (3,291,793) | | | | | | (7,199) | | |
| Increase (decrease) in net assets resulting from operations | | | | | (1,703,722) | | | | | | 3,180,580 | | | | | | (64) | | |
| FROM DISTRIBUTIONS TO SHAREHOLDERS: | | | | | | | | | | | | | | | | | | | |
| Net investment income: | | | | | | | | | | | | | | | | | | | |
| Class ADV | | | | | (292,320) | | | | | | (278,053) | | | | | | — | | |
| Class I | | | | | (72,668) | | | | | | (41,530) | | | | | | — | | |
| Class S | | | | | (245,405) | | | | | | (201,219) | | | | | | — | | |
| Class S2 | | | | | (39,840) | | | | | | (55,145) | | | | | | — | | |
| Class T | | | | | (27) | | | | | | (31) | | | | | | — | | |
| Class Z | | | | | (2,379) | | | | | | — | | | | | | — | | |
| Net realized gains: | | | | | | | | | | | | | | | | | | | |
| Class ADV | | | | | (2,921,488) | | | | | | (1,203,256) | | | | | | — | | |
| Class I | | | | | (488,658) | | | | | | (134,385) | | | | | | — | | |
| Class S | | | | | (1,953,282) | | | | | | (741,487) | | | | | | — | | |
| Class S2 | | | | | (416,612) | | | | | | (237,458) | | | | | | — | | |
| Class T | | | | | (378) | | | | | | (184) | | | | | | — | | |
| Class Z | | | | | (15,988) | | | | | | — | | | | | | — | | |
| Total distributions | | | | | (6,449,045) | | | | | | (2,892,748) | | | | | | — | | |
| FROM CAPITAL SHARE TRANSACTIONS: | | | | |
| Net proceeds from sale of shares | | | | | 32,927,242 | | | | | | 23,259,708 | | | | | | 607,321 | | |
| Reinvestment of distributions | | | | | 6,448,642 | | | | | | 2,892,748 | | | | | | — | | |
| | | | | | 39,375,884 | | | | | | 26,152,456 | | | | | | 607,321 | | |
| Cost of shares redeemed | | | | | (21,064,074) | | | | | | (11,668,378) | | | | | | (209,649) | | |
| Net increase in net assets resulting from capital share transactions | | | | | 18,311,810 | | | | | | 14,484,078 | | | | | | 397,672 | | |
| Net increase in net assets | | | | | 10,159,043 | | | | | | 14,771,910 | | | | | | 397,608 | | |
| NET ASSETS: | | | | |
| Beginning of year or period | | | | | 61,910,875 | | | | | | 47,138,965 | | | | | | — | | |
| End of year or period | | | | $ | 72,069,918 | | | | | $ | 61,910,875 | | | | | $ | 397,608 | | |
| Undistributed net investment income at end of year or period | | | | $ | 1,243,025 | | | | | $ | 652,377 | | | | | $ | 2,288 | | |
| |
(1)
Commencement of operations.
See Accompanying Notes to Financial Statements
Selected data for a share of beneficial interest outstanding throughout each year or period.
| | | | | | | | | | Income
(loss) from
investment
operations | | | | | | | | | Less
Distributions | | | | | | | | | | | | | | | | | | | | | | | | | | | Ratios to average
net assets | | | Supplemental
Data | |
| | | | Net asset value, beginning of year
or period | | | Net investment income (loss) | | | Net realized and unrealized
gain (loss) | | | Total from investment operations | | | From net investment income | | | From net realized gains | | | From return of capital | | | Total distributions | | | Payment by affiliate | | | Net asset value, end of year
or period | | | Total Return(1) | | | Expenses before
reductions/additions(2)(3)(4) | | | Expenses net of fee waivers
and/or recoupments if any(2)(3)(4) | | | Expense net of all
reductions/additions(2)(3)(4) | | | Net investment income (loss)(2)(3) | | | Net assets, end of year or period | | | Portfolio turnover rate | |
Year or
period ended | | | ($) | | | ($) | | | ($) | | | ($) | | | ($) | | | ($) | | | ($) | | | ($) | | | ($) | | | ($) | | | (%) | | | (%) | | | (%) | | | (%) | | | (%) | | | ($000’s) | | | (%) | |
| Voya Index Solution Income Portfolio | | | | | | | | | | | | | | | | | | | | | | | | | | | | | | | | | | | | | | | | | | | | | | | | | | | | | | | | | | | | | | | | | | | | | | | | | | | | | | | | | | | | | | | | | | | | | | | | | | | | | | | |
| Class ADV | | | | | | | | | | | | | | | | | | | | | | | | | | | | | | | | | | | | | | | | | | | | | | | | | | | | | | | | | | | | | | | | | | | | | | | | | | | | | | | | | | | | | | | | | | | | | | | | | | | | | | | |
| 12-31-15 | | | | | 10.53 | | | | | | 0.21• | | | | | | (0.33) | | | | | | (0.12) | | | | | | 0.19 | | | | | | 0.67 | | | | | | — | | | | | | 0.86 | | | | | | — | | | | | | 9.55 | | | | | | (1.37) | | | | | | 0.77 | | | | | | 0.62 | | | | | | 0.62 | | | | | | 2.17 | | | | | | 134,515 | | | | | | 34 | | |
| 12-31-14 | | | | | 10.73 | | | | | | 0.17 | | | | | | 0.43 | | | | | | 0.60 | | | | | | 0.23 | | | | | | 0.57 | | | | | | — | | | | | | 0.80 | | | | | | — | | | | | | 10.53 | | | | | | 5.68 | | | | | | 0.78 | | | | | | 0.62 | | | | | | 0.62 | | | | | | 1.50 | | | | | | 37,651 | | | | | | 23 | | |
| 12-31-13 | | | | | 10.64 | | | | | | 0.19• | | | | | | 0.58 | | | | | | 0.77 | | | | | | 0.30 | | | | | | 0.38 | | | | | | — | | | | | | 0.68 | | | | | | — | | | | | | 10.73 | | | | | | 7.50 | | | | | | 0.76 | | | | | | 0.61 | | | | | | 0.61 | | | | | | 1.74 | | | | | | 37,886 | | | | | | 39 | | |
| 12-31-12 | | | | | 10.42 | | | | | | 0.19• | | | | | | 0.67 | | | | | | 0.86 | | | | | | 0.26 | | | | | | 0.38 | | | | | | — | | | | | | 0.64 | | | | | | — | | | | | | 10.64 | | | | | | 8.36 | | | | | | 0.71 | | | | | | 0.62 | | | | | | 0.62 | | | | | | 1.79 | | | | | | 31,359 | | | | | | 45 | | |
| 12-31-11 | | | | | 10.76 | | | | | | 0.14 | | | | | | 0.09 | | | | | | 0.23 | | | | | | 0.25 | | | | | | 0.32 | | | | | | — | | | | | | 0.57 | | | | | | — | | | | | | 10.42 | | | | | | 2.35 | | | | | | 0.62 | | | | | | 0.62 | | | | | | 0.62 | | | | | | 1.46 | | | | | | 25,479 | | | | | | 78 | | |
| Class I | | | | | | | | | | | | | | | | | | | | | | | | | | | | | | | | | | | | | | | | | | | | | | | | | | | | | | | | | | | | | | | | | | | | | | | | | | | | | | | | | | | | | | | | | | | | | | | | | | | | | | | |
| 12-31-15 | | | | | 10.76 | | | | | | 0.28• | | | | | | (0.36) | | | | | | (0.08) | | | | | | 0.24 | | | | | | 0.67 | | | | | | — | | | | | | 0.91 | | | | | | — | | | | | | 9.77 | | | | | | (0.91) | | | | | | 0.27 | | | | | | 0.12 | | | | | | 0.12 | | | | | | 2.84 | | | | | | 30,873 | | | | | | 34 | | |
| 12-31-14 | | | | | 10.94 | | | | | | 0.22• | | | | | | 0.45 | | | | | | 0.67 | | | | | | 0.28 | | | | | | 0.57 | | | | | | — | | | | | | 0.85 | | | | | | — | | | | | | 10.76 | | | | | | 6.23 | | | | | | 0.28 | | | | | | 0.12 | | | | | | 0.12 | | | | | | 2.00 | | | | | | 5,042 | | | | | | 23 | | |
| 12-31-13 | | | | | 10.82 | | | | | | 0.22• | | | | | | 0.63 | | | | | | 0.85 | | | | | | 0.35 | | | | | | 0.38 | | | | | | — | | | | | | 0.73 | | | | | | — | | | | | | 10.94 | | | | | | 8.10 | | | | | | 0.26 | | | | | | 0.11 | | | | | | 0.11 | | | | | | 2.01 | | | | | | 5,682 | | | | | | 39 | | |
| 12-31-12 | | | | | 10.59 | | | | | | 0.27• | | | | | | 0.64 | | | | | | 0.91 | | | | | | 0.30 | | | | | | 0.38 | | | | | | — | | | | | | 0.68 | | | | | | — | | | | | | 10.82 | | | | | | 8.75 | | | | | | 0.21 | | | | | | 0.12 | | | | | | 0.12 | | | | | | 2.53 | | | | | | 10,690 | | | | | | 45 | | |
| 12-31-11 | | | | | 10.90 | | | | | | 0.21• | | | | | | 0.09 | | | | | | 0.30 | | | | | | 0.29 | | | | | | 0.32 | | | | | | — | | | | | | 0.61 | | | | | | — | | | | | | 10.59 | | | | | | 2.99 | | | | | | 0.12 | | | | | | 0.12 | | | | | | 0.12 | | | | | | 2.01 | | | | | | 6,699 | | | | | | 78 | | |
| Class S | | | | | | | | | | | | | | | | | | | | | | | | | | | | | | | | | | | | | | | | | | | | | | | | | | | | | | | | | | | | | | | | | | | | | | | | | | | | | | | | | | | | | | | | | | | | | | | | | | | | | | | |
| 12-31-15 | | | | | 10.66 | | | | | | 0.23• | | | | | | (0.33) | | | | | | (0.10) | | | | | | 0.21 | | | | | | 0.67 | | | | | | — | | | | | | 0.88 | | | | | | — | | | | | | 9.68 | | | | | | (1.11) | | | | | | 0.52 | | | | | | 0.37 | | | | | | 0.37 | | | | | | 2.24 | | | | | | 199,999 | | | | | | 34 | | |
| 12-31-14 | | | | | 10.85 | | | | | | 0.19• | | | | | | 0.44 | | | | | | 0.63 | | | | | | 0.25 | | | | | | 0.57 | | | | | | — | | | | | | 0.82 | | | | | | — | | | | | | 10.66 | | | | | | 5.90 | | | | | | 0.53 | | | | | | 0.37 | | | | | | 0.37 | | | | | | 1.73 | | | | | | 124,505 | | | | | | 23 | | |
| 12-31-13 | | | | | 10.74 | | | | | | 0.21• | | | | | | 0.60 | | | | | | 0.81 | | | | | | 0.32 | | | | | | 0.38 | | | | | | — | | | | | | 0.70 | | | | | | — | | | | | | 10.85 | | | | | | 7.78 | | | | | | 0.51 | | | | | | 0.36 | | | | | | 0.36 | | | | | | 1.92 | | | | | | 134,689 | | | | | | 39 | | |
| 12-31-12 | | | | | 10.51 | | | | | | 0.21• | | | | | | 0.68 | | | | | | 0.89 | | | | | | 0.28 | | | | | | 0.38 | | | | | | — | | | | | | 0.66 | | | | | | — | | | | | | 10.74 | | | | | | 8.52 | | | | | | 0.46 | | | | | | 0.37 | | | | | | 0.37 | | | | | | 1.97 | | | | | | 141,443 | | | | | | 45 | | |
| 12-31-11 | | | | | 10.82 | | | | | | 0.19 | | | | | | 0.08 | | | | | | 0.27 | | | | | | 0.26 | | | | | | 0.32 | | | | | | — | | | | | | 0.58 | | | | | | — | | | | | | 10.51 | | | | | | 2.73 | | | | | | 0.37 | | | | | | 0.37 | | | | | | 0.37 | | | | | | 1.64 | | | | | | 142,821 | | | | | | 78 | | |
| Class S2 | | | | | | | | | | | | | | | | | | | | | | | | | | | | | | | | | | | | | | | | | | | | | | | | | | | | | | | | | | | | | | | | | | | | | | | | | | | | | | | | | | | | | | | | | | | | | | | | | | | | | | | |
| 12-31-15 | | | | | 10.46 | | | | | | 0.22• | | | | | | (0.33) | | | | | | (0.11) | | | | | | 0.18 | | | | | | 0.67 | | | | | | — | | | | | | 0.85 | | | | | | — | | | | | | 9.50 | | | | | | (1.25) | | | | | | 0.77 | | | | | | 0.52 | | | | | | 0.52 | | | | | | 2.28 | | | | | | 14,859 | | | | | | 34 | | |
| 12-31-14 | | | | | 10.66 | | | | | | 0.17• | | | | | | 0.43 | | | | | | 0.60 | | | | | | 0.23 | | | | | | 0.57 | | | | | | — | | | | | | 0.80 | | | | | | — | | | | | | 10.46 | | | | | | 5.78 | | | | | | 0.78 | | | | | | 0.52 | | | | | | 0.52 | | | | | | 1.56 | | | | | | 4,595 | | | | | | 23 | | |
| 12-31-13 | | | | | 10.58 | | | | | | 0.20• | | | | | | 0.58 | | | | | | 0.78 | | | | | | 0.32 | | | | | | 0.38 | | | | | | — | | | | | | 0.70 | | | | | | — | | | | | | 10.66 | | | | | | 7.64 | | | | | | 0.76 | | | | | | 0.51 | | | | | | 0.51 | | | | | | 1.87 | | | | | | 5,531 | | | | | | 39 | | |
| 12-31-12 | | | | | 10.39 | | | | | | 0.22• | | | | | | 0.64 | | | | | | 0.86 | | | | | | 0.29 | | | | | | 0.38 | | | | | | — | | | | | | 0.67 | | | | | | — | | | | | | 10.58 | | | | | | 8.38 | | | | | | 0.71 | | | | | | 0.52 | | | | | | 0.52 | | | | | | 2.06 | | | | | | 4,328 | | | | | | 45 | | |
| 12-31-11 | | | | | 10.75 | | | | | | 0.15• | | | | | | 0.09 | | | | | | 0.24 | | | | | | 0.28 | | | | | | 0.32 | | | | | | — | | | | | | 0.60 | | | | | | — | | | | | | 10.39 | | | | | | 2.52 | | | | | | 0.62 | | | | | | 0.52 | | | | | | 0.52 | | | | | | 1.46 | | | | | | 1,763 | | | | | | 78 | | |
| Class T | | | | | | | | | | | | | | | | | | | | | | | | | | | | | | | | | | | | | | | | | | | | | | | | | | | | | | | | | | | | | | | | | | | | | | | | | | | | | | | | | | | | | | | | | | | | | | | | | | | | | | | |
| 12-31-15 | | | | | 10.60 | | | | | | 0.18• | | | | | | (0.31) | | | | | | (0.13) | | | | | | 0.17 | | | | | | 0.67 | | | | | | — | | | | | | 0.84 | | | | | | — | | | | | | 9.63 | | | | | | (1.47) | | | | | | 1.02 | | | | | | 0.82 | | | | | | 0.82 | | | | | | 1.82 | | | | | | 6 | | | | | | 34 | | |
| 12-31-14 | | | | | 10.79 | | | | | | 0.13 | | | | | | 0.45 | | | | | | 0.58 | | | | | | 0.20 | | | | | | 0.57 | | | | | | — | | | | | | 0.77 | | | | | | — | | | | | | 10.60 | | | | | | 5.47 | | | | | | 1.03 | | | | | | 0.82 | | | | | | 0.82 | | | | | | 1.31 | | | | | | 3 | | | | | | 23 | | |
| 12-31-13 | | | | | 10.69 | | | | | | 0.16 | | | | | | 0.59 | | | | | | 0.75 | | | | | | 0.27 | | | | | | 0.38 | | | | | | — | | | | | | 0.65 | | | | | | — | | | | | | 10.79 | | | | | | 7.28 | | | | | | 1.01 | | | | | | 0.81 | | | | | | 0.81 | | | | | | 1.51 | | | | | | 3 | | | | | | 39 | | |
| 12-31-12 | | | | | 10.46 | | | | | | 0.16 | | | | | | 0.68 | | | | | | 0.84 | | | | | | 0.23 | | | | | | 0.38 | | | | | | — | | | | | | 0.61 | | | | | | — | | | | | | 10.69 | | | | | | 8.09 | | | | | | 0.96 | | | | | | 0.82 | | | | | | 0.82 | | | | | | 1.53 | | | | | | 3 | | | | | | 45 | | |
| 12-31-11 | | | | | 10.78 | | | | | | 0.13 | | | | | | 0.08 | | | | | | 0.21 | | | | | | 0.21 | | | | | | 0.32 | | | | | | — | | | | | | 0.53 | | | | | | — | | | | | | 10.46 | | | | | | 2.20 | | | | | | 0.87 | | | | | | 0.82 | | | | | | 0.82 | | | | | | 1.19 | | | | | | 3 | | | | | | 78 | | |
| Class Z | | | | | | | | | | | | | | | | | | | | | | | | | | | | | | | | | | | | | | | | | | | | | | | | | | | | | | | | | | | | | | | | | | | | | | | | | | | | | | | | | | | | | | | | | | | | | | | | | | | | | | | |
| 05-01-15(5) - 12-31-15 | | | | | 11.02 | | | | | | 0.58• | | | | | | (0.90) | | | | | | (0.32) | | | | | | 0.24 | | | | | | 0.67 | | | | | | — | | | | | | 0.91 | | | | | | — | | | | | | 9.79 | | | | | | (3.06) | | | | | | 0.28 | | | | | | 0.00 | | | | | | 0.00 | | | | | | 9.14 | | | | | | 1,635 | | | | | | 34 | | |
| Voya Index Solution 2020 Portfolio | | | | | | | | | | | | | | | | | | | | | | | | | | | | | | | | | | | | | | | | | | | | | | | | | | | | | | | | | | | | | | | | | | | | | | | | | | | | | | | | | | | | | | | | | | | | | | | | | | | | | | | |
| Class ADV | | | | | | | | | | | | | | | | | | | | | | | | | | | | | | | | | | | | | | | | | | | | | | | | | | | | | | | | | | | | | | | | | | | | | | | | | | | | | | | | | | | | | | | | | | | | | | | | | | | | | | | |
| 12-31-15 | | | | | 11.82 | | | | | | 0.46• | | | | | | (0.46) | | | | | | 0.00* | | | | | | 0.15 | | | | | | 0.30 | | | | | | — | | | | | | 0.45 | | | | | | — | | | | | | 11.37 | | | | | | 0.00 | | | | | | 2.22 | | | | | | 0.63 | | | | | | 0.63 | | | | | | 4.05 | | | | | | 4,703 | | | | | | 108 | | |
| 12-31-14 | | | | | 12.11 | | | | | | 0.15 | | | | | | 0.47 | | | | | | 0.62 | | | | | | 0.23 | | | | | | 0.68 | | | | | | — | | | | | | 0.91 | | | | | | — | | | | | | 11.82 | | | | | | 5.27 | | | | | | 71.22 | | | | | | 0.63 | | | | | | 0.63 | | | | | | 1.31 | | | | | | 4 | | | | | | 23 | | |
| 12-31-13 | | | | | 11.41 | | | | | | 0.19 | | | | | | 1.30 | | | | | | 1.49 | | | | | | 0.26 | | | | | | 0.54 | | | | | | — | | | | | | 0.80 | | | | | | 0.01 | | | | | | 12.11 | | | | | | 13.55(a) | | | | | | 95.97 | | | | | | 0.62 | | | | | | 0.62 | | | | | | 1.61 | | | | | | 4 | | | | | | 36 | | |
| 12-31-12 | | | | | 10.76 | | | | | | 0.17 | | | | | | 1.02 | | | | | | 1.19 | | | | | | 0.02 | | | | | | 0.52 | | | | | | — | | | | | | 0.54 | | | | | | — | | | | | | 11.41 | | | | | | 11.12 | | | | | | 58.46 | | | | | | 0.62 | | | | | | 0.62 | | | | | | 1.54 | | | | | | 3 | | | | | | 61 | | |
| 10-03-11(5) - 12-31-11 | | | | | 10.00 | | | | | | 0.01 | | | | | | 0.75 | | | | | | 0.76 | | | | | | — | | | | | | — | | | | | | — | | | | | | — | | | | | | — | | | | | | 10.76 | | | | | | 7.60 | | | | | | 0.62 | | | | | | 0.62 | | | | | | 0.62 | | | | | | 0.42 | | | | | | 3 | | | | | | 41 | | |
See Accompanying Notes to Financial Statements
Financial Highlights (continued)
| | | | | | | | | | Income
(loss) from
investment
operations | | | | | | | | | Less
Distributions | | | | | | | | | | | | | | | | | | | | | | | | | | | Ratios to average
net assets | | | Supplemental
Data | |
| | | | Net asset value, beginning of year
or period | | | Net investment income (loss) | | | Net realized and unrealized
gain (loss) | | | Total from investment operations | | | From net investment income | | | From net realized gains | | | From return of capital | | | Total distributions | | | Payment by affiliate | | | Net asset value, end of year
or period | | | Total Return(1) | | | Expenses before
reductions/additions(2)(3)(4) | | | Expenses net of fee waivers
and/or recoupments if any(2)(3)(4) | | | Expense net of all
reductions/additions(2)(3)(4) | | | Net investment income (loss)(2)(3) | | | Net assets, end of year or period | | | Portfolio turnover rate | |
Year or
period ended | | | ($) | | | ($) | | | ($) | | | ($) | | | ($) | | | ($) | | | ($) | | | ($) | | | ($) | | | ($) | | | (%) | | | (%) | | | (%) | | | (%) | | | (%) | | | ($000’s) | | | (%) | |
| Voya Index Solution 2020 Portfolio (continued) | | | | | | | | | | | | | | | | | | | | | | | | | | | | | | | | | | | | | | | | | | | | | | | | | | | | | | | | | | | | | | | | | | | | | | | | | | | | | | | | | | | | | | | | | | | | | | | | | | | | | | | |
| Class I | | | | | | | | | | | | | | | | | | | | | | | | | | | | | | | | | | | | | | | | | | | | | | | | | | | | | | | | | | | | | | | | | | | | | | | | | | | | | | | | | | | | | | | | | | | | | | | | | | | | | | | |
| 12-31-15 | | | | | 11.91 | | | | | | 0.34• | | | | | | (0.33) | | | | | | 0.01 | | | | | | 0.07 | | | | | | 0.30 | | | | | | — | | | | | | 0.37 | | | | | | — | | | | | | 11.55 | | | | | | 0.04 | | | | | | 1.72 | | | | | | 0.13 | | | | | | 0.13 | | | | | | 2.98 | | | | | | 311 | | | | | | 108 | | |
| 12-31-14 | | | | | 12.18 | | | | | | 0.21 | | | | | | 0.49 | | | | | | 0.70 | | | | | | 0.29 | | | | | | 0.68 | | | | | | — | | | | | | 0.97 | | | | | | — | | | | | | 11.91 | | | | | | 5.86 | | | | | | 70.72 | | | | | | 0.13 | | | | | | 0.13 | | | | | | 1.82 | | | | | | 4 | | | | | | 23 | | |
| 12-31-13 | | | | | 11.47 | | | | | | 0.25 | | | | | | 1.30 | | | | | | 1.55 | | | | | | 0.31 | | | | | | 0.54 | | | | | | — | | | | | | 0.85 | | | | | | 0.01 | | | | | | 12.18 | | | | | | 14.02(a) | | | | | | 95.47 | | | | | | 0.12 | | | | | | 0.12 | | | | | | 2.11 | | | | | | 4 | | | | | | 36 | | |
| 12-31-12 | | | | | 10.77 | | | | | | 0.23 | | | | | | 1.02 | | | | | | 1.25 | | | | | | 0.03 | | | | | | 0.52 | | | | | | — | | | | | | 0.55 | | | | | | — | | | | | | 11.47 | | | | | | 11.69 | | | | | | 57.96 | | | | | | 0.12 | | | | | | 0.12 | | | | | | 2.04 | | | | | | 3 | | | | | | 61 | | |
| 10-03-11(5) - 12-31-11 | | | | | 10.00 | | | | | | 0.02 | | | | | | 0.75 | | | | | | 0.77 | | | | | | — | | | | | | — | | | | | | — | | | | | | — | | | | | | — | | | | | | 10.77 | | | | | | 7.70 | | | | | | 0.12 | | | | | | 0.12 | | | | | | 0.12 | | | | | | 0.90 | | | | | | 3 | | | | | | 41 | | |
| Class S | | | | | | | | | | | | | | | | | | | | | | | | | | | | | | | | | | | | | | | | | | | | | | | | | | | | | | | | | | | | | | | | | | | | | | | | | | | | | | | | | | | | | | | | | | | | | | | | | | | | | | | |
| 12-31-15 | | | | | 11.91 | | | | | | 0.58• | | | | | | (0.59) | | | | | | (0.01) | | | | | | 0.05 | | | | | | 0.30 | | | | | | — | | | | | | 0.35 | | | | | | — | | | | | | 11.55 | | | | | | (0.08) | | | | | | 1.97 | | | | | | 0.38 | | | | | | 0.38 | | | | | | 5.10 | | | | | | 1,084 | | | | | | 108 | | |
| 12-31-14 | | | | | 12.19 | | | | | | 0.18 | | | | | | 0.48 | | | | | | 0.66 | | | | | | 0.26 | | | | | | 0.68 | | | | | | — | | | | | | 0.94 | | | | | | — | | | | | | 11.91 | | | | | | 5.54 | | | | | | 70.97 | | | | | | 0.38 | | | | | | 0.38 | | | | | | 1.57 | | | | | | 4 | | | | | | 23 | | |
| 12-31-13 | | | | | 11.43 | | | | | | 0.22 | | | | | | 1.29 | | | | | | 1.51 | | | | | | 0.22 | | | | | | 0.54 | | | | | | — | | | | | | 0.76 | | | | | | 0.01 | | | | | | 12.19 | | | | | | 13.63(a) | | | | | | 95.72 | | | | | | 0.37 | | | | | | 0.37 | | | | | | 1.86 | | | | | | 4 | | | | | | 36 | | |
| 12-31-12 | | | | | 10.76 | | | | | | 0.20 | | | | | | 1.01 | | | | | | 1.21 | | | | | | 0.02 | | | | | | 0.52 | | | | | | — | | | | | | 0.54 | | | | | | — | | | | | | 11.43 | | | | | | 11.36 | | | | | | 58.21 | | | | | | 0.37 | | | | | | 0.37 | | | | | | 1.79 | | | | | | 3 | | | | | | 61 | | |
| 10-03-11(5) - 12-31-11 | | | | | 10.00 | | | | | | 0.02 | | | | | | 0.74 | | | | | | 0.76 | | | | | | — | | | | | | — | | | | | | — | | | | | | — | | | | | | — | | | | | | 10.76 | | | | | | 7.60 | | | | | | 0.37 | | | | | | 0.37 | | | | | | 0.37 | | | | | | 0.66 | | | | | | 3 | | | | | | 41 | | |
| Class S2 | | | | | | | | | | | | | | | | | | | | | | | | | | | | | | | | | | | | | | | | | | | | | | | | | | | | | | | | | | | | | | | | | | | | | | | | | | | | | | | | | | | | | | | | | | | | | | | | | | | | | | | |
| 12-31-15 | | | | | 11.84 | | | | | | 0.46• | | | | | | (0.48) | | | | | | (0.02) | | | | | | 0.00* | | | | | | 0.30 | | | | | | — | | | | | | 0.30 | | | | | | — | | | | | | 11.52 | | | | | | (0.16) | | | | | | 2.22 | | | | | | 0.53 | | | | | | 0.53 | | | | | | 3.99 | | | | | | 367 | | | | | | 108 | | |
| 12-31-14 | | | | | 12.13 | | | | | | 0.16 | | | | | | 0.48 | | | | | | 0.64 | | | | | | 0.25 | | | | | | 0.68 | | | | | | — | | | | | | 0.93 | | | | | | — | | | | | | 11.84 | | | | | | 5.36 | | | | | | 71.22 | | | | | | 0.53 | | | | | | 0.53 | | | | | | 1.41 | | | | | | 4 | | | | | | 23 | | |
| 12-31-13 | | | | | 11.43 | | | | | | 0.20 | | | | | | 1.31 | | | | | | 1.51 | | | | | | 0.28 | | | | | | 0.54 | | | | | | — | | | | | | 0.82 | | | | | | 0.01 | | | | | | 12.13 | | | | | | 13.64(a) | | | | | | 95.97 | | | | | | 0.52 | | | | | | 0.52 | | | | | | 1.71 | | | | | | 4 | | | | | | 36 | | |
| 12-31-12 | | | | | 10.76 | | | | | | 0.21 | | | | | | 1.00 | | | | | | 1.21 | | | | | | 0.02 | | | | | | 0.52 | | | | | | — | | | | | | 0.54 | | | | | | — | | | | | | 11.43 | | | | | | 11.33 | | | | | | 58.46 | | | | | | 0.52 | | | | | | 0.52 | | | | | | 1.90 | | | | | | 3 | | | | | | 61 | | |
| 10-03-11(5) - 12-31-11 | | | | | 10.00 | | | | | | 0.01 | | | | | | 0.75 | | | | | | 0.76 | | | | | | — | | | | | | — | | | | | | — | | | | | | — | | | | | | — | | | | | | 10.76 | | | | | | 7.60 | | | | | | 0.62 | | | | | | 0.52 | | | | | | 0.52 | | | | | | 0.54 | | | | | | 3 | | | | | | 41 | | |
| Class T | | | | | | | | | | | | | | | | | | | | | | | | | | | | | | | | | | | | | | | | | | | | | | | | | | | | | | | | | | | | | | | | | | | | | | | | | | | | | | | | | | | | | | | | | | | | | | | | | | | | | | | |
| 12-31-15 | | | | | 11.79 | | | | | | 0.22 | | | | | | (0.28) | | | | | | (0.06) | | | | | | — | | | | | | 0.30 | | | | | | — | | | | | | 0.30 | | | | | | — | | | | | | 11.43 | | | | | | (0.54) | | | | | | 2.47 | | | | | | 0.83 | | | | | | 0.83 | | | | | | 1.87 | | | | | | 4 | | | | | | 108 | | |
| 12-31-14 | | | | | 12.08 | | | | | | 0.13 | | | | | | 0.47 | | | | | | 0.60 | | | | | | 0.21 | | | | | | 0.68 | | | | | | — | | | | | | 0.89 | | | | | | — | | | | | | 11.79 | | | | | | 5.07 | | | | | | 71.47 | | | | | | 0.83 | | | | | | 0.83 | | | | | | 1.11 | | | | | | 4 | | | | | | 23 | | |
| 12-31-13 | | | | | 11.38 | | | | | | 0.17 | | | | | | 1.29 | | | | | | 1.46 | | | | | | 0.23 | | | | | | 0.54 | | | | | | — | | | | | | 0.77 | | | | | | 0.01 | | | | | | 12.08 | | | | | | 13.30(a) | | | | | | 96.22 | | | | | | 0.82 | | | | | | 0.82 | | | | | | 1.40 | | | | | | 4 | | | | | | 36 | | |
| 12-31-12 | | | | | 10.75 | | | | | | 0.15 | | | | | | 1.01 | | | | | | 1.16 | | | | | | 0.01 | | | | | | 0.52 | | | | | | — | | | | | | 0.53 | | | | | | — | | | | | | 11.38 | | | | | | 10.88 | | | | | | 58.71 | | | | | | 0.82 | | | | | | 0.82 | | | | | | 1.34 | | | | | | 3 | | | | | | 61 | | |
| 10-03-11(5) - 12-31-11 | | | | | 10.00 | | | | | | 0.00* | | | | | | 0.75 | | | | | | 0.75 | | | | | | — | | | | | | — | | | | | | — | | | | | | — | | | | | | — | | | | | | 10.75 | | | | | | 7.50 | | | | | | 0.87 | | | | | | 0.82 | | | | | | 0.82 | | | | | | 0.18 | | | | | | 3 | | | | | | 41 | | |
| Class Z | | | | | | | | | | | | | | | | | | | | | | | | | | | | | | | | | | | | | | | | | | | | | | | | | | | | | | | | | | | | | | | | | | | | | | | | | | | | | | | | | | | | | | | | | | | | | | | | | | | | | | | |
| 05-01-15(5) - 12-31-15 | | | | | 12.30 | | | | | | 0.38• | | | | | | (0.74) | | | | | | (0.36) | | | | | | 0.07 | | | | | | 0.30 | | | | | | — | | | | | | 0.37 | | | | | | — | | | | | | 11.57 | | | | | | (2.97) | | | | | | 1.70 | | | | | | 0.00 | | | | | | 0.00 | | | | | | 4.91 | | | | | | 2,030 | | | | | | 108 | | |
| Voya Index Solution 2025 Portfolio | | | | | | | | | | | | | | | | | | | | | | | | | | | | | | | | | | | | | | | | | | | | | | | | | | | | | | | | | | | | | | | | | | | | | | | | | | | | | | | | | | | | | | | | | | | | | | | | | | | | | | | |
| Class ADV | | | | | | | | | | | | | | | | | | | | | | | | | | | | | | | | | | | | | | | | | | | | | | | | | | | | | | | | | | | | | | | | | | | | | | | | | | | | | | | | | | | | | | | | | | | | | | | | | | | | | | | |
| 12-31-15 | | | | | 11.49 | | | | | | 0.19 | | | | | | (0.36) | | | | | | (0.17) | | | | | | 0.16 | | | | | | 0.97 | | | | | | — | | | | | | 1.13 | | | | | | — | | | | | | 10.19 | | | | | | (1.80) | | | | | | 0.77 | | | | | | 0.63 | | | | | | 0.63 | | | | | | 1.75 | | | | | | 228,081 | | | | | | 40 | | |
| 12-31-14 | | | | | 11.63 | | | | | | 0.15 | | | | | | 0.46 | | | | | | 0.61 | | | | | | 0.19 | | | | | | 0.56 | | | | | | — | | | | | | 0.75 | | | | | | — | | | | | | 11.49 | | | | | | 5.41 | | | | | | 0.77 | | | | | | 0.62 | | | | | | 0.62 | | | | | | 1.29 | | | | | | 242,980 | | | | | | 33 | | |
| 12-31-13 | | | | | 10.38 | | | | | | 0.18• | | | | | | 1.54 | | | | | | 1.72 | | | | | | 0.16 | �� | | | | | 0.31 | | | | | | — | | | | | | 0.47 | | | | | | — | | | | | | 11.63 | | | | | | 16.77 | | | | | | 0.75 | | | | | | 0.61 | | | | | | 0.61 | | | | | | 1.66 | | | | | | 245,758 | | | | | | 40 | | |
| 12-31-12 | | | | | 9.56 | | | | | | 0.16• | | | | | | 1.04 | | | | | | 1.20 | | | | | | 0.12 | | | | | | 0.26 | | | | | | — | | | | | | 0.38 | | | | | | — | | | | | | 10.38 | | | | | | 12.74 | | | | | | 0.71 | | | | | | 0.62 | | | | | | 0.62 | | | | | | 1.63 | | | | | | 181,218 | | | | | | 39 | | |
| 12-31-11 | | | | | 10.40 | | | | | | 0.12• | | | | | | (0.34) | | | | | | (0.22) | | | | | | 0.15 | | | | | | 0.47 | | | | | | — | | | | | | 0.62 | | | | | | — | | | | | | 9.56 | | | | | | (1.75) | | | | | | 0.62 | | | | | | 0.62 | | | | | | 0.62 | | | | | | 1.19 | | | | | | 114,181 | | | | | | 95 | | |
| Class I | | | | | | | | | | | | | | | | | | | | | | | | | | | | | | | | | | | | | | | | | | | | | | | | | | | | | | | | | | | | | | | | | | | | | | | | | | | | | | | | | | | | | | | | | | | | | | | | | | | | | | | |
| 12-31-15 | | | | | 11.72 | | | | | | 0.26• | | | | | | (0.37) | | | | | | (0.11) | | | | | | 0.22 | | | | | | 0.97 | | | | | | — | | | | | | 1.19 | | | | | | — | | | | | | 10.42 | | | | | | (1.25) | | | | | | 0.27 | | | | | | 0.13 | | | | | | 0.13 | | | | | | 2.29 | | | | | | 49,275 | | | | | | 40 | | |
| 12-31-14 | | | | | 11.84 | | | | | | 0.22• | | | | | | 0.46 | | | | | | 0.68 | | | | | | 0.24 | | | | | | 0.56 | | | | | | — | | | | | | 0.80 | | | | | | — | | | | | | 11.72 | | | | | | 5.95 | | | | | | 0.27 | | | | | | 0.12 | | | | | | 0.12 | | | | | | 1.89 | | | | | | 46,808 | | | | | | 33 | | |
| 12-31-13 | | | | | 10.54 | | | | | | 0.24• | | | | | | 1.56 | | | | | | 1.80 | | | | | | 0.19 | | | | | | 0.31 | | | | | | — | | | | | | 0.50 | | | | | | — | | | | | | 11.84 | | | | | | 17.38 | | | | | | 0.25 | | | | | | 0.11 | | | | | | 0.11 | | | | | | 2.13 | | | | | | 33,098 | | | | | | 40 | | |
| 12-31-12 | | | | | 9.69 | | | | | | 0.24• | | | | | | 1.02 | | | | | | 1.26 | | | | | | 0.15 | | | | | | 0.26 | | | | | | — | | | | | | 0.41 | | | | | | — | | | | | | 10.54 | | | | | | 13.26 | | | | | | 0.21 | | | | | | 0.12 | | | | | | 0.12 | | | | | | 2.32 | | | | | | 29,471 | | | | | | 39 | | |
| 12-31-11 | | | | | 10.52 | | | | | | 0.16• | | | | | | (0.34) | | | | | | (0.18) | | | | | | 0.18 | | | | | | 0.47 | | | | | | — | | | | | | 0.65 | | | | | | — | | | | | | 9.69 | | | | | | (1.24) | | | | | | 0.12 | | | | | | 0.12 | | | | | | 0.12 | | | | | | 1.55 | | | | | | 15,692 | | | | | | 95 | | |
See Accompanying Notes to Financial Statements
Financial Highlights (continued)
| | | | | | | | | | Income
(loss) from
investment
operations | | | | | | | | | Less
Distributions | | | | | | | | | | | | | | | | | | | | | | | | | | | Ratios to average
net assets | | | Supplemental
Data | |
| | | | Net asset value, beginning of year
or period | | | Net investment income (loss) | | | Net realized and unrealized
gain (loss) | | | Total from investment operations | | | From net investment income | | | From net realized gains | | | From return of capital | | | Total distributions | | | Payment by affiliate | | | Net asset value, end of year
or period | | | Total Return(1) | | | Expenses before
reductions/additions(2)(3)(4) | | | Expenses net of fee waivers
and/or recoupments if any(2)(3)(4) | | | Expense net of all
reductions/additions(2)(3)(4) | | | Net investment income (loss)(2)(3) | | | Net assets, end of year or period | | | Portfolio turnover rate | |
Year or
period ended | | | ($) | | | ($) | | | ($) | | | ($) | | | ($) | | | ($) | | | ($) | | | ($) | | | ($) | | | ($) | | | (%) | | | (%) | | | (%) | | | (%) | | | (%) | | | ($000’s) | | | (%) | |
| Voya Index Solution 2025 Portfolio (continued) | | | | | | | | | | | | | | | | | | | | | | | | | | | | | | | | | | | | | | | | | | | | | | | | | | | | | | | | | | | | | | | | | | | | | | | | | | | | | | | | | | | | | | | | | | | | | | | | | | | | | | | |
| Class S | | | | | | | | | | | | | | | | | | | | | | | | | | | | | | | | | | | | | | | | | | | | | | | | | | | | | | | | | | | | | | | | | | | | | | | | | | | | | | | | | | | | | | | | | | | | | | | | | | | | | | | |
| 12-31-15 | | | | | 11.61 | | | | | | 0.23 | | | | | | (0.36) | | | | | | (0.13) | | | | | | 0.20 | | | | | | 0.97 | | | | | | — | | | | | | 1.17 | | | | | | — | | | | | | 10.31 | | | | | | (1.50) | | | | | | 0.52 | | | | | | 0.38 | | | | | | 0.38 | | | | | | 1.99 | | | | | | 166,420 | | | | | | 40 | | |
| 12-31-14 | | | | | 11.74 | | | | | | 0.18 | | | | | | 0.47 | | | | | | 0.65 | | | | | | 0.22 | | | | | | 0.56 | | | | | | — | | | | | | 0.78 | | | | | | — | | | | | | 11.61 | | | | | | 5.67 | | | | | | 0.52 | | | | | | 0.37 | | | | | | 0.37 | | | | | | 1.55 | | | | | | 186,666 | | | | | | 33 | | |
| 12-31-13 | | | | | 10.47 | | | | | | 0.21• | | | | | | 1.54 | | | | | | 1.75 | | | | | | 0.17 | | | | | | 0.31 | | | | | | — | | | | | | 0.48 | | | | | | — | | | | | | 11.74 | | | | | | 17.00 | | | | | | 0.50 | | | | | | 0.36 | | | | | | 0.36 | | | | | | 1.88 | | | | | | 174,380 | | | | | | 40 | | |
| 12-31-12 | | | | | 9.62 | | | | | | 0.19• | | | | | | 1.05 | | | | | | 1.24 | | | | | | 0.13 | | | | | | 0.26 | | | | | | — | | | | | | 0.39 | | | | | | — | | | | | | 10.47 | | | | | | 13.12 | | | | | | 0.46 | | | | | | 0.37 | | | | | | 0.37 | | | | | | 1.84 | | | | | | 138,176 | | | | | | 39 | | |
| 12-31-11 | | | | | 10.46 | | | | | | 0.14• | | | | | | (0.34) | | | | | | (0.20) | | | | | | 0.17 | | | | | | 0.47 | | | | | | — | | | | | | 0.64 | | | | | | — | | | | | | 9.62 | | | | | | (1.55) | | | | | | 0.37 | | | | | | 0.37 | | | | | | 0.37 | | | | | | 1.42 | | | | | | 98,843 | | | | | | 95 | | |
| Class S2 | | | | | | | | | | | | | | | | | | | | | | | | | | | | | | | | | | | | | | | | | | | | | | | | | | | | | | | | | | | | | | | | | | | | | | | | | | | | | | | | | | | | | | | | | | | | | | | | | | | | | | | |
| 12-31-15 | | | | | 11.44 | | | | | | 0.20• | | | | | | (0.35) | | | | | | (0.15) | | | | | | 0.16 | | | | | | 0.97 | | | | | | — | | | | | | 1.13 | | | | | | — | | | | | | 10.16 | | | | | | (1.63) | | | | | | 0.77 | | | | | | 0.53 | | | | | | 0.53 | | | | | | 1.83 | | | | | | 34,934 | | | | | | 40 | | |
| 12-31-14 | | | | | 11.58 | | | | | | 0.16• | | | | | | 0.46 | | | | | | 0.62 | | | | | | 0.20 | | | | | | 0.56 | | | | | | — | | | | | | 0.76 | | | | | | — | | | | | | 11.44 | | | | | | 5.52 | | | | | | 0.77 | | | | | | 0.52 | | | | | | 0.52 | | | | | | 1.36 | | | | | | 42,853 | | | | | | 33 | | |
| 12-31-13 | | | | | 10.34 | | | | | | 0.20• | | | | | | 1.52 | | | | | | 1.72 | | | | | | 0.17 | | | | | | 0.31 | | | | | | — | | | | | | 0.48 | | | | | | — | | | | | | 11.58 | | | | | | 16.87 | | | | | | 0.75 | | | | | | 0.51 | | | | | | 0.51 | | | | | | 1.80 | | | | | | 48,649 | | | | | | 40 | | |
| 12-31-12 | | | | | 9.53 | | | | | | 0.18• | | | | | | 1.03 | | | | | | 1.21 | | | | | | 0.14 | | | | | | 0.26 | | | | | | — | | | | | | 0.40 | | | | | | — | | | | | | 10.34 | | | | | | 12.88 | | | | | | 0.71 | | | | | | 0.52 | | | | | | 0.52 | | | | | | 1.77 | | | | | | 32,743 | | | | | | 39 | | |
| 12-31-11 | | | | | 10.40 | | | | | | 0.09• | | | | | | (0.31) | | | | | | (0.22) | | | | | | 0.18 | | | | | | 0.47 | | | | | | — | | | | | | 0.65 | | | | | | — | | | | | | 9.53 | | | | | | (1.70) | | | | | | 0.62 | | | | | | 0.52 | | | | | | 0.52 | | | | | | 0.93 | | | | | | 13,158 | | | | | | 95 | | |
| Class T | | | | | | | | | | | | | | | | | | | | | | | | | | | | | | | | | | | | | | | | | | | | | | | | | | | | | | | | | | | | | | | | | | | | | | | | | | | | | | | | | | | | | | | | | | | | | | | | | | | | | | | |
| 12-31-15 | | | | | 11.53 | | | | | | 0.17 | | | | | | (0.35) | | | | | | (0.18) | | | | | | 0.14 | | | | | | 0.97 | | | | | | — | | | | | | 1.11 | | | | | | — | | | | | | 10.24 | | | | | | (1.87) | | | | | | 1.02 | | | | | | 0.83 | | | | | | 0.83 | | | | | | 1.55 | | | | | | 3 | | | | | | 40 | | |
| 12-31-14 | | | | | 11.66 | | | | | | 0.12 | | | | | | 0.47 | | | | | | 0.59 | | | | | | 0.16 | | | | | | 0.56 | | | | | | — | | | | | | 0.72 | | | | | | — | | | | | | 11.53 | | | | | | 5.23 | | | | | | 1.02 | | | | | | 0.82 | | | | | | 0.82 | | | | | | 1.10 | | | | | | 4 | | | | | | 33 | | |
| 12-31-13 | | | | | 10.39 | | | | | | 0.16 | | | | | | 1.54 | | | | | | 1.70 | | | | | | 0.12 | | | | | | 0.31 | | | | | | — | | | | | | 0.43 | | | | | | — | | | | | | 11.66 | | | | | | 16.58 | | | | | | 1.00 | | | | | | 0.81 | | | | | | 0.81 | | | | | | 1.42 | | | | | | 3 | | | | | | 40 | | |
| 12-31-12 | | | | | 9.55 | | | | | | 0.14 | | | | | | 1.04 | | | | | | 1.18 | | | | | | 0.08 | | | | | | 0.26 | | | | | | — | | | | | | 0.34 | | | | | | — | | | | | | 10.39 | | | | | | 12.54 | | | | | | 0.96 | | | | | | 0.82 | | | | | | 0.82 | | | | | | 1.34 | | | | | | 3 | | | | | | 39 | | |
| 12-31-11 | | | | | 10.37 | | | | | | 0.10 | | | | | | (0.34) | | | | | | (0.24) | | | | | | 0.11 | | | | | | 0.47 | | | | | | — | | | | | | 0.58 | | | | | | — | | | | | | 9.55 | | | | | | (1.93) | | | | | | 0.87 | | | | | | 0.82 | | | | | | 0.82 | | | | | | 0.97 | | | | | | 3 | | | | | | 95 | | |
| Class Z | | | | | | | | | | | | | | | | | | | | | | | | | | | | | | | | | | | | | | | | | | | | | | | | | | | | | | | | | | | | | | | | | | | | | | | | | | | | | | | | | | | | | | | | | | | | | | | | | | | | | | | |
| 05-01-15(5) - 12-31-15 | | | | | 12.17 | | | | | | 0.41• | | | | | | (0.96) | | | | | | (0.55) | | | | | | 0.22 | | | | | | 0.97 | | | | | | — | | | | | | 1.19 | | | | | | — | | | | | | 10.43 | | | | | | (4.81) | | | | | | 0.28 | | | | | | 0.00 | | | | | | 0.00 | | | | | | 5.95 | | | | | | 2,310 | | | | | | 40 | | |
| Voya Index Solution 2030 Portfolio | | | | | | | | | | | | | | | | | | | | | | | | | | | | | | | | | | | | | | | | | | | | | | | | | | | | | | | | | | | | | | | | | | | | | | | | | | | | | | | | | | | | | | | | | | | | | | | | | | | | | | | |
| Class ADV | | | | | | | | | | | | | | | | | | | | | | | | | | | | | | | | | | | | | | | | | | | | | | | | | | | | | | | | | | | | | | | | | | | | | | | | | | | | | | | | | | | | | | | | | | | | | | | | | | | | | | | |
| 12-31-15 | | | | | 12.70 | | | | | | 0.48• | | | | | | (0.53) | | | | | | (0.05) | | | | | | 0.07 | | | | | | 0.19 | | | | | | — | | | | | | 0.26 | | | | | | — | | | | | | 12.39 | | | | | | (0.48) | | | | | | 3.36 | | | | | | 0.63 | | | | | | 0.63 | | | | | | 3.93 | | | | | | 2,598 | | | | | | 136 | | |
| 12-31-14 | | | | | 13.19 | | | | | | 0.14 | | | | | | 0.50 | | | | | | 0.64 | | | | | | 0.22 | | | | | | 0.91 | | | | | | — | | | | | | 1.13 | | | | | | — | | | | | | 12.70 | | | | | | 5.00 | | | | | | 65.69 | | | | | | 0.63 | | | | | | 0.63 | | | | | | 1.10 | | | | | | 4 | | | | | | 32 | | |
| 12-31-13 | | | | | 11.85 | | | | | | 0.19• | | | | | | 1.95 | | | | | | 2.14 | | | | | | 0.27 | | | | | | 0.55 | | | | | | — | | | | | | 0.82 | | | | | | 0.02 | | | | | | 13.19 | | | | | | 18.71(b) | | | | | | 87.48 | | | | | | 0.61 | | | | | | 0.61 | | | | | | 1.48 | | | | | | 4 | | | | | | 41 | | |
| 12-31-12 | | | | | 11.00 | | | | | | 0.20 | | | | | | 1.33 | | | | | | 1.53 | | | | | | 0.01 | | | | | | 0.67 | | | | | | — | | | | | | 0.68 | | | | | | — | | | | | | 11.85 | | | | | | 13.99 | | | | | | 43.07 | | | | | | 0.62 | | | | | | 0.62 | | | | | | 1.74 | | | | | | 4 | | | | | | 51 | | |
| 10-03-11(5) - 12-31-11 | | | | | 10.00 | | | | | | (0.00)* | | | | | | 1.00 | | | | | | 1.00 | | | | | | — | | | | | | — | | | | | | — | | | | | | — | | | | | | — | | | | | | 11.00 | | | | | | 10.00 | | | | | | 0.62 | | | | | | 0.62 | | | | | | 0.62 | | | | | | (0.00)* | | | | | | 3 | | | | | | 50 | | |
| Class I | | | | | | | | | | | | | | | | | | | | | | | | | | | | | | | | | | | | | | | | | | | | | | | | | | | | | | | | | | | | | | | | | | | | | | | | | | | | | | | | | | | | | | | | | | | | | | | | | | | | | | | |
| 12-31-15 | | | | | 12.79 | | | | | | 0.99• | | | | | | (0.99) | | | | | | 0.00* | | | | | | — | | | | | | 0.19 | | | | | | — | | | | | | 0.19 | | | | | | — | | | | | | 12.60 | | | | | | (0.03) | | | | | | 2.86 | | | | | | 0.13 | | | | | | 0.13 | | | | | | 8.08 | | | | | | 779 | | | | | | 136 | | |
| 12-31-14 | | | | | 13.28 | | | | | | 0.20 | | | | | | 0.51 | | | | | | 0.71 | | | | | | 0.29 | | | | | | 0.91 | | | | | | — | | | | | | 1.20 | | | | | | — | | | | | | 12.79 | | | | | | 5.52 | | | | | | 65.19 | | | | | | 0.13 | | | | | | 0.13 | | | | | | 1.61 | | | | | | 4 | | | | | | 32 | | |
| 12-31-13 | | | | | 11.91 | | | | | | 0.25• | | | | | | 1.97 | | | | | | 2.22 | | | | | | 0.32 | | | | | | 0.55 | | | | | | — | | | | | | 0.87 | | | | | | 0.02 | | | | | | 13.28 | | | | | | 19.32(b) | | | | | | 86.98 | | | | | | 0.11 | | | | | | 0.11 | | | | | | 1.97 | | | | | | 4 | | | | | | 41 | | |
| 12-31-12 | | | | | 11.01 | | | | | | 0.26• | | | | | | 1.33 | | | | | | 1.59 | | | | | | 0.02 | | | | | | 0.67 | | | | | | — | | | | | | 0.69 | | | | | | — | | | | | | 11.91 | | | | | | 14.55 | | | | | | 42.57 | | | | | | 0.12 | | | | | | 0.12 | | | | | | 2.23 | | | | | | 4 | | | | | | 51 | | |
| 10-03-11(5) - 12-31-11 | | | | | 10.00 | | | | | | 0.01 | | | | | | 1.00 | | | | | | 1.01 | | | | | | — | | | | | | — | | | | | | — | | | | | | — | | | | | | — | | | | | | 11.01 | | | | | | 10.10 | | | | | | 0.12 | | | | | | 0.12 | | | | | | 0.12 | | | | | | 0.46 | | | | | | 3 | | | | | | 50 | | |
| Class S | | | | | | | | | | | | | | | | | | | | | | | | | | | | | | | | | | | | | | | | | | | | | | | | | | | | | | | | | | | | | | | | | | | | | | | | | | | | | | | | | | | | | | | | | | | | | | | | | | | | | | | |
| 12-31-15 | | | | | 12.79 | | | | | | 0.43• | | | | | | (0.46) | | | | | | (0.03) | | | | | | — | | | | | | 0.19 | | | | | | — | | | | | | 0.19 | | | | | | — | | | | | | 12.57 | | | | | | (0.27) | | | | | | 3.11 | | | | | | 0.38 | | | | | | 0.38 | | | | | | 3.45 | | | | | | 521 | | | | | | 136 | | |
| 12-31-14 | | | | | 13.27 | | | | | | 0.17 | | | | | | 0.52 | | | | | | 0.69 | | | | | | 0.26 | | | | | | 0.91 | | | | | | — | | | | | | 1.17 | | | | | | — | | | | | | 12.79 | | | | | | 5.32 | | | | | | 65.44 | | | | | | 0.38 | | | | | | 0.38 | | | | | | 1.35 | | | | | | 4 | | | | | | 32 | | |
| 12-31-13 | | | | | 11.87 | | | | | | 0.22 | | | | | | 1.94 | | | | | | 2.16 | | | | | | 0.23 | | | | | | 0.55 | | | | | | — | | | | | | 0.78 | | | | | | 0.02 | | | | | | 13.27 | | | | | | 18.78(b) | | | | | | 87.23 | | | | | | 0.36 | | | | | | 0.36 | | | | | | 1.73 | | | | | | 4 | | | | | | 41 | | |
| 12-31-12 | | | | | 11.00 | | | | | | 0.23 | | | | | | 1.32 | | | | | | 1.55 | | | | | | 0.01 | | | | | | 0.67 | | | | | | — | | | | | | 0.68 | | | | | | — | | | | | | 11.87 | | | | | | 14.22 | | | | | | 42.82 | | | | | | 0.37 | | | | | | 0.37 | | | | | | 2.00 | | | | | | 4 | | | | | | 51 | | |
| 10-03-11(5) - 12-31-11 | | | | | 10.00 | | | | | | 0.00* | | | | | | 1.00 | | | | | | 1.00 | | | | | | — | | | | | | — | | | | | | — | | | | | | — | | | | | | — | | | | | | 11.00 | | | | | | 10.00 | | | | | | 0.37 | | | | | | 0.37 | | | | | | 0.37 | | | | | | 0.17 | | | | | | 3 | | | | | | 50 | | |
See Accompanying Notes to Financial Statements
Financial Highlights (continued)
| | | | | | | | | | Income
(loss) from
investment
operations | | | | | | | | | Less
Distributions | | | | | | | | | | | | | | | | | | | | | | | | | | | Ratios to average
net assets | | | Supplemental
Data | |
| | | | Net asset value, beginning of year
or period | | | Net investment income (loss) | | | Net realized and unrealized
gain (loss) | | | Total from investment operations | | | From net investment income | | | From net realized gains | | | From return of capital | | | Total distributions | | | Payment by affiliate | | | Net asset value, end of year
or period | | | Total Return(1) | | | Expenses before
reductions/additions(2)(3)(4) | | | Expenses net of fee waivers
and/or recoupments if any(2)(3)(4) | | | Expense net of all
reductions/additions(2)(3)(4) | | | Net investment income (loss)(2)(3) | | | Net assets, end of year or period | | | Portfolio turnover rate | |
Year or
period ended | | | ($) | | | ($) | | | ($) | | | ($) | | | ($) | | | ($) | | | ($) | | | ($) | | | ($) | | | ($) | | | (%) | | | (%) | | | (%) | | | (%) | | | (%) | | | ($000’s) | | | (%) | |
| Voya Index Solution 2030 Portfolio (continued) | | | | | | | | | | | | | | | | | | | | | | | | | | | | | | | | | | | | | | | | | | | | | | | | | | | | | | | | | | | | | | | | | | | | | | | | | | | | | | | | | | | | | | | | | | | | | | | | | | | | | | | |
| Class S2 | | | | | | | | | | | | | | | | | | | | | | | | | | | | | | | | | | | | | | | | | | | | | | | | | | | | | | | | | | | | | | | | | | | | | | | | | | | | | | | | | | | | | | | | | | | | | | | | | | | | | | | |
| 12-31-15 | | | | | 12.71 | | | | | | 0.48• | | | | | | (0.55) | | | | | | (0.07) | | | | | | — | | | | | | 0.19 | | | | | | — | | | | | | 0.19 | | | | | | — | | | | | | 12.45 | | | | | | (0.58) | | | | | | 3.36 | | | | | | 0.53 | | | | | | 0.53 | | | | | | 3.87 | | | | | | 47 | | | | | | 136 | | |
| 12-31-14 | | | | | 13.21 | | | | | | 0.15 | | | | | | 0.49 | | | | | | 0.64 | | | | | | 0.23 | | | | | | 0.91 | | | | | | — | | | | | | 1.14 | | | | | | — | | | | | | 12.71 | | | | | | 5.00 | | | | | | 65.69 | | | | | | 0.53 | | | | | | 0.53 | | | | | | 1.20 | | | | | | 4 | | | | | | 32 | | |
| 12-31-13 | | | | | 11.87 | | | | | | 0.20 | | | | | | 1.95 | | | | | | 2.15 | | | | | | 0.28 | | | | | | 0.55 | | | | | | — | | | | | | 0.83 | | | | | | 0.02 | | | | | | 13.21 | | | | | | 18.79(b) | | | | | | 87.48 | | | | | | 0.51 | | | | | | 0.51 | | | | | | 1.58 | | | | | | 4 | | | | | | 41 | | |
| 12-31-12 | | | | | 11.00 | | | | | | 0.23 | | | | | | 1.32 | | | | | | 1.55 | | | | | | 0.01 | | | | | | 0.67 | | | | | | — | | | | | | 0.68 | | | | | | — | | | | | | 11.87 | | | | | | 14.20 | | | | | | 43.07 | | | | | | 0.52 | | | | | | 0.52 | | | | | | 1.97 | | | | | | 4 | | | | | | 51 | | |
| 10-03-11(5) - 12-31-11 | | | | | 10.00 | | | | | | 0.00* | | | | | | 1.00 | | | | | | 1.00 | | | | | | — | | | | | | — | | | | | | — | | | | | | — | | | | | | — | | | | | | 11.00 | | | | | | 10.00 | | | | | | 0.62 | | | | | | 0.52 | | | | | | 0.52 | | | | | | 0.11 | | | | | | 3 | | | | | | 50 | | |
| Class T | | | | | | | | | | | | | | | | | | | | | | | | | | | | | | | | | | | | | | | | | | | | | | | | | | | | | | | | | | | | | | | | | | | | | | | | | | | | | | | | | | | | | | | | | | | | | | | | | | | | | | | |
| 12-31-15 | | | | | 12.66 | | | | | | 0.24 | | | | | | (0.36) | | | | | | (0.12) | | | | | | — | | | | | | 0.19 | | | | | | — | | | | | | 0.19 | | | | | | — | | | | | | 12.35 | | | | | | (0.99) | | | | | | 3.61 | | | | | | 0.83 | | | | | | 0.83 | | | | | | 1.88 | | | | | | 4 | | | | | | 136 | | |
| 12-31-14 | | | | | 13.17 | | | | | | 0.11 | | | | | | 0.50 | | | | | | 0.61 | | | | | | 0.21 | | | | | | 0.91 | | | | | | — | | | | | | 1.12 | | | | | | — | | | | | | 12.66 | | | | | | 4.75 | | | | | | 65.94 | | | | | | 0.83 | | | | | | 0.83 | | | | | | 0.91 | | | | | | 4 | | | | | | 32 | | |
| 12-31-13 | | | | | 11.82 | | | | | | 0.16 | | | | | | 1.96 | | | | | | 2.12 | | | | | | 0.24 | | | | | | 0.55 | | | | | | — | | | | | | 0.79 | | | | | | 0.02 | | | | | | 13.17 | | | | | | 18.56(b) | | | | | | 87.73 | | | | | | 0.81 | | | | | | 0.81 | | | | | | 1.27 | | | | | | 4 | | | | | | 41 | | |
| 12-31-12 | | | | | 10.99 | | | | | | 0.18 | | | | | | 1.32 | | | | | | 1.50 | | | | | | 0.00* | | | | | | 0.67 | | | | | | — | | | | | | 0.67 | | | | | | — | | | | | | 11.82 | | | | | | 13.75 | | | | | | 43.32 | | | | | | 0.82 | | | | | | 0.82 | | | | | | 1.52 | | | | | | 4 | | | | | | 51 | | |
| 10-03-11(5) - 12-31-11 | | | | | 10.00 | | | | | | (0.01) | | | | | | 1.00 | | | | | | 0.99 | | | | | | — | | | | | | — | | | | | | — | | | | | | — | | | | | | — | | | | | | 10.99 | | | | | | 9.90 | | | | | | 0.87 | | | | | | 0.82 | | | | | | 0.82 | | | | | | (0.29) | | | | | | 3 | | | | | | 50 | | |
| Class Z | | | | | | | | | | | | | | | | | | | | | | | | | | | | | | | | | | | | | | | | | | | | | | | | | | | | | | | | | | | | | | | | | | | | | | | | | | | | | | | | | | | | | | | | | | | | | | | | | | | | | | | |
| 05-01-15(5) - 12-31-15 | | | | | 13.34 | | | | | | 0.36• | | | | | | (0.92) | | | | | | (0.56) | | | | | | — | | | | | | 0.19 | | | | | | — | | | | | | 0.19 | | | | | | — | | | | | | 12.59 | | | | | | (4.23) | | | | | | 2.82 | | | | | | 0.00 | | | | | | 0.00 | | | | | | 4.30 | | | | | | 1,196 | | | | | | 136 | | |
| Voya Index Solution 2035 Portfolio | | | | | | | | | | | | | | | | | | | | | | | | | | | | | | | | | | | | | | | | | | | | | | | | | | | | | | | | | | | | | | | | | | | | | | | | | | | | | | | | | | | | | | | | | | | | | | | | | | | | | | | |
| Class ADV | | | | | | | | | | | | | | | | | | | | | | | | | | | | | | | | | | | | | | | | | | | | | | | | | | | | | | | | | | | | | | | | | | | | | | | | | | | | | | | | | | | | | | | | | | | | | | | | | | | | | | | |
| 12-31-15 | | | | | 11.86 | | | | | | 0.18 | | | | | | (0.35) | | | | | | (0.17) | | | | | | 0.15 | | | | | | 1.20 | | | | | | — | | | | | | 1.35 | | | | | | — | | | | | | 10.34 | | | | | | (1.91) | | | | | | 0.77 | | | | | | 0.64 | | | | | | 0.64 | | | | | | 1.62 | | | | | | 199,097 | | | | | | 38 | | |
| 12-31-14 | | | | | 12.01 | | | | | | 0.13 | | | | | | 0.53 | | | | | | 0.66 | | | | | | 0.17 | | | | | | 0.64 | | | | | | — | | | | | | 0.81 | | | | | | — | | | | | | 11.86 | | | | | | 5.65 | | | | | | 0.76 | | | | | | 0.63 | | | | | | 0.63 | | | | | | 1.12 | | | | | | 213,542 | | | | | | 44 | | |
| 12-31-13 | | | | | 10.25 | | | | | | 0.17• | | | | | | 2.01 | | | | | | 2.18 | | | | | | 0.12 | | | | | | 0.30 | | | | | | — | | | | | | 0.42 | | | | | | — | | | | | | 12.01 | | | | | | 21.67 | | | | | | 0.75 | | | | | | 0.62 | | | | | | 0.62 | | | | | | 1.51 | | | | | | 208,246 | | | | | | 45 | | |
| 12-31-12 | | | | | 9.30 | | | | | | 0.15• | | | | | | 1.21 | | | | | | 1.36 | | | | | | 0.09 | | | | | | 0.32 | | | | | | — | | | | | | 0.41 | | | | | | — | | | | | | 10.25 | | | | | | 14.87 | | | | | | 0.71 | | | | | | 0.62 | | | | | | 0.62 | | | | | | 1.47 | | | | | | 150,358 | | | | | | 34 | | |
| 12-31-11 | | | | | 10.27 | | | | | | 0.11• | | | | | | (0.51) | | | | | | (0.40) | | | | | | 0.12 | | | | | | 0.45 | | | | | | — | | | | | | 0.57 | | | | | | — | | | | | | 9.30 | | | | | | (3.46) | | | | | | 0.62 | | | | | | 0.62 | | | | | | 0.62 | | | | | | 1.06 | | | | | | 94,263 | | | | | | 100 | | |
| Class I | | | | | | | | | | | | | | | | | | | | | | | | | | | | | | | | | | | | | | | | | | | | | | | | | | | | | | | | | | | | | | | | | | | | | | | | | | | | | | | | | | | | | | | | | | | | | | | | | | | | | | | |
| 12-31-15 | | | | | 12.11 | | | | | | 0.25• | | | | | | (0.37) | | | | | | (0.12) | | | | | | 0.21 | | | | | | 1.20 | | | | | | — | | | | | | 1.41 | | | | | | — | | | | | | 10.58 | | | | | | (1.47) | | | | | | 0.27 | | | | | | 0.14 | | | | | | 0.14 | | | | | | 2.18 | | | | | | 37,272 | | | | | | 38 | | |
| 12-31-14 | | | | | 12.24 | | | | | | 0.21• | | | | | | 0.53 | | | | | | 0.74 | | | | | | 0.23 | | | | | | 0.64 | | | | | | — | | | | | | 0.87 | | | | | | — | | | | | | 12.11 | | | | | | 6.16 | | | | | | 0.26 | | | | | | 0.13 | | | | | | 0.13 | | | | | | 1.73 | | | | | | 34,038 | | | | | | 44 | | |
| 12-31-13 | | | | | 10.42 | | | | | | 0.23• | | | | | | 2.05 | | | | | | 2.28 | | | | | | 0.16 | | | | | | 0.30 | | | | | | — | | | | | | 0.46 | | | | | | — | | | | | | 12.24 | | | | | | 22.29 | | | | | | 0.25 | | | | | | 0.12 | | | | | | 0.12 | | | | | | 1.99 | | | | | | 20,257 | | | | | | 45 | | |
| 12-31-12 | | | | | 9.43 | | | | | | 0.21• | | | | | | 1.23 | | | | | | 1.44 | | | | | | 0.13 | | | | | | 0.32 | | | | | | — | | | | | | 0.45 | | | | | | — | | | | | | 10.42 | | | | | | 15.49 | | | | | | 0.21 | | | | | | 0.12 | | | | | | 0.12 | | | | | | 2.05 | | | | | | 18,530 | | | | | | 34 | | |
| 12-31-11 | | | | | 10.40 | | | | | | 0.14• | | | | | | (0.51) | | | | | | (0.37) | | | | | | 0.15 | | | | | | 0.45 | | | | | | — | | | | | | 0.60 | | | | | | — | | | | | | 9.43 | | | | | | (3.06) | | | | | | 0.12 | | | | | | 0.12 | | | | | | 0.12 | | | | | | 1.43 | | | | | | 11,109 | | | | | | 100 | | |
| Class S | | | | | | | | | | | | | | | | | | | | | | | | | | | | | | | | | | | | | | | | | | | | | | | | | | | | | | | | | | | | | | | | | | | | | | | | | | | | | | | | | | | | | | | | | | | | | | | | | | | | | | | |
| 12-31-15 | | | | | 11.99 | | | | | | 0.22 | | | | | | (0.36) | | | | | | (0.14) | | | | | | 0.18 | | | | | | 1.20 | | | | | | — | | | | | | 1.38 | | | | | | — | | | | | | 10.47 | | | | | | (1.63) | | | | | | 0.52 | | | | | | 0.39 | | | | | | 0.39 | | | | | | 1.87 | | | | | | 129,764 | | | | | | 38 | | |
| 12-31-14 | | | | | 12.13 | | | | | | 0.16 | | | | | | 0.54 | | | | | | 0.70 | | | | | | 0.20 | | | | | | 0.64 | | | | | | — | | | | | | 0.84 | | | | | | — | | | | | | 11.99 | | | | | | 5.90 | | | | | | 0.51 | | | | | | 0.38 | | | | | | 0.38 | | | | | | 1.38 | | | | | | 145,942 | | | | | | 44 | | |
| 12-31-13 | | | | | 10.34 | | | | | | 0.20• | | | | | | 2.03 | | | | | | 2.23 | | | | | | 0.14 | | | | | | 0.30 | | | | | | — | | | | | | 0.44 | | | | | | — | | | | | | 12.13 | | | | | | 21.97 | | | | | | 0.50 | | | | | | 0.37 | | | | | | 0.37 | | | | | | 1.76 | | | | | | 133,001 | | | | | | 45 | | |
| 12-31-12 | | | | | 9.37 | | | | | | 0.17• | | | | | | 1.23 | | | | | | 1.40 | | | | | | 0.11 | | | | | | 0.32 | | | | | | — | | | | | | 0.43 | | | | | | — | | | | | | 10.34 | | | | | | 15.15 | | | | | | 0.46 | | | | | | 0.37 | | | | | | 0.37 | | | | | | 1.69 | | | | | | 93,319 | | | | | | 34 | | |
| 12-31-11 | | | | | 10.34 | | | | | | 0.13• | | | | | | (0.51) | | | | | | (0.38) | | | | | | 0.14 | | | | | | 0.45 | | | | | | — | | | | | | 0.59 | | | | | | — | | | | | | 9.37 | | | | | | (3.26) | | | | | | 0.37 | | | | | | 0.37 | | | | | | 0.37 | | | | | | 1.30 | | | | | | 64,863 | | | | | | 100 | | |
| Class S2 | | | | | | | | | | | | | | | | | | | | | | | | | | | | | | | | | | | | | | | | | | | | | | | | | | | | | | | | | | | | | | | | | | | | | | | | | | | | | | | | | | | | | | | | | | | | | | | | | | | | | | | |
| 12-31-15 | | | | | 11.83 | | | | | | 0.19• | | | | | | (0.34) | | | | | | (0.15) | | | | | | 0.15 | | | | | | 1.20 | | | | | | — | | | | | | 1.35 | | | | | | — | | | | | | 10.33 | | | | | | (1.78) | | | | | | 0.77 | | | | | | 0.54 | | | | | | 0.54 | | | | | | 1.71 | | | | | | 31,067 | | | | | | 38 | | |
| 12-31-14 | | | | | 11.98 | | | | | | 0.14• | | | | | | 0.54 | | | | | | 0.68 | | | | | | 0.19 | | | | | | 0.64 | | | | | | — | | | | | | 0.83 | | | | | | — | | | | | | 11.83 | | | | | | 5.77 | | | | | | 0.76 | | | | | | 0.53 | | | | | | 0.53 | | | | | | 1.17 | | | | | | 40,100 | | | | | | 44 | | |
| 12-31-13 | | | | | 10.23 | | | | | | 0.18• | | | | | | 2.01 | | | | | | 2.19 | | | | | | 0.14 | | | | | | 0.30 | | | | | | — | | | | | | 0.44 | | | | | | — | | | | | | 11.98 | | | | | | 21.74 | | | | | | 0.75 | | | | | | 0.52 | | | | | | 0.52 | | | | | | 1.66 | | | | | | 44,066 | | | | | | 45 | | |
| 12-31-12 | | | | | 9.29 | | | | | | 0.16• | | | | | | 1.22 | | | | | | 1.38 | | | | | | 0.12 | | | | | | 0.32 | | | | | | — | | | | | | 0.44 | | | | | | — | | | | | | 10.23 | | | | | | 15.04 | | | | | | 0.71 | | | | | | 0.52 | | | | | | 0.52 | | | | | | 1.63 | | | | | | 28,712 | | | | | | 34 | | |
| 12-31-11 | | | | | 10.29 | | | | | | 0.07• | | | | | | (0.47) | | | | | | (0.40) | | | | | | 0.15 | | | | | | 0.45 | | | | | | — | | | | | | 0.60 | | | | | | — | | | | | | 9.29 | | | | | | (3.44) | | | | | | 0.62 | | | | | | 0.52 | | | | | | 0.52 | | | | | | 0.71 | | | | | | 8,819 | | | | | | 100 | | |
See Accompanying Notes to Financial Statements
Financial Highlights (continued)
| | | | | | | | | | Income
(loss) from
investment
operations | | | | | | | | | Less
Distributions | | | | | | | | | | | | | | | | | | | | | | | | | | | Ratios to average
net assets | | | Supplemental
Data | |
| | | | Net asset value, beginning of year
or period | | | Net investment income (loss) | | | Net realized and unrealized
gain (loss) | | | Total from investment operations | | | From net investment income | | | From net realized gains | | | From return of capital | | | Total distributions | | | Payment by affiliate | | | Net asset value, end of year
or period | | | Total Return(1) | | | Expenses before
reductions/additions(2)(3)(4) | | | Expenses net of fee waivers
and/or recoupments if any(2)(3)(4) | | | Expense net of all
reductions/additions(2)(3)(4) | | | Net investment income (loss)(2)(3) | | | Net assets, end of year or period | | | Portfolio turnover rate | |
Year or
period ended | | | ($) | | | ($) | | | ($) | | | ($) | | | ($) | | | ($) | | | ($) | | | ($) | | | ($) | | | ($) | | | (%) | | | (%) | | | (%) | | | (%) | | | (%) | | | ($000’s) | | | (%) | |
| Voya Index Solution 2035 Portfolio (continued) | | | | | | | | | | | | | | | | | | | | | | | | | | | | | | | | | | | | | | | | | | | | | | | | | | | | | | | | | | | | | | | | | | | | | | | | | | | | | | | | | | | | | | | | | | | | | | | | | | | | | | | |
| Class T | | | | | | | | | | | | | | | | | | | | | | | | | | | | | | | | | | | | | | | | | | | | | | | | | | | | | | | | | | | | | | | | | | | | | | | | | | | | | | | | | | | | | | | | | | | | | | | | | | | | | | | |
| 12-31-15 | | | | | 11.89 | | | | | | 0.16 | | | | | | (0.35) | | | | | | (0.19) | | | | | | 0.13 | | | | | | 1.20 | | | | | | — | | | | | | 1.33 | | | | | | — | | | | | | 10.37 | | | | | | (2.08) | | | | | | 1.02 | | | | | | 0.84 | | | | | | 0.84 | | | | | | 1.44 | | | | | | 3 | | | | | | 38 | | |
| 12-31-14 | | | | | 12.02 | | | | | | 0.10 | | | | | | 0.56 | | | | | | 0.66 | | | | | | 0.15 | | | | | | 0.64 | | | | | | — | | | | | | 0.79 | | | | | | — | | | | | | 11.89 | | | | | | 5.57 | | | | | | 1.01 | | | | | | 0.83 | | | | | | 0.83 | | | | | | 0.92 | | | | | | 4 | | | | | | 44 | | |
| 12-31-13 | | | | | 10.25 | | | | | | 0.14 | | | | | | 2.02 | | | | | | 2.16 | | | | | | 0.09 | | | | | | 0.30 | | | | | | — | | | | | | 0.39 | | | | | | — | | | | | | 12.02 | | | | | | 21.38 | | | | | | 1.00 | | | | | | 0.82 | | | | | | 0.82 | | | | | | 1.27 | | | | | | 4 | | | | | | 45 | | |
| 12-31-12 | | | | | 9.29 | | | | | | 0.12 | | | | | | 1.21 | | | | | | 1.33 | | | | | | 0.05 | | | | | | 0.32 | | | | | | — | | | | | | 0.37 | | | | | | — | | | | | | 10.25 | | | | | | 14.56 | | | | | | 0.96 | | | | | | 0.82 | | | | | | 0.82 | | | | | | 1.19 | | | | | | 3 | | | | | | 34 | | |
| 12-31-11 | | | | | 10.24 | | | | | | 0.09 | | | | | | (0.51) | | | | | | (0.42) | | | | | | 0.08 | | | | | | 0.45 | | | | | | — | | | | | | 0.53 | | | | | | — | | | | | | 9.29 | | | | | | (3.69) | | | | | | 0.87 | | | | | | 0.82 | | | | | | 0.82 | | | | | | 0.88 | | | | | | 3 | | | | | | 100 | | |
| Class Z | | | | | | | | | | | | | | | | | | | | | | | | | | | | | | | | | | | | | | | | | | | | | | | | | | | | | | | | | | | | | | | | | | | | | | | | | | | | | | | | | | | | | | | | | | | | | | | | | | | | | | | |
| 05-01-15(5) - 12-31-15 | | | | | 12.66 | | | | | | 0.43• | | | | | | (1.07) | | | | | | (0.64) | | | | | | 0.21 | | | | | | 1.20 | | | | | | — | | | | | | 1.41 | | | | | | — | | | | | | 10.61 | | | | | | (5.49) | | | | | | 0.28 | | | | | | 0.00 | | | | | | 0.00 | | | | | | 6.12 | | | | | | 2,456 | | | | | | 38 | | |
| Voya Index Solution 2040 Portfolio | | | | | | | | | | | | | | | | | | | | | | | | | | | | | | | | | | | | | | | | | | | | | | | | | | | | | | | | | | | | | | | | | | | | | | | | | | | | | | | | | | | | | | | | | | | | | | | | | | | | | | | |
| Class ADV | | | | | | | | | | | | | | | | | | | | | | | | | | | | | | | | | | | | | | | | | | | | | | | | | | | | | | | | | | | | | | | | | | | | | | | | | | | | | | | | | | | | | | | | | | | | | | | | | | | | | | | |
| 12-31-15 | | | | | 13.60 | | | | | | 0.52• | | | | | | (0.73) | | | | | | (0.21) | | | | | | 0.13 | | | | | | 0.64 | | | | | | — | | | | | | 0.77 | | | | | | — | | | | | | 12.62 | | | | | | (1.78) | | | | | | 5.76 | | | | | | 0.63 | | | | | | 0.63 | | | | | | 4.17 | | | | | | 1,252 | | | | | | 106 | | |
| 12-31-14 | | | | | 13.98 | | | | | | 0.14• | | | | | | 0.64 | | | | | | 0.78 | | | | | | 0.20 | | | | | | 0.96 | | | | | | — | | | | | | 1.16 | | | | | | — | | | | | | 13.60 | | | | | | 5.73 | | | | | | 61.99 | | | | | | 0.63 | | | | | | 0.63 | | | | | | 0.98 | | | | | | 5 | | | | | | 32 | | |
| 12-31-13 | | | | | 12.06 | | | | | | 0.17 | | | | | | 2.54 | | | | | | 2.71 | | | | | | 0.18 | | | | | | 0.63 | | | | | | — | | | | | | 0.81 | | | | | | 0.02 | | | | | | 13.98 | | | | | | 23.19(c) | | | | | | 83.06 | | | | | | 0.61 | | | | | | 0.61 | | | | | | 1.29 | | | | | | 4 | | | | | | 41 | | |
| 12-31-12 | | | | | 11.18 | | | | | | 0.14 | | | | | | 1.53 | | | | | | 1.67 | | | | | | — | | | | | | 0.79 | | | | | | — | | | | | | 0.79 | | | | | | — | | | | | | 12.06 | | | | | | 15.03 | | | | | | 54.52 | | | | | | 0.62 | | | | | | 0.62 | | | | | | 1.14 | | | | | | 4 | | | | | | 44 | | |
| 10-03-11(5) - 12-31-11 | | | | | 10.00 | | | | | | (0.01) | | | | | | 1.19 | | | | | | 1.18 | | | | | | — | | | | | | — | | | | | | — | | | | | | — | | | | | | — | | | | | | 11.18 | | | | | | 11.80 | | | | | | 0.62 | | | | | | 0.62 | | | | | | 0.62 | | | | | | (0.32) | | | | | | 3 | | | | | | 56 | | |
| Class I | | | | | | | | | | | | | | | | | | | | | | | | | | | | | | | | | | | | | | | | | | | | | | | | | | | | | | | | | | | | | | | | | | | | | | | | | | | | | | | | | | | | | | | | | | | | | | | | | | | | | | | |
| 12-31-15 | | | | | 13.71 | | | | | | 1.29• | | | | | | (1.47) | | | | | | (0.18) | | | | | | 0.10 | | | | | | 0.64 | | | | | | — | | | | | | 0.74 | | | | | | — | | | | | | 12.79 | | | | | | (1.50) | | | | | | 5.26 | | | | | | 0.13 | | | | | | 0.13 | | | | | | 10.20 | | | | | | 165 | | | | | | 106 | | |
| 12-31-14 | | | | | 14.09 | | | | | | 0.19 | | | | | | 0.66 | | | | | | 0.85 | | | | | | 0.27 | | | | | | 0.96 | | | | | | — | | | | | | 1.23 | | | | | | — | | | | | | 13.71 | | | | | | 6.21 | | | | | | 61.49 | | | | | | 0.13 | | | | | | 0.13 | | | | | | 1.42 | | | | | | 5 | | | | | | 32 | | |
| 12-31-13 | | | | | 12.13 | | | | | | 0.24• | | | | | | 2.57 | | | | | | 2.81 | | | | | | 0.24 | | | | | | 0.63 | | | | | | — | | | | | | 0.87 | | | | | | 0.02 | | | | | | 14.09 | | | | | | 23.90(c) | | | | | | 82.56 | | | | | | 0.11 | | | | | | 0.11 | | | | | | 1.79 | | | | | | 4 | | | | | | 41 | | |
| 12-31-12 | | | | | 11.19 | | | | | | 0.20 | | | | | | 1.54 | | | | | | 1.74 | | | | | | 0.01 | | | | | | 0.79 | | | | | | — | | | | | | 0.80 | | | | | | — | | | | | | 12.13 | | | | | | 15.63 | | | | | | 54.02 | | | | | | 0.12 | | | | | | 0.12 | | | | | | 1.64 | | | | | | 4 | | | | | | 44 | | |
| 10-03-11(5) - 12-31-11 | | | | | 10.00 | | | | | | 0.00* | | | | | | 1.19 | | | | | | 1.19 | | | | | | — | | | | | | — | | | | | | — | | | | | | — | | | | | | — | | | | | | 11.19 | | | | | | 11.90 | | | | | | 0.12 | | | | | | 0.12 | | | | | | 0.12 | | | | | | 0.11 | | | | | | 3 | | | | | | 56 | | |
| Class S | | | | | | | | | | | | | | | | | | | | | | | | | | | | | | | | | | | | | | | | | | | | | | | | | | | | | | | | | | | | | | | | | | | | | | | | | | | | | | | | | | | | | | | | | | | | | | | | | | | | | | | |
| 12-31-15 | | | | | 13.72 | | | | | | 0.51• | | | | | | (0.71) | | | | | | (0.20) | | | | | | 0.05 | | | | | | 0.64 | | | | | | — | | | | | | 0.69 | | | | | | — | | | | | | 12.83 | | | | | | (1.65) | | | | | | 5.51 | | | | | | 0.38 | | | | | | 0.38 | | | | | | 3.95 | | | | | | 401 | | | | | | 106 | | |
| 12-31-14 | | | | | 14.09 | | | | | | 0.16 | | | | | | 0.66 | | | | | | 0.82 | | | | | | 0.23 | | | | | | 0.96 | | | | | | — | | | | | | 1.19 | | | | | | — | | | | | | 13.72 | | | | | | 6.03 | | | | | | 61.74 | | | | | | 0.38 | | | | | | 0.38 | | | | | | 1.16 | | | | | | 4 | | | | | | 32 | | |
| 12-31-13 | | | | | 12.08 | | | | | | 0.20• | | | | | | 2.56 | | | | | | 2.76 | | | | | | 0.14 | | | | | | 0.63 | | | | | | — | | | | | | 0.77 | | | | | | 0.02 | | | | | | 14.09 | | | | | | 23.53(c) | | | | | | 82.81 | | | | | | 0.36 | | | | | | 0.36 | | | | | | 1.54 | | | | | | 4 | | | | | | 41 | | |
| 12-31-12 | | | | | 11.18 | | | | | | 0.17 | | | | | | 1.52 | | | | | | 1.69 | | | | | | 0.00* | | | | | | 0.79 | | | | | | — | | | | | | 0.79 | | | | | | — | | | | | | 12.08 | | | | | | 15.23 | | | | | | 54.27 | | | | | | 0.37 | | | | | | 0.37 | | | | | | 1.39 | | | | | | 4 | | | | | | 44 | | |
| 10-03-11(5) - 12-31-11 | | | | | 10.00 | | | | | | (0.00)* | | | | | | 1.18 | | | | | | 1.18 | | | | | | — | | | | | | — | | | | | | — | | | | | | — | | | | | | — | | | | | | 11.18 | | | | | | 11.80 | | | | | | 0.37 | | | | | | 0.37 | | | | | | 0.37 | | | | | | (0.18) | | | | | | 3 | | | | | | 56 | | |
| Class S2 | | | | | | | | | | | | | | | | | | | | | | | | | | | | | | | | | | | | | | | | | | | | | | | | | | | | | | | | | | | | | | | | | | | | | | | | | | | | | | | | | | | | | | | | | | | | | | | | | | | | | | | |
| 12-31-15 | | | | | 13.62 | | | | | | 0.38• | | | | | | (0.61) | | | | | | (0.23) | | | | | | 0.05 | | | | | | 0.64 | | | | | | — | | | | | | 0.69 | | | | | | — | | | | | | 12.70 | | | | | | (1.88) | | | | | | 5.76 | | | | | | 0.53 | | | | | | 0.53 | | | | | | 2.84 | | | | | | 14 | | | | | | 106 | | |
| 12-31-14 | | | | | 14.00 | | | | | | 0.13 | | | | | | 0.66 | | | | | | 0.79 | | | | | | 0.21 | | | | | | 0.96 | | | | | | — | | | | | | 1.17 | | | | | | — | | | | | | 13.62 | | | | | | 5.80 | | | | | | 61.99 | | | | | | 0.53 | | | | | | 0.53 | | | | | | 1.01 | | | | | | 4 | | | | | | 32 | | |
| 12-31-13 | | | | | 12.07 | | | | | | 0.18 | | | | | | 2.55 | | | | | | 2.73 | | | | | | 0.19 | | | | | | 0.63 | | | | | | — | | | | | | 0.82 | | | | | | 0.02 | | | | | | 14.00 | | | | | | 23.36(c) | | | | | | 83.06 | | | | | | 0.51 | | | | | | 0.51 | | | | | | 1.38 | | | | | | 4 | | | | | | 41 | | |
| 12-31-12 | | | | | 11.18 | | | | | | 0.15 | | | | | | 1.53 | | | | | | 1.68 | | | | | | 0.00* | | | | | | 0.79 | | | | | | — | | | | | | 0.79 | | | | | | — | | | | | | 12.07 | | | | | | 15.13 | | | | | | 54.52 | | | | | | 0.52 | | | | | | 0.52 | | | | | | 1.24 | | | | | | 4 | | | | | | 44 | | |
| 10-03-11(5) - 12-31-11 | | | | | 10.00 | | | | | | (0.01) | | | | | | 1.19 | | | | | | 1.18 | | | | | | — | | | | | | — | | | | | | — | | | | | | — | | | | | | — | | | | | | 11.18 | | | | | | 11.80 | | | | | | 0.62 | | | | | | 0.52 | | | | | | 0.52 | | | | | | (0.21) | | | | | | 3 | | | | | | 56 | | |
| Class T | | | | | | | | | | | | | | | | | | | | | | | | | | | | | | | | | | | | | | | | | | | | | | | | | | | | | | | | | | | | | | | | | | | | | | | | | | | | | | | | | | | | | | | | | | | | | | | | | | | | | | | |
| 12-31-15 | | | | | 13.56 | | | | | | 0.24 | | | | | | (0.51) | | | | | | (0.27) | | | | | | 0.01 | | | | | | 0.64 | | | | | | — | | | | | | 0.65 | | | | | | — | | | | | | 12.64 | | | | | | (2.19) | | | | | | 6.01 | | | | | | 0.83 | | | | | | 0.83 | | | | | | 1.81 | | | | | | 4 | | | | | | 106 | | |
| 12-31-14 | | | | | 13.95 | | | | | | 0.09 | | | | | | 0.66 | | | | | | 0.75 | | | | | | 0.18 | | | | | | 0.96 | | | | | | — | | | | | | 1.14 | | | | | | — | | | | | | 13.56 | | | | | | 5.54 | | | | | | 62.24 | | | | | | 0.83 | | | | | | 0.83 | | | | | | 0.72 | | | | | | 4 | | | | | | 32 | | |
| 12-31-13 | | | | | 12.03 | | | | | | 0.14 | | | | | | 2.55 | | | | | | 2.69 | | | | | | 0.16 | | | | | | 0.63 | | | | | | — | | | | | | 0.79 | | | | | | 0.02 | | | | | | 13.95 | | | | | | 23.02(c) | | | | | | 83.31 | | | | | | 0.81 | | | | | | 0.81 | | | | | | 1.09 | | | | | | 4 | | | | | | 41 | | |
| 12-31-12 | | | | | 11.17 | | | | | | 0.11 | | | | | | 1.54 | | | | | | 1.65 | | | | | | — | | | | | | 0.79 | | | | | | — | | | | | | 0.79 | | | | | | — | | | | | | 12.03 | | | | | | 14.85 | | | | | | 54.77 | | | | | | 0.82 | | | | | | 0.82 | | | | | | 0.94 | | | | | | 4 | | | | | | 44 | | |
| 10-03-11(5) - 12-31-11 | | | | | 10.00 | | | | | | (0.02) | | | | | | 1.19 | | | | | | 1.17 | | | | | | — | | | | | | — | | | | | | — | | | | | | — | | | | | | — | | | | | | 11.17 | | | | | | 11.70 | | | | | | 0.87 | | | | | | 0.82 | | | | | | 0.82 | | | | | | (0.57) | | | | | | 3 | | | | | | 56 | | |
See Accompanying Notes to Financial Statements
Financial Highlights (continued)
| | | | | | | | | | Income
(loss) from
investment
operations | | | | | | | | | Less
Distributions | | | | | | | | | | | | | | | | | | | | | | | | | | | Ratios to average
net assets | | | Supplemental
Data | |
| | | | Net asset value, beginning of year
or period | | | Net investment income (loss) | | | Net realized and unrealized
gain (loss) | | | Total from investment operations | | | From net investment income | | | From net realized gains | | | From return of capital | | | Total distributions | | | Payment by affiliate | | | Net asset value, end of year
or period | | | Total Return(1) | | | Expenses before
reductions/additions(2)(3)(4) | | | Expenses net of fee waivers
and/or recoupments if any(2)(3)(4) | | | Expense net of all
reductions/additions(2)(3)(4) | | | Net investment income (loss)(2)(3) | | | Net assets, end of year or period | | | Portfolio turnover rate | |
Year or
period ended | | | ($) | | | ($) | | | ($) | | | ($) | | | ($) | | | ($) | | | ($) | | | ($) | | | ($) | | | ($) | | | (%) | | | (%) | | | (%) | | | (%) | | | (%) | | | ($000’s) | | | (%) | |
| Voya Index Solution 2040 Portfolio (continued) | | | | | | | | | | | | | | | | | | | | | | | | | | | | | | | | | | | | | | | | | | | | | | | | | | | | | | | | | | | | | | | | | | | | | | | | | | | | | | | | | | | | | | | | | | | | | | | | | | | | | | | |
| Class Z | | | | | | | | | | | | | | | | | | | | | | | | | | | | | | | | | | | | | | | | | | | | | | | | | | | | | | | | | | | | | | | | | | | | | | | | | | | | | | | | | | | | | | | | | | | | | | | | | | | | | | | |
| 05-01-15(5) - 12-31-15 | | | | | 14.34 | | | | | | 0.57• | | | | | | (1.37) | | | | | | (0.80) | | | | | | 0.10 | | | | | | 0.64 | | | | | | — | | | | | | 0.74 | | | | | | — | | | | | | 12.80 | | | | | | (5.75) | | | | | | 5.12 | | | | | | 0.00 | | | | | | 0.00 | | | | | | 6.74 | | | | | | 1,086 | | | | | | 106 | | |
| Voya Index Solution 2045 Portfolio | | | | | | | | | | | | | | | | | | | | | | | | | | | | | | | | | | | | | | | | | | | | | | | | | | | | | | | | | | | | | | | | | | | | | | | | | | | | | | | | | | | | | | | | | | | | | | | | | | | | | | | |
| Class ADV | | | | | | | | | | | | | | | | | | | | | | | | | | | | | | | | | | | | | | | | | | | | | | | | | | | | | | | | | | | | | | | | | | | | | | | | | | | | | | | | | | | | | | | | | | | | | | | | | | | | | | | |
| 12-31-15 | | | | | 12.16 | | | | | | 0.16 | | | | | | (0.34) | | | | | | (0.18) | | | | | | 0.12 | | | | | | 1.31 | | | | | | — | | | | | | 1.43 | | | | | | — | | | | | | 10.55 | | | | | | (2.05) | | | | | | 0.76 | | | | | | 0.64 | | | | | | 0.64 | | | | | | 1.44 | | | | | | 133,884 | | | | | | 36 | | |
| 12-31-14 | | | | | 12.25 | | | | | | 0.10• | | | | | | 0.59 | �� | | | | | 0.69 | | | | | | 0.14 | | | | | | 0.64 | | | | | | — | | | | | | 0.78 | | | | | | — | | | | | | 12.16 | | | | | | 5.80 | | | | | | 0.75 | | | | | | 0.63 | | | | | | 0.63 | | | | | | 0.83 | | | | | | 138,235 | | | | | | 44 | | |
| 12-31-13 | | | | | 10.26 | | | | | | 0.14• | | | | | | 2.26 | | | | | | 2.40 | | | | | | 0.10 | | | | | | 0.31 | | | | | | — | | | | | | 0.41 | | | | | | — | | | | | | 12.25 | | | | | | 23.74 | | | | | | 0.75 | | | | | | 0.61 | | | | | | 0.61 | | | | | | 1.27 | | | | | | 128,133 | | | | | | 48 | | |
| 12-31-12 | | | | | 9.18 | | | | | | 0.12• | | | | | | 1.30 | | | | | | 1.42 | | | | | | 0.08 | | | | | | 0.26 | | | | | | — | | | | | | 0.34 | | | | | | — | | | | | | 10.26 | | | | | | 15.64 | | | | | | 0.71 | | | | | | 0.62 | | | | | | 0.62 | | | | | | 1.22 | | | | | | 86,051 | | | | | | 28 | | |
| 12-31-11 | | | | | 10.12 | | | | | | 0.10• | | | | | | (0.58) | | | | | | (0.48) | | | | | | 0.09 | | | | | | 0.37 | | | | | | — | | | | | | 0.46 | | | | | | — | | | | | | 9.18 | | | | | | (4.48) | | | | | | 0.62 | | | | | | 0.62 | | | | | | 0.62 | | | | | | 1.01 | | | | | | 52,209 | | | | | | 102 | | |
| Class I | | | | | | | | | | | | | | | | | | | | | | | | | | | | | | | | | | | | | | | | | | | | | | | | | | | | | | | | | | | | | | | | | | | | | | | | | | | | | | | | | | �� | | | | | | | | | | | | | | | | | | | | | |
| 12-31-15 | | | | | 12.46 | | | | | | 0.25• | | | | | | (0.38) | | | | | | (0.13) | | | | | | 0.18 | | | | | | 1.31 | | | | | | — | | | | | | 1.49 | | | | | | — | | | | | | 10.84 | | | | | | (1.61) | | | | | | 0.26 | | | | | | 0.14 | | | | | | 0.14 | | | | | | 2.09 | | | | | | 27,900 | | | | | | 36 | | |
| 12-31-14 | | | | | 12.52 | | | | | | 0.18• | | | | | | 0.59 | | | | | | 0.77 | | | | | | 0.19 | | | | | | 0.64 | | | | | | — | | | | | | 0.83 | | | | | | — | | | | | | 12.46 | | | | | | 6.32 | | | | | | 0.25 | | | | | | 0.13 | | | | | | 0.13 | | | | | | 1.42 | | | | | | 19,837 | | | | | | 44 | | |
| 12-31-13 | | | | | 10.46 | | | | | | 0.20• | | | | | | 2.31 | | | | | | 2.51 | | | | | | 0.14 | | | | | | 0.31 | | | | | | — | | | | | | 0.45 | | | | | | — | | | | | | 12.52 | | | | | | 24.34 | | | | | | 0.25 | | | | | | 0.11 | | | | | | 0.11 | | | | | | 1.74 | | | | | | 11,306 | | | | | | 48 | | |
| 12-31-12 | | | | | 9.34 | | | | | | 0.17• | | | | | | 1.33 | | | | | | 1.50 | | | | | | 0.12 | | | | | | 0.26 | | | | | | — | | | | | | 0.38 | | | | | | — | | | | | | 10.46 | | | | | | 16.19 | | | | | | 0.21 | | | | | | 0.12 | | | | | | 0.12 | | | | | | 1.73 | | | | | | 14,728 | | | | | | 28 | | |
| 12-31-11 | | | | | 10.26 | | | | | | 0.15• | | | | | | (0.59) | | | | | | (0.44) | | | | | | 0.11 | | | | | | 0.37 | | | | | | — | | | | | | 0.48 | | | | | | — | | | | | | 9.34 | | | | | | (3.92) | | | | | | 0.12 | | | | | | 0.12 | | | | | | 0.12 | | | | | | 1.50 | | | | | | 9,152 | | | | | | 102 | | |
| Class S | | | | | | | | | | | | | | | | | | | | | | | | | | | | | | | | | | | | | | | | | | | | | | | | | | | | | | | | | | | | | | | | | | | | | | | | | | | | | | | | | | | | | | | | | | | | | | | | | | | | | | | |
| 12-31-15 | | | | | 12.32 | | | | | | 0.20 | | | | | | (0.36) | | | | | | (0.16) | | | | | | 0.15 | | | | | | 1.31 | | | | | | — | | | | | | 1.46 | | | | | | — | | | | | | 10.70 | | | | | | (1.86) | | | | | | 0.51 | | | | | | 0.39 | | | | | | 0.39 | | | | | | 1.66 | | | | | | 80,586 | | | | | | 36 | | ��� |
| 12-31-14 | | | | | 12.40 | | | | | | 0.13 | | | | | | 0.60 | | | | | | 0.73 | | | | | | 0.17 | | | | | | 0.64 | | | | | | — | | | | | | 0.81 | | | | | | — | | | | | | 12.32 | | | | | | 6.01 | | | | | | 0.50 | | | | | | 0.38 | | | | | | 0.38 | | | | | | 1.07 | | | | | | 90,710 | | | | | | 44 | | |
| 12-31-13 | | | | | 10.37 | | | | | | 0.18• | | | | | | 2.28 | | | | | | 2.46 | | | | | | 0.12 | | | | | | 0.31 | | | | | | — | | | | | | 0.43 | | | | | | — | | | | | | 12.40 | | | | | | 24.07 | | | | | | 0.50 | | | | | | 0.36 | | | | | | 0.36 | | | | | | 1.53 | | | | | | 83,716 | | | | | | 48 | | |
| 12-31-12 | | | | | 9.27 | | | | | | 0.14• | | | | | | 1.32 | | | | | | 1.46 | | | | | | 0.10 | | | | | | 0.26 | | | | | | — | | | | | | 0.36 | | | | | | — | | | | | | 10.37 | | | | | | 15.88 | | | | | | 0.46 | | | | | | 0.37 | | | | | | 0.37 | | | | | | 1.42 | | | | | | 54,383 | | | | | | 28 | | |
| 12-31-11 | | | | | 10.19 | | | | | | 0.13• | | | | | | (0.58) | | | | | | (0.45) | | | | | | 0.10 | | | | | | 0.37 | | | | | | — | | | | | | 0.47 | | | | | | — | | | | | | 9.27 | | | | | | (4.09) | | | | | | 0.37 | | | | | | 0.37 | | | | | | 0.37 | | | | | | 1.27 | | | | | | 38,266 | | | | | | 102 | | |
| Class S2 | | | | | | | | | | | | | | | | | | | | | | | | | | | | | | | | | | | | | | | | | | | | | | | | | | | | | | | | | | | | | | | | | | | | | | | | | | | | | | | | | | | | | | | | | | | | | | | | | | | | | | | |
| 12-31-15 | | | | | 12.16 | | | | | | 0.18• | | | | | | (0.35) | | | | | | (0.17) | | | | | | 0.12 | | | | | | 1.31 | | | | | | — | | | | | | 1.43 | | | | | | — | | | | | | 10.56 | | | | | | (1.99) | | | | | | 0.76 | | | | | | 0.54 | | | | | | 0.54 | | | | | | 1.54 | | | | ��� | | 16,368 | | | | | | 36 | | |
| 12-31-14 | | | | | 12.24 | | | | | | 0.11 | | | | | | 0.60 | | | | | | 0.71 | | | | | | 0.15 | | | | | | 0.64 | | | | | | — | | | | | | 0.79 | | | | | | — | | | | | | 12.16 | | | | | | 5.95 | | | | | | 0.75 | | | | | | 0.53 | | | | | | 0.53 | | | | | | 0.90 | | | | | | 20,479 | | | | | | 44 | | |
| 12-31-13 | | | | | 10.25 | | | | | | 0.16• | | | | | | 2.25 | | | | | | 2.41 | | | | | | 0.11 | | | | | | 0.31 | | | | | | — | | | | | | 0.42 | | | | | | — | | | | | | 12.24 | | | | | | 23.86 | | | | | | 0.75 | | | | | | 0.51 | | | | | | 0.51 | | | | | | 1.41 | | | | | | 20,484 | | | | | | 48 | | |
| 12-31-12 | | | | | 9.19 | | | | | | 0.13• | | | | | | 1.29 | | | | | | 1.42 | | | | | | 0.10 | | | | | | 0.26 | | | | | | — | | | | | | 0.36 | | | | | | — | | | | | | 10.25 | | | | | | 15.65 | | | | | | 0.71 | | | | | | 0.52 | | | | | | 0.52 | | | | | | 1.33 | | | | | | 13,683 | | | | | | 28 | | |
| 12-31-11 | | | | | 10.14 | | | | | | 0.08• | | | | | | (0.55) | | | | | | (0.47) | | | | | | 0.11 | | | | | | 0.37 | | | | | | — | | | | | | 0.48 | | | | | | — | | | | | | 9.19 | | | | | | (4.32) | | | | | | 0.62 | | | | | | 0.52 | | | | | | 0.52 | | | | | | 0.87 | | | | | | 5,408 | | | | | | 102 | | |
| Class T | | | | | | | | | | | | | | | | | | | | | | | | | | | | | | | | | | | | | | | | | | | | | | | | | | | | | | | | | | | | | | | | | | | | | | | | | | | | | | | | | | | | | | | | | | | | | | | | | | | | | | | |
| 12-31-15 | | | | | 12.22 | | | | | | 0.15 | | | | | | (0.37) | | | | | | (0.22) | | | | | | 0.10 | | | | | | 1.31 | | | | | | — | | | | | | 1.41 | | | | | | — | | | | | | 10.59 | | | | | | (2.38) | | | | | | 1.01 | | | | | | 0.84 | | | | | | 0.84 | | | | | | 1.25 | | | | | | 3 | | | | | | 36 | | |
| 12-31-14 | | | | | 12.28 | | | | | | 0.07 | | | | | | 0.62 | | | | | | 0.69 | | | | | | 0.11 | | | | | | 0.64 | | | | | | — | | | | | | 0.75 | | | | | | — | | | | | | 12.22 | | | | | | 5.76 | | | | | | 1.00 | | | | | | 0.83 | | | | | | 0.83 | | | | | | 0.62 | | | | | | 4 | | | | | | 44 | | |
| 12-31-13 | | | | | 10.27 | | | | | | 0.12 | | | | | | 2.27 | | | | | | 2.39 | | | | | | 0.07 | | | | | | 0.31 | | | | | | — | | | | | | 0.38 | | | | | | — | | | | | | 12.28 | | | | | | 23.52 | | | | | | 1.00 | | | | | | 0.81 | | | | | | 0.81 | | | | | | 1.02 | | | | | | 4 | | | | | | 48 | | |
| 12-31-12 | | | | | 9.18 | | | | | | 0.09 | | | | | | 1.30 | | | | | | 1.39 | | | | | | 0.04 | | | | | | 0.26 | | | | | | — | | | | | | 0.30 | | | | | | — | | | | | | 10.27 | | | | | | 15.31 | | | | | | 0.96 | | | | | | 0.82 | | | | | | 0.82 | | | | | | 0.93 | | | | | | 3 | | | | | | 28 | | |
| 12-31-11 | | | | | 10.09 | | | | | | 0.08 | | | | | | (0.57) | | | | | | (0.49) | | | | | | 0.05 | | | | | | 0.37 | | | | | | — | | | | | | 0.42 | | | | | | — | | | | | | 9.18 | | | | | | (4.61) | | | | | | 0.87 | | | | | | 0.82 | | | | | | 0.82 | | | | | | 0.86 | | | | | | 3 | | | | | | 102 | | |
| Class Z | | | | | | | | | | | | | | | | | | | | | | | | | | | | | | | | | | | | | | | | | | | | | | | | | | | | | | | | | | | | | | | | | | | | | | | | | | | | | | | | | | | | | | | | | | | | | | | | | | | | | | | |
| 05-01-15(5) - 12-31-15 | | | | | 13.09 | | | | | | 0.59• | | | | | | (1.34) | | | | | | (0.75) | | | | | | 0.18 | | | | | | 1.31 | | | | | | — | | | | | | 1.49 | | | | | | — | | | | | | 10.85 | | | | | | (6.26) | | | | | | 0.32 | | | | | | 0.00 | | | | | | 0.00 | | | | | | 8.27 | | | | | | 544 | | | | | | 36 | | |
See Accompanying Notes to Financial Statements
Financial Highlights (continued)
| | | | | | | | | | Income
(loss) from
investment
operations | | | | | | | | | Less
Distributions | | | | | | | | | | | | | | | | | | | | | | | | | | | Ratios to average
net assets | | | Supplemental
Data | |
| | | | Net asset value, beginning of year
or period | | | Net investment income (loss) | | | Net realized and unrealized
gain (loss) | | | Total from investment operations | | | From net investment income | | | From net realized gains | | | From return of capital | | | Total distributions | | | Payment by affiliate | | | Net asset value, end of year
or period | | | Total Return(1) | | | Expenses before
reductions/additions(2)(3)(4) | | | Expenses net of fee waivers
and/or recoupments if any(2)(3)(4) | | | Expense net of all
reductions/additions(2)(3)(4) | | | Net investment income (loss)(2)(3) | | | Net assets, end of year or period | | | Portfolio turnover rate | |
Year or
period ended | | | ($) | | | ($) | | | ($) | | | ($) | | | ($) | | | ($) | | | ($) | | | ($) | | | ($) | | | ($) | | | (%) | | | (%) | | | (%) | | | (%) | | | (%) | | | ($000’s) | | | (%) | |
| Voya Index Solution 2050 Portfolio | | | | | | | | | | | | | | | | | | | | | | | | | | | | | | | | | | | | | | | | | | | | | | | | | | | | | | | | | | | | | | | | | | | | | | | | | | | | | | | | | | | | | | | | | | | | | | | | | | | | | | | |
| Class ADV | | | | | | | | | | | | | | | | | | | | | | | | | | | | | | | | | | | | | | | | | | | | | | | | | | | | | | | | | | | | | | | | | | | | | | | | | | | | | | | | | | | | | | | | | | | | | | | | | | | | | | | |
| 12-31-15 | | | | | 13.68 | | | | | | 0.44• | | | | | | (0.68) | | | | | | (0.24) | | | | | | 0.04 | | | | | | 0.71 | | | | | | — | | | | | | 0.75 | | | | | | — | | | | | | 12.69 | | | | | | (1.97) | | | | | | 7.70 | | | | | | 0.64 | | | | | | 0.64 | | | | | | 3.52 | | | | | | 666 | | | | | | 195 | | |
| 12-31-14 | | | | | 14.03 | | | | | | 0.10 | | | | | | 0.68 | | | | | | 0.78 | | | | | | 0.19 | | | | | | 0.94 | | | | | | — | | | | | | 1.13 | | | | | | — | | | | | | 13.68 | | | | | | 5.64 | | | | | | 62.26 | | | | | | 0.64 | | | | | | 0.64 | | | | | | 0.77 | | | | | | 4 | | | | | | 32 | | |
| 12-31-13 | | | | | 11.95 | | | | | | 0.16 | | | | | | 2.59 | | | | | | 2.75 | | | | | | 0.17 | | | | | | 0.52 | | | | | | — | | | | | | 0.69 | | | | | | 0.02 | | | | | | 14.03 | | | | | | 23.69(d) | | | | | | 83.28 | | | | | | 0.62 | | | | | | 0.62 | | | | | | 1.20 | | | | | | 4 | | | | | | 39 | | |
| 12-31-12 | | | | | 11.18 | | | | | | 0.14 | | | | | | 1.55 | | | | | | 1.69 | | | | | | — | | | | | | 0.92 | | | | | | — | | | | | | 0.92 | | | | | | — | | | | | | 11.95 | | | | | | 15.24 | | | | | | 42.58 | | | | | | 0.62 | | | | | | 0.62 | | | | | | 1.14 | | | | | | 4 | | | | | | 43 | | |
| 10-03-11(5) - 12-31-11 | | | | | 10.00 | | | | | | (0.01) | | | | | | 1.19 | | | | | | 1.18 | | | | | | — | | | | | | — | | | | | | — | | | | | | — | | | | | | — | | | | | | 11.18 | | | | | | 11.80 | | | | | | 0.62 | | | | | | 0.62 | | | | | | 0.62 | | | | | | (0.36) | | | | | | 3 | | | | | | 55 | | |
| Class I | | | | | | | | | | | | | | | | | | | | | | | | | | | | | | | | | | | | | | | | | | | | | | | | | | | | | | | | | | | | | | | | | | | | | | | | | | | | | | | | | | | | | | | | | | | | | | | | | | | | | | | |
| 12-31-15 | | | | | 13.79 | | | | | | 0.44• | | | | | | (0.61) | | | | | | (0.17) | | | | | | 0.11 | | | | | | 0.71 | | | | | | — | | | | | | 0.82 | | | | | | — | | | | | | 12.80 | | | | | | (1.45) | | | | | | 7.20 | | | | | | 0.14 | | | | | | 0.14 | | | | | | 3.47 | | | | | | 295 | | | | | | 195 | | |
| 12-31-14 | | | | | 14.14 | | | | | | 0.18 | | | | | | 0.67 | | | | | | 0.85 | | | | | | 0.26 | | | | | | 0.94 | | | | | | — | | | | | | 1.20 | | | | | | — | | | | | | 13.79 | | | | | | 6.12 | | | | | | 61.76 | | | | | | 0.14 | | | | | | 0.14 | | | | | | 1.29 | | | | | | 5 | | | | | | 32 | | |
| 12-31-13 | | | | | 12.02 | | | | | | 0.22• | | | | | | 2.63 | | | | | | 2.85 | | | | | | 0.23 | | | | | | 0.52 | | | | | | — | | | | | | 0.75 | | | | | | 0.02 | | | | | | 14.14 | | | | | | 24.41(d) | | | | | | 82.78 | | | | | | 0.12 | | | | | | 0.12 | | | | | | 1.70 | | | | | | 4 | | | | | | 39 | | |
| 12-31-12 | | | | | 11.19 | | | | | | 0.20 | | | | | | 1.56 | | | | | | 1.76 | | | | | | 0.01 | | | | | | 0.92 | | | | | | — | | | | | | 0.93 | | | | | | — | | | | | | 12.02 | | | | | | 15.83 | | | | | | 42.08 | | | | | | 0.12 | | | | | | 0.12 | | | | | | 1.65 | | | | | | 4 | | | | | | 43 | | |
| 10-03-11(5) - 12-31-11 | | | | | 10.00 | | | | | | 0.00* | | | | | | 1.19 | | | | | | 1.19 | | | | | | — | | | | | | — | | | | | | — | | | | | | — | | | | | | — | | | | | | 11.19 | | | | | | 11.90 | | | | | | 0.12 | | | | | | 0.12 | | | | | | 0.12 | | | | | | 0.10 | | | | | | 3 | | | | | | 55 | | |
| Class S | | | | | | | | | | | | | | | | | | | | | | | | | | | | | | | | | | | | | | | | | | | | | | | | | | | | | | | | | | | | | | | | | | | | | | | | | | | | | | | | | | | | | | | | | | | | | | | | | | | | | | | |
| 12-31-15 | | | | | 13.80 | | | | | | 0.55• | | | | | | (0.74) | | | | | | (0.19) | | | | | | 0.07 | | | | | | 0.71 | | | | | | — | | | | | | 0.78 | | | | | | — | | | | | | 12.83 | | | | | | (1.60) | | | | | | 7.45 | | | | | | 0.39 | | | | | | 0.39 | | | | | | 4.31 | | | | | | 254 | | | | | | 195 | | |
| 12-31-14 | | | | | 14.14 | | | | | | 0.14 | | | | | | 0.68 | | | | | | 0.82 | | | | | | 0.22 | | | | | | 0.94 | | | | | | — | | | | | | 1.16 | | | | | | — | | | | | | 13.80 | | | | | | 5.93 | | | | | | 62.01 | | | | | | 0.39 | | | | | | 0.39 | | | | | | 1.04 | | | | | | 5 | | | | | | 32 | | |
| 12-31-13 | | | | | 11.97 | | | | | | 0.19• | | | | | | 2.61 | | | | | | 2.80 | | | | | | 0.13 | | | | | | 0.52 | | | | | | — | | | | | | 0.65 | | | | | | 0.02 | | | | | | 14.14 | | | | | | 24.03(d) | | | | | | 83.03 | | | | | | 0.37 | | | | | | 0.37 | | | | | | 1.44 | | | | | | 4 | | | | | | 39 | | |
| 12-31-12 | | | | | 11.19 | | | | | | 0.16 | | | | | | 1.54 | | | | | | 1.70 | | | | | | 0.00* | | | | | | 0.92 | | | | | | — | | | | | | 0.92 | | | | | | — | | | | | | 11.97 | | | | | | 15.33 | | | | | | 42.33 | | | | | | 0.37 | | | | | | 0.37 | | | | | | 1.35 | | | | | | 4 | | | | | | 43 | | |
| 10-03-11(5) - 12-31-11 | | | | | 10.00 | | | | | | (0.01) | | | | | | 1.20 | | | | | | 1.19 | | | | | | — | | | | | | — | | | | | | — | | | | | | — | | | | | | — | | | | | | 11.19 | | | | | | 11.90 | | | | | | 0.37 | | | | | | 0.37 | | | | | | 0.37 | | | | | | (0.21) | | | | | | 3 | | | | | | 55 | | |
| Class S2 | | | | | | | | | | | | | | | | | | | | | | | | | | | | | | | | | | | | | | | | | | | | | | | | | | | | | | | | | | | | | | | | | | | | | | | | | | | | | | | | | | | | | | | | | | | | | | | | | | | | | | | |
| 12-31-15 | | | | | 13.70 | | | | | | 0.32• | | | | | | (0.54) | | | | | | (0.22) | | | | | | 0.06 | | | | | | 0.71 | | | | | | — | | | | | | 0.77 | | | | | | — | | | | | | 12.71 | | | | | | (1.83) | | | | | | 7.70 | | | | | | 0.54 | | | | | | 0.54 | | | | | | 2.43 | | | | | | 14 | | | | | | 195 | | |
| 12-31-14 | | | | | 14.05 | | | | | | 0.12 | | | | | | 0.67 | | | | | | 0.79 | | | | | | 0.20 | | | | | | 0.94 | | | | | | — | | | | | | 1.14 | | | | | | — | | | | | | 13.70 | | | | | | 5.71 | | | | | | 62.26 | | | | | | 0.54 | | | | | | 0.54 | | | | | | 0.88 | | | | | | 4 | | | | | | 32 | | |
| 12-31-13 | | | | | 11.97 | | | | | | 0.17 | | | | | | 2.59 | | | | | | 2.76 | | | | | | 0.18 | | | | | | 0.52 | | | | | | — | | | | | | 0.70 | | | | | | 0.02 | | | | | | 14.05 | | | | | | 23.76(d) | | | | | | 83.28 | | | | | | 0.52 | | | | | | 0.52 | | | | | | 1.30 | | | | | | 4 | | | | | | 39 | | |
| 12-31-12 | | | | | 11.19 | | | | | | 0.15 | | | | | | 1.55 | | | | | | 1.70 | | | | | | 0.00* | | | | | | 0.92 | | | | | | — | | | | | | 0.92 | | | | | | — | | | | | | 11.97 | | | | | | 15.33 | | | | | | 42.58 | | | | | | 0.52 | | | | | | 0.52 | | | | | | 1.28 | | | | | | 4 | | | | | | 43 | | |
| 10-03-11(5) - 12-31-11 | | | | | 10.00 | | | | | | (0.01) | | | | | | 1.20 | | | | | | 1.19 | | | | | | — | | | | | | — | | | | | | — | | | | | | — | | | | | | — | | | | | | 11.19 | | | | | | 11.90 | | | | | | 0.62 | | | | | | 0.52 | | | | | | 0.52 | | | | | | (0.24) | | | | | | 3 | | | | | | 55 | | |
| Class T | | | | | | | | | | | | | | | | | | | | | | | | | | | | | | | | | | | | | | | | | | | | | | | | | | | | | | | | | | | | | | | | | | | | | | | | | | | | | | | | | | | | | | | | | | | | | | | | | | | | | | | |
| 12-31-15 | | | | | 13.63 | | | | | | 0.25 | | | | | | (0.50) | | | | | | (0.25) | | | | | | 0.02 | | | | | | 0.71 | | | | | | — | | | | | | 0.73 | | | | | | — | | | | | | 12.65 | | | | | | (2.09) | | | | | | 7.95 | | | | | | 0.84 | | | | | | 0.84 | | | | | | 1.82 | | | | | | 4 | | | | | | 195 | | |
| 12-31-14 | | | | | 14.00 | | | | | | 0.08 | | | | | | 0.66 | | | | | | 0.74 | | | | | | 0.17 | | | | | | 0.94 | | | | | | — | | | | | | 1.11 | | | | | | — | | | | | | 13.63 | | | | | | 5.38 | | | | | | 62.51 | | | | | | 0.84 | | | | | | 0.84 | | | | | | 0.59 | | | | | | 4 | | | | | | 32 | | |
| 12-31-13 | | | | | 11.92 | | | | | | 0.13 | | | | | | 2.60 | | | | | | 2.73 | | | | | | 0.15 | | | | | | 0.52 | | | | | | — | | | | | | 0.67 | | | | | | 0.02 | | | | | | 14.00 | | | | | | 23.53(d) | | | | | | 83.53 | | | | | | 0.82 | | | | | | 0.82 | | | | | | 0.99 | | | | | | 4 | | | | | | 39 | | |
| 12-31-12 | | | | | 11.18 | | | | | | 0.11 | | | | | | 1.55 | | | | | | 1.66 | | | | | | — | | | | | | 0.92 | | | | | | — | | | | | | 0.92 | | | | | | — | | | | | | 11.92 | | | | | | 14.96 | | | | | | 42.83 | | | | | | 0.82 | | | | | | 0.82 | | | | | | 0.96 | | | | | | 4 | | | | | | 43 | | |
| 10-03-11(5) - 12-31-11 | | | | | 10.00 | | | | | | (0.02) | | | | | | 1.20 | | | | | | 1.18 | | | | | | — | | | | | | — | | | | | | — | | | | | | — | | | | | | — | | | | | | 11.18 | | | | | | 11.80 | | | | | | 0.87 | | | | | | 0.82 | | | | | | 0.82 | | | | | | (0.62) | | | | | | 3 | | | | | | 55 | | |
| Class Z | | | | | | | | | | | | | | | | | | | | | | | | | | | | | | | | | | | | | | | | | | | | | | | | | | | | | | | | | | | | | | | | | | | | | | | | | | | | | | | | | | | | | | | | | | | | | | | | | | | | | | | |
| 05-01-15(5) - 12-31-15 | | | | | 14.46 | | | | | | 0.61• | | | | | | (1.45) | | | | | | (0.84) | | | | | | 0.11 | | | | | | 0.71 | | | | | | — | | | | | | 0.82 | | | | | | — | | | | | | 12.80 | | | | | | (6.02) | | | | | | 7.05 | | | | | | 0.00 | | | | | | 0.00 | | | | | | 7.16 | | | | | | 576 | | | | | | 195 | | |
| Voya Index Solution 2055 Portfolio | | | | | | | | | | | | | | | | | | | | | | | | | | | | | | | | | | | | | | | | | | | | | | | | | | | | | | | | | | | | | | | | | | | | | | | | | | | | | | | | | | | | | | | | | | | | | | | | | | | | | | | |
| Class ADV | | | | | | | | | | | | | | | | | | | | | | | | | | | | | | | | | | | | | | | | | | | | | | | | | | | | | | | | | | | | | | | | | | | | | | | | | | | | | | | | | | | | | | | | | | | | | | | | | | | | | | | |
| 12-31-15 | | | | | 14.69 | | | | | | 0.20• | | | | | | (0.45) | | | | | | (0.25) | | | | | | 0.12 | | | | | | 1.20 | | | | | | — | | | | | | 1.32 | | | | | | — | | | | | | 13.12 | | | | | | (2.15) | | | | | | 0.78 | | | | | | 0.65 | | | | | | 0.65 | | | | | | 1.42 | | | | | | 37,162 | | | | | | 39 | | |
| 12-31-14 | | | | | 14.57 | | | | | | 0.13• | | | | | | 0.74 | | | | | | 0.87 | | | | | | 0.14 | | | | | | 0.61 | | | | | | — | | | | | | 0.75 | | | | | | — | | | | | | 14.69 | | | | | | 6.08 | | | | | | 0.78 | | | | | | 0.63 | | | | | | 0.63 | | | | | | 0.88 | | | | | | 31,811 | | | | | | 44 | | |
| 12-31-13 | | | | | 12.06 | | | | | | 0.17• | | | | | | 2.67 | | | | | | 2.84 | | | | | | 0.10 | | | | | | 0.23 | | | | | | — | | | | | | 0.33 | | | | | | — | | | | | | 14.57 | | | | | | 23.83 | | | | | | 0.80 | | | | | | 0.61 | | | | | | 0.61 | | | | | | 1.31 | | | | | | 24,873 | | | | | | 50 | | |
| 12-31-12 | | | | | 10.57 | | | | | | 0.15• | | | | | | 1.48 | | | | | | 1.63 | | | | | | 0.03 | | | | | | 0.11 | | | | | | — | | | | | | 0.14 | | | | | | — | | | | | | 12.06 | | | | | | 15.52 | | | | | | 0.74 | | | | | | 0.62 | | | | | | 0.62 | | | | | | 1.29 | | | | | | 13,319 | | | | | | 28 | | |
| 12-31-11 | | | | | 11.19 | | | | | | 0.09• | | | | | | (0.59) | | | | | | (0.50) | | | | | | 0.00* | | | | | | 0.12 | | | | | | — | | | | | | 0.12 | | | | | | — | | | | | | 10.57 | | | | | | (4.40) | | | | | | 0.62 | | | | | | 0.62 | | | | | | 0.62 | | | | | | 0.81 | | | | | | 5,676 | | | | | | 135 | | |
See Accompanying Notes to Financial Statements
Financial Highlights (continued)
| | | | | | | | | | Income
(loss) from
investment
operations | | | | | | | | | Less
Distributions | | | | | | | | | | | | | | | | | | | | | | | | | | | Ratios to average
net assets | | | Supplemental
Data | |
| | | | Net asset value, beginning of year
or period | | | Net investment income (loss) | | | Net realized and unrealized
gain (loss) | | | Total from investment operations | | | From net investment income | | | From net realized gains | | | From return of capital | | | Total distributions | | | Payment by affiliate | | | Net asset value, end of year
or period | | | Total Return(1) | | | Expenses before
reductions/additions(2)(3)(4) | | | Expenses net of fee waivers
and/or recoupments if any(2)(3)(4) | | | Expense net of all
reductions/additions(2)(3)(4) | | | Net investment income (loss)(2)(3) | | | Net assets, end of year or period | | | Portfolio turnover rate | |
Year or
period ended | | | ($) | | | ($) | | | ($) | | | ($) | | | ($) | | | ($) | | | ($) | | | ($) | | | ($) | | | ($) | | | (%) | | | (%) | | | (%) | | | (%) | | | (%) | | | ($000’s) | | | (%) | |
| Voya Index Solution 2055 Portfolio (continued) | | | | | | | | | | | | | | | | | | | | | | | | | | | | | | | | | | | | | | | | | | | | | | | | | | | | | | | | | | | | | | | | | | | | | | | | | | | | | | | | | | | | | | | | | | | | | | | | | | | | | | | |
| Class I | | | | | | | | | | | | | | | | | | | | | | | | | | | | | | | | | | | | | | | | | | | | | | | | | | | | | | | | | | | | | | | | | | | | | | | | | | | | | | | | | | | | | | | | | | | | | | | | | | | | | | | |
| 12-31-15 | | | | | 14.94 | | | | | | 0.32• | | | | | | (0.50) | | | | | | (0.18) | | | | | | 0.18 | | | | | | 1.20 | | | | | | — | | | | | | 1.38 | | | | | | — | | | | | | 13.38 | | | | | | (1.66) | | | | | | 0.28 | | | | | | 0.15 | | | | | | 0.15 | | | | | | 2.23 | | | | | | 8,113 | | | | | | 39 | | |
| 12-31-14 | | | | | 14.78 | | | | | | 0.22• | | | | | | 0.74 | | | | | | 0.96 | | | | | | 0.19 | | | | | | 0.61 | | | | | | — | | | | | | 0.80 | | | | | | — | | | | | | 14.94 | | | | | | 6.61 | | | | | | 0.28 | | | | | | 0.13 | | | | | | 0.13 | | | | | | 1.44 | | | | | | 3,974 | | | | | | 44 | | |
| 12-31-13 | | | | | 12.21 | | | | | | 0.26• | | | | | | 2.67 | | | | | | 2.93 | | | | | | 0.13 | | | | | | 0.23 | | | | | | — | | | | | | 0.36 | | | | | | — | | | | | | 14.78 | | | | | | 24.32 | | | | | | 0.30 | | | | | | 0.11 | | | | | | 0.11 | | | | | | 1.89 | | | | | | 1,782 | | | | | | 50 | | |
| 12-31-12 | | | | | 10.66 | | | | | | 0.21• | | | | | | 1.50 | | | | | | 1.71 | | | | | | 0.05 | | | | | | 0.11 | | | | | | — | | | | | | 0.16 | | | | | | — | | | | | | 12.21 | | | | | | 16.18 | | | | | | 0.24 | | | | | | 0.12 | | | | | | 0.12 | | | | | | 1.80 | | | | | | 1,750 | | | | | | 28 | | |
| 12-31-11 | | | | | 11.24 | | | | | | 0.10• | | | | | | (0.55) | | | | | | (0.45) | | | | | | 0.01 | | | | | | 0.12 | | | | | | — | | | | | | 0.13 | | | | | | — | | | | | | 10.66 | | | | | | (3.93) | | | | | | 0.12 | | | | | | 0.12 | | | | | | 0.12 | | | | | | 0.91 | | | | | | 618 | | | | | | 135 | | |
| Class S | | | | | | | | | | | | | | | | | | | | | | | | | | | | | | | | | | | | | | | | | | | | | | | | | | | | | | | | | | | | | | | | | | | | | | | | | | | | | | | | | | | | | | | | | | | | | | | | | | | | | | | |
| 12-31-15 | | | | | 14.82 | | | | | | 0.21 | | | | | | (0.43) | | | | | | (0.22) | | | | | | 0.15 | | | | | | 1.20 | | | | | | — | | | | | | 1.35 | | | | | | — | | | | | | 13.25 | | | | | | (1.93) | | | | | | 0.53 | | | | | | 0.40 | | | | | | 0.40 | | | | | | 1.55 | | | | | | 20,530 | | | | | | 39 | | |
| 12-31-14 | | | | | 14.68 | | | | | | 0.16• | | | | | | 0.76 | | | | | | 0.92 | | | | | | 0.17 | | | | | | 0.61 | | | | | | — | | | | | | 0.78 | | | | | | — | | | | | | 14.82 | | | | | | 6.35 | | | | | | 0.53 | | | | | | 0.38 | | | | | | 0.38 | | | | | | 1.09 | | | | | | 20,758 | | | | | | 44 | | |
| 12-31-13 | | | | | 12.13 | | | | | | 0.21• | | | | | | 2.68 | | | | | | 2.89 | | | | | | 0.11 | | | | | | 0.23 | | | | | | — | | | | | | 0.34 | | | | | | — | | | | | | 14.68 | | | | | | 24.15 | | | | | | 0.55 | | | | | | 0.36 | | | | | | 0.36 | | | | | | 1.57 | | | | | | 15,267 | | | | | | 50 | | |
| 12-31-12 | | | | | 10.61 | | | | | | 0.17• | | | | | | 1.50 | | | | | | 1.67 | | | | | | 0.04 | | | | | | 0.11 | | | | | | — | | | | | | 0.15 | | | | | | — | | | | | | 12.13 | | | | | | 15.89 | | | | | | 0.49 | | | | | | 0.37 | | | | | | 0.37 | | | | | | 1.48 | | | | | | 8,886 | | | | | | 28 | | |
| 12-31-11 | | | | | 11.21 | | | | | | 0.12• | | | | | | (0.59) | | | | | | (0.47) | | | | | | 0.01 | | | | | | 0.12 | | | | | | — | | | | | | 0.13 | | | | | | — | | | | | | 10.61 | | | | | | (4.17) | | | | | | 0.37 | | | | | | 0.37 | | | | | | 0.37 | | | | | | 1.13 | | | | | | 3,385 | | | | | | 135 | | |
| Class S2 | | | | | | | | | | | | | | | | | | | | | | | | | | | | | | | | | | | | | | | | | | | | | | | | | | | | | | | | | | | | | | | | | | | | | | | | | | | | | | | | | | | | | | | | | | | | | | | | | | | | | | | |
| 12-31-15 | | | | | 14.72 | | | | | | 0.21• | | | | | | (0.45) | | | | | | (0.24) | | | | | | 0.11 | | | | | | 1.20 | | | | | | — | | | | | | 1.31 | | | | | | — | | | | | | 13.17 | | | | | | (2.04) | | | | | | 0.78 | | | | | | 0.55 | | | | | | 0.55 | | | | | | 1.50 | | | | | | 5,816 | | | | | | 39 | | |
| 12-31-14 | | | | | 14.59 | | | | | | 0.13• | | | | | | 0.75 | | | | | | 0.88 | | | | | | 0.14 | | | | | | 0.61 | | | | | | — | | | | | | 0.75 | | | | | | — | | | | | | 14.72 | | | | | | 6.15 | | | | | | 0.78 | | | | | | 0.53 | | | | | | 0.53 | | | | | | 0.89 | | | | | | 5,363 | | | | | | 44 | | |
| 12-31-13 | | | | | 12.07 | | | | | | 0.18• | | | | | | 2.67 | | | | | | 2.85 | | | | | | 0.10 | | | | | | 0.23 | | | | | | — | | | | | | 0.33 | | | | | | — | | | | | | 14.59 | | | | | | 23.92 | | | | | | 0.80 | | | | | | 0.51 | | | | | | 0.51 | | | | | | 1.36 | | | | | | 5,212 | | | | | | 50 | | |
| 12-31-12 | | | | | 10.58 | | | | | | 0.17• | | | | | | 1.48 | | | | | | 1.65 | | | | | | 0.05 | | | | | | 0.11 | | | | | | — | | | | | | 0.16 | | | | | | — | | | | | | 12.07 | | | | | | 15.69 | | | | | | 0.74 | | | | | | 0.52 | | | | | | 0.52 | | | | | | 1.44 | | | | | | 3,663 | | | | | | 28 | | |
| 12-31-11 | | | | | 11.20 | | | | | | 0.05• | | | | | | (0.54) | | | | | | (0.49) | | | | | | 0.01 | | | | | | 0.12 | | | | | | — | | | | | | 0.13 | | | | | | — | | | | | | 10.58 | | | | | | (4.32) | | | | | | 0.62 | | | | | | 0.52 | | | | | | 0.52 | | | | | | 0.43 | | | | | | 733 | | | | | | 135 | | |
| Class T | | | | | | | | | | | | | | | | | | | | | | | | | | | | | | | | | | | | | | | | | | | | | | | | | | | | | | | | | | | | | | | | | | | | | | | | | | | | | | | | | | | | | | | | | | | | | | | | | | | | | | | |
| 12-31-15 | | | | | 14.67 | | | | | | 0.17 | | | | | | (0.44) | | | | | | (0.27) | | | | | | 0.09 | | | | | | 1.20 | | | | | | — | | | | | | 1.29 | | | | | | — | | | | | | 13.11 | | | | | | (2.31) | | | | | | 1.03 | | | | | | 0.85 | | | | | | 0.85 | | | | | | 1.17 | | | | | | 4 | | | | | | 39 | | |
| 12-31-14 | | | | | 14.55 | | | | | | 0.09 | | | | | | 0.74 | | | | | | 0.83 | | | | | | 0.10 | | | | | | 0.61 | | | | | | — | | | | | | 0.71 | | | | | | — | | | | | | 14.67 | | | | | | 5.82 | | | | | | 1.03 | | | | | | 0.83 | | | | | | 0.83 | | | | | | 0.62 | | | | | | 5 | | | | | | 44 | | |
| 12-31-13 | | | | | 12.02 | | | | | | 0.14 | | | | | | 2.67 | | | | | | 2.81 | | | | | | 0.05 | | | | | | 0.23 | | | | | | — | | | | | | 0.28 | | | | | | — | | | | | | 14.55 | | | | | | 23.61 | | | | | | 1.05 | | | | | | 0.81 | | | | | | 0.81 | | | | | | 1.02 | | | | | | 4 | | | | | | 50 | | |
| 12-31-12 | | | | | 10.53 | | | | | | 0.11 | | | | | | 1.49 | | | | | | 1.60 | | | | | | — | | | | | | 0.11 | | | | | | — | | | | | | 0.11 | | | | | | — | | | | | | 12.02 | | | | | | 15.28 | | | | | | 0.99 | | | | | | 0.82 | | | | | | 0.82 | | | | | | 0.98 | | | | | | 4 | | | | | | 28 | | |
| 12-31-11 | | | | | 11.17 | | | | | | 0.10 | | | | | | (0.62) | | | | | | (0.52) | | | | | | — | | | | | | 0.12 | | | | | | — | | | | | | 0.12 | | | | | | — | | | | | | 10.53 | | | | | | (4.59) | | | | | | 0.87 | | | | | | 0.82 | | | | | | 0.82 | | | | | | 0.86 | | | | | | 3 | | | | | | 135 | | |
| Class Z | | | | | | | | | | | | | | | | | | | | | | | | | | | | | | | | | | | | | | | | | | | | | | | | | | | | | | | | | | | | | | | | | | | | | | | | | | | | | | | | | | | | | | | | | | | | | | | | | | | | | | | |
| 05-01-15(5) - 12-31-15 | | | | | 15.69 | | | | | | 0.28• | | | | | | (1.19) | | | | | | (0.91) | | | | | | 0.18 | | | | | | 1.20 | | | | | | — | | | | | | 1.38 | | | | | | — | | | | | | 13.40 | | | | | | (6.22) | | | | | | 0.30 | | | | | | 0.00 | | | | | | 0.00 | | | | | | 3.14 | | | | | | 446 | | | | | | 39 | | |
| Voya Index Solution 2060 Portfolio | | | | | | | | | | | | | | | | | | | | | | | | | | | | | | | | | | | | | | | | | | | | | | | | | | | | | | | | | | | | | | | | | | | | | | | | | | | | | | | | | | | | | | | | | | | | | | | | | | | | | | | |
| Class ADV | | | | | | | | | | | | | | | | | | | | | | | | | | | | | | | | | | | | | | | | | | | | | | | | | | | | | | | | | | | | | | | | | | | | | | | | | | | | | | | | | | | | | | | | | | | | | | | | | | | | | | | |
| 02-09-15(5) - 12-31-15 | | | | | 10.00 | | | | | | 0.20• | | | | | | (0.43) | | | | | | (0.23) | | | | | | — | | | | | | — | | | | | | — | | | | | | — | | | | | | — | | | | | | 9.77 | | | | | | (2.30) | | | | | | 36.51 | | | | | | 0.65 | | | | | | 0.65 | | | | | | 2.29 | | | | | | 87 | | | | | | 208 | | |
| Class I | | | | | | | | | | | | | | | | | | | | | | | | | | | | | | | | | | | | | | | | | | | | | | | | | | | | | | | | | | | | | | | | | | | | | | | | | | | | | | | | | | | | | | | | | | | | | | | | | | | | | | | |
| 02-09-15(5) - 12-31-15 | | | | | 10.00 | | | | | | 0.51• | | | | | | (0.69) | | | | | | (0.18) | | | | | | — | | | | | | — | | | | | | — | | | | | | — | | | | | | — | | | | | | 9.82 | | | | | | (1.80) | | | | | | 36.01 | | | | | | 0.15 | | | | | | 0.15 | | | | | | 5.86 | | | | | | 32 | | | | | | 208 | | |
| Class S | | | | | | | | | | | | | | | | | | | | | | | | | | | | | | | | | | | | | | | | | | | | | | | | | | | | | | | | | | | | | | | | | | | | | | | | | | | | | | | | | | | | | | | | | | | | | | | | | | | | | | | |
| 02-09-15(5) - 12-31-15 | | | | | 10.00 | | | | | | 0.58• | | | | | | (0.79) | | | | | | (0.21) | | | | | | — | | | | | | — | | | | | | — | | | | | | — | | | | | | — | | | | | | 9.79 | | | | | | (2.10) | | | | | | 36.26 | | | | | | 0.40 | | | | | | 0.40 | | | | | | 6.61 | | | | | | 131 | | | | | | 208 | | |
| Class S2 | | | | | | | | | | | | | | | | | | | | | | | | | | | | | | | | | | | | | | | | | | | | | | | | | | | | | | | | | | | | | | | | | | | | | | | | | | | | | | | | | | | | | | | | | | | | | | | | | | | | | | | |
| 02-09-15(5) - 12-31-15 | | | | | 10.00 | | | | | | 0.06• | | | | | | (0.29) | | | | | | (0.23) | | | | | | — | | | | | | — | | | | | | — | | | | | | — | | | | | | — | | | | | | 9.77 | | | | | | (2.30) | | | | | | 36.51 | | | | | | 0.55 | | | | | | 0.55 | | | | | | 0.73 | | | | | | 4 | | | | | | 208 | | |
| Class Z | | | | | | | | | | | | | | | | | | | | | | | | | | | | | | | | | | | | | | | | | | | | | | | | | | | | | | | | | | | | | | | | | | | | | | | | | | | | | | | | | | | | | | | | | | | | | | | | | | | | | | | |
| 05-01-15(5) - 12-31-15 | | | | | 10.46 | | | | | | 0.03• | | | | | | (0.67) | | | | | | (0.64) | | | | | | — | | | | | | — | | | | | | — | | | | | | — | | | | | | — | | | | | | 9.82 | | | | | | (6.12) | | | | | | 35.54 | | | | | | 0.00 | | | | | | 0.00 | | | | | | 0.52 | | | | | | 143 | | | | | | 208 | | |
See Accompanying Notes to Financial Statements
Financial Highlights (continued)
(1)
Total return is calculated assuming reinvestment of all dividends, capital gain distributions and return of capital distributions, if any, at net asset value and does not reflect the effect of insurance contract charges. Total return for periods less than one year is not annualized.
(2)
Annualized for periods less than one year.
(3)
Ratios reflect operating expenses of a Portfolio. Expenses before reductions/additions do not reflect amounts reimbursed by an Investment Adviser and/or Distributor or reductions from brokerage service arrangements or other expense offset arrangements and do not represent the amount paid by a Portfolio during periods when reimbursements or reductions occur. Expenses net of fee waivers reflect expenses after reimbursement by an Investment Adviser and/or Distributor but prior to reductions from brokerage service arrangements or other expense offset arrangements. Expenses net of all reductions/additions represent the net expenses paid by a Portfolio. Net investment income (loss) is net of all such additions or reductions.
(4)
Ratios do not include expenses of underlying funds and do not include fees and expenses charged under the variable annuity contract or variable life insurance policy.
(5)
Commencement of operations.
(a)
During the year ended December 31, 2013, Voya Investments, LLC voluntarily reimbursed Voya Index Solution 2020 Portfolio $22 for the foregone investment opportunities attributable to uninvested cash. Excluding this payment by affiliate, total return would have been 13.41%, 13.88%, 13.50%, 13.50% and 13.16% on Classes ADV, I, S, S2 and T, respectively.
(b)
During the year ended December 31, 2013, Voya Investments, LLC voluntarily reimbursed Voya Index Solution 2030 Portfolio $24 for the foregone investment opportunities attributable to uninvested cash. Excluding this payment by affiliate, total return would have been 18.53%, 19.14%, 18.60%, 18.62% and 18.38% on Classes ADV, I, S, S2 and T, respectively.
(c)
During the year ended December 31, 2013, Voya Investments, LLC voluntarily reimbursed Voya Index Solution 2040 Portfolio $30 for the foregone investment opportunities attributable to uninvested cash. Excluding this payment by affiliate, total return would have been 23.01%, 23.72%, 23.35%, 23.18% and 22.85% on Classes ADV, I, S, S2 and T, respectively.
(d)
During the year ended December 31, 2013, Voya Investments, LLC voluntarily reimbursed Voya Index Solution 2050 Portfolio $31 for the foregone investment opportunities attributable to uninvested cash. Excluding this payment by affiliate, total return would have been 23.51%, 24.22%, 23.85%, 23.58% and 23.35% on Classes ADV, I, S, S2 and T, respectively.
•
Calculated using average number of shares outstanding throughout the period.
*
Amount is less than $0.005 or 0.005% or more than $(0.005) or (0.005)%.
See Accompanying Notes to Financial Statements
NOTES TO FINANCIAL STATEMENTS as of December 31, 2015
NOTE 1 — ORGANIZATION
Voya Partners, Inc. (the “Company”) is an open-end management investment company registered under the Investment Company Act of 1940, as amended (the “1940 Act”). It was incorporated under the laws of Maryland on May 7, 1997. The Articles of Incorporation permit the Company to offer separate series, each of which has its own investment objective, policies and restrictions. The series of the Company serve as investment options in underlying variable annuity contracts and variable life insurance policies offered by Directed Services LLC. The Company currently consists of forty-one active separate investment series. The ten series (each, a “Portfolio” and collectively, the “Portfolios”) included in this report are: Voya Index Solution Income Portfolio (“Index Solution Income”), Voya Index Solution 2020 Portfolio (“Index Solution 2020”), Voya Index Solution 2025 Portfolio (“Index Solution 2025”), Voya Index Solution 2030 Portfolio (“Index Solution 2030”), Voya Index Solution 2035 Portfolio (“Index Solution 2035”), Voya Index Solution 2040 Portfolio (“Index Solution 2040”), Voya Index Solution 2045 Portfolio (“Index Solution 2045”), Voya Index Solution 2050 Portfolio (“Index Solution 2050”), Voya Index Solution 2055 Portfolio (“Index Solution 2055”) and Voya Index Solution 2060 Portfolio (“Index Solution 2060”), each a diversified series of the Company.
Index Solution 2020, Index Solution 2025, Index Solution 2030, Index Solution 2035, Index Solution 2040, Index Solution 2045, Index Solution 2050, Index Solution 2055 and Index Solution 2060 are structured and managed around a specific target retirement or financial goal date (“Target Date”). When these Portfolios reach their respective Target Date, they may be combined with the Index Solution Income, without a vote of shareholders, if approved by the Board of Directors (the “Board”).
The classes of shares included in this report are: Adviser (“Class ADV”), Initial (“Class I”), Service (“Class S”), Service 2 (“Class S2”), Class T and Class Z; however each Portfolio may not offer all share classes. Shares of the Portfolios may be offered to separate accounts (“Separate Accounts”) of insurance companies as investment options in connection with variable annuity contracts and variable life insurance policies (“Variable Contracts”) and to certain of the Portfolios’ investment advisers and their affiliates. In the future, shares may also be offered to qualified pension and retirement plans (“Qualified Plans”) outside the Separate Account context. Each class has equal rights as to voting privileges. The classes differ principally in the applicable distribution and shareholder service fees. Generally, shareholders of each class also bear certain expenses that pertain to that particular class. All shareholders bear the common expenses of a portfolio
and earn income and realized gains/losses from a portfolio pro rata based on the daily ending net assets of each class, without distinction between share classes. Expenses that are specific to a portfolio or a class are charged directly to that portfolio or class. Other operating expenses shared by several portfolios are generally allocated among those portfolios based on average net assets. Distributions are determined separately for each class based on income and expenses allocated to each class. Realized gain distributions are allocated to each class pro rata based on the shares outstanding of each class on the date of distribution. Differences in per share dividend rates generally result from differences in separate class expenses, including distribution and shareholder service fees, if applicable.
Directed Services LLC (“DSL” or the “Investment Adviser”), a Delaware limited liability company and an affiliate of Voya Investments, LLC, serves as the Investment Adviser to the Portfolios. DSL oversees all investment management and portfolio management services for the Portfolios and assists in managing and supervising all aspects of the general day-to-day business activities and operations of the Portfolios, including custodial, transfer agency, dividend disbursing, accounting, auditing, compliance and related services. Voya Investment Management Co. LLC (“Voya IM” or the “Sub-Adviser”), a Delaware limited liability company, serves as the Sub-Adviser to the Portfolios. Voya Investments Distributor, LLC (“VID” or the “Distributor”), a Delaware limited liability company, serves as the principal underwriter to the Portfolios.
Each Portfolio seeks to achieve its investment objective by investing in other investment companies (“Underlying Funds”) and uses asset allocation strategies to determine how much to invest in the Underlying Funds. The investment objective of the Portfolios is described in the respective Portfolio’s Prospectus.
NOTE 2 — SIGNIFICANT ACCOUNTING POLICIES
The following significant accounting policies are consistently followed by the Portfolios in the preparation of their financial statements. Each Portfolio is considered an investment company under U.S. generally accepted accounting principles (“GAAP”) and follows the accounting and reporting guidance applicable to investment companies.
A. Security Valuation. Each Portfolio is open for business every day the New York Stock Exchange (“NYSE”) opens for regular trading (each such day, a “Business Day”). The net asset value (“NAV”) per share for each class of each Portfolio is determined each Business Day as of the close of the regular trading session (“Market Close”), as
NOTES TO FINANCIAL STATEMENTS as of December 31, 2015 (continued)
NOTE 2 — SIGNIFICANT ACCOUNTING POLICIES (continued)
determined by the Consolidated Tape Association (“CTA”), the central distributor of transaction prices for exchange-traded securities (normally 4:00 p.m. Eastern time unless otherwise designated by the CTA). The NAV per share of each class of each Portfolio is calculated by taking the value of the Portfolio’s assets attributable to that class, subtracting the Portfolio’s liabilities attributable to that class, and dividing by the number of shares of that class that are outstanding. On days when a Portfolio is closed for business, Portfolio shares will not be priced and a Portfolio does not transact purchase and redemption orders. To the extent a Portfolio’s assets are traded in other markets on days when a Portfolio does not price its shares, the value of a Portfolio’s assets will likely change and you will not be able to purchase or redeem shares of a Portfolio.
Assets for which market quotations are readily available are valued at market value. A security listed or traded on an exchange is valued at its last sales price or official closing price as of the close of the regular trading session on the exchange where the security is principally traded or, if such price is not available, at the last sale price as of the Market Close for such security provided by the CTA. Bank loans are valued at the average of the averages between the bid and ask prices provided to an independent loan pricing service by brokers. Futures contracts are valued at the final settlement price set by an exchange on which they are principally traded. Listed options are valued at the mean between the last bid and ask prices from the exchange on which they are principally traded. Investments in open-end registered investment companies that do not trade on an exchange are valued at the end of day NAV per share. Investments in registered investment companies that trade on an exchange are valued at the last sales price or official closing price as of the close of the regular trading session on the exchange where the security is principally traded.
When a market quotation is not readily available or is deemed unreliable, each Portfolio will determine a fair value for the relevant asset in accordance with procedures adopted by the Board. Such procedures provide, for example, that: (a) Exchange-traded securities are valued at the mean of the closing bid and ask; (b) Debt obligations are valued using an evaluated price provided by an independent pricing service. Evaluated prices provided by the pricing service may be determined without exclusive reliance on quoted prices, and may reflect factors such as institution-size trading in similar groups of securities, developments related to specific securities, benchmark yield, quality, type of issue, coupon rate, maturity, individual trading characteristics and other market data; (c) Securities traded in the over-the-counter market are
valued based on prices provided by independent pricing services or market makers; (d) Options not listed on an exchange are valued by an independent source using an industry accepted model, such as Black-Scholes; (e) Centrally cleared swap agreements are valued using a price provided by the central counterparty clearinghouse; (f) Over-the-counter swap agreements are valued using a price provided by an independent pricing service; (g) Forward foreign currency contracts are valued utilizing current and forward rates obtained from an independent pricing service. Such prices from the third party pricing service are for specific settlement periods and each Portfolio’s forward foreign currency contracts are valued at an interpolated rate between the closest preceding and subsequent period reported by the independent pricing service and (h) Securities for which market prices are not provided by any of the above methods may be valued based upon quotes furnished by brokers.
The prospectuses of the open-end registered investment companies in which each Portfolio may invest explain the circumstances under which they will use fair value pricing and the effects of using fair value pricing.
Foreign securities’ (including foreign exchange contracts) prices are converted into U.S. dollar amounts using the applicable exchange rates as of Market Close. If market quotations are available and believed to be reliable for foreign exchange-traded equity securities, the securities will be valued at the market quotations. Because trading hours for certain foreign securities end before Market Close, closing market quotations may become unreliable. An independent pricing service determines the degree of certainty, based on historical data, that the closing price in the principal market where a foreign security trades is not the current value as of Market Close. Foreign securities’ prices meeting the approved degree of certainty that the price is not reflective of current value will be valued by the independent pricing service using pricing models designed to estimate likely changes in the values of those securities between the times in which the trading in those securities is substantially completed and Market Close. Multiple factors may be considered by the independent pricing service in determining the value of such securities and may include information relating to sector indices, American Depositary Receipts and domestic and foreign index futures.
All other assets for which market quotations are not readily available or became unreliable (or if the above fair valuation methods are unavailable or determined to be unreliable) are valued at fair value as determined in good faith by or under the supervision of the Board following procedures approved by the Board. The Board has delegated to the Investment Adviser responsibility for overseeing the implementation of the Portfolios’ valuation
NOTES TO FINANCIAL STATEMENTS as of December 31, 2015 (continued)
NOTE 2 — SIGNIFICANT ACCOUNTING POLICIES (continued)
procedures; a “Pricing Committee” comprised of employees of the Investment Adviser or its affiliates has responsibility for applying the fair valuation methods set forth in the procedures and, if a fair valuation cannot be determined pursuant to the fair valuation methods, determining the fair value of assets held by the Portfolios. Issuer specific events, transaction price, position size, nature and duration of restrictions on disposition of the security, market trends, bid/ask quotes of brokers and other market data may be reviewed in the course of making a good faith determination of a security’s fair value. Valuations change in response to many factors including the historical and prospective earnings of the issuer, the value of the issuer’s assets, general economic conditions, interest rates, investor perceptions and market liquidity. Because of the inherent uncertainties of fair valuation, the values used to determine each Portfolio’s NAV may materially differ from the value received upon actual sale of those investments. Thus, fair valuation may have an unintended dilutive or accretive effect on the value of shareholders’ investments in each Portfolio.
Each investment asset or liability of the Portfolios is assigned a level at measurement date based on the significance and source of the inputs to its valuation. Quoted prices in active markets for identical securities are classified as “Level 1,” inputs other than quoted prices for an asset or liability that are observable are classified as “Level 2” and unobservable inputs, including the Sub-Adviser’s or Pricing Committee’s judgment about the assumptions that a market participant would use in pricing an asset or liability are classified as “Level 3.” The inputs used for valuing securities are not necessarily an indication of the risks associated with investing in those securities. Short-term securities of sufficient credit quality are generally considered to be Level 2 securities under applicable accounting rules. The Portfolios classify each of their investments in the Underlying Funds as Level 1, without consideration as to the classification level of the specific investments held by the Underlying Funds. A table summarizing each Portfolio’s investments under these levels of classification is included following the Portfolio of Investments.
U.S. GAAP requires a reconciliation of the beginning to ending balances for reported fair values that presents changes attributable to total realized and unrealized gains or losses, purchases and sales, and transfers in or out of the Level 3 category during the period. The beginning of period timing recognition is used for the transfers between Levels of a Portfolio’s assets and liabilities. A reconciliation of Level 3 investments is presented only when a Portfolio has a significant amount of Level 3 investments.
For the year ended December 31, 2015, there have been no significant changes to the fair valuation methodologies.
B. Security Transactions and Revenue Recognition. Security transactions are accounted for on the trade date. Dividend income received from the Underlying Funds is recognized on the ex-dividend date and is recorded as income distributions in the Statements of Operations. Capital gain distributions received from the Underlying Funds are recognized on the ex-dividend date and are recorded on the Statements of Operations as such. Realized gains and losses are reported on the basis of identified cost of securities sold.
C. Distributions to Shareholders. The Portfolios record distributions to their shareholders on the ex-dividend date. Dividends from net investment income and capital gain distributions, if any, are declared and paid annually. The Portfolios may make distributions on a more frequent basis to comply with the distribution requirements of the Internal Revenue Code. The characteristics of income and gains to be distributed are determined in accordance with income tax regulations, which may differ from U.S. GAAP for investment companies.
D. Federal Income Taxes. It is the policy of each Portfolio to comply with the requirements of subchapter M of the Internal Revenue Code that are applicable to regulated investment companies and to distribute substantially all of its net investment income and any net realized capital gains to its shareholders. Therefore, a federal income tax or excise tax provision is not required. Management has considered the sustainability of the Portfolios’ tax positions taken on federal income tax returns for all open tax years in making this determination. No capital gain distributions shall be made until the capital loss carryforwards have been fully utilized or expire.
The Portfolios may utilize equalization accounting for tax purposes, whereby a portion of redemption payments are treated as distributions of income or gain.
E. Use of Estimates. The preparation of financial statements in conformity with U.S. GAAP requires management to make estimates and assumptions that affect the reported amounts of assets and liabilities and disclosure of contingent assets and liabilities at the date of the financial statements and the reported amounts of increases and decreases in net assets from operations during the reporting period. Actual results could differ from those estimates.
F. Risk Exposures and the Use of Derivative Instruments. Each Portfolio’s investment strategies permit it to enter into various types of derivatives contracts, including, but not limited to, futures contracts. In doing so, a Portfolio will employ strategies in differing combinations to
NOTES TO FINANCIAL STATEMENTS as of December 31, 2015 (continued)
NOTE 2 — SIGNIFICANT ACCOUNTING POLICIES (continued)
permit it to increase or decrease the level of risk, or change the level or types of exposure to market risk factors. This may allow a Portfolio to pursue its objectives more quickly and efficiently than if it were to make direct purchases or sales of securities capable of affecting a similar response to market factors.
Market Risk Factors. In pursuit of its investment objectives, a Portfolio may seek to use derivatives to increase or decrease its exposure to the following market risk factors:
Equity Risk. Stock prices may be volatile or have reduced liquidity in response to real or perceived impacts of factors including, but not limited to, economic conditions, changes in market interest rates, and political events. Stock markets tend to be cyclical, with periods when stock prices generally rise and periods when stock prices generally decline. Any given stock market segment may remain out of favor with investors for a short or long period of time, and stocks as an asset class may underperform bonds or other asset classes during some periods. Additionally, legislative, regulatory or tax policies or developments in these areas may adversely impact the investment techniques available to a manager, add to costs and impair the ability of a Portfolio to achieve its investment objectives.
Risks of Investing in Derivatives. Each Portfolio’s use of derivatives can result in losses due to unanticipated changes in the market risk factors and the overall market. In instances where a Portfolio is using derivatives to decrease, or hedge, exposures to market risk factors for securities held by a Portfolio, there are also risks that those derivatives may not perform as expected resulting in losses for the combined or hedged positions.
Derivative instruments are subject to a number of risks, including the risk of changes in the market price of the underlying securities, credit risk with respect to the counterparty, risk of loss due to changes in market interest rates and liquidity and volatility risk. The amounts required to purchase certain derivatives may be small relative to the magnitude of exposure assumed by a Portfolio. Therefore, the purchase of certain derivatives may have an economic leveraging effect on a Portfolio and exaggerate any increase or decrease in the net asset value. Derivatives may not perform as expected, so a Portfolio may not realize the intended benefits. When used for hedging purposes, the change in value of a derivative may not correlate as expected with the currency, security or other risk being hedged. When used as an alternative or substitute for direct cash investments, the return provided
by the derivative may not provide the same return as direct cash investment. In addition, given their complexity, derivatives expose a Portfolio to the risk of improper valuation.
Generally, derivatives are sophisticated financial instruments whose performance is derived, at least in part, from the performance of an underlying asset or assets. Derivatives include, among other things, swap agreements, options, forwards and futures. Investments in derivatives are generally negotiated over-the-counter with a single counterparty and as a result are subject to credit risks related to the counterparty’s ability or willingness to perform its obligations; any deterioration in the counterparty’s creditworthiness could adversely affect the value of the derivative. In addition, derivatives and their underlying securities may experience periods of illiquidity which could cause a Portfolio to hold a security it might otherwise sell, or to sell a security it otherwise might hold at inopportune times or at an unanticipated price. A manager might imperfectly judge the direction of the market. For instance, if a derivative is used as a hedge to offset investment risk in another security, the hedge might not correlate to the market’s movements and may have unexpected or undesired results such as a loss or a reduction in gains.
The U.S. government has enacted legislation that provides for new regulation of the derivatives market, including clearing, margin, reporting, and registration requirements. The European Union (and other countries outside of the European Union) is implementing similar requirements, which will affect a Portfolio when it enters into a derivatives transaction with a counterparty organized in that country or otherwise subject to that country’s derivatives regulations. Because these requirements are new and evolving (and some of the rules are not yet final), their ultimate impact remains unclear. Central clearing is expected to reduce counterparty risk and increase liquidity, however, there is no assurance that it will achieve that result, and in the meantime, central clearing and related requirements expose a Portfolio to new kinds of costs and risks.
G. Futures Contracts. Certain Portfolios may enter into futures contracts involving foreign currency, interest rates, securities and security indices. A futures contract is a commitment to buy or sell a specific amount of a financial instrument at a negotiated price on a stipulated future date. A Portfolio may buy and sell futures contracts. Futures contracts traded on a commodities or futures exchange will be valued at the final settlement price or official closing price on the principal exchange as reported by such principal exchange at its trading session ending at, or most recently prior to, the time when each Portfolio’s assets are valued.
NOTES TO FINANCIAL STATEMENTS as of December 31, 2015 (continued)
NOTE 2 — SIGNIFICANT ACCOUNTING POLICIES (continued)
Upon entering into a futures contract, a Portfolio is required to deposit either cash or securities (initial margin) in an amount equal to a certain percentage of the contract value. Subsequent payments (variation margin) are made or received by a Portfolio each day. The variation margin payments are equal to the daily changes in the contract value and are recorded as unrealized gains and losses. Open futures contracts are reported on a table following each Portfolio’s Portfolio of Investments. Securities held in collateralized accounts to cover initial margin requirements on open futures contracts, if any, are footnoted in the Portfolio of Investments. Cash collateral held by the broker to cover initial margin requirements on open futures contracts are noted in the Statements of Assets and Liabilities. The net change in unrealized appreciation and depreciation is reported in the Statements of Operations. Realized gains (losses) are reported in the Statements of Operations at the closing or expiration of futures contracts.
Futures contracts are exposed to the market risk factor of the underlying financial instrument. During the year ended December 31, 2015, certain Portfolios had purchased futures contracts on various equity indices to “equitize” cash. Futures contracts are purchased to provide immediate market exposure proportionate to the size of the Portfolio’s respective cash flows and residual cash balances in order to decrease potential tracking error if the cash remained uninvested in the market. Certain Portfolios also purchased futures contracts on U.S. Treasury Notes and sold futures contracts on equity indices as part of their tactical asset allocation strategy. Additional associated risks of entering into futures contracts include the possibility that there may be an illiquid market where the Portfolios are unable to liquidate the contract or enter into an offsetting position and, if used for hedging purposes, the risk that the price of the contract will correlate imperfectly with the prices of the Portfolios’ securities. With futures, there is minimal counterparty credit risk to the Portfolios since futures are exchange traded and the exchange’s clearinghouse, as counterparty to all exchange traded futures, guarantees the futures against default.
During the year ended December 31, 2015, the following Portfolios had average notional values on futures contracts purchased and sold as disclosed below. There were no open futures contracts held by any Portfolio at December 31, 2015.
| | | | Purchased | | | Sold | |
| Index Solution Income | | | | $ | 2,167,594 | | | | | $ | 7,874,725 | | |
| Index Solution 2025 | | | | | 4,261,636 | | | | | | — | | |
| Index Solution 2035 | | | | | 3,667,090 | | | | | | 4,073,133 | | |
| | | | Purchased | | | Sold | |
| Index Solution 2045 | | | | | 3,142,391 | | | | | | 7,738,952 | | |
| Index Solution 2055 | | | | | 1,134,315 | | | | | | 2,036,567 | | |
H. Offering Costs. Costs incurred with the offering of shares of a Portfolio are deferred and amortized over a twelve month period on a straight-line basis starting at the commencement of operations.
I. Indemnifications. In the normal course of business, the Company may enter into contracts that provide certain indemnifications. The Company’s maximum exposure under these arrangements is dependent on future claims that may be made against the Portfolios and, therefore, cannot be estimated; however, based on experience, management considers the risk of loss from such claims remote.
NOTE 3 — INVESTMENTS IN UNDERLYING FUNDS
For the year ended December 31, 2015, the cost of purchases and the proceeds from sales of the Underlying Funds were as follows:
| | | | Purchases | | | Sales | |
| Index Solution Income | | | | $ | 85,823,162 | | | | | $ | 111,514,309 | | |
| Index Solution 2020 | | | | | 10,393,083 | | | | | | 1,818,619 | | |
| Index Solution 2025 | | | | | 206,169,728 | | | | | | 214,626,508 | | |
| Index Solution 2030 | | | | | 6,455,821 | | | | | | 1,263,196 | | |
| Index Solution 2035 | | | | | 164,639,924 | | | | | | 174,016,064 | | |
| Index Solution 2040 | | | | | 3,518,795 | | | | | | 571,922 | | |
| Index Solution 2045 | | | | | 104,333,009 | | | | | | 99,220,642 | | |
| Index Solution 2050 | | | | | 2,484,016 | | | | | | 686,137 | | |
| Index Solution 2055 | | | | | 41,158,681 | | | | | | 27,101,188 | | |
| Index Solution 2060 | | | | | 615,434 | | | | | | 216,186 | | |
NOTE 4 — INVESTMENT MANAGEMENT FEES
Prior to May 1, 2015, the Portfolios had entered into an investment management agreement (“Management Agreement”) with the Investment Adviser. The Management Agreement compensated the Investment Adviser with an annual management fee of 0.10% of each Portfolio’s average daily nets assets invested in affiliated Underlying Funds and 0.30% of each Portfolio’s average daily net assets invested in unaffiliated Underlying Funds and/or other investments. Amounts paid to the Investment Adviser through April 30, 2015 are reflected as investment management fees on the accompanying Statements of Operations.
Also, prior to May 1, 2015, the Portfolios had entered into an administrative agreement (“Administrative Agreement”) with Voya Funds Services, LLC (the “Administrator”), a Delaware limited liability company. The Administrator provided certain administrative and shareholder services necessary for each Portfolio’s operations and was
NOTES TO FINANCIAL STATEMENTS as of December 31, 2015 (continued)
NOTE 4 — INVESTMENT MANAGEMENT FEES (continued)
responsible for the supervision of other service providers. For its services, the Administrator was entitled to receive from each Portfolio a fee at an annual rate of 0.10% of each Portfolio’s average daily net assets. Amounts paid to the Administrator through April 30, 2015 are reflected as administrative service fees on the accompanying Statements of Operations.
Effective May 1, 2015, the terms of the Portfolios’ Management Agreement and Administrative Agreement were combined under a single Amended and Restated Investment Management Agreement with a single management fee. The single management fee rate under the Portfolios’ Amended and Restated Investment Management Agreement does not exceed the former combined investment management and administrative services fee rates for the Portfolios and there is no change to the investment management or administrative services provided.
The Amended and Restated Investment Management Agreement compensates the Investment Adviser with a management fee of 0.20% of each Portfolio’s average daily nets assets invested in affiliated Underlying Funds and 0.40% of each Portfolio’s average daily net assets invested in unaffiliated Underlying Funds and/or other investments. Single management fee amounts paid to the Investment Adviser from May 1, 2015 through December 31, 2015 are reflected as investment management fees on the accompanying Statement of Operations.
The Investment Adviser has entered into a sub-advisory agreement with Voya IM. Subject to such policies as the Board or the Investment Adviser may determine, Voya IM manages the Portfolios’ assets in accordance with the Portfolios’ investment objectives, policies, and limitations.
NOTE 5 — DISTRIBUTION AND SERVICE FEES
Classes ADV, S2 and T of the respective Portfolios have a plan of distribution pursuant to Rule 12b-1 under the 1940 Act (the “12b-1 Plans”), whereby the Distributor is reimbursed or compensated by the Portfolios for expenses incurred in the distribution of each respective Portfolio’s shares (“Distribution Fees”). The Distributor may pay, on behalf of each Portfolio, out of its distribution fee, compensation to certain financial institutions for providing distribution assistance pursuant to a Distribution Services Agreement. Under the 12b-1 Plans each Portfolio makes payments to the Distributor at an annual rate of 0.25%, 0.25% and 0.50% of each Portfolio’s average daily net assets attributable to its Class ADV, Class S2 and Class T shares, respectively. The Distributor has contractually
agreed to waive a portion of its fee equal to 0.10% of each Portfolio’s average daily net assets attributable to the distribution fee paid by Class S2 shares, so that the actual fee paid is an annual rate of 0.15%. Termination or modification of this obligation requires approval by the Board. With the exception of Index Solution 2060, which does not offer Class T shares, the Distributor has contractually agreed to waive a portion of its fee equal to 0.05% of each Portfolio’s average daily net assets attributable to the distribution fee paid by Class T shares, so that the actual fee paid is an annual rate of 0.45%. Termination or modification of this obligation requires approval by the Board.
The Company has a shareholder servicing plan (“Service Plan”) for the Classes ADV, S, S2 and T shares of each respective Portfolio. The Service Plan allows the Distributor to enter into shareholder servicing agreements with insurance companies, broker dealers or other financial intermediaries that provide administrative services related to Classes ADV, S, S2 and T shares and their shareholders including Variable Contract owners or Qualified Plan participants with interests in the Portfolios. Under the Service Plan, each Portfolio makes payments to the Distributor which shall not exceed an annual rate of 0.25% of each Portfolio’s average daily net assets attributable to its Classes ADV, S, S2 and T shares.
NOTE 6 — OTHER TRANSACTIONS WITH AFFILIATES AND RELATED PARTIES
At December 31, 2015, the following direct or indirect, wholly-owned subsidiaries of Voya Financial, Inc. owned more than 5% of the following Portfolios:
| Subsidiary | | | Portfolio | | | Percentage | |
| ReliaStar Life Insurance Company | | | Index Solution 2060 | | | | | 5.37% | | |
| Voya Institutional Trust Company | | | Index Solution Income | | | | | 49.29 | | |
| | | | Index Solution 2020 | | | | | 33.81 | | |
| | | | Index Solution 2025 | | | | | 22.12 | | |
| | | | Index Solution 2030 | | | | | 39.96 | | |
| | | | Index Solution 2035 | | | | | 18.30 | | |
| | | | Index Solution 2040 | | | | | 7.00 | | |
| | | | Index Solution 2045 | | | | | 14.65 | | |
| | | | Index Solution 2050 | | | | | 5.71 | | |
| | | | Index Solution 2055 | | | | | 10.14 | | |
| | | | Index Solution 2060 | | | | | 6.44 | | |
| Voya Retirement Insurance and Annuity Company | | | Index Solution Income | | | | | 50.67 | | |
| | | | Index Solution 2020 | | | | | 66.14 | | |
| | | | Index Solution 2025 | | | | | 77.81 | | |
| | | | Index Solution 2030 | | | | | 59.95 | | |
| | | | Index Solution 2035 | | | | | 81.64 | | |
| | | | Index Solution 2040 | | | | | 92.59 | | |
| | | | Index Solution 2045 | | | | | 85.35 | | |
NOTES TO FINANCIAL STATEMENTS as of December 31, 2015 (continued)
NOTE 6 — OTHER TRANSACTIONS WITH AFFILIATES AND RELATED PARTIES (continued)
| Subsidiary | | | Portfolio | | | Percentage | |
| | | | Index Solution 2050 | | | | | 93.84 | | |
| | | | Index Solution 2055 | | | | | 89.86 | | |
| | | | Index Solution 2060 | | | | | 88.17 | | |
Under the 1940 Act, the direct or indirect beneficial owner of more than 25% of the voting securities of a company (including a fund) is presumed to control such company. Companies under common control (e.g., companies with a common owner of greater than 25% of their respective voting securities) are affiliates under the 1940 Act.
The Portfolios have adopted a deferred compensation plan (the “Plan”), which allows eligible non-affiliated directors, as described in the Plan, to defer the receipt of all or a portion of the directors’ fees that they are entitled to receive from the Portfolios. For purposes of determining the amount owed to the director under the Plan, the amounts deferred are invested in shares of the funds selected by the director (the “Notional Funds”). The Portfolios purchase shares of the Notional Funds, which are all advised by Voya Investments, LLC, in amounts equal to the directors’ deferred fees, resulting in a Portfolio asset equal to the deferred compensation liability. Such assets are included as a component of “Other assets” on the accompanying Statement of Assets and Liabilities. Deferral of directors’ fees under the Plan will not affect net assets of the Portfolio, and will not materially affect the Portfolios’ assets, liabilities or net investment income per share. Amounts will be deferred until distributed in accordance with the Plan.
NOTE 7 — EXPENSE LIMITATION AGREEMENTS
The Investment Adviser has entered into a written expense limitation agreement (“Expense Limitation Agreement”) with each Portfolio whereby the Investment Adviser has agreed to limit expenses, excluding interest, taxes, investment-related costs, leverage expenses, and extraordinary expenses, except for Class Z, to the levels listed in the table below. For Class Z, the Expense Limitation Agreement excludes investment-related costs, extraordinary expenses and acquired fund fees and expenses to the levels listed in the table below.
| Portfolio | | | Class
ADV(1) | | | Class
I(1) | | | Class
S(1) | | | Class
S2(1) | | | Class
T(1) | | | Class
Z(2)(3) | |
| Index Solution Income | | | | | 1.01% | | | | | | 0.51% | | | | | | 0.76% | | | | | | 0.91% | | | | | | 1.21% | | | | | | 0.00% | | |
| Index Solution 2020 | | | | | 1.01% | | | | | | 0.51% | | | | | | 0.76% | | | | | | 0.91% | | | | | | 1.21% | | | | | | 0.00% | | |
| Index Solution 2025 | | | | | 1.01% | | | | | | 0.51% | | | | | | 0.76% | | | | | | 0.91% | | | | | | 1.21% | | | | | | 0.00% | | |
| Index Solution 2030 | | | | | 1.01% | | | | | | 0.51% | | | | | | 0.76% | | | | | | 0.91% | | | | | | 1.21% | | | | | | 0.00% | | |
| Index Solution 2035 | | | | | 1.01% | | | | | | 0.51% | | | | | | 0.76% | | | | | | 0.91% | | | | | | 1.21% | | | | | | 0.00% | | |
| Index Solution 2040 | | | | | 1.00% | | | | | | 0.50% | | | | | | 0.75% | | | | | | 0.90% | | | | | | 1.20% | | | | | | 0.00% | | |
| Portfolio | | | Class
ADV(1) | | | Class
I(1) | | | Class
S(1) | | | Class
S2(1) | | | Class
T(1) | | | Class
Z(2)(3) | |
| Index Solution 2045 | | | | | 1.01% | | | | | | 0.51% | | | | | | 0.76% | | | | | | 0.91% | | | | | | 1.21% | | | | | | 0.00% | | |
| Index Solution 2050 | | | | | 1.01% | | | | | | 0.51% | | | | | | 0.76% | | | | | | 0.91% | | | | | | 1.21% | | | | | | 0.00% | | |
| Index Solution 2055 | | | | | 1.01% | | | | | | 0.51% | | | | | | 0.76% | | | | | | 0.91% | | | | | | 1.21% | | | | | | 0.00% | | |
| Index Solution 2060 | | | | | 1.01% | | | | | | 0.51% | | | | | | 0.76% | | | | | | 0.91% | | | | | | N/A | | | | | | 0.00% | | |
(1)
The operating expense limits take into account the operating expenses incurred at the Underlying Fund level. The amount of fees and expenses of an Underlying Fund borne by each Portfolio will vary based on each Portfolio’s allocation of assets to, and the net expenses of, a particular Underlying Fund.
(2)
Pursuant to a side letter agreement, through May 1, 2018, the Investment Adviser has agreed to waive all or a portion of the advisory fee so that the direct expense limits are 0.00% for all Portfolios. Any fees waived pursuant to the side letter agreement shall not be eligible for recoupment. Termination or modification of this obligation requires approval by the Board.
(3)
The operating expense limits shown apply only at each Portfolio level and do not include the fees payable by the Underlying Funds in which each Portfolio invests.
The Investment Adviser may at a later date recoup, except for Class Z, from a Portfolio for fees waived and other expenses assumed by the Investment Adviser during the previous 36 months, but only if, after such recoupment, a Portfolio’s expense ratio does not exceed the percentage described above. Waived and reimbursed fees net of any recoupment by the Investment Adviser of such waived and reimbursed fees are reflected on the accompanying Statements of Operations. Amounts payable by the Investment Adviser are reflected on the accompanying Statements of Assets and Liabilities.
As of December 31, 2015, the amounts of waived and/or reimbursed fees that are subject to possible recoupment by the Investment Adviser, and the related expiration dates are as follows:
| | | | December 31, | | | | | | | |
| | | | 2016 | | | 2017 | | | 2018 | | | Total | |
| Index Solution Income | | | | $ | 262,538 | | | | | $ | 283,370 | | | | | $ | 374,853 | | | | | $ | 920,761 | | |
| Index Solution 2020 | | | | | 17,073 | | | | | | 13,317 | | | | | | 23,703 | | | | | | 54,093 | | |
| Index Solution 2025 | | | | | 623,562 | | | | | | 759,707 | | | | | | 713,698 | | | | | | 2,096,967 | | |
| Index Solution 2030 | | | | | 16,565 | | | | | | 13,352 | | | | | | 22,957 | | | | | | 52,874 | | |
| Index Solution 2035 | | | | | 451,323 | | | | | | 552,136 | | | | | | 538,481 | | | | | | 1,541,940 | | |
| Index Solution 2040 | | | | | 16,327 | | | | | | 13,502 | | | | | | 22,307 | | | | | | 52,136 | | |
| Index Solution 2045 | | | | | 268,695 | | | | | | 314,407 | | | | | | 321,987 | | | | | | 905,089 | | |
| Index Solution 2050 | | | | | 16,307 | | | | | | 13,467 | | | | | | 21,910 | | | | | | 51,684 | | |
| Index Solution 2055 | | | | | 66,067 | | | | | | 80,383 | | | | | | 91,837 | | | | | | 238,287 | | |
| Index Solution 2060 | | | | | — | | | | | | — | | | | | | 26,627 | | | | | | 26,627 | | |
The Expense Limitation Agreement is contractual through May 1, 2018 (except for Index Solution 2060, which is through May 1, 2017) and shall renew automatically for one-year terms. Termination or modification of this obligation requires approval by the Board.
NOTES TO FINANCIAL STATEMENTS as of December 31, 2015 (continued)
NOTE 7 — EXPENSE LIMITATION AGREEMENTS (continued)
For the year ended December 31, 2015, Index Solution 2060 had a payable to the Investment Adviser of $569 representing a recoupment of previously reimbursed fees.
NOTE 8 — LINE OF CREDIT
The Portfolios, in addition to certain other funds managed by the Investment Adviser, have entered into an unsecured committed revolving line of credit agreement (the “Credit Agreement”) with The Bank of New York Mellon for an aggregate amount of $200,000,000. The proceeds may be used only to: (1) temporarily finance the purchase and sale of securities; or (2) finance the redemption of shares of an
investor in the funds. The funds to which the line of credit is available pay a commitment fee equal to 0.10% per annum on the daily unused portion of the committed line amount payable quarterly in arrears. Prior to May 22, 2015, the funds to which the Credit Agreement is available paid a commitment fee equal to 0.07% per annum on the daily unused portion of the committed line amount payable quarterly in arrears.
Borrowings under the Credit Agreement accrue interest at the federal funds rate plus a specified margin. Repayments generally must be made within 60 days after the date of a revolving credit advance.
The Portfolios did not utilize the line of credit during the year ended December 31, 2015.
NOTE 9 — CAPITAL SHARES
Transactions in capital shares and dollars were as follows:
| | | | Shares
sold | | | Shares
issued in
merger | | | Reinvestment
of
distributions | | | Shares
redeemed | | | Net increase
(decrease)
in shares
outstanding | | | Shares
sold | | | Proceeds
from shares
issued in
merger | | | Reinvestment
of
distributions | | | Shares
redeemed | | | Net increase
(decrease) | |
| Year or period ended | | | # | | | # | | | # | | | # | | | # | | | ($) | | | ($) | | | ($) | | | ($) | | | ($) | |
| Index Solution Income | |
| Class ADV | | | | | | | | | | | |
| 12/31/2015 | | | | | 1,343,831 | | | | | | 10,951,625 | | | | | | 297,898 | | | | | | (2,083,879) | | | | | | 10,509,475 | | | | | | 13,444,759 | | | | | | 106,767,778 | | | | | | 2,910,466 | | | | | | (20,716,015) | | | | | | 102,406,988 | | |
| 12/31/2014 | | | | | 960,343 | | | | | | — | | | | | | 261,302 | | | | | | (1,176,479) | | | | | | 45,166 | | | | | | 10,358,076 | | | | | | — | | | | | | 2,701,861 | | | | | | (12,697,126) | | | | | | 362,811 | | |
| Class I | | | | | | | | | | | |
| 12/31/2015 | | | | | 421,734 | | | | | | 2,669,648 | | | | | | 49,225 | | | | | | (450,785) | | | | | | 2,689,822 | | | | | | 4,260,951 | | | | | | 26,589,402 | | | | | | 491,261 | | | | | | (4,459,722) | | | | | | 26,881,892 | | |
| 12/31/2014 | | | | | 275,491 | | | | | | — | | | | | | 33,104 | | | | | | (359,382) | | | | | | (50,787) | | | | | | 3,018,885 | | | | | | — | | | | | | 349,244 | | | | | | (3,938,992) | | | | | | (570,863) | | |
| Class S | | | | | | | | | | | |
| 12/31/2015 | | | | | 610,317 | | | | | | 10,746,585 | | | | | | 983,529 | | | | | | (3,365,521) | | | | | | 8,974,910 | | | | | | 6,142,945 | | | | | | 106,152,600 | | | | | | 9,736,935 | | | | | | (33,612,981) | | | | | | 88,419,499 | | |
| 12/31/2014 | | | | | 385,860 | | | | | | — | | | | | | 910,672 | | | | | | (2,034,823) | | | | | | (738,291) | | | | | | 4,245,797 | | | | | | — | | | | | | 9,534,738 | | | | | | (22,066,112) | | | | | | (8,285,577) | | |
| Class S2 | | | | | | | | | | | |
| 12/31/2015 | | | | | 110,560 | | | | | | 1,274,307 | | | | | | 28,268 | | | | | | (288,516) | | | | | | 1,124,619 | | | | | | 1,092,463 | | | | | | 12,355,591 | | | | | | 274,769 | | | | | | (2,906,358) | | | | | | 10,816,465 | | |
| 12/31/2014 | | | | | 58,265 | | | | | | — | | | | | | 35,275 | | | | | | (173,057) | | | | | | (79,517) | | | | | | 619,992 | | | | | | — | | | | | | 362,274 | | | | | | (1,824,233) | | | | | | (841,967) | | |
| Class T | | | | | | | | | | | |
| 12/31/2015 | | | | | — | | | | | | 303 | | | | | | — | | | | | | —* | | | | | | 303 | | | | | | — | | | | | | 2,976 | | | | | | — | | | | | | — | | | | | | 2,976 | | |
| 12/31/2014 | | | | | — | | | | | | — | | | | | | 22 | | | | | | — | | | | | | 22 | | | | | | — | | | | | | — | | | | | | 231 | | | | | | — | | | | | | 231 | | |
| Class Z | | | | | | | | | | | |
5/1/2015(1) -
12/31/2015 | | | | | 190,009 | | | | | | — | | | | | | 30 | | | | | | (23,061) | | | | | | 166,978 | | | | | | 1,873,621 | | | | | | — | | | | | | 297 | | | | | | (224,641) | | | | | | 1,649,277 | | |
| Index Solution 2020 | |
| Class ADV | | | | | | | | | | | |
| 12/31/2015 | | | | | 418,271 | | | | | | — | | | | | | 30 | | | | | | (4,950) | | | | | | 413,351 | | | | | | 4,779,768 | | | | | | — | | | | | | 344 | | | | | | (56,611) | | | | | | 4,723,501 | | |
| 12/31/2014 | | | | | — | | | | | | — | | | | | | 24 | | | | | | — | | | | | | 24 | | | | | | — | | | | | | — | | | | | | 275 | | | | | | — | | | | | | 275 | | |
| Class I | | | | | | | | | | | |
| 12/31/2015 | | | | | 32,278 | | | | | | — | | | | | | —* | | | | | | (5,644) | | | | | | 26,634 | | | | | | 369,062 | | | | | | — | | | | | | 1 | | | | | | (66,188) | | | | | | 302,875 | | |
| 12/31/2014 | | | | | — | | | | | | — | | | | | | 25 | | | | | | — | | | | | | 25 | | | | | | — | | | | | | — | | | | | | 291 | | | | | | — | | | | | | 291 | | |
| Class S | | | | | | | | | | | |
| 12/31/2015 | | | | | 102,494 | | | | | | — | | | | | | —* | | | | | | (9,024) | | | | | | 93,470 | | | | | | 1,190,661 | | | | | | — | | | | | | —* | | | | | | (105,325) | | | | | | 1,085,336 | | |
| 12/31/2014 | | | | | — | | | | | | — | | | | | | 24 | | | | | | — | | | | | | 24 | | | | | | — | | | | | | — | | | | | | 283 | | | | | | — | | | | | | 283 | | |
| Class S2 | | | | | | | | | | | |
| 12/31/2015 | | | | | 35,668 | | | | | | — | | | | | | —* | | | | | | (4,121) | | | | | | 31,547 | | | | | | 416,642 | | | | | | — | | | | | | —* | | | | | | (47,695) | | | | | | 368,947 | | |
| 12/31/2014 | | | | | — | | | | | | — | | | | | | 24 | | | | | | — | | | | | | 24 | | | | | | — | | | | | | — | | | | | | 278 | | | | | | — | | | | | | 278 | | |
| Class T | | | | | | | | | | | |
| 12/31/2015 | | | | | —* | | | | | | — | | | | | | —* | | | | | | — | | | | | | —* | | | | | | 3 | | | | | | — | | | | | | —* | | | | | | — | | | | | | 3 | | |
| 12/31/2014 | | | | | — | | | | | | — | | | | | | 23 | | | | | | — | | | | | | 23 | | | | | | — | | | | | | — | | | | | | 268 | | | | | | — | | | | | | 268 | | |
NOTES TO FINANCIAL STATEMENTS as of December 31, 2015 (continued)
NOTE 9 — CAPITAL SHARES (continued)
| | | | Shares
sold | | | Shares
issued in
merger | | | Reinvestment
of
distributions | | | Shares
redeemed | | | Net increase
(decrease)
in shares
outstanding | | | Shares
sold | | | Proceeds
from shares
issued in
merger | | | Reinvestment
of
distributions | | | Shares
redeemed | | | Net increase
(decrease) | |
| Year or period ended | | | # | | | # | | | # | | | # | | | # | | | ($) | | | ($) | | | ($) | | | ($) | | | ($) | |
| Index Solution 2020 (continued) | |
| Class Z | | | | | | | | | | | |
5/1/2015(1) -
12/31/2015 | | | | | 180,141 | | | | | | — | | | | | | 51 | | | | | | (4,754) | | | | | | 175,438 | | | | | | 2,098,180 | | | | | | — | | | | | | 603 | | | | | | (55,508) | | | | | | 2,043,275 | | |
| Index Solution 2025 | |
| Class ADV | | | | | | | | | | | |
| 12/31/2015 | | | | | 2,925,766 | | | | | | — | | | | | | 2,238,320 | | | | | | (3,934,257) | | | | | | 1,229,829 | | | | | | 32,697,172 | | | | | | — | | | | | | 23,681,428 | | | | | | (43,355,227) | | | | | | 13,023,373 | | |
| 12/31/2014 | | | | | 2,803,677 | | | | | | — | | | | | | 1,404,015 | | | | | | (4,196,702) | | | | | | 10,990 | | | | | | 32,950,980 | | | | | | — | | | | | | 15,865,368 | | | | | | (48,971,969) | | | | | | (155,621) | | |
| Class I | | | | | | | | | | | |
| 12/31/2015 | | | | | 1,223,807 | | | | | | — | | | | | | 508,755 | | | | | | (996,076) | | | | | | 736,486 | | | | | | 13,996,775 | | | | | | — | | | | | | 5,489,468 | | | | | | (10,660,151) | | | | | | 8,826,092 | | |
| 12/31/2014 | | | | | 2,381,776 | | | | | | — | | | | | | 244,603 | | | | | | (1,428,179) | | | | | | 1,198,200 | | | | | | 28,457,059 | | | | | | — | | | | | | 2,812,938 | | | | | | (16,899,085) | | | | | | 14,370,912 | | |
| Class S | | | | | | | | | | | |
| 12/31/2015 | | | | | 2,475,618 | | | | | | — | | | | | | 1,816,551 | | | | | | (4,223,848) | | | | | | 68,321 | | | | | | 28,299,354 | | | | | | — | | | | | | 19,418,927 | | | | | | (45,861,924) | | | | | | 1,856,357 | | |
| 12/31/2014 | | | | | 2,554,614 | | | | | | — | | | | | | 1,008,589 | | | | | | (2,342,926) | | | | | | 1,220,277 | | | | | | 29,849,422 | | | | | | — | | | | | | 11,508,003 | | | | | | (27,687,498) | | | | | | 13,669,927 | | |
| Class S2 | | | | | | | | | | | |
| 12/31/2015 | | | | | 425,446 | | | | | | — | | | | | | 329,593 | | | | | | (1,061,017) | | | | | | (305,978) | | | | | | 4,660,744 | | | | | | — | | | | | | 3,473,910 | | | | | | (12,060,973) | | | | | | (3,926,319) | | |
| 12/31/2014 | | | | | 732,632 | | | | | | — | | | | | | 274,394 | | | | | | (1,462,988) | | | | | | (455,962) | | | | | | 8,538,246 | | | | | | — | | | | | | 3,086,930 | | | | | | (16,641,199) | | | | | | (5,016,023) | | |
| Class T | | | | | | | | | | | |
| 12/31/2015 | | | | | — | | | | | | — | | | | | | — | | | | | | — | | | | | | — | | | | | | — | | | | | | — | | | | | | — | | | | | | — | | | | | | — | | |
| 12/31/2014 | | | | | — | | | | | | — | | | | | | 19 | | | | | | — | | | | | | 19 | | | | | | — | | | | | | — | | | | | | 219 | | | | | | — | | | | | | 219 | | |
| Class Z | | | | | | | | | | | |
5/1/2015(1) -
12/31/2015 | | | | | 239,522 | | | | | | — | | | | | | 48 | | | | | | (18,079) | | | | | | 221,491 | | | | | | 2,514,264 | | | | | | — | | | | | | 522 | | | | | | (190,849) | | | | | | 2,323,937 | | |
| Index Solution 2030 | |
| Class ADV | | | | | | | | | | | |
| 12/31/2015 | | | | | 227,492 | | | | | | — | | | | | | 115 | | | | | | (18,266) | | | | | | 209,341 | | | | | | 2,843,605 | | | | | | — | | | | | | 1,462 | | | | | | (226,871) | | | | | | 2,618,196 | | |
| 12/31/2014 | | | | | — | | | | | | — | | | | | | 27 | | | | | | — | | | | | | 27 | | | | | | — | | | | | | — | | | | | | 342 | | | | | | — | | | | | | 342 | | |
| Class I | | | | | | | | | | | |
| 12/31/2015 | | | | | 62,097 | | | | | | — | | | | | | —* | | | | | | (541) | | | | | | 61,556 | | | | | | 783,259 | | | | | | — | | | | | | —* | | | | | | (6,817) | | | | | | 776,442 | | |
| 12/31/2014 | | | | | — | | | | | | — | | | | | | 29 | | | | | | — | | | | | | 29 | | | | | | — | | | | | | — | | | | | | 363 | | | | | | — | | | | | | 363 | | |
| Class S | | | | | | | | | | | |
| 12/31/2015 | | | | | 58,036 | | | | | | — | | | | | | —* | | | | | | (16,932) | | | | | | 41,104 | | | | | | 735,399 | | | | | | — | | | | | | —* | | | | | | (214,270) | | | | | | 521,129 | | |
| 12/31/2014 | | | | | — | | | | | | — | | | | | | 28 | | | | | | — | | | | | | 28 | | | | | | — | | | | | | — | | | | | | 352 | | | | | | — | | | | | | 352 | | |
| Class S2 | | | | | | | | | | | |
| 12/31/2015 | | | | | 3,853 | | | | | | — | | | | | | —* | | | | | | (426) | | | | | | 3,427 | | | | | | 48,461 | | | | | | — | | | | | | —* | | | | | | (5,317) | | | | | | 43,144 | | |
| 12/31/2014 | | | | | — | | | | | | — | | | | | | 28 | | | | | | — | | | | | | 28 | | | | | | — | | | | | | — | | | | | | 345 | | | | | | — | | | | | | 345 | | |
| Class T | | | | | | | | | | | |
| 12/31/2015 | | | | | — | | | | | | — | | | | | | —* | | | | | | — | | | | | | —* | | | | | | 3 | | | | | | — | | | | | | —* | | | | | | (1) | | | | | | 2 | | |
| 12/31/2014 | | | | | — | | | | | | — | | | | | | 27 | | | | | | — | | | | | | 27 | | | | | | — | | | | | | — | | | | | | 338 | | | | | | — | | | | | | 338 | | |
| Class Z | | | | | | | | | | | |
5/1/2015(1) -
12/31/2015 | | | | | 118,696 | | | | | | — | | | | | | 22 | | | | | | (23,735) | | | | | | 94,983 | | | | | | 1,508,488 | | | | | | — | | | | | | 287 | | | | | | (302,767) | | | | | | 1,206,008 | | |
| Index Solution 2035 | |
| Class ADV | | | | | | | | | | | |
| 12/31/2015 | | | | | 2,166,518 | | | | | | — | | | | | | 2,232,892 | | | | | | (3,152,755) | | | | | | 1,246,655 | | | | | | 25,011,219 | | | | | | — | | | | | | 24,137,564 | | | | | | (35,451,057) | | | | | | 13,697,726 | | |
| 12/31/2014 | | | | | 2,870,042 | | | | | | — | | | | | | 1,199,820 | | | | | | (3,405,171) | | | | | | 664,691 | | | | | | 34,531,485 | | | | | | — | | | | | | 13,977,905 | | | | | | (41,063,964) | | | | | | 7,445,426 | | |
| Class I | | | | | | | | | | | |
| 12/31/2015 | | | | | 1,188,894 | | | | | | — | | | | | | 429,617 | | | | | | (908,306) | | | | | | 710,205 | | | | | | 14,069,611 | | | | | | — | | | | | | 4,742,973 | | | | | | (9,984,964) | | | | | | 8,827,620 | | |
| 12/31/2014 | | | | | 1,645,774 | | | | | | — | | | | | | 168,587 | | | | | | (658,627) | | | | | | 1,155,734 | | | | | | 20,190,708 | | | | | | — | | | | | | 2,001,125 | | | | | | (8,068,263) | | | | | | 14,123,570 | | |
| Class S | | | | | | | | | | | |
| 12/31/2015 | | | | | 2,164,681 | | | | | | — | | | | | | 1,587,740 | | | | | | (3,526,780) | | | | | | 225,641 | | | | | | 25,342,780 | | | | | | — | | | | | | 17,353,998 | | | | | | (39,171,851) | | | | | | 3,524,927 | | |
| 12/31/2014 | | | | | 2,487,915 | | | | | | — | | | | | | 782,784 | | | | | | (2,065,642) | | | | | | 1,205,057 | | | | | | 29,847,400 | | | | | | — | | | | | | 9,213,372 | | | | | | (25,343,630) | | | | | | 13,717,142 | | |
| Class S2 | | | | | | | | | | | |
| 12/31/2015 | | | | | 386,767 | | | | | | — | | | | | | 337,442 | | | | | | (1,105,555) | | | | | | (381,346) | | | | | | 4,365,413 | | | | | | — | | | | | | 3,640,999 | | | | | | (12,933,530) | | | | | | (4,927,118) | | |
| 12/31/2014 | | | | | 634,379 | | | | | | — | | | | | | 263,076 | | | | | | (1,185,849) | | | | | | (288,394) | | | | | | 7,690,776 | | | | | | — | | | | | | 3,056,947 | | | | | | (13,784,046) | | | | | | (3,036,323) | | |
| Class T | | | | | | | | | | | |
| 12/31/2015 | | | | | — | | | | | | — | | | | | | — | | | | | | — | | | | | | — | | | | | | — | | | | | | — | | | | | | — | | | | | | — | | | | | | — | | |
| 12/31/2014 | | | | | — | | | | | | — | | | | | | 20 | | | | | | — | | | | | | 20 | | | | | | — | | | | | | — | | | | | | 236 | | | | | | — | | | | | | 236 | | |
NOTES TO FINANCIAL STATEMENTS as of December 31, 2015 (continued)
NOTE 9 — CAPITAL SHARES (continued)
| | | | Shares
sold | | | Shares
issued in
merger | | | Reinvestment
of
distributions | | | Shares
redeemed | | | Net increase
(decrease)
in shares
outstanding | | | Shares
sold | | | Proceeds
from shares
issued in
merger | | | Reinvestment
of
distributions | | | Shares
redeemed | | | Net increase
(decrease) | |
| Year or period ended | | | # | | | # | | | # | | | # | | | # | | | ($) | | | ($) | | | ($) | | | ($) | | | ($) | |
| Index Solution 2035 (continued) | |
| Class Z | | | | | | | | | | | |
5/1/2015(1) -
12/31/2015 | | | | | 233,338 | | | | | | — | | | | | | 629 | | | | | | (2,350) | | | | | | 231,617 | | | | | | 2,515,923 | | | | | | — | | | | | | 6,956 | | | | | | (25,449) | | | | | | 2,497,430 | | |
| Index Solution 2040 | |
| Class ADV | | | | | | | | | | | |
| 12/31/2015 | | | | | 108,014 | | | | | | — | | | | | | 15 | | | | | | (9,148) | | | | | | 98,881 | | | | | | 1,379,869 | | | | | | — | | | | | | 198 | | | | | | (115,566) | | | | | | 1,264,501 | | |
| 12/31/2014 | | | | | 64 | | | | | | — | | | | | | 26 | | | | | | —* | | | | | | 90 | | | | | | 858 | | | | | | — | | | | | | 349 | | | | | | (3) | | | | | | 1,204 | | |
| Class I | | | | | | | | | | | |
| 12/31/2015 | | | | | 13,472 | | | | | | — | | | | | | —* | | | | | | (885) | | | | | | 12,587 | | | | | | 171,135 | | | | | | — | | | | | | 1 | | | | | | (11,381) | | | | | | 159,755 | | |
| 12/31/2014 | | | | | — | | | | | | — | | | | | | 28 | | | | | | — | | | | | | 28 | | | | | | — | | | | | | — | | | | | | 371 | | | | | | — | | | | | | 371 | | |
| Class S | | | | | | | | | | | |
| 12/31/2015 | | | | | 40,416 | | | | | | — | | | | | | —* | | | | | | (9,448) | | | | | | 30,968 | | | | | | 526,030 | | | | | | — | | | | | | 1 | | | | | | (122,735) | | | | | | 403,296 | | |
| 12/31/2014 | | | | | — | | | | | | — | | | | | | 27 | | | | | | — | | | | | | 27 | | | | | | — | | | | | | — | | | | | | 360 | | | | | | — | | | | | | 360 | | |
| Class S2 | | | | | | | | | | | |
| 12/31/2015 | | | | | 810 | | | | | | — | | | | | | —* | | | | | | (39) | | | | | | 771 | | | | | | 10,416 | | | | | | — | | | | | | 1 | | | | | | (490) | | | | | | 9,927 | | |
| 12/31/2014 | | | | | — | | | | | | — | | | | | | 26 | | | | | | — | | | | | | 26 | | | | | | — | | | | | | — | | | | | | 353 | | | | | | — | | | | | | 353 | | |
| Class T | | | | | | | | | | | |
| 12/31/2015 | | | | | — | | | | | | — | | | | | | —* | | | | | | — | | | | | | —* | | | | | | — | | | | | | — | | | | | | 1 | | | | | | — | | | | | | 1 | | |
| 12/31/2014 | | | | | — | | | | | | — | | | | | | 26 | | | | | | — | | | | | | 26 | | | | | | — | | | | | | — | | | | | | 344 | | | | | | — | | | | | | 344 | | |
| Class Z | | | | | | | | | | | |
5/1/2015(1) -
12/31/2015 | | | | | 86,298 | | | | | | — | | | | | | 78 | | | | | | (1,502) | | | | | | 84,874 | | | | | | 1,110,907 | | | | | | — | | | | | | 1,040 | | | | | | (19,263) | | | | | | 1,092,684 | | |
| Index Solution 2045 | |
| Class ADV | | | | | | | | | | | |
| 12/31/2015 | | | | | 1,840,874 | | | | | | — | | | | | | 1,468,178 | | | | | | (1,977,968) | | | | | | 1,331,084 | | | | | | 21,429,285 | | | | | | — | | | | | | 16,238,051 | | | | | | (22,675,585) | | | | | | 14,991,751 | | |
| 12/31/2014 | | | | | 2,181,890 | | | | | | — | | | | | | 725,093 | | | | | | (2,000,961) | | | | | | 906,022 | | | | | | 26,901,772 | | | | | | — | | | | | | 8,672,107 | | | | | | (24,478,375) | | | | | | 11,095,504 | | |
| Class I | | | | | | | | | | | |
| 12/31/2015 | | | | | 1,215,424 | | | | | | — | | | | | | 276,723 | | | | | | (510,383) | | | | | | 981,764 | | | | | | 14,519,501 | | | | | | — | | | | | | 3,140,806 | | | | | | (5,643,479) | | | | | | 12,016,828 | | |
| 12/31/2014 | | | | | 975,805 | | | | | | — | | | | | | 90,829 | | | | | | (378,117) | | | | | | 688,517 | | | | | | 12,285,409 | | | | | | — | | | | | | 1,110,842 | | | | | | (4,731,449) | | | | | | 8,664,802 | | |
| Class S | | | | | | | | | | | |
| 12/31/2015 | | | | | 1,531,338 | | | | | | — | | | | | | 979,519 | | | | | | (2,341,112) | | | | | | 169,745 | | | | | | 18,249,450 | | | | | | — | | | | | | 10,980,412 | | | | | | (26,872,818) | | | | | | 2,357,044 | | |
| 12/31/2014 | | | | | 1,414,398 | | | | | | — | | | | | | 457,391 | | | | | | (1,265,130) | | | | | | 606,659 | | | | | | 17,550,350 | | | | | | — | | | | | | 5,534,428 | | | | | | (15,794,362) | | | | | | 7,290,416 | | |
| Class S2 | | | | | | | | | | | |
| 12/31/2015 | | | | | 315,781 | | | | | | — | | | | | | 172,923 | | | | | | (622,382) | | | | | | (133,678) | | | | | | 3,634,347 | | | | | | — | | | | | | 1,914,261 | | | | | | (7,454,252) | | | | | | (1,905,644) | | |
| 12/31/2014 | | | | | 390,464 | | | | | | — | | | | | | 112,971 | | | | | | (492,469) | | | | | | 10,966 | | | | | | 4,805,566 | | | | | | — | | | | | | 1,350,003 | | | | | | (5,955,400) | | | | | | 200,169 | | |
| Class T | | | | | | | | | | | |
| 12/31/2015 | | | | | — | | | | | | — | | | | | | — | | | | | | — | | | | | | — | | | | | | — | | | | | | — | | | | | | — | | | | | | — | | | | | | — | | |
| 12/31/2014 | | | | | — | | | | | | — | | | | | | 19 | | | | | | — | | | | | | 19 | | | | | | — | | | | | | — | | | | | | 226 | | | | | | — | | | | | | 226 | | |
| Class Z | | | | | | | | | | | |
5/1/2015(1) -
12/31/2015 | | | | | 50,832 | | | | | | — | | | | | | 31 | | | | | | (748) | | | | | | 50,115 | | | | | | 553,429 | | | | | | — | | | | | | 358 | | | | | | (8,155) | | | | | | 545,632 | | |
| Index Solution 2050 | |
| Class ADV | | | | | | | | | | | |
| 12/31/2015 | | | | | 75,462 | | | | | | — | | | | | | —* | | | | | | (23,295) | | | | | | 52,167 | | | | | | 962,895 | | | | | | — | | | | | | 1 | | | | | | (302,268) | | | | | | 660,628 | | |
| 12/31/2014 | | | | | — | | | | | | — | | | | | | 25 | | | | | | — | | | | | | 25 | | | | | | — | | | | | | — | | | | | | 338 | | | | | | — | | | | | | 338 | | |
| Class I | | | | | | | | | | | |
| 12/31/2015 | | | | | 26,404 | | | | | | — | | | | | | —* | | | | | | (3,674) | | | | | | 22,730 | | | | | | 335,518 | | | | | | — | | | | | | 1 | | | | | | (47,087) | | | | | | 288,432 | | |
| 12/31/2014 | | | | | — | | | | | | — | | | | | | 27 | | | | | | — | | | | | | 27 | | | | | | — | | | | | | — | | | | | | 359 | | | | | | — | | | | | | 359 | | |
| Class S | | | | | | | | | | | |
| 12/31/2015 | | | | | 23,747 | | ��� | | | | — | | | | | | —* | | | | | | (4,255) | | | | | | 19,492 | | | | | | 306,231 | | | | | | — | | | | | | 1 | | | | | | (54,538) | | | | | | 251,694 | | |
| 12/31/2014 | | | | | — | | | | | | — | | | | | | 26 | | | | | | — | | | | | | 26 | | | | | | — | | | | | | — | | | | | | 349 | | | | | | — | | | | | | 349 | | |
| Class S2 | | | | | | | | | | | |
| 12/31/2015 | | | | | 743 | | | | | | — | | | | | | —* | | | | | | —* | | | | | | 743 | | | | | | 9,307 | | | | | | — | | | | | | 1 | | | | | | — | | | | | | 9,308 | | |
| 12/31/2014 | | | | | — | | | | | | — | | | | | | 25 | | | | | | — | | | | | | 25 | | | | | | — | | | | | | — | | | | | | 342 | | | | | | — | | | | | | 342 | | |
| Class T | | | | | | | | | | | |
| 12/31/2015 | | | | | — | | | | | | — | | | | | | —* | | | | | | — | | | | | | —* | | | | | | 23 | | | | | | — | | | | | | 1 | | | | | | — | | | | | | 24 | | |
| 12/31/2014 | | | | | — | | | | | | — | | | | | | 25 | | | | | | — | | | | | | 25 | | | | | | — | | | | | | — | | | | | | 333 | | | | | | — | | | | | | 333 | | |
NOTES TO FINANCIAL STATEMENTS as of December 31, 2015 (continued)
NOTE 9 — CAPITAL SHARES (continued)
| | | | Shares
sold | | | Shares
issued in
merger | | | Reinvestment
of
distributions | | | Shares
redeemed | | | Net increase
(decrease)
in shares
outstanding | | | Shares
sold | | | Proceeds
from shares
issued in
merger | | | Reinvestment
of
distributions | | | Shares
redeemed | | | Net increase
(decrease) | |
| Year or period ended | | | # | | | # | | | # | | | # | | | # | | | ($) | | | ($) | | | ($) | | | ($) | | | ($) | |
| Index Solution 2050 (continued) | |
| Class Z | | | | | | | | | | | |
5/1/2015(1) -
12/31/2015 | | | | | 46,905 | | | | | | — | | | | | | 85 | | | | | | (2,027) | | | | | | 44,963 | | | | | | 603,971 | | | | | | — | | | | | | 1,140 | | | | | | (25,938) | | | | | | 579,173 | | |
| Index Solution 2055 | |
| Class ADV | | | | | | | | | | | |
| 12/31/2015 | | | | | 900,410 | | | | | | — | | | | | | 233,561 | | | | | | (467,458) | | | | | | 666,513 | | | | | | 12,838,610 | | | | | | — | | | | | | 3,213,808 | | | | | | (6,571,970) | | | | | | 9,480,448 | | |
| 12/31/2014 | | | | | 722,460 | | | | | | — | | | | | | 102,726 | | | | | | (365,872) | | | | | | 459,314 | | | | | | 10,668,614 | | | | | | — | | | | | | 1,481,309 | | | | | | (5,352,497) | | | | | | 6,797,426 | | |
| Class I | | | | | | | | | | | |
| 12/31/2015 | | | | | 433,679 | | | | | | — | | | | | | 40,066 | | | | | | (133,475) | | | | | | 340,270 | | | | | | 6,190,272 | | | | | | — | | | | | | 561,326 | | | | | | (1,802,931) | | | | | | 4,948,667 | | |
| 12/31/2014 | | | | | 183,611 | | | | | | — | | | | | | 12,024 | | | | | | (50,103) | | | | | | 145,532 | | | | | | 2,747,158 | | | | | | — | | | | | | 175,914 | | | | | | (736,098) | | | | | | 2,186,974 | | |
| Class S | | | | | | | | | | | |
| 12/31/2015 | | | | | 783,303 | | | | | | — | | | | | | 158,293 | | | | | | (793,583) | | | | | | 148,013 | | | | | | 11,259,852 | | | | | | — | | | | | | 2,198,688 | | | | | | (11,059,282) | | | | | | 2,399,258 | | |
| 12/31/2014 | | | | | 540,460 | | | | | | — | | | | | | 64,880 | | | | | | (243,976) | | | | | | 361,364 | | | | | | 8,028,381 | | | | | | — | | | | | | 942,707 | | | | | | (3,632,274) | | | | | | 5,338,814 | | |
| Class S2 | | | | | | | | | | | |
| 12/31/2015 | | | | | 155,806 | | | | | | — | | | | | | 33,052 | | | | | | (111,625) | | | | | | 77,233 | | | | | | 2,176,589 | | | | | | — | | | | | | 456,452 | | | | | | (1,626,637) | | | | | | 1,006,404 | | |
| 12/31/2014 | | | | | 123,109 | | | | | | — | | | | | | 20,263 | | | | | | (136,203) | | | | | | 7,169 | | | | | | 1,815,555 | | | | | | — | | | | | | 292,603 | | | | | | (1,947,509) | | | | | | 160,649 | | |
| Class T | | | | | | | | | | | |
| 12/31/2015 | | | | | — | | | | | | — | | | | | | —* | | | | | | — | | | | | | —* | | | | | | — | | | | | | — | | | | | | 1 | | | | | | — | | | | | | 1 | | |
| 12/31/2014 | | | | | — | | | | | | — | | | | | | 15 | | | | | | — | | | | | | 15 | | | | | | — | | | | | | — | | | | | | 215 | | | | | | — | | | | | | 215 | | |
| Class Z | | | | | | | | | | | |
5/1/2015(1) -
12/31/2015 | | | | | 32,196 | | | | | | — | | | | | | 1,310 | | | | | | (243) | | | | | | 33,263 | | | | | | 461,919 | | | | | | — | | | | | | 18,367 | | | | | | (3,254) | | | | | | 477,032 | | |
| Index Solution 2060 | |
| Class ADV | | | | | | | | | | | |
2/9/2015(1) -
12/31/2015 | | | | | 21,787 | | | | | | — | | | | | | — | | | | | | (12,921) | | | | | | 8,866 | | | | | | 213,509 | | | | | | — | | | | | | — | | | | | | (129,000) | | | | | | 84,509 | | |
| Class I | | | | | | | | | | | |
2/9/2015(1) -
12/31/2015 | | | | | 4,605 | | | | | | — | | | | | | — | | | | | | (1,335) | | | | | | 3,270 | | | | | | 45,138 | | | | | | — | | | | | | — | | | | | | (13,001) | | | | | | 32,137 | | |
| Class S | | | | | | | | | | | |
2/9/2015(1) -
12/31/2015 | | | | | 14,774 | | | | | | — | | | | | | — | | | | | | (1,390) | | | | | | 13,384 | | | | | | 146,710 | | | | | | — | | | | | | — | | | | | | (13,729) | | | | | | 132,981 | | |
| Class S2 | | | | | | | | | | | |
2/9/2015(1) -
12/31/2015 | | | | | 5,812 | | | | | | — | | | | | | — | | | | | | (5,364) | | | | | | 448 | | | | | | 54,743 | | | | | | — | | | | | | — | | | | | | (53,298) | | | | | | 1,445 | | |
| Class Z | | | | | | | | | | | |
5/1/2015(1) -
12/31/2015 | | | | | 14,664 | | | | | | — | | | | | | — | | | | | | (64) | | | | | | 14,600 | | | | | | 147,221 | | | | | | — | | | | | | — | | | | | | (621) | | | | | | 146,600 | | |
(1)
Commencement of operations.
*
Amount is less than 0.500 per share or $0.50.
NOTE 10 — REORGANIZATIONS
On August 14, 2015, Index Solution Income (“Acquiring Portfolio”) acquired all of the assets of, and assumed all of the liabilities of Voya Index Solution 2015 Portfolio (“Acquired Portfolio”), which is not included in this report, an open-end investment company in a tax-free reorganization in exchange for shares of the Acquiring Portfolio, pursuant to a plan of reorganization. The transaction occurred due to the Acquired Portfolio reaching its Target Date in 2015. For financial reporting purposes, assets received and shares issued by the Acquiring Portfolio were recorded at fair value; however, the cost basis of the investments received from the Acquired
Portfolio were carried forward to align ongoing reporting of the Acquiring Portfolio’s realized and unrealized gains and losses with amounts distributable to shareholders for tax purposes.
Assuming the acquisition had been completed on January 1, 2015, the beginning of the annual reporting period of the Acquiring Portfolio, the Acquiring Portfolio’s pro forma results of operations for the year ended December 31, 2015, are as follows:
| | Net investment income | | | | $ | 8,301,108 | | |
| | Net realized and unrealized loss on investments | | | | $ | (12,026,946) | | |
| | Net decrease in net assets resulting from operations | | | | $ | (3,725,838) | | |
NOTES TO FINANCIAL STATEMENTS as of December 31, 2015 (continued)
NOTE 10 — REORGANIZATIONS (continued)
Because the combined investment portfolios have been managed as a single integrated portfolio since the acquisition was completed, it is not practicable to separate the amounts of revenue and earnings of the Acquired Portfolio that have been included in the Acquiring Portfolio’s statement of operations since August 14, 2015. Net assets and unrealized appreciation or depreciation as of the reorganization date were as follows:
| | Total
Net Assets of
Acquired
Portfolio
(000s) | | | Total
Net Assets of
Acquiring
Portfolio
(000s) | | | Acquired
Portfolio’s
Capital Loss
Carryforwards
(000s) | | | Acquired
Portfolio’s
Unrealized
Depreciation
(000s) | | | Portfolios’
Conversion
Ratio | |
| | $251,868 | | | | $ | 164,154 | | | | | $ | — | | | | | $ | (6,096) | | | | | | 0.9345 | | |
The net assets of the Acquiring Portfolio after the acquisition were $416,022,017.
NOTE 11 — FEDERAL INCOME TAXES
The amount of distributions from net investment income and net realized capital gains are determined in accordance with federal income tax regulations, which may differ from U.S. GAAP for investment companies. These book/tax differences may be either temporary or permanent. Permanent differences are reclassified within the capital accounts based on their federal tax-basis treatment; temporary differences are not reclassified. Key differences include the treatment of short-term capital gains, foreign currency transactions, and wash sale deferrals. Distributions in excess of net investment income and/or net realized capital gains for tax purposes are reported as return of capital.
The following permanent tax differences have been reclassified as of December 31, 2015:
| | | | Undistributed Net
Investment Income | | | Accumulated
Net Realized
Gains/(Losses) | |
| Index Solution Income | | | | $ | 317,962 | | | | | $ | (317,962) | | |
| Index Solution 2020 | | | | | 40 | | | | | | (40) | | |
| Index Solution 2025 | | | | | 1,069,410 | | | | | | (1,069,410) | | |
| Index Solution 2030 | | | | | 53 | | | | | | (53) | | |
| Index Solution 2035 | | | | | 864,487 | | | | | | (864,487) | | |
| Index Solution 2040 | | | | | 64 | | | | | | (64) | | |
| Index Solution 2045 | | | | | 643,731 | | | | | | (643,731) | | |
| Index Solution 2050 | | | | | 61 | | | | | | (61) | | |
| Index Solution 2055 | | | | | 161,852 | | | | | | (161,852) | | |
| Index Solution 2060 | | | | | 48 | | | | | | (48) | | |
Dividends paid by the Portfolios from net investment income and distributions of net realized short-term capital gains are, for federal income tax purposes, taxable as ordinary income to shareholders.
The tax composition of dividends and distributions to shareholders was as follows:
| | | | Year Ended
December 31, 2015 | | | Year Ended
December 31, 2014 | |
| | | | Ordinary
Income | | | Long-term
Capital
Gains | | | Ordinary
Income | | | Long-term
Capital
Gains | |
| Index Solution Income | | | | $ | 3,808,025 | | | | | $ | 9,605,971 | | | | | $ | 3,886,586 | | | | | $ | 9,061,762 | | |
| Index Solution 2020 | | | | | 381 | | | | | | 1,148 | | | | | | 371 | | | | | | 1,024 | | |
| Index Solution 2025 | | | | | 9,305,750 | | | | | | 42,758,861 | | | | | | 8,893,053 | | | | | | 24,380,405 | | |
| Index Solution 2030 | | | | | 480 | | | | | | 1,604 | | | | | | 365 | | | | | | 1,375 | | |
| Index Solution 2035 | | | | | 7,447,396 | | | | | | 42,435,520 | | | | | | 6,463,656 | | | | | | 21,785,929 | | |
| Index Solution 2040 | | | | | 390 | | | | | | 2,013 | | | | | | 325 | | | | | | 1,452 | | |
| Index Solution 2045 | | | | | 4,001,461 | | | | | | 28,272,874 | | | | | | 3,247,357 | | | | | | 13,420,249 | | |
| Index Solution 2050 | | | | | 364 | | | | | | 2,038 | | | | | | 309 | | | | | | 1,412 | | |
| Index Solution 2055 | | | | | 882,789 | | | | | | 5,566,256 | | | | | | 575,978 | | | | | | 2,316,770 | | |
The tax-basis components of distributable earnings as of December 31, 2015 were:
| | | | Undistributed
Ordinary
Income | | | Undistributed
Long-term
Capital Gains | | | Unrealized
Appreciation/
(Depreciation) | |
| Index Solution Income | | | | $ | 6,129,408 | | | | | $ | 5,288,324 | | | | | $ | (24,645,228) | | |
| Index Solution 2020 | | | | | 83,834 | | | | | | 2,227 | | | | | | (128,129) | | |
| Index Solution 2025 | | | | | 11,003,292 | | | | | | 36,182,755 | | | | | | (28,022,629) | | |
| Index Solution 2030 | | | | | 52,018 | | | | | | 4,133 | | | | | | (93,211) | | |
| Index Solution 2035 | | | | | 8,747,021 | | | | | | 37,290,287 | | | | | | (24,751,354) | | |
| Index Solution 2040 | | | | | 28,897 | | | | | | 4,657 | | | | | | (57,945) | | |
| Index Solution 2045 | | | | | 5,100,066 | | | | | | 24,493,116 | | | | | | (16,450,309) | | |
| Index Solution 2050 | | | | | 33,883 | | | | | | 4,263 | | | | | | (35,256) | | |
| Index Solution 2055 | | | | | 1,243,528 | | | | | | 5,680,335 | | | | | | (5,835,923) | | |
| Index Solution 2060 | | | | | 7,582 | | | | | | 1,570 | | | | | | (9,216) | | |
At December 31, 2015, the Portfolios did not have any capital loss carryovers for U.S. federal income tax purposes.
The Portfolios’ major tax jurisdictions are U.S. federal and Arizona state.
As of December 31, 2015, no provision for income tax is required in the Portfolios’ financial statements as a result of tax positions taken on federal and state income tax returns for open tax years. The Portfolios’ federal and state income and federal excise tax returns for tax years for which the applicable statutes of limitations have not expired are subject to examination by the Internal Revenue Service and state department of revenue. The earliest tax year that remains subject to examination by these jurisdictions is 2011.
NOTE 12 — SUBSEQUENT EVENTS
The Portfolios have evaluated events occurring after the Statements of Assets and Liabilities date (“subsequent events”), to determine whether any subsequent events necessitated adjustment to or disclosure in the financial statements. No such subsequent events were identified.
PORTFOLIO OF INVESTMENTS
| Voya Index Solution Income Portfolio | as of December 31, 2015 |
| Shares | | | Value | | | Percentage
of Net
Assets | |
| EXCHANGE-TRADED FUNDS: 13.2% | |
| | | 33,273 | | | | iShares Barclays 20+ Year
Treasury Bond Fund | | | | $ | 4,013,389 | | | | | | 1.1 | | |
| | | 35,137 | | | | iShares iBoxx High Yield
Corporate Bond Fund | | | | | 2,831,339 | | | | | | 0.7 | | |
| | | 53,414 | | | | iShares U.S. Real Estate
ETF | | | | | 4,011,926 | | | | | | 1.0 | | |
| | | 352,577 | | | | PowerShares Senior Loan
Portfolio | | | | | 7,897,725 | | | | | | 2.1 | | |
| | | 588,620 | | | | SPDR Barclays Capital
High Yield Bond ETF | | | | | 19,960,104 | | | | | | 5.2 | | |
| | | 97,971 | | | | SPDR Dow Jones
International Real Estate
ETF | | | | | 3,832,626 | | | | | | 1.0 | | |
| | | 38,843 | | | | SPDR Trust Series 1 | | | | | 7,919,699 | | | | | | 2.1 | | |
| | | | | | | Total Exchange-Traded
Funds
(Cost $55,895,809) | | | | | 50,466,808 | | | | | | 13.2 | | |
| MUTUAL FUNDS: 86.7% | |
| | | | | | | Affiliated Investment Companies: 85.7% | |
| | | 413,096 | | | | Voya Emerging Markets
Index Portfolio - Class I | | | | | 3,655,900 | | | | | | 1.0 | | |
| | | 2,510,497 | | | | Voya International Index
Portfolio - Class I | | | | | 22,644,680 | | | | | | 5.9 | | |
| | | 742,009 | | | | Voya Russell™ Mid Cap
Index Portfolio - Class I | | | | | 11,382,412 | | | | | | 3.0 | | |
| | | 20,361,494 | | | | Voya U.S. Bond Index
Portfolio - Class I | | | | | 214,202,917 | | | | | | 56.1 | | |
| | | 5,651,992 | | | | Voya U.S. Stock Index
Portfolio - Class I | | | | | 75,397,570 | | | | | | 19.7 | | |
| | | | | | | | | | | | 327,283,479 | | | | | | 85.7 | | |
| | Shares | | | Value | | | Percentage
of Net
Assets | |
| | MUTUAL FUNDS: (continued) | |
| | | | | | | | Unaffiliated Investment Companies: 1.0% | |
| | | | 819,010 | @ | | Credit Suisse Commodity
Return Strategy Fund -
Class I | | | | $ | 3,693,736 | | | | | | 1.0 | | |
| | | | | | | | Total Mutual Funds
(Cost $344,738,938) | | | | | 330,977,215 | | | | | | 86.7 | | |
| | | | | | | | Total Investments in
Securities
(Cost $400,634,747) | | | | $ | 381,444,023 | | | | | | 99.9 | | |
| | | | | | | | Assets in Excess of
Other Liabilities | | | | | 443,395 | | | | | | 0.1 | | |
| | | | | | | | Net Assets | | | | $ | 381,887,418 | | | | | | 100.0 | | |
| |
@
Non-income producing security.
Cost for federal income tax purposes is $406,089,251.
Net unrealized depreciation consists of:
| | Gross Unrealized Appreciation | | | | $ | 48,616 | | |
| | Gross Unrealized Depreciation | | | | | (24,693,844) | | |
| | Net Unrealized Depreciation | | | | $ | (24,645,228) | | |
| |
Fair Value Measurements^
The following is a summary of the fair valuations according to the inputs used as of December 31, 2015 in valuing the assets and liabilities:
| | | | Quoted Prices
in Active Markets
for Identical
Investments
(Level 1) | | | Significant
Other
Observable
Inputs
(Level 2) | | | Significant
Unobservable
Inputs
(Level 3) | | | Fair Value
at
December 31,
2015 | |
| Asset Table | | | | | |
| Investments, at fair value | | | | | |
| Exchange-Traded Funds | | | | $ | 50,466,808 | | | | | $ | — | | | | | $ | — | | | | | $ | 50,466,808 | | |
| Mutual Funds | | | | | 330,977,215 | | | | | | — | | | | | | — | | | | | | 330,977,215 | | |
| Total Investments, at fair value | | | | $ | 381,444,023 | | | | | $ | — | | | | | $ | — | | | | | $ | 381,444,023 | | |
| |
^
See Note 2, “Significant Accounting Policies” in the Notes to Financial Statements for additional information.
See Accompanying Notes to Financial Statements
PORTFOLIO OF INVESTMENTS
| Voya Index Solution Income Portfolio | as of December 31, 2015 (continued) |
Transactions with Affiliates
An investment of at least 5% of the voting securities of an issuer, or a company which is under common control results in that issuer becoming an affiliated person as defined by the 1940 Act.
The following table provides transactions during the year ended December 31, 2015, where the following issuers were considered an affiliate:
| Issuer | | | Beginning
Fair Value
at 12/31/14 | | | Purchases
at Cost | | | Sales
at Cost | | | Acquired
at Cost
(Note 10) | | | Acquired
Unrealized
Appreciation/
(Depreciation)
(Note 10) | | | Change in
Unrealized
Appreciation/
(Depreciation) | | | Ending
Fair Value
at 12/31/15 | | | Investment
Income | | | Realized
Gains/
(Losses) | | | Net
Capital Gain
Distributions | |
Voya Emerging Markets
Index Portfolio - Class I | | | | $ | 1,620,242 | | | | | $ | 865,894 | | | | | | (1,010,597) | | | | | $ | 2,883,047 | | | | | $ | (430,926) | | | | | $ | (271,760) | | | | | $ | 3,655,900 | | | | | $ | 31,992 | | | | | $ | (174,199) | | | | | $ | — | | |
| Voya International Index Portfolio - Class I | | | | | 9,897,061 | | | | | | 3,884,519 | | | | | | (4,068,311) | | | | | | 14,943,886 | | | | | | 84,312 | | | | | | (2,096,787) | | | | | | 22,644,680 | | | | | | 290,731 | | | | | | 823,343 | | | | | | — | | |
Voya Russell™ Mid Cap
Index Portfolio - Class I | | | | | 13,758,745 | | | | | | 3,131,275 | | | | | | (13,092,109) | | | | | | 11,617,995 | | | | | | 1,022,351 | | | | | | (5,055,845) | | | | | | 11,382,412 | | | | | | 101,793 | | | | | | 3,926,947 | | | | | | 628,567 | | |
| Voya U.S. Bond Index Portfolio - Class I | | | | | 91,093,301 | | | | | | 34,756,563 | | | | | | (42,962,116) | | | | | | 134,506,875 | | | | | | (1,215,274) | | | | | | (1,976,432) | | | | | | 214,202,917 | | | | | | 3,423,515 | | | | | | (1,527,489) | | | | | | 188,713 | | |
| Voya U.S. Stock Index Portfolio - Class I | | | | | 27,241,973 | | | | | | 21,500,746 | | | | | | (22,542,552) | | | | | | 55,805,172 | | | | | | (3,071,312) | | | | | | (3,536,457) | | | | | | 75,397,570 | | | | | | 1,290,279 | | | | | | (431,860) | | | | | | 2,547,056 | | |
| | | | | $ | 143,611,322 | | | | | $ | 64,138,997 | | | | | $ | (83,675,685) | | | | | $ | 219,756,975 | | | | | $ | (3,610,849) | | | | | $ | (12,937,281) | | | | | $ | 327,283,479 | | | | | $ | 5,138,310 | | | | | $ | 2,616,742 | | | | | $ | 3,364,336 | | |
| |
The financial statements for the above mutual fund[s] can be found at www.sec.gov.
The effect of derivative instruments by primary risk exposure on the Portfolio’s Statement of Operations for the year ended December 31, 2015 was as follows:
| | | | Amount of Realized Gain or (Loss) on
Derivatives Recognized in Income | |
| Derivatives not accounted for as hedging instruments | | | Futures | |
| Equity contracts | | | | $ | (204,654) | | |
| Interest rate contracts | | | | | (59,819) | | |
| Total | | | | $ | (264,473) | | |
| |
| | | | Change in Unrealized Appreciation or (Depreciation)
on Derivatives Recognized in Income | |
| Derivatives not accounted for as hedging instruments | | | Futures | |
| Equity contracts | | | | $ | 91,413 | | |
| Total | | | | $ | 91,413 | | |
| |
See Accompanying Notes to Financial Statements
PORTFOLIO OF INVESTMENTS
| Voya Index Solution 2020 Portfolio | as of December 31, 2015 |
| | Shares | | | | | | Value | | | Percentage
of Net
Assets | |
| | EXCHANGE-TRADED FUNDS: 12.9% | |
| | | | 637 | | | | iShares iBoxx High Yield
Corporate Bond Fund | | | | $ | 51,330 | | | | | | 0.6 | | |
| | | | 984 | | | | iShares U.S. Real Estate ETF | | | | | 73,908 | | | | | | 0.9 | | |
| | | | 7,173 | | | | PowerShares Senior Loan
Portfolio | | | | | 160,675 | | | | | | 1.9 | | |
| | | | 12,359 | | | | SPDR Barclays Capital High
Yield Bond ETF | | | | | 419,094 | | | | | | 4.9 | | |
| | | | 1,814 | | | | SPDR Dow Jones
International Real Estate
ETF | | | | | 70,964 | | | | | | 0.8 | | |
| | | | 1,560 | | | | SPDR Trust Series 1 | | | | | 318,068 | | | | | | 3.8 | | |
| | | | | | | | Total Exchange-Traded
Funds
(Cost $1,123,731) | | | | | 1,094,039 | | | | | | 12.9 | | |
| | MUTUAL FUNDS: 87.0% | |
| | | | | | | | Affiliated Investment Companies: 86.1% | |
| | | | 19,483 | | | | Voya Emerging Markets
Index Portfolio - Class I | | | | | 172,425 | | | | | | 2.0 | | |
| | | | 112,782 | | | | Voya International Index
Portfolio - Class I | | | | | 1,017,291 | | | | | | 12.0 | | |
| | | | 22,359 | | | | Voya Russell™ Mid Cap
Index Portfolio - Class I | | | | | 342,985 | | | | | | 4.0 | | |
| | | | 11,807 | | | | Voya Russell™ Small Cap
Index Portfolio - Class I | | | | | 168,249 | | | | | | 2.0 | | |
| | | | 320,605 | | | | Voya U.S. Bond Index
Portfolio - Class I | | | | | 3,372,768 | | | | | | 39.7 | | |
| | | | 167,905 | | | | Voya U.S. Stock Index
Portfolio - Class I | | | | | 2,239,848 | | | | | | 26.4 | | |
| | | | | | | | | | | | | 7,313,566 | | | | | | 86.1 | | |
| | Shares | | | | | | Value | | | Percentage
of Net
Assets | |
| | MUTUAL FUNDS: (continued) | |
| | | | | | | | Unaffiliated Investment Companies: 0.9% | |
| | | | 17,796 | @ | | Credit Suisse Commodity
Return Strategy Fund -
Class I | | | | $ | 80,260 | | | | | | 0.9 | | |
| | | | | | | | Total Mutual Funds
(Cost $7,485,603) | | | | | 7,393,826 | | | | | | 87.0 | | |
| | | | | | | | Total Investments in
Securities
(Cost $8,609,334) | | | | $ | 8,487,865 | | | | | | 99.9 | | |
| | | | | | | | Assets in Excess of
Other Liabilities | | | | | 10,456 | | | | | | 0.1 | | |
| | | | | | | | Net Assets | | | | $ | 8,498,321 | | | | | | 100.0 | | |
| |
@
Non-income producing security.
Cost for federal income tax purposes is $8,615,994.
Net unrealized depreciation consists of:
| | Gross Unrealized Appreciation | | | | $ | 2,468 | | |
| | Gross Unrealized Depreciation | | | | | (130,597) | | |
| | Net Unrealized Depreciation | | | | $ | (128,129) | | |
| |
Fair Value Measurements^
The following is a summary of the fair valuations according to the inputs used as of December 31, 2015 in valuing the assets and liabilities:
| | | | Quoted Prices
in Active Markets
for Identical
Investments
(Level 1) | | | Significant
Other
Observable
Inputs
(Level 2) | | | Significant
Unobservable
Inputs
(Level 3) | | | Fair Value
at
December 31,
2015 | |
| Asset Table | | | | | |
| Investments, at fair value | | | | | |
| Exchange-Traded Funds | | | | $ | 1,094,039 | | | | | $ | — | | | | | $ | — | | | | | $ | 1,094,039 | | |
| Mutual Funds | | | | | 7,393,826 | | | | | | — | | | | | | — | | | | | | 7,393,826 | | |
| Total Investments, at fair value | | | | $ | 8,487,865 | | | | | $ | — | | | | | $ | — | | | | | $ | 8,487,865 | | |
| |
^
See Note 2, “Significant Accounting Policies” in the Notes to Financial Statements for additional information.
See Accompanying Notes to Financial Statements
PORTFOLIO OF INVESTMENTS
| Voya Index Solution 2020 Portfolio | as of December 31, 2015 (continued) |
Transactions with Affiliates
An investment of at least 5% of the voting securities of an issuer, or a company which is under common control results in that issuer becoming an affiliated person as defined by the 1940 Act.
The following table provides transactions during the year ended December 31, 2015, where the following issuers were considered an affiliate:
| Issuer | | | Beginning
Fair Value
at 12/31/14 | | | Purchases
at Cost | | | Sales
at Cost | | | Change in
Unrealized
Appreciation/
(Depreciation) | | | Ending
Fair Value
at 12/31/15 | | | Investment
Income | | | Realized
Gains/
(Losses) | | | Net Capital
Gain
Distributions | |
| Voya Emerging Markets Index Portfolio - Class I | | | | $ | 338 | | | | | $ | 182,791 | | | | | $ | (4,058) | | | | | $ | (6,646) | | | | | $ | 172,425 | | | | | $ | 7 | | | | | $ | (147) | | | | | $ | — | | |
| Voya International Index Portfolio - Class I | | | | | 2,147 | | | | | | 1,077,730 | | | | | | (52,121) | | | | | | (10,465) | | | | | | 1,017,291 | | | | | | 66 | | | | | | 612 | | | | | | — | | |
| Voya Russell™ Mid Cap Index Portfolio - Class I | | | | | 2,051 | | | | | | 455,428 | | | | | | (109,897) | | | | | | (4,597) | | | | | | 342,985 | | | | | | 14 | | | | | | 2,987 | | | | | | 85 | | |
| Voya Russell™ Small Cap Index Portfolio - Class I | | | | | 363 | | | | | | 172,939 | | | | | | (2,026) | | | | | | (3,027) | | | | | | 168,249 | | | | | | 4 | | | | | | 15 | | | | | | 32 | | |
| Voya U.S. Bond Index Portfolio - Class I | | | | | 6,148 | | | | | | 4,321,658 | | | | | | (921,853) | | | | | | (33,185) | | | | | | 3,372,768 | | | | | | 22,201 | | | | | | (1,143) | | | | | | 14 | | |
| Voya U.S. Stock Index Portfolio - Class I | | | | | 4,436 | | | | | | 2,770,059 | | | | | | (505,542) | | | | | | (29,105) | | | | | | 2,239,848 | | | | | | 33,207 | | | | | | 20,925 | | | | | | 861 | | |
| | | | | $ | 15,483 | | | | | $ | 8,980,605 | | | | | $ | (1,595,497) | | | | | $ | (87,025) | | | | | $ | 7,313,566 | | | | | $ | 55,499 | | | | | $ | 23,249 | | | | | $ | 992 | | |
| |
The financial statements for the above mutual fund[s] can be found at www.sec.gov.
See Accompanying Notes to Financial Statements
PORTFOLIO OF INVESTMENTS
| Voya Index Solution 2025 Portfolio | as of December 31, 2015 |
| Shares | | | | | | Value | | | Percentage
of Net
Assets | |
| EXCHANGE-TRADED FUNDS: 14.4% | |
| | | 44,834 | | | | iShares iBoxx High Yield
Corporate Bond Fund | | | | $ | 3,612,724 | | | | | | 0.7 | | |
| | | 68,363 | | | | iShares U.S. Real Estate ETF | | | | | 5,134,745 | | | | | | 1.1 | | |
| | | 451,286 | | | | PowerShares Senior Loan
Portfolio | | | | | 10,108,806 | | | | | | 2.1 | | |
| | | 751,481 | | | | SPDR Barclays Capital High
Yield Bond ETF | | | | | 25,482,721 | | | | | | 5.3 | | |
| | | 124,948 | | | | SPDR Dow Jones International
Real Estate ETF | | | | | 4,887,966 | | | | | | 1.0 | | |
| | | 99,415 | | | | SPDR Trust Series 1 | | | | | 20,269,724 | | | | | | 4.2 | | |
| | | | | | | Total Exchange-Traded Funds
(Cost $75,592,522) | | | | | 69,496,686 | | | | | | 14.4 | | |
| MUTUAL FUNDS: 85.5% | |
| | | | | | | Affiliated Investment Companies: 84.5% | |
| | | 1,573,365 | | | | Voya Emerging Markets Index
Portfolio - Class I | | | | | 13,924,282 | | | | | | 2.9 | | |
| | | 7,949,957 | | | | Voya International Index
Portfolio - Class I | | | | | 71,708,609 | | | | | | 14.9 | | |
| | | 2,154,766 | | | | Voya Russell™ Mid Cap
Index Portfolio - Class I | | | | | 33,054,103 | | | | | | 6.9 | | |
| | | 1,010,784 | | | | Voya Russell™ Small Cap
Index Portfolio - Class I | | | | | 14,403,666 | | | | | | 3.0 | | |
| | | 12,788,807 | | | | Voya U.S. Bond Index
Portfolio - Class I | | | | | 134,538,253 | | | | | | 28.0 | | |
| | | 10,393,329 | | | | Voya U.S. Stock Index
Portfolio - Class I | | | | | 138,647,008 | | | | | | 28.8 | | |
| | | | | | | | | | | | 406,275,921 | | | | | | 84.5 | | |
| | Shares | | | | | | Value | | | Percentage
of Net
Assets | |
| | MUTUAL FUNDS: (continued) | |
| | | | | | | | Unaffiliated Investment Companies: 1.0% | |
| | | | 1,057,886 | @ | | Credit Suisse Commodity
Return Strategy Fund -
Class I | | | | $ | 4,771,067 | | | | | | 1.0 | | |
| | | | | | | | Total Mutual Funds
(Cost $428,451,094) | | | | | 411,046,988 | | | | | | 85.5 | | |
| | | | | | | | Total Investments in
Securities
(Cost $504,043,616) | | | | $ | 480,543,674 | | | | | | 99.9 | | |
| | | | | | | | Assets in Excess of Other
Liabilities | | | | | 478,985 | | | | | | 0.1 | | |
| | | | | | | | Net Assets | | | | $ | 481,022,659 | | | | | | 100.0 | | |
| |
@
Non-income producing security.
Cost for federal income tax purposes is $508,566,303.
Net unrealized depreciation consists of:
| | Gross Unrealized Appreciation | | | | $ | 423,341 | | |
| | Gross Unrealized Depreciation | | | | | (28,445,970) | | |
| | Net Unrealized Depreciation | | | | $ | (28,022,629) | | |
| |
Fair Value Measurements^
The following is a summary of the fair valuations according to the inputs used as of December 31, 2015 in valuing the assets and liabilities:
| | | | Quoted Prices
in Active Markets
for Identical
Investments
(Level 1) | | | Significant
Other
Observable
Inputs
(Level 2) | | | Significant
Unobservable
Inputs
(Level 3) | | | Fair Value
at
December 31,
2015 | |
| Asset Table | | | | | |
| Investments, at fair value | | | | | |
| Exchange-Traded Funds | | | | $ | 69,496,686 | | | | | $ | — | | | | | $ | — | | | | | $ | 69,496,686 | | |
| Mutual Funds | | | | | 411,046,988 | | | | | | — | | | | | | — | | | | | | 411,046,988 | | |
| Total Investments, at fair value | | | | $ | 480,543,674 | | | | | $ | — | | | | | $ | — | | | | | $ | 480,543,674 | | |
| |
^
See Note 2, “Significant Accounting Policies” in the Notes to Financial Statements for additional information.
See Accompanying Notes to Financial Statements
PORTFOLIO OF INVESTMENTS
| Voya Index Solution 2025 Portfolio | as of December 31, 2015 (continued) |
Transactions with Affiliates
An investment of at least 5% of the voting securities of an issuer, or a company which is under common control results in that issuer becoming an affiliated person as defined by the 1940 Act.
The following table provides transactions during the year ended December 31, 2015, where the following issuers were considered an affiliate:
| Issuer | | | Beginning
Fair Value
at 12/31/14 | | | Purchases
at Cost | | | Sales
at Cost | | | Change in
Unrealized
Appreciation/
(Depreciation) | | | Ending
Fair Value
at 12/31/15 | | | Investment
Income | | | Realized
Gains/
(Losses) | | | Net Capital
Gain
Distributions | |
Voya Emerging Markets Index Portfolio -
Class I | | | | $ | 14,829,930 | | | | | $ | 5,475,268 | | | | | $ | (3,909,008) | | | | | $ | (2,471,908) | | | | | $ | 13,924,282 | | | | | $ | 307,632 | | | | | $ | (207,371) | | | | | $ | — | | |
| Voya International Index Portfolio - Class I | | | | | 75,382,254 | | | | | | 15,620,306 | | | | | | (13,362,462) | | | | | | (5,931,489) | | | | | | 71,708,609 | | | | | | 2,329,712 | | | | | | 3,359,487 | | | | | | — | | |
Voya Russell™ Mid Cap Index Portfolio -
Class I | | | | | 73,315,139 | | | | | | 10,598,915 | | | | | | (32,956,871) | | | | | | (17,903,080) | | | | | | 33,054,103 | | | | | | 586,667 | | | | | | 13,748,739 | | | | | | 3,622,654 | | |
| Voya Russell™ Small Cap Index Portfolio - Class I | | | | | 15,960,453 | | | | | | 3,652,753 | | | | | | (2,370,012) | | | | | | (2,839,528) | | | | | | 14,403,666 | | | | | | 168,315 | | | | | | 652,013 | | | | | | 1,355,539 | | |
| Voya U.S. Bond Index Portfolio - Class I | | | | | 115,918,387 | | | | | | 62,655,096 | | | | | | (42,058,071) | | | | | | (1,977,159) | | | | | | 134,538,253 | | | | | | 2,903,979 | | | | | | (1,114,826) | | | | | | 285,400 | | |
| Voya U.S. Stock Index Portfolio - Class I | | | | | 141,135,730 | | | | | | 51,501,029 | | | | | | (36,086,601) | | | | | | (17,903,150) | | | | | | 138,647,008 | | | | | | 2,693,430 | | | | | | 3,883,151 | | | | | | 13,354,581 | | |
| | | | | $ | 436,541,893 | | | | | $ | 149,503,367 | | | | | $ | (130,743,025) | | | | | $ | (49,026,314) | | | | | $ | 406,275,921 | | | | | $ | 8,989,735 | | | | | $ | 20,321,193 | | | | | $ | 18,618,174 | | |
| |
The financial statements for the above mutual fund[s] can be found at www.sec.gov.
The effect of derivative instruments by primary risk exposure on the Portfolio’s Statement of Operations for the year ended December 31, 2015 was as follows:
| | | | Amount of Realized Gain or (Loss) on
Derivatives Recognized in Income | |
| Derivatives not accounted for as hedging instruments | | | Futures | |
| Equity contracts | | | | $ | 683,313 | | |
| Total | | | | $ | 683,313 | | |
| |
| | | | Change in Unrealized Appreciation or (Depreciation)
on Derivatives Recognized in Income | |
| Derivatives not accounted for as hedging instruments | | | Futures | |
| Equity contracts | | | | $ | 265,099 | | |
| Total | | | | $ | 265,099 | | |
| |
See Accompanying Notes to Financial Statements
PORTFOLIO OF INVESTMENTS
| Voya Index Solution 2030 Portfolio | as of December 31, 2015 |
| | Shares | | | | | | Value | | | Percentage
of Net
Assets | |
| | EXCHANGE-TRADED FUNDS: 12.1% | |
| | | | 140 | | | | iShares iBoxx High Yield
Corporate Bond Fund | | | | $ | 11,281 | | | | | | 0.2 | | |
| | | | 910 | | | | iShares U.S. Real Estate ETF | | | | | 68,350 | | | | | | 1.3 | | |
| | | | 4,358 | | | | PowerShares Senior Loan
Portfolio | | | | | 97,619 | | | | | | 1.9 | | |
| | | | 5,364 | | | | SPDR Barclays Capital High
Yield Bond ETF | | | | | 181,893 | | | | | | 3.6 | | |
| | | | 1,723 | | | | SPDR Dow Jones
International Real Estate ETF | | | | | 67,404 | | | | | | 1.3 | | |
| | | | 948 | | | | SPDR Trust Series 1 | | | | | 193,288 | | | | | | 3.8 | | |
| | | | | | | | Total Exchange-Traded Funds
(Cost $632,615) | | | | | 619,835 | | | | | | 12.1 | | |
| | MUTUAL FUNDS: 87.8% | |
| | | | | | | | Affiliated Investment Companies: 87.0% | |
| | | | 23,631 | | | | Voya Emerging Markets Index
Portfolio - Class I | | | | | 209,130 | | | | | | 4.1 | | |
| | | | 106,069 | | | | Voya International Index
Portfolio - Class I | | | | | 956,738 | | | | | | 18.6 | | |
| | | | 25,192 | | | | Voya Russell™ Mid Cap Index
Portfolio - Class I | | | | | 386,443 | | | | | | 7.5 | | |
| | | | 10,813 | | | | Voya Russell™ Small Cap
Index Portfolio - Class I | | | | | 154,091 | | | | | | 3.0 | | |
| | | | 95,000 | | | | Voya U.S. Bond Index
Portfolio - Class I | | | | | 999,397 | | | | | | 19.4 | | |
| | | | 132,564 | | | | Voya U.S. Stock Index
Portfolio - Class I | | | | | 1,768,409 | | | | | | 34.4 | | |
| | | | | | | | | | | | | 4,474,208 | | | | | | 87.0 | | |
| | Shares | | | | | | Value | | | Percentage
of Net
Assets | |
| | MUTUAL FUNDS: (continued) | |
| | | | | | | | Unaffiliated Investment Companies: 0.8% | |
| | | | 9,852 | @ | | Credit Suisse Commodity
Return Strategy Fund -
Class I | | | | $ | 44,433 | | | | | | 0.8 | | |
| | | | | | | | Total Mutual Funds
(Cost $4,592,437) | | | | | 4,518,641 | | | | | | 87.8 | | |
| | | | | | | | Total Investments in
Securities
(Cost $5,225,052) | | | | $ | 5,138,476 | | | | | | 99.9 | | |
| | | | | | | | Assets in Excess of
Other Liabilities | | | | | 6,193 | | | | | | 0.1 | | |
| | | | | | | | Net Assets | | | | $ | 5,144,669 | | | | | | 100.0 | | |
| |
@
Non-income producing security.
Cost for federal income tax purposes is $5,231,687.
Net unrealized depreciation consists of:
| | Gross Unrealized Appreciation | | | | $ | 562 | | |
| | Gross Unrealized Depreciation | | | | | (93,773) | | |
| | Net Unrealized Depreciation | | | | $ | (93,211) | | |
| |
Fair Value Measurements^
The following is a summary of the fair valuations according to the inputs used as of December 31, 2015 in valuing the assets and liabilities:
| | | | Quoted Prices
in Active Markets
for Identical
Investments
(Level 1) | | | Significant
Other
Observable
Inputs
(Level 2) | | | Significant
Unobservable
Inputs
(Level 3) | | | Fair Value
at
December 31,
2015 | |
| Asset Table | | | | | |
| Investments, at fair value | | | | | |
| Exchange-Traded Funds | | | | $ | 619,835 | | | | | $ | — | | | | | $ | — | | | | | $ | 619,835 | | |
| Mutual Funds | | | | | 4,518,641 | | | | | | — | | | | | | — | | | | | | 4,518,641 | | |
| Total Investments, at fair value | | | | $ | 5,138,476 | | | | | $ | — | | | | | $ | — | | | | | $ | 5,138,476 | | |
| | | | | | |
^
See Note 2, “Significant Accounting Policies” in the Notes to Financial Statements for additional information.
See Accompanying Notes to Financial Statements
PORTFOLIO OF INVESTMENTS
| Voya Index Solution 2030 Portfolio | as of December 31, 2015 (continued) |
Transactions with Affiliates
An investment of at least 5% of the voting securities of an issuer, or a company which is under common control results in that issuer becoming an affiliated person as defined by the 1940 Act.
The following table provides transactions during the year ended December 31, 2015, where the following issuers were considered an affiliate:
| Issuer | | | Beginning
Fair Value
at 12/31/14 | | | Purchases
at Cost | | | Sales
at Cost | | | Change in
Unrealized
Appreciation/
(Depreciation) | | | Ending
Fair Value
at 12/31/15 | | | Investment
Income | | | Realized
Gains/
(Losses) | | | Net Capital
Gain
Distributions | |
| Voya Emerging Markets Index Portfolio - Class I | | | | $ | 772 | | | | | $ | 231,214 | | | | | $ | (15,295) | | | | | $ | (7,561) | | | | | $ | 209,130 | | | | | $ | 16 | | | | | $ | (456) | | | | | $ | — | | |
| Voya International Index Portfolio - Class I | | | | | 3,927 | | | | | | 1,080,034 | | | | | | (116,035) | | | | | | (11,188) | | | | | | 956,738 | | | | | | 120 | | | | | | (799) | | | | | | — | | |
| Voya Russell™ Mid Cap Index Portfolio - Class I | | | | | 2,864 | | | | | | 481,959 | | | | | | (91,518) | | | | | | (6,862) | | | | | | 386,443 | | | | | | 23 | | | | | | 1,450 | | | | | | 140 | | |
| Voya Russell™ Small Cap Index Portfolio - Class I | | | | | 624 | | | | | | 170,329 | | | | | | (13,908) | | | | | | (2,954) | | | | | | 154,091 | | | | | | 7 | | | | | | (11) | | | | | | 53 | | |
| Voya U.S. Bond Index Portfolio - Class I | | | | | 2,882 | | | | | | 1,472,123 | | | | | | (465,556) | | | | | | (10,052) | | | | | | 999,397 | | | | | | 6,121 | | | | | | (495) | | | | | | 7 | | |
| Voya U.S. Stock Index Portfolio - Class I | | | | | 6,535 | | | | | | 2,269,208 | | | | | | (473,450) | | | | | | (33,884) | | | | | | 1,768,409 | | | | | | 26,081 | | | | | | 15,236 | | | | | | 1,613 | | |
| | | | | $ | 17,604 | | | | | $ | 5,704,867 | | | | | $ | (1,175,762) | | | | | $ | (72,501) | | | | | $ | 4,474,208 | | | | | $ | 32,368 | | | | | $ | 14,925 | | | | | $ | 1,813 | | |
| |
The financial statements for the above mutual fund[s] can be found at www.sec.gov.
See Accompanying Notes to Financial Statements
PORTFOLIO OF INVESTMENTS
| Voya Index Solution 2035 Portfolio | as of December 31, 2015 |
| Shares | | | | | | Value | | | Percentage
of Net
Assets | |
| EXCHANGE-TRADED FUNDS: 13.4% | |
| | | 11,617 | | | | iShares iBoxx High Yield
Corporate Bond Fund | | | | $ | 936,098 | | | | | | 0.2 | | |
| | | 85,086 | | | | iShares U.S. Real Estate
ETF | | | | | 6,390,809 | | | | | | 1.6 | | |
| | | 374,427 | | | | PowerShares Senior Loan
Portfolio | | | | | 8,387,165 | | | | | | 2.1 | | |
| | | 445,072 | | | | SPDR Barclays Capital High
Yield Bond ETF | | | | | 15,092,391 | | | | | | 3.8 | | |
| | | 156,010 | | | | SPDR Dow Jones
International Real Estate ETF | | | | | 6,103,111 | | | | | | 1.5 | | |
| | | 82,477 | | | | SPDR Trust Series 1 | | | | | 16,816,236 | | | | | | 4.2 | | |
| | | | | | | Total Exchange-Traded
Funds
(Cost $57,535,551) | | | | | 53,725,810 | | | | | | 13.4 | | |
| MUTUAL FUNDS: 86.5% | |
| | | | | | | Affiliated Investment Companies: 85.5% | |
| | | 1,750,554 | | | | Voya Emerging Markets
Index Portfolio - Class I | | | | | 15,492,406 | | | | | | 3.9 | | |
| | | 8,164,809 | | | | Voya International Index
Portfolio - Class I | | | | | 73,646,576 | | | | | | 18.4 | | |
| | | 2,212,048 | | | | Voya Russell™ Mid Cap Index
Portfolio - Class I | | | | | 33,932,811 | | | | | | 8.5 | | |
| | | 1,122,464 | | | | Voya Russell™ Small Cap
Index Portfolio - Class I | | | | | 15,995,118 | | | | | | 4.0 | | |
| | | 4,128,222 | | | | Voya U.S. Bond Index
Portfolio - Class I | | | | | 43,428,897 | | | | | | 10.9 | | |
| | | 11,926,476 | | | | Voya U.S. Stock Index
Portfolio - Class I | | | | | 159,099,195 | | | | | | 39.8 | | |
| | | | | | | | | | | | 341,595,003 | | | | | | 85.5 | | |
| | Shares | | | | | | Value | | | Percentage
of Net
Assets | |
| | MUTUAL FUNDS: (continued) | |
| | | | | | | | Unaffiliated Investment Companies: 1.0% | |
| | | | 872,091 | @ | | Credit Suisse Commodity
Return Strategy Fund -
Class I | | | | $ | 3,933,129 | | | | | | 1.0 | | |
| | | | | | | | Total Mutual Funds
(Cost $365,228,264) | | | | | 345,528,132 | | | | | | 86.5 | | |
| | | | | | | | Total Investments in
Securities
(Cost $422,763,815) | | | | $ | 399,253,942 | | | | | | 99.9 | | |
| | | | | | | | Assets in Excess of
Other Liabilities | | | | | 405,875 | | | | | | 0.1 | | |
| | | | | | | | Net Assets | | | | $ | 399,659,817 | | | | | | 100.0 | | |
| |
@
Non-income producing security.
Cost for federal income tax purposes is $424,005,296.
Net unrealized depreciation consists of:
| | Gross Unrealized Appreciation | | | | $ | 346,824 | | |
| | Gross Unrealized Depreciation | | | | | (25,098,178) | | |
| | Net Unrealized Depreciation | | | | $ | (24,751,354) | | |
| |
Fair Value Measurements^
The following is a summary of the fair valuations according to the inputs used as of December 31, 2015 in valuing the assets and liabilities:
| | | | Quoted Prices
in Active Markets
for Identical
Investments
(Level 1) | | | Significant
Other
Observable
Inputs
(Level 2) | | | Significant
Unobservable
Inputs
(Level 3) | | | Fair Value
at
December 31,
2015 | |
| Asset Table | | | | | |
| Investments, at fair value | | | | | |
| Exchange-Traded Funds | | | | $ | 53,725,810 | | | | | $ | — | | | | | $ | — | | | | | $ | 53,725,810 | | |
| Mutual Funds | | | | | 345,528,132 | | | | | | — | | | | | | — | | | | | | 345,528,132 | | |
| Total Investments, at fair value | | | | $ | 399,253,942 | | | | | $ | — | | | | | $ | — | | | | | $ | 399,253,942 | | |
| | | | | | |
^
See Note 2, “Significant Accounting Policies” in the Notes to Financial Statements for additional information.
See Accompanying Notes to Financial Statements
PORTFOLIO OF INVESTMENTS
| Voya Index Solution 2035 Portfolio | as of December 31, 2015 (continued) |
Transactions with Affiliates
An investment of at least 5% of the voting securities of an issuer, or a company which is under common control results in that issuer becoming an affiliated person as defined by the 1940 Act.
The following table provides transactions during the year ended December 31, 2015, where the following issuers were considered an affiliate:
| Issuer | | | Beginning
Fair Value
at 12/31/14 | | | Purchases
at Cost | | | Sales
at Cost | | | Change in
Unrealized
Appreciation/
(Depreciation) | | | Ending
Fair Value
at 12/31/15 | | | Investment
Income | | | Realized
Gains/
(Losses) | | | Net Capital
Gain
Distributions | |
| Voya Emerging Markets Index Portfolio - Class I | | | | $ | 16,566,575 | | | | | $ | 5,758,887 | | | | | $ | (4,073,020) | | | | | $ | (2,760,036) | | | | | $ | 15,492,406 | | | | | $ | 342,659 | | | | | $ | (260,313) | | | | | $ | — | | |
| Voya International Index Portfolio - Class I | | | | | 84,214,562 | | | | | | 14,794,700 | | | | | | (17,847,802) | | | | | | (7,514,884) | | | | | | 73,646,576 | | | | | | 2,594,898 | | | | | | 4,692,321 | | | | | | — | | |
| Voya Russell™ Mid Cap Index Portfolio - Class I | | | | | 65,815,463 | | | | | | 8,663,062 | | | | | | (24,847,732) | | | | | | (15,697,982) | | | | | | 33,932,811 | | | | | | 544,404 | | | | | | 11,556,231 | | | | | | 3,361,682 | | |
| Voya Russell™ Small Cap Index Portfolio - Class I | | | | | 17,830,097 | | | | | | 3,752,348 | | | | | | (2,471,159) | | | | | | (3,116,168) | | | | | | 15,995,118 | | | | | | 187,487 | | | | | | 645,124 | | | | | | 1,509,944 | | |
| Voya U.S. Bond Index Portfolio - Class I | | | | | 26,425,533 | | | | | | 33,523,834 | | | | | | (15,364,074) | | | | | | (1,156,396) | | | | | | 43,428,897 | | | | | | 840,679 | | | | | | 153,710 | | | | | | 85,696 | | |
| Voya U.S. Stock Index Portfolio - Class I | | | | | 166,379,505 | | | | | | 47,898,322 | | | | | | (35,571,979) | | | | | | (19,606,653) | | | | | | 159,099,195 | | | | | | 3,120,519 | | | | | | 3,086,051 | | | | | | 15,398,420 | | |
| | | | | $ | 377,231,735 | | | | | $ | 114,391,153 | | | | | $ | (100,175,766) | | | | | $ | (49,852,119) | | | | | $ | 341,595,003 | | | | | $ | 7,630,646 | | | | | $ | 19,873,124 | | | | | $ | 20,355,742 | | |
| |
The financial statements for the above mutual fund[s] can be found at www.sec.gov.
The effect of derivative instruments by primary risk exposure on the Portfolio’s Statement of Operations for the year ended December 31, 2015 was as follows:
| | | | Amount of Realized Gain or (Loss) on
Derivatives Recognized in Income | |
| Derivatives not accounted for as hedging instruments | | | Futures | |
| Equity contracts | | | | $ | 343,578 | | |
| Interest rate contracts | | | | | (30,873) | | |
| Total | | | | $ | 312,705 | | |
| |
| | | | Change in Unrealized Appreciation or (Depreciation)
on Derivatives Recognized in Income | |
| Derivatives not accounted for as hedging instruments | | | Futures | |
| Equity contracts | | | | $ | 222,439 | | |
| Total | | | | $ | 222,439 | | |
| |
See Accompanying Notes to Financial Statements
PORTFOLIO OF INVESTMENTS
| Voya Index Solution 2040 Portfolio | as of December 31, 2015 |
| Shares | | | Value | | | Percentage
of Net
Assets | |
| EXCHANGE-TRADED FUNDS: 10.3% | |
| | | 605 | | | | iShares U.S. Real Estate ETF | | | | $ | 45,442 | | | | | | 1.6 | | |
| | | 2,721 | | | | PowerShares Senior Loan
Portfolio | | | | | 60,950 | | | | | | 2.1 | | |
| | | 802 | | | | SPDR Barclays Capital High
Yield Bond ETF | | | | | 27,196 | | | | | | 0.9 | | |
| | | 1,159 | | | | SPDR Dow Jones
International Real Estate
ETF | | | | | 45,340 | | | | | | 1.6 | | |
| | | 593 | | | | SPDR Trust Series 1 | | | | | 120,907 | | | | | | 4.1 | | |
| | | | | | | Total Exchange-Traded
Funds
(Cost $303,672) | | | | | 299,835 | | | | | | 10.3 | | |
| MUTUAL FUNDS: 89.6% | |
| | | | | | | Affiliated Investment Companies: 88.6% | |
| | | 16,687 | | | | Voya Emerging Markets
Index Portfolio - Class I | | | | | 147,682 | | | | | | 5.0 | | |
| | | 63,124 | | | | Voya International Index
Portfolio - Class I | | | | | 569,378 | | | | | | 19.5 | | |
| | | 16,162 | | | | Voya Russell™ Mid Cap
Index Portfolio - Class I | | | | | 247,925 | | | | | | 8.5 | | |
| | | 8,165 | | | | Voya Russell™ Small Cap
Index Portfolio - Class I | | | | | 116,357 | | | | | | 4.0 | | |
| | | 24,953 | | | | Voya U.S. Bond Index
Portfolio - Class I | | | | | 262,501 | | | | | | 9.0 | | |
| | | 93,429 | | | | Voya U.S. Stock Index
Portfolio - Class I | | | | | 1,246,336 | | | | | | 42.6 | | |
| | | | | | | | | | | | 2,590,179 | | | | | | 88.6 | | |
| | Shares | | | Value | | | Percentage
of Net
Assets | |
| | MUTUAL FUNDS: (continued) | |
| | | | | | | | Unaffiliated Investment Companies: 1.0% | |
| | | | 6,789 | @ | | Credit Suisse Commodity
Return Strategy Fund -
Class I | | | | $ | 30,619 | | | | | | 1.0 | | |
| | | | | | | | Total Mutual Funds
(Cost $2,671,067) | | | | | 2,620,798 | | | | | | 89.6 | | |
| | | | | | | | Total Investments in
Securities
(Cost $2,974,739) | | | | $ | 2,920,633 | | | | | | 99.9 | | |
| | | | | | | | Assets in Excess of
Other Liabilities | | | | | 2,845 | | | | | | 0.1 | | |
| | | | | | | | Net Assets | | | | $ | 2,923,478 | | | | | | 100.0 | | |
| |
@
Non-income producing security.
Cost for federal income tax purposes is $2,978,578.
Net unrealized depreciation consists of:
| | Gross Unrealized Appreciation | | | | $ | 307 | | |
| | Gross Unrealized Depreciation | | | | | (58,252) | | |
| | Net Unrealized Depreciation | | | | $ | (57,945) | | |
| |
Fair Value Measurements^
The following is a summary of the fair valuations according to the inputs used as of December 31, 2015 in valuing the assets and liabilities:
| | | | Quoted Prices
in Active Markets
for Identical
Investments
(Level 1) | | | Significant
Other
Observable
Inputs
(Level 2) | | | Significant
Unobservable
Inputs
(Level 3) | | | Fair Value
at
December 31,
2015 | |
| Asset Table | | | | | |
| Investments, at fair value | | | | | |
| Exchange-Traded Funds | | | | $ | 299,835 | | | | | $ | — | | | | | $ | — | | | | | $ | 299,835 | | |
| Mutual Funds | | | | | 2,620,798 | | | | | | — | | | | | | — | | | | | | 2,620,798 | | |
| Total Investments, at fair value | | | | $ | 2,920,633 | | | | | $ | — | | | | | $ | — | | | | | $ | 2,920,633 | | |
| | | | | | |
^
See Note 2, “Significant Accounting Policies” in the Notes to Financial Statements for additional information.
See Accompanying Notes to Financial Statements
PORTFOLIO OF INVESTMENTS
| Voya Index Solution 2040 Portfolio | as of December 31, 2015 (continued) |
Transactions with Affiliates
An investment of at least 5% of the voting securities of an issuer, or a company which is under common control results in that issuer becoming an affiliated person as defined by the 1940 Act.
The following table provides transactions during the year ended December 31, 2015, where the following issuers were considered an affiliate:
| Issuer | | | Beginning
Fair Value
at 12/31/14 | | | Purchases
at Cost | | | Sales
at Cost | | | Change in
Unrealized
Appreciation/
(Depreciation) | | | Ending
Fair Value
at 12/31/15 | | | Investment
Income | | | Realized
Gains/
(Losses) | | | Net Capital
Gain
Distributions | |
| Voya Emerging Markets Index Portfolio - Class I | | | | $ | 1,097 | | | | | $ | 161,597 | | | | | $ | (8,889) | | | | | $ | (6,123) | | | | | $ | 147,682 | | | | | $ | 24 | | | | | $ | (521) | | | | | $ | — | | |
| Voya International Index Portfolio - Class I | | | | | 4,603 | | | | | | 628,563 | | | | | | (54,798) | | | | | | (8,990) | | | | | | 569,378 | | | | | | 152 | | | | | | 457 | | | | | | — | | |
| Voya Russell™ Mid Cap Index Portfolio - Class I | | | | | 3,675 | | | | | | 292,410 | | | | | | (43,450) | | | | | | (4,710) | | | | | | 247,925 | | | | | | 37 | | | | | | 1,198 | | | | | | 228 | | |
| Voya Russell™ Small Cap Index Portfolio - Class I | | | | | 939 | | | | | | 123,917 | | | | | | (6,244) | | | | | | (2,254) | | | | | | 116,358 | | | | | | 11 | | | | | | 14 | | | | | | 85 | | |
| Voya U.S. Bond Index Portfolio - Class I | | | | | 919 | | | | | | 409,096 | | | | | | (145,768) | | | | | | (1,746) | | | | | | 262,501 | | | | | | 1,602 | | | | | | (661) | | | | | | 3 | | |
| Voya U.S. Stock Index Portfolio - Class I | | | | | 9,346 | | | | | | 1,553,773 | | | | | | (289,022) | | | | | | (27,762) | | | | | | 1,246,335 | | | | | | 19,259 | | | | | | 6,482 | | | | | | 1,685 | | |
| | | | | $ | 20,579 | | | | | $ | 3,169,356 | | | | | $ | (548,171) | | | | | $ | (51,585) | | | | | $ | 2,590,179 | | | | | $ | 21,085 | | | | | $ | 6,969 | | | | | $ | 2,001 | | |
| |
The financial statements for the above mutual fund[s] can be found at www.sec.gov.
See Accompanying Notes to Financial Statements
PORTFOLIO OF INVESTMENTS
| Voya Index Solution 2045 Portfolio | as of December 31, 2015 |
| Shares | | | Value | | | Percentage
of Net
Assets | |
| EXCHANGE-TRADED FUNDS: 10.4% | |
| | | 22,650 | | | | iShares Barclays 20+ Year
Treasury Bond Fund | | | | $ | 2,732,043 | | | | | | 1.0 | | |
| | | 54,542 | | | | iShares U.S. Real Estate
ETF | | | | | 4,096,650 | | | | | | 1.6 | | |
| | | 240,014 | | | | PowerShares Senior Loan
Portfolio | | | | | 5,376,314 | | | | | | 2.1 | | |
| | | 99,652 | | | | SPDR Dow Jones
International Real Estate
ETF | | | | | 3,898,386 | | | | | | 1.5 | | |
| | | 52,869 | | | | SPDR Trust Series 1 | | | | | 10,779,460 | | | | | | 4.2 | | |
| | | | | | | Total Exchange-Traded
Funds
(Cost $27,634,792) | | | | | 26,882,853 | | | | | | 10.4 | | |
| MUTUAL FUNDS: 89.5% | |
| | | | | | | Affiliated Investment Companies: 88.5% | |
| | | 1,700,029 | | | | Voya Emerging Markets
Index Portfolio - Class I | | | | | 15,045,258 | | | | | | 5.8 | | |
| | | 5,870,483 | | | | Voya International Index
Portfolio - Class I | | | | | 52,951,756 | | | | | | 20.4 | | |
| | | 1,770,411 | | | | Voya Russell™ Mid Cap
Index Portfolio - Class I | | | | | 27,158,102 | | | | | | 10.5 | | |
| | | 727,669 | | | | Voya Russell™ Small Cap
Index Portfolio - Class I | | | | | 10,369,280 | | | | | | 4.0 | | |
| | | 973,486 | | | | Voya U.S. Bond Index
Portfolio - Class I | | | | | 10,241,070 | | | | | | 3.9 | | |
| | | 8,530,153 | | | | Voya U.S. Stock Index
Portfolio - Class I | | | | | 113,792,246 | | | | | | 43.9 | | |
| | | | | | | | | | | | 229,557,712 | | | | | | 88.5 | | |
| | Shares | | | Value | | | Percentage
of Net
Assets | |
| | MUTUAL FUNDS: (continued) | |
| | | | | | | | Unaffiliated Investment Companies: 1.0% | |
| | | | 569,361 | @ | | Credit Suisse Commodity
Return Strategy Fund -
Class I | | | | $ | 2,567,817 | | | | | | 1.0 | | |
| | | | | | | | Total Mutual Funds
(Cost $246,775,426) | | | | | 232,125,529 | | | | | | 89.5 | | |
| | | | | | | | Total Investments in
Securities
(Cost $274,410,218) | | | | $ | 259,008,382 | | | | | | 99.9 | | |
| | | | | | | | Assets in Excess of
Other Liabilities | | | | | 276,974 | | | | | | 0.1 | | |
| | | | | | | | Net Assets | | | | $ | 259,285,356 | | | | | | 100.0 | | |
| |
@
Non-income producing security.
Cost for federal income tax purposes is $275,458,691.
Net unrealized depreciation consists of:
| | Gross Unrealized Appreciation | | | | $ | 230,153 | | |
| | Gross Unrealized Depreciation | | | | | (16,680,462) | | |
| | Net Unrealized Depreciation | | | | $ | (16,450,309) | | |
| |
Fair Value Measurements^
The following is a summary of the fair valuations according to the inputs used as of December 31, 2015 in valuing the assets and liabilities:
| | | | Quoted Prices
in Active Markets
for Identical
Investments
(Level 1) | | | Significant
Other
Observable
Inputs
(Level 2) | | | Significant
Unobservable
Inputs
(Level 3) | | | Fair Value
at
December 31,
2015 | |
| Asset Table | | | | | |
| Investments, at fair value | | | | | |
| Exchange-Traded Funds | | | | $ | 26,882,853 | | | | | $ | — | | | | | $ | — | | | | | $ | 26,882,853 | | |
| Mutual Funds | | | | | 232,125,529 | | | | | | — | | | | | | — | | | | | | 232,125,529 | | |
| Total Investments, at fair value | | | | $ | 259,008,382 | | | | | $ | — | | | | | $ | — | | | | | $ | 259,008,382 | | |
| | | | | | |
^
See Note 2, “Significant Accounting Policies” in the Notes to Financial Statements for additional information.
See Accompanying Notes to Financial Statements
PORTFOLIO OF INVESTMENTS
| Voya Index Solution 2045 Portfolio | as of December 31, 2015 (continued) |
Transactions with Affiliates
An investment of at least 5% of the voting securities of an issuer, or a company which is under common control results in that issuer becoming an affiliated person as defined by the 1940 Act.
The following table provides transactions during the year ended December 31, 2015, where the following issuers were considered an affiliate:
| Issuer | | | Beginning
Fair Value
at 12/31/14 | | | Purchases
at Cost | | | Sales
at Cost | | | Change in
Unrealized
Appreciation/
(Depreciation) | | | Ending
Fair Value
at 12/31/15 | | | Investment
Income | | | Realized
Gains/
(Losses) | | | Net Capital
Gain
Distributions | |
| Voya Emerging Markets Index Portfolio - Class I | | | | $ | 18,041,836 | | | | | $ | 6,412,702 | | | | | $ | (6,930,527) | | | | | $ | (2,478,753) | | | | | $ | 15,045,258 | | | | | $ | 378,112 | | | | | $ | (873,726) | | | | | $ | — | | |
| Voya International Index Portfolio - Class I | | | | | 57,645,216 | | | | | | 12,152,176 | | | | | | (11,764,212) | | | | | | (5,081,424) | | | | | | 52,951,756 | | | | | | 1,799,823 | | | | | | 2,962,123 | | | | | | — | | |
| Voya Russell™ Mid Cap Index Portfolio - Class I | | | | | 46,417,767 | | | | | | 8,123,853 | | | | | | (16,796,573) | | | | | | (10,586,945) | | | | | | 27,158,102 | | | | | | 481,847 | | | | | | 6,774,979 | | | | | | 2,975,394 | | |
| Voya Russell™ Small Cap Index Portfolio - Class I | | | | | 11,095,631 | | | | | | 2,745,214 | | | | | | (1,496,565) | | | | | | (1,975,000) | | | | | | 10,369,280 | | | | | | 118,224 | | | | | | 401,914 | | | | | | 952,126 | | |
| Voya U.S. Bond Index Portfolio - Class I | | | | | 8,241,369 | | | | | | 8,814,604 | | | | | | (6,595,003) | | | | | | (219,901) | | | | | | 10,241,069 | | | | | | 181,898 | | | | | | 51,497 | | | | | | 12,029 | | |
| Voya U.S. Stock Index Portfolio - Class I | | | | | 111,704,109 | | | | | | 38,328,583 | | | | | | (23,125,724) | | | | | | (13,114,721) | | | | | | 113,792,247 | | | | | | 2,189,037 | | | | | | 1,849,780 | | | | | | 10,482,170 | | |
| | | | | $ | 253,145,928 | | | | | $ | 76,577,132 | | | | | $ | (66,708,604) | | | | | $ | (33,456,744) | | | | | $ | 229,557,712 | | | | | $ | 5,148,941 | | | | | $ | 11,166,567 | | | | | $ | 14,421,719 | | |
| |
The financial statements for the above mutual fund[s] can be found at www.sec.gov.
The effect of derivative instruments by primary risk exposure on the Portfolio’s Statement of Operations for the year ended December 31, 2015 was as follows:
| | | | Amount of Realized Gain or (Loss) on
Derivatives Recognized in Income | |
| Derivatives not accounted for as hedging instruments | | | Futures | |
| Equity contracts | | | | $ | (75,930) | | |
| Interest rate contracts | | | | | (57,886) | | |
| Total | | | | $ | (133,816) | | |
| |
| | | | Change in Unrealized Appreciation or (Depreciation)
on Derivatives Recognized in Income | |
| Derivatives not accounted for as hedging instruments | | | Futures | |
| Equity contracts | | | | $ | 137,120 | | |
| Total | | | | $ | 137,120 | | |
| |
See Accompanying Notes to Financial Statements
PORTFOLIO OF INVESTMENTS
| Voya Index Solution 2050 Portfolio | as of December 31, 2015 |
| Shares | | | Value | | | Percentage
of Net
Assets | |
| EXCHANGE-TRADED FUNDS: 9.8% | |
| | | 129 | | | | iShares Barclays 20+ Year
Treasury Bond Fund | | | | $ | 15,560 | | | | | | 0.8 | | |
| | | 364 | | | | iShares U.S. Real Estate ETF | | | | | 27,340 | | | | | | 1.5 | | |
| | | 1,630 | | | | PowerShares Senior Loan
Portfolio | | | | | 36,512 | | | | | | 2.0 | | |
| | | 690 | | | | SPDR Dow Jones
International Real Estate
ETF | | | | | 26,993 | | | | | | 1.5 | | |
| | | 354 | | | | SPDR Trust Series 1 | | | | | 72,177 | | | | | | 4.0 | | |
| | | | | | | Total Exchange-Traded
Funds
(Cost $179,631) | | | | | 178,582 | | | | | | 9.8 | | |
| MUTUAL FUNDS: 90.0% | |
| | | | | | | Affiliated Investment Companies: 89.1% | |
| | | 12,184 | | | | Voya Emerging Markets
Index Portfolio - Class I | | | | | 107,827 | | | | | | 6.0 | | |
| | | 41,247 | | | | Voya International Index
Portfolio - Class I | | | | | 372,048 | | | | | | 20.6 | | |
| | | 12,418 | | | | Voya Russell™ Mid Cap
Index Portfolio - Class I | | | | | 190,491 | | | | | | 10.5 | | |
| | | 5,062 | | | | Voya Russell™ Small Cap
Index Portfolio - Class I | | | | | 72,128 | | | | | | 4.0 | | |
| | | 6,941 | | | | Voya U.S. Bond Index
Portfolio - Class I | | | | | 73,022 | | | | | | 4.0 | | |
| | | 59,663 | | | | Voya U.S. Stock Index
Portfolio - Class I | | | | | 795,906 | | | | | | 44.0 | | |
| | | | | | | | | | | | 1,611,422 | | | | | | 89.1 | | |
| | Shares | | | Value | | | Percentage
of Net
Assets | |
| | MUTUAL FUNDS: (continued) | |
| | | | | | | | Unaffiliated Investment Companies: 0.9% | |
| | | | 3,579 | @ | | Credit Suisse Commodity
Return Strategy Fund -
Class I | | | | $ | 16,141 | | | | | | 0.9 | | |
| | | | | | | | Total Mutual Funds
(Cost $1,658,858) | | | | | 1,627,563 | | | | | | 90.0 | | |
| | | | | | | | Total Investments in
Securities
(Cost $1,838,489) | | | | $ | 1,806,145 | | | | | | 99.8 | | |
| | | | | | | | Assets in Excess of
Other Liabilities | | | | | 2,799 | | | | | | 0.2 | | |
| | | | | | | | Net Assets | | | | $ | 1,808,944 | | | | | | 100.0 | | |
| |
@
Non-income producing security.
Cost for federal income tax purposes is $1,841,401.
Net unrealized depreciation consists of:
| | Gross Unrealized Appreciation | | | | $ | 322 | | |
| | Gross Unrealized Depreciation | | | | | (35,578) | | |
| | Net Unrealized Depreciation | | | | $ | (35,256) | | |
| |
Fair Value Measurements^
The following is a summary of the fair valuations according to the inputs used as of December 31, 2015 in valuing the assets and liabilities:
| | | | Quoted Prices
in Active Markets
for Identical
Investments
(Level 1) | | | Significant
Other
Observable
Inputs
(Level 2) | | | Significant
Unobservable
Inputs
(Level 3) | | | Fair Value
at
December 31,
2015 | |
| Asset Table | | | | | |
| Investments, at fair value | | | | | |
| Exchange-Traded Funds | | | | $ | 178,582 | | | | | $ | — | | | | | $ | — | | | | | $ | 178,582 | | |
| Mutual Funds | | | | | 1,627,563 | | | | | | — | | | | | | — | | | | | | 1,627,563 | | |
| Total Investments, at fair value | | | | $ | 1,806,145 | | | | | $ | — | | | | | $ | — | | | | | $ | 1,806,145 | | |
| | | | | | |
^
See Note 2, “Significant Accounting Policies” in the Notes to Financial Statements for additional information.
See Accompanying Notes to Financial Statements
PORTFOLIO OF INVESTMENTS
| Voya Index Solution 2050 Portfolio | as of December 31, 2015 (continued) |
Transactions with Affiliates
An investment of at least 5% of the voting securities of an issuer, or a company which is under common control results in that issuer becoming an affiliated person as defined by the 1940 Act.
The following table provides transactions during the year ended December 31, 2015, where the following issuers were considered an affiliate:
| Issuer | | | Beginning
Fair Value
at 12/31/14 | | | Purchases
at Cost | | | Sales
at Cost | | | Change in
Unrealized
Appreciation/
(Depreciation) | | | Ending
Fair Value
at 12/31/15 | | | Investment
Income | | | Realized
Gains/
(Losses) | | | Net Capital
Gain
Distributions | |
| Voya Emerging Markets Index Portfolio - Class I | | | | $ | 1,468 | | | | | $ | 137,454 | | | | | $ | (27,317) | | | | | $ | (3,778) | | | | | $ | 107,827 | | | | | $ | 30 | | | | | $ | (144) | | | | | $ | — | | |
| Voya International Index Portfolio - Class I | | | | | 4,660 | | | | | | 458,832 | | | | | | (86,516) | | | | | | (4,928) | | | | | | 372,048 | | | | | | 144 | | | | | | 2,517 | | | | | | — | | |
| Voya Russell™ Mid Cap Index Portfolio - Class I | | | | | 3,762 | | | | | | 255,327 | | | | | | (64,926) | | | | | | (3,672) | | | | | | 190,491 | | | | | | 38 | | | | | | 2,336 | | | | | | 237 | | |
| Voya Russell™ Small Cap Index Portfolio - Class I | | | | | 902 | | | | | | 87,713 | | | | | | (14,972) | | | | | | (1,515) | | | | | | 72,128 | | | | | | 9 | | | | | | 501 | | | | | | 76 | | |
| Voya U.S. Bond Index Portfolio - Class I | | | | | 666 | | | | | | 181,062 | | | | | | (108,101) | | | | | | (605) | | | | | | 73,022 | | | | | | 513 | | | | | | (223) | | | | | | 1 | | |
| Voya U.S. Stock Index Portfolio - Class I | | | | | 9,031 | | | | | | 1,139,317 | | | | | | (333,195) | | | | | | (19,247) | | | | | | 795,906 | | | | | | 12,470 | | | | | | 14,948 | | | | | | 1,554 | | |
| | | | | $ | 20,489 | | | | | $ | 2,259,705 | | | | | $ | (635,027) | | | | | $ | (33,745) | | | | | $ | 1,611,422 | | | | | $ | 13,204 | | | | | $ | 19,935 | | | | | $ | 1,868 | | |
| |
The financial statements for the above mutual fund[s] can be found at www.sec.gov.
See Accompanying Notes to Financial Statements
PORTFOLIO OF INVESTMENTS
| Voya Index Solution 2055 Portfolio | as of December 31, 2015 |
| Shares | | | Value | | | Percentage
of Net
Assets | |
| EXCHANGE-TRADED FUNDS: 8.1% | |
| | | 6,167 | | | | iShares Barclays 20+ Year
Treasury Bond Fund | | | | $ | 743,863 | | | | | | 1.0 | | |
| | | 14,851 | | | | iShares U.S. Real Estate ETF | | | | | 1,115,459 | | | | | | 1.5 | | |
| | | 27,164 | | | | SPDR Dow Jones
International Real Estate
ETF | | | | | 1,062,656 | | | | | | 1.5 | | |
| | | 14,395 | | | | SPDR Trust Series 1 | | | | | 2,934,996 | | | | | | 4.1 | | |
| | | | | | | Total Exchange-Traded
Funds
(Cost $5,928,651) | | | | | 5,856,974 | | | | | | 8.1 | | |
| MUTUAL FUNDS: 91.8% | |
| | | | | | | Affiliated Investment Companies: 90.8% | |
| | | 472,263 | | | | Voya Emerging Markets
Index Portfolio - Class I | | | | | 4,179,532 | | | | | | 5.8 | | |
| | | 1,751,259 | | | | Voya International Index
Portfolio - Class I | | | | | 15,796,359 | | | | | | 21.9 | | |
| | | 492,572 | | | | Voya Russell™ Mid Cap
Index Portfolio - Class I | | | | | 7,556,062 | | | | | | 10.5 | | |
| | | 202,242 | | | | Voya Russell™ Small Cap
Index Portfolio - Class I | | | | | 2,881,956 | | | | | | 4.0 | | |
| | | 277,619 | | | | Voya U.S. Bond Index
Portfolio - Class I | | | | | 2,920,551 | | | | | | 4.0 | | |
| | | 2,407,530 | | | | Voya U.S. Stock Index
Portfolio - Class I | | | | | 32,116,444 | | | | | | 44.6 | | |
| | | | | | | | | | | | 65,450,904 | | | | | | 90.8 | | |
| | Shares | | | Value | | | Percentage
of Net
Assets | |
| | MUTUAL FUNDS: (continued) | |
| | | | | | | | Unaffiliated Investment Companies: 1.0% | |
| | | | 154,846 | @ | | Credit Suisse Commodity
Return Strategy Fund -
Class I | | | | $ | 698,356 | | | | | | 1.0 | | |
| | | | | | | | Total Mutual Funds
(Cost $71,561,990) | | | | | 66,149,260 | | | | | | 91.8 | | |
| | | | | | | | Total Investments in
Securities
(Cost $77,490,641) | | | | $ | 72,006,234 | | | | | | 99.9 | | |
| | | | | | | | Assets in Excess of
Other Liabilities | | | | | 63,684 | | | | | | 0.1 | | |
| | | | | | | | Net Assets | | | | $ | 72,069,918 | | | | | | 100.0 | | |
| |
@
Non-income producing security.
Cost for federal income tax purposes is $77,842,157.
Net unrealized depreciation consists of:
| | Gross Unrealized Appreciation | | | | $ | 55,496 | | |
| | Gross Unrealized Depreciation | | | | | (5,891,419) | | |
| | Net Unrealized Depreciation | | | | $ | (5,835,923) | | |
| |
Fair Value Measurements^
The following is a summary of the fair valuations according to the inputs used as of December 31, 2015 in valuing the assets and liabilities:
| | | | Quoted Prices
in Active Markets
for Identical
Investments
(Level 1) | | | Significant
Other
Observable
Inputs
(Level 2) | | | Significant
Unobservable
Inputs
(Level 3) | | | Fair Value
at
December 31,
2015 | |
| Asset Table | | | | | |
| Investments, at fair value | | | | | |
| Exchange-Traded Funds | | | | $ | 5,856,974 | | | | | $ | — | | | | | $ | — | | | | | $ | 5,856,974 | | |
| Mutual Funds | | | | | 66,149,260 | | | | | | — | | | | | | — | | | | | | 66,149,260 | | |
| Total Investments, at fair value | | | | $ | 72,006,234 | | | | | $ | — | | | | | $ | — | | | | | $ | 72,006,234 | | |
| |
^
See Note 2, “Significant Accounting Policies” in the Notes to Financial Statements for additional information.
See Accompanying Notes to Financial Statements
PORTFOLIO OF INVESTMENTS
| Voya Index Solution 2055 Portfolio | as of December 31, 2015 (continued) |
Transactions with Affiliates
An investment of at least 5% of the voting securities of an issuer, or a company which is under common control results in that issuer becoming an affiliated person as defined by the 1940 Act.
The following table provides transactions during the year ended December 31, 2015, where the following issuers were considered an affiliate:
| Issuer | | | Beginning
Fair Value
at 12/31/14 | | | Purchases
at Cost | | | Sales
at Cost | | | Change in
Unrealized
Appreciation/
(Depreciation) | | | Ending
Fair Value
at 12/31/15 | | | Investment
Income | | | Realized
Gains/
(Losses) | | | Net Capital
Gain
Distributions | |
| Voya Emerging Markets Index Portfolio - Class I | | | | $ | 4,150,660 | | | | | $ | 2,657,196 | | | | | $ | (1,945,267) | | | | | $ | (683,057) | | | | | $ | 4,179,532 | | | | | $ | 93,821 | | | | | $ | (221,448) | | | | | $ | — | | |
| Voya International Index Portfolio - Class I | | | | | 13,254,966 | | | | | | 6,330,980 | | | | | | (2,481,460) | | | | | | (1,308,127) | | | | | | 15,796,359 | | | | | | 446,587 | | | | | | 606,953 | | | | | | — | | |
| Voya Russell™ Mid Cap Index Portfolio - Class I | | | | | 10,669,525 | | | | | | 4,102,707 | | | | | | (4,842,209) | | | | | | (2,373,961) | | | | | | 7,556,062 | | | | | | 119,565 | | | | | | 1,382,815 | | | | | | 738,313 | | |
| Voya Russell™ Small Cap Index Portfolio - Class I | | | | | 2,550,214 | | | | | | 1,268,644 | | | | | | (459,798) | | | | | | (477,104) | | | | | | 2,881,956 | | | | | | 29,335 | | | | | | 67,874 | | | | | | 236,254 | | |
| Voya U.S. Bond Index Portfolio - Class I | | | | | 1,893,699 | | | | | | 2,648,222 | | | | | | (1,561,183) | | | | | | (60,187) | | | | | | 2,920,551 | | | | | | 48,559 | | | | | | 11,584 | | | | | | 2,984 | | |
| Voya U.S. Stock Index Portfolio - Class I | | | | | 26,975,612 | | | | | | 16,867,992 | | | | | | (8,502,482) | | | | | | (3,224,678) | | | | | | 32,116,444 | | | | | | 618,375 | | | | | | 179,688 | | | | | | 2,818,058 | | |
| | | | | $ | 59,494,676 | | | | | $ | 33,875,741 | | | | | $ | (19,792,399) | | | | | $ | (8,127,114) | | | | | $ | 65,450,904 | | | | | $ | 1,356,242 | | | | | $ | 2,027,466 | | | | | $ | 3,795,609 | | |
| |
The financial statements for the above mutual fund[s] can be found at www.sec.gov.
The effect of derivative instruments by primary risk exposure on the Portfolio’s Statement of Operations for the year ended December 31, 2015 was as follows:
| | | | Amount of Realized Gain or (Loss) on
Derivatives Recognized in Income | |
| Derivatives not accounted for as hedging instruments | | | Futures | |
| Equity contracts | | | | $ | (32,589) | | |
| Interest rate contracts | | | | | (15,436) | | |
| Total | | | | $ | (48,025) | | |
| |
| | | | Change in Unrealized Appreciation or (Depreciation)
on Derivatives Recognized in Income | |
| Derivatives not accounted for as hedging instruments | | | Futures | |
| Equity contracts | | | | $ | 30,471 | | |
| Total | | | | $ | 30,471 | | |
| |
See Accompanying Notes to Financial Statements
PORTFOLIO OF INVESTMENTS
| Voya Index Solution 2060 Portfolio | as of December 31, 2015 |
| Shares | | | Value | | | Percentage
of Net
Assets | |
| EXCHANGE-TRADED FUNDS: 8.5% | |
| | | 35 | | | | iShares Barclays 20+ Year
Treasury Bond Fund | | | | $ | 4,222 | | | | | | 1.1 | | |
| | | 84 | | | | iShares U.S. Real Estate ETF | | | | | 6,309 | | | | | | 1.6 | | |
| | | 161 | | | | SPDR Dow Jones International
Real Estate ETF | | | | | 6,298 | | | | | | 1.6 | | |
| | | 83 | | | | SPDR Trust Series 1 | | | | | 16,923 | | | | | | 4.2 | | |
| | | | | | | Total Exchange-Traded Funds
(Cost $33,895) | | | | | 33,752 | | | | | | 8.5 | | |
| MUTUAL FUNDS: 91.3% | |
| | | | | | | Affiliated Investment Companies: 90.3% | |
| | | 2,681 | | | | Voya Emerging Markets Index
Portfolio - Class I | | | | | 23,730 | | | | | | 6.0 | | |
| | | 9,689 | | | | Voya International Index
Portfolio - Class I | | | | | 87,393 | | | | | | 22.0 | | |
| | | 2,714 | | | | Voya Russell™ Mid Cap Index
Portfolio - Class I | | | | | 41,640 | | | | | | 10.5 | | |
| | | 1,099 | | | | Voya Russell™ Small Cap Index
Portfolio - Class I | | | | | 15,667 | �� | | | | | 3.9 | | |
| | | 1,505 | | | | Voya U.S. Bond Index Portfolio -
Class I | | | | | 15,831 | | | | | | 4.0 | | |
| | | 13,094 | | | | Voya U.S. Stock Index Portfolio -
Class I | | | | | 174,671 | | | | | | 43.9 | | |
| | | | | | | | | | | | 358,932 | | | | | | 90.3 | | |
| | Shares | | | Value | | | Percentage
of Net
Assets | |
| | MUTUAL FUNDS: (continued) | |
| | | | | | | | Unaffiliated Investment Companies: 1.0% | |
| | | | 945 | @ | | Credit Suisse Commodity
Return Strategy Fund - Class I | | | | $ | 4,260 | | | | | | 1.0 | | |
| | | | | | | | Total Mutual Funds
(Cost $370,248) | | | | | 363,192 | | | | | | 91.3 | | |
| | | | | | | | Total Investments in
Securities
(Cost $404,143) | | | | $ | 396,944 | | | | | | 99.8 | | |
| | | | | | | | Assets in Excess of
Other Liabilities | | | | | 664 | | | | | | 0.2 | | |
| | | | | | | | Net Assets | | | | $ | 397,608 | | | | | | 100.0 | | |
| |
@
Non-income producing security.
Cost for federal income tax purposes is $406,160.
Net unrealized depreciation consists of:
| | Gross Unrealized Appreciation | | | | $ | 62 | | |
| | Gross Unrealized Depreciation | | | | | (9,278) | | |
| | Net Unrealized Depreciation | | | | $ | (9,216) | | |
| |
Fair Value Measurements^
The following is a summary of the fair valuations according to the inputs used as of December 31, 2015 in valuing the assets and liabilities:
| | | | Quoted Prices
in Active Markets
for Identical
Investments
(Level 1) | | | Significant
Other
Observable
Inputs
(Level 2) | | | Significant
Unobservable
Inputs
(Level 3) | | | Fair Value
at
December 31,
2015 | |
| Asset Table | | | | | |
| Investments, at fair value | | | | | |
| Exchange-Traded Funds | | | | $ | 33,752 | | | | | $ | — | | | | | $ | — | | | | | $ | 33,752 | | |
| Mutual Funds | | | | | 363,192 | | | | | | — | | | | | | — | | | | | | 363,192 | | |
| Total Investments, at fair value | | | | $ | 396,944 | | | | | $ | — | | | | | $ | — | | | | | $ | 396,944 | | |
| |
See Accompanying Notes to Financial Statements
PORTFOLIO OF INVESTMENTS
| Voya Index Solution 2060 Portfolio | as of December 31, 2015 (continued) |
Transactions with Affiliates
An investment of at least 5% of the voting securities of an issuer, or a company which is under common control results in that issuer becoming an affiliated person as defined by the 1940 Act.
The following table provides transactions during the year ended December 31, 2015, where the following issuers were considered an affiliate:
| Issuer | | | Beginning
Fair Value
at 12/31/14 | | | Purchases
at Cost | | | Sales
at Cost | | | Change in
Unrealized
Appreciation/
(Depreciation) | | | Ending
Fair Value
at 12/31/15 | | | Investment
Income | | | Realized
Gains/
(Losses) | | | Net Capital
Gain
Distributions | |
| Voya Emerging Markets Index Portfolio - Class I | | | | $ | — | | | | | $ | 37,657 | | | | | $ | (13,198) | | | | | $ | (729) | | | | | $ | 23,730 | | | | | $ | 22 | | | | | $ | (126) | | | | | $ | — | | |
| Voya International Index Portfolio - Class I | | | | | — | | | | | | 128,746 | | | | | | (39,990) | | | | | | (1,363) | | | | | | 87,393 | | | | | | 104 | | | | | | 151 | | | | | | — | | |
| Voya Russell™ Mid Cap Index Portfolio - Class I | | | | | — | | | | | | 66,745 | | | | | | (24,470) | | | | | | (635) | | | | | | 41,640 | | | | | | 28 | | | | | | 137 | | | | | | 172 | | |
| Voya Russell™ Small Cap Index Portfolio - Class I | | | | | — | | | | | | 21,883 | | | | | | (5,888) | | | | | | (328) | | | | | | 15,667 | | | | | | 7 | | | | | | 29 | | | | | | 55 | | |
| Voya U.S. Bond Index Portfolio - Class I | | | | | — | | | | | | 35,762 | | | | | | (19,870) | | | | | | (61) | | | | | | 15,831 | | | | | | 105 | | | | | | (69) | | | | | | 1 | | |
| Voya U.S. Stock Index Portfolio - Class I | | | | | — | | | | | | 284,594 | | | | | | (106,223) | | | | | | (3,700) | | | | | | 174,671 | | | | | | 2,116 | | | | | | 3,164 | | | | | | 1,390 | | |
| | | | | $ | — | | | | | $ | 575,387 | | | | | $ | (209,639) | | | | | $ | (6,816) | | | | | $ | 358,932 | | | | | $ | 2,382 | | | | | $ | 3,286 | | | | | $ | 1,618 | | |
| |
The financial statements for the above mutual fund[s] can be found at www.sec.gov.
See Accompanying Notes to Financial Statements
TAX INFORMATION (Unaudited)
Dividends and distributions paid during the year ended December 31, 2015 were as follows:
| Portfolio Name | | | Type | | | Per Share Amount | |
| Voya Index Solution Income Portfolio | |
| Class ADV | | | NII | | | | $ | 0.1863 | | |
| Class I | | | NII | | | | $ | 0.2421 | | |
| Class S | | | NII | | | | $ | 0.2122 | | |
| Class S2 | | | NII | | | | $ | 0.1800 | | |
| Class T | | | NII | | | | $ | 0.1651 | | |
Class Z(1) | | | NII | | | | $ | 0.2421 | | |
| All Classes | | | STCG | | | | $ | 0.0417 | | |
| All Classes | | | LTCG | | | | $ | 0.6269 | | |
| Voya Index Solution 2020 Portfolio | |
| Class ADV | | | NII | | | | $ | 0.1543 | | |
| Class I | | | NII | | | | $ | 0.0680 | | |
| Class S | | | NII | | | | $ | 0.0535 | | |
| Class S2 | | | NII | | | | $ | 0.0030 | | |
| Class T | | | NII | | | | $ | — | | |
Class Z(1) | | | NII | | | | $ | 0.0680 | | |
| All Classes | | | STCG | | | | $ | 0.0160 | | |
| All Classes | | | LTCG | | | | $ | 0.2869 | | |
| Voya Index Solution 2025 Portfolio | |
| Class ADV | | | NII | | | | $ | 0.1635 | | |
| Class I | | | NII | | | | $ | 0.2229 | | |
| Class S | | | NII | | | | $ | 0.1959 | | |
| Class S2 | | | NII | | | | $ | 0.1623 | | |
| Class T | | | NII | | | | $ | 0.1429 | | |
Class Z(1) | | | NII | | | | $ | 0.2229 | | |
| All Classes | | | STCG | | | | $ | 0.0247 | | |
| All Classes | | | LTCG | | | | $ | 0.9470 | | |
| Voya Index Solution 2030 Portfolio | |
| Class ADV | | | NII | | | | $ | 0.0650 | | |
| Class I | | | NII | | | | $ | — | | |
| Class S | | | NII | | | | $ | — | | |
| Class S2 | | | NII | | | | $ | — | | |
| Class T | | | NII | | | | $ | — | | |
Class Z(1) | | | NII | | | | $ | — | | |
| All Classes | | | STCG | | | | $ | 0.0099 | | |
| All Classes | | | LTCG | | | | $ | 0.1813 | | |
| Voya Index Solution 2035 Portfolio | |
| Class ADV | | | NII | | | | $ | 0.1514 | | |
| Class I | | | NII | | | | $ | 0.2108 | | |
| Class S | | | NII | | | | $ | 0.1830 | | |
| Class S2 | | | NII | | | | $ | 0.1468 | | |
| Portfolio Name | | | Type | | | Per Share Amount | |
| Class T | | | NII | | | | $ | 0.1310 | | |
Class Z(1) | | | NII | | | | $ | 0.2108 | | |
| All Classes | | | STCG | | | | $ | 0.0368 | | |
| All Classes | | | LTCG | | | | $ | 1.1636 | | |
| Voya Index Solution 2040 Portfolio | |
| Class ADV | | | NII | | | | $ | 0.1284 | | |
| Class I | | | NII | | | | $ | 0.1038 | | |
| Class S | | | NII | | | | $ | 0.0506 | | |
| Class S2 | | | NII | | | | $ | 0.0528 | | |
| Class T | | | NII | | | | $ | 0.0104 | | |
Class Z(1) | | | NII | | | | $ | 0.1038 | | |
| All Classes | | | STCG | | | | $ | 0.0301 | | |
| All Classes | | | LTCG | | | | $ | 0.6122 | | |
| Voya Index Solution 2045 Portfolio | |
| Class ADV | | | NII | | | | $ | 0.1192 | | |
| Class I | | | NII | | | | $ | 0.1786 | | |
| Class S | | | NII | | | | $ | 0.1496 | | |
| Class S2 | | | NII | | | | $ | 0.1164 | | |
| Class T | | | NII | | | | $ | 0.0985 | | |
Class Z(1) | | | NII | | | | $ | 0.1786 | | |
| All Classes | | | STCG | | | | $ | 0.0439 | | |
| All Classes | | | LTCG | | | | $ | 1.2632 | | |
| Voya Index Solution 2050 Portfolio | |
| Class ADV | | | NII | | | | $ | 0.0442 | | |
| Class I | | | NII | | | | $ | 0.1145 | | |
| Class S | | | NII | | | | $ | 0.0735 | | |
| Class S2 | | | NII | | | | $ | 0.0632 | | |
| Class T | | | NII | | | | $ | 0.0185 | | |
Class Z(1) | | | NII | | | | $ | 0.1145 | | |
| All Classes | | | STCG | | | | $ | 0.0341 | | |
| All Classes | | | LTCG | | | | $ | 0.6757 | | |
| Voya Index Solution 2055 Portfolio | |
| Class ADV | | | NII | | | | $ | 0.1197 | | |
| Class I | | | NII | | | | $ | 0.1779 | | |
| Class S | | | NII | | | | $ | 0.1503 | | |
| Class S2 | | | NII | | | | $ | 0.1144 | | |
| Class T | | | NII | | | | $ | 0.0856 | | |
Class Z(1) | | | NII | | | | $ | 0.1780 | | |
| All Classes | | | STCG | | | | $ | 0.0475 | | |
| All Classes | | | LTCG | | | | $ | 1.1488 | | |
NII - Net investment income
STCG - Short-term capital gain
LTCG - Long-term capital gain
(1)
Commenced operations on May 1, 2015.
TAX INFORMATION (Unaudited) (continued)
Of the ordinary distributions made during the year ended December 31, 2015, the following percentages qualify for the dividends received deduction (DRD) available to corporate shareholders:
| | Voya Index Solution Income Portfolio | | | | | 19.68% | | |
| | Voya Index Solution 2020 Portfolio | | | | | 6.24% | | |
| | Voya Index Solution 2025 Portfolio | | | | | 41.41% | | |
| | Voya Index Solution 2030 Portfolio | | | | | 8.27% | | |
| | Voya Index Solution 2035 Portfolio | | | | | 55.78% | | |
| | Voya Index Solution 2040 Portfolio | | | | | 16.03% | | |
| | Voya Index Solution 2045 Portfolio | | | | | 68.66% | | |
| | Voya Index Solution 2050 Portfolio | | | | | 21.18% | | |
| | Voya Index Solution 2055 Portfolio | | | | | 70.61% | | |
The Portfolios designate the following amounts of long-term capital gain distributions as 20% rate long-term capital gain dividends under Internal Revenue Code Section 852(b)(3)(C):
| | Voya Index Solution Income Portfolio | | | | $ | 9,605,971 | | |
| | Voya Index Solution 2020 Portfolio | | | | $ | 1,148 | | |
| | Voya Index Solution 2025 Portfolio | | | | $ | 42,758,861 | | |
| | Voya Index Solution 2030 Portfolio | | | | $ | 1,604 | | |
| | Voya Index Solution 2035 Portfolio | | | | $ | 42,435,520 | | |
| | Voya Index Solution 2040 Portfolio | | | | $ | 2,013 | | |
| | Voya Index Solution 2045 Portfolio | | | | $ | 28,272,874 | | |
| | Voya Index Solution 2050 Portfolio | | | | $ | 2,038 | | |
| | Voya Index Solution 2055 Portfolio | | | | $ | 5,566,256 | | |
The Regulated Investment Company Modernization Act of 2010 allows qualified fund-of-funds to elect to pass through the ability to take foreign tax credits (or deductions) to the extent that foreign taxes are passed through from underlying funds.
A qualified fund-of-funds is a regulated investment company that has at least 50% of the value of its total assets invested in other regulated investment companies at the end of each quarter of the taxable year. Pursuant to Section 853 of the Internal Revenue Code, the Portfolios designate the following amounts as foreign taxes paid for the year ended December 31, 2015:
| | | | Creditable
Foreign Taxes
Paid | | | Per Share
Amount | | | Portion of Ordinary Income
Distribution Derived from
Foreign Sourced Income* | |
| Voya Index Solution Income Portfolio | | | | $ | 34,986 | | | | | $ | 0.0009 | | | | | | 4.68% | | |
| Voya Index Solution 2020 Portfolio | | | | $ | 1,533 | | | | | $ | 0.0021 | | | | | | 1.68% | | |
| Voya Index Solution 2025 Portfolio | | | | $ | 119,121 | | | | | $ | 0.0025 | | | | | | 19.23% | | |
| Voya Index Solution 2030 Portfolio | | | | $ | 1,576 | | | | | $ | 0.0039 | | | | | | 2.89% | | |
| Voya Index Solution 2035 Portfolio | | | | $ | 126,765 | | | | | $ | 0.0032 | | | | | | 26.37% | | |
| Voya Index Solution 2040 Portfolio | | | | $ | 1,060 | | | | | $ | 0.0045 | | | | | | 3.75% | | |
| Voya Index Solution 2045 Portfolio | | | | $ | 101,428 | | | | | $ | 0.0041 | | | | | | 33.05% | | |
| Voya Index Solution 2050 Portfolio | | | | $ | 717 | | | | | $ | 0.0049 | | | | | | 2.40% | | |
| Voya Index Solution 2055 Portfolio | | | | $ | 29,692 | | | | | $ | 0.0052 | | | | | | 33.25% | | |
| Voya Index Solution 2060 Portfolio | | | | $ | 170 | | | | | $ | 0.0040 | | | | | | 3.53% | | |
*
None of the Portfolios listed above derived any income from ineligible foreign sources as defined under Section 901(j) of the Internal Revenue Code.
TAX INFORMATION (Unaudited) (continued)
Foreign taxes paid or withheld must be included in taxable income with an offsetting deduction from gross income or as a credit for taxes paid to foreign governments. Shareholders are strongly advised to consult their own tax advisors regarding the appropriate treatment of foreign taxes paid.
Above figures may differ from those cited elsewhere in this report due to differences in the calculation of income and gains under U.S. generally accepted accounting principles (book) purposes and Internal Revenue Service (tax) purposes.
Shareholders are strongly advised to consult their own tax advisers with respect to the tax consequences of their investments in the Portfolios. In January, shareholders, excluding corporate shareholders, receive an IRS 1099-DIV regarding the federal tax status of the dividends and distributions they received in the calendar year.
DIRECTOR AND OFFICER INFORMATION (Unaudited)
The business and affairs of the Company are managed under the direction of the Board. A Director, who is not an interested person of the Company, as defined in the 1940 Act, is an independent director (“Independent Director”). The Directors and Officers of the Company are listed below. The Statement of Additional Information includes additional information about directors of the Company and is available, without charge, upon request at (800) 262-3862.
| | Name, Address and Age | | | Position(s)
Held with the
Company | | | Term of Office and
Length of Time
Served(1) | | | Principal
Occupation(s) –
During the Past 5 Years | | | Number of
funds in
Fund
Complex
Overseen by
Director(2) | | | Other Board Positions
Held by Director | |
| | Independent Directors*: | | | | | | |
| | Colleen D. Baldwin
7337 East Doubletree Ranch Rd. Suite 100
Scottsdale, Arizona 85258
Age: 55 | | | Director | | | November 2007 – Present | | | President, Glantuam Partners, LLC, a business consulting firm (January 2009 – Present). | | | 151 | | | DSM/Dentaquest, Boston, MA (February 2014 – Present). | |
| | John V. Boyer
7337 East Doubletree Ranch Rd.
Suite 100
Scottsdale, Arizona 85258
Age: 62 | | | Chairperson
Director | | | January 2014 – Present November 1997 – Present | | | President and Chief Executive Officer, Bechtler Arts Foundation, an arts and education foundation (January 2008 – Present). | | | 151 | | | None. | |
| | Patricia W. Chadwick
7337 East Doubletree Ranch Rd.
Suite 100
Scottsdale, Arizona 85258
Age: 67 | | | Director | | | January 2006 – Present | | | Consultant and President, Ravengate Partners LLC, a consulting firm that provides advice regarding financial markets and the global economy (January 2000 – Present). | | | 151 | | | Wisconsin Energy Corporation (June 2006 – Present); The Royce Funds (35 funds) (December 2009 – Present); and AMICA Mutual Insurance Company (1992 – Present). | |
| | Peter S. Drotch
7337 East Doubletree Ranch Rd.
Suite 100
Scottsdale, Arizona 85258
Age: 74 | | | Director | | | November 2007 – Present | | | Retired. | | | 151 | | | First Marblehead Corporation (September 2003 – Present). | |
| | Martin J. Gavin
7337 East Doubletree Ranch Rd.
Suite 100
Scottsdale, AZ 85258-2034
Age: 65 | | | Director | | | August 2015 – Present | | | Retired. Formerly, President and Chief Executive Officer, Connecticut Children’s Medical Center (May 2006 – November 2015). | | | 151 | | | None. | |
| | Russell H. Jones
7337 East Doubletree Ranch Rd.
Suite 100
Scottsdale, Arizona 85258
Age: 71 | | | Director | | | May 2013 – Present | | | Retired. | | | 151 | | | None. | |
| | Patrick W. Kenny
7337 East Doubletree Ranch Rd.
Suite 100
Scottsdale, Arizona 85258
Age: 73 | | | Director | | | March 2002 – Present | | | Retired. | | | 151 | | | Assured Guaranty Ltd. (April 2004 – Present). | |
| | Joseph E. Obermeyer
7337 East Doubletree Ranch Rd.
Suite 100
Scottsdale, Arizona 85258
Age: 58 | | | Director | | | May 2013 – Present | | | President, Obermeyer & Associates, Inc., a provider of financial and economic consulting services (November 1999 – Present). | | | 151 | | | None. | |
DIRECTOR AND OFFICER INFORMATION (Unaudited) (continued)
| | Name, Address and Age | | | Position(s)
Held with the
Company | | | Term of Office and
Length of Time
Served(1) | | | Principal
Occupation(s) –
During the Past 5 Years | | | Number of
funds in
Fund
Complex
Overseen by
Director(2) | | | Other Board Positions
Held by Director | |
| | Sheryl K. Pressler
7337 East Doubletree Ranch Rd.
Suite 100
Scottsdale, Arizona 85258
Age: 65 | | | Director | | | January 2006 – Present | | | Consultant (May 2001 – Present). | | | 151 | | | None. | |
| | Christopher P. Sullivan
7337 East Doubletree Ranch Rd.
Suite 100
Scottsdale, Arizona 85258
Age: 62 | | | Director | | | October 2015 - Present | | | Retired. Formerly, President, Bond Division, Fidelity Management and Research (June 2009 – September 2012). | | | 151 | | | None. | |
| | Roger B. Vincent
7337 East Doubletree Ranch Rd.
Suite 100
Scottsdale, Arizona 85258
Age: 70 | | | Director | | | January 2005 – Present | | | Retired. Formerly, President, Springwell Corporation, a corporate finance firm (March 1989 – August 2011). | | | 151 | | | UGI Corporation (February 2006 – Present) and UGI Utilities, Inc. (February 2006 – Present). | |
| | Director who is an “interested person”: | |
| | Shaun P. Mathews(3)
7337 East Doubletree Ranch Rd.
Suite 100
Scottsdale, Arizona 85258
Age: 60 | | | Director | | | November 2007 – Present | | | President and Chief Executive Officer, Voya Investments, LLC (December 2006 – Present). | | | 151 | | | Voya Capital Corporation, LLC and Voya Investments Distributor, LLC (December 2005 – Present); Voya Funds Services, LLC, Voya Investments, LLC and Voya Investment Management, LLC (March 2006 – Present); and Voya Investment Trust Co. (April 2009 – Present). | |
(1)
Directors serve until their successors are duly elected and qualified. The tenure of each Director who is not an “interested person” as defined in the 1940 Act, of each Portfolio (“Independent Director”) is subject to the Board’s retirement policy which states that each duly elected or appointed Independent Director shall retire from and cease to be a member of the Board of Directors at the close of business on December 31 of the calendar year in which the Independent Director attains the age of 75. A majority vote of the Board’s other Independent Directors may extend the retirement date of an Independent Director if the retirement would trigger a requirement to hold a meeting of shareholders of the Company under applicable law, whether for the purposes of appointing a successor to the Independent Director or otherwise comply under applicable law, in which case the extension would apply until such time as the shareholder meeting can be held or is no longer required (as determined by a vote of a majority of the other Independent Directors).
(2)
For the purposes of this table, “Fund Complex” means the Voya family of funds including the following investment companies: Voya Asia Pacific High Dividend Equity Income Fund; Voya Balanced Portfolio, Inc.; Voya Emerging Markets High Dividend Equity Fund; Voya Equity Trust; Voya Funds Trust; Voya Global Advantage and Premium Opportunity Fund; Voya Global Equity Dividend and Premium Opportunity Fund; Voya Infrastructure, Industrials and Materials Fund; Voya Intermediate Bond Portfolio; Voya International High Dividend Equity Income Fund; Voya Investors Trust; Voya Money Market Portfolio; Voya Mutual Funds; Voya Natural Resources Equity Income Fund; Voya Partners, Inc.; Voya Prime Rate Trust; Voya Senior Income Fund; Voya Separate Portfolios Trust; Voya Series Fund, Inc.; Voya Strategic Allocation Portfolios, Inc.; Voya Variable Funds; Voya Variable Insurance Trust; Voya Variable Portfolios, Inc.; and Voya Variable Products Trust. The number of funds in the Fund Complex is as of January 31, 2016.
(3)
Mr. Mathews is deemed to be an “interested person” of the Company as defined in the 1940 Act, because of his current affiliation with the Voya funds, Voya Financial, Inc., or Voya Financial, Inc.’s affiliates.
*
Effective December 31, 2015, Dr. Albert E. DePrince, Jr. retired as a Director of the Board.
DIRECTOR AND OFFICER INFORMATION (Unaudited) (continued)
| | Name, Address and Age | | | Position(s) Held
With the Company | | | Term of Office and
Length of Time Served(1) | | | Principal Occupation(s) -
During the Past 5 Years | |
| | Shaun P. Mathews
7337 East Doubletree Ranch Rd.
Suite 100
Scottsdale, Arizona 85258
Age: 60 | | | President and Chief Executive Officer | | | November 2006 – Present | | | President and Chief Executive Officer, Voya Investments, LLC (December 2006 – Present). | |
| | Michael J. Roland
7337 East Doubletree Ranch Rd.
Suite 100
Scottsdale, Arizona 85258
Age: 57 | | | Managing Director and Chief Operating Officer | | | April 2012 – Present | | | Managing Director and Chief Operating Officer, Voya Investments, LLC and Voya Funds Services, LLC (April 2012 – Present). Formerly, Chief Compliance Officer, Directed Services LLC and Voya Investments, LLC (March 2011 – December 2013); Executive Vice President and Chief Operating Officer, Voya Investments, LLC and Voya Funds Services, LLC (January 2007 – April 2012) and Chief Compliance Officer, Voya Family of Funds (March 2011 – February 2012). | |
| | Stanley D. Vyner
230 Park Avenue
New York, New York 10169
Age: 65 | | | Executive Vice President
Chief Investment Risk Officer | | | January 2005 – Present
September 2009 – Present | | | Executive Vice President, Voya Investments, LLC (July 2000 – Present) and Chief Investment Risk Officer, Voya Investments, LLC (January 2003 – Present). | |
| | Kevin M. Gleason
7337 East Doubletree Ranch Rd.
Suite 100
Scottsdale, Arizona 85258
Age: 49 | | | Chief Compliance Officer | | | February 2012 – Present | | | Senior Vice President, Voya Investments, LLC and Chief Compliance Officer, Voya Family of Funds (February 2012 – Present). Formerly, Assistant General Counsel and Assistant Secretary, The Northwestern Mutual Life Insurance Company (June 2004 – January 2012). | |
| | Todd Modic
7337 East Doubletree Ranch Rd.
Suite 100
Scottsdale, Arizona 85258
Age: 48 | | | Senior Vice President, Chief/Principal Financial Officer and Assistant Secretary | | | March 2005 – Present | | | Senior Vice President, Voya Investments, LLC and Voya Funds Services, LLC (April 2005 – Present). | |
| | Kimberly A. Anderson
7337 East Doubletree Ranch Rd.
Suite 100
Scottsdale, Arizona 85258
Age: 51 | | | Senior Vice President | | | January 2005 – Present | | | Senior Vice President, Voya Investments, LLC (September 2003 – Present). | |
| | Julius A. Drelick, III
7337 East Doubletree Ranch Rd.
Suite 100
Scottsdale, Arizona 85258
Age: 49 | | | Senior Vice President | | | July 2012 – Present | | | Senior Vice President and Chief Compliance Officer of Directed Services LLC and Voya Investments, LLC (January 2014 – Present); and Senior Vice President – Fund Compliance, Voya Funds Services, LLC (June 2012 – Present). Formerly, Vice President – Platform Product Management & Project Management, Voya Investments, LLC (April 2007 – June 2012). | |
| | Robert Terris
7337 East Doubletree Ranch Rd.
Suite 100
Scottsdale, Arizona 85258
Age: 45 | | | Senior Vice President | | | May 2006 – Present | | | Senior Vice President, Head of Division Operations, Voya Investments, LLC (October 2015 – Present) and Voya Funds Services, LLC (March 2006 – Present). | |
| | Fred Bedoya
7337 East Doubletree Ranch Rd.
Suite 100
Scottsdale, Arizona 85258
Age: 43 | | | Vice President and Treasurer | | | September 2012 – Present | | | Vice President, Voya Investments, LLC (October 2015 – Present) and Voya Funds Services, LLC (July 2012 – Present). Formerly, Assistant Vice President – Director, Voya Funds Services, LLC (March 2003 – March 2012). | |
| | Maria M. Anderson
7337 East Doubletree Ranch Rd.
Suite 100
Scottsdale, Arizona 85258
Age: 57 | | | Vice President | | | January 2005 – Present | | | Vice President, Voya Investments, LLC (October 2015 – Present) and Voya Funds Services, LLC (September 2004 – Present). | |
DIRECTOR AND OFFICER INFORMATION (Unaudited) (continued)
| | Name, Address and Age | | | Position(s) Held
With the Company | | | Term of Office and
Length of Time Served(1) | | | Principal Occupation(s) -
During the Past 5 Years | |
| | Lauren D. Bensinger
7337 East Doubletree Ranch Rd.
Suite 100
Scottsdale, Arizona 85258
Age: 62 | | | Vice President | | | January 2005 – Present | | | Vice President, Voya Funds Services, LLC (February 1996 – Present) and Voya Investments, LLC (October 2004 – Present); Vice President and Money Laundering Reporting Officer, Voya Investments Distributor, LLC (April 2010 – Present); Anti-Money Laundering Compliance Officer, Voya Financial, Inc. (January 2013 – Present); and Money Laundering Reporting Officer, Voya Investment Management Trust Co. (October 2012 – Present). | |
| | Sara M. Donaldson
7337 East Doubletree Ranch Rd.
Suite 100
Scottsdale, Arizona 85258
Age: 56 | | | Vice President | | | September 2014 – Present | | | Vice President, Voya Investments, LLC (October 2015 – Present). Formerly Vice President, Voya Funds Services, LLC (April 2014 – October 2015). Formerly, Director, Compliance, AXA Rosenberg Global Services, LLC (September 1997 – March 2014). | |
| | Robyn L. Ichilov
7337 East Doubletree Ranch Rd.
Suite 100
Scottsdale, Arizona 85258
Age: 48 | | | Vice President | | | January 2005 – Present | | | Vice President, Voya Funds Services, LLC (November 1995 – Present) and Voya Investments, LLC (August 1997 – Present). Formerly, Treasurer, Voya Family of Funds (November 1999 – February 2012). | |
| | Jason Kadavy
7337 East Doubletree Ranch Rd.
Suite 100
Scottsdale, Arizona 85258
Age: 39 | | | Vice President | | | September 2012 – Present | | | Vice President, Voya Investments, LLC (October 2015 – Present) and Voya Funds Services, LLC (July 2007 – Present). | |
| | Kimberly K. Springer
7337 East Doubletree Ranch Rd.
Suite 100
Scottsdale, Arizona 85258
Age: 58 | | | Vice President | | | March 2006 – Present | | | Vice President – Mutual Fund Product Development, Voya Investments, LLC (July 2012 – Present); Vice President, Voya Investment Management – Voya Family of Funds (March 2010 – Present) and Vice President, Voya Funds Services, LLC (March 2006 – Present). Formerly Managing Paralegal, Registration Statements (June 2003 – July 2012). | |
| | Craig Wheeler
7337 East Doubletree Ranch Rd.
Suite 100
Scottsdale, Arizona 85258
Age: 46 | | | Vice President | | | May 2013 – Present | | | Vice President – Director of Tax, Voya Investments, LLC (October 2015 – Present) and Voya Funds Services, LLC (March 2013 – Present). Formerly, Assistant Vice President – Director of Tax, Voya Funds Services, LLC (March 2008 – February 2013). | |
| | Huey P. Falgout, Jr.
7337 East Doubletree Ranch Rd.
Suite 100
Scottsdale, Arizona 85258
Age: 52 | | | Secretary | | | August 2003 – Present | | | Senior Vice President and Chief Counsel, Voya Investment Management – Mutual Fund Legal Department (March 2010 – Present). | |
| | Paul A. Caldarelli
7337 East Doubletree Ranch Rd.
Suite 100
Scottsdale, Arizona 85258
Age: 64 | | | Assistant Secretary | | | June 2010 – Present | | | Vice President and Senior Counsel, Voya Investment Management – Mutual Fund Legal Department (March 2010 – Present). | |
| | Theresa K. Kelety
7337 East Doubletree Ranch Rd.
Suite 100
Scottsdale, Arizona 85258
Age: 53 | | | Assistant Secretary | | | August 2003 – Present | | | Vice President and Senior Counsel, Voya Investment Management – Mutual Fund Legal Department (March 2010 – Present). | |
(1)
The Officers hold office until the next annual meeting of the Board of Directors and until their successors shall have been elected and qualified.
Investment Adviser
Directed Services LLC
1475 Dunwoody Drive
West Chester, Pennsylvania 19380
Distributor
Voya Investments Distributor, LLC
7337 East Doubletree Ranch Road, Suite 100
Scottsdale, Arizona 85258
Transfer Agent
BNY Mellon Investment Servicing (U.S.) Inc.
301 Bellevue Parkway
Wilmington, Delaware 19809
Independent Registered Public Accounting Firm
KPMG LLP
Two Financial Center
60 South Street
Boston, Massachusetts 02111
Custodian
The Bank of New York Mellon
225 Liberty Street
New York, New York 10286
Legal Counsel
Ropes & Gray LLP
Prudential Tower
800 Boylston Street
Boston, Massachusetts 02199
Before investing, carefully consider the investment objectives, risks, charges and expenses of the variable annuity contract or variable life insurance policy and the underlying variable investment options. This and other information is contained in the prospectus for the variable annuity contract or variable life insurance policy and the underlying variable investment options. Obtain these prospectuses from your agent/registered representative and read them carefully before investing.
RETIREMENT | INVESTMENTS | INSURANCE
voyainvestments.com
VPAR-VINDSOL (1215-021716)
Annual Report
December 31, 2015
Classes ADV and S
Voya Partners, Inc.
■
VY® Fidelity® VIP Contrafund® Portfolio*
■
VY® Fidelity® VIP Equity-Income Portfolio*
■
VY® Fidelity® VIP Mid Cap Portfolio*
| | | This report is submitted for general information to shareholders of the Voya mutual funds. It is not authorized for distribution to prospective shareholders unless accompanied or preceded by a prospectus which includes details regarding the funds’ investment objectives, risks, charges, expenses and other information. This information should be read carefully. | | |
*
Fidelity and Contrafund are registered trademarks of FMR LLC.
Used with permission.
| | | | | | | 1 | | |
| | | | | | | 2 | | |
| | | | | | | 4 | | |
| | | | | | | 7 | | |
| | | | | | | 8 | | |
| | | | | | | 9 | | |
| | | | | | | 10 | | |
| | | | | | | 11 | | |
| | | | | | | 13 | | |
| | | | | | | 15 | | |
| | | | | | | 21 | | |
| | | | | | | 24 | | |
| | | | | | | 25 | | |
PROXY VOTING INFORMATION
A description of the policies and procedures that the Portfolios use to determine how to vote proxies related to portfolio securities is available: (1) without charge, upon request, by calling Shareholder Services toll-free at (800) 992-0180; (2) on the Portfolios’ website at www.voyainvestments.com; and (3) on the U.S. Securities and Exchange Commission’s (“SEC’s”) website at www.sec.gov. Information regarding how the Portfolios voted proxies related to portfolio securities during the most recent 12-month period ended June 30 is available without charge on the Portfolios’ website at www.voyainvestments.com and on the SEC’s website at www.sec.gov.
QUARTERLY PORTFOLIO HOLDINGS
The Portfolios file their complete schedule of portfolio holdings with the SEC for the first and third quarters of each fiscal year on Form N-Q. The Portfolios’ Forms N-Q are available on the SEC’s website at www.sec.gov. The Portfolios’ Forms N-Q may be reviewed and copied at the SEC’s Public Reference Room in Washington, DC, and information on the operation of the Public Reference Room may be obtained by calling (800) SEC-0330. The Portfolios’ Forms N-Q, as well as a complete portfolio of investments, are available without charge upon request from the Portfolios by calling Shareholder Services toll-free at (800) 992-0180.
Fed action — global reaction
Dear Shareholder,
One of the most anticipated events of 2015 came to pass with only a few weeks left on the calendar. Following the mid-December gathering of its policy-making Federal Open Market Committee, the Federal Reserve Board (“Fed”) announced the first increase of the federal funds target rate in nearly a decade, hiking its key policy interest rate 0.25% to a range of 0.25% – 0.50%. In its announcement, the central bank cited considerable improvement in labor-market conditions and a reasonable confidence that inflation will approach its 2% objective over the medium term. The widely expected interest rate hike already had been priced into most asset classes and thus had minimal immediate impact on the direction of financial markets.
Worth noting is that the Fed’s decision to begin raising short-term interest rates comes at a time when other major central banks — notably, in Europe, China and Japan — continue to provide massive amounts of support to their economies and are biased more toward further accommodation. The disruptions that potentially may emerge from this divergence in central bank policies will demand close attention in the year ahead. Witness January stock market performance.
Though the Fed believes the U.S. economy is strong enough to bear a fed funds interest rate increase, many of the same risks and opportunities persist in the markets. The global economic backdrop and geopolitical stresses continue to induce uncertainty, which could lead to periods of intense volatility, in our view. How can investors keep their perspective in such times? Don’t let today’s uncertainties distract you from focusing on your long-term goals, and don’t risk compromising your goals for the sake of avoiding volatility now. Keep your portfolio well-diversified and thoroughly discuss any prospective changes with your investment advisor before you take action.
At Voya Investment Management, we seek to be a reliable partner committed to reliable investing, helping you and your investment advisor achieve your goals. We appreciate your continued confidence in us, and we look forward to serving your investment needs in the future.
Sincerely,
Shaun Mathews
President and Chief Executive Officer
January 12, 2016
The views expressed in the President’s Letter reflect those of the President as of the date of the letter. Any such views are subject to change at any time based upon market or other conditions and the Voya mutual funds disclaim any responsibility to update such views. These views may not be relied on as investment advice and because investment decisions for a Voya mutual fund are based on numerous factors, may not be relied on as an indication of investment intent on behalf of any Voya mutual fund. Reference to specific company securities should not be construed as recommendations or investment advice.
International investing poses special risks including currency fluctuation, economic and political risks not found in investments that are solely domestic.
Market Perspective: Year Ended December 31, 2015
In our semi-annual report, we described how equity market interest had recently moved from the U.S. to Europe with the advent of the European Central Bank’s (“ECB”) quantitative easing program. But from there, attention moved east and in August an unexpected announcement from China re-awakened other concerns, sending global equities, in the form of the MSCI World IndexSM (the “Index”) measured in local currencies, including net reinvested dividends, on a roller-coaster ride. Having been up 4.14% for the half-year, the Index finally ended 2015 with a gain of 2.08%. (The Index returned -0.87% for the one year ended December 31, 2015, measured in U.S. dollars.)
U.S. economic data was mixed in what was still a rather pedestrian recovery. A disappointing October employment report was followed by a very strong one in November showing that 271,000 jobs had been created the previous month. Sluggish annual wage growth improved to 2.5%, which doesn’t sound like much, but it was the best since 2009. The unemployment rate fell to 5.0%. The December report was a little weaker. Gross domestic product (“GDP”), initially held back by another harsh winter, rebounded to 3.9% in the second quarter of 2015, before an inventory downturn pegged it back to 2.0% in the third. Industrial production was uneven, while retail sales were still showing no acceleration despite lower gasoline prices.
Superimposed on this was the prospect of rising U.S. interest rates. The Federal Open Market Committee (“FOMC”) had not increased the federal funds interest rate for nine years and many feared that it would feel pressed to act before the economy was really ready. But when on September 17 the FOMC left rates unchanged, citing weakness overseas, investors seemed unnerved at this new narrative rather than relieved. Perhaps sensing a credibility problem, the FOMC tried to re-set expectations, signaling in October the December increase of 0.25% that eventually took place, to a range of 0.25% – 0.50%.
Internationally, as noted, the ECB at last implemented a program of quantitative easing in March. Before long the economic data started to look a little less weak: the unemployment rate ticked down to 10.7% and GDP rose 1.6% year-over-year in the third quarter of 2015. Core inflation edged above 1.0% before slipping back. In December, ECB President Draghi’s much anticipated intensification of the program disappointed markets. Sentiment also suffered in mid-year when the integrity of the euro zone itself was threatened, as Greece wrangled over the terms of its bailout. Creditors stood firm and facing ejection, Greece finally accepted even stricter terms.
Annual GDP growth in China decelerated to 7.0% in the first and second quarters of 2015, the slowest in six years, then to 6.9% in the third. But to many commentators 7.0% was suspiciously close to government targets and perhaps overstated. They watched nervously as the Shanghai Stock Exchange Composite Index (“Shanghai Composite”) soared 64% in 2015 by June 12, fueled by retail savings and margin debt. The Shanghai Composite was already in retreat when on August 11, global commodities and equity markets were shaken as China announced a 2% devaluation of the yuan, suggesting that the Chinese economy, the largest single contributor to global growth in recent years, was indeed weaker than had previously been admitted. By August 26 the Shanghai Composite was down 43% from its peak. But gradually the feeling grew that concerns had been overdone. The
Bank of China lowered interest rates, eased bank reserve requirements and by the end of December, with the yuan gradually depreciating, the Shanghai Composite had regained over a quarter of its losses.
In U.S. fixed income markets, the Barclays U.S. Aggregate Bond Index (“Barclays Aggregate”) gained 0.55% in 2015, while the Barclays U.S. Treasury Bond sub-index added 0.84%. Indices of riskier classes fared worse: the Barclays U.S. Corporate Investment Grade Bond sub-index lost 0.68%, while the Barclays High Yield Bond — 2% Issuer Constrained Composite Index (not a part of the Barclays Aggregate) sagged 4.43%. Reflecting another kind of risk, the Barclays Global Inflation Linked U.S. TIPS Index dipped 1.44% as inflationary expectations receded.
U.S. equities, represented by the S&P 500® Index including dividends, crept up 1.38% over the year, within which August represented the worst month since September 2011, while October was the strongest since October 2011. The consumer discretionary sector did best, rising 10.11%. The most challenged sector was understandably energy, slumping 21.12%. S&P 500® earnings per share, dragged down by the energy sector, recorded their first year-over-year decline since 2012 in the second quarter of 2015, despite continuing high levels of share buybacks, and declined again in the third. Shares of companies with smaller market capitalizations lagged: the Russell Midcap® Index fell 2.44% and the Russell 2000® Index fell 4.41%.
In currencies, “divergence” became the word on the experts’ lips to describe the prospect of the U.S. starting to raise interest rates just as the ECB ratcheted up its quantitative easing program. Unsurprisingly the dollar rose 11.47% against the euro over the year. It rose less, 5.75%, against the pound, as the UK is much closer to raising rates than the euro zone. The dollar’s gains against the yen had been made before the period started and it barely moved, rising just 0.40%.
International markets fell sharply after the events in August, with a partial recovery which was faltering by year-end. The MSCI Japan® Index held on to a gain of 9.93% for the year, amid renewed optimism about the yen-denominated profitability and better governance of Japanese corporations. The MSCI Europe ex UK® Index was cushioned by the introduction of quantitative easing, plus the declining euro that went with it and advanced 8.30%. The MSCI UK® Index, burdened by its large, losing holdings in the energy, materials and banking sectors, dropped 2.21%.
All indices are unmanaged and investors cannot invest directly in an index. Past performance does not guarantee future results. The performance quoted represents past performance. Investment return and principal value of an investment will fluctuate, and shares, when redeemed, may be worth more or less than their original cost. The Portfolios’ performance is subject to change since the period’s end and may be lower or higher than the performance data shown. Please call (800) 262-3862 or log on to www.voyainvestments.com to obtain performance data current to the most recent month end.
Market Perspective reflects the views of Voya Investment Management’s Chief Investment Risk Officer only through the end of the period, and is subject to change based on market and other conditions.
| | | Index | | | | Description | | |
| | | Barclays Global Inflation Linked U.S. TIPS Index | | | | The index measures the performance of the US Treasury Inflation Protected Securities (TIPS) market. | | |
| | | Barclays High Yield Bond — 2% Issuer Constrained Composite Index | | | | An unmanaged index that includes all fixed-income securities having a maximum quality rating of Ba1, a minimum amount outstanding of $150 million, and at least one year to maturity. | | |
| | | Barclays U.S. Aggregate Bond Index | | | | An unmanaged index of publicly issued investment grade U.S. Government, mortgage-backed, asset-backed and corporate debt securities. | | |
| | | Barclays U.S. Corporate Investment Grade Bond Index | | | | An unmanaged index consisting of publicly issued, fixed rate, nonconvertible, investment grade debt securities. | | |
| | | Barclays U.S. Treasury Bond Index | | | | A market capitalization-weighted index that measures the performance of public obligations of the U.S. Treasury that have a remaining maturity of one year or more. | | |
| | | MSCI Europe ex UK® Index | | | | A free float-adjusted market capitalization index that is designed to measure developed market equity performance in Europe, excluding the UK. | | |
| | | MSCI Japan® Index | | | | A free float-adjusted market capitalization index that is designed to measure developed market equity performance in Japan. | | |
| | | MSCI UK® Index | | | | A free float-adjusted market capitalization index that is designed to measure developed market equity performance in the UK. | | |
| | | MSCI World IndexSM | | | | An unmanaged index that measures the performance of over 1,400 securities listed on exchanges in the U.S., Europe, Canada, Australia, New Zealand and the Far East. | | |
| | | Russell 2000® Index | | | | An unmanaged index that measures the performance of securities of small U.S. companies. | | |
| | | Russell 3000® Value Index | | | | A market capitalization-weighted index of stocks of the 3,000 largest U.S. domiciled companies that exhibit value oriented companies. | | |
| | | Russell Midcap® Index | | | | An unmanaged index that measures the performance of the 800 smallest companies in the Russell 1000® Index, which represents approximately 26% of the total market capitalization of the Russell 1000® Index. | | |
| | | S&P 500® Index | | | | An unmanaged index that measures the performance of securities of approximately 500 large-capitalization companies whose securities are traded on major U.S. stock markets. | | |
| | | S&P MidCap 400 Index | | | | An unmanaged index that measures the performance of the mid-size company segment of the U.S. market. | | |
| | | Shanghai Stock Exchange Composite Index | | | | A capitalization-weighted index. The index tracks the daily price performance of all A-shares and B-shares listed on the Shanghai Stock Exchange. The index was developed on December 19, 1990 with a base value of 100. | | |
| VY® Fidelity® VIP Contrafund® Portfolio | Portfolio Managers’ Report |
VY® Fidelity® VIP Contrafund® Portfolio (the “Portfolio”) seeks long-term capital appreciation by investing all of its assets in the Service Class 2 shares of the Fidelity® VIP Contrafund® Portfolio, a series of Fidelity Variable Insurance Products Fund II, a registered open-end investment company. Please refer to Management’s Discussion of Fund Performance on page 4 of the included Fidelity® Variable Insurance Products: Contrafund® Portfolio Annual Report.
| | | Average Annual Total Returns for the Periods Ended December 31, 2015 | | |
| | | | | | 1 Year | | | 5 Year | | | 10 Year | | |
| | | Class ADV | | | | | -0.16% | | | | | | 10.03% | | | | | | 6.41% | | | |
| | | Class S | | | | | 0.08% | | | | | | 10.29% | | | | | | 6.68% | | | |
| | | S&P 500® Index | | | | | 1.38% | | | | | | 12.57% | | | | | | 7.31% | | | |
| | | | | |
Based on a $10,000 initial investment, the graph and table above illustrate the total return of VY® Fidelity® VIP Contrafund® Portfolio against the index indicated. The index is unmanaged, has no cash in its portfolio, imposes no sales charges and incurs no operating expenses. An investor cannot invest directly in the index. The Portfolio’s performance is shown without the imposition of any expenses or charges which are, or may be, imposed under your variable annuity contract or variable life insurance policy. Total returns would have been lower if such expenses or charges were included.
The performance graph and table do not reflect the deduction of taxes that a shareholder will pay on Portfolio distributions or the redemption of Portfolio shares.
The performance shown may include the effect of fee waivers and/or expense reimbursements by the Investment Adviser and/or other service providers, which have the effect of increasing total return. Had all fees and expenses been considered, the total returns would have been lower.
The performance update illustrates performance for a variable investment option available through a variable annuity contract or a variable life insurance policy. The performance shown indicates past performance and is not a projection or prediction of future results. Actual investment returns and principal value will fluctuate so that shares and/or units, at redemption, may be worth more or less than their original cost. Please call (800) 262-3862 to get performance through the most recent month end.
| Portfolio Managers’ Report | VY® Fidelity® VIP Equity-Income Portfolio |
VY® Fidelity® VIP Equity-Income Portfolio (the “Portfolio”) seeks reasonable income and considers the potential for capital appreciation by investing all of its assets in the Service Class 2 shares of the Fidelity® VIP Equity-Income Portfolio, a series of Fidelity Variable Insurance Products Fund, a registered open-end investment company. Please refer to Management’s Discussion of Fund Performance on page 4 of the included Fidelity® Variable Insurance Products: Equity-Income Portfolio Annual Report.
| | | Average Annual Total Returns for the Periods Ended December 31, 2015 | | |
| | | | | | 1 Year | | | 5 Year | | | 10 Year | | |
| | | Class ADV | | | | | -4.82% | | | | | | 8.78% | | | | | | 4.37% | | | |
| | | Class S | | | | | -4.60% | | | | | | 9.03% | | | | | | 4.64% | | | |
| | | Russell 3000® Value Index | | | | | -4.13% | | | | | | 10.98% | | | | | | 6.11% | | | |
| | | | | |
Based on a $10,000 initial investment, the graph and table above illustrate the total return of VY® Fidelity® VIP Equity-Income Portfolio against the index indicated. The index is unmanaged, has no cash in its portfolio, imposes no sales charges and incurs no operating expenses. An investor cannot invest directly in the index. The Portfolio’s performance is shown without the imposition of any expenses or charges which are, or may be, imposed under your variable annuity contract or variable life insurance policy. Total returns would have been lower if such expenses or charges were included.
The performance graph and table do not reflect the deduction of taxes that a shareholder will pay on Portfolio distributions or the redemption of Portfolio shares.
The performance shown may include the effect of fee waivers and/or expense reimbursements by the Investment Adviser and/or other service providers, which have the effect of increasing total return. Had all fees and expenses been considered, the total returns would have been lower.
The performance update illustrates performance for a variable investment option available through a variable annuity contract or a variable life insurance policy. The performance shown indicates past performance and is not a projection or prediction of future results. Actual investment returns and principal value will fluctuate so that shares and/or units, at redemption, may be worth more or less than their original cost. Please call (800) 262-3862 to get performance through the most recent month end.
| VY® Fidelity® VIP Mid Cap Portfolio | Portfolio Managers’ Report |
VY® Fidelity® VIP Mid Cap Portfolio (the “Portfolio”) seeks long-term growth of capital by investing all of its assets in the Service Class 2 shares of the Fidelity® VIP Mid Cap Portfolio, a series of Fidelity Variable Insurance Products Fund III, a registered open-end investment company. Please refer to Management’s Discussion of Fund Performance on page 4 of the included Fidelity® Variable Insurance Products: Mid Cap Portfolio Annual Report.
| | | Average Annual Total Returns for the Periods Ended December 31, 2015 | | |
| | | | | | 1 Year | | | 5 Year | | | 10 Year | | |
| | | Class ADV | | | | | -2.19% | | | | | | 7.09% | | | | | | 6.78% | | | |
| | | Class S | | | | | -1.88% | | | | | | 7.35% | | | | | | 7.05% | | | |
| | | S&P MidCap 400 Index | | | | | -2.18% | | | | | | 10.68% | | | | | | 8.18% | | | |
| | | | | |
Based on a $10,000 initial investment, the graph and table above illustrate the total return of VY® Fidelity® VIP Mid Cap Portfolio against the index indicated. The index is unmanaged, has no cash in its portfolio, imposes no sales charges and incurs no operating expenses. An investor cannot invest directly in the index. The Portfolio’s performance is shown without the imposition of any expenses or charges which are, or may be, imposed under your variable annuity contract or variable life insurance policy. Total returns would have been lower if such expenses or charges were included.
The performance graph and table do not reflect the deduction of taxes that a shareholder will pay on Portfolio distributions or the redemption of Portfolio shares.
The performance shown may include the effect of fee waivers and/or expense reimbursements by the Investment Adviser and/or other service providers, which have the effect of increasing total return. Had all fees and expenses been considered, the total returns would have been lower.
The performance update illustrates performance for a variable investment option available through a variable annuity contract or a variable life insurance policy. The performance shown indicates past performance and is not a projection or prediction of future results. Actual investment returns and principal value will fluctuate so that shares and/or units, at redemption, may be worth more or less than their original cost. Please call (800) 262-3862 to get performance through the most recent month end.
SHAREHOLDER EXPENSE EXAMPLES (Unaudited)
As a shareholder of a Portfolio, you incur two types of costs: (1) transaction costs, including redemption fees and exchange fees; and (2) ongoing costs, including management fees, distribution and/or service (12b-1) fees, and other Portfolio expenses. These Examples are intended to help you understand your ongoing costs (in dollars) of investing in a Portfolio and to compare these costs with the ongoing costs of investing in other mutual funds.
The Examples are based on an investment of $1,000 invested at the beginning of the period and held for the entire period from July 1, 2015 to December 31, 2015. The Portfolios’ expenses are shown without the imposition of any charges which are, or may be, imposed under your variable annuity contract, variable life insurance policy, qualified pension or retirement plan. Expenses would have been higher if such charges were included.
Actual Expenses
The left section of the table shown below, “Actual Portfolio Return,” provides information about actual account values and actual expenses. You may use the information in this section, together with the amount you invested, to estimate the expenses that you paid over the period. Simply divide your account value by $1,000 (for example, an $8,600 account value divided by $1,000 = 8.6), then multiply the result by the number in the first section under the heading entitled “Expenses Paid During the Period” to estimate the expenses you paid on your account during this period.
Hypothetical Example for Comparison Purposes
The right section of the table shown below, “Hypothetical (5% return before expenses),” provides information about hypothetical account values and hypothetical expenses based on a Portfolio’s actual expense ratio and an assumed rate of return of 5% per year before expenses, which is not a Portfolio’s actual return. The hypothetical account values and expenses may not be used to estimate the actual ending account balance or expenses you paid for the period. You may use this information to compare the ongoing costs of investing in a Portfolio and other mutual funds. To do so, compare this 5% hypothetical example with the 5% hypothetical examples that appear in the shareholder reports of the other mutual funds.
Please note that the expenses shown in the table are meant to highlight your ongoing costs only and do not reflect any transactional costs, such as redemption fees or exchange fees. Therefore, the hypothetical section of the table is useful in comparing ongoing costs only, and will not help you determine the relative total costs of owning different mutual funds. In addition, if these transactional costs were included, your costs would have been higher.
| | | | Actual Portfolio Return | | | Hypothetical (5% return before expenses) | |
| | | | Beginning
Account
Value
July 1,
2015 | | | Ending
Account
Value
December 31,
2015 | | | Annualized
Expense
Ratio | | | Expenses Paid
During the
Period Ended
December 31,
2015* | | | Beginning
Account
Value
July 1,
2015 | | | Ending
Account
Value
December 31,
2015 | | | Annualized
Expense
Ratio* | | | Expenses Paid
During the
Period Ended
December 31,
2015* | |
| VY® Fidelity® VIP Contrafund® Portfolio | |
| Class ADV | | | | $ | 1,000.00 | | | | | $ | 970.50 | | | | | | 1.43% | | | | | $ | 7.10 | | | | | $ | 1,000.00 | | | | | $ | 1,018.00 | | | | | | 1.43% | | | | | $ | 7.27 | | |
| Class S | | | | | 1,000.00 | | | | | | 971.70 | | | | | | 1.18 | | | | | | 5.86 | | | | | | 1,000.00 | | | | | | 1,019.26 | | | | | | 1.18 | | | | | | 6.01 | | |
| VY® Fidelity® VIP Equity-Income Portfolio | |
| Class ADV | | | | $ | 1,000.00 | | | | | $ | 946.30 | | | | | | 1.34% | | | | | $ | 6.57 | | | | | $ | 1,000.00 | | | | | $ | 1,018.45 | | | | | | 1.34% | | | | | $ | 6.82 | | |
| Class S | | | | | 1,000.00 | | | | | | 947.10 | | | | | | 1.09 | | | | | | 5.35 | | | | | | 1,000.00 | | | | | | 1,019.71 | | | | | | 1.09 | | | | | | 5.55 | | |
| VY® Fidelity® VIP Mid Cap Portfolio | |
| Class ADV | | | | $ | 1,000.00 | | | | | $ | 933.30 | | | | | | 1.43% | | | | | $ | 6.97 | | | | | $ | 1,000.00 | | | | | $ | 1,018.00 | | | | | | 1.43% | | | | | $ | 7.27 | | |
| Class S | | | | | 1,000.00 | | | | | | 935.20 | | | | | | 1.18 | | | | | | 5.76 | | | | | | 1,000.00 | | | | | | 1,019.26 | | | | | | 1.18 | | | | | | 6.01 | | |
*
Expenses are equal to each Portfolio’s respective annualized expense ratios, including the expenses of the master fund, multiplied by the average account value over the period, multiplied by 184/365 to reflect the most recent fiscal half-year.
REPORT OF INDEPENDENT REGISTERED PUBLIC ACCOUNTING FIRM
The Shareholders and Board of Directors
Voya Partners, Inc.
We have audited the accompanying statements of assets and liabilities, including the portfolios of investments, of VY® Fidelity® VIP Contrafund® Portfolio, VY® Fidelity® VIP Equity-Income Portfolio, and VY® Fidelity® VIP Mid Cap Portfolio, each a series of Voya Partners, Inc., as of December 31, 2015, and the related statements of operations for the year then ended, the statements of changes in net assets for each of the years in the two-year period then ended, and the financial highlights for each of the years in the five-year period then ended. These financial statements and financial highlights are the responsibility of management. Our responsibility is to express an opinion on these financial statements and financial highlights based on our audits.
We conducted our audits in accordance with the standards of the Public Company Accounting Oversight Board (United States). Those standards require that we plan and perform the audit to obtain reasonable assurance about whether the financial statements and financial highlights are free of material misstatement. An audit includes examining, on a test basis, evidence supporting the amounts and disclosures in the financial statements. Our procedures included confirmation of securities owned as of December 31, 2015, by correspondence with custodian, transfer agent, and brokers, or by other appropriate auditing procedures when replies from brokers were not received. An audit also includes assessing the accounting principles used and significant estimates made by management, as well as evaluating the overall financial statement presentation. We believe that our audits provide a reasonable basis for our opinion.
In our opinion, the financial statements and financial highlights referred to above present fairly, in all material respects, the financial position of the aforementioned funds of Voya Partners, Inc. as of December 31, 2015, the results of their operations for the year then ended, the changes in their net assets for each of the years in the two-year period then ended, and the financial highlights for each of the years in the five-year period then ended, in conformity with U.S. generally accepted accounting principles.
Boston, Massachusetts
February 22, 2016
STATEMENTS OF ASSETS AND LIABILITIES as of December 31, 2015
| | | | VY® Fidelity®
VIP Contrafund®
Portfolio | | | VY® Fidelity®
VIP Equity-Income
Portfolio | | | VY® Fidelity®
VIP Mid Cap
Portfolio | |
| ASSETS: | | | | | | | | | | | | | | | | | | | |
| Investments in master fund at fair value*(1) | | | | $ | 235,943,852 | | | | | $ | 10,410,775 | | | | | $ | 32,582,807 | | |
| Cash | | | | | 1,167,663 | | | | | | 23,806 | | | | | | 121,996 | | |
| Receivables: | | | | | | | | | | | | | | | | | | | |
| Investment in master fund sold | | | | | 832,322 | | | | | | 242,041 | | | | | | — | | |
| Fund shares sold | | | | | 2,957 | | | | | | — | | | | | | 13,459 | | |
| Prepaid expenses | | | | | 531 | | | | | | 22 | | | | | | 72 | | |
| Reimbursement due from manager | | | | | 22,101 | | | | | | 2,256 | | | | | | 8,647 | | |
| Other assets | | | | | 7,748 | | | | | | 622 | | | | | | 1,210 | | |
| Total assets | | | | | 237,977,174 | | | | | | 10,679,522 | | | | | | 32,728,191 | | |
| LIABILITIES: | | | | | | | | | | | | | | | | | | | |
| Payable for investments in master fund purchased | | | | | 2,935 | | | | | | — | | | | | | 13,444 | | |
| Payable for fund shares redeemed | | | | | 832,344 | | | | | | 242,041 | | | | | | 15 | | |
| Payable for investment management fees | | | | | 20,469 | | | | | | 936 | | | | | | 2,814 | | |
| Payable for distribution and shareholder service fees | | | | | 52,593 | | | | | | 2,399 | | | | | | 7,146 | | |
| Payable for directors fees | | | | | 1,376 | | | | | | 60 | | | | | | 186 | | |
| Payable to directors under the deferred compensation plan (Note 6) | | | | | 7,748 | | | | | | 622 | | | | | | 1,210 | | |
| Other accrued expenses and liabilities | | | | | 90,840 | | | | | | 11,189 | | | | | | 36,116 | | |
| Total liabilities | | | | | 1,008,305 | | | | | | 257,247 | | | | | | 60,931 | | |
| NET ASSETS | | | | $ | 236,968,869 | | | | | $ | 10,422,275 | | | | | $ | 32,667,260 | | |
| NET ASSETS WERE COMPRISED OF: | | | | | | | | | | | | | | | | | | | |
| Paid-in capital | | | | $ | 214,198,805 | | | | | $ | 23,499,450 | | | | | $ | 29,494,917 | | |
| Undistributed (distributions in excess of) net investment income | | | | | 3,150,059 | | | | | | 370,598 | | | | | | (1,216) | | |
| Accumulated net realized gain (loss) | | | | | (44,277,360) | | | | | | (13,009,022) | | | | | | 3,778,328 | | |
| Net unrealized appreciation (depreciation) | | | | | 63,897,365 | | | | | | (438,751) | | | | | | (604,769) | | |
| NET ASSETS | | | | $ | 236,968,869 | | | | | $ | 10,422,275 | | | | | $ | 32,667,260 | | |
*
Cost of investments in master fund at value | | | | $ | 172,046,487 | | | | | $ | 10,849,526 | | | | | $ | 33,187,576 | | |
| Class ADV | | | | |
| Net assets | | | | $ | 6,722,484 | | | | | $ | 278,094 | | | | | $ | 521,070 | | |
| Shares authorized | | | | | 100,000,000 | | | | | | 100,000,000 | | | | | | 100,000,000 | | |
| Par value | | | | $ | 0.001 | | | | | $ | 0.001 | | | | | $ | 0.001 | | |
| Shares outstanding | | | | | 463,127 | | | | | | 24,787 | | | | | | 34,299 | | |
| Net asset value and redemption price per share | | | | $ | 14.52 | | | | | $ | 11.22 | | | | | $ | 15.19 | | |
| Class S | | | | |
| Net assets | | | | $ | 230,246,385 | | | | | $ | 10,144,181 | | | | | $ | 32,146,190 | | |
| Shares authorized | | | | | 100,000,000 | | | | | | 100,000,000 | | | | | | 100,000,000 | | |
| Par value | | | | $ | 0.001 | | | | | $ | 0.001 | | | | | $ | 0.001 | | |
| Shares outstanding | | | | | 15,719,506 | | | | | | 903,249 | | | | | | 2,087,693 | | |
| Net asset value and redemption price per share | | | | $ | 14.65 | | | | | $ | 11.23 | | | | | $ | 15.40 | | |
(1)
The master funds for the VY® Fidelity® VIP Contrafund®, VY® Fidelity® VIP Equity-Income and VY® Fidelity® VIP Mid Cap Portfolios are the Fidelity® VIP Contrafund®, Fidelity® VIP Equity-Income and Fidelity® VIP Mid Cap Portfolios, respectively. These financial statements should be read in conjunction with the master Fidelity funds’ financial statements.
See Accompanying Notes to Financial Statements
STATEMENTS OF OPERATIONS for the year ended December 31, 2015
| | | | VY® Fidelity®
VIP Contrafund®
Portfolio | | | VY® Fidelity®
VIP Equity-Income
Portfolio | | | VY® Fidelity®
VIP Mid Cap
Portfolio |
| INVESTMENT INCOME: | | | | |
| Dividends from master fund(1) | | | | $ | 1,974,647 | | | | | $ | 346,471 | | | | | $ | 86,935 |
| Total investment income | | | | | 1,974,647 | | | | | | 346,471 | | | | | | 86,935 |
| EXPENSES: | | | | | | | | | | | | | | | | | |
| Investment management fees(2) | | | | | 176,755 | | | | | | 7,836 | | | | | | 24,156 |
| Distribution and shareholder service fees: | | | | |
| Class ADV | | | | | 33,708 | | | | | | 1,404 | | | | | | 2,629 |
| Class S | | | | | 671,186 | | | | | | 29,180 | | | | | | 91,581 |
Class S2(3) | | | | | — | | | | | | — | | | | | | 11 |
| Transfer agent fees | | | | | 251 | | | | | | 4 | | | | | | 745 |
Administrative service fees(2) | | | | | 98,459 | | | | | | 4,116 | | | | | | 13,004 |
| Shareholder reporting expense | | | | | 18,250 | | | | | | 1,825 | | | | | | 10,494 |
| Registration fees | | | | | 696 | | | | | | — | | | | | | 348 |
| Professional fees | | | | | 77,745 | | | | | | 10,950 | | | | | | 16,429 |
| Custody and accounting expense | | | | | 24,090 | | | | | | 1,095 | | | | | | 3,210 |
| Directors fees | | | | | 8,256 | | | | | | 359 | | | | | | 1,115 |
| Miscellaneous expense | | | | | 13,606 | | | | | | 7,029 | | | | | | 7,347 |
| Total expenses | | | | | 1,123,002 | | | | | | 63,798 | | | | | | 171,069 |
| Net waived and reimbursed fees | | | | | (277,407) | | | | | | (26,982) | | | | | | (58,253) |
| Net expenses | | | | | 845,595 | | | | | | 36,816 | | | | | | 112,816 |
| Net investment income (loss) | | | | | 1,129,052 | | | | | | 309,655 | | | | | | (25,881) |
| REALIZED AND UNREALIZED GAIN (LOSS): | | | | | | | | | | | | | | | | | |
| Net realized gain (loss) on: | | | | |
| Capital gain distributions from master fund | | | | | 26,481,186 | | | | | | 1,152,411 | | | | | | 4,740,325 |
| Sale of investments in master fund | | | | | 44,074,851 | | | | | | 257,709 | | | | | | 2,363,606 |
| Net realized gain | | | | | 70,556,037 | | | | | | 1,410,120 | | | | | | 7,103,931 |
| Net change in unrealized appreciation (depreciation) on: | | | | |
| Master fund | | | | | (70,634,233) | | | | | | (2,263,512) | | | | | | (7,608,324) |
| Net change in unrealized appreciation (depreciation) | | | | | (70,634,233) | | | | | | (2,263,512) | | | | | | (7,608,324) |
| Net realized and unrealized loss | | | | | (78,196) | | | | | | (853,392) | | | | | | (504,393) |
| Increase (decrease) in net assets resulting from operations | | | | $ | 1,050,856 | | | | | $ | (543,737) | | | | | $ | (530,274) |
| |
(1)
The master funds for the VY® Fidelity® VIP Contrafund®, VY® Fidelity® VIP Equity-Income and VY® Fidelity® VIP Mid Cap Portfolios are the Fidelity® VIP Contrafund®, Fidelity® VIP Equity-Income and Fidelity® VIP Mid Cap Portfolios, respectively. These financial statements should be read in conjunction with the master Fidelity funds’ financial statements.
(2)
Effective May 1, 2015, the investment management fee and administration fee were combined under a single amended and restated investment management agreement. Please see Note 4 for further information.
(3)
Class S2 of VY® Fidelity® VIP Mid Cap Portfolio liquidated on May 28, 2015.
See Accompanying Notes to Financial Statements
STATEMENTS OF CHANGES IN NET ASSETS
| | | | VY® Fidelity® VIP
Contrafund® Portfolio | | | VY® Fidelity® VIP
Equity-Income Portfolio |
| | | | Year Ended
December 31,
2015 | | | Year Ended
December 31,
2014 | | | Year Ended
December 31,
2015 | | | Year Ended
December 31,
2014 |
| FROM OPERATIONS: | | | | | | | | | | | | | | | | | | | | | | | |
| Net investment income | | | | $ | 1,129,052 | | | | | $ | 1,229,502 | | | | | $ | 309,655 | | | | | $ | 307,550 |
| Net realized gain | | | | | 70,556,037 | | | | | | 31,864,676 | | | | | | 1,410,120 | | | | | | 1,100,032 |
| Net change in unrealized appreciation (depreciation) | | | | | (70,634,233) | | | | | | 826,231 | | | | | | (2,263,512) | | | | | | (259,623) |
| Increase (decrease) in net assets resulting from operations | | | | | 1,050,856 | | | | | | 33,920,409 | | | | | | (543,737) | | | | | | 1,147,959 |
| FROM DISTRIBUTIONS TO SHAREHOLDERS: | | | | | |
| Net investment income: | | | | | |
| Class ADV | | | | | (174,251) | | | | | | (24,081) | | | | | | (10,681) | | | | | | (10,601) |
| Class S | | | | | (7,189,918) | | | | | | (1,674,200) | | | | | | (448,151) | | | | | | (589,465) |
| Total distributions | | | | | (7,364,169) | | | | | | (1,698,281) | | | | | | (458,832) | | | | | | (600,066) |
| FROM CAPITAL SHARE TRANSACTIONS: | | | | | |
| Net proceeds from sale of shares | | | | | 6,825,556 | | | | | | 9,267,936 | | | | | | 657,951 | | | | | | 901,113 |
| Reinvestment of distributions | | | | | 7,364,169 | | | | | | 1,698,281 | | | | | | 458,832 | | | | | | 600,066 |
| | | | | | 14,189,725 | | | | | | 10,966,217 | | | | | | 1,116,783 | | | | | | 1,501,179 |
| Cost of shares redeemed | | | | | (78,056,879) | | | | | | (79,991,121) | | | | | | (2,694,039) | | | | | | (3,600,173) |
| Net decrease in net assets resulting from capital share transactions | | | | | (63,867,154) | | | | | | (69,024,904) | | | | | | (1,577,256) | | | | | | (2,098,994) |
| Net decrease in net assets | | | | | (70,180,467) | | | | | | (36,802,776) | | | | | | (2,579,825) | | | | | | (1,551,101) |
| NET ASSETS: | | | | | |
| Beginning of year or period | | | | | 307,149,336 | | | | | | 343,952,112 | | | | | | 13,002,100 | | | | | | 14,553,201 |
| End of year or period | | | | $ | 236,968,869 | | | | | $ | 307,149,336 | | | | | $ | 10,422,275 | | | | | $ | 13,002,100 |
| Undistributed net investment income at end of year or period | | | | $ | 3,150,059 | | | | | $ | 7,357,262 | | | | | $ | 370,598 | | | | | $ | 458,175 |
| |
See Accompanying Notes to Financial Statements
STATEMENTS OF CHANGES IN NET ASSETS
| | | | VY® Fidelity® VIP
Mid Cap Portfolio | |
| | | | Year Ended
December 31,
2015 | | | Year Ended
December 31,
2014 | |
| FROM OPERATIONS: | | | |
| Net investment (loss) | | | | $ | (25,881) | | | | | $ | (123,227) | | |
| Net realized gain | | | | | 7,103,931 | | | | | | 6,112,711 | | |
| Net change in unrealized appreciation (depreciation) | | | | | (7,608,324) | | | | | | (3,665,690) | | |
| Increase (decrease) in net assets resulting from operations | | | | | (530,274) | | | | | | 2,323,794 | | |
| FROM DISTRIBUTIONS TO SHAREHOLDERS: | | | |
| Net investment income: | | | |
| Class ADV | | | | | (4,189) | | | | | | (48,801) | | |
| Class S | | | | | (465,055) | | | | | | (2,047,718) | | |
Class S2(1) | | | | | — | | | | | | (273) | | |
| Net realized gains: | | | |
| Class ADV | | | | | (32,225) | | | | | | (74,539) | | |
| Class S | | | | | (2,136,248) | | | | | | (2,906,187) | | |
Class S2(1) | | | | | — | | | | | | (393) | | |
| Total distributions | | | | | (2,637,717) | | | | | | (5,077,911) | | |
| FROM CAPITAL SHARE TRANSACTIONS: | | | |
| Net proceeds from sale of shares | | | | | 2,392,518 | | | | | | 2,088,992 | | |
| Reinvestment of distributions | | | | | 2,637,717 | | | | | | 5,077,245 | | |
| | | | | | 5,030,235 | | | | | | 7,166,237 | | |
| Cost of shares redeemed | | | | | (9,406,202) | | | | | | (10,462,728) | | |
| Net decrease in net assets resulting from capital share transactions | | | | | (4,375,967) | | | | | | (3,296,491) | | |
| Net decrease in net assets | | | | | (7,543,958) | | | | | | (6,050,608) | | |
| NET ASSETS: | | | |
| Beginning of year or period | | | | | 40,211,218 | | | | | | 46,261,826 | | |
| End of year or period | | | | $ | 32,667,260 | | | | | $ | 40,211,218 | | |
| Undistributed (distributions in excess of) net investment income at end of year or period | | | | $ | (1,216) | | | | | $ | 467,098 | | |
| |
(1)
Class S2 liquidated on May 28, 2015.
See Accompanying Notes to Financial Statements
Selected data for a share of beneficial interest outstanding throughout each year or period.
| | | | | | | | | | Income
(loss) from
investment
operations | | | | | | | | | Less distributions | | | | | | Ratios to average
net assets | | | Supplemental
data | | | Ratios and Supplemental
data including the master
fund | |
| | | | Net asset value, beginning of year
or period | | | Net investment income (loss) | | | Net realized and unrealized gain
(loss) on master fund | | | Total from investment operations | | | From net investment income | | | From net realized gains from
master fund | | | From return of capital from
master fund | | | Total distributions | | | Net asset value, end of year or
period | | | Total Return(1) | | | Gross expenses excluding
expenses of the master fund(2)(3)(4) | | | Net expenses excluding expenses
of the master fund(2)(3)(4) | | | Net investment income (loss)
excluding expenses of the master
fund(2)(4) | | | Net assets, end of year or period | | | Portfolio turnover rate(5) | | | Expenses including gross
expenses of the master fund(2)(3)(4) | | | Expenses including expenses net
of voluntary waivers, if any, of the
master fund(2)(3)(4) | | | Expenses including expenses net
of all reductions of the master
fund(2)(3)(4) | | | Portfolio turnover rate of the
master fund | |
Year or
period ended | | | ($) | | | ($) | | | ($) | | | ($) | | | ($) | | | ($) | | | ($) | | | ($) | | | ($) | | | (%) | | | (%) | | | (%) | | | (%) | | | ($000’s) | | | (%) | | | (%) | | | (%) | | | (%) | | | (%) | |
VY® Fidelity® VIP Contrafund® Portfolio | | | | | | | | | | | | | | | | | | | | | | | | | | | | | | | | | | | | | | | | | | | | | | | | | | | | | | | | | | | | | | | | | | | | | | | | | | | | | | | | | | | | | | | | | | | | | | | | | | | | | | | | | | | | | | | | | | | |
| Class ADV | | | | | | | | | | | | | | | | | | | | | | | | | | | | | | | | | | | | | | | | | | | | | | | | | | | | | | | | | | | | | | | | | | | | | | | | | | | | | | | | | | | | | | | | | | | | | | | | | | | | | | | | | | | | | | | | | | | |
| 12-31-15 | | | | | 14.92 | | | | | | 0.04 | | | | | | (0.05) | | | | | | (0.01) | | | | | | 0.39 | | | | | | — | | | | | | — | | | | | | 0.39 | | | | | | 14.52 | | | | | | (0.16) | | | | | | 0.65 | | | | | | 0.55 | | | | | | 0.26 | | | | | | 6,722 | | | | | | 13 | | | | | | 1.53 | | | | | | 1.43 | | | | | | 1.42 | | | | | | 80 | | |
| 12-31-14 | | | | | 13.49 | | | | | | 0.03 | | | | | | 1.45 | | | | | | 1.48 | | | | | | 0.05 | | | | | | — | | | | | | — | | | | | | 0.05 | | | | | | 14.92 | | | | | | 11.02 | | | | | | 0.65 | | | | | | 0.55 | | | | | | 0.21 | | | | | | 6,674 | | | | | | 5 | | | | | | 1.53 | | | | | | 1.43 | | | | | | 1.43 | | | | | | 74 | | |
| 12-31-13 | | | | | 10.42 | | | | | | 0.04 | | | | | | 3.11 | | | | | | 3.15 | | | | | | 0.08 | | | | | | — | | | | | | — | | | | | | 0.08 | | | | | | 13.49 | | | | | | 30.31 | | | | | | 0.65 | | | | | | 0.55 | | | | | | 0.29 | | | | | | 6,336 | | | | | | 4 | | | | | | 1.54 | | | | | | 1.43 | | | | | | 1.42 | | | | | | 86 | | |
| 12-31-12 | | | | | 9.05 | | | | | | 0.07 | | | | | | 1.33 | | | | | | 1.40 | | | | | | 0.03 | | | | | | — | | | | | | — | | | | | | 0.03 | | | | | | 10.42 | | | | | | 15.46 | | | | | | 0.61 | | | | | | 0.55 | | | | | | 0.77 | | | | | | 5,451 | | | | | | 5 | | | | | | 1.50 | | | | | | 1.44 | | | | | | 1.43 | | | | | | 87 | | |
| 12-31-11 | | | | | 9.42 | | | | | | 0.01 | | | | | | (0.33) | | | | | | (0.32) | | | | | | 0.05 | | | | | | — | | | | | | — | | | | | | 0.05 | | | | | | 9.05 | | | | | | (3.31) | | | | | | 0.55 | | | | | | 0.55 | | | | | | 0.24 | | | | | | 4,023 | | | | | | 8 | | | | | | 1.45 | | | | | | 1.44 | | | | | | 1.43 | | | | | | 135 | | |
| Class S | | | | | | | | | | | | | | | | | | | | | | | | | | | | | | | | | | | | | | | | | | | | | | | | | | | | | | | | | | | | | | | | | | | | | | | | | | | | | | | | | | | | | | | | | | | | | | | | | | | | | | | | | | | | | | | | | | | |
| 12-31-15 | | | | | 15.04 | | | | | | 0.06• | | | | | | (0.03) | | | | | | 0.03 | | | | | | 0.42 | | | | | | — | | | | | | — | | | | | | 0.42 | | | | | | 14.65 | | | | | | 0.08 | | | | | | 0.40 | | | | | | 0.30 | | | | | | 0.41 | | | | | | 230,246 | | | | | | 13 | | | | | | 1.28 | | | | | | 1.18 | | | | | | 1.17 | | | | | | 80 | | |
| 12-31-14 | | | | | 13.58 | | | | | | 0.06 | | | | | | 1.48 | | | | | | 1.54 | | | | | | 0.08 | | | | | | — | | | | | | — | | | | | | 0.08 | | | | | | 15.04 | | | | | | 11.36 | | | | | | 0.40 | | | | | | 0.30 | | | | | | 0.39 | | | | | | 300,476 | | | | | | 5 | | | | | | 1.28 | | | | | | 1.18 | | | | | | 1.18 | | | | | | 74 | | |
| 12-31-13 | | | | | 10.49 | | | | | | 0.06• | | | | | | 3.13 | | | | | | 3.19 | | | | | | 0.10 | | | | | | — | | | | | | — | | | | | | 0.10 | | | | | | 13.58 | | | | | | 30.46 | | | | | | 0.40 | | | | | | 0.30 | | | | | | 0.49 | | | | | | 337,616 | | | | | | 4 | | | | | | 1.29 | | | | | | 1.18 | | | | | | 1.17 | | | | | | 86 | | |
| 12-31-12 | | | | | 9.10 | | | | | | 0.08• | | | | | | 1.36 | | | | | | 1.44 | | | | | | 0.05 | | | | | | — | | | | | | — | | | | | | 0.05 | | | | | | 10.49 | | | | | | 15.82 | | | | | | 0.36 | | | | | | 0.30 | | | | | | 0.77 | | | | | | 309,112 | | | | | | 5 | | | | | | 1.25 | | | | | | 1.19 | | | | | | 1.18 | | | | | | 87 | | |
| 12-31-11 | | | | | 9.47 | | | | | | 0.05 | | | | | | (0.35) | | | | | | (0.30) | | | | | | 0.07 | | | | | | — | | | | | | — | | | | | | 0.07 | | | | | | 9.10 | | | | | | (3.10) | | | | | | 0.30 | | | | | | 0.30 | | | | | | 0.45 | | | | | | 311,215 | | | | | | 8 | | | | | | 1.20 | | | | | | 1.19 | | | | | | 1.18 | | | | | | 135 | | |
VY® Fidelity® VIP Equity-Income Portfolio | | | | | | | | | | | | | | | | | | | | | | | | | | | | | | | | | | | | | | | | | | | | | | | | | | | | | | | | | | | | | | | | | | | | | | | | | | | | | | | | | | | | | | | | | | | | | | | | | | | | | | | | | | | | | | | | | | | |
| Class ADV | | | | | | | | | | | | | | | | | | | | | | | | | | | | | | | | | | | | | | | | | | | | | | | | | | | | | | | | | | | | | | | | | | | | | | | | | | | | | | | | | | | | | | | | | | | | | | | | | | | | | | | | | | | | | | | | | | | |
| 12-31-15 | | | | | 12.24 | | | | | | 0.30• | | | | | | (0.87) | | | | | | (0.57) | | | | | | 0.45 | | | | | | — | | | | | | — | | | | | | 0.45 | | | | | | 11.22 | | | | | | (4.82) | | | | | | 0.78 | | | | | | 0.55 | | | | | | 2.53 | | | | | | 278 | | | | | | 18 | | | | | | 1.57 | | | | | | 1.34 | | | | | | 1.33 | | | | | | 46 | | |
| 12-31-14 | | | | | 11.81 | | | | | | 0.27• | | | | | | 0.66 | | | | | | 0.93 | | | | | | 0.50 | | | | | | — | | | | | | — | | | | | | 0.50 | | | | | | 12.24 | | | | | | 8.00 | | | | | | 0.74 | | | | | | 0.55 | | | | | | 2.20 | | | | | | 273 | | | | | | 10 | | | | | | 1.53 | | | | | | 1.34 | | | | | | 1.34 | | | | | | 40 | | |
| 12-31-13 | | | | | 9.62 | | | | | | 0.20• | | | | | | 2.38 | | | | | | 2.58 | | | | | | 0.39 | | | | | | — | | | | | | — | | | | | | 0.39 | | | | | | 11.81 | | | | | | 27.03 | | | | | | 0.68 | | | | | | 0.55 | | | | | | 1.81 | | | | | | 247 | | | | | | 17 | | | | | | 1.48 | | | | | | 1.34 | | | | | | 1.34 | | | | | | 32 | | |
| 12-31-12 | | | | | 8.36 | | | | | | 0.10• | | | | | | 1.27 | | | | | | 1.37 | | | | | | 0.11 | | | | | | — | | | | | | — | | | | | | 0.11 | | | | | | 9.62 | | | | | | 16.47 | | | | | | 0.69 | | | | | | 0.55 | | | | | | 1.08 | | | | | | 203 | | | | | | 17 | | | | | | 1.49 | | | | | | 1.35 | | | | | | 1.34 | | | | | | 48 | | |
| 12-31-11 | | | | | 8.47 | | | | | | 0.16 | | | | | | (0.16) | | | | | | 0.00* | | | | | | 0.11 | | | | | | — | | | | | | — | | | | | | 0.11 | | | | | | 8.36 | | | | | | 0.14 | | | | | | 0.55 | | | | | | 0.55 | | | | | | 1.83 | | | | | | 454 | | | | | | 20 | | | | | | 1.36 | | | | | | 1.36 | | | | | | 1.35 | | | | | | 96 | | |
| Class S | | | | | | | | | | | | | | | | | | | | | | | | | | | | | | | | | | | | | | | | | | | | | | | | | | | | | | | | | | | | | | | | | | | | | | | | | | | | | | | | | | | | | | | | | | | | | | | | | | | | | | | | | | | | | | | | | | | |
| 12-31-15 | | | | | 12.24 | | | | | | 0.31• | | | | | | (0.85) | | | | | | (0.54) | | | | | | 0.47 | | | | | | — | | | | | | — | | | | | | 0.47 | | | | | | 11.23 | | | | | | (4.60) | | | | | | 0.53 | | | | | | 0.30 | | | | | | 2.59 | | | | | | 10,144 | | | | | | 18 | | | | | | 1.32 | | | | | | 1.09 | | | | | | 1.08 | | | | | | 46 | | |
| 12-31-14 | | | | | 11.80 | | | | | | 0.26 | | | | | | 0.70 | | | | | | 0.96 | | | | | | 0.52 | | | | | | — | | | | | | — | | | | | | 0.52 | | | | | | 12.24 | | | | | | 8.23 | | | | | | 0.49 | | | | | | 0.30 | | | | | | 2.16 | | | | | | 12,729 | | | | | | 10 | | | | | | 1.28 | | | | | | 1.09 | | | | | | 1.09 | | | | | | 40 | | |
| 12-31-13 | | | | | 9.63 | | | | | | 0.17• | | | | | | 2.45 | | | | | | 2.62 | | | | | | 0.45 | | | | | | — | | | | | | — | | | | | | 0.45 | | | | | | 11.80 | | | | | | 27.46 | | | | | | 0.43 | | | | | | 0.30 | | | | | | 1.59 | | | | | | 14,306 | | | | | | 17 | | | | | | 1.23 | | | | | | 1.09 | | | | | | 1.09 | | | | | | 32 | | |
| 12-31-12 | | | | | 8.43 | | | | | | 0.22• | | | | | | 1.18 | | | | | | 1.40 | | | | | | 0.20 | | | | | | — | | | | | | — | | | | | | 0.20 | | | | | | 9.63 | | | | | | 16.68 | | | | | | 0.44 | | | | | | 0.30 | | | | | | 2.44 | | | | | | 16,883 | | | | | | 17 | | | | | | 1.24 | | | | | | 1.10 | | | | | | 1.09 | | | | | | 48 | | |
| 12-31-11 | | | | | 8.54 | | | | | | 0.14• | | | | | | (0.13) | | | | | | 0.01 | | | | | | 0.12 | | | | | | — | | | | | | — | | | | | | 0.12 | | | | | | 8.43 | | | | | | 0.33 | | | | | | 0.30 | | | | | | 0.30 | | | | | | 1.66 | | | | | | 17,687 | | | | | | 20 | | | | | | 1.11 | | | | | | 1.11 | | | | | | 1.10 | | | | | | 96 | | |
VY® Fidelity® VIP Mid Cap Portfolio | | | | | | | | | | | | | | | | | | | | | | | | | | | | | | | | | | | | | | | | | | | | | | | | | | | | | | | | | | | | | | | | | | | | | | | | | | | | | | | | | | | | | | | | | | | | | | | | | | | | | | | | | | | | | | | | | | | |
| Class ADV | | | | | | | | | | | | | | | | | | | | | | | | | | | | | | | | | | | | | | | | | | | | | | | | | | | | | | | | | | | | | | | | | | | | | | | | | | | | | | | | | | | | | | | | | | | | | | | | | | | | | | | | | | | | | | | | | | | |
| 12-31-15 | | | | | 16.63 | | | | | | (0.05) | | | | | | (0.24) | | | | | | (0.29) | | | | | | 0.13 | | | | | | 1.02 | | | | | | — | | | | | | 1.15 | | | | | | 15.19 | | | | | | (2.19) | | | | | | 0.71 | | | | | | 0.55 | | | | | | (0.29) | | | | | | 521 | | | | | | 19 | | | | | | 1.59 | | | | | | 1.43 | | | | | | 1.43 | | | | | | 26 | | |
| 12-31-14 | | | | | 17.89 | | | | | | (0.09)• | | | | | | 0.98 | | | | | | 0.89 | | | | | | 0.85 | | | | | | 1.30 | | | | | | — | | | | | | 2.15 | | | | | | 16.63 | | | | | | 5.44 | | | | | | 0.69 | | | | | | 0.55 | | | | | | (0.54) | | | | | | 514 | | | | | | 7 | | | | | | 1.57 | | | | | | 1.43 | | | | | | 1.43 | | | | | | 142 | | |
| 12-31-13 | | | | | 13.24 | | | | | | (0.05)• | | | | | | 4.70 | | | | | | 4.65 | | | | | | — | | | | | | — | | | | | | — | | | | | | — | | | | | | 17.89 | | | | | | 35.12 | | | | | | 0.67 | | | | | | 0.55 | | | | | | (0.33) | | | | | | 1,118 | | | | | | 20 | | | | | | 1.56 | | | | | | 1.44 | | | | | | 1.43 | | | | | | 132 | | |
| 12-31-12 | | | | | 11.62 | | | | | | (0.04) | | | | | | 1.66 | | | | | | 1.62 | | | | | | — | | | | | | — | | | | | | — | | | | | | — | | | | | | 13.24 | | | | | | 13.94 | | | | | | 0.65 | | | | | | 0.55 | | | | | | (0.23) | | | | | | 1,609 | | | | | | 11 | | | | | | 1.55 | | | | | | 1.45 | | | | | | 1.43 | | | | | | 187 | | |
| 12-31-11 | | | | | 13.10 | | | | | | (0.07)• | | | | | | (1.41) | | | | | | (1.48) | | | | | | — | | | | | | — | | | | | | — | | | | | | — | | | | | | 11.62 | | | | | | (11.30) | | | | | | 0.55 | | | | | | 0.55 | | | | | | (0.54) | | | | | | 1,783 | | | | | | 6 | | | | | | 1.46 | | | | | | 1.46 | | | | | | 1.45 | | | | | | 84 | | |
See Accompanying Notes to Financial Statements
Financial Highlights (continued)
| | | | | | | | | | Income
(loss) from
investment
operations | | | | | | | | | Less
distributions | | | | | | Ratios to
average
net assets | | | Supplemental
data | | | Ratios and Supplemental
data including the master
fund | |
| | | | Net asset value, beginning of year
or period | | | Net investment income (loss) | | | Net realized and unrealized gain
(loss) on master fund | | | Total from investment operations | | | From net investment income | | | From net realized gains from
master fund | | | From return of capital from
master fund | | | Total distributions | | | Net asset value, end of year or
period | | | Total Return(1) | | | Gross expenses excluding
expenses of the master fund(2)(3)(4) | | | Net expenses excluding expenses
of the master fund(2)(3)(4) | | | Net investment income (loss)
excluding expenses of the master
fund(2)(4) | | | Net assets, end of year or period | | | Portfolio turnover rate(5) | | | Expenses including gross
expenses of the master fund(2)(3)(4) | | | Expenses including expenses net
of voluntary waivers, if any, of the
master fund(2)(3)(4) | | | Expenses including expenses net
of all reductions of the master
fund(2)(3)(4) | | | Portfolio turnover rate of the
master fund | |
Year or
period ended | | | ($) | | | ($) | | | ($) | | | ($) | | | ($) | | | ($) | | | ($) | | | ($) | | | ($) | | | (%) | | | (%) | | | (%) | | | (%) | | | ($000’s) | | | (%) | | | (%) | | | (%) | | | (%) | | | (%) | |
VY® Fidelity® VIP Mid Cap Portfolio (continued) | | | | | | | | | | | | | | | | | | | | | | | | | | | | | | | | | | | | | | | | | | | | | | | | | | | | | | | | | | | | | | | | | | | | | | | | | | | | | | | | | | | | | | | | | | | | | | | | | | | | | | | | | | | | | | | | | | | |
| Class S | | | | | | | | | | | | | | | | | | | | | | | | | | | | | | | | | | | | | | | | | | | | | | | | | | | | | | | | | | | | | | | | | | | | | | | | | | | | | | | | | | | | | | | | | | | | | | | | | | | | | | | | | | | | | | | | | | | |
| 12-31-15 | | | | | 16.88 | | | | | | (0.01)• | | | | | | (0.23) | | | | | | (0.24) | | | | | | 0.22 | | | | | | 1.02 | | | | | | — | | | | | | 1.24 | | | | | | 15.40 | | | | | | (1.88) | | | | | | 0.46 | | | | | | 0.30 | | | | | | (0.07) | | | | | | 32,146 | | | | | | 19 | | | | | | 1.34 | | | | | | 1.18 | | | | | | 1.18 | | | | | | 26 | | |
| 12-31-14 | | | | | 18.15 | | | | | | (0.05)• | | | | | | 1.00 | | | | | | 0.95 | | | | | | 0.92 | | | | | | 1.30 | | | | | | — | | | | | | 2.22 | | | | | | 16.88 | | | | | | 5.69 | | | | | | 0.44 | | | | | | 0.30 | | | | | | (0.28) | | | | | | 39,692 | | | | | | 7 | | | | | | 1.32 | | | | | | 1.18 | | | | | | 1.18 | | | | | | 142 | | |
| 12-31-13 | | | | | 13.41 | | | | | | (0.01) | | | | | | 4.76 | | | | | | 4.75 | | | | | | 0.01 | | | | | | — | | | | | | — | | | | | | 0.01 | | | | | | 18.15 | | | | | | 35.41 | | | | | | 0.42 | | | | | | 0.30 | | | | | | (0.04) | | | | | | 45,139 | | | | | | 20 | | | | | | 1.31 | | | | | | 1.19 | | | | | | 1.18 | | | | | | 132 | | |
| 12-31-12 | | | | | 11.74 | | | | | | 0.00* | | | | | | 1.67 | | | | | | 1.67 | | | | | | — | | | | | | — | | | | | | — | | | | | | — | | | | | | 13.41 | | | | | | 14.22 | | | | | | 0.40 | | | | | | 0.30 | | | | | | 0.03 | | | | | | 38,972 | | | | | | 11 | | | | | | 1.30 | | | | | | 1.20 | | | | | | 1.18 | | | | | | 187 | | |
| 12-31-11 | | | | | 13.23 | | | | | | (0.04) | | | | | | (1.43) | | | | | | (1.47) | | | | | | 0.02 | | | | | | — | | | | | | — | | | | | | 0.02 | | | | | | 11.74 | | | | | | (11.11) | | | | | | 0.30 | | | | | | 0.30 | | | | | | (0.28) | | | | | | 49,159 | | | | | | 6 | | | | | | 1.21 | | | | | | 1.21 | | | | | | 1.20 | | | | | | 84 | | |
(1)
Total return is calculated assuming reinvestment of all dividends, capital gain distributions and return of capital distributions, if any, at net asset value and does not reflect the effect of insurance contract charges. Total return for periods less than one year is not annualized.
(2)
Annualized for periods less than one year.
(3)
Expense ratios do not include fees and expenses charged under the variable annuity contract or variable life insurance policy.
(4)
Expense ratios reflect operating expenses of a Portfolio. Expenses before reductions/additions do not reflect amounts reimbursed by the Investment Adviser and/or Distributor or reductions from brokerage commission recapture arrangements or other expense offset arrangements and do not represent the amount paid by a Portfolio during periods when reimbursements or reductions occur. Expenses net of fee waivers reflect expenses after reimbursement by the Investment Adviser and/or Distributor but prior to reductions from brokerage commission recapture arrangements or other expense offset arrangements. Expenses net of all reductions/additions represent the net expenses paid by a Portfolio. Net investment income (loss) is net of all such additions or reductions.
(5)
Portfolio turnover rate is calculated based on the Portfolio’s purchases or sales of the master fund.
(6)
Commencement of operations.
•
Calculated using average number of shares outstanding throughout the period.
*
Amount is less than $0.005 or 0.005% or more than $(0.005) or (0.005)%.
See Accompanying Notes to Financial Statements
NOTES TO FINANCIAL STATEMENTS as of December 31, 2015
NOTE 1 — ORGANIZATION
Voya Partners, Inc. (the “Company”) is an open-end management investment company registered under the Investment Company Act of 1940, as amended (the “1940 Act”). It was incorporated under the laws of Maryland on May 7, 1997. The Articles of Incorporation permit the Company to offer separate series, each of which has its own investment objective, policies and restrictions. The series of the Company serve as investment options in underlying variable annuity contracts and variable life insurance policies offered by Directed Services LLC. The Company currently consists of forty-one active separate investment series. The three series (each, a “Portfolio” and collectively, the “Portfolios”) included in this report are: VY® Fidelity® VIP Contrafund® Portfolio* (“VY® Fidelity® VIP Contrafund®”); VY® Fidelity® VIP Equity-Income Portfolio (“VY® Fidelity® VIP Equity-Income”) and VY® Fidelity® VIP Mid Cap Portfolio (“VY® Fidelity® VIP Mid Cap”), each a diversified series of the Company.
Each Portfolio in this report operates as a “feeder fund” and seeks to achieve its investment objective by investing all its investable assets in a separate mutual fund (“Master Fund”). Each Master Fund is a registered open-end management investment company that has the same investment objective and substantially similar policies as each corresponding Portfolio. The investment objective of the Portfolios is described in the respective Portfolio’s Prospectus.
As of December 31, 2015, VY® Fidelity® VIP Contrafund®, VY® Fidelity® VIP Equity-Income, and VY® Fidelity® VIP Mid Cap each held 1.27%, 0.20% and 0.40% of their respective Master Fund. Each Master Fund directly acquires securities and a Portfolio investing in the Master Fund has indirect exposure to those securities.
The classes of shares included in this report are: Adviser (“Class ADV”) and Service (“Class S”). Shares of the Portfolios may be offered to separate accounts (“Separate Accounts”) of insurance companies as investment options in connection with variable annuity contracts and variable life insurance policies (“Variable Contracts”) and to certain of the Portfolios’ investment advisers and their affiliates. In the future, shares may also be offered to qualified pension and retirement plans (“Qualified Plans”) outside the Separate Account context. Each class has equal rights as to voting privileges. The classes differ principally in the applicable distribution and shareholder service fees. Generally, shareholders of each class also bear certain expenses that pertain to that particular class. All shareholders bear the common expenses of a portfolio and earn income and realized gains/losses from a portfolio
pro rata based on the daily ending net assets of each class, without distinction between share classes. Expenses that are specific to a portfolio or a class are charged directly to that portfolio or class. Other operating expenses shared by several portfolios are generally allocated among those portfolios based on average net assets. Distributions are determined separately for each class based on income and expenses allocated to each class. Realized gain distributions are allocated to each class pro rata based on the shares outstanding of each class on the date of distribution. Differences in per share dividend rates generally result from differences in separate class expenses, including distribution and shareholder service fees, if applicable.
Directed Services LLC (“DSL” or the “Investment Adviser”), a Delaware limited liability company and an affiliate of Voya Investments, LLC, serves as the Investment Adviser to the Portfolios. DSL oversees all investment management and portfolio management services for the Portfolios and assists in managing and supervising all aspects of the general day-to-day business activities and operations of the Portfolios, including custodial, transfer agency, dividend disbursing, accounting, auditing, compliance and related services. Voya Investments Distributor, LLC (“VID” or the “Distributor”), a Delaware limited liability company, serves as the principal underwriter to the Portfolios.
NOTE 2 — SIGNIFICANT ACCOUNTING POLICIES
The following significant accounting policies are consistently followed by the Portfolios in the preparation of their financial statements. Each Portfolio is considered an investment company under U.S. generally accepted accounting principles (“GAAP”) and follows the accounting and reporting guidance applicable to investment companies.
A. Security Valuation. Each Portfolio is open for business every day the New York Stock Exchange (“NYSE”) opens for regular trading (each such day, a “Business Day”). The net asset value (“NAV”) per share for each class of each Portfolio is determined each Business Day as of the close of the regular trading session (“Market Close”), as determined by the Consolidated Tape Association (“CTA”), the central distributor of transaction prices for exchange-traded securities (normally 4:00 p.m. Eastern time unless otherwise designated by the CTA). The NAV per share of each class of each Portfolio is computed by taking the value of the Portfolio’s assets attributable to that class, subtracting the Portfolio’s liabilities attributable to that class, and dividing by the number of shares of that class that are outstanding. On days when a Portfolio is
*
Fidelity and Contrafund are registered trademarks of FMR LLC. Used with permission.
NOTES TO FINANCIAL STATEMENTS as of December 31, 2015 (continued)
NOTE 2 — SIGNIFICANT ACCOUNTING POLICIES (continued)
closed for business, Portfolio shares will not be priced and a Portfolio does not transact purchase and redemption orders. To the extent a Portfolio’s assets are traded in other markets on days when the Portfolio does not price its shares, the value of the Portfolio’s assets will likely change and you will not be able to purchase or redeem shares of the Portfolio. The NAV of each Portfolio is determined based upon the NAV of the respective Master Fund.
Securities of each Master Fund are valued at their NAV. For more information regarding the determination of NAV of each Master Fund, including the circumstances under which the Master Funds will use fair value pricing and the effects of using fair value pricing, see the Master Funds’ Prospectus and SAI.
When your Variable Contract or Qualified Plan is buying shares of a Portfolio, it will pay the NAV that is next calculated after the order from the Variable Contract owner or Qualified Plan participant is received in proper form. When the Variable Contract owner or Qualified Plan participant is selling shares, it will normally receive the NAV that is next calculated after the order form is received from the Variable Contract owner or Qualified Plan participant in proper form. Investments will be processed at the NAV next calculated after an order is received and accepted by a Portfolio or its designated agent. In order to receive that day’s price, your order must be received by Market Close.
Each investment asset or liability of the Portfolios is assigned a level at measurement date based on the significance and source of the inputs to its valuation. Quoted prices in active markets for identical securities are classified as “Level 1,” inputs other than quoted prices for an asset or liability that are observable are classified as “Level 2” and unobservable inputs, including the pricing committee’s judgment about the assumptions that a market participant would use in pricing an asset or liability are classified as “Level 3.” The inputs used for valuing securities are not necessarily an indication of the risks associated with investing in those securities. Securities valued at amortized cost are generally considered to be Level 2 securities under applicable accounting rules. A table summarizing the Portfolios’ investments under these levels of classification is included following the Portfolios of Investments.
The Board has delegated to the Investment Adviser responsibility for overseeing the implementation of the Portfolios’ valuation procedures; a “Pricing Committee” comprised of employees of the Investment Adviser or its affiliates has responsibility for applying the fair valuation methods set forth in the procedures and, if a fair valuation
cannot be determined pursuant to the fair valuation methods, determining the fair value of assets held by the Portfolios.
U.S. GAAP requires a reconciliation of the beginning to ending balances for reported fair values that presents changes attributable to total realized and unrealized gains or losses, purchases and sales, and transfers in or out of the Level 3 category during the period. The beginning of period timing recognition is used for the transfers between Levels of a Portfolio’s assets and liabilities. A reconciliation of Level 3 investments is presented only when a Portfolio has a significant amount of Level 3 investments.
For the year ended December 31, 2015, there have been no significant changes to the fair valuation methodologies.
B. Security Transactions and Revenue Recognition. Security transactions are accounted for on the trade date. Dividend income received from the master funds is recognized on the ex-dividend date and is recorded as income distributions in the Statements of Operations. Capital gain distributions received from the master funds are recognized on the ex-dividend date and are recorded on the Statements of Operations as such. Costs used in determining realized gains and losses on the sales of investment securities are on the basis of specific identification.
C. Distributions to Shareholders. The Portfolios record distributions to their shareholders on the ex-dividend date. Each Portfolio declares and pays dividends and capital gain distributions, if any, annually. The Portfolios may make distributions on a more frequent basis to comply with the distribution requirements of the Internal Revenue Code. The characteristics of income and gains to be distributed are determined in accordance with income tax regulations, which may differ from U.S. GAAP for investment companies.
D. Federal Income Taxes. It is the policy of each Portfolio to comply with the requirements of subchapter M of the Internal Revenue Code that are applicable to regulated investment companies and to distribute substantially all of its net investment income and any net realized capital gains to its shareholders. Therefore, a federal income tax or excise tax provision is not required. Management has considered the sustainability of the Portfolios’ tax positions taken on federal income tax returns for all open tax years in making this determination. No capital gain distributions shall be made until the capital loss carryforwards have been fully utilized or expire.
The Portfolios may utilize equalization accounting for tax purposes, whereby a portion of redemption payments are treated as distributions of income or gain.
NOTES TO FINANCIAL STATEMENTS as of December 31, 2015 (continued)
NOTE 2 — SIGNIFICANT ACCOUNTING POLICIES (continued)
E. Use of Estimates. The preparation of financial statements in conformity with U.S. GAAP requires management to make estimates and assumptions that affect the reported amounts of assets and liabilities and disclosure of contingent assets and liabilities at the date of the financial statements and the reported amounts of increases and decreases in net assets from operations during the reporting period. Actual results could differ from those estimates.
F. Indemnifications. In the normal course of business, the Company may enter into contracts that provide certain indemnifications. The Company’s maximum exposure under these arrangements is dependent on future claims that may be made against the Portfolios and, therefore, cannot be estimated; however, based on experience, management considers the risk of loss from such claims remote.
NOTE 3 — INVESTMENTS IN MASTER FUNDS
For the year ended December 31, 2015, the cost of purchases and the proceeds from sales of the Master Funds were as follows:
| | | | Purchases | | | Sales | |
| VY® Fidelity® VIP Contrafund® | | | | $ | 34,439,058 | | | | | $ | 105,325,070 | | |
| VY® Fidelity® VIP Equity-Income | | | | | 2,094,252 | | | | | | 3,826,976 | | |
| VY® Fidelity® VIP Mid Cap | | | | | 7,102,692 | | | | | | 14,162,902 | | |
NOTE 4 — INVESTMENT MANAGEMENT AND MASTER FUNDS EXPENSES
Fidelity Management & Research Company (“FMR”) serves as investment adviser to each Master Fund. FMR has day-to-day responsibility for choosing investments for each Master Fund. As shareholders of the Master Funds, the Portfolios indirectly pay a portion of the master-level management fee.(1)
Each Master Fund, Fidelity® VIP Contrafund® Portfolio, Fidelity® VIP Equity-Income Portfolio and Fidelity® VIP Mid Cap Portfolio, pays FMR a management fee for advisory services at annual rates of 0.55%, 0.45% and 0.55%, of each respective Master Fund’s current average daily net assets. Prior to May 1, 2015 and pursuant to its Management Agreement with the Company, if the respective Portfolio did not invest substantially all of its assets in another investment company, DSL may have
charged an annual management fee at annual rates equal to 0.58%, 0.48% and 0.58% of average daily net assets for VY® Fidelity® VIP Contrafund®, VY® Fidelity® VIP Equity-Income and VY® Fidelity® VIP Mid Cap, respectively. If a Portfolio invested substantially all of its assets in another investment company, DSL did not charge a management fee. No management fees were paid to the Investment Adviser through April 30, 2015, as each Portfolio invested substantially all of its assets in another investment company.
Also, prior to May 1, 2015, the Portfolios had entered into an administrative agreement (“Administrative Agreement”) with Voya Funds Services, LLC (the “Administrator”), a Delaware limited liability company. The Administrator provided certain administrative and shareholder services necessary for each Portfolio’s operations and was responsible for the supervision of other service providers. For its services, the Administrator was entitled to receive from each Portfolio a management fee at an annual rate of 0.10% of each Portfolio’s average daily net assets. Amounts paid to the Administrator through April 30, 2015 are reflected as administrative service fees on the accompanying Statements of Operations.
Effective May 1, 2015, the terms of the Portfolios’ Management Agreement and Administrative Agreement were combined under a single Amended and Restated Investment Management Agreement with a single management fee. The single management fee rate under the Portfolios’ Amended and Restated Investment Management Agreement does not exceed the former combined investment management and administrative services fee rates for the Portfolios and there is no change to the investment management or administrative services provided.
Pursuant to its Amended and Restated Investment Management Agreement with the Company, if the respective Portfolio does not invest substantially all of its assets in another investment company, DSL may charge an annual management fee at annual rates equal to 0.68%, 0.58% and 0.68% of average daily net assets for VY® Fidelity® VIP Contrafund®, VY® Fidelity® VIP Equity-Income and VY® Fidelity® VIP Mid Cap, respectively. If a Portfolio invests substantially all of its assets in another investment company, DSL may charge an annual management fee at annual rates equal to 0.10% of average daily net assets for each Portfolio. Each Portfolio anticipates investing substantially all of its assets in another investment company. Single management fee
(1)
Investors in the Portfolios should recognize that an investment in the Portfolios bears not only a proportionate share of the expenses of the Portfolios (including operating costs and management fees, if any), but also indirectly similar expenses of the Master Funds in which each Portfolio invests. Investors also bear their proportionate share of any sales charges incurred by the Portfolios related to the purchase of shares of the mutual fund investments.
NOTES TO FINANCIAL STATEMENTS as of December 31, 2015 (continued)
NOTE 4 — INVESTMENT MANAGEMENT AND MASTER FUNDS EXPENSES (continued)
amounts paid to the Investment Adviser from May 1, 2015 through December 31, 2015 are reflected as investment management fees on the accompanying Statement of Operations.
For the year ended December 31, 2015, each Portfolio invested substantially all of its assets in its respective Master Fund.
NOTE 5 — DISTRIBUTION AND SERVICE FEES
The Portfolios have a shareholder servicing plan (“Service Plan”) for the Class ADV and Class S shares of each respective Portfolio. Under the Service Plan, a Portfolio pays the Distributor a fee calculated at an annual rate of 0.25% of a Portfolio’s average daily net assets attributable to its Class ADV and Class S shares.
The Portfolios have a plan of distribution pursuant to Rule 12b-1 under the 1940 Act (“Distribution Plan”) for the Class ADV shares of each respective Portfolio. The Distribution Plan provides for a distribution fee, payable to the Distributor at an annual rate not to exceed 0.25% of a Portfolio’s average daily net assets attributable to its Class ADV shares.
Fidelity Distributors Corporation (“FDC”) distributes Service Class 2 shares of each Master Fund. Service Class 2 of each Master Fund currently pays FDC a 12b-1 (service) fee at an annual rate of 0.25% of its average net assets throughout the month. Shareholders of Class ADV and Class S shares of each respective Portfolio pay only their proportionate share of the Master Fund’s 12b-1 plan expenses.
NOTE 6 — OTHER TRANSACTIONS WITH AFFILIATES AND RELATED PARTIES
At December 31, 2015, the following direct or indirect, wholly-owned subsidiary of Voya Financial, Inc. owned more than 5% of the following Portfolios:
| Subsidiary | | | Portfolio | | | Percentage | |
Voya Retirement
Insurance and Annuity
Company | | | VY® Fidelity® VIP Contrafund® | | | | | 99.25% | | |
| | VY® Fidelity® VIP Equity-Income | | | | | 96.57 | | |
| | VY® Fidelity® VIP Mid Cap | | | | | 98.76 | | |
Under the 1940 Act, the direct or indirect beneficial owner of more than 25% of the voting securities of a company (including a fund) is presumed to control such company. Companies under common control (e.g., companies with a common owner of greater than 25% of their respective voting securities) are affiliates under the 1940 Act.
The Portfolios have adopted a deferred compensation plan (the “Plan”), which allows eligible non-affiliated directors, as described in the Plan, to defer the receipt of all or a portion of the directors’ fees that they are entitled to receive from the Portfolios. For purposes of determining the amount owed to the director under the Plan, the amounts deferred are invested in shares of the funds selected by the director (the “Notional Funds”). The Portfolios purchase shares of the Notional Funds, which are all advised by Voya Investments, LLC, in amounts equal to the directors’ deferred fees, resulting in a Portfolio asset equal to the deferred compensation liability. Such assets are included as a component of “Other assets” on the accompanying Statement of Assets and Liabilities. Deferral of directors’ fees under the Plan will not affect net assets of the Portfolio, and will not materially affect the Portfolios’ assets, liabilities or net investment income per share. Amounts will be deferred until distributed in accordance with the Plan.
NOTE 7 — OTHER ACCRUED EXPENSES AND LIABILITIES
At December 31, 2015, the following Portfolio had the below payables included in Other Accrued Expenses and Liabilities on the Statements of Assets and Liabilities that exceeded 5% of total liabilities:
| Portfolio | | | Accrued Expense | | | Amount | |
VY® Fidelity® VIP Mid Cap | | | Audit | | | | $ | 5,837 | | |
| | Shareholder Reporting | | | | | 20,935 | | |
NOTE 8 — EXPENSE LIMITATION AGREEMENT
The Investment Adviser has entered into a written expense limitation agreement (“Expense Limitation Agreement”) with each Portfolio whereby the Investment Adviser has agreed to limit expenses for each Portfolio, excluding interest, taxes, investment-related costs, leverage expenses, Master Fund Fees and Expenses, and extraordinary expenses to 0.55% and 0.30% for Class ADV and Class S, respectively.
The Investment Adviser may at a later date recoup from a Portfolio for fees waived and other expenses assumed by the Investment Adviser during the previous 36 months, but only if, after such recoupment, a Portfolio’s expense ratio does not exceed the percentage described above. Waived and reimbursed fees net of any recoupment by the Investment Adviser of such waived and reimbursed fees are reflected on the accompanying Statements of Operations. Amounts payable by the Investment Adviser are reflected on the accompanying Statements of Assets and Liabilities.
NOTES TO FINANCIAL STATEMENTS as of December 31, 2015 (continued)
NOTE 8 — EXPENSE LIMITATION AGREEMENT (continued)
As of December 31, 2015, the amounts of waived and/or reimbursed fees subject to possible recoupment by the Investment Adviser, and the related expiration dates are as follows:
| | | | December 31, | | |
| | | | 2016 | | | 2017 | | | 2018 | | | Total | |
VY® Fidelity® VIP Contrafund® | | | | $ | 316,955 | | | | | $ | 320,070 | | | | | $ | 277,407 | | | | | $ | 914,432 | | |
| | | | December 31, | | |
| | | | 2016 | | | 2017 | | | 2018 | | | Total | |
VY® Fidelity® VIP Equity-Income | | | | | 22,012 | | | | | | 26,392 | | | | | | 26,982 | | | | | | 75,386 | | |
| VY® Fidelity® VIP Mid Cap | | | | | 53,428 | | | | | | 57,390 | | | | | | 58,251 | | | | | | 169,069 | | |
The Expense Limitation Agreement is contractual through May 1, 2016 and shall renew automatically for one-year terms. Termination or modification of this obligation requires approval by the Board.
NOTE 9 — CAPITAL SHARES
Transactions in capital shares and dollars were as follows:
| | | | Shares
sold | | | Shares
issued in
merger | | | Reinvestment
of
distributions | | | Shares
redeemed | | | Net increase
(decrease)
in shares
outstanding | | | Shares
sold | | | Proceeds
from
shares
issued in
merger | | | Reinvestment
of
distributions | | | Shares
redeemed | | | Net increase
(decrease) | |
Year or
period ended | | | # | | | # | | | # | | | # | | | # | | | ($) | | | ($) | | | ($) | | | ($) | | | ($) | |
| VY® Fidelity® VIP Contrafund® | |
| Class ADV | |
| 12/31/2015 | | | | | 43,826 | | | | | | — | | | | | | 11,563 | | | | | | (39,610) | | | | | | 15,779 | | | | | | 649,368 | | | | | | — | | | | | | 174,251 | | | | | | (588,505) | | | | | | 235,114 | | |
| 12/31/2014 | | | | | 124,454 | | | | | | — | | | | | | 1,713 | | | | | | (148,588) | | | | | | (22,421) | | | | | | 1,726,506 | | | | | | — | | | | | | 24,081 | | | | | | (2,074,739) | | | | | | (324,152) | | |
| Class S | |
| 12/31/2015 | | | | | 406,235 | | | | | | — | | | | | | 473,332 | | | | | | (5,140,167) | | | | | | (4,260,600) | | | | | | 6,176,188 | | | | | | — | | | | | | 7,189,918 | | | | | | (77,468,374) | | | | | | (64,102,268) | | |
| 12/31/2014 | | | | | 534,851 | | | | | | — | | | | | | 118,234 | | | | | | (5,525,929) | | | | | | (4,872,844) | | | | | | 7,541,430 | | | | | | — | | | | | | 1,674,200 | | | | | | (77,916,382) | | | | | | (68,700,752) | | |
| VY® Fidelity® VIP Equity-Income | |
| Class ADV | |
| 12/31/2015 | | | | | 3,671 | | | | | | — | | | | | | 900 | | | | | | (2,098) | | | | | | 2,473 | | | | | | 44,596 | | | | | | — | | | | | | 10,681 | | | | | | (25,617) | | | | | | 29,660 | | |
| 12/31/2014 | | | | | 873 | | | | | | — | | | | | | 886 | | | | | | (334) | | | | | | 1,425 | | | | | | 10,526 | | | | | | — | | | | | | 10,601 | | | | | | (4,108) | | | | | | 17,019 | | |
| Class S | |
| 12/31/2015 | | | | | 51,365 | | | | | | — | | | | | | 37,755 | | | | | | (225,665) | | | | | | (136,545) | | | | | | 613,355 | | | | | | — | | | | | | 448,151 | | | | | | (2,668,422) | | | | | | (1,606,916) | | |
| 12/31/2014 | | | | | 73,964 | | | | | | — | | | | | | 49,327 | | | | | | (295,821) | | | | | | (172,530) | | | | | | 890,587 | | | | | | — | | | | | | 589,465 | | | | | | (3,596,065) | | | | | | (2,116,013) | | |
| VY® Fidelity® VIP Mid Cap | |
| Class ADV | |
| 12/31/2015 | | | | | 5,105 | | | | | | — | | | | | | 2,231 | | | | | | (3,969) | | | | | | 3,367 | | | | | | 87,714 | | | | | | — | | | | | | 36,414 | | | | | | (67,505) | | | | | | 56,623 | | |
| 12/31/2014 | | | | | 8,353 | | | | | | — | | | | | | 7,675 | | | | | | (47,582) | | | | | | (31,554) | | | | | | 147,725 | | | | | | — | | | | | | 123,340 | | | | | | (786,244) | | | | | | (515,179) | | |
| Class S | |
| 12/31/2015 | | | | | 135,395 | | | | | | — | | | | | | 157,464 | | | | | | (556,063) | | | | | | (263,204) | | | | | | 2,304,804 | | | | | | — | | | | | | 2,601,303 | | | | | | (9,333,399) | | | | | | (4,427,292) | | |
| 12/31/2014 | | | | | 109,232 | | | | | | — | | | | | | 303,920 | | | | | | (549,039) | | | | | | (135,887) | | | | | | 1,941,267 | | | | | | — | | | | | | 4,953,905 | | | | | | (9,676,484) | | | | | | (2,781,312) | | |
| Class S2(1) | |
| 12/31/2015 | | | | | — | | | | | | — | | | | | | — | | | | | | (302) | | | | | | (302) | | | | | | — | | | | | | — | | | | | | — | | | | | | (5,298) | | | | | | (5,298) | | |
| 12/31/2014 | | | | | — | | | | | | — | | | | | | — | | | | | | — | | | | | | — | | | | | | — | | | | | | — | | | | | | — | | | | | | — | | | | | | | | |
—
(1)
Class S2 liquidated on May 28, 2015.
NOTE 10 — Federal Income Taxes
The amount of distributions from net investment income and net realized capital gains are determined in accordance with federal income tax regulations, which may differ from U.S. GAAP for investment companies. These book/tax differences may be either temporary or permanent. Permanent differences are reclassified within the capital accounts based on their federal tax-basis treatment; temporary differences are not reclassified. Key differences include the treatment of short-term capital gains, foreign currency transactions, and wash sale deferrals. Distributions in excess of net investment income and/or net realized capital gains for tax purposes are reported as return of capital.
NOTES TO FINANCIAL STATEMENTS as of December 31, 2015 (continued)
NOTE 10 — Federal Income Taxes (continued)
The following permanent tax differences have been reclassified as of December 31, 2015:
| | | | Paid-in
Capital | | | Undistributed Net
Investment
Income | | | Accumulated
Net Realized
Gains/(Losses) | |
| VY® Fidelity® VIP Contrafund® | | | | $ | — | | | | | $ | 2,027,914 | | | | | $ | (2,027,914) | | |
| VY® Fidelity® VIP Equity-Income | | | | | — | | | | | | 61,600 | | | | | | (61,600) | | |
| VY® Fidelity® VIP Mid Cap | | | | | (185) | | | | | | 26,811 | | | | | | (26,626) | | |
Dividends paid by the Portfolios from net investment income and distributions of net realized short-term capital gains are, for federal income tax purposes, taxable as ordinary income to shareholders.
The tax composition of dividends and distributions to shareholders was as follows:
| | | | Year Ended
December 31, 2015 | | | Year Ended
December 31, 2014 | |
| | | | Ordinary
Income | | | Long-term
Capital Gains | | | Ordinary
Income | | | Long-term
Capital Gains | |
| VY® Fidelity® VIP Contrafund® | | | | $ | 7,364,169 | | | | | $ | — | | | | | $ | 1,698,281 | | | | | $ | — | | |
| VY® Fidelity® VIP Equity-Income | | | | | 458,832 | | | | | | — | | | | | | 600,066 | | | | | | — | | |
| VY® Fidelity® VIP Mid Cap | | | | | 564,612 | | | | | | 2,073,105 | | | | | | 2,096,792 | | | | | | 2,981,119 | | |
The tax-basis components of distributable earnings and the capital loss carryforwards which may be used to offset future realized capital gains for federal income tax purposes as of December 31, 2015 are detailed below. The Regulated Investment Company Modernization Act of 2010 (the “Act”) provides an unlimited carryforward period for newly generated capital losses. Under the Act, there may be a greater likelihood that all or a portion of the Portfolios’ pre-enactment capital loss carryforwards may expire without being utilized due to the fact that post-enactment capital losses are required to be utilized before pre-enactment capital loss carryforwards.
| | | | Undistributed
Ordinary
Income | | | Undistributed
Long-term
Capital
Gains | | | Unrealized
Appreciation/
(Depreciation) | | | Capital Loss Carryforwards | |
| Amount | | | Character | | | Expiration | | |
| VY® Fidelity® VIP Contrafund® | | | | $ | 3,157,772 | | | | | $ | — | | | | | $ | 28,429,791 | | | | | $ | (1,420,874) | | | | Short-term | | | 2017 | |
| | | | | | | | | | | | | | | | | | | | | | | | (7,388,912) | | | | Short-term | | | 2018 | |
| | | | | | | | | | | | | | | | | | | | | | | $ | (8,809,786)* | | | | | | | | |
| VY® Fidelity® VIP Equity-Income | | | | | 371,256 | | | | | | — | | | | | | (1,763,378) | | | | | | (4,401,655) | | | | Short-term | | | 2017 | |
| | | | | | | | | | | | | | | | | | | | | | | | (5,708,489) | | | | Short-term | | | 2018 | |
| | | | | | | | | | | | | | | | | | | | | | | | (42,629) | | | | Short-term | | | None | |
| | | | | | | | | | | | | | | | | | | | | | | | (1,531,622) | | | | Long-term | | | None | |
| | | | | | | | | | | | | | | | | | | | | | | $ | (11,684,395) | | | | | | | | |
| VY® Fidelity® VIP Mid Cap | | | | | — | | | | | | 4,842,306 | | | | | | (1,668,747) | | | | | | — | | | | — | | | — | |
*
Utilization of these capital losses is subject to annual limitations under Section 382 of the Internal Revenue Code.
The Portfolios’ major tax jurisdictions are U.S. federal and Arizona state.
As of December 31, 2015, no provision for income tax is required in the Portfolios’ financial statements as a result of tax positions taken on federal and state income tax returns for open tax years. The Portfolios’ federal and state income and federal excise tax returns for tax years for which the applicable statutes of limitations have not expired are subject to examination by the Internal Revenue Service and state department of revenue. The earliest tax year that remains subject to examination by these jurisdictions is 2011.
NOTE 11 — SUBSEQUENT EVENT
The Portfolios have evaluated events occurring after the Statements of Assets and Liabilities date (“subsequent events”), to determine whether any subsequent events necessitated adjustment to or disclosure in the financial statements. No such subsequent events were identified.
PORTFOLIO OF INVESTMENTS
| VY® Fidelity® VIP Contrafund® Portfolio | as of December 31, 2015 |
| Shares | | | Value | | | Percentage
of Net
Assets | |
| Master Fund: 99.6% | |
| | | 7,096,056 | | | | Fidelity VIP Contrafund
Portfolio - Service Class 2 | | | | $ | 235,943,852 | | | | | | 99.6 | | |
| | | | | | | Total Investments in
Master Fund
(Cost $172,046,487) | | | | $ | 235,943,852 | | | | | | 99.6 | | |
| | | | | | | Assets in Excess of
Other Liabilities | | | | | 1,025,017 | | | | | | 0.4 | | |
| | | | | | | Net Assets | | | | $ | 236,968,869 | | | | | | 100.0 | | |
| |
Cost for federal income tax purposes is $207,514,061.
Net unrealized appreciation consists of:
| | Gross Unrealized Appreciation | | | | $ | 28,429,791 | | |
| | Gross Unrealized Depreciation | | | | | — | | |
| | Net Unrealized Appreciation | | | | $ | 28,429,791 | | |
| |
Fair Value Measurements^
The following is a summary of the fair valuations according to the inputs used as of December 31, 2015 in valuing the assets and liabilities:
| | | | Quoted Prices
in Active Markets
for Identical
Investments
(Level 1) | | | Significant
Other
Observable
Inputs
(Level 2) | | | Significant
Unobservable
Inputs
(Level 3) | | | Fair Value
at
December 31,
2015 | |
| Asset Table | | | | | |
| Investments, at fair value | | | | | |
| Master Fund | | | | $ | 235,943,852 | | | | | $ | — | | | | | $ | — | | | | | $ | 235,943,852 | | |
| Total Investments, at fair value | | | | $ | 235,943,852 | | | | | $ | — | | | | | $ | — | | | | | $ | 235,943,852 | | |
| |
^
See Note 2, “Significant Accounting Policies” in the Notes to Financial Statements for additional information.
See Accompanying Notes to Financial Statements
PORTFOLIO OF INVESTMENTS
| VY® Fidelity® VIP Equity-Income Portfolio | as of December 31, 2015 |
| Shares | | | Value | | | Percentage
of Net
Assets | |
| Master Fund: 99.9% | |
| | | 519,500 | | | | Fidelity VIP Equity-Income
Portfolio - Service Class 2 | | | | $ | 10,410,775 | | | | | | 99.9 | | |
| | | | | | | Total Investments in
Master Fund
(Cost $10,849,526) | | | | $ | 10,410,775 | | | | | | 99.9 | | |
| | | | | | | Assets in Excess of
Other Liabilities | | | | | 11,500 | | | | | | 0.1 | | |
| | | | | | | Net Assets | | | | $ | 10,422,275 | | | | | | 100.0 | | |
| |
Cost for federal income tax purposes is $12,174,153.
Net unrealized depreciation consists of:
| | Gross Unrealized Appreciation | | | | $ | — | | |
| | Gross Unrealized Depreciation | | | | | (1,763,378) | | |
| | Net Unrealized Depreciation | | | | $ | (1,763,378) | | |
| |
Fair Value Measurements^
The following is a summary of the fair valuations according to the inputs used as of December 31, 2015 in valuing the assets and liabilities:
| | | | Quoted Prices
in Active Markets
for Identical
Investments
(Level 1) | | | Significant
Other
Observable
Inputs
(Level 2) | | | Significant
Unobservable
Inputs
(Level 3) | | | Fair Value
at
December 31,
2015 | |
| Asset Table | | | | | |
| Investments, at fair value | | | | | |
| Master Fund | | | | $ | 10,410,775 | | | | | $ | — | | | | | $ | — | | | | | $ | 10,410,775 | | |
| Total Investments, at fair value | | | | $ | 10,410,775 | | | | | $ | — | | | | | $ | — | | | | | $ | 10,410,775 | | |
| |
^
See Note 2, “Significant Accounting Policies” in the Notes to Financial Statements for additional information.
See Accompanying Notes to Financial Statements
PORTFOLIO OF INVESTMENTS
| VY® Fidelity® VIP Mid Cap Portfolio | as of December 31, 2015 |
| Shares | | | Value | | | Percentage
of Net
Assets | |
| Master Fund: 99.7% | |
| | | 1,023,651 | | | | Fidelity VIP Mid Cap
Portfolio - Service Class 2 | | | | $ | 32,582,807 | | | | | | 99.7 | | |
| | | | | | | Total Investments in
Master Fund
(Cost $33,187,576) | | | | $ | 32,582,807 | | | | | | 99.7 | | |
| | | | | | | Assets in Excess of
Other Liabilities | | | | | 84,453 | | | | | | 0.3 | | |
| | | | | | | Net Assets | | | | $ | 32,667,260 | | | | | | 100.0 | | |
| |
Cost for federal income tax purposes is $34,251,554.
Net unrealized depreciation consists of:
| | Gross Unrealized Appreciation | | | | $ | — | | |
| | Gross Unrealized Depreciation | | | | | (1,668,747) | | |
| | Net Unrealized Depreciation | | | | $ | (1,668,747) | | |
| |
Fair Value Measurements^
The following is a summary of the fair valuations according to the inputs used as of December 31, 2015 in valuing the assets and liabilities:
| | | | Quoted Prices
in Active Markets
for Identical
Investments
(Level 1) | | | Significant
Other
Observable
Inputs
(Level 2) | | | Significant
Unobservable
Inputs
(Level 3) | | | Fair Value
at
December 31,
2015 | |
| Asset Table | | | | | |
| Investments, at fair value | | | | | |
| Master Fund | | | | $ | 32,582,807 | | | | | $ | — | | | | | $ | — | | | | | $ | 32,582,807 | | |
| Total Investments, at fair value | | | | $ | 32,582,807 | | | | | $ | — | | | | | $ | — | | | | | $ | 32,582,807 | | |
| |
^
See Note 2, “Significant Accounting Policies” in the Notes to Financial Statements for additional information.
See Accompanying Notes to Financial Statements
TAX INFORMATION (Unaudited)
Dividends and distributions paid during the year ended December 31, 2015 were as follows:
| Portfolio Name | | | Type | | | Per Share
Amount | |
| VY® Fidelity® VIP Contrafund® Portfolio | | | |
| Class ADV | | | NII | | | | $ | 0.3908 | | |
| Class S | | | NII | | | | $ | 0.4167 | | |
| VY® Fidelity® VIP Equity-Income Portfolio | | | |
| Class ADV | | | NII | | | | $ | 0.4545 | | |
| Class S | | | NII | | | | $ | 0.4730 | | |
| VY® Fidelity® VIP Mid Cap Portfolio | | | |
| Class ADV | | | NII | | | | $ | 0.1326 | | |
| Class S | | | NII | | | | $ | 0.2224 | | |
| All Classes | | | STCG | | | | $ | 0.0455 | | |
| All Classes | | | LTCG | | | | $ | 0.9789 | | |
NII – Net investment income
STCG – Short-term capital gain
LTCG – Long-term capital gain
Of the ordinary distributions made during the year ended December 31, 2015, the following percentages qualify for the dividends received deduction (DRD) available to corporate shareholders:
| | VY® Fidelity® VIP Contrafund® Portfolio | | | | | 55.48% | | |
| | VY® Fidelity® VIP Equity-Income Portfolio | | | | | 64.50% | | |
| | VY® Fidelity® VIP Mid Cap Portfolio | | | | | 52.89% | | |
The Portfolios designate the following amount of long-term capital gain distributions as 20% rate long-term capital gain dividends under Internal Revenue Code Section 852(b)(3)(C):
| | VY® Fidelity® VIP Mid Cap Portfolio | | | | $ | 2,073,105 | | |
Above figures may differ from those cited elsewhere in this report due to differences in the calculation of income and gains under U.S. generally accepted accounting principles (book) purposes and Internal Revenue Service (tax) purposes.
Shareholders are strongly advised to consult their own tax advisers with respect to the tax consequences of their investments in the Portfolios. In January, shareholders, excluding corporate shareholders, receive an IRS 1099-DIV regarding the federal tax status of the dividends and distributions they received in the calendar year.
DIRECTOR AND OFFICER INFORMATION (Unaudited)
The business and affairs of the Company are managed under the direction of the Board. A Director, who is not an interested person of the Company, as defined in the 1940 Act, is an independent director (“Independent Director”). The Directors and Officers of the Company are listed below. The Statement of Additional Information includes additional information about directors of the Company and is available, without charge, upon request at (800) 262-3862.
| Name, Address and Age | | | Position(s)
Held with the
Company | | | Term of Office and
Length of Time
Served(1) | | | Principal
Occupation(s) –
During the Past 5 Years | | | Number of
funds in
Fund
Complex
Overseen by
Director(2) | | | Other Board Positions
Held by Director | |
| Independent Directors*: | | | | | | |
Colleen D. Baldwin
7337 East Doubletree Ranch Rd.
Suite 100
Scottsdale, Arizona 85258
Age: 55 | | | Director | | | November 2007 – Present | | | President, Glantuam Partners, LLC, a business consulting firm (January 2009 – Present). | | | 151 | | | DSM/Dentaquest, Boston, MA (February 2014 – Present). | |
John V. Boyer
7337 East Doubletree Ranch Rd.
Suite 100
Scottsdale, Arizona 85258
Age: 62 | | | Chairperson
Director | | | January 2014 – Present
November 1997 – Present | | | President and Chief Executive Officer, Bechtler Arts Foundation, an arts and education foundation (January 2008 – Present). | | | 151 | | | None. | |
Patricia W. Chadwick
7337 East Doubletree Ranch Rd.
Suite 100
Scottsdale, Arizona 85258
Age: 67 | | | Director | | | January 2006 – Present | | | Consultant and President, Ravengate Partners LLC, a consulting firm that provides advice regarding financial markets and the global economy (January 2000 – Present). | | | 151 | | | Wisconsin Energy Corporation (June 2006 – Present); The Royce Funds (35 funds) (December 2009 – Present); and AMICA Mutual Insurance Company (1992 – Present). | |
Peter S. Drotch
7337 East Doubletree Ranch Rd.
Suite 100
Scottsdale, Arizona 85258
Age: 74 | | | Director | | | November 2007 – Present | | | Retired. | | | 151 | | | First Marblehead Corporation (September 2003 – Present). | |
Martin J. Gavin
7337 East Doubletree Ranch Rd.
Suite 100
Scottsdale, AZ 85258-2034
Age: 65 | | | Director | | | August 2015 – Present | | | Retired. Formerly, President and Chief Executive Officer, Connecticut Children’s Medical Center (May 2006 – November 2015). | | | 151 | | | None. | |
Russell H. Jones
7337 East Doubletree Ranch Rd.
Suite 100
Scottsdale, Arizona 85258
Age: 71 | | | Director | | | May 2013 – Present | | | Retired. | | | 151 | | | None. | |
Patrick W. Kenny
7337 East Doubletree Ranch Rd.
Suite 100
Scottsdale, Arizona 85258
Age: 73 | | | Director | | | March 2002 – Present | | | Retired. | | | 151 | | | Assured Guaranty Ltd. (April 2004 – Present). | |
Joseph E. Obermeyer
7337 East Doubletree Ranch Rd.
Suite 100
Scottsdale, Arizona 85258
Age: 58 | | | Director | | | May 2013 – Present | | | President, Obermeyer & Associates, Inc., a provider of financial and economic consulting services (November 1999 – Present). | | | 151 | | | None. | |
Sheryl K. Pressler
7337 East Doubletree Ranch Rd.
Suite 100
Scottsdale, Arizona 85258
Age: 65 | | | Director | | | January 2006 – Present | | | Consultant (May 2001 – Present). | | | 151 | | | None. | |
DIRECTOR AND OFFICER INFORMATION (Unaudited) (continued)
| Name, Address and Age | | | Position(s)
Held with the
Company | | | Term of Office and
Length of Time
Served(1) | | | Principal
Occupation(s) –
During the Past 5 Years | | | Number of
funds in
Fund
Complex
Overseen by
Director(2) | | | Other Board Positions
Held by Director | |
Christopher P. Sullivan
7337 East Doubletree Ranch Rd.
Suite 100
Scottsdale, Arizona 85258
Age: 62 | | | Director | | | October 2015 – Present | | | Retired. Formerly, President, Bond Division, Fidelity Management and Research (June 2009 – September 2012). | | | 151 | | | None. | |
Roger B. Vincent
7337 East Doubletree Ranch Rd.
Suite 100
Scottsdale, Arizona 85258
Age: 70 | | | Director | | | January 2005 – Present | | | Retired. Formerly, President, Springwell Corporation, a corporate finance firm (March 1989 – August 2011). | | | 151 | | | UGI Corporation (February 2006 – Present) and UGI Utilities, Inc. (February 2006 – Present). | |
| Director who is an “interested person”: | | | | | |
Shaun P. Mathews(3)
7337 East Doubletree Ranch Rd.
Suite 100
Scottsdale, Arizona 85258
Age: 60 | | | Director | | | November 2007 – Present | | | President and Chief Executive Officer, Voya Investments, LLC (December 2006 – Present). | | | 151 | | | Voya Capital Corporation, LLC and Voya Investments Distributor, LLC (December 2005 – Present); Voya Funds Services, LLC, Voya Investments, LLC and Voya Investment Management, LLC (March 2006 – Present); and Voya Investment Trust Co. (April 2009 – Present). | |
(1)
Directors serve until their successors are duly elected and qualified. The tenure of each Director who is not an “interested person” as defined in the 1940 Act, of each Portfolio (“Independent Director”) is subject to the Board’s retirement policy which states that each duly elected or appointed Independent Director shall retire from and cease to be a member of the Board of Directors at the close of business on December 31 of the calendar year in which the Independent Director attains the age of 75. A majority vote of the Board’s other Independent Directors may extend the retirement date of an Independent Director if the retirement would trigger a requirement to hold a meeting of shareholders of the Company under applicable law, whether for the purposes of appointing a successor to the Independent Director or otherwise comply under applicable law, in which case the extension would apply until such time as the shareholder meeting can be held or is no longer required (as determined by a vote of a majority of the other Independent Directors).
(2)
For the purposes of this table, “Fund Complex” means the Voya family of funds including the following investment companies: Voya Asia Pacific High Dividend Equity Income Fund; Voya Balanced Portfolio, Inc.; Voya Emerging Markets High Dividend Equity Fund; Voya Equity Trust; Voya Funds Trust; Voya Global Advantage and Premium Opportunity Fund; Voya Global Equity Dividend and Premium Opportunity Fund; Voya Infrastructure, Industrials and Materials Fund; Voya Intermediate Bond Portfolio; Voya International High Dividend Equity Income Fund; Voya Investors Trust; Voya Money Market Portfolio; Voya Mutual Funds; Voya Natural Resources Equity Income Fund; Voya Partners, Inc.; Voya Prime Rate Trust; Voya Senior Income Fund; Voya Separate Portfolios Trust; Voya Series Fund, Inc.; Voya Strategic Allocation Portfolios, Inc.; Voya Variable Funds; Voya Variable Insurance Trust; Voya Variable Portfolios, Inc.; and Voya Variable Products Trust. The number of funds in the Fund Complex is as of January 31, 2016.
(3)
Mr. Mathews is deemed to be an “interested person” of the Company as defined in the 1940 Act, because of his current affiliation with the Voya funds, Voya Financial, Inc., or Voya Financial, Inc.’s affiliates.
*
Effective December 31, 2015, Dr. Albert E. DePrince, Jr. retired as a Director of the Board.
DIRECTOR AND OFFICER INFORMATION (Unaudited) (continued)
| Name, Address and Age | | | Position(s) Held
With the Company | | | Term of Office and
Length of Time Served(1) | | | Principal Occupation(s) – During the Past 5 Years | |
Shaun P. Mathews
7337 East Doubletree Ranch Rd.
Suite 100
Scottsdale, Arizona 85258
Age: 60 | | | President and Chief Executive Officer | | | November 2006 – Present | | | President and Chief Executive Officer, Voya Investments, LLC (December 2006 – Present). | |
Michael J. Roland
7337 East Doubletree Ranch Rd.
Suite 100
Scottsdale, Arizona 85258
Age: 57 | | | Managing Director and Chief Operating Officer | | | April 2012 – Present | | | Managing Director and Chief Operating Officer, Voya Investments, LLC and Voya Funds Services, LLC (April 2012 – Present). Formerly, Chief Compliance Officer, Directed Services LLC and Voya Investments, LLC (March 2011 – December 2013); Executive Vice President and Chief Operating Officer, Voya Investments, LLC and Voya Funds Services, LLC (January 2007 – April 2012) and Chief Compliance Officer, Voya Family of Funds (March 2011 – February 2012). | |
Stanley D. Vyner
230 Park Avenue
New York, New York 10169
Age: 65 | | | Executive Vice President
Chief Investment Risk Officer | | | January 2005 – Present
September 2009 – Present | | | Executive Vice President, Voya Investments, LLC (July 2000 – Present) and Chief Investment Risk Officer, Voya Investments, LLC (January 2003 – Present). | |
Kevin M. Gleason
7337 East Doubletree Ranch Rd.
Suite 100
Scottsdale, Arizona 85258
Age: 49 | | | Chief Compliance Officer | | | February 2012 – Present | | | Senior Vice President, Voya Investments, LLC and Chief Compliance Officer, Voya Family of Funds (February 2012 – Present). Formerly, Assistant General Counsel and Assistant Secretary, The Northwestern Mutual Life Insurance Company (June 2004 – January 2012). | |
Todd Modic
7337 East Doubletree Ranch Rd.
Suite 100
Scottsdale, Arizona 85258
Age: 48 | | | Senior Vice President, Chief/Principal Financial Officer and Assistant Secretary | | | March 2005 – Present | | | Senior Vice President, Voya Investments, LLC and Voya Funds Services, LLC (April 2005 – Present). | |
Kimberly A. Anderson
7337 East Doubletree Ranch Rd.
Suite 100
Scottsdale, Arizona 85258
Age: 51 | | | Senior Vice President | | | January 2005 – Present | | | Senior Vice President, Voya Investments, LLC (September 2003 – Present). | |
Julius A. Drelick, III
7337 East Doubletree Ranch Rd.
Suite 100
Scottsdale, Arizona 85258
Age: 49 | | | Senior Vice President | | | July 2012 – Present | | | Senior Vice President and Chief Compliance Officer of Directed Services LLC and Voya Investments, LLC (January 2014 – Present); and Senior Vice President – Fund Compliance, Voya Funds Services, LLC (June 2012 – Present). Formerly, Vice President – Platform Product Management & Project Management, Voya Investments, LLC (April 2007 – June 2012). | |
Robert Terris
7337 East Doubletree Ranch Rd.
Suite 100
Scottsdale, Arizona 85258
Age: 45 | | | Senior Vice President | | | May 2006 – Present | | | Senior Vice President, Head of Division Operations, Voya Investments, LLC (October 2015 – Present) and Voya Funds Services, LLC (March 2006 – Present). | |
Fred Bedoya
7337 East Doubletree Ranch Rd.
Suite 100
Scottsdale, Arizona 85258
Age: 43 | | | Vice President and Treasurer | | | September 2012 – Present | | | Vice President, Voya Investments, LLC (October 2015 – Present) and Voya Funds Services, LLC (July 2012 – Present). Formerly, Assistant Vice President – Director, Voya Funds Services, LLC (March 2003 – March 2012). | |
Maria M. Anderson
7337 East Doubletree Ranch Rd.
Suite 100
Scottsdale, Arizona 85258
Age: 57 | | | Vice President | | | January 2005 – Present | | | Vice President, Voya Investments, LLC (October 2015 – Present) and Voya Funds Services, LLC (September 2004 – Present). | |
DIRECTOR AND OFFICER INFORMATION (Unaudited) (continued)
| Name, Address and Age | | | Position(s) Held
With the Company | | | Term of Office and
Length of Time Served(1) | | | Principal Occupation(s) – During the Past 5 Years | |
Lauren D. Bensinger
7337 East Doubletree Ranch Rd.
Suite 100
Scottsdale, Arizona 85258
Age: 62 | | | Vice President | | | January 2005 – Present | | | Vice President, Voya Funds Services, LLC (February 1996 – Present) and Voya Investments, LLC (October 2004 – Present); Vice President and Money Laundering Reporting Officer, Voya Investments Distributor, LLC (April 2010 – Present); Anti-Money Laundering Compliance Officer, Voya Financial, Inc. (January 2013 – Present); and Money Laundering Reporting Officer, Voya Investment Management Trust Co. (October 2012 – Present). | |
Sara M. Donaldson
7337 East Doubletree Ranch Rd.
Suite 100
Scottsdale, Arizona 85258
Age: 56 | | | Vice President | | | September 2014 – Present | | | Vice President, Voya Investments, LLC (October 2015 – Present). Formerly Vice President, Voya Funds Services, LLC (April 2014 – October 2015). Formerly, Director, Compliance, AXA Rosenberg Global Services, LLC (September 1997 – March 2014). | |
Robyn L. Ichilov
7337 East Doubletree Ranch Rd.
Suite 100
Scottsdale, Arizona 85258
Age: 48 | | | Vice President | | | January 2005 – Present | | | Vice President, Voya Funds Services, LLC (November 1995 – Present) and Voya Investments, LLC (August 1997 – Present). Formerly, Treasurer, Voya Family of Funds (November 1999 – February 2012). | |
Jason Kadavy
7337 East Doubletree Ranch Rd.
Suite 100
Scottsdale, Arizona 85258
Age: 39 | | | Vice President | | | September 2012 – Present | | | Vice President, Voya Investments, LLC (October 2015 – Present) and Voya Funds Services, LLC (July 2007 – Present). | |
Kimberly K. Springer
7337 East Doubletree Ranch Rd.
Suite 100
Scottsdale, Arizona 85258
Age: 58 | | | Vice President | | | March 2006 – Present | | | Vice President – Mutual Fund Product Development, Voya Investments, LLC (July 2012 – Present); Vice President, Voya Investment Management – Voya Family of Funds (March 2010 – Present) and Vice President, Voya Funds Services, LLC (March 2006 – Present). Formerly Managing Paralegal, Registration Statements (June 2003 – July 2012). | |
Craig Wheeler
7337 East Doubletree Ranch Rd.
Suite 100
Scottsdale, Arizona 85258
Age: 46 | | | Vice President | | | May 2013 – Present | | | Vice President – Director of Tax, Voya Investments, LLC (October 2015 – Present) and Voya Funds Services, LLC (March 2013 – Present). Formerly, Assistant Vice President – Director of Tax, Voya Funds Services, LLC (March 2008 – February 2013). | |
Huey P. Falgout, Jr.
7337 East Doubletree Ranch Rd.
Suite 100
Scottsdale, Arizona 85258
Age: 52 | | | Secretary | | | August 2003 – Present | | | Senior Vice President and Chief Counsel, Voya Investment Management – Mutual Fund Legal Department (March 2010 – Present). | |
Paul A. Caldarelli
7337 East Doubletree Ranch Rd.
Suite 100
Scottsdale, Arizona 85258
Age: 64 | | | Assistant Secretary | | | June 2010 – Present | | | Vice President and Senior Counsel, Voya Investment Management – Mutual Fund Legal Department (March 2010 – Present). | |
Theresa K. Kelety
7337 East Doubletree Ranch Rd.
Suite 100
Scottsdale, Arizona 85258
Age: 53 | | | Assistant Secretary | | | August 2003 – Present | | | Vice President and Senior Counsel, Voya Investment Management – Mutual Fund Legal Department (March 2010 – Present). | |
(1)
The Officers hold office until the next annual meeting of the Board of Directors and until their successors shall have been elected and qualified.
Fidelity® Variable Insurance Products:
Contrafund® Portfolio
Annual Report
December 31, 2015


To view a fund’s proxy voting guidelines and proxy voting record for the 12-month period ended June 30, visit http://www.fidelity.com/proxyvotingresults or visit the Securities and Exchange Commission’s (SEC) web site at http://www.sec.gov.
You may also call 1-877-208-0098 to request a free copy of the proxy voting guidelines.
Fidelity® Variable Insurance Products are separate account options which are purchased through a variable insurance contract.
Standard & Poor’s, S&P and S&P 500 are registered service marks of The McGraw-Hill Companies, Inc. and have been licensed for use by Fidelity Distributors Corporation.
Other third-party marks appearing herein are the property of their respective owners.
All other marks appearing herein are registered or unregistered trademarks or service marks of FMR LLC or an affiliated company. © 2016 FMR LLC. All rights reserved.
This report and the financial statements contained herein are submitted for the general information of the shareholders of the Fund. This report is not authorized for distribution to prospective investors in the Fund unless preceded or accompanied by an effective prospectus.
A fund files its complete schedule of portfolio holdings with the SEC for the first and third quarters of each fiscal year on Form N-Q. Forms N-Q are available on the SEC’s web site at http://www.sec.gov. A fund’s Forms N-Q may be reviewed and copied at the SEC’s Public Reference Room in Washington, DC. Information regarding the operation of the SEC’s Public Reference Room may be obtained by calling 1-800-SEC-0330.
For a complete list of a fund’s portfolio holdings, view the most recent holdings listing, semiannual report, or annual report on Fidelity’s web site at http://www.fidelity.com, http://www.advisor.fidelity.com, or http://www.401k.com, as applicable.
NOT FDIC INSURED •MAY LOSE VALUE •NO BANK GUARANTEE
Neither the Fund nor Fidelity Distributors Corporation is a bank.
Annual Report
Performance: The Bottom Line
Average annual total return reflects the change in the value of an investment, assuming reinvestment of distributions from dividend income and capital gains (the profits earned upon the sale of securities that have grown in value, if any) and assuming a constant rate of performance each year. During periods of reimbursement by Fidelity, a fund’s total return will be greater than it would be had the reimbursement not occurred. Performance numbers are net of all underlying fund operating expenses, but do not include any insurance charges imposed by your insurance company’s separate account. If performance information included the effect of these additional charges, the total returns would have been lower. How a fund did yesterday is no guarantee of how it will do tomorrow.
| Average Annual Total Returns |
| For the periods ended December 31, 2015 | Past 1 | Past 5 | Past 10 |
| | year | years | years |
| Initial Class | 0.64% | 10.91% | 7.26% |
| Service Class | 0.56% | 10.80% | 7.16% |
| Service Class 2 | 0.39% | 10.63% | 7.00% |
| Investor Class | 0.56% | 10.82% | 7.17% |
Let’s say hypothetically that $10,000 was invested in VIP ContrafundSM Portfolio – Initial Class on December 31, 2005.
The chart shows how the value of your investment would have changed, and also shows how the S&P 500® Index performed over the same period.

Management’s Discussion of Fund Performance
Market Recap: U.S. stocks gained modestly in 2015, rebounding from a steep decline in August and September over worries about China’s slowing economic growth. The S&P 500® index rose 1.38% for the period, its lowest calendar-year return since 2008. After the late-summer rout, stocks sharply reversed course in October, lifted by the U.S. Federal Reserve’s decision to put off raising near-term interest rates until mid-December. Investors also were encouraged by an interest-rate cut in China and economic stimulus in Europe. Overall, growth stocks fared much better than their value counterparts, as investors sought growth in a subpar economic environment. This helped lift the technology-heavy Nasdaq Composite Index® 6.96% for the year. Sector performance in the broader market was split, with five of 10 sectors in the S&P 500® gaining ground and five retreating. Consumer discretionary (+10%) led the way, benefiting from rising personal income and low inflation. Health care (+7%), consumer staples (+7%) and information technology (+6%) also outpaced the broad market amid strong fundamentals. Conversely, energy (-21%) was by far the worst performer, stung by deflated commodity prices that also hit materials (-8%). The defensive, but rate-sensitive utilities sector (-5%) lost ground on the cusp of Fed tightening, while industrials (-3%) were dragged down with energy prices and a slower-growing China.
Comments from Co-Portfolio Manager Robert Stansky: For the year, the fund’s share classes posted small gains while trailing the benchmark S&P 500® index. Stock selection in the consumer discretionary sector was the biggest drag on relative performance. One stock responsible for a lot of the negative impact here was strong-performing online retailer Amazon.com, the fund’s biggest relative detractor and a stock we didn’t own for much of the period because of concerns about its valuation. Given Amazon’s improving profitability and its recent success in cloud computing, Co-Manager Peter Dixon built an overweighted position here in November. Also detracting was chipmaker Marvell Technology Group, an out-of-benchmark position. Not owning industrial conglomerate General Electric also detracted, as did a sizable underweighting in PC software provider Microsoft. Both were strong-performing index names. Conversely, the fund got a boost from stock picking in industrials. Shares of Roper Technologies, the fund’s top relative contributor and fourth-largest holding at the end of 2015, rose about 22% for the year. The maker of pumps and other equipment used in the energy and industrials sectors, as well as medical software and scientific imaging products, posted strong third-quarter earnings. Other noteworthy contributors were coffee-bar operator Starbucks and managed-care provider CIGNA.
Note to shareholders: On November 2, 2015, Peter Dixon was named Co-Manager of the fund to manage its consumer discretionary sleeve, succeeding Peter Saperstone.
The views expressed above reflect those of the portfolio manager(s) only through the end of the period as stated on the cover of this report and do not necessarily represent the views of Fidelity or any other person in the Fidelity organization. Any such views are subject to change at any time based upon market or other conditions and Fidelity disclaims any responsibility to update such views. These views may not be relied on as investment advice and, because investment decisions for a Fidelity fund are based on numerous factors, may not be relied on as an indication of trading intent on behalf of any Fidelity fund.
��
| Investment Summary (Unaudited) |
| Top Ten Stocks as of December 31, 2015 |
| | | | | | % of fund’s |
| | | % of fund’s | | net assets |
| | | net assets | | 6 months ago |
| Alphabet, Inc. Class C | | | 3.0 | | | | 1.8 | |
| Apple, Inc. | | | 2.5 | | | | 4.2 | |
| Danaher Corp. | | | 2.4 | | | | 1.9 | |
| Roper Technologies, Inc. | | | 2.2 | | | | 1.6 | |
| AMETEK, Inc. | | | 2.2 | | | | 1.7 | |
| JPMorgan Chase & Co. | | | 1.7 | | | | 1.9 | |
| Capital One Financial Corp. | | | 1.6 | | | | 1.8 | |
| Amazon.com, Inc. | | | 1.6 | | | | 0.0 | |
| Facebook, Inc. Class A | | | 1.4 | | | | 0.9 | |
| The Coca-Cola Co. | | | 1.4 | | | | 1.2 | |
| | | | 20.0 | | | | | |
| Market Sectors as of December 31, 2015 |
| | | | | | % of fund’s |
| | | % of fund’s | | net assets |
| | | net assets | | 6 months ago |
| Information Technology | | | 19.8 | | | | 18.3 | |
| Financials | | | 15.8 | | | | 16.3 | |
| Health Care | | | 15.2 | | | | 15.3 | |
| Consumer Discretionary | | | 13.7 | | | | 14.6 | |
| Consumer Staples | | | 9.8 | | | | 9.0 | |
| Industrials | | | 8.9 | | | | 9.8 | |
| Energy | | | 6.5 | | | | 7.6 | |
| Materials | | | 3.7 | | | | 3.8 | |
| Utilities | | | 2.9 | | | | 2.7 | |
| Telecommunication Services | | | 2.2 | | | | 1.8 | |
| Asset Allocation (% of fund’s net assets) |
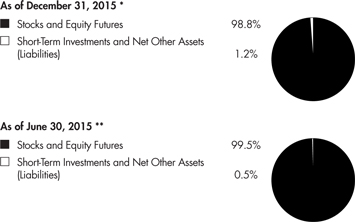
| * | Foreign investments – 12.0% |
| ** | Foreign investments – 11.5% |
Percentages shown as 0.0% may reflect amounts less than 0.05%.
| Investments December 31, 2015 |
| Showing Percentage of Net Assets | | | |
| | | Shares | | | Value | |
| | | | | | | |
| CONSUMER DISCRETIONARY – 13.7% | | | | | | | | |
| Auto Components – 0.6% | | | | | | | | |
| Delphi Automotive PLC | | | 1,216,400 | | | $ | 104,281,972 | |
| Automobiles – 0.3% | | | | | | | | |
| Tesla Motors, Inc. (a) | | | 239,100 | | | | 57,386,391 | |
| Diversified Consumer Services – 0.3% | | | | | | | | |
| 2U, Inc. (a) | | | 785,400 | | | | 21,975,492 | |
| H&R Block, Inc. | | | 1,260,100 | | | | 41,973,931 | |
| | | | | | | | 63,949,423 | |
| Hotels, Restaurants & Leisure – 1.6% | | | | | | | | |
| Fiesta Restaurant Group, Inc. (a) | | | 602,500 | | | | 20,244,000 | |
| Hilton Worldwide Holdings, Inc. | | | 5,497,700 | | | | 117,650,780 | |
| Las Vegas Sands Corp. | | | 1,010,900 | | | | 44,317,856 | |
| Starbucks Corp. | | | 1,989,400 | | | | 119,423,682 | |
| Tuniu Corp. Class A sponsored ADR (a) | | | 309,109 | | | | 4,939,562 | |
| | | | | | | | 306,575,880 | |
| Household Durables – 0.2% | | | | | | | | |
| Lennar Corp. Class A | | | 384,414 | | | | 18,801,689 | |
| PulteGroup, Inc. | | | 1,590,640 | | | | 28,345,205 | |
| | | | | | | | 47,146,894 | |
| Internet & Catalog Retail – 1.6% | | | | | | | | |
| Amazon.com, Inc. (a) | | | 433,700 | | | | 293,133,493 | |
| Media – 3.5% | | | | | | | | |
| Charter Communications, Inc. Class A (a)(b) | | | 738,200 | | | | 135,164,420 | |
| Comcast Corp. Class A | | | 238,300 | | | | 13,447,269 | |
| ITV PLC | | | 37,801,500 | | | | 154,140,803 | |
| Legend Pictures LLC (a)(c)(d) | | | 2,062 | | | | 3,777,378 | |
| Manchester United PLC (b) | | | 1,352,629 | | | | 24,090,322 | |
| MDC Partners, Inc. Class A | | | 2,088,521 | | | | 45,362,676 | |
| The Madison Square Garden Co. (a) | | | 201,306 | | | | 32,571,311 | |
| The Walt Disney Co. | | | 2,213,700 | | | | 232,615,596 | |
| Weinstein Co. Holdings LLC Class A-1 unit (a)(c)(d) | | | 11,499 | | | | 3,438,201 | |
| | | | | | | | 644,607,976 | |
| Multiline Retail – 0.4% | | | | | | | | |
| B&M European Value Retail S.A. | | | 15,805,466 | | | | 66,336,290 | |
| Specialty Retail – 3.4% | | | | | | | | |
| AutoZone, Inc. (a) | | | 112,445 | | | | 83,424,070 | |
| Home Depot, Inc. | | | 1,517,494 | | | | 200,688,582 | |
| L Brands, Inc. | | | 1,682,371 | | | | 161,204,789 | |
| Ross Stores, Inc. | | | 1,652,450 | | | | 88,918,335 | |
| TJX Companies, Inc. | | | 1,383,939 | | | | 98,135,114 | |
| | | | | | | | 632,370,890 | |
| Textiles, Apparel & Luxury Goods – 1.8% | | | | | | | | |
| NIKE, Inc. Class B | | | 3,038,802 | | | | 189,925,125 | |
| VF Corp. | | | 2,248,800 | | | | 139,987,800 | |
| | | | | | | | 329,912,925 | |
| | | | | | | | | |
| TOTAL CONSUMER DISCRETIONARY | | | | | | | 2,545,702,134 | |
| | | | | | | | | |
| CONSUMER STAPLES – 9.8% | | | | | | | | |
| Beverages – 2.1% | | | | | | | | |
| Anheuser-Busch InBev SA NV | | | 36,571 | | | | 4,551,161 | |
| | | | | | | |
| | | Shares | | | Value | |
| | | | | | | |
| Constellation Brands, Inc. Class A (sub. vtg.) | | | 495,200 | | | $ | 70,536,288 | |
| Monster Beverage Corp. | | | 395,033 | | | | 58,844,116 | |
| The Coca-Cola Co. | | | 6,127,306 | | | | 263,229,066 | |
| | | | | | | | 397,160,631 | |
| Food & Staples Retailing – 2.1% | | | | | | | | |
| CVS Health Corp. | | | 2,021,364 | | | | 197,628,758 | |
| Kroger Co. | | | 2,748,764 | | | | 114,980,798 | |
| Sprouts Farmers Market LLC (a) | | | 724,000 | | | | 19,251,160 | |
| Wal-Mart Stores, Inc. | | | 394,276 | | | | 24,169,119 | |
| Whole Foods Market, Inc. | | | 1,286,806 | | | | 43,108,001 | |
| | | | | | | | 399,137,836 | |
| Food Products – 1.1% | | | | | | | | |
| Blue Buffalo Pet Products, Inc. (a)(b) | | | 289,900 | | | | 5,424,029 | |
| Keurig Green Mountain, Inc. | | | 762,133 | | | | 68,576,727 | |
| Mead Johnson Nutrition Co. Class A | | | 1,025,989 | | | | 81,001,832 | |
| The Hershey Co. | | | 440,490 | | | | 39,322,542 | |
| | | | | | | | 194,325,130 | |
| Household Products – 1.4% | | | | | | | | |
| Colgate-Palmolive Co. | | | 2,416,900 | | | | 161,013,878 | |
| Procter & Gamble Co. | | | 1,241,184 | | | | 98,562,421 | |
| | | | | | | | 259,576,299 | |
| Personal Products – 0.4% | | | | | | | | |
| Estee Lauder Companies, Inc. Class A | | | 675,928 | | | | 59,522,220 | |
| Nu Skin Enterprises, Inc. Class A | | | 472,937 | | | | 17,919,583 | |
| | | | | | | | 77,441,803 | |
| Tobacco – 2.7% | | | | | | | | |
| Altria Group, Inc. | | | 3,877,554 | | | | 225,712,418 | |
| British American Tobacco PLC sponsored ADR | | | 1,854,279 | | | | 204,805,116 | |
| Philip Morris International, Inc. | | | 729,400 | | | | 64,121,554 | |
| Reynolds American, Inc. | | | 73,436 | | | | 3,389,071 | |
| | | | | | | | 498,028,159 | |
| | | | | | | | | |
| TOTAL CONSUMER STAPLES | | | | | | | 1,825,669,858 | |
| | | | | | | | | |
| ENERGY – 6.4% | | | | | | | | |
| Energy Equipment & Services – 1.5% | | | | | | | | |
| Baker Hughes, Inc. | | | 1,036,200 | | | | 47,820,630 | |
| Dril-Quip, Inc. (a) | | | 276,749 | | | | 16,391,843 | |
| Halliburton Co. | | | 717,982 | | | | 24,440,107 | |
| Independence Contract Drilling, Inc. (a) | | | 1,081,939 | | | | 5,463,792 | |
| Oceaneering International, Inc. | | | 479,162 | | | | 17,978,158 | |
| Schlumberger Ltd. | | | 2,274,000 | | | | 158,611,500 | |
| | | | | | | | 270,706,030 | |
| Oil, Gas & Consumable Fuels – 4.9% | | | | | | | | |
| Anadarko Petroleum Corp. | | | 1,824,121 | | | | 88,615,798 | |
| Apache Corp. | | | 1,003,600 | | | | 44,630,092 | |
| Black Stone Minerals LP | | | 1,195,000 | | | | 17,243,850 | |
| Cabot Oil & Gas Corp. | | | 1,718,635 | | | | 30,402,653 | |
| Chevron Corp. | | | 1,345,900 | | | | 121,077,164 | |
| Cimarex Energy Co. | | | 249,300 | | | | 22,282,434 | |
| Encana Corp. | | | 4,618,200 | | | | 23,463,139 | |
| EOG Resources, Inc. | | | 803,574 | | | | 56,885,003 | |
| Exxon Mobil Corp. | | | 1,619,002 | | | | 126,201,206 | |
See accompanying notes which are an integral part of the financial statements.
| Common Stocks – continued |
| | | Shares | | | Value | |
| | | | | | | |
| ENERGY – continued | | | | | | | | |
| Oil, Gas & Consumable Fuels – continued | | | | | | | | |
| Kinder Morgan, Inc. | | | 269,700 | | | $ | 4,023,924 | |
| Memorial Resource Development Corp. (a) | | | 1,499,500 | | | | 24,216,925 | |
| Noble Energy, Inc. | | | 2,471,800 | | | | 81,396,374 | |
| Parsley Energy, Inc. Class A (a) | | | 1,629,457 | | | | 30,063,482 | |
| Phillips 66 Co. | | | 999,439 | | | | 81,754,110 | |
| Pioneer Natural Resources Co. | | | 406,600 | | | | 50,979,508 | |
| PrairieSky Royalty Ltd. (b) | | | 1,444,612 | | | | 22,884,943 | |
| SM Energy Co. (b) | | | 1,240,600 | | | | 24,390,196 | |
| Suncor Energy, Inc. | | | 2,386,195 | | | | 61,599,252 | |
| | | | | | | | 912,110,053 | |
| | | | | | | | | |
| TOTAL ENERGY | | | | | | | 1,182,816,083 | |
| | | | | | | | | |
| FINANCIALS – 15.8% | | | | | | | | |
| Banks – 6.6% | | | | | | | | |
| Bank of America Corp. | | | 14,439,214 | | | | 243,011,972 | |
| Citigroup, Inc. | | | 4,177,450 | | | | 216,183,038 | |
| Comerica, Inc. | | | 1,157,500 | | | | 48,418,225 | |
| Huntington Bancshares, Inc. | | | 3,415,181 | | | | 37,771,902 | |
| JPMorgan Chase & Co. | | | 4,821,006 | | | | 318,331,026 | |
| M&T Bank Corp. | | | 496,500 | | | | 60,165,870 | |
| Regions Financial Corp. | | | 3,286,900 | | | | 31,554,240 | |
| Synovus Financial Corp. | | | 950,023 | | | | 30,761,745 | |
| U.S. Bancorp | | | 3,805,544 | | | | 162,382,562 | |
| Wells Fargo & Co. | | | 983,200 | | | | 53,446,752 | |
| Zions Bancorporation | | | 1,008,500 | | | | 27,532,050 | |
| | | | | | | | 1,229,559,382 | |
| Capital Markets – 1.8% | | | | | | | | |
| Bank of New York Mellon Corp. | | | 990,400 | | | | 40,824,288 | |
| BlackRock, Inc. Class A | | | 191,113 | | | | 65,077,799 | |
| E*TRADE Financial Corp. (a) | | | 1,456,278 | | | | 43,164,080 | |
| Goldman Sachs Group, Inc. | | | 581,100 | | | | 104,731,653 | |
| Invesco Ltd. | | | 735,357 | | | | 24,619,752 | |
| Northern Trust Corp. | | | 483,364 | | | | 34,845,711 | |
| Oaktree Capital Group LLC Class A | | | 331,134 | | | | 15,801,714 | |
| | | | | | | | 329,064,997 | |
| Consumer Finance – 2.1% | | | | | | | | |
| Capital One Financial Corp. | | | 4,084,248 | | | | 294,801,021 | |
| Navient Corp. | | | 3,176,876 | | | | 36,375,230 | |
| OneMain Holdings, Inc. (a) | | | 495,098 | | | | 20,566,371 | |
| SLM Corp. (a) | | | 5,632,376 | | | | 36,723,092 | |
| | | | | | | | 388,465,714 | |
| Diversified Financial Services – 1.0% | | | | | | | | |
| Berkshire Hathaway, Inc.: | | | | | | | | |
| Class A (a) | | | 47 | | | | 9,296,600 | |
| Class B (a) | | | 768,800 | | | | 101,512,352 | |
| IntercontinentalExchange, Inc. | | | 249,109 | | | | 63,836,672 | |
| KBC Ancora | | | 450,178 | | | | 19,038,422 | |
| | | | | | | | 193,684,046 | |
| Insurance – 1.9% | | | | | | | | |
| Direct Line Insurance Group PLC | | | 5,376,391 | | | | 32,297,943 | |
| Fairfax Financial Holdings Ltd. (sub. vtg.) | | | 21,700 | | | | 10,302,050 | |
| Marsh & McLennan Companies, Inc. | | | 1,226,970 | | | | 68,035,487 | |
| | | | | | | |
| | | Shares | | | Value | |
| | | | | | | |
| MetLife, Inc. | | | 938,487 | | | $ | 45,244,458 | |
| The Chubb Corp. | | | 1,404,300 | | | | 186,266,352 | |
| Unum Group | | | 635,100 | | | | 21,142,479 | |
| | | | | | | | 363,288,769 | |
| Real Estate Investment Trusts – 2.1% | | | | | | | | |
| Altisource Residential Corp. Class B | | | 2,101,682 | | | | 26,081,874 | |
| American Tower Corp. | | | 242,100 | | | | 23,471,595 | |
| Boston Properties, Inc. | | | 326,000 | | | | 41,578,040 | |
| Crown Castle International Corp. | | | 156,600 | | | | 13,538,070 | |
| Digital Realty Trust, Inc. | | | 508,200 | | | | 38,430,084 | |
| Duke Realty LP | | | 1,550,100 | | | | 32,583,102 | |
| Extra Space Storage, Inc. | | | 255,400 | | | | 22,528,834 | |
| FelCor Lodging Trust, Inc. | | | 1,352,900 | | | | 9,876,170 | |
| Outfront Media, Inc. | | | 587,014 | | | | 12,814,516 | |
| Store Capital Corp. | | | 1,879,000 | | | | 43,592,800 | |
| Sun Communities, Inc. | | | 801,969 | | | | 54,958,936 | |
| Ventas, Inc. | | | 796,000 | | | | 44,918,280 | |
| VEREIT, Inc. | | | 2,582,800 | | | | 20,455,776 | |
| | | | | | | | 384,828,077 | |
| Real Estate Management & Development – 0.3% | | | | | | | | |
| CBRE Group, Inc. (a) | | | 1,402,389 | | | | 48,494,612 | |
| | | | | | | | | |
| TOTAL FINANCIALS | | | | | | | 2,937,385,597 | |
| | | | | | | | | |
| HEALTH CARE – 15.2% | | | | | | | | |
| Biotechnology – 4.8% | | | | | | | | |
| AbbVie, Inc. | | | 2,025,421 | | | | 119,985,940 | |
| Alexion Pharmaceuticals, Inc. (a) | | | 542,432 | | | | 103,468,904 | |
| Amgen, Inc. | | | 1,298,520 | | | | 210,788,752 | |
| Baxalta, Inc. | | | 1,882,425 | | | | 73,471,048 | |
| Biogen, Inc. (a) | | | 118,931 | | | | 36,434,512 | |
| BioMarin Pharmaceutical, Inc. (a) | | | 246,893 | | | | 25,864,511 | |
| Celgene Corp. (a) | | | 1,135,700 | | | | 136,011,432 | |
| Gilead Sciences, Inc. | | | 1,701,961 | | | | 172,221,434 | |
| Vertex Pharmaceuticals, Inc. (a) | | | 34,100 | | | | 4,290,803 | |
| | | | | | | | 882,537,336 | |
| Health Care Equipment & Supplies – 3.3% | | | | | | | | |
| Abbott Laboratories | | | 2,216,400 | | | | 99,538,524 | |
| Boston Scientific Corp. (a) | | | 7,962,549 | | | | 146,829,404 | |
| Edwards Lifesciences Corp. (a) | | | 855,484 | | | | 67,566,126 | |
| Medtronic PLC | | | 3,264,390 | | | | 251,096,879 | |
| The Cooper Companies, Inc. | | | 186,020 | | | | 24,963,884 | |
| Wright Medical Group NV (a) | | | 1,204,200 | | | | 29,117,556 | |
| | | | | | | | 619,112,373 | |
| Health Care Providers & Services – 2.9% | | | | | | | | |
| Brookdale Senior Living, Inc. (a) | | | 409,233 | | | | 7,554,441 | |
| Cigna Corp. | | | 879,126 | | | | 128,642,508 | |
| HCA Holdings, Inc. (a) | | | 669,114 | | | | 45,252,180 | |
| Henry Schein, Inc. (a) | | | 473,641 | | | | 74,925,270 | |
| McKesson Corp. | | | 539,100 | | | | 106,326,693 | |
| UnitedHealth Group, Inc. | | | 1,465,100 | | | | 172,354,364 | |
| | | | | | | | 535,055,456 | |
| Life Sciences Tools & Services – 0.8% | | | | | | | | |
| Agilent Technologies, Inc. | | | 1,361,700 | | | | 56,932,677 | |
| Thermo Fisher Scientific, Inc. | | | 670,613 | | | | 95,126,454 | |
| | | | | | | | 152,059,131 | |
See accompanying notes which are an integral part of the financial statements.
Investments – continued
| Common Stocks – continued |
| | | Shares | | | Value | |
| | | | | | | |
| HEALTH CARE – continued | | | | | | | | |
| Pharmaceuticals – 3.4% | | | | | | | | |
| Allergan PLC (a) | | | 754,352 | | | $ | 235,735,000 | |
| Bristol-Myers Squibb Co. | | | 3,318,705 | | | | 228,293,717 | |
| Endo Health Solutions, Inc. (a) | | | 810,100 | | | | 49,594,322 | |
| Horizon Pharma PLC (a) | | | 1,448,700 | | | | 31,393,329 | |
| Teva Pharmaceutical Industries Ltd. sponsored ADR | | | 1,345,700 | | | | 88,331,748 | |
| | | | | | | | 633,348,116 | |
| | | | | | | | | |
| TOTAL HEALTH CARE | | | | | | | 2,822,112,412 | |
| | | | | | | | | |
| INDUSTRIALS – 8.9% | | | | | | | | |
| Electrical Equipment – 2.3% | | | | | | | | |
| AMETEK, Inc. | | | 7,459,547 | | | | 399,757,124 | |
| SolarCity Corp. (a) | | | 385,500 | | | | 19,668,210 | |
| | | | | | | | 419,425,334 | |
| Industrial Conglomerates – 4.6% | | | | | | | | |
| Danaher Corp. | | | 4,774,221 | | | | 443,429,646 | |
| Roper Technologies, Inc. | | | 2,174,340 | | | | 412,667,989 | |
| | | | | | | | 856,097,635 | |
| Machinery – 1.2% | | | | | | | | |
| WABCO Holdings, Inc. (a) | | | 965,979 | | | | 98,781,013 | |
| Wabtec Corp. | | | 1,732,535 | | | | 123,217,889 | |
| | | | | | | | 221,998,902 | |
| Professional Services – 0.3% | | | | | | | | |
| Verisk Analytics, Inc. (a) | | | 629,032 | | | | 48,359,980 | |
| WageWorks, Inc. (a) | | | 59,257 | | | | 2,688,490 | |
| | | | | | | | 51,048,470 | |
| Road & Rail – 0.5% | | | | | | | | |
| eHi Car Service Co. Ltd. sponsored ADR (a) | | | 40 | | | | 504 | |
| J.B. Hunt Transport Services, Inc. | | | 1,354,583 | | | | 99,372,209 | |
| | | | | | | | 99,372,713 | |
| Trading Companies & Distributors – 0.0% | | | | | | | | |
| AerCap Holdings NV (a) | | | 181,400 | | | | 7,829,224 | |
| | | | | | | | | |
| TOTAL INDUSTRIALS | | | | | | | 1,655,772,278 | |
| | | | | | | | | |
| INFORMATION TECHNOLOGY – 19.8% | | | | | | | | |
| Communications Equipment – 0.6% | | | | | | | | |
| CommScope Holding Co., Inc. (a) | | | 250,600 | | | | 6,488,034 | |
| Qualcomm Technologies, Inc. | | | 2,038,629 | | | | 101,900,871 | |
| | | | | | | | 108,388,905 | |
| Electronic Equipment & Components – 0.2% | | | | | | | | |
| Fitbit, Inc. | | | 593,900 | | | | 17,573,501 | |
| Samsung SDI Co. Ltd. | | | 224,010 | | | | 21,485,525 | |
| | | | | | | | 39,059,026 | |
| Internet Software & Services – 7.0% | | | | | | | | |
| 58.com, Inc. ADR (a) | | | 387,455 | | | | 25,556,532 | |
| Alibaba Group Holding Ltd. sponsored ADR (a) | | | 2,708,400 | | | | 220,111,668 | |
| Alphabet, Inc.: | | | | | | | | |
| Class A (a) | | | 27,000 | | | | 21,006,270 | |
| Class C | | | 729,136 | | | | 553,326,721 | |
| Box, Inc. Class A (b) | | | 1,467,400 | | | | 20,484,904 | |
| Cvent, Inc. (a) | | | 1,779,131 | | | | 62,109,463 | |
| | | | | | | |
| | | Shares | | | Value | |
| | | | | | | |
| Facebook, Inc. Class A (a) | | | 2,540,776 | | | $ | 265,917,616 | |
| Just Dial Ltd. | | | 1,155,420 | | | | 14,642,806 | |
| New Relic, Inc. | | | 635,992 | | | | 23,169,189 | |
| Opower, Inc. (a)(b)(e) | | | 2,860,761 | | | | 30,209,636 | |
| Shopify, Inc. Class A | | | 11,600 | | | | 299,280 | |
| Tencent Holdings Ltd. | | | 1,395,700 | | | | 27,327,787 | |
| Yahoo!, Inc. (a) | | | 1,224,100 | | | | 40,713,566 | |
| | | | | | | | 1,304,875,438 | |
| IT Services – 1.3% | | | | | | | | |
| Alliance Data Systems Corp. (a) | | | 88,100 | | | | 24,365,817 | |
| Blackhawk Network Holdings, Inc. (a) | | | 1,203,680 | | | | 53,214,693 | |
| Fidelity National Information Services, Inc. | | | 534,900 | | | | 32,414,940 | |
| Global Payments, Inc. | | | 280,300 | | | | 18,082,153 | |
| Sabre Corp. | | | 1,144,544 | | | | 32,012,896 | |
| The Western Union Co. | | | 205,900 | | | | 3,687,669 | |
| Travelport Worldwide Ltd. | | | 6,053,205 | | | | 78,086,345 | |
| Worldline SA (a)(f) | | | 361,963 | | | | 9,389,582 | |
| | | | | | | | 251,254,095 | |
| Semiconductors & Semiconductor Equipment – 3.0% | | | | | | | | |
| Broadcom Corp. Class A | | | 575,800 | | | | 33,292,756 | |
| Intersil Corp. Class A | | | 1,380,029 | | | | 17,609,170 | |
| Marvell Technology Group Ltd. | | | 9,461,328 | | | | 83,448,913 | |
| Maxim Integrated Products, Inc. | | | 818,700 | | | | 31,110,600 | |
| Micron Technology, Inc. (a) | | | 2,609,900 | | | | 36,956,184 | |
| NVIDIA Corp. | | | 1,002,102 | | | | 33,029,282 | |
| NXP Semiconductors NV (a) | | | 1,001,500 | | | | 84,376,375 | |
| Qorvo, Inc. (a) | | | 4,304,395 | | | | 219,093,706 | |
| Semtech Corp. (a) | | | 762,400 | | | | 14,424,608 | |
| | | | | | | | 553,341,594 | |
| Software – 3.8% | | | | | | | | |
| Activision Blizzard, Inc. | | | 673,171 | | | | 26,058,449 | |
| Adobe Systems, Inc. (a) | | | 354,729 | | | | 33,323,242 | |
| Autodesk, Inc. (a) | | | 2,263,100 | | | | 137,890,683 | |
| Electronic Arts, Inc. (a) | | | 1,851,600 | | | | 127,241,952 | |
| Fleetmatics Group PLC (a) | | | 304,689 | | | | 15,475,154 | |
| HubSpot, Inc. (a) | | | 73,785 | | | | 4,154,833 | |
| Imperva, Inc. (a) | | | 141,720 | | | | 8,972,293 | |
| Microsoft Corp. | | | 2,852,613 | | | | 158,262,969 | |
| Mobileye NV (a) | | | 100,800 | | | | 4,261,824 | |
| Salesforce.com, Inc. (a) | | | 1,791,157 | | | | 140,426,709 | |
| Varonis Systems, Inc. (a)(b) | | | 762,445 | | | | 14,333,966 | |
| Zendesk, Inc. (a) | | | 1,210,300 | | | | 32,000,332 | |
| | | | | | | | 702,402,406 | |
| Technology Hardware, Storage & Peripherals – 3.9% | | | | | | | | |
| Apple, Inc. | | | 4,462,892 | | | | 469,764,012 | |
| EMC Corp. | | | 2,798,100 | | | | 71,855,208 | |
| HP, Inc. | | | 7,749,400 | | | | 91,752,896 | |
| SanDisk Corp. | | | 807,500 | | | | 61,361,925 | |
| Western Digital Corp. | | | 681,900 | | | | 40,948,095 | |
| | | | | | | | 735,682,136 | |
| | | | | | | | | |
| TOTAL INFORMATION TECHNOLOGY | | | | | | | 3,695,003,600 | |
See accompanying notes which are an integral part of the financial statements.
| Common Stocks – continued |
| | | Shares | | | Value | |
| | | | | | | |
| MATERIALS – 3.7% | | | | | | | | |
| Chemicals – 3.2% | | | | | | | | |
| E.I. du Pont de Nemours & Co. | | | 1,347,400 | | | $ | 89,736,840 | |
| Eastman Chemical Co. | | | 769,441 | | | | 51,944,962 | |
| Ecolab, Inc. | | | 2,162,194 | | | | 247,311,750 | |
| LyondellBasell Industries NV Class A | | | 378,624 | | | | 32,902,426 | |
| Monsanto Co. | | | 688,176 | | | | 67,799,100 | |
| PPG Industries, Inc. | | | 526,800 | | | | 52,058,376 | |
| The Dow Chemical Co. | | | 630,900 | | | | 32,478,732 | |
| W.R. Grace & Co. (a) | | | 305,522 | | | | 30,426,936 | |
| | | | | | | | 604,659,122 | |
| Construction Materials – 0.1% | | | | | | | | |
| Eagle Materials, Inc. | | | 396,359 | | | | 23,951,974 | |
| Containers & Packaging – 0.4% | | | | | | | | |
| Graphic Packaging Holding Co. | | | 1,571,733 | | | | 20,165,334 | |
| WestRock Co. | | | 1,080,540 | | | | 49,294,235 | |
| | | | | | | | 69,459,569 | |
| | | | | | | | | |
| TOTAL MATERIALS | | | | | | | 698,070,665 | |
| | | | | | | | | |
| TELECOMMUNICATION SERVICES – 2.2% | | | | | | | | |
| Diversified Telecommunication Services – 2.2% | | | | | | | | |
| AT&T, Inc. | | | 6,207,568 | | | | 213,602,415 | |
| CenturyLink, Inc. | | | 486,632 | | | | 12,243,661 | |
| Cogent Communications Group, Inc. | | | 401,339 | | | | 13,922,450 | |
| Frontier Communications Corp. | | | 546,500 | | | | 2,552,155 | |
| inContact, Inc. (a) | | | 1,547,317 | | | | 14,761,404 | |
| Level 3 Communications, Inc. (a) | | | 726,886 | | | | 39,513,523 | |
| Verizon Communications, Inc. | | | 2,325,568 | | | | 107,487,753 | |
| | | | | | | | 404,083,361 | |
| Wireless Telecommunication Services – 0.0% | | | | | | | | |
| T-Mobile U.S., Inc. (a) | | | 55,400 | | | | 2,167,248 | |
| Telephone & Data Systems, Inc. | | | 256,603 | | | | 6,643,452 | |
| | | | | | | | 8,810,700 | |
| | | | | | | | | |
| TOTAL TELECOMMUNICATION SERVICES | | | | | | | 412,894,061 | |
| | | | | | | | | |
| UTILITIES – 2.9% | | | | | | | | |
| Electric Utilities – 1.7% | | | | | | | | |
| Edison International | | | 696,226 | | | | 41,223,541 | |
| Exelon Corp. | | | 3,101,292 | | | | 86,122,879 | |
| FirstEnergy Corp. | | | 166,600 | | | | 5,286,218 | |
| NextEra Energy, Inc. | | | 1,044,300 | | | | 108,492,327 | |
| PPL Corp. | | | 1,893,772 | | | | 64,634,438 | |
| | | | | | | | 305,759,403 | |
| Independent Power and Renewable Electricity Producers – 0.1% | | | | | | | | |
| NRG Energy, Inc. | | | 1,526,352 | | | | 17,965,163 | |
| NRG Yield, Inc. Class C (b) | | | 532,400 | | | | 7,858,224 | |
| | | | | | | | 25,823,387 | |
| Multi-Utilities – 1.1% | | | | | | | | |
| Dominion Resources, Inc. | | | 1,070,431 | | | | 72,403,953 | |
| DTE Energy Co. | | | 67,536 | | | | 5,415,712 | |
| NiSource, Inc. | | | 820,877 | | | | 16,015,310 | |
| | | | | | | |
| | | Shares | | | Value | |
| | | | | | | |
| PG&E Corp. | | | 994,834 | | | $ | 52,915,220 | |
| Sempra Energy | | | 697,550 | | | | 65,576,676 | |
| | | | | | | | 212,326,871 | |
| | | | | | | | | |
| TOTAL UTILITIES | | | | | | | 543,909,661 | |
| | | | | | | | | |
| TOTAL COMMON STOCKS | | | | | | | | |
| (Cost $15,239,181,638) | | | | | | | 18,319,336,349 | |
| | | | | | | | | |
| Convertible Preferred Stocks – 0.1% | |
| | | | | | | | | |
| ENERGY – 0.1% | | | | | | | | |
| Oil, Gas & Consumable Fuels – 0.1% | | | | | | | | |
| Southwestern Energy Co. Series B 6.25% | | | 429,700 | | | | 7,970,935 | |
| | | | | | | | | |
| INFORMATION TECHNOLOGY – 0.0% | | | | | | | | |
| Software – 0.0% | | | | | | | | |
| MongoDB, Inc. Series F, 8.00% (a)(d) | | | 299,866 | | | | 2,416,920 | |
| | | | | | | | | |
| TOTAL CONVERTIBLE PREFERRED STOCKS | | | | | | | | |
| (Cost $26,432,798) | | | | | | | 10,387,855 | |
| | | | | | | | | |
| U.S. Treasury Obligations – 0.0% | |
| | | Principal | | | | | |
| | | Amount | | | | | |
| | | | | | | | | |
| U.S. Treasury Bills, yield at date of purchase 0.1% to 0.27% 1/28/16 to 3/10/16 (g) | | | | | | | | |
| (Cost $5,739,522) | | $ | 5,740,000 | | | | 5,739,488 | |
| | | | | | | | | |
| Money Market Funds – 2.4% | |
| | | Shares | | | | | |
| | | | | | | | | |
| Fidelity Cash Central Fund, 0.33% (h) | | | 330,668,416 | | | | 330,668,416 | |
| Fidelity Securities Lending Cash Central Fund, 0.35% (h)(i) | | | 115,366,217 | | | | 115,366,217 | |
| | | | | | | | | |
| TOTAL MONEY MARKET FUNDS | | | | | | | | |
| (Cost $446,034,633) | | | | | | | 446,034,633 | |
| | | | | | | | | |
| TOTAL INVESTMENT PORTFOLIO – 100.9% | | | | | | | | |
| (Cost $15,717,388,591) | | | | | | | 18,781,498,325 | |
| | | | | | | | | |
| NET OTHER ASSETS (LIABILITIES) – (0.9)% | | | | | | | (158,621,516 | ) |
| NET ASSETS – 100% | | | | | | $ | 18,622,876,809 | |
See accompanying notes which are an integral part of the financial statements.
Investments – continued
| Futures Contracts | | | | | | | | |
| | | | | Underlying | | | Unrealized | |
| | | Expiration | | Face Amount | | | Appreciation/ | |
| | | Date | | at Value | | | (Depreciation) | |
| Purchased | | | | | | | | | | |
| | | | | | | | | | | |
| Equity Index Contracts | | | | | | | | | | |
| 568 CME E-mini S&P 500 Index Contracts (United States) | | March 2016 | | $ | 57,805,360 | | | $ | 973,787 | |
The face value of futures purchased as a percentage of Net Assets is 0.3%
Legend
| (b) | Security or a portion of the security is on loan at period end. |
| (c) | Investment is owned by an entity that is treated as a corporation for U.S. tax purposes and is wholly-owned by the Fund. |
| (d) | Restricted securities – Investment in securities not registered under the Securities Act of 1933 (excluding 144A issues). At the end of the period, the value of restricted securities (excluding 144A issues) amounted to $9,632,499 or 0.1% of net assets. |
| (f) | Security exempt from registration under Rule 144A of the Securities Act of 1933. These securities may be resold in transactions exempt from registration, normally to qualified institutional buyers. At the end of the period, the value of these securities amounted to $9,389,582 or 0.1% of net assets. |
| (g) | Security or a portion of the security was pledged to cover margin requirements for futures contracts. At period end, the value of securities pledged amounted to $3,714,664. |
| (h) | Affiliated fund that is generally available only to investment companies and other accounts managed by Fidelity Investments. The rate quoted is the annualized seven-day yield of the fund at period end. A complete unaudited listing of the fund’s holdings as of its most recent quarter end is available upon request. In addition, each Fidelity Central Fund’s financial statements, which are not covered by the Fund’s Report of Independent Registered Public Accounting Firm, are available on the SEC’s website or upon request. |
| (i) | Investment made with cash collateral received from securities on loan. |
Additional information on each restricted holding is as follows:
| | | Acquisition | | | |
| Security | | Date | | Acquisition Cost | |
| Legend Pictures LLC | | 9/23/10 | | $ | 1,546,500 | |
| MongoDB, Inc. Series F, 8.00% | | 10/2/13 | | $ | 5,014,998 | |
| Weinstein Co. Holdings LLC Class A-1 unit | | 10/19/05 | | $ | 11,499,000 | |
See accompanying notes which are an integral part of the financial statements.
Affiliated Central Funds
Information regarding fiscal year to date income earned by the Fund from investments in Fidelity Central Funds is as follows:
| Fund | | Income earned | |
| Fidelity Cash Central Fund | | $ | 596,492 | |
| Fidelity Securities Lending Cash Central Fund | | | 1,523,547 | |
| Total | | $ | 2,120,039 | |
Other Affiliated Issuers
An affiliated company is a company in which the Fund has ownership of at least 5% of the voting securities. Fiscal year to date transactions with companies which are or were affiliates are as follows:
| | | Value, | | | | | | | | | | | | Value, | |
| | | beginning of | | | | | | Sales | | | Dividend | | | end of | |
| Affiliate | | period | | | Purchases | | | Proceeds | | | Income | | | period | |
| Jumei International Holding Ltd. sponsored ADR | | $ | — | | | $ | 47,470,775 | | | $ | 39,084,426 | | | $ | — | | | $ | — | |
| Opower, Inc. | | | 27,573,841 | | | | 11,231,435 | | | | — | | | | — | | | | 30,209,636 | |
| Total | | $ | 27,573,841 | | | $ | 58,702,210 | | | $ | 39,084,426 | | | $ | — | | | $ | 30,209,636 | |
Investment Valuation
The following is a summary of the inputs used, as of December 31, 2015, involving the Fund’s assets and liabilities carried at fair value. The inputs or methodology used for valuing securities may not be an indication of the risk associated with investing in those securities. For more information on valuation inputs, and their aggregation into the levels used below, please refer to the Investment Valuation section in the accompanying Notes to Financial Statements.
| Valuation Inputs at Reporting Date: |
| Description | | Total | | | Level 1 | | | Level 2 | | | Level 3 | |
| Investments in Securities: | | | | | | | | | | | | | | | | |
| Equities: | | | | | | | | | | | | | | | | |
| Consumer Discretionary | | $ | 2,545,702,134 | | | $ | 2,538,486,555 | | | $ | — | | | $ | 7,215,579 | |
| Consumer Staples | | | 1,825,669,858 | | | | 1,821,118,697 | | | | 4,551,161 | | | | — | |
| Energy | | | 1,190,787,018 | | | | 1,190,787,018 | | | | — | | | | — | |
| Financials | | | 2,937,385,597 | | | | 2,937,385,597 | | | | — | | | | — | |
| Health Care | | | 2,822,112,412 | | | | 2,822,112,412 | | | | — | | | | — | |
| Industrials | | | 1,655,772,278 | | | | 1,655,772,278 | | | | — | | | | — | |
| Information Technology | | | 3,697,420,520 | | | | 3,631,547,482 | | | | 63,456,118 | | | | 2,416,920 | |
| Materials | | | 698,070,665 | | | | 698,070,665 | | | | — | | | | — | |
| Telecommunication Services | | | 412,894,061 | | | | 412,894,061 | | | | — | | | | — | |
| Utilities | | | 543,909,661 | | | | 543,909,661 | | | | — | | | | — | |
| U.S. Government and Government Agency Obligations | | | 5,739,488 | | | | — | | | | 5,739,488 | | | | — | |
| Money Market Funds | | | 446,034,633 | | | | 446,034,633 | | | | — | | | | — | |
| Total Investments in Securities: | | $ | 18,781,498,325 | | | $ | 18,698,119,059 | | | $ | 73,746,767 | | | $ | 9,632,499 | |
| Derivative Instruments: | | | | | | | | | | | | | | | | |
| Assets | | | | | | | | | | | | | | | | |
| Futures Contracts | | $ | 973,787 | | | $ | 973,787 | | | $ | — | | | $ | — | |
| Total Assets | | $ | 973,787 | | | $ | 973,787 | | | $ | — | | | $ | — | |
| Total Derivative Instruments: | | $ | 973,787 | | | $ | 973,787 | | | $ | — | | | $ | — | |
Value of Derivative Instruments
The following table is a summary of the Fund’s value of derivative instruments by primary risk exposure as of December 31, 2015. For additional information on derivative instruments, please refer to the Derivative Instruments section in the accompanying Notes to Financial Statements.
See accompanying notes which are an integral part of the financial statements.
Investments – continued
| Primary Risk Exposure / Derivative Type | | Value | |
| | | Asset | | | Liability | |
| Equity Risk | | | | | | | | |
| Futures Contracts (a) | | $ | 973,787 | | | $ | 0 | |
| Total Equity Risk | | $ | 973,787 | | | $ | 0 | |
| Total Value of Derivatives | | $ | 973,787 | | | $ | 0 | |
| (a) | Reflects gross cumulative appreciation (depreciation) on futures contracts as presented in the Schedule of Investments. Only the period end receivable or payable for daily variation margin and net unrealized appreciation (depreciation) are presented in the Statement of Assets and Liabilities. |
Other Information
Distribution of investments by country or territory of incorporation, as a percentage of Total Net Assets, is as follows (Unaudited):
| United States of America | | | 88.0 | % |
| Ireland | | | 3.1 | % |
| United Kingdom | | | 2.5 | % |
| Cayman Islands | | | 1.6 | % |
| Others (Individually Less Than 1%) | | | 4.8 | % |
| | | | 100.0 | % |
See accompanying notes which are an integral part of the financial statements.
Financial Statements
| Statement of Assets and Liabilities |
| | | | | | December 31, 2015 | |
| Assets | | | | | | | | |
| Investment in securities, at value (including securities loaned of $112,814,119) — See accompanying schedule: | | | | | | | | |
| Unaffiliated issuers (cost $15,224,727,118) | | $ | 18,305,254,056 | | | | | |
| Fidelity Central Funds (cost $446,034,633) | | | 446,034,633 | | | | | |
| Other affiliated issuers (cost $46,626,840) | | | 30,209,636 | | | | | |
| Total Investments (cost $15,717,388,591) | | | | | | $ | 18,781,498,325 | |
| Receivable for investments sold | | | | | | | 11,796,095 | |
| Receivable for fund shares sold | | | | | | | 2,371,862 | |
| Dividends receivable | | | | | | | 23,371,256 | |
| Distributions receivable from Fidelity Central Funds | | | | | | | 349,575 | |
| Prepaid expenses | | | | | | | 40,104 | |
| Other receivables | | | | | | | 1,006,912 | |
| Total assets | | | | | | | 18,820,434,129 | |
| | | | | | | | | |
| Liabilities | | | | | | | | |
| Payable for investments purchased | | $ | 45,629,131 | | | | | |
| Payable for fund shares redeemed | | | 23,267,985 | | | | | |
| Accrued management fee | | | 8,599,218 | | | | | |
| Distribution and service plan fees payable | | | 1,892,942 | | | | | |
| Payable for daily variation margin for derivative instruments | | | 642,622 | | | | | |
| Other affiliated payables | | | 1,260,397 | | | | | |
| Other payables and accrued expenses | | | 898,808 | | | | | |
| Collateral on securities loaned, at value | | | 115,366,217 | | | | | |
| Total liabilities | | | | | | | 197,557,320 | |
| | | | | | | | | |
| Net Assets | | | | | | $ | 18,622,876,809 | |
| Net Assets consist of: | | | | | | | | |
| Paid in capital | | | | | | $ | 14,224,031,817 | |
| Distributions in excess of net investment income | | | | | | | (780,806 | ) |
| Accumulated undistributed net realized gain (loss) on investments and foreign currency transactions | | | | | | | 1,334,668,790 | |
| Net unrealized appreciation (depreciation) on investments and assets and liabilities in foreign currencies | | | | | | | 3,064,957,008 | |
| Net Assets | | | | | | $ | 18,622,876,809 | |
| | | | | | | | | |
| Initial Class: | | | | | | | | |
| Net Asset Value, offering price and redemption price per share ($7,436,130,270 ÷ 219,262,221 shares) | | | | | | $ | 33.91 | |
| | | | | | | | | |
| Service Class: | | | | | | | | |
| Net Asset Value, offering price and redemption price per share ($1,546,863,855 ÷ 45,781,036 shares) | | | | | | $ | 33.79 | |
| | | | | | | | | |
| Service Class 2: | | | | | | | | |
| Net Asset Value, offering price and redemption price per share ($8,363,075,583 ÷ 251,484,786 shares) | | | | | | $ | 33.25 | |
| | | | | | | | | |
| Investor Class: | | | | | | | | |
| Net Asset Value, offering price and redemption price per share ($1,276,807,101 ÷ 37,815,086 shares) | | | | | | $ | 33.76 | |
See accompanying notes which are an integral part of the financial statements.
Financial Statements – continued
| | | | | | Year ended December | |
| | | | | | 31, 2015 | |
| Investment Income | | | | | | | | |
| Dividends | | | | | | $ | 315,035,042 | |
| Interest | | | | | | | 2,371 | |
| Income from Fidelity Central Funds | | | | | | | 2,120,039 | |
| Total income | | | | | | | 317,157,452 | |
| | | | | | | | | |
| Expenses | | | | | | | | |
| Management fee | | $ | 106,872,546 | | | | | |
| Transfer agent fees | | | 13,883,996 | | | | | |
| Distribution and service plan fees | | | 23,441,424 | | | | | |
| Accounting and security lending fees | | | 1,706,048 | | | | | |
| Custodian fees and expenses | | | 379,623 | | | | | |
| Independent trustees’ compensation | | | 84,348 | | | | | |
| Appreciation in deferred trustee compensation account | | | 32 | | | | | |
| Audit | | | 96,943 | | | | | |
| Legal | | | 70,881 | | | | | |
| Miscellaneous | | | 131,775 | | | | | |
| Total expenses before reductions | | | 146,667,616 | | | | | |
| Expense reductions | | | (1,098,180 | ) | | | 145,569,436 | |
| | | | | | | | | |
| Net investment income (loss) | | | | | | | 171,588,016 | |
| Realized and Unrealized Gain (Loss) | | | | | | | | |
| Net realized gain (loss) on: | | | | | | | | |
| Investment securities: | | | | | | | | |
| Unaffiliated issuers | | | 1,530,712,419 | | | | | |
| Other affiliated issuers | | | (8,386,349 | ) | | | | |
| Foreign currency transactions | | | (316,439 | ) | | | | |
| Futures contracts | | | 2,138,003 | | | | | |
| Total net realized gain (loss) | | | | | | | 1,524,147,634 | |
| Change in net unrealized appreciation (depreciation) on: | | | | | | | | |
| Investment securities | | | (1,581,220,096 | ) | | | | |
| Assets and liabilities in foreign currencies | | | (25,202 | ) | | | | |
| Futures contracts | | | (215,223 | ) | | | | |
| Total change in net unrealized appreciation (depreciation) | | | | | | | (1,581,460,521 | ) |
| Net gain (loss) | | | | | | | (57,312,887 | ) |
| Net increase (decrease) in net assets resulting from operations | | | | | | $ | 114,275,129 | |
| | | | | | | | | |
| Statement of Changes in Net Assets | | | | | | | | |
| | | Year ended December | | | Year ended December | |
| | | 31, 2015 | | | 31, 2014 | |
| Increase (Decrease) in Net Assets | | | | | | | | |
| Operations | | | | | | | | |
| Net investment income (loss) | | $ | 171,588,016 | | | $ | 169,153,778 | |
| Net realized gain (loss) | | | 1,524,147,634 | | | | 2,187,512,453 | |
| Change in net unrealized appreciation (depreciation) | | | (1,581,460,521 | ) | | | (227,810,831 | ) |
| Net increase (decrease) in net assets resulting from operations | | | 114,275,129 | | | | 2,128,855,400 | |
| Distributions to shareholders from net investment income | | | (176,945,760 | ) | | | (161,948,221 | ) |
| Distributions to shareholders from net realized gain | | | (1,751,090,544 | ) | | | (388,082,984 | ) |
| Total distributions | | | (1,928,036,304 | ) | | | (550,031,205 | ) |
| Share transactions – net increase (decrease) | | | 730,822,309 | | | | (730,491,919 | ) |
| Redemption fees | | | – | | | | 13 | |
| Total increase (decrease) in net assets | | | (1,082,938,866 | ) | | | 848,332,289 | |
| | | | | | | | | |
| Net Assets | | | | | | | | |
| Beginning of period | | | 19,705,815,675 | | | | 18,857,483,386 | |
| End of period (including distributions in excess of net investment income of $780,806 and undistributed net investment income of $1,449,774, respectively) | | $ | 18,622,876,809 | | | $ | 19,705,815,675 | |
See accompanying notes which are an integral part of the financial statements.
| Financial Highlights — VIP Contrafund Portfolio Initial Class |
| Years ended December 31, | | 2015 | | | 2014 | | | 2013 | | | 2012 | | | 2011 | |
| Selected Per–Share Data | | | | | | | | | | | | | | | | | | | | |
| Net asset value, beginning of period | | $ | 37.36 | | | $ | 34.35 | | | $ | 26.44 | | | $ | 23.02 | | | $ | 23.88 | |
| Income from Investment Operations | | | | | | | | | | | | | | | | | | | | |
| Net investment income (loss)A | | | .35 | | | | .36 | | | | .32 | | | | .32 | | | | .25 | |
| Net realized and unrealized gain (loss) | | | (.14 | ) | | | 3.76 | | | | 7.94 | | | | 3.46 | | | | (.86 | ) |
| Total from investment operations | | | .21 | | | | 4.12 | | | | 8.26 | | | | 3.78 | | | | (.61 | ) |
| Distributions from net investment income | | | (.37 | ) | | | (.36 | ) | | | (.34 | ) | | | (.34 | )B | | | (.25 | ) |
| Distributions from net realized gain | | | (3.30 | ) | | | (.75 | ) | | | (.01 | ) | | | (.01 | )B | | | – | |
| Total distributions | | | (3.66 | )C | | | (1.11 | ) | | | (.35 | ) | | | (.36 | )D | | | (.25 | ) |
| Redemption fees added to paid in capitalA | | | – | | | | – | E | | | – | E | | | – | E | | | – | E |
| Net asset value, end of period | | $ | 33.91 | | | $ | 37.36 | | | $ | 34.35 | | | $ | 26.44 | | | $ | 23.02 | |
| Total ReturnF,G | | | .64 | % | | | 11.94 | % | | | 31.29 | % | | | 16.42 | % | | | (2.53 | )% |
| Ratios to Average Net AssetsH,I | | | | | | | | | | | | | | | | | | | | |
| Expenses before reductions | | | .63 | % | | | .63 | % | | | .64 | % | | | .64 | % | | | .65 | % |
| Expenses net of fee waivers, if any | | | .63 | % | | | .63 | % | | | .63 | % | | | .64 | % | | | .64 | % |
| Expenses net of all reductions | | | .62 | % | | | .63 | % | | | .62 | % | | | .63 | % | | | .63 | % |
| Net investment income (loss) | | | 1.01 | % | | | 1.01 | % | | | 1.05 | % | | | 1.27 | % | | | 1.03 | % |
| Supplemental Data | | | | | | | | | | | | | | | | | | | | |
| Net assets, end of period (000 omitted) | | $ | 7,436,130 | | | $ | 8,005,930 | | | $ | 7,654,305 | | | $ | 6,440,357 | | | $ | 6,113,440 | |
| Portfolio turnover rateJ | | | 80 | % | | | 74 | % | | | 86 | % | | | 87 | % | | | 135 | % |
| A | Calculated based on average shares outstanding during the period. |
| B | The amounts shown reflect certain reclassifications related to book to tax differences that were made in the year shown. |
| C | Total distributions of $3.66 per share is comprised of distributions from net investment income of $.369 and distributions from net realized gain of $3.295 per share. |
| D | Total distributions of $.36 per share is comprised of distributions from net investment income of $.342 and distributions from net realized gain of $.013 per share. |
| E | Amount represents less than $.005 per share. |
| F | Total returns do not reflect charges attributable to your insurance company’s separate account. Inclusion of these charges would reduce the total returns shown. |
| G | Total returns would have been lower if certain expenses had not been reduced during the applicable periods shown. |
| H | Fees and expenses of any underlying Fidelity Central Funds are not included in the Fund’s expense ratio. The Fund indirectly bears its proportionate share of the expenses of any underlying Fidelity Central Funds. |
| I | Expense ratios reflect operating expenses of the class. Expenses before reductions do not reflect amounts reimbursed by the investment adviser or reductions from brokerage service arrangements or reductions from other expense offset arrangements and do not represent the amount paid by the class during periods when reimbursements or reductions occur. Expenses net of fee waivers reflect expenses after reimbursement by the investment adviser but prior to reductions from brokerage service arrangements or other expense offset arrangements. Expenses net of all reductions represent the net expenses paid by the class. |
| J | Amount does not include the portfolio activity of any underlying Fidelity Central Funds. |
See accompanying notes which are an integral part of the financial statements.
| Financial Highlights — VIP Contrafund Portfolio Service Class |
| Years ended December 31, | | 2015 | | | 2014 | | | 2013 | | | 2012 | | | 2011 | |
| Selected Per–Share Data | | | | | | | | | | | | | | | | | | | | |
| Net asset value, beginning of period | | $ | 37.23 | | | $ | 34.24 | | | $ | 26.36 | | | $ | 22.95 | | | $ | 23.81 | |
| Income from Investment Operations | | | | | | | | | | | | | | | | | | | | |
| Net investment income (loss)A | | | .32 | | | | .33 | | | | .29 | | | | .30 | | | | .22 | |
| Net realized and unrealized gain (loss) | | | (.13 | ) | | | 3.73 | | | | 7.91 | | | | 3.44 | | | | (.85 | ) |
| Total from investment operations | | | .19 | | | | 4.06 | | | | 8.20 | | | | 3.74 | | | | (.63 | ) |
| Distributions from net investment income | | | (.33 | ) | | | (.32 | ) | | | (.31 | ) | | | (.32 | )B | | | (.23 | ) |
| Distributions from net realized gain | | | (3.30 | ) | | | (.75 | ) | | | (.01 | ) | | | (.01 | )B | | | – | |
| Total distributions | | | (3.63 | ) | | | (1.07 | ) | | | (.32 | ) | | | (.33 | ) | | | (.23 | ) |
| Redemption fees added to paid in capitalA | | | – | | | | – | C | | | – | C | | | – | C | | | – | C |
| Net asset value, end of period | | $ | 33.79 | | | $ | 37.23 | | | $ | 34.24 | | | $ | 26.36 | | | $ | 22.95 | |
| Total ReturnD,E | | | .56 | % | | | 11.82 | % | | | 31.14 | % | | | 16.31 | % | | | (2.64 | )% |
| Ratios to Average Net AssetsF,G | | | | | | | | | | | | | | | | | | | | |
| Expenses before reductions | | | .73 | % | | | .73 | % | | | .74 | % | | | .74 | % | | | .75 | % |
| Expenses net of fee waivers, if any | | | .73 | % | | | .73 | % | | | .73 | % | | | .74 | % | | | .74 | % |
| Expenses net of all reductions | | | .72 | % | | | .73 | % | | | .72 | % | | | .73 | % | | | .73 | % |
| Net investment income (loss) | | | .91 | % | | | .91 | % | | | .95 | % | | | 1.16 | % | | | .93 | % |
| Supplemental Data | | | | | | | | | | | | | | | | | | | | |
| Net assets, end of period (000 omitted) | | $ | 1,546,864 | | | $ | 1,714,615 | | | $ | 1,688,448 | | | $ | 1,374,781 | | | $ | 1,277,101 | |
| Portfolio turnover rateH | | | 80 | % | | | 74 | % | | | 86 | % | | | 87 | % | | | 135 | % |
| A | Calculated based on average shares outstanding during the period. |
| B | The amounts shown reflect certain reclassifications related to book to tax differences that were made in the year shown. |
| C | Amount represents less than $.005 per share. |
| D | Total returns do not reflect charges attributable to your insurance company’s separate account. Inclusion of these charges would reduce the total returns shown. |
| E | Total returns would have been lower if certain expenses had not been reduced during the applicable periods shown. |
| F | Fees and expenses of any underlying Fidelity Central Funds are not included in the Fund’s expense ratio. The Fund indirectly bears its proportionate share of the expenses of any underlying Fidelity Central Funds. |
| G | Expense ratios reflect operating expenses of the class. Expenses before reductions do not reflect amounts reimbursed by the investment adviser or reductions from brokerage service arrangements or reductions from other expense offset arrangements and do not represent the amount paid by the class during periods when reimbursements or reductions occur. Expenses net of fee waivers reflect expenses after reimbursement by the investment adviser but prior to reductions from brokerage service arrangements or other expense offset arrangements. Expenses net of all reductions represent the net expenses paid by the class. |
| H | Amount does not include the portfolio activity of any underlying Fidelity Central Funds. |
See accompanying notes which are an integral part of the financial statements.
| Financial Highlights — VIP Contrafund Portfolio Service Class 2 |
| Years ended December 31, | | 2015 | | | 2014 | | | 2013 | | | 2012 | | | 2011 | |
| Selected Per–Share Data | | | | | | | | | | | | | | | | | | | | |
| Net asset value, beginning of period | | $ | 36.70 | | | $ | 33.77 | | | $ | 26.00 | | | $ | 22.64 | | | $ | 23.49 | |
| Income from Investment Operations | | | | | | | | | | | | | | | | | | | | |
| Net investment income (loss)A | | | .26 | | | | .27 | | | | .24 | | | | .26 | | | | .18 | |
| Net realized and unrealized gain (loss) | | | (.14 | ) | | | 3.68 | | | | 7.80 | | | | 3.39 | | | | (.84 | ) |
| Total from investment operations | | | .12 | | | | 3.95 | | | | 8.04 | | | | 3.65 | | | | (.66 | ) |
| Distributions from net investment income | | | (.28 | ) | | | (.27 | ) | | | (.26 | ) | | | (.28 | )B | | | (.19 | ) |
| Distributions from net realized gain | | | (3.30 | ) | | | (.75 | ) | | | (.01 | ) | | | (.01 | )B | | | – | |
| Total distributions | | | (3.57 | )C | | | (1.02 | ) | | | (.27 | ) | | | (.29 | ) | | | (.19 | ) |
| Redemption fees added to paid in capitalA | | | – | | | | – | D | | | – | D | | | – | D | | | – | D |
| Net asset value, end of period | | $ | 33.25 | | | $ | 36.70 | | | $ | 33.77 | | | $ | 26.00 | | | $ | 22.64 | |
| Total ReturnE,F | | | .39 | % | | | 11.65 | % | | | 30.95 | % | | | 16.14 | % | | | (2.78 | )% |
| Ratios to Average Net AssetsG,H | | | | | | | | | | | | | | | | | | | | |
| Expenses before reductions | | | .88 | % | | | .88 | % | | | .89 | % | | | .89 | % | | | .90 | % |
| Expenses net of fee waivers, if any | | | .88 | % | | | .88 | % | | | .88 | % | | | .89 | % | | | .89 | % |
| Expenses net of all reductions | | | .87 | % | | | .88 | % | | | .87 | % | | | .88 | % | | | .88 | % |
| Net investment income (loss) | | | .76 | % | | | .76 | % | | | .80 | % | | | 1.02 | % | | | .78 | % |
| Supplemental Data | | | | | | | | | | | | | | | | | | | | |
| Net assets, end of period (000 omitted) | | $ | 8,363,076 | | | $ | 8,764,266 | | | $ | 8,472,780 | | | $ | 7,740,640 | | | $ | 6,980,191 | |
| Portfolio turnover rateI | | | 80 | % | | | 74 | % | | | 86 | % | | | 87 | % | | | 135 | % |
| A | Calculated based on average shares outstanding during the period. |
| B | The amounts shown reflect certain reclassifications related to book to tax differences that were made in the year shown. |
| C | Total distributions of $3.57 per share is comprised of distributions from net investment income of $.279 and distributions from net realized gain of $3.295 per share. |
| D | Amount represents less than $.005 per share. |
| E | Total returns do not reflect charges attributable to your insurance company’s separate account. Inclusion of these charges would reduce the total returns shown. |
| F | Total returns would have been lower if certain expenses had not been reduced during the applicable periods shown. |
| G | Fees and expenses of any underlying Fidelity Central Funds are not included in the Fund’s expense ratio. The Fund indirectly bears its proportionate share of the expenses of any underlying Fidelity Central Funds. |
| H | Expense ratios reflect operating expenses of the class. Expenses before reductions do not reflect amounts reimbursed by the investment adviser or reductions from brokerage service arrangements or reductions from other expense offset arrangements and do not represent the amount paid by the class during periods when reimbursements or reductions occur. Expenses net of fee waivers reflect expenses after reimbursement by the investment adviser but prior to reductions from brokerage service arrangements or other expense offset arrangements. Expenses net of all reductions represent the net expenses paid by the class. |
| I | Amount does not include the portfolio activity of any underlying Fidelity Central Funds. |
See accompanying notes which are an integral part of the financial statements.
| Financial Highlights — VIP Contrafund Portfolio Investor Class |
| Years ended December 31, | | 2015 | | | 2014 | | | 2013 | | | 2012 | | | 2011 | |
| Selected Per–Share Data | | | | | | | | | | | | | | | | | | | | |
| Net asset value, beginning of period | | $ | 37.21 | | | $ | 34.22 | | | $ | 26.35 | | | $ | 22.94 | | | $ | 23.80 | |
| Income from Investment Operations | | | | | | | | | | | | | | | | | | | | |
| Net investment income (loss)A | | | .32 | | | | .33 | | | | .29 | | | | .30 | | | | .23 | |
| Net realized and unrealized gain (loss) | | | (.13 | ) | | | 3.74 | | | | 7.91 | | | | 3.45 | | | | (.86 | ) |
| Total from investment operations | | | .19 | | | | 4.07 | | | | 8.20 | | | | 3.75 | | | | (.63 | ) |
| Distributions from net investment income | | | (.34 | ) | | | (.33 | ) | | | (.32 | ) | | | (.32 | )B | | | (.23 | ) |
| Distributions from net realized gain | | | (3.30 | ) | | | (.75 | ) | | | (.01 | ) | | | (.01 | )B | | | – | |
| Total distributions | | | (3.64 | ) | | | (1.08 | ) | | | (.33 | ) | | | (.34 | )C | | | (.23 | ) |
| Redemption fees added to paid in capitalA | | | – | | | | – | D | | | – | D | | | – | D | | | – | D |
| Net asset value, end of period | | $ | 33.76 | | | $ | 37.21 | | | $ | 34.22 | | | $ | 26.35 | | | $ | 22.94 | |
| Total ReturnE,F | | | .56 | % | | | 11.85 | % | | | 31.15 | % | | | 16.34 | % | | | (2.62 | )% |
| Ratios to Average Net AssetsG,H | | | | | | | | | | | | | | | | | | | | |
| Expenses before reductions | | | .71 | % | | | .71 | % | | | .72 | % | | | .73 | % | | | .73 | % |
| Expenses net of fee waivers, if any | | | .71 | % | | | .71 | % | | | .71 | % | | | .73 | % | | | .73 | % |
| Expenses net of all reductions | | | .70 | % | | | .71 | % | | | .71 | % | | | .71 | % | | | .71 | % |
| Net investment income (loss) | | | .93 | % | | | .93 | % | | | .97 | % | | | 1.18 | % | | | .94 | % |
| Supplemental Data | | | | | | | | | | | | | | | | | | | | |
| Net assets, end of period (000 omitted) | | $ | 1,276,807 | | | $ | 1,210,592 | | | $ | 1,031,358 | | | $ | 698,845 | | | $ | 577,021 | |
| Portfolio turnover rateI | | | 80 | % | | | 74 | % | | | 86 | % | | | 87 | % | | | 135 | % |
| A | Calculated based on average shares outstanding during the period. |
| B | The amounts shown reflect certain reclassifications related to book to tax differences that were made in the year shown. |
| C | Total distributions of $.34 per share is comprised of distributions from net investment income of $.322 and distributions from net realized gain of $.013 per share. |
| D | Amount represents less than $.005 per share. |
| E | Total returns do not reflect charges attributable to your insurance company’s separate account. Inclusion of these charges would reduce the total returns shown. |
| F | Total returns would have been lower if certain expenses had not been reduced during the applicable periods shown. |
| G | Fees and expenses of any underlying Fidelity Central Funds are not included in the Fund’s expense ratio. The Fund indirectly bears its proportionate share of the expenses of any underlying Fidelity Central Funds. |
| H | Expense ratios reflect operating expenses of the class. Expenses before reductions do not reflect amounts reimbursed by the investment adviser or reductions from brokerage service arrangements or reductions from other expense offset arrangements and do not represent the amount paid by the class during periods when reimbursements or reductions occur. Expenses net of fee waivers reflect expenses after reimbursement by the investment adviser but prior to reductions from brokerage service arrangements or other expense offset arrangements. Expenses net of all reductions represent the net expenses paid by the class. |
| I | Amount does not include the portfolio activity of any underlying Fidelity Central Funds. |
See accompanying notes which are an integral part of the financial statements.
Notes to Financial Statements
For the period ended December 31, 2015
1. Organization.
VIP Contrafund Portfolio (the Fund) is a fund of Variable Insurance Products Fund II (the Trust) and is authorized to issue an unlimited number of shares. The Trust is registered under the Investment Company Act of 1940, as amended (the 1940 Act), as an open-end management investment company organized as a Massachusetts business trust. Shares of the Fund may only be purchased by insurance companies for the purpose of funding variable annuity or variable life insurance contracts. The Fund offers the following classes of shares: Initial Class shares, Service Class shares, Service Class 2 shares and Investor Class shares. The Fund offered Service Class 2R shares during the period April 24, 2002 through April 30, 2015, and all outstanding shares were converted to Service Class 2 shares by April 30, 2015. All classes have equal rights and voting privileges, except for matters affecting a single class.
2. Investments in Fidelity Central Funds.
The Fund invests in Fidelity Central Funds, which are open-end investment companies generally available only to other investment companies and accounts managed by the investment adviser and its affiliates. The Fund’s Schedule of Investments lists each of the Fidelity Central Funds held as of period end, if any, as an investment of the Fund, but does not include the underlying holdings of each Fidelity Central Fund. As an Investing Fund, the Fund indirectly bears its proportionate share of the expenses of the underlying Fidelity Central Funds.
The Money Market Central Funds seek preservation of capital and current income and are managed by Fidelity Investments Money Management, Inc. (FIMM), an affiliate of the investment adviser. Annualized expenses of the Money Market Central Funds as of their most recent shareholder report date are less than .005%.
A complete unaudited list of holdings for each Fidelity Central Fund is available upon request or at the Securities and Exchange Commission (the SEC) website at www.sec.gov. In addition, the financial statements of the Fidelity Central Funds, which are not covered by the Fund’s Report of Independent Registered Public Accounting Firm, are available on the SEC website or upon request.
3. Significant Accounting Policies.
The financial statements have been prepared in conformity with accounting principles generally accepted in the United States of America (GAAP), which require management to make certain estimates and assumptions at the date of the financial statements. Actual results could differ from those estimates. Subsequent events, if any, through the date that the financial statements were issued have been evaluated in the preparation of the financial statements. The following summarizes the significant accounting policies of the Fund:
Investment Valuation. Investments are valued as of 4:00 p.m. Eastern time on the last calendar day of the period. The Board of Trustees (the Board) has delegated the day to day responsibility for the valuation of the Fund’s investments to the Fidelity Management & Research Company (FMR) Fair Value Committee (the Committee). In accordance with valuation policies and procedures approved by the Board, the Fund attempts to obtain prices from one or more third party pricing vendors or brokers to value its investments. When current market prices, quotations or currency exchange rates are not readily available or reliable, investments will be fair valued in good faith by the Committee, in accordance with procedures adopted by the Board. Factors used in determining fair value vary by investment type and may include market or investment specific events, changes in interest rates and credit quality. The frequency with which these procedures are used cannot be predicted and they may be utilized to a significant extent. The Committee oversees the Fund’s valuation policies and procedures and reports to the Board on the Committee’s activities and fair value determinations. The Board monitors the appropriateness of the procedures used in valuing the Fund’s investments and ratifies the fair value determinations of the Committee.
The Fund categorizes the inputs to valuation techniques used to value its investments into a disclosure hierarchy consisting of three levels as shown below:
Level 1 – quoted prices in active markets for identical investments
Level 2 – other significant observable inputs (including quoted prices for similar investments, interest rates, prepayment speeds, etc.)
Level 3 – unobservable inputs (including the Fund’s own assumptions based on the best information available)
Valuation techniques used to value the Fund’s investments by major category are as follows:
Equity securities, including restricted securities, for which market quotations are readily available, are valued at the last reported sale price or official closing price as reported by a third party pricing vendor on the primary market or exchange on which they are traded and are categorized as Level 1 in the hierarchy. In the event there were no sales during the day or closing prices are not available, securities are valued at the last quoted bid price or may be valued using the last available price and are generally categorized as Level 2 in the hierarchy. For foreign equity securities, when market or security specific events arise, comparisons to the valuation of American Depositary Receipts (ADRs), futures contracts, Exchange-Traded Funds (ETFs) and certain indexes as well as quoted prices for similar securities may be used and would be categorized as Level 2 in the hierarchy. Utilizing these techniques may result in transfers between Level 1 and Level 2. For equity securities, including restricted
Notes to Financial Statements – continued
securities, where observable inputs are limited, assumptions about market activity and risk are used and these securities may be categorized as Level 3 in the hierarchy.
Debt securities, including restricted securities, are valued based on evaluated prices received from third party pricing vendors or from brokers who make markets in such securities. U.S. government and government agency obligations are valued by pricing vendors who utilize matrix pricing which considers yield or price of bonds of comparable quality, coupon, maturity and type or by broker-supplied prices. When independent prices are unavailable or unreliable, debt securities may be valued utilizing pricing methodologies which consider similar factors that would be used by third party pricing vendors. Debt securities are generally categorized as Level 2 in the hierarchy but may be Level 3 depending on the circumstances.
Futures contracts are valued at the settlement price established each day by the board of trade or exchange on which they are traded and are categorized as Level 1 in the hierarchy. Investments in open-end mutual funds, including the Fidelity Central Funds, are valued at their closing net asset value (NAV) each business day and are categorized as Level 1 in the hierarchy.
Changes in valuation techniques may result in transfers in or out of an assigned level within the disclosure hierarchy. The aggregate value of investments by input level as of December 31, 2015, is included at the end of the Fund’s Schedule of Investments.
Foreign Currency. The Fund may use foreign currency contracts to facilitate transactions in foreign-denominated securities. Gains and losses from these transactions may arise from changes in the value of the foreign currency or if the counterparties do not perform under the contracts’ terms.
Foreign-denominated assets, including investment securities, and liabilities are translated into U.S. dollars at the exchange rates at period end. Purchases and sales of investment securities, income and dividends received and expenses denominated in foreign currencies are translated into U.S. dollars at the exchange rate in effect on the transaction date.
The effects of exchange rate fluctuations on investments are included with the net realized and unrealized gain (loss) on investment securities. Other foreign currency transactions resulting in realized and unrealized gain (loss) are disclosed separately.
Investment Transactions and Income. For financial reporting purposes, the Fund’s investment holdings and NAV include trades executed through the end of the last business day of the period. The NAV per share for processing shareholder transactions is calculated as of the close of business of the New York Stock Exchange (NYSE), normally 4:00 p.m. Eastern time and includes trades executed through the end of the prior business day. Gains and losses on securities sold are determined on the basis of identified cost and may include proceeds received from litigation. Dividend income is recorded on the ex-dividend date, except for certain dividends from foreign securities where the ex-dividend date may have passed, which are recorded as soon as the Fund is informed of the ex-dividend date. Non-cash dividends included in dividend income, if any, are recorded at the fair market value of the securities received. Income and capital gain distributions from Fidelity Central Funds, if any, are recorded on the ex-dividend date. Distributions received on securities that represent a return of capital or capital gain are recorded as a reduction of cost of investments and/or as a realized gain. Subsequent to ex-dividend date the Fund determines the components of these distributions, based upon receipt of tax filings or other correspondence relating to the underlying investment. Interest income is accrued as earned and includes coupon interest and amortization of premium and accretion of discount on debt securities as applicable. Investment income is recorded net of foreign taxes withheld where recovery of such taxes is uncertain.
Class Allocations and Expenses. Investment income, realized and unrealized capital gains and losses, common expenses of the Fund, and certain fund-level expense reductions, if any, are allocated daily on a pro-rata basis to each class based on the relative net assets of each class to the total net assets of the Fund. Each class differs with respect to transfer agent and distribution and service plan fees incurred. Certain expense reductions may also differ by class. For the reporting period, the allocated portion of income and expenses to each class as a percent of its average net assets may vary due to the timing of recording these transactions in relation to fluctuating net assets of the classes. Expenses directly attributable to a fund are charged to that fund. Expenses attributable to more than one fund are allocated among the respective funds on the basis of relative net assets or other appropriate methods. Expense estimates are accrued in the period to which they relate and adjustments are made when actual amounts are known.
Deferred Trustee Compensation. Under a Deferred Compensation Plan (the Plan), independent Trustees may elect to defer receipt of a portion of their annual compensation. Deferred amounts are invested in a cross-section of Fidelity funds, are marked-to-market and remain in the Fund until distributed in accordance with the Plan. The investment of deferred amounts and the offsetting payable to the Trustees are included in the accompanying Statement of Assets and Liabilities.
Income Tax Information and Distributions to Shareholders. Each year, the Fund intends to qualify as a regulated investment company under Subchapter M of the Internal Revenue Code, including distributing substantially all of its taxable income and realized gains. As a result, no provision for U.S. Federal income taxes is required. As of December 31, 2015, the Fund did not have any unrecognized tax benefits in the financial statements; nor is the Fund aware of any tax positions for which it is reasonably possible that the total amounts of unrecognized tax benefits will significantly change in the next twelve months. The Fund files a U.S. federal tax return, in addition to state and local tax returns as required. The Fund’s federal income tax returns are subject to examination by the Internal Revenue Service (IRS) for a period of three fiscal years after they
are filed. State and local tax returns may be subject to examination for an additional fiscal year depending on the jurisdiction. Foreign taxes are provided for based on the Fund’s understanding of the tax rules and rates that exist in the foreign markets in which it invests.
Distributions are declared and recorded on the ex-dividend date. Income dividends and capital gain distributions are declared separately for each class. Income and capital gain distributions are determined in accordance with income tax regulations, which may differ from GAAP.
Capital accounts within the financial statements are adjusted for permanent book-tax differences. These adjustments have no impact on net assets or the results of operations. Capital accounts are not adjusted for temporary book-tax differences which will reverse in a subsequent period.
Book-tax differences are primarily due to future contracts, foreign currency transactions, short-term gain distributions from the underlying funds, passive foreign investment companies (PFIC), market discount, partnerships, deferred trustees compensation and losses deferred due to wash sales and excise tax regulations.
The federal tax cost of investment securities and unrealized appreciation (depreciation) as of period end were as follows:
| Gross unrealized appreciation | | $ | 3,885,918,269 | |
| Gross unrealized depreciation | | | (878,064,417 | ) |
| Net unrealized appreciation (depreciation) on securities | | $ | 3,007,853,852 | |
| Tax Cost | | $ | 15,773,644,473 | |
The tax-based components of distributable earnings as of period end were as follows:
| Undistributed long-term capital gain | | $ | 1,451,089,124 | |
| Net unrealized appreciation (depreciation) on securities and other investments | | $ | 3,007,727,338 | |
The Fund intends to elect to defer to its next fiscal year $59,189,705 of capital losses recognized during the period November 1, 2015 to December 31, 2015.
The tax character of distributions paid was as follows:
| | | December 31, 2015 | | | December 31, 2014 | |
| Ordinary Income | | $ | 332,205,069 | | | $ | 550,031,205 | |
| Long-term Capital Gains | | | 1,595,831,235 | | | | – | |
| Total | | $ | 1,928,036,304 | | | $ | 550,031,205 | |
Trading (Redemption) Fees. Service Class 2R shares held by investors less than 60 days may have been subject to a redemption fee equal to 1% of the NAV of shares redeemed. All redemption fees, which reduce the proceeds of the shareholder redemption, are retained by the Fund and accounted for as an addition to paid in capital. These redemption fees were eliminated effective April 30, 2015.
Restricted Securities. The Fund may invest in securities that are subject to legal or contractual restrictions on resale. These securities generally may be resold in transactions exempt from registration or to the public if the securities are registered. Disposal of these securities may involve time-consuming negotiations and expense, and prompt sale at an acceptable price may be difficult. Information regarding restricted securities is included at the end of the Fund’s Schedule of Investments.
4. Derivative Instruments.
Risk Exposures and the Use of Derivative Instruments. The Fund’s investment objective allows the Fund to enter into various types of derivative contracts, including futures contracts. Derivatives are investments whose value is primarily derived from underlying assets, indices or reference rates and may be transacted on an exchange or over-the-counter (OTC). Derivatives may involve a future commitment to buy or sell a specified asset based on specified terms, to exchange future cash flows at periodic intervals based on a notional principal amount, or for one party to make one or more payments upon the occurrence of specified events in exchange for periodic payments from the other party.
The Fund used derivatives to increase returns and to manage exposure to certain risks as defined below. The success of any strategy involving derivatives depends on analysis of numerous economic factors, and if the strategies for investment do not work as intended, the Fund may not achieve its objectives.
The Fund’s use of derivatives increased or decreased its exposure to the following risk:
Notes to Financial Statements – continued
| Equity Risk | Equity risk relates to the fluctuations in the value of financial instruments as a result of changes in market prices (other than those arising from interest rate risk or foreign exchange risk), whether caused by factors specific to an individual investment, its issuer, or all factors affecting all instruments traded in a market or market segment. |
The Fund is also exposed to additional risks from investing in derivatives, such as liquidity risk and counterparty credit risk. Liquidity risk is the risk that the Fund will be unable to close out the derivative in the open market in a timely manner. Counterparty credit risk is the risk that the counterparty will not be able to fulfill its obligation to the Fund. Counterparty credit risk related to exchange-traded futures contracts may be mitigated by the protection provided by the exchange on which they trade.
Investing in derivatives may involve greater risks than investing in the underlying assets directly and, to varying degrees, may involve risk of loss in excess of any initial investment and collateral received and amounts recognized in the Statement of Assets and Liabilities. In addition, there may be the risk that the change in value of the derivative contract does not correspond to the change in value of the underlying instrument.
Futures Contracts. A futures contract is an agreement between two parties to buy or sell a specified underlying instrument for a fixed price at a specified future date. The Fund used futures contracts to manage its exposure to the stock market.
Upon entering into a futures contract, a fund is required to deposit either cash or securities (initial margin) with a clearing broker in an amount equal to a certain percentage of the face value of the contract. Futures contracts are marked-to-market daily and subsequent daily payments (variation margin) are made or received by a fund depending on the daily fluctuations in the value of the futures contracts and are recorded as unrealized appreciation or (depreciation). This receivable and/or payable, if any, is included in daily variation margin for derivative instruments in the Statement of Assets and Liabilities. Realized gain or (loss) is recorded upon the expiration or closing of a futures contract.
Any open futures contracts at period end are presented in the Schedule of Investments under the caption “Futures Contracts”. The underlying face amount at value reflects each contract’s exposure to the underlying instrument or index at period end and is representative of volume of activity during the period. Securities deposited to meet initial margin requirements are identified in the Schedule of Investments.
During the period the Fund recognized net realized gain (loss) of $2,138,003 and a change in net unrealized appreciation (depreciation) of $(215,223) related to its investment in futures contracts. These amounts are included in the Statement of Operations.
5. Purchases and Sales of Investments.
Purchases and sales of securities, other than short-term securities, aggregated $15,215,723,815 and $16,217,211,883, respectively.
6. Fees and Other Transactions with Affiliates.
Management Fee. Fidelity Management & Research Company (the investment adviser) and its affiliates provide the Fund with investment management related services for which the Fund pays a monthly management fee. The management fee is the sum of an individual fund fee rate that is based on an annual rate of .30% of the Fund’s average net assets and an annualized group fee rate that averaged .25% during the period. The group fee rate is based upon the average net assets of all the mutual funds advised by the investment adviser, including any mutual funds previously advised by the investment adviser that are currently advised by Fidelity SelectCo, LLC, an affiliate of the investment adviser. The group fee rate decreases as assets under management increase and increases as assets under management decrease. For the reporting period, the total annual management fee rate was .55% of the Fund’s average net assets.
Distribution and Service Plan Fees. In accordance with Rule 12b-1 of the 1940 Act, the Fund has adopted separate 12b-1 Plans for each Service Class of shares. Each Service Class pays Fidelity Distributors Corporation (FDC), an affiliate of the investment adviser, a service fee. For the period, the service fee is based on an annual rate of .10% of Service Class’ average net assets and .25% of Service Class 2’s and Service Class 2R’s average net assets.
For the period, total fees, all of which were re-allowed to insurance companies for the distribution of shares and providing shareholder support services, were as follows:
| Service Class | | $ | 1,650,945 | |
| Service Class 2 | | | 21,781,847 | |
| Service Class 2R(a) | | | 8,632 | |
| | | $ | 23,441,424 | |
(a) For the period January 1, 2015 through April 30, 2015.
Transfer Agent Fees. Fidelity Investments Institutional Operations Company, Inc. (FIIOC), an affiliate of the investment adviser, is the Fund’s transfer, dividend disbursing, and shareholder servicing agent. FIIOC receives an asset-based fee with respect to each class. Each class (with the exception of Investor Class) pays a fee for transfer agent services, typesetting, printing and mailing of shareholder reports, excluding mailing of
proxy statements and out of pocket expenses, equal to an annual rate of .07% (.15% for Investor Class) of class-level average net assets. For the period, transfer agent fees for each class, including out of pocket expenses, were as follows:
| Initial Class | | $ | 5,191,806 | |
| Service Class | | | 1,090,201 | |
| Service Class 2 | | | 5,751,481 | |
| Service Class 2R(a) | | | 2,276 | |
| Investor Class | | | 1,848,232 | |
| | | $ | 13,883,996 | |
(a) For the period January 1, 2015 through April 30, 2015.
Accounting and Security Lending Fees. Fidelity Service Company, Inc. (FSC), an affiliate of the investment adviser, maintains the Fund’s accounting records. The accounting fee is based on the level of average net assets for each month. Under a separate contract, FSC administers the security lending program. The security lending fee is based on the number and duration of lending transactions.
Brokerage Commissions. The Fund placed a portion of its portfolio transactions with brokerage firms which are affiliates of the investment adviser. Brokerage commissions are included in net realized gain (loss) and change in net unrealized appreciation (depreciation) in the Statement of Operations. The commissions paid to these affiliated firms were $244,252 for the period.
Interfund Trades. The Fund may purchase from or sell securities to other Fidelity Funds under procedures adopted by the Board. The procedures have been designed to ensure these interfund trades are executed in accordance with Rule 17a-7 of the 1940 Act. Interfund trades are included within the respective purchases and sales amounts shown in the Purchases and Sales of Investments note.
Other. During the period, the investment adviser reimbursed the Fund for certain losses in the amount of $7,531.
7. Committed Line of Credit.
The Fund participates with other funds managed by the investment adviser or an affiliate in a $4.25 billion credit facility (the “line of credit”) to be utilized for temporary or emergency purposes to fund shareholder redemptions or for other short-term liquidity purposes. The Fund has agreed to pay commitment fees on its pro-rata portion of the line of credit, which amounted to $28,208 and is reflected in Miscellaneous expenses on the Statement of Operations. During the period, the Fund did not borrow on this line of credit.
8. Security Lending.
The Fund lends portfolio securities through a lending agent from time to time in order to earn additional income. For equity securities, a lending agent is used and may loan securities to certain qualified borrowers, including Fidelity Capital Markets (FCM), a broker-dealer affiliated with the Fund. On the settlement date of the loan, the Fund receives collateral (in the form of U.S. Treasury obligations, letters of credit and/or cash) against the loaned securities and maintains collateral in an amount not less than 100% of the market value of the loaned securities during the period of the loan. The market value of the loaned securities is determined at the close of business of the Fund and any additional required collateral is delivered to the Fund on the next business day. The Fund or borrower may terminate the loan at any time, and if the borrower defaults on its obligation to return the securities loaned because of insolvency or other reasons, the Fund may apply collateral received from the borrower against the obligation. The Fund may experience delays and costs in recovering the securities loaned. Any cash collateral received is invested in the Fidelity Securities Lending Cash Central Fund. The value of loaned securities and cash collateral at period end are disclosed on the Fund’s Statement of Assets and Liabilities. The value of securities loaned to FCM at period end was $2,824,800. Security lending income represents the income earned on investing cash collateral, less rebates paid to borrowers and any lending agent fees associated with the loan, plus any premium payments received for lending certain types of securities. Security lending income is presented in the Statement of Operations as a component of income from Fidelity Central Funds. Total security lending income during the period amounted to $1,523,547, including $69,724 from securities loaned to FCM.
9. Expense Reductions.
Commissions paid to certain brokers with whom the investment adviser, or its affiliates, places trades on behalf of the Fund include an amount in addition to trade execution, which may be rebated back to the Fund to offset certain expenses. This amount totaled $993,689 for the period.
In addition, during the period the investment adviser reimbursed and/or waived a portion of fund-level operating expenses in the amount of $79,633 and a portion of class-level operating expenses as follows:
| | | Amount | |
| Investor Class | | $ | 24,858 | |
Notes to Financial Statements – continued
10. Distributions to Shareholders.
Distributions to shareholders of each class were as follows:
| Years ended December 31, | | 2015(a) | | | 2014 | |
| From net investment income | | | | | | | | |
| Initial Class | | $ | 79,941,331 | | | $ | 74,463,277 | |
| Service Class | | | 14,932,185 | | | | 14,364,873 | |
| Service Class 2 | | | 69,447,147 | | | | 62,622,769 | |
| Service Class 2R | | | 856 | | | | 73,371 | |
| Investor Class | | | 12,624,241 | | | | 10,423,931 | |
| Total | | $ | 176,945,760 | | | $ | 161,948,221 | |
| From net realized gain | | | | | | | | |
| Initial Class | | $ | 703,131,983 | | | $ | 156,226,874 | |
| Service Class | | | 150,460,594 | | | | 33,622,782 | |
| Service Class 2 | | | 788,053,180 | | | | 174,366,001 | |
| Service Class 2R | | | 864,532 | | | | 208,163 | |
| Investor Class | | | 108,580,255 | | | | 23,659,164 | |
| Total | | $ | 1,751,090,544 | | | $ | 388,082,984 | |
| (a) | All Service Class 2R shares were converted by April 30, 2015. |
11. Share Transactions.
Transactions for each class of shares were as follows:
| | | Shares | | | Shares | | | Dollars | | | Dollars | |
Years ended
December 31, | | 2015(a) | | | 2014 | | | 2015(a) | | | 2014 | |
| Initial Class | | | | | | | | | | | | | | | | |
| Shares sold | | | 8,952,835 | | | | 10,169,551 | | | $ | 315,514,465 | | | $ | 365,094,273 | |
| Reinvestment of distributions | | | 22,901,483 | | | | 6,099,687 | | | | 783,073,314 | | | | 230,690,151 | |
| Shares redeemed | | | (26,888,922 | ) | | | (24,801,841 | ) | | | (943,774,825 | ) | | | (891,153,398 | ) |
| Net increase (decrease) | | | 4,965,396 | | | | (8,532,603 | ) | | $ | 154,812,954 | | | $ | (295,368,974 | ) |
| Service Class | | | | | | | | | | | | | | | | |
| Shares sold | | | 1,554,871 | | | | 1,837,138 | | | $ | 54,599,900 | | | $ | 66,530,853 | |
| Reinvestment of distributions | | | 4,853,587 | | | | 1,273,220 | | | | 165,392,779 | | | | 47,987,655 | |
| Shares redeemed | | | (6,683,290 | ) | | | (6,372,556 | ) | | | (233,768,207 | ) | | | (228,362,389 | ) |
| Net increase (decrease) | | | (274,832 | ) | | | (3,262,198 | ) | | $ | (13,775,528 | ) | | $ | (113,843,881 | ) |
| Service Class 2 | | | | | | | | | | | | | | | | |
| Shares sold | | | 21,717,333 | | | | 19,214,314 | | | $ | 748,436,481 | | | $ | 682,228,630 | |
| Reinvestment of distributions | | | 25,563,476 | | | | 6,379,240 | | | | 857,500,327 | | | | 236,988,770 | |
| Shares redeemed | | | (34,618,040 | ) | | | (37,694,574 | ) | | | (1,186,593,252 | ) | | | (1,326,668,678 | ) |
| Net increase (decrease) | | | 12,662,769 | | | | (12,101,020 | ) | | $ | 419,343,556 | | | $ | (407,451,278 | ) |
| Service Class 2R | | | | | | | | | | | | | | | | |
| Shares sold | | | 11,068 | | | | 17,673 | | | $ | 389,193 | | | $ | 616,867 | |
| Reinvestment of distributions | | | 25,733 | | | | 7,591 | | | | 865,388 | | | | 281,534 | |
| Shares redeemed | | | (321,045 | ) | | | (55,287 | ) | | | (11,097,459 | ) | | | (1,946,621 | ) |
| Net increase (decrease) | | | (284,244 | ) | | | (30,023 | ) | | $ | (9,842,878 | ) | | $ | (1,048,220 | ) |
| Investor Class | | | | | | | | | | | | | | | | |
| Shares sold | | | 3,099,314 | | | | 2,779,701 | | | $ | 107,242,291 | | | $ | 99,365,365 | |
| Reinvestment of distributions | | | 3,561,108 | | | | 904,781 | | | | 121,204,496 | | | | 34,083,095 | |
| Shares redeemed | | | (1,379,023 | ) | | | (1,288,330 | ) | | | (48,162,582 | ) | | | (46,228,026 | ) |
| Net increase (decrease) | | | 5,281,399 | | | | 2,396,152 | | | $ | 180,284,205 | | | $ | 87,220,434 | |
| (a) | All Service Class 2R shares were converted by April 30, 2015. |
12. Other.
The Fund’s organizational documents provide former and current trustees and officers with a limited indemnification against liabilities arising in connection with the performance of their duties to the Fund. In the normal course of business, the Fund may also enter into contracts that provide general indemnifications. The Fund’s maximum exposure under these arrangements is unknown as this would be dependent on future claims that may be made against the Fund. The risk of material loss from such claims is considered remote.
At the end of the period, the investment adviser or its affiliates were the owners of record of 12% of the total outstanding shares of the Fund and one otherwise unaffiliated shareholder was the owner of record of 10% of the total outstanding shares of the Fund.
Report of Independent Registered Public Accounting Firm
To the Trustees of Variable Insurance Products Fund II and Shareholders of VIP Contrafund Portfolio:
We have audited the accompanying statement of assets and liabilities of VIP Contrafund Portfolio (the Fund), a fund of Variable Insurance Products Fund II, including the schedule of investments, as of December 31, 2015, and the related statement of operations for the year then ended, the statement of changes in net assets for each of the two years in the period then ended, and the financial highlights for each of the five years in the period then ended. These financial statements and financial highlights are the responsibility of the Fund’s management. Our responsibility is to express an opinion on these financial statements and financial highlights based on our audits.
We conducted our audits in accordance with the standards of the Public Company Accounting Oversight Board (United States). Those standards require that we plan and perform the audit to obtain reasonable assurance about whether the financial statements and financial highlights are free of material misstatement. The Fund is not required to have, nor were we engaged to perform, an audit of its internal control over financial reporting. Our audits included consideration of internal control over financial reporting as a basis for designing audit procedures that are appropriate in the circumstances, but not for the purpose of expressing an opinion on the effectiveness of the Fund’s internal control over financial reporting. Accordingly, we express no such opinion. An audit also includes examining, on a test basis, evidence supporting the amounts and disclosures in the financial statements, assessing the accounting principles used and significant estimates made by management, as well as evaluating the overall financial statement presentation. Our procedures included confirmation of securities owned as of December 31, 2015, by correspondence with the custodians and brokers; when replies were not received from brokers, we performed other auditing procedures. We believe that our audits provide a reasonable basis for our opinion.
In our opinion, such financial statements and financial highlights referred to above present fairly, in all material respects, the financial position of VIP Contrafund Portfolio as of December 31, 2015, the results of its operations for the year then ended, the changes in its net assets for each of the two years in the period then ended, and the financial highlights for the each of the five years in the period then ended, in conformity with accounting principles generally accepted in the United States of America.
DELOITTE & TOUCHE LLP
Boston, Massachusetts
February 16, 2016
Trustees and Officers
The Trustees, Members of the Advisory Board (if any), and officers of the trust and fund, as applicable, are listed below. The Board of Trustees governs the fund and is responsible for protecting the interests of shareholders. The Trustees are experienced executives who meet periodically throughout the year to oversee the fund’s activities, review contractual arrangements with companies that provide services to the fund, oversee management of the risks associated with such activities and contractual arrangements, and review the fund’s performance. Each of the Trustees oversees 170 funds.
The Trustees hold office without limit in time except that (a) any Trustee may resign; (b) any Trustee may be removed by written instrument, signed by at least two-thirds of the number of Trustees prior to such removal; (c) any Trustee who requests to be retired or who has become incapacitated by illness or injury may be retired by written instrument signed by a majority of the other Trustees; and (d) any Trustee may be removed at any special meeting of shareholders by a two-thirds vote of the outstanding voting securities of the trust. Each Trustee who is not an interested person (as defined in the 1940 Act) of the trust and the fund is referred to herein as an Independent Trustee. Each Independent Trustee shall retire not later than the last day of the calendar year in which his or her 75th birthday occurs. The Independent Trustees may waive this mandatory retirement age policy with respect to individual Trustees. Officers and Advisory Board Members hold office without limit in time, except that any officer or Advisory Board Member may resign or may be removed by a vote of a majority of the Trustees at any regular meeting or any special meeting of the Trustees. Except as indicated, each individual has held the office shown or other offices in the same company for the past five years.
The fund’s Statement of Additional Information (SAI) includes more information about the Trustees. To request a free copy, call Fidelity at 1-877-208-0098.
Experience, Skills, Attributes, and Qualifications of the Trustees. The Governance and Nominating Committee has adopted a statement of policy that describes the experience, qualifications, attributes, and skills that are necessary and desirable for potential Independent Trustee candidates (Statement of Policy). The Board believes that each Trustee satisfied at the time he or she was initially elected or appointed a Trustee, and continues to satisfy, the standards contemplated by the Statement of Policy. The Governance and Nominating Committee also engages professional search firms to help identify potential Independent Trustee candidates who have the experience, qualifications, attributes, and skills consistent with the Statement of Policy. From time to time, additional criteria based on the composition and skills of the current Independent Trustees, as well as experience or skills that may be appropriate in light of future changes to board composition, business conditions, and regulatory or other developments, have also been considered by the professional search firms and the Governance and Nominating Committee. In addition, the Board takes into account the Trustees’ commitment and participation in Board and committee meetings, as well as their leadership of standing and ad hoc committees throughout their tenure.
In determining that a particular Trustee was and continues to be qualified to serve as a Trustee, the Board has considered a variety of criteria, none of which, in isolation, was controlling. The Board believes that, collectively, the Trustees have balanced and diverse experience, qualifications, attributes, and skills, which allow the Board to operate effectively in governing the fund and protecting the interests of shareholders. Information about the specific experience, skills, attributes, and qualifications of each Trustee, which in each case led to the Board’s conclusion that the Trustee should serve (or continue to serve) as a trustee of the fund, is provided below.
Board Structure and Oversight Function. James C. Curvey is an interested person and currently serves as Chairman. The Trustees have determined that an interested Chairman is appropriate and benefits shareholders because an interested Chairman has a personal and professional stake in the quality and continuity of services provided to the fund. Independent Trustees exercise their informed business judgment to appoint an individual of their choosing to serve as Chairman, regardless of whether the Trustee happens to be independent or a member of management. The Independent Trustees have determined that they can act independently and effectively without having an Independent Trustee serve as Chairman and that a key structural component for assuring that they are in a position to do so is for the Independent Trustees to constitute a substantial majority for the Board. The Independent Trustees also regularly meet in executive session. Ned C. Lautenbach serves as Chairman of the Independent Trustees and as such (i) acts as a liaison between the Independent Trustees and management with respect to matters important to the Independent Trustees and (ii) with management prepares agendas for Board meetings.
Fidelity® funds are overseen by different Boards of Trustees. The fund’s Board oversees Fidelity’s high income and certain equity funds, and other Boards oversee Fidelity’s investment-grade bond, money market, asset allocation, and sector funds. The asset allocation funds may invest in Fidelity® funds overseen by the fund’s Board. The use of separate Boards, each with its own committee structure, allows the Trustees of each group of Fidelity® funds to focus on the unique issues of the funds they oversee, including common research, investment, and operational issues. On occasion, the separate Boards establish joint committees to address issues of overlapping consequences for the Fidelity® funds overseen by each Board.
The Trustees operate using a system of committees to facilitate the timely and efficient consideration of all matters of importance to the Trustees, the fund, and fund shareholders and to facilitate compliance with legal and regulatory requirements and oversight of the fund’s activities and associated risks. The Board, acting through its committees, has charged FMR and its affiliates with (i) identifying events or circumstances the occurrence of which could have demonstrably adverse effects on the fund’s business and/or reputation; (ii) implementing processes and controls to lessen the possibility that such events or circumstances occur or to mitigate the effects of such events or circumstances if they do occur; and (iii) creating and maintaining a system designed to evaluate continuously business and market conditions in order to facilitate the identification and implementation processes described in (i) and (ii) above. Because the day-to-day operations and activities of the fund are carried out by or through FMR, its affiliates, and other service providers, the fund’s exposure to risks is mitigated but not eliminated by the processes overseen
Trustees and Officers – continued
by the Trustees. While each of the Board’s committees has responsibility for overseeing different aspects of the fund’s activities, oversight is exercised primarily through the Operations, Audit, and Compliance Committees. In addition, the Independent Trustees have worked with FMR to enhance the Board’s oversight of investment and financial risks, legal and regulatory risks, technology risks, and operational risks, including the development of additional risk reporting to the Board. For example, a working group comprised of Independent Trustees and FMR has worked and continues to work to review the Fidelity® funds’ valuation-related activities, reporting and risk management. Appropriate personnel, including but not limited to the fund’s Chief Compliance Officer (CCO), FMR’s internal auditor, the independent accountants, the fund’s Treasurer and portfolio management personnel, make periodic reports to the Board’s committees, as appropriate, including an annual review of Fidelity’s risk management program for the Fidelity® funds. The responsibilities of each standing committee, including their oversight responsibilities, are described further under “Standing Committees of the Trustees.”
Interested Trustees*:
Correspondence intended for a Trustee who is an interested person may be sent to Fidelity Investments, 245 Summer Street, Boston, Massachusetts 02210.
Name, Year of Birth; Principal Occupations and Other Relevant Experience+
James C. Curvey (1935)
Year of Election or Appointment: 2007
Trustee
Chairman of the Board of Trustees
Mr. Curvey also serves as Trustee of other Fidelity® funds. Mr. Curvey is a Director of Fidelity Research & Analysis Co. (investment adviser firm, 2009-present), and Vice Chairman (2007-present) and Director of FMR LLC (diversified financial services company). In addition, Mr. Curvey serves as an Overseer for the Boston Symphony Orchestra and a member of the board of Artis-Naples, Naples, Florida, and as a Trustee for Brewster Academy, Wolfeboro, New Hampshire. Previously, Mr. Curvey served as a Director of Fidelity Investments Money Management, Inc. (investment adviser firm, 2009-2014) and a Director of FMR and FMR Co., Inc. (investment adviser firms, 2007-2014).
Charles S. Morrison (1960)
Year of Election or Appointment: 2014
Trustee
Mr. Morrison also serves as Trustee of other funds. He serves as a Director of Fidelity Investments Money Management, Inc. (FIMM) (investment adviser firm, 2014-present), Director of Fidelity SelectCo, LLC (investment adviser firm, 2014-present), President, Asset Management (2014-present), and is an employee of Fidelity Investments. Previously, Mr. Morrison served as Vice President of Fidelity’s Fixed Income and Asset Allocation Funds (2012-2014), President, Fixed Income (2011-2014), Vice President of Fidelity’s Money Market Funds (2005-2009), President, Money Market Group Leader of FMR (investment adviser firm, 2009), and Senior Vice President, Money Market Group of FMR (2004-2009). Mr. Morrison also served as Vice President of Fidelity’s Bond Funds (2002-2005), certain Balanced Funds (2002-2005), and certain Asset Allocation Funds (2002-2007), and as Senior Vice President (2002-2005) of Fidelity’s Bond Division.
| * | Determined to be an “Interested Trustee” by virtue of, among other things, his or her affiliation with the trust or various entities under common control with FMR. |
| + | The information includes the Trustee’s principal occupation during the last five years and other information relating to the experience, attributes, and skills relevant to the Trustee’s qualifications to serve as a Trustee, which led to the conclusion that the Trustee should serve as a Trustee for the fund. |
Independent Trustees:
Correspondence intended for an Independent Trustee may be sent to Fidelity Investments, P.O. Box 55235, Boston, Massachusetts 02205-5235.
Name, Year of Birth; Principal Occupations and Other Relevant Experience+
Dennis J. Dirks (1948)
Year of Election or Appointment: 2005
Trustee
Mr. Dirks also serves as Trustee of other Fidelity® funds. Prior to his retirement in May 2003, Mr. Dirks was Chief Operating Officer and a member of the Board of The Depository Trust & Clearing Corporation (DTCC). He also served as President, Chief Operating Officer, and Board member of The Depository Trust Company (DTC) and President and Board member of the National Securities Clearing Corporation (NSCC). In addition, Mr. Dirks served as Chief Executive Officer and Board member of the Government Securities Clearing Corporation, Chief Executive Officer and Board member of the Mortgage-Backed Securities Clearing Corporation, as a Trustee and a member of the Finance Committee of Manhattan College (2005-2008), as a Trustee and a member of the Finance Committee of AHRC of Nassau County (2006-2008), and as a member of the Independent Directors Council (IDC) Governing Council (2010-2015). Mr. Dirks is a member of the Board of Directors for The Brookville Center for Children’s Services, Inc. (2009-present).
Alan J. Lacy (1953)
Year of Election or Appointment: 2008
Trustee
Mr. Lacy also serves as Trustee of other Fidelity® funds. Mr. Lacy serves as Chairman (2014-present) and a member (2010-present) of the Board of Directors of Dave & Buster’s Entertainment, Inc. (restaurant and entertainment complexes) and a Director of Bristol-Myers Squibb Company (global pharmaceuticals, 2008-present). He is a Trustee of the California Chapter of The Nature Conservancy (2015-present) and a Director of the Center for Advanced Study in the Behavioral Sciences at Stanford University (2015-present). In addition, Mr. Lacy served as Senior Adviser (2007-2014) of Oak Hill Capital Partners, L.P. (private equity) and also served as Chief Executive Officer (2005) and Vice Chairman (2005-2006) of Sears Holdings Corporation (retail) and Chief Executive Officer and Chairman of the Board of Sears, Roebuck and Co. (retail, 2000-2005). Previously, Mr. Lacy served as Chairman (2008-2011) and a member (2006-2015) of the Board of Trustees of the National Parks Conservation Association and as a member of the Board of Directors for The Western Union Company (global money transfer, 2006-2011), The Hillman Companies, Inc. (hardware wholesalers, 2010-2014), and Earth Fare, Inc. (retail grocery, 2010-2014).
Ned C. Lautenbach (1944)
Year of Election or Appointment: 2000
Trustee
Chairman of the Independent Trustees
Mr. Lautenbach also serves as Trustee of other Fidelity® funds. Mr. Lautenbach currently serves as the Lead Director of the Eaton Corporation Board of Directors (diversified industrial, 1997-present). Mr. Lautenbach is Chairman of the Board of Directors of Artis-Naples in Naples, Florida (2012-present), a member of the Council on Foreign Relations (1994-present), and a member of the Board of Governors, State University System of Florida (2013-present). Previously, Mr. Lautenbach was a Partner/Advisory Partner at Clayton, Dubilier & Rice, LLC (private equity investment, 1998-2010), as well as a Director of Sony Corporation (2006-2007).
Joseph Mauriello (1944)
Year of Election or Appointment: 2008
Trustee
Mr. Mauriello also serves as Trustee of other Fidelity® funds. Prior to his retirement in January 2006, Mr. Mauriello served in numerous senior management positions including Deputy Chairman and Chief Operating Officer (2004-2005), and Vice Chairman of Financial Services (2002-2004) of KPMG LLP US (professional services, 1965-2005). Mr. Mauriello currently serves as a member of the Board of Directors of XL Group plc. (global insurance and re-insurance, 2006-present) and the Independent Directors Council (IDC) Governing Council (2015-present). Previously, Mr. Mauriello served as a Director of the Hamilton Funds of the Bank of New York (2006-2007) and of Arcadia Resources Inc. (health care services and products, 2007-2012).
Trustees and Officers – continued
Robert W. Selander (1950)
Year of Election or Appointment: 2011
Trustee
Mr. Selander also serves as Trustee of other Fidelity® funds. Mr. Selander serves as a Director of The Western Union Company (global money transfer, 2014-present) and a non-executive Chairman of Health Equity, Inc. (health savings custodian, 2015-present). Previously, Mr. Selander served as a Member of the Advisory Board of other Fidelity® funds (2011), and Executive Vice Chairman (2010), Chief Executive Officer (2009-2010), and President and Chief Executive Officer (1997-2009) of Mastercard, Inc.
Cornelia M. Small (1944)
Year of Election or Appointment: 2005
Trustee
Ms. Small also serves as Trustee of other Fidelity® funds. Ms. Small is a member of the Board of Directors (2009-present) and Chair of the Investment Committee (2010-present) of the Teagle Foundation. Ms. Small also serves on the Investment Committee of the Berkshire Taconic Community Foundation (2008-present). Previously, Ms. Small served as Chairperson (2002-2008) and a member of the Investment Committee and Chairperson (2008-2012) and a member of the Board of Trustees of Smith College. In addition, Ms. Small served as Chief Investment Officer, Director of Global Equity Investments, and a member of the Board of Directors of Scudder, Stevens & Clark and Scudder Kemper Investments.
William S. Stavropoulos (1939)
Year of Election or Appointment: 2001
Trustee
Vice Chairman of the Independent Trustees
Mr. Stavropoulos also serves as Trustee of other Fidelity® funds. Mr. Stavropoulos serves as President and Founder of the Michigan Baseball Foundation, the Great Lakes Loons (2007-present). Mr. Stavropoulos is Chairman Emeritus of the Board of Directors of The Dow Chemical Company, where he previously served in numerous senior management positions, including President, CEO (1995-2000; 2002-2004), Chairman of the Executive Committee (2000-2006), and as a member of the Board of Directors (1990-2006). Currently, Mr. Stavropoulos is Chairman of the Board of Directors of Univar Inc. (global distributor of commodity and specialty chemicals), a Director of Teradata Corporation (data warehousing and technology solutions), and Maersk Inc. (industrial conglomerate), and a member of the Advisory Board for Metalmark Capital LLC (private equity investment, 2005-present). Mr. Stavropoulos is an operating advisor to Clayton, Dubilier & Rice, LLC (private equity investment). In addition, Mr. Stavropoulos is a member of the University of Notre Dame Advisory Council for the College of Science, a Trustee of the Rollin L. Gerstacker Foundation, and a Director of the Naples Philharmonic Center for the Arts. Previously, Mr. Stavropoulos served as a Director of Chemical Financial Corporation (bank holding company, 1993-2012) and Tyco International, Ltd. (multinational manufacturing and services, 2007-2012).
David M. Thomas (1949)
Year of Election or Appointment: 2008
Trustee
Mr. Thomas also serves as Trustee of other Fidelity® funds. Mr. Thomas serves as Non-Executive Chairman of the Board of Directors of Fortune Brands Home and Security (home and security products, 2011-present), as a member of the Board of Directors (2004-present) and Presiding Director (2013-present) of Interpublic Group of Companies, Inc. (marketing communication), and as a member of the Board of Trustees of the University of Florida (2013-present). Previously, Mr. Thomas served as Executive Chairman (2005-2006) and Chairman and Chief Executive Officer (2000-2005) of IMS Health, Inc. (pharmaceutical and healthcare information solutions), and a Director of Fortune Brands, Inc. (consumer products, 2000-2011).
+ The information includes the Trustee’s principal occupation during the last five years and other information relating to the experience, attributes, and skills relevant to the Trustee’s qualifications to serve as a Trustee, which led to the conclusion that the Trustee should serve as a Trustee for the fund.
Advisory Board Members and Officers:
Correspondence intended for an officer or Peter S. Lynch may be sent to Fidelity Investments, 245 Summer Street, Boston, Massachusetts 02210. Officers appear below in alphabetical order.
Name, Year of Birth; Principal Occupation
Peter S. Lynch (1944)
Year of Election or Appointment: 2003
Member of the Advisory Board
Mr. Lynch also serves as Member of the Advisory Board of other Fidelity® funds. Mr. Lynch is Vice Chairman and a Director of FMR (investment adviser firm) and FMR Co., Inc. (investment adviser firm). In addition, Mr. Lynch serves as a Trustee of Boston College and as the Chairman of the Inner-City Scholarship Fund. Previously, Mr. Lynch served on the Special Olympics International Board of Directors (1997-2006).
Marc R. Bryant (1966)
Year of Election or Appointment: 2015
Secretary and Chief Legal Officer (CLO)
Mr. Bryant also serves as Secretary and CLO of other funds. Mr. Bryant serves as CLO, Secretary, and Senior Vice President of Fidelity Management & Research Company (investment adviser firm, 2015-present) and FMR Co., Inc. (investment adviser firm, 2015-present); Secretary of Fidelity SelectCo, LLC (investment adviser firm, 2015-present) and Fidelity Investments Money Management, Inc. (investment adviser firm, 2015-present); and CLO of Fidelity Management & Research (Hong Kong) Limited (investment adviser firm, 2015-present). He is Senior Vice President and Deputy General Counsel of FMR LLC (diversified financial services company). Previously, Mr. Bryant served as Secretary and CLO of Fidelity Rutland Square Trust II (2010-2014) and Assistant Secretary of Fidelity’s Fixed Income and Asset Allocation Funds (2013-2015). Prior to joining Fidelity Investments, Mr. Bryant served as a Senior Vice President and the Head of Global Retail Legal for AllianceBernstein L.P. (2006-2010), and as the General Counsel for ProFund Advisors LLC (2001-2006).
William C. Coffey (1969)
Year of Election or Appointment: 2009
Assistant Secretary
Mr. Coffey also serves as Assistant Secretary of other funds. He is Senior Vice President and Deputy General Counsel of FMR LLC (diversified financial services company, 2010-present), and is an employee of Fidelity Investments. Previously, Mr. Coffey served as Vice President and Associate General Counsel of FMR LLC (2005-2009).
Jonathan Davis (1968)
Year of Election or Appointment: 2010
Assistant Treasurer
Mr. Davis also serves as Assistant Treasurer of other funds, and is an employee of Fidelity Investments. Previously, Mr. Davis served as Vice President and Associate General Counsel of FMR LLC (diversified financial services company, 2003-2010).
Adrien E. Deberghes (1967)
Year of Election or Appointment: 2008
Deputy Treasurer
Mr. Deberghes also serves as an officer of other funds. He is an employee of Fidelity Investments (2008-present). Prior to joining Fidelity Investments, Mr. Deberghes was Senior Vice President of Mutual Fund Administration at State Street Corporation (2007-2008), Senior Director of Mutual Fund Administration at Investors Bank & Trust (2005-2007), and Director of Finance for Dunkin’ Brands (2000-2005).
Stephanie J. Dorsey (1969)
Year of Election or Appointment: 2010
Assistant Treasurer
Ms. Dorsey also serves as an officer of other funds. She is an employee of Fidelity Investments (2008-present) and has served in other fund officer roles. Prior to joining Fidelity Investments, Ms. Dorsey served as Treasurer (2004-2008) of the JPMorgan Mutual Funds and Vice President (2004-2008) of JPMorgan Chase Bank.
Howard J. Galligan III (1966)
Year of Election or Appointment: 2014
Chief Financial Officer
Mr. Galligan also serves as Chief Financial Officer of other funds. Mr. Galligan serves as President of Fidelity Pricing and Cash Management Services (FPCMS) (2014-present) and as a Director of Strategic Advisers, Inc. (investment adviser firm, 2008-present). Previously, Mr. Galligan served as Chief Administrative Officer of Asset Management (2011-2014) and Chief Operating Officer and Senior Vice President of Investment Support for Strategic Advisers, Inc. (2003-2011).
Trustees and Officers – continued
Scott C. Goebel (1968)
Year of Election or Appointment: 2015
Vice President
Mr. Goebel serves as Vice President of other funds and is an employee of Fidelity Investments (2001-present). Previously, Mr. Goebel served as Secretary of Fidelity SelectCo, LLC (investment adviser firm, 2013-2015), Fidelity Investments Money Management, Inc. (FIMM) (investment adviser firm, 2010-2015), and Fidelity Research and Analysis Company (FRAC) (investment adviser firm, 2010-2015); General Counsel, Secretary, and Senior Vice President of Fidelity Management & Research Company (investment adviser firm, 2008-2015) and FMR Co., Inc. (investment adviser firm, 2008-2015); Assistant Secretary of Fidelity Management & Research (Japan) Limited (investment adviser firm, 2008-2015) and FMR Investment Management (U.K.) Limited (investment adviser firm, 2008-2015); Chief Legal Officer (CLO) of Fidelity Management & Research (Hong Kong) Limited (investment adviser firm, 2008-2015); Secretary and CLO of certain Fidelity® funds (2008-2015); Assistant Secretary of FIMM (2008-2010), FRAC (2008-2010), and certain funds (2007-2008); and as Vice President and Secretary of Fidelity Distributors Corporation (FDC) (2005-2007).
Brian B. Hogan (1964)
Year of Election or Appointment: 2009
Vice President
Mr. Hogan also serves as Trustee or Vice President of other funds. Mr. Hogan serves as a Director of Fidelity SelectCo, LLC (investment adviser firm, 2014-present) and President of the Equity Division of FMR (investment adviser firm, 2009-present). Previously, Mr. Hogan served as Senior Vice President, Equity Research of FMR (2006-2009) and as a portfolio manager.
Chris Maher (1972)
Year of Election or Appointment: 2013
Assistant Treasurer
Mr. Maher serves as Assistant Treasurer of other funds. Mr. Maher is Vice President of Valuation Oversight and is an employee of Fidelity Investments. Previously, Mr. Maher served as Vice President of Asset Management Compliance (2013), Vice President of the Program Management Group of FMR (investment adviser firm, 2010-2013), and Vice President of Valuation Oversight (2008-2010).
John F. Papandrea (1972)
Year of Election or Appointment: 2016
Anti-Money Laundering (AML) Officer
Mr. Papandrea also serves as AML Officer of other funds. Mr. Papandrea is Vice President of FMR LLC (diversified financial services company, 2008-present) and is an employee of Fidelity Investments (2005-present).
Melissa M. Reilly (1971)
Year of Election or Appointment: 2014
Vice President of certain Equity Funds
Ms. Reilly also serves as Vice President of other funds. Ms. Reilly is an employee of Fidelity Investments (2004-present).
Kenneth B. Robins (1969)
Year of Election or Appointment: 2008
President and Treasurer
Mr. Robins also serves as an officer of other funds. Mr. Robins serves as Executive Vice President of Fidelity Investments Money Management, Inc. (FIMM) (investment adviser firm, 2013-present) and is an employee of Fidelity Investments (2004-present). Previously, Mr. Robins served in other fund officer roles.
Stacie M. Smith (1974)
Year of Election or Appointment: 2013
Deputy Treasurer
Ms. Smith also serves as an officer of other funds. She is an employee of Fidelity Investments (2009-present) and has served in other fund officer roles. Prior to joining Fidelity Investments, Ms. Smith served as Senior Audit Manager of Ernst & Young LLP (1996-2009).
Renee Stagnone (1975)
Year of Election or Appointment: 2013
Deputy Treasurer
Ms. Stagnone also serves as Deputy Treasurer of other funds. Ms. Stagnone is an employee of Fidelity Investments (1997-present).
Linda J. Wondrack (1964)
Year of Election or Appointment: 2014
Chief Compliance Officer
Ms. Wondrack also serves as Chief Compliance Officer of other funds. Ms. Wondrack is Executive Vice President and head of the Ethics Office and Asset Management Compliance for Fidelity Investments (2012-present). Ms. Wondrack also serves as Chief Compliance Officer of Fidelity SelectCo, LLC (investment adviser firm, 2014-present); Chief Compliance Officer of Impresa Management LLC (2013-present); and Chief Compliance Officer of FMR Co., Inc. (investment adviser firm), Fidelity Investments Money Management, Inc. (investment adviser firm), FMR Investment Management (U.K.) Limited (investment adviser firm), Fidelity Management & Research (Hong Kong) (investment adviser firm), Fidelity Management & Research Company (investment adviser firm), FIAM LLC (investment adviser firm), and Strategic Advisers, Inc. (investment adviser firm), Ballyrock Investment Advisors LLC, and Northern Neck Investors LLC (2012-present). Previously, Ms. Wondrack served as Chief Compliance Officer of Fidelity Management & Research (Japan) Limited (investment adviser firm, 2012-2016); Senior Vice President and Chief Compliance Officer for Columbia Management Investment Advisers, LLC (2005-2012); Chief Compliance Officer for certain funds within the Columbia Family of Funds (2007-2012); and Senior Vice President of Compliance Risk Management at Bank of America (2005-2010).
Joseph F. Zambello (1957)
Year of Election or Appointment: 2011
Deputy Treasurer
Mr. Zambello also serves as Deputy Treasurer of other funds. Mr. Zambello is an employee of Fidelity Investments (1991-present). Previously, Mr. Zambello served as Vice President of the Program Management Group of FMR (investment adviser firm, 2009-2011) and Vice President of the Transfer Agent Oversight Group (2005-2009).
Shareholder Expense Example
As a shareholder of the Fund, you incur two types of costs: (1) transaction costs and (2) ongoing costs, including management fees, distribution and/or service (12b-1) fees and other Fund expenses. This Example is intended to help you understand your ongoing costs (in dollars) of investing in the Fund and to compare these costs with the ongoing costs of investing in other mutual funds.
The Example is based on an investment of $1,000 invested at the beginning of the period and held for the entire period (July 1, 2015 to December 31, 2015).
Actual Expenses
The first line of the accompanying table for each class of the Fund provides information about actual account values and actual expenses. You may use the information in this line, together with the amount you invested, to estimate the expenses that you paid over the period. Simply divide your account value by $1,000.00 (for example, an $8,600 account value divided by $1,000.00 = 8.6), then multiply the result by the number in the first line for a class of the Fund under the heading entitled “Expenses Paid During Period” to estimate the expenses you paid on your account during this period. The estimate of expenses does not include any fees or other expenses of any variable annuity or variable life insurance product. If they were, the estimate of expenses you paid during the period would be higher, and your ending account value would be lower. In addition, the Fund, as a shareholder in the underlying Fidelity Central Funds, will indirectly bear its pro-rata share of the fees and expenses incurred by the underlying Fidelity Central Funds. These fees and expenses are not included in the Fund’s annualized expense ratio used to calculate the expense estimate in the table below.
Hypothetical Example for Comparison Purposes
The second line of the accompanying table for each class of the Fund provides information about hypothetical account values and hypothetical expenses based on a Class’ actual expense ratio and an assumed rate of return of 5% per year before expenses, which is not the Class’ actual return. The hypothetical account values and expenses may not be used to estimate the actual ending account balance or expenses you paid for the period. You may use this information to compare the ongoing costs of investing in the Fund and other funds. To do so, compare this 5% hypothetical example with the 5% hypothetical examples that appear in the shareholder reports of the other funds. The estimate of expenses does not include any fees or other expenses of any variable annuity or variable life insurance product. If they were, the estimate of expenses you paid during the period would be higher, and your ending account value would be lower. In addition, the Fund, as a shareholder in the underlying Fidelity Central Funds, will indirectly bear its pro-rata share of the fees and expenses incurred by the underlying Fidelity Central Funds. These fees and expenses are not included in the Fund’s annualized expense ratio used to calculate the expense estimate in the table below.
Please note that the expenses shown in the table are meant to highlight your ongoing costs only and do not reflect any transaction costs. Therefore, the second line of the table is useful in comparing ongoing costs only, and will not help you determine the relative total costs of owning different funds. In addition, if these transactional costs were included, your costs would have been higher.
| | | | | | | | | | | Expenses Paid | |
| | | Annualized | | Beginning | | | Ending | | | During Period-B | |
| | | Expense | | Account Value | | | Account Value | | | July 1, 2015 | |
| | | Ratio-A | | July 1, 2015 | | | December 31, 2015 | | | to December 31, 2015 | |
| Initial Class | | .63% | | | | | | | | | | | | |
| Actual | | | | $ | 1,000.00 | | | $ | 974.20 | | | $ | 3.13 | |
| Hypothetical-C | | | | $ | 1,000.00 | | | $ | 1,022.03 | | | $ | 3.21 | |
| Service Class | | .73% | | | | | | | | | | | | |
| Actual | | | | $ | 1,000.00 | | | $ | 973.90 | | | $ | 3.63 | |
| Hypothetical-C | | | | $ | 1,000.00 | | | $ | 1,021.53 | | | $ | 3.72 | |
| Service Class 2 | | .88% | | | | | | | | | | | | |
| Actual | | | | $ | 1,000.00 | | | $ | 972.90 | | | $ | 4.38 | |
| Hypothetical-C | | | | $ | 1,000.00 | | | $ | 1,020.77 | | | $ | 4.48 | |
| Investor Class | | .71% | | | | | | | | | | | | |
| Actual | | | | $ | 1,000.00 | | | $ | 973.60 | | | $ | 3.53 | |
| Hypothetical-C | | | | $ | 1,000.00 | | | $ | 1,021.63 | | | $ | 3.62 | |
| A | Annualized expense ratio reflects expenses net of applicable fee waivers. |
| B | Expenses are equal to each Class’ annualized expense ratio, multiplied by the average account value over the period, multiplied by 184/365 (to reflect the one-half year period). |
| C | 5% return per year before expenses |
Distributions (Unaudited)
The Board of Trustees of VIP Contrafund Portfolio voted to pay to shareholders of record at the opening of business on record date, the following distributions per share derived from capital gains realized from sales of portfolio securities, and dividends derived from net investment income:
| | | Pay Date | | Record Date | | Dividends | | | Capital Gains | |
| Initial Class | | 02/05/2016 | | 02/05/2016 | | $ | 0.00 | | | $ | 2.648 | |
| Service Class | | 02/05/2016 | | 02/05/2016 | | $ | 0.00 | | | $ | 2.648 | |
| Service Class 2 | | 02/05/2016 | | 02/05/2016 | | $ | 0.00 | | | $ | 2.648 | |
| Investor Class | | 02/05/2016 | | 02/05/2016 | | $ | 0.00 | | | $ | 2.648 | |
The fund hereby designates as a capital gain dividend with respect to the taxable year ended December 31, 2015 $1,452,533,002, or, if subsequently determined to be different, the net capital gain of such year.
A percentage of the dividends distributed during the fiscal year for the following funds qualify for the dividends–received deduction for corporate shareholders:
| | | February | | | | |
| | | 2015 | | | December 2015 | |
| Initial Class | | | 20 | % | | | 70 | % |
| Service Class | | | 21 | % | | | 74 | % |
| Service Class 2 | | | 22 | % | | | 81 | % |
| Investor Class | | | 20 | % | | | 73 | % |
| Service Class 2R | | | 22 | % | | | 0 | % |
Board Approval of Investment Advisory Contracts and Management Fees
VIP Contrafund Portfolio
Each year, the Board of Trustees, including the Independent Trustees (together, the Board), votes on the renewal of the management contract with Fidelity Management & Research Company (FMR) and the sub-advisory agreements (together, the Advisory Contracts) for the fund. The Board, assisted by the advice of fund counsel and Independent Trustees’ counsel, requests and considers a broad range of information relevant to the renewal of the Advisory Contracts throughout the year.
The Board meets regularly and, at each of its meetings, covers an extensive agenda of topics and materials and considers factors that are relevant to its annual consideration of the renewal of the fund’s Advisory Contracts, including the services and support provided to the fund and its shareholders. The Board has established various standing committees (Committees), each composed of and chaired by Independent Trustees with varying backgrounds, to which the Board has assigned specific subject matter responsibilities in order to enhance effective decision-making by the Board. The Board, acting directly and through its Committees, requests and receives information concerning the annual consideration of the renewal of the fund’s Advisory Contracts. The Board also meets as needed to consider matters specifically related to the Board’s annual consideration of the renewal of the Advisory Contracts. Members of the Board may also meet with trustees of other Fidelity funds through ad hoc joint committees to discuss certain matters relevant to all of the Fidelity funds.
At its July 2015 meeting, the Board unanimously determined to renew the fund’s Advisory Contracts. In reaching its determination, the Board considered all factors it believed relevant, including (i) the nature, extent, and quality of the services to be provided to the fund and its shareholders (including the investment performance of the fund); (ii) the competitiveness of the fund’s management fee and total expense ratio relative to peer funds; (iii) the total costs of the services to be provided by and the profits to be realized by Fidelity from its relationship with the fund; and (iv) the extent to which (if any) economies of scale exist and would be realized as the fund grows, and whether any economies of scale are appropriately shared with fund shareholders.
In considering whether to renew the Advisory Contracts for the fund, the Board reached a determination, with the assistance of fund counsel and Independent Trustees’ counsel and through the exercise of its business judgment, that the renewal of the Advisory Contracts was in the best interests of the fund and its shareholders and that the compensation payable under the Advisory Contracts was fair and reasonable. The Board’s decision to renew the Advisory Contracts was not based on any single factor, but rather was based on a comprehensive consideration of all the information provided to the Board at its meetings throughout the year. The Board, in reaching its determination to renew the Advisory Contracts, was aware that shareholders of the fund have a broad range of investment choices available to them, including a wide choice among funds offered by Fidelity’s competitors, and that the fund’s shareholders, who have the opportunity to review and weigh the disclosure provided by the fund in its prospectus and other public disclosures, have chosen to invest in this fund, which is part of the Fidelity family of funds.
Nature, Extent, and Quality of Services Provided. The Board considered Fidelity’s staffing as it relates to the fund, including the backgrounds of investment personnel of Fidelity, and also considered the fund’s investment objective, strategies, and related investment philosophy. The Independent Trustees also had discussions with senior management of Fidelity’s investment operations and investment groups. The Board considered the structure of the portfolio manager compensation program and whether this structure provides appropriate incentives to act in the best interests of the fund. Additionally, the Board considered the portfolio managers’ investments, if any, in the funds that they manage.
Resources Dedicated to Investment Management and Support Services. The Board and the Fund Oversight and Research Committees reviewed the general qualifications and capabilities of Fidelity’s investment staff, including its size, education, experience, and resources, as well as Fidelity’s approach to recruiting, training, managing, and compensating investment personnel. The Board noted that Fidelity has continued to increase the resources devoted to non-U.S. offices, including expansion of Fidelity’s global investment organization. The Board also noted that Fidelity’s analysts have extensive resources, tools and capabilities that allow them to conduct sophisticated quantitative and fundamental analysis, as well as credit analysis of issuers, counterparties and guarantors. Further, the Board considered that Fidelity’s investment professionals have sufficient access to global information and data so as to provide competitive investment results over time, and that those professionals also have access to sophisticated tools that permit them to assess portfolio construction and risk and performance attribution characteristics continuously, as well as to transmit new information and research conclusions rapidly around the world. Additionally, in its deliberations, the Board considered Fidelity’s trading, risk management, and compliance capabilities and resources, which are integral parts of the investment management process.
Shareholder and Administrative Services. The Board considered (i) the nature, extent, quality, and cost of advisory, administrative, and shareholder services performed by FMR, the sub-advisers (together with FMR, the Investment Advisers), and their affiliates under the Advisory Contracts and under separate agreements covering transfer agency, pricing and bookkeeping, and securities lending services for the fund; (ii) the nature and extent of the supervision of third party service providers, principally custodians and subcustodians; and (iii) the resources devoted to, and the record of compliance with, the fund’s compliance policies and procedures. The Board also reviewed the allocation of fund brokerage, including allocations to brokers affiliated with the Investment Advisers, the use of brokerage commissions to pay fund expenses, and the use of “soft” commission dollars to pay for research services.
The Board noted that the growth of fund assets over time across the complex allows Fidelity to reinvest in the development of services designed to enhance the value or convenience of the Fidelity funds as investment vehicles. These services include 24-hour access to account information
and market information through telephone representatives and over the Internet, investor education materials and asset allocation tools, and the expanded availability of Fidelity Investor Centers.
In 2014, the Board formed an ad hoc Committee on Transfer Agency Fees to review the variety of transfer agency fee structures throughout the industry and Fidelity’s competitive positioning with respect to industry participants.
Investment in a Large Fund Family. The Board considered the benefits to shareholders of investing in a Fidelity fund, including the benefits of investing in a fund that is part of a large family of funds offering a variety of investment disciplines and providing a large variety of mutual fund investor services. The Board noted that Fidelity had taken, or had made recommendations that resulted in the Fidelity funds taking, a number of actions over the previous year that benefited particular funds, including (i) continuing to dedicate additional resources to investment research and to the support of the senior management team that oversees asset management; (ii) continuing efforts to enhance Fidelity’s global research capabilities; (iii) launching new funds and making other enhancements to meet client needs; (iv) reducing management fees and total expenses for certain index funds and diversified international funds; (v) continuing to launch dedicated lower cost underlying funds to meet portfolio construction needs related to expanding underlying fund options for Fidelity funds of funds, specifically for the Freedom Fund product lines; (vi) rationalizing product lines and gaining increased efficiencies through fund mergers; (vii) launching active fixed-income exchange-traded funds; (viii) continuing to develop, acquire and implement systems and technology to improve services to the funds and information security and to increase efficiency; (ix) implementing investment enhancements to further strengthen Fidelity’s target date product line to increase investors’ probability of success in achieving their goals; (x) modifying the eligibility criteria for certain share classes to accommodate roll-over assets from employer-sponsored retirement plans; (xi) launching a new Class W of the Freedom Index Funds to attract and retain Fidelity record-kept retirement plan assets; and (xii) implementing changes to Fidelity’s money market product line in response to recent money market regulatory reforms.
Investment Performance. The Board considered whether the fund has operated in accordance with its investment objective, as well as its record of compliance with its investment restrictions and its performance history. The Board noted that there were portfolio management changes for the fund in April 2013 and June 2013.
The Board took into account discussions with representatives of the Investment Advisers about fund investment performance that occur at Board meetings throughout the year. In this regard the Board noted that as part of regularly scheduled fund reviews and other reports to the Board on fund performance, the Board considers annualized return information for the fund, for different time periods, measured against a securities market index (“benchmark index”) and a peer group of funds with similar objectives (“peer group”), if any. In its evaluation of fund investment performance, the Board gave particular attention to information indicating changes in performance of certain Fidelity funds for specific time periods and discussed with the Investment Advisers the reasons for any overperformance or underperformance.
In addition to reviewing absolute and relative fund performance, the Independent Trustees periodically consider the appropriateness of fund performance metrics in evaluating the results achieved. In general, the Independent Trustees believe that fund performance should be evaluated based on net performance (after fees and expenses) of both the highest performing and lowest performing fund share classes, where applicable, compared to appropriate benchmark indices, over appropriate time periods that may include full market cycles, and compared to peer groups, as applicable, over the same periods, taking into account relevant factors including the following: general market conditions; issuer-specific information; and fund cash flows and other factors.
The Independent Trustees recognize that shareholders evaluate performance on a net basis over their own holding periods, for which one-, three-, and five-year periods are often used as a proxy. For this reason, the performance information reviewed by the Board also included net cumulative calendar year total return information for the fund and an appropriate benchmark index and peer group for the most recent one-, three-, and five-year periods, as shown below. Returns are shown compared to the 25th percentile (top of box, 75% beaten) and 75th percentile (bottom of box, 25% beaten) of the peer universe.
Board Approval of Investment Advisory Contracts and Management Fees – continued
VIP Contrafund Portfolio

The Board noted that, on April 30, 2015 (after the periods shown in the chart above), FMR converted assets in Service Class 2 R into Service Class 2.
Based on its review, the Board concluded that the nature, extent, and quality of services provided to the fund under the Advisory Contracts should benefit the shareholders of the fund.
Competitiveness of Management Fee and Total Expense Ratio. The Board considered the fund’s management fee and total expense ratio compared to “mapped groups” of competitive funds and classes created for the purpose of facilitating the Trustees’ competitive analysis of management fees and total expenses. Fidelity creates “mapped groups” by combining similar Lipper investment objective categories that have comparable investment mandates. Combining Lipper investment objective categories aids the Board’s management fee and total expense ratio comparisons by broadening the competitive group used for comparison.
Management Fee. The Board considered two proprietary management fee comparisons for the 12-month periods shown in basis points (BP) in the chart below. The group of Lipper funds used by the Board for management fee comparisons is referred to below as the “Total Mapped Group.” The Total Mapped Group comparison focuses on a fund’s standing in terms of gross management fees before expense reimbursements or caps relative to the total universe of funds with comparable investment mandates, regardless of whether their management fee structures also are comparable. Funds with comparable investment mandates offer exposure to similar types of securities. Funds with comparable management fee structures have similar management fee contractual arrangements (e.g., flat rate charged for advisory services, all-inclusive fee rate, etc.). “TMG %” represents the percentage of funds in the Total Mapped Group that had management fees that were lower than the fund’s. For example, a hypothetical TMG % of 20% would mean that 80% of the funds in the Total Mapped Group had higher, and 20% had lower, management fees than the fund. The fund’s actual TMG %s and the number of funds in the Total Mapped Group are in the chart below. The “Asset-Size Peer Group” (ASPG) comparison focuses on a fund’s standing relative to a subset of non-Fidelity funds within the Total Mapped Group that are similar in size and management fee structure without taking into account performance adjustments, if any. For example, if a fund is in the first quartile of the ASPG, the fund’s management fee ranks in the least expensive or lowest 25% of funds in the ASPG. The ASPG represents at least 15% of the funds in the Total Mapped Group with comparable asset size and management fee structures, subject to a minimum of 50 funds (or all funds in the Total Mapped Group if fewer than 50). Additional information, such as the ASPG quartile in which the fund’s management fee rate ranked, is also included in the chart and considered by the Board.
VIP Contrafund Portfolio
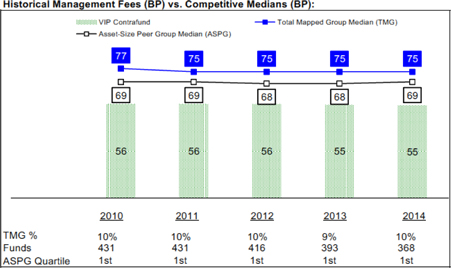
The Board noted that the fund’s management fee rate ranked below the median of its Total Mapped Group and below the median of its ASPG for 2014.
The Board noted that, in 2014, the ad hoc Committee on Group Fee was formed by it and other Fidelity fund boards to conduct an in-depth review of the “group fee” component of the management fee of funds with such management fee structures. Committee focus included the mechanics of the group fee, the competitive landscape of group fee structures, Fidelity funds with no group fee component and investment products not included in group fee assets. The Board also considered that, for funds subject to the group fee, FMR agreed to voluntarily waive fees over a specified period of time in amounts designed to account for assets converted from certain funds to certain collective investment trusts.
The Board also noted that, in 2013, the ad hoc Committee on Management Fees was formed to conduct an in-depth review of the management fee rates of Fidelity’s active equity mutual funds. The Committee focused on the following areas: (i) standard fee structures; (ii) research consumption and trading evolution; (iii) management fee competitiveness/profitability by category; and (iv) factors that drive institutional pricing.
Based on its review, the Board concluded that the fund’s management fee is fair and reasonable in light of the services that the fund receives and the other factors considered.
Total Expense Ratio. In its review of each class’s total expense ratio, the Board considered the fund’s management fee as well as other fund or class expenses, as applicable, such as transfer agent fees, pricing and bookkeeping fees, fund-paid 12b-1 fees, and custodial, legal, and audit fees. The Board also noted that Fidelity may agree to waive fees and expenses from time to time, and the extent to which, if any, it has done so for the fund. As part of its review, the Board also considered the current and historical total expense ratios of each class of the fund compared to competitive fund median expenses. Each class of the fund is compared to those funds and classes in the Total Mapped Group (used by the Board for management fee comparisons) that have a similar sales load structure.
The Board noted that the total expense ratio of each class ranked below its competitive median for 2014.
Fees Charged to Other Fidelity Clients. The Board also considered Fidelity fee structures and other information with respect to clients of Fidelity, such as other funds advised or subadvised by Fidelity, pension plan clients, and other institutional clients with similar mandates. The Board noted the findings of the 2013 ad hoc joint committee (created with the board of other Fidelity funds), which reviewed and compared Fidelity’s institutional investment advisory business with its business of providing services to the Fidelity funds, including the differences in services provided, fees charged, and costs incurred, as well as competition in their respective marketplaces.
Based on its review of total expense ratios and fees charged to other Fidelity clients, the Board concluded that the total expense ratio of each class of the fund was reasonable in light of the services that the fund and its shareholders receive and the other factors considered.
Costs of the Services and Profitability. The Board considered the revenues earned and the expenses incurred by Fidelity in conducting the business of developing, marketing, distributing, managing, administering and servicing the fund and servicing the fund’s shareholders. The Board also considered the level of Fidelity’s profits in respect of all the Fidelity funds.
On an annual basis, Fidelity presents to the Board information about the profitability of its relationship with the fund. Fidelity calculates profitability information for each fund, as well as aggregate profitability information for groups of Fidelity funds and all Fidelity funds, using a series of
Board Approval of Investment Advisory Contracts and Management Fees – continued
detailed revenue and cost allocation methodologies which originate with the books and records of Fidelity on which Fidelity’s audited financial statements are based. The Audit Committee of the Board reviews any significant changes from the prior year’s methodologies.
PricewaterhouseCoopers LLP (PwC), independent registered public accounting firm and auditor to Fidelity and certain Fidelity funds, has been engaged annually by the Board as part of the Board’s assessment of Fidelity’s profitability analysis. PwC’s engagement includes the review and assessment of the methodologies used by Fidelity in determining the revenues and expenses attributable to Fidelity’s mutual fund business, and completion of agreed-upon procedures in respect of the mathematical accuracy of fund profitability and its conformity to established allocation methodologies. After considering PwC’s reports issued under the engagement and information provided by Fidelity, the Board concluded that while other allocation methods may also be reasonable, Fidelity’s profitability methodologies are reasonable in all material respects.
The Board also reviewed Fidelity’s non-fund businesses and fall-out benefits related to the mutual fund business as well as cases where Fidelity’s affiliates may benefit from or be related to the fund’s business.
The Board considered the costs of the services provided by and the profits realized by Fidelity in connection with the operation of the fund and was satisfied that the profitability was not excessive.
Economies of Scale. The Board considered whether there have been economies of scale in respect of the management of the Fidelity funds, whether the Fidelity funds (including the fund) have appropriately benefited from any such economies of scale, and whether there is potential for realization of any further economies of scale. The Board considered the extent to which the fund will benefit from economies of scale as assets grow through increased services to the fund, through waivers or reimbursements, or through fee or expense ratio reductions. The Board also noted that in 2013, it and the boards of other Fidelity funds created an ad hoc committee (the Economies of Scale Committee) to analyze whether Fidelity attains economies of scale in respect of the management and servicing of the Fidelity funds, whether the Fidelity funds have appropriately benefited from such economies of scale, and whether there is potential for realization of any further economies of scale.
The Board recognized that the fund’s management contract incorporates a “group fee” structure, which provides for lower group fee rates as total group assets increase, and for higher group fee rates as total group assets decrease (with “group assets” defined to include fund assets under FMR’s management plus sector fund assets previously under FMR’s management and currently managed by Fidelity SelectCo, LLC). FMR calculates the group fee rates based on a tiered asset “breakpoint” schedule that varies based on asset class. The Board considered that the group fee is designed to deliver the benefits of economies of scale to fund shareholders when total Fidelity fund assets increase, even if assets of any particular fund are unchanged or have declined, because some portion of Fidelity’s costs are attributable to services provided to all Fidelity funds, and all funds benefit if those costs can be allocated among more assets. The Board concluded that, given the group fee structure, fund shareholders will benefit from lower management fees as group assets increase at the fund complex level, regardless of whether Fidelity achieves any such economies of scale.
The Board concluded, taking into account the analysis of the Economies of Scale Committee, that economies of scale, if any, are being appropriately shared between fund shareholders and Fidelity.
Additional Information Requested by the Board. In order to develop fully the factual basis for consideration of the Fidelity funds’ Advisory Contracts, the Board requested and received additional information on certain topics, including: (i) fund performance trends and Fidelity’s long-term strategies for certain funds; (ii) the various share classes employed by Fidelity and the attributes of each class, together with similar information on the distribution and servicing payments made by Fidelity or the funds to third-party participants in the distribution channels; (iii) fund profitability, and fund performance in relation to fund profitability; (iv) the methodology with respect to evaluating competitive fund data and peer group classifications and fee comparisons; (v) annual fund profitability margins, with particular focus on certain funds with negative margins; (vi) the realization of fall-out benefits in certain Fidelity business units; (vii) economies of scale and the way in which they are shared with fund shareholders; (viii) Fidelity’s group fee structures, including the group fee schedule of breakpoints; (ix) the impact of cost containment measures on the funds; and (x) the transfer agent fee structure.
Based on its evaluation of all of the conclusions noted above, and after considering all factors it believed relevant, the Board concluded that the advisory fee structures are fair and reasonable, and that the fund’s Advisory Contracts should be renewed.

VIPCON-ANN-0216
1.540131.118
Fidelity® Variable Insurance Products:
Equity-Income Portfolio
Annual Report
December 31, 2015

Contents
To view a fund’s proxy voting guidelines and proxy voting record for the 12-month period ended June 30, visit http://www.fidelity.com/proxyvotingresults or visit the Securities and Exchange Commission’s (SEC) web site at http://www.sec.gov.
You may also call 1-877-208-0098 to request a free copy of the proxy voting guidelines.
Fidelity® Variable Insurance Products are separate account options which are purchased through a variable insurance contract.
Standard & Poor’s, S&P and S&P 500 are registered service marks of The McGraw-Hill Companies, Inc. and have been licensed for use by Fidelity Distributors Corporation.
Other third-party marks appearing herein are the property of their respective owners.
All other marks appearing herein are registered or unregistered trademarks or service marks of FMR LLC or an affiliated company. © 2016 FMR LLC. All rights reserved.
This report and the financial statements contained herein are submitted for the general information of the shareholders of the Fund. This report is not authorized for distribution to prospective investors in the Fund unless preceded or accompanied by an effective prospectus.
A fund files its complete schedule of portfolio holdings with the SEC for the first and third quarters of each fiscal year on Form N-Q. Forms N-Q are available on the SEC’s web site at http://www.sec.gov. A fund’s Forms N-Q may be reviewed and copied at the SEC’s Public Reference Room in Washington, DC. Information regarding the operation of the SEC’s Public Reference Room may be obtained by calling 1-800-SEC-0330.
For a complete list of a fund’s portfolio holdings, view the most recent holdings listing, semiannual report, or annual report on Fidelity’s web site at http:// www.fidelity.com, http://www.advisor.fidelity.com, or http://www.401k.com, as applicable.
NOT FDIC INSURED • MAY LOSE VALUE • NO BANK GUARANTEE
Neither the Fund nor Fidelity Distributors Corporation is a bank.
Performance: The Bottom Line
Average annual total return reflects the change in the value of an investment, assuming reinvestment of distributions from dividend income and capital gains (the profits earned upon the sale of securities that have grown in value, if any) and assuming a constant rate of performance each year. During periods of reimbursement by Fidelity, a fund’s total return will be greater than it would be had the reimbursement not occurred. Performance numbers are net of all underlying fund operating expenses, but do not include any insurance charges imposed by your insurance company’s separate account. If performance information included the effect of these additional charges, the total returns would have been lower. How a fund did yesterday is no guarantee of how it will do tomorrow.
| Average Annual Total Returns |
| For the periods ended December 31, 2015 | | Past 1 | | | Past 5 | | | Past 10 | |
| | | year | | | years | | | years | |
| Initial Class | | | -4.08 | % | | | 9.65 | % | | | 5.22 | % |
| Service Class | | | -4.17 | % | | | 9.53 | % | | | 5.11 | % |
| Service Class 2 | | | -4.32 | % | | | 9.36 | % | | | 4.96 | % |
| Investor Class | | | -4.18 | % | | | 9.55 | % | | | 5.12 | % |
Let’s say hypothetically that $10,000 was invested in VIP Equity-Income PortfolioSM – Initial Class on December 31, 2005.
The chart shows how the value of your investment would have changed, and also shows how the Russell 3000® Value Index performed over the same period.

Management’s Discussion of Fund Performance
Market Recap: U.S. stocks gained modestly in 2015, rebounding from a steep decline in August and September over worries about China’s slowing economic growth. The S&P 500® index rose 1.38% for the period, its lowest calendar-year return since 2008. After the late-summer rout, stocks sharply reversed course in October, lifted by the Federal Reserve’s decision to put off raising near-term interest rates until mid-December. Investors also were encouraged by an interest-rate cut in China and economic stimulus in Europe. Overall, growth stocks fared much better than their value counterparts, as investors sought growth in a subpar economic environment. This helped lift the technology-heavy Nasdaq Composite Index® 6.96% for the year. Sector performance in the broader market was split, with five of 10 sectors in the S&P 500® gaining ground and five retreating. Consumer discretionary (+10%) led the way, benefiting from rising personal income and low inflation. Health care (+7%), consumer staples (+7%) and information technology (+6%) also outpaced the broad market amid strong fundamentals. Conversely, the energy sector (-21%) was by far the worst performer, stung by deflated commodity prices that also hit materials (-8%). The defensive, but rate-sensitive utilities sector (-5%) lost ground on the cusp of Fed tightening, while industrials (-3%) were dragged down with energy prices and a slower-growing China.
Comments from Portfolio Manager James Morrow: For the year, the fund’s share classes struggled to mid-single-digit declines, roughly in line with the –4.13% return of the benchmark Russell 3000® Value Index. The fund was hurt by poor stock picking in the materials sector, as well as a substantial underweighting in health care. A strong dollar also hurt the value of the fund’s overseas investments. Conversely, underweighting the energy sector – by far the market’s biggest laggard – proved helpful, even as stock picking in the group hurt. Specifically, master limited partnership Williams Partners and its majority-owned energy transportation company Williams Companies were detractors. Both of these non-benchmark entities were hard hit by upheaval in the energy business. CONSOL Energy, a producer of coal and natural gas, also hampered results. Despite the multiple challenges in energy, the fund benefited from largely avoiding Exxon Mobil and not owning ConocoPhillips. On the positive side, security selection in consumer discretionary and consumer staples were positives, as was an underweighting in utilities. On an individual basis, General Electric, among the fund’s largest holdings and a notable overweighting, contributed meaningfully. The fund also was helped by a position in Chubb, a provider of property and casualty insurance.
The views expressed above reflect those of the portfolio manager(s) only through the end of the period as stated on the cover of this report and do not necessarily represent the views of Fidelity or any other person in the Fidelity organization. Any such views are subject to change at any time based upon market or other conditions and Fidelity disclaims any responsibility to update such views. These views may not be relied on as investment advice and, because investment decisions for a Fidelity fund are based on numerous factors, may not be relied on as an indication of trading intent on behalf of any Fidelity fund.
Investment Summary (Unaudited)
| Top Ten Stocks as of December 31, 2015 |
| | | | | | % of fund’s | |
| | | % of fund’s | | | net assets | |
| | | net assets | | | 6 months ago | |
| Johnson & Johnson | | | 5.7 | | | | 4.3 | |
| General Electric Co.(a) | | | 4.2 | | | | 3.9 | |
| Chevron Corp. | | | 3.9 | | | | 3.0 | |
| Procter & Gamble Co. | | | 3.5 | | | | 2.5 | |
| JPMorgan Chase & Co.(a) | | | 3.4 | | | | 4.5 | |
| United Parcel Service, Inc. Class B(a) | | | 2.4 | | | | 2.2 | |
| AT&T, Inc. | | | 2.1 | | | | 1.3 | |
| Cisco Systems, Inc. | | | 2.0 | | | | 1.8 | |
| Verizon Communications, Inc. | | | 2.0 | | | | 1.7 | |
| MetLife, Inc. | | | 1.8 | | | | 1.7 | |
| | | | 31.0 | | | | | |
| (a) | Security or a portion of the security is pledged as collateral for call options written. |
| Top Five Market Sectors as of December 31, 2015 |
| | | | | | % of fund’s | |
| | | % of fund’s | | | net assets | |
| | | net assets | | | 6 months ago | |
| Financials | | | 24.9 | | | | 27.7 | |
| Industrials | | | 12.1 | | | | 11.4 | |
| Health Care | | | 11.4 | | | | 9.4 | |
| Information Technology | | | 11.4 | | | | 11.7 | |
| Energy | | | 9.9 | | | | 10.9 | |
| Asset Allocation (% of fund’s net assets) |

| * | Foreign investments – 9.0% |
| ** | Written options – (0.1)% |
| *** | Foreign investments – 10.5% |
| † | Written options – (0.1)% |
Investments December 31, 2015
Showing Percentage of Net Assets
| | | | | | | |
| | | Shares | | | Value | |
| CONSUMER DISCRETIONARY – 8.1% | | | | | | | | |
| Automobiles – 1.2% | | | | | | | | |
| Ford Motor Co. | | | 752,100 | | | $ | 10,597,089 | |
| General Motors Co. | | | 1,595,000 | | | | 54,245,950 | |
| | | | | | | | 64,843,039 | |
| Hotels, Restaurants & Leisure – 1.4% | | | | | | | | |
| Compass Group PLC | | | 33,600 | | | | 582,228 | |
| Dunkin’ Brands Group, Inc. (a) | | | 320,600 | | | | 13,654,354 | |
| McDonald’s Corp. (b) | | | 330,400 | | | | 39,033,456 | |
| Whitbread PLC | | | 79,714 | | | | 5,171,808 | |
| Yum! Brands, Inc. (b) | | | 223,900 | | | | 16,355,895 | |
| | | | | | | | 74,797,741 | |
| Household Durables – 0.7% | | | | | | | | |
| M.D.C. Holdings, Inc. (a) | | �� | 469,100 | | | | 11,976,123 | |
| Tupperware Brands Corp. | | | 386,700 | | | | 21,519,855 | |
| | | | | | | | 33,495,978 | |
| Leisure Products – 0.9% | | | | | | | | |
| Mattel, Inc. (a) | | | 1,092,300 | | | | 29,677,791 | |
| New Academy Holding Co. LLC unit (c)(d)(e) | | | 127,200 | | | | 18,840,864 | |
| | | | | | | | 48,518,655 | |
| Media – 1.5% | | | | | | | | |
| Comcast Corp. Class A | | | 1,240,543 | | | | 70,003,841 | |
| Time Warner, Inc. | | | 151,600 | | | | 9,803,972 | |
| | | | | | | | 79,807,813 | |
| Multiline Retail – 1.7% | | | | | | | | |
| Kohl’s Corp. | | | 242,175 | | | | 11,534,795 | |
| Macy’s, Inc. | | | 462,300 | | | | 16,171,254 | |
| Target Corp. | | | 813,960 | | | | 59,101,636 | |
| | | | | | | | 86,807,685 | |
| Specialty Retail – 0.7% | | | | | | | | |
| Foot Locker, Inc. | | | 252,200 | | | | 16,415,698 | |
| GNC Holdings, Inc. | | | 421,000 | | | | 13,059,420 | |
| Stage Stores, Inc. (a) | | | 724,300 | | | | 6,598,373 | |
| | | | | | | | 36,073,491 | |
| | | | | | | | | |
| TOTAL CONSUMER DISCRETIONARY | | | | | | | 424,344,402 | |
| | | | | | | | | |
| CONSUMER STAPLES – 9.6% | | | | | | | | |
| Beverages – 1.8% | | | | | | | | |
| Anheuser-Busch InBev SA NV ADR | | | 134,700 | | | | 16,837,500 | |
| Molson Coors Brewing Co. | | | | | | | | |
| Class B (b) | | | 241,800 | | | | 22,709,856 | |
| The Coca-Cola Co. | | | 1,222,400 | | | | 52,514,304 | |
| | | | | | | | 92,061,660 | |
| Food & Staples Retailing – 2.9% | | | | | | | | |
| CVS Health Corp. | | | 830,400 | | | | 81,188,208 | |
| Tesco PLC | | | 1,741,800 | | | | 3,827,216 | |
| Wal-Mart Stores, Inc. | | | 640,878 | | | | 39,285,821 | |
| Walgreens Boots Alliance, Inc. | | | 252,307 | | | | 21,485,203 | |
| Whole Foods Market, Inc. | | | 234,600 | | | | 7,859,100 | |
| | | | | | | | 153,645,548 | |
| Food Products – 1.2% | | | | | | | | |
| B&G Foods, Inc. Class A | | | 337,813 | | | | 11,830,211 | |
| Sanderson Farms, Inc. (a) | | | 94,000 | | | | 7,286,880 | |
| The Hershey Co. (b) | | | 506,200 | | | | 45,188,474 | |
| | | | | | | | 64,305,565 | |
| | | | | | | |
| | | | | | | |
| | | Shares | | | Value | |
| Household Products – 3.5% | | | | | | | | |
| Procter & Gamble Co. | | | 2,297,719 | | | $ | 182,461,866 | |
| Personal Products – 0.2% | | | | | | | | |
| Avon Products, Inc. (a) | | | 2,849,500 | | | | 11,540,475 | |
| | | | | | | | | |
| TOTAL CONSUMER STAPLES | | | | | | | 504,015,114 | |
| | | | | | | | | |
| ENERGY – 9.7% | | | | | | | | |
| Energy Equipment & Services – 0.4% | | | | | | | | |
| Ensco PLC Class A | | | 609,876 | | | | 9,385,992 | |
| National Oilwell Varco, Inc. | | | 181,806 | | | | 6,088,683 | |
| Oceaneering International, Inc. | | | 165,400 | | | | 6,205,808 | |
| | | | | | | | 21,680,483 | |
| Oil, Gas & Consumable Fuels – 9.3% | | | | | | | | |
| Anadarko Petroleum Corp. | | | 250,886 | | | | 12,188,042 | |
| Apache Corp. | | | 658,268 | | | | 29,273,178 | |
| Avance Gas Holding Ltd. (a) | | | 467,758 | | | | 5,991,721 | |
| BW LPG Ltd. (a) | | | 877,356 | | | | 7,191,674 | |
| Cameco Corp. (a) | | | 318,700 | | | | 3,931,639 | |
| Chevron Corp. | | | 2,244,780 | | | | 201,940,409 | |
| CONSOL Energy, Inc. (a) | | | 788,235 | | | | 6,227,057 | |
| Foresight Energy LP (a) | | | 654,880 | | | | 2,311,726 | |
| Golar LNG Ltd. | | | 173,200 | | | | 2,734,828 | |
| Imperial Oil Ltd. | | | 120,300 | | | | 3,919,292 | |
| Kinder Morgan, Inc. | | | 1,221,400 | | | | 18,223,288 | |
| Legacy Reserves LP | | | 1,295,801 | | | | 2,267,652 | |
| MPLX LP | | | 671,657 | | | | 26,416,270 | |
| Noble Energy, Inc. | | | 267,700 | | | | 8,815,361 | |
| Suncor Energy, Inc. | | | 2,025,500 | | | | 52,287,967 | |
| The Williams Companies, Inc. | | | 1,589,549 | | | | 40,851,409 | |
| Williams Partners LP | | | 2,170,256 | | | | 60,441,630 | |
| | | | | | | | 485,013,143 | |
| | | | | | | | | |
| TOTAL ENERGY | | | | | | | 506,693,626 | |
| | | | | | | | | |
| FINANCIALS – 24.8% | | | | | | | | |
| Banks – 11.8% | | | | | | | | |
| Bank of America Corp. | | | 4,092,400 | | | | 68,875,092 | |
| Comerica, Inc. | | | 658,648 | | | | 27,551,246 | |
| First Niagara Financial Group, Inc. | | | 1,910,414 | | | | 20,727,992 | |
| FirstMerit Corp. | | | 897,121 | | | | 16,731,307 | |
| JPMorgan Chase & Co. (b) | | | 2,695,264 | | | | 177,968,282 | |
| KeyCorp | | | 1,395,300 | | | | 18,404,007 | |
| Lloyds Banking Group PLC | | | 4,385,500 | | | | 4,718,777 | |
| M&T Bank Corp. | | | 633,391 | | | | 76,754,321 | |
| Regions Financial Corp. | | | 3,694,800 | | | | 35,470,080 | |
| Standard Chartered PLC (United Kingdom) | | | 1,290,092 | | | | 10,720,749 | |
| SunTrust Banks, Inc. | | | 949,700 | | | | 40,685,148 | |
| U.S. Bancorp | | | 1,208,138 | | | | 51,551,248 | |
| Wells Fargo & Co. (b) | | | 1,289,286 | | | | 70,085,587 | |
| | | | | | | | 620,243,836 | |
| Capital Markets – 5.3% | | | | | | | | |
| Apollo Global Management LLC Class A | | | 88,900 | | | | 1,349,502 | |
| Apollo Investment Corp. (a) | | | 2,029,047 | | | | 10,591,625 | |
| Ares Capital Corp. | | | 841,995 | | | | 11,998,429 | |
See accompanying notes which are an integral part of the financial statements.
| Common Stocks – continued |
| | | | | | | |
| | | Shares | | | Value | |
| FINANCIALS – continued | | | | | | | | |
| Capital Markets – continued | | | | | | | | |
| Ares Management LP | | | 351,466 | | | $ | 4,544,455 | |
| KKR & Co. LP | | | 4,721,121 | | | | 73,602,276 | |
| Morgan Stanley | | | 650,075 | | | | 20,678,886 | |
| PJT Partners, Inc. (a)(d) | | | 69,430 | | | | 1,964,175 | |
| State Street Corp. | | | 908,502 | | | | 60,288,193 | |
| The Blackstone Group LP | | | 2,950,826 | | | | 86,282,152 | |
| TPG Specialty Lending, Inc. | | | 273,600 | | | | 4,437,792 | |
| | | | | | | | 275,737,485 | |
| Consumer Finance – 0.4% | | | | | | | | |
| Synchrony Financial (d) | | | 630,120 | | | | 19,161,949 | |
| Insurance – 4.9% | | | | | | | | |
| ACE Ltd. (b) | | | 268,011 | | | | 31,317,085 | |
| MetLife, Inc. | | | 1,972,970 | | | | 95,116,884 | |
| Prudential Financial, Inc. | | | 437,762 | | | | 35,638,204 | |
| The Chubb Corp. | | | 631,600 | | | | 83,775,424 | |
| The Travelers Companies, Inc. | | | 108,345 | | | | 12,227,817 | |
| | | | | | | | 258,075,414 | |
| Real Estate Investment Trusts – 2.3% | | | | | | | | |
| American Capital Agency Corp. | | | 526,148 | | | | 9,123,406 | |
| American Tower Corp. | | | 29,500 | | | | 2,860,025 | |
| Annaly Capital Management, Inc. | | | 993,209 | | | | 9,316,300 | |
| Coresite Realty Corp. | | | 80,947 | | | | 4,591,314 | |
| Cousins Properties, Inc. | | | 917,700 | | | | 8,653,911 | |
| Crown Castle International Corp. | | | 194,400 | | | | 16,805,880 | |
| Duke Realty LP | | | 745,700 | | | | 15,674,614 | |
| First Potomac Realty Trust | | | 1,163,557 | | | | 13,264,550 | |
| Piedmont Office Realty Trust, Inc. Class A | | | 618,024 | | | | 11,668,293 | |
| Public Storage | | | 26,500 | | | | 6,564,050 | |
| Retail Properties America, Inc. | | | 406,232 | | | | 6,000,047 | |
| Sabra Health Care REIT, Inc. | | | 180,800 | | | | 3,657,584 | |
| Two Harbors Investment Corp. | | | 746,134 | | | | 6,043,685 | |
| Ventas, Inc. | | | 150,990 | | | | 8,520,366 | |
| | | | | | | | 122,744,025 | |
| Thrifts & Mortgage Finance – 0.1% | | | | | | | | |
| Radian Group, Inc. | | | 586,308 | | | | 7,850,664 | |
| | | | | | | | | |
| TOTAL FINANCIALS | | | | | | | 1,303,813,373 | |
| | | | | | | | | |
| HEALTH CARE – 11.3% | | | | | | | | |
| Biotechnology – 1.4% | | | | | | | | |
| AbbVie, Inc. | | | 391,800 | | | | 23,210,232 | |
| Amgen, Inc. | | | 146,471 | | | | 23,776,637 | |
| Gilead Sciences, Inc. | | | 274,300 | | | | 27,756,417 | |
| | | | | | | | 74,743,286 | |
| Health Care Equipment & Supplies – 1.9% | | | | | | | | |
| DENTSPLY International, Inc. | | | 200,500 | | | | 12,200,425 | |
| Medtronic PLC | | | 962,152 | | | | 74,008,732 | |
| St. Jude Medical, Inc. | | | 185,246 | | | | 11,442,645 | |
| | | | | | | | 97,651,802 | |
| Pharmaceuticals – 8.0% | | | | | | | | |
| GlaxoSmithKline PLC | | | 2,350,400 | | | | 47,468,306 | |
| Johnson & Johnson | | | 2,915,168 | | | | 299,446,057 | |
| Merck & Co., Inc. | | | 300,500 | | | | 15,872,410 | |
| | | | | | | |
| | | | | | | |
| | | Shares | | | Value | |
| Pfizer, Inc. | | | 599,812 | | | $ | 19,361,931 | |
| Sanofi SA | | | 182,756 | | | | 15,574,790 | |
| Teva Pharmaceutical Industries Ltd. sponsored ADR | | | 346,200 | | | | 22,724,568 | |
| | | | | | | | 420,448,062 | |
| | | | | | | | | |
| TOTAL HEALTH CARE | | | | | | | 592,843,150 | |
| | | | | | | | | |
| INDUSTRIALS – 12.1% | | | | | | | | |
| Aerospace & Defense – 2.9% | | | | | | | | |
| General Dynamics Corp. | | | 141,600 | | | | 19,450,176 | |
| Raytheon Co. | | | 182,100 | | | | 22,676,913 | |
| The Boeing Co. (b) | | | 298,800 | | | | 43,203,492 | |
| United Technologies Corp. | | | 669,371 | | | | 64,306,472 | |
| | | | | | | | 149,637,053 | |
| Air Freight & Logistics – 3.0% | | | | | | | | |
| C.H. Robinson Worldwide, Inc. | | | 196,428 | | | | 12,182,465 | |
| PostNL NV (d) | | | 4,812,100 | | | | 18,303,424 | |
| United Parcel Service, Inc. Class B (b) | | | 1,329,637 | | | | 127,950,969 | |
| | | | | | | | 158,436,858 | |
| Airlines – 0.2% | | | | | | | | |
| Copa Holdings SA Class A | | | 204,700 | | | | 9,878,822 | |
| Commercial Services & Supplies – 0.5% | | | | | | | | |
| KAR Auction Services, Inc. | | | 549,600 | | | | 20,351,688 | |
| Republic Services, Inc. | | | 155,726 | | | | 6,850,387 | |
| | | | | | | | 27,202,075 | |
| Electrical Equipment – 1.2% | | | | | | | | |
| Eaton Corp. PLC | | | 518,700 | | | | 26,993,148 | |
| Emerson Electric Co. | | | 772,703 | | | | 36,958,384 | |
| | | | | | | | 63,951,532 | |
| Industrial Conglomerates – 4.2% | | | | | | | | |
| General Electric Co. (b) | | | 7,093,147 | | | | 220,951,529 | |
| Machinery – 0.1% | | | | | | | | |
| Cummins, Inc. | | | 62,800 | | | | 5,527,028 | |
| | | | | | | | | |
| TOTAL INDUSTRIALS | | | | | | | 635,584,897 | |
| | | | | | | | | |
| INFORMATION TECHNOLOGY – 11.2% | | | | | | | | |
| Communications Equipment – 3.1% | | | | | | | | |
| Cisco Systems, Inc. | | | 3,776,531 | | | | 102,551,699 | |
| Qualcomm Technologies, Inc. | | | 1,211,239 | | | | 60,543,781 | |
| | | | | | | | 163,095,480 | |
| Electronic Equipment & Components – 0.4% | | | | | | | | |
| Hitachi Ltd. | | | 1,324,000 | | | | 7,502,282 | |
| TE Connectivity Ltd. | | | 244,361 | | | | 15,788,164 | |
| | | | | | | | 23,290,446 | |
| Internet Software & Services – 0.5% | | | | | | | | |
| Yahoo!, Inc. (d) | | | 718,900 | | | | 23,910,614 | |
| IT Services – 2.5% | | | | | | | | |
| First Data Corp. | | | 2,006,096 | | | | 28,923,892 | |
| IBM Corp. | | | 560,023 | | | | 77,070,365 | |
| Paychex, Inc. | | | 460,169 | | | | 24,338,338 | |
| | | | | | | | 130,332,595 | |
See accompanying notes which are an integral part of the financial statements.
Investments – continued
| Common Stocks – continued |
| | | | | | | |
| | | Shares | | | Value | |
| INFORMATION TECHNOLOGY – continued | | | | | | | | |
| Semiconductors & Semiconductor Equipment – 1.4% | | | | | | | | |
| Applied Materials, Inc. | | | 2,451,600 | | | $ | 45,771,372 | |
| Maxim Integrated Products, Inc. | | | 745,900 | | | | 28,344,200 | |
| | | | | | | | 74,115,572 | |
| Software – 0.9% | | | | | | | | |
| Microsoft Corp. | | | 819,224 | | | | 45,450,548 | |
| Technology Hardware, Storage & Peripherals – 2.4% | | | | | | | | |
| Apple, Inc. | | | 481,900 | | | | 50,724,794 | |
| EMC Corp. | | | 2,582,300 | | | | 66,313,464 | |
| Seagate Technology LLC | | | 255,700 | | | | 9,373,962 | |
| | | | | | | | 126,412,220 | |
| | | | | | | | | |
| TOTAL INFORMATION TECHNOLOGY | | | | | | | 586,607,475 | |
| | | | | | | | | |
| MATERIALS – 1.3% | | | | | | | | |
| Chemicals – 0.5% | | | | | | | | |
| LyondellBasell Industries NV Class A | | | 148,700 | | | | 12,922,030 | |
| Potash Corp. of Saskatchewan, Inc. | | | 718,700 | | | | 12,309,887 | |
| Syngenta AG sponsored ADR | | | 11,300 | | | | 889,649 | |
| Tronox Ltd. Class A | | | 451,800 | | | | 1,766,538 | |
| | | | | | | | 27,888,104 | |
| Containers & Packaging – 0.5% | | | | | | | | |
| Packaging Corp. of America | | | 221,200 | | | | 13,946,660 | |
| WestRock Co. | | | 304,800 | | | | 13,904,976 | |
| | | | | | | | 27,851,636 | |
| Metals & Mining – 0.3% | | | | | | | | |
| Freeport-McMoRan, Inc. | | | 505,278 | | | | 3,420,732 | |
| Nucor Corp. | | | 254,500 | | | | 10,256,350 | |
| | | | | | | | 13,677,082 | |
| | | | | | | | | |
| TOTAL MATERIALS | | | | | | | 69,416,822 | |
| | | | | | | | | |
| TELECOMMUNICATION SERVICES – 4.2% | | | | | | | | |
| Diversified Telecommunication Services – 4.1% | | | | | | | | |
| AT&T, Inc. | | | 3,251,393 | | | | 111,880,433 | |
| Verizon Communications, Inc. | | | 2,194,359 | | | | 101,423,273 | |
| | | | | | | | 213,303,706 | |
| Wireless Telecommunication Services – 0.1% | | | | | | | | |
| KDDI Corp. | | | 238,000 | | | | 6,180,906 | |
| | | | | | | | | |
| TOTAL TELECOMMUNICATION SERVICES | | | | | | | 219,484,612 | |
| | | | | | | | | |
| UTILITIES – 5.2% | | | | | | | | |
| Electric Utilities – 4.9% | | | | | | | | |
| American Electric Power Co., Inc. | | | 479,571 | | | | 27,944,602 | |
| Entergy Corp. | | | 311,800 | | | | 21,314,648 | |
| Exelon Corp. | | | 2,883,100 | | | | 80,063,687 | |
| NextEra Energy, Inc. | | | 49,983 | | | | 5,192,734 | |
| PPL Corp. | | | 1,674,900 | | | | 57,164,337 | |
| Southern Co. | | | 1,225,977 | | | | 57,363,464 | |
| Xcel Energy, Inc. | | | 259,700 | | | | 9,325,827 | |
| | | | | | | | 258,369,299 | |
| | | | | | | |
| | | | | | | |
| | | Shares | | | Value | |
| Multi-Utilities – 0.3% | | | | | | | | |
| CenterPoint Energy, Inc. | | | 799,300 | | | $ | 14,675,148 | |
| | | | | | | | | |
| TOTAL UTILITIES | | | | | | | 273,044,447 | |
| | | | | | | | | |
TOTAL COMMON STOCKS
(Cost $4,603,004,640) | | | | | | | 5,115,847,918 | |
| | | | | | | | | |
| Convertible Preferred Stocks – 0.2% | | |
| | | | | | | | | |
| HEALTH CARE – 0.1% | | | | | | | | |
| Health Care Providers & Services – 0.0% | | | | | | | | |
| AmSurg Corp. Series A-1, 5.25% | | | 16,150 | | | | 2,319,544 | |
| Pharmaceuticals – 0.1% | | | | | | | | |
| Allergan PLC 5.50% | | | 2,275 | | | | 2,343,660 | |
| | | | | | | | | |
| TOTAL HEALTH CARE | | | | | | | 4,663,204 | |
| | | | | | | | | |
| TELECOMMUNICATION SERVICES – 0.0% | | | | | | | | |
| Wireless Telecommunication Services – 0.0% | | | | | | | | |
| T-Mobile U.S., Inc. Series A 5.50% | | | 39,985 | | | | 2,707,384 | |
| | | | | | | | | |
| UTILITIES – 0.1% | | | | | | | | |
| Independent Power and Renewable Electricity Producers – 0.1% | | | | | | | | |
| Dynegy, Inc. 5.375% | | | 31,800 | | | | 1,594,134 | |
| Multi-Utilities – 0.0% | | | | | | | | |
| CenterPoint Energy, Inc. 2.00% ZENS (d) | | | 24,500 | | | | 1,398,031 | |
| | | | | | | | | |
| TOTAL UTILITIES | | | | | | | 2,992,165 | |
| | | | | | | | | |
TOTAL CONVERTIBLE PREFERRED STOCKS
(Cost $11,060,121) | | | | | | | 10,362,753 | |
| | | | | | | |
| Corporate Bonds – 0.5% | |
| | | Principal | | | | |
| | | Amount(f) | | | | |
| Convertible Bonds – 0.4% | | | | | | |
| | | | | | | | | |
| CONSUMER DISCRETIONARY – 0.0% | | | | | | | | |
| Household Durables – 0.0% | | | | | | | | |
| Jarden Corp. 1.875% 9/15/18 | | $ | 1,340,000 | | | | 2,436,288 | |
| | | | | | | | | |
| ENERGY – 0.2% | | | | | | | | |
| Oil, Gas & Consumable Fuels – 0.2% | | | | | | | | |
| Amyris, Inc. 3% 2/27/17 | | | 1,383,000 | | | | 1,264,228 | |
| Scorpio Tankers, Inc. 2.375% 7/1/19 (g) | | | 7,335,000 | | | | 6,780,291 | |
| Whiting Petroleum Corp. 1.25% 4/1/20 (g) | | | 1,690,000 | | | | 1,149,200 | |
| | | | | | | | 9,193,719 | |
| | | | | | | | | |
| INFORMATION TECHNOLOGY – 0.2% | | | | | | | | |
| Communications Equipment – 0.1% | | | | | | | | |
| InterDigital, Inc. 1.5% 3/1/20 (g) | | | 4,600,000 | | | | 4,413,125 | |
See accompanying notes which are an integral part of the financial statements.
| Corporate Bonds – continued |
| | | Principal | | | | |
| | | Amount(f) | | | Value | |
| | | | | | | |
| Convertible Bonds – continued | | | | | | | | |
| | | | | | | | | |
| INFORMATION TECHNOLOGY – continued | | | | | | | | |
| Semiconductors & Semiconductor Equipment – 0.1% | | | | | | | | |
| Micron Technology, Inc. 3.125% 5/1/32 | | $ | 1,160,000 | | | $ | 1,843,675 | |
| NXP Semiconductors NV 1% 12/1/19 | | | 2,350,000 | | | | 2,574,719 | |
| | | | | | | | 4,418,394 | |
| | | | | | | | | |
| TOTAL INFORMATION TECHNOLOGY | | | | | | | 8,831,519 | |
| | | | | | | | | |
| TOTAL CONVERTIBLE BONDS | | | | | | | 20,461,526 | |
| | | | | | | | | |
| Nonconvertible Bonds – 0.1% | | | | | | | | |
| | | | | | | | | |
| CONSUMER DISCRETIONARY – 0.1% | | | | | | | | |
| Media – 0.1% | | | | | | | | |
| Altice SA 7.625% 2/15/25 (g) | | | 3,220,000 | | | | 2,777,250 | |
| | | | | | | | | |
| CONSUMER STAPLES – 0.0% | | | | | | | | |
| Tobacco – 0.0% | | | | | | | | |
| Vector Group Ltd. 7.75% 2/15/21 | | | 2,350,000 | | | | 2,479,250 | |
| | | | | | | | | |
| MATERIALS – 0.0% | | | | | | | | |
| Metals & Mining – 0.0% | | | | | | | | |
| Walter Energy, Inc. 8.5% 4/15/21 (h) | | | 5,250,000 | | | | 525 | |
| | | | | | | | | |
| TOTAL NONCONVERTIBLE BONDS | | | | | | | 5,257,025 | |
| | | | | | | | | |
TOTAL CORPORATE BONDS
(Cost $32,411,935) | | | | | | | 25,718,551 | |
| | | | | | | | | |
| Preferred Securities – 0.1% | | |
| | | | | | | | | |
| FINANCIALS – 0.1% | | | | | | | | |
| Diversified Financial Services – 0.1% | | | | | | | | |
Baggot Securities Ltd. 10.24%
(Cost $3,931,535) (g)(i) | | EUR | 2,560,000 | | | | 3,027,398 | |
| | | | | | | | | |
| Money Market Funds – 2.8% | | |
| | | | Shares | | | | | |
| Fidelity Cash Central Fund, 0.33% (j) | | | 101,348,301 | | | | 101,348,301 | |
| Fidelity Securities Lending Cash Central Fund, 0.35% (j)(k) | | | 47,684,836 | | | | 47,684,836 | |
| | | | | | | | | |
TOTAL MONEY MARKET FUNDS
(Cost $149,033,137) | | | | | | | 149,033,137 | |
| | | | | | | | | |
| | | | | | | | | |
TOTAL INVESTMENT PORTFOLIO – 101.1%
(Cost $4,799,441,368) | | | | | | | 5,303,989,757 | |
| | | | | | | | | |
| NET OTHER ASSETS (LIABILITIES) – (1.1)% | | | | | | | (57,144,334 | ) |
| NET ASSETS – 100% | | | | | | $ | 5,246,845,423 | |
| | | Expiration | | | | | | | | | |
| | | Date/ | | Number | | | | | | | |
| | | Exercise | | of | | | | | | | |
| | | Price | | Contracts | | | Premium | | | Value | |
| Call Options | | | | | | | | | | | | | | |
| ACE Ltd. | | 2/19/16 – $120.00 | | | 635 | | | $ | 118,384 | | | $ | (107,950 | ) |
| General Electric Co. | | 1/15/16 – $31.00 | | | 25,070 | | | | 765,483 | | | | (1,266,035 | ) |
| General Electric Co. | | 3/18/16 – $33.00 | | | 11,802 | | | | 248,899 | | | | (336,357 | ) |
| JPMorgan Chase & Co. | | 2/19/16 – $70.00 | | | 4,100 | | | | 360,993 | | | | (170,150 | ) |
| McDonald’s Corp. | | 1/15/16 – $115.00 | | | 1,145 | | | | 207,900 | | | | (443,688 | ) |
| Molson Coors Brewing Co. Class B | | 1/15/16 – $100.00 | | | 763 | | | | 89,269 | | | | (9,538 | ) |
| The Boeing Co. | | 1/15/16 – $150.00 | | | 1,027 | | | | 393,221 | | | | (37,486 | ) |
| The Hershey Co. | | 2/19/16 – $90.00 | | | 1,632 | | | | 207,929 | | | | (474,912 | ) |
| United Parcel Service, Inc. Class B | | 1/15/16 – $105.00 | | | 4,293 | | | | 786,758 | | | | (12,879 | ) |
| Wells Fargo & Co. | | 1/15/16 – $57.50 | | | 4,073 | | | | 279,240 | | | | (24,438 | ) |
| Yum! Brands, Inc. | | 1/15/16 – $75.00 | | | 723 | | | | 125,077 | | | | (61,454 | ) |
| TOTAL WRITTEN OPTIONS | | | | | | | | $ | 3,583,153 | | | $ | (2,944,887 | ) |
See accompanying notes which are an integral part of the financial statements.
Investments – continued
Currency Abbreviations
EUR – European Monetary Unit
Legend
| (a) | Security or a portion of the security is on loan at period end. |
| (b) | Security or a portion of the security is pledged as collateral for call options written. At period end, the value of securities pledged amounted to $268,193,820. |
| (c) | Restricted securities – Investment in securities not registered under the Securities Act of 1933 (excluding 144A issues). At the end of the period, the value of restricted securities (excluding 144A issues) amounted to $18,840,864 or 0.4% of net assets. |
| (e) | Investment is owned by an entity that is treated as a U.S. Corporation for tax purposes in which the Fund holds a percentage ownership. |
| (f) | Amount is stated in United States dollars unless otherwise noted. |
| (g) | Security exempt from registration under Rule 144A of the Securities Act of 1933. These securities may be resold in transactions exempt from |
| | registration, normally to qualified institutional buyers. At the end of the period, the value of these securities amounted to $18,147,264 or 0.3% of net assets. |
| (h) | Non-income producing – Security is in default. |
| (i) | Security is perpetual in nature with no stated maturity date. |
| (j) | Affiliated fund that is generally available only to investment companies and other accounts managed by Fidelity Investments. The rate quoted is the annualized seven-day yield of the fund at period end. A complete unaudited listing of the fund’s holdings as of its most recent quarter end is available upon request. In addition, each Fidelity Central Fund’s financial statements, which are not covered by the Fund’s Report of Independent Registered Public Accounting Firm, are available on the SEC’s website or upon request. |
| (k) | Investment made with cash collateral received from securities on loan. |
Additional information on each restricted holding is as follows:
| | | Acquisition | | | |
| Security | | Date | | Acquisition Cost | |
| | | | | | |
| New Academy Holding Co. LLC unit | | 8/1/11 | | $ | 13,406,880 | |
Affiliated Central Funds
Information regarding fiscal year to date income earned by the Fund from investments in Fidelity Central Funds is as follows:
| Fund | | Income earned | |
| Fidelity Cash Central Fund | | $ | 328,083 | |
| Fidelity Securities Lending Cash Central Fund | | | 672,703 | |
| Total | | $ | 1,000,786 | |
Investment Valuation
The following is a summary of the inputs used, as of December 31, 2015, involving the Fund’s assets and liabilities carried at fair value. The inputs or methodology used for valuing securities may not be an indication of the risk associated with investing in those securities. For more information on valuation inputs, and their aggregation into the levels used below, please refer to the Investment Valuation section in the accompanying Notes to Financial Statements.
Valuation Inputs at Reporting Date:
| Description | | Total | | | Level 1 | | | Level 2 | | | Level 3 | |
| Investments in Securities: | | | | | | | | | | | | | | | | |
| Equities: | | | | | | | | | | | | | | | | |
| Consumer Discretionary | | $ | 424,344,402 | | | $ | 404,921,310 | | | $ | 582,228 | | | $ | 18,840,864 | |
| Consumer Staples | | | 504,015,114 | | | | 500,187,898 | | | | 3,827,216 | | | | – | |
| Energy | | | 506,693,626 | | | | 493,510,231 | | | | 13,183,395 | | | | – | |
| Financials | | | 1,303,813,373 | | | | 1,299,094,596 | | | | 4,718,777 | | | | – | |
| Health Care | | | 597,506,354 | | | | 532,143,714 | | | | 65,362,640 | | | | – | |
| Industrials | | | 635,584,897 | | | | 635,584,897 | | | | – | | | | – | |
| Information Technology | | | 586,607,475 | | | | 550,181,301 | | | | 36,426,174 | | | | – | |
| Materials | | | 69,416,822 | | | | 69,416,822 | | | | – | | | | – | |
| Telecommunication Services | | | 222,191,996 | | | | 216,011,090 | | | | 6,180,906 | | | | – | |
| Utilities | | | 276,036,612 | | | | 274,638,581 | | | | 1,398,031 | | | | – | |
| Corporate Bonds | | | 25,718,551 | | | | – | | | | 25,718,551 | | | | – | |
| Preferred Securities | | | 3,027,398 | | | | – | | | | 3,027,398 | | | | – | |
| Money Market Funds | | | 149,033,137 | | | | 149,033,137 | | | | – | | | | – | |
| Total Investments in Securities: | | $ | 5,303,989,757 | | | $ | 5,124,723,577 | | | $ | 160,425,316 | | | $ | 18,840,864 | |
| Derivative Instruments: | | | | | | | | | | | | | | | | |
| Liabilities | | | | | | | | | | | | | | | | |
| Written Options | | $ | (2,944,887 | ) | | $ | (2,944,887 | ) | | $ | – | | | $ | – | |
| Total Liabilities | | $ | (2,944,887 | ) | | $ | (2,944,887 | ) | | $ | – | | | $ | – | |
| Total Derivative Instruments: | | $ | (2,944,887 | ) | | $ | (2,944,887 | ) | | $ | – | | | $ | – | |
See accompanying notes which are an integral part of the financial statements.
Value of Derivative Instruments
The following table is a summary of the Fund’s value of derivative instruments by primary risk exposure as of December 31, 2015. For additional information on derivative instruments, please refer to the Derivative Instruments section in the accompanying Notes to Financial Statements.
| Primary Risk Exposure / Derivative Type | | Value | |
| | | Asset | | | Liability | |
| Equity Risk | | | | | | | | |
| Written Options (a) | | $ | 0 | | | $ | (2,944,887 | ) |
| Total Equity Risk | | | 0 | | | | (2,944,887 | ) |
| Total Value of Derivatives | | $ | 0 | | | $ | (2,944,887 | ) |
(a) Gross value is presented in the Statement of Assets and Liabilities in the written options, at value line-item.
See accompanying notes which are an integral part of the financial statements.
Financial Statements
| Statement of Assets and Liabilities |
| | | | | | December 31, 2015 | |
| Assets | | | | | | | | |
| Investment in securities, at value (including securities loaned of $46,333,760) – See accompanying schedule: | | | | | | | | |
| Unaffiliated issuers (cost $4,650,408,231) | | $ | 5,154,956,620 | | | | | |
| Fidelity Central Funds (cost $149,033,137) | | | 149,033,137 | | | | | |
| Total Investments (cost $4,799,441,368) | | | | | | $ | 5,303,989,757 | |
| Cash | | | | | | | 225,161 | |
| Foreign currency held at value (cost $951,744) | | | | | | | 951,746 | |
| Receivable for investments sold | | | | | | | 7,280,235 | |
| Receivable for fund shares sold | | | | | | | 808,613 | |
| Dividends receivable | | | | | | | 7,987,833 | |
| Interest receivable | | | | | | | 275,257 | |
| Distributions receivable from Fidelity Central Funds | | | | | | | 201,147 | |
| Prepaid expenses | | | | | | | 12,202 | |
| Other receivables | | | | | | | 438,670 | |
| Total assets | | | | | | | 5,322,170,621 | |
| Liabilities | | | | | | | | |
| Payable for investments purchased | | $ | 18,187,477 | | | | | |
| Payable for fund shares redeemed | | | 3,349,438 | | | | | |
| Accrued management fee | | | 1,967,501 | | | | | |
| Distribution and service plan fees payable | | | 308,611 | | | | | |
| Written options, at value (premium received $3,583,153) | | | 2,944,887 | | | | | |
| Other affiliated payables | | | 407,361 | | | | | |
| Other payables and accrued expenses | | | 475,087 | | | | | |
| Collateral on securities loaned, at value | | | 47,684,836 | | | | | |
| Total liabilities | | | | | | | 75,325,198 | |
| Net Assets | | | | | | $ | 5,246,845,423 | |
| Net Assets consist of: | | | | | | | | |
| Paid in capital | | | | | | $ | 4,428,083,522 | |
| Distributions in excess of net investment income | | | | | | | (15,247,286 | ) |
| Accumulated undistributed net realized gain (loss) on investments and foreign currency transactions | | | | | | | 328,848,538 | |
| Net unrealized appreciation (depreciation) on investments and assets and liabilities in foreign currencies | | | | | | | 505,160,649 | |
| Net Assets | | | | | | $ | 5,246,845,423 | |
| Initial Class: | | | | | | | | |
| Net Asset Value, offering price and redemption price per share ($3,238,579,995 ÷ 158,288,156 shares) | | | | | | $ | 20.46 | |
| Service Class: | | | | | | | | |
| Net Asset Value, offering price and redemption price per share ($309,668,720 ÷ 15,201,706 shares) | | | | | | $ | 20.37 | |
| Service Class 2: | | | | | | | | |
| Net Asset Value, offering price and redemption price per share ($1,348,911,710 ÷ 67,311,488 shares) | | | | | | $ | 20.04 | |
| Investor Class: | | | | | | | | |
| Net Asset Value, offering price and redemption price per share ($349,684,998 ÷ 17,162,940 shares) | | | | | | $ | 20.37 | |
See accompanying notes which are an integral part of the financial statements.
| | | | | | Year ended | |
| | | | | | December 31, 2015 | |
| Investment Income | | | | | | | | |
| Dividends | | | | | | $ | 192,727,501 | |
| Interest | | | | | | | 3,773,450 | |
| Income from Fidelity Central Funds | | | | | | | 1,000,786 | |
| Total income | | | | | | | 197,501,737 | |
| Expenses | | | | | | | | |
| Management fee | | $ | 26,200,773 | | | | | |
| Transfer agent fees | | | 4,162,111 | | | | | |
| Distribution and service plan fees | | | 4,255,589 | | | | | |
| Accounting and security lending fees | | | 1,123,303 | | | | | |
| Custodian fees and expenses | | | 119,593 | | | | | |
| Independent trustees’ compensation | | | 26,181 | | | | | |
| Appreciation in deferred trustee compensation account | | | 66 | | | | | |
| Audit | | | 85,908 | | | | | |
| Legal | | | 21,767 | | | | | |
| Miscellaneous | | | 41,642 | | | | | |
| Total expenses before reductions | | | 36,036,933 | | | | | |
| Expense reductions | | | (339,997 | ) | | | 35,696,936 | |
| Net investment income (loss) | | | | | | | 161,804,801 | |
| Realized and Unrealized Gain (Loss) | | | | | | | | |
| Net realized gain (loss) on: | | | | | | | | |
| Investment securities: | | | | | | | | |
| Unaffiliated issuers | | | 370,975,049 | | | | | |
| Foreign currency transactions | | | (46,475 | ) | | | | |
| Written options | | | 15,127,152 | | | | | |
| Total net realized gain (loss) | | | | | | | 386,055,726 | |
| Change in net unrealized appreciation (depreciation) on: | | | | | | | | |
| Investment securities | | | (781,720,652 | ) | | | | |
| Assets and liabilities in foreign currencies | | | 41,270 | | | | | |
| Written options | | | 3,441,483 | | | | | |
| Total change in net unrealized appreciation (depreciation) | | | | | | | (778,237,899 | ) |
| Net gain (loss) | | | | | | | (392,182,173 | ) |
| Net increase (decrease) in net assets resulting from operations | | | | | | $ | (230,377,372 | ) |
| Statement of Changes in Net Assets |
| | | Year ended December | | | Year ended December | |
| | | 31, 2015 | | | 31, 2014 | |
| Increase (Decrease) in Net Assets | | | | | | | | |
| Operations | | | | | | | | |
| Net investment income (loss) | | $ | 161,804,801 | | | $ | 182,361,728 | |
| Net realized gain (loss) | | | 386,055,726 | | | | 591,213,191 | |
| Change in net unrealized appreciation (depreciation) | | | (778,237,899 | ) | | | (239,753,698 | ) |
| Net increase (decrease) in net assets resulting from operations | | | (230,377,372 | ) | | | 533,821,221 | |
| Distributions to shareholders from net investment income | | | (173,549,033 | ) | | | (173,173,144 | ) |
| Distributions to shareholders from net realized gain | | | (562,610,777 | ) | | | (87,899,582 | ) |
| Total distributions | | | (736,159,810 | ) | | | (261,072,726 | ) |
| Share transactions – net increase (decrease) | | | (79,940,029 | ) | | | (437,948,697 | ) |
| Redemption fees | | | 3,144 | | | | 7,981 | |
| Total increase (decrease) in net assets | | | (1,046,474,067 | ) | | | (165,192,221 | ) |
| Net Assets | | | | | | | | |
| Beginning of period | | | 6,293,319,490 | | | | 6,458,511,711 | |
| End of period (including distributions in excess of net investment income of $15,247,286 and distributions in excess of net investment income of $3,340,048, respectively) | | $ | 5,246,845,423 | | | $ | 6,293,319,490 | |
See accompanying notes which are an integral part of the financial statements.
| Financial Highlights – VIP Equity-Income Portfolio Initial Class |
| Years ended December 31, | | 2015 | | | 2014 | | | 2013 | | | 2012 | | | 2011 | |
| Selected Per–Share Data | | | | | | | | | | | | | | | | | | | | |
| Net asset value, beginning of period | | $ | 24.30 | | | $ | 23.29 | | | $ | 19.94 | | | $ | 18.69 | | | $ | 19.02 | |
| Income from Investment Operations | | | | | | | | | | | | | | | | | | | | |
| Net investment income (loss)A | | | .63 | | | | .71 | B | | | .56 | | | | .59 | | | | .48 | |
| Net realized and unrealized gain (loss) | | | (1.57 | )C | | | 1.35 | | | | 4.96 | | | | 2.59 | | | | (.31 | ) |
| Total from investment operations | | | (.94 | ) | | | 2.06 | | | | 5.52 | | | | 3.18 | | | | .17 | |
| Distributions from net investment income | | | (.71 | ) | | | (.71 | ) | | | (.60 | ) | | | (.63 | )D | | | (.50 | ) |
| Distributions from net realized gain | | | (2.19 | ) | | | (.34 | ) | | | (1.57 | ) | | | (1.30 | )D | | | – | |
| Total distributions | | | (2.90 | ) | | | (1.05 | ) | | | (2.17 | ) | | | (1.93 | ) | | | (.50 | ) |
| Redemption fees added to paid in capitalA,E | | | – | | | | – | | | | – | | | | – | | | | – | |
| Net asset value, end of period | | $ | 20.46 | | | $ | 24.30 | | | $ | 23.29 | | | $ | 19.94 | | | $ | 18.69 | |
| Total Return F,G | | | (4.08 | )%C | | | 8.85 | % | | | 28.15 | % | | | 17.31 | % | | | .97 | % |
| Ratios to Average Net AssetsH,I | | | | | | | | | | | | | | | | | | | | |
| Expenses before reductions | | | .54 | % | | | .54 | % | | | .55 | % | | | .55 | % | | | .56 | % |
| Expenses net of fee waivers, if any | | | .54 | % | | | .54 | % | | | .54 | % | | | .55 | % | | | .55 | % |
| Expenses net of all reductions | | | .53 | % | | | .54 | % | | | .54 | % | | | .54 | % | | | .54 | % |
| Net investment income (loss) | | | 2.85 | % | | | 2.94 | %B | | | 2.43 | % | | | 2.94 | % | | | 2.48 | % |
| Supplemental Data | | | | | | | | | | | | | | | | | | | | |
| Net assets, end of period (000 omitted) | | $ | 3,238,580 | | | $ | 3,817,228 | | | $ | 3,947,728 | | | $ | 3,461,083 | | | $ | 3,345,762 | |
| Portfolio turnover rateJ | | | 46 | % | | | 40 | % | | | 32 | % | | | 48 | % | | | 96 | % |
| A | Calculated based on average shares outstanding during the period. |
| B | Net Investment income per share reflects a large, non-recurring dividend which amounted to $.08 per share. Excluding this non-recurring dividend, the ratio of net investment income (loss) to average net assets would have been 2.59%. |
| C | Net realized and unrealized gain (loss) per share reflects proceeds from litigation which amounted to $.02 per share. Excluding these litigation proceeds, the total return would have been (4.18)%. |
| D | The amounts shown reflect certain reclassifications related to book to tax differences that were made in the year shown. |
| E | Amount represents less than $.005 per share. |
| F | Total returns do not reflect charges attributable to your insurance company’s separate account. Inclusion of these charges would reduce the total returns shown. |
| G | Total returns would have been lower if certain expenses had not been reduced during the applicable periods shown. |
| H | Fees and expenses of any underlying Fidelity Central Funds are not included in the Fund’s expense ratio. The Fund indirectly bears its proportionate share of the expenses of any underlying Fidelity Central Funds. |
| I | Expense ratios reflect operating expenses of the class. Expenses before reductions do not reflect amounts reimbursed by the investment adviser or reductions from brokerage service arrangements or reductions from other expense offset arrangements and do not represent the amount paid by the class during periods when reimbursements or reductions occur. Expenses net of fee waivers reflect expenses after reimbursement by the investment adviser but prior to reductions from brokerage service arrangements or other expense offset arrangements. Expenses net of all reductions represent the net expenses paid by the class. |
| J | Amount does not include the portfolio activity of any underlying Fidelity Central Funds. |
See accompanying notes which are an integral part of the financial statements.
| Financial Highlights – VIP Equity-Income Portfolio Service Class |
| Years ended December 31, | | 2015 | | | 2014 | | | 2013 | | | 2012 | | | 2011 | |
| Selected Per–Share Data | | | | | | | | | | | | | | | | | | | | |
| Net asset value, beginning of period | | $ | 24.20 | | | $ | 23.20 | | | $ | 19.87 | | | $ | 18.63 | | | $ | 18.96 | |
| Income from Investment Operations | | | | | | | | | | | | | | | | | | | | |
| Net investment income (loss)A | | | .61 | | | | .69 | B | | | .53 | | | | .57 | | | | .46 | |
| Net realized and unrealized gain (loss) | | | (1.56 | )C | | | 1.34 | | | | 4.94 | | | | 2.57 | | | | (.31 | ) |
| Total from investment operations | | | (.95 | ) | | | 2.03 | | | | 5.47 | | | | 3.14 | | | | .15 | |
| Distributions from net investment income | | | (.69 | ) | | | (.68 | ) | | | (.57 | ) | | | (.60 | )D | | | (.48 | ) |
| Distributions from net realized gain | | | (2.19 | ) | | | (.34 | ) | | | (1.57 | ) | | | (1.30 | )D | | | – | |
| Total distributions | | | (2.88 | ) | | | (1.03 | )E | | | (2.14 | ) | | | (1.90 | ) | | | (.48 | ) |
| Redemption fees added to paid in capital A,F | | | – | | | | – | | | | – | | | | – | | | | – | |
| Net asset value, end of period | | $ | 20.37 | | | $ | 24.20 | | | $ | 23.20 | | | $ | 19.87 | | | $ | 18.63 | |
| Total Return G,H | | | (4.17 | )%C | | | 8.74 | % | | | 28.01 | % | | | 17.19 | % | | | .86 | % |
| Ratios to Average Net Assets I,J | | | | | | | | | | | | | | | | | | | | |
| Expenses before reductions | | | .64 | % | | | .64 | % | | | .65 | % | | | .65 | % | | | .66 | % |
| Expenses net of fee waivers, if any | | | .64 | % | | | .64 | % | | | .64 | % | | | .65 | % | | | .66 | % |
| Expenses net of all reductions | | | .63 | % | | | .64 | % | | | .64 | % | | | .64 | % | | | .64 | % |
| Net investment income (loss) | | | 2.75 | % | | | 2.84 | %B | | | 2.33 | % | | | 2.84 | % | | | 2.38 | % |
| Supplemental Data | | | | | | | | | | | | | | | | | | | | |
| Net assets, end of period (000 omitted) | | $ | 309,669 | | | $ | 369,024 | | | $ | 391,896 | | | $ | 350,493 | | | $ | 347,999 | |
| Portfolio turnover rateK | | | 46 | % | | | 40 | % | | | 32 | % | | | 48 | % | | | 96 | % |
| A | Calculated based on average shares outstanding during the period. |
| B | Net Investment income per share reflects a large, non-recurring dividend which amounted to $.08 per share. Excluding this non-recurring dividend, the ratio of net investment income (loss) to average net assets would have been 2.49%. |
| C | Net realized and unrealized gain (loss) per share reflects proceeds from litigation which amounted to $.02 per share. Excluding these litigation proceeds, the total return would have been (4.27)%. |
| D | The amounts shown reflect certain reclassifications related to book to tax differences that were made in the year shown. |
| E | A total distribution of $1.03 per share is comprised of distributions from net investment income of $.684 and distributions from net realized gain of $.342 per share. |
| F | Amount represents less than $.005 per share. |
| G | Total returns do not reflect charges attributable to your insurance company’s separate account. Inclusion of these charges would reduce the total returns shown. |
| H | Total returns would have been lower if certain expenses had not been reduced during the applicable periods shown. |
| I | Fees and expenses of any underlying Fidelity Central Funds are not included in the Fund’s expense ratio. The Fund indirectly bears its proportionate share of the expenses of any underlying Fidelity Central Funds. |
| J | Expense ratios reflect operating expenses of the class. Expenses before reductions do not reflect amounts reimbursed by the investment adviser or reductions from brokerage service arrangements or reductions from other expense offset arrangements and do not represent the amount paid by the class during periods when reimbursements or reductions occur. Expenses net of fee waivers reflect expenses after reimbursement by the investment adviser but prior to reductions from brokerage service arrangements or other expense offset arrangements. Expenses net of all reductions represent the net expenses paid by the class. |
| K | Amount does not include the portfolio activity of any underlying Fidelity Central Funds. |
See accompanying notes which are an integral part of the financial statements.
| Financial Highlights – VIP Equity-Income Portfolio Service Class 2 |
| Years ended December 31, | | 2015 | | | 2014 | | | 2013 | | | 2012 | | | 2011 | |
| Selected Per–Share Data | | | | | | | | | | | | | | | | | | | | |
| Net asset value, beginning of period | | $ | 23.85 | | | $ | 22.88 | | | $ | 19.62 | | | $ | 18.41 | | | $ | 18.75 | |
| Income from Investment Operations | | | | | | | | | | | | | | | | | | | | |
| Net investment income (loss)A | | | .57 | | | | .64 | B | | | .49 | | | | .53 | | | | .42 | |
| Net realized and unrealized gain (loss) | | | (1.54 | )C | | | 1.32 | | | | 4.88 | | | | 2.55 | | | | (.31 | ) |
| Total from investment operations | | | (.97 | ) | | | 1.96 | | | | 5.37 | | | | 3.08 | | | | .11 | |
| Distributions from net investment income | | | (.65 | ) | | | (.65 | ) | | | (.54 | ) | | | (.57 | )D | | | (.45 | ) |
| Distributions from net realized gain | | | (2.19 | ) | | | (.34 | ) | | | (1.57 | ) | | | (1.30 | )D | | | – | |
| Total distributions | | | (2.84 | ) | | | (.99 | ) | | | (2.11 | ) | | | (1.87 | ) | | | (.45 | ) |
| Redemption fees added to paid in capital A,E | | | – | | | | – | | | | – | | | | – | | | | – | |
| Net asset value, end of period | | $ | 20.04 | | | $ | 23.85 | | | $ | 22.88 | | | $ | 19.62 | | | $ | 18.41 | |
| Total Return F,G | | | (4.32 | )%C | | | 8.57 | % | | | 27.83 | % | | | 17.05 | % | | | .66 | % |
| Ratios to Average Net Assets H,I | | | | | | | | | | | | | | | | | | | | |
| Expenses before reductions | | | .79 | % | | | .79 | % | | | .80 | % | | | .80 | % | | | .81 | % |
| Expenses net of fee waivers, if any | | | .79 | % | | | .79 | % | | | .79 | % | | | .80 | % | | | .81 | % |
| Expenses net of all reductions | | | .78 | % | | | .79 | % | | | .79 | % | | | .79 | % | | | .80 | % |
| Net investment income (loss) | | | 2.60 | % | | | 2.69 | %B | | | 2.18 | % | | | 2.69 | % | | | 2.23 | % |
| Supplemental Data | | | | | | | | | | | | | | | | | | | | |
| Net assets, end of period (000 omitted) | | $ | 1,348,912 | | | $ | 1,702,854 | | | $ | 1,755,769 | | | $ | 1,560,856 | | | $ | 1,457,230 | |
| Portfolio turnover rateJ | | | 46 | % | | | 40 | % | | | 32 | % | | | 48 | % | | | 96 | % |
| A | Calculated based on average shares outstanding during the period. |
| B | Net Investment income per share reflects a large, non-recurring dividend which amounted to $.08 per share. Excluding this non-recurring dividend, the ratio of net investment income (loss) to average net assets would have been 2.34%. |
| C | Net realized and unrealized gain (loss) per share reflects proceeds from litigation which amounted to $.02 per share. Excluding these litigation proceeds, the total return would have been (4.42)%. |
| D | The amounts shown reflect certain reclassifications related to book to tax differences that were made in the year shown. |
| E | Amount represents less than $.005 per share. |
| F | Total returns do not reflect charges attributable to your insurance company’s separate account. Inclusion of these charges would reduce the total returns shown. |
| G | Total returns would have been lower if certain expenses had not been reduced during the applicable periods shown. |
| H | Fees and expenses of any underlying Fidelity Central Funds are not included in the Fund’s expense ratio. The Fund indirectly bears its proportionate share of the expenses of any underlying Fidelity Central Funds. |
| I | Expense ratios reflect operating expenses of the class. Expenses before reductions do not reflect amounts reimbursed by the investment adviser or reductions from brokerage service arrangements or reductions from other expense offset arrangements and do not represent the amount paid by the class during periods when reimbursements or reductions occur. Expenses net of fee waivers reflect expenses after reimbursement by the investment adviser but prior to reductions from brokerage service arrangements or other expense offset arrangements. Expenses net of all reductions represent the net expenses paid by the class. |
| J | Amount does not include the portfolio activity of any underlying Fidelity Central Funds. |
See accompanying notes which are an integral part of the financial statements.
| Financial Highlights – VIP Equity-Income Portfolio Investor Class |
| Years ended December 31, | | 2015 | | | 2014 | | | 2013 | | | 2012 | | | 2011 | |
| Selected Per–Share Data | | | | | | | | | | | | | | | | | | | | |
| Net asset value, beginning of period | | $ | 24.21 | | | $ | 23.21 | | | $ | 19.89 | | | $ | 18.64 | | | $ | 18.97 | |
| Income from Investment Operations | | | | | | | | | | | | | | | | | | | | |
| Net investment income (loss)A | | | .61 | | | | .69 | B | | | .54 | | | | .57 | | | | .46 | |
| Net realized and unrealized gain (loss) | | | (1.56 | )C | | | 1.34 | | | | 4.93 | | | | 2.59 | | | | (.31 | ) |
| Total from investment operations | | | (.95 | ) | | | 2.03 | | | | 5.47 | | | | 3.16 | | | | .15 | |
| Distributions from net investment income | | | (.70 | ) | | | (.69 | ) | | | (.58 | ) | | | (.61 | )D | | | (.48 | ) |
| Distributions from net realized gain | | | (2.19 | ) | | | (.34 | ) | | | (1.57 | ) | | | (1.30 | )D | | | – | |
| Total distributions | | | (2.89 | ) | | | (1.03 | ) | | | (2.15 | ) | | | (1.91 | ) | | | (.48 | ) |
| Redemption fees added to paid in capital A,E | | | – | | | | – | | | | – | | | | – | | | | – | |
| Net asset value, end of period | | $ | 20.37 | | | $ | 24.21 | | | $ | 23.21 | | | $ | 19.89 | | | $ | 18.64 | |
| Total Return F,G | | | (4.18 | )%C | | | 8.77 | % | | | 27.99 | % | | | 17.27 | % | | | .89 | % |
| Ratios to Average Net Assets H,I | | | | | | | | | | | | | | | | | | | | |
| Expenses before reductions | | | .62 | % | | | .62 | % | | | .63 | % | | | .64 | % | | | .64 | % |
| Expenses net of fee waivers, if any | | | .62 | % | | | .62 | % | | | .62 | % | | | .64 | % | | | .64 | % |
| Expenses net of all reductions | | | .61 | % | | | .62 | % | | | .62 | % | | | .63 | % | | | .63 | % |
| Net investment income (loss) | | | 2.77 | % | | | 2.86 | %B | | | 2.35 | % | | | 2.85 | % | | | 2.39 | % |
| Supplemental Data | | | | | | | | | | | | | | | | | | | | |
| Net assets, end of period (000 omitted) | | $ | 349,685 | | | $ | 388,773 | | | $ | 351,139 | | | $ | 220,311 | | | $ | 178,499 | |
| Portfolio turnover rateJ | | | 46 | % | | | 40 | % | | | 32 | % | | | 48 | % | | | 96 | % |
| A | Calculated based on average shares outstanding during the period. |
| B | Net Investment income per share reflects a large, non-recurring dividend which amounted to $.08 per share. Excluding this non-recurring dividend, the ratio of net investment income (loss) to average net assets would have been 2.51%. |
| C | Net realized and unrealized gain (loss) per share reflects proceeds from litigation which amounted to $.02 per share. Excluding these litigation proceeds, the total return would have been (4.28)%. |
| D | The amounts shown reflect certain reclassifications related to book to tax differences that were made in the year shown. |
| E | Amount represents less than $.005 per share. |
| F | Total returns do not reflect charges attributable to your insurance company’s separate account. Inclusion of these charges would reduce the total returns shown. |
| G | Total returns would have been lower if certain expenses had not been reduced during the applicable periods shown. |
| H | Fees and expenses of any underlying Fidelity Central Funds are not included in the Fund’s expense ratio. The Fund indirectly bears its proportionate share of the expenses of any underlying Fidelity Central Funds. |
| I | Expense ratios reflect operating expenses of the class. Expenses before reductions do not reflect amounts reimbursed by the investment adviser or reductions from brokerage service arrangements or reductions from other expense offset arrangements and do not represent the amount paid by the class during periods when reimbursements or reductions occur. Expenses net of fee waivers reflect expenses after reimbursement by the investment adviser but prior to reductions from brokerage service arrangements or other expense offset arrangements. Expenses net of all reductions represent the net expenses paid by the class. |
| J | Amount does not include the portfolio activity of any underlying Fidelity Central Funds. |
See accompanying notes which are an integral part of the financial statements.
Notes to Financial Statements
For the period ended December 31, 2015
1. Organization.
VIP Equity-Income Portfolio (the Fund) is a fund of Variable Insurance Products Fund (the Trust) and is authorized to issue an unlimited number of shares. The Trust is registered under the Investment Company Act of 1940, as amended (the 1940 Act), as an open-end management investment company organized as a Massachusetts business trust. Shares of the Fund may only be purchased by insurance companies for the purpose of funding variable annuity or variable life insurance contracts. The Fund offers the following classes of shares: Initial Class shares, Service Class shares, Service Class 2 shares and Investor Class shares. The Fund offered Service Class 2R shares during the period April 24, 2002 through April 30, 2015, and all outstanding shares were converted to Service Class 2 shares by April 30, 2015. All classes have equal rights and voting privileges, except for matters affecting a single class.
2. Investments in Fidelity Central Funds.
The Fund invests in Fidelity Central Funds, which are open-end investment companies generally available only to other investment companies and accounts managed by the investment adviser and its affiliates. The Fund’s Schedule of Investments lists each of the Fidelity Central Funds held as of period end, if any, as an investment of the Fund, but does not include the underlying holdings of each Fidelity Central Fund. As an Investing Fund, the Fund indirectly bears its proportionate share of the expenses of the underlying Fidelity Central Funds.
The Money Market Central Funds seek preservation of capital and current income and are managed by Fidelity Investments Money Management, Inc. (FIMM), an affiliate of the investment adviser. Annualized expenses of the Money Market Central Funds as of their most recent shareholder report date are less than .005%.
A complete unaudited list of holdings for each Fidelity Central Fund is available upon request or at the Securities and Exchange Commission (the SEC) website at www.sec.gov. In addition, the financial statements of the Fidelity Central Funds, which are not covered by the Fund’s Report of Independent Registered Public Accounting Firm, are available on the SEC website or upon request.
3. Significant Accounting Policies.
The financial statements have been prepared in conformity with accounting principles generally accepted in the United States of America (GAAP), which require management to make certain estimates and assumptions at the date of the financial statements. Actual results could differ from those estimates. Subsequent events, if any, through the date that the financial statements were issued have been evaluated in the preparation of the financial statements. The following summarizes the significant accounting policies of the Fund:
Investment Valuation. Investments are valued as of 4:00 p.m. Eastern time on the last calendar day of the period. The Board of Trustees (the Board) has delegated the day to day responsibility for the valuation of the Fund’s investments to the Fidelity Management & Research Company (FMR) Fair Value Committee (the Committee). In accordance with valuation policies and procedures approved by the Board, the Fund attempts to obtain prices from one or more third party pricing vendors or brokers to value its investments. When current market prices, quotations or currency exchange rates are not readily available or reliable, investments will be fair valued in good faith by the Committee, in accordance with procedures adopted by the Board. Factors used in determining fair value vary by investment type and may include market or investment specific events, changes in interest rates and credit quality. The frequency with which these procedures are used cannot be predicted and they may be utilized to a significant extent. The Committee oversees the Fund’s valuation policies and procedures and reports to the Board on the Committee’s activities and fair value determinations. The Board monitors the appropriateness of the procedures used in valuing the Fund’s investments and ratifies the fair value determinations of the Committee.
The Fund categorizes the inputs to valuation techniques used to value its investments into a disclosure hierarchy consisting of three levels as shown below:
Level 1 – quoted prices in active markets for identical investments
Level 2 – other significant observable inputs (including quoted prices for similar investments, interest rates, prepayment speeds, etc.)
Level 3 – unobservable inputs (including the Fund’s own assumptions based on the best information available)
Valuation techniques used to value the Fund’s investments by major category are as follows:
Equity securities, including restricted securities, for which market quotations are readily available, are valued at the last reported sale price or official closing price as reported by a third party pricing vendor on the primary market or exchange on which they are traded and are categorized as Level 1 in the hierarchy. In the event there were no sales during the day or closing prices are not available, securities are valued at the last quoted bid price or may be valued using the last available price and are generally categorized as Level 2 in the hierarchy. For foreign equity securities, when market or security specific events arise, comparisons to the valuation of American Depositary Receipts (ADRs), futures contracts, Exchange-Traded Funds (ETFs) and certain indexes as well as quoted prices for similar securities may be used and would be categorized as Level 2 in the hierarchy. Utilizing these techniques may result in transfers between Level 1 and Level 2. For equity securities, including restricted
securities, where observable inputs are limited, assumptions about market activity and risk are used and these securities may be categorized as Level 3 in the hierarchy.
Debt securities, including restricted securities, are valued based on evaluated prices received from third party pricing vendors or from brokers who make markets in such securities. Corporate bonds and preferred securities are valued by pricing vendors who utilize matrix pricing which considers yield or price of bonds of comparable quality, coupon, maturity and type or by broker-supplied prices. When independent prices are unavailable or unreliable, debt securities may be valued utilizing pricing methodologies which consider similar factors that would be used by third party pricing vendors. Debt securities are generally categorized as Level 2 in the hierarchy but may be Level 3 depending on the circumstances.
Exchange-traded options are valued using the last sale price or, in the absence of a sale, the last offering price and are categorized as Level 1 in the hierarchy.
Investments in open-end mutual funds, including the Fidelity Central Funds, are valued at their closing net asset value (NAV) each business day and are categorized as Level 1 in the hierarchy.
Changes in valuation techniques may result in transfers in or out of an assigned level within the disclosure hierarchy. The aggregate value of investments by input level, as of December 31, 2015, is included at the end of the Fund’s Schedule of Investments.
Foreign Currency. The Fund may use foreign currency contracts to facilitate transactions in foreign-denominated securities. Gains and losses from these transactions may arise from changes in the value of the foreign currency or if the counterparties do not perform under the contracts’ terms.
Foreign-denominated assets, including investment securities, and liabilities are translated into U.S. dollars at the exchange rates at period end. Purchases and sales of investment securities, income and dividends received and expenses denominated in foreign currencies are translated into U.S. dollars at the exchange rate in effect on the transaction date.
The effects of exchange rate fluctuations on investments are included with the net realized and unrealized gain (loss) on investment securities. Other foreign currency transactions resulting in realized and unrealized gain (loss) are disclosed separately.
Investment Transactions and Income. For financial reporting purposes, the Fund’s investment holdings and NAV include trades executed through the end of the last business day of the period. The NAV per share for processing shareholder transactions is calculated as of the close of business of the New York Stock Exchange (NYSE), normally 4:00 p.m. Eastern time and includes trades executed through the end of the prior business day. Gains and losses on securities sold are determined on the basis of identified cost and may include proceeds received from litigation. Dividend income is recorded on the ex-dividend date, except for certain dividends from foreign securities where the ex-dividend date may have passed, which are recorded as soon as the Fund is informed of the ex-dividend date. Non-cash dividends included in dividend income, if any, are recorded at the fair market value of the securities received. Income and capital gain distributions from Fidelity Central Funds, if any, are recorded on the ex-dividend date. Distributions received on securities that represent a return of capital or capital gain are recorded as a reduction of cost of investments and/or as a realized gain. Subsequent to ex-dividend date the Fund determines the components of these distributions, based upon receipt of tax filings or other correspondence relating to the underlying investment. Interest income is accrued as earned and includes coupon interest and amortization of premium and accretion of discount on debt securities as applicable. Investment income is recorded net of foreign taxes withheld where recovery of such taxes is uncertain. Debt obligations may be placed on non-accrual status and related interest income may be reduced by ceasing current accruals and writing off interest receivables when the collection of all or a portion of interest has become doubtful based on consistently applied procedures. A debt obligation is removed from non-accrual status when the issuer resumes interest payments or when collectability of interest is reasonably assured.
Class Allocations and Expenses. Investment income, realized and unrealized capital gains and losses, common expenses of the Fund, and certain fund-level expense reductions, if any, are allocated daily on a pro-rata basis to each class based on the relative net assets of each class to the total net assets of the Fund. Each class differs with respect to transfer agent and distribution and service plan fees incurred. Certain expense reductions may also differ by class. For the reporting period, the allocated portion of income and expenses to each class as a percent of its average net assets may vary due to the timing of recording these transactions in relation to fluctuating net assets of the classes. Expenses directly attributable to a fund are charged to that fund. Expenses attributable to more than one fund are allocated among the respective funds on the basis of relative net assets or other appropriate methods. Expense estimates are accrued in the period to which they relate and adjustments are made when actual amounts are known.
Deferred Trustee Compensation. Under a Deferred Compensation Plan (the Plan), independent Trustees may elect to defer receipt of a portion of their annual compensation. Deferred amounts are invested in a cross-section of Fidelity funds, are marked-to-market and remain in the Fund until distributed in accordance with the Plan. The investment of deferred amounts and the offsetting payable to the Trustees are included in the accompanying Statement of Assets and Liabilities.
Income Tax Information and Distributions to Shareholders. Each year, the Fund intends to qualify as a regulated investment company under Subchapter M of the Internal Revenue Code, including distributing substantially all of its taxable income and realized gains. As a result, no
Notes to Financial Statements – continued
provision for U.S. Federal income taxes is required. As of December 31, 2015, the Fund did not have any unrecognized tax benefits in the financial statements; nor is the Fund aware of any tax positions for which it is reasonably possible that the total amounts of unrecognized tax benefits will significantly change in the next twelve months. The Fund files a U.S. federal tax return, in addition to state and local tax returns as required. The Fund’s federal income tax returns are subject to examination by the Internal Revenue Service (IRS) for a period of three fiscal years after they are filed. State and local tax returns may be subject to examination for an additional fiscal year depending on the jurisdiction. Foreign taxes are provided for based on the Fund’s understanding of the tax rules and rates that exist in the foreign markets in which it invests.
Distributions are declared and recorded on the ex-dividend date. Income dividends and capital gain distributions are declared separately for each class. Income and capital gain distributions are determined in accordance with income tax regulations, which may differ from GAAP.
Capital accounts within the financial statements are adjusted for permanent book-tax differences. These adjustments have no impact on net assets or the results of operations. Capital accounts are not adjusted for temporary book-tax differences which will reverse in a subsequent period.
Book-tax differences are primarily due to foreign currency transactions, equity–debt classification, certain conversion ratio adjustments, contingent interest, market discount, options transactions, partnerships, deferred trustees compensation and losses deferred due to wash sales and excise tax regulations.
The federal tax cost of investment securities and unrealized appreciation (depreciation) as of period end were as follows:
| Gross unrealized appreciation | | $ | 996,553,186 | |
| Gross unrealized depreciation | | | (469,990,890 | ) |
| Net unrealized appreciation (depreciation) on securities | | $ | 526,562,296 | |
| Tax Cost | | $ | 4,777,427,461 | |
The tax-based components of distributable earnings as of period end were as follows:
| Undistributed long-term capital gain | | $ | 326,387,012 | |
| | | | | |
| Net unrealized appreciation (depreciation) on securities and other investments | | $ | 527,175,265 | |
The Fund intends to elect to defer to its next fiscal year $19,438,423 of capital losses recognized during the period November 1, 2015 to December 31, 2015.
The tax character of distributions paid was as follows:
| | | December 31, 2015 | | | December 31, 2014 | |
| Ordinary Income | | $ | 202,573,284 | | | $ | 242,650,166 | |
| Long-term Capital Gains | | | 533,586,526 | | | | 18,422,560 | |
| Total | | $ | 736,159,810 | | | $ | 261,072,726 | |
Trading (Redemption) Fees. Service Class 2R shares held by investors less than 60 days may have been subject to a redemption fee equal to 1% of the NAV of shares redeemed. All redemption fees, which reduce the proceeds of the shareholder redemption, are retained by the Fund and accounted for as an addition to paid in capital. These redemption fees were eliminated effective April 30, 2015.
Restricted Securities. The Fund may invest in securities that are subject to legal or contractual restrictions on resale. These securities generally may be resold in transactions exempt from registration or to the public if the securities are registered. Disposal of these securities may involve time-consuming negotiations and expense, and prompt sale at an acceptable price may be difficult. Information regarding restricted securities is included at the end of the Fund’s Schedule of Investments.
4. Derivative Instruments.
Risk Exposures and the Use of Derivative Instruments. The Fund’s investment objective allows the Fund to enter into various types of derivative contracts, including options. Derivatives are investments whose value is primarily derived from underlying assets, indices or reference rates and may be transacted on an exchange or over-the-counter (OTC). Derivatives may involve a future commitment to buy or sell a specified asset based on specified terms, to exchange future cash flows at periodic intervals based on a notional principal amount, or for one party to make one or more payments upon the occurrence of specified events in exchange for periodic payments from the other party.
The Fund used derivatives to increase returns and to manage exposure to certain risks as defined below. The success of any strategy involving derivatives depends on analysis of numerous economic factors, and if the strategies for investment do not work as intended, the Fund may not
achieve its objectives.
The Fund’s use of derivatives increased or decreased its exposure to the following risk:
| Equity Risk | Equity risk relates to the fluctuations in the value of financial instruments as a result of changes in market prices (other than those arising from interest rate risk or foreign exchange risk), whether caused by factors specific to an individual investment, its issuer, or all factors affecting all instruments traded in a market or market segment. |
The Fund is also exposed to additional risks from investing in derivatives, such as liquidity risk and counterparty credit risk. Liquidity risk is the risk that the Fund will be unable to close out the derivative in the open market in a timely manner. Counterparty credit risk is the risk that the counterparty will not be able to fulfill its obligation to the Fund. Counterparty credit risk related to exchange-traded options may be mitigated by the protection provided by the exchange on which they trade.
Investing in derivatives may involve greater risks than investing in the underlying assets directly and, to varying degrees, may involve risk of loss in excess of any initial investment and collateral received and amounts recognized in the Statement of Assets and Liabilities. In addition, there may be the risk that the change in value of the derivative contract does not correspond to the change in value of the underlying instrument.
Options. Options give the purchaser the right, but not the obligation, to buy (call) or sell (put) an underlying security or financial instrument at an agreed exercise or strike price between or on certain dates. Options obligate the seller (writer) to buy (put) or sell (call) an underlying instrument at the exercise or strike price or cash settle an underlying derivative instrument if the holder exercises the option on or before the expiration date.
The Fund used exchange-traded written covered call options to manage its exposure to the market. When the Fund writes a covered call option, the Fund holds the underlying instrument which must be delivered to the holder upon the exercise of the option.
Upon entering into a written options contract, the Fund will receive a premium. Premiums received are reflected as a liability on the Statement of Assets and Liabilities. Options are valued daily and any unrealized appreciation (depreciation) is reflected on the Statement of Assets and Liabilities. When a written option is exercised, the premium is added to the proceeds from the sale of the underlying instrument in determining the gain or loss realized on that investment. When an option is closed the Fund will realize a gain or loss depending on whether the proceeds or amount paid for the closing sale transaction are greater or less than the premium received. When an option expires, gains and losses are realized to the extent of premiums received. The net realized gain (loss) on closed and expired written options and the change in net unrealized appreciation (depreciation) on written options are reflected separately on the Statement of Operations.
Writing call options tends to decrease exposure to the underlying instrument and risk of loss is the change in value in excess of the premium received.
Any open options at period end are presented in the Schedule of Investments under the caption “Written Options”.
During the period, the Fund recognized net realized gain (loss) of $15,127,152 and a change in net unrealized appreciation (depreciation) of $3,441,483 related to its investment in written options. This amount is included in the Statement of Operations.
The following is a summary of the Fund’s written options activity:
| Written Options | | Number of Contracts | | | Amount of Premiums | |
| Outstanding at beginning of period | | | 17,086 | | | $ | 1,503,953 | |
| Options Opened | | | 319,412 | | | | 28,477,955 | |
| Options Exercised | | | (89,901 | ) | | | (8,269,373 | ) |
| Options Closed | | | (96,405 | ) | | | (9,624,661 | ) |
| Options Expired | | | (94,929 | ) | | | (8,504,721 | ) |
| Outstanding at end of period | | | 55,263 | | | $ | 3,583,153 | |
5. Purchases and Sales of Investments.
Purchases and sales of securities, other than short-term securities, aggregated $2,591,089,543 and $3,086,366,914, respectively.
6. Fees and Other Transactions with Affiliates.
Management Fee. Fidelity Management & Research Company (the investment adviser) and its affiliates provide the Fund with investment management related services for which the Fund pays a monthly management fee. The management fee is the sum of an individual fund fee rate that is based on an annual rate of .20% of the Fund’s average net assets and an annualized group fee rate that averaged .25% during the period. The group fee rate is based upon the average net assets of all the mutual funds advised by the investment adviser, including any mutual funds
Notes to Financial Statements – continued
previously advised by the investment adviser that are currently advised by Fidelity SelectCo, LLC, an affiliate of the investment adviser. The group fee rate decreases as assets under management increase and increases as assets under management decrease. For the reporting period, the total annual management fee rate was .45% of the Fund’s average net assets.
Distribution and Service Plan Fees. In accordance with Rule 12b-1 of the 1940 Act, the Fund has adopted separate 12b-1 Plans for each Service Class of shares. Each Service Class pays Fidelity Distributors Corporation (FDC), an affiliate of the investment adviser, a service fee. For the period, the service fee is based on an annual rate of .10% of Service Class’ average net assets and .25% of Service Class 2’s and Service Class 2R’s average net assets.
For the period, total fees, all of which were re-allowed to insurance companies for the distribution of shares and providing shareholder support services, were as follows:
| Service Class | | $ | 344,600 | |
| Service Class 2 | | | 3,898,418 | |
| Service Class 2R(a) | | | 12,571 | |
| | | $ | 4,255,589 | |
(a) For the period January 1, 2015 through April 30, 2015.
Transfer Agent Fees. Fidelity Investments Institutional Operations Company, Inc. (FIIOC), an affiliate of the investment adviser, is the Fund’s transfer, dividend disbursing, and shareholder servicing agent. FIIOC receives an asset-based fee with respect to each class. Each class (with the exception of Investor Class) pays a fee for transfer agent services, typesetting, printing and mailing of shareholder reports, excluding mailing of proxy statements and out of pocket expenses, equal to an annual rate of .07% (.15% for Investor Class) of class-level average net assets For the period, transfer agent fees for each class, including out of pocket expenses, were as follows:
| Initial Class | | $ | 2,354,728 | |
| Service Class | | | 227,693 | |
| Service Class 2 | | | 1,030,558 | |
| Service Class 2R(a) | | | 3,315 | |
| Investor Class | | | 545,817 | |
| | | $ | 4,162,111 | |
(a) For the period January 1, 2015 through April 30, 2015.
Accounting and Security Lending Fees. Fidelity Service Company, Inc. (FSC), an affiliate of the investment adviser, maintains the Fund’s accounting records. The accounting fee is based on the level of average net assets for each month. Under a separate contract, FSC administers the security lending program. The security lending fee is based on the number and duration of lending transactions.
Brokerage Commissions. The Fund placed a portion of its portfolio transactions with brokerage firms which are affiliates of the investment adviser. Brokerage commissions are included in net realized gain (loss) and change in net unrealized appreciation (depreciation) in the Statement of Operations. The commissions paid to these affiliated firms were $30,960 for the period.
Interfund Trades. The Fund may purchase from or sell securities to other Fidelity Funds under procedures adopted by the Board. The procedures have been designed to ensure these interfund trades are executed in accordance with Rule 17a-7 of the 1940 Act. Interfund trades are included within the respective purchases and sales amounts shown in the Purchases and Sales of Investments note.
Other. During the period, the investment adviser reimbursed the Fund for certain losses in the amount of $196,680.
7. Committed Line of Credit.
The Fund participates with other funds managed by the investment adviser or an affiliate in a $4.25 billion credit facility (the “line of credit”) to be utilized for temporary or emergency purposes to fund shareholder redemptions or for other short-term liquidity purposes. The Fund has agreed to pay commitment fees on its pro-rata portion of the line of credit, which amounted to $8,769 and is reflected in Miscellaneous expenses on the Statement of Operations. During the period, the Fund did not borrow on this line of credit.
8. Security Lending.
The Fund lends portfolio securities through a lending agent from time to time in order to earn additional income. For equity securities, a lending agent is used and may loan securities to certain qualified borrowers, including Fidelity Capital Markets (FCM), a broker-dealer affiliated with the Fund. On the settlement date of the loan, the Fund receives collateral (in the form of U.S. Treasury obligations, letters of credit and/or cash) against the loaned securities and maintains collateral in an amount not less than 100% of the market value of the loaned securities during the
period of the loan. The market value of the loaned securities is determined at the close of business of the Fund and any additional required collateral is delivered to the Fund on the next business day. The Fund or borrower may terminate the loan at any time, and if the borrower defaults on its obligation to return the securities loaned because of insolvency or other reasons, the Fund may apply collateral received from the borrower against the obligation. The Fund may experience delays and costs in recovering the securities loaned. Any cash collateral received is invested in the Fidelity Securities Lending Cash Central Fund. The value of loaned securities and cash collateral at period end are disclosed on the Fund’s Statement of Assets and Liabilities. The value of securities loaned to FCM at period end was $5,930,322. Security lending income represents the income earned on investing cash collateral, less rebates paid to borrowers and any lending agent fees associated with the loan, plus any premium payments received for lending certain types of securities. Security lending income is presented in the Statement of Operations as a component of income from Fidelity Central Funds. Total security lending income during the period amounted to $672,703, including $47,413 from securities loaned to FCM.
9. Expense Reductions.
Commissions paid to certain brokers with whom the investment adviser, or its affiliates, places trades on behalf of the Fund include an amount in addition to trade execution, which may be rebated back to the Fund to offset certain expenses. This amount totaled $306,883 for the period. In addition, through arrangements with the Fund’s custodian, credits realized as a result of certain uninvested cash balances were used to reduce the Fund’s expenses. During the period, these credits reduced the Fund’s custody expenses by $689.
In addition, during the period the investment adviser reimbursed and/or waived a portion of fund-level operating expenses in the amount of $24,221 and a portion of class-level operating expenses as follows:
| | | Amount | |
| Investor Class | | $ | 8,204 | |
10. Distributions to Shareholders.
Distributions to shareholders of each class were as follows:
| Years ended December 31, | | 2015(a) | | | 2014 | |
| From net investment income | | | | | | | | |
| Initial Class | | $ | 109,149,565 | | | $ | 107,336,069 | |
| Service Class | | | 10,156,613 | | | | 10,064,095 | |
| Service Class 2 | | | 42,706,986 | | | | 44,643,796 | |
| Service Class 2R | | | 11,545 | | | | 416,261 | |
| Investor Class | | | 11,524,324 | | | | 10,712,923 | |
| Total | | $ | 173,549,033 | | | $ | 173,173,144 | |
| From net realized gain | | | | | | | | |
| Initial Class | | $ | 339,608,604 | | | $ | 53,100,552 | |
| Service Class | | | 33,003,823 | | | | 5,192,387 | |
| Service Class 2 | | | 153,933,197 | | | | 24,163,154 | |
| Service Class 2R | | | 1,316,715 | | | | 208,074 | |
| Investor Class | | | 34,748,438 | | | | 5,235,415 | |
| Total | | $ | 562,610,777 | | | $ | 87,899,582 | |
(a) All Service Class 2R shares were converted by April 30, 2015.
11. Share Transactions.
Transactions for each class of shares were as follows:
| Years ended | | Shares | | | Shares | | | Dollars | | | Dollars | |
| December 31, | | 2015(a) | | | 2014 | | | 2015(a) | | | 2014 | |
| Initial Class | | | | | | | | | | | | | | | | |
| Shares sold | | | 2,942,434 | | | | 3,745,247 | | | $ | 64,636,128 | | | $ | 90,278,141 | |
| Reinvestment of distributions | | | 20,908,619 | | | | 6,589,354 | | | | 448,758,169 | | | | 160,436,620 | |
| Shares redeemed | | | (22,650,939 | ) | | | (22,744,482 | ) | | | (503,270,251 | ) | | | (547,118,347 | ) |
| Net increase (decrease) | | | 1,200,114 | | | | (12,409,881 | ) | | $ | 10,124,046 | | | $ | (296,403,586 | ) |
Notes to Financial Statements – continued
| Years ended | | Shares | | | Shares | | | Dollars | | | Dollars | |
| December 31, | | 2015(a) | | | 2014 | | | 2015(a) | | | 2014 | |
| Service Class | | | | | | | | | | | | | | | | |
| Shares sold | | | 583,466 | | | | 560,667 | | | $ | 12,999,462 | | | $ | 13,553,192 | |
| Reinvestment of distributions | | | 2,018,226 | | | | 629,390 | | | | 43,160,436 | | | | 15,256,482 | |
| Shares redeemed | | | (2,646,679 | ) | | | (2,833,591 | ) | | | (58,306,592 | ) | | | (68,623,532 | ) |
| Net increase (decrease) | | | (44,987 | ) | | | (1,643,534 | ) | | $ | (2,146,694 | ) | | $ | (39,813,858 | ) |
| Service Class 2 | | | | | | | | | | | | | | | | |
| Shares sold | | | 4,829,943 | | | | 4,230,671 | | | $ | 104,917,377 | | | $ | 100,211,368 | |
| Reinvestment of distributions | | | 9,327,616 | | | | 2,879,996 | | | | 196,640,183 | | | | 68,806,950 | |
| Shares redeemed | | | (18,242,504 | ) | | | (12,454,297 | ) | | | (397,542,395 | ) | | | (296,579,008 | ) |
| Net increase (decrease) | | | (4,084,945 | ) | | | (5,343,630 | ) | | $ | (95,984,835 | ) | | $ | (127,560,690 | ) |
| Service Class 2R | | | | | | | | | | | | | | | | |
| Shares sold | | | 44,755 | | | | 205,262 | | | $ | 994,924 | | | $ | 4,868,639 | |
| Reinvestment of distributions | | | 61,837 | | | | 26,268 | | | | 1,328,260 | | | | 624,335 | |
| Shares redeemed | | | (758,460 | ) | | | (106,535 | ) | | | (16,752,939 | ) | | | (2,539,192 | ) |
| Net increase (decrease) | | | (651,868 | ) | | | 124,995 | | | $ | (14,429,755 | ) | | $ | 2,953,782 | |
| Investor Class | | | | | | | | | | | | | | | | |
| Shares sold | | | 1,061,340 | | | | 1,906,050 | | | $ | 23,323,259 | | | $ | 45,905,466 | |
| Reinvestment of distributions | | | 2,166,600 | | | | 656,848 | | | | 46,272,762 | | | | 15,948,338 | |
| Shares redeemed | | | (2,123,884 | ) | | | (1,632,275 | ) | | | (47,098,812 | ) | | | (38,978,149 | ) |
| Net increase (decrease) | | | 1,104,056 | | | | 930,623 | | | $ | 22,497,209 | | | $ | 22,875,655 | |
(a) All Service Class 2R shares were converted by April 30, 2015.
12. Other.
The Fund’s organizational documents provide former and current trustees and officers with a limited indemnification against liabilities arising in connection with the performance of their duties to the Fund. In the normal course of business, the Fund may also enter into contracts that provide general indemnifications. The Fund’s maximum exposure under these arrangements is unknown as this would be dependent on future claims that may be made against the Fund. The risk of material loss from such claims is considered remote.
At the end of the period, the investment adviser or its affiliates were the owners of record of 14% of the total outstanding shares of the Fund and one otherwise unaffiliated shareholder was the owner of record of 19% of the total outstanding shares of the Fund.
Report of Independent Registered Public Accounting Firm
To the Trustees of Variable Insurance Products Fund and Shareholders of VIP Equity-Income Portfolio:
In our opinion, the accompanying statement of assets and liabilities, including the schedule of investments, and the related statements of operations and of changes in net assets and the financial highlights present fairly, in all material respects, the financial position of VIP Equity-Income Portfolio (a fund of Variable Insurance Products Fund) at December 31, 2015, the results of its operations for the year then ended, the changes in its net assets for each of the two years in the period then ended and the financial highlights for each of the five years in the period then ended, in conformity with accounting principles generally accepted in the United States of America. These financial statements and financial highlights (hereafter referred to as “financial statements”) are the responsibility of the VIP Equity-Income Portfolio’s management. Our responsibility is to express an opinion on these financial statements based on our audits. We conducted our audits of these financial statements in accordance with the standards of the Public Company Accounting Oversight Board (United States). Those standards require that we plan and perform the audit to obtain reasonable assurance about whether the financial statements are free of material misstatement. An audit includes examining, on a test basis, evidence supporting the amounts and disclosures in the financial statements, assessing the accounting principles used and significant estimates made by management, and evaluating the overall financial statement presentation. We believe that our audits, which included confirmation of securities at December 31, 2015 by correspondence with the custodian and brokers, provide a reasonable basis for our opinion.
PricewaterhouseCoopers LLP
Boston, Massachusetts
February 17, 2016
Trustees and Officers
The Trustees, Members of the Advisory Board (if any), and officers of the trust and fund, as applicable, are listed below. The Board of Trustees governs the fund and is responsible for protecting the interests of shareholders. The Trustees are experienced executives who meet periodically throughout the year to oversee the fund’s activities, review contractual arrangements with companies that provide services to the fund, oversee management of the risks associated with such activities and contractual arrangements, and review the fund’s performance. Each of the Trustees oversees 170 funds.
The Trustees hold office without limit in time except that (a) any Trustee may resign; (b) any Trustee may be removed by written instrument, signed by at least two-thirds of the number of Trustees prior to such removal; (c) any Trustee who requests to be retired or who has become incapacitated by illness or injury may be retired by written instrument signed by a majority of the other Trustees; and (d) any Trustee may be removed at any special meeting of shareholders by a two-thirds vote of the outstanding voting securities of the trust. Each Trustee who is not an interested person (as defined in the 1940 Act) of the trust and the fund is referred to herein as an Independent Trustee. Each Independent Trustee shall retire not later than the last day of the calendar year in which his or her 75th birthday occurs. The Independent Trustees may waive this mandatory retirement age policy with respect to individual Trustees. Officers and Advisory Board Members hold office without limit in time, except that any officer or Advisory Board Member may resign or may be removed by a vote of a majority of the Trustees at any regular meeting or any special meeting of the Trustees. Except as indicated, each individual has held the office shown or other offices in the same company for the past five years.
The fund’s Statement of Additional Information (SAI) includes more information about the Trustees. To request a free copy, call Fidelity at 1-877-208-0098.
Experience, Skills, Attributes, and Qualifications of the Trustees. The Governance and Nominating Committee has adopted a statement of policy that describes the experience, qualifications, attributes, and skills that are necessary and desirable for potential Independent Trustee candidates (Statement of Policy). The Board believes that each Trustee satisfied at the time he or she was initially elected or appointed a Trustee, and continues to satisfy, the standards contemplated by the Statement of Policy. The Governance and Nominating Committee also engages professional search firms to help identify potential Independent Trustee candidates who have the experience, qualifications, attributes, and skills consistent with the Statement of Policy. From time to time, additional criteria based on the composition and skills of the current Independent Trustees, as well as experience or skills that may be appropriate in light of future changes to board composition, business conditions, and regulatory or other developments, have also been considered by the professional search firms and the Governance and Nominating Committee. In addition, the Board takes into account the Trustees’ commitment and participation in Board and committee meetings, as well as their leadership of standing and ad hoc committees throughout their tenure.
In determining that a particular Trustee was and continues to be qualified to serve as a Trustee, the Board has considered a variety of criteria, none of which, in isolation, was controlling. The Board believes that, collectively, the Trustees have balanced and diverse experience, qualifications, attributes, and skills, which allow the Board to operate effectively in governing the fund and protecting the interests of shareholders. Information about the specific experience, skills, attributes, and qualifications of each Trustee, which in each case led to the Board’s conclusion that the Trustee should serve (or continue to serve) as a trustee of the fund, is provided below.
Board Structure and Oversight Function. James C. Curvey is an interested person and currently serves as Chairman. The Trustees have determined that an interested Chairman is appropriate and benefits shareholders because an interested Chairman has a personal and professional stake in the quality and continuity of services provided to the fund. Independent Trustees exercise their informed business judgment to appoint an individual of their choosing to serve as Chairman, regardless of whether the Trustee happens to be independent or a member of management. The Independent Trustees have determined that they can act independently and effectively without having an Independent Trustee serve as Chairman and that a key structural component for assuring that they are in a position to do so is for the Independent Trustees to constitute a substantial majority for the Board. The Independent Trustees also regularly meet in executive session. Ned C. Lautenbach serves as Chairman of the Independent Trustees and as such (i) acts as a liaison between the Independent Trustees and management with respect to matters important to the Independent Trustees and (ii) with management prepares agendas for Board meetings.
Fidelity® funds are overseen by different Boards of Trustees. The fund’s Board oversees Fidelity’s high income and certain equity funds, and other Boards oversee Fidelity’s investment-grade bond, money market, asset allocation, and sector funds. The asset allocation funds may invest in Fidelity® funds overseen by the fund’s Board. The use of separate Boards, each with its own committee structure, allows the Trustees of each group of Fidelity® funds to focus on the unique issues of the funds they oversee, including common research, investment, and operational issues. On occasion, the separate Boards establish joint committees to address issues of overlapping consequences for the Fidelity® funds overseen by each Board.
The Trustees operate using a system of committees to facilitate the timely and efficient consideration of all matters of importance to the Trustees, the fund, and fund shareholders and to facilitate compliance with legal and regulatory requirements and oversight of the fund’s activities and associated risks. The Board, acting through its committees, has charged FMR and its affiliates with (i) identifying events or circumstances the occurrence of which could have demonstrably adverse effects on the fund’s business and/or reputation; (ii) implementing processes and controls to lessen the possibility that such events or circumstances occur or to mitigate the effects of such events or circumstances if they do occur; and (iii) creating and maintaining a system designed to evaluate continuously business and market conditions in order to facilitate the identification and implementation processes described in (i) and (ii) above. Because the day-to-day operations and activities of the fund are carried out by or through FMR, its affiliates, and other service providers, the fund’s exposure to risks is mitigated but not eliminated by the processes overseen
by the Trustees. While each of the Board’s committees has responsibility for overseeing different aspects of the fund’s activities, oversight is exercised primarily through the Operations, Audit, and Compliance Committees. In addition, the Independent Trustees have worked with FMR to enhance the Board’s oversight of investment and financial risks, legal and regulatory risks, technology risks, and operational risks, including the development of additional risk reporting to the Board. For example, a working group comprised of Independent Trustees and FMR has worked and continues to work to review the Fidelity®funds’ valuation-related activities, reporting and risk management. Appropriate personnel, including but not limited to the fund’s Chief Compliance Officer (CCO), FMR’s internal auditor, the independent accountants, the fund’s Treasurer and portfolio management personnel, make periodic reports to the Board’s committees, as appropriate, including an annual review of Fidelity’s risk management program for the Fidelity®funds. The responsibilities of each standing committee, including their oversight responsibilities, are described further under “Standing Committees of the Trustees.”
Interested Trustees*:
Correspondence intended for a Trustee who is an interested person may be sent to Fidelity Investments, 245 Summer Street, Boston, Massachusetts 02210.
Name, Year of Birth; Principal Occupations and Other Relevant Experience+
James C. Curvey (1935)
Year of Election or Appointment: 2007
Trustee
Chairman of the Board of Trustees
Mr. Curvey also serves as Trustee of other Fidelity® funds. Mr. Curvey is a Director of Fidelity Research & Analysis Co. (investment adviser firm, 2009-present), and Vice Chairman (2007-present) and Director of FMR LLC (diversified financial services company). In addition, Mr. Curvey serves as an Overseer for the Boston Symphony Orchestra and a member of the board of Artis-Naples, Naples, Florida, and as a Trustee for Brewster Academy, Wolfeboro, New Hampshire. Previously, Mr. Curvey served as a Director of Fidelity Investments Money Management, Inc. (investment adviser firm, 2009-2014) and a Director of FMR and FMR Co., Inc. (investment adviser firms, 2007-2014).
Charles S. Morrison (1960)
Year of Election or Appointment: 2014
Trustee
Mr. Morrison also serves as Trustee of other funds. He serves as a Director of Fidelity Investments Money Management, Inc. (FIMM) (investment adviser firm, 2014-present), Director of Fidelity SelectCo, LLC (investment adviser firm, 2014-present), President, Asset Management (2014-present), and is an employee of Fidelity Investments. Previously, Mr. Morrison served as Vice President of Fidelity’s Fixed Income and Asset Allocation Funds (2012-2014), President, Fixed Income (2011-2014), Vice President of Fidelity’s Money Market Funds (2005-2009), President, Money Market Group Leader of FMR (investment adviser firm, 2009), and Senior Vice President, Money Market Group of FMR (2004-2009). Mr. Morrison also served as Vice President of Fidelity’s Bond Funds (2002-2005), certain Balanced Funds (2002-2005), and certain Asset Allocation Funds (2002-2007), and as Senior Vice President (2002-2005) of Fidelity’s Bond Division.
| * | Determined to be an “Interested Trustee” by virtue of, among other things, his or her affiliation with the trust or various entities under common control with FMR. |
| + | The information includes the Trustee’s principal occupation during the last five years and other information relating to the experience, attributes, and skills relevant to the Trustee’s qualifications to serve as a Trustee, which led to the conclusion that the Trustee should serve as a Trustee for the fund. |
Trustees and Officers – continued
Independent Trustees:
Correspondence intended for an Independent Trustee may be sent to Fidelity Investments, P.O. Box 55235, Boston, Massachusetts 02205-5235.
Name, Year of Birth; Principal Occupations and Other Relevant Experience+
Dennis J. Dirks (1948)
Year of Election or Appointment: 2005
Trustee
Mr. Dirks also serves as Trustee of other Fidelity® funds. Prior to his retirement in May 2003, Mr. Dirks was Chief Operating Officer and a member of the Board of The Depository Trust & Clearing Corporation (DTCC). He also served as President, Chief Operating Officer, and Board member of The Depository Trust Company (DTC) and President and Board member of the National Securities Clearing Corporation (NSCC). In addition, Mr. Dirks served as Chief Executive Officer and Board member of the Government Securities Clearing Corporation, Chief Executive Officer and Board member of the Mortgage-Backed Securities Clearing Corporation, as a Trustee and a member of the Finance Committee of Manhattan College (2005-2008), as a Trustee and a member of the Finance Committee of AHRC of Nassau County (2006-2008), and as a member of the Independent Directors Council (IDC) Governing Council (2010-2015). Mr. Dirks is a member of the Board of Directors for The Brookville Center for Children’s Services, Inc. (2009-present).
Alan J. Lacy (1953)
Year of Election or Appointment: 2008
Trustee
Mr. Lacy also serves as Trustee of other Fidelity® funds. Mr. Lacy serves as Chairman (2014-present) and a member (2010-present) of the Board of Directors of Dave & Buster’s Entertainment, Inc. (restaurant and entertainment complexes) and a Director of Bristol-Myers Squibb Company (global pharmaceuticals, 2008-present). He is a Trustee of the California Chapter of The Nature Conservancy (2015-present) and a Director of the Center for Advanced Study in the Behavioral Sciences at Stanford University (2015-present). In addition, Mr. Lacy served as Senior Adviser (2007-2014) of Oak Hill Capital Partners, L.P. (private equity) and also served as Chief Executive Officer (2005) and Vice Chairman (2005-2006) of Sears Holdings Corporation (retail) and Chief Executive Officer and Chairman of the Board of Sears, Roebuck and Co. (retail, 2000-2005). Previously, Mr. Lacy served as Chairman (2008-2011) and a member (2006-2015) of the Board of Trustees of the National Parks Conservation Association and as a member of the Board of Directors for The Western Union Company (global money transfer, 2006-2011), The Hillman Companies, Inc. (hardware wholesalers, 2010-2014), and Earth Fare, Inc. (retail grocery, 2010-2014).
Ned C. Lautenbach (1944)
Year of Election or Appointment: 2000
Trustee
Chairman of the Independent Trustees
Mr. Lautenbach also serves as Trustee of other Fidelity® funds. Mr. Lautenbach currently serves as the Lead Director of the Eaton Corporation Board of Directors (diversified industrial, 1997-present). Mr. Lautenbach is Chairman of the Board of Directors of Artis-Naples in Naples, Florida (2012-present), a member of the Council on Foreign Relations (1994-present), and a member of the Board of Governors, State University System of Florida (2013-present). Previously, Mr. Lautenbach was a Partner/Advisory Partner at Clayton, Dubilier & Rice, LLC (private equity investment, 1998-2010), as well as a Director of Sony Corporation (2006-2007).
Joseph Mauriello (1944)
Year of Election or Appointment: 2008
Trustee
Mr. Mauriello also serves as Trustee of other Fidelity® funds. Prior to his retirement in January 2006, Mr. Mauriello served in numerous senior management positions including Deputy Chairman and Chief Operating Officer (2004-2005), and Vice Chairman of Financial Services (2002-2004) of KPMG LLP US (professional services, 1965-2005). Mr. Mauriello currently serves as a member of the Board of Directors of XL Group plc. (global insurance and re-insurance, 2006-present) and the Independent Directors Council (IDC) Governing Council (2015-present). Previously, Mr. Mauriello served as a Director of the Hamilton Funds of the Bank of New York (2006-2007) and of Arcadia Resources Inc. (health care services and products, 2007-2012).
Robert W. Selander (1950)
Year of Election or Appointment: 2011
Trustee
Mr. Selander also serves as Trustee of other Fidelity® funds. Mr. Selander serves as a Director of The Western Union Company (global money transfer, 2014-present) and a non-executive Chairman of Health Equity, Inc. (health savings custodian, 2015-present). Previously, Mr. Selander served as a Member of the Advisory Board of other Fidelity® funds (2011), and Executive Vice Chairman (2010), Chief Executive Officer (2009-2010), and President and Chief Executive Officer (1997-2009) of Mastercard, Inc.
Cornelia M. Small (1944)
Year of Election or Appointment: 2005
Trustee
Ms. Small also serves as Trustee of other Fidelity® funds. Ms. Small is a member of the Board of Directors (2009-present) and Chair of the Investment Committee (2010-present) of the Teagle Foundation. Ms. Small also serves on the Investment Committee of the Berkshire Taconic Community Foundation (2008-present). Previously, Ms. Small served as Chairperson (2002-2008) and a member of the Investment Committee and Chairperson (2008-2012) and a member of the Board of Trustees of Smith College. In addition, Ms. Small served as Chief Investment Officer, Director of Global Equity Investments, and a member of the Board of Directors of Scudder, Stevens & Clark and Scudder Kemper Investments.
William S. Stavropoulos (1939)
Year of Election or Appointment: 2001
Trustee
Vice Chairman of the Independent Trustees
Mr. Stavropoulos also serves as Trustee of other Fidelity® funds. Mr. Stavropoulos serves as President and Founder of the Michigan Baseball Foundation, the Great Lakes Loons (2007-present). Mr. Stavropoulos is Chairman Emeritus of the Board of Directors of The Dow Chemical Company, where he previously served in numerous senior management positions, including President, CEO (1995-2000; 2002-2004), Chairman of the Executive Committee (2000-2006), and as a member of the Board of Directors (1990-2006). Currently, Mr. Stavropoulos is Chairman of the Board of Directors of Univar Inc. (global distributor of commodity and specialty chemicals), a Director of Teradata Corporation (data warehousing and technology solutions), and Maersk Inc. (industrial conglomerate), and a member of the Advisory Board for Metalmark Capital LLC (private equity investment, 2005-present). Mr. Stavropoulos is an operating advisor to Clayton, Dubilier & Rice, LLC (private equity investment). In addition, Mr. Stavropoulos is a member of the University of Notre Dame Advisory Council for the College of Science, a Trustee of the Rollin L. Gerstacker Foundation, and a Director of the Naples Philharmonic Center for the Arts. Previously, Mr. Stavropoulos served as a Director of Chemical Financial Corporation (bank holding company, 1993-2012) and Tyco International, Ltd. (multinational manufacturing and services, 2007-2012).
David M. Thomas (1949)
Year of Election or Appointment: 2008
Trustee
Mr. Thomas also serves as Trustee of other Fidelity® funds. Mr. Thomas serves as Non-Executive Chairman of the Board of Directors of Fortune Brands Home and Security (home and security products, 2011-present), as a member of the Board of Directors (2004-present) and Presiding Director (2013-present) of Interpublic Group of Companies, Inc. (marketing communication), and as a member of the Board of Trustees of the University of Florida (2013-present). Previously, Mr. Thomas served as Executive Chairman (2005-2006) and Chairman and Chief Executive Officer (2000-2005) of IMS Health, Inc. (pharmaceutical and healthcare information solutions), and a Director of Fortune Brands, Inc. (consumer products, 2000-2011).
| + | The information includes the Trustee’s principal occupation during the last five years and other information relating to the experience, attributes, and skills relevant to the Trustee’s qualifications to serve as a Trustee, which led to the conclusion that the Trustee should serve as a Trustee for the fund. |
Advisory Board Members and Officers:
Correspondence intended for an officer or Peter S. Lynch may be sent to Fidelity Investments, 245 Summer Street, Boston, Massachusetts 02210. Officers appear below in alphabetical order.
Trustees and Officers – continued
Name, Year of Birth; Principal Occupation
Peter S. Lynch (1944)
Year of Election or Appointment: 2003
Member of the Advisory Board
Mr. Lynch also serves as Member of the Advisory Board of other Fidelity® funds. Mr. Lynch is Vice Chairman and a Director of FMR (investment adviser firm) and FMR Co., Inc. (investment adviser firm). In addition, Mr. Lynch serves as a Trustee of Boston College and as the Chairman of the Inner-City Scholarship Fund. Previously, Mr. Lynch served on the Special Olympics International Board of Directors (1997-2006).
Marc R. Bryant (1966)
Year of Election or Appointment: 2015
Secretary and Chief Legal Officer (CLO)
Mr. Bryant also serves as Secretary and CLO of other funds. Mr. Bryant serves as CLO, Secretary, and Senior Vice President of Fidelity Management & Research Company (investment adviser firm, 2015-present) and FMR Co., Inc. (investment adviser firm, 2015-present); Secretary of Fidelity SelectCo, LLC (investment adviser firm, 2015-present) and Fidelity Investments Money Management, Inc. (investment adviser firm, 2015-present); and CLO of Fidelity Management & Research (Hong Kong) Limited (investment adviser firm, 2015-present). He is Senior Vice President and Deputy General Counsel of FMR LLC (diversified financial services company). Previously, Mr. Bryant served as Secretary and CLO of Fidelity Rutland Square Trust II (2010-2014) and Assistant Secretary of Fidelity’s Fixed Income and Asset Allocation Funds (2013-2015). Prior to joining Fidelity Investments, Mr. Bryant served as a Senior Vice President and the Head of Global Retail Legal for AllianceBernstein L.P. (2006-2010), and as the General Counsel for ProFund Advisors LLC (2001-2006).
William C. Coffey (1969)
Year of Election or Appointment: 2009
Assistant Secretary
Mr. Coffey also serves as Assistant Secretary of other funds. He is Senior Vice President and Deputy General Counsel of FMR LLC (diversified financial services company, 2010-present), and is an employee of Fidelity Investments. Previously, Mr. Coffey served as Vice President and Associate General Counsel of FMR LLC (2005-2009).
Jonathan Davis (1968)
Year of Election or Appointment: 2010
Assistant Treasurer
Mr. Davis also serves as Assistant Treasurer of other funds, and is an employee of Fidelity Investments. Previously, Mr. Davis served as Vice President and Associate General Counsel of FMR LLC (diversified financial services company, 2003-2010).
Adrien E. Deberghes (1967)
Year of Election or Appointment: 2008
Deputy Treasurer
Mr. Deberghes also serves as an officer of other funds. He is an employee of Fidelity Investments (2008-present). Prior to joining Fidelity Investments, Mr. Deberghes was Senior Vice President of Mutual Fund Administration at State Street Corporation (2007-2008), Senior Director of Mutual Fund Administration at Investors Bank & Trust (2005-2007), and Director of Finance for Dunkin’ Brands (2000-2005).
Stephanie J. Dorsey (1969)
Year of Election or Appointment: 2010
Assistant Treasurer
Ms. Dorsey also serves as an officer of other funds. She is an employee of Fidelity Investments (2008-present) and has served in other fund officer roles. Prior to joining Fidelity Investments, Ms. Dorsey served as Treasurer (2004-2008) of the JPMorgan Mutual Funds and Vice President (2004-2008) of JPMorgan Chase Bank.
Howard J. Galligan III (1966)
Year of Election or Appointment: 2014
Chief Financial Officer
Mr. Galligan also serves as Chief Financial Officer of other funds. Mr. Galligan serves as President of Fidelity Pricing and Cash Management Services (FPCMS) (2014-present) and as a Director of Strategic Advisers, Inc. (investment adviser firm, 2008-present). Previously, Mr. Galligan served as Chief Administrative Officer of Asset Management (2011-2014) and Chief Operating Officer and Senior Vice President of Investment Support for Strategic Advisers, Inc. (2003-2011).
Scott C. Goebel (1968)
Year of Election or Appointment: 2015
Vice President
Mr. Goebel serves as Vice President of other funds and is an employee of Fidelity Investments (2001-present). Previously, Mr. Goebel served as Secretary of Fidelity SelectCo, LLC (investment adviser firm, 2013-2015), Fidelity Investments Money Management, Inc. (FIMM) (investment adviser firm, 2010-2015), and Fidelity Research and Analysis Company (FRAC) (investment adviser firm, 2010-2015); General Counsel, Secretary, and Senior Vice President of Fidelity Management & Research Company (investment adviser firm, 2008-2015) and FMR Co., Inc. (investment adviser firm, 2008-2015); Assistant Secretary of Fidelity Management & Research (Japan) Limited (investment adviser firm, 2008-2015) and FMR Investment Management (U.K.) Limited (investment adviser firm, 2008-2015); Chief Legal Officer (CLO) of Fidelity Management & Research (Hong Kong) Limited (investment adviser firm, 2008-2015); Secretary and CLO of certain Fidelity® funds (2008-2015); Assistant Secretary of FIMM (2008-2010), FRAC (2008-2010), and certain funds (2007-2008); and as Vice President and Secretary of Fidelity Distributors Corporation (FDC) (2005-2007).
Thomas C. Hense (1964)
Year of Election or Appointment: 2008, 2010, or 2015
Vice President
Mr. Hense serves as Vice President of Fidelity Advisor® Multi-Asset Income Fund (2015) and other funds (High Income (2008), Small Cap (2008), and Value (2010) funds), and is an employee of Fidelity Investments (1993-present). Previously, Mr. Hense served as a portfolio manager for Fidelity’s Institutional Money Management Group (Pyramis) (2003-2008).
Brian B. Hogan (1964)
Year of Election or Appointment: 2009
Vice President
Mr. Hogan also serves as Trustee or Vice President of other funds. Mr. Hogan serves as a Director of Fidelity SelectCo, LLC (investment adviser firm, 2014-present) and President of the Equity Division of FMR (investment adviser firm, 2009-present). Previously, Mr. Hogan served as Senior Vice President, Equity Research of FMR (2006-2009) and as a portfolio manager.
Chris Maher (1972)
Year of Election or Appointment: 2013
Assistant Treasurer
Mr. Maher serves as Assistant Treasurer of other funds. Mr. Maher is Vice President of Valuation Oversight and is an employee of Fidelity Investments. Previously, Mr. Maher served as Vice President of Asset Management Compliance (2013), Vice President of the Program Management Group of FMR (investment adviser firm, 2010-2013), and Vice President of Valuation Oversight (2008-2010).
John F. Papandrea (1972)
Year of Election or Appointment: 2016
Anti-Money Laundering (AML) Officer
Mr. Papandrea also serves as AML Officer of other funds. Mr. Papandrea is Vice President of FMR LLC (diversified financial services company, 2008-present) and is an employee of Fidelity Investments (2005-present).
Kenneth B. Robins (1969)
Year of Election or Appointment: 2008
President and Treasurer
Mr. Robins also serves as an officer of other funds. Mr. Robins serves as Executive Vice President of Fidelity Investments Money Management, Inc. (FIMM) (investment adviser firm, 2013-present) and is an employee of Fidelity Investments (2004-present). Previously, Mr. Robins served in other fund officer roles.
Stacie M. Smith (1974)
Year of Election or Appointment: 2013
Deputy Treasurer
Ms. Smith also serves as an officer of other funds. She is an employee of Fidelity Investments (2009-present) and has served in other fund officer roles. Prior to joining Fidelity Investments, Ms. Smith served as Senior Audit Manager of Ernst & Young LLP (1996-2009).
Trustees and Officers – continued
Renee Stagnone (1975)
Year of Election or Appointment: 2013
Deputy Treasurer
Ms. Stagnone also serves as Deputy Treasurer of other funds. Ms. Stagnone is an employee of Fidelity Investments (1997-present).
Linda J. Wondrack (1964)
Year of Election or Appointment: 2014
Chief Compliance Officer
Ms. Wondrack also serves as Chief Compliance Officer of other funds. Ms. Wondrack is Executive Vice President and head of the Ethics Office and Asset Management Compliance for Fidelity Investments (2012-present). Ms. Wondrack also serves as Chief Compliance Officer of Fidelity SelectCo, LLC (investment adviser firm, 2014-present); Chief Compliance Officer of Impresa Management LLC (2013-present); and Chief Compliance Officer of FMR Co., Inc. (investment adviser firm), Fidelity Investments Money Management, Inc. (investment adviser firm), FMR Investment Management (U.K.) Limited (investment adviser firm), Fidelity Management & Research (Hong Kong) (investment adviser firm), Fidelity Management & Research Company (investment adviser firm), FIAM LLC (investment adviser firm), and Strategic Advisers, Inc. (investment adviser firm), Ballyrock Investment Advisors LLC, and Northern Neck Investors LLC (2012-present). Previously, Ms. Wondrack served as Chief Compliance Officer of Fidelity Management & Research (Japan) Limited (investment adviser firm, 2012-2016); Senior Vice President and Chief Compliance Officer for Columbia Management Investment Advisers, LLC (2005-2012); Chief Compliance Officer for certain funds within the Columbia Family of Funds (2007-2012); and Senior Vice President of Compliance Risk Management at Bank of America (2005-2010).
Joseph F. Zambello (1957)
Year of Election or Appointment: 2011
Deputy Treasurer
Mr. Zambello also serves as Deputy Treasurer of other funds. Mr. Zambello is an employee of Fidelity Investments (1991-present). Previously, Mr. Zambello served as Vice President of the Program Management Group of FMR (investment adviser firm, 2009-2011) and Vice President of the Transfer Agent Oversight Group (2005-2009).
Shareholder Expense Example
As a shareholder of the Fund, you incur two types of costs: (1) transaction costs and (2) ongoing costs, including management fees, distribution and/or service (12b-1) fees and other Fund expenses. This Example is intended to help you understand your ongoing costs (in dollars) of investing in the Fund and to compare these costs with the ongoing costs of investing in other mutual funds.
The Example is based on an investment of $1,000 invested at the beginning of the period and held for the entire period (July 1, 2015 to December 31, 2015).
Actual Expenses
The first line of the accompanying table for each class of the Fund provides information about actual account values and actual expenses. You may use the information in this line, together with the amount you invested, to estimate the expenses that you paid over the period. Simply divide your account value by $1,000.00 (for example, an $8,600 account value divided by $1,000.00 = 8.6), then multiply the result by the number in the first line for a class of the Fund under the heading entitled “Expenses Paid During Period” to estimate the expenses you paid on your account during this period. The estimate of expenses does not include any fees or other expenses of any variable annuity or variable life insurance product. If they were, the estimate of expenses you paid during the period would be higher, and your ending account value would be lower. In addition, the Fund, as a shareholder in the underlying Fidelity Central Funds, will indirectly bear its pro-rata share of the fees and expenses incurred by the underlying Fidelity Central Funds. These fees and expenses are not included in the Fund’s annualized expense ratio used to calculate the expense estimate in the table below.
Hypothetical Example for Comparison Purposes
The second line of the accompanying table for each class of the Fund provides information about hypothetical account values and hypothetical expenses based on a Class’ actual expense ratio and an assumed rate of return of 5% per year before expenses, which is not the Class’ actual return. The hypothetical account values and expenses may not be used to estimate the actual ending account balance or expenses you paid for the period. You may use this information to compare the ongoing costs of investing in the Fund and other funds. To do so, compare this 5% hypothetical example with the 5% hypothetical examples that appear in the shareholder reports of the other funds. The estimate of expenses does not include any fees or other expenses of any variable annuity or variable life insurance product. If they were, the estimate of expenses you paid during the period would be higher, and your ending account value would be lower. In addition, the Fund, as a shareholder in the underlying Fidelity Central Funds, will indirectly bear its pro-rata share of the fees and expenses incurred by the underlying Fidelity Central Funds. These fees and expenses are not included in the Fund’s annualized expense ratio used to calculate the expense estimate in the table below.
Please note that the expenses shown in the table are meant to highlight your ongoing costs only and do not reflect any transaction costs. Therefore, the second line of the table is useful in comparing ongoing costs only, and will not help you determine the relative total costs of owning different funds. In addition, if these transactional costs were included, your costs would have been higher.
| | | | | | | | | | | | Expenses Paid | |
| | | Annualized | | | Beginning | | | Ending | | | During Period-B | |
| | | Expense | | | Account Value | | | Account Value | | | July 1, 2015 | |
| | | Ratio-A | | | July 1, 2015 | | | December 31, 2015 | | | to December 31, 2015 | |
| Initial Class | | | .54 | % | | | | | | | | | | | | |
| Actual | | | | | | $ | 1,000.00 | | | $ | 950.00 | | | $ | 2.65 | |
| Hypothetical-C | | | | | | $ | 1,000.00 | | | $ | 1,022.48 | | | $ | 2.75 | |
| Service Class | | | .64 | % | | | | | | | | | | | | |
| Actual | | | | | | $ | 1,000.00 | | | $ | 949.60 | | | $ | 3.14 | |
| Hypothetical-C | | | | | | $ | 1,000.00 | | | $ | 1,021.98 | | | $ | 3.26 | |
| Service Class 2 | | | .79 | % | | | | | | | | | | | | |
| Actual | | | | | | $ | 1,000.00 | | | $ | 948.80 | | | $ | 3.88 | |
| Hypothetical-C | | | | | | $ | 1,000.00 | | | $ | 1,021.22 | | | $ | 4.02 | |
| Investor Class | | | .62 | % | | | | | | | | | | | | |
| Actual | | | | | | $ | 1,000.00 | | | $ | 949.40 | | | $ | 3.05 | |
| Hypothetical-C | | | | | | $ | 1,000.00 | | | $ | 1,022.08 | | | $ | 3.16 | |
| A | Annualized expense ratio reflects expenses net of applicable fee waivers. |
| B | Expenses are equal to each Class’ annualized expense ratio, multiplied by the average account value over the period, multiplied by 184/365 (to reflect the one-half year period). |
| C | 5% return per year before expenses |
Distributions (Unaudited)
The Board of Trustees of VIP Equity – Income Portfolio voted to pay to shareholders of record at the opening of business on record date, the following distributions per share derived from capital gains realized from sales of portfolio securities:
| | Pay Date | Record Date | Capital Gains |
| Initial Class | 02/12/2016 | 02/12/2016 | $1.254 |
| Service Class | 02/12/2016 | 02/12/2016 | $1.254 |
| Service Class 2 | 02/12/2016 | 02/12/2016 | $1.254 |
| Investor Class | 02/12/2016 | 02/12/2016 | $1.254 |
The fund hereby designates as a capital gain dividend with respect to the taxable year ended December 31, 2015 $327,277,152, or, if subsequently determined to be different, the net capital gain of such year.
Initial Class designates 71%; Service Class designates 73% Service Class 2 designates 76% and Investor Class designates 72% of the dividends distributed in December 2015, during the fiscal year as qualifying for the dividends-received deduction for corporate shareholders.
Board Approval of Investment Advisory Contracts and Management Fees
VIP Equity-Income Portfolio
Each year, the Board of Trustees, including the Independent Trustees (together, the Board), votes on the renewal of the management contract with Fidelity Management & Research Company (FMR) and the sub-advisory agreements (together, the Advisory Contracts) for the fund. The Board, assisted by the advice of fund counsel and Independent Trustees’ counsel, requests and considers a broad range of information relevant to the renewal of the Advisory Contracts throughout the year.
The Board meets regularly and, at each of its meetings, covers an extensive agenda of topics and materials and considers factors that are relevant to its annual consideration of the renewal of the fund’s Advisory Contracts, including the services and support provided to the fund and its shareholders. The Board has established various standing committees (Committees), each composed of and chaired by Independent Trustees with varying backgrounds, to which the Board has assigned specific subject matter responsibilities in order to enhance effective decision-making by the Board. The Board, acting directly and through its Committees, requests and receives information concerning the annual consideration of the renewal of the fund’s Advisory Contracts. The Board also meets as needed to consider matters specifically related to the Board’s annual consideration of the renewal of the Advisory Contracts. Members of the Board may also meet with trustees of other Fidelity funds through ad hoc joint committees to discuss certain matters relevant to all of the Fidelity funds.
At its July 2015 meeting, the Board unanimously determined to renew the fund’s Advisory Contracts. In reaching its determination, the Board considered all factors it believed relevant, including (i) the nature, extent, and quality of the services to be provided to the fund and its shareholders (including the investment performance of the fund); (ii) the competitiveness of the fund’s management fee and total expense ratio relative to peer funds; (iii) the total costs of the services to be provided by and the profits to be realized by Fidelity from its relationship with the fund; and (iv) the extent to which (if any) economies of scale exist and would be realized as the fund grows, and whether any economies of scale are appropriately shared with fund shareholders.
In considering whether to renew the Advisory Contracts for the fund, the Board reached a determination, with the assistance of fund counsel and Independent Trustees’ counsel and through the exercise of its business judgment, that the renewal of the Advisory Contracts was in the best interests of the fund and its shareholders and that the compensation payable under the Advisory Contracts was fair and reasonable. The Board’s decision to renew the Advisory Contracts was not based on any single factor, but rather was based on a comprehensive consideration of all the information provided to the Board at its meetings throughout the year. The Board, in reaching its determination to renew the Advisory Contracts, was aware that shareholders of the fund have a broad range of investment choices available to them, including a wide choice among funds offered by Fidelity’s competitors, and that the fund’s shareholders, who have the opportunity to review and weigh the disclosure provided by the fund in its prospectus and other public disclosures, have chosen to invest in this fund, which is part of the Fidelity family of funds.
Nature, Extent, and Quality of Services Provided. The Board considered Fidelity’s staffing as it relates to the fund, including the backgrounds of investment personnel of Fidelity, and also considered the fund’s investment objective, strategies, and related investment philosophy. The Independent Trustees also had discussions with senior management of Fidelity’s investment operations and investment groups. The Board considered the structure of the portfolio manager compensation program and whether this structure provides appropriate incentives to act in the best interests of the fund. Additionally, the Board considered the portfolio managers’ investments, if any, in the funds that they manage.
Resources Dedicated to Investment Management and Support Services. The Board and the Fund Oversight and Research Committees reviewed the general qualifications and capabilities of Fidelity’s investment staff, including its size, education, experience, and resources, as well as Fidelity’s approach to recruiting, training, managing, and compensating investment personnel. The Board noted that Fidelity has continued to increase the resources devoted to non-U.S. offices, including expansion of Fidelity’s global investment organization. The Board also noted that Fidelity’s analysts have extensive resources, tools and capabilities that allow them to conduct sophisticated quantitative and fundamental analysis, as well as credit analysis of issuers, counterparties and guarantors. Further, the Board considered that Fidelity’s investment professionals have sufficient access to global information and data so as to provide competitive investment results over time, and that those professionals also have access to sophisticated tools that permit them to assess portfolio construction and risk and performance attribution characteristics continuously, as well as to transmit new information and research conclusions rapidly around the world. Additionally, in its deliberations, the Board considered Fidelity’s trading, risk management, and compliance capabilities and resources, which are integral parts of the investment management process.
Shareholder and Administrative Services. The Board considered (i) the nature, extent, quality, and cost of advisory, administrative, and shareholder services performed by FMR, the sub-advisers (together with FMR, the Investment Advisers), and their affiliates under the Advisory Contracts and under separate agreements covering transfer agency, pricing and bookkeeping, and securities lending services for the fund; (ii) the nature and extent of the supervision of third party service providers, principally custodians and subcustodians; and (iii) the resources devoted to, and the record of compliance with, the fund’s compliance policies and procedures. The Board also reviewed the allocation of fund brokerage, including allocations to brokers affiliated with the Investment Advisers, the use of brokerage commissions to pay fund expenses, and the use of “soft” commission dollars to pay for research services.
The Board noted that the growth of fund assets over time across the complex allows Fidelity to reinvest in the development of services designed to enhance the value or convenience of the Fidelity funds as investment vehicles. These services include 24-hour access to account information
Board Approval of Investment Advisory Contracts and Management Fees – continued
and market information through telephone representatives and over the Internet, investor education materials and asset allocation tools, and the expanded availability of Fidelity Investor Centers.
In 2014, the Board formed an ad hoc Committee on Transfer Agency Fees to review the variety of transfer agency fee structures throughout the industry and Fidelity’s competitive positioning with respect to industry participants.
Investment in a Large Fund Family. The Board considered the benefits to shareholders of investing in a Fidelity fund, including the benefits of investing in a fund that is part of a large family of funds offering a variety of investment disciplines and providing a large variety of mutual fund investor services. The Board noted that Fidelity had taken, or had made recommendations that resulted in the Fidelity funds taking, a number of actions over the previous year that benefited particular funds, including (i) continuing to dedicate additional resources to investment research and to the support of the senior management team that oversees asset management; (ii) continuing efforts to enhance Fidelity’s global research capabilities; (iii) launching new funds and making other enhancements to meet client needs; (iv) reducing management fees and total expenses for certain index funds and diversified international funds; (v) continuing to launch dedicated lower cost underlying funds to meet portfolio construction needs related to expanding underlying fund options for Fidelity funds of funds, specifically for the Freedom Fund product lines; (vi) rationalizing product lines and gaining increased efficiencies through fund mergers; (vii) launching active fixed-income exchange-traded funds; (viii) continuing to develop, acquire and implement systems and technology to improve services to the funds and information security and to increase efficiency; (ix) implementing investment enhancements to further strengthen Fidelity’s target date product line to increase investors’ probability of success in achieving their goals; (x) modifying the eligibility criteria for certain share classes to accommodate roll-over assets from employer-sponsored retirement plans; (xi) launching a new Class W of the Freedom Index Funds to attract and retain Fidelity record-kept retirement plan assets; and (xii) implementing changes to Fidelity’s money market product line in response to recent money market regulatory reforms.
Investment Performance. The Board considered whether the fund has operated in accordance with its investment objective, as well as its record of compliance with its investment restrictions and its performance history.
The Board took into account discussions with representatives of the Investment Advisers about fund investment performance that occur at Board meetings throughout the year. In this regard the Board noted that as part of regularly scheduled fund reviews and other reports to the Board on fund performance, the Board considers annualized return information for the fund, for different time periods, measured against a securities market index (“benchmark index”) and a peer group of funds with similar objectives (“peer group”), if any. In its evaluation of fund investment performance, the Board gave particular attention to information indicating changes in performance of certain Fidelity funds for specific time periods and discussed with the Investment Advisers the reasons for any overperformance or underperformance.
In addition to reviewing absolute and relative fund performance, the Independent Trustees periodically consider the appropriateness of fund performance metrics in evaluating the results achieved. In general, the Independent Trustees believe that fund performance should be evaluated based on net performance (after fees and expenses) of both the highest performing and lowest performing fund share classes, where applicable, compared to appropriate benchmark indices, over appropriate time periods that may include full market cycles, and compared to peer groups, as applicable, over the same periods, taking into account relevant factors including the following: general market conditions; issuer-specific information; and fund cash flows and other factors.
The Independent Trustees recognize that shareholders evaluate performance on a net basis over their own holding periods, for which one-, three-, and five-year periods are often used as a proxy. For this reason, the performance information reviewed by the Board also included net cumulative calendar year total return information for the fund and an appropriate benchmark index and peer group for the most recent one-, three-, and five-year periods, as shown below. Returns are shown compared to the 25th percentile (top of box, 75% beaten) and 75th percentile (bottom of box, 25% beaten) of the peer universe.
VIP Equity-Income Portfolio

The Board noted that, on April 30, 2015 (after the periods shown in the chart above), FMR converted assets in Service Class 2 R into Service Class 2.
Based on its review, the Board concluded that the nature, extent, and quality of services provided to the fund under the Advisory Contracts should benefit the shareholders of the fund.
Competitiveness of Management Fee and Total Expense Ratio. The Board considered the fund’s management fee and total expense ratio compared to “mapped groups” of competitive funds and classes created for the purpose of facilitating the Trustees’ competitive analysis of management fees and total expenses. Fidelity creates “mapped groups” by combining similar Lipper investment objective categories that have comparable investment mandates. Combining Lipper investment objective categories aids the Board’s management fee and total expense ratio comparisons by broadening the competitive group used for comparison.
Management Fee. The Board considered two proprietary management fee comparisons for the 12-month periods shown in basis points (BP) in the chart below. The group of Lipper funds used by the Board for management fee comparisons is referred to below as the “Total Mapped Group.” The Total Mapped Group is broader than the Lipper peer group used by the Board for performance comparisons because the Total Mapped Group combines several Lipper investment objective categories while the Lipper peer group does not. The Total Mapped Group comparison focuses on a fund’s standing in terms of gross management fees before expense reimbursements or caps relative to the total universe of funds with comparable investment mandates, regardless of whether their management fee structures also are comparable. Funds with comparable investment mandates offer exposure to similar types of securities. Funds with comparable management fee structures have similar management fee contractual arrangements (e.g., flat rate charged for advisory services, all-inclusive fee rate, etc.). “TMG %” represents the percentage of funds in the Total Mapped Group that had management fees that were lower than the fund’s. For example, a hypothetical TMG % of 20% would mean that 80% of the funds in the Total Mapped Group had higher, and 20% had lower, management fees than the fund. The fund’s actual TMG %s and the number of funds in the Total Mapped Group are in the chart below. The “Asset-Size Peer Group” (ASPG) comparison focuses on a fund’s standing relative to a subset of non-Fidelity funds within the Total Mapped Group that are similar in size and management fee structure without taking into account performance adjustments, if any. For example, if a fund is in the first quartile of the ASPG, the fund’s management fee ranks in the least expensive or lowest 25% of funds in the ASPG. The ASPG represents at least 15% of the funds in the Total Mapped Group with comparable asset size and management fee structures, subject to a minimum of 50 funds (or all funds in the Total Mapped Group if fewer than 50). Additional information, such as the ASPG quartile in which the fund’s management fee rate ranked, is also included in the chart and considered by the Board.
Board Approval of Investment Advisory Contracts and Management Fees – continued
VIP Equity-Income Portfolio

The Board noted that the fund’s management fee rate ranked below the median of its Total Mapped Group and below the median of its ASPG for 2014.
The Board noted that, in 2014, the ad hoc Committee on Group Fee was formed by it and other Fidelity fund boards to conduct an in-depth review of the “group fee” component of the management fee of funds with such management fee structures. Committee focus included the mechanics of the group fee, the competitive landscape of group fee structures, Fidelity funds with no group fee component and investment products not included in group fee assets. The Board also considered that, for funds subject to the group fee, FMR agreed to voluntarily waive fees over a specified period of time in amounts designed to account for assets converted from certain funds to certain collective investment trusts.
The Board also noted that, in 2013, the ad hoc Committee on Management Fees was formed to conduct an in-depth review of the management fee rates of Fidelity’s active equity mutual funds. The Committee focused on the following areas: (i) standard fee structures; (ii) research consumption and trading evolution; (iii) management fee competitiveness/profitability by category; and (iv) factors that drive institutional pricing.
Based on its review, the Board concluded that the fund’s management fee is fair and reasonable in light of the services that the fund receives and the other factors considered.
Total Expense Ratio. In its review of each class’s total expense ratio, the Board considered the fund’s management fee as well as other fund or class expenses, as applicable, such as transfer agent fees, pricing and bookkeeping fees, fund-paid 12b-1 fees, and custodial, legal, and audit fees. The Board also noted that Fidelity may agree to waive fees and expenses from time to time, and the extent to which, if any, it has done so for the fund. As part of its review, the Board also considered the current and historical total expense ratios of each class of the fund compared to competitive fund median expenses. Each class of the fund is compared to those funds and classes in the Total Mapped Group (used by the Board for management fee comparisons) that have a similar sales load structure.
The Board noted that the total expense ratio of each class ranked below its competitive median for 2014.
Fees Charged to Other Fidelity Clients. The Board also considered Fidelity fee structures and other information with respect to clients of Fidelity, such as other funds advised or subadvised by Fidelity, pension plan clients, and other institutional clients with similar mandates. The Board noted the findings of the 2013 ad hoc joint committee (created with the board of other Fidelity funds), which reviewed and compared Fidelity’s institutional investment advisory business with its business of providing services to the Fidelity funds, including the differences in services provided, fees charged, and costs incurred, as well as competition in their respective marketplaces.
Based on its review of total expense ratios and fees charged to other Fidelity clients, the Board concluded that the total expense ratio of each class of the fund was reasonable in light of the services that the fund and its shareholders receive and the other factors considered.
Costs of the Services and Profitability. The Board considered the revenues earned and the expenses incurred by Fidelity in conducting the business of developing, marketing, distributing, managing, administering and servicing the fund and servicing the fund’s shareholders. The Board also considered the level of Fidelity’s profits in respect of all the Fidelity funds.
On an annual basis, Fidelity presents to the Board information about the profitability of its relationship with the fund. Fidelity calculates profitability information for each fund, as well as aggregate profitability information for groups of Fidelity funds and all Fidelity funds, using a series of
detailed revenue and cost allocation methodologies which originate with the books and records of Fidelity on which Fidelity’s audited financial statements are based. The Audit Committee of the Board reviews any significant changes from the prior year’s methodologies.
PricewaterhouseCoopers LLP (PwC), independent registered public accounting firm and auditor to Fidelity and certain Fidelity funds, has been engaged annually by the Board as part of the Board’s assessment of Fidelity’s profitability analysis. PwC’s engagement includes the review and assessment of the methodologies used by Fidelity in determining the revenues and expenses attributable to Fidelity’s mutual fund business, and completion of agreed-upon procedures in respect of the mathematical accuracy of fund profitability and its conformity to established allocation methodologies. After considering PwC’s reports issued under the engagement and information provided by Fidelity, the Board concluded that while other allocation methods may also be reasonable, Fidelity’s profitability methodologies are reasonable in all material respects.
The Board also reviewed Fidelity’s non-fund businesses and fall-out benefits related to the mutual fund business as well as cases where Fidelity’s affiliates may benefit from or be related to the fund’s business.
The Board considered the costs of the services provided by and the profits realized by Fidelity in connection with the operation of the fund and was satisfied that the profitability was not excessive.
Economies of Scale. The Board considered whether there have been economies of scale in respect of the management of the Fidelity funds, whether the Fidelity funds (including the fund) have appropriately benefited from any such economies of scale, and whether there is potential for realization of any further economies of scale. The Board considered the extent to which the fund will benefit from economies of scale as assets grow through increased services to the fund, through waivers or reimbursements, or through fee or expense ratio reductions. The Board also noted that in 2013, it and the boards of other Fidelity funds created an ad hoc committee (the Economies of Scale Committee) to analyze whether Fidelity attains economies of scale in respect of the management and servicing of the Fidelity funds, whether the Fidelity funds have appropriately benefited from such economies of scale, and whether there is potential for realization of any further economies of scale.
The Board recognized that the fund’s management contract incorporates a “group fee” structure, which provides for lower group fee rates as total group assets increase, and for higher group fee rates as total group assets decrease (with “group assets” defined to include fund assets under FMR’s management plus sector fund assets previously under FMR’s management and currently managed by Fidelity SelectCo, LLC). FMR calculates the group fee rates based on a tiered asset “breakpoint” schedule that varies based on asset class. The Board considered that the group fee is designed to deliver the benefits of economies of scale to fund shareholders when total Fidelity fund assets increase, even if assets of any particular fund are unchanged or have declined, because some portion of Fidelity’s costs are attributable to services provided to all Fidelity funds, and all funds benefit if those costs can be allocated among more assets. The Board concluded that, given the group fee structure, fund shareholders will benefit from lower management fees as group assets increase at the fund complex level, regardless of whether Fidelity achieves any such economies of scale.
The Board concluded, taking into account the analysis of the Economies of Scale Committee, that economies of scale, if any, are being appropriately shared between fund shareholders and Fidelity.
Additional Information Requested by the Board. In order to develop fully the factual basis for consideration of the Fidelity funds’ Advisory Contracts, the Board requested and received additional information on certain topics, including: (i) fund performance trends and Fidelity’s long-term strategies for certain funds; (ii) the various share classes employed by Fidelity and the attributes of each class, together with similar information on the distribution and servicing payments made by Fidelity or the funds to third-party participants in the distribution channels; (iii) fund profitability, and fund performance in relation to fund profitability; (iv) the methodology with respect to evaluating competitive fund data and peer group classifications and fee comparisons; (v) annual fund profitability margins, with particular focus on certain funds with negative margins; (vi) the realization of fall-out benefits in certain Fidelity business units; (vii) economies of scale and the way in which they are shared with fund shareholders;(viii) Fidelity’s group fee structures, including the group fee schedule of breakpoints;(ix) the impact of cost containment measures on the funds; and (x) the transfer agent fee structure.
Based on its evaluation of all of the conclusions noted above, and after considering all factors it believed relevant, the Board concluded that the advisory fee structures are fair and reasonable, and that the fund’s Advisory Contracts should be renewed.

VIPEI-ANN-0216
1.540027.118
Fidelity® Variable Insurance Products:
Mid Cap Portfolio
Annual Report
December 31, 2015
To view a fund’s proxy voting guidelines and proxy voting record for the 12-month period ended June 30, visit http://www.fidelity.com/proxyvotingresults or visit the Securities and Exchange Commission’s (SEC) web site at http://www.sec.gov.
You may also call 1-877-208-0098 to request a free copy of the proxy voting guidelines.
Fidelity® Variable Insurance Products are separate account options which are purchased through a variable insurance contract.
Standard & Poor’s, S&P and S&P 500 are registered service marks of The McGraw-Hill Companies, Inc. and have been licensed for use by Fidelity Distributors Corporation.
Other third-party marks appearing herein are the property of their respective owners.
All other marks appearing herein are registered or unregistered trademarks or service marks of FMR LLC or an affiliated company. © 2016 FMR LLC. All rights reserved.
This report and the financial statements contained herein are submitted for the general information of the shareholders of the Fund. This report is not authorized for distribution to prospective investors in the Fund unless preceded or accompanied by an effective prospectus.
A fund files its complete schedule of portfolio holdings with the SEC for the first and third quarters of each fiscal year on Form N-Q. Forms N-Q are available on the SEC’s web site at http://www.sec.gov. A fund’s Forms N-Q may be reviewed and copied at the SEC’s Public Reference Room in Washington, DC. Information regarding the operation of the SEC’s Public Reference Room may be obtained by calling 1-800-SEC-0330.
For a complete list of a fund’s portfolio holdings, view the most recent holdings listing, semiannual report, or annual report on Fidelity’s web site at http:// www.fidelity.com, http://www.advisor.fidelity.com, or http://www.401k.com, as applicable.
NOT FDIC INSURED •MAY LOSE VALUE •NO BANK GUARANTEE
Neither the Fund nor Fidelity Distributors Corporation is a bank.
Annual Report
Performance: The Bottom Line
Average annual total return reflects the change in the value of an investment, assuming reinvestment of distributions from dividend income and capital gains (the profits earned upon the sale of securities that have grown in value, if any) and assuming a constant rate of performance each year. During periods of reimbursement by Fidelity, a fund’s total return will be greater than it would be had the reimbursement not occurred. Performance numbers are net of all underlying fund operating expenses, but do not include any insurance charges imposed by your insurance company’s separate account. If performance information included the effect of these additional charges, the total returns would have been lower. How a fund did yesterday is no guarantee of how it will do tomorrow.
| Average Annual Total Returns |
| For the periods ended December 31, 2015 | | Past 1 | | Past 5 | | Past 10 |
| | | year | | years | | years |
| Initial Class | | -1.39% | | 7.94% | | 7.64% |
| Service Class | | -1.50% | | 7.84% | | 7.53% |
| Service Class 2 | | -1.63% | | 7.68% | | 7.37% |
| Investor Class | | -1.47% | | 7.85% | | 7.54% |
Let’s say hypothetically that $10,000 was invested in VIP Mid Cap Portfolio – Initial Class on December 31, 2005.
The chart shows how the value of your investment would have changed, and also shows how the S&P MidCap 400® Index performed over the same period.
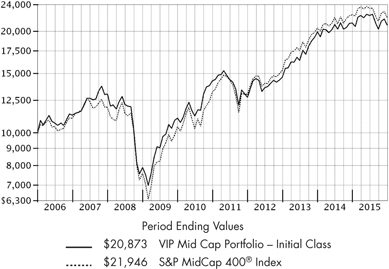
Management’s Discussion of Fund Performance
Market Recap: U.S. stocks gained modestly in 2015, rebounding from a steep decline in August and September over worries about China’s slowing economic growth. The S&P 500® index rose 1.38% for the period, its lowest calendar-year return since 2008. After the late-summer rout, stocks sharply reversed course in October, lifted by the Federal Reserve’s decision to put off raising near-term interest rates until mid-December. Investors also were encouraged by an interest-rate cut in China and economic stimulus in Europe. Overall, growth stocks fared much better than their value counterparts, as investors sought growth in a subpar economic environment. This helped lift the technology-heavy Nasdaq Composite Index® 6.96% for the year. Sector performance in the broader market was split, with five of 10 sectors in the S&P 500® gaining ground and five retreating. Consumer discretionary (+10%) led the way, benefiting from rising personal income and low inflation. Health care (+7%), consumer staples (+7%) and information technology (+6%) also outpaced the broad market amid strong fundamentals. Conversely, the energy sector (-21%) was by far the worst performer, stung by deflated commodity prices that also hit materials (-8%). The defensive, but rate-sensitive utilities sector (-5%) lost ground on the cusp of Fed tightening, while industrials (-3%) were dragged down with energy prices and a slower-growing China.
Comments from Portfolio Manager Thomas Allen: For the year, the fund’s share classes recorded small declines and finished modestly ahead of the -2.18% return of the benchmark S&P MidCap 400® index. Positioning in information technology, energy, materials and health care aided the fund’s performance versus the index. Underweighting the lower end of the benchmark’s market capitalization spectrum also was helpful, as larger-caps tended to perform better this period. At the stock level, Global Payments was the fund’s top contributor. The provider of payment processing services announced strong quarterly results in both July and October, which aided its stock. Electronic Arts, a leading maker of video games, also was helpful, as were Freescale Semiconductor and Netherlands-based NXP Semiconductors. All three were non-index positions. NXP closed a deal to buy Freescale during the period. Conversely, performance was hampered by stock picking in industrials and financials. In the former category, a non-index position in Spirit Airlines was by far our biggest relative detractor. Another detractor from transportation – a group where I reduced the fund’s allocation during the period – was less-than-truckload (LTL) hauler and logistics provider Saia. One detractor from the technology sector was Belden, a manufacturer of networking, connectivity and cable products.
The views expressed above reflect those of the portfolio manager(s) only through the end of the period as stated on the cover of this report and do not necessarily represent the views of Fidelity or any other person in the Fidelity organization. Any such views are subject to change at any time based upon market or other conditions and Fidelity disclaims any responsibility to update such views. These views may not be relied on as investment advice and, because investment decisions for a Fidelity fund are based on numerous factors, may not be relied on as an indication of trading intent on behalf of any Fidelity fund.
Investment Summary (Unaudited)
| Top Ten Stocks as of December 31, 2015 |
| | | | | | | |
| | | | | | % of fund’s |
| | | % of fund’s | | net assets |
| | | net assets | | 6 months ago |
| Global Payments, Inc. | | | 1.6 | | | | 1.4 | |
| Jones Lang LaSalle, Inc. | | | 1.1 | | | | 1.1 | |
| CBRE Group, Inc. | | | 1.1 | | | | 1.1 | |
| Electronic Arts, Inc. | | | 1.1 | | | | 1.1 | |
| Total System Services, Inc. | | | 1.1 | | | | 1.0 | |
| Cardinal Health, Inc. | | | 1.1 | | | | 1.1 | |
| McGraw Hill Financial, Inc. | | | 1.0 | | | | 0.9 | |
| Textron, Inc. | | | 1.0 | | | | 1.2 | |
| CDW Corp. | | | 1.0 | | | | 0.8 | |
| Steris PLC | | | 0.9 | | | | 0.9 | |
| | | | 11.0 | | | | | |
| Top Five Market Sectors as of December 31, 2015 |
| | | | | | | |
| | | | | | % of fund’s |
| | | % of fund’s | | net assets |
| | | net assets | | 6 months ago |
| Information Technology | | | 24.4 | | | | 23.9 | |
| Financials | | | 20.5 | | | | 18.2 | |
| Consumer Discretionary | | | 17.8 | | | | 18.5 | |
| Industrials | | | 14.5 | | | | 15.5 | |
| Health Care | | | 13.6 | | | | 13.8 | |
| Asset Allocation (% of fund’s net assets) |
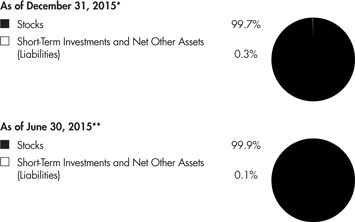
| * | Foreign investments – 11.9% |
| ** | Foreign investments – 11.7% |
Investments December 31, 2015
Showing Percentage of Net Assets
| Common Stocks – 99.6% |
| | | Shares | | | Value | |
| | | | | | | |
| CONSUMER DISCRETIONARY – 17.8% | | | | | | | | |
| Auto Components – 1.6% | | | | | | | | |
| Delphi Automotive PLC | | | 483,061 | | | $ | 41,412,820 | |
| Gentex Corp. | | | 2,316,292 | | | | 37,083,835 | |
| Johnson Controls, Inc. | | | 370,200 | | | | 14,619,198 | |
| Modine Manufacturing Co. (a) | | | 147,000 | | | | 1,330,350 | |
| Tenneco, Inc. (a) | | | 177,476 | | | | 8,147,923 | |
| Visteon Corp. | | | 235,822 | | | | 27,001,619 | |
| | | | | | | | 129,595,745 | |
| Diversified Consumer Services – 0.6% | | | | | | | | |
| Houghton Mifflin Harcourt Co. (a) | | | 1,831,364 | | | | 39,887,108 | |
| ServiceMaster Global Holdings, Inc. (a) | | | 213,200 | | | | 8,365,968 | |
| | | | | | | | 48,253,076 | |
| Hotels, Restaurants & Leisure – 2.8% | | | | | | | | |
| Brinker International, Inc. | | | 79,767 | | | | 3,824,828 | |
| Buffalo Wild Wings, Inc. (a) | | | 89,100 | | | | 14,224,815 | |
| DineEquity, Inc. | | | 696,400 | | | | 58,964,188 | |
| Interval Leisure Group, Inc. | | | 470,600 | | | | 7,346,066 | |
| Jubilant Foodworks Ltd. | | | 75,070 | | | | 1,675,961 | |
| Las Vegas Sands Corp. | | | 618,188 | | | | 27,101,362 | |
| Panera Bread Co. Class A (a) | | | 99,518 | | | | 19,384,116 | |
| Texas Roadhouse, Inc. Class A | | | 936,500 | | | | 33,498,605 | |
| The Restaurant Group PLC | | | 166,500 | | | | 1,682,589 | |
| Wyndham Worldwide Corp. | | | 796,600 | | | | 57,872,990 | |
| | | | | | | | 225,575,520 | |
| Household Durables – 4.1% | | | | | | | | |
| Ethan Allen Interiors, Inc. | | | 100,900 | | | | 2,807,038 | |
| Harman International Industries, Inc. | | | 198,205 | | | | 18,672,893 | |
| iRobot Corp. (a)(b) | | | 25,500 | | | | 902,700 | |
| Jarden Corp. (a) | | | 1,235,350 | | | | 70,563,192 | |
| Lennar Corp. Class A (b) | | | 1,291,900 | | | | 63,186,829 | |
| Mohawk Industries, Inc. (a) | | | 37,800 | | | | 7,158,942 | |
| NVR, Inc. (a) | | | 40,614 | | | | 66,728,802 | |
| PulteGroup, Inc. | | | 3,463,000 | | | | 61,710,660 | |
| Toll Brothers, Inc. (a) | | | 1,031,700 | | | | 34,355,610 | |
| Whirlpool Corp. | | | 50,899 | | | | 7,475,536 | |
| | | | | | | | 333,562,202 | |
| Leisure Products – 0.9% | | | | | | | | |
| Brunswick Corp. | | | 488,200 | | | | 24,658,982 | |
| Polaris Industries, Inc. (b) | | | 529,819 | | | | 45,537,943 | |
| | | | | | | | 70,196,925 | |
| Media – 1.6% | | | | | | | | |
| AMC Networks, Inc. Class A (a) | | | 410,100 | | | | 30,626,268 | |
| Interpublic Group of Companies, Inc. | | | 2,228,985 | | | | 51,890,771 | |
| John Wiley & Sons, Inc. Class A | | | 18,100 | | | | 815,043 | |
| Lions Gate Entertainment Corp. (b) | | | 376,300 | | | | 12,188,357 | |
| MDC Partners, Inc. Class A | | | 67,300 | | | | 1,461,756 | |
| Naspers Ltd. Class N | | | 62,800 | | | | 8,583,776 | |
| News Corp. Class A | | | 791,100 | | | | 10,569,096 | |
| Omnicom Group, Inc. | | | 135,800 | | | | 10,274,628 | |
| | | | | | | | 126,409,695 | |
| Multiline Retail – 0.8% | | | | | | | | |
| Dollar Tree, Inc. (a) | | | 874,200 | | | | 67,505,724 | |
| | | | | | | |
| | | Shares | | | Value | |
| | | | | | | |
| Specialty Retail – 3.0% | | | | | | | | |
| AutoZone, Inc. (a) | | | 52,732 | | | $ | 39,122,398 | |
| Dick’s Sporting Goods, Inc. | | | 510,600 | | | | 18,049,710 | |
| Foot Locker, Inc. | | | 647,087 | | | | 42,118,893 | |
| GNC Holdings, Inc. | | | 823,000 | | | | 25,529,460 | |
| L Brands, Inc. | | | 141,600 | | | | 13,568,112 | |
| Party City Holdco, Inc. (b) | | | 179,500 | | | | 2,317,345 | |
| Select Comfort Corp. (a) | | | 71,400 | | | | 1,528,674 | |
| Signet Jewelers Ltd. | | | 340,743 | | | | 42,146,502 | |
| TJX Companies, Inc. | | | 536,800 | | | | 38,064,488 | |
| Urban Outfitters, Inc. (a) | | | 365,800 | | | | 8,321,950 | |
| Williams-Sonoma, Inc. | | | 183,200 | | | | 10,700,712 | |
| | | | | | | | 241,468,244 | |
| Textiles, Apparel & Luxury Goods – 2.4% | | | | | | | | |
| Deckers Outdoor Corp. (a) | | | 540,500 | | | | 25,511,600 | |
| G-III Apparel Group Ltd. (a) | | | 1,274,866 | | | | 56,425,569 | |
| Hanesbrands, Inc. | | | 748,700 | | | | 22,034,241 | |
| Kate Spade & Co. (a) | | | 368,800 | | | | 6,553,576 | |
| Page Industries Ltd. | | | 21,178 | | | | 4,270,835 | |
| PVH Corp. | | | 444,000 | | | | 32,700,600 | |
| Ralph Lauren Corp. | | | 259,100 | | | | 28,884,468 | |
| VF Corp. | | | 214,276 | | | | 13,338,681 | |
| | | | | | | | 189,719,570 | |
| | | | | | | | | |
| TOTAL CONSUMER DISCRETIONARY | | | | | | | 1,432,286,701 | |
| | | | | | | | | |
| CONSUMER STAPLES – 2.2% | | | | | | | | |
| Beverages – 0.8% | | | | | | | | |
| C&C Group PLC | | | 1,473,293 | | | | 5,944,889 | |
| Dr. Pepper Snapple Group, Inc. | | | 641,525 | | | | 59,790,130 | |
| | | | | | | | 65,735,019 | |
| Food & Staples Retailing – 0.9% | | | | | | | | |
| CVS Health Corp. | | | 405,447 | | | | 39,640,553 | |
| Kroger Co. | | | 815,880 | | | | 34,128,260 | |
| | | | | | | | 73,768,813 | |
| Food Products – 0.5% | | | | | | | | |
| Amplify Snack Brands, Inc. | | | 70,500 | | | | 812,160 | |
| Archer Daniels Midland Co. | | | 127,854 | | | | 4,689,685 | |
| Britannia Industries Ltd. | | | 15,000 | | | | 669,588 | |
| Bunge Ltd. | | | 374,988 | | | | 25,604,181 | |
| Ingredion, Inc. | | | 59,405 | | | | 5,693,375 | |
| | | | | | | | 37,468,989 | |
| | | | | | | | | |
| TOTAL CONSUMER STAPLES | | | | | | | 176,972,821 | |
| | | | | | | | | |
| ENERGY – 3.1% | | | | | | | | |
| Energy Equipment & Services – 1.1% | | | | | | | | |
| Baker Hughes, Inc. | | | 264,581 | | | | 12,210,413 | |
| Dril-Quip, Inc. (a) | | | 478,600 | | | | 28,347,478 | |
| Ensco PLC Class A | | | 107,000 | | | | 1,646,730 | |
| Halliburton Co. | | | 839,200 | | | | 28,566,368 | |
| Nuverra Environmental Solutions, Inc. (a) | | | 470 | | | | 241 | |
| Oceaneering International, Inc. | | | 569,700 | | | | 21,375,144 | |
| | | | | | | | 92,146,374 | |
| Oil, Gas & Consumable Fuels – 2.0% | | | | | | | | |
| Apache Corp. | | | 379,496 | | | | 16,876,187 | |
See accompanying notes which are an integral part of the financial statements.
| Common Stocks – continued |
| | | Shares | | | Value | |
| | | | | | | |
| ENERGY – continued | | | | | | | | |
| Oil, Gas & Consumable Fuels – continued | | | | | | | | |
| Cimarex Energy Co. | | | 298,752 | | | $ | 26,702,454 | |
| Columbia Pipeline Group, Inc. | | | 67,721 | | | | 1,354,420 | |
| Emerald Oil, Inc. warrants 2/4/16 (a) | | | 6,490 | | | | 0 | |
| Energen Corp. | | | 26,603 | | | | 1,090,457 | |
| EOG Resources, Inc. | | | 50,800 | | | | 3,596,132 | |
| Newfield Exploration Co. (a) | | | 558,100 | | | | 18,171,736 | |
| PDC Energy, Inc. (a) | | | 74,800 | | | | 3,992,824 | |
| Phillips 66 Co. | | | 238,285 | | | | 19,491,713 | |
| Rice Energy, Inc. (a) | | | 81,100 | | | | 883,990 | |
| SM Energy Co. | | | 274,500 | | | | 5,396,670 | |
| Southwestern Energy Co. (a)(b) | | | 1,276,900 | | | | 9,078,759 | |
| Suncor Energy, Inc. | | | 1,778,800 | | | | 45,919,445 | |
| Western Refining, Inc. | | | 149,200 | | | | 5,314,504 | |
| | | | | | | | 157,869,291 | |
| | | | | | | | | |
| TOTAL ENERGY | | | | | | | 250,015,665 | |
| | | | | | | | | |
| FINANCIALS – 20.4% | | | | | | | | |
| Banks – 6.5% | | | | | | | | |
| Boston Private Financial Holdings, Inc. | | | 1,579,316 | | | | 17,909,443 | |
| CIT Group, Inc. | | | 528,300 | | | | 20,973,510 | |
| Comerica, Inc. | | | 787,529 | | | | 32,942,338 | |
| Commerce Bancshares, Inc. | | | 820,449 | | | | 34,901,900 | |
| CVB Financial Corp. | | | 1,142,400 | | | | 19,329,408 | |
| First Citizen Bancshares, Inc. | | | 44,300 | | | | 11,436,931 | |
| First Commonwealth Financial Corp. | | | 1,170,400 | | | | 10,615,528 | |
| First Republic Bank | | | 538,200 | | | | 35,553,492 | |
| Hilltop Holdings, Inc. (a) | | | 389,400 | | | | 7,484,268 | |
| Huntington Bancshares, Inc. | | | 4,846,716 | | | | 53,604,679 | |
| Investors Bancorp, Inc. | | | 2,678,600 | | | | 33,321,784 | |
| Lakeland Financial Corp. | | | 679,346 | | | | 31,671,111 | |
| M&T Bank Corp. | | | 395,300 | | | | 47,902,454 | |
| PacWest Bancorp | | | 606,093 | | | | 26,122,608 | |
| Prosperity Bancshares, Inc. | | | 259,000 | | | | 12,395,740 | |
| Regions Financial Corp. | | | 3,919,900 | | | | 37,631,040 | |
| SunTrust Banks, Inc. | | | 1,093,165 | | | | 46,831,189 | |
| UMB Financial Corp. | | | 786,200 | | | | 36,597,610 | |
| Valley National Bancorp | | | 266,400 | | | | 2,624,040 | |
| | | | | | | | 519,849,073 | |
| Capital Markets – 3.1% | | | | | | | | |
| Ameriprise Financial, Inc. | | | 280,913 | | | | 29,894,761 | |
| E*TRADE Financial Corp. (a) | | | 156,600 | | | | 4,641,624 | |
| Franklin Resources, Inc. | | | 196,800 | | | | 7,246,176 | |
| Greenhill & Co., Inc. | | | 235,500 | | | | 6,737,655 | |
| Invesco Ltd. | | | 1,770,100 | | | | 59,262,948 | |
| Lazard Ltd. Class A | | | 839,745 | | | | 37,796,922 | |
| Legg Mason, Inc. | | | 240,500 | | | | 9,434,815 | |
| PJT Partners, Inc. (a) | | | 34,123 | | | | 965,340 | |
| Raymond James Financial, Inc. | | | 817,795 | | | | 47,407,576 | |
| Stifel Financial Corp. (a) | | | 590,800 | | | | 25,026,288 | |
| The Blackstone Group LP | | | 810,935 | | | | 23,711,739 | |
| | | | | | | | 252,125,844 | |
| | | | | | | |
| | | Shares | | | Value | |
| | | | | | | |
| Consumer Finance – 1.6% | | | | | | | | |
| American Express Co. | | | 63,989 | | | $ | 4,450,435 | |
| Capital One Financial Corp. | | | 488,500 | | | | 35,259,930 | |
| Discover Financial Services | | | 245,600 | | | | 13,169,072 | |
| OneMain Holdings, Inc. (a) | | | 355,700 | | | | 14,775,778 | |
| SLM Corp. (a) | | | 8,999,300 | | | | 58,675,436 | |
| Synchrony Financial (a) | | | 161,100 | | | | 4,899,051 | |
| | | | | | | | 131,229,702 | |
| Diversified Financial Services – 1.2% | | | | | | | | |
| CRISIL Ltd. | | | 84,555 | | | | 2,504,881 | |
| McGraw Hill Financial, Inc. | | | 814,130 | | | | 80,256,935 | |
| Moody’s Corp. | | | 167,900 | | | | 16,847,086 | |
| | | | | | | | 99,608,902 | |
| Insurance – 4.5% | | | | | | | | |
| ACE Ltd. | | | 32,300 | | | | 3,774,255 | |
| AFLAC, Inc. | | | 704,500 | | | | 42,199,550 | |
| Bajaj Finserv Ltd. | | | 58,922 | | | | 1,765,540 | |
| Brown & Brown, Inc. | | | 56,700 | | | | 1,820,070 | |
| First American Financial Corp. | | | 1,466,308 | | | | 52,640,457 | |
| Hiscox Ltd. | | | 1,760,076 | | | | 27,348,181 | |
| Marsh & McLennan Companies, Inc. | | | 1,165,084 | | | | 64,603,908 | |
| Primerica, Inc. | | | 550,920 | | | | 26,019,952 | |
| Principal Financial Group, Inc. | | | 1,107,100 | | | | 49,797,358 | |
| Progressive Corp. | | | 319,600 | | | | 10,163,280 | |
| Reinsurance Group of America, Inc. | | | 674,058 | | | | 57,665,662 | |
| The Chubb Corp. | | | 147,100 | | | | 19,511,344 | |
| The Travelers Companies, Inc. | | | 9,000 | | | | 1,015,740 | |
| | | | | | | | 358,325,297 | |
| Real Estate Investment Trusts – 0.5% | | | | | | | | |
| Ladder Capital Corp. Class A | | | 1,444,799 | | | | 17,944,404 | |
| Mid-America Apartment Communities, Inc. | | | 121,300 | | | | 11,015,253 | |
| SL Green Realty Corp. | | | 8,400 | | | | 949,032 | |
| VEREIT, Inc. | | | 754,400 | | | | 5,974,848 | |
| | | | | | | | 35,883,537 | |
| Real Estate Management & Development – 2.2% | | | | | | | | |
| CBRE Group, Inc. (a) | | | 2,547,523 | | | | 88,093,345 | |
| Colliers International Group, Inc. | | | 24,800 | | | | 1,104,840 | |
| Jones Lang LaSalle, Inc. | | | 566,560 | | | | 90,570,282 | |
| Realogy Holdings Corp. (a) | | | 21,900 | | | | 803,073 | |
| | | | | | | | 180,571,540 | |
| Thrifts & Mortgage Finance – 0.8% | | | | | | | | |
| Beneficial Bancorp, Inc. (a) | | | 427,862 | | | | 5,699,122 | |
| BofI Holding, Inc. (a)(b) | | | 106,700 | | | | 2,246,035 | |
| Essent Group Ltd. (a) | | | 2,413,800 | | | | 52,838,082 | |
| Housing Development Finance Corp. Ltd. | | | 349,130 | | | | 6,635,357 | |
| | | | | | | | 67,418,596 | |
| | | | | | | | | |
| TOTAL FINANCIALS | | | | | | | 1,645,012,491 | |
| | | | | | | | | |
| HEALTH CARE – 13.6% | | | | | | | | |
| Biotechnology – 0.9% | | | | | | | | |
| Amgen, Inc. | | | 32,700 | | | | 5,308,191 | |
| Baxalta, Inc. | | | 344,000 | | | | 13,426,320 | |
| Biogen, Inc. (a) | | | 54,800 | | | | 16,787,980 | |
| BioMarin Pharmaceutical, Inc. (a) | | | 8,500 | | | | 890,460 | |
See accompanying notes which are an integral part of the financial statements.
Investments – continued
| Common Stocks – continued |
| | | Shares | | | Value | |
| | | | | | | |
| HEALTH CARE – continued | | | | | | | | |
| Biotechnology – continued | | | | | | | | |
| Medivation, Inc. (a) | | | 19,900 | | | $ | 961,966 | |
| United Therapeutics Corp. (a) | | | 196,300 | | | | 30,742,543 | |
| | | | | | | | 68,117,460 | |
| Health Care Equipment & Supplies – 4.3% | | | | | | | | |
| Alere, Inc. (a) | | | 37,000 | | | | 1,446,330 | |
| Becton, Dickinson & Co. | | | 173,300 | | | | 26,703,797 | |
| Boston Scientific Corp. (a) | | | 3,814,103 | | | | 70,332,059 | |
| DENTSPLY International, Inc. | | | 783,000 | | | | 47,645,550 | |
| Hologic, Inc. (a) | | | 1,594,824 | | | | 61,703,741 | |
| St. Jude Medical, Inc. | | | 62,300 | | | | 3,848,271 | |
| Steris PLC (b) | | | 966,500 | | | | 72,816,110 | |
| Zimmer Biomet Holdings, Inc. | | | 635,100 | | | | 65,154,909 | |
| | | | | | | | 349,650,767 | |
| Health Care Providers & Services – 3.8% | | | | | | | | |
| Cardinal Health, Inc. | | | 950,847 | | | | 84,882,112 | |
| Cigna Corp. | | | 97,500 | | | | 14,267,175 | |
| Community Health Systems, Inc. (a) | | | 473,900 | | | | 12,572,567 | |
| DaVita HealthCare Partners, Inc. (a) | | | 728,500 | | | | 50,783,735 | |
| HCA Holdings, Inc. (a) | | | 638,135 | | | | 43,157,070 | |
| Laboratory Corp. of America Holdings (a) | | | 340,900 | | | | 42,148,876 | |
| McKesson Corp. | | | 250,750 | | | | 49,455,423 | |
| Molina Healthcare, Inc. (a) | | | 32,400 | | | | 1,948,212 | |
| Surgery Partners, Inc. (a)(b) | | | 181,800 | | | | 3,725,082 | |
| Surgical Care Affiliates, Inc. (a) | | | 103,100 | | | | 4,104,411 | |
| Universal Health Services, Inc. Class B | | | 6,200 | | | | 740,838 | |
| | | | | | | | 307,785,501 | |
| Life Sciences Tools & Services – 1.5% | | | | | | | | |
| Agilent Technologies, Inc. | | | 814,606 | | | | 34,058,677 | |
| Bruker Corp. (a) | | | 616,800 | | | | 14,969,736 | |
| Thermo Fisher Scientific, Inc. | | | 489,963 | | | | 69,501,252 | |
| | | | | | | | 118,529,665 | |
| Pharmaceuticals – 3.1% | | | | | | | | |
| Allergan PLC (a) | | | 186,745 | | | | 58,357,813 | |
| Catalent, Inc. (a) | | | 511,500 | | | | 12,802,845 | |
| Endo Health Solutions, Inc. (a) | | | 870,800 | | | | 53,310,376 | |
| Horizon Pharma PLC (a) | | | 165,870 | | | | 3,594,403 | |
| Jazz Pharmaceuticals PLC (a) | | | 405,271 | | | | 56,964,892 | |
| Perrigo Co. PLC | | | 10,900 | | | | 1,577,230 | |
| Teva Pharmaceutical Industries Ltd. sponsored ADR | | | 951,656 | | | | 62,466,700 | |
| | | | | | | | 249,074,259 | |
| | | | | | | | | |
| TOTAL HEALTH CARE | | | | | | | 1,093,157,652 | |
| | | | | | | | | |
| INDUSTRIALS – 14.5% | | | | | | | | |
| Aerospace & Defense – 2.4% | | | | | | | | |
| Curtiss-Wright Corp. | | | 396,548 | | | | 27,163,538 | |
| Esterline Technologies Corp. (a) | | | 238,248 | | | | 19,298,088 | |
| Huntington Ingalls Industries, Inc. | | | 234,800 | | | | 29,784,380 | |
| Rockwell Collins, Inc. | | | 445,583 | | | | 41,127,311 | |
| Textron, Inc. | | | 1,879,181 | | | | 78,944,394 | |
| | | | | | | | 196,317,711 | |
| | | | | | | |
| | | Shares | | | Value | |
| | | | | | | |
| Air Freight & Logistics – 0.9% | | | | | | | | |
| C.H. Robinson Worldwide, Inc. | | | 242,600 | | | $ | 15,046,052 | |
| FedEx Corp. | | | 369,011 | | | | 54,978,949 | |
| | | | | | | | 70,025,001 | |
| Airlines – 1.3% | | | | | | | | |
| Allegiant Travel Co. | | | 63,400 | | | | 10,640,422 | |
| Copa Holdings SA Class A | | | 67,400 | | | | 3,252,724 | |
| Southwest Airlines Co. | | | 777,600 | | | | 33,483,456 | |
| Spirit Airlines, Inc. (a) | | | 1,456,013 | | | | 58,022,118 | |
| | | | | | | | 105,398,720 | |
| Building Products – 0.5% | | | | | | | | |
| A.O. Smith Corp. | | | 207,800 | | | | 15,919,558 | |
| Lennox International, Inc. | | | 210,356 | | | | 26,273,464 | |
| | | | | | | | 42,193,022 | |
| Commercial Services & Supplies – 1.1% | | | | | | | | |
| Copart, Inc. (a) | | | 111,100 | | | | 4,222,911 | |
| G&K Services, Inc. Class A | | | 203,000 | | | | 12,768,700 | |
| Herman Miller, Inc. | | | 303,600 | | | | 8,713,320 | |
| HNI Corp. | | | 231,277 | | | | 8,339,849 | |
| KAR Auction Services, Inc. | | | 321,282 | | | | 11,897,072 | |
| Knoll, Inc. | | | 1,026,700 | | | | 19,301,960 | |
| Matthews International Corp. Class A | | | 104,700 | | | | 5,596,215 | |
| Multi-Color Corp. | | | 66,100 | | | | 3,953,441 | |
| Republic Services, Inc. | | | 301,213 | | | | 13,250,360 | |
| | | | | | | | 88,043,828 | |
| Construction & Engineering – 1.0% | | | | | | | | |
| AECOM (a) | | | 31,800 | | | | 954,954 | |
| EMCOR Group, Inc. | | | 925,707 | | | | 44,470,964 | |
| Jacobs Engineering Group, Inc. (a) | | | 755,055 | | | | 31,674,557 | |
| Quanta Services, Inc. (a) | | | 360,371 | | | | 7,297,513 | |
| | | | | | | | 84,397,988 | |
| Electrical Equipment – 0.1% | | | | | | | | |
| AMETEK, Inc. | | | 185,500 | | | | 9,940,945 | |
| Rockwell Automation, Inc. | | | 15,900 | | | | 1,631,499 | |
| | | | | | | | 11,572,444 | |
| Industrial Conglomerates – 0.6% | | | | | | | | |
| Roper Technologies, Inc. | | | 233,686 | | | | 44,351,266 | |
| Machinery – 4.6% | | | | | | | | |
| AGCO Corp. | | | 672,000 | | | | 30,502,080 | |
| Caterpillar, Inc. (b) | | | 55,265 | | | | 3,755,809 | |
| Colfax Corp. (a) | | | 783,400 | | | | 18,292,390 | |
| Cummins, Inc. | | | 203,175 | | | | 17,881,432 | |
| Deere & Co. (b) | | | 356,600 | | | | 27,197,882 | |
| IDEX Corp. | | | 17,500 | | | | 1,340,675 | |
| Illinois Tool Works, Inc. | | | 439,367 | | | | 40,720,534 | |
| Ingersoll-Rand PLC | | | 627,345 | | | | 34,685,905 | |
| Manitowoc Co., Inc. (b) | | | 882,579 | | | | 13,547,588 | |
| Mueller Industries, Inc. | | | 719,904 | | | | 19,509,398 | |
| Rexnord Corp. (a) | | | 3,617,434 | | | | 65,547,904 | |
| Snap-On, Inc. | | | 160,600 | | | | 27,531,658 | |
| Stanley Black & Decker, Inc. | | | 74,400 | | | | 7,940,712 | |
| Valmont Industries, Inc. | | | 141,881 | | | | 15,042,224 | |
| Wabtec Corp. | | | 116,660 | | | | 8,296,859 | |
See accompanying notes which are an integral part of the financial statements.
| Common Stocks – continued |
| | | Shares | | | Value | |
| | | | | | | |
| INDUSTRIALS – continued | | | | | | | | |
| Machinery – continued | | | | | | | | |
| Woodward, Inc. | | | 527,107 | | | $ | 26,176,134 | |
| Xylem, Inc. | | | 263,600 | | | | 9,621,400 | |
| | | | | | | | 367,590,584 | |
| Professional Services – 0.7% | | | | | | | | |
| CEB, Inc. | | | 224,600 | | | | 13,788,194 | |
| Dun & Bradstreet Corp. | | | 428,205 | | | | 44,503,346 | |
| | | | | | | | 58,291,540 | |
| Road & Rail – 0.6% | | | | | | | | |
| ArcBest Corp. | | | 30,140 | | | | 644,695 | |
| CSX Corp. | | | 193,000 | | | | 5,008,350 | |
| J.B. Hunt Transport Services, Inc. | | | 52,500 | | | | 3,851,400 | |
| Old Dominion Freight Lines, Inc. (a) | | | 269,300 | | | | 15,907,551 | |
| Saia, Inc. (a) | | | 741,205 | | | | 16,491,811 | |
| Swift Transporation Co. (a) | | | 588,178 | | | | 8,128,620 | |
| | | | | | | | 50,032,427 | |
| Trading Companies & Distributors – 0.7% | | | | | | | | |
| Air Lease Corp. Class A (b) | | | 1,018,894 | | | | 34,112,571 | |
| HD Supply Holdings, Inc. (a) | | | 82,900 | | | | 2,489,487 | |
| Misumi Group, Inc. | | | 775,200 | | | | 10,708,345 | |
| WESCO International, Inc. (a) | | | 111,400 | | | | 4,865,952 | |
| | | | | | | | 52,176,355 | |
| | | | | | | | | |
| TOTAL INDUSTRIALS | | | | | | | 1,170,390,886 | |
| | | | | | | | | |
| INFORMATION TECHNOLOGY – 24.4% | | | | | | | | |
| Communications Equipment – 1.1% | | | | | | | | |
| Brocade Communications Systems, Inc. | | | 868,403 | | | | 7,971,940 | |
| CommScope Holding Co., Inc. (a) | | | 1,207,390 | | | | 31,259,327 | |
| F5 Networks, Inc. (a) | | | 455,554 | | | | 44,170,516 | |
| Juniper Networks, Inc. | | | 189,962 | | | | 5,242,951 | |
| | | | | | | | 88,644,734 | |
| Electronic Equipment & Components – 4.3% | | | | | | | | |
| Arrow Electronics, Inc. (a) | | | 648,180 | | | | 35,118,392 | |
| Avnet, Inc. | | | 816,630 | | | | 34,984,429 | |
| Belden, Inc. | | | 870,300 | | | | 41,495,904 | |
| CDW Corp. | | | 1,821,220 | | | | 76,564,089 | |
| IPG Photonics Corp. (a)(b) | | | 315,200 | | | | 28,103,232 | |
| Jabil Circuit, Inc. | | | 260,900 | | | | 6,076,361 | |
| Keysight Technologies, Inc. (a) | | | 365,453 | | | | 10,353,283 | |
| Littelfuse, Inc. | | | 29,500 | | | | 3,156,795 | |
| Methode Electronics, Inc. Class A | | | 529,000 | | | | 16,838,070 | |
| TE Connectivity Ltd. | | | 737,266 | | | | 47,634,756 | |
| Trimble Navigation Ltd. (a) | | | 1,649,600 | | | | 35,383,920 | |
| Zebra Technologies Corp. Class A (a) | | | 155,100 | | | | 10,802,715 | |
| | | | | | | | 346,511,946 | |
| Internet Software & Services – 0.7% | | | | | | | | |
| Alphabet, Inc. Class C | | | 60,302 | | | | 45,761,982 | |
| Tencent Holdings Ltd. | | | 549,000 | | | | 10,749,412 | |
| | | | | | | | 56,511,394 | |
| IT Services – 10.4% | | | | | | | | |
| Alliance Data Systems Corp. (a) | | | 226,990 | | | | 62,778,624 | |
| Blackhawk Network Holdings, Inc. (a) | | | 1,492,994 | | | | 66,005,265 | |
| | | | | | | |
| | | Shares | | | Value | |
| | | | | | | |
| Broadridge Financial Solutions, Inc. | | | 311,203 | | | $ | 16,720,937 | |
| Cognizant Technology Solutions Corp. Class A (a) | | | 74,400 | | | | 4,465,488 | |
| Euronet Worldwide, Inc. (a) | | | 983,477 | | | | 71,233,239 | |
| EVERTEC, Inc. | | | 1,003,693 | | | | 16,801,821 | |
| Fidelity National Information | | | | | | | | |
| Services, Inc. | | | 980,777 | | | | 59,435,086 | |
| Fiserv, Inc. (a) | | | 701,614 | | | | 64,169,616 | |
| FleetCor Technologies, Inc. (a) | | | 387,240 | | | | 55,348,213 | |
| Genpact Ltd. (a) | | | 2,744,988 | | | | 68,569,800 | |
| Global Payments, Inc. | | | 1,965,376 | | | | 126,786,398 | |
| Maximus, Inc. | | | 440,300 | | | | 24,766,875 | |
| The Western Union Co. | | | 1,509,648 | | | | 27,037,796 | |
| Total System Services, Inc. | | | 1,723,410 | | | | 85,825,818 | |
| Vantiv, Inc. (a) | | | 576,400 | | | | 27,332,888 | |
| Visa, Inc. Class A | | | 404,100 | | | | 31,337,955 | |
| Xerox Corp. | | | 2,686,149 | | | | 28,553,764 | |
| | | | | | | | 837,169,583 | |
| Semiconductors & Semiconductor Equipment – 3.0% | | | | | | | | |
| Atmel Corp. | | | 1,777,633 | | | | 15,305,420 | |
| Broadcom Corp. Class A | | | 733,200 | | | | 42,393,624 | |
| Cree, Inc. (a) | | | 796,800 | | | | 21,250,656 | |
| Intersil Corp. Class A | | | 658,608 | | | | 8,403,838 | |
| Maxim Integrated Products, Inc. | | | 584,300 | | | | 22,203,400 | |
| Microchip Technology, Inc. (b) | | | 101,875 | | | | 4,741,263 | |
| NVIDIA Corp. | | | 1,467,033 | | | | 48,353,408 | |
| NXP Semiconductors NV (a) | | | 799,643 | | | | 67,369,923 | |
| Qorvo, Inc. (a) | | | 74,800 | | | | 3,807,320 | |
| Semtech Corp. (a) | | | 325,000 | | | | 6,149,000 | |
| | | | | | | | 239,977,852 | |
| Software – 3.8% | | | | | | | | |
| Activision Blizzard, Inc. | | | 1,350,700 | | | | 52,285,597 | |
| Cadence Design Systems, Inc. (a) | | | 2,450,100 | | | | 50,986,581 | |
| Electronic Arts, Inc. (a) | | | 1,251,890 | | | | 86,029,881 | |
| Fair Isaac Corp. | | | 334,900 | | | | 31,540,882 | |
| Intuit, Inc. | | | 192,997 | | | | 18,624,211 | |
| Parametric Technology Corp. (a) | | | 884,741 | | | | 30,638,581 | |
| Synopsys, Inc. (a) | | | 884,749 | | | | 40,353,402 | |
| | | | | | | | 310,459,135 | |
| Technology Hardware, Storage & Peripherals – 1.1% | | | | | | | | |
| EMC Corp. | | | 1,075,239 | | | | 27,612,138 | |
| SanDisk Corp. | | | 431,500 | | | | 32,789,685 | |
| Western Digital Corp. | | | 470,300 | | | | 28,241,515 | |
| | | | | | | | 88,643,338 | |
| | | | | | | | | |
| TOTAL INFORMATION TECHNOLOGY | | | | | | | 1,967,917,982 | |
| | | | | | | | | |
| MATERIALS – 3.0% | | | | | | | | |
| Chemicals – 2.1% | | | | | | | | |
| Albemarle Corp. U.S. | | | 776,956 | | | | 43,517,306 | |
| Ashland, Inc. | | | 86,126 | | | | 8,845,140 | |
| Eastman Chemical Co. | | | 553,500 | | | | 37,366,785 | |
| Ferro Corp. (a) | | | 1,648,609 | | | | 18,332,532 | |
| PolyOne Corp. | | | 928,460 | | | | 29,487,890 | |
| PPG Industries, Inc. | | | 99,900 | | | | 9,872,118 | |
| Praxair, Inc. | | | 189,300 | | | | 19,384,320 | |
| | | | | | | | 166,806,091 | |
See accompanying notes which are an integral part of the financial statements.
Investments – continued
| Common Stocks – continued |
| | | Shares | | | Value | |
| | | | | | | |
| MATERIALS – continued | | | | | | | | |
| Containers & Packaging – 0.4% | | | | | | | | |
| Aptargroup, Inc. | | | 189,630 | | | $ | 13,776,620 | |
| WestRock Co. | | | 519,500 | | | | 23,699,590 | |
| | | | | | | | 37,476,210 | |
| Metals & Mining – 0.2% | | | | | | | | |
| B2Gold Corp. (a) | | | 8,111,000 | | | | 8,206,548 | |
| New Gold, Inc. (a) | | | 2,039,120 | | | | 4,745,224 | |
| Randgold Resources Ltd. sponsored ADR | | | 41,100 | | | | 2,545,323 | |
| | | | | | | | 15,497,095 | |
| Paper & Forest Products – 0.3% | | | | | | | | |
| Boise Cascade Co. (a) | | | 986,464 | | | | 25,184,426 | |
| | | | | | | | | |
| TOTAL MATERIALS | | | | | | | 244,963,822 | |
| | | | | | | | | |
| UTILITIES – 0.6% | | | | | | | | |
| Electric Utilities – 0.5% | | | | | | | | |
| Exelon Corp. | | | 1,107,300 | | | | 30,749,721 | |
| OGE Energy Corp. | | | 295,000 | | | | 7,755,550 | |
| | | | | | | | 38,505,271 | |
| Independent Power and Renewable Electricity Producers – 0.0% | | | | | | | | |
| Calpine Corp. (a) | | | 171,700 | | | | 2,484,499 | |
| Dynegy, Inc. (a) | | | 254,900 | | | | 3,415,660 | |
| | | | | | | | 5,900,159 | |
| Multi-Utilities – 0.1% | | | | | | | | |
| CMS Energy Corp. | | | 160,519 | | | | 5,791,526 | |
| NiSource, Inc. | | | 67,721 | | | | 1,321,237 | |
| | | | | | | | 7,112,763 | |
| | | | | | | | | |
| TOTAL UTILITIES | | | | | | | 51,518,193 | |
| | | | | | | | | |
| TOTAL COMMON STOCKS | | | | | | | | |
| (Cost $7,196,519,579) | | | | | | | 8,032,236,213 | |
| | | | | | | | | |
| Nonconvertible Preferred Stocks – 0.1% | |
| | | | | | | | | |
| FINANCIALS – 0.1% | | | | | | | | |
| Capital Markets – 0.1% | | | | | | | | |
| GMAC Capital Trust I Series 2, 8.125% | | | | | | | | |
| (Cost $8,358,700) | | | 405,466 | | | | 10,282,618 | |
| Money Market Funds – 1.3% |
| | | Shares | | | Value | |
| | | | | | | |
| Fidelity Cash Central Fund, 0.33% (c) | | | 30,864,252 | | | $ | 30,864,252 | |
| Fidelity Securities Lending Cash Central Fund, 0.35% (c)(d) | | | 72,375,074 | | | | 72,375,074 | |
| | | | | | | | | |
| TOTAL MONEY MARKET FUNDS | | | | | | | | |
| (Cost $103,239,326) | | | | | | | 103,239,326 | |
| | | | | | | | | |
| TOTAL INVESTMENT PORTFOLIO – 101.0% | | | | | | | | |
| (Cost $7,308,117,605) | | | | | | | 8,145,758,157 | |
| | | | | | | | | |
| NET OTHER ASSETS (LIABILITIES) – (1.0)% | | | | | | | (82,484,203 | ) |
| NET ASSETS – 100% | | | | | | $ | 8,063,273,954 | |
See accompanying notes which are an integral part of the financial statements.
Legend
| (b) | Security or a portion of the security is on loan at period end. |
| (c) | Affiliated fund that is generally available only to investment companies and other accounts managed by Fidelity Investments. The rate quoted is the annualized seven-day yield of the fund at period end. A complete |
unaudited listing of the fund’s holdings as of its most recent quarter end is available upon request. In addition, each Fidelity Central Fund’s financial statements, which are not covered by the Fund’s Report of Independent Registered Public Accounting Firm, are available on the SEC’s website or upon request.
| (d) | Investment made with cash collateral received from securities on loan. |
Affiliated Central Funds
Information regarding fiscal year to date income earned by the Fund from investments in Fidelity Central Funds is as follows:
| Fund | | Income earned | |
| Fidelity Cash Central Fund | | $ | 68,209 | |
| Fidelity Securities Lending Cash Central Fund | | | 333,919 | |
| Total | | $ | 402,128 | |
Investment Valuation
The following is a summary of the inputs used, as of December 31, 2015, involving the Fund’s assets and liabilities carried at fair value. The inputs or methodology used for valuing securities may not be an indication of the risk associated with investing in those securities. For more information on valuation inputs, and their aggregation into the levels used below, please refer to the Investment Valuation section in the accompanying Notes to Financial Statements.
| Valuation Inputs at Reporting Date: |
| Description | | Total | | | Level 1 | | | Level 2 | | | Level 3 | |
| Investments in Securities: | | | | | | | | | | | | | | | | |
| Equities: | | | | | | | | | | | | | | | | |
| Consumer Discretionary | | $ | 1,432,286,701 | | | $ | 1,417,756,129 | | | $ | 14,530,572 | | | $ | — | |
| Consumer Staples | | | 176,972,821 | | | | 176,303,233 | | | | 669,588 | | | | — | |
| Energy | | | 250,015,665 | | | | 250,015,665 | | | | — | | | | — | |
| Financials | | | 1,655,295,109 | | | | 1,644,389,331 | | | | 10,905,778 | | | | — | |
| Health Care | | | 1,093,157,652 | | | | 1,093,157,652 | | | | — | | | | — | |
| Industrials | | | 1,170,390,886 | | | | 1,159,682,541 | | | | 10,708,345 | | | | — | |
| Information Technology | | | 1,967,917,982 | | | | 1,957,168,570 | | | | 10,749,412 | | | | — | |
| Materials | | | 244,963,822 | | | | 244,963,822 | | | | — | | | | — | |
| Utilities | | | 51,518,193 | | | | 51,518,193 | | | | — | | | | — | |
| Money Market Funds | | | 103,239,326 | | | | 103,239,326 | | | | — | | | | — | |
| Total Investments in Securities: | | $ | 8,145,758,157 | | | $ | 8,098,194,462 | | | $ | 47,563,695 | | | $ | — | |
Other Information
Distribution of investments by country or territory of incorporation, as a percentage of Total Net Assets, is as follows (Unaudited):
| United States of America | | | 88.1 | % |
| Bermuda | | | 3.8 | % |
| Ireland | | | 2.6 | % |
| Canada | | | 1.0 | % |
| Others (Individually Less Than 1%) | | | 4.5 | % |
| | | | 100.0 | % |
See accompanying notes which are an integral part of the financial statements.
Financial Statements
| Statement of Assets and Liabilities |
| | | | | | December 31, 2015 | |
| Assets | | | | | | | | |
| Investment in securities, at value (including securities loaned of $70,372,992) — See accompanying schedule: | | | | | | | | |
| Unaffiliated issuers (cost $7,204,878,279) | | $ | 8,042,518,831 | | | | | |
| Fidelity Central Funds (cost $103,239,326) | | | 103,239,326 | | | | | |
| Total Investments (cost $7,308,117,605) | | | | | | $ | 8,145,758,157 | |
| Receivable for investments sold | | | | | | | 2,413,943 | |
| Receivable for fund shares sold | | | | | | | 1,668,407 | |
| Dividends receivable | | | | | | | 8,844,998 | |
| Distributions receivable from Fidelity Central Funds | | | | | | | 57,265 | |
| Prepaid expenses | | | | | | | 18,370 | |
| Other receivables | | | | | | | 118,918 | |
| Total assets | | | | | | | 8,158,880,058 | |
| | | | | | | | | |
| Liabilities | | | | | | | | |
| Payable for investments purchased | | $ | 12,379,836 | | | | | |
| Payable for fund shares redeemed | | | 5,154,612 | | | | | |
| Accrued management fee | | | 3,747,681 | | | | | |
| Distribution and service plan fees payable | | | 1,234,422 | | | | | |
| Other affiliated payables | | | 588,392 | | | | | |
| Other payables and accrued expenses | | | 126,087 | | | | | |
| Collateral on securities loaned, at value | | | 72,375,074 | | | | | |
| Total liabilities | | | | | | | 95,606,104 | |
| | | | | | | | | |
| Net Assets | | | | | | $ | 8,063,273,954 | |
| Net Assets consist of: | | | | | | | | |
| Paid in capital | | | | | | $ | 6,760,040,663 | |
| Distributions in excess of net investment income | | | | | | | (115,077 | ) |
| Accumulated undistributed net realized gain (loss) on investments and foreign currency transactions | | | | | | | 465,748,069 | |
| Net unrealized appreciation (depreciation) on investments and assets and liabilities in foreign currencies | | | | | | | 837,600,299 | |
| | | | | | | | | |
| Net Assets | | | | | | $ | 8,063,273,954 | |
| | | | | | | | | |
| Initial Class: | | | | | | | | |
| Net Asset Value, offering price and redemption price per share ($1,382,527,358 ÷ 42,341,816 shares) | | | | | | $ | 32.65 | |
| | | | | | | | | |
| Service Class: | | | | | | | | |
| Net Asset Value, offering price and redemption price per share ($566,348,884 ÷ 17,474,295 shares) | | | | | | $ | 32.41 | |
| | | | | | | | | |
| Service Class 2: | | | | | | | | |
| Net Asset Value, offering price and redemption price per share ($5,591,029,554 ÷ 175,676,779 shares) | | | | | | $ | 31.83 | |
| | | | | | | | | |
| Investor Class: | | | | | | | | |
| Net Asset Value, offering price and redemption price per share ($523,368,158 ÷ 16,102,145 shares) | | | | | | $ | 32.50 | |
See accompanying notes which are an integral part of the financial statements.
| Statement of Operations |
| | | | | | Year ended | |
| | | | | | December 31, 2015 | |
| Investment Income | | | | | | | | |
| Dividends | | | | | | $ | 98,775,296 | |
| Income from Fidelity Central Funds | | | | | | | 402,128 | |
| Total income | | | | | | | 99,177,424 | |
| | | | | | | | | |
| Expenses | | | | | | | | |
| Management fee | | $ | 48,488,119 | | | | | |
| Transfer agent fees | | | 6,277,624 | | | | | |
| Distribution and service plan fees | | | 16,125,395 | | | | | |
| Accounting and security lending fees | | | 1,257,908 | | | | | |
| Custodian fees and expenses | | | 129,012 | | | | | |
| Independent trustees’ compensation | | | 38,064 | | | | | |
| Audit | | | 74,079 | | | | | |
| Legal | | | 31,695 | | | | | |
| Interest | | | 16,782 | | | | | |
| Miscellaneous | | | 59,847 | | | | | |
| Total expenses before reductions | | | 72,498,525 | | | | | |
| Expense reductions | | | (132,320 | ) | | | 72,366,205 | |
| | | | | | | | | |
| Net investment income (loss) | | | | | | | 26,811,219 | |
| Realized and Unrealized Gain (Loss) | | | | | | | | |
| Net realized gain (loss) on: | | | | | | | | |
| Investment securities: | | | | | | | | |
| Unaffiliated issuers | | | 506,895,720 | | | | | |
| Foreign currency transactions | | | 66,493 | | | | | |
| Total net realized gain (loss) | | | | | | | 506,962,213 | |
| Change in net unrealized appreciation (depreciation) on: | | | | | | | | |
| Investment securities | | | (648,517,058 | ) | | | | |
| Assets and liabilities in foreign currencies | | | (3,073 | ) | | | | |
| Total change in net unrealized appreciation (depreciation) | | | | | | | (648,520,131 | ) |
| Net gain (loss) | | | | | | | (141,557,918 | ) |
| Net increase (decrease) in net assets resulting from operations | | | | | | $ | (114,746,699 | ) |
| Statement of Changes in Net Assets |
| | | Year ended December | | | Year ended December | |
| | | 31, 2015 | | | 31, 2014 | |
| Increase (Decrease) in Net Assets | | | | | | | | |
| Operations | | | | | | | | |
| Net investment income (loss) | | $ | 26,811,219 | | | $ | 14,348,386 | |
| Net realized gain (loss) | | | 506,962,213 | | | | 1,118,713,559 | |
| Change in net unrealized appreciation (depreciation) | | | (648,520,131 | ) | | | (608,445,007 | ) |
| Net increase (decrease) in net assets resulting from operations | | | (114,746,699 | ) | | | 524,616,938 | |
| Distributions to shareholders from net investment income | | | (24,497,724 | ) | | | (6,886,171 | ) |
| Distributions to shareholders from net realized gain | | | (1,074,651,414 | ) | | | (212,967,306 | ) |
| Total distributions | | | (1,099,149,138 | ) | | | (219,853,477 | ) |
| Share transactions – net increase (decrease) | | | 244,251,301 | | | | (445,133,654 | ) |
| Total increase (decrease) in net assets | | | (969,644,536 | ) | | | (140,370,193 | ) |
| | | | | | | | | |
| Net Assets | | | | | | | | |
| Beginning of period | | | 9,032,918,490 | | | | 9,173,288,683 | |
| End of period (including distributions in excess of net investment income of $115,077 and distributions in excess of net investment income of $109,829, respectively) | | $ | 8,063,273,954 | | | $ | 9,032,918,490 | |
See accompanying notes which are an integral part of the financial statements.
| Financial Highlights — VIP Mid Cap Portfolio Initial Class |
| Years ended December 31, | | 2015 | | | 2014 | | | 2013 | | | 2012 | | | 2011 | |
| Selected Per–Share Data | | | | | | | | | | | | | | | | | | | | |
| Net asset value, beginning of period | | $ | 37.68 | | | $ | 36.39 | | | $ | 30.55 | | | $ | 29.08 | | | $ | 32.69 | |
| Income from Investment Operations | | | | | | | | | | | | | | | | | | | | |
| Net investment income (loss)A | | | .17 | | | | .13 | | | | .18 | | | | .29 | | | | .08 | |
| Net realized and unrealized gain (loss) | | | (.59 | ) | | | 2.11 | | | | 10.57 | | | | 3.99 | | | | (3.55 | ) |
| Total from investment operations | | | (.42 | ) | | | 2.24 | | | | 10.75 | | | | 4.28 | | | | (3.47 | ) |
| Distributions from net investment income | | | (.16 | )B | | | (.10 | ) | | | (.19 | ) | | | (.20 | )B | | | (.08 | ) |
| Distributions from net realized gain | | | (4.45 | )B | | | (.85 | ) | | | (4.72 | ) | | | (2.61 | )B | | | (.06 | ) |
| Total distributions | | | (4.61 | ) | | | (.95 | ) | | | (4.91 | ) | | | (2.81 | ) | | | (.14 | ) |
| Net asset value, end of period | | $ | 32.65 | | | $ | 37.68 | | | $ | 36.39 | | | $ | 30.55 | | | $ | 29.08 | |
| Total ReturnC,D | | | (1.39 | )% | | | 6.29 | % | | | 36.23 | % | | | 14.83 | % | | | (10.61 | )% |
| Ratios to Average Net AssetsE,F | | | | | | | | | | | | | | | | | | | | |
| Expenses before reductions | | | .63 | % | | | .64 | % | | | .64 | % | | | .65 | % | | | .66 | % |
| Expenses net of fee waivers, if any | | | .63 | % | | | .64 | % | | | .64 | % | | | .65 | % | | | .66 | % |
| Expenses net of all reductions | | | .63 | % | | | .63 | % | | | .63 | % | | | .63 | % | | | .65 | % |
| Net investment income (loss) | | | .49 | % | | | .35 | % | | | .52 | % | | | .90 | % | | | .25 | % |
| Supplemental Data | | | | | | | | | | | | | | | | | | | | |
| Net assets, end of period (000 omitted) | | $ | 1,382,527 | | | $ | 1,476,171 | | | $ | 1,489,788 | | | $ | 1,217,359 | | | $ | 1,085,843 | |
| Portfolio turnover rateG | | | 26 | %H | | | 142 | % | | | 132 | % | | | 187 | % | | | 84 | % |
| A | Calculated based on average shares outstanding during the period. |
| B | The amounts shown reflect certain reclassifications related to book to tax differences that were made in the year shown. |
| C | Total returns do not reflect charges attributable to your insurance company’s separate account. Inclusion of these charges would reduce the total returns shown. |
| D | Total returns would have been lower if certain expenses had not been reduced during the applicable periods shown. |
| E | Fees and expenses of any underlying Fidelity Central Funds are not included in the Fund’s expense ratio. The Fund indirectly bears its proportionate share of the expenses of any underlying Fidelity Central Funds. |
| F | Expense ratios reflect operating expenses of the class. Expenses before reductions do not reflect amounts reimbursed by the investment adviser or reductions from brokerage service arrangements or reductions from other expense offset arrangements and do not represent the amount paid by the class during periods when reimbursements or reductions occur. Expenses net of fee waivers reflect expenses after reimbursement by the investment adviser but prior to reductions from brokerage service arrangements or other expense offset arrangements. Expenses net of all reductions represent the net expenses paid by the class. |
| G | Amount does not include the portfolio activity of any underlying Fidelity Central Funds. |
| H | The portfolio turnover rate does not include the assets acquired in the merger. |
See accompanying notes which are an integral part of the financial statements.
| Financial Highlights — VIP Mid Cap Portfolio Service Class |
| Years ended December 31, | | 2015 | | | 2014 | | | 2013 | | | 2012 | | | 2011 | |
| Selected Per–Share Data | | | | | | | | | | | | | | | | | | | | |
| Net asset value, beginning of period | | $ | 37.44 | | | $ | 36.16 | | | $ | 30.39 | | | $ | 28.93 | | | $ | 32.52 | |
| Income from Investment Operations | | | | | | | | | | | | | | | | | | | | |
| Net investment income (loss)A | | | .13 | | | | .09 | | | | .15 | | | | .25 | | | | .05 | |
| Net realized and unrealized gain (loss) | | | (.59 | ) | | | 2.10 | | | | 10.49 | | | | 3.98 | | | | (3.54 | ) |
| Total from investment operations | | | (.46 | ) | | | 2.19 | | | | 10.64 | | | | 4.23 | | | | (3.49 | ) |
| Distributions from net investment income | | | (.13 | )B | | | (.06 | ) | | | (.15 | ) | | | (.16 | )B | | | (.05 | ) |
| Distributions from net realized gain | | | (4.45 | )B | | | (.85 | ) | | | (4.72 | ) | | | (2.61 | )B | | | (.06 | ) |
| Total distributions | | | (4.57 | )C | | | (.91 | ) | | | (4.87 | ) | | | (2.77 | ) | | | (.10 | )D |
| Net asset value, end of period | | $ | 32.41 | | | $ | 37.44 | | | $ | 36.16 | | | $ | 30.39 | | | $ | 28.93 | |
| Total ReturnE,F | | | (1.50 | )% | | | 6.20 | % | | | 36.06 | % | | | 14.75 | % | | | (10.72 | )% |
| Ratios to Average Net AssetsG,H | | | | | | | | | | | | | | | | | | | | |
| Expenses before reductions | | | .73 | % | | | .74 | % | | | .74 | % | | | .75 | % | | | .76 | % |
| Expenses net of fee waivers, if any | | | .73 | % | | | .74 | % | | | .74 | % | | | .75 | % | | | .76 | % |
| Expenses net of all reductions | | | .73 | % | | | .73 | % | | | .73 | % | | | .73 | % | | | .75 | % |
| Net investment income (loss) | | | .39 | % | | | .25 | % | | | .42 | % | | | .80 | % | | | .15 | % |
| Supplemental Data | | | | | | | | | | | | | | | | | | | | |
| Net assets, end of period (000 omitted) | | $ | 566,349 | | | $ | 622,227 | | | $ | 638,612 | | | $ | 525,875 | | | $ | 566,560 | |
| Portfolio turnover rateI | | | 26 | %J | | | 142 | % | | | 132 | % | | | 187 | % | | | 84 | % |
| A | Calculated based on average shares outstanding during the period. |
| B | The amounts shown reflect certain reclassifications related to book to tax differences that were made in the year shown. |
| C | Total distributions of $4.57 per share is comprised of distributions from net investment income of $.128 and distributions from net realized gain of $4.445 per share. |
| D | Total distributions of $.10 per share is comprised of distributions from net investment income of $.048 and distributions from net realized gain of $.055 per share. |
| E | Total returns do not reflect charges attributable to your insurance company’s separate account. Inclusion of these charges would reduce the total returns shown. |
| F | Total returns would have been lower if certain expenses had not been reduced during the applicable periods shown. |
| G | Fees and expenses of any underlying Fidelity Central Funds are not included in the Fund’s expense ratio. The Fund indirectly bears its proportionate share of the expenses of any underlying Fidelity Central Funds. |
| H | Expense ratios reflect operating expenses of the class. Expenses before reductions do not reflect amounts reimbursed by the investment adviser or reductions from brokerage service arrangements or reductions from other expense offset arrangements and do not represent the amount paid by the class during periods when reimbursements or reductions occur. Expenses net of fee waivers reflect expenses after reimbursement by the investment adviser but prior to reductions from brokerage service arrangements or other expense offset arrangements. Expenses net of all reductions represent the net expenses paid by the class. |
| I | Amount does not include the portfolio activity of any underlying Fidelity Central Funds. |
| J | The portfolio turnover rate does not include the assets acquired in the merger. |
See accompanying notes which are an integral part of the financial statements.
| Financial Highlights — VIP Mid Cap Portfolio Service Class 2 |
| Years ended December 31, | | 2015 | | | 2014 | | | 2013 | | | 2012 | | | 2011 | |
| Selected Per–Share Data | | | | | | | | | | | | | | | | | | | | |
| Net asset value, beginning of period | | $ | 36.84 | | | $ | 35.60 | | | $ | 29.98 | | | $ | 28.58 | | | $ | 32.13 | |
| Income from Investment Operations | | | | | | | | | | | | | | | | | | | | |
| Net investment income (loss)A | | | .08 | | | | .04 | | | | .09 | | | | .20 | | | | – | B |
| Net realized and unrealized gain (loss) | | | (.57 | ) | | | 2.06 | | | | 10.35 | | | | 3.93 | | | | (3.49 | ) |
| Total from investment operations | | | (.49 | ) | | | 2.10 | | | | 10.44 | | | | 4.13 | | | | (3.49 | ) |
| Distributions from net investment income | | | (.08 | )C | | | (.01 | ) | | | (.10 | ) | | | (.12 | )C | | | (.01 | ) |
| Distributions from net realized gain | | | (4.45 | )C | | | (.85 | ) | | | (4.72 | ) | | | (2.61 | )C | | | (.06 | ) |
| Total distributions | | | (4.52 | )D | | | (.86 | ) | | | (4.82 | ) | | | (2.73 | ) | | | (.06 | )E |
| Net asset value, end of period | | $ | 31.83 | | | $ | 36.84 | | | $ | 35.60 | | | $ | 29.98 | | | $ | 28.58 | |
| Total ReturnF,G | | | (1.63 | )% | | | 6.03 | % | | | 35.87 | % | | | 14.56 | % | | | (10.85 | )% |
| Ratios to Average Net AssetsH,I | | | | | | | | | | | | | | | | | | | | |
| Expenses before reductions | | | .88 | % | | | .88 | % | | | .89 | % | | | .90 | % | | | .91 | % |
| Expenses net of fee waivers, if any | | | .88 | % | | | .88 | % | | | .89 | % | | | .90 | % | | | .91 | % |
| Expenses net of all reductions | | | .88 | % | | | .88 | % | | | .88 | % | | | .88 | % | | | .90 | % |
| Net investment income (loss) | | | .24 | % | | | .10 | % | | | .27 | % | | | .65 | % | | | - | %J |
| Supplemental Data | | | | | | | | | | | | | | | | | | | | |
| Net assets, end of period (000 omitted) | | $ | 5,591,030 | | | $ | 6,431,011 | | | $ | 6,574,623 | | | $ | 5,335,565 | | | $ | 4,888,475 | |
| Portfolio turnover rateK | | | 26 | %L | | | 142 | % | | | 132 | % | | | 187 | % | | | 84 | % |
| A | Calculated based on average shares outstanding during the period. |
| B | Amount represents less than $.005 per share. |
| C | The amounts shown reflect certain reclassifications related to book to tax differences that were made in the year shown. |
| D | Total distributions of $4.52 per share is comprised of distributions from net investment income of $.075 and distributions from net realized gain of $4.446 per share. |
| E | Total distributions of $.06 per share is comprised of distributions from net investment income of $.007 and distributions from net realized gain of $.055 per share. |
| F | Total returns do not reflect charges attributable to your insurance company’s separate account. Inclusion of these charges would reduce the total returns shown. |
| G | Total returns would have been lower if certain expenses had not been reduced during the applicable periods shown. |
| H | Fees and expenses of any underlying Fidelity Central Funds are not included in the Fund’s expense ratio. The Fund indirectly bears its proportionate share of the expenses of any underlying Fidelity Central Funds. |
| I | Expense ratios reflect operating expenses of the class. Expenses before reductions do not reflect amounts reimbursed by the investment adviser or reductions from brokerage service arrangements or reductions from other expense offset arrangements and do not represent the amount paid by the class during periods when reimbursements or reductions occur. Expenses net of fee waivers reflect expenses after reimbursement by the investment adviser but prior to reductions from brokerage service arrangements or other expense offset arrangements. Expenses net of all reductions represent the net expenses paid by the class. |
| J | Amount represents less than .005%. |
| K | Amount does not include the portfolio activity of any underlying Fidelity Central Funds. |
| L | The portfolio turnover rate does not include the assets acquired in the merger. |
See accompanying notes which are an integral part of the financial statements.
| Financial Highlights — VIP Mid Cap Portfolio Investor Class |
| Years ended December 31, | | 2015 | | | 2014 | | | 2013 | | | 2012 | | | 2011 | |
| Selected Per–Share Data | | | | | | | | | | | | | | | | | | | | |
| Net asset value, beginning of period | | $ | 37.53 | | | $ | 36.25 | | | $ | 30.46 | | | $ | 29.00 | | | $ | 32.60 | |
| Income from Investment Operations | | | | | | | | | | | | | | | | | | | | |
| Net investment income (loss)A | | | .14 | | | | .10 | | | | .15 | | | | .26 | | | | .05 | |
| Net realized and unrealized gain (loss) | | | (.59 | ) | | | 2.10 | | | | 10.52 | | | | 3.98 | | | | (3.54 | ) |
| Total from investment operations | | | (.45 | ) | | | 2.20 | | | | 10.67 | | | | 4.24 | | | | (3.49 | ) |
| Distributions from net investment income | | | (.14 | )B | | | (.07 | ) | | | (.16 | ) | | | (.17 | )B | | | (.06 | ) |
| Distributions from net realized gain | | | (4.45 | )B | | | (.85 | ) | | | (4.72 | ) | | | (2.61 | )B | | | (.06 | ) |
| Total distributions | | | (4.58 | )C | | | (.92 | ) | | | (4.88 | ) | | | (2.78 | ) | | | (.11 | )D |
| Net asset value, end of period | | $ | 32.50 | | | $ | 37.53 | | | $ | 36.25 | | | $ | 30.46 | | | $ | 29.00 | |
| Total ReturnE,F | | | (1.47 | )% | | | 6.20 | % | | | 36.08 | % | | | 14.74 | % | | | (10.70 | )% |
| Ratios to Average Net AssetsG,H | | | | | | | | | | | | | | | | | | | | |
| Expenses before reductions | | | .71 | % | | | .72 | % | | | .73 | % | | | .74 | % | | | .74 | % |
| Expenses net of fee waivers, if any | | | .71 | % | | | .72 | % | | | .72 | % | | | .74 | % | | | .74 | % |
| Expenses net of all reductions | | | .71 | % | | | .71 | % | | | .71 | % | | | .72 | % | | | .73 | % |
| Net investment income (loss) | | | .41 | % | | | .27 | % | | | .44 | % | | | .82 | % | | | .17 | % |
| Supplemental Data | | | | | | | | | | | | | | | | | | | | |
| Net assets, end of period (000 omitted) | | $ | 523,368 | | | $ | 503,509 | | | $ | 470,265 | | | $ | 312,004 | | | $ | 314,362 | |
| Portfolio turnover rateI | | | 26 | %J | | | 142 | % | | | 132 | % | | | 187 | % | | | 84 | % |
| A | Calculated based on average shares outstanding during the period. |
| B | The amounts shown reflect certain reclassifications related to book to tax differences that were made in the year shown. |
| C | Total distributions of $4.58 per share is comprised of distributions from net investment income of $.137 and distributions from net realized gain of $4.446 per share. |
| D | Total distributions of $.11 per share is comprised of distributions from net investment income of $.056 and distributions from net realized gain of $.055 per share. |
| E | Total returns do not reflect charges attributable to your insurance company’s separate account. Inclusion of these charges would reduce the total returns shown. |
| F | Total returns would have been lower if certain expenses had not been reduced during the applicable periods shown. |
| G | Fees and expenses of any underlying Fidelity Central Funds are not included in the Fund’s expense ratio. The Fund indirectly bears its proportionate share of the expenses of any underlying Fidelity Central Funds. |
| H | Expense ratios reflect operating expenses of the class. Expenses before reductions do not reflect amounts reimbursed by the investment adviser or reductions from brokerage service arrangements or reductions from other expense offset arrangements and do not represent the amount paid by the class during periods when reimbursements or reductions occur. Expenses net of fee waivers reflect expenses after reimbursement by the investment adviser but prior to reductions from brokerage service arrangements or other expense offset arrangements. Expenses net of all reductions represent the net expenses paid by the class. |
| I | Amount does not include the portfolio activity of any underlying Fidelity Central Funds. |
| J | The portfolio turnover rate does not include the assets acquired in the merger. |
See accompanying notes which are an integral part of the financial statements.
Notes to Financial Statements
For the period ended December 31, 2015
1. Organization.
VIP Mid Cap Portfolio (the Fund) is a fund of Variable Insurance Products Fund III (the Trust) and is authorized to issue an unlimited number of shares. The Trust is registered under the Investment Company Act of 1940, as amended (the 1940 Act), as an open-end management investment company organized as a Massachusetts business trust. Shares of the Fund may only be purchased by insurance companies for the purpose of funding variable annuity or variable life insurance contracts. The Fund offers the following classes of shares: Initial Class shares, Service Class shares, Service Class 2 shares and Investor Class shares. All classes have equal rights and voting privileges, except for matters affecting a single class.
2. Investments in Fidelity Central Funds.
The Fund invests in Fidelity Central Funds, which are open-end investment companies generally available only to other investment companies and accounts managed by the investment adviser and its affiliates. The Fund’s Schedule of Investments lists each of the Fidelity Central Funds held as of period end, if any, as an investment of the Fund, but does not include the underlying holdings of each Fidelity Central Fund. As an Investing Fund, the Fund indirectly bears its proportionate share of the expenses of the underlying Fidelity Central Funds.
The Money Market Central Funds seek preservation of capital and current income and are managed by Fidelity Investments Money Management, Inc. (FIMM), an affiliate of the investment adviser. Annualized expenses of the Money Market Central Funds as of their most recent shareholder report date are less than .005%.
A complete unaudited list of holdings for each Fidelity Central Fund is available upon request or at the Securities and Exchange Commission (the SEC) website at www.sec.gov. In addition, the financial statements of the Fidelity Central Funds, which are not covered by the Fund’s Report of Independent Registered Public Accounting Firm, are available on the SEC website or upon request.
3. Significant Accounting Policies.
The financial statements have been prepared in conformity with accounting principles generally accepted in the United States of America (GAAP), which require management to make certain estimates and assumptions at the date of the financial statements. Actual results could differ from those estimates. Subsequent events, if any, through the date that the financial statements were issued have been evaluated in the preparation of the financial statements. The following summarizes the significant accounting policies of the Fund:
Investment Valuation. Investments are valued as of 4:00 p.m. Eastern time on the last calendar day of the period. The Board of Trustees (the Board) has delegated the day to day responsibility for the valuation of the Fund’s investments to the Fidelity Management & Research Company (FMR) Fair Value Committee (the Committee). In accordance with valuation policies and procedures approved by the Board, the Fund attempts to obtain prices from one or more third party pricing vendors or brokers to value its investments. When current market prices, quotations or currency exchange rates are not readily available or reliable, investments will be fair valued in good faith by the Committee, in accordance with procedures adopted by the Board. Factors used in determining fair value vary by investment type and may include market or investment specific events. The frequency with which these procedures are used cannot be predicted and they may be utilized to a significant extent. The Committee oversees the Fund’s valuation policies and procedures and reports to the Board on the Committee’s activities and fair value determinations. The Board monitors the appropriateness of the procedures used in valuing the Fund’s investments and ratifies the fair value determinations of the Committee.
The Fund categorizes the inputs to valuation techniques used to value its investments into a disclosure hierarchy consisting of three levels as shown below:
Level 1 – quoted prices in active markets for identical investments
Level 2 – other significant observable inputs (including quoted prices for similar investments, interest rates, prepayment speeds, etc.)
Level 3 – unobservable inputs (including the Fund’s own assumptions based on the best information available)
Valuation techniques used to value the Fund’s investments by major category are as follows:
Equity securities, including restricted securities, for which market quotations are readily available, are valued at the last reported sale price or official closing price as reported by a third party pricing vendor on the primary market or exchange on which they are traded and are categorized as Level 1 in the hierarchy. In the event there were no sales during the day or closing prices are not available, securities are valued at the last quoted bid price or may be valued using the last available price and are generally categorized as Level 2 in the hierarchy. For foreign equity securities, when market or security specific events arise, comparisons to the valuation of American Depositary Receipts (ADRs), futures contracts, Exchange-Traded Funds (ETFs) and certain indexes as well as quoted prices for similar securities may be used and would be categorized as Level 2 in the hierarchy. Utilizing these techniques may result in transfers between Level 1 and Level 2. For equity securities, including restricted securities, where observable inputs are limited, assumptions about market activity and risk are used and these securities may be categorized as Level 3 in the hierarchy.
Investments in open-end mutual funds, including the Fidelity Central Funds, are valued at their closing net asset value (NAV) each business day and are categorized as Level 1 in the hierarchy.
Changes in valuation techniques may result in transfers in or out of an assigned level within the disclosure hierarchy. The aggregate value of investments by input level, as of December 31, 2015, is included at the end of the Fund’s Schedule of Investments.
Foreign Currency. The Fund may use foreign currency contracts to facilitate transactions in foreign-denominated securities. Gains and losses from these transactions may arise from changes in the value of the foreign currency or if the counterparties do not perform under the contracts’ terms.
Foreign-denominated assets, including investment securities, and liabilities are translated into U.S. dollars at the exchange rates at period end. Purchases and sales of investment securities, income and dividends received and expenses denominated in foreign currencies are translated into U.S. dollars at the exchange rate in effect on the transaction date.
The effects of exchange rate fluctuations on investments are included with the net realized and unrealized gain (loss) on investment securities. Other foreign currency transactions resulting in realized and unrealized gain (loss) are disclosed separately.
Investment Transactions and Income. For financial reporting purposes, the Fund’s investment holdings and NAV include trades executed through the end of the last business day of the period. The NAV per share for processing shareholder transactions is calculated as of the close of business of the New York Stock Exchange (NYSE), normally 4:00 p.m. Eastern time and includes trades executed through the end of the prior business day. Gains and losses on securities sold are determined on the basis of identified cost and may include proceeds received from litigation. Dividend income is recorded on the ex-dividend date, except for certain dividends from foreign securities where the ex-dividend date may have passed, which are recorded as soon as the Fund is informed of the ex-dividend date. Non-cash dividends included in dividend income, if any, are recorded at the fair market value of the securities received. Income and capital gain distributions from Fidelity Central Funds, if any, are recorded on the ex-dividend date. Distributions received on securities that represent a return of capital or capital gain are recorded as a reduction of cost of investments and/or as a realized gain. Subsequent to ex-dividend date the Fund determines the components of these distributions, based upon receipt of tax filings or other correspondence relating to the underlying investment. Investment income is recorded net of foreign taxes withheld where recovery of such taxes is uncertain.
Class Allocations and Expenses. Investment income, realized and unrealized capital gains and losses, common expenses of the Fund, and certain fund-level expense reductions, if any, are allocated daily on a pro-rata basis to each class based on the relative net assets of each class to the total net assets of the Fund. Each class differs with respect to transfer agent and distribution and service plan fees incurred. Certain expense reductions may also differ by class. For the reporting period, the allocated portion of income and expenses to each class as a percent of its average net assets may vary due to the timing of recording these transactions in relation to fluctuating net assets of the classes. Expenses directly attributable to a fund are charged to that fund. Expenses attributable to more than one fund are allocated among the respective funds on the basis of relative net assets or other appropriate methods. Expense estimates are accrued in the period to which they relate and adjustments are made when actual amounts are known.
Income Tax Information and Distributions to Shareholders. Each year, the Fund intends to qualify as a regulated investment company under Subchapter M of the Internal Revenue Code, including distributing substantially all of its taxable income and realized gains. As a result, no provision for U.S. Federal income taxes is required. As of December 31, 2015, the Fund did not have any unrecognized tax benefits in the financial statements; nor is the Fund aware of any tax positions for which it is reasonably possible that the total amounts of unrecognized tax benefits will significantly change in the next twelve months. The Fund files a U.S. federal tax return, in addition to state and local tax returns as required. The Fund’s federal income tax returns are subject to examination by the Internal Revenue Service (IRS) for a period of three fiscal years after they are filed. State and local tax returns may be subject to examination for an additional fiscal year depending on the jurisdiction. Foreign taxes are provided for based on the Fund’s understanding of the tax rules and rates that exist in the foreign markets in which it invests. The Fund is subject to a tax imposed on capital gains by certain countries in which it invests.
Distributions are declared and recorded on the ex-dividend date. Income dividends and capital gain distributions are declared separately for each class. Income and capital gain distributions are determined in accordance with income tax regulations, which may differ from GAAP. These differences resulted in distribution reclassifications.
Capital accounts within the financial statements are adjusted for permanent book-tax differences. These adjustments have no impact on net assets or the results of operations. Capital accounts are not adjusted for temporary book-tax differences which will reverse in a subsequent period.
Book-tax differences are primarily due to foreign currency transactions, partnerships, certain foreign taxes, equity-debt classifications and losses deferred due to wash sales and excise tax regulations.
Notes to Financial Statements – continued
The federal tax cost of investment securities and unrealized appreciation (depreciation) as of period end were as follows:
| Gross unrealized appreciation | | $ | 1,472,882,706 | |
| Gross unrealized depreciation | | | (654,677,896 | ) |
| Net unrealized appreciation (depreciation) on securities | | $ | 818,204,810 | |
| Tax Cost | | $ | 7,327,553,347 | |
The tax-based components of distributable earnings as of period end were as follows:
| Undistributed long-term capital gain | | $ | 493,205,790 | |
| Net unrealized appreciation (depreciation) on securities and other investments | | $ | 818,164,557 | |
The Fund intends to elect to defer to its next fiscal year $8,021,978 of capital losses recognized during the period November 1, 2015 to December 31, 2015.
The tax character of distributions paid was as follows:
| | | December 31, 2015 | | | December 31, 2014 | |
| Ordinary Income | | $ | 30,795,763 | | | $ | 87,283,265 | |
| Long-term Capital Gains | | | 1,068,353,375 | | | | 132,570,212 | |
| Total | | $ | 1,099,149,138 | | | $ | 219,853,477 | |
4. Purchases and Sales of Investments.
Purchases and sales of securities, other than short-term securities and securities acquired in the merger, aggregated $2,296,119,671 and $3,188,329,627, respectively.
5. Fees and Other Transactions with Affiliates.
Management Fee. Fidelity Management & Research Company (the investment adviser) and its affiliates provide the Fund with investment management related services for which the Fund pays a monthly management fee. The management fee is the sum of an individual fund fee rate that is based on an annual rate of .30% of the Fund’s average net assets and an annualized group fee rate that averaged .25% during the period. The group fee rate is based upon the average net assets of all the mutual funds advised by the investment adviser, including any mutual funds previously advised by the investment adviser that are currently advised by Fidelity SelectCo, LLC, an affiliate of the investment adviser. The group fee rate decreases as assets under management increase and increases as assets under management decrease. For the reporting period, the total annual management fee rate was .55% of the Fund’s average net assets.
Distribution and Service Plan Fees. In accordance with Rule 12b-1 of the 1940 Act, the Fund has adopted separate 12b-1 Plans for each Service Class of shares. Each Service Class pays Fidelity Distributors Corporation (FDC), an affiliate of the investment adviser, a service fee. For the period, the service fee is based on an annual rate of .10% of Service Class’ average net assets and .25% of Service Class 2’s average net assets.
For the period, total fees, all of which were re-allowed to insurance companies for the distribution of shares and providing shareholder support services, were as follows:
| Service Class | | $ | 614,201 | |
| Service Class 2 | | | 15,511,194 | |
| | | $ | 16,125,395 | |
Transfer Agent Fees. Fidelity Investments Institutional Operations Company, Inc. (FIIOC), an affiliate of the investment adviser, is the Fund’s transfer, dividend disbursing, and shareholder servicing agent. FIIOC receives an asset-based fee with respect to each class. Each class (with the exception of Investor Class) pays a fee for transfer agent services, typesetting, printing and mailing of shareholder reports, excluding mailing of proxy statements and out of pocket expenses, equal to an annual rate of .07% (.15% for Investor Class) of class-level average net assets. For the period, transfer agent fees for each class, including out of pocket expenses, were as follows:
| Initial Class | | $ | 978,036 | |
| Service Class | | | 405,885 | |
| Service Class 2 | | | 4,095,758 | |
| Investor Class | | | 797,945 | |
| | | $ | 6,277,624 | |
Accounting and Security Lending Fees. Fidelity Service Company, Inc. (FSC), an affiliate of the investment adviser, maintains the Fund’s accounting records. The accounting fee is based on the level of average net assets for each month. Under a separate contract, FSC administers the security lending program. The security lending fee is based on the number and duration of lending transactions.
Brokerage Commissions. The Fund placed a portion of its portfolio transactions with brokerage firms which are affiliates of the investment adviser. Brokerage commissions are included in net realized gain (loss) and change in net unrealized appreciation (depreciation) in the Statement of Operations. The commissions paid to these affiliated firms were $53,341 for the period.
Interfund Lending Program. Pursuant to an Exemptive Order issued by the SEC, the Fund, along with other registered investment companies having management contracts with Fidelity Management & Research Company (FMR) or other affiliated entities of FMR, may participate in an interfund lending program. This program provides an alternative credit facility allowing the funds to borrow from, or lend money to, other participating affiliated funds. At period end, there were no interfund loans outstanding. The Fund’s activity in this program during the period for which loans were outstanding was as follows:
| | | | | | Weighted Average | | | | |
| Borrower or Lender | | Average Loan Balance | | | Interest Rate | | | Interest Expense | |
| Borrower | | $ | 9,404,229 | | | | .36 | % | | $ | 9,964 | |
Interfund Trades. The Fund may purchase from or sell securities to other Fidelity Funds under procedures adopted by the Board. The procedures have been designed to ensure these interfund trades are executed in accordance with Rule 17a-7 of the 1940 Act. Interfund trades are included within the respective purchases and sales amounts shown in the Purchases and Sales of Investments note.
6. Committed Line of Credit.
The Fund participates with other funds managed by the investment adviser or an affiliate in a $4.25 billion credit facility (the “line of credit”) to be utilized for temporary or emergency purposes to fund shareholder redemptions or for other short-term liquidity purposes. The Fund has agreed to pay commitment fees on its pro-rata portion of the line of credit, which amounted to $12,913 and is reflected in Miscellaneous expenses on the Statement of Operations. During the period, the Fund did not borrow on this line of credit.
7. Security Lending.
The Fund lends portfolio securities through a lending agent from time to time in order to earn additional income. For equity securities, a lending agent is used and may loan securities to certain qualified borrowers, including Fidelity Capital Markets (FCM), a broker-dealer affiliated with the Fund. On the settlement date of the loan, the Fund receives collateral (in the form of U.S. Treasury obligations, letters of credit and/or cash) against the loaned securities and maintains collateral in an amount not less than 100% of the market value of the loaned securities during the period of the loan. The market value of the loaned securities is determined at the close of business of the Fund and any additional required collateral is delivered to the Fund on the next business day. The Fund or borrower may terminate the loan at any time, and if the borrower defaults on its obligation to return the securities loaned because of insolvency or other reasons, the Fund may apply collateral received from the borrower against the obligation. The Fund may experience delays and costs in recovering the securities loaned. Any cash collateral received is invested in the Fidelity Securities Lending Cash Central Fund. The value of loaned securities and cash collateral at period end are disclosed on the Fund’s Statement of Assets and Liabilities. At period end, there were no security loans outstanding with FCM. Security lending income represents the income earned on investing cash collateral, less rebates paid to borrowers and any lending agent fees associated with the loan, plus any premium payments received for lending certain types of securities. Security lending income is presented in the Statement of Operations as a component of income from Fidelity Central Funds. Total security lending income during the period amounted to $333,919, including $876 from securities loaned to FCM.
8. Bank Borrowings.
The Fund is permitted to have bank borrowings for temporary or emergency purposes to fund shareholder redemptions or for other short-term liquidity requirements. The Fund has established borrowing arrangements with certain banks. The interest rate on the borrowings is the bank’s base rate, as revised from time to time. The average loan balance during the period for which loans were outstanding amounted to $11,037,722. The weighted average interest rate was ..62%. The interest expense amounted to $6,818 under the bank borrowing program. At period end, there were no bank borrowings outstanding.
Notes to Financial Statements – continued
9. Expense Reductions.
Commissions paid to certain brokers with whom the investment adviser, or its affiliates, places trades on behalf of the Fund include an amount in addition to trade execution, which may be rebated back to the Fund to offset certain expenses. This amount totaled $84,123 for the period. In addition, through arrangements with the Fund’s custodian, credits realized as a result of certain uninvested cash balances were used to reduce the Fund’s expenses. During the period, these credits reduced the Fund’s custody expenses by $145.
In addition, during the period the investment adviser reimbursed and/or waived a portion of fund-level operating expenses in the amount $36,698 and a portion of class-level operating expenses as follows:
| | | Amount | |
| Investor Class | | $ | 11,354 | |
10. Distributions to Shareholders.
Distributions to shareholders of each class were as follows:
| Years ended December 31, | | 2015 | | | 2014 | |
| From net investment income | | | | | | | | |
| Initial Class | | $ | 6,856,691 | | | $ | 3,774,917 | |
| Service Class | | | 2,239,466 | | | | 990,351 | |
| Service Class 2 | | | 13,204,712 | | | | 1,215,921 | |
| Investor Class | | | 2,196,855 | | | | 904,982 | |
| Total | | $ | 24,497,724 | | | $ | 6,886,171 | |
| From net realized gain | | | | | | | | |
| Initial Class | | $ | 173,008,924 | | | $ | 34,174,917 | |
| Service Class | | | 73,895,308 | | | | 14,603,745 | |
| Service Class 2 | | | 768,328,236 | | | | 153,016,366 | |
| Investor Class | | | 59,418,946 | | | | 11,172,278 | |
| Total | | $ | 1,074,651,414 | | | $ | 212,967,306 | |
11. Share Transactions.
Transactions for each class of shares were as follows:
| | | Shares | | | Shares | | | Dollars | | | Dollars | |
| Years ended | | | | | | | | | | | | |
| December 31, | | 2015 | | | 2014 | | | 2015 | | | 2014 | |
| Initial Class | | | | | | | | | | | | | | | | |
| Shares sold | | | 4,347457 | | | | 3,868,698 | | | $ | 150,311,214 | | | $ | 141,786,603 | |
| Issued in exchange for the shares of VIP Growth Strategies Portfolio | | | 360,771 | | | | – | | | | 12,767,680 | | | | – | |
| Reinvestment of distributions | | | 5,354,795 | | | | 1,054,394 | | | | 179,865,615 | | | | 37,949,834 | |
| Shares redeemed | | | (6,893,278 | ) | | | (6,692,546 | ) | | | (237,965,645 | ) | | | (244,766,127 | ) |
| Net increase (decrease) | | | 3,169,745 | | | | (1,769,454 | ) | | $ | 104,978,864 | | | $ | (65,029,690 | ) |
| Service Class | | | | | | | | | | | | | | | | |
| Shares sold | | | 1,507,053 | | | | 1,246,174 | | | $ | 51,724,215 | | | $ | 45,087,196 | |
| Issued in exchange for the shares of VIP Growth Strategies Portfolio | | | 2,365 | | | | – | | | | 83,060 | | | | – | |
| Reinvestment of distributions | | | 2,283,479 | | | | 437,179 | | | | 76,134,774 | | | | 15,594,096 | |
| Shares redeemed | | | (2,939,119 | ) | | | (2,725,033 | ) | | | (101,018,159 | ) | | | (98,952,997 | ) |
| Net increase (decrease) | | | 853,778 | | | | (1,041,680 | ) | | $ | 26,923,890 | | | $ | (38,271,705 | ) |
| Service Class 2 | | | | | | | | | | | | | | | | |
| Shares sold | | | 8,545,475 | | | | 12,121,569 | | | $ | 287,200,999 | | | $ | 436,064,579 | |
| Issued in exchange for the shares of VIP Growth Strategies Portfolio | | | 219,579 | | | | – | | | | 7,566,682 | | | | – | |
| Reinvestment of distributions | | | 23,864,809 | | | | 4,408,382 | | | | 781,532,948 | | | | 154,232,287 | |
| Shares redeemed | | | (31,525,458 | ) | | | (26,657,188 | ) | | | (1,056,122,491 | ) | | | (947,962,455 | ) |
| Net increase (decrease) | | | 1,104,405 | | | | (10,127,237 | ) | | $ | 20,178,138 | | | $ | (357,665,589 | ) |
| Investor Class | | | | | | | | | | | | | | | | |
| Shares sold | | | 1,067,585 | | | | 1,116,739 | | | $ | 36,914,564 | | | $ | 40,550,127 | |
| Issued in exchange for the shares of VIP Growth Strategies Portfolio | | | 1,289,847 | | | | – | | | | 45,428,423 | | | | – | |
| | | Shares | | | Shares | | | Dollars | | | Dollars | |
| Years ended | | | | | | | | | | | | |
| December 31, | | 2015 | | | 2014 | | | 2015 | | | 2014 | |
| Reinvestment of distributions | | | 1,843,002 | | | | 336,975 | | | | 61,615,801 | | | | 12,077,260 | |
| Shares redeemed | | | (1,513,170 | ) | | | (1,012,211 | ) | | | (51,788,379 | ) | | | (36,794,057 | ) |
| Net increase (decrease) | | | 2,687,264 | | | | 441,503 | | | $ | 92,170,409 | | | $ | 15,833,330 | |
12. Other.
The Fund’s organizational documents provide former and current trustees and officers with a limited indemnification against liabilities arising in connection with the performance of their duties to the Fund. In the normal course of business, the Fund may also enter into contracts that provide general indemnifications. The Fund’s maximum exposure under these arrangements is unknown as this would be dependent on future claims that may be made against the Fund. The risk of material loss from such claims is considered remote.
At the end of the period, the investment adviser or its affiliates were the owners of record of 11% of the total outstanding shares of the Fund.
13. Merger Information.
On April 24, 2015, the Fund acquired all of the assets and assumed all of the liabilities of VIP Growth Strategies Portfolio (“Target Fund”) pursuant to an Agreement and Plan of Reorganization approved by the Board of Trustees (“The Board”). The acquisition was accomplished by an exchange of shares of each class of the Fund for corresponding shares then outstanding of the Target Fund at their respective net asset value on the acquisition date. The reorganization provides shareholders of the Target Fund access to a larger portfolio with a similar investment objective and lower expenses. The reorganization qualified as a tax-free reorganization for federal income tax purposes with no gain or loss recognized to the funds or their shareholders. The Target Fund’s net assets of $65,845,845, including securities of $65,918,670 and unrealized appreciation of $3,990,039 were combined with the Fund’s net assets of $9,322,211,254 for total net assets after the acquisition of $9,388,057,099.
Pro forma results of operations of the combined entity for the entire period ended December 31, 2015, as though the acquisition had occurred as of the beginning of the year (rather than on the actual acquisition date), are as follows:
| Net Investment income (loss) | | $ | 26,894,205 | |
| Total net realized gain (loss) | | | 515,198,842 | |
| Total change in net unrealized appreciation (depreciation) | | | (653,262,046 | ) |
| Net increase (decrease) in net assets resulting from operations | | $ | (111,168,999 | ) |
Because the combined investment portfolios have been managed as a single portfolio since the acquisition was completed, it is not practicable to separate the amounts of revenue and earnings of the acquired fund that have been included in the Fund’s accompanying Statement of Operations since April 24, 2015.
Report of Independent Registered Public Accounting Firm
To the Trustees of Variable Insurance Products Fund III and Shareholders of VIP Mid Cap Portfolio:
In our opinion, the accompanying statement of assets and liabilities, including the schedule of investments, and the related statements of operations and of changes in net assets and the financial highlights present fairly, in all material respects, the financial position of VIP Mid Cap Portfolio (a fund of Variable Insurance Products Fund III) at December 31, 2015, the results of its operations for the year then ended, the changes in its net assets for each of the two years in the period then ended and the financial highlights for each of the five years in the period then ended, in conformity with accounting principles generally accepted in the United States of America. These financial statements and financial highlights (hereafter referred to as “financial statements”) are the responsibility of the VIP Mid Cap Portfolio’s management. Our responsibility is to express an opinion on these financial statements based on our audits. We conducted our audits of these financial statements in accordance with the standards of the Public Company Accounting Oversight Board (United States). Those standards require that we plan and perform the audit to obtain reasonable assurance about whether the financial statements are free of material misstatement. An audit includes examining, on a test basis, evidence supporting the amounts and disclosures in the financial statements, assessing the accounting principles used and significant estimates made by management, and evaluating the overall financial statement presentation. We believe that our audits, which included confirmation of securities at December 31, 2015 by correspondence with the custodian and brokers, provide a reasonable basis for our opinion.
PricewaterhouseCoopers LLP
Boston, Massachusetts
February 16, 2016
Trustees and Officers
The Trustees, Members of the Advisory Board (if any), and officers of the trust and fund, as applicable, are listed below. The Board of Trustees governs the fund and is responsible for protecting the interests of shareholders. The Trustees are experienced executives who meet periodically throughout the year to oversee the fund’s activities, review contractual arrangements with companies that provide services to the fund, oversee management of the risks associated with such activities and contractual arrangements, and review the fund’s performance. Each of the Trustees oversees 170 funds.
The Trustees hold office without limit in time except that (a) any Trustee may resign; (b) any Trustee may be removed by written instrument, signed by at least two-thirds of the number of Trustees prior to such removal; (c) any Trustee who requests to be retired or who has become incapacitated by illness or injury may be retired by written instrument signed by a majority of the other Trustees; and (d) any Trustee may be removed at any special meeting of shareholders by a two-thirds vote of the outstanding voting securities of the trust. Each Trustee who is not an interested person (as defined in the 1940 Act) of the trust and the fund is referred to herein as an Independent Trustee. Each Independent Trustee shall retire not later than the last day of the calendar year in which his or her 75th birthday occurs. The Independent Trustees may waive this mandatory retirement age policy with respect to individual Trustees. Officers and Advisory Board Members hold office without limit in time, except that any officer or Advisory Board Member may resign or may be removed by a vote of a majority of the Trustees at any regular meeting or any special meeting of the Trustees. Except as indicated, each individual has held the office shown or other offices in the same company for the past five years.
The fund’s Statement of Additional Information (SAI) includes more information about the Trustees. To request a free copy, call Fidelity at 1-877-208-0098.
Experience, Skills, Attributes, and Qualifications of the Trustees. The Governance and Nominating Committee has adopted a statement of policy that describes the experience, qualifications, attributes, and skills that are necessary and desirable for potential Independent Trustee candidates (Statement of Policy). The Board believes that each Trustee satisfied at the time he or she was initially elected or appointed a Trustee, and continues to satisfy, the standards contemplated by the Statement of Policy. The Governance and Nominating Committee also engages professional search firms to help identify potential Independent Trustee candidates who have the experience, qualifications, attributes, and skills consistent with the Statement of Policy. From time to time, additional criteria based on the composition and skills of the current Independent Trustees, as well as experience or skills that may be appropriate in light of future changes to board composition, business conditions, and regulatory or other developments, have also been considered by the professional search firms and the Governance and Nominating Committee. In addition, the Board takes into account the Trustees’ commitment and participation in Board and committee meetings, as well as their leadership of standing and ad hoc committees throughout their tenure.
In determining that a particular Trustee was and continues to be qualified to serve as a Trustee, the Board has considered a variety of criteria, none of which, in isolation, was controlling. The Board believes that, collectively, the Trustees have balanced and diverse experience, qualifications, attributes, and skills, which allow the Board to operate effectively in governing the fund and protecting the interests of shareholders. Information about the specific experience, skills, attributes, and qualifications of each Trustee, which in each case led to the Board’s conclusion that the Trustee should serve (or continue to serve) as a trustee of the fund, is provided below.
Board Structure and Oversight Function. James C. Curvey is an interested person and currently serves as Chairman. The Trustees have determined that an interested Chairman is appropriate and benefits shareholders because an interested Chairman has a personal and professional stake in the quality and continuity of services provided to the fund. Independent Trustees exercise their informed business judgment to appoint an individual of their choosing to serve as Chairman, regardless of whether the Trustee happens to be independent or a member of management. The Independent Trustees have determined that they can act independently and effectively without having an Independent Trustee serve as Chairman and that a key structural component for assuring that they are in a position to do so is for the Independent Trustees to constitute a substantial majority for the Board. The Independent Trustees also regularly meet in executive session. Ned C. Lautenbach serves as Chairman of the Independent Trustees and as such (i) acts as a liaison between the Independent Trustees and management with respect to matters important to the Independent Trustees and (ii) with management prepares agendas for Board meetings.
Fidelity® funds are overseen by different Boards of Trustees. The fund’s Board oversees Fidelity’s high income and certain equity funds, and other Boards oversee Fidelity’s investment-grade bond, money market, asset allocation, and sector funds. The asset allocation funds may invest in Fidelity® funds overseen by the fund’s Board. The use of separate Boards, each with its own committee structure, allows the Trustees of each group of Fidelity® funds to focus on the unique issues of the funds they oversee, including common research, investment, and operational issues. On occasion, the separate Boards establish joint committees to address issues of overlapping consequences for the Fidelity® funds overseen by each Board.
The Trustees operate using a system of committees to facilitate the timely and efficient consideration of all matters of importance to the Trustees, the fund, and fund shareholders and to facilitate compliance with legal and regulatory requirements and oversight of the fund’s activities and associated risks. The Board, acting through its committees, has charged FMR and its affiliates with (i) identifying events or circumstances the occurrence of which could have demonstrably adverse effects on the fund’s business and/or reputation; (ii) implementing processes and controls to lessen the possibility that such events or circumstances occur or to mitigate the effects of such events or circumstances if they do occur; and (iii) creating and maintaining a system designed to evaluate continuously business and market conditions in order to facilitate the identification and implementation processes described in (i) and (ii) above. Because the day-to-day operations and activities of the fund are carried out by or through FMR, its affiliates, and other service providers, the fund’s exposure to risks is mitigated but not eliminated by the processes overseen
Trustees and Officers – continued
by the Trustees. While each of the Board’s committees has responsibility for overseeing different aspects of the fund’s activities, oversight is exercised primarily through the Operations, Audit, and Compliance Committees. In addition, the Independent Trustees have worked with FMR to enhance the Board’s oversight of investment and financial risks, legal and regulatory risks, technology risks, and operational risks, including the development of additional risk reporting to the Board. For example, a working group comprised of Independent Trustees and FMR has worked and continues to work to review the Fidelity®funds’ valuation-related activities, reporting and risk management. Appropriate personnel, including but not limited to the fund’s Chief Compliance Officer (CCO), FMR’s internal auditor, the independent accountants, the fund’s Treasurer and portfolio management personnel, make periodic reports to the Board’s committees, as appropriate, including an annual review of Fidelity’s risk management program for the Fidelity®funds. The responsibilities of each standing committee, including their oversight responsibilities, are described further under “Standing Committees of the Trustees.”
Interested Trustees*:
Correspondence intended for a Trustee who is an interested person may be sent to Fidelity Investments, 245 Summer Street, Boston, Massachusetts 02210.
Name, Year of Birth; Principal Occupations and Other Relevant Experience+
James C. Curvey (1935)
Year of Election or Appointment: 2007
Trustee
Chairman of the Board of Trustees
Mr. Curvey also serves as Trustee of other Fidelity® funds. Mr. Curvey is a Director of Fidelity Research & Analysis Co. (investment adviser firm, 2009-present), and Vice Chairman (2007-present) and Director of FMR LLC (diversified financial services company). In addition, Mr. Curvey serves as an Overseer for the Boston Symphony Orchestra and a member of the board of Artis-Naples, Naples, Florida, and as a Trustee for Brewster Academy, Wolfeboro, New Hampshire. Previously, Mr. Curvey served as a Director of Fidelity Investments Money Management, Inc. (investment adviser firm, 2009-2014) and a Director of FMR and FMR Co., Inc. (investment adviser firms, 2007-2014).
Charles S. Morrison (1960)
Year of Election or Appointment: 2014
Trustee
Mr. Morrison also serves as Trustee of other funds. He serves as a Director of Fidelity Investments Money Management, Inc. (FIMM) (investment adviser firm, 2014-present), Director of Fidelity SelectCo, LLC (investment adviser firm, 2014-present), President, Asset Management (2014-present), and is an employee of Fidelity Investments. Previously, Mr. Morrison served as Vice President of Fidelity’s Fixed Income and Asset Allocation Funds (2012-2014), President, Fixed Income (2011-2014), Vice President of Fidelity’s Money Market Funds (2005-2009), President, Money Market Group Leader of FMR (investment adviser firm, 2009), and Senior Vice President, Money Market Group of FMR (2004-2009). Mr. Morrison also served as Vice President of Fidelity’s Bond Funds (2002-2005), certain Balanced Funds (2002-2005), and certain Asset Allocation Funds (2002-2007), and as Senior Vice President (2002-2005) of Fidelity’s Bond Division.
* Determined to be an “Interested Trustee” by virtue of, among other things, his or her affiliation with the trust or various entities under common control with FMR.
+ The information includes the Trustee’s principal occupation during the last five years and other information relating to the experience, attributes, and skills relevant to the Trustee’s qualifications to serve as a Trustee, which led to the conclusion that the Trustee should serve as a Trustee for the fund.
Independent Trustees:
Correspondence intended for an Independent Trustee may be sent to Fidelity Investments, P.O. Box 55235, Boston, Massachusetts 02205-5235.
Name, Year of Birth; Principal Occupations and Other Relevant Experience+
Dennis J. Dirks (1948)
Year of Election or Appointment: 2005
Trustee
Mr. Dirks also serves as Trustee of other Fidelity® funds. Prior to his retirement in May 2003, Mr. Dirks was Chief Operating Officer and a member of the Board of The Depository Trust & Clearing Corporation (DTCC). He also served as President, Chief Operating Officer, and Board member of The Depository Trust Company (DTC) and President and Board member of the National Securities Clearing Corporation (NSCC). In addition, Mr. Dirks served as Chief Executive Officer and Board member of the Government Securities Clearing Corporation, Chief Executive Officer and Board member of the Mortgage-Backed Securities Clearing Corporation, as a Trustee and a member of the Finance Committee of Manhattan College (2005-2008), as a Trustee and a member of the Finance Committee of AHRC of Nassau County (2006-2008), and as a member of the Independent Directors Council (IDC) Governing Council (2010-2015). Mr. Dirks is a member of the Board of Directors for The Brookville Center for Children’s Services, Inc. (2009-present).
Alan J. Lacy (1953)
Year of Election or Appointment: 2008
Trustee
Mr. Lacy also serves as Trustee of other Fidelity® funds. Mr. Lacy serves as Chairman (2014-present) and a member (2010-present) of the Board of Directors of Dave & Buster’s Entertainment, Inc. (restaurant and entertainment complexes) and a Director of Bristol-Myers Squibb Company (global pharmaceuticals, 2008-present). He is a Trustee of the California Chapter of The Nature Conservancy (2015-present) and a Director of the Center for Advanced Study in the Behavioral Sciences at Stanford University (2015-present). In addition, Mr. Lacy served as Senior Adviser (2007-2014) of Oak Hill Capital Partners, L.P. (private equity) and also served as Chief Executive Officer (2005) and Vice Chairman (2005-2006) of Sears Holdings Corporation (retail) and Chief Executive Officer and Chairman of the Board of Sears, Roebuck and Co. (retail, 2000-2005). Previously, Mr. Lacy served as Chairman (2008-2011) and a member (2006-2015) of the Board of Trustees of the National Parks Conservation Association and as a member of the Board of Directors for The Western Union Company (global money transfer, 2006-2011), The Hillman Companies, Inc. (hardware wholesalers, 2010-2014), and Earth Fare, Inc. (retail grocery, 2010-2014).
Ned C. Lautenbach (1944)
Year of Election or Appointment: 2000
Trustee
Chairman of the Independent Trustees
Mr. Lautenbach also serves as Trustee of other Fidelity® funds. Mr. Lautenbach currently serves as the Lead Director of the Eaton Corporation Board of Directors (diversified industrial, 1997-present). Mr. Lautenbach is Chairman of the Board of Directors of Artis-Naples in Naples, Florida (2012-present), a member of the Council on Foreign Relations (1994-present), and a member of the Board of Governors, State University System of Florida (2013-present). Previously, Mr. Lautenbach was a Partner/Advisory Partner at Clayton, Dubilier & Rice, LLC (private equity investment, 1998-2010), as well as a Director of Sony Corporation (2006-2007).
Joseph Mauriello (1944)
Year of Election or Appointment: 2008
Trustee
Mr. Mauriello also serves as Trustee of other Fidelity® funds. Prior to his retirement in January 2006, Mr. Mauriello served in numerous senior management positions including Deputy Chairman and Chief Operating Officer (2004-2005), and Vice Chairman of Financial Services (2002-2004) of KPMG LLP US (professional services, 1965-2005). Mr. Mauriello currently serves as a member of the Board of Directors of XL Group plc. (global insurance and re-insurance, 2006-present) and the Independent Directors Council (IDC) Governing Council (2015-present). Previously, Mr. Mauriello served as a Director of the Hamilton Funds of the Bank of New York (2006-2007) and of Arcadia Resources Inc. (health care services and products, 2007-2012).
Trustees and Officers – continued
Robert W. Selander (1950)
Year of Election or Appointment: 2011
Trustee
Mr. Selander also serves as Trustee of other Fidelity® funds. Mr. Selander serves as a Director of The Western Union Company (global money transfer, 2014-present) and a non-executive Chairman of Health Equity, Inc. (health savings custodian, 2015-present). Previously, Mr. Selander served as a Member of the Advisory Board of other Fidelity® funds (2011), and Executive Vice Chairman (2010), Chief Executive Officer (2009-2010), and President and Chief Executive Officer (1997-2009) of Mastercard, Inc.
Cornelia M. Small (1944)
Year of Election or Appointment: 2005
Trustee
Ms. Small also serves as Trustee of other Fidelity® funds. Ms. Small is a member of the Board of Directors (2009-present) and Chair of the Investment Committee (2010-present) of the Teagle Foundation. Ms. Small also serves on the Investment Committee of the Berkshire Taconic Community Foundation (2008-present). Previously, Ms. Small served as Chairperson (2002-2008) and a member of the Investment Committee and Chairperson (2008-2012) and a member of the Board of Trustees of Smith College. In addition, Ms. Small served as Chief Investment Officer, Director of Global Equity Investments, and a member of the Board of Directors of Scudder, Stevens & Clark and Scudder Kemper Investments.
William S. Stavropoulos (1939)
Year of Election or Appointment: 2002
Trustee
Vice Chairman of the Independent Trustees
Mr. Stavropoulos also serves as Trustee of other Fidelity® funds. Mr. Stavropoulos serves as President and Founder of the Michigan Baseball Foundation, the Great Lakes Loons (2007-present). Mr. Stavropoulos is Chairman Emeritus of the Board of Directors of The Dow Chemical Company, where he previously served in numerous senior management positions, including President, CEO (1995-2000; 2002-2004), Chairman of the Executive Committee (2000-2006), and as a member of the Board of Directors (1990-2006). Currently, Mr. Stavropoulos is Chairman of the Board of Directors of Univar Inc. (global distributor of commodity and specialty chemicals), a Director of Teradata Corporation (data warehousing and technology solutions), and Maersk Inc. (industrial conglomerate), and a member of the Advisory Board for Metalmark Capital LLC (private equity investment, 2005-present). Mr. Stavropoulos is an operating advisor to Clayton, Dubilier & Rice, LLC (private equity investment). In addition, Mr. Stavropoulos is a member of the University of Notre Dame Advisory Council for the College of Science, a Trustee of the Rollin L. Gerstacker Foundation, and a Director of the Naples Philharmonic Center for the Arts. Previously, Mr. Stavropoulos served as a Director of Chemical Financial Corporation (bank holding company, 1993-2012) and Tyco International, Ltd. (multinational manufacturing and services, 2007-2012).
David M. Thomas (1949)
Year of Election or Appointment: 2008
Trustee
Mr. Thomas also serves as Trustee of other Fidelity® funds. Mr. Thomas serves as Non-Executive Chairman of the Board of Directors of Fortune Brands Home and Security (home and security products, 2011-present), as a member of the Board of Directors (2004-present) and Presiding Director (2013-present) of Interpublic Group of Companies, Inc. (marketing communication), and as a member of the Board of Trustees of the University of Florida (2013-present). Previously, Mr. Thomas served as Executive Chairman (2005-2006) and Chairman and Chief Executive Officer (2000-2005) of IMS Health, Inc. (pharmaceutical and healthcare information solutions), and a Director of Fortune Brands, Inc. (consumer products, 2000-2011).
| + | The information includes the Trustee’s principal occupation during the last five years and other information relating to the experience, attributes, and skills relevant to the Trustee’s qualifications to serve as a Trustee, which led to the conclusion that the Trustee should serve as a Trustee for the fund. |
Advisory Board Members and Officers:
Correspondence intended for an officer or Peter S. Lynch may be sent to Fidelity Investments, 245 Summer Street, Boston, Massachusetts 02210. Officers appear below in alphabetical order.
Name, Year of Birth; Principal Occupation
Peter S. Lynch (1944)
Year of Election or Appointment: 2003
Member of the Advisory Board
Mr. Lynch also serves as Member of the Advisory Board of other Fidelity® funds. Mr. Lynch is Vice Chairman and a Director of FMR (investment adviser firm) and FMR Co., Inc. (investment adviser firm). In addition, Mr. Lynch serves as a Trustee of Boston College and as the Chairman of the Inner-City Scholarship Fund. Previously, Mr. Lynch served on the Special Olympics International Board of Directors (1997-2006).
Marc R. Bryant (1966)
Year of Election or Appointment: 2015
Secretary and Chief Legal Officer (CLO)
Mr. Bryant also serves as Secretary and CLO of other funds. Mr. Bryant serves as CLO, Secretary, and Senior Vice President of Fidelity Management & Research Company (investment adviser firm, 2015-present) and FMR Co., Inc. (investment adviser firm, 2015-present); Secretary of Fidelity SelectCo, LLC (investment adviser firm, 2015-present) and Fidelity Investments Money Management, Inc. (investment adviser firm, 2015-present); and CLO of Fidelity Management & Research (Hong Kong) Limited (investment adviser firm, 2015-present). He is Senior Vice President and Deputy General Counsel of FMR LLC (diversified financial services company). Previously, Mr. Bryant served as Secretary and CLO of Fidelity Rutland Square Trust II (2010-2014) and Assistant Secretary of Fidelity’s Fixed Income and Asset Allocation Funds (2013-2015). Prior to joining Fidelity Investments, Mr. Bryant served as a Senior Vice President and the Head of Global Retail Legal for AllianceBernstein L.P. (2006-2010), and as the General Counsel for ProFund Advisors LLC (2001-2006).
William C. Coffey (1969)
Year of Election or Appointment: 2009
Assistant Secretary
Mr. Coffey also serves as Assistant Secretary of other funds. He is Senior Vice President and Deputy General Counsel of FMR LLC (diversified financial services company, 2010-present), and is an employee of Fidelity Investments. Previously, Mr. Coffey served as Vice President and Associate General Counsel of FMR LLC (2005-2009).
Jonathan Davis (1968)
Year of Election or Appointment: 2010
Assistant Treasurer
Mr. Davis also serves as Assistant Treasurer of other funds, and is an employee of Fidelity Investments. Previously, Mr. Davis served as Vice President and Associate General Counsel of FMR LLC (diversified financial services company, 2003-2010).
Adrien E. Deberghes (1967)
Year of Election or Appointment: 2008
Deputy Treasurer
Mr. Deberghes also serves as an officer of other funds. He is an employee of Fidelity Investments (2008-present). Prior to joining Fidelity Investments, Mr. Deberghes was Senior Vice President of Mutual Fund Administration at State Street Corporation (2007-2008), Senior Director of Mutual Fund Administration at Investors Bank & Trust (2005-2007), and Director of Finance for Dunkin’ Brands (2000-2005).
Stephanie J. Dorsey (1969)
Year of Election or Appointment: 2010
Assistant Treasurer
Ms. Dorsey also serves as an officer of other funds. She is an employee of Fidelity Investments (2008-present) and has served in other fund officer roles. Prior to joining Fidelity Investments, Ms. Dorsey served as Treasurer (2004-2008) of the JPMorgan Mutual Funds and Vice President (2004-2008) of JPMorgan Chase Bank.
Howard J. Galligan III (1966)
Year of Election or Appointment: 2014
Chief Financial Officer
Mr. Galligan also serves as Chief Financial Officer of other funds. Mr. Galligan serves as President of Fidelity Pricing and Cash Management Services (FPCMS) (2014-present) and as a Director of Strategic Advisers, Inc. (investment adviser firm, 2008-present). Previously, Mr. Galligan served as Chief Administrative Officer of Asset Management (2011-2014) and Chief Operating Officer and Senior Vice President of Investment Support for Strategic Advisers, Inc. (2003-2011).
Trustees and Officers – continued
Scott C. Goebel (1968)
Year of Election or Appointment: 2015
Vice President
Mr. Goebel serves as Vice President of other funds and is an employee of Fidelity Investments (2001-present). Previously, Mr. Goebel served as Secretary of Fidelity SelectCo, LLC (investment adviser firm, 2013-2015), Fidelity Investments Money Management, Inc. (FIMM) (investment adviser firm, 2010-2015), and Fidelity Research and Analysis Company (FRAC) (investment adviser firm, 2010-2015); General Counsel, Secretary, and Senior Vice President of Fidelity Management & Research Company (investment adviser firm, 2008-2015) and FMR Co., Inc. (investment adviser firm, 2008-2015); Assistant Secretary of Fidelity Management & Research (Japan) Limited (investment adviser firm, 2008-2015) and FMR Investment Management (U.K.) Limited (investment adviser firm, 2008-2015); Chief Legal Officer (CLO) of Fidelity Management & Research (Hong Kong) Limited (investment adviser firm, 2008-2015); Secretary and CLO of certain Fidelity® funds (2008-2015); Assistant Secretary of FIMM (2008-2010), FRAC (2008-2010), and certain funds (2007-2008); and as Vice President and Secretary of Fidelity Distributors Corporation (FDC) (2005-2007).
Brian B. Hogan (1964)
Year of Election or Appointment: 2009
Vice President
Mr. Hogan also serves as Trustee or Vice President of other funds. Mr. Hogan serves as a Director of Fidelity SelectCo, LLC (investment adviser firm, 2014-present) and President of the Equity Division of FMR (investment adviser firm, 2009-present). Previously, Mr. Hogan served as Senior Vice President, Equity Research of FMR (2006-2009) and as a portfolio manager.
Chris Maher (1972)
Year of Election or Appointment: 2013
Assistant Treasurer
Mr. Maher serves as Assistant Treasurer of other funds. Mr. Maher is Vice President of Valuation Oversight and is an employee of Fidelity Investments. Previously, Mr. Maher served as Vice President of Asset Management Compliance (2013), Vice President of the Program Management Group of FMR (investment adviser firm, 2010-2013), and Vice President of Valuation Oversight (2008-2010).
John F. Papandrea (1972)
Year of Election or Appointment: 2016
Anti-Money Laundering (AML) Officer
Mr. Papandrea also serves as AML Officer of other funds. Mr. Papandrea is Vice President of FMR LLC (diversified financial services company, 2008-present) and is an employee of Fidelity Investments (2005-present).
Melissa M. Reilly (1971)
Year of Election or Appointment: 2014
Vice President of certain Equity Funds
Ms. Reilly also serves as Vice President of other funds. Ms. Reilly is an employee of Fidelity Investments (2004-present).
Kenneth B. Robins (1969)
Year of Election or Appointment: 2008
President and Treasurer
Mr. Robins also serves as an officer of other funds. Mr. Robins serves as Executive Vice President of Fidelity Investments Money Management, Inc. (FIMM) (investment adviser firm, 2013-present) and is an employee of Fidelity Investments (2004-present). Previously, Mr. Robins served in other fund officer roles.
Stacie M. Smith (1974)
Year of Election or Appointment: 2013
Deputy Treasurer
Ms. Smith also serves as an officer of other funds. She is an employee of Fidelity Investments (2009-present) and has served in other fund officer roles. Prior to joining Fidelity Investments, Ms. Smith served as Senior Audit Manager of Ernst & Young LLP (1996-2009).
Renee Stagnone (1975)
Year of Election or Appointment: 2013
Deputy Treasurer
Ms. Stagnone also serves as Deputy Treasurer of other funds. Ms. Stagnone is an employee of Fidelity Investments (1997-present).
Linda J. Wondrack (1964)
Year of Election or Appointment: 2014
Chief Compliance Officer
Ms. Wondrack also serves as Chief Compliance Officer of other funds. Ms. Wondrack is Executive Vice President and head of the Ethics Office and Asset Management Compliance for Fidelity Investments (2012-present). Ms. Wondrack also serves as Chief Compliance Officer of Fidelity SelectCo, LLC (investment adviser firm, 2014-present); Chief Compliance Officer of Impresa Management LLC (2013-present); and Chief Compliance Officer of FMR Co., Inc. (investment adviser firm), Fidelity Investments Money Management, Inc. (investment adviser firm), FMR Investment Management (U.K.) Limited (investment adviser firm), Fidelity Management & Research (Hong Kong) (investment adviser firm), Fidelity Management & Research Company (investment adviser firm), FIAM LLC (investment adviser firm), and Strategic Advisers, Inc. (investment adviser firm), Ballyrock Investment Advisors LLC, and Northern Neck Investors LLC (2012-present). Previously, Ms. Wondrack served as Chief Compliance Officer of Fidelity Management & Research (Japan) Limited (investment adviser firm, 2012-2016); Senior Vice President and Chief Compliance Officer for Columbia Management Investment Advisers, LLC (2005-2012); Chief Compliance Officer for certain funds within the Columbia Family of Funds (2007-2012); and Senior Vice President of Compliance Risk Management at Bank of America (2005-2010).
Joseph F. Zambello (1957)
Year of Election or Appointment: 2011
Deputy Treasurer
Mr. Zambello also serves as Deputy Treasurer of other funds. Mr. Zambello is an employee of Fidelity Investments (1991-present). Previously, Mr. Zambello served as Vice President of the Program Management Group of FMR (investment adviser firm, 2009-2011) and Vice President of the Transfer Agent Oversight Group (2005-2009).
Shareholder Expense Example
As a shareholder of the Fund, you incur two types of costs: (1) transaction costs and (2) ongoing costs, including management fees, distribution and/or service (12b-1) fees and other Fund expenses. This Example is intended to help you understand your ongoing costs (in dollars) of investing in the Fund and to compare these costs with the ongoing costs of investing in other mutual funds.
The Example is based on an investment of $1,000 invested at the beginning of the period and held for the entire period (July 1, 2015 to December 31, 2015).
Actual Expenses
The first line of the accompanying table for each class of the Fund provides information about actual account values and actual expenses. You may use the information in this line, together with the amount you invested, to estimate the expenses that you paid over the period. Simply divide your account value by $1,000.00 (for example, an $8,600 account value divided by $1,000.00 = 8.6), then multiply the result by the number in the first line for a class of the Fund under the heading entitled “Expenses Paid During Period” to estimate the expenses you paid on your account during this period. The estimate of expenses does not include any fees or other expenses of any variable annuity or variable life insurance product. If they were, the estimate of expenses you paid during the period would be higher, and your ending account value would be lower. In addition, the Fund, as a shareholder in the underlying Fidelity Central Funds, will indirectly bear its pro-rata share of the fees and expenses incurred by the underlying Fidelity Central Funds. These fees and expenses are not included in the Fund’s annualized expense ratio used to calculate the expense estimate in the table below.
Hypothetical Example for Comparison Purposes
The second line of the accompanying table for each class of the Fund provides information about hypothetical account values and hypothetical expenses based on a Class’ actual expense ratio and an assumed rate of return of 5% per year before expenses, which is not the Class’ actual return. The hypothetical account values and expenses may not be used to estimate the actual ending account balance or expenses you paid for the period. You may use this information to compare the ongoing costs of investing in the Fund and other funds. To do so, compare this 5% hypothetical example with the 5% hypothetical examples that appear in the shareholder reports of the other funds. The estimate of expenses does not include any fees or other expenses of any variable annuity or variable life insurance product. If they were, the estimate of expenses you paid during the period would be higher, and your ending account value would be lower. In addition, the Fund, as a shareholder in the underlying Fidelity Central Funds, will indirectly bear its pro-rata share of the fees and expenses incurred by the underlying Fidelity Central Funds. These fees and expenses are not included in the Fund’s annualized expense ratio used to calculate the expense estimate in the table below.
Please note that the expenses shown in the table are meant to highlight your ongoing costs only and do not reflect any transaction costs.
Therefore, the second line of the table is useful in comparing ongoing costs only, and will not help you determine the relative total costs of owning different funds.
| | | | | | | | | | | Expenses Paid | |
| | | Annualized | | Beginning | | | Ending | | | During Period-B | |
| | | Expense | | Account Value | | | Account Value | | | July 1, 2015 | |
| | | Ratio-A | | July 1, 2015 | | | December 31, 2015 | | | to December 31, 2015 | |
| Initial Class | | .63% | | | | | | | | | | | | |
| Actual | | | | $ | 1,000.00 | | | $ | 936.90 | | | $ | 3.08 | |
| Hypothetical-C | | | | $ | 1,000.00 | | | $ | 1,022.03 | | | $ | 3.21 | |
| Service Class | | .73% | | | | | | | | | | | | |
| Actual | | | | $ | 1,000.00 | | | $ | 936.50 | | | $ | 3.56 | |
| Hypothetical-C | | | | $ | 1,000.00 | | | $ | 1,021.53 | | | $ | 3.72 | |
| Service Class 2 | | .88% | | | | | | | | | | | | |
| Actual | | | | $ | 1,000.00 | | | $ | 936.10 | | | $ | 4.29 | |
| Hypothetical-C | | | | $ | 1,000.00 | | | $ | 1,020.77 | | | $ | 4.48 | |
| Investor Class | | .71% | | | | | | | | | | | | |
| Actual | | | | $ | 1,000.00 | | | $ | 936.70 | | | $ | 3.47 | |
| Hypothetical-C | | | | $ | 1,000.00 | | | $ | 1,021.63 | | | $ | 3.62 | |
| A | Annualized expense ratio reflects expenses net of applicable fee waivers. |
| B | Expenses are equal to each Class’ annualized expense ratio, multiplied by the average account value over the period, multiplied by 184/365 (to reflect the one-half year period). |
| C | 5% return per year before expenses |
Distributions (Unaudited)
The Board of Trustees of VIP Growth Strategies Portfolio voted to pay to shareholders of record at the opening of business on record date, the following distributions per share derived from capital gains realized from sales of portfolio securities:
| | | Pay Date | | Record Date | | Capital Gains | |
| Initial Class | | 04/21/15 | | 04/21/15 | | $ | 1.272 | |
| Service Class | | 04/21/15 | | 04/21/15 | | $ | 1.272 | |
| Service Class 2 | | 04/21/15 | | 04/21/15 | | $ | 1.272 | |
| Investor Class | | 04/21/15 | | 04/21/15 | | $ | 1.272 | |
The Board of Trustees of VIP Mid Cap Portfolio voted to pay to shareholders of record at the opening of business on record date, the following distributions per share derived from capital gains realized from sales of portfolio securities:
| | | Pay Date | | Record Date | | Capital Gains | |
| Initial Class | | 02/05/16 | | 02/05/16 | | $ | 1.983 | |
| Service Class | | 02/05/16 | | 02/05/16 | | $ | 1.983 | |
| Service Class 2 | | 02/05/16 | | 02/05/16 | | $ | 1.983 | |
| Investor Class | | 02/05/16 | | 02/05/16 | | $ | 1.983 | |
VIP Growth Strategies Portfolio hereby designates as a capital gain dividend with respect to the taxable year ended April 24, 2015 $5,514,443, or, if subsequently determined to be different, the net capital gain of such year.
VIP Mid Cap Portfolio hereby designates as a capital gain dividend with respect to the taxable year ended December 31, 2015 $495,935,518, or, if subsequently determined to be different, the net capital gain of such year.
VIP Mid Cap Portfolio Initial Class, VIP Mid Cap Portfolio Service Class, VIP Mid Cap Portfolio Service Class 2, and VIP Mid Cap Portfolio Investor Class designate 100% of the dividends distributed in December 2015, as qualifying for the dividends-received deduction for corporate shareholders.
Board Approval of Investment Advisory Contracts and Management Fees
VIP Mid Cap Portfolio
Each year, the Board of Trustees, including the Independent Trustees (together, the Board), votes on the renewal of the management contract with Fidelity Management & Research Company (FMR) and the sub-advisory agreements (together, the Advisory Contracts) for the fund. The Board, assisted by the advice of fund counsel and Independent Trustees’ counsel, requests and considers a broad range of information relevant to the renewal of the Advisory Contracts throughout the year.
The Board meets regularly and, at each of its meetings, covers an extensive agenda of topics and materials and considers factors that are relevant to its annual consideration of the renewal of the fund’s Advisory Contracts, including the services and support provided to the fund and its shareholders. The Board has established various standing committees (Committees), each composed of and chaired by Independent Trustees with varying backgrounds, to which the Board has assigned specific subject matter responsibilities in order to enhance effective decision-making by the Board. The Board, acting directly and through its Committees, requests and receives information concerning the annual consideration of the renewal of the fund’s Advisory Contracts. The Board also meets as needed to consider matters specifically related to the Board’s annual consideration of the renewal of the Advisory Contracts. Members of the Board may also meet with trustees of other Fidelity funds through ad hoc joint committees to discuss certain matters relevant to all of the Fidelity funds.
At its July 2015 meeting, the Board unanimously determined to renew the fund’s Advisory Contracts. In reaching its determination, the Board considered all factors it believed relevant, including (i) the nature, extent, and quality of the services to be provided to the fund and its shareholders (including the investment performance of the fund); (ii) the competitiveness of the fund’s management fee and total expense ratio relative to peer funds; (iii) the total costs of the services to be provided by and the profits to be realized by Fidelity from its relationship with the fund; and (iv) the extent to which (if any) economies of scale exist and would be realized as the fund grows, and whether any economies of scale are appropriately shared with fund shareholders.
In considering whether to renew the Advisory Contracts for the fund, the Board reached a determination, with the assistance of fund counsel and Independent Trustees’ counsel and through the exercise of its business judgment, that the renewal of the Advisory Contracts was in the best interests of the fund and its shareholders and that the compensation payable under the Advisory Contracts was fair and reasonable. The Board’s decision to renew the Advisory Contracts was not based on any single factor, but rather was based on a comprehensive consideration of all the information provided to the Board at its meetings throughout the year. The Board, in reaching its determination to renew the Advisory Contracts, was aware that shareholders of the fund have a broad range of investment choices available to them, including a wide choice among funds offered by Fidelity’s competitors, and that the fund’s shareholders, who have the opportunity to review and weigh the disclosure provided by the fund in its prospectus and other public disclosures, have chosen to invest in this fund, which is part of the Fidelity family of funds.
Nature, Extent, and Quality of Services Provided. The Board considered Fidelity’s staffing as it relates to the fund, including the backgrounds of investment personnel of Fidelity, and also considered the fund’s investment objective, strategies, and related investment philosophy. The Independent Trustees also had discussions with senior management of Fidelity’s investment operations and investment groups. The Board considered the structure of the portfolio manager compensation program and whether this structure provides appropriate incentives to act in the best interests of the fund. Additionally, the Board considered the portfolio managers’ investments, if any, in the funds that they manage.
Resources Dedicated to Investment Management and Support Services. The Board and the Fund Oversight and Research Committees reviewed the general qualifications and capabilities of Fidelity’s investment staff, including its size, education, experience, and resources, as well as Fidelity’s approach to recruiting, training, managing, and compensating investment personnel. The Board noted that Fidelity has continued to increase the resources devoted to non-U.S. offices, including expansion of Fidelity’s global investment organization. The Board also noted that Fidelity’s analysts have extensive resources, tools and capabilities that allow them to conduct sophisticated quantitative and fundamental analysis, as well as credit analysis of issuers, counterparties and guarantors. Further, the Board considered that Fidelity’s investment professionals have sufficient access to global information and data so as to provide competitive investment results over time, and that those professionals also have access to sophisticated tools that permit them to assess portfolio construction and risk and performance attribution characteristics continuously, as well as to transmit new information and research conclusions rapidly around the world. Additionally, in its deliberations, the Board considered Fidelity’s trading, risk management, and compliance capabilities and resources, which are integral parts of the investment management process.
Shareholder and Administrative Services. The Board considered (i) the nature, extent, quality, and cost of advisory, administrative, and shareholder services performed by FMR, the sub-advisers (together with FMR, the Investment Advisers), and their affiliates under the Advisory Contracts and under separate agreements covering transfer agency, pricing and bookkeeping, and securities lending services for the fund; (ii) the nature and extent of the supervision of third party service providers, principally custodians and subcustodians; and (iii) the resources devoted to, and the record of compliance with, the fund’s compliance policies and procedures. The Board also reviewed the allocation of fund brokerage, including allocations to brokers affiliated with the Investment Advisers, the use of brokerage commissions to pay fund expenses, and the use of “soft” commission dollars to pay for research services.
The Board noted that the growth of fund assets over time across the complex allows Fidelity to reinvest in the development of services designed to enhance the value or convenience of the Fidelity funds as investment vehicles. These services include 24-hour access to account information
and market information through telephone representatives and over the Internet, investor education materials and asset allocation tools, and the expanded availability of Fidelity Investor Centers.
In 2014, the Board formed an ad hoc Committee on Transfer Agency Fees to review the variety of transfer agency fee structures throughout the industry and Fidelity’s competitive positioning with respect to industry participants.
Investment in a Large Fund Family. The Board considered the benefits to shareholders of investing in a Fidelity fund, including the benefits of investing in a fund that is part of a large family of funds offering a variety of investment disciplines and providing a large variety of mutual fund investor services. The Board noted that Fidelity had taken, or had made recommendations that resulted in the Fidelity funds taking, a number of actions over the previous year that benefited particular funds, including (i) continuing to dedicate additional resources to investment research and to the support of the senior management team that oversees asset management; (ii) continuing efforts to enhance Fidelity’s global research capabilities; (iii) launching new funds and making other enhancements to meet client needs; (iv) reducing management fees and total expenses for certain index funds and diversified international funds; (v) continuing to launch dedicated lower cost underlying funds to meet portfolio construction needs related to expanding underlying fund options for Fidelity funds of funds, specifically for the Freedom Fund product lines; (vi) rationalizing product lines and gaining increased efficiencies through fund mergers; (vii) launching active fixed-income exchange-traded funds; (viii) continuing to develop, acquire and implement systems and technology to improve services to the funds and information security and to increase efficiency; (ix) implementing investment enhancements to further strengthen Fidelity’s target date product line to increase investors’ probability of success in achieving their goals; (x) modifying the eligibility criteria for certain share classes to accommodate roll-over assets from employer-sponsored retirement plans; (xi) launching a new Class W of the Freedom Index Funds to attract and retain Fidelity record-kept retirement plan assets; and (xii) implementing changes to Fidelity’s money market product line in response to recent money market regulatory reforms.
Investment Performance. The Board considered whether the fund has operated in accordance with its investment objective, as well as its record of compliance with its investment restrictions and its performance history.
The Board took into account discussions with representatives of the Investment Advisers about fund investment performance that occur at Board meetings throughout the year. In this regard the Board noted that as part of regularly scheduled fund reviews and other reports to the Board on fund performance, the Board considers annualized return information for the fund, for different time periods, measured against a securities market index (“benchmark index”) and a peer group of funds with similar objectives (“peer group”), if any. In its evaluation of fund investment performance, the Board gave particular attention to information indicating changes in performance of certain Fidelity funds for specific time periods and discussed with the Investment Advisers the reasons for any overperformance or underperformance.
In addition to reviewing absolute and relative fund performance, the Independent Trustees periodically consider the appropriateness of fund performance metrics in evaluating the results achieved. In general, the Independent Trustees believe that fund performance should be evaluated based on net performance (after fees and expenses) of both the highest performing and lowest performing fund share classes, where applicable, compared to appropriate benchmark indices, over appropriate time periods that may include full market cycles, and compared to peer groups, as applicable, over the same periods, taking into account relevant factors including the following: general market conditions; issuer-specific information; and fund cash flows and other factors.
The Independent Trustees recognize that shareholders evaluate performance on a net basis over their own holding periods, for which one-, three-, and five-year periods are often used as a proxy. For this reason, the performance information reviewed by the Board also included net cumulative calendar year total return information for the fund and an appropriate benchmark index and peer group for the most recent one-, three-, and five-year periods, as shown below. Returns are shown compared to the 25th percentile (top of box, 75% beaten) and 75th percentile (bottom of box, 25% beaten) of the peer universe.
Board Approval of Investment Advisory Contracts and Management Fees – continued
VIP Mid Cap Portfolio
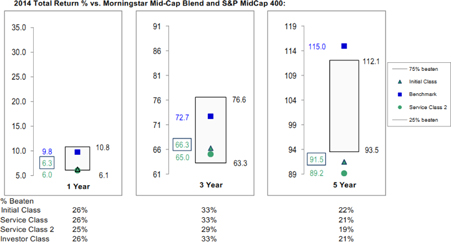
The Board has discussed with FMR the fund’s underperformance (based on the December 31, 2014 data presented herein) and has engaged with FMR to consider what steps might be taken to remediate the fund’s underperformance. The Board noted that the fund’s performance has improved since the period shown.
Based on its review, the Board concluded that the nature, extent, and quality of services provided to the fund under the Advisory Contracts should benefit the shareholders of the fund.
Competitiveness of Management Fee and Total Expense Ratio. The Board considered the fund’s management fee and total expense ratio compared to “mapped groups” of competitive funds and classes created for the purpose of facilitating the Trustees’ competitive analysis of management fees and total expenses. Fidelity creates “mapped groups” by combining similar Lipper investment objective categories that have comparable investment mandates. Combining Lipper investment objective categories aids the Board’s management fee and total expense ratio comparisons by broadening the competitive group used for comparison.
Management Fee. The Board considered two proprietary management fee comparisons for the 12-month periods shown in basis points (BP) in the chart below. The group of Lipper funds used by the Board for management fee comparisons is referred to below as the “Total Mapped Group.” The Total Mapped Group comparison focuses on a fund’s standing in terms of gross management fees before expense reimbursements or caps relative to the total universe of funds with comparable investment mandates, regardless of whether their management fee structures also are comparable. Funds with comparable investment mandates offer exposure to similar types of securities. Funds with comparable management fee structures have similar management fee contractual arrangements (e.g., flat rate charged for advisory services, all-inclusive fee rate, etc.). “TMG %” represents the percentage of funds in the Total Mapped Group that had management fees that were lower than the fund’s. For example, a hypothetical TMG % of 20% would mean that 80% of the funds in the Total Mapped Group had higher, and 20% had lower, management fees than the fund. The fund’s actual TMG %s and the number of funds in the Total Mapped Group are in the chart below. The “Asset-Size Peer Group” (ASPG) comparison focuses on a fund’s standing relative to a subset of non-Fidelity funds within the Total Mapped Group that are similar in size and management fee structure without taking into account performance adjustments, if any. For example, if a fund is in the first quartile of the ASPG, the fund’s management fee ranks in the least expensive or lowest 25% of funds in the ASPG. The ASPG represents at least 15% of the funds in the Total Mapped Group with comparable asset size and management fee structures, subject to a minimum of 50 funds (or all funds in the Total Mapped Group if fewer than 50). Additional information, such as the ASPG quartile in which the fund’s management fee rate ranked, is also included in the chart and considered by the Board.
VIP Mid Cap Portfolio

The Board noted that the fund’s management fee rate ranked below the median of its Total Mapped Group and below the median of its ASPG for 2014.
The Board noted that, in 2014, the ad hoc Committee on Group Fee was formed by it and other Fidelity fund boards to conduct an in-depth review of the “group fee” component of the management fee of funds with such management fee structures. Committee focus included the mechanics of the group fee, the competitive landscape of group fee structures, Fidelity funds with no group fee component and investment products not included in group fee assets. The Board also considered that, for funds subject to the group fee, FMR agreed to voluntarily waive fees over a speci-fied period of time in amounts designed to account for assets converted from certain funds to certain collective investment trusts.
The Board also noted that, in 2013, the ad hoc Committee on Management Fees was formed to conduct an in-depth review of the management fee rates of Fidelity’s active equity mutual funds. The Committee focused on the following areas: (i) standard fee structures; (ii) research consumption and trading evolution; (iii) management fee competitiveness/profitability by category; and (iv) factors that drive institutional pricing.
Based on its review, the Board concluded that the fund’s management fee is fair and reasonable in light of the services that the fund receives and the other factors considered.
Total Expense Ratio. In its review of each class’s total expense ratio, the Board considered the fund’s management fee as well as other fund or class expenses, as applicable, such as transfer agent fees, pricing and bookkeeping fees, fund-paid 12b-1 fees, and custodial, legal, and audit fees. The Board also noted that Fidelity may agree to waive fees and expenses from time to time, and the extent to which, if any, it has done so for the fund. As part of its review, the Board also considered the current and historical total expense ratios of each class of the fund compared to competitive fund median expenses. Each class of the fund is compared to those funds and classes in the Total Mapped Group (used by the Board for management fee comparisons) that have a similar sales load structure.
The Board noted that the total expense ratio of each class ranked below its competitive median for 2014.
Fees Charged to Other Fidelity Clients. The Board also considered Fidelity fee structures and other information with respect to clients of Fidelity, such as other funds advised or subadvised by Fidelity, pension plan clients, and other institutional clients with similar mandates. The Board noted the findings of the 2013 ad hoc joint committee (created with the board of other Fidelity funds), which reviewed and compared Fidelity’s institutional investment advisory business with its business of providing services to the Fidelity funds, including the differences in services provided, fees charged, and costs incurred, as well as competition in their respective marketplaces.
Based on its review of total expense ratios and fees charged to other Fidelity clients, the Board concluded that the total expense ratio of each class of the fund was reasonable in light of the services that the fund and its shareholders receive and the other factors considered.
Costs of the Services and Profitability. The Board considered the revenues earned and the expenses incurred by Fidelity in conducting the business of developing, marketing, distributing, managing, administering and servicing the fund and servicing the fund’s shareholders. The Board also considered the level of Fidelity’s profits in respect of all the Fidelity funds.
On an annual basis, Fidelity presents to the Board information about the profitability of its relationship with the fund. Fidelity calculates profitability information for each fund, as well as aggregate profitability information for groups of Fidelity funds and all Fidelity funds, using a series of
Board Approval of Investment Advisory Contracts and Management Fees – continued
detailed revenue and cost allocation methodologies which originate with the books and records of Fidelity on which Fidelity’s audited financial statements are based. The Audit Committee of the Board reviews any significant changes from the prior year’s methodologies.
PricewaterhouseCoopers LLP (PwC), independent registered public accounting firm and auditor to Fidelity and certain Fidelity funds, has been engaged annually by the Board as part of the Board’s assessment of Fidelity’s profitability analysis. PwC’s engagement includes the review and assessment of the methodologies used by Fidelity in determining the revenues and expenses attributable to Fidelity’s mutual fund business, and completion of agreed-upon procedures in respect of the mathematical accuracy of fund profitability and its conformity to established allocation methodologies. After considering PwC’s reports issued under the engagement and information provided by Fidelity, the Board concluded that while other allocation methods may also be reasonable, Fidelity’s profitability methodologies are reasonable in all material respects.
The Board also reviewed Fidelity’s non-fund businesses and fall-out benefits related to the mutual fund business as well as cases where Fidelity’s affiliates may benefit from or be related to the fund’s business.
The Board considered the costs of the services provided by and the profits realized by Fidelity in connection with the operation of the fund and was satisfied that the profitability was not excessive.
Economies of Scale. The Board considered whether there have been economies of scale in respect of the management of the Fidelity funds, whether the Fidelity funds (including the fund) have appropriately benefited from any such economies of scale, and whether there is potential for realization of any further economies of scale. The Board considered the extent to which the fund will benefit from economies of scale as assets grow through increased services to the fund, through waivers or reimbursements, or through fee or expense ratio reductions. The Board also noted that in 2013, it and the boards of other Fidelity funds created an ad hoc committee (the Economies of Scale Committee) to analyze whether Fidelity attains economies of scale in respect of the management and servicing of the Fidelity funds, whether the Fidelity funds have appropriately benefited from such economies of scale, and whether there is potential for realization of any further economies of scale.
The Board recognized that the fund’s management contract incorporates a “group fee” structure, which provides for lower group fee rates as total group assets increase, and for higher group fee rates as total group assets decrease (with “group assets” defined to include fund assets under FMR’s management plus sector fund assets previously under FMR’s management and currently managed by Fidelity SelectCo, LLC). FMR calculates the group fee rates based on a tiered asset “breakpoint” schedule that varies based on asset class. The Board considered that the group fee is designed to deliver the benefits of economies of scale to fund shareholders when total Fidelity fund assets increase, even if assets of any particular fund are unchanged or have declined, because some portion of Fidelity’s costs are attributable to services provided to all Fidelity funds, and all funds benefit if those costs can be allocated among more assets. The Board concluded that, given the group fee structure, fund shareholders will benefit from lower management fees as group assets increase at the fund complex level, regardless of whether Fidelity achieves any such economies of scale.
The Board concluded, taking into account the analysis of the Economies of Scale Committee, that economies of scale, if any, are being appropriately shared between fund shareholders and Fidelity.
Additional Information Requested by the Board. In order to develop fully the factual basis for consideration of the Fidelity funds’ Advisory Contracts, the Board requested and received additional information on certain topics, including: (i) fund performance trends and Fidelity’s long-term strategies for certain funds; (ii) the various share classes employed by Fidelity and the attributes of each class, together with similar information on the distribution and servicing payments made by Fidelity or the funds to third-party participants in the distribution channels; (iii) fund profitability, and fund performance in relation to fund profitability; (iv) the methodology with respect to evaluating competitive fund data and peer group classifications and fee comparisons; (v) annual fund profitability margins, with particular focus on certain funds with negative margins; (vi) the realization of fall-out benefits in certain Fidelity business units; (vii) economies of scale and the way in which they are shared with fund shareholders;(viii) Fidelity’s group fee structures, including the group fee schedule of breakpoints;(ix) the impact of cost containment measures on the funds; and (x) the transfer agent fee structure.
Based on its evaluation of all of the conclusions noted above, and after considering all factors it believed relevant, the Board concluded that the advisory fee structures are fair and reasonable, and that the fund’s Advisory Contracts should be renewed.
VIPMID-ANN-0216
1.735273.116
Investment Adviser
Directed Services LLC
1475 Dunwoody Drive
West Chester, Pennsylvania 19380
Distributor
Voya Investments Distributor, LLC
7337 East Doubletree Ranch Road, Suite 100
Scottsdale, Arizona 85258
Transfer Agent
BNY Mellon Investment Servicing (U.S.) Inc.
301 Bellevue Parkway
Wilmington, Delaware 19809
Independent Registered Public Accounting Firm
KPMG LLP
Two Financial Center
60 South Street
Boston, Massachusetts 02111
Custodian
The Bank of New York Mellon
225 Liberty Street
New York, New York 10286
Legal Counsel
Ropes & Gray LLP
Prudential Tower
800 Boylston Street
Boston, Massachusetts 02199
Before investing, carefully consider the investment objectives, risks, charges and expenses of the variable annuity contract or variable life insurance policy and the underlying variable investment options. This and other information is contained in the prospectus for the variable annuity contract or variable life insurance policy and the underlying variable investment options. Obtain these prospectuses from your agent/registered representative and read them carefully before investing.
RETIREMENT | INVESTMENTS | INSURANCE
voyainvestments.com
VPAR-VYFID (1215-021716)
Item 2. Code of Ethics.
As of the end of the period covered by this report, Registrant had adopted a code of ethics, as defined in Item 2 of Form N-CSR, that applies to the Registrant’s principal executive officer and principal financial officer. There were no amendments to the Code during the period covered by the report. The Registrant did not grant any waivers, including implicit waivers, from any provisions of the Code during the period covered by this report. The code of ethics is filed herewith pursuant to Item 10(a)(1), Exhibit 99.CODE ETH.
Item 3. Audit Committee Financial Expert.
The Board of Trustees has determined that Colleen D. Baldwin, Peter S. Drotch, Patrick W. Kenny, Joseph E. Obermeyer, and Roger B. Vincent are audit committee financial experts, as defined in Item 3 of Form N-CSR. Ms. Baldwin, Mr. Drotch, Mr. Kenny, Mr. Obermeyer and Mr. Vincent are “independent” for purposes of Item 3 of Form N-CSR.
Item 4. Principal Accountant Fees and Services.
| (a) | Audit Fees: The aggregate fees billed for each of the last two fiscal years for professional services rendered by KPMG LLP (“KPMG”), the principal accountant for the audit of the registrant’s annual financial statements, for services that are normally provided by the accountant in connection with statutory and regulatory filings or engagements for those fiscal years were $872,625 for year ended December 31, 2015 and $896,000 for year ended December 31, 2014. |
| (b) | Audit-Related Fees: The aggregate fees billed in each of the last two fiscal years for assurance and related services by KPMG that are reasonably related to the performance of the audit of the registrant’s financial statements and are not reported under paragraph (a) of this Item were $111,100 for year ended December 31, 2015 and $110,850 for year ended December 31, 2014. |
| (c) | Tax Fees: The aggregate fees billed in each of the last two fiscal years for professional services rendered by KPMG for tax compliance, tax advice, and tax planning were $231,398 in the year ended December 31, 2015 and $216,300 in the year ended December 31, 2014. Such services included review of excise distribution calculations (if applicable), preparation of the Funds’ federal, state and excise tax returns, tax services related to mergers and routine consulting. |
| (d) | All Other Fees: The aggregate fees billed in each of the last two fiscal years for products and services provided by KPMG, other than the services reported in paragraphs (a) through (c) of this Item were $0 in the year ended December 31, 2015 and $13,654 in the year ended December 31, 2014. |
| (e) (1) | Audit Committee Pre-Approval Policies and Procedures |
AUDIT AND NON-AUDIT SERVICES
PRE-APPROVAL POLICY
| I. | Statement of Principles |
Under the Sarbanes-Oxley Act of 2002 (the “Act”), the Audit Committee of the Board of Directors or Trustees (the “Committee”) of the Voya funds (each a “Fund,” collectively, the “Funds”) set out on Exhibit A to this Audit and Non-Audit Services Pre-Approval Policy (“Policy”) is responsible for the oversight of the work of the Funds’ independent auditors. As part of its responsibilities, the Committee must pre-approve the audit and non-audit services performed by the auditors in order to assure that the provision of these services does not impair the auditors’ independence from the Funds. The Committee has adopted, and the Board has ratified, this Policy, which sets out the procedures and conditions under which the services of the independent auditors may be pre-approved.
Under Securities and Exchange Commission (“SEC”) rules promulgated in accordance with the Act, the Funds may establish two different approaches to pre-approving audit and non-audit services. The Committee may approve services without consideration of specific case-by-case services (“general pre-approval”) or it may pre-approve specific services (“specific pre-approval”). The Committee believes that the combination of these approaches contemplated in this Policy results in an effective and efficient method for pre-approving audit and non-audit services to be performed by the Funds’ independent auditors. Under this Policy, services that are not of a type that may receive general pre-approval require specific pre-approval by the Committee. Any proposed services that exceed pre-approved cost levels or budgeted amounts will also require the Committee’s specific pre-approval.
For both types of approval, the Committee considers whether the subject services are consistent with the SEC’s rules on auditor independence and that such services are compatible with maintaining the auditors independence. The Committee also considers whether a particular audit firm is in the best position to provide effective and efficient services to the Funds. Reasons that the auditors are in the best position include the auditors’ familiarity with the Funds’ business, personnel, culture, accounting systems, risk profile, and other factors, and whether the services will enhance the Funds’ ability to manage and control risk or improve audit quality. Such factors will be considered as a whole, with no one factor being determinative.
The appendices attached to this Policy describe the audit, audit-related, tax-related, and other services that have the Committee’s general pre-approval. For any service that has been approved through general pre-approval, the general pre-approval will remain in place for a period 12 months from the date of pre-approval, unless the Committee determines that a different period is appropriate. The Committee will annually review and pre-approve the services that may be provided by the independent auditors without specific pre-approval. The Committee will revise the list of services subject to general pre-approval as appropriate. This Policy does not serve as a delegation to Fund management of the Committee’s duty to pre-approve services performed by the Funds’ independent auditors.
The annual audit services engagement terms and fees are subject to the Committee’s specific pre-approval. Audit services are those services that are normally provided by auditors in connection with statutory and regulatory filings or engagements or those that generally only independent auditors can reasonably provide. They include the Funds’ annual financial statement audit and procedures that the independent auditors must perform in order to form an opinion on the Funds’ financial statements (e.g., information systems and procedural reviews and testing). The Committee will monitor the audit services engagement and approve any changes in terms, conditions or fees deemed by the Committee to be necessary or appropriate.
The Committee may grant general pre-approval to other audit services, such as statutory audits and services associated with SEC registration statements, periodic reports and other documents filed with the SEC or issued in connection with securities offerings.
The Committee has pre-approved the audit services listed on Appendix A. The Committee must specifically approve all audit services not listed on Appendix A.
| III. | Audit-related Services |
Audit-related services are assurance and related services that are reasonably related to the performance of the audit or the review of the Funds’ financial statements or are traditionally performed by the independent auditors. The Committee believes that the provision of audit-related services will not impair the independent auditors’ independence, and therefore may grant pre-approval to audit-related services. Audit-related services include accounting consultations related to accounting, financial reporting or disclosure matters not classified as “audit services;” assistance with understanding and implementing new accounting and financial reporting guidance from rulemaking authorities; agreed-upon or expanded audit procedures relating to accounting and/or billing records required to respond to or comply with financial, accounting or regulatory reporting matters; and assistance with internal control reporting requirements under Form N-SAR or Form N-CSR.
The Committee has pre-approved the audit-related services listed on Appendix B. The Committee must specifically approve all audit-related services not listed on Appendix B.
The Committee believes the independent auditors can provide tax services to the Funds, including tax compliance, tax planning, and tax advice, without compromising the auditors’ independence. Therefore, the Committee may grant general pre-approval with respect to tax services historically provided by the Funds’ independent auditors that do not, in the Committee’s view, impair auditor independence and that are consistent with the SEC’s rules on auditor independence.
The Committee will not grant pre-approval if the independent auditors initially recommends a transaction the sole business purpose of which is tax avoidance and the tax treatment of which may not be supported in the Internal Revenue Code and related regulations. The Committee may consult
outside counsel to determine that tax planning and reporting positions are consistent with this Policy.
The Committee has pre-approved the tax-related services listed on Appendix C. The Committee must specifically approve all tax-related services not listed on Appendix C.
The Committee believes it may grant approval of non-audit services that are permissible services for independent auditors to a Fund. The Committee has determined to grant general pre-approval to other services that it believes are routine and recurring, do not impair auditor independence, and are consistent with SEC rules on auditor independence.
The Committee has pre-approved the non-audit services listed on Appendix D. The Committee must specifically approve all non-audit services not listed on Appendix D.
A list of the SEC’s prohibited non-audit services is attached to this Policy as Appendix E. The SEC’s rules and relevant guidance should be consulted to determine the precise definitions of these impermissible services and the applicability of exceptions to certain of the SEC’s prohibitions.
| VI. | Pre-approval of Fee levels and Budgeted Amounts |
The Committee will annually establish pre-approval fee levels or budgeted amounts for audit, audit-related, tax and non-audit services to be provided to the Funds by the independent auditors. Any proposed services exceeding these levels or amounts require the Committee’s specific pre-approval. The Committee considers fees for audit and non-audit services when deciding whether to pre-approve services. The Committee may determine, for a pre-approval period of 12 months, the appropriate ratio between the total amount of fees for the Fund’s audit, audit-related, and tax services (including fees for services provided to Fund affiliates that are subject to pre-approval), and the total amount of fees for certain permissible non-audit services for the Fund classified as other services (including any such services provided to Fund affiliates that are subject to pre-approval).
Requests or applications for services to be provided by the independent auditors will be submitted to management. If management determines that the services do not fall within those services generally pre-approved by the Committee and set out in the appendices to these procedures, management will submit the services to the Committee or its delagee. Any such submission will include a detailed description of the services to be rendered. Notwithstanding this paragraph, the Committee will, on a quarterly basis, receive from the independent auditors a list of services provided for the previous calendar quarter on a cumulative basis by the auditors during the Pre-Approval Period.
The Committee may delegate pre-approval authority to one or more of the Committee’s members. Any member or members to whom such pre-approval authority is delegated must report any pre-approval decisions, including any pre-approved services, to the Committee at its next scheduled meeting. The Committee will identify any member to whom pre-approval authority is delegated in writing. The member will retain such authority for a period of 12 months from the date of pre-approval unless the Committee determines that a different period is appropriate. The period of delegated authority may be terminated by the Committee or at the option of the member.
| IX. | Additional Requirements |
The Committee will take any measures the Committee deems necessary or appropriate to oversee the work of the independent auditors and to assure the auditors’ independence from the Funds. This may include reviewing a formal written statement from the independent auditors delineating all relationships between the auditors and the Funds, consistent with Independence Standards Board No. 1, and discussing with the auditors their methods and procedures for ensuring independence.
Part of KPMG’s performance of an audit in accordance with standards of the Public Company Accounting Oversight Board (US) includes their responsibility to maintain and monitor auditor independence with respect to the Voya funds. Using a proprietary system called Sentinel, the audit team is able to identify and manage potential conflicts of interest across the member firms of the KPMG International Network and prevent the provision of prohibited services to the Voya entities that would impair KPMG independence with the respect to the Voya funds. KPMG requests pre-approval from the Voya funds Audit Committee for services provided to the Voya funds and for services to affiliated entities that relate to the financial reporting or nature of operations of the Voya Funds. Additionally, KPMG provides an annual summary of the fees for services that have commenced for Voya funds and Affiliates.
Last Approved: November 20, 2014
Appendix A
Pre-Approved Audit Services for the Pre-Approval Period January 1, 2015 through December 31, 2015
| Service |
| | The Fund(s) | Fee Range |
| Statutory audits or financial audits (including tax services associated with audit services) | √ | As presented to Audit Committee1 |
| Services associated with SEC registration statements, periodic reports and other documents filed with the SEC or other documents issued in connection with securities offerings (e.g., consents), and assistance in responding to SEC comment letters. | √ | Not to exceed $9,750 per filing |
| Consultations by Fund management with respect to accounting or disclosure treatment of transactions or events and/or the actual or potential effect of final or proposed rules, standards or interpretations by the SEC, Financial Accounting Standards Board, or other regulatory or standard setting bodies. | √ | Not to exceed $8,000 during the Pre-Approval Period |
| Seed capital audit and related review and issuance of consent on the N-2 registration statement | √ | Not to exceed $13,750 per audit |
| Audit of summary portfolio of investments | √ | Not to exceed $525 per fund |
| 1 | For new Funds launched during the Pre-Approval Period, the fee ranges pre-approved will be the same as those for existing Funds, pro-rated in accordance with inception dates as provided in the auditors’ Proposal or any Engagement Letter covering the period at issue. Fees in the Engagement Letter will be controlling. |
Appendix B
Pre-Approved Audit-Related Services for the Pre-Approval Period January 1, 2015 through December 31, 2015
| Service |
| | The Fund(s) | Fund Affiliates | Fee Range |
| Services related to Fund mergers (Excludes tax services - See Appendix C for tax services associated with Fund mergers) | √ | √ | Not to exceed $10,000 per merger |
| Consultations by Fund management with respect to accounting or disclosure treatment of transactions or events and/or the actual or potential effect of final or proposed rules, standards or interpretations by the SEC, Financial Accounting Standards Board, or other regulatory or standard setting bodies. [Note: Under SEC rules some consultations may be “audit” services and others may be “audit-related” services.] | √ | | Not to exceed $5,000 per occurrence during the Pre-Approval Period |
| Review of the Funds’ semi-annual and quarterly financial statements | √ | | Not to exceed $2,525 per set of financial statements per fund |
| Reports to regulatory or government agencies related to the annual engagement | √ | | Up to $5,000 per occurrence during the Pre-Approval Period |
| Regulatory compliance assistance | √ | √ | Not to exceed $5,000 per quarter |
| Training courses | | √ | Not to exceed $5,000 per course |
| For Prime Rate Trust, agreed upon procedures for quarterly reports to rating agencies | √ | | Not to exceed $9,450 per quarter |
Appendix C
Pre-Approved Tax Services for the Pre-Approval Period January 1, 2015 through December 31, 2015
| Service |
| | The Fund(s) | Fund
Affiliates | Fee Range |
| Preparation of federal and state income tax returns and federal excise tax returns for the Funds including assistance and review with excise tax distributions | √ | | As presented to Audit Committee2 |
| Review of IRC Sections 851(b) and 817(h) diversification testing on a real-time basis | √ | | As presented to Audit Committee2 |
| Assistance and advice regarding year-end reporting for 1099’s, as requested | √ | | As presented to Audit Committee2 |
| Tax assistance and advice regarding statutory, regulatory or administrative developments | √ | √ | Not to exceed $5,000 for the Funds or for the Funds’ investment adviser during the Pre-Approval Period |
| 2 | For new Funds launched during the Pre-Approval Period, the fee ranges pre-approved will be the same as those for existing Funds, pro-rated in accordance with inception dates as provided in the auditors’ Proposal or any Engagement Letter covering the period at issue. Fees in the Engagement Letter will be controlling. |
Appendix C, continued
| Service |
| | The Fund(s) | Fund
Affiliates | Fee Range |
| Tax training courses | | √ | Not to exceed $5,000 per course during the Pre-Approval Period |
| Tax services associated with Fund mergers | √ | √ | Not to exceed $4,000 per fund per merger during the Pre-Approval Period |
| Other tax-related assistance and consultation, including, without limitation, assistance in evaluating derivative financial instruments and international tax issues, qualification and distribution issues, and similar routine tax consultations. | √ | | Not to exceed $120,000 during the Pre-Approval Period |
Appendix D
Pre-Approved Other Services for the Pre-Approval Period January 1, 2015 through December 31, 2015
| Service |
| | The Fund(s) | Fund Affiliates | Fee Range |
| Agreed-upon procedures for Class B share 12b-1 programs | | √ | Not to exceed $60,000 during the Pre-Approval Period |
Security counts performed pursuant to Rule 17f-2 of the 1940 Act (i.e., counts for Funds holding securities with affiliated sub-custodians) Cost to be borne 50% by the Funds and 50% by Voya Investments, LLC. | √ | √ | Not to exceed $5,300 per Fund during the Pre-Approval Period |
| Agreed upon procedures for 15 (c) FACT Books | √ | | Not to exceed $50,000 during the Pre-Approval Period |
Appendix E
Prohibited Non-Audit Services
| Dated: | January 1, 2015 to December 31, 2015 |
| · | Bookkeeping or other services related to the accounting records or financial statements of the Funds |
| · | Financial information systems design and implementation |
| · | Appraisal or valuation services, fairness opinions, or contribution-in-kind reports |
| · | Internal audit outsourcing services |
| · | Broker-dealer, investment adviser, or investment banking services |
| · | Expert services unrelated to the audit |
| · | Any other service that the Public Company Accounting Oversight Board determines, by regulation, is impermissible |
EXHIBIT A
VOYA ASIA PACIFIC HIGH DIVIDEND EQUITY INCOME FUND
VOYA BALANCED PORTFOLIO, INC.
VOYA EMERGING MARKETS HIGH DIVIDEND EQUITY FUND
VOYA EQUITY TRUST
VOYA FUNDS TRUST
VOYA GLOBAL ADVANTAGE AND PREMIUM OPPORTUNITY FUND
VOYA GLOBAL EQUITY DIVIDEND AND PREMIUM OPPORTUNITY FUND
VOYA INFRASTRUCTURE, INDUSTRIALS, AND MATERIALS FUND
VOYA INTERMEDIATE BOND PORTFOLIO
VOYA INTERNATIONAL HIGH DIVIDEND EQUITY INCOME FUND
VOYA INVESTORS TRUST
VOYA MONEY MARKET PORTFOLIO
VOYA MUTUAL FUNDS
VOYA PARTNERS, INC.
VOYA PRIME RATE TRUST
VOYA NATURAL RESOURCES EQUITY INCOME FUND
VOYA SENIOR INCOME FUND
VOYA SEPARATE PORTFOLIOS TRUST
VOYA SERIES FUND, INC.
VOYA STRATEGIC ALLOCATIONS PORTFOLIOS, INC.
VOYA VARIABLE FUNDS
VOYA VARIABLE PORTFOLIOS INC,
VOYA VARIABLE PRODUCTS TRUST
| (e) (2) | Percentage of services referred to in 4(b) — (4)(d) that were approved by the audit committee 100% of the services were approved by the audit committee. |
| (f) | Percentage of hours expended attributable to work performed by other than full time employees of KPMG if greater than 50%. |
Not applicable.
| (g) | Non-Audit Fees: The following table presents (i) the aggregate non-audit fees (i.e., fees for audit-related, tax, and other services) billed to each Registrant by the independent registered public accounting firm for each Registrant's fiscal years ended December 31, 2015 and December 31, 2014; and (ii) the aggregate non-audit fees billed to the investment adviser, or any of its affiliates that provide ongoing services to the registrant, by the independent registered public accounting firm for the same time periods. |
| Registrant/Investment Adviser | | 2015 | | | 2014 | |
| Voya Partners, Inc. | | $ | 342,498 | | | $ | 340,804 | |
| Voya Investments, LLC (1) | | $ | 145,625 | | | $ | 184,250 | |
(1) Each Registrant's investment adviser and any of its affiliates, which are subsidiaries of Voya Financial, Inc.
| (h) | Principal Accountants Independence: The Registrant’s Audit committee has considered whether the provision of non-audit services that were rendered to the registrant’s investment adviser and any entity controlling, controlled by, or under common control with the investment adviser that provides ongoing services to the registrant that were not pre-approved pursuant to Rule 2-01(c)(7)(ii) of Regulation S-X is compatible with maintaining KPMG’s independence. |
Item 5. Audit Committee of Listed Registrants.
Not applicable.
Item 6. Schedule of Investments
Complete schedule of investments, as applicable, is included as part of the report to shareholders filed under Item 1 of this Form and filed herein, as applicable.
Report of Independent Registered Public Accounting Firm
The Shareholders and Board of Directors
Voya Partners, Inc.
We have audited the accompanying statements of assets and liabilities, including the summary portfolios of investments, of Voya Global Bond Portfolio, VY® American Century Small-Mid Cap Value Portfolio, VY® Baron Growth Portfolio, VY® Columbia Contrarian Core Portfolio, VY® Columbia Small Cap Value II Portfolio, VY® Invesco Comstock Portfolio, VY® Invesco Equity and Income Portfolio, VY® JPMorgan Mid Cap Value Portfolio, VY® Oppenheimer Global Portfolio, VY® Pioneer High Yield Portfolio, VY® T. Rowe Price Diversified Mid Cap Growth Portfolio, VY® T. Rowe Price Growth Equity Portfolio, and VY® Templeton Foreign Equity Portfolio, and including the portfolios of investments of VY® Fidelity® VIP Contrafund® Portfolio, VY® Fidelity® VIP Equity-Income Portfolio, VY® Fidelity® VIP Mid Cap Portfolio, Voya Solution Aggressive Portfolio, Voya Solution Balanced Portfolio, Voya Solution Conservative Portfolio, Voya Solution Income Portfolio, Voya Solution Moderately Aggressive Portfolio, Voya Solution Moderately Conservative Portfolio, Voya Solution 2020 Portfolio, Voya Solution 2025 Portfolio, Voya Solution 2030 Portfolio, Voya Solution 2035 Portfolio, Voya Solution 2040 Portfolio, Voya Solution 2045 Portfolio, Voya Solution 2050 Portfolio, Voya Solution 2055 Portfolio, Voya Solution 2060 Portfolio, Voya Index Solution Income Portfolio, Voya Index Solution 2020 Portfolio, Voya Index Solution 2025 Portfolio, Voya Index Solution 2030 Portfolio, Voya Index Solution 2035 Portfolio, Voya Index Solution 2040 Portfolio, Voya Index Solution 2045 Portfolio, Voya Index Solution 2050 Portfolio, Voya Index Solution 2055 Portfolio, and Voya Index Solution 2060 Portfolio, each a series of Voya Partners, Inc., as of December 31, 2015, and the related statements of operations for the year then ended, the statements of changes in net assets for each of the years in the two-year period then ended (collectively, the "financial statements"), the financial highlights for each of the years or periods in the five-year period then ended (the financial statements and financial highlights are included in Item 1 of this Form N-CSR), and the portfolios of investments of Voya Global Bond Portfolio, VY® American Century Small-Mid Cap Value Portfolio, VY® Baron Growth Portfolio, VY® Columbia Contrarian Core Portfolio, VY® Columbia Small Cap Value II Portfolio, VY® Invesco Comstock Portfolio, VY® Invesco Equity and Income Portfolio, VY® JPMorgan Mid Cap Value Portfolio, VY® Oppenheimer Global Portfolio, VY® Pioneer High Yield Portfolio, VY® T. Rowe Price Diversified Mid Cap Growth Portfolio, VY® T. Rowe Price Growth Equity Portfolio, and VY® Templeton Foreign Equity Portfolio, as of December 31, 2015 (included in Item 6 of this Form N-CSR). These financial statements, financial highlights, and portfolios of investments are the responsibility of management. Our responsibility is to express an opinion on these financial statements, financial highlights, and portfolios of investments based on our audits.
We conducted our audits in accordance with the standards of the Public Company Accounting Oversight Board (United States). Those standards require that we plan and perform the audit to obtain reasonable assurance about whether the financial statements, financial highlights, and portfolios of investments are free of material misstatement. An audit includes examining, on a test basis, evidence supporting the amounts and disclosures in the financial statements and portfolios of investments. Our procedures included confirmation of securities owned as of December 31, 2015, by correspondence with the custodian, transfer agent, and brokers, or by other appropriate auditing procedures when replies from brokers were not received. An audit also includes assessing the accounting principles used and significant estimates made by management, as well as evaluating the overall financial statement presentation. We believe that our audits provide a reasonable basis for our opinion.
In our opinion, the financial statements, financial highlights, and portfolios of investments referred to above present fairly, in all material respects, the financial position of the aforementioned funds of Voya Partners, Inc. as of December 31, 2015, and the results of their operations for the year then ended, the changes in their net assets for each of the years in the two-year period then ended, and the financial highlights for each of the years or periods in the five-year period then ended, in conformity with U.S. generally accepted accounting principles.

Boston, Massachusetts
February 25, 2016
| Voya Global Bond Portfolio | PORTFOLIO OF INVESTMENTS
as of December 31, 2015 |
Principal
Amount† | | | | | | | Value | | | Percentage
of Net
Assets | |
| CORPORATE BONDS/NOTES: 24.4% | | | | | | | | |
| | | | | | | Australia: 0.3% | | | | | | | | |
| | 703,000 | | | | | BHP Billiton Finance USA Ltd., 5.000%, 09/30/43 | | | 639,322 | | | | 0.3 | |
| | | | | | | | | | | | | | | |
| | | | | | | Canada: 0.1% | | | | | | | | |
| | 324,000 | | | | | Goldcorp, Inc., 3.700%, 03/15/23 | | | 296,402 | | | | 0.1 | |
| | | | | | | | | | | | | | | |
| | | | | | | Cayman Islands: 0.2% | | | | | | | | |
| | 601,000 | | | | | Alibaba Group Holding Ltd, 3.600%, 11/28/24 | | | 576,264 | | | | 0.2 | |
| | | | | | | | | | | | | | | |
| | | | | | | France: 1.0% | | | | | | | | |
| | 294,000 | | | | | BPCE SA, 2.500%, 12/10/18 | | | 296,739 | | | | 0.1 | |
| | 287,000 | | | # | | BPCE SA, 5.150%, 07/21/24 | | | 289,941 | | | | 0.1 | |
| | 456,000 | | | # | | Electricite de France SA, 2.350%, 10/13/20 | | | 449,495 | | | | 0.2 | |
| | 940,000 | | | # | | Numericable Group SA, 6.000%, 05/15/22 | | | 914,150 | | | | 0.4 | |
| | 433,000 | | | # | | Societe Generale SA, 5.625%, 11/24/45 | | | 415,996 | | | | 0.2 | |
| | | | | | | | | | 2,366,321 | | | | 1.0 | |
| | | | | | | | | | | | | | | |
| | | | | | | Germany: 0.3% | | | | | | | | |
| | 730,000 | | | | | Deutsche Bank AG/London, 1.875%, 02/13/18 | | | 724,145 | | | | 0.3 | |
| | | | | | | | | | | | | | | |
| | | | | | | Guernsey: 0.3% | | | | | | | | |
| | 716,000 | | | # | | Credit Suisse Group Funding Guernsey Ltd., 2.750%, 03/26/20 | | | 709,983 | | | | 0.3 | |
| | | | | | | | | | | | | | | |
| | | | | | | Ireland: 0.3% | | | | | | | | |
| | 706,000 | | | # | | GE Capital International Funding Co., 4.418%, 11/15/35 | | | 722,145 | | | | 0.3 | |
| | | | | | | | | | | | | | | |
| | | | | | | Italy: 0.1% | | | | | | | | |
| | 286,000 | | | | | Intesa Sanpaolo SpA, 3.875%, 01/15/19 | | | 294,766 | | | | 0.1 | |
| | | | | | | | | | | | | | | |
| | | | | | | Japan: 0.4% | | | | | | | | |
| | 790,000 | | | # | | Bank of Tokyo-Mitsubishi UFJ Ltd./The, 2.300%, 03/05/20 | | | 779,818 | | | | 0.3 | |
| | 200,000 | | | # | | Mizuho Bank Ltd., 3.200%, 03/26/25 | | | 195,975 | | | | 0.1 | |
| | | | | | | | | | 975,793 | | | | 0.4 | |
| | | | | | | | | | | | | | | |
| | | | | | | Luxembourg: 0.3% | | | | | | | | |
| | 690,000 | | | | | Actavis Funding SCS, 2.350%, 03/12/18 | | | 691,193 | | | | 0.3 | |
| | | | | | | | | | | | | | | |
| | | | | | | Mexico: 0.0% | | | | | | | | |
| MXN | 1,007,437 | | | ± | | Banco Invex S.A., 6.450%, 03/13/34 | | | – | | | | – | |
| MXN | 196,402 | | | | | JPMorgan Hipotecaria su Casita, 6.100%, 09/25/35 | | | 11,996 | | | | 0.0 | |
| | | | | | | | | | 11,996 | | | | 0.0 | |
| | | | | | | | | | | | | | | |
| | | | | | | Netherlands: 1.0% | | | | | | | | |
| | 200,000 | | | # | | Carlson Wagonlit BV, 6.875%, 06/15/19 | | | 205,500 | | | | 0.1 | |
| | 269,000 | | | | | Cooperatieve Centrale Raiffeisen-Boerenleenbank BA/Netherlands, 4.500%, 01/11/21 | | | 293,026 | | | | 0.1 | |
| | 340,000 | | | | | Shell International Finance BV, 1.625%, 11/10/18 | | | 338,415 | | | | 0.2 | |
| | 690,000 | | | | | Shell International Finance BV, 3.250%, 05/11/25 | | | 675,072 | | | | 0.3 | |
| | 800,000 | | | # | | Siemens Financieringsmaatschappij NV, 2.900%, 05/27/22 | | | 801,362 | | | | 0.3 | |
| | | | | | | | | | 2,313,375 | | | | 1.0 | |
| | | | | | | | | | | | | | | |
| | | | | | | Norway: 0.2% | | | | | | | | |
| | 380,000 | | | | | Statoil ASA, 2.450%, 01/17/23 | | | 360,946 | | | | 0.2 | |
| | | | | | | | | | | | | | | |
| | | | | | | Sweden: 0.4% | | | | | | | | |
| | 298,000 | | | # | | Nordea Bank AB, 5.500%, 09/29/49 | | | 297,627 | | | | 0.1 | |
| | 670,000 | | | # | | Swedbank AB, 2.200%, 03/04/20 | | | 662,817 | | | | 0.3 | |
| | | | | | | | | | 960,444 | | | | 0.4 | |
| | | | | | | | | | | | | | | |
| | | | | | | Switzerland: 0.3% | | | | | | | | |
| | 400,000 | | | # | | Credit Suisse AG, 6.500%, 08/08/23 | | | 431,920 | | | | 0.2 | |
| | 250,000 | | | | | UBS AG/Stamford CT, 7.625%, 08/17/22 | | | 285,376 | | | | 0.1 | |
| | | | | | | | | | 717,296 | | | | 0.3 | |
| | | | | | | | | | | | | | | |
| | | | | | | United Kingdom: 0.8% | | | | | | | | |
| | 1,002,000 | | | | | Abbey National Treasury Services PLC/United Kingdom, 2.375%, 03/16/20 | | | 1,001,679 | | | | 0.5 | |
| | 283,000 | | | | | Aon PLC, 2.800%, 03/15/21 | | | 282,280 | | | | 0.1 | |
| | 280,000 | | | | | AstraZeneca PLC, 2.375%, 11/16/20 | | | 278,424 | | | | 0.1 | |
| | 265,000 | | | # | | Barclays Bank PLC, 6.050%, 12/04/17 | | | 282,949 | | | | 0.1 | |
| | | | | | | | | | 1,845,332 | | | | 0.8 | |
| | | | | | | | | | | | | | | |
| | | | | | | United States: 18.4% | | | | | | | | |
| | 424,000 | | | | | 21st Century Fox America, Inc., 4.500%, 02/15/21 | | | 456,969 | | | | 0.2 | |
| | 338,000 | | | | | 21st Century Fox America, Inc., 5.400%, 10/01/43 | | | 353,084 | | | | 0.1 | |
| | 616,000 | | | | | AbbVie, Inc., 2.500%, 05/14/20 | | | 610,535 | | | | 0.3 | |
| | 80,000 | | | | | Albemarle Corp., 3.000%, 12/01/19 | | | 78,566 | | | | 0.0 | |
| | 570,000 | | | # | | Alliance Data Systems Corp., 5.375%, 08/01/22 | | | 544,350 | | | | 0.2 | |
| | 638,000 | | | | | Amsurg Corp., 5.625%, 07/15/22 | | | 634,012 | | | | 0.3 | |
| | 1,050,000 | | | | | Apple Inc., 1.000%, 05/03/18 | | | 1,042,112 | | | | 0.4 | |
| | 710,000 | | | | | Apple, Inc., 3.200%, 05/13/25 | | | 719,891 | | | | 0.3 | |
| Voya Global Bond Portfolio | PORTFOLIO OF INVESTMENTS
as of December 31, 2015 (continued) |
Principal
Amount† | | | | | | | Value | | | Percentage
of Net
Assets | |
| CORPORATE BONDS/NOTES: (continued) | | | | | | | | |
| | | | | | | United States: (continued) | | | | | | | | |
| | 295,000 | | | | | AT&T, Inc., 3.000%, 06/30/22 | | | 287,386 | | | | 0.1 | |
| | 368,000 | | | | | Bank of America Corp., 3.300%, 01/11/23 | | | 363,399 | | | | 0.2 | |
| | 458,000 | | | | | Bank of America Corp., 4.100%, 07/24/23 | | | 474,523 | | | | 0.2 | |
| | 309,000 | | | | | Bank of America Corp., 4.000%, 04/01/24 | | | 316,736 | | | | 0.1 | |
| | 1,309,000 | | | | | Barrick North America Finance LLC, 5.750%, 05/01/43 | | | 949,444 | | | | 0.4 | |
| | 65,000 | | | # | | Building Materials Corp. of America, 6.000%, 10/15/25 | | | 66,625 | | | | 0.0 | |
| | 540,000 | | | # | | Calpine Corp., 6.000%, 01/15/22 | | | 560,083 | | | | 0.2 | |
| | 395,000 | | | | | CBRE Services, Inc., 5.250%, 03/15/25 | | | 400,863 | | | | 0.2 | |
| | 216,000 | | | | | CBS Corp., 3.700%, 08/15/24 | | | 210,558 | | | | 0.1 | |
| | 689,000 | | | | | CCO Holdings LLC / CCO Holdings Capital Corp., 5.125%, 02/15/23 | | | 691,584 | | | | 0.3 | |
| | 472,000 | | | # | | CCO Safari II LLC, 4.464%, 07/23/22 | | | 470,887 | | | | 0.2 | |
| | 501,000 | | | | | Celgene Corp., 4.000%, 08/15/23 | | | 515,276 | | | | 0.2 | |
| | 290,000 | | | | | Chevron Corp., 2.419%, 11/17/20 | | | 288,755 | | | | 0.1 | |
| | 382,000 | | | | | Citigroup, Inc., 4.000%, 08/05/24 | | | 379,272 | | | | 0.2 | |
| | 469,000 | | | | | Citigroup, Inc., 5.500%, 09/13/25 | | | 510,400 | | | | 0.2 | |
| | 758,000 | | | | | Citizens Bank NA/Providence RI, 2.450%, 12/04/19 | | | 746,657 | | | | 0.3 | |
| | 262,000 | | | | | ConocoPhillips Co., 4.300%, 11/15/44 | | | 218,211 | | | | 0.1 | |
| | 562,000 | | | # | | COX Communications, Inc., 2.950%, 06/30/23 | | | 495,925 | | | | 0.2 | |
| | 777,000 | | | | | CVS Health Corp., 2.800%, 07/20/20 | | | 781,628 | | | | 0.3 | |
| | 789,000 | | | | | Devon Energy Corp., 5.600%, 07/15/41 | | | 597,681 | | | | 0.3 | |
| | 299,000 | | | | | DIRECTV Holdings LLC / DIRECTV Financing Co., Inc., 5.150%, 03/15/42 | | | 279,538 | | | | 0.1 | |
| | 442,000 | | | | | Discover Bank/Greenwood DE, 7.000%, 04/15/20 | | | 503,802 | | | | 0.2 | |
| | 277,000 | | | | | Eastman Chemical Co., 2.700%, 01/15/20 | | | 274,636 | | | | 0.1 | |
| | 545,000 | | | | | Eaton Corp., 4.150%, 11/02/42 | | | 504,427 | | | | 0.2 | |
| | 523,000 | | | | | eBay, Inc., 2.600%, 07/15/22 | | | 487,733 | | | | 0.2 | |
| | 105,000 | | | | | Emerson Electric Co., 2.625%, 12/01/21 | | | 104,422 | | | | 0.0 | |
| | 1,026,000 | | | | | Energy Transfer Partners L.P., 4.900%, 02/01/24 | | | 916,282 | | | | 0.4 | |
| | 558,000 | | | | | Entergy Corp., 5.125%, 09/15/20 | | | 600,440 | | | | 0.3 | |
| | 539,000 | | | | | Fifth Third Bancorp, 8.250%, 03/01/38 | | | 754,506 | | | | 0.3 | |
| | 532,000 | | | | | FirstEnergy Corp., 4.250%, 03/15/23 | | | 542,346 | | | | 0.2 | |
| | 478,000 | | | | | General Dynamics Corp., 2.250%, 11/15/22 | | | 460,298 | | | | 0.2 | |
| | 205,000 | | | | | General Electric Capital Corp., 6.750%, 03/15/32 | | | 268,290 | | | | 0.1 | |
| | 200,000 | | | | | General Motors Financial Co., Inc., 4.300%, 07/13/25 | | | 194,443 | | | | 0.1 | |
| | 255,000 | | | # | | Glencore Funding LLC, 2.500%, 01/15/19 | | | 213,074 | | | | 0.1 | |
| | 627,000 | | | | | Goldman Sachs Group, Inc., 5.250%, 07/27/21 | | | 694,402 | | | | 0.3 | |
| | 605,000 | | | | | Hartford Financial Services Group, Inc., 6.625%, 03/30/40 | | | 749,207 | | | | 0.3 | |
| | 721,000 | | | | | HCP, Inc., 4.250%, 11/15/23 | | | 723,235 | | | | 0.3 | |
| | 436,000 | | | # | | Kraft Heinz Foods Co., 3.950%, 07/15/25 | | | 441,071 | | | | 0.2 | |
| | 258,000 | | | # | | Hewlett Packard Enterprise Co., 2.450%, 10/05/17 | | | 257,903 | | | | 0.1 | |
| | 194,000 | | | # | | Hewlett Packard Enterprise Co., 2.850%, 10/05/18 | | | 194,057 | | | | 0.1 | |
| | 570,000 | | | | | Huntington National Bank, 2.200%, 11/06/18 | | | 568,886 | | | | 0.2 | |
| | 294,000 | | | | | Huntington Bancshares, Inc./OH, 2.600%, 08/02/18 | | | 294,549 | | | | 0.1 | |
| | 1,041,000 | | | | | Indiana Michigan Power Co., 7.000%, 03/15/19 | | | 1,180,852 | | | | 0.5 | |
| | 570,000 | | | # | | JBS USA LLC / JBS USA Finance, Inc., 5.875%, 07/15/24 | | | 518,700 | | | | 0.2 | |
| | 384,000 | | | | | JM Smucker Co/The, 3.000%, 03/15/22 | | | 382,615 | | | | 0.2 | |
| | 362,000 | | | | | JPMorgan Chase & Co., 1.625%, 05/15/18 | | | 359,462 | | | | 0.2 | |
| | 478,000 | | | | | JPMorgan Chase & Co., 6.000%, 12/29/49 | | | 478,528 | | | | 0.2 | |
| | 50 | | | # | | Kern River Funding Corp., 4.893%, 04/30/18 | | | 52 | | | | 0.0 | |
| | 222,000 | | | | | Kinder Morgan Energy Partners L.P., 4.250%, 09/01/24 | | | 189,316 | | | | 0.1 | |
| | 127,000 | | | | | Kohls Corp., 4.750%, 12/15/23 | | | 129,886 | | | | 0.1 | |
| | 218,000 | | | | | Lockheed Martin Corp., 3.100%, 01/15/23 | | | 218,220 | | | | 0.1 | |
| | 375,000 | | | | | Medtronic, Inc., 3.150%, 03/15/22 | | | 379,476 | | | | 0.2 | |
| | 393,000 | | | | | Medtronic, Inc., 3.500%, 03/15/25 | | | 398,119 | | | | 0.2 | |
| | 700,000 | | | | | Microsoft Corp., 2.000%, 11/03/20 | | | 700,748 | | | | 0.3 | |
| | 372,000 | | | | | Morgan Stanley, 3.750%, 02/25/23 | | | 381,862 | | | | 0.2 | |
| | 587,000 | | | | | Morgan Stanley, 3.875%, 04/29/24 | | | 599,485 | | | | 0.3 | |
| | 618,000 | | | | | Morgan Stanley, 4.100%, 05/22/23 | | | 625,745 | | | | 0.3 | |
| | 240,000 | | | | | MPT Operating Partnership L.P./MPT Finance Corp., 6.375%, 02/15/22 | | | 245,700 | | | | 0.1 | |
| | 1,048,000 | | | | | Mylan, Inc., 2.600%, 06/24/18 | | | 1,040,672 | | | | 0.4 | |
| | 625,000 | | | | | Netflix, Inc., 5.750%, 03/01/24 | | | 645,312 | | | | 0.3 | |
| | 438,000 | | | | | Newell Rubbermaid, Inc., 2.875%, 12/01/19 | | | 423,081 | | | | 0.2 | |
| | 381,000 | | | | | NextEra Energy Capital Holdings, Inc., 3.625%, 06/15/23 | | | 380,379 | | | | 0.2 | |
| | 504,000 | | | | | Oracle Corp., 2.950%, 05/15/25 | | | 492,681 | | | | 0.2 | |
| Voya Global Bond Portfolio | PORTFOLIO OF INVESTMENTS
as of December 31, 2015 (continued) |
Principal
Amount† | | | | | | | Value | | | Percentage
of Net
Assets | |
| CORPORATE BONDS/NOTES: (continued) | | | | | | | | |
| | | | | | | United States: (continued) | | | | | | | | |
| | 110,000 | | | #,L | | Owens-Brockway Glass Container, Inc., 5.875%, 08/15/23 | | | 111,856 | | | | 0.0 | |
| | 568,000 | | | | | Philip Morris International, Inc., 4.250%, 11/10/44 | | | 550,046 | | | | 0.2 | |
| | 280,000 | | | | | Regency Energy Partners L.P. / Regency Energy Finance Corp., 4.500%, 11/01/23 | | | 242,740 | | | | 0.1 | |
| | 280,000 | | | | | Regency Energy Partners L.P. / Regency Energy Finance Corp., 5.500%, 04/15/23 | | | 252,468 | | | | 0.1 | |
| | 272,000 | | | | | Reynolds American, Inc., 6.150%, 09/15/43 | | | 309,371 | | | | 0.1 | |
| | 470,000 | | | # | | Sable International Finance Ltd., 8.750%, 02/01/20 | | | 494,675 | | | | 0.2 | |
| | 585,000 | | | # | | Sanmina Corp., 4.375%, 06/01/19 | | | 589,387 | | | | 0.2 | |
| | 117,000 | | | | | Scripps Networks Interactive, Inc., 2.750%, 11/15/19 | | | 115,216 | | | | 0.0 | |
| | 676,000 | | | | | St Jude Medical, Inc., 2.500%, 01/15/16 | | | 676,247 | | | | 0.3 | |
| | 570,000 | | | | | Starz LLC / Starz Finance Corp., 5.000%, 09/15/19 | | | 578,550 | | | | 0.2 | |
| | 104,000 | | | | | Sunoco Logistics Partners Operations L.P., 4.250%, 04/01/24 | | | 90,149 | | | | 0.0 | |
| | 445,000 | | | | | Synchrony Financial, 4.250%, 08/15/24 | | | 439,811 | | | | 0.2 | |
| | 585,000 | | | | | Tenet Healthcare Corp., 6.000%, 10/01/20 | | | 618,637 | | | | 0.3 | |
| | 272,000 | | | | | Time Warner Cable, Inc., 5.875%, 11/15/40 | | | 258,529 | | | | 0.1 | |
| | 485,000 | | | | | Time Warner, Inc., 6.500%, 11/15/36 | | | 550,744 | | | | 0.2 | |
| | 505,000 | | | # | | Valeant Pharmaceuticals International, 7.250%, 07/15/22 | | | 496,162 | | | | 0.2 | |
| | 270,000 | | | | | Verizon Communications, Inc., 5.012%, 08/21/54 | | | 248,161 | | | | 0.1 | |
| | 1,071,000 | | | | | Verizon Communications, Inc., 5.150%, 09/15/23 | | | 1,179,388 | | | | 0.5 | |
| | 272,000 | | | | | Verizon Communications, Inc., 6.550%, 09/15/43 | | | 324,036 | | | | 0.1 | |
| | 600,000 | | | | | Visa, Inc., 3.150%, 12/14/25 | | | 602,017 | | | | 0.3 | |
| | 599,000 | | | | | Wells Fargo & Co., 4.100%, 06/03/26 | | | 605,452 | | | | 0.3 | |
| | 514,000 | | | | | Wells Fargo & Co., 2.550%, 12/07/20 | | | 511,775 | | | | 0.2 | |
| | 455,000 | | | | | Xerox Corp., 2.750%, 09/01/20 | | | 429,234 | | | | 0.2 | |
| | | | | | | | | | 43,838,501 | | | | 18.4 | |
| | | | | | | | | | | | | | | |
| | | | | Total Corporate Bonds/Notes | | | | | | | | |
| | | | | (Cost $59,095,482) | | | 58,044,224 | | | | 24.4 | |
| | | | | | | | | | | | | | | |
| COLLATERALIZED MORTGAGE OBLIGATIONS: 15.3% | | | | | | | | |
| | | | | | | United States: 15.3% | | | | | | | | |
| | 648,495 | | | | | Adjustable Rate Mortgage Trust 2006-2, 2.843%, 05/25/36 | | | 606,220 | | | | 0.2 | |
| | 473,485 | | | | | Alternative Loan Trust 2005-51 3A2A, 1.547%, 11/20/35 | | | 403,160 | | | | 0.2 | |
| | 125,299 | | | | | Alternative Loan Trust 2006-13T1 A9, 6.000%, 05/25/36 | | | 107,144 | | | | 0.0 | |
| | 443,396 | | | | | American Home Mortgage Assets Trust 2006-3 2A11, 1.197%, 10/25/46 | | | 318,119 | | | | 0.1 | |
| | 372,735 | | | | | Banc of America Alternative Loan Trust 2004-1 4A1, 4.750%, 02/25/19 | | | 375,179 | | | | 0.2 | |
| | 810,000 | | | | | Banc of America Commercial Mortgage Trust 2007-3 AJ, 5.558%, 06/10/49 | | | 821,840 | | | | 0.3 | |
| | 700,000 | | | | | Banc of America Commercial Mortgage Trust 2007-3 B, 5.558%, 06/10/49 | | | 692,564 | | | | 0.3 | |
| | 540,000 | | | | | Banc of America Commercial Mortgage Trust 2007-4 AJ, 5.809%, 02/10/51 | | | 548,288 | | | | 0.2 | |
| | 868,241 | | | | | Banc of America Funding Corp., 5.500%, 02/25/35 | | | 877,970 | | | | 0.4 | |
| | 1,130,000 | | | # | | Banc of America Merrill Lynch Commercial Mortgage, Inc. 2004-4 G, 5.402%, 07/10/42 | | | 1,131,340 | | | | 0.5 | |
| | 8,020,000 | | | #,^ | | BBCCRE Trust 2015-GTP XA, 0.597%, 08/10/33 | | | 404,674 | | | | 0.2 | |
| | 574,250 | | | | | Bear Stearns ALT-A Trust 2005-10 22A1, 2.608%, 01/25/36 | | | 497,575 | | | | 0.2 | |
| | 440,000 | | | # | | Bear Stearns Commercial Mortgage Securities Trust 2004-PWR6, 5.406%, 11/11/41 | | | 472,894 | | | | 0.2 | |
| | 500,000 | | | | | Bear Stearns Commercial Mortgage Securities Trust 2005-TOP20, 5.177%, 10/12/42 | | | 499,444 | | | | 0.2 | |
| | 140,000 | | | # | | Bear Stearns Commercial Mortgage Securities Trust 2006-TOP22 E, 5.620%, 04/12/38 | | | 140,131 | | | | 0.1 | |
| | 497,440 | | | # | | Beckman Coulter, Inc. 2000-A A, 7.498%, 12/15/18 | | | 524,998 | | | | 0.2 | |
| | 431,966 | | | | | ChaseFlex Trust Series 2006-2 A3, 5.053%, 09/25/36 | | | 379,358 | | | | 0.2 | |
| | 240,000 | | | # | | Citigroup Commercial Mortgage Trust 2012-GC8 D, 4.877%, 09/10/45 | | | 230,804 | | | | 0.1 | |
| | 234,440 | | | | | Citigroup Mortgage Loan Trust, Inc. 2005-2 1A3, 2.800%, 05/25/35 | | | 233,810 | | | | 0.1 | |
| | 572,340 | | | | | CitiMortgage Alternative Loan Trust Series 2006-A3 1A7, 6.000%, 07/25/36 | | | 517,793 | | | | 0.2 | |
| | 680,000 | | | # | | COMM 2004-LNB2 H Mortgage Trust H, 6.067%, 03/10/39 | | | 735,082 | | | | 0.3 | |
| | 10,774,658 | | | #,^ | | COMM 2012 - LTRT XA Mortgage Trust, 1.060%, 10/05/30 | | | 554,782 | | | | 0.2 | |
| | 3,951,125 | | | ^ | | COMM 2012-CCRE1 XA Mortgage Trust, 2.080%, 05/15/45 | | | 341,884 | | | | 0.1 | |
| Voya Global Bond Portfolio | PORTFOLIO OF INVESTMENTS
as of December 31, 2015 (continued) |
Principal
Amount† | | | | | | | Value | | | Percentage
of Net
Assets | |
| COLLATERALIZED MORTGAGE OBLIGATIONS: (continued) | | | | | | | | |
| | | | | | | United States: (continued) | | | | | | | | |
| | 2,953,092 | | | ^ | | COMM 2013-LC6 XA Mortgage Trust, 1.742%, 01/10/46 | | | 202,419 | | | | 0.1 | |
| | 4,401,334 | | | ^ | | COMM 2014-CCRE17 XA Mortgage Trust, 1.191%, 05/10/47 | | | 277,262 | | | | 0.1 | |
| | 225,478 | | | ^ | | Commercial Mortgage Pass Through Certificates, 1.394%, 04/10/47 | | | 15,973 | | | | 0.0 | |
| | 480,000 | | | # | | Commercial Mortgage Trust 2004-GG1 F, 6.047%, 06/10/36 | | | 486,719 | | | | 0.2 | |
| | 92,190 | | | | | Countrywide Alternative Loan Trust 2005-53T2 2A6, 0.922%, 11/25/35 | | | 58,598 | | | | 0.0 | |
| | 145,652 | | | | | Countrywide Home Loan Mortgage Pass-through Trust, 5.500%, 11/25/35 | | | 144,973 | | | | 0.1 | |
| | 158,977 | | | | | Countrywide Home Loan Mortgage Pass-through Trust, 5.500%, 09/25/35 | | | 157,338 | | | | 0.1 | |
| | 23,937 | | | # | | Credit Suisse First Boston Mortgage Securities Corp. 2003-C4 J, 5.322%, 08/15/36 | | | 23,907 | | | | 0.0 | |
| | 372,029 | | | # | | Credit Suisse Mortgage Capital Certificates 2009-3R 30A1, 2.380%, 07/27/37 | | | 373,279 | | | | 0.2 | |
| | 3,057,972 | | | #,^ | | DBUBS 2011-LC1 XA Mortgage Trust, 1.127%, 11/10/46 | | | 64,549 | | | | 0.0 | |
| | 55,972 | | | # | | Deutsche Alternative-A Securities, Inc. Alternate Loan Trust, 0.922%, 01/27/37 | | | 108,191 | | | | 0.0 | |
| | 320,000 | | | | | Fannie Mae Connecticut Avenue Securities 2014-C03 2M2, 3.322%, 07/25/24 | | | 292,351 | | | | 0.1 | |
| | 1,780,000 | | | | | Fannie Mae Connecticut Avenue Securities 2014-CO4 M2, 5.322%, 11/25/24 | | | 1,815,618 | | | | 0.8 | |
| | 9,289,095 | | | ^ | | Freddie Mac Series K704 X1, 1.966%, 08/25/18 | | | 403,600 | | | | 0.2 | |
| | 1,100,000 | | | | | Freddie Mac Structured Agency Credit Risk Debt Notes 2014-DN4 M3, 4.972%, 10/25/24 | | | 1,092,614 | | | | 0.5 | |
| | 340,000 | | | | | Freddie Mac Structured Agency Credit Risk Debt Notes 2014-HQ3 M3, 5.172%, 10/25/24 | | | 341,716 | | | | 0.1 | |
| | 180,000 | | | | | Freddie Mac Structured Agency Credit Risk Debt Notes 2015-DN1 M3, 4.572%, 01/25/25 | | | 177,674 | | | | 0.1 | |
| | 200,000 | | | | | Freddie Mac Structured Agency Credit Risk Debt Notes 2015-HQ1 M2, 2.622%, 03/25/25 | | | 199,583 | | | | 0.1 | |
| | 220,000 | | | | | Freddie Mac Structured Agency Credit Risk Debt Notes 2015-HQ1 M3, 4.222%, 03/25/25 | | | 212,401 | | | | 0.1 | |
| | 44,040,460 | | | #,^ | | FREMF Mortgage Trust, 0.100%, 12/25/44 | | | 208,708 | | | | 0.1 | |
| | 24,529 | | | # | | GE Capital Commercial Mortgage Series 2005-C2, 5.464%, 05/10/43 | | | 24,508 | | | | 0.0 | |
| | 346,486 | | | | | GreenPoint Mortgage Funding Trust 2006-AR3 4A1, 0.632%, 04/25/36 | | | 262,111 | | | | 0.1 | |
| | 290,000 | | | | | GS Mortgage Securities Trust 2006-GG6 D, 5.666%, 04/10/38 | | | 289,738 | | | | 0.1 | |
| | 110,000 | | | | | GS Mortgage Securities Trust 2006-GG6, 5.666%, 04/10/38 | | | 109,913 | | | | 0.0 | |
| | 143,453 | | | | | GSR Mortgage Loan Trust, 2.793%, 09/25/35 | | | 144,926 | | | | 0.1 | |
| | 194,385 | | | | | HomeBanc Mortgage Trust 2006-2 A1, 0.602%, 12/25/36 | | | 172,745 | | | | 0.1 | |
| | 906,028 | | | | | IndyMac INDX Mortgage Loan Trust 2006-AR2 1A1B, 0.632%, 04/25/46 | | | 703,412 | | | | 0.3 | |
| | 500,000 | | | | | JP Morgan Chase Commercial Mortgage Securities Corp. 2006-LDP8 B, 5.520%, 05/15/45 | | | 501,405 | | | | 0.2 | |
| | 2,940,000 | | | #,^ | | JP Morgan Chase Commercial Mortgage Securities Corp. 2012-LC9 XB, 0.356%, 12/15/47 | | | 62,454 | | | | 0.0 | |
| | 372,842 | | | # | | JP Morgan Chase Commercial Mortgage Securities Trust 2003-LN1 H, 5.482%, 10/15/37 | | | 372,511 | | | | 0.2 | |
| | 270,000 | | | | | JP Morgan Chase Commercial Mortgage Securities Trust 2004-CIBC9 E, 5.366%, 06/12/41 | | | 262,585 | | | | 0.1 | |
| | 60,000 | | | | | JP Morgan Chase Commercial Mortgage Securities Trust 2006-LDP8, 5.549%, 05/15/45 | | | 60,002 | | | | 0.0 | |
| | 8,495,255 | | | ^ | | JP Morgan Chase Commercial Mortgage Securities Trust 2012-CIBX XA, 1.746%, 06/15/45 | | | 534,773 | | | | 0.2 | |
| | 720,699 | | | | | JP Morgan Mortgage Trust 2005-A4 B1, 2.535%, 07/25/35 | | | 642,431 | | | | 0.3 | |
| | 180,450 | | | | | JPMorgan Mortgage Trust, 2.685%, 07/25/35 | | | 179,233 | | | | 0.1 | |
| | 360,000 | | | | | LB-UBS Commercial Mortgage Trust 2005-C3 E, 4.983%, 07/15/40 | | | 383,365 | | | | 0.2 | |
| | 780,000 | | | | | LB-UBS Commercial Mortgage Trust 2006-C4 D, 5.840%, 06/15/38 | | | 788,833 | | | | 0.3 | |
| | 260,000 | | | | | LB-UBS Commercial Mortgage Trust 2006-C4 E, 5.840%, 06/15/38 | | | 259,021 | | | | 0.1 | |
| | 360,000 | | | # | | LB-UBS Commercial Mortgage Trust 2006-C6 JR14, 5.990%, 09/15/39 | | | 364,214 | | | | 0.1 | |
| | 150,000 | | | # | | LB-UBS Commercial Mortgage Trust 2006-C6 JR15, 5.990%, 09/15/39 | | | 151,295 | | | | 0.1 | |
| | 150,000 | | | # | | LB-UBS Commercial Mortgage Trust 2006-C6 JR16, 5.990%, 09/15/39 | | | 149,893 | | | | 0.1 | |
| | 217,916 | | | | | Lehman XS Trust Series 2005-5N 1A2, 0.782%, 11/25/35 | | | 173,675 | | | | 0.1 | |
| | 451,487 | | | | | Lehman XS Trust Series 2006-14N 2A, 0.622%, 09/25/46 | | | 362,442 | | | | 0.1 | |
| Voya Global Bond Portfolio | PORTFOLIO OF INVESTMENTS
as of December 31, 2015 (continued) |
Principal
Amount† | | | | | | | Value | | | Percentage
of Net
Assets | |
| COLLATERALIZED MORTGAGE OBLIGATIONS: (continued) | | | | | | | | |
| | | | | | | United States: (continued) | | | | | | | | |
| | 197,599 | | | | | MASTR Adjustable Rate Mortgages Trust, 2.751%, 04/25/36 | | | 191,149 | | | | 0.1 | |
| | 360,000 | | | | | Merrill Lynch Mortgage Investors Trust Series 1998-C1-CTL E, 6.750%, 11/15/26 | | | 390,528 | | | | 0.2 | |
| | 210,000 | | | | | Merrill Lynch Mortgage Trust 2006-C2 AJ, 5.802%, 08/12/43 | | | 209,947 | | | | 0.1 | |
| | 130,000 | | | | | Merrill Lynch Mortgage Trust, 5.666%, 05/12/39 | | | 129,715 | | | | 0.1 | |
| | 570,000 | | | # | | Morgan Stanley Capital I Trust 2011-C1 D, 5.438%, 09/15/47 | | | 601,725 | | | | 0.2 | |
| | 460,000 | | | # | | Morgan Stanley Capital I Trust 2011-C1 E, 5.438%, 09/15/47 | | | 474,475 | | | | 0.2 | |
| | 865,000 | | | # | | Morgan Stanley Capital I Trust 2011-C1, 5.438%, 09/15/47 | | | 942,112 | | | | 0.4 | |
| | 290,000 | | | # | | Morgan Stanley Re-REMIC Trust, 0.250%, 07/27/49 | | | 263,407 | | | | 0.1 | |
| | 216,789 | | | # | | N-Star Real Estate CDO Ltd. 2013-1A A, 2.272%, 08/25/29 | | | 216,724 | | | | 0.1 | |
| | 269,940 | | | | | Opteum Mortgage Acceptance Corp. Trust 2006-1 1APT, 0.632%, 04/25/36 | | | 234,617 | | | | 0.1 | |
| | 590,000 | | | | | Opteum Mortgage Acceptance Corp. Trust 2006-1, 0.722%, 04/25/36 | | | 487,997 | | | | 0.2 | |
| | 4,075 | | | | | Residential Accredit Loans, Inc., 3.156%, 04/25/35 | | | 379 | | | | 0.0 | |
| | 560,183 | | | # | | TIAA CMBS I Trust 2001-C1A L, 5.770%, 06/19/33 | | | 573,734 | | | | 0.2 | |
| | 6,596,150 | | | #,^ | | UBS-Barclays Commercial Mortgage Trust 2012-C3 XA, 2.089%, 08/10/49 | | | 609,844 | | | | 0.3 | |
| | 380,000 | | | | | Wachovia Bank Commercial Mortgage Trust Series 2005-C22, 5.565%, 12/15/44 | | | 378,951 | | | | 0.2 | |
| | 130,000 | | | | | Wachovia Bank Commercial Mortgage Trust Series 2006-C23, 5.625%, 01/15/45 | | | 129,703 | | | | 0.1 | |
| | 190,000 | | | | | Wachovia Bank Commercial Mortgage Trust Series 2006-C25, 5.767%, 05/15/43 | | | 191,011 | | | | 0.1 | |
| | 82,924 | | | | | WaMu Mortgage Pass-Through Certificates Series 2006-AR12 1A1, 2.431%, 10/25/36 | | | 74,743 | | | | 0.0 | |
| | 1,340,522 | | | | | WaMu Mortgage Pass-Through Certificates Series 2006-AR16 Trust 3A1, 3.824%, 12/25/36 | | | 1,222,973 | | | | 0.5 | |
| | 317,242 | | | | | WaMu Mortgage Pass-Through Certificates Series 2006-AR8 1A4, 2.397%, 08/25/46 | | | 273,905 | | | | 0.1 | |
| | 606,111 | | | | | WaMu Mortgage Pass-Through Certificates Series 2007-HY2 1A1, 2.300%, 12/25/36 | | | 529,517 | | | | 0.2 | |
| | 168,836 | | | | | WaMu Mortgage Pass-Through Certificates Series 2007-HY4 1A1, 1.972%, 04/25/37 | | | 144,019 | | | | 0.1 | |
| | 192,181 | | | | | Washington Mutual Mortgage Pass-Through Certificates WMALT Series 2006-AR10 Trust, 0.522%, 12/25/36 | | | 128,158 | | | | 0.0 | |
| | 235,961 | | | | | Wells Fargo Alternative Loan 2007-PA2 2A1, 0.852%, 06/25/37 | | | 171,912 | | | | 0.1 | |
| | 6,019,310 | | | #,^ | | Wells Fargo Commercial Mortgage Trust 2012-LC5 XA, 2.061%, 10/15/45 | | | 528,387 | | | | 0.2 | |
| | 593,448 | | | | | Wells Fargo Mortgage Backed Securities Trust 2005-AR14 A1, 2.740%, 08/25/35 | | | 587,915 | | | | 0.2 | |
| | 441,598 | | | | | Wells Fargo Mortgage Backed Securities 2006-AR17 Trust A1, 2.733%, 10/25/36 | | | 421,597 | | | | 0.2 | |
| | 95,247 | | | | | Wells Fargo Mortgage Backed Securities 2006-AR17 Trust A2, 2.733%, 10/25/36 | | | 90,933 | | | | 0.0 | |
| | 510,545 | | | | | Wells Fargo Mortgage Backed Securities 2006-AR7 Trust 2A1, 2.738%, 05/25/36 | | | 487,425 | | | | 0.2 | |
| | 467,771 | | | | | Wells Fargo Mortgage Backed Securities 2006-AR8 Trust 3A2, 2.808%, 04/25/36 | | | 455,201 | | | | 0.2 | |
| | 101,727 | | | | | Wells Fargo Mortgage-Backed Securities Trust, 2.753%, 02/25/34 | | | 103,013 | | | | 0.0 | |
| | 2,962,718 | | | #,^ | | WFRBS Commercial Mortgage Trust 2012-C8 XA, 2.164%, 08/15/45 | | | 246,975 | | | | 0.1 | |
| | | | | | | | | | | | | | | |
| | | | | Total Collateralized Mortgage Obligations | | | | | | | | |
| | | | | (Cost $36,418,133) | | | 36,520,702 | | | | 15.3 | |
| | | | | | | | | | | | | | | |
| STRUCTURED PRODUCTS: 0.0% | | | | | | | | |
| | | | | | | Russia: 0.0% | | | | | | | | |
| RUB | 6,309,181 | | | | | Morgan Stanley & Co. International PLC - EM Whole Loan SA /Russian Federation Total Return Linked Bonds, Series 007, Cl. VR, 4.390%, 08/22/34 | | | 38,156 | | | | 0.0 | |
| | | | | | | | | | | | | | | |
| | | | | Total Structured Products | | | | | | | | |
| | | | | (Cost $224,649) | | | 38,156 | | | | 0.0 | |
| | | | | | | | | | | | | | | |
| U.S. TREASURY OBLIGATIONS: 6.9% | | | | | | | | |
| | | | | | | U.S. Treasury Bonds: 1.7% | | | | | | | | |
| | 1,951,000 | | | | | 2.875%, due 08/15/45 | | | 1,891,631 | | | | 0.8 | |
| | 2,269,000 | | | L | | 2.250%, due 11/15/25 | | | 2,264,145 | | | | 0.9 | |
| | | | | | | | | | 4,155,776 | | | | 1.7 | |
| | | | | | | | | | | | | | | |
| | | | | | | U.S. Treasury Notes: 5.2% | | | | | | | | |
| | 6,083,700 | | | L | | 0.875%, due 11/30/17 | | | 6,067,158 | | | | 2.6 | |
| | 1,890,000 | | | | | 1.250%, due 12/15/18 | | | 1,886,379 | | | | 0.8 | |
| | 1,931,000 | | | | | 1.750%, due 12/31/20 | | | 1,929,824 | | | | 0.8 | |
| Voya Global Bond Portfolio | PORTFOLIO OF INVESTMENTS
as of December 31, 2015 (continued) |
Principal
Amount† | | | | | | | Value | | | Percentage
of Net
Assets | |
| U.S. TREASURY OBLIGATIONS: (continued) | | | | | | | | |
| | | | | | | U.S. Treasury Notes: (continued) | | | | | | | | |
| | 2,438,000 | | | | | 2.000%, due 11/30/22 | | | 2,424,981 | | | | 1.0 | |
| | | | | | | | | | 12,308,342 | | | | 5.2 | |
| | | | | | | | | | | | | | | |
| | | | | Total U.S. Treasury Obligations | | | | | | | | |
| | | | | (Cost $16,476,858) | | | 16,464,118 | | | | 6.9 | |
| | | | | | | | | | | | | | | |
| FOREIGN GOVERNMENT BONDS: 6.6% | | | | | | | | |
| | | | | | | Austria: 1.5% | | | | | | | | |
| EUR | 3,000,000 | | | # | | Austria Government Bond, 1.650%, 10/21/24 | | | 3,520,257 | | | | 1.5 | |
| | | | | | | | | | | | | | | |
| | | | | | | Brazil: 0.2% | | | | | | | | |
| BRL | 705,000 | | | | | Brazil Notas do Tesouro Nacional Series F, 6.000%, 05/15/45 | | | 421,191 | | | | 0.2 | |
| | | | | | | | | | | | | | | |
| | | | | | | Germany: 0.4% | | | | | | | | |
| EUR | 10,000 | | | | | Bundesrepublik Deutschland, 2.000%, 08/15/23 | | | 12,255 | | | | 0.0 | |
| EUR | 140,000 | | | | | Bundesschatzanweisungen, -0.330%, 09/15/17 | | | 153,017 | | | | 0.0 | |
| EUR | 830,000 | | | | | Bundesschatzanweisungen, -0.350%, 06/16/17 | | | 906,645 | | | | 0.4 | |
| | | | | | | | | | 1,071,917 | | | | 0.4 | |
| | | | | | | | | | | | | | | |
| | | | | | | South Africa: 0.0% | | | | | | | | |
| ZAR | 1,000,000 | | | | | Transnet SOC Ltd., 10.800%, 11/06/23 | | | 62,541 | | | | 0.0 | |
| | | | | | | | | | | | | | | |
| | | | | | | Spain: 4.5% | | | | | | | | |
| EUR | 7,300,000 | | | # | | Spain Government Bond, 1.600%, 04/30/25 | | | 7,891,619 | | | | 3.3 | |
| EUR | 2,340,000 | | | # | | Spain Government Bond, 2.750%, 10/31/24 | | | 2,776,457 | | | | 1.2 | |
| | | | | | | | | | 10,668,076 | | | | 4.5 | |
| | | | | | | | | | | | | | | |
| | | | | Total Foreign Government Bonds | | | | | | | | |
| | | | | (Cost $16,459,970) | | | 15,743,982 | | | | 6.6 | |
| | | | | | | | | | | | | | | |
| U.S. GOVERNMENT AGENCY OBLIGATIONS: 19.4% | | | | | | | | |
| | | | | | | Federal Home Loan Mortgage Corporation: 8.4%## | | | | | | | | |
| | 1,391,000 | | | W | | 0.010%, due 12/15/42 | | | 1,388,811 | | | | 0.6 | |
| | 41,017 | | | | | 0.781%, due 02/15/29 | | | 41,481 | | | | 0.0 | |
| | 14,237 | | | | | 0.831%, due 03/15/32 | | | 14,422 | | | | 0.0 | |
| | 56,612 | | | | | 0.831%, due 01/15/33 | | | 57,178 | | | | 0.0 | |
| | 21,275 | | | | | 1.281%, due 08/15/31 | | | 21,910 | | | | 0.0 | |
| | 11,681 | | | | | 1.281%, due 02/15/32 | | | 12,038 | | | | 0.0 | |
| | 12,515 | | | | | 1.331%, due 02/15/32 | | | 12,846 | | | | 0.0 | |
| | 12,201 | | | | | 1.331%, due 02/15/32 | | | 12,524 | | | | 0.0 | |
| | 17,513 | | | | | 1.331%, due 03/15/32 | | | 17,981 | | | | 0.0 | |
| | 1,469,601 | | | | | 3.000%, due 04/01/45 | | | 1,469,230 | | | | 0.6 | |
| | 1,436,597 | | | | | 3.000%, due 04/01/45 | | | 1,436,680 | | | | 0.6 | |
| | 532,968 | | | | | 3.000%, due 09/01/45 | | | 532,689 | | | | 0.2 | |
| | 1,984,000 | | | W | | 3.500%, due 07/15/41 | | | 2,042,454 | | | | 0.9 | |
| | 974,746 | | | ^ | | 4.000%, due 02/15/43 | | | 182,898 | | | | 0.1 | |
| | 15,332,354 | | | ^ | | 4.000%, due 04/15/43 | | | 2,766,503 | | | | 1.2 | |
| | 1,013,671 | | | | | 4.000%, due 09/01/45 | | | 1,072,155 | | | | 0.5 | |
| | 352,259 | | | | | 4.000%, due 09/01/45 | | | 372,583 | | | | 0.2 | |
| | 482,806 | | | | | 4.000%, due 09/01/45 | | | 511,035 | | | | 0.2 | |
| | 252,191 | | | | | 4.000%, due 09/01/45 | | | 266,780 | | | | 0.1 | |
| | 312,663 | | | | | 4.000%, due 09/01/45 | | | 330,774 | | | | 0.1 | |
| | 195,015 | | | | | 4.000%, due 09/01/45 | | | 206,417 | | | | 0.1 | |
| | 1,245,288 | | | | | 4.000%, due 10/01/45 | | | 1,317,136 | | | | 0.6 | |
| | 5,710,031 | | | ^ | | 4.120%, due 05/15/36 | | | 567,133 | | | | 0.2 | |
| | 5,444 | | | | | 5.000%, due 01/01/20 | | | 5,743 | | | | 0.0 | |
| | 23,424 | | | | | 5.000%, due 02/01/20 | | | 24,720 | | | | 0.0 | |
| | 184,115 | | | | | 5.000%, due 09/15/23 | | | 197,216 | | | | 0.1 | |
| | 702,924 | | | | | 5.000%, due 02/15/34 | | | 774,384 | | | | 0.3 | |
| | 628,082 | | | | | 5.000%, due 11/15/34 | | | 688,083 | | | | 0.3 | |
| | 18,991 | | | | | 5.000%, due 12/01/34 | | | 21,059 | | | | 0.0 | |
| | 10,457 | | | | | 5.500%, due 01/01/18 | | | 10,793 | | | | 0.0 | |
| | 2,321,284 | | | ^ | | 5.620%, due 10/15/36 | | | 336,835 | | | | 0.2 | |
| | 5,988,929 | | | ^ | | 5.670%, due 05/15/36 | | | 533,507 | | | | 0.2 | |
| | 4,882,986 | | | ^ | | 5.670%, due 01/15/39 | | | 662,073 | | | | 0.3 | |
| | 5,126,356 | | | ^ | | 5.720%, due 07/15/40 | | | 734,137 | | | | 0.3 | |
| | 128,670 | | | ^ | | 5.820%, due 07/15/35 | | | 21,868 | | | | 0.0 | |
| | 2,474,601 | | | ^ | | 5.920%, due 11/15/32 | | | 445,522 | | | | 0.2 | |
| | 6,248 | | | | | 6.000%, due 05/15/17 | | | 6,419 | | | | 0.0 | |
| | 54,206 | | | | | 6.000%, due 02/01/34 | | | 61,664 | | | | 0.0 | |
| | 1,130,015 | | | ^ | | 6.270%, due 08/15/28 | | | 85,505 | | | | 0.0 | |
| | 1,971 | | | | | 6.500%, due 04/01/18 | | | 2,014 | | | | 0.0 | |
| | 13,676 | | | | | 6.500%, due 02/01/22 | | | 15,583 | | | | 0.0 | |
| | 17,576 | | | | | 6.500%, due 09/01/22 | | | 20,027 | | | | 0.0 | |
| | 53,406 | | | | | 6.500%, due 04/15/28 | | | 59,015 | | | | 0.0 | |
| | 11,228 | | | | | 6.500%, due 06/15/31 | | | 12,457 | | | | 0.0 | |
| | 89,746 | | | | | 6.500%, due 02/15/32 | | | 102,570 | | | | 0.1 | |
| | 65,233 | | | | | 6.500%, due 06/15/32 | | | 74,231 | | | | 0.0 | |
| | 5,017 | | | | | 6.500%, due 08/01/32 | | | 5,852 | | | | 0.0 | |
| | 7,443 | | | | | 6.500%, due 07/01/34 | | | 8,484 | | | | 0.0 | |
| | 10,612 | | | | | 6.500%, due 07/01/34 | | | 12,097 | | | | 0.0 | |
| | 54,043 | | | | | 6.750%, due 02/15/24 | | | 59,355 | | | | 0.0 | |
| | 95,691 | | | | | 7.000%, due 09/15/26 | | | 106,667 | | | | 0.1 | |
| | 16,151 | | | ^ | | 7.000%, due 03/15/28 | | | 3,917 | | | | 0.0 | |
| | 89,442 | | | ^ | | 7.000%, due 04/15/28 | | | 21,846 | | | | 0.0 | |
| | 149,607 | | | ^ | | 7.320%, due 03/15/29 | | | 32,978 | | | | 0.0 | |
| | 140,691 | | | ^ | | 7.370%, due 03/15/29 | | | 26,282 | | | | 0.0 | |
| | 81,774 | | | | | 7.500%, due 09/15/22 | | | 90,141 | | | | 0.0 | |
| | 98,665 | | | | | 8.000%, due 05/15/35 | | | 113,017 | | | | 0.1 | |
| | 203,998 | | | ^ | | 8.620%, due 08/15/29 | | | 51,470 | | | | 0.0 | |
| | 8,094 | | | | | 23.172%, due 06/15/34 | | | 8,914 | | | | 0.0 | |
| | 27,180 | | | | | 23.538%, due 08/15/35 | | | 40,790 | | | | 0.0 | |
| | | | | | | | | | 20,130,893 | | | | 8.4 | |
| | | | | | | | | | | | | | | |
| | | | | | | Federal National Mortgage Association: 9.4%## | | | | | | | | |
| | 8,191 | | | | | 0.822%, due 11/25/33 | | | 8,246 | | | | 0.0 | |
| | 8,830 | | | | | 0.860%, due 10/18/32 | | | 8,956 | | | | 0.0 | |
| | 4,086 | | | | | 1.422%, due 04/25/32 | | | 4,200 | | | | 0.0 | |
| | 13,277 | | | | | 1.422%, due 04/25/32 | | | 13,647 | | | | 0.0 | |
| | 39,624 | | | | | 1.422%, due 09/25/32 | | | 40,696 | | | | 0.0 | |
| | 39,630 | | | | | 1.422%, due 12/25/32 | | | 40,701 | | | | 0.0 | |
| | 292,011 | | | | | 2.491%, due 10/01/36 | | | 309,078 | | | | 0.1 | |
| | 468,000 | | | W | | 2.500%, due 01/15/28 | | | 471,736 | | | | 0.2 | |
| | 142,784 | | | | | 2.500%, due 06/01/30 | | | 144,123 | | | | 0.1 | |
| | 95,078 | | | | | 2.500%, due 06/01/30 | | | 95,970 | | | | 0.0 | |
| | 57,503 | | | | | 2.500%, due 07/01/30 | | | 58,042 | | | | 0.0 | |
| | 2,296,836 | | | ^ | | 3.000%, due 06/25/33 | | | 341,142 | | | | 0.2 | |
| | 1,501,000 | | | W | �� | 3.000%, due 09/25/42 | | | 1,501,131 | | | | 0.6 | |
| | 1,054,078 | | | | | 3.000%, due 07/01/43 | | | 1,056,605 | | | | 0.5 | |
| | 3,660,333 | | | | | 3.000%, due 07/01/43 | | | 3,691,539 | | | | 1.6 | |
| | 1,214,246 | | | ^ | | 3.500%, due 08/25/33 | | | 161,769 | | | | 0.1 | |
| | 747,151 | | | ^ | | 3.500%, due 08/25/43 | | | 146,819 | | | | 0.1 | |
| | 2,036,117 | | | ^ | | 3.628%, due 02/25/37 | | | 29,393 | | | | 0.0 | |
| | 302,000 | | | W | | 4.000%, due 08/25/40 | | | 319,592 | | | | 0.1 | |
| | 2,274,687 | | | ^ | | 4.000%, due 06/25/42 | | | 389,065 | | | | 0.2 | |
| | 144,111 | | | | | 4.500%, due 08/25/25 | | | 152,571 | | | | 0.1 | |
| | 3,483,043 | | | | | 4.500%, due 05/01/44 | | | 3,763,414 | | | | 1.6 | |
| | 1,771,499 | | | ^ | | 5.000%, due 05/25/18 | | | 64,603 | | | | 0.0 | |
| | 262,994 | | | | | 5.000%, due 07/25/40 | | | 277,533 | | | | 0.1 | |
| | 127,390 | | | | | 5.000%, due 06/01/41 | | | 140,749 | | | | 0.1 | |
| | 15,268 | | | | | 5.500%, due 09/01/19 | | | 15,983 | | | | 0.0 | |
| | 13,934 | | | | | 5.500%, due 09/01/19 | | | 14,656 | | | | 0.0 | |
| | 44,041 | | | | | 5.500%, due 09/01/24 | | | 49,063 | | | | 0.0 | |
| | 69,935 | | | ^ | | 5.500%, due 07/25/33 | | | 14,813 | | | | 0.0 | |
| | 28,838 | | | ^ | | 5.500%, due 06/01/35 | | | 6,133 | | | | 0.0 | |
| | 3,070,054 | | | ^ | | 5.518%, due 01/25/38 | | | 546,945 | | | | 0.2 | |
| Voya Global Bond Portfolio | PORTFOLIO OF INVESTMENTS
as of December 31, 2015 (continued) |
Principal
Amount† | | | | | | | Value | | | Percentage
of Net
Assets | |
| U.S. GOVERNMENT AGENCY OBLIGATIONS: (continued) | | | | | | | | |
| | | | | | | Federal National Mortgage Association: (continued) | | | | | | | | |
| | 5,322,507 | | | ^ | | 5.528%, due 09/25/41 | | | 834,013 | | | | 0.4 | |
| | 4,679,380 | | | ^ | | 5.558%, due 11/25/41 | | | 752,111 | | | | 0.3 | |
| | 3,322,672 | | | ^ | | 5.678%, due 01/25/43 | | | 778,870 | | | | 0.3 | |
| | 4,632 | | | | | 6.000%, due 03/25/17 | | | 4,740 | | | | 0.0 | |
| | 10,711 | | | | | 6.000%, due 06/01/17 | | | 10,967 | | | | 0.0 | |
| | 9,042 | | | | | 6.000%, due 05/01/21 | | | 9,586 | | | | 0.0 | |
| | 29,660 | | | | | 6.000%, due 01/25/32 | | | 33,693 | | | | 0.0 | |
| | 129,370 | | | ^ | | 6.000%, due 12/01/32 | | | 28,904 | | | | 0.0 | |
| | 55,222 | | | ^ | | 6.000%, due 02/01/33 | | | 10,814 | | | | 0.0 | |
| | 53,917 | | | ^ | | 6.000%, due 03/01/33 | | | 12,426 | | | | 0.0 | |
| | 64,743 | | | ^ | | 6.000%, due 03/01/33 | | | 14,652 | | | | 0.0 | |
| | 162,733 | | | | | 6.000%, due 11/01/34 | | | 184,966 | | | | 0.1 | |
| | 250,541 | | | | | 6.000%, due 04/01/35 | | | 284,926 | | | | 0.1 | |
| | 30,744 | | | ^ | | 6.000%, due 09/01/35 | | | 6,142 | | | | 0.0 | |
| | 4,292,968 | | | ^ | | 6.028%, due 02/25/42 | | | 655,617 | | | | 0.3 | |
| | 139,634 | | | ^ | | 6.118%, due 06/25/37 | | | 22,918 | | | | 0.0 | |
| | 1,896,717 | | | ^ | | 6.128%, due 09/25/37 | | | 337,146 | | | | 0.2 | |
| | 4,891,308 | | | ^ | | 6.138%, due 06/25/41 | | | 923,544 | | | | 0.4 | |
| | 437,122 | | | ^ | | 6.148%, due 06/25/36 | | | 78,145 | | | | 0.0 | |
| | 25,034 | | | ^ | | 6.328%, due 05/25/35 | | | 4,627 | | | | 0.0 | |
| | 21,265 | | | | | 6.500%, due 04/25/29 | | | 24,309 | | | | 0.0 | |
| | 30,479 | | | | | 6.500%, due 11/25/29 | | | 34,589 | | | | 0.0 | |
| | 110,155 | | | | | 6.500%, due 12/01/29 | | | 125,991 | | | | 0.1 | |
| | 35,379 | | | | | 6.500%, due 10/25/31 | | | 39,229 | | | | 0.0 | |
| | 222,841 | | | ^ | | 6.500%, due 02/01/32 | | | 51,916 | | | | 0.0 | |
| | 33,795 | | | | | 6.500%, due 04/25/32 | | | 38,105 | | | | 0.0 | |
| | 45,588 | | | | | 6.500%, due 01/01/34 | | | 52,329 | | | | 0.0 | |
| | 35,618 | | | ^ | | 6.678%, due 06/25/23 | | | 4,129 | | | | 0.0 | |
| | 129,219 | | | ^ | | 6.808%, due 09/25/36 | | | 23,585 | | | | 0.0 | |
| | 91 | | | | | 7.000%, due 11/01/17 | | | 91 | | | | 0.0 | |
| | 39,415 | | | ^ | | 7.000%, due 02/01/28 | | | 9,073 | | | | 0.0 | |
| | 49,406 | | | ^ | | 7.000%, due 03/25/33 | | | 14,013 | | | | 0.0 | |
| | 1,117 | | | | | 7.000%, due 04/01/33 | | | 1,283 | | | | 0.0 | |
| | 40,106 | | | ^ | | 7.000%, due 04/25/33 | | | 10,538 | | | | 0.0 | |
| | 210,181 | | | ^ | | 7.128%, due 10/25/33 | | | 39,458 | | | | 0.0 | |
| | 85,885 | | | ^ | | 7.208%, due 03/25/23 | | | 2,810 | | | | 0.0 | |
| | 137,173 | | | ^ | | 7.328%, due 07/25/31 | | | 31,463 | | | | 0.0 | |
| | 75,951 | | | ^ | | 7.328%, due 02/25/32 | | | 15,068 | | | | 0.0 | |
| | 54,587 | | | ^ | | 7.500%, due 01/01/24 | | | 11,000 | | | | 0.0 | |
| | 31,841 | | | | | 7.500%, due 09/01/32 | | | 39,481 | | | | 0.0 | |
| | 77,249 | | | | | 7.500%, due 01/01/33 | | | 91,907 | | | | 0.0 | |
| | 47,634 | | | ^ | | 7.528%, due 07/25/32 | | | 10,653 | | | | 0.0 | |
| | 1,559,579 | | | ^ | | 7.640%, due 12/18/32 | | | 337,729 | | | | 0.2 | |
| | 240,912 | | | | | 8.000%, due 05/25/43 | | | 268,125 | | | | 0.1 | |
| | 163,781 | | | | | 22.288%, due 10/25/35 | | | 283,095 | | | | 0.1 | |
| | 122,747 | | | | | 22.314%, due 07/25/35 | | | 203,492 | | | | 0.1 | |
| | 76,724 | | | | | 22.653%, due 06/25/36 | | | 118,800 | | | | 0.1 | |
| | 248,774 | | | | | 22.863%, due 10/25/40 | | | 576,972 | | | | 0.3 | |
| | 26,820 | | | | | 23.021%, due 03/25/36 | | | 41,158 | | | | 0.0 | |
| | 54,450 | | | | | 26.305%, due 04/25/35 | | | 92,469 | | | | 0.0 | |
| | 493,825 | | | | | 31.342%, due 11/25/36 | | | 879,560 | | | | 0.4 | |
| | | | | | | | | | 22,340,140 | | | | 9.4 | |
| | | | | | | | | | | | | | | |
| | | | | | | Government National Mortgage Association: 1.6% | | | | | | | | |
| | 280,000 | | | W | | 3.500%, due 11/20/41 | | | 291,222 | | | | 0.1 | |
| | 212,995 | | | | | 3.500%, due 06/20/45 | | | 222,431 | | | | 0.1 | |
| | 8,387,827 | | | ^ | | 4.000%, due 04/20/38 | | | 625,699 | | | | 0.3 | |
| | 70,368 | | | | | 5.000%, due 04/15/34 | | | 78,461 | | | | 0.0 | |
| | 4,487,951 | | | ^ | | 5.448%, due 06/20/40 | | | 691,166 | | | | 0.3 | |
| | 2,685,503 | | | ^ | | 6.356%, due 07/16/41 | | | 518,858 | | | | 0.2 | |
| | 24,496 | | | | | 6.500%, due 02/20/35 | | | 29,062 | | | | 0.0 | |
| | 251,201 | | | | | 8.000%, due 02/16/30 | | | 289,670 | | | | 0.1 | |
| | 687,827 | | | | | 20.745%, due 03/20/37 | | | 1,073,844 | | | | 0.5 | |
| | | | | | | | | | 3,820,413 | | | | 1.6 | |
| | | | | | | | | | | | | | | |
| | | | | Total U.S. Government Agency Obligations | | | | | | | | |
| | | | | (Cost $45,019,750) | | | 46,291,446 | | | | 19.4 | |
| | | | | | | | | | | | | | | |
| ASSET-BACKED SECURITIES: 3.1% | | | | | | | | |
| | | | | | | Cayman Islands: 2.5% | | | | | | | | |
| | 740,000 | | | # | | ARES XII CLO Ltd., 2.393%, 11/25/20 | | | 726,579 | | | | 0.3 | |
| | 463,461 | | | # | | Black Diamond CLO 2005-1A C, 1.340%, 06/20/17 | | | 462,136 | | | | 0.2 | |
| | 1,000,000 | | | # | | Bluemountain CLO III Ltd. 2007-3A C, 1.216%, 03/17/21 | | | 964,181 | | | | 0.4 | |
| | 1,000,000 | | | # | | ColumbusNova CLO IV Ltd. 2007-2A C, 2.571%, 10/15/21 | | | 986,331 | | | | 0.4 | |
| | 1,300,000 | | | # | | Madison Park Funding Ltd. 2007-6A C, 1.320%, 07/26/21 | | | 1,233,580 | | | | 0.5 | |
| | 1,550,000 | | | # | | Muir Grove CLO Ltd. 2007-1A B, 2.320%, 03/25/20 | | | 1,501,834 | | | | 0.7 | |
| | | | | | | | | | 5,874,641 | | | | 2.5 | |
| | | | | | | | | | | | | | | |
| | | | | | | United States: 0.6% | | | | | | | | |
| | 446,977 | | | + | | Citigroup Mortgage Loan Trust 2006-WF1 A2E, 5.342%, 03/25/36 | | | 321,937 | | | | 0.1 | |
| | 711,903 | | | | | First Franklin Mortgage Loan Trust 2006-FF5, 0.582%, 04/25/36 | | | 600,697 | | | | 0.2 | |
| | 690,691 | | | | | Securitized Asset Backed Receivables LLC Trust 2006-NC2 A3, 0.662%, 03/25/36 | | | 610,254 | | | | 0.3 | |
| | | | | | | | | | 1,532,888 | | | | 0.6 | |
| | | | | | | | | | | | | | | |
| | | | | Total Asset-Backed Securities | | | | | | | | |
| | | | | (Cost $7,465,751) | | | 7,407,529 | | | | 3.1 | |
| Shares | | | | | | | Value | | | Percentage
of Net
Assets | |
| COMMON STOCK: 0.0% | |
| | | | | | | United States: 0.0% | | | | | | | | |
| | 43,083 | | | @,L | | American Media, Inc. | | | – | | | | – | |
| | 4,988 | | | @ | | Resolute Forest Products | | | 37,759 | | | | 0.0 | |
| | 102 | | | | | WestRock Co. | | | 4,653 | | | | 0.0 | |
| | | | | | | | | | | | | | | |
| | | | | Total Common Stock | | | | | | | | |
| | | | | (Cost $1,304,494) | | | 42,412 | | | | 0.0 | |
| | | | | | | | | | | | | | | |
| MUTUAL FUNDS: 22.7% |
| | | | | | | United States: 22.7% | | | | | | | | |
| | 1,082,430 | | | | | Voya Emerging Markets Corporate Debt Fund - Class P | | | 10,077,423 | | | | 4.3 | |
| | 1,688,653 | | | | | Voya Emerging Markets Hard Currency Debt Fund - Class P | | | 15,265,422 | | | | 6.4 | |
| | 2,919,202 | | | | | Voya Emerging Markets Local Currency Debt Fund - Class P | | | 20,054,916 | | | | 8.4 | |
| | 1,136,436 | | | | | Voya High Yield Bond Fund - Class P | | | 8,523,268 | | | | 3.6 | |
| | | | | | | | | | | | | | | |
| | | | | Total Mutual Funds | | | | | | | | |
| | | | | (Cost $66,383,121) | | | 53,921,029 | | | | 22.7 | |
| | | | | | | | | | | | | | | |
| | | | | Total Long-Term Investments | | | | | | | | |
| | | | | (Cost $248,848,208) | | | 234,473,598 | | | | 98.4 | |
| Voya Global Bond Portfolio | PORTFOLIO OF INVESTMENTS
as of December 31, 2015 (continued) |
Principal
Amount† | | | | | | | Value | | | Percentage
of Net
Assets | |
| SHORT-TERM INVESTMENTS: 5.0% | |
| | | | | | | Securities Lending Collateralcc: 3.1% | | | | | | | | |
| | 369,116 | | | | | Bank of Nova Scotia, Repurchase Agreement dated 12/31/15, 0.30%, due 01/04/16 (Repurchase Amount $369,128, collateralized by various U.S. Government Securities, 0.000%-8.500%, Market Value plus accrued interest $376,511, due 02/29/16-02/15/45) | | | 369,116 | | | | 0.2 | |
| | 1,753,606 | | | | | Citigroup, Inc., Repurchase Agreement dated 12/31/15, 0.34%, due 01/04/16 (Repurchase Amount $1,753,671, collateralized by various U.S. Government Agency Obligations, 0.000%-11.500%, Market Value plus accrued interest $1,788,678, due 01/15/16-04/01/51) | | | 1,753,606 | | | | 0.7 | |
| | 1,753,606 | | | | | Merrill Lynch & Co., Inc., Repurchase Agreement dated 12/31/15, 0.31%, due 01/04/16 (Repurchase Amount $1,753,666, collateralized by various U.S. Government Agency Obligations, 3.000%-4.500%, Market Value plus accrued interest $1,788,678, due 11/15/42-02/20/45) | | | 1,753,606 | | | | 0.7 | |
| | 1,753,606 | | | | | Millenium Fixed Income Ltd., Repurchase Agreement dated 12/31/15, 0.37%, due 01/04/16 (Repurchase Amount $1,753,677, collateralized by various U.S. Government Securities, 1.500%-3.625%, Market Value plus accrued interest $1,788,678, due 03/31/21-02/15/44) | | | 1,753,606 | | | | 0.8 | |
| | 1,753,606 | | | | | Nomura Securities, Repurchase Agreement dated 12/31/15, 0.33%, due 01/04/16 (Repurchase Amount $1,753,669, collateralized by various U.S. Government/U.S. Government Agency Obligations, 0.000%-10.500%, Market Value plus accrued interest $1,788,678, due 01/15/16-10/20/65) | | | 1,753,606 | | | | 0.7 | |
| | | | | | | | | | 7,383,540 | | | | 3.1 | |
| Shares | | | | | | | Value | | | Percentage
of Net
Assets | |
| | | | | | | Mutual Funds: 1.9% | | | | | | | | |
| | 4,639,000 | | | | | BlackRock Liquidity Funds, TempFund, Institutional Class, 0.270%†† | | | | | | | | |
| | | | | | | (Cost $4,639,000) | | | 4,639,000 | | | | 1.9 | |
| | | | | | | | | | | | | | | |
| | | | | Total Short-Term Investments | | | | | | | | |
| | | | | (Cost $12,022,540) | | | 12,022,540 | | | | 5.0 | |
| | | | | | | | | | | | | | | |
| | | | | Total Investments in Securities
(Cost $260,870,748) | | $ | 246,496,138 | | | | 103.4 | |
| | | | | Liabilities in Excess of Other Assets | | | (8,214,217 | ) | | | (3.4 | ) |
| | | | | Net Assets | | $ | 238,281,921 | | | | 100.0 | |
| † | Unless otherwise indicated, principal amount is shown in USD. |
| †† | Rate shown is the 7-day yield as of December 31, 2015. |
| # | Securities with purchases pursuant to Rule 144A or section 4(a)(2), under the Securities Act of 1933 and may not be resold subject to that rule except to qualified institutional buyers. |
| ## | The Federal Housing Finance Agency (“FHFA”) placed the Federal Home Loan Mortgage Corporation and Federal National Mortgage Association into conservatorship with FHFA as the conservator. As such, the FHFA oversees the continuing affairs of these companies. |
| @ | Non-income producing security. |
| + | Step-up basis bonds. Interest rates shown reflect current and next coupon rates. |
| cc | Represents securities purchased with cash collateral received for securities on loan. |
| W | Settlement is on a when-issued or delayed-delivery basis. |
| L | Loaned security, a portion or all of the security is on loan at December 31, 2015. |
| ± | Defaulted security |
| ^ | Interest only securities represent the right to receive the monthly interest payments on an underlying pool of mortgage loans. Principal amount shown represents the notional amount on which current interest is calculated. Payments of principal on the pool reduce the value of the interest only security. |
| BRL | Brazilian Real |
| EUR | EU Euro |
| MXN | Mexican Peso |
| RUB | Russian Ruble |
| ZAR | South African Rand |
| | Cost for federal income tax purposes is $260,618,207. |
| Net unrealized depreciation consists of: |
| |
| Gross Unrealized Appreciation | | $ | 3,288,346 | |
| Gross Unrealized Depreciation | | | (17,410,415 | ) |
| | | | | |
| Net Unrealized Depreciation | | $ | (14,122,069 | ) |
VY® American Century
Small-Mid Cap Value Portfolio | PORTFOLIO OF INVESTMENTS as of December 31, 2015 |
| Shares | | | | | | | Value | | | Percentage
of Net
Assets | |
| COMMON STOCK: 97.3% | |
| | | | | | | Consumer Discretionary: 8.3% | | | | | | | | |
| | 13,609 | | | | | Advance Auto Parts, Inc. | | | 2,048,291 | | | | 0.7 | |
| | 16,899 | | | | | Carnival Corp. | | | 920,657 | | | | 0.3 | |
| | 5,505 | | | @ | | Cavco Industries, Inc. | | | 458,622 | | | | 0.2 | |
| | 33,875 | | | @ | | Century Communities, Inc. | | | 599,926 | | | | 0.2 | |
| | 87,263 | | | | | ClubCorp Holdings, Inc. | | | 1,594,295 | | | | 0.6 | |
| | 48,522 | | | | | CST Brands, Inc. | | | 1,899,151 | | | | 0.7 | |
| | 19,652 | | | | | Culp, Inc. | | | 500,536 | | | | 0.2 | |
| | 23,894 | | | | | Destination Maternity Corp. | | | 208,356 | | | | 0.1 | |
| | 28,006 | | | @ | | Entercom Communications Corp. | | | 314,507 | | | | 0.1 | |
| | 170,384 | | | | | Entravision Communications Corp. | | | 1,313,661 | | | | 0.5 | |
| | 38,124 | | | @ | | Honda Motor Co., Ltd. ADR | | | 1,217,299 | | | | 0.4 | |
| | 6,937 | | | | | Lowe's Cos, Inc. | | | 527,489 | | | | 0.2 | |
| | 31,727 | | | @ | | Malibu Boats, Inc. | | | 519,371 | | | | 0.2 | |
| | 18,671 | | | @ | | MarineMax, Inc. | | | 343,920 | | | | 0.1 | |
| | 53,278 | | | | | Mattel, Inc. | | | 1,447,563 | | | | 0.5 | |
| | 17,870 | | | @ | | MCBC Holdings, Inc. | | | 244,819 | | | | 0.1 | |
| | 10,564 | | | L | | Nexstar Broadcasting Group, Inc. | | | 620,107 | | | | 0.2 | |
| | 23,334 | | | L | | Peak Resorts, Inc. | | | 140,237 | | | | 0.0 | |
| | 17,688 | | | | | Penske Auto Group, Inc. | | | 748,910 | | | | 0.3 | |
| | 80,130 | | | | | Pulte Group, Inc. | | | 1,427,917 | | | | 0.5 | |
| | 11,489 | | | | | Ralph Lauren Corp. | | | 1,280,794 | | | | 0.4 | |
| | 13,519 | | | | | Red Robin Gourmet Burgers, Inc. | | | 834,663 | | | | 0.3 | |
| | 11,081 | | | @ | | Stoneridge, Inc. | | | 163,999 | | | | 0.0 | |
| | 10,437 | | | | | Target Corp. | | | 757,831 | | | | 0.3 | |
| | 23,378 | | | @ | | Thor Industries, Inc. | | | 1,312,675 | | | | 0.5 | |
| | 23,426 | | | | | Toll Brothers, Inc. | | | 780,086 | | | | 0.3 | |
| | 17,078 | | | | | Tower International, Inc. | | | 487,918 | | | | 0.2 | |
| | 15,045 | | | @,L | | Townsquare Media, Inc. | | | 179,938 | | | | 0.1 | |
| | 4,557 | | | L | | Tupperware Corp. | | | 253,597 | | | | 0.1 | |
| | | | | | | | | | 23,147,135 | | | | 8.3 | |
| | | | | | | | | | | | | | | |
| | | | | | | Consumer Staples: 6.2% | | | | | | | | |
| | 64,891 | | | | | ConAgra Foods, Inc. | | | 2,735,804 | | | | 1.0 | |
| | 23,562 | | | @,L | | Fresh Market, Inc. | | | 551,822 | | | | 0.2 | |
| | 26,039 | | | | | General Mills, Inc. | | | 1,501,409 | | | | 0.6 | |
| | 46,789 | | | @ | | Inventure Foods, Inc. | | | 332,202 | | | | 0.1 | |
| | 16,292 | | | | | JM Smucker Co. | | | 2,009,455 | | | | 0.7 | |
| | 27,670 | | | | | Kellogg Co. | | | 1,999,711 | | | | 0.7 | |
| | 38,182 | | | | | Mondelez International, Inc. | | | 1,712,081 | | | | 0.6 | |
| | 153,219 | | | | | Sysco Corp. | | | 6,281,979 | | | | 2.3 | |
| | | | | | | | | | 17,124,463 | | | | 6.2 | |
| | | | | | | | | | | | | | | |
| | | | | | | Energy: 9.6% | | | | | | | | |
| | 30,692 | | | @ | | Aegean Marine Petroleum Network, Inc. | | | 256,585 | | | | 0.1 | |
| | 26,126 | | | | | Anadarko Petroleum Corp. | | | 1,269,201 | | | | 0.5 | |
| | 42,286 | | | | | Ardmore Shipping Corp. | | | 537,878 | | | | 0.2 | |
| | 51,038 | | | @ | | Cameron International Corp. | | | 3,225,602 | | | | 1.2 | |
| | 9,272 | | | | | Carrizo Oil & Gas, Inc. | | | 274,266 | | | | 0.1 | |
| | 18,589 | | | | | Cimarex Energy Co. | | | 1,661,485 | | | | 0.6 | |
| | 8,459 | | | | | Delek US Holdings, Inc. | | | 208,091 | | | | 0.1 | |
| | 52,654 | | | | | Devon Energy Corp. | | | 1,684,928 | | | | 0.6 | |
| | 9,035 | | | @ | | Dril-Quip, Inc. | | | 535,143 | | | | 0.2 | |
| | 54,057 | | | | | EQT Corp. | | | 2,817,991 | | | | 1.0 | |
| | 23,761 | | | @ | | Euronav NV | | | 325,763 | | | | 0.1 | |
| | 57,435 | | | @ | | FMC Technologies, Inc. | | | 1,666,189 | | | | 0.6 | |
| | 45,412 | | | @ | | Forum Energy Technologies, Inc. | | | 565,834 | | | | 0.2 | |
| | 32,965 | | | L | | Helmerich & Payne, Inc. | | | 1,765,276 | | | | 0.6 | |
| | 113,080 | | | | | Imperial Oil Ltd. | | | 3,684,069 | | | | 1.3 | |
| | 17,190 | | | @ | | Matrix Service Co. | | | 353,083 | | | | 0.1 | |
| | 85,072 | | | | | Noble Energy, Inc. | | | 2,801,421 | | | | 1.0 | |
| | 38,501 | | | | | Occidental Petroleum Corp. | | | 2,603,053 | | | | 0.9 | |
| | 3,548 | | | @ | | PDC Energy, Inc. | | | 189,392 | | | | 0.1 | |
| | 35,244 | | | | | Scorpio Tankers, Inc. | | | 282,657 | | | | 0.1 | |
| | | | | | | | | | 26,707,907 | | | | 9.6 | |
| | | | | | | | | | | | | | | |
| | | | | | | Financials: 29.2% | | | | | | | | |
| | 25,044 | | | | | ACE Ltd. | | | 2,926,391 | | | | 1.0 | |
| | 16,275 | | | | | Aflac, Inc. | | | 974,872 | | | | 0.3 | |
| | 45,186 | | | | | Allied World Assurance Co. Holdings Ltd. | | | 1,680,467 | | | | 0.6 | |
| | 15,087 | | | | | Allstate Corp. | | | 936,752 | | | | 0.3 | |
| | 13,389 | | | | | Apollo Commercial Real Estate Finance, Inc. | | | 230,692 | | | | 0.1 | |
| | 42,526 | | | L | | Ares Management L.P. | | | 549,861 | | | | 0.2 | |
| | 41,074 | | | | | Armada Hoffler Properties, Inc. | | | 430,456 | | | | 0.1 | |
| | 27,086 | | | @ | | Atlas Financial Holdings, Inc. | | | 539,011 | | | | 0.2 | |
| | 23,316 | | | | | Bank of Hawaii Corp. | | | 1,466,576 | | | | 0.5 | |
| | 16,673 | | | | | Bank of the Ozarks, Inc. | | | 824,647 | | | | 0.3 | |
| | 37,522 | | | | | BankUnited, Inc. | | | 1,353,043 | | | | 0.5 | |
| | 43,283 | | | | | BB&T Corp. | | | 1,636,530 | | | | 0.6 | |
| | 11,010 | | | | | Blackstone Mortgage Trust, Inc. | | | 294,628 | | | | 0.1 | |
| | 17,134 | | | L | | BOK Financial Corp. | | | 1,024,442 | | | | 0.4 | |
| | 63,815 | | | | | Boston Private Financial Holdings, Inc. | | | 723,662 | | | | 0.3 | |
| | 4,227 | | | | | Boston Properties, Inc. | | | 539,112 | | | | 0.2 | |
| | 43,501 | | | | | Brown & Brown, Inc. | | | 1,396,382 | | | | 0.5 | |
| | 62,206 | | | | | Campus Crest Communities, Inc. | | | 423,001 | | | | 0.1 | |
| | 39,281 | | | | | Capital Bank Financial Corp. | | | 1,256,206 | | | | 0.4 | |
| | 135,156 | | | | | Capitol Federal Financial, Inc. | | | 1,697,559 | | | | 0.6 | |
| | 14,427 | | | | | CBL & Associates Properties, Inc. | | | 178,462 | | | | 0.1 | |
| | 17,564 | | | | | Chatham Lodging Trust | | | 359,711 | | | | 0.1 | |
| | 24,968 | | | | | Comerica, Inc. | | | 1,044,411 | | | | 0.4 | |
| | 49,880 | | | | | Commerce Bancshares, Inc. | | | 2,121,895 | | | | 0.8 | |
| | 45,854 | | | | | Compass Diversified Trust | | | 728,620 | | | | 0.3 | |
| | 78,361 | | | | | Corrections Corp. of America | | | 2,075,783 | | | | 0.7 | |
| | 29,872 | | | L | | Cullen/Frost Bankers, Inc. | | | 1,792,320 | | | | 0.6 | |
VY® American Century
Small-Mid Cap Value Portfolio | PORTFOLIO OF INVESTMENTS as of December 31, 2015 (continued) |
| Shares | | | | | | | Value | | | Percentage
of Net
Assets | |
| COMMON STOCK: (continued) | |
| | | | | | | Financials: (continued) | | | | | | | | |
| | 14,759 | | | @ | | DiamondRock Hospitality Co. | | | 142,424 | | | | 0.0 | |
| | 10,999 | | | @ | | Eagle Bancorp, Inc. | | | 555,120 | | | | 0.2 | |
| | 13,678 | | | | | Easterly Government Properties, Inc. | | | 234,988 | | | | 0.1 | |
| | 45,116 | | | | | Empire State Realty Trust, Inc. | | | 815,246 | | | | 0.3 | |
| | 19,737 | | | | | Endurance Specialty Holdings Ltd. | | | 1,262,971 | | | | 0.4 | |
| | 4,496 | | | | | EPR Properties | | | 262,791 | | | | 0.1 | |
| | 21,117 | | | @,L | | FCB Financial Holdings, Inc. | | | 755,777 | | | | 0.3 | |
| | 29,751 | | | | | First Financial Bankshares, Inc. | | | 897,588 | | | | 0.3 | |
| | 4,691 | | | @ | | First NBC Bank Holding Co. | | | 175,396 | | | | 0.1 | |
| | 36,647 | | | | | Franklin Resources, Inc. | | | 1,349,343 | | | | 0.5 | |
| | 18,670 | | | | | Hatteras Financial Corp. | | | 245,510 | | | | 0.1 | |
| | 5,958 | | | | | Healthcare Realty Trust, Inc. | | | 168,731 | | | | 0.1 | |
| | 19,355 | | | | | Home Bancshares, Inc. | | | 784,265 | | | | 0.3 | |
| | 68,379 | | | | | Host Hotels & Resorts, Inc. | | | 1,048,934 | | | | 0.4 | |
| | 3,265 | | | @ | | Infinity Property & Casualty Corp. | | | 268,481 | | | | 0.1 | |
| | 10,660 | | | @ | | James River Group Holdings Ltd. | | | 357,536 | | | | 0.1 | |
| | 35,533 | | | | | Kite Realty Group Trust | | | 921,371 | | | | 0.3 | |
| | 40,925 | | | | | LegacyTexas Financial Group, Inc. | | | 1,023,944 | | | | 0.4 | |
| | 55,928 | | | | | Lexington Realty Trust | | | 447,424 | | | | 0.2 | |
| | 23,138 | | | L | | LPL Financial Holdings, Inc. | | | 986,836 | | | | 0.4 | |
| | 18,723 | | | | | M&T Bank Corp. | | | 2,268,853 | | | | 0.8 | |
| | 32,228 | | | @ | | Markit Ltd. | | | 972,319 | | | | 0.3 | |
| | 31,430 | | | @ | | Medical Properties Trust, Inc. | | | 361,759 | | | | 0.1 | |
| | 21,334 | | | | | Metlife, Inc. | | | 1,028,512 | | | | 0.4 | |
| | 28,413 | | | | | MFA Mortgage Investments, Inc. | | | 187,526 | | | | 0.1 | |
| | 13,493 | | | | | New Residential Investment Corp. | | | 164,075 | | | | 0.1 | |
| | 82,407 | | | | | Northern Trust Corp. | | | 5,940,721 | | | | 2.1 | |
| | 25,657 | | | | | Outfront Media, Inc. | | | 560,092 | | | | 0.2 | |
| | 18,675 | | | | | Pennymac Mortgage Investment Trust | | | 284,981 | | | | 0.1 | |
| | 112,754 | | | | | Piedmont Office Realty Trust, Inc. | | | 2,128,796 | | | | 0.8 | |
| | 19,463 | | | | | PNC Financial Services Group, Inc. | | | 1,855,019 | | | | 0.7 | |
| | 20,748 | | | | | ProAssurance Corp. | | | 1,006,900 | | | | 0.4 | |
| | 23,153 | | | | | Reinsurance Group of America, Inc. | | | 1,980,739 | | | | 0.7 | |
| | 11,282 | | | | | Rexford Industrial Realty, Inc. | | | 184,574 | | | | 0.1 | |
| | 9,980 | | | | | RLJ Lodging Trust | | | 215,867 | | | | 0.1 | |
| | 26,136 | | | L | | Rouse Properties, Inc. | | | 380,540 | | | | 0.1 | |
| | 10,914 | | | | | Sabra Healthcare REIT, Inc. | | | 220,790 | | | | 0.1 | |
| | 3,754 | | | | | ServisFirst Bancshares, Inc. | | | 178,428 | | | | 0.1 | |
| | 39,731 | | | | | Southside Bancshares, Inc. | | | 954,339 | | | | 0.3 | |
| | 23,380 | | | | | State Street Corp. | | | 1,551,497 | | | | 0.6 | |
| | 33,471 | | | @ | | Summit Hotel Properties, Inc. | | | 399,978 | | | | 0.1 | |
| | 13,088 | | | | | Sunstone Hotel Investors, Inc. | | | 163,469 | | | | 0.1 | |
| | 26,886 | | | | | SunTrust Bank | | | 1,151,796 | | | | 0.4 | |
| | 16,371 | | | | | T. Rowe Price Group, Inc. | | | 1,170,363 | | | | 0.4 | |
| | 21,586 | | | @ | | Texas Capital Bancshares, Inc. | | | 1,066,780 | | | | 0.4 | |
| | 15,125 | | | | | Torchmark Corp. | | | 864,545 | | | | 0.3 | |
| | 5,599 | | | | | Travelers Cos., Inc. | | | 631,903 | | | | 0.2 | |
| | 54,275 | | | | | Two Harbors Investment Corp. | | | 439,628 | | | | 0.2 | |
| | 36,430 | | | | | UMB Financial Corp. | | | 1,695,817 | | | | 0.6 | |
| | 55,007 | | | | | Unum Group | | | 1,831,183 | | | | 0.7 | |
| | 21,338 | | | | | Urstadt Biddle Properties, Inc. | | | 410,543 | | | | 0.1 | |
| | 18,836 | | | | | Validus Holdings Ltd. | | | 871,918 | | | | 0.3 | |
| | 31,131 | | | | | Valley National Bancorp. | | | 306,640 | | | | 0.1 | |
| | 8,066 | | | | | Washington Real Estate Investment Trust | | | 218,266 | | | | 0.1 | |
| | 47,740 | | | L | | Westamerica Bancorp. | | | 2,231,845 | | | | 0.8 | |
| | 109,995 | | | | | Weyerhaeuser Co. | | | 3,297,650 | | | | 1.2 | |
| | | | | | | | | | 81,088,819 | | | | 29.2 | |
| | | | | | | | | | | | | | | |
| | | | | | | Health Care: 7.2% | | | | | | | | |
| | 26,172 | | | @ | | AMN Healthcare Services, Inc. | | | 812,641 | | | | 0.3 | |
| | 78,058 | | | | | Baxter International, Inc. | | | 2,977,913 | | | | 1.1 | |
| | 8,196 | | | | | Becton Dickinson & Co. | | | 1,262,922 | | | | 0.4 | |
| | 115,499 | | | @ | | Boston Scientific Corp. | | | 2,129,802 | | | | 0.8 | |
| | 26,101 | | | @ | | Haemonetics Corp. | | | 841,496 | | | | 0.3 | |
| | 20,352 | | | @ | | Hanger Orthopedic Group, Inc. | | | 334,790 | | | | 0.1 | |
| | 48,058 | | | @ | | LifePoint Hospitals, Inc. | | | 3,527,457 | | | | 1.3 | |
| | 14,138 | | | @ | | PharMerica Corp. | | | 494,830 | | | | 0.2 | |
| | 8,154 | | | @ | | Providence Service Corp. | | | 382,586 | | | | 0.1 | |
| | 37,995 | | | | | Quest Diagnostics, Inc. | | | 2,702,964 | | | | 1.0 | |
| | 10,438 | | | | | Utah Medical Products, Inc. | | | 611,040 | | | | 0.2 | |
| | 37,347 | | | | | Zimmer Biomet Holdings, Inc. | | | 3,831,429 | | | | 1.4 | |
| | | | | | | | | | 19,909,870 | | | | 7.2 | |
| | | | | | | | | | | | | | | |
| | | | | | | Industrials: 13.2% | | | | | | | | |
| | 16,368 | | | @ | | Actuant Corp. | | | 392,177 | | | | 0.1 | |
| | 47,468 | | | | | ADT Corp. | | | 1,565,495 | | | | 0.6 | |
| | 14,605 | | | | | Albany International Corp. | | | 533,813 | | | | 0.2 | |
| | 27,947 | | | @ | | Babcock & Wilcox Enterprises, Inc. | | | 583,254 | | | | 0.2 | |
| | 18,781 | | | | | Brink's Co. | | | 542,020 | | | | 0.2 | |
| | 19,623 | | | | | CDI Corp. | | | 132,651 | | | | 0.0 | |
| | 63,339 | | | @ | | Clean Harbors, Inc. | | | 2,638,069 | | | | 0.9 | |
| | 37,215 | | | @ | | Continental Building Products, Inc. | | | 649,774 | | | | 0.2 | |
| | 17,465 | | | @ | | CSW Industrials, Inc. | | | 657,907 | | | | 0.2 | |
| | 23,764 | | | | | CSX Corp. | | | 616,676 | | | | 0.2 | |
| | 13,408 | | | | | Cubic Corp. | | | 633,528 | | | | 0.2 | |
| | 21,600 | | | @ | | DXP Enterprises, Inc. | | | 492,480 | | | | 0.2 | |
| | 28,998 | | | | | Dynamic Materials Corp. | | | 202,696 | | | | 0.1 | |
| | 52,187 | | | | | Emerson Electric Co. | | | 2,496,104 | | | | 0.9 | |
| | 13,303 | | | @ | | EnPro Industries, Inc. | | | 583,204 | | | | 0.2 | |
| | 14,028 | | | | | Global Brass & Copper Holdings, Inc. | | | 298,796 | | | | 0.1 | |
| | 30,043 | | | | | Graham Corp. | | | 505,323 | | | | 0.2 | |
VY® American Century
Small-Mid Cap Value Portfolio | PORTFOLIO OF INVESTMENTS as of December 31, 2015 (continued) |
| Shares | | | | | | | Value | | | Percentage
of Net
Assets | |
| COMMON STOCK: (continued) | |
| | | | | | | Industrials: (continued) | | | | | | | | |
| | 30,631 | | | @ | | Great Lakes Dredge & Dock Corp. | | | 121,299 | | | | 0.0 | |
| | 129,705 | | | | | Heartland Express, Inc. | | | 2,207,579 | | | | 0.8 | |
| | 1,793 | | | | | Hubbell, Inc. | | | 181,165 | | | | 0.1 | |
| | 68,711 | | | @ | | Innerworkings, Inc. | | | 515,333 | | | | 0.2 | |
| | 9,187 | | | | | Kforce, Inc. | | | 232,247 | | | | 0.1 | |
| | 81,269 | | | | | Koninklijke Philips NV | | | 2,074,343 | | | | 0.8 | |
| | 13,636 | | | | | Marten Transport Ltd. | | | 241,357 | | | | 0.1 | |
| | 14,143 | | | | | MSC Industrial Direct Co. | | | 795,827 | | | | 0.3 | |
| | 21,639 | | | | | Multi-Color Corp. | | | 1,294,229 | | | | 0.5 | |
| | 22,629 | | | @ | | NCI Building Systems, Inc. | | | 280,826 | | | | 0.1 | |
| | 16,676 | | | | | On Assignment, Inc. | | | 749,586 | | | | 0.3 | |
| | 23,528 | | | | | Oshkosh Corp. | | | 918,533 | | | | 0.3 | |
| | 13,294 | | | | | Parker Hannifin Corp. | | | 1,289,252 | | | | 0.5 | |
| | 48,616 | | | @ | | PGT, Inc. | | | 553,736 | | | | 0.2 | |
| | 33,379 | | | | | Raven Industries, Inc. | | | 520,712 | | | | 0.2 | |
| | 108,073 | | | | | Republic Services, Inc. | | | 4,754,131 | | | | 1.7 | |
| | 9,558 | | | | | Rockwell Automation, Inc. | | | 980,746 | | | | 0.3 | |
| | 25,523 | | | | | Textron, Inc. | | | 1,072,221 | | | | 0.4 | |
| | 101,849 | | | | | Tyco International Plc | | | 3,247,965 | | | | 1.2 | |
| | 9,259 | | | | | Valmont Industries, Inc. | | | 981,639 | | | | 0.4 | |
| | | | | | | | | | 36,536,693 | | | | 13.2 | |
| | | | | | | | | | | | | | | |
| | | | | | | Information Technology: 10.2% | | | | | | | | |
| | 178,792 | | | | | Applied Materials, Inc. | | | 3,338,047 | | | | 1.2 | |
| | 20,670 | | | @ | | AVG Technologies | | | 414,434 | | | | 0.2 | |
| | 29,725 | | | @ | | BroadSoft, Inc. | | | 1,051,076 | | | | 0.4 | |
| | 81,461 | | | | | Cypress Semiconductor Corp. | | | 799,132 | | | | 0.3 | |
| | 85,302 | | | | | EVERTEC, Inc. | | | 1,427,955 | | | | 0.5 | |
| | 92,119 | | | @ | | Exar Corp. | | | 564,689 | | | | 0.2 | |
| | 8,863 | | | | | Harris Corp. | | | 770,195 | | | | 0.3 | |
| | 14,179 | | | | | Ingram Micro, Inc. | | | 430,758 | | | | 0.2 | |
| | 71,981 | | | @ | | Keysight Technologies, Inc. | | | 2,039,222 | | | | 0.7 | |
| | 54,501 | | | @ | | Kulicke & Soffa Industries, Inc. | | | 636,027 | | | | 0.2 | |
| | 17,771 | | | L | | Lam Research Corp. | | | 1,411,373 | | | | 0.5 | |
| | 52,949 | | | | | Maxim Integrated Products | | | 2,012,062 | | | | 0.7 | |
| | 66,982 | | | | | Mentor Graphics Corp. | | | 1,233,808 | | | | 0.5 | |
| | 43,075 | | | | | Microchip Technology, Inc. | | | 2,004,711 | | | | 0.7 | |
| | 21,903 | | | | | Polycom, Inc. | | | 275,759 | | | | 0.1 | |
| | 30,661 | | | | | SanDisk Corp. | | | 2,329,929 | | | | 0.9 | |
| | 34,763 | | | @ | | Semtech Corp. | | | 657,716 | | | | 0.2 | |
| | 92,842 | | | @ | | Silicon Graphics International Corp. | | | 547,768 | | | | 0.2 | |
| | 30,681 | | | | | TE Connectivity Ltd. | | | 1,982,299 | | | | 0.7 | |
| | 93,123 | | | | | Teradyne, Inc. | | | 1,924,852 | | | | 0.7 | |
| | 48,936 | | | @ | | VeriFone Holdings, Inc. | | | 1,371,187 | | | | 0.5 | |
| | 15,435 | | | | | Western Digital Corp. | | | 926,872 | | | | 0.3 | |
| | | | | | | | | | 28,149,871 | | | | 10.2 | |
| | | | | | | | | | | | | | | |
| | | | | | | Materials: 5.1% | | | | | | | | |
| | 20,151 | | | | | Bemis Co., Inc. | | | 900,548 | | | | 0.3 | |
| | 36,472 | | | @ | | Berry Plastics Group, Inc. | | | 1,319,557 | | | | 0.5 | |
| | 9,338 | | | | | Compass Minerals International, Inc. | | | 702,871 | | | | 0.2 | |
| | 101,785 | | | | | Graphic Packaging Holding Co. | | | 1,305,902 | | | | 0.5 | |
| | 17,927 | | | | | Innophos Holdings, Inc. | | | 519,524 | | | | 0.2 | |
| | 15,409 | | | | | Innospec, Inc. | | | 836,863 | | | | 0.3 | |
| | 45,185 | | | | | KapStone Paper and Packaging Corp. | | | 1,020,729 | | | | 0.4 | |
| | 19,361 | | | | | Minerals Technologies, Inc. | | | 887,895 | | | | 0.3 | |
| | 25,027 | | | | | Mosaic Co. | | | 690,495 | | | | 0.2 | |
| | 67,729 | | | @ | | Multi Packaging Solutions International Ltd. | | | 1,175,098 | | | | 0.4 | |
| | 46,862 | | | | | Nucor Corp. | | | 1,888,539 | | | | 0.7 | |
| | 42,652 | | | | | Sonoco Products Co. | | | 1,743,187 | | | | 0.6 | |
| | 28,051 | | | | | WestRock Co. | | | 1,279,687 | | | | 0.5 | |
| | | | | | | | | | 14,270,895 | | | | 5.1 | |
| | | | | | | | | | | | | | | |
| | | | | | | Telecommunication Services: 0.8% | | | | | | | | |
| | 87,427 | | | | | CenturyLink, Inc. | | | 2,199,663 | | | | 0.8 | |
| | | | | | | | | | | | | | | |
| | | | | | | Utilities: 7.5% | | | | | | | | |
| | 7,703 | | | | | Allete, Inc. | | | 391,543 | | | | 0.1 | |
| | 23,921 | | | @ | | Ameren Corp. | | | 1,034,105 | | | | 0.4 | |
| | 25,529 | | | | | Atmos Energy Corp. | | | 1,609,348 | | | | 0.6 | |
| | 15,360 | | | | | Consolidated Edison, Inc. | | | 987,187 | | | | 0.4 | |
| | 50,351 | | | | | Edison International | | | 2,981,283 | | | | 1.1 | |
| | 6,100 | | | @ | | El Paso Electric Co. | | | 234,850 | | | | 0.1 | |
| | 58,882 | | | | | Great Plains Energy, Inc. | | | 1,608,067 | | | | 0.6 | |
| | 33,548 | | | | | Laclede Group, Inc. | | | 1,993,087 | | | | 0.7 | |
| | 19,726 | | | | | NorthWestern Corp. | | | 1,070,136 | | | | 0.4 | |
| | 58,108 | | | | | PG&E Corp. | | | 3,090,765 | | | | 1.1 | |
| | 8,963 | | | | | South Jersey Industries, Inc. | | | 210,810 | | | | 0.1 | |
| | 67,718 | | | | | Westar Energy, Inc. | | | 2,871,920 | | | | 1.0 | |
| | 71,657 | | | | | Xcel Energy, Inc. | | | 2,573,203 | | | | 0.9 | |
| | | | | | | | | | 20,656,304 | | | | 7.5 | |
| | | | | | | | | | | | | | | |
| | | | | Total Common Stock | | | | | | | | |
| | | | | (Cost $271,826,090) | | | 269,791,620 | | | | 97.3 | |
| | | | | | | | | | | | | | | |
| EXCHANGE-TRADED FUNDS: 0.7% |
| | 29,327 | | | | | iShares Russell Midcap Value Index Fund | | | 2,014,178 | | | | 0.7 | |
| | | | | | | | | | | | | | | |
| | | | | Total Exchange-Traded Funds | | | | | | | | |
| | | | | (Cost $2,079,966) | | | 2,014,178 | | | | 0.7 | |
| | | | | | | | | | | | | | | |
| | | | | Total Long-Term Investments | | | | | | | | |
| | | | | (Cost $273,906,056) | | | 271,805,798 | | | | 98.0 | |
Principal
Amount† | | | | | | | Value | | | Percentage
of Net
Assets | |
| SHORT-TERM INVESTMENTS: 5.2% | | | | | |
| | | | | | Securities Lending Collateralcc: 2.8% | | | | | | |
| | 382,071 | | | | | Bank of Nova Scotia, Repurchase Agreement dated 12/31/15, 0.30%, due 01/04/16 (Repurchase Amount $382,084, collateralized by various U.S. Government Securities, 0.000%-8.500%, Market Value plus accrued interest $389,725, due 02/29/16-02/15/45) | | | 382,071 | | | | 0.1 | |
VY® American Century
Small-Mid Cap Value Portfolio | PORTFOLIO OF INVESTMENTS as of December 31, 2015 (continued) |
Principal
Amount† | | | | | | | Value | | | Percentage
of Net
Assets | |
| SHORT-TERM INVESTMENTS: (continued) | | | | | |
| | | | | | Securities Lending Collateralcc: (continued) | | | | | | |
| | 1,815,157 | | | | | Citigroup, Inc., Repurchase Agreement dated 12/31/15, 0.34%, due 01/04/16 (Repurchase Amount $1,815,225, collateralized by various U.S. Government Agency Obligations, 0.000%-11.500%, Market Value plus accrued interest $1,851,460, due 01/15/16-04/01/51) | | | 1,815,157 | | | | 0.7 | |
| | 1,815,157 | | | | | Merrill Lynch & Co., Inc., Repurchase Agreement dated 12/31/15, 0.31%, due 01/04/16 (Repurchase Amount $1,815,219, collateralized by various U.S. Government Agency Obligations, 3.000%-4.500%, Market Value plus accrued interest $1,851,460, due 11/15/42-02/20/45) | | | 1,815,157 | | | | 0.7 | |
| | 1,815,157 | | | | | Millenium Fixed Income Ltd., Repurchase Agreement dated 12/31/15, 0.37%, due 01/04/16 (Repurchase Amount $1,815,231, collateralized by various U.S. Government Securities, 1.500%-3.625%, Market Value plus accrued interest $1,851,461, due 03/31/21-02/15/44) | | | 1,815,157 | | | | 0.6 | |
| | 1,815,157 | | | | | Nomura Securities, Repurchase Agreement dated 12/31/15, 0.33%, due 01/04/16 (Repurchase Amount $1,815,223, collateralized by various U.S. Government/U.S. Government Agency Obligations, 0.000%-10.500%, Market Value plus accrued interest $1,851,460, due 01/15/16-10/20/65) | | | 1,815,157 | | | | 0.7 | |
| | | | | | | | | | 7,642,699 | | | | 2.8 | |
| Shares | | | | | | | Value | | | Percentage
of Net
Assets | |
| | | | | | | Mutual Funds: 2.4% | | | | | | | | |
| | 6,773,161 | | | | | BlackRock Liquidity Funds, TempFund, Institutional Class, 0.270%†† | | | | | | | | |
| | | | | | | (Cost $6,773,161) | | | 6,773,161 | | | | 2.4 | |
| | | | | | | | | | | | | | | |
| | | | | Total Short-Term Investments | | | | | | | | |
| | | | | (Cost $14,415,860) | | | 14,415,860 | | | | 5.2 | |
| | | | | | | | | | | | | | | |
| | | | | Total Investments in Securities
(Cost $288,321,916) | | $ | 286,221,658 | | | | 103.2 | |
| | | | | Liabilities in Excess of Other Assets | | | (8,822,636 | ) | | | (3.2 | ) |
| | | | | Net Assets | | $ | 277,399,022 | | | | 100.0 | |
| † | Unless otherwise indicated, principal amount is shown in USD. |
| †† | Rate shown is the 7-day yield as of December 31, 2015. |
| @ | Non-income producing security. |
| ADR | American Depositary Receipt |
| cc | Represents securities purchased with cash collateral received for securities on loan. |
| L | Loaned security, a portion or all of the security is on loan at December 31, 2015. |
| | Cost for federal income tax purposes is $291,022,226. |
| Net unrealized depreciation consists of: |
| |
| Gross Unrealized Appreciation | | $ | 19,007,337 | |
| Gross Unrealized Depreciation | | | (23,807,905 | ) |
| | | | | |
| Net Unrealized Depreciation | | $ | (4,800,568 | ) |
| VY® Baron Growth Portfolio | PORTFOLIO OF INVESTMENTS
as of December 31, 2015 |
| Shares | | | | | | | Value | | | Percentage
of Net
Assets | |
| COMMON STOCK: 99.2% |
| | | | | | | Consumer Discretionary: 30.9% | | | | | | | | |
| | 2,790,684 | | | @ | | AO World PLC | | | 6,422,033 | | | | 0.8 | |
| | 429,000 | | | @ | | Bright Horizons Family Solutions, Inc. | | | 28,657,200 | | | | 3.4 | |
| | 570,000 | | | | | Choice Hotels International, Inc. | | | 28,733,700 | | | | 3.4 | |
| | 210,000 | | | | | ClubCorp Holdings, Inc. | | | 3,836,700 | | | | 0.4 | |
| | 400,000 | | | | | Dick's Sporting Goods, Inc. | | | 14,140,000 | | | | 1.7 | |
| | 230,721 | | | | | Interval Leisure Group, Inc. | | | 3,601,555 | | | | 0.4 | |
| | 761,383 | | | | | Manchester United PLC - Class A | | | 13,560,231 | | | | 1.6 | |
| | 167,500 | | | | | Marriott Vacations Worldwide Corp. | | | 9,539,125 | | | | 1.1 | |
| | 157,000 | | | | | Morningstar, Inc. | | | 12,624,370 | | | | 1.5 | |
| | 161,264 | | | @ | | Nord Anglia Education, Inc. | | | 3,270,434 | | | | 0.4 | |
| | 66,700 | | | @ | | Panera Bread Co. | | | 12,991,826 | | | | 1.5 | |
| | 400,380 | | | @ | | Penn National Gaming, Inc. | | | 6,414,088 | | | | 0.7 | |
| | 593,691 | | | @ | | Pinnacle Entertainment, Inc. | | | 18,475,664 | | | | 2.2 | |
| | 485,000 | | | @ | | Under Armour, Inc. | | | 39,095,850 | | | | 4.6 | |
| | 475,000 | | | | | Vail Resorts, Inc. | | | 60,795,250 | | | | 7.2 | |
| | | | | | | | | | 262,158,026 | | | | 30.9 | |
| | | | | | | | | | | | | | | |
| | | | | | | Consumer Staples: 7.5% | | | | | | | | |
| | 63,294 | | | @ | | Boston Beer Co., Inc. | | | 12,779,691 | | | | 1.5 | |
| | 192,000 | | | | | Church & Dwight Co., Inc. | | | 16,296,960 | | | | 1.9 | |
| | 148,903 | | | @ | | Performance Food Group Co. | | | 3,445,615 | | | | 0.4 | |
| | 470,000 | | | @ | | Smart & Final Stores, Inc. | | | 8,558,700 | | | | 1.0 | |
| | 203,000 | | | @ | | TreeHouse Foods, Inc. | | | 15,927,380 | | | | 1.9 | |
| | 175,096 | | | @ | | United Natural Foods, Inc. | | | 6,891,779 | | | | 0.8 | |
| | | | | | | | | | 63,900,125 | | | | 7.5 | |
| | | | | | | | | | | | | | | |
| | | | | | | Financials: 17.3% | | | | | | | | |
| | 17,500 | | | | | Alexander's, Inc. | | | 6,721,925 | | | | 0.8 | |
| | 82,000 | | | | | Alexandria Real Estate Equities, Inc. | | | 7,409,520 | | | | 0.9 | |
| | 115,000 | | | | | American Assets Trust, Inc. | | | 4,410,250 | | | | 0.5 | |
| | 195,000 | | | @ | | Arch Capital Group Ltd. | | | 13,601,250 | | | | 1.6 | |
| | 272,255 | | | | | Artisan Partners Asset Management, Inc. | | | 9,817,515 | | | | 1.2 | |
| | 335,000 | | | | | Carlyle Group L.P. | | | 5,232,700 | | | | 0.6 | |
| | 420,000 | | | | | Cohen & Steers, Inc. | | | 12,801,600 | | | | 1.5 | |
| | 474,170 | | | | | Douglas Emmett, Inc. | | | 14,784,621 | | | | 1.7 | |
| | 297,229 | | | | | Financial Engines, Inc. | | | 10,007,700 | | | | 1.2 | |
| | 504,411 | | | | | Gaming and Leisure Properties, Inc. | | | 14,022,626 | | | | 1.6 | |
| | 107,500 | | | | | LaSalle Hotel Properties | | | 2,704,700 | | | | 0.3 | |
| | 161,498 | | | | | Moelis & Co. | | | 4,712,512 | | | | 0.5 | |
| | 208,000 | | | | | MSCI, Inc. - Class A | | | 15,003,040 | | | | 1.8 | |
| | 160,000 | | | | | Oaktree Capital Group, LLC | | | 7,635,200 | | | | 0.9 | |
| | 390,000 | | | | | Primerica, Inc. | | | 18,419,700 | | | | 2.2 | |
| | | | | | | | | | 147,284,859 | | | | 17.3 | |
| | | | | | | | | | | | | | | |
| | | | | | | Health Care: 9.7% | | | | | | | | |
| | 105,000 | | | | | Bio-Techne Corp. | | | 9,450,000 | | | | 1.1 | |
| | 155,000 | | | @ | | Community Health Systems, Inc. | | | 4,112,150 | | | | 0.5 | |
| | 161,119 | | | @ | | ConforMIS, Inc. | | | 2,785,748 | | | | 0.3 | |
| | 115,000 | | | @ | | Diplomat Pharmacy, Inc. | | | 3,935,300 | | | | 0.5 | |
| | 40,000 | | | @ | | Edwards Lifesciences Corp. | | | 3,159,200 | | | | 0.4 | |
| | 244,400 | | | | | Idexx Laboratories, Inc. | | | 17,821,648 | | | | 2.1 | |
| | 465,000 | | | @ | | Inovalon Holdings, Inc. | | | 7,905,000 | | | | 0.9 | |
| | 68,000 | | | @ | | Mettler Toledo International, Inc. | | | 23,060,840 | | | | 2.7 | |
| | 47,008 | | | @ | | Neogen Corp. | | | 2,656,892 | | | | 0.3 | |
| | 130,000 | | | | | West Pharmaceutical Services, Inc. | | | 7,828,600 | | | | 0.9 | |
| | | | | | | | | | 82,715,378 | | | | 9.7 | |
| | | | | | | | | | | | | | | |
| | | | | | | Industrials: 10.5% | | | | | | | | |
| | 230,000 | | | | | Air Lease Corp. | | | 7,700,400 | | | | 0.9 | |
| | 80,000 | | | @ | | Colfax Corp. | | | 1,868,000 | | | | 0.2 | |
| | 157,000 | | | @ | | CoStar Group, Inc. | | | 32,450,330 | | | | 3.8 | |
| | 102,500 | | | @ | | Generac Holdings, Inc. | | | 3,051,425 | | | | 0.4 | |
| | 112,796 | | | @ | | Genesee & Wyoming, Inc. | | | 6,056,017 | | | | 0.7 | |
| | 318,000 | | | @ | | Middleby Corp. | | | 34,302,660 | | | | 4.0 | |
| | 100,000 | | | @ | | Trex Co., Inc. | | | 3,804,000 | | | | 0.5 | |
| | | | | | | | | | 89,232,832 | | | | 10.5 | |
| | | | | | | | | | | | | | | |
| | | | | | | Information Technology: 18.1% | | | | | | | | |
| | 239,000 | | | @ | | Ansys, Inc. | | | 22,107,500 | | | | 2.6 | |
| | 300,448 | | | @ | | Benefitfocus, Inc. | | | 10,933,303 | | | | 1.3 | |
| | 417,500 | | | | | Booz Allen Hamilton Holding Corp. | | | 12,879,875 | | | | 1.5 | |
| | 85,000 | | | | | Factset Research Systems, Inc. | | | 13,818,450 | | | | 1.6 | |
| | 387,000 | | | @ | | Gartner, Inc. | | | 35,100,900 | | | | 4.1 | |
| | 165,000 | | | @ | | Guidewire Software, Inc. | | | 9,926,400 | | | | 1.2 | |
| | 400,000 | | | | | MAXIMUS, Inc. | | | 22,500,000 | | | | 2.7 | |
| | 385,000 | | | | | SS&C Technologies Holdings, Inc. | | | 26,283,950 | | | | 3.1 | |
| | | | | | | | | | 153,550,378 | | | | 18.1 | |
| | | | | | | | | | | | | | | |
| | | | | | | Materials: 2.1% | | | | | | | | |
| | 402,000 | | | @ | | Caesar Stone Sdot Yam Ltd. | | | 17,422,680 | | | | 2.1 | |
| | | | | | | | | | | | | | | |
| | | | | | | Telecommunication Services: 0.9% | | | | | | | | |
| | 921,311 | | | @ | | Iridium Communications, Inc. | | | 7,748,225 | | | | 0.9 | |
| | | | | | | | | | | | | | | |
| | | | | | | Utilities: 2.2% | | | | | | | | |
| | 480,000 | | | | | ITC Holdings Corp. | | | 18,840,000 | | | | 2.2 | |
| | | | | | | | | | | | | | | |
| | | | | Total Common Stock | | | | | | | | |
| | | | | (Cost $415,110,941) | | | 842,852,503 | | | | 99.2 | |
| VY® Baron Growth Portfolio | PORTFOLIO OF INVESTMENTS
as of December 31, 2015 (continued) |
| Shares | | | | | | | Value | | | Percentage
of Net
Assets | |
| SHORT-TERM INVESTMENTS: 1.2% | | | | | | |
| | | | | | | Mutual Funds: 1.2% | | | | | | | | |
| | 9,848,887 | | | | | BlackRock Liquidity Funds, TempFund, Institutional Class, 0.270%†† | | | | | | | | |
| | | | | | | (Cost $9,848,887) | | | 9,848,887 | | | | 1.2 | |
| | | | | | | | | | | | | | | |
| | | | | Total Short-Term Investments | | | | | | | | |
| | | | | (Cost $9,848,887) | | | 9,848,887 | | | | 1.2 | |
| | | | | | | | | | | | | | | |
| | | | | Total Investments in Securities
(Cost $424,959,828) | | $ | 852,701,390 | | | | 100.4 | |
| | | | | Liabilities in Excess of Other Assets | | | (3,253,860 | ) | | | (0.4 | ) |
| | | | | Net Assets | | $ | 849,447,530 | | | | 100.0 | |
| †† | Rate shown is the 7-day yield as of December 31, 2015. |
| @ | Non-income producing security. |
| | Cost for federal income tax purposes is $426,668,976. |
| Net unrealized appreciation consists of: | | | | |
| | | | | |
| Gross Unrealized Appreciation | | $ | 440,444,758 | |
| Gross Unrealized Depreciation | | | (14,412,344 | ) |
| | | | | |
| Net Unrealized Appreciation | | $ | 426,032,414 | |
| VY® Columbia Contrarian Core Portfolio | PORTFOLIO OF INVESTMENTS
as of December 31, 2015 |
| Shares | | | | | | | Value | | | Percentage
of Net
Assets | |
| COMMON STOCK: 98.7% | |
| | | | | | | Consumer Discretionary: 12.0% | | | | | | | | |
| | 56,427 | | | | | ARAMARK Holdings Corp. | | | 1,819,771 | | | | 0.5 | |
| | 84,310 | | | | | CBS Corp. - Class B | | | 3,973,530 | | | | 1.2 | |
| | 104,195 | | | | | Coach, Inc. | | | 3,410,302 | | | | 1.0 | |
| | 133,917 | | | | | Comcast Corp. – Class A | | | 7,556,936 | | | | 2.2 | |
| | 58,768 | | | | | Delphi Automotive PLC | | | 5,038,181 | | | | 1.5 | |
| | 55,525 | | | | | Johnson Controls, Inc. | | | 2,192,682 | | | | 0.7 | |
| | 84,724 | | | | | Lowe's Cos, Inc. | | | 6,442,413 | | | | 1.9 | |
| | 40,985 | | | | | McDonald's Corp. | | | 4,841,968 | | | | 1.4 | |
| | 68,727 | | | @ | | Michaels Cos, Inc. | | | 1,519,554 | | | | 0.5 | |
| | 33,435 | | | | | PVH Corp. | | | 2,462,488 | | | | 0.7 | |
| | 9,160 | | | | | Whirlpool Corp. | | | 1,345,329 | | | | 0.4 | |
| | | | | | | | | | 40,603,154 | | | | 12.0 | |
| | | | | | | | | | | | | | | |
| | | | | | | Consumer Staples: 7.9% | | | | | | | | |
| | 53,155 | | | | | Archer-Daniels-Midland Co. | | | 1,949,725 | | | | 0.5 | |
| | 89,141 | | | | | CVS Health Corp. | | | 8,715,316 | | | | 2.6 | |
| | 33,510 | | | | | Diageo PLC ADR | | | 3,654,936 | | | | 1.1 | |
| | 63,638 | | | | | PepsiCo, Inc. | | | 6,358,709 | | | | 1.9 | |
| | 47,140 | | | | | Philip Morris International, Inc. | | | 4,144,077 | | | | 1.2 | |
| | 23,132 | | | | | Walgreens Boots Alliance, Inc. | | | 1,969,805 | | | | 0.6 | |
| | | | | | | | | | 26,792,568 | | | | 7.9 | |
| | | | | | | | | | | | | | | |
| | | | | | | Energy: 5.5% | | | | | | | | |
| | 91,932 | | | | | Canadian Natural Resources Ltd. | | | 2,006,876 | | | | 0.6 | |
| | 51,371 | | | | | Chevron Corp. | | | 4,621,335 | | | | 1.3 | |
| | 50,437 | | | | | ConocoPhillips | | | 2,354,903 | | | | 0.7 | |
| | 17,490 | | | | | EQT Corp. | | | 911,754 | | | | 0.3 | |
| | 75,795 | | | | | Exxon Mobil Corp. | | | 5,908,220 | | | | 1.7 | |
| | 27,680 | | | | | Noble Energy, Inc. | | | 911,502 | | | | 0.3 | |
| | 28,865 | | | | | Schlumberger Ltd. | | | 2,013,334 | | | | 0.6 | |
| | | | | | | | | | 18,727,924 | | | | 5.5 | |
| | | | | | | | | | | | | | | |
| | | | | | | Financials: 18.5% | | | | | | | | |
| | 75,275 | | | | | American Express Co. | | | 5,235,376 | | | | 1.5 | |
| | 23,165 | | | | | American Tower Corp. | | | 2,245,847 | | | | 0.7 | |
| | 35,278 | | | | | Aon PLC | | | 3,252,984 | | | | 0.9 | |
| | 317,823 | | | | | Bank of America Corp. | | | 5,348,961 | | | | 1.6 | |
| | 108,116 | | | | | Bank of New York Mellon Corp. | | | 4,456,542 | | | | 1.3 | |
| | 68,097 | | | @ | | Berkshire Hathaway, Inc. – Class B | | | 8,991,528 | | | | 2.6 | |
| | 15,674 | | | | | Blackrock, Inc. | | | 5,337,311 | | | | 1.6 | |
| | 187,096 | | | | | Citigroup, Inc. | | | 9,682,218 | | | | 2.9 | |
| | 7,064 | | | | | Goldman Sachs Group, Inc. | | | 1,273,145 | | | | 0.4 | |
| | 141,408 | | | | | JPMorgan Chase & Co. | | | 9,337,170 | | | | 2.8 | |
| | 124,315 | | | | | Wells Fargo & Co. | | | 6,757,763 | | | | 2.0 | |
| | 22,455 | | | | | Weyerhaeuser Co. | | | 673,201 | | | | 0.2 | |
| | | | | | | | | | 62,592,046 | | | | 18.5 | |
| | | | | | | | | | | | | | | |
| | | | | | | Health Care: 18.4% | | | | | | | | |
| | 112,570 | | | | | Abbott Laboratories | | | 5,055,519 | | | | 1.5 | |
| | 11,270 | | | | | Allergan plc | | | 3,521,875 | | | | 1.0 | |
| | 91,945 | | | | | Baxalta, Inc. | | | 3,588,613 | | | | 1.1 | |
| | 14,770 | | | @ | | Biogen, Inc. | | | 4,524,790 | | | | 1.3 | |
| | 73,109 | | | | | Cardinal Health, Inc. | | | 6,526,441 | | | | 1.9 | |
| | 30,564 | | | @ | | Celgene Corp. | | | 3,660,345 | | | | 1.1 | |
| | 28,603 | | | | | Cigna Corp. | | | 4,185,477 | | | | 1.2 | |
| | 16,765 | | | | | Cooper Cos., Inc. | | | 2,249,863 | | | | 0.7 | |
| | 29,150 | | | @ | | Endo International PLC | | | 1,784,563 | | | | 0.5 | |
| | 78,114 | | | | | Johnson & Johnson | | | 8,023,870 | | | | 2.4 | |
| | 113,158 | | | @ | | Medtronic PLC | | | 8,704,113 | | | | 2.6 | |
| | 154,805 | | | | | Pfizer, Inc. | | | 4,997,105 | | | | 1.5 | |
| | 21,521 | | | @ | | Vertex Pharmaceuticals, Inc. | | | 2,707,987 | | | | 0.8 | |
| | 25,295 | | | | | Zimmer Biomet Holdings, Inc. | | | 2,595,014 | | | | 0.8 | |
| | | | | | | | | | 62,125,575 | | | | 18.4 | |
| | | | | | | | | | | | | | | |
| | | | | | | Industrials: 9.6% | | | | | | | | |
| | 19,323 | | | | | Dun & Bradstreet Corp. | | | 2,008,239 | | | | 0.6 | |
| | 46,392 | | | | | Eaton Corp. PLC | | | 2,414,240 | | | | 0.7 | |
| | 20,076 | | | | | FedEx Corp. | | | 2,991,123 | | | | 0.9 | |
| | 226,800 | | | | | General Electric Co. | | | 7,064,820 | | | | 2.1 | |
| | 60,877 | | | | | Honeywell International, Inc. | | | 6,305,031 | | | | 1.9 | |
| | 4,084 | | | @ | | IHS, Inc. | | | 483,668 | | | | 0.1 | |
| | 136,925 | | | | | Nielsen NV | | | 6,380,705 | | | | 1.9 | |
| | 66,022 | | | | | Tyco International Plc | | | 2,105,442 | | | | 0.6 | |
| | 26,840 | | | | | United Technologies Corp. | | | 2,578,519 | | | | 0.8 | |
| | | | | | | | | | 32,331,787 | | | | 9.6 | |
| | | | | | | | | | | | | | | |
| | | | | | | Information Technology: 21.2% | | | | | | | | |
| | 186,685 | | | | | Activision Blizzard, Inc. | | | 7,226,576 | | | | 2.1 | |
| | 5,310 | | | @ | | Alibaba Group Holding Ltd. ADR | | | 431,544 | | | | 0.1 | |
| | 6,223 | | | @ | | Alphabet, Inc. - Class A | | | 4,841,556 | | | | 1.4 | |
| | 10,759 | | | | | Alphabet, Inc. - Class C | | | 8,164,790 | | | | 2.4 | |
| | 107,416 | | | | | Apple, Inc. | | | 11,306,608 | | | | 3.4 | |
| | 84,437 | | | | | Broadcom Corp. | | | 4,882,147 | | | | 1.5 | |
| | 21,709 | | | @ | | Electronic Arts, Inc. | | | 1,491,842 | | | | 0.5 | |
| | 171,344 | | | | | EMC Corp. | | | 4,400,114 | | | | 1.3 | |
| | 47,385 | | | @ | | Facebook, Inc. | | | 4,959,314 | | | | 1.5 | |
| | 178,398 | | | | | Hewlett Packard Enterprise Co. | | | 2,711,650 | | | | 0.8 | |
| | 17,966 | | | | | Intuit, Inc. | | | 1,733,719 | | | | 0.5 | |
| | 49,475 | | | | | Mastercard, Inc. | | | 4,816,886 | | | | 1.4 | |
| | 165,325 | | | | | Microsoft Corp. | | | 9,172,231 | | | | 2.7 | |
| | 31,728 | | | @ | | PayPal Holdings, Inc. | | | 1,148,554 | | | | 0.3 | |
| | 44,145 | | | | | Qualcomm, Inc. | | | 2,206,588 | | | | 0.7 | |
| | 26,308 | | | | | Skyworks Solutions, Inc. | | | 2,021,244 | | | | 0.6 | |
| | | | | | | | | | 71,515,363 | | | | 21.2 | |
| | | | | | | | | | | | | | | |
| | | | | | | Materials: 1.5% | | | | | | | | |
| | 49,910 | | | | | Monsanto Co. | | | 4,917,133 | | | | 1.5 | |
| | | | | | | | | | | | | | | |
| | | | | | | Telecommunication Services: 2.7% | | | | | | | | |
| | 198,227 | | | | | Verizon Communications, Inc. | | | 9,162,052 | | | | 2.7 | |
| | | | | | | | | | | | | | | |
| | | | | | | Utilities: 1.4% | | | | | | | | |
| | 24,310 | | | | | DTE Energy Co. | | | 1,949,419 | | | | 0.6 | |
| | 46,386 | | | | | Edison International | | | 2,746,515 | | | | 0.8 | |
| | | | | | | | | | 4,695,934 | | | | 1.4 | |
| | | | | | | | | | | | | | | |
| | | | | Total Common Stock | | | | | | | | |
| | | | | (Cost $297,516,833) | | | 333,463,536 | | | | 98.7 | |
| VY® Columbia Contrarian Core Portfolio | PORTFOLIO OF INVESTMENTS
as of December 31, 2015 (continued) |
Principal
Amount† | | | | | | | Value | | | Percentage
of Net
Assets | |
| CORPORATE BONDS/NOTES: –% | | | | | | | |
| | | | | | | Materials: –% | | | | | | | | |
| | 649,000 | | | | | SINO Forest Corp. Escrow, 5.000%, 08/01/14 | | | – | | | | – | |
| | | | | | | | | | | | | | | |
| | | | | Total Corporate Bonds/Notes | | | | | | | | |
| | | | | (Cost $–) | | | – | | | | – | |
| | | | | | | | | | | | | | | |
| | | | | Total Investments in Securities
(Cost $297,516,833) | | $ | 333,463,536 | | | | 98.7 | |
| | | | | Assets in Excess of Other Liabilities | | | 4,253,963 | | | | 1.3 | |
| | | | | Net Assets | | $ | 337,717,499 | | | | 100.0 | |
| † | Unless otherwise indicated, principal amount is shown in USD. |
| @ | Non-income producing security. |
| ADR | American Depositary Receipt |
| | Cost for federal income tax purposes is $298,302,666. |
| Net unrealized appreciation consists of: | | | | |
| | | | | |
| Gross Unrealized Appreciation | | $ | 44,287,089 | |
| Gross Unrealized Depreciation | | | (9,126,219 | ) |
| | | | | |
| Net Unrealized Appreciation | | $ | 35,160,870 | |
| VY® Columbia Small Cap Value II Portfolio | PORTFOLIO OF INVESTMENTS
as of December 31, 2015 |
| Shares | | | | | | | Value | | | Percentage
of Net
Assets | |
| COMMON STOCK: 97.7% |
| | | | | | | Consumer Discretionary: 11.6% | | | | | | | | |
| | 55,000 | | | | | AMC Entertainment Holdings, Inc. | | | 1,320,000 | | | | 0.6 | |
| | 122,000 | | | | | American Eagle Outfitters | | | 1,891,000 | | | | 0.9 | |
| | 47,000 | | | @ | | Bloomin Brands, Inc. | | | 793,830 | | | | 0.4 | |
| | 52,993 | | | | | CalAtlantic Group, Inc. | | | 2,009,495 | | | | 0.9 | |
| | 20,000 | | | | | Childrens Place Retail Stores, Inc. | | | 1,104,000 | | | | 0.5 | |
| | 52,000 | | | | | EW Scripps Co. | | | 988,000 | | | | 0.5 | |
| | 53,000 | | | | | Guess?, Inc. | | | 1,000,640 | | | | 0.5 | |
| | 24,000 | | | @ | | Helen of Troy Ltd. | | | 2,262,000 | | | | 1.1 | |
| | 168,000 | | | | | JC Penney Co., Inc. | | | 1,118,880 | | | | 0.5 | |
| | 94,000 | | | @ | | Nord Anglia Education, Inc. | | | 1,906,320 | | | | 0.9 | |
| | 87,000 | | | @ | | Penn National Gaming, Inc. | | | 1,393,740 | | | | 0.7 | |
| | 18,000 | | | | | Red Robin Gourmet Burgers, Inc. | | | 1,111,320 | | | | 0.5 | |
| | 119,000 | | | @ | | Sequential Brands Group, Inc. | | | 941,290 | | | | 0.4 | |
| | 63,000 | | | | | Sinclair Broadcast Group, Inc. | | | 2,050,020 | | | | 1.0 | |
| | 36,000 | | | @ | | Tenneco, Inc. | | | 1,652,760 | | | | 0.8 | |
| | 63,857 | | | | | Tower International, Inc. | | | 1,824,394 | | | | 0.9 | |
| | 121,000 | | | @ | | Travelcenters of America LLC | | | 1,137,400 | | | | 0.5 | |
| | | | | | | | | | 24,505,089 | | | | 11.6 | |
| | | | | | | | | | | | | | | |
| | | | �� | | | Consumer Staples: 3.4% | | | | | | | | |
| | 16,000 | | | | | Nu Skin Enterprises, Inc. | | | 606,240 | | | | 0.3 | |
| | 70,000 | | | @ | | Performance Food Group Co. | | | 1,619,800 | | | | 0.8 | |
| | 57,000 | | | | | SpartanNash Co. | | | 1,233,480 | | | | 0.6 | |
| | 203,000 | | | @ | | SUPERVALU, Inc. | | | 1,376,340 | | | | 0.6 | |
| | 31,000 | | | @ | | TreeHouse Foods, Inc. | | | 2,432,260 | | | | 1.1 | |
| | | | | | | | | | 7,268,120 | | | | 3.4 | |
| | | | | | | | | | | | | | | |
| | | | | | | Energy: 4.9% | | | | | | | | |
| | 100,000 | | | @ | | Aegean Marine Petroleum Network, Inc. | | | 836,000 | | | | 0.4 | |
| | 27,000 | | | | | Carrizo Oil & Gas, Inc. | | | 798,660 | | | | 0.4 | |
| | 84,000 | | | @ | | Matador Resources Co. | | | 1,660,680 | | | | 0.8 | |
| | 70,000 | | | @ | | Parsley Energy, Inc. | | | 1,291,500 | | | | 0.6 | |
| | 123,000 | | | | | Patterson-UTI Energy, Inc. | | | 1,854,840 | | | | 0.9 | |
| | 19,000 | | | @ | | PDC Energy, Inc. | | | 1,014,220 | | | | 0.5 | |
| | 78,000 | | | | | Rowan Companies PLC | | | 1,322,100 | | | | 0.6 | |
| | 210,000 | | | | | Teekay Tankers Ltd. | | | 1,444,800 | | | | 0.7 | |
| | | | | | | | | | 10,222,800 | | | | 4.9 | |
| | | | | | | | | | | | | | | |
| | | | | | | Financials: 38.2% | | | | | | | | |
| | 66,000 | | | | | American Assets Trust, Inc. | | | 2,531,100 | | | | 1.2 | |
| | 80,000 | | | | | American Equity Investment Life Holding Co. | | | 1,922,400 | | | | 0.9 | |
| | 65,000 | | | | | Ameris Bancorp. | | | 2,209,350 | | | | 1.0 | |
| | 60,000 | | | | | Amerisafe, Inc. | | | 3,054,000 | | | | 1.4 | |
| | 32,000 | | | | | Amtrust Financial Services, Inc. | | | 1,970,560 | | | | 0.9 | |
| | 50,831 | | | | | Argo Group International Holdings Ltd. | | | 3,041,727 | | | | 1.4 | |
| | 32,500 | | | | | Bank of the Ozarks, Inc. | | | 1,607,450 | | | | 0.8 | |
| | 116,300 | | | | | Brandywine Realty Trust | | | 1,588,658 | | | | 0.8 | |
| | 54,000 | | | | | Cathay General Bancorp. | | | 1,691,820 | | | | 0.8 | |
| | 126,000 | | | | | CNO Financial Group, Inc. | | | 2,405,340 | | | | 1.1 | |
| | 71,000 | | | | | Community Bank System, Inc. | | | 2,835,740 | | | | 1.3 | |
| | 97,000 | | | | | CubeSmart | | | 2,970,140 | | | | 1.4 | |
| | 68,000 | | | @ | | Customers Bancorp, Inc. | | | 1,850,960 | | | | 0.9 | |
| | 123,000 | | | | | EverBank Financial Corp. | | | 1,965,540 | | | | 0.9 | |
| | 67,000 | | | | | First American Financial Corp. | | | 2,405,300 | | | | 1.1 | |
| | 110,000 | | | | | First Industrial Realty Trust, Inc. | | | 2,434,300 | | | | 1.2 | |
| | 125,000 | | | | | FirstMerit Corp. | | | 2,331,250 | | | | 1.1 | |
| | 53,000 | | | | | Highwoods Properties, Inc. | | | 2,310,800 | | | | 1.1 | |
| | 60,000 | | | @ | | Hilltop Holdings, Inc. | | | 1,153,200 | | | | 0.5 | |
| | 65,000 | | | | | Independent Bank Corp. | | | 3,023,800 | | | | 1.4 | |
| | 24,000 | | | | | Kilroy Realty Corp. | | | 1,518,720 | | | | 0.7 | |
| | 32,000 | | | | | LaSalle Hotel Properties | | | 805,120 | | | | 0.4 | |
| | 71,000 | | | | | Mack-Cali Realty Corp. | | | 1,657,850 | | | | 0.8 | |
| | 109,000 | | | @ | | MGIC Investment Corp. | | | 962,470 | | | | 0.5 | |
| | 66,000 | | | | | PrivateBancorp, Inc. | | | 2,707,320 | | | | 1.3 | |
| | 17,000 | | | | | Prosperity Bancshares, Inc. | | | 813,620 | | | | 0.4 | |
| | 16,000 | | | | | PS Business Parks, Inc. | | | 1,398,880 | | | | 0.7 | |
| | 68,000 | | | @ | | Radian Group, Inc. | | | 910,520 | | | | 0.4 | |
| | 83,000 | | | | | Renasant Corp. | | | 2,856,030 | | | | 1.4 | |
| | 41,000 | | | | | RLJ Lodging Trust | | | 886,830 | | | | 0.4 | |
| | 83,000 | | | | | Sandy Spring Bancorp, Inc. | | | 2,237,680 | | | | 1.1 | |
| | 195,000 | | | | | Sterling Bancorp/DE | | | 3,162,900 | | | | 1.5 | |
| | 21,500 | | | | | Sun Communities, Inc. | | | 1,473,395 | | | | 0.7 | |
| | 40,000 | | | | | TriplePoint Venture Growth BDC Corp. | | | 478,400 | | | | 0.2 | |
| | 103,000 | | | | | Umpqua Holdings Corp. | | | 1,637,700 | | | | 0.8 | |
| | 107,000 | | | | | Union Bankshares Corp. | | | 2,700,680 | | | | 1.3 | |
| | 89,000 | | | | | Virtu Financial, Inc. | | | 2,014,960 | | | | 1.0 | |
| | 76,000 | | | @ | | Western Alliance Bancorp. | | | 2,725,360 | | | | 1.3 | |
| | 212,800 | | | | | Wilshire Bancorp., Inc. | | | 2,457,840 | | | | 1.2 | |
| | 39,000 | | | | | Wintrust Financial Corp. | | | 1,892,280 | | | | 0.9 | |
| | | | | | | | | | 80,601,990 | | | | 38.2 | |
| | | | | | | | | | | | | | | |
| | | | | | | Health Care: 6.3% | | | | | | | | |
| | 39,000 | | | @ | | Catalent, Inc. | | | 976,170 | | | | 0.5 | |
| | 70,000 | | | @ | | Globus Medical Inc | | | 1,947,400 | | | | 0.9 | |
| | 47,500 | | | @ | | LHC Group, Inc. | | | 2,151,275 | | | | 1.0 | |
| | 18,500 | | | @ | | LifePoint Hospitals, Inc. | | | 1,357,900 | | | | 0.6 | |
| | 17,500 | | | @ | | Parexel International Corp. | | | 1,192,100 | | | | 0.6 | |
| | 83,500 | | | @ | | PharMerica Corp. | | | 2,922,500 | | | | 1.4 | |
| | 48,000 | | | @ | | VCA, Inc. | | | 2,640,000 | | | | 1.3 | |
| | | | | | | | | | 13,187,345 | | | | 6.3 | |
| | | | | | | | | | | | | | | |
| | | | | | | Industrials: 13.4% | | | | | | | | |
| | 56,000 | | | @ | | ABM Industries, Inc. | | | 1,594,320 | | | | 0.8 | |
| | 56,000 | | | @ | | Actuant Corp. | | | 1,341,760 | | | | 0.6 | |
| | 17,000 | | | | | Alaska Air Group, Inc. | | | 1,368,670 | | | | 0.6 | |
| | 39,000 | | | | | Barnes Group, Inc. | | | 1,380,210 | | | | 0.7 | |
| VY® Columbia Small Cap Value II Portfolio | PORTFOLIO OF INVESTMENTS
as of December 31, 2015 (continued) |
| Shares | | | | | | | Value | | | Percentage
of Net
Assets | |
| COMMON STOCK: (continued) |
| | | | | | | Industrials: (continued) | | | | | | | | |
| | 63,000 | | | @ | | Beacon Roofing Supply, Inc. | | | 2,594,340 | | | | 1.2 | |
| | 37,000 | | | | | Deluxe Corp. | | | 2,017,980 | | | | 1.0 | |
| | 50,600 | | | | | EMCOR Group, Inc. | | | 2,430,824 | | | | 1.1 | |
| | 19,800 | | | @ | | Esterline Technologies Corp. | | | 1,603,800 | | | | 0.8 | |
| | 39,000 | | | | | Franklin Electric Co., Inc. | | | 1,054,170 | | | | 0.5 | |
| | 94,000 | | | @ | | Mastec, Inc. | | | 1,633,720 | | | | 0.8 | |
| | 106,132 | | | @ | | Neff Corp. | | | 812,971 | | | | 0.4 | |
| | 24,000 | | | | | On Assignment, Inc. | | | 1,078,800 | | | | 0.5 | |
| | 26,000 | | | | | Oshkosh Corp. | | | 1,015,040 | | | | 0.5 | |
| | 65,000 | | | | | Skywest, Inc. | | | 1,236,300 | | | | 0.6 | |
| | 72,000 | | | | | Steelcase, Inc. | | | 1,072,800 | | | | 0.5 | |
| | 63,500 | | | @ | | Trinity Industries, Inc. | | | 1,525,270 | | | | 0.7 | |
| | 64,500 | | | | | TrueBlue, Inc. | | | 1,661,520 | | | | 0.8 | |
| | 109,000 | | | @ | | Wabash National Corp. | | | 1,289,470 | | | | 0.6 | |
| | 72,000 | | | | | West Corp. | | | 1,553,040 | | | | 0.7 | |
| | | | | | | | | | 28,265,005 | | | | 13.4 | |
| | | | | | | | | | | | | | | |
| | | | | | | Information Technology: 10.8% | | | | | | | | |
| | 50,000 | | | @ | | AVG Technologies | | | 1,002,500 | | | | 0.5 | |
| | 175,000 | | | | | Cypress Semiconductor Corp. | | | 1,716,750 | | | | 0.8 | |
| | 133,000 | | | @ | | Fairchild Semiconductor International, Inc. | | | 2,754,430 | | | | 1.3 | |
| | 101,000 | | | @ | | Finisar Corp. | | | 1,468,540 | | | | 0.7 | |
| | 121,000 | | | @ | | II-VI, Inc. | | | 2,245,760 | | | | 1.1 | |
| | 58,000 | | | | | Integrated Device Technology, Inc. | | | 1,528,300 | | | | 0.7 | |
| | 97,000 | | | | | IXYS Corp. | | | 1,225,110 | | | | 0.6 | |
| | 158,000 | | | @ | | Kulicke & Soffa Industries, Inc. | | | 1,843,860 | | | | 0.9 | |
| | 22,700 | | | | | Leidos Holdings, Inc. | | | 1,277,102 | | | | 0.6 | |
| | 24,000 | | | @ | | Rogers Corp. | | | 1,237,680 | | | | 0.6 | |
| | 29,000 | | | | | Science Applications International Corp. | | | 1,327,620 | | | | 0.6 | |
| | 57,000 | | | @ | | Super Micro Computer, Inc. | | | 1,397,070 | | | | 0.6 | |
| | 18,500 | | | @ | | SYNNEX Corp. | | | 1,663,705 | | | | 0.8 | |
| | 60,500 | | | @ | | Take-Two Interactive Software, Inc. | | | 2,107,820 | | | | 1.0 | |
| | | | | | | | | | 22,796,247 | | | | 10.8 | |
| | | | | | | | | | | | | | | |
| | | | | | | Materials: 4.6% | | | | | | | | |
| | 32,000 | | | | | Cabot Corp. | | | 1,308,160 | | | | 0.6 | |
| | 50,000 | | | | | Carpenter Technology Corp. | | | 1,513,500 | | | | 0.7 | |
| | 104,000 | | | | | Huntsman Corp. | | | 1,182,480 | | | | 0.5 | |
| | 54,000 | | | | | Materion Corp. | | | 1,512,000 | | | | 0.7 | |
| | 39,704 | | | | | Neenah Paper, Inc. | | | 2,478,721 | | | | 1.2 | |
| | 61,000 | | | | | Orion Engineered Carbons SA | | | 768,600 | | | | 0.4 | |
| | 19,400 | | | @ | | US Concrete Inc. | | | 1,021,604 | | | | 0.5 | |
| | | | | | | | | | 9,785,065 | | | | 4.6 | |
| | | | | | | | | | | | | | | |
| | | | | | | Utilities: 4.5% | | | | | | | | |
| | 80,000 | | | | | Avista Corp. | | | 2,829,600 | | | | 1.3 | |
| | 72,000 | | | | | New Jersey Resources Corp. | | | 2,373,120 | | | | 1.1 | |
| | 79,000 | | | | | South Jersey Industries, Inc. | | | 1,858,080 | | | | 0.9 | |
| | 45,000 | | | | | Southwest Gas Corp. | | | 2,482,200 | | | | 1.2 | |
| | | | | | | | | | 9,543,000 | | | | 4.5 | |
| | | | | | | | | | | | | | | |
| | | | | Total Common Stock | | | | | | | | |
| | | | | (Cost $187,735,670) | | | 206,174,661 | | | | 97.7 | |
| | | | | | | | | | | | | | | |
| SHORT-TERM INVESTMENTS: 2.4% | | | | | | | |
| | | | | | | Mutual Funds: 2.4% | | | | | | | | |
| | 5,109,137 | | | | | BlackRock Liquidity Funds, TempFund, Institutional Class, 0.270%†† | | | | | | | | |
| | | | | | | (Cost $5,109,137) | | | 5,109,137 | | | | 2.4 | |
| | | | | | | | | | | | | | | |
| | | | | Total Short-Term Investments | | | | | | | | |
| | | | | (Cost $5,109,137) | | | 5,109,137 | | | | 2.4 | |
| | | | | | | | | | | | | | | |
| | | | | Total Investments in Securities
(Cost $192,844,807) | | $ | 211,283,798 | | | | 100.1 | |
| | | | | Liabilities in Excess of Other Assets | | | (313,809 | ) | | | (0.1 | ) |
| | | | | Net Assets | | $ | 210,969,989 | | | | 100.0 | |
| †† | Rate shown is the 7-day yield as of December 31, 2015. |
| @ | Non-income producing security. |
| | Cost for federal income tax purposes is $193,092,206. |
| Net unrealized appreciation consists of: | | | | |
| | | | | |
| Gross Unrealized Appreciation | | $ | 31,479,713 | |
| Gross Unrealized Depreciation | | | (13,288,121 | ) |
| | | | | |
| Net Unrealized Appreciation | | $ | 18,191,592 | |
| VY® Invesco Comstock Portfolio | PORTFOLIO OF INVESTMENTS
as of December 31, 2015 |
| Shares | | | | | | | Value | | | Percentage
of Net
Assets | |
| COMMON STOCK: 94.9% |
| | | | | | | Consumer Discretionary: 14.7% | | | | | | | | |
| | 285,248 | | | | | Carnival Corp. | | | 15,540,311 | | | | 2.9 | |
| | 48,651 | | | | | CBS Corp. - Class B | | | 2,292,922 | | | | 0.4 | |
| | 146,887 | | | | | Comcast Corp. – Class A | | | 8,288,833 | | | | 1.6 | |
| | 291,956 | | | | | General Motors Co. | | | 9,929,424 | | | | 1.9 | |
| | 222,481 | | | | | Johnson Controls, Inc. | | | 8,785,775 | | | | 1.6 | |
| | 137,870 | | | | | Kohl's Corp. | | | 6,566,748 | | | | 1.2 | |
| | 69,591 | | | | | Mattel, Inc. | | | 1,890,787 | | | | 0.4 | |
| | 82,409 | | | | | Target Corp. | | | 5,983,718 | | | | 1.1 | |
| | 29,185 | | | | | Time Warner Cable, Inc. | | | 5,416,444 | | | | 1.0 | |
| | 33,861 | | | | | Time Warner, Inc. | | | 2,189,791 | | | | 0.4 | |
| | 220,414 | | | | | Twenty-First Century Fox, Inc. Class B | | | 6,001,873 | | | | 1.1 | |
| | 140,503 | | | | | Viacom, Inc. Class B | | | 5,783,103 | | | | 1.1 | |
| | | | | | | | | | 78,669,729 | | | | 14.7 | |
| | | | | | | | | | | | | | | |
| | | | | | | Consumer Staples: 4.7% | | | | | | | | |
| | 205,054 | | | | | Coca-Cola Co. | | | 8,809,120 | | | | 1.6 | |
| | 96,615 | | | | | ConAgra Foods, Inc. | | | 4,073,288 | | | | 0.8 | |
| | 24,644 | | | | | CVS Health Corp. | | | 2,409,444 | | | | 0.4 | |
| | 53,956 | | | | | Mondelez International, Inc. | | | 2,419,387 | | | | 0.5 | |
| | 57,686 | | | @ | | Unilever NV ADR | | | 2,498,958 | | | | 0.5 | |
| | 80,061 | | | | | Wal-Mart Stores, Inc. | | | 4,907,739 | | | | 0.9 | |
| | | | | | | | | | 25,117,936 | | | | 4.7 | |
| | | | | | | | | | | | | | | |
| | | | | | | Energy: 13.0% | | | | | | | | |
| | 266,621 | | | | | BP PLC ADR | | | 8,334,572 | | | | 1.6 | |
| | 88,879 | | | | | Chevron Corp. | | | 7,995,555 | | | | 1.5 | |
| | 134,756 | | | | | Devon Energy Corp. | | | 4,312,192 | | | | 0.8 | |
| | 130,509 | | | | | Halliburton Co. | | | 4,442,526 | | | | 0.8 | |
| | 95,373 | | | | | Hess Corp. | | | 4,623,683 | | | | 0.9 | |
| | 28,670 | | | L | | Murphy Oil Corp. | | | 643,642 | | | | 0.1 | |
| | 229,171 | | | L | | Noble Corp. PLC | | | 2,417,754 | | | | 0.5 | |
| | 69,765 | | | | | Occidental Petroleum Corp. | | | 4,716,812 | | | | 0.9 | |
| | 244,098 | | | | | QEP Resources, Inc. | | | 3,270,913 | | | | 0.6 | |
| | 202,359 | | | @ | | Royal Dutch Shell PLC - Class A ADR | | | 9,266,019 | | | | 1.7 | |
| | 434,465 | | | | | Suncor Energy, Inc. | | | 11,209,197 | | | | 2.1 | |
| | 974,333 | | | @ | | Weatherford International PLC | | | 8,174,654 | | | | 1.5 | |
| | | | | | | | | | 69,407,519 | | | | 13.0 | |
| | | | | | | | | | | | | | | |
| | | | | | | Financials: 28.3% | | | | | | | | |
| | 107,455 | | | | | Aflac, Inc. | | | 6,436,555 | | | | 1.2 | |
| | 107,466 | | | | | Allstate Corp. | | | 6,672,564 | | | | 1.2 | |
| | 287,340 | | | @ | | Ally Financial, Inc. | | | 5,356,018 | | | | 1.0 | |
| | 951,010 | | | | | Bank of America Corp. | | | 16,005,498 | | | | 3.0 | |
| | 146,943 | | | | | Bank of New York Mellon Corp. | | | 6,056,990 | | | | 1.1 | |
| | 496,522 | | | | | Citigroup, Inc. | | | 25,695,014 | | | | 4.8 | |
| | 162,401 | | | | | Citizens Financial Group, Inc. | | | 4,253,282 | | | | 0.8 | |
| | 392,554 | | | | | Fifth Third Bancorp | | | 7,890,335 | | | | 1.5 | |
| | 29,760 | | | | | Goldman Sachs Group, Inc. | | | 5,363,645 | | | | 1.0 | |
| | 306,416 | | | | | JPMorgan Chase & Co. | | | 20,232,648 | | | | 3.8 | |
| | 159,461 | | | | | Metlife, Inc. | | | 7,687,615 | | | | 1.4 | |
| | 263,453 | | | | | Morgan Stanley | | | 8,380,440 | | | | 1.6 | |
| | 99,621 | | | | | PNC Financial Services Group, Inc. | | | 9,494,878 | | | | 1.8 | |
| | 130,098 | | | | | State Street Corp. | | | 8,633,303 | | | | 1.6 | |
| | 51,947 | | | | | US Bancorp | | | 2,216,578 | | | | 0.4 | |
| | 205,886 | | | | | Wells Fargo & Co. | | | 11,191,963 | | | | 2.1 | |
| | | | | | | | | | 151,567,326 | | | | 28.3 | |
| | | | | | | | | | | | | | | |
| | | | | | | Health Care: 11.0% | | | | | | | | |
| | 76,703 | | | | | AbbVie, Inc. | | | 4,543,886 | | | | 0.8 | |
| | 36,503 | | | | | Anthem, Inc. | | | 5,089,978 | | | | 0.9 | |
| | 54,001 | | | @ | | Express Scripts Holding Co. | | | 4,720,227 | | | | 0.9 | |
| | 50,704 | | | @ | | GlaxoSmithKline PLC ADR | | | 2,045,906 | | | | 0.4 | |
| | 53,790 | | | @ | | Medtronic PLC | | | 4,137,527 | | | | 0.8 | |
| | 199,703 | | | | | Merck & Co., Inc. | | | 10,548,313 | | | | 2.0 | |
| | 83,902 | | | | | Novartis AG | | | 7,217,189 | | | | 1.3 | |
| | 285,385 | | | | | Pfizer, Inc. | | | 9,212,228 | | | | 1.7 | |
| | 139,867 | | | | | Roche Holding AG ADR | | | 4,821,216 | | | | 0.9 | |
| | 159,237 | | | | | Sanofi-Aventis SA ADR | | | 6,791,458 | | | | 1.3 | |
| | | | | | | | | | 59,127,928 | | | | 11.0 | |
| | | | | | | | | | | | | | | |
| | | | | | | Industrials: 6.9% | | | | | | | | |
| | 108,592 | | | | | Caterpillar, Inc. | | | 7,379,912 | | | | 1.4 | |
| | 159,152 | | | | | Emerson Electric Co. | | | 7,612,240 | | | | 1.4 | |
| | 398,910 | | | | | General Electric Co. | | | 12,426,046 | | | | 2.3 | |
| | 56,244 | | | | | Ingersoll-Rand PLC - Class A | | | 3,109,731 | | | | 0.6 | |
| | 148,773 | | | | | Textron, Inc. | | | 6,249,954 | | | | 1.2 | |
| | | | | | | | | | 36,777,883 | | | | 6.9 | |
| | | | | | | | | | | | | | | |
| | | | | | | Information Technology: 12.8% | | | | | | | | |
| | 466,738 | | | | | Cisco Systems, Inc. | | | 12,674,270 | | | | 2.4 | |
| | 52,734 | | | @ | | Citrix Systems, Inc. | | | 3,989,327 | | | | 0.8 | |
| | 181,802 | | | | | Corning, Inc. | | | 3,323,341 | | | | 0.6 | |
| | 255,299 | | | | | eBay, Inc. | | | 7,015,617 | | | | 1.3 | |
| | 68,177 | | | | | Hewlett Packard Enterprise Co. | | | 1,036,290 | | | | 0.2 | |
| | 223,642 | | | | | HP, Inc. | | | 2,647,921 | | | | 0.5 | |
| | 153,868 | | | | | Intel Corp. | | | 5,300,753 | | | | 1.0 | |
| | 162,036 | | | | | Microsoft Corp. | | | 8,989,757 | | | | 1.7 | |
| | 284,639 | | | | | NetApp, Inc. | | | 7,551,473 | | | | 1.4 | |
| | 142,325 | | | @ | | PayPal Holdings, Inc. | | | 5,152,165 | | | | 1.0 | |
| | 364,562 | | | | | Symantec Corp. | | | 7,655,802 | | | | 1.4 | |
| | 87,715 | | | @ | | Yahoo!, Inc. | | | 2,917,401 | | | | 0.5 | |
| | | | | | | | | | 68,254,117 | | | | 12.8 | |
| | | | | | | | | | | | | | | |
| | | | | | | Materials: 1.7% | | | | | | | | |
| | 441,529 | | | | | Alcoa, Inc. | | | 4,357,891 | | | | 0.8 | |
| | 127,108 | | | | | International Paper Co. | | | 4,791,972 | | | | 0.9 | |
| | | | | | | | | | 9,149,863 | | | | 1.7 | |
| | | | | | | | | | | | | | | |
| | | | | | | Telecommunication Services: 0.7% | | | | | | | | |
| | 846,306 | | | | | Frontier Communications Corp. | | | 3,952,249 | | | | 0.7 | |
| | | | | | | | | | | | | | | |
| | | | | | | Utilities: 1.1% | | | | | | | | |
| | 75,784 | | | | | FirstEnergy Corp. | | | 2,404,626 | | | | 0.4 | |
| | 65,351 | | | | | PG&E Corp. | | | 3,476,020 | | | | 0.7 | |
| | | | | | | | | | 5,880,646 | | | | 1.1 | |
| | | | | | | | | | | | | | | |
| | | | | Total Common Stock | | | | | | | | |
| | | | | (Cost $466,305,430) | | | 507,905,196 | | | | 94.9 | |
| VY® Invesco Comstock Portfolio | PORTFOLIO OF INVESTMENTS
as of December 31, 2015 (continued) |
Principal
Amount† | | | | | | | Value | | | Percentage
of Net
Assets | |
| SHORT-TERM INVESTMENTS: 5.3% | | | | | | | |
| | | | | | | Securities Lending Collateralcc: 0.5% | | | | | | | | |
| | 490,134 | | | | | HSBC Securities USA, Repurchase Agreement dated 12/31/15, 0.29%, due 01/04/16 (Repurchase Amount $490,150, collateralized by various U.S. Government Securities, 3.000%, Market Value plus accrued interest $499,938, due 11/15/44) | | | 490,134 | | | | 0.1 | |
| | 1,000,000 | | | | | Millenium Fixed Income Ltd., Repurchase Agreement dated 12/31/15, 0.37%, due 01/04/16 (Repurchase Amount $1,000,041, collateralized by various U.S. Government Securities, 1.500%-3.625%, Market Value plus accrued interest $1,020,000, due 03/31/21-02/15/44) | | | 1,000,000 | | | | 0.2 | |
| | 1,000,000 | | | | | Nomura Securities, Repurchase Agreement dated 12/31/15, 0.33%, due 01/04/16 (Repurchase Amount $1,000,036, collateralized by various U.S. Government/U.S. Government Agency Obligations, 0.000%-10.500%, Market Value plus accrued interest $1,020,000, due 01/15/16-10/20/65) | | | 1,000,000 | | | | 0.2 | |
| | | | | | | | | | 2,490,134 | | | | 0.5 | |
| Shares | | | | | | | Value | | | Percentage
of Net
Assets | |
| | | | | | | Mutual Funds: 4.8% | | | | | | | | |
| | 26,009,739 | | | | | BlackRock Liquidity Funds, TempFund, Institutional Class, 0.270%†† | | | | | | | | |
| | | | | | | (Cost $26,009,739) | | | 26,009,739 | | | | 4.8 | |
| | | | | | | | | | | | | | | |
| | | | | Total Short-Term Investments | | | | | | | | |
| | | | | (Cost $28,499,873) | | | 28,499,873 | | | | 5.3 | |
| | | | | | | | | | | | | | | |
| | | | | Total Investments in Securities
(Cost $494,805,303) | | $ | 536,405,069 | | | | 100.2 | |
| | | | | Liabilities in Excess of Other Assets | | | (859,468 | ) | | | (0.2 | ) |
| | | | | Net Assets | | $ | 535,545,601 | | | | 100.0 | |
| † | Unless otherwise indicated, principal amount is shown in USD. |
| †† | Rate shown is the 7-day yield as of December 31, 2015. |
| @ | Non-income producing security. |
| ADR | American Depositary Receipt |
| cc | Represents securities purchased with cash collateral received for securities on loan. |
| L | Loaned security, a portion or all of the security is on loan at December 31, 2015. |
| | Cost for federal income tax purposes is $505,619,061. | |
| Net unrealized appreciation consists of: | | | | |
| | | | | |
| Gross Unrealized Appreciation | | $ | 79,898,562 | |
| Gross Unrealized Depreciation | | | (49,112,554 | ) |
| | | | | |
| Net Unrealized Appreciation | | $ | 30,786,008 | |
| VY® Invesco Equity and Income Portfolio | PORTFOLIO OF INVESTMENTS |
| as of December 31, 2015 |
| Shares | | | | | | | Value | | | Percentage
of Net
Assets | |
| COMMON STOCK: 64.2% | | | | | | | | |
| | | | | | | Consumer Discretionary: 5.8% | | | | | | | | |
| | 450,810 | | | | | Carnival Corp. | | | 24,560,129 | | | | 1.3 | |
| | 66,626 | | | | | CBS Corp. - Class B | | | 3,140,083 | | | | 0.2 | |
| | 288,175 | | | | | Comcast Corp. – Class A | | | 16,261,715 | | | | 0.9 | |
| | 315,428 | | | | | General Motors Co. | | | 10,727,706 | | | | 0.6 | |
| | 298,043 | | | | | Target Corp. | | | 21,640,902 | | | | 1.2 | |
| | 221,664 | | | | | Thomson Reuters Corp. | | | 8,395,903 | | | | 0.5 | |
| | 62,917 | | | | | Time Warner Cable, Inc. | | | 11,676,766 | | | | 0.6 | |
| | 132,955 | | | | | Time Warner, Inc. | | | 8,598,200 | | | | 0.5 | |
| | | | | | | | | | 105,001,404 | | | | 5.8 | |
| | | | | | | | | | | | | | | |
| | | | | | | Consumer Staples: 5.0% | | | | | | | | |
| | 334,583 | | | | | Archer-Daniels-Midland Co. | | | 12,272,504 | | | | 0.7 | |
| | 364,734 | | | | | Mondelez International, Inc. | | | 16,354,673 | | | | 0.9 | |
| | 198,395 | | | | | Philip Morris International, Inc. | | | 17,440,904 | | | | 1.0 | |
| | 200,739 | | | | | Procter & Gamble Co. | | | 15,940,684 | | | | 0.9 | |
| | 235,399 | | | | | Sysco Corp. | | | 9,651,359 | | | | 0.5 | |
| | 304,985 | | | | | Wal-Mart Stores, Inc. | | | 18,695,581 | | | | 1.0 | |
| | | | | | | | | | 90,355,705 | | | | 5.0 | |
| | | | | | | | | | | | | | | |
| | | | | | | Energy: 6.9% | | | | | | | | |
| | 110,508 | | | | | Anadarko Petroleum Corp. | | | 5,368,479 | | | | 0.3 | |
| | 431,857 | | | | | Apache Corp. | | | 19,204,681 | | | | 1.1 | |
| | 250,281 | | | | | Baker Hughes, Inc. | | | 11,550,468 | | | | 0.6 | |
| | 501,465 | | | L | | Canadian Natural Resources Ltd. | | | 10,951,993 | | | | 0.6 | |
| | 313,362 | | | | | Devon Energy Corp. | | | 10,027,584 | | | | 0.5 | |
| | 138,120 | | | | | Exxon Mobil Corp. | | | 10,766,454 | | | | 0.6 | |
| | 179,093 | | | | | Occidental Petroleum Corp. | | | 12,108,478 | | | | 0.7 | |
| | 951,911 | | | | | Royal Dutch Shell PLC - Class A | | | 21,560,113 | | | | 1.2 | |
| | 300,639 | | | L | | Total S.A. | | | 13,478,137 | | | | 0.7 | |
| | 1,235,632 | | | @ | | Weatherford International PLC | | | 10,366,952 | | | | 0.6 | |
| | | | | | | | | | 125,383,339 | | | | 6.9 | |
| | | | | | | | | | | | | | | |
| | | | | | | Financials: 20.4% | | | | | | | | |
| | 136,449 | | | | | Aon PLC | | | 12,581,962 | | | | 0.7 | |
| | 2,084,928 | | | | | Bank of America Corp. | | | 35,089,338 | | | | 1.9 | |
| | 282,115 | | | | | BB&T Corp. | | | 10,666,768 | | | | 0.6 | |
| | 407,467 | | | | | Charles Schwab Corp. | | | 13,417,888 | | | | 0.7 | |
| | 1,071,888 | | | | | Citigroup, Inc. | | | 55,470,204 | | | | 3.1 | |
| | 869,395 | | | | | Citizens Financial Group, Inc. | | | 22,769,455 | | | | 1.3 | |
| | 90,208 | | | | | CME Group, Inc. | | | 8,172,845 | | | | 0.5 | |
| | 268,108 | | | | | Comerica, Inc. | | | 11,214,958 | | | | 0.6 | |
| | 661,617 | | | | | Fifth Third Bancorp | | | 13,298,502 | | | | 0.7 | |
| | 546,950 | | | | | First Horizon National Corp. | | | 7,941,714 | | | | 0.4 | |
| | 72,494 | | | | | Goldman Sachs Group, Inc. | | | 13,065,594 | | | | 0.7 | |
| | 868,509 | | | | | JPMorgan Chase & Co. | | | 57,347,649 | | | | 3.2 | |
| | 240,571 | | | | | Marsh & McLennan Cos., Inc. | | | 13,339,662 | | | | 0.7 | |
| | 897,048 | | | | | Morgan Stanley | | | 28,535,097 | | | | 1.6 | |
| | 188,028 | | | | | Northern Trust Corp. | | | 13,554,938 | | | | 0.8 | |
| | 247,590 | | | | | PNC Financial Services Group, Inc. | | | 23,597,803 | | | | 1.3 | |
| | 254,805 | | | | | State Street Corp. | | | 16,908,860 | | | | 0.9 | |
| | 246,112 | | | | | Willis Group Holdings PLC | | | 11,953,660 | | | | 0.7 | |
| | | | | | | | | | 368,926,897 | | | | 20.4 | |
| | | | | | | | | | | | | | | |
| | | | | | | Health Care: 9.1% | | | | | | | | |
| | 74,555 | | | | | Amgen, Inc. | | | 12,102,513 | | | | 0.7 | |
| | 67,019 | | | | | Anthem, Inc. | | | 9,345,129 | | | | 0.5 | |
| | 72,360 | | | | | Baxalta, Inc. | | | 2,824,211 | | | | 0.1 | |
| | 304,172 | | | | | Baxter International, Inc. | | | 11,604,162 | | | | 0.6 | |
| | 166,656 | | | | | Eli Lilly & Co. | | | 14,042,435 | | | | 0.8 | |
| | 117,330 | | | @ | | Express Scripts Holding Co. | | | 10,255,815 | | | | 0.6 | |
| | 218,444 | | | | | Medtronic PLC | | | 16,802,713 | | | | 0.9 | |
| | 405,137 | | | | | Merck & Co., Inc. | | | 21,399,336 | | | | 1.2 | |
| | 193,652 | | | | | Novartis AG | | | 16,657,805 | | | | 0.9 | |
| | 387,437 | | | | | Pfizer, Inc. | | | 12,506,466 | | | | 0.7 | |
| | 137,545 | | | | | Sanofi | | | 11,721,890 | | | | 0.7 | |
| | 252,967 | | | | | Teva Pharmaceutical Industries Ltd. ADR | | | 16,604,754 | | | | 0.9 | |
| | 74,858 | | | | | UnitedHealth Group, Inc. | | | 8,806,295 | | | | 0.5 | |
| | | | | | | | | | 164,673,524 | | | | 9.1 | |
| | | | | | | | | | | | | | | |
| | | | | | | Industrials: 5.5% | | | | | | | | |
| | 122,490 | | | | | Caterpillar, Inc. | | | 8,324,420 | | | | 0.5 | |
| | 418,717 | | | | | CSX Corp. | | | 10,865,706 | | | | 0.6 | |
| | 110,678 | | | | | General Dynamics Corp. | | | 15,202,730 | | | | 0.8 | |
| | 1,448,783 | | | | | General Electric Co. | | | 45,129,590 | | | | 2.5 | |
| | 177,009 | | | | | Ingersoll-Rand PLC - Class A | | | 9,786,828 | | | | 0.5 | |
| | 353,214 | | | | | Tyco International Plc | | | 11,263,995 | | | | 0.6 | |
| | | | | | | | | | 100,573,269 | | | | 5.5 | |
| | | | | | | | | | | | | | | |
| | | | | | | Information Technology: 8.3% | | | | | | | | |
| | 146,977 | | | | | Amdocs Ltd. | | | 8,020,535 | | | | 0.5 | |
| | 692,396 | | | | | Applied Materials, Inc. | | | 12,927,033 | | | | 0.7 | |
| | 706,708 | | | | | Cisco Systems, Inc. | | | 19,190,656 | | | | 1.1 | |
| | 147,168 | | | @ | | Citrix Systems, Inc. | | | 11,133,259 | | | | 0.6 | |
| | 457,224 | | | | | eBay, Inc. | | | 12,564,515 | | | | 0.7 | |
| | 471,121 | | | | | Intel Corp. | | | 16,230,118 | | | | 0.9 | |
| | 511,458 | | | | | Juniper Networks, Inc. | | | 14,116,241 | | | | 0.8 | |
| | 305,449 | | | | | Microsoft Corp. | | | 16,946,311 | | | | 0.9 | |
| | 418,790 | | | | | NetApp, Inc. | | | 11,110,499 | | | | 0.6 | |
| | 365,614 | | | @ | | PayPal Holdings, Inc. | | | 13,235,227 | | | | 0.7 | |
| | 296,188 | | | | | Qualcomm, Inc. | | | 14,804,957 | | | | 0.8 | |
| | | | | | | | | | 150,279,351 | | | | 8.3 | |
| | | | | | | | | | | | | | | |
| | | | | | | Materials: 0.4% | | | | | | | | |
| | 267,082 | | | | | Mosaic Co. | | | 7,368,792 | | | | 0.4 | |
| | | | | | | | | | | | | | | |
| | | | | | | Telecommunication Services: 1.8% | | | | | | | | |
| | 204,718 | | | | | Orange SA | | | 3,424,076 | | | | 0.2 | |
| | 915,795 | | | @ | | Koninklijke KPN NV | | | 3,463,889 | | | | 0.2 | |
| | 1,912,551 | | | L | | Telecom Italia S.p.A. - TIT | | | 2,423,817 | | | | 0.1 | |
| | 182,275 | | | @ | | Telefonica S.A. | | | 2,022,156 | | | | 0.1 | |
| | 207,829 | | | | | Verizon Communications, Inc. | | | 9,605,856 | | | | 0.5 | |
| | 367,015 | | | | | Vodafone Group PLC ADR | | | 11,839,904 | | | | 0.7 | |
| | | | | | | | | | 32,779,698 | | | | 1.8 | |
| VY® Invesco Equity and Income Portfolio | PORTFOLIO OF INVESTMENTS |
| as of December 31, 2015 (continued) |
| Shares | | | | | | | Value | | | Percentage
of Net
Assets | |
| COMMON STOCK: (continued) | | | | | | | | |
| | | | | | | Utilities: 1.0% | | | | | | | | |
| | 305,593 | | | | | FirstEnergy Corp. | | | 9,696,466 | | | | 0.5 | |
| | 170,378 | | | | | PG&E Corp. | | | 9,062,406 | | | | 0.5 | |
| | | | | | | | | | 18,758,872 | | | | 1.0 | |
| | | | | | | | | | | | | | | |
| | | | | Total Common Stock
(Cost $1,154,435,740) | | | 1,164,100,851 | | | | 64.2 | |
| | | | | | | | | | | | | | | |
| PREFERRED STOCK: 1.0% | | | | | | | | |
| | | | | | | Energy: 0.3% | | | | | | | | |
| | 140,612 | | | P | | El Paso Energy Capital Trust I | | | 5,791,457 | | | | 0.3 | |
| | | | | | | | | | | | | | | |
| | | | | | | Financials: 0.7% | | | | | | | | |
| | 68,900 | | | | | AMG Capital Trust II | | | 3,884,237 | | | | 0.3 | |
| | 56,155 | | | | | Keycorp | | | 7,446,153 | | | | 0.4 | |
| | 4,467 | | | P | | State Street Corp. | | | 123,647 | | | | 0.0 | |
| | 4,000 | | | P | | Wells Fargo & Co. | | | 104,480 | | | | 0.0 | |
| | | | | | | | | | 11,558,517 | | | | 0.7 | |
| | | | | | | | | | | | | | | |
| | | | | Total Preferred Stock
(Cost $16,606,816) | | | 17,349,974 | | | | 1.0 | |
Principal
Amount† | | | | | | | Value | | | Percentage
of Net
Assets | |
| CORPORATE BONDS/NOTES: 19.8% | | | | |
| | | | | | | Basic Materials: 0.3% | | | | | | | | |
| | 80,000 | | | | | ArcelorMittal, 7.500%, 03/01/41 | | | 54,500 | | | | 0.0 | |
| | 460,000 | | | | | ArcelorMittal, 10.600%, 06/01/19 | | | 433,550 | | | | 0.0 | |
| | 1,320,000 | | | | | Eastman Chemical Co., 2.700%, 01/15/20 | | | 1,308,734 | | | | 0.1 | |
| | 195,000 | | | | | International Paper Co., 6.000%, 11/15/41 | | | 205,169 | | | | 0.0 | |
| | 315,000 | | | | | Monsanto Co., 2.125%, 07/15/19 | | | 314,891 | | | | 0.0 | |
| | 770,000 | | | # | | Montell Finance Co. BV, 8.100%, 03/15/27 | | | 961,925 | | | | 0.1 | |
| | 150,000 | | | | | Rio Tinto Finance USA Ltd., 7.125%, 07/15/28 | | | 177,264 | | | | 0.0 | |
| | 335,000 | | | | | Rio Tinto Finance USA Ltd., 9.000%, 05/01/19 | | | 391,416 | | | | 0.0 | |
| | 726,000 | | | # | | Solvay Finance America LLC, 4.450%, 12/03/25 | | | 718,160 | | | | 0.1 | |
| | 835,000 | | | | | Sunoco Logistics Partner, 5.300%, 04/01/44 | | | 623,353 | | | | 0.0 | |
| | 550,000 | | | | | Sunoco Logistics Partner, 5.500%, 02/15/30 | | | 571,000 | | | | 0.0 | |
| | | | | | | | | | 5,759,962 | | | | 0.3 | |
| | | | | | | | | | | | | | | |
| | | | | | | Communications: 2.4% | | | | | | | | |
| | 225,000 | | | | | America Movil S.A.B de CV, 2.375%, 09/08/16 | | | 225,945 | | | | 0.0 | |
| | 455,000 | | | | | America Movil S.A.B de CV, 4.375%, 07/16/42 | | | 403,687 | | | | 0.0 | |
| | 466,000 | | | | | AT&T, Inc., 3.400%, 05/15/25 | | | 448,813 | | | | 0.0 | |
| | 837,000 | | | | | AT&T, Inc., 3.000%, 06/30/22 | | | 815,397 | | | | 0.0 | |
| | 747,000 | | | | | AT&T, Inc., 4.500%, 05/15/35 | | | 693,110 | | | | 0.0 | |
| | 101,000 | | | | | AT&T, Inc., 5.350%, 09/01/40 | | | 100,095 | | | | 0.0 | |
| | 270,000 | | | | | AT&T, Inc., 6.150%, 09/15/34 | | | 288,609 | | | | 0.0 | |
| | 365,000 | | | | | British Telecommunications PLC, 1.250%, 02/14/17 | | | 363,387 | | | | 0.0 | |
| | 1,635,000 | | | # | | CCO Safari II LLC, 4.464%, 07/23/22 | | | 1,631,143 | | | | 0.1 | |
| | 2,421,000 | | | | | Ciena Corp., 4.000%, 12/15/20 | | | 3,156,379 | | | | 0.2 | |
| | 1,115,000 | | | | | Comcast Corp., 4.400%, 08/15/35 | | | 1,123,869 | | | | 0.1 | |
| | 1,019,000 | | | | | Comcast Corp., 5.700%, 05/15/18 | | | 1,114,337 | | | | 0.1 | |
| | 135,000 | | | | | Comcast Corp., 6.450%, 03/15/37 | | | 168,330 | | | | 0.0 | |
| | 340,000 | | | # | | Cox Communications, Inc., 4.700%, 12/15/42 | | | 258,930 | | | | 0.0 | |
| | 1,210,000 | | | # | | Cox Communications, Inc., 8.375%, 03/01/39 | | | 1,336,276 | | | | 0.1 | |
| | 2,700,000 | | | # | | Crown Castle Towers, LLC, 4.883%, 08/15/20 | | | 2,894,108 | | | | 0.2 | |
| | 435,000 | | | # | | Crown Castle Towers, LLC, 6.113%, 01/15/40 | | | 475,736 | | | | 0.0 | |
| | 505,000 | | | | | DIRECTV Holdings LLC / DIRECTV Financing Co., Inc., 3.800%, 03/15/22 | | | 509,196 | | | | 0.0 | |
| | 2,960,000 | | | | | DIRECTV Holdings LLC / DIRECTV Financing Co., Inc., 5.150%, 03/15/42 | | | 2,767,334 | | | | 0.2 | |
| | 1,576,000 | | | # | | FireEye, Inc., 1.000%, 06/01/35 | | | 1,348,465 | | | | 0.1 | |
| | 1,576,000 | | | # | | FireEye, Inc., 1.625%, 06/01/35 | | | 1,271,635 | | | | 0.1 | |
| | 285,000 | | | | | Interpublic Group of Cos., Inc., 2.250%, 11/15/17 | | | 284,268 | | | | 0.0 | |
| | 4,912,000 | | | | | JDS Uniphase Corp., 0.625%, 08/15/33 | | | 4,626,490 | | | | 0.3 | |
| | 2,419,000 | | | | | Liberty Interactive LLC, 0.750%, 03/30/43 | | | 3,649,666 | | | | 0.2 | |
| | 9,559,000 | | | | | Liberty Media Corp., 1.375%, 10/15/23 | | | 9,409,641 | | | | 0.5 | |
| | 125,000 | | | | | NBCUniversal Media, LLC, 5.150%, 04/30/20 | | | 139,704 | | | | 0.0 | |
| | 210,000 | | | | | NBCUniversal Media, LLC, 5.950%, 04/01/41 | | | 251,687 | | | | 0.0 | |
| | 415,000 | | | | | Rogers Communications, Inc., 4.500%, 03/15/43 | | | 387,483 | | | | 0.0 | |
| | 370,000 | | | | | Telefonica Emisones SAU, 7.045%, 06/20/36 | | | 446,040 | | | | 0.0 | |
| | 535,000 | | | | | Verizon Communications, Inc., 4.400%, 11/01/34 | | | 495,141 | | | | 0.0 | |
| | 1,058,000 | | | | | Verizon Communications, Inc., 4.522%, 09/15/48 | | | 949,890 | | | | 0.1 | |
| | 467,000 | | | | | Verizon Communications, Inc., 5.012%, 08/21/54 | | | 429,226 | | | | 0.0 | |
| | 745,000 | | | | | Verizon Communications, Inc., 5.150%, 09/15/23 | | | 820,396 | | | | 0.1 | |
| | 280,000 | | | | | Verizon Communications, Inc., 6.400%, 02/15/38 | | | 320,106 | | | | 0.0 | |
| VY® Invesco Equity and Income Portfolio | PORTFOLIO OF INVESTMENTS |
| as of December 31, 2015 (continued) |
Principal
Amount† | | | | | | | Value | | | Percentage
of Net
Assets | |
| CORPORATE BONDS/NOTES: (continued) | | | | |
| | | | | | | Communications: (continued) | | | | | | | | |
| | 559,000 | | | | | Viacom, Inc., 4.850%, 12/15/34 | | | 457,799 | | | | 0.0 | |
| | | | | | | | | | 44,062,318 | | | | 2.4 | |
| | | | | | | | | | | | | | | |
| | | | | | | Consumer, Cyclical: 1.3% | | | | | | | | |
| | 450,000 | | | | | Advance Auto Parts, Inc., 4.500%, 12/01/23 | | | 459,778 | | | | 0.0 | |
| | 387,000 | | | | | Advance Auto Parts, Inc., 5.750%, 05/01/20 | | | 420,166 | | | | 0.0 | |
| | 711,077 | | | | | American Airlines 2014-1 Class A Pass Through Trust, 3.700%, 10/01/26 | | | 712,393 | | | | 0.1 | |
| | 315,000 | | | | | Cintas Corp. No 2, 2.850%, 06/01/16 | | | 316,267 | | | | 0.0 | |
| | 375,562 | | | | | Continental Airlines 2009-1 Pass Through Trust, 9.000%, 01/08/18 | | | 387,862 | | | | 0.0 | |
| | 226,580 | | | | | Continental Airlines 2010-1 Class A Pass Through Trust, 4.750%, 07/15/22 | | | 238,759 | | | | 0.0 | |
| | 350,781 | | | | | Continental Airlines 2012-1 Class A Pass Thru Trusts, 4.150%, 04/11/24 | | | 360,340 | | | | 0.0 | |
| | 626,632 | | | | | CVS Pass-Through Trust, 6.036%, 12/10/28 | | | 689,683 | | | | 0.0 | |
| | 620,000 | | | | | CVS Caremark Corp., 3.375%, 08/12/24 | | | 615,025 | | | | 0.0 | |
| | 149,016 | | | | | Delta Air Lines 2010-1 Class A Pass Through Trust, 6.200%, 01/02/20 | | | 159,820 | | | | 0.0 | |
| | 595,000 | | | | | Dollar General Corp., 3.250%, 04/15/23 | | | 567,586 | | | | 0.0 | |
| | 1,056,000 | | | | | Ford Motor Credit Co. LLC, 4.134%, 08/04/25 | | | 1,054,856 | | | | 0.1 | |
| | 2,040,000 | | | | | Ford Motor Credit Co. LLC, 2.500%, 01/15/16 | | | 2,040,473 | | | | 0.1 | |
| | 1,284,000 | | | # | | GNC Holdings, Inc., 1.500%, 08/15/20 | | | 1,034,422 | | | | 0.1 | |
| | 2,035,000 | | | | | Iconix Brand Group, Inc., 1.500%, 03/15/18 | | | 1,007,325 | | | | 0.1 | |
| | 1,526,000 | | | | | Iconix Brand Group, Inc., 2.500%, 06/01/16 | | | 1,373,400 | | | | 0.1 | |
| | 2,815,000 | | | | | Johnson Controls, Inc., 5.500%, 01/15/16 | | | 2,818,068 | | | | 0.2 | |
| | 725,000 | | | | | MDC Holdings, Inc., 6.000%, 01/15/43 | | | 576,375 | | | | 0.0 | |
| | 1,460,000 | | | | | QVC, Inc., 5.450%, 08/15/34 | | | 1,266,397 | | | | 0.1 | |
| | 594,000 | | | | | Ross Stores, Inc., 3.375%, 09/15/24 | | | 585,797 | | | | 0.0 | |
| | 645,000 | | | | | Target Corp., 2.900%, 01/15/22 | | | 656,658 | | | | 0.0 | |
| | 2,190,000 | | | | | Target Corp., 5.875%, 07/15/16 | | | 2,247,032 | | | | 0.1 | |
| | 885,000 | | | | | United Airlines 2014-2 Class A Pass Through Trust, 3.750%, 03/03/28 | | | 893,894 | | | | 0.1 | |
| | 1,362,327 | | | # | | Virgin Australia 2013-1A Trust, 5.000%, 04/23/25 | | | 1,408,306 | | | | 0.1 | |
| | 1,000,000 | | | | | Walgreens Boots Alliance, Inc., 3.300%, 11/18/21 | | | 982,452 | | | | 0.1 | |
| | 737,000 | | | | | Walgreens Boots Alliance, Inc., 4.500%, 11/18/34 | | | 675,115 | | | | 0.0 | |
| | 375,000 | | | | | Wal-Mart Stores, Inc., 3.300%, 04/22/24 | | | 387,669 | | | | 0.0 | |
| | 50,000 | | | | | Wal-Mart Stores, Inc., 6.500%, 08/15/37 | | | 64,722 | | | | 0.0 | |
| | 135,000 | | | | | Wyndham Worldwide Corp., 2.950%, 03/01/17 | | | 135,861 | | | | 0.0 | |
| | | | | | | | | | 24,136,501 | | | | 1.3 | |
| | | | | | | | | | | | | | | |
| | | | | | | Consumer, Non-cyclical: 4.7% | | | | | | | | |
| | 1,137,000 | | | | | AbbVie, Inc., 4.500%, 05/14/35 | | | 1,116,776 | | | | 0.1 | |
| | 1,455,000 | | | | | Actavis Funding SCS, 1.850%, 03/01/17 | | | 1,458,070 | | | | 0.1 | |
| | 985,000 | | | | | Actavis Funding SCS, 4.850%, 06/15/44 | | | 978,709 | | | | 0.1 | |
| | 610,000 | | | | | Aetna, Inc., 3.950%, 09/01/20 | | | 643,163 | | | | 0.0 | |
| | 1,430,000 | | | | | Allergan, Inc., 5.750%, 04/01/16 | | | 1,441,673 | | | | 0.1 | |
| | 1,130,000 | | | | | Amgen, Inc., 2.300%, 06/15/16 | | | 1,136,612 | | | | 0.1 | |
| | 1,285,000 | | | | | Anheuser-Busch InBev Worldwide, Inc., 2.875%, 02/15/16 | | | 1,287,467 | | | | 0.1 | |
| | 981,000 | | | # | | Bayer US Finance LLC, 3.000%, 10/08/21 | | | 990,627 | | | | 0.1 | |
| | 530,000 | | | | | Becton Dickinson and Co., 1.750%, 11/08/16 | | | 532,797 | | | | 0.0 | |
| | 507,000 | | | | | Becton Dickinson and Co., 2.675%, 12/15/19 | | | 510,377 | | | | 0.0 | |
| | 715,000 | | | | | Becton Dickinson and Co., 3.875%, 05/15/24 | | | 726,080 | | | | 0.0 | |
| | 435,000 | | | | | Becton Dickinson and Co., 4.875%, 05/15/44 | | | 441,092 | | | | 0.0 | |
| | 3,611,000 | | | | | BioMarin Pharmaceutical, Inc., 1.500%, 10/15/20 | | | 4,843,254 | | | | 0.3 | |
| | 4,224,000 | | | | | Brookdale Senior Living, Inc., 2.750%, 06/15/18 | | | 4,221,360 | | | | 0.2 | |
| | 1,445,000 | | | | | Celgene Corp., 4.625%, 05/15/44 | | | 1,370,087 | | | | 0.1 | |
| | 325,000 | | | | | Celgene Corp., 4.000%, 08/15/23 | | | 334,261 | | | | 0.0 | |
| | 260,000 | | | | | Celgene Corp., 5.000%, 08/15/45 | | | 261,994 | | | | 0.0 | |
| | 750,000 | | | | | Coca-Cola Co., 1.800%, 09/01/16 | | | 754,867 | | | | 0.0 | |
| | 910,000 | | | | | ConAgra Foods, Inc., 1.300%, 01/25/16 | | | 910,146 | | | | 0.1 | |
| | 240,000 | | | | | Corn Products International, Inc., 6.625%, 04/15/37 | | | 283,335 | | | | 0.0 | |
| | 2,405,000 | | | | | Dr Pepper Snapple Group, Inc., 2.900%, 01/15/16 | | | 2,405,909 | | | | 0.1 | |
| | 493,000 | | | | | Edwards Lifesciences Corp., 2.875%, 10/15/18 | | | 499,149 | | | | 0.0 | |
| | 965,000 | | | # | | ERAC USA Finance LLC, 2.350%, 10/15/19 | | | 952,272 | | | | 0.1 | |
| | 420,000 | | | | | Express Scripts Holding Co., 2.250%, 06/15/19 | | | 417,914 | | | | 0.0 | |
| | 2,285,000 | | | | | Express Scripts, Inc., 3.125%, 05/15/16 | | | 2,300,479 | | | | 0.1 | |
| | 1,400,000 | | | | | General Mills, Inc., 0.875%, 01/29/16 | | | 1,399,857 | | | | 0.1 | |
| | 1,400,000 | | | | | General Mills, Inc., 2.200%, 10/21/19 | | | 1,401,702 | | | | 0.1 | |
| | 500,000 | | | | | Gilead Sciences, Inc., 3.050%, 12/01/16 | | | 508,518 | | | | 0.0 | |
| VY® Invesco Equity and Income Portfolio | PORTFOLIO OF INVESTMENTS |
| as of December 31, 2015 (continued) |
Principal
Amount† | | | | | | | Value | | | Percentage
of Net
Assets | |
| CORPORATE BONDS/NOTES: (continued) | | | | |
| | | | | | | Consumer, Non-cyclical: (continued) | | | | | | | | |
| | 755,000 | | | | | Gilead Sciences, Inc., 4.400%, 12/01/21 | | | 816,135 | | | | 0.1 | |
| | 80,000 | | | | | GlaxoSmithKline Capital, Inc., 6.375%, 05/15/38 | | | 102,299 | | | | 0.0 | |
| | 785,000 | | | # | | Grupo Bimbo SAB de CV, 3.875%, 06/27/24 | | | 765,651 | | | | 0.1 | |
| | 4,573,000 | | | | | HealthSouth Corp., 2.000%, 12/01/43 | | | 4,950,272 | | | | 0.3 | |
| | 1,644,000 | | | # | | HJ Heinz Co., 1.600%, 06/30/17 | | | 1,639,954 | | | | 0.1 | |
| | 2,410,000 | | | L | | Jazz Investments I Ltd., 1.875%, 08/15/21 | | | 2,533,512 | | | | 0.1 | |
| | 963,000 | | | | | Laboratory Corp. of America Holdings, 3.200%, 02/01/22 | | | 946,767 | | | | 0.1 | |
| | 423,000 | | | | | Laboratory Corp. of America Holdings, 4.700%, 02/01/45 | | | 389,919 | | | | 0.0 | |
| | 1,768,000 | | | | | Live Nation Entertainment, Inc., 2.500%, 05/15/19 | | | 1,806,675 | | | | 0.1 | |
| | 730,000 | | | | | McKesson Corp., 2.284%, 03/15/19 | | | 727,734 | | | | 0.0 | |
| | 2,760,000 | | | | | McKesson Corp., 3.250%, 03/01/16 | | | 2,770,008 | | | | 0.2 | |
| | 92,000 | | | | | Mead Johnson Nutrition Co., 4.125%, 11/15/25 | | | 92,922 | | | | 0.0 | |
| | 1,733,000 | | | | | Medtronic, Inc., 3.150%, 03/15/22 | | | 1,753,687 | | | | 0.1 | |
| | 615,000 | | | | | Medtronic, Inc., 4.375%, 03/15/35 | | | 622,546 | | | | 0.0 | |
| | 390,000 | | | | | Medtronic, Inc., 4.000%, 04/01/43 | | | 362,808 | | | | 0.0 | |
| | 2,940,000 | | | | | Merck & Co., Inc., 0.700%, 05/18/16 | | | 2,940,497 | | | | 0.2 | |
| | 1,820,000 | | | | | Mondelez International, Inc., 4.125%, 02/09/16 | | | 1,824,741 | | | | 0.1 | |
| | 630,000 | | | | | Moody's Corp., 4.500%, 09/01/22 | | | 668,644 | | | | 0.0 | |
| | 639,000 | | | | | Moodys Corp., 4.875%, 02/15/24 | | | 681,310 | | | | 0.0 | |
| | 2,201,000 | | | | | NuVasive, Inc., 2.750%, 07/01/17 | | | 3,013,994 | | | | 0.2 | |
| | 3,840,000 | | | | | PepsiCo, Inc., 2.500%, 05/10/16 | | | 3,863,589 | | | | 0.2 | |
| | 275,000 | | | | | Perrigo Co. PLC, 2.300%, 11/08/18 | | | 271,316 | | | | 0.0 | |
| | 328,000 | | | | | Philip Morris International, Inc., 1.250%, 08/11/17 | | | 328,584 | | | | 0.0 | |
| | 1,635,000 | | | | | Philip Morris International, Inc., 2.500%, 05/16/16 | | | 1,645,162 | | | | 0.1 | |
| | 275,000 | | | | | Philip Morris International, Inc., 3.600%, 11/15/23 | | | 287,024 | | | | 0.0 | |
| | 820,000 | | | | | Philip Morris International, Inc., 4.875%, 11/15/43 | | | 868,208 | | | | 0.1 | |
| | 4,315,000 | | | | | Sanofi, 2.625%, 03/29/16 | | | 4,333,624 | | | | 0.2 | |
| | 825,000 | | | | | Tupperware Brands Corp., 4.750%, 06/01/21 | | | 842,563 | | | | 0.1 | |
| | 354,000 | | | | | Tyson Foods, Inc., 4.875%, 08/15/34 | | | 362,146 | | | | 0.0 | |
| | 1,965,000 | | | | | Unilever Capital Corp., 2.750%, 02/10/16 | | | 1,968,511 | | | | 0.1 | |
| | 145,000 | | | | | Ventas Realty L.P., 5.700%, 09/30/43 | | | 159,915 | | | | 0.0 | |
| | 795,000 | | | | | Verisk Analytics, Inc., 5.500%, 06/15/45 | | | 761,666 | | | | 0.0 | |
| | 3,018,000 | | | # | | Wright Medical Group, Inc., 2.000%, 02/15/20 | | | 3,136,834 | | | | 0.2 | |
| | 2,000,000 | | | | | Zoetis, Inc., 1.150%, 02/01/16 | | | 1,999,682 | | | | 0.1 | |
| | 79,000 | | | | | Zoetis, Inc., 4.700%, 02/01/43 | | | 69,243 | | | | 0.0 | |
| | | | | | | | | | 84,436,689 | | | | 4.7 | |
| | | | | | | | | | | | | | | |
| | | | | | | Energy: 1.3% | | | | | | | | |
| | 2,284,000 | | | | | Chevron Corp., 1.365%, 03/02/18 | | | 2,266,580 | | | | 0.1 | |
| | 360,000 | | | | | Chevron Corp., 1.718%, 06/24/18 | | | 358,354 | | | | 0.0 | |
| | 2,947,000 | | | | | Cobalt International Energy, Inc., 2.625%, 12/01/19 | | | 1,681,632 | | | | 0.1 | |
| | 1,425,000 | | | | | ConocoPhillips Co., 2.875%, 11/15/21 | | | 1,385,563 | | | | 0.1 | |
| | 1,528,000 | | | | | ConocoPhillips Co., 4.150%, 11/15/34 | | | 1,326,492 | | | | 0.1 | |
| | 715,000 | | | | | Devon Energy Corp., 2.250%, 12/15/18 | | | 653,167 | | | | 0.1 | |
| | 291,000 | | | L | | Devon Energy Corp., 3.250%, 05/15/22 | | | 247,808 | | | | 0.0 | |
| | 460,000 | | | | | Enable Midstream Partners L.P., 2.400%, 05/15/19 | | | 409,080 | | | | 0.0 | |
| | 570,000 | | | | | Energy Transfer Partners L.P., 4.900%, 03/15/35 | | | 415,379 | | | | 0.0 | |
| | 3,320,000 | | | | | Enterprise Products Operating, LLC, 3.200%, 02/01/16 | | | 3,321,129 | | | | 0.2 | |
| | 175,000 | | | | | Enterprise Products Operating L.P., 5.250%, 01/31/20 | | | 184,533 | | | | 0.0 | |
| | 300,000 | | | | | Enterprise Products Operating L.P., 6.500%, 01/31/19 | | | 329,880 | | | | 0.0 | |
| | 615,000 | | | | | Enterprise Products Operating LLC, 2.550%, 10/15/19 | | | 590,324 | | | | 0.1 | |
| | 1,943,000 | | | | | Helix Energy Solutions Group, Inc., 3.250%, 03/15/32 | | | 1,541,042 | | | | 0.1 | |
| | 250,000 | | | | | Husky Energy, Inc., 3.950%, 04/15/22 | | | 232,088 | | | | 0.0 | |
| | 700,000 | | | | | Kinder Morgan, Inc./DE, 5.300%, 12/01/34 | | | 552,855 | | | | 0.0 | |
| | 570,000 | | | | | Noble Energy, Inc., 5.250%, 11/15/43 | | | 461,544 | | | | 0.0 | |
| | 130,000 | | | L | | Noble Holding International Ltd., 2.500%, 03/15/17 | | | 122,684 | | | | 0.0 | |
| | 295,000 | | | | | Plains All American Pipeline L.P. / PAA Finance Corp., 3.650%, 06/01/22 | | | 253,608 | | | | 0.0 | |
| | 371,000 | | | | | Rowan Cos, Inc., 5.400%, 12/01/42 | | | 222,408 | | | | 0.0 | |
| | 318,000 | | | | | Southwestern Energy Co., 4.100%, 03/15/22 | | | 200,407 | | | | 0.0 | |
| | 165,000 | | | | | Spectra Energy Capital, LLC, 7.500%, 09/15/38 | | | 163,950 | | | | 0.0 | |
| VY® Invesco Equity and Income Portfolio | PORTFOLIO OF INVESTMENTS |
| as of December 31, 2015 (continued) |
Principal
Amount† | | | | | | | Value | | | Percentage
of Net
Assets | |
| CORPORATE BONDS/NOTES: (continued) | | | | |
| | | | | | | Energy: (continued) | | | | | | | | |
| | 1,615,000 | | | | | Spectra Energy Partners L.P., 2.950%, 06/15/16 | | | 1,621,009 | | | | 0.1 | |
| | 858,000 | | | | | Spectra Energy Partners L.P., 4.500%, 03/15/45 | | | 661,537 | | | | 0.1 | |
| | 4,224,000 | | | L | | Stone Energy Corp., 1.750%, 03/01/17 | | | 3,141,600 | | | | 0.2 | |
| | 544,000 | | | | | Suncor Energy, Inc., 3.600%, 12/01/24 | | | 513,679 | | | | 0.0 | |
| | 215,000 | | | | | Texas Eastern Transmission LP, 7.000%, 07/15/32 | | | 236,723 | | | | 0.0 | |
| | 171,000 | | | | | Williams Partners L.P., 5.100%, 09/15/45 | | | 112,854 | | | | 0.0 | |
| | | | | | | | | | 23,207,909 | | | | 1.3 | |
| | | | | | | | | | | | | | | |
| | | | | | | Financial: 5.5% | | | | | | | | |
| | 3,445,000 | | | | | Abbey National Treasury Services PLC/London, 4.000%, 04/27/16 | | | 3,476,990 | | | | 0.2 | |
| | 1,690,000 | | | # | | ABN AMRO Bank NV, 1.375%, 01/22/16 | | | 1,691,394 | | | | 0.1 | |
| | 395,000 | | | | | American International Group, Inc., 2.300%, 07/16/19 | | | 392,028 | | | | 0.0 | |
| | 1,325,000 | | | | | Air Lease Corp., 2.625%, 09/04/18 | | | 1,310,839 | | | | 0.1 | |
| | 1,870,000 | | | | | Air Lease Corp., 4.250%, 09/15/24 | | | 1,837,275 | | | | 0.1 | |
| | 543,000 | | | | | American Express Co., 3.625%, 12/05/24 | | | 532,420 | | | | 0.0 | |
| | 1,200,000 | | | | | American Financial Group, Inc./OH, 9.875%, 06/15/19 | | | 1,458,463 | | | | 0.1 | |
| | 1,140,000 | | | | | American International Group, Inc., 4.375%, 01/15/55 | | | 983,691 | | | | 0.1 | |
| | 440,000 | | | # | | Apollo Management Holdings L.P., 4.000%, 05/30/24 | | | 435,315 | | | | 0.0 | |
| | 927,000 | | | # | | Athene Global Funding, 2.875%, 10/23/18 | | | 912,419 | | | | 0.1 | |
| | 1,475,000 | | | | | Australia & New Zealand Banking Group Ltd., 0.900%, 02/12/16 | | | 1,475,363 | | | | 0.1 | |
| | 445,000 | | | | | Bank of America Corp., 1.250%, 01/11/16 | | | 445,035 | | | | 0.0 | |
| | 500,000 | | | | | Bank of America Corp., 5.650%, 05/01/18 | | | 537,939 | | | | 0.0 | |
| | 400,000 | | | | | Bank of America Corp., 5.750%, 12/01/17 | | | 428,117 | | | | 0.0 | |
| | 525,000 | | | | | Barclays Bank PLC, 6.750%, 05/22/19 | | | 597,116 | | | | 0.0 | |
| | 1,295,000 | | | | | BB&T Corp., 3.200%, 03/15/16 | | | 1,298,561 | | | | 0.1 | |
| | 725,000 | | | # | | BBVA Bancomer SA/Texas, 4.375%, 04/10/24 | | | 717,750 | | | | 0.0 | |
| | 860,000 | | | | | BNP Paribas SA, 4.250%, 10/15/24 | | | 853,567 | | | | 0.1 | |
| | 1,023,000 | | | | | Boeing Capital Corp., 2.125%, 08/15/16 | | | 1,030,206 | | | | 0.1 | |
| | 765,000 | | | | | Brookfield Asset Management, Inc., 4.000%, 01/15/25 | | | 748,728 | | | | 0.0 | |
| | 1,930,000 | | | | | Citigroup, Inc., 4.000%, 08/05/24 | | | 1,916,216 | | | | 0.1 | |
| | 260,000 | | | | | Citigroup, Inc., 5.300%, 05/06/44 | | | 271,230 | | | | 0.0 | |
| | 560,000 | | | | | Citigroup, Inc., 6.675%, 09/13/43 | | | 689,015 | | | | 0.0 | |
| | 325,000 | | | | | CNA Financial Corp., 5.875%, 08/15/20 | | | 360,645 | | | | 0.0 | |
| | 472,000 | | | # | | Credit Suisse AG, 6.500%, 08/08/23 | | | 509,666 | | | | 0.0 | |
| | 1,540,000 | | | # | | Farmers Exchange Capital III, 5.454%, 10/15/54 | | | 1,501,907 | | | | 0.1 | |
| | 4,196,000 | | | | | Fifth Third Bancorp., 3.625%, 01/25/16 | | | 4,203,469 | | | | 0.2 | |
| | 4,011,000 | | | # | | Goldman Sachs Group, Inc., 1.000%, 03/15/17 | | | 5,726,665 | | | | 0.3 | |
| | 4,179,000 | | | # | | Goldman Sachs Group, Inc., 1.000%, 09/28/20 | | | 4,731,798 | | | | 0.3 | |
| | 820,000 | | | | | Goldman Sachs Group, Inc., 4.250%, 10/21/25 | | | 815,858 | | | | 0.1 | |
| | 355,000 | | | | | Goldman Sachs Group, Inc., 5.250%, 07/27/21 | | | 393,162 | | | | 0.0 | |
| | 465,000 | | | # | | HBOS PLC, 6.750%, 05/21/18 | | | 508,369 | | | | 0.0 | |
| | 840,000 | | | | | HCP, Inc., 3.875%, 08/15/24 | | | 815,615 | | | | 0.1 | |
| | 320,000 | | | | | HCP, Inc., 4.200%, 03/01/24 | | | 318,656 | | | | 0.0 | |
| | 500,000 | | | | | HSBC Finance Corp., 5.500%, 01/19/16 | | | 500,824 | | | | 0.0 | |
| | 1,020,000 | | | | | Intercontinental Exchange, Inc., 3.750%, 12/01/25 | | | 1,024,689 | | | | 0.1 | |
| | 4,851,000 | | | | | Jefferies Group, Inc., 3.875%, 11/01/29 | | | 4,844,936 | | | | 0.3 | |
| | 515,000 | | | | | JPMorgan Chase & Co., 4.250%, 10/01/27 | | | 515,446 | | | | 0.0 | |
| | 665,000 | | | | | JPMorgan Chase & Co., 5.000%, 12/29/49 | | | 632,581 | | | | 0.0 | |
| | 1,120,000 | | | | | JPMorgan Chase & Co., 5.300%, 12/29/49 | | | 1,118,600 | | | | 0.1 | |
| | 1,825,000 | | | | | JPMorgan Chase & Co., 6.100%, 10/29/49 | | | 1,836,589 | | | | 0.1 | |
| | 443,000 | | | # | | KKR Group Finance Co. III LLC, 5.125%, 06/01/44 | | | 434,828 | | | | 0.0 | |
| | 1,830,000 | | | | | Lazard Group LLC, 3.750%, 02/13/25 | | | 1,691,793 | | | | 0.1 | �� |
| | 2,000,000 | | | # | | Liberty Mutual Group, Inc., 4.850%, 08/01/44 | | | 1,859,470 | | | | 0.1 | |
| | 375,000 | | | | | Lloyds Bank PLC, 2.300%, 11/27/18 | | | 376,843 | | | | 0.0 | |
| | 510,000 | | | # | | Macquarie Bank Ltd., 5.000%, 02/22/17 | | | 527,608 | | | | 0.0 | |
| | 285,000 | | | | | Markel Corp., 5.000%, 03/30/43 | | | 285,054 | | | | 0.0 | |
| | 275,000 | | | | | Marsh & McLennan Cos, Inc., 4.050%, 10/15/23 | | | 284,761 | | | | 0.0 | |
| | 715,000 | | | | | MetLife, Inc., 4.600%, 05/13/46 | | | 721,337 | | | | 0.0 | |
| | 1,076,000 | | | | | MGIC Investment Corp., 2.000%, 04/01/20 | | | 1,501,020 | | | | 0.1 | |
| | 2,779,000 | | | | | MGIC Investment Corp., 5.000%, 05/01/17 | | | 2,872,791 | | | | 0.2 | |
| | 2,360,000 | | | # | | Mizuho Financial Group Cayman 3 Ltd., 4.600%, 03/27/24 | | | 2,434,836 | | | | 0.1 | |
| | 2,975,000 | | | | | Morgan Stanley, 2.375%, 07/23/19 | | | 2,968,205 | | | | 0.2 | |
| | 1,040,000 | | | | | Morgan Stanley, 4.000%, 07/23/25 | | | 1,073,983 | | | | 0.1 | |
| VY® Invesco Equity and Income Portfolio | PORTFOLIO OF INVESTMENTS |
| as of December 31, 2015 (continued) |
Principal
Amount† | | | | | | | Value | | | Percentage
of Net
Assets | |
| CORPORATE BONDS/NOTES: (continued) | | | | |
| | | | | | | Financial: (continued) | | | | | | | | |
| | 560,000 | | | | | Morgan Stanley, 6.375%, 07/24/42 | | | 694,433 | | | | 0.0 | |
| | 165,000 | | | | | National Rural Utilities Cooperative Finance Corp., 3.050%, 02/15/22 | | | 166,759 | | | | 0.0 | |
| | 1,515,000 | | | # | | Nationwide Financial Services, Inc., 5.300%, 11/18/44 | | | 1,522,372 | | | | 0.1 | |
| | 1,293,000 | | | | | Old Republic International Corp., 3.750%, 03/15/18 | | | 1,643,726 | | | | 0.1 | |
| | 400,000 | | | | | Piedmont Operating Partnership L.P., 4.450%, 03/15/24 | | | 401,160 | | | | 0.0 | |
| | 2,545,000 | | | | | PNC Bank NA, 1.300%, 10/03/16 | | | 2,550,632 | | | | 0.1 | |
| | 275,000 | | | | | Prudential Financial, Inc., 5.100%, 08/15/43 | | | 287,585 | | | | 0.0 | |
| | 648,000 | | | | | Radian Group, Inc., 2.250%, 03/01/19 | | | 837,945 | | | | 0.1 | |
| | 1,607,000 | | | L | | Radian Group, Inc., 3.000%, 11/15/17 | | | 2,019,798 | | | | 0.1 | |
| | 125,000 | | | | | Realty Income Corp., 2.000%, 01/31/18 | | | 125,130 | | | | 0.0 | |
| | 525,000 | | | | | Reinsurance Group of America, Inc., 4.700%, 09/15/23 | | | 554,672 | | | | 0.0 | |
| | 1,360,000 | | | # | | Societe Generale SA, 2.625%, 09/16/20 | | | 1,360,768 | | | | 0.1 | |
| | 805,000 | | | # | | Societe Generale SA, 5.000%, 01/17/24 | | | 822,291 | | | | 0.1 | |
| | 1,025,000 | | | # | | Societe Generale SA, 5.625%, 11/24/45 | | | 984,747 | | | | 0.1 | |
| | 1,100,000 | | | | | Sumitomo Mitsui Banking Corp., 2.650%, 07/23/20 | | | 1,100,069 | | | | 0.1 | |
| | 3,535,000 | | | | | Suntrust Bk., 3.600%, 04/15/16 | | | 3,553,304 | | | | 0.2 | |
| | 445,000 | | | | | Travelers Cos, Inc./The, 4.600%, 08/01/43 | | | 468,601 | | | | 0.0 | |
| | 170,000 | | | | | Ventas Realty L.P. / Ventas Capital Corp., 4.250%, 03/01/22 | | | 175,592 | | | | 0.0 | |
| | 1,255,000 | | | | | Visa, Inc., 3.150%, 12/14/25 | | | 1,259,218 | | | | 0.1 | |
| | 1,020,000 | | | | | Visa, Inc., 4.150%, 12/14/35 | | | 1,031,741 | | | | 0.1 | |
| | 585,000 | | | | | Visa, Inc., 4.300%, 12/14/45 | | | 594,437 | | | | 0.0 | |
| | 140,000 | | | | | Wells Fargo & Co., 1.500%, 01/16/18 | | | 139,470 | | | | 0.0 | |
| | 965,000 | | | | | Wells Fargo & Co., 3.550%, 09/29/25 | | | 975,029 | | | | 0.1 | |
| | 2,285,000 | | | | | Wells Fargo & Co., 3.900%, 05/01/45 | | | 2,112,119 | | | | 0.1 | |
| | 470,000 | | | | | Wells Fargo & Co., 4.100%, 06/03/26 | | | 475,063 | | | | 0.0 | |
| | 2,000,000 | | | | | Wells Fargo & Co., 4.650%, 11/04/44 | | | 1,950,442 | | | | 0.1 | |
| | 350,000 | | | | | WR Berkley Corp., 4.625%, 03/15/22 | | | 370,300 | | | | 0.0 | |
| | | | | | | | | | 99,609,084 | | | | 5.5 | |
| | | | | | | | | | | | | | | |
| | | | | | | Industrial: 0.9% | | | | | | | | |
| | 1,105,000 | | | # | | Aviation Capital Group Corp., 2.875%, 09/17/18 | | | 1,100,041 | | | | 0.1 | |
| | 1,095,000 | | | # | | Aviation Capital Group Corp., 4.875%, 10/01/25 | | | 1,089,656 | | | | 0.1 | |
| | 435,000 | | | # | | BAE Systems Holdings, Inc., 2.850%, 12/15/20 | | | 434,571 | | | | 0.0 | |
| | 1,335,000 | | | | | Burlington Northern Santa Fe LLC, 5.150%, 09/01/43 | | | 1,412,214 | | | | 0.1 | |
| | 500,000 | | | | | Canadian National Railway Co., 5.800%, 06/01/16 | | | 510,227 | | | | 0.0 | |
| | 330,000 | | | | | CSX Corp., 5.500%, 04/15/41 | | | 364,775 | | | | 0.0 | |
| | 1,015,000 | | | | | Deere & Co., 2.600%, 06/08/22 | | | 1,002,140 | | | | 0.1 | |
| | 295,000 | | | | | FedEx Corp., 4.900%, 01/15/34 | | | 303,952 | | | | 0.0 | |
| | 605,000 | | | | | FedEx Corp., 5.100%, 01/15/44 | | | 628,775 | | | | 0.0 | |
| | 156,000 | | | | | L-3 Communications Corp., 3.950%, 05/28/24 | | | 148,538 | | | | 0.0 | |
| | 1,535,000 | | | | | Lockheed Martin Corp., 2.125%, 09/15/16 | | | 1,545,730 | | | | 0.1 | |
| | 304,000 | | | | | Northrop Grumman Corp., 3.850%, 04/15/45 | | | 274,479 | | | | 0.0 | |
| | 703,000 | | | | | Packaging Corp. of America, 4.500%, 11/01/23 | | | 739,704 | | | | 0.1 | |
| | 510,000 | | | # | | Penske Truck Leasing Co. Lp / PTL Finance Corp., 2.500%, 03/15/16 | | | 510,910 | | | | 0.0 | |
| | 545,000 | | | | | Pentair Finance SA, 5.000%, 05/15/21 | | | 568,922 | | | | 0.0 | |
| | 285,000 | | | | | Precision Castparts Corp., 2.500%, 01/15/23 | | | 275,460 | | | | 0.0 | |
| | 1,075,000 | | | | | Thermo Fisher Scientific, Inc., 2.250%, 08/15/16 | | | 1,081,068 | | | | 0.1 | |
| | 157,000 | | | | | Union Pacific Corp., 3.646%, 02/15/24 | | | 164,124 | | | | 0.0 | |
| | 730,000 | | | | | Union Pacific Corp., 4.150%, 01/15/45 | | | 725,516 | | | | 0.1 | |
| | 375,000 | | | | | Union Pacific Corp., 4.850%, 06/15/44 | | | 407,902 | | | | 0.0 | |
| | 550,000 | | | | | Valmont Industries, Inc., 5.000%, 10/01/44 | | | 481,315 | | | | 0.0 | |
| | 2,193,000 | | | | | Valmont Industries, Inc., 5.250%, 10/01/54 | | | 1,875,798 | | | | 0.1 | |
| | 752,000 | | | | | Waste Management, Inc., 3.900%, 03/01/35 | | | 705,435 | | | | 0.0 | |
| | | | | | | | | | 16,351,252 | | | | 0.9 | |
| | | | | | | | | | | | | | | |
| | | | | | | Technology: 3.3% | | | | | | | | |
| | 1,146,000 | | | | | Apple, Inc., 2.150%, 02/09/22 | | | 1,113,679 | | | | 0.1 | |
| | 7,292,000 | | | L | | Citrix Systems, Inc., 0.500%, 04/15/19 | | | 7,966,510 | | | | 0.4 | |
| | 340,000 | | | | | Computer Sciences Corp., 4.450%, 09/15/22 | | | 349,303 | | | | 0.0 | |
| | 2,055,000 | | | # | | Hewlett Packard Enterprise Co., 2.850%, 10/05/18 | | | 2,055,600 | | | | 0.1 | |
| | 1,025,000 | | | # | | HP Enterprise Co., 6.200%, 10/15/35 | | | 989,950 | | | | 0.1 | |
| | 5,367,000 | | | L | | Lam Research Corp., 1.250%, 05/15/18 | | | 7,711,708 | | | | 0.4 | |
| | 960,000 | | | | | Lam Research Corp., 3.800%, 03/15/25 | | | 906,120 | | | | 0.0 | |
| | 2,788,000 | | | # | | Microchip Technology, Inc., 1.625%, 02/15/25 | | | 2,784,515 | | | | 0.2 | |
| | 5,485,000 | | | L | | Micron Technology, Inc., 3.000%, 11/15/43 | | | 4,586,831 | | | | 0.3 | |
| VY® Invesco Equity and Income Portfolio | PORTFOLIO OF INVESTMENTS |
| as of December 31, 2015 (continued) |
Principal
Amount† | | | | | | | Value | | | Percentage
of Net
Assets | |
| CORPORATE BONDS/NOTES: (continued) | | | | |
| | | | | | | Technology: (continued) | | | | | | | | |
| | 649,000 | | | | | Microsoft Corp., 3.500%, 02/12/35 | | | 601,142 | | | | 0.0 | |
| | 3,387,000 | | | | | NetSuite, Inc., 0.250%, 06/01/18 | | | 3,353,130 | | | | 0.2 | |
| | 1,613,000 | | | # | | Nuance Communications, Inc., 1.000%, 12/15/35 | | | 1,559,569 | | | | 0.1 | |
| | 6,651,000 | | | | | NVIDIA Corp., 1.000%, 12/01/18 | | | 11,111,327 | | | | 0.6 | |
| | 5,271,000 | | | #,L | | ON Semiconductor Corp., 1.000%, 12/01/20 | | | 4,934,974 | | | | 0.3 | |
| | 1,005,000 | | | | | Oracle Corp., 4.300%, 07/08/34 | | | 1,000,957 | | | | 0.1 | |
| | 330,000 | | | | | Pitney Bowes, Inc., 4.625%, 03/15/24 | | | 323,978 | | | | 0.0 | |
| | 6,090,000 | | | | | SanDisk Corp., 0.500%, 10/15/20 | | | 6,333,600 | | | | 0.3 | |
| | 540,000 | | | | | Seagate HDD Cayman, 4.750%, 01/01/25 | | | 450,693 | | | | 0.0 | |
| | 1,146,000 | | | # | | Seagate HDD Cayman, 5.750%, 12/01/34 | | | 803,900 | | | | 0.0 | |
| | 1,141,000 | | | L | | Xerox Corp., 4.800%, 03/01/35 | | | 1,046,267 | | | | 0.1 | |
| | | | | | | | | | 59,983,753 | | | | 3.3 | |
| | | | | | | | | | | | | | | |
| | | | | | | Utilities: 0.1% | | | | | | | | |
| | 1,384,000 | | | | | Georgia Power Co., 3.000%, 04/15/16 | | | 1,391,757 | | | | 0.1 | |
| | 605,000 | | | | | Oglethorpe Power Corp., 4.550%, 06/01/44 | | | 575,576 | | | | 0.0 | |
| | | | | | | | | | 1,967,333 | | | | 0.1 | |
| | | | | | | | | | | | | | | |
| | | | | Total Corporate Bonds/Notes
(Cost $361,965,373) | | | 359,514,801 | | | | 19.8 | |
| | | | | | | | | | | | | | | |
| MUNICIPAL BONDS: 0.0% | | | | | | | | |
| | | | | | | Georgia: 0.0% | | | | | | | | |
| | 175,000 | | | | | Municipal Electric Authority of Georgia, 6.637%, 04/01/57 | | | 208,423 | | | | 0.0 | |
| | 325,000 | | | | | Municipal Electric Authority of Georgia, 6.655%, 04/01/57 | | | 382,548 | | | | 0.0 | |
| | | | | | | | | | | | | | | |
| | | | | Total Municipal Bonds
(Cost $503,978) | | | 590,971 | | | | 0.0 | |
| | | | | | | | | | | | | | | |
| U.S. TREASURY OBLIGATIONS: 9.8% | | | | | | | | |
| | | | | | | U.S. Treasury Bonds: 1.6% | | | | | | | | |
| | 13,689,300 | | | | | 2.875%, due 08/15/45 | | | 13,272,735 | | | | 0.7 | |
| | 16,308,200 | | | | | 2.250%, due 11/15/25 | | | 16,273,300 | | | | 0.9 | |
| | | | | | | | | | 29,546,035 | | | | 1.6 | |
| | | | | | | | | | | | | | | |
| | | | | | | U.S. Treasury Notes: 8.2% | | | | | | | | |
| | 120,000 | | | | | 0.875%, due 04/30/17 | | | 119,973 | | | | 0.0 | |
| | 55,323,000 | | | L | | 0.875%, due 11/30/17 | | | 55,172,577 | | | | 3.1 | |
| | 56,840,000 | | | | | 1.250%, due 12/15/18 | | | 56,731,095 | | | | 3.1 | |
| | 34,683,000 | | | | | 1.625%, due 11/30/20 | | | 34,489,850 | | | | 1.9 | |
| | 1,631,000 | | | | | 2.000%, due 11/30/22 | | | 1,622,290 | | | | 0.1 | |
| | 180,000 | | | | | 2.625%, due 11/15/20 | | | 187,119 | | | | 0.0 | |
| | | | | | | | | | 148,322,904 | | | | 8.2 | |
| | | | | | | | | | | | | | | |
| | | | | Total U.S. Treasury Obligations
(Cost $178,184,204) | | | 177,868,939 | | | | 9.8 | |
| | | | | | | | | | | | | | | |
| FOREIGN GOVERNMENT BONDS: 0.1% | | | | | | | | |
| | 150,000 | | | # | | Electricite de France SA, 4.600%, 01/27/20 | | | 161,786 | | | | 0.0 | |
| | 620,000 | | | # | | Electricite de France SA, 4.875%, 01/22/44 | | | 595,288 | | | | 0.0 | |
| | 640,000 | | | # | | Electricite de France SA, 5.625%, 12/29/49 | | | 611,040 | | | | 0.1 | |
| | | | | | | | | | | | | | | |
| | | | | | | | | | | | | | | |
| | | | | Total Foreign Government Bonds
(Cost $1,383,604) | | | 1,368,114 | | | | 0.1 | |
| | | | | | | | | | | | | | | |
| U.S. GOVERNMENT AGENCY OBLIGATIONS: 0.2% | | | | | | | | |
| | | | | | | Federal Home Loan Mortgage Corporation: 0.1%## | | | | | | | | |
| | 2,400,000 | | | | | 4.875%, due 06/13/18 | | | 2,607,523 | | | | 0.1 | |
| | | | | | | | | | | | | | | |
| | | | | | | Federal National Mortgage Association: 0.1%## | | | | | | | | |
| | 915,000 | | | | | 6.625%, due 11/15/30 | | | 1,298,434 | | | | 0.1 | |
| | | | | | | | | | | | | | | |
| | | | | Total U.S. Government Agency Obligations
(Cost $3,513,788) | | | 3,905,957 | | | | 0.2 | |
| | | | | | | | | | | | | | | |
| | | | | Total Long-Term Investments
(Cost $1,716,593,503) | | | 1,724,699,607 | | | | 95.1 | |
| | | | | | | | | | | | | | | |
| SHORT-TERM INVESTMENTS: 8.6% |
| | | | | | | Securities Lending Collateralcc: 4.0% | | | | | | | | |
| | 1,931,950 | | | | | BNP Paribas Bank, Repurchase Agreement dated 12/31/15, 0.31%, due 01/04/16 (Repurchase Amount $1,932,016, collateralized by various U.S. Government/U.S. Government Agency Obligations, 0.000%-4.500%, Market Value plus accrued interest $1,970,589, due 06/09/16-05/20/45) | | | 1,931,950 | | | | 0.1 | |
| | 17,303,564 | | | | | Citigroup, Inc., Repurchase Agreement dated 12/31/15, 0.34%, due 01/04/16 (Repurchase Amount $17,304,209, collateralized by various U.S. Government Agency Obligations, 0.000%-11.500%, Market Value plus accrued interest $17,649,636, due 01/15/16-04/01/51) | | | 17,303,564 | | | | 0.9 | |
| VY® Invesco Equity and Income Portfolio | PORTFOLIO OF INVESTMENTS |
| as of December 31, 2015 (continued) |
Principal
Amount† | | | | | | | Value | | | Percentage
of Net
Assets | |
| SHORT-TERM INVESTMENTS: (continued) | | | | |
| | | | | | | Securities Lending Collateralcc: (continued) | | | | | | | | |
| | 11,893,669 | | | | | HSBC Securities USA, Repurchase Agreement dated 12/31/15, 0.29%, due 01/04/16 (Repurchase Amount $11,894,047, collateralized by various U.S. Government Securities, 3.000%, Market Value plus accrued interest $12,131,576, due 11/15/44) | | | 11,893,669 | | | | 0.7 | |
| | 17,303,564 | | | | | Mizuho Securities USA Inc., Repurchase Agreement dated 12/31/15, 0.30%, due 01/04/16 (Repurchase Amount $17,304,133, collateralized by various U.S. Government Agency Obligations, 0.000%-9.000%, Market Value plus accrued interest $17,649,635, due 06/13/16-03/01/44) | | | 17,303,564 | | | | 1.0 | |
| | 17,303,564 | | | | | Nomura Securities, Repurchase Agreement dated 12/31/15, 0.33%, due 01/04/16 (Repurchase Amount $17,304,190, collateralized by various U.S. Government/U.S. Government Agency Obligations, 0.000%-10.500%, Market Value plus accrued interest $17,649,635, due 01/15/16-10/20/65) | | | 17,303,564 | | | | 0.9 | |
| | 7,120,141 | | | | | State of Wisconsin Investment Board, Repurchase Agreement dated 12/31/15, 0.41%, due 01/04/16 (Repurchase Amount $7,120,461, collateralized by various U.S. Government Securities, 0.125%-2.500%, Market Value plus accrued interest $7,267,774, due 01/15/17-02/15/42) | | | 7,120,141 | | | | 0.4 | |
| | | | | | | | | | 72,856,452 | | | | 4.0 | |
| Shares | | | | | | | Value | | | Percentage
of Net
Assets | |
| | | | | | | Mutual Funds: 4.6% | | | | | | | | |
| | 82,471,643 | | | | | BlackRock Liquidity Funds, TempFund, Institutional Class, 0.270%†† | | | | | | | | |
| | | | | | | (Cost $82,471,643) | | | 82,471,643 | | | | 4.6 | |
| | | | | | | | | | | | | | | |
| | | | | | | | | | | | | | | |
| | | | | Total Short-Term Investments
(Cost $155,328,095) | | | 155,328,095 | | | | 8.6 | |
| | | | | | | | | | | | | | | |
| | | | | Total Investments in Securities
(Cost $1,871,921,598) | | $ | 1,880,027,702 | | | | 103.7 | |
| | | | | Liabilities in Excess of Other Assets | | | (66,940,320 | ) | | | (3.7 | ) |
| | | | | Net Assets | | $ | 1,813,087,382 | | | | 100.0 | |
| † | Unless otherwise indicated, principal amount is shown in USD. |
| †† | Rate shown is the 7-day yield as of December 31, 2015. |
| # | Securities with purchases pursuant to Rule 144A or section 4(a)(2), under the Securities Act of 1933 and may not be resold subject to that rule except to qualified institutional buyers. |
| ## | The Federal Housing Finance Agency (“FHFA”) placed the Federal Home Loan Mortgage Corporation and Federal National Mortgage Association into conservatorship with FHFA as the conservator. As such, the FHFA oversees the continuing affairs of these companies. |
| @ | Non-income producing security. |
| ADR | American Depositary Receipt |
| P | Preferred Stock may be called prior to convertible date. |
| cc | Represents securities purchased with cash collateral received for securities on loan. |
| L | Loaned security, a portion or all of the security is on loan at December 31, 2015. |
| | |
| | Cost for federal income tax purposes is $1,875,786,971. |
| Net unrealized appreciation consists of: | | | | |
| | | | | |
| Gross Unrealized Appreciation | | $ | 121,537,596 | |
| Gross Unrealized Depreciation | | | (117,296,865 | ) |
| | | | | |
| Net Unrealized Appreciation | | $ | 4,240,731 | |
VY® JPMorgan Mid Cap Value
Portfolio | PORTFOLIO OF INVESTMENTS as of December 31, 2015 |
| Shares | | | | | | | Value | | | Percentage of Net Assets | |
| COMMON STOCK: 100.8% | |
| | | | | | | Consumer Discretionary: 17.8% | | | | | | | | |
| | 10,080 | | | @ | | Autozone, Inc. | | | 7,478,453 | | | | 1.2 | |
| | 113,310 | | | @ | | Bed Bath & Beyond, Inc. | | | 5,467,207 | | | | 0.9 | |
| | 216,930 | | | | | Best Buy Co., Inc. | | | 6,605,518 | | | | 1.1 | |
| | 79,779 | | | | | CBS Corp. - Class B | | | 3,759,984 | | | | 0.6 | |
| | 108,110 | | | @ | | Dish Network Corp. - Class A | | | 6,181,730 | | | | 1.0 | |
| | 71,870 | | | | | Expedia, Inc. | | | 8,933,441 | | | | 1.4 | |
| | 233,700 | | | | | Gap, Inc. | | | 5,772,390 | | | | 0.9 | |
| | 75,420 | | | | | Genuine Parts Co. | | | 6,477,824 | | | | 1.1 | |
| | 152,095 | | | @ | | Jarden Corp. | | | 8,687,666 | | | | 1.4 | |
| | 189,270 | | | | | Kohl's Corp. | | | 9,014,930 | | | | 1.5 | |
| | 67,476 | | | L | | Marriott International, Inc. | | | 4,523,591 | | | | 0.7 | |
| | 58,860 | | | @ | | Mohawk Industries, Inc. | | | 11,147,495 | | | | 1.8 | |
| | 85,710 | | | L | | Nordstrom, Inc. | | | 4,269,215 | | | | 0.7 | |
| | 65,130 | | | | | PVH Corp. | | | 4,796,825 | | | | 0.8 | |
| | 12,539 | | | | | Starwood Hotels & Resorts Worldwide, Inc. | | | 868,702 | | | | 0.1 | |
| | 194,960 | | | | | TEGNA, Inc. | | | 4,975,379 | | | | 0.8 | |
| | 84,840 | | | | | Tiffany & Co. | | | 6,472,444 | | | | 1.0 | |
| | 146,650 | | | | | Time, Inc. | | | 2,298,006 | | | | 0.4 | |
| | 41,280 | | | | | VF Corp. | | | 2,569,680 | | | | 0.4 | |
| | | | | | | | | | 110,300,480 | | | | 17.8 | |
| | | | | | | | | | | | | | | |
| | | | | | | Consumer Staples: 6.3% | | | | | | | | |
| | 40,250 | | | | | Constellation Brands, Inc. | | | 5,733,210 | | | | 0.9 | |
| | 80,880 | | | | | Dr Pepper Snapple Group, Inc. | | | 7,538,016 | | | | 1.2 | |
| | 62,633 | | | | | Edgewell Personal Care Co. | | | 4,908,548 | | | | 0.8 | |
| | 65,763 | | | | | Energizer Holdings, Inc. | | | 2,239,888 | | | | 0.4 | |
| | 50,770 | | | | | Hershey Co. | | | 4,532,238 | | | | 0.7 | |
| | 218,340 | | | | | Kroger Co. | | | 9,133,162 | | | | 1.5 | |
| | 663,420 | | | @ | | Rite Aid Corp. | | | 5,201,213 | | | | 0.8 | |
| | | | | | | | | | 39,286,275 | | | | 6.3 | |
| | | | | | | | | | | | | | | |
| | | | | | | Energy: 3.5% | | | | | | | | |
| | 377,390 | | | | | Columbia Pipeline Group, Inc. | | | 7,547,800 | | | | 1.2 | |
| | 158,130 | | | | | EQT Corp. | | | 8,243,317 | | | | 1.3 | |
| | 105,650 | | | | | PBF Energy, Inc. | | | 3,888,976 | | | | 0.6 | |
| | 299,550 | | | @,L | | Southwestern Energy Co. | | | 2,129,801 | | | | 0.4 | |
| | | | | | | | | | 21,809,894 | | | | 3.5 | |
| | | | | | | | | | | | | | | |
| | | | | | | Financials: 33.0% | | | | | | | | |
| | 9,153 | | | | | Alleghany Corp. | | | 4,374,493 | | | | 0.7 | |
| | 219,200 | | | | | Ally Financial, Inc. | | | 4,085,888 | | | | 0.7 | |
| | 111,190 | | | | | American Campus Communities, Inc. | | | 4,596,594 | | | | 0.7 | |
| | 156,530 | | | | | American Homes 4 Rent | | | 2,607,790 | | | | 0.4 | |
| | 72,590 | | | | | Ameriprise Financial, Inc. | | | 7,725,028 | | | | 1.2 | |
| | 43,220 | | | | | AvalonBay Communities, Inc. | | | 7,958,099 | | | | 1.3 | |
| | 37,400 | | | | | Boston Properties, Inc. | | | 4,769,996 | | | | 0.8 | |
| | 224,930 | | | | | Brixmor Property Group, Inc. | | | 5,807,693 | | | | 0.9 | |
| | 51,840 | | | | | Chubb Corp. | | | 6,876,058 | | | | 1.1 | |
| | 207,740 | | | | | Citizens Financial Group, Inc. | | | 5,440,711 | | | | 0.9 | |
| | 494,320 | | | | | Fifth Third Bancorp | | | 9,935,832 | | | | 1.6 | |
| | 86,230 | | | | | First Republic Bank/San Francisco CA | | | 5,696,354 | | | | 0.9 | |
| | 218,740 | | | | | General Growth Properties, Inc. | | | 5,951,915 | | | | 1.0 | |
| | 175,240 | | | | | Hartford Financial Services Group, Inc. | | | 7,615,930 | | | | 1.2 | |
| | 92,990 | | | | | HCP, Inc. | | | 3,555,938 | | | | 0.6 | |
| | 220,290 | | | | | Huntington Bancshares, Inc. | | | 2,436,407 | | | | 0.4 | |
| | 172,650 | | | | | Invesco Ltd. | | | 5,780,322 | | | | 0.9 | |
| | 287,150 | | | | | Kimco Realty Corp. | | | 7,597,989 | | | | 1.2 | |
| | 72,060 | | | | | LaSalle Hotel Properties | | | 1,813,030 | | | | 0.3 | |
| | 76,860 | | | | | Legg Mason, Inc. | | | 3,015,218 | | | | 0.5 | |
| | 266,930 | | | | | Loews Corp. | | | 10,250,112 | | | | 1.6 | |
| | 91,233 | | | | | M&T Bank Corp. | | | 11,055,615 | | | | 1.8 | |
| | 158,880 | | | | | Marsh & McLennan Cos., Inc. | | | 8,809,896 | | | | 1.4 | |
| | 62,060 | | | | | Northern Trust Corp. | | | 4,473,905 | | | | 0.7 | |
| | 150,342 | | | | | Outfront Media, Inc. | | | 3,281,966 | | | | 0.5 | |
| | 88,080 | | | | | Progressive Corp. | | | 2,800,944 | | | | 0.5 | |
| | 160,460 | | | | | Rayonier, Inc. | | | 3,562,212 | | | | 0.6 | |
| | 64,980 | | | | | Regency Centers Corp. | | | 4,426,438 | | | | 0.7 | |
| | 220,540 | | | | | SunTrust Bank | | | 9,447,934 | | | | 1.5 | |
| | 101,300 | | | | | T. Rowe Price Group, Inc. | | | 7,241,937 | | | | 1.2 | |
| | 177,890 | | | | | Unum Group | | | 5,921,958 | | | | 1.0 | |
| | 72,776 | | | | | Vornado Realty Trust | | | 7,274,689 | | | | 1.2 | |
| | 168,930 | | | | | Weyerhaeuser Co. | | | 5,064,521 | | | | 0.8 | |
| | 30,860 | | | | | WP Carey, Inc. | | | 1,820,740 | | | | 0.3 | |
| | 49,270 | | | | | WR Berkley Corp. | | | 2,697,532 | | | | 0.4 | |
| | 190,830 | | | | | XL Group Plc | | | 7,476,719 | | | | 1.2 | |
| | 69,220 | | | | | Zions Bancorp. | | | 1,889,706 | | | | 0.3 | |
| | | | | | | | | | 205,138,109 | | | | 33.0 | |
| | | | | | | | | | | | | | | |
| | | | | | | Health Care: 5.4% | | | | | | | | |
| | 77,710 | | | | | AmerisourceBergen Corp. | | | 8,059,304 | | | | 1.3 | |
| | 57,570 | | | | | Cigna Corp. | | | 8,424,218 | | | | 1.4 | |
| | 31,120 | | | @ | | Henry Schein, Inc. | | | 4,922,873 | | | | 0.8 | |
| | 46,780 | | | | | Humana, Inc. | | | 8,350,698 | | | | 1.3 | |
| | 32,780 | | | | | Universal Health Services, Inc. | | | 3,916,882 | | | | 0.6 | |
| | | | | | | | | | 33,673,975 | | | | 5.4 | |
| | | | | | | | | | | | | | | |
| | | | | | | Industrials: 9.3% | | | | | | | | |
| | 110,880 | | | | | Ametek, Inc. | | | 5,942,059 | | | | 1.0 | |
| | 80,430 | | | | | Carlisle Cos., Inc. | | | 7,133,337 | | | | 1.1 | |
| | 48,830 | | | @ | | Equifax, Inc. | | | 5,438,197 | | | | 0.9 | |
| | 109,850 | | | | | Fortune Brands Home & Security, Inc. | | | 6,096,675 | | | | 1.0 | |
| | 73,130 | | | | | Hubbell, Inc. | | | 7,389,055 | | | | 1.2 | |
| | 93,440 | | | | | IDEX Corp. | | | 7,158,438 | | | | 1.1 | |
| | 97,080 | | | | | MSC Industrial Direct Co. | | | 5,462,692 | | | | 0.9 | |
| | 67,520 | | | | | Regal-Beloit Corp. | | | 3,951,270 | | | | 0.6 | |
| | 165,905 | | | @ | | Rexnord Corp. | | | 3,006,199 | | | | 0.5 | |
| | 35,321 | | | | | Snap-On, Inc. | | | 6,055,079 | | | | 1.0 | |
| | | | | | | | | | 57,633,001 | | | | 9.3 | |
| | | | | | | | | | | | | | | |
| | | | | | | Information Technology: 9.3% | | | | | | | | |
| | 113,700 | | | | | Amphenol Corp. | | | 5,938,551 | | | | 1.0 | |
| | 106,680 | | | | | Analog Devices, Inc. | | | 5,901,538 | | | | 0.9 | |
VY® JPMorgan Mid Cap Value
Portfolio | PORTFOLIO OF INVESTMENTS as of December 31, 2015 (continued) |
| Shares | | | | | | | Value | | | Percentage of Net Assets | |
| COMMON STOCK: (continued) | |
| | | | | | | Information Technology: (continued) | | | | | | | | |
| | 179,610 | | | @ | | Arrow Electronics, Inc. | | | 9,731,270 | | | | 1.6 | |
| | 124,606 | | | @ | | CommScope Holding Co., Inc. | | | 3,226,049 | | | | 0.5 | |
| | 152,596 | | | | | Jack Henry & Associates, Inc. | | | 11,911,644 | | | | 1.9 | |
| | 59,690 | | | | | KLA-Tencor Corp. | | | 4,139,501 | | | | 0.7 | |
| | 28,100 | | | @,L | | Match Group, Inc. | | | 380,755 | | | | 0.1 | |
| | 208,050 | | | @ | | Synopsys, Inc. | | | 9,489,161 | | | | 1.5 | |
| | 143,966 | | | | | Xilinx, Inc. | | | 6,762,083 | | | | 1.1 | |
| | | | | | | | | | 57,480,552 | | | | 9.3 | |
| | | | | | | | | | | | | | | |
| | | | | | | Materials: 5.4% | | | | | | | | |
| | 36,940 | | | | | Airgas, Inc. | | | 5,109,541 | | | | 0.8 | |
| | 69,898 | | | | | Albemarle Corp. | | | 3,914,987 | | | | 0.6 | |
| | 77,750 | | | | | Ball Corp. | | | 5,654,758 | | | | 0.9 | |
| | 18,620 | | | | | Sherwin-Williams Co. | | | 4,833,752 | | | | 0.8 | |
| | 148,045 | | | | | Silgan Holdings, Inc. | | | 7,952,977 | | | | 1.3 | |
| | 129,620 | | | | | WestRock Co. | | | 5,913,264 | | | | 1.0 | |
| | | | | | | | | | 33,379,279 | | | | 5.4 | |
| | | | | | | | | | | | | | | |
| | | | | | | Utilities: 10.8% | | | | | | | | |
| | 447,510 | | | | | Centerpoint Energy, Inc. | | | 8,216,284 | | | | 1.3 | |
| | 200,000 | | | | | CMS Energy Corp. | | | 7,216,000 | | | | 1.2 | |
| | 95,940 | | | | | Edison International | | | 5,680,607 | | | | 0.9 | |
| | 230,914 | | | | | Energen Corp. | | | 9,465,165 | | | | 1.5 | |
| | 80,730 | | | | | National Fuel Gas Co. | | | 3,451,207 | | | | 0.6 | |
| | 425,650 | | | | | Questar Corp. | | | 8,291,662 | | | | 1.3 | |
| | 40,900 | | | | | Sempra Energy | | | 3,845,009 | | | | 0.6 | |
| | 115,600 | | | | | WEC Energy Group, Inc. | | | 5,931,436 | | | | 0.9 | |
| | 184,520 | | | | | Westar Energy, Inc. | | | 7,825,493 | | | | 1.3 | |
| | 203,990 | | | | | Xcel Energy, Inc. | | | 7,325,281 | | | | 1.2 | |
| | | | | | | | | | 67,248,144 | | | | 10.8 | |
| | | | | | | | | | | | | | | |
| | | | | Total Common Stock | | | | | | | | |
| | | | | (Cost $512,997,428) | | | 625,949,709 | | | | 100.8 | |
Principal
Amount† | | | | | | | Value | | | Percentage of Net Assets | |
| SHORT-TERM INVESTMENTS: 2.1% | |
| | | | | | | Securities Lending Collateralcc: 1.8% | | | | | | | | |
| | 2,149,083 | | | | | BNP Paribas Bank, Repurchase Agreement dated 12/31/15, 0.31%, due 01/04/16 (Repurchase Amount $2,149,156, collateralized by various U.S. Government/U.S. Government Agency Obligations, 0.000%-4.500%, Market Value plus accrued interest $2,192,065, due 06/09/16-05/20/45) | | | 2,149,083 | | | | 0.4 | |
| | 2,689,559 | | | | | Citigroup, Inc., Repurchase Agreement dated 12/31/15, 0.34%, due 01/04/16 (Repurchase Amount $2,689,659, collateralized by various U.S. Government Agency Obligations, 0.000%-11.500%, Market Value plus accrued interest $2,743,350, due 01/15/16-04/01/51) | | | 2,689,559 | | | | 0.4 | |
| | 2,689,559 | | | | | Millenium Fixed Income Ltd., Repurchase Agreement dated 12/31/15, 0.37%, due 01/04/16 (Repurchase Amount $2,689,668, collateralized by various U.S. Government Securities, 1.500%-3.625%, Market Value plus accrued interest $2,743,351, due 03/31/21-02/15/44) | | | 2,689,559 | | | | 0.4 | |
| | 2,689,559 | | | | | Nomura Securities, Repurchase Agreement dated 12/31/15, 0.33%, due 01/04/16 (Repurchase Amount $2,689,656, collateralized by various U.S. Government/U.S. Government Agency Obligations, 0.000%-10.500%, Market Value plus accrued interest $2,743,350, due 01/15/16-10/20/65) | | | 2,689,559 | | | | 0.4 | |
| | 1,106,604 | | | | | State of Wisconsin Investment Board, Repurchase Agreement dated 12/31/15, 0.41%, due 01/04/16 (Repurchase Amount $1,106,654, collateralized by various U.S. Government Securities, 0.125%-2.500%, Market Value plus accrued interest $1,129,549, due 01/15/17-02/15/42) | | | 1,106,604 | | | | 0.2 | |
| | | | | | | | | | 11,324,364 | | | | 1.8 | |
VY® JPMorgan Mid Cap Value
Portfolio | PORTFOLIO OF INVESTMENTS as of December 31, 2015 (continued) |
| Shares | | | | | | | Value | | | Percentage
of Net
Assets | |
| SHORT-TERM INVESTMENTS: (continued) | | | | | | |
| | | | | | | Mutual Funds: 0.3% | | | | | | | | |
| | 1,863,222 | | | | | BlackRock Liquidity Funds, TempFund, Institutional Class, 0.270%†† | | | | | | | | |
| | | | | | | (Cost $1,863,222) | | | 1,863,222 | | | | 0.3 | |
| | | | | | | | | | | | | | | |
| | | | | Total Short-Term Investments | | | | | | | | |
| | | | | (Cost $13,187,586) | | | 13,187,586 | | | | 2.1 | |
| | | | | | | | | | | | | | | |
| | | | | Total Investments in Securities
(Cost $526,185,014) | | $ | 639,137,295 | | | | 102.9 | |
| | | | | Liabilities in Excess of Other Assets | | | (17,871,774 | ) | | | (2.9 | ) |
| | | | | Net Assets | | $ | 621,265,521 | | | | 100.0 | |
| † | Unless otherwise indicated, principal amount is shown in USD. |
| †† | Rate shown is the 7-day yield as of December 31, 2015. |
| @ | Non-income producing security. |
| cc | Represents securities purchased with cash collateral received for securities on loan. |
| L | Loaned security, a portion or all of the security is on loan at December 31, 2015. |
| | |
| | Cost for federal income tax purposes is $527,325,111. |
| Net unrealized appreciation consists of: | | | | |
| | | | | |
| Gross Unrealized Appreciation | | $ | 151,428,286 | |
| Gross Unrealized Depreciation | | | (39,616,102 | ) |
| | | | | |
| Net Unrealized Appreciation | | $ | 111,812,184 | |
VY® Oppenheimer Global
Portfolio | PORTFOLIO OF INVESTMENTS as of December 31, 2015 |
| Shares | | | | | | | Value | | | Percentage of Net Assets | |
| COMMON STOCK: 96.8% | |
| | | | | | | Brazil: 0.8% | | | | | | | | |
| | 428,350 | | | @ | | Embraer SA ADR | | | 12,653,459 | | | | 0.8 | |
| | | | | | | | | | | | | | | |
| | | | | | | China: 1.7% | | | | | | | | |
| | 634,217 | | | @ | | JD.com, Inc. ADR | | | 20,463,012 | | | | 1.3 | |
| | 100,310 | | | @,L | | Qihoo 360 Technology Co. Ltd. ADR | | | 7,303,571 | | | | 0.4 | |
| | | | | | | | | | 27,766,583 | | | | 1.7 | |
| | | | | | | | | | | | | | | |
| | | | | | | Denmark: 0.3% | | | | | | | | |
| | 127,522 | | | L | | FLSmidth & Co. A/S | | | 4,430,752 | | | | 0.3 | |
| | | | | | | | | | | | | | | |
| | | | | | | France: 4.6% | | | | | | | | |
| | 183,818 | | | | | LVMH Moet Hennessy Louis Vuitton SE | | | 28,872,492 | | | | 1.8 | |
| | 112,560 | | | | | Kering | | | 19,245,047 | | | | 1.2 | |
| | 320,940 | | | | | Societe Generale | | | 14,789,683 | | | | 0.9 | |
| | 227,644 | | | L | | Technip S.A. | | | 11,320,858 | | | | 0.7 | |
| | | | | | | | | | 74,228,080 | | | | 4.6 | |
| | | | | | | | | | | | | | | |
| | | | | | | Germany: 7.4% | | | | | | | | |
| | 163,361 | | | | | Allianz SE | | | 28,797,111 | | | | 1.8 | |
| | 185,954 | | | | | Bayer AG | | | 23,223,990 | | | | 1.4 | |
| | 577,566 | | | | | Deutsche Bank AG | | | 14,026,078 | | | | 0.9 | |
| | 87,228 | | | | | Linde AG | | | 12,600,890 | | | | 0.8 | |
| | 396,008 | | | | | SAP SE | | | 31,424,663 | | | | 2.0 | |
| | 80,225 | | | | | Siemens AG | | | 7,761,480 | | | | 0.5 | |
| | | | | | | | | | 117,834,212 | | | | 7.4 | |
| | | | | | | | | | | | | | | |
| | | | | | | India: 3.2% | | | | | | | | |
| | 10,626,808 | | | | | DLF Ltd. | | | 18,535,741 | | | | 1.2 | |
| | 2,515,850 | | | | | ICICI Bank Ltd. ADR | | | 19,699,105 | | | | 1.2 | |
| | 2,081,880 | | | | | Zee Telefilms Ltd. | | | 13,723,719 | | | | 0.8 | |
| | | | | | | | | | 51,958,565 | | | | 3.2 | |
| | | | | | | | | | | | | | | |
| | | | | | | Italy: 1.5% | | | | | | | | |
| | 4,230,895 | | | @ | | Banca Monte dei Paschi di Siena SpA | | | 5,600,946 | | | | 0.4 | |
| | 268,717 | | | L | | Brunello Cucinelli SpA | | | 4,750,110 | | | | 0.3 | |
| | 302,841 | | | | | Prysmian S.p.A. | | | 6,616,848 | | | | 0.4 | |
| | 88,264 | | | L | | Tod's S.p.A. | | | 6,966,130 | | | | 0.4 | |
| | | | | | | | | | 23,934,034 | | | | 1.5 | |
| | | | | | | | | | | | | | | |
| | | | | | | Japan: 12.4% | | | | | | | | |
| | 1,340,100 | | | | | Dai-ichi Life Insurance Co., Ltd. | | | 22,296,167 | | | | 1.4 | |
| | 63,600 | | | | | Fanuc Ltd. | | | 10,957,636 | | | | 0.7 | |
| | 962,100 | | | | | KDDI Corp. | | | 24,985,925 | | | | 1.6 | |
| | 47,751 | | | | | Keyence Corp. | | | 26,244,196 | | | | 1.6 | |
| | 379,600 | | | | | Kyocera Corp. | | | 17,628,827 | | | | 1.1 | |
| | 252,300 | | | | | Murata Manufacturing Co., Ltd. | | | 36,301,250 | | | | 2.3 | |
| | 330,900 | | | | | Nidec Corp. | | | 23,995,541 | | | | 1.5 | |
| | 26,500 | | | | | Nintendo Co., Ltd. | | | 3,644,018 | | | | 0.2 | |
| | 1,319,300 | | | | | Nomura Holdings, Inc. | | | 7,348,574 | | | | 0.4 | |
| | 452,700 | | | | | Sumitomo Mitsui Financial Group, Inc. | | | 17,085,373 | | | | 1.1 | |
| | 272,500 | | | | | Suzuki Motor Corp. | | | 8,279,590 | | | | 0.5 | |
| | | | | | | | | | 198,767,097 | | | | 12.4 | |
| | | | | | | | | | | | | | | |
| | | | | | | Mexico: 0.5% | | | | | | | | |
| | 94,472 | | | @ | | Fomento Economico Mexicano SAB de CV ADR | | | 8,724,489 | | | | 0.5 | |
| | | | | | | | | | | | | | | |
| | | | | | | Netherlands: 2.3% | | | | | | | | |
| | 543,083 | | | | | Airbus Group SE | | | 36,597,137 | | | | 2.3 | |
| | | | | | | | | | | | | | | |
| | | | | | | Spain: 3.2% | | | | | | | | |
| | 1,760,079 | | | | | Banco Bilbao Vizcaya Argentaria S.A. | | | 12,860,591 | | | | 0.8 | |
| | 883,343 | | | | | Industria de Diseno Textil SA | | | 30,346,641 | | | | 1.9 | |
| | 687,083 | | | | | Repsol YPF S.A. | | | 7,564,322 | | | | 0.5 | |
| | | | | | | | | | 50,771,554 | | | | 3.2 | |
| | | | | | | | | | | | | | | |
| | | | | | | Sweden: 3.1% | | | | | | | | |
| | 1,296,882 | | | | | Assa Abloy AB | | | 27,147,251 | | | | 1.7 | |
| | 2,379,402 | | | | | Telefonaktiebolaget LM Ericsson | | | 22,940,542 | | | | 1.4 | |
| | | | | | | | | | 50,087,793 | | | | 3.1 | |
| | | | | | | | | | | | | | | |
| | | | | | | Switzerland: 5.1% | | | | | | | | |
| | 877,446 | | | @ | | Credit Suisse Group AG | | | 18,901,910 | | | | 1.2 | |
| | 219,245 | | | | | Nestle S.A. | | | 16,275,708 | | | | 1.0 | |
| | 54,233 | | | | | Roche Holding AG | | | 15,028,421 | | | | 1.0 | |
| | 1,582,016 | | | | | UBS Group AG | | | 30,690,275 | | | | 1.9 | |
| | | | | | | | | | 80,896,314 | | | | 5.1 | |
| | | | | | | | | | | | | | | |
| | | | | | | United Kingdom: 5.6% | | | | | | | | |
| | 2,784,375 | | | @ | | Circassia Pharmaceuticals Plc | | | 13,106,466 | | | | 0.8 | |
| | 6,224,814 | | | L | | Earthport PLC | | | 2,271,227 | | | | 0.1 | |
| | 480,187 | | | @,L | | International Game Technology PLC | | | 7,769,426 | | | | 0.5 | |
| | 1,241,676 | | | | | Prudential PLC | | | 27,974,492 | | | | 1.8 | |
| | 148,570 | | | | | Shire PLC | | | 10,193,062 | | | | 0.6 | |
| | 667,635 | | | | | Unilever PLC | | | 28,636,476 | | | | 1.8 | |
| | | | | | | | | | 89,951,149 | | | | 5.6 | |
| | | | | | | | | | | | | | | |
| | | | | | | United States: 45.1% | | | | | | | | |
| | 147,760 | | | | | 3M Co. | | | 22,258,566 | | | | 1.4 | |
| | 289,330 | | | @,L | | Acadia Pharmaceuticals, Inc. | | | 10,314,615 | | | | 0.6 | |
| | 375,173 | | | @ | | Adobe Systems, Inc. | | | 35,243,752 | | | | 2.2 | |
| | 358,940 | | | | | Aetna, Inc. | | | 38,808,593 | | | | 2.4 | |
| | 46,230 | | | @ | | Alphabet, Inc. - Class A | | | 35,967,402 | | | | 2.2 | |
| | 47,957 | | | | | Alphabet, Inc. - Class C | | | 36,393,608 | | | | 2.3 | |
| | 193,280 | | | | | Anthem, Inc. | | | 26,950,963 | | | | 1.7 | |
| | 55,680 | | | @ | | Biogen, Inc. | | | 17,057,568 | | | | 1.1 | |
| | 123,910 | | | @ | | BioMarin Pharmaceutical, Inc. | | | 12,980,812 | | | | 0.8 | |
| | 113,250 | | | @ | | Bluebird Bio, Inc. | | | 7,272,915 | | | | 0.5 | |
| | 766,730 | | | @,L | | Celldex Therapeutics, Inc. | | | 12,022,326 | | | | 0.8 | |
| | 28,940 | | | | | Cigna Corp. | | | 4,234,790 | | | | 0.3 | |
| | 662,210 | | | | | Citigroup, Inc. | | | 34,269,368 | | | | 2.1 | |
| | 107,470 | | | @,L | | Clovis Oncology, Inc. | | | 3,761,450 | | | | 0.2 | |
| | 518,870 | | | | | Colgate-Palmolive Co. | | | 34,567,119 | | | | 2.2 | |
| | 624,570 | | | @ | | eBay, Inc. | | | 17,163,184 | | | | 1.1 | |
| | 223,440 | | | | | Emerson Electric Co. | | | 10,687,135 | | | | 0.7 | |
| | 277,620 | | | @ | | Facebook, Inc. | | | 29,055,709 | | | | 1.8 | |
| | 351,160 | | | | | FNF Group | | | 12,174,717 | | | | 0.8 | |
| | 212,960 | | | | | Gilead Sciences, Inc. | | | 21,549,422 | | | | 1.3 | |
| | 131,290 | | | | | Goldman Sachs Group, Inc. | | | 23,662,397 | | | | 1.5 | |
| | 8,350 | | | | | Humana, Inc. | | | 1,490,559 | | | | 0.1 | |
VY® Oppenheimer Global
Portfolio | PORTFOLIO OF INVESTMENTS as of December 31, 2015 (continued) |
| Shares | | | | | | | Value | | | Percentage of Net Assets | |
| COMMON STOCK: (continued) | |
| | | | | | | United States: (continued) | | | | | | | | |
| | 304,760 | | | | | Intuit, Inc. | | | 29,409,340 | | | | 1.8 | |
| | 109,230 | | | @,L | | Ionis Pharmaceuticals, Inc. | | | 6,764,614 | | | | 0.4 | |
| | 250,260 | | | @ | | MacroGenics, Inc. | | | 7,750,552 | | | | 0.5 | |
| | 836,080 | | | | | Maxim Integrated Products | | | 31,771,040 | | | | 2.0 | |
| | 87,150 | | | | | McDonald's Corp. | | | 10,295,901 | | | | 0.6 | |
| | 429,360 | | | | | McGraw-Hill Cos., Inc. | | | 42,326,309 | | | | 2.6 | |
| | 96,220 | | | | | Medivation, Inc. | | | 4,651,275 | | | | 0.3 | |
| | 624,570 | | | @ | | PayPal Holdings, Inc. | | | 22,609,434 | | | | 1.4 | |
| | 159,030 | | | | | St. Jude Medical, Inc. | | | 9,823,283 | | | | 0.6 | |
| | 2,493,850 | | | @,L | | SunEdison, Inc. | | | 12,693,697 | | | | 0.8 | |
| | 100,411 | | | @,L | | Theravance Biopharma, Inc. | | | 1,645,736 | | | | 0.1 | |
| | 240,720 | | | | | Tiffany & Co. | | | 18,364,529 | | | | 1.1 | |
| | 211,090 | | | | | United Parcel Service, Inc. - Class B | | | 20,313,191 | | | | 1.3 | |
| | 61,810 | | | @ | | Vertex Pharmaceuticals, Inc. | | | 7,777,552 | | | | 0.5 | |
| | 286,590 | | | | | Walt Disney Co. | | | 30,114,877 | | | | 1.9 | |
| | 166,470 | | | | | Zimmer Biomet Holdings, Inc. | | | 17,078,157 | | | | 1.1 | |
| | | | | | | | | | 721,276,457 | | | | 45.1 | |
| | | | | | | | | | | | | | | |
| | | | | Total Common Stock | | | | | | | | |
| | | | | (Cost $1,001,566,910) | | | 1,549,877,675 | | | | 96.8 | |
| | | | | | | | | | | | | | | |
| PREFERRED STOCK: 1.9% | | | | | | | | |
| | | | | | | Germany: 1.8% | | | | | | | | |
| | 349,294 | | | | | Bayerische Motoren Werke AG | | | 29,223,948 | | | | 1.8 | |
| | | | | | | | | | | | | | | |
| | | | | | | India: 0.1% | | | | | | | | |
| | 50,809,899 | | | | | Zee Entertainment Enterprises Ltd. | | | 691,226 | | | | 0.1 | |
| | | | | | | | | | | | | | | |
| | | | | Total Preferred Stock | | | | | | | | |
| | | | | (Cost $13,137,519) | | | 29,915,174 | | | | 1.9 | |
| | | | | | | | | | | | | | | |
| RIGHTS: 0.0% | | | | | | | | | |
| | | | | | | Spain: 0.0% | | | | | | | | |
| | 687,083 | | | @ | | Repsol SA | | | 342,731 | | | | 0.0 | |
| | | | | | | | | | | | | | | |
| | | | | Total Rights | | | | | | | | |
| | | | | (Cost $349,653) | | | 342,731 | | | | 0.0 | |
| | | | | | | | | | | | | | | |
| | | | | Total Long-Term Investments | | | | | | | | |
| | | | | (Cost $1,015,054,082) | | | 1,580,135,580 | | | | 98.7 | |
Principal
Amount† | | | | | | | Value | | | Percentage
of Net
Assets | |
| SHORT-TERM INVESTMENTS: 4.5% | |
| | | | | | | Securities Lending Collateralcc: 3.1% | | | | | | | | |
| | 11,681,399 | | | | | BNP Paribas Bank, Repurchase Agreement dated 12/31/15, 0.30%, due 01/04/16 (Repurchase Amount $11,681,783, collateralized by various U.S. Government/U.S. Government Agency Obligations, 0.000%-5.500%, Market Value plus accrued interest $11,915,027, due 06/06/16-05/04/37) | | | 11,681,399 | | | | 0.8 | |
| | 11,681,399 | | | | | Citigroup, Inc., Repurchase Agreement dated 12/31/15, 0.34%, due 01/04/16 (Repurchase Amount $11,681,834, collateralized by various U.S. Government Agency Obligations, 0.000%-11.500%, Market Value plus accrued interest $11,915,027, due 01/15/16-04/01/51) | | | 11,681,399 | | | | 0.7 | |
| | 9,333,582 | | | | | HSBC Securities USA, Repurchase Agreement dated 12/31/15, 0.29%, due 01/04/16 (Repurchase Amount $9,333,879, collateralized by various U.S. Government Securities, 3.000%, Market Value plus accrued interest $9,520,280, due 11/15/44) | | | 9,333,582 | | | | 0.6 | |
| | 11,681,399 | | | | | Nomura Securities, Repurchase Agreement dated 12/31/15, 0.33%, due 01/04/16 (Repurchase Amount $11,681,821, collateralized by various U.S. Government/U.S. Government Agency Obligations, 0.000%-10.500%, Market Value plus accrued interest $11,915,027, due 01/15/16-10/20/65) | | | 11,681,399 | | | | 0.7 | |
VY® Oppenheimer Global
Portfolio | PORTFOLIO OF INVESTMENTS as of December 31, 2015 (continued) |
Principal
Amount† | | | | | Value | | | Percentage
of Net
Assets | |
| SHORT-TERM INVESTMENTS: (continued) | |
| | | | | | | Securities Lending Collateralcc: (continued) | | | | | | | | |
| | 4,806,633 | | | | | State of Wisconsin Investment Board, Repurchase Agreement dated 12/31/15, 0.41%, due 01/04/16 (Repurchase Amount $4,806,849, collateralized by various U.S. Government Securities, 0.125%-2.500%, Market Value plus accrued interest $4,906,296, due 01/15/17-02/15/42) | | | 4,806,633 | | | | 0.3 | |
| | | | | | | | | | 49,184,412 | | | | 3.1 | |
| Shares | | | | | | | Value | | | Percentage of Net Assets | |
| | | | | | | Mutual Funds: 1.4% | | | | | | | | |
| | 23,288,328 | | | | | BlackRock Liquidity Funds, TempFund, Institutional Class, 0.270%†† | | | | | | | | |
| | | | | | | (Cost $23,288,328) | | | 23,288,328 | | | | 1.4 | |
| | | | | | | | | | | | | | | |
| | | | | Total Short-Term Investments | | | | | | | | |
| | | | | (Cost $72,472,740) | | | 72,472,740 | | | | 4.5 | |
| | | | | | | | | | | | | | | |
| | | | | Total Investments in Securities
(Cost $1,087,526,822) | | $ | 1,652,608,320 | | | | 103.2 | |
| | | | | Liabilities in Excess of Other Assets | | | (52,006,727 | ) | | | (3.2 | ) |
| | | | | Net Assets | | $ | 1,600,601,593 | | | | 100.0 | |
| † | Unless otherwise indicated, principal amount is shown in USD. |
| †† | Rate shown is the 7-day yield as of December 31, 2015. |
| @ | Non-income producing security. |
| ADR | American Depositary Receipt |
| cc | Represents securities purchased with cash collateral received for securities on loan. |
| L | Loaned security, a portion or all of the security is on loan at December 31, 2015. |
| | |
| | Cost for federal income tax purposes is $1,099,378,453. |
| Net unrealized appreciation consists of: | | | | |
| | | | | |
| Gross Unrealized Appreciation | | $ | 629,223,136 | |
| Gross Unrealized Depreciation | | | (75,993,269 | ) |
| | | | | |
| Net Unrealized Appreciation | | $ | 553,229,867 | |
| VY® Pioneer High Yield Portfolio | PORTFOLIO OF INVESTMENTS as of December 31, 2015 |
Principal
Amount† | | | | | | | Value | | | Percentage of Net Assets | |
| CORPORATE BONDS/NOTES: 83.2% | | | | |
| | | | | | | Basic Materials: 2.6% | | | | | | | | |
| | 50,000 | | | # | | Blue Cube Spinco, Inc., 9.750%, 10/15/23 | | | 54,187 | | | | 0.1 | |
| | 50,000 | | | # | | Blue Cube Spinco, Inc., 10.000%, 10/15/25 | | | 55,250 | | | | 0.1 | |
| | 225,000 | | | # | | Cliffs Natural Resources, Inc., 8.250%, 03/31/20 | | | 172,687 | | | | 0.2 | |
| | 375,000 | | | # | | Evolution Escrow Issuer LLC, 7.500%, 03/15/22 | | | 218,438 | | | | 0.2 | |
| | 195,000 | | | | | Hexion US Finance Corp. / Hexion Nova Scotia Finance ULC, 8.875%, 02/01/18 | | | 138,450 | | | | 0.1 | |
| | 219,000 | | | | | Hexion US Finance Corp. / Hexion Nova Scotia Finance ULC, 9.000%, 11/15/20 | | | 84,863 | | | | 0.1 | |
| | 60,000 | | | | | Hexion US Finance Corp., 6.625%, 04/15/20 | | | 47,250 | | | | 0.0 | |
| | 300,000 | | | # | | IAMGOLD Corp., 6.750%, 10/01/20 | | | 190,500 | | | | 0.2 | |
| | 200,000 | | | # | | INEOS Group Holdings SA, 5.875%, 02/15/19 | | | 194,750 | | | | 0.2 | |
| | 155,000 | | | | | Millar Western Forest Products Ltd., 8.500%, 04/01/21 | | | 81,375 | | | | 0.1 | |
| | 80,000 | | | # | | Prince Mineral Holding Corp., 11.500%, 12/15/19 | | | 58,000 | | | | 0.1 | |
| | 410,000 | | | | | Resolute Forest Products, Inc., 5.875%, 05/15/23 | | | 300,325 | | | | 0.3 | |
| | 410,000 | | | | | Tronox Finance LLC, 6.375%, 08/15/20 | | | 248,788 | | | | 0.3 | |
| | 120,000 | | | # | | Unifrax I LLC / Unifrax Holding Co., 7.500%, 02/15/19 | | | 107,400 | | | | 0.1 | |
| | 295,000 | | | | | United States Steel Corp., 7.500%, 03/15/22 | | | 146,025 | | | | 0.1 | |
| | 240,000 | | | # | | WR Grace & Co-Conn, 5.125%, 10/01/21 | | | 243,000 | | | | 0.2 | |
| | 155,000 | | | | | Xerium Technologies, Inc., 8.875%, 06/15/18 | | | 152,210 | | | | 0.2 | |
| | | | | | | | | | 2,493,498 | | | | 2.6 | |
| | | | | | | | | | | | | | | |
| | | | | | | Communications: 12.0% | | | | | | | | |
| | 200,000 | | | # | | Altice Financing SA, 6.625%, 02/15/23 | | | 198,000 | | | | 0.2 | |
| | 200,000 | | | # | | Altice US Finance I Corp., 5.375%, 07/15/23 | | | 201,000 | | | | 0.2 | |
| | 550,000 | | | | | CCO Holdings LLC / CCO Holdings Capital Corp., 6.500%, 04/30/21 | | | 573,031 | | | | 0.6 | |
| | 210,000 | | | # | | CCOH Safari LLC, 5.750%, 02/15/26 | | | 211,050 | | | | 0.2 | |
| | 580,000 | | | | | CenturyLink, Inc., 6.450%, 06/15/21 | | | 568,400 | | | | 0.6 | |
| | 155,000 | | | # | | CommScope Tech Finance LLC, 6.000%, 06/15/25 | | | 149,575 | | | | 0.2 | |
| | 115,000 | | | # | | CommScope, Inc., 5.500%, 06/15/24 | | | 109,681 | | | | 0.1 | |
| | 120,000 | | | # | | CommScope, Inc., 5.000%, 06/15/21 | | | 115,500 | | | | 0.1 | |
| | 330,000 | | | # | | DigitalGlobe, Inc., 5.250%, 02/01/21 | | | 278,850 | | | | 0.3 | |
| | 400,000 | | | | | Equinix, Inc., 5.375%, 01/01/22 | | | 412,000 | | | | 0.4 | |
| | 195,000 | | | | | Equinix, Inc., 5.375%, 04/01/23 | | | 199,875 | | | | 0.2 | |
| | 245,000 | | | | | Finisar Corp., 0.500%, 12/15/33 | | | 228,156 | | | | 0.2 | |
| | 50,000 | | | # | | FireEye, Inc., 1.000%, 06/01/35 | | | 42,781 | | | | 0.0 | |
| | 50,000 | | | # | | FireEye, Inc., 1.625%, 06/01/35 | | | 40,344 | | | | 0.0 | |
| | 218,000 | | | | | Frontier Communications Corp., 8.500%, 04/15/20 | | | 219,090 | | | | 0.2 | |
| | 555,000 | | | | | Frontier Communications Corp., 8.750%, 04/15/22 | | | 516,150 | | | | 0.5 | |
| | 65,000 | | | # | | Frontier Communications Corp., 8.875%, 09/15/20 | | | 65,975 | | | | 0.1 | |
| | 65,000 | | | # | | Frontier Communications Corp., 10.500%, 09/15/22 | | | 64,756 | | | | 0.1 | |
| | 200,000 | | | | | Intelsat Luxembourg SA, 7.750%, 06/01/21 | | | 94,000 | | | | 0.1 | |
| | 275,000 | | | | | Liberty Media Corp., 1.375%, 10/15/23 | | | 270,703 | | | | 0.3 | |
| | 465,500 | | | | | McGraw-Hill School Educcation, 6.250%, 12/17/19 | | | 458,518 | | | | 0.5 | |
| | 270,000 | | | # | | MDC Partners, Inc., 6.750%, 04/01/20 | | | 279,112 | | | | 0.3 | |
| | 85,000 | | | # | | MPL 2 Acquisition Canco, Inc., 9.875%, 08/15/18 | | | 88,613 | | | | 0.1 | |
| | 125,000 | | | | | NeuStar, Inc., 4.500%, 01/15/23 | | | 100,750 | | | | 0.1 | |
| | 200,000 | | | # | | Numericable Group SA, 6.000%, 05/15/22 | | | 194,500 | | | | 0.2 | |
| | 350,000 | | | | | Quebecor Media, Inc., 5.750%, 01/15/23 | | | 353,938 | | | | 0.4 | |
| | 480,000 | | | | | Shutterfly, Inc., 0.250%, 05/15/18 | | | 465,000 | | | | 0.5 | |
| | 170,000 | | | # | | Sirius XM Radio, Inc., 4.625%, 05/15/23 | | | 167,238 | | | | 0.2 | |
| | 1,670,000 | | | | | Sprint Corp., 7.250%, 09/15/21 | | | 1,248,325 | | | | 1.3 | |
| | 245,000 | | | # | | Taylor Morrison Communities, Inc. / Monarch Communities, Inc., 5.625%, 03/01/24 | | | 236,425 | | | | 0.2 | |
| | 425,000 | | | | | TEGNA, Inc., 6.375%, 10/15/23 | | | 449,437 | | | | 0.5 | |
| | 70,000 | | | | | T-Mobile USA, Inc., 6.500%, 01/15/24 | | | 71,575 | | | | 0.1 | |
| | 100,000 | | | | | T-Mobile USA, Inc., 6.500%, 01/15/26 | | | 101,199 | | | | 0.1 | |
| | 100,000 | | | | | T-Mobile USA, Inc., 6.633%, 04/28/21 | | | 104,750 | | | | 0.1 | |
| | 155,000 | | | | | Twitter, Inc., 0.250%, 09/15/19 | | | 132,428 | | | | 0.1 | |
| VY® Pioneer High Yield Portfolio | PORTFOLIO OF INVESTMENTS as of December 31, 2015 (continued) |
| Principal Amount† | | | | | | | Value | | | Percentage of Net Assets | |
| CORPORATE BONDS/NOTES: (continued) | | | | |
| | | | | | | Communications: (continued) | | | | | | | | |
| | 58,291 | | | | | Univision Communications, Inc., 4.000%, 03/01/20 | | | 57,174 | | | | 0.1 | |
| | 160,000 | | | # | | Univision Communications, Inc., 5.125%, 02/15/25 | | | 152,400 | | | | 0.2 | |
| | 269,328 | | | | | Virgin Media Investment Holding Ltd., 3.500%, 06/30/23 | | | 264,054 | | | | 0.3 | |
| | 315,000 | | | | | WebMD Health Corp., 1.500%, 12/01/20 | | | 353,391 | | | | 0.4 | |
| | 600,000 | | | | | WebMD Health Corp., 2.500%, 01/31/18 | | | 620,250 | | | | 0.6 | |
| | 279,348 | | | | | West Corp., 3.250%, 06/30/18 | | | 275,158 | | | | 0.3 | |
| | 375,000 | | | | | Windstream Corp., 6.375%, 08/01/23 | | | 271,406 | | | | 0.3 | |
| | 360,000 | | | | | Windstream Corp., 7.500%, 06/01/22 | | | 277,650 | | | | 0.3 | |
| | 200,000 | | | | | Windstream Corp., 7.750%, 10/15/20 | | | 169,250 | | | | 0.2 | |
| | | | | | | | | | 11,451,458 | | | | 12.0 | |
| | | | | | | | | | | | | | | |
| | | | | | | Consumer, Cyclical: 11.4% | | | | | | | | |
| | 245,000 | | | | | Allegion US Holding Co., Inc., 5.750%, 10/01/21 | | | 249,287 | | | | 0.3 | |
| | 335,000 | | | | | Asbury Automotive Group, Inc., 6.000%, 12/15/24 | | | 347,562 | | | | 0.4 | |
| | 300,000 | | | # | | Brookfield Residential Properties, Inc., 6.500%, 12/15/20 | | | 290,625 | | | | 0.3 | |
| | 342,250 | | | | | Camping World, 5.750%, 02/20/20 | | | 340,111 | | | | 0.3 | |
| | 285,000 | | | | | DR Horton, Inc., 5.750%, 08/15/23 | | | 305,235 | | | | 0.3 | |
| | 315,000 | | | # | | DriveTime Automotive Group, Inc. / DT Acceptance Corp., 8.000%, 06/01/21 | | | 281,925 | | | | 0.3 | |
| | 173,022 | | | | | Federal Mogul Corp., 4.750%, 12/27/15 | | | 153,038 | | | | 0.2 | |
| | 100,000 | | | | | Ferrellgas L.P. / Ferrellgas Finance Corp., 6.500%, 05/01/21 | | | 85,500 | | | | 0.1 | |
| | 375,000 | | | | | Ferrellgas L.P. / Ferrellgas Finance Corp., 6.750%, 01/15/22 | | | 317,812 | | | | 0.3 | |
| | 345,000 | | | | | Global Partners L.P. / GLP Finance Corp., 6.250%, 07/15/22 | | | 277,725 | | | | 0.3 | |
| | 265,000 | | | | | Global Partners L.P. / GLP Finance Corp., 7.000%, 06/15/23 | | | 218,625 | | | | 0.2 | |
| | 300,000 | | | | | Group 1 Automotive, Inc., 5.000%, 06/01/22 | | | 298,500 | | | | 0.3 | |
| | 380,000 | | | | | Jarden Corp., 1.125%, 03/15/34 | | | 468,112 | | | | 0.5 | |
| | 406,000 | | | # | | JLL/Delta Dutch Newco BV, 7.500%, 02/01/22 | | | 397,372 | | | | 0.4 | |
| | 650,000 | | | | | KB Home, 1.375%, 02/01/19 | | | 584,594 | | | | 0.6 | |
| | 400,000 | | | | | KB Home, 7.000%, 12/15/21 | | | 396,500 | | | | 0.4 | |
| | 245,000 | | | | | KB Home, 7.500%, 09/15/22 | | | 245,000 | | | | 0.3 | |
| | 98,987 | | | | | Landrys, Inc., 4.000%, 04/24/18 | | | 98,632 | | | | 0.1 | |
| | 250,000 | | | | | Lennar Corp., 4.500%, 06/15/19 | | | 255,469 | | | | 0.3 | |
| | 465,000 | | | | | Lennar Corp., 4.750%, 11/15/22 | | | 463,372 | | | | 0.5 | |
| | 100,000 | | | | | LKQ Corp., 4.750%, 05/15/23 | | | 94,250 | | | | 0.1 | |
| | 310,000 | | | | | MDC Holdings, Inc., 5.500%, 01/15/24 | | | 314,650 | | | | 0.3 | |
| | 145,000 | | | | | Meritage Homes Corp., 7.000%, 04/01/22 | | | 152,613 | | | | 0.2 | |
| | 300,000 | | | # | | NCL Corp. Ltd., 5.250%, 11/15/19 | | | 306,000 | | | | 0.3 | |
| | 200,000 | | | # | | Nexteer Automotive Group Ltd., 5.875%, 11/15/21 | | | 205,000 | | | | 0.2 | |
| | 665,000 | | | | | Outerwall, Inc., 5.875%, 06/15/21 | | | 548,625 | | | | 0.6 | |
| | 270,000 | | | | | Regal Entertainment Group, 5.750%, 02/01/25 | | | 261,563 | | | | 0.3 | |
| | 150,000 | | | | | Regal Entertainment Group, 5.750%, 03/15/22 | | | 150,563 | | | | 0.1 | |
| | 330,000 | | | | | Ryland Group, Inc., 0.250%, 06/01/19 | | | 296,794 | | | | 0.3 | |
| | 130,000 | | | | | Ryland Group, Inc., 5.375%, 10/01/22 | | | 131,300 | | | | 0.1 | |
| | 185,000 | | | # | | Sabre GLBL, Inc., 5.250%, 11/15/23 | | | 183,844 | | | | 0.2 | |
| | 150,000 | | | | | Scientific Games International, Inc., 6.250%, 09/01/20 | | | 71,250 | | | | 0.1 | |
| | 1,315,000 | | | | | Scientific Games International, Inc., 10.000%, 12/01/22 | | | 940,225 | | | | 1.0 | |
| | 75,000 | | | # | | Shea Homes L.P. / Shea Homes Funding Corp., 5.875%, 04/01/23 | | | 77,250 | | | | 0.1 | |
| | 235,000 | | | | | CalAtlantic Group, Inc., 1.250%, 08/01/32 | | | 262,025 | | | | 0.3 | |
| | 427,802 | | | | | Tower Automotive Holdings - TL B 1L, 4.000%, 04/17/20 | | | 410,690 | | | | 0.4 | |
| | 245,000 | | | # | | Viking Cruises Ltd., 8.500%, 10/15/22 | | | 233,363 | | | | 0.2 | |
| | 160,000 | | | # | | ZF North America Capital, Inc., 4.750%, 04/29/25 | | | 153,000 | | | | 0.2 | |
| | | | | | | | | | 10,868,001 | | | | 11.4 | |
| | | | | | | | | | | | | | | |
| | | | | | | Consumer, Non-cyclical: 18.3% | | | | | | | | |
| | 116,032 | | | | | AdvancePierre Foods - TL L, 5.750%, 07/10/17 | | | 116,003 | | | | 0.1 | |
| | 140,000 | | | | | Alere, Inc., 3.000%, 05/15/16 | | | 145,425 | | | | 0.2 | |
| | 570,000 | | | | | Alliance One International, Inc., 9.875%, 07/15/21 | | | 421,087 | | | | 0.4 | |
| | 155,000 | | | | | Ascent Capital Group, Inc., 4.000%, 07/15/20 | | | 102,009 | | | | 0.1 | |
| | 69,612 | | | | | BioScrip, Inc. - TL B DD, 6.500%, 07/31/20 | | | 63,782 | | | | 0.1 | |
| | 119,732 | | | | | BioScrip, Inc. - TL B, 6.500%, 07/31/20 | | | 109,704 | | | | 0.1 | |
| | 225,000 | | | | | BioScrip, Inc., 8.875%, 02/15/21 | | | 180,000 | | | | 0.2 | |
| | 115,000 | | | | | BioMarin Pharmaceutical, Inc., 1.500%, 10/15/20 | | | 154,244 | | | | 0.2 | |
| | 215,000 | | | # | | C&S Group Enterprises LLC, 5.375%, 07/15/22 | | | 194,575 | | | | 0.2 | |
| VY® Pioneer High Yield Portfolio | PORTFOLIO OF INVESTMENTS as of December 31, 2015 (continued) |
| Principal Amount† | | | | | | | Value | | | Percentage of Net Assets | |
| CORPORATE BONDS/NOTES: (continued) | | | | |
| | | | | | | Consumer, Non-cyclical: (continued) | | | | | | | | |
| | 490,000 | | | | | Cardtronics, Inc., 1.000%, 12/01/20 | | | 457,231 | | | | 0.5 | |
| | 120,000 | | | | | Carriage Services, Inc., 2.750%, 03/15/21 | | | 141,975 | | | | 0.1 | |
| | 225,000 | | | # | | Cenveo Corp., 6.000%, 08/01/19 | | | 159,750 | | | | 0.2 | |
| | 290,000 | | | | | Cepheid, 1.250%, 02/01/21 | | | 259,006 | | | | 0.3 | |
| | 67,000 | | | | | Chiquita Brands International, Inc. / Chiquita Brands LLC, 7.875%, 02/01/21 | | | 70,434 | | | | 0.1 | |
| | 70,000 | | | | | CHS/Community Health Systems, Inc., 6.875%, 02/01/22 | | | 66,762 | | | | 0.1 | |
| | 870,000 | | | | | CHS/Community Health Systems, Inc., 8.000%, 11/15/19 | | | 880,875 | | | | 0.9 | |
| | 375,000 | | | # | | Cimpress NV, 7.000%, 04/01/22 | | | 361,406 | | | | 0.4 | |
| | 225,000 | | | | | Constellation Brands, Inc., 3.750%, 05/01/21 | | | 226,125 | | | | 0.2 | |
| | 275,000 | | | | | Constellation Brands, Inc., 4.250%, 05/01/23 | | | 275,687 | | | | 0.3 | |
| | 305,000 | | | # | | Constellis Holdings LLC / Constellis Finance Corp., 9.750%, 05/15/20 | | | 251,625 | | | | 0.3 | |
| | 430,000 | | | | | Del Monte Foods Company, 8.250%, 07/26/21 | | | 354,033 | | | | 0.4 | |
| | 310,000 | | | # | | Dole Food Co., Inc., 7.250%, 05/01/19 | | | 307,675 | | | | 0.3 | |
| | 32,000 | | | | | DynCorp International, Inc., 10.375%, 07/01/17 | | | 23,840 | | | | 0.0 | |
| | 411,000 | | | | | Emergent Biosolutions, Inc., 2.875%, 01/15/21 | | | 567,437 | | | | 0.6 | |
| | 315,000 | | | # | | Endo Finance LLC, 5.750%, 01/15/22 | | | 307,125 | | | | 0.3 | |
| | 140,000 | | | # | | Endo Finance LLC, 5.875%, 01/15/23 | | | 137,900 | | | | 0.1 | |
| | 180,000 | | | | | Endologix, Inc., 2.250%, 12/15/18 | | | 146,362 | | | | 0.2 | |
| | 115,000 | | | | | Endologix, Inc., 3.250%, 11/01/20 | | | 125,278 | | | | 0.1 | |
| | 250,000 | | | # | | FAGE Dairy Industry SA / FAGE USA Dairy Industry, Inc., 9.875%, 02/01/20 | | | 260,469 | | | | 0.3 | |
| | 350,000 | | | | | FTI Consulting, Inc., 6.000%, 11/15/22 | | | 367,937 | | | | 0.4 | |
| | 270,000 | | | | | H&E Equipment Services, Inc., 7.000%, 09/01/22 | | | 265,950 | | | | 0.3 | |
| | 250,000 | | | #,& | | Igloo Holdings Corp., 8.250%, 12/15/17 | | | 250,237 | | | | 0.3 | |
| | 120,000 | | | # | | Immunomedics, Inc., 4.750%, 02/15/20 | | | 95,775 | | | | 0.1 | |
| | 390,000 | | | # | | Impax Laboratories, Inc., 2.000%, 06/15/22 | | | 384,150 | | | | 0.4 | |
| | 490,000 | | | | | Insulet Corp., 2.000%, 06/15/19 | | | 508,681 | | | | 0.5 | |
| | 290,000 | | | # | | Ironwood Pharmaceuticals, Inc., 2.250%, 06/15/22 | | | 271,512 | | | | 0.3 | |
| | 200,000 | | | | | Jazz Investments I Ltd., 1.875%, 08/15/21 | | | 210,250 | | | | 0.2 | |
| | 255,000 | | | | | Kindred Healthcare, Inc., 6.375%, 04/15/22 | | | 212,606 | | | | 0.2 | |
| | 240,000 | | | | | Kindred Healthcare, Inc., 8.000%, 01/15/20 | | | 225,600 | | | | 0.2 | |
| | 333,325 | | | | | Lantheus Medical Imaging, Inc. - TL B 1L, 7.000%, 06/30/22 | | | 306,659 | | | | 0.3 | |
| | 205,000 | | | # | | Medicines Co, 2.500%, 01/15/22 | | | 260,863 | | | | 0.3 | |
| | 144,041 | | | | | Metaldyne LLC, 3.750%, 10/08/21 | | | 142,720 | | | | 0.1 | |
| | 205,000 | | | # | | Molina Healthcare, Inc., 5.375%, 11/15/22 | | | 205,513 | | | | 0.2 | |
| | 100,000 | | | | | Monitronics International, Inc., 9.125%, 04/01/20 | | | 79,750 | | | | 0.1 | |
| | 124,000 | | | | | NuVasive, Inc., 2.750%, 07/01/17 | | | 169,803 | | | | 0.2 | |
| | 238,000 | | | | | PDL BioPharma, Inc., 4.000%, 02/01/18 | | | 191,739 | | | | 0.2 | |
| | 260,000 | | | # | | Post Holdings, Inc., 6.000%, 12/15/22 | | | 255,775 | | | | 0.3 | |
| | 100,000 | | | # | | Post Holdings, Inc., 6.750%, 12/01/21 | | | 102,250 | | | | 0.1 | |
| | 550,000 | | | | | Post Holdings, Inc., 7.375%, 02/15/22 | | | 575,438 | | | | 0.6 | |
| | 100,000 | | | # | | Post Holdings, Inc., 7.750%, 03/15/24 | | | 105,000 | | | | 0.1 | |
| | 245,000 | | | | | Quidel Corp., 3.250%, 12/15/20 | | | 238,722 | | | | 0.2 | |
| | 255,000 | | | # | | Quintiles Transnational Corp., 4.875%, 05/15/23 | | | 257,550 | | | | 0.3 | |
| | 155,000 | | | | | Rent-A-Center, Inc./TX, 4.750%, 05/01/21 | | | 116,638 | | | | 0.1 | |
| | 250,000 | | | | | Revlon Consumer Products Corp., 5.750%, 02/15/21 | | | 243,125 | | | | 0.3 | |
| | 100,000 | | | | | Reynolds Group Issuer, Inc., 5.750%, 10/15/20 | | | 101,969 | | | | 0.1 | |
| | 235,000 | | | | | Reynolds Group Issuer, Inc., 8.250%, 02/15/21 | | | 227,363 | | | | 0.2 | |
| | 335,000 | | | | | Reynolds Group Issuer, Inc., 8.500%, 05/15/18 | | | 331,650 | | | | 0.3 | |
| | 265,000 | | | | | Reynolds Group Issuer, Inc., 9.875%, 08/15/19 | | | 267,319 | | | | 0.3 | |
| | 165,000 | | | # | | Safway Group Holding LLC / Safway Finance Corp., 7.000%, 05/15/18 | | | 165,413 | | | | 0.2 | |
| | 465,000 | | | # | | Sothebys, 5.250%, 10/01/22 | | | 425,475 | | | | 0.4 | |
| | 255,000 | | | # | | Southern States Cooperative, Inc., 10.000%, 08/15/21 | | | 221,850 | | | | 0.2 | |
| | 202,815 | | | | | Surgical Care Affiliates, Inc. - TL B 1L, 4.250%, 03/17/22 | | | 202,181 | | | | 0.2 | |
| | 480,000 | | | | | Theravance, Inc., 2.125%, 01/15/23 | | | 361,500 | | | | 0.4 | |
| | 440,000 | | | | | Truven Health Analytics, Inc., 10.625%, 06/01/20 | | | 444,400 | | | | 0.5 | |
| | 275,000 | | | | | Universal Hospital Services, Inc., 7.625%, 08/15/20 | | | 259,531 | | | | 0.3 | |
| | 905,000 | | | # | | VRX Escrow Corp., 5.875%, 05/15/23 | | | 812,238 | | | | 0.9 | |
| | 480,000 | | | | | WellCare Health Plans, Inc., 5.750%, 11/15/20 | | | 496,200 | | | | 0.5 | |
| | 220,000 | | | # | | Wright Medical Group, Inc., 2.000%, 02/15/20 | | | 228,663 | | | | 0.2 | |
| | | | | | | | | | 17,457,819 | | | | 18.3 | |
| VY® Pioneer High Yield Portfolio | PORTFOLIO OF INVESTMENTS as of December 31, 2015 (continued) |
Principal
Amount† | | | | | | | Value | | | Percentage of Net Assets | |
| CORPORATE BONDS/NOTES: (continued) | | | | |
| | | | | | | Diversified: 0.2% | | | | | | | | |
| | 230,000 | | | # | | Argos Merger Sub, Inc., 7.125%, 03/15/23 | | | 228,620 | | | | 0.2 | |
| | | | | | | | | | | | | | | |
| | | | | | | Energy: 9.9% | | | | | | | | |
| | 175,000 | | | | | Antero Resources Corp., 6.000%, 12/01/20 | | | 147,000 | | | | 0.2 | |
| | 350,000 | | | | | Approach Resources, Inc., 7.000%, 06/15/21 | | | 126,000 | | | | 0.1 | |
| | 235,000 | | | | | Berry Petroleum Co., 6.375%, 09/15/22 | | | 58,162 | | | | 0.1 | |
| | 185,000 | | | | | Bonanza Creek Energy, Inc., 5.750%, 02/01/23 | | | 97,125 | | | | 0.1 | |
| | 350,000 | | | | | Calumet Specialty Products Partners L.P. / Calumet Finance Corp., 6.500%, 04/15/21 | | | 306,250 | | | | 0.3 | |
| | 175,000 | | | # | | Calumet Specialty Products Partners L.P. / Calumet Finance Corp., 7.750%, 04/15/23 | | | 149,625 | | | | 0.2 | |
| | 140,000 | | | | | Chaparral Energy, Inc., 8.250%, 09/01/21 | | | 34,300 | | | | 0.0 | |
| | 173,000 | | | # | | Chesapeake Energy Corp., 8.000%, 12/15/22 | | | 85,635 | | | | 0.1 | |
| | 515,000 | | | | | Cobalt International Energy, Inc., 2.625%, 12/01/19 | | | 293,872 | | | | 0.3 | |
| | 335,000 | | | | | Comstock Resources, Inc., 7.750%, 04/01/19 | | | 51,925 | | | | 0.1 | |
| | 200,000 | | | | | Concho Resources, Inc., 5.500%, 04/01/23 | | | 186,000 | | | | 0.2 | |
| | 210,000 | | | # | | ContourGlobal Power Holdings SA, 7.125%, 06/01/19 | | | 200,025 | | | | 0.2 | |
| | 115,000 | | | | | Crestwood Midstream Partners L.P. / Crestwood Midstream Finance Corp., 6.000%, 12/15/20 | | | 85,100 | | | | 0.1 | |
| | 270,000 | | | | | Denbury Resources, Inc., 4.625%, 07/15/23 | | | 88,258 | | | | 0.1 | |
| | 300,000 | | | | | Denbury Resources, Inc., 5.500%, 05/01/22 | | | 101,094 | | | | 0.1 | |
| | 195,000 | | | | | EP Energy LLC / Everest Acquisition Finance, Inc., 6.375%, 06/15/23 | | | 98,475 | | | | 0.1 | |
| | 275,000 | | | | | EP Energy, LLC, 7.750%, 09/01/22 | | | 141,625 | | | | 0.2 | |
| | 255,000 | | | | | EPL Oil & Gas, Inc., 8.250%, 02/15/18 | | | 68,850 | | | | 0.1 | |
| | 510,000 | | | | | Archrock Partners L.P. / Archrock Partners Finance Corp., 6.000%, 04/01/21 | | | 422,025 | | | | 0.4 | |
| | 2,000 | | | | | Green Field Energy Services, Inc. - escrow, 11/15/16 | | | – | | | | – | |
| | 380,000 | | | | | Gulfport Energy Corp., 7.750%, 11/01/20 | | | 342,000 | | | | 0.4 | |
| | 131,000 | | | # | | Halcon Resources Corp., 12.000%, 02/15/22 | | | 86,460 | | | | 0.1 | |
| | 90,000 | | | # | | Hiland Partners L.P. / Hiland Partners Finance Corp., 5.500%, 05/15/22 | | | 86,569 | | | | 0.1 | |
| | 170,000 | | | # | | Hiland Partners L.P. / Hiland Partners Finance Corp., 7.250%, 10/01/20 | | | 171,912 | | | | 0.2 | |
| | 285,000 | | | # | | Hilcorp Energy I L.P. / Hilcorp Finance Co., 5.750%, 10/01/25 | | | 249,375 | | | | 0.3 | |
| | 200,000 | | | | | Holly Energy Partners L.P. / Holly Energy Finance Corp., 6.500%, 03/01/20 | | | 199,000 | | | | 0.2 | |
| | 250,380 | | | | | Jonah Energy, 7.500%, 05/12/21 | | | 157,739 | | | | 0.2 | |
| | 200,000 | | | | | Legacy Reserves L.P. / Legacy Reserves Finance Corp., 6.625%, 12/01/21 | | | 43,000 | | | | 0.0 | |
| | 207,000 | | | # | | Linn Energy LLC / Linn Energy Finance Corp., 12.000%, 12/15/20 | | | 105,570 | | | | 0.1 | |
| | 110,000 | | | | | Linn Energy LLC / Linn Energy Finance Corp., 6.250%, 11/01/19 | | | 18,700 | | | | 0.0 | |
| | 345,000 | | | | | MarkWest Energy Partners L.P. / MarkWest Energy Finance Corp., 4.875%, 06/01/25 | | | 310,500 | | | | 0.3 | |
| | 180,000 | | | | | Memorial Production Partners L.P. / Memorial Production Finance Corp., 6.875%, 08/01/22 | | | 54,900 | | | | 0.1 | |
| | 200,000 | | | | | Memorial Production Partners L.P. / Memorial Production Finance Corp., 7.625%, 05/01/21 | | | 61,000 | | | | 0.1 | |
| | 200,000 | | | | | Midstates Petroleum Co., Inc. / Midstates Petroleum Co. LLC, 9.250%, 06/01/21 | | | 24,000 | | | | 0.0 | |
| | 250,000 | | | | | Murphy Oil USA, Inc., 6.000%, 08/15/23 | | | 263,750 | | | | 0.3 | |
| | 585,000 | | | | | Noble Energy, Inc., 5.625%, 05/01/21 | | | 572,888 | | | | 0.6 | |
| | 240,000 | | | | | Noble Energy, Inc., 5.875%, 06/01/22 | | | 228,610 | | | | 0.2 | |
| | 170,000 | | | | | Northern Oil and Gas, Inc., 8.000%, 06/01/20 | | | 113,900 | | | | 0.1 | |
| | 245,000 | | | | | ONEOK, Inc., 7.500%, 09/01/23 | | | 204,575 | | | | 0.2 | |
| | 240,000 | | | | | PDC Energy, Inc., 7.750%, 10/15/22 | | | 231,600 | | | | 0.2 | |
| | 285,000 | | | | | Penn Virginia Corp., 8.500%, 05/01/20 | | | 46,312 | | | | 0.1 | |
| | 275,000 | | | | | Range Resources Corp., 5.000%, 03/15/23 | | | 206,250 | | | | 0.2 | |
| | 210,000 | | | | | Rice Energy, Inc., 6.250%, 05/01/22 | | | 152,250 | | | | 0.2 | |
| | 325,000 | | | | | Sabine Pass Liquefaction LLC, 5.625%, 02/01/21 | | | 300,625 | | | | 0.3 | |
| | 155,000 | | | | | Sabine Pass Liquefaction LLC, 5.750%, 05/15/24 | | | 135,625 | | | | 0.1 | |
| | 360,000 | | | | | Sanchez Energy Corp., 7.750%, 06/15/21 | | | 221,400 | | | | 0.2 | |
| | 136,000 | | | | | SandRidge Energy, Inc., 8.125%, 10/16/22 | | | 26,775 | | | | 0.0 | |
| | 130,000 | | | | | SEACOR Holdings, Inc., 3.000%, 11/15/28 | | | 103,675 | | | | 0.1 | |
| | 360,000 | | | | | SolarCity Corp., 1.625%, 11/01/19 | | | 292,500 | | | | 0.3 | |
| | 200,000 | | | | | Swift Energy Co., 7.875%, 03/01/22 | | | 17,000 | | | | 0.0 | |
| VY® Pioneer High Yield Portfolio | PORTFOLIO OF INVESTMENTS as of December 31, 2015 (continued) |
Principal
Amount† | | | | | | | Value | | | Percentage of Net Assets | |
| CORPORATE BONDS/NOTES: (continued) | | | | |
| | | | | | | Energy: (continued) | | | | | | | | |
| | 175,000 | | | | | Swift Energy Co., 8.875%, 01/15/20 | | | 14,875 | | | | 0.0 | |
| | 130,000 | | | | | Targa Resources Partners L.P. / Targa Resources Partners Finance Corp., 4.250%, 11/15/23 | | | 100,750 | | | | 0.1 | |
| | 190,000 | | | | | Targa Resources Partners L.P., 6.375%, 08/01/22 | | | 164,825 | | | | 0.2 | |
| | 110,000 | | | # | | TerraForm Power Operating LLC, 5.875%, 02/01/23 | | | 91,575 | | | | 0.1 | |
| | 300,000 | | | | | Tesoro Corp., 5.375%, 10/01/22 | | | 301,875 | | | | 0.3 | |
| | 155,000 | | | | | Unit Corp., 6.625%, 05/15/21 | | | 112,375 | | | | 0.1 | |
| | 210,000 | | | | | Vanguard Natural Resources, LLC, 7.875%, 04/01/20 | | | 56,700 | | | | 0.1 | |
| | 295,000 | | | | | Western Refining Logistics L.P. / WNRL Finance Corp., 7.500%, 02/15/23 | | | 283,200 | | | | 0.3 | |
| | 260,000 | | | # | | Whiting Petroleum Corp., 1.250%, 04/01/20 | | | 178,100 | | | | 0.2 | |
| | 150,000 | | | | | WPX Energy, Inc., 7.500%, 08/01/20 | | | 122,250 | | | | 0.1 | |
| | 235,000 | | | | | WPX Energy, Inc., 8.250%, 08/01/23 | | | 188,588 | | | | 0.2 | |
| | | | | | | | | | 9,384,919 | | | | 9.9 | |
| | | | | | | | | | | | | | | |
| | | | | | | Financial: 10.9% | | | | | | | | |
| | 218,276 | | | #,& | | AAF Holdings LLC/AAF Finance Co., 12.000%, 07/01/19 | | | 207,362 | | | | 0.2 | |
| | 72,125 | | | | | Alliant Holdings I LLC, 4.500%, 08/12/22 | | | 70,750 | | | | 0.1 | |
| | 300,000 | | | | | Ally Financial, Inc., 4.625%, 03/30/25 | | | 297,000 | | | | 0.3 | |
| | 200,000 | | | | | Ally Financial, Inc., 4.625%, 05/19/22 | | | 201,500 | | | | 0.2 | |
| | 305,000 | | | | | Ally Financial, Inc., 5.750%, 11/20/25 | | | 309,575 | | | | 0.3 | |
| | 300,000 | | | # | | Ausdrill Finance Pty Ltd., 6.875%, 11/01/19 | | | 216,000 | | | | 0.2 | |
| | 325,000 | | | | | Bank of America Corp., 6.250%, 09/29/49 | | | 326,219 | | | | 0.3 | |
| | 375,000 | | | | | Bank of America Corp., 6.500%, 10/29/49 | | | 395,625 | | | | 0.4 | |
| | 325,000 | | | | | Capital One Financial Corp., 5.550%, 12/29/49 | | | 324,187 | | | | 0.3 | |
| | 175,000 | | | | | Citigroup, Inc., 5.900%, 12/29/49 | | | 172,375 | | | | 0.2 | |
| | 190,000 | | | | | CNO Financial Group, Inc., 4.500%, 05/30/20 | | | 194,275 | | | | 0.2 | |
| | 311,914 | | | | | Confie Seguros Holding II - TL 1L, 5.750%, 11/08/18 | | | 308,015 | | | | 0.3 | |
| | 400,000 | | | | | DuPont Fabros Technology L.P., 5.875%, 09/15/21 | | | 418,000 | | | | 0.4 | |
| | 140,000 | | | # | | Fidelity & Guaranty Life Holdings, Inc., 6.375%, 04/01/21 | | | 143,500 | | | | 0.2 | |
| | 400,000 | | | | | Fly Leasing Ltd, 6.375%, 10/15/21 | | | 399,500 | | | | 0.4 | |
| | 250,000 | | | # | | Galileo Re Ltd., 7.598%, 01/09/19 | | | 252,687 | | | | 0.3 | |
| | 480,000 | | | | | Geo Group, Inc./The, 5.875%, 10/15/24 | | | 468,000 | | | | 0.5 | |
| | 300,000 | | | | | Iron Mountain, Inc., 5.750%, 08/15/24 | | | 290,625 | | | | 0.3 | |
| | 250,000 | | | | | Kennedy-Wilson, Inc., 5.875%, 04/01/24 | | | 241,875 | | | | 0.3 | |
| | 250,000 | | | # | | Kilimanjaro Re Ltd., 4.703%, 04/30/18 | | | 247,637 | | | | 0.3 | |
| | 250,000 | | | # | | Kilimanjaro Re Ltd., 9.250%, 12/06/19 | | | 251,912 | | | | 0.3 | |
| | 285,000 | | | | | MJ Acquisition Corp., 9.000%, 05/08/23 | | | 279,471 | | | | 0.3 | |
| | 350,000 | | | | | Morgan Stanley, 5.550%, 12/29/49 | | | 350,437 | | | | 0.4 | |
| | 300,000 | | | | | MPT Operating Partnership L.P. / MPT Finance Corp., 5.500%, 05/01/24 | | | 300,000 | | | | 0.3 | |
| | 220,000 | | | | | Nationstar Mortgage LLC / Nationstar Capital Corp., 6.500%, 06/01/22 | | | 191,125 | | | | 0.2 | |
| | 575,000 | | | | | Nationstar Mortgage LLC / Nationstar Capital Corp., 6.500%, 07/01/21 | | | 511,031 | | | | 0.5 | |
| | 100,000 | | | | | Nationstar Mortgage LLC / Nationstar Capital Corp., 6.500%, 08/01/18 | | | 97,500 | | | | 0.1 | |
| | 125,000 | | | | | Ocwen Financial Corp., 6.625%, 05/15/19 | | | 110,625 | | | | 0.1 | |
| | 435,000 | | | # | | Provident Funding Associates L.P. / PFG Finance Corp., 6.750%, 06/15/21 | | | 423,038 | | | | 0.4 | |
| | 250,000 | | | # | | Queen Street VII Re Ltd., 8.803%, 04/08/16 | | | 251,931 | | | | 0.3 | |
| | 250,000 | | | # | | Residential Reinsurance 2012 Ltd., 5.953%, 12/06/18 | | | 254,213 | | | | 0.3 | |
| | 250,000 | | | # | | Residential Reinsurance 2012 Ltd., 12.953%, 12/06/18 | | | 261,763 | | | | 0.3 | |
| | 400,000 | | | | | Royal Bank of Scotland Group PLC, 8.000%, 12/29/49 | | | 424,000 | | | | 0.4 | |
| | 250,000 | | | # | | Sanders Re Ltd., 4.203%, 05/05/17 | | | 250,213 | | | | 0.3 | |
| | 210,000 | | | # | | TMX Finance LLC / TitleMax Finance Corp., 8.500%, 09/15/18 | | | 157,500 | | | | 0.2 | |
| | 525,000 | | | | | United Rentals North America, Inc., 5.750%, 11/15/24 | | | 522,375 | | | | 0.5 | |
| | 250,000 | | | | | Wells Fargo & Co., 5.875%, 12/31/49 | | | 263,438 | | | | 0.3 | |
| | | | | | | | | | 10,385,279 | | | | 10.9 | |
| | | | | | | | | | | | | | | |
| | | | | | | Industrial: 10.1% | | | | | | | | |
| | 105,000 | | | | | AECOM, 5.750%, 10/15/22 | | | 108,544 | | | | 0.1 | |
| | 105,000 | | | | | AECOM, 5.875%, 10/15/24 | | | 107,494 | | | | 0.1 | |
| | 350,000 | | | | | AEP Industries, Inc., 8.250%, 04/15/19 | | | 361,375 | | | | 0.4 | |
| | 150,000 | | | # | | Aguila 3 SA, 7.875%, 01/31/18 | | | 150,937 | | | | 0.2 | |
| | 208,587 | | | #,& | | American Energy - Utica LLC, 3.500%, 03/01/21 | | | 7,301 | | | | 0.0 | |
| | 345,000 | | | # | | Amsted Industries, Inc., 5.000%, 03/15/22 | | | 346,725 | | | | 0.4 | |
| VY® Pioneer High Yield Portfolio | PORTFOLIO OF INVESTMENTS as of December 31, 2015 (continued) |
Principal
Amount† | | | | | | | Value | | | Percentage of Net Assets | |
| CORPORATE BONDS/NOTES: (continued) | | | | |
| | | | | | | Industrial: (continued) | | | | | | | | |
| | 397,535 | | | #,& | | Ardagh Finance Holdings SA, 8.625%, 06/15/19 | | | 393,806 | | | | 0.4 | |
| | 35,294 | | | # | | Ardagh Packaging Finance PLC, 7.000%, 11/15/20 | | | 34,853 | | | | 0.0 | |
| | 250,000 | | | # | | Aviation Capital Group Corp., 6.750%, 04/06/21 | | | 280,312 | | | | 0.3 | |
| | 325,000 | | | | | Ball Corp., 4.000%, 11/15/23 | | | 311,594 | | | | 0.3 | |
| | 575,000 | | | | | Ball Corp., 5.250%, 07/01/25 | | | 590,094 | | | | 0.6 | |
| | 350,000 | | | # | | BC Mountain LLC / BC Mountain Finance, Inc., 7.000%, 02/01/21 | | | 271,250 | | | | 0.3 | |
| | 85,000 | | | # | | Belden, Inc., 5.250%, 07/15/24 | | | 78,625 | | | | 0.1 | |
| | 195,000 | | | # | | Belden, Inc., 5.500%, 09/01/22 | | | 188,662 | | | | 0.2 | |
| | 50,000 | | | # | | Beverage Packaging Holdings Luxembourg II SA / Beverage Packaging Holdings II Is, 6.000%, 06/15/17 | | | 48,562 | | | | 0.1 | |
| | 305,000 | | | # | | Cleaver-Brooks, Inc., 8.750%, 12/15/19 | | | 295,850 | | | | 0.3 | |
| | 300,000 | | | # | | Coveris Holding Corp., 10.000%, 06/01/18 | | | 286,500 | | | | 0.3 | |
| | 640,000 | | | | | Crown Cork & Seal Co., Inc., 7.375%, 12/15/26 | | | 691,200 | | | | 0.7 | |
| | 100,000 | | | | | Darling Ingredients, Inc., 5.375%, 01/15/22 | | | 98,875 | | | | 0.1 | |
| | 250,000 | | | # | | Dycom Industries, Inc., 0.750%, 09/15/21 | | | 246,875 | | | | 0.3 | |
| | 31,582 | | | | | Filtration Group, Inc., 8.250%, 11/22/21 | | | 30,727 | | | | 0.0 | |
| | 270,000 | | | # | | Florida East Coast Holdings Corp., 6.750%, 05/01/19 | | | 247,725 | | | | 0.3 | |
| | 100,000 | | | | | GCI, Inc., 6.750%, 06/01/21 | | | 102,000 | | | | 0.1 | |
| | 744,000 | | | | | General Cable Corp., 4.500%, 11/15/29 | | | 458,955 | | | | 0.5 | |
| | 300,000 | | | | | Golar LNG Ltd., 3.750%, 03/07/17 | | | 280,020 | | | | 0.3 | |
| | 505,000 | | | | | Griffon Corp., 5.250%, 03/01/22 | | | 483,537 | | | | 0.5 | |
| | 115,000 | | | | | IAC/InterActiveCorp, 4.875%, 11/30/18 | | | 115,719 | | | | 0.1 | |
| | 175,000 | | | # | | Intrepid Aviation Group Holdings LLC / Intrepid Finance Co., 6.875%, 02/15/19 | | | 144,375 | | | | 0.2 | |
| | 310,000 | | | # | | JB Poindexter & Co., Inc., 9.000%, 04/01/22 | | | 325,500 | | | | 0.3 | |
| | 335,000 | | | # | | JMC Steel Group, 8.250%, 03/15/18 | | | 223,613 | | | | 0.2 | |
| | 114,328 | | | #,& | | Liberty Tire Recycling LLC, 11.000%, 03/31/21 | | | 70,598 | | | | 0.1 | |
| | 575,000 | | | # | | NANA Development Corp., 9.500%, 03/15/19 | | | 508,875 | | | | 0.5 | |
| | 400,000 | | | # | | Rentech Nitrogen Partners L.P. / Rentech Nitrogen Finance Corp., 6.500%, 04/15/21 | | | 390,000 | | | | 0.4 | |
| | 400,000 | | | # | | Rexel SA, 5.250%, 06/15/20 | | | 414,000 | | | | 0.4 | |
| | 190,000 | | | | | SunPower Corp., 0.875%, 06/01/21 | | | 166,013 | | | | 0.2 | |
| | 200,000 | | | # | | Syncreon Group BV / Syncreon Global Finance US, Inc., 8.625%, 11/01/21 | | | 158,000 | | | | 0.2 | |
| | 125,000 | | | | | Triumph Group, Inc., 5.250%, 06/01/22 | | | 101,250 | | | | 0.1 | |
| | 100,000 | | | # | | Videotron Ltd., 5.375%, 06/15/24 | | | 100,750 | | | | 0.1 | |
| | 545,000 | | | | | Vishay Intertechnology, Inc., 2.250%, 05/15/41 | | | 419,309 | | | | 0.4 | |
| | | | | | | | | | 9,640,400 | | | | 10.1 | |
| | | | | | | | | | | | | | | |
| | | | | | | Technology: 5.5% | | | | | | | | |
| | 150,000 | | | | | Advanced Micro Devices, Inc., 6.750%, 03/01/19 | | | 109,500 | | | | 0.1 | |
| | 160,000 | | | | | Advanced Micro Devices, Inc., 7.500%, 08/15/22 | | | 109,600 | | | | 0.1 | |
| | 150,000 | | | # | | Audatex North America, Inc., 6.000%, 06/15/21 | | | 151,687 | | | | 0.1 | |
| | 215,000 | | | # | | Brocade Communications Systems, Inc., 1.375%, 01/01/20 | | | 206,937 | | | | 0.2 | |
| | 210,000 | | | | | Brocade Communications Systems, Inc., 4.625%, 01/15/23 | | | 200,550 | | | | 0.2 | |
| | 150,000 | | | | | Citrix Systems, Inc., 0.500%, 04/15/19 | | | 163,875 | | | | 0.2 | |
| | 375,000 | | | # | | Entegris, Inc., 6.000%, 04/01/22 | | | 381,094 | | | | 0.4 | |
| | 74,083 | | | | | Expert Global Solutions, Inc., 8.500%, 04/03/18 | | | 73,712 | | | | 0.1 | |
| | 420,000 | | | # | | First Data Corp., 5.750%, 01/15/24 | | | 414,750 | | | | 0.4 | |
| | 155,000 | | | # | | First Data Corp., 7.000%, 12/01/23 | | | 155,388 | | | | 0.2 | |
| | 510,000 | | | | | j2 Global, Inc., 8.000%, 08/01/20 | | | 535,500 | | | | 0.6 | |
| | 145,000 | | | | | KEYW Holding Corp., 2.500%, 07/15/19 | | | 108,297 | | | | 0.1 | |
| | 250,000 | | | | | MedAssets, Inc., 8.000%, 11/15/18 | | | 255,000 | | | | 0.3 | |
| | 395,000 | | | | | Mentor Graphics Corp., 4.000%, 04/01/31 | | | 413,516 | | | | 0.4 | |
| | 315,000 | | | # | | Micron Technology, Inc., 5.250%, 08/01/23 | | | 284,288 | | | | 0.3 | |
| | 250,000 | | | # | | MSCI, Inc., 5.250%, 11/15/24 | | | 254,375 | | | | 0.3 | |
| | 265,000 | | | | | NCR Corp., 5.000%, 07/15/22 | | | 258,044 | | | | 0.3 | |
| | 160,000 | | | | | NCR Corp., 6.375%, 12/15/23 | | | 158,200 | | | | 0.2 | |
| | 69,000 | | | # | | Nuance Communications, Inc., 1.000%, 12/15/35 | | | 66,714 | | | | 0.1 | |
| | 162,000 | | | | | Nuance Communications, Inc., 1.500%, 11/01/35 | | | 174,656 | | | | 0.2 | |
| | 375,000 | | | # | | ON Semiconductor Corp., 1.000%, 12/01/20 | | | 351,094 | | | | 0.4 | |
| | 197,500 | | | | | SkillSoft, 5.750%, 04/28/21 | | | 154,050 | | | | 0.1 | |
| | 180,000 | | | | | Synchronoss Technologies, Inc., 0.750%, 08/15/19 | | | 181,800 | | | | 0.2 | |
| VY® Pioneer High Yield Portfolio | PORTFOLIO OF INVESTMENTS as of December 31, 2015 (continued) |
Principal
Amount† | | | | | | | Value | | | Percentage of Net Assets | |
| CORPORATE BONDS/NOTES: (continued) | | | | |
| | | | | | | Technology: (continued) | | | | | | | | |
| | 47,774 | | | | | Vertafore, Inc., 4.250%, 07/31/16 | | | 47,433 | | | | 0.0 | |
| | | | | | | | | | 5,210,060 | | | | 5.5 | |
| | | | | | | | | | | | | | | |
| | | | | | | Utilities: 2.3% | | | | | | | | |
| | 505,000 | | | | | AES Corp., 4.875%, 05/15/23 | | | 444,400 | | | | 0.5 | |
| | 100,000 | | | | | AES Corp., 5.500%, 03/15/24 | | | 89,750 | | | | 0.1 | |
| | 350 | | | | | AES Red Oak, LLC, 8.540%, 11/30/19 | | | 366 | | | | 0.0 | |
| | 675,000 | | | | | NRG Energy, Inc., 6.250%, 05/01/24 | | | 570,510 | | | | 0.6 | |
| | 150,000 | | | | | NRG Energy, Inc., 6.250%, 07/15/22 | | | 130,875 | | | | 0.1 | |
| | 275,000 | | | | | NRG Energy, Inc., 7.625%, 01/15/18 | | | 288,063 | | | | 0.3 | |
| | 540,000 | | | # | | Talen Energy Supply LLC, 5.125%, 07/15/19 | | | 407,700 | | | | 0.4 | |
| | 345,000 | | | # | | Talen Energy Supply LLC, 6.500%, 06/01/25 | | | 229,425 | | | | 0.3 | |
| | | | | | | | | | | | | | | |
| | | | | | | | | | 2,161,089 | | | | 2.3 | |
| | | | | | | | | | | | | | | |
| | | | | Total Corporate Bonds/Notes | | | | | | | | |
| | | | | (Cost $88,828,204) | | | 79,281,143 | | | | 83.2 | |
| | | | | | | | | | | | | | | |
| COLLATERALIZED MORTGAGE OBLIGATIONS: 1.0% | | | | | | | | |
| | 1,000,000 | | | # | | Timberstar Trust, 7.530%, 10/15/36 | | | 1,008,890 | | | | 1.0 | |
| | | | | | | | | | | | | | | |
| | | | | Total Collateralized Mortgage Obligations | | | | | | | | |
| | | | | (Cost $1,007,921) | | | 1,008,890 | | | | 1.0 | |
| | | | | | | | | | | | | | | |
| FOREIGN GOVERNMENT BONDS: 0.0% | | | | | | | | |
| | 13,615 | | | & | | Mashantucket Western Pequot Tribe, 2.000%, 07/01/36 | | | 75 | | | | 0.0 | |
| | | | | | | | | | | | | | | |
| | | | | Total Foreign Government Bonds | | | | | | | | |
| | | | | (Cost $518) | | | 75 | | | | 0.0 | |
| Shares | | | | | | | Value | | | Percentage
of Net
Assets | |
| COMMON STOCK: 6.5% | | | | | | | | | |
| | | | | | | Consumer Discretionary: 1.1% | | | | | | | | |
| | 3,636 | | | @ | | Cengage Learning Holdings II L.P. | | | 83,628 | | | | 0.1 | |
| | 50,408 | | | | | Ford Motor Co. | | | 710,249 | | | | 0.7 | |
| | 5,043 | | | | | Starbucks Corp. | | | 302,731 | | | | 0.3 | |
| | | | | | | | | | 1,096,608 | | | | 1.1 | |
| | | | | | | | | | | | | | | |
| | | | | | | Energy: 0.3% | | | | | | | | |
| | 20 | | | @ | | Green Field Energy Service, Inc. | | | – | | | | – | |
| | 25,289 | | | | | Halcon Resources Corp. | | | 31,864 | | | | 0.0 | |
| | 6,900 | | | | | Marathon Oil Corp. | | | 86,871 | | | | 0.1 | |
| | 3,743 | | | | | Marathon Petroleum Corp. | | | 194,037 | | | | 0.2 | |
| | 11,755 | | | @ | | SandRidge Energy, Inc. | | | 2,351 | | | | 0.0 | |
| | | | | | | | | | 315,123 | | | | 0.3 | |
| | | | | | | | | | | | | | | |
| | | | | | | Financials: 1.1% | | | | | | | | |
| | 1,252 | | | | | Capital One Financial Corp. | | | 90,369 | | | | 0.1 | |
| | 5,760 | | | @ | | Communications Sales & Leasing, Inc. | | | 107,655 | | | | 0.1 | |
| | 35,040 | | | @ | | Forest City Enterprises, Inc. | | | 768,427 | | | | 0.8 | |
| | 1,630 | | | | | JPMorgan Chase & Co. | | | 107,629 | | | | 0.1 | |
| | 1,476 | | | #,@ | | Perseus Holding Corp. | | | – | | | | – | |
| | | | | | | | | | 1,074,080 | | | | 1.1 | |
| | | | | | | | | | | | | | | |
| | | | | | | Health Care: 1.8% | | | | | | | | |
| | 2,690 | | | | | Aetna, Inc. | | | 290,843 | | | | 0.3 | |
| | 15,129 | | | @ | | BioScrip, Inc. | | | 26,476 | | | | 0.0 | |
| | 1,274 | | | | | Bio-Rad Laboratories, Inc. | | | 176,653 | | | | 0.2 | |
| | 2,670 | | | | | Cigna Corp. | | | 390,701 | | | | 0.4 | |
| | 4,020 | | | @ | | Mylan NV | | | 217,361 | | | | 0.3 | |
| | 4,129 | | | | | Thermo Fisher Scientific, Inc. | | | 585,699 | | | | 0.6 | |
| | | | | | | | | | 1,687,733 | | | | 1.8 | |
| | | | | | | | | | | | | | | |
| | | | | | | Industrials: 0.8% | | | | | | | | |
| | 123 | | | @ | | Ceva Holdings LLC | | | 55,508 | | | | 0.1 | |
| | 19,600 | | | @ | | Commercial Vehicle Group, Inc. | | | 54,096 | | | | 0.1 | |
| | 9,985 | | | | | General Cable Corp. | | | 134,098 | | | | 0.1 | |
| | 3,055 | | | | | Joy Global, Inc. | | | 38,524 | | | | 0.0 | |
| | 5,449 | | | | | Kennametal, Inc. | | | 104,621 | | | | 0.1 | |
| | 5,836 | | | @ | | Liberty Tire Recycling | | | – | | | | – | |
| | 1,224 | | | | | Orbital ATK, Inc. | | | 109,352 | | | | 0.1 | |
| | 4,490 | | | @ | | United Continental Holdings, Inc. | | | 257,277 | | | | 0.3 | |
| | | | | | | | | | 753,476 | | | | 0.8 | |
| | | | | | | | | | | | | | | |
| | | | | | | Information Technology: 0.8% | | | | | | | | |
| | 5,800 | | | | | EMC Corp. | | | 148,944 | | | | 0.2 | |
| | 13,491 | | | @ | | NCR Corp. | | | 329,990 | | | | 0.3 | |
| | 3,986 | | | | | TE Connectivity Ltd. | | | 257,535 | | | | 0.3 | |
| | | | | | | | | | 736,469 | | | | 0.8 | |
| | | | | | | | | | | | | | | |
| | | | | | | Materials: 0.6% | | | | | | | | |
| | 10,495 | | | | | Axiall Corp. | | | 161,623 | | | | 0.2 | |
| | 4,308 | | | @ | | LyondellBasell Industries NV - Class A | | | 374,365 | | | | 0.4 | |
| | | | | | | | | | 535,988 | | | | 0.6 | |
| | | | | | | | | | | | | | | |
| | | | | | | Telecommunication Services: 0.0% | | | | | | | | |
| | 4,800 | | | | | Windstream Holdings, Inc. | | | 30,912 | | | | 0.0 | |
| | | | | | | | | | | | | | | |
| | | | | Total Common Stock | | | | | | | | |
| | | | | (Cost $5,200,320) | | | 6,230,389 | | | | 6.5 | |
| | | | | | | | | | | | | | | |
| PREFERRED STOCK: 2.4% | | | | | | | | |
| | | | | | | Consumer Discretionary: 0.8% | | | | | | | | |
| | 7,900 | | | @ | | Sealy Corp. | | | 697,624 | | | | 0.8 | |
| | | | | | | | | | | | | | | |
| | | | | | | Energy: 0.0% | | | | | | | | |
| | 285 | | | | | Halcon Resources Corp. | | | 19,024 | | | | 0.0 | |
| | 1,016 | | | | | SandRidge Energy, Inc. 7.0% Conv PS | | | 2,540 | | | | 0.0 | |
| | 1,400 | | | | | SandRidge Energy, Inc. 8.5% Conv PS | | | 6,650 | | | | 0.0 | |
| | | | | | | | | | 28,214 | | | | 0.0 | |
| | | | | | | | | | | | | | | |
| | | | | | | Financials: 1.0% | | | | | | | | |
| | 22,770 | | | P | | Citigroup, Inc. | | | 637,788 | | | | 0.7 | |
| | 13,000 | | | P | | GMAC Capital Trust I | | | 329,680 | | | | 0.3 | |
| | 310 | | | P | | Morgan Stanley | | | 8,227 | | | | 0.0 | |
| | 775 | | | #,@ | | Perseus Holding Corp. | | | – | | | | – | |
| | | | | | | | | | 975,695 | | | | 1.0 | |
| VY® Pioneer High Yield Portfolio | PORTFOLIO OF INVESTMENTS as of December 31, 2015 (continued) |
| Shares | | | | | | | Value | | | Percentage
of Net
Assets | |
| PREFERRED STOCK: (continued) | | | | | | | |
| | | | | | | Health Care: 0.5% | | | | | | | | |
| | 811 | | | | | Alere, Inc. | | | 227,056 | | | | 0.3 | |
| | 125 | | | @ | | Allergan PLC | | | 128,772 | | | | 0.1 | |
| | 150 | | | @ | | Kindred Healthcare, Inc. | | | 101,779 | | | | 0.1 | |
| | | | | | | | | | 457,607 | | | | 0.5 | |
| | | | | | | | | | | | | | | |
| | | | | | | Industrials: 0.1% | | | | | | | | |
| | 267 | | | @ | | Ceva Holdings Series A-2 | | | 120,163 | | | | 0.1 | |
| | | | | | | | | | | | | | | |
| | | | | Total Preferred Stock | | | | | | | | |
| | | | | (Cost $2,932,942) | | | 2,279,303 | | | | 2.4 | |
| | | | | | | | | | | | | | | |
| RIGHTS: –% | | | | | | |
| | | | | | | Health Care: –% | | | | | | | | |
| | 44 | | | @ | | BioScrip, Inc. | | | – | | | | – | |
| | | | | | | | | | | | | | | |
| | | | | Total Rights | | | | | | | | |
| | | | | (Cost $–) | | | – | | | | – | |
| | | | | | | | | | | | | | | |
| | | | | Total Long-Term Investments | | | | | | | | |
| | | | | (Cost $97,969,905) | | | 88,799,800 | | | | 93.1 | |
| | | | | | | | | | | | | | | |
| SHORT-TERM INVESTMENTS: 5.5% |
| | | | | | | Mutual Funds: 5.5% | | | | | | | | |
| | 5,223,470 | | | | | BlackRock Liquidity Funds, TempFund, Institutional Class, 0.270%†† | | | | | | | | |
| | | | | | | (Cost $5,223,470) | | | 5,223,470 | | | | 5.5 | |
| | | | | | | | | | | | | | | |
| | | | | Total Short-Term Investments | | | | | | | | |
| | | | | (Cost $5,223,470) | | | 5,223,470 | | | | 5.5 | |
| | | | | | | | | | | | | | | |
| | | | | Total Investments in Securities
(Cost $103,193,375) | | $ | 94,023,270 | | | | 98.6 | |
| | | | | Assets in Excess of Other Liabilities | | | 1,312,141 | | | | 1.4 | |
| | | | | Net Assets | | $ | 95,335,411 | | | | 100.0 | |
| † | Unless otherwise indicated, principal amount is shown in USD. |
| †† | Rate shown is the 7-day yield as of December 31, 2015. |
| # | Securities with purchases pursuant to Rule 144A or section 4(a)(2), under the Securities Act of 1933 and may not be resold subject to that rule except to qualified institutional buyers. |
| @ | Non-income producing security. |
| & | Payment-in-kind |
| P | Preferred Stock may be called prior to convertible date. |
| | |
| | Cost for federal income tax purposes is $103,750,287. |
| Net unrealized depreciation consists of: | | | | |
| | | | | |
| Gross Unrealized Appreciation | | $ | 3,163,483 | |
| Gross Unrealized Depreciation | | | (12,890,500 | ) |
| | | | | |
| Net Unrealized Depreciation | | $ | (9,727,017 | ) |
VY® T. Rowe Price Diversified
Mid Cap Growth Portfolio | PORTFOLIO OF INVESTMENTS
as of December 31, 2015 |
| Shares | | | | | | | Value | | | Percentage
of Net
Assets | |
| COMMON STOCK: 98.5% | | | | | | | | |
| | | | | | | Consumer Discretionary: 20.7% | | | | | | | | |
| | 10,000 | | | @ | | Autozone, Inc. | | | 7,419,100 | | | | 0.9 | |
| | 88,300 | | | @ | | Bloomin Brands, Inc. | | | 1,491,387 | | | | 0.2 | |
| | 86,300 | | | | | BorgWarner, Inc. | | | 3,730,749 | | | | 0.4 | |
| | 45,600 | | | | | Brinker International, Inc. | | | 2,186,520 | | | | 0.3 | |
| | 70,600 | | | @ | | Burlington Stores, Inc. | | | 3,028,740 | | | | 0.4 | |
| | 124,300 | | | @ | | Carmax, Inc. | | | 6,708,471 | | | | 0.8 | |
| | 7,600 | | | @ | | Chipotle Mexican Grill, Inc. | | | 3,646,860 | | | | 0.4 | |
| | 48,300 | | | | | Choice Hotels International, Inc. | | | 2,434,803 | | | | 0.3 | |
| | 75,400 | | | | | Coach, Inc. | | | 2,467,842 | | | | 0.3 | |
| | 57,000 | | | @,L | | Ctrip.com International Ltd. ADR | | | 2,640,810 | | | | 0.3 | |
| | 18,900 | | | | | Delphi Automotive PLC | | | 1,620,297 | | | | 0.2 | |
| | 38,300 | | | | | Dick's Sporting Goods, Inc. | | | 1,353,905 | | | | 0.2 | |
| | 57,200 | | | @ | | Discovery Communications, Inc. - Class C | | | 1,442,584 | | | | 0.2 | |
| | 108,400 | | | | | Dollar General Corp. | | | 7,790,708 | | | | 0.9 | |
| | 48,100 | | | @ | | Dollar Tree, Inc. | | | 3,714,282 | | | | 0.4 | |
| | 96,000 | | | | | Extended Stay America, Inc. | | | 1,526,400 | | | | 0.2 | |
| | 35,900 | | | @,L | | Ferrari NV | | | 1,723,200 | | | | 0.2 | |
| | 42,500 | | | @ | | Five Below, Inc. | | | 1,364,250 | | | | 0.2 | |
| | 19,700 | | | @,L | | Fossil Group, Inc. | | | 720,232 | | | | 0.1 | |
| | 95,200 | | | | | Gentex Corp. | | | 1,524,152 | | | | 0.2 | |
| | 284,900 | | | | | Hanesbrands, Inc. | | | 8,384,607 | | | | 1.0 | |
| | 29,700 | | | | | Harley-Davidson, Inc. | | | 1,348,083 | | | | 0.2 | |
| | 16,500 | | | | | Harman International Industries, Inc. | | | 1,554,465 | | | | 0.2 | |
| | 109,000 | | | | | Interpublic Group of Cos., Inc. | | | 2,537,520 | | | | 0.3 | |
| | 111,700 | | | @ | | Kate Spade & Co. | | | 1,984,909 | | | | 0.2 | |
| | 55,300 | | | | | L Brands, Inc. | | | 5,298,846 | | | | 0.6 | |
| | 62,500 | | | @ | | Liberty Interactive Corp. QVC Group | | | 1,707,500 | | | | 0.2 | |
| | 23,800 | | | L | | Lululemon Athletica, Inc. | | | 1,248,786 | | | | 0.1 | |
| | 52,912 | | | L | | Marriott International, Inc. | | | 3,547,221 | | | | 0.4 | |
| | 76,300 | | | | | Mattel, Inc. | | | 2,073,071 | | | | 0.2 | |
| | 46,300 | | | | | McGraw-Hill Cos., Inc. | | | 4,564,254 | | | | 0.6 | |
| | 154,800 | | | @ | | MGM Resorts International | | | 3,517,056 | | | | 0.4 | |
| | 94,700 | | | @ | | Michaels Cos, Inc. | | | 2,093,817 | | | | 0.3 | |
| | 75,100 | | | | | Newell Rubbermaid, Inc. | | | 3,310,408 | | | | 0.4 | |
| | 42,200 | | | @ | | Norwegian Cruise Line Holdings Ltd. | | | 2,472,920 | | | | 0.3 | |
| | 21,200 | | | | | Omnicom Group, Inc. | | | 1,603,992 | | | | 0.2 | |
| | 24,000 | | | @ | | O'Reilly Automotive, Inc. | | | 6,082,080 | | | | 0.7 | |
| | 49,400 | | | @ | | Pandora Media, Inc. | | | 662,454 | | | | 0.1 | |
| | 8,700 | | | @ | | Panera Bread Co. | | | 1,694,586 | | | | 0.2 | |
| | 28,700 | | | @ | | Papa John's International, Inc. | | | 1,603,469 | | | | 0.2 | |
| | 18,800 | | | @ | | Polaris Industries, Inc. | | | 1,615,860 | | | | 0.2 | |
| | 88,900 | | | | | Pulte Group, Inc. | | | 1,584,198 | | | | 0.2 | |
| | 32,300 | | | | | PVH Corp. | | | 2,378,895 | | | | 0.3 | |
| | 24,600 | | | @,L | | Restoration Hardware Holdings, Inc. | | | 1,954,470 | | | | 0.2 | |
| | 145,200 | | | | | Ross Stores, Inc. | | | 7,813,212 | | | | 0.9 | |
| | 23,600 | | | | | Royal Caribbean Cruises Ltd. | | | 2,388,556 | | | | 0.3 | |
| | 115,700 | | | | | Service Corp. International | | | 3,010,514 | | | | 0.4 | |
| | 26,800 | | | @ | | Signet Jewelers Ltd. | | | 3,314,892 | | | | 0.4 | |
| | 36,500 | | | | | Sotheby's | | | 940,240 | | | | 0.1 | |
| | 55,200 | | | | | Starwood Hotels & Resorts Worldwide, Inc. | | | 3,824,256 | | | | 0.5 | |
| | 11,800 | | | @,L | | Tesla Motors, Inc. | | | 2,832,118 | | | | 0.3 | |
| | 50,700 | | | | | Tiffany & Co. | | | 3,867,903 | | | | 0.5 | |
| | 69,600 | | | | | Toll Brothers, Inc. | | | 2,317,680 | | | | 0.3 | |
| | 62,700 | | | | | Tractor Supply Co. | | | 5,360,850 | | | | 0.6 | |
| | 18,400 | | | @ | | TripAdvisor, Inc. | | | 1,568,600 | | | | 0.2 | |
| | 13,400 | | | @ | | Ulta Salon Cosmetics & Fragrance, Inc. | | | 2,479,000 | | | | 0.3 | |
| | 142,200 | | | @ | | Vipshop Holdings Ltd. ADR | | | 2,171,394 | | | | 0.3 | |
| | 33,020 | | | @,L | | Wayfair, Inc. | | | 1,572,412 | | | | 0.2 | |
| | 37,000 | | | | | Williams-Sonoma, Inc. | | | 2,161,170 | | | | 0.3 | |
| | 56,500 | | | @ | | Wolverine World Wide, Inc. | | | 944,115 | | | | 0.1 | |
| | 18,400 | | | L | | Wynn Resorts Ltd. | | | 1,273,096 | | | | 0.2 | |
| | | | | | | | | | 171,198,767 | | | | 20.7 | |
| | | | | | | | | | | | | | | |
| | | | | | | Consumer Staples: 6.0% | | | | | | | | |
| | 47,600 | | | @,L | | Blue Buffalo Pet Products, Inc. | | | 890,596 | | | | 0.1 | |
| | 39,650 | | | | | Brown-Forman Corp. - Class B | | | 3,936,452 | | | | 0.5 | |
| | 37,600 | | | | | Church & Dwight Co., Inc. | | | 3,191,488 | | | | 0.4 | |
| | 13,000 | | | | | Clorox Co. | | | 1,648,790 | | | | 0.2 | |
| | 38,400 | | | | | Constellation Brands, Inc. | | | 5,469,696 | | | | 0.7 | |
| | 23,700 | | | | | Dr Pepper Snapple Group, Inc. | | | 2,208,840 | | | | 0.3 | |
| | 120,700 | | | | | Flowers Foods, Inc. | | | 2,593,843 | | | | 0.3 | |
| | 41,000 | | | @ | | Fresh Market, Inc. | | | 960,220 | | | | 0.1 | |
| | 48,300 | | | @ | | Hain Celestial Group, Inc. | | | 1,950,837 | | | | 0.2 | |
| | 49,500 | | | | | Hershey Co. | | | 4,418,865 | | | | 0.5 | |
| | 13,600 | | | | | JM Smucker Co. | | | 1,677,424 | | | | 0.2 | |
| | 47,800 | | | | | McCormick & Co., Inc. | | | 4,089,768 | | | | 0.5 | |
| | 61,600 | | | | | Mead Johnson Nutrition Co. | | | 4,863,320 | | | | 0.6 | |
| | 25,200 | | | | | Monster Beverage Corp. | | | 3,753,792 | | | | 0.4 | |
| | 17,900 | | | | | Pricesmart, Inc. | | | 1,485,521 | | | | 0.2 | |
| | 445,900 | | | @ | | Rite Aid Corp. | | | 3,495,856 | | | | 0.4 | |
| | 61,400 | | | @ | | Sprouts Farmers Market, Inc. | | | 1,632,626 | | | | 0.2 | |
| | 41,900 | | | | | Whole Foods Market, Inc. | | | 1,403,650 | | | | 0.2 | |
| | | | | | | | | | 49,671,584 | | | | 6.0 | |
| | | | | | | | | | | | | | | |
| | | | | | | Energy: 1.7% | | | | | | | | |
| | 53,500 | | | | | Cabot Oil & Gas Corp. | | | 946,415 | | | | 0.1 | |
| | 15,100 | | | | | Cimarex Energy Co. | | | 1,349,638 | | | | 0.2 | |
| | 59,600 | | | | | Columbia Pipeline Group, Inc. | | | 1,192,000 | | | | 0.1 | |
| | 16,000 | | | @ | | Concho Resources, Inc./Midland TX | | | 1,485,760 | | | | 0.2 | |
| | 22,200 | | | @,L | | Continental Resources, Inc. | | | 510,156 | | | | 0.1 | |
| | 22,400 | | | @ | | Diamondback Energy, Inc. | | | 1,498,560 | | | | 0.2 | |
VY® T. Rowe Price Diversified
Mid Cap Growth Portfolio | PORTFOLIO OF INVESTMENTS
as of December 31, 2015 (continued) |
| Shares | | | | | | | Value | | | Percentage
of Net
Assets | |
| COMMON STOCK: (continued) | | | | | | | | |
| | | | | | | Energy: (continued) | | | | | | | | |
| | 24,500 | | | | | EQT Corp. | | | 1,277,185 | | | | 0.2 | |
| | 31,900 | | | | | Oceaneering International, Inc. | | | 1,196,888 | | | | 0.1 | |
| | 10,300 | | | | | Pioneer Natural Resources Co. | | | 1,291,414 | | | | 0.2 | |
| | 39,900 | | | L | | Range Resources Corp. | | | 981,939 | | | | 0.1 | |
| | 19,600 | | | | | Tesoro Corp. | | | 2,065,252 | | | | 0.2 | |
| | | | | | | | | | 13,795,207 | | | | 1.7 | |
| | | | | | | | | | | | | | | |
| | | | | | | Financials: 9.2% | | | | | | | | |
| | 40,200 | | | | | American Campus Communities, Inc. | | | 1,661,868 | | | | 0.2 | |
| | 56,200 | | | | | Aon PLC | | | 5,182,202 | | | | 0.6 | |
| | 64,500 | | | | | BankUnited, Inc. | | | 2,325,870 | | | | 0.3 | |
| | 64,933 | | | | | CBOE Holdings, Inc. | | | 4,214,152 | | | | 0.5 | |
| | 94,400 | | | | | Crown Castle International Corp. | | | 8,160,880 | | | | 1.0 | |
| | 106,100 | | | @ | | E*Trade Financial Corp. | | | 3,144,804 | | | | 0.4 | |
| | 9,515 | | | | | Equinix, Inc. | | | 2,877,336 | | | | 0.3 | |
| | 14,300 | | | @ | | Federal Realty Investment Trust | | | 2,089,230 | | | | 0.2 | |
| | 84,300 | | | | | Fifth Third Bancorp | | | 1,694,430 | | | | 0.2 | |
| | 35,400 | | | | | Financial Engines, Inc. | | | 1,191,918 | | | | 0.1 | |
| | 129,100 | | | | | FNF Group | | | 4,475,897 | | | | 0.5 | |
| | 21,600 | | | | | Intercontinental Exchange, Inc. | | | 5,535,216 | | | | 0.7 | |
| | 39,100 | | | | | Invesco Ltd. | | | 1,309,068 | | | | 0.2 | |
| | 57,400 | | | | | Iron Mountain, Inc. | | | 1,550,374 | | | | 0.2 | |
| | 18,400 | | | | | Jones Lang LaSalle, Inc. | | | 2,941,424 | | | | 0.4 | |
| | 77,000 | | | | | Lazard Ltd. | | | 3,465,770 | | | | 0.4 | |
| | 38,000 | | | L | | LPL Financial Holdings, Inc. | | | 1,620,700 | | | | 0.2 | |
| | 69,700 | | | @ | | Markit Ltd. | | | 2,102,849 | | | | 0.3 | |
| | 40,700 | | | @ | | Moody's Corp. | | | 4,083,838 | | | | 0.5 | |
| | 34,300 | | | | | MSCI, Inc. - Class A | | | 2,474,059 | | | | 0.3 | |
| | 25,200 | | | | | Northern Trust Corp. | | | 1,816,668 | | | | 0.2 | |
| | 80,100 | | | | | Progressive Corp. | | | 2,547,180 | | | | 0.3 | |
| | 21,300 | | | @ | | SVB Financial Group | | | 2,532,570 | | | | 0.3 | |
| | 21,300 | | | @ | | Taubman Centers, Inc. | | | 1,634,136 | | | | 0.2 | |
| | 108,400 | | | @ | | TD Ameritrade Holding Corp. | | | 3,762,564 | | | | 0.5 | |
| | 26,699 | | | @ | | WeWork Companies, Inc., Classs A | | | 878,118 | | | | 0.1 | |
| | 79,400 | | | | | WisdomTree Investments, Inc. | | | 1,244,992 | | | | 0.1 | |
| | | | | | | | | | 76,518,113 | | | | 9.2 | |
| | | | | | | | | | | | | | | |
| | | | | | | Health Care: 15.2% | | | | | | | | |
| | 47,700 | | | @ | | Acadia Pharmaceuticals, Inc. | | | 1,700,505 | | | | 0.2 | |
| | 70,200 | | | | | Agilent Technologies, Inc. | | | 2,935,062 | | | | 0.4 | |
| | 8,600 | | | @,L | | Agios Pharmaceuticals, Inc. | | | 558,312 | | | | 0.1 | |
| | 48,200 | | | @,L | | Akorn, Inc. | | | 1,798,342 | | | | 0.2 | |
| | 31,800 | | | @ | | Align Technology, Inc. | | | 2,094,030 | | | | 0.3 | |
| | 74,300 | | | @ | | Alkermes PLC | | | 5,897,934 | | | | 0.7 | |
| | 16,600 | | | @ | | Alnylam Pharmaceuticals, Inc. | | | 1,562,724 | | | | 0.2 | |
| | 55,800 | | | | | AmerisourceBergen Corp. | | | 5,787,018 | | | | 0.7 | |
| | 9,800 | | | @,L | | Athenahealth, Inc. | | | 1,577,506 | | | | 0.2 | |
| | 85,000 | | | | | Baxalta, Inc. | | | 3,317,550 | | | | 0.4 | |
| | 50,000 | | | @ | | BioMarin Pharmaceutical, Inc. | | | 5,238,000 | | | | 0.6 | |
| | 10,700 | | | @ | | Bluebird Bio, Inc. | | | 687,154 | | | | 0.1 | |
| | 67,900 | | | @ | | Bruker BioSciences Corp. | | | 1,647,933 | | | | 0.2 | |
| | 139,184 | | | @ | | Catalent, Inc. | | | 3,483,776 | | | | 0.4 | |
| | 40,100 | | | @ | | Centene Corp. | | | 2,638,981 | | | | 0.3 | |
| | 43,400 | | | @ | | Cerner Corp. | | | 2,611,378 | | | | 0.3 | |
| | 11,800 | | | @ | | Clovis Oncology, Inc. | | | 413,000 | | | | 0.1 | |
| | 36,500 | | | @ | | DaVita, Inc. | | | 2,544,415 | | | | 0.3 | |
| | 36,400 | | | | | Dentsply International, Inc. | | | 2,214,940 | | | | 0.3 | |
| | 46,100 | | | @ | | Endo International PLC | | | 2,822,242 | | | | 0.3 | |
| | 75,500 | | | @ | | Envision Healthcare Holdings, Inc. | | | 1,960,735 | | | | 0.2 | |
| | 22,300 | | | @ | | Henry Schein, Inc. | | | 3,527,637 | | | | 0.4 | |
| | 41,700 | | | @,L | | Horizon Pharma PLC | | | 903,639 | | | | 0.1 | |
| | 15,600 | | | | | Humana, Inc. | | | 2,784,756 | | | | 0.3 | |
| | 56,600 | | | | | Idexx Laboratories, Inc. | | | 4,127,272 | | | | 0.5 | |
| | 8,500 | | | @ | | Illumina, Inc. | | | 1,631,532 | | | | 0.2 | |
| | 55,600 | | | @ | | Incyte Corp., Ltd. | | | 6,029,820 | | | | 0.7 | |
| | 7,150 | | | @,L | | Intercept Pharmaceuticals, Inc. | | | 1,067,853 | | | | 0.1 | |
| | 12,000 | | | @ | | Intuitive Surgical, Inc. | | | 6,553,920 | | | | 0.8 | |
| | 59,700 | | | @ | | Ironwood Pharmaceuticals, Inc. | | | 691,923 | | | | 0.1 | |
| | 15,100 | | | @ | | Jazz Pharmaceuticals PLC | | | 2,122,456 | | | | 0.3 | |
| | 20,100 | | | @ | | Mallinckrodt PLC - W/I | | | 1,500,063 | | | | 0.2 | |
| | 31,700 | | | @ | | Medidata Solutions, Inc. | | | 1,562,493 | | | | 0.2 | |
| | 35,700 | | | | | Mednax, Inc. | | | 2,558,262 | | | | 0.3 | |
| | 12,000 | | | @ | | Mettler Toledo International, Inc. | | | 4,069,560 | | | | 0.5 | |
| | 21,600 | | | @ | | Neurocrine Biosciences, Inc. | | | 1,221,912 | | | | 0.2 | |
| | 15,700 | | | | | Pacira Pharmaceuticals, Inc./DE | | | 1,205,603 | | | | 0.1 | |
| | 13,100 | | | @ | | Puma Biotechnology, Inc. | | | 1,027,040 | | | | 0.1 | |
| | 26,200 | | | | | Quintiles Transnational Holdings, Inc. | | | 1,798,892 | | | | 0.2 | |
| | 39,100 | | | @ | | Seattle Genetics, Inc. | | | 1,754,808 | | | | 0.2 | |
| | 26,100 | | | @ | | Sirona Dental Systems, Inc. | | | 2,859,777 | | | | 0.3 | |
| | 25,500 | | | @ | | Team Health Holdings, Inc. | | | 1,119,195 | | | | 0.1 | |
| | 21,900 | | | | | Teleflex, Inc. | | | 2,878,755 | | | | 0.4 | |
| | 11,100 | | | | | Ultragenyx Pharmaceutical, Inc. | | | 1,245,198 | | | | 0.2 | |
| | 12,500 | | | | | United Therapeutics Corp. | | | 1,957,625 | | | | 0.2 | |
| | 16,800 | | | | | Universal Health Services, Inc. | | | 2,007,432 | | | | 0.2 | |
| | 102,700 | | | @,L | | Veeva Systems, Inc. | | | 2,962,895 | | | | 0.4 | |
| | 17,000 | | | @ | | Vertex Pharmaceuticals, Inc. | | | 2,139,110 | | | | 0.3 | |
| | 26,000 | | | @ | | WellCare Health Plans, Inc. | | | 2,033,460 | | | | 0.2 | |
| | 25,100 | | | | | West Pharmaceutical Services, Inc. | | | 1,511,522 | | | | 0.2 | |
| | 118,950 | | | | | Zoetis, Inc. | | | 5,700,084 | | | | 0.7 | |
| | | | | | | | | | 126,046,031 | | | | 15.2 | |
| | | | | | | | | | | | | | | |
| | | | | | | Industrials: 18.1% | | | | | | | | |
| | 49,000 | | | | | Alaska Air Group, Inc. | | | 3,944,990 | | | | 0.5 | |
| | 7,300 | | | @ | | Allegiant Travel Co. | | | 1,225,159 | | | | 0.1 | |
| | 62,800 | | | | | Allegion Public Ltd. | | | 4,139,776 | | | | 0.5 | |
| | 53,562 | | | @ | | Ametek, Inc. | | | 2,870,388 | | | | 0.3 | |
| | 29,400 | | | @ | | Armstrong World Industries, Inc. | | | 1,344,462 | | | | 0.2 | |
VY® T. Rowe Price Diversified
Mid Cap Growth Portfolio | PORTFOLIO OF INVESTMENTS
as of December 31, 2015 (continued) |
| Shares | | | | | | | Value | | | Percentage
of Net
Assets | |
| COMMON STOCK: (continued) | | | | | | | | |
| | | | | | | Industrials: (continued) | | | | | | | | |
| | 43,600 | | | @ | | Avis Budget Group, Inc. | | | 1,582,244 | | | | 0.2 | |
| | 26,900 | | | | | CH Robinson Worldwide, Inc. | | | 1,668,338 | | | | 0.2 | |
| | 29,500 | | | | | Clarcor, Inc. | | | 1,465,560 | | | | 0.2 | |
| | 46,200 | | | @ | | Colfax Corp. | | | 1,078,770 | | | | 0.1 | |
| | 24,800 | | | @,L | | Copa Holdings S.A. | | | 1,196,848 | | | | 0.1 | |
| | 44,500 | | | @ | | Copart, Inc. | | | 1,691,445 | | | | 0.2 | |
| | 15,900 | | | @ | | CoStar Group, Inc. | | | 3,286,371 | | | | 0.4 | |
| | 44,100 | | | @ | | DigitalGlobe, Inc. | | | 690,606 | | | | 0.1 | |
| | 85,200 | | | | | Donaldson Co., Inc. | | | 2,441,832 | | | | 0.3 | |
| | 41,000 | | | | | Equifax, Inc. | | | 4,566,170 | | | | 0.6 | |
| | 53,700 | | | | | Expeditors International Washington, Inc. | | | 2,421,870 | | | | 0.3 | |
| | 40,700 | | | L | | Fastenal Co. | | | 1,661,374 | | | | 0.2 | |
| | 67,600 | | | | | Flowserve Corp. | | | 2,844,608 | | | | 0.3 | |
| | 52,800 | | | | | Fortune Brands Home & Security, Inc. | | | 2,930,400 | | | | 0.4 | |
| | 35,100 | | | @,L | | Generac Holdings, Inc. | | | 1,044,927 | | | | 0.1 | |
| | 35,200 | | | @ | | Genesee & Wyoming, Inc. | | | 1,889,888 | | | | 0.2 | |
| | 56,500 | | | | | Graco, Inc. | | | 4,071,955 | | | | 0.5 | |
| | 64,500 | | | @ | | Hertz Global Holdings, Inc. | | | 917,835 | | | | 0.1 | |
| | 16,100 | | | | | Hubbell, Inc. | | | 1,626,744 | | | | 0.2 | |
| | 29,600 | | | | | IDEX Corp. | | | 2,267,656 | | | | 0.3 | |
| | 37,800 | | | @ | | IHS, Inc. | | | 4,476,654 | | | | 0.5 | |
| | 37,600 | | | | | JB Hunt Transport Services, Inc. | | | 2,758,336 | | | | 0.3 | |
| | 33,100 | | | | | Kansas City Southern | | | 2,471,577 | | | | 0.3 | |
| | 70,100 | | | | | KAR Auction Services, Inc. | | | 2,595,803 | | | | 0.3 | |
| | 23,000 | | | @ | | Kirby Corp. | | | 1,210,260 | | | | 0.1 | |
| | 23,900 | | | | | Landstar System, Inc. | | | 1,401,735 | | | | 0.2 | |
| | 32,200 | | | @ | | Manpower, Inc. | | | 2,714,138 | | | | 0.3 | |
| | 17,800 | | | @ | | Middleby Corp. | | | 1,920,086 | | | | 0.2 | |
| | 42,500 | | | | | Nielsen NV | | | 1,980,500 | | | | 0.2 | |
| | 19,800 | | | | | Nordson Corp. | | | 1,270,170 | | | | 0.2 | |
| | 29,300 | | | @ | | Old Dominion Freight Line | | | 1,730,751 | | | | 0.2 | |
| | 26,000 | | | | | Paccar, Inc. | | | 1,232,400 | | | | 0.1 | |
| | 88,400 | | | | | Ritchie Brothers Auctioneers, Inc. | | | 2,131,324 | | | | 0.3 | |
| | 41,700 | | | | | Robert Half International, Inc. | | | 1,965,738 | | | | 0.2 | |
| | 26,000 | | | | | Rockwell Collins, Inc. | | | 2,399,800 | | | | 0.3 | |
| | 118,810 | | | | | Rollins, Inc. | | | 3,077,179 | | | | 0.4 | |
| | 24,300 | | | | | Roper Technologies, Inc. | | | 4,611,897 | | | | 0.6 | |
| | 119,400 | | | @ | | Sensata Technologies Holdings N.V. | | | 5,499,564 | | | | 0.7 | |
| | 19,000 | | | | | Snap-On, Inc. | | | 3,257,170 | | | | 0.4 | |
| | 154,700 | | | | | Southwest Airlines Co. | | | 6,661,382 | | | | 0.8 | |
| | 39,700 | | | @ | | Spirit Airlines, Inc. | | | 1,582,045 | | | | 0.2 | |
| | 12,700 | | | @ | | Stericycle, Inc. | | | 1,531,620 | | | | 0.2 | |
| | 97,300 | | | | | Textron, Inc. | | | 4,087,573 | | | | 0.5 | |
| | 23,300 | | | @ | | Towers Watson & Co. | | | 2,993,118 | | | | 0.4 | |
| | 19,100 | | | @ | | TransDigm Group, Inc. | | | 4,363,395 | | | | 0.5 | |
| | 66,500 | | | @ | | TransUnion | | | 1,833,405 | | | | 0.2 | |
| | 95,041 | | | @ | | United Continental Holdings, Inc. | | | 5,445,849 | | | | 0.7 | |
| | 13,900 | | | | | Valmont Industries, Inc. | | | 1,473,678 | | | | 0.2 | |
| | 84,200 | | | @ | | Verisk Analytics, Inc. | | | 6,473,296 | | | | 0.8 | |
| | 16,800 | | | @ | | WABCO Holdings, Inc. | | | 1,717,968 | | | | 0.2 | |
| | 42,800 | | | | | Wabtec Corp. | | | 3,043,936 | | | | 0.4 | |
| | 30,400 | | | | | Waste Connections, Inc. | | | 1,712,128 | | | | 0.2 | |
| | 10,000 | | | L | | WW Grainger, Inc. | | | 2,025,900 | | | | 0.2 | |
| | 50,800 | | | | | Xylem, Inc. | | | 1,854,200 | | | | 0.2 | |
| | | | | | | | | | 150,374,791 | | | | 18.1 | |
| | | | | | | | | | | | | | | |
| | | | | | | Information Technology: 19.8% | | | | | | | | |
| | 74,000 | | | @ | | Akamai Technologies, Inc. | | | 3,894,620 | | | | 0.5 | |
| | 15,500 | | | @ | | Alliance Data Systems Corp. | | | 4,286,835 | | | | 0.5 | |
| | 106,300 | | | | | Amphenol Corp. | | | 5,552,049 | | | | 0.7 | |
| | 18,200 | | | @ | | Ansys, Inc. | | | 1,683,500 | | | | 0.2 | |
| | 92,500 | | | | | ARM Holdings PLC ADR | | | 4,184,700 | | | | 0.5 | |
| | 37,341 | | | @ | | Atlassian Corp. PLC | | | 1,123,217 | | | | 0.1 | |
| | 104,338 | | | @ | | Atlassian Corp. PLC | | | 2,981,563 | | | | 0.3 | |
| | 25,900 | | | @ | | Autodesk, Inc. | | | 1,578,087 | | | | 0.2 | |
| | 79,500 | | | @ | | Black Knight Financial Services, Inc. | | | 2,628,270 | | | | 0.3 | |
| | 19,500 | | | @ | | Check Point Software Technologies | | | 1,586,910 | | | | 0.2 | |
| | 45,800 | | | | | Cognex Corp. | | | 1,546,666 | | | | 0.2 | |
| | 98,600 | | | | | CoreLogic, Inc. | | | 3,338,596 | | | | 0.4 | |
| | 44,255 | | | @ | | Dropbox, Inc. - Class A | | | 416,046 | | | | 0.1 | |
| | 19,495 | | | @ | | Dropbox, Inc. - Class B | | | 183,274 | | | | 0.0 | |
| | 48,000 | | | @ | | Electronic Arts, Inc. | | | 3,298,560 | | | | 0.4 | |
| | 20,600 | | | @ | | EPAM Systems, Inc. | | | 1,619,572 | | | | 0.2 | |
| | 17,300 | | | | | F5 Networks, Inc. | | | 1,677,408 | | | | 0.2 | |
| | 9,800 | | | | | Factset Research Systems, Inc. | | | 1,593,186 | | | | 0.2 | |
| | 20,600 | | | | | FEI Co. | | | 1,643,674 | | | | 0.2 | |
| | 85,900 | | | | | Fidelity National Information Services, Inc. | | | 5,205,540 | | | | 0.6 | |
| | 65,200 | | | @ | | Fiserv, Inc. | | | 5,963,192 | | | | 0.7 | |
| | 78,500 | | | | | Fortinet, Inc. | | | 2,446,845 | | | | 0.3 | |
| | 50,600 | | | @ | | Gartner, Inc. | | | 4,589,420 | | | | 0.6 | |
| | 65,500 | | | @ | | Genpact Ltd. | | | 1,636,190 | | | | 0.2 | |
| | 49,900 | | | | | Global Payments, Inc. | | | 3,219,049 | | | | 0.4 | |
| | 40,200 | | | @ | | Guidewire Software, Inc. | | | 2,418,432 | | | | 0.3 | |
| | 46,100 | | | | | Integrated Device Technology, Inc. | | | 1,214,735 | | | | 0.1 | |
| | 53,100 | | | | | Intuit, Inc. | | | 5,124,150 | | | | 0.6 | |
| | 27,400 | | | @,L | | IPG Photonics Corp. | | | 2,442,984 | | | | 0.3 | |
| | 34,950 | | | @ | | Keysight Technologies, Inc. | | | 990,133 | | | | 0.1 | |
| | 43,100 | | | | | KLA-Tencor Corp. | | | 2,988,985 | | | | 0.4 | |
| | 68,800 | | | | | Linear Technology Corp. | | | 2,921,936 | | | | 0.3 | |
| | 26,100 | | | @ | | LinkedIn Corp. | | | 5,874,588 | | | | 0.7 | |
| | 33,100 | | | @,L | | Match Group, Inc. | | | 448,505 | | | | 0.1 | |
| | 13,400 | | | @ | | Mercadolibre, Inc. | | | 1,532,156 | | | | 0.2 | |
| | 51,700 | | | | | Microchip Technology, Inc. | | | 2,406,118 | | | | 0.3 | |
| | 48,600 | | | | | Microsemi Corp. | | | 1,583,874 | | | | 0.2 | |
| | 49,100 | | | @,L | | Mobileye NV | | | 2,075,948 | | | | 0.2 | |
| | 25,100 | | | | | Motorola Solutions, Inc. | | | 1,718,095 | | | | 0.2 | |
| | 44,700 | | | @,L | | NetSuite, Inc. | | | 3,782,514 | | | | 0.5 | |
| | 26,000 | | | @ | | Palo Alto Networks, Inc. | | | 4,579,640 | | | | 0.6 | |
| | 37,500 | | | | | Paychex, Inc. | | | 1,983,375 | | | | 0.2 | |
| | 75,600 | | | @,L | | Pure Storage, Inc. | | | 1,177,092 | | | | 0.1 | |
| | 52,800 | | | @ | | QLIK Technologies, Inc. | | | 1,671,648 | | | | 0.2 | |
| | 75,300 | | | @ | | Red Hat, Inc. | | | 6,235,593 | | | | 0.7 | |
| | 111,100 | | | | | Sabre Corp. | | | 3,107,467 | | | | 0.4 | |
| | 44,700 | | | | | SanDisk Corp. | | | 3,396,753 | | | | 0.4 | |
| | 66,600 | | | @ | | ServiceNow, Inc. | | | 5,764,896 | | | | 0.7 | |
| | 53,700 | | | | | Skyworks Solutions, Inc. | | | 4,125,771 | | | | 0.5 | |
| | 44,500 | | | @ | | Splunk, Inc. | | | 2,617,045 | | | | 0.3 | |
| | 34,400 | | | | | SS&C Technologies Holdings, Inc. | | | 2,348,488 | | | | 0.3 | |
| | 73,800 | | | @ | | Trimble Navigation Ltd. | | | 1,583,010 | | | | 0.2 | |
VY® T. Rowe Price Diversified
Mid Cap Growth Portfolio | PORTFOLIO OF INVESTMENTS
as of December 31, 2015 (continued) |
| Shares | | | | | | | Value | | | Percentage
of Net
Assets | |
| COMMON STOCK: (continued) | | | | | | | | |
| | | | | | | Information Technology: (continued) | | | | | | | | |
| | 63,900 | | | @ | | Twitter, Inc. | | | 1,478,646 | | | | 0.2 | |
| | 105,600 | | | @ | | Vantiv, Inc. | | | 5,007,552 | | | | 0.6 | |
| | 54,600 | | | @,L | | VeriSign, Inc. | | | 4,769,856 | | | | 0.6 | |
| | 18,699 | | | | | WEX, Inc. | | | 1,652,992 | | | | 0.2 | |
| | 37,647 | | | @ | | Workday, Inc. | | | 2,999,713 | | | | 0.4 | |
| | 60,400 | | | | | Xilinx, Inc. | | | 2,836,988 | | | | 0.3 | |
| | 23,900 | | | L | | Zillow Group, Inc. - A | | | 622,356 | | | | 0.1 | |
| | 47,800 | | | @,L | | Zillow Group, Inc. - C | | | 1,122,344 | | | | 0.1 | |
| | | | | | | | | | 164,481,347 | | | | 19.8 | |
| | | | | | | | | | | | | | | |
| | | | | | | Materials: 6.0% | | | | | | | | |
| | 21,900 | | | | | Air Products & Chemicals, Inc. | | | 2,849,409 | | | | 0.3 | |
| | 35,000 | | | | | Ashland, Inc. | | | 3,594,500 | | | | 0.4 | |
| | 77,500 | | | | | Ball Corp. | | | 5,636,575 | | | | 0.7 | |
| | 27,100 | | | | | Carpenter Technology Corp. | | | 820,317 | | | | 0.1 | |
| | 67,500 | | | | | Celanese Corp. | | | 4,544,775 | | | | 0.6 | |
| | 51,200 | | | | | CF Industries Holdings, Inc. | | | 2,089,472 | | | | 0.3 | |
| | 19,300 | | | | | Compass Minerals International, Inc. | | | 1,452,711 | | | | 0.2 | |
| | 20,500 | | | | | Eagle Materials, Inc. | | | 1,238,815 | | | | 0.2 | |
| | 4,800 | | | | | NewMarket Corp. | | | 1,827,504 | | | | 0.2 | |
| | 46,100 | | | | | PolyOne Corp. | | | 1,464,136 | | | | 0.2 | |
| | 81,800 | | | | | RPM International, Inc. | | | 3,604,108 | | | | 0.4 | |
| | 77,200 | | | | | Sealed Air Corp. | | | 3,443,120 | | | | 0.4 | |
| | 21,700 | | | | | Sherwin-Williams Co. | | | 5,633,320 | | | | 0.7 | |
| | 119,100 | | | L | | Silver Wheaton Corp. | | | 1,479,222 | | | | 0.2 | |
| | 133,700 | | | @ | | Stillwater Mining Co | | | 1,145,809 | | | | 0.1 | |
| | 53,900 | | | | | Valspar Corp. | | | 4,471,005 | | | | 0.5 | |
| | 43,400 | | | | | Vulcan Materials Co. | | | 4,121,698 | | | | 0.5 | |
| | | | | | | | | | 49,416,496 | | | | 6.0 | |
| | | | | | | | | | | | | | | |
| | | | | | | Telecommunication Services: 1.3% | | | | | | | | |
| | 74,650 | | | @ | | SBA Communications Corp. | | | 7,843,475 | | | | 1.0 | |
| | 72,700 | | | @ | | T-Mobile US, Inc. | | | 2,844,024 | | | | 0.3 | |
| | | | | | | | | | 10,687,499 | | | | 1.3 | |
| | | | | | | | | | | | | | | |
| | | | | | | Utilities: 0.5% | | | | | | | | |
| | 37,400 | | | | | Atmos Energy Corp. | | | 2,357,696 | | | | 0.3 | |
| | 79,600 | | | | | NiSource, Inc. | | | 1,552,996 | | | | 0.2 | |
| | | | | | | | | | 3,910,692 | | | | 0.5 | |
| | | | | | | | | | | | | | | |
| | | | | Total Common Stock | | | | | | | | |
| | | | | (Cost $610,591,624) | | | 816,100,527 | | | | 98.5 | |
| | | | | | | | | | | | | | | |
| PREFERRED STOCK: 1.4% | | | | | | | | |
| | | | | | | Financials: 0.4% | | | | | | | | |
| | 44,396 | | | @ | | WeWork Companies, Inc. - Series D-1 | | | 1,460,166 | | | | 0.2 | |
| | 34,882 | | | @ | | WeWork Companies, Inc. - Series D-2 | | | 1,147,254 | | | | 0.1 | |
| | 24,709 | | | @ | | WeWork Companies, Inc. - Series E | | | 812,668 | | | | 0.1 | |
| | | | | | | | | | 3,420,088 | | | | 0.4 | |
| | | | | | | | | | | | | | | |
| | | | | | | Information Technology: 1.0% | | | | | | | | |
| | 32,391 | | | @ | | AirBNB, Inc. - Series D | | | 3,015,421 | | | | 0.4 | |
| | 3,719 | | | @ | | AirBNB, Inc. - Series E | | | 346,218 | | | | 0.0 | |
| | 24,209 | | | @ | | Dropbox, Inc. - Series A | | | 227,591 | | | | 0.0 | |
| | 118,921 | | | @ | | Dropbox, Inc. - Series A-1 | | | 1,117,988 | | | | 0.2 | |
| | 8,859 | | | @ | | Flipkart - Series G | | | 1,260,104 | | | | 0.2 | |
| | 353,970 | | | @ | | Tanium, Inc.- Series G | | | 1,757,213 | | | | 0.2 | |
| | | | | | | | | | 7,724,535 | | | | 1.0 | |
| | | | | | | | | | | | | | | |
| | | | | Total Preferred Stock | | | | | | | | |
| | | | | (Cost $7,911,058) | | | 11,144,623 | | | | 1.4 | |
| | | | | | | | | | | | | | | |
| | | | | Total Long-Term Investments | | | | | | | | |
| | | | | (Cost $618,502,682) | | | 827,245,150 | | | | 99.9 | |
Principal
Amount† | | | | | | | Value | | | Percentage
of Net
Assets | |
| SHORT-TERM INVESTMENTS: 5.4% | | | | | | | | |
| | | | | | | Securities Lending Collateralcc: 5.4% | | | | | | | | |
| | 8,443,479 | | | | | BNP Paribas Bank, Repurchase Agreement dated 12/31/15, 0.31%, due 01/04/16 (Repurchase Amount $8,443,766, collateralized by various U.S. Government/U.S. Government Agency Obligations, 0.000%-4.500%, Market Value plus accrued interest $8,612,349, due 06/09/16-05/20/45) | | | 8,443,479 | | | | 1.0 | |
| | 10,567,478 | | | | | Citigroup, Inc., Repurchase Agreement dated 12/31/15, 0.34%, due 01/04/16 (Repurchase Amount $10,567,872, collateralized by various U.S. Government Agency Obligations, 0.000%-11.500%, Market Value plus accrued interest $10,778,828, due 01/15/16-04/01/51) | | | 10,567,478 | | | | 1.3 | |
| | 10,567,478 | | | | | Mizuho Securities USA Inc., Repurchase Agreement dated 12/31/15, 0.30%, due 01/04/16 (Repurchase Amount $10,567,825, collateralized by various U.S. Government Agency Obligations, 0.000%-9.000%, Market Value plus accrued interest $10,778,828, due 06/13/16-03/01/44) | | | 10,567,478 | | | | 1.3 | |
VY® T. Rowe Price Diversified
Mid Cap Growth Portfolio | PORTFOLIO OF INVESTMENTS
as of December 31, 2015 (continued) |
Principal
Amount† | | | | | | | Value | | | Percentage
of Net
Assets | |
| SHORT-TERM INVESTMENTS: (continued) | | | | | | | | |
| | | | | | | Securities Lending Collateralcc: (continued) | | | | | | | | |
| | 10,567,478 | | | | | Nomura Securities, Repurchase Agreement dated 12/31/15, 0.33%, due 01/04/16 (Repurchase Amount $10,567,860, collateralized by various U.S. Government/U.S. Government Agency Obligations, 0.000%-10.500%, Market Value plus accrued interest $10,778,828, due 01/15/16-10/20/65) | | | 10,567,478 | | | | 1.3 | |
| | 4,348,334 | | | | | State of Wisconsin Investment Board, Repurchase Agreement dated 12/31/15, 0.41%, due 01/04/16 (Repurchase Amount $4,348,529, collateralized by various U.S. Government Securities, 0.125%-2.500%, Market Value plus accrued interest $4,438,495, due 01/15/17-02/15/42) | | | 4,348,334 | | | | 0.5 | |
| | | | | | | | | | 44,494,247 | | | | 5.4 | |
| Shares | | | | | | | Value | | | Percentage
of Net
Assets | |
| | | | | | | Mutual Funds: 0.0% | | | | | | | | |
| | 463,213 | | | | | T. Rowe Price Reserve Investment Fund, 0.225%†† | | | | | | | | |
| | | | | | | (Cost $463,213) | | | 463,213 | | | | 0.0 | |
| | | | | | | | | | | | | | | |
| | | | | Total Short-Term Investments | | | | | | | | |
| | | | | (Cost $44,957,460) | | | 44,957,460 | | | | 5.4 | |
| | | | | | | | | | | | | | | |
| | | | | Total Investments in Securities
(Cost $663,460,142) | | $ | 872,202,610 | | | | 105.3 | |
| | | | | Liabilities in Excess of Other Assets | | | (43,685,436 | ) | | | (5.3 | ) |
| | | | | Net Assets | | $ | 828,517,174 | | | | 100.0 | |
| † | Unless otherwise indicated, principal amount is shown in USD. |
| †† | Rate shown is the 7-day yield as of December 31, 2015. |
| @ | Non-income producing security. |
| ADR | American Depositary Receipt |
| cc | Represents securities purchased with cash collateral received for securities on loan. |
| L | Loaned security, a portion or all of the security is on loan at December 31, 2015. |
| | Cost for federal income tax purposes is $664,758,972. |
| Net unrealized appreciation consists of: |
| | | | | |
| Gross Unrealized Appreciation | | $ | 247,309,886 | |
| Gross Unrealized Depreciation | | | (39,866,248 | ) |
| | | | | |
| Net Unrealized Appreciation | | $ | 207,443,638 | |
VY® T. Rowe Price Growth Equity Portfolio | PORTFOLIO OF INVESTMENTS as of December 31, 2015 |
| Shares | | | | | | | Value | | | Percentage
of Net
Assets | |
| COMMON STOCK: 97.0% | | | | | | | | |
| | | | | | | Consumer Discretionary: 26.9% | | | | | | | | |
| | 186,300 | | | @ | | Amazon.com, Inc. | | | 125,918,307 | | | | 7.2 | |
| | 26,600 | | | @ | | Autozone, Inc. | | | 19,734,806 | | | | 1.1 | |
| | 271,900 | | | | | BorgWarner, Inc. | | | 11,754,237 | | | | 0.7 | |
| | 204,600 | | | @ | | Carmax, Inc. | | | 11,042,262 | | | | 0.6 | |
| | 24,100 | | | @ | | Chipotle Mexican Grill, Inc. | | | 11,564,385 | | | | 0.7 | |
| | 78,600 | | | | | Delphi Automotive PLC | | | 6,738,378 | | | | 0.4 | |
| | 91,520 | | | @,L | | Ferrari NV | | | 4,392,960 | | | | 0.2 | |
| | 3,088 | | | @ | | Flipkart Online Services Pvt. Ltd. | | | 439,237 | | | | 0.0 | |
| | 577,400 | | | | | Hanesbrands, Inc. | | | 16,992,882 | | | | 1.0 | |
| | 331,400 | | | | | Hilton Worldwide Holdings, Inc. | | | 7,091,960 | | | | 0.4 | |
| | 65,800 | | | | | Home Depot, Inc. | | | 8,702,050 | | | | 0.5 | |
| | 158,400 | | | | | Las Vegas Sands Corp. | | | 6,944,256 | | | | 0.4 | |
| | 302,400 | | | | | Lowe's Cos, Inc. | | | 22,994,496 | | | | 1.3 | |
| | 172,900 | | | L | | Marriott International, Inc. | | | 11,591,216 | | | | 0.7 | |
| | 872,760 | | | @ | | MGM Resorts International | | | 19,829,107 | | | | 1.1 | |
| | 54,800 | | | | | Netflix, Inc. | | | 6,268,024 | | | | 0.3 | |
| | 314,800 | | | | | Nike, Inc. | | | 19,675,000 | | | | 1.1 | |
| | 47,959 | | | @ | | Priceline.com, Inc. | | | 61,145,327 | | | | 3.5 | |
| | 218,900 | | | | | Ross Stores, Inc. | | | 11,779,009 | | | | 0.7 | |
| | 118,900 | | | | | Royal Caribbean Cruises Ltd. | | | 12,033,869 | | | | 0.7 | |
| | 236,700 | | | | | Starbucks Corp. | | | 14,209,101 | | | | 0.8 | |
| | 84,280 | | | @,L | | Tesla Motors, Inc. | | | 20,228,043 | | | | 1.1 | |
| | 182,300 | | | | | Tractor Supply Co. | | | 15,586,650 | | | | 0.9 | |
| | 256,400 | | | | | Walt Disney Co. | | | 26,942,512 | | | | 1.5 | |
| | | | | | | | | | 473,598,074 | | | | 26.9 | |
| | | | | | | | | | | | | | | |
| | | | | | | Consumer Staples: 2.2% | | | | | | | | |
| | 33,900 | | | | | Costco Wholesale Corp. | | | 5,474,850 | | | | 0.3 | |
| | 129,400 | | | | | CVS Health Corp. | | | 12,651,438 | | | | 0.8 | |
| | 231,000 | | | | | Walgreens Boots Alliance, Inc. | | | 19,670,805 | | | | 1.1 | |
| | | | | | | | | | 37,797,093 | | | | 2.2 | |
| | | | | | | | | | | | | | | |
| | | | | | | Financials: 5.4% | | | | | | | | |
| | 236,900 | | | | | American Tower Corp. | | | 22,967,455 | | | | 1.3 | |
| | 12,800 | | | | | Blackrock, Inc. | | | 4,358,656 | | | | 0.3 | |
| | 147,012 | | | | | Crown Castle International Corp. | | | 12,709,187 | | | | 0.7 | |
| | 67,800 | | | | | Intercontinental Exchange, Inc. | | | 17,374,428 | | | | 1.0 | |
| | 563,400 | | | | | Morgan Stanley | | | 17,921,754 | | | | 1.0 | |
| | 157,400 | | | | | State Street Corp. | | | 10,445,064 | | | | 0.6 | |
| | 242,800 | | | @ | | TD Ameritrade Holding Corp. | | | 8,427,588 | | | | 0.5 | |
| | 5,062 | | | @ | | WeWork Companies, Inc., Classs A | | | 166,487 | | | | 0.0 | |
| | | | | | | | | | 94,370,619 | | | | 5.4 | |
| | | | | | | | | | | | | | | |
| | | | | | | Health Care: 21.3% | | | | | | | | |
| | 197,200 | | | @ | | Alexion Pharmaceuticals, Inc. | | | 37,615,900 | | | | 2.1 | |
| | 173,231 | | | @ | | Allergan plc | | | 54,134,688 | | | | 3.1 | |
| | 160,000 | | | | | Anthem, Inc. | | | 22,310,400 | | | | 1.3 | |
| | 45,400 | | | @ | | Biogen, Inc. | | | 13,908,290 | | | | 0.8 | |
| | 80,900 | | | @ | | BioMarin Pharmaceutical, Inc. | | | 8,475,084 | | | | 0.5 | |
| | 291,400 | | | | | Bristol-Myers Squibb Co. | | | 20,045,406 | | | | 1.1 | |
| | 226,016 | | | @ | | Celgene Corp. | | | 27,067,676 | | | | 1.5 | |
| | 93,000 | | | | | Cigna Corp. | | | 13,608,690 | | | | 0.8 | |
| | 231,700 | | | | | Gilead Sciences, Inc. | | | 23,445,723 | | | | 1.3 | |
| | 82,100 | | | | | Humana, Inc. | | | 14,655,671 | | | | 0.8 | |
| | 30,800 | | | @ | | Illumina, Inc. | | | 5,911,906 | | | | 0.3 | |
| | 122,000 | | | @ | | Incyte Corp., Ltd. | | | 13,230,900 | | | | 0.8 | |
| | 46,600 | | | @ | | Intuitive Surgical, Inc. | | | 25,451,056 | | | | 1.5 | |
| | 109,600 | | | | | McKesson Corp. | | | 21,616,408 | | | | 1.2 | |
| | 31,800 | | | @ | | Regeneron Pharmaceuticals, Inc. | | | 17,263,266 | | | | 1.0 | |
| | 180,400 | | | | | UnitedHealth Group, Inc. | | | 21,222,256 | | | | 1.2 | |
| | 188,900 | | | @ | | Valeant Pharmaceuticals International, Inc. - USD | | | 19,201,685 | | | | 1.1 | |
| | 124,300 | | | @ | | Vertex Pharmaceuticals, Inc. | | | 15,640,669 | | | | 0.9 | |
| | | | | | | | | | 374,805,674 | | | | 21.3 | |
| | | | | | | | | | | | | | | |
| | | | | | | Industrials: 10.4% | | | | | | | | |
| | 711,200 | | | | | American Airlines Group, Inc. | | | 30,119,320 | | | | 1.7 | |
| | 198,800 | | | | | Boeing Co. | | | 28,744,492 | | | | 1.6 | |
| | 112,100 | | | L | | Canadian Pacific Railway Ltd | | | 14,303,960 | | | | 0.8 | |
| | 533,500 | | | | | Danaher Corp. | | | 49,551,480 | | | | 2.8 | |
| | 64,600 | | | | | FedEx Corp. | | | 9,624,754 | | | | 0.6 | |
| | 178,332 | | | | | Flowserve Corp. | | | 7,504,210 | | | | 0.4 | |
| | 17,400 | | | @ | | IHS, Inc. | | | 2,060,682 | | | | 0.1 | |
| | 101,300 | | | | | Roper Technologies, Inc. | | | 19,225,727 | | | | 1.1 | |
| | 169,740 | | | @ | | United Continental Holdings, Inc. | | | 9,726,102 | | | | 0.6 | |
| | 175,300 | | | | | Wabtec Corp. | | | 12,467,336 | | | | 0.7 | |
| | | | | | | | | | 183,328,063 | | | | 10.4 | |
| | | | | | | | | | | | | | | |
| | | | | | | Information Technology: 29.7% | | | | | | | | |
| | 160,900 | | | @ | | Akamai Technologies, Inc. | | | 8,468,167 | | | | 0.5 | |
| | 186,092 | | | @ | | Alibaba Group Holding Ltd. ADR | | | 15,123,697 | | | | 0.8 | |
| | 81,250 | | | @ | | Alphabet, Inc. - Class A | | | 63,213,313 | | | | 3.6 | |
| | 75,671 | | | | | Alphabet, Inc. - Class C | | | 57,425,208 | | | | 3.3 | |
| | 344,800 | | | | | Apple, Inc. | | | 36,293,648 | | | | 2.1 | |
| | 53,200 | | | @,L | | ASML Holding NV-NY REG | | | 4,722,564 | | | | 0.3 | |
| | 143,343 | | | @ | | Dropbox, Inc. - Class A | | | 1,347,582 | | | | 0.1 | |
| | 481,500 | | | @ | | Facebook, Inc. | | | 50,393,790 | | | | 2.9 | |
| | 136,100 | | | @ | | Fiserv, Inc. | | | 12,447,706 | | | | 0.7 | |
| | 78,900 | | | @ | | LinkedIn Corp. | | | 17,758,812 | | | | 1.0 | |
| | 84,501 | | | @ | | LivingSocial.com | | | – | | | | – | |
| | 490,500 | | | | | Mastercard, Inc. | | | 47,755,080 | | | | 2.7 | |
| | 1,053,500 | | | | | Microsoft Corp. | | | 58,448,180 | | | | 3.3 | |
| | 256,500 | | | @,L | | Mobileye NV | | | 10,844,820 | | | | 0.6 | |
| | 89,700 | | | @,L | | NetSuite, Inc. | | | 7,590,414 | | | | 0.4 | |
| | 42,700 | | | | | Palo Alto Networks, Inc. | | | 7,521,178 | | | | 0.4 | |
| | 228,100 | | | @ | | PayPal Holdings, Inc. | | | 8,257,220 | | | | 0.5 | |
| | 239,964 | | | @ | | Salesforce.com, Inc. | | | 18,813,178 | | | | 1.1 | |
| | 118,800 | | | @ | | ServiceNow, Inc. | | | 10,283,328 | | | | 0.6 | |
| | 1,137,000 | | | | | Tencent Holdings Ltd. | | | 22,262,444 | | | | 1.2 | |
| | 180,200 | | | @,L | | VeriSign, Inc. | | | 15,742,272 | | | | 0.9 | |
VY® T. Rowe Price Growth Equity Portfolio | PORTFOLIO OF INVESTMENTS as of December 31, 2015 (continued) |
| Shares | | | | | | | Value | | | Percentage
of Net
Assets | |
| COMMON STOCK: (continued) | | | | | | | | |
| | | | | | | Information Technology: (continued) | | | | | | | | |
| | 620,700 | | | | | Visa, Inc. - Class A | | | 48,135,285 | | | | 2.7 | |
| | | | | | | | | | 522,847,886 | | | | 29.7 | |
| | | | | | | | | | | | | | | |
| | | | | | | Materials: 1.0% | | | | | | | | |
| | 100,300 | | | | | Ashland, Inc. | | | 10,300,810 | | | | 0.6 | |
| | 56,100 | | | | | Martin Marietta Materials, Inc. | | | 7,662,138 | | | | 0.4 | |
| | | | | | | | | | 17,962,948 | | | | 1.0 | |
| | | | | | | | | | | | | | | |
| | | | | | | Telecommunication Services: 0.1% | | | | | | | | |
| | 44,200 | | | @ | | T-Mobile US, Inc. | | | 1,729,104 | | | | 0.1 | |
| | | | | | | | | | | | | | | |
| | | | | Total Common Stock | | | | | | | | |
| | | | | (Cost $1,228,942,341) | | | 1,706,439,461 | | | | 97.0 | |
| | | | | | | | | | | | | | | |
| PREFERRED STOCK: 1.1% | | | | | | | | |
| | | | | | | Consumer Discretionary: 0.2% | | | | | | | | |
| | 1,054 | | | @ | | Flipkart Online Services Pvt. Ltd., - Series A | | | 149,921 | | | | 0.0 | |
| | 1,862 | | | @ | | Flipkart Online Services Pvt. Ltd., - Series C | | | 264,851 | | | | 0.0 | |
| | 3,462 | | | @ | | Flipkart Online Services Pvt. Ltd., - Series E | | | 492,435 | | | | 0.1 | |
| | 14,029 | | | @ | | Flipkart Online Services Pvt. Ltd., - Series H | | | 1,995,485 | | | | 0.1 | |
| | | | | | | | | | 2,902,692 | | | | 0.2 | |
| | | | | | | | | | | | | | | |
| | | | | | | Financials: 0.1% | | | | | | | | |
| | 45,554 | | | @ | | WeWork Companies, Inc. - Series E | | | 1,498,251 | | | | 0.1 | |
| | | | | | | | | | | | | | | |
| | | | | | | Information Technology: 0.8% | | | | | | | | |
| | 59,241 | | | @ | | AirBNB, Inc. - Series D | | | 5,515,005 | | | | 0.3 | |
| | 16,058 | | | @ | | AirBNB, Inc. - Series E | | | 1,494,910 | | | | 0.1 | |
| | 16,556 | | | @ | | Flipkart - Series G | | | 2,354,926 | | | | 0.1 | |
| | 73,385 | | | @ | | Uber Technologies, Inc. - Series G | | | 3,579,150 | | | | 0.2 | |
| | 68,026 | | | @ | | Xiaoju Kuaizhi, Inc., Series A-17 | | | 2,079,997 | | | | 0.1 | |
| | | | | | | | | | 15,023,988 | | | | 0.8 | |
| | | | | | | | | | | | | | | |
| | | | | Total Preferred Stock | | | | | | | | |
| | | | | (Cost $15,555,205) | | | 19,424,931 | | | | 1.1 | |
| | | | | | | | | | | | | | | |
| | | | | Total Long-Term Investments | | | | | | | | |
| | | | | (Cost $1,244,497,546) | | | 1,725,864,392 | | | | 98.1 | |
Principal
Amount† | | | | | | | Value | | | Percentage
of Net
Assets | |
| SHORT-TERM INVESTMENTS: 6.3% | | | | | | | | |
| | | | | | | Securities Lending Collateralcc: 4.1% | | | | | | | | |
| | 17,248,744 | | | | | BNP Paribas Bank, Repurchase Agreement dated 12/31/15, 0.30%, due 01/04/16 (Repurchase Amount $17,249,311, collateralized by various U.S. Government/U.S. Government Agency Obligations, 0.000%-5.500%, Market Value plus accrued interest $17,593,719, due 06/06/16-05/04/37) | | | 17,248,744 | | | | 0.9 | |
| | 17,248,744 | | | | | Citigroup, Inc., Repurchase Agreement dated 12/31/15, 0.34%, due 01/04/16 (Repurchase Amount $17,249,387, collateralized by various U.S. Government Agency Obligations, 0.000%-11.500%, Market Value plus accrued interest $17,593,719, due 01/15/16-04/01/51) | | | 17,248,744 | | | | 1.0 | |
| | 13,782,070 | | | | | HSBC Securities USA, Repurchase Agreement dated 12/31/15, 0.29%, due 01/04/16 (Repurchase Amount $13,782,508, collateralized by various U.S. Government Securities, 3.000%, Market Value plus accrued interest $14,057,751, due 11/15/44) | | | 13,782,070 | | | | 0.8 | |
| | 17,248,744 | | | | | Nomura Securities, Repurchase Agreement dated 12/31/15, 0.33%, due 01/04/16 (Repurchase Amount $17,249,368, collateralized by various U.S. Government/U.S. Government Agency Obligations, 0.000%-10.500%, Market Value plus accrued interest $17,593,719, due 01/15/16-10/20/65) | | | 17,248,744 | | | | 1.0 | |
| | 7,097,511 | | | | | State of Wisconsin Investment Board, Repurchase Agreement dated 12/31/15, 0.41%, due 01/04/16 (Repurchase Amount $7,097,830, collateralized by various U.S. Government Securities, 0.125%-2.500%, Market Value plus accrued interest $7,244,674, due 01/15/17-02/15/42) | | | 7,097,511 | | | | 0.4 | |
| | | | | | | | | | 72,625,813 | | | | 4.1 | |
VY® T. Rowe Price Growth Equity Portfolio | PORTFOLIO OF INVESTMENTS as of December 31, 2015 (continued) |
| Shares | | | | | | | Value | | | Percentage
of Net
Assets | |
| SHORT-TERM INVESTMENTS: (continued) | | | | | | |
| | | | | | | Affiliated Investment Companies: 2.2% | | | | | | | | |
| | 38,829,375 | | | | | T. Rowe Price Reserve Investment Fund, 0.225%†† | | | | | | | | |
| | | | | | | (Cost $38,829,375) | | | 38,829,375 | | | | 2.2 | |
| | | | | | | | | | | | | | | |
| | | | | Total Short-Term Investments | | | | | | | | |
| | | | | (Cost $111,455,188) | | | 111,455,188 | | | | 6.3 | |
| | | | | | | | | | | | | | | |
| | | | | Total Investments in Securities
(Cost $1,355,952,734) | | $ | 1,837,319,580 | | | | 104.4 | |
| | | | | Liabilities in Excess of Other Assets | | | (78,044,934 | ) | | | (4.4 | ) |
| | | | | Net Assets | | | | $ | 1,759,274,646 | | | | 100.0 | |
| † | Unless otherwise indicated, principal amount is shown in USD. |
| †† | Rate shown is the 7-day yield as of December 31, 2015. |
| @ | Non-income producing security. |
| ADR | American Depositary Receipt |
| cc | Represents securities purchased with cash collateral received for securities on loan. |
| L | Loaned security, a portion or all of the security is on loan at December 31, 2015. |
| | |
| | Cost for federal income tax purposes is $1,358,458,985. |
| Net unrealized appreciation consists of: | | | | |
| | | | | |
| Gross Unrealized Appreciation | | $ | 511,736,502 | |
| Gross Unrealized Depreciation | | | (32,875,907 | ) |
| | | | | |
| Net Unrealized Appreciation | | $ | 478,860,595 | |
| VY® Templeton Foreign Equity Portfolio | PORTFOLIO OF INVESTMENTS as of December 31, 2015 |
| Shares | | | | | | | Value | | | Percentage
of Net
Assets | |
| COMMON STOCK: 96.3% | | | | | | | | |
| | | | | | | Brazil: 0.2% | | | | | | | | |
| | 345,617 | | | @,L | | Petroleo Brasileiro SA ADR | | | 1,486,153 | | | | 0.2 | |
| | | | | | | | | | | | | | | |
| | | | | | | China: 6.1% | | | | | | | | |
| | 2,585,000 | | | | | China Life Insurance Co., Ltd. | | | 8,298,363 | | | | 1.1 | |
| | 774,500 | | | | | China Mobile Ltd. | | | 8,717,854 | | | | 1.2 | |
| | 21,246,000 | | | | | China Telecom Corp., Ltd. | | | 9,910,559 | | | | 1.4 | |
| | 4,266,600 | | | @,L | | CRRC Corp. Ltd | | | 5,241,356 | | | | 0.7 | |
| | 4,230,000 | | | | | Kunlun Energy Co. Ltd. | | | 3,755,860 | | | | 0.5 | |
| | 1,368,800 | | | | | Sinopharm Group Co. | | | 5,464,557 | | | | 0.8 | |
| | 2,352,000 | | | | | Weichai Power Co. Ltd. | | | 2,590,163 | | | | 0.4 | |
| | | | | | | | | | 43,978,712 | | | | 6.1 | |
| | | | | | | | | | | | | | | |
| | | | | | | France: 11.5% | | | | | | | | |
| | 473,266 | | | | | AXA S.A. | | | 12,931,388 | | | | 1.8 | |
| | 273,888 | | | | | BNP Paribas | | | 15,495,933 | | | | 2.1 | |
| | 191,520 | | | | | Cie de Saint-Gobain | | | 8,299,616 | | | | 1.2 | |
| | 120,314 | | | | | Cie Generale des Etablissements Michelin | | | 11,451,858 | | | | 1.6 | |
| | 638,860 | | | | | Credit Agricole SA | | | 7,528,458 | | | | 1.0 | |
| | 135,141 | | | | | Sanofi | | | 11,517,016 | | | | 1.6 | |
| | 103,640 | | | L | | Technip S.A. | | | 5,154,073 | | | | 0.7 | |
| | 242,964 | | | | | Total S.A. | | | 10,892,473 | | | | 1.5 | |
| | | | | | | | | | 83,270,815 | | | | 11.5 | |
| | | | | | | | | | | | | | | |
| | | | | | | Germany: 12.0% | | | | | | | | |
| | 100,971 | | | | | Bayer AG | | | 12,610,374 | | | | 1.7 | |
| | 85,980 | | | | | Deutsche Boerse AG | | | 7,557,785 | | | | 1.0 | |
| | 144,348 | | | | | Deutsche Post AG | | | 4,035,675 | | | | 0.6 | |
| | 156,915 | | | | | HeidelbergCement AG | | | 12,788,256 | | | | 1.8 | |
| | 569,995 | | | | | Infineon Technologies AG | | | 8,309,838 | | | | 1.2 | |
| | 74,860 | | | | | Lanxess | | | 3,444,868 | | | | 0.5 | |
| | 103,258 | | | | | Merck KGaA | | | 9,997,581 | | | | 1.4 | |
| | 193,800 | | | | | Metro AG | | | 6,173,983 | | | | 0.9 | |
| | 42,620 | | | | | Morphosys AG | | | 2,652,028 | | | | 0.4 | |
| | 34,327 | | | | | Muenchener Rueckversicherungs-Gesellschaft AG | | | 6,839,250 | | | | 0.9 | |
| | 58,986 | | | | | SAP SE | | | 4,680,752 | | | | 0.6 | |
| | 74,750 | | | | | Siemens AG | | | 7,231,793 | | | | 1.0 | |
| | | | | | | | | | 86,322,183 | | | | 12.0 | |
| | | | | | | | | | | | | | | |
| | | | | | | Hong Kong: 2.8% | | | | | | | | |
| | 973,900 | | | | | AIA Group Ltd. | | | 5,819,133 | | | | 0.8 | |
| | 485,640 | | | | | Cheung Kong Property Holdings Ltd. | | | 3,141,598 | | | | 0.4 | |
| | 228,400 | | | @ | | CK Hutchison Holdings Ltd. ADR | | | 3,069,696 | | | | 0.4 | |
| | 485,640 | | | | | CK Hutchison Holdings Ltd. | | | 6,527,938 | | | | 0.9 | |
| | 6,871,000 | | | L | | Noble Group Ltd. | | | 1,920,556 | | | | 0.3 | |
| | | | | | | | | | 20,478,921 | | | | 2.8 | |
| | | | | | | | | | | | | | | |
| | | | | | | India: 1.3% | | | | | | | | |
| | 496,486 | | | | | Housing Development Finance Corp. | | | 9,443,085 | | | | 1.3 | |
| | | | | | | | | | | | | | | |
| | | | | | | Israel: 2.3% | | | | | | | | |
| | 253,929 | | | | | Teva Pharmaceutical Industries Ltd. ADR | | | 16,667,900 | | | | 2.3 | |
| | | | | | | | | | | | | | | |
| | | | | | | Italy: 3.0% | | | | | | | | |
| | 680,187 | | | | | ENI S.p.A. | | | 10,106,408 | | | | 1.4 | |
| | 1,072,600 | | | | | Intesa Sanpaolo SpA - ISP | | | 3,562,124 | | | | 0.5 | |
| | 1,493,810 | | | | | UniCredit SpA | | | 8,258,858 | | | | 1.1 | |
| | | | | | | | | | 21,927,390 | | | | 3.0 | |
| | | | | | | | | | | | | | | |
| | | | | | | Japan: 6.9% | | | | | | | | |
| | 503,800 | | | | | Konica Minolta Holdings, Inc. | | | 5,045,648 | | | | 0.7 | |
| | 1,282,100 | | | | | Nissan Motor Co., Ltd. | | | 13,424,539 | | | | 1.9 | |
| | 171,300 | | | | | SoftBank Group Corp. | | | 8,645,580 | | | | 1.2 | |
| | 240,400 | | | | | Suntory Beverage & Food Ltd. | | | 10,523,785 | | | | 1.4 | |
| | 1,397,000 | | | | | Toshiba Corp. | | | 2,871,149 | | | | 0.4 | |
| | 149,600 | | | | | Toyota Motor Corp. | | | 9,212,222 | | | | 1.3 | |
| | | | | | | | | | 49,722,923 | | | | 6.9 | |
| | | | | | | | | | | | | | | |
| | | | | | | Netherlands: 5.4% | | | | | | | | |
| | 159,998 | | | | | Akzo Nobel NV | | | 10,690,910 | | | | 1.5 | |
| | 216,195 | | | | | Koninklijke Philips NV | | | 5,518,249 | | | | 0.8 | |
| | 150,904 | | | | | Qiagen NV | | | 4,090,152 | | | | 0.6 | |
| | 455,036 | | | | | Royal Dutch Shell PLC - Class B | | | 10,370,755 | | | | 1.4 | |
| | 374,301 | | | L | | SBM Offshore NV | | | 4,728,471 | | | | 0.6 | |
| | 427,150 | | | | | TNT Express NV | | | 3,613,210 | | | | 0.5 | |
| | | | | | | | | | 39,011,747 | | | | 5.4 | |
| | | | | | | | | | | | | | | |
| | | | | | | Norway: 2.1% | | | | | | | | |
| | 485,530 | | | | | Subsea 7 SA | | | 3,436,573 | | | | 0.5 | |
| | 166,074 | | | | | Statoil ASA | | | 2,316,197 | | | | 0.3 | |
| | 573,623 | | | | | Telenor ASA | | | 9,561,476 | | | | 1.3 | |
| | | | | | | | | | 15,314,246 | | | | 2.1 | |
| | | | | | | | | | | | | | | |
| | | | | | | Portugal: 0.9% | | | | | | | | |
| | 564,750 | | | | | Galp Energia SGPS SA | | | 6,589,919 | | | | 0.9 | |
| | | | | | | | | | | | | | | |
| | | | | | | Russia: 0.4% | | | | | | | | |
| | 226,203 | | | @ | | MMC Norilsk Nickel PJSC ADR | | | 2,871,647 | | | | 0.4 | |
| | | | | | | | | | | | | | | |
| | | | | | | Singapore: 2.8% | | | �� | | | | | |
| | 886,582 | | | | | DBS Group Holdings Ltd. | | | 10,390,302 | | | | 1.4 | |
| | 3,902,000 | | | | | Singapore Telecommunications Ltd. | | | 10,060,390 | | | | 1.4 | |
| | | | | | | | | | 20,450,692 | | | | 2.8 | |
| | | | | | | | | | | | | | | |
| | | | | | | South Korea: 5.6% | | | | | | | | |
| | 171,216 | | | | | Hana Financial Group, Inc. | | | 3,421,394 | | | | 0.5 | |
| | 35,481 | | | | | Hyundai Mobis | | | 7,423,674 | | | | 1.0 | |
| | 247,680 | | | @ | | KB Financial Group, Inc. ADR | | | 6,902,841 | | | | 0.9 | |
| | 58,716 | | | @ | | POSCO ADR | | | 2,076,198 | | | | 0.3 | |
| | 17,817 | | | | | POSCO | | | 2,495,829 | | | | 0.4 | |
| | 34,081 | | | | | Samsung Electronics Co., Ltd. GDR | | | 18,069,237 | | | | 2.5 | |
| | | | | | | | | | 40,389,173 | | | | 5.6 | |
| | | | | | | | | | | | | | | |
| | | | | | | Spain: 1.8% | | | | | | | | |
| | 178,256 | | | L | | Repsol YPF S.A. | | | 1,962,479 | | | | 0.3 | |
| VY® Templeton Foreign Equity Portfolio | PORTFOLIO OF INVESTMENTS as of December 31, 2015 (continued) |
| Shares | | | | | | | Value | | | Percentage
of Net
Assets | |
| COMMON STOCK: (continued) | | | | | | | | |
| | | | | | | Spain: (continued) | | | | | | | | |
| | 1,007,321 | | | | | Telefonica S.A. | | | 11,175,205 | | | | 1.5 | |
| | | | | | | | | | 13,137,684 | | | | 1.8 | |
| | | | | | | | | | | | | | | |
| | | | | | | Sweden: 1.5% | | | | | | | | |
| | 364,710 | | | | | Telefonaktiebolaget LM Ericsson | | | 3,516,281 | | | | 0.5 | |
| | 282,620 | | | | | Getinge AB | | | 7,403,304 | | | | 1.0 | |
| | | | | | | | | | 10,919,585 | | | | 1.5 | |
| | | | | | | | | | | | | | | |
| | | | | | | Switzerland: 7.9% | | | | | | | | |
| | 199,690 | | | @ | | ABB Ltd. | | | 3,563,990 | | | | 0.5 | |
| | 638,169 | | | @ | | Credit Suisse Group AG | | | 13,747,413 | | | | 1.9 | |
| | 1,905,170 | | | | | Glencore PLC | | | 2,524,611 | | | | 0.4 | |
| | 82,527 | | | | | Novartis AG | | | 7,098,913 | | | | 1.0 | |
| | 57,076 | | | | | Roche Holding AG | | | 15,816,240 | | | | 2.2 | |
| | 142,055 | | | | | Swiss Re Ltd. | | | 13,873,987 | | | | 1.9 | |
| | | | | | | | | | 56,625,154 | | | | 7.9 | |
| | | | | | | | | | | | | | | |
| | | | | | | Taiwan: 0.6% | | | | | | | | |
| | 948,251 | | | | | Taiwan Semiconductor Manufacturing Co., Ltd. | | | 4,090,984 | | | | 0.6 | |
| | | | | | | | | | | | | | | |
| | | | | | | Thailand: 0.7% | | | | | | | | |
| | 1,168,800 | | | | | Bangkok Bank PCL - Foreign Reg | | | 4,990,907 | | | | 0.7 | |
| | | | | | | | | | | | | | | |
| | | | | | | United Kingdom: 20.5% | | | | | | | | |
| | 1,446,095 | | | | | Aviva PLC | | | 10,976,614 | | | | 1.5 | |
| | 1,403,493 | | | | | BAE Systems PLC | | | 10,333,301 | | | | 1.4 | |
| | 2,345,820 | | | | | Barclays PLC | | | 7,550,699 | | | | 1.0 | |
| | 2,113,824 | | | | | BP PLC | | | 10,984,942 | | | | 1.5 | |
| | 609,930 | | | | | Sky PLC | | | 9,998,490 | | | | 1.4 | |
| | 451,664 | | | | | CRH PLC - London | | | 13,076,524 | | | | 1.8 | |
| | 648,766 | | | | | GlaxoSmithKline PLC | | | 13,102,453 | | | | 1.8 | |
| | 1,466,000 | | | | | HSBC Holdings PLC | | | 11,591,086 | | | | 1.6 | |
| | 2,163,454 | | | | | Kingfisher PLC | | | 10,478,717 | | | | 1.5 | |
| | 7,476,467 | | | | | Lloyds Banking Group Plc | | | 8,044,689 | | | | 1.1 | |
| | 1,471,390 | | | | | Marks & Spencer Group PLC | | | 9,796,861 | | | | 1.4 | |
| | 430,980 | | | | | Petrofac Ltd. | | | 5,055,294 | | | | 0.7 | |
| | 702,723 | | | | | Rexam PLC | | | 6,267,977 | | | | 0.9 | |
| | 748,061 | | | @ | | Standard Chartered PLC | | | 6,206,813 | | | | 0.9 | |
| | 2,612,090 | | | | | Tesco PLC | | | 5,739,517 | | | | 0.8 | |
| | 2,762,541 | | | | | Vodafone Group PLC | | | 8,958,329 | | | | 1.2 | |
| | | | | | | | | | 148,162,306 | | | | 20.5 | |
| | | | | | | | | | | | | | | |
| | | | | Total Common Stock | | | | | | | | |
| | | | | (Cost $625,817,843) | | | 695,852,126 | | | | 96.3 | |
Principal
Amount† | | | | | | | Value | | | Percentage
of Net
Assets | |
| SHORT-TERM INVESTMENTS: 4.8% | | | | | | | | |
| | | | | | | U.S. Government Agency Obligations: 2.7% | | | | | | | | |
| | 11,000,000 | | | | | Farmer Mac Discount Notes, 0.120%, 01/04/16 | | | 11,000,000 | | | | 1.6 | |
| | 8,000,000 | | | | | Freddie Mac Discount Notes, 0.090%, 01/04/16 | | | 8,000,000 | | | | 1.1 | |
| | | | | | | | | | 19,000,000 | | | | 2.7 | |
| | | | | | | | | | | | | | | |
| | | | | | | Securities Lending Collateralcc: 2.1% | | | | | | | | |
| | 3,686,971 | | | | | Citigroup, Inc., Repurchase Agreement dated 12/31/15, 0.34%, due 01/04/16 (Repurchase Amount $3,687,108, collateralized by various U.S. Government Agency Obligations, 0.000%-11.500%, Market Value plus accrued interest $3,760,710, due 01/15/16-04/01/51) | | | 3,686,971 | | | | 0.5 | |
| | 2,945,850 | | | | | HSBC Securities USA, Repurchase Agreement dated 12/31/15, 0.29%, due 01/04/16 (Repurchase Amount $2,945,944, collateralized by various U.S. Government Securities, 3.000%, Market Value plus accrued interest $3,004,775, due 11/15/44) | | | 2,945,850 | | | | 0.4 | |
| | 3,686,971 | | | | | Mizuho Securities USA Inc., Repurchase Agreement dated 12/31/15, 0.30%, due 01/04/16 (Repurchase Amount $3,687,092, collateralized by various U.S. Government Agency Obligations, 0.000%-9.000%, Market Value plus accrued interest $3,760,710, due 06/13/16-03/01/44) | | | 3,686,971 | | | | 0.5 | |
| | 3,686,971 | | | | | Nomura Securities, Repurchase Agreement dated 12/31/15, 0.33%, due 01/04/16 (Repurchase Amount $3,687,104, collateralized by various U.S. Government/U.S. Government Agency Obligations, 0.000%-10.500%, Market Value plus accrued interest $3,760,710, due 01/15/16-10/20/65) | | | 3,686,971 | | | | 0.5 | |
| VY® Templeton Foreign Equity Portfolio | PORTFOLIO OF INVESTMENTS as of December 31, 2015 (continued) |
Principal
Amount† | | | | | | | Value | | | Percentage
of Net
Assets | |
| SHORT-TERM INVESTMENTS: (continued) | | | | | | | �� | |
| | | | | | | Securities Lending Collateralcc: (continued) | | | | | | | | |
| | 1,517,067 | | | | | State of Wisconsin Investment Board, Repurchase Agreement dated 12/31/15, 0.41%, due 01/04/16 (Repurchase Amount $1,517,135, collateralized by various U.S. Government Securities, 0.125%-2.500%, Market Value plus accrued interest $1,548,523, due 01/15/17-02/15/42) | | | 1,517,067 | | | | 0.2 | |
| | | | | | | | | | 15,523,830 | | | | 2.1 | |
| | | | | | | | | | | | | | | |
| | | | | Total Short-Term Investments | | | | | | | | |
| | | | | (Cost $34,523,773) | | | 34,523,830 | | | | 4.8 | |
| | | | | | | | | | | | | | | |
| | | | | Total Investments in Securities
(Cost $660,341,616) | | $ | 730,375,956 | | | | 101.1 | |
| | | | | Liabilities in Excess of Other Assets | | | (7,689,416 | ) | | | (1.1 | ) |
| | | | | Net Assets | | $ | 722,686,540 | | | | 100.0 | |
| † | Unless otherwise indicated, principal amount is shown in USD. |
| @ | Non-income producing security. |
| ADR | American Depositary Receipt |
| GDR | Global Depositary Receipt |
| cc | Represents securities purchased with cash collateral received for securities on loan. |
| L | Loaned security, a portion or all of the security is on loan at December 31, 2015. |
| | |
| | Cost for federal income tax purposes is $664,448,248. |
| Net unrealized appreciation consists of: | | | | |
| | | | | |
| Gross Unrealized Appreciation | | $ | 158,702,381 | |
| Gross Unrealized Depreciation | | | (92,774,673 | ) |
| | | | | |
| Net Unrealized Appreciation | | $ | 65,927,708 | |
Item 7. Disclosure of Proxy Voting Policies and Procedures for Closed-End Management Investment Companies.
Not applicable.
Item 8. Portfolio Managers of Closed-End Management Investment Companies.
Not applicable.
Item 9. Purchases of Equity Securities by Closed-End Management Investment Company and Affiliated Purchasers
Not applicable.
Item 10. Submission of Matters to a Vote of Security Holders.
N/A.
Item 11. Controls and Procedures.
| (a) | Based on our evaluation conducted within 90 days of the filing date, hereof, the design and operation of the registrant’s disclosure controls and procedures are effective to ensure that material information relating to the registrant is made known to the certifying officers by others within the appropriate entities, particularly during the period in which Forms N-CSR are being prepared, and the registrant’s disclosure controls and procedures allow timely preparation and review of the information for the registrant’s Form N-CSR and the officer certifications of such Form N-CSR. |
| (b) | There were no significant changes in the registrant’s internal controls that occurred during the second fiscal quarter of the period covered by this report that has materially affected, or is reasonably likely to materially affect, the registrant’s internal control over financial reporting. |
Item 12. Exhibits.
| (a)(1) | Code of Ethics pursuant to Item 2 of Form N-CSR is filed and attached hereto as EX-99.CODE ETH. |
| (a)(2) | A separate certification for each principal executive officer and principal financial officer of the registrant as required by Rule 30a-2 under the Act (17 CFR 270.30a-2) is attached hereto as EX-99.CERT. |
| (b) | The officer certifications required by Section 906 of the Sarbanes-Oxley Act of 2002 are attached hereto as EX-99.906CERT. |
SIGNATURES
Pursuant to the requirements of the Securities Exchange Act of 1934 and the Investment Company Act of 1940, the registrant has duly caused this report to be signed on its behalf by the undersigned, thereunto duly authorized.
(Registrant): Voya Partners, Inc.
| By | /s/ Shaun P. Mathews | Shaun P. Mathews |
| | President and Chief Executive Officer | |
Date: March 8, 2016
Pursuant to the requirements of the Securities Exchange Act of 1934 and the Investment Company Act of 1940, this report has been signed below by the following persons on behalf of the registrant and in the capacities and on the dates indicated.
| By | /s/ Shaun P. Mathews | Shaun P. Mathews |
| | President and Chief Executive Officer | |
Date: March 8, 2016
| By | /s/ Todd Modic | Todd Modic |
| | Senior Vice President and Chief Financial Officer | |
Date: March 8, 2016
![[MISSING IMAGE: ing_cov.jpg]](https://capedge.com/proxy/N-CSR/0001571049-16-012730/ing_cov.jpg)
![[MISSING IMAGE: voya_covinvmgt.jpg]](https://capedge.com/proxy/N-CSR/0001571049-16-012730/voya_covinvmgt.jpg)
![[MISSING IMAGE: ph_shaun-mathews.jpg]](https://capedge.com/proxy/N-CSR/0001571049-16-012730/ph_shaun-mathews.jpg)
![[MISSING IMAGE: sg_shaun-mathews.jpg]](https://capedge.com/proxy/N-CSR/0001571049-16-012730/sg_shaun-mathews.jpg)
![[MISSING IMAGE: t1600165_chart-globalbond.jpg]](https://capedge.com/proxy/N-CSR/0001571049-16-012730/t1600165_chart-globalbond.jpg)
![[MISSING IMAGE: t1600165_chrt-americentury.jpg]](https://capedge.com/proxy/N-CSR/0001571049-16-012730/t1600165_chrt-americentury.jpg)
![[MISSING IMAGE: t1600165_chart-barongrwth.jpg]](https://capedge.com/proxy/N-CSR/0001571049-16-012730/t1600165_chart-barongrwth.jpg)
![[MISSING IMAGE: t1600165_chrt-columbiacont.jpg]](https://capedge.com/proxy/N-CSR/0001571049-16-012730/t1600165_chrt-columbiacont.jpg)
![[MISSING IMAGE: t1600165_chart-columbiascv.jpg]](https://capedge.com/proxy/N-CSR/0001571049-16-012730/t1600165_chart-columbiascv.jpg)
![[MISSING IMAGE: t1600165_chart-comstock.jpg]](https://capedge.com/proxy/N-CSR/0001571049-16-012730/t1600165_chart-comstock.jpg)
![[MISSING IMAGE: t1600165_chrt-equityincome.jpg]](https://capedge.com/proxy/N-CSR/0001571049-16-012730/t1600165_chrt-equityincome.jpg)
![[MISSING IMAGE: t1600165_chart-midcapvalue.jpg]](https://capedge.com/proxy/N-CSR/0001571049-16-012730/t1600165_chart-midcapvalue.jpg)
![[MISSING IMAGE: t1600165_chrt-oppenglobal.jpg]](https://capedge.com/proxy/N-CSR/0001571049-16-012730/t1600165_chrt-oppenglobal.jpg)
![[MISSING IMAGE: t1600165_chart-pioneerhy.jpg]](https://capedge.com/proxy/N-CSR/0001571049-16-012730/t1600165_chart-pioneerhy.jpg)
![[MISSING IMAGE: t1600165_chrt-dmidcapgrwth.jpg]](https://capedge.com/proxy/N-CSR/0001571049-16-012730/t1600165_chrt-dmidcapgrwth.jpg)
![[MISSING IMAGE: t1600165_chrt-growthequity.jpg]](https://capedge.com/proxy/N-CSR/0001571049-16-012730/t1600165_chrt-growthequity.jpg)
![[MISSING IMAGE: t1600165_chart-templetonfe.jpg]](https://capedge.com/proxy/N-CSR/0001571049-16-012730/t1600165_chart-templetonfe.jpg)
![[MISSING IMAGE: t1600160_chart-aggressive.jpg]](https://capedge.com/proxy/N-CSR/0001571049-16-012730/t1600160_chart-aggressive.jpg)
![[MISSING IMAGE: t1600160_chart-balanced.jpg]](https://capedge.com/proxy/N-CSR/0001571049-16-012730/t1600160_chart-balanced.jpg)
![[MISSING IMAGE: t1600160_chart-conservative.jpg]](https://capedge.com/proxy/N-CSR/0001571049-16-012730/t1600160_chart-conservative.jpg)
![[MISSING IMAGE: t1600160_chart-income.jpg]](https://capedge.com/proxy/N-CSR/0001571049-16-012730/t1600160_chart-income.jpg)
![[MISSING IMAGE: t1600160_chart-growth.jpg]](https://capedge.com/proxy/N-CSR/0001571049-16-012730/t1600160_chart-growth.jpg)
![[MISSING IMAGE: t1600160_chart-moderate.jpg]](https://capedge.com/proxy/N-CSR/0001571049-16-012730/t1600160_chart-moderate.jpg)
![[MISSING IMAGE: t1600160_chart-2020.jpg]](https://capedge.com/proxy/N-CSR/0001571049-16-012730/t1600160_chart-2020.jpg)
![[MISSING IMAGE: t1600160_chart-2025.jpg]](https://capedge.com/proxy/N-CSR/0001571049-16-012730/t1600160_chart-2025.jpg)
![[MISSING IMAGE: t1600160_chart-2030.jpg]](https://capedge.com/proxy/N-CSR/0001571049-16-012730/t1600160_chart-2030.jpg)
![[MISSING IMAGE: t1600160_chart-2035.jpg]](https://capedge.com/proxy/N-CSR/0001571049-16-012730/t1600160_chart-2035.jpg)
![[MISSING IMAGE: t1600160_chart-2040.jpg]](https://capedge.com/proxy/N-CSR/0001571049-16-012730/t1600160_chart-2040.jpg)
![[MISSING IMAGE: t1600160_chart-2045.jpg]](https://capedge.com/proxy/N-CSR/0001571049-16-012730/t1600160_chart-2045.jpg)
![[MISSING IMAGE: t1600160_chart-2050.jpg]](https://capedge.com/proxy/N-CSR/0001571049-16-012730/t1600160_chart-2050.jpg)
![[MISSING IMAGE: t1600160_chart-2055.jpg]](https://capedge.com/proxy/N-CSR/0001571049-16-012730/t1600160_chart-2055.jpg)
![[MISSING IMAGE: t1600160_chart-2060.jpg]](https://capedge.com/proxy/N-CSR/0001571049-16-012730/t1600160_chart-2060.jpg)
![[MISSING IMAGE: t1600161_chrt-isi.jpg]](https://capedge.com/proxy/N-CSR/0001571049-16-012730/t1600161_chrt-isi.jpg)
![[MISSING IMAGE: t1600161_chart-index2020.jpg]](https://capedge.com/proxy/N-CSR/0001571049-16-012730/t1600161_chart-index2020.jpg)
![[MISSING IMAGE: t1600161_chart-index2025.jpg]](https://capedge.com/proxy/N-CSR/0001571049-16-012730/t1600161_chart-index2025.jpg)
![[MISSING IMAGE: t1600161_chart-index2030.jpg]](https://capedge.com/proxy/N-CSR/0001571049-16-012730/t1600161_chart-index2030.jpg)
![[MISSING IMAGE: t1600161_chart-index2035.jpg]](https://capedge.com/proxy/N-CSR/0001571049-16-012730/t1600161_chart-index2035.jpg)
![[MISSING IMAGE: t1600161_chart-index2040.jpg]](https://capedge.com/proxy/N-CSR/0001571049-16-012730/t1600161_chart-index2040.jpg)
![[MISSING IMAGE: t1600161_chart-index2045.jpg]](https://capedge.com/proxy/N-CSR/0001571049-16-012730/t1600161_chart-index2045.jpg)
![[MISSING IMAGE: t1600161_chart-index2050.jpg]](https://capedge.com/proxy/N-CSR/0001571049-16-012730/t1600161_chart-index2050.jpg)
![[MISSING IMAGE: t1600161_chart-index2055.jpg]](https://capedge.com/proxy/N-CSR/0001571049-16-012730/t1600161_chart-index2055.jpg)
![[MISSING IMAGE: t1600161_chart-index2060.jpg]](https://capedge.com/proxy/N-CSR/0001571049-16-012730/t1600161_chart-index2060.jpg)
![[MISSING IMAGE: t1600159_chart-contrafund.jpg]](https://capedge.com/proxy/N-CSR/0001571049-16-012730/t1600159_chart-contrafund.jpg)
![[MISSING IMAGE: t1600159_chart-equityincome.jpg]](https://capedge.com/proxy/N-CSR/0001571049-16-012730/t1600159_chart-equityincome.jpg)
![[MISSING IMAGE: t1600159_chart-midcap.jpg]](https://capedge.com/proxy/N-CSR/0001571049-16-012730/t1600159_chart-midcap.jpg)