UNITED STATES
SECURITIES AND EXCHANGE COMMISSION
Washington, D.C. 20549
FORM N-CSR
CERTIFIED SHAREHOLDER REPORT OF REGISTERED
MANAGEMENT INVESTMENT COMPANIES
Investment Company Act file number : 811-08231
SPIRIT OF AMERICA INVESTMENT FUND, INC.
(Exact name of registrant as specified in charter)
477 Jericho Turnpike
P.O. Box 9006
Syosset, NY 11791-9006
(Address of principal executive offices) (Zip code)
Mr. David Lerner
David Lerner Associates
477 Jericho Turnpike
P.O. Box 9006
Syosset, NY 11791-9006
(Name and address of agent for service)
Registrant’s telephone number, including area code: 1-516-390-5565
Date of fiscal year end: December 31
Date of reporting period: December 31, 2015
Form N-CSR is to be used by management investment companies to file reports with the Commission not later than 10 days after the transmission to stockholders of any report that is required to be transmitted to stockholders under Rule 30e-1 under the Investment Company Act of 1940 (17 CFR 270.30e-1). The Commission may use the information provided on Form N-CSR in its regulatory, disclosure review, inspection and policymaking roles.
A registrant is required to disclose the information specified by Form N-CSR, and the Commission will make this information public. A registrant is not required to respond to the collection of information contained in Form N-CSR unless the Form displays a currently valid Office of Management and Budget (“OMB”) control number. Please direct comments concerning the accuracy of the information collection burden estimate and any suggestions for reducing the burden to Secretary, Securities and Exchange Commission, 450 Fifth Street, NW, Washington, DC 20549-0609. The OMB has reviewed this collection of information under the clearance requirements of 44 U.S.C. § 3507.
Item 1. Reports to Stockholders.

ANNUAL REPORT
DECEMBER 31, 2015
MESSAGE TO OUR SHAREHOLDERS
Dear Shareholder,
We are happy to have this opportunity to share with you, our shareholders, the Annual Report for the Spirit of America Real Estate Income and Growth Fund. This includes a review of our performance in 2015, in addition to a discussion of the economy, and our thoughts on the securities markets.
At Spirit of America Investment Funds, our team takes a comprehensive approach to investing. We analyze economic trends, and evaluate industries that could benefit from those trends. Based upon this analysis, we select investments we believe are positioned to provide the best potential returns. Our portfolio managers utilize their extensive backgrounds in their respective fields to carefully scrutinize each security in the portfolio on an ongoing basis.
The Spirit of America Real Estate Income and Growth Fund’s investment philosophy continues to be to seek enduring value in the infrastructure of America by investing in real estate companies which own office buildings, shopping malls, hotels, apartments, and other income producing assets. Our goal is to maximize total return to shareholders by benefitting from the income generated through the rental of these properties, while also participating in potential long term appreciation of asset values.
We thank you for your support, and look forward to your future investment in the Spirit of America Real Estate Income and Growth Fund.
Sincerely,
| | | | |
| REAL ESTATE INCOME AND GROWTH FUND | | | 1 | |
MANAGEMENT DISCUSSION (UNAUDITED)
Economic Summary
The Federal Reserve raised rates to a range between 0.25% and 0.5% signaling the beginning of the end for the central bank’s stimulus program as anticipated during their December meeting. Fed officials emphasized that they intend to raise rates gradually and only if economic growth continues. They are predicting that if all goes smoothly short-term rates may rise by about one percentage point a year for the next three years.
At the end of December the Department of Commerce revised the U.S. gross domestic product (GDP) for the 3rd quarter of 2015 up to a 2.0% annual pace. The increase in GDP this quarter primarily reflected positive contributions from personal consumption, nonresidential fixed investment, state and local spending, residential fixed investment, and exports that were partly offset by a negative contribution from private inventory investment and an increase in imports. In the 2nd quarter GDP increased by a 3.9% pace following the 0.02% contraction in the 1st quarter.
The latest employment data released by the Bureau of Labor Statistics in the December jobs report shows total nonfarm payroll employment rose by 292,000 jobs. In 2015, payroll employment growth totaled 2.7 million, compared with 3.1 million in 2014. The unemployment rate was 5.0%, down by 0.6% over the past 12 months.
Market Commentary
This past year the S&P 500 hit a record high in May only to slump in August over fears of a China-led global economic slowdown. For the year, the S&P 500 was down 0.73%. The Dow Jones industrial average lost 2.23% for the year, its first annual decline since 2008. The Nasdaq
Composite gained 5.73% after surpassing levels not seen since the dot-com bubble in 2000.
Led by the Self-Storage and Residential property sectors, REITs outperformed the S&P 500 Index in 2015. For the year as a whole, total returns of the FTSE/NAREIT All Equity REIT Index rose 2.83 percent; the S&P 500 Index returned 1.38 percent; the Dow Jones Industrial returned .21 percent during the same period. Self-storage and Residential property were the outperformers in the REIT sector with 40.65 percent and 17.07 percent respectively. Manufactured Homes led the Residential properties returning 25.65 percent in 2015. Lodging and Resorts underperformed the FTSE NAREIT All Equity REITs, with a loss of 24.42 percent.
Fund Summary
The Spirit of America Real Estate Income and Growth Fund, SOAAX (the “Fund”), aims to provide high total return through a combination of capital appreciation and dividend income.
As of December 31, 2015 the Fund was invested over 93% in REITs. A REIT, or Real Estate Investment Trust, is a company that owns or finances income-producing real estate. REITs provide investors regular income streams, diversification and long-term capital appreciation. REITs typically pay out all of their taxable income as dividends to shareholders. REITs are tied to almost all aspects of the economy, including apartments, hospitals, hotels, industrial facilities, infrastructure, nursing homes, offices, shopping malls, storage centers, and student housing.
Return Summary
The Spirit of America Real Estate Income and Growth Fund, SOAAX (the “Fund”), had a total one year return of -0.33% (no
MANAGEMENT DISCUSSION (UNAUDITED) (CONT.)
load, gross of fees). This compares to the 2.52% returned by its benchmark, the MSCI US REIT Index, for the same period. That result does not take the maximum front end sales charge of 5.25% or the expense ratio of 1.56% for Class A shares into account.
Including sales charge and expenses, as of December 31, 2015 the Fund’s one year return was -7.05%. The annualized five year return was 7.67% per year, while the average annual return over the past ten years was 3.06%.
| | | | |
| REAL ESTATE INCOME AND GROWTH FUND | | | 3 | |
ILLUSTRATION OF INVESTMENT (UNAUDITED)
Summary of Portfolio Holdings (Unaudited)
As of December 31, 2015
| | | | | | | | |
| Residential (REITs) | | | 25.88 | % | | $ | 30,041,822 | |
| Specialized (REITs) | | | 20.08 | % | | | 23,312,027 | |
| Retail (REITs) | | | 15.54 | % | | | 18,037,055 | |
| Office (REITs) | | | 14.20 | % | | | 16,481,928 | |
| Energy | | | 6.03 | % | | | 7,002,116 | |
| Hotel & Resort (REITs) | | | 5.96 | % | | | 6,915,838 | |
| Diversified (REITs) | | | 4.67 | % | | | 5,421,900 | |
| Industrial (REITs) | | | 4.43 | % | | | 5,141,077 | |
| Mortgage (REITs) | | | 2.58 | % | | | 2,990,888 | |
| Financials | | | 0.52 | % | | | 607,000 | |
| Health Care (REITs) | | | 0.11 | % | | | 131,400 | |
| Total Investments | | | 100.00 | % | | $ | 116,083,051 | |
ILLUSTRATION OF INVESTMENT (UNAUDITED) (CONT.)
Average Annual Returns (Unaudited)
(For the Periods Ended December 31, 2015)
| | | | | | | | | | | | |
| | | | |
| | | 1 Year | | | 5 Year | | | 10 Year | |
| Spirit of America Real Estate Income and Growth Fund (NAV) | | | (1.88 | )% | | | 8.85% | | | | 3.61% | |
| Spirit of America Real Estate Income and Growth Fund (POP) | | | (7.05 | )% | | | 7.67% | | | | 3.06% | |
| MSCI US REIT Index | | | 2.52 | % | | | 11.88% | | | | 7.35% | |
NAV represents the Net Asset Value. Returns at NAV do not reflect the maximum 5.25% sales charge. POP represents Public Offering Price and returns at POP do reflect the maximum 5.25% sales charge. Total returns for periods less than one year are not annualized.
Performance data quoted represents past performance; past performance is no guarantee of future results.
The investment return and principal value of an investment will fluctuate so that an investor’s shares, when redeemed, may be worth more or less than their original cost. Current performance may be lower or higher than the performance quoted.
Growth of $10,000 (Unaudited)
(includes one-time 5.25% maximum sales charge and reinvestment of all distributions)
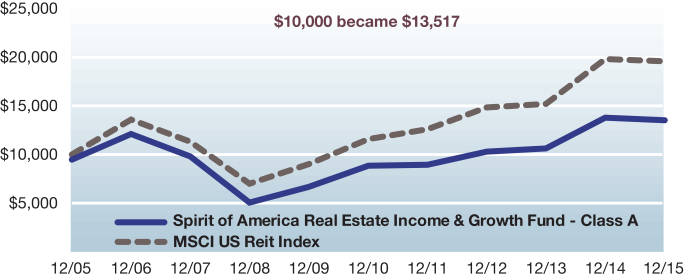
Past performance does not guarantee future results. The performance data quoted represents past performance and current returns may be lower or higher. The investment return and net asset value will fluctuate so that an investor’s shares, when redeemed may be worth more or less than the original cost. To obtain performance information current to the most recent month-end, please call 1-800- 452-4892.
The Morgan Stanley Capital International (“MSCI”) US REIT Index is an unmanaged index. The MSCI US REIT Index is a free float- adjusted market capitalization weighted index that is comprised of equity Real Estate Investment Trusts (“REITs”) that are included in the MSCI US Investable Market 2500 Index, with the exception of specialty equity REITs that do not generate a majority of their revenue and income from real estate rental and leasing operations. The index represents approximately 85% of the US REIT universe. The performance of an index assumes no transaction costs, taxes, management fees or other expenses. A direct investment in an index is not possible.
| | | | |
| REAL ESTATE INCOME AND GROWTH FUND | | | 5 | |
DISCLOSURE OF FUND EXPENSES (UNAUDITED)
FOR THE SIX MONTH PERIOD JULY 1, 2015 TO DECEMBER 31, 2015
We believe it is important for you to understand the impact of fees regarding your investment. All mutual funds have operating expenses. As a shareholder of the Fund, you incur ongoing costs, which include costs for portfolio management, administrative services, and shareholder reports (like this one), among others. Operating expenses, which are deducted from the Fund’s gross income, directly reduce the investment return of the Fund.
The Fund’s expenses are expressed as a percentage of its average net assets. This figure is known as the expense ratio. The following examples are intended to help you understand the ongoing fees (in dollars) of investing in your Fund and to compare these costs with those of other mutual funds. The examples are based on an investment of $1,000 made at the beginning of the period shown and held for the six month period, July 1, 2015 to December 31, 2015.
Spirit of America Real Estate Income and Growth Fund
| | | | | | | | | | | | | | | | |
| | | Beginning
Account Value
July 1, 2015 | | | Ending Account Value December 31, 2015 | | | Expense Ratio(1) | | | Expenses
Paid During
Period(2) | |
Actual Fund Return | | $ | 1,000.00 | | | $ | 1,037.40 | | | | 1.58 | % | | $ | 8.10 | |
Hypothetical 5% Return | | $ | 1,000.00 | | | $ | 1,017.26 | | | | 1.58 | % | | $ | 8.02 | |
This table illustrates your Fund’s costs in two ways:
Actual Fund Return: This section helps you to estimate the actual expenses that you paid over the period. The “Ending Account Value” shown is derived from the Fund’s actual return, the third column shows the period’s annualized expense ratio, and the last column shows the dollar amount that would have been paid by an investor who started with $1,000 in the Fund at the beginning of the period. You may use the information here, together with your account value, to estimate the expenses that you paid over the period.
To do so, simply divide your account value by $1,000 (for example, an $8,600 account value divided by $1,000 = 8.6), then multiply the result by the number in the first line under the heading entitled “Expenses Paid During Period.”
Hypothetical 5% Return: This section is intended to help you compare your Fund’s costs with those of other mutual funds. It assumes that the Fund had a return of 5% before expenses during the period shown, but that the expense ratio is unchanged. In this case, because the return used is not the Fund’s actual return, the results do not apply to your investment. You can assess your Fund’s costs by comparing this hypothetical example with the hypothetical examples that appear in shareholder reports of other funds.
Please note that the expenses shown in the table are meant to highlight your ongoing costs only and do not reflect any transactional costs such as sales charges (loads), or redemption fees.
| (1) | Annualized, based on the Fund’s most recent half-year expenses. |
| (2) | Expenses are equal to the Fund’s annualized expense ratio multiplied by the average account value over the period, multiplied by the number of days in the period (184), then divided by 365. |
| | |
| SCHEDULE OF INVESTMENTS | | DECEMBER 31, 2015 |
| | | | | | | | |
| | | Shares | | | Market Value | |
| Common Stocks 99.11% | | | | | | | | |
| | |
Diversified REITs 1.85% | | | | | | | | |
American Assets Trust, Inc. | | | 10,000 | | | $ | 383,500 | |
WP Carey, Inc. | | | 30,000 | | | | 1,770,000 | |
| | | | | | | 2,153,500 | |
| | |
Energy 6.03% | | | | | | | | |
Calumet Specialty Products Partners LP | | | 74,530 | | | | 1,483,892 | |
Cheniere Energy Partners LP | | | 2,300 | | | | 59,961 | |
Enterprise Products Partners LP | | | 72,402 | | | | 1,852,043 | |
Magellan Midstream Partners LP | | | 15,000 | | | | 1,018,800 | |
MPLX LP | | | 22,486 | | | | 884,374 | |
Sunoco Logistics Partners LP | | | 7,500 | | | | 192,750 | |
Sunoco LP | | | 5,650 | | | | 223,797 | |
USA Compression Partners LP | | | 50,000 | | | | 574,500 | |
Western Gas Partners LP | | | 14,980 | | | | 711,999 | |
| | | | | | | 7,002,116 | |
| | |
Financials 0.52% | | | | | | | | |
NorthStar Asset Management Group, Inc. | | | 50,000 | | | | 607,000 | |
| | |
Health Care REITs 2.96% | | | | | | | | |
CareTrust REIT, Inc. | | | 12,000 | | | | 131,400 | |
Ventas, Inc. | | | 37,650 | | | | 2,124,590 | |
Welltower, Inc. | | | 17,300 | | | | 1,176,919 | |
| | | | | | | 3,432,909 | |
| | |
Hotel & Resort REITs 13.41% | | | | | | | | |
Apple Hospitality REIT, Inc. | | | 47,800 | | | | 954,566 | |
Ashford Hospitality Prime, Inc. | | | 33,100 | | | | 479,950 | |
Ashford Hospitality Trust, Inc. | | | 115,125 | | | | 726,439 | |
Chesapeake Lodging Trust | | | 33,200 | | | | 835,312 | |
DiamondRock Hospitality Co. | | | 317,600 | | | | 3,064,840 | |
FelCor Lodging Trust, Inc. | | | 287,926 | | | | 2,101,860 | |
HCP, Inc. | | | 50,000 | | | | 1,912,000 | |
Hersha Hospitality Trust | | | 80,000 | | | | 1,740,800 | |
Pebblebrook Hotel Trust | | | 123,000 | | | | 3,446,460 | |
Sotherly Hotels, Inc. | | | 52,000 | | | | 320,320 | |
| | | | | | | 15,582,547 | |
See accompanying notes which are an integral part of these financial statements.
| | | | |
| REAL ESTATE INCOME AND GROWTH FUND | | | 7 | |
| | |
| SCHEDULE OF INVESTMENTS (CONT.) | | DECEMBER 31, 2015 |
| | | | | | | | |
| | | Shares | | | Market Value | |
| | |
Industrial REITs 4.15% | | | | | | | | |
DCT Industrial Trust, Inc. | | | 14,214 | | | $ | 531,177 | |
Prologis, Inc. | | | 100,000 | | | | 4,292,000 | |
| | | | | | | 4,823,177 | |
| | |
Mortgage REITs 2.57% | | | | | | | | |
Blackstone Mortgage Trust, Inc. | | | 45,000 | | | | 1,204,200 | |
Hannon Armstrong Sustainable Infrastructure Capital, Inc. | | | 83,567 | | | | 1,581,088 | |
Starwood Property Trust, Inc. | | | 10,000 | | | | 205,600 | |
| | | | | | | 2,990,888 | |
| | |
Office REITs 12.30% | | | | | | | | |
Boston Properties, Inc. | | | 24,000 | | | | 3,060,960 | |
City Office REIT, Inc. | | | 127,258 | | | | 1,550,002 | |
Hudson Pacific Properties, Inc. | | | 90,000 | | | | 2,532,600 | |
Kilroy Realty Corp. | | | 45,000 | | | | 2,847,600 | |
SL Green Realty Corp. | | | 29,200 | | | | 3,299,016 | |
Vornado Realty Trust | | | 10,000 | | | | 999,600 | |
| | | | 14,289,778 | |
| | |
Residential REITs 25.86% | | | | | | | | |
Apartment Investment & Management Co. | | | 86,400 | | | | 3,458,592 | |
AvalonBay Communities, Inc. | | | 30,000 | | | | 5,523,900 | |
Camden Property Trust | | | 25,000 | | | | 1,919,000 | |
Equity LifeStyle Properties, Inc. | | | 15,050 | | | | 1,003,384 | |
Equity Residential | | | 58,800 | | | | 4,797,492 | |
Essex Property Trust, Inc. | | | 17,971 | | | | 4,302,437 | |
Mid-America Apartment Communities, Inc. | | | 43,972 | | | | 3,993,097 | |
Sun Communities, Inc. | | | 18,200 | | | | 1,247,246 | |
UDR, Inc. | | | 101,056 | | | | 3,796,674 | |
| | | | 30,041,822 | |
| | |
Retail REITs 15.53% | | | | | | | | |
Federal Realty Investment Trust | | | 40,000 | | | | 5,844,000 | |
General Growth Properties, Inc. | | | 40,000 | | | | 1,088,400 | |
Kimco Realty Corp. | | | 74,250 | | | | 1,964,655 | |
Regency Centers Corp. | | | 20,000 | | | | 1,362,400 | |
Simon Property Group, Inc. | | | 40,000 | | | | 7,777,600 | |
| | | | 18,037,055 | |
| | |
Specialized REITs 13.93% | | | | | | | | |
CorEnergy Infrastructure Trust, Inc. | | | 27,362 | | | | 406,052 | |
CoreSite Realty Corp. | | | 40,000 | | | | 2,268,800 | |
See accompanying notes which are an integral part of these financial statements.
| | |
| SCHEDULE OF INVESTMENTS (CONT.) | | DECEMBER 31, 2015 |
| | | | | | | | |
| | | Shares | | | Market Value | |
| | |
Specialized REITs (cont.) | | | | | | | | |
CubeSmart | | | 20,000 | | | $ | 612,400 | |
CyrusOne, Inc. | | | 25,000 | | | | 936,250 | |
Digital Realty Trust, Inc. | | | 50,000 | | | | 3,781,000 | |
DuPont Fabros Technology, Inc. | | | 10,000 | | | | 317,900 | |
Extra Space Storage, Inc. | | | 25,000 | | | | 2,205,250 | |
QTS Realty Trust, Inc., Class A | | | 50,000 | | | | 2,255,500 | |
Sovran Self Storage, Inc. | | | 31,700 | | | | 3,401,727 | |
| | | | 16,184,879 | |
Total Common Stocks | | | | | | | | |
(Cost $84,430,731) | | | | 115,145,671 | |
| | |
| Preferred Stocks 0.81% | | | | | | | | |
|
Specialized REITs 0.81% | |
CorEnergy Infrastructure Trust, Inc., Series A, 7.38% | | | 20,000 | | | | 364,200 | |
Digital Realty Trust, Inc., Series I, 6.35% | | | 10,000 | | | | 256,800 | |
Digital Realty Trust, Inc., Series E, 7.00% | | | 6,000 | | | | 154,980 | |
Public Storage, Series Z, 6.00% | | | 6,000 | | | | 161,400 | |
Total Preferred Stocks | | | | | | | | |
(Cost $1,066,928) | | | | | | | 937,380 | |
| | |
Total Investments — 99.92% | | | | | | | | |
(Cost $85,497,659) | | | | | | | 116,083,051 | |
Other Assets in Excess of Liabilities — 0.08% | | | | | | | 96,591 | |
| | | | | | | | |
NET ASSETS — 100.00% | | | | | | $ | 116,179,642 | |
REIT - Real Estate Investment Trust
The Global Industry Classification Standard (GICS®) was developed by and/or is the exclusive property of MSCI, Inc. and Standard & Poor Financial Services LLC (“S&P”). GICS is a service mark of MSCI, Inc. and S&P and has been licensed for use by Ultimus Asset Services, LLC (formerly Huntington Asset Services, Inc.).
See accompanying notes which are an integral part of these financial statements.
| | | | |
| REAL ESTATE INCOME AND GROWTH FUND | | | 9 | |
| | |
| STATEMENT OF ASSETS AND LIABILITIES | | DECEMBER 31, 2015 |
| | | | |
| |
ASSETS | | | | |
Investments in securities at value (cost $85,497,659) | | $ | 116,083,051 | |
Receivable for Fund shares sold | | | 13,723 | |
Dividends and interest receivable | | | 610,169 | |
Receivable for investments sold | | | 644,003 | |
Prepaid expenses | | | 5,353 | |
TOTAL ASSETS | | | 117,356,299 | |
| |
LIABILITIES | | | | |
Payable for return of short-term borrowings | | | 913,015 | |
Payable for Fund shares redeemed | | | 72,489 | |
Payable for investment advisory fees | | | 95,560 | |
Payable for accounting and administration fees | | | 6,482 | |
Payable for distribution fees | | | 29,555 | |
Payable to custodian | | | 1,826 | |
Payable for audit fees | | | 27,500 | |
Payable for printing fees | | | 16,402 | |
Payable for transfer agent fees | | | 11,492 | |
Payable for chief compliance officer salary | | | 289 | |
Other accrued expenses | | | 2,047 | |
TOTAL LIABILITIES | | | 1,176,657 | |
NET ASSETS | | $ | 116,179,642 | |
Net assets applicable to 9,838,189 shares outstanding, $0.001 par value (500,000,000 authorized shares) | | $ | 116,179,642 | |
Net asset value and redemption price per share ($116,179,642 ÷ 9,838,189 shares) | | $ | 11.81 | |
Maximum offering price per share ($11.81÷ 0.9475) | | $ | 12.46 | |
| |
SOURCE OF NET ASSETS | | | | |
As of December 31 2015, net assets consisted of: | | | | |
Paid-in capital | | $ | 81,581,188 | |
Accumulated undistributed net investment income | | | 5,068 | |
Accumulated net realized gain on investments | | | 4,007,994 | |
Net unrealized appreciation on investments | | | 30,585,392 | |
NET ASSETS | | $ | 116,179,642 | |
See accompanying notes which are an integral part of these financial statements.
STATEMENT OF OPERATIONS
| | | | |
| | | For the Year
Ended
December 31, 2015 | |
| |
INVESTMENT INCOME | | | | |
Dividends and interest | | $ | 2,696,609 | |
TOTAL INVESTMENT INCOME | | | 2,696,609 | |
| |
EXPENSES | | | | |
Investment advisory | | | 1,266,383 | |
Distribution | | | 391,666 | |
Accounting and Administration | | | 80,602 | |
Transfer agent | | | 119,932 | |
Audit | | | 28,100 | |
Chief Compliance Officer salary | | | 3,959 | |
Custodian | | | 11,557 | |
Directors | | | 14,163 | |
Insurance | | | 28,848 | |
Legal | | | 11,573 | |
Printing | | | 66,297 | |
Registration | | | 13,632 | |
Line of credit | | | 1,131 | |
Interest | | | 3,216 | |
Other | | | 4,406 | |
TOTAL EXPENSES | | | 2,045,465 | |
NET EXPENSES | | | 2,045,465 | |
NET INVESTMENT INCOME | | | 651,144 | |
| |
REALIZED AND UNREALIZED GAIN (LOSS) ON
INVESTMENTS | | | | |
Net realized gain from investment transactions | | | 12,146,550 | |
Net change in unrealized appreciation (depreciation) of investments | | | (15,363,427 | ) |
Net realized and unrealized loss on investments | | | (3,216,877 | ) |
NET DECREASE IN NET ASSETS RESULTING FROM OPERATIONS | | $ | (2,565,733 | ) |
See accompanying notes which are an integral part of these financial statements.
| | | | |
| REAL ESTATE INCOME AND GROWTH FUND | | | 11 | |
STATEMENTS OF CHANGES IN NET ASSETS
| | | | | | | | |
| | | For the Year
Ended
December 31, 2015 | | | For the Year
Ended
December 31, 2014 | |
| |
OPERATIONS | | | | | |
Net investment income | | $ | 651,144 | | | $ | 1,768,475 | |
Net realized gain on investment transactions | | | 12,146,550 | | | | 20,722,534 | |
Net change in unrealized appreciation/depreciation of investments | | | (15,363,427 | ) | | | 11,151,021 | |
Net increase (decrease) in net assets resulting from operations | | | (2,565,733 | ) | | | 33,642,030 | |
| |
DISTRIBUTIONS TO SHAREHOLDERS | | | | | |
Distributions from net investments income | | | (651,144 | ) | | | (1,768,475 | ) |
Distributions from realized gains | | | (9,154,195 | ) | | | (52,762 | ) |
Total distributions to shareholders | | | (9,805,339 | ) | | | (1,821,237 | ) |
| |
CAPITAL SHARE TRANSACTIONS (Dollar Activity) | | | | | |
Shares sold | | | 11,901,788 | | | | 14,028,022 | |
Shares issued from reinvestment of distributions | | | 8,690,185 | | | | 1,602,379 | |
Shares redeemed | | | (30,579,816 | ) | | | (35,764,678 | ) |
Decrease in net assets derived from capital share transactions | | | (9,987,843 | ) | | | (20,134,277 | ) |
Total increase (decrease) in net assets | | | (22,358,915 | ) | | | 11,686,516 | |
| |
NET ASSETS | | | | | |
Beginning of year | | | 138,538,557 | | | | 126,852,041 | |
End of year | | $ | 116,179,642 | | | $ | 138,538,557 | |
| | |
Accumulated undistributed net investment income (loss) | | $ | 5,068 | | | $ | — | |
| |
Transactions in capital stock were: | | | | | |
Shares sold | | | 903,665 | | | | 1,176,933 | |
Shares issued from reinvestment of distributions | | | 726,241 | | | | 130,772 | |
Shares redeemed | | | (2,358,503 | ) | | | (3,103,137 | ) |
Decrease in shares outstanding | | | (728,597 | ) | | | (1,795,432 | ) |
See accompanying notes which are an integral part of these financial statements.
FINANCIAL HIGHLIGHTS
The table below sets forth financial data for one share of beneficial interest outstanding throughout the period presented.
| | | | | | | | | | | | | | | | | | | | |
| | | For The Year
Ended
December 31,
2015 | | | For The Year
Ended
December 31,
2014 | | | For The Year
Ended
December 31,
2013 | | | For The Year
Ended
December 31,
2012 | | | For The Year
Ended
December 31,
2011 | |
Net Asset Value, Beginning of Year | | $ | 13.11 | | | $ | 10.26 | | | $ | 10.06 | | | $ | 8.88 | | | $ | 8.94 | |
| | | | | |
Income from Investment Operations: | | | | | | | | | | | | | | | | | | | | |
Net investment income | | | 0.06 | | | | 0.16 | | | | 0.04 | | | | 0.08 | 1 | | | 0.03 | 1 |
Net realized and unrealized gain (loss) on investments | | | (0.30 | ) | | | 2.86 | | | | 0.28 | | | | 1.26 | | | | 0.08 | |
Total income from investment operations | | | (0.24 | ) | | | 3.02 | | | | 0.32 | | | | 1.34 | | | | 0.11 | |
| | | | | |
Less Distributions: | | | | | | | | | | | | | | | | | | | | |
Distributions from net investment income | | | (0.06 | ) | | | (0.16 | ) | | | (0.04 | ) | | | (0.16 | ) | | | (0.04 | ) |
Distributions from capital gains | | | (1.00 | ) | | | (0.01 | ) | | | — | | | | — | | | | — | |
Distributions from return of capital | | | — | | | | — | | | | (0.08 | ) | | | — | | | | (0.13 | ) |
Total distributions | | | (1.06 | ) | | | (0.17 | ) | | | (0.12 | ) | | | (0.16 | ) | | | (0.17 | ) |
| | | | | |
| | | | | | | | | | | | | | | | | | | | | |
Net Asset Value, End of Year | | $ | 11.81 | | | $ | 13.11 | | | $ | 10.26 | | | $ | 10.06 | | | $ | 8.88 | |
Total Return2 | | | (1.88 | )% | | | 29.55 | % | | | 3.15 | % | | | 15.10 | % | | | 1.24 | % |
| | | | | |
Ratios/Supplemental Data: | | | | | | | | | | | | | | | | | | | | |
Net assets, end of year (000) | | $ | 116,180 | | | $ | 138,539 | | | $ | 126,852 | | | $ | 134,353 | | | $ | 139,027 | |
Ratio of expenses to average net assets | | | 1.57 | % | | | 1.56 | % | | | 1.68 | % | | | 1.75 | % | | | 1.74 | % |
Ratio of net investment income to average net assets | | | 0.50 | % | | | 1.36 | % | | | 0.33 | % | | | 0.84 | % | | | 0.38 | % |
Portfolio turnover | | | 37 | % | | | 43 | % | | | 31 | % | | | 10 | % | | | 7 | % |
1 Calculated based on the average number of shares outstanding during the period.
2 Calculation does not reflect sales load.
See accompanying notes which are an integral part of these financial statements.
| | | | |
| REAL ESTATE INCOME AND GROWTH FUND | | | 13 | |
| | |
| NOTES TO FINANCIAL STATEMENTS | | DECEMBER 31, 2015 |
Note 1 – Organization
Spirit of America Real Estate Income and Growth Fund (the “Fund”), a series of the Spirit of America Investment Fund, Inc. (the “Company”), is an open-end diversified mutual fund registered under the Investment Company Act of 1940, as amended (the “1940 Act”). The Company was incorporated under the laws of Maryland on May 15, 1997. The Fund commenced operations on January 9, 1998. The Fund currently offers one class of shares, Class A shares. The Fund seeks current income and growth of capital by investing in equity real estate investment trusts (“REITs”) and the equity securities of real estate industry companies.
Note 2 – Significant Accounting Policies
The Fund is an investment company and follows accounting and reporting guidance under Financial Accounting Standards Board (“FASB”) Accounting Standards Codification (“ASC”) Topic 946, “Financial Services-Investment Companies”. The following is a summary of significant accounting policies consistently followed by the Fund in the preparation of its financial statements. These policies are in conformity with generally accepted accounting principles in the United States of America (“GAAP”) for investment companies.
A. Security Valuation: The offering price and net asset value (“NAV”) per share for the Fund are calculated as of the close of regular trading on the New York Stock Exchange (“NYSE”), currently 4:00 p.m., Eastern Time on each day the NYSE is open for trading. The Fund’s securities are valued at the official close or the last reported sales price on the principal exchange on which the security trades, or if no sales price is reported, the mean of the latest bid and asked prices is used. Securities traded over-the-counter are priced at the mean of the latest bid and asked prices. Unlisted securities traded in the over-the-counter market are valued using an evaluated quote provided by the independent pricing service, or, if an evaluated quote is unavailable, such securities are valued using prices received from dealers, provided that if the dealer supplies both bid and ask prices, the price to be used is the mean of the bid and
asked prices. The independent pricing service derives an evaluated quote by obtaining dealer quotes, analyzing the listed markets, reviewing trade execution data and employing sensitivity analysis. Evaluated quotes may also reflect appropriate factors such as individual characteristics of the issue, communications with broker-dealers, and other market data. Short-term investments having a maturity of 60 days or less are valued at amortized cost, which the Board of Directors (the “Board”) believes represents fair value. Fund securities for which market quotations are not readily available are valued at fair value as determined in good faith under procedures established by and under the supervision of the Board.
B. Fair Value Measurements: Various inputs are used in determining the fair value of investments which are as follows:
| | |
• Level 1 – | | Unadjusted quoted prices in active markets for identical investments and/or registered investment companies where the value per share is determined and published and is the basis for current transactions for identical assets or liabilities at the valuation date. |
| |
• Level 2 – | | Observable inputs other than quoted prices included in level 1 that are observable for the asset or liability, either directly or indirectly. These inputs may include quoted prices for the identical instrument on an inactive market, prices for similar instruments, interest rates, prepayment speeds, credit risk, yield curves, default rates and similar data. |
| |
• Level 3 – | | Unobservable inputs based on the best information available in the circumstances, to the extent observable inputs are not available (including the Fund’s own assumptions used in determining the fair value of investments). |
| | |
| NOTES TO FINANCIAL STATEMENTS (CONT.) | | DECEMBER 31, 2015 |
The summary of inputs used to value the Fund’s net assets as of December 31, 2015 is as follows:
| | | | | | | | | | | | | | | | |
| | | Value Inputs | |
| Assets | | Level 1 | | | Level 2 | | | Level 3 | | | Totals | |
Common Stocks* | | $ | 115,145,671 | | | $ | — | | | $ | — | | | $ | 115,145,671 | |
Preferred Stocks | | | 937,380 | | | | — | | | | — | | | | 937,380 | |
| | | | | | | | | | | | | | | | |
Total | | $ | 116,083,051 | | | $ | — | | | $ | — | | | $ | 116,083,051 | |
| | | | |
| | | | | | | | | | | | | | | | |
| * | Refer to Schedule of Investments for industry classifications. |
The Fund did not have any transfers between levels during the year ended December 31, 2015. The Fund recognizes transfers between fair value hierarchy levels at the end of the reporting period.
C. Investment Income and Securities Transactions: Security transactions are accounted for on the date the securities are purchased or sold (trade date). Cost is determined and gains and losses are based on the identified cost basis for both financial statement and federal income tax purposes. Dividend income and distributions to shareholders are reported on the ex-dividend date. Interest income and expenses are accrued daily.
D. Federal Income Taxes: The Fund intends to comply with all requirements of the Internal Revenue Code applicable to regulated investment companies and to distribute substantially all of its taxable income to its shareholders. Therefore, no federal income tax provision is required.
E. Use of Estimates: In preparing financial statements in conformity with GAAP, management makes estimates and assumptions that affect the reported amounts of assets and liabilities at the date of the financial statements, as well as the reported amounts of revenues and expenses during the reporting period. Actual results could differ from those estimates.
F. Distributions to Shareholders: The Fund intends to distribute substantially all of its net investment income and capital gains to shareholders each year. Normally, income
distributions will be paid quarterly. Capital gains, if any, will be distributed annually in December, but may be distributed more frequently if deemed advisable by the Board. All such distributions are taxable to the shareholders whether received in cash or reinvested in shares. The Fund has made certain investments in REITs which pay distributions to their shareholders based upon available funds from operations. Each REIT reports annually the tax character of its distributions. It is quite common for these distributions to exceed the REIT’s taxable earnings and profits resulting in the excess portion of such distributions being designated as a return of capital or long-term capital gain. The Fund intends to include the gross distributions from such REITs in its distributions to its shareholders; accordingly, a portion of the distributions paid to the Fund and subsequently distributed to shareholders may be re-characterized. The final determination of the amount of the Fund’s return of capital distribution for the period will be made after the end of each calendar year.
Note 3 – Purchases and Sales of Securities
Purchases and proceeds from the sales of securities for the year ended December 31, 2015, excluding short-term investments, were $47,637,758 and $59,001,558, respectively.
Note 4 – Investment Management Fee and Other Transactions with Affiliates
Spirit of America Management Corp. (the “Adviser”) has been retained to act as the Company’s investment adviser pursuant to an Investment Advisory Agreement (the “Advisory Agreement”). The Adviser was
| | | | |
| REAL ESTATE INCOME AND GROWTH FUND | | | 15 | |
| | |
| NOTES TO FINANCIAL STATEMENTS (CONT.) | | DECEMBER 31, 2015 |
incorporated in 1997 and is a registered investment adviser under the Investment Advisers Act of 1940, as amended. Under the Advisory Agreement, the Fund pays the Adviser a monthly fee of 1/12 of 0.97% of the Fund’s average daily net assets. Investment advisory fees for the year ended December 31, 2015, were $1,266,383.
The Adviser has contractually agreed to waive advisory fees and/or reimburse expenses so that the total operating expenses for Class A Shares will not exceed 1.97% of the average daily net assets of each class through April 30, 2016. For the year ended December 31, 2015, there were no advisory fees reimbursed to the Fund.
Any amounts waived or reimbursed by the Adviser are subject to reimbursement by the Fund within the following three years, provided the Fund is able to make such reimbursement and remain in compliance with the expense limitation as stated above. For the year ended December 31, 2015, the Fund did not reimburse the Adviser. There is no balance of recoverable expenses to the Adviser at December 31, 2015.
The Fund has adopted a distribution plan for Class A Shares pursuant to Rule 12b-1 (“Plan”). The Plan permits the Fund to pay David Lerner Associates, Inc. (the “Distributor”), a monthly fee of 1/12 of 0.30% from the average daily net assets of Class A Shares, for the Distributor’s services and expenses in distributing shares of the class and providing personal services and/or maintaining shareholder accounts. For the year ended December 31, 2015, fees paid to the Distributor under the Plan were $391,666 for Class A Shares.
The Fund’s Class A Shares are subject to an initial sales charge imposed at the time of purchase, in accordance with the Fund’s current prospectus. For the year ended December 31, 2015, sales charges on Class A Shares paid to the Distributor were $612,115. A contingent deferred sales charge (“CDSC”)
of 1.00% may be imposed on redemptions of $1 million or more made within one year of purchase on Class A Shares.
Certain Officers and Directors of the Company are “affiliated persons”, as that term is defined in the 1940 Act, of the Adviser or the Distributor. Each Director of the Company, who is not an affiliated person of the Adviser or Distributor, receives a quarterly retainer of $5,250, $1,000 for each Board meeting attended, and $500 for each committee meeting attended plus reimbursement for certain travel and other out-of-pocket expenses incurred in connection with attending Board meetings. The Company does not compensate the Officers for the services they provide. There are no Directors’ fees paid to affiliated Directors of the Company. For the year ended December 31, 2015, the Fund was allocated $3,959 of the Chief Compliance Officer’s salary.
Note 5 – Concentration Risk
The Fund invests primarily in real estate related securities. A fund that concentrates its investments is subject to greater risk of loss than a fund that has a more diversified portfolio of investments. Investments in real estate and real estate-related equity securities involve risks different from, and in certain cases greater than, the risks presented by equity securities generally. The main risks are those presented by direct ownership of real estate or real estate industry securities, including possible declines in the value of real estate, environmental problems and changes in interest rates. To the extent that assets underlying the Fund’s investments are concentrated geographically, by property type or in certain other respects, the Fund may be subject to these risks to a greater extent. The stocks purchased by the Fund may not appreciate in value as the Adviser anticipates. In addition, if the Fund receives rental income or income from the disposition of real property acquired as a result of a default on securities the Fund owns, its ability to retain its tax status as a regulated investment company may be adversely affected.
| | |
| NOTES TO FINANCIAL STATEMENTS (CONT.) | | DECEMBER 31, 2015 |
Note 6 – Federal Income Taxes
The tax character of distributions paid for the years ended December 31, 2015 and 2014 were as follows:
Taxable Distributions
| | | | | | | | | | | | | | | | | | | | |
| | | Ordinary
Income | | | Net Long-Term
Capital Gains | | | Total Taxable
Distributions | | | Return of
Capital | | | Total
Distribution | |
| 12/31/2015 | | $ | 651,144 | | | $ | 9,154,195 | | | $ | 9,805,339 | | | $ | — | | | $ | 9,805,339 | |
| 12/31/2014 | | $ | 1,768,475 | | | $ | 52,762 | | | $ | 1,821,237 | | | $ | — | | | $ | 1,821,237 | |
| | | | | | | | | | | | | | | | | | | | |
Distribution classifications may differ from the Statements of Changes in Net Assets as a result of the treatment of short-term capital gains as ordinary income for tax purposes.
The adjusted cost basis of investment and gross unrealized appreciation (depreciation) of investments for federal income tax purposes were as follows:
| | | | |
| | | As of
December 31,
2015 | |
Gross unrealized appreciation | | $ | 35,969,513 | |
Gross unrealized depreciation | | | (5,379,053 | ) |
| | | | |
Net unrealized appreciation(a) | | | 30,590,460 | |
| | | | |
Cost basis of investments | | $ | 85,492,591 | |
| | | | |
| | | | |
| (a) | The difference between book-basis and tax-basis net unrealized appreciation is primarily due to tax treatment of partnership investments. |
As of December 31, 2015, the components of accumulated distributable earnings for the Fund on a tax basis were as follows:
| | | | |
Undistributed long term capital gains | | $ | 4,145,105 | |
Accumulated capital and other losses | | | (137,111 | ) |
Unrealized appreciation | | | 30,590,460 | |
| | | | |
Total accumulated earnings (losses) | | $ | 34,598,454 | |
| | | | |
| | | | |
Certain capital and qualified late year losses incurred after October 31 and within the current taxable year are deemed to arise on the first business day of the Fund’s following taxable year. For the year ended December 31, 2015, the Fund deferred post-October losses in the amount of $137,111.
Management of the Fund has reviewed tax positions taken in tax years that remain subject to examination by all major tax jurisdictions, including federal (i.e., the last three tax year ends and the interim tax period since then). Management believes there is no tax liability resulting from unrecognized tax benefits related to uncertain tax positions taken.
Note 7 – Line of Credit
The Fund participates in a short-term credit agreement (“Line of Credit) with The Huntington National Bank, the custodian of the Fund’s investments expiring on May 25, 2016. Borrowing under this agreement bear interest at London Interbank Offered Rate (“LIBOR”) plus 1.500%. Maximum borrowings for the Fund is the lesser of $3,000,000 or 10% of the Fund’s daily market value.
| | | | |
| REAL ESTATE INCOME AND GROWTH FUND | | | 17 | |
| | |
| NOTES TO FINANCIAL STATEMENTS (CONT.) | | DECEMBER 31, 2015 |
| | | | |
Total bank line of credit as of December 31, 2015 | | $ | 2,086,985 | |
Average borrowings during year | | | 235,053 | |
Number of days outstanding* | | | 79 | |
Average interest rate during year | | | 1.688 | % |
Highest balance drawn during year | | | 2,039,359 | |
Highest balance interest rate | | | 1.922 | % |
Interest expense incurred | | $ | 3,216 | |
Interest rate at June 30, 2015 | | | 1.922 | % |
| | | | |
| * | Number of days outstanding represents the total days during the year ended December 31, 2015 that the Fund utilized the line of credit. |
Note 8 – Other Matters
On May 7, 2010, each of William Mason, the Portfolio Manager for the Real Estate Fund, Income Fund, and Opportunity Fund, and DLA, the Fund’s principal underwriter and distributor, received a Notice of Complaint from the Department of Enforcement of the Financial Industry Regulatory Authority (“FINRA”) relating to Mr. Mason’s activities as head of the fixed income trading department of DLA and DLA’s activities as a municipal securities and collateralized mortgage obligations dealer. The Complaint alleges that each of Mr. Mason and DLA had violated certain NASD and Municipal Securities Rule Making Board fair pricing rules relating to the period January 1, 2005 through January 31, 2007. On April 4, 2012, a FINRA hearing panel issued a decision in this matter and assessed monetary fines and other sanctions against DLA and Mr. Mason, including a suspension of Mr. Mason from association with a FINRA member firm for six (6) months. Both DLA and Mr. Mason appealed the decision.
On May 27, 2011, FINRA filed a complaint against DLA, the Fund’s principal underwriter and distributor, related to its sales practices in connection with its role as managing dealer of
an unaffiliated Real Estate Investment Trust offering, Apple REIT Ten, Inc. (“Apple REIT”). More specifically, FINRA alleged that DLA failed to conduct adequate due diligence, thereby leaving it without a reasonable basis for recommending customer purchases of Apple REIT, in addition to using false, exaggerated and misleading statements regarding the performance of earlier closed Apple REITs. In June 2011, several class action complaints were filed against DLA, Apple REIT entities and certain individuals, also in connection with the sale of various Apple REIT securities. In January 2012, FINRA amended its complaint to add David Lerner as an individual respondent and alleged violations of Section 17(a) of the Securities Act of 1933, as amended, including allegations of false, exaggerated and misleading communications to the public, through customer correspondence and investment seminars, about the investment returns, market values, performance of earlier closed Apple REITs as well as allegations of untrue statements and/or omitted material facts concerning the prior performance, steady distribution rates, unchanging valuations, and prospects of the earlier closed Apple REITs and/or Apple REIT. On October 22, 2012, DLA, Mr. Lerner and Mr. Mason settled all of the foregoing FINRA investigations and actions involving Apple REIT securities and municipal bond and collateralized mortgage obligation pricing. Without admitting or denying the allegations, in connection with the settlement, DLA, Mr. Lerner and Mr. Mason each agreed, among other things, to pay a fine; and Mr. Lerner agreed to a suspension from affiliation with any FINRA member, including DLA, in any capacity for a period of one year and in any principal capacity for a period of two years thereafter beginning on November 19, 2012; and Mr. Mason agreed to a suspension from affiliation with any FINRA member, including DLA, in any capacity for a period of six months, which suspension ended on June 16, 2013. The fines and suspensions do not involve the Energy Fund or the
| | |
| NOTES TO FINANCIAL STATEMENTS (CONT.) | | DECEMBER 31, 2015 |
Adviser. On April 3, 2013, the class action complaints were dismissed, with prejudice, in their entirety. On April 12, 2013, plaintiffs filed a notice of appeal of the class action dismissal. On April 23, 2014, the United States Court of Appeals for the Second Circuit substantially affirmed the April 3, 2013 decision of United States District Judge, Kiyo A. Matsumoto, dismissing with prejudice the class action complaint in In Re Apple REITs Litigation. The Second Circuit held that Judge Matsumoto correctly found that there were no material misrepresentations or omissions in the offering materials for Apple REITs Six through Ten. The appeals court upheld dismissal of ten of the thirteen claims in the case, including all federal and state securities law claims, and also upheld Judge Matsumoto’s refusal to allow plaintiffs to amend their complaint. The appeals court remanded three state common law claims to the District Court for the Eastern District of New York for further proceedings. On March 25, 2015, the District Court dismissed the remaining state common law claims against DLA, with prejudice. Plaintiffs did not file an appeal. Neither the Adviser nor the Fund were a party to any of the investigations or actions listed in this section.
In October 2013, a class action litigation, titled Lewis v. Delaware Charter Guarantee & Trust Company, et al., (the “Litigation”) was commenced in federal court in Nevada against DLA, the Funds’ principal underwriter and distributor, along with other defendants, alleging, inter alia, breach of fiduciary duty, aiding and abetting breach of fiduciary duty, negligence and misrepresentation. The plaintiffs, purportedly customers who maintain individual retirement accounts at DLA which contained non-traded REIT securities, allege, among other things, that the defendants failed to accurately provide annual fair market values for those REIT securities. The Litigation was transferred to the U.S. District Court for the Eastern District of New York. On March 30, 2015, the District Court dismissed all claims against DLA, with prejudice. Plaintiffs
appealed the decision dismissing the claims. While it is unlikely that plaintiffs’ appeal will be successful, there cannot be any assurance that if the class action plaintiffs were to ultimately be successful in the pursuit of an appeal of the decision dismissing the claims against DLA that such outcome would not materially affect DLA’s ability to act as the Funds’ principal underwriter and distributor, although it is not considered likely at this time that such material and adverse effects would occur. Neither the Adviser nor the Fund are a party to the Litigation.
Note 9 – Subsequent Events
Management has evaluated the impact of all subsequent events on the Fund and has determined that there were no events that require recognition or disclosure in the financial statements.
Tax Information (Unaudited)
All designations are based on financial information available as of the date of this annual report and, accordingly, are subject to change. For each item, it is the intention of the Fund to designate the maximum amount permitted under the Internal Revenue Code and the regulations thereunder.
Qualified Dividend Income
For the year ended December 31, 2015, 43.85% of the distributions paid by the Fund from ordinary income qualifies for a reduced tax rate pursuant to The Jobs and Growth Tax Relief Reconciliation Act of 2003.
Dividends Received Deduction
For the year ended December 31, 2015, 32.85% of the ordinary income distribution qualifies for the Dividends Received Deduction available to corporations.
Long-Term Capital Gain Dividends
The Fund designates $9,154,195 as long-term capital gain distributions pursuant to section 852(b)(3) of the Internal Revenue Code for the year ended December 31, 2015.
| | | | |
| REAL ESTATE INCOME AND GROWTH FUND | | | 19 | |
REPORT OF INDEPENDENT REGISTERED PUBLIC ACCOUNTING FIRM
To the Shareholders of Spirit of America Real Estate Income and Growth Fund and Board of Directors Spirit of America Investment Fund, Inc.
Syosset, New York
We have audited the accompanying statement of assets and liabilities of the Spirit of America Real Estate Income and Growth Fund (the “Fund”), a series of shares of beneficial interest in Spirit of America Investment Fund, Inc., including the schedule of investments as of December 31, 2015, and the related statement of operations for the year then ended, the statements of changes in net assets for each of the two years in the period then ended, and the financial highlights for each of the five years in the period then ended. These financial statements and financial highlights are the responsibility of the Fund’s management. Our responsibility is to express an opinion on these financial statements and financial highlights based on our audits.
We conducted our audits in accordance with the standards of the Public Company Accounting Oversight Board (United States). Those standards require that we plan and perform the audit to obtain reasonable assurance about whether the financial statements and financial highlights are free of material misstatement. The Fund is not required to have, nor were we engaged to perform, an audit of its internal control over financial reporting. Our audits included consideration of internal control over financial reporting as a basis for designing audit
procedures that are appropriate in the circumstances, but not for the purpose of expressing an opinion on the effectiveness of the Fund’s internal control over financial reporting. Accordingly, we express no such opinion. An audit includes examining, on a test basis, evidence supporting the amounts and disclosures in the financial statements. Our procedures included confirmation of securities owned as of December 31, 2015 by correspondence with the custodian. An audit also includes assessing the accounting principles used and significant estimates made by management, as well as evaluating the overall financial statement presentation. We believe that our audits provide a reasonable basis for our opinion.
In our opinion, the financial statements and financial highlights referred to above present fairly, in all material respects, the financial position of the Spirit of America Real Estate Income and Growth Fund as of December 31, 2015, the results of its operations for the year then ended, the changes in its net assets for each of the two years in the period then ended, and the financial highlights for each of the five years in the period then ended, in conformity with accounting principles generally accepted in the United States of America.
TAIT, WELLER & BAKER LLP
Philadelphia, Pennsylvania
February 23, 2016
APPROVAL OF THE INVESTMENT ADVISORY AGREEMENT (UNAUDITED)
The Investment Company Act of 1940, as amended (the “1940 Act”) requires that the continuance of a registered management investment company’s investment advisory agreement be approved annually by both the board of directors and also by a majority of its directors who are not parties to the investment advisory agreement or “interested persons” (as defined by the 1940 Act) of any such party (the “Independent Directors”). At a meeting held on December 1, 2015, the Board of Directors (the “Board” or “Directors”) of Spirit of America Investment Fund, Inc. (the “Company”) met in person (the “Meeting”) to, among other things, consider the approval of the Investment Advisory Agreement (the “Advisory Agreement”) by and between Spirit of America Management Corp. (the “Adviser”) and the Company, on behalf of Spirit of America Real Estate Income and Growth Fund, Spirit of America Large Cap Value Fund, Spirit of America Municipal Tax Free Bond Fund, Spirit of America Income Fund, Spirit of America Income & Opportunity Fund, and Spirit of America Energy Fund (collectively, the “Funds”). At the Meeting, the Board, including the Independent Directors voting separately, approved the Advisory Agreement after determining that the Adviser’s compensation, pursuant to the terms of the Advisory Agreement, would be fair and reasonable and concluded that the approval of the Advisory Agreement would be in the best interest of the Funds’ shareholders. The Board’s approval was based on consideration and evaluation of the information and material provided to the Board and a variety of specific factors discussed at the Meeting and at prior meetings of the Board, including the factors described below.
As part of the approval process and oversight of the advisory relationship, counsel to the Independent Directors (“Independent Counsel”) sent an information request letter to the Adviser seeking certain relevant information and the Directors received, for their review in advance of the Meeting, the
Adviser’s responses. In addition, the Directors were provided with the opportunity to request additional materials. In advance of the Meeting, the Board including the Independent Directors, requested and received materials provided by the Adviser and Independent Counsel, including, among other things, the following: (i) Independent Counsel’s 15c questionnaire and the responses provided by the Adviser; (ii) comparative information on the investment performance of the Funds, relevant indices and Lipper category peer funds as of September 30, 2015 in the form of reports generated by Strategic Insight Simfund/MF Desktop; (iii) graphs of fee comparisons for the minimum fee, maximum fee, average fee and median fee in the form of reports generated by the Funds’ administrator; (iv) graphs of performance comparisons for the minimum performing fund, the maximum performing fund, average performing fund and median performing fund for the one year, three years, five years and since inception time periods in the form of reports generated by the Funds’ administrator; (v) the allocation of the Funds’ brokerage, the record of compliance with the Funds’ investment policies and restrictions and with the Funds’ Code of Ethics and the structure and responsibilities of the Adviser’s compliance departments; (vi) the profitability of the Funds’ investment advisory business to the Adviser taking into account both advisory fees and any other potential direct or indirect benefits; (vii) the Form ADV of the Adviser; and (viii) a memorandum from Independent Counsel regarding the responsibilities of the Independent Directors related to the approval of the Investment Advisory Agreement.
In evaluating the Investment Advisory Agreement, the Board, including the Independent Directors, requested, reviewed and considered materials furnished by the Adviser and questioned personnel of the Adviser, including the Funds’ portfolio managers, regarding, among other things, the personnel, each Fund’s performance, operations and
| | | | |
| REAL ESTATE INCOME AND GROWTH FUND | | | 21 | |
APPROVAL OF THE INVESTMENT ADVISORY AGREEMENT (UNAUDITED) (CONT.)
financial condition of the Adviser. Among other information, the Board, including the Independent Directors, requested and was provided information regarding:
| • | | The Investment performance of each Fund over various time periods both by itself and in relation to relevant indices; |
| • | | The fees charged by the Adviser for investment advisory services, as well as the compensation received by the Adviser and its affiliates; |
| • | | The waivers of fees and reimbursements of expenses at times by the Adviser under the Operating Expenses Agreement; |
| • | | The investment performance, fees and total expenses of mutual funds with similar objectives and strategies managed by other investment advisers; |
| • | | The investment management staffing and the experience of the investment advisory, administrative and other personnel providing services to the Funds and the historical quality of the services provided by the Adviser; and |
| • | | The profitability to the Adviser of managing and its affiliate distributing the Funds and the methodology in allocating expenses to the management of the Funds. |
At the Meeting, Independent Counsel also referred to the “Gartenberg Memorandum” which had been distributed to each Director in advance of the Meeting, outlining the legal standards applicable to the Independent Directors under the 1940 Act with respect to the approval of the continuation of the Investment Advisory Agreement on behalf of each of the Funds. He explained that the Board must consider the (1) nature, extent and quality of services to be provided by the Adviser to the Funds; (2) the investment performance of each Fund independently; (3) the costs of the services provided and
profits realized by the Adviser and its affiliates from the relationship with each Fund; (4) the extent to which economies of scale have been realized as each Fund grows and whether fee levels reflect these economies of scale for the benefit of each Fund’s investors; and (5) any other relevant considerations that the Board deems appropriate. In addition, the Independent Directors met at length with Independent Counsel during the Compliance Committee meeting to discuss the materials provided by the Adviser and to consider any additional questions they had of the Adviser.
The following is a summary of the Board’s discussion and views regarding the factors it considered in evaluating the continuation of the Investment Advisory Agreement:
1. Nature, Extent, and Quality of Services.
The Board, including the Independent Directors, considered the nature, quality and extent of advisory, administrative and shareholder services performed by the Adviser, including: regulatory filings and disclosure to shareholders, general oversight of the service providers, coordination of Fund marketing initiatives, review of Fund legal issues, assisting the Board, including the Independent Directors, in their capacity as directors and other services. The Board, including the Independent Directors, noted the increased responsibilities of the Adviser in response to an increasingly regulated industry. The Board, including the Independent Directors, concluded that the services are extensive in nature, that the Adviser delivered a high level of service to each Fund and that the Adviser is positioned to continue providing such quality of service in the future.
2. Investment Performance of the Funds and the Adviser.
The Board, including the Independent Directors, considered short-term and long-term investment performance for the Funds
APPROVAL OF THE INVESTMENT ADVISORY AGREEMENT (UNAUDITED) (CONT.)
over various periods of time as compared to both relevant indices and the performance of such Funds’ peer groups, and concluded that each Fund was delivering reasonable performance results, especially over the long-term, consistent with the conservative investment strategies that the Funds pursue.
3. Costs of Services and Profits Realized by the Adviser.
a. The Board, including the Independent Directors, considered the information provided by Strategic Insight Simfund/MF Desktop, as well as the comparative graphs provided by HASI, regarding each Fund’s management fee rate and overall expense ratio relative to industry averages for each Fund’s peer group category and the advisory fees charged by the Adviser to other accounts. The Municipal Fund had a gross management fee of 0.60% as compared to the median in its peer group of 0.53%; and, the performance for the 1 year period was 2.28% as compared to the median of its peer group of 2.74%. The Income Fund had a gross management fee of 0.60% as compared to the median in its peer group of 0.60%; and, the performance for the 1 year period was 1.65% as compared to the median of its peer group of (2.29%). The Real Estate Fund had a gross management fee of 0.97% as compared to the median in its peer group of 0.73%; and, the performance for the 1 year period was (1.06%) as compared to the median of its peer group of 0.91%. The Value Fund had a gross management fee of 0.97% as compared to the median in its peer group of 0.69%; and, the performance for the 1 year period was (3.16%) as compared to the median of its peer group of (0.73%). The Opportunity Fund had a gross management fee of 0.65% as compared to the median in its peer group of 1.00%; and, the performance for the 1 year period was (6.21%) as compared to the median of its peer group of (4.57%). The Energy Fund had a gross management fee of 0.95% as compared to the median in its peer group of 0.84%; and, the performance for the 1 year
period was (28.09%) as compared to the average of its peer group of (32.16%). The Board viewed favorably the current and historic willingness of the Adviser to limit the overall expense ratios of each Fund. Recognizing that the fees paid by some Funds were higher than some of the comparable funds and higher than the medians in some Fund’s peer groups, the Board nonetheless noted that the fees were still close enough to the medians in each case and that several peer funds had higher fees. The Board noted that although higher, the fees were not unreasonable.
b. Profitability and Costs of Services to the Adviser. The Board, including the Independent Directors, considered estimates of the Adviser’s profitability and costs attributable to the Funds. The Board recognized that increased fixed costs, particularly legal and audit fees in response to increasing regulations, have a greater impact on small fund families, such as the Funds, than on larger fund complexes. Given this, the Board recognized that the Funds’ overall expenses compare unfavorably to some funds identified as peers. The Board also considered whether the amount of the Adviser’s profit is a fair profit for the management of the Funds and noted that the Adviser has devoted a large amount of its resources into the Funds over the years. Mr. Chodosh reported that the fund by fund expense analysis is the same as previous years, but that it does not reflect all of the overhead costs paid by DLA which may be attributed to the Adviser. The Board, including the Independent Directors, concluded that the Adviser’s profitability was at a fair and acceptable level, particularly in light of the quality of the services being provided to the Funds, and bore a reasonable relationship to the services rendered.
4. Extent of Economies of Scale as the Funds Grow.
The Board, including the Independent Directors, considered whether there have been
| | | | |
| REAL ESTATE INCOME AND GROWTH FUND | | | 23 | |
APPROVAL OF THE INVESTMENT ADVISORY AGREEMENT (UNAUDITED) (CONT.)
economies of scale with respect to the management of the Funds and whether the Funds have appropriately benefited from any economies of scale. Given the size of each Fund, the Board did not believe that significant (if any) economies of scale have been achieved at this time.
5. Whether Fee Levels Reflect Economies of Scale.
The Board took into consideration that the Adviser does not currently offer breakpoints in its fees that would otherwise allow investors to benefit directly from economies of scale in the form of lower fees as fund assets grow. However, the Board, including the Independent Directors, did consider enhancements in personnel and services provided to the Funds by the Adviser, without an increase in fees. The Board also noted that few of the Funds’ peers offered breakpoints despite having significantly more assets under management. The Board stated that they would continue to review this in future years as the Funds’ assets grow.
6. Other Relevant Considerations.
a. Personnel and Methods. The Board, including the Independent Directors, reviewed the Adviser’s Form ADV and questioned the Adviser regarding the size, education and experience of the staff of the Adviser, its fundamental research capabilities, approach to recruiting, training and retaining portfolio managers and other research and management personnel, and concluded that these enable them to provide a high level of service to the Funds. The Board considered the recent management structuring changes and concluded that these changes are likely to positively impact
the management of the Funds. The Board also considered the history, reputation, qualifications and background of the Adviser as well as the qualifications of its personnel.
b. The Board, including the Independent Directors, also considered the character and amount of other direct and incidental benefits received by the Adviser and its affiliates from their association with the Funds, including the benefits received by the affiliated distributor. The Board concluded that potential “fall-out” benefits that the Adviser and its affiliates may receive, such as greater name recognition or increased ability to obtain research services (although the Board noted that the Adviser currently does not use soft dollars to obtain research services), appear to be reasonable, and may in some cases benefit the Funds.
Conclusions. The Board, including the Independent Directors, did not identify any factor as all-important or all-controlling and instead considered the above listed and other factors collectively in light of the Funds’ surrounding circumstances. Each Independent Director gave the weight to each factor that he deemed appropriate in his own judgment. The Independent Directors considered the renewal of the Investment Advisory Agreement on a Fund-by-Fund basis and determined that the renewal of the Investment Advisory Agreement was in the best interests of the shareholders of each Fund. The Independent Directors also determined that the fees charged to each Fund for the services provided were reasonable. Therefore, the Board, including the Independent Directors, determined that continuation of the Investment Advisory Agreement was in the best interests of each Fund.
MANAGEMENT OF THE COMPANY (UNAUDITED)
Information pertaining to the Directors and Officers of the Company is set forth below. The Statement of Additional Information includes additional information about the Directors and is available without charge, upon request, by calling 516-390-5565.
| | | | | | | | |
Name, (Age) and Address1 Position(s) with the Company | | Term of Office2
and Length of Time Served | | Principal Occupation(s) During Past Five Years | | Number of Portfolios
in Fund Complex Overseen by Director | | Other Directorships Held by Director |
| | | |
INTERESTED DIRECTORS | | | | | | |
David Lerner3 (79) Director, Chairman of the Board, President | | Since 1998 | | Founder, David Lerner Associates, Inc., a registered broker-dealer and the Company’s Distributor; and President, Spirit of America Management Corp., the Company’s investment adviser. | | 6 | | President and a Director of Spirit of America Management Corp., the Company’s investment adviser. |
| | | | |
Daniel Lerner3 (54) Director | | Since 1998 | | Senior Vice President, Investment Counselor with David Lerner Associates, Inc., a registered broker-dealer and the Company’s Distributor, since September 2000. | | 6 | | Director of David Lerner Associates, Inc., a registered broker-dealer and the Company’s Distributor. |
| | | |
INDEPENDENT DIRECTORS | | | | | | |
Allen Kaufman (79) Director | | Since 1998 | | President and Chief Executive Officer of K.G.K. Agency, Inc., a property and casualty insurance agency, since 1963.4 | | 6 | | Director of K.G.K. Agency, Inc., a property and casualty insurance agency. |
| | | | |
Stanley S. Thune (79) Lead Director | | Since 1998 | | President and Chief Executive Officer, Freight Management Systems, Inc., a third party logistics management company, since 1994; private investor. | | 6 | | Director of Freight Management Systems, Inc. |
| | | | |
Richard Weinberger (79) Director | | Since 2005 | | Of Counsel to Ballon Stoll Bader & Nadler, P.C., a mid-sized law firm, since January 2005 to March 2011; Shareholder, Ballon Stoll Bader & Nadler, P.C., January 2000 to December 2004. | | 6 | | None. |
| | | | |
OFFICERS | | | | | | | | |
David Lerner President (see biography above) | | | | | | | | |
| | | | |
Alan P. Chodosh (62) Treasurer and Secretary | | Since 2003
(Treasurer) Since 2005 (Secretary) | | Financial and Operations Officer
of David Lerner Associates, Inc. since June 1999. | | N/A | | N/A |
| | | | |
Joseph Pickard (55) Chief Compliance Officer | | Since 2007 | | Chief Compliance Officer of Spirit of America Investment Fund, Inc. and Spirit of America Management Corp. since July 2007; Counsel to the Interested Directors of Spirit of America Investment Fund, Inc. since July 2002; Senior Vice President and General Counsel of David Lerner Associates, Inc. since July 2002. | | N/A | | N/A |
| 1 | All addresses are in c/o Spirit of America Investment Fund, Inc., 477 Jericho Turnpike, Syosset, New York 11791. |
| 2 | Each Director serves for an indefinite term, until his successor is elected. |
| 3 | David Lerner is an “interested” Director, as defined in the 1940 Act, by reason of his positions with the Adviser, and Daniel Lerner is an “interested” Director by reason of his position with the Distributor. Daniel Lerner is the son of David Lerner. |
| 4 | K.G.K. Agency, Inc. provides insurance to David Lerner Associates, Inc. and affiliated entities. However, the Board has determined that Mr. Kaufman is not an “interested” Director because the insurance services are less than $120,000 in value. |
| | | | |
| REAL ESTATE INCOME AND GROWTH FUND | | | 25 | |
Proxy Voting Information
The Company’s Statement of Additional Information (“SAI”) containing a description of the policies and procedures that the Spirit of America Real Estate Income and Growth Fund uses to determine how to vote proxies relating to portfolio securities, along with the Company’s proxy voting record relating to portfolio securities held during the 12-month period ended June 30 are available (i) without charge, upon request, by calling (516) 390-5565; and (ii) on the SEC’s website at http://www.sec.gov.
Information on Form N-Q
The Company will file its complete schedule of portfolio holdings with the SEC for the first and third quarters of each fiscal year on Form N-Q within sixty days after the end of the period. The Company’s Forms N-Q will be available on the SEC’s website at http://www.sec.gov, and may be reviewed and copied at the SEC’s Public Reference Room in Washington, DC. Information on the operation of the Public Reference Room may be obtained by calling 1-800-SEC-0030.

Investment Adviser
Spirit of America Management Corp.
477 Jericho Turnpike
P.O. Box 9006
Syosset, NY 11791-9006
Distributor
David Lerner Associates, Inc.
477 Jericho Turnpike
P.O. Box 9006
Syosset, NY 11791-9006
Shareholder Services
Ultimus Asset Services, LLC
2960 North Meridian Street, Suite 300
Indianapolis, IN 46208
Custodian
The Huntington National Bank
7 Easton Oval
Columbus, OH 43219
Independent Registered Public Accounting Firm
Tait Weller & Baker LLP
1818 Market Street, Suite 2400
Philadelphia, PA 19103
Counsel
Blank Rome LLP
405 Lexington Avenue
New York, NY 10174
For additional information about the Spirit of America Real Estate Income and Growth Fund, call (800) 452-4892 or (516) 390-5565.
This report is submitted for the general information of the shareholders of the Fund. It is not authorized for distribution to prospective investors in the Fund unless preceded or accompanied by an effective Prospectus which includes details regarding the Fund’s objectives, risks, policies, expenses, and other information.
©Copyright 2015 Spirit of America SOARE-AR15

ANNUAL REPORT
DECEMBER 31, 2015

MESSAGE TO OUR SHAREHOLDERS
Dear Shareholder,
We welcome this opportunity to share with you, our investors, the Annual Report for the Spirit of America Large Cap Value Fund, (the “Fund”) along with our thoughts on the market and recent events.
At Spirit of America, we take a comprehensive approach to investing. Our portfolio managers use their extensive backgrounds in their respective fields to carefully scrutinize each security in the portfolio on an ongoing basis. We evaluate economic trends, we analyze sectors that could benefit from those trends, and finally, invest in companies that we believe possess strong fundamentals qualities.
Despite challenges that the financial industry as a whole faces in the current market environment, we see an opportunity emerging to accumulate what we believe are quality stocks at historically low valuations. We believe that investing in sound companies with reasonable share prices will help enhance the long-term returns of the Fund. We are committed to our investment philosophy.
We appreciate your continued support and look forward to your future investment in the Spirit of America Large Cap Value Fund.
Sincerely,
| | | | | | |
 | |  | |  | |  |
| | David Lerner | | | Alpana Sen |
| | President | | | Portfolio Manager |
| | Spirit of America Investment Fund, Inc. | | | | |
MANAGEMENT DISCUSSION (UNAUDITED)
Economic Summary
The Federal Reserve raised rates to a range between 0.25% and 0.5% signaling the beginning of the end for the central bank’s stimulus program as anticipated during their December meeting. Fed officials emphasized that they intend to raise rates gradually and only if economic growth continues. They are predicting that if all goes smoothly short-term rates may rise by about one percentage point a year for the next three years.
At the end of December the Department of Commerce revised the U.S. gross domestic product (GDP) for the 3rd quarter of 2015 up to a 2.0% annual pace. The increase in GDP this quarter primarily reflected positive contributions from personal consumption, nonresidential fixed investment, state and local spending, residential fixed investment, and exports that were partly offset by a negative contribution from private inventory investment and an increase in imports. In the 2nd quarter GDP increased by a 3.9% pace following the 0.02% contraction in the 1st quarter.
The latest employment data released by the Bureau of Labor Statistics in the December jobs report shows total nonfarm payroll employment rose by 292,000 jobs. In 2015, payroll employment growth totaled 2.7 million, compared with 3.1 million in 2014. The unemployment rate was 5.0%, down by 0.6% over the past 12 months.
Market Commentary
This past year the S&P 500 hit a record high in May only to slump in August over fears of a China-led global economic slowdown. For the year, the S&P 500 was down 0.73%. The Dow Jones industrial average lost 2.23% for the year, its first annual decline since 2008. The Nasdaq
Composite gained 5.73% after surpassing levels not seen since the dot-com bubble in 2000.
Fund Summary
The Spirit of America Value Fund’s, (SOAVX) (the “Fund”) seeks to provide capital appreciation with a secondary objective of current income. The emphasis of the Fund is focused on investing in a diversified portfolio. We are invested in all 10 sectors on the S&P 500 Index.
The Fund does not make decisions based on complicated algorithms. We are not a hedge fund. At Spirit of America, technology works for us; we do not work for technology. We do not receive buy signals from a computer generated model. We invest the old fashioned way — utilizing hard work, intensive research, and intuitive decisions. Our decisions are based on experience.
Return Summary
The Spirit of America Large Cap Value Fund, SOAVX (the “Fund”), had a total return of -1.25% (no load, gross of fees) underperforming the S&P 500 Index which was up 1.38% for the year 2015.
The Fund’s underperformance relative to its benchmark was primarily due to its underweight in the technology sector. The second contributor of relative underperformance came from under weighting the consumer discretionary sector.
Including sales charge and expenses, as of December 31, 2015 the Fund’s one year return was -7.95%. The annualized five year return was 7.85%, while the annualized ten year return was 5.03%.
ILLUSTRATION OF INVESTMENT (UNAUDITED)
Summary of Portfolio Holdings (Unaudited)
As of December 31, 2015
| | | | | | | | |
| Information Technology | | | 19.94 | % | | $ | 14,346,459 | |
| Health Care | | | 18.84 | | | | 13,558,711 | |
| Financials | | | 14.15 | | | | 10,184,476 | |
| Consumer Discretionary | | | 11.22 | | | | 8,078,380 | |
| Consumer Staples | | | 9.66 | | | | 6,955,592 | |
| Energy | | | 6.43 | | | | 4,629,581 | |
| Industrials | | | 6.16 | | | | 4,437,310 | |
| Real Estate Investment Trusts | | | 4.15 | | | | 2,985,593 | |
| Telecommunication Services | | | 3.23 | | | | 2,321,283 | |
| Materials | | | 3.14 | | | | 2,258,614 | |
| Utilities | | | 1.87 | | | | 1,346,221 | |
| Money Market | | | 1.21 | | | | 874,065 | |
| Total Investments | | | 100.00 | % | | $ | 71,976,285 | |
ILLUSTRATION OF INVESTMENT (UNAUDITED) (CONT.)
Average Annual Returns (Unaudited)
(For the Periods Ended December 31, 2015)
| | | | | | | | | | | | |
| | | | |
| | | 1 Year | | | 5 Year | | | 10 Year | |
Spirit of America Large Cap Value Fund (NAV) | | | (2.83 | )% | | | 9.01 | % | | | 5.60 | % |
Spirit of America Large Cap Value Fund (POP) | | | (7.95 | )% | | | 7.85 | % | | | 5.03 | % |
S&P 500® Index | | | 1.38 | % | | | 12.57 | % | | | 7.31 | % |
NAV represents the Net Asset Value. Returns at NAV do not reflect the maximum 5.25% sales charge. POP represents Public Offering Price and returns at POP do reflect the maximum 5.25% sales charge. Total returns for periods less than one year are not annualized.
Performance data quoted represents past performance; past performance is no guarantee of future results.
The investment return and principal value of an investment will fluctuate so that an investor’s shares, when redeemed, may be worth more or less than their original cost. Current performance may be lower or higher than the performance quoted.
Growth of $10,000 (Unaudited)
(includes one-time 5.25% maximum sales charge and reinvestment of all distributions)
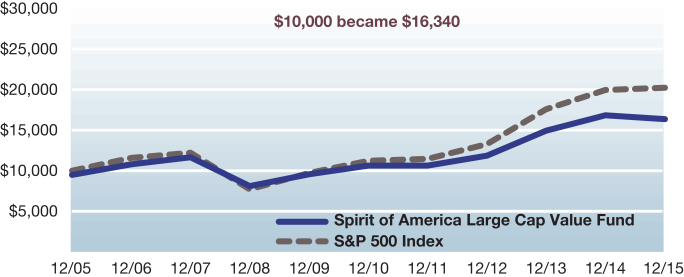
Past performance does not guarantee future results. The performance data quoted represents past performance and current returns may be lower or higher. The investment return and net asset value will fluctuate so that an investor’s shares, when redeemed may be worth more or less than the original cost. To obtain performance information current to the most recent month-end, please call 1-800-452-4892.
S&P 500 Index is an unmanaged capitalization-weighted index of 500 stocks designed to measure the performance of the broad domestic economy through changes in the aggregate market value of 500 stocks representing all major industries. The performance of an index assumes no transaction costs, taxes, management fees or other expenses. A direct investment in an index is not possible.
DISCLOSURE OF FUND EXPENSES (UNAUDITED)
FOR THE SIX MONTH PERIOD JULY 1, 2015 TO DECEMBER 31, 2015
We believe it is important for you to understand the impact of fees regarding your investment. All mutual funds have operating expenses. As a shareholder of the Fund, you incur ongoing costs, which include costs for portfolio management, administrative services, and shareholder reports (like this one), among others. Operating expenses, which are deducted from the Fund’s gross income, directly reduce the investment return of the Fund.
The Fund’s expenses are expressed as a percentage of its average net assets. This figure is known as the expense ratio. The following examples are intended to help you understand the ongoing fees (in dollars) of investing in your Fund and to compare these costs with those of other mutual funds. The examples are based on an investment of $1,000 made at the beginning of the period shown and held for the six month period, July 1, 2015 to December 31, 2015.
Spirit of America Large Cap Value Fund
| | | | | | | | |
| | | Beginning
Account Value
7/1/15 | | Ending Account
Value 12/31/15 | | Expense Ratio(1) | | Expenses
Paid During
Period(2) |
Actual Fund Return | | $1,000.00 | | $969.40 | | 1.63% | | $8.09 |
Hypothetical 5% Return | | $1,000.00 | | $1,016.99 | | 1.63% | | $8.28 |
This table illustrates your Fund’s costs in two ways:
Actual Fund Return: This section helps you to estimate the actual expenses that you paid over the period. The “Ending Account Value” shown is derived from the Fund’s actual return, the third column shows the period’s annualized expense ratio, and the last column shows the dollar amount that would have been paid by an investor who started with $1,000 in the Fund at the beginning of the period. You may use the information here, together with your account value, to estimate the expenses that you paid over the period.
To do so, simply divide your account value by $1,000 (for example, an $8,600 account value divided by $1,000 = 8.6), then multiply the result by the number in the first line under the heading entitled “Expenses Paid During Period.”
Hypothetical 5% Return: This section is intended to help you compare your Fund’s costs with those of other mutual funds. It assumes that the Fund had a return of 5% before expenses during the period shown, but that the expense ratio is unchanged. In this case, because the return used is not the Fund’s actual return, the results do not apply to your investment. You can assess your Fund’s costs by comparing this hypothetical example with the hypothetical examples that appear in shareholder reports of other funds.
Please note that the expenses shown in the table are meant to highlight your ongoing costs only and do not reflect any transactional costs such as sales charges (loads), or redemption fees.
| (1) | Annualized, based on the Fund’s most recent half-year expenses. |
| (2) | Expenses are equal to the Fund’s annualized expense ratio multiplied by the average account value over the period, multiplied by the number of days in the period (184), then divided by 365. |
| | |
| SCHEDULE OF INVESTMENTS | | DECEMBER 31, 2015 |
| | | | | | | | |
| | |
| | | Shares | | | Market Value | |
| | |
| Common Stocks 94.54% | | | | | | | | |
| | |
Consumer Discretionary 11.21% | | | | | | | | |
CBS Corp., Class B | | | 6,400 | | | $ | 301,632 | |
Comcast Corp., Class A | | | 12,400 | | | | 699,732 | |
Delphi Automotive PLC | | | 3,600 | | | | 308,628 | |
Home Depot, Inc. (The) | | | 17,800 | | | | 2,354,050 | |
Johnson Controls, Inc. | | | 12,000 | | | | 473,880 | |
McDonald’s Corp. | | | 7,580 | | | | 895,501 | |
Ross Stores, Inc. | | | 6,200 | | | | 333,622 | |
Walt Disney Co. (The) | | | 22,000 | | | | 2,311,760 | |
Wyndham Worldwide Corp. | | | 5,500 | | | | 399,575 | |
| | | | | | | 8,078,380 | |
| | |
Consumer Staples 9.51% | | | | | | | | |
Altria Group, Inc. | | | 25,700 | | | | 1,495,997 | |
Coca-Cola Co.(The) | | | 15,700 | | | | 674,472 | |
ConAgra Foods, Inc. | | | 2,300 | | | | 96,968 | |
Kimberly-Clark Corp. | | | 4,000 | | | | 509,200 | |
Kraft Heinz Co. (The) | | | 2,999 | | | | 218,207 | |
PepsiCo, Inc. | | | 9,150 | | | | 914,268 | |
Philip Morris International, Inc. | | | 9,400 | | | | 826,354 | |
Procter & Gamble Co. (The) | | | 4,900 | | | | 389,109 | |
Rite Aid Corp.* | | | 89,050 | | | | 698,152 | |
Walgreens Boots Alliance, Inc. | | | 8,350 | | | | 711,044 | |
Wal-Mart Stores, Inc. | | | 5,124 | | | | 314,101 | |
| | | | | | | 6,847,872 | |
| | |
Energy 6.14% | | | | | | | | |
Apache Corp. | | | 3,000 | | | | 133,410 | |
Chevron Corp. | | | 6,600 | | | | 593,736 | |
ConocoPhillips | | | 10,550 | | | | 492,580 | |
Devon Energy Corp. | | | 5,100 | | | | 163,200 | |
EOG Resources, Inc. | | | 4,700 | | | | 332,713 | |
Exxon Mobil Corp. | | | 15,300 | | | | 1,192,635 | |
Halliburton Co. | | | 7,100 | | | | 241,684 | |
Schlumberger Ltd. | | | 6,375 | | | | 444,656 | |
Tesoro Corp. | | | 2,000 | | | | 210,740 | |
Valero Energy Corp. | | | 8,700 | | | | 615,177 | |
| | | | | | | 4,420,531 | |
See accompanying notes which are an integral part of these financial statements.
| | |
| SCHEDULE OF INVESTMENTS (CONT.) | | DECEMBER 31, 2015 |
| | | | | | | | |
| | |
| | | Shares | | | Market Value | |
| | |
Financials 11.86% | | | | | | | | |
American Express Co. | | | 10,000 | | | $ | 695,500 | |
Bank of America Corp. | | | 43,100 | | | | 725,373 | |
Blackstone Group LP (The) | | | 14,200 | | | | 415,208 | |
Capital One Financial Corp. | | | 2,500 | | | | 180,450 | |
Citigroup, Inc. | | | 14,500 | | | | 750,375 | |
CME Group, Inc. | | | 1,100 | | | | 99,660 | |
FNF Group, Class A | | | 2,500 | | | | 86,675 | |
Goldman Sachs Group, Inc.(The) | | | 4,615 | | | | 831,761 | |
Hartford Financial Services Group, Inc.(The) | | | 14,000 | | | | 608,440 | |
JPMorgan Chase & Co. | | | 20,227 | | | | 1,335,589 | |
MetLife, Inc. | | | 10,875 | | | | 524,284 | |
Prudential Financial, Inc. | | | 6,000 | | | | 488,460 | |
Travelers Cos., Inc.(The) | | | 4,500 | | | | 507,870 | |
U.S. Bancorp | | | 9,700 | | | | 413,899 | |
Wells Fargo & Co. | | | 16,186 | | | | 879,871 | |
| | | | | | | 8,543,415 | |
| | |
Health Care 18.64% | | | | | | | | |
AbbVie, Inc. | | | 7,700 | | | | 456,148 | |
Aetna, Inc. | | | 3,800 | | | | 410,856 | |
Allergan PLC* | | | 6,100 | | | | 1,906,250 | |
Amgen, Inc. | | | 3,250 | | | | 527,573 | |
Bristol-Myers Squibb Co. | | | 8,700 | | | | 598,473 | |
Celgene Corp.* | | | 4,000 | | | | 479,040 | |
Cigna Corp. | | | 2,000 | | | | 292,660 | |
Gilead Sciences, Inc. | | | 8,000 | | | | 809,520 | |
Humana, Inc. | | | 3,000 | | | | 535,530 | |
IMS Health Holdings, Inc.* | | | 19,700 | | | | 501,759 | |
Johnson & Johnson | | | 12,010 | | | | 1,233,667 | |
McKesson Corp. | | | 5,000 | | | | 986,150 | |
Medtronic PLC | | | 10,229 | | | | 786,815 | |
Merck & Co., Inc. | | | 15,500 | | | | 818,710 | |
Mylan NV* | | | 9,600 | | | | 519,072 | |
Pfizer, Inc. | | | 16,900 | | | | 545,532 | |
Quest Diagnostics, Inc. | | | 2,500 | | | | 177,850 | |
Thermo Fisher Scientific, Inc. | | | 2,700 | | | | 382,995 | |
UnitedHealth Group, Inc. | | | 12,400 | | | | 1,458,736 | |
| | | | | | | 13,427,336 | |
| | |
Industrials 6.16% | | | | | | | | |
3M Co. | | | 5,650 | | | | 851,116 | |
Boeing Co.(The) | | | 6,200 | | | | 896,458 | |
Caterpillar, Inc. | | | 3,000 | | | | 203,880 | |
See accompanying notes which are an integral part of these financial statements.
| | |
| SCHEDULE OF INVESTMENTS (CONT.) | | DECEMBER 31, 2015 |
| | | | | | | | |
| | |
| | | Shares | | | Market Value | |
| | |
Industrials (cont.) | | | | | | | | |
CSX Corp. | | | 10,000 | | | $ | 259,500 | |
General Electric Co. | | | 32,881 | | | | 1,024,243 | |
Honeywell International, Inc. | | | 6,200 | | | | 642,134 | |
Masco Corp. | | | 5,000 | | | | 141,500 | |
Tyco International PLC | | | 7,700 | | | | 245,553 | |
United Technologies Corp. | | | 1,800 | | | | 172,926 | |
| | | | | | | 4,437,310 | |
| | |
Information Technology 19.91% | | | | | | | | |
Accenture PLC, Class A | | | 3,000 | | | | 313,500 | |
Adobe Systems, Inc.* | | | 4,200 | | | | 394,548 | |
Apple, Inc. | | | 25,200 | | | | 2,652,552 | |
Applied Materials, Inc. | | | 17,800 | | | | 332,326 | |
Cisco Systems, Inc. | | | 24,500 | | | | 665,297 | |
Cognizant Technology Solutions Corp., Class A* | | | 10,100 | | | | 606,202 | |
Corning, Inc. | | | 13,200 | | | | 241,296 | |
EMC Corp. | | | 7,000 | | | | 179,760 | |
Hewlett Packard Enterprise Co. | | | 11,000 | | | | 167,200 | |
HP, Inc. | | | 11,000 | | | | 130,240 | |
Intel Corp. | | | 26,400 | | | | 909,480 | |
International Business Machines Corp. | | | 2,858 | | | | 393,318 | |
MasterCard, Inc., Class A | | | 9,000 | | | | 876,240 | |
Microsoft Corp. | | | 34,450 | | | | 1,911,286 | |
NetApp, Inc. | | | 3,000 | | | | 79,590 | |
Oracle Corp. | | | 24,800 | | | | 905,944 | |
Paychex, Inc. | | | 6,200 | | | | 327,918 | |
QUALCOMM, Inc. | | | 8,800 | | | | 439,868 | |
Symantec Corp. | | | 21,100 | | | | 443,100 | |
Texas Instruments, Inc. | | | 14,925 | | | | 818,039 | |
Visa, Inc. | | | 20,100 | | | | 1,558,755 | |
| | | | | | | 14,346,459 | |
| | |
Materials 3.14% | | | | | | | | |
Ball Corp. | | | 3,100 | | | | 225,463 | |
Dow Chemical Co.(The) | | | 8,650 | | | | 445,302 | |
EI du Pont de Nemours & Co. | | | 11,000 | | | | 732,600 | |
LyondellBasell Industries NV, Class A | | | 4,850 | | | | 421,465 | |
Packaging Corp. of America | | | 6,880 | | | | 433,784 | |
| | | | | | | 2,258,614 | |
See accompanying notes which are an integral part of these financial statements.
| | |
| SCHEDULE OF INVESTMENTS (CONT.) | | DECEMBER 31, 2015 |
| | | | | | | | |
| | |
| | | Shares | | | Market Value | |
| | |
Real Estate Investment Trusts 3.60% | | | | | | | | |
Apartment Investment & Management Co., Class A | | | 2,500 | | | $ | 100,075 | |
Apple Hospitality REIT, Inc. | | | 11,600 | | | | 231,652 | |
DiamondRock Hospitality Co. | | | 20,100 | | | | 193,965 | |
Digital Realty Trust, Inc. | | | 5,400 | | | | 408,348 | |
Essex Property Trust, Inc. | | | 500 | | | | 119,705 | |
FelCor Lodging Trust, Inc. | | | 25,000 | | | | 182,500 | |
HCP, Inc. | | | 10,100 | | | | 386,224 | |
Prologis, Inc. | | | 5,000 | | | | 214,600 | |
Public Storage | | | 1,000 | | | | 247,700 | |
Simon Property Group, Inc. | | | 2,600 | | | | 505,544 | |
| | | | | | | 2,590,313 | |
| | |
Telecommunication Services 2.58% | | | | | | | | |
AT&T, Inc. | | | 25,350 | | | | 872,293 | |
CenturyLink, Inc. | | | 1,800 | | | | 45,288 | |
Verizon Communications, Inc. | | | 20,440 | | | | 944,737 | |
| | | | | | | 1,862,318 | |
| | |
Utilities 1.79% | | | | | | | | |
American Electric Power Co., Inc. | | | 1,750 | | | | 101,973 | |
NextEra Energy, Inc. | | | 4,100 | | | | 425,949 | |
WEC Energy Group, Inc. | | | 14,900 | | | | 764,519 | |
| | | | | | | 1,292,441 | |
Total Common Stocks | | | | | | | | |
(Cost $43,054,266) | | | | | | | 68,104,989 | |
| | |
| Preferred Stocks 4.16% | | | | | | | | |
|
Consumer Staples 0.15% | |
CHS, Inc., Series 3, 6.75% | | | 2,000 | | | | 53,620 | |
CHS, Inc., Series 4, 7.50% | | | 2,000 | | | | 54,100 | |
| | | | | | | 107,720 | |
| | |
Energy 0.29% | | | | | | | | |
Callon Petroleum Co., Series A, 10.00% | | | 5,000 | | | | 209,050 | |
| | |
Financials 2.28% | | | | | | | | |
Aegon NV, 6.38% | | | 5,000 | | | | 129,000 | |
Aegon NV, 8.00% | | | 3,000 | | | | 82,620 | |
American Financial Group, Inc., 6.00% | | | 5,300 | | | | 136,051 | |
AmTrust Financial Services, Inc., 7.50% | | | 2,500 | | | | 64,675 | |
Bank of America Corp., Series W, 6.63% | | | 2,000 | | | | 53,600 | |
See accompanying notes which are an integral part of these financial statements.
| | |
| SCHEDULE OF INVESTMENTS (CONT.) | | DECEMBER 31, 2015 |
| | | | | | | | |
| | |
| | | Shares | | | Market Value | |
| | |
Financials (cont.) | | | | | | | | |
BGC Partners, Inc., 8.13% | | | 5,000 | | | $ | 134,550 | |
Capital One Financial Corp., Series D, 6.70% | | | 2,000 | | | | 55,100 | |
Charles Schwab Corp. (The), Series C, 6.00% | | | 2,000 | | | | 53,860 | |
Citigroup, Inc., Series L, 6.88% | | | 3,000 | | | | 82,260 | |
First Republic Bank, Series F, 5.70% | | | 5,000 | | | | 127,500 | |
Hancock Holding Co., 5.95% | | | 2,500 | | | | 61,275 | |
JPMorgan Chase & Co., Series BB, 6.15% | | | 4,000 | | | | 103,600 | |
JPMorgan Chase & Co., Series T, 6.70% | | | 2,000 | | | | 54,960 | |
JPMorgan Chase & Co., Series Y, 6.13% | | | 4,000 | | | | 104,480 | |
KKR Financial Holdings LLC, Series A, 7.38% | | | 3,000 | | | | 79,740 | |
Ladenburg Thalmann Financial Services, Inc., Series A, 8.00% | | | 7,000 | | | | 173,110 | |
Oxford Lane Capital Corp., 8.13% | | | 2,000 | | | | 50,680 | |
Prospect Capital Corp., 6.25% | | | 4,000 | | | | 94,000 | |
| | | | | | | 1,641,061 | |
| | |
Health Care 0.18% | | | | | | | | |
AdCare Health Systems, Inc., Series A, 10.88% | | | 3,500 | | | | 77,000 | |
Peregrine Pharmaceuticals, Inc., Series E, 10.50% | | | 2,500 | | | | 54,375 | |
| | | | | | | 131,375 | |
| | |
Real Estate Investment Trusts 0.55% | | | | | | | | |
American Capital Agency Corp., 7.75% | | | 3,000 | | | | 70,980 | |
Digital Realty Trust, Inc., Series H, 7.38% | | | 5,000 | | | | 134,500 | |
Digital Realty Trust, Inc., Series I, 6.35% | | | 2,500 | | | | 64,200 | |
Inland Real Estate Corp., Series B, 6.95% | | | 5,000 | | | | 125,600 | |
| | | | | | | 395,280 | |
| | |
Telecommunication Services 0.64% | | | | | | | | |
Qwest Corp, 6.63% | | | 2,500 | | | | 62,950 | |
Qwest Corp., 6.88% | | | 2,000 | | | | 51,500 | |
Qwest Corp., 7.00% | | | 5,000 | | | | 129,900 | |
Telephone & Data Systems, Inc., 7.00% | | | 4,000 | | | | 100,560 | |
United States Cellular Corp., 7.25% | | | 2,500 | | | | 62,775 | |
United States Cellular Corp., 7.25% | | | 2,000 | | | | 51,280 | |
| | | | | | | 458,965 | |
| | |
Utilities 0.07% | | | | | | | | |
Southern Co./The, 6.25% | | | 2,000 | | | | 53,780 | |
| | |
Total Preferred Stocks | | | | | | | | |
(Cost $2,932,309) | | | | | | | 2,997,231 | |
See accompanying notes which are an integral part of these financial statements.
| | |
| SCHEDULE OF INVESTMENTS (CONT.) | | DECEMBER 31, 2015 |
| | | | | | | | |
| | |
| | | Shares | | | Market Value | |
| | |
Money Market 1.21% | | | | | | | | |
Fidelity Prime Money Market Portfolio,
Institutional Class, 0.32%(a) | | | 874,065 | | | $ | 874,065 | |
| | |
Total Money Market | | | | | | | | |
(Cost $874,065) | | | | | | | 874,065 | |
| | |
Total Investments — 99.91% | | | | | | | | |
(Cost $46,860,640) | | | | | | | 71,976,285 | |
Other Assets in Excess of Liabilities — 0.09% | | | | | | | 63,002 | |
NET ASSETS — 100.00% | | | | | | $ | 72,039,287 | |
| * | Non-income producing security. |
| (a) | Rate disclosed is the seven day yield as of December 31, 2015. |
The Global Industry Classification Standard (GICS®) was developed by and/or is the exclusive property of MSCI, Inc. and Standard & Poor Financial Services LLC (“S&P”). GICS is a service mark of MSCI, Inc. and S&P and has been licensed for use by Ultimus Asset Services, LLC (formerly Huntington Asset Services, Inc.).
See accompanying notes which are an integral part of these financial statements.
| | |
| STATEMENT OF ASSETS AND LIABILITIES | | DECEMBER 31, 2015 |
| | | | |
| |
ASSETS | | | | |
Investments in securities at value (cost $46,860,640) | | $ | 71,976,285 | |
Receivable for Fund shares sold | | | 17,364 | |
Dividends and interest receivable | | | 121,023 | |
Receivable for investments sold | | | 416,623 | |
Prepaid expenses | | | 4,773 | |
TOTAL ASSETS | | | 72,536,068 | |
| |
LIABILITIES | | | | |
Payable for Fund shares redeemed | | | 48,898 | |
Payable for investment advisory fees | | | 59,524 | |
Payable for accounting and administration fees | | | 5,034 | |
Payable for distribution fees | | | 18,410 | |
Payable for investments purchased | | | 317,275 | |
Payable to custodian | | | 1,196 | |
Payable for audit fees | | | 22,900 | |
Payable for printing fees | | | 15,420 | |
Payable for transfer agent fees | | | 6,519 | |
Payable for chief compliance officer salary | | | 179 | |
Other accrued expenses | | | 1,426 | |
TOTAL LIABILITIES | | | 496,781 | |
NET ASSETS | | $ | 72,039,287 | |
Net assets applicable to 3,866,304 shares outstanding, $0.001 par value
(500,000,000 authorized shares) | | $ | 72,039,287 | |
Net asset value and redemption price per share
($72,039,287 ÷ 3,866,304 shares) | | $ | 18.63 | |
Maximum offering price per share ($18.63÷ 0.9475) | | $ | 19.66 | |
| |
SOURCE OF NET ASSETS | | | | |
As of December 31 2015, net assets consisted of: | | | | |
Paid-in capital | | $ | 46,435,410 | |
Accumulated undistributed net investment income | | | 1,238 | |
Accumulated net realized gain on investments | | | 486,994 | |
Net unrealized appreciation on investments | | | 25,115,645 | |
NET ASSETS | | $ | 72,039,287 | |
See accompanying notes which are an integral part of these financial statements.
STATEMENT OF OPERATIONS
| | | | |
| | | For the Year Ended
December 31, 2015 | |
| |
INVESTMENT INCOME | | | | |
Dividends | | $ | 1,529,535 | |
Foreign dividend taxes withheld | | | (729 | ) |
TOTAL INVESTMENT INCOME | | | 1,528,806 | |
| |
EXPENSES | | | | |
Investment advisory | | | 740,609 | |
Distribution | | | 229,055 | |
Accounting and Administration | | | 51,072 | |
Transfer agent | | | 68,751 | |
Audit | | | 23,500 | |
Chief Compliance Officer salary | | | 2,305 | |
Custodian | | | 7,214 | |
Directors | | | 8,334 | |
Insurance | | | 16,447 | |
Legal | | | 6,710 | |
Printing | | | 53,093 | |
Registration | | | 13,185 | |
Line of credit | | | 674 | |
Interest | | | 2 | |
Other | | | 2,960 | |
TOTAL EXPENSES | | | 1,223,911 | |
NET INVESTMENT INCOME | | | 304,895 | |
| |
REALIZED AND UNREALIZED GAIN (LOSS) ON
INVESTMENTS | | | | |
Net realized gain from investment transactions | | | 2,507,865 | |
Net change in unrealized appreciation (depreciation) of investments | | | (5,035,097 | ) |
Net realized and unrealized loss on investments | | | (2,527,232 | ) |
NET DECREASE IN NET ASSETS RESULTING FROM OPERATIONS | | $ | (2,222,337 | ) |
See accompanying notes which are an integral part of these financial statements.
STATEMENTS OF CHANGES IN NET ASSETS
| | | | | | | | |
| | | For the Year Ended
December 31, 2015 | | | For the Year Ended
December 31, 2014 | |
| | |
OPERATIONS | | | | | | | | |
Net investment income | | $ | 304,895 | | | $ | 562,662 | |
Net realized gain on investment transactions | | | 2,507,865 | | | | 2,874,210 | |
Net change in unrealized appreciation/depreciation of investments | | | (5,035,097 | ) | | | 5,281,025 | |
Net increase (decrease) in net assets resulting from operations | | | (2,222,337 | ) | | | 8,717,897 | |
| | |
DISTRIBUTIONS TO SHAREHOLDERS | | | | | | | | |
Distributions from net investments income | | | (352,126 | ) | | | (553,198 | ) |
Distributions from realized gains | | | (1,909,115 | ) | | | (151,598 | ) |
Total distributions to shareholders | | | (2,261,241 | ) | | | (704,796 | ) |
| |
CAPITAL SHARE TRANSACTIONS (Dollar Activity) | | | | | |
Shares sold | | | 15,155,485 | | | | 11,339,332 | |
Shares issued from reinvestment of distributions | | | 2,123,477 | | | | 671,079 | |
Shares redeemed | | | (16,893,608 | ) | | | (15,133,778 | ) |
Increase (decrease) in net assets derived from capital share transactions | | | 385,354 | | | | (3,123,367 | ) |
Total increase (decrease) in net assets | | | (4,098,224 | ) | | | 4,889,734 | |
| | |
NET ASSETS | | | | | | | | |
Beginning of year | | | 76,137,511 | | | | 71,247,777 | |
End of year | | $ | 72,039,287 | | | $ | 76,137,511 | |
| | |
Accumulated undistributed net investment income | | $ | 1,238 | | | $ | 9,979 | |
| | |
Transactions in capital stock were: | | | | | | | | |
Shares sold | | | 772,300 | | | | 609,419 | |
Shares issued from reinvestment of distributions | | | 112,512 | | | | 34,815 | |
Shares redeemed | | | (867,209 | ) | | | (816,784 | ) |
Increase (decrease) in shares outstanding | | | 17,603 | | | | (172,550 | ) |
See accompanying notes which are an integral part of these financial statements.
FINANCIAL HIGHLIGHTS
The table below sets forth financial data for one share of beneficial interest outstanding throughout the period presented.
| | | | | | | | | | | | | | | | | | | | |
| | | Year Ended
December 31,
2015 | | | Year Ended
December 31,
2014 | | | Year Ended
December 31,
2013 | | | Year Ended
December 31,
2012 | | | Year Ended
December 31,
2011 | |
| | | | | |
Net Asset Value, Beginning of Year | | $ | 19.78 | | | $ | 17.72 | | | $ | 14.18 | | | $ | 12.78 | | | $ | 12.82 | |
| | | | | |
Income from Investment
Operations: | | | | | | | | | | | | | | | | | | | | |
Net investment income | | | 0.08 | | | | 0.14 | | | | 0.12 | | | | 0.09 | 1 | | | 0.03 | 1 |
Net realized and unrealized gain (loss) on investments | | | (0.63 | ) | | | 2.10 | | | | 3.54 | | | | 1.40 | | | | (0.02 | ) |
Total income from investment operations | | | (0.55 | ) | | | 2.24 | | | | 3.66 | | | | 1.49 | | | | 0.01 | |
| | | | | |
Less Distributions: | | | | | | | | | | | | | | | | | | | | |
Distributions from net investment income | | | (0.09 | ) | | | (0.14 | ) | | | (0.12 | ) | | | (0.09 | ) | | | (0.05 | ) |
Distributions from capital gains | | | (0.51 | ) | | | (0.04 | ) | | | — | | | | — | | | | — | |
Total distributions | | | (0.60 | ) | | | (0.18 | ) | | | (0.12 | ) | | | (0.09 | ) | | | (0.05 | ) |
| | | | | |
| | | | | | | | | | | | | | | | | | | | | |
Net Asset Value, End of Year | | $ | 18.63 | | | $ | 19.78 | | | $ | 17.72 | | | $ | 14.18 | | | $ | 12.78 | |
Total Return2 | | | (2.83 | )% | | | 12.68 | % | | | 25.90 | % | | | 11.63 | % | | | 0.05 | % |
| | | | | |
Ratios/Supplemental Data: | | | | | | | | | | | | | | | | | | | | |
Net assets, end of year (000) | | $ | 72,039 | | | $ | 76,138 | | | $ | 71,248 | | | $ | 54,436 | | | $ | 49,676 | |
Ratio of expenses to average net assets: | | | | | | | | | | | | | | | | | | | | |
Before expense reimbursement or recapture | | | 1.60 | % | | | 1.60 | % | | | 1.68 | % | | | 1.86 | % | | | 1.89 | % |
After expense reimbursement or recapture | | | 1.60 | % | | | 1.60 | % | | | 1.68 | % | | | 1.86 | % | | | 1.96 | % |
Ratio of net investment income to average net assets | | | 0.40 | % | | | 0.78 | % | | | 0.77 | % | | | 0.60 | % | | | 0.26 | % |
Portfolio turnover | | | 19 | % | | | 15 | % | | | 22 | % | | | 12 | % | | | 19 | % |
1 Calculated based on the average number of shares outstanding during the period.
2 Calculation does not reflect sales load.
See accompanying notes which are an integral part of these financial statements.
| | |
| NOTES TO FINANCIAL STATEMENTS (CONT.) | | DECEMBER 31, 2015 |
Note 1 – Organization
Spirit of America Large Cap Value Fund (the “Fund”), a series of Spirit of America Investment Fund, Inc. (the “Company”), is an open-end diversified mutual fund registered under the Investment Company Act of 1940, as amended (the “1940 Act”). The Company was incorporated under the laws of Maryland on May 15, 1997. The Fund commenced operations on August 1, 2002. The Fund seeks capital appreciation with a secondary objective of current income by investing in equity securities in the large cap value segment of the U.S. equity market. The Fund offers one class of shares.
Note 2 – Significant Accounting Policies
The Fund is an investment company and follows accounting and reporting guidance under Financial Accounting Standards Board (“FASB”) Accounting Standards Codification (“ASC”) Topic 946, “Financial Services-Investment Companies”. The following is a summary of significant accounting policies consistently followed by the Fund in the preparation of its financial statements. These policies are in conformity with generally accepted accounting principles in the United States of America (“GAAP”) for investment companies.
A. Security Valuation: The offering price and net asset value (“NAV”) per share for the Fund are calculated as of the close of regular trading on the New York Stock Exchange (“NYSE”), currently 4:00 p.m., Eastern Time on each day the NYSE is open for trading. The Fund’s securities are valued at the official close or the last reported sales price on the principal exchange on which the security trades, or if no sales price is reported, the mean of the latest bid and asked prices is used. Securities traded over-the-counter are priced at the mean of the latest bid and asked prices. Unlisted securities traded in the over-the-counter market are valued using an evaluated quote provided by the independent pricing service, or, if an evaluated quote is unavailable, such securities
are valued using prices received from dealers, provided that if the dealer supplies both bid and ask prices, the price to be used is the mean of the bid and asked prices. The independent pricing service derives an evaluated quote by obtaining dealer quotes, analyzing the listed markets, reviewing trade execution data and employing sensitivity analysis. Evaluated quotes may also reflect appropriate factors such as individual characteristics of the issue, communications with broker-dealers, and other market data. Short-term investments having a maturity of 60 days or less are valued at amortized cost, which the Board of Directors (the “Board”) believes represents fair value. Fund securities for which market quotations are not readily available are valued at fair value as determined in good faith under procedures established by and under the supervision of the Board.
B. Fair Value Measurements: Various inputs are used in determining the fair value of investments which are as follows:
| | |
• Level 1 – | | Unadjusted quoted prices in active markets for identical investments and/or registered investment companies where the value per share is determined and published and is the basis for current transactions for identical assets or liabilities at the valuation date. |
| |
• Level 2 – | | Observable inputs other than quoted prices included in level 1 that are observable for the asset or liability, either directly or indirectly. These inputs may include quoted prices for the identical instrument on an inactive market, prices for similar instruments, interest rates, prepayment speeds, credit risk, yield curves, default rates and similar data. |
| | |
| NOTES TO FINANCIAL STATEMENTS (CONT.) | | DECEMBER 31, 2015 |
| | |
| |
• Level 3 – | | Unobservable inputs based on the best information available in the circumstances, to the extent observable inputs are not available (including the Fund’s own assumptions used in determining the fair value of investments). |
The summary of inputs used to value the Fund’s net assets as of December 31, 2015 is as follows:
| | | | | | | | | | | | | | | | |
| | | Value Inputs | |
| Assets | | Level 1 | | | Level 2 | | | Level 3 | | | Totals | |
Common Stocks* | | $ | 68,104,989 | | | $ | — | | | $ | — | | | $ | 68,104,989 | |
Preferred Stocks | | | 2,997,231 | | | | — | | | | — | | | | 2,997,231 | |
Money Market Securities | | | 874,065 | | | | — | | | | — | | | | 874,065 | |
| | | | | | | | | | | | | | | | |
Total | | $ | 71,976,285 | | | $ | — | | | $ | — | | | $ | 71,976,285 | |
| | | | |
| | | | | | | | | | | | | | | | |
| * | Refer to Schedule of Investments for industry classifications. |
The Fund did not have any transfers between levels during the year ended December 31, 2015. The Fund recognizes transfers between fair value hierarchy levels at the end of the reporting period.
C. Investment Income and Securities Transactions: Security transactions are accounted for on the date the securities are purchased or sold (trade date). Cost is determined and gains and losses are based on the identified cost basis for both financial statement and federal income tax purposes. Dividend income and distributions to shareholders are reported on the ex-dividend date. Interest income and expenses are accrued daily.
D. Federal Income Taxes: The Fund intends to comply with all requirements of the Internal Revenue Code applicable to regulated investment companies and to distribute substantially all of its taxable income to its shareholders. Therefore, no federal income tax provision is required.
E. Use of Estimates: In preparing financial statements in conformity with GAAP,
management makes estimates and assumptions that affect the reported amounts of assets and liabilities at the date of the financial statements, as well as the reported amounts of revenues and expenses during the reporting period. Actual results could differ from those estimates.
G. Distributions to Shareholders: The Fund intends to distribute substantially all of its net investment income and capital gains to shareholders each year. Normally, income distributions will be paid quarterly. Capital gains, if any, will be distributed annually in December, but may be distributed more frequently if deemed advisable by the Board. All such distributions are taxable to the shareholders whether received in cash or reinvested in shares. The Fund has made certain investments in REITs which pay distributions to their shareholders based upon available funds from operations. Each REIT reports annually the tax character of its distributions. It is quite common for these distributions to exceed the REIT’s taxable earnings and profits resulting in the excess portion of such distributions being designated as a return of capital or long-term capital gain.
| | |
| NOTES TO FINANCIAL STATEMENTS (CONT.) | | DECEMBER 31, 2015 |
The Fund intends to include the gross distributions from such REITs in its distributions to its shareholders; accordingly, a portion of the distributions paid to the Fund and subsequently distributed to shareholders may be re-characterized. The final determination of the amount of the Fund’s return of capital distribution for the period will be made after the end of each calendar year.
Note 3 – Purchases and Sales of Securities
Purchases and proceeds from the sales of securities for the year ended December 31, 2015, excluding short-term investments, were $14,355,919 and $16,169,330, respectively.
Note 4 – Investment Management Fee and Other Transactions with Affiliates
Spirit of America Management Corp. (the “Adviser”) has been retained to act as the Company’s investment adviser pursuant to an Investment Advisory Agreement (the “Advisory Agreement”). The Adviser was incorporated in 1997 and is a registered investment adviser under the Investment Advisers Act of 1940, as amended. Under the Advisory Agreement, the Fund pays the Adviser a monthly fee of 1/12 of 0.97% of the Fund’s average daily net assets. Investment advisory fees for the year ended December 31, 2015, were $740,609.
The Adviser has contractually agreed to waive advisory fees and/or reimburse expenses so that the total operating expenses will not exceed 1.97% of the average daily net assets of each class through April 30, 2016. For the year ended December 31, 2015, there were no advisory fees reimbursed to the Fund.
Any amounts waived or reimbursed by the Adviser are subject to reimbursement by the Fund within the following three years, provided the Fund is able to make such reimbursement and remain in compliance with the expense limitation as stated above. For the year ended December 31, 2015, the Fund did
not reimburse the Adviser. There is no balance of recoverable expenses to the Adviser at December 31, 2015.
The Fund has adopted a distribution plan for Class A Shares pursuant to Rule 12b-1 (“Plan”). The Plan permits the Fund to pay David Lerner Associates, Inc. (the “Distributor”), a monthly fee of 1/12 of 0.30% of the Fund’s average daily net assets for the Distributor’s services and expenses in distributing shares of the class and providing personal services and/or maintaining shareholder accounts. For the year ended December 31, 2015, fees paid to the Distributor under the Plan were $229,055. The Fund’s shares are subject to an initial sales charge imposed at the time of purchase, in accordance with the Fund’s current prospectus.
For the year ended December 31, 2015, sales charges on Class A Shares paid to the Distributor were $687,078. A contingent deferred sales charge (“CDSC”) of 1.00% may be imposed on redemptions of $1 million or more made within one year of purchase.
Certain Officers and Directors of the Company are “affiliated persons”, as that term is defined in the 1940 Act, of the Adviser or the Distributor. Each Director of the Company, who is not an affiliated person of the Adviser or Distributor, receives a quarterly retainer of $5,250, $1,000 for each Board meeting attended, and $500 for each committee meeting attended plus reimbursement for certain travel and other out-of-pocket expenses incurred in connection with attending Board meetings. The Company does not compensate the Officers for the services they provide. There are no Directors’ fees paid to affiliated Directors of the Company. For the year ended December 31, 2015, the Fund was allocated $2,305 of the Chief Compliance Officer’s salary.
| | |
| NOTES TO FINANCIAL STATEMENTS (CONT.) | | DECEMBER 31, 2015 |
Note 5 – Federal Income Taxes
The tax character of distributions paid for the years ended December 31, 2015 and 2014 were as follows:
Taxable Basis Distributions
| | | | | | | | | | | | | | | | |
| | | Ordinary
Income | | | Tax Exempt
Income | | | Net
Long-Term
Capital Gains | | | Total
Distributions | |
| 12/31/2015 | | $ | 352,126 | | | $ | — | | | $ | 1,909,115 | | | $ | 2,261,241 | |
| 12/31/2014 | | $ | 553,198 | | | $ | — | | | $ | 151,598 | | | $ | 704,796 | |
| | | | | | | | | | | | | | | | |
Distribution classifications may differ from the Statements of Changes in Net Assets as a result of the treatment of short-term capital gains as ordinary income for tax purposes.
The adjusted cost basis of investment and gross unrealized appreciation and depreciation of investments for federal income tax purposes were as follows:
| | | | |
| | | As of
December 31, 2015 | |
Gross unrealized appreciation | | $ | 26,284,325 | |
Gross unrealized depreciation | | | (1,167,442 | ) |
| | | | |
Net unrealized appreciation (a) | | | 25,116,883 | |
Cost basis of investments | | $ | 46,859,402 | |
| | | | |
| | | | |
| (a) | The difference between book-basis and tax- basis net unrealized appreciation is primarily due to tax treatment of Trust Preferred Securities. |
At December 31, 2015, the components of accumulated earnings (losses) for the Fund on a tax basis were as follows:
| | | | |
Undistributed long term capital gains | | $ | 536,552 | |
Other accumulated losses | | | (49,558 | ) |
Unrealized appreciation | | | 25,116,883 | |
| | | | |
Total accumulated earnings | | $ | 25,603,877 | |
| | | | |
| | | | |
At December 31, 2015, the Fund had no capital loss carryforwards for federal income tax purposes.
At December 31, 2015, the Fund had Deferred Post-October Losses of $49,558.
Management of the Fund has reviewed tax positions taken in tax years that remain subject to examination by all major tax jurisdictions, including federal (i.e., the last three tax year ends and the interim tax period since then). Management believes there is no tax liability resulting from unrecognized tax benefits related to uncertain tax positions taken.
Note 6 – Reclassification
Permanent differences, incurred during the year ended December 31, 2015, resulting from differences in book and tax accounting have been reclassified at year end to undistributed net investment income, accumulated realized gain (loss) and paid-in capital as follows:
| | | | |
Undistributed Net Investment Income | | $ | 38,490 | |
Accumulated Net Realized Gain (Loss) | | | (38,208 | ) |
Paid-In Capital | | | (282 | ) |
| | | | |
Note 7 – Line of Credit
The Fund participates in a short-term credit agreement (“Line of Credit”) with The Huntington National Bank, the custodian of the Fund’s investments expiring on May 25, 2016. Borrowing under this agreement bear
| | |
| NOTES TO FINANCIAL STATEMENTS (CONT.) | | DECEMBER 31, 2015 |
interest at London Interbank Offered Rate (“LIBOR”) plus 1.500%. Maximum borrowings for the Fund is the lesser of $3,000,000 or 10% of the Fund’s daily market value.
| | | | |
Total bank line of credit as of December 31, 2015 | | $ | 3,000,000 | |
Average borrowings during period | | | 6,596 | |
Number of days outstanding* | | | 2 | |
Average interest rate during period | | | 1.688 | % |
Highest balance drawn during period | | | 13,192 | |
Highest balance interest rate | | | 1.922 | % |
Interest expense incurred | | $ | 2 | |
Interest rate at December 31, 2015 | | | 1.922 | % |
| | | | |
| * | Number of days outstanding represents the total days during the year ended December 31, 2015 that the Fund utilized the line of credit. |
Note 8 – Other Matters
On May 7, 2010, each of William Mason, the Portfolio Manager for the Real Estate Fund, Income Fund, and Opportunity Fund, and DLA, the Fund’s principal underwriter and distributor, received a Notice of Complaint from the Department of Enforcement of the Financial Industry Regulatory Authority (“FINRA”) relating to Mr. Mason’s activities as head of the fixed income trading department of DLA and DLA’s activities as a municipal securities and collateralized mortgage obligations dealer. The Complaint alleges that each of Mr. Mason and DLA had violated certain NASD and Municipal Securities Rule Making Board fair pricing rules relating to the period January 1, 2005 through January 31, 2007. On April 4, 2012, a FINRA hearing panel issued a decision in this matter and assessed monetary fines and other sanctions against DLA and Mr. Mason, including a suspension of Mr. Mason from association with a FINRA member firm for
six (6) months. Both DLA and Mr. Mason appealed the decision.
On May 27, 2011, FINRA filed a complaint against DLA, the Fund’s principal underwriter and distributor, related to its sales practices in connection with its role as managing dealer of an unaffiliated Real Estate Investment Trust offering, Apple REIT Ten, Inc. (“Apple REIT”). More specifically, FINRA alleged that DLA failed to conduct adequate due diligence, thereby leaving it without a reasonable basis for recommending customer purchases of Apple REIT, in addition to using false, exaggerated and misleading statements regarding the performance of earlier closed Apple REITs. In June 2011, several class action complaints were filed against DLA, Apple REIT entities and certain individuals, also in connection with the sale of various Apple REIT securities. In January 2012, FINRA amended its complaint to add David Lerner as an individual respondent and alleged violations of Section 17(a) of the Securities Act of 1933, as amended, including allegations of false, exaggerated and misleading communications to the public, through customer correspondence and investment seminars, about the investment returns, market values, performance of earlier closed Apple REITs as well as allegations of untrue statements and/or omitted material facts concerning the prior performance, steady distribution rates, unchanging valuations, and prospects of the earlier closed Apple REITs and/or Apple REIT. On October 22, 2012, DLA, Mr. Lerner and Mr. Mason settled all of the foregoing FINRA investigations and actions involving Apple REIT securities and municipal bond and collateralized mortgage obligation pricing. Without admitting or denying the allegations, in connection with the settlement, DLA, Mr. Lerner and Mr. Mason each agreed, among other things, to pay a fine; and Mr. Lerner agreed to a suspension from affiliation with any FINRA member, including DLA, in any capacity for a period of one year and in any principal capacity for a period of
| | |
| NOTES TO FINANCIAL STATEMENTS (CONT.) | | DECEMBER 31, 2015 |
two years thereafter beginning on November 19, 2012; and Mr. Mason agreed to a suspension from affiliation with any FINRA member, including DLA, in any capacity for a period of six months, which suspension ended on June 16, 2013. The fines and suspensions do not involve the Energy Fund or the Adviser. On April 3, 2013, the class action complaints were dismissed, with prejudice, in their entirety. On April 12, 2013, plaintiffs filed a notice of appeal of the class action dismissal. On April 23, 2014, the United States Court of Appeals for the Second Circuit substantially affirmed the April 3, 2013 decision of United States District Judge, Kiyo A. Matsumoto, dismissing with prejudice the class action complaint in In Re Apple REITs Litigation. The Second Circuit held that Judge Matsumoto correctly found that there were no material misrepresentations or omissions in the offering materials for Apple REITs Six through Ten. The appeals court upheld dismissal of ten of the thirteen claims in the case, including all federal and state securities law claims, and also upheld Judge Matsumoto’s refusal to allow plaintiffs to amend their complaint. The appeals court remanded three state common law claims to the District Court for the Eastern District of New York for further proceedings. On March 25, 2015, the District Court dismissed the remaining state common law claims against DLA, with prejudice. Plaintiffs did not file an appeal. Neither the Adviser nor the Fund were a party to any of the investigations or actions listed in this section.
In October 2013, a class action litigation, titled Lewis v. Delaware Charter Guarantee & Trust Company, et al., (the “Litigation”) was commenced in federal court in Nevada against DLA, the Funds’ principal underwriter and distributor, along with other defendants, alleging, inter alia, breach of fiduciary duty, aiding and abetting breach of fiduciary duty, negligence and misrepresentation. The plaintiffs, purportedly customers who maintain individual retirement accounts at DLA which contained non-traded REIT securities, allege,
among other things, that the defendants failed to accurately provide annual fair market values for those REIT securities. The Litigation was transferred to the U.S. District Court for the Eastern District of New York. On March 30, 2015, the District Court dismissed all claims against DLA, with prejudice. Plaintiffs appealed the decision dismissing the claims. While it is unlikely that plaintiffs’ appeal will be successful, there cannot be any assurance that if the class action plaintiffs were to ultimately be successful in the pursuit of an appeal of the decision dismissing the claims against DLA that such outcome would not materially affect DLA’s ability to act as the Funds’ principal underwriter and distributor, although it is not considered likely at this time that such material and adverse effects would occur. Neither the Adviser nor the Fund are a party to the Litigation.
Note 9 – Subsequent Events
Management has evaluated the impact of all subsequent events on the Fund and has determined that there were no events that require recognition or disclosure in the financial statements.
Tax Information (Unaudited)
All designations are based on financial information available as of the date of this annual report and, accordingly, are subject to change. For each item, it is the intention of the Fund to designate the maximum amount permitted under the Internal Revenue Code and the regulations thereunder.
Qualified Dividend Income
For the year ended December 31, 2015, 100% of the distributions paid by the Fund from ordinary income qualifies for a reduced tax rate pursuant to The Jobs and Growth Tax Relief Reconciliation Act of 2003.
| | |
| NOTES TO FINANCIAL STATEMENTS (CONT.) | | DECEMBER 31, 2015 |
Dividends Received Deduction
For the year ended December 31, 2015, 100% of the ordinary income distribution qualifies for the Dividends Received Deduction available to corporations.
Long-Term Capital Gain Dividends
The Fund designates $1,909,115 as long-term capital gain distributions pursuant to section 852(b)(3) of the Internal Revenue Code for the year ended December 31, 2015.
REPORT OF INDEPENDENT REGISTERED PUBLIC ACCOUNTING FIRM
To the Shareholders of Spirit of America Large Cap Value Fund and Board of Directors of Spirit of America Investment Fund, Inc.
Syosset, New York
We have audited the accompanying statement of assets and liabilities of Spirit of the America Large Cap Value Fund (the “Fund”), a series of shares of beneficial interest in Spirit of America Investment Fund, Inc., including the schedule of investments as of December 31, 2015, and the related statement of operations for the year then ended, the statements of changes in net assets for each of the two years in the period then ended and the financial highlights for each of the five years in the period then ended. These financial statements and financial highlights are the responsibility of the Fund’s management. Our responsibility is to express an opinion on these financial statements and financial highlights based on our audits.
We conducted our audits in accordance with the standards of the Public Company Accounting Oversight Board (United States). Those standards require that we plan and perform the audit to obtain reasonable assurance about whether the financial statements and financial highlights are free of material misstatement. The Fund is not required to have, nor were we engaged to perform, an audit of its internal control over financial reporting. Our audits included consideration of internal control over financial reporting as a basis for designing audit procedures that are appropriate in the
circumstances, but not for the purpose of expressing an opinion on the effectiveness of the Fund’s internal control over financial reporting. Accordingly, we express no such opinion. An audit includes examining, on a test basis, evidence supporting the amounts and disclosures in the financial statements. Our procedures included confirmation of securities owned as of December 31, 2015 by correspondence with the custodian and brokers or by other appropriate auditing procedures where replies from brokers were not received. An audit also includes assessing the accounting principles used and significant estimates made by management, as well as evaluating the overall financial statement presentation. We believe that our audits provide a reasonable basis for our opinion.
In our opinion, the financial statements and financial highlights referred to above present fairly, in all material respects, the financial position of the Spirit of America Large Cap Value Fund as of December 31, 2015, the results of its operations for the year then ended, the changes in its net assets for each of the two years in the period then ended and the financial highlights for each of the five years in the period then ended, in conformity with accounting principles generally accepted in the United States of America.
TAIT, WELLER & BAKER LLP
Philadelphia, Pennsylvania
February 23, 2016
APPROVAL OF THE INVESTMENT ADVISORY AGREEMENT (UNAUDITED)
The Investment Company Act of 1940, as amended (the “1940 Act”) requires that the continuance of a registered management investment company’s investment advisory agreement be approved annually by both the board of directors and also by a majority of its directors who are not parties to the investment advisory agreement or “interested persons” (as defined by the 1940 Act) of any such party (the “Independent Directors”). At a meeting held on December 1, 2015, the Board of Directors (the “Board” or “Directors”) of Spirit of America Investment Fund, Inc. (the “Company”) met in person (the “Meeting”) to, among other things, consider the approval of the Investment Advisory Agreement (the “Advisory Agreement”) by and between Spirit of America Management Corp. (the “Adviser”) and the Company, on behalf of Spirit of America Real Estate Income and Growth Fund, Spirit of America Large Cap Value Fund, Spirit of America Municipal Tax Free Bond Fund, Spirit of America Income Fund, Spirit of America Income & Opportunity Fund, and Spirit of America Energy Fund (collectively, the “Funds”). At the Meeting, the Board, including the Independent Directors voting separately, approved the Advisory Agreement after determining that the Adviser’s compensation, pursuant to the terms of the Advisory Agreement, would be fair and reasonable and concluded that the approval of the Advisory Agreement would be in the best interest of the Funds’ shareholders. The Board’s approval was based on consideration and evaluation of the information and material provided to the Board and a variety of specific factors discussed at the Meeting and at prior meetings of the Board, including the factors described below.
As part of the approval process and oversight of the advisory relationship, counsel to the Independent Directors (“Independent Counsel”) sent an information request letter to the Adviser seeking certain relevant information and the Directors received, for their review in advance of the Meeting, the
Adviser’s responses. In addition, the Directors were provided with the opportunity to request additional materials. In advance of the Meeting, the Board including the Independent Directors, requested and received materials provided by the Adviser and Independent Counsel, including, among other things, the following: (i) Independent Counsel’s 15c questionnaire and the responses provided by the Adviser; (ii) comparative information on the investment performance of the Funds, relevant indices and Lipper category peer funds as of September 30, 2015 in the form of reports generated by Strategic Insight Simfund/MF Desktop; (iii) graphs of fee comparisons for the minimum fee, maximum fee, average fee and median fee in the form of reports generated by the Funds’ administrator; (iv) graphs of performance comparisons for the minimum performing fund, the maximum performing fund, average performing fund and median performing fund for the one year, three years, five years and since inception time periods in the form of reports generated by the Funds’ administrator; (v) the allocation of the Funds’ brokerage, the record of compliance with the Funds’ investment policies and restrictions and with the Funds’ Code of Ethics and the structure and responsibilities of the Adviser’s compliance departments; (vi) the profitability of the Funds’ investment advisory business to the Adviser taking into account both advisory fees and any other potential direct or indirect benefits; (vii) the Form ADV of the Adviser; and (viii) a memorandum from Independent Counsel regarding the responsibilities of the Independent Directors related to the approval of the Investment Advisory Agreement.
In evaluating the Investment Advisory Agreement, the Board, including the Independent Directors, requested, reviewed and considered materials furnished by the Adviser and questioned personnel of the Adviser, including the Funds’ portfolio managers, regarding, among other things, the personnel, each Fund’s performance,
APPROVAL OF THE INVESTMENT ADVISORY AGREEMENT (UNAUDITED) (CONT.)
operations and financial condition of the Adviser. Among other information, the Board, including the Independent Directors, requested and was provided information regarding:
| • | | The Investment performance of each Fund over various time periods both by itself and in relation to relevant indices; |
| • | | The fees charged by the Adviser for investment advisory services, as well as the compensation received by the Adviser and its affiliates; |
| • | | The waivers of fees and reimbursements of expenses at times by the Adviser under the Operating Expenses Agreement; |
| • | | The investment performance, fees and total expenses of mutual funds with similar objectives and strategies managed by other investment advisers; |
| • | | The investment management staffing and the experience of the investment advisory, administrative and other personnel providing services to the Funds and the historical quality of the services provided by the Adviser; and |
| • | | The profitability to the Adviser of managing and its affiliate distributing the Funds and the methodology in allocating expenses to the management of the Funds. |
At the Meeting, Independent Counsel also referred to the “Gartenberg Memorandum” which had been distributed to each Director in advance of the Meeting, outlining the legal standards applicable to the Independent Directors under the 1940 Act with respect to the approval of the continuation of the Investment Advisory Agreement on behalf of each of the Funds. He explained that the Board must consider the (1) nature, extent and quality of services to be provided by the Adviser to the Funds; (2) the investment performance of each Fund independently;
(3) the costs of the services provided and profits realized by the Adviser and its affiliates from the relationship with each Fund; (4) the extent to which economies of scale have been realized as each Fund grows and whether fee levels reflect these economies of scale for the benefit of each Fund’s investors; and (5) any other relevant considerations that the Board deems appropriate. In addition, the Independent Directors met at length with Independent Counsel during the Compliance Committee meeting to discuss the materials provided by the Adviser and to consider any additional questions they had of the Adviser.
The following is a summary of the Board’s discussion and views regarding the factors it considered in evaluating the continuation of the Investment Advisory Agreement:
1. Nature, Extent, and Quality of Services.
The Board, including the Independent Directors, considered the nature, quality and extent of advisory, administrative and shareholder services performed by the Adviser, including: regulatory filings and disclosure to shareholders, general oversight of the service providers, coordination of Fund marketing initiatives, review of Fund legal issues, assisting the Board, including the Independent Directors, in their capacity as directors and other services. The Board, including the Independent Directors, noted the increased responsibilities of the Adviser in response to an increasingly regulated industry. The Board, including the Independent Directors, concluded that the services are extensive in
nature, that the Adviser delivered a high level of service to each Fund and that the Adviser is positioned to continue providing such quality of service in the future.
2. Investment Performance of the Funds and the Adviser.
The Board, including the Independent Directors, considered short-term and
APPROVAL OF THE INVESTMENT ADVISORY AGREEMENT (UNAUDITED) (CONT.)
long-term investment performance for the Funds over various periods of time as compared to both relevant indices and the performance of such Funds’ peer groups, and concluded that each Fund was delivering reasonable performance results, especially over the long-term, consistent with the conservative investment strategies that the Funds pursue.
3. Costs of Services and Profits Realized by the Adviser.
a. The Board, including the Independent Directors, considered the information provided by Strategic Insight Simfund/MF Desktop, as well as the comparative graphs provided by HASI, regarding each Fund’s management fee rate and overall expense ratio relative to industry averages for each Fund’s peer group category and the advisory fees charged by the Adviser to other accounts. The Municipal Fund had a gross management fee of 0.60% as compared to the median in its peer group of 0.53%; and, the performance for the 1 year period was 2.28% as compared to the median of its peer group of 2.74%. The Income Fund had a gross management fee of 0.60% as compared to the median in its peer group of 0.60%; and, the performance for the 1 year period was 1.65% as compared to the median of its peer group of (2.29%). The Real Estate Fund had a gross management fee of 0.97% as compared to the median in its peer group of 0.73%; and, the performance for the 1 year period was (1.06%) as compared to the median of its peer group of 0.91%. The Value Fund had a gross management fee of 0.97% as compared to the median in its peer group of 0.69%; and, the performance for the 1 year period was (3.16%) as compared to the median of its peer group of (0.73%). The Opportunity Fund had a gross management fee of 0.65% as compared to the median in its peer group of 1.00%; and, the performance for the 1 year period was (6.21%) as compared to the median of its peer group of (4.57%). The Energy Fund had a gross management fee of 0.95% as compared to the median in its peer
group of 0.84%; and, the performance for the 1 year period was (28.09%) as compared to the average of its peer group of (32.16%). The Board viewed favorably the current and historic willingness of the Adviser to limit the overall expense ratios of each Fund. Recognizing that the fees paid by some Funds were higher than some of the comparable funds and higher than the medians in some Fund’s peer groups, the Board nonetheless noted that the fees were still close enough to the medians in each case and that several peer funds had higher fees. The Board noted that although higher, the fees were not unreasonable.
b. Profitability and Costs of Services to the Adviser. The Board, including the Independent Directors, considered estimates of the Adviser’s profitability and costs attributable to the Funds. The Board recognized that increased fixed costs, particularly legal and audit fees in response to increasing regulations, have a greater impact on small fund families, such as the Funds, than on larger fund complexes. Given this, the Board recognized that the Funds’ overall expenses compare unfavorably to some funds identified as peers. The Board also considered whether the amount of the Adviser’s profit is a fair profit for the management of the Funds and noted that the Adviser has devoted a large amount of its resources into the Funds over the years. Mr. Chodosh reported that the fund by fund expense analysis is the same as previous years, but that it does not reflect all of the overhead costs paid by DLA which may be attributed to the Adviser. The Board, including the Independent Directors, concluded that the Adviser’s profitability was at a fair and acceptable level, particularly in light of the quality of the services being provided to the Funds, and bore a reasonable relationship to the services rendered.
4. Extent of Economies of Scale as the Funds Grow.
The Board, including the Independent Directors, considered whether there have been
APPROVAL OF THE INVESTMENT ADVISORY AGREEMENT (UNAUDITED) (CONT.)
economies of scale with respect to the management of the Funds and whether the Funds have appropriately benefited from any economies of scale. Given the size of each Fund, the Board did not believe that significant (if any) economies of scale have been achieved at this time.
5. Whether Fee Levels Reflect Economies of Scale.
The Board took into consideration that the Adviser does not currently offer breakpoints in its fees that would otherwise allow investors to benefit directly from economies of scale in the form of lower fees as fund assets grow. However, the Board, including the Independent Directors, did consider enhancements in personnel and services provided to the Funds by the Adviser, without an increase in fees. The Board also noted that few of the Funds’ peers offered breakpoints despite having significantly more assets under management. The Board stated that they would continue to review this in future years as the Funds’ assets grow.
6. Other Relevant Considerations.
a. Personnel and Methods. The Board, including the Independent Directors, reviewed the Adviser’s Form ADV and questioned the Adviser regarding the size, education and experience of the staff of the Adviser, its fundamental research capabilities, approach to recruiting, training and retaining portfolio managers and other research and management personnel, and concluded that these enable them to provide a high level of service to the Funds. The Board considered the recent management structuring changes and concluded that these changes are likely to
positively impact the management of the Funds. The Board also considered the history, reputation, qualifications and background of the Adviser as well as the qualifications of its personnel.
b. The Board, including the Independent Directors, also considered the character and amount of other direct and incidental benefits received by the Adviser and its affiliates from their association with the Funds, including the benefits received by the affiliated distributor. The Board concluded that potential “fall-out” benefits that the Adviser and its affiliates may receive, such as greater name recognition or increased ability to obtain research services (although the Board noted that the Adviser currently does not use soft dollars to obtain research services), appear to be reasonable, and may in some cases benefit the Funds.
Conclusions. The Board, including the Independent Directors, did not identify any factor as all-important or all-controlling and instead considered the above listed and other factors collectively in light of the Funds’ surrounding circumstances. Each Independent Director gave the weight to each factor that he deemed appropriate in his own judgment. The Independent Directors considered the renewal of the Investment Advisory Agreement on a Fund-by-Fund basis and determined that the renewal of the Investment Advisory Agreement was in the best interests of the shareholders of each Fund. The Independent Directors also determined that the fees charged to each Fund for the services provided were reasonable. Therefore, the Board, including the Independent Directors, determined that continuation of the Investment Advisory Agreement was in the best interests of each Fund.
MANAGEMENT OF THE COMPANY (UNAUDITED)
Information pertaining to the Directors and Officers of the Company is set forth below. The Statement of Additional Information includes additional information about the Directors and is available without charge, upon request, by calling 516-390-5565.
| | | | | | | | |
Name, (Age) and Address1 Position(s) with the Company | | Term of Office2
and Length of
Time Served | | Principal Occupation(s) During Past Five Years | | Number of Portfolios
in Fund Complex Overseen by Director | | Other Directorships Held by Director |
|
INTERESTED DIRECTORS |
David Lerner3 (79) Director, Chairman of the Board, President | | Since 1998 | | Founder, David Lerner Associates, Inc., a registered broker-dealer and the Company’s Distributor; and President, Spirit of America Management Corp., the Company’s investment adviser. | | 6 | | President and a Director of Spirit of America Management Corp., the Company’s investment adviser. |
| | | | |
Daniel Lerner3 (54) Director | | Since 1998 | | Senior Vice President, Investment Counselor with David Lerner Associates, Inc., a registered broker-dealer and the Company’s Distributor, since September 2000. | | 6 | | Director of David Lerner Associates, Inc., a registered broker-dealer and the Company’s Distributor. |
|
INDEPENDENT DIRECTORS |
Allen Kaufman (79) Director | | Since 1998 | | President and Chief Executive Officer of K.G.K. Agency, Inc., a property and casualty insurance agency, since 1963.4 | | 6 | | Director of K.G.K. Agency, Inc., a property and casualty insurance agency. |
| | | | |
Stanley S. Thune (79) Lead Director | | Since 1998 | | President and Chief Executive Officer, Freight Management Systems, Inc., a third party logistics management company, since 1994; private investor. | | 6 | | Director of Freight Management Systems, Inc. |
| | | | |
Richard Weinberger (79) Director | | Since 2005 | | Of Counsel to Ballon Stoll Bader & Nadler, P.C., a mid-sized law firm, since January 2005 to March 2011; Shareholder, Ballon Stoll Bader & Nadler, P.C., January 2000 to December 2004. | | 6 | | None. |
|
OFFICERS |
David Lerner President (see biography above) | | | | | | | | |
| | | | |
Alan P. Chodosh (62) Treasurer and Secretary | | Since 2003
(Treasurer) Since 2005 (Secretary) | | Financial and Operations Officer of David Lerner Associates, Inc. since June 1999. | | N/A | | N/A |
| | | | |
Joseph Pickard (55) Chief Compliance Officer | | Since 2007 | | Chief Compliance Officer of Spirit of America Investment Fund, Inc. and Spirit of America Management Corp. since July 2007; Counsel to the Interested Directors of Spirit of America Investment Fund, Inc. since July 2002; Senior Vice President and General Counsel of David Lerner Associates, Inc. since July 2002. | | N/A | | N/A |
| 1 | All addresses are in c/o Spirit of America Investment Fund, Inc., 477 Jericho Turnpike, Syosset, New York 11791. |
| 2 | Each Director serves for an indefinite term, until his successor is elected. |
| 3 | David Lerner is an “interested” Director, as defined in the 1940 Act, by reason of his positions with the Adviser, and Daniel Lerner is an “interested” Director by reason of his position with the Distributor. Daniel Lerner is the son of David Lerner. |
| 4 | K.G.K. Agency, Inc. provides insurance to David Lerner Associates, Inc. and affiliated entities. However, the Board has determined that Mr. Kaufman is not an “interested” Director because the insurance services are less than $120,000 in value. |
Proxy Voting Information
The Company’s Statement of Additional Information (“SAI”) containing a description of the policies and procedures that the Spirit of America Large Cap Value Fund uses to determine how to vote proxies relating to portfolio securities, along with the Company’s proxy voting record relating to portfolio securities held during the 12-month period ended June 30 are available (i) without charge, upon request, by calling (516) 390-5565; and (ii) on the SEC’s website at http://www.sec.gov.
Information on Form N-Q
The Company will file its complete schedule of portfolio holdings with the SEC for the first and third quarters of each fiscal year on Form N-Q within sixty days after the end of the period. The Company’s Forms N-Q will be available on the SEC’s website at http://www.sec.gov, and may be reviewed and copied at the SEC’s Public Reference Room in Washington, DC. Information on the operation of the Public Reference Room may be obtained by calling 1-800-SEC-0030.

Investment Adviser
Spirit of America Management Corp.
477 Jericho Turnpike
P.O. Box 9006
Syosset, NY 11791-9006
Distributor
David Lerner Associates, Inc.
477 Jericho Turnpike
P.O. Box 9006
Syosset, NY 11791-9006
Shareholder Services
Ultimus Asset Services, LLC
2960 North Meridian Street, Suite 300
Indianapolis, IN 46208
Custodian
The Huntington National Bank
7 Easton Oval
Columbus, OH 43219
Independent Registered Public Accounting Firm
Tait Weller & Baker LLP
1818 Market Street, Suite 2400
Philadelphia, PA 19103
Counsel
Blank Rome LLP
405 Lexington Avenue
New York, NY 10174
For additional information about the Spirit of America Large Cap Value Fund, call (800) 452-4892 or (516) 390-5565.
This report is submitted for the general information of the shareholders of the Fund. It is not authorized for distribution to prospective investors in the Fund unless preceded or accompanied by an effective Prospectus which includes details regarding the Fund’s objectives, risks, policies, expenses, and other information.
©Copyright 2015 Spirit of America SOALC-AR15

ANNUAL REPORT
DECEMBER 31, 2015

MESSAGE TO OUR SHAREHOLDERS
Dear Shareholder,
We are very pleased to provide the 2015 Annual report for the Spirit of America Municipal Tax Free Bond Fund, (“the Fund”). We look forward to the continued inflows and further development of the Fund.
Our many years of experience in the municipal bond market have helped us to pursue a balance between yield and risk. Our goal is to continue seeking high current income that is exempt from federal income tax, while employing a relatively conservative approach to investing in the municipal market. Although the mandate of the Fund allows it to invest in lower rated securities, at this time, the focus will continue to be investing in bonds which are investment grade.
We appreciate your support of our fund and look forward to your future investment in the Spirit of America Municipal Tax Free Bond Fund.
Thank you for being a part of the Spirit of America Family of Funds.
Sincerely,
| | | | | | |
 | |  | |  | |  |
| | David Lerner | | | Douglas Revello |
| | President | | | Portfolio Manager |
| | Spirit of America Investment Fund, Inc. | | | | |
| | | | |
| MUNICIPAL TAX FREE BOND FUND | | | 1 | |
MANAGEMENT DISCUSSION (UNAUDITED)
Economic Summary
The Federal Reserve raised rates to a range between 0.25% and 0.5% signaling the beginning of the end for the central bank’s stimulus program as anticipated during their December meeting. Fed officials emphasized that they intend to raise rates gradually and only if economic growth continues. They are predicting that if all goes smoothly short-term rates may rise by about one percentage point a year for the next three years.
At the end of December the Department of Commerce revised the U.S. gross domestic product (GDP) for the 3rd quarter of 2015 up to a 2.0% annual pace. The increase in GDP this quarter primarily reflected positive contributions from personal consumption, nonresidential fixed investment, state and local spending, residential fixed investment, and exports that were partly offset by a negative contribution from private inventory investment and an increase in imports. In the 2nd quarter GDP increased by a 3.9% pace following the 0.02% contraction in the 1st quarter.
The latest employment data released by the Bureau of Labor Statistics in the December jobs report shows total nonfarm payroll employment rose by 292,000 jobs. In 2015, payroll employment growth totaled 2.7 million, compared with 3.1 million in 2014. The unemployment rate was 5.0%, down by 0.6% over the past 12 months.
Market Commentary
The 2015 municipal bond issuance volume totaled $397.7 billion, significantly higher than the previous two years and the highest figure since 2010. Supply outpaced demand in the beginning months of the year, as issuers were concerned that interest rates would increase in the second half of the year. In the second half of the year the supply/demand dynamic reversed as demand began to outpace supply.
Despite the apparent minimal movement of the Municipal Market Data (MMD) Tax-Free 30 Year AAA yield from 2.83 on 1/2/15 to a 2.82 on 12/31/15, when broken down by a quarter by quarter basis it reveals significant movement throughout the year. In the 1st quarter the Municipal Market Data (MMD) Tax-Free 30 Year AAA yield remained relatively stable opening at 2.83 on 1/2/15 and ending at 2.80 on 3/31/15. However, in the 2nd quarter, the yield began to steadily climb, reaching 3.28 on 6/30/15, as supply outpaced demand.
As reported on Bloomberg, “Bond sales fell off the record pace to start the year during the final months of 2015 as the Fed prepared to increase borrowing costs for the first time in almost a decade. That flipped net issuance into negative territory.” In the 3rd quarter, the MMD yield rallied from its 3.28 level to 3.04 on 9/30/15. The lack of new debt coupled with increased demand in the second half of the year helped keep municipal yields low, ending the year with a 2.82 yield.
In 2015 the 30 Year US Treasury yield moved 33 basis points from a 2.69 on 1/2/15 to a 3.02 on 12/31/15.
Fund Summary
The Spirit of America Municipal Tax Free Bond Fund’s (SOAMX), (“the Fund”), seeks to provide high current income that is exempt from federal income tax, including alternative minimum tax. The Fund focuses on quality credits in the municipal market. We are pursuing a balance between yield and risk.
As a Municipal Bond Fund, the mandate allows the Fund to invest in lower rated securities; however we have kept our focus on investing in bonds that are investment grade. Our plan is to continue with this relatively conservative approach to investing in the municipal market.
MANAGEMENT DISCUSSION (UNAUDITED) (CONT.)
In keeping with this philosophy, the Fund has been able to maintain attractive yields without venturing into the speculative, below investment grade, segment of the municipal market. As of December 31, 2015, approximately 96.18% of the portfolio was above investment grade, with 91.59% rated “A” or better. The average rating of holdings in the Fund is A1/A+.
One of the Fund’s goals has been to diversify with respect to geographic location and sector. As of the end of December 2015, the Fund consists of 336 different positions varied across 44 states, 2 territories and the District of Columbia. The holdings range throughout various sectors, including areas such as: general obligations, healthcare, education, industrial development and other public improvement bonds.
While it certainly has not been a primary goal of the Fund, we have been able to maintain a percentage of bonds in states and territories which have a state tax exemption in New York, New Jersey and Connecticut, where a majority of our clients reside. Additionally, Puerto Rico bonds are exempt from state tax. Due to the struggles Puerto Rico has been facing, the Fund has actively managed its Puerto Rico holdings. As of December 31, 2015, Puerto Rico holdings represent 1.67% of the portfolio, down from 3.64% at the end of 2014.
| | | | |
| MUNICIPAL TAX FREE BOND FUND | | | 3 | |
MANAGEMENT DISCUSSION (UNAUDITED) (CONT.)
Return Summary
The Fund’s Net Asset Value (NAV) went from $9.64 to $9.57 during 2015. The Fund is currently at $102.62 million in net assets with 3,696 shareholder accounts as of December 31, 2015.
The Fund had a total one year return of 3.94% (no load, gross of fees) for 2015. This compares to the 3.30% return of its benchmark, the Barclays Municipal Bond Index, for the same period. That result does not take the Fund’s sales charge and expense ratio into account. The main factor that led to the funds outperformance of the index was the security selection.
Including the sales charge and expenses, as of December 31, 2015, the Fund’s one year return was -1.89%. The fund had an annualized five year return of 4.33% and an annualized return since inception of 3.64%.
Our plan is to proceed with the same strategy that we have utilized since the Fund’s inception. We will continue to seek out municipal bonds that provide a balance between credit risk and the potential to offer high current income and consistently attractive yields.
Ratings are provided by Moody’s Investor Services and Standard & Poor’s. The Moody’s ratings in the following ratings explanations are in parenthesis.
AAA (Aaa) - The highest rating assigned by Moody’s and S&P. Capacity to pay interest and repay principal is extremely strong.
AA (Aa) - Debt has a very strong capacity to pay interest and repay principal and differs from the highest rated issues only in a small degree.
A - Debt rated “A” has a strong capacity to pay interest and repay principal, although it is somewhat more susceptible to the adverse effects of changes in circumstances and economic conditions than debt in higher-rated categories.
BBB (Baa) - Debt is regarded as having an adequate capacity to pay interest and repay principal. These ratings by Moody’s and S&P are the “cut-off” for a bond to be considered investment grade. Whereas debt normally exhibits adequate protection parameters, adverse economic conditions or changing circumstances are more likely to lead to a weakened capacity to pay interest and repay principal in this category than in higher-rated categories.
BB (Bb), B, CCC (Ccc), CC (Cc), C - Debt rated in these categories is regarded as having predominantly speculative characteristics with respect to capacity to pay interest and repay principal. “BB” indicates the least degree of speculation and “C” the highest. While such debt will likely have some quality and protective characteristics, these are outweighed by large uncertainties or market exposure to adverse conditions and are not considered to be investment grade.
D - Debt rated “D” is in payment default. This rating category is used when interest payments or principal payments are not made on the date due, even if the applicable grace period has not expired, unless S&P believes that such payments will be made during such grace period.
Ratings are subject to change.
Ratings apply to the bonds in the portfolio. They do not remove market risk associated with the fund.
Ratings are based on Moody’s and S&P, as applicable. Credit ratings are based largely on the rating agency’s investment analysis at the time of rating and the rating assigned to any particular security is not necessarily a reflection of the issuer’s current financial condition. The rating assigned to a security by a rating agency does not necessarily reflect its assessment of the volatility of a security’s market value or of the liquidity of an investment in the security. If securities are rated differently by the rating agencies, the higher of the two rating is applied thus improving the overall evaluation of the portfolio.
ILLUSTRATION OF INVESTMENT (UNAUDITED)
Summary of Portfolio Holdings (Unaudited)
As of December 31, 2015
| | | | | | | | |
| New York | | | 24.77 | % | | $ | 25,303,805 | |
| New Jersey | | | 11.79 | % | | $ | 12,048,889 | |
| Connecticut | | | 10.31 | % | | $ | 10,530,738 | |
| Florida | | | 7.30 | % | | $ | 7,458,225 | |
| Pennsylvania | | | 6.93 | % | | $ | 7,078,328 | |
| Texas | | | 3.72 | % | | $ | 3,803,228 | |
| Michigan | | | 3.29 | % | | $ | 3,359,428 | |
| Indiana | | | 2.89 | % | | $ | 2,955,694 | |
| California | | | 2.44 | % | | $ | 2,490,582 | |
| Rhode Island | | | 1.94 | % | | $ | 1,985,592 | |
| Washington | | | 1.93 | % | | $ | 1,967,730 | |
| Maryland | | | 1.84 | % | | $ | 1,874,856 | |
| Georgia | | | 1.76 | % | | $ | 1,800,157 | |
| Puerto Rico | | | 1.67 | % | | $ | 1,711,148 | |
| New Mexico | | | 1.63 | % | | $ | 1,667,819 | |
| Illinois | | | 1.47 | % | | $ | 1,501,395 | |
| District of Columbia | | | 1.16 | % | | $ | 1,188,267 | |
| Maine | | | 1.10 | % | | $ | 1,123,276 | |
| Massachusetts | | | 1.01 | % | | $ | 1,032,029 | |
| Missouri | | | 0.99 | % | | $ | 1,009,371 | |
| Louisiana | | | 0.89 | % | | $ | 907,103 | |
| Ohio | | | 0.71 | % | | $ | 721,839 | |
| North Carolina | | | 0.70 | % | | $ | 719,590 | |
| Alaska | | | 0.65 | % | | $ | 662,956 | |
| Wisconsin | | | 0.60 | % | | $ | 615,574 | |
| Colorado | | | 0.60 | % | | $ | 614,500 | |
| West Virginia | | | 0.49 | % | | $ | 502,766 | |
| Wyoming | | | 0.49 | % | | $ | 498,435 | |
| Virginia | | | 0.48 | % | | $ | 492,510 | |
| Utah | | | 0.40 | % | | $ | 409,259 | |
| Kentucky | | | 0.36 | % | | $ | 371,836 | |
| Oregon | | | 0.36 | % | | $ | 370,297 | |
| Tennessee | | | 0.33 | % | | $ | 341,119 | |
| Iowa | | | 0.33 | % | | $ | 337,974 | |
| Nebraska | | | 0.29 | % | | $ | 294,585 | |
| Mississippi | | | 0.27 | % | | $ | 280,367 | |
| Kansas | | | 0.27 | % | | $ | 275,770 | |
| Oklahoma | | | 0.25 | % | | $ | 259,573 | |
| Vermont | | | 0.24 | % | | $ | 244,811 | |
| Arizona | | | 0.22 | % | | $ | 222,653 | |
| New Hampshire | | | 0.12 | % | | $ | 117,912 | |
| Virgin Islands | | | 0.11 | % | | $ | 110,138 | |
| Alabama | | | 0.11 | % | | $ | 108,286 | |
| Nevada | | | 0.10 | % | | $ | 105,628 | |
| North Dakota | | | 0.10 | % | | $ | 99,779 | |
| South Carolina | | | 0.05 | % | | $ | 54,780 | |
| Hawaii | | | 0.04 | % | | $ | 44,978 | |
| Money Market | | | 0.50 | % | | $ | 515,330 | |
| Total Investments | | | 100.00 | % | | $ | 102,190,905 | |
| | | | |
| MUNICIPAL TAX FREE BOND FUND | | | 5 | |
ILLUSTRATION OF INVESTMENT (UNAUDITED) (CONT.)
Average Annual Returns (Unaudited)
(For the Periods Ended December 31, 2015)
| | | | | | | | | | | | |
| | | | |
| | | 1 Year | | | 5 Year | | | Since
Inception (February 29,
2008) | |
Spirit of America Municipal Tax Free
Bond Fund (NAV) | | | 3.01% | | | | 5.35% | | | | 4.29% | |
Spirit of America Municipal Tax Free
Bond Fund (POP) | | | (1.89)% | | | | 4.33% | | | | 3.64% | |
| Barclays Municipal Bond Index | | | 3.30% | | | | 5.35% | | | | 5.21% | |
NAV represents the Net Asset Value. Returns at NAV do not reflect the maximum 4.75% sales charge. POP represents Public Offering Price and returns at POP do reflect the maximum 4.75% sales charge. Total returns for periods less than one year are not annualized.
Performance data quoted represents past performance; past performance is no guarantee of future results.
The investment return and principal value of an investment will fluctuate so that an investor’s shares, when redeemed, may be worth more or less than their original cost. Current performance may be lower or higher than the performance quoted.
Growth of $10,000 (Unaudited)
(includes one-time 4.75% maximum sales charge and reinvestment of all distributions)
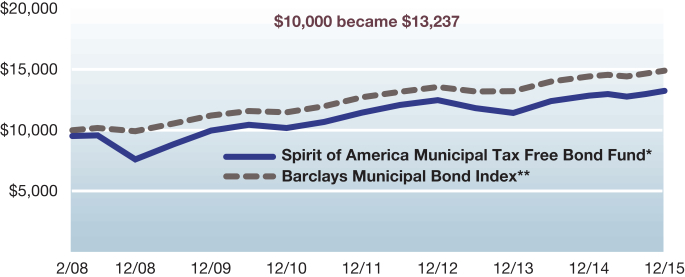
| * | Fund commenced operations February 29, 2008. |
| ** | The Barclays Municipal Bond Index benchmark is based on a start date of February 29, 2008. |
Past performance does not guarantee future results. The performance data quoted represents past performance and current returns may be lower or higher. The investment return and net asset value will fluctuate so that an investor’s shares, when redeemed may be worth more or less than the original cost. To obtain performance information current to the most recent month-end, please call 1-800-452-4892.
The Barclays Municipal Bond Index is an unmanaged index. The performance of an index assumes no transaction costs, taxes, management fees or other expenses. A direct investment in an index is not possible.
DISCLOSURE OF FUND EXPENSES (UNAUDITED)
FOR THE SIX MONTH PERIOD JULY 1, 2015 TO DECEMBER 31, 2015
We believe it is important for you to understand the impact of fees regarding your investment. All mutual funds have operating expenses. As a shareholder of the Fund, you incur ongoing costs, which include costs for portfolio management, administrative services, and shareholder reports (like this one), among others. Operating expenses, which are deducted from the Fund’s gross income, directly reduce the investment return of the Fund.
The Fund’s expenses are expressed as a percentage of its average net assets. This figure is known as the expense ratio. The following examples are intended to help you understand the ongoing fees (in dollars) of investing in your Fund and to compare these costs with those of other mutual funds. The examples are based on an investment of $1,000 made at the beginning of the period shown and held for the six month period, July 1, 2015 to December 31, 2015.
Spirit of America Municipal Tax Free Bond Fund
| | | | | | | | | | | | | | | | |
| | | Beginning
Account Value
July 1, 2015 | | | Ending Account Value December 31,
2015 | | | Expense Ratio(1) | | | Expenses
Paid During
Period(2) | |
Actual Fund Return | | $ | 1,000.00 | | | $ | 1,037.10 | | | | 0.90 | % | | $ | 4.62 | |
Hypothetical 5% Return | | $ | 1,000.00 | | | $ | 1,020.67 | | | | 0.90 | % | | $ | 4.58 | |
This table illustrates your Fund’s costs in two ways:
Actual Fund Return: This section helps you to estimate the actual expenses that you paid over the period. The “Ending Account Value” shown is derived from the Fund’s actual return, the third column shows the period’s annualized expense ratio, and the last column shows the dollar amount that would have been paid by an investor who started with $1,000 in the Fund at the beginning of the period. You may use the information here, together with your account value, to estimate the expenses that you paid over the period.
To do so, simply divide your account value by $1,000 (for example, an $8,600 account value divided by $1,000 = 8.6), then multiply the result by the number in the first line under the heading entitled “Expenses Paid During Period.”
Hypothetical 5% Return: This section is intended to help you compare your Fund’s costs with those of other mutual funds. It assumes that the Fund had a return of 5% before expenses during the period shown, but that the expense ratio is unchanged. In this case, because the return used is not the Fund’s actual return, the results do not apply to your investment. You can assess your Fund’s costs by comparing this hypothetical example with the hypothetical examples that appear in shareholder reports of other funds.
Please note that the expenses shown in the table are meant to highlight your ongoing costs only and do not reflect any transactional costs such as sales charges (loads), or redemption fees.
| (1) | Annualized, based on the Fund’s most recent half-year expenses. |
| (2) | Expenses are equal to the Fund’s annualized expense ratio multiplied by the average account value over the period, multiplied by the number of days in the period (184), then divided by 365. |
| | | | |
| MUNICIPAL TAX FREE BOND FUND | | | 7 | |
| | |
| SCHEDULE OF INVESTMENTS | | DECEMBER 31, 2015 |
| | | | | | | | |
| | | Principal
Amount | | | Market Value | |
| Municipal Bonds 98.90% | |
|
Alabama 0.11% | |
Cullman County Health Care Authority, Refunding Revenue Bonds, Series A, Callable 02/01/19 @ 100, (OID), 6.75%, 02/01/29 | | $ | 100,000 | | | $ | 108,286 | |
|
Alaska 0.65% | |
Alaska Housing Finance Corp., State Single-Family Housing, Revenue Bonds, Series A, Callable 06/01/21 @ 100, (OID), 4.25%, 12/01/40 | | | 100,000 | | | | 103,262 | |
Alaska Housing Finance Corp., State Single-Family Housing, Revenue Bonds, Series A, Callable 06/01/21 @ 100, (OID), 4.13%, 12/01/37 | | | 100,000 | | | | 103,174 | |
Northern Tobacco Securitization Corp., Refunding Revenue Bonds, Series A, Callable 01/22/16 @ 100, (OID), 5.00%, 06/01/32 | | | 500,000 | | | | 456,520 | |
| | | | 662,956 | |
|
Arizona 0.22% | |
Arizona Health Facilities Authority, Refunding Revenue Bonds, Callable 07/01/19 @ 100, (OID), 5.00%, 07/01/28 | | | 100,000 | | | | 110,766 | |
State of Arizona Lottery Revenue, Public Improvements Revenue Bonds, Series A, Callable 01/01/20 @ 100, (AGM), 5.00%, 07/01/28 | | | 100,000 | | | | 111,887 | |
| | | | 222,653 | |
|
California 2.42% | |
California Educational Facilities Authority, University & College Improvements, Revenue Bonds, Callable 10/01/21 @ 100, (OID), 6.13%, 10/01/30 | | | 250,000 | | | | 302,147 | |
City of Los Angeles, CA Wastewater System Revenue, Refunding Revenue Bonds, Subseries B, Callable 06/01/22 @ 100, (OID), 3.38%, 06/01/29 | | | 100,000 | | | | 103,466 | |
County of San Bernardino, CA, Refunding Bonds, Certificate of Participation, Series A, Callable 08/01/19 @ 100, (OID), 5.25%, 08/01/26 | | | 50,000 | | | | 56,029 | |
County of San Bernardino, CA, Refunding Bonds, Certificate of Participation, Series A, Callable 08/01/19 @ 100, 5.50%, 08/01/22 | | | 250,000 | | | | 284,812 | |
San Francisco, CA Bay Area Rapid Transit, Public & Highway Improvements, General Obligation Unlimited, 5.00%, 08/01/33 | | | 250,000 | | | | 302,437 | |
See accompanying notes which are an integral part of these financial statements.
| | |
| SCHEDULE OF INVESTMENTS (CONT.) | | DECEMBER 31, 2015 |
| | | | | | | | |
| | | Principal
Amount | | | Market Value | |
|
California (cont.) | |
State of California, Public Improvements, General Obligation Unlimited, Callable 04/01/19 @ 100, (OID), 6.00%, 04/01/38 | | $ | 100,000 | | | $ | 115,603 | |
State of California, Port, Airport & Marina Improvements, General Obligation Unlimited, Callable 11/01/20 @ 100, (OID), 5.25%, 11/01/30 | | | 250,000 | | | | 293,170 | |
State of California, General Obligation Unlimited, Callable 08/01/25 @ 100, 5.00%, 08/01/29 | | | 250,000 | | | | 304,797 | |
State of California, Refunding Bonds, General Obligation Unlimited, Callable 08/01/18 @ 100, (OID), 5.00%, 08/01/34 | | | 500,000 | | | | 546,995 | |
Washington Township Health Care District, Hospital Improvements, General Obligation Unlimited, Series A, Callable 08/01/19 @ 100, (OID), 5.25%, 08/01/28 | | | 140,000 | | | | 158,493 | |
Washington Township Health Care District, Hospital Improvements, General Obligation Unlimited, Series A, Callable 08/01/19 @ 100, (OID), 5.00%, 08/01/20 | | | 20,000 | | | | 22,633 | |
| | | | 2,490,582 | |
|
Colorado 0.60% | |
Colorado Health Facilities Authority, Refunding Revenue Bonds, Series B, Callable 01/01/20 @ 100, 5.25%, 01/01/30 | | | 100,000 | | | | 113,460 | |
Montrose Memorial Hospital, Inc., Hospital Improvements, Revenue Bonds, Callable 02/08/16 @ 100, (OID), 6.00%, 12/01/33 | | | 500,000 | | | | 501,040 | |
| | | | 614,500 | |
|
Connecticut 10.24% | |
Connecticut Housing Finance Authority, Refunding Revenue Bonds, Subseries E-1, Callable 05/15/20 @ 100, (GO OF AUTH), 4.88%, 11/15/46 | | | 100,000 | | | | 104,194 | |
Connecticut Housing Finance Authority, Refunding Revenue Bonds, Series E-2, Callable 05/15/21 @ 100, (GO OF AUTH) (OID), 4.63%, 11/15/41 | | | 30,000 | | | | 30,376 | |
Connecticut Housing Finance Authority, Refunding Revenue Bonds, Series G-REMK 11/15/12, Callable 05/15/22 @ 100, 3.05%, 05/15/31 | | | 250,000 | | | | 236,310 | |
Connecticut Housing Finance Authority, Multi-Family Housing, Revenue Bonds, Subseries F-1, Callable 05/15/21 @ 100, (GO OF AUTH), 4.63%, 11/15/41 | | | 215,000 | | | | 223,834 | |
Connecticut Housing Finance Authority, State Single-Family Housing, Revenue Bonds, Subseries C-1, Callable 05/15/21 @ 100, 3.50%, 05/15/31 | | | 250,000 | | | | 251,025 | |
See accompanying notes which are an integral part of these financial statements.
| | | | |
| MUNICIPAL TAX FREE BOND FUND | | | 9 | |
| | |
| SCHEDULE OF INVESTMENTS (CONT.) | | DECEMBER 31, 2015 |
| | | | | | | | |
| | | Principal
Amount | | | Market Value | |
|
Connecticut (cont.) | |
Connecticut Housing Finance Authority, Refunding Revenue Bonds, Subseries C-1, Callable 05/15/21 @ 100, 3.25%, 11/15/27 | | $ | 150,000 | | | $ | 151,952 | |
Connecticut Housing Finance Authority, Refunding Revenue Bonds, Subseries B-1, Callable 05/15/21 @ 100, (GO OF AUTH), 3.35%, 05/15/28 | | | 250,000 | | | | 253,613 | |
Connecticut Housing Finance Authority, State Single-Family Housing, Revenue Bonds, Subseries D-1, Callable 05/15/21 @ 100, 4.00%, 11/15/34 | | | 250,000 | | | | 255,620 | |
Connecticut Housing Finance Authority, State Single-Family Housing, Revenue Bonds, Subseries D-2, Callable 05/15/21 @ 100, 4.15%, 05/15/42 | | | 250,000 | | | | 254,440 | |
Connecticut Housing Finance Authority, Refunding Revenue Bonds, Subseries G-1, Callable 11/15/21 @ 100, (OID), 3.75%, 11/15/55 | | | 250,000 | | | | 246,423 | |
Connecticut Housing Finance Authority, State Single-Family Housing, Revenue Bonds, Subseries C-1, Callable 05/15/21 @ 100, 3.88%, 11/15/38 | | | 750,000 | | | | 761,407 | |
Connecticut Housing Finance Authority, Refunding Revenue Bonds, Series F-1, Callable 11/15/21 @ 100, (OID), 3.30%, 11/15/37 | | | 250,000 | | | | 237,073 | |
Connecticut Housing Finance Authority, State Single-Family Housing, Revenue Bonds, Subseries C-1, Callable 05/15/21 @ 100, 3.75%, 11/15/35 | | | 500,000 | | | | 504,945 | |
Connecticut State Health & Educational Facility Authority, Revenue Bonds, Callable 07/01/18 @ 100, (BHAC-CR) (NATL-RE) (OID), 5.00%, 07/01/37 | | | 150,000 | | | | 164,463 | |
Connecticut State Health & Educational Facility Authority, Revenue Bonds, Callable 07/01/18 @ 100, (BHAC-CR) (NATL-RE) (OID), 5.00%, 07/01/37 | | | 100,000 | | | | 107,746 | |
Connecticut State Health & Educational Facility Authority, Hospital Improvements, Revenue Bonds, Series E, Callable 07/01/24 @ 100, 5.00%, 07/01/34 | | | 100,000 | | | | 113,284 | |
Connecticut State Health & Educational Facility Authority, University & College Improvements, Revenue Bonds, Series P, Callable 07/01/20 @ 100, 5.00%, 07/01/28 | | | 100,000 | | | | 112,445 | |
Connecticut State Health & Educational Facility Authority, Healthcare, Hospital, & Nursing Home Improvements, Refunding Revenue Bonds, Series A, Callable 07/01/21 @ 100, 5.00%, 07/01/32 | | | 440,000 | | | | 488,202 | |
See accompanying notes which are an integral part of these financial statements.
| | |
| SCHEDULE OF INVESTMENTS (CONT.) | | DECEMBER 31, 2015 |
| | | | | | | | |
| | | Principal
Amount | | | Market Value | |
|
Connecticut (cont.) | |
Connecticut State Health & Educational Facility Authority, University & College Improvements, Revenue Bonds, Series O, Callable 07/01/20 @ 100, (OID), 5.00%, 07/01/40 | | $ | 125,000 | | | $ | 136,849 | |
Connecticut State Health & Educational Facility Authority, University & College Improvements, Revenue Bonds, Series O, Callable 07/01/20 @ 100, (OID), 4.75%, 07/01/30 | | | 100,000 | | | | 109,804 | |
Connecticut State Health & Educational Facility Authority, Private Primary Schools, Revenue Bonds, Series C, Callable 07/01/22 @ 100, 4.00%, 07/01/33 | | | 100,000 | | | | 104,592 | |
Connecticut State Health & Educational Facility Authority, Hospital Improvements, Revenue Bonds, Series J, Callable 07/01/22 @ 100, (OID), 4.25%, 07/01/31 | | | 500,000 | | | | 522,180 | |
Connecticut State Health & Educational Facility Authority, Hospital Improvements, Revenue Bonds, Series J, Callable 07/01/22 @ 100, (OID), 4.50%, 07/01/38 | | | 500,000 | | | | 513,295 | |
Connecticut State Health & Educational Facility Authority, Hospital Improvements, Revenue Bonds, Series B, Callable 07/01/21 @ 100, (AGM) (OID), 4.00%, 07/01/37 | | | 250,000 | | | | 257,575 | |
Connecticut State Health & Educational Facility Authority, Hospital Improvements, Revenue Bonds, Series J, Callable 07/01/22 @ 100, 5.00%, 07/01/42 | | | 500,000 | | | | 536,280 | |
State of Connecticut, General Obligation Unlimited, Series F, Callable 11/15/25 @ 100, 5.00%, 11/15/26 | | | 250,000 | | | | 306,507 | |
State of Connecticut, General Obligation Unlimited, Series B, Callable 06/15/25 @ 100, 5.00%, 06/15/28 | | | 250,000 | | | | 298,787 | |
State of Connecticut, Public Improvements, General Obligation Unlimited, Series B, Callable 04/15/22 @ 100, 4.00%, 04/15/32 | | | 250,000 | | | | 265,075 | |
State of Connecticut, Public Improvements, General Obligation Unlimited, Series A, Callable 03/01/24 @ 100, (OID), 4.00%, 03/01/33 | | | 400,000 | | | | 424,264 | |
State of Connecticut, General Obligation Unlimited, Series B, 5.00%, 06/15/24 | | | 250,000 | | | | 303,015 | |
State of Connecticut Special Tax Revenue, Highway Improvements, Revenue Bonds, Series A, Callable 10/01/23 @ 100, 5.00%, 10/01/30 | | | 250,000 | | | | 293,512 | |
State of Connecticut Special Tax Revenue, Public Improvements, Revenue Bonds, Callable 01/01/23 @ 100, 3.00%, 01/01/33 | | | 1,000,000 | | | | 977,800 | |
State of Connecticut Special Tax Revenue, Public Improvements, Revenue Bonds, Callable 01/01/23 @ 100, 5.00%, 01/01/28 | | | 445,000 | | | | 521,820 | |
See accompanying notes which are an integral part of these financial statements.
| | | | |
| MUNICIPAL TAX FREE BOND FUND | | | 11 | |
| | |
| SCHEDULE OF INVESTMENTS (CONT.) | | DECEMBER 31, 2015 |
| | | | | | | | |
| | | Principal
Amount | | | Market Value | |
|
Connecticut (cont.) | |
State of Connecticut Special Tax Revenue, Highway Improvements, Revenue Bonds, Callable 11/01/20 @ 100, 5.00%, 11/01/22 | | $ | 100,000 | | | $ | 115,960 | |
University of Connecticut, University & College Improvements, Revenue Bonds, Series A, Callable 02/15/24 @ 100, 5.00%, 02/15/34 | | | 250,000 | | | | 289,445 | |
University of Connecticut, University & College Improvements, Revenue Bonds, Series A, Callable 02/15/20 @ 100, (GO OF UNIVERSITY), 5.00%, 02/15/28 | | | 50,000 | | | | 56,626 | |
| | | | 10,530,738 | |
|
District of Columbia 1.16% | |
District of Columbia, Hospital Improvements, Revenue Bonds, Subseries 2, Callable 07/15/18 @ 101, (AGM), 5.45%, 07/15/35 | | | 505,000 | | | | 558,838 | |
District of Columbia Housing Finance Agency, State Multi-Family Housing, Revenue Bonds, Callable 06/15/23 @ 100, (Fannie Mae), 4.45%, 06/15/31 | | | 320,000 | | | | 337,504 | |
District of Columbia Housing Finance Agency, State Single-Family Housing, Revenue Bonds, Callable 12/01/21 @ 100, (Fannie Mae), 4.90%, 06/01/40 | | | 280,000 | | | | 291,925 | |
| | | | 1,188,267 | |
|
Florida 7.26% | |
Citizens Property Insurance Corp., Miscellaneous Purposes, Revenue Bonds, Series A-1, 4.75%, 06/01/20 | | | 150,000 | | | | 169,736 | |
City of Miami, FL, Parking Facility Improvements, Revenue Bonds, Series A, Callable 07/01/20 @ 100, (AGM) (OID), 5.25%, 07/01/35 | | | 105,000 | | | | 117,655 | |
City of Miami, FL, Parking Facility Improvements, Revenue Bonds, Series A, Callable 07/01/20 @ 100, (AGM) (OID), 5.25%, 07/01/39 | | | 125,000 | | | | 138,716 | |
City of Miami, FL Parking System Revenue, Refunding Revenue Bonds, Callable 10/01/19 @ 100, (OID), 5.35%, 10/01/39 | | | 500,000 | | | | 555,795 | |
City of Orlando, FL, Public Improvements, Revenue Bonds, Series B, Callable 10/01/24 @ 100, 5.00%, 10/01/46 | | | 1,000,000 | | | | 1,129,680 | |
County of Miami-Dade, FL, Hospital Improvements, Revenue Bonds, Callable 06/01/19 @ 100, (OID), 5.75%, 06/01/39 | | | 110,000 | | | | 125,018 | |
County of Miami-Dade, FL, Recreational Facility Improvements, Revenue Bonds, Series C, Callable 10/01/19 @ 100, (OID), 5.38%, 10/01/28 | | | 250,000 | | | | 282,630 | |
See accompanying notes which are an integral part of these financial statements.
| | |
| SCHEDULE OF INVESTMENTS (CONT.) | | DECEMBER 31, 2015 |
| | | | | | | | |
| | | Principal
Amount | | | Market Value | |
|
Florida (cont.) | |
County of Miami-Dade, FL, Public Improvements, General Obligation Unlimited, Series B-1, Callable 07/01/18 @ 100, (OID), 5.63%, 07/01/38 | | $ | 250,000 | | | $ | 276,042 | |
County of Miami-Dade, FL Aviation Revenue, Port, Airport & Marina Improvements, Revenue Bonds, Series A, Callable 10/01/20 @ 100, (OID), 5.25%, 10/01/30 | | | 150,000 | | | | 171,920 | |
Escambia County Health Facilities Authority, Hospital Improvements, Revenue Bonds, Callable 08/15/20 @ 100, (OID), 5.50%, 08/15/24 | | | 250,000 | | | | 286,197 | |
Escambia County Health Facilities Authority, Hospital Improvements, Revenue Bonds, Callable 08/15/20 @ 100, (OID), 5.75%, 08/15/29 | | | 160,000 | | | | 184,456 | |
Florida Gulf Coast University Financing Corp., University & College Improvements, Revenue Bonds, Series A, Callable 02/01/21 @ 100, 5.00%, 02/01/28 | | | 100,000 | | | | 112,900 | |
Florida Higher Educational Facilities Financial Authority, University & College Improvements, Refunding Revenue Bonds, Callable 04/01/21 @ 100, (OID), 6.00%, 04/01/26 | | | 130,000 | | | | 151,086 | |
Florida Housing Finance Corp., State Single-Family Housing, Revenue Bonds, Series 2, Callable 07/01/19 @ 100, (Freddie Mac) (Fannie Mae) (Ginnie Mae), 5.00%, 07/01/39 | | | 80,000 | | | | 81,971 | |
Florida Municipal Loan Council, Water Utility Improvements, Revenue Bonds, Series D, Callable 10/01/21 @ 100, (AGM) (OID), 5.50%, 10/01/41 | | | 100,000 | | | | 117,571 | |
Florida Municipal Loan Council, Water Utility Improvements, Revenue Bonds, Series D, Callable 10/01/21 @ 100, (AGM) (OID), 5.25%, 10/01/33 | | | 100,000 | | | | 115,184 | |
FSU Financial Assistance, Inc., State Single-Family Housing, Refunding Revenue Bonds, Series A, Callable 10/01/22 @ 100, 5.00%, 10/01/30 | | | 500,000 | | | | 568,725 | |
Greater Orlando Aviation Authority, Port, Airport & Marina Improvements, Revenue Bonds, Series A, Callable 10/01/20 @ 100, 5.00%, 10/01/25 | | | 200,000 | | | | 231,486 | |
Hillsborough County Industrial Development Authority, School Improvements, Revenue Bonds, Callable 05/15/17 @ 100, 5.13%, 05/15/37 | | | 250,000 | | | | 250,293 | |
JEA Electric System Revenue, Revenue Bonds, Series THREE-B, Callable 10/01/17 @ 100, (OID), 3.75%, 10/01/39 | | | 500,000 | | | | 500,980 | |
JEA Water & Sewer System Revenue, Revenue Bonds, Series B, Callable 10/01/17 @ 100, (OID), 4.00%, 10/01/41 | | | 515,000 | | | | 519,192 | |
JEA Water & Sewer System Revenue, Revenue Bonds, Subseries B, Callable 10/01/17 @ 100, (OID), 3.88%, 10/01/37 | | | 250,000 | | | | 251,723 | |
See accompanying notes which are an integral part of these financial statements.
| | | | |
| MUNICIPAL TAX FREE BOND FUND | | | 13 | |
| | |
| SCHEDULE OF INVESTMENTS (CONT.) | | DECEMBER 31, 2015 |
| | | | | | | | |
| | | Principal
Amount | | | Market Value | |
|
Florida (cont.) | |
Miami-Dade County Educational Facilities Authority, University & College Improvements, Revenue Bonds, Series B, (AMBAC), 5.25%, 04/01/31 | | $ | 260,000 | | | $ | 327,460 | |
North Sumter County Utility Dependent District, Water & Utility Improvements, Revenue Bonds, Callable 10/01/20 @ 100, (AGM) (OID), 5.38%, 10/01/40 | | | 400,000 | | | | 449,524 | |
Orange County Health Facilities Authority, Hospital Improvements, Revenue Bonds, 5.25%, 10/01/19 | | | 160,000 | | | | 179,731 | |
Palm Beach County School District, Refunding Bonds, Certificate of Participation, Series A, Callable 08/01/21 @ 100, 5.00%, 08/01/24 | | | 45,000 | | | | 52,210 | |
Tampa-Hillsborough County Expressway Authority, Refunding Revenue Bonds, Series A, Callable 07/01/22 @ 100, 5.00%, 07/01/37 | | | 100,000 | | | | 110,344 | |
| | | | 7,458,225 | |
|
Georgia 1.75% | |
Albany-Dougherty Inner City Authority, University & College Improvements, Revenue Bonds, Callable 07/01/20 @ 100, 5.00%, 07/01/35 | | | 250,000 | | | | 273,698 | |
Albany-Dougherty Payroll Development Authority, University & College Improvements, Revenue Bonds, Callable 06/15/20 @ 100, (AGM) (OID), 5.50%, 06/15/36 | | | 325,000 | | | | 376,259 | |
City of Atlanta, GA Water & Wastewater Revenue, Refunding Revenue Bonds, Callable 05/01/25 @ 100, 5.00%, 11/01/34 | | | 200,000 | | | | 235,506 | |
City of Atlanta, GA Water & Wastewater Revenue, Refunding Revenue Bonds, Series B, Callable 11/01/19 @ 100, (AGM) (OID), 5.38%, 11/01/39 | | | 250,000 | | | | 280,185 | |
Fulton County Development Authority, Refunding Revenue Bonds, Callable 10/01/22 @ 100, (OID), 4.25%, 10/01/37 | | | 100,000 | | | | 106,064 | |
Fulton County Development Authority, Refunding Revenue Bonds, 5.00%, 10/01/22 | | | 150,000 | | | | 178,016 | |
Fulton County Development Authority, University & College Improvements, Revenue Bonds, Callable 04/01/21 @ 100, (OID), 5.75%, 10/01/31 | | | 50,000 | | | | 59,194 | |
Fulton County Development Authority, University & College Improvements, Revenue Bonds, Callable 04/01/21 @ 100, (OID), 5.75%, 10/01/41 | | | 250,000 | | | | 291,235 | |
| | | | 1,800,157 | |
See accompanying notes which are an integral part of these financial statements.
| | |
| SCHEDULE OF INVESTMENTS (CONT.) | | DECEMBER 31, 2015 |
| | | | | | | | |
| | | Principal
Amount | | | Market Value | |
|
Hawaii 0.04% | |
Hawai’i Pacific Health, Hospital Improvements, Revenue Bonds, Series B, Callable 07/01/20 @ 100, (OID), 5.75%, 07/01/40 | | $ | 40,000 | | | $ | 44,978 | |
|
Illinois 1.46% | |
Illinois Finance Authority, Refunding Revenue Bonds, Series A, Callable 02/15/20 @ 100, (OID), 6.00%, 08/15/38 | | | 175,000 | | | | 192,021 | |
Illinois Finance Authority, Hospital Improvements, Revenue Bonds, Series A, Callable 08/15/21 @ 100, (OID), 5.88%, 08/15/34 | | | 100,000 | | | | 118,418 | |
Illinois Finance Authority, Hospital Improvements, Revenue Bonds, Series A, Callable 08/15/18 @ 100, (OID), 5.25%, 08/15/47 | | | 250,000 | | | | 263,553 | |
Illinois Finance Authority, Refunding Revenue Bonds, Series A, Callable 02/15/20 @ 100, (OID), 5.50%, 08/15/24 | | | 215,000 | | | | 239,940 | |
Railsplitter Tobacco Settlement Authority, Public Improvements, Revenue Bonds, Callable 06/01/21 @ 100, (OID), 6.00%, 06/01/28 | | | 250,000 | | | | 295,482 | |
Railsplitter Tobacco Settlement Authority, Public Improvements, Revenue Bonds, (OID), 5.13%, 06/01/19 | | | 250,000 | | | | 277,400 | |
University of Illinois, University & College Improvements, Revenue Bonds, Series A, Callable 04/01/21 @ 100, 5.50%, 04/01/31 | | | 100,000 | | | | 114,581 | |
| | | | 1,501,395 | |
|
Indiana 2.88% | |
Indiana Finance Authority, Refunding Revenue Bonds, Series A, Callable 12/01/19 @ 100, (OID), 5.25%, 12/01/38 | | | 265,000 | | | | 294,958 | |
Indiana Finance Authority, Refunding Revenue Bonds, Series A, Callable 05/01/19 @ 100, (OID), 5.75%, 05/01/31 | | | 115,000 | | | | 129,729 | |
Indiana Finance Authority, Hospital Improvements, Revenue Bonds, Callable 11/01/19 @ 100, (OID), 5.25%, 11/01/39 | | | 250,000 | | | | 278,167 | |
Town of Munster, IN, Public Improvements, Tax Allocation Bonds, Callable 07/15/21 @ 100, (OID), 5.13%, 01/15/31 | | | 2,000,000 | | | | 2,252,840 | |
| | | | 2,955,694 | |
|
Iowa 0.33% | |
Iowa Finance Authority, Revenue Bonds, Series A-REMK, Callable 08/15/19 @ 100, (OID), 5.38%, 08/15/29 | | | 300,000 | | | | 337,974 | |
See accompanying notes which are an integral part of these financial statements.
| | | | |
| MUNICIPAL TAX FREE BOND FUND | | | 15 | |
| | |
| SCHEDULE OF INVESTMENTS (CONT.) | | DECEMBER 31, 2015 |
| | | | | | | | |
| | | Principal
Amount | | | Market Value | |
|
Kansas 0.27% | |
Kansas Development Finance Authority, Refunding Revenue Bonds, Series A, Callable 01/01/20 @ 100, 5.00%, 01/01/35 | | $ | 250,000 | | | $ | 275,770 | |
|
Kentucky 0.36% | |
Kentucky Municipal Power Agency, Electric Lights & Power Improvements, Revenue Bonds, Series A, Callable 09/01/20 @ 100, (AGM), 5.00%, 09/01/23 | | | 325,000 | | | | 371,836 | |
|
Louisiana 0.88% | |
Louisiana Local Government Environmental Facilities & Community Development Authority, Sewer Improvements, Revenue Bonds, Callable 02/01/23 @ 100, (OID), 4.00%, 02/01/48 | | | 500,000 | | | | 507,690 | |
Louisiana Local Government Environmental Facilities & Community Development Authority, Sewer Improvements, Revenue Bonds, Callable 02/01/23 @ 100, 5.00%, 02/01/35 | | | 100,000 | | | | 112,993 | |
Louisiana Public Facilities Authority, Refunding Revenue Bonds, Series A, Callable 07/01/19 @ 100, (OID), 6.00%, 07/01/29 | | | 250,000 | | | | 286,420 | |
| | | | 907,103 | |
|
Maine 1.09% | |
Maine Health & Higher Educational Facilities Authority, Refunding Revenue Bonds, Callable 07/01/22 @ 100, (OID), 3.63%, 07/01/41 | | | 500,000 | | | | 505,915 | |
Maine State Housing Authority, State Single-Family Housing, Revenue Bonds, Series D-2, Callable 11/15/22 @ 100, 4.50%, 11/15/37 | | | 250,000 | | | | 259,625 | |
Maine State Housing Authority, State Single-Family Housing, Revenue Bonds, Series A-3, Callable 11/15/24 @ 100, 3.75%, 11/15/44 | | | 100,000 | | | | 96,906 | |
Maine State Housing Authority, State Single-Family Housing, Revenue Bonds, Series B, Callable 11/15/22 @ 100, 3.45%, 11/15/32 | | | 100,000 | | | | 100,011 | |
Maine State Housing Authority, State Single-Family Housing, Revenue Bonds, Series B, Callable 11/15/22 @ 100, 3.60%, 11/15/36 | | | 100,000 | | | | 99,706 | |
Maine Turnpike Authority, Refunding Revenue Bonds, Callable 07/01/25 @ 100, 5.00%, 07/01/26 | | | 50,000 | | | | 61,113 | |
| | | | 1,123,276 | |
See accompanying notes which are an integral part of these financial statements.
| | |
| SCHEDULE OF INVESTMENTS (CONT.) | | DECEMBER 31, 2015 |
| | | | | | | | |
| | | Principal
Amount | | | Market Value | |
|
Maryland 1.82% | |
Maryland Community Development Administration, State Single-Family Housing, Revenue Bonds, Series B, Callable 09/01/18 @ 100, 4.75%, 09/01/39 | | $ | 250,000 | | | $ | 257,200 | |
Maryland Economic Development Corp., Port, Airport & Marina Improvements, Revenue Bonds, Series B, Callable 06/01/20 @ 100, (OID), 5.75%, 06/01/35 | | | 445,000 | | | | 487,413 | |
Maryland Economic Development Corp., Port, Airport & Marina Improvements, Revenue Bonds, Series B, Callable 06/01/20 @ 100, (OID), 5.38%, 06/01/25 | | | 500,000 | | | | 546,680 | |
Maryland Health & Higher Educational Facilities Authority, Hospital Improvements, Revenue Bonds, Callable 05/15/16 @ 100, 5.25%, 05/15/46 | | | 165,000 | | | | 167,911 | |
Maryland Health & Higher Educational Facilities Authority, Hospital Improvements, Revenue Bonds, Callable 05/15/20 @ 100, (OID), 4.63%, 05/15/35 | | | 60,000 | | | | 65,077 | |
Montgomery County Housing Opportunities Commission, Revenue Bonds, Series B, Callable 01/01/22 @ 100, (Freddie Mac) (Fannie Mae) (Ginnie Mae), 3.63%, 07/01/33 | | | 345,000 | | | | 350,575 | |
| | | | 1,874,856 | |
|
Massachusetts 1.00% | |
Massachusetts Educational Financing Authority, Refunding Revenue Bonds, Series A, Callable 01/01/20 @ 100, (OID), 5.25%, 01/01/29 | | | 60,000 | | | | 64,340 | |
Massachusetts Educational Financing Authority, Refunding Revenue Bonds, Series A, Callable 01/01/20 @ 100, (OID), 5.20%, 01/01/27 | | | 135,000 | | | | 144,956 | |
Massachusetts Health & Educational Facilities Authority, Healthcare, Hospital, & Nursing Home Improvements, Refunding Revenue Bonds, Series C, Callable 07/01/20 @ 100, (OID), 5.00%, 07/01/30 | | | 130,000 | | | | 138,642 | |
Massachusetts Health & Educational Facilities Authority, Refunding Revenue Bonds, Series C, 4.25%, 07/01/18 | | | 150,000 | | | | 158,933 | |
Massachusetts Housing Finance Agency, State Multi-Family Housing, Revenue Bonds, Series A, Callable 06/01/20 @ 100, (FHA) (INS), 5.25%, 12/01/35 | | | 175,000 | | | | 190,402 | |
Massachusetts Housing Finance Agency, State Multi-Family Housing, Revenue Bonds, Series C, Callable 06/01/19 @ 100, 5.13%, 12/01/39 | | | 100,000 | | | | 104,742 | |
Massachusetts Housing Finance Agency, State Multi-Family Housing, Revenue Bonds, Series C, Callable 06/01/19 @ 100, 4.85%, 12/01/29 | | | 100,000 | | | | 105,198 | |
See accompanying notes which are an integral part of these financial statements.
| | | | |
| MUNICIPAL TAX FREE BOND FUND | | | 17 | |
| | |
| SCHEDULE OF INVESTMENTS (CONT.) | | DECEMBER 31, 2015 |
| | | | | | | | |
| | | Principal
Amount | | | Market Value | |
|
Massachusetts (cont.) | |
Massachusetts School Building Authority, Revenue Bonds, Series C, Callable 08/15/25 @ 100, 5.00%, 08/15/26 | | $ | 100,000 | | | $ | 124,816 | |
| | | | 1,032,029 | |
|
Michigan 3.27% | |
Michigan Public Educational Facilities Authority, School Improvements, Refunding Revenue Bonds, Series A, Callable 02/08/16 @ 100, 6.00%, 12/01/35 | | | 500,000 | | | | 496,525 | |
Michigan State Building Authority, Refunding Revenue Bonds, Series I-A, Callable 10/15/21 @ 100, (OID), 5.38%, 10/15/36 | | | 100,000 | | | | 114,845 | |
Michigan State Building Authority, Refunding Revenue Bonds, Series I-A, Callable 10/15/21 @ 100, (OID), 5.20%, 10/15/31 | | | 750,000 | �� | | | 862,590 | |
Michigan State Housing Development Authority, State Multi-Family Housing, Revenue Bonds, Series A2, Callable 04/01/22 @ 100, (GO OF AUTH), 4.50%, 10/01/36 | | | 710,000 | | | | 729,184 | |
Michigan State Housing Development Authority, State Multi-Family Housing, Revenue Bonds, Series A, Callable 06/01/21 @ 100, (GO OF AUTH), 4.60%, 12/01/26 | | | 70,000 | | | | 73,864 | |
Michigan Tobacco Settlement Finance Authority, Refunding Revenue Bonds, Series A, Callable 06/01/18 @ 100, (OID), 6.88%, 06/01/42 | | | 250,000 | | | | 256,210 | |
Michigan Tobacco Settlement Finance Authority, Miscellaneous Purposes, Revenue Bonds, Series A, Callable 06/01/17 @ 100, (OID), 6.00%, 06/01/48 | | | 595,000 | | | | 530,853 | |
Royal Oak Hospital Finance Authority, Refunding Revenue Bonds, Series W, Callable 08/01/19 @ 100, 6.38%, 08/01/29 | | | 250,000 | | | | 295,357 | |
| | | | 3,359,428 | |
|
Mississippi 0.27% | |
Mississippi Hospital Equipment & Facilities Authority, Refunding Revenue Bonds, Callable 01/01/20 @ 100, 5.25%, 01/01/30 | | | 250,000 | | | | 280,367 | |
|
Missouri 0.98% | |
Hanley Road Corridor Transportation Development District, Refunding Revenue Bonds, Series A, Callable 10/01/19 @ 100, (OID), 5.88%, 10/01/36 | | | 275,000 | | | | 300,798 | |
Health & Educational Facilities Authority of the State of Missouri, Healthcare, Hospital & Nursing Home Improvements, Revenue Bonds, Callable 11/15/22 @ 100, (OID), 3.75%, 11/15/39 | | | 100,000 | | | | 99,840 | |
See accompanying notes which are an integral part of these financial statements.
| | |
| SCHEDULE OF INVESTMENTS (CONT.) | | DECEMBER 31, 2015 |
| | | | | | | | |
| | | Principal
Amount | | | Market Value | |
|
Missouri (cont.) | |
Health & Educational Facilities Authority of the State of Missouri, Healthcare, Hospital & Nursing Home Improvements, Revenue Bonds, Series F, Callable 11/15/24 @ 100, (OID), 4.00%, 11/15/45 | | $ | 500,000 | | | $ | 508,575 | |
Missouri Housing Development Commission, State Single-Family Housing, Revenue Bonds, Series D, Callable 09/01/19 @ 100, (Freddie Mac) (Fannie Mae) (Ginnie Mae), 4.70%, 03/01/35 | | | 95,000 | | | | 100,158 | |
| | | | 1,009,371 | |
|
Nebraska 0.29% | |
Nebraska Public Power District, Electric Lights & Power Improvements, Revenue Bonds, Series A, Callable 01/01/22 @ 100, 5.00%, 01/01/25 | | | 250,000 | | | | 294,585 | |
|
Nevada 0.10% | |
City of Reno, NV, Hospital Improvements, Revenue Bonds, Callable 06/01/18 @ 100, (AMBAC) (OID), 5.50%, 06/01/28 | | | 50,000 | | | | 54,715 | |
Nevada Housing Division, State Single-Family Housing, Revenue Bonds, Series I, Callable 04/01/20 @ 100, (Fannie Mae) (Ginnie Mae), 4.40%, 04/01/27 | | | 50,000 | | | | 50,913 | |
| | | | 105,628 | |
|
New Hampshire 0.11% | |
New Hampshire Health and Education Facilities Authority Act, Refunding Revenue Bonds, Callable 10/01/19 @ 100, (FHA), 6.25%, 04/01/26 | | | 100,000 | | | | 117,912 | |
|
New Jersey 11.72% | |
Essex County Improvement Authority, Public Improvements, Revenue Bonds, Series B, Callable 11/01/20 @ 100, (AGM) (OID), 5.75%, 11/01/30 | | | 250,000 | | | | 278,722 | |
Hudson County Improvement Authority, Refunding Revenue Bonds, (AGM), 5.40%, 10/01/25 | | | 150,000 | | | | 186,062 | |
New Jersey Economic Development Authority, Revenue Bonds, Series II, Callable 03/01/22 @ 100, 5.00%, 03/01/25 | | | 1,000,000 | | | | 1,080,040 | |
New Jersey Economic Development Authority, Refunding Revenue Bonds, Series GG, Callable 03/01/21 @ 100, (State Appropriation) (OID), 5.25%, 09/01/26 | | | 920,000 | | | | 990,325 | |
See accompanying notes which are an integral part of these financial statements.
| | | | |
| MUNICIPAL TAX FREE BOND FUND | | | 19 | |
| | |
| SCHEDULE OF INVESTMENTS (CONT.) | | DECEMBER 31, 2015 |
| | | | | | | | |
| | | Principal
Amount | | | Market Value | |
|
New Jersey (cont.) | |
New Jersey Economic Development Authority, School Improvements, Revenue Bonds, Series CC-2, Callable 06/15/20 @ 100, 5.00%, 12/15/32 | | $ | 100,000 | | | $ | 105,278 | |
New Jersey Economic Development Authority, School Improvements, Refunding Revenue Bonds, Callable 03/01/23 @ 100, 5.00%, 03/01/31 | | | 300,000 | | | | 318,102 | |
New Jersey Economic Development Authority, University & College Improvements, Revenue Bonds, Callable 06/15/23 @ 100, 5.00%, 06/15/30 | | | 250,000 | | | | 292,382 | |
New Jersey Health Care Facilities Financing Authority, Hospital Improvements, Revenue Bonds, Callable 10/01/19 @ 100, (State Appropriation) (OID), 5.75%, 10/01/31 | | | 545,000 | | | | 602,852 | |
New Jersey Health Care Facilities Financing Authority, Refunding Revenue Bonds, Callable 07/01/21 @ 100, (OID), 6.00%, 07/01/37 | | | 200,000 | | | | 237,708 | |
New Jersey Health Care Facilities Financing Authority, Refunding Revenue Bonds, Series A, Callable 07/01/18 @ 100, (OID), 5.00%, 07/01/27 | | | 275,000 | | | | 298,754 | |
New Jersey Higher Education Student Assistance Authority, Refunding Revenue Bonds, Series 1A, Callable 12/01/19 @ 100, 5.25%, 12/01/32 | | | 100,000 | | | | 108,149 | |
New Jersey Higher Education Student Assistance Authority, Revenue Bonds, Series 2, Callable 12/01/20 @ 100, (OID), 5.00%, 12/01/36 | | | 65,000 | | | | 70,514 | |
New Jersey Higher Education Student Assistance Authority, Refunding Revenue Bonds, Series 1A, Callable 12/01/19 @ 100, 5.25%, 12/01/28 | | | 185,000 | | | | 200,076 | |
New Jersey Housing & Mortgage Finance Agency, State Single-Family Housing, Revenue Bonds, Series CC, Callable 04/01/19 @ 100, 5.00%, 10/01/34 | | | 85,000 | | | | 88,375 | |
New Jersey Transportation Trust Fund Authority, Transit Improvements, Revenue Bonds, Series A, Callable 06/15/22 @ 100, (State Appropriation), 5.00%, 06/15/42 | | | 1,175,000 | | | | 1,229,567 | |
New Jersey Transportation Trust Fund Authority, Revenue Bonds, Series D-REMK 11/25, Callable 12/15/24 @ 100, 5.00%, 06/15/32 | | | 750,000 | | | | 797,197 | |
New Jersey Transportation Trust Fund Authority, Revenue Bonds, Series AA, 5.00%, 06/15/21 | | | 150,000 | | | | 165,194 | |
New Jersey Transportation Trust Fund Authority, Transit Improvements, Revenue Bonds, Series AA, Callable 06/15/22 @ 100, 5.00%, 06/15/38 | | | 1,000,000 | | | | 1,045,860 | |
See accompanying notes which are an integral part of these financial statements.
| | |
| SCHEDULE OF INVESTMENTS (CONT.) | | DECEMBER 31, 2015 |
| | | | | | | | |
| | | Principal
Amount | | | Market Value | |
|
New Jersey (cont.) | |
New Jersey Transportation Trust Fund Authority, Transit Improvements, Revenue Bonds, Series A, Callable 06/15/21 @ 100, (State Appropriation), 5.00%, 06/15/22 | | $ | 150,000 | | | $ | 164,010 | |
New Jersey Transportation Trust Fund Authority, Transit Improvements, Revenue Bonds, Series A, Callable 06/15/21 @ 100, (State Appropriation) (OID), 5.25%, 06/15/31 | | | 220,000 | | | | 236,887 | |
New Jersey Transportation Trust Fund Authority, Transit Improvements, Revenue Bonds, Series B, Callable 06/15/21 @ 100, (OID), 5.00%, 06/15/42 | | | 100,000 | | | | 103,509 | |
New Jersey Turnpike Authority, Highway Improvements, Revenue Bonds, Series A, Callable 07/01/22 @ 100, 5.00%, 01/01/31 | | | 200,000 | | | | 229,122 | |
New Jersey Turnpike Authority, Revenue Bonds, Series B, Callable 01/01/23 @ 100, 5.00%, 01/01/29 | | | 500,000 | | | | 576,550 | |
New Jersey Turnpike Authority, Highway Improvements, Revenue Bonds, Series A, Callable 07/01/22 @ 100, 5.00%, 01/01/32 | | | 500,000 | | | | 571,200 | |
Newark Housing Authority, Public Improvements, Revenue Bonds, Callable 12/01/19 @ 100, 6.75%, 12/01/38 | | | 750,000 | | | | 867,495 | |
State of New Jersey, Public Improvements, General Obligation Unlimited, Callable 06/01/25 @ 100, 4.00%, 06/01/34 | | | 250,000 | | | | 261,980 | |
Tenafly School District, Refunding Bonds, General Obligation Unlimited, Callable 07/15/22 @ 100, (OID), 3.00%, 07/15/30 | | | 250,000 | | | | 253,260 | |
Tenafly School District, Refunding Bonds, General Obligation Unlimited, Callable 07/15/22 @ 100, (OID), 3.00%, 07/15/29 | | | 250,000 | | | | 253,560 | |
Tobacco Settlement Financing Corp., Refunding Bonds, Revenue Bonds, Series 1A, Callable 06/01/17 @ 100, (OID), 5.00%, 06/01/41 | | | 525,000 | | | | 436,159 | |
| | | | 12,048,889 | |
|
New Mexico 1.62% | |
New Mexico Hospital Equipment Loan Council, Hospital Improvements, Revenue Bonds, Callable 08/01/19 @ 100, 5.13%, 08/01/35 | | | 445,000 | | | | 492,023 | |
New Mexico Hospital Equipment Loan Council, Hospital Improvements, Revenue Bonds, Callable 08/01/19 @ 100, (OID), 5.00%, 08/01/39 | | | 225,000 | | | | 246,024 | |
New Mexico Hospital Equipment Loan Council, Hospital Improvements, Revenue Bonds, Callable 08/01/22 @ 100, (OID), 4.00%, 08/01/42 | | | 500,000 | | | | 512,185 | |
See accompanying notes which are an integral part of these financial statements.
| | | | |
| MUNICIPAL TAX FREE BOND FUND | | | 21 | |
| | |
| SCHEDULE OF INVESTMENTS (CONT.) | | DECEMBER 31, 2015 |
| | | | | | | | |
| | | Principal
Amount | | | Market Value | |
|
New Mexico (cont.) | |
New Mexico Mortgage Finance Authority, Revenue Bonds, Callable 03/01/22 @ 100, (Freddie Mac) (Fannie Mae) (Ginnie Mae) (GTD) (INS), 3.25%, 09/01/27 | | $ | 130,000 | | | $ | 129,435 | |
New Mexico Mortgage Finance Authority, Revenue Bonds, Callable 03/01/22 @ 100, (Freddie Mac) (Fannie Mae) (Ginnie Mae) (GTD) (INS), 3.55%, 09/01/32 | | | 210,000 | | | | 210,124 | |
Village of Los Ranchos de Albuquerque, NM, Refunding Revenue Bonds, Callable 09/01/20 @ 100, (OID), 4.50%, 09/01/40 | | | 75,000 | | | | 78,028 | |
| | | | 1,667,819 | |
|
New York 24.61% | |
Hudson Yards Infrastructure Corp., Public Improvements, Revenue Bonds, Series A, Callable 02/15/21 @ 100, 5.25%, 02/15/47 | | | 200,000 | | | | 224,584 | |
Hudson Yards Infrastructure Corp., Public Improvements, Revenue Bonds, Series A, Callable 02/15/21 @ 100, 5.75%, 02/15/47 | | | 250,000 | | | | 287,822 | |
Hudson Yards Infrastructure Corp., Transit Improvements, Revenue Bonds, Series A, Callable 02/15/17 @ 100, 5.00%, 02/15/47 | | | 60,000 | | | | 61,949 | |
Long Island Power Authority, Electric Lights & Power Improvements, Revenue Bonds, Series A, Callable 05/01/21 @ 100, (AGM), 5.00%, 05/01/36 | | | 125,000 | | | | 137,979 | |
Long Island Power Authority, Electric Lights & Power Improvements, Revenue Bonds, Series A, Callable 04/01/19 @ 100, (OID), 5.75%, 04/01/39 | | | 250,000 | | | | 280,147 | |
Metropolitan Transportation Authority, Transit Improvements, Revenue Bonds, Series D, Callable 11/15/21 @ 100, 5.00%, 11/15/36 | | | 250,000 | | | | 283,565 | |
Metropolitan Transportation Authority, Transit Improvements, Revenue Bonds, Series D, Callable 11/15/21 @ 100, (OID), 4.88%, 11/15/46 | | | 100,000 | | | | 108,435 | |
Metropolitan Transportation Authority, Transit Improvements, Revenue Bonds, Series D, Callable 11/15/21 @ 100, (OID), 4.75%, 11/15/36 | | | 250,000 | | | | 273,758 | |
Metropolitan Transportation Authority, Transit Improvements, Revenue Bonds, Series B, Callable 05/15/23 @ 100, 5.00%, 11/15/33 | | | 100,000 | | | | 114,821 | |
Metropolitan Transportation Authority, Transit Improvements, Revenue Bonds, Series A, Callable 05/15/23 @ 100, 5.00%, 11/15/43 | | | 500,000 | | | | 567,335 | |
See accompanying notes which are an integral part of these financial statements.
| | |
| SCHEDULE OF INVESTMENTS (CONT.) | | DECEMBER 31, 2015 |
| | | | | | | | |
| | | Principal
Amount | | | Market Value | |
|
New York (cont.) | |
Metropolitan Transportation Authority, Transit Improvements, Revenue Bonds, Series B, Callable 05/15/24 @ 100, 5.25%, 11/15/44 | | $ | 1,000,000 | | | $ | 1,160,400 | |
Metropolitan Transportation Authority, Transit Improvements, Revenue Bonds, Series A, Callable 11/15/21 @ 100, (OID), 5.00%, 11/15/37 | | | 250,000 | | | | 282,112 | |
Metropolitan Transportation Authority, Revenue Bonds, Subseries C-1, Callable 11/15/25 @ 100, 5.25%, 11/15/28 | | | 500,000 | | | | 617,990 | |
Metropolitan Transportation Authority, Transit Improvements, Refunding Revenue Bonds, Series B, Callable 05/15/25 @ 100, 5.00%, 11/15/28 | | | 250,000 | | | | 300,240 | |
Metropolitan Transportation Authority, Transit Improvements, Revenue Bonds, Subseries A-1, Callable 05/15/25 @ 100, 5.00%, 11/15/45 | | | 500,000 | | | | 570,530 | |
Metropolitan Transportation Authority, Refunding Revenue Bonds, Series D, Callable 11/15/23 @ 100, 5.25%, 11/15/28 | | | 50,000 | | | | 60,149 | |
Metropolitan Transportation Authority, Transit Improvements, Revenue Bonds, Series D, Callable 11/15/20 @ 100, (OID), 5.25%, 11/15/34 | | | 500,000 | | | | 578,630 | |
Metropolitan Transportation Authority, Transit Improvements, Revenue Bonds, Series C, Callable 05/15/23 @ 100, 5.00%, 11/15/32 | | | 500,000 | | | | 575,905 | |
Monroe County Industrial Development Corp., Hospital Improvements, Revenue Bonds, Callable 02/15/21 @ 100, (FHA) (INS), 5.75%, 08/15/35 | | | 250,000 | | | | 293,975 | |
New York City Housing Development Corp., Local Multi-Family Housing, Revenue Bonds, Series C, Callable 11/01/19 @ 100, 4.95%, 05/01/47 | | | 500,000 | | | | 516,465 | |
New York City Housing Development Corp., Local Multi-Family Housing, Revenue Bonds, Series L-1-RMKT 03/16/10, Callable 03/16/20 @ 100, 4.90%, 11/01/40 | | | 250,000 | | | | 260,853 | |
New York City Housing Development Corp., Local Multi-Family Housing, Revenue Bonds, Series D-1-A, Callable 05/01/20 @ 100, 4.85%, 11/01/35 | | | 250,000 | | | | 260,658 | |
New York City Housing Development Corp., Local Multi-Family Housing, Revenue Bonds, Series J-1, 5.00%, 05/01/20 | | | 150,000 | | | | 167,409 | |
New York City Housing Development Corp., Local Multi-Family Housing, Revenue Bonds, Series G, Callable 11/01/20 @ 100, 4.75%, 05/01/41 | | | 250,000 | | | | 262,380 | |
New York City Housing Development Corp., Local Multi-Family Housing, Revenue Bonds, Series F, Callable 05/01/19 @ 100, 4.85%, 05/01/41 | | | 250,000 | | | | 257,235 | |
See accompanying notes which are an integral part of these financial statements.
| | | | |
| MUNICIPAL TAX FREE BOND FUND | | | 23 | |
| | |
| SCHEDULE OF INVESTMENTS (CONT.) | | DECEMBER 31, 2015 |
| | | | | | | | |
| | | Principal
Amount | | | Market Value | |
|
New York (cont.) | |
New York City Housing Development Corp., Local Multi-Family Housing, Revenue Bonds, Series F, Callable 05/01/19 @ 100, 4.60%, 11/01/29 | | $ | 100,000 | | | $ | 105,469 | |
New York City Housing Development Corp., Refunding Revenue Bonds, Series J, Callable 05/01/19 @ 100, 4.80%, 05/01/36 | | | 250,000 | | | | 259,335 | |
New York City Housing Development Corp., Local Multi-Family Housing, Revenue Bonds, Series K, Callable 05/01/19 @ 100, 4.75%, 11/01/29 | | | 100,000 | | | | 103,769 | |
New York City Industrial Development Agency, Recreational Facility Improvements, Revenue Bonds, Callable 01/01/19 @ 100, (OID), 6.50%, 01/01/46 | | | 650,000 | | | | 734,376 | |
New York City Industrial Development Agency, Recreational Facility Improvements, Revenue Bonds, Callable 09/01/16 @ 100, (FGIC) (OID), 4.50%, 03/01/39 | | | 100,000 | | | | 100,520 | |
New York City Industrial Development Agency, Recreational Facility Improvements, Revenue Bonds, Callable 09/01/16 @ 100, (FGIC), 5.00%, 03/01/46 | | | 1,500,000 | | | | 1,528,905 | |
New York City Industrial Development Agency, Recreational Facility Improvements, Revenue Bonds, Callable 09/01/16 @ 100, (FGIC), 5.00%, 03/01/31 | | | 145,000 | | | | 148,512 | |
New York City Industrial Development Agency, Recreational Facility Improvements, Revenue Bonds, Callable 09/01/16 @ 100, 5.00%, 03/01/36 | | | 115,000 | | | | 117,596 | |
New York City Transitional Finance Authority Building Aid Revenue, School Improvements, Revenue Bonds, Series S-3, Callable 01/15/19 @ 100, (State Aid Withholding) (OID), 5.38%, 01/15/34 | | | 250,000 | | | | 278,780 | |
New York City Transitional Finance Authority Building Aid Revenue, Public Improvements, Revenue Bonds, Series S-1, Callable 01/15/25 @ 100, (State Aid Withholding), 5.00%, 07/15/27 | | | 250,000 | | | | 302,912 | |
New York City Transitional Finance Authority Building Aid Revenue, Revenue Bonds, Series S-1, Callable 01/15/25 @ 100, (State Aid Withholding), 5.00%, 07/15/35 | | | 500,000 | | | | 585,010 | |
New York City Transitional Finance Authority Future Tax Secured Revenue, Public Improvements, Revenue Bonds, 5.00%, 08/01/24 | | | 100,000 | | | | 123,783 | |
New York City Transitional Finance Authority Future Tax Secured Revenue, Public Improvements, Revenue Bonds, Callable 08/01/25 @ 100, 5.00%, 08/01/27 | | | 25,000 | | | | 30,672 | |
See accompanying notes which are an integral part of these financial statements.
| | |
| SCHEDULE OF INVESTMENTS (CONT.) | | DECEMBER 31, 2015 |
| | | | | | | | |
| | | Principal
Amount | | | Market Value | |
|
New York (cont.) | |
New York City Transitional Finance Authority Future Tax Secured Revenue, Public Improvements, Revenue Bonds, Series C, Callable 11/01/20 @ 100, (OID), 5.00%, 11/01/33 | | $ | 500,000 | | | $ | 575,530 | |
New York City Transitional Finance Authority Future Tax Secured Revenue, Revenue Bonds, Callable 08/01/25 @ 100, 5.00%, 08/01/34 | | | 1,000,000 | | | | 1,184,470 | |
New York City Transitional Finance Authority Future Tax Secured Revenue, Public Improvements, Revenue Bonds, 5.00%, 08/01/23 | | | 100,000 | | | | 122,390 | |
New York City Transitional Finance Authority Future Tax Secured Revenue, Public Improvements, Revenue Bonds, 5.00%, 08/01/21 | | | 100,000 | | | | 118,692 | |
New York City Water & Sewer System, Revenue Bonds, Series EE, Callable 06/15/23 @ 100, 5.00%, 06/15/47 | | | 150,000 | | | | 169,874 | |
New York City Water & Sewer System, Revenue Bonds, Series BB, Callable 12/15/22 @ 100, 5.00%, 06/15/47 | | | 325,000 | | | | 367,848 | |
New York City Water & Sewer System, Refunding Revenue Bonds, Series CC, Callable 12/15/21 @ 100, 5.00%, 06/15/45 | | | 250,000 | | | | 283,862 | |
New York City Water & Sewer System, Refunding Revenue Bonds, Series EE, Callable 06/15/22 @ 100, (OID), 3.38%, 06/15/34 | | | 100,000 | | | | 101,243 | |
New York City Water & Sewer System, Revenue Bonds, Series FF, Callable 06/15/22 @ 100, 5.00%, 06/15/45 | | | 1,000,000 | | | | 1,128,200 | |
New York Liberty Development Corp., Refunding Revenue Bonds, Callable 01/15/20 @ 100, 5.63%, 07/15/47 | | | 250,000 | | | | 282,190 | |
New York State Dormitory Authority, University & College Improvements, Revenue Bonds, Series A, Callable 07/01/21 @ 100, (OID), 5.25%, 07/01/31 | | | 40,000 | | | | 47,132 | |
New York State Dormitory Authority, Revenue Bonds, 5.00%, 08/15/21 | | | 100,000 | | | | 117,814 | |
New York State Dormitory Authority, University & College Improvements, Revenue Bonds, Callable 07/01/19 @ 100, (INS) (OID), 5.25%, 07/01/33 | | | 200,000 | | | | 227,280 | |
New York State Dormitory Authority, Hospital Improvements, Revenue Bonds, Callable 05/01/19 @ 100, 5.50%, 05/01/30 | | | 500,000 | | | | 571,685 | |
New York State Dormitory Authority, School Improvements, Revenue Bonds, Series B, Callable 10/01/20 @ 100, (AGM), 4.75%, 10/01/40 | | | 165,000 | | | | 178,487 | |
New York State Dormitory Authority, Revenue Bonds, 5.00%, 05/15/20 | | | 100,000 | | | | 115,673 | |
New York State Dormitory Authority, Revenue Bonds, 5.00%, 05/15/22 | | | 165,000 | | | | 197,571 | |
See accompanying notes which are an integral part of these financial statements.
| | | | |
| MUNICIPAL TAX FREE BOND FUND | | | 25 | |
| | |
| SCHEDULE OF INVESTMENTS (CONT.) | | DECEMBER 31, 2015 |
| | | | | | | | |
| | | Principal
Amount | | | Market Value | |
|
New York (cont.) | |
New York State Dormitory Authority, Revenue Bonds, Callable 07/01/25 @ 100, 5.00%, 07/01/37 | | $ | 385,000 | | | $ | 448,159 | |
New York State Dormitory Authority, Refunding Revenue Bonds, Series H, Callable 10/01/22 @ 100, (State Aid Withholding), 3.25%, 04/01/31 | | | 280,000 | | | | 284,917 | |
New York State Dormitory Authority, Revenue Bonds, Series A, Callable 07/01/18 @ 100, 5.25%, 07/01/48 | | | 750,000 | | | | 828,465 | |
New York State Housing Finance Agency, State Multi-Family Housing, Revenue Bonds, Series B, Callable 05/01/20 @ 100, (SONYMA), 4.75%, 05/01/31 | | | 200,000 | | | | 209,646 | |
New York State Housing Finance Agency, State Multi-Family Housing, Revenue Bonds, Series A, Callable 05/01/20 @ 100, 4.85%, 11/01/36 | | | 100,000 | | | | 104,689 | |
New York State Housing Finance Agency, State Multi-Family Housing, Revenue Bonds, Series B, Callable 05/01/19 @ 100, 4.85%, 11/01/41 | | | 205,000 | | | | 213,005 | |
New York State Housing Finance Agency, State Multi-Family Housing, Revenue Bonds, Series B, Callable 05/01/19 @ 100, 5.00%, 11/01/45 | | | 150,000 | | | | 155,936 | |
New York State Housing Finance Agency, State Multi-Family Housing, Revenue Bonds, Series B, Callable 05/01/19 @ 100, 4.80%, 11/01/34 | | | 250,000 | | | | 260,210 | |
New York State Housing Finance Agency, State Multi-Family Housing, Revenue Bonds, Series B, Callable 05/01/20 @ 100, (SONYMA), 5.20%, 05/01/42 | | | 500,000 | | | | 522,545 | |
New York State Urban Development Corp., Public Improvements, Revenue Bonds, Series A, 5.00%, 03/15/20 | | | 100,000 | | | | 114,912 | |
Orange County Funding Corp., University & College Improvements, Revenue Bonds, Series A, Callable 07/01/22 @ 100, (OID), 3.25%, 07/01/32 | | | 500,000 | | | | 460,395 | |
Orange County Funding Corp., University & College Improvements, Revenue Bonds, Series B, Callable 07/01/22 @ 100, (OID), 3.25%, 07/01/32 | | | 500,000 | | | | 460,395 | |
Port Authority of New York & New Jersey, Port, Airport & Marina Improvements, Revenue Bonds, Callable 12/01/22 @ 100, (OID), 3.25%, 12/01/38 | | | 250,000 | | | | 250,148 | |
Port Authority of New York & New Jersey, Port, Airport & Marina Improvements, Revenue Bonds, Callable 12/01/22 @ 100, (OID), 3.25%, 12/01/42 | | | 250,000 | | | | 245,585 | |
State of New York Mortgage Agency, State Single-Family Housing, Revenue Bonds, Series 168, Callable 10/01/21 @ 100, 3.75%, 10/01/32 | | | 1,000,000 | | | | 1,011,030 | |
See accompanying notes which are an integral part of these financial statements.
| | |
| SCHEDULE OF INVESTMENTS (CONT.) | | DECEMBER 31, 2015 |
| | | | | | | | |
| | | Principal
Amount | | | Market Value | |
|
New York (cont.) | |
State of New York Mortgage Agency, State Single-Family Housing, Revenue Bonds, 5.00%, 04/01/18 | | $ | 50,000 | | | $ | 53,472 | |
Triborough Bridge & Tunnel Authority, Revenue Bonds, Series 2008 B-3-REMK 11/16/15, Callable 11/15/25 @ 100, 5.00%, 11/15/27 | | | 100,000 | | | | 123,096 | |
Triborough Bridge & Tunnel Authority, Revenue Bonds, Series 2008 B-3-REMK 11/16/15, Callable 11/15/25 @ 100, 5.00%, 11/15/35 | | | 250,000 | | | | 296,375 | |
Triborough Bridge & Tunnel Authority, Revenue Bonds, Series B, Callable 11/15/25 @ 100, 5.00%, 11/15/40 | | | 310,000 | | | | 362,564 | |
Triborough Bridge & Tunnel Authority, Revenue Bonds, Series B, 5.00%, 11/15/21 | | | 50,000 | | | | 59,841 | |
Triborough Bridge & Tunnel Authority, Revenue Bonds, Series B, 5.00%, 11/15/23 | | | 100,000 | | | | 123,514 | |
| | | | 25,303,805 | |
|
North Carolina 0.70% | |
Charlotte-Mecklenburg Hospital Authority/The, Refunding Revenue Bonds, Callable 01/15/19 @ 100, (OID), 5.25%, 01/15/34 | | | 100,000 | | | | 109,802 | |
North Carolina Eastern Municipal Power Agency, Refunding Revenue Bonds, Series B, Callable 01/01/19 @ 100, (OID), 4.50%, 01/01/22 | | | 250,000 | | | | 275,522 | |
North Carolina Turnpike Authority, Highway Improvements, Revenue Bonds, Series A, Callable 01/01/19 @ 100, (OID), 5.75%, 01/01/39 | | | 200,000 | | | | 218,590 | |
University of North Carolina at Charlotte/The, University & College Improvements, Revenue Bonds, Callable 04/01/25 @ 100, 5.00%, 04/01/40 | | | 100,000 | | | | 115,676 | |
| | | | 719,590 | |
|
North Dakota 0.10% | |
City of Bismarck, ND Sanitary Sewer Revenue, Revenue Bonds, Callable 05/01/25 @ 100, 3.00%, 05/01/29 | | | 100,000 | | | | 99,779 | |
|
Ohio 0.70% | |
Buckeye Tobacco Settlement Financing Authority, Miscellaneous Purposes, Revenue Bonds, Series A-2, Callable 06/01/17 @ 100, 6.50%, 06/01/47 | | | 80,000 | | | | 74,271 | |
Buckeye Tobacco Settlement Financing Authority, Miscellaneous Purposes, Revenue Bonds, Series A-2, Callable 06/01/17 @ 100, (OID), 6.00%, 06/01/42 | | | 420,000 | | | | 371,091 | |
See accompanying notes which are an integral part of these financial statements.
| | | | |
| MUNICIPAL TAX FREE BOND FUND | | | 27 | |
| | |
| SCHEDULE OF INVESTMENTS (CONT.) | | DECEMBER 31, 2015 |
| | | | | | | | |
| | | Principal
Amount | | | Market Value | |
|
Ohio (cont.) | |
Ohio Higher Educational Facility Commission, Refunding Revenue Bonds, Callable 07/01/20 @ 100, (OID), 5.00%, 07/01/44 | | $ | 250,000 | | | $ | 276,477 | |
| | | | 721,839 | |
|
Oklahoma 0.25% | |
Oklahoma Municipal Power Authority, Electric Lights & Power Improvements, Revenue Bonds, Series A, Callable 01/01/23 @ 100, 4.00%, 01/01/47 | | | 250,000 | | | | 259,573 | |
|
Oregon 0.36% | |
Medford Hospital Facilities Authority, Refunding Revenue Bonds, Callable 08/15/20 @ 100, (AGM), 5.00%, 08/15/21 | | | 100,000 | | | | 114,661 | |
Oregon Health & Science University, Refunding Revenue Bonds, Series E, Callable 07/01/22 @ 100, 5.00%, 07/01/32 | | | 35,000 | | | | 40,186 | |
Oregon State Facilities Authority, Refunding Revenue Bonds, Series A, Callable 11/01/19 @ 100, 5.00%, 11/01/39 | | | 200,000 | | | | 215,450 | |
| | | | 370,297 | |
|
Pennsylvania 6.89% | |
Allegheny County Sanitary Authority, Sewer Improvements, Revenue Bonds, Callable 12/01/23 @ 100, 5.25%, 12/01/44 | | | 500,000 | | | | 572,185 | |
City of Philadelphia, PA, Public Improvements Refunding Bonds, General Obligation Limited, Series B, Callable 07/15/16 @ 100, (OID), 7.13%, 07/15/38 | | | 750,000 | | | | 776,467 | |
City of Philadelphia, PA, Refunding Bonds, General Obligation Unlimited, Callable 08/01/16 @ 100, (OID), 5.88%, 08/01/31 | | | 220,000 | | | | 226,857 | |
City of Philadelphia, PA, Refunding Bonds, General Obligation Unlimited, Callable 08/01/20 @ 100, (AGM) (OID), 5.25%, 08/01/26 | | | 135,000 | | | | 155,277 | |
Montgomery County Industrial Development Authority, Hospital Improvements, Revenue Bonds, Callable 08/01/20 @ 100, (FHA) (INS), 5.38%, 08/01/38 | | | 500,000 | | | | 589,860 | |
Pennsylvania Higher Educational Facilities Authority, Hospital Improvements, Revenue Bonds, Callable 11/01/22 @ 100, 5.00%, 05/01/42 | | | 100,000 | | | | 105,241 | |
Pennsylvania Higher Educational Facilities Authority, Hospital Improvements, Revenue Bonds, Callable 11/01/22 @ 100, (OID), 4.00%, 05/01/32 | | | 100,000 | | | | 100,948 | |
Pennsylvania Higher Educational Facilities Authority, Hospital Improvements, Revenue Bonds, Callable 11/01/22 @ 100, 5.00%, 05/01/37 | | | 100,000 | | | | 105,667 | |
See accompanying notes which are an integral part of these financial statements.
| | |
| SCHEDULE OF INVESTMENTS (CONT.) | | DECEMBER 31, 2015 |
| | | | | | | | |
| | | Principal
Amount | | | Market Value | |
|
Pennsylvania (cont.) | |
Pennsylvania Higher Educational Facilities Authority, Hospital Improvements, Revenue Bonds, Callable 08/15/21 @ 100, (OID), 5.25%, 08/15/26 | | $ | 240,000 | | | $ | 281,599 | |
Pennsylvania Turnpike Commission, Revenue Bonds, Series B, Callable 12/01/25 @ 100, 5.00%, 12/01/45 | | | 250,000 | | | | 278,930 | |
Pennsylvania Turnpike Commission, Revenue Bonds, Series A, (AGM), 5.25%, 07/15/28 | | | 150,000 | | | | 188,961 | |
Pennsylvania Turnpike Commission, Highway Improvements, Revenue Bonds, Callable 12/01/22 @ 100, 5.00%, 12/01/43 | | | 2,000,000 | | | | 2,212,200 | |
Pennsylvania Turnpike Commission, Highway Improvements, Revenue Bonds, Subseries D, Callable 12/01/19 @ 100, 5.50%, 12/01/41 | | | 500,000 | | | | 564,375 | |
Philadelphia Municipal Authority, Public Improvements, Revenue Bonds, Callable 04/01/19 @ 100, (OID), 6.50%, 04/01/39 | | | 100,000 | | | | 113,894 | |
Philadelphia Municipal Authority, Public Improvements, Revenue Bonds, Callable 04/01/19 @ 100, (OID), 6.38%, 04/01/29 | | | 250,000 | | | | 286,982 | |
West View Municipal Authority Water Revenue, Water Utility Improvements, Revenue Bonds, Callable 11/15/24 @ 100, (OID), 4.00%, 11/15/43 | | | 500,000 | | | | 518,885 | |
| | | | 7,078,328 | |
|
Puerto Rico 1.66% | |
Commonwealth of Puerto Rico, General Obligation Unlimited, Series A, Callable 07/01/16 @ 100, (OID), 6.13%, 07/01/33 | | | 100,000 | | | | 65,938 | |
Commonwealth of Puerto Rico, General Obligation Unlimited, Series C, Callable 07/01/21 @ 100, (AGM) (OID), 5.25%, 07/01/26 | | | 100,000 | | | | 102,002 | |
Commonwealth of Puerto Rico, Refunding Bonds, General Obligation Unlimited, Series A-4-REMK, Callable 01/01/20 @ 101, (AGM), 5.00%, 07/01/31 | | | 200,000 | | | | 200,252 | |
Commonwealth of Puerto Rico, General Obligation Unlimited, Callable 07/01/16 @ 100, 5.00%, 07/01/18 | | | 250,000 | | | | 170,195 | |
Commonwealth of Puerto Rico, General Obligation Unlimited, Series A, 5.50%, 07/01/19 | | | 500,000 | | | | 516,355 | |
Puerto Rico Commonwealth Aqueduct & Sewer Authority, Refunding Revenue Bonds, Series A, 5.00%, 07/01/22 | | | 250,000 | | | | 173,125 | |
Puerto Rico Public Buildings Authority, Refunding Revenue Bonds, Series U, (Commonwealth Guaranteed), 5.00%, 07/01/22 | | | 185,000 | | | | 111,231 | |
See accompanying notes which are an integral part of these financial statements.
| | | | |
| MUNICIPAL TAX FREE BOND FUND | | | 29 | |
| | |
| SCHEDULE OF INVESTMENTS (CONT.) | | DECEMBER 31, 2015 |
| | | | | | | | |
| | | Principal
Amount | | | Market Value | |
|
Puerto Rico (cont.) | |
Puerto Rico Public Buildings Authority, Refunding Revenue Bonds, Series M, (Commonwealth Guaranteed), 6.00%, 07/01/20 | | $ | 100,000 | | | $ | 64,500 | |
Puerto Rico Public Buildings Authority, Refunding Revenue Bonds, Series P, Callable 02/08/16 @ 100, (Commonwealth Guaranteed), 7.00%, 07/01/25 | | | 250,000 | | | | 158,750 | |
Puerto Rico Public Buildings Authority, Refunding Revenue Bonds, Series P, Callable 07/01/19 @ 100, (Commonwealth Guaranteed) (OID), 6.75%, 07/01/36 | | | 240,000 | | | | 148,800 | |
| | | | 1,711,148 | |
|
Rhode Island 1.93% | |
Rhode Island Housing & Mortgage Finance Corp., Refunding Revenue Bonds, Callable 04/01/21 @ 100, 4.10%, 10/01/37 | | | 155,000 | | | | 157,365 | |
Rhode Island Housing & Mortgage Finance Corp., State Single-Family Housing, Revenue Bonds, Series 5, Callable 04/01/22 @ 100, (Freddie Mac) (Fannie Mae) (Ginnie Mae), 3.45%, 04/01/35 | | | 235,000 | | | | 230,128 | |
Rhode Island Housing & Mortgage Finance Corp., Refunding Revenue Bonds, Callable 04/01/21 @ 100, 3.45%, 04/01/26 | | | 500,000 | | | | 510,080 | |
Rhode Island Housing & Mortgage Finance Corp., Refunding Revenue Bonds, Series 1, Callable 04/01/20 @ 100, 5.88%, 10/01/51 | | | 250,000 | | | | 268,788 | |
Rhode Island Housing & Mortgage Finance Corp., Refunding Revenue Bonds, Series 1, Callable 04/01/20 @ 100, 5.38%, 10/01/35 | | | 215,000 | | | | 231,654 | |
Rhode Island Student Loan Authority, Refunding Revenue Bonds, Series A, Callable 12/01/19 @ 100, 6.35%, 12/01/30 | | | 500,000 | | | | 549,625 | |
Rhode Island Turnpike & Bridge Authority, Highway Improvements, Revenue Bonds, Series A, Callable 12/01/20 @ 100, (OID), 5.00%, 12/01/39 | | | 35,000 | | | | 37,952 | |
| | | | 1,985,592 | |
|
South Carolina 0.05% | |
South Carolina Jobs-Economic Development Authority, Refunding Revenue Bonds, Callable 08/01/19 @ 100, (OID), 5.75%, 08/01/39 | | | 50,000 | | | | 54,780 | |
|
Tennessee 0.33% | |
City of Memphis, TN, General Obligation Unlimited, Series B, Callable 04/01/24 @ 100, 5.00%, 04/01/44 | | | 100,000 | | | | 114,025 | |
See accompanying notes which are an integral part of these financial statements.
| | |
| SCHEDULE OF INVESTMENTS (CONT.) | | DECEMBER 31, 2015 |
| | | | | | | | |
| | | Principal
Amount | | | Market Value | |
|
Tennessee (cont.) | |
Metropolitan Government of Nashville & Davidson County Convention Center Authority, Public Improvements, Revenue Bonds, Series A-1, Callable 07/01/20 @ 100, 5.00%, 07/01/26 | | $ | 200,000 | | | $ | 227,094 | |
| | | | 341,119 | |
|
Texas 3.70% | |
City of Houston, TX, Refunding Revenue Bonds, Series A, Callable 09/01/21 @ 100, 5.25%, 09/01/29 | | | 500,000 | | | | 574,320 | |
Clifton Higher Education Finance Corp., School Improvements, Refunding Revenue Bonds, Callable 08/15/24 @ 100, (GTD), 4.00%, 08/15/44 | | | 500,000 | | | | 515,800 | |
Fort Bend Grand Parkway Toll Road Authority, Refunding Revenue Bonds, Callable 03/01/22 @ 100, 4.00%, 03/01/46 | | | 250,000 | | | | 256,438 | |
Harris County Cultural Education Facilities Finance Corp., Refunding Revenue Bonds, Callable 10/01/19 @ 100, (OID), 4.75%, 10/01/25 | | | 175,000 | | | | 195,722 | |
Harris County Cultural Education Facilities Finance Corp., Refunding Revenue Bonds, 5.00%, 10/01/19 | | | 120,000 | | | | 135,857 | |
North Texas Tollway Authority, Refunding Revenue Bonds, Callable 01/01/21 @ 100, (OID), 6.00%, 01/01/38 | | | 100,000 | | | | 117,697 | |
North Texas Tollway Authority, Refunding Revenue Bonds, Series F, Callable 1/01/16 @ 100, 6.13%, 01/01/31 | | | 1,250,000 | | | | 1,250,000 | |
San Antonio Public Facilities Corp., Public Improvements, Refunding Revenue Bonds, Callable 09/15/22 @ 100, (OID), 4.00%, 09/15/42 | | | 250,000 | | | | 256,788 | |
Tarrant County Cultural Education Facilities Finance Corp., Hospital Improvements, Revenue Bonds, Series B, (OID), 4.50%, 09/01/19 | | | 100,000 | | | | 110,285 | |
Tarrant County Cultural Education Facilities Finance Corp., Hospital Improvements, Revenue Bonds, Series B, Callable 09/01/19 @ 100, (OID), 5.13%, 09/01/25 | | | 100,000 | | | | 112,419 | |
Tarrant County Health Facilities Development Corp., Hospital Improvements, Revenue Bonds, 5.00%, 12/01/16 | | | 50,000 | | | | 51,992 | |
Tarrant County Health Facilities Development Corp., Hospital Improvements, Revenue Bonds, Callable 12/01/19 @ 100, 5.00%, 12/01/23 | | | 100,000 | | | | 114,116 | |
Texas A&M University, Refunding Revenue Bonds, Series B, Callable 05/15/20 @ 100, 5.00%, 05/15/39 | | | 100,000 | | | | 111,794 | |
| | | | 3,803,228 | |
See accompanying notes which are an integral part of these financial statements.
| | | | |
| MUNICIPAL TAX FREE BOND FUND | | | 31 | |
| | |
| SCHEDULE OF INVESTMENTS (CONT.) | | DECEMBER 31, 2015 |
| | | | | | | | |
| | | Principal
Amount | | | Market Value | |
|
Utah 0.40% | |
University of Utah, University & College Improvements, Revenue Bonds, Series A, Callable 08/01/23 @ 100, 5.00%, 08/01/43 | | $ | 250,000 | | | $ | 286,542 | |
Utah Housing Corp., State Single-Family Housing, Revenue Bonds, Series A1 CL III, Callable 01/01/21 @ 100, 5.25%, 01/01/25 | | | 45,000 | | | | 46,092 | |
Utah Housing Corp., State Single-Family Housing, Revenue Bonds, Series A1 CL II, Callable 01/01/21 @ 100, 5.75%, 01/01/33 | | | 75,000 | | | | 76,625 | |
| | | | 409,259 | |
|
Vermont 0.24% | |
Vermont Housing Finance Agency, State Multi-Family Housing, Revenue Bonds, Series B, Callable 08/15/22 @ 100, 3.75%, 08/15/37 | | | 245,000 | | | | 244,811 | |
|
Virgin Islands 0.11% | |
Virgin Islands Public Finance Authority, Refunding Revenue Bonds, Callable 10/01/19 @ 100, 5.00%, 10/01/25 | | | 100,000 | | | | 110,138 | |
|
Virginia 0.48% | |
Virginia Housing Development Authority, State Single-Family Housing, Revenue Bonds, Series E, Callable 04/01/20 @ 100, (GO OF AUTH), 4.50%, 10/01/45 | | | 215,000 | | | | 219,390 | |
Virginia Resources Authority, Revenue Bonds, Callable 11/01/25 @ 100, 4.00%, 11/01/33 | | | 250,000 | | | | 273,120 | |
| | | | 492,510 | |
|
Washington 1.91% | |
Spokane Public Facilities District, Public Improvements, Revenue Bonds, Series A, Callable 06/01/23 @ 100, 5.00%, 05/01/43 | | | 1,000,000 | | | | 1,106,660 | |
Washington Health Care Facilities Authority, Revenue Bonds, Callable 11/01/19 @ 100, 5.00%, 11/01/28 | | | 250,000 | | | | 279,885 | |
Washington Health Care Facilities Authority, Hospital Improvements, Revenue Bonds, Callable 10/01/19 @ 100, (OID), 5.63%, 10/01/38 | | | 500,000 | | | | 581,185 | |
| | | | 1,967,730 | |
See accompanying notes which are an integral part of these financial statements.
| | |
| SCHEDULE OF INVESTMENTS (CONT.) | | DECEMBER 31, 2015 |
| | | | | | | | |
| | | Principal
Amount | | | Market Value | |
|
West Virginia 0.49% | |
West Virginia Hospital Finance Authority, Hospital Improvements, Revenue Bonds, Callable 09/01/19 @ 100, (OID), 5.63%, 09/01/32 | | $ | 200,000 | | | $ | 226,014 | |
West Virginia Hospital Finance Authority, Hospital Improvements, Revenue Bonds, 5.00%, 09/01/19 | | | 250,000 | | | | 276,752 | |
| | | | 502,766 | |
|
Wisconsin 0.60% | |
Wisconsin Health & Educational Facilities Authority, Hospital Improvements, Revenue Bonds, Callable 08/15/16 @ 100, 5.25%, 08/15/31 | | | 100,000 | | | | 102,520 | |
Wisconsin Health & Educational Facilities Authority, Hospital Improvements, Revenue Bonds, Callable 08/15/16 @ 100, 5.25%, 08/15/18 | | | 400,000 | | | | 411,076 | |
Wisconsin Housing & Economic Development Authority, State Multi-Family Housing, Revenue Bonds, Series A, Callable 05/01/20 @ 100, (GO OF AUTH) (OID), 5.63%, 11/01/35 | | | 95,000 | | | | 101,978 | |
| | | | 615,574 | |
|
Wyoming 0.49% | |
Wyoming Community Development Authority, State Single-Family Housing, Revenue Bonds, Series 3, Callable 06/01/24 @ 100, 3.70%, 06/01/39 | | | 500,000 | | | | 498,435 | |
Total Municipal Bonds
(Cost $96,376,578) | | | | | | | 101,675,575 | |
| | |
| | | Shares | | | | |
| | |
| Money Market 0.50% | | | | | | | | |
Federated Municipal Obligations Fund, 0.01% (a) | | | 515,330 | | | | 515,330 | |
Total Money Market
(Cost $515,330) | | | | | | | 515,330 | |
| | |
Total Investments — 99.40% | | | | | | | | |
(Cost $96,891,908) | | | | | | | 102,190,905 | |
Other Assets in Excess of Liabilities — 0.60% | | | | | | | 614,418 | |
NET ASSETS — 100.00% | | | | | | $ | 102,805,323 | |
See accompanying notes which are an integral part of these financial statements.
| | | | |
| MUNICIPAL TAX FREE BOND FUND | | | 33 | |
| | |
| SCHEDULE OF INVESTMENTS (CONT.) | | DECEMBER 31, 2015 |
| (a) | Rate disclosed is the seven day yield as of December 31, 2015. |
AGM - Assured Guaranty Municipal Corp.
AMBAC - American Municipal Bond Assurance Corp.
BHAC-CR - Berkshire Hathaway Assurance Corp. Custodial Receipts
FGIC - Financial Guaranty Insurance Co.
FHA - Insured by Federal Housing Administration.
GO - General Obligation
GTD - Guaranteed
INS - Insured
NATL-RE - Insured by National Public Finance Guarantee Corp.
OID - Original Issue Discount
See accompanying notes which are an integral part of these financial statements.
| | |
| STATEMENT OF ASSETS AND LIABILITIES | | DECEMBER 31, 2015 |
| | | | |
| |
ASSETS | | | | |
Investments in securities at value (cost $96,891,908) | | $ | 102,190,905 | |
Receivable for Fund shares sold | | | 325,705 | |
Dividends and interest receivable | | | 1,242,426 | |
Prepaid expenses | | | 4,088 | |
TOTAL ASSETS | | | 103,763,124 | |
| |
LIABILITIES | | | | |
Payable for Fund shares redeemed | | | 115,442 | |
Payable for investments purchased | | | 618,670 | |
Payable for distributions to shareholders | | | 103,112 | |
Payable for investment advisory fees | | | 33,924 | |
Payable for accounting and administration fees | | | 19,399 | |
Payable for distribution fees | | | 12,874 | |
Payable to custodian | | | 1,508 | |
Payable for audit fees | | | 22,900 | |
Payable for printing fees | | | 22,867 | |
Payable for transfer agent fees | | | 5,116 | |
Payable for chief compliance officer salary | | | 243 | |
Other accrued expenses | | | 1,746 | |
TOTAL LIABILITIES | | | 957,801 | |
NET ASSETS | | $ | 102,805,323 | |
Net assets applicable to 10,747,235 shares outstanding, $0.001 par value
(500,000,000 authorized shares) | | $ | 102,805,323 | |
Net asset value and redemption price per share
($102,805,323 ÷ 10,747,235 shares) | | $ | 9.57 | |
Maximum offering price per share ($9.57 ÷ 0.9525) | | $ | 10.05 | |
| |
SOURCE OF NET ASSETS | | | | |
As of December 31 2015, net assets consisted of: | | | | |
Paid-in capital | | $ | 106,192,479 | |
Accumulated net realized loss on investments | | | (8,686,153 | ) |
Net unrealized appreciation on investments | | | 5,298,997 | |
NET ASSETS | | $ | 102,805,323 | |
See accompanying notes which are an integral part of these financial statements.
| | | | |
| MUNICIPAL TAX FREE BOND FUND | | | 35 | |
STATEMENT OF OPERATIONS
| | | | |
| | | For the Year Ended December 31, 2015 | |
| |
INVESTMENT INCOME | | | | |
Interest | | | 4,541,358 | |
TOTAL INVESTMENT INCOME | | | 4,541,358 | |
| |
EXPENSES | | | | |
Investment advisory | | | 619,220 | |
Distribution | | | 154,805 | |
Accounting and Administration | | | 117,266 | |
Transfer agent | | | 63,395 | |
Audit | | | 23,500 | |
Chief Compliance Officer salary | | | 3,113 | |
Custodian | | | 8,558 | |
Directors | | | 11,102 | |
Insurance | | | 22,174 | |
Legal | | | 11,857 | |
Printing | | | 76,398 | |
Registration | | | 17,775 | |
Line of credit | | | 901 | |
Interest | | | 4,712 | |
Other | | | 2,701 | |
TOTAL EXPENSES | | | 1,137,477 | |
Fees waived by Adviser | | | (203,144 | ) |
NET EXPENSES | | | 934,333 | |
NET INVESTMENT INCOME | | | 3,607,025 | |
| |
REALIZED AND UNREALIZED GAIN (LOSS) ON
INVESTMENTS | | | | |
Net realized loss from investment transactions | | | (793,373 | ) |
Net change in unrealized appreciation (depreciation) of investments | | | 60,925 | |
Net realized and unrealized loss on investments | | | (732,448 | ) |
NET INCREASE IN NET ASSETS RESULTING FROM OPERATIONS | | $ | 2,874,577 | |
See accompanying notes which are an integral part of these financial statements.
STATEMENTS OF CHANGES IN NET ASSETS
| | | | | | | | |
| | | For the Year Ended December 31, 2015 | | | For the Year Ended December 31, 2014 | |
| | |
OPERATIONS | | | | | | | | |
Net investment income | | $ | 3,607,025 | | | $ | 4,065,338 | |
Net realized loss on investment transactions | | | (793,373 | ) | | | (2,320,092 | ) |
Net change in unrealized appreciation/depreciation of investments | | | 60,925 | | | | 10,963,835 | |
Net increase in net assets resulting from operations | | | 2,874,577 | | | | 12,709,081 | |
| | |
DISTRIBUTIONS TO SHAREHOLDERS | | | | | | | | |
Distributions from net investments income | | | (3,607,025 | ) | | | (4,065,338 | ) |
Total distributions to shareholders | | | (3,607,025 | ) | | | (4,065,338 | ) |
| | |
CAPITAL SHARE TRANSACTIONS (Dollar Activity) | | | | | | | | |
Shares sold | | | 21,777,653 | | | | 14,055,325 | |
Shares issued from reinvestment of distributions | | | 2,333,304 | | | | 2,627,122 | |
Shares redeemed | | | (27,926,223 | ) | | | (29,823,607 | ) |
Decrease in net assets derived from capital share transactions | | | (3,815,266 | ) | | | (13,141,160 | ) |
Total decrease in net assets | | | (4,547,714 | ) | | | (4,497,417 | ) |
| | |
NET ASSETS | | | | | | | | |
Beginning of year | | | 107,353,037 | | | | 111,850,454 | |
End of year | | $ | 102,805,323 | | | $ | 107,353,037 | |
| | |
Transactions in capital stock were: | | | | | | | | |
Shares sold | | | 2,290,315 | | | | 1,489,732 | |
Shares issued from reinvestment of distributions | | | 244,840 | | | | 279,085 | |
Shares redeemed | | | (2,941,798 | ) | | | (3,193,377 | ) |
Decrease in shares outstanding | | | (406,643 | ) | | | (1,424,560 | ) |
See accompanying notes which are an integral part of these financial statements.
| | | | |
| MUNICIPAL TAX FREE BOND FUND | | | 37 | |
FINANCIAL HIGHLIGHTS
The table below sets forth financial data for one share of beneficial interest outstanding throughout the period presented.
| | | | | | | | | | | | | | | | | | | | |
| | | Year Ended December 31, 2015 | | | Year Ended December 31, 2014 | | | Year Ended December 31, 2013 | | | Year Ended December 31, 2012 | | | Year Ended December 31, 2011 | |
Net Asset Value, Beginning of Year | | $ | 9.62 | | | $ | 8.89 | | | $ | 10.08 | | | $ | 9.64 | | | $ | 9.04 | |
| | | | | |
Income from Investment Operations: | | | | | | | | | | | | | | | | | | | | |
Net investment income | | | 0.33 | | | | 0.35 | | | | 0.36 | | | | 0.41 | 1 | | | 0.49 | 1 |
Net realized and unrealized gain (loss) on investments | | | (0.05 | ) | | | 0.73 | | | | (1.19 | ) | | | 0.44 | | | | 0.60 | |
Total income from investment operations | | | 0.28 | | | | 1.08 | | | | (0.83 | ) | | | 0.85 | | | | 1.09 | |
| | | | | |
Less Distributions: | | | | | | | | | | | | | | | | | | | | |
Distributions from net investment income | | | (0.33 | ) | | | (0.35 | ) | | | (0.36 | ) | | | (0.41 | ) | | | (0.49 | ) |
Total distributions | | | (0.33 | ) | | | (0.35 | ) | | | (0.36 | ) | | | (0.41 | ) | | | (0.49 | ) |
| | | | | |
| | | | | | | | | | | | | | | | | | | | | |
Net Asset Value, End of Year | | $ | 9.57 | | | $ | 9.62 | | | $ | 8.89 | | | $ | 10.08 | | | $ | 9.64 | |
Total Return2 | | | 3.01 | % | | | 12.35 | % | | | (8.39 | )% | | | 8.91 | % | | | 12.41 | % |
| | | | | |
Ratios/Supplemental Data: | | | | | | | | | | | | | | | | | | | | |
Net assets, end of year (000) | | $ | 102,805 | | | $ | 107,353 | | | $ | 111,850 | | | $ | 156,793 | | | $ | 102,477 | |
Ratio of expenses to average net assets: | | | | | | | | | | | | | | | | | | | | |
Before expense reimbursement or recapture | | | 1.10 | % | | | 1.10 | % | | | 1.11 | % | | | 1.15 | % | | | 1.20 | % |
After expense reimbursement or recapture | | | 0.91 | %3 | | | 0.90 | % | | | 0.90 | % | | | 0.90 | % | | | 0.90 | % |
Ratio of net investment income to average net assets | | | 3.50 | % | | | 3.78 | % | | | 3.78 | % | | | 4.01 | % | | | 5.28 | % |
Portfolio turnover | | | 11 | % | | | 7 | % | | | 19 | % | | | 13 | % | | | 23 | % |
1 Calculated based on the average number of shares outstanding during the period.
2 Calculation does not reflect sales load.
3 Includes interest expense of 0.01%
See accompanying notes which are an integral part of these financial statements.
| | |
| NOTES TO FINANCIAL STATEMENTS | | DECEMBER 31, 2015 |
Note 1 – Organization
Spirit of America Municipal Tax Free Bond Fund (the “Fund”), a series of Spirit of America Investment Fund, Inc. (the “Company”), is an open-end diversified mutual fund registered under the Investment Company Act of 1940, as amended (the “1940 Act”). Prior to August 31, 2015 the Fund was known as the Spirit of America High Yield Tax Free Bond Fund. The Company was incorporated under the laws of Maryland on May 15, 1997. The Fund commenced operations on February 29, 2008. The Fund seeks high current income that is exempt from federal income tax, investing at least 80% of its assets in municipal bonds. The Fund offers one class of shares.
Note 2 – Significant Accounting Policies
The Fund is an investment company and follows accounting and reporting guidance under Financial Accounting Standards Board (“FASB”) Accounting Standards Codification (“ASC”) Topic 946, “Financial Services-Investment Companies”. The following is a summary of significant accounting policies consistently followed by the Fund in the preparation of its financial statements. These policies are in conformity with generally accepted accounting principles in the United States of America (“GAAP”) for investment companies.
A. Security Valuation: The offering price and net asset value (“NAV”) per share for the Fund are calculated as of the close of regular trading on the New York Stock Exchange (“NYSE”), currently 4:00 p.m., Eastern Time on each day the NYSE is open for trading. The Fund’s securities are valued at the official close or the last reported sales price on the principal exchange on which the security trades, or if no sales price is reported, the mean of the latest bid and asked prices is used. Securities traded over-the-counter are priced at the mean of the latest bid and asked prices. Unlisted securities traded in the over-the-counter market are valued using an evaluated quote provided by the independent pricing service, or, if an evaluated
quote is unavailable, such securities are valued using prices received from dealers, provided that if the dealer supplies both bid and ask prices, the price to be used is the mean of the bid and asked prices. The independent pricing service derives an evaluated quote by obtaining dealer quotes, analyzing the listed markets, reviewing trade execution data and employing sensitivity analysis. Evaluated quotes may also reflect appropriate factors such as individual characteristics of the issue, communications with broker-dealers, and other market data. Short-term investments having a maturity of 60 days or less are valued at amortized cost, which the Board of Directors (the “Board”) believes represents fair value. Fund securities for which market quotations are not readily available are valued at fair value as determined in good faith under procedures established by and under the supervision of the Board.
B. Fair Value Measurements: Various inputs are used in determining the fair value of investments which are as follows:
| | |
• Level 1 – | | Unadjusted quoted prices in active markets for identical investments and/or registered investment companies where the value per share is determined and published and is the basis for current transactions for identical assets or liabilities at the valuation date. |
| |
• Level 2 – | | Observable inputs other than quoted prices included in level 1 that are observable for the asset or liability, either directly or indirectly. These inputs may include quoted prices for the identical instrument on an inactive market, prices for similar instruments, interest rates, prepayment speeds, credit risk, yield curves, default rates and similar data. |
| | | | |
| MUNICIPAL TAX FREE BOND FUND | | | 39 | |
| | |
| NOTES TO FINANCIAL STATEMENTS (CONT.) | | DECEMBER 31, 2015 |
| | |
• Level 3 – | | Unobservable inputs based on the best information available in the circumstances, to the extent observable inputs are not available |
| | |
| | (including the Fund’s own assumptions used in determining the fair value of investments). |
The summary of inputs used to value the Fund’s net assets as of December 31, 2015 is as follows:
| | | | | | | | | | | | | | | | |
| | | Value Inputs | |
| Assets | | Level 1 | | | Level 2 | | | Level 3 | | | Totals | |
Municipal Bonds | | $ | — | | | $ | 101,675,575 | | | $ | — | | | $ | 101,675,575 | |
Money Market | | | 515,330 | | | | — | | | | — | | | | 515,330 | |
| | | | | | | | | | | | | | | | |
Total | | $ | 515,330 | | | $ | 101,675,575 | | | $ | — | | | $ | 102,190,905 | |
| | | | |
| | | | | | | | | | | | | | | | |
The Fund did not have any transfers between levels as of December 31, 2015. The Fund recognizes transfers between fair value hierarchy levels at the end of the reporting period
C. Investment Income and Securities Transactions: Security transactions are accounted for on the date the securities are purchased or sold (trade date). Cost is determined and gains and losses are based on the identified cost basis for both financial statement and federal income tax purposes. Dividend income and distributions to shareholders are reported on the ex-dividend date. Interest income and expenses are accrued daily.
D. Federal Income Taxes: The Fund intends to comply with all requirements of the Internal Revenue Code applicable to regulated investment companies and to distribute substantially all of its taxable income to its shareholders. Therefore, no federal income tax provision is required.
E. Use of Estimates: In preparing financial statements in conformity with GAAP, management makes estimates and assumptions that affect the reported amounts of assets and liabilities at the date of the financial statements, as well as the reported amounts of revenues and expenses during the reporting period. Actual results could differ from those estimates.
F. Distributions to Shareholders: The Fund intends to distribute substantially all of its net investment income and capital gains to shareholders each year. Normally, income distributions will be declared daily and paid monthly. Capital gains, if any, will be distributed annually in December, but may be distributed more frequently if deemed advisable by the Board. All such distributions are taxable to the shareholders whether received in cash or reinvested in shares.
Note 3 – Purchases and Sales of Securities
Purchases and proceeds from the sales of securities for the year ended December 31, 2015, excluding short-term investments, were $11,114,939 and $14,209,766, respectively.
Note 4 – Investment Management Fee and Other Transactions with Affiliates
Spirit of America Management Corp. (the “Adviser”) has been retained to act as the Company’s investment adviser pursuant to an Investment Advisory Agreement (the “Advisory Agreement”). The Adviser was incorporated in 1997 and is a registered investment adviser under the Investment Advisers Act of 1940, as amended. Under the Advisory Agreement, the Fund pays the Adviser a monthly fee of 1/12 of 0.60% of the Fund’s average daily net assets. Investment advisory fees for the year ended December 31, 2015, were $619,220.
| | |
| NOTES TO FINANCIAL STATEMENTS (CONT.) | | DECEMBER 31, 2015 |
The Adviser has contractually agreed to waive advisory fees and/or reimburse expenses so that the total operating expenses will not exceed 0.90% of the average daily net assets of the Fund through April 30, 2016. The waiver does not include, front end or contingent deferred loads, taxes, interest, dividend expenses, brokerage commissions or expenses incurred in connection with any merger, reorganization, or extraordinary expenses such as litigation. For the year ended December 31, 2015, the Adviser waived advisory fees in the amount of $203,144.
Any amounts waived or reimbursed by the Adviser are subject to reimbursement by the Fund within the following three years, provided the Fund is able to make such reimbursement and remain in compliance with the expense limitation as stated above. The balance of recoverable expenses to the Adviser as of December 31, 2015 was $715,829.
Of this balance, $301,815 will expire in 2016, $210,870 will expire in 2017 and $203,144 will expire in 2018.
The Fund has adopted a plan of distribution pursuant to Rule 12b-1 (the “Plan”). The Plan permits the Fund to pay David Lerner Associates, Inc. (the “Distributor”) a monthly fee of 1/12 of 0.15% of the Funds average daily net assets for the Distributor’s services and expenses in distributing shares of the Fund and providing personal services and/or maintaining shareholder accounts. For the year ended December 31, 2015, fees paid to the Distributor under the Plan were $154,805. The Fund’s shares are subject to an initial sales charge imposed at the time of purchase, in accordance with the Fund’s current prospectus. For the year ended December 31, 2015, sales charges received by the Distributor were $914,006. A contingent deferred sales charge (“CDSC”) of 1.00% may be imposed on redemptions of $1 million or more made within one year of purchase. Certain redemptions made within seven years of purchase are subject to a CDSC, in accordance
with the Fund’s current prospectus.
Certain Officers and Directors of the Company are “affiliated persons”, as that term is defined in the 1940 Act, of the Adviser or the Distributor. Each Director of the Company, who is not an affiliated person of the Adviser or Distributor, receives a quarterly retainer of $5,250, $1,000 for each Board meeting attended, and $500 for each committee meeting attended plus reimbursement for certain travel and other out-of-pocket expenses incurred in connection with attending Board meetings. The Company does not compensate the Officers for the services they provide. There are no Directors’ fees paid to affiliated Directors of the Company. For the year ended December 31, 2015, the Fund was allocated $3,113 of the Chief Compliance Officer’s salary.
Note 5 – Concentration and Other Risks
The Fund’s performance could be adversely affected by interest rate risk, which is the possibility that overall bond prices will decline because of rising interest rates. Interest rate risk is expected to be high for the Fund because it invests mainly in long-term bonds, whose prices are much more sensitive to interest fluctuations than are the prices of short-term bonds.
The Fund may be affected by credit risk, which is the possibility that the issuer of a bond will fail to pay interest and principal in a timely manner, or that negative perceptions of the issuer’s ability to make such payments will cause the price of that bond to decline. This risk may be greater to the extent that the Fund may invest in junk bonds.
The Fund may be affected by credit risk of lower grade securities, which is the possibility that municipal securities rated below investment grade, or unrated of similar quality, (frequently called “junk bonds”), may be subject to greater price fluctuations and risks of loss of income and principal than
| | | | |
| MUNICIPAL TAX FREE BOND FUND | | | 41 | |
| | |
| NOTES TO FINANCIAL STATEMENTS (CONT.) | | DECEMBER 31, 2015 |
investment- grade municipal securities. Securities that are (or that have fallen) below investment-grade have a greater risk that the issuers may not meet their debt obligations. These types of securities are generally considered speculative in relation to the issuer’s ongoing ability to make principal and interest payments. During periods of rising interest rates or economic downturn, the trading market for these securities may not be active and may reduce the Fund’s ability to sell
these securities at an acceptable price. If the issuer of securities is in default in payment of interest or principal, the Fund may lose its entire investment in those securities.
Other risks include income risk, liquidity risk, municipal project specific risk, municipal lease obligation risk, zero coupon securities risk, market risk, manager risk, taxability risk, state- specific risk and exchange traded funds risk.
Note 6 – Federal Income Taxes
The tax character of distributions paid for the years ended December 31, 2015 and 2014 were as follows:
| | | | | | | | | | | | | | | | |
| | | Ordinary Income | | | Tax Exempt Income | | | Net Long-Term Capital Gains | | | Total Distributions | |
| 12/31/2015 | | $ | 26,383 | | | $ | 3,580,642 | | | $ | — | | | $ | 3,607,025 | |
| 12/31/2014 | | $ | 29,906 | | | $ | 4,035,432 | | | $ | — | | | $ | 4,065,338 | |
| | | | | | | | | | | | | | | | |
Distribution classifications may differ from the Statements of Changes in Net Assets as a result of the treatment of short-term capital gains as ordinary income for tax purposes.
The adjusted cost basis of investment and gross unrealized appreciation and depreciation of investments for federal income tax purposes were as follows:
| | | | |
| | | As of
December 31,
2015 | |
Gross unrealized appreciation | | $ | 6,039,349 | |
Gross unrealized depreciation | | | (742,628 | ) |
| | | | |
Net unrealized appreciation(a) | | | 5,296,721 | |
| | | | |
Cost basis of investments | | $ | 96,894,184 | |
| | | | |
| | | | |
| (a) | The difference between book-basis and tax- basis net unrealized appreciation is primarily due to wash sales. |
At December 31, 2015, the components of accumulated distributable earnings (losses) for the Fund on a tax basis were as follows:
| | | | |
Capital Loss Carryforward | | $ | (8,683,877 | ) |
Unrealized appreciation | | | 5,296,721 | |
| | | | |
Total accumulated earnings (losses) | | $ | (3,387,156 | ) |
| | | | |
| | | | |
At December 31, 2015, the Fund had net capital loss carryforwards for federal income tax purposes of $8,683,877, of which $522,821 is available to reduce future required distributions of net capital gains to shareholders through the year 2017. The remaining capital loss carryforward is not subject to expiration and retains the character as follows:
| | | | | | | | | | | | |
| | | Short-
Term | | | Long-
Term | | | Total | |
Capital Loss Carryforward not subject to expiration | | $ | 2,453,547 | | | $ | 5,707,509 | | | $ | 8,161,056 | |
Non-expiring carryforwards will be utilized prior to the utilization of carryforwards with expiration dates.
| | |
| NOTES TO FINANCIAL STATEMENTS (CONT.) | | DECEMBER 31, 2015 |
Management of the Fund has reviewed tax positions taken in tax years that remain subject to examination by all major tax jurisdictions, including federal (i.e., the last three tax year ends and the interim tax period since then). Management believes there is no tax liability resulting from unrecognized tax benefits related to uncertain tax positions taken.
Note 7 – Line of Credit
The Fund participates in a short-term credit agreement (“Line of Credit) with The Huntington National Bank, the custodian of the Fund’s investments expiring on May 25, 2016. Borrowing under this agreement bear interest at London Interbank Offered Rate (“LIBOR”) plus 1.500%. Maximum borrowings for the Fund is the lesser of $3,000,000 or 10% of the Fund’s daily market value.
| | | | |
Total bank line of credit as of December 31, 2015 | | $ | 3,000,000 | |
Average borrowings during year | | | 147,856 | |
Number of days outstanding* | | | 65 | |
Average interest rate during year | | | 1.688 | % |
Highest balance drawn during year | | | 1,291,860 | |
Highest balance interest rate | | | 1.922 | % |
Interest expense incurred | | $ | 4,712 | |
Interest rate at December 31, 2015 | | | 1.922 | % |
| * | Number of days outstanding represents the total days during the six months ended December 31, 2015 that the Fund utilized the line of credit. |
Note 8– Other Matters
On May 7, 2010, each of William Mason, the Portfolio Manager for the Real Estate Fund, Income Fund, and Opportunity Fund, and DLA, the Fund’s principal underwriter and distributor, received a Notice of Complaint from the Department of Enforcement of the Financial Industry Regulatory Authority (“FINRA”) relating to Mr. Mason’s activities as head of the fixed income trading department of DLA and DLA’s activities as a municipal securities and collateralized mortgage obligations dealer. The Complaint alleges that each of Mr. Mason and DLA had violated certain NASD and Municipal
Securities Rule Making Board fair pricing rules relating to the period January 1, 2005 through January 31, 2007. On April 4, 2012, a FINRA hearing panel issued a decision in this matter and assessed monetary fines and other sanctions against DLA and Mr. Mason, including a suspension of Mr. Mason from association with a FINRA member firm for six (6) months. Both DLA and Mr. Mason appealed the decision.
On May 27, 2011, FINRA filed a complaint against DLA, the Fund’s principal underwriter and distributor, related to its sales practices in connection with its role as managing dealer of an unaffiliated Real Estate Investment Trust offering, Apple REIT Ten, Inc. (“Apple REIT”). More specifically, FINRA alleged that DLA failed to conduct adequate due diligence, thereby leaving it without a reasonable basis for recommending customer purchases of Apple REIT, in addition to using false, exaggerated and misleading statements regarding the performance of earlier closed Apple REITs. In June 2011, several class action complaints were filed against DLA, Apple REIT entities and certain individuals, also in connection with the sale of various Apple REIT securities. In January 2012, FINRA amended its complaint to add David Lerner as an individual respondent and alleged violations of Section 17(a) of the Securities Act of 1933, as amended, including allegations of false, exaggerated and misleading communications to the public, through customer correspondence and investment seminars, about the investment returns, market values, performance of earlier closed Apple REITs as well as allegations of untrue statements and/or omitted material facts concerning the prior performance, steady distribution rates, unchanging valuations, and prospects of the earlier closed Apple REITs and/or Apple REIT. On October 22, 2012, DLA, Mr. Lerner and Mr. Mason settled all of the foregoing FINRA investigations and actions involving Apple REIT securities and municipal bond and collateralized mortgage obligation pricing. Without admitting or denying the allegations, in connection with
| | | | |
| MUNICIPAL TAX FREE BOND FUND | | | 43 | |
| | |
| NOTES TO FINANCIAL STATEMENTS (CONT.) | | DECEMBER 31, 2015 |
the settlement, DLA, Mr. Lerner and Mr. Mason each agreed, among other things, to pay a fine; and Mr. Lerner agreed to a suspension from affiliation with any FINRA member, including DLA, in any capacity for a period of one year and in any principal capacity for a period of two years thereafter beginning on November 19, 2012; and Mr. Mason agreed to a suspension from affiliation with any FINRA member, including DLA, in any capacity for a period of six months, which suspension ended on June 16, 2013. The fines and suspensions do not involve the Energy Fund or the Adviser. On April 3, 2013, the class action complaints were dismissed, with prejudice, in their entirety. On April 12, 2013, plaintiffs filed a notice of appeal of the class action dismissal. On April 23, 2014, the United States Court of Appeals for the Second Circuit substantially affirmed the April 3, 2013 decision of United States District Judge, Kiyo A. Matsumoto, dismissing with prejudice the class action complaint in In Re Apple REITs Litigation. The Second Circuit held that Judge Matsumoto correctly found that there were no material misrepresentations or omissions in the offering materials for Apple REITs Six through Ten. The appeals court upheld dismissal of ten of the thirteen claims in the case, including all federal and state securities law claims, and also upheld Judge Matsumoto’s refusal to allow plaintiffs to amend their complaint. The appeals court remanded three state common law claims to the District Court for the Eastern District of New York for further proceedings. On March 25, 2015, the District Court dismissed the remaining state common law claims against DLA, with prejudice. Plaintiffs did not file an appeal. Neither the Adviser nor the Fund were a party to any of the investigations or actions listed in this section.
In October 2013, a class action litigation, titled Lewis v. Delaware Charter Guarantee & Trust Company, et al., (the “Litigation”) was commenced in federal court in Nevada against DLA, the Funds’ principal underwriter and distributor, along with other defendants, alleging, inter alia, breach of fiduciary duty, aiding and abetting breach of fiduciary duty,
negligence and misrepresentation. The plaintiffs, purportedly customers who maintain individual retirement accounts at DLA which contained non-traded REIT securities, allege, among other things, that the defendants failed to accurately provide annual fair market values for those REIT securities. The Litigation was transferred to the U.S. District Court for the Eastern District of New York. On March 30, 2015, the District Court dismissed all claims against DLA, with prejudice. Plaintiffs appealed the decision dismissing the claims. While it is unlikely that plaintiffs’ appeal will be successful, there cannot be any assurance that if the class action plaintiffs were to ultimately be successful in the pursuit of an appeal of the decision dismissing the claims against DLA that such outcome would not materially affect DLA’s ability to act as the Funds’ principal underwriter and distributor, although it is not considered likely at this time that such material and adverse effects would occur. Neither the Adviser nor the Fund are a party to the Litigation.
Note 9 – Subsequent Events
Management has evaluated the impact of all subsequent events on the Fund and has determined that there were no events that require recognition or disclosure in the financial statements.
Tax Information (Unaudited)
All designations are based on financial information available as of the date of this annual report and, accordingly, are subject to change. For each item, it is the intention of the Fund to designate the maximum amount permitted under the Internal Revenue Code and the regulations thereunder.
Exempt Interest Dividends
For the period ended December 31, 2015, in accordance with the Internal Revenue Code 852 (b)(5), the Fund qualifies to designate $3,580,642 as exempt-interest dividends. Shareholders may treat these distributions as excludable from gross income per Internal Revenue Code 103(a).
REPORT OF INDEPENDENT REGISTERED PUBLIC ACCOUNTING FIRM
To the Shareholders of Spirit of America Municipal Tax Free Bond Fund and Board of Directors Spirit of America Investment Fund, Inc.
Syosset, New York
We have audited the accompanying statement of assets and liabilities of the Spirit of America Municipal Tax Free Bond Fund, formerly known as Spirit of America High Yield Tax Free Bond Fund (the “Fund”), a series of shares of beneficial interest in Spirit of America Investment Fund, Inc., including the schedule of investments as of December 31, 2015, and the related statement of operations for the year then ended, the statements of changes in net assets for each of the two years in the period then ended, and the financial highlights for each of the five years in the period then ended. These financial statements and financial highlights are the responsibility of the Fund’s management. Our responsibility is to express an opinion on these financial statements and financial highlights based on our audits.
We conducted our audits in accordance with the standards of the Public Company Accounting Oversight Board (United States). Those standards require that we plan and perform the audit to obtain reasonable assurance about whether the financial statements and financial highlights are free of material misstatement. The Fund is not required to have, nor were we engaged to perform, an audit of its internal control over financial reporting. Our audits included consideration of internal control over financial
reporting as a basis for designing audit procedures that are appropriate in the circumstances, but not for the purpose of expressing an opinion on the effectiveness of the Fund’s internal control over financial reporting. Accordingly, we express no such opinion. An audit includes examining, on a test basis, evidence supporting the amounts and disclosures in the financial statements. Our procedures included confirmation of securities owned as of December 31, 2015 by correspondence with the custodian and broker. An audit also includes assessing the accounting principles used and significant estimates made by management, as well as evaluating the overall financial statement presentation. We believe that our audits provide a reasonable basis for our opinion.
In our opinion, the financial statements and financial highlights referred to above present fairly, in all material respects, the financial position of the Spirit of America Municipal Tax Free Bond Fund as of December 31, 2015, the results of its operations for the year then ended, the changes in its net assets for each of the two years in the period then ended, and the financial highlights for each of the five years in the period then ended, in conformity with accounting principles generally accepted in the United States of America.
TAIT, WELLER & BAKER LLP
Philadelphia, Pennsylvania
February 23, 2016
| | | | |
| MUNICIPAL TAX FREE BOND FUND | | | 45 | |
APPROVAL OF THE INVESTMENT ADVISORY AGREEMENT (UNAUDITED)
The Investment Company Act of 1940, as amended (the “1940 Act”) requires that the continuance of a registered management investment company’s investment advisory agreement be approved annually by both the board of directors and also by a majority of its directors who are not parties to the investment advisory agreement or “interested persons” (as defined by the 1940 Act) of any such party (the “Independent Directors”). At a meeting held on December 1, 2015, the Board of Directors (the “Board” or “Directors”) of Spirit of America Investment Fund, Inc. (the “Company”) met in person (the “Meeting”) to, among other things, consider the approval of the Investment Advisory Agreement (the “Advisory Agreement”) by and between Spirit of America Management Corp. (the “Adviser”) and the Company, on behalf of Spirit of America Real Estate Income and Growth Fund, Spirit of America Large Cap Value Fund, Spirit of America Municipal Tax Free Bond Fund, Spirit of America Income Fund, Spirit of America Income & Opportunity Fund, and Spirit of America Energy Fund (collectively, the “Funds”). At the Meeting, the Board, including the Independent Directors voting separately, approved the Advisory Agreement after determining that the Adviser’s compensation, pursuant to the terms of the Advisory Agreement, would be fair and reasonable and concluded that the approval of the Advisory Agreement would be in the best interest of the Funds’ shareholders. The Board’s approval was based on consideration and evaluation of the information and material provided to the Board and a variety of specific factors discussed at the Meeting and at prior meetings of the Board, including the factors described below.
As part of the approval process and oversight of the advisory relationship, counsel to the Independent Directors (“Independent Counsel”) sent an information request letter to the Adviser seeking certain relevant information and the Directors received, for their review in advance of the Meeting, the
Adviser’s responses. In addition, the Directors were provided with the opportunity to request additional materials. In advance of the Meeting, the Board including the Independent Directors, requested and received materials provided by the Adviser and Independent Counsel, including, among other things, the following: (i) Independent Counsel’s 15c questionnaire and the responses provided by the Adviser; (ii) comparative information on the investment performance of the Funds, relevant indices and Lipper category peer funds as of September 30, 2015 in the form of reports generated by Strategic Insight Simfund/MF Desktop; (iii) graphs of fee comparisons for the minimum fee, maximum fee, average fee and median fee in the form of reports generated by the Funds’ administrator; (iv) graphs of performance comparisons for the minimum performing fund, the maximum performing fund, average performing fund and median performing fund for the one year, three years, five years and since inception time periods in the form of reports generated by the Funds’ administrator; (v) the allocation of the Funds’ brokerage, the record of compliance with the Funds’ investment policies and restrictions and with the Funds’ Code of Ethics and the structure and responsibilities of the Adviser’s compliance departments; (vi) the profitability of the Funds’ investment advisory business to the Adviser taking into account both advisory fees and any other potential direct or indirect benefits; (vii) the Form ADV of the Adviser; and (viii) a memorandum from Independent Counsel regarding the responsibilities of the Independent Directors related to the approval of the Investment Advisory Agreement.
In evaluating the Investment Advisory Agreement, the Board, including the Independent Directors, requested, reviewed and considered materials furnished by the Adviser and questioned personnel of the Adviser, including the Funds’ portfolio managers, regarding, among other things, the personnel, each Fund’s performance,
APPROVAL OF THE INVESTMENT ADVISORY AGREEMENT (UNAUDITED) (CONT.)
operations and financial condition of the Adviser. Among other information, the Board, including the Independent Directors, requested and was provided information regarding:
| • | | The Investment performance of each Fund over various time periods both by itself and in relation to relevant indices; |
| • | | The fees charged by the Adviser for investment advisory services, as well as the compensation received by the Adviser and its affiliates; |
| • | | The waivers of fees and reimbursements of expenses at times by the Adviser under the Operating Expenses Agreement; |
| • | | The investment performance, fees and total expenses of mutual funds with similar objectives and strategies managed by other investment advisers; |
| • | | The investment management staffing and the experience of the investment advisory, administrative and other personnel providing services to the Funds and the historical quality of the services provided by the Adviser; and |
| • | | The profitability to the Adviser of managing and its affiliate distributing the Funds and the methodology in allocating expenses to the management of the Funds. |
At the Meeting, Independent Counsel also referred to the “Gartenberg Memorandum” which had been distributed to each Director in advance of the Meeting, outlining the legal standards applicable to the Independent Directors under the 1940 Act with respect to the approval of the continuation of the Investment Advisory Agreement on behalf of each of the Funds. He explained that the Board must consider the (1) nature, extent and quality of services to be provided by the Adviser to the Funds; (2) the investment performance of each Fund independently; (3) the costs of the services provided and profits
realized by the Adviser and its affiliates from the relationship with each Fund; (4) the extent to which economies of scale have been realized as each Fund grows and whether fee levels reflect these economies of scale for the benefit of each Fund’s investors; and (5) any other relevant considerations that the Board deems appropriate. In addition, the Independent Directors met at length with Independent Counsel during the Compliance Committee meeting to discuss the materials provided by the Adviser and to consider any additional questions they had of the Adviser.
The following is a summary of the Board’s discussion and views regarding the factors it considered in evaluating the continuation of the Investment Advisory Agreement:
1. Nature, Extent, and Quality of Services.
The Board, including the Independent Directors, considered the nature, quality and extent of advisory, administrative and shareholder services performed by the Adviser, including: regulatory filings and disclosure to shareholders, general oversight of the service providers, coordination of Fund marketing initiatives, review of Fund legal issues, assisting the Board, including the Independent Directors, in their capacity as directors and other services. The Board, including the Independent Directors, noted the increased responsibilities of the Adviser in response to an increasingly regulated industry. The Board, including the Independent Directors, concluded that the services are extensive in nature, that the Adviser delivered a high level of service to each Fund and that the Adviser is positioned to continue providing such quality of service in the future.
2. Investment Performance of the Funds and the Adviser.
The Board, including the Independent Directors, considered short-term and long-term investment performance for the Funds
| | | | |
| MUNICIPAL TAX FREE BOND FUND | | | 47 | |
APPROVAL OF THE INVESTMENT ADVISORY AGREEMENT (UNAUDITED) (CONT.)
over various periods of time as compared to both relevant indices and the performance of such Funds’ peer groups, and concluded that each Fund was delivering reasonable performance results, especially over the long-term, consistent with the conservative investment strategies that the Funds pursue.
3. Costs of Services and Profits Realized by the Adviser.
a. The Board, including the Independent Directors, considered the information provided by Strategic Insight Simfund/MF Desktop, as well as the comparative graphs provided by HASI, regarding each Fund’s management fee rate and overall expense ratio relative to industry averages for each Fund’s peer group category and the advisory fees charged by the Adviser to other accounts. The Municipal Fund had a gross management fee of 0.60% as compared to the median in its peer group of 0.53%; and, the performance for the 1 year period was 2.28% as compared to the median of its peer group of 2.74%. The Income Fund had a gross management fee of 0.60% as compared to the median in its peer group of 0.60%; and, the performance for the 1 year period was 1.65% as compared to the median of its peer group of (2.29%). The Real Estate Fund had a gross management fee of 0.97% as compared to the median in its peer group of 0.73%; and, the performance for the 1 year period was (1.06%) as compared to the median of its peer group of 0.91%. The Value Fund had a gross management fee of 0.97% as compared to the median in its peer group of 0.69%; and, the performance for the 1 year period was (3.16%) as compared to the median of its peer group of (0.73%). The Opportunity Fund had a gross management fee of 0.65% as compared to the median in its peer group of 1.00%; and, the performance for the 1 year period was (6.21%) as compared to the median of its peer group of (4.57%). The Energy Fund had a gross management fee of 0.95% as compared to the median in its peer group of 0.84%; and, the performance for the
1 year period was (28.09%) as compared to the average of its peer group of (32.16%). The Board viewed favorably the current and historic willingness of the Adviser to limit the overall expense ratios of each Fund. Recognizing that the fees paid by some Funds were higher than some of the comparable funds and higher than the medians in some Fund’s peer groups, the Board nonetheless noted that the fees were still close enough to the medians in each case and that several peer funds had higher fees. The Board noted that although higher, the fees were not unreasonable.
b. Profitability and Costs of Services to the Adviser. The Board, including the Independent Directors, considered estimates of the Adviser’s profitability and costs attributable to the Funds. The Board recognized that increased fixed costs, particularly legal and audit fees in response to increasing regulations, have a greater impact on small fund families, such as the Funds, than on larger fund complexes. Given this, the Board recognized that the Funds’ overall expenses compare unfavorably to some funds identified as peers. The Board also considered whether the amount of the Adviser’s profit is a fair profit for the management of the Funds and noted that the Adviser has devoted a large amount of its resources into the Funds over the years. Mr. Chodosh reported that the fund by fund expense analysis is the same as previous years, but that it does not reflect all of the overhead costs paid by DLA which may be attributed to the Adviser. The Board, including the Independent Directors, concluded that the Adviser’s profitability was at a fair and acceptable level, particularly in light of the quality of the services being provided to the Funds, and bore a reasonable relationship to the services rendered.
4. Extent of Economies of Scale as the Funds Grow.
The Board, including the Independent Directors, considered whether there have been economies of scale with respect to the
APPROVAL OF THE INVESTMENT ADVISORY AGREEMENT (UNAUDITED) (CONT.)
management of the Funds and whether the Funds have appropriately benefited from any economies of scale. Given the size of each Fund, the Board did not believe that significant (if any) economies of scale have been achieved at this time.
5. Whether Fee Levels Reflect Economies of Scale.
The Board took into consideration that the Adviser does not currently offer breakpoints in its fees that would otherwise allow investors to benefit directly from economies of scale in the form of lower fees as fund assets grow. However, the Board, including the Independent Directors, did consider enhancements in personnel and services provided to the Funds by the Adviser, without an increase in fees. The Board also noted that few of the Funds’ peers offered breakpoints despite having significantly more assets under management. The Board stated that they would continue to review this in future years as the Funds’ assets grow.
6. Other Relevant Considerations.
a. Personnel and Methods. The Board, including the Independent Directors, reviewed the Adviser’s Form ADV and questioned the Adviser regarding the size, education and experience of the staff of the Adviser, its fundamental research capabilities, approach to recruiting, training and retaining portfolio managers and other research and management personnel, and concluded that these enable them to provide a high level of service to the Funds. The Board considered the recent management structuring changes and concluded that these changes are likely to positively impact the
management of the Funds. The Board also considered the history, reputation, qualifications and background of the Adviser as well as the qualifications of its personnel.
b. The Board, including the Independent Directors, also considered the character and amount of other direct and incidental benefits received by the Adviser and its affiliates from their association with the Funds, including the benefits received by the affiliated distributor. The Board concluded that potential “fall-out” benefits that the Adviser and its affiliates may receive, such as greater name recognition or increased ability to obtain research services (although the Board noted that the Adviser currently does not use soft dollars to obtain research services), appear to be reasonable, and may in some cases benefit the Funds.
Conclusions. The Board, including the Independent Directors, did not identify any factor as all-important or all-controlling and instead considered the above listed and other factors collectively in light of the Funds’ surrounding circumstances. Each Independent Director gave the weight to each factor that he deemed appropriate in his own judgment. The Independent Directors considered the renewal of the Investment Advisory Agreement on a Fund-by-Fund basis and determined that the renewal of the Investment Advisory Agreement was in the best interests of the shareholders of each Fund. The Independent Directors also determined that the fees charged to each Fund for the services provided were reasonable. Therefore, the Board, including the Independent Directors, determined that continuation of the Investment Advisory Agreement was in the best interests of each Fund.
| | | | |
| MUNICIPAL TAX FREE BOND FUND | | | 49 | |
MANAGEMENT OF THE COMPANY (UNAUDITED)
Information pertaining to the Directors and Officers of the Company is set forth below. The Statement of Additional Information includes additional information about the Directors and is available without charge, upon request, by calling 516-390-5565.
| | | | | | | | |
Name, (Age) and Address1 Position(s) with the Company | | Term of Office2
and Length of Time Served | | Principal Occupation(s) During Past Five Years | | Number of Portfolios
in Fund Complex Overseen by Director | | Other Directorships Held by Director |
| | | |
INTERESTED DIRECTORS | | | | | | |
David Lerner3 (79) Director, Chairman of the Board, President | | Since 1998 | | Founder, David Lerner Associates, Inc., a registered broker-dealer and the Company’s Distributor; and President, Spirit of America Management Corp., the Company’s investment adviser. | | 6 | | President and a Director of Spirit of America Management Corp., the Company’s investment adviser. |
| | | | |
Daniel Lerner3 (54) Director | | Since 1998 | | Executive Vice President, Investment Counselor with David Lerner Associates, Inc., a registered broker-dealer and the Company’s Distributor, since September 2000. | | 6 | | Director of David Lerner Associates, Inc., a registered broker-dealer and the Company’s Distributor. |
| | | |
INDEPENDENT DIRECTORS | | | | | | |
Allen Kaufman (79) Director | | Since 1998 | | President and Chief Executive Officer of K.G.K. Agency, Inc., a property and casualty insurance agency, since 1963.4 | | 6 | | Director of K.G.K. Agency, Inc., a property and casualty insurance agency. |
| | | | |
Stanley S. Thune (79) Lead Director | | Since 1998 | | President and Chief Executive Officer, Freight Management Systems, Inc., a third party logistics management company, since 1994; private investor. | | 6 | | Director of Freight Management Systems, Inc. |
| | | | |
Richard Weinberger (79) Director | | Since 2005 | | Of Counsel to Ballon Stoll Bader & Nadler, P.C., a mid-sized law firm, since January 2005 to March 2011; Shareholder, Ballon Stoll Bader & Nadler, P.C., January 2000 to December 2004. | | 6 | | None. |
| | | | |
OFFICERS | | | | | | | | |
David Lerner President (see biography above) | | | | | | | | |
Alan P. Chodosh (62) Treasurer and Secretary | | Since 2003
(Treasurer) Since 2005 (Secretary) | | Financial and Operations Officer of David Lerner Associates, Inc. since June 1999. | | N/A | | N/A |
| | | | |
Joseph Pickard (55) Chief Compliance Officer | | Since 2007 | | Chief Compliance Officer of Spirit of America Investment Fund, Inc. and Spirit of America Management Corp. since July 2007; Counsel to the Interested Directors of Spirit of America Investment Fund, Inc. since July 2002; Senior Vice President and General Counsel of David Lerner Associates, Inc. since July 2002. | | N/A | | N/A |
| 1 | All addresses are in c/o Spirit of America Investment Fund, Inc., 477 Jericho Turnpike, Syosset, New York 11791. |
| 2 | Each Director serves for an indefinite term, until his successor is elected. |
| 3 | David Lerner is an “interested” Director, as defined in the 1940 Act, by reason of his positions with the Adviser, and Daniel Lerner is an “interested” Director by reason of his position with the Distributor. Daniel Lerner is the son of David Lerner. |
| 4 | K.G.K. Agency, Inc. provides insurance to David Lerner Associates, Inc. and affiliated entities. However, the Board has determined that Mr. Kaufman is not an “interested” Director because the insurance services are less than $120,000 in value. |
Proxy Voting Information
The Company’s Statement of Additional Information (“SAI”) containing a description of the policies and procedures that the Spirit of America Municipal Tax Free Bond Fund uses to determine how to vote proxies relating to portfolio securities, along with the Company’s proxy voting record relating to portfolio securities held during the 12-month period ended June 30 are available (i) without charge, upon request, by calling (516) 390-5565; and (ii) on the SEC’s website at http://www.sec.gov.
Information on Form N-Q
The Company will file its complete schedule of portfolio holdings with the SEC for the first and third quarters of each fiscal year on Form N-Q within sixty days after the end of the period. The Company’s Forms N-Q will be available on the SEC’s website at http://www.sec.gov, and may be reviewed and copied at the SEC’s Public Reference Room in Washington, DC. Information on the operation of the Public Reference Room may be obtained by calling 1-800-SEC-0030.

Investment Adviser
Spirit of America Management Corp.
477 Jericho Turnpike
P.O. Box 9006
Syosset, NY 11791-9006
Distributor
David Lerner Associates, Inc.
477 Jericho Turnpike
P.O. Box 9006
Syosset, NY 11791-9006
Shareholder Services
Ultimus Asset Services, LLC
2960 North Meridian Street, Suite 300
Indianapolis, IN 46208
Custodian
The Huntington National Bank
7 Easton Oval
Columbus, OH 43219
Independent Registered Public Accounting Firm
Tait Weller & Baker LLP
1818 Market Street, Suite 2400
Philadelphia, PA 19103
Counsel
Blank Rome LLP
405 Lexington Avenue
New York, NY 10174
For additional information about the Spirit of America Municipal Tax Free Bond Fund, call (800) 452-4892 or (516) 390-5565.
This report is submitted for the general information of the shareholders of the Fund. It is not authorized for distribution to prospective investors in the Fund unless preceded or accompanied by an effective Prospectus which includes details regarding the Fund’s objectives, risks, policies, expenses, and other information.
©Copyright 2015 Spirit of America SOAMX-AR15

ANNUAL REPORT
DECEMBER 31, 2015

MESSAGE TO OUR SHAREHOLDERS
Dear Shareholder,
We are pleased to send you the 2015 Annual Report for the Spirit of America Income Fund, (the “Fund”). The Fund began operations on December 31, 2008.
As 2015 comes to an end, we could not be more proud and excited about the progress of this fund. The Fund has over $200 million in assets under management and over 11,000 investors.
We firmly maintain our philosophy that striving for the optimal balance between yield and risk will continue to position us to achieve long term success. Our dedication to providing our investors with a fund that will merit their long term commitment and satisfaction has never been stronger. Now is an excellent time to team up with your Investment Counselor to evaluate your portfolio and make sure you are properly positioned to achieve your investment goals.
Your support is sincerely appreciated and we look forward to your continued confidence in the Spirit of America Income Fund.
Sincerely,
| | | | | | |
 | |  | |  | |  |
| | David Lerner | | | William Mason |
| | President | | | Portfolio Manager |
| | Spirit of America Investment Fund, Inc. | | | | |
MANAGEMENT DISCUSSION (UNAUDITED)
Economic Summary
The Federal Reserve raised rates to a range between 0.25% and 0.5% signaling the beginning of the end for the central bank’s stimulus program as anticipated during their December meeting. Fed officials emphasized that they intend to raise rates gradually and only if economic growth continues. They are predicting that if all goes smoothly short-term rates may rise by about one percentage point a year for the next three years.
At the end of December the Department of Commerce revised the U.S. gross domestic product (GDP) for the 3rd quarter of 2015 up to a 2.0% annual pace. The increase in GDP this quarter primarily reflected positive contributions from personal consumption, nonresidential fixed investment, state and local spending, residential fixed investment, and exports that were partly offset by a negative contribution from private inventory investment and an increase in imports. In the 2nd quarter GDP increased by a 3.9% pace following the 0.02% contraction in the 1st quarter.
The latest employment data released by the Bureau of Labor Statistics in the December jobs report shows total nonfarm payroll employment rose by 292,000 jobs. In 2015, payroll employment growth totaled 2.7 million, compared with 3.1 million in 2014. The unemployment rate was 5.0%, down by 0.6% over the past 12 months.
Market Commentary
This past year the S&P 500 hit a record high in May only to slump in August over fears of a China-led global economic slowdown. For the year, the S&P 500 was down 0.73%. The Dow Jones industrial average lost 2.23% for the year, its first annual decline since 2008. The Nasdaq
Composite gained 5.73% after surpassing levels not seen since the dot-com bubble in 2000.
The Fund invests a portion of its assets in Master Limited Partnerships (MLPs). The Alerian MLP Index (AMZ), a capitalization-weighted composite of 50 energy Master Limited Partnerships, had a total return of -32.59% for the period of December 31, 2014 through December 31, 2015.
Treasuries and taxable municipal bonds were down in 2015. The 30 Year US Treasury Yield moved from a 2.69 on 1/2/15 to a 3.02 12/31/15. At the same time, the MMD Taxable 30 Year AAA yield began the year at a 3.49 on 1/2/15 and ended the year at a 3.86 on 12/31/15.
Fund Summary
The Spirit of America Income Fund, (SOAIX) (the “Fund”) is the second largest fund of the Spirit of America Family of Funds in assets under management. The Fund’s objective is to seek high current income. The emphasis of the Fund is focused on investing in a diversified portfolio of taxable municipal bonds, income producing convertible securities, high yield U.S. corporate bonds, preferred stocks, collateralized mortgage obligations, and master limited partnerships (MLPs).
At the end of 2015, the Fund had over 73% of its assets in taxable municipal bonds, 10% in preferred stock, over 8% in corporate bonds, and over 3% in MLPs. We remain diligent in our approach to the market. Here at Spirit of America each and every credit goes through vigorous credit analysis and we have a wealth of knowledge and experience in trading.
The Fund does not make decisions based on complicated algorithms. We are not a hedge fund. At Spirit of America, technology
MANAGEMENT DISCUSSION (UNAUDITED) (CONT.)
works for us; we do not work for technology. We do not receive buy signals from a computer generated model.
We invest the old fashioned way – utilizing hard work, intensive research, and intuitive decisions. Our decisions are based on experience. When we began the Fund, we felt the environment was favorable to start an income fund and while past performance is no guarantee of future results; our results have validated that belief.
Return Summary
Despite the decline in 30 Year Treasury and taxable municipal market, the Fund had a total return of 0.92% (no load, gross of fees) for the year ending December 31, 2015. This compares to the 0.55% return of its benchmark, the Barclay U.S. Aggregate Index, for the same period. That result does not take the Fund’s sales charge and expense ratio into account.
Including the sales charge and expenses, as of December 31, 2015, the Fund’s one year return was -4.92%. The Fund, which began operations in January 2009, had an annualized five year return of 6.10% and an annualized return since inception of 7.90%.
We plan to proceed with the same game plan we have employed since the Fund began: pursuing a balance between yield and risk.
ILLUSTRATION OF INVESTMENT (UNAUDITED)
Summary of Portfolio Holdings (Unaudited)
As of December 31, 2015
| | | | | | | | |
| Municipal Bonds | | | 74.26 | % | | $ | 147,822,107 | |
| Preferred Stocks | | | 10.07 | % | | | 20,055,310 | |
| Corporate Bonds | | | 8.46 | % | | | 16,842,934 | |
| Common Stocks | | | 5.02 | % | | | 9,992,908 | |
| Collateralized Mortgage Obligations | | | 0.19 | % | | | 372,459 | |
| Money Market | | | 2.00 | % | | | 3,990,251 | |
| Total Investments | | | 100.00 | % | | $ | 199,075,969 | |
Average Annual Returns (Unaudited)
(For the Periods Ended December 31, 2015)
| | | | | | | | | | | | |
| | | | |
| | | 1 Year | | | 5 Year | | | Since
Inception
(December 31,
2008) | |
| Spirit of America Income Fund (NAV) | | | (0.17 | )% | | | 7.14 | % | | | 8.66 | % |
| Spirit of America Income Fund (POP) | | | (4.92 | )% | | | 6.10 | % | | | 7.90 | % |
| The Barclays U.S. Aggregate Bond Index | | | 0.55 | % | | | 3.25 | % | | | 4.05 | % |
NAV represents the Net Asset Value. Returns at NAV do not reflect the maximum 4.75% sales charge. POP represents Public Offering Price and returns at POP do reflect the maximum 4.75% sales charge. Total returns for periods less than one year are not annualized.
Performance data quoted represents past performance; past performance is no guarantee of future results.
The investment return and principal value of an investment will fluctuate so that an investor’s shares, when redeemed, may be worth more or less than their original cost. Current performance may be lower or higher than the performance quoted.
ILLUSTRATION OF INVESTMENT (UNAUDITED) (CONT.)
Growth of $10,000 (Unaudited)
(includes one-time 4.75% maximum sales charge and reinvestment of all distributions)
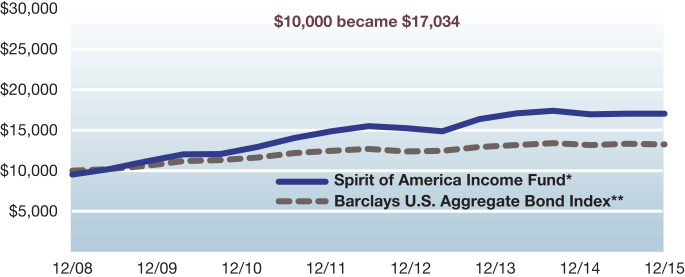
| * | Fund commenced operations December 31, 2008. |
| ** | The Barclays U.S. Aggregate Bond Index benchmark is based on a start date of December 31, 2008. |
Past performance does not guarantee future results. The performance data quoted represents past performance and current returns may be lower or higher. The investment return and net asset value will fluctuate so that an investor’s shares, when redeemed may be worth more or less than the original cost. To obtain performance information current to the most recent month-end, please call 1-800- 452-4892.
The Barclays U.S. Aggregate Bond Index is an unmanaged index. The performance of an index assumes no transaction costs, taxes, management fees or other expenses. A direct investment in an index is not possible.
DISCLOSURE OF FUND EXPENSES (UNAUDITED)
FOR THE SIX MONTH PERIOD JULY 1, 2015 TO DECEMBER 31, 2015
We believe it is important for you to understand the impact of fees regarding your investment. All mutual funds have operating expenses. As a shareholder of the Fund, you incur ongoing costs, which include costs for portfolio management, administrative services, and shareholder reports (like this one), among others. Operating expenses, which are deducted from the Fund’s gross income, directly reduce the investment return of the Fund.
The Fund’s expenses are expressed as a percentage of its average net assets. This figure is known as the expense ratio. The following examples are intended to help you understand the ongoing fees (in dollars) of investing in your Fund and to compare these costs with those of other mutual funds. The examples are based on an investment of $1,000 made at the beginning of the period shown and held for the six month period, July 1, 2015 to December 31, 2015.
Spirit of America Income Fund
| | | | | | | | |
| | | Beginning
Account Value
July 1, 2015 | | Ending Account Value December 31, 2015 | | Expense Ratio(1) | | Expenses
Paid During
Period(2) |
Actual Fund Return | | $1,000.00 | | $1,005.60 | | 1.10% | | $5.56 |
Hypothetical 5% Return | | $1,000.00 | | $1,019.66 | | 1.10% | | $5.60 |
This table illustrates your Fund’s costs in two ways:
Actual Fund Return: This section helps you to estimate the actual expenses that you paid over the period. The “Ending Account Value” shown is derived from the Fund’s actual return, the third column shows the period’s annualized expense ratio, and the last column shows the dollar amount that would have been paid by an investor who started with $1,000 in the Fund at the beginning of the period. You may use the information here, together with your account value, to estimate the expenses that you paid over the period.
To do so, simply divide your account value by $1,000 (for example, an $8,600 account value divided by $1,000 = 8.6), then multiply the result by the number in the first line under the heading entitled “Expenses Paid During Period.”
Hypothetical 5% Return: This section is intended to help you compare your Fund’s costs with those of other mutual funds. It assumes that the Fund had a return of 5% before expenses during the period shown, but that the expense ratio is unchanged. In this case, because the return used is not the Fund’s actual return, the results do not apply to your investment. You can assess your Fund’s costs by comparing this hypothetical example with the hypothetical examples that appear in shareholder reports of other funds.
Please note that the expenses shown in the table are meant to highlight your ongoing costs only and do not reflect any transactional costs such as sales charges (loads), or redemption fees.
| (1) | Annualized, based on the Fund’s most recent half-year expenses. |
| (2) | Expenses are equal to the Fund’s annualized expense ratio multiplied by the average account value over the period, multiplied by the number of days in the period (184), then divided by 365. |
| | |
| SCHEDULE OF INVESTMENTS | | DECEMBER 31, 2015 |
| | | | | | | | |
| | | Principal
Amount | | | Market
Value | |
| Collateralized Mortgage Obligations 0.19% | |
CHL Mortgage Pass-Through Trust 2005-21, A27, 5.50%, 10/25/35 | | $ | 68,694 | | | $ | 64,687 | |
CHL Mortgage Pass-Through Trust 2005-21, A7, 5.50%, 10/25/35 | | | 74,264 | | | | 69,932 | |
Citicorp Mortgage Securities, Inc., 1A12, 5.00%, 02/25/35 | | | 238,404 | | | | 237,840 | |
Total Collateralized Mortgage Obligations
(Cost $258,178) | | | | | | | 372,459 | |
| | |
| Municipal Bonds 73.28% | | | | | | | | |
|
Alabama 2.66% | |
Health Care Authority for Baptist Health/The, Refunding Revenue Bonds, Series A, 5.50%, 11/15/43 | | | 4,000,000 | | | | 4,008,760 | |
University of Alabama/The, University & College Improvements, Build America Revenue Bonds, Callable 06/01/20 @ 100, (OID), 6.13%, 06/01/39 | | | 715,000 | | | | 795,259 | |
University of Alabama/The, University & College Improvements, Build America Revenue Bonds, Callable 06/01/20 @ 100, (OID), 6.13%, 06/01/42 | | | 500,000 | | | | 555,690 | |
| | | | 5,359,709 | |
|
Arizona 1.49% | |
Arizona School Facilities Board, School Improvements, Certificate Participation, 6.00%, 09/01/27 | | | 225,000 | | | | 244,154 | |
Northern Arizona University, University & College Improvements, Build America Revenue Bonds, Callable 08/01/20 @ 100, 5.92%, 08/01/22 | | | 1,365,000 | | | | 1,525,879 | |
University of Arizona, University & College Improvements, Build America Revenue Bonds, Callable 08/01/20 @ 100, 6.64%, 08/01/44 | | | 1,085,000 | | | | 1,227,330 | |
| | | | 2,997,363 | |
|
California 6.05% | |
Alhambra Unified School District, University & College Improvements, General Obligation Unlimited, 6.70%, 02/01/26 | | | 465,000 | | | | 573,726 | |
Bay Area Toll Authority, Highway Improvements, Build America Revenue Bonds, Series S1-SUB, 6.92%, 04/01/40 | | | 250,000 | | | | 330,245 | |
City of Tulare, CA Sewer Revenue, Sewer Improvements, Build America Revenue Bonds, Callable 11/15/19 @ 100, (AGM) (OID), 8.75%, 11/15/44 | | | 1,000,000 | | | | 1,168,400 | |
Colton Joint Unified School District, School Improvements, General Obligation Unlimited, Series C, 6.01%, 08/01/26 | | | 1,000,000 | | | | 1,157,170 | |
See accompanying notes which are an integral part of these financial statements.
| | |
| SCHEDULE OF INVESTMENTS (CONT.) | | DECEMBER 31, 2015 |
| | | | | | | | |
| | | Principal
Amount | | | Market
Value | |
|
California (cont.) | |
County of San Bernardino, CA, Refunding Revenue Bonds, (AGM), 6.02%, 08/01/23 | | $ | 190,000 | | | $ | 208,713 | |
Los Angeles Department of Water & Power, Electric Light & Power Improvements, Build America Revenue Bonds, Callable 07/01/21 @ 100, 7.00%, 07/01/41 | | | 500,000 | | | | 582,110 | |
Napa Valley Unified School District, School Improvements, General Obligation Unlimited, 6.51%, 08/01/43 | | | 500,000 | | | | 625,070 | |
Oakland Redevelopment Agency Successor Agency, Economic Improvements, Tax Allocation, Series T, (OID), 8.50%, 09/01/20 | | | 500,000 | | | | 572,525 | |
Peralta Community College District, Refunding Revenue Bonds, 7.31%, 08/01/31 | | | 1,310,000 | | | | 1,557,957 | |
Peralta Community College District, Refunding Revenue Bonds, 6.91%, 08/01/25 | | | 500,000 | | | | 587,055 | |
San Bernardino City Unified School District, School Improvements, Certificate Participation, (AGM) (OID), 8.05%, 02/01/23 | | | 1,000,000 | | | | 1,228,710 | |
San Bernardino City Unified School District, School Improvements, Certificate Participation, (AGM) (OID), 8.25%, 02/01/26 | | | 500,000 | | | | 637,495 | |
State of California, Recreational Facility, Water Facility & Correctional Facility Improvements, Build America Bonds, General Obligation Unlimited, (AGM-CR) (OID), 6.88%, 11/01/26 | | | 1,000,000 | | | | 1,287,010 | |
University of California, University & College Improvements, Refunding Revenue Bonds, Series J, 3.66%, 05/15/27 | | | 250,000 | | | | 250,200 | |
West Contra Costa Unified School District, School Improvements, General Obligation Unlimited, Series A-1-, 6.25%, 08/01/30 | | | 1,250,000 | | | | 1,440,437 | |
| | | | 12,206,823 | |
| | |
Colorado 1.01% | | | | | | | | |
Adams State University, University & College Improvements, Build America Revenue Bonds, Callable 05/15/19 @ 100, (State Higher Education Intercept Program) (OID), 6.47%, 05/15/38 | | | 250,000 | | | | 272,658 | |
City of Brighton, CO, Public Improvements, Build America Bonds, Certificate Participation, Callable 12/01/20 @ 100, (AGM) (OID), 6.75%, 12/01/35 | | | 250,000 | | | | 271,420 | |
Colorado Mesa University, University & College Improvements, Build America Revenue Bonds, Series B, (State Higher Education Intercept Program), 6.75%, 05/15/42 | | | 1,000,000 | | | | 1,234,120 | |
See accompanying notes which are an integral part of these financial statements.
| | |
| SCHEDULE OF INVESTMENTS (CONT.) | | DECEMBER 31, 2015 |
| | | | | | | | |
| | | Principal
Amount | | | Market
Value | |
| | |
Colorado (cont.) | | | | | | | | |
County of Gunnison, CO, Public Improvements, Build America Bonds, Certificate Participation, Series B-BUILD AMER BDS, Callable 07/15/20 @ 100, 5.95%, 07/15/30 | | $ | 250,000 | | | $ | 269,510 | |
| | | | 2,047,708 | |
|
Connecticut 0.85% | |
City of Bridgeport, CT, School Improvements, Build America Bonds, General Obligation Unlimited, Callable 08/15/20 @ 100, (AGM), 6.57%, 08/15/28 | | | 1,000,000 | | | | 1,152,120 | |
City of Waterbury, CT, Public Improvements, General Obligation Unlimited, Callable 09/01/20 @ 100, (AGM), 6.10%, 09/01/30 | | | 500,000 | | | | 555,645 | |
| | | | 1,707,765 | |
|
District of Columbia 0.28% | |
Washington Metropolitan Area Transit Authority, Transit Improvements, Build America Revenue Bonds, Callable 07/01/19 @ 100, (OID), 7.00%, 07/01/34 | | | 500,000 | | | | 568,650 | |
|
Florida 6.15% | |
City of Lake City, FL Utility System Revenue, Water Utility Improvements, Build America Revenue Bonds, Callable 07/01/20 @ 100, (AGM), 6.03%, 07/01/30 | | | 100,000 | | | | 109,054 | |
City of Lake City, FL Utility System Revenue, Water Utility Improvements, Build America Revenue Bonds, Callable 07/01/20 @ 100, (AGM), 6.28%, 07/01/40 | | | 200,000 | | | | 220,256 | |
City of Miami Gardens, FL, Public Improvements, Build America Bonds, Certificate Participation, 7.17%, 06/01/26 | | | 1,250,000 | | | | 1,496,725 | |
City of Oakland Park, FL Water & Sewer Revenue, Sewer Improvements, Build America Revenue Bonds, Callable 09/01/20 @ 100, (AGM), 6.14%, 09/01/35 | | | 300,000 | | | | 318,294 | |
City of Orlando, FL, Recreational Facilities Improvements, Build America Revenue Bonds, Callable 10/01/19 @ 100, 7.10%, 10/01/39 | | | 415,000 | | | | 474,926 | |
City of Orlando, FL, Recreational Facilities Improvements, Build America Revenue Bonds, Callable 10/01/19 @ 100, 6.85%, 10/01/29 | | | 250,000 | | | | 284,665 | |
County of Miami-Dade, FL, Port, Airport & Marina Improvements, Build America Revenue Bonds, (AGM) (OID), 7.50%, 04/01/40 | | | 1,000,000 | | | | 1,288,010 | |
County of Miami-Dade, FL, Public Improvements, Build America Revenue Bonds, Series B, Callable 04/01/20 @ 100, 6.54%, 04/01/30 | | | 500,000 | | | | 569,650 | |
See accompanying notes which are an integral part of these financial statements.
| | |
| SCHEDULE OF INVESTMENTS (CONT.) | | DECEMBER 31, 2015 |
| | | | | | | | |
| | | Principal
Amount | | | Market
Value | |
|
Florida (cont.) | |
County of Miami-Dade, FL, Public Improvements, Build America Revenue Bonds, Callable 04/01/19 @ 100, 6.97%, 04/01/39 | | $ | 750,000 | | | $ | 825,825 | |
County of Miami-Dade, FL, Recreational Facility Improvements, Revenue Bonds, Series D, (AGM), 7.08%, 10/01/29 | | | 250,000 | | | | 281,450 | |
County of Miami-Dade, FL Transit System, Transit Improvements, Build America Revenue Bonds, Series B, 5.53%, 07/01/32 | | | 500,000 | | | | 551,450 | |
County of Miami-Dade, FL Transit System, Transit Improvements, Build America Revenue Bonds, Series B, Callable 07/01/19 @ 100, 6.91%, 07/01/39 | | | 1,000,000 | | | | 1,133,640 | |
Florida Atlantic University Finance Corp., University & College Improvements, Build America Revenue Bonds, Callable 07/01/20 @ 100, 7.64%, 07/01/40 | | | 165,000 | | | | 194,099 | |
Florida Department of Environmental Protection, Public Improvements, Build America Revenue Bonds, Callable 07/01/19 @ 100, 7.05%, 07/01/29 | | | 1,500,000 | | | | 1,730,745 | |
Florida Governmental Utility Authority, Build America Revenue Bonds, Callable 10/01/20 @ 100, 6.55%, 10/01/40 | | | 1,000,000 | | | | 1,102,970 | |
Florida State Board of Governors, University & College Improvements, Build America Revenue Bonds, Callable 11/01/20 @ 100, 7.50%, 11/01/35 | | | 250,000 | | | | 263,350 | |
Osceola County School Board, School Improvements, Certificate Participation, 6.66%, 04/01/27 | | | 1,000,000 | | | | 1,071,190 | |
Town of Davie, FL Water & Sewer Revenue, Water Utility Improvements, Build America Revenue Bonds, Series B, Callable 10/01/20 @ 100, (AGM), 6.85%, 10/01/40 | | | 250,000 | | | | 292,807 | |
Town of Miami Lakes, FL, Public Improvements, Build America Revenue Bonds, 7.59%, 12/01/30 | | | 150,000 | | | | 192,279 | |
| | | | 12,401,385 | |
|
Georgia 2.39% | |
Municipal Electric Authority of Georgia, Electric Lights & Power Improvements, Build America Bonds, Refunding Revenue Bonds, 7.06%, 04/01/57 | | | 2,500,000 | | | | 2,799,375 | |
State of Georgia, Public Improvements, General Obligation Unlimited, Series B, Callable 02/01/24 @ 100, 3.84%, 02/01/32 | | | 2,000,000 | | | | 2,025,720 | |
| | | | 4,825,095 | |
See accompanying notes which are an integral part of these financial statements.
| | |
| SCHEDULE OF INVESTMENTS (CONT.) | | DECEMBER 31, 2015 |
| | | | | | | | |
| | | Principal
Amount | | | Market
Value | |
|
Hawaii 0.75% | |
State of Hawaii, General Obligation Unlimited, Series FA, Callable 10/01/25 @ 100, 4.05%, 10/01/32 | | $ | 1,495,000 | | | $ | 1,504,508 | |
|
Idaho 0.44% | |
Idaho Water Resource Board, Water Utility Improvements, Revenue Bonds, Callable 09/01/22 @ 100, (OID), 5.25%, 09/01/24 | | | 900,000 | | | | 896,211 | |
|
Illinois 3.31% | |
City of Chicago Heights, IL, Refunding Bonds, General Obligation Unlimited, Callable 01/15/21 @ 100, (AGM) (OID), 6.00%, 01/15/28 | | | 150,000 | | | | 160,086 | |
City of Chicago Heights, IL, Refunding Bonds, General Obligation Unlimited, Callable 01/15/21 @ 100, (AGM) (OID), 5.50%, 01/15/24 | | | 500,000 | | | | 524,730 | |
City of Chicago, IL Waterworks Revenue, Water Utility Improvements, Build America Revenue Bonds, 6.74%, 11/01/40 | | | 250,000 | | | | 285,185 | |
Henry Hospital District, Hospital Improvements, Build America Bonds, General Obligation Unlimited, Callable 12/01/19 @ 100, (AGM), 6.65%, 12/01/29 | | | 840,000 | | | | 890,375 | |
Lake County Community Unit School District No. 187 North Chicago, School Improvements, General Obligation Unlimited, Series B, Callable 01/01/20 @ 100, (AGM) (OID), 7.13%, 01/01/35 | | | 1,000,000 | | | | 1,093,700 | |
Northern Illinois University, University & College Improvements, Build America Revenue Bonds, Callable 04/01/20 @ 100, (AGM), 8.15%, 04/01/41 | | | 570,000 | | | | 650,569 | |
Northern Illinois University, University & College Improvements, Build America Revenue Bonds, Callable 04/01/20 @ 100, (AGM), 7.75%, 04/01/30 | | | 250,000 | | | | 283,200 | |
Village of Glenwood, IL, Public Improvements, Build America Bonds, General Obligation Unlimited, (AGM), 7.03%, 12/01/28 | | | 1,500,000 | | | | 1,774,080 | |
Village of Rosemont, IL, Public Improvements, General Obligation Unlimited, Series B, (AGM) (OID), 6.13%, 12/01/30 | | | 500,000 | | | | 542,330 | |
Will County Forest Preservation District, Public Improvements, Build America Bonds, General Obligation Limited, 5.71%, 12/15/30 | | | 400,000 | | | | 469,208 | |
| | | | 6,673,463 | |
See accompanying notes which are an integral part of these financial statements.
| | |
| SCHEDULE OF INVESTMENTS (CONT.) | | DECEMBER 31, 2015 |
| | | | | | | | |
| | | Principal
Amount | | | Market
Value | |
|
Indiana 1.42% | |
Anderson School Building Corp., Refunding Bonds, General Obligation Limited, Callable 07/05/23 @ 100, 3.95%, 07/05/29 | | $ | 1,000,000 | | | $ | 979,060 | |
Anderson School Building Corp., Refunding Bonds, General Obligation Limited, Callable 07/05/23 @ 100, (OID), 3.75%, 07/05/28 | | | 1,000,000 | | | | 976,400 | |
Evansville Redevelopment Authority, Recreational Facility Improvements, Build America Refunding Revenue Bonds, Callable 08/01/20 @ 100, 7.21%, 02/01/39 | | | 800,000 | | | | 907,312 | |
| | | | 2,862,772 | |
|
Kansas 0.71% | |
Kansas Development Finance Authority, Public Improvements, Build America Revenue Bonds, Callable 11/01/19 @ 100, 6.26%, 11/01/28 | | | 390,000 | | | | 432,268 | |
Kansas Development Finance Authority, Revenue Bonds, Series H, 4.73%, 04/15/37 | | | 1,000,000 | | | | 1,004,400 | |
| | | | 1,436,668 | |
|
Kentucky 1.38% | |
Kentucky Municipal Power Agency, Electric Lights & Power Improvements, Build America Revenue Bonds, Callable 09/01/20 @ 100, (AGM), 6.49%, 09/01/37 | | | 250,000 | | | | 269,463 | |
Kentucky State Property & Building Commission, Economic Improvements, University & College Improvements, Build America Revenue Bonds, Series C, 5.37%, 11/01/25 | | | 400,000 | | | | 444,684 | |
Paducah Independent School District Finance Corp., School Improvements, Revenue Bonds, Callable 12/01/21 @ 100, (SEEK), 5.00%, 12/01/30 | | | 1,000,000 | | | | 1,035,320 | |
Perry County School District Finance Corp., School Improvements, Revenue Bonds, Callable 12/01/21 @ 100, (SEEK), 5.00%, 12/01/30 | | | 1,000,000 | | | | 1,045,550 | |
| | | | 2,795,017 | |
|
Louisiana 1.55% | |
City of New Orleans, LA, Swap Termination Refunding Bonds, General Obligation Limited, Callable 09/01/22 @ 100, 4.59%, 09/01/27 | | | 500,000 | | | | 510,695 | |
East Baton Rouge Sewerage Commission, Refunding Revenue Bonds, Series A, Callable 02/01/25 @ 100, 3.95%, 02/01/30 | | | 1,000,000 | | | | 992,510 | |
See accompanying notes which are an integral part of these financial statements.
| | |
| SCHEDULE OF INVESTMENTS (CONT.) | | DECEMBER 31, 2015 |
| | | | | | | | |
| | | Principal
Amount | | | Market
Value | |
|
Louisiana (cont.) | |
Tangipahoa Parish Hospital Service District No. 1, Hospital Improvements, Build America Revenue Bonds, Callable 02/01/20 @ 100, 7.20%, 02/01/42 | | $ | 1,540,000 | | | $ | 1,628,242 | |
| | | | 3,131,447 | |
|
Massachusetts 0.65% | |
City of Worcester, MA, Pension Funding, General Obligation Limited, (AGM) (OID), 6.25%, 01/01/28 | | | 230,000 | | | | 259,985 | |
Massachusetts Health & Educational Facilities Authority, Refunding Revenue Bonds, 6.43%, 10/01/35 | | | 750,000 | | | | 875,827 | |
University of Massachusetts Building Authority, University & College Improvements, Build America Revenue Bonds, Callable 05/01/19 @ 100, 6.57%, 05/01/39 | | | 165,000 | | | | 182,549 | |
| | | | 1,318,361 | |
|
Michigan 3.99% | |
Avondale School District, School Improvements, Build America Bonds, General Obligation Unlimited, Callable 05/01/20 @ 100, (AGM), 5.75%, 05/01/32 | | | 500,000 | | | | 534,465 | |
Belding Area Schools, School Improvements, Build America Bonds, General Obligation Unlimited, Callable 01/07/16 @ 103, 6.67%, 05/01/40 | | | 1,490,000 | | | | 1,534,953 | |
Belding Area Schools, School Improvements, Build America Bonds, General Obligation Unlimited, Callable 01/07/16 @ 103, 6.62%, 05/01/35 | | | 310,000 | | | | 319,353 | |
Chippewa Valley Schools, School Improvements, Build America Bonds, General Obligation Unlimited, Callable 05/01/20 @ 100, 6.85%, 05/01/35 | | | 100,000 | | | | 105,282 | |
Chippewa Valley Schools, School Improvements, Build America Bonds, General Obligation Unlimited, Callable 05/01/20 @ 100, 6.60%, 05/01/30 | | | 150,000 | | | | 158,819 | |
Comstock Park Public Schools, School Improvements, General Obligation Unlimited, Callable 05/01/21 @ 100, 6.20%, 05/01/24 | | | 200,000 | | | | 220,982 | |
County of Macomb, MI, Retirement Facilities, General Obligation Limited, Callable 11/01/25 @ 100, 4.13%, 11/01/30 | | | 250,000 | | | | 254,173 | |
Eastern Michigan University, University & College Improvements, Build America Revenue Bonds, Callable 02/15/19 @ 100, 7.21%, 02/15/38 | | | 250,000 | | | | 266,573 | |
Lincoln Consolidated School District, School Improvements, Build America Bonds, General Obligation Unlimited, Callable 05/01/20 @ 100, (AGM), 6.83%, 05/01/40 | | | 250,000 | | | | 271,563 | |
See accompanying notes which are an integral part of these financial statements.
| | |
| SCHEDULE OF INVESTMENTS (CONT.) | | DECEMBER 31, 2015 |
| | | | | | | | |
| | | Principal
Amount | | | Market
Value | |
|
Michigan (cont.) | |
Michigan Finance Authority, Revenue Bonds, Series A, Callable 09/01/25 @ 100, 3.90%, 09/01/30 | | $ | 250,000 | | | $ | 244,145 | |
Michigan Finance Authority, School Improvements, Revenue Bonds, Series C, Callable 05/01/21 @ 100, 6.20%, 05/01/22 | | | 495,000 | | | | 540,456 | |
Michigan Finance Authority, School Improvements, Revenue Bonds, Callable 11/01/20 @ 100, 6.38%, 11/01/25 | | | 500,000 | | | | 555,135 | |
Michigan Tobacco Settlement Finance Authority, Miscellaneous Purposes Revenue Bonds, Series A, Callable 02/01/23 @ 100, (OID), 7.31%, 06/01/34 | | | 2,635,000 | | | | 2,279,749 | |
Milan Area Schools, School Improvements, General Obligation Unlimited, Callable 05/01/19 @ 100, (OID), 7.10%, 05/01/34 | | | 485,000 | | | | 539,029 | |
Onsted Community Schools, School Improvements, General Obligation Unlimited, Callable 05/01/20 @ 100, 5.90%, 05/01/27 | | | 150,000 | | | | 158,030 | |
St Johns Public Schools, General Obligation Unlimited, Callable 05/01/20 @ 100, 6.65%, 05/01/40 | | | 5,000 | | | | 5,348 | |
Warren Consolidated Schools, School Improvements, Build America Bonds, General Obligation Unlimited, Callable 05/01/20 @ 100, (OID), 6.70%, 05/01/35 | | | 50,000 | | | | 52,181 | |
| | | | 8,040,236 | |
|
Mississippi 0.47% | |
State of Mississippi, Refunding Bonds, General Obligation Unlimited, Series D, 3.43%, 10/01/29 | | | 1,000,000 | | | | 956,300 | |
|
Missouri 2.77% | |
City of Kansas City, MO, Revenue Bonds, Series D, 7.83%, 04/01/40 | | | 2,500,000 | | | | 3,159,000 | |
City of Sedalia, MO, Sewer Improvements, Build America Bonds, Certificate Participation, Callable 06/01/20 @ 100, (AGM), 6.50%, 06/01/24 | | | 250,000 | | | | 263,295 | |
City of St Charles, MO, Water Utility Improvements Build America Bonds, Certificate Participation, Callable 08/01/20 @ 100, 5.65%, 02/01/30 | | | 275,000 | | | | 278,982 | |
Missouri Joint Municipal Electric Utility Commission, Electric Lights & Power Improvements, Build America Revenue Bonds, 7.90%, 01/01/42 | | | 1,000,000 | | | | 1,297,110 | |
Missouri Joint Municipal Electric Utility Commission, Electric Lights & Power Improvements, Build America Revenue Bonds, 7.73%, 01/01/39 | | | 475,000 | | | | 590,311 | |
| | | | | | | 5,588,698 | |
See accompanying notes which are an integral part of these financial statements.
| | |
| SCHEDULE OF INVESTMENTS (CONT.) | | DECEMBER 31, 2015 |
| | | | | | | | |
| | | Principal
Amount | | | Market
Value | |
|
Nebraska 0.11% | |
Nebraska Public Power District, Electric Lights & Power Improvements, Build America Revenue Bonds, 5.32%, 01/01/30 | | $ | 200,000 | | | $ | 218,094 | |
|
Nevada 3.02% | |
City of Las Vegas, NV, Public Improvements, Build America Bonds, Certificate Participation, Callable 09/01/19 @ 100, (OID), 7.75%, 09/01/29 | | | 1,100,000 | | | | 1,294,458 | |
County of Clark, NV, Transit Improvements, Build America Bonds, General Obligation Limited, Callable 07/01/20 @ 100, (OID), 7.00%, 07/01/38 | | | 1,000,000 | | | | 1,170,010 | |
County of Washoe, NV, Public Improvements, Build America Revenue Bonds, 7.88%, 02/01/40 | | | 250,000 | | | | 319,895 | |
County of Washoe, NV, Public Improvements, Build America Revenue Bonds, 7.97%, 02/01/40 | | | 1,590,000 | | | | 2,018,887 | |
Las Vegas Valley Water District, Water Utility Improvements, Build America Bonds, General Obligation Limited, Callable 06/01/19 @ 100, 7.10%, 06/01/39 | | | 925,000 | | | | 1,059,782 | |
Pershing County School District, School Improvements, Build America Bonds, General Obligation Limited, Callable 04/01/20 @ 100, (GTD), 6.25%, 04/01/30 | | | 220,000 | | | | 229,977 | |
| | | | 6,093,009 | |
|
New Jersey 2.83% | |
Essex County Improvement Authority, Refunding Revenue Bonds, Series B, Callable 02/08/16 @ 100, (AMBAC) (GTD) (OID), 5.00%, 10/01/24 | | | 500,000 | | | | 500,770 | |
New Jersey Economic Development Authority, School Improvements, Build America Revenue Bonds, Series CC-1, Callable 06/15/20 @ 100, 6.43%, 12/15/35 | | | 500,000 | | | | 525,935 | |
New Jersey Educational Facilities Authority, University & College Improvements, Build America Revenue Bonds, Callable 07/01/20 @ 100, 6.19%, 07/01/40 | | | 500,000 | | | | 532,730 | |
New Jersey Educational Facilities Authority, University & College Improvements, Build America Revenue Bonds, Callable 07/01/19 @ 100, 7.40%, 07/01/40 | | | 1,000,000 | | | | 1,104,190 | |
New Jersey Housing & Mortgage Finance Agency, State Multi Family Housing, Refunding Revenue Bonds, Series E, Callable 11/01/24 @ 100, 4.27%, 11/01/30 | | | 390,000 | | | | 384,996 | |
New Jersey Turnpike Authority, Highway Improvements, Build America Revenue Bonds, 7.10%, 01/01/41 | | | 250,000 | | | | 343,865 | |
See accompanying notes which are an integral part of these financial statements.
| | |
| SCHEDULE OF INVESTMENTS (CONT.) | | DECEMBER 31, 2015 |
| | | | | | | | |
| | | Principal
Amount | | | Market
Value | |
|
New Jersey (cont.) | |
South Jersey Transportation Authority LLC, Highway Improvements, Build America Revenue Bonds, (OID), 7.00%, 11/01/38 | | $ | 500,000 | | | $ | 542,225 | |
Township of Brick, NJ, General Obligation Unlimited, Callable 09/01/23 @ 100, 3.75%, 09/01/28 | | | 1,780,000 | | | | 1,772,809 | |
| | | | 5,707,520 | |
|
New York 8.90% | |
City of New York, NY, Public Improvements, Build America Bonds, General Obligation Unlimited, Callable 12/01/19 @ 100, 6.39%, 12/01/29 | | | 500,000 | | | | 563,845 | |
City of New York, NY, Public Improvements, Build America Bonds, General Obligation Unlimited, 5.21%, 10/01/31 | | | 100,000 | | | | 121,237 | |
City of New York, NY, Public Improvements, Build America Bonds, General Obligation Unlimited, Callable 10/01/20 @ 100, 5.82%, 10/01/31 | | | 250,000 | | | | 275,523 | |
City of New York, NY, Public Improvements, Build America Bonds, General Obligation Unlimited, Callable 03/01/20 @ 100, 6.27%, 03/01/31 | | | 500,000 | | | | 562,705 | |
City of New York, NY, Public Improvements, Build America Bonds, General Obligation Unlimited, 5.70%, 03/01/27 | | | 145,000 | | | | 173,176 | |
County of Nassau, NY, Public Improvements, Build America Bonds, General Obligation Unlimited, Callable 10/01/20 @ 100, 7.40%, 10/01/35 | | | 500,000 | | | | 566,235 | |
County of Nassau, NY, Public Improvements, Build America Bonds, General Obligation Unlimited, Series G, 5.38%, 10/01/24 | | | 500,000 | | | | 578,285 | |
Long Island Power Authority, Revenue Bonds, (OID), 5.85%, 05/01/41 | | | 195,000 | | | | 218,490 | |
Metropolitan Transportation Authority, Transit Improvements, Build America Revenue Bonds, 6.59%, 11/15/30 | | | 100,000 | | | | 123,342 | |
Metropolitan Transportation Authority, Transit Improvements, Build America Revenue Bonds, 6.67%, 11/15/39 | | | 1,000,000 | | | | 1,307,590 | |
Metropolitan Transportation Authority, Transit Improvements, Build America Revenue Bonds, 5.99%, 11/15/30 | | | 125,000 | | | | 151,461 | |
Metropolitan Transportation Authority, Transit Improvements, Build America Revenue Bonds, Callable 11/15/20 @ 100, 7.13%, 11/15/30 | | | 500,000 | | | | 595,890 | |
Metropolitan Transportation Authority, Transit Improvements, Build America Revenue Bonds, 6.20%, 11/15/26 | | | 875,000 | | | | 1,024,756 | |
Metropolitan Transportation Authority, Transit Improvements, Build America Revenue Bonds, 6.69%, 11/15/40 | | | 1,500,000 | | | | 1,980,255 | |
See accompanying notes which are an integral part of these financial statements.
| | |
| SCHEDULE OF INVESTMENTS (CONT.) | | DECEMBER 31, 2015 |
| | | | | | | | |
| | | Principal
Amount | | | Market
Value | |
|
New York (cont.) | |
New York City Housing Development Corp., Multi-Family Housing Revenue Bonds, Series I, Callable 05/01/19 @ 100, 6.42%, 11/01/39 | | $ | 2,500,000 | | | $ | 2,672,275 | |
New York City Industrial Development Agency, Recreational Facilities Improvements Revenue Bonds, 5.90%, 03/01/46 | | | 680,000 | | | | 704,711 | |
New York City Transitional Finance Authority Building Aid Revenue, School Improvements, Build America Revenue Bonds, Callable 07/15/20 @ 100, (State Aid Withholding), 7.13%, 07/15/30 | | | 500,000 | | | | 591,180 | |
New York City Transitional Finance Authority Building Aid Revenue, School Improvements, Build America Revenue Bonds, (State Aid Withholding), 6.83%, 07/15/40 | | | 500,000 | | | | 662,320 | |
New York City Transitional Finance Authority Future Tax Secured Revenue, Public Improvements, Build America Revenue Bonds, 5.47%, 05/01/36 | | | 300,000 | | | | 348,777 | |
New York City Transitional Finance Authority Future Tax Secured Revenue, Public Improvements, Build America Revenue Bonds, Callable 05/01/20 @ 100, 5.72%, 05/01/30 | | | 1,000,000 | | | | 1,072,350 | |
New York City Transitional Finance Authority Future Tax Secured Revenue, Public Improvements, Build America Revenue Bonds, Callable 08/01/20 @ 100, 5.81%, 08/01/30 | | | 500,000 | | | | 562,205 | |
New York City Water & Sewer System, Build America Refunding Revenue Bonds, Callable 06/15/20 @ 100, 6.49%, 06/15/42 | | | 200,000 | | | | 226,560 | |
New York Municipal Bond Bank Agency, Build America Refunding Revenue Bonds, Callable 12/15/19 @ 100, 6.88%, 12/15/34 | | | 500,000 | | | | 528,130 | |
Port Authority of New York & New Jersey, Port, Airport & Marina Improvements, Revenue Bonds, Series 187, Callable 10/15/24 @ 100, 3.92%, 10/15/28 | | | 2,115,000 | | | | 2,152,837 | |
Western Nassau County Water Authority, Build America Revenue Bonds, 6.70%, 04/01/40 | | | 150,000 | | | | 183,554 | |
| | | | 17,947,689 | |
|
North Carolina 0.13% | |
County of Cabarrus, NC, School Improvements, Revenue Bonds, Callable 04/01/21 @ 100, 5.50%, 04/01/26 | | | 235,000 | | | | 256,824 | |
See accompanying notes which are an integral part of these financial statements.
| | |
| SCHEDULE OF INVESTMENTS (CONT.) | | DECEMBER 31, 2015 |
| | | | | | | | |
| | | Principal
Amount | | | Market
Value | |
|
Ohio 3.13% | |
American Municipal Power, Inc., Electric Lights & Power Improvements, Build America Revenue Bonds, 7.83%, 02/15/41 | | $ | 430,000 | | | $ | 592,187 | |
American Municipal Power, Inc., Electric Lights & Power Improvements, Build America Revenue Bonds, 7.50%, 02/15/50 | | | 1,350,000 | | | | 1,788,885 | |
American Municipal Power, Inc., Build America Refunding Revenue Bonds, Callable 02/15/20 @ 100, 5.96%, 02/15/24 | | | 500,000 | | | | 550,360 | |
Cincinnati City School District, Refunding Bonds, Certificate Participation, Callable 12/15/24 @ 100, (OID), 4.00%, 12/15/32 | | | 200,000 | | | | 189,020 | |
County of Cuyahoga, OH, Hospital Improvements, Build America Revenue Bonds, 8.22%, 02/15/40 | | | 1,000,000 | | | | 1,211,190 | |
Franklin County Convention Facilities Authority, Economic Improvements, Build America Revenue Bonds, 6.64%, 12/01/42 | | | 500,000 | | | | 607,925 | |
Madison Local School District/Lake County, School Improvements, Build America Bonds, General Obligation Unlimited, Callable 10/01/20 @ 100, (School District Credit Program), 5.70%, 04/01/35 | | | 250,000 | | | | 261,923 | |
Mariemont City School District, Build America Bonds, General Obligation Unlimited, Callable 12/01/20 @ 100, 5.90%, 12/01/30 | | | 115,000 | | | | 128,511 | |
Olentangy Local School District, Refunding Bonds, General Obligation Unlimited, Series A, Callable 06/01/25 @ 100, 3.50%, 12/01/29 | | | 500,000 | | | | 482,065 | |
Springfield Local School District/Summit County, School Improvements, Build America Bonds, General Obligation Unlimited, Callable 09/01/19 @ 100, (School District Credit Program), 5.65%, 09/01/31 | | | 200,000 | | | | 204,714 | |
State of Ohio, Public Improvements, Build America Revenue Bonds, Callable 10/01/19 @ 100, 6.52%, 10/01/28 | | | 250,000 | | | | 293,135 | |
| | | | 6,309,915 | |
|
Oklahoma 0.27% | |
Bryan County Independent School District No. 72 Durant, School Improvements, Build America Bonds, Certificate Participation, Callable 12/01/19 @ 102, (OID), 6.80%, 12/01/33 | | | 500,000 | | | | 548,060 | |
|
Oregon 0.14% | |
State of Oregon Department of Administrative Services, Hospital Improvements, Build America Bonds, Certificate Participation, Series B, Callable 05/01/20 @ 100, 6.18%, 05/01/35 | | | 250,000 | | | | 278,230 | |
See accompanying notes which are an integral part of these financial statements.
| | |
| SCHEDULE OF INVESTMENTS (CONT.) | | DECEMBER 31, 2015 |
| | | | | | | | |
| | | Principal
Amount | | | Market
Value | |
|
Pennsylvania 1.42% | |
Philadelphia Authority for Industrial Development, Pension Funding, Revenue Bonds, Series A, (AGM) (OID), 6.35%, 04/15/28 | | $ | 630,000 | | | $ | 701,940 | |
Philadelphia Municipal Authority, Public Improvements, Revenue Bonds, 5.09%, 03/15/28 | | | 500,000 | | | | 493,730 | |
Pittsburgh Water & Sewer Authority, Refunding Revenue Bonds, Series A, (AGM), 6.61%, 09/01/24 | | | 300,000 | | | | 361,689 | |
Sports & Exhibition Authority of Pittsburgh and Allegheny County, Recreational Facilities Improvements, Revenue Bonds, 7.04%, 11/01/39 | | | 1,000,000 | | | | 1,135,880 | |
Township of Bristol, PA, Pension Funding, General Obligation Unlimited, Callable 09/15/18 @ 100, (AGM), 7.15%, 09/15/38 | | | 150,000 | | | | 172,650 | |
| | | | 2,865,889 | |
|
Rhode Island 0.05% | |
Rhode Island Housing & Mortgage Finance Corp, Refunding Revenue Bonds, Callable 10/01/22 @ 100, 4.46%, 10/01/31 | | | 100,000 | | | | 100,000 | |
|
South Carolina 0.13% | |
Moncks Corner Regional Recreation Corp., Recreational Facility Improvements, Build America Revenue Bonds, Callable 12/01/20 @ 100, 6.55%, 12/01/39 | | | 250,000 | | | | 261,743 | |
|
South Dakota 0.22% | |
South Dakota State Building Authority, University & College Improvements, Build America Revenue Bonds, Callable 06/01/21 @ 100, 6.15%, 06/01/31 | | | 400,000 | | | | 438,244 | |
|
Tennessee 2.58% | |
Coffee County Public Building Authority, Public Improvements, Build America Revenue Bonds, Callable 06/01/19 @ 100, (GTD), 7.20%, 06/01/44 | | | 1,500,000 | | | | 1,626,465 | |
Metropolitan Government of Nashville & Davidson County Convention Center Authority, Public Improvements, Build America Revenue Bonds, 7.43%, 07/01/43 | | | 2,000,000 | | | | 2,588,400 | |
Metropolitan Government of Nashville & Davidson County, TN, Refunding Bonds, General Obligation Unlimited, Series B, 3.29%, 07/01/27 | | | 500,000 | | | | 492,130 | |
Metropolitan Government of Nashville & Davidson County, TN, Refunding Bonds, General Obligation Unlimited, Series B, 3.39%, 07/01/28 | | | 500,000 | | | | 490,405 | |
| | | | 5,197,400 | |
See accompanying notes which are an integral part of these financial statements.
| | |
| SCHEDULE OF INVESTMENTS (CONT.) | | DECEMBER 31, 2015 |
| | | | | | | | |
| | | Principal
Amount | | | Market
Value | |
|
Texas 5.91% | |
Austin Community College District, University & College Improvements, Revenue Bonds, Series A, Callable 02/01/19 @ 100, 5.00%, 02/01/26 | | $ | 985,000 | | | $ | 1,043,736 | |
City of Lancaster, TX, Public Improvements, Build America Bonds, General Obligation Limited, Callable 02/15/20 @ 100, 6.53%, 02/15/40 | | | 750,000 | | | | 842,917 | |
City of Laredo, TX Sports Venue Sales Tax Revenue, Recreational Facility Improvements, Revenue Bonds, Callable 03/15/18 @ 100, (AGM) (OID), 5.45%, 03/15/31 | | | 500,000 | | | | 517,110 | |
City of San Antonio, TX, Public Improvements, Build America Bonds, General Obligation Limited, Callable 08/01/20 @ 100, 6.04%, 08/01/40 | | | 250,000 | | | | 281,098 | |
County of Bexar, TX, Public Improvements, Build America Bonds, General Obligation Limited, Callable 06/15/19 @ 100, 6.63%, 06/15/39 | | | 500,000 | | | | 566,900 | |
Dallas Convention Center Hotel Development Corp., Public Improvements, Build America Revenue Bonds, 7.09%, 01/01/42 | | | 1,500,000 | | | | 1,933,410 | |
Ector County Hospital District, Hospital Improvements, Build America Revenue Bonds, Callable 09/15/20 @ 100, 7.18%, 09/15/35 | | | 250,000 | | | | 270,090 | |
El Paso Downtown Development Corp., Recreational Facility Improvements, Revenue Bonds, 7.25%, 08/15/43 | | | 1,000,000 | | | | 1,099,320 | |
Frisco Economic Development Corp., Public Improvements, Revenue Bonds, Callable 02/15/24 @ 100, 4.20%, 02/15/34 | | | 1,000,000 | | | | 971,300 | |
Midland County Hospital District, Health, Hospital, & Nursing Home Improvements, Build America Bonds, General Obligation Limited, 6.44%, 05/15/39 | | | 260,000 | | | | 313,357 | |
North Texas Tollway Authority, Highway Improvements, Build America Revenue Bonds, Callable 02/01/20 @ 100, 8.91%, 02/01/30 | | | 2,000,000 | | | | 2,379,720 | |
Orchard Cultural Education Facilities Finance Corp., Recreational Facility Improvements, Revenue Bonds, Callable 11/15/20 @ 100, 6.48%, 11/15/34 | | | 860,000 | | | | 937,400 | |
San Antonio Industrial Development Corp., Refunding Revenue Bonds, Callable 08/15/23 @ 100, 4.75%, 08/15/33 | | | 750,000 | | | | 765,787 | |
| | | | 11,922,145 | |
|
Utah 0.27% | |
Central Weber Sewer Improvement District, Sewer Improvements, Build America Revenue Bonds, Callable 03/01/19 @ 100, (OID), 6.38%, 03/01/34 | | | 500,000 | | | | 550,255 | |
See accompanying notes which are an integral part of these financial statements.
| | |
| SCHEDULE OF INVESTMENTS (CONT.) | | DECEMBER 31, 2015 |
| | | | | | | | |
| | | Principal
Amount | | | Market Value | |
|
Virgin Islands 0.97% | |
Virgin Islands Water & Power Authority—Electric System, Electric Lights & Power Improvements, Build America Revenue Bonds, (AGM), 6.85%, 07/01/35 | | $ | 1,000,000 | | | $ | 1,051,300 | |
Virgin Islands Water & Power Authority—Electric System, Electric Lights & Power Improvements, Build America Revenue Bonds, (AGM), 6.65%, 07/01/28 | | | 840,000 | | | | 898,632 | |
| | | | 1,949,932 | |
|
Virginia 2.33% | |
Tobacco Settlement Financing Corp., Refunding Revenue Bonds, Series A-1, Callable 01/22/16 @ 100, (OID), 6.71%, 06/01/46 | | | 6,085,000 | | | | 4,705,835 | |
|
Washington 1.08% | |
City of Seattle, WA Municipal Light & Power Revenue, Electric Lights & Power Improvements, Build America Revenue Bonds, (OID), 5.57%, 02/01/40 | | | 250,000 | | | | 283,923 | |
Douglas County Public Utility District No. 1, Electric Lights & Power Improvements, Revenue Bonds, Series A, 5.35%, 09/01/30 | | | 250,000 | | | | 273,620 | |
Klickitat County Public Utility District No. 1, Electric Lights & Power Improvements, Refunding Revenue Bonds, Callable 12/01/21 @ 100, 5.25%, 12/01/29 | | | 705,000 | | | | 760,117 | |
Public Utility District No. 1 of Cowlitz County, WA, Electric Lights & Power Improvements, Build America Revenue Bonds, 6.88%, 09/01/32 | | | 500,000 | | | | 579,855 | |
Snohomish County Public Utility District No. 1, Electric Lights & Power Improvements, Build America Revenue Bonds, (OID), 5.68%, 12/01/40 | | | 250,000 | | | | 282,693 | |
| | | | 2,180,208 | |
|
West Virginia 0.94% | |
Tobacco Settlement Finance Authority, Miscellaneous Purposes Revenue Bonds, Series A, 7.47%, 06/01/47 | | | 2,200,000 | | | | 1,907,356 | |
|
Wisconsin 0.53% | |
Glendale Community Development Authority, Economic Improvements Tax Allocation Bonds, Callable 10/01/17 @ 100, 6.97%, 10/01/29 | | | 1,000,000 | | | | 1,065,580 | |
Total Municipal Bonds
(Cost $138,489,020) | | | | | | | 147,822,107 | |
See accompanying notes which are an integral part of these financial statements.
| | |
| SCHEDULE OF INVESTMENTS (CONT.) | | DECEMBER 31, 2015 |
| | | | | | | | |
| | | Principal
Amount | | | Market
Value | |
| | |
| Common Stocks 4.95% | | | | | | | | |
|
Energy 3.53% | |
Buckeye Partners LP | | $ | 10,590 | | | $ | 698,516 | |
Calumet Specialty Products Partners LP | | | 8,500 | | | | 169,235 | |
Cone Midstream Partners LP | | | 8,500 | | | | 83,725 | |
Enbridge Energy Partners LP | | | 34,519 | | | | 796,353 | |
Energy Transfer Partners LP | | | 33,631 | | | | 1,134,374 | |
EnLink Midstream Partners LP | | | 33,865 | | | | 561,482 | |
Global Partners LP | | | 7,215 | | | | 126,768 | |
Kinder Morgan, Inc. | | | 51,442 | | | | 767,515 | |
MPLX LP | | | 14,800 | | | | 582,084 | |
Plains All American Pipeline LP | | | 3,200 | | | | 73,920 | |
Targa Resources Partners LP | | | 20,547 | | | | 339,642 | |
TC PipeLines LP | | | 10,695 | | | | 531,648 | |
Tesoro Logistics LP | | | 6,405 | | | | 322,300 | |
USA Compression Partners LP | | | 12,796 | | | | 147,026 | |
Western Gas Partners LP | | | 6,500 | | | | 308,945 | |
Williams Partners LP | | | 17,022 | | | | 474,063 | |
| | | | 7,117,596 | |
|
Financials 0.10% | |
Blackstone Group LP/The | | | 7,100 | | | | 207,604 | |
|
Real Estate Investment Trusts 1.22% | |
Apple Hospitality REIT, Inc. | | | 21,850 | | | | 436,344 | |
Blackstone Mortgage Trust, Inc. | | | 11,565 | | | | 309,479 | |
City Office REIT, Inc. | | | 20,000 | | | | 243,600 | |
Hannon Armstrong Sustainable Infrastructure Capital, Inc. | | | 77,792 | | | | 1,471,825 | |
| | | | 2,461,248 | |
|
Telecommunication Services 0.10% | |
AT&T, Inc. | | | 6,000 | | | | 206,460 | |
Total Common Stocks
(Cost $11,999,578) | | | | | | | 9,992,908 | |
| | |
| Corporate Bonds 8.35% | | | | | | | | |
Choice Hotels International, Inc., 5.70%, 08/28/20 | | | 200,000 | | | | 215,000 | |
DDR Corp., 7.50%, 07/15/18 | | | 500,000 | | | | 561,373 | |
Digital Realty Trust LP, 5.88%, 02/01/20 | | | 1,000,000 | | | | 1,103,465 | |
Dow Chemical Co./The, 3.05%, 02/15/22 | | | 1,000,000 | | | | 995,530 | |
Duke Realty LP, 4.38%, 06/15/22 | | | 250,000 | | | | 257,970 | |
Entergy Texas, Inc., 5.15%, 06/01/45 | | | 100,000 | | | | 98,418 | |
See accompanying notes which are an integral part of these financial statements.
| | |
| SCHEDULE OF INVESTMENTS (CONT.) | | DECEMBER 31, 2015 |
| | | | | | | | |
| | | Principal
Amount | | | Market
Value | |
| | |
| Corporate Bonds (cont.) | | | | | | | | |
Exelon Generation Co. LLC, 5.60%, 06/15/42 (a) | | $ | 400,000 | | | $ | 373,705 | |
Fifth Third Bancorp, 8.25%, 03/01/38 | | | 250,000 | | | | 350,187 | |
General Electric Co, 4.00%, 12/29/49 (b) | | | 1,765,335 | | | | 1,767,542 | |
Goldman Sachs Group, Inc./The, 6.45%, 05/01/36 | | | 500,000 | | | | 566,899 | |
Goldman Sachs Group, Inc./The, 6.75%, 10/01/37 | | | 1,350,000 | | | | 1,582,859 | |
Hospitality Properties Trust, 4.50%, 03/15/25 | | | 500,000 | | | | 480,936 | |
Kilroy Realty LP, 4.80%, 07/15/18 | | | 100,000 | | | | 105,017 | |
Kinder Morgan Energy Partners LP, 6.50%, 02/01/37 | | | 250,000 | | | | 215,332 | |
MetLife Capital Trust X, 9.25%, 04/08/38 (a) | | | 1,500,000 | | | | 2,073,750 | |
MetLife, Inc., 10.75%, 08/01/39 | | | 1,000,000 | | | | 1,568,750 | |
National Retail Properties, Inc., 5.50%, 07/15/21 | | | 350,000 | | | | 386,925 | |
Noble Holding International Ltd., 6.05%, 03/01/41 | | | 1,000,000 | | | | 599,345 | |
PECO Energy Capital Trust IV, 5.75%, 06/15/33 | | | 1,000,000 | | | | 954,592 | |
Qwest Corp., 7.13%, 11/15/43 | | | 1,000,000 | | | | 953,250 | |
Simon Property Group LP, 10.35%, 04/01/19 | | | 150,000 | | | | 184,146 | |
SL Green Realty Corp., 7.75%, 03/15/20 | | | 1,000,000 | | | | 1,168,239 | |
Valero Energy Corp., 8.75%, 06/15/30 | | | 224,000 | | | | 279,704 | |
Total Corporate Bonds
(Cost $16,409,352) | | | | | | | 16,842,934 | |
| | |
| | | Shares | | | | |
| | |
| Preferred Stocks 9.94% | | | | | | | | |
|
Financials 2.29% | |
Aegon NV, 8.00% | | | 12,900 | | | | 355,266 | |
Aflac, Inc., 5.50% | | | 8,850 | | | | 228,684 | |
American Financial Group, Inc., 6.00% | | | 8,700 | | | | 223,329 | |
Aviva PLC, 8.25% | | | 12,990 | | | | 343,845 | |
Bank of New York Mellon Corp./The, 5.20% | | | 8,700 | | | | 223,764 | |
First Republic Bank, 5.70% | | | 9,000 | | | | 229,500 | |
Hancock Holding Co., 5.95% | | | 3,700 | | | | 90,687 | |
JPMorgan Chase & Co, 5.45% | | | 4,480 | | | | 113,075 | |
JPMorgan Chase & Co., 6.30% | | | 8,750 | | | | 229,775 | |
KKR Financial Holdings LLC, 7.50% | | | 10,000 | | | | 261,700 | |
KKR Financial Holdings LLC, 8.38% | | | 30,000 | | | | 794,100 | |
PNC Financial Services Group, Inc./The, 5.38% | | | 4,250 | | | | 108,588 | |
Protective Life Corp., 6.25% | | | 11,300 | | | | 296,625 | |
Royal Bank of Canada, 5.50% | | | 11,700 | | | | 296,010 | |
State Street Corp., 5.25% | | | 8,050 | | | | 210,910 | |
U.S. Bancorp, 6.50% | | | 7,300 | | | | 209,510 | |
Wells Fargo & Co., 5.20% | | | 15,850 | | | | 402,273 | |
| | | | 4,617,641 | |
See accompanying notes which are an integral part of these financial statements.
| | |
| SCHEDULE OF INVESTMENTS (CONT.) | | DECEMBER 31, 2015 |
| | | | | | | | |
| | | Shares | | | Market
Value | |
| Preferred Stocks (cont.) | |
|
Industrials 0.34% | |
Pitney Bowes, Inc., 6.70% | | | 5,700 | | | $ | 153,672 | |
Stanley Black & Decker, Inc., 5.75% | | | 20,687 | | | | 536,000 | |
| | | | 689,672 | |
|
Real Estate Investment Trusts 6.76% | |
DDR Corp., 6.50% | | | 9,184 | | | | 231,437 | |
Digital Realty Trust, Inc., 6.35% | | | 16,000 | | | | 410,880 | |
Digital Realty Trust, Inc., 6.63% | | | 11,552 | | | | 302,200 | |
Digital Realty Trust, Inc., 7.00% | | | 33,392 | | | | 862,515 | |
Equity Commonwealth, 5.75% | | | 10,000 | | | | 245,100 | |
Kilroy Realty Corp., 6.88% | | | 20,264 | | | | 523,014 | |
Kimco Realty Corp., 6.00% | | | 32,490 | | | | 840,516 | |
Kimco Realty Corp., 5.50% | | | 39,809 | | | | 982,486 | |
Kimco Realty Corp., 5.63% | | | 24,367 | | | | 611,124 | |
National Retail Properties, Inc., 6.63% | | | 14,440 | | | | 376,306 | |
PS Business Parks, Inc., 6.45% | | | 13,537 | | | | 356,429 | |
PS Business Parks, Inc., 6.00% | | | 40,522 | | | | 1,034,932 | |
PS Business Parks, Inc., 5.70% | | | 6,498 | | | | 162,515 | |
Public Storage, 5.90% | | | 12,487 | | | | 323,164 | |
Public Storage, 5.88% | | | 7,076 | | | | 187,160 | |
Public Storage, 6.35% | | | 32,490 | | | | 839,217 | |
Public Storage, 6.50% | | | 14,440 | | | | 366,920 | |
Regency Centers Corp., 6.00% | | | 28,225 | | | | 721,431 | |
Regency Centers Corp., 6.63% | | | 36,221 | | | | 958,045 | |
Senior Housing Properties Trust, 5.63% | | | 40,000 | | | | 1,015,200 | |
Taubman Centers, Inc., 6.25% | | | 13,046 | | | | 332,673 | |
Taubman Centers, Inc., 6.50% | | | 9,416 | | | | 240,296 | |
Ventas Capital Corp., 5.45% | | | 10,000 | | | | 261,100 | |
Vornado Realty Trust, 6.88% | | | 16,170 | | | | 413,629 | |
Vornado Realty Trust, 5.40% | | | 12,298 | | | | 298,841 | |
Welltower, Inc., 6.50% | | | 28,880 | | | | 746,259 | |
| | | | | | | 13,643,389 | |
|
Utilities 0.55% | |
Duke Energy Corp., 5.13% | | | 9,030 | | | | 231,710 | |
NextEra Energy Capital Holdings, Inc., 5.00% | | | 6,700 | | | | 165,959 | |
NextEra Energy Capital Holdings, Inc., 5.63% | | | 8,775 | | | | 222,885 | |
SCE Trust I, 5.63% | | | 19,125 | | | | 484,054 | |
| | | | 1,104,608 | |
Total Preferred Stocks | | | | | | | | |
(Cost $19,549,291) | | | | | | | 20,055,310 | |
See accompanying notes which are an integral part of these financial statements.
| | |
| SCHEDULE OF INVESTMENTS (CONT.) | | DECEMBER 31, 2015 |
| | | | | | | | |
| | | Shares | | | Market
Value | |
| | |
| Money Market 1.98% | | | | | | | | |
Fidelity Prime Money Market Portfolio, Institutional Class, 0.32% (c) | | | 3,990,251 | | | | 3,990,251 | |
Total Money Market
(Cost $3,990,251) | | | | | | | 3,990,251 | |
| | |
Total Investments — 98.69% | | | | | | | | |
(Cost $190,695,670) | | | | | | | 199,075,969 | |
Other Assets in Excess of Liabilities — 1.31% | | | | | | | 2,642,525 | |
| | | | | | | | |
NET ASSETS — 100.00% | | | | | | $ | 201,718,494 | |
| (a) | Security exempt from registration under Rule 144A or Section 4(2) of the Securities Act of 1933. The security may be resold in transactions exempt from registration, normally to qualified institutional buyers. As of December 31, 2015, total illiquid restricted securities amounted to $2,447,455 or 1% of net assets. |
| (b) | Variable or Floating Rate Security. Rate disclosed is as of December 31, 2015. |
| (c) | Rate disclosed is the seven day yield as of December 31, 2015. |
AGM - Assured Guaranty Municipal Corp.
AGM-CR - Assured Guaranty Municipal Corp. Custody Receipts
AMBAC - American Municipal Bond Assurance Corp.
GTD - Guaranteed
OID - Original Issue Discount
SEEK - Support Education Excellence in Kentucky
The Global Industry Classification Standard (GICS®) was developed by and/or is the exclusive property of MSCI, Inc. and Standard & Poor Financial Services LLC (“S&P”). GICS is a service mark of MSCI, Inc. and S&P and has been licensed for use by Ultimus Asset Services, LLC (formerly Huntington Asset Services, Inc.).
See accompanying notes which are an integral part of these financial statements.
| | |
| STATEMENT OF ASSETS AND LIABILITIES | | DECEMBER 31, 2015 |
| | | | |
| |
ASSETS | | | | |
Investments in securities at value (cost $190,695,670) | | $ | 199,075,969 | |
Receivable for Fund shares sold | | | 703,473 | |
Dividends and interest receivable | | | 2,692,824 | |
Prepaid expenses | | | 9,464 | |
TOTAL ASSETS | | | 202,481,730 | |
| |
LIABILITIES | | | | |
Payable for Fund shares redeemed | | | 209,688 | |
Payable for distributions to shareholders | | | 325,737 | |
Payable for investment advisory fees | | | 90,936 | |
Payable for accounting and administration fees | | | 19,694 | |
Payable for distribution fees | | | 42,034 | |
Payable to custodian | | | 3,138 | |
Payable for audit fees | | | 22,900 | |
Payable for printing fees | | | 29,745 | |
Payable for transfer agent fees | | | 15,146 | |
Payable for chief compliance officer salary | | | 477 | |
Other accrued expenses | | | 3,741 | |
TOTAL LIABILITIES | | | 763,236 | |
NET ASSETS | | $ | 201,718,494 | |
Net assets applicable to 17,294,738 shares outstanding, $0.001 par value
(500,000,000 authorized shares) | | $ | 201,718,494 | |
Net asset value and redemption price per share
($201,718,494 ÷ 17,294,738 shares) | | $ | 11.66 | |
Maximum offering price per share ($11.66 ÷ 0.9525) | | $ | 12.24 | |
| |
SOURCE OF NET ASSETS | | | | |
As of December 31, 2015, net assets consisted of: | | | | |
Paid-in capital | | $ | 196,628,905 | |
Accumulated undistributed net investment loss | | | (327,157 | ) |
Accumulated net realized loss on investments | | | (2,963,553 | ) |
Net unrealized appreciation on investments | | | 8,380,299 | |
NET ASSETS | | $ | 201,718,494 | |
See accompanying notes which are an integral part of these financial statements.
STATEMENT OF OPERATIONS
| | | | |
| | | For the Year Ended December 31, 2015 | |
| |
INVESTMENT INCOME | | | | |
Dividends | | $ | 1,542,632 | |
Interest | | | 9,524,956 | |
TOTAL INVESTMENT INCOME | | | 11,067,588 | |
| |
EXPENSES | | | | |
Investment advisory | | | 1,243,825 | |
Distribution | | | 518,258 | |
Accounting and Administration | | | 163,444 | |
Transfer agent | | | 182,968 | |
Audit | | | 23,500 | |
Chief Compliance Officer salary | | | 6,261 | |
Custodian | | | 18,178 | |
Directors | | | 22,280 | |
Insurance | | | 44,816 | |
Legal | | | 18,113 | |
Printing | | | 111,064 | |
Registration | | | 19,205 | |
Line of credit | | | 1,807 | |
Interest | | | 2,668 | |
Other | | | 6,364 | |
TOTAL EXPENSES | | | 2,382,751 | |
Fees waived by Adviser | | | (98,192 | ) |
NET EXPENSES | | | 2,284,559 | |
NET INVESTMENT INCOME | | | 8,783,029 | |
| |
REALIZED AND UNREALIZED (LOSS) ON INVESTMENTS | | | | |
Net realized loss from investment transactions | | | (1,218,733 | ) |
Net change in unrealized appreciation (depreciation) of investments | | | (7,969,270 | ) |
Net realized and unrealized loss on investments | | | (9,188,003 | ) |
NET DECREASE IN NET ASSETS RESULTING FROM OPERATIONS | | $ | (404,974 | ) |
See accompanying notes which are an integral part of these financial statements.
STATEMENTS OF CHANGES IN NET ASSETS
| | | | | | | | |
| | | For the Year Ended December 31, 2015 | | | For the Year Ended December 31, 2014 | |
| | |
OPERATIONS | | | | | | | | |
Net investment income | | $ | 8,783,029 | | | $ | 9,064,400 | |
Net realized gain (loss) on investment transactions | | | (1,218,733 | ) | | | 269,420 | |
Net change in unrealized appreciation/depreciation of investments | | | (7,969,270 | ) | | | 18,943,376 | |
Net increase (decrease) in net assets resulting from operations | | | (404,974 | ) | | | 28,277,196 | |
| | |
DISTRIBUTIONS TO SHAREHOLDERS | | | | | | | | |
Distributions from net investments income | | | (8,752,009 | ) | | | (9,156,574 | ) |
Distributions from return of capital | | | (773,014 | ) | | | (914,734 | ) |
Total distributions to shareholders | | | (9,525,023 | ) | | | (10,071,308 | ) |
| |
CAPITAL SHARE TRANSACTIONS (Dollar Activity) | | | | | |
Shares sold | | | 52,557,128 | | | | 38,522,474 | |
Shares issued from reinvestment of distributions | | | 6,629,987 | | | | 6,871,241 | |
Shares redeemed | | | (57,808,173 | ) | | | (65,531,345 | ) |
Increase (decrease) in net assets derived from capital share transactions | | | 1,378,942 | | | | (20,137,630 | ) |
Total decrease in net assets | | | (8,551,055 | ) | | | (1,931,742 | ) |
| | |
NET ASSETS | | | | | | | | |
Beginning of year | | | 210,269,549 | | | | 212,201,291 | |
End of year | | $ | 201,718,494 | | | $ | 210,269,549 | |
| | |
Accumulated undistributed net investment
income (loss) | | $ | (327,157 | ) | | $ | (378,484 | ) |
| | |
Transactions in capital stock were: | | | | | | | | |
Shares sold | | | 4,385,572 | | | | 3,226,699 | |
Shares issued from reinvestment of distributions | | | 552,485 | | | | 575,098 | |
Shares redeemed | | | (4,830,992 | ) | | | (5,575,874 | ) |
Increase (decrease) in shares outstanding | | | 107,065 | | | | (1,774,077 | ) |
See accompanying notes which are an integral part of these financial statements.
FINANCIAL HIGHLIGHTS
The table below sets forth financial data for one share of beneficial interest outstanding throughout the period presented.
| | | | | | | | | | | | | | | | | | | | |
| | | Year Ended
December 31,
2015 | | | Year Ended
December 31,
2014 | | | Year Ended
December 31,
2013 | | | Year Ended
December 31,
2012 | | | Year Ended
December 31,
2011 | |
Net Asset Value, Beginning of Year | | $ | 12.23 | | | $ | 11.19 | | | $ | 12.24 | | | $ | 11.69 | | | $ | 10.73 | |
| | | | | |
Income from Investment
Operations: | | | | | | | | | | | | | | | | | | | | |
Net investment income | | | 0.51 | | | | 0.53 | | | | 0.53 | | | | 0.59 | | | | 0.70 | 1 |
Net realized and unrealized gain (loss) on investments | | | (0.53 | ) | | | 1.10 | | | | (1.00 | ) | | | 0.61 | | | | 0.98 | |
Total income from investment operations | | | (0.02 | ) | | | 1.63 | | | | (0.47 | ) | | | 1.20 | | | | 1.68 | |
| | | | | |
Less Distributions: | | | | | | | | | | | | | | | | | | | | |
Distributions from net investment income | | | (0.51 | ) | | | (0.54 | ) | | | (0.52 | ) | | | (0.60 | ) | | | (0.71 | ) |
Distributions from capital gains | | | — | | | | — | | | | — | | | | (0.05 | ) | | | (0.01 | ) |
Distributions from return of capital | | | (0.04 | ) | | | (0.05 | ) | | | (0.06 | ) | | | — | | | | — | |
Total distributions | | | (0.55 | ) | | | (0.59 | ) | | | (0.58 | ) | | | (0.65 | ) | | | (0.72 | ) |
| | | | | |
| | | | | | | | | | | | | | | | | | | | | |
Net Asset Value, End of Year | | $ | 11.66 | | | $ | 12.23 | | | $ | 11.19 | | | $ | 12.24 | | | $ | 11.69 | |
Total Return2 | | | (0.17 | )% | | | 14.79 | % | | | (3.97 | )% | | | 10.51 | % | | | 16.12 | % |
| | | | | |
Ratios/Supplemental Data: | | | | | | | | | | | | | | | | | | | | |
Net assets, end of year (000) | | $ | 201,718 | | | $ | 210,270 | | | $ | 212,201 | | | $ | 252,025 | | | $ | 150,472 | |
Ratio of expenses to average net assets: | | | | | | | | | | | | | | | | | | | | |
Before expense reimbursement or recapture | | | 1.15 | % | | | 1.15 | % | | | 1.19 | % | | | 1.22 | % | | | 1.30 | % |
After expense reimbursement or recapture | | | 1.10 | % | | | 1.10 | % | | | 1.10 | % | | | 1.10 | % | | | 1.10 | % |
Ratio of net investment income to average net assets | | | 4.24 | % | | | 4.44 | % | | | 4.47 | % | | | 4.85 | % | | | 6.19 | % |
Portfolio turnover | | | 9 | % | | | 9 | % | | | 25 | % | | | 3 | % | | | 3 | % |
1 Calculated based on the average number of shares outstanding during the period.
2 Calculation does not reflect sales load.
See accompanying notes which are an integral part of these financial statements.
| | |
| NOTES TO FINANCIAL STATEMENTS | | DECEMBER 31, 2015 |
Note 1 – Organization
Spirit of America Income Fund (the “Fund”), a series of Spirit of America Investment Fund, Inc. (the “Company”), is an open-end diversified mutual fund registered under the Investment Company Act of 1940, as amended (the “1940 Act”). The Company was incorporated under the laws of Maryland on May 15, 1997. The Fund commenced operations on December 31, 2008. The Fund seeks high current income, investing at least 80% of its assets in a portfolio of taxable municipal bonds, income producing convertible securities, preferred stocks, high yield U.S. corporate bonds (frequently called “junk” bonds), and collateralized mortgage obligations (“CMOs”). The Fund offers one class of shares.
Note 2 – Significant Accounting Policies
The Fund is an investment company and follows accounting and reporting guidance under Financial Accounting Standards Board (“FASB”) Accounting Standards Codification (“ASC”) Topic 946, “Financial Services-Investment Companies”. The following is a summary of significant accounting policies consistently followed by the Fund in the preparation of its financial statements. These policies are in conformity with generally accepted accounting principles in the United States of America (“GAAP”) for investment companies.
A. Security Valuation: The offering price and net asset value (“NAV”) per share for the Fund are calculated as of the close of regular trading on the New York Stock Exchange (“NYSE”), currently 4:00 p.m., Eastern Time on each day the NYSE is open for trading. The Fund’s securities are valued at the official close or the last reported sales price on the principal
exchange on which the security trades, or if no sales price is reported, the mean of the latest bid and asked prices is used. Securities traded over-the-counter are priced at the mean of the latest bid and asked prices. Unlisted securities traded in the over-the-counter market are valued using an evaluated quote provided by the independent pricing service, or, if an evaluated quote is unavailable, such securities are valued using prices received from dealers, provided that if the dealer supplies both bid and ask prices, the price to be used is the mean of the bid and asked prices. The independent pricing service derives an evaluated quote by obtaining dealer quotes, analyzing the listed markets, reviewing trade execution data and employing sensitivity analysis. Evaluated quotes may also reflect appropriate factors such as individual characteristics of the issue, communications with broker-dealers, and other market data. Short-term investments having a maturity of 60 days or less are valued at amortized cost, which the Board of Directors (the “Board”) believes represents fair value. Fund securities for which market quotations are not readily available are valued at fair value as determined in good faith under procedures established by and under the supervision of the Board.
B. Fair Value Measurements: Various inputs are used in determining the fair value of investments which are as follows:
| | |
• Level 1 – | | Unadjusted quoted prices in active markets for identical investments and/or registered investment companies where the value per share is determined and published and is the basis for current transactions for identical assets or liabilities at the valuation date. |
| | |
| NOTES TO FINANCIAL STATEMENTS (CONT.) | | DECEMBER 31, 2015 |
| | |
| |
• Level 2 – | | Observable inputs other than quoted prices included in level 1 that are observable for the asset or liability, either directly or indirectly. These inputs may include quoted prices for the identical instrument on an inactive market, prices for similar instruments, interest rates, prepayment speeds, credit risk, yield curves, default rates and similar data. |
| | |
| |
• Level 3 – | | Unobservable inputs based on the best information available in the circumstances, to the extent observable inputs are not available (including the Fund’s own assumptions used in determining the fair value of investments). |
The summary of inputs used to value the Fund’s net assets as of December 31, 2015 is as follows:
| | | | | | | | | | | | | | | | |
| Value Inputs | |
| Assets | | Level 1 | | | Level 2 | | | Level 3 | | | Totals | |
Collateralized Mortgage Obligations | | $ | — | | | $ | 372,459 | | | $ | — | | | $ | 372,459 | |
Municipal Bonds | | | — | | | | 147,822,107 | | | | — | | | | 147,822,107 | |
Common Stocks* | | | 9,992,908 | | | | — | | | | — | | | | 9,992,908 | |
Corporate Bonds | | | — | | | | 16,842,934 | | | | — | | | | 16,842,934 | |
Preferred Stocks* | | | 20,055,310 | | | | — | | | | — | | | | 20,055,310 | |
Money Market | | | 3,990,251 | | | | — | | | | — | | | | 3,990,251 | |
| | | | | | | | | | | | | | | | |
Total | | $ | 34,038,469 | | | $ | 165,037,500 | | | $ | — | | | $ | 199,075,969 | |
| | | | | | | | | | | | | | | | |
| | | | | | | | | | | | | | | | |
The Fund did not have any transfers between levels as of December 31, 2015. The Fund recognizes transfers between fair value hierarchy levels at the end of the reporting period.
C. Investment Income and Securities Transactions: Security transactions are accounted for on the date the securities are purchased or sold (trade date). Cost is determined and gains and losses are based on the identified cost basis for both financial statement and federal income tax purposes. Dividend income and distributions to shareholders are reported on the ex-dividend date. Interest income and expenses are accrued daily.
D. Federal Income Taxes: The Fund intends to comply with all requirements of the Internal Revenue Code applicable to regulated investment companies and to distribute substantially all of its taxable income to its
shareholders. Therefore, no federal income tax provision is required.
E. Use of Estimates: In preparing financial statements in conformity with GAAP, management makes estimates and assumptions that affect the reported amounts of assets and liabilities at the date of the financial statements, as well as the reported amounts of revenues and expenses during the reporting period. Actual results could differ from those estimates.
F. Distributions to Shareholders: The Fund intends to distribute substantially all of its net investment income and capital gains to shareholders each year. Normally, income distributions will be declared daily and paid monthly. Capital gains, if any, will be distributed annually in December, but may be distributed more frequently if deemed advisable by the Board. All such distributions are taxable to the shareholders whether received in cash or reinvested in shares.
| | |
| NOTES TO FINANCIAL STATEMENTS (CONT.) | | DECEMBER 31, 2015 |
Note 3 – Purchases and Sales of Securities
Purchases and proceeds from the sales of securities for the year ended December 31, 2015, excluding short-term investments, were $17,473,645 and $20,018,961, respectively.
Note 4 – Investment Management Fee and Other Transactions with Affiliates
Spirit of America Management Corp. (the “Adviser”) has been retained to act as the Company’s investment adviser pursuant to an Investment Advisory Agreement (the “Advisory Agreement”). The Adviser was incorporated in 1997 and is a registered investment adviser under the Investment Advisers Act of 1940, as amended. Under the Advisory Agreement, the Fund pays the Adviser a monthly fee of 1/12 of 0.60% of the Fund’s average daily net assets. Investment advisory fees for the year ended December 31, 2015, were $1,243,825.
The Adviser has contractually agreed to waive advisory fees and/or reimburse expenses so that the total operating expenses will not exceed 1.10% of the average daily net assets of the Fund through April 30, 2016. The waiver does not include, front end or contingent deferred loads, taxes, interest, dividend expenses, brokerage commissions or expenses incurred in connection with any merger, reorganization, or extraordinary expenses such as litigation. For the year ended December 31, 2015, the Adviser waived advisory fees in the amount of $98,192.
Any amounts waived or reimbursed by the Adviser are subject to reimbursement by the Fund within the following three years, provided the Fund is able to make such reimbursement and remain in compliance with the expense limitation as stated above. The balance of recoverable expenses to the Adviser as of December 31, 2015 was $426,344. Of this balance, $230,568 will expire in 2016, $97,584 will expire in 2017 and $98,192 will expire in 2018.
The Fund has adopted a plan of distribution pursuant to Rule 12b-1 (the “Plan”). The Plan permits the Fund to pay David Lerner Associates, Inc. (the “Distributor”) a monthly fee of 1/12 of 0.25% of the Fund’s average daily net assets for the Distributor’s services and expenses in distributing shares of the Fund and providing personal services and/or maintaining shareholder accounts. For the year ended December 31, 2015, fees paid to the Distributor under the Plan were $518,258.
The Fund’s shares are subject to an initial sales charge imposed at the time of purchase, in accordance with the Fund’s current prospectus. For the year ended December 31, 2015, sales charges received by the Distributor were $2,337,919. A contingent deferred sales charge (“CDSC”) of 1.00% may be imposed on redemptions of $1 million or more made within one year of purchase.
Certain Officers and Directors of the Company are “affiliated persons”, as that term is defined in the 1940 Act, of the Adviser or the Distributor. Each Director of the Company, who is not an affiliated person of the Adviser or Distributor, receives a quarterly retainer of $5,250, $1,000 for each Board meeting attended, and $500 for each committee meeting attended plus reimbursement for certain travel and other out-of-pocket expenses incurred in connection with attending Board meetings. The Company does not compensate the Officers for the services they provide. There are no Directors’ fees paid to affiliated Directors of the Company. For the year ended December 31, 2015, the Fund was allocated $6,261 of the Chief Compliance Officer’s salary.
Note 5 – Restricted Securities
Restricted securities are securities that may only be resold upon registration under federal securities laws or in transactions exempt from such registration. In some cases, the issuer of restricted securities has agreed to register such securities for resale, at the issuer’s expense,
| | |
| NOTES TO FINANCIAL STATEMENTS (CONT.) | | DECEMBER 31, 2015 |
either upon demand by the Funds or in connection with another registered offering of the securities. Many restricted securities may be resold in the secondary market in transactions exempt from registration. Such restricted securities may be determined to be liquid. The Funds will not incur any registration costs upon such resale. The Funds’ restricted securities are valued at the price provided by dealers in the secondary market or, if no market prices are available, at the fair value as determined by the Board. At December 31, 2015, the Fund held illiquid restricted securities representing 1% of net assets, as listed below:
| | | | | | | | | | | | | | | | |
| Issuer Description | | Acquisition
Date | | | Principal
Amount | | | Cost | | | Value | |
Corporate Bonds | | | | | | | | | | | | | | | | |
Exelon Generation Co. LLC, 5.60%, 06/15/42 | | | 7/12/2012 | | | $ | 400,000 | | | $ | 421,894 | | | $ | 373,705 | |
MetLife Capital Trust X, 9.25%, 04/08/38 | | | 6/4/2013 | | | $ | 1,500,000 | | | $ | 2,113,430 | | | $ | 2,073,750 | |
| | | | | | | | | | | | | | | | |
| | | | | | | | | | | | | | $ | 2,447,455 | |
| | | | | | | | | | | | | | | | |
Note 6 – Concentration and Other Risks
The Fund’s performance could be adversely affected by interest rate risk, which is the possibility that overall bond prices will decline because of rising interest rates. Interest rate risk is expected to be high for the Fund because it invests mainly in long-term bonds, whose prices are much more sensitive to interest fluctuations than are the prices of short-term bonds.
The Fund may be affected by credit risk, which is the possibility that the issuer of a bond will fail to pay interest and principal in a timely manner, or that negative perceptions of the issuer’s ability to make such payments will cause the price of that bond to decline. This risk may be greater to the extent that the Fund may invest in junk bonds.
The Fund may be affected by credit risk of lower grade securities, which is the possibility that municipal securities rated below investment grade, or unrated of similar quality, (frequently called “junk bonds”), may be
subject to greater price fluctuations and risks of loss of income and principal than investment- grade municipal securities. Securities that are (or that have fallen) below investment-grade have a greater risk that the issuers may not meet their debt obligations. These types of securities are generally considered speculative in relation to the issuer’s ongoing ability to make principal and interest payments. During periods of rising interest rates or economic downturn, the trading market for these securities may not be active and may reduce the Fund’s ability to sell these securities at an acceptable price. If the issuer of securities is in default in payment of interest or principal, the Fund may lose its entire investment in those securities.
Other risks include income risk, liquidity risk, prepayment risk on collateralized mortgage obligations, municipal project specific risk, municipal lease obligation risk, zero coupon securities risk, market risk, manager risk, taxability risk, state- specific risk and exchange traded funds risk.
| | |
| NOTES TO FINANCIAL STATEMENTS (CONT.) | | DECEMBER 31, 2015 |
Note 7 – Federal Income Taxes
The tax character of distributions paid for the years ended December 31, 2015 and 2014 were as follows:
Taxable Basis Distributions
| | | | | | | | | | | | | | | | | | | | |
| | | Ordinary
Income | | | Tax Exempt
Income | | | Net
Long-Term
Capital Gains | | | Return
of
Capital | | | Total
Distributions | |
| 12/31/2015 | | $ | 8,752,009 | | | $ | — | | | $ | — | | | $ | 773,014 | | | $ | 9,525,023 | |
| 12/31/2014 | | $ | 9,156,574 | | | $ | — | | | $ | — | | | $ | 914,734 | | | $ | 10,071,308 | |
| | | | | | | | | | | | | | | | | | | | |
Distribution classifications may differ from the Statements of Changes in Net Assets as a result of the treatment of short-term capital gains as ordinary income for tax purposes.
The adjusted cost basis of investment and gross unrealized appreciation and depreciation of investments for federal income tax purposes were as follows:
| | | | |
| | | As of
December 31,
2015 | |
Gross unrealized appreciation | | $ | 15,059,505 | |
Gross unrealized depreciation | | | (6,693,400 | ) |
| | | | |
Net unrealized appreciation | | | 8,366,105 | |
| | | | |
Cost basis of investments | | $ | 190,709,864 | |
| | | | |
| | | | |
At December 31, 2015, the components of accumulated distributable earnings for the Fund on a tax basis were as follows:
| | | | |
Unrealized appreciation | | $ | 8,366,105 | |
Other accumulated losses | | | (3,276,516 | ) |
| | | | |
Total accumulated earnings (losses) | | $ | 5,089,589 | |
| | | | |
| | | | |
Other accumulated losses consist of distribution payable of $325,737 not deducted for tax purposes, capital loss carryforwards and post-October losses.
At December 31, 2015, the Fund had short-term and long-term capital loss carryforwards of $1,559,189 and $1,246,148, respectively,
which do not expire, and Deferred Post-October Losses of $145,442. The difference between appreciation for book purposes and tax purposes is primarily due to Trust Preferred securities and wash sales.
Management of the Fund has reviewed tax positions taken in tax years that remain subject to examination by all major tax jurisdictions, including federal (i.e., the last three tax year ends and the interim tax period since then). Management believes there is no tax liability resulting from unrecognized tax benefits related to uncertain tax positions taken.
Note 8 – Reclassification
Permanent differences, incurred during the year ended December 31, 2015, resulting from differences in book and tax accounting have been reclassified at year end to undistributed net investment income, accumulated realized gain (loss) and paid-in capital as follows:
| | | | |
Undistributed Net Investment Income | | $ | 20,307 | |
Accumulated Net Realized Gain (Loss) | | | (11,740 | ) |
Paid-In Capital | | | (8,567 | ) |
| | | | |
Note 9 – Line of Credit
The Fund participates in a short-term credit agreement (“Line of Credit) with The Huntington National Bank, the custodian of the Fund’s investments expiring on May 25, 2016. Borrowing under this agreement bear interest at London Interbank Offered Rate (“LIBOR”) plus 1.500%. Maximum
| | |
| NOTES TO FINANCIAL STATEMENTS (CONT.) | | DECEMBER 31, 2015 |
borrowings for the Fund is the lesser of $3,000,000 or 10% of the Fund’s daily market value.
| | | | |
Total bank line of credit as of December 31, 2015 | | $ | 3,000,000 | |
Average borrowings during year | | | 175,408 | |
Number of days outstanding* | | | 48 | |
Average interest rate during year | | | 1.688 | % |
Highest balance drawn during year | | | 1,776,257 | |
Highest balance interest rate | | | 1.922 | % |
Interest expense incurred | | $ | 2,668 | |
Interest rate at December 31, 2015 | | | 1.922 | % |
| | | | |
| * | Number of days outstanding represents the total days during the year ended December 31, 2015 that the Fund utilized the line of credit. |
Note 10 – Other Matters
On May 7, 2010, each of William Mason, the Portfolio Manager for the Real Estate Fund, Income Fund, and Opportunity Fund, and DLA, the Fund’s principal underwriter and distributor, received a Notice of Complaint from the Department of Enforcement of the Financial Industry Regulatory Authority (“FINRA”) relating to Mr. Mason’s activities as head of the fixed income trading department of DLA and DLA’s activities as a municipal securities and collateralized mortgage obligations dealer. The Complaint alleges that each of Mr. Mason and DLA had violated certain NASD and Municipal Securities Rule Making Board fair pricing rules relating to the period January 1, 2005 through January 31, 2007. On April 4, 2012, a FINRA hearing panel issued a decision in this matter and assessed monetary fines and other sanctions against DLA and Mr. Mason, including a suspension of Mr. Mason from association with a FINRA member firm for six (6) months. Both DLA and Mr. Mason appealed the decision.
On May 27, 2011, FINRA filed a complaint against DLA, the Fund’s principal underwriter and distributor, related to its sales practices in
connection with its role as managing dealer of an unaffiliated Real Estate Investment Trust offering, Apple REIT Ten, Inc. (“Apple REIT”). More specifically, FINRA alleged that DLA failed to conduct adequate due diligence, thereby leaving it without a reasonable basis for recommending customer purchases of Apple REIT, in addition to using false, exaggerated and misleading statements regarding the performance of earlier closed Apple REITs. In June 2011, several class action complaints were filed against DLA, Apple REIT entities and certain individuals, also in connection with the sale of various Apple REIT securities. In January 2012, FINRA amended its complaint to add David Lerner as an individual respondent and alleged violations of Section 17(a) of the Securities Act of 1933, as amended, including allegations of false, exaggerated and misleading communications to the public, through customer correspondence and investment seminars, about the investment returns, market values, performance of earlier closed Apple REITs as well as allegations of untrue statements and/or omitted material facts concerning the prior performance, steady distribution rates, unchanging valuations, and prospects of the earlier closed Apple REITs and/or Apple REIT. On October 22, 2012, DLA, Mr. Lerner and Mr. Mason settled all of the foregoing FINRA investigations and actions involving Apple REIT securities and municipal bond and collateralized mortgage obligation pricing. Without admitting or denying the allegations, in connection with the settlement, DLA, Mr. Lerner and Mr. Mason each agreed, among other things, to pay a fine; and Mr. Lerner agreed to a suspension from affiliation with any FINRA member, including DLA, in any capacity for a period of one year and in any principal capacity for a period of two years thereafter beginning on November 19, 2012; and Mr. Mason agreed to a suspension from affiliation with any FINRA member, including DLA, in any capacity for a period of six months, which suspension ended on June 16, 2013. The fines and suspensions
| | |
| NOTES TO FINANCIAL STATEMENTS (CONT.) | | DECEMBER 31, 2015 |
do not involve the Energy Fund or the Adviser. On April 3, 2013, the class action complaints were dismissed, with prejudice, in their entirety. On April 12, 2013, plaintiffs filed a notice of appeal of the class action dismissal. On April 23, 2014, the United States Court of Appeals for the Second Circuit substantially affirmed the April 3, 2013 decision of United States District Judge, Kiyo A. Matsumoto, dismissing with prejudice the class action complaint in In Re Apple REITs Litigation. The Second Circuit held that Judge Matsumoto correctly found that there were no material misrepresentations or omissions in the offering materials for Apple REITs Six through Ten. The appeals court upheld dismissal of ten of the thirteen claims in the case, including all federal and state securities law claims, and also upheld Judge Matsumoto’s refusal to allow plaintiffs to amend their complaint. The appeals court remanded three state common law claims to the District Court for the Eastern District of New York for further proceedings. On March 25, 2015, the District Court dismissed the remaining state common law claims against DLA, with prejudice. Plaintiffs did not file an appeal. Neither the Adviser nor the Fund were a party to any of the investigations or actions listed in this section.
In October 2013, a class action litigation, titled Lewis v. Delaware Charter Guarantee & Trust Company, et al., (the “Litigation”) was commenced in federal court in Nevada against DLA, the Funds’ principal underwriter and distributor, along with other defendants, alleging, inter alia, breach of fiduciary duty, aiding and abetting breach of fiduciary duty, negligence and misrepresentation. The plaintiffs, purportedly customers who maintain individual retirement accounts at DLA which contained non-traded REIT securities, allege, among other things, that the defendants failed to accurately provide annual fair market values for those REIT securities. The Litigation was transferred to the U.S. District Court for the Eastern District of New York. On March 30, 2015, the District Court dismissed all claims
against DLA, with prejudice. Plaintiffs appealed the decision dismissing the claims. While it is unlikely that plaintiffs’ appeal will be successful, there cannot be any assurance that if the class action plaintiffs were to ultimately be successful in the pursuit of an appeal of the decision dismissing the claims against DLA that such outcome would not materially affect DLA’s ability to act as the Funds’ principal underwriter and distributor, although it is not considered likely at this time that such material and adverse effects would occur. Neither the Adviser nor the Fund are a party to the Litigation.
Note 11 – Subsequent Events
Management has evaluated the impact of all subsequent events on the Fund and has determined that there were no events that require recognition or disclosure in the financial statements.
Tax Information (Unaudited)
All designations are based on financial information available as of the date of this annual report and, accordingly, are subject to change. For each item, it is the intention of the Fund to designate the maximum amount permitted under the Internal Revenue Code and the regulations thereunder.
Qualified Dividend Income
For the year ended December 31, 2015, 6.87% of the distributions paid by the Fund from ordinary income qualifies for a reduced tax rate pursuant to The Jobs and Growth Tax Relief Reconciliation Act of 2003.
Dividends Received Deduction
For the year ended December 31, 2015, 8.56% of the ordinary income distribution qualifies for the Dividends Received Deduction available to corporations.
REPORT OF INDEPENDENT REGISTERED PUBLIC ACCOUNTING FIRM
To the Shareholders of Spirit of America Income Fund and
Board of Directors Spirit of America Investment Fund, Inc.
Syosset, New York
We have audited the accompanying statement of assets and liabilities of the Spirit of America Income Fund (the “Fund”), a series of shares of beneficial interest in Spirit of America Investment Fund, Inc., including the schedule of investments as of December 31, 2015, and the related statement of operations for the year then ended, the statements of changes in net assets for each of the two years in the period then ended and the financial highlights for each of the five years in the period then ended. These financial statements and financial highlights are the responsibility of the Fund’s management. Our responsibility is to express an opinion on these financial statements and financial highlights based on our audits.
We conducted our audits in accordance with the standards of the Public Company Accounting Oversight Board (United States). Those standards require that we plan and perform the audit to obtain reasonable assurance about whether the financial statements and financial highlights are free of material misstatement. The Fund is not required to have, nor were we engaged to perform, an audit of its internal control over financial reporting. Our audits included consideration of internal control over financial
reporting as a basis for designing audit
procedures that are appropriate in the circumstances, but not for the purpose of expressing an opinion on the effectiveness of the Fund’s internal control over financial reporting. Accordingly, we express no such opinion. An audit includes examining, on a test basis, evidence supporting the amounts and disclosures in the financial statements. Our procedures included confirmation of securities owned as of December 31, 2015 by correspondence with the custodian. An audit also includes assessing the accounting principles used and significant estimates made by management, as well as evaluating the overall financial statement presentation. We believe that our audits provide a reasonable basis for our opinion.
In our opinion, the financial statements and financial highlights referred to above present fairly, in all material respects, the financial position of the Spirit of America Income Fund as of December 31, 2015, the results of its operations for the year then ended, the changes in its net assets for each of the two years in the period then ended and the financial highlights for each of the five years in the period then ended, in conformity with accounting principles generally accepted in the United States of America.
TAIT, WELLER & BAKER LLP
Philadelphia, Pennsylvania
February 23, 2016
APPROVAL OF THE INVESTMENT ADVISORY AGREEMENT (UNAUDITED)
The Investment Company Act of 1940, as amended (the “1940 Act”) requires that the continuance of a registered management investment company’s investment advisory agreement be approved annually by both the board of directors and also by a majority of its directors who are not parties to the investment advisory agreement or “interested persons” (as defined by the 1940 Act) of any such party (the “Independent Directors”). At a meeting held on December 1, 2015, the Board of Directors (the “Board” or “Directors”) of Spirit of America Investment Fund, Inc. (the “Company”) met in person (the “Meeting”) to, among other things, consider the approval of the Investment Advisory Agreement (the “Advisory Agreement”) by and between Spirit of America Management Corp. (the “Adviser”) and the Company, on behalf of Spirit of America Real Estate Income and Growth Fund, Spirit of America Large Cap Value Fund, Spirit of America Municipal Tax Free Bond Fund, Spirit of America Income Fund, Spirit of America Income & Opportunity Fund, and Spirit of America Energy Fund (collectively, the “Funds”). At the Meeting, the Board, including the Independent Directors voting separately, approved the Advisory Agreement after determining that the Adviser’s compensation, pursuant to the terms of the Advisory Agreement, would be fair and reasonable and concluded that the approval of the Advisory Agreement would be in the best interest of the Funds’ shareholders. The Board’s approval was based on consideration and evaluation of the information and material provided to the Board and a variety of specific factors discussed at the Meeting and at prior meetings of the Board, including the factors described below.
As part of the approval process and oversight of the advisory relationship, counsel to the Independent Directors (“Independent Counsel”) sent an information request letter to the Adviser seeking certain relevant information and the Directors received, for
their review in advance of the Meeting, the Adviser’s responses. In addition, the Directors were provided with the opportunity to request additional materials. In advance of the Meeting, the Board including the Independent Directors, requested and received materials provided by the Adviser and Independent Counsel, including, among other things, the following: (i) Independent Counsel’s 15c questionnaire and the responses provided by the Adviser; (ii) comparative information on the investment performance of the Funds, relevant indices and Lipper category peer funds as of September 30, 2015 in the form of reports generated by Strategic Insight Simfund/MF Desktop; (iii) graphs of fee comparisons for the minimum fee, maximum fee, average fee and median fee in the form of reports generated by the Funds’ administrator; (iv) graphs of performance comparisons for the minimum performing fund, the maximum performing fund, average performing fund and median performing fund for the one year, three years, five years and since inception time periods in the form of reports generated by the Funds’ administrator; (v) the allocation of the Funds’ brokerage, the record of compliance with the Funds’ investment policies and restrictions and with the Funds’ Code of Ethics and the structure and responsibilities of the Adviser’s compliance departments; (vi) the profitability of the Funds’ investment advisory business to the Adviser taking into account both advisory fees and any other potential direct or indirect benefits; (vii) the Form ADV of the Adviser; and (viii) a memorandum from Independent Counsel regarding the responsibilities of the Independent Directors related to the approval of the Investment Advisory Agreement.
In evaluating the Investment Advisory Agreement, the Board, including the Independent Directors, requested, reviewed and considered materials furnished by the Adviser and questioned personnel of the Adviser, including the Funds’ portfolio
APPROVAL OF THE INVESTMENT ADVISORY AGREEMENT (UNAUDITED) (CONT.)
managers, regarding, among other things, the personnel, each Fund’s performance, operations and financial condition of the Adviser. Among other information, the Board, including the Independent Directors, requested and was provided information regarding:
| • | | The Investment performance of each Fund over various time periods both by itself and in relation to relevant indices; |
| • | | The fees charged by the Adviser for investment advisory services, as well as the compensation received by the Adviser and its affiliates; |
| • | | The waivers of fees and reimbursements of expenses at times by the Adviser under the Operating Expenses Agreement; |
| • | | The investment performance, fees and total expenses of mutual funds with similar objectives and strategies managed by other investment advisers; |
| • | | The investment management staffing and the experience of the investment advisory, administrative and other personnel providing services to the Funds and the historical quality of the services provided by the Adviser; and |
| • | | The profitability to the Adviser of managing and its affiliate distributing the Funds and the methodology in allocating expenses to the management of the Funds. |
At the Meeting, Independent Counsel also referred to the “Gartenberg Memorandum” which had been distributed to each Director in advance of the Meeting, outlining the legal standards applicable to the Independent Directors under the 1940 Act with respect to the approval of the continuation of the Investment Advisory Agreement on behalf of each of the Funds. He explained that the Board must consider the (1) nature, extent and
quality of services to be provided by the Adviser to the Funds; (2) the investment performance of each Fund independently; (3) the costs of the services provided and profits realized by the Adviser and its affiliates from the relationship with each Fund; (4) the extent to which economies of scale have been realized as each Fund grows and whether fee levels reflect these economies of scale for the benefit of each Fund’s investors; and (5) any other relevant considerations that the Board deems appropriate. In addition, the Independent Directors met at length with Independent Counsel during the Compliance Committee meeting to discuss the materials provided by the Adviser and to consider any additional questions they had of the Adviser.
The following is a summary of the Board’s discussion and views regarding the factors it considered in evaluating the continuation of the Investment Advisory Agreement:
1. Nature, Extent, and Quality of Services.
The Board, including the Independent Directors, considered the nature, quality and extent of advisory, administrative and shareholder services performed by the Adviser, including: regulatory filings and disclosure to shareholders, general oversight of the service providers, coordination of Fund marketing initiatives, review of Fund legal issues, assisting the Board, including the Independent Directors, in their capacity as directors and other services. The Board, including the Independent Directors, noted the increased responsibilities of the Adviser in response to an increasingly regulated industry. The Board, including the Independent Directors, concluded that the services are extensive in nature, that the Adviser delivered a high level of service to each Fund and that the Adviser is positioned to continue providing such quality of service in the future.
APPROVAL OF THE INVESTMENT ADVISORY AGREEMENT (UNAUDITED) (CONT.)
2. Investment Performance of the Funds and the Adviser.
The Board, including the Independent Directors, considered short-term and long-term investment performance for the Funds over various periods of time as compared to both relevant indices and the performance of such Funds’ peer groups, and concluded that each Fund was delivering reasonable performance results, especially over the long-term, consistent with the conservative investment strategies that the Funds pursue.
3. Costs of Services and Profits Realized by the Adviser.
a. The Board, including the Independent Directors, considered the information provided by Strategic Insight Simfund/MF Desktop, as well as the comparative graphs provided by HASI, regarding each Fund’s management fee rate and overall expense ratio relative to industry averages for each Fund’s peer group category and the advisory fees charged by the Adviser to other accounts. The Municipal Fund had a gross management fee of 0.60% as compared to the median in its peer group of 0.53%; and, the performance for the 1 year period was 2.28% as compared to the median of its peer group of 2.74%. The Income Fund had a gross management fee of 0.60% as compared to the median in its peer group of 0.60%; and, the performance for the 1 year period was 1.65% as compared to the median of its peer group of (2.29%). The Real Estate Fund had a gross management fee of 0.97% as compared to the median in its peer group of 0.73%; and, the performance for the 1 year period was (1.06%) as compared to the median of its peer group of 0.91%. The Value Fund had a gross management fee of 0.97% as compared to the median in its peer group of 0.69%; and, the performance for the 1 year period was (3.16%) as compared to the median of its peer group of (0.73%). The Opportunity Fund had a gross management fee of 0.65% as compared to the median in its
peer group of 1.00%; and, the performance for the 1 year period was (6.21%) as compared to the median of its peer group of (4.57%). The Energy Fund had a gross management fee of 0.95% as compared to the median in its peer group of 0.84%; and, the performance for the 1 year period was (28.09%) as compared to the average of its peer group of (32.16%). The Board viewed favorably the current and historic willingness of the Adviser to limit the overall expense ratios of each Fund. Recognizing that the fees paid by some Funds were higher than some of the comparable funds and higher than the medians in some Fund’s peer groups, the Board nonetheless noted that the fees were still close enough to the medians in each case and that several peer funds had higher fees. The Board noted that although higher, the fees were not unreasonable.
b. Profitability and Costs of Services to the Adviser. The Board, including the Independent Directors, considered estimates of the Adviser’s profitability and costs attributable to the Funds. The Board recognized that increased fixed costs, particularly legal and audit fees in response to increasing regulations, have a greater impact on small fund families, such as the Funds, than on larger fund complexes. Given this, the Board recognized that the Funds’ overall expenses compare unfavorably to some funds identified as peers. The Board also considered whether the amount of the Adviser’s profit is a fair profit for the management of the Funds and noted that the Adviser has devoted a large amount of its resources into the Funds over the years. Mr. Chodosh reported that the fund by fund expense analysis is the same as previous years, but that it does not reflect all of the overhead costs paid by DLA which may be attributed to the Adviser. The Board, including the Independent Directors, concluded that the Adviser’s profitability was at a fair and acceptable level, particularly in light of the quality of the services being provided to the Funds, and bore a reasonable relationship to the services rendered.
APPROVAL OF THE INVESTMENT ADVISORY AGREEMENT (UNAUDITED) (CONT.)
4. Extent of Economies of Scale as the Funds Grow.
The Board, including the Independent Directors, considered whether there have been economies of scale with respect to the management of the Funds and whether the Funds have appropriately benefited from any economies of scale. Given the size of each Fund, the Board did not believe that significant (if any) economies of scale have been achieved at this time.
5. Whether Fee Levels Reflect Economies of Scale.
The Board took into consideration that the Adviser does not currently offer breakpoints in its fees that would otherwise allow investors to benefit directly from economies of scale in the form of lower fees as fund assets grow. However, the Board, including the Independent Directors, did consider enhancements in personnel and services provided to the Funds by the Adviser, without an increase in fees. The Board also noted that few of the Funds’ peers offered breakpoints despite having significantly more assets under management. The Board stated that they would continue to review this in future years as the Funds’ assets grow.
6. Other Relevant Considerations.
a. Personnel and Methods. The Board, including the Independent Directors, reviewed the Adviser’s Form ADV and questioned the Adviser regarding the size, education and experience of the staff of the Adviser, its fundamental research capabilities, approach to recruiting, training and retaining portfolio managers and other research and management personnel, and concluded that these enable them to provide a high level of service to the
Funds. The Board considered the recent
management structuring changes and concluded that these changes are likely to positively impact the management of the Funds. The Board also considered the history, reputation, qualifications and background of the Adviser as well as the qualifications of its personnel.
b. The Board, including the Independent Directors, also considered the character and amount of other direct and incidental benefits received by the Adviser and its affiliates from their association with the Funds, including the benefits received by the affiliated distributor. The Board concluded that potential “fall-out” benefits that the Adviser and its affiliates may receive, such as greater name recognition or increased ability to obtain research services (although the Board noted that the Adviser currently does not use soft dollars to obtain research services), appear to be reasonable, and may in some cases benefit the Funds.
Conclusions. The Board, including the Independent Directors, did not identify any factor as all-important or all-controlling and instead considered the above listed and other factors collectively in light of the Funds’ surrounding circumstances. Each Independent Director gave the weight to each factor that he deemed appropriate in his own judgment. The Independent Directors considered the renewal of the Investment Advisory Agreement on a Fund-by-Fund basis and determined that the renewal of the Investment Advisory Agreement was in the best interests of the shareholders of each Fund. The Independent Directors also determined that the fees charged to each Fund for the services provided were reasonable. Therefore, the Board, including the Independent Directors, determined that continuation of the Investment Advisory Agreement was in the best interests of each Fund.
MANAGEMENT OF THE COMPANY (UNAUDITED)
Information pertaining to the Directors and Officers of the Company is set forth below. The Statement of Additional Information includes additional information about the Directors and is available without charge, upon request, by calling 516-390-5565.
| | | | | | | | |
Name, (Age) and Address1 Position(s) with the Company | | Term of Office2
and Length of
Time Served | | Principal Occupation(s) During Past Five Years | | Number of Portfolios
in Fund Complex Overseen by Director | | Other Directorships Held by Director |
| | | |
INTERESTED DIRECTORS | | | | | | |
David Lerner3 (79) Director, Chairman of the Board, President | | Since 1998 | | Founder, David Lerner Associates, Inc., a registered broker-dealer and the Company’s Distributor; and President, Spirit of America Management Corp., the Company’s investment adviser. | | 6 | | President and a Director of Spirit of America Management Corp., the Company’s investment adviser. |
| | | | |
Daniel Lerner3 (54) Director | | Since 1998 | | Senior Vice President, Investment Counselor with David Lerner Associates, Inc., a registered broker-dealer and the Company’s Distributor, since September 2000. | | 6 | | Director of David Lerner Associates, Inc., a registered broker-dealer and the Company’s Distributor. |
| | | |
INDEPENDENT DIRECTORS | | | | | | |
Allen Kaufman (79) Director | | Since 1998 | | President and Chief Executive Officer of K.G.K. Agency, Inc., a property and casualty insurance agency, since 1963.4 | | 6 | | Director of K.G.K. Agency, Inc., a property and casualty insurance agency. |
| | | | |
Stanley S. Thune (79) Lead Director | | Since 1998 | | President and Chief Executive Officer, Freight Management Systems, Inc., a third party logistics management company, since 1994; private investor. | | 6 | | Director of Freight Management Systems, Inc. |
| | | | |
Richard Weinberger (79) Director | | Since 2005 | | Of Counsel to Ballon Stoll Bader & Nadler, P.C., a mid-sized law firm, since January 2005 to March 2011; Shareholder, Ballon Stoll Bader & Nadler, P.C., January 2000 to December 2004. | | 6 | | None. |
| | | | |
OFFICERS | | | | | | | | |
David Lerner President (see biography above) | | | | | | | | |
| | | | |
Alan P. Chodosh (62) Treasurer and Secretary | | Since 2003
(Treasurer) Since 2005 (Secretary) | | Financial and Operations Officer of David Lerner Associates, Inc. since June 1999. | | N/A | | N/A |
| | | | |
Joseph Pickard (55) Chief Compliance Officer | | Since 2007 | | Chief Compliance Officer of Spirit of America Investment Fund, Inc. and Spirit of America Management Corp. since July 2007; Counsel to the Interested Directors of Spirit of America Investment Fund, Inc. since July 2002; Senior Vice President and General Counsel of David Lerner Associates, Inc. since July 2002. | | N/A | | N/A |
| 1 | All addresses are in c/o Spirit of America Investment Fund, Inc., 477 Jericho Turnpike, Syosset, New York 11791. |
| 2 | Each Director serves for an indefinite term, until his successor is elected. |
| 3 | David Lerner is an “interested” Director, as defined in the 1940 Act, by reason of his positions with the Adviser, and Daniel Lerner is an “interested” Director by reason of his position with the Distributor. Daniel Lerner is the son of David Lerner. |
| 4 | K.G.K. Agency, Inc. provides insurance to David Lerner Associates, Inc. and affiliated entities. However, the Board has determined that Mr. Kaufman is not an “interested” Director because the insurance services are less than $120,000 in value. |
Proxy Voting Information
The Company’s Statement of Additional Information (“SAI”) containing a description of the policies and procedures that the Spirit of America Income Fund uses to determine how to vote proxies relating to portfolio securities, along with the Company’s proxy voting record relating to portfolio securities held during the 12-month period ended June 30 are available (i) without charge, upon request, by calling (516) 390-5565; and (ii) on the SEC’s website at http://www.sec.gov.
Information on Form N-Q
The Company will file its complete schedule of portfolio holdings with the SEC for the first and third quarters of each fiscal year on Form N-Q within sixty days after the end of the period. The Company’s Forms N-Q will be available on the SEC’s website at http://www.sec.gov, and may be reviewed and copied at the SEC’s Public Reference Room in Washington, DC. Information on the operation of the Public Reference Room may be obtained by calling 1-800-SEC-0030.

Investment Adviser
Spirit of America Management Corp.
477 Jericho Turnpike
P.O. Box 9006
Syosset, NY 11791-9006
Distributor
David Lerner Associates, Inc.
477 Jericho Turnpike
P.O. Box 9006
Syosset, NY 11791-9006
Shareholder Services
Ultimus Asset Services, LLC
2960 North Meridian Street, Suite 300
Indianapolis, IN 46208
Custodian
The Huntington National Bank
7 Easton Oval
Columbus, OH 43219
Independent Registered Public Accounting Firm
Tait Weller & Baker LLP
1818 Market Street, Suite 2400
Philadelphia, PA 19103
Counsel
Blank Rome LLP
405 Lexington Avenue
New York, NY 10174
For additional information about the Spirit of America Income Fund, call (800) 452-4892 or (516) 390-5565.
This report is submitted for the general information of the shareholders of the Fund. It is not authorized for distribution to prospective investors in the Fund unless preceded or accompanied by an effective Prospectus which includes details regarding the Fund’s objectives, risks, policies, expenses, and other information.
©Copyright 2015 Spirit of America SOAIN-AR15

ANNUAL REPORT
DECEMBER 31, 2015

MESSAGE TO OUR SHAREHOLDERS
Dear Shareholder,
We are pleased to send you the Annual Report for The Spirit of America Income and Opportunity Fund, (the “Fund”). The Fund began operations on July 4, 2013.
We hope you are as excited as we are to be a part of our fund, which we anticipate will continue to grow and is designed to deliver attractive returns to our investors. Since its inception the Fund has experienced an increase in assets under management and we look forward to continued inflows and further development in the upcoming year.
We firmly believe that striving for the optimal balance between yield and risk will position us to achieve long term success. Our dedication to providing our investors with a fund that will merit their long term commitment and satisfaction has never been stronger. Now is an excellent time to team up with your Investment Counselor to evaluate your portfolio and make sure you are properly positioned to achieve your investment goals for the upcoming year.
We appreciate your support of our fund and look forward to your continued investment in The Spirit of America Income and Opportunity Fund.
Sincerely,
| | | | | | |
 | |  | |  | |  |
| | David Lerner | | | William Mason |
| | President | | | Portfolio Manager |
| | Spirit of America Investment Fund, Inc. | | | | |
| | | | |
| INCOME & OPPORTUNITY FUND | | | 1 | |
MANAGEMENT DISCUSSION (UNAUDITED)
Economic Summary
The Federal Reserve raised rates to a range between 0.25% and 0.5% signaling the beginning of the end for the central bank’s stimulus program as anticipated during their December meeting. Fed officials emphasized that they intend to raise rates gradually and only if economic growth continues. They are predicting that if all goes smoothly short-term rates may rise by about one percentage point a year for the next three years.
At the end of December the Department of Commerce revised the U.S. gross domestic product (GDP) for the 3rd quarter of 2015 up to a 2.0% annual pace. The increase in GDP this quarter primarily reflected positive contributions from personal consumption, nonresidential fixed investment, state and local spending, residential fixed investment, and exports that were partly offset by a negative contribution from private inventory investment and an increase in imports. In the 2nd quarter GDP increased by a 3.9% pace following the 0.02% contraction in the 1st quarter.
The latest employment data released by the Bureau of Labor Statistics in the December jobs report shows total nonfarm payroll employment rose by 292,000 jobs. In 2015, payroll employment growth totaled 2.7 million, compared with 3.1 million in 2014. The unemployment rate was 5.0%, down by 0.6% over the past 12 months.
Market Commentary
This past year the S&P 500 hit a record high in May only to slump in August over fears of a China-led global economic slowdown. For the year, the S&P 500 was down 0.73%. The Dow Jones industrial average lost 2.23% for the year, its first annual decline since 2008. The Nasdaq
Composite gained 5.73% after surpassing levels not seen since the dot-com bubble in 2000.
The Fund invests a portion of its assets in Master Limited Partnerships (MLPs). The Alerian MLP Index (AMZ), a capitalization-weighted composite of 50 energy Master Limited Partnerships, had a total return of -32.59% for the period of December 31, 2014 through December 31, 2015.
Treasuries and taxable municipal bonds were down in 2015. The 30 Year US Treasury Yield moved from a 2.69 on 1/2/15 to a 3.02 12/31/15. At the same time, the MMD Taxable 30 Year AAA yield began the year at a 3.49 on 1/2/15 and ended the year at a 3.86 on 12/31/15.
Fund Summary
The Spirit of America Income and Opportunity Fund’s, (SOAIX) (the “Fund”) objective is to provide shareholders with current income and the potential for capital appreciation. The emphasis of the Fund is focused on investing in a diversified portfolio of equity securities, fixed income securities, REIT’s, and master limited partnerships (MLPs).
At the end of 2015, the Fund had 38% of its assets invested in taxable municipal bonds, over 19% in preferred stock, over 13% in master limited partnerships (MLPs), over 5% in corporate bonds, and over 20% in non-MLP common stock positions.
The Fund does not make decisions based on complicated algorithms. We are not a hedge fund. At Spirit of America, technology works for us; we do not work for technology. We do not receive buy signals from a computer generated model. We invest the old fashioned way — utilizing hard work, intensive research, and intuitive
MANAGEMENT DISCUSSION (UNAUDITED) (CONT.)
decisions. Our decisions are based on experience.
Return Summary
The Spirit of America Income and Opportunity Fund, SOAOX (the “Fund”), had a total one year return of -5.01% (no load, gross of fees) as of December 31, 2015. This compares to the 0.55% return of its benchmark, the Barclay U.S. Aggregate Index, for the same period. That result does not take the Fund’s sales charge and expense ratio into account.
As we mentioned earlier, the yield increased on both the US 30 Year Treasury and taxable municipal market during 2015. The upward trajectory of the yields in the bond market led fixed income securities to decrease in value contributing to the Fund’s negative return. The major factor contributing to the Fund’s underperformance compared to the index is the Fund’s allocation in common stock, MLP and preferred stock positions. These asset classes are not included in the index.
Including the sales charge and expenses, as of December 31, 2015, the Fund’s one year return was -10.66%. The Fund, which began operations in July 2013, had a return since inception of -0.73% as December 31, 2015.
We plan to proceed with the same game plan we have employed since the Fund began: pursuing a balance between yield and risk.
| | | | |
| INCOME & OPPORTUNITY FUND | | | 3 | |
ILLUSTRATION OF INVESTMENT (UNAUDITED)
Summary of Portfolio Holdings (Unaudited)
As of December 31, 2015
| | | | | | | | |
| Municipal Bonds | | | 38.03 | % | | $ | 19,482,342 | |
| Common Stocks | | | 34.32 | | | | 17,586,763 | |
| Preferred Stocks | | | 19.52 | | | | 10,001,787 | |
| Corporate Bonds | | | 5.30 | | | | 2,716,957 | |
| Money Market Securities | | | 2.83 | | | | 1,450,221 | |
| Total Investments | | | 100.00 | % | | $ | 51,238,070 | |
ILLUSTRATION OF INVESTMENT (UNAUDITED) (CONT.)
Average Annual Returns (Unaudited)
(For the Periods Ended December 31, 2015)
| | | | | | | | |
| | | 1 Year | | | Since
Inception
(July 8, 2013) | |
| Spirit of America Income & Opportunity Fund (NAV) | | | (6.19 | )% | | | 1.24% | |
| Spirit of America Income & Opportunity Fund (POP) | | | (10.66 | )% | | | (0.73)% | |
| Barclays U.S. Aggregate Bond Index | | | 0.55 | % | | | 3.19% | |
NAV represents the Net Asset Value. Returns at NAV do not reflect the maximum 4.75% sales charge. POP represents Public Offering Price and returns at POP do reflect the maximum 4.75% sales charge. Total returns for periods less than one year are not annualized.
Performance data quoted represents past performance; past performance is no guarantee of future results.
The investment return and principal value of an investment will fluctuate so that an investor’s shares, when redeemed, may be worth more or less than their original cost. Current performance may be lower or higher than the performance quoted.
Growth of $10,000 (Unaudited)
(includes one-time 4.75% maximum sales charge and reinvestment of all distributions)
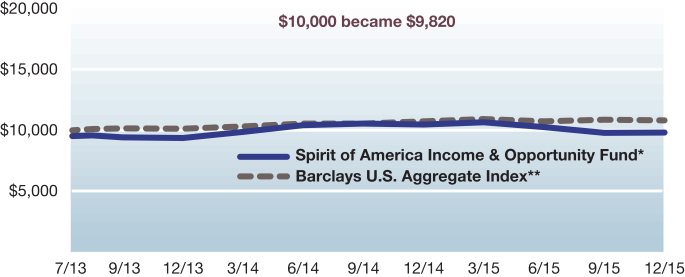
| * | Fund commenced operations July 8, 2013. |
| ** | The Barclays U.S. Aggregate Bond Index benchmark is based on a start date of July 8, 2013. |
Past performance does not guarantee future results. The performance data quoted represents past performance and current returns may be lower or higher. The investment return and net asset value will fluctuate so that an investor’s shares, when redeemed may be worth more or less than the original cost. To obtain performance information current to the most recent month-end, please call 1-800- 452-4892.
The Barclays U.S. Aggregate Bond Index is an unmanaged index. The performance of an index assumes no transaction costs, taxes, management fees or other expenses. A direct investment in an index is not possible.
| | | | |
| INCOME & OPPORTUNITY FUND | | | 5 | |
DISCLOSURE OF FUND EXPENSES (UNAUDITED)
FOR THE SIX MONTH PERIOD JULY 1, 2015 TO DECEMBER 31, 2015
We believe it is important for you to understand the impact of fees regarding your investment. All mutual funds have operating expenses. As a shareholder of the Fund, you incur ongoing costs, which include costs for portfolio management, administrative services, and shareholder reports (like this one), among others. Operating expenses, which are deducted from the Fund’s gross income, directly reduce the investment return of the Fund.
The Fund’s expenses are expressed as a percentage of its average net assets. This figure is known as the expense ratio. The following examples are intended to help you understand the ongoing fees (in dollars) of investing in your Fund and to compare these costs with those of other mutual funds. The examples are based on an investment of $1,000 made at the beginning of the period shown and held for the six month period, July 1, 2015 to December 31, 2015.
Spirit of America Income & Opportunity Fund
| | | | | | | | |
| | | Beginning
Account Value
7/1/15 | | Ending Account
Value 12/31/15 | | Expense Ratio(1) | | Expenses
Paid During
Period(2) |
Actual Fund Return | | $1,000.00 | | $956.60 | | 1.25% | | $6.16 |
Hypothetical 5% Return | | $1,000.00 | | $1,018.90 | | 1.25% | | $6.36 |
This table illustrates your Fund’s costs in two ways:
Actual Fund Return: This section helps you to estimate the actual expenses that you paid over the period. The “Ending Account Value” shown is derived from the Fund’s actual return, the third column shows the period’s annualized expense ratio, and the last column shows the dollar amount that would have been paid by an investor who started with $1,000 in the Fund at the beginning of the period. You may use the information here, together with your account value, to estimate the expenses that you paid over the period.
To do so, simply divide your account value by $1,000 (for example, an $8,600 account value divided by $1,000 = 8.6), then multiply the result by the number in the first line under the heading entitled “Expenses Paid During Period.”
Hypothetical 5% Return: This section is intended to help you compare your Fund’s costs with those of other mutual funds. It assumes that the Fund had a return of 5% before expenses during the period shown, but that the expense ratio is unchanged. In this case, because the return used is not the Fund’s actual return, the results do not apply to your investment. You can assess your Fund’s costs by comparing this hypothetical example with the hypothetical examples that appear in shareholder reports of other funds.
Please note that the expenses shown in the table are meant to highlight your ongoing costs only and do not reflect any transactional costs such as sales charges (loads), or redemption fees.
| (1) | Annualized, based on the Fund’s most recent half-year expenses. |
| (2) | Expenses are equal to the Fund’s annualized expense ratio multiplied by the average account value over the period, multiplied by the number of days in the period (184), then divided by 365. |
| | |
| SCHEDULE OF INVESTMENTS | | DECEMBER 31, 2015 |
| | | | | | | | |
| | | Principal
Amount | | | Market Value | |
| Municipal Bonds 37.81% | | | | | | | | |
| | |
Alabama 1.95% | | | | | | | | |
Health Care Authority for Baptist Health/The, Health, Hospital, Nursing Home Improvements, Refunding Revenue Bonds, Series A, 5.50%, 11/15/43 | | $ | 1,000,000 | | | $ | 1,002,190 | |
| | |
Arizona 2.14% | | | | | | | | |
City of Glendale, AZ, Senior Excise Tax Revenue, Refunding Revenue Bonds, 3.93%, 07/01/31 | | | 500,000 | | | | 474,975 | |
City of Tucson, AZ, Certificate Participation, Refunding Revenue Bonds, (AGM), 4.83%, 07/01/34 | | | 620,000 | | | | 630,143 | |
| | | | | | | 1,105,118 | |
| | |
California 3.31% | | | | | | | | |
City of Newport Beach, CA, Certificate Participation, Public Improvements, Build America Revenue Bonds, 7.17%, 07/01/40 | | | 800,000 | | | | 1,008,064 | |
San Bernardino Community College District, Public Improvements, General Obligation Unlimited, 7.63%, 08/01/44 | | | 505,000 | | | | 698,966 | |
| | | | | | | 1,707,030 | |
| | |
Florida 1.89% | | | | | | | | |
Pasco County School Board, School Improvements, Certificate Participation, Callable 12/01/24 @ 100, (AGM), 5.00%, 12/01/37 | | | 1,000,000 | | | | 974,240 | |
| | |
Georgia 2.17% | | | | | | | | |
Municipal Electric Authority of Georgia, Electric Lights & Power Improvements, Build America Refunding Revenue Bonds, 7.06%, 04/01/57 | | | 1,000,000 | | | | 1,119,750 | |
| | |
Kansas 1.95% | | | | | | | | |
Kansas Development Finance Authority, Revenue Bonds, Series H, 4.73%, 04/15/37 | | | 1,000,000 | | | | 1,004,400 | |
| | |
Louisiana 0.97% | | | | | | | | |
City of New Orleans, LA, Public & Recreational Facilities Improvements, General Obligation Unlimited, Series A, Callable 12/01/24 @ 100, (AGM) (OID), 4.00%, 12/01/31 | | | 500,000 | | | | 499,400 | |
See accompanying notes which are an integral part of these financial statements.
| | | | |
| INCOME & OPPORTUNITY FUND | | | 7 | |
| | |
| SCHEDULE OF INVESTMENTS (CONT.) | | DECEMBER 31, 2015 |
| | | | | | | | |
| | | Principal
Amount | | | Market Value | |
| | |
Michigan 1.97% | | | | | | | | |
County of Macomb, MI, Retirement Facilities, General Obligation Limited, Callable 11/01/25 @ 100, 4.42%, 11/01/35 | | $ | 1,000,000 | | | $ | 1,017,180 | |
| | |
Minnesota 0.49% | | | | | | | | |
Housing & Redevelopment Authority of The City of St Paul Minnesota, Revenue Bonds, 4.19%, 07/01/27 | | | 250,000 | | | | 250,803 | |
| | |
Nebraska 3.05% | | | | | | | | |
Public Power Generation Agency, Electric Lights & Power Improvements, Build America Revenue Bonds, 7.24%, 01/01/41 | | | 1,315,000 | | | | 1,569,400 | |
| | |
Nevada 0.25% | | | | | | | | |
County of Washoe, NV, Public & Highway Improvements, Build America Revenue Bonds, 7.97%, 02/01/40 | | | 100,000 | | | | 126,974 | |
| | |
New Jersey 1.40% | | | | | | | | |
New Jersey Housing & Mortgage Finance Agency, State Multi-Family Housing, Refunding Revenue Bonds, Series E, Callable 11/01/24 @ 100, 4.47%, 11/01/37 | | | 750,000 | | | | 720,015 | |
| | |
New York 1.19% | | | | | | | | |
Metropolitan Transportation Authority, Revenue Bonds, 6.65%, 11/15/39 | | | 225,000 | | | | 292,916 | |
New York City Transitional Finance Authority Building Aid Revenue, School Improvements, Miscellaneous Purposes Revenue Bonds, (State Aid Withholding), 5.00%, 07/15/30 | | | 300,000 | | | | 320,598 | |
| | | | | | | 613,514 | |
| | |
Ohio 5.76% | | | | | | | | |
American Municipal Power, Inc., Electric Lights & Power Improvements, Build America Revenue Bonds, 8.08%, 02/15/50 | | | 1,000,000 | | | | 1,475,840 | |
American Municipal Power, Inc., Revenue Bonds, 7.83%, 02/15/41 | | | 1,000,000 | | | | 1,377,180 | |
American Municipal Power, Inc., Electric Lights & Power Improvements, Build America Revenue Bonds, 5.94%, 02/15/47 | | | 100,000 | | | | 115,685 | |
| | | | | | | 2,968,705 | |
See accompanying notes which are an integral part of these financial statements.
| | |
| SCHEDULE OF INVESTMENTS (CONT.) | | DECEMBER 31, 2015 |
| | | | | | | | |
| | | Principal
Amount | | | Market Value | |
| | |
Oregon 1.89% | | | | | | | | |
Washington & Multnomah Counties School District No. 48J Beaverton, Pension Funding, General Obligation Limited, Callable 06/30/25 @ 100, 4.06%, 06/30/34 | | $ | 1,000,000 | | | $ | 975,700 | |
| | |
Pennsylvania 2.02% | | | | | | | | |
City of Reading, PA, General Obligation Unlimited, Refunding Revenue Bonds, Callable 11/01/24 @ 100, (AGM) (OID), 5.30%, 11/01/33 | | | 1,000,000 | | | | 1,040,650 | |
| | |
Tennessee 1.45% | | | | | | | | |
Metropolitan Government of Nashville & Davidson County Convention Center Authority, Public Improvements, Revenue Bonds, 7.43%, 07/01/43 | | | 500,000 | | | | 647,100 | |
Metropolitan Government of Nashville & Davidson County, TN, General Obligation Unlimited, Refunding Revenue Bonds, Series B, 3.49%, 07/01/29 | | | 100,000 | | | | 97,558 | |
| | | | | | | 744,658 | |
| | |
Texas 1.60% | | | | | | | | |
El Paso Downtown Development Corp., Recreational Facility Improvements, Revenue Bonds, 7.25%, 08/15/43 | | | 750,000 | | | | 824,490 | |
| | |
Wisconsin 2.36% | | | | | | | | |
Public Finance Authority, Parking Facility Improvements, Revenue Bonds, Callable 11/01/24 @ 100, (OID), 5.00%, 11/01/44 | | | 1,250,000 | | | | 1,218,125 | |
Total Municipal Bonds
(Cost $19,412,170) | | | | | | | 19,482,342 | |
| | |
| | | Shares | | | Market Value | |
| | |
| Preferred Stocks 19.41% | | | | | | | | |
| | |
Consumer Staples 1.26% | | | | | | | | |
CHS, Inc., 7.50% | | | 24,000 | | | $ | 649,200 | |
| | |
Energy 0.05% | | | | | | | | |
Vanguard Natural Resources LLC, 7.63% | | | 3,100 | | | | 28,365 | |
| | |
Financials 6.14% | | | | | | | | |
Aegon NV, 8.00% | | | 2,000 | | | | 55,080 | |
Aegon NV, 6.38% | | | 10,000 | | | | 258,000 | |
See accompanying notes which are an integral part of these financial statements.
| | | | |
| INCOME & OPPORTUNITY FUND | | | 9 | |
| | |
| SCHEDULE OF INVESTMENTS (CONT.) | | DECEMBER 31, 2015 |
| | | | | | | | |
| | |
| | | Shares | | | Market Value | |
| | |
Financials (cont.) | | | | | | | | |
Aviva PLC, 8.25% | | | 2,000 | | | $ | 52,940 | |
Capital One Financial Corp., 6.70% | | | 10,000 | | | | 275,500 | |
Citigroup, Inc., 6.88% | | | 12,000 | | | | 334,320 | |
First Republic Bank, 5.70% | | | 10,000 | | | | 255,000 | |
Hancock Holding Co., 5.95% | | | 10,200 | | | | 250,002 | |
JPMorgan Chase & Co., 6.10% | | | 10,000 | | | | 258,800 | |
JPMorgan Chase & Co., 6.70% | | | 10,000 | | | | 274,800 | |
JPMorgan Chase & Co., 6.30% | | | 15,750 | | | | 413,595 | |
Northern Trust Corp., 5.85% | | | 6,000 | | | | 160,560 | |
Zions Bancorp, 6.95% | | | 20,000 | | | | 575,200 | |
| | | | | | | 3,163,797 | |
| | |
Industrials 0.63% | | | | | | | | |
Pitney Bowes, Inc., 6.70% | | | 12,000 | | | | 323,520 | |
| | |
Real Estate Investment Trusts 8.48% | | | | | | | | |
Alexandria Real Estate Equities, Inc., 6.45% | | | 10,800 | | | | 279,828 | |
CBL & Associates Properties, Inc., 6.63% | | | 2,640 | | | | 65,868 | |
CBL & Associates Properties, Inc., 7.38% | | | 4,800 | | | | 121,392 | |
DDR Corp., 6.50% | | | 11,500 | | | | 289,800 | |
Digital Realty Trust, Inc., 7.38% | | | 13,848 | | | | 372,511 | |
Digital Realty Trust, Inc., 6.35% | | | 10,000 | | | | 256,800 | |
Equity Commonwealth, 5.75% | | | 10,000 | | | | 245,100 | |
Equity Commonwealth, 7.25% | | | 14,060 | | | | 359,795 | |
Equity Commonwealth, 6.50% | | | 6,000 | | | | 148,440 | |
Gramercy Property Trust, 7.13% | | | 3,000 | | | | 74,400 | |
Kilroy Realty Corp., 6.88% | | | 2,495 | | | | 64,396 | |
LaSalle Hotel Properties, 7.50% | | | 10,339 | | | | 258,475 | |
Pebblebrook Hotel Trust, 8.00% | | | 2,600 | | | | 67,132 | |
Pebblebrook Hotel Trust, 7.88% | | | 6,000 | | | | 150,720 | |
Realty Income Corp., 6.63% | | | 6,500 | | | | 172,185 | |
SL Green Realty Corp., 6.50% | | | 8,100 | | | | 206,226 | |
Taubman Centers, Inc., 6.25% | | | 3,211 | | | | 81,881 | |
Taubman Centers, Inc., 6.50% | | | 16,436 | | | | 419,447 | |
Urstadt Biddle Properties, Inc., 6.75% | | | 4,000 | | | | 104,920 | |
Urstadt Biddle Properties, Inc., 7.13% | | | 10,000 | | | | 258,600 | |
VEREIT, Inc., 6.70% | | | 15,029 | | | | 369,713 | |
| | | | | | | 4,367,629 | |
| | |
Telecommunication Services 1.02% | | | | | | | | |
Qwest Corp., 6.88% | | | 12,000 | | | | 309,000 | |
United States Cellular Corp., 7.25% | | | 8,500 | | | | 217,940 | |
| | | | | | | 526,940 | |
See accompanying notes which are an integral part of these financial statements.
| | |
| SCHEDULE OF INVESTMENTS (CONT.) | | DECEMBER 31, 2015 |
| | | | | | | | |
| | |
| | | Shares | | | Market Value | |
| | |
Utilities 1.83% | | | | | | | | |
Duke Energy Corp., 5.13% | | | 10,000 | | | $ | 256,600 | |
Entergy Mississippi, Inc., 6.00% | | | 2,150 | | | | 55,836 | |
NextEra Energy Capital Holdings, Inc., 5.63% | | | 10,000 | | | | 254,000 | |
SCE Trust I, 5.63% | | | 10,000 | | | | 253,100 | |
SCE Trust II, 5.10% | | | 5,000 | | | | 122,800 | |
| | | | | | | 942,336 | |
Total Preferred Stocks
(Cost $9,658,529) | | | | | | | 10,001,787 | |
| | |
| Common Stocks 34.14% | | | | | | | | |
| | |
Consumer Staples 1.81% | | | | | | | | |
Altria Group, Inc. | | | 6,590 | | | | 383,604 | |
Philip Morris International, Inc. | | | 4,210 | | | | 370,101 | |
Reynolds American, Inc. | | | 3,852 | | | | 177,770 | |
| | | | | | | 931,475 | |
| | |
Energy 14.36% | | | | | | | | |
American Midstream Partners LP | | | 17,415 | | | | 140,887 | |
Buckeye Partners LP | | | 5,705 | | | | 376,302 | |
Calumet Specialty Products Partners LP | | | 14,620 | | | | 291,084 | |
Cheniere Energy Partners LP | | | 11,400 | | | | 297,198 | |
Cone Midstream Partners LP | | | 21,900 | | | | 215,715 | |
DCP Midstream Partners LP | | | 10,415 | | | | 256,938 | |
Enbridge Energy Partners LP | | | 22,561 | | | | 520,482 | |
Energy Transfer Partners LP | | | 15,903 | | | | 536,408 | |
EnLink Midstream Partners LP | | | 20,140 | | | | 333,921 | |
Enterprise Products Partners LP | | | 18,180 | | | | 465,044 | |
Global Partners LP | | | 11,665 | | | | 204,954 | |
Kinder Morgan, Inc. | | | 19,832 | | | | 295,894 | |
MPLX LP | | | 8,000 | | | | 314,640 | |
NGL Energy Partners LP | | | 8,449 | | | | 93,277 | |
Plains All American Pipeline LP | | | 13,870 | | | | 320,397 | |
Rose Rock Midstream LP | | | 4,340 | | | | 65,274 | |
Southcross Energy Partners LP | | | 17,861 | | | | 63,585 | |
Sunoco Logistics Partners LP | | | 12,900 | | | | 331,530 | |
Sunoco LP | | | 7,200 | | | | 285,192 | |
Targa Resources Partners LP | | | 12,500 | | | | 206,625 | |
TC PipeLines LP | | | 6,320 | | | | 314,167 | |
Tesoro Logistics LP | | | 14,285 | | | | 718,821 | |
USA Compression Partners LP | | | 16,966 | | | | 194,939 | |
Williams Partners LP | | | 19,985 | | | | 556,582 | |
| | | | | | | 7,399,856 | |
See accompanying notes which are an integral part of these financial statements.
| | | | |
| INCOME & OPPORTUNITY FUND | | | 11 | |
| | |
| SCHEDULE OF INVESTMENTS (CONT.) | | DECEMBER 31, 2015 |
| | | | | | | | |
| | |
| | | Shares | | | Market Value | |
| | |
Financials 2.03% | | | | | | | | |
BGC Partners, Inc. | | | 69,044 | | | $ | 677,322 | |
Blackstone Group LP/The | | | 12,505 | | | | 365,646 | |
| | | | | | | 1,042,968 | |
| | |
Real Estate Investment Trusts 12.58% | | | | | | | | |
Apple Hospitality REIT, Inc. | | | 27,150 | | | | 542,186 | |
Blackstone Mortgage Trust, Inc. | | | 18,305 | | | | 489,842 | |
City Office REIT, Inc. | | | 56,470 | | | | 687,805 | |
Digital Realty Trust, Inc. | | | 4,760 | | | | 359,951 | |
Gramercy Property Trust | | | 49,314 | | | | 380,704 | |
Hannon Armstrong Sustainable Infrastructure Capital, Inc. | | | 77,829 | | | | 1,472,525 | |
HCP, Inc. | | | 12,482 | | | | 477,312 | |
Independence Realty Trust, Inc. | | | 76,579 | | | | 575,108 | |
Lexington Realty Trust | | | 65,336 | | | | 522,688 | |
Starwood Property Trust, Inc. | | | 19,990 | | | | 410,994 | |
WP Carey, Inc. | | | 9,550 | | | | 563,450 | |
| | | | | | | 6,482,565 | |
| | |
Telecommunication Services 1.66% | | | | | | | | |
AT&T, Inc. | | | 24,864 | | | | 855,570 | |
| | |
Utilities 1.70% | | | | | | | | |
American Electric Power Co., Inc. | | | 6,170 | | | | 359,526 | |
Consolidated Edison, Inc. | | | 8,010 | | | | 514,803 | |
| | | | | | | 874,329 | |
Total Common Stocks
(Cost $20,513,396) | | | | | | | 17,586,763 | |
| | |
| | | Principal
Amount | | | Market Value | |
| | |
| Corporate Bonds 5.27% | | | | | | | | |
American University, 4.32%, 04/01/45 | | $ | 250,000 | | | $ | 234,457 | |
Entergy Texas, Inc., 5.15%, 06/01/45 | | | 100,000 | | | | 98,418 | |
Ford Motor Co., 9.98%, 02/15/47 | | | 500,000 | | | | 702,371 | |
McLaren Health Care Corp., 4.53%, 05/15/38 | | | 290,000 | | | | 271,225 | |
QUALCOMM, Inc., 4.80%, 05/20/45 | | | 1,000,000 | | | | 890,486 | |
Wells Fargo & Co., 7.98%, 03/29/49 (a) | | | 500,000 | | | | 520,000 | |
Total Corporate Bonds
(Cost $2,882,800) | | | | | | | 2,716,957 | |
See accompanying notes which are an integral part of these financial statements.
| | |
| SCHEDULE OF INVESTMENTS (CONT.) | | DECEMBER 31, 2015 |
| | | | | | | | |
| | | Shares | | | | Market Value | |
| | |
Money Market 2.82% | | | | | | | | |
Fidelity Prime Money Market Portfolio, Institutional Class, 0.32% (b) | | | 1,450,221 | | | $ | 1,450,221 | |
| | |
Total Money Market
(Cost $1,450,221) | | | | | | | 1,450,221 | |
| | |
Total Investments — 99.45% | | | | | | | | |
(Cost $53,917,116) | | | | | | | 51,238,070 | |
Other Assets in Excess of Liabilities — 0.55% | | | | | | | 284,743 | |
| | | | | | | | |
NET ASSETS — 100.00% | | | | | | $ | 51,522,813 | |
| (a) | Variable or Floating Rate Security. Rate disclosed is as of December 31, 2015. |
| (b) | Rate disclosed is the seven day yield as of December 31, 2015. |
AGM - Assured Guaranty Municipal Corp.
OID - Original Issue Discount
REIT - Real Estate Investment Trust
The Global Industry Classification Standard (GICS®) was developed by and/or is the exclusive property of MSCI, Inc. and Standard & Poor Financial Services LLC (“S&P”). GICS is a service mark of MSCI, Inc. and S&P and has been licensed for use by Ultimus Asset Services, LLC (formerly Huntington Asset Services, Inc.).
See accompanying notes which are an integral part of these financial statements.
| | | | |
| INCOME & OPPORTUNITY FUND | | | 13 | |
| | |
| STATEMENT OF ASSETS AND LIABILITIES | | DECEMBER 31, 2015 |
| | | | |
|
ASSETS | |
Investments in securities at value (cost $53,917,116) | | $ | 51,238,070 | |
Receivable for Fund shares sold | | | 103,332 | |
Dividends and interest receivable | | | 471,917 | |
Prepaid expenses | | | 5,006 | |
TOTAL ASSETS | | | 51,818,325 | |
| |
LIABILITIES | | | | |
Payable for Fund shares redeemed | | | 109,126 | |
Payable for distributions to shareholders | | | 104,091 | |
Payable for investment advisory fees | | | 22,217 | |
Payable for accounting and administration fees | | | 4,561 | |
Payable for distribution fees | | | 10,699 | |
Payable to custodian | | | 800 | |
Payable for audit fees | | | 22,900 | |
Payable for printing fees | | | 12,978 | |
Payable for transfer agent fees | | | 3,419 | |
Payable for chief compliance officer salary | | | 123 | |
Other accrued expenses | | | 4,598 | |
TOTAL LIABILITIES | | | 295,512 | |
NET ASSETS | | $ | 51,522,813 | |
Net assets applicable to 5,627,258 shares outstanding, $0.001 par value (500,000,000 authorized shares) | | $ | 51,522,813 | |
Net asset value and redemption price per share
($51,522,813 ÷ 5,627,258 shares) | | $ | 9.16 | |
Maximum offering price per share ($9.16 ÷ 0.9525) | | $ | 9.62 | |
| |
SOURCE OF NET ASSETS | | | | |
As of December 31 2015, net assets consisted of: | | | | |
Paid-in capital | | $ | 55,910,096 | |
Accumulated undistributed net investment loss | | | (99,905 | ) |
Accumulated net realized loss on investments | | | (1,608,332 | ) |
Net unrealized depreciation on investments | | | (2,679,046 | ) |
NET ASSETS | | $ | 51,522,813 | |
See accompanying notes which are an integral part of these financial statements.
STATEMENT OF OPERATIONS
| | | | |
| | | For the Year
Ended
December 31, 2015 | |
| |
INVESTMENT INCOME | | | | |
Dividends | | $ | 813,513 | |
Interest | | | 949,625 | |
TOTAL INVESTMENT INCOME | | | 1,763,138 | |
| |
EXPENSES | | | | |
Investment advisory | | | 294,908 | |
Distribution | | | 113,426 | |
Accounting and Administration | | | 34,396 | |
Transfer agent | | | 35,004 | |
Audit | | | 23,500 | |
Chief Compliance Officer salary | | | 1,366 | |
Custodian | | | 5,005 | |
Directors | | | 4,885 | |
Insurance | | | 8,878 | |
Legal | | | 3,875 | |
Printing | | | 38,988 | |
Registration | | | 15,301 | |
Line of credit | | | 375 | |
Other | | | 3,482 | |
TOTAL EXPENSES | | | 583,389 | |
Fees waived by Adviser | | | (15,173 | ) |
NET EXPENSES | | | 568,216 | |
NET INVESTMENT INCOME | | | 1,194,922 | |
| |
REALIZED AND UNREALIZED (LOSS) ON
INVESTMENTS | | | | |
Net realized loss from investment transactions | | | (1,137,541 | ) |
Net change in unrealized appreciation (depreciation) of investments | | | (3,394,005 | ) |
Net realized and unrealized loss on investments | | | (4,531,546 | ) |
NET DECREASE IN NET ASSETS RESULTING FROM OPERATIONS | | $ | (3,336,624 | ) |
See accompanying notes which are an integral part of these financial statements.
| | | | |
| INCOME & OPPORTUNITY FUND | | | 15 | |
STATEMENTS OF CHANGES IN NET ASSETS
| | | | | | | | |
| | | For the Year
Ended
December 31, 2015 | | | For the Year
Ended
December 31, 2014 | |
| |
OPERATIONS | | | | | |
Net investment income | | $ | 1,194,922 | | | $ | 576,567 | |
Net realized loss on investment transactions | | | (1,137,541 | ) | | | (472,009 | ) |
Net change in unrealized appreciation/depreciation of investments | | | (3,394,005 | ) | | | 865,721 | |
Net increase (decrease) in net assets resulting from operations | | | (3,336,624 | ) | | | 970,279 | |
| |
DISTRIBUTIONS TO SHAREHOLDERS | | | | | |
Distributions from net investments income | | | (1,244,119 | ) | | | (620,404 | ) |
Distributions from return of capital | | | (800,789 | ) | | | (245,196 | ) |
Total distributions to shareholders | | | (2,044,908 | ) | | | (865,600 | ) |
| |
CAPITAL SHARE TRANSACTIONS (Dollar Activity) | | | | | |
Shares sold | | | 37,720,439 | | | | 25,306,364 | |
Shares issued from reinvestment of distributions | | | 1,418,799 | | | | 665,850 | |
Shares redeemed | | | (12,705,183 | ) | | | (3,004,299 | ) |
Increase in net assets derived from capital share transactions | | | 26,434,055 | | | | 22,967,915 | |
Total increase in net assets | | | 21,052,523 | | | | 23,072,594 | |
| |
NET ASSETS | | | | | |
Beginning of year | | | 30,470,290 | | | | 7,397,696 | |
End of year | | $ | 51,522,813 | | | $ | 30,470,290 | |
| | |
Accumulated undistributed net investment income (loss) | | $ | (99,905 | ) | | $ | (50,587 | ) |
| |
Transactions in capital stock were: | | | | | |
Shares sold | | | 3,803,916 | | | | 2,447,021 | |
Shares issued from reinvestment of distributions | | | 146,268 | | | | 64,327 | |
Shares redeemed | | | (1,311,154 | ) | | | (292,409 | ) |
Increase in shares outstanding | | | 2,639,030 | | | | 2,218,939 | |
See accompanying notes which are an integral part of these financial statements.
FINANCIAL HIGHLIGHTS
The table below sets forth financial data for one share of beneficial interest outstanding throughout the period presented.
| | | | | | | | | | | | |
| | | Year Ended
December 31,
2015 | | | Year Ended
December 31,
2014 | | | For the
Period Ended
December 31,
2013* | |
| | | |
Net Asset Value, Beginning of Period | | $ | 10.20 | | | $ | 9.62 | | | $ | 10.00 | |
| | | |
Income from Investment Operations: | | | | | | | | | | | | |
Net investment income | | | 0.25 | | | | 0.39 | | | | 0.14 | |
Net realized and unrealized gain (loss) on investments | | | (0.86 | ) | | | 0.73 | | | | (0.31 | ) |
Total income from investment operations | | | (0.61 | ) | | | 1.12 | | | | (0.17 | ) |
| | | |
Less Distributions: | | | | | | | | | | | | |
Distributions from net investment income | | | (0.26 | ) | | | (0.39 | ) | | | (0.15 | ) |
Distributions from capital gains | | | — | | | | — | | | | (0.01 | ) |
Distributions from return of capital | | | (0.17 | ) | | | (0.15 | ) | | | (0.05 | ) |
Total distributions | | | (0.43 | ) | | | (0.54 | ) | | | (0.21 | ) |
| | | |
| | | | | | | | | | | | | |
Net Asset Value, End of Period | | $ | 9.16 | | | $ | 10.20 | | | $ | 9.62 | |
Total Return1 | | | (6.19 | )% | | | 11.74 | % | | | (1.63 | )%2 |
| | | |
Ratios/Supplemental Data: | | | | | | | | | | | | |
Net assets, end of period (000) | | $ | 51,523 | | | $ | 30,470 | | | $ | 7,398 | |
Ratio of expenses to average net assets: | | | | | | | | | | | | |
Before expense reimbursement or recapture | | | 1.28 | % | | | 1.66 | %4 | | | 2.72 | %3 |
After expense reimbursement or recapture | | | 1.25 | % | | | 1.26 | %4 | | | 1.50 | %3 |
Ratio of net investment income to average net assets | | | 2.63 | % | | | 3.83 | % | | | 3.25 | %3 |
Portfolio turnover | | | 8 | % | | | 20 | % | | | 12 | %2 |
1 Calculation does not reflect sales load.
2 Calculation is not annualized.
3 Calculation is annualized.
4 Includes interest expense of 0.01%
* For the period July 8, 2013 (commencement of operations) to December 31, 2013.
See accompanying notes which are an integral part of these financial statements.
| | | | |
| INCOME & OPPORTUNITY FUND | | | 17 | |
| | |
| NOTES TO FINANCIAL STATEMENTS | | DECEMBER 31, 2015 |
Note 1 – Organization
Spirit of America Income & Opportunity Fund (the “Fund”), a series of Spirit of America Investment Fund, Inc. (the “Company”), is an open-end diversified mutual fund registered under the Investment Company Act of 1940, as amended (the “1940 Act”). The Company was incorporated under the laws of Maryland on May 15, 1997. The Fund commenced operations on July 8, 2013. The Fund seeks to achieve its investment objective of providing shareholders with current income and the potential for capital appreciation by investing a substantial percentage of its total assets in a portfolio of common and preferred stocks, fixed income securities of any grade, as well non-rated fixed income securities, both short-term and long- term, including zero-coupon securities, taxable and tax-free municipal bonds, income producing convertible securities, corporate bonds, including high-yield U.S. corporate bonds, floating rate bonds and step coupon bonds, municipal lease agreements, certificates of participation and collateralized mortgage obligations (“CMOs”), U.S. government agency securities, including securities issued by the Federal National Mortgage Association (“FNMA”), the Federal Home Loan Mortgage Corporation (“FHLMC”), and the Government National Mortgage Association (“GNMA”), equity real estate investment companies (“REITs”), which are subject to federal income tax, and Master Limited Partnerships (“MLPs”). The Fund offers one class of shares.
Note 2 – Significant Accounting Policies
The Fund is an investment company and follows accounting and reporting guidance under Financial Accounting Standards Board (“FASB”) Accounting Standards Codification (“ASC”) Topic 946, “Financial Services-Investment Companies”. The following is a summary of significant accounting policies consistently followed by the Fund in the preparation of its financial statements. These policies are in conformity with generally
accepted accounting principles in the United States of America (“GAAP”) for investment companies.
A. Security Valuation: The offering price and net asset value (“NAV”) per share for the Fund are calculated as of the close of regular trading on the New York Stock Exchange (“NYSE”), currently 4:00 p.m., Eastern Time on each day the NYSE is open for trading. The Fund’s securities are valued at the official close or the last reported sales price on the principal exchange on which the security trades, or if no sales price is reported, the mean of the latest bid and asked prices is used. Securities traded over-the-counter are priced at the mean of the latest bid and asked prices. Unlisted securities traded in the over-the-counter market are valued using an evaluated quote provided by the independent pricing service, or, if an evaluated quote is unavailable, such securities are valued using prices received from dealers, provided that if the dealer supplies both bid and ask prices, the price to be used is the mean of the bid and asked prices. The independent pricing service derives an evaluated quote by obtaining dealer quotes, analyzing the listed markets, reviewing trade execution data and employing sensitivity analysis. Evaluated quotes may also reflect appropriate factors such as individual characteristics of the issue, communications with broker-dealers, and other market data. Short-term investments having a maturity of 60 days or less are valued at amortized cost, which the Board of Directors (the “Board”) believes represents fair value. Fund securities for which market quotations are not readily available are valued at fair value as determined in good faith under procedures established by and under the supervision of the Board.
| | |
| NOTES TO FINANCIAL STATEMENTS (CONT.) | | DECEMBER 31, 2015 |
B. Fair Value Measurements: Various inputs are used in determining the fair value of investments which are as follows:
| | |
• Level 1 – | | Unadjusted quoted prices in active markets for identical investments and/or registered investment companies where the value per share is determined and published and is the basis for current transactions for identical assets or liabilities at the valuation date. |
| |
• Level 2 – | | Observable inputs other than quoted prices included in level 1 that are observable for the asset or |
| | |
| | liability, either directly or indirectly. These inputs may include quoted prices for the identical instrument on an inactive market, prices for similar instruments, interest rates, prepayment speeds, credit risk, yield curves, default rates and similar data. |
| |
• Level 3 – | | Unobservable inputs based on the best information available in the circumstances, to the extent observable inputs are not available (including the Fund’s own assumptions used in determining the fair value of investments). |
The summary of inputs used to value the Fund’s net assets as of December 31, 2015 is as follows:
| | | | | | | | | | | | | | | | |
| | | Value Inputs | |
| Assets | | Level 1 | | | Level 2 | | | Level 3 | | | Totals | |
Municipal Bonds | | $ | — | | | $ | 19,482,342 | | | $ | — | | | $ | 19,482,342 | |
Preferred Stocks* | | | 10,001,787 | | | | — | | | | — | | | | 10,001,787 | |
Common Stocks* | | | 17,586,763 | | | | — | | | | — | | | | 17,586,763 | |
Corporate Bonds | | | — | | | | 2,716,957 | | | | — | | | | 2,716,957 | |
Money Market Securities | | | 1,450,221 | | | | — | | | | — | | | | 1,450,221 | |
| | | | | | | | | | | | | | | | |
Total | | $ | 29,038,771 | | | $ | 22,199,299 | | | $ | — | | | $ | 51,238,070 | |
| | | | |
| | | | | | | | | | | | | | | | |
The Fund did not have any transfers between levels as of December 31, 2015. The Fund recognizes transfers between fair value hierarchy levels at the end of the reporting period.
C. Investment Income and Securities Transactions: Security transactions are accounted for on the date the securities are purchased or sold (trade date). Cost is determined and gains and losses are based on the identified cost basis for both financial statement and federal income tax purposes. Dividend income and distributions to shareholders are reported on the ex-dividend date. Interest income and expenses are accrued daily.
D. Federal Income Taxes: The Fund intends to comply with all requirements of the Internal Revenue Code applicable to regulated investment companies and to distribute substantially all of its taxable income to its shareholders. Therefore, no federal income tax provision is required.
E. Use of Estimates: In preparing financial statements in conformity with GAAP, management makes estimates and assumptions that affect the reported amounts of assets and liabilities at the date of the financial statements, as well as the reported amounts of revenues and expenses during the reporting period. Actual results could differ from those estimates.
| | | | |
| INCOME & OPPORTUNITY FUND | | | 19 | |
| | |
| NOTES TO FINANCIAL STATEMENTS (CONT.) | | DECEMBER 31, 2015 |
F. Distributions to Shareholders: The Fund intends to distribute substantially all of its net investment income and capital gains to shareholders each year. Normally, income distributions will be declared daily and paid monthly. Capital gains, if any, will be distributed annually in December, but may be distributed more frequently if deemed advisable by the Board. All such distributions are taxable to the shareholders whether received in cash or reinvested in shares.
Note 3 – Purchases and Sales of Securities
Purchases and proceeds from the sales of securities for the year ended December 31, 2015, excluding short-term investments, were $31,620,792 and $3,209,768, respectively.
Note 4 – Investment Management Fee and Other Transactions with Affiliates
Spirit of America Management Corp. (the “Adviser”) has been retained to act as the Company’s investment adviser pursuant to an Investment Advisory Agreement (the “Advisory Agreement”). The Adviser was incorporated in 1997 and is a registered investment adviser under the Investment Advisers Act of 1940, as amended. Under the Advisory Agreement, the Fund pays the Adviser a monthly fee of 1/12 of 0.65% of the Fund’s average daily net assets. Investment advisory fees for the year ended December 31, 2015, were $294,908.
The Adviser has contractually agreed to waive advisory fees and/or reimburse expenses so that the total operating expenses will not exceed 1.25% of the average daily net assets of the Fund through April 30, 2016. The waiver does not include, front end or contingent deferred loads, taxes, interest, dividend expenses, brokerage commissions or expenses incurred in connection with any merger, reorganization, or extraordinary expenses such as litigation. For the year ended December 31, 2015, the Adviser waived advisory fees in the amount of $15,173.
Any amounts waived or reimbursed by the Adviser are subject to reimbursement by the Fund within the following three years, provided the Fund is able to make such reimbursement and remain in compliance with the expense limitation as stated above. The balance of recoverable expenses to the Adviser as of December 31, 2015 was $102,757. Of this balance, $27,925 will expire in 2016, $59,659 will expire in 2017 and $15,173 will expire in 2018.
The Fund has adopted a plan of distribution pursuant to Rule 12b-1 (the “Plan”). The Plan permits the Fund to pay David Lerner Associates, Inc. (the “Distributor”) a monthly fee of 1/12 of 0.25% of the Funds average daily net assets for the Distributor’s services and expenses in distributing shares of the Fund and providing personal services and/or maintaining shareholder accounts. For the year ended December 31, 2015, fees paid to the Distributor under the Plan were $113,426.
The Fund’s shares are subject to an initial sales charge imposed at the time of purchase, in accordance with the Fund’s current prospectus. For the year ended December 31, 2015, sales charges received by the Distributor were $1,643,990. A contingent deferred sales charge (“CDSC”) of 1.00% may be imposed on redemptions of $1 million or more made within one year of purchase.
Certain Officers and Directors of the Company are “affiliated persons”, as that term is defined in the 1940 Act, of the Adviser or the Distributor. Each Director of the Company, who is not an affiliated person of the Adviser or Distributor, receives a quarterly retainer of $5,250, $1,000 for each Board meeting attended, and $500 for each committee meeting attended plus reimbursement for certain travel and other out-of-pocket expenses incurred in connection with attending Board meetings. The Company does not compensate the Officers for the
| | |
| NOTES TO FINANCIAL STATEMENTS (CONT.) | | DECEMBER 31, 2015 |
services they provide. There are no Directors’ fees paid to affiliated Directors of the Company. For the year ended December 31, 2015, the Fund was allocated $1,366 of the Chief Compliance Officer’s salary.
Note 5 – Concentration and Other Risks
The Fund is non-diversified such that the Fund may invest a larger percentage of its assets in a given security than a diversified fund.
The Fund’s performance could be adversely affected by interest rate risk, which is the possibility that overall bond prices will decline because of rising interest rates. Interest rate risk is expected to be high for the Fund because it invests mainly in long-term bonds, whose prices are much more sensitive to interest fluctuations than are the prices of short-term bonds.
The Fund may be affected by credit risk, which is the possibility that the issuer of a bond will fail to pay interest and principal in a timely manner, or that negative perceptions of the issuer’s ability to make such payments will cause the price of that bond to decline. This risk may be greater to the extent that the Fund may invest in junk bonds.
The Fund may be affected by credit risk of lower grade securities, which is the possibility that municipal securities rated below investment grade, or unrated of similar quality, (frequently called “junk bonds”), may be subject to greater price fluctuations and risks of loss of income and principal than investment- grade municipal securities. Securities that are (or that have fallen) below investment-grade have a greater risk that the issuers may not meet their debt obligations. These types of securities are generally considered speculative in relation to the issuer’s ongoing ability to make principal and interest payments. During periods of rising interest rates or economic downturn, the trading market for these securities may not be active and may reduce the Fund’s ability to sell these securities at an acceptable price. If the issuer of securities is in default in payment of interest or principal, the Fund may lose its entire investment in those securities.
Other risks include income risk, liquidity risk, prepayment risk on collateralized mortgage obligations, municipal project specific risk, municipal lease obligation risk, zero coupon securities risk, market risk, manager risk, taxability risk, state-specific risk and exchange traded funds risk.
Note 6 – Federal Income Taxes
The tax character of distributions paid for the years ended December 31, 2015 and 2014 were as follows:
Taxable Basis Distributions
| | | | | | | | | | | | | | | | | | | | |
| | | Ordinary
Income | | | Tax Exempt
Income | | | Net
Long-Term
Capital Gains | | | Return of
Capital | | | Total
Distributions | |
| 12/31/2015 | | $ | 1,244,119 | | | $ | — | | | $ | — | | | $ | 800,789 | | | $ | 2,044,908 | |
| 12/31/2014 | | $ | 620,404 | | | $ | — | | | $ | — | | | $ | 245,196 | | | $ | 865,600 | |
| | | | | | | | | | | | | | | | | | | | |
Distribution classifications may differ from the Statements of Changes in Net Assets as a result of the treatment of short-term capital gains as ordinary income for tax purposes.
| | | | |
| INCOME & OPPORTUNITY FUND | | | 21 | |
| | |
| NOTES TO FINANCIAL STATEMENTS (CONT.) | | DECEMBER 31, 2015 |
The adjusted cost basis of investment and gross unrealized appreciation and depreciation of investments for federal income tax purposes were as follows:
| | | | |
| | | As of
December 31,
2015 | |
Gross unrealized appreciation | | $ | 1,986,299 | |
Gross unrealized depreciation | | | (4,675,174 | ) |
| | | | |
Net unrealized depreciation(a) | | | (2,688,875 | ) |
| | | | |
Cost basis of investments | | $ | 53,926,945 | |
| | | | |
| | | | |
| (a) | The difference between book-basis and tax-basis net unrealized appreciation is attributable primarily to wash sales and the tax treatment of Trust Preferred securities. |
At December 31, 2015, the components of accumulated distributable earnings (losses) for the Fund on a tax basis were as follows:
| | | | |
Unrealized depreciation | | $ | (2,688,875 | ) |
Other accumulated losses | | | (1,698,408 | ) |
| | | | |
Total accumulated earnings (losses) | | $ | (4,387,283 | ) |
| | | | |
| | | | |
Other accumulated losses consist of distribution payable of $104,091 not deducted for tax purposes, $892,914 of capital loss carryforwards, and $701,403 of post-October losses.
As of December 31, 2015, the Fund had available for federal tax purposes $793,691 and $99,223 in short-term and long-term capital loss carryforwards, respectively, with no expiration, which are available for offset against future taxable net capital gains.
Certain capital and qualified late year losses incurred after October 31 and within the current taxable year are deemed to arise on the first business day of the Fund’s following
taxable year. For the year ended December 31, 2015, the Fund deferred post-October losses in the amount of $701,403.
Management of the Fund has reviewed tax positions taken in tax years that remain subject to examination by all major tax jurisdictions, including federal (i.e., the last three tax year ends and the interim tax period since then). Management believes there is no tax liability resulting from unrecognized tax benefits related to uncertain tax positions taken.
Note 7 – Reclassification
Permanent differences, incurred during the year ended December 31, 2015, resulting from differences in book and tax accounting have been reclassified at year end to undistributed net investment income, accumulated realized gain (loss) and paid-in capital as follows:
| | | | |
Undistributed Net Investment Income | | $ | (121 | ) |
Accumulated Net Realized Gain (Loss) | | | 1,218 | |
Paid-In Capital | | | (1,097 | ) |
| | | | |
Note 8 – Line of Credit
The Fund participates in a short-term credit agreement (“Line of Credit) with The Huntington National Bank, the custodian of the Fund’s investments expiring on May 25, 2016. Borrowing under this agreement bear interest at London Interbank Offered Rate (“LIBOR”) plus 1.500%. Maximum borrowings for the Fund is the lesser of $3,000,000 or 10% of the Fund’s daily market value.
| | |
| NOTES TO FINANCIAL STATEMENTS (CONT.) | | DECEMBER 31, 2015 |
| | | | |
Total bank line of credit as of December 31, 2015 | | $ | 3,000,000 | |
Average borrowings during year | | | 7,504 | |
Number of days outstanding* | | | 3 | |
Average interest rate during year | | | 1.688 | % |
Highest balance drawn during year | | | 12,857 | |
Highest balance interest rate | | | 1.922 | % |
Interest expense incurred | | $ | — | |
Interest rate at December 31, 2015 | | | 1.922 | % |
| | | | |
| * | Number of days outstanding represents the total days during the year ended December 31, 2015 that the Fund utilized the line of credit. |
Note 9 – Other Matters
On May 7, 2010, each of William Mason, the Portfolio Manager for the Real Estate Fund, Income Fund, and Opportunity Fund, and DLA, the Fund’s principal underwriter and distributor, received a Notice of Complaint from the Department of Enforcement of the Financial Industry Regulatory Authority (“FINRA”) relating to Mr. Mason’s activities as head of the fixed income trading department of DLA and DLA’s activities as a municipal securities and collateralized mortgage obligations dealer. The Complaint alleges that each of Mr. Mason and DLA had violated certain NASD and Municipal Securities Rule Making Board fair pricing rules relating to the period January 1, 2005 through January 31, 2007. On April 4, 2012, a FINRA hearing panel issued a decision in this matter and assessed monetary fines and other sanctions against DLA and Mr. Mason, including a suspension of Mr. Mason from association with a FINRA member firm for six (6) months. Both DLA and Mr. Mason appealed the decision.
On May 27, 2011, FINRA filed a complaint against DLA, the Fund’s principal underwriter
and distributor, related to its sales practices in connection with its role as managing dealer of an unaffiliated Real Estate Investment Trust offering, Apple REIT Ten, Inc. (“Apple REIT”). More specifically, FINRA alleged that DLA failed to conduct adequate due diligence, thereby leaving it without a reasonable basis for recommending customer purchases of Apple REIT, in addition to using false, exaggerated and misleading statements regarding the performance of earlier closed Apple REITs. In June 2011, several class action complaints were filed against DLA, Apple REIT entities and certain individuals, also in connection with the sale of various Apple REIT securities. In January 2012, FINRA amended its complaint to add David Lerner as an individual respondent and alleged violations of Section 17(a) of the Securities Act of 1933, as amended, including allegations of false, exaggerated and misleading communications to the public, through customer correspondence and investment seminars, about the investment returns, market values, performance of earlier closed Apple REITs as well as allegations of untrue statements and/or omitted material facts concerning the prior performance, steady distribution rates, unchanging valuations, and prospects of the earlier closed Apple REITs and/or Apple REIT. On October 22, 2012, DLA, Mr. Lerner and Mr. Mason settled all of the foregoing FINRA investigations and actions involving Apple REIT securities and municipal bond and collateralized mortgage obligation pricing. Without admitting or denying the allegations, in connection with the settlement, DLA, Mr. Lerner and Mr. Mason each agreed, among other things, to pay a fine; and Mr. Lerner agreed to a suspension from affiliation with any FINRA member, including DLA, in any capacity for a period of one year and in any principal capacity for a period of two years thereafter beginning on November 19, 2012; and Mr. Mason agreed to a suspension from affiliation with any FINRA member, including DLA, in any capacity for a period of six months, which suspension ended
| | | | |
| INCOME & OPPORTUNITY FUND | | | 23 | |
| | |
| NOTES TO FINANCIAL STATEMENTS (CONT.) | | DECEMBER 31, 2015 |
on June 16, 2013. The fines and suspensions do not involve the Energy Fund or the Adviser. On April 3, 2013, the class action complaints were dismissed, with prejudice, in their entirety. On April 12, 2013, plaintiffs filed a notice of appeal of the class action dismissal. On April 23, 2014, the United States Court of Appeals for the Second Circuit substantially affirmed the April 3, 2013 decision of United States District Judge, Kiyo A. Matsumoto, dismissing with prejudice the class action complaint in In Re Apple REITs Litigation. The Second Circuit held that Judge Matsumoto correctly found that there were no material misrepresentations or omissions in the offering materials for Apple REITs Six through Ten. The appeals court upheld dismissal of ten of the thirteen claims in the case, including all federal and state securities law claims, and also upheld Judge Matsumoto’s refusal to allow plaintiffs to amend their complaint. The appeals court remanded three state common law claims to the District Court for the Eastern District of New York for further proceedings. On March 25, 2015, the District Court dismissed the remaining state common law claims against DLA, with prejudice. Plaintiffs did not file an appeal. Neither the Adviser nor the Fund were a party to any of the investigations or actions listed in this section.
In October 2013, a class action litigation, titled Lewis v. Delaware Charter Guarantee & Trust Company, et al., (the “Litigation”) was commenced in federal court in Nevada against DLA, the Funds’ principal underwriter and distributor, along with other defendants, alleging, inter alia, breach of fiduciary duty, aiding and abetting breach of fiduciary duty, negligence and misrepresentation. The plaintiffs, purportedly customers who maintain individual retirement accounts at DLA which contained non-traded REIT securities, allege, among other things, that the defendants failed to accurately provide annual fair market values for those REIT securities. The Litigation was transferred to the U.S. District Court for the Eastern District of New York. On March 30,
2015, the District Court dismissed all claims against DLA, with prejudice. Plaintiffs appealed the decision dismissing the claims. While it is unlikely that plaintiffs’ appeal will be successful, there cannot be any assurance that if the class action plaintiffs were to ultimately be successful in the pursuit of an appeal of the decision dismissing the claims against DLA that such outcome would not materially affect DLA’s ability to act as the Funds’ principal underwriter and distributor, although it is not considered likely at this time that such material and adverse effects would occur. Neither the Adviser nor the Fund are a party to the Litigation.
Note 10 – Subsequent Events
Management has evaluated the impact of all subsequent events on the Fund and has determined that there were no events that require recognition or disclosure in the financial statements.
Tax Information (Unaudited)
All designations are based on financial information available as of the date of this annual report and, accordingly, are subject to change. For each item, it is the intention of the Fund to designate the maximum amount permitted under the Internal Revenue Code and the regulations thereunder.
Qualified Dividend Income
For the year ended December 31, 2015, 30.71% of the distributions paid by the Fund from ordinary income qualifies for a reduced tax rate pursuant to The Jobs and Growth Tax Relief Reconciliation Act of 2003.
Dividends Received Deduction
For the year ended December 31, 2015, 47.87% of the ordinary income distribution qualifies for the Dividends Received Deduction available to corporations.
REPORT OF INDEPENDENT REGISTERED PUBLIC ACCOUNTING FIRM
To the Shareholders of Spirit of America Income and Opportunity Fund and Board of Directors Spirit of America Investment Fund, Inc.
Syosset, New York
We have audited the accompanying statement of assets and liabilities of the Spirit of America Income and Opportunity Fund (the “Fund”), a series of shares of beneficial interest in Spirit of America Investment Fund, Inc., including the schedule of investments as of December 31, 2015, the related statement of operations for the year then ended, the statements of changes in net assets for each of the two years in the period then ended and the financial highlights for each of the two years in the period then ended and for the period July 8, 2013 (commencement of operations) through December 31, 2013. These financial statements and financial highlights are the responsibility of the Fund’s management. Our responsibility is to express an opinion on these financial statements and financial highlights based on our audits.
We conducted our audits in accordance with the standards of the Public Company Accounting Oversight Board (United States). Those standards require that we plan and perform the audit to obtain reasonable assurance about whether the financial statements and financial highlights are free of material misstatement. The Fund is not required to have, nor were we engaged to perform, an audit of its internal control over financial reporting. Our audits included consideration of internal control over financial reporting as a basis for designing audit
procedures that are appropriate in the circumstances, but not for the purpose of expressing an opinion on the effectiveness of the Fund’s internal control over financial reporting. Accordingly, we express no such opinion. An audit includes examining, on a test basis, evidence supporting the amounts and disclosures in the financial statements. Our procedures included confirmation of securities owned as of December 31, 2015 by correspondence with the custodian. An audit also includes assessing the accounting principles used and significant estimates made by management, as well as evaluating the overall financial statement presentation. We believe that our audits provide a reasonable basis for our opinion.
In our opinion, the financial statements and financial highlights referred to above present fairly, in all material respects, the financial position of the Spirit of America Income and Opportunity Fund as of December 31, 2015, the results of its operations for the year then ended, the changes in its net assets for each of the two years in the period then ended and the financial highlights for each of the two years in the period then ended and for the period July 8, 2013 (Commencement of operations) through December 31, 2013, in conformity with accounting principles generally accepted in the United States of America.
TAIT, WELLER & BAKER LLP
Philadelphia, Pennsylvania
February 23, 2016
| | | | |
| INCOME & OPPORTUNITY FUND | | | 25 | |
APPROVAL OF THE INVESTMENT ADVISORY AGREEMENT (UNAUDITED)
The Investment Company Act of 1940, as amended (the “1940 Act”) requires that the continuance of a registered management investment company’s investment advisory agreement be approved annually by both the board of directors and also by a majority of its directors who are not parties to the investment advisory agreement or “interested persons” (as defined by the 1940 Act) of any such party (the “Independent Directors”). At a meeting held on December 1, 2015, the Board of Directors (the “Board” or “Directors”) of Spirit of America Investment Fund, Inc. (the “Company”) met in person (the “Meeting”) to, among other things, consider the approval of the Investment Advisory Agreement (the “Advisory Agreement”) by and between Spirit of America Management Corp. (the “Adviser”) and the Company, on behalf of Spirit of America Real Estate Income and Growth Fund, Spirit of America Large Cap Value Fund, Spirit of America Municipal Tax Free Bond Fund, Spirit of America Income Fund, Spirit of America Income & Opportunity Fund, and Spirit of America Energy Fund (collectively, the “Funds”). At the Meeting, the Board, including the Independent Directors voting separately, approved the Advisory Agreement after determining that the Adviser’s compensation, pursuant to the terms of the Advisory Agreement, would be fair and reasonable and concluded that the approval of the Advisory Agreement would be in the best interest of the Funds’ shareholders. The Board’s approval was based on consideration and evaluation of the information and material provided to the Board and a variety of specific factors discussed at the Meeting and at prior meetings of the Board, including the factors described below.
As part of the approval process and oversight of the advisory relationship, counsel to the Independent Directors (“Independent Counsel”) sent an information request letter to the Adviser seeking certain relevant information and the Directors received, for their review in advance of the Meeting, the
Adviser’s responses. In addition, the Directors were provided with the opportunity to request additional materials. In advance of the Meeting, the Board including the Independent Directors, requested and received materials provided by the Adviser and Independent Counsel, including, among other things, the following: (i) Independent Counsel’s 15c questionnaire and the responses provided by the Adviser; (ii) comparative information on the investment performance of the Funds, relevant indices and Lipper category peer funds as of September 30, 2015 in the form of reports generated by Strategic Insight Simfund/MF Desktop; (iii) graphs of fee comparisons for the minimum fee, maximum fee, average fee and median fee in the form of reports generated by the Funds’ administrator; (iv) graphs of performance comparisons for the minimum performing fund, the maximum performing fund, average performing fund and median performing fund for the one year, three years, five years and since inception time periods in the form of reports generated by the Funds’ administrator; (v) the allocation of the Funds’ brokerage, the record of compliance with the Funds’ investment policies and restrictions and with the Funds’ Code of Ethics and the structure and responsibilities of the Adviser’s compliance departments; (vi) the profitability of the Funds’ investment advisory business to the Adviser taking into account both advisory fees and any other potential direct or indirect benefits; (vii) the Form ADV of the Adviser; and (viii) a memorandum from Independent Counsel regarding the responsibilities of the Independent Directors related to the approval of the Investment Advisory Agreement.
In evaluating the Investment Advisory Agreement, the Board, including the Independent Directors, requested, reviewed and considered materials furnished by the Adviser and questioned personnel of the Adviser, including the Funds’ portfolio managers, regarding, among other things, the personnel, each Fund’s performance,
APPROVAL OF THE INVESTMENT ADVISORY AGREEMENT (UNAUDITED) (CONT.)
operations and financial condition of the Adviser. Among other information, the Board, including the Independent Directors, requested and was provided information regarding:
| • | | The Investment performance of each Fund over various time periods both by itself and in relation to relevant indices; |
| • | | The fees charged by the Adviser for investment advisory services, as well as the compensation received by the Adviser and its affiliates; |
| • | | The waivers of fees and reimbursements of expenses at times by the Adviser under the Operating Expenses Agreement; |
| • | | The investment performance, fees and total expenses of mutual funds with similar objectives and strategies managed by other investment advisers; |
| • | | The investment management staffing and the experience of the investment advisory, administrative and other personnel providing services to the Funds and the historical quality of the services provided by the Adviser; and |
| • | | The profitability to the Adviser of managing and its affiliate distributing the Funds and the methodology in allocating expenses to the management of the Funds. |
At the Meeting, Independent Counsel also referred to the “Gartenberg Memorandum” which had been distributed to each Director in advance of the Meeting, outlining the legal standards applicable to the Independent Directors under the 1940 Act with respect to the approval of the continuation of the Investment Advisory Agreement on behalf of each of the Funds. He explained that the Board must consider the (1) nature, extent and quality of services to be provided by the Adviser to the Funds; (2) the investment performance of each Fund independently; (3) the costs of the services provided and
profits realized by the Adviser and its affiliates from the relationship with each Fund; (4) the extent to which economies of scale have been realized as each Fund grows and whether fee levels reflect these economies of scale for the benefit of each Fund’s investors; and (5) any other relevant considerations that the Board deems appropriate. In addition, the Independent Directors met at length with Independent Counsel during the Compliance Committee meeting to discuss the materials provided by the Adviser and to consider any additional questions they had of the Adviser.
The following is a summary of the Board’s discussion and views regarding the factors it considered in evaluating the continuation of the Investment Advisory Agreement:
1. Nature, Extent, and Quality of Services.
The Board, including the Independent Directors, considered the nature, quality and extent of advisory, administrative and shareholder services performed by the Adviser, including: regulatory filings and disclosure to shareholders, general oversight of the service providers, coordination of Fund marketing initiatives, review of Fund legal issues, assisting the Board, including the Independent Directors, in their capacity as directors and other services. The Board, including the Independent Directors, noted the increased responsibilities of the Adviser in response to an increasingly regulated industry. The Board, including the Independent Directors, concluded that the services are extensive in nature, that the Adviser delivered a high level of service to each Fund and that the Adviser is positioned to continue providing such quality of service in the future.
2. Investment Performance of the Funds and the Adviser.
The Board, including the Independent Directors, considered short-term and long-term investment performance for the Funds
| | | | |
| INCOME & OPPORTUNITY FUND | | | 27 | |
APPROVAL OF THE INVESTMENT ADVISORY AGREEMENT (UNAUDITED) (CONT.)
over various periods of time as compared to both relevant indices and the performance of such Funds’ peer groups, and concluded that each Fund was delivering reasonable performance results, especially over the long-term, consistent with the conservative investment strategies that the Funds pursue.
3. Costs of Services and Profits Realized by the Adviser.
a. The Board, including the Independent Directors, considered the information provided by Strategic Insight Simfund/MF Desktop, as well as the comparative graphs provided by HASI, regarding each Fund’s management fee rate and overall expense ratio relative to industry averages for each Fund’s peer group category and the advisory fees charged by the Adviser to other accounts. The Municipal Fund had a gross management fee of 0.60% as compared to the median in its peer group of 0.53%; and, the performance for the 1 year period was 2.28% as compared to the median of its peer group of 2.74%. The Income Fund had a gross management fee of 0.60% as compared to the median in its peer group of 0.60%; and, the performance for the 1 year period was 1.65% as compared to the median of its peer group of (2.29%). The Real Estate Fund had a gross management fee of 0.97% as compared to the median in its peer group of 0.73%; and, the performance for the 1 year period was (1.06%) as compared to the median of its peer group of 0.91%. The Value Fund had a gross management fee of 0.97% as compared to the median in its peer group of 0.69%; and, the performance for the 1 year period was (3.16%) as compared to the median of its peer group of (0.73%). The Opportunity Fund had a gross management fee of 0.65% as compared to the median in its peer group of 1.00%; and, the performance for the 1 year period was (6.21%) as compared to the median of its peer group of (4.57%). The Energy Fund had a gross management fee of 0.95% as compared to the median in its peer group of 0.84%; and, the performance for the
1 year period was (28.09%) as compared to the average of its peer group of (32.16%). The Board viewed favorably the current and historic willingness of the Adviser to limit the overall expense ratios of each Fund. Recognizing that the fees paid by some Funds were higher than some of the comparable funds and higher than the medians in some Fund’s peer groups, the Board nonetheless noted that the fees were still close enough to the medians in each case and that several peer funds had higher fees. The Board noted that although higher, the fees were not unreasonable.
b. Profitability and Costs of Services to the Adviser. The Board, including the Independent Directors, considered estimates of the Adviser’s profitability and costs attributable to the Funds. The Board recognized that increased fixed costs, particularly legal and audit fees in response to increasing regulations, have a greater impact on small fund families, such as the Funds, than on larger fund complexes. Given this, the Board recognized that the Funds’ overall expenses compare unfavorably to some funds identified as peers. The Board also considered whether the amount of the Adviser’s profit is a fair profit for the management of the Funds and noted that the Adviser has devoted a large amount of its resources into the Funds over the years. Mr. Chodosh reported that the fund by fund expense analysis is the same as previous years, but that it does not reflect all of the overhead costs paid by DLA which may be attributed to the Adviser. The Board, including the Independent Directors, concluded that the Adviser’s profitability was at a fair and acceptable level, particularly in light of the quality of the services being provided to the Funds, and bore a reasonable relationship to the services rendered.
4. Extent of Economies of Scale as the Funds Grow.
The Board, including the Independent Directors, considered whether there have been
APPROVAL OF THE INVESTMENT ADVISORY AGREEMENT (UNAUDITED) (CONT.)
economies of scale with respect to the management of the Funds and whether the Funds have appropriately benefited from any economies of scale. Given the size of each Fund, the Board did not believe that significant (if any) economies of scale have been achieved at this time.
5. Whether Fee Levels Reflect Economies of Scale.
The Board took into consideration that the Adviser does not currently offer breakpoints in its fees that would otherwise allow investors to benefit directly from economies of scale in the form of lower fees as fund assets grow. However, the Board, including the Independent Directors, did consider enhancements in personnel and services provided to the Funds by the Adviser, without an increase in fees. The Board also noted that few of the Funds’ peers offered breakpoints despite having significantly more assets under management. The Board stated that they would continue to review this in future years as the Funds’ assets grow.
6. Other Relevant Considerations.
a. Personnel and Methods. The Board, including the Independent Directors, reviewed the Adviser’s Form ADV and questioned the Adviser regarding the size, education and experience of the staff of the Adviser, its fundamental research capabilities, approach to recruiting, training and retaining portfolio managers and other research and management personnel, and concluded that these enable them to provide a high level of service to the Funds. The Board considered the recent management structuring changes and concluded that these changes are likely to positively impact the
management of the Funds. The Board also considered the history, reputation, qualifications and background of the Adviser as well as the qualifications of its personnel.
b. The Board, including the Independent Directors, also considered the character and amount of other direct and incidental benefits received by the Adviser and its affiliates from their association with the Funds, including the benefits received by the affiliated distributor. The Board concluded that potential “fall-out” benefits that the Adviser and its affiliates may receive, such as greater name recognition or increased ability to obtain research services (although the Board noted that the Adviser currently does not use soft dollars to obtain research services), appear to be reasonable, and may in some cases benefit the Funds.
Conclusions. The Board, including the Independent Directors, did not identify any factor as all-important or all-controlling and instead considered the above listed and other factors collectively in light of the Funds’ surrounding circumstances. Each Independent Director gave the weight to each factor that he deemed appropriate in his own judgment. The Independent Directors considered the renewal of the Investment Advisory Agreement on a Fund-by-Fund basis and determined that the renewal of the Investment Advisory Agreement was in the best interests of the shareholders of each Fund. The Independent Directors also determined that the fees charged to each Fund for the services provided were reasonable. Therefore, the Board, including the Independent Directors, determined that continuation of the Investment Advisory Agreement was in the best interests of each Fund.
| | | | |
| INCOME & OPPORTUNITY FUND | | | 29 | |
MANAGEMENT OF THE COMPANY (UNAUDITED)
Information pertaining to the Directors and Officers of the Company is set forth below. The Statement of Additional Information includes additional information about the Directors and is available without charge, upon request, by calling 516-390-5565.
| | | | | | | | |
Name, (Age) and Address1 Position(s) with the Company | | Term of Office2
and Length of
Time Served | | Principal Occupation(s) During Past Five Years | | Number of Portfolios
in Fund Complex Overseen by Director | | Other Directorships Held by Director |
| | | |
INTERESTED DIRECTORS | | | | | | |
David Lerner3 (79) Director, Chairman of the Board, President | | Since 1998 | | Founder, David Lerner Associates, Inc., a registered broker-dealer and the Company’s Distributor; and President, Spirit of America Management Corp., the Company’s investment adviser. | | 6 | | President and a Director of Spirit of America Management Corp., the Company’s investment adviser. |
| | | | |
Daniel Lerner3 (54) Director | | Since 1998 | | Senior Vice President, Investment Counselor with David Lerner Associates, Inc., a registered broker-dealer and the Company’s Distributor, since September 2000. | | 6 | | Director of David Lerner Associates, Inc., a registered broker-dealer and the Company’s Distributor. |
| | | |
INDEPENDENT DIRECTORS | | | | | | |
Allen Kaufman (79) Director | | Since 1998 | | President and Chief Executive Officer of K.G.K. Agency, Inc., a property and casualty insurance agency, since 1963.4 | | 6 | | Director of K.G.K. Agency, Inc., a property and casualty insurance agency. |
| | | | |
Stanley S. Thune (79) Lead Director | | Since 1998 | | President and Chief Executive Officer, Freight Management Systems, Inc., a third party logistics management company, since 1994; private investor. | | 6 | | Director of Freight Management Systems, Inc. |
| | | | |
Richard Weinberger (79) Director | | Since 2005 | | Of Counsel to Ballon Stoll Bader & Nadler, P.C., a mid-sized law firm, since January 2005 to March 2011; Shareholder, Ballon Stoll Bader & Nadler, P.C., January 2000 to December 2004. | | 6 | | None. |
| | | | |
OFFICERS | | | | | | | | |
David Lerner President (see biography above) | | | | | | | | |
| | | | |
Alan P. Chodosh (62) Treasurer and Secretary | | Since 2003
(Treasurer) Since 2005 (Secretary) | | Financial and Operations Officer of David Lerner Associates, Inc. since June 1999. | | N/A | | N/A |
| | | | |
Joseph Pickard (55) Chief Compliance Officer | | Since 2007 | | Chief Compliance Officer of Spirit of America Investment Fund, Inc. and Spirit of America Management Corp. since July 2007; Counsel to the Interested Directors of Spirit of America Investment Fund, Inc. since July 2002; Senior Vice President and General Counsel of David Lerner Associates, Inc. since July 2002. | | N/A | | N/A |
| 1 | All addresses are in c/o Spirit of America Investment Fund, Inc., 477 Jericho Turnpike, Syosset, New York 11791. |
| 2 | Each Director serves for an indefinite term, until his successor is elected. |
| 3 | David Lerner is an “interested” Director, as defined in the 1940 Act, by reason of his positions with the Adviser, and Daniel Lerner is an “interested” Director by reason of his position with the Distributor. Daniel Lerner is the son of David Lerner. |
| 4 | K.G.K. Agency, Inc. provides insurance to David Lerner Associates, Inc. and affiliated entities. However, the Board has determined that Mr. Kaufman is not an “interested” Director because the insurance services are less than $120,000 in value. |
Proxy Voting Information
The Company’s Statement of Additional Information (“SAI”) containing a description of the policies and procedures that the Spirit of America Income & Opportunity Fund uses to determine how to vote proxies relating to portfolio securities, along with the Company’s proxy voting record relating to portfolio securities held during the 12-month period ended June 30 are available (i) without charge, upon request, by calling (516) 390-5565; and (ii) on the SEC’s website at http://www.sec.gov.
Information on Form N-Q
The Company will file its complete schedule of portfolio holdings with the SEC for the first and third quarters of each fiscal year on Form N-Q within sixty days after the end of the period. The Company’s Forms N-Q will be available on the SEC’s website at http://www.sec.gov, and may be reviewed and copied at the SEC’s Public Reference Room in Washington, DC. Information on the operation of the Public Reference Room may be obtained by calling 1-800-SEC-0030.

Investment Adviser
Spirit of America Management Corp.
477 Jericho Turnpike
P.O. Box 9006
Syosset, NY 11791-9006
Distributor
David Lerner Associates, Inc.
477 Jericho Turnpike
P.O. Box 9006
Syosset, NY 11791-9006
Shareholder Services
Ultimus Asset Services, LLC
2960 North Meridian Street, Suite 300
Indianapolis, IN 46208
Custodian
The Huntington National Bank
7 Easton Oval
Columbus, OH 43219
Independent Registered
Public Accounting Firm
Tait Weller & Baker LLP
1818 Market Street, Suite 2400
Philadelphia, PA 19103
Counsel
Blank Rome LLP
405 Lexington Avenue
New York, NY 10174
For additional information about the Spirit of America Income & Opportunity Fund, call (800) 452-4892 or (516) 390-5565.
This report is submitted for the general information of the shareholders of the Fund. It is not authorized for distribution to prospective investors in the Fund unless preceded or accompanied by an effective Prospectus which includes details regarding the Fund’s objectives, risks, policies, expenses, and other information.
©Copyright 2015 Spirit of America SOAIO-AR15
Item 2. Code of Ethics.
(a) As of the end of the period covered by the report, the registrant has adopted a code of ethics that applies to the registrant’s Principal Executive Officer and Principal Financial Officer.
(b) Not applicable.
(c) During the period covered by the report, with respect to the registrant’s code of ethics that applies to its Principal Executive Officer and Principal Financial Officer: there have been no amendments to a provision that relates to any element of the code of ethics definition enumerated in paragraph (b) of this Item 2.
(d) During the period covered by the report, with respect to the registrant’s code of ethics that applies to its Principal Executive Officer and Principal Financial Officer: there have been no waivers granted from a provision that relates to any element of the code of ethics definition enumerated in paragraph (b) of this Item 2.
(f) The registrant has included a copy of the code of ethics that applies to the registrant’s Principal Executive Officer and Principal Financial Officer. This code of ethics is included as an Exhibit on this Form N-CSR.
Item 3. Audit Committee Financial Expert.
(a) The registrant’s board of trustees has determined that the registrant does not have an audit committee financial expert. The committee members and the full Board considered a possibility of adding a member that would qualify as an expert. The audit committee determined that, although none of its members meet the technical definition of an audit committee expert, the committee has sufficient financial expertise to adequately perform its duties under the Audit Committee Charter without the addition of a qualified expert.
Item 4. Principal Accountant Fees and Services.
(a) Audit Fees billed to the registrant by its principal accountants for the two most recent fiscal years:
Fiscal year ended 2015: $100,600
Fiscal year ended 2014: $98,100
(b) Audit-Related Fees billed to the registrant by its principal accountants for the two most recent fiscal years:
Fiscal year ended 2015: $0
Fiscal year ended 2014: $0
Fees for 2015 and 2014 related to the agreed-upon review of items within the Management’s Discussion of Fund Performance sections of the Funds’ Form N-CSR filing. Amount requiring approval of the registrant’s audit committee pursuant to paragraph (c)(7)(ii) of Rule 2-01 of Regulation S-X, $0 and $0 respectively.
(c) Tax Fees billed to the registrant by its principal accountants for the two most recent fiscal years:
Fiscal year ended 2015: $18,500
Fiscal year ended 2014: $18,000
Fees for 2015 and 2014 related to the review of the registrant’s tax returns. Amount requiring approval of the registrant’s audit committee pursuant to paragraph (c)(7)(ii) of Rule 2-01 of Regulation S-X, $0 and $0 respectively.
(d) All other fees billed to the registrant by its principal accountants for the two most recent fiscal years:
Fiscal year ended 2015: $0
Fiscal year ended 2014: $0
Amount requiring approval of the registrant’s audit committee pursuant to paragraph (c)(7)(ii) of Rule 2-01 of Regulation S-X, $0 and $0 respectively.
(e)(1) Disclose the audit committee’s pre-approval policies and procedures described in paragraph (c)(7) of Rule 2-01 of Regulation S-X
Pre-Approval of Audit and Permitted Non-Audit Services Provided to the Company
Pre-Approval Requirements. The Committee shall pre-approve all auditing services and permissible non-audit services (e.g., tax services) to be provided to the Company by the Auditor, including the fees therefor. The Committee may delegate to one or more of its members the authority to grant pre-approvals. In connection with such delegation, the Committee shall establish pre-approval policies and procedures, including the requirement that the decisions of any member to whom authority is delegated under this section (B) shall be presented to the full Committee at each of its scheduled meetings.
De Minimis Exception to Pre-Approval: Pre-approval for a permitted non-audit service shall not be required if:
| | a. | the aggregate amount of all such non-audit services is not more than 5% of the total revenues paid by the Company to the Auditor in the fiscal year in which the non-audit services are provided; |
| | b. | such services were not recognized by the Company at the time of the engagement to be non-audit services; and |
| | c. | such services are promptly brought to the attention of the Committee and approved prior to the completion of the audit by the Committee or by one or more members of the Committee to whom authority to grant such approvals has been delegated by the Committee. |
Additionally, the Committee shall pre-approve the Auditor’s engagements for non-audit services with the Adviser and any affiliate of the Adviser that provides ongoing services to the Company in accordance with the foregoing, if the engagement relates directly to the operations and financial reporting of the Company, unless the aggregate amount of all services provided constitutes no more than 5% of the total amount of revenues paid to the Auditor by the Company, the Adviser and any affiliate of the Adviser that provides ongoing services to the Company during the fiscal year in which the services are provided that would have to be pre-approved by the Committee pursuant to this paragraph (without regard to this exception).
(e)(2) The percentage of services described in each of paragraphs (b) through (d) of this Item that were approved by the audit committee pursuant to paragraph (c)(7)(i)(C) of Rule 2-01 of Regulation S-X are as follows:
(b) 0%
(c) 0%
(d) 0%
(f) The percentage of hours expended on the principal accountant’s engagement to audit the registrant’s financial statements for the most recent fiscal year that were attributed to work performed by persons other than the principal accountant’s full-time, permanent employees was 0%.
(g) The aggregate non-audit fees billed by the registrant’s accountant for services rendered to the registrant, and rendered to the registrant’s investment adviser (not including any sub-adviser whose role is primarily portfolio management and is subcontracted with or overseen by another investment adviser), and any entity controlling, controlled by, or under common control with the adviser that provides ongoing services to the registrant for fiscal years ended December 31, 2014 and December 31, 2015 are $0 and $0, respectively
(h) The registrant’s audit committee of the board of directors has considered whether the provision of non-audit services that were rendered to the registrant’s investment adviser (not including any sub-adviser whose role is primarily portfolio management and is subcontracted with or overseen by another investment adviser), and any entity controlling, controlled by, or under common control with the investment adviser that provides ongoing services to the registrant that were not pre-approved pursuant to paragraph (c)(7)(ii) of Rule 2-01 of Regulation S-X is compatible with maintaining the principal accountant’s independence.
Item 5. Audit Committee of Listed Registrants.
Not applicable.
Item 6. Schedule of Investments.
(a) Not applicable.
(b) Not applicable.
Item 7. Disclosure of Proxy Voting Policies and Procedures for Closed-End Management Investment Companies.
Not applicable.
Item 8. Portfolio Managers of Closed-End Management Investment Companies.
Not applicable.
Item 9. Purchases of Equity Securities by Closed-End Management Investment Company and Affiliated Purchasers.
Not applicable.
Item 10. Submission of Matters to a Vote of Security Holders.
Not applicable.
Item 11. Controls and Procedures.
(a) The registrant’s Principal Executive Officer and Principal Financial Officer have concluded that the registrant’s disclosure controls and procedures (as defined in Rule 30a-3(c) under the Act) are effective in design and operation and are sufficient to form the basis of the certifications required by Rule 30a-2 under the Act, based on their evaluation of these disclosure controls and procedures within 90 days of the filing of this report on Form N-CSR.
(b) There were no changes in the registrant’s internal control over financial reporting (as defined in Rule 30a-3(d) under the Act (17 CFR 270.30a-3(d)) that occurred during the period covered by this report that have materially affected or are reasonably likely to materially affect, the registrant’s internal control over financial reporting.
Item 12. Exhibits.
(a)(1) The code of ethics that is the subject of the disclosure required by Item 2 is attached hereto.
(a)(2) Certifications pursuant to Rule 30a-2(a) are attached hereto.
(a)(3) Not applicable.
(b) Certifications pursuant to Rule 30a-2(b) are furnished herewith.
SIGNATURES
Pursuant to the requirements of the Securities Exchange Act of 1934 and the Investment Company Act of 1940, the registrant has duly caused this report to be signed on its behalf by the undersigned, thereunto duly authorized.
| | | | |
| (Registrant) | | Spirit of America Investment Fund, Inc. |
| | | | | | | | |
| | | |
| By (Signature and Title) | | /s/ David Lerner | | | | |
| | David Lerner, Principal Executive Officer | | | | |
Pursuant to the requirements of the Securities Exchange Act of 1934 and the Investment Company Act of 1940, this report has been signed below by the following persons on behalf of the registrant and in the capacities and on the dates indicated.
| | | | | | | | |
| By (Signature and Title) | | /s/ David Lerner | | | | |
| | David Lerner, Principal Executive Officer | | | | |
| | | | | | | | |
| | | |
| By (Signature and Title) | | /s/ Alan P. Chodosh | | | | |
| | Alan P. Chodosh, Principal Financial Officer | | | | |