UNITED STATES
SECURITIES AND EXCHANGE COMMISSION
Washington, D.C. 20549
FORM N-CSR
CERTIFIED SHAREHOLDER REPORT OF REGISTERED
MANAGEMENT INVESTMENT COMPANIES
Investment Company Act file number : 811-08231
SPIRIT OF AMERICA INVESTMENT FUND, INC.
(Exact name of registrant as specified in charter)
477 Jericho Turnpike
P.O. Box 9006
Syosset, NY 11791-9006
(Address of principal executive offices) (Zip code)
Mr. David Lerner
David Lerner Associates
477 Jericho Turnpike
P.O. Box 9006
Syosset, NY 11791-9006
(Name and address of agent for service)
Registrant’s telephone number, including area code: 1-516-390-5565
Date of fiscal year end: November 30
Date of reporting period: November 30, 2016
Form N-CSR is to be used by management investment companies to file reports with the Commission not later than 10 days after the transmission to stockholders of any report that is required to be transmitted to stockholders under Rule 30e-1 under the Investment Company Act of 1940 (17 CFR 270.30e-1). The Commission may use the information provided on Form N-CSR in its regulatory, disclosure review, inspection and policymaking roles.
A registrant is required to disclose the information specified by Form N-CSR, and the Commission will make this information public. A registrant is not required to respond to the collection of information contained in Form N-CSR unless the Form displays a currently valid Office of Management and Budget (“OMB”) control number. Please direct comments concerning the accuracy of the information collection burden estimate and any suggestions for reducing the burden to Secretary, Securities and Exchange Commission, 450 Fifth Street, NW, Washington, DC 20549-0609. The OMB has reviewed this collection of information under the clearance requirements of 44 U.S.C. § 3507.
Item 1. Reports to Stockholders.

ANNUAL REPORT
NOVEMBER 30, 2016
Energy Fund
MESSAGE TO OUR SHAREHOLDERS (UNAUDITED)
Dear Shareholder,
We would like to start off by thanking you, our clients, for investing in the Spirit of America Energy Fund. We believe that the future of energy is bright. The idea of energy independence in this country is one we find appealing and probable. We believe that as American energy infrastructure is enhanced, the benefits will be substantial.
When we first began this fund in July of 2014, we believed that there has always been a strong and consistent demand for energy; that new sources of energy were creating investment opportunities; and that there was potential for long term growth in the energy sector. This vision is still firmly in place.
The Spirit of America Energy Fund’s investment philosophy moving into 2017 will be to continue to invest in the energy infrastructure in our country. We believe there is long term value to investing in companies that are involved in the midstream oil and gas sector. We are dedicated to diligently focusing on quality companies with the potential for long term growth.
At the end of the 2016 fiscal year, we are extremely proud to highlight that the Spirit of America Energy Fund now has over $550 million in assets under management and over 17,000 investors.
We thank you for your support and look forward to a prosperous and successful 2017.
Sincerely,
| | | | | | |
 | |  | |  | |  |
| | David Lerner | | | William Mason |
| | President | | | Portfolio Manager |
| | Spirit of America Investment Fund, Inc. | | | | |
MANAGEMENT DISCUSSION (UNAUDITED)
Economic Summary
At the end of November 2016, the U.S. Bureau of Economic Analysis released its second revision of the third quarter 2016 gross domestic product (GDP) raising the estimate to an annual growth rate of 3.2%, up from the initial 2.9% reading. This growth is the strongest since the third quarter of 2014, up sharply from the 1.1% average pace from the first half of 2016. Data ranging from housing to retail sales and manufacturing suggest the economy has retained this momentum early in the fourth quarter.
The U.S. Bureau of Labor Statistics reported the U.S. economy added 178,000 nonfarm payroll jobs in November, with employment gains in professional and business services and in health care. Thus far in 2016, employment growth has averaged 180,000 per month. This is down from the average monthly job increase of 229,000 in 2015. The unemployment rate declined to by 0.3% to 4.6% in November after showing little movement from August 2015 through October 2016.
Minutes from the November meeting of the Federal Reserve (Fed) indicated officials were looking for signs of an improving economy before increasing rates. Since then, the U.S. has seen a steady stream of robust economic news and a brighter consumer outlook in the wake of Donald Trump’s election. The minutes also showed most Fed officials believe a rate increase could become appropriate “relatively soon” if data continued to point towards an improving economy.
Market Commentary
During the year ended November 30, 2016, the S&P 500 provided a total return of 8.06%. The Alerian MLP Index had a total return of 9.29% over the same period. At the same time, oil prices increased 18.70% with U.S. crude oil closing at $49.44, up significantly from its low of the year of $26.21 on February 11, 2016.
At the end of November 2016, the Organization of the Petroleum Exporting Countries (OPEC), which accounts for a third of global oil supply, agreed to curb oil production for the first time since 2008. If OPEC adheres to the agreed upon cut, slated to take effect in January, output will be reduced to around 1.2 million barrels per day (bpd), a decrease of over 3% bring production down to 32.5 million bpd.
Fund Summary
The Spirit of America Energy Fund, SOAEX (the “Fund”), remained diversified across many U.S. geographic areas, with a heavy focus on midstream MLPs. The Fund’s Class A Shares had a total return of 6.75% (no load, gross of fees) for the fiscal year ended November 30, 2016. This compares to the 8.06% returned by its benchmark, the S&P 500 Index, for the same period. The Fund’s underperformance relative to its benchmark was primarily due to its focus solely on the energy segment of the market compared to the S&P 500, which covers a broader spectrum. Including the maximum sales charge and operating expenses, as of November 30, 2016 the Fund’s Class A Shares fiscal year return was -0.84%.
Summary of Portfolio Holdings (Unaudited)
| | | | | | | | |
| Oil & Gas Storage & Transportation (MLP) | | | 77.52 | % | | $ | 432,395,723 | |
| Oil & Gas Refining, Marketing & Transportation (MLP) | | | 1.11 | % | | | 6,231,524 | |
| Oil & Gas Equipment & Services (MLP) | | | 2.95 | % | | | 16,441,366 | |
| Common Stocks (non-MLP) | | | 15.20 | % | | | 84,759,827 | |
| Diversified Metals & Mining (MLP) | | | 1.19 | % | | | 6,612,705 | |
| Oil & Gas Exploration & Production (MLP) | | | 0.01 | % | | | 37,890 | |
| Money Market | | | 2.02 | % | | | 11,284,200 | |
| Total Investments | | | 100.00 | % | | $ | 557,763,235 | |
ILLUSTRATION OF INVESTMENT (UNAUDITED)
Average Annual Returns (Unaudited)
For the periods ended November 30, 2016
| | | | | | | | |
| | | |
| | | 1 Year Return | | | Since Inception
July 10, 2014 | |
| Class A Shares — no load | | | 5.17 | % | | | (16.26 | )% |
| Class A Shares — with load | | | (0.84 | )% | | | (18.31 | )% |
| Class C Shares — no load1 | | | 3.67 | % | | | (17.13 | )% |
| Class C Shares — with load1 | | | 2.78 | % | | | (17.13 | )% |
| S&P 500 Index2 | | | 8.06 | % | | | 7.08 | % |
The Fund’s past performance does not guarantee future results. The investment return and principal value of an investment in the Fund will fluctuate so that an investor’s shares, when redeemed, may be worth more or less than their original cost. Current performance of the Fund may be lower or higher than the performance quoted. Returns shown do not reflect the deduction of taxes that a shareholder would pay on Fund distributions or the redemption of Fund shares. Total returns, with load, include the 5.75% maximum sales charge for the Class A Shares or the 1.00% maximum deferred sales charge for the Class C Shares.
| 1 | Class C Shares commenced operations on March 15, 2016. Prior to March 15, 2016, performance is based on the performance of Class A Shares adjusted for the Class C Shares’ 12b-1 fees and contingent deferred sales charge. |
| 2 | S&P 500 Index is an unmanaged capitalization-weighted index of 500 stocks designed to measure the performance of the broad domestic economy through changes in the aggregate market value of 500 stocks representing all major industries. The performance of an index assumes no transaction costs, taxes, management fees or other expenses. A direct investment in an index is not possible. |
Growth of $10,000 (Unaudited)
(includes one-time 5.75% maximum sales charge and reinvestment of all distributions)
The graph below compares the increase in value of a $10,000 investment in the Spirit of America Energy Fund Class A Shares with the performance of the S&P 500® Index. The values and returns for Spirit of America Energy Fund Class A Shares include reinvested dividends and the impact of the maximum sales charge of 5.75% placed on purchases. The returns shown do not reflect taxes that a shareholder would pay on fund distributions or on the redemption of fund shares.
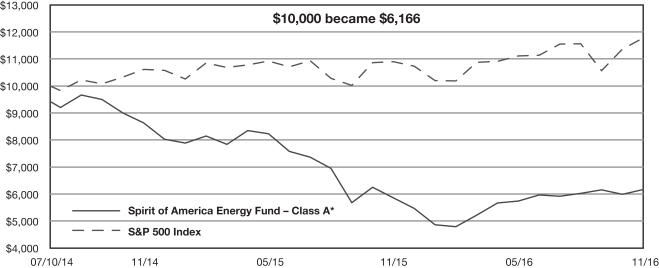
| * | Fund commenced operations July 10, 2014. |
ILLUSTRATION OF INVESTMENT (CONT.) (UNAUDITED)
Past performance does not guarantee future results. The performance data quoted represents past performance and current returns may be lower or higher. The investment return and net asset value will fluctuate so that an investor’s shares, when redeemed may be worth more or less than the original cost. To obtain performance information current to the most recent month-end, please call 1-800-452-4892.
S&P 500 Index is an unmanaged capitalization-weighted index of 500 stocks designed to measure the performance of the broad domestic economy through changes in the aggregate market value of 500 stocks representing all major industries. The performance of an index assumes no transaction costs, taxes, management fees or other expenses. A direct investment in an index is not possible.
| | |
| SCHEDULE OF INVESTMENTS | | NOVEMBER 30, 2016 |
| | | | | | | | |
| | | Shares | | | Market Value | |
| Master Limited Partnerships — Common Stocks 82.89% | | | | | | | | |
| | |
Diversified Metals & Mining 1.19% | | | | | | | | |
Hi-Crush Partners LP* | | �� | 362,340 | | | $ | 6,612,705 | |
| | |
Oil & Gas Equipment & Services 2.95% | | | | | | | | |
Archrock Partners LP | | | 119,426 | | | | 1,903,650 | |
USA Compression Partners LP | | | 810,804 | | | | 14,537,716 | |
| | | | | | | 16,441,366 | |
| | |
Oil & Gas Exploration & Production 0.01% | | | | | | | | |
Memorial Production Partners LP | | | 72,893 | | | | 37,890 | |
| | |
Oil & Gas Refining, Marketing & Transportation 1.12% | | | | | | | | |
AmeriGas Partners LP | | | 92,620 | | | | 4,156,786 | |
Calumet Specialty Products Partners LP | | | 356,209 | | | | 1,424,836 | |
Ferrellgas Partners LP | | | 38,594 | | | | 214,583 | |
Suburban Propane Partners LP | | | 15,366 | | | | 435,319 | |
| | | | | | | 6,231,524 | |
| | |
Oil & Gas Storage & Transportation 77.62% | | | | | | | | |
American Midstream Partners LP | | | 91,794 | | | | 1,353,961 | |
Antero Midstream Partners LP | | | 666,524 | | | | 18,775,981 | |
Blueknight Energy Partners LP | | | 222,955 | | | | 1,471,503 | |
Boardwalk Pipeline Partners LP | | | 589,300 | | | | 10,118,281 | |
Buckeye Partners LP | | | 193,870 | | | | 12,473,596 | |
Cheniere Energy Partners LP | | | 371,361 | | | | 10,906,873 | |
Cone Midstream Partners LP | | | 826,353 | | | | 18,427,672 | |
DCP Midstream Partners LP | | | 332,650 | | | | 11,519,669 | |
Dominion Midstream Partners LP | | | 518,649 | | | | 13,277,414 | |
Dynagas LNG Partners LP | | | 37,500 | | | | 581,625 | |
Enable Midstream Partners LP | | | 654,035 | | | | 10,216,027 | |
Enbridge Energy Partners LP | | | 232,980 | | | | 5,754,606 | |
Energy Transfer Partners LP | | | 402,377 | | | | 14,131,480 | |
EnLink Midstream Partners LP | | | 788,752 | | | | 13,818,935 | |
Enterprise Products Partners LP | | | 647,824 | | | | 16,798,076 | |
EQT GP Holdings LP | | | 67,189 | | | | 1,659,568 | |
EQT Midstream Partners LP | | | 96,815 | | | | 7,089,762 | |
Genesis Energy LP | | | 361,342 | | | | 12,625,289 | |
Global Partners LP | | | 65,097 | | | | 1,028,533 | |
Golar LNG Partners LP | | | 530,152 | | | | 11,811,787 | |
Holly Energy Partners LP | | | 260,227 | | | | 8,394,923 | |
Magellan Midstream Partners LP | | | 215,655 | | | | 14,934,109 | |
Martin Midstream Partners LP | | | 29,619 | | | | 503,523 | |
Midcoast Energy Partners LP | | | 141,241 | | | | 882,756 | |
MPLX LP | | | 575,443 | | | | 18,903,302 | |
NGL Energy Partners LP | | | 284,968 | | | | 5,286,156 | |
NuStar Energy LP | | | 202,201 | | | | 9,653,076 | |
ONEOK Partners LP | | | 101,650 | | | | 4,248,970 | |
Phillips 66 Partners LP | | | 218,567 | | | | 9,863,929 | |
Plains All American Pipeline LP | | | 349,649 | | | | 11,520,934 | |
Rice Midstream Partners LP | | | 925,392 | | | | 19,942,198 | |
Shell Midstream Partners LP | | | 323,143 | | | | 8,912,284 | |
See accompanying notes which are an integral part of these financial statements.
| | |
| SCHEDULE OF INVESTMENTS (CONT.) | | NOVEMBER 30, 2016 |
| | | | | | | | |
| | | Shares | | | Market Value | |
| | |
Oil & Gas Storage & Transportation (cont.) | | | | | | | | |
Spectra Energy Partners LP | | | 374,404 | | | $ | 15,908,426 | |
Sprague Resources LP | | | 217,863 | | | | 4,912,811 | |
Summit Midstream Partners LP | | | 246,608 | | | | 5,536,350 | |
Sunoco Logistics Partners LP | | | 593,100 | | | | 14,050,539 | |
Sunoco LP | | | 213,729 | | | | 5,150,869 | |
Tallgrass Energy Partners LP | | | 249,982 | | | | 11,709,157 | |
TC PipeLines LP | | | 150,269 | | | | 7,986,797 | |
Teekay LNG Partners LP | | | 355,856 | | | | 5,462,390 | |
Tesoro Logistics LP | | | 202,120 | | | | 9,525,916 | |
Valero Energy Partners LP | | | 221,340 | | | | 8,946,563 | |
Western Gas Equity Partners LP | | | 112,573 | | | | 4,833,885 | |
Western Gas Partners LP | | | 329,339 | | | | 18,795,377 | |
Williams Partners LP | | | 347,667 | | | | 12,689,845 | |
| | | | | | | 432,395,723 | |
Total Master Limited Partnerships — Common Stocks
(Cost $472,895,352) | | | | | | | 461,719,208 | |
| | |
Common Stocks 15.22% | | | | | | | | |
| | |
Integrated Oil & Gas 1.21% | | | | | | | | |
Exxon Mobil Corp. | | | 28,925 | | | | 2,525,152 | |
Occidental Petroleum Corp. | | | 59,400 | | | | 4,238,784 | |
| | | | | | | 6,763,936 | |
| | |
Oil & Gas Equipment & Services 0.12% | | | | | | | | |
Archrock, Inc. | | | 50,000 | | | | 672,500 | |
| | |
Oil & Gas Exploration & Production 2.36% | | | | | | | | |
California Resources Corp. * | | | 435 | | | | 7,569 | |
Marathon Oil Corp. | | | 46,550 | | | | 840,693 | |
Parsley Energy, Inc. * | | | 321,650 | | | | 12,270,947 | |
| | | | | | | 13,119,209 | |
| | |
Oil & Gas Refining & Marketing 1.81% | | | | | | | | |
Marathon Petroleum Corp. | | | 29,750 | | | | 1,398,845 | |
Valero Energy Corp. | | | 49,750 | | | | 3,062,610 | |
Western Refining, Inc. | | | 156,356 | | | | 5,608,490 | |
| | | | | | | 10,069,945 | |
| | |
Oil & Gas Refining, Marketing & Transportation 1.59% | | | | | | | | |
Phillips 66 | | | 48,287 | | | | 4,011,684 | |
UGI Corp. | | | 107,550 | | | | 4,818,240 | |
| | | | | | | 8,829,924 | |
| | |
Oil & Gas Storage & Transportation 7.38% | | | | | | | | |
Enbridge Energy Management LLC * | | | 1 | | | | 25 | |
Enbridge, Inc. | | | 58,329 | | | | 2,452,151 | |
Golar LNG Ltd. | | | 251,322 | | | | 6,132,257 | |
Kinder Morgan, Inc. | | | 525,144 | | | | 11,658,197 | |
SemGroup Corp., Class A | | | 113,159 | | | | 4,079,382 | |
See accompanying notes which are an integral part of these financial statements.
| | |
| SCHEDULE OF INVESTMENTS (CONT.) | | NOVEMBER 30, 2016 |
| | | | | | | | |
| | | Shares | | | Market Value | |
| | |
Oil & Gas Storage & Transportation (cont.) | | | | | | | | |
Spectra Energy Corp. | | | 108,150 | | | $ | 4,428,742 | |
Tallgrass Energy GP LP | | | 66,878 | | | | 1,618,448 | |
Targa Resources Corp. | | | 183,516 | | | | 9,779,568 | |
TransCanada Corp. | | | 21,300 | | | | 954,879 | |
| | | | | | | 41,103,649 | |
| | |
Real Estate 0.75% | | | | | | | | |
Hannon Armstrong Sustainable Infrastructure Capital, Inc. | | | 211,301 | | | | 4,200,664 | |
Total Common Stocks | | | | | | | | |
(Cost $73,737,650) | | | | | | | 84,759,827 | |
| | |
Money Market 2.02% | | | | | | | | |
Morgan Stanley Institutional Liquidity Government Portfolio, Institutional Class, 0.29%(a) | | | 11,284,200 | | | | 11,284,200 | |
Total Money Market | | | | | | | | |
(Cost $11,284,200) | | | | | | | 11,284,200 | |
| | |
Total Investments — 100.13% | | | | | | | | |
(Cost $557,917,202) | | | | | | | 557,763,235 | |
Liabilities in Excess of Other Assets — (0.13)% | | | | | | | (730,418 | ) |
| | | | | | | | |
NET ASSETS — 100.00% | | | | | | $ | 557,032,817 | |
| (a) | Rate disclosed is the seven day effective yield as of November 30, 2016. |
| * | Non-income producing security. |
See accompanying notes which are an integral part of these financial statements.
STATEMENT OF ASSETS AND LIABILITIES
| | | | |
| |
ASSETS | | | | |
Investments in securities at value (cost $557,917,202) | | $ | 557,763,235 | |
Receivable for Fund shares sold | | | 3,816,048 | |
Dividends and interest receivable | | | 161,452 | |
Income tax receivable | | | 52,033 | |
Prepaid expenses | | | 19,609 | |
TOTAL ASSETS | | | 561,812,377 | |
| |
LIABILITIES | | | | |
Payable for Fund shares redeemed | | | 569,916 | |
Payable for distributions to shareholders | | | 3,427,443 | |
Payable for investment advisory fees | | | 416,500 | |
Payable for distribution (12b-1) fees | | | 111,132 | |
Payable for accounting and administration fees | | | 23,844 | |
Payable for transfer agent fees | | | 9,756 | |
Franchise tax expense | | | 80,012 | |
Other accrued expenses | | | 140,957 | |
TOTAL LIABILITIES | | | 4,779,560 | |
NET ASSETS | | $ | 557,032,817 | |
| |
SOURCE OF NET ASSETS | | | | |
As of November 30 2016, net assets consisted of: | | | | |
Paid-in capital | | $ | 616,322,174 | |
Accumulated undistributed net investment loss, net of deferred taxes | | | (6,645,657 | ) |
Accumulated net realized loss on investments, net of deferred taxes | | | (52,489,803 | ) |
Net unrealized depreciation on investments, net of deferred taxes | | | (153,897 | ) |
NET ASSETS | | $ | 557,032,817 | |
| |
NET ASSETS: | | | | |
Class A Shares | | | 554,182,229 | |
Class C Shares | | | 2,850,588 | |
SHARES OUTSTANDING ($0.001 par value, 500,000,000 authorized shares): | | | | |
Class A Shares | | | 112,871,622 | |
Class C Shares | | | 584,704 | |
NET ASSET VALUE AND REDEMPTION PRICE PER SHARE | | | | |
Class A Shares | | | 4.91 | |
Class C Shares (a) | | | 4.88 | |
OFFERING PRICE PER SHARE (100%/(100% – maximum sales charge) of net asset value adjusted to the nearest cent) per share: | | | | |
Class A Shares | | | 5.21 | |
MAXIMUM SALES CHARGE: | | | | |
Class A Shares | | | 5.75 | % |
(a) A contingent deferred sales charge (“CDSC”) of 1.00% may be charged on shares held less than 13 months.
See accompanying notes which are an integral part of these financial statements.
STATEMENT OF OPERATIONS
| | | | |
| | | For the Year Ended
November 30, 2016 | |
| |
INVESTMENT INCOME | | | | |
MLP Distributions | | $ | 24,548,473 | |
Less Return of Capital | | | (24,548,473 | ) |
Dividends (net of foreign taxes withheld of $8,906) | | | 2,088,980 | |
Interest | | | 111,629 | |
TOTAL INVESTMENT INCOME | | | 2,200,609 | |
| |
EXPENSES | | | | |
Investment advisory | | | 3,758,610 | |
Distribution (12b-1) — Class A | | | 986,891 | |
Accounting and Administration | | | 221,002 | |
Transfer agent | | | 146,889 | |
Franchise tax expense | | | 110,006 | |
Printing | | | 72,054 | |
Insurance | | | 62,137 | |
Directors | | | 46,216 | |
Custodian | | | 39,003 | |
Registration | | | 36,083 | |
Legal | | | 33,951 | |
Auditing | | | 31,475 | |
Chief Compliance Officer | | | 9,688 | |
Distribution (12b-1) — Class C (a) | | | 8,943 | |
Line of credit | | | 3,079 | |
Other | | | 151,511 | |
TOTAL EXPENSES | | | 5,717,538 | |
NET INVESTMENT LOSS BEFORE TAXES | | | (3,516,929 | ) |
Current and deferred income tax expense/(benefit), net of valuation allowance | | | (1,576 | ) |
NET INVESTMENT LOSS NET OF DEFERRED TAXES | | | (3,515,353 | ) |
| |
REALIZED AND UNREALIZED GAIN (LOSS) ON INVESTMENTS | | | | |
Net realized loss from investment transactions | | | (41,828,197 | ) |
Net realized loss on foreign currency transactions | | | (14 | ) |
Net realized gain on written option transactions | | | 132,381 | |
Current and deferred income tax expense/(benefit), net of valuation allowance | | | 5,379 | |
Net realized loss, net of deferred taxes | | | (41,690,451 | ) |
Net change in unrealized appreciation (depreciation) of investments | | | 85,780,695 | |
Current and deferred income tax expense/(benefit), net of valuation allowance | | | 43,315 | |
NET REALIZED AND UNREALIZED GAIN ON INVESTMENTS | | | 44,133,559 | |
NET INCREASE IN NET ASSETS RESULTING FROM OPERATIONS | | $ | 40,618,206 | |
(a) For the period March 15, 2016 (commencement of operations) through November 30, 2016.
See accompanying notes which are an integral part of these financial statements.
STATEMENTS OF CHANGES IN NET ASSETS
| | | | | | | | |
| | | For the Year Ended November 30, 2016 | | | For the Year Ended
November 30, 2015 | |
| | |
OPERATIONS | | | | | | | | |
Net investment loss, net of deferred taxes | | $ | (3,515,353 | ) | | $ | (2,800,886 | ) |
Net realized loss on investment transactions, net of deferred taxes | | | (41,690,451 | ) | | | (11,121,392 | ) |
Net change in unrealized appreciation (depreciation) of investments, net of deferred taxes | | | 85,824,010 | | | | (76,838,921 | ) |
Net increase (decrease) in net assets resulting from operations | | | 40,618,206 | | | | (90,761,199 | ) |
| | |
DISTRIBUTIONS TO SHAREHOLDERS | | | | | | | | |
From return of capital | |
Class A | | | (63,140,451 | ) | | | (24,733,753 | ) |
Class C (a) | | | (154,067 | ) | | | — | |
Total distributions to shareholders | | | (63,294,518 | ) | | | (24,733,753 | ) |
| | |
CAPITAL TRANSACTIONS | | | | | | | | |
Class A Shares: | | | | | | | | |
Shares sold | | | 286,640,056 | | | | 302,192,985 | |
Shares issued from reinvestment of distributions | | | 33,045,682 | | | | 14,717,286 | |
Shares redeemed | | | (34,565,508 | ) | | | (30,893,506 | ) |
Proceeds from contingent deferred sales charges | | | 2,500 | | | | — | |
Total Class A Shares | | | 285,122,730 | | | | 286,016,765 | |
Class C Shares (a): | | | | | | | | |
Shares sold | | | 2,800,777 | | | | — | |
Shares issued from reinvestment of distributions | | | 71,111 | | | | — | |
Shares redeemed | | | (18,531 | ) | | | — | |
Proceeds from contingent deferred sales charges | | | 102 | | | | — | |
Total Class C Shares | | | 2,853,459 | | | | — | |
Increase in net assets derived from capital share transactions | | | 287,976,189 | | | | 286,016,765 | |
Total increase in net assets | | | 265,299,877 | | | | 170,521,813 | |
| | |
NET ASSETS | | | | | | | | |
Beginning of year | | | 291,732,940 | | | | 121,211,127 | |
End of year | | $ | 557,032,817 | | | $ | 291,732,940 | |
| | |
Accumuluated undistributed net investment income (loss) | | $ | (6,645,657 | ) | | $ | (3,130,304 | ) |
| | |
SHARE TRANSACTIONS | | | | | | | | |
Class A Shares: | | | | | | | | |
Shares sold | | | 59,662,965 | | | | 42,337,185 | |
Shares issued from reinvestment of distributions | | | 6,826,232 | | | | 2,180,647 | |
Shares redeemed | | | (7,171,461 | ) | | | (4,540,292 | ) |
Total Class A Shares | | | 59,317,736 | | | | 39,977,540 | |
Class C Shares (a): | | | | | | | | |
Shares sold | | | 573,955 | | | | — | |
Shares issued from reinvestment of distributions | | | 14,490 | | | | — | |
Shares redeemed | | | (3,741 | ) | | | — | |
Total Class C Shares | | | 584,704 | | | | — | |
Increase in shares outstanding | | | 59,902,440 | | | | 39,977,540 | |
(a) For the period March 15, 2016 (commencement of operations) through November 30, 2016.
See accompanying notes which are an integral part of these financial statements.
FINANCIAL HIGHLIGHTS — CLASS A
The table below sets forth financial data for one share of beneficial interest outstanding throughout each period presented.
| | | | | | | | | | | | |
| | | For the Year Ended November 30, 2016 | | | For the Year Ended November 30, 2015 | | | For the Period Ended November 30, 2014* | |
Net Asset Value, Beginning of Period | | $ | 5.45 | | | $ | 8.93 | | | $ | 10.00 | |
| | | |
Income from Investment Operations: | | | | | | | | | | | | |
Net investment income (loss)1 | | | (0.04 | ) | | | (0.09 | ) | | | (0.05 | ) |
Return of capital1 | | | 0.30 | | | | 0.51 | | | | 0.26 | |
Net realized and unrealized loss on investments | | | (0.05 | ) | | | (3.15 | ) | | | (1.03 | ) |
Total income from investment operations | | | 0.21 | | | | (2.73 | ) | | | (0.82 | ) |
| | | |
Less distributions: | | | | | | | | | | | | |
Distributions from net investment income | | | — | | | | — | | | | (0.01 | ) |
From return of capital | | | (0.75 | ) | | | (0.75 | ) | | | (0.24 | ) |
Total distributions | | | (0.75 | ) | | | (0.75 | ) | | | (0.25 | ) |
Net Asset Value, End of Period | | $ | 4.91 | | | $ | 5.45 | | | $ | 8.93 | |
Total Return2 | | | 5.17 | % | | | (32.13 | )% | | | (8.35 | )%3 |
| | | |
Ratios/Supplemental Data: | | | | | | | | | | | | |
Net assets, end of period (000) | | $ | 554,182 | | | $ | 291,733 | | | $ | 121,211 | |
Ratio of expenses to average net assets: | | | | | | | | | | | | |
Before expense waivers or recoupment and deferred tax benefit | | | 1.43 | % | | | 1.49 | % | | | 1.86 | %4 |
Net of expense waivers or recoupment and before deferred tax benefit | | | 1.43 | % | | | 1.52 | % | | | 1.55 | %4 |
Deferred tax expense5 | | | 0.00 | % | | | 0.02 | % | | | 0.00 | %4 |
Total net expenses | | | 1.43 | % | | | 1.54 | % | | | 1.55 | %4 |
Ratio of net investment income (loss) to average net assets: | | | | | | | | | | | | |
Before expense waivers or recoupment and deferred tax benefit | | | (0.87 | )% | | | (1.12 | )% | | | (1.76 | )%4 |
Net of expense waivers or recoupment and before deferred tax benefit | | | (0.87 | )% | | | (1.15 | )% | | | (1.45 | )%4 |
Deferred tax benefit (loss)6 | | | 0.00 | % | | | (0.06 | )% | | | 0.51 | %4 |
Net investment loss | | | (0.87 | )% | | | (1.21 | )% | | | (0.94 | )%4 |
Portfolio turnover | | | 18 | % | | | 15 | % | | | 12 | %3 |
* For the period July 10, 2014 (commencement of operations) to November 30, 2014.
1 Calculated using average shares method.
2 Calculation does not reflect sales load.
3 Calculation is not annualized.
4 Calculation is annualized.
5 Deferred tax expense (benefit) estimate for the ratio calculation is derived from the net investment income (loss) and realized and unrealized gain (loss).
6 Deferred tax benefit (expense) estimate for the ratio calculation is derived from the net investment income (loss) only.
FINANCIAL HIGHLIGHTS — CLASS C
The table below sets forth financial data for one share of beneficial interest outstanding throughout each period presented.
| | | | |
| | | For the Period Ended November 30, 2016* | |
Net Asset Value, Beginning of Period | | $ | 4.47 | |
| |
Income from Investment Operations: | | | | |
Net investment income (loss)1 | | | (0.06 | ) |
Return of capital1 | | | 0.24 | |
Net realized and unrealized gain on investments | | | 0.79 | |
Total income from investment operations | | | 0.97 | |
| |
Less distributions: | | | | |
From return of capital | | | (0.56 | ) |
Total distributions | | | (0.56 | ) |
Net Asset Value, End of Period | | $ | 4.88 | |
Total Return2 | | | 21.58 | %3 |
| |
Ratios/Supplemental Data: | | | | |
Net assets, end of period (000) | | $ | 2,851 | |
Ratio of expenses to average net assets: | | | | |
Net of expense waivers or recoupment and before deferred tax benefit | | | 2.16 | %4 |
Deferred tax expense5 | | | 0.00 | %4 |
Total net expenses | | | 2.16 | %4 |
Ratio of net investment income (loss) to average net assets: | | | | |
Net of expense waivers or recoupment and before deferred tax benefit | | | (1.67 | )%4 |
Deferred tax benefit (loss)6 | | | 0.00 | %4 |
Net investment loss | | | (1.67 | )%4 |
Portfolio turnover | | | 18 | %3 |
* For the period March 15, 2016 (commencement of operations) to November 30, 2016.
1 Calculated using average shares method.
2 Calculation does not reflect sales load.
3 Calculation is not annualized.
4 Calculation is annualized.
5 Deferred tax expense (benefit) estimate for the ratio calculation is derived from the net investment income (loss) and realized and unrealized gain (loss).
6 Deferred tax benefit (expense) estimate for the ratio calculation is derived from the net investment income (loss) only.
| | |
| NOTES TO FINANCIAL STATEMENTS | | NOVEMBER 30, 2016 |
Note 1 – Organization
Spirit of America Energy Fund (the “Fund”), a series of Spirit of America Investment Fund, Inc. (the “Company”), is an open-end nondiversified mutual fund registered under the Investment Company Act of 1940, as amended (the “1940 Act”). The Company was incorporated under the laws of Maryland on May 15, 1997. The Fund commenced operations on July 10, 2014. The Fund seeks to provide shareholders with long-term capital appreciation and attractive levels of current income through diversified exposure to securities of companies principally engaged in activities in the energy industry, such as the exploration, production, and transmission of energy or energy fuels; the making and servicing of component products for such activities; energy research; and energy conservation.
The Fund currently offers Class A Shares and Class C Shares. Each class of shares for each Fund has identical rights and privileges except with respect to distribution (12b-1) and service fees, voting rights on matters affecting a single class of shares, exchange privileges of each class of shares and sales charges. The price at which the Fund will offer or redeem shares is the net asset value (“NAV”) per share next determined after the order is considered received, subject to any applicable front end or contingent deferred sales charges. Class A shares have a maximum sales charge on purchases of 5.75% as a percentage of the original purchase price. A Contingent Deferred Sales Charge (“CDSC”) of 1.00% may be imposed on redemptions of Class A shares that were purchased within one year of the redemption date where an indirect commission was paid. CDSC on Class C Shares applies to shares sold within 13 months of purchase.
Note 2 – Significant Accounting Policies
The Fund is an investment company and follows accounting and reporting guidance under Financial Accounting Standards Board Accounting Standards Codification (“ASC”) Topic 946, “Financial Services-Investment Companies”. The following is a summary of significant accounting policies consistently followed by the Fund in the preparation of its financial statements. These policies are in conformity with generally accepted accounting principles in the United States of America (“GAAP”) for investment companies.
A. Security Valuation: The offering price and net asset value (“NAV”) per share for the Fund are calculated as of the close of regular trading on the New York Stock Exchange (“NYSE”), currently 4:00 p.m., Eastern Time on each day the NYSE is open for trading. The Fund’s securities are valued at the official close or the last reported sales price on the principal exchange on which the security trades, or if no sales price is reported, the mean of the latest bid and asked prices is used. Securities traded over-the-counter are priced at the mean of the latest bid and asked prices. Unlisted securities traded in the over-the-counter market are valued using an evaluated quote provided by the independent pricing service, or, if an evaluated quote is unavailable, such securities are valued using prices received from dealers, provided that if the dealer supplies both bid and ask prices, the price to be used is the mean of the bid and asked prices. The independent pricing service derives an evaluated quote by obtaining dealer quotes, analyzing the listed markets, reviewing trade execution data and employing sensitivity analysis. Evaluated quotes may also reflect appropriate factors such as individual characteristics of the issue, communications with broker-dealers, and other market data. Short-term investments having a maturity of 60 days or less are valued at amortized cost, which the Board of Directors (the “Board”) believes represents fair value. Fund securities for which market quotations are not readily available are valued at fair value as determined in good faith under procedures established by and under the supervision of the Board.
B. Fair Value Measurements: Various inputs are used in determining the fair value of investments which are as follows:
| | |
• Level 1 – | | Inputs that reflect unadjusted quoted prices in active markets for identical assets or liabilities that the Fund has the ability to access at the measurement date. |
| |
• Level 2 – | | Observable inputs other than quoted prices included in level 1 that are observable for the asset or liability, either directly or indirectly. These inputs may include quoted prices for the identical instrument on an inactive market, prices for similar instruments, interest rates, prepayment speeds, credit risk, yield curves, default rates and similar data. |
| |
• Level 3 – | | Unobservable inputs based on the best information available in the circumstances, to the extent observable inputs are not available (including the Fund’s own assumptions used in determining the fair value of investments). |
| | |
| NOTES TO FINANCIAL STATEMENTS (CONT.) | | NOVEMBER 30, 2016 |
The summary of inputs used to value the Fund’s investments as of November 30, 2016 is as follows:
| | | | | | | | | | | | | | | | |
| | | Level 1 | | | Level 2 | | | Level 3 | | | Total | |
Investment Securities: | | | | | | | | | | | | | | | | |
Master Limited Partnerships – Common Stocks | | $ | 461,719,208 | | | $ | — | | | $ | — | | | $ | 461,719,208 | |
Common Stocks | | | 84,759,827 | | | | — | | | | — | | | | 84,759,827 | |
Money Market | | | 11,284,200 | | | | — | | | | — | | | | 11,284,200 | |
| | | | | | | | | | | | | | | | |
Total Investment Securities | | $ | 557,763,235 | | | $ | — | | | $ | — | | | $ | 557,763,235 | |
| | | | |
| | | | | | | | | | | | | | | | |
The Fund did not hold any investments during the reporting period for which significant unobservable inputs (Level 3) were used in determining fair value; therefore, no reconciliation of Level 3 securities is included for this reporting period. The Trust recognizes transfers between fair value hierarchy levels at the reporting period end. There were no transfers between any levels as of November 30, 2016 based on input levels assigned at November 30, 2015.
C. Investment Income and Securities Transactions: Security transactions are accounted for on the date the securities are purchased or sold (trade date) for financial reporting purposes. Cost is determined and gains and losses are based on the identified cost basis for both financial statement and federal income tax purposes.
Discounts and premiums on securities purchased are accreted and amortized over the lives of the respective securities. Dividend income and distributions to shareholders are reported on the ex-dividend date. Interest income and expenses are accrued daily.
D. Federal Income Taxes: The Fund is taxed as a regular C-corporation for federal income tax purposes. Currently, the maximum marginal regular federal income tax rate for a corporation is 35 percent. The Fund may be subject to a 20 percent federal alternative minimum tax on its federal alternative taxable income to the extent that its alternative minimum tax exceeds its regular federal income tax. This differs from most investment companies, which elect to be treated as “regulated investment companies” under the Code in order to avoid paying entity level income taxes. Under current law, the Fund is not eligible to elect treatment as a regulated investment company due to its investments primarily in MLPs invested in energy assets. As a result, the Fund will be obligated to pay applicable federal and state corporate income taxes on its taxable income as opposed to most other investment companies which are not so obligated. The Fund expects that a portion of the distributions it receives from MLPs may be treated as a tax-deferred return of capital, thus reducing the Fund’s current tax liability. However, the amount of taxes currently paid by the Fund will vary depending on the amount of income and gains derived from investments and/or sales of MLP interests and such taxes will reduce your return from an investment in the Fund.
Cash distributions from MLPs to the Fund that exceed such Fund’s allocable share of such MLP’s net taxable income are considered a tax- deferred return of capital that will reduce the Fund’s adjusted tax basis in the equity securities of the MLP. These reductions in such Fund’s adjusted tax basis in the MLP equity securities will increase the amount of gain (or decrease the amount of loss) recognized by the Fund on a subsequent sale of the securities. The Fund will accrue deferred income taxes for any future tax liability associated with (i) that portion of MLP distributions considered to be a tax-deferred return of capital as well as (ii) capital appreciation of its investments. Upon the sale of an MLP security, the Fund may be liable for previously deferred taxes. The Fund will rely to some extent on information provided by the MLPs, which is not necessarily timely, to estimate deferred tax liability for purposes of financial statement reporting and determining the NAV. From time to time, Spirit of America Energy Fund will modify the estimates or assumptions related to the Fund’s deferred tax liability as new information becomes available. The Fund will generally compute deferred income taxes based on the marginal regular federal income tax rate applicable to corporations and an assumed rate attributable to state taxes.
Since the Fund will be subject to taxation on its taxable income, the NAV of Fund shares will also be reduced by the accrual of any deferred tax liabilities.
| | |
| NOTES TO FINANCIAL STATEMENTS (CONT.) | | NOVEMBER 30, 2016 |
The Fund’s income tax expense/(benefit) consists of the following:
| | | | | | | | | | | | |
| November 30, 2016 | | Current | | | Deferred | | | Total | |
Federal | | $ | (48,421 | ) | | $ | 13,363,116 | | | $ | 13,411,537 | |
State (net of federal) | | | (1,849 | ) | | | 726,500 | | | | 728,349 | |
Valuation Allowance | | | — | | | | (14,089,616 | ) | | | (14,089,616 | ) |
| | | | | | | | | | | | |
Total tax expense | | $ | (50,270 | ) | | $ | — | | | $ | 50,270 | |
| | | | |
| | | | | | | | | | | | |
Deferred income taxes reflect the net tax effect of temporary differences between the carrying amount of assets and liabilities for financial reporting and tax purposes.
Components of the Fund’s deferred tax assets and liabilities are as follows:
| | | | |
| Deferred tax assets: | | As of November 30, 2016 | |
Net operating loss carryforward | | $ | 11,242,670 | |
Net capital loss carryforward | | | 16,211,020 | |
Other | | | 35,179 | |
Valuation Allowance | | | (22,133,077 | ) |
| | | | |
| | | 5,355,792 | |
Deferred tax liability: | | | (5,355,792 | ) |
Net deferred Tax Asset/(Liability) | | | — | |
| | | | |
Net operating loss carryforwards are available to offset future taxable income. Net operating loss carryforwards can be carried forward for 20 years and, accordingly, would begin to expire as of November 30, 2035. The Fund has net operating loss carryforwards for federal income tax purposes as follows:
| | | | | | | | |
| Year-Ended | | Amount | | | Expiration | |
November 30, 2015 | | $ | 5,229,524 | | | | November 30, 2035 | |
November 30, 2016 | | | 25,437,879 | | | | November 30, 2036 | |
| | | | | | | | |
Net capital loss carryforwards are available to offset future capital gains. Capital loss carryforwards can be carried forward for 5 years and, accordingly, would begin to expire as of November 30, 2020. The Fund has net capital loss carryforwards for federal income tax purposes as follows:
| | | | | | | | |
| Year-Ended | | Amount | | | Expiration | |
November 30, 2015 | | $ | 9,221,227 | | | | November 30, 2020 | |
November 30, 2016 | | | 34,998,685 | | | | November 30, 2021 | |
| | | | | | | | |
The Fund reviews the recoverability of its deferred tax assets based upon the weight of available evidence. When assessing the recoverability of its deferred tax assets, significant weight was given to the effects of potential future realized and unrealized gains on investments and the period over which these deferred tax assets can be realized. Currently, any capital losses that may be generated by the Fund are eligible to be carried back up to three years and can be carried forward for five years to offset capital gains recognized by the Fund in those years. Net operating losses that may be generated by the Fund are eligible to be carried back up to two years and can be carried forward for 20 years to offset income generated by the Fund in those years.
Based upon the Fund’s assessment, it has determined that is it more likely than not that a portion of its deferred tax assets will not be realized through future taxable income of the appropriate character. Accordingly a valuation allowance has been established for the Fund’s deferred tax assets. The Fund will continue to assess the need for additional valuation allowance in the future. Significant declines in the fair value of its portfolio investments may change the Fund’s assessment of the recoverability of these assets and may result in the recording of additional valuation allowances against all or a portion of the Fund’s gross deferred tax assets.
| | |
| NOTES TO FINANCIAL STATEMENTS (CONT.) | | NOVEMBER 30, 2016 |
Total income tax benefit (current and deferred) differs from the amount computed by applying the federal statutory income tax rate of 34% to net investment and realized and unrealized gain/ (losses) on investment before taxes as follows:
| | | | |
| | | Fiscal Year Ended November 30, 2016 | |
Income tax expense at statutory rate | | $ | 13,793,098 | |
State income taxes (net of federal benefit) | | | 1,095,709 | |
Permanent differences, net | | | (345,908 | ) |
Change in estimated state deferred rate | | | (320,180 | ) |
Other | | | (183,373 | ) |
Valuation Allowance | | | (14,089,616 | ) |
| | | | |
Net income tax expense | | $ | (50,270 | ) |
| | | | |
The Fund recognizes interest accrued related to unrecognized tax benefits and penalties as income tax expense. For the fiscal year ended November 30, 2016, the Fund had no accrued penalties or interest.
The Fund recognizes the tax benefits of uncertain tax positions only where the position is “more likely than not” to be sustained assuming examination by tax authorities. Management has analyzed the Fund’s tax positions, and has concluded that no liability for unrecognized tax benefits should be recorded related to uncertain tax positions taken on U.S. tax returns and state tax returns filed since inception of the fund. No U.S. federal or state income tax returns are currently under examination. The tax periods ended November 30, 2014, November 30, 2015 and November 30, 2016 remains subject to examination by tax authorities in the United States. Due to the nature of the Fund’s investments, the Fund may be required to file income tax returns in several states. The Fund is not aware of any tax positions for which it is reasonably possible that the total amounts of unrecognized tax benefits will change materially in the next 12 months.
The adjusted cost basis of investment and gross unrealized appreciation and depreciation of investments for federal income tax purposes were as follows:
| | | | |
| | | Fiscal Year Ended November 30, 2016 | |
Gross unrealized appreciation – investment securities | | $ | 50,270,202 | |
Gross unrealized depreciation – investment securities | | | (35,660,840 | ) |
| | | | |
Net unrealized appreciation – investment securities | | | 14,609,362 | |
| | | | |
Cost basis of investments | | $ | 543,153,872 | |
| | | | |
E. Use of Estimates: In preparing financial statements in conformity with GAAP, management makes estimates and assumptions that affect the reported amounts of assets and liabilities at the date of the financial statements, as well as the reported amounts of revenues and expenses during the reporting period. Actual results could differ from those estimates.
F. Distributions to Shareholders: The Fund intends to declare and pay distributions monthly which are expected to be characterized as return of capital distributions generated from the Fund’s holdings. The Fund intends to declare and pay income dividends generated from the Fund’s earnings annually, however, the Fund may distribute such dividends more frequently. All such dividends and distributions are generally taxable to the shareholder whether received in cash or reinvested in shares. The final determination of the amount of the Fund’s return of capital distributions for the period will be made after the end of each calendar year. The Fund anticipates that a significant portion of its distributions to shareholders will consist of a tax-free return of capital with respect to an investor’s principal investment for U.S. federal income tax purposes.
G. Allocation of Income, Expenses, Gains and Losses: Income, expenses (other than those attributable to a specific class), gains and losses are allocated on a daily basis to each class of shares based upon the relative proportion of net assets represented by such class. Operating expenses directly attributable to a specific class are charged against the operations of that class.
| | |
| NOTES TO FINANCIAL STATEMENTS (CONT.) | | NOVEMBER 30, 2016 |
Note 3 – Derivative Transactions
Written Options Contracts – The Fund may write options contracts for which premiums received are recorded as liabilities and are subsequently adjusted to the current value of the options written. Premiums received from writing options which expire are treated as realized gains. Premiums received from writing options which are either exercised or closed are offset against the proceeds received or the amount paid on the transaction to determine realized gains or losses. Investing in written options contracts exposes a Fund to equity price risk. The following is a summary of the written option activity:
| | | | | | | | |
| | | Number of
Contracts | | | Premiums
Received | |
Outstanding at November 30, 2015 | | | 1,000 | | | $ | 132,456 | |
Call options written | | | 230 | | | | 23,690 | |
Call options expired | | | (1,000 | ) | | | (132,456 | ) |
Call options exercised | | | (225 | ) | | | (23,075 | ) |
Call options closed | | | (5 | ) | | | (615 | ) |
| | | | | | | | |
Outstanding at November 30, 2016 | | | — | | | $ | — | |
| | | | |
| | | | | | | | |
The Fund’s use of derivatives for the fiscal year ended November 30, 2016, was limited to written options. There were no derivative instruments outstanding as of November 30, 2016. The amounts of realized and changes in unrealized gains and losses on derivative instruments during the period, as disclosed in the Statement of Operations, serve as indicators of the volume of derivative activity for the Fund. The month-end average notional amount for the year ended November 30, 2016 was $11,473. Following is a summary of how these derivatives are treated in the financial statements and their impact on the Fund:
Statement of Operations
| | | | | | | | |
| Location of Gain (Loss) on Derivatives Recognized | | Amount of
Realized Gain
(Loss) | | | Amount of
Unrealized
Gain (Loss) | |
Net realized gain on written option transactions | | $ | 132,381 | | | $ | — | |
| | | | | | | | |
Note 4 – Purchases and Sales of Securities
Purchases and proceeds from the sales of securities for the fiscal year ended November 30, 2016, excluding short-term investments, were $297,570,485 and $71,268,653, respectively.
Note 5 – Investment Management Fee and Other Transactions with Affiliates
Spirit of America Management Corp. (the “Adviser”) has been retained to act as the Company’s investment adviser pursuant to an Investment Advisory Agreement (the “Advisory Agreement”). The Adviser was incorporated in 1997 and is a registered investment adviser under the Investment Advisers Act of 1940, as amended. Under the Advisory Agreement, the Fund pays the Adviser a monthly fee of 1/12 of 0.95% of the Fund’s average daily net assets. Investment advisory fees for the fiscal year ended November 30, 2016 were $3,758,610.
The Adviser has agreed to waive all or a portion of its fees and to reimburse certain expenses so that the total operating expenses of the Fund’s Class A Shares and Class C Shares until April 30, 2017 will not exceed 1.55% and 2.30% of the Fund’s average daily net assets, respectively. The waiver does not include front end or contingent deferred loads, taxes, interest, dividend expenses on short sales, brokerage commissions or expenses incurred in connection with any merger or reorganization or extraordinary expenses such as litigation. Any amounts waived or reimbursed by the Adviser are subject to repayment by the Fund within a period of three years after such waivers or expenses were incurred, provided the Fund is able to make such repayments and remain in compliance with the expense limitation as stated above. There were no repayments made to the Adviser during the current fiscal year.
The Fund has adopted a Plan of Distribution (the “12b-1 Plan”) pursuant to Rule 12b-1 under the 1940 Act. The 12b-1 Plan permits the Fund or class, as applicable, to pay David Lerner Associates, Inc. (the “Distributor”) from its own assets for the Distributor’s services and expenses in distributing shares of the Fund (“12b-1 fees”) and providing personal services and/
| | |
| NOTES TO FINANCIAL STATEMENTS (CONT.) | | NOVEMBER 30, 2016 |
or maintaining shareholder accounts (“service fees”). The Energy Fund’s Class A Shares pay a 12b-1 fee at the annual rate of 0.25% of average daily net assets. With respect to Class C Shares, the fee paid to the Distributor by the Fund is 1.00% of the average daily net assets of the Class C Shares. Of this amount, 0.75% represents distribution fees and 0.25% represents shareholder servicing fees that may be paid to institutions that have agreements with the Distributor to provide such services. Each class of shares of the Energy Fund has exclusive voting rights with respect to its 12b-1 Plan. Since 12b-1 fees are paid out of the assets of the respective share class of the Energy Fund on an on-going basis, over time these fees will increase the cost of your investment and may cost you more than paying other types of sales charges. For the fiscal year ended November 30, 2016, fees paid to the Distributor under the Plan were $986,891 for Class A Shares and $8,943 for Class C Shares.
The Fund’s Class A Shares are subject to an initial sales charge imposed at the time of purchase, in accordance with the Fund’s current prospectus. For the fiscal year ended November 30, 2016, sales charges received by the Distributor were $10,205,579. A contingent deferred sales charge (“CDSC”) of 1.00% may be imposed on redemptions of Class A shares that were purchased within one year of the redemption date where an indirect commission was paid. CDSC on Class C Shares applies to shares sold within 13 months of purchase.
Certain Officers and Directors of the Company are “affiliated persons”, as that term is defined in the 1940 Act, of the Adviser or the Distributor. Each Director of the Company, who is not an affiliated person of the Adviser or Distributor, receives a quarterly retainer of $5,250, $1,000 for each Board meeting attended, and $500 for each committee meeting attended plus reimbursement for certain travel and other out-of-pocket expenses incurred in connection with attending Board meetings. The Company does not compensate the Officers for the services they provide. There are no Directors’ fees paid to affiliated Directors of the Company. For the fiscal year ended November 30, 2016, the Fund was allocated $9,688 of the Chief Compliance Officer’s salary.
Note 6 – Concentration and Other Risks
The Fund concentrates its investments in securities and other assets of energy and energy related companies. A fund that invests primarily in a particular sector could experience greater volatility than funds investing in a broader range of industries. Due to the fact that the Fund normally invests at least 80% of its assets in the securities of companies principally engaged in activities in the energy industry, the Fund’s performance largely depends on the overall condition of the energy industry. The energy industry could be adversely affected by energy prices, supply-and- demand for energy resources, and various political, regulatory, and economic factors. Investments in securities of MLPs involve risks that differ from investments in common stock, including risks related to limited control and limited rights to vote on matters affecting the MLP, risks related to potential conflicts of interest between the MLP and the MLP’s general partner, cash flow risks, dilution risks and risks related to the general partner’s right to require unit holders to sell their common units at an undesirable time or price.
Note 7 – Line of Credit
The Fund participates in a short-term credit agreement (“Line of Credit) with The Huntington National Bank, the custodian of the Fund’s investments expiring on May 26, 2017. Borrowing under this Line of Credit bears interest at London Interbank Offered Rate (“LIBOR”) plus 1.500%. Maximum borrowings for the Fund is the lesser of $3,000,000 or 30% of the Fund’s daily market value. The Fund did not utilize the Line of Credit during the fiscal year ended November 30, 2016.
Note 8 – Legal Proceedings
On May 7, 2010, each of William Mason, the Portfolio Manager for the Energy Fund, and DLA, the Fund’s principal underwriter and distributor, received a Notice of Complaint from the Department of Enforcement of the Financial Industry Regulatory Authority (“FINRA”) relating to Mr. Mason’s activities as head of the fixed income trading department of DLA and DLA’s activities as a municipal securities and collateralized mortgage obligations dealer. The Notice of Complaint alleged that each of Mr. Mason and DLA had violated certain NASD and Municipal Securities Rule Making Board fair pricing rules relating to the period January 1, 2005 through January 31, 2007. On April 4, 2012, a FINRA hearing panel issued a decision in this matter, finding that DLA willfully charged excessive markups on certain municipal bond and CMO transactions involving customers, and assessed monetary fines and other sanctions against DLA and Mr. Mason, including the suspension described below. Both DLA and Mr. Mason appealed the decision. On May 27, 2011, FINRA filed a
| | |
| NOTES TO FINANCIAL STATEMENTS (CONT.) | | NOVEMBER 30, 2016 |
complaint against DLA, the Fund’s principal underwriter and distributor, related to its sales practices in connection with its role as managing dealer of an unaffiliated Real Estate Investment Trust offering, Apple REIT Ten, Inc. (“Apple REIT”). More specifically, FINRA alleged that DLA failed to conduct adequate due diligence, thereby leaving it without a reasonable basis for recommending customer purchases of Apple REIT, in addition to using false, exaggerated and misleading statements regarding the performance of earlier closed Apple REITs. In June 2011, several class action complaints were filed against DLA, Apple REIT entities and certain individuals, also in connection with the sale of various Apple REIT securities. In January 2012, FINRA amended its complaint to add David Lerner as an individual respondent and alleged violations of Section 17(a) of the Securities Act of 1933, as amended, including allegations of false, exaggerated and misleading communications to the public, through customer correspondence and investment seminars, about the investment returns, market values, performance of earlier closed Apple REITs as well as allegations of untrue statements and/or omitted material facts concerning the prior performance, steady distribution rates, unchanging valuations, and prospects of the earlier closed Apple REITs and/or Apple REIT. On October 22, 2012, DLA, Mr. Lerner and Mr. Mason settled all of the foregoing FINRA investigations and actions involving Apple REIT securities and municipal bond and collateralized mortgage obligation pricing. Without admitting or denying the allegations, in connection with the settlement, DLA, Mr. Lerner and Mr. Mason each agreed, among other things, to pay a fine; and Mr. Lerner agreed to a suspension from affiliation with any FINRA member, including DLA, in any capacity for a period of one year and in any principal capacity for a period of two years thereafter beginning on November 19, 2012; and Mr. Mason agreed to a suspension from affiliation with any FINRA member, including DLA, in any capacity for a period of six months, which suspension ended on June 16, 2013. The fines and suspensions do not involve the Funds or the Adviser. On April 3, 2013, the class action complaints were dismissed, with prejudice, in their entirety. On April 12, 2013, plaintiffs filed a notice of appeal of the class action dismissal. On April 23, 2014, the United States Court of Appeals for the Second Circuit substantially affirmed the April 3, 2013 decision of United States District Judge, Kiyo A. Matsumoto, dismissing with prejudice the class action complaint in In Re Apple REITs Litigation. The Second Circuit held that Judge Matsumoto correctly found that there were no material misrepresentations or omissions in the offering materials for Apple REITs Six through Ten. The appeals court upheld dismissal of ten of the thirteen claims in the case, including all federal and state securities law claims, and also upheld Judge Matsumoto’s refusal to allow plaintiffs to amend their complaint. The appeals court remanded three state common law claims to the District Court for the Eastern District of New York for further proceedings. On March 25, 2015, the District Court dismissed the remaining state common law claims against DLA, with prejudice. Plaintiffs did not file an appeal. Neither the Adviser nor the Funds were a party to any of the investigations or actions listed in this section.
In October 2013, a class action litigation, titled Lewis v. Delaware Charter Guarantee & Trust Company, et al., (the “Litigation”) was commenced in federal court in Nevada against DLA, the Fund’s principal underwriter and distributor, along with other defendants, alleging, inter alia, breach of fiduciary duty, aiding and abetting breach of fiduciary duty, negligence and misrepresentation. The plaintiffs, purportedly customers who maintain individual retirement accounts at DLA which contained non-traded REIT securities, allege, among other things, that the defendants failed to accurately provide annual fair market values for those REIT securities. The Litigation was transferred to the U.S. District Court for the Eastern District of New York. On March 30, 2015, the District Court dismissed all claims against DLA, with prejudice. Plaintiffs appealed the decision dismissing the claims. On April 4, 2016, the United States Court of Appeals for the Second Circuit unanimously affirmed the judgment of the District Court dismissing the claims against DLA. Plaintiffs did not appeal that dismissal. Neither the Adviser nor the Fund were parties to the Litigation.
Note 9 – Subsequent Events
Management of the Fund has evaluated the need for disclosures resulting from subsequent events through the date these financial statements were issued. Management has determined that there were no items requiring additional disclosure.
REPORT OF INDEPENDENT REGISTERED PUBLIC ACCOUNTING FIRM
To the Board of Directors and Shareholders
Spirit of America Energy Fund
We have audited the accompanying statement of assets and liabilities of Spirit of America Energy Fund (the “Fund”), a series of Spirit of America Investment Fund, Inc., including the schedule of investments, as of November 30, 2016, and the related statement of operations for the year then ended, the statement of changes in net assets for the each of the two years in the period then ended, and the financial highlights for each of the two years in the period then ended and for the period July 10, 2014 (commencement of operations) to November 30, 2014. These financial statements and financial highlights are the responsibility of the Fund’s management. Our responsibility is to express an opinion on these financial statements and financial highlights based on our audits.
We conducted our audits in accordance with the standards of the Public Company Accounting Oversight Board (United States). Those standards require that we plan and perform the audit to obtain reasonable assurance about whether the financial statements and financial highlights are free of material misstatement. The Fund is not required to have, nor were we engaged to perform, an audit of its internal control over financial reporting. Our audits included consideration of internal control over financial reporting as a basis for designing audit procedures that are appropriate in the circumstances, but not for the purpose of expressing an opinion on the effectiveness of the Fund’s internal control over financial reporting. Accordingly, we express no such opinion. An audit includes examining, on a test basis, evidence supporting the amounts and disclosures in the financial statements. Our procedures included confirmation of securities owned as of November 30, 2016, by correspondence with the custodian. An audit also includes assessing the accounting principles used and significant estimates made by management, as well as evaluating the overall financial statement presentation. We believe that our audits provide a reasonable basis for our opinion.
In our opinion, the financial statements and financial highlights referred to above present fairly, in all material respects, the financial position of Spirit of America Energy Fund as of November 30, 2016, and the results of its operations for the year then ended, the statement of changes in net assets for each of the two years in the period then ended, and the financial highlights for each of the two years in the period then ended and for the period July 10, 2014 (commencement of operations) to November 30, 2014, in conformity with accounting principles generally accepted in the United States of America.
TAIT, WELLER & BAKER LLP
Philadelphia, Pennsylvania
January 30, 2017
APPROVAL OF THE INVESTMENT ADVISORY AGREEMENT (UNAUDITED)
The Investment Company Act of 1940, as amended (the “1940 Act”) requires that the continuance of a registered management investment company’s investment advisory agreement be approved annually by both the board of directors and also by a majority of its directors who are not parties to the investment advisory agreement or “interested persons” (as defined by the 1940 Act) of any such party (the “Independent Directors”). At a meeting held on November 9, 2016, the Board of Directors (the “Board” or “Directors”) of Spirit of America Investment Fund, Inc. (the “Company”) met in person (the “Meeting”) to, among other things, consider the approval of the Investment Advisory Agreement (the “Advisory Agreement”) by and between Spirit of America Management Corp. (the “Adviser”) and the Company, on behalf of the Spirit of America Energy Fund. At the Meeting, the Board, including the Independent Directors voting separately, approved the Advisory Agreement after determining that the Adviser’s compensation, pursuant to the terms of the Advisory Agreement, would be fair and reasonable and concluded that the approval of the Advisory Agreement would be in the best interest of the Fund’s shareholders. The Board’s approval was based on consideration and evaluation of the information and material provided to the Board and a variety of specific factors discussed at the Meeting and at prior meetings of the Board, including the factors described below.
As part of the approval process and oversight of the advisory relationship, counsel to the Independent Directors (“Independent Counsel”) sent an information request letter to the Adviser seeking certain relevant information and the Directors received, for their review in advance of the Meeting, the Adviser’s responses. In addition, the Directors were provided with the opportunity to request additional materials. In advance of the Meeting, the Board including the Independent Directors, requested and received materials provided by the Adviser and Independent Counsel, including, among other things, the following: (i) Independent Counsel’s 15c questionnaire and the responses provided by the Adviser; (ii) comparative information on the investment performance of the Fund, relevant indices and Morningstar category peer funds as of June 30, 2015 in the form of reports generated by the Fund’s administrator; (iii) graphs of fee comparisons for the minimum fee, maximum fee, average fee and median fee in the form of reports generated by the Fund’s administrator; (iv) graphs of performance comparisons for the minimum performing fund, the maximum performing fund, average performing fund and median performing fund for the one year, three year and five year time periods in the form of reports generated by the Fund’s administrator; (v) the allocation of the Fund’s brokerage commissions, (vi) the record of compliance with the Fund’s investment policies and restrictions and with the Fund’s Code of Ethics as well as the structure and responsibilities of the Adviser’s compliance departments; (vii) the profitability of the Fund’s investment advisory business to the Adviser taking into account both advisory fees and any other potential direct or indirect benefits; (viii) the Form ADV of the Adviser; and (ix) a memorandum from Independent Counsel regarding the responsibilities of the Independent Directors related to the approval of the Investment Advisory Agreement.
In evaluating the Investment Advisory Agreement, the Board, including the Independent Directors, requested, reviewed and considered materials furnished by the Adviser and questioned personnel of the Adviser, including the Fund’s portfolio managers, regarding, among other things, the personnel, the Fund’s performance, operations and financial condition of the Adviser. Among other information, the Board, including the Independent Directors, requested and was provided information regarding:
| | • | | The Investment performance of the Fund over various time periods both by itself and in relation to relevant indices; |
| | • | | The fees charged by the Adviser for investment advisory services, as well as the compensation received by the Adviser and its affiliates; |
| | • | | The waivers of fees and reimbursements of expenses at times by the Adviser under the Operating Expenses Agreement; |
| | • | | The investment performance, fees and total expenses of mutual funds with similar objectives and strategies managed by other investment advisers; |
| | • | | The investment management staffing and the experience of the investment advisory, administrative and other personnel providing services to the Fund and the historical quality of the services provided by the Adviser; and |
| | • | | The profitability to the Adviser of managing and its affiliate distributing the Fund and the methodology in allocating expenses to the management of the Fund. |
At the Meeting, Independent Counsel also referred to the “Gartenberg Memorandum” which had been distributed to each Director in advance of the Meeting, outlining the legal standards applicable to the Independent Directors under the 1940
APPROVAL OF THE INVESTMENT ADVISORY AGREEMENT (UNAUDITED) (CONT.)
Act with respect to the approval of the continuation of the Investment Advisory Agreement on behalf of the Fund. He explained that the Board must consider the (1) nature, extent and quality of services to be provided by the Adviser to the Fund; (2) the investment performance of Fund independently; (3) the costs of the services provided and profits realized by the Adviser and its affiliates from the relationship with Fund; (4) the extent to which economies of scale have been realized as the Fund grows; (5) whether fee levels reflect these economies of scale for the benefit of the Fund’s investors; and (6) any other relevant considerations that the Board deems appropriate. In addition, the Independent Directors met at length with Independent Counsel during the Compliance Committee meeting to discuss the materials provided by the Adviser and to consider any additional questions they had of the Adviser.
The following is a summary of the Board’s discussion and views regarding the factors it considered in evaluating the continuation of the Investment Advisory Agreement:
1. Nature, Extent, and Quality of Services.
The Board, including the Independent Directors, considered the nature, quality and extent of advisory, administrative and shareholder services performed by the Adviser, including: regulatory filings and disclosure to shareholders, general oversight of the service providers, coordination of Fund marketing initiatives, review of Fund legal issues, assisting the Board, including the Independent Directors, in their capacity as directors and other services. The Board, including the Independent Directors, noted the increased responsibilities of the Adviser in response to an increasingly regulated industry. The Board, including the Independent Directors, concluded that the services are extensive in nature, that the Adviser delivered a high level of service to the Fund and that the Adviser is positioned to continue providing such quality of service in the future.
2. Investment Performance of the Fund and the Adviser.
The Board, including the Independent Directors, considered short-term and long-term investment performance for the Fund over various periods of time as compared to both relevant indices and the performance of the Fund’s peer group, and concluded that the Fund was delivering reasonable performance results, especially over the long-term, consistent with the conservative investment strategies that the Fund pursues.
3. Costs of Services and Profits Realized by the Adviser.
a. The Board, including the Independent Directors, considered the information provided by the Fund’s administrator, including the comparative graphs, regarding the Fund’s management fee rate and overall expense ratio relative to industry averages for the Fund’s peer group category and the advisory fees charged by the Adviser to other accounts. The Energy Fund had a gross management fee of 0.95% as compared to the median in its peer group of 1.00%; and, the performance for the 1 year period was (21.29%) as compared to the average of its peer group of (21.79%). The Board viewed favorably the current and historic willingness of the Adviser to limit the overall expense ratios of the Fund. The Board noted that the fees were lower than the median of its peer group. The Board noted that the fees were not unreasonable.
b. Profitability and Costs of Services to the Adviser. The Board, including the Independent Directors, considered estimates of the Adviser’s profitability and costs attributable to the Fund. The Board recognized that increased fixed costs, particularly legal and audit fees in response to increasing regulations, have a greater impact on small fund families, such as the Fund, than on larger fund complexes. Given this, the Board recognized that the Fund’s overall expenses may compare favorably to some funds identified as peers. The Board also considered whether the amount of the Adviser’s profit is a fair profit for the management of the Fund and noted that the Adviser has devoted a large amount of its resources into the Fund since its inception. Mr. Chodosh reported that the fund expense analysis is the same as previous years, but that it does not reflect all of the overhead costs paid by DLA which may be attributed to the Adviser. The Board, including the Independent Directors, concluded that the Adviser’s profitability was at a fair and acceptable level, particularly in light of the quality of the services being provided to the Fund, and bore a reasonable relationship to the services rendered.
4. Extent of Economies of Scale as the Funds Grow.
The Board, including the Independent Directors, considered whether there have been economies of scale with respect to the management of the Fund and whether the Fund will appropriately benefit from any economies of scale. Given the relative small size of the Fund, the Board did not believe that significant (if any) economies of scale have been achieved at this time.
APPROVAL OF THE INVESTMENT ADVISORY AGREEMENT (UNAUDITED) (CONT.)
5. Whether Fee Levels Reflect Economies of Scale.
The Board took into consideration that the Adviser does not currently offer breakpoints in its fees that would otherwise allow investors to benefit directly from economies of scale in the form of lower fees as fund assets grow. However, the Board, including the Independent Directors, did consider enhancements in personnel and services provided to the Fund by the Adviser, without an increase in fees. The Board also noted that few of the Fund’s peers offered breakpoints despite having significantly more assets under management. The Board stated that they would continue to review this in future years as the Fund’s assets grow.
6. Other Relevant Considerations.
a. Personnel and Methods. The Board, including the Independent Directors, reviewed the Adviser’s Form ADV and questioned the Adviser regarding the size, education and experience of the staff of the Adviser, its fundamental research capabilities, approach to recruiting, training and retaining portfolio managers and other research and management personnel, and concluded that these enable the Adviser to provide a high level of service to the Fund. The Board considered the recent management structuring changes and concluded that these changes have positively impacted the management of the Fund. The Board also considered the history, reputation, qualifications and background of the Adviser as well as the qualifications of its personnel.
b. The Board, including the Independent Directors, also considered the character and amount of other direct and incidental benefits received by the Adviser and its affiliates from their association with the Fund, including the benefits received by the affiliated distributor. The Board concluded that potential “fall-out” benefits that the Adviser and its affiliates may receive, such as greater name recognition or increased ability to obtain research services (although the Board noted that the Adviser currently does not use soft dollars to obtain research services), appear to be reasonable, and may in some cases benefit the Fund.
Conclusions. The Board, including the Independent Directors, did not identify any factor as all-important or all-controlling and instead considered the above listed factors and other factors collectively in light of the Fund’s surrounding circumstances. Each Independent Director gave the weight to each factor that he deemed appropriate in his own judgment. The Independent Directors considered the renewal of the Investment Advisory Agreement and determined that the renewal of the Investment Advisory Agreement was in the best interests of the shareholders of the Fund. The Independent Directors also determined that the fees charged to the Fund for the services provided were reasonable. Therefore, the Board, including the Independent Directors, determined that continuation of the Investment Advisory Agreement was in the best interests of the Fund and its shareholders.
DISCLOSURE OF FUND EXPENSES (UNAUDITED)
FOR THE SIX MONTH PERIOD JUNE 1, 2016 TO NOVEMBER 30, 2016
We believe it is important for you to understand the impact of fees regarding your investment. All mutual funds have operating expenses. As a shareholder of the Fund, you incur ongoing costs, which include costs for portfolio management, administrative services, and shareholder reports (like this one), among others. Operating expenses, which are deducted from the Fund’s gross income, directly reduce the investment return of the Fund.
The Fund’s expenses are expressed as a percentage of its average net assets. This figure is known as the expense ratio. The following examples are intended to help you understand the ongoing fees (in dollars) of investing in your Fund and to compare these costs with those of other mutual funds. The examples are based on an investment of $1,000 made at the beginning of the period shown and held for the six month period, June 1, 2016 to November 30, 2016.
| | | | | | | | | | | | | | | | |
| | | Beginning
Account Value,
June 1, 2016 | | | Ending
Account Value,
November 30, 2016 | | | Expenses
Annualized
Expense Ratio | | | Expenses
Paid During
Period(1) | |
Class A Shares | | | | | | | | | | | | | | | | |
Actual | | $ | 1,000.00 | | | $ | 1,073.60 | | | | 1.43 | % | | $ | 7.41 | |
Hypothetical(2) | | $ | 1,000.00 | | | $ | 1,017.85 | | | | 1.43 | % | | $ | 7.21 | |
Class C Shares | | | | | | | | | | | | | | | | |
Actual | | $ | 1,000.00 | | | $ | 1,071.90 | | | | 2.18 | % | | $ | 11.29 | |
Hypothetical(2) | | $ | 1,000.00 | | | $ | 1,014.10 | | | | 2.18 | % | | $ | 10.98 | |
| | | | | | | | | | | | | | | | |
| (1) | Expenses are equal to the Fund’s annualized expense ratios, multiplied by the average account value over the period, multiplied by 183/366 (to reflect the one-half year period). |
| (2) | Assumes a 5% annual return before expenses. |
This table illustrates your Fund’s costs in two ways:
Actual Fund Return: This section helps you to estimate the actual expenses that you paid over the period. The “Ending Account Value” shown is derived from the Fund’s actual return, the third column shows the period’s annualized expense ratio, and the last column shows the dollar amount that would have been paid by an investor who started with $1,000 in the Fund at the beginning of the period. You may use the information here, together with your account value, to estimate the expenses that you paid over the period.
To do so, simply divide your account value by $1,000 (for example, an $8,600 account value divided by $1,000 = 8.6), then multiply the result by the number in the first line under the heading entitled “Expenses Paid During Period.”
Hypothetical 5% Return: This section is intended to help you compare your Fund’s costs with those of other mutual funds. It assumes that the Fund had a return of 5% before expenses during the period shown, but that the expense ratio is unchanged. In this case, because the return used is not the Fund’s actual return, the results do not apply to your investment. You can assess your Fund’s costs by comparing this hypothetical example with the hypothetical examples that appear in shareholder reports of other funds.
Please note that the expenses shown in the table are meant to highlight your ongoing costs only and do not reflect any transactional costs such as sales charges (loads), or redemption fees.
MANAGEMENT OF THE COMPANY (UNAUDITED)
Information pertaining to the Directors and Officers of the Company is set forth below. The Statement of Additional Information includes additional information about the Directors and is available without charge, upon request, by calling 516-390-5565.
| | | | | | | | | | | | |
Name, (Age) and Address1 Position(s) with the Company | |
| Term of Office2
and Length of Time Served |
| | Principal Occupation(s) During Past Five Years | |
| Number of
Portfolios in
Fund Complex
Overseen by
Director |
| | Other Directorships Held by Director |
| | | | |
INTERESTED DIRECTORS | | | | | | | | | | | | |
David Lerner3 (80) Director, Chairman of the Board, President | | | Since 1998 | | | Founder, David Lerner Associates, Inc., a registered broker-dealer and the Company’s Distributor; and President, Spirit of America Management Corp., the Company’s investment adviser. | | | 6 | | | President and a Director of Spirit of America Management Corp., the Company’s investment adviser. |
| | | | |
Daniel Lerner3 (55) Director | | | Since 1998 | | | Senior Vice President, Investment Counselor with David Lerner Associates, Inc., a registered broker-dealer and the Company’s Distributor, since September 2000. | | | 6 | | | Director of David Lerner Associates, Inc., a registered broker-dealer and the Company’s Distributor. |
| | | | |
INDEPENDENT DIRECTORS | | | | | | | | | | | | |
Allen Kaufman (80) Director | | | Since 1998 | | | President and Chief Executive Officer of K.G.K. Agency, Inc., a property and casualty insurance agency, since 1963.4 | | | 6 | | | Director of K.G.K. Agency, Inc., a property and casualty insurance agency. |
| | | | |
Stanley S. Thune (80) Lead Director | | | Since 1998 | | | President and Chief Executive Officer, Freight Management Systems, Inc., a third party logistics management company, since 1994; private investor. | | | 6 | | | Director of Freight Management Systems, Inc. |
| | | | |
Richard Weinberger (80) Director | | | Since 2005 | | | Of Counsel to Ballon Stoll Bader & Nadler, P.C., a mid-sized law firm, since January 2005 to March 2011; Shareholder, Ballon Stoll Bader & Nadler, P.C., January 2000 to December 2004. | | | 6 | | | None. |
| | | | |
OFFICERS | | | | | | | | | | | | |
David Lerner President (see biography above) | | | | | | | | | | | | |
| | | | |
Alan P. Chodosh (63) Treasurer and Secretary | |
| Since 2003
(Treasurer) Since 2005 (Secretary) |
| | Executive Vice President and Chief Financial Officer of David Lerner Associates, Inc. since June 1999. | | | N/A | | | N/A |
| | | | |
Joseph Pickard (56) Chief Compliance Officer | | | Since 2007 | | | Chief Compliance Officer of Spirit of America Investment Fund, Inc. and Spirit of America Management Corp. since July 2007; Counsel to the Interested Directors of Spirit of America Investment Fund, Inc. since July 2002; General Counsel of David Lerner Associates, Inc. since July 2002. | | | N/A | | | N/A |
| 1 | All addresses are in c/o Spirit of America Investment Fund, Inc., 477 Jericho Turnpike, Syosset, New York 11791. |
| 2 | Each Director serves for an indefinite term, until his successor is elected. |
| 3 | David Lerner is an “interested” Director, as defined in the 1940 Act, by reason of his positions with the Adviser, and Daniel Lerner is an “interested” Director by reason of his position with the Distributor. Daniel Lerner is the son of David Lerner. |
| 4 | K.G.K. Agency, Inc. provides insurance to David Lerner Associates, Inc. and affiliated entities. However, the Board has determined that Mr. Kaufman is not an “interested” Director because the insurance services are less than $120,000 in value. |
Proxy Voting Information
The Company’s Statement of Additional Information (“SAI”) containing a description of the policies and procedures that the Spirit of America Energy Fund uses to determine how to vote proxies relating to portfolio securities, along with the Company’s proxy voting record relating to portfolio securities held during the 12-month period ended June 30 are available (i) without charge, upon request, by calling (516) 390-5565; and (ii) on the SEC’s website at http://www.sec.gov.
Information on Form N-Q
The Company will file its complete schedule of portfolio holdings with the SEC for the first and third quarters of each fiscal year on Form N-Q within sixty days after the end of the period. The Company’s Forms N-Q will be available on the SEC’s website at http://www.sec.gov, and may be reviewed and copied at the SEC’s Public Reference Room in Washington, DC. Information on the operation of the Public Reference Room may be obtained by calling 1-800-SEC-0030.
Investment Adviser
Spirit of America Management Corp.
477 Jericho Turnpike
P.O. Box 9006
Syosset, NY 11791-9006
Distributor
David Lerner Associates, Inc.
477 Jericho Turnpike
P.O. Box 9006
Syosset, NY 11791-9006
Shareholder Services
Ultimus Asset Services, LLC
225 Pictoria Drive, Suite 450
Cincinnati, OH 45246
Custodian
The Huntington National Bank
7 Easton Oval
Columbus, OH 43219
Independent Registered
Public Accounting Firm
Tait Weller & Baker LLP
1818 Market Street, Suite 2400
Philadelphia, PA 19103
Counsel
Blank Rome LLP
405 Lexington Avenue
New York, NY 10174

For additional information about the Spirit of America Energy Fund, call (800) 452-4892 or (610) 382-7819.
This report is submitted for the general information of the shareholders of the Fund. It is not authorized for distribution to prospective investors in the Fund unless preceded or accompanied by an effective Prospectus which includes details regarding the Fund’s objectives, risks, policies, expenses, and other information.
©Copyright 2016 Spirit of America SOAEN-AR16
Item 2. Code of Ethics.
(a) As of the end of the period covered by the report, the registrant has adopted a code of ethics that applies to the registrant’s Principal Executive Officer and Principal Financial Officer.
(b) Not applicable.
(c) During the period covered by the report, with respect to the registrant’s code of ethics that applies to its Principal Executive Officer and Principal Financial Officer: there have been no amendments to a provision that relates to any element of the code of ethics definition enumerated in paragraph (b) of this Item 2.
(d) During the period covered by the report, with respect to the registrant’s code of ethics that applies to its Principal Executive Officer and Principal Financial Officer: there have been no waivers granted from a provision that relates to any element of the code of ethics definition enumerated in paragraph (b) of this Item 2.
(e) Not applicable.
(f) The registrant has included a copy of the code of ethics that applies to the registrant’s Principal Executive Officer and Principal Financial Officer. This code of ethics is included as an Exhibit on this Form N-CSR.
Item 3. Audit Committee Financial Expert.
(a) The registrant’s board of trustees has determined that the registrant does not have an audit committee financial expert. The committee members and the full Board considered a possibility of adding a member that would qualify as an expert. The audit committee determined that, although none of its members meet the technical definition of an audit committee expert, the committee has sufficient financial expertise to adequately perform its duties under the Audit Committee Charter without the addition of a qualified expert.
Item 4. Principal Accountant Fees and Services.
(a) Audit Fees billed to the registrant by its principal accountants for the two most recent fiscal years:
Fiscal year ended 2016: $19,775
Fiscal year ended 2015: $19,200
(b) Audit-Related Fees billed to the registrant by its principal accountants for the two most recent fiscal years:
Fiscal year ended 2016: $0
Fiscal year ended 2015: $0
Fees for 2015 and 2014 related to the agreed-upon review of items within the Management’s Discussion of Fund Performance sections of the Funds’ Form N-CSR filing. Amount requiring approval of the registrant’s audit committee pursuant to paragraph (c)(7)(ii) of Rule 2-01 of Regulation S-X, $0 and $0 respectively.
(c) Tax Fees billed to the registrant by its principal accountants for the two most recent fiscal years:
Fiscal year ended 2016: $3,800
Fiscal year ended 2015: $3,700
Fees for 2015 and 2014 related to the review of the registrant’s tax returns. Amount requiring approval of the registrant’s audit committee pursuant to paragraph (c)(7)(ii) of Rule 2-01 of Regulation S-X, $0 and $0 respectively.
(d) All other fees billed to the registrant by its principal accountants for the two most recent fiscal years:
Fiscal year ended 2016: $0
Fiscal year ended 2015: $0
Amount requiring approval of the registrant’s audit committee pursuant to paragraph (c)(7)(ii) of Rule 2-01 of Regulation S-X, $0 and $0 respectively.
(e)(1) Disclose the audit committee’s pre-approval policies and procedures described in paragraph (c)(7) of Rule 2-01 of Regulation S-X
Pre-Approval of Audit and Permitted Non-Audit Services Provided to the Company
Pre-Approval Requirements. The Committee shall pre-approve all auditing services and permissible non-audit services (e.g., tax services) to be provided to the Company by the Auditor, including the fees therefor. The Committee may delegate to one or more of its members the authority to grant pre-approvals. In connection with such delegation, the Committee shall establish pre-approval policies and procedures, including the requirement that the decisions of any member to whom authority is delegated under this section (B) shall be presented to the full Committee at each of its scheduled meetings.
De Minimis Exception to Pre-Approval: Pre-approval for a permitted non-audit service shall not be required if:
| | a. | the aggregate amount of all such non-audit services is not more than 5% of the total revenues paid by the Company to the Auditor in the fiscal year in which the non-audit services are provided; |
| | b. | such services were not recognized by the Company at the time of the engagement to be non-audit services; and |
| | c. | such services are promptly brought to the attention of the Committee and approved prior to the completion of the audit by the Committee or by one or more members of the Committee to whom authority to grant such approvals has been delegated by the Committee. |
Additionally, the Committee shall pre-approve the Auditor’s engagements for non-audit services with the Adviser and any affiliate of the Adviser that provides ongoing services to the Company in accordance with the foregoing, if the engagement relates directly to the operations and financial reporting of the Company, unless the aggregate amount of all services provided constitutes no more than 5% of the total amount of revenues paid to the Auditor by the Company, the Adviser and any affiliate of the Adviser that provides ongoing services to the Company during the fiscal year in which the services are provided that would have to be pre-approved by the Committee pursuant to this paragraph (without regard to this exception).
(e)(2) The percentage of services described in each of paragraphs (b) through (d) of this Item that were approved by the audit committee pursuant to paragraph (c)(7)(i)(C) of Rule 2-01 of Regulation S-X are as follows:
(b) 0%
(c) 0%
(d) 0%
(f) The percentage of hours expended on the principal accountant’s engagement to audit the registrant’s financial statements for the most recent fiscal year that were attributed to work performed by persons other than the principal accountant’s full-time, permanent employees was 0%.
(g) The aggregate non-audit fees billed by the registrant’s accountant for services rendered to the registrant, and rendered to the registrant’s investment adviser (not including any sub-adviser whose role is primarily portfolio management and is subcontracted with or overseen by another investment adviser), and any entity controlling, controlled by, or under common control with the adviser that provides ongoing services to the registrant for fiscal years ended November 30, 2015 and November 30, 2016 are $0 and $0, respectively
(h) The registrant’s audit committee of the board of directors has considered whether the provision of non-audit services that were rendered to the registrant’s investment adviser (not including any sub-adviser whose role is primarily portfolio management and is subcontracted with or overseen by another investment adviser), and any entity controlling, controlled by, or under common control with the investment adviser that provides ongoing services to the registrant that were not pre-approved pursuant to paragraph (c)(7)(ii) of Rule 2-01 of Regulation S-X is compatible with maintaining the principal accountant’s independence.
Item 5. Audit Committee of Listed Registrants.
Not applicable.
Item 6. Schedule of Investments.
(a) Not applicable.
(b) Not applicable.
Item 7. Disclosure of Proxy Voting Policies and Procedures for Closed-End Management Investment Companies.
Not applicable.
Item 8. Portfolio Managers of Closed-End Management Investment Companies.
Not applicable.
Item 9. Purchases of Equity Securities by Closed-End Management Investment Company and Affiliated Purchasers.
Not applicable.
Item 10. Submission of Matters to a Vote of Security Holders.
Not applicable.
Item 11. Controls and Procedures.
(a) The registrant’s Principal Executive Officer and Principal Financial Officer have concluded that the registrant’s disclosure controls and procedures (as defined in Rule 30a-3(c) under the Act) are effective in design and operation and are sufficient to form the basis of the certifications required by Rule 30a-2 under the Act, based on their evaluation of these disclosure controls and procedures within 90 days of the filing of this report on Form N-CSR.
(b) There were no changes in the registrant’s internal control over financial reporting (as defined in Rule 30a-3(d) under the Act (17 CFR 270.30a-3(d)) that occurred during the period covered by this report that have materially affected or are reasonably likely to materially affect, the registrant’s internal control over financial reporting.
Item 12. Exhibits.
(a)(1) The code of ethics that is the subject of the disclosure required by Item 2 is attached hereto.
(a)(2) Certifications pursuant to Rule 30a-2(a) are attached hereto.
(a)(3) Not applicable.
(b) Certifications pursuant to Rule 30a-2(b) are furnished herewith.
SIGNATURES
Pursuant to the requirements of the Securities Exchange Act of 1934 and the Investment Company Act of 1940, the registrant has duly caused this report to be signed on its behalf by the undersigned, thereunto duly authorized.
(Registrant) The Spirit of America Funds, Inc.
| | | | |
| By (Signature and Title)* | | /s/ David Lerner | | |
| | David Lerner, Principal Executive Officer | | |
Date 1/24/17
Pursuant to the requirements of the Securities Exchange Act of 1934 and the Investment Company Act of 1940, this report has been signed below by the following persons on behalf of the registrant and in the capacities and on the dates indicated.
| | | | |
| By (Signature and Title)* | | /s/ David Lerner | | |
| | David Lerner, Principal Executive Officer | | |
Date 1/24/17
| | | | |
| By (Signature and Title)* | | /s/ Alan P. Chodosh | | |
| | Alan P. Chodosh, Principal Financial Officer | | |
Date 1/24/2017