UNITED STATES
SECURITIES AND EXCHANGE COMMISSION
Washington, D.C. 20549
FORMN-CSR
CERTIFIED SHAREHOLDER REPORT OF REGISTERED
MANAGEMENT INVESTMENT COMPANIES
Investment Company Act file number:811-08257
STATE STREET INSTITUTIONAL FUNDS
(Exact name of registrant as specified in charter)
One Iron Street
Boston, Massachusetts 02210
(Address of principal executive offices)(Zip code)
| | |
| (Name and Address of Agent for Service) | | Copy to: |
| |
Sean O’Malley, Esq. Senior Vice President and Deputy General Counsel c/o SSGA Funds Management, Inc. One Iron Street Boston, Massachusetts 02210 | | Timothy W. Diggins, Esq. Ropes & Gray LLP Prudential Tower 800 Boylston Street Boston, Massachusetts 02199-3600 |
Registrant’s telephone number, including area code:800-242-0134
Date of fiscal year end: September 30
Date of reporting period: March 31, 2020
| Item 1. | Shareholder Report. |
Semi-Annual Report
March 31, 2020
State Street Institutional Funds
Beginning on January 1, 2021, as permitted by regulations adopted by the U.S. Securities and Exchange Commission, paper copies of a Fund’s annual and semi-annual shareholder reports will no longer be sent by mail, unless you specifically request paper copies of the reports from the Fund (or from your financial intermediary, such as a broker-dealer or bank). Instead, the reports will be made available on a Fund’s website (www.ssga.com/geam), and you will be notified by mail each time a report is posted, and provided with a website link to access the report. If you already elected to receive shareholder reports electronically, you will not be affected by this change and you need not take any action. You may elect to receive shareholder reports and other communications from a Fund by calling800-242-0134.
You may elect to receive all future reports in paper free of charge. If you invest through a financial intermediary, you can contact your financial intermediary to request that you continue to receive paper copies of your shareholder reports. If you invest directly with a Fund, you can inform the Fund that you wish to continue receiving paper copies of your shareholder reports by calling 800-242-0134. Your election to receive reports in paper will apply to all funds held in your account, if you invest through your financial intermediary or all funds held with the fund complex if you invest directly with a Fund.

State Street Institutional Funds
Semi-Annual Report
March 31, 2020
Table of Contents
This report has been prepared for shareholders and may be distributed to others only if accompanied with a current prospectus and/or summary prospectus.
State Street Institutional Funds
Notes to Performance — March 31, 2020 (Unaudited)
Total return performance shown in this report for the State Street Institutional Funds (the “Trust”) and each of its series portfolios (each, a “Fund” and collectively, the “Funds”) takes into account changes in share price and assumes reinvestment of dividends and capital gains distributions, if any. Total returns shown are net of Fund expenses.
The performance data quoted represents past performance; past performance does not guarantee future results. Investment return and principal value will fluctuate, so your shares, when redeemed, may be worth more or less than their original cost. Current performance may be higher or lower than the performance data quoted. Periods of less than one year are not annualized. Please call toll-free (800)242-0134 or visit the Funds’ website at http://www.ssga.com/geam for the most recentmonth-end performance data.
An investment in a Fund is not a deposit of any bank and is not insured or guaranteed by the Federal Deposit Insurance Corporation (“FDIC”) or any other government agency. An investment in a Fund is subject to risk, including possible loss of principal invested.
State Street Global Advisors Funds Distributors, LLC, member of FINRA & SIPC is the principal underwriter and distributor of the State Street Institutional Funds and an indirect wholly-owned subsidiary of State Street Corporation. References to State Street may include State Street Corporation and its affiliates. The Funds pay State Street Bank and Trust Company for its services as custodian and Fund Accounting agent, and pay SSGA Funds Management, Inc. (“SSGA FM” or the “Adviser”) for investment advisory and administrative services.
State Street Institutional U.S. Equity Fund
Understanding Your Fund’s Expenses — March 31, 2020 (Unaudited)
As a shareholder of the Fund you incur ongoing costs. Ongoing costs include portfolio management fees, distribution and service fees (for Service Class shares) and trustees’ fees. The following example is intended to help you understand your ongoing costs (in dollars) of investing in the Fund and to compare these costs with the ongoing costs of investing in other mutual funds.
To illustrate these ongoing costs, we have provided an example and calculated the expenses paid by investors in each share class of the Fund during the period. The information in the following table is based on an investment of $1,000, which is invested at the beginning of the period and held for the entiresix-month period ended March 31, 2020.
Actual Expenses
The first section of the table provides information about actual account values and actual expenses. You may use the information in this section, together with the amount you invested, to estimate the expenses that you paid over the period. To do so, simply divide your account value by $1,000 (for example, an $8,600 account value divided by $1,000 = 8.6), then multiply the result by the number given for your class under the heading “Expenses paid during the period” to estimate the expenses you paid on your account during the period.
Hypothetical Example for Comparison Purposes
The second section of the table provides information about hypothetical account values and hypothetical expenses based on the Fund’s actual expense ratio and an assumed rate of return of 5% per year before expenses, which is not the Fund’s actual return. The hypothetical account values and expenses may not be used to estimate the actual ending account balance or expenses you paid for the period. You may use this information to compare the ongoing costs of investing in the Fund and other funds. To do so, compare this 5% hypothetical example with the 5% hypothetical examples that appear in the shareholders reports of other funds.
Please note that the expenses shown in the table are meant to highlight and help you compare ongoing costs only and do not reflect transaction costs, such as sales charges or redemption fees, if any. Therefore, the second section of the table is useful in comparing ongoing costs only, and will not help you determine the relative total costs of owning different funds.
| | | | | | | | |
Investment Class | | Actual
Fund Return | | | Hypothetical
5% Return
(2.5% for
the period) | |
Actual Fund Return | | | | | | | | |
Beginning Account Value October 1, 2019 | | $ | 1,000.00 | | | $ | 1,000.00 | |
Ending Account Value March 31, 2020 | | $ | 904.30 | | | $ | 1,023.20 | |
Expenses Paid During Period* | | $ | 1.76 | | | $ | 1.87 | |
| | |
Service Class | | | | | | |
Actual Fund Return | | | | | | | | |
Beginning Account Value October 1, 2019 | | $ | 1,000.00 | | | $ | 1,000.00 | |
Ending Account Value March 31, 2020 | | $ | 903.30 | | | $ | 1,021.90 | |
Expenses Paid During Period* | | $ | 2.95 | | | $ | 3.13 | |
| * | Expenses are equal to the Fund’s annualized expense ratio of 0.37% for Investment Class shares and 0.62% for Service Class shares (for the period October 1, 2019-March 31, 2020), multiplied by the average account value over the period, multiplied by 183/366 (to reflect theone-half year period). |
| | |
| 2 | | State Street Institutional U.S. Equity Fund |
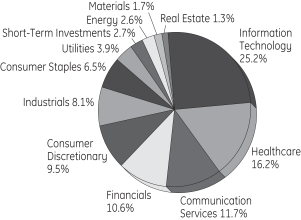
State Street Institutional U.S. Equity Fund
Performance Summary — March 31, 2020 (Unaudited)
Sector Allocation
Portfolio Composition as a % of Fair Value of $350,889 (in thousands) as of March 31, 2020(a)(b)
Top Ten Largest Holdings
as of March 31, 2020 (as a % of Fair Value)(a)(b)
| | | | |
Microsoft Corp. | | | 5.64 | % |
| |
Amazon.com Inc. | | | 4.61 | % |
| |
Apple Inc. | | | 3.90 | % |
| |
Alphabet Inc., Class A | | | 2.84 | % |
| |
Visa Inc., Class A | | | 2.49 | % |
| |
JPMorgan Chase & Co. | | | 2.43 | % |
| |
Merck & Company Inc. | | | 2.43 | % |
| |
Facebook Inc., Class A | | | 2.32 | % |
| |
UnitedHealth Group Inc. | | | 2.23 | % |
| |
salesforce.com Inc. | | | 1.81 | % |
| (a) | Fair Value basis is inclusive of short-term investment in State Street Institutional U.S. Government Money Market Fund – Class G Shares. |
| (b) | The securities information regarding holdings, allocations and other characteristics is presented to illustrate examples of securities that the Fund has bought and the diversity of areas in which the Fund may invest as of a particular date. It may not be representative of the Fund’s current or future investments and should not be construed as a recommendation to purchase or sell a particular security. |
| | | | |
| State Street Institutional U.S. Equity Fund | | | 3 | |
State Street Institutional U.S. Equity Fund
Schedule of Investments — March 31, 2020 (Unaudited)
| | | | | | | | |
| | | Number
of Shares | | | Fair
Value $ | |
| | | | | | | | |
| | | | | | | | |
|
| Common Stock - 97.2%† | |
Aerospace & Defense - 0.9% | |
Hexcel Corp. | | | 20,602 | | | | 766,188 | |
Raytheon Co. | | | 13,208 | | | | 1,732,229 | |
The Boeing Co. | | | 4,211 | | | | 628,029 | |
| | | | | | | | |
| | | | 3,126,446 | |
| | | | | | | | |
|
Air Freight & Logistics - 0.3% | |
United Parcel Service Inc., Class B | | | 12,667 | | | | 1,183,351 | |
| | | | | | | | |
|
Application Software - 2.7% | |
Adobe Inc. (a) | | | 8,043 | | | | 2,559,604 | |
Intuit Inc. | | | 2,701 | | | | 621,230 | |
salesforce.com Inc. (a) | | | 44,049 | | | | 6,342,175 | |
| | | | | | | | |
| | | | 9,523,009 | |
| | | | | | | | |
|
Asset Management & Custody Banks - 0.4% | |
The Blackstone Group Inc., Class A | | | 27,021 | | | | 1,231,347 | |
| | | | | | | | |
|
Auto Parts & Equipment - 0.1% | |
Aptiv PLC | | | 6,168 | | | | 303,712 | |
| | | | | | | | |
|
Automotive Retail - 0.4% | |
O’Reilly Automotive Inc. (a) | | | 4,841 | | | | 1,457,383 | |
| | | | | | | | |
|
Biotechnology - 2.4% | |
Alexion Pharmaceuticals Inc. (a) | | | 14,887 | | | | 1,336,704 | |
BioMarin Pharmaceutical Inc. (a) | | | 19,596 | | | | 1,655,862 | |
Gilead Sciences Inc. | | | 33,286 | | | | 2,488,461 | |
Vertex Pharmaceuticals Inc. (a) | | | 12,629 | | | | 3,005,071 | |
| | | | | | | | |
| | | | 8,486,098 | |
| | | | | | | | |
|
Building Products - 1.3% | |
Allegion PLC | | | 6,718 | | | | 618,191 | |
Trane Technologies PLC | | | 47,292 | | | | 3,905,846 | |
| | | | | | | | |
| | | | 4,524,037 | |
| | | | | | | | |
|
Cable & Satellite - 1.8% | |
Charter Communications Inc., Class A (a) | | | 9,310 | | | | 4,062,046 | |
Comcast Corp., Class A | | | 67,606 | | | | 2,324,294 | |
| | | | | | | | |
| | | | 6,386,340 | |
| | | | | | | | |
|
Communications Equipment - 0.6% | |
Cisco Systems Inc. | | | 52,780 | | | | 2,074,782 | |
| | | | | | | | |
|
Construction Materials - 0.1% | |
Vulcan Materials Co. | | | 2,552 | | | | 275,795 | |
| | | | | | | | |
| | | | | | | | |
| | | Number
of Shares | | | Fair
Value $ | |
|
Data Processing & Outsourced Services - 3.8% | |
Fidelity National Information Services Inc. | | | 10,650 | | | | 1,295,466 | |
Mastercard Inc., Class A | | | 13,914 | | | | 3,361,066 | |
Visa Inc., Class A | | | 54,296 | | | | 8,748,171 | |
| | | | | | | | |
| | | | 13,404,703 | |
| | | | | | | | |
|
Diversified Banks - 2.4% | |
JPMorgan Chase & Co. | | | 94,735 | | | | 8,528,992 | |
| | | | | | | | |
|
Diversified Support Services - 0.1% | |
Cintas Corp. | | | 2,796 | | | | 484,323 | |
| | | | | | | | |
|
Electric Utilities - 1.6% | |
American Electric Power Company Inc. | | | 7,009 | | | | 560,580 | |
Exelon Corp. | | | 47,502 | | | | 1,748,548 | |
NextEra Energy Inc. | | | 14,266 | | | | 3,432,685 | |
| | | | | | | | |
| | | | 5,741,813 | |
| | | | | | | | |
|
Electronic Components - 2.3% | |
Amphenol Corp., Class A | | | 43,691 | | | | 3,184,200 | |
Corning Inc. | | | 230,467 | | | | 4,733,792 | |
| | | | | | | | |
| | | | 7,917,992 | |
| | | | | | | | |
|
Environmental & Facilities Services - 1.1% | |
Republic Services Inc. | | | 8,598 | | | | 645,366 | |
Waste Connections Inc. | | | 3,773 | | | | 292,408 | |
Waste Management Inc. | | | 30,747 | | | | 2,845,942 | |
| | | | | | | | |
| | | | 3,783,716 | |
| | | | | | | | |
|
Financial Exchanges & Data - 3.3% | |
CME Group Inc. | | | 26,652 | | | | 4,608,397 | |
MSCI Inc. | | | 4,350 | | | | 1,256,976 | |
S&P Global Inc. | | | 18,654 | | | | 4,571,163 | |
Tradeweb Markets Inc., Class A | | | 23,357 | | | | 981,928 | |
| | | | | | | | |
| | | | 11,418,464 | |
| | | | | | | | |
|
Footwear - 0.7% | |
NIKE Inc., Class B | | | 30,415 | | | | 2,516,537 | |
| | | | | | | | |
|
Gold - 0.2% | |
Newmont Corp. | | | 11,220 | | | | 508,042 | |
| | | | | | | | |
|
Healthcare Equipment - 3.2% | |
Abbott Laboratories | | | 10,618 | | | | 837,866 | |
Becton Dickinson and Co. | | | 10,091 | | | | 2,318,609 | |
Boston Scientific Corp. (a) | | | 176,482 | | | | 5,758,608 | |
Medtronic PLC | | | 27,355 | | | | 2,466,874 | |
| | | | | | | | |
| | | | 11,381,957 | |
| | | | | | | | |
See Notes to Schedules of Investments and Notes to Financial Statements.
| | |
| 4 | | State Street Institutional U.S. Equity Fund |
State Street Institutional U.S. Equity Fund
Schedule of Investments, continued — March 31, 2020 (Unaudited)
| | | | | | | | |
| | | Number
of Shares | | | Fair
Value $ | |
| | | | | | | | |
Healthcare Services - 1.2% | |
Cigna Corp. (a) | | | 13,474 | | | | 2,387,323 | |
Quest Diagnostics Inc. | | | 22,793 | | | | 1,830,278 | |
| | | | | | | | |
| | | | 4,217,601 | |
| | | | | | | | |
|
Home Improvement Retail - 1.7% | |
Lowe’s Companies Inc. | | | 55,495 | | | | 4,775,345 | |
The Home Depot Inc. | | | 5,983 | | | | 1,117,086 | |
| | | | | | | | |
| | | | 5,892,431 | |
| | | | | | | | |
|
Hotels, Resorts & Cruise Lines - 0.2% | |
Marriott International Inc., Class A | | | 8,697 | | | | 650,623 | |
| | | | | | | | |
|
Household Products - 1.6% | |
Colgate-Palmolive Co. | | | 22,077 | | | | 1,465,030 | |
The Procter & Gamble Co. | | | 37,472 | | | | 4,121,920 | |
| | | | | | | | |
| | | | 5,586,950 | |
| | | | | | | | |
|
Hypermarkets & Super Centers - 0.5% | |
Walmart Inc. | | | 16,616 | | | | 1,887,910 | |
| | | | | | | | |
|
Industrial Conglomerates - 2.0% | |
Honeywell International Inc. | | | 39,497 | | | | 5,284,304 | |
Roper Technologies Inc. | | | 6,021 | | | | 1,877,408 | |
| | | | | | | | |
| | | | 7,161,712 | |
| | | | | | | | |
|
Industrial Gases - 0.8% | |
Air Products & Chemicals Inc. | | | 13,176 | | | | 2,630,061 | |
| | | | | | | | |
|
Industrial Machinery - 0.4% | |
Xylem Inc. | | | 23,814 | | | | 1,551,006 | |
| | | | | | | | |
|
Insurance Brokers - 0.4% | |
Brown & Brown Inc. | | | 8,981 | | | | 325,292 | |
Marsh & McLennan Companies Inc. | | | 13,612 | | | | 1,176,893 | |
| | | | | | | | |
| | | | 1,502,185 | |
| | | | | | | | |
|
Integrated Oil & Gas - 1.5% | |
Chevron Corp. | | | 55,575 | | | | 4,026,964 | |
Exxon Mobil Corp. | | | 35,104 | | | | 1,332,899 | |
| | | | | | | | |
| | | | 5,359,863 | |
| | | | | | | | |
|
Integrated Telecommunication Services - 0.7% | |
AT&T Inc. | | | 23,677 | | | | 690,185 | |
Verizon Communications Inc. | | | 30,439 | | | | 1,635,487 | |
| | | | | | | | |
| | | | 2,325,672 | |
| | | | | | | | |
|
Interactive Home Entertainment - 0.3% | |
Activision Blizzard Inc. | | | 10,926 | | | | 649,878 | |
Electronic Arts Inc. (a) | | | 5,562 | | | | 557,146 | |
| | | | | | | | |
| | | | 1,207,024 | |
| | | | | | | | |
| | | | | | | | |
| | | Number
of Shares | | | Fair
Value $ | |
Interactive Media & Services - 6.6% | |
Alphabet Inc., Class A (a) | | | 8,565 | | | | 9,952,102 | |
Alphabet Inc., Class C (a) | | | 4,379 | | | | 5,091,945 | |
Facebook Inc., Class A (a) | | | 48,791 | | | | 8,138,339 | |
| | | | | | | | |
| | | | 23,182,386 | |
| | | | | | | | |
|
Internet & Direct Marketing Retail - 5.1% | |
Amazon.com Inc. (a)(b) | | | 8,296 | | | | 16,174,877 | |
Booking Holdings Inc. (a) | | | 1,288 | | | | 1,732,772 | |
| | | | | | | | |
| | | | 17,907,649 | |
| | | | | | | | |
|
IT Consulting & Other Services - 0.7% | |
Accenture PLC, Class A | | | 7,303 | | | | 1,192,288 | |
International Business Machines Corp. | | | 10,119 | | | | 1,122,501 | |
| | | | | | | | |
| | | | 2,314,789 | |
| | | | | | | | |
|
Life Sciences Tools & Services - 1.3% | |
Avantor Inc. (a) | | | 46,328 | | | | 578,637 | |
IQVIA Holdings Inc. (a) | | | 36,269 | | | | 3,911,974 | |
| | | | | | | | |
| | | | 4,490,611 | |
| | | | | | | | |
|
Managed Healthcare - 2.2% | |
UnitedHealth Group Inc. | | | 31,393 | | | | 7,828,786 | |
| | | | | | | | |
|
Movies & Entertainment - 2.0% | |
Netflix Inc. (a) | | | 3,416 | | | | 1,282,708 | |
The Walt Disney Co. | | | 60,927 | | | | 5,885,548 | |
| | | | | | | | |
| | | | 7,168,256 | |
| | | | | | | | |
|
Multi-Line Insurance - 0.1% | |
American International Group Inc. | | | 19,612 | | | | 475,591 | |
| | | | | | | | |
|
Multi-Sector Holdings - 1.2% | |
Berkshire Hathaway Inc., Class B (a) | | | 23,669 | | | | 4,327,403 | |
| | | | | | | | |
|
Multi-Utilities - 2.2% | |
CMS Energy Corp. | | | 31,304 | | | | 1,839,110 | |
Sempra Energy | | | 53,349 | | | | 6,027,904 | |
| | | | | | | | |
| | | | 7,867,014 | |
| | | | | | | | |
|
Oil & Gas Equipment & Services - 0.5% | |
Schlumberger Ltd. | | | 115,981 | | | | 1,564,584 | |
| | | | | | | | |
|
Oil & Gas Exploration & Production - 0.5% | |
ConocoPhillips | | | 29,046 | | | | 894,617 | |
EOG Resources Inc. | | | 4,131 | | | | 148,385 | |
Pioneer Natural Resources Co. | | | 9,325 | | | | 654,149 | |
| | | | | | | | |
| | | | 1,697,151 | |
| | | | | | | | |
See Notes to Schedules of Investments and Notes to Financial Statements.
| | | | |
| State Street Institutional U.S. Equity Fund | | | 5 | |
State Street Institutional U.S. Equity Fund
Schedule of Investments, continued — March 31, 2020 (Unaudited)
| | | | | | | | |
| | | Number
of Shares | | | Fair
Value $ | |
| | | | | | | | |
Oil & Gas Refining & Marketing - 0.1% | |
Marathon Petroleum Corp. | | | 19,771 | | | | 466,991 | |
| | | | | | | | |
|
Packaged Foods & Meats - 2.0% | |
General Mills Inc. | | | 25,044 | | | | 1,321,572 | |
Mondelez International Inc., Class A | | | 116,943 | | | | 5,856,505 | |
| | | | | | | | |
| | | | 7,178,077 | |
| | | | | | | | |
|
Personal Products - 0.1% | |
The Estee Lauder Companies Inc., Class A | | | 2,370 | | | | 377,636 | |
| | | | | | | | |
|
Pharmaceuticals - 5.8% | |
Bristol-Myers Squibb Co. | | | 51,131 | | | | 2,850,042 | |
Elanco Animal Health Inc. (a) | | | 119,977 | | | | 2,686,285 | |
Johnson & Johnson | | | 39,223 | | | | 5,143,312 | |
Merck & Company Inc. | | | 110,640 | | | | 8,512,642 | |
Mylan N.V. (a) | | | 74,710 | | | | 1,113,926 | |
| | | | | | | | |
| | | | 20,306,207 | |
| | | | | | | | |
|
Property & Casualty Insurance - 0.6% | |
Chubb Ltd. | | | 10,425 | | | | 1,164,368 | |
The Progressive Corp. | | | 14,499 | | | | 1,070,606 | |
| | | | | | | | |
| | | | 2,234,974 | |
| | | | | | | | |
|
Railroads - 0.6% | |
Union Pacific Corp. | | | 13,945 | | | | 1,966,803 | |
| | | | | | | | |
|
Regional Banks - 2.1% | |
First Republic Bank | | | 64,485 | | | | 5,305,826 | |
Regions Financial Corp. | | | 96,043 | | | | 861,506 | |
SVB Financial Group (a) | | | 9,026 | | | | 1,363,648 | |
| | | | | | | | |
| | | | 7,530,980 | |
| | | | | | | | |
|
Restaurants - 0.9% | |
Domino’s Pizza Inc. | | | 2,221 | | | | 719,760 | |
McDonald’s Corp. | | | 14,880 | | | | 2,460,408 | |
| | | | | | | | |
| | | | 3,180,168 | |
| | | | | | | | |
|
Semiconductor Equipment - 1.7% | |
Applied Materials Inc. | | | 120,360 | | | | 5,514,895 | |
Lam Research Corp. | | | 1,601 | | | | 384,240 | |
| | | | | | | | |
| | | | 5,899,135 | |
| | | | | | | | |
|
Semiconductors - 2.9% | |
Intel Corp. | | | 37,053 | | | | 2,005,308 | |
NVIDIA Corp. | | | 15,074 | | | | 3,973,507 | |
QUALCOMM Inc. | | | 11,371 | | | | 769,248 | |
Texas Instruments Inc. | | | 33,629 | | | | 3,360,546 | |
| | | | | | | | |
| | | | 10,108,609 | |
| | | | | | | | |
| | | | | | | | |
| | | Number
of Shares | | | Fair
Value $ | |
Soft Drinks - 1.8% | |
PepsiCo Inc. | | | 51,153 | | | | 6,143,475 | |
| | | | | | | | |
|
Specialized REITs - 1.3% | |
American Tower Corp. | | | 11,313 | | | | 2,463,406 | |
Extra Space Storage Inc. | | | 20,447 | | | | 1,958,005 | |
| | | | | | | | |
| | | | 4,421,411 | |
| | | | | | | | |
|
Specialty Chemicals - 0.7% | |
Albemarle Corp. | | | 17,690 | | | | 997,185 | |
DuPont de Nemours Inc. | | | 32,151 | | | | 1,096,349 | |
Ecolab Inc. | | | 1,619 | | | | 252,289 | |
| | | | | | | | |
| | | | 2,345,823 | |
| | | | | | | | |
|
Specialty Stores - 0.4% | |
Tractor Supply Co. | | | 18,151 | | | | 1,534,667 | |
| | | | | | | | |
|
Systems Software - 6.7% | |
Microsoft Corp. | | | 125,412 | | | | 19,778,726 | |
Oracle Corp. | | | 39,161 | | | | 1,892,651 | |
ServiceNow Inc. (a) | | | 6,644 | | | | 1,904,038 | |
| | | | | | | | |
| | | | 23,575,415 | |
| | | | | | | | |
|
Technology Hardware, Storage & Peripherals - 3.9% | |
Apple Inc. | | | 53,894 | | | | 13,704,705 | |
| | | | | | | | |
|
Tobacco - 0.5% | |
Philip Morris International Inc. | | | 24,141 | | | | 1,761,327 | |
| | | | | | | | |
|
Trading Companies & Distributors - 1.1% | |
United Rentals Inc. (a) | | | 36,172 | | | | 3,722,099 | |
| | | | | | | | |
|
Trucking - 0.3% | |
Lyft Inc., Class A (a) | | | 38,311 | | | | 1,028,650 | |
| | | | | | | | |
|
Wireless Telecommunication Services - 0.3% | |
T-Mobile US Inc. (a) | | | 10,964 | | | | 919,880 | |
| | | | | | | | |
| |
Total Common Stock
(Cost $305,961,332) | | | | 341,463,129 | |
| | | | | | | | |
|
| Short-Term Investments - 2.7% | |
State Street Institutional U.S. Government Money Market Fund - Class G Shares 0.36%
(Cost $9,425,638) (c)(d) | | | 9,425,638 | | | | 9,425,638 | |
| | | | | | | | |
| |
Total Investments
(Cost $315,386,970) | | | | 350,888,767 | |
| |
| Other Assets and Liabilities, net - 0.1% | | | | 518,647 | |
| | | | | | | | |
| |
| NET ASSETS - 100.0% | | | | 351,407,414 | |
| | | | | | | | |
See Notes to Schedules of Investments and Notes to Financial Statements.
| | |
| 6 | | State Street Institutional U.S. Equity Fund |
State Street Institutional U.S. Equity Fund
Schedule of Investments, continued — March 31, 2020 (Unaudited)
Other Information:
The Fund had the following long futures contracts open at March 31, 2020:
| | | | | | | | | | | | | | | | | | | | |
| Description | | Expiration
date | | | Number of
Contracts | | | Notional
Amount | | | Value | | | Unrealized
Depreciation | |
S&P 500 Emini Index Futures | | | June 2020 | | | | 44 | | | $ | 5,748,304 | | | $ | 5,653,340 | | | $ | (94,964 | ) |
| | | | | | | | | | | | | | | | | | | | |
During the period ended March 31, 2020, average notional value related to long and short futures contracts was $3,561,171 or 1.01% of net assets and $274,031 or 0.08% of net assets, respectively.
The views expressed in this document reflect our judgment as of the publication date and are subject to change at any time without notice. The securities cited may not be representative of the Fund’s future investments and should not be construed as a recommendation to purchase or sell a particular security. See the Fund’s summary prospectus and statutory prospectus for complete descriptions of investment objectives, policies, risks and permissible investments.
| (a) | Non-income producing security. |
| (b) | At March 31, 2020, all or a portion of this security was pledged to cover collateral requirements for futures. |
| (c) | Coupon amount represents effective yield. |
| (d) | Sponsored by SSGA Funds Management, Inc., the Fund’s investment adviser and administrator, and an affiliate of State Street Bank & Trust Co., the Fund’s sub-administrator, custodian and accounting agent. |
| † | Percentages are based on net assets as of March 31, 2020. |
Abbreviations:
REIT - Real Estate Investment Trust
The following table presents the Fund’s investments measured at fair value on a recurring basis at March 31, 2020:
| | | | | | | | | | | | | | | | | | |
| Fund | | Investments | | Level 1 | | | Level 2 | | | Level 3 | | | Total | |
| | | | | |
| State Street Institutional U.S. Equity Fund | | Investments in Securities | | | | | | | | | | | | | | | | |
| | | | | |
| | Common Stock | | $ | 341,463,129 | | | $ | — | | | $ | — | | | $ | 341,463,129 | |
| | | | | |
| | Short-Term Investments | | | 9,425,638 | | | | — | | | | — | | | | 9,425,638 | |
| | | | | | | | | | | | | | | | | | |
| | | | | |
| | Total Investments in Securities | | $ | 350,888,767 | | | $ | — | | | $ | — | | | $ | 350,888,767 | |
| | | | | | | | | | | | | | | | | | |
| | | | | |
| | Other Financial Instruments | | | | | | | | | | | | | | | | |
| | | | | |
| | Long Futures Contracts - Unrealized Depreciation | | $ | (94,964 | ) | | $ | — | | | $ | — | | | $ | (94,964 | ) |
| | | | | | | | | | | | | | | | | | |
Affiliate Table
| | | | | | | | | | | | | | | | | | | | | | | | | | | | | | | | | | | | |
| | | Number
of Shares
Held at
9/30/19 | | | Value At
9/30/19 | | | Cost of
Purchases | | | Proceeds
from
Shares
Sold | | | Realized
Gain
(Loss) | | | Change in
Unrealized
Appreciation/
Depreciation | | | Number
of Shares
Held at
3/31/20 | | | Value at
3/31/20 | | | Dividend
Income | |
State Street Institutional U.S. Government Money Market Fund, Class G Shares | | | 21,310,507 | | | $ | 21,310,507 | | | $ | 37,849,719 | | | $ | 49,734,588 | | | $ | — | | | $ | — | | | | 9,425,638 | | | $ | 9,425,638 | | | $ | 86,818 | |
See Notes to Schedules of Investments and Notes to Financial Statements.
| | | | |
| State Street Institutional U.S. Equity Fund | | | 7 | |
State Street Institutional Premier Growth Equity Fund
Understanding Your Fund’s Expenses — March 31, 2020 (Unaudited)
As a shareholder of the Fund you incur ongoing costs. Ongoing costs include portfolio management fees, distribution and service fees (for Service Class shares) and trustees’ fees. The following example is intended to help you understand your ongoing costs (in dollars) of investing in the Fund and to compare these costs with the ongoing costs of investing in other mutual funds.
To illustrate these ongoing costs, we have provided an example and calculated the expenses paid by investors in each share class of the Fund during the period. The information in the following table is based on an investment of $1,000, which is invested at the beginning of the period and held for the entiresix-month period ended March 31, 2020.
Actual Expenses
The first section of the table provides information about actual account values and actual expenses. You may use the information in this section, together with the amount you invested, to estimate the expenses that you paid over the period. To do so, simply divide your account value by $1,000 (for example, an $8,600 account value divided by $1,000 = 8.6), then multiply the result by the number given for your class under the heading “Expenses paid during period” to estimate the expenses you paid on your account during the period.
Hypothetical Example for Comparison Purposes
The second section of the table provides information about hypothetical account values and hypothetical expenses based on the Fund’s actual expense ratio and an assumed rate of return of 5% per year before expenses, which is not the Fund’s actual return. The hypothetical account values and expenses may not be used to estimate the actual ending account balance or expenses you paid for the period. You may use this information to compare the ongoing costs of investing in the Fund and other funds. To do so, compare this 5% hypothetical example with the 5% hypothetical examples that appear in the shareholders reports of other funds.
Please note that the expenses shown in the table are meant to highlight and help you compare ongoing costs only and do not reflect transaction costs, such as sales charges or redemption fees, if any. Therefore, the second section of the table is useful in comparing ongoing costs only, and will not help you determine the relative total costs of owning different funds.
| | | | | | | | |
Investment Class | | Actual
Fund Return | | | Hypothetical
5% Return
(2.5% for
the period) | |
Actual Fund Return | | | | | | | | |
Beginning Account Value October 1, 2019 | | $ | 1,000.00 | | | $ | 1,000.00 | |
Ending Account Value March 31, 2020 | | $ | 984.60 | | | $ | 1,023.00 | |
Expenses Paid During Period* | | $ | 1.98 | | | $ | 2.02 | |
| | |
Service Class | | | | | | |
Actual Fund Return | | | | | | | | |
Beginning Account Value October 1, 2019 | | $ | 1,000.00 | | | $ | 1,000.00 | |
Ending Account Value March 31, 2020 | | $ | 982.50 | | | $ | 1,021.70 | |
Expenses Paid During Period* | | $ | 3.27 | | | $ | 3.34 | |
| * | Expenses are equal to the Fund’s annualized expense ratio of 0.40% for Investment Class shares and 0.65% for Service Class shares (for the period October 1, 2019-March 31, 2020), multiplied by the average account value over the period, multiplied by 183/366 (to reflect theone-half year period). |
| | |
| 8 | | State Street Institutional Premier Growth Equity Fund |
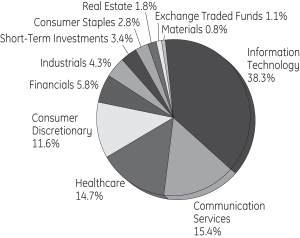
State Street Institutional Premier Growth Equity Fund
Performance Summary — March 31, 2020 (Unaudited)
Sector Allocation
Portfolio Composition as a % of Fair Value of $66,934 (in thousands) as of March 31, 2020(a)(b)
Top Ten Largest Holdings
as of March 31, 2020 (as a % of Fair Value)(a)(b)
| | | | |
Microsoft Corp. | | | 9.87 | % |
| |
Apple Inc. | | | 7.26 | % |
| |
Amazon.com Inc. | | | 6.11 | % |
| |
Alphabet Inc., Class C | | | 4.85 | % |
| |
Visa Inc., Class A | | | 4.53 | % |
| |
Facebook Inc., Class A | | | 4.19 | % |
| |
salesforce.com Inc. | | | 3.31 | % |
| |
Applied Materials Inc. | | | 2.83 | % |
| |
PepsiCo Inc. | | | 2.81 | % |
| |
UnitedHealth Group Inc. | | | 2.75 | % |
| (a) | Fair Value basis is inclusive of short-term investment in State Street Institutional U.S. Government Money Market Fund – Class G Shares. |
| (b) | The securities information regarding holdings, allocations and other characteristics is presented to illustrate examples of securities that the Fund has bought and the diversity of areas in which the Fund may invest as of a particular date. It may not be representative of the Fund’s current or future investments and should not be construed as a recommendation to purchase or sell a particular security. |
| | | | |
| State Street Institutional Premier Growth Equity Fund | | | 9 | |
State Street Institutional Premier Growth Equity Fund
Schedule of Investments — March 31, 2020 (Unaudited)
| | | | | | | | |
| | | Number
of Shares | | | Fair
Value $ | |
| | | | | | | | |
|
| Common Stock - 94.3%† | |
Application Software - 3.3% | | | | | |
salesforce.com Inc. (a) | | | 15,403 | | | | 2,217,724 | |
| | | | | | | | |
|
Biotechnology - 5.7% | |
Alexion Pharmaceuticals Inc. (a) | | | 15,174 | | | | 1,362,473 | |
BioMarin Pharmaceutical Inc. (a) | | | 11,595 | | | | 979,778 | |
Vertex Pharmaceuticals Inc. (a) | | | 6,362 | | | | 1,513,838 | |
| | | | | | | | |
| | | | 3,856,089 | |
| | | | | | | | |
|
Cable & Satellite - 2.3% | |
Charter Communications Inc., Class A (a) | | | 3,529 | | | | 1,539,738 | |
| | | | | | | | |
|
Data Processing & Outsourced Services - 7.9% | |
Fidelity National Information Services Inc. | | | 10,710 | | | | 1,302,765 | |
Mastercard Inc., Class A | | | 4,325 | | | | 1,044,747 | |
Visa Inc., Class A | | | 18,811 | | | | 3,030,828 | |
| | | | | | | | |
| | | | | | | 5,378,340 | |
| | | | | | | | |
|
Electronic Components - 1.3% | |
Corning Inc. | | | 44,027 | | | | 904,315 | |
| | | | | | | | |
|
Financial Exchanges & Data - 4.5% | |
CME Group Inc. | | | 7,671 | | | | 1,326,392 | |
S&P Global Inc. | | | 7,057 | | | | 1,729,318 | |
| | | | | | | | |
| | | | 3,055,710 | |
| | | | | | | | |
|
Healthcare Equipment - 4.5% | |
Boston Scientific Corp. (a) | | | 54,522 | | | | 1,779,053 | |
Intuitive Surgical Inc. (a) | | | 2,526 | | | | 1,250,900 | |
| | | | | | | | |
| | | | 3,029,953 | |
| | | | | | | | |
|
Home Improvement Retail - 1.9% | |
Lowe’s Companies Inc. | | | 14,597 | | | | 1,256,072 | |
| | | | | | | | |
|
Industrial Conglomerates - 1.8% | |
Honeywell International Inc. | | | 9,056 | | | | 1,211,602 | |
| | | | | | | | |
|
Interactive Media & Services - 10.6% | |
Alphabet Inc., Class A (a) | | | 997 | | | | 1,158,464 | |
Alphabet Inc., Class C (a) | | | 2,793 | | | | 3,247,728 | |
Facebook Inc., Class A (a) | | | 16,820 | | | | 2,805,576 | |
| | | | | | | | |
| | | | 7,211,768 | |
| | | | | | | | |
|
Internet & Direct Marketing Retail - 8.8% | |
Alibaba Group Holding Ltd. ADR (a)(b) | | | 5,311 | | | | 1,032,883 | |
Amazon.com Inc. (a) | | | 2,098 | | | | 4,090,513 | |
Booking Holdings Inc. (a) | | | 616 | | | | 828,717 | |
| | | | | | | | |
| | | | 5,952,113 | |
| | | | | | | | |
| | | | | | | | |
| | | Number
of Shares | | | Fair Value $ | |
Managed Healthcare - 2.7% | |
UnitedHealth Group Inc. | | | 7,368 | | | | 1,837,432 | |
| | | | | | | | |
|
Movies & Entertainment - 2.3% | |
The Walt Disney Co. | | | 16,043 | | | | 1,549,754 | |
| | | | | | | | |
|
Pharmaceuticals - 1.6% | |
Elanco Animal Health Inc. (a) | | | 49,314 | | | | 1,104,140 | |
| | | | | | | | |
|
Regional Banks - 1.2% | |
First Republic Bank | | | 9,856 | | | | 810,952 | |
| | | | | | | | |
|
Restaurants - 0.8% | |
Domino’s Pizza Inc. | | | 1,766 | | | | 572,308 | |
| | | | | | | | |
|
Semiconductor Equipment - 4.0% | |
Applied Materials Inc. | | | 41,414 | | | | 1,897,590 | |
ASML Holding N.V. (b) | | | 3,158 | | | | 826,259 | |
| | | | | | | | |
| | | | 2,723,849 | |
| | | | | | | | |
|
Semiconductors - 2.0% | |
NVIDIA Corp. | | | 5,184 | | | | 1,366,502 | |
| | | | | | | | |
|
Soft Drinks - 2.8% | |
PepsiCo Inc. | | | 15,650 | | | | 1,879,565 | |
| | | | | | | | |
|
Specialized REITs - 1.8% | |
American Tower Corp. | | | 5,500 | | | | 1,197,625 | |
| | | | | | | | |
|
Specialty Chemicals - 0.8% | |
Albemarle Corp. | | | 9,517 | | | | 536,473 | |
| | | | | | | | |
|
Systems Software - 12.0% | |
Microsoft Corp. | | | 41,874 | | | | 6,603,949 | |
ServiceNow Inc. (a) | | | 5,419 | | | | 1,552,977 | |
| | | | | | | | |
| | | | 8,156,926 | |
| | | | | | | | |
|
Technology Hardware, Storage & Peripherals - 7.2% | |
Apple Inc. | | | 19,114 | | | | 4,860,499 | |
| | | | | | | | |
|
Trading Companies & Distributors - 1.9% | |
United Rentals Inc. (a) | | | 12,387 | | | | 1,274,622 | |
| | | | | | | | |
|
Trucking - 0.6% | |
Lyft Inc., Class A (a) | | | 15,524 | | | | 416,819 | |
| | | | | | | | |
| |
Total Common Stock
(Cost $45,719,385) | | | | 63,900,890 | |
| | | | | | | | |
See Notes to Schedules of Investments and Notes to Financial Statements.
| | |
| 10 | | State Street Institutional Premier Growth Equity Fund |
State Street Institutional Premier Growth Equity Fund
Schedule of Investments, continued — March 31, 2020 (Unaudited)
| | | | | | | | |
| | | Number
of Shares | | | Fair Value $ | |
| | | | | | | | |
Exchange Traded & Mutual Funds - 1.1% | |
The Consumer Discretionary Select Sector SPDR Fund
(Cost $834,139) | | | 7,435 | | | | 729,225 | |
| | | | | | | | |
| |
Total Investments in Securities
(Cost $46,553,524) | | | | 64,630,115 | |
| | | | | | | | |
| | | | | | | | |
| | | Number
of Shares | | | Fair Value $ | |
|
| Short-Term Investments - 3.4% | |
State Street Institutional U.S. Government Money Market Fund - Class G Shares 0.36%
(Cost $2,303,428) (b)(c)(d) | | | 2,303,428 | | | | 2,303,428 | |
| | | | | | | | |
| |
Total Investments
(Cost $48,856,952) | | | | 66,933,543 | |
| |
| Other Assets and Liabilities, net - 1.2% | | | | 801,818 | |
| | | | | | | | |
| |
| NET ASSETS - 100.0% | | | | 67,735,361 | |
| | | | | | | | |
Other Information:
The Fund had the following long futures contracts open at March 31, 2020:
| | | | | | | | | | | | | | | | | | | | |
| Description | | Expiration
date | | | Number of
Contracts | | | Notional
Amount | | | Value | | | Unrealized
Appreciation | |
S&P 500 Emini Index Futures | | | June 2020 | | | | 10 | | | $ | 1,239,177 | | | $ | 1,284,850 | | | $ | 45,673 | |
| | | | | | | | | | | | | | | | | | | | |
During the period ended March 31, 2020, average notional value related to long and short futures contracts was $1,557,766 or 2.3% of net assets and $512,960 or 0.8% of net assets, respectively.
The views expressed in this document reflect our judgment as of the publication date and are subject to change at any time without notice. The securities cited may not be representative of the Fund’s future investments and should not be construed as a recommendation to purchase or sell a particular security. See the Fund’s summary prospectus and statutory prospectus for complete descriptions of investment objectives, policies, risks and permissible investments.
| (a) | Non-income producing security |
| (b) | At March 31, 2020, all or a portion of this security was pledged to cover collateral requirements for futures. |
| (c) | Coupon amount represents effective yield. |
| (d) | Sponsored by SSGA Funds Management, Inc., the Fund’s investment adviser and administrator, and an affiliate of State Street Bank & Trust Co., the Fund’s sub-administrator, custodian and accounting agent. |
| † | Percentages are based on net assets as of March 31, 2020. |
Abbreviations:
ADR - American Depositary Receipt
REIT - Real Estate Investment Trust
SPDR - Standard and Poor’s Depositary Receipt
See Notes to Schedules of Investments and Notes to Financial Statements.
| | | | |
| State Street Institutional Premier Growth Equity Fund | | | 11 | |
State Street Institutional Premier Growth Equity Fund
Schedule of Investments, continued — March 31, 2020 (Unaudited)
The following table presents the Fund’s investments measured at fair value on a recurring basis at March 31, 2020:
| | | | | | | | | | | | | | | | | | |
| Fund | | Investments | | Level 1 | | | Level 2 | | | Level 3 | | | Total | |
| | | | | |
| State Street Institutional Premier Growth Equity Fund | | Investments in Securities | | | | | | | | | | | | | | | | |
| | | | | |
| | Common Stock | | $ | 63,900,890 | | | $ | — | | | $ | — | | | $ | 63,900,890 | |
| | | | | |
| | Exchange Traded & Mutual Funds | | | 729,225 | | | | — | | | | — | | | | 729,225 | |
| | | | | |
| | Short-Term Investments | | | 2,303,428 | | | | — | | | | — | | | | 2,303,428 | |
| | | | | | | | | | | | | | | | | | |
| | | | | |
| | Total Investments in Securities | | $ | 66,933,543 | | | $ | — | | | $ | — | | | $ | 66,933,543 | |
| | | | | | | | | | | | | | | | | | |
| | | | | |
| | Other Financial Instruments | | | | | | | | | | | | | | | | |
| | | | | |
| | Long Futures Contracts - Unrealized Appreciation | | $ | 45,673 | | | $ | — | | | $ | — | | | $ | 45,673 | |
| | | | | | | | | | | | | | | | | | |
Affiliate Table
| | | | | | | | | | | | | | | | | | | | | | | | | | | | | | | | | | | | |
| | | Number of
Shares
Held at
9/30/19 | | | Value At
9/30/19 | | | Cost of
Purchases | | | Proceeds
from
Shares
Sold | | | Realized
Gain
(Loss) | | | Change in
Unrealized
Appreciation/ Depreciation | | | Number
of Shares
Held at
3/31/20 | | | Value at
3/31/20 | | | Dividend
Income | |
The Consumer Discretionary Select Sector SPDR Fund | | | 18,198 | | | $ | 2,196,499 | | | $ | 407,619 | | | $ | 1,689,184 | | | $ | (62,299 | ) | | $ | (123,410 | ) | | | 7,435 | | | $ | 729,225 | | | $ | 9,194 | |
State Street Institutional U.S. Government Money Market Fund, Class G Shares | | | 1,985,510 | | | | 1,985,510 | | | | 29,735,983 | | | | 29,418,065 | | | | — | | | | — | | | | 2,303,428 | | | | 2,303,428 | | | | 45,440 | |
| | | | | | | | | | | | | | | | | | | | | | | | | | | | | | | | | | | | |
| | | | | | | | | |
TOTAL | | | | | | $ | 4,182,009 | | | $ | 30,143,602 | | | $ | 31,107,249 | | | $ | (62,299 | ) | | $ | (123,410 | ) | | | | | | $ | 3,032,653 | | | $ | 54,634 | |
| | | | | | | | | | | | | | | | | | | | | | | | | | | | | | | | | | | | |
See Notes to Schedules of Investments and Notes to Financial Statements.
| | |
| 12 | | State Street Institutional Premier Growth Equity Fund |
State Street InstitutionalSmall-Cap Equity Fund
Understanding Your Fund’s Expenses — March 31, 2020 (Unaudited)
As a shareholder of the Fund you incur ongoing costs. Ongoing costs include portfolio management fees, distribution and service fees (for Service Class shares) and trustees’ fees. The following example is intended to help you understand your ongoing costs (in dollars) of investing in the Fund and to compare these costs with the ongoing costs of investing in other mutual funds.
To illustrate these ongoing costs, we have provided an example and calculated the expenses paid by investors in each share class of the Fund during the period. The information in the following table is based on an investment of $1,000, which is invested at the beginning of the period and held for the entiresix-month period ended March 31, 2020.
Actual Expenses
The first section of the table provides information about actual account values and actual expenses. You may use the information in this section, together with the amount you invested, to estimate the expenses that you paid over the period. To do so, simply divide your account value by $1,000 (for example, an $8,600 account value divided by $1,000 = 8.6), then multiply the result by the number given for your class under the heading “Expenses paid during the period” to estimate the expenses you paid on your account during the period.
Hypothetical Example for Comparison Purposes
The second section of the table provides information about hypothetical account values and hypothetical expenses based on the Fund’s actual expense ratio and an assumed rate of return of 5% per year before expenses, which is not the Fund’s actual return. The hypothetical account values and expenses may not be used to estimate the actual ending account balance or expenses you paid for the period. You may use this information to compare the ongoing costs of investing in the Fund and other funds. To do so, compare this 5% hypothetical example with the 5% hypothetical examples that appear in the shareholders reports of other funds.
Please note that the expenses shown in the table are meant to highlight and help you compare ongoing costs only and do not reflect transaction costs, such as sales charges or redemption fees, if any. Therefore, the second section of the table is useful in comparing ongoing costs only, and will not help you determine the relative total costs of owning different funds.
| | | | | | | | |
Investment Class | | Actual
Fund Return | | | Hypothetical
5% Return
(2.5% for
the period) | |
Actual Fund Return | | | | | | | | |
Beginning Account Value October 1, 2019 | | $ | 1,000.00 | | | $ | 1,000.00 | |
Ending Account Value March 31, 2020 | | $ | 745.80 | | | $ | 1,020.60 | |
Expenses Paid During Period* | | $ | 3.84 | | | $ | 4.45 | |
| | |
Service Class | | | | | | |
Actual Fund Return | | | | | | | | |
Beginning Account Value October 1, 2019 | | $ | 1,000.00 | | | $ | 1,000.00 | |
Ending Account Value March 31, 2020 | | $ | 745.30 | | | $ | 1,019.40 | |
Expenses Paid During Period* | | $ | 4.93 | | | $ | 5.70 | |
| * | Expenses are equal to the Fund’s annualized expense ratio of 0.88% for Investment Class shares and 1.13% for Service Class shares (for the period October 1, 2019-March 31, 2020), multiplied by the average account value over the period, multiplied by 183/366 (to reflect theone-half year period). |
| | | | |
| State Street InstitutionalSmall-Cap Equity Fund | | | 13 | |
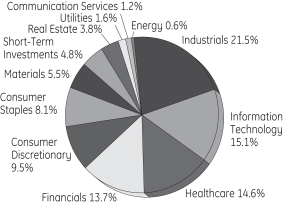
State Street InstitutionalSmall-Cap Equity Fund
Performance Summary — March 31, 2020 (Unaudited)
Sector Allocation
Portfolio Composition as a % of Fair Value of $833,714 (in thousands) as of March 31, 2020(a)(b)
Top Ten Largest Holdings
as of March 31, 2020 (as a % of Fair Value)(a)(b)
| | | | |
Darling Ingredients Inc. | | | 1.22 | % |
| |
Dycom Industries Inc. | | | 1.10 | % |
| |
John Wiley & Sons Inc., Class A | | | 1.08 | % |
| |
The Brink’s Co. | | | 1.03 | % |
| |
IDACORP Inc. | | | 1.02 | % |
| |
Hill-Rom Holdings Inc. | | | 1.01 | % |
| |
Sanderson Farms Inc. | | | 0.99 | % |
| |
Barnes Group Inc. | | | 0.97 | % |
| |
Ritchie Bros Auctioneers Inc. | | | 0.96 | % |
| |
The Timken Co. | | | 0.96 | % |
| (a) | Fair Value basis is inclusive of short-term investment in State Street Institutional U.S. Government Money Market Fund – Class G Shares. |
| (b) | The securities information regarding holdings, allocations and other characteristics is presented to illustrate examples of securities that the Fund has bought and the diversity of areas in which the Fund may invest as of a particular date. It may not be representative of the Fund’s current or future investments and should not be construed as a recommendation to purchase or sell a particular security. |
| | |
| 14 | | State Street InstitutionalSmall-Cap Equity Fund |
State Street InstitutionalSmall-Cap Equity Fund
Schedule of Investments — March 31, 2020 (Unaudited)
| | | | | | | | |
| | | Number
of Shares | | | Fair
Value $ | |
| | | | | | | | |
|
| Common Stock - 94.6%† | |
Aerospace & Defense - 0.8% | |
Cubic Corp. | | | 15,600 | | | | 644,436 | |
Teledyne Technologies Inc. (a) | | | 19,659 | | | | 5,844,031 | |
| | | | | | | | |
| | | | 6,488,467 | |
| | | | | | | | |
|
Agricultural & Farm Machinery - 0.9% | |
AGCO Corp. | | | 168,121 | | | | 7,943,717 | |
| | | | | | | | |
|
Agricultural Products - 1.2% | |
Darling Ingredients Inc. (a) | | | 529,892 | | | | 10,158,030 | |
| | | | | | | | |
|
Air Freight & Logistics - 0.3% | |
Air Transport Services Group Inc. (a) | | | 32,308 | | | | 590,590 | |
Echo Global Logistics Inc. (a) | | | 31,329 | | | | 535,100 | |
Forward Air Corp. | | | 14,463 | | | | 732,551 | |
Hub Group Inc., Class A (a) | | | 13,749 | | | | 625,167 | |
| | | | | | | | |
| | | | | | | 2,483,408 | |
| | | | | | | | |
|
Airlines - 0.0%* | |
Hawaiian Holdings Inc. | | | 14,716 | | | | 153,635 | |
| | | | | | | | |
|
Apparel Retail - 0.7% | |
American Eagle Outfitters Inc. | | | 173,736 | | | | 1,381,201 | |
Burlington Stores Inc. (a) | | | 16,374 | | | | 2,594,624 | |
Chico’s FAS Inc. | | | 217,043 | | | | 279,986 | |
The Buckle Inc. | | | 126,417 | | | | 1,733,177 | |
| | | | | | | | |
| | | | 5,988,988 | |
| | | | | | | | |
|
Application Software - 5.6% | |
ACI Worldwide Inc. (a) | | | 156,473 | | | | 3,778,823 | |
Altair Engineering Inc., Class A (a) | | | 66,619 | | | | 1,765,404 | |
Blackbaud Inc. | | | 108,176 | | | | 6,009,177 | |
Blackline Inc. (a) | | | 87,089 | | | | 4,581,752 | |
Box Inc., Class A (a) | | | 32,899 | | | | 461,902 | |
Cloudera Inc. (a) | | | 38,228 | | | | 300,854 | |
Cornerstone OnDemand Inc. (a) | | | 70,128 | | | | 2,226,564 | |
Digital Turbine Inc. (a) | | | 78,793 | | | | 339,598 | |
Envestnet Inc. (a) | | | 59,500 | | | | 3,199,910 | |
Medallia Inc. (a) | | | 115,000 | | | | 2,304,600 | |
Mitek Systems Inc. (a) | | | 72,809 | | | | 573,735 | |
New Relic Inc. (a) | | | 118,225 | | | | 5,466,724 | |
Q2 Holdings Inc. (a) | | | 102,500 | | | | 6,053,650 | |
RealPage Inc. (a) | | | 54,096 | | | | 2,863,301 | |
SPS Commerce Inc. (a) | | | 4,965 | | | | 230,922 | |
Verint Systems Inc. (a) | | | 29,543 | | | | 1,270,349 | |
Yext Inc. (a) | | | 458,000 | | | | 4,667,020 | |
Zix Corp. (a) | | | 147,492 | | | | 635,691 | |
| | | | | | | | |
| | | | 46,729,976 | |
| | | | | | | | |
| | | | | | | | |
| | | Number
of Shares | | | Fair
Value $ | |
Asset Management & Custody Banks - 0.1% | |
Brightsphere Investment Group Inc. (a) | | | 48,744 | | | | 311,474 | |
Cohen & Steers Inc. | | | 14,143 | | | | 642,800 | |
| | | | | | | | |
| | | | 954,274 | |
| | | | | | | | |
|
Auto Parts & Equipment - 0.6% | |
Dana Inc. | | | 101,182 | | | | 790,231 | |
Dorman Products Inc. (a) | | | 14,447 | | | | 798,486 | |
LCI Industries | | | 18,231 | | | | 1,218,378 | |
Modine Manufacturing Co. (a) | | | 84,162 | | | | 273,526 | |
Standard Motor Products Inc. | | | 48,300 | | | | 2,007,831 | |
| | | | | | | | |
| | | | 5,088,452 | |
| | | | | | | | |
|
Automobile Manufacturers - 0.7% | |
Thor Industries Inc. | | | 138,619 | | | | 5,846,949 | |
Winnebago Industries Inc. | | | 16,344 | | | | 454,527 | |
| | | | | | | | |
| | | | 6,301,476 | |
| | | | | | | | |
|
Automotive Retail - 1.3% | |
America’sCar-Mart Inc. (a) | | | 29,175 | | | | 1,644,011 | |
Group 1 Automotive Inc. | | | 55,625 | | | | 2,461,963 | |
Lithia Motors Inc., Class A | | | 3,966 | | | | 324,379 | |
Monro Inc. | | | 28,651 | | | | 1,255,200 | |
Murphy USA Inc. (a) | | | 61,479 | | | | 5,186,369 | |
| | | | | | | | |
| | | | 10,871,922 | |
| | | | | | | | |
|
Biotechnology - 0.5% | |
Emergent BioSolutions Inc. (a) | | | 36,025 | | | | 2,084,406 | |
Heron Therapeutics Inc. (a) | | | 118,419 | | | | 1,390,239 | |
Ironwood Pharmaceuticals Inc. (a) | | | 42,651 | | | | 430,349 | |
Vanda Pharmaceuticals Inc. (a) | | | 32,400 | | | | 335,664 | |
| | | | | | | | |
| | | | 4,240,658 | |
| | | | | | | | |
|
Brewers - 0.4% | |
The Boston Beer Company Inc., Class A (a) | | | 8,240 | | | | 3,028,694 | |
| | | | | | | | |
|
Building Products - 0.7% | |
American Woodmark Corp. (a) | | | 16,630 | | | | 757,829 | |
Builders FirstSource Inc. (a) | | | 36,199 | | | | 442,714 | |
CSW Industrials Inc. | | | 26,500 | | | | 1,718,525 | |
Patrick Industries Inc. | | | 14,467 | | | | 407,391 | |
Universal Forest Products Inc. | | | 57,717 | | | | 2,146,495 | |
| | | | | | | | |
| | | | 5,472,954 | |
| | | | | | | | |
|
Commodity Chemicals - 0.6% | |
AdvanSix Inc. (a) | | | 30,014 | | | | 286,334 | |
Koppers Holdings Inc. (a) | | | 379,485 | | | | 4,694,229 | |
| | | | | | | | |
| | | | 4,980,563 | |
| | | | | | | | |
See Notes to Schedules of Investments and Notes to Financial Statements.
| | | | |
| State Street InstitutionalSmall-Cap Equity Fund | | | 15 | |
State Street InstitutionalSmall-Cap Equity Fund
Schedule of Investments, continued — March 31, 2020 (Unaudited)
| | | | | | | | |
| | | Number
of Shares | | | Fair
Value $ | |
| | | | | | | | |
Communications Equipment - 0.6% | |
Extreme Networks Inc. (a) | | | 350,529 | | | | 1,083,135 | |
Infinera Corp. (a) | | | 127,039 | | | | 673,307 | |
Lumentum Holdings Inc. (a) | | | 22,944 | | | | 1,690,973 | |
NETGEAR Inc. (a) | | | 41,728 | | | | 953,067 | |
Plantronics Inc. | | | 41,332 | | | | 415,800 | |
| | | | | | | | |
| | | | 4,816,282 | |
| | | | | | | | |
|
Computer & Electronics Retail - 0.0%* | |
Rent-A-Center Inc. | | | 20,810 | | | | 294,253 | |
| | | | | | | | |
|
Construction & Engineering - 2.2% | |
Aegion Corp. (a) | | | 308,359 | | | | 5,528,877 | |
Comfort Systems USA Inc. | | | 10,382 | | | | 379,462 | |
Dycom Industries Inc. (a) | | | 359,082 | | | | 9,210,453 | |
EMCOR Group Inc. | | | 9,880 | | | | 605,842 | |
Great Lakes Dredge & Dock Corp. (a) | | | 80,890 | | | | 671,387 | |
MasTec Inc. (a) | | | 13,172 | | | | 431,119 | |
Valmont Industries Inc. | | | 14,961 | | | | 1,585,567 | |
| | | | | | | | |
| | | | 18,412,707 | |
| | | | | | | | |
|
Construction Machinery & Heavy Trucks - 1.6% | |
Alamo Group Inc. | | | 24,275 | | | | 2,155,134 | |
Astec Industries Inc. | | | 29,457 | | | | 1,030,111 | |
The Greenbrier Companies Inc. | | | 42,120 | | | | 747,209 | |
The Manitowoc Company Inc. (a) | | | 137,281 | | | | 1,166,889 | |
Trinity Industries Inc. | | | 464,269 | | | | 7,460,803 | |
Wabash National Corp. | | | 119,550 | | | | 863,151 | |
| | | | | | | | |
| | | | 13,423,297 | |
| | | | | | | | |
|
Construction Materials - 0.1% | |
Eagle Materials Inc. | | | 15,309 | | | | 894,352 | |
| | | | | | | | |
|
Consumer Electronics - 0.0%* | |
Universal Electronics Inc. (a) | | | 9,344 | | | | 358,529 | |
| | | | | | | | |
|
Consumer Finance - 0.2% | |
Curo Group Holdings Corp. | | | 35,714 | | | | 189,284 | |
Enova International Inc. (a) | | | 57,244 | | | | 829,466 | |
Green Dot Corp., Class A (a) | | | 18,550 | | | | 470,984 | |
| | | | | | | | |
| | | | 1,489,734 | |
| | | | | | | | |
|
Data Processing & Outsourced Services - 1.9% | |
Broadridge Financial Solutions Inc. | | | 60,390 | | | | 5,726,784 | |
Cass Information Systems Inc. | | | 7,538 | | | | 265,036 | |
CSG Systems International Inc. | | | 64,795 | | | | 2,711,671 | |
EVERTEC Inc. | | | 35,381 | | | | 804,210 | |
ExlService Holdings Inc. (a) | | | 5,822 | | | | 302,918 | |
I3 Verticals Inc., Class A (a) | | | 27,420 | | | | 523,448 | |
| | | | | | | | |
| | | Number
of Shares | | | Fair
Value $ | |
MAXIMUS Inc. | | | 11,839 | | | | 689,030 | |
NIC Inc. | | | 224,451 | | | | 5,162,373 | |
| | | | | | | | |
| | | | 16,185,470 | |
| | | | | | | | |
|
Distillers & Vintners - 0.2% | |
MGP Ingredients Inc. | | | 77,240 | | | | 2,076,984 | |
| | | | | | | | |
|
Distributors - 0.5% | |
Core-Mark Holding Company Inc. | | | 21,024 | | | | 600,656 | |
LKQ Corp. (a) | | | 179,343 | | | | 3,678,325 | |
| | | | | | | | |
| | | | 4,278,981 | |
| | | | | | | | |
|
Diversified Metals & Mining - 0.3% | |
Compass Minerals International Inc. | | | 56,651 | | | | 2,179,364 | |
Materion Corp. | | | 14,804 | | | | 518,288 | |
| | | | | | | | |
| | | | 2,697,652 | |
| | | | | | | | |
|
Diversified REITs - 0.2% | |
American Assets Trust Inc. | | | 40,799 | | | | 1,019,975 | |
Essential Properties Realty Trust Inc. | | | 51,445 | | | | 671,872 | |
| | | | | | | | |
| | | | 1,691,847 | |
| | | | | | | | |
|
Diversified Support Services - 1.7% | |
Healthcare Services Group Inc. | | | 176,432 | | | | 4,218,489 | |
IAA Inc. (a) | | | 42,440 | | | | 1,271,502 | |
Ritchie Bros Auctioneers Inc. | | | 235,130 | | | | 8,036,744 | |
UniFirst Corp. | | | 6,220 | | | | 939,780 | |
| | | | | | | | |
| | | | 14,466,515 | |
| | | | | | | | |
|
Education Services - 0.3% | |
K12 Inc. (a) | | | 130,769 | | | | 2,466,303 | |
| | | | | | | | |
|
Electric Utilities - 1.1% | |
ALLETE Inc. | | | 18,301 | | | | 1,110,505 | |
IDACORP Inc. | | | 96,579 | | | | 8,478,670 | |
| | | | | | | | |
| | | | 9,589,175 | |
| | | | | | | | |
|
Electrical Components & Equipment - 0.6% | |
Atkore International Group Inc. (a) | | | 24,447 | | | | 515,098 | |
EnerSys | | | 7,188 | | | | 355,950 | |
Generac Holdings Inc. (a) | | | 26,127 | | | | 2,434,253 | |
Regal Beloit Corp. | | | 21,319 | | | | 1,342,031 | |
| | | | | | | | |
| | | | 4,647,332 | |
| | | | | | | | |
|
Electronic Components - 1.4% | |
Belden Inc. | | | 215,890 | | | | 7,789,311 | |
Littelfuse Inc. | | | 29,849 | | | | 3,982,454 | |
Rogers Corp. (a) | | | 3,695 | | | | 348,882 | |
| | | | | | | | |
| | | | 12,120,647 | |
| | | | | | | | |
See Notes to Schedules of Investments and Notes to Financial Statements.
| | |
| 16 | | State Street InstitutionalSmall-Cap Equity Fund |
State Street InstitutionalSmall-Cap Equity Fund
Schedule of Investments, continued — March 31, 2020 (Unaudited)
| | | | | | | | |
| | | Number
of Shares | | | Fair
Value $ | |
| | | | | | | | |
Electronic Equipment & Instruments - 1.0% | |
Itron Inc. (a) | | | 10,541 | | | | 588,504 | |
National Instruments Corp. | | | 58,286 | | | | 1,928,101 | |
Novanta Inc. (a) | | | 8,690 | | | | 694,157 | |
OSI Systems Inc. (a) | | | 2,435 | | | | 167,820 | |
Zebra Technologies Corp., Class A (a) | | | 25,117 | | | | 4,611,481 | |
| | | | | | | | |
| | | | 7,990,063 | |
| | | | | | | | |
|
Electronic Manufacturing Services - 0.7% | |
Fabrinet (a) | | | 14,493 | | | | 790,738 | |
Methode Electronics Inc. | | | 47,192 | | | | 1,247,285 | |
Plexus Corp. (a) | | | 31,046 | | | | 1,693,870 | |
Sanmina Corp. (a) | | | 25,065 | | | | 683,773 | |
TTM Technologies Inc. (a) | | | 129,428 | | | | 1,338,285 | |
| | | | | | | | |
| | | | 5,753,951 | |
| | | | | | | | |
|
Environmental & Facilities Services - 0.8% | |
Clean Harbors Inc. (a) | | | 123,040 | | | | 6,316,874 | |
| | | | | | | | |
|
Food Distributors - 0.4% | |
Performance Food Group Co. (a) | | | 146,770 | | | | 3,628,154 | |
| | | | | | | | |
|
Food Retail - 0.2% | |
Casey’s General Stores Inc. | | | 5,479 | | | | 725,913 | |
Sprouts Farmers Market Inc. (a) | | | 37,017 | | | | 688,146 | |
| | | | | | | | |
| | | | 1,414,059 | |
| | | | | | | | |
|
Footwear - 0.5% | |
Deckers Outdoor Corp. (a) | | | 11,070 | | | | 1,483,380 | |
Wolverine World Wide Inc. | | | 185,500 | | | | 2,819,600 | |
| | | | | | | | |
| | | | 4,302,980 | |
| | | | | | | | |
|
Forest Products - 0.1% | |
Boise Cascade Co. | | | 26,228 | | | | 623,702 | |
| | | | | | | | |
|
Gas Utilities - 0.3% | |
Chesapeake Utilities Corp. | | | 7,461 | | | | 639,482 | |
Spire Inc. | | | 26,389 | | | | 1,965,453 | |
| | | | | | | | |
| | | | 2,604,935 | |
| | | | | | | | |
|
Health Care REITs - 0.3% | |
National Health Investors Inc. | | | 21,060 | | | | 1,042,891 | |
Physicians Realty Trust | | | 100,559 | | | | 1,401,793 | |
| | | | | | | | |
| | | | 2,444,684 | |
| | | | | | | | |
|
Healthcare Distributors - 0.2% | |
Covetrus Inc. (a) | | | 160,057 | | | | 1,302,864 | |
| | | | | | | | |
|
Healthcare Equipment - 5.0% | |
AtriCure Inc. (a) | | | 92,810 | | | | 3,117,488 | |
Cantel Medical Corp. | | | 92,000 | | | | 3,302,800 | |
| | | | | | | | |
| | | Number
of Shares | | | Fair
Value $ | |
Cardiovascular Systems Inc. (a) | | | 146,835 | | | | 5,170,060 | |
CONMED Corp. | | | 70,000 | | | | 4,008,900 | |
Envista Holdings Corp. (a) | | | 12,445 | | | | 185,928 | |
Globus Medical Inc., Class A (a) | | | 36,905 | | | | 1,569,570 | |
Hill-Rom Holdings Inc. | | | 83,324 | | | | 8,382,395 | |
Integer Holdings Corp. (a) | | | 9,422 | | | | 592,267 | |
Integra LifeSciences Holdings Corp. (a) | | | 152,000 | | | | 6,789,840 | |
IntriCon Corp. (a) | | | 80,491 | | | | 947,379 | |
LeMaitre Vascular Inc. | | | 32,488 | | | | 809,601 | |
LivaNova PLC (a) | | | 13,405 | | | | 606,576 | |
Masimo Corp. (a) | | | 14,500 | | | | 2,568,240 | |
Orthofix Medical Inc. (a) | | | 34,193 | | | | 957,746 | |
Penumbra Inc. (a) | | | 17,950 | | | | 2,895,874 | |
Tactile Systems Technology Inc. (a) | | | 10,840 | | | | 435,334 | |
| | | | | | | | |
| | | | 42,339,998 | |
| | | | | | | | |
|
Healthcare Facilities - 0.7% | |
Acadia Healthcare Company Inc. (a) | | | 149,963 | | | | 2,751,821 | |
Hanger Inc. (a) | | | 99,930 | | | | 1,556,910 | |
Select Medical Holdings Corp. (a) | | | 41,095 | | | | 616,425 | |
Tenet Healthcare Corp. (a) | | | 16,437 | | | | 236,693 | |
The Ensign Group Inc. | | | 14,376 | | | | 540,681 | |
| | | | | | | | |
| | | | 5,702,530 | |
| | | | | | | | |
|
Healthcare Services - 1.1% | |
Amedisys Inc. (a) | | | 5,483 | | | | 1,006,350 | |
AMN Healthcare Services Inc. (a) | | | 45,620 | | | | 2,637,292 | |
BioTelemetry Inc. (a) | | | 76,552 | | | | 2,948,018 | |
LHC Group Inc. (a) | | | 2,319 | | | | 325,124 | |
MEDNAX Inc. (a) | | | 137,760 | | | | 1,603,526 | |
R1 RCM Inc. (a) | | | 58,893 | | | | 535,337 | |
| | | | | | | | |
| | | | 9,055,647 | |
| | | | | | | | |
|
Healthcare Supplies - 0.8% | |
Avanos Medical Inc. (a) | | | 186,500 | | | | 5,022,445 | |
Haemonetics Corp. (a) | | | 1,917 | | | | 191,048 | |
Lantheus Holdings Inc. (a) | | | 47,434 | | | | 605,258 | |
Quidel Corp. (a) | | | 7,420 | | | | 725,750 | |
| | | | | | | | |
| | | | 6,544,501 | |
| | | | | | | | |
|
Healthcare Technology - 1.3% | |
Computer Programs & Systems Inc. | | | 21,615 | | | | 480,934 | |
HMS Holdings Corp. (a) | | | 171,297 | | | | 4,328,675 | |
Inspire Medical Systems Inc. (a) | | | 47,515 | | | | 2,864,204 | |
NextGen Healthcare Inc. (a) | | | 76,811 | | | | 801,907 | |
Omnicell Inc. (a) | | | 17,951 | | | | 1,177,227 | |
Teladoc Health Inc. (a) | | | 10,500 | | | | 1,627,605 | |
| | | | | | | | |
| | | | 11,280,552 | |
| | | | | | | | |
See Notes to Schedules of Investments and Notes to Financial Statements.
| | | | |
| State Street InstitutionalSmall-Cap Equity Fund | | | 17 | |
State Street InstitutionalSmall-Cap Equity Fund
Schedule of Investments, continued — March 31, 2020 (Unaudited)
| | | | | | | | |
| | | Number
of Shares | | | Fair
Value $ | |
| | | | | | | | |
Home Building - 0.8% | |
Cavco Industries Inc. (a) | | | 11,631 | | | | 1,685,797 | |
Installed Building Products Inc. (a) | | | 6,725 | | | | 268,126 | |
LGI Homes Inc. (a) | | | 19,969 | | | | 901,600 | |
Meritage Homes Corp. (a) | | | 8,115 | | | | 296,279 | |
Skyline Champion Corp. (a) | | | 63,093 | | | | 989,298 | |
TopBuild Corp. (a) | | | 31,063 | | | | 2,225,353 | |
| | | | | | | | |
| | | | 6,366,453 | |
| | | | | | | | |
|
Home Furnishing Retail - 0.3% | |
Aaron’s Inc. | | | 81,900 | | | | 1,865,682 | |
RH (a) | | | 6,385 | | | | 641,501 | |
Sleep Number Corp. (a) | | | 13,883 | | | | 265,998 | |
| | | | | | | | |
| | | | 2,773,181 | |
| | | | | | | | |
|
Hotel & Resort REITs - 0.2% | |
RLJ Lodging Trust | | | 245,103 | | | | 1,892,195 | |
| | | | | | | | |
|
Hotels, Resorts & Cruise Lines - 0.8% | |
Extended Stay America Inc. | | | 876,913 | | | | 6,410,234 | |
| | | | | | | | |
|
Household Appliances - 0.1% | |
Helen of Troy Ltd. (a) | | | 6,567 | | | | 945,845 | |
| | | | | | | | |
|
Human Resource & Employment Services - 0.3% | |
ASGN Inc. (a) | | | 15,373 | | | | 542,974 | |
Barrett Business Services Inc. | | | 8,117 | | | | 321,758 | |
Heidrick & Struggles International Inc. | | | 18,099 | | | | 407,228 | |
Insperity Inc. | | | 13,228 | | | | 493,404 | |
Kforce Inc. | | | 29,316 | | | | 749,610 | |
| | | | | | | | |
| | | | 2,514,974 | |
| | | | | | | | |
|
Hypermarkets & Super Centers - 0.1% | |
BJ’s Wholesale Club Holdings Inc. (a) | | | 33,473 | | | | 852,557 | |
| | | | | | | | |
|
Industrial Machinery - 6.9% | |
Albany International Corp., Class A | | | 11,000 | | | | 520,630 | |
Altra Industrial Motion Corp. | | | 283,653 | | | | 4,961,091 | |
Barnes Group Inc. | | | 192,735 | | | | 8,062,105 | |
Crane Co. | | | 127,733 | | | | 6,281,909 | |
Enerpac Tool Group Corp. | | | 332,369 | | | | 5,500,707 | |
Evoqua Water Technologies Corp. (a) | | | 65,500 | | | | 734,255 | |
John Bean Technologies Corp. | | | 85,835 | | | | 6,374,965 | |
LB Foster Co., Class A (a) | | | 49,845 | | | | 616,084 | |
Lydall Inc. (a) | | | 34,490 | | | | 222,805 | |
Mueller Industries Inc. | | | 150,530 | | | | 3,603,688 | |
Standex International Corp. | | | 44,500 | | | | 2,181,390 | |
The Timken Co. (a) | | | 247,987 | | | | 8,019,900 | |
TriMas Corp. | | | 116,110 | | | | 2,682,141 | |
| | | | | | | | |
| | | Number
of Shares | | | Fair
Value $ | |
Watts Water Technologies Inc., Class A | | | 41,275 | | | | 3,493,929 | |
Welbilt Inc. (a) | | | 431,000 | | | | 2,211,030 | |
Woodward Inc. | | | 38,988 | | | | 2,317,447 | |
| | | | | | | | |
| | | | 57,784,076 | |
| | | | | | | | |
|
Industrial REITs - 0.8% | |
EastGroup Properties Inc. | | | 44,194 | | | | 4,617,389 | |
Monmouth Real Estate Investment Corp. | | | 103,649 | | | | 1,248,971 | |
Rexford Industrial Realty Inc. | | | 20,904 | | | | 857,273 | |
| | | | | | | | |
| | | | 6,723,633 | |
| | | | | | | | |
|
Interactive Home Entertainment - 0.1% | |
Glu Mobile Inc. (a) | | | 103,099 | | | | 648,493 | |
| | | | | | | | |
|
Internet & Direct Marketing Retail - 0.1% | |
1-800-Flowers.com Inc.,
Class A (a) | | | 43,577 | | | | 576,524 | |
| | | | | | | | |
|
Investment Banking & Brokerage - 1.0% | |
Evercore Inc., Class A | | | 10,580 | | | | 487,315 | |
Houlihan Lokey Inc. | | | 24,468 | | | | 1,275,272 | |
Piper Sandler Cos., | | | 30,318 | | | | 1,533,181 | |
Raymond James Financial Inc. | | | 56,530 | | | | 3,572,696 | |
Stifel Financial Corp. | | | 34,070 | | | | 1,406,410 | |
| | | | | | | | |
| | | | 8,274,874 | |
| | | | | | | | |
|
IT Consulting & Other Services - 0.4% | |
Perficient Inc. (a) | | | 26,302 | | | | 712,521 | |
Unisys Corp. (a) | | | 154,304 | | | | 1,905,655 | |
Virtusa Corp. (a) | | | 28,700 | | | | 815,080 | |
| | | | | | | | |
| | | | 3,433,256 | |
| | | | | | | | |
|
Leisure Facilities - 0.0%* | |
SeaWorld Entertainment Inc. (a) | | | 21,804 | | | | 240,280 | |
| | | | | | | | |
|
Leisure Products - 0.7% | |
Callaway Golf Co. | | | 53,091 | | | | 542,590 | |
Malibu Boats Inc., Class A (a) | | | 18,854 | | | | 542,807 | |
MasterCraft Boat Holdings Inc. (a) | | | 37,417 | | | | 273,144 | |
Polaris Inc. | | | 92,771 | | | | 4,466,923 | |
| | | | | | | | |
| | | | 5,825,464 | |
| | | | | | | | |
|
Life & Health Insurance - 0.2% | |
Trupanion Inc. (a) | | | 51,776 | | | | 1,347,729 | |
| | | | | | | | |
|
Life Sciences Tools & Services - 2.8% | |
Bruker Corp. | | | 112,726 | | | | 4,042,354 | |
ICON PLC (a) | | | 47,041 | | | | 6,397,576 | |
Medpace Holdings Inc. (a) | | | 13,610 | | | | 998,702 | |
PRA Health Sciences Inc. (a) | | | 10,872 | | | | 902,811 | |
Repligen Corp. (a) | | | 61,206 | | | | 5,908,827 | |
See Notes to Schedules of Investments and Notes to Financial Statements.
| | |
| 18 | | State Street InstitutionalSmall-Cap Equity Fund |
State Street InstitutionalSmall-Cap Equity Fund
Schedule of Investments, continued — March 31, 2020 (Unaudited)
| | | | | | | | |
| | | Number
of Shares | | | Fair
Value $ | |
| | | | | | | | |
Syneos Health Inc. (a) | | | 125,091 | | | | 4,931,087 | |
| | | | | | | | |
| | | | 23,181,357 | |
| | | | | | | | |
|
Managed Healthcare - 0.0%* | |
Magellan Health Inc. (a) | | | 8,216 | | | | 395,272 | |
| | | | | | | | |
|
Marine - 0.1% | |
Kirby Corp. (a) | | | 12,685 | | | | 551,417 | |
| | | | | | | | |
|
Metal & Glass Containers - 0.0%* | |
Silgan Holdings Inc. | | | 8,098 | | | | 235,004 | |
| | | | | | | | |
|
Mortgage REITs - 0.1% | |
Blackstone Mortgage Trust Inc., Class A | | | 17,918 | | | | 333,633 | |
Redwood Trust Inc. | | | 153,460 | | | | 776,508 | |
| | | | | | | | |
| | | | 1,110,141 | |
| | | | | | | | |
|
Multi-Line Insurance - 0.5% | |
Horace Mann Educators Corp. | | | 94,211 | | | | 3,447,180 | |
National General Holdings Corp. | | | 33,309 | | | | 551,264 | |
| | | | | | | | |
| | | | 3,998,444 | |
| | | | | | | | |
|
Multi-Utilities - 0.2% | |
Black Hills Corp. | | | 21,392 | | | | 1,369,730 | |
| | | | | | | | |
|
Office REITs - 1.2% | |
Corporate Office Properties Trust | | | 67,104 | | | | 1,485,011 | |
Cousins Properties Inc. | | | 207,122 | | | | 6,062,461 | |
Easterly Government Properties Inc. | | | 95,306 | | | | 2,348,340 | |
| | | | | | | | |
| | | | 9,895,812 | |
| | | | | | | | |
|
Office Services & Supplies - 1.2% | |
Herman Miller Inc. | | | 22,856 | | | | 507,403 | |
HNI Corp. | | | 46,360 | | | | 1,167,809 | |
Knoll Inc. | | | 37,135 | | | | 383,233 | |
MSA Safety Inc. | | | 67,531 | | | | 6,834,137 | |
Steelcase Inc., Class A | | | 125,722 | | | | 1,240,876 | |
| | | | | | | | |
| | | | 10,133,458 | |
| | | | | | | | |
|
Oil & Gas Drilling - 0.1% | |
Helmerich & Payne Inc. | | | 33,720 | | | | 527,718 | |
| | | | | | | | |
|
Oil & Gas Equipment & Services - 0.1% | |
Apergy Corp. (a) | | | 31,745 | | | | 182,534 | |
Natural Gas Services Group Inc. (a) | | | 47,791 | | | | 213,148 | |
Oil States International Inc. (a) | | | 257,290 | | | | 522,299 | |
ProPetro Holding Corp. (a) | | | 48,531 | | | | 121,327 | |
| | | | | | | | |
| | | | 1,039,308 | |
| | | | | | | | |
| | | | | | | | |
| | | Number
of Shares | | | Fair
Value $ | |
Oil & Gas Exploration & Production - 0.4% | |
Cabot Oil & Gas Corp. | | | 31,187 | | | | 536,105 | |
Cimarex Energy Co. | | | 73,117 | | | | 1,230,559 | |
Ovintiv Inc. | | | 228,845 | | | | 617,882 | |
PDC Energy Inc. (a) | | | 190,383 | | | | 1,182,278 | |
| | | | | | | | |
| | | | 3,566,824 | |
| | | | | | | | |
|
Other Diversified Financial Services - 0.0%* | |
Voya Financial Inc. | | | 8,819 | | | | 357,610 | |
| | | | | | | | |
|
Packaged Foods & Meats - 5.0% | |
B&G Foods Inc. | | | 182,000 | | | | 3,292,380 | |
Freshpet Inc. (a) | | | 78,500 | | | | 5,013,795 | |
Hostess Brands Inc. (a) | | | 537,000 | | | | 5,724,420 | |
J&J Snack Foods Corp. | | | 12,500 | | | | 1,512,500 | |
John B Sanfilippo & Son Inc. | | | 8,881 | | | | 793,961 | |
Lancaster Colony Corp. | | | 52,500 | | | | 7,593,600 | |
Sanderson Farms Inc. | | | 66,959 | | | | 8,257,384 | |
The Simply Good Foods Co. (a) | | | 247,500 | | | | 4,766,850 | |
TreeHouse Foods Inc. (a) | | | 112,000 | | | | 4,944,800 | |
| | | | | | | | |
| | | | 41,899,690 | |
| | | | | | | | |
|
Paper Products - 0.1% | |
Neenah Inc. | | | 20,749 | | | | 894,904 | |
| | | | | | | | |
|
Personal Products - 0.3% | |
elf Beauty Inc. (a) | | | 199,500 | | | | 1,963,080 | |
Medifast Inc. | | | 6,584 | | | | 411,500 | |
| | | | | | | | |
| | | | 2,374,580 | |
| | | | | | | | |
|
Pharmaceuticals - 2.1% | |
ANI Pharmaceuticals Inc. (a) | | | 15,041 | | | | 612,770 | |
Catalent Inc. (a) | | | 119,695 | | | | 6,218,155 | |
Collegium Pharmaceutical Inc. (a) | | | 37,510 | | | | 612,538 | |
Endo International PLC (a) | | | 46,616 | | | | 172,479 | |
Horizon Therapeutics PLC (a) | | | 46,757 | | | | 1,384,943 | |
Prestige Consumer Healthcare Inc. (a) | | | 213,919 | | | | 7,846,549 | |
Supernus Pharmaceuticals Inc. (a) | | | 20,450 | | | | 367,896 | |
| | | | | | | | |
| | | | 17,215,330 | |
| | | | | | | | |
|
Property & Casualty Insurance - 2.5% | |
AMERISAFE Inc. | | | 61,952 | | | | 3,994,045 | |
Argo Group International Holdings Ltd. | | | 137,788 | | | | 5,106,423 | |
James River Group Holdings Ltd. | | | 66,500 | | | | 2,409,960 | |
Kemper Corp. | | | 6,521 | | | | 484,967 | |
Palomar Holdings Inc. (a) | | | 30,500 | | | | 1,773,880 | |
RLI Corp. | | | 47,039 | | | | 4,136,139 | |
Selective Insurance Group Inc. | | | 53,555 | | | | 2,661,684 | |
See Notes to Schedules of Investments and Notes to Financial Statements.
| | | | |
| State Street InstitutionalSmall-Cap Equity Fund | | | 19 | |
State Street InstitutionalSmall-Cap Equity Fund
Schedule of Investments, continued — March 31, 2020 (Unaudited)
| | | | | | | | |
| | | Number
of Shares | | | Fair
Value $ | |
| | | | | | | | |
Stewart Information Services Corp. | | | 12,192 | | | | 325,161 | |
| | | | | | | | |
| | | | 20,892,259 | |
| | | | | | | | |
|
Publishing - 1.1% | |
John Wiley & Sons Inc., Class A | | | 240,879 | | | | 9,030,554 | |
| | | | | | | | |
|
Real Estate Services - 0.0%* | |
Newmark Group Inc., Class A | | | 31,057 | | | | 131,992 | |
| | | | | | | | |
|
Regional Banks - 8.2% | |
1st Source Corp. | | | 41,977 | | | | 1,361,314 | |
Atlantic Union Bankshares Corp. | | | 52,028 | | | | 1,139,413 | |
BankUnited Inc. | | | 26,966 | | | | 504,264 | |
Bryn Mawr Bank Corp. | | | 58,500 | | | | 1,660,230 | |
Cadence BanCorp | | | 151,265 | | | | 990,786 | |
Community Bank System Inc. | | | 56,000 | | | | 3,292,800 | |
Cullen/Frost Bankers Inc. | | | 39,328 | | | | 2,194,109 | |
CVB Financial Corp. | | | 139,500 | | | | 2,796,975 | |
Enterprise Financial Services Corp. | | | 47,443 | | | | 1,324,134 | |
Equity Bancshares Inc., Class A (a) | | | 68,321 | | | | 1,178,537 | |
First Interstate BancSystem Inc., Class A | | | 30,942 | | | | 892,367 | |
Franklin Financial Network Inc. | | | 37,592 | | | | 766,501 | |
Fulton Financial Corp. | | | 266,169 | | | | 3,058,282 | |
German American Bancorp Inc. | | | 66,500 | | | | 1,825,425 | |
Glacier Bancorp Inc. | | | 18,442 | | | | 627,120 | |
Home BancShares Inc. | | | 49,599 | | | | 594,692 | |
IBERIABANK Corp. | | | 83,085 | | | | 3,004,354 | |
Independent Bank Corp. | | | 68,000 | | | | 4,377,160 | |
Investors Bancorp Inc. | | | 82,530 | | | | 659,415 | |
Lakeland Financial Corp. | | | 19,506 | | | | 716,846 | |
National Bank Holdings Corp., Class A | | | 41,960 | | | | 1,002,844 | |
Origin Bancorp Inc. | | | 52,297 | | | | 1,059,014 | |
PacWest Bancorp | | | 70,712 | | | | 1,267,159 | |
Pinnacle Financial Partners Inc. | | | 23,115 | | | | 867,737 | |
Prosperity Bancshares Inc. | | | 126,786 | | | | 6,117,425 | |
Renasant Corp. | | | 185,775 | | | | 4,057,326 | |
Sandy Spring Bancorp Inc. | | | 53,482 | | | | 1,210,832 | |
Stock Yards Bancorp Inc. | | | 55,000 | | | | 1,591,150 | |
UMB Financial Corp. | | | 98,500 | | | | 4,568,430 | |
United Community Banks Inc. | | | 64,345 | | | | 1,178,157 | |
Valley National Bancorp | | | 87,993 | | | | 643,229 | |
Washington Trust Bancorp Inc. | | | 47,000 | | | | 1,718,320 | |
Westamerica Bancorporation | | | 80,667 | | | | 4,741,606 | |
Western Alliance Bancorp | | | 120,061 | | | | 3,675,067 | |
Wintrust Financial Corp. | | | 56,250 | | | | 1,848,375 | |
| | | | | | | | |
| | | | 68,511,395 | |
| | | | | | | | |
| | | | | | | | |
| | | Number
of Shares | | | Fair
Value $ | |
Research & Consulting Services - 0.7% | |
CoreLogic Inc. | | | 115,972 | | | | 3,541,785 | |
Resources Connection Inc. | | | 252,394 | | | | 2,768,762 | |
| | | | | | | | |
| | | | 6,310,547 | |
| | | | | | | | |
|
Residential REITs - 0.1% | |
NexPoint Residential Trust Inc. | | | 48,285 | | | | 1,217,265 | |
| | | | | | | | |
|
Restaurants - 1.0% | |
Bloomin’ Brands Inc. | | | 17,697 | | | | 126,357 | |
Brinker International Inc. | | | 20,743 | | | | 249,123 | |
Cracker Barrel Old Country Store Inc. | | | 14,207 | | | | 1,182,306 | |
Dave & Buster’s Entertainment Inc. | | | 12,222 | | | | 159,864 | |
Ruth’s Hospitality Group Inc. | | | 77,941 | | | | 520,646 | |
Texas Roadhouse Inc. | | | 118,116 | | | | 4,878,191 | |
The Cheesecake Factory Inc. | | | 60,629 | | | | 1,035,543 | |
| | | | | | | | |
| | | | 8,152,030 | |
| | | | | | | | |
|
Retail REITs - 0.1% | |
Retail Opportunity Investments Corp. | | | 53,007 | | | | 439,428 | |
| | | | | | | | |
|
Security & Alarm Services - 1.0% | |
The Brink’s Co. | | | 165,220 | | | | 8,599,701 | |
| | | | | | | | |
|
Semiconductor Equipment - 0.7% | |
Brooks Automation Inc. | | | 57,140 | | | | 1,742,770 | |
Ichor Holdings Ltd. (a) | | | 74,129 | | | | 1,420,312 | |
Onto Innovation Inc. (a) | | | 83,880 | | | | 2,488,719 | |
| | | | | | | | |
| | | | 5,651,801 | |
| | | | | | | | |
|
Semiconductors - 0.5% | |
Diodes Inc. (a) | | | 17,117 | | | | 695,549 | |
Semtech Corp. (a) | | | 104,481 | | | | 3,918,038 | |
| | | | | | | | |
| | | | 4,613,587 | |
| | | | | | | | |
|
Soft Drinks - 0.3% | |
Primo Water Corp. | | | 258,889 | | | | 2,345,534 | |
| | | | | | | | |
|
Specialized Consumer Services - 0.3% | |
OneSpaWorld Holdings Ltd. | | | 136,683 | | | | 554,933 | |
ServiceMaster Global Holdings Inc. (a) | | | 63,049 | | | | 1,702,323 | |
WW International Inc. (a) | | | 14,181 | | | | 239,801 | |
| | | | | | | | |
| | | | 2,497,057 | |
| | | | | | | | |
|
Specialized REITs - 0.9% | |
CoreSite Realty Corp. | | | 27,330 | | | | 3,167,547 | |
National Storage Affiliates Trust | | | 39,128 | | | | 1,158,189 | |
PotlatchDeltic Corp. | | | 59,655 | | | | 1,872,570 | |
See Notes to Schedules of Investments and Notes to Financial Statements.
| | |
| 20 | | State Street InstitutionalSmall-Cap Equity Fund |
State Street InstitutionalSmall-Cap Equity Fund
Schedule of Investments, continued — March 31, 2020 (Unaudited)
| | | | | | | | |
| | | Number
of Shares | | | Fair
Value $ | |
| | | | | | | | |
QTS Realty Trust Inc., Class A | | | 19,661 | | | | 1,140,535 | |
| | | | | | | | |
| | | | 7,338,841 | |
| | | | | | | | |
|
Specialty Chemicals - 3.7% | |
Chase Corp. | | | 16,500 | | | | 1,357,785 | |
HB Fuller Co. | | | 100,122 | | | | 2,796,407 | |
Ingevity Corp. (a) | | | 91,336 | | | | 3,215,027 | |
Innospec Inc. | | | 37,520 | | | | 2,607,265 | |
Minerals Technologies Inc. | | | 19,684 | | | | 713,742 | |
PolyOne Corp. | | | 176,404 | | | | 3,346,384 | |
Quaker Chemical Corp. | | | 34,011 | | | | 4,294,909 | |
Sensient Technologies Corp. | | | 151,720 | | | | 6,601,337 | |
Stepan Co. | | | 71,254 | | | | 6,303,129 | |
| | | | | | | | |
| | | | 31,235,985 | |
| | | | | | | | |
|
Specialty Stores - 0.5% | |
Hudson Ltd., Class A (a) | | | 37,505 | | | | 188,275 | |
National Vision Holdings Inc. (a) | | | 93,500 | | | | 1,815,770 | |
Sally Beauty Holdings Inc. (a) | | | 316,278 | | | | 2,555,526 | |
| | | | | | | | |
| | | | 4,559,571 | |
| | | | | | | | |
|
Steel - 0.5% | |
Carpenter Technology Corp. | | | 34,193 | | | | 666,764 | |
Commercial Metals Co. | | | 152,651 | | | | 2,410,359 | |
Steel Dynamics Inc. | | | 56,278 | | | | 1,268,506 | |
| | | | | | | | |
| | | | 4,345,629 | |
| | | | | | | | |
|
Systems Software - 1.3% | |
CommVault Systems Inc. (a) | | | 9,879 | | | | 399,902 | |
Progress Software Corp. | | | 23,800 | | | | 761,600 | |
Qualys Inc. (a) | | | 17,000 | | | | 1,478,830 | |
SailPoint Technologies Holding Inc. (a) | | | 217,500 | | | | 3,310,350 | |
Tenable Holdings Inc. (a) | | | 226,500 | | | | 4,951,290 | |
| | | | | | | | |
| | | | 10,901,972 | |
| | | | | | | | |
|
Technology Distributors - 0.2% | |
ePlus Inc. (a) | | | 6,270 | | | | 392,627 | |
Insight Enterprises Inc. (a) | | | 14,173 | | | | 597,109 | |
SYNNEX Corp. | | | 6,060 | | | | 442,986 | |
| | | | | | | | |
| | | | 1,432,722 | |
| | | | | | | | |
|
Technology Hardware, Storage & Peripherals - 0.7% | |
Pure Storage Inc., Class A (a) | | | 487,000 | | | | 5,990,100 | |
| | | | | | | | |
|
Thrifts & Mortgage Finance - 0.9% | |
Axos Financial Inc. (a) | | | 44,140 | | | | 800,258 | |
Essent Group Ltd. | | | 18,615 | | | | 490,319 | |
Flagstar Bancorp Inc. | | | 42,217 | | | | 837,163 | |
FS Bancorp Inc. | | | 8,657 | | | | 311,652 | |
HomeStreet Inc. | | | 61,547 | | | | 1,368,190 | |
| | | | | | | | |
| | | Number
of Shares | | | Fair
Value $ | |
Kearny Financial Corp. | | | 51,068 | | | | 438,674 | |
NMI Holdings Inc., Class A (a) | | | 33,832 | | | | 392,789 | |
WSFS Financial Corp. | | | 109,530 | | | | 2,729,488 | |
| | | | | | | | |
| | | | 7,368,533 | |
| | | | | | | | |
|
Tires & Rubber - 0.1% | |
Cooper Tire & Rubber Co. | | | 69,863 | | | | 1,138,767 | |
| | | | | | | | |
|
Trading Companies & Distributors - 0.9% | |
Applied Industrial Technologies Inc. | | | 119,667 | | | | 5,471,175 | |
BMC Stock Holdings Inc. (a) | | | 33,867 | | | | 600,462 | |
Foundation Building Materials Inc. (a) | | | 38,061 | | | | 391,648 | |
GMS Inc. (a) | | | 29,783 | | | | 468,487 | |
Herc Holdings Inc. (a) | | | 22,923 | | | | 469,004 | |
| | | | | | | | |
| | | | 7,400,776 | |
| | | | | | | | |
|
Trucking - 0.7% | |
ArcBest Corp. | | | 16,980 | | | | 297,489 | |
Avis Budget Group Inc. (a) | | | 21,737 | | | | 302,144 | |
Marten Transport Ltd. | | | 83,507 | | | | 1,713,564 | |
PAM Transportation Services Inc. (a) | | | 3,985 | | | | 122,539 | |
Saia Inc. (a) | | | 48,763 | | | | 3,586,031 | |
| | | | | | | | |
| | | | 6,021,767 | |
| | | | | | | | |
| |
Total Common Stock
(Cost $883,641,942) | | | | 793,584,948 | |
| | | | | | | | |
|
| Short-Term Investments - 4.8% | |
State Street Institutional U.S. Government Money Market Fund - Class G Shares 0.36%
(Cost $40,129,515) (b)(c)(d) | | | 40,129,515 | | | | 40,129,515 | |
| | | | | | | | |
| |
Total Investments
(Cost $923,771,457) | | | | 833,714,463 | |
| |
| Other Assets and Liabilities, net - 0.6% | | | | 4,933,931 | |
| | | | | | | | |
| |
| NET ASSETS - 100.0% | | | | 838,648,394 | |
| | | | | | | | |
See Notes to Schedules of Investments and Notes to Financial Statements.
| | | | |
| State Street InstitutionalSmall-Cap Equity Fund | | | 21 | |
State Street InstitutionalSmall-Cap Equity Fund
Schedule of Investments, continued — March 31, 2020 (Unaudited)
Other Information:
The Fund had the following long futures contracts open at March 31, 2020:
| | | | | | | | | | | | | | | | | | | | |
| Description | | Expiration
date | | | Number of
Contracts | | | Notional
Amount | | | Value | | | Unrealized
Appreciation | |
E-mini Russell 2000 Index Futures | | | June 2020 | | | | 238 | | | $ | 12,422,407 | | | $ | 13,656,440 | | | $ | 1,234,033 | |
| | | | | | | | | | | | | | | | | | | | |
During the period ended March 31, 2020, average notional value related to long futures contracts was $15,066,250 or 1.8% of net assets.
The views expressed in this document reflect our judgment as of the publication date and are subject to change at any time without notice. The securities cited may not be representative of the Fund’s future investments and should not be construed as a recommendation to purchase or sell a particular security. See the Fund’s summary prospectus and statutory prospectus for complete descriptions of investment objectives, policies, risks and permissible investments.
| (a) | Non-income producing security. |
| (b) | At March 31, 2020, all or a portion of this security was pledged to cover collateral requirements for futures. |
| (c) | Coupon amount represents effective yield. |
| (d) | Sponsored by SSGA Funds Management, Inc., the Fund’s investment adviser and administrator, and an affiliate of State Street Bank & Trust Co., the Fund’s sub-administrator, custodian and accounting agent. |
| † | Percentages are based on net assets as of March 31, 2020. |
Abbreviations:
REIT- Real Estate Investment Trust
The following table presents the Fund’s investments measured at fair value on a recurring basis at March 31, 2020:
| | | | | | | | | | | | | | | | | | |
| Fund | | Investments | | Level 1 | | | Level 2 | | | Level 3 | | | Total | |
| | | | | |
| State Street InstitutionalSmall-Cap Equity Fund | | Investments in Securities | | | | | | | | | | | | | | | | |
| | | | | |
| | Common Stock | | $ | 793,584,948 | | | $ | — | | | $ | — | | | $ | 793,584,948 | |
| | | | | |
| | Short-Term Investments | | | 40,129,515 | | | | — | | | | — | | | | 40,129,515 | |
| | | | | | | | | | | | | | | | | | |
| | | | | |
| | Total Investments in Securities | | $ | 833,714,463 | | | $ | — | | | $ | — | | | $ | 833,714,463 | |
| | | | | | | | | | | | | | | | | | |
| | | | | |
| | Other Financial Instruments | | | | | | | | | | | | | | | | |
| | | | | |
| | Long Futures Contracts - Unrealized Appreciation | | $ | 1,234,033 | | | $ | — | | | $ | — | | | $ | 1,234,033 | |
| | | | | | | | | | | | | | | | | | |
Affiliate Table
| | | | | | | | | | | | | | | | | | | | | | | | | | | | | | | | | | | | |
| | | Number
of Shares
Held at
9/30/19 | | | Value At
9/30/19 | | | Cost of
Purchases | | | Proceeds
from
Shares
Sold | | | Realized
Gain
(Loss) | | | Change in
Unrealized
Appreciation/
Depreciation | | | Number
of Shares
Held at
3/31/20 | | | Value at
3/31/20 | | | Dividend
Income | |
State Street Institutional U.S. Government Money Market Fund, Class G Shares | | | 66,352,770 | | | $ | 66,352,770 | | | $ | 273,373,672 | | | $ | 299,596,927 | | | $ | — | | | $ | — | | | | 40,129,515 | | | $ | 40,129,515 | | | $ | 551,675 | |
See Notes to Schedules of Investments and Notes to Financial Statements.
| | |
| 22 | | State Street InstitutionalSmall-Cap Equity Fund |
State Street Institutional International Equity Fund
Understanding Your Fund’s Expenses — March 31, 2020 (Unaudited)
As a shareholder of the Fund you incur ongoing costs. Ongoing costs include portfolio management fees, distribution and service fees (for Service Class shares) and trustees’ fees. The following example is intended to help you understand your ongoing costs (in dollars) of investing in the Fund and to compare these costs with the ongoing costs of investing in other mutual funds.
To illustrate these ongoing costs, we have provided an example and calculated the expenses paid by investors in each share class of the Fund during the period. The information in the following table is based on an investment of $1,000, which is invested at the beginning of the period and held for the entiresix-month period ended March 31, 2020.
Actual Expenses
The first section of the table provides information about actual account values and actual expenses. You may use the information in this section, together with the amount you invested, to estimate the expenses that you paid over the period. To do so, simply divide your account value by $1,000 (for example, an $8,600 account value divided by $1,000 = 8.6), then multiply the result by the number given for your class under the heading “Expenses paid during the period” to estimate the expenses you paid on your account during the period.
Hypothetical Example for Comparison Purposes
The second section of the table provides information about hypothetical account values and hypothetical expenses based on the Fund’s actual expense ratio and an assumed rate of return of 5% per year before expenses, which is not the Fund’s actual return. The hypothetical account values and expenses may not be used to estimate the actual ending account balance or expenses you paid for the period. You may use this information to compare the ongoing costs of investing in the Fund and other funds. To do so, compare this 5% hypothetical example with the 5% hypothetical examples that appear in the shareholders reports of other funds.
Please note that the expenses shown in the table are meant to highlight and help you compare ongoing costs only and do not reflect transaction costs, such as sales charges or redemption fees, if any. Therefore, the second section of the table is useful in comparing ongoing costs only, and will not help you determine the relative total costs of owning different funds.
| | | | | | | | |
Investment Class | | Actual
Fund Return | | | Hypothetical
5% Return
(2.5% for
the period) | |
Actual Fund Return | | | | | | | | |
Beginning Account Value October 1, 2019 | | $ | 1,000.00 | | | $ | 1,000.00 | |
Ending Account Value March 31, 2020 | | $ | 857.30 | | | $ | 1,022.30 | |
Expenses Paid During Period* | | $ | 2.55 | | | $ | 2.78 | |
| | |
Service Class | | | | | | |
Actual Fund Return | | | | | | | | |
Beginning Account Value October 1, 2019 | | $ | 1,000.00 | | | $ | 1,000.00 | |
Ending Account Value March 31, 2020 | | $ | 856.20 | | | $ | 1,021.00 | |
Expenses Paid During Period* | | $ | 3.71 | | | $ | 4.04 | |
| * | Expenses are equal to the Fund’s annualized expense ratio of 0.55% for Investment Class shares and 0.80% for Service Class shares (for the period October 1, 2019-March 31, 2020), multiplied by the average account value over the period, multiplied by 183/366 (to reflect theone-half year period). |
| | | | |
| State Street Institutional International Equity Fund | | | 23 | |
State Street Institutional International Equity Fund
Performance Summary — March 31, 2020 (Unaudited)
Regional Allocation
Portfolio Composition as a % of Fair Value of $70,032 (in thousands) as of March 31, 2020(a)(b)
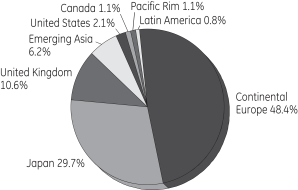
Top Ten Largest Holdings
as of March 31, 2020 (as a % of Fair Value)(a)(b)
| | | | |
Nestle S.A. | | | 4.72 | % |
| |
Roche Holding AG | | | 4.35 | % |
| |
Novartis AG | | | 4.28 | % |
| |
AstraZeneca PLC | | | 3.85 | % |
| |
AIA Group Ltd. | | | 3.39 | % |
| |
Hoya Corp. | | | 3.30 | % |
| |
Air Liquide S.A. | | | 3.19 | % |
| |
SAP SE | | | 2.98 | % |
| |
ASML Holding N.V. | | | 2.94 | % |
| |
Schneider Electric SE | | | 2.83 | % |
| (a) | Fair Value basis is inclusive of short-term investment in State Street Institutional U.S. Government Money Market Fund – Class G Shares. |
| (b) | The securities information regarding holdings, allocations and other characteristics is presented to illustrate examples of securities that the Fund has bought and the diversity of areas in which the Fund may invest as of a particular date. It may not be representative of the Fund’s current or future investments and should not be construed as a recommendation to purchase or sell a particular security. |
| | |
| 24 | | State Street Institutional International Equity Fund |
State Street Institutional International Equity Fund
Schedule of Investments — March 31, 2020 (Unaudited)
| | | | | | | | |
| | | Number
of Shares | | | Fair
Value $ | |
| | | | | | | | |
| | |
| Common Stock - 94.8%† | | | | | | | | |
Australia - 1.5% | | | | | | | | |
BHP Group PLC | | | 70,623 | | | | 1,094,147 | |
| | | | | | | | |
| | |
Brazil - 0.8% | | | | | | | | |
Itau Unibanco Holding S.A. ADR | | | 131,755 | | | | 591,580 | |
| | | | | | | | |
| | |
Canada - 1.0% | | | | | | | | |
Brookfield Asset Management Inc., Class A | | | 17,013 | | | | 745,615 | |
| | | | | | | | |
| | |
China - 1.2% | | | | | | | | |
Alibaba Group Holding Ltd. ADR (a) | | | 4,394 | | | | 854,545 | |
| | | | | | | | |
| | |
France - 14.9% | | | | | | | | |
Air Liquide S.A. (b) | | | 17,586 | | | | 2,233,309 | |
AXA S.A. | | | 63,277 | | | | 1,065,914 | |
BNP Paribas S.A. | | | 37,077 | | | | 1,076,927 | |
LVMH Moet Hennessy Louis Vuitton SE | | | 4,468 | | | | 1,630,251 | |
Safran S.A. | | | 17,541 | | | | 1,546,121 | |
Schneider Electric SE | | | 23,569 | | | | 1,981,916 | |
Vivendi S.A. (b) | | | 59,889 | | | | 1,259,770 | |
| | | | | | | | |
| | | | 10,794,208 | |
| | | | | | | | |
| | |
Germany - 5.5% | | | | | | | | |
Adidas AG | | | 3,612 | | | | 797,855 | |
Fresenius SE & Company KGaA | | | 7,977 | | | | 295,484 | |
HeidelbergCement AG | | | 18,813 | | | | 799,631 | |
SAP SE | | | 18,789 | | | | 2,087,008 | |
| | | | | | | | |
| | | | 3,979,978 | |
| | | | | | | | |
| | |
Hong Kong - 3.3% | | | | | | | | |
AIA Group Ltd. (b) | | | 265,402 | | | | 2,377,145 | |
| | | | | | | | |
| | |
Ireland - 1.9% | | | | | | | | |
Kerry Group PLC, Class A | | | 12,007 | | | | 1,385,977 | |
| | | | | | | | |
| | |
Japan - 28.8% | | | | | | | | |
Daikin Industries Ltd. | | | 13,100 | | | | 1,575,055 | |
Disco Corp. | | | 6,700 | | | | 1,298,311 | |
FANUC Corp. | | | 6,049 | | | | 805,083 | |
Fast Retailing Company Ltd. | | | 2,780 | | | | 1,129,838 | |
Hoya Corp. | | | 27,254 | | | | 2,308,218 | |
Kao Corp. | | | 20,000 | | | | 1,622,875 | |
Keyence Corp. | | | 3,700 | | | | 1,184,857 | |
Komatsu Ltd. | | | 57,100 | | | | 920,392 | |
Mitsubishi UFJ Financial Group Inc. | | | 230,774 | | | | 860,014 | |
Mitsui Fudosan Company Ltd. | | | 22,425 | | | | 386,736 | |
Murata Manufacturing Company Ltd. | | | 33,737 | | | | 1,670,545 | |
| | | | | | | | |
| | | Number
of Shares | | | Fair
Value $ | |
Nidec Corp. | | | 8,058 | | | | 413,611 | |
Secom Company Ltd. | | | 14,300 | | | | 1,178,016 | |
Shimadzu Corp. | | | 55,343 | | | | 1,438,601 | |
Shiseido Company Ltd. | | | 27,138 | | | | 1,588,614 | |
SoftBank Group Corp. | | | 25,702 | | | | 906,288 | |
Suzuki Motor Corp. | | | 16,753 | | | | 397,320 | |
Tokio Marine Holdings Inc. | | | 24,549 | | | | 1,118,754 | |
| | | | | | | | |
| | | | 20,803,128 | |
| | | | | | | | |
| | |
Netherlands - 4.0% | | | | | | | | |
ASML Holding N.V. (b) | | | 7,845 | | | | 2,057,464 | |
ING Groep N.V. (b) | | | 167,721 | | | | 855,016 | |
| | | | | | | | |
| | | | 2,912,480 | |
| | | | | | | | |
| | |
Norway - 1.4% | | | | | | | | |
Equinor ASA | | | 79,074 | | | | 975,932 | |
| | | | | | | | |
| | |
Portugal - 1.6% | | | | | | | | |
Galp Energia SGPS S.A. | | | 102,186 | | | | 1,162,631 | |
| | | | | | | | |
| | |
Sweden - 3.0% | | | | | | | | |
Assa Abloy AB, Class B (b) | | | 84,057 | | | | 1,566,835 | |
Hexagon AB, Class B | | | 13,837 | | | | 584,205 | |
| | | | | | | | |
| | | | 2,151,040 | |
| | | | | | | | |
| | |
Switzerland - 14.6% | | | | | | | | |
Givaudan S.A. | | | 381 | | | | 1,166,209 | |
Nestle S.A. | | | 32,495 | | | | 3,309,079 | |
Novartis AG | | | 36,520 | | | | 2,997,130 | |
Roche Holding AG | | | 9,523 | | | | 3,047,956 | |
| | | | | | | | |
| | | | 10,520,374 | |
| | | | | | | | |
| | |
Taiwan - 1.0% | | | | | | | | |
Taiwan Semiconductor Manufacturing Company Ltd. | | | 82,548 | | | | 743,123 | |
| | | | | | | | |
| | |
United Kingdom - 10.3% | | | | | | | | |
Ashtead Group PLC (b) | | | 52,337 | | | | 1,129,251 | |
AstraZeneca PLC | | | 30,275 | | | | 2,692,800 | |
London Stock Exchange Group PLC | | | 16,665 | | | | 1,488,201 | |
Prudential PLC | | | 96,392 | | | | 1,205,685 | |
Vodafone Group PLC (b) | | | 662,520 | | | | 914,973 | |
| | | | | | | | |
| | | | 7,430,910 | |
| | | | | | | | |
| |
Total Common Stock
(Cost $69,589,668) | | | | 68,522,813 | |
| | | | | | | | |
See Notes to Schedules of Investments and Notes to Financial Statements.
| | | | |
| State Street Institutional International Equity Fund | | | 25 | |
State Street Institutional International Equity Fund
Schedule of Investments, continued — March 31, 2020 (Unaudited)
| | | | | | | | |
| | | Number
of Shares | | | Fair
Value $ | |
| | | | | | | | |
|
| Short-Term Investments - 2.1% | |
State Street Institutional U.S. Government Money Market Fund - Class G Shares 0.36%
(Cost $1,509,460) (c)(d) | | | 1,509,460 | | | | 1,509,460 | |
| | | | | | | | |
| |
Total Investments
(Cost $71,099,128) | | | | 70,032,273 | |
| |
| Other Assets and Liabilities, net - 3.1% | | | | 2,228,664 | |
| | | | | | | | |
| |
| NET ASSETS - 100.0% | | | | 72,260,937 | |
| | | | | | | | |
Other Information:
The Fund had the following long futures contracts open at March 31, 2020:
| | | | | | | | | | | | | | | | | | | | |
| Description | | Expiration
date | | | Number of
Contracts | | | Notional
Amount | | | Value | | | Unrealized
Appreciation | |
MSCI EAFE Mini Index Futures | | | June 2020 | | | | 15 | | | $ | 1,050,528 | | | $ | 1,169,475 | | | $ | 118,947 | |
| | | | | | | | | | | | | | | | | | | | |
During the period ended March 31, 2020, average notional value related to long and short futures contracts was $780,420 or 1.1% of net assets and $83,040 or 0.1% of net assets, respectively.
The views expressed in this document reflect our judgment as of the publication date and are subject to change at any time without notice. The securities cited may not be representative of the Fund’s future investments and should not be construed as a recommendation to purchase or sell a particular security. See the Fund’s summary prospectus and statutory prospectus for complete descriptions of investment objectives, policies, risks and permissible investments.
| † | Percentages are based on net assets as of March 31, 2020. |
| (a) | Non-income producing security. |
| (b) | At March 31, 2020, all or a portion of this security was pledged to cover collateral requirements for futures. |
| (c) | Sponsored by SSGA Funds Management, Inc., the Fund’s investment adviser and administrator, and an affiliate of State Street Bank & Trust Co., the Fund’s sub-administrator, custodian and accounting agent. |
| (d) | Coupon amount represents effective yield. |
Abbreviations:
ADR - American Depositary Receipt
The following table presents the Fund’s investments measured at fair value on a recurring basis at March 31, 2020:
| | | | | | | | | | | | | | | | | | |
| Fund | | Investments | | Level 1 | | | Level 2 | | | Level 3 | | | Total | |
| | | | | |
| State Street Institutional International Equity Fund | | Investments in Securities | | | | | | | | | | | | | | | | |
| | | | | |
| | Common Stock | | $ | 3,577,717 | | | $ | 64,945,096 | | | $ | — | | | $ | 68,522,813 | |
| | | | | |
| | Short-Term Investments | | | 1,509,460 | | | | — | | | | — | | | | 1,509,460 | |
| | | | | | | | | | | | | | | | | | |
| | | | | |
| | Total Investments in Securities | | $ | 5,087,177 | | | $ | 64,945,096 | | | $ | — | | | $ | 70,032,273 | |
| | | | | | | | | | | | | | | | | | |
| | | | | |
| | Other Financial Instruments | | | | | | | | | | | | | | | | |
| | | | | |
| | Long Futures Contracts - Unrealized Appreciation | | $ | 118,947 | | | $ | — | | | $ | — | | | $ | 118,947 | |
| | | | | | | | | | | | | | | | | | |
See Notes to Schedules of Investments and Notes to Financial Statements.
| | |
| 26 | | State Street Institutional International Equity Fund |
State Street Institutional International Equity Fund
Schedule of Investments, continued — March 31, 2020 (Unaudited)
The Fund was invested in the following sectors at March 31, 2020 (unaudited):
| | | | |
| Sector | | Percentage
(based on
Fair Value) | |
Pharmaceuticals | | | 12.48% | |
Packaged Foods & Meats | | | 6.70% | |
Life & Health Insurance | | | 5.12% | |
Diversified Banks | | | 4.83% | |
Semiconductor Equipment | | | 4.79% | |
Personal Products | | | 4.59% | |
Electronic Equipment & Instruments | | | 4.58% | |
Building Products | | | 4.49% | |
Apparel, Accessories & Luxury Goods | | | 3.47% | |
Electrical Components & Equipment | | | 3.42% | |
Healthcare Supplies | | | 3.30% | |
Industrial Gases | | | 3.19% | |
Integrated Oil & Gas | | | 3.05% | |
Application Software | | | 2.98% | |
Wireless Telecommunication Services | | | 2.60% | |
Electronic Components | | | 2.39% | |
Aerospace & Defense | | | 2.21% | |
Financial Exchanges & Data | | | 2.12% | |
Movies & Entertainment | | | 1.80% | |
Security & Alarm Services | | | 1.68% | |
Specialty Chemicals | | | 1.67% | |
Apparel Retail | | | 1.61% | |
| | | | |
| Sector | | Percentage
(based on
Fair Value) | |
Trading Companies & Distributors | | | 1.61% | |
Property & Casualty Insurance | | | 1.60% | |
Diversified Metals & Mining | | | 1.56% | |
Multi-Line Insurance | | | 1.52% | |
Construction Machinery & Heavy Trucks | | | 1.31% | |
Internet & Direct Marketing Retail | | | 1.22% | |
Industrial Machinery | | | 1.15% | |
Construction Materials | | | 1.14% | |
Asset Management & Custody Banks | | | 1.06% | |
Semiconductors | | | 1.06% | |
Automobile Manufacturers | | | 0.57% | |
Diversified Real Estate Activities | | | 0.55% | |
Healthcare Services | | | 0.42% | |
| | | | |
| | | 97.84% | |
| | | | |
Short-Term Investments | | | | |
Short-Term Investments | | | 2.16% | |
| | | | |
| | | 2.16% | |
| | | | |
| | | 100.00% | |
| | | | |
Affiliate Table
| | | | | | | | | | | | | | | | | | | | | | | | | | | | | | | | | | | | |
| | | Number
of Shares
Held at
9/30/19 | | | Value At
9/30/19 | | | Cost of
Purchases | | | Proceeds
from
Shares
Sold | | | Realized
Gain
(Loss) | | | Change in
Unrealized
Appreciation/
Depreciation | | | Number
of Shares
Held at
3/31/20 | | | Value at
3/31/20 | | | Dividend
Income | |
State Street Institutional U.S. Government Money Market Fund, Class G Shares | | | 723,844 | | | $ | 723,844 | | | $ | 11,729,980 | | | $ | 10,944,364 | | | $ | — | | | $ | — | | | | 1,509,460 | | | $ | 1,509,460 | | | $ | 13,337 | |
See Notes to Schedules of Investments and Notes to Financial Statements.
| | | | |
| State Street Institutional International Equity Fund | | | 27 | |
State Street Active Core Bond Fund
Understanding Your Fund’s Expenses — March 31, 2020 (Unaudited)
As a shareholder of the Fund you incur ongoing costs. Ongoing costs include portfolio management fees, distribution and service fees (for Service Class shares) and trustees’ fees. The following example is intended to help you understand your ongoing costs (in dollars) of investing in the Fund and to compare these costs with the ongoing costs of investing in other mutual funds.
To illustrate these ongoing costs, we have provided an example and calculated the expenses paid by investors in each share class of the Fund during the period. The information in the following table is based on an investment of $1,000, which is invested at the beginning of the period and held for the entiresix-month period ended March 31, 2020.
Actual Expenses
The first section of the table provides information about actual account values and actual expenses. You may use the information in this section, together with the amount you invested, to estimate the expenses that you paid over the period. To do so, simply divide your account value by $1,000 (for example, an $8,600 account value divided by $1,000 = 8.6), then multiply the result by the number given for your class under the heading “Expenses paid during the period” to estimate the expenses you paid on your account during the period.
Hypothetical Example for Comparison Purposes
The second section of the table provides information about hypothetical account values and hypothetical expenses based on the Fund’s actual expense ratio and an assumed rate of return of 5% per year before expenses, which is not the Fund’s actual return. The hypothetical account values and expenses may not be used to estimate the actual ending account balance or expenses you paid for the period. You may use this information to compare the ongoing costs of investing in the Fund and other funds. To do so, compare this 5% hypothetical example with the 5% hypothetical examples that appear in the shareholders reports of other funds.
Please note that the expenses shown in the table are meant to highlight and help you compare ongoing costs only and do not reflect transaction costs, such as sales charges or redemption fees, if any. Therefore, the second section of the table is useful in comparing ongoing costs only, and will not help you determine the relative total costs of owning different funds.
| | | | | | | | |
Investment Class | | Actual
Fund Return | | | Hypothetical
5% Return
(2.5% for
the period) | |
Actual Fund Return | | | | | | | | |
Beginning Account Value October 1, 2019 | | $ | 1,000.00 | | | $ | 1,000.00 | |
Ending Account Value March 31, 2020 | | $ | 1,013.80 | | | $ | 1,023.60 | |
Expenses Paid During Period* | | $ | 1.41 | | | $ | 1.42 | |
| | |
Service Class | | | | | | |
Actual Fund Return | | | | | | | | |
Beginning Account Value October 1, 2019 | | $ | 1,000.00 | | | $ | 1,000.00 | |
Ending Account Value March 31, 2020 | | $ | 1,012.30 | | | $ | 1,022.40 | |
Expenses Paid During Period* | | $ | 2.67 | | | $ | 2.68 | |
| * | Expenses are equal to the Fund’s annualized expense ratio of 0.28% for Investment Class shares and 0.53% for Service Class shares (for the period October 1, 2019-March 31, 2020), multiplied by the average account value over the period, multiplied by 183/366 (to reflect theone-half year period). |
| | |
| 28 | | State Street Active Core Bond Fund |
State Street Active Core Bond Fund
Performance Summary — March 31, 2020 (Unaudited)
Quality Ratings
as of March 31, 2020 as a % of Fair Value(a)(b)
| | | | |
Moody’s / S&P / Rating* | | Percentage of
Fair Value | |
| |
Aaa / AAA | �� | | 27.87 | % |
| |
Aa / AA | | | 46.61 | % |
| |
A / A | | | 6.7 | % |
| |
Baa / BBB | | | 16.55 | % |
| |
Ba / BB and lower | | | 1.45 | % |
| |
NR / Other | | | 0.82 | % |
| | | | |
| | | 100.00 | % |
| | | | |
| * | Moody’s Investors Services, Inc. (“Moody’s”) and S&P Global Ratings (“S&P”) are nationally recognized statistical rating organizations. The quality ratings represent the lower of Moody’s or S&P credit ratings. When a rating from only one of the rating agencies is available, that rating is used. Securities not rated by Moody’s or S&P are categorized as not rated. Credit quality measures a bond issuer’s ability to repay interest and principal in a timely manner. Credit quality ratings assigned by a rating agency are subject to change periodically and are not absolute standard of quality. In formulating investment decisions for the Fund, SSGA Funds Management, Inc. (“SSGA FM”) develops its own analysis of the credit quality and risks associated with individual debt instruments, rather than relying exclusively on rating agency ratings. |
Sector Allocation
Portfolio Composition as a % of Fair Value of $137,905 (in thousands) as of March 31, 2020(a)(b)
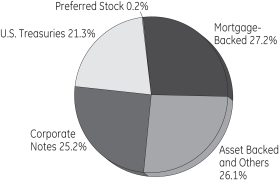
| (a) | Fair Value basis is inclusive of short-term investment in State Street Institutional U.S. Government Money Market Fund – Class G Shares. |
| (b) | The securities information regarding holdings, allocations and other characteristics is presented to illustrate examples of securities that the Fund has bought and the diversity of areas in which the Fund may invest as of a particular date. It may not be representative of the Fund’s current or future investments and should not be construed as a recommendation to purchase or sell a particular security. |
| | | | |
| State Street Active Core Bond Fund | | | 29 | |
State Street Active Core Bond Fund
Schedule of Investments — March 31, 2020 (Unaudited)
| | | | | | | | |
| | | Principal
Amount ($) | | | Fair
Value
$ | |
| | | | | | | | |
|
| Bonds and Notes - 90.7%† | |
U.S. Treasuries - 25.0% | | | | | | | | |
U.S. Treasury Bonds | | | | | | | | |
2.25%, 08/15/46 (a) | | | 742,600 | | | | 885,434 | |
3.00%, 08/15/48 (a) | | | 3,098,200 | | | | 4,285,198 | |
4.50%, 08/15/39 | | | 136,000 | | | | 214,795 | |
U.S. Treasury Notes | | | | | | | | |
1.38%, 01/31/22 (a) | | | 889,000 | | | | 907,544 | |
1.50%, 01/15/23 (a) | | | 562,000 | | | | 580,968 | |
1.63%, 12/15/22 - 02/15/26 (a) | | | 5,905,800 | | | | 6,242,953 | |
1.75%, 12/31/24 (a) | | | 869,600 | | | | 925,513 | |
1.88%, 06/30/20 - 12/15/20 (a) | | | 8,914,500 | | | | 8,984,710 | |
2.50%, 01/31/24 (a) | | | 3,279,900 | | | | 3,547,673 | |
2.63%, 02/15/29 (a) | | | 2,458,300 | | | | 2,868,913 | |
| | | | | | | | |
| | | | 29,443,701 | |
| | | | | | | | |
|
Agency Mortgage Backed - 27.2% | |
Federal Home Loan Mortgage Corp. | | | | | | | | |
3.00%, 03/01/43 - 04/01/43 (a) | | | 1,662,570 | | | | 1,760,658 | |
4.50%, 06/01/33 - 02/01/35 (a) | | | 8,549 | | | | 9,328 | |
5.00%, 07/01/35 (a) | | | 66,080 | | | | 73,378 | |
5.50%, 05/01/20 - 04/01/39 (a) | | | 149,702 | | | | 167,703 | |
6.00%, 02/01/29 - 11/01/37 (a) | | | 190,291 | | | | 219,608 | |
6.50%, 08/01/29 - 10/01/33 (a) | | | 815 | | | | 951 | |
7.00%, 06/01/29 - 08/01/36 (a) | | | 44,982 | | | | 53,501 | |
7.50%, 01/01/30 - 09/01/33 (a) | | | 1,774 | | | | 1,984 | |
8.00%, 11/01/30 (a) | | | 10,043 | | | | 11,439 | |
8.50%, 04/01/30 (a) | | | 10,823 | | | | 13,666 | |
Federal National Mortgage Assoc. | | | | | | | | |
3.50%, 06/01/44 - 08/01/45 (a) | | | 1,974,075 | | | | 2,116,248 | |
4.00%, 01/01/41 - 12/01/41 (a) | | | 1,489,720 | | | | 1,618,601 | |
4.50%, 07/01/20 - 02/01/40 (a) | | | 932,736 | | | | 1,027,670 | |
5.00%, 07/01/20 - 05/01/39 (a) | | | 204,313 | | | | 225,884 | |
5.50%, 06/01/20 - 04/01/38 (a) | | | 315,545 | | | | 354,344 | |
6.00%, 05/01/20 - 07/01/35 (a) | | | 380,666 | | | | 439,334 | |
6.50%, 05/01/21 - 08/01/36 (a) | | | 35,819 | | | | 40,231 | |
7.00%, 10/01/32 - 02/01/34 (a) | | | 6,286 | | | | 7,010 | |
7.50%, 12/01/23 - 03/01/33 (a) | | | 30,504 | | | | 35,117 | |
8.00%, 07/01/25 - 10/01/31 (a) | | | 7,245 | | | | 8,050 | |
9.00%, 12/01/22 (a) | | | 218 | | | | 225 | |
Federal National Mortgage Assoc. 1.25% + USD COF11
5.50%, 10/01/24 (a)(b) | | | 4,324 | | | | 4,508 | |
Federal National Mortgage Assoc. 1.60% + 12 month USD LIBOR
4.47%, 04/01/37 (a)(b) | | | 2,196 | | | | 2,224 | |
Federal National Mortgage Assoc. REMIC 6.00% - 1 month USD LIBOR
5.05%, 09/25/46 (a)(b)(c) | | | 1,433,011 | | | | 331,515 | |
| | | | | | | | |
| | | Principal
Amount ($) | | | Fair
Value
$ | |
Federal National Mortgage Assoc. TBA | | | | | | | | |
2.50%, TBA (d) | | | 3,026,000 | | | | 3,137,659 | |
3.00%, TBA (d) | | | 2,529,000 | | | | 2,651,682 | |
3.50%, TBA (d) | | | 2,249,000 | | | | 2,377,845 | |
4.00%, TBA (d) | | | 4,549,000 | | | | 4,831,777 | |
4.50%, TBA (d) | | | 1,285,000 | | | | 1,382,853 | |
Government National Mortgage Assoc. | | | | | | | | |
3.00%, 12/20/42 (a) | | | 1,548,072 | | | | 1,665,954 | |
4.00%, 01/20/41 - 04/20/43 (a) | | | 1,551,958 | | | | 1,700,177 | |
4.50%, 08/15/33 - 05/20/40 (a) | | | 267,768 | | | | 294,402 | |
5.00%, 08/15/33 (a) | | | 20,749 | | | | 22,987 | |
6.00%, 04/15/27 - 09/15/36 (a) | | | 141,267 | | | | 162,672 | |
6.50%, 02/15/24 - 09/15/36 (a) | | | 56,353 | | | | 63,194 | |
7.00%, 10/15/27 - 10/15/36 (a) | | | 28,202 | | | | 32,648 | |
7.50%, 01/15/23 - 11/15/31 (a) | | | 2,243 | | | | 2,332 | |
8.00%, 05/15/30 - 09/15/30 (a) | | | 203 | | | | 223 | |
9.00%, 12/15/21 (a) | | | 86 | | | | 88 | |
2.50%, TBA (d) | | | 761,000 | | | | 795,085 | |
3.00%, TBA (d) | | | 706,000 | | | | 746,602 | |
3.50%, TBA (d) | | | 3,447,000 | | | | 3,633,862 | |
| | | | | | | | |
| | | | 32,025,219 | |
| | | | | | | | |
Agency Collateralized Mortgage Obligations - 1.4% | |
Federal Home Loan Mortgage Corp. | | | | | | | | |
0.08%, 09/25/43 (a)(b)(c) | | | 576,132 | | | | 1,659 | |
2.43%, 08/25/29 (a) | | | 673,000 | | | | 710,270 | |
2.51%, 07/25/29 (a) | | | 290,000 | | | | 308,093 | |
Federal Home Loan Mortgage Corp. REMIC | | | | | | | | |
3.50%, 09/15/29 - 11/15/30 (a)(c) | | | 181,451 | | | | 6,527 | |
5.50%, 06/15/33 (a)(c) | | | 21,631 | | | | 3,725 | |
7.50%, 07/15/27 (a)(c) | | | 2,273 | | | | 326 | |
Federal Home Loan Mortgage Corp. REMIC 6.15% - 1 month USD LIBOR | | | | | | | | |
5.45%, 10/15/42 (a)(b)(c) | | | 1,205,007 | | | | 204,327 | |
Federal Home Loan Mortgage Corp. REMIC 6.60% - 1 month USD LIBOR | | | | | | | | |
5.90%, 08/15/25 (a)(b)(c) | | | 60,102 | | | | 2,522 | |
Federal Home Loan Mortgage Corp. STRIPS | | | | | | | | |
1.47%, 08/01/27 (a)(e) | | | 517 | | | | 491 | |
8.00%, 02/01/23 - 07/01/24 (a)(c) | | | 1,326 | | | | 145 | |
Federal National Mortgage Assoc. REMIC | | | | | | | | |
1.10%, 12/25/42 (b)(c) | | | 104,966 | | | | 4,197 | |
5.00%, 02/25/40 - 09/25/40 (a)(c) | | | 98,935 | | | | 10,929 | |
See Notes to Schedules of Investments and Notes to Financial Statements.
| | |
| 30 | | State Street Active Core Bond Fund |
State Street Active Core Bond Fund
Schedule of Investments, continued — March 31, 2020 (Unaudited)
| | | | | | | | |
| | | Principal
Amount ($) | | | Fair
Value
$ | |
| | | | | | | | |
Federal National Mortgage Assoc. REMIC 6.00% - 1 month USD LIBOR | | | | | | | | |
5.05%, 07/25/38 (a)(b)(c) | | | 39,665 | | | | 6,438 | |
Federal National Mortgage Assoc. REMIC 6.55% - 1 month USD LIBOR | | | | | | | | |
5.60%, 11/25/41 (a)(b)(c) | | | 1,597,249 | | | | 393,312 | |
Federal National Mortgage Assoc. STRIPS | | | | | | | | |
1.87%, 12/25/34 (a)(e) | | | 9,802 | | | | 9,095 | |
4.50%, 08/25/35 - 01/25/36 (a)(c) | | | 71,279 | | | | 10,234 | |
5.00%, 03/25/38 - 05/25/38 (a)(c) | | | 37,360 | | | | 5,854 | |
5.50%, 12/25/33 (a)(c) | | | 9,874 | | | | 1,911 | |
6.00%, 01/25/35 (a)(c) | | | 44,054 | | | | 8,884 | |
7.50%, 11/25/23 (a)(c) | | | 4,938 | | | | 436 | |
8.00%, 08/25/23 - 07/25/24 (a)(c) | | | 2,759 | | | | 315 | |
8.50%, 07/25/22 (a)(c) | | | 29 | | | | 2 | |
9.00%, 05/25/22 (a)(c) | | | 21 | | | | 1 | |
Government National Mortgage Assoc. REMIC | | | | | | | | |
4.50%, 05/20/38 - 08/16/39 (a)(c) | | | 47,937 | | | | 776 | |
5.00%, 09/20/38 (a)(c)** | | | 178 | | | | — | |
| | | | | | | | |
| | | | 1,690,469 | |
| | | | | | | | |
|
Asset Backed - 3.3% | |
Ally Auto Receivables Trust | | | | | | | | |
2.35%, 06/15/22 | | | 67,990 | | | | 68,131 | |
American Express Credit Account Master Trust 0.24% + 1 month USD LIBOR | | | | | | | | |
0.94%, 04/15/24 (a)(b) | | | 490,000 | | | | 479,287 | |
BA Credit Card Trust2018-A1 | | | | | | | | |
2.70%, 07/17/23 (a) | | | 432,000 | | | | 432,599 | |
CarMax Auto Owner Trust | | | | | | | | |
3.13%, 06/15/23 | | | 101,000 | | | | 102,657 | |
Chase Funding Trust2004-1 | | | | | | | | |
4.99%, 11/25/33 (a)(f) | | | 136,838 | | | | 129,656 | |
Enterprise Fleet Financing2019-1 LLC | | | | | | | | |
3.07%, 10/20/24 (a)(g) | | | 473,000 | | | | 467,572 | |
GMF Floorplan Owner Revolving Trust 0.32% + 1 month USD LIBOR | | | | | | | | |
1.02%, 09/15/22 (a)(b)(g) | | | 219,000 | | | | 217,084 | |
Hyundai Auto Lease Securitization Trust2018-A | | | | | | | | |
2.89%, 03/15/22 (a)(g) | | | 619,000 | | | | 619,089 | |
| | | | | | | | |
| | | Principal
Amount ($) | | | Fair
Value
$ | |
Nissan Auto Lease Trust | | | | | | | | |
1.80%, 05/16/22 | | | 163,000 | | | | 163,344 | |
Nissan Auto Lease Trust2019-A | | | | | | | | |
2.76%, 03/15/22 (a) | | | 400,000 | | | | 402,045 | |
Securitized Term Auto Receivables Trust2018-1A | | | | | | | | |
3.30%, 11/25/22 (a)(g) | | | 118,000 | | | | 117,617 | |
Toyota Auto Receivables Owner Trust | | | | | | | | |
2.05%, 09/15/22 (a) | | | 241,000 | | | | 240,353 | |
Trillium Credit Card Trust II | | | | | | | | |
3.04%, 01/26/24 (a)(g) | | | 482,000 | | | | 482,585 | |
| | | | | | | | |
| | | | 3,922,019 | |
| | | | | | | | |
|
Corporate Notes - 29.5% | |
3M Co. | | | | | | | | |
2.65%, 04/15/25 | | | 35,000 | | | | 36,227 | |
3.05%, 04/15/30 | | | 40,000 | | | | 41,918 | |
3.13%, 09/19/46 (a) | | | 52,000 | | | | 50,267 | |
3.70%, 04/15/50 | | | 25,000 | | | | 28,382 | |
Abbott Laboratories | | | | | | | | |
3.75%, 11/30/26 (a) | | | 223,000 | | | | 248,870 | |
4.90%, 11/30/46 (a) | | | 34,000 | | | | 46,509 | |
AbbVie Inc. | | | | | | | | |
2.60%, 11/21/24 (a)(g) | | | 65,000 | | | | 65,626 | |
2.95%, 11/21/26 (a)(g) | | | 85,000 | | | | 86,023 | |
3.20%, 05/14/26 (a) | | | 24,000 | | | | 24,462 | |
3.20%, 11/21/29 (a)(g) | | | 80,000 | | | | 79,540 | |
4.05%, 11/21/39 (a)(g) | | | 35,000 | | | | 36,286 | |
4.25%, 11/21/49 (a)(g) | | | 25,000 | | | | 26,634 | |
4.70%, 05/14/45 (a) | | | 9,000 | | | | 10,111 | |
4.88%, 11/14/48 (a) | | | 7,000 | | | | 8,118 | |
Aetna Inc. | | | | | | | | |
3.50%, 11/15/24 (a) | | | 29,000 | | | | 29,588 | |
Aircastle Ltd. | | | | | | | | |
4.25%, 06/15/26 (a) | | | 58,000 | | | | 48,897 | |
Albemarle Wodgina Pty Ltd. | | | | | | | | |
3.45%, 11/15/29 (a)(g) | | | 69,000 | | | | 63,027 | |
Alexandria Real Estate Equities Inc. | | | | | | | | |
4.70%, 07/01/30 (a) | | | 50,000 | | | | 51,042 | |
Alimentation Couche-Tard Inc. | | | | | | | | |
2.95%, 01/25/30 (a)(g) | | | 33,000 | | | | 30,573 | |
3.80%, 01/25/50 (a)(g) | | | 51,000 | | | | 44,689 | |
Allergan Finance LLC | | | | | | | | |
3.25%, 10/01/22 (a) | | | 29,000 | | | | 29,185 | |
4.63%, 10/01/42 (a) | | | 4,000 | | | | 4,730 | |
Allergan Funding SCS | | | | | | | | |
3.45%, 03/15/22 (a) | | | 87,000 | | | | 87,535 | |
Allergan Sales LLC | | | | | | | | |
5.00%, 12/15/21 (a)(g) | | | 55,000 | | | | 58,205 | |
See Notes to Schedules of Investments and Notes to Financial Statements.
| | | | |
| State Street Active Core Bond Fund | | | 31 | |
State Street Active Core Bond Fund
Schedule of Investments, continued — March 31, 2020 (Unaudited)
| | | | | | | | |
| | | Principal
Amount ($) | | | Fair
Value
$ | |
| | | | | | | | |
Ally Financial Inc. | | | | | | | | |
5.75%, 11/20/25 (a) | | | 42,000 | | | | 41,105 | |
Altria Group Inc. | | | | | | | | |
2.95%, 05/02/23 (a) | | | 23,000 | | | | 22,926 | |
3.80%, 02/14/24 (a) | | | 15,000 | | | | 15,215 | |
4.25%, 08/09/42 (a) | | | 3,000 | | | | 2,724 | |
4.50%, 05/02/43 (a) | | | 13,000 | | | | 12,322 | |
4.80%, 02/14/29 (a) | | | 58,000 | | | | 60,232 | |
Amazon.com Inc. | | | | | | | | |
3.15%, 08/22/27 (a) | | | 31,000 | | | | 34,222 | |
4.05%, 08/22/47 (a) | | | 12,000 | | | | 15,223 | |
4.25%, 08/22/57 (a) | | | 6,000 | | | | 8,011 | |
Ameren Corp. | | | | | | | | |
2.50%, 09/15/24 (a) | | | 75,000 | | | | 72,912 | |
3.50%, 01/15/31 | | | 35,000 | | | | 34,917 | |
American Electric Power Company Inc. | | | | | | | | |
3.25%, 03/01/50 (a) | | | 30,000 | | | | 26,755 | |
American Electric Power Company Inc. | | | | | | | | |
2.30%, 03/01/30 (a) | | | 30,000 | | | | 28,087 | |
American Express Co. | | | | | | | | |
3.00%, 10/30/24 (a) | | | 167,000 | | | | 173,262 | |
American International Group Inc. | |
4.25%, 03/15/29 (a) | | | 151,000 | | | | 156,561 | |
4.50%, 07/16/44 (a) | | | 80,000 | | | | 82,178 | |
American International Group Inc. (5.75% fixed rate until 04/01/28; 2.87% + 3 month USD LIBOR thereafter) | | | | | | | | |
5.75%, 04/01/48 (a)(b) | | | 49,000 | | | | 42,037 | |
American Tower Corp. | |
2.90%, 01/15/30 (a) | | | 40,000 | | | | 38,414 | |
3.70%, 10/15/49 (a) | | | 6,000 | | | | 5,543 | |
3.80%, 08/15/29 (a) | | | 31,000 | | | | 31,515 | |
4.70%, 03/15/22 (a) | | | 100,000 | | | | 102,406 | |
American Water Capital Corp. | |
2.95%, 09/01/27 (a) | | | 75,000 | | | | 73,723 | |
Amgen Inc. | |
2.45%, 02/21/30 (a) | | | 135,000 | | | | 133,774 | |
2.65%, 05/11/22 (a) | | | 86,000 | | | | 86,930 | |
3.15%, 02/21/40 (a) | | | 68,000 | | | | 67,931 | |
3.38%, 02/21/50 (a) | | | 68,000 | | | | 70,623 | |
4.56%, 06/15/48 (a) | | | 24,000 | | | | 29,367 | |
4.66%, 06/15/51 (a) | | | 7,000 | | | | 8,784 | |
Anheuser-Busch Companies LLC/Anheuser-Busch InBev Worldwide Inc. | | | | | | | | |
3.65%, 02/01/26 (a) | | | 116,000 | | | | 121,530 | |
4.70%, 02/01/36 (a) | | | 16,000 | | | | 16,705 | |
4.90%, 02/01/46 (a) | | | 27,000 | | | | 29,407 | |
| | | | | | | | |
| | | Principal
Amount ($) | | | Fair
Value
$ | |
Anheuser-Busch InBev Worldwide Inc. | | | | | | | | |
4.00%, 04/13/28 (a) | | | 42,000 | | | | 44,506 | |
4.38%, 04/15/38 (a) | | | 49,000 | | | | 50,457 | |
4.60%, 04/15/48 (a) | | | 23,000 | | | | 24,300 | |
4.75%, 04/15/58 (a) | | | 13,000 | | | | 13,281 | |
5.55%, 01/23/49 (a) | | | 44,000 | | | | 51,646 | |
Anthem Inc. | |
2.88%, 09/15/29 (a) | | | 21,000 | | | | 20,430 | |
3.30%, 01/15/23 (a) | | | 27,000 | | | | 27,440 | |
3.70%, 09/15/49 (a) | | | 21,000 | | | | 20,790 | |
Apache Corp. | |
4.38%, 10/15/28 (a) | | | 9,000 | | | | 4,890 | |
5.10%, 09/01/40 (a) | | | 41,000 | | | | 19,587 | |
Apollo Management Holdings LP (4.95% fixed rate until 12/17/24; 3.27% + 5 year CMT Rate thereafter) | | | | | | | | |
4.95%, 01/14/50 (a,b,g) | | | 50,000 | | | | 45,347 | |
Apple Inc. | |
2.15%, 02/09/22 (a) | | | 150,000 | | | | 153,444 | |
2.20%, 09/11/29 (a) | | | 76,000 | | | | 77,859 | |
2.85%, 05/11/24 (a) | | | 126,000 | | | | 132,668 | |
2.95%, 09/11/49 (a) | | | 20,000 | | | | 21,135 | |
3.35%, 02/09/27 (a) | | | 15,000 | | | | 16,373 | |
3.45%, 02/09/45 (a) | | | 37,000 | | | | 41,616 | |
3.85%, 08/04/46 (a) | | | 43,000 | | | | 52,184 | |
Applied Materials Inc. | |
4.35%, 04/01/47 (a) | | | 48,000 | | | | 61,278 | |
Aptiv PLC | | | | | | | | |
4.40%, 10/01/46 (a) | | | 23,000 | | | | 17,880 | |
Archer-Daniels-Midland Co. | | | | | | | | |
2.50%, 08/11/26 (a) | | | 13,000 | | | | 13,071 | |
Ares Capital Corp. | | | | | | | | |
3.25%, 07/15/25 (a) | | | 202,000 | | | | 162,660 | |
Ascension Health | | | | | | | | |
4.85%, 11/15/53 (a) | | | 17,000 | | | | 22,787 | |
AstraZeneca PLC | | | | | | | | |
3.50%, 08/17/23 (a) | | | 21,000 | | | | 22,117 | |
4.00%, 01/17/29 (a) | | | 14,000 | | | | 15,692 | |
4.38%, 08/17/48 (a) | | | 6,000 | | | | 7,419 | |
AT&T Inc. | | | | | | | | |
2.63%, 12/01/22 (a) | | | 500,000 | | | | 501,265 | |
4.35%, 03/01/29 (a) | | | 84,000 | | | | 89,972 | |
4.45%, 04/01/24 (a) | | | 24,000 | | | | 25,561 | |
4.50%, 05/15/35 (a) | | | 36,000 | | | | 38,770 | |
4.55%, 03/09/49 (a) | | | 31,000 | | | | 33,286 | |
4.75%, 05/15/46 (a) | | | 45,000 | | | | 49,252 | |
4.80%, 06/15/44 (a) | | | 24,000 | | | | 26,115 | |
4.85%, 03/01/39 (a) | | | 38,000 | | | | 42,479 | |
5.15%, 11/15/46 (a) | | | 5,000 | | | | 5,836 | |
5.25%, 03/01/37 (a) | | | 28,000 | | | | 32,668 | |
5.35%, 12/15/43 (a) | | | 18,000 | | | | 19,228 | |
See Notes to Schedules of Investments and Notes to Financial Statements.
| | |
| 32 | | State Street Active Core Bond Fund |
State Street Active Core Bond Fund
Schedule of Investments, continued — March 31, 2020 (Unaudited)
| | | | | | | | |
| | | Principal
Amount ($) | | | Fair
Value
$ | |
| | | | | | | | |
5.45%, 03/01/47 (a) | | | 31,000 | | | | 37,319 | |
Athene Holding Ltd. | | | | | | | | |
6.15%, 04/03/30 | | | 67,000 | | | | 66,871 | |
Avangrid Inc. | | | | | | | | |
3.15%, 12/01/24 (a) | | | 45,000 | | | | 45,006 | |
Avery Dennison Corp. | | | | | | | | |
2.65%, 04/30/30 (a) | | | 55,000 | | | | 51,942 | |
Bank of America Corp. | | | | | | | | |
3.25%, 10/21/27 (a) | | | 4,000 | | | | 4,225 | |
3.95%, 04/21/25 (a) | | | 89,000 | | | | 92,772 | |
4.18%, 11/25/27 (a) | | | 130,000 | | | | 136,760 | |
Bank of America Corp. (3.12% fixed rate until 01/20/22; 1.16% + 3 month USD LIBOR thereafter) | | | | | | | | |
3.12%, 01/20/23 (a)(b) | | | 31,000 | | | | 31,346 | |
Bank of America Corp. (3.37% fixed rate until 01/23/25; 0.81% + 3 month USD LIBOR thereafter) | | | | | | | | |
3.37%, 01/23/26 (a)(b) | | | 19,000 | | | | 19,789 | |
Bank of America Corp. (3.56% fixed rate until 04/23/26; 1.06% + 3 month USD LIBOR thereafter) | | | | | | | | |
3.56%, 04/23/27 (a)(b) | | | 102,000 | | | | 106,690 | |
Bank of America Corp. (3.95% fixed rate until 01/23/48; 1.19% + 3 month USD LIBOR thereafter) | | | | | | | | |
3.95%, 01/23/49 (a)(b) | | | 121,000 | | | | 131,986 | |
Bank of America Corp. (4.24% fixed rate until 04/24/37; 1.81% + 3 month USD LIBOR thereafter) | | | | | | | | |
4.24%, 04/24/38 (a)(b) | | | 114,000 | | | | 127,142 | |
Bank of America Corp. (4.27% fixed rate until 07/23/28; 1.31% + 3 month USD LIBOR thereafter) | | | | | | | | |
4.27%, 07/23/29 (a)(b) | | | 97,000 | | | | 105,093 | |
Bank of America Corp. (4.30% fixed rate until 01/28/25; 2.66% + 3 month USD LIBOR thereafter) | | | | | | | | |
4.30%, 12/31/99 (a)(b) | | �� | 80,000 | | | | 69,074 | |
Bank of America Corp. (4.44% fixed rate until 01/20/47; 1.99% + 3 month USD LIBOR thereafter) | | | | | | | | |
4.44%, 01/20/48 (a)(b) | | | 52,000 | | | | 58,932 | |
| | | | | | | | |
| | | Principal
Amount ($) | | | Fair
Value
$ | |
Bank of Montreal (4.34% fixed rate until 10/05/23; 1.28% + USD 5 year Swap Rate thereafter) | | | | | | | | |
4.34%, 10/05/28 (a)(b) | | | 45,000 | | | | 45,913 | |
Barclays PLC | | | | | | | | |
4.84%, 05/09/28 (a) | | | 200,000 | | | | 204,064 | |
Barrick North America Finance LLC | | | | | | | | |
5.70%, 05/30/41 (a) | | | 5,000 | | | | 6,066 | |
BAT Capital Corp. | | | | | | | | |
2.76%, 08/15/22 (a) | | | 26,000 | | | | 25,552 | |
3.56%, 08/15/27 (a) | | | 20,000 | | | | 19,148 | |
4.39%, 08/15/37 (a) | | | 37,000 | | | | 33,935 | |
4.54%, 08/15/47 (a) | | | 19,000 | | | | 17,312 | |
4.70%, 04/02/27 | | | 67,000 | | | | 68,680 | |
4.91%, 04/02/30 | | | 67,000 | | | | 68,753 | |
5.28%, 04/02/50 | | | 45,000 | | | | 45,013 | |
Baxter International Inc. | | | | | | | | |
3.75%, 10/01/25 (a)(g) | | | 45,000 | | | | 47,854 | |
3.95%, 04/01/30 (a)(g) | | | 20,000 | | | | 21,646 | |
Becton Dickinson and Co. | | | | | | | | |
2.89%, 06/06/22 (a) | | | 27,000 | | | | 26,822 | |
3.70%, 06/06/27 (a) | | | 26,000 | | | | 26,297 | |
3.73%, 12/15/24 (a) | | | 4,000 | | | | 4,124 | |
4.67%, 06/06/47 (a) | | | 4,000 | | | | 4,333 | |
4.69%, 12/15/44 (a) | | | 3,000 | | | | 3,208 | |
Berkshire Hathaway Energy Co. | | | | | | | | |
3.25%, 04/15/28 (a) | | | 19,000 | | | | 19,621 | |
3.70%, 07/15/30 (g) | | | 50,000 | | | | 53,752 | |
3.80%, 07/15/48 (a) | | | 47,000 | | | | 48,421 | |
4.25%, 10/15/50 (g) | | | 55,000 | | | | 62,909 | |
6.13%, 04/01/36 (a) | | | 79,000 | | | | 104,482 | |
BNP Paribas S.A. (2.82% fixed rate until 11/19/24; 1.11% + 3 month USD LIBOR thereafter) | | | | | | | | |
2.82%, 11/19/25 (a)(b)(g) | | | 204,000 | | | | 198,166 | |
Boardwalk Pipelines LP | | | | | | | | |
4.80%, 05/03/29 (a) | | | 28,000 | | | | 21,366 | |
Boston Scientific Corp. | | | | | | | | |
4.70%, 03/01/49 (a) | | | 11,000 | | | | 12,383 | |
BP Capital Markets America Inc. | | | | | | | | |
3.00%, 02/24/50 (a) | | | 55,000 | | | | 51,350 | |
3.02%, 01/16/27 (a) | | | 69,000 | | | | 69,175 | |
3.22%, 11/28/23 (a) | | | 31,000 | | | | 31,823 | |
BPCE S.A. | | | | | | | | |
4.50%, 03/15/25 (a)(g) | | | 202,000 | | | | 204,951 | |
Bristol-Myers Squibb Co. | | | | | | | | |
3.20%, 06/15/26 (a)(g) | | | 64,000 | | | | 68,020 | |
3.40%, 07/26/29 (a)(g) | | | 52,000 | | | | 57,291 | |
3.45%, 11/15/27 (a)(g) | | | 15,000 | | | | 15,969 | |
4.13%, 06/15/39 (a)(g) | | | 23,000 | | | | 27,554 | |
4.25%, 10/26/49 (a)(g) | | | 23,000 | | | | 29,043 | |
See Notes to Schedules of Investments and Notes to Financial Statements.
| | | | |
| State Street Active Core Bond Fund | | | 33 | |
State Street Active Core Bond Fund
Schedule of Investments, continued — March 31, 2020 (Unaudited)
| | | | | | | | |
| | | Principal
Amount ($) | | | Fair
Value
$ | |
| | | | | | | | |
4.35%, 11/15/47 (a)(g) | | | 4,000 | | | | 5,012 | |
4.55%, 02/20/48 (a)(g) | | | 57,000 | | | | 72,563 | |
5.00%, 08/15/45 (a)(g) | | | 33,000 | | | | 44,030 | |
Broadcom Corp./Broadcom Cayman Finance Ltd. | | | | | | | | |
2.65%, 01/15/23 (a) | | | 6,000 | | | | 5,845 | |
3.00%, 01/15/22 (a) | | | 46,000 | | | | 45,469 | |
3.13%, 01/15/25 (a) | | | 7,000 | | | | 6,571 | |
3.88%, 01/15/27 (a) | | | 6,000 | | | | 5,731 | |
Brown-Forman Corp. | | | | | | | | |
4.00%, 04/15/38 (a) | | | 6,000 | | | | 6,195 | |
Bunge Limited Finance Corp. | | | | | | | | |
3.75%, 09/25/27 (a) | | | 12,000 | | | | 10,668 | |
Burlington Northern Santa Fe LLC | | | | | | | | |
4.15%, 12/15/48 (a) | | | 75,000 | | | | 88,235 | |
4.55%, 09/01/44 (a) | | | 38,000 | | | | 45,527 | |
Cameron LNG LLC | | | | | | | | |
3.30%, 01/15/35 (a)(g) | | | 21,000 | | | | 18,246 | |
Canadian Natural Resources Ltd. | | | | | | | | |
3.85%, 06/01/27 (a) | | | 42,000 | | | | 32,994 | |
4.95%, 06/01/47 (a) | | | 5,000 | | | | 3,590 | |
Canadian Pacific Railway Co. | | | | | | | | |
2.90%, 02/01/25 (a) | | | 13,000 | | | | 13,312 | |
Capital One Financial Corp. | | | | | | | | |
3.75%, 07/28/26 (a) | | | 225,000 | | | | 213,874 | |
Cardinal Health Inc. | | | | | | | | |
2.62%, 06/15/22 (a) | | | 13,000 | | | | 13,067 | |
3.08%, 06/15/24 (a) | | | 12,000 | | | | 11,873 | |
Carlisle Companies Inc. | | | | | | | | |
2.75%, 03/01/30 (a) | | | 60,000 | | | | 52,331 | |
Carrier Global Corp. | | | | | | | | |
2.72%, 02/15/30 (a)(g) | | | 45,000 | | | | 41,420 | |
3.38%, 04/05/40 (a)(g) | | | 30,000 | | | | 26,505 | |
3.58%, 04/05/50 (a)(g) | | | 45,000 | | | | 39,035 | |
Caterpillar Inc. | | | | | | | | |
3.25%, 09/19/49 (a) | | | 39,000 | | | | 39,088 | |
3.80%, 08/15/42 (a) | | | 8,000 | | | | 8,802 | |
Centene Corp. | | | | | | | | |
3.38%, 02/15/30 (a)(g) | | | 93,000 | | | | 86,576 | |
4.25%, 12/15/27 (a)(g) | | | 99,000 | | | | 97,029 | |
4.63%, 12/15/29 (a)(g) | | | 31,000 | | | | 31,138 | |
Charter Communications Operating LLC/Charter Communications Operating Capital | | | | | | | | |
4.46%, 07/23/22 (a) | | | 90,000 | | | | 93,288 | |
4.80%, 03/01/50 | | | 22,000 | | | | 23,050 | |
4.91%, 07/23/25 (a) | | | 13,000 | | | | 13,795 | |
5.05%, 03/30/29 (a) | | | 48,000 | | | | 51,795 | |
5.75%, 04/01/48 (a) | | | 45,000 | | | | 51,237 | |
6.38%, 10/23/35 (a) | | | 4,000 | | | | 4,755 | |
6.48%, 10/23/45 (a) | | | 19,000 | | | | 22,737 | |
| | | | | | | | |
| | | Principal
Amount ($) | | | Fair
Value
$ | |
Cheniere Corpus Christi Holdings LLC | | | | | | | | |
5.88%, 03/31/25 (a) | | | 81,000 | | | | 68,093 | |
Chevron Corp. | | | | | | | | |
3.19%, 06/24/23 (a) | | | 47,000 | | | | 49,146 | |
Chevron Phillips Chemical Company LLC/Chevron Phillips Chemical Company LP | | | | | | | | |
5.13%, 04/01/25 (a)(g) | | | 112,000 | | | | 115,426 | |
Chubb INA Holdings Inc. | | | | | | | | |
4.35%, 11/03/45 (a) | | | 58,000 | | | | 71,453 | |
Cigna Corp. | | | | | | | | |
2.40%, 03/15/30 (a) | | | 40,000 | | | | 38,076 | |
3.25%, 04/15/25 (a)(g) | | | 24,000 | | | | 23,917 | |
3.40%, 09/17/21 - 03/15/50 (a) | | | 36,000 | | | | 35,738 | |
3.40%, 03/01/27 (a)(g) | | | 13,000 | | | | 13,139 | |
3.75%, 07/15/23 (a) | | | 48,000 | | | | 49,380 | |
3.88%, 10/15/47 (a)(g) | | | 4,000 | | | | 3,993 | |
4.13%, 11/15/25 (a) | | | 34,000 | | | | 36,309 | |
4.38%, 10/15/28 (a) | | | 14,000 | | | | 15,045 | |
4.80%, 08/15/38 (a) | | | 12,000 | | | | 13,473 | |
4.90%, 12/15/48 (a) | | | 2,000 | | | | 2,389 | |
Cisco Systems Inc. | | | | | | | | |
5.90%, 02/15/39 (a) | | | 16,000 | | | | 23,026 | |
Citigroup Inc. | | | | | | | | |
2.70%, 10/27/22 (a) | | | 188,000 | | | | 189,000 | |
4.65%, 07/23/48 (a) | | | 112,000 | | | | 134,504 | |
4.75%, 05/18/46 (a) | | | 51,000 | | | | 55,239 | |
5.50%, 09/13/25 (a) | | | 81,000 | | | | 91,212 | |
Citigroup Inc. (2.88% fixed rate until 07/24/22; 0.95% + 3 month USD LIBOR thereafter) | | | | | | | | |
2.88%, 07/24/23 (a)(b) | | | 65,000 | | | | 65,123 | |
Citigroup Inc. (2.98% fixed rate until 11/05/29; 1.42% + SOFR thereafter) | | | | | | | | |
2.98%, 11/05/30 (a)(b) | | | 142,000 | | | | 137,747 | |
Citigroup Inc. (3.88% fixed rate until 01/24/38; 1.17% + 3 month USD LIBOR thereafter) | | | | | | | | |
3.88%, 01/24/39 (a)(b) | | | 39,000 | | | | 41,196 | |
Citigroup Inc. (4.70% fixed rate until 01/30/25; 3.23% + SOFR thereafter) | | | | | | | | |
4.70%, 12/31/99 (a)(b) | | | 83,000 | | | | 70,296 | |
CMS Energy Corp. | | | | | | | | |
4.88%, 03/01/44 (a) | | | 53,000 | | | | 59,804 | |
CNA Financial Corp. | | | | | | | | |
3.45%, 08/15/27 (a) | | | 37,000 | | | | 35,487 | |
3.90%, 05/01/29 (a) | | | 85,000 | | | | 84,566 | |
CNOOC Nexen Finance 2014 ULC | | | | | | | | |
4.25%, 04/30/24 (a) | | | 233,000 | | | | 250,801 | |
See Notes to Schedules of Investments and Notes to Financial Statements.
| | |
| 34 | | State Street Active Core Bond Fund |
State Street Active Core Bond Fund
Schedule of Investments, continued — March 31, 2020 (Unaudited)
| | | | | | | | |
| | | Principal
Amount ($) | | | Fair
Value
$ | |
| | | | | | | | |
Comcast Corp. | | | | | | | | |
3.10%, 04/01/25 (a) | | | 35,000 | | | | 37,144 | |
3.20%, 07/15/36 (a) | | | 27,000 | | | | 28,121 | |
3.25%, 11/01/39 (a) | | | 62,000 | | | | 63,875 | |
3.45%, 02/01/50 (a) | | | 30,000 | | | | 32,479 | |
3.97%, 11/01/47 (a) | | | 63,000 | | | | 72,479 | |
4.15%, 10/15/28 (a) | | | 15,000 | | | | 16,837 | |
4.60%, 08/15/45 (a) | | | 8,000 | | | | 9,708 | |
4.70%, 10/15/48 (a) | | | 54,000 | | | | 69,794 | |
CommonSpirit Health | | | | | | | | |
4.35%, 11/01/42 (a) | | | 129,000 | | | | 126,911 | |
Conagra Brands Inc. | | | | | | | | |
5.30%, 11/01/38 (a) | | | 14,000 | | | | 15,255 | |
5.40%, 11/01/48 (a) | | | 12,000 | | | | 13,420 | |
Concho Resources Inc. | | | | | | | | |
3.75%, 10/01/27 (a) | | | 10,000 | | | | 8,436 | |
4.30%, 08/15/28 (a) | | | 47,000 | | | | 40,543 | |
4.88%, 10/01/47 (a) | | | 9,000 | | | | 6,847 | |
ConocoPhillips Co. | | | | | | | | |
4.30%, 11/15/44 (a) | | | 27,000 | | | | 24,077 | |
Consolidated Edison Company of New York Inc. | | | | | | | | |
2.90%, 12/01/26 (a) | | | 29,000 | | | | 27,718 | |
3.35%, 04/01/30 | | | 20,000 | | | | 20,668 | |
3.88%, 06/15/47 (a) | | | 65,000 | | | | 65,931 | |
3.95%, 04/01/50 | | | 30,000 | | | | 31,912 | |
Constellation Brands Inc. | | | | | | | | |
3.15%, 08/01/29 (a) | | | 138,000 | | | | 128,547 | |
3.70%, 12/06/26 (a) | | | 49,000 | | | | 47,966 | |
4.50%, 05/09/47 (a) | | | 23,000 | | | | 21,470 | |
Continental Resources Inc. | | | | | | | | |
4.50%, 04/15/23 (a) | | | 122,000 | | | | 67,665 | |
Corning Inc. | | | | | | | | |
4.38%, 11/15/57 (a) | | | 24,000 | | | | 25,282 | |
Crown Castle International Corp. | | | | | | | | |
3.30%, 07/01/30 | | | 70,000 | | | | 69,425 | |
4.15%, 07/01/50 | | | 20,000 | | | | 19,780 | |
5.20%, 02/15/49 (a) | | | 44,000 | | | | 47,337 | |
CSX Corp. | | | | | | | | |
4.50%, 03/15/49 - 08/01/54 (a) | | | 84,000 | | | | 95,412 | |
CubeSmart LP | | | | | | | | |
4.38%, 02/15/29 (a) | | | 94,000 | | | | 98,313 | |
CVS Health Corp. | | | | | | | | |
3.00%, 08/15/26 (a) | | | 23,000 | | | | 23,165 | |
3.25%, 08/15/29 (a) | | | 25,000 | | | | 24,985 | |
3.35%, 03/09/21 (a) | | | 11,000 | | | | 11,071 | |
3.63%, 04/01/27 | | | 40,000 | | | | 41,054 | |
3.75%, 04/01/30 | | | 30,000 | | | | 30,959 | |
3.88%, 07/20/25 (a) | | | 13,000 | | | | 13,449 | |
4.10%, 03/25/25 (a) | | | 31,000 | | | | 32,792 | |
4.25%, 04/01/50 | | | 25,000 | | | | 26,140 | |
4.30%, 03/25/28 (a) | | | 19,000 | | | | 20,141 | |
4.78%, 03/25/38 (a) | | | 13,000 | | | | 14,355 | |
| | | | | | | | |
| | | Principal
Amount ($) | | | Fair
Value
$ | |
5.00%, 12/01/24 (a) | | | 28,000 | | | | 30,213 | |
5.05%, 03/25/48 (a) | | | 29,000 | | | | 33,113 | |
5.13%, 07/20/45 (a) | | | 27,000 | | | | 30,953 | |
Deere & Co. | | | | | | | | |
2.75%, 04/15/25 | | | 65,000 | | | | 67,913 | |
3.10%, 04/15/30 | | | 45,000 | | | | 48,205 | |
3.75%, 04/15/50 | | | 40,000 | | | | 45,840 | |
Dell International LLC/EMC Corp. | | | | | | | | |
4.00%, 07/15/24 (a)(g) | | | 34,000 | | | | 34,370 | |
4.42%, 06/15/21 (a)(g) | | | 40,000 | | | | 39,972 | |
5.45%, 06/15/23 (a)(g) | | | 119,000 | | | | 122,313 | |
6.02%, 06/15/26 (a)(g) | | | 13,000 | | | | 13,451 | |
8.10%, 07/15/36 (a)(g) | | | 3,000 | | | | 3,429 | |
8.35%, 07/15/46 (a)(g) | | | 33,000 | | | | 38,644 | |
Deutsche Telekom AG | | | | | | | | |
3.63%, 01/21/50 (a)(g) | | | 152,000 | | | | 149,430 | |
Devon Energy Corp. | | | | | | | | |
5.00%, 06/15/45 (a) | | | 14,000 | | | | 8,967 | |
DH Europe Finance II Sarl | | | | | | | | |
2.60%, 11/15/29 (a) | | | 35,000 | | | | 34,814 | |
3.25%, 11/15/39 (a) | | | 21,000 | | | | 20,157 | |
3.40%, 11/15/49 (a) | | | 11,000 | | | | 10,870 | |
Diamondback Energy Inc. | | | | | | | | |
2.88%, 12/01/24 (a) | | | 50,000 | | | | 34,878 | |
3.25%, 12/01/26 (a) | | | 35,000 | | | | 24,825 | |
3.50%, 12/01/29 (a) | | | 31,000 | | | | 21,300 | |
5.38%, 05/31/25 (a) | | | 122,000 | | | | 90,275 | |
Digital Realty Trust LP | | | | | | | | |
3.60%, 07/01/29 (a) | | | 45,000 | | | | 44,266 | |
Discovery Communications LLC | | | | | | | | |
2.95%, 03/20/23 (a) | | | 123,000 | | | | 122,519 | |
3.95%, 03/20/28 (a) | | | 55,000 | | | | 54,037 | |
4.95%, 05/15/42 (a) | | | 5,000 | | | | 4,821 | |
5.00%, 09/20/37 (a) | | | 9,000 | | | | 9,005 | |
Dollar Tree Inc. | | | | | | | | |
4.00%, 05/15/25 (a) | | | 51,000 | | | | 52,401 | |
Dominion Energy Inc. | | | | | | | | |
3.07%, 08/15/24 (a)(f) | | | 26,000 | | | | 25,811 | |
3.38%, 04/01/30 | | | 65,000 | | | | 64,347 | |
Dover Corp. | | | | | | | | |
2.95%, 11/04/29 (a) | | | 40,000 | | | | 41,920 | |
DTE Energy Co. | | | | | | | | |
2.85%, 10/01/26 (a) | | | 29,000 | | | | 28,535 | |
3.85%, 12/01/23 (a) | | | 15,000 | | | | 15,492 | |
Duke Energy Carolinas LLC | | | | | | | | |
3.95%, 03/15/48 (a) | | | 17,000 | | | | 19,234 | |
Duke Energy Corp. | | | | | | | | |
1.80%, 09/01/21 (a) | | | 34,000 | | | | 33,760 | |
3.75%, 09/01/46 (a) | | | 11,000 | | | | 11,003 | |
See Notes to Schedules of Investments and Notes to Financial Statements.
| | | | |
| State Street Active Core Bond Fund | | | 35 | |
State Street Active Core Bond Fund
Schedule of Investments, continued — March 31, 2020 (Unaudited)
| | | | | | | | |
| | | Principal
Amount ($) | | | Fair
Value
$ | |
| | | | | | | | |
Duke Energy Corp. (4.88% fixed rate until 09/16/24; 3.39% + 5 year CMT Rate thereafter) | | | | | | | | |
4.88%, 12/31/99 (a)(b) | | | 75,000 | | | | 64,202 | |
Duke Energy Progress LLC | | | | | | | | |
4.15%, 12/01/44 (a) | | | 22,000 | | | | 24,042 | |
Duke Realty LP | | | | | | | | |
3.05%, 03/01/50 (a) | | | 20,000 | | | | 15,895 | |
3.38%, 12/15/27 (a) | | | 37,000 | | | | 37,154 | |
DuPont de Nemours Inc. | | | | | | | | |
5.32%, 11/15/38 (a) | | | 9,000 | | | | 10,092 | |
5.42%, 11/15/48 (a) | | | 9,000 | | | | 10,399 | |
Duquesne Light Holdings Inc. | | | | | | | | |
3.62%, 08/01/27 (a)(g) | | | 22,000 | | | | 21,463 | |
Eastman Chemical Co. | | | | | | | | |
3.50%, 12/01/21 (a) | | | 27,000 | | | | 27,367 | |
4.50%, 01/15/21 (a) | | | 57,000 | | | | 57,565 | |
4.65%, 10/15/44 (a) | | | 44,000 | | | | 47,401 | |
Eaton Corp. | | | | | | | | |
3.10%, 09/15/27 (a) | | | 51,000 | | | | 51,292 | |
Edison International | | | | | | | | |
2.40%, 09/15/22 (a) | | | 123,000 | | | | 118,604 | |
4.95%, 04/15/25 | | | 75,000 | | | | 74,827 | |
5.75%, 06/15/27 (a) | | | 8,000 | | | | 8,314 | |
Eli Lilly & Co. | | | | | | | | |
3.95%, 03/15/49 (a) | | | 36,000 | | | | 45,291 | |
Emera US Finance LP | | | | | | | | |
4.75%, 06/15/46 (a) | | | 3,000 | | | | 2,799 | |
Enbridge Energy Partners LP | | | | | | | | |
5.50%, 09/15/40 (a) | | | 4,000 | | | | 3,870 | |
Energy Transfer Operating LP | | | | | | | | |
4.25%, 03/15/23 (a) | | | 52,000 | | | | 46,791 | |
4.50%, 04/15/24 (a) | | | 8,000 | | | | 7,199 | |
4.95%, 06/15/28 (a) | | | 11,000 | | | | 9,266 | |
6.13%, 12/15/45 (a) | | | 6,000 | | | | 5,145 | |
6.50%, 02/01/42 (a) | | | 26,000 | | | | 22,888 | |
Energy Transfer Operating LP (6.75% fixed rate until 05/15/25; 5.13% + 5 year CMT Rate thereafter) | | | | | | | | |
6.75%, 12/31/99 (a)(b) | | | 123,000 | | | | 74,928 | |
Energy Transfer Partners LP/Regency Energy Finance Corp. | | | | | | | | |
4.50%, 11/01/23 (a) | | | 18,000 | | | | 16,253 | |
Entergy Louisiana LLC | | | | | | | | |
3.05%, 06/01/31 (a) | | | 16,000 | | | | 16,074 | |
4.00%, 03/15/33 (a) | | | 17,000 | | | | 18,840 | |
Enterprise Products Operating LLC | | | | | | | | |
4.25%, 02/15/48 (a) | | | 43,000 | | | | 40,838 | |
| | | | | | | | |
| | | Principal
Amount ($) | | | Fair
Value
$ | |
Enterprise Products Operating LLC (5.25% fixed rate until 08/16/27; 3.03% + 3 month USD LIBOR thereafter) | | | | | | | | |
5.25%, 08/16/77 (a)(b) | | | 13,000 | | | | 8,947 | |
EOG Resources Inc. | | | | | | | | |
4.15%, 01/15/26 (a) | | | 6,000 | | | | 6,188 | |
5.10%, 01/15/36 (a) | | | 11,000 | | | | 10,821 | |
EPR Properties | | | | | | | | |
4.95%, 04/15/28 (a) | | | 18,000 | | | | 16,349 | |
Equinor ASA | | | | | | | | |
3.25%, 11/18/49 (a) | | | 20,000 | | | | 19,897 | |
ERP Operating LP | | | | | | | | |
4.50%, 07/01/44 (a) | | | 36,000 | | | | 39,995 | |
Essex Portfolio LP | | | | | | | | |
2.65%, 03/15/32 (a) | | | 25,000 | | | | 22,594 | |
Eversource Energy | | | | | | | | |
3.45%, 01/15/50 (a) | | | 80,000 | | | | 73,450 | |
Exelon Corp. | | | | | | | | |
3.50%, 06/01/22 (a) | | | 30,000 | | | | 29,127 | |
4.05%, 04/15/30 | | | 67,000 | | | | 68,364 | |
4.45%, 04/15/46 (a) | | | 48,000 | | | | 47,701 | |
4.70%, 04/15/50 | | | 45,000 | | | | 47,268 | |
FedEx Corp. | | | | | | | | |
4.10%, 02/01/45 (a) | | | 53,000 | | | | 47,337 | |
FirstEnergy Corp. | | | | | | | | |
3.90%, 07/15/27 (a) | | | 12,000 | | | | 12,190 | |
FirstEnergy Transmission LLC | | | | | | | | |
4.55%, 04/01/49 (a)(g) | | | 80,000 | | | | 79,938 | |
Fiserv Inc. | | | | | | | | |
3.50%, 07/01/29 (a) | | | 70,000 | | | | 72,570 | |
4.40%, 07/01/49 (a) | | | 12,000 | | | | 12,672 | |
Florida Power & Light Co. | | | | | | | | |
2.85%, 04/01/25 (a) | | | 80,000 | | | | 83,498 | |
4.13%, 02/01/42 (a) | | | 73,000 | | | | 82,881 | |
Ford Motor Credit Company LLC | | | | | | | | |
5.88%, 08/02/21 (a) | | | 205,000 | | | | 200,875 | |
General Dynamics Corp. | | | | | | | | |
3.25%, 04/01/25 (a) | | | 25,000 | | | | 26,583 | |
4.25%, 04/01/50 (a) | | | 35,000 | | | | 43,870 | |
General Mills Inc. | | | | | | | | |
2.88%, 04/15/30 | | | 25,000 | | | | 24,950 | |
3.70%, 10/17/23 (a) | | | 51,000 | | | | 53,071 | |
4.55%, 04/17/38 (a) | | | 14,000 | | | | 15,397 | |
4.70%, 04/17/48 (a) | | | 4,000 | | | | 4,553 | |
General Motors Co. | | | | | | | | |
5.20%, 04/01/45 (a) | | | 4,000 | | | | 3,064 | |
5.40%, 04/01/48 (a) | | | 9,000 | | | | 6,346 | |
General Motors Financial Company Inc. | | | | | | | | |
3.45%,01/14/22 - 04/10/22 (a) | | | 441,000 | | | | 409,675 | |
3.55%, 04/09/21 (a) | | | 104,000 | | | | 99,496 | |
5.25%, 03/01/26 (a) | | | 24,000 | | | | 21,137 | |
See Notes to Schedules of Investments and Notes to Financial Statements.
| | |
| 36 | | State Street Active Core Bond Fund |
State Street Active Core Bond Fund
Schedule of Investments, continued — March 31, 2020 (Unaudited)
| | | | | | | | |
| | | Principal
Amount ($) | | | Fair
Value
$ | |
| | | | | | | | |
Georgia-Pacific LLC | | | | | | | | |
3.60%, 03/01/25 (a)(g) | | | 41,000 | | | | 43,302 | |
Gilead Sciences Inc. | | | | | | | | |
2.95%, 03/01/27 (a) | | | 6,000 | | | | 6,198 | |
3.50%, 02/01/25 (a) | | | 13,000 | | | | 13,913 | |
3.65%, 03/01/26 (a) | | | 99,000 | | | | 106,888 | |
4.15%, 03/01/47 (a) | | | 30,000 | | | | 36,590 | |
4.80%, 04/01/44 (a) | | | 11,000 | | | | 14,075 | |
GlaxoSmithKline Capital Inc. | | | | | | | | |
3.38%, 05/15/23 (a) | | | 29,000 | | | | 30,489 | |
3.63%, 05/15/25 (a) | | | 28,000 | | | | 30,336 | |
GlaxoSmithKline Capital PLC | | | | | | | | |
3.38%, 06/01/29 (a) | | | 32,000 | | | | 34,420 | |
Grupo Televisa SAB | | | | | | | | |
5.00%, 05/13/45 (a) | | | 209,000 | | | | 207,349 | |
Halliburton Co. | | | | | | | | |
3.80%, 11/15/25 (a) | | | 2,000 | | | | 1,876 | |
5.00%, 11/15/45 (a) | | | 16,000 | | | | 12,357 | |
HCA Inc. | | | | | | | | |
4.13%, 06/15/29 (a) | | | 100,000 | | | | 99,892 | |
Hess Corp. | | | | | | | | |
5.60%, 02/15/41 (a) | | | 8,000 | | | | 5,491 | |
5.80%, 04/01/47 (a) | | | 5,000 | | | | 3,364 | |
Hewlett Packard Enterprise Co. | | | | | | | | |
6.35%, 10/15/45 (a) | | | 7,000 | | | | 8,370 | |
Highwoods Realty LP | | | | | | | | |
4.13%, 03/15/28 (a) | | | 42,000 | | | | 43,440 | |
4.20%, 04/15/29 (a) | | | 127,000 | | | | 133,647 | |
Honeywell International Inc. | | | | | | | | |
2.70%, 08/15/29 (a) | | | 53,000 | | | | 53,373 | |
HSBC Holdings PLC | | | | | | | | |
4.25%, 03/14/24 (a) | | | 248,000 | | | | 257,781 | |
HSBC Holdings PLC (6.50% fixed rate until 03/23/28; 3.61% + USD 5 yearMid-Market Swap Rate thereafter) | | | | | | | | |
6.50%, 12/31/99 (a)(b) | | | 160,000 | | | | 149,685 | |
Huntington Bancshares Inc. | | | | | | | | |
2.55%, 02/04/30 (a) | | | 84,000 | | | | 76,234 | |
Hyundai Capital America | | | | | | | | |
3.10%, 04/05/22 (a)(g) | | | 17,000 | | | | 16,622 | |
ING Groep N.V. | | | | | | | | |
4.10%, 10/02/23 (a) | | | 204,000 | | | | 209,112 | |
Ingersoll-Rand Luxembourg Finance S.A. | | | | | | | | |
3.55%, 11/01/24 (a) | | | 26,000 | | | | 25,873 | |
3.80%, 03/21/29 (a) | | | 64,000 | | | | 65,782 | |
Intel Corp. | | | | | | | | |
2.45%, 11/15/29 (a) | | | 122,000 | | | | 123,693 | |
2.60%, 05/19/26 (a) | | | 33,000 | | | | 33,815 | |
3.10%, 02/15/60 (a) | | | 65,000 | | | | 67,657 | |
| | | | | | | | |
| | | Principal
Amount ($) | | | Fair
Value
$ | |
International Business Machines Corp. | | | | | | | | |
4.15%, 05/15/39 (a) | | | 141,000 | | | | 159,439 | |
4.25%, 05/15/49 (a) | | | 141,000 | | | | 165,489 | |
International Paper Co. | | | | | | | | |
4.40%, 08/15/47 (a) | | | 45,000 | | | | 44,914 | |
Interstate Power & Light Co. | | | | | | | | |
3.40%, 08/15/25 (a) | | | 24,000 | | | | 25,267 | |
Jabil Inc. | | | | | | | | |
3.95%, 01/12/28 (a) | | | 24,000 | | | | 22,715 | |
John Deere Capital Corp. | | | | | | | | |
2.45%, 01/09/30 (a) | | | 150,000 | | | | 152,263 | |
Johnson & Johnson | | | | | | | | |
3.63%, 03/03/37 (a) | | | 38,000 | | | | 44,383 | |
Johnson Controls International PLC | | | | | | | | |
4.50%, 02/15/47 (a) | | | 8,000 | | | | 8,543 | |
JPMorgan Chase & Co. | | | | | | | | |
3.30%, 04/01/26 (a) | | | 238,000 | | | | 248,144 | |
3.63%, 12/01/27 (a) | | | 45,000 | | | | 47,383 | |
JPMorgan Chase & Co. (3.88% fixed rate until 07/24/37; 1.36% + 3 month USD LIBOR thereafter) | | | | | | | | |
3.88%, 07/24/38 (a)(b) | | | 110,000 | | | | 122,719 | |
JPMorgan Chase & Co. (3.90% fixed rate until 01/23/48; 1.22% + 3 month USD LIBOR thereafter) | | | | | | | | |
3.90%, 01/23/49 (a)(b) | | | 145,000 | | | | 166,627 | |
JPMorgan Chase & Co. (3.96% fixed rate until 01/29/26; 1.25% + 3 month USD LIBOR thereafter) | | | | | | | | |
3.96%, 01/29/27 (a)(b) | | | 152,000 | | | | 163,312 | |
JPMorgan Chase & Co. (4.01% fixed rate until 04/23/28; 1.12% + 3 month USD LIBOR thereafter) | | | | | | | | |
4.01%, 04/23/29 (a)(b) | | | 76,000 | | | | 81,793 | |
JPMorgan Chase & Co. (4.60% fixed rate until 02/01/25; 3.13% + SOFR thereafter) | | | | | | | | |
4.60%, 12/31/99 (a)(b) | | | 81,000 | | | | 71,316 | |
JPMorgan Chase & Co. (6.10% fixed rate until 10/01/24; 3.33% + 3 month USD LIBOR thereafter) | | | | | | | | |
6.10%, 10/29/49 (a)(b) | | | 170,000 | | | | 166,471 | |
Keurig Dr Pepper Inc. | | | | | | | | |
3.55%, 05/25/21 (a) | | | 150,000 | | | | 151,681 | |
4.50%, 11/15/45 (a) | | | 12,000 | | | | 12,712 | |
4.60%, 05/25/28 (a) | | | 19,000 | | | | 20,796 | |
See Notes to Schedules of Investments and Notes to Financial Statements.
| | | | |
| State Street Active Core Bond Fund | | | 37 | |
State Street Active Core Bond Fund
Schedule of Investments, continued — March 31, 2020 (Unaudited)
| | | | | | | | |
| | | Principal
Amount ($) | | | Fair
Value
$ | |
| | | | | | | | |
KeyCorp | | | | | | | | |
2.25%, 04/06/27 (a) | | | 133,000 | | | | 123,767 | |
Kinder Morgan Energy Partners LP | | | | | | | | |
3.50%, 03/01/21 (a) | | | 88,000 | | | | 86,962 | |
4.70%, 11/01/42 (a) | | | 5,000 | | | | 4,711 | |
5.00%, 03/01/43 (a) | | | 16,000 | | | | 14,687 | |
5.30%, 09/15/20 (a) | | | 20,000 | | | | 19,962 | |
6.38%, 03/01/41 (a) | | | 13,000 | | | | 10,951 | |
Kinder Morgan Inc. | | | | | | | | |
5.05%, 02/15/46 (a) | | | 13,000 | | | | 12,429 | |
KLA Corp. | | | | | | | | |
3.30%, 03/01/50 (a) | | | 45,000 | | | | 42,479 | |
4.65%, 11/01/24 (a) | | | 66,000 | | | | 69,831 | |
L3Harris Technologies Inc. | | | | | | | | |
3.85%, 12/15/26 (a)(g) | | | 194,000 | | | | 203,797 | |
Lam Research Corp. | | | | | | | | |
4.00%, 03/15/29 (a) | | | 38,000 | | | | 42,024 | |
Lear Corp. | | | | | | | | |
4.25%, 05/15/29 (a) | | | 34,000 | | | | 29,817 | |
5.25%, 05/15/49 (a) | | | 15,000 | | | | 12,993 | |
Lincoln National Corp. | | | | | | | | |
3.63%, 12/12/26 (a) | | | 32,000 | | | | 32,207 | |
4.35%, 03/01/48 (a) | | | 104,000 | | | | 96,288 | |
Lockheed Martin Corp. | | | | | | | | |
3.55%, 01/15/26 (a) | | | 9,000 | | | | 9,646 | |
3.80%, 03/01/45 (a) | | | 18,000 | | | | 19,976 | |
4.50%, 05/15/36 (a) | | | 27,000 | | | | 30,902 | |
Lowe’s Companies Inc. | | | | | | | | |
3.70%, 04/15/46 (a) | | | 14,000 | | | | 13,549 | |
4.00%, 04/15/25 (a) | | | 35,000 | | | | 37,466 | |
4.05%, 05/03/47 (a) | | | 12,000 | | | | 12,282 | |
4.55%, 04/05/49 (a) | | | 31,000 | | | | 34,116 | |
5.13%, 04/15/50 (a) | | | 25,000 | | | | 30,607 | |
LYB International Finance BV | | | | | | | | |
4.88%, 03/15/44 (a) | | | 7,000 | | | | 7,510 | |
LYB International Finance II BV | | | | | | | | |
3.50%, 03/02/27 (a) | | | 9,000 | | | | 8,742 | |
Marathon Oil Corp. | | | | | | | | |
3.85%, 06/01/25 (a) | | | 14,000 | | | | 9,986 | |
Marsh & McLennan Companies Inc. | | | | | | | | |
3.50%, 03/10/25 (a) | | | 171,000 | | | | 179,169 | |
4.90%, 03/15/49 (a) | | | 136,000 | | | | 166,542 | |
Masco Corp. | | | | | | | | |
3.50%, 11/15/27 (a) | | | 7,000 | | | | 6,515 | |
Mastercard Inc. | | | | | | | | |
3.30%, 03/26/27 (a) | | | 40,000 | | | | 43,718 | |
3.85%, 03/26/50 (a) | | | 15,000 | | | | 18,452 | |
McDonald’s Corp. | | | | | | | | |
3.30%, 07/01/25 | | | 50,000 | | | | 52,092 | |
3.60%, 07/01/30 | | | 90,000 | | | | 95,018 | |
3.63%, 09/01/49 (a) | | | 12,000 | | | | 12,077 | |
| | | | | | | | |
| | | Principal
Amount ($) | | | Fair
Value
$ | |
3.70%, 01/30/26 (a) | | | 9,000 | | | | 9,495 | |
3.80%, 04/01/28 (a) | | | 25,000 | | | | 26,431 | |
4.20%, 04/01/50 | | | 55,000 | | | | 61,599 | |
4.88%, 12/09/45 (a) | | | 17,000 | | | | 19,799 | |
McKesson Corp. | | | | | | | | |
3.65%, 11/30/20 (a) | | | 113,000 | | | | 113,871 | |
Medtronic Inc. | | | | | | | | |
4.63%, 03/15/45 (a) | | | 4,000 | | | | 5,332 | |
Memorial Sloan-Kettering Cancer Center | | | | | | | | |
4.13%, 07/01/52 (a) | | | 34,000 | | | | 39,151 | |
Merck & Company Inc. | | | | | | | | |
2.75%, 02/10/25 (a) | | | 23,000 | | | | 24,261 | |
4.00%, 03/07/49 (a) | | | 6,000 | | | | 7,518 | |
MetLife Inc. | | | | | | | | |
4.05%, 03/01/45 (a) | | | 13,000 | | | | 13,757 | |
4.72%, 12/15/44 (a) | | | 63,000 | | | | 70,433 | |
Microsoft Corp. | | | | | | | | |
2.40%, 08/08/26 (a) | | | 63,000 | | | | 66,880 | |
2.88%, 02/06/24 (a) | | | 150,000 | | | | 159,561 | |
3.45%, 08/08/36 (a) | | | 18,000 | | | | 20,106 | |
3.50%, 02/12/35 (a) | | | 18,000 | | | | 21,144 | |
3.70%, 08/08/46 (a) | | | 74,000 | | | | 88,618 | |
3.95%, 08/08/56 (a) | | | 37,000 | | | | 46,146 | |
4.10%, 02/06/37 (a) | | | 5,000 | | | | 6,035 | |
4.50%, 02/06/57 (a) | | | 5,000 | | | | 6,895 | |
Morgan Stanley | | | | | | | | |
2.75%, 05/19/22 (a) | | | 272,000 | | | | 273,553 | |
3.70%, 10/23/24 (a) | | | 130,000 | | | | 137,281 | |
3.95%, 04/23/27 (a) | | | 183,000 | | | | 188,144 | |
4.35%, 09/08/26 (a) | | | 67,000 | | | | 72,710 | |
Morgan Stanley (2.72% fixed rate until 07/22/24; 1.15% + SOFR thereafter) | | | | | | | | |
2.72%, 07/22/25 (a)(b) | | | 97,000 | | | | 97,466 | |
Morgan Stanley (3.62% fixed rate until 04/01/30; 3.12% + SOFR thereafter) | | | | | | | | |
3.62%, 04/01/31 (b) | | | 55,000 | | | | 57,817 | |
Morgan Stanley (3.97% fixed rate until 07/22/37; 1.46% + 3 month USD LIBOR thereafter) | | | | | | | | |
3.97%, 07/22/38 (a)(b) | | | 91,000 | | | | 96,996 | |
MPLX LP | | | | | | | | |
3.38%, 03/15/23 (a) | | | 164,000 | | | | 149,292 | |
5.20%, 12/01/47 (a)(g) | | | 8,000 | | | | 6,418 | |
5.25%, 01/15/25 (a)(g) | | | 162,000 | | | | 150,132 | |
6.25%, 10/15/22 (a)(g) | | | 48,000 | | | | 44,064 | |
MPLX LP 1.10% + 3 month USD LIBOR | | | | | | | | |
2.10%, 09/09/22 (a)(b) | | | 65,000 | | | | 61,979 | |
Mylan Inc. | | | | | | | | |
5.20%, 04/15/48 (a) | | | 14,000 | | | | 13,939 | |
See Notes to Schedules of Investments and Notes to Financial Statements.
| | |
| 38 | | State Street Active Core Bond Fund |
State Street Active Core Bond Fund
Schedule of Investments, continued — March 31, 2020 (Unaudited)
| | | | | | | | |
| | | Principal
Amount ($) | | | Fair
Value
$ | |
| | | | | | | | |
National Oilwell Varco Inc. | | | | | | | | |
3.60%, 12/01/29 (a) | | | 61,000 | | | | 45,889 | |
National Retail Properties Inc. | | | | | | | | |
4.00%, 11/15/25 (a) | | | 82,000 | | | | 85,032 | |
Newfield Exploration Co. | | | | | | | | |
5.63%, 07/01/24 (a) | | | 217,000 | | | | 108,064 | |
Newmont Corp. | | | | | | | | |
2.25%, 10/01/30 (a) | | | 55,000 | | | | 51,240 | |
4.88%, 03/15/42 (a) | | | 21,000 | | | | 24,697 | |
Nexen Inc. | | | | | | | | |
6.40%, 05/15/37 (a) | | | 69,000 | | | | 93,267 | |
NextEra Energy Capital Holdings Inc. | | | | | | | | |
3.25%, 04/01/26 (a) | | | 39,000 | | | | 39,925 | |
NextEra Energy Capital Holdings Inc. (5.65% fixed rate until 05/01/29; 3.16% + 3 month USD LIBOR thereafter) | | | | | | | | |
5.65%, 05/01/79 (a)(b) | | | 80,000 | | | | 74,113 | |
NIKE Inc. | | | | | | | | |
2.40%, 03/27/25 | | | 112,000 | | | | 116,781 | |
2.85%, 03/27/30 | | | 55,000 | | | | 58,266 | |
3.38%, 03/27/50 | | | 45,000 | | | | 49,407 | |
NiSource Inc. | | | | | | | | |
3.95%, 03/30/48 (a) | | | 14,000 | | | | 14,311 | |
Noble Energy Inc. | | | | | | | | |
3.85%, 01/15/28 (a) | | | 43,000 | | | | 30,422 | |
3.90% 11/15/24 (a) | | | 16,000 | | | | 12,895 | |
4.20%, 10/15/49 (a) | | | 6,000 | | | | 3,243 | |
5.05%, 11/15/44 (a) | | | 4,000 | | | | 2,348 | |
Nordstrom Inc. | | | | | | | | |
4.38%, 04/01/30 (a) | | | 20,000 | | | | 16,061 | |
5.00%, 01/15/44 (a) | | | 4,000 | | | | 2,794 | |
Norfolk Southern Corp. | | | | | | | | |
3.95%, 10/01/42 (a) | | | 19,000 | | | | 20,361 | |
Northrop Grumman Corp. | | | | | | | | |
2.55%, 10/15/22 (a) | | | 64,000 | | | | 63,958 | |
3.85%, 04/15/45 (a) | | | 4,000 | | | | 4,370 | |
4.03%, 10/15/47 (a) | | | 7,000 | | | | 8,000 | |
Novartis Capital Corp. | | | | | | | | |
2.20%, 08/14/30 (a) | | | 67,000 | | | | 68,534 | |
Nucor Corp. | | | | | | | | |
3.95%, 05/01/28 (a) | | | 26,000 | | | | 26,415 | |
4.40%, 05/01/48 (a) | | | 25,000 | | | | 27,629 | |
Nutrien Ltd. | | | | | | | | |
4.00%, 12/15/26 (a) | | | 16,000 | | | | 16,420 | |
4.90%, 06/01/43 (a) | | | 15,000 | | | | 16,823 | |
NVIDIA Corp. | | | | | | | | |
2.85%, 04/01/30 | | | 20,000 | | | | 20,950 | |
3.50%, 04/01/50 | | | 55,000 | | | | 60,309 | |
Occidental Petroleum Corp. | | | | | | | | |
2.70%, 08/15/22 (a) | | | 65,000 | | | | 46,405 | |
2.90%, 08/15/24 (a) | | | 17,000 | | | | 9,346 | |
| | | | | | | | |
| | | Principal
Amount ($) | | | Fair
Value
$ | |
Olahoma G & E Co. | | | | | | | | |
3.25%, 04/01/30 | | | 35,000 | | | | 35,178 | |
Omnicom Group Inc./Omnicom Capital Inc. | | | | | | | | |
3.63%, 05/01/22 (a) | | | 26,000 | | | | 26,413 | |
Oncor Electric Delivery Company LLC | | | | | | | | |
3.80%, 09/30/47 (a) | | | 16,000 | | | | 16,761 | |
ONEOK Inc. | | | | | | | | |
4.35%, 03/15/29 (a) | | | 38,000 | | | | 31,024 | |
5.20%, 07/15/48 (a) | | | 41,000 | | | | 32,573 | |
Oracle Corp. | | | | | | | | |
2.40%, 09/15/23 (a) | | | 18,000 | | | | 18,337 | |
2.50%, 04/01/25 | | | 67,000 | | | | 67,976 | |
2.65%, 07/15/26 (a) | | | 28,000 | | | | 28,494 | |
2.95%, 04/01/30 | | | 67,000 | | | | 67,582 | |
3.60%, 04/01/50 | | | 45,000 | | | | 44,928 | |
3.80%, 11/15/37 (a) | | | 8,000 | | | | 8,203 | |
4.00%, 07/15/46- 11/15/47 (a) | | | 47,000 | | | | 50,457 | |
4.13%, 05/15/45 (a) | | | 5,000 | | | | 5,475 | |
Otis Worldwide Corp. | | | | | | | | |
2.06%, 04/05/25 (a)(g) | | | 55,000 | | | | 53,729 | |
2.57%, 02/15/30 (a)(g) | | | 30,000 | | | | 29,053 | |
3.36%, 02/15/50 (a)(g) | | | 25,000 | | | | 24,251 | |
Owens Corning | | | | | | | | |
4.40%, 01/30/48 (a) | | | 18,000 | | | | 15,546 | |
PacifiCorp | | | | | | | | |
6.25%, 10/15/37 (a) | | | 140,000 | | | | 179,369 | |
Parker-Hannifin Corp. | | | | | | | | |
3.25%, 06/14/29 (a) | | | 26,000 | | | | 26,414 | |
PayPal Holdings Inc. | | | | | | | | |
2.65%, 10/01/26 (a) | | | 45,000 | | | | 44,018 | |
PepsiCo Inc. | | | | | | | | |
2.63%, 07/29/29 (a) | | | 63,000 | | | | 65,740 | |
3.45%, 10/06/46 (a) | | | 18,000 | | | | 20,272 | |
Petroleos Mexicanos | | | | | | | | |
5.35%, 02/12/28 (a) | | | 45,000 | | | | 31,017 | |
5.63%, 01/23/46 (a) | | | 39,000 | | | | 23,737 | |
6.49%, 01/23/27 (a)(g) | | | 20,000 | | | | 14,737 | |
6.50%, 03/13/27 (a) | | | 114,000 | | | | 84,412 | |
7.69%, 01/23/50 (a)(g) | | | 27,000 | | | | 18,350 | |
Pfizer Inc. | | | | | | | | |
2.63%, 04/01/30 | | | 45,000 | | | | 47,339 | |
3.45%, 03/15/29 (a) | | | 35,000 | | | | 38,529 | |
3.60%, 09/15/28 (a) | | | 34,000 | | | | 37,229 | |
3.90%, 03/15/39 (a) | | | 17,000 | | | | 19,686 | |
4.13%, 12/15/46 (a) | | | 10,000 | | | | 12,248 | |
4.40%, 05/15/44 (a) | | | 6,000 | | | | 7,563 | |
Philip Morris International Inc. | | | | | | | | |
4.13%, 03/04/43 (a) | | | 3,000 | | | | 3,179 | |
Phillips 66 Partners LP | | | | | | | | |
3.75%, 03/01/28 (a) | | | 15,000 | | | | 13,825 | |
4.68%, 02/15/45 (a) | | | 16,000 | | | | 13,087 | |
See Notes to Schedules of Investments and Notes to Financial Statements.
| | | | |
| State Street Active Core Bond Fund | | | 39 | |
State Street Active Core Bond Fund
Schedule of Investments, continued — March 31, 2020 (Unaudited)
| | | | | | | | |
| | | Principal
Amount ($) | | | Fair
Value
$ | |
| | | | | | | | |
Plains All American Pipeline LP/PAA Finance Corp. | | | | | | | | |
3.55%, 12/15/29 (a) | | | 83,000 | | | | 58,771 | |
3.65%, 06/01/22 (a) | | | 40,000 | | | | 36,675 | |
PPL Capital Funding Inc. | | | | | | | | |
3.10%, 05/15/26 (a) | | | 71,000 | | | | 70,306 | |
Precision Castparts Corp. | | | | | | | | |
4.38%, 06/15/45 (a) | | | 17,000 | | | | 18,891 | |
Prologis LP | | | | | | | | |
4.38%, 02/01/29 (a) | | | 24,000 | | | | 25,972 | |
Prudential Financial Inc. (5.70% fixed rate until 09/15/28; 2.67% + 3 month USD LIBOR thereafter) | | | | | | | | |
5.70%, 09/15/48 (a)(b) | | | 102,000 | | | | 87,315 | |
QUALCOMM Inc. | | | | | | | | |
2.90%, 05/20/24 (a) | | | 12,000 | | | | 12,415 | |
3.00%, 05/20/22 (a) | | | 8,000 | | | | 8,156 | |
3.25%, 05/20/27 (a) | | | 4,000 | | | | 4,208 | |
4.30%, 05/20/47 (a) | | | 2,000 | | | | 2,438 | |
Quest Diagnostics Inc. | | | | | | | | |
2.95%, 06/30/30 (a) | | | 15,000 | | | | 14,669 | |
Realty Income Corp. | | | | | | | | |
3.00%, 01/15/27 (a) | | | 51,000 | | | | 48,501 | |
Rio Tinto Finance USA PLC | | | | | | | | |
4.13%, 08/21/42 (a) | | | 15,000 | | | | 17,664 | |
Rockwell Automation Inc. | | | | | | | | |
4.20%, 03/01/49 (a) | | | 36,000 | | | | 40,809 | |
Rockwell Collins Inc. | | | | | | | | |
3.50%, 03/15/27 (a) | | | 19,000 | | | | 19,617 | |
Rogers Communications Inc. | | | | | | | | |
5.00%, 03/15/44 (a) | | | 9,000 | | | | 10,683 | |
Roper Technologies Inc. | | | | | | | | |
2.95%, 09/15/29 (a) | | | 54,000 | | | | 53,515 | |
RPM International Inc. | | | | | | | | |
3.75%, 03/15/27 (a) | | | 21,000 | | | | 19,923 | |
Ryder System Inc. | | | | | | | | |
2.90%, 12/01/26 (a) | | | 105,000 | | | | 102,820 | |
Sabine Pass Liquefaction LLC | | | | | | | | |
4.20%, 03/15/28 (a) | | | 14,000 | | | | 11,988 | |
5.00%, 03/15/27 (a) | | | 8,000 | | | | 7,053 | |
5.88%, 06/30/26 (a) | | | 67,000 | | | | 60,865 | |
Schlumberger Holdings Corp. | | | | | | | | |
3.90%, 05/17/28 (a)(g) | | | 16,000 | | | | 14,884 | |
Sempra Energy | | | | | | | | |
3.80%, 02/01/38 (a) | | | 11,000 | | | | 10,467 | |
4.00%, 02/01/48 (a) | | | 26,000 | | | | 26,103 | |
Shell International Finance BV | | | | | | | | |
2.38%, 08/21/22 (a) | | | 61,000 | | | | 61,300 | |
3.13%, 11/07/49 (a) | | | 81,000 | | | | 80,439 | |
3.75%, 09/12/46 (a) | | | 10,000 | | | | 10,759 | |
4.13%, 05/11/35 (a) | | | 15,000 | | | | 17,207 | |
| | | | | | | | |
| | | Principal
Amount ($) | | | Fair
Value
$ | |
Shire Acquisitions Investments Ireland DAC | | | | | | | | |
2.88%, 09/23/23 (a) | | | 2,000 | | | | 2,021 | |
3.20%, 09/23/26 (a) | | | 12,000 | | | | 12,212 | |
Simon Property Group LP | | | | | | | | |
3.38%, 06/15/27 (a) | | | 67,000 | | | | 65,097 | |
Southern California Edison Co. | | | | | | | | |
2.40%, 02/01/22 (a) | | | 37,000 | | | | 36,343 | |
2.90%, 03/01/21 (a) | | | 46,000 | | | | 45,844 | |
4.00%, 04/01/47 (a) | | | 57,000 | | | | 59,691 | |
4.20%, 03/01/29 (a) | | | 39,000 | | | | 41,553 | |
Southern Company Gas Capital Corp. | | | | | | | | |
3.95%, 10/01/46 (a) | | | 41,000 | | | | 36,596 | |
4.40%, 05/30/47 (a) | | | 13,000 | | | | 13,497 | |
Southwest Airlines Co. | | | | | | | | |
2.63%, 02/10/30 (a) | | | 67,000 | | | | 56,163 | |
Southwestern Electric Power Co. | | | | | | | | |
2.75%, 10/01/26 (a) | | | 23,000 | | | | 21,840 | |
Spectra Energy Partners LP | | | | | | | | |
3.38%, 10/15/26 (a) | | | 8,000 | | | | 7,393 | |
4.50%, 03/15/45 (a) | | | 4,000 | | | | 3,644 | |
Standard Chartered PLC (2.82% fixed rate until 01/30/25; 1.21% + 3 month USD LIBOR thereafter) | | | | | | | | |
2.82%, 01/30/26 (a)(b)(g) | | | 203,000 | | | | 190,444 | |
Starbucks Corp. | | | | | | | | |
4.00%, 11/15/28 (a) | | | 19,000 | | | | 20,314 | |
Steel Dynamics Inc. | | | | | | | | |
3.45%, 04/15/30 (a) | | | 30,000 | | | | 27,133 | |
4.13%, 09/15/25 (a) | | | 240,000 | | | | 222,029 | |
Sumitomo Mitsui Financial Group Inc. | | | | | | | | |
2.35%, 01/15/25 (a) | | | 200,000 | | | | 197,796 | |
Suncor Energy Inc. | | | | | | | | |
4.00%, 11/15/47 (a) | | | 5,000 | | | | 4,620 | |
Sunoco Logistics Partners Operations LP | | | | | | | | |
5.30%, 04/01/44 (a) | | | 19,000 | | | | 13,113 | |
Sysco Corp. | | | | | | | | |
3.25%, 07/15/27 (a) | | | 19,000 | | | | 17,342 | |
5.65%, 04/01/25 | | | 25,000 | | | | 26,113 | |
5.95%, 04/01/30 | | | 15,000 | | | | 15,825 | |
6.60%, 04/01/50 | | | 10,000 | | | | 10,746 | |
Tampa Electric Co. | | | | | | | | |
4.35%, 05/15/44 (a) | | | 44,000 | | | | 47,911 | |
Target Corp. | | | | | | | | |
2.25%, 04/15/25 | | | 67,000 | | | | 68,483 | |
2.50%, 04/15/26 (a) | | | 24,000 | | | | 24,655 | |
2.65%, 09/15/30 | | | 15,000 | | | | 15,641 | |
TELUS Corp. | | | | | | | | |
3.70%, 09/15/27 (a) | | | 150,000 | | | | 161,289 | |
See Notes to Schedules of Investments and Notes to Financial Statements.
| | |
| 40 | | State Street Active Core Bond Fund |
State Street Active Core Bond Fund
Schedule of Investments, continued — March 31, 2020 (Unaudited)
| | | | | | | | |
| | | Principal
Amount ($) | | | Fair
Value
$ | |
| | | | | | | | |
Texas Instruments Inc. | | | | | | | | |
3.88%, 03/15/39 (a) | | | 23,000 | | | | 26,308 | |
The Allstate Corp. (5.75% fixed rate until 08/15/23; 2.94% + 3 month USD LIBOR thereafter) | | | | | | | | |
5.75%, 08/15/53 (a)(b) | | | 40,000 | | | | 35,556 | |
The Bank of New York Mellon Corp. (4.63% fixed rate until 09/20/26; 3.13% + 3 month USD LIBOR thereafter) | | | | | | | | |
4.63%, 12/29/49 (a)(b) | | | 86,000 | | | | 75,929 | |
The Bank of Nova Scotia (4.65% fixed rate until 10/12/22; 2.65% + 3 month USD LIBOR thereafter) | | | | | | | | |
4.65%, 12/31/99 (a)(b) | | | 109,000 | | | | 85,935 | |
The Boeing Co. | | | | | | | | |
2.70%, 02/01/27 (a) | | | 58,000 | | | | 53,078 | |
2.95%, 02/01/30 (a) | | | 13,000 | | | | 12,016 | |
3.25%, 03/01/28 (a) | | | 18,000 | | | | 17,000 | |
3.55%, 03/01/38 (a) | | | 19,000 | | | | 16,665 | |
3.75%, 02/01/50 (a) | | | 39,000 | | | | 35,561 | |
The Cleveland Electric Illuminating Co. | | | | | | | | |
4.55%, 11/15/30 (a)(g) | | | 71,000 | | | | 75,017 | |
The Dow Chemical Co. | | | | | | | | |
4.25%, 10/01/34 (a) | | | 26,000 | | | | 24,906 | |
5.55%, 11/30/48 (a) | | | 16,000 | | | | 18,160 | |
The Estee Lauder Companies Inc. | | | | | | | | |
2.38%, 12/01/29 (a) | | | 80,000 | | | | 77,543 | |
3.13%, 12/01/49 (a) | | | 25,000 | | | | 24,198 | |
The George Washington University | | | | | | | | |
4.13%, 09/15/48 (a) | | | 84,000 | | | | 91,473 | |
The Goldman Sachs Group Inc. | | | | | | | | |
2.60%, 02/07/30 (a) | | | 40,000 | | | | 37,636 | |
3.50%, 04/01/25 | | | 40,000 | | | | 41,078 | |
3.50%, 11/16/26 (a) | | | 146,000 | | | | 149,796 | |
3.85%, 01/26/27 (a) | | | 114,000 | | | | 116,547 | |
4.25%, 10/21/25 (a) | | | 4,000 | | | | 4,148 | |
5.15%, 05/22/45 (a) | | | 71,000 | | | | 79,773 | |
The Goldman Sachs Group Inc. (3.81% fixed rate until 04/23/28; 1.16% + 3 month USD LIBOR thereafter) | | | | | | | | |
3.81%, 04/23/29 (a)(b) | | | 216,000 | | | | 223,165 | |
The Goldman Sachs Group Inc. (4.02% fixed rate until 10/31/37; 1.37% + 3 month USD LIBOR thereafter) | | | | | | | | |
4.02%, 10/31/38 (a)(b) | | | 50,000 | | | | 51,393 | |
The Hartford Financial Services Group Inc. | | | | | | | | |
2.80%, 08/19/29 (a) | | | 65,000 | | | | 63,289 | |
| | | | | | | | |
| | | Principal
Amount ($) | | | Fair
Value
$ | |
The Hartford Financial Services Group Inc. (3.82% fixed rate until 05/01/20; 2.13% + 3 month USD LIBOR) | | | | | | | | |
3.82%, 02/12/67 (a)(b)(g) | | | 95,000 | | | | 61,681 | |
The Home Depot Inc. | | | | | | | | |
2.70%, 04/15/30 | | | 50,000 | | | | 51,020 | |
3.35%, 04/15/50 | | | 90,000 | | | | 94,742 | |
3.50%, 09/15/56 (a) | | | 21,000 | | | | 21,520 | |
3.90%, 12/06/28 - 06/15/47 (a) | | | 64,000 | | | | 71,155 | |
4.50%, 12/06/48 (a) | | | 38,000 | | | | 46,225 | |
The Interpublic Group of Companies Inc. | | | | | | | | |
3.75%, 10/01/21 (a) | | | 139,000 | | | | 140,440 | |
The Kroger Co. | | | | | | | | |
2.95%, 11/01/21 (a) | | | 43,000 | | | | 43,418 | |
4.65%, 01/15/48 (a) | | | 12,000 | | | | 13,248 | |
The Mosaic Co. | | | | | | | | |
5.63%, 11/15/43 (a) | | | 4,000 | | | | 3,579 | |
The Procter & Gamble Co. | | | | | | | | |
2.45%, 03/25/25 (a) | | | 45,000 | | | | 47,403 | |
3.60%, 03/25/50 (a) | | | 20,000 | | | | 24,834 | |
The Sherwin-Williams Co. | | | | | | | | |
3.45%, 06/01/27 (a) | | | 7,000 | | | | 7,067 | |
4.50%, 06/01/47 (a) | | | 6,000 | | | | 6,562 | |
The Southern Co. | | | | | | | | |
3.25%, 07/01/26 (a) | | | 8,000 | | | | 7,927 | |
4.40%, 07/01/46 (a) | | | 5,000 | | | | 5,201 | |
The Walt Disney Co. | | | | | | | | |
3.38%, 11/15/26 (a) | | | 7,000 | | | | 7,323 | |
4.00%, 10/01/23 (a) | | | 358,000 | | | | 382,541 | |
4.75%, 11/15/46 (a) | | | 5,000 | | | | 6,342 | |
6.65%, 11/15/37 (a) | | | 31,000 | | | | 43,632 | |
The Williams Companies Inc. | | | | | | | | |
3.75%, 06/15/27 (a) | | | 6,000 | | | | 5,564 | |
4.85%, 03/01/48 (a) | | | 15,000 | | | | 14,019 | |
5.40%, 03/04/44 (a) | | | 4,000 | | | | 3,602 | |
Thermo Fisher Scientific Inc. | | | | | | | | |
4.13%, 03/25/25 (a) | | | 15,000 | | | | 16,142 | |
4.50%, 03/25/30 (a) | | | 15,000 | | | | 16,930 | |
Time Warner Cable LLC | | | | | | | | |
4.50%, 09/15/42 (a) | | | 4,000 | | | | 3,812 | |
6.55%, 05/01/37 (a) | | | 17,000 | | | | 20,085 | |
TJX Companies Inc. | | | | | | | | |
3.50%, 04/15/25 | | | 50,000 | | | | 51,256 | |
3.88%, 04/15/30 | | | 35,000 | | | | 36,233 | |
4.50%, 04/15/50 | | | 25,000 | | | | 26,987 | |
Total Capital International S.A. | | | | | | | | |
3.46%, 02/19/29 (a) | | | 54,000 | | | | 57,242 | |
TransCanada PipeLines Ltd. | | | | | | | | |
4.25%, 05/15/28 (a) | | | 39,000 | | | | 39,647 | |
4.88%, 01/15/26 (a) | | | 7,000 | | | | 7,587 | |
See Notes to Schedules of Investments and Notes to Financial Statements.
| | | | |
| State Street Active Core Bond Fund | | | 41 | |
State Street Active Core Bond Fund
Schedule of Investments, continued — March 31, 2020 (Unaudited)
| | | | | | | | |
| | | Principal
Amount ($) | | | Fair
Value
$ | |
| | | | | | | | |
Transcontinental Gas Pipe Line Company LLC | | | | | | | | |
4.00%, 03/15/28 (a) | | | 16,000 | | | | 14,681 | |
Trinity Health Corp. | | | | | | | | |
3.43%, 12/01/48 (a) | | | 16,000 | | | | 16,749 | |
Truist Bank (3.50% fixed rate until 08/02/21; 0.59% + 3 month USD LIBOR thereafter) | | | | | | | | |
3.50%, 08/02/22 (a)(b) | | | 40,000 | | | | 41,140 | |
Truist Financial Corp. (4.80% fixed rate until 09/01/24; 3.00% + 5 year CMT Rate thereafter) | | | | | | | | |
4.80%, 12/31/99 (a)(b) | | | 83,000 | | | | 68,800 | |
TWDC Enterprises 18 Corp. | | | | | | | | |
4.13%, 06/01/44 (a) | | | 5,000 | | | | 5,497 | |
Tyco Electronics Group S.A. | | | | | | | | |
3.13%, 08/15/27 (a) | | | 28,000 | | | | 29,567 | |
Tyson Foods Inc. | | | | | | | | |
4.00%, 03/01/26 (a) | | | 79,000 | | | | 83,578 | |
4.55%, 06/02/47 (a) | | | 4,000 | | | | 4,457 | |
UDR Inc. | | | | | | | | |
3.00%, 08/15/31 (a) | | | 25,000 | | | | 23,613 | |
Union Pacific Corp. | | | | | | | | |
3.50%, 06/08/23 (a) | | | 31,000 | | | | 32,098 | |
3.60%, 09/15/37 (a) | | | 6,000 | | | | 6,214 | |
4.10%, 09/15/67 (a) | | | 21,000 | | | | 21,653 | |
4.30%, 03/01/49 (a) | | | 26,000 | | | | 29,447 | |
United Technologies Corp. | | | | | | | | |
3.13%, 05/04/27 (a) | | | 93,000 | | | | 94,805 | |
3.65%, 08/16/23 (a) | | | 4,000 | | | | 4,219 | |
3.95%, 08/16/25 (a) | | | 14,000 | | | | 15,253 | |
4.13%, 11/16/28 (a) | | | 6,000 | | | | 6,580 | |
4.15%, 05/15/45 (a) | | | 18,000 | | | | 19,499 | |
4.45%, 11/16/38 (a) | | | 14,000 | | | | 15,711 | |
4.50%, 06/01/42 (a) | | | 12,000 | | | | 13,697 | |
UnitedHealth Group Inc. | | | | | | | | |
4.45% 12/15/48 (a) | | | 18,000 | | | | 21,670 | |
4.75%, 07/15/45 (a) | | | 9,000 | | | | 11,529 | |
Vale S.A. | | | | | | | | |
5.63%, 09/11/42 (a) | | | 19,000 | | | | 19,066 | |
Valero Energy Corp. | | | | | | | | |
4.00%, 04/01/29 (a) | | | 26,000 | | | | 24,177 | |
Ventas Realty LP | | | | | | | | |
3.25%, 10/15/26 (a) | | | 88,000 | | | | 83,318 | |
Verizon Communications Inc. | | | | | | | | |
2.45%, 11/01/22 (a) | | | 350,000 | | | | 354,998 | |
4.33%, 09/21/28 (a) | | | 51,000 | | | | 57,813 | |
4.40%, 11/01/34 (a) | | | 64,000 | | | | 74,104 | |
4.52%, 09/15/48 (a) | | | 18,000 | | | | 22,716 | |
4.67%, 03/15/55 (a) | | | 33,000 | | | | 41,960 | |
5.25%, 03/16/37 (a) | | | 16,000 | | | | 20,351 | |
| | | | | | | | |
| | | Principal
Amount ($) | | | Fair
Value
$ | |
ViacomCBS Inc. | | | | | | | | |
2.90%, 01/15/27 (a) | | | 16,000 | | | | 14,344 | |
3.45%, 10/04/26 (a) | | | 19,000 | | | | 17,754 | |
3.70%, 06/01/28 (a) | | | 38,000 | | | | 34,383 | |
4.38%, 03/15/43 (a) | | | 41,000 | | | | 35,827 | |
5.25%, 04/01/44 (a) | | | 4,000 | | | | 3,804 | |
Virginia Electric & Power Co. | | | | | | | | |
4.00%, 11/15/46 (a) | | | 42,000 | | | | 46,157 | |
Visa Inc. | | | | | | | | |
1.90%, 04/15/27 | | | 178,000 | | | | 177,498 | |
2.05%, 04/15/30 | | | 45,000 | | | | 44,935 | |
2.70%, 04/15/40 | | | 25,000 | | | | 24,816 | |
4.30%, 12/14/45 (a) | | | 49,000 | | | | 61,294 | |
Vodafone Group PLC | | | | | | | | |
4.38%, 05/30/28 (a) | | | 48,000 | | | | 50,574 | |
5.25%, 05/30/48 (a) | | | 22,000 | | | | 26,101 | |
Vornado Realty LP | | | | | | | | |
3.50%, 01/15/25 (a) | | | 14,000 | | | | 13,430 | |
Vulcan Materials Co. | | | | | | | | |
3.90%, 04/01/27 (a) | | | 14,000 | | | | 14,049 | |
Walmart Inc. | | | | | | | | |
3.63%, 12/15/47 (a) | | | 14,000 | | | | 16,381 | |
3.70%, 06/26/28 (a) | | | 29,000 | | | | 32,546 | |
3.95%, 06/28/38 (a) | | | 29,000 | | | | 34,276 | |
4.05%, 06/29/48 (a) | | | 43,000 | | | | 53,538 | |
WEC Energy Group Inc. | | | | | | | | |
3.55%, 06/15/25 (a) | | | 30,000 | | | | 30,389 | |
Wells Fargo & Co. | | | | | | | | |
4.15%, 01/24/29 (a) | | | 82,000 | | | | 89,344 | |
4.75%, 12/07/46 (a) | | | 71,000 | | | | 79,626 | |
Wells Fargo & Co. (2.88% fixed rate until 10/30/29; 1.17% + 3 month USD LIBOR thereafter) | | | | | | | | |
2.88%, 10/30/30 (a)(b) | | | 20,000 | | | | 19,804 | |
Wells Fargo & Co. (3.20% fixed rate until 06/17/26; 1.17% + 3 month USD LIBOR thereafter) | | | | | | | | |
3.20%, 06/17/27 (a)(b) | | | 317,000 | | | | 326,218 | |
Wells Fargo & Co. (5.88% fixed rate until 06/15/25; 3.99% + 3 month USD LIBOR thereafter) | | | | | | | | |
5.88%, 12/29/49 (a)(b) | | | 117,000 | | | | 118,872 | |
Western Midstream Operating LP | | | | | | | | |
3.10%, 02/01/25 (a) | | | 95,000 | | | | 48,446 | |
5.38%, 06/01/21 (a) | | | 49,000 | | | | 39,227 | |
Westpac Banking Corp. (2.89% fixed rate until 02/04/25; 1.35% + 5 year CMT Rate thereafter) | | | | | | | | |
2.89%, 02/04/30 (a)(b) | | | 82,000 | | | | 78,763 | |
See Notes to Schedules of Investments and Notes to Financial Statements.
| | |
| 42 | | State Street Active Core Bond Fund |
State Street Active Core Bond Fund
Schedule of Investments, continued — March 31, 2020 (Unaudited)
| | | | | | | | |
| | | Principal
Amount ($) | | | Fair
Value
$ | |
| | | | | | | | |
Westpac Banking Corp. (4.11% fixed rate until 07/24/29; 2.00% + 5 year CMT Rate thereafter) | | | | | | | | |
4.11%, 07/24/34 (a)(b) | | | 32,000 | | | | 30,747 | |
Weyerhaeuser Co. | | | | | | | | |
4.00%, 04/15/30 | | | 112,000 | | | | 113,119 | |
Willis North America Inc. | | | | | | | | |
3.60%, 05/15/24 (a) | | | 75,000 | | | | 76,346 | |
WPP Finance 2010 | | | | | | | | |
3.75%, 09/19/24 (a) | | | 19,000 | | | | 19,195 | |
WRKCo Inc. | | | | | | | | |
3.00%, 09/15/24 (a) | | | 19,000 | | | | 18,383 | |
Xcel Energy Inc. | | | | | | | | |
3.40%, 06/01/30 | | | 55,000 | | | | 56,135 | |
Xilinx Inc. | | | | | | | | |
2.95%, 06/01/24 (a) | | | 15,000 | | | | 14,735 | |
Zoetis Inc. | | | | | | | | |
3.00%, 09/12/27 (a) | | | 7,000 | | | | 7,106 | |
3.90%, 08/20/28 (a) | | | 21,000 | | | | 23,103 | |
| | | | | | | | |
| | | | | | | 34,809,939 | |
| | | | | | | | |
|
Non-Agency Collateralized Mortgage Obligations - 3.2% | |
Benchmark2019-B12 Mortgage Trust | | | | | | | | |
3.12%, 08/15/52 (a) | | | 300,000 | | | | 314,819 | |
Cantor Commercial Real Estate Lending2019-CF3 | | | | | | | | |
3.01%, 01/15/53 (a) | | | 222,000 | | | | 225,185 | |
CD2019-CD8 Mortgage Trust | | | | | | | | |
2.91%, 08/15/57 (a) | | | 827,000 | | | | 856,205 | |
Citigroup Commercial Mortgage Trust2016-P6 | | | | | | | | |
3.72%, 12/10/49 (a)(b) | | | 268,803 | | | | 292,272 | |
GS Mortgage Securities Trust 2012-GCJ9 | | | | | | | | |
1.94%, 11/10/45 (a)(b)(c) | | | 693,459 | | | | 28,599 | |
GS Mortgage Securities Trust2016-GS3 | | | | | | | | |
2.85%, 10/10/49 (a) | | | 379,000 | | | | 390,287 | |
JP Morgan Chase Commercial Mortgage Securities Trust2012-LC9 | | | | | | | | |
1.50%, 12/15/47 (a)(b)(c) | | | 586,443 | | | | 18,379 | |
JPMBB Commercial Mortgage Securities Trust2015-C32 | | | | | | | | |
4.66%, 11/15/48 (a)(b) | | | 494,000 | | | | 472,546 | |
MASTR Alternative Loan Trust2003-5 | | | | | | | | |
5.00%, 08/25/18 (a)(c) | | | 1,114 | | | | 39 | |
| | | | | | | | |
| | | Principal
Amount ($) | | | Fair
Value
$ | |
Morgan Stanley Bank of America Merrill Lynch Trust2015-C21 | | | | | | | | |
0.88%, 03/15/48 (a)(b)(c) | | | 3,516,849 | | | | 120,061 | |
Morgan Stanley Capital I Trust 2006-IQ11 | | | | | | | | |
6.06%, 10/15/42 (a)(b) | | | 211,601 | | | | 203,116 | |
UBS Commercial Mortgage Trust2018-C12 | | | | | | | | |
4.79%, 08/15/51 (a)(b) | | | 189,000 | | | | 188,310 | |
Wells Fargo Commercial Mortgage Trust2015-C26 | | | | | | | | |
1.21%, 02/15/48 (a)(b)(c) | | | 2,760,502 | | | | 127,559 | |
WFRBS Commercial Mortgage Trust 2014-LC14 | | | | | | | | |
4.35%, 03/15/47 (a)(b) | | | 544,000 | | | | 563,198 | |
| | | | | | | | |
| | | | | | | 3,800,575 | |
| | | | | | | | |
| | |
Sovereign Bonds - 0.6% | | | | | | | | |
Government of Chile | | | | | | | | |
2.55%, 01/27/32 (a) | | | 203,000 | | | | 202,669 | |
Government of Mexico | | | | | | | | |
4.60%, 02/10/48 (a) | | | 202,000 | | | | 201,836 | |
Government of Peru | |
5.63%, 11/18/50 (a) | | | 113,000 | | | | 165,647 | |
Government of Uruguay | |
5.10%, 06/18/50 (a) | | | 117,568 | | | | 133,796 | |
| | | | | | | | |
| | | | 703,948 | |
| | | | | | | | |
|
Municipal Bonds and Notes - 0.5% | |
American Municipal Power Inc. | | | | | | | | |
6.27%, 02/15/50 (a) | | | 105,000 | | | | 140,163 | |
State of California | |
4.60%, 04/01/38 (a) | | | 165,000 | | | | 181,677 | |
State of Illinois | |
5.10%, 06/01/33 (a) | | | 100,000 | | | | 99,263 | |
The University of Texas System | | | | | | | | |
3.35%, 08/15/47 (a) | | | 95,000 | | | | 101,611 | |
| | | | | | | | |
| | | | 522,714 | |
| | | | | | | | |
| |
Total Bonds and Notes
(Cost $103,558,202) | | | | 106,918,584 | |
| | | | | | | | |
| | |
| | | Number of
Shares | | | | |
| | | | | | | | |
| | |
| Domestic Equity - 0.2% | | | | | | | | |
Preferred Stock - 0.2% | | | | | | | | |
Wells Fargo & Co.
3.09% + 3 month USD LIBOR
(Cost $214,450) (a)(b) | | | 8,578 | | | | 208,874 | |
See Notes to Schedules of Investments and Notes to Financial Statements.
| | | | |
| State Street Active Core Bond Fund | | | 43 | |
State Street Active Core Bond Fund
Schedule of Investments, continued — March 31, 2020 (Unaudited)
| | | | | | | | |
| | | Notional
Amount ($) | | | Fair
Value
$ | |
| | | | | | | | |
| |
| Purchased Options - 0.1% | | | | | |
10 Yr. U.S. Treasury Notes Futures (Strike price 138.00USD, expiration date 05/22/20) (a) | | | 20,000 | | | | 35,000 | |
U.S. Treasury Bond (Strike price 175 USD, expiration date 05/22/20) (a) | | | 15,000 | | | | 91,406 | |
| | | | | | | | |
| |
Total Options
(Cost $77,047) | | | | 126,406 | |
| | | | | | | | |
| |
Total Investments in Securities
(Cost $103,849,699) | | | | 107,253,864 | |
| | | | | | | | |
| | | | | | | | |
| | | Number
of Shares | | | Fair
Value
$ | |
Short-Term Investments - 26.0% | |
State Street Institutional U.S. Government Money Market Fund - Class G Shares 0.36%
(Cost $30,650,715) (a)(h)(i) | | | 30,650,715 | | | | 30,650,715 | |
| | | | | | | | |
| |
Total Short-Term Investments
(Cost $30,650,715) | | | | 30,650,715 | |
| | | | | | | | |
| |
Total Investments
(Cost $134,500,414) | | | | 137,904,579 | |
| |
| Liabilities in Excess of Other Assets, net - (17.0)% | | | | (20,036,080 | ) |
| | | | | | | | |
| |
| NET ASSETS - 100.0% | | | | 117,868,499 | |
| | | | | | | | |
Other Information:
Centrally Cleared Credit Default Swaps
| | | | | | | | | | | | | | | | | | | | | | | | | | |
Reference
Entity | | Counterparty | | Notional
Amount
(000s omitted) | | | Contract
Annual
Fixed Rate/
Payment
Frequency | | | Termination
Date | | | Market
Value | | | Unamortized
Upfront
Payments
Received
(Paid) | | | Unrealized
Appreciation/
Depreciation | |
Buy Protection | |
Markit CDX North America
High Yield Index | | Intercontinental
Exchange | | $ | 4,867 | | | | 1.00%/Quarterly | | | | 12/20/24 | | | $ | (22,338 | ) | | $ | (76,040 | ) | | $ | 53,702 | |
Markit CDX North America
High Yield Index | | Intercontinental
Exchange | | | 6,315 | | | | 5.00%/Quarterly | | | | 12/20/24 | | | | (374,463 | ) | | | (298,711 | ) | | | (75,752 | ) |
| | | | | | | | | | | | | | | | | | | | | | | | | | |
| | | $ | (22,050 | ) |
| | | | | | | | | | | | | | | | | | | | | | | | | | |
Centrally Cleared Interest Rate Swaps
| | | | | | | | | | | | | | | | | | | | | | | | | | | | | | |
| Counterparty | | Notional
Amount
(000s
omitted) | | Fund
Pays/Receives
Fixed
Rate/Payment
Frequency | | | Floating Rate | | | Contract
Annual
Fixed
Rate | | | Termination
Date | | | Market
Value | | | Unamortized
Upfront
Payments
Received
(Paid) | | | Unrealized
Depreciation | |
CME Group, Inc. | | $9,488 | | | Pays/Quarterly | | |
| 3 Month U.S.
Dollar
LIBOR |
| | | 3.06% | | | | 11/19/21 | | | $ | (479,482 | ) | | $ | — | | | $ | (479,482 | ) |
| | | | | | | | | | | | | | | | | | | | | | | | | | | | | | |
See Notes to Schedules of Investments and Notes to Financial Statements.
| | |
| 44 | | State Street Active Core Bond Fund |
State Street Active Core Bond Fund
Schedule of Investments, continued — March 31, 2020 (Unaudited)
The Fund had the following long futures contracts open at March 31, 2020:
| | | | | | | | | | | | | | | | | | | | |
| Description | | Expiration
date | | | Number of
Contracts | | | Notional
Amount | | | Value | | | Unrealized
Appreciation | |
Ultra Long-Term U.S. Treasury Bond Futures | | | June 2020 | | | | 11 | | | $ | 2,271,118 | | | $ | 2,440,625 | | | $ | 169,507 | |
2 Yr. U.S. Treasury Notes Futures | | | June 2020 | | | | 106 | | | | 23,173,640 | | | | 23,360,578 | | | | 186,938 | |
5 Yr. U.S. Treasury Notes Futures | | | June 2020 | | | | 24 | | | | 2,982,840 | | | | 3,008,625 | | | | 25,785 | |
| | | | | | | | | | | | | | | | | | | | |
| | | $ | 382,230 | |
| | | | | | | | | | | | | | | | | | | | |
The Fund had the following short futures contracts open at March 31, 2020:
| | | | | | | | | | | | | | | | | | | | |
| Description | | Expiration
date | | | Number of
Contracts | | | Notional
Amount | | | Value | | | Unrealized
Depreciation | |
U.S. Long Bond Futures | | | June 2020 | | | | 2 | | | $ | (341,840 | ) | | $ | (358,125 | ) | | $ | (16,285 | ) |
10 Yr. U.S. Treasury Notes Futures | | | June 2020 | | | | 15 | | | | (2,054,412 | ) | | | (2,080,312 | ) | | | (25,900 | ) |
10 Yr. U.S. Treasury Ultra Futures | | | June 2020 | | | | 30 | | | | (4,531,755 | ) | | | (4,680,938 | ) | | | (149,183 | ) |
| | | | | | | | | | | | | | | | | | | | |
| | | $ | (191,368 | ) |
| | | | | | | | | | | | | | | | | | | | |
| | | $ | 190,862 | |
| | | | | | | | | | | | | | | | | | | | |
The Fund had the following Purchased Options contracts at March 31, 2020:
| | | | | | | | | | | | | | | | | | | | | | | | | | | | | | | | |
| Description | | Counterparty | | | Strike
Price | | | Expiration
Date | | | Number of
Contracts | | | Notional
Amount | | | Market
Value | | | Premiums
Paid
(Received) by
Fund | | | Unrealized
Appreciation/
Depreciation | |
10 Yr. U.S. Treasury Notes Futures (Strike price 138.00 USD, expiration date 05/22/20) | | | Goldman Sachs & Co. | | | $ | 138.00 | | | | 05/22/20 | | | | 20 | | | $ | 20,000 | | | $ | 35,000 | | | $ | 34,518 | | | $ | 482 | |
U.S. Treasury Bond (Strike price 175 USD, expiration date 05/22/20) | | | Goldman Sachs & Co. | | | | 175.00 | | | | 05/22/20 | | | | 15 | | | | 15,000 | | | | 91,406 | | | | 42,529 | | | | 48,877 | |
| | | | | | | | | | | | | | | | | | | | | | | | | | | | | | | | |
| | | $ | 49,359 | |
| | | | | | | | | | | | | | | | | | | | | | | | | | | | | | | | |
During the period ended March 31, 2020 average notional values related to derivative contracts were as follows:
| | | | | | | | | | | | | | | | | | | | | | | | | | | | | | |
| | | Purchased Put Options | | Purchased Call Options | | | Written Put Options | | | Written Call Options | | | Long Futures Contracts | | | Short Futures Contracts | | | Credit Default Swap Contracts | | | Interest Rate Swap Contracts | |
| | | | | | | | | | | | | | | | | | | | | | | | | | | | | | |
Average Notional Value | | $— | | $ | 18,058 | | | $ | — | | | $ | — | | | $ | 21,933,256 | | | $ | 8,093,131 | | | $ | 5,880,246 | | | $ | 9,488,443 | |
See Notes to Schedules of Investments and Notes to Financial Statements.
| | | | |
| State Street Active Core Bond Fund | | | 45 | |
State Street Active Core Bond Fund
Schedule of Investments, continued — March 31, 2020 (Unaudited)
The views expressed in this document reflect our judgment as of the publication date and are subject to change at any time without notice. The securities cited may not be representative of the Funds’ future investments and should not be construed as a recommendation to purchase or sell a particular security. See each Fund’s summary prospectus and the Funds’ statutory prospectus for complete descriptions of investment objectives, policies, risks and permissible investments.
| (a) | At March 31, 2020, all or a portion of this security was pledged to cover collateral requirements for futures, options, swaps and/or TBAs. |
| (b) | Variable Rate Security - Interest rate shown is rate in effect at March 31, 2020. For securities based on a published reference rate and spread, the reference rate and spread are indicated in the description above. |
| (c) | Interest only security. These securities represent the right to receive the monthly interest payments on an underlying pool of mortgages. Payments of principal on the pool reduce the value of the “interest only” holding. |
| (d) | Settlement is on a delayed delivery or when-issued basis with final maturity to be announced (“TBA”) in the future. |
| (e) | Principal only security. These securities represent the right to receive the monthly principal payments on an underlying pool of mortgages. No payments of interest on the pool are passed through to the “principal only” holder. |
| (g) | Pursuant to Rule 144A of the Securities Act of 1933, as amended, these securities may be resold in transactions exempt from registration, normally to qualified institutional buyers. At March 31, 2020, these securities amounted to $5,294,572 or 4.49% of the net assets of the State Street Active Core Bond Fund. These securities have been determined to be liquid using procedures established by the Fund’s Board of Trustees . |
| (h) | Coupon amount represents effective yield. |
| (i) | Sponsored by SSGA Funds Management, Inc., the Funds’ investment adviser and administrator, and an affiliate of State Street Bank & Trust Co., the Funds’ sub-administrator, custodian and accounting agent. |
| † | Percentages are based on net assets as of March 31, 2020. |
| ** | Amount is less than $0.50. |
Abbreviations:
CMT - Constant Maturity Treasury
LIBOR - London Interbank Offered Rate
REIT- Real Estate Investment Trust
REMIC - Real Estate Mortgage Investment Conduit
SOFR - Secured Overnight Financing Rate
STRIPS - Separate Trading of Registered Interest and Principal of Security
TBA - To Be Announced
See Notes to Schedules of Investments and Notes to Financial Statements.
| | |
| 46 | | State Street Active Core Bond Fund |
State Street Active Core Bond Fund
Schedule of Investments, continued — March 31, 2020 (Unaudited)
The following table presents the Fund’s investments measured at fair value on a recurring basis at March 31, 2020:
| | | | | | | | | | | | | | | | | | |
| Fund | | Investments | | Level 1 | | | Level 2 | | | Level 3 | | | Total | |
| | | | | |
| State Street Active Core Bond Fund | | Investments in Securities | | | | | | | | | | | | | | | | |
| | | | | |
| | U.S. Treasuries | | $ | — | | | $ | 29,443,701 | | | $ | — | | | $ | 29,443,701 | |
| | | | | |
| | Agency Mortgage Backed | | | — | | | | 32,025,219 | | | | — | | | | 32,025,219 | |
| | | | | |
| | Agency Collateralized Mortgage Obligations | | | — | | | | 1,690,469 | | | | — | | | | 1,690,469 | |
| | | | | |
| | Asset Backed | | | — | | | | 3,922,019 | | | | — | | | | 3,922,019 | |
| | | | | |
| | Corporate Notes | | | — | | | | 34,809,939 | | | | — | | | | 34,809,939 | |
| | | | | |
| | Non-Agency Collateralized Mortgage Obligations | | | — | | | | 3,800,575 | | | | — | | | | 3,800,575 | |
| | | | | |
| | Sovereign Bonds | | | — | | | | 703,948 | | | | — | | | | 703,948 | |
| | | | | |
| | Municipal Bonds and Notes | | | — | | | | 522,714 | | | | — | | | | 522,714 | |
| | | | | |
| | Preferred Stock | | | 208,874 | | | | — | | | | — | | | | 208,874 | |
| | | | | |
| | Purchased Options | | | 126,406 | | | | | | | | — | | | | 126,406 | |
| | | | | |
| | Short-Term Investments | | | 30,650,715 | | | | — | | | | — | | | | 30,650,715 | |
| | | | | | | | | | | | | | | | | | |
| | | | | |
| | Total Investments in Securities | | $ | 30,985,995 | | | $ | 106,918,584 | | | $ | — | | | $ | 137,904,579 | |
| | | | | | | | | | | | | | | | | | |
| | | | | |
| | Other Financial Instruments | | | | | | | | | | | | | | | | |
| | | | | |
| | Credit Default Swap Contracts - Unrealized Appreciation | | | | | | | 53,702 | | | | | | | | 53,702 | |
| | | | | |
| | Credit Default Swap Contracts - Unrealized Depreciation | | | | | | | (75,752 | ) | | | | | | | (75,752 | ) |
| | | | | |
| | Interest Rate Swap Contracts - Unrealized Depreciation | | | | | | | (479,482 | ) | | | | | | | (479,482 | ) |
| | | | | |
| | Long Futures Contracts - Unrealized Appreciation | | $ | 382,230 | | | $ | — | | | $ | — | | | $ | 382,230 | |
| | | | | |
| | Short Futures Contracts - Unrealized Depreciation | | | (191,368 | ) | | | — | | | | — | | | | (191,368 | ) |
| | | | | | | | | | | | | | | | | | |
| | | | | |
| | Total Other Financial Instruments | | $ | 190,862 | | | $ | (501,532 | ) | | $ | — | | | $ | (310,670 | ) |
| | | | | | | | | | | | | | | | | | |
Affiliate Table
| | | | | | | | | | | | | | | | | | | | | | | | | | | | | | | | | | | | |
| | | Number
of Shares
Held at
9/30/19 | | | Value At
9/30/19 | | | Cost of
Purchases | | | Proceeds
from
Shares
Sold | | | Realized
Gain
(Loss) | | | Change in
Unrealized
Appreciation/
Depreciation | | | Number
of Shares
Held at
3/31/20 | | | Value at
3/31/20 | | | Dividend
Income | |
State Street Institutional U.S. Government Money Market Fund, Class G Shares | | | 47,836,549 | | | $ | 47,836,549 | | | $ | 67,606,160 | | | $ | 84,791,994 | | | $ | — | | | $ | — | | | | 30,650,715 | | | $ | 30,650,715 | | | $ | 170,727 | |
Notes to Schedules of Investments and Notes to Financial Statements.
| | | | |
| State Street Active Core Bond Fund | | | 47 | |
State Street Institutional U.S. Equity Fund
Financial Highlights
Selected data based on a share outstanding throughout the periods indicated
| | | | | | | | | | | | | | | | | | | | | | | | |
| | | Investment Class | |
| | | 3/31/20† | | | 9/30/19 | | | 9/30/18 | | | 9/30/17 | | | 9/30/16 | | | 9/30/15** | |
| Inception date | | | | | | | | | | | | | | | | | | | | | | | 11/25/97 | |
| | | | | | |
Net asset value, beginning of period | | $ | 12.30 | | | $ | 13.74 | | | $ | 14.95 | | | $ | 13.50 | | | $ | 14.46 | | | $ | 17.32 | |
| | | | | | | | | | | | | | | | | | | | | | | | |
|
Income/(loss) from investment operations: | |
Net investment income | | | 0.08 | * | | | 0.15 | * | | | 0.16 | * | | | 0.18 | * | | | 0.21 | * | | | 0.21 | * |
Net realized and unrealized gains/(losses) on investments | | | (1.10 | )* | | | 0.05 | * | | | 1.95 | * | | | 2.16 | * | | | 1.52 | * | | | (0.65 | )* |
| | | | | | | | | | | | | | | | | | | | | | | | |
Total income/(loss) from investment operations | | | (1.02 | ) | | | 0.20 | | | | 2.11 | | | | 2.34 | | | | 1.73 | | | | (0.44 | ) |
| | | | | | | | | | | | | | | | | | | | | | | | |
|
Less distributions from: | |
Net investment income | | | 0.16 | | | | 0.18 | | | | 0.21 | | | | 0.21 | | | | 0.24 | | | | 0.25 | |
Net realized gains | | | 0.66 | | | | 1.46 | | | | 3.11 | | | | 0.68 | | | | 2.45 | | | | 2.17 | |
| | | | | | | | | | | | | | | | | | | | | | | | |
Total distributions | | | 0.82 | | | | 1.64 | | | | 3.32 | | | | 0.89 | | | | 2.69 | | | | 2.42 | |
| | | | | | | | | | | | | | | | | | | | | | | | |
Net asset value, end of period | | $ | 10.46 | | | $ | 12.30 | | | $ | 13.74 | | | $ | 14.95 | | | $ | 13.50 | | | $ | 14.46 | |
| | | | | | | | | | | | | | | | | | | | | | | | |
Total return(a) | | | (9.57 | )% | | | 4.43 | % | | | 16.72 | % | | | 18.29 | % | | | 13.29 | % | | | (3.57 | )% |
|
Ratios/Supplemental Data: | |
Net assets, end of period (in thousands) | | $ | 351,365 | | | $ | 419,296 | | | $ | 522,658 | | | $ | 461,828 | | | $ | 603,060 | | | $ | 615,024 | |
|
Ratios to average net assets: | |
Net expenses | | | 0.37 | %*** | | | 0.38 | % | | | 0.37 | % | | | 0.37 | % | | | 0.37 | % | | | 0.37 | % |
Gross expenses | | | 0.37 | %*** | | | 0.38 | % | | | 0.37 | % | | | 0.37 | % | | | 0.37 | % | | | 0.37 | % |
Net investment income | | | 1.20 | %*** | | | 1.29 | % | | | 1.21 | % | | | 1.29 | % | | | 1.61 | % | | | 1.32 | % |
Portfolio turnover rate | | | 24 | % | | | 35 | % | | | 48 | % | | | 80 | % | | | 43 | % | | | 41 | % |
| |
| | | Service Class | |
| | | 3/31/20† | | | 9/30/19 | | | 9/30/18 | | | 9/30/17 | | | 9/30/16 | | | 9/30/15** | |
| Inception date | | | | | | | | | | | | | | | | | | | 1/3/01 | |
| | | | | | |
Net asset value, beginning of period | | $ | 13.32 | | | $ | 14.70 | | | $ | 15.77 | | | $ | 14.18 | | | $ | 15.06 | | | $ | 17.95 | |
| | | | | | | | | | | | | | | | | | | | | | | | |
|
Income/(loss) from investment operations: | |
Net investment income | | | 0.06 | * | | | 0.14 | * | | | 0.14 | * | | | 0.15 | * | | | 0.19 | * | | | 0.18 | * |
Net realized and unrealized gains/(losses) on investments | | | (1.21 | )* | | | 0.09 | * | | | 2.08 | * | | | 2.29 | * | | | 1.58 | * | | | (0.69 | )* |
| | | | | | | | | | | | | | | | | | | | | | | | |
Total income/(loss) from investment operations | | | (1.15 | ) | | | 0.23 | | | | 2.22 | | | | 2.44 | | | | 1.77 | | | | (0.51 | ) |
| | | | | | | | | | | | | | | | | | | | | | | | |
|
Less distributions from: | |
Net investment income | | | 0.11 | | | | 0.15 | | | | 0.18 | | | | 0.17 | | | | 0.20 | | | | 0.21 | |
Net realized gains | | | 0.66 | | | | 1.46 | | | | 3.11 | | | | 0.68 | | | | 2.45 | | | | 2.17 | |
| | | | | | | | | | | | | | | | | | | | | | | | |
Total distributions | | | 0.77 | | | | 1.61 | | | | 3.29 | | | | 0.85 | | | | 2.65 | | | | 2.38 | |
| | | | | | | | | | | | | | | | | | | | | | | | |
Net asset value, end of period | | $ | 11.40 | | | $ | 13.32 | | | $ | 14.70 | | | $ | 15.77 | | | $ | 14.18 | | | $ | 15.06 | |
| | | | | | | | | | | | | | | | | | | | | | | | |
Total return(a) | | | (9.67 | )% | | | 4.23 | % | | | 16.35 | % | | | 18.07 | % | | | 12.96 | % | | | (3.83 | )% |
|
Ratios/Supplemental Data: | |
Net assets, end of period (in thousands) | | $ | 42 | | | $ | 48 | | | $ | 104 | | | $ | 95 | | | $ | 95 | | | $ | 104 | |
|
Ratios to average net assets: | |
Net expenses | | | 0.62 | %*** | | | 0.63 | % | | | 0.62 | % | | | 0.62 | % | | | 0.62 | % | | | 0.62 | % |
Gross expenses | | | 0.62 | %*** | | | 0.63 | % | | | 0.62 | % | | | 0.62 | % | | | 0.62 | % | | | 0.62 | % |
Net investment income | | | 0.95 | %*** | | | 1.06 | % | | | 0.95 | % | | | 1.04 | % | | | 1.35 | % | | | 1.07 | % |
Portfolio turnover rate | | | 24 | % | | | 35 | % | | | 48 | % | | | 80 | % | | | 43 | % | | | 41 | % |
See Notes to Financial Highlights and Notes to Financial Statements
State Street Institutional Premier Growth Equity Fund
Financial Highlights
Selected data based on a share outstanding throughout the periods indicated
| | | | | | | | | | | | | | | | | | | | | | | | |
| | | Investment Class | |
| | | 3/31/20† | | | 9/30/19 | | | 9/30/18 | | | 9/30/17 | | | 9/30/16 | | | 9/30/15** | |
| Inception date | | | | | | | | | | | | | | | | | | | | | | | 10/29/99 | |
| | | | | | |
Net asset value, beginning of period | | $ | 15.51 | | | $ | 17.49 | | | $ | 15.69 | | | $ | 14.23 | | | $ | 13.61 | | | $ | 14.96 | |
| | | | | | | | | | | | | | | | | | | | | | | | |
|
Income/(loss) from investment operations: | |
Net investment income | | | 0.03 | * | | | 0.09 | * | | | 0.11 | * | | | 0.13 | * | | | 0.13 | * | | | 0.13 | * |
Net realized and unrealized gains/(losses) on investments | | | 0.77 | * | | | (0.03 | )* | | | 2.82 | * | | | 2.60 | * | | | 1.88 | * | | | (0.11 | )* |
| | | | | | | | | | | | | | | | | | | | | | | | |
Total income from investment operations | | | 0.80 | | | | 0.06 | | | | 2.93 | | | | 2.73 | | | | 2.01 | | | | 0.02 | |
| | | | | | | | | | | | | | | | | | | | | | | | |
|
Less distributions from: | |
Net investment income | | | 0.09 | | | | 0.11 | | | | 0.13 | | | | 0.12 | | | | 0.14 | | | | 0.13 | |
Net realized gains | | | 8.64 | | | | 1.93 | | | | 1.00 | | | | 1.15 | | | | 1.25 | | | | 1.24 | |
| | | | | | | | | | | | | | | | | | | | | | | | |
Total distributions | | | 8.73 | | | | 2.04 | | | | 1.13 | | | | 1.27 | | | | 1.39 | | | | 1.37 | |
| | | | | | | | | | | | | | | | | | | | | | | | |
Net asset value, end of period | | $ | 7.58 | | | $ | 15.51 | | | $ | 17.49 | | | $ | 15.69 | | | $ | 14.23 | | | $ | 13.61 | |
| | | | | | | | | | | | | | | | | | | | | | | | |
Total return(a) | | | (1.54 | )% | | | 3.57 | % | | | 19.64 | % | | | 21.18 | % | | | 15.25 | % | | | (0.47 | )% |
|
Ratios/Supplemental Data: | |
Net assets, end of period (in thousands) | | $ | 61,074 | | | $ | 192,144 | | | $ | 365,078 | | | $ | 360,416 | | | $ | 325,700 | | | $ | 334,227 | |
|
Ratios to average net assets: | |
Net expenses | | | 0.40 | %*** | | | 0.39 | % | | | 0.38 | % | | | 0.38 | % | | | 0.38 | % | | | 0.38 | % |
Gross expenses | | | 0.40 | %*** | | | 0.39 | % | | | 0.38 | % | | | 0.38 | % | | | 0.38 | % | | | 0.38 | % |
Net investment income | | | 0.46 | %*** | | | 0.59 | % | | | 0.68 | % | | | 0.88 | % | | | 0.95 | % | | | 0.89 | % |
Portfolio turnover rate | | | 17 | % | | | 27 | % | | | 21 | % | | | 24 | % | | | 21 | % | | | 21 | % |
| |
| | | Service Class | |
| | | 3/31/20† | | | 9/30/19 | | | 9/30/18 | | | 9/30/17 | | | 9/30/16 | | | 9/30/15** | |
| Inception date | | | | | | | | | | | | | | | | | | | 1/3/01 | |
| | | | | | |
Net asset value, beginning of period | | $ | 15.27 | | | $ | 17.24 | | | $ | 15.48 | | | $ | 14.06 | | | $ | 13.46 | | | $ | 14.82 | |
| | | | | | | | | | | | | | | | | | | | | | | | |
|
Income/(loss) from investment operations: | |
Net investment income | | | 0.01 | * | | | 0.05 | * | | | 0.07 | * | | | 0.09 | * | | | 0.09 | * | | | 0.09 | * |
Net realized and unrealized gains/(losses) on investments | | | 0.76 | * | | | (0.02 | )* | | | 2.78 | * | | | 2.57 | * | | | 1.87 | * | | | (0.12 | )* |
| | | | | | | | | | | | | | | | | | | | | | | | |
Total income/(loss) from investment operations | | | 0.77 | | | | 0.03 | | | | 2.85 | | | | 2.66 | | | | 1.96 | | | | (0.03 | ) |
| | | | | | | | | | | | | | | | | | | | | | | | |
|
Less distributions from: | |
Net investment income | | | 0.04 | | | | 0.07 | | | | 0.09 | | | | 0.09 | | | | 0.11 | | | | 0.09 | |
Net realized gains | | | 8.64 | | | | 1.93 | | | | 1.00 | | | | 1.15 | | | | 1.25 | | | | 1.24 | |
| | | | | | | | | | | | | | | | | | | | | | | | |
Total distributions | | | 8.68 | | | | 2.00 | | | | 1.09 | | | | 1.24 | | | | 1.36 | | | | 1.33 | |
| | | | | | | | | | | | | | | | | | | | | | | | |
Net asset value, end of period | | $ | 7.36 | | | $ | 15.27 | | | $ | 17.24 | | | $ | 15.48 | | | $ | 14.06 | | | $ | 13.46 | |
| | | | | | | | | | | | | | | | | | | | | | | | |
Total return(a) | | | (1.75 | )% | | | 3.32 | % | | | 19.37 | % | | | 20.84 | % | | | 14.99 | % | | | (0.77 | )% |
|
Ratios/Supplemental Data: | |
Net assets, end of period (in thousands) | | $ | 6,661 | | | $ | 9,609 | | | $ | 17,298 | | | $ | 16,136 | | | $ | 11,547 | | | $ | 5,820 | |
|
Ratios to average net assets: | |
Net expenses | | | 0.65 | %*** | | | 0.64 | % | | | 0.63 | % | | | 0.63 | % | | | 0.63 | % | | | 0.63 | % |
Gross expenses | | | 0.65 | %*** | | | 0.64 | % | | | 0.63 | % | | | 0.63 | % | | | 0.63 | % | | | 0.63 | % |
Net investment income | | | 0.17 | %*** | | | 0.34 | % | | | 0.43 | % | | | 0.62 | % | | | 0.67 | % | | | 0.61 | % |
Portfolio turnover rate | | | 17 | % | | | 27 | % | | | 21 | % | | | 24 | % | | | 21 | % | | | 21 | % |
See Notes to Financial Highlights and Notes to Financial Statements
State Street InstitutionalSmall-Cap Equity Fund
Financial Highlights
Selected data based on a share outstanding throughout the periods indicated
| | | | | | | | | | | | | | | | | | | | | | | | |
| | | Investment Class | |
| | | 3/31/20 | | | 9/30/19 | | | 9/30/18 | | | 9/30/17 | | | 9/30/16 | | | 9/30/15** | |
| Inception date | | | | | | | | | | | | | | | | | | | | | | | 8/3/98 | |
| | | | | | |
Net asset value, beginning of period | | $ | 17.04 | | | $ | 21.94 | | | $ | 20.79 | | | $ | 17.96 | | | $ | 17.18 | | | $ | 19.32 | |
| | | | | | | | | | | | | | | | | | | | | | | | |
|
Income/(loss) from investment operations: | |
Net investment income | | | 0.04 | * | | | 0.06 | * | | | 0.03 | * | | | 0.05 | * | | | 0.04 | * | | | 0.03 | * |
Net realized and unrealized gains/(losses) on investments | | | (4.03 | )* | | | (2.06 | )* | | | 2.95 | * | | | 3.42 | * | | | 2.79 | * | | | (0.08 | )* |
| | | | | | | | | | | | | | | | | | | | | | | | |
Total income/(loss) from investment operations | | | (3.99 | ) | | | (2.00 | ) | | | 2.98 | | | | 3.47 | | | | 2.83 | | | | (0.05 | ) |
| | | | | | | | | | | | | | | | | | | | | | | | |
|
Less distributions from: | |
Net investment income | | | 0.07 | | | | 0.04 | | | | 0.04 | | | | 0.04 | | | | 0.03 | | | | 0.02 | |
Net realized gains | | | 1.02 | | | | 2.86 | | | | 1.79 | | | | 0.60 | | | | 2.02 | | | | 2.07 | |
| | | | | | | | | | | | | | | | | | | | | | | | |
Total distributions | | | 1.09 | | | | 2.90 | | | | 1.83 | | | | 0.64 | | | | 2.05 | | | | 2.09 | |
| | | | | | | | | | | | | | | | | | | | | | | | |
Net asset value, end of period | | $ | 11.96 | | | $ | 17.04 | | | $ | 21.94 | | | $ | 20.79 | | | $ | 17.96 | | | $ | 17.18 | |
| | | | | | | | | | | | | | | | | | | | | | | | |
Total return(a) | | | (25.42 | )% | | | (6.21 | )% | | | 15.47 | % | | | 19.65 | % | | | 18.24 | % | | | (0.90 | )% |
|
Ratios/Supplemental Data: | |
Net assets, end of period (in thousands) | | $ | 837,365 | | | $ | 1,255,899 | | | $ | 1,528,575 | | | $ | 1,464,018 | | | $ | 1,298,789 | | | $ | 1,171,984 | |
|
Ratios to average net assets: | |
Net expenses | | | 0.88 | %*** | | | 0.88 | % | | | 0.88 | % | | | 0.88 | % | | | 0.89 | % | | | 0.89 | % |
Gross expenses | | | 0.88 | %*** | | | 0.88 | % | | | 0.88 | % | | | 0.88 | % | | | 0.89 | % | | | 0.89 | % |
Net investment income | | | 0.50 | %*** | | | 0.37 | % | | | 0.14 | % | | | 0.27 | % | | | 0.25 | % | | | 0.17 | % |
Portfolio turnover rate | | | 16 | % | | | 29 | % | | | 38 | % | | | 34 | % | | | 33 | % | | | 40 | % |
| |
| | | Service Class | |
| | | 3/31/20 | | | 9/30/19 | | | 9/30/18 | | | 9/30/17 | | | 9/30/16 | | | 9/30/15** | |
| Inception date | | | | | | | | | | | | | | | | | | | 9/30/05 | |
| | | | | | |
Net asset value, beginning of period | | $ | 17.02 | | | $ | 21.93 | | | $ | 20.79 | | | $ | 17.98 | | | $ | 17.21 | | | $ | 19.37 | |
| | | | | | | | | | | | | | | | | | | | | | | | |
|
Income/(loss) from investment operations: | |
Net investment income (loss) | | | 0.02 | * | | | 0.02 | * | | | (0.02 | )* | | | 0.01 | * | | | (0.00 | )*(b) | | | (0.01 | )* |
Net realized and unrealized gains/(losses) on investments | | | (4.03 | )* | | | (2.05 | )* | | | 2.95 | * | | | 3.41 | * | | | 2.80 | * | | | (0.08 | )* |
| | | | | | | | | | | | | | | | | | | | | | | | |
Total income/(loss) from investment operations | | | (4.01 | ) | | | (2.03 | ) | | | 2.93 | | | | 3.42 | | | | 2.80 | | | | (0.09 | ) |
| | | | | | | | | | | | | | | | | | | | | | | | |
|
Less distributions from: | |
Net investment income | | | 0.02 | | | | 0.02 | | | | — | | | | 0.01 | | | | 0.01 | | | | — | |
Net realized gains | | | 1.02 | | | | 2.86 | | | | 1.79 | | | | 0.60 | | | | 2.02 | | | | 2.07 | |
| | | | | | | | | | | | | | | | | | | | | | | | |
Total distributions | | | 1.04 | | | | 2.88 | | | | 1.79 | | | | 0.61 | | | | 2.03 | | | | 2.07 | |
| | | | | | | | | | | | | | | | | | | | | | | | |
Net asset value, end of period | | $ | 11.97 | | | $ | 17.02 | | | $ | 21.93 | | | $ | 20.79 | | | $ | 17.98 | | | $ | 17.21 | |
| | | | | | | | | | | | | | | | | | | | | | | | |
Total return(a) | | | (25.47 | )% | | | (6.44 | )% | | | 15.14 | % | | | 19.38 | % | | | 17.96 | % | | | (1.12 | )% |
|
Ratios/Supplemental Data: | |
Net assets, end of period (in thousands) | | $ | 1,284 | | | $ | 1,937 | | | $ | 2,671 | | | $ | 2,373 | | | $ | 2,579 | | | $ | 1,741 | |
|
Ratios to average net assets: | |
Net expenses | | | 1.13 | %*** | | | 1.13 | % | | | 1.13 | % | | | 1.13 | % | | | 1.14 | % | | | 1.14 | % |
Gross expenses | | | 1.13 | %*** | | | 1.13 | % | | | 1.13 | % | | | 1.13 | % | | | 1.14 | % | | | 1.14 | % |
Net investment income (loss) | | | 0.26 | %*** | | | 0.12 | % | | | (0.11 | )% | | | 0.03 | % | | | (0.00 | )%(c) | | | (0.07 | )% |
Portfolio turnover rate | | | 16 | % | | | 29 | % | | | 38 | % | | | 34 | % | | | 33 | % | | | 40 | % |
See Notes to Financial Highlights and Notes to Financial Statements
State Street Institutional International Equity Fund
Financial Highlights
Selected data based on a share outstanding throughout the periods indicated
| | | | | | | | | | | | | | | | | | | | | | | | |
| | | Investment Class | |
| | | 3/31/20 | | | 9/30/19 | | | 9/30/18 | | | 9/30/17 | | | 9/30/16 | | | 9/30/15** | |
| Inception date | | | | | | | | | | | | | | | | | | | | | | | 11/25/97 | |
| | | | | | |
Net asset value, beginning of period | | $ | 13.42 | | | $ | 13.37 | | | $ | 13.42 | | | $ | 11.83 | | | $ | 11.41 | | | $ | 12.72 | |
| | | | | | | | | | | | | | | | | | | | | | | | |
|
Income/(loss) from investment operations: | |
Net investment income | | | 0.13 | * | | | 0.15 | * | | | 0.23 | * | | | 0.17 | * | | | 0.20 | * | | | 0.18 | * |
Net realized and unrealized gains/(losses) on investments | | | (1.99 | )* | | | 0.22 | * | | | (0.09 | )* | | | 1.63 | * | | | 0.40 | * | | | (1.15 | )* |
| | | | | | | | | | | | | | | | | | | | | | | | |
Total income/(loss) from investment operations | | | (1.86 | ) | | | 0.37 | | | | 0.14 | | | | 1.80 | | | | 0.60 | | | | (0.97 | ) |
| | | | | | | | | | | | | | | | | | | | | | | | |
|
Less distributions from: | |
Net investment income | | | 0.27 | | | | 0.32 | | | | 0.19 | | | | 0.21 | | | | 0.18 | | | | 0.34 | |
| | | | | | | | | | | | | | | | | | | | | | | | |
Total distributions | | | 0.27 | | | | 0.32 | | | | 0.19 | | | | 0.21 | | | | 0.18 | | | | 0.34 | |
| | | | | | | | | | | | | | | | | | | | | | | | |
Net asset value, end of period | | $ | 11.29 | | | $ | 13.42 | | | $ | 13.37 | | | $ | 13.42 | | | $ | 11.83 | | | $ | 11.41 | |
| | | | | | | | | | | | | | | | | | | | | | | | |
Total return(a) | | | (14.27 | )% | | | 3.18 | % | | | 1.01 | % | | | 15.58 | % | | | 5.32 | % | | | (7.80 | )% |
|
Ratios/Supplemental Data: | |
Net assets, end of period (in thousands) | | $ | 61,458 | | | $ | 73,060 | | | $ | 1,095,253 | | | $ | 1,213,757 | | | $ | 1,238,011 | | | $ | 1,284,412 | |
|
Ratios to average net assets: | |
Net expenses | | | 0.55 | %*** | | | 0.56 | % | | | 0.57 | % | | | 0.57 | % | | | 0.57 | % | | | 0.56 | % |
Gross expenses | | | 0.68 | %*** | | | 0.63 | % | | | 0.57 | % | | | 0.57 | % | | | 0.57 | % | | | 0.56 | % |
Net investment income | | | 2.15 | %*** | | | 1.15 | % | | | 1.68 | % | | | 1.40 | % | | | 1.73 | % | | | 1.38 | % |
Portfolio turnover rate | | | 15 | % | | | 20 | % | | | 24 | % | | | 30 | % | | | 33 | % | | | 26 | % |
| |
| | | Service Class | |
| | | 3/31/20 | | | 9/30/19 | | | 9/30/18 | | | 9/30/17 | | | 9/30/16 | | | 9/30/15** | |
| Inception date | | | | | | | | | | | | | | | | | | | 1/3/01 | |
| | | | | | |
Net asset value, beginning of period | | $ | 13.37 | | | $ | 13.28 | | | $ | 13.34 | | | $ | 11.76 | | | $ | 11.33 | | | $ | 12.62 | |
| | | | | | | | | | | | | | | | | | | | | | | | |
|
Income/(loss) from investment operations: | |
Net investment income | | | 0.13 | * | | | 0.22 | * | | | 0.20 | * | | | 0.14 | * | | | 0.17 | * | | | 0.08 | * |
Net realized and unrealized gains/(losses) on investments | | | (2.00 | )* | | | 0.13 | * | | | (0.10 | )* | | | 1.63 | * | | | 0.40 | * | | | (1.06 | )* |
| | | | | | | | | | | | | | | | | | | | | | | | |
Total income/(loss) from investment operations | | | (1.87 | ) | | | 0.35 | | | | 0.10 | | | | 1.77 | | | | 0.57 | | | | (0.98 | ) |
| | | | | | | | | | | | | | | | | | | | | | | | |
|
Less distributions from: | |
Net investment income | | | 0.24 | | | | 0.26 | | | | 0.16 | | | | 0.19 | | | | 0.14 | | | | 0.31 | |
| | | | | | | | | | | | | | | | | | | | | | | | |
Total distributions | | | 0.24 | | | | 0.26 | | | | 0.16 | | | | 0.19 | | | | 0.14 | | | | 0.31 | |
| | | | | | | | | | | | | | | | | | | | | | | | |
Net asset value, end of period | | $ | 11.26 | | | $ | 13.37 | | | $ | 13.28 | | | $ | 13.34 | | | $ | 11.76 | | | $ | 11.33 | |
| | | | | | | | | | | | | | | | | | | | | | | | |
Total return(a) | | | (14.38 | )% | | | 3.03 | % | | | 0.75 | % | | | 15.33 | % | | | 5.01 | % | | | (7.95 | )% |
|
Ratios/Supplemental Data: | |
Net assets, end of period (in thousands) | | $ | 10,803 | | | $ | 13,228 | | | $ | 17,820 | | | $ | 18,687 | | | $ | 17,796 | | | $ | 19,562 | |
|
Ratios to average net assets: | |
Net expenses | | | 0.80 | %*** | | | 0.81 | % | | | 0.82 | % | | | 0.82 | % | | | 0.82 | % | | | 0.81 | % |
Gross expenses | | | 0.93 | %*** | | | 0.94 | % | | | 0.82 | % | | | 0.82 | % | | | 0.82 | % | | | 0.81 | % |
Net investment income | | | 1.85 | %*** | | | 1.80 | % | | | 1.44 | % | | | 1.14 | % | | | 1.45 | % | | | 0.63 | % |
Portfolio turnover rate | | | 15 | % | | | 20 | % | | | 24 | % | | | 30 | % | | | 33 | % | | | 26 | % |
See Notes to Financial Highlights and Notes to Financial Statements
State Street Active Core Bond Fund
Financial Highlights
Selected data based on a share outstanding throughout the periods indicated
| | | | | | | | | | | | | | | | | | | | | | | | |
| | | Investment Class | |
| | | 3/31/20 | | | 9/30/19 | | | 9/30/18 | | | 9/30/17 | | | 9/30/16 | | | 9/30/15** | |
| Inception date | | | | | | | | | | | | | | | | | | | | | | | 11/21/97 | |
| | | | | | |
Net asset value, beginning of period | | $ | 9.66 | | | $ | 9.07 | | | $ | 9.52 | | | $ | 9.67 | | | $ | 9.45 | | | $ | 9.51 | |
| | | | | | | | | | | | | | | | | | | | | | | | |
|
Income/(loss) from investment operations: | |
Net investment income | | | 0.11 | * | | | 0.27 | * | | | 0.26 | * | | | 0.24 | * | | | 0.26 | * | | | 0.25 | * |
Net realized and unrealized gains/(losses) on investments | | | 0.01 | * | | | 0.60 | * | | | (0.38 | )* | | | (0.15 | )* | | | 0.31 | * | | | (0.05 | )* |
| | | | | | | | | | | | | | | | | | | | | | | | |
Total income/(loss) from investment operations | | | 0.12 | | | | 0.87 | | | | (0.12 | ) | | | 0.09 | | | | 0.57 | | | | 0.20 | |
| | | | | | | | | | | | | | | | | | | | | | | | |
|
Less distributions from: | |
Net investment income | | | 0.15 | | | | 0.28 | | | | 0.27 | | | | 0.23 | | | | 0.26 | | | | 0.26 | |
Net realized gains | | | 0.14 | | | | — | | | | 0.06 | | | | 0.01 | | | | 0.09 | | | | — | |
| | | | | | | | | | | | | | | | | | | | | | | | |
Total distributions | | | 0.29 | | | | 0.28 | | | | 0.33 | | | | 0.24 | | | | 0.35 | | | | 0.26 | |
| | | | | | | | | | | | | | | | | | | | | | | | |
Net asset value, end of period | | $ | 9.49 | | | $ | 9.66 | | | $ | 9.07 | | | $ | 9.52 | | | $ | 9.67 | | | $ | 9.45 | |
| | | | | | | | | | | | | | | | | | | | | | | | |
Total return(a) | | | 1.38 | % | | | 9.76 | % | | | (1.35 | )% | | | 0.98 | % | | | 6.18 | % | | | 2.05 | % |
|
Ratios/Supplemental Data: | |
Net assets, end of period (in thousands) | | $ | 117,779 | | | $ | 115,089 | | | $ | 221,201 | | | $ | 220,157 | | | $ | 298,908 | | | $ | 291,252 | |
|
Ratios to average net assets: | |
Net expenses | | | 0.28 | %*** | | | 0.26 | % | | | 0.25 | % | | | 0.24 | % | | | 0.24 | % | | | 0.23 | % |
Gross expenses | | | 0.29 | %*** | | | 0.26 | % | | | 0.25 | % | | | 0.24 | % | | | 0.24 | % | | | 0.23 | % |
Net investment income | | | 2.30 | %*** | | | 2.92 | % | | | 2.83 | % | | | 2.56 | % | | | 2.79 | % | | | 2.65 | % |
Portfolio turnover rate | | | 55 | %(d) | | | 438 | % | | | 181 | % | | | 326 | % | | | 219 | % | | | 297 | % |
| |
| | | Service Class | |
| | | 3/31/20 | | | 9/30/19 | | | 9/30/18 | | | 9/30/17 | | | 9/30/16 | | | 9/30/15** | |
| Inception date | | | | | | | | | | | | | | | | | | | 9/30/05 | |
| | | | | | |
Net asset value, beginning of period | | $ | 9.89 | | | $ | 9.28 | | | $ | 9.73 | | | $ | 9.89 | | | $ | 9.66 | | | $ | 9.72 | |
| | | | | | | | | | | | | | | | | | | | | | | | |
|
Income/(loss) from investment operations: | |
Net investment income | | | 0.10 | * | | | 0.25 | * | | | 0.24 | * | | | 0.22 | * | | | 0.25 | * | | | 0.23 | * |
Net realized and unrealized gains/(losses) on investments | | | 0.01 | * | | | 0.62 | * | | | (0.38 | )* | | | (0.16 | )* | | | 0.31 | * | | | (0.05 | )* |
| | | | | | | | | | | | | | | | | | | | | | | | |
Total income/(loss) from investment operations | | | 0.11 | | | | 0.87 | | | | (0.14 | ) | | | 0.06 | | | | 0.56 | | | | 0.18 | |
| | | | | | | | | | | | | | | | | | | | | | | | |
|
Less distributions from: | |
Net investment income | | | 0.12 | | | | 0.26 | | | | 0.25 | | | | 0.21 | | | | 0.24 | | | | 0.24 | |
Net realized gains | | | 0.14 | | | | — | | | | 0.06 | | | | 0.01 | | | | 0.09 | | | | — | |
| | | | | | | | | | | | | | | | | | | | | | | | |
Total distributions | | | 0.26 | | | | 0.26 | | | | 0.31 | | | | 0.22 | | | | 0.33 | | | | 0.24 | |
| | | | | | | | | | | | | | | | | | | | | | | | |
Net asset value, end of period | | $ | 9.74 | | | $ | 9.89 | | | $ | 9.28 | | | $ | 9.73 | | | $ | 9.89 | | | $ | 9.66 | |
| | | | | | | | | | | | | | | | | | | | | | | | |
Total return(a) | | | 1.23 | % | | | 9.56 | % | | | (1.51 | )% | | | 0.65 | % | | | 5.95 | % | | | 1.81 | % |
|
Ratios/Supplemental Data: | |
Net assets, end of period (in thousands) | | $ | 90 | | | $ | 86 | | | $ | 80 | | | $ | 90 | | | $ | 181 | | | $ | 248 | |
|
Ratios to average net assets: | |
Net expenses | | | 0.53 | %*** | | | 0.51 | % | | | 0.50 | % | | | 0.49 | % | | | 0.49 | % | | | 0.48 | % |
Gross expenses | | | 0.54 | %*** | | | 0.51 | % | | | 0.50 | % | | | 0.49 | % | | | 0.49 | % | | | 0.48 | % |
Net investment income | | | 2.05 | %*** | | | 2.65 | % | | | 2.57 | % | | | 2.28 | % | | | 2.58 | % | | | 2.40 | % |
Portfolio turnover rate | | | 55 | %(d) | | | 438 | % | | | 181 | % | | | 326 | % | | | 219 | % | | | 297 | % |
See Notes to Financial Highlights and Notes to Financial Statements
State Street Institutional Funds
Notes to Financial Highlights
| (a) | | Total returns are historical and assume changes in share price and reinvestment of dividends and capital gains distributions. |
| (d) | | The portfolio turnover calculated for the period ended 3/31/20 did not include To-Be-Announced transactions and, if it had, the portfolio turnover would have been 261%. |
| * | | Per share values have been calculated using the average share method. |
| ** | | Beginning with the year ended September 30, 2016, the Funds were audited by Ernst & Young LLP. The previous years were audited by another independent registered public accounting firm. |
| *** | | Annualized for periods less than one year. |
The accompanying Notes are an integral part of these financial statements.
State Street Institutional Funds
Statements of Assets and Liabilities — March 31, 2020 (Unaudited)
| | | | | | | | | | | | |
| | | State Street
Institutional
U.S. Equity
Fund | | | State Street
Institutional
Premier
Growth
Equity Fund | | | State Street
Institutional
Small-Cap
Equity Fund | |
| | | | | | | | | | | | |
Assets | | | | | | | | | | | | |
Investments in securities, at fair value (cost $305,961,332; $45,719,385; $883,641,942; $69,589,668; and $103,849,699, respectively) | | $ | 341,463,129 | | | $ | 63,900,890 | | | $ | 793,584,948 | |
Investments in affiliated securities, at fair value (cost $0; $834,139; $0; $0; and $0, respectively) | | | — | | | | 729,225 | | | | — | |
Short-term affiliated investments, at fair value | | | 9,425,638 | | | | 2,303,428 | | | | 40,129,515 | |
Cash | | | 22,933 | | | | — | | | | — | |
Net Cash collateral on deposit with broker for future contracts | | | 556,568 | | | | 62,421 | | | | 5,457,160 | |
Net Cash collateral on deposit with broker for swap contracts | | | — | | | | — | | | | — | |
Foreign currency (cost $0; $0; $0; $707,239; and $0, respectively) | | | — | | | | — | | | | — | |
Receivable for investments sold | | | 1,114,959 | | | | 769,155 | | | | 2,228,781 | |
Income receivables | | | 350,891 | | | | 11,196 | | | | 863,581 | |
Receivable for fund shares sold | | | 30,956 | | | | 4,431 | | | | 87,439 | |
Income receivable from affiliated investments | | | 7,830 | | | | 1,565 | | | | 39,202 | |
Receivable for accumulated variation margin on futures contracts | | | — | | | | 45,695 | | | | 1,234,540 | |
| | | | | | | | | | | | |
| | | |
Total assets | | | 352,972,904 | | | | 67,828,006 | | | | 843,625,166 | |
| | | | | | | | | | | | |
| | | |
Liabilities | | | | | | | | | | | | |
Due to custodian | | | — | | | | — | | | | 2,029,823 | |
Net cash collateral on futures contracts due to broker | | | — | | | | — | | | | — | |
Payable for investments purchased | | | 1,356,888 | | | | — | | | | 2,124,691 | |
Payable for fund shares redeemed | | | — | | | | 61,379 | | | | 138,329 | |
Payable for accumulated variation margin on swap contracts | | | — | | | | — | | | | — | |
Payable for accumulated variation margin on futures contracts | | | 94,863 | | | | — | | | | — | |
Payable to the Adviser | | | 113,385 | | | | 29,222 | | | | 682,289 | |
Accrued other expenses | | | 345 | | | | 597 | | | | 1,345 | |
Distribution and service fees | | | 9 | | | | 1,447 | | | | 295 | |
Accrued foreign capital gains tax | | | — | | | | — | | | | — | |
| | | | | | | | | | | | |
| | | |
Total liabilities | | | 1,565,490 | | | | 92,645 | | | | 4,976,772 | |
| | | | | | | | | | | | |
| | | | | | | | | | | | |
| | | |
Net Assets | | $ | 351,407,414 | | | $ | 67,735,361 | | | $ | 838,648,394 | |
| | | | | | | | | | | | |
| | | |
Net Assets Consist of: | | | | | | | | | | | | |
Capital paid in | | $ | 307,306,349 | | | $ | 48,045,297 | | | $ | 940,845,189 | |
Total distributable earnings (loss) | | | 44,101,065 | | | | 19,690,064 | | | | (102,196,795 | ) |
| | | | | | | | | | | | |
| | | |
Net Assets | | $ | 351,407,414 | | | $ | 67,735,361 | | | $ | 838,648,394 | |
| | | | | | | | | | | | |
| | | | | | | | | | | | |
Investment Class: | | | | | | | | | | | | |
Net Assets | | $ | 351,365,001 | | | $ | 61,074,343 | | | $ | 837,364,808 | |
Shares outstanding ($0.001 par value, unlimited shares authorized) | | | 33,591,209 | | | | 8,056,387 | | | | 69,991,234 | |
Net asset value, offering and redemption price per share | | $ | 10.46 | | | $ | 7.58 | | | $ | 11.96 | |
| | | | | | | | | | | | |
Service Class: | | | | | | | | | | | | |
Net Assets | | $ | 42,413 | | | $ | 6,661,018 | | | $ | 1,283,586 | |
Shares outstanding ($0.001 par value, unlimited shares authorized) | | | 3,721 | | | | 904,726 | | | | 107,272 | |
Net asset value, offering and redemption price per share | | $ | 11.40 | | | $ | 7.36 | | | $ | 11.97 | |
The accompanying Notes are an integral part of these financial statements.
| | |
| 54 | | Statements of Assets and Liabilities |
| | | | | | |
State Street
Institutional
International
Equity Fund | | | State Street Active Core Bond Fund | |
| | | | | | |
| | | | | | |
$ | 68,522,813 | | | $ | 107,253,864 | |
| — | | | | — | |
| | 1,509,460 | | | | 30,650,715 | |
| | — | | | | — | |
| | 27,311 | | | | — | |
| | — | | | | 666,435 | |
| | 708,661 | | | | — | |
| | 1,171,943 | | | | 29,239,084 | |
| | 1,457,516 | | | | 552,469 | |
| | 8,122 | | | | 10,954 | |
| | 1,471 | | | | 17,009 | |
| | 118,890 | | | | 191,193 | |
| | | | | | |
| |
| | 73,526,187 | | | | 168,581,723 | |
| | | | | | |
| |
| | | | | | |
| | — | | | | 31,916 | |
| | — | | | | 572,994 | |
| | 1,224,772 | | | | 49,207,436 | |
| | 67 | | | | 358 | |
| | — | | | | 876,283 | |
| | — | | | | — | |
| | 32,877 | | | | 23,617 | |
| | — | | | | 601 | |
| | 2,346 | | | | 19 | |
| | 5,188 | | | | — | |
| | | | | | |
| |
| | 1,265,250 | | | | 50,713,224 | |
| | | | | | |
| | | | | | |
| |
| $ | 72,260,937 | | | $ | 117,868,499 | |
| | | | | | |
| |
| | | | | | |
| $ | 76,107,066 | | | $ | 115,698,737 | |
| | (3,846,129 | ) | | | 2,169,762 | |
| | | | | | |
| |
| $ | 72,260,937 | | | $ | 117,868,499 | |
| | | | | | |
| | | | | | |
| | | | | | |
| $ | 61,458,310 | | | $ | 117,778,840 | |
| | 5,443,888 | | | | 12,407,096 | |
| $ | 11.29 | | | $ | 9.49 | |
| | | | | | |
| | | | | | |
| $ | 10,802,627 | | | $ | 89,659 | |
| | 959,195 | | | | 9,204 | |
| $ | 11.26 | | | $ | 9.74 | |
The accompanying Notes are an integral part of these financial statements.
| | | | |
| Statements of Assets and Liabilities | | | 55 | |
State Street Institutional Funds
Statements of Operations — For the period ended March 31, 2020 (Unaudited)
| | | | | | | | | | | | |
| | | State Street
Institutional
U.S. Equity
Fund | | | State Street
Institutional
Premier
Growth
Equity Fund | | | State Street
Institutional
Small-Cap
Equity Fund | |
| | | | | | | | | | | | |
Investment Income | |
Income | |
Dividend | | $ | 3,228,146 | | | $ | 782,137 | | | $ | 7,818,275 | |
Interest | | | — | | | | — | | | | — | |
Income from affiliated investments | | | 86,818 | | | | 54,634 | | | | 551,675 | |
Less: Foreign taxes withheld | | | (1,022 | ) | | | (1,640 | ) | | | (23,275 | ) |
| | | | | | | | | | | | |
Total income | | | 3,313,942 | | | | 835,131 | | | | 8,346,675 | |
| | | | | | | | | | | | |
|
Expenses | |
Advisory and administration fees | | | 773,070 | | | | 377,244 | | | | 5,312,878 | |
Distribution and service fees | | | | | | | | | | | | |
Service Class | | | 63 | | | | 10,722 | | | | 2,299 | |
Trustees’ fees | | | 10,218 | | | | 9,544 | | | | 15,003 | |
| | | | | | | | | | | | |
Total expenses before waivers | | | 783,351 | | | | 397,510 | | | | 5,330,180 | |
| | | | | | | | | | | | |
Less: Expenses waived or borne by the adviser | | | — | | | | — | | | | — | |
| | | | | | | | | | | | |
Total expenses | | | 783,351 | | | | 397,510 | | | | 5,330,180 | |
| | | | | | | | | | | | |
Net investment income | | $ | 2,530,591 | | | $ | 437,621 | | | $ | 3,016,495 | |
| | | | | | | | | | | | |
|
Net Realized and Unrealized Gain (Loss) on Investments | |
Realized gain (loss) on: | |
Unaffiliated investments | | $ | 14,587,793 | | | $ | 62,441,692 | | | $ | 17,309,297 | |
Affiliated investments | | | — | | | | (62,299 | ) | | | — | |
Futures | | | (1,138,299 | ) | | | (34,969 | ) | | | (5,881,149 | ) |
Written options | | | — | | | | — | | | | — | |
Swap contracts | | | — | | | | — | | | | — | |
Foreign currency transactions | | | (3 | ) | | | — | | | | — | |
Increase (decrease) in unrealized appreciation/depreciation on: | |
Unaffiliated investments | | | (51,658,341 | ) | | | (52,109,831 | ) | | | (306,649,065 | ) |
Affiliated investments | | | — | | | | (123,410 | ) | | | — | |
Futures | | | (41,102 | ) | | | 14,292 | | | | 1,817,023 | |
Swap contracts | | | — | | | | — | | | | — | |
Foreign currency translations | | | — | | | | — | | | | — | |
| | | | | | | | | | | | |
| | | |
Net realized and unrealized gain (loss) on investments | | | (38,249,952 | ) | | | 10,125,475 | | | | (293,403,894 | ) |
| | | | | | | | | | | | |
| | | |
Net Increase (Decrease) in Net Assets Resulting from Operations | | $ | (35,719,361 | ) | | $ | 10,563,096 | | | $ | (290,387,399 | ) |
| | | | | | | | | | | | |
| (a) | | Includes foreign capital gain taxes of $(8,119). |
| (b) | | Includes foreign deferred taxes of $(5,188). |
The accompanying Notes are an integral part of these financial statements.
| | |
| 56 | | Statements of Operations |
| | | | | | |
State Street Institutional International Equity Fund | | | State Street
Active Core
Bond Fund | |
| | | | | | |
| | | | | | |
| | | | | | |
| $ | 750,247 | | | $ | 683 | |
| | — | | | | 1,328,917 | |
| | 13,337 | | | | 170,727 | |
| | 401,726 | | | | (37 | ) |
| | | | | | |
| | 1,165,310 | | | | 1,500,290 | |
| | | | | | |
| |
| | | | | | |
| | 287,509 | | | | 160,557 | |
| | | | | | |
| | 16,582 | | | | 118 | |
| | 8,458 | | | | 9,078 | |
| | | | | | |
| | 312,549 | | | | 169,753 | |
| | | | | | |
| | (58,116 | ) | | | (7,845 | ) |
| | | | | | |
| | 254,433 | | | | 161,908 | |
| | | | | | |
| $ | 910,877 | | | $ | 1,338,382 | |
| | | | | | |
| |
| | | | | | |
| | | | | | |
| $ | 280,384 | (a) | | $ | 1,447,772 | |
| | — | | | | — | |
| | (308,693 | ) | | | (417,303 | ) |
| | — | | | | 56,610 | |
| | — | | | | (660,410 | ) |
| | (2,842 | ) | | | — | |
| | | | | | |
| | (13,044,806 | )(b) | | | (405,338 | ) |
| | — | | | | — | |
| | 117,876 | | | | 200,856 | |
| | — | | | | (157,809 | ) |
| | 22,195 | | | | — | |
| | | | | | |
| |
| | (12,935,886 | ) | | | 64,378 | |
| | | | | | |
| |
$ | (12,025,009 | ) | | $ | 1,402,760 | |
| | | | | | |
The accompanying Notes are an integral part of these financial statements.
| | | | |
| Statements of Operations | | | 57 | |
State Street Institutional Funds
Statements of Changes in Net Assets
| | | | | | | | | | | | | | | | |
| | | State Street Institutional
U.S. Equity Fund | | | State Street Institutional
Premier Growth Equity Fund | |
| | | Six Months
Ended March 31,
2020* | | | Year Ended September 30,
2019 | | | Six Months
Ended March 31,
2020* | | | Year Ended September 30, 2019 | |
| | | | | | | | | | | | | | | | |
Increase (Decrease) in Net Assets | |
|
Operations: | |
Net investment income | | $ | 2,530,591 | | | $ | 5,325,947 | | | $ | 437,621 | | | $ | 1,658,486 | |
Net realized gain (loss) on investments, futures, swap contracts and foreign currency transactions | | | 13,449,491 | | | | 35,203,076 | | | | 62,344,424 | | | | 69,342,586 | |
Net increase (decrease) in unrealized appreciation/ depreciation on investments, futures, swap contracts and foreign currency translations | | | (51,699,443 | ) | | | (28,183,576 | ) | | | (52,218,949 | ) | | | (66,366,188 | ) |
| | | | | | | | | | | | | | | | |
Net increase (decrease) from operations | | | (35,719,361 | ) | | | 12,345,447 | | | | 10,563,096 | | | | 4,634,884 | |
| | | | | | | | | | | | | | | | |
|
Distributions to shareholders: | |
Total distributions | | | | | | | | | | | | | | | | |
Investment Class | | | (26,072,740 | ) | | | (51,146,504 | ) | | | (122,991,014 | ) | | | (42,353,247 | ) |
Service Class | | | (2,748 | ) | | | (11,658 | ) | | | (4,866,436 | ) | | | (1,739,540 | ) |
| | | | | | | | | | | | | | | | |
Total distributions | | | (26,075,488 | ) | | | (51,158,162 | ) | | | (127,857,450 | ) | | | (44,092,787 | ) |
| | | | | | | | | | | | | | | | |
Increase (decrease) in assets from operations and distributions | | | (61,794,849 | ) | | | (38,812,715 | ) | | | (117,294,354 | ) | | | (39,457,903 | ) |
| | | | | | | | | | | | | | | | |
|
Share transactions: | |
Proceeds from sale of shares | | | | | | | | | | | | | | | | |
Investment Class | | | 12,082,882 | | | | 19,779,530 | | | | 14,347,559 | | | | 25,674,167 | |
Service Class | | | 5,000 | | | | 10,736 | | | | 917,001 | | | | 1,436,396 | |
Value of distributions reinvested | | | | | | | | | | | | | | | | |
Investment Class | | | 25,797,811 | | | | 50,829,580 | | | | 122,990,094 | | | | 42,353,031 | |
Service Class | | | 2,748 | | | | 11,658 | | | | 4,866,436 | | | | 1,739,540 | |
Cost of shares redeemed | | | | | | | | | | | | | | | | |
Investment Class | | | (44,024,188 | ) | | | (135,167,778 | ) | | | (155,820,637 | ) | | | (203,786,330 | ) |
Service Class | | | (5,995 | ) | | | (69,590 | ) | | | (4,023,015 | ) | | | (8,582,328 | ) |
| | | | | | | | | | | | | | | | |
Net increase (decrease) from share transactions | | | (6,141,742 | ) | | | (64,605,864 | ) | | | (16,722,562 | ) | | | (141,165,524 | ) |
| | | | | | | | | | | | | | | | |
| | | | |
Total increase (decrease) in net assets | | | (67,936,591 | ) | | | (103,418,579 | ) | | | (134,016,916 | ) | | | (180,623,427 | ) |
|
Net Assets | |
Beginning of period | | | 419,344,005 | | | | 522,762,584 | | | | 201,752,277 | | | | 382,375,704 | |
| | | | | | | | | | | | | | | | |
| | | | |
End of period | | $ | 351,407,414 | | | $ | 419,344,005 | | | $ | 67,735,361 | | | $ | 201,752,277 | |
| | | | | | | | | | | | | | | | |
|
Changes in Fund Shares | |
Investment Class | |
Shares sold | | | 949,789 | | | | 1,634,786 | | | | 1,163,167 | | | | 1,816,182 | |
Issued for distributions reinvested | | | 2,034,528 | | | | 5,160,363 | | | | 12,292,292 | | | | 3,480,118 | |
Shares redeemed | | | (3,468,568 | ) | | | (10,745,205 | ) | | | (17,783,748 | ) | | | (13,784,432 | ) |
| | | | | | | | | | | | | | | | |
Net increase (decrease) in fund shares | | | (484,251 | ) | | | (3,950,056 | ) | | | (4,328,289 | ) | | | (8,488,132 | ) |
| | | | | | | | | | | | | | | | |
|
Service Class | |
Shares sold | | | 350 | | | | 814 | | | | 80,354 | | | | 97,423 | |
Issued for distributions reinvested | | | 199 | | | | 1,092 | | | | 494,189 | | | | 144,962 | |
Shares redeemed | | | (409 | ) | | | (5,413 | ) | | | (299,076 | ) | | | (616,726 | ) |
| | | | | | | | | | | | | | | | |
Net increase (decrease) in fund shares | | | 140 | | | | (3,507 | ) | | | 275,467 | | | | (374,341 | ) |
| | | | | | | | | | | | | | | | |
The accompanying Notes are an integral part of these financial statements.
| | |
| 58 | | Statements of Changes in Net Assets |
| | | | | | | | | | | | | | | | | | | | | | |
State Street Institutional
Small-Cap Equity Fund | | | State Street Institutional
International Equity Fund | | | State Street Institutional
Active Core Bond Fund | |
Six Months
Ended March 31,
2020* | | | Year Ended September 30,
2019 | | | Six Months
Ended March 31,
2020* | | | Year Ended September 30,
2019 | | | Six Months
Ended March 31,
2020* | | | Year Ended September 30,
2019 | |
| | | | | | | | | | | | | | | | | | | | | | |
| | | | | | | | | | | | | | | | | | | | | | |
| | | | | |
| | | | | | | | | | | | | | | | | | | | | | |
| $ | 3,016,495 | | | $ | 4,820,698 | | | $ | 910,877 | | | $ | 2,020,628 | | | $ | 1,338,382 | | | $ | 5,541,524 | |
| 11,428,148 | | | | 63,095,678 | | | | (31,151 | ) | | | 60,234,710 | | | | 426,669 | | | | 6,811,921 | |
| (304,832,042 | ) | | | (168,810,934 | ) | | | (12,904,735 | ) | | | (147,445,599 | ) | | | (362,291 | ) | | | 6,137,047 | |
| | | | | | | | | | | | | | | | | | | | | | |
| | (290,387,399 | ) | | | (100,894,558 | ) | | | (12,025,009 | ) | | | (85,190,261 | ) | | | 1,402,760 | | | | 18,490,492 | |
| | | | | | | | | | | | | | | | | | | | | | |
| | | | | |
| | | | | | | | | | | | | | | | | | | | | | |
| | | | | | | | | | | | | | | | | | | | | | |
| | (77,013,163 | ) | | | (193,897,894 | ) | | | (1,417,916 | ) | | | (19,402,183 | ) | | | (3,497,117 | ) | | | (5,762,735 | ) |
| | (109,788 | ) | | | (335,145 | ) | | | (230,486 | ) | | | (344,397 | ) | | | (2,536 | ) | | | (2,279 | ) |
| | | | | | | | | | | | | | | | | | | | | | |
| | (77,122,951 | ) | | | (194,233,039 | ) | | | (1,648,402 | ) | | | (19,746,580 | ) | | | (3,499,653 | ) | | | (5,765,014 | ) |
| | | | | | | | | | | | | | | | | | | | | | |
| | (367,510,350 | ) | | | (295,127,597 | ) | | | (13,673,411 | ) | | | (104,936,841 | ) | | | (2,096,893 | ) | | | 12,725,478 | |
| | | | | | | | | | | | | | | | | | | | | | |
| | | | | |
| | | | | | | | | | | | | | | | | | | | | | |
| | | | | | | | | | | | | | | | | | | | | | |
| | 38,587,827 | | | | 33,843,372 | | | | 2,524,728 | | | | 2,385,163 | | | | 11,722,727 | | | | 62,779,155 | |
| | 176,831 | | | | 272,639 | | | | 151,156 | | | | 155,994 | | | | 18,761 | | | | — | |
| | | | | | | | | | | | | | | | | | | | | | |
| | 77,013,163 | | | | 193,897,894 | | | | 1,417,425 | | | | 19,401,437 | | | | 3,487,215 | | | | 5,460,386 | |
| | 109,787 | | | | 335,145 | | | | 230,375 | | | | 343,612 | | | | 2,536 | | | | 2,279 | |
| | | | | | | | | | | | | | | | | | | | | | |
| | (167,181,862 | ) | | | (205,807,797 | ) | | | (3,907,767 | ) | | | (939,204,381 | ) | | | (10,424,981 | ) | | | (187,071,527 | ) |
| | (382,118 | ) | | | (824,015 | ) | | | (769,458 | ) | | | (4,930,445 | ) | | | (15,983 | ) | | | (1,340 | ) |
| | | | | | | | | | | | | | | | | | | | | | |
| | (51,676,372 | ) | | | 21,717,238 | | | | (353,541 | ) | | | (921,848,620 | ) | | | 4,790,275 | | | | (118,831,047 | ) |
| | | | | | | | | | | | | | | | | | | | | | |
| | | | | |
| | (419,186,722 | ) | | | (273,410,359 | ) | | | (14,026,952 | ) | | | (1,026,785,461 | ) | | | 2,693,382 | | | | (106,105,569 | ) |
| | | | | |
| | | | | | | | | | | | | | | | | | | | | | |
| | 1,257,835,116 | | | | 1,531,245,475 | | | | 86,287,889 | | | | 1,113,073,350 | | | | 115,175,117 | | | | 221,280,686 | |
| | | | | | | | | | | | | | | | | | | | | | |
| | | | | |
| $ | 838,648,394 | | | $ | 1,257,835,116 | | | $ | 72,260,937 | | | $ | 86,287,889 | | | $ | 117,868,499 | | | $ | 115,175,117 | |
| | | | | | | | | | | | | | | | | | | | | | |
| | | | | |
| | | | | | | | | | | | | | | | | | | | | | |
| | | | | | | | | | | | | | | | | | | | | | |
| | 2,293,307 | | | | 1,949,822 | | | | 178,436 | | | | 195,795 | | | | 1,222,474 | | | | 6,707,445 | |
| | 4,426,044 | | | | 13,849,850 | | | | 98,982 | | | | 1,670,182 | | | | 365,880 | | | | 589,748 | |
| | (10,421,707 | ) | | | (11,776,123 | ) | | | (277,980 | ) | | | (78,354,272 | ) | | | (1,092,090 | ) | | | (19,766,822 | ) |
| | | | | | | | | | | | | | | | | | | | | | |
| | (3,702,356 | ) | | | 4,023,549 | | | | (562 | ) | | | (76,488,295 | ) | | | 496,264 | | | | (12,469,629 | ) |
| | | | | | | | | | | | | | | | | | | | | | |
| | | | | |
| | | | | | | | | | | | | | | | | | | | | | |
| | 10,403 | | | | 15,822 | | | | 11,246 | | | | 12,551 | | | | 1,895 | | | | — | |
| | 6,306 | | | | 23,922 | | | | 16,121 | | | | 29,931 | | | | 259 | | | | 239 | |
| | (23,217 | ) | | | (47,743 | ) | | | (57,528 | ) | | | (394,952 | ) | | | (1,670 | ) | | | (144 | ) |
| | | | | | | | | | | | | | | | | | | | | | |
| | (6,508 | ) | | | (7,999 | ) | | | (30,161 | ) | | | (352,470 | ) | | | 484 | | | | 95 | |
| | | | | | | | | | | | | | | | | | | | | | |
The accompanying Notes are an integral part of these financial statements.
| | | | |
| Statements of Changes in Net Assets | | | 59 | |
State Street Institutional Funds
Notes to Financial Statements — March 31, 2020 (Unaudited)
| 1. | | Organization of the Funds |
State Street Institutional Funds (the “Trust”) is registered under the Investment Company Act of 1940, as amended (the “1940 Act”), as anopen-end management investment company. The Trust was organized as a Delaware business trust on May 23, 1997, and is authorized to issue an unlimited number of shares. It is currently comprised of the following five series (each, a “Fund” and collectively, the “Funds”): State Street Institutional U.S. Equity Fund, State Street Institutional Premier Growth Equity Fund, State Street InstitutionalSmall-Cap Equity Fund, State Street Institutional International Equity Fund and State Street Active Core Bond Fund. Each Fund presently offers two classes of shares — the Investment Class and the Service Class. The Trust expects that most of the time, each Fund will have relatively few shareholders (as compared with most mutual funds), but that these shareholders will invest substantial amounts in a Fund (minimum initial investment requirements are described in the current summary prospectus for each Fund and in the Funds’ statutory prospectus). Each Fund is a diversified investment company within the meaning of the 1940 Act.
Under the Trust’s organizational documents, its officers and trustees are indemnified against certain liabilities arising out of the performance of their duties to the Trust. Additionally, in the normal course of business, the Trust enters into contracts with service providers that contain general indemnification clauses. The Trust’s maximum exposure under these arrangements is unknown as this would involve future claims that may be made against the Trust that have not yet occurred.
| 2. | | Summary of Significant Accounting Policies |
The following is a summary of significant accounting policies followed by the Trust in the preparation of its financial statements:
The preparation of financial statements in accordance with U.S. generally accepted accounting principles (“U.S. GAAP”) requires management to make estimates and assumptions that affect the reported amounts and disclosures in the financial statements. Actual results could differ from those estimates. Each Fund is an investment company under U.S. GAAP and follows the accounting and reporting guidance applicable to investment companies.
Security Valuation Each Fund’s investments are valued at fair value each day that the New York Stock Exchange (“NYSE”) is open and, for financial reporting purposes, as of the report date should the reporting period end on a day that the NYSE is not open. Fair value is generally defined as the price a fund would receive to sell an asset or pay to transfer a liability in an orderly transaction between market participants at the measurement date. By its nature, a fair value price is a good faith estimate of the valuation in a current sale and may not reflect an actual market price. The investments of each Fund are valued pursuant to the policy and procedures developed by the Oversight Committee (the “Committee”) and approved by the Board of Trustees of the Trust (the “Board”). The Committee provides oversight of the valuation of investments for the Funds. The Board has responsibility for overseeing the determination of the fair value of investments.
Valuation techniques used to value each Fund’s investments by major category are as follows:
| | • | | Equity investments (including preferred stocks and registered investment companies that are exchange-traded funds) traded on a recognized securities exchange for which market quotations are readily available are valued at the last sale price or official closing price, as applicable, on the primary market or exchange on which they trade. Equity investments traded on a recognized exchange for which there were no sales on that day are valued at the last published sale price or at fair value. |
| | • | | Investments in registered investment companies (including money market funds) or other unitized pooled investment vehicles that are not traded on an exchange are valued at that day’s published net asset value (“NAV”) per share or unit. |
| | • | | Rights and warrants are valued at the last reported sale price obtained from independent pricing services or brokers on the valuation date. If no price is obtained from pricing services or brokers, valuation will be based upon the intrinsic value pursuant to the valuation policy and procedures approved by the Board. |
| | • | | Government and municipal fixed income securities are generally valued using quotations from independent pricing services or brokers. Certain government inflation-indexed securities may require a calculated fair valuation as the cumulative inflation is contained within the price provided by the pricing service or broker. For these securities, the inflation component of the price is “cleaned” from the pricing service or broker price utilizing the published inflation factors in order to ensure proper accrual of income. |
| | |
| 60 | | Notes to Financial Statements |
State Street Institutional Funds
Notes to Financial Statements, continued — March 31, 2020 (Unaudited)
| | • | | Debt obligations (including short term investments and convertible debt securities) are valued using quotations from independent pricing services or brokers or are generally valued at the last reported evaluated prices. |
| | • | | Exchange-traded futures contracts are valued at the closing settlement price on the primary market on which they are traded most extensively. Exchange-traded futures contracts traded on a recognized exchange for which there were no sales on that day are valued at the last reported sale price obtained from independent pricing services or brokers or at fair value. |
| | • | | Options on futures are priced at their last sale price on the principal market on which they are traded on the valuation date. If there were no sales on that day, options on futures are valued at either the last reported sale or official closing price on their primary exchange determined in accordance with the valuation policy and procedures approved by the Board. |
| | • | | Swap agreements are valued daily based upon prices supplied by Board approved pricing vendors or through brokers. Depending on the product and terms of the transaction, the value of agreements is determined using a series of techniques including valuation models that incorporate a number of market data factors, such as discounted cash flows, yields, curves, trades and values of the underlying reference instruments. In the event SSGA Funds Management, Inc. (the “Adviser” or “SSGA FM”) is unable to obtain an independent, third-party valuation the agreements will be fair valued. |
In the event prices or quotations are not readily available or that the application of these valuation methods results in a price for an investment that is deemed to be not representative of the fair value of such investment, fair value will be determined in good faith by the Committee, in accordance with the valuation policy and procedures approved by the Board.
A “significant event” is an event that the Board believes, with a reasonably high degree of certainty, has caused the closing market prices of a Fund’s portfolio securities to no longer reflect their value at the time of the Fund’s NAV calculation. Fair value may be determined using an independent fair value service under valuation procedures approved by the Board. The independent fair value service takes into account multiple factors including, but not limited to, movements in the U.S. securities markets, certain depositary receipts, futures contracts and foreign currency exchange rates that have occurred subsequent to the close of foreign securities exchanges. The use of the independent fair value service or alternative fair valuation methods would result in the investments being classified within Level 2 of the fair value hierarchy.
The Funds value their assets and liabilities at fair value using a fair value hierarchy consisting of three broad levels that prioritize the inputs to valuation techniques giving the highest priority to readily available unadjusted quoted prices in active markets for identical assets or liabilities (Level 1 measurements) and the lowest priority to unobservable inputs (Level 3 measurements) when market prices are not readily available or reliable. The categorization of a value determined for an investment within the hierarchy is based upon the pricing transparency of the investment and is not necessarily an indication of the risk associated with investing in it.
The three levels of the fair value hierarchy are as follows:
| | • | | Level 1 — Unadjusted quoted prices in active markets for an identical asset or liability; |
| | • | | Level 2 — Inputs other than quoted prices included within Level 1 that are observable for the asset or liability either directly or indirectly, including quoted prices for similar assets or liabilities in active markets, quoted prices for identical or similar assets or liabilities in markets that are not considered to be active, inputs other than quoted prices that are observable for the asset or liability (such as exchange rates, financing terms, interest rates, yield curves, volatilities, prepayment speeds, loss severities, credit risks and default rates) or other market-corroborated inputs; and |
| | • | | Level 3 — Unobservable inputs for the asset or liability, including the Committee’s assumptions used in determining the fair value of investments. |
The value of each Fund’s investments according to the fair value hierarchy as of March 31, 2020 is disclosed in each Fund’s respective Schedule of Investments.
Investment Transactions and Income Recognition Investment transactions are accounted for on trade date for financial reporting purposes. Realized gains and losses from the sale or disposition of investments and foreign exchange transactions, if any, are determined using the identified cost method.
Dividend income and capital gain distributions, if any, are recognized on theex-dividend date, net of any foreign taxes withheld at source, if any.
| | | | |
| Notes to Financial Statements | | | 61 | |
State Street Institutional Funds
Notes to Financial Statements, continued — March 31, 2020 (Unaudited)
Interest income is recorded daily on an accrual basis. All premiums and discounts are amortized/accreted for financial reporting purposes.
Non-cash dividends received in the form of stock are recorded as dividend income at fair value.
Expenses Each Fund pays a “unitary fee” to SSGA FM equivalent to the Fund’s advisory and administration fee. This fee includes all operating expenses payable by each Fund, except for fees and expenses associated with the Trust’s independent Trustees, shareholder servicing and distribution(12b-1) fees, brokerage fees and commissions, and expenses that are not normal operating expenses of the Fund (such as extraordinary expenses, interest and taxes).
Foreign Currency Translation The accounting records of the Funds are maintained in U.S. dollars. Foreign currencies as well as investment securities and other assets and liabilities denominated in a foreign currency are translated to U.S. dollars using exchange rates at period end. Purchases and sales of securities, income receipts and expense payments denominated in foreign currencies are translated into U.S. dollars at the prevailing exchange rate on the respective dates of the transactions.
The effects of exchange rate fluctuations on investments are included with the net realized and unrealized gain (loss) on investment securities. Other foreign currency transactions resulting in realized and unrealized gain (loss) are disclosed separately.
Foreign Taxes The Funds may be subject to foreign taxes (a portion of which may be reclaimable) on income, stock dividends, realized and unrealized capital gains on investments or certain foreign currency transactions. Foreign taxes are recorded in accordance with SSGA FM’s understanding of the applicable foreign tax regulations and rates that exist in the foreign jurisdictions in which the Funds invest. These foreign taxes, if any, are paid by the Funds and are reflected in the Statements of Operations, if applicable. Foreign taxes payable or deferred as of March 31, 2020, if any, are disclosed in the Funds’ Statements of Assets and Liabilities.
Distributions Distributions from net investment income, if any, are declared and paid annually for all Funds except the State Street Active Core Bond Fund. The State Street Active Core Bond Fund declares them daily and pays them monthly.
Net realized capital gains, if any, are distributed annually, unless additional distributions are required for compliance with applicable tax regulations. The amount and character of income and capital gains to be distributed are determined in accordance with applicable tax regulations which may differ from net investment income and realized gains recognized for U.S. GAAP purposes.
| 3. | | Securities and Other Investments |
Delayed Delivery Transactions and When-Issued Securities During the period, certain Funds transacted in securities on a delayed delivery or when-issued basis. Payment and delivery may take place after the customary settlement period for that security. The price of the underlying securities and the date when the securities will be delivered and paid for are fixed at the time the transaction is negotiated. The securities purchased on a delayed delivery or when-issued basis are identified as such in each applicable Fund’s Schedule of Investments. A Fund may receive compensation for interest forgone in the purchase of a delayed delivery or when-issued security. With respect to such purchase commitments, a Fund identifies securities as segregated in its records with a value at least equal to the amount of the commitment. Losses may arise due to changes in the value of the underlying securities or if the counterparty does not perform under the contract’s terms, or if the issuer does not issue the securities due to political, economic or other factors.
To-Be-Announced Transactions Certain Funds may seek to obtain exposure to U.S. agency mortgage pass-through securities through the use of“to-be-announced” or “TBA transactions.” “TBA” refers to a commonly used mechanism for the forward settlement of U.S. agency mortgage pass-through securities. In a TBA transaction, the buyer and seller decide on general trade parameters, such as agency, settlement date, coupon, and price.
A Fund may use TBA transactions to “roll over” such agreements prior to the settlement date. This type of TBA transaction is sometimes known as a “TBA roll.” In a TBA roll, a Fund generally will sell the obligation to purchase the pools stipulated in the TBA agreement prior to the settlement date and will enter into a new TBA agreement for future delivery of pools of mortgage pass-through securities. A Fund may also enter into TBA agreements and settle such transactions on the stipulated settlement date by accepting actual receipt or delivery of the pools of mortgage pass-through securities.
| | |
| 62 | | Notes to Financial Statements |
State Street Institutional Funds
Notes to Financial Statements, continued — March 31, 2020 (Unaudited)
Default by or bankruptcy of a counterparty to a TBA transaction would expose a Fund to possible loss because of adverse market action, expenses or delays in connection with the purchase or sale of the pools of mortgage pass-through securities specified in the TBA transaction. To minimize this risk, a Fund will enter into TBA transactions only with established counterparties. A Fund’s use of “TBA rolls” may impact portfolio turnover, transaction costs and capital gain distributions to shareholders.
| 4. | | Derivative Financial Instruments |
Futures Contracts Each Fund may enter into futures contracts to meet the Fund’s objectives. A futures contract is a standardized, exchange-traded agreement to buy or sell a financial instrument at a set price on a future date. Upon entering into a futures contract, the Fund is required to deposit with the broker, cash or securities in an amount equal to the minimum initial margin requirements of the clearing house. Subsequent payments are made or received by a Fund equal to the daily change in the contract value and are recorded as variation margin receivable or payable with a corresponding offset to unrealized gains or losses. A Fund recognizes a realized gain or loss when the contract is closed.
Losses may arise if the value of a futures contract decreases due to unfavorable changes in the market rates or values of the underlying instrument during the term of the contract or if the counterparty does not perform under the contract. The use of futures contracts also involves the risk that the movements in the price of the futures contracts do not correlate the movement of the assets underlying such contracts.
For the period ended March 31, 2020, the following Funds entered into futures contracts for strategies listed below:
| | |
| Fund | | Strategies |
State Street Institutional U.S. Equity Fund | | Equitization of Cash |
State Street Institutional Premier Growth Equity Fund | | Equitization of Cash |
State Street InstitutionalSmall-Cap Equity Fund | | Equitization of Cash |
State Street Institutional International Equity Fund | | Equitization of Cash |
State Street Active Core Bond Fund | | Management of Interest Rate Risk |
Options on Futures Contracts Each Fund may purchase and write options, including options on futures contracts, subject to certain limitations. Writing puts and buying calls tend to increase a Fund’s exposure to the underlying instrument while buying puts and writing calls tend to decrease the Fund’s exposure to the underlying instrument. A Fund will not enter into a transaction involving options for speculative purposes. A Fund’s risks in using these contracts include changes in the value of the underlying instruments,non-performance of the counterparties under the contracts’ terms and changes in the liquidity of
the secondary market for the contracts.
When a Fund writes an option, the amount of the premium received is recorded as a liability and is subsequently adjusted to the current fair value of the option written. Premiums received from writing options that expire unexercised are treated by a Fund on the expiration date as realized gains from investments. The difference between the premium and the amount paid on effecting a closing purchase transaction, including brokerage commissions, is also treated as a realized gain, or if the premium is less than the amount paid for the closing purchase, as a realized loss. When an option is exercised, the proceeds from the sale of the underlying instrument or the cost basis of the securities purchased is adjusted by the original premium received or paid. In return for a premium paid, call and put options on futures contracts give the holder the right, but not the obligation, to purchase or sell, respectively, a position in a particular futures contract at a specified exercise price.
For the period ended March 31, 2020, the State Street Active Core Bond Fund purchased and wrote options in order to manage interest rate risk.
Credit Default Swaps During the period ended March 31, 2020, the State Street Active Core Bond Fund engaged in credit default swaps to manage credit risk. When the Fund is the buyer in a credit default swap contract, the Fund is entitled to receive the par (or other agreed upon) value (full notional value) of a referenced debt obligation (or basket of debt obligations) from the counterparty (or central clearing party (“CCP”) in the case of a centrally cleared swap) to the contract if a credit event by a third party, such as a U.S. or foreign corporate issuer or sovereign issuer, on the debt obligation occurs. In return, the Fund pays the counterparty a periodic stream of payments over the term of the contract provided that no credit event has occurred. If no credit event occurs, the Fund loses its investment and recovers nothing. However, if a credit event occurs, the Fund receives full notional value for a referenced debt obligation that may have little or no value. When the Fund is the seller
| | | | |
| Notes to Financial Statements | | | 63 | |
State Street Institutional Funds
Notes to Financial Statements, continued — March 31, 2020 (Unaudited)
of a credit default swap, it receives a fixed rate of income throughout the term of the contract, provided there is no credit event. If a credit event occurs, the Fund is obligated to pay the notional amount of the swap and in certain instances take delivery of securities of the reference entity upon the occurrence of a credit event, as defined under the terms of that particular swap agreement. Credit events are contract specific but may include bankruptcy, failure to pay, restructuring, obligation acceleration and repudiation/moratorium. If the Fund is a seller of protection and a credit event occurs, the maximum potential amount of future payments that the Fund could be required to make would be an amount equal to the notional amount of the agreement. This potential amount would be partially offset by any recovery value of the respective referenced obligation, or net amount received from the settlement of a buy protection credit default swap agreement entered into by the Fund for the same referenced obligation. As the seller, the Fund may create economic leverage to its portfolio because, in addition to its total net assets, the Fund is subject to investment exposure on the notional amount of the swap. The interest fee paid or received on the swap, which is based on a specified interest rate on a fixed notional amount, is accrued daily as a component of unrealized appreciation (depreciation) and is recorded as realized gain upon receipt or realized loss upon payment. The Fund also records an increase or decrease to unrealized appreciation (depreciation) in an amount equal to the daily valuation. For centrally cleared swaps, the daily change in valuation is recorded as a receivable or payable for variation margin and settled in cash with the CCP daily. All upfront payments, if any, are amortized over the life of the swap as realized gains or losses. Those upfront payments that are paid or received, typically fornon-centrally cleared swaps, are recorded as other assets or other liabilities, respectively, net of amortization. For financial reporting purposes, unamortized upfront payments, if any, are netted with unrealized appreciation or depreciation on swaps to determine the market value of swaps. The Fund segregates assets in the form of cash or liquid securities in an amount equal to the notional amount of the credit default swaps of which it is the seller. The Fund segregates assets in the form of cash or liquid securities in an amount equal to any unrealized depreciation of the credit default swaps of which it is the buyer, marked to market on a daily basis. Credit default swaps involve greater risks than if the Fund had invested in the referenced debt obligation directly. If the Fund is a buyer of a credit default swap and no credit event occurs, the Fund will not earn any return on its investment. If the Fund is a seller of a credit default swap, the Fund’s risk of loss may be the entire notional amount of the swap. Swaps may also subject the Fund to the risk that the counterparty to the transaction may not fulfill its obligation. In the case of centrally cleared swaps, counterparty risk is minimal due to protections provided by the CCP.
Interest Rate Swaps Interest rate swaps involve the exchange by a Fund with another party of their respective commitments to pay or receive interest, such as an exchange of fixed rate payments for floating rate payments.
During the period ended March 31, 2020, the State Street Active Core Bond Fund entered into interest rate swaps in order to manage interest rate risk.
The following tables summarize the value of the Funds’ derivative instruments as of March 31, 2020 and the related location in the accompanying Statements of Assets and Liabilities and Statements of Operations, presented by primary underlying risk exposure:
Asset Derivatives
| | | | | | | | | | | | | | | | | | | | | | | | |
| | | Interest
Rate
Contracts
Risk | | | Foreign
Exchange
Contracts
Risk | | | Credit
Contracts
Risk | | | Equity
Contracts
Risk | | | Commodity
Contracts
Risk | | | Total | |
| | | | | | | | | | | | | | | | | | | | | | | | |
State Street Institutional Premier Growth Equity Fund | | | | | | | | | | | | | | | | | | | | | | | | |
Futures Contracts | | $ | — | | | $ | — | | | $ | — | | | $ | 45,695 | | | $ | — | | | $ | 45,695 | |
State Street InstitutionalSmall-Cap Equity Fund | | | | | | | | | | | | | | | | | | | | | | | | |
Future Contracts | | $ | | | | $ | | | | $ | | | | $ | 1,234,540 | | | $ | | | | $ | 1,234,540 | |
State Street Institutional International Equity Fund | | | | | | | | | | | | | | | | | | | | | | | | |
Futures Contracts | | $ | — | | | $ | — | | | $ | — | | | $ | 118,890 | | | $ | — | | | $ | 118,890 | |
State Street Active Core Bond Fund | | | | | | | | | | | | | | | | | | | | | | | | |
Futures Contracts | | $ | | | | $ | — | | | $ | — | | | $ | 191,193 | | | $ | — | | | $ | 191,193 | |
Purchased Option Contracts (a) | | | 126,406 | | | | — | | | | — | | | | — | | | | — | | | | 126,406 | |
| | (a) | Purchased options are included in investments in securities. |
| | |
| 64 | | Notes to Financial Statements |
State Street Institutional Funds
Notes to Financial Statements, continued — March 31, 2020 (Unaudited)
Liability Derivatives
| | | | | | | | | | | | | | | | | | | | | | | | |
| | | Interest
Rate
Contracts
Risk | | | Foreign
Exchange
Contracts
Risk | | | Credit
Contracts
Risk | | | Equity
Contracts
Risk | | | Commodity
Contracts
Risk | | | Total | |
| | | | | | | | | | | | | | | | | | | | | | | | |
State Street Institutional U.S. Equity Fund | | | | | | | | | | | | | | | | | | | | | | | | |
Futures Contracts | | $ | — | | | $ | — | | | $ | — | | | $ | (94,863 | ) | | $ | — | | | $ | (94,863 | ) |
State Street Active Core Bond Fund | | | | | | | | | | | | | | | | | | | | | | | | |
Swap Contracts | | $ | (479,482 | ) | | $ | — | | | $ | (396,801 | ) | | $ | — | | | $ | — | | | $ | (876,283 | ) |
Realized Gain/Loss
| | | | | | | | | | | | | | | | | | | | | | | | |
| | | Interest
Rate
Contracts
Risk | | | Foreign
Exchange
Contracts
Risk | | | Credit
Contracts
Risk | | | Equity
Contracts
Risk | | | Commodity
Contracts
Risk | | | Total | |
| | | | | | | | | | | | | | | | | | | | | | | | |
State Street Institutional U.S. Equity Fund | | | | | | | | | | | | | | | | | | | | | | | | |
Futures Contracts | | $ | — | | | $ | — | | | $ | — | | | $ | (1,138,299 | ) | | $ | — | | | $ | (1,138,299 | ) |
State Street Institutional Premier Growth Equity Fund | | | | | | | | | | | | | | | | | | | | | | | | |
Futures Contracts | | $ | — | | | $ | — | | | $ | — | | | $ | (34,969 | ) | | $ | — | | | $ | (34,969 | ) |
State Street InstitutionalSmall-Cap Equity Fund | | | | | | | | | | | | | | | | | | | | | | | | |
Futures Contracts | | $ | — | | | $ | — | | | $ | — | | | $ | (5,881,149 | ) | | $ | — | | | $ | (5,881,149 | ) |
State Street Institutional International Equity Fund | | | | | | | | | | | | | | | | | | | | | | | | |
Futures Contracts | | $ | — | | | $ | — | | | $ | — | | | $ | (308,693 | ) | | $ | — | | | $ | (308,693 | ) |
State Street Active Core Bond Fund | | | | | | | | | | | | | | | | | | | | | | | | |
Futures Contracts | | $ | (404,959 | ) | | $ | — | | | $ | — | | | $ | — | | | $ | — | | | $ | (404,959 | ) |
Swap Contracts | | | (81,995 | ) | | | — | | | | (578,415 | ) | | | — | | | | — | | | | (660,410 | ) |
Purchased Option Contracts(a) | | | 56,610 | | | | — | | | | — | | | | — | | | | — | | | | 56,610 | |
| | (a) | Purchased Options are included in realized gain (loss) on investments. |
Net Change in Unrealized Appreciation (Depreciation)
| | | | | | | | | | | | | | | | | | | | | | | | |
| | | Interest
Rate
Contracts
Risk | | | Foreign
Exchange
Contracts
Risk | | | Credit
Contracts
Risk | | | Equity
Contracts
Risk | | | Commodity
Contracts
Risk | | | Total | |
| | | | | | | | | | | | | | | | | | | | | | | | |
State Street Institutional U.S. Equity Fund | | | | | | | | | | | | | | | | | | | | | | | | |
Futures Contracts | | $ | — | | | $ | — | | | $ | — | | | $ | (41,102 | ) | | $ | — | | | $ | (41,102 | ) |
State Street Institutional Premier Growth Equity Fund | | | | | | | | | | | | | | | | | | | | | | | | |
Futures Contracts | | $ | — | | | $ | — | | | $ | — | | | $ | 14,292 | | | $ | — | | | $ | 14,292 | |
State Street InstitutionalSmall-Cap Equity Fund | | | | | | | | | | | | | | | | | | | | | | | | |
Future Contracts | | $ | | | | $ | | | | $ | | | | $ | 1,817,023 | | | $ | | | | $ | 1,817,023 | |
State Street Institutional International Equity Fund | | | | | | | | | | | | | | | | | | | | | | | | |
Futures Contracts | | $ | — | | | $ | — | | | $ | — | | | $ | 117,876 | | | $ | — | | | $ | 117,876 | |
State Street Active Core Bond Fund | | | | | | | | | | | | | | | | | | | | | | | | |
Futures Contracts | | $ | 200,856 | | | $ | — | | | $ | — | | | $ | — | | | $ | — | | | $ | 200,856 | |
Swap Contracts | | | (107,011 | ) | | | — | | | | (50,798 | ) | | | — | | | | — | | | | (157,809 | ) |
Purchased Option Contracts(a) | | | 49,359 | | | | — | | | | — | | | | — | | | | — | | | | 49,359 | |
| | (a) | Purchased options are included in increase (decrease) in unrealized appreciation/depreciation on investments. |
| | | | |
| Notes to Financial Statements | | | 65 | |
State Street Institutional Funds
Notes to Financial Statements, continued — March 31, 2020 (Unaudited)
| 5. | | Fees and Transactions with Affiliates |
Advisory Fee SSGA FM, a registered investment adviser, was retained by the Board to act as investment adviser and administrator of each Fund. SSGA FM’s compensation for investment advisory and administrative services (“Management Fee”) is paid monthly based on the average daily net assets of each Fund. The Management Fee is stated in the following schedule:
| | | | | | |
| Fund | | Average Daily
Net Assets of Fund | | Management Fee | |
| | |
State Street Institutional U.S. Equity Fund | | First $25 million | | | 0.55 | % |
| | |
State Street Institutional Premier Growth Equity Fund | | Next $25 million | | | 0.45 | % |
| | |
| | | Over $50 million | | | 0.35 | % |
| | |
State Street InstitutionalSmall-Cap Equity Fund | | First $250 million | | | 0.95 | % |
| | |
| | Next $250 million | | | 0.90 | % |
| | |
| | | Over $500 million | | | 0.85 | % |
| | |
State Street Institutional International Equity Fund | | First $25 million | | | 0.75 | % |
| | |
| | Next $50 million | | | 0.65 | % |
| | |
| | | Over $75 million | | | 0.55 | % |
| | |
State Street Active Core Bond Fund | | First $25 million | | | 0.35 | % |
| | |
| | Next $25 million | | | 0.30 | % |
| | |
| | Next $50 million | | | 0.25 | % |
| | |
| | | Over $100 million | | | 0.20 | % |
Each Fund’s Management Fee is a “unitary” fee that includes all operating expenses payable by the Fund, except for fees and expenses associated with the Trust’s independent Trustees, shareholder servicing and distribution(12b-1) fees, brokerage fees and commissions, and expenses that are not normal operating expenses of the Fund (such as extraordinary expenses, interest and taxes).
SSGA FM is contractually obligated, until January 31, 2021 (i) to waive up to the full amount of the advisory fee payable by the State Street Institutional International Equity Fund and/or (ii) to reimburse the Fund for expenses to the extent that the Total Annual Fund Operating Expenses (exclusive ofnon-recurring account fees, extraordinary expenses, distribution and shareholder servicing fees) exceed 0.55% of average daily net assets on an annual basis (and certain class specific expenses, such as). This fee waiver and/or expense reimbursement arrangement may not be terminated prior to January 31, 2021, except with approval of the Board.
SSGA FM is contractually obligated until January 31, 2021 to waive its management fee and/or reimburse certain expenses for the State Street Active Core Bond Fund, in an amount equal to any acquired fund fees and expenses (“AFFEs”), excluding AFFEs derived from the Fund’s holdings in acquired funds for cash management purposes, if any. This fee waiver and/or expense reimbursement arrangement may not be terminated prior to January 31, 2021 except with approval of the Board.
Amounts waived or reimbursed are included in the respective Statements of Operations.
Distribution and Shareholder Servicing Fees The Funds have adopted a Shareholder Servicing and Distribution Plan (the “Plan”) pursuant to Rule12b-1 under the 1940 Act with respect to the Service Class shares of each Fund. Each Fund pays State Street Global Advisors Funds Distributors, LLC (“SSGA FD”), the Funds’ principal underwriter, a monthly fee for distribution and/or shareholder services provided, at an annual rate of 0.25% of the average daily net assets of such Fund attributable to the Service Class shares. Currently, Investment Class shares are not subject to a12b-1 fee.
Other Transactions with Affiliates The Funds may invest in affiliated entities, including securities issued by State Street Corporation, affiliated funds, or entities deemed to be affiliates as a result of the Funds owning more than five percent of the entity’s voting securities or outstanding shares. Amounts relating to these transactions during the period ended March 31, 2020 are disclosed in the Schedules of Investments.
| | |
| 66 | | Notes to Financial Statements |
State Street Institutional Funds
Notes to Financial Statements, continued — March 31, 2020 (Unaudited)
Due to Custodian In certain circumstances, the Funds may have cash overdrafts with the custodian due to expense payments, capital transactions, trading of securities, investment operations or derivative transactions. The Due to Custodian amount, if any, reflects cash overdrawn with State Street Bank and Trust Company, as custodian, who is an affiliate of the Funds.
The fees and expenses of the Trust’s trustees who are not “interested persons” of the Trust, as defined in the 1940 Act (“Independent Trustees”), are paid directly by the Funds. The Independent Trustees are reimbursed for travel and otherout-of-pocket expenses in connection with meeting attendance and industry seminars.
| 7. | | Investment Transactions |
Purchases and sales of investments (excludingin-kind transactions, short term investments and derivative contracts) for the period ended March 31, 2020 were as follows:
| | | | | | | | | | | | | | | | |
| | | U.S. Government
Obligations | | | Other
Securities | |
| Fund | | Purchases | | | Sales | | | Purchases | | | Sales | |
State Street Institutional U.S. Equity Fund | | $ | — | | | $ | — | | | | 12,478,992 | | | | 15,371,257 | |
State Street Institutional Premier Growth Equity Fund | | | — | | | | — | | | | 29,632,682 | | | | 175,010,086 | |
State Street InstitutionalSmall-Cap Equity Fund | | | — | | | | — | | | | 94,529,920 | | | | 120,671,025 | |
State Street Institutional International Equity Fund | | | — | | | | — | | | | 177,821,026 | | | | 287,266,348 | |
State Street Active Core Bond Fund | | | 32,737,490 | | | | 35,417,764 | | | | 17,104,353 | | | | 10,004,711 | |
RedemptionIn-Kind In accordance with guidelines described in a Fund’s prospectus, a Fund may distribute portfolio securities rather than cash as payment for a redemption of Fund shares(in-kind redemption). For financial reporting purposes, a Fund recognizes a gain onin-kind redemptions to the extent the value of the distributed securities on the date of redemption exceeds the cost of those securities. Gains and losses realized onin-kind redemptions are not recognized for tax purposes and are reclassified from undistributed realized gain (loss) topaid-in capital. These reclassifications have no effect on net assets or NAV per share. The net realizedin-kind gains or losses are disclosed in the Statements of Operations.
During the year ended September 30, 2019, the State Street Institutional International Equity Fund had a redemptionin-kind
that resulted in a redemption from the Fund of $919,887,389. The redemption was paid in securities and cash in the amounts
of $845,305,430 and $74,581,959, respectively.
| 8. | | Income Tax Information |
The Funds have qualified and intend to continue to qualify as regulated investment companies under Subchapter M of the Internal Revenue Code of 1986, as amended. Each Fund will not be subject to federal income taxes to the extent it distributes its taxable income, including any net realized capital gains, for each fiscal year. Therefore, no provision for federal income tax is required.
The Funds file federal and various state and local tax returns as required. No income tax returns are currently under examination. Generally, the federal returns are subject to examination by the Internal Revenue Service for a period of three years from date of filing, while the state returns may remain open for an additional year depending upon jurisdiction. SSGA FM has analyzed the Funds’ tax positions taken on tax returns for all open years and does not believe there are any uncertain tax positions that would require recognition of a tax liability.
Distributions to shareholders are recorded onex-dividend date. Income dividends and gain distributions are determined in accordance with income tax rules and regulations, which may differ from generally accepted accounting principles.
| | | | |
| Notes to Financial Statements | | | 67 | |
State Street Institutional Funds
Notes to Financial Statements, continued — March 31, 2020 (Unaudited)
As of March 31, 2020, gross unrealized appreciation and gross unrealized depreciation of investments and other financial instruments based on cost for federal income tax purposes were as follows:
| | | | | | | | | | | | | | | | |
| Fund | | Cost of
Investments
for Tax
Purposes | | | Gross Tax
Appreciation | | | Gross Tax
Depreciation | | | Net Tax
Appreciation/
(Depreciation) | |
| | | | | | | | | | | | | | | | |
State Street Institutional U.S. Equity Fund | | $ | 319,608,073 | | | $ | 68,538,520 | | | $ | (37,352,790 | ) | | $ | 31,185,730 | |
State Street Institutional Premier Growth Equity Fund | | | 51,349,026 | | | | 21,733,902 | | | | (6,103,712 | ) | | | 15,630,190 | |
State Street InstitutionalSmall-Cap Equity Fund | | | 942,718,244 | | | | 114,539,381 | | | | (222,309,129 | ) | | | (107,769,748 | ) |
State Street Institutional International Equity Fund | | | 71,521,347 | | | | 10,383,005 | | | | (11,753,132 | ) | | | (1,370,127 | ) |
State Street Institutional Active Core Bond Fund | | | 135,806,814 | | | | 4,759,594 | | | | (2,923,139 | ) | | | 1,836,455 | |
The Funds and other affiliated funds (each, a “Participant” and collectively, the “Participants”) have access to $200 million of a $500 million revolving credit facility provided by a syndication of banks under which the Participants may borrow to fund shareholder redemptions. This agreement expires in October 2020 unless extended or renewed.
The Participants are charged an annual commitment fee which is calculated based on the unused portion of the shared credit line. Commitment fees are allocated among each of the Participants based on relative net assets. Commitment fees are ordinary fund operating expenses. A Participant incurs and pays the interest expense related to its borrowing. Interest is calculated at a rate per annum equal to the sum of 1% plus the greater of the New York Fed Bank Rate and1-month LIBOR rate.
The Funds had no outstanding loans as of March 31, 2020.
Concentration Risk As a result of a Fund’s ability to invest a large percentage of its assets in obligations of issuers within the same country, state, region, currency or economic sector, an adverse economic, business or political development may affect the value of a Fund’s investments more than if a Fund was more broadly diversified.
Interest Rate Risk Is the risk that fixed income securities will decline in value because of changes in interest rates. Bond prices generally rise when interest rates decline and generally decline when interest rates rise. Changes in governmental policy, including changes in central bank monetary policy, could cause interest rates to rise rapidly, or cause investors to expect a rapid rise in interest rates. This could lead to heightened levels of interest rate, volatility and liquidity risks for the fixed income markets generally and could have a substantial and immediate effect on the values of a Fund’s investments.
Foreign and Emerging Markets Risk Investing in foreign markets involves risks and considerations not typically associated with investing in the U.S. Foreign securities may be subject to risk of loss because of government regulation, economic, political and social instability in the countries in which a Fund invests. Foreign markets may be less liquid than investments in the U.S. and may be subject to the risks of currency fluctuations. To the extent that a Fund invests in securities of issuers located in emerging markets, these risks may be even more pronounced.
Credit Risk A Fund may be exposed to credit risk in the event that an issuer or guarantor fails to perform or that an institution or entity with which a Fund has unsettled or open transactions defaults.
Market Risk The Fund’s investments are subject to changes in general economic conditions, and general market fluctuations and the risks inherent in investment in securities markets. Investment markets can be volatile and prices of investments can change substantially due to various factors including, but not limited to, economic growth or recession, changes in interest rates, changes in the actual or perceived creditworthiness of issuers, and general market liquidity. The Fund is subject to the risk that geopolitical events will disrupt securities markets and adversely affect global economies and markets. Local, regional or global events such as war, acts of terrorism, the spread of infectious illness or other public health issues, or other events could have a significant impact on the Fund and its investments.
An outbreak of a respiratory disease caused by a novel coronavirus (known asCOVID-19) first detected in China in December 2019 has resulted in a global pandemic and major disruptions to economies and markets around the world, including the
| | |
| 68 | | Notes to Financial Statements |
State Street Institutional Funds
Notes to Financial Statements, continued — March 31, 2020 (Unaudited)
United States. Financial markets have experienced extreme volatility and severe losses, and trading in many instruments has been disrupted. Liquidity for many instruments has been greatly reduced for periods of time. Some interest rates are very low and in some cases yields are negative. Governments and central banks, including the Federal Reserve in the United States, have taken extraordinary and unprecedented actions to support local and global economies and the financial markets. The impact of these measures, and whether they will be effective to mitigate the economic and market disruption, will not be known for some time. In addition, the outbreak ofCOVID-19, and measures taken to mitigate its effects, could result in disruptions to the services provided to a Fund by its service providers.
| 11. | | Change in Accounting Principle |
In March 2017, the Financial Accounting Standards Board issued Accounting Standards Update2017-08, Receivables — Nonrefundable Fees and Other Costs (Subtopic310-20) — Premium Amortization on Purchased Callable Debt Securities (“ASU2017-08”). For callable debt securities held at a premium that have explicit,non-contingent call features and that are callable at fixed prices on preset dates, ASU2017-08 requires the premium to be amortized to the earliest call date. The adoption resulted in a change in accounting principle, since the Funds had historically amortized such premiums to maturity for U.S. GAAP. Accordingly, the Funds have adopted ASU2017-08 to amend the premium amortization period for certain purchased callable debt securities withnon-contingent call features to the earliest call date. In accordance with the transition provisions of the standard, each Fund applied the amendments on a modified retrospective basis by recognizing a cumulative effect adjustment that decreased the beginning of period cost of investments and increased the unrealized appreciation on investments as follows:
| | | | |
| Fund | | Adjustment | |
State Street Institutional Active Core Bond Fund | | $ | 4,944 | |
This change in accounting policy has been made to comply with the newly issued accounting standard and had no impact on total accumulated earnings (loss) or the net asset value of each Fund. With respect to each Fund’s results of operations, amortization of premium to first call date accelerates amortization with the intent of more closely aligning the recognition of income on such bonds with the economics of the instrument.
Management has evaluated the impact of all subsequent events on the Funds through the date on which the financial statements were available to be issued and has determined that there were no subsequent events requiring adjustment or disclosure in the financial statements.
| | | | |
| Notes to Financial Statements | | | 69 | |
State Street Institutional Funds
Other Information — March 31, 2020 (Unaudited)
Liquidity Risk Management Program
Pursuant to Rule22e-4 under the 1940 Act, the Funds have adopted a liquidity risk management program. SSGA FM has been designated by the Board to administer the Funds’ liquidity risk management program. The program’s principal objectives include assessing, managing and periodically reviewing each Fund’s liquidity risk, based on factors specific to the circumstances of the Fund. Liquidity risk is defined as the risk that a Fund could not meet redemption requests without significant dilution of remaining investors’ interests in the Fund. During the fiscal year, SSGA FM provided the Board with a report addressing the operations of the program and assessing its adequacy and effectiveness of implementation.
During the period covered by the liquidity program report to the Board, the program supported each Fund’s ability to honor redemption requests timely and SSGA FM’s management of each Fund’s liquidity profile, including during periods of market volatility and net redemptions. SSGA FM reported that the program operated adequately and that the implementation of the program was effective to manage each Fund’s liquidity risk.
There can be no assurance that the program will achieve its objectives in the future. Please refer to your Fund’s prospectus for more information regarding the Fund’s exposure to liquidity risk and other principal risks to which an investment in the Fund may be subject.
Proxy Voting Policies and Procedures and Record
A description of the policies and procedures that the Funds have adopted to determine how to vote proxies relating to portfolio securities is available (i) without charge, upon request, by calling1-800-242-0134, (ii) on the Funds’ website at http://www.ssga.com/geam, or (iii) on the SEC’s website at www.sec.gov. Information regarding how the Funds voted proxies, if any, during the most recent12-month period ended June 30 is available by August 31 of each year without charge (1) by calling1-800-242-0134 (toll free), and (2) on the website of the SEC at www.sec.gov.
Quarterly Portfolio Schedule
Following the Funds’ first and third fiscal quarter-ends, a complete schedule of investments is filed with the SEC as an exhibit to their reports on FormN-PORT, which can be found on the SEC’s website at www.sec.gov. The Funds’ schedules of investments are available upon request, without charge, by calling1-800-242-0134.
State Street Institutional Funds
Trustees:
Michael F. Holland,Co-Chairperson
Patrick J. Riley,Co-Chairperson
John R. Costantino
Donna M. Rapaccioli
Michael A. Jessee
Richard D. Shirk
Rina K. Spence
Jeanne M. La Porta
Ellen M. Needham
Officers:
Ellen M. Needham,President
Brian Harris,Chief Compliance Officer, Anti-Money Laundering Officer and Code of Ethics Compliance Officer
Bruce S. Rosenberg,Treasurer
Ann M. Carpenter,Vice President and Deputy Treasurer
Chad C. Hallett,Deputy Treasurer
Arthur A. Jensen,Deputy Treasurer
Darlene Anderson-Vasquez,Deputy Treasurer
Sujata Upreti,Assistant Treasurer
Daniel Foley,Assistant Treasurer
Daniel G. Plourde,Assistant Treasurer
Sean O’Malley,Chief Legal Officer
Andrew DeLorme,Secretary
Kevin Morris,Assistant Secretary
David Urman,Assistant Secretary
Investment Adviser and Administrator
SSGA Funds Management, Inc.
One Iron Street
Boston, Massachusetts 02210
Custodian and Sub-Administrator
State Street Bank and Trust Company
One Lincoln Street
Boston, Massachusetts 02111
Distributor
State Street Global Advisors Funds Distributors, LLC
One Iron Street
Boston, Massachusetts 02210
Independent Registered Public Accounting Firm
Ernst & Young LLP
200 Clarendon Street
Boston, Massachusetts 02116
Not applicable to this filing.
| Item 3. | Audit Committee Financial Expert. |
Not applicable to this filing.
| Item 4. | Principal Accountant Fees and Services. |
Not applicable to this filing.
| Item 5. | Audit Committee of Listed Registrants. |
Not applicable to the State Street Institutional Funds (the “Trust” or “Registrant”).
| (a) | Schedules of Investments are included as part of the reports to shareholders filed under Item 1 of this FormN-CSR. |
| (b) | Not applicable to the Registrant. |
| Item 7. | Disclosure of Proxy Voting Policies and Procedures forClosed-End Management Investment Companies. |
Not applicable to the Registrant.
| Item 8. | Portfolio Managers ofClosed-End Management Investment Companies. |
Not applicable to the Registrant.
| Item 9. | Purchases of Equity Securities byClosed-End Management Investment Company and Affiliated Purchasers. |
Not applicable to the Registrant.
| Item 10. | Submission of Matters to a Vote of Security Holders. |
There were no material changes to the procedures by which shareholders may recommend nominees to the Registrant’s Board of Trustees.
| Item 11. | Controls and Procedures. |
(a) The Trust’s principal executive officer and principal financial officer have concluded that the Registrant’s disclosure controls and procedures (as defined in Rule30a-3(c) under the Investment Company Act of 1940, as amended (the “1940 Act”)) are effective to provide reasonable assurance that information required to be disclosed by the Trust on FormN-CSR is
recorded, processed, summarized and reported as of a date within 90 days of the filing date of this report, based on their evaluation of these controls and procedures required by Rule30a-3(b) under the 1940 Act and Rules13a-15(b) or15d-15(b) under the Securities Exchange Act of 1934, as amended.
(b) There were no changes in the Trust’s internal control over financial reporting (as defined in Rule30a-3(d) under the 1940 Act) that occurred during the period covered by this report that have materially affected, or are reasonably likely to materially affect, the Trust’s internal control over financial reporting.
| Item 12. | Disclosure of Securities Lending Activities forClosed-End Management Investment Companies. |
(a) Not applicable to the Registrant.
(b) Not applicable to the Registrant.
SIGNATURES
Pursuant to the requirements of the Securities Exchange Act of 1934 and the Investment Company Act of 1940, the Registrant has duly caused this report to be signed on its behalf by the undersigned, thereunto duly authorized.
| | |
Registrant: | | STATE STREET INSTITUTIONAL FUNDS |
| |
| By: | | /s/ Ellen M. Needham |
| | Ellen M. Needham |
| | President |
| |
Date: | | June 5, 2020 |
Pursuant to the requirements of the Securities Exchange Act of 1934 and the Investment Company Act of 1940, this report has been signed below by the following persons on behalf of the Registrant and in the capacities and on the dates indicated.
| | |
| By: | | /s/ Ellen M. Needham |
| | Ellen M. Needham |
| | President (Principal Executive Officer) |
| |
Date: | | June 5, 2020 |
| |
| By: | | /s/ Bruce S. Rosenberg |
| | Bruce S. Rosenberg |
| | Treasurer (Principal Financial Officer) |
| |
Date: | | June 5, 2020 |