UNITED STATES
SECURITIES AND EXCHANGE COMMISSION
Washington, D.C. 20549
FORM N-CSR
CERTIFIED SHAREHOLDER REPORT OF REGISTERED
MANAGEMENT INVESTMENT COMPANIES
Investment Company Act file number | 811-08243 |
|
Direxion Funds |
(Exact name of registrant as specified in charter) |
|
1301 Avenue of the Americas (6th Ave.), 35th Floor New York , NY | | 10019 |
(Address of principal executive offices) | | (Zip code) |
|
1301 Avenue of the Americas (6th Ave.), 35th Floor New York , NY 10019 |
(Name and address of agent for service) |
|
Registrant’s telephone number, including area code: | 646-572-3390 | |
|
Date of fiscal year end: | October 31, 2014 | |
|
Date of reporting period: | October 31, 2014 | |
| | | | | | | | |
Form N-CSR is to be used by management investment companies to file reports with the Commission not later than 10 days after the transmission to stockholders of any report that is required to be transmitted to stockholders under Rule 30e-1 under the Investment Company Act of 1940 (17 CFR 270.30e-1). The Commission may use the information provided on Form N-CSR in its regulatory, disclosure review, inspection, and policymaking roles.
A registrant is required to disclose the information specified by Form N-CSR, and the Commission will make this information public. A registrant is not required to respond to the collection of information contained in Form N-CSR unless the Form displays a currently valid Office of Management and Budget (“OMB”) control number. Please direct comments concerning the accuracy of the information collection burden estimate and any suggestions for reducing the burden to Secretary, Securities and Exchange Commission, 450 Fifth Street, NW, Washington, DC 20549-0609. The OMB has reviewed this collection of information under the clearance requirements of 44 U.S.C. § 3507.
Item 1. Report to Stockholders.

ANNUAL REPORT OCTOBER 31, 2014
1301 Avenue of the Americas (6th Ave.), 35th Floor New York, New York 10019 www.direxioninvestments.com
Direxion Indexed Commodity Strategy Fund (Consolidated)
Direxion/Wilshire Dynamic Fund
Direxion Indexed Managed Futures Strategy Fund (Consolidated)
Direxion Indexed CVT Strategy Fund
(Formerly Direxion Indexed Synthetic Convertible Strategy Fund)
Letter to Shareholders | | | 4 | | |
| Performance Summary | | | 8 | | |
| Expense Example | | | 12 | | |
| Expense Example Table | | | 13 | | |
| Allocation of Portfolio Holdings | | | 14 | | |
| Schedules of Investments | | | 15 | | |
| Statements of Assets and Liabilities | | | 20 | | |
| Statements of Operations | | | 22 | | |
| Statements of Changes in Net Assets | | | 23 | | |
| Financial Highlights | | | 25 | | |
| Notes to the Financial Statements | | | 27 | | |
Report of Independent Registered Public
Accounting Firm | | | 40 | | |
| Supplemental Information (Unaudited) | | | 41 | | |
Investment Advisory Agreement Approvals
(Unaudited) | | | 42 | | |
| Trustees and Officers | | | 45 | | |
Help Preserve the Environment – Go Green!
Go paperless with Direxion e-Delivery – a service allowing shareholders to reduce clutter with full online access to regulatory documents. Begin the preservation process with e-delivery.
With Direxion e-Delivery you can:
• Receive email notifications when your most recent shareholder communications are available for review.
• Access prospectuses, annual reports and semiannual reports online.
It's easy to enroll:
1. Visit www.direxioninvestments.com/edelivery
2. Follow the simple enrollment instructions
If you have questions about Direxion e-Delivery services, contact one of our shareholder representatives at 800-851-0511.


Dear Shareholders,
This Annual Report for the Direxion Funds covers the period from November 1, 2013 to October 31, 2014, (the "Annual Period").
Market Review:
The last year added to an established financial market history of volatility upswings taking place in the months of September and October. Equity markets around the world corrected during the first two weeks of October 2014, erasing gains accumulated earlier in the year. The change in market sentiment was driven mainly by growing concerns about global economic growth amid soft data out of Europe, Japan and China at a time when the U.S. Federal Reserve was concluding an historic period of accommodative monetary policy. High-yield debt and commodities added to losses begun in late June while developed country government bonds and the U.S. dollar provided safe havens.
Fortunately, it wasn't too long before the equity market found firmer footing. Major stock markets regained most of their losses by the end of the Annual Period with the S&P 500 Index posting a solid 17% gain following last year's 27% return, and the Tech-laden NASDAQ Index marking a 14-year high. Each fixed income sector gained ground during the month of October but high yield bonds only partially recovered losses established earlier in the Annual Period to end with a return near 5% (as measured by the iBoxx HY Index) and close to that of the 10-year Treasury. WTI Crude Oil and Brent Crude Oil moved significantly lower in October taking their performances in the Annual Period to -18% and -23%, respectively.
Peering ahead, most economists are forecasting slightly faster U.S. and global economic growth in 2015 than in 2014. The U.S. economy has proved itself to be durable the past two quarters and is expected to continue to benefit from supportive fiscal and monetary backdrops in the year ahead. Japan's economy has contracted the past two quarters and is seen as a drag on the global economy. On October 7, the International Monetary Fund shaved its global economic growth forecast to 3.3% in 2014 and 3.8% in 2015. Translating the economic outlook to the financial markets, Wall Street research analysts are forecasting S&P 500 earnings per share growth of 10.7% in the year ahead according to Bloomberg LLP.
As a new annual period begins, short and medium term risks that could reduce confidence in the investment outlook includes geopolitical risks, slowing growth in emerging market economies as they mature, the legacy of high debt burdens, unemployment and mediocre long-term growth prospects in several developed economies, and the prospect of higher interest rates at some point in the future.
Fund Performance Review:
The Direxion Indexed Managed Futures Strategy Fund (the "Managed Futures Fund") seeks to match, after expenses, the return of the Auspice Managed Futures Index, a long/short managed futures index. The Auspice Managed Futures Index aims to capture upward and downward trends in the commodity and financial markets while attempting to carefully manage risk. The Auspice Managed Futures Index uses a quantitative methodology to track either long or short positions in a diversified portfolio of twenty-one exchange traded futures which track the energy, metal, agricultural, interest rate, and currency sectors. It attempts to incorporate dynamic risk management and contract rolling methods to take advantage of price anomalies across different tenors and maturities (expiration dates) of futures contracts. During the Annual Period, the Auspice Managed Futures Index returned 5.60%, while the Managed Futures Fund's Class A returned 3.86%.
The Managed Futures Fund posted modest gains for the Annual Period but the year really had two distinct halves with choppy markets alongside low volatility leading to negative performance in the first half and steady positive performance taking root in the second half amid higher volatility and clearer trends. The Managed Futures Fund faced early headwinds in Agricultural, Interest Rate and Currencies as the Annual Period commenced. In January, the Metals sector corrected. A number of trend reversals took place in the first three months of 2014 and the Managed Futures Fund ended March 75% long. Volatility reached low levels in many asset classes in the spring but Cotton and Grains prices moved sharply lower in
DIREXION ANNUAL REPORT
4
May. Fortunes began to turn upward in June. Volatility peaked and Energy prices rose, with Crude making a new high for the year. In July the fund shifted to be more negative on Currencies and Commodities. Short positions in Corn, Copper, Wheat and Sugar helped gains in the Agricultural sector more than make up for losses in Energy, Metals and Currencies. A rally in the US dollar and lower rates aided the Managed Futures Fund in August. Broad-based volatility gains gave way to beneficial trends in Currencies and Commodities in September. The year ended well for the fund with four of five sectors of the index – Energy, Metals, Interest Rates and Currencies – adding to performance. The Managed Futures Fund ended the Annual Period positioned for lower Commodity prices and Interest Rates alongside a stronger US dollar.
The Direxion Indexed Commodity Strategy Fund (the "Commodity Fund") seeks to match, after expenses, the return of the Auspice Broad Commodity Index, a long/flat commodities index. A long/flat approach allows the Commodity Fund to attempt to take advantage of higher commodity prices, and at the same time shift into a cash position of an individual commodity that shows a downward trend in price. The Auspice Broad Commodity Index attempts to capture upward trends in the commodity markets while minimizing risk during down trends. The Auspice Broad Commodity Index will use a quantitative methodology to track either long or flat positions in a diversified portfolio of twelve commodity futures which cover the energy, metal, and agricultural sectors. It attempts to incorporate dynamic risk management and contract rolling methods. During the Annual Period, the Auspice Broad Commodity Index returned -7.62%, while the Commodity Fund's Class A returned -8.81%.
The Direxion Indexed Commodity Strategy Fund experienced choppy but flat performance in the first half of the Annual Period followed by losses in the second half of the period that were stopped out by the strategy's long-flat methodology while the peer group continued to post losses as the Annual Period ended. A rally in the Energy sector ensued as winter got underway. Geopolitical tensions, cold weather and drought concerns helped the Commodity Fund post gains in all three sectors – Energy, Metals and Agriculture – even though half the positions were flat in February. This proved to be the highpoint for the Annual Period. The Commodity Fund faced losses in March but firming prices in general led to the fund holding 9 long positions out of a possible 12 at month's end. This led to gains in April. In May the Commodity Fund suffered as Agricultural prices moved sharply lower, especially Corn and Wheat. Markets then calmed down until most commodities sold off aggressively in July leaving the strategy with just 4 long positions. Further commodity price softness took the fund to just 2 long positions in August and a completely flat stance in September which proved beneficial in October.
The Direxion/Wilshire Dynamic Fund (the "Wilshire Fund") seeks capital appreciation through the use of built-in tactical strategies to attempt to capitalize on short-term market inefficiencies and is designed for investors seeking to outperform a traditional strategic (long-term only) asset allocation approach. To achieve its investment objective, the Wilshire Fund combines a strategic asset allocation with a "tactical overlay" to position the Wilshire Fund defensively or aggressively, depending upon the outlook of the Wilshire Associates Incorporated (the "Sub-Adviser"). Under normal circumstances, the Wilshire Fund is managed by Rafferty Asset Management, LLC (the "Adviser") pursuant to the Sub-Adviser's traditional asset allocation model. This model allocates approximately 60% of the Wilshire Fund's total assets to equity securities and 40% to fixed income securities, with a tactical overlay to increase or decrease the Fund's risk exposure based on the Sub-adviser's outlook for the market. The Sub-Adviser's tactical model evaluates asset class allocations on a monthly basis. In response to market conditions, the Sub-Adviser may recommend that the Adviser rebalance the Wilshire Fund's portfolio, use short positions and/or employ leverage in its tactical allocations. For the Annual Period, the Wilshire Fund's Class A returned 3.51%, as compared to a total net return of 8.67% from the MSCI World Index, 4.14% for the Barclays Capital Aggregate Bond Index and 6.86% for a 60:40 respective composite of the two.
The Wilshire Fund's allocation mix within equities was the largest detractor to relative performance during the Annual Period, as developed international equities were favored relative to U.S. equities. Overweight allocations to high yield and tactical positioning in developed market debt also detracted from relative performance. Conversely, an underweight allocation to investment grade fixed income early in the period added value, as did the Wilshire Fund's systematic reduction of its higher quality fixed income underweight position throughout the Annual Period.
Over the course of the Annual Period, the Wilshire Fund made a number of tactical changes, a few of which are highlighted here. In December 2013 the Wilshire Fund decreased its position in non-U.S. fixed income to underweight and increased its already overweight stance in non-U.S. equities as the European Central Bank affirmed its accommodative policy stance
DIREXION ANNUAL REPORT
5
by lowering key interest rates by 0.25%. In March, the Wilshire Fund consolidated its EAFE exposure through use of the iShares MSCI EAFE ETF rather than through specific country/regional ETFs. In April the Wilshire Fund shifted to a neutral stance between equities and Fixed Income after several months of favoring equities. In September the Fund shifted to an overweight position in emerging market equities and in October the Wilshire Fund moved to favor large cap equities over small cap equities.
The Direxion Indexed CVT Strategy Fund seeks investments results, before fees and expenses, which track the performance of the QES Synthetic Convertible Index. The QES Synthetic Convertible Index seeks to replicate the total return of the U.S. convertible bond market while also providing the potential for added liquidity and transparency and freedom from capital constraints that may impact convertible bond strategies. The QES Synthetic Convertible Index is designed to capture high correlation and similar overall returns to the convertible bond universe by investing in liquid market instruments with comparable characteristics to convertible bonds.
The Direxion Indexed CVT Strategy Fund returned 11.45% from its February 5, 2014 inception date through the end of the Annual Period with the fund's high point taking place on July 3, 2014, the same date that volatility bottomed, as measured by the Chicago Board Options Exchange SPX Volatility Index, best known as the VIX Index. The QES Synthetic Convertible Index returned 13.60% over the same period.
As always, we thank you for using the Direxion Funds and we look forward to our mutual success.
Regards,

| | 
| |
Eric Falkeis | | Patrick Rudnick | |
Principal Executive Officer | | Principal Financial Officer | |
The performance data quoted represents past performance; past performance does not guarantee future results. The investment return and principal value of an investment will fluctuate and an investor's shares, when redeemed, may be worth more or less than their original cost. Current performance may be higher or lower than the performance data quoted. To obtain performance data current to the most recent month-end, please call toll-free, 1.800.851.0511, or visit www.direxioninvestments.com.
An investment in the Funds involves risk, including the possible loss of principal. There is no guarantee the Funds will achieve their objective. The Funds are non-diversified and include risks associated with concentration risk which results from the Funds' investments in a particular industry or sector and can increase volatility over time. Diversification does not ensure a profit nor guarantee against loss. For certain Funds the performance of the portfolio is based upon the price movements of a physical commodity which may be subject to greater volatility. Certain Funds performance is linked to daily performance of the spot price of the exchange rate in foreign currencies which can be highly volatile due to political, economic and legal factors the Fund cannot control. The use of derivatives may subject the Funds to market risks that may cause their prices to fluctuate over time and may result in larger losses or smaller gains than investing in other financial instruments. Leverage by the Funds can accelerate the velocity of potential losses. Some Funds use investment techniques that may be considered aggressive and may entail a significantly higher than normal risk. For a detailed explanation of these risks, please read the prospectus. An investment in any of the Direxion Funds is subject to a number of risks that could affect the value of its shares. It is important that investors closely review and understand these risks before making an investment.
An investor should consider the investment objectives, risks, charges and expenses of the Direxion Funds carefully before investing. The prospectus contains this and other information about the Direxion Funds. To obtain a
DIREXION ANNUAL REPORT
6
prospectus, please call the Direxion Funds at 1-800-851-0511 or visit www.direxioninvestments.com. The prospectus should be read carefully before investing.
The views in this report were those of the Adviser as of October 31, 2014 and may not reflect their views on the date this report is first published or anytime thereafter. These views are intended to assist shareholders of the Fund in understanding their investments in the Fund and do not constitute investment advice.
The total annual fund operating expense ratios of the Direxion Indexed Managed Futures Strategy Fund Class A, Direxion Indexed Commodity Strategy Fund Class A, Direxion/Wilshire Dynamic Fund Class A and Direxion Indexed CVT Strategy Fund is 1.45%, 1.26%, 1.43% and 1.51%, respectively, gross of any fee, waivers or expense reimbursements.
The total annual fund operating expense ratios include Acquired Fund Fees and Expenses, indirect fees and expenses the Funds incur that are required to be disclosed. Without Acquired Fund Fees and Expenses, total annual operating expense ratios of the Direxion Indexed Managed Futures Strategy Fund Class A, Direxion Indexed Commodity Strategy Fund Class A, Direxion/Wilshire Dynamic Fund Class A and Direxion Indexed CVT Strategy Fund is 1.45%, 1.26%, 1.16% and 1.35% , respectively. Investment performance reflects fee waivers in effect. In the absence of such waivers, total return would be reduced. The Adviser has contractually agreed to waive expenses of the Funds through September 1, 2016.
The Auspice Managed Futures Index aims to capture upward and downward trends in the commodity and financial markets. The Index will use a quantitative methodology to track either long or short positions in a diversified portfolio of 21 exchange-traded futures which cover the energy, metal, agricultural, interest rate, and currency sectors.
The Auspice Broad Commodity Index aims to capture upward trends in the commodity markets while minimizing risk during downtrends. The index will use a quantitative methodology to track either long or flat positions in a diversified portfolio of 12 commodity futures which cover the energy, metal, and agricultural sectors.
The QES Synthetic Convertible Index seeks to replicate the total return of the US convertible bond market while also providing the potential for added liquidity and transparency and freedom from capital constraints that may impact convertible bond strategies.
The MSCI World Index is a free float-adjusted market capitalization weighted index that is designed to measure the equity market performance of developed markets. As of December 31, 2013, the MSCI World Index consisted of the following 24 developed market country indices: Australia, Austria, Belgium, Canada, Denmark, Finland, France, Germany, Greece, Hong Kong, Ireland, Israel, Italy, Japan, Netherlands, New Zealand, Norway, Portugal, Singapore, Spain, Sweden, Switzerland, the United Kingdom and the United States.
The Barclays Capital U.S. Aggregate Bond Index is an unmanaged, market value weighted index of investment grade, fixed-rate debt issues, including government, corporate, asset-backed, and mortgage-backed securities, with maturities of at least one year.
Please note that you cannot invest directly in an index, although you may invest in the underlying securities represented in the index. Index returns are adjusted to reflect the reinvestment of dividends on securities in the index but do not reflect the expenses of the Fund.
Distributed by: Rafferty Capital Markets, LLC
DIREXION ANNUAL REPORT
7
Direxion Indexed Commodity Strategy Fund (Consolidated)
Performance Summary (Unaudited)
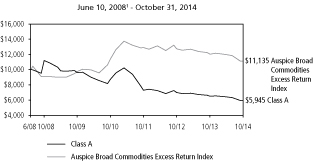
Class A
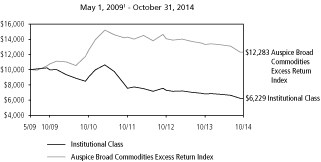
Institutional Class
Class C

These charts illustrate the performance of a hypothetical $10,000 investment made on the inception date of each Fund class, and is not intended to imply any future performance. The returns shown do not reflect the deduction or taxes that a shareholder would pay on fund distributions or the redemption of fund shares. The performance of the Auspice Broad Commodity Index, the Fund's benchmark, does not reflect the deduction of fees associated with a mutual fund, such as investment management fees. Investors cannot invest directly in an index, although they can invest in its underlying securities.
An up-front sales charge of 5.50% is associated with the purchase of Class A shares of the Fund. Prior to February 1, 2012, the Class A shares were called Investor Class shares. On February 1, 2012, all Investor Class shares were converted to Class A shares. Those investors whose Investor Class shares were converted to Class A Shares were not charged this sales charge.
The Fund may impose a 1.00% redemption fee on Class A and Institutional Class shares redeemed (through sales or exchanges) within 30 days of the date of purchase. Performance data does not reflect the redemption fee. If reflected, total returns would be reduced.
The Fund imposes a 1.00% contingent deferred sales charge of the net amount of the redemption of Class C shares if redeemed within 12 months of purchase.
The performance data shown represents past performance and does not guarantee future results.
| | | Average Annual Total Return2 | |
| | | 1 Year | | 3 Year | | 5 Year | | Since Inception | |
Class A | | | (8.81 | )% | | | (6.58 | )% | | | (9.18 | )% | | | (7.81 | )% | |
Auspice Broad
Commodities
Excess Return
Index | | | (7.62 | )% | | | (4.86 | )% | | | 2.68 | % | | | 1.70 | % | |
| | | Average Annual Total Return2 | |
| | | 1 Year | | 3 Year | | 5 Year | | Since Inception | |
Institutional Class | | | (8.58 | )% | | | (6.36 | )% | | | (8.96 | )% | | | (8.24 | )% | |
Auspice Broad
Commodities
Excess Return
Index | | | (7.62 | )% | | | (4.86 | )% | | | 2.68 | % | | | 3.81 | % | |
| | | Average Annual Total Return2 | |
| | | 1 Year | | 3 Year | | 5 Year | | Since Inception | |
Class C3 | | | (9.50 | )% | | | (7.25 | )% | | | N/A | | | | (8.56 | )% | |
Auspice Broad
Commodities
Excess Return
Index | | | (7.62 | )% | | | (4.86 | )% | | | N/A | | | | 2.44 | % | |
Market Exposure
Investment Type | | Percent of
Net Assets | |
Futures Contracts | | | 0.0 | % | |
Total Exposure | | | 0.0 | % | |
"Market Exposure" includes the value of total investments (including the contract value of any derivatives) and excludes any short-term investments and cash equivalents divided by net assets.
1 Commencement of operations.
2 As of October 31, 2014.
3 These returns do not include the contingent deferred sales charge. Had this sales charge been included the 1 year total return would be (10.41)%.
DIREXION ANNUAL REPORT
8
Direxion/Wilshire Dynamic Fund
Performance Summary (Unaudited)
Class A

Class C
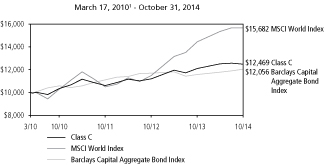
These charts illustrate the performance of a hypothetical $10,000 investment made on the inception date of each Fund class, and is not intended to imply any future performance. The returns shown do not reflect the deduction or taxes that a shareholder would pay on fund distributions or the redemption of fund shares. The performance of the MSCI World Index and Barclays Capital Aggregate Bond Index does not reflect the deduction of fees associated with a mutual fund, such as investment management fees. Investors cannot invest directly in an index, although they can invest in its underlying securities.
An up-front sales charge of 5.50% is associated with the purchase of Class A shares of the Fund. Prior to February 1, 2012, the Class A shares were called Investor Class shares. On February 1, 2012, all Investor Class shares were converted to Class A shares. Those investors whose Investor Class shares were converted to Class A Shares were not charged this sales charge.
The Fund may impose a 1.00% redemption fee on Class A shares redeemed (through sales or exchanges) within 30 days of the date of purchase. Performance data does not reflect the redemption fee. If reflected, total returns would be reduced.
The Fund imposes a 1.00% contingent deferred sales charge of the net amount of the redemption of Class C shares if redeemed within 12 months of purchase.
The performance data shown represents past performance and does not guarantee future results.
| | | Average Annual Total Return2 | |
| | | 1 Year | | 3 Year | | 5 Year | | Since Inception | |
Class A | | | 3.69 | % | | | 6.35 | % | | | 6.60 | % | | | 12.16 | % | |
MSCI World Index | | | 8.67 | % | | | 14.37 | % | | | 11.41 | % | | | 19.19 | % | |
Barclays Capital
Aggregate Bond
Index | | | 4.14 | % | | | 2.73 | % | | | 4.22 | % | | | 5.00 | % | |
| | | Average Annual Total Return2 | |
| | | 1 Year | | 3 Year | | Since Inception | |
Class C3 | | | 2.92 | % | | | 5.56 | % | | | 4.89 | % | |
MSCI World Index | | | 8.67 | % | | | 14.37 | % | | | 10.22 | % | |
Barclays Capital Aggregate
Bond Index | | | 4.14 | % | | | 2.73 | % | | | 4.13 | % | |
Market Exposure
Investment Type | | Percent of
Net Assets | |
Investment Companies | | | 85.1 | % | |
Swap Contracts | | | 11.1 | % | |
Total Exposure | | | 96.2 | % | |
"Market Exposure" includes the value of total investments (including the contract value of any derivatives) and excludes any short-term investments and cash equivalents divided by net assets.
1 Commencement of operations.
2 As of October 31, 2014.
3 These returns do not include the contingent deferred sales charge. Had this sales charge been included the 1 year total return would be 1.89%.
DIREXION ANNUAL REPORT
9
Direxion Indexed Managed Futures Strategy Fund (Consolidated)
Performance Summary (Unaudited)
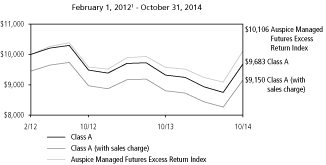
Class A
Institutional Class
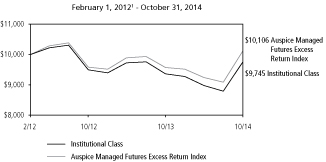
Class C
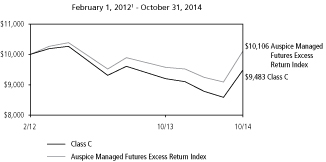
These charts illustrate the performance of a hypothetical $10,000 investment made on the inception date of each Fund class, and is not intended to imply any future performance. The returns shown do not reflect the deduction or taxes that a shareholder would pay on fund distributions or the redemption of fund shares. The performance of the Auspice Managed Futures Excess Return Index, the Fund's benchmark, does not reflect the deduction of fees associated with a mutual fund, such as investment management fees. Investors cannot invest directly in an index, although they can invest in its underlying securities.
An up-front sales charge of 5.50% is associated with the purchase of Class A shares of the Fund.
The Fund may impose a 1.00% redemption fee on Class A and Institutional Class shares redeemed (through sales or exchanges) within 30 days of the date of purchase. Performance data does not reflect the redemption fee. If reflected, total returns would be reduced.
The Fund imposes a 1.00% contingent deferred sales charge of the net amount of the redemption of Class C shares if redeemed within 12 months of purchase.
The performance data shown represents past performance and does not guarantee future results.
| | | Average Annual Total Return2 | |
| | | 1 Year | | Since Inception | |
Class A | | | 3.86 | % | | | (1.17 | )% | |
Class A (with sales charge) | | | (1.85 | )% | | | (3.18 | )% | |
Auspice Managed Futures Excess
Return Index | | | 5.60 | % | | | 0.39 | % | |
| | | Average Annual Total Return2 | |
| | | 1 Year | | Since Inception | |
Institutional Class | | | 4.14 | % | | | (0.94 | )% | |
Auspice Managed Futures Excess
Return Index | | | 5.60 | % | | | 0.39 | % | |
| | | Average Annual Total Return2 | |
| | | 1 Year | | Since Inception | |
Class C3 | | | 3.07 | % | | | (1.92 | )% | |
Auspice Managed Futures Excess
Return Index | | | 5.60 | % | | | 0.39 | % | |
Market Exposure
Investment Type | | Percent of
Net Assets | |
Futures Contracts | | | (113.7 | )% | |
Total Exposure | | | (113.7 | )% | |
"Market Exposure" includes the value of total investments (including the contract value of any derivatives) and excludes any short-term investments and cash equivalents divided by net assets.
1 Commencement of operations.
2 As of October 31, 2014.
3 This return does not include the contingent deferred sales charge. Had this sales charge been included the 1 year total return would be 2.04%.
DIREXION ANNUAL REPORT
10
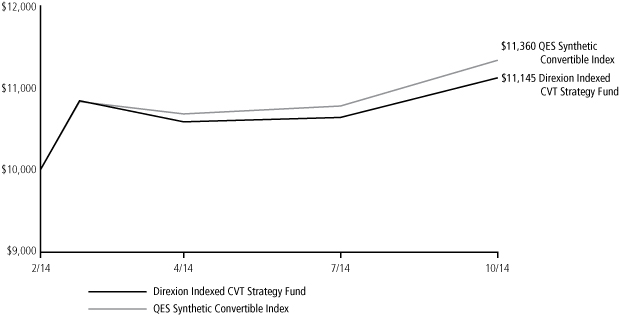
Direxion Indexed CVT Strategy Fund
February 5, 20141 - October 31, 2014 (Unaudited)
Investment Objective: Seeks investment results, before fees and expenses, that track the performance of the QES Synthetic Convertible Index. The QES Synthetic Convertible Index seeks to replicate the total return of the U.S. Convertible bond market.
| | | Average Annual Total Return2 | |
| | | Since Inception | |
Direxion Indexed CVT Strategy Fund | | | 11.45 | % | |
QES Synthetic Convertible Index | | | 13.60 | % | |
This chart illustrates the performance of a hypothetical $10,000 investment made on the Fund's inception, and is not intended to imply any future performance. The returns shown do not reflect the deduction of taxes that a shareholder would pay on fund distributions of the redemption of fund shares. The performance of the QES Synthetic Convertible Index does not reflect the deduction of fees associated with a mutual fund, such as investment management fees. Investors cannot invest directly in an index, although they can invest in its underlying securities.
The performance data shown represents past performance and does not guarantee future results.
Market Exposure2
Investment Type | | Percent of
Net Assets | |
Investment Companies | | | 36.3 | % | |
Swap Contracts | | | 92.6 | % | |
Futures Contracts | | | 11.3 | % | |
Total Exposure | | | 140.2 | % | |
"Market Exposure" includes the value of total investments (including the contract value of any derivatives) and excludes any short-term investments and cash equivalents divided by Net Assets.
1 Commencement of operations.
2 As of October 31, 2014.
DIREXION ANNUAL REPORT
11
October 31, 2014 (Unaudited)
As a shareholder of a mutual fund, you incur two types of costs: (1) transaction costs, including sales charges (loads) on purchase payments, reinvested dividends, or other distributions; redemption fees; and exchange fees; and (2) ongoing costs, including management fees; distribution and/or service fees; and other fund expenses. This example is intended to help you understand your ongoing costs (in dollars) of investing in a fund and to compare costs with the ongoing costs of investing in other mutual funds.
The example is based on an investment of $1,000 invested at the beginning of the period and held the entire period (May 1, 2014 — October 31, 2014).
Actual expenses
The first line of the following table provides information about actual account values and actual expenses. You will be charged a sales charge of 5.50% as a percentage of the offering price on your purchases of Class A shares of the Fund. You will be charged a redemption fee equal to 1.00% of the net amount of the redemption if you redeem Class A or Institutional Class shares of the Fund that have been held for less than 90 days. You may be charged a contingent deferred sales charge of 1.00% of the net amount of the redemption if you redeem Class A shares of the Fund within 24 months of purchase and a contingent deferred sales charge of 1.00% on Class C shares of the Fund within 12 months of purchase. You may use the information in this line, together with the amount you invested, to estimate the expenses that you paid over the period. Simply divide your account value by $1,000 (for example, an $8,600 account value divided by $1,000 = 8.6), then multiply the result by the number in the first line under the heading entitled "Expenses Paid During Period" to estimate the expenses you paid on your account during this period.
Hypothetical example for comparison purposes
The second line of the following table provides information about hypothetical account values and hypothetical expenses based on the Funds' actual expense ratios and an assumed rate of return of 5% per year before expenses, which is not the Funds' actual return. The hypothetical account values and expenses may not be used to estimate the actual ending account balance or expenses you paid for the period. You may use this information to compare the ongoing costs of investing in the Funds and other funds. To do so, compare this 5% hypothetical example with the 5% hypothetical examples that appear in the shareholder reports of the other funds.
Please note that the expenses shown in the table are meant to highlight your ongoing costs only and do not reflect any transactional costs, such as wire transfers, redemption fees, sales charges (loads), returned checks or stop payment orders. Therefore, the second line of the table is useful in comparing ongoing costs only, and will not help you determine the relative costs of owning different funds. In addition, if these transactional costs were included, your costs would have been higher.
DIREXION ANNUAL REPORT
12
October 31, 2014 (Unaudited)
| | | Expense
Ratio1 | | Beginning
Account Value
May 1, 2014 | | Ending
Account Value
October 31, 2014 | | Expenses
Paid During
Period2 | |
Direxion Indexed Commodity Strategy
Fund (Consolidated) Class A | |
Based on actual fund return | | | 1.26 | % | | $ | 1,000.00 | | | $ | 906.70 | | | $ | 6.06 | | |
Based on hypothetical 5% return | | | 1.26 | % | | | 1,000.00 | | | | 1,018.85 | | | | 6.41 | | |
Direxion Indexed Commodity Strategy
Fund (Consolidated) Institutional Class | |
Based on actual fund return | | | 1.01 | % | | | 1,000.00 | | | | 908.10 | | | | 4.86 | | |
Based on hypothetical 5% return | | | 1.01 | % | | | 1,000.00 | | | | 1,020.11 | | | | 5.14 | | |
Direxion Indexed Commodity Strategy
Fund (Consolidated) Class C | |
Based on actual fund return | | | 2.01 | % | | | 1,000.00 | | | | 903.50 | | | | 9.64 | | |
Based on hypothetical 5% return | | | 2.01 | % | | | 1,000.00 | | | | 1,015.07 | | | | 10.21 | | |
Direxion/Wilshire Dynamic Fund Class A | |
Based on actual fund return | | | 1.16 | % | | | 1,000.00 | | | | 999.60 | | | | 5.85 | | |
Based on hypothetical 5% return | | | 1.16 | % | | | 1,000.00 | | | | 1,019.36 | | | | 5.90 | | |
Direxion/Wilshire Dynamic Fund Class C | |
Based on actual fund return | | | 1.91 | % | | | 1,000.00 | | | | 995.90 | | | | 9.61 | | |
Based on hypothetical 5% return | | | 1.91 | % | | | 1,000.00 | | | | 1,015.58 | | | | 9.70 | | |
Direxion Indexed Managed Futures Strategy
Fund (Consolidated) Class A | |
Based on actual fund return | | | 1.45 | % | | | 1,000.00 | | | | 1,084.30 | | | | 7.62 | | |
Based on hypothetical 5% return | | | 1.45 | % | | | 1,000.00 | | | | 1,017.90 | | | | 7.38 | | |
Direxion Indexed Managed Futures Strategy
Fund (Consolidated) Institutional Class | |
Based on actual fund return | | | 1.20 | % | | | 1,000.00 | | | | 1,085.50 | | | | 6.31 | | |
Based on hypothetical 5% return | | | 1.20 | % | | | 1,000.00 | | | | 1,019.16 | | | | 6.11 | | |
Direxion Indexed Managed Futures Strategy
Fund (Consolidated) Class C | |
Based on actual fund return | | | 2.20 | % | | | 1,000.00 | | | | 1,080.00 | | | | 11.53 | | |
Based on hypothetical 5% return | | | 2.20 | % | | | 1,000.00 | | | | 1,014.11 | | | | 11.17 | | |
Direxion Indexed CVT Strategy Fund Investor Class | |
Based on actual fund return | | | 1.28 | % | | | 1,000.00 | | | | 1,052.00 | | | | 6.62 | | |
Based on hypothetical 5% return | | | 1.28 | % | | | 1,000.00 | | | | 1,018.75 | | | | 6.51 | | |
1 Annualized.
2 Expenses are equal to the Fund's annualized expense ratio, multiplied by the average account value over the period, multiplied by the number of days in period of May 1, 2014 to October 31, 2014, then divided by 365.
DIREXION ANNUAL REPORT
13
Allocation of Portfolio Holdings
| | | Cash* | | Investment
Companies | | Futures | | Swaps | | Total | |
Direxion Indexed Commodity Strategy Fund (Consolidated) | | | 100 | % | | | — | | | | — | | | | — | | | | 100 | % | |
Direxion/Wilshire Dynamic Fund | | | 15 | % | | | 85 | % | | | — | | | | 0 | %** | | | 100 | % | |
Direxion Indexed Managed Futures Strategy Fund (Consolidated) | | | 91 | % | | | — | | | | 9 | % | | | — | | | | 100 | % | |
Direxion Indexed CVT Strategy Fund | | | 63 | % | | | 36 | % | | | 0 | %** | | | 1 | % | | | 100 | % | |
Allocation of Portfolio Holdings reflects percentages of net assets.
* Cash, cash equivalents and other assets less liabilities.
** Percentage is less than 0.5%.
DIREXION ANNUAL REPORT
14
Direxion Indexed Commodity Strategy Fund (Consolidated)
| | | | | Value | |
No reportable investments. | |
| | | TOTAL INVESTMENTS
(Cost $0) - 0.0% | | $ | — | | |
| | | Other Assets in Excess of
Liabilities - 100.0% | | | 62,124,557 | | |
| | | TOTAL NET ASSETS - 100.0% | | $ | 62,124,557 | | |
Percentages are stated as a percent of net assets.
The accompanying notes are an integral part of these financial statements.
DIREXION ANNUAL REPORT
15
Direxion/Wilshire Dynamic Fund
Shares | | | | Value | |
INVESTMENT COMPANIES - 85.1% | | | |
| | 6,906 | | | iShares 7-10 Year Treasury
Bond ETF | | $ | 725,268 | | |
| | 3,315 | | | iShares Core U.S. Aggregate
Bond ETF | | | 364,915 | | |
| | 50,244 | | | iShares MSCI EAFE ETF | | | 3,213,104 | | |
| | 16,595 | | | iShares MSCI Emerging
Markets ETF | | | 699,479 | | |
| | 6,837 | | | Market Vectors Emerging Markets
Local Currency Bond ETF | | | 156,636 | | |
| | 22,561 | | | SPDR Barclays High Yield Bond ETF | | | 910,562 | | |
| | 2,643 | | | Vanguard Emerging Markets
Government Bond ETF | | | 210,541 | | |
| | 14,896 | | | Vanguard S&P 500 ETF | | | 2,754,717 | | |
| | 2,004 | | | Vanguard Small-Cap ETF | | | 231,723 | | |
| | | | | TOTAL INVESTMENT COMPANIES
(Cost $9,155,378) | | $ | 9,266,945 | | |
| | | | | TOTAL INVESTMENTS
(Cost $9,155,378) - 85.1% | | $ | 9,266,945 | | |
| | | | | Other Assets in Excess of
Liabilities - 14.9% (a) | | | 1,617,685 | | |
| | | | | TOTAL NET ASSETS - 100.0% | | $ | 10,884,630 | | |
Percentages are stated as a percent of net assets.
(a) $200,000 of cash is pledged as collateral for swap contracts.
Long Equity Swap Contracts
October 31, 2014
Counterparty | | Reference Entity | | Number of
Contracts | | Notional
Amount | | Interest
Rate
Received/
(Paid) | | Termination
Date | | Unrealized
Appreciation/
(Depreciation) | |
Credit Suisse Capital, LLC | | Vanguard Total International Bond ETF | | | 22,950 | | | $ | 1,174,357 | | | | (0.504 | %) | | 7/13/2015 | | $ | 31,015 | | |
The accompanying notes are an integral part of these financial statements.
DIREXION ANNUAL REPORT
16
Direxion Indexed Managed Futures Strategy Fund (Consolidated)
| | | | | Value | |
No reportable investments. | | | |
| | | | | TOTAL INVESTMENTS
(Cost $0) - 0.0% | | $ | — | | |
| | | | | Other Assets in Excess of
Liabilities - 100.0% | | | 89,759,040 | | |
| | | TOTAL NET ASSETS - 100.0% | | $ | 89,759,040 | | |
Percentages are stated as a percent of net assets.
Long Futures Contracts
October 31, 2014
Contracts | | | | Unrealized
Appreciation/
(Depreciation) | |
| | 95 | | | U.S. 5 Year T-Note Futures
Expiring December 2014 (Underlying Face Amount at Market Value $11,345,820) | | $ | 52,308 | | |
| | 57 | | | U.S. 10 Year T-Note Futures
Expiring December 2014 (Underlying Face Amount at Market Value $7,202,484) | | | 39,083 | | |
| | 78 | | | U.S. Dollar Index Futures
Expiring December 2014 (Underlying Face Amount at Market Value $6,787,249) | | | 225,432 | | |
| | 32 | | | U.S. Long T-Bond Futures
Expiring December 2014 (Underlying Face Amount at Market Value $4,515,000) | | | 57,380 | | |
| | | | | | | $ | 374,203 | | |
Short Futures Contracts
October 31, 2014
Contracts | | | | Unrealized
Appreciation/
(Depreciation) | |
| | 44 | | | Australian Dollar Futures
Expiring December 2014 (Underlying Face Amount at Market Value $3,858,360) | | $ | 99,301 | | |
| | 55 | | | British Pound Futures
Expiring December 2014 (Underlying Face Amount at Market Value $5,494,844) | | | 39,075 | | |
| | 58 | | | Canadian Dollar Futures
Expiring December 2014 (Underlying Face Amount at Market Value $5,138,800) | | | 87,881 | | |
| | 169 | | | Copper Futures
Expiring December 2014 (Underlying Face Amount at Market Value $12,873,575) | | | (72,497 | ) | |
| | 448 | | | Corn Futures
Expiring March 2015 (Underlying Face Amount at Market Value $8,719,200) | | | (87,630 | ) | |
| | 241 | | | Cotton No. 2 Futures
Expiring December 2014 (Underlying Face Amount at Market Value $7,766,225) | | | 1,264,816 | | |
| | 37 | | | Euro FX Futures
Expiring December 2014 (Underlying Face Amount at Market Value $5,795,125) | | | 167,249 | | |
| | 97 | | | Gasoline RBOB Futures
Expiring March 2015 (Underlying Face Amount at Market Value $8,887,838) | | | (41,389 | ) | |
| | 130 | | | Gold Futures
Expiring December 2014 (Underlying Face Amount at Market Value $15,230,800) | | | 770,004 | | |
| | 46 | | | Japanese Yen Futures
Expiring December 2014 (Underlying Face Amount at Market Value $5,122,100) | | | 296,003 | | |
| | 126 | | | NY Harbor ULSD Futures
Expiring January 2015 (Underlying Face Amount at Market Value $13,269,161) | | | 1,544,336 | | |
| | 158 | | | Natural Gas Futures
Expiring January 2015 (Underlying Face Amount at Market Value $6,255,220) | | | 508,272 | | |
| | 41 | | | Silver Futures
Expiring December 2014 (Underlying Face Amount at Market Value $3,301,730) | | | 642,591 | | |
The accompanying notes are an integral part of these financial statements.
DIREXION ANNUAL REPORT
17
Direxion Indexed Managed Futures Strategy Fund (Consolidated)
Contracts | | | | Unrealized
Appreciation/
(Depreciation) | |
| | 150 | | | Soybean Futures
Expiring May 2015 (Underlying Face Amount at Market Value $7,935,000) | | $ | 10,700 | | |
| | 361 | | | Sugar No. 11 Futures
Expiring March 2015 (Underlying Face Amount at Market Value $6,485,293) | | | 593,800 | | |
| | 98 | | | WTI Crude Oil Futures
Expiring June 2015 (Underlying Face Amount at Market Value $7,861,560) | | | 1,054,598 | | |
| | 289 | | | Wheat Futures
Expiring March 2015 (Underlying Face Amount at Market Value $7,886,088) | | | 389,791 | | |
| | | | | | | $ | 7,266,901 | | |
The accompanying notes are an integral part of these financial statements.
DIREXION ANNUAL REPORT
18
Direxion Indexed CVT Strategy Fund
Shares | | | | Value | |
INVESTMENT COMPANIES - 36.3% | |
| | 701,431 | | | iShares iBoxx $ High Yield
Corporate Bond ETF | | $ | 64,903,410 | | |
| | | TOTAL INVESTMENT COMPANIES
(Cost $64,914,505) | | $ | 64,903,410 | | |
| | | TOTAL INVESTMENTS
(Cost $64,914,505) - 36.3% | | $ | 64,903,410 | | |
| | | Other Assets in Excess of
Liabilities - 63.7% (a)(b) | | | 114,019,697 | | |
| | | TOTAL NET ASSETS - 100.0% | | $ | 178,923,107 | | |
Percentages are stated as a percent of net assets.
(a) Includes $21,896,009 cash segregated as collateral for swap contracts.
(b) $145,910 of cash is pledged as collateral for futures contracts.
Long Futures Contracts
October 31, 2014
Contracts | | | | Unrealized
Appreciation/
(Depreciation) | |
| | 170 | | | U.S. 5 Year T-Note Futures
Expiring December 2014 (Underlying Face Amount at Market Value $20,303,047) | | $ | (53,051 | ) | |
Long Equity Swap Contracts
October 31, 2014
Counterparty | | Reference Entity | | Number of
Contracts | | Notional
Amount | | Interest
Rate
Received/
(Paid) | | Termination
Date | | Unrealized
Appreciation/
(Depreciation) | |
Credit Suisse International | | iShares 3-7 Year Treasury Bond ETF | | | 2,492 | | | $ | 305,520 | | | | (0.504 | %) | | 8/6/2015 | | $ | (634 | ) | |
Credit Suisse International | | iShares Russell 2000 ETF | | | 564,703 | | | | 64,328,097 | | | | (0.154 | %) | | 8/6/2015 | | | 1,492,736 | | |
Credit Suisse International | | iShares iBoxx $ Investment Grade
Corporate Bond ETF | | | 343,201 | | | | 41,020,300 | | | | (0.504 | %) | | 8/6/2015 | | | (64,701 | ) | |
Credit Suisse International | | SPDR S&P 500 ETF Trust | | | 290,170 | | | | 57,569,475 | | | | (0.504 | %) | | 8/6/2015 | | | 943,405 | | |
| | | | | | | $ | 163,223,392 | | | | | | | $ | 2,370,806 | | |
The accompanying notes are an integral part of these financial statements.
DIREXION ANNUAL REPORT
19
Statements of Assets & Liabilities
| | | Direxion Indexed
Commodity Strategy
Fund (Consolidated) | | Direxion/Wilshire
Dynamic Fund | | Direxion Indexed
Managed Futures
Strategy Fund
(Consolidated) | | Direxion Indexed CVT
Strategy Fund | |
Assets: | |
Investments, at fair value (Note 2) | | $ | — | | | $ | 9,266,945 | | | $ | — | | | $ | 64,903,410 | | |
Cash | | | 62,240,679 | | | | 901,986 | | | | 83,196,855 | | | | 54,693,439 | | |
Receivable for Fund shares sold | | | 44,947 | | | | 27,150 | | | | 273,992 | | | | 58,542,172 | | |
Receivable for investment
securities sold | | | — | | | | 4,383,865 | | | | — | | | | — | | |
Deposit at broker for futures | | | — | | | | — | | | | — | | | | 145,910 | | |
Deposit at broker for swaps | | | — | | | | 200,000 | | | | — | | | | 21,896,009 | | |
Due from broker for swaps | | | — | | | | 192 | | | | — | | | | 79,512 | | |
Unrealized appreciation on swaps | | | — | | | | 31,015 | | | | — | | | | 2,436,141 | | |
Due from broker for futures | | | — | | | | — | | | | 6,966,659 | | | | — | | |
Receivable for variation margin | | | — | | | | — | | | | 685,409 | | | | — | | |
Total Assets | | | 62,285,626 | | | | 14,811,153 | | | | 91,122,915 | | | | 202,696,593 | | |
Liabilities: | |
Payable for Fund shares redeemed | | | 102,432 | | | | 1,500 | | | | 45,064 | | | | 137,061 | | |
Payable for investment securities
purchased | | | — | | | | 3,912,974 | | | | — | | | | 22,134,143 | | |
Deposits from brokers for futures | | | — | | | | — | | | | 1,214,044 | | | | — | | |
Due to broker for swaps | | | — | | | | — | | | | — | | | | 1,375,268 | | |
Unrealized depreciation on swaps | | | — | | | | — | | | | — | | | | 65,335 | | |
Due to broker for futures | | | — | | | | — | | | | — | | | | 32,482 | | |
Payable for variation margin | | | — | | | | — | | | | — | | | | 19,933 | | |
Accrued investment advisory fees | | | 45,952 | | | | 6,877 | | | | 67,143 | | | | 2,406 | | |
Accrued operating services fees | | | 8,650 | | | | 1,467 | | | | 17,669 | | | | 4,001 | | |
Accrued distribution expenses | | | 4,035 | | | | 3,705 | | | | 19,955 | | | | 2,857 | | |
Total Liabilities | | | 161,069 | | | | 3,926,523 | | | | 1,363,875 | | | | 23,773,486 | | |
Net Assets | | $ | 62,124,557 | | | $ | 10,884,630 | | | $ | 89,759,040 | | | $ | 178,923,107 | | |
Net Assets Consist of: | |
Capital stock | | $ | 62,856,180 | | | $ | 9,440,769 | | | $ | 83,841,868 | | | $ | 180,931,632 | | |
Undistributed (accumulated) net
investment income (loss) | | | (731,623 | ) | | | 114,631 | | | | (1,037,733 | ) | | | 126,610 | | |
Undistributed (accumulated) net
realized gain (loss) | | | — | | | | 1,186,648 | | | | (686,199 | ) | | | (4,441,795 | ) | |
Net unrealized appreciation
(depreciation) on: | |
Investments | | | — | | | | 111,567 | | | | — | | | | (11,095 | ) | |
Futures | | | — | | | | — | | | | 7,641,104 | | | | (53,051 | ) | |
Swaps | | | — | | | | 31,015 | | | | — | | | | 2,370,806 | | |
Net Assets | | $ | 62,124,557 | | | $ | 10,884,630 | | | $ | 89,759,040 | | | $ | 178,923,107 | | |
Cost of Investments | | $ | — | | | $ | 9,155,378 | | | $ | — | | | $ | 64,914,505 | | |
The accompanying notes are an integral part of these financial statements.
DIREXION ANNUAL REPORT
20
Statements of Assets & Liabilities, continued
| | | Direxion Indexed
Commodity Strategy
Fund (Consolidated) | | Direxion/Wilshire
Dynamic Fund | | Direxion Indexed
Managed Futures
Strategy Fund
(Consolidated) | | Direxion Indexed CVT
Strategy Fund | |
Calculation of Net Asset Value
Per Share: | |
Class A Shares: | |
Net assets | | $ | 11,476,663 | | | $ | 8,067,662 | | | $ | 30,628,784 | | | | N/A | | |
Shares outstanding (unlimited
shares of beneficial interest
authorized, no par value) | | | 663,681 | | | | 171,182 | | | | 790,865 | | | | N/A | | |
Net asset value, redemption price
and offering price per share | | $ | 17.29 | | | $ | 47.13 | | | $ | 38.73 | | | | N/A | | |
Institutional Class Shares: | |
Net assets | | $ | 46,601,721 | | | | N/A | | | $ | 51,666,484 | | | | N/A | | |
Shares outstanding (unlimited
shares of beneficial interest
authorized, no par value) | | | 2,666,662 | | | | N/A | | | | 1,325,382 | | | | N/A | | |
Net asset value, redemption price
and offering price per share | | $ | 17.48 | | | | N/A | | | $ | 38.98 | | | | N/A | | |
Class C Shares: | |
Net assets | | $ | 4,046,173 | | | $ | 2,816,968 | | | $ | 7,463,772 | | | | N/A | | |
Shares outstanding (unlimited
shares of beneficial interest
authorized, no par value) | | | 241,414 | | | | 60,900 | | | | 196,769 | | | | N/A | | |
Net asset value, redemption price
and offering price per share | | $ | 16.76 | | | $ | 46.26 | | | $ | 37.93 | | | | N/A | | |
Investor Class Shares: | |
Net assets | | | N/A | | | | N/A | | | | N/A | | | $ | 178,923,107 | | |
Shares outstanding (unlimited
shares of beneficial interest
authorized, no par value) | | | N/A | | | | N/A | | | | N/A | | | | 4,013,639 | | |
Net asset value, redemption price
and offering price per share | | | N/A | | | | N/A | | | | N/A | | | $ | 44.5788 | | |
The accompanying notes are an integral part of these financial statements.
DIREXION ANNUAL REPORT
21
For the Year Ended October 31, 2014
| | | Direxion Indexed
Commodity Strategy
Fund (Consolidated) | | Direxion/Wilshire
Dynamic Fund | | Direxion Indexed
Managed Futures
Strategy Fund
(Consolidated) | | Direxion Indexed CVT
Strategy Fund1 | |
Investment Income: | |
Dividend income | | $ | — | | | $ | 347,756 | | | $ | — | | | $ | 337,979 | | |
Interest income | | | 20,192 | | | | 298 | | | | 25,063 | | | | 1,190 | | |
Total investment income | | | 20,192 | | | | 348,054 | | | | 25,063 | | | | 339,169 | | |
Expenses: | |
Investment advisory fees | | | 651,976 | | | | 91,341 | | | | 927,589 | | | | 125,641 | | |
Operating services fees | | | 122,724 | | | | 19,486 | | | | 244,102 | | | | 58,633 | | |
Distribution expenses — Class A
Shares | | | 79,286 | | | | 22,349 | | | | 104,198 | | | | — | | |
Distribution expenses — Class C
Shares | | | 47,011 | | | | 32,392 | | | | 62,823 | | | | — | | |
Distribution expenses — Investor
Class Shares | | | — | | | | — | | | | — | | | | 41,880 | | |
Total expenses | | | 900,997 | | | | 165,568 | | | | 1,338,712 | | | | 226,154 | | |
Less: Reimbursement of
expenses from Adviser | | | — | | | | — | | | | — | | | | (13,595 | ) | |
Net Expenses | | | 900,997 | | | | 165,568 | | | | 1,338,712 | | | | 212,559 | | |
Net investment income (loss) | | | (880,805 | ) | | | 182,486 | | | | (1,313,649 | ) | | | 126,610 | | |
Realized and unrealized gain
(loss) on investments: | |
Net realized gain (loss) on: | |
Investments | | | — | | | | 1,281,831 | | | | — | | | | (1,297,428 | ) | |
Futures | | | (7,153,920 | ) | | | — | | | | (6,059,844 | ) | | | (13,089 | ) | |
Swaps | | | — | | | | 295,393 | | | | — | | | | (3,131,278 | ) | |
| | | | (7,153,920 | ) | | | 1,577,224 | | | | (6,059,844 | ) | | | (4,441,795 | ) | |
Capital gain distributions from
regulated investment companies | | | — | | | | 2,620 | | | | — | | | | — | | |
Change in net unrealized
appreciation (depreciation) on: | |
Investments | | | — | | | | (1,243,825 | ) | | | — | | | | (11,095 | ) | |
Futures | | | 923,921 | | | | — | | | | 7,796,847 | | | | (53,051 | ) | |
Swaps | | | — | | | | (102,354 | ) | | | — | | | | 2,370,806 | | |
| | | | 923,921 | | | | (1,346,179 | ) | | | 7,796,847 | | | | 2,306,660 | | |
Net realized and unrealized
gain (loss) on investments | | | (6,229,999 | ) | | | 233,665 | | | | 1,737,003 | | | | (2,135,135 | ) | |
Net increase (decrease) in net
assets resulting from
operations | | $ | (7,110,804 | ) | | $ | 416,151 | | | $ | 423,354 | | | $ | (2,008,525 | ) | |
1 Represents the period from February 5, 2014 (commencement of operations) to October 31, 2014.
The accompanying notes are an integral part of these financial statements.
DIREXION ANNUAL REPORT
22
Statements of Changes in Net Assets
| | | Direxion Indexed Commodity
Strategy Fund (Consolidated) | | Direxion/Wilshire
Dynamic Fund | |
| | | Year Ended
October 31, 2014 | | Year Ended
October 31, 2013 | | Year Ended
October 31, 2014 | | Year Ended
October 31, 2013 | |
Increase (decrease) in net assets from: | |
Operations: | |
Net investment income (loss) | | $ | (880,805 | ) | | $ | (726,913 | ) | | $ | 182,486 | | | $ | 151,665 | | |
Net realized gain (loss) on investments | | | (7,153,920 | ) | | | (4,076,732 | ) | | | 1,577,224 | | | | 1,816,433 | | |
Capital gain distributions from regulated
investment companies | | | — | | | | — | | | | 2,620 | | | | — | | |
Change in net unrealized appreciation
(depreciation) on investments | | | 923,921 | | | | 367,034 | | | | (1,346,179 | ) | | | (436,820 | ) | |
Net increase (decrease) in net assets
resulting from operations | | | (7,110,804 | ) | | | (4,436,611 | ) | | | 416,151 | | | | 1,531,278 | | |
Distributions to shareholders: | |
Net investment income: | |
Class A Shares | | | — | | | | — | | | | (205,555 | ) | | | (356,372 | ) | |
Institutional Class Shares | | | — | | | | — | | | | — | | | | — | | |
Class C Shares | | | — | | | | — | | | | (45,371 | ) | | | (28,332 | ) | |
Net realized gains | |
Class A Shares | | | — | | | | — | | | | (380,722 | ) | | | (435,668 | ) | |
Institutional Class Shares | | | — | | | | — | | | | — | | | | — | | |
Class C Shares | | | — | | | | — | | | | (131,626 | ) | | | (89,294 | ) | |
Total distributions to shareholders | | | — | | | | — | | | | (763,274 | ) | | | (909,666 | ) | |
Capital share transactions: | |
Total increase (decrease) in net assets from
net change in capital share transactions(a) | | | 4,924,704 | | | | 12,542,768 | | | | (3,221,514 | ) | | | (19,541,371 | ) | |
Total increase (decrease) in net assets | | | (2,186,100 | ) | | | 8,106,157 | | | | (3,568,637 | ) | | | (18,919,759 | ) | |
Net assets: | |
Beginning of year | | | 64,310,657 | | | | 56,204,500 | | | | 14,453,267 | | | | 33,373,026 | | |
End of year | | $ | 62,124,557 | | | $ | 64,310,657 | | | $ | 10,884,630 | | | $ | 14,453,267 | | |
Undistributed (accumulated) net
investment income (loss), end of year | | $ | (731,623 | ) | | $ | (1,107,309 | ) | | $ | 114,631 | | | $ | 185,637 | | |
(a) Summary of capital share transactions is as follows:
| | | Direxion Indexed Commodity Strategy Fund
(Consolidated) | | Direxion/Wilshire Dynamic Fund | |
| | | Year Ended
October 31, 2014 | | Year Ended
October 31, 2013 | | Year Ended
October 31, 2014 | | Year Ended
October 31, 2013 | |
| | | Shares | | Value | | Shares | | Value | | Shares | | Value | | Shares | | Value | |
Shares sold | |
Class A Shares | | | 944,270 | | | $ | 17,788,021 | | | | 1,460,193 | | | $ | 28,995,490 | | | | 20,361 | | | $ | 952,794 | | | | 73,244 | | | $ | 3,373,883 | | |
Institutional Class
Shares | | | 2,598,064 | | | | 48,583,825 | | | | 936,060 | | | | 18,919,636 | | | | — | | | | — | | | | — | | | | — | | |
Class C Shares | | | 85,704 | | | | 1,563,848 | | | | 127,050 | | | | 2,465,371 | | | | 2,788 | | | | 128,298 | | | | 14,200 | | | | 646,137 | | |
Shares issued in
reinvestment
of distributions | |
Class A Shares | | | — | | | | — | | | | — | | | | — | | | | 12,606 | | | | 568,132 | | �� | | 14,705 | | | | 662,915 | | |
Institutional Class
Shares | | | — | | | | — | | | | — | | | | — | | | | — | | | | — | | | | — | | | | — | | |
Class C Shares | | | — | | | | — | | | | — | | | | — | | | | 3,842 | | | | 171,078 | | | | 2,611 | | | | 116,391 | | |
Shares redeemed | |
Class A Shares | | | (2,371,857 | ) | | | (43,406,540 | ) | | | (1,213,330 | ) | | | (24,120,917 | ) | | | (86,806 | ) | | | (4,039,637 | ) | | | (467,519 | ) | | | (21,104,589 | ) | |
Institutional Class
Shares | | | (978,767 | ) | | | (17,924,020 | ) | | | (603,564 | ) | | | (12,099,427 | ) | | | — | | | | — | | | | — | | | | — | | |
Class C Shares | | | (94,208 | ) | | | (1,680,430 | ) | | | (82,885 | ) | | | (1,617,385 | ) | | | (21,629 | ) | | | (1,002,179 | ) | | | (71,280 | ) | | | (3,236,108 | ) | |
Net increase (decrease) | | | 183,206 | | | $ | 4,924,704 | | | | 623,524 | | | $ | 12,542,768 | | | | (68,838 | ) | | $ | (3,221,514 | ) | | | (434,039 | ) | | $ | (19,541,371 | ) | |
The accompanying notes are an integral part of these financial statements.
DIREXION ANNUAL REPORT
23
Statements of Changes in Net Assets
| | | Direxion Indexed Managed Futures
Strategy Fund (Consolidated) | | Direxion Indexed CVT
Strategy Fund | |
| | | Year Ended
October 31, 2014 | | Year Ended
October 31, 2013 | | February 5, 20141 through
October 31, 2014 | |
Increase (decrease) in net assets from: | |
Operations: | |
Net investment income (loss) | | $ | (1,313,649 | ) | | $ | (1,161,028 | ) | | $ | 126,610 | | |
Net realized loss on investments | | | (6,059,844 | ) | | | (2,643,830 | ) | | | (4,441,795 | ) | |
Change in net unrealized appreciation on investments | | | 7,796,847 | | | | 544,874 | | | | 2,306,660 | | |
Net increase (decrease) in net assets resulting from
operations | | | 423,354 | | | | (3,259,984 | ) | | | (2,008,525 | ) | |
Distributions to shareholders: | |
Total distributions to shareholders | | | — | | | | — | | | | — | | |
Capital share transactions: | |
Total increase (decrease) in net assets from
net change in capital share transactions(a) | | | (29,062,895 | ) | | | 68,155,558 | | | | 180,931,632 | | |
Total increase (decrease) in net assets | | | (28,639,541 | ) | | | 64,895,574 | | | | 178,923,107 | | |
Net assets: | |
Beginning of year/period | | | 118,398,581 | | | | 53,503,007 | | | | — | | |
End of year/period | | $ | 89,759,040 | | | $ | 118,398,581 | | | $ | 178,923,107 | | |
Undistributed (accumulated) net investment
income (loss), end of year/period | | $ | (1,037,733 | ) | | $ | (1,025,316 | ) | | $ | 126,610 | | |
(a) Summary of capital share transactions is as follows:
| | | Direxion Indexed Managed Futures
Strategy Fund (Consolidated) | | Direxion Indexed CVT
Strategy Fund | |
| | | Year Ended
October 31, 2014 | | Year Ended
October 31, 2013 | | February 5, 20141 through
October 31, 2014 | |
| | | Shares | | Value | | Shares | | Value | | Shares | | Value | |
Shares sold | |
Class A Shares | | | 400,744 | | | $ | 14,861,557 | | | | 1,197,644 | | | $ | 46,190,131 | | | | — | | | $ | — | | |
Institutional Class Shares | | | 1,092,897 | | | | 40,710,985 | | | | 1,920,962 | | | | 73,872,859 | | | | — | | | | — | | |
Class C Shares | | | 124,926 | | | | 4,536,131 | | | | 113,273 | | | | 4,276,910 | | | | — | | | | — | | |
Investor Class Shares | | | — | | | | — | | | | — | | | | — | | | | 9,243,847 | | | | 404,680,123 | | |
Shares redeemed | |
Class A Shares | | | (1,065,260 | ) | | | (38,334,105 | ) | | | (812,137 | ) | | | (30,838,183 | ) | | | — | | | | — | | |
Institutional Class Shares | | | (1,369,662 | ) | | | (49,374,811 | ) | | | (617,808 | ) | | | (23,773,600 | ) | | | — | | | | — | | |
Class C Shares | | | (41,087 | ) | | | (1,462,652 | ) | | | (41,704 | ) | | | (1,572,559 | ) | | | — | | | | — | | |
Investor Class Shares | | | — | | | | — | | | | — | | | | — | | | | (5,230,208 | ) | | | (223,748,491 | ) | |
Net increase (decrease) | | | (857,442 | ) | | $ | (29,062,895 | ) | | | 1,760,230 | | | $ | 68,155,558 | | | | 4,013,639 | | | $ | 180,931,632 | | |
1 Commencement of operations.
The accompanying notes are an integral part of these financial statements.
DIREXION ANNUAL REPORT
24
| | | | | RATIOS TO AVERAGE NET ASSETS | |
| | | Net Asset
Value,
Beginning
of Year/
Period | | Net
Investment
Income
(Loss)1 | | Net Realized on
and Unrealized
Gain (Loss)
Investments | | Net Increase
(Decrease) in
Net Asset
Value Resulting
from Operations | | Dividends
from Net
Investment
Income | | Distributions
from
Realized
Capital Gains | | Return of
Capital
Distribution | | Total
Distributions | | Redemption
Fees Paid
to Fund | | Net
Asset
Value,
End of
Year/
Period | | Total
Return2 | | Net
Assets,
End of
Year/
Period
(,000) | | Total
Expenses3 | | Net
Expenses3 | | Net Investment
Income (Loss)
after Expense
Reimbursement/
Recoupment3 | | Portfolio
Turnover
Rate4 | |
Direxion Indexed Commodity Strategy Fund (Consolidated) | |
Class A Shares | |
Year ended October 31, 2014 | | $ | 18.96 | | | $ | (0.23 | ) | | $ | (1.44 | ) | | $ | (1.67 | ) | | $ | — | | | $ | — | | | $ | — | | | $ | — | | | $ | —5 | | | $ | 17.29 | | | | (8.81 | )% | | $ | 11,477 | | | | 1.26 | % | | | 1.26 | % | | | (1.23 | )% | | | 0 | % | |
Year ended October 31, 2013 | | $ | 20.32 | | | | (0.24 | ) | | | (1.12 | ) | | | (1.36 | ) | | | — | | | | — | | | | — | | | | — | | | | —5 | | | $ | 18.96 | | | | (6.69 | )% | | $ | 39,656 | | | | 1.26 | % | | | 1.26 | % | | | (1.20 | )% | | | 0 | % | |
Year ended October 31, 2012 | | $ | 21.23 | | | | (0.28 | ) | | | (0.64 | ) | | | (0.92 | ) | | | — | | | | — | | | | — | | | | — | | | | 0.01 | | | $ | 20.32 | | | | (4.29 | )% | | $ | 37,480 | | | | 1.42 | % | | | 1.42 | % | | | (1.33 | )% | | | 0 | % | |
Year ended October 31, 2011 | | $ | 25.43 | | | | (0.46 | ) | | | (3.77 | ) | | | (4.23 | ) | | | — | | | | — | | | | — | | | | — | | | | 0.03 | | | $ | 21.23 | | | | (16.52 | )% | | $ | 60,639 | | | | 1.74 | % | | | 1.74 | % | | | (1.69 | )% | | | 0 | % | |
Year ended October 31, 2010 | | $ | 28.81 | | | | (0.43 | ) | | | (2.19 | ) | | | (2.62 | ) | | | (0.77 | ) | | | — | | | | —5 | | | | (0.77 | ) | | | 0.01 | | | $ | 25.43 | | | | (9.24 | )% | | $ | 126,967 | | | | 1.78 | % | | | 1.78 | % | | | (1.66 | )% | | | 0 | % | |
Institutional Class Shares | |
Year ended October 31, 2014 | | $ | 19.12 | | | | (0.18 | ) | | | (1.46 | ) | | | (1.64 | ) | | | — | | | | — | | | | — | | | | — | | | | —5 | | | $ | 17.48 | | | | (8.58 | )% | | $ | 46,602 | | | | 1.01 | % | | | 1.01 | % | | | (0.99 | )% | | | 0 | % | |
Year ended October 31, 2013 | | $ | 20.44 | | | | (0.19 | ) | | | (1.13 | ) | | | (1.32 | ) | | | — | | | | — | | | | — | | | | — | | | | —5 | | | $ | 19.12 | | | | (6.46 | )% | | $ | 20,026 | | | | 1.01 | % | | | 1.01 | % | | | (0.95 | )% | | | 0 | % | |
Year ended October 31, 2012 | | $ | 21.29 | | | | (0.21 | ) | | | (0.64 | ) | | | (0.85 | ) | | | — | | | | — | | | | — | | | | — | | | | —5 | | | $ | 20.44 | | | | (3.99 | )% | | $ | 14,610 | | | | 1.09 | % | | | 1.09 | % | | | (1.00 | )% | | | 0 | % | |
Year ended October 31, 2011 | | $ | 25.46 | | | | (0.32 | ) | | | (3.85 | ) | | | (4.17 | ) | | | — | | | | — | | | | — | | | | — | | | | —5 | | | $ | 21.29 | | | | (16.38 | )% | | $ | 26,772 | | | | 1.24 | % | | | 1.24 | % | | | (1.19 | )% | | | 0 | % | |
Year ended October 31, 2010 | | $ | 28.87 | | | | (0.30 | ) | | | (2.24 | ) | | | (2.54 | ) | | | (0.87 | ) | | | — | | | | — | | | | (0.87 | ) | | | —5 | | | $ | 25.46 | | | | (8.98 | )% | | $ | 21,317 | | | | 1.27 | % | | | 1.27 | % | | | (1.16 | )% | | | 0 | % | |
Class C Shares | |
Year ended October 31, 2014 | | $ | 18.52 | | | | (0.36 | ) | | | (1.40 | ) | | | (1.76 | ) | | | — | | | | — | | | | — | | | | — | | | | — | | | $ | 16.76 | | | | (9.50 | )% | | $ | 4,046 | | | | 2.01 | % | | | 2.01 | % | | | (1.98 | )% | | | 0 | % | |
Year ended October 31, 2013 | | $ | 20.00 | | | | (0.38 | ) | | | (1.10 | ) | | | (1.48 | ) | | | — | | | | — | | | | — | | | | — | | | | — | | | $ | 18.52 | | | | (7.40 | )% | | $ | 4,629 | | | | 2.01 | % | | | 2.01 | % | | | (1.95 | )% | | | 0 | % | |
Year ended October 31, 2012 | | $ | 21.03 | | | | (0.41 | ) | | | (0.62 | ) | | | (1.03 | ) | | | — | | | | — | | | | — | | | | — | | | | — | | | $ | 20.00 | | | | (4.90 | )% | | $ | 4,115 | | | | 2.08 | % | | | 2.08 | % | | | (1.99 | )% | | | 0 | % | |
Year ended October 31, 2011 | | $ | 25.35 | | | | (0.57 | ) | | | (3.75 | ) | | | (4.32 | ) | | | — | | | | — | | | | — | | | | — | | | | —5 | | | $ | 21.03 | | | | (17.04 | )% | | $ | 4,943 | | | | 2.24 | % | | | 2.24 | % | | | (2.20 | )% | | | 0 | % | |
March 4, 20106 to October 31, 2010 | | $ | 25.46 | | | | (0.33 | ) | | | 0.22 | | | | (0.11 | ) | | | — | | | | — | | | | — | | | | — | | | | — | | | $ | 25.35 | | | | (0.43 | )% | | $ | 372 | | | | 2.24 | % | | | 2.24 | % | | | (2.10 | )% | | | 0 | % | |
Direxion/Wilshire Dynamic Fund | |
Class A Shares | |
Year ended October 31, 2014 | | $ | 48.25 | | | | 0.80 | | | | 0.85 | | | | 1.65 | | | | (0.97 | ) | | | (1.80 | ) | | | — | | | | (2.77 | ) | | | —5 | | | $ | 47.13 | | | | 3.69 | % | | $ | 8,068 | | | | 1.16 | % | | | 1.16 | % | | | 1.70 | % | | | 223 | % | |
Year ended October 31, 2013 | | $ | 45.55 | | | | 0.33 | | | | 3.70 | | | | 4.03 | | | | (0.60 | ) | | | (0.73 | ) | | | — | | | | (1.33 | ) | | | —5 | | | $ | 48.25 | | | | 9.07 | % | | $ | 10,857 | | | | 1.16 | % | | | 1.16 | % | | | 0.72 | % | | | 272 | % | |
Year ended October 31, 2012 | | $ | 43.96 | | | | (0.10 | ) | | | 2.81 | | | | 2.71 | | | | (0.05 | ) | | | (1.08 | ) | | | — | | | | (1.13 | ) | | | 0.01 | | | $ | 45.55 | | | | 6.37 | % | | $ | 27,541 | | | | 1.21 | % | | | 1.21 | % | | | (0.23 | )% | | | 40 | % | |
Year ended October 31, 2011 | | $ | 45.03 | | | | (0.13 | ) | | | 1.46 | | | | 1.33 | | | | — | | | | (2.46 | ) | | | — | | | | (2.46 | ) | | | 0.06 | | | $ | 43.96 | | | | 3.17 | % | | $ | 19,184 | | | | 1.41 | % | | | 1.41 | % | | | (0.28 | )% | | | 151 | % | |
Year ended October 31, 2010 | | $ | 41.75 | | | | (0.14 | ) | | | 4.60 | | | | 4.46 | | | | (0.10 | ) | | | (1.09 | ) | | | — | | | | (1.19 | ) | | | 0.01 | | | $ | 45.03 | | | | 10.92 | % | | $ | 15,531 | | | | 1.55 | % | | | 1.55 | % | | | (0.33 | )% | | | 107 | % | |
Class C Shares | |
Year ended October 31, 2014 | | $ | 47.39 | | | | 0.44 | | | | 0.85 | | | | 1.29 | | | | (0.62 | ) | | | (1.80 | ) | | | — | | | | (2.42 | ) | | | — | | | $ | 46.26 | | | | 2.92 | % | | $ | 2,817 | | | | 1.91 | % | | | 1.91 | % | | | 0.94 | % | | | 223 | % | |
Year ended October 31, 2013 | | $ | 44.74 | | | | 0.01 | | | | 3.60 | | | | 3.61 | | | | (0.23 | ) | | | (0.73 | ) | | | — | | | | (0.96 | ) | | | — | | | $ | 47.39 | | | | 8.22 | % | | $ | 3,597 | | | | 1.91 | % | | | 1.91 | % | | | 0.03 | % | | | 272 | % | |
Year ended October 31, 2012 | | $ | 43.50 | | | | (0.40 | ) | | | 2.75 | | | | 2.35 | | | | (0.03 | ) | | | (1.08 | ) | | | — | | | | (1.11 | ) | | | — | | | $ | 44.74 | | | | 5.59 | % | | $ | 5,832 | | | | 1.94 | % | | | 1.94 | % | | | (0.91 | )% | | | 40 | % | |
Year ended October 31, 2011 | | $ | 44.90 | | | | (0.42 | ) | | | 1.48 | | | | 1.06 | | | | — | | | | (2.46 | ) | | | — | | | | (2.46 | ) | | | — | | | $ | 43.50 | | | | 2.40 | % | | $ | 3,981 | | | | 2.05 | % | | | 2.05 | % | | | (0.97 | )% | | | 151 | % | |
March 17, 20106 to October 31, 2010 | | $ | 43.37 | | | | (0.34 | ) | | | 1.87 | | | | 1.53 | | | | — | | | | — | | | | — | | | | — | | | | — | | | $ | 44.90 | | | | 3.53 | % | | $ | 1,911 | | | | 2.05 | % | | | 2.05 | % | | | (1.26 | )% | | | 107 | % | |
1 Net investment income (loss) per share represents net investment income (loss) divided by the daily average shares of beneficial interest outstanding throughout each period.
2 All returns reflect reinvested dividends, if any, but do not reflect the impact of taxes. Total return for a period of less than one year is not annualized. Class C returns do not include the contingent deferred sales charge.
3 For periods of less than one year, these ratios are annualized.
4 Portfolio turnover is not annualized and is calculated without regard to short-term securities having a maturity of less than one year. Investments in options, swaps, forward contracts, futures contracts and repurchase agreements are deemed short-term securities.
5 Amount is less than $0.005.
6 Commencement of operations.
The accompanying notes are an integral part of these financial statements.
DIREXION ANNUAL REPORT
25
| | | | | RATIOS TO AVERAGE NET ASSETS | |
| | | Net Asset
Value,
Beginning
of Year/
Period | | Net
Investment
Income
(Loss)1 | | Net Realized on
and Unrealized
Gain (Loss)
Investments | | Net Increase
(Decrease) in
Net Asset
Value Resulting
from Operations | | Dividends
from Net
Investment
Income | | Distributions
from
Realized
Capital Gains | | Return of
Capital
Distribution | | Total
Distributions | | Redemption
Fees Paid
to Fund | | Net
Asset
Value,
End of
Year/
Period | | Total
Return2 | | Net
Assets,
End of
Year/
Period
(,000) | | Total
Expenses3 | | Net
Expenses3 | | Net Investment
Income (Loss)
after Expense
Reimbursement/
Recoupment3 | | Portfolio
Turnover
Rate4 | |
Direxion Indexed Managed Futures Strategy Fund (Consolidated) | |
Class A Shares | |
Year ended October 31, 2014 | | $ | 37.29 | | | $ | (0.52 | ) | | $ | 1.96 | | | $ | 1.44 | | | $ | — | | | $ | — | | | $ | — | | | $ | — | | | $ | —5 | | | $ | 38.73 | | | | 3.86 | % | | $ | 30,629 | | | | 1.45 | % | | | 1.45 | % | | | (1.42 | )% | | | 0 | % | |
Year ended October 31, 2013 | | $ | 37.94 | | | | (0.54 | ) | | | (0.11 | ) | | | (0.65 | ) | | | — | | | | — | | | | — | | | | — | | | | —5 | | | $ | 37.29 | | | | (1.71 | )% | | $ | 54,271 | | | | 1.45 | % | | | 1.45 | % | | | (1.40 | )% | | | 0 | % | |
February 1, 20126 to October 31, 2012 | | $ | 40.00 | | | | (0.38 | ) | | | (1.68 | ) | | | (2.06 | ) | | | — | | | | — | | | | — | | | | — | | | | —5 | | | $ | 37.94 | | | | (5.15 | )% | | $ | 40,588 | | | | 1.45 | % | | | 1.45 | % | | | (1.32 | )% | | | 0 | % | |
Institutional Class Shares | |
Year ended October 31, 2014 | | $ | 37.43 | | | | (0.43 | ) | | | 1.97 | | | | 1.54 | | | | — | | | | — | | | | — | | | | — | | | | 0.01 | | | $ | 38.98 | | | | 4.14 | % | | $ | 51,666 | | | | 1.20 | % | | | 1.20 | % | | | (1.17 | )% | | | 0 | % | |
Year ended October 31, 2013 | | $ | 37.98 | | | | (0.44 | ) | | | (0.12 | ) | | | (0.56 | ) | | | — | | | | — | | | | — | | | | — | | | | 0.01 | | | $ | 37.43 | | | | (1.45 | )% | | $ | 59,972 | | | | 1.20 | % | | | 1.20 | % | | | (1.15 | )% | | | 0 | % | |
February 1, 20126 to October 31, 2012 | | $ | 40.00 | | | | (0.32 | ) | | | (1.70 | ) | | | (2.02 | ) | | | — | | | | — | | | | — | | | | — | | | | —5 | | | $ | 37.98 | | | | (5.05 | )% | | $ | 11,355 | | | | 1.20 | % | | | 1.20 | % | | | (1.08 | )% | | | 0 | % | |
Class C Shares | |
Year ended October 31, 2014 | | $ | 36.80 | | | | (0.77 | ) | | | 1.90 | | | | 1.13 | | | | — | | | | — | | | | — | | | | — | | | | — | | | $ | 37.93 | | | | 3.07 | % | | $ | 7,464 | | | | 2.20 | % | | | 2.20 | % | | | (2.17 | )% | | | 0 | % | |
Year ended October 31, 2013 | | $ | 37.72 | | | | (0.81 | ) | | | (0.11 | ) | | | (0.92 | ) | | | — | | | | — | | | | — | | | | — | | | | — | | | $ | 36.80 | | | | (2.44 | )% | | $ | 4,155 | | | | 2.20 | % | | | 2.20 | % | | | (2.15 | )% | | | 0 | % | |
February 1, 20126 to October 31, 2012 | | $ | 40.00 | | | | (0.60 | ) | | | (1.68 | ) | | | (2.28 | ) | | | — | | | | — | | | | — | | | | — | | | | — | | | $ | 37.72 | | | | (5.70 | )% | | $ | 1,560 | | | | 2.20 | % | | | 2.20 | % | | | (2.07 | )% | | | 0 | % | |
Direxion Indexed CVT Strategy Fund | |
Investor Class Shares | |
February 5, 20146 to October 31, 2014 | | $ | 40.0000 | | | | 0.2370 | | | | 4.3418 | | | | 4.5788 | | | | — | | | | — | | | | — | | | | — | | | | — | | | $ | 44.5788 | | | | 11.45 | %7 | | $ | 178,923 | | | | 1.35 | % | | | 1.27 | % | | | 0.76 | %8 | | | 840 | % | |
1 Net investment income (loss) per share represents net investment income (loss) divided by the daily average shares of beneficial interest outstanding throughout each period.
2 All returns reflect reinvested dividends, if any, but do not reflect the impact of taxes. Total return for a period of less than one year is not annualized. Class C returns do not include the contingent deferred sales charge.
3 For periods of less than one year, these ratios are annualized.
4 Portfolio turnover is not annualized and is calculated without regard to short-term securities having a maturity of less than one year. Investments in options, swaps, forward contracts, futures contracts and repurchase agreements are deemed short-term securities.
5 Amount is less than $0.005.
6 Commencement of operations.
7 The Advisor voluntarily reimbursed expenses of the Fund. If this reimbursement had not been made, the total return would have been 0.01% lower.
8 Net investment income (loss) ratio before expense reimbursement/recoupment for the period ended October 31, 2014 was 0.67%.
The accompanying notes are an integral part of these financial statements.
DIREXION ANNUAL REPORT
26
NOTES TO THE FINANCIAL STATEMENTS
1. ORGANIZATION
Direxion Funds (the "Trust") was organized as a Massachusetts Business Trust on June 6, 1997 and is registered under the Investment Company Act of 1940, as amended (the "1940 Act"), as an open-end management investment company issuing its shares in series, each series representing a distinct portfolio with its own investment objective and policies. The Trust currently has 16 series, of which 4 are included in this report: Direxion Indexed Commodity Strategy Fund, Direxion/Wilshire Dynamic Fund, Direxion Indexed Managed Futures Strategy Fund and Direxion Indexed CVT Strategy Fund (formerly Direxion Indexed Synthetic Convertible Strategy Fund) (each a "Fund" and collectively, the "Funds"). Each Fund is a non-diversified series of the Trust pursuant to the 1940 Act. The Direxion Indexed Commodity Strategy Fund and Direxion Indexed Managed Futures Strategy Fund offer Class A, Class C and Institutional Class Shares. The Direxion/Wilshire Dynamic Fund offers Class A and Class C shares. The Direxion Indexed CVT Strategy Fund offers Investor Class shares. A sales load is not imposed on Investor Class shares and can be purchased directly through the Funds and financial intermediaries. Class A shares are sold by the Funds directly without the services of a financial advisor. A sales load of 5.50% is imposed on purchases of Class A shares. Class C shares are offered primarily by authorized securities brokers and other financial intermediaries. Class C shares may be subject to a contingent deferred sales charge for one year. Institutional Class shares are sold by financial advisors that provide services to the Funds. Income, expenses (other than expenses attributable to a specific class) and realized and unrealized gains or losses on investments are allocated to each class of shares based on its relative net assets.
The Direxion Indexed Commodity Strategy Fund is managed to track the performance of the Auspice Broad Commodity Index. The Auspice Broad Commodity Index is a long/flat commodities index. A long/flat approach allows the Fund to attempt to take advantage of higher commodity prices, and at the same time shift into a cash position of an individual commodity that shows a downward trend in price. The Fund invests in a combination of commodity-linked derivatives, other investment companies and fixed income securities directly and/or indirectly through its wholly-owned Subsidiary ("CTS Fund") in order to track the returns of the Auspice Broad Commodity Index within the limitation of the federal tax requirements applicable to regulated investment companies.
The objective of the Direxion/Wilshire Dynamic Fund is to seek capital appreciation by combining a strategic asset allocation with a "tactical overlay" to position the Fund defensively or aggressively, depending upon the outlook of Wilshire Associates Incorporated, the Fund's Sub-Adviser ("Sub-Adviser"). Under normal circumstances, the Fund is managed by Rafferty Asset Management, LLC (the "Adviser") pursuant to the Sub-Adviser's traditional asset allocation model, which allocates approximately 60% of the Fund's total assets to equity securities and 40% to fixed income securities, with a tactical overlay to increase or decrease the Fund's risk exposure based on the Sub-Adviser's outlook for the market.
The Direxion Indexed Managed Futures Strategy Fund seeks investment results that track the performance of the Auspice Managed Futures Excess Return Index. The Auspice Managed Futures Excess Return Index aims to capture upward and downward trends in the commodity, currency and financial markets using a quantitative methodology to track prices of a diversified portfolio of traditional commodity, financial and currency futures contracts. The Fund primarily invests in a combination of (long and short) commodity, currency and financial futures, commodity-linked notes, swap contracts, other investment companies and fixed income securities directly and/or indirectly through its wholly-owned subsidiary ("MFS Fund") in order to track the returns of the Auspice Managed Futures Excess Returns Index within the limitation of the federal tax requirements applicable to regulated investment companies.
The Direxion Indexed CVT Strategy Fund commenced operations on February 5, 2014 and is managed to track the performance of the QES Synthetic Convertible Index by investing in a combination of securities and/or financial instruments that provide exposure to the Index. The QES Synthetic Convertible Index seeks to replicate the total return of the U.S. Convertible bond market. The financial instruments in which this Fund may invest include stock index or fixed income futures contracts, swap agreements and options on securities and on stock indices. The Fund may also invest in exchange-traded funds ("ETFs") and fixed income securities that include U.S. Government investment grade and high yield fixed income securities, commonly known as "junk bonds". Additionally, the Fund may invest the collateral related to financial instruments in U.S. Government securities, investment grade short-term fixed income securities, money market instruments, overnight and fixed-term repurchase agreements, cash, and other cash equivalents that have terms to maturity of less than 297 days and have high quality credit profiles.
DIREXION ANNUAL REPORT
27
2. SIGNIFICANT ACCOUNTING POLICIES
The following is a summary of significant accounting policies consistently followed by the Funds in the preparation of their financial statements. These policies are in conformity with U.S. generally accepted accounting principles ("GAAP").
a) Investment Valuation – The Net Asset Value ("NAV") per share of each Fund is determined daily, as of the close of regular trading on the New York Stock Exchange ("NYSE") (normally at 4:00 p.m. Eastern Time ("Valuation Time")), each day the NYSE is open for business. Equity securities and ETFs are valued at their last sales price, or if not available, at the average of the last bid and ask prices. Investments in open-end mutual funds are valued at their respective quoted NAVs on the valuation date. Futures are valued at the settlement price established on the exchange on which they are traded, if that settlement price reflects trading prior to the Valuation Time. If the settlement price established by the exchange reflects trading after the Valuation Time, then the last sales price prior to Valuation Time will be used. Options are valued at the composite price, using the National Best Bid and Offer quotes ("NBBO"). NBBO consists of the highest bid price and lowest ask price across any of the exchanges on which an option is quoted. Specifically, composite pricing looks at the last trades on the exchanges where the options are traded. If there are no trades for the option on a given business day, the composite pricing calculates the mean of the highest bid and lowest ask price across the exchanges where the option is traded. Over-the-counter securities are valued at the average of the last bid and ask prices. Securities primarily traded on the NASDAQ National Market are valued using the NASDAQ Official Closing Price. Swap contracts are valued using the closing price of the underlying reference entity or the closing value of the underlying reference index. Short-term debt securities with a remaining maturity of 60 days or less and money market securities are valued using the amortized cost method. Other debt securities are valued by using the mean prices provided by the Fund's pricing service or, if such services are unavailable, by a pricing matrix method. Securities or swap contracts are fair valued as determined by the Adviser under the supervision of the Board of Trustees (the "Board") in the following scenarios: a) reliable market quotations are not readily available; b) the Funds' pricing service does not provide a valuation for such securities; c) the Funds' pricing service provides valuation that in the judgement of the Adviser does not represent fair value; or d) the Fund or Adviser believes the market price is stale. Additionally, the Adviser will monitor developments in the marketplace for significant events that may affect the value of those securities whose closing prices were established before the Valuation Time.
b) Repurchase Agreements – Each Fund may enter into repurchase agreements with institutions that are members of the Federal Reserve System or securities dealers who are members of a national securities exchange or are primary dealers in U.S. Government securities. In connection with transactions in repurchase agreements, it is the Trust's policy that the Fund receives, as collateral, cash and/or securities (primarily U.S. Government securities) whose fair value, including accrued interest, at all times will be at least equal to 100% of the amount invested by the Fund in each repurchase agreement, including accrued interest. If the seller defaults, and the value of the collateral declines, realization of the collateral by the Fund may be delayed or limited. The Funds invested in repurchase agreements during the year ended October 31, 2014; however, they were not invested in repurchase agreements at October 31, 2014.
c) Swap Contracts – Each Fund may enter into equity swap contacts. Standard equity swap contracts are between two parties that agree to exchange the returns (or differentials in rates of return) earned or realized on particular predetermined investments or instruments. The gross amount to be exchanged is calculated with respect to a "notional amount" (i.e. the return on or increase in value of a particular dollar amount invested in a "basket" of securities representing a particular index or industry sector). A Fund enters into master netting agreements with the counterparty. These agreements calculate the obligations of the parties on a "net basis". Consequently, a Fund's current obligations under a swap agreement generally will be equal to the net amount to be paid or received under the agreement based on the relative value of the positions held by each party. A Fund's obligations are accrued daily and offset by any amounts owed to the Fund. However, a Fund does not offset the fair value amounts of the swap contract and the related collateral on the Statement of Assets and Liabilities arising from swap contracts executed with the same counterparty under such master netting agreements. The Direxion/Wilshire Dynamic Fund and Direxion Indexed CVT Strategy Fund were invested in equity swap contracts at October 31, 2014.
In a "long" equity swap agreement, the counterparty will generally agree to pay the Fund the amount, if any, by which the notional amount of the swap contract would have increased in value if the Fund had been invested in the particular referenced securities, plus dividends that would have been received on those securities. The Fund will agree to pay the counterparty a floating rate of interest on the notional amount of the swap contract plus the amount, if any, by which the notional amount would have decreased in value had it been invested in such referenced securities plus, in certain instances, commissions or trading spreads on the notional amounts. Thus, the return on the swap contract should be the gain or loss
DIREXION ANNUAL REPORT
28
on the notional amount plus dividends on the securities less the interest paid by the Fund on the notional amount. However, in certain instances, market factors such as the interest rate environment and the demand to borrow the securities underlying the swap agreement can cause a scenario in which the counterparty will pay the Fund interest. Payments may be made at the conclusion of the contract or periodically during its term. Swap contracts do not include the delivery of securities. The net amount of the excess, if any, of the Fund's obligations over its entitlement with respect to each swap is accrued on a daily basis and an amount of cash or liquid assets, having an aggregate net asset value at least equal to such accrued excess is maintained in a segregated account. Until a swap contract is settled in cash, the gain or loss on the notional amount plus dividends on the securities less the interest paid by the Fund on the notional amount are recorded as "unrealized appreciation or depreciation on swaps" and when cash is exchanged, the gain or loss is recorded as "realized gains or losses on swaps."
Each Fund may enter into swap contracts that provide the opposite return of the particular benchmark or security ("short" the index or security). The operations are similar to that of the swaps disclosed above except that the counterparty pays interest to the Fund on the notional amount outstanding and the dividends on the underlying securities reduce the return of the swap. However, in certain instances, market factors such as the interest rate environment and the demand to borrow the securities underlying the swap agreement can cause a scenario in which the Fund pays the counterparty interest. These amounts are netted with any unrealized appreciation or depreciation to determine the value of the swap. The Funds will typically enter into equity swap agreements to obtain leverage in order to meet their objectives.
A Fund collateralizes swap agreements with cash and certain securities as indicated on the Schedule of Investments of each Fund, respectively. Such collateral is held for the benefit of the counterparty in a segregated account at U.S. Bank, N.A. (the "Custodian") to protect the counterparty against non-payment by a Fund. A Fund does not net collateral on the Statements of Assets and Liabilities. In the event of a default by the counterparty, a Fund will seek return of this collateral and may incur certain costs exercising their rights with respect to the collateral. Amounts expected to be owed to a Fund are collateralized daily directly to a Fund while amounts expected to be owed to the counterparty are collateralized daily in a segregated account at the Custodian.
The Funds enter into master netting agreements with the counterparties. These agreements calculate the obligations of the parties on a "net basis". Consequently, the Funds' current obligations under a swap agreement generally will be equal to the net amount to be paid or received under the agreement based on the relative value of the positions held by each party. The Funds' obligations are accrued daily and offset by any amounts owed to the Funds. However, the Funds do not offset the fair value amounts of the swap contracts and the related collateral on the Statements of Assets and Liabilities arising from swap contracts executed with the same counterparty under such master netting agreements. The following presents the gross and net amounts of assets and liabilities related to the swap agreements covered by master netting agreements as of October 31, 2014:
Assets:
Description: Swap Contract
| | | | | | | | | Gross Amounts not
offset in the Statements
of Asset and Liabilities | | | |
Fund Name | | Gross Amounts
of Recognized
Assets | | Gross Amounts
Offset in the
Statement of
Asset and
Liabilities | | Net Amounts
Presented in the
Statement of
Asset and
Liabilities | | Financial
Instruments | | Collateral
Pledged
(Received) | | Net Amount | |
Direxion Indexed Commodity
Strategy Fund (Consolidated) | | $ | — | | | $ | — | | | $ | — | | | $ | — | | | $ | — | | | $ | — | | |
Direxion/Wilshire Dynamic Fund | | | 31,015 | | | | — | | | | 31,015 | | | | — | | | | 31,015 | | | | — | | |
Direxion Indexed Managed
Futures Strategy Fund
(Consolidated) | | | — | | | | — | | | | — | | | | — | | | | — | | | | — | | |
Direxion Indexed CVT
Strategy Fund | | | 2,436,141 | | | | (65,335 | ) | | | 2,370,806 | | | | — | | | | 2,370,806 | | | | — | | |
DIREXION ANNUAL REPORT
29
Liabilities:
Description: Swap Contract
| | | | | | | | | Gross Amounts not
offset in the Statements
of Asset and Liabilities | | | |
Fund Name | | Gross Amounts
of Recognized
Liabilities | | Gross Amounts
Offset in the
Statement of
Asset and
Liabilities | | Net Amounts
Presented in the
Statement of
Asset and
Liabilities | | Financial
Instruments | | Collateral
Pledged
(Received) | | Net Amount | |
Direxion Indexed Commodity
Strategy Fund (Consolidated) | | $ | — | | | $ | — | | | $ | — | | | $ | — | | | $ | — | | | $ | — | | |
Direxion/Wilshire Dynamic Fund | | | — | | | | — | | | | — | | | | — | | | | — | | | | — | | |
Direxion Indexed Managed
Futures Strategy Fund
(Consolidated) | | | — | | | | — | | | | — | | | | — | | | | — | | | | — | | |
Direxion Indexed CVT
Strategy Fund | | | 65,335 | | | | (65,335 | ) | | | — | | | | — | | | | — | | | | — | | |
In the event of the counterparty's default, bankruptcy or any other event for which the counterparty cannot meet its obligations, a Fund bears the risk of loss equal to the amount of the daily appreciation owed to the Fund. This obligation represents the daily gain accrued to the Fund from the close of business day prior to this event to the day on which this event occurs and the counterparty can no longer meet its obligations. A Fund will enter into swap agreements only with large, well-capitalized and established financial institutions. The creditworthiness of each of the firms that is a party to a swap agreement is monitored by the Adviser. Shareholders may obtain swap counterparty financial statements at www.sec.gov. Swap contracts are subject to credit risk. Credit risk occurs when the financial condition of an issuer of a security or instrument may cause it to default or become unable to pay interest or principal due on the security. The counterparty to a swap contract might default on its obligations. In addition, a Fund has agreements with certain counterparties with which it enters into swap contracts that contain credit risk-related contingent features that could be triggered subject to certain circumstances. Such circumstances include agreed upon net asset value and performance-based thresholds.
d) Short Positions – Each Fund may engage in short sale transactions. For financial statement purposes, an amount equal to the settlement amount is included in the Statements of Assets and Liabilities as an asset and an equivalent liability. The amount of the liability is subsequently marked-to-market to reflect the fair value of the short position. Subsequent fluctuations in the market prices of short securities may require purchasing the securities at prices which may differ from the market value reflected on the Statements of Assets and Liabilities. The Fund is liable to the buyer for any dividends payable on securities while those securities are in a short position. As collateral for its short positions, the Fund is required under the 1940 Act to segregate assets consisting of cash, cash equivalents or liquid securities equal to the market value of the securities sold short. This collateral is required to be adjusted daily. The Funds did not invest in short positions during the year ended October 31, 2014.
e) Futures Contracts and Options on Futures Contracts – Each Fund may purchase and sell futures contracts and options on futures contracts. A Fund may use futures contracts to gain exposure to, or hedge against, changes in the values of commodities, equities, interest rates or foreign currencies. Upon entering into a contract, the Fund deposits and maintains as collateral such initial margin as required by the exchange on which the transaction is effected. Pursuant to the contract, the Fund agrees to receive from or pay to the broker an amount of cash equal to the daily fluctuation in value of the contract. Such receipts or payments are known as "variation margin" and are recorded by the Fund as unrealized gains and losses. When the contract is closed, the Fund records a realized gain or loss equal to the difference between the value of the contract at the time it was opened and the value at the time it was closed. As collateral for futures contracts, the Fund is required under the 1940 Act to maintain assets consisting of cash, cash equivalents or liquid securities. This collateral is required to be adjusted daily to reflect the market value of the purchase obligation for long futures contracts or the market value of the instrument underlying the contract, but not less than the market price at which the futures contract was established, for short futures contracts. The Direxion Indexed Commodity Strategy Fund and the Direxion Indexed Managed Futures Strategy Fund were invested in futures contracts during the year ended October 31, 2014.
DIREXION ANNUAL REPORT
30
f) Risks of Options, Futures Contracts, Options on Futures Contracts and Short Positions – The risks inherent in the use of options, futures contracts, options on futures contracts and short positions include 1) adverse changes in the fair value of such instruments; 2) imperfect correlation between the price of options and futures contracts and options thereon and movements in the price of the underlying securities, index or futures contracts; 3) the possible absence of a liquid secondary market for any particular instrument at any time; 4) the possible need to defer closing out certain positions to avoid adverse tax consequences; and 5) the possible nonperformance by the counterparty under the terms of the contract. The Funds designate cash, cash equivalents and liquid securities as collateral for written options, futures contracts, options on futures contracts and short positions. The Funds were not invested in any type of options during the year ended October 31, 2014.
g) Forward Currency Exchange Contracts – A forward currency exchange contract is an obligation to buy or sell a specific currency at a future date, which may be any fixed number of days from the date of the contract agreed upon by the parties, at a price set at the time of the contract. The valuation of a foreign currency exchange contract is represented by the difference between the forward exchange rate at the date of the entry into the contract and the forward exchange rate at the reporting date on the Statements of Assets and Liabilities. The Funds were invested in forward currency exchange contracts during the year ended October 31, 2014.
h) Risks of Investing in Forward Currency Exchange Contracts – Currency exchange rate risk and currency investment risk highlight the risks of investing in forward currency exchange contracts. Changes in foreign currency exchange rates affect the value of a Fund's investments in securities denominated in a country's currency and a Fund's share price. Generally, when the U.S. Dollar rises in value against a foreign currency, an investment in that country loses value because that currency is worth fewer U.S. Dollars. Devaluation of a currency by a country's government or banking authority also will have a significant impact on the value of any investments denominated in that currency. Currency markets generally are not as regulated as securities markets. Additionally, a Fund may invest in a limited number of currencies. As a result, an increase or decrease in the value of any of these currencies would have a greater impact on a Fund's NAV and total return than if a Fund held a more diversified number of currencies. With currency investment risk, the performance of a Fund in part is linked to the daily performance of the spot price of the exchange rates of foreign currencies. The relationship in price between a foreign currency with the U.S. Dollar may be highly volatile and can change quickly and unpredictably due to a number of factors, including the supply of and demand for each currency, political, economic, legal, financial, accounting and tax matters and other events that a Fund cannot control. In addition, the demand for a foreign currency might not be sufficient to accommodate a sudden change in the supply of the foreign currency to the market. Consequently, the price of the foreign currency could decline, which would adversely affect an investment in a Fund if it held that currency.
i) Risks of Investing in Foreign Securities – Investments in foreign securities involve greater risks than investing in domestic securities. As a result, the Funds' returns and net asset values may be affected to a large degree by fluctuations in currency exchange rates, political, diplomatic or economic conditions and regulatory requirements in other countries. The laws and accounting, auditing, and financial reporting standards in foreign countries typically are not as strict as they are in the U.S. and there may be less public information available about foreign companies. Investments in foreign emerging markets present a greater risk than investing in foreign issuers in general. The risk of political or social upheaval is greater in emerging markets. In addition, there may be risks of an economy's dependence on revenues from particular commodities, currency transfer restrictions, a limited number of potential buyers for such securities, and delays and disruptions in securities settlement procedures.
j) Basis for Consolidation – The Direxion Indexed Commodity Strategy Fund may invest up to 25% of its total assets in the CTS Fund. The CTS Fund, which is organized under the laws of the Cayman Islands, is wholly-owned and controlled by the Direxion Indexed Commodity Strategy Fund. The CTS Fund acts as an investment vehicle in order to enter into certain investments for the Direxion Indexed Commodity Strategy Fund consistent with the Direxion Indexed Commodity Strategy Fund's investment objectives and policies specified in its prospectus and statement of additional information. As of October 31, 2014, net assets of the Direxion Indexed Commodity Strategy Fund were $62,124,557, of which $1,099,752, or approximately 1.77%, represented the Direxion Indexed Commodity Strategy Fund's ownership of all issued shares and voting rights of the CTS Fund. All intercompany balances, revenues and expenses have been eliminated in consolidation.
The Direxion Indexed Managed Futures Strategy Fund may invest up to 25% of its total assets in the MFS Fund. The MFS Fund, which is organized under the laws of the Cayman Islands, is wholly-owned and controlled by the Direxion Indexed Managed Futures Strategy Fund. The MFS Fund acts as an investment vehicle in order to enter into certain investments for the Direxion Indexed Managed Futures Strategy Fund consistent with the Direxion Indexed Managed Futures Strategy Fund's investment objectives and policies specified in its prospectus and statement of additional information. As of October 31,
DIREXION ANNUAL REPORT
31
2014, net assets of the Direxion Indexed Managed Futures Strategy Fund were $89,759,040, of which $13,297,114, or approximately 14.81%, represented the Direxion Indexed Managed Futures Strategy Fund's ownership of all issued shares and voting rights of the MFS Fund. All intercompany balances, revenues and expenses have been eliminated in consolidation.
k) Risks of Investing Commodity-Linked Derivatives – Both the Direxion Indexed Commodity Strategy Fund and the Direxion Indexed Managed Futures Strategy Fund, through their investment in their subsidiaries, hold commodity-linked derivatives. Commodity-linked derivatives provide exposure, which may include long and/or short exposure, to the investment returns of physical commodities that trade in the commodities markets without investing directly in physical commodities. The value of a commodity-linked derivative investment typically is based upon the price movements of a physical commodity (such as heating oil, precious metals, livestock, or agricultural products), a commodity futures contract or commodity index, or some other readily measurable economic variable. The value of commodity-linked derivative instruments may be affected by changes in overall market movements, volatility of the underlying benchmark, changes in interest rates, or factors affecting a particular industry or commodity, such as drought, floods, weather, livestock disease, embargoes, tariffs and international economic, political and regulatory developments. The value of commodity-linked derivatives will rise or fall in response to changes in the underlying commodity or related index. Investments in commodity-linked derivatives may be subject to greater volatility than non-derivative based investments. A highly liquid secondary market may not exist for certain commodity-linked derivatives, and there can be no assurance that one will develop.
l) Investment Transactions – Investment transactions are recorded on trade date. The Funds determine the gain or loss realized from investment transactions by comparing the identified cost, which is the same basis used for federal income tax purposes, with the net sales proceeds.
m) Federal Income Taxes – Each Fund intends to comply with the requirements of Subchapter M of the Internal Revenue Code necessary to qualify as a regulated investment company and to make the requisite distributions of income and capital gains to its shareholders sufficient to relieve it from all or substantially all federal income taxes and excise taxes. No provision for federal income taxes has been made.
n) Income and Expenses – Dividend income is recorded on the ex-dividend date. Interest income, including amortization of premium and discount, and dividends received from money market funds, is recognized on an accrual basis. Expenses are charged to the Funds daily. Expenses are computed based on each Fund's respective daily net assets. For an additional discussion on expenses, refer to Note 4. Income and expenses are allocated to each class of shares based upon relative net assets.
o) Distributions to Shareholders – Each Fund pays dividends from net investment income and distributes net realized capital gains, if any, at least annually. Income and capital gain distributions are determined in accordance with income tax regulations which may differ from GAAP. Certain Funds also utilize earnings and profits distributed to shareholders on redemptions of shares as part of the dividends paid deduction. Distributions to shareholders are recorded on the ex-dividend date.
The tax character of distributions during the years ended October 31, 2014 and October 31, 2013, were as follows:
| | | Direxion Indexed Commodity
Strategy Fund (Consolidated) | | Direxion/Wilshire
Dynamic Fund | |
| | | Year Ended
October 31, 2014 | | Year Ended
October 31, 2013 | | Year Ended
October 31, 2014 | | Year Ended
October 31, 2013 | |
Distributions paid from: | |
Ordinary Income | | $ | — | | | $ | — | | | $ | 763,273 | | | $ | 909,666 | | |
Long-Term Capital Gains | | | — | | | | — | | | | — | | | | — | | |
Total Distributions paid | | $ | — | | | $ | — | | | $ | 763,273 | | | $ | 909,666 | | |
DIREXION ANNUAL REPORT
32
| | | Direxion Indexed Managed Futures
Strategy Fund (Consolidated) | | Direxion Indexed
CVT Strategy Fund1 | |
| | | Year Ended
October 31, 2014 | | Year Ended
October 31, 2013 | | Period of
February 5, 2014 to
October 31, 2014 | |
Distributions paid from: | |
Ordinary Income | | $ | — | | | $ | — | | | $ | — | | |
Long-Term Capital Gains | | | — | | | | — | | | | — | | |
Total Distributions paid | | $ | — | | | $ | — | | | $ | — | | |
1 Commenced operations on February 5, 2014.
The Funds are designating as long-term capital gain dividends, pursuant to Internal Revenue Code 852(b)(3), the amount necessary to reduce the earnings and profits of the Funds related to net capital gain to zero for the tax year ended October 31, 2014. To the extent necessary to fully distribute such capital gains, the Funds also designate earnings and profits distributed to shareholders on the redemption of shares.
As of October 31, 2014, the components of distributable earnings of the Funds on a tax basis were as follows:
| | | Direxion Indexed
Commodity Strategy
Fund (Consolidated) | | Direxion/Wilshire
Dynamic Fund | | Direxion Indexed
Managed Futures
Strategy Fund
(Consolidated) | | Direxion Indexed CVT
Strategy Fund | |
Tax cost of investments | | $ | — | | | $ | 9,156,820 | | | $ | — | | | $ | 65,871,615 | | |
Gross unrealized appreciation | | | — | | | | 168,128 | | | | — | | | | 62,524 | | |
Gross unrealized depreciation | | | — | | | | (58,003 | ) | | | — | | | | (1,030,729 | ) | |
Net unrealized appreciation
(depreciation) | | $ | — | | | $ | 110,125 | | | $ | — | | | $ | (968,205 | ) | |
Undistributed ordinary income | | | — | | | | 421,882 | | | | — | | | | 126,610 | | |
Undistributed long-term capital gain | | | — | | | | 892,803 | | | | 377,512 | | | | — | | |
Total distributable earnings | | | — | | | | 1,314,685 | | | | 377,512 | | | | 126,610 | | |
Other accumulated gain/(loss) | | | (731,623 | ) | | | 19,052 | | | | 5,539,660 | | | | (1,166,930 | ) | |
Total accumulated gain/(loss) | | $ | (731,623 | ) | | $ | 1,443,862 | | | $ | 5,917,172 | | | $ | (2,008,525 | ) | |
The difference between book cost of investments and tax cost of investments is attributable primarily to the tax deferral of losses on wash sales. Other accumulated gain/(loss) is generally comprised of capital loss carryforwards, qualified late year loss deferrals and/or unrealized gain/(loss) on derivative positions.
On the Statements of Assets and Liabilities, the following adjustments were made for permanent tax differences between accounting for net investment income (loss) and net realized gain and losses under GAAP and tax reporting:
| | | Net Investment
Income (Loss) | | Realized
Gain (Loss) | | Capital Stock | |
Direxion Indexed Commodity Strategy Fund (Consolidated) | | $ | 1,256,491 | | | $ | 7,153,920 | | | $ | (8,410,411 | ) | |
Direxion/Wilshire Dynamic Fund | | | (2,566 | ) | | | (248,297 | ) | | | 250,863 | | |
Direxion Indexed Managed Futures Strategy Fund (Consolidated) | | | 1,301,232 | | | | 6,761,748 | | | | (8,062,980 | ) | |
Direxion Indexed CVT Strategy Fund | | | — | | | | — | | | | — | | |
Net investment income (loss) and net realized gains and losses for federal income tax purposes may differ from that reported on the financial statements because of permanent book-to-tax differences. GAAP requires that permanent differences in net investment income (loss) and net realized gains and losses due to differences between financial reporting and tax reporting be reclassified between various components of net assets. The permanent differences primarily relate to realized ordinary and capital losses of the Subsidiaries, net operating losses, swap contract adjustments and dividend on redemption adjustments with differing book and tax methods.
DIREXION ANNUAL REPORT
33
In order to meet certain excise tax distribution requirements, the Funds are required to measure and distribute annually net capital gains realized during a twelve month period ending October 31 and net investment income earned during a twelve month period ending December 31. In connection with this, the Funds are permitted for tax purposes to defer into their next fiscal year qualified late year losses. Qualified late year ordinary losses are generally losses incurred between January 1 and the end of their fiscal year, October 31, 2014.
At October 31, 2014, the following Funds deferred, on a tax basis, qualified late year losses of:
| | | Late Year
Ordinary Losses | |
Direxion Indexed Commodity Strategy Fund (Consolidated) | | $ | (731,623 | ) | |
Direxion/Wilshire Dynamic Fund | | | — | | |
Direxion Indexed Managed Futures Strategy Fund (Consolidated) | | | (1,037,733 | ) | |
Direxion Indexed CVT Strategy Fund | | | — | | |
Under the Regulated Investment Company Modernization Act of 2010, net capital losses recognized for tax years beginning after December 22, 2010, may be carried forward indefinitely, and their character is retained as short-term and/or long-term.
At October 31, 2014, the following Funds had capital loss carryforwards on a tax basis of:
| | | ST | | LT | | Total | | | |
Direxion Indexed Commodity Strategy Fund (Consolidated) | | $ | — | | | $ | — | | | $ | — | | | | | | |
Direxion/Wilshire Dynamic Fund | | | — | | | | — | | | | — | | | | | | |
Direxion Indexed Managed Futures Strategy Fund (Consolidated) | | | — | | | | — | | | | — | | | | |
Direxion Indexed CVT Strategy Fund | | | (3,498,052 | ) | | | (39,684 | ) | | | (3,537,736 | ) | | No Expiration | |
To the extent that the Funds realize future net capital gains, those gains will be offset by any unused capital loss carryover.
The Funds follow authoritative financial reporting rules regarding recognition and measurement of tax positions taken or expected to be taken on a tax return. The Funds have reviewed all open tax years and concluded that there is no effect to the Fund's financial positions or results of operations and no tax liability resulting from unrecognized tax benefits relating to uncertain income tax position taken or expected to be taken on a tax return. Open tax years are those years that are open for examination by the relevant income taxing authority. As of October 31, 2014, open Federal and state income tax years include the tax years ended October 31, 2011 through October 31, 2014. The Funds have no examination in progress. The Funds are also not aware of any tax positions for which it is reasonably possible that the total amounts of unrecognized tax expense will significantly change in the next twelve months.
p) Guarantees and Indemnifications – In the ordinary course of business, the Funds enter into contracts that contain a variety of indemnification provisions pursuant to which the Funds agree to indemnify third parties upon occurrence of specified events. The Funds' maximum exposure relating to these indemnification agreements is unknown. However, the Funds have not had prior claims or losses in connection with these provisions and believe the risk of loss is remote.
q) Use of Estimates – The preparation of financial statements in conformity with GAAP requires management to make estimates and assumptions that affect the reported amounts of assets and liabilities and disclosure of contingent assets and liabilities at the date of the financial statements and the reported amounts of revenues and expenses during the reporting period. Actual results could differ from those estimates.
DIREXION ANNUAL REPORT
34
3. INVESTMENT TRANSACTIONS
During the year ended October 31, 2014, the aggregate purchases and sales of investments (excluding short-term investments, swaps, futures and forward currency exchange contracts) were:
| | | Purchases | | Sales | |
Direxion Indexed Commodity Strategy Fund (Consolidated) | | $ | — | | | $ | — | | |
Direxion/Wilshire Dynamic Fund | | | 24,058,908 | | | | 27,631,069 | | |
Direxion Indexed Managed Futures Strategy Fund (Consolidated) | | | — | | | | — | | |
Direxion Indexed CVT Strategy Fund1 | | | 171,012,969 | | | | 104,801,036 | | |
1 Commenced operations on February 5, 2014.
The Funds had no purchases or sales of long-term U.S. Government securities for the year ended October 31, 2014.
4. INVESTMENT ADVISORY AND OTHER AGREEMENTS
Investment Advisory Fees: The Funds have entered into an investment advisory agreement with the Adviser. The Adviser earns a fee, computed daily and payable monthly, applied to each Fund's average daily net assets at the annual rates presented below:
Direxion Indexed Commodity Strategy Fund | | | 0.85 | % | |
Direxion/Wilshire Dynamic Fund | | | 0.75 | % | |
Direxion Indexed Managed Futures Strategy Fund | | | 0.95 | % | |
Direxion Indexed CVT Strategy Fund | | | 0.75 | % | |
In addition, the Adviser has entered into a sub-advisory agreement with Wilshire Associates Incorporated for the Direxion/Wilshire Dynamic Fund whereby the Sub-Adviser will direct the investment activities of the Direxion/Wilshire Dynamic Fund. The Adviser pays out of the management fees it receives from this Fund a fee for these sub-advisory services.
Operating Services Agreement: The Funds have entered into an Operating Services Agreement (the "Agreement") with the Adviser. Under the Agreement, the Adviser will be responsible for all expenses of the Trust except the following: management fees, distribution and/or service fees, acquired fund fees, taxes, leverage interest, dividends or interest on short positions, other interest expenses, brokerage commissions and other extraordinary expenses outside the typical day-to-day operations of the Funds through September 1, 2016.
In consideration for the services rendered pursuant to the Agreement, the Funds will pay to the Adviser, as compensation for the services provided by the Adviser under the Agreement, a monthly fee. The monthly fee is calculated on an annualized basis on the daily average net assets of each Fund and the below amount:
Direxion Indexed Commodity Strategy Fund | | | 0.16 | % | |
Direxion Wilshire/Dynamic Fund | | | 0.16 | % | |
Direxion Indexed Managed Futures Strategy Fund | | | 0.25 | % | |
Direxion Indexed CVT Strategy Fund | | | 0.35 | % | |
Distribution Expenses: Shares of the Funds are subject to an annual 12b-1 fee of up to 1.00% of a Fund's average daily net assets. The Investor Class and Class A shares of the Funds currently pay a 12b-1 fee of 0.25% of the Funds' respective Investor Class and Class A average daily net assets. The Class C shares of the Funds currently pay a 12b-1 fee of 1.00% of the Funds' Class C average daily net assets. The Institutional Class shares of the Funds do not pay a 12b-1 fee.
During the year ended October 31, 2014, the Adviser voluntarily reimbursed $13,595 of expenses in the Direxion Indexed CVT Strategy Fund. This reimbursement was made so that the Fund could more closely track the performance of its underlying benchmark. This reimbursement is reflected on the Statement of Operations as Reimbursement of Expenses from Adviser and the effect of this reimbursement is presented on the Financial Highlights.
Rafferty Capital Markets, LLC (the "Distributor") serves as principal underwriter of the Funds and acts as the Funds' distributor in a continuous public offering of the Funds' shares. The Distributor is an affiliate of the Adviser.
DIREXION ANNUAL REPORT
35
5. VALUATION MEASUREMENTS
The Funds follow authoritative fair valuation accounting standards, which establish an authoritative definition of fair value and set out a hierarchy for measuring fair value. These standards require additional disclosures about the various inputs and valuation techniques used to develop the measurements of fair value and a discussion in changes in valuation techniques and related inputs during the period. These inputs are summarized in the three broad levels below:
Level 1 – Quoted prices in active markets for identical securities
Level 2 – Evaluated price based on other significant observable inputs (including quoted prices for similar securities, interest rates, prepayment speeds, credit risk, etc.)
Level 3 – Significant unobservable inputs (including the Fund's own assumptions in determining fair value of investments)
The inputs or methodology used for valuing investments are not an indication of the credit risk associated with investing in those financial instruments.
The follow is a summary of the inputs used to value the Funds' investments as of October 31, 2014:
| | | Direxion Indexed Commodity Strategy Fund (Consolidated)1 | |
| | | Level 1 | | Level 2 | | Level 3 | | Total | |
Short-Term Investments | | $ | — | | | $ | — | | | $ | — | | | $ | — | | |
Other Financial Instruments* | | | — | | | | — | | | | — | | | | — | | |
1 The Fund did not hold any reportable investments as of October 31, 2014.
| | | Direxion/Wilshire Dynamic Fund | |
| | | Level 1 | | Level 2 | | Level 3 | | Total | |
Investment Companies-Equity | | $ | 6,899,023 | | | $ | — | | | $ | — | | | $ | 6,899,023 | | |
Investment Companies-Fixed Income | | | 2,367,922 | | | | — | | | | — | | | | 2,367,922 | | |
Short-Term Investments | | | — | | | | — | | | | — | | | | — | | |
Other Financial Instruments* | | | — | | | | 31,015 | | | | — | | | | 31,015 | | |
| | | Direxion Indexed Managed Futures Strategy Fund (Consolidated) | |
| | | Level 1 | | Level 2 | | Level 3 | | Total | |
Short-Term Investments | | $ | — | | | $ | — | | | $ | — | | | $ | — | | |
Other Financial Instruments* | | | 7,641,104 | | | | — | | | | — | | | | 7,641,104 | | |
| | | Direxion Indexed CVT Strategy Fund | |
| | | Level 1 | | Level 2 | | Level 3 | | Total | |
Investment Companies-Fixed Income | | $ | 64,903,410 | | | $ | — | | | $ | — | | | $ | 64,903,410 | | |
Other Financial Instruments* | | | (53,501 | ) | | | 2,370,806 | | | | — | | | | 2,317,305 | | |
For further detail on each asset class, see Schedules of Investments.
* Other financial instruments are derivative instruments not reflected in the Schedules of Investments, such as futures and swap contracts. Futures contracts and swap contracts are valued at the unrealized appreciation (depreciation) on the instrument.
The Funds follow authoritative accounting standards, which require additional disclosure regarding fair value measurements. Specifically, these standards require reporting entities to disclose a) the input and valuation techniques used to measure fair value for both recurring and nonrecurring fair value measurements, for Level 2 or Level 3 positions, b) transfers between all levels (including Level 1 and Level 2) on a gross basis (i.e. transfers out must be disclosed separately from transfers in) as well as the reason(s) for the transfers, and c) purchases and sales on a gross basis in the Level 3 rollforward rather than as one net number. Additionally, reporting entities are required to disclose quantitative information about unobservable inputs used in the fair value measurements categorized within Level 3 of the fair value hierarchy.
There were no transfers between Level 1 and Level 2 securities during the year ended October 31, 2014. There were no Level 3 securities held by the Funds during the year ended October 31, 2014.
DIREXION ANNUAL REPORT
36
6. ADDITIONAL DISCLOSURES ABOUT DERIVATIVE INSTRUMENTS
The Funds follow authoritative standards of accounting for derivative instruments, which establish disclosure requirements for derivative instruments. These standards improve financial reporting for derivative instruments by requiring enhanced disclosures that enable investors to understand how and why a fund uses derivatives instruments, how derivatives instruments are accounted for and how derivative instruments affect a fund's financial position and results of operations.
The Funds use derivative instruments as part of their principal investment strategy to achieve their investment objective. For additional discussion on the risks associated with derivative instruments refer to Note 2. As of October 31, 2014, the Funds were invested in swap contracts and futures contracts.
At October 31, 2014, the fair value of derivatives instruments, by primary risk, were as follows:
Asset Derivatives1 | |
| | |
| | Commodity
Risk | | Credit
Risk | | Currency
Risk | | Equity
Risk | | Interest Rate
Risk | | Total | |
Direxion Indexed
Commodity
Strategy Fund
(Consolidated) | | Futures contracts* | | $ | — | | | $ | — | | | $ | — | | | $ | — | | | $ | — | | | $ | — | | |
Direxion/Wilshire
Dynamic Fund | | Swap contracts | | | — | | | | 31,015 | | | | — | | | | — | | | | — | | | | 31,015 | | |
Direxion Indexed
Managed Futures
Strategy Fund
(Consolidated) | | Futures contracts* | | | 6,778,908 | | | | — | | | | 914,941 | | | | — | | | | 148,771 | | | | 7,842,620 | | |
Direxion Indexed
CVT Strategy
Fund | | Swap contracts | | | — | | | | — | | | | — | | | | 2,436,141 | | | | — | | | | 2,436,141 | | |
Direxion Indexed
CVT Strategy
Fund | | Futures contracts* | | | — | | | | — | | | | — | | | | — | | | | — | | | | — | | |
Liability Derivatives2 | |
| | |
| | Commodity
Risk | | Credit
Risk | | Currency
Risk | | Equity
Risk | | Interest Rate
Risk | | Total | |
Direxion Indexed
Commodity
Strategy Fund
(Consolidated) | | Futures contracts* | | $ | — | | | $ | — | | | $ | — | | | $ | — | | | $ | — | | | $ | — | | |
Direxion Indexed
Managed Futures
Strategy Fund
(Consolidated) | | Futures contracts* | | | 201,516 | | | | — | | | | — | | | | — | | | | — | | | | 201,516 | | |
Direxion Indexed
CVT Strategy
Fund | | Swap contracts | | | — | | | | 64,701 | | | | — | | | | — | | | | 634 | | | | 65,335 | | |
Direxion Indexed
CVT Strategy
Fund | | Futures contracts* | | | — | | | | — | | | | — | | | | — | | | | 53,051 | | | | 53,051 | | |
1 Statements of Assets and Liabilities location: Unrealized appreciation on swaps, variation margin receivable, receivable for forward currency exchange contracts.
DIREXION ANNUAL REPORT
37
2 Statements of Assets and Liabilities location: Unrealized depreciation on swaps, variation margin payable, payable for forward currency exchange contracts.
* Cumulative appreciation (depreciation) of futures contracts as reported in the Schedule of Investments. Only current day's variation margin, if any, is reported within the Statements of Assets and Liabilities.
Transactions in derivative instruments during the year ended October 31, 2014, by primary risk, were as follows:
| | |
| | Commodity
Risk | | Credit
Risk | | Currency
Risk | | Equity
Risk | | Interest
Rate Risk | | Total | |
Direxion Indexed
Commodity
Strategy Fund
(Consolidated) | | Net realized
gain (loss)1
Futures contracts | | $ | (7,153,920 | ) | | $ | — | | | $ | — | | | $ | — | | | $ | — | | | $ | (7,153,920 | ) | |
| | | Change in net
unrealized
appreciation
(depreciation)2
Futures contracts | | | 923,921 | | | | — | | | | — | | | | — | | | | — | | | | 923,921 | | |
Direxion/Wilshire
Dynamic Fund | | Net realized
gain (loss)1
Swap contracts | | | — | | | | 4,682 | | | | — | | | | 290,711 | | | | — | | | | 295,393 | | |
| | | Change in net
unrealized
appreciation
(depreciation)2
Swap contracts | | | — | | | | 31,015 | | | | — | | | | (133,369 | ) | | | | | | | (102,354 | ) | |
Direxion Indexed
Managed Futures
Strategy Fund
(Consolidated) | | Net realized
gain (loss)1
Futures contracts | | | (7,013,420 | ) | | | — | | | | 889,673 | | | | — | | | | 63,903 | | | | (6,059,844 | ) | |
| | Change in net
unrealized
appreciation
(depreciation)2
Futures contracts | | | 6,540,460 | | | | — | | | | 672,096 | | | | — | | | | 584,291 | | | | 7,796,847 | | |
Direxion Indexed
CVT Strategy
Fund | | Net realized
gain (loss)1
Swap contracts | | | — | | | | 38,636 | | | | — | | | | (3,174,989 | ) | | | 5,075 | | | | (3,131,278 | ) | |
| | | Futures contracts | | | — | | | | — | | | | — | | | | — | | | | (13,089 | ) | | | (13,089 | ) | |
| | Change in net
unrealized
appreciation
(depreciation)2
Swap contracts | | | — | | | | (64,701 | ) | | | — | | | | 2,436,141 | | | | (634 | ) | | | 2,370,806 | | |
| | | | | Futures contracts | | | — | | | | — | | | | — | | | | — | | | | (53,051 | ) | | | (53,051 | ) | |
1 Statements of Operations location: Net realized gain (loss) on futures, swaps, and forward currency exchange contracts.
2 Statements of Operations location: Change in net unrealized appreciation (depreciation) on futures, swaps, and forward currency exchange contracts.
DIREXION ANNUAL REPORT
38
For the year ended October 31, 2014, the average volume of the derivatives held by the Funds were as follows:
| | | Quarterly Average Gross Notional Amount | |
| | | Long Equity Swaps
Contracts | | Short Equity Swaps
Contracts | | Long Futures
Contracts | | Short Futures
Contracts | |
Direxion Indexed Commodity
Strategy Fund (Consolidated) | | $ | — | | | $ | — | | | $ | 50,776,597 | | | $ | — | | |
Direxion/Wilshire Dynamic Fund | | | 1,391,249 | | | | — | | | | — | | | | — | | |
Direxion Indexed Managed Futures
Strategy Fund (Consolidated) | | | — | | | | — | | | | 110,176,098 | | | | 93,685,947 | | |
Direxion Indexed CVT Strategy Fund1 | | | 46,122,774 | | | | — | | | | 5,743,685 | | | | — | | |
1 Commenced operations February 5, 2014.
The Direxion Indexed Commodity Strategy Fund utilizes this volume of derivatives in order to track the performance of the Auspice Broad Commodity Index through investments in futures contracts. The Direxion/Wilshire Dynamic Fund uses its investments in derivatives to tactically tilt the strategic allocation of its investment strategy. The Direxion Indexed Managed Futures Strategy Fund uses futures contracts in order to meet its investment objective of seeking results that track the performance of the Auspice Managed Futures Excess Return Index. The Direxion Indexed CVT Strategy Fund uses its investments in derivatives in order to meet its investment objective of seeking results that track the performance of the QES Synthetic Convertible Index.
7. SUBSEQUENT EVENTS
The Funds follow authoritative standards of accounting for and disclosure of events that occur after the Statement of Assets and Liabilities date but before financial statements are issued or are available to be issued. These standards require the Funds to recognize in the financial statements the effects of all recognized subsequent events that provide additional evidence about conditions that existed at the date of the Statements of Assets and Liabilities. For nonrecognized subsequent events that must be disclosed to keep the financial statements from being misleading, the Funds are required to disclose the nature of the event as well as an estimate of its financial effect, or a statement that such an estimate cannot be made.
On December 1, 2014, the Direxion Indexed Managed Futures Strategy Fund declared a $0.15721 per share long-term capital gain distribution to the Fund's Class A, Class C and Institutional Class Shares with a record date of December 15, 2014 and an ex-date and payable date of December 16, 2014. Additionally, the Direxion Indexed CVT Strategy Fund declared a $0.35690712 per share income distribution to its Fund shares with a record date of December 15, 2014 and an ex-date and payable date of December 16, 2014.
The Funds have evaluated subsequent events through the issuance of the Funds' financial statements and have determined there is no impact to the Funds' financial statements.
DIREXION ANNUAL REPORT
39
Report of Independent Registered Public Accounting Firm
The Board of Trustees and Shareholders of Direxion Funds
We have audited the accompanying statements of assets and liabilities, including the schedules of investments, of Direxion Indexed Commodity Strategy Fund (Consolidated), Direxion/Wilshire Dynamic Fund, Direxion Indexed Managed Futures Strategy Fund, and Direxion Indexed CVT Strategy Fund (four of the series of the Direxion Funds (the "Funds")) as of October 31, 2014, and the related statements of operations , changes in net assets and the financial highlights for each of the periods indicated therein. These financial statements and financial highlights are the responsibility of the Funds' management. Our responsibility is to express an opinion on these financial statements and financial highlights based on our audits.
We conducted our audits in accordance with the standards of the Public Company Accounting Oversight Board (United States). Those standards require that we plan and perform the audit to obtain reasonable assurance about whether the financial statements and financial highlights are free of material misstatement. We were not engaged to perform an audit of the Funds' internal control over financial reporting. Our audits included consideration of internal control over financial reporting as a basis for designing audit procedures that are appropriate in the circumstances, but not for the purpose of expressing an opinion on the effectiveness of the Funds' internal control over financial reporting. Accordingly, we express no such opinion. An audit also includes examining, on a test basis, evidence supporting the amounts and disclosures in the financial statements and financial highlights, assessing the accounting principles used and significant estimates made by management, and evaluating the overall financial statement presentation. Our procedures included confirmation of securities owned as of October 31, 2014, by correspondence with the custodian and brokers. We believe that our audits provide a reasonable basis for our opinion.
In our opinion, the financial statements and financial highlights referred to above present fairly, in all material respects, the financial position of each of the respective Funds constituting the Direxion Funds at October 31, 2014, the results of their operations, the changes in their net assets, and the financial highlights for each of the periods indicated therein, in conformity with U.S. generally accepted accounting principles.
New York, New York
December 23, 2014
DIREXION ANNUAL REPORT
40
Supplemental Information (Unaudited)
Federal Tax Status of Dividends Declared during the Tax Year
For the period ended October 31, 2014, certain dividends paid by the Funds may be subject to a maximum rate of 15%, as provided for by the Jobs and Growth Tax Relief Reconciliation Act of 2003. The percentage of dividends declared from ordinary income designated as qualified income was 9.39% for the Direxion/Wilshire Dynamic Fund.
For corporate shareholders, the percent of ordinary income distributions qualifying for the corporate dividends received deduction for the period ended October 31, 2014 was 10.00% for the Direxion/Wilshire Dynamic Fund.
Householding
In an effort to decrease costs, the Funds intend to reduce the number of duplicate prospectuses, Annual and Semi-Annual Reports, proxy statements and other similar documents you receive by sending only one copy of each to those addresses shared by two or more accounts and to shareholders we reasonably believe are from the same family or household. Householding begins once you have signed your account application. After such time, if you would like to discontinue householding for your accounts, please call toll-free at (800) 851-0511 to request individual copies of these documents. Once the Funds receive notice to stop householding, we will begin sending individual copies thirty days after receiving your request. This policy does not apply to account statements.
Shareholder Meeting Results
A special meeting of the Trust's shareholders was held on September 10, 2014. The election of six Trustees to serve on the Board of Trustees of the Direxion Funds was the matter voted upon at the meeting. The number of votes cast for, against or withheld, the number of abstentions, and the number of broker non-votes (if any) with respect to the matter, is set forth below:
Trustee | | Shares Voted "For" | | Shares Voted "Against" | | Abstentions | | Broker Non-Votes | |
Gerald E. Shanley III | | | 13,779,298 | | | | 342,553 | | | | — | | | | — | | |
John A. Weisser | | | 12,520,826 | | | | 1,601,026 | | | | — | | | | — | | |
David L. Driscoll | | | 13,832,367 | | | | 289,484 | | | | — | | | | — | | |
Jacob C. Gaffey | | | 13,776,630 | | | | 345,222 | | | | — | | | | — | | |
Daniel D. O'Neill | | | 13,867,505 | | | | 254,346 | | | | — | | | | — | | |
Eric W. Falkeis | | | 12,551,138 | | | | 1,570,713 | | | | — | | | | — | | |
DIREXION ANNUAL REPORT
41
Investment Advisory and Subadvisory Agreements Approvals (Unaudited)
Provided below is a summary of certain of the factors the Board considered at its August 13, 2014 Board meeting in renewing, as applicable: (1) the Advisory Agreement between Rafferty Asset Management ("Rafferty") and the Direxion Funds (the "Direxion Trust"), on behalf of the Direxion Indexed Commodity Strategy Funds, Direxion Indexed Managed Futures Strategy Fund and Direxion/Wilshire Dynamic Fund, each a series of the Direxion Trust; and (2) the Subadvisory Agreement between Rafferty and Wilshire Associates Incorporated ("Wilshire") on behalf of the Direxion/Wilshire Dynamic Fund, a series of the Direxion Trust.
Each series of the Direxion Trust is referred to herein as a "Fund" and collectively as the "Funds." The Funds are referred to as the "Non-Leveraged Funds." The Fund managed by Wilshire is referred to as the "Subadvised Fund."
The Board did not identify any particular information that was most relevant to its consideration to approve each Advisory or Subadvisory Agreement (each an "Agreement" and collectively, the "Agreements") and each Trustee may have afforded different weight to the various factors. In addition, the Board noted that the Trustees have considered various reports and information provided throughout the year at their regular Board meetings and otherwise, and that the Independent Board members had met separately on August 6, 2014, to consider these specific contract renewals. In considering whether to renew the Agreements, the Board considered each Fund's individual investment advisory relationship and the best interests of each Fund separately.
In each instance, the Board considered, among others, the following factors: (1) the nature, extent, and quality of the services provided; (2) the investment performance of the Fund; (3) the profitability of the advisory business to Rafferty, and for the Subadvised Fund, the profitability of the advisory business to Wilshire; (4) the extent to which economies of scale have been taken into account in setting fee schedules; (5) whether fee levels reflect these economies of scale, if any, for the benefit of Fund shareholders; (6) comparisons of services and fees with contracts entered into by Rafferty and, for the Subadvised Fund with Wilshire, with other clients (such as pension funds and other institutional investors), if any; and (7) other benefits derived or anticipated to be derived and identified by Rafferty or a subadviser from its relationship with the Funds.
Nature, Extent and Quality of Services Provided. The Board reviewed the nature, extent and quality of the services provided or to be provided under the Advisory Agreements by Rafferty. The Board noted that Rafferty has provided services to the Direxion Trust since its inception and has developed an expertise in managing the Direxion Funds, particularly those using a leveraged strategy. The Board also noted that Rafferty trades efficiently with low commission schedules, which helps improve performance results. The Board considered Rafferty's representation that it has the financial resources and appropriate staffing to manage the Funds and meet its expense reimbursement obligations, if any. The Board also considered that reports from Rafferty's Chief Compliance Officer have been provided to the Board at its regularly scheduled quarterly Board meetings, and the Board expects to continue receiving such reports. The Board considered that Rafferty oversees all aspects of the operation of the Funds, including oversight of the Funds' service providers and subadviser.
Based on these and other considerations, the Board determined that, in the exercise of its business judgment, the nature, extent and quality of the services provided by Rafferty to the Funds under the Agreements, and for the Subadvised Fund, the Subadvisory Agreement with Wilshire, were fair and reasonable.
Performance of the Funds. The Board considered relative performance information for each Fund. The Board utilized performance reports provided to the Board in anticipation of the meeting, as well as performance reports provided at regular Board meetings throughout the year, for the Non-Leveraged Funds and the Subadvised Fund. The Board evaluated the performance of each Non-Leveraged Fund and the Subadvised Fund relative to: (1) its benchmark index for year-to-date, one-year, three-year, five-year, ten-year and since inception periods ended June 30, 2014, as applicable; and (2) the average performance of the relevant Morningstar peer fund universe ("Morningstar Peer Group") for monthly, annual and since inception periods ended June 30, 2014.
DIREXION ANNUAL REPORT
42
Investment Advisory and Subadvisory Agreements Approvals (Unaudited)
Non-Leveraged Funds:
With respect to the Direxion Indexed Commodity Strategy Fund (the "Commodity Fund"), the Board considered the performance of the Fund's Morningstar Peer Group. The Board also considered that, as of June 30, 2014, the Commodity Fund underperformed the average of its relevant Morningstar Peer Group for all applicable periods. The Board also considered that the Commodity Fund is an index fund whose investment strategy is to track the performance of its index, and that it had approved a change in the Commodity Fund's index and investment strategy that went into effect on February 1, 2012. The Board noted, however, that Rafferty had represented that the Fund had maintained close correlation with the performance of its index.
With respect to the Direxion Indexed Managed Futures Strategy Fund (the "Managed Futures Fund"), the Board considered the performance of the Fund's Morningstar Peer Group. The Board also considered that the Managed Futures Fund underperformed the average of its relevant Morningstar Peer Group for the year-to-date and one-year periods ended June 30, 2014. The Board considered, however, that the Managed Futures Fund is an index fund whose investment strategy is to track the performance of its index. The Board noted, however, that Rafferty had represented that the Fund had maintained close correlation with the performance of its index.
Subadvised Fund:
With respect to the Subadvised Fund, the Board considered the performance of the Fund's Morningstar Peer Group. The Board also considered that as of June 30, 2014, the Fund underperformed the average of its relevant Morningstar peer funds for all periods.
Costs of Services Provided to the Funds and Profits Realized. With respect to the overall fairness of the Agreements, the Board considered the investment advisory fees paid to Rafferty given the services provided and the costs of such services, as compared to a peer group of broadly comparable funds. The Board also considered advisory fees charged by, and total expense ratios of, comparable fund groups. The Board also considered the total expense ratios to those of other funds in a Fund's Morningstar expense group ("Morningstar Expense Group").
The Board considered that Rafferty contractually agreed to limit the total expenses (subject to certain exclusions) for the most recent and upcoming fiscal years for each Fund utilizing an Operating Services Fee. Under the Operating Services Agreement, Rafferty contractually agreed to pay certain expenses of each Fund.
The Board also considered the overall profitability of Rafferty's investment business, and the profitability realized by Rafferty on a Fund-by-Fund basis.
Non-Leveraged Funds:
With respect to Commodity Fund, the Board considered that the Fund's actual advisory fee rate was at the median of the Fund's Morningstar Expense Group and the Fund' total expense ratio was lower than the median of the Fund's Morningstar Expense Group.
With respect to Managed Futures Fund, the Board considered that the Fund's actual advisory fee rate and total expense ratio were both lower than the respective medians of the Fund's Morningstar Expense Group.
Subadvised Fund
With respect to the Subadvised Fund, the Board considered that the Fund's actual advisory fee rate was at the median of the Fund's expense group and the Fund' total expense ratio was higher than the median of the Fund's expense group. The
DIREXION ANNUAL REPORT
43
Investment Advisory and Subadvisory Agreements Approvals (Unaudited)
Board considered the profits or losses realized by Wilshire for the services it provides to the Fund. The Board noted that Wilshire provides subadvisory services to different clients at different fee rates, depending on the types of services that Wilshire provides to a subadvisory client. The Board noted that at the Fund's asset level for the period ended June 30, 2014, Wilshire subadvised the Fund at a loss.
Based on these considerations, the Board determined that, in the exercise of its business judgment, the costs of the services provided and the profits realized under the Agreements were fair and reasonable.
Economies of Scale. The Board also considered Rafferty's representation that it believes that asset levels at this time are not sufficient to achieve economies of scale and do not warrant the addition of breakpoints. Rafferty noted that it was continuing to work on its sales and marketing efforts to raise additional assets. Based on these and other considerations, the Board determined that, in the exercise of its business judgment, any reduction in fee rates or addition of breakpoints were not necessary at this time.
Other Benefits. The Board considered any indirect or "fall-out" benefits that Rafferty or its affiliates may derive from their relationship to the Funds. Such benefits may include Rafferty's ability to leverage its investment management personnel or infrastructure to manage other accounts. The Board also considered that Rafferty's overall business with brokerage firms helps to lower commission rates and provide better execution for Fund portfolio transactions. In addition, the Board considered that Wilshire benefits from increased recognition in the marketplace due to the co-branded Subadvised Fund. Based on these and other considerations, the Board determined that, in the exercise of its business judgment, the benefits to Rafferty were fair and reasonable.
Conclusion. Based on, but not limited to, the above considerations and determinations, the Board determined that the Agreements for the Funds were fair and reasonable in light of the services to be performed, fees, expenses and such other matters as the Board considered relevant in the exercise of its business judgment. On this basis, the Board unanimously voted in favor of the continuance of the Agreements.
DIREXION ANNUAL REPORT
44
The business affairs of the Funds are managed by or under the direction of the Board of Trustees. Information pertaining to the Trustees and Officers of the Funds is set below. The SAI includes additional information about the Funds' Trustees and Officers and is available without charge, upon request by calling 1-800-851-0511.
Interested Trustees
Name, Address and
Age | | Position(s)
Held with
Fund | | Term of Office
and Length of
Time Served | | Principal Occupation(s)
During Past Five Years | | # of Portfolios
in Direxion
Family of
Investment
Companies
Overseen
by Trustee(3) | | Other Trusteeships/
Directorships Held by
Trustee During Past
Five Years | |
Daniel D. O'Neill(1)
Age: 46 | |
Chairman of the Board of Trustees | |
Lifetime of Trust until removal or resignation; Since 2014 | |
Managing Director of Rafferty, 1999-present. | | |
121 | | |
None. | |
Eric Falkeis(2)
Age: 40 | |
Trustee | |
Lifetime of Trust until removal or resignation; Since 2014 | |
Chief Operating Officer, since April 2014, Rafferty Asset Management, LLC; formerly President Rafferty Asset Management, LLC, March 2013-April 2014; formerly, Senior Vice President, USBFS, September 2007-March 2013; Chief Financial Officer, USBFS, April 2006-March 2013; Vice President, USBFS, 1997-2007; formerly, Chief Financial Officer, Quasar Distributors, LLC (2000-2003). | | |
121 | | |
Trustee,
Professionally
Managed Portfolios
(45 Funds) | |
Non-Interested Trustees
Name, Address and
Age | | Position(s)
Held with
Fund | | Term of Office
and Length of
Time Served | | Principal Occupation(s)
During Past Five Years | | # of Portfolios
in Direxion
Family of
Investment
Companies
Overseen
by Trustee(3) | | Other Trusteeships/
Directorships Held by
Trustee During Past
Five Years | |
Gerald E. Shanley III
Age: 71 | |
Trustee | |
Lifetime of Trust until removal or resignation; Since 1997 | |
Retired, Since 2002; Business Consultant, 1985-present; Trustee of Trust Under Will of Charles S. Payson, 1987-present; C.P.A., 1979-present. | | |
121 | | |
None. | |
(1) Mr. O'Neill is affiliated with Rafferty. Mr. O'Neill is the Managing Director of Rafferty and owns a beneficial interest in Rafferty.
(2) Mr. Falkeis is affiliated with Rafferty. Mr. Falkeis is the Chief Operating Officer of Rafferty.
(3) The Direxion Family of Investment Companies consists of the Direxion Funds which, as of the date of this report, offers for sale to the public 17 portfolios, the Direxion Insurance Trust which, as of the date of this report, offers for sale 3 of the 8 funds registered with the SEC and the Direxion Shares ETF Trust which, as of the date of this report, offers for sale to the public 55 of the 96 funds registered with the SEC.
DIREXION ANNUAL REPORT
45
Name, Address and
Age | | Position(s)
Held with
Fund | | Term of Office
and Length of
Time Served | | Principal Occupation(s)
During Past Five Years | | # of Portfolios
in Direxion
Family of
Investment
Companies
Overseen
by Trustee(1) | | Other Trusteeships/
Directorships Held by
Trustee During Past
Five Years | |
John Weisser
Age: 73 | |
Trustee | |
Lifetime of Trust until removal or resignation; Since 2007 | |
Retired, Since 1995; Salomon Brothers, Inc., 1971-1995, most recently as Managing Director. | |
121 | |
Director, The MainStay Funds Trust (35 Funds), The MainStay Funds (12 Funds), MainStay VP Fund Series (29 Funds), Mainstay Defined Term Municipal Opportunities Fund (1 Fund); Private Advisors Alternative Strategy Fund (1 Fund); Private Advisors Alternative Strategies Master Fund (1 Fund). | |
David L. Driscoll
Age: 44 | |
Trustee | |
Lifetime of Trust until removal or resignation; Since 2014 | |
Partner, King Associates, LLP, since 2004; Board Advisor, University Common Real Estate, since 2012; Principal, Grey Oaks LLP since 2003; Member, Kendrick LLC, since 2006. | |
121 | |
None. | |
Jacob C. Gaffey
Age: 66 | |
Trustee | |
Lifetime of Trust until removal or resignation; Since 2014 | |
Managing Director of Loomis & Co. since 2013; Partner, Bay Capital Advisors, LLC 2008-2012. | |
121 | |
Director, Costa, Inc. (formerly A.T.
Cross, Inc.). | |
(1) The Direxion Family of Investment Companies consists of the Direxion Funds which, as of the date of this report, offers for sale to the public 17 portfolios, the Direxion Insurance Trust which, as of the date of this report, offers for sale 3 of the 8 funds registered with the SEC and the Direxion Shares ETF Trust which, as of the date of this report, offers for sale to the public 55 of the 96 funds registered with the SEC.
DIREXION ANNUAL REPORT
46
Principal Officers of the Trust
The officers of the Trust conduct and supervise its daily business. Unless otherwise noted, an individual's business address is 1301 Avenue of the Americas, 35th Floor, New York, New York 10019. As of the date of this report, the officers of the Trust, their ages, their business address and their principal occupations during the past five years are as follows:
Name, Address and
Age | | Position(s)
Held with
Fund | | Term of Office
and Length of
Time Served | | Principal Occupation(s)
During Past Five Years | | # of Portfolios
in the Direxion
Family of
Investment
Companies
Overseen
by Trustee(3) | | Other Trusteeships/
Directorships Held by
Trustee During Past
Five Years | |
Daniel D. O'Neill(1)
Age: 46 | |
Chief Executive Officer and Chief Investment Officer | |
One Year; Since 2006 | |
Managing Director of Rafferty, 1999-present. | |
121 | |
N/A | |
Eric Falkeis(2)
Age: 40 | |
Principal Executive Officer | |
One Year; Since 2014 | |
Chief Operating Officer, since April 2014, Rafferty Asset Management, LLC; formerly President Rafferty Asset Management, LLC, March 2013 – April 2014; formerly, Senior Vice President, USBFS, September 2007 – March 2013; Chief Financial Officer, USBFS, April 2006 – March 2013; Vice President, USBFS, 1997-2007; formerly, Chief Financial Officer, Quasar Distributors, LLC (2000-2003). | |
121 | |
Trustee, Professionally Managed Portfolios (45 Funds) | |
Brian Jacobs
Age: 54 | |
President | |
One Year; Since 2014 | |
President, since April 2014, Rafferty Asset Management, LLC; formerly, Managing Partner, Jacobs Strategic Consulting (2012-2014); formerly, Chief Executive Officer, Hatteras Funds (2010-2012); formerly, Chief Distribution Officer, Baron Capital (2009); formerly, Managing Director, Allianz Global Investors (2000-2008). | |
N/A | |
Formerly, Board Member, Wheelhouse Analytics; formerly, Board Member, Raise Hope Foundation. | |
(1) Mr. O'Neill serves as Chairman of the Board of Trustees of the Direxion Funds, Direxion Insurance Trust and Direxion Shares ETF Trust.
(2) Mr. Falkeis serves as a Trustee of the Direxion Funds, Direxion Insurance Trust and Direxion Shares ETF Trust.
(3) The Direxion Family of Investment Companies consists of the Direxion Funds which, as of the date of this report, offers for sale to the public 17 portfolios, the Direxion Insurance Trust which, as of the date of this report, offers for sale 3 of the 8 funds registered with the SEC and the Direxion Shares ETF Trust which, as of the date of this report, offers for sale to the public 55 of the 96 funds registered with the SEC.
DIREXION ANNUAL REPORT
47
Name, Address and
Age | | Position(s)
Held with
Fund | | Term of Office
and Length of
Time Served | | Principal Occupation(s)
During Past Five Years | | # of Portfolios
in the Direxion
Family of
Investment
Companies
Overseen
by Trustee(1) | | Other Trusteeships/
Directorships Held by
Trustee During Past
Five Years | |
Patrick J. Rudnick
Age: 41 | |
Principal Financial Officer and Assistant Secretary | |
One Year; Since 2010 | |
Senior Vice President and Principal Financial Officer, Rafferty Asset Management, LLC, since March 2013; formerly Vice President, USBFS (2006-2013); formerly, Manager, PricewaterhouseCoopers LLP (1999-2006). | |
N/A | |
N/A | |
Angela Brickl
Age: 38 | |
Chief Compliance Officer Secretary | |
One Year; Since 2012
One Year; Since 2011 | |
General Counsel and Chief Compliance Officer, Rafferty Asset Management, LLC, since October 2010; Summer Associate at Skadden, Arps, Slate, Meagher & Flom, LLP, May – August 2009; Summer Associate at Foley & Lardner, LLP May – August 2008; Vice President USBFS November 2003 – August 2007. | |
N/A | |
N/A | |
(1) The Direxion Family of Investment Companies consists of the Direxion Funds which, as of the date of this report, offers for sale to the public 17 portfolios, the Direxion Insurance Trust which, as of the date of this report, offers for sale to the public 3 of the 8 funds registered with the SEC and the Direxion Shares ETF Trust which, as of the date of this report, offers for sale to the public 55 of the 96 funds registered with the SEC.
DIREXION ANNUAL REPORT
48
THIS PAGE INTENTIONALLY LEFT BLANK
49
THIS PAGE INTENTIONALLY LEFT BLANK
50
At the Direxion Funds, we are committed to protecting your privacy. To open and service your Direxion accounts, we collect and maintain certain nonpublic personal information about you, such as your address, phone number, social security number, purchases, sales, account balances, bank account information and other personal financial information. We collect this information from the following sources:
• Account applications or other forms on which you provide information,
• Mail, e-mail, the telephone and our website, and
• Your transactions and account inquiries with us.
We safeguard the personal information that you have entrusted to us in the following ways:
• As a general policy, only those employees who maintain your account and respond to your requests for additional services have access to your account information.
• We maintain physical, electronic, and procedural safeguards to insure the security of your personal information and to prevent unauthorized access to your information.
We do not disclose any nonpublic personal information about you or our former shareholders to anyone, except as permitted or required by law. In the course of conducting business and maintaining your account we may share shareholder information, as allowed by law, with our affiliated companies and with other service providers, including financial intermediaries, custodians, transfer agents and marketing consultants. Those companies are contractually bound to use that information only for the services for which we hired them. They are not permitted to use or share our shareholders' nonpublic personal information for any other purpose. There also may be times when we provide information to federal, state or local authorities as required by law.
In the event that you hold fund shares of Direxion through a financial intermediary, including, but not limited to, a broker-dealer, bank, or trust company, the privacy policy of your financial intermediary would govern how your nonpublic personal information would be shared with nonaffiliated third parties.
For questions about our policy, please contact us at (800) 851-0511.
This page is not a part of the Annual Report.
DIREXION ANNUAL REPORT

ANNUAL REPORT OCTOBER 31, 2014
1301 Avenue of the Americas (6th Ave.), 35th Floor New York, New York 10019 (800) 851-0511 www.direxioninvestments.com
Investment Adviser
Rafferty Asset Management, LLC
1301 Avenue of the Americas (6th Ave.), 35th Floor
New York, NY 10019
Administrator, Transfer Agent, Dividend Paying Agent & Shareholding Servicing Agent
U.S. Bancorp Fund Services, LLC
P.O. Box 1993
Milwaukee, WI 53201-1993
Custodian
U.S. Bank, N.A.
1555 RiverCenter Dr., Suite 302
Milwaukee, WI 53212
Independent Registered Public Accounting Firm
Ernst & Young LLP
5 Times Square
New York, NY 10036
Distributor
Rafferty Capital Markets, LLC
1010 Franklin Ave., 3rd Floor
Garden City, NY 11530
The Trust's Proxy Voting Policies are available without charge by calling 1-800-851-0511, or by accessing the SEC's website, at www.sec.gov.
The actual voting records relating to portfolio securities during the most recent period ended June 30 (starting with the year ended June 30, 2005) is available without charge by calling 1-800-851-0511 or by accessing the SEC's website at www.sec.gov.
The Trust files complete schedules of portfolio holdings with the SEC on Form N-Q. The Form N-Q is available without change, upon request, by calling 1-800-851-0511, or by accessing the SEC's website, at www.sec.gov.
This report has been prepared for shareholders and may be distributed to others only if preceded or accompanied by a current prospectus.
Item 2. Code of Ethics.
The registrant has adopted a code of ethics that applies to the registrant’s principal executive officer and principal financial officer. The registrant has not made any amendments to its code of ethics during the period covered by this report. The registrant has not granted any waivers from any provisions of the code of ethics during the period covered by this report. A copy of the registrant’s Code of Ethics is filed herewith.
Item 3. Audit Committee Financial Expert.
The registrant’s board of trustees has determined that there is at least one audit committee financial expert serving on its audit committee. Gerald E. Shanley III is the “audit committee financial expert” and is considered to be “independent” as each term is defined in Item 3 of Form N-CSR.
Item 4. Principal Accountant Fees and Services.
The registrant has engaged its principal accountant to perform audit services, audit-related services, tax services and other services during the past fiscal year. “Audit services” refer to performing an audit of the registrant’s annual financial statements or services that are normally provided by the accountant in connection with statutory and regulatory filings or engagements for the fiscal year. “Audit-related services” refer to the assurance and related services by the principal accountant that are reasonably related to the performance of the audit. “Tax services” refer to professional services rendered by the principal accountant for tax compliance, tax advice, and tax planning, including assessment of ASC 740 for the Funds and additional tax research. There were no “Other services” provided by the principal accountant. The following table details the aggregate fees billed or expected to be billed for each of the last fiscal year for audit fees, audit-related fees, tax fees and other fees by the principal accountant. The table presents aggregate fees billed to the registrant and reflected in the financial statements of the report to shareholders.
| | FYE 10/31/2014 | | FYE 10/31/2013 | |
Audit Fees | | $ | 80,250 | | $ | 89,200 | |
Audit-Related Fees | | — | | — | |
Tax Fees | | $ | 27,820 | | 21,600 | |
All Other Fees | | — | | — | |
| | | | | | | |
The audit committee has adopted pre-approval policies and procedures that require the audit committee to pre-approve all audit and non-audit services of the registrant, including services provided to any entity affiliated with the registrant.
The percentages of fees billed by Ernst & Young LLP applicable to non-audit services pursuant to waiver of pre-approval requirement were as follows:
| | FYE 10/31/2014 | | FYE 10/31/2013 | |
Audit-Related Fees | | 0 | % | 0 | % |
Tax Fees | | 0 | % | 0 | % |
All Other Fees | | 0 | % | 0 | % |
All of the principal accountant’s hours spent on auditing the registrant’s financial statements were attributed to work performed by full-time permanent employees of the principal accountant. (If more than 50 percent of the accountant’s hours were spent to audit the registrant’s financial statements for the fiscal year, state how many hours were attributed to work performed by persons other than the principal accountant’s full-time, permanent employees.)
The following table indicates the non-audit fees billed or expected to be billed by the registrant’s accountant for services to the registrant and to the registrant’s investment adviser (and any other controlling entity, etc.—not sub-adviser) for the last year. The audit committee of the board of trustees has considered whether the provision of non-audit services that were rendered to the registrant’s investment adviser is compatible with maintaining the principal accountant’s independence and has concluded that the provision of such non-audit services by the accountant has not compromised the accountant’s independence.
Non-Audit Related Fees | | FYE 10/31/2014 | | FYE 10/31/2013 | |
Registrant | | None | | None | |
Registrant’s Investment Adviser | | None | | None | |
Item 5. Audit Committee of Listed Registrants.
Not applicable to registrants who are not listed issuers (as defined in Rule 10A-3 under the Securities Exchange Act of 1934).
Item 6. Schedule of Investments.
Schedule of Investments is included as part of the report to shareholders filed under Item 1 of this Form.
Item 7. Disclosure of Proxy Voting Policies and Procedures for Closed-End Management Investment Companies.
Not applicable to open-end investment companies.
Item 8. Portfolio Managers of Closed-End Management Investment Companies.
Not applicable to open-end investment companies.
Item 9. Purchases of Equity Securities by Closed-End Management Investment Company and Affiliated Purchasers.
Not applicable to open-end investment companies.
Item 10. Submission of Matters to a Vote of Security Holders.
There have been no material changes to the procedures by which shareholders may recommend nominees to the registrant’s board of directors/trustees.
Item 11. Controls and Procedures.
(a) The Registrant’s President and Principal Financial Officer have reviewed the Registrant’s disclosure controls and procedures (as defined in Rule 30a-3(c) under the Investment Company Act of 1940 (the “Act”)) as of a date within 90 days of the filing of this report, as required by Rule 30a-3(b) under the Act and Rules 13a-15(b) or 15d-15(b) under the Securities Exchange Act of 1934. Based on their review, such officers have concluded that the disclosure controls and procedures are effective in ensuring that information required to be disclosed in this report is appropriately recorded, processed, summarized and reported and made known to them by others within the Registrant and by the Registrant’s service provider.
(b) There were no changes in the Registrant’s internal control over financial reporting (as defined in Rule 30a-3(d) under the Act) that occurred during the second fiscal quarter of the period covered by this report that has materially affected, or is reasonably likely to materially affect, the Registrant’s internal control over financial reporting.
Item 12. Exhibits.
(a) (1) Any code of ethics or amendment thereto, that is subject of the disclosure required by Item 2, to the extent that the registrant intends to satisfy Item 2 requirements through filing an exhibit. Filed herewith.
(2) Certifications pursuant to Section 302 of the Sarbanes-Oxley Act of 2002. Filed herewith.
(3) Any written solicitation to purchase securities under Rule 23c-1 under the Act sent or given during the period covered by the report by or on behalf of the registrant to 10 or more persons. Not applicable to open-end investment companies.
(b) Certification pursuant to Section 906 of the Sarbanes-Oxley Act of 2002. Furnished herewith.
SIGNATURES
Pursuant to the requirements of the Securities Exchange Act of 1934 and the Investment Company Act of 1940, the registrant has duly caused this report to be signed on its behalf by the undersigned, thereunto duly authorized.
(Registrant) | Direxion Funds | |
| |
| | |
By (Signature and Title) | /s/ Eric W. Falkeis | |
| Eric W. Falkeis, Principal Executive Officer | |
| |
| |
Date | 1-5-15 | |
| | | | |
Pursuant to the requirements of the Securities Exchange Act of 1934 and the Investment Company Act of 1940, this report has been signed below by the following persons on behalf of the registrant and in the capacities and on the dates indicated.
By (Signature and Title) | /s/ Eric W. Falkeis | |
| Eric W. Falkeis, Principal Executive Officer | |
| |
| |
Date | 1-5-15 | |
| | | |
By (Signature and Title) | /s/ Patrick J. Rudnick | |
| Patrick J. Rudnick, Principal Financial Officer | |
| |
| |
Date | 1-5-15 | |
| | | |
